
|
|
|
|
|
|
|
|
|
|
Previous: BANC OF AMERICA COMMERCIAL MORTGAGE INC, 8-K, EX-99, 2000-08-31 |
Next: HEALTH SYSTEMS DESIGN CORP, 8-K, 2000-08-31 |
Mosaic Focus Fund
Semi-Annual Report (unaudited)
June 30, 2000
Mosaic Funds
www.mosaicfunds.com
Contents
MOSAIC FOCUS FUND June 30, 2000
(photograph of) Katherine Frank
The stock market of 2000 has made generalizations dangerous: The market's disposition has changed as often as the weather. At the beginning of this semi-annual period the year was shaping up to look a lot like the previous year's narrow market. While the broad market was down or flat, technology companies whose earnings were mere promises and whose stock valuations were off the charts continued to prosper. Then, in March and April, the market demonstrated second thoughts, as the Nasdaq market, where many of these stocks trade, dropped some 35% from its peak.
As we had been anticipating, some of the money coming out of the more speculative stocks went into the more reasonably priced, steadily growing companies that Mosaic owns. So even as the headlines concentrated on the billions being lost as high-flying technology stocks dropped, the value of Focus held steady. Towards the end of the six-month period there was a resurgence in technology stocks, but this time with a bias for the larger, profitable companies. As you will see in the report, we were able to benefit from this turn by purchasing some high-quality stocks when their prices were depressed by the overall sell-off in technology.
One of the tenets of our management style is risk consciousness. In other words, we screen stocks for both upward potential and downside risk. The benefits of this approach were clear during this past six months, when our approach did a nice job of dampening the volatility of the more speculative edges of the market. At the same time, we are not happy unless we're helping shareholders build wealth. We feel the stocks in the Focus Fund hold great potential for growth, and will realize this growth best in a market that values earnings and steady growth. We believe we are moving into just such a market.
Our current newsletter, Mosaic Update, which was enclosed with your June 30, 2000 statements, discusses our management approach at greater length. If you missed the newsletter, or would like extra copies, give us a call at 1-800-368-3195.
Sincerely,
(signature)
Katherine L. Frank
President
The first half of 2000 proved once again that high stock valuations and instability go hand-in-hand, as the market, especially the Nasdaq, experienced significant setbacks. The index saw as much as a 35% decline from its early March peak, yet recovered to end the period down -2.54%. The Dow Jones Industrial Average was down -8.44%; the S&P 500 was down -0.42%. Extreme valuations and rising interest rates were the main culprits of the decline. The technology sector was the hardest hit, as the stocks that had gone up the most seemed to be the ones most vulnerable. In a reversal of 1999, when Nasdaq stocks without earnings were the market's darlings, non-revenue producing Internet companies were battered, and it appeared that bottom-line results once again mattered.
As was true for much of 1999, we saw a period of rapid economic growth accompanied with strong corporate earnings growth. On the negative side were increasing signs of inflation. In May, the Federal Reserve Board reacted by increasing interest rates by 50 basis points (.50%). They met again at the end of June, held rates steady, but signaled that further rate increases would occur if warranted. On a week-by-week basis stock investors monitored the major economic indicators, buoyed when news suggested a slowing economy (which would discourage interest rates hikes), and driving markets down when the news suggested inflation or continued expansion (since these are the drivers of higher Federal Reserve rates).
During the period the market was decidedly mixed. The healthcare
sector had the best results, propelled by acquisitions and optimism regarding the economic
promise of biotechnology. Fears of a slowing economy drove down companies in the basic
materials and consumer cyclical areas. In the end, many of the major indices recouped much
of their early losses, and some of the larger, well-known tech names were once again near
all-time highs. By the end of June the market was characterized by increased interest in
the kind of steadily growing companies held in Mosaic's Focus Fund and very high
valuations for most of the leading technology companies.
Outlook for the remainder of the year 2000
Given that earnings are likely to slow along with the economy, we will continue to seek to own great companies that we believe can deliver solid earning gains in this environment. As always, we buy only when valuations appear reasonable. Despite the loss in value in some sectors of the market, we don't believe the market has been stripped of excessive risk. We do hope that the quick, substantial decline seen in the March through May period will remind investors of the risk the stock market has to offer, and that stocks that seem to have no price ceiling may be subject to major reversals. The prospect of a slowing economy also reinforces our determination to buy only those companies with consistent earnings growth that are available at reasonable valuations. We believe a slowing economy, which is exactly what the Federal Reserve is insisting upon, will bring more investors our way, rewarding our shareholders for sticking with a solid long-standing investment discipline.
Interview with lead equity manager Jay Sekelsky
(photograph of) Jay Sekelsky
How did Focus perform in the first half of 2000?
Due to its concentration, Focus has the potential for greater swings
in performance than a more diversified portfolio, and that was certainly true in the first
six months of 2000. The stocks we prefer were decidedly out of favor in 1999 and that
trend continued into the new year. As the value of technology stocks peaked in early
March, Focus was hitting lows for the period. When the tech-heavy Nasdaq index entered its
major slide in March, the more reliable earners in Focus began to look considerably more
attractive to investors, so that by the end of the first quarter, the fund had recovered
much of its losses for the year. The second half of the six-month period continued this
positive trend, with the fund ending the six-month period down -2.52%.
Did you make any significant additions to the portfolio since December 31, 1999?
During the first half of 2000 we added to our technology exposure in
the wake of the sell-off in that sector in March and April. In particular, we added
Microsoft and Tellabs, a telecommunications equipment manufacturer. We also added Target,
a discount retailer, and Pepsico.
What holdings were the strongest contributors to fund performance?
The best sector for the fund over the six-months was the consumer
area, where we had strong returns from Pepsico and Safeway. Although our overall
technology holdings were a slight drag on performance, our Intel holding did quite well.
We also had good results from our holding in pharmaceutical Abbott Labs. The second half
of the period showed stronger performance than the first half, as we received a lift from
our "blue-chip" technology holdings and benefited from the overall market
recovery in the latter part of the period.
What holdings were the largest constraints on performance?
Our largest sector exposure was to financials, and these stocks
underperformed through the six months. We had particularly disappointing results from
long-time holding Freddie Mac and MGIC Investment, the mortgage insurance company. While
the financial holdings hurt us over the short-term, we believe they have the potential to
drive the portfolio's growth going forward. We're confident that the companies are strong
and that the market's lack of interest in them should turn when the Federal Reserve
completes its latest round of interest rate increases. We also saw negative news in one of
our technology holdings Compuware Corp., in a sector that has been priced for perfection.
Compuware has been sold from the portfolio.
What is your outlook for the year 2000?
We will continue to buy great companies we believe are capable of generating consistently strong earnings growth. As always, we require that valuations appear reasonable. Recent volatility reinforces our determination to buy only those companies with consistent earnings growth at reasonable valuations.
For some time we've invested in a market that does not seem to value the qualities we seek. From the beginning of this trend we've been firm in our belief that this is a temporary situation. This past period shows signs of confirming our patience. We have great faith in our investing discipline and believe we have a portfolio of extremely solid companies. We look forward to reporting on their progress.
TOP FIVE STOCK HOLDINGS AS OF JUNE 30, 2000
% of net assets |
|
| Worldcom, Incorporated | 11.7% |
| Federal Home Loan Mortgage | 8.4% |
| Bristol Myers Squibb | 7.9% |
| Tellabs Inc. | 6.9% |
| MGIC Investment Corp. | 6.8% |
MOSAIC FOCUS FUND June 30, 2000
Portfolio of Investments (unaudited)
NUMBERS |
|
|
| COMMON STOCKS: 97.7% of net assets | ||
| BANKS: 4.2% | ||
| ---Wells Fargo & Co. | 3,400 |
$131,750 |
| CONSUMER CYCLICALS: 9.5% | ||
| ---Lowe's Companies | 3,500 |
143,719 |
| ---Target Corporation | 2,700 |
156,600 |
| CONSUMER SERVICES - TELECOMMUNICATIONS: 11.7% | ||
| ---WorldCom, Inc.* | 8,020 |
367,917 |
| CONSUMER STAPLES - FOOD & BEVERAGE: 4.6% | ||
| ---Pepsico, Incorporated | 3,250 |
144,422 |
| CONSUMER STAPLES - RETAIL: 11.5% | ||
| ---CVS Corporation | 5,000 |
200,000 |
| ---Safeway, Incorporated* | 3,600 |
162,450 |
| ENTERTAINMENT: 3.5% | ||
| ---Time Warner, Inc. | 1,450 |
110,200 |
| FINANCIAL - SERVICES: 12.1% | ||
| ---Associates First Capital | 5,300 |
118,256 |
| ---Federal Home Loan Mortgage Corp. | 6,500 |
263,250 |
| HEALTHCARE: 17.5% | ||
| ---Abbott Laboratories | 3,350 |
149,284 |
| ---Bristol-Meyers Squibb | 4,300 |
250,475 |
| ---ohnson & Johnson | 1,500 |
152,813 |
| INSURANCE: 6.8% | ||
| ---MGIC Investment Corp. | 4,700 |
213,850 |
| TECHNOLOGY: 16.3% | ||
| ---Intel Corporation | 1,000 |
133,688 |
| ---Microsoft Corporation* | 2,000 |
160,000 |
| ---Tellabs Incorporated* | 3,200 |
219,000 |
| ------TOTAL COMMON STOCKS (cost $3,083,685) | 3,077,674 |
|
| REPURCHASE AGREEMENT:
1.0% of net assets With Donaldson, Lufkin & Jenrette Securities Corporation issued 6/30/00 at 5.25%, due 7/03/00, collateralized by $33,665 in United States Treasury Notes due 11/15/08. Proceeds at maturity are $33,014. (cost $33,000) |
|
|
| TOTAL INVESTMENTS:
98.7% of net assets (cost $3,116,685) |
3,110,674 |
|
| CASH AND RECEIVABLES LESS
LIABILITIES: 1.3% of net assets |
|
|
| NET ASSETS: 100% | $03,151,780 |
*Non-income producing
The Notes to Financial Statements are an integral part of these statements.
Statement of Assets and Liabilities (unaudited)
| ASSETS | |
| Investments, at value (Notes 1 and 2) | |
| ---Investment securities* | $3,077,674 |
| ---Repurchase agreements | 33,000 |
| Total investments | 3,110,674 |
| Cash | 953 |
| Receivables | |
| ---Investment securities sold | 55,442 |
| ---Dividends and interest | 14 |
| ---Capital shares sold | 1,200 |
| Total assets | 3,168,283 |
| LIABILITIES | |
| Investment securities purchased | 16,503 |
| Total liabilities | 16,503 |
| NET ASSETS (Note 7) | $3,151,780 |
| CAPITAL SHARES OUTSTANDING | 127,415 |
| NET ASSET VALUE PER SHARE | $24.74 |
| *INVESTMENT SECURITIES, AT COST | $3,083,685 |
Statement of Operations (unaudited)
For the six-month period ended June 30, 2000
| INVESTMENT INCOME (Note 1) | |
| ---Interest income | $2,469 |
| ---Dividend income | 13,121 |
| ---Other income | 237 |
| ------Total investment income | 15,827 |
| EXPENSES (Notes 3 and 5) | |
| ---Investment advisory fees | 11,967 |
| ---Transfer agent and administrative expenses | 7,959 |
| ------Total expenses | 19,926 |
| NET INVESTMENT LOSS | (4,099) |
| REALIZED AND UNREALIZED GAIN (LOSS) ON INVESTMENTS | |
| ---Net realized loss on investments | (217,901) |
| ---Change in net unrealized appreciation of investments | 115,594) |
| ------Net realized and unrealized loss on investments | (102,307) |
| TOTAL DECREASE IN NET
ASSETS RESULTING FROM OPERATIONS |
|
Statements of Changes in Net Assets
(unaudited) |
|
|
| INCREASE (DECREASE) IN NET ASSETS RESULTING FROM OPERATIONS | ||
| ---Net investment loss | $ (4,099) |
$ (9,602) |
| ---Net realized gain (loss) on investments | (217,901) |
185,505 |
| ---Change in net unrealized appreciation ---(depreciation) of investments |
|
|
| ------Total decrease in net assets ------resulting from operations |
|
|
| DISTRIBUTIONS TO SHAREHOLDERS | ||
| ---From net investment income | --) |
-- |
| ---From net capital gains | --) |
(98,292) |
| ------Total distributions | --) |
(98,292) |
| CAPITAL SHARE TRANSACTIONS (Note 8) | (461,504) |
2,377,484 |
| TOTAL INCREASE (DECREASE)
IN NET ASSETS |
|
|
| NET ASSETS | ||
| Beginning of period | $3,719,690 |
$1,725,464 |
| End of period | $3,151,780 |
$3,719,690 |
Selected data for a share outstanding for the periods indicated.
Six
Months |
|
||
2000 |
1999 |
1998 |
|
| Net asset value beginning of period | $25.38 |
$28.36 |
$21.09 |
| Investment operations: | |||
| ---Net investment income (loss) | (0.03) |
(0.07) |
0.03 |
| ---Net realized and unrealized gain ---(loss) on securities |
|
|
|
| Total from investment operations | (0.64) |
(2.29) |
9.05 |
| ---Less distributions: | |||
| ------From net investment income | .-- |
.-- |
(0.10) |
| ------From capital gains | .-- |
(0.69) |
(1.68) |
| Total distributions | .-- |
(0.69) |
(1.78) |
| Net asset value, end of period | $24.74 |
$25.38 |
$28.36 |
| Total return (%) | (5.04)-1 |
(8.05) |
44.23 |
| Ratios and supplemental data | |||
| Net assets, end of period (in thousands) | $3,152 |
$3,720 |
$1,725 |
| ---Ratio of expenses to average ---net assets (%) |
|
|
|
| ---Ratio of net investmen income ---to average net assets (%) |
|
|
|
| Portfolio turnover (%) | 39 |
140 |
112 |
1 Annualized.
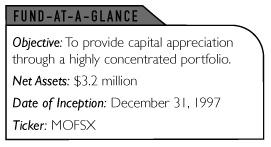
1. Summary of Significant Accounting Principles. Mosaic Focus Fund (the "Fund") adopted its current investment objectives and policies effective January 1, 1998. It is a non-diversified equity fund seeking long-term growth of capital. Its policies are to invest in approximately 12-18 stocks. The Fund is organized as a Massachusetts Business Trust. The Fund is registered under the Investment Company Act of 1940, as amended, as an open-end management investment company. Prior to 1998, the Fund, known as Madison Opportunity Fund, Inc., was a diversified, small to mid-cap growth portfolio that was never publicly offered to investors. Its portfolio was liquidated prior to 1998. As such, the financial information in this report for periods prior to January 1, 1998 is not presented because it is not indicative of the operations or performance of the Fund under its current investment objectives, policies and operations.
Securities Valuation: Securities traded on a national securities exchange are valued at their closing sale price, if available, and if not available such securities are valued at the mean between their bid and asked prices. Other securities, for which current market quotations are not readily available, are valued at their fair value as determined in good faith by the Board of Trustees. Investment transactions are recorded on the trade date. The cost of investments sold is determined on the identified cost basis for financial statement and federal income tax purposes. Short-term securities (maturing within 60 days) are valued at amortized cost which approximates market value. Securities with maturities in excess of 60 days are valued at market value.
Investment Income: Dividend income is recognized on the ex-dividend date and interest and other income is accrued on a daily basis.
Dividends: Substantially all of the Fund's accumulated net investment income, if any, determined as gross investment income less expenses, is declared as a regular dividend and distributed to shareholders at year end. Capital gain distributions, if any, are declared and paid annually at year end. Additional distributions may be made if necessary.
Income Tax: No provision is made for Federal income taxes since it is the intention of the Fund to comply with the provisions of the Internal Revenue Code available to investment companies and to make the requisite distribution to shareholders of taxable income which will be sufficient to relieve it from all or substantially all Federal income taxes.
Use of Estimates: The preparation of the financial statements in conformity with generally accepted accounting principles requires management to make estimates and assumptions that affect the reported amounts of assets and liabilities and reported amounts of increases and decreases in net assets from operations during the reporting period. Actual results could differ from those estimates.
2. Investments in Repurchase Agreements. When the Fund purchases securities under agreements to resell, the securities are held for safekeeping by the custodian bank as collateral. Should the market value of the securities purchased under such an agreement decrease below the principal amount to be received at the termination of the agreement plus accrued interest, the counterparty is required to place an equivalent amount of additional securities in safekeeping with the Fund's custodian bank. Repurchase agreements may be terminated within seven days. Pursuant to an Exemptive Order issued by the Securities and Exchange Commission, the Fund, along with other registered investment companies having Advisory and Services Agreements with the same advisor, transfers uninvested cash balances into a joint trading account. The aggregate balance in this joint trading account is invested in one or more consolidated repurchase agreements whose underlying securities are U.S. Treasury or federal agency obligations.
3. Investment Advisory Agreement. The Investment Advisor to the Fund, Madison Mosaic, LLC, a wholly owned subsidiary of Madison Investment Advisors, Inc., (the "Advisor"), earns an advisory fee of 0.75% per annum of the average net assets of the Fund; the fees are accrued daily and are paid monthly.
4. Investment Transactions. For the six-month period ended June 30, 2000, the purchases and sales of investment securities (excluding short-term securities) were $1,228,942 and $1,564,993, respectively.
5. Other expenses. All support services are provided by the Advisor under a Services Agreement for fees based on a percentage (0.50%) of net assets.
6. Aggregate Cost and Unrealized Appreciation (Depreciation). The aggregate cost for federal income tax purposes and the net unrealized depreciation are as follows as of June 30, 2000.
| Aggregate Cost | $3,116,685 |
| Gross unrealized appreciation | 224,824 |
| Gross unrealized depreciation | (230,835) |
| Net unrealized depreciation | $(6,011) |
7. Net Assets. At June 30, 2000, net assets include the following:
| Net paid in capital on shares of beneficial interest | $3,252,550 |
| Accumulated net investment loss | (13,700) |
| Accumulated net realized loss | (81,059) |
| Net unrealized depreciation on investments | (6,011) |
| Total net assets | $3,151,780 |
8. Capital Share Transactions. An unlimited number of capital shares, without par value, are authorized. Transactions in capital shares for the following periods were:
(unaudited) |
|
|
| In Dollars | ||
| Shares sold | $125,026 |
$2,791,279 |
| Shares issued in
reinvestment of dividends |
|
|
| Total shares issued | 125,026 |
2,889,378 |
| Shares redeemed | (586,530) |
(511,894) |
| Net increase (decrease) | $(461,504) |
$2,377,484 |
| In Shares | ||
| Shares sold | 5,345 |
100,603 |
| Shares issued in
reinvestment of dividends |
|
|
| Total shares issued | 5,345 |
104,519 |
| Shares redeemed | (24,518) |
(18,769) |
| Net increase (decrease) | (19,173) |
85,750 |
Mosaic Equity Trust
Mosaic Focus Fund
Mosaic Income Trust
Mosaic Tax-Free Trust
Mosaic Government Money Market
For more complete information on any Mosaic Fund, including charges and expenses, request a prospectus by calling 1-800-368-3195. Read it carefully before you invest or send money. This document does not constitute an offering by the distributor in any jurisdiction in which such offering may not be lawfully made. Mosaic Funds Distributor, LLC.
Transfer Agent
Mosaic Funds
c/o Firstar Mutual Fund Services, LLC
P.O. Box 701
Milwaukee, WI 53201-0701
888-670-3600
Telephone Numbers
Shareholder Service
Toll-free nationwide: 888 670 3600
Mosaic Tiles (24 hour automated information)
Toll-free nationwide: 800 336 3063
Mosaic Funds
www.mosaicfunds.com
|
|