|
|
|
|
|
|
|
|
|
|
Previous: WASHINGTON GAS LIGHT CO, 10-K, EX-12, 2000-12-18 |
Next: WASHINGTON GAS LIGHT CO, 10-K, EX-21, 2000-12-18 |
|
Financial Information Table of Contents Selected Financial and Operations Data (5-Year) Management’s Discussion and Analysis of Financial Condition and Results of Operations Consolidated
Financial Statements Notes
to Consolidated Financial Statements Management’s Responsibility for Financial Statements Report of the Audit Review Committee Report of Independent Public Accountants Supplementary Financial Information Shareholder and Investor Information
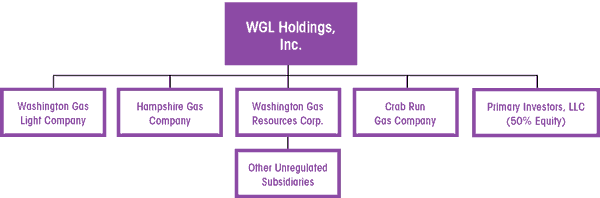
Glossary of Key TermsACI: American Combustion Industries, Inc. is a subsidiary of Washington Gas Resources Corp. that provides HVAC-related products and services to commercial customers. Bundled Service: Service in which customers purchase both the natural gas commodity and the distribution or delivery of the commodity from the local regulated utility. When customers purchase bundled service from Washington Gas, no mark-up is applied to the cost of the natural gas commodity that is passed through to customers. The regulated utility has an opportunity to earn a fair rate of return on the delivery of the natural gas. City Gate: A point or measuring station at which a gas distribution system receives gas from a pipeline or transmission system. Delivery Service: The regulated distribution, or delivery, of natural gas to retail customers. Washington Gas provides delivery service to retail customers in Washington, DC and parts of Maryland and Virginia. Firm Customers: Customers whose gas supply will not be disrupted to meet the needs of other customers. Typically, this class of customers comprises residential customers and the vast majority of commercial customers. HVAC: Heating, ventilating and air conditioning products and services. Interruptible Customers: Large commercial customers whose service can be temporarily interrupted in order for Washington Gas to meet the needs of firm customers. These customers pay a lower delivery rate than firm customers and they must be able to readily substitute an alternate fuel for natural gas. The effect on net income of any changes in delivered volumes or prices to the interruptible class is minimized by margin sharing arrangements in the company’s tariffs. Merchant Function: The purchase of the natural gas commodity by the regulated utility on behalf of retail customers. PSC of DC: Public Service Commission of the District of Columbia, a three-member board that regulates the Washington Gas distribution operations in the District of Columbia. PSC of MD: Public Service Commission of Maryland, a five-member board that regulates the Washington Gas distribution operations in Maryland. Regulated Utility: See Utility Operations. Retail Energy Marketing: Unregulated sales of the natural gas and electricity commodities by company subsidiary, Washington Gas Energy Services, Inc. SCC of VA: State Corporation Commission of Virginia, a three-member board that regulates the Washington Gas distribution operations in Virginia. Service Area: The region in which Washington Gas, the regulated utility, operates. The company`s service area includes metropolitan Washington, DC and surrounding regions in Maryland and Virginia. Tariffs: Documents issued by regulatory commissions in each state jurisdiction that set the prices the regulated distribution company may charge and the practices it must follow when providing service to its customers. Third-Party Marketer: Unregulated companies that sell natural gas and electricity directly to retail customers. Washington Gas Energy Services, Inc., a subsidiary company, is a third-party marketer. Therm: A measure of heating value. Washington Gas reports its natural gas sales and deliveries in therms. Unbundling: The separation of the delivery of natural gas or electricity from the sales of these commodities and related services that, in the past, were provided only by a regulated utility. Utility Net Revenues: Utility revenues, less the associated cost of gas and applicable revenue taxes. Utility Operations: The company segment that sells and distributes natural gas primarily to retail customers in Washington, DC, Maryland and Virginia. Utility operations are regulated by state and federal regulatory commissions. WGEServices: Washington Gas Energy Services, Inc., is a subsidiary of Washington Gas Resources Corp. that markets natural gas and electricity to retail customers. WGESystems: Washington Gas Energy Systems, Inc., is a subsidiary of Washington Gas Resources Corp. that offers HVAC-related products and services to commercial customers. WGL Holdings: WGL Holdings, Inc., is a newly formed holding company that, effective November 1, 2000, became the parent company of Washington Gas and its subsidiaries. Weather
Insurance: An insurance policy which provides the utility’s
earnings with some protection from the effects of warmer-than-normal winter
weather conditions. |
Washington
Gas Light Company
|
|
|
||||||||||||||||
| (Dollars in Thousands, Except Per Share Data) |
2000
|
1999
|
1998
|
1997
|
1996
|
|||||||||||
|
|
||||||||||||||||
| SUMMARY OF EARNINGS | ||||||||||||||||
| Utility operating revenues | $ | 1,031,105 | $ | 972,120 | $ | 1,040,618 | $ | 1,055,754 | $ | 969,778 | ||||||
| Less: Cost of gas | 552,579 | 505,346 | 575,786 | 572,925 | 469,925 | |||||||||||
| Revenue taxes | 35,598 | 34,793 | 39,659 | 43,719 | 44,349 | |||||||||||
|
|
||||||||||||||||
| Utility net revenues | $ | 442,928 | $ | 431,981 | $ | 425,173 | $ | 439,110 | $ | 455,504 | ||||||
|
|
||||||||||||||||
| Utility
operation and maintenance expenses |
$ | 177,504 | $ | 201,229 | $ | 200,794 | $ | 197,050 | $ | 220,922 | ||||||
| Non-utility operating revenues | $ | 218,087 | $ | 140,096 | $ | 102,834 | $ | 44,926 | $ | 3,382 | ||||||
| Net income | $ | 84,574 | $ | 68,768 | $ | 68,629 | $ | 82,019 | $ | 81,591 | ||||||
| Dividends on preferred stock | 1,323 | 1,331 | 1,331 | 1,331 | 1,332 | |||||||||||
|
|
||||||||||||||||
| Net
income applicable to common stock |
$ | 83,251 | $ | 67,437 | $ | 67,298 | $ | 80,688 | $ | 80,259 | ||||||
|
|
||||||||||||||||
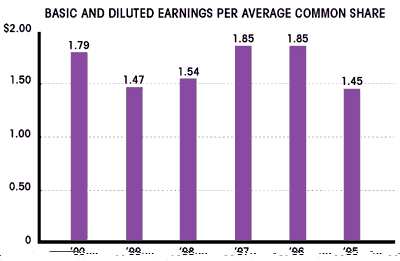
| Earnings
per average common share —basic and diluted |
$ | 1.79 | $ | 1.47 | $ | 1.54 | $ | 1.85 | $ | 1.85 | ||||||
|
|
||||||||||||||||
| CAPITALIZATION—YEAR-END | ||||||||||||||||
| Common shareholders’ equity | $ | 711,496 | $ | 684,034 | $ | 607,755 | $ | 589,035 | $ | 558,809 | ||||||
| Preferred stock | 28,173 | 28,420 | 28,424 | 28,430 | 28,440 | |||||||||||
| Long-term debt | 559,575 | 506,084 | 428,641 | 431,575 | 353,893 | |||||||||||
|
|
||||||||||||||||
| Total capitalization | $ | 1,299,244 | $ | 1,218,538 | $ | 1,064,820 | $ | 1,049,040 | $ | 941,142 | ||||||
|
|
||||||||||||||||
| OTHER FINANCIAL DATA | ||||||||||||||||
| Total assets—year-end | $ | 1,939,840 | $ | 1,775,499 | $ | 1,682,433 | $ | 1,552,032 | $ | 1,464,601 | ||||||
| Property, plant and equipment—net | $ | 1,460,280 | $ | 1,402,742 | $ | 1,319,501 | $ | 1,217,137 | $ | 1,130,574 | ||||||
| Capital expenditures | $ | 124,067 | $ | 158,733 | $ | 158,874 | $ | 139,871 | $ | 124,414 | ||||||
| Long-term obligations—year-end | $ | 559,575 | $ | 506,084 | $ | 428,929 | $ | 432,368 | $ | 353,893 | ||||||
| COMMON STOCK DATA | ||||||||||||||||
| Annualized dividends per share | $ | 1.24 | $ | 1.22 | $ | 1.20 | $ | 1.18 | $ | 1.14 | ||||||
| Dividends declared per share | $ | 1.235 | $ | 1.215 | $ | 1.195 | $ | 1.170 | $ | 1.135 | ||||||
| Book value per share—year-end | $ | 15.31 | $ | 14.72 | $ | 13.86 | $ | 13.48 | $ | 12.79 | ||||||
| Return on average common equity | 11.9 | % | 10.4 | % | 11.2 | % | 14.1 | % | 15.0 | % | ||||||
| Dividend yield on book value | 8.1 | % | 8.3 | % | 8.6 | % | 8.7 | % | 8.9 | % | ||||||
| Payout ratio | 69.0 | % | 82.7 | % | 77.6 | % | 63.2 | % | 61.4 | % | ||||||
| Common
shares outstanding—year-end (thousands) |
46,470 | 46,473 | 43,839 | 43,700 | 43,703 | |||||||||||
| GAS
SALES AND DELIVERIES BY THE UTILITY (thousands of therms) |
||||||||||||||||
| Gas sold and delivered | ||||||||||||||||
| Residential—firm | 557,825 | 604,162 | 615,786 | 665,452 | 739,603 | |||||||||||
| Commercial and industrial | ||||||||||||||||
| Firm | 240,239 | 285,349 | 345,809 | 426,831 | 473,645 | |||||||||||
| Interruptible | 27,627 | 48,989 | 73,554 | 147,375 | 182,730 | |||||||||||
| Electric generation | — | — | — | 51 | 1,808 | |||||||||||
|
|
||||||||||||||||
| Total gas sold and delivered | 825,691 | 938,500 | 1,035,149 | 1,239,709 | 1,397,786 | |||||||||||
|
|
||||||||||||||||
| Gas delivered for others | ||||||||||||||||
| Firm | 306,933 | 191,620 | 110,542 | 27,574 | 3,772 | |||||||||||
| Interruptible | 262,923 | 272,046 | 243,166 | 185,487 | 84,788 | |||||||||||
| Electric generation | 211,928 | 129,700 | 93,721 | 94,022 | 57,689 | |||||||||||
|
|
||||||||||||||||
| Total gas sold for others | 781,784 | 593,366 | 447,429 | 307,083 | 146,249 | |||||||||||
|
|
||||||||||||||||
| Total gas sales and deliveries | 1,607,475 | 1,531,866 | 1,482,578 | 1,546,792 | 1,544,035 | |||||||||||
|
|
||||||||||||||||
| OTHER STATISTICS | ||||||||||||||||
| Customer meters—year-end | 875,817 | 846,381 | 819,719 | 798,739 | 772,281 | |||||||||||
| Degree days—actual | 3,637 | 3,652 | 3,662 | 3,876 | 4,570 | |||||||||||
| Percent colder (warmer) than normal | (5.0 | )% | (5.2 | )% | (5.1 | )% | 0.5 | % | 18.6 | % | ||||||
| (Thousands) |
2000
|
1999
|
Increase/
(Decrease) |
1999
|
1998
|
Increase/
(Decrease) |
||||||||||||
|
|
||||||||||||||||||
| Retail Energy Marketing | $ | 529 | $ | 1,564 | $ | (1,035 | ) | $ | 1,564 | $ | 288 | $ | 1,276 | |||||
| HVAC | ||||||||||||||||||
| Commercial | 3,177 | 1,247 | 1,930 | 1,247 | (334 | ) | 1,581 | |||||||||||
| Residential | (1,735 | ) | (57 | ) | (1,678 | ) | (57 | ) | — | (57 | ) | |||||||
| Consumer Financing | 765 | 1,739 | (974 | ) | 1,739 | 1,270 | 469 | |||||||||||
|
|
||||||||||||||||||
| Total | $ | 2,736 | $ | 4,493 | $ | (1,757 | ) | $ | 4,493 | $ | 1,224 | $ | 3,269 | |||||
|
|
||||||||||||||||||
|
Nonrecurring Transactions. The company’s earnings for the three reported years include a number of nonrecurring items. The fiscal year 2000 results include a $1.2 million after-tax gain from the sales of two minor non-utility assets. The fiscal year 1999 results include a $1.8 million after-tax gain from a subsidiary’s sale of undeveloped land, offset by a $1.9 million after-tax loss from the sale of natural gas utility assets located in West Virginia. The fiscal year 1998 results include $3.2 million of after-tax gains from non-utility asset sales, partially offset by a $1.0 million after-tax write-off of a regulatory asset. The following table summarizes the net income applicable to common stock and earnings per average common share that were produced by the company’s recurring operations during fiscal years 2000, 1999 and 1998. NET INCOME APPLICABLE TO COMMON STOCK FROM RECURRING OPERATIONS |
|
Years
Ended September 30,
|
||||||||
|
|
||||||||
|
2000
|
1999
|
1998
|
||||||
|
|
||||||||
| Net Income Applicable to Common Stock from Recurring Operations (millions) |
$
|
82.1 |
$
|
67.5 |
$
|
65.1 | ||
|
|
||||||||
| Earnings Per Average Common Share from Recurring Operations |
$
|
1.77 |
$
|
1.47 |
$
|
1.49 | ||
|
|
||||||||
|
Interest Expense. During fiscal year 2000, interest expense rose by $6.8 million primarily because of an increase in the average balance of total debt outstanding coupled with higher short-term debt costs and a lower allowance for funds used during construction. Additional short-term debt issued during fiscal year 2000 was used to fund non-utility investments, a higher volume and cost of storage gas balances and increased customer accounts receivable as compared with fiscal year 1999. Regulated Utility Operating ResultsThis section describes the detailed results of the company’s consolidated regulated utility operations in the District of Columbia, Maryland, Virginia and West Virginia. During fiscal years 2000, 1999 and 1998, utility operations contributed $1.76, $1.38 and $1.45, respectively, toward basic and diluted earnings per average common share. Utility Net RevenuesUtility net revenues increased by $10.9 million or 2.5 percent in fiscal year 2000, and increased by $6.8 million or 1.6 percent in fiscal year 1999. The growth in utility net revenues resulted primarily from increased firm therm deliveries, reflecting a 3.5 percent and a 3.25 percent rise in the number of customer meters during fiscal years 2000 and 1999, respectively. 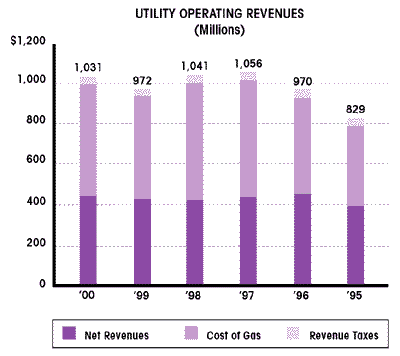
The following table provides the factors contributing to the changes in net revenues between years. COMPOSITION
OF UTILITY NET REVENUE CHANGES
|
|
Increase/(Decrease)
from Prior Year |
|
|||
|
|
||||
| (Millions) |
2000
|
1999
|
|
|
|
|
||||
| Gas Delivered to Firm Customers | ||||
| Volumes | $ 12.0 | $ 4.6 | ||
| Rate Increases | — | 0.4 | ||
| Gas Delivered to Interruptible Customers | (1.9 | ) | 1.4 | |
| Other | 0.8 | 0.4 | ||
|
|
||||
| Total | $ 10.9 | $ 6.8 | ||
|
|
||||
|
Winter weather, which typically can cause significant changes in the level of natural gas delivered to firm customers, was nearly identical during fiscal years 2000, 1999 and 1998. As a result, winter weather had little impact on the changes in firm deliveries during these years. However, because winter weather for fiscal years 2000, 1999 and 1998, respectively, was 5.0 percent, 5.2 percent and 5.1 percent warmer than normal, the level of firm therm deliveries was lower than normal in all three years (see Selected Financial and Operations Data on page 17 for a five-year comparison of actual to normal winter weather). The company’s rates are based on normal winter weather temperatures and none of its tariffs include a weather normalization provision. However, Washington Gas does have declining block rates in its Maryland and Virginia jurisdictions that reduce the impact that deviations from normal winter weather have on net revenues. Gas Delivered to Interruptible Customers. Deliveries to interruptible customers during fiscal year 2000 decreased by 30.5 million therms or 9.5 percent from the fiscal year 1999 level, which resulted in a $1.9 million decline in net revenues from interruptible customers. The decline by interruptible customers reflects the absence of 8.1 million retail therm sales and deliveries to the company’s former West Virginia operations and a brief planned interruption associated with the changeover to the Year 2000. In addition, a number of interruptible customers have elected to switch to firm service. Deliveries to interruptible customers in fiscal year 1999 increased by 4.3 million therms or 1.4 percent over fiscal year 1998. This increase reflects higher customer demand, partially offset by the absence of 1.8 million therms of interruptible retail deliveries to the company’s former West Virginia operations that were made during fiscal year 1998. During fiscal year 1999, net utility revenues associated with therms delivered to interruptible customers increased by $1.4 million over fiscal year 1998. Other. The “Other” net revenue category includes: 1) gas deliveries to customers for electric generation; 2) amounts generated from optimizing the value of the company’s contractual assets for transportation and storage of natural gas on the interstate pipelines; 3) wholesale deliveries to the current owner of the company’s former West Virginia utility operations; and 4) miscellaneous other operating revenues that are not associated with the volume of gas sold. Other net revenues increased by $0.8 million during fiscal year 2000 and $0.4 million during fiscal year 1999 over the preceding years’ results. The company sells and/or delivers natural gas for use at two electric generation facilities in Maryland, which are each owned by separate companies independent of Washington Gas. Variations in the volumes of deliveries to these two customers have little impact on the company’s net revenues and net income because of a margin-sharing arrangement in Maryland. Under that arrangement, the company calculates the gross margins, less related expenses, and the cost to recover the company’s investment in the facilities constructed to serve these two customers. Most of the remaining gross margins from these customers are used to reduce firm customers’ rates. During fiscal years 2000 and 1999, deliveries to electric generation customers increased by 82.2 million therms (63.4 percent) and 36.0 million therms (38.4 percent), respectively, over the prior years’ results. The marked increase in fiscal year 2000 deliveries occurred because an operational problem at one customer’s electric generation facility precluded it from receiving delivery of alternate fossil fuels that it typically includes in its fuel mix. Neither Washington Gas nor the customer can predict how long the operational problem at the affected electric generation facility will continue or how long that facility will continue to use natural gas as its only fuel. Cost of Gas. The company’s cost of natural gas includes both fixed and variable components. The company pays the fixed costs or “demand charges” to pipeline companies for system capacity needed to transport and store natural gas. The company pays the variable costs, or the cost of the natural gas commodity itself, to natural gas producers. Variations in the company’s cost of gas expense result from changes in gas sales volumes, the price of the gas purchased and the level of gas costs collected through the operation of firm gas cost recovery mechanisms. Under these regulated recovery mechanisms, the company defers the difference between the firm gas costs it pays and the gas costs recovered from customers. In subsequent periods, the company recovers from, or refunds to, customers any differences. Therefore, increases or decreases in the cost of gas associated with sales made to firm customers have no effect on net revenues and net income. The company’s average cost of gas on a per therm basis, excluding the cost and related volumes applicable to sales made outside of the company’s service territory, increased to 42.29¢ in fiscal year 2000 from 36.43¢ in fiscal year 1999. The increase reflects higher commodity gas prices in the current year. The commodity cost of gas invoiced to the company was 31.71¢ and 23.40¢ per therm for fiscal years 2000 and 1999, respectively. This increase reflects the higher market prices incurred during fiscal year 2000. The company’s average cost of gas on a per therm basis decreased 2.52¢ per therm in fiscal year 1999 from 38.95¢ in fiscal year 1998. The decrease resulted primarily from lower commodity gas prices during most of fiscal year 1999. The average commodity cost of gas invoiced to the company in fiscal year 1999 also decreased 4.73¢ from 28.13¢ per therm in fiscal year 1998 because of continuing warmer-than-normal winter weather, which resulted in a surplus of natural gas in the marketplace that depressed natural gas commodity prices. In response to the surplus of low-cost gas during fiscal year 1999, a number of natural gas producers curtailed their production, which contributed to a decline in the availability and an increase in the price of natural gas in the marketplace during fiscal year 2000. Other Utility Operating ExpensesOperation and maintenance expenses declined $23.7 million or 11.8 percent in fiscal year 2000 and increased $435,000 or 0.2 percent in fiscal year 1999 over the prior years’ results. The reduction in operation and maintenance expenses in fiscal year 2000 improved earnings per average common share by $0.32 over fiscal year 1999 results. 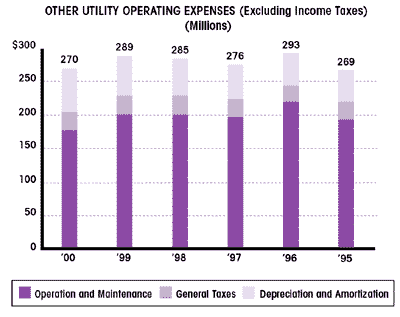
The following table summarizes the major factors that contributed to the changes in operation and maintenance expenses. COMPOSITION
OF OPERATION AND
|
|
Increase/(Decrease)
from Prior Year |
||||
|
|
||||
| (Millions) |
2000
|
|
1999
|
|
|
|
||||
| Labor and Labor-Related Expenses | $ 10.0 | $ (2.2 | ) | |
| Pension and Postretirement Medical and | ||||
| Life Insurance Benefit Expenses | (11.3 | ) | (1.6 |
)
|
| Technological Initiatives | (5.9 | ) | 3.9 | |
| Uncollectible Accounts | (3.2 | ) | (1.6 | ) |
| Regulatory Asset Write-Off (1998) | — | (1.6 | ) | |
| Operating Unit and Other Expenses (Non-Labor) | (13.3 | ) | 3.5 | |
|
|
||||
| Total | $ (23.7 | ) | $ 0.4 | |
|
|
||||
|
During fiscal year 2000, the company implemented enhanced resource allocation measures that spanned nearly every aspect of the utility’s operations, including the delivery service, advertising and business development functions. These improvements support the utility’s efforts to maintain high-quality safe and reliable service. The $13.3 million decrease in “Operating Unit and Other Expenses (Non-Labor)” reflects those improvements. During fiscal years 2000 and 1999, depreciation and amortization rose by $5.6 million (9.3 percent) and $5.1 million (9.2 percent), respectively. The increases reflect additions of $146.7 million and $145.4 million, respectively, to property, plant and equipment that were made to meet continuing customer growth and to upgrade existing facilities and systems. Depreciation and amortization expenses in fiscal years 2000 and 1999 included $4.1 million and $1.4 million, respectively, of amortization related to the company’s new enterprise-wide software system that was completed in the second half of fiscal year 1999. The company amortizes the costs associated with this software system on a straight-line basis over its useful life. The company expects that depreciation and amortization expense will increase less in fiscal year 2001 than it did in fiscal year 2000, because a full year of amortization for the enterprise-wide software system is included in fiscal year 2000 results. The company’s composite depreciation rate was 2.94 percent in fiscal year 2000, compared to 2.93 percent in both fiscal years 1999 and 1998. During fiscal year 1999, Shenandoah Gas Company (Shenandoah), a former subsidiary that was merged into Washington Gas in April 2000, sold its utility assets located in West Virginia and recorded a $2.9 million pre-tax loss. The company sold these assets because they were not performing satisfactorily and the proceeds of a sale could be reinvested more effectively elsewhere in the business (see Note 3 to the Consolidated Financial Statements). The Consolidated Statements of Income Taxes on page 36 detail the composition of the changes in income tax expense. Non-Utility Operating ResultsDuring fiscal years 2000, 1999 and 1998, Washington Gas had three primary unregulated operating segments: 1) retail energy marketing; 2) HVAC; and 3) consumer financing. These activities, plus the impact of other incidental unregulated activities, contributed $0.06, $0.13 and $0.10 per basic and diluted average common share in fiscal years 2000, 1999 and 1998, respectively. These results include $1.2 million, $1.8 million and $3.2 million of nonrecurring after-tax gains from the sales of minor non-utility assets in fiscal years 2000, 1999 and 1998, respectively (see Note 3 to the Consolidated Financial Statements). Excluding the effect of these and other minor items, the primary unregulated activities contributed $0.06, $0.10 and $0.03, of basic and diluted earnings per average common share in fiscal years 2000, 1999 and 1998, respectively. The following table shows the composition of the change in revenues for these non-utility operating segments. COMPOSITION OF NON-UTILITY REVENUE CHANGES |
|
Increase/(Decrease)
from Prior Year |
||||
|
|
||||
| (Millions) |
2000
|
|
1999
|
|
|
|
||||
| Retail Energy Marketing | $ 62.8 | $ 20.7 | ||
| HVAC (Commercial) | 16.3 | 17.4 | ||
| Consumer Financing | (0.8 | ) | 0.6 | |
| Other Non-Utility | (0.3 | ) | (1.4 | ) |
|
|
||||
| Total | $ 78.0 | $ 37.3 | ||
|
|
||||
|
Retail Energy Marketing. The company’s retail energy marketing subsidiary, WGEServices, comprises the company’s retail energy marketing segment. Established in 1997, WGEServices sells natural gas on an unregulated competitive basis directly to residential, commercial and industrial customers. Revenues for this segment were $166.7 million, $103.9 million and $83.2 million in fiscal years 2000, 1999 and 1998, respectively. The retail energy marketing segment expanded its customer base by over 100 percent in each of the last two fiscal years. Further, WGEServices increased the volume of gas it delivered from 34.3 billion cubic feet (bcf) in fiscal year 1999 to 45.6 bcf in fiscal year 2000—a 33 percent increase. During fiscal year 1999, WGEServices increased its volumes delivered by over 29 percent from fiscal year 1998 levels. WGEServices’ aggressive marketing strategies and the growing participation of customers in various customer choice pilot programs generated the significant growth in WGEServices’ revenues, customer base and volumes delivered. Net income from the retail energy marketing segment was $0.5 million in fiscal year 2000, $1.6 million in fiscal year 1999 and $0.3 million in fiscal year 1998. In 1999, declining natural gas prices in the marketplace resulted in higher gross margins and a significant improvement in net income. As natural gas prices rose during fiscal year 2000, WGEServices’ gross margins declined. Thus, despite significant growth in both the number of customers and the volume of sales, the lower gross margins earned in fiscal year 2000, combined with increased selling, general and administrative expenses incurred to prepare for marketing electricity, caused a modest decrease in WGEServices’ net income. HVAC. Two subsidiaries, ACI and WGESystems, which offer large-scale HVAC installations and related services to commercial and government customers, are included in the company’s primary HVAC activities. In addition, the company has a 50 percent equity investment in Primary Investors, a company that focuses on investments in companies that provide products and services for residential and light commercial HVAC customers (see Notes 3 and 15 to the Consolidated Financial Statements). Revenues from commercial HVAC activities were $47.5 million in fiscal year 2000, reflecting an increase of $16.3 million or 52.1 percent over fiscal year 1999 results. During fiscal year 1999, commercial HVAC revenues increased by $17.4 million from fiscal year 1998, as ACI completed its first full year of operations under company ownership. Net income from commercial HVAC activities, which increased from $1.2 million in fiscal year 1999 to $3.2 million in fiscal year 2000, reflects continued attractive revenue growth combined with controlled costs. The commercial HVAC operations incurred a loss of $0.3 million during fiscal year 1998 because of start-up costs that ACI incurred as it began its first year of operations. The company’s 50 percent equity investment in Primary Investors produced a $1.7 million after-tax loss in fiscal year 2000 and a negligible loss in fiscal year 1999. Primary Investors, through its wholly owned subsidiary, Primary Services Group, LLC (PSG), is in the process of acquiring HVAC companies and integrating their operations. To date, PSG has acquired nine companies with annualized revenues of approximately $50 million. The net loss incurred by Primary Investors during fiscal year 2000 resulted from the relatively high level of integration costs, combined with cool summer weather that lowered the demand for HVAC products and services. Excluding net losses incurred to date from its investment, Washington Gas invested $18.3 million in Primary Investors through September 30, 2000. Consumer Financing. This business segment offers financing for residential and small commercial customers to purchase gas appliances and other energy-related equipment. The consumer financing segment sells, with recourse, receivables that result from these financing arrangements to financial institutions. Revenues from the consumer financing segment decreased 21.6 percent in fiscal year 2000 and net income from this segment dropped from $1.7 million in fiscal year 1999 to $0.8 million in fiscal year 2000. These decreases were attributable to a lower volume of contracts sold by the company to banks, in addition to an increase in interest rates charged by those banks compared to last year. A strengthening of the company’s credit criteria, fewer programs offering interest deferrals, as well as a warmer-than-normal winter and a cooler-than-normal summer (which reduced demand for HVAC products financed by the company) lowered the volume of contracts sold. Revenues from this segment rose 17.9 percent in fiscal year 1999 and net income increased from $1.3 million in fiscal year 1998 to $1.7 million in fiscal year 1999, primarily because of an increase in the volume of contracts sold during fiscal year 1999. Interest ExpenseTotal interest expense increased by $6.8 million or 18.3 percent in fiscal year 2000 and decreased by $0.7 million or 2.0 percent in fiscal year 1999. The following table shows the components of the changes in interest expense between years. COMPOSITION OF INTEREST EXPENSE CHANGES |
|
Increase/(Decrease)
from Prior Year |
||||
|
|
||||
| (Millions) |
2000
|
|
1999
|
|
|
|
||||
| Long-Term Debt | $ 1.4 | $ 0.9 | ||
| Short-Term Debt | 4.8 | (0.8 | ) | |
| Other | 0.6 | (0.8 | ) | |
|
|
||||
| Total | $ 6.8 | $ (0.7 | ) | |
|
|
||||
|
Short-term Debt. The $4.8 million increase in interest expense on short-term debt during fiscal year 2000 resulted from a $70.5 million rise in the average short-term debt balance and a 0.89 percentage point increase in the weighted-average cost of such debt. See “Short-term Cash Requirements and Related Financing” for a discussion of fluctuations in short-term debt balances. Other. Other interest expense increased $0.6 million during fiscal year 2000, due primarily to a decrease in the accrual for the allowance for funds used during construction (AFUDC). The decreased accrual for AFUDC reflects a decline in average construction work in progress due to the completion of a number of capital projects during fiscal years 2000 and 1999, including the company’s enterprise-wide software system. LIQUIDITY AND CAPITAL RESOURCESThe company has a goal to maintain its common equity ratio in the mid-50 percent range of total capital. In addition, the company has a general policy to reduce short-term debt balances in the spring, because a significant portion of the company’s current assets is converted into cash at the end of the heating season. Accomplishing these objectives and maintaining sufficient cash flow are necessary to preserve the company’s credit ratings and to allow access to capital at relatively low costs. At September 30, 2000, total capitalization, including current maturities of long-term debt, was comprised of 54.7 percent common equity, 2.2 percent preferred stock and 43.1 percent long-term debt. 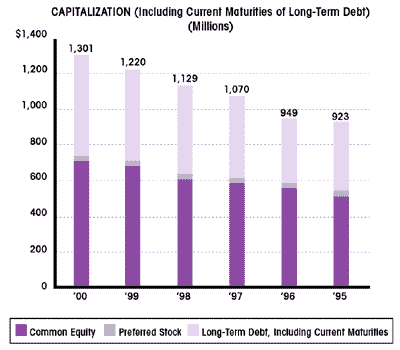
Short-term Cash Requirements and Related FinancingThe company’s business is weather-sensitive and seasonal. In fiscal year 2000, approximately 75 percent of the total therms delivered in the company’s franchise area (excluding deliveries to two electric generation facilities) were made in the first and second fiscal quarters. This weather sensitivity causes short-term cash requirements to vary significantly during the year. Cash requirements peak in the fall and winter months when accounts receivable, accrued utility revenues and storage gas inventories are at their highest levels. After the winter heating season, these assets convert into cash, which the company generally uses to reduce short-term debt and acquire storage gas for the next heating season. Storage gas represents gas purchased from producers and primarily stored in facilities owned by interstate pipelines. The company generally pays for storage gas between heating seasons and withdraws it during the heating season. Significant variations in storage balances at September 30 are usually caused by variations in inventory levels, as well as the price paid to producers and marketers, which is a function of short-term market fluctuations in gas costs. Such costs are a component of the cost of gas recovered from customers. Variations in the timing of collections of gas costs under the company’s gas cost recovery mechanisms and the level of refunds from pipeline companies that will be returned to customers can significantly affect short-term cash requirements. At September 30, 2000, the company had a $3.3 million net over-collection of gas costs, compared to a $6.2 million net over-collection at September 30, 1999. The company reflects the amounts under-collected and over-collected in the captions “Gas costs due from customers” and “Gas costs due to customers,” respectively, in the Consolidated Balance Sheets. Most of the current balances will be collected from, or returned to, customers in fiscal year 2001. At September 30, 2000, refunds received from pipelines that are being returned to the company’s customers totaled $0.6 million, compared to $2.2 million at September 30, 1999. The company uses short-term debt in the form of commercial paper and unsecured short-term bank loans to fund seasonal requirements. Alternate sources include unsecured lines of credit, some of which are seasonal, and $160 million in a revolving credit agreement maintained with a group of banks. In addition, two subsidiaries each have $5 million of secured lines of credit under revolving credit agreements. The company can activate these financing options to support or replace its commercial paper. Note 4 to the Consolidated Financial Statements includes additional information regarding the company’s short-term borrowing capabilities. At September 30, 2000, the company had notes payable outstanding of $161.4 million, compared to $113.1 million outstanding at September 30, 1999. A significantly higher cost of gas in storage due to rising commodity prices, a larger customer accounts receivable balance and a $10.8 million increase in the investment in Primary Investors generated most of the increase in fiscal year 2000. At September 30, 2000, current maturities of long-term debt were $1.7 million. Long-term Cash Requirements and Related FinancingThe company’s long-term cash requirements primarily depend upon the level of capital expenditures, long-term debt maturity requirements and decisions to refinance long-term debt. The company devotes the majority of its capital expenditures to adding new customers in its existing service area. At September 30, 2000, the company was authorized to issue up to $122 million of long-term debt over approximately two years under an existing shelf registration. Note 5 to the Consolidated Financial Statements further discusses the nature of the company’s long-term debt. Cash Flow from Operating Activities. In fiscal year 2000, net cash provided by operating activities was $88.5 million, a decrease of $64.2 million from the fiscal year 1999 level. This decline primarily reflects increased amounts needed to fund higher levels of customer accounts receivable, accrued utility revenues and storage gas inventories. Partially offsetting these uses of cash in fiscal year 2000 was a $16.6 million increase in net income, adjusted for non-cash items, and an increase in the level of accounts payable related primarily to gas cost increases. In fiscal year 1999, net cash provided by operating activities was $152.7 million, an improvement of $28.9 million from the fiscal year 1998 level. The improvement was brought about by: 1) lower funds used to support accounts receivable and accrued utility revenues; and 2) increased sources of cash provided by accounts payable resulting from the timing of payments related to gas purchases. Partially offsetting these improvements were: 1) higher funds used to support storage gas balances due to a greater level of gas volumes in storage at higher prices; and 2) lower funds provided by customer deposits and advance payments. Cash Flow from Financing Activities. During fiscal year 2000, no cash was either generated through common stock issuances or used to reacquire common stock. Since August 1999, all stock for the Dividend Reinvestment Plan (DRP) and Employee Savings Plans has been acquired from open market purchases. Thus, the DRP and Employee Savings Plans were not a source of funds during fiscal year 2000. The company raised $55.7 million during fiscal year 1999 through the sale of 2.3 million shares of common stock. Through its DRP and Employee Savings Plans, the company raised $8.6 million by issuing 342,000 shares of common stock during fiscal year 1999 and raised $5.3 million by issuing 212,000 shares of common stock during fiscal year 1998. During the first quarter of fiscal year 1998, the company paid $2.3 million to repurchase 88,700 shares of common stock for the company’s stock-based compensation plans. The following table shows the issuances and retirements of long-term debt that occurred during fiscal years 2000, 1999 and 1998. For additional information regarding these debt issuances, see Note 5 to the Consolidated Financial Statements. LONG-TERM DEBT ACTIVITY |
| 2000 |
|
1999 |
|
1998 | ||||||||
|
|
||||||||||||
| (Millions, Except Percentages) |
Interest
Rate |
|
Amount
|
|
Interest
Rate
|
|
Amount
|
|
Interest
Rate
|
|
Amount
|
|
|
|
||||||||||||
| First Mortgage Bonds | ||||||||||||
| Retired | — | $ — | 8.63–8.75% | $(43.0 | ) | 8.63–8.75% | $(15.0 | ) | ||||
| Medium Term Notes | ||||||||||||
| Issued | 7.45–7.70% | 53.0 | 5.49–6.92% | 75.0 | 6.57–6.85% | 72.0 | ||||||
| Retired | — | — | 6.50–7.97% | (21.7 | ) | 6.43–8.00% | (18.8 | ) | ||||
| Premium on Redemption | — | — | — | — | — | (0.5 | ) | |||||
| Project Financing | 7.44–7.70% | 1.7 | 7.44–7.70% | 5.3 | — | — | ||||||
| Other | Various | (0.9 | ) | Various | (1.0 | ) | Various | (0.6 | ) | |||
|
|
||||||||||||
| Total | $ 53.8 | $ 14.6 | $ 37.1 | |||||||||
|
|
||||||||||||
|
Cash Flow from Investing Activities. Capital expenditures for fiscal years 2000, 1999 and 1998 totaled $124.1 million, $158.7 million and $158.9 million, respectively. Investments in new business construction, which include amounts invested to convert customers from other energy sources, result in additional therm deliveries. During fiscal years 2000, 1999 and 1998, capital expenditures for new business equaled $75.6 million, $83.6 million and $87.4 million, respectively, which represented 60.9 percent, 52.7 percent and 55.0 percent of each year’s respective total capital expenditures. Capital expenditures also included $21.1 million and $19.1 million in fiscal years 1999 and 1998, respectively, for the enterprise-wide software system that was implemented in fiscal year 1999. In addition, the company made $10.8 million and $7.5 million of equity investments in Primary Investors during fiscal years 2000 and 1999, respectively. During fiscal years 2000 and 1998, the company received $0.7 million and $1.6 million, respectively, from the sales of minor non-utility investments. Also, in fiscal year 1998, the company sold all of its retail propane assets for $4.1 million. In fiscal year 1998, the company bought ACI for $3.0 million in cash and $2.0 million of debt, which was repaid in monthly installments over a two-year period that ended March 2000. Note 3 to the Consolidated Financial Statements more fully discusses the disposition of the retail propane assets and the acquisition of ACI. During fiscal year 2000, the sum of net income and non-cash charges, less dividends on common and preferred stock, totaled $97.3 million, representing 72.2 percent of capital expenditures and investments. For fiscal years 1999 and 1998, respectively, the sum of net income and non-cash charges, less dividends on common and preferred stock, totaled $82.5 million and $83.6 million and represented 49.7 percent and 51.0 percent of capital expenditures and investments. Sales of Accounts ReceivableDuring fiscal year 2000, the company augmented cash flow by selling $23.9 million of certain non-utility accounts receivable from its consumer financing segment to commercial banks. Similar sales of non-utility accounts receivable in fiscal years 1999 and 1998 amounted to $28.6 million and $27.2 million, respectively. For further discussion of the company’s sales of non-utility accounts receivable, see Note 13 to the Consolidated Financial Statements. Long-term Debt MaturitiesNote 5 to the Consolidated Financial Statements describes the maturities on long-term debt for the ensuing five-year period. Security RatingsThe table below shows the ratings on the company’s outstanding debt instruments at September 30, 2000. |
| Rating Service |
Unsecured Medium
Term Notes |
|
Commercial Paper
|
|
|
|
||||
| Fitch, Inc. |
AA-
|
|
F1+
|
|
| Moody’s Investors Service |
Aa2
|
|
P-1
|
|
| Standard & Poor’s Corporation |
AA-
|
|
A-1+
|
|
Capital ExpendituresThe following table shows the company’s actual capital expenditures for fiscal years 1998, 1999 and 2000 and projected capital expenditures for fiscal years 2001 through 2005. This table excludes the company’s investment in Primary Investors of $10.8 million in fiscal year 2000 and $7.5 million in fiscal year 1999, as well as the commitment to invest up to $6.7 million of additional funds in Primary Investors in the future. The company believes that the combination of available internal and external sources of funds will be adequate to meet its requirements. CAPITAL EXPENDITURES |
|
Actual
|
|
Projected
|
|||||||||||||||
|
|
|||||||||||||||||
| (Millions) |
1998
|
|
1999
|
|
2000
|
|
2001
|
|
2002
|
|
2003
|
|
2004
|
|
2005
|
|
Total
|
|
|
|||||||||||||||||
| New Business | $ 87.4 | $ 83.6 | $ 75.6 | $ 68.1 | $ 74.3 | $ 73.6 | $ 67.6 | $ 67.9 | $351.5 | ||||||||
| Replacements | 36.2 | 37.5 | 27.1 | 40.4 | 41.4 | 42.1 | 43.0 | 44.0 | 210.9 | ||||||||
| Other | 35.3 | 37.6 | 21.4 | 26.6 | 24.9 | 16.8 | 17.7 | 16.4 | 102.4 | ||||||||
|
|
|||||||||||||||||
| Total | $158.9 | $158.7 | $124.1 | $135.1 | $140.6 | $132.5 | $128.3 | $128.3 | $664.8 | ||||||||
|
|
|||||||||||||||||
|
| Jurisdiction |
Effective Date
|
|
Test Year
12 Months Ended |
|
Increase in Annual Revenues
(Millions) |
Allowed Return
on Common Equity |
||||||||||||
|
|
||||||||||||||||||
|
Requested
|
Granted
|
|||||||||||||||||
|
|
||||||||||||||||||
| Virginia | 7/6/90 | 3/31/90 | $ 7.7 | $ 7.1 | 13.00% | |||||||||||||
| Maryland | 8/1/93 | 12/31/92 | 26.2 | 10.6 | a/ | |||||||||||||
| District of Columbia | 10/19/93 | 9/30/92 | 24.5 | 4.7 | 11.50% | |||||||||||||
| District of Columbia | 8/1/94 | 9/30/93 | 17.3 | 6.4 | b/ | |||||||||||||
| Virginia | 9/27/94 | 12/31/93 | 15.7 | 6.8 | 11.50% | |||||||||||||
| Maryland | 12/1/94 | 3/31/94 | 17.6 | 7.4 | a/ | |||||||||||||
|
b/ Application was settled without stipulating the return on common equity. Incentive Rate PlanOn January 6, 2000, the company announced that it filed with the Public Service Commission of Maryland (PSC of MD) a non-unanimous settlement agreement that would freeze Maryland customers’ basic delivery rates at the present levels and insulate them from potential rate increases over the next five years. The only adjustments that would have been allowed under the agreement would have been for material changes in costs due to extraordinary events, such as tax rate changes or new regulatory requirements. The agreement also included the potential to reduce customers’ bills and increase returns to shareholders through the use of an earnings-sharing mechanism. In addition, the agreement included a provision for residential heating customers that would reduce fluctuations in customers’ bills due to the effects of weather deviations from normal levels. On October 19, 2000, the PSC of MD issued an order that declined to approve the agreement. On November 6, 2000, Washington Gas filed a request for a rehearing of the PSC of MD’s order. District of Columbia Regulatory MattersOn February 17, 2000, the District of Columbia’s Office of the People’s Counsel (OPC) filed a complaint with the Public Service Commission of the District of Columbia (PSC of DC) requesting an investigation into the rates and charges of Washington Gas. The complaint alleges that: 1) Washington Gas earned an actual return on equity that is significantly higher than authorized by the PSC of DC; and 2) the return on equity that the PSC of DC authorizes Washington Gas to earn is higher than is appropriate, given current economic conditions. On February 28, 2000, Washington Gas requested the PSC of DC to dismiss the OPC complaint chiefly on the grounds that the OPC’s analysis of the company’s rates was substantively flawed. The PSC of DC is currently reviewing the OPC’s complaint and the company’s response thereto. No specific timeline has been established for the PSC of DC to render its final decision on this matter. Year 2000Washington Gas has continued to operate successfully through the turn of the century and during other key dates associated with the transition to the Year 2000. The company continues to monitor its systems for Year 2000 issues. The following table reflects the amounts charged to expense and capitalized early in fiscal year 2000 and during the fiscal years ended September 30, 1999, 1998 and 1997 for business-application systems remediation, embedded systems replacement, end-user applications remediation and replacement, independent verification and validation costs and business continuity initiatives. |
| (Millions) |
2000
|
|
1999
|
|
1998
|
|
1997
|
|
Total
|
|
|
|
||||||||||
| Expense | $ — | $ 6 | $ 5 | $ 1 | $ 12 | |||||
| Capital | 1 | 24 | 20 | — | 45 | |||||
|
|
Years
Ended September 30,
|
||||||
|
|
||||||
| (Thousands, Except Per Share Data) |
2000
|
|
1999
|
|
1998
|
|
|
|
||||||
| UTILITY OPERATIONS | ||||||
| Operating Revenues (Note 1) | $ 1,031,105 | $ 972,120 | $ 1,040,618 | |||
| Less: Cost of gas (Note 1) | 552,579 | 505,346 | 575,786 | |||
| Revenue taxes | 35,598 | 34,793 | 39,659 | |||
|
|
||||||
| Utility Net Revenues | 442,928 | 431,981 | 425,173 | |||
|
|
||||||
| Other Operating Expenses | ||||||
| Operation | 146,288 | 165,605 | 162,336 | |||
| Maintenance | 31,216 | 35,624 | 38,458 | |||
| Depreciation and amortization (Note 1) | 65,514 | 59,940 | 54,875 | |||
| General taxes | 27,226 | 28,125 | 29,519 | |||
| Loss on sale of utility property (Note 3) | — | 2,927 | — | |||
| Income taxes (See Statements of Income Taxes and Note 9) | 47,821 | 38,689 | 38,022 | |||
|
|
||||||
| Utility Other Operating Expenses | 318,065 | 330,910 | 323,210 | |||
|
|
||||||
| Utility Operating Income | 124,863 | 101,071 | 101,963 | |||
|
|
||||||
| NON-UTILITY OPERATIONS | ||||||
| Operating Revenues (Notes 1 and 15) | ||||||
| Retail energy marketing | 166,705 | 103,851 | 83,176 | |||
| Heating, ventilating and air conditioning | 47,473 | 31,208 | 13,815 | |||
| Consumer financing | 2,962 | 3,779 | 3,206 | |||
| Other non-utility | 947 | 1,258 | 2,637 | |||
|
|
||||||
| Non-Utility Revenues | 218,087 | 140,096 | 102,834 | |||
|
|
||||||
| Equity
Loss in 50%-Owned Residential HVAC Investment (Notes 3 and 15) |
(1,949 | ) | (54 | ) | — | |
|
|
||||||
| Other Operating Expenses (Income) | ||||||
| Operating expenses | 211,325 | 132,505 | 100,537 | |||
| Gains on sales of non-utility assets (Note 3) | (711 | ) | (2,979 | ) | (4,103 | ) |
| Income taxes (See Statements of Income Taxes and Note 9) | 1,442 | 3,826 | 1,640 | |||
|
|
||||||
| Non-Utility Operating Expenses (Income) | 212,056 | 133,352 | 98,074 | |||
|
|
||||||
| Non-Utility Operating Income | 4,082 | 6,690 | 4,760 | |||
|
|
||||||
| TOTAL OPERATING INCOME | 128,945 | 107,761 | 106,723 | |||
| Other Income (Expenses)—Net (See Statements of Income Taxes) | (635 | ) | (2,022 | ) | (375 | ) |
|
|
||||||
| INCOME BEFORE INTEREST EXPENSE | 128,310 | 105,739 | 106,348 | |||
|
|
||||||
| INTEREST EXPENSE | ||||||
| Interest on long-term debt | 36,115 | 34,684 | 33,859 | |||
| Other | 7,621 | 2,287 | 3,860 | |||
|
|
||||||
| Total Interest Expense | 43,736 | 36,971 | 37,719 | |||
|
|
||||||
| NET INCOME | 84,574 | 68,768 | 68,629 | |||
| DIVIDENDS ON PREFERRED STOCK | 1,323 | 1,331 | 1,331 | |||
|
|
||||||
| NET INCOME APPLICABLE TO COMMON STOCK | $ 83,251 | $ 67,437 | $ 67,298 | |||
|
|
||||||
| AVERAGE COMMON SHARES OUTSTANDING | 46,473 | 45,984 | 43,691 | |||
|
|
||||||
| EARNINGS
PER AVERAGE COMMON SHARE—BASIC AND DILUTED (Note 8) |
$ 1.79 | $ 1.47 | $ 1.54 | |||
|
|
||||||
|
Washington
Gas LIght Company
|
|
September
30,
|
||||||
|
|
||||||
| (Thousands) |
2000
|
1999
|
||||
|
|
||||||
| ASSETS | ||||||
| Property, Plant and Equipment (Notes 1 and 5) | ||||||
| At original cost | $ | 2,225,312 | $ | 2,114,071 | ||
| Accumulated depreciation and amortization | (765,032 | ) | (711,329 | ) | ||
|
|
||||||
| Net Property, Plant and Equipment | 1,460,280 | 1,402,742 | ||||
|
|
||||||
| Current Assets | ||||||
| Cash and cash equivalents | 24,336 | 26,935 | ||||
| Accounts receivable | 106,446 | 74,295 | ||||
| Gas costs due from customers (Note 1) | 2,313 | 5,127 | ||||
| Allowance for doubtful accounts | (7,186 | ) | (6,626 | ) | ||
| Accrued utility revenues (Note 1) | 21,497 | 17,141 | ||||
| Materials and supplies—principally at average cost | 16,341 | 17,207 | ||||
| Storage gas—at cost (first-in, first-out) | 138,684 | 80,481 | ||||
| Deferred income taxes (See Statements of Income Taxes and Note 9) | 16,232 | 19,662 | ||||
| Other prepayments—principally taxes | 7,467 | 14,888 | ||||
| Deferred gas costs—unregulated operations (Note 1) | 13,741 | 8,775 | ||||
| Other | 5,991 | 1,355 | ||||
|
|
||||||
| Total Current Assets | 345,862 | 259,240 | ||||
|
|
||||||
| Deferred Charges and Other Assets | ||||||
| Regulatory assets (Note 1) | 78,364 | 84,278 | ||||
| Equity in 50%-owned residential HVAC investment (Notes 3 and 15) | 16,247 | 7,446 | ||||
| Prepaid pensions and benefits (Note 10) | 17,327 | — | ||||
| Other | 21,760 | 21,793 | ||||
|
|
||||||
| Total Deferred Charges and Other Assets | 133,698 | 113,517 | ||||
|
|
||||||
| Total Assets | $ | 1,939,840 | $ | 1,775,499 | ||
|
|
||||||
| CAPITALIZATION AND LIABILITIES | ||||||
| Capitalization (See Statements of Capitalization and Shareholders’ Equity) | ||||||
| Common shareholders’ equity (Notes 2, 6 and 11) | $ | 711,496 | $ | 684,034 | ||
| Preferred stock (Notes 2 and 7) | 28,173 | 28,420 | ||||
| Long-term debt (Notes 1, 2 and 5) | 559,575 | 506,084 | ||||
|
|
||||||
| Total Capitalization | 1,299,244 | 1,218,538 | ||||
|
|
||||||
| Current Liabilities | ||||||
| Current maturities of long-term debt (Notes 2 and 5) | 1,668 | 1,431 | ||||
| Notes payable (Note 4) | 161,423 | 113,067 | ||||
| Accounts payable | 138,218 | 117,059 | ||||
| Wages payable | 13,875 | 9,824 | ||||
| Dividends declared | 14,738 | 14,507 | ||||
| Customer deposits and advance payments | 10,746 | 15,853 | ||||
| Gas costs due to customers (Note 1) | 5,640 | 11,321 | ||||
| Other | 13,693 | 10,839 | ||||
|
|
||||||
| Total Current Liabilities | 360,001 | 293,901 | ||||
|
|
||||||
| Deferred Credits | ||||||
| Unamortized investment tax credits | 18,539 | 19,439 | ||||
| Deferred income taxes (See Statements of Income Taxes and Note 9) | 169,442 | 156,495 | ||||
| Accrued pensions and benefits (Note 10) | 37,936 | 40,087 | ||||
| Other (Notes 1, 12 and 13) | 54,678 | 47,039 | ||||
|
|
||||||
| Total Deferred Credits | 280,595 | 263,060 | ||||
|
|
||||||
| Commitments and Contingencies (Notes 12 and 13) | ||||||
| Total Capitalization and Liabilities | $ | 1,939,840 | $ | 1,775,499 | ||
|
|
||||||
|
The accompanying Notes to Consolidated Financial Statements are an integral part of these consolidated statements.
Washington
Gas Light Company
|
|
Years
Ended September 30,
|
|||||||||
|
|
|||||||||
| (Thousands) |
2000
|
1999
|
1998
|
||||||
|
|
|||||||||
| OPERATING ACTIVITIES | |||||||||
| Net income | $ | 84,574 | $ | 68,768 | $ | 68,629 | |||
| ADJUSTMENTS TO RECONCILE NET INCOME TO NET CASH | |||||||||
| PROVIDED BY OPERATING ACTIVITIES | |||||||||
| Depreciation and amortization(a) | 69,808 | 66,247 | 60,291 | ||||||
| Deferred income taxes—net | 17,470 | 9,576 | 11,055 | ||||||
| Amortization of investment tax credits | (900 | ) | (1,054 | ) | (934 | ) | |||
| Accrued/deferred pension cost (Note 10) | (12,944 | ) | (169 | ) | 931 | ||||
| Allowance for funds used during construction | (679 | ) | (1,642 | ) | (815 | ) | |||
| Equity loss in 50%-owned residential HVAC investment | (1,949 | ) | (54 | ) | — | ||||
| Other
non-cash charges and (credits)—net, including gains and losses on investing activities |
399 | (2,496 | ) | (2,337 | ) | ||||
|
|
|||||||||
| 155,779 | 139,176 | 136,820 | |||||||
| CHANGES IN ASSETS AND LIABILITIES | |||||||||
| Accounts receivable and accrued utility revenues | (35,947 | ) | 13,922 | (18,637 | ) | ||||
| Gas costs due from/to customers—net (Note 1) | (2,867 | ) | 9,790 | 2,777 | |||||
| Storage gas | (58,203 | ) | (4,143 | ) | 4,734 | ||||
| Other prepayments—principally taxes | 7,421 | (1,024 | ) | (1,894 | ) | ||||
| Accounts payable | 20,216 | 13,413 | 613 | ||||||
| Wages payable | 4,051 | (3,703 | ) | (63 | ) | ||||
| Customer deposits and advance payments | (5,107 | ) | (3,505 | ) | 2,792 | ||||
| Accrued taxes | 3,026 | (142 | ) | (389 | ) | ||||
| Deferred purchased gas costs—net (Note 1) | 5,933 | 1,713 | 897 | ||||||
| Deferred unregulated purchased gas costs (Note 1) | (4,966 | ) | (8,377 | ) | (398 | ) | |||
| Other—net | (806 | ) | (4,381 | ) | (3,428 | ) | |||
|
|
|||||||||
| Net Cash Provided by Operating Activities | 88,530 | 152,739 | 123,824 | ||||||
|
|
|||||||||
| FINANCING ACTIVITIES | |||||||||
| Common stock issued (Note 6) | — | 64,266 | 5,279 | ||||||
| Common stock repurchased | — | — | (2,340 | ) | |||||
| Long-term debt issued (Note 5) | 54,931 | 80,823 | 72,166 | ||||||
| Long-term debt retired (Notes 1 and 5) | (1,169 | ) | (66,193 | ) | (34,537 | ) | |||
| Premium on long-term debt retired | — | — | (493 | ) | |||||
| Debt issuance costs | (451 | ) | (588 | ) | (494 | ) | |||
| Notes
payable—net of effects from purchase of subsidiary in 1998 (Note 3) |
48,356 | (11,876 | ) | 55,698 | |||||
| Dividends on common and preferred stock | (58,471 | ) | (56,631 | ) | (53,228 | ) | |||
| Other financing | 840 | (12 | ) | (1,512 | ) | ||||
|
|
|||||||||
| Net Cash Provided by Financing Activities | 44,036 | 9,789 | 40,539 | ||||||
|
|
|||||||||
| INVESTING ACTIVITIES | |||||||||
| Capital expenditures | (124,067 | ) | (158,733 | ) | (158,874 | ) | |||
| Net proceeds from sales of | |||||||||
| West Virginia utility assets (Note 3) | — | 12,559 | — | ||||||
| Retail propane assets (Note 3) | — | — | 4,050 | ||||||
| Other non-utility assets (Note 3) | 711 | 4,073 | 1,619 | ||||||
| Purchase of subsidiary—net of cash acquired (Note 3) | — | — | (2,990 | ) | |||||
| 50%-owned residential HVAC investment (Note 3) | (10,750 | ) | (7,500 | ) | — | ||||
| Other investing activities | (1,059 | ) | (3,868 | ) | — | ||||
|
|
|||||||||
| Net Cash Used in Investing Activities | (135,165 | ) | (153,469 | ) | (156,195 | ) | |||
|
|
|||||||||
| INCREASE (DECREASE) IN CASH AND CASH EQUIVALENTS(b) | (2,599 | ) | 9,059 | 8,168 | |||||
| Cash and Cash Equivalents at Beginning of Year(b) | 26,935 | 17,876 | 9,708 | ||||||
|
|
|||||||||
| Cash and Cash Equivalents at End of Year(b) | $ | 24,336 | $ | 26,935 | $ | 17,876 | |||
|
|
|||||||||
| (a) Includes amounts charged to other accounts. | |||||||||
| (b) Cash equivalents are highly liquid investments with a maturity of three months or less when purchased. | |||||||||
| SUPPLEMENTAL DISCLOSURES OF CASH FLOW INFORMATION | |||||||||
| Income taxes paid | $ | 27,302 | $ | 29,519 | $ | 32,925 | |||
| Interest paid | $ | 43,472 | $ | 38,685 | $ | 37,811 | |||
|
Washington
Gas Light Company
|
|
September
30,
|
||||||||||
|
|
||||||||||
| (Thousands) |
2000
|
1999
|
||||||||
|
|
||||||||||
| Common Shareholders’ Equity (See Statements of | ||||||||||
| Common Shareholders’ Equity and Notes 6 and 11) | ||||||||||
| Common stock, $1 par value, authorized 80,000,000 shares, | ||||||||||
| issued 46,612,580 and 46,596,737 shares, respectively | $ | 46,613 | $ | 46,597 | ||||||
| Paid-in capital | 373,895 | 372,453 | ||||||||
| Retained earnings | 295,302 | 269,430 | ||||||||
| Deferred compensation | (544 | ) | (1,190 | ) | ||||||
| Treasury
stock—at cost, 142,866 and 123,393 shares, respectively |
(3,770 | ) | (3,256 | ) | ||||||
|
|
||||||||||
| Total Common Shareholders’ Equity | 711,496 | 54.8 | % | 684,034 | 56.1 | % | ||||
|
|
||||||||||
| Preferred Stock without par value, 1,500,000 shares authorized | ||||||||||
| Shares issued and outstanding | ||||||||||
| $4.80 series, 150,000 shares | 15,000 | 15,000 | ||||||||
| $4.25 series, 70,600 shares | 7,173 | 7,173 | ||||||||
| $5.00 series, 60,000 shares | 6,000 | 6,000 | ||||||||
| $4.36 convertible series, zero and 1,901 shares (See Note 7) | — | 190 | ||||||||
| $4.60 convertible series, zero and 569 shares (See Note 7) | — | 57 | ||||||||
|
|
||||||||||
| Total Preferred Stock | 28,173 | 2.1 | 28,420 | 2.4 | ||||||
|
|
||||||||||
| Long-Term Debt (Note 5) | ||||||||||
| Unsecured Medium-Term Notes | ||||||||||
| Due fiscal year 2002, 6.90% to 7.56% | 42,600 | 42,600 | ||||||||
| Due fiscal year 2003, 6.90% | 5,000 | 5,000 | ||||||||
| Due fiscal year 2005, 7.45% | 20,500 | — | ||||||||
| Due fiscal year 2008, 6.51% to 6.61% | 20,100 | 20,100 | ||||||||
| Due fiscal year 2009, 5.49% to 6.92% | 75,000 | 75,000 | ||||||||
| Due fiscal year 2010, 7.50% to 7.70% | 24,000 | — | ||||||||
| Due fiscal year 2022, 6.94% to 6.95% | 5,000 | 5,000 | ||||||||
| Due fiscal year 2023, 6.50% to 7.04% | 50,000 | 50,000 | ||||||||
| Due fiscal year 2024, 6.95% | 36,000 | 36,000 | ||||||||
| Due fiscal year 2025, 6.50% to 7.76% | 40,000 | 40,000 | ||||||||
| Due fiscal year 2026, 6.15% | 50,000 | 50,000 | ||||||||
| Due fiscal year 2027, 6.40% to 6.82% | 125,000 | 125,000 | ||||||||
| Due fiscal year 2028, 6.57% to 6.85% | 52,000 | 52,000 | ||||||||
| Due fiscal year 2030, 7.50% | 8,500 | — | ||||||||
|
|
||||||||||
| Total Unsecured Medium-Term Notes | 553,700 | 500,700 | ||||||||
| Other long-term debt | 8,259 | 7,410 | ||||||||
| Unamortized premium (discount)—net | (716 | ) | (595 | ) | ||||||
| Less current maturities | 1,668 | 1,431 | ||||||||
|
|
||||||||||
| Total Long-Term Debt | 559,575 | 43.1 | 506,084 | 41.5 | ||||||
|
|
||||||||||
| Total Capitalization | $ | 1,299,244 | 100.0 | % | $ | 1,218,538 | 100.0 | % | ||
|
|
||||||||||
|
Washington
Gas Light Company
|
|
|
||||||||||||||||||||
| (Dollars in Thousands) |
Common
Stock Issued
|
Paid-in
Capital
|
Retained
Earnings
|
Deferred
Compensation
|
Treasury
Stock
|
Total
|
||||||||||||||
|
|
||||||||||||||||||||
|
Shares
|
Amount
|
|||||||||||||||||||
|
|
||||||||||||||||||||
| Balance September 30, 1997 | 43,742,148 | $ | 43,742 | $ | 305,123 | $ | 243,175 | $ | (2,022 | ) | $ | (983 | ) | $ | 589,035 | |||||
| Net income | — | — | — | 68,629 | — | — | 68,629 | |||||||||||||
| Deferred compensation | — | — | 255 | — | 74 | 100 | 429 | |||||||||||||
| Director compensation plan | — | — | 21 | — | — | 82 | 103 | |||||||||||||
| Dividend reinvestment plan | 188,812 | 189 | 4,500 | — | — | — | 4,689 | |||||||||||||
| Employee savings plans | 23,090 | 23 | 573 | — | — | 97 | 693 | |||||||||||||
| Conversion of preferred stock | 608 | 1 | 5 | — | — | — | 6 | |||||||||||||
| Common stock repurchased | — | — | — | — | — | (2,340 | ) | (2,340 | ) | |||||||||||
| Dividends declared: | ||||||||||||||||||||
| Common
stock ($1.195 per share) |
— | — | — | (52,158 | ) | — | — | (52,158 | ) | |||||||||||
| Preferred stock | — | — | — | (1,331 | ) | — | — | (1,331 | ) | |||||||||||
|
|
||||||||||||||||||||
| Balance September 30, 1998 | 43,954,658 | 43,955 | 310,477 | 258,315 | (1,948 | ) | (3,044 | ) | 607,755 | |||||||||||
| Net income | — | — | — | 68,768 | — | — | 68,768 | |||||||||||||
| Common stock issued | 2,300,000 | 2,300 | 55,344 | — | — | — | 57,644 | |||||||||||||
| Common stock expense | — | — | (1,953 | ) | — | — | — | (1,953 | ) | |||||||||||
| Stock-based compensation | — | — | 348 | — | 758 | (212 | ) | 894 | ||||||||||||
| Dividend reinvestment plan | 273,464 | 274 | 6,620 | — | — | — | 6,894 | |||||||||||||
| Employee savings plans | 68,196 | 68 | 1,613 | — | — | — | 1,681 | |||||||||||||
| Conversion of preferred stock | 419 | — | 4 | — | — | — | 4 | |||||||||||||
| Dividends declared: | ||||||||||||||||||||
| Common
stock ($1.215 per share) |
— | — | — | (56,322 | ) | — | — | (56,322 | ) | |||||||||||
| Preferred stock | — | — | — | (1,331 | ) | — | — | (1,331 | ) | |||||||||||
|
|
||||||||||||||||||||
| Balance September 30, 1999 | 46,596,737 | 46,597 | 372,453 | 269,430 | (1,190 | ) | (3,256 | ) | 684,034 | |||||||||||
| Net income | — | — | — | 84,574 | — | — | 84,574 | |||||||||||||
| Stock-based compensation | — | — | 1,341 | — | 646 | (514 | ) | 1,473 | ||||||||||||
| Conversion of preferred stock | 15,843 | 16 | 101 | — | — | — | 117 | |||||||||||||
| Dividends declared: | ||||||||||||||||||||
| Common
stock ($1.235 per share) |
— | — | — | (57,379 | ) | — | — | (57,379 | ) | |||||||||||
| Preferred stock | — | — | — | (1,323 | ) | — | — | (1,323 | ) | |||||||||||
|
|
||||||||||||||||||||
| Balance September 30, 2000 | 46,612,580 | $ | 46,613 | $ | 373,895 | $ | 295,302 | $ | (544 | ) | $ | (3,770 | ) | $ | 711,496 | |||||
|
|
||||||||||||||||||||
|
Washington
Gas Light Company
|
|
Years
Ended September 30,
|
|||||||||
|
|
|||||||||
| (Thousands) |
2000
|
1999
|
1998
|
||||||
|
|
|||||||||
| Income Tax Expense (Note 9) | |||||||||
| Charged to other utility operating expenses | |||||||||
| Current | $ | 30,564 | $ | 30,298 | $ | 28,242 | |||
|
|
|||||||||
| Deferred | |||||||||
| Accelerated depreciation | 15,132 | 12,832 | 11,550 | ||||||
| Losses/gains on reacquired debt | (212 | ) | (235 | ) | 556 | ||||
| Deferred gas costs | 1,359 | (6,987 | ) | 473 | |||||
| Pensions and other employee benefit costs | 3,403 | 1,912 | 879 | ||||||
| Demand-side management costs | (718 | ) | (604 | ) | (414 | ) | |||
| Inventory overheads | 1,069 | 83 | (962 | ) | |||||
| Other | (1,876 | ) | 2,444 | (1,368 | ) | ||||
|
|
|||||||||
| Total Deferred Income Tax Expense | 18,157 | 9,445 | 10,714 | ||||||
|
|
|||||||||
| Amortization of investment tax credits | (900 | ) | (1,054 | ) | (934 | ) | |||
|
|
|||||||||
| 47,821 | 38,689 | 38,022 | |||||||
|
|
|||||||||
| Charged to other non-utility operating expenses | |||||||||
| Current | 1,796 | 3,322 | 1,591 | ||||||
| Deferred | (354 | ) | 504 | 49 | |||||
|
|
|||||||||
| 1,442 | 3,826 | 1,640 | |||||||
|
|
|||||||||
| Charged to other income (expenses)—net | |||||||||
| Current | (1,262 | ) | (566 | ) | (148 | ) | |||
| Deferred | (333 | ) | (373 | ) | 292 | ||||
|
|
|||||||||
| (1,595 | ) | (939 | ) | 144 | |||||
|
|
|||||||||
| Total Income Tax Expense | $ | 47,668 | $ | 41,576 | $ | 39,806 | |||
|
|
|||||||||
|
Years
Ended September 30,
|
|||||||||||||||
|
|
|||||||||||||||
| (Dollars in Thousands) |
2000
|
1999
|
1998
|
||||||||||||
|
|
|||||||||||||||
| Reconciliation Between the Statutory Federal | |||||||||||||||
| Income Tax Rate and the Effective Tax Rate | |||||||||||||||
| Income
tax at statutory federal income tax rate |
$ | 46,285 | 35.00 | % | $ | 38,620 | 35.00 | % | $ | 37,952 | 35.00 | % | |||
| Increases (decreases) in tax resulting from | |||||||||||||||
| Accelerated
depreciation less amount deferred |
2,440 | 1.85 | 2,874 | 2.60 | 2,655 | 2.44 | |||||||||
| Amortization of investment tax credits | (900 | ) | (0.68 | ) | (1,054 | ) | (0.95 | ) | (934 | ) | (0.86 | ) | |||
| Cost of removal | (737 | ) | (0.56 | ) | (879 | ) | (0.80 | ) | (566 | ) | (0.52 | ) | |||
| State income taxes | 1,981 | 1.50 | 1,721 | 1.56 | 1,840 | 1.70 | |||||||||
| Other—net | (1,401 | ) | (1.06 | ) | 294 | 0.27 | (1,141 | ) | (1.05 | ) | |||||
|
|
|||||||||||||||
| Income
Tax Expense and Effective Tax Rate |
$ | 47,668 | 36.05 | % | $ | 41,576 | 37.68 | % | $ | 39,806 | 36.71 | % | |||
|
|
|||||||||||||||
|
At
September 30,
|
||||||||||||
|
|
||||||||||||
| (thousands) |
2000
|
1999
|
||||||||||
|
|
||||||||||||
|
Current
|
Non-current
|
Current
|
Non-current
|
|||||||||
|
|
|
|||||||||||
| Accumulated Deferred Income Taxes | ||||||||||||
| Deferred Income Tax Assets | ||||||||||||
| Pensions and other employee benefit costs | $ | 4,093 | $ | 323 | $ | 3,496 | $ | 2,992 | ||||
| Uncollectible accounts | 1,457 | — | 1,046 | — | ||||||||
| Inventory accounts | 9,761 | — | 10,835 | — | ||||||||
| Valuation allowance | — | — | — | (943 | ) | |||||||
| Other | 698 | 11,250 | 602 | 9,439 | ||||||||
|
|
||||||||||||
| Total Assets | 16,009 | 11,573 | 15,979 | 11,488 | ||||||||
|
|
||||||||||||
| Deferred Income Tax Liabilities | ||||||||||||
| Accelerated depreciation | — | 158,116 | — | 143,310 | ||||||||
| Losses/gains on reacquired debt | — | 3,217 | — | 3,431 | ||||||||
| Construction overheads | — | 2,376 | — | 2,583 | ||||||||
| Income taxes recoverable through future rates—net | — | 12,143 | — | 13,236 | ||||||||
| Deferred gas costs | (223 | ) | (1,502 | ) | (3,683 | ) | 600 | |||||
| Demand-side management costs | — | 6,223 | — | 7,081 | ||||||||
| Other | — | 442 | — | (2,258 | ) | |||||||
|
|
||||||||||||
| Total Liabilities | (223 | ) | 181,015 | (3,683 | ) | 167,983 | ||||||
|
|
||||||||||||
| Net
Accumulated Deferred Income Tax Assets (Liabilities) |
$ | 16,232 | $ | (169,442 | ) | $ | 19,662 | $ | (156,495 | ) | ||
|
|
||||||||||||
|
Assets
|
Liabilities
|
||||||||||
|
|
|||||||||||
| (Millions) |
2000
|
1999
|
2000
|
1999
|
|||||||
|
|
|||||||||||
| Income
tax-related amounts due from/to customers (Note 9) |
$ | 31.3 | $ | 33.7 | $ | 19.2 | $ | 20.5 | |||
| Demand-side management costs | 17.2 | 19.3 | — | — | |||||||
| Other postretirement | |||||||||||
| benefit costs (Note 10) | 10.1 | 11.3 | — | — | |||||||
| Losses on reacquired debt | 8.7 | 9.2 | — | — | |||||||
| Deferred pension costs | — | — | 7.6 | 3.7 | |||||||
| Gas costs due: | |||||||||||
| From customers | 2.3 | 5.1 | — | — | |||||||
| To customers | — | — | 5.6 | 11.3 | |||||||
| Environmental response | |||||||||||
| costs (Note 12) | 6.4 | 6.9 | — | — | |||||||
| Purchased gas costs | — | 1.8 | 4.1 | — | |||||||
| Rights-of-way fees | 2.4 | — | — | — | |||||||
| Refunds due to customers | — | — | 0.6 | 2.2 | |||||||
| Other | 2.3 | 2.1 | 3.7 | 2.1 | |||||||
|
|
|||||||||||
| Total | $ | 80.7 | $ | 89.4 | $ | 40.8 | $ | 39.8 | |||
|
|
|||||||||||
|
Description/
Amount of Credit |
Commitment
or Facility Fees Per Annum |
Expiration Date | |||||
|---|---|---|---|---|---|---|---|
| Permanent Lines of Credit | |||||||
| $ 15 million |
0.07%
|
June 30, 2001 | |||||
| $ 10 million |
0.04%
|
June 30, 2001 | |||||
| $ 5 million |
0.07%
|
*
|
June 30, 2001 | ||||
|
|
|||||||
| Seasonal Lines of Credit | |||||||
| $ 5 million |
0.07%
|
*
|
March 31, 2001 | ||||
| $ 5 million |
0.07%
|
*
|
April 1, 2001 | ||||
| $ 5 million |
0.15%
|
*
|
April 30, 2001 | ||||
|
|
|||||||
| Revolving Credit Agreement | |||||||
| $160 million |
0.07%
|
May 17, 2001 | |||||
| $ 5 million |
None
|
March 31, 2001 | |||||
| $ 5 million |
0.15%
|
June 30, 2001 | |||||
|
Date
Issued |
Amount
of
Issuance (Millions) |
Coupon
Rate |
Maturity
Date |
Redeemable
Prior To Maturity |
|||||||||
|
|
|||||||||||||
| April 2000 | $ 8.5 | 7.50 | % |
April
2030
|
Yes | * | |||||||
| April 2000 | 4.0 | 7.50 | % |
April
2010
|
No | ||||||||
| June 2000 | 20.5 | 7.45 | % |
June
2005
|
No | ||||||||
| June 2000 | 20.0 | 7.70 | % |
June
2010
|
No | ||||||||
|
|
|||||||||||||
| Total | $53.0 | ||||||||||||
|
|
|||||||||||||
| Reserved for |
Number
of Shares
|
||
|
|
|||
| Incentive Compensation Plan | 999,000 | ||
| Dividend Reinvestment and Common Stock Purchase Plan | 473,478 | ||
| Employee Savings Plans | 137,196 | ||
| Directors’ Stock Compensation Plan | 21,083 | ||
|
|
|||
| Total Common Stock Reserves | 1,630,757 | ||
|
|
|||
|
Preferred
Series |
Shares
Outstanding |
Liquidation
Preference
Per Share |
Call
Price
Per Share |
|||||||
|
|
||||||||||
|
Involuntary
|
Voluntary
|
|||||||||
|
|
||||||||||
|
$4.80
|
150,000
|
$100
|
$101
|
$101
|
||||||
|
4.25
|
70,600
|
100
|
105
|
105
|
||||||
|
5.00
|
60,000
|
100
|
102
|
102
|
||||||
| (Thousands, Except Per Share Data) |
Net
Income |
|
Shares
|
|
|
Per
Share
Amount |
||
|
|
||||||||
| For the Year Ended September 30, 2000 | ||||||||
|
|
||||||||
| Basic EPS: | ||||||||
| Net Income Applicable to Common Stock | $ | 83,251 | 46,473 |
$1.79
|
||||
| Effect of Dilutive Securities: | ||||||||
| $4.60
and $4.36 Convertible Stock, Assuming Conversion on October 1, 1999 * |
3 | 9 | ||||||
| Stock-Based Compensation Plans | — | 55 | ||||||
|
|
||||||||
| Diluted EPS: | ||||||||
| Net Income Applicable to Common Stock | $ | 83,254 | 46,537 |
$1.79
|
||||
|
|
||||||||
| *All outstanding convertible preferred stock was either converted or redeemed effective February 1, 2000. | ||||||||
| For the Year Ended September 30, 1999 | ||||||||
|
|
||||||||
| Basic EPS: | ||||||||
| Net Income Applicable to Common Stock | $ | 67,437 | 45,984 |
$1.47
|
||||
| Effect of Dilutive Securities: | ||||||||
| $4.60
and $4.36 Convertible Stock, Assuming Conversion on October 1, 1998 |
11 | 26 | ||||||
| Stock-Based Compensation Plans | — | 13 | ||||||
|
|
||||||||
| Diluted EPS: | ||||||||
| Net Income Applicable to Common Stock | $ | 67,448 | 46,023 |
$1.47
|
||||
|
|
||||||||
| For the Year Ended September 30, 1998 | ||||||||
|
|
||||||||
| Basic EPS: | ||||||||
| Net Income Applicable to Common Stock | $ | 67,298 | 43,691 |
$1.54
|
||||
| Effect of Dilutive Securities: | ||||||||
| $4.60
and $4.36 Convertible Stock, Assuming Conversion on October 1, 1997 |
11 | 26 | ||||||
|
|
||||||||
| Diluted EPS: | ||||||||
| Net Income Applicable to Common Stock | $ | 67,309 | 43,717 |
$1.54
|
||||
|
|
||||||||
| Pension Benefits | Health & Life Benefits | |||||||||||
|
|
||||||||||||
| (Millions) | 2000 | 1999 | 2000 | 1999 | ||||||||
|
|
||||||||||||
| Years Ended September 30, | ||||||||||||
| Change in benefit obligation | ||||||||||||
| Benefit obligation at beginning of year | $ | 459.8 | $ | 495.4 | $ | 206.5 | $ | 224.6 | ||||
| Service cost | 8.0 | 9.7 | 4.6 | 5.0 | ||||||||
| Interest cost | 33.5 | 31.5 | 15.1 | 14.3 | ||||||||
| Amendment | 2.5 | — | — | — | ||||||||
| Actuarial gain | (14.2 | ) | (46.8 | ) | (3.0 | ) | (28.0 | ) | ||||
| Benefits paid | (28.6 | ) | (30.0 | ) | (10.6 | ) | (9.4 | ) | ||||
|
|
||||||||||||
| Benefit obligation at end of year | 461.0 | 459.8 | 212.6 | 206.5 | ||||||||
|
|
||||||||||||
| Change in plan assets | ||||||||||||
| Fair value of plan assets at beginning of year | 692.9 | 631.2 | 99.0 | 83.5 | ||||||||
| Actual return on plan assets | 73.5 | 89.8 | 5.7 | 2.9 | ||||||||
| Company contributions | 1.1 | 3.9 | 20.4 | 22.0 | ||||||||
| Expenses | (2.4 | ) | (2.0 | ) | — | — | ||||||
| Benefits paid | (28.6 | ) | (30.0 | ) | (10.6 | ) | (9.4 | ) | ||||
|
|
||||||||||||
| Fair value of plan assets at end of year | 736.5 | 692.9 | 114.5 | 99.0 | ||||||||
|
|
||||||||||||
| Funded status | ||||||||||||
| Funded status of the plan | 275.5 | 233.1 | (98.1 | ) | (107.5 | ) | ||||||
| Unrecognized actuarial net gains | (291.0 | ) | (263.6 | ) | (46.3 | ) | (47.5 | ) | ||||
| Unrecognized prior service cost | 24.6 | 24.4 | — | — | ||||||||
| Unrecognized transition (assets) obligation | (2.9 | ) | (5.3 | ) | 124.0 | 133.5 | ||||||
|
|
||||||||||||
| Accrued benefit cost | $ | 6.2 | $ | (11.4 | ) | $ | (20.4 | ) | $ | (21.5 | ) | |
|
|
||||||||||||
| Total amounts recognized in balance sheet | ||||||||||||
| Prepaid benefit cost | $ | 17.3 | $ | — | $ | — | $ | — | ||||
| Accrued benefit liability | (14.0 | ) | (16.1 | ) | (20.4 | ) | (21.5 | ) | ||||
| Intangible assets | 2.9 | 4.7 | — | — | ||||||||
|
|
||||||||||||
| Total recognized | $ | 6.2 | $ | (11.4 | ) | $ | (20.4 | ) | $ | (21.5 | ) | |
|
|
||||||||||||
|
Pension
Benefits
|
Health
& Life Benefits
|
||||||||||||||
|
|
|||||||||||||||
|
Assumptions
as of September 30,
|
2000
|
1999
|
2000
|
1999
|
|||||||||||
|
|
|||||||||||||||
| Discount rate | 7.75 | % | 7.50 | % | 7.75 | % | 7.50 | % | |||||||
| Expected return on plan assets | 8.50 | % | 8.25 | % | 8.25 | % | 8.25 | % | |||||||
| Rate of compensation increase | 4.00 | % | 4.00 | % | 4.00 | % | 4.00 | % | |||||||
|
|
|
Pension
Benefits
|
Health
& Life Benefits
|
|||||||||||||||||
|
|
||||||||||||||||||
| (Millions) |
2000
|
1999
|
1998
|
2000
|
1999
|
1998
|
||||||||||||
|
|
||||||||||||||||||
| Components of net periodic benefit cost | ||||||||||||||||||
| Service cost | $ | 8.0 | $ | 9.7 | $ | 9.3 | $ | 4.6 | $ | 5.0 | $ | 4.5 | ||||||
| Interest cost | 33.4 | 31.5 | 32.2 | 15.1 | 14.3 | 14.5 | ||||||||||||
| Expected return on plan assets | (48.8 | ) | (41.6 | ) | (38.7 | ) | (7.5 | ) | (6.3 | ) | (5.1 | ) | ||||||
| Recognized prior service cost | 2.1 | 2.1 | 2.1 | — | — | — | ||||||||||||
| Recognized actuarial gain | (8.8 | ) | (0.4 | ) | (2.3 | ) | (2.4 | ) | (0.7 | ) | (2.0 | ) | ||||||
| Amortization of transition obligation | (2.4 | ) | (2.5 | ) | (2.4 | ) | 9.5 | 9.5 | 9.6 | |||||||||
|
|
||||||||||||||||||
| Net periodic benefit cost | (16.5 | ) | (1.2 | ) | 0.2 | 19.3 | 21.8 | 21.5 | ||||||||||
| Amount capitalized as construction cost | 3.1 | 0.8 | 0.4 | (3.9 | ) | (4.4 | ) | (4.2 | ) | |||||||||
| Amount deferred as a regulatory asset—net | 3.9 | 0.9 | 0.6 | 1.2 | 0.5 | 1.5 | ||||||||||||
|
|
||||||||||||||||||
| Amount charged to expense (income) | $ | (9.5 | ) | $ | 0.5 | $ | 1.2 | $ | 16.6 | $ | 17.9 | $ | 18.8 | |||||
|
|
||||||||||||||||||
|
The projected benefit obligation and accumulated benefit obligation for the company’s nonfunded SERP, which has accumulated benefits in excess of plan assets, were $16.4 million and $14.0 million, respectively, as of September 30, 2000 and $17.0 million and $14.9 million, respectively, as of September 30, 1999. The plan has no assets. The assumed healthcare trend rate has a significant effect on the amounts reported for the healthcare plans. A one-percentage-point change in the assumed healthcare trend rate would have the following effects: |
| (Millions) |
1-Percentage-
Point Increase |
1-Percentage-
Point Decrease |
||||||||
|
|
||||||||||
| Increase (decrease) total service |
|
|
||||||||
| and interest cost components |
$
|
2.9 |
$
|
(2.4 | ) | |||||
| Increase (decrease) postretirement |
|
|||||||||
| obligation |
$
|
30.0 |
$
|
(24.6 | ) | |||||
|
Long-term
Incentive
Compensation Plan |
1999
Plan
|
||||||||||||||
|
|
|||||||||||||||
|
2000
|
1999
|
1998
|
2000
|
1999
|
|||||||||||
|
|
|||||||||||||||
| Shares outstanding—beginning of period |
|
86,510 | 116,380 | 139,915 | 45,702 | — | |||||||||
| Shares granted | |||||||||||||||
| Performance shares | — | — | — | 33,622 | 45,702 | ||||||||||
| Restricted shares |
|
— | — | 32,350 | 1,000 | — | |||||||||
| Shares vested |
|
(39,930 | ) | (29,870 | ) | (55,885 | ) | — | — | ||||||
| Shares forfeited |
|
(9,880 | ) | — | — | (6,630 | ) | — | |||||||
|
|
|||||||||||||||
| Shares outstanding—end of period | 36,700 | 86,510 | 116,380 | 73,694 | 45,702 | ||||||||||
|
|
|||||||||||||||
| Weighted-average fair value on grant dates |
$
|
— | $ | — | $ | 27.21 | $ |
27.09
|
$ | 22.63 | |||||
|
|
|||||||||||||||
| Compensation expense recognized |
$
|
465,000 | $ | 758,000 | $ | 955,000 | $ | 1,267,000 | $ | 303,000 | |||||
|
|
|||||||||||||||
|
In fiscal years 1999 and 2000, the company granted an aggregate of 209,969 nonqualified stock options to officers under the 1999 Plan, all of which were outstanding at September 30, 2000. Since the stock options were granted at the fair market value of the company’s stock on the grant dates, no compensation expense was recognized for either fiscal year. During fiscal year 2000, a total of 27,615 stock options became vested and may be exercised through June 2001 at prices ranging from $22.63 to $27.13 with a weighted-average exercise price of $24.75. The remaining 182,354 stock options continue to be outstanding and will vest three years after the date of the grant and expire on the tenth anniversary of the grant date. The following table provides additional information regarding nonqualified stock options granted under the 1999 Plan for fiscal years 2000 and 1999, including the assumptions used to calculate fair market value of the stock options granted in each fiscal year. STOCK OPTIONS |
|
Years
Ended
September 30, |
||||||
|
|
||||||
|
2000
|
1999
|
|||||
|
|
||||||
| Outstanding, beginning of year | 99,465 | — | ||||
| Granted | 110,504 | 99,465 | ||||
|
|
||||||
| Outstanding, end of year | 209,969 | 99,465 | ||||
|
|
||||||
| Exercise prices of shares | ||||||
| outstanding, end of year: | ||||||
| Low | $ | 22.63 | $ | 22.63 | ||
| High | 27.13 | 22.63 | ||||
| Weighted-average | 24.70 | 22.63 | ||||
|
|
||||||
| Weighted-average remaining vesting | ||||||
| life of shares outstanding, end of year | 1.9 years | 2.5 years | ||||
|
|
||||||
| Fair Market Assumptions | ||||||
| (Black-Scholes model): | ||||||
| Dividend yield | 4.8% | 4.8% | ||||
| Expected stock-price volatility | 24.0% | 24.0% | ||||
| Risk-free interest rate | 6.3% | 6.3% | ||||
| Expected option life | 3 years | 3 years | ||||
| Weighted-average
fair market value of stock options granted during the year |
$ | 4.52 | $ | 3.85 | ||
|
PRO FORMA EFFECT OF STOCK OPTIONS |
|
Years
Ended
September 30, |
||||||
|
|
||||||
| (Thousands, Except Per Share Data) |
2000
|
1999
|
||||
|
|
||||||
| Net income | ||||||
| As reported | $ | 84,574 | $ | 68,768 | ||
| Pro forma* | 84,396 | 68,727 | ||||
| Net income applicable to common stock | ||||||
| As reported | $ | 83,251 | $ | 67,437 | ||
| Pro forma* | 83,073 | 67,396 | ||||
| Earnings per average common share—basic | ||||||
| As reported | $ | 1.79 | $ | 1.47 | ||
| Pro forma* | 1.79 | 1.47 | ||||
| Earnings per average common share—diluted | ||||||
| As reported | $ | 1.79 | $ | 1.47 | ||
| Pro forma* | 1.79 | 1.46 | ||||
| (Millions) |
2001
|
|
2002
|
|
2003
|
|
2004
|
|
2005
|
|
Total
|
||||||||
|
|
|||||||||||||||||||
| Natural gas purchase contracts | $ | 4.7 | $ | 2.5 | $ | 1.8 | $ | — | $ | — | $ | 9.0 | |||||||
| Pipeline contracts | 90.9 | 89.1 | 83.0 | 76.9 | 61.5 | 401.4 | |||||||||||||
|
|
|||||||||||||||||||
| Total | $ | 95.6 | $ | 91.6 | $ | 84.8 | $ | 76.9 | $ | 61.5 | $ | 410.4 | |||||||
|
|
|||||||||||||||||||
|
2000
|
1999
|
|||||||||||
|
|
||||||||||||
| (Millions) |
Carrying
Amount |
Fair
Value |
Carrying
Amount |
Fair
Value
|
||||||||
|
|
||||||||||||
| Current assets | $ | 147.4 | $ | 147.4 | $ | 116.9 | $ | 116.9 | ||||
| Current liabilities | 349.9 | 349.9 | 286.5 | 286.5 | ||||||||
| Long-term debt | 559.6 | 532.8 | 506.1 | 487.9 | ||||||||
|
The same accounting policies as those described in Note 1 apply to the reported segments. While net income or loss is the primary criterion for measuring a segment’s performance, the company also evaluates segments based on other relevant factors, such as penetration into their respective markets. The following table presents operating segment information. OPERATING
SEGMENT FINANCIAL INFORMATION
|
| (Thousands) |
Regulated Utility
|
Non-Utility Operations
|
Eliminations/
Other |
Consolidated
|
||||||||||||||||||||||||||||
|
|
||||||||||||||||||||||||||||||||
|
Retail Energy
Marketing |
HVAC
|
Consumer
Financing |
Other
Activities |
Total
|
||||||||||||||||||||||||||||
|
|
||||||||||||||||||||||||||||||||
| Year Ended September 30, 2000 | ||||||||||||||||||||||||||||||||
|
|
||||||||||||||||||||||||||||||||
| Total Revenues | $ | 1,031,105 | $ | 166,705 | $ | 47,473 | $ | 2,962 | $ | 947 | $ | 218,087 | $ | — | $ | 1,249,192 | ||||||||||||||||
| Operating Expenses | ||||||||||||||||||||||||||||||||
| Depreciation and Amortization | 65,514 | 32 | 568 | — | — | 600 | — | 66,114 | ||||||||||||||||||||||||
| Other Operating Expenses(a) | 792,907 | 165,617 | 40,885 | 1,532 | 1,980 | 210,014 | — | 1,002,921 | ||||||||||||||||||||||||
| Income Tax Expense (Benefit) | 47,821 | 519 | 1,511 | 495 | (1,083 | ) | 1,442 | — | 49,263 | |||||||||||||||||||||||
|
|
||||||||||||||||||||||||||||||||
| Total Operating Expenses | 906,242 | 166,168 | 42,964 | 2,027 | 897 | 212,056 | — | 1,118,298 | ||||||||||||||||||||||||
| Equity in Loss of 50% Investment | — | — | (1,949 | ) | — | — | (1,949 | ) | — | (1,949 | ) | |||||||||||||||||||||
|
|
||||||||||||||||||||||||||||||||
| Operating Income | 124,863 | 537 | 2,560 | 935 | 50 | 4,082 | — | 128,945 | ||||||||||||||||||||||||
| Interest Expense—Net | 41,643 | 8 | 1,108 | 170 | 2 | 1,288 | 805 | 43,736 | ||||||||||||||||||||||||
| Other Non-Operating Inc. (Exp.)(b) | — | — | (10 | ) | — | — | (10 | ) | (625 | ) | (635 | ) | ||||||||||||||||||||
|
|
||||||||||||||||||||||||||||||||
| Net Income (Loss) | $ | 83,220 | $ | 529 | $ | 1,442 | $ | 765 | $ | 48 | $ | 2,784 | $ | (1,430 | ) | $ | 84,574 | |||||||||||||||
|
|
||||||||||||||||||||||||||||||||
| Total Assets | $ | 1,825,760 | $ | 47,933 | $ | 40,932 | $ | 11,763 | $ | 680 | $ | 101,308 | $ | 12,772 | $ | 1,939,840 | ||||||||||||||||
|
|
||||||||||||||||||||||||||||||||
| Capital Expenditures/Investments | $ | 122,480 | $ | 145 | $ | 10,999 | $ | 1,193 | $ | — | $ | 12,337 | $ | — | $ | 134,817 | ||||||||||||||||
|
|
||||||||||||||||||||||||||||||||
| Year Ended September 30, 1999 | ||||||||||||||||||||||||||||||||
|
|
||||||||||||||||||||||||||||||||
| Total Revenues | $ | 972,120 | $ | 103,851 | $ | 31,208 | $ | 3,779 | $ | 1,258 | $ | 140,096 | $ | — | $ | 1,112,216 | ||||||||||||||||
| Operating Expenses | ||||||||||||||||||||||||||||||||
| Depreciation and Amortization | 59,940 | 26 | 177 | — | — | 203 | — | 60,143 | ||||||||||||||||||||||||
| Other Operating Expenses(a) | 772,420 | 101,492 | 28,485 | 790 | (1,444 | ) | 129,323 | — | 901,743 | |||||||||||||||||||||||
| Income Tax Expense (Benefit) | 38,689 | 764 | 885 | 1,100 | 1,077 | 3,826 | — | 42,515 | ||||||||||||||||||||||||
|
|
||||||||||||||||||||||||||||||||
| Total Operating Expenses | 871,049 | 102,282 | 29,547 | 1,890 | (367 | ) | 133,352 | — | 1,004,401 | |||||||||||||||||||||||
| Equity in Loss of 50% Investment | — | — | (54 | ) | — | — | (54 | ) | — | (54 | ) | |||||||||||||||||||||
|
|
||||||||||||||||||||||||||||||||
| Operating Income | 101,071 | 1,569 | 1,607 | 1,889 | 1,625 | 6,690 | — | 107,761 | ||||||||||||||||||||||||
| Interest Expense—Net | 36,297 | 5 | 474 | 150 | 4 | 633 | 41 | 36,971 | ||||||||||||||||||||||||
| Other Non-Operating Inc. (Exp.)(b) | — | — | 57 | — | — | 57 | (2,079 | ) | (2,022 | ) | ||||||||||||||||||||||
|
|
||||||||||||||||||||||||||||||||
| Net Income (Loss) | $ | 64,774 | $ | 1,564 | $ | 1,190 | $ | 1,739 | $ | 1,621 | $ | 6,114 | $ | (2,120 | ) | $ | 68,768 | |||||||||||||||
|
|
||||||||||||||||||||||||||||||||
| Total Assets | $ | 1,698,143 | $ | 33,872 | $ | 20,560 | $ | 12,270 | $ | 239 | $ | 66,941 | $ | 10,415 | $ | 1,775,499 | ||||||||||||||||
|
|
||||||||||||||||||||||||||||||||
| Capital Expenditures/Investments | $ | 158,190 | $ | 38 | $ | 8,005 | $ | — | $ | — | $ | 8,043 | $ | — | $ | 166,233 | ||||||||||||||||
|
|
||||||||||||||||||||||||||||||||
| Year Ended September 30, 1998 | ||||||||||||||||||||||||||||||||
|
|
||||||||||||||||||||||||||||||||
| Total Revenues | $ | 1,040,618 | $ | 83,176 | $ | 13,815 | $ | 3,206 | $ | 2,637 | $ | 102,834 | $ | — | $ | 1,143,452 | ||||||||||||||||
| Operating Expenses | ||||||||||||||||||||||||||||||||
| Depreciation and Amortization | 54,875 | 26 | 99 | — | 73 | 198 | — | 55,073 | ||||||||||||||||||||||||
| Other Operating Expenses(a) | 845,758 | 82,702 | 14,083 | 984 | (1,533 | ) | 96,236 | — | 941,994 | |||||||||||||||||||||||
| Income Tax Expense (Benefit) | 38,022 | 173 | (176 | ) | 803 | 840 | 1,640 | — | 39,662 | |||||||||||||||||||||||
|
|
||||||||||||||||||||||||||||||||
| Total Operating Expenses | 938,655 | 82,901 | 14,006 | 1,787 | (620 | ) | 98,074 | — | 1,036,729 | |||||||||||||||||||||||
|
|
||||||||||||||||||||||||||||||||
| Operating Income | 101,963 | 275 | (191 | ) | 1,419 | 3,257 | 4,760 | — | 106,723 | |||||||||||||||||||||||
| Interest Expense—Net | 37,383 | (13 | ) | 143 | 149 | 57 | 336 | — | 37,719 | |||||||||||||||||||||||
| Other Non-Operating Inc. (Exp.)(b) | — | — | — | — | — | — | (375 | ) | (375 | ) | ||||||||||||||||||||||
|
|
||||||||||||||||||||||||||||||||
| Net Income (Loss) | $ | 64,580 | $ | 288 | $ | (334 | ) | $ | 1,270 | $ | 3,200 | $ | 4,424 | $ | (375 | ) | $ | 68,629 | ||||||||||||||
|
|
||||||||||||||||||||||||||||||||
| Total Assets | $ | 1,649,247 | $ | 21,355 | $ | 11,863 | $ | 3,101 | $ | 641 | $ | 36,960 | $ | (3,774 | ) | $ | 1,682,433 | |||||||||||||||
|
|
||||||||||||||||||||||||||||||||
| Capital Expenditures/Investments | $ | 158,778 | $ | 34 | $ | 5,052 | $ | — | $ | — | $ | 5,086 | $ | — | $ | 163,864 | ||||||||||||||||
|
|
||||||||||||||||||||||||||||||||
| /s/ James H. DeGraffenreidt, Jr. | /s/ Frederic M. Kline |
| James H. DeGraffenreidt, Jr., | Frederic M. Kline, |
| Chairman, President and Chief Executive Officer | Vice President and Chief Financial Officer |
|
Quarter
Ended
|
||||||||||||
|
|
||||||||||||
| (Thousands, Except Per Share Data) |
Dec.
31
|
|
March
31
|
|
June
30
|
|
Sept.
30
|
|||||
|
|
||||||||||||
| Fiscal Year 2000 | ||||||||||||
| Operating revenues(a) | $ | 365,613 | $ | 468,970 | $ | 211,359 | $ | 203,250 | ||||
| Operating income (loss)(a) | 50,736 | 76,166 | 5,229 | (3,186 | ) | |||||||
| Net income (loss) | 39,779 | 65,243 | (5,295 | ) | (15,153 | ) | ||||||
| Earnings (loss) per average share of common stock: | ||||||||||||
| Basic(b) | 0.85 | 1.40 | (0.12 | ) | (0.33 | ) | ||||||
| Diluted(b) | 0.85 | 1.39 | (0.12 | ) | (0.33 | ) | ||||||
| Fiscal Year 1999 | ||||||||||||
| Operating revenues(a) | $ | 328,875 | $ | 447,418 | $ | 175,297 | $ | 160,626 | ||||
| Operating income (loss)(a) | 35,686 | 74,592 | 2,153 | (4,670 | ) | |||||||
| Net income (loss) | 24,915 | 64,844 | (6,764 | ) | (14,227 | ) | ||||||
| Earnings (loss) per average share of common stock: | ||||||||||||
| Basic and Diluted(b) | 0.55 | 1.39 | (0.15 | ) | (0.31 | ) | ||||||
|
(a) Certain previously reported quarterly amounts have been reclassified to conform to the presentation for the current period. (b) The sum of these amounts may not equal the annual amount because the quarterly calculations are based on varying numbers of common shares outstanding. At September 30, 2000, Washington Gas had 20,029 common shareholders of record. During the fiscal years ended September 30, 2000 and 1999, Washington Gas common stock was listed for trading on the New York Stock Exchange and on the Philadelphia Stock Exchange and was shown as “WashGasLt” or “WashGs” in newspapers. The table below shows quarterly price ranges and quarterly dividends paid for the fiscal years ended September 30, 2000 and 1999: COMMON STOCK PRICE RANGE AND DIVIDENDS PAID |
|
High
|
|
Low
|
|
Dividends
Paid
Per Share |
|
Dividend
Payment Date |
||||||||
|
|
||||||||||||||
| Fiscal Year 2000 | ||||||||||||||
| Fourth quarter |
$27
|
3/4 |
|
$23
|
15/16 |
|
$0.310
|
|
8/1/00
|
|||||
| Third quarter |
27
|
5/8 |
|
24
|
1/16 |
|
0.310
|
|
5/1/00
|
|||||
| Second quarter |
27
|
5/8 |
|
21
|
3/4 |
|
0.305
|
|
2/1/00
|
|||||
| First quarter |
29
|
7/16 |
|
25
|
|
0.305
|
|
11/1/99
|
||||||
| Fiscal Year 1999 | ||||||||||||||
| Fourth quarter |
$28
|
7/8 |
|
$25
|
|
$0.305
|
|
8/1/99
|
||||||
| Third quarter |
27
|
1/16 |
|
21
|
|
0.305
|
|
5/1/99
|
||||||
| Second quarter |
27
|
3/8 |
|
21
|
5/16 |
|
0.300
|
|
2/1/99
|
|||||
| First quarter |
28
|
3/4 |
|
24
|
15/16 |
|
0.300
|
|
11/1/98
|
|||||
|
Effective November 1, 2000, the common stock of Washington Gas became common stock of WGL Holdings, Inc. Currently, WGL Holdings common stock is listed only on the New York Stock Exchange and is shown as “WGL Hldgs”or “WGL Hold” in newspapers. There was no change in Washington Gas preferred stock. Preferred stock that was outstanding at the time of the reorganization continues to be Washington Gas preferred stock and continues to be traded on the Philadelphia Stock Exchange.
Shareholder and Investor InformationEffective November 1, 2000, WGL Holdings, Inc. (WGL Holdings) became the parent company of Washington Gas Light Company (Washington Gas) and its previous subsidiaries. At that time, the common stock of Washington Gas automatically represented the same number of shares of common stock in WGL Holdings. Washington Gas common stock is no longer publicly traded. See Note 2 to the Consolidated Financial Statements for additional details regarding this change. Certificates for shares of Washington Gas common stock are automatically treated as certificates for the same number of shares of WGL Holdings common stock. Shareholders of Washington Gas common stock do not need to surrender their certificates. However, shareholders who wish to exchange their certificates of Washington Gas common stock for certificates representing the same number of shares of WGL Holdings common stock should send their Washington Gas common stock certificates to: The Bank of New
York Shareholders should not sign or endorse their certificates, but may want to send them by certified mail, return receipt requested. SHAREHOLDER INQUIRIESThe Bank of New York serves as the Transfer Agent and Shareholder Recordkeeper for WGL Holdings common stock and for Washington Gas preferred stock. Shareholder inquiries, such as name and address changes, lost certificates, transfer matters, forms 1099, etc., should be directed to: The Bank of New
York Should you need to contact someone at either WGL Holdings about your common stock account or Washington Gas about your preferred stock account, please call 1-800-221-9427, or in the Washington, D.C. area, 202-624-6558. DIVIDEND REINVESTMENT PLANWGL Holdings offers a Dividend Reinvestment and Common Stock Purchase Plan (DRP) to its shareholders. The plan provides a convenient, economical way to purchase additional shares of WGL Holdings common stock. Participants may invest all or part of their dividends and make cash purchases between $25 and $20,000 per quarter. Prior to the corporate reorganization, Washington Gas also had a similar DRP. Effective November 1, 2000, shareholders who previously participated in the Washington Gas DRP automatically became participants in the WGL Holdings DRP and the balance of Washington Gas common stock that participants had previously purchased in the Washington Gas DRP was automatically transferred to the WGL Holdings DRP. To obtain a prospectus and enrollment card for the WGL Holdings DRP, please contact WGL Holdings Shareholder Services, 1100 H Street, N.W., Washington, DC 20080. Shareholders who need additional information regarding the status of their former Washington Gas DRP account should contact The Bank of New York. REQUEST FOR PUBLICATIONSThe following publications may be obtained, when available, without charge by calling 1-800-221-9427, or in the Washington, DC area, 202-624-6558: SEC
Forms 10-K (Annual Report) SEC Forms
10-Q (Quarterly Report) These publications, as well as filings made with the Securities and Exchange Commission, are also available at WGL Holdings’ website at http://www.wglholdings.com. FINANCIAL COMMUNITY INQUIRIESSecurity analysts, other members of the financial community and current and potential investors who need additional information about WGL Holdings or Washington Gas should contact Investor Relations at 202-624-6410 or e-mail: [email protected]. ANNUAL MEETINGWGL Holdings will conduct its first Annual Meeting of Shareholders at 10:00 a.m. on Friday, March 2, 2001, at the Ronald Reagan Building and International Trade Center located at 1300 Pennsylvania Avenue, NW, Washington, D.C. 20004. SHAREHOLDER INFORMATION WGL
Holdings common stock is listed on the New York Stock Exchange. The ticker
symbol is “WGL,” which is the same symbol previously used by
Washington Gas. The common stock of WGL Holdings is typically listed as
“WGL Hldgs” or “WGL Hold” in newspapers. Preferred
stock is listed on the Philadelphia Stock Exchange. Normally, dividends
on WGL Holdings common stock and Washington Gas preferred stock will be
recorded and payable as shown below: |
| Dates | |
|
|
|
| Record | Payable |
|
|
|
| January 10 | February 1 |
| April 10 | May 1 |
| July 10 | August 1 |
| October 10 | November 1 |
|
Dividends paid by WGL Holdings and Washington Gas are 100 percent taxable. Both companies are required to perform back-up withholding of federal income taxes if they have not received a certified Tax Identification Number. In most cases, this is the shareholder’s social security number. Both companies must also report to the Internal Revenue Service the total amount of dividends paid to individual shareholders during the calendar year. Copies of the report, Form 1099-DIV, will be mailed to shareholders by January 31 of the year following the one in which the dividends were received. INFORMATION ON THE INTERNETFinancial information, press releases and other information about WGL Holdings may be obtained over the Internet at http://www.wglholdings.com. This webpage also contains links to the major subsidiaries of WGL Holdings, including a link to Washington Gas. Internet users may also go directly to the Washington Gas webpage at http://www.washgas.com. The Bank of New York also maintains a site on the Internet at http://stock.bankofny.com. |
|
|