
|
|
|
|
|
|
|
|
|
|
Previous: MITCHELL HUTCHINS LIR MONEY SERIES, N-30D, 2001-01-08 |
Next: GLOBAL VACATION GROUP INC, 8-A12B/A, 2001-01-08 |
Table of Contents
| Evergreen Funds
|
|
Evergreen Funds is one of the nation’s fastest growing investment companies with more than $80 billion in assets under management. We offer over 80 mutual funds to choose among and acclaimed service and operations capabilities, giving investors a broad range of quality investment products and services designed to meet their needs. The Evergreen Funds employ intensive, research-driven investment strategies executed by over 90 research analysts and portfolio managers. The fund company remains dedicated to meeting the needs of investors and their advisors in a global economy. Look to Evergreen Funds to provide a distinctive level of service and excellence in investment management. |
This semiannual report must be preceded or accompanied by a prospectus of an Evergreen fund contained herein. The prospectus contains more complete information, including fees and expenses, and should be read carefully before investing or sending money.
| Mutual Funds: |
Evergreen Distributor, Inc.
Evergreen FundsSM is a service mark of Evergreen Investment Services, Inc.
December 2000

William M. Ennis
President and CEO
Dear Evergreen Shareholders,
We are pleased to provide the Evergreen Long Term Bond Funds semiannual report, which covers the six-month period ended October 31, 2000.
Bond Markets React to Volatile Equity Markets
Over the past year, U.S. bond markets experienced significant turmoil, which was largely overshadowed by the volatility in the stock market. Bond prices fell and interest rates rose in the first half of the period as the Federal Reserve Board increased interest rates in an effort to curtail what they believed was an overheated economy. Reports that second quarter economic growth might have heated up again drove the Federal Reserve Board to notch rates up again in May and caused bond prices to drop further.
Investor demand for bonds is typically closely linked to the performance of the stock market, but when the equity markets are volatile, investors buy bonds to preserve gains rather than to generate returns. By some measures, bonds produced relatively attractive returns in 2000. For example, for the ten-month period beginning December 31, 1999 through October 31, 2000, the Lehman Brothers Aggregate Bond Index, which measures 6,600 taxable government investment-grade corporate and mortgage securities, returned 7.83%. This outperformed the Standard & Poor’s 500 Index return of – 1.81% for the same period. The S&P 500 tracks 500 of the most widely held domestic, large-company stocks, representing about 70% of the U.S. stock market’s total value.
While it appears that the Federal Reserve Board’s monetary policy has begun to ease, we believe that it is too soon to tell. Additionally, we think that the economy is poised for a slowdown, which may push bond prices higher and interest rates lower. In this environment, we will maintain a defensive posture and remain cautiously optimistic about the continued growth of the U.S. economy.
The Value of Diversification
An environment like this year’s offers many reasons for building a diversified portfolio rather than trying to predict the market’s movements. Diversification provides exposure to many different opportunities while reducing the risk of any single investment or strategy. We encourage you to talk to your financial advisor to confirm that your investment portfolio is appropriately diversified and structured to support your long-term investment objectives.
Thank you for your continued investment in Evergreen Funds.
Sincerely,

William M. Ennis
President and CEO
Evergreen Investment Company, Inc.
1
EVERGREEN
Diversified Bond Fund
Fund at a Glance as of October 31, 2000

| CURRENT INVESTMENT STYLE1
|

Morningstar’s Style Box is based on a portfolio date as of 10/31/2000.
The Fixed-Income Style Box placement is based on a fund’s average effective maturity or duration and the average credit rating of the bond portfolio.
1 Source: 2000 Morningstar, Inc.
2 Past performance is no guarantee of future results. The investment return and principal value of an investment will fluctuate so that an investor’s shares, when redeemed, may be worth more or less than their original cost. The performance of each class may vary based on differences in loads, fees and expenses paid by the shareholders investing in each class. Performance includes the reinvestment of income dividends and capital gain distributions.
Historical performance shown for Classes A, C and Y prior to their inception is based on the performance of Class B, the original class offered. These historical returns for Classes A and Y have been adjusted to eliminate the effect of the higher 12b-1 fees applicable to Class B. These fees are 0.25% for Class A and 1.00% for Classes B and C. Class Y does not pay a 12b-1 fee. If these fees had not been eliminated, returns would have been lower.
Class Y shares are only offered to persons who owned Class Y shares of an Evergreen Fund on or before 12/31/1994; certain institutional investors; and investment advisory clients of an investment advisor of an Evergreen Fund (or the investment advisor’s affiliates).
The Fund’s investment objective is non-fundamental and may be changed without the vote of the Fund’s shareholders.
Funds that invest in high-yield, lower-rated bonds may contain more risk due to increased possibility of default.
Foreign investments may contain more risk due to the inherent risks associated with changing political climates, foreign market instability and foreign currency fluctuations.
All data is as of October 31, 2000 and subject to change.
| PERFORMANCE AND RETURNS2
|
||||||||||||||||
| Portfolio Inception Date: 9/11/1935 | Class A
|
Class B
|
Class C
|
Class Y
|
||||||||||||
| Class Inception Date | 1/20/1998
|
9/11/1935
|
4/07/1998
|
2/11/1998
|
||||||||||||
| |
|
|
|
|
||||||||||||
| Average Annual Returns* | ||||||||||||||||
| |
|
|
|
|
||||||||||||
| 6 months with sales charge | -1.29 | % | -1.77 | % | 1.23 | % | n/a
|
|||||||||
| |
|
|
|
|
||||||||||||
| 6 months w/o sales charge | 3.61 | % | 3.23 | % | 3.23 | % | 3.74
|
% | ||||||||
| |
|
|
|
|
||||||||||||
| 1 year with sales charge | 0.12 | % | -0.55 | % | 2.38 | % | n/a
|
|||||||||
| |
|
|
|
|
||||||||||||
| 1 year w/o sales charge | 5.13 | % | 4.34 | % | 4.34 | % | 5.39 | % | ||||||||
| |
|
|
|
|
||||||||||||
| 5 years | 4.79 | % | 4.72 | % | 5.02 | % | 5.91 | % | ||||||||
| |
|
|
|
|
||||||||||||
| 10 years | 7.77 | % | 7.43 | % | 7.41 | % | 8.49 | % | ||||||||
| |
|
|
|
|
||||||||||||
| Maximum Sales Charge | 4.75 | % | 5.00 | % | 2.00 | % | n/a
|
|||||||||
| Front End
|
CDSC
|
CDSC
|
||||||||||||||
| |
|
|
|
|
||||||||||||
| 30-day SEC yield | 6.33
|
%
|
5.89
|
%
|
5.87
|
%
|
6.91
|
%
|
||||||||
| |
|
|
|
|
||||||||||||
|
6-month income
|
$ | 0.50 | $ | 0.44 | $ | 0.44 | $ | 0.52 | ||||||||
| |
|
|
|
|
||||||||||||
| * Adjusted for maximum applicable sales charge unless noted. | ||||||||||||||||
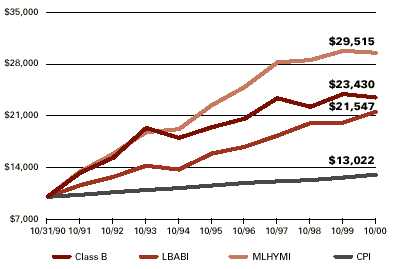
| LONG TERM GROWTH
|
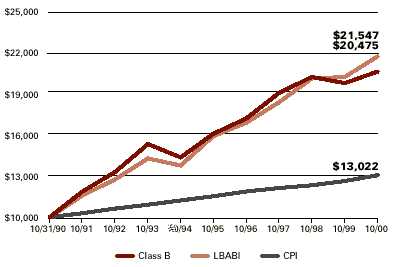
Comparison of a $10,000 investment in Evergreen Diversified Bond Fund, Class B shares2 , versus a similar investment in the Lehman Brothers Aggregate Bond Index (LBABI) and the Consumer Price Index (CPI).
The LBABI is an unmanaged market index, which does not include transaction costs associated with buying and selling securities or any mutual fund expenses. The CPI is a commonly used measure of inflation and does not represent an investment return. It is not possible to invest directly in an index.
2
EVERGREEN
Diversified Bond Fund
Portfolio Manager Interview
| How did the Fund perform? |
For the six-month period ended October 31, 2000, Evergreen Diversified Bond Fund Class B Shares returned 3 .23%, before the deduction of any applicable sales charges . For the same period, the Lehman Brothers Aggregate Bond Index returned 5.80%, while the average return of BBB-rated Corporate Bond Funds was 4.11%, according to Lipper Inc., an independent monitor of mutual fund performance.
| Portfolio
|
|||
| Characteristics
|
|||
| |
|||
| Total Net Assets | $344,290,305
|
||
| |
|
||
| Average Credit Quality | AA- | ||
| |
|
||
| Effective Maturity | 10.9 Years
|
||
| |
|
||
| Average Duration | 5.6 Years
|
||
| |
|
||
| What was the investment environment like during the period? |
It was a generally positive period for bonds, especially treasury and government agency securities as interest rates trended lower and prices of high-grade bonds tended to rise. The start of the period marked the peak of fears about the Federal Reserve Board’s effort to slow economic growth by tightening the money supply through increases in short-term interest rates. Investors were worried about how long these rate increases would continue and about the severity of a potential slowdown. However, after the Federal Reserve Board raised short-term rates by 0.50% in May, we saw evidence that economic growth was slowing to moderate levels and that the end of Federal Reserve Board tightening might be near. Soon, interest rates started to go down and the Treasury Bond market began to rally through the end of the period. The yield on the 10-year Treasury began the six-month period at 6.17%, but fell to 5.71% by the end of fiscal period on October 31, 2000. The drop in interest rates was more pronounced among shorter-term and intermediate-term securities, and among treasuries and government agency securities.
Other sectors, particularly corporate securities, did not perform as well as government securities. Investors were concerned that an economic slowdown could cut int o corporate revenues and affect the ability of corporations to pay their debts. The heightened volatility in the stock market only added to those fears. Both the Standard & Poor’s 500 Index, a gauge of large-company stock performance, and the NASDAQ Composite Index, which is heavily influenced by technology stocks, fell during the six-month period.
While investment grade corporate bonds still had positive returns, high-yielding, lower quality corporates had negative returns during the period because of growing concerns about credit quality and the potential risks of defaults.
In contrast to problems in the corporate bond sector, mortgage securities performed very well. Mortgage rates remained high enough to discourage any significant influx of new mortgage loans. Investors were attracted to the relatively safe income of mortgage-backed securities at a time when fears were rising about the credit risks of corporate bonds. Moreover, as investors anticipated an end to the Federal Reserve Board’s tightening policies, volatility in the fixed income markets fell, helping the performance of mortgage securities.
3
EVERGREEN
Diversified Bond Fund
Portfolio Manager Interview
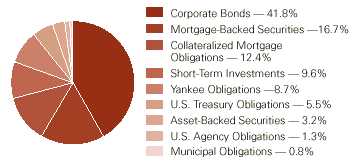
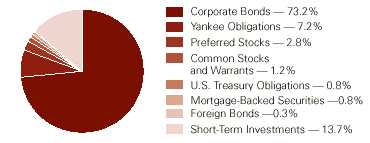
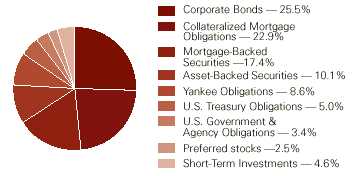
| PORTFOLIO COMPOSITION
|
|
| (as a percentage
of 10/31/2000 portfolio assets)
|
| What were your principal strategies during the period? |
To take advantage of declining interest rates, we lengthened duration, or interest-rate sensitivity, primarily by increasing our emphasis on intermediate-term bonds. We also maintained a relatively low weighting in high yield bonds, about 19-to-20% of net assets. Within the corporate bond sector, we also emphasized defensive sectors, such as energy and finance, while underweighting sectors such as Telecommunications and Consumer Cyclicals.
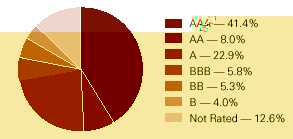
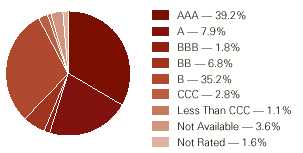
At the end of the six-month period, the average credit quality of the portfolio was a relatively high AA-, as measured by Standard & Poor’s, and the weighted average life of securities was 10.9 years and the duration was 5.6 years.
Performance was helped by our decisions to lengthen duration and build up our position among intermediate-term bonds. Our emphasis on defensive sectors in the corporate bond market also supported performance. However, even though we deemphasized high yield bonds, performance nevertheless was held back by the below-investment-grade sector, the poorest performing part of the domestic fixed income market.
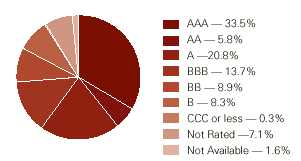
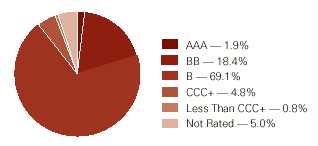
| PORTFOLIO QUALITY
|
|
| (as a percentage of 10/31/2000 market value of bonds)
|
| What is your outlook? |
We believe economic growth will continue to slow, and corporations will feel increased pressure on their profit margins. Production costs are likely to rise because of the tight labor supply and increases in the prices of raw materials. However, corporations continue to have very little pricing power and may be unable to pass on their higher production costs to consumers.
While the financial markets have been uneasy and volatile because of the potential effects of an economic slowdown, the effects of a slowdown haven’t yet been felt in the general economy. Eventually, however, the consumer will begin to feel the effects of a slowdown. Any reduction in consumer spending eventually should lead to lower interest rates and even an easing of the money supply by the Federal Reserve Board. This would be favorable to the bond market in general, and high -grade securities in particular.
4
EVERGRE
EN
High Yield Bond Fund
Fund at a Glance as of October 31, 2000

| CURRENT INVESTMENT STYLE1
|

Morningstar’s Style Box is based on a portfolio date as o f 10/31/2000.
The Fixed-Income Style Box placement is based on a fund’s average effective maturity or duration and the average credit rating of the bond portfolio.
1 Source: 2000 Morningstar, Inc.
2 Past performance is no guarantee of future results. The investment return and principal value of an investment will fluctuate so that an investor’s shares, when redeemed, may be worth more or less than their original cost. The performance of each class may vary based on differences in loads, fees and expenses paid by the shareholders investing in each class. Performance includes the reinvestment of income dividends and capital gain distributions.
Historical performance shown for Classes A, C and Y prior to their inception is based on the performance of Class B, the original class offered. These historical returns for Classes A and Y have been adjusted to eliminate the effect of the higher 12b-1 fees applicable to Class B. These fees are 0.25% for Class A and 1.00% for Classes B and C. Class Y does not pay a 12b-1 fee. If these fees had not been eliminated, returns would have been lower. Returns reflect expense limits previously in effect, without which returns would have been lower.
Class Y shares are only offered to persons who owned Class Y shares of an Evergreen Fund on or before 12/31/1994; certain institutional investors; and investment advisory clients of an investment advisor of an Evergreen Fund (or the investment advisor’s affiliates).
The Fund’s investment objective is non-fundamental and may be changed without the vote of the Fund’s shareholders.
Funds that invest in high yield, lower-rated bonds may contain more risk due to increased possibility of default.
Foreign investments may contain more risk due to the inherent risks associated with changing political climates, foreign market instability and foreign currency fluctuations.
All data is as of October 31, 2000 and subject to change.
| PERFORMANCE AND RETURNS2
|
||||||||||||||||
| Portfolio Inception Date: 9/11/1935 | Class A
|
Class B
|
Class C
|
Class Y
|
||||||||||||
| Class Inception Date | 1/20/1998
|
9/11/1935
|
1/22/1998
|
4/14/1998
|
||||||||||||
| |
|
|
|
|
||||||||||||
| Average Annual Returns* | ||||||||||||||||
| |
|
|
|
|
||||||||||||
| 6 months with sales charge | -7.86 | % | -8.14 | % | -5.37 | % | n/a
|
|||||||||
| |
|
|
|
|
||||||||||||
| 6 months w/o sales charge | -3.15 | % | -3.52 | % | -3.52 | % | -3.03
|
% | ||||||||
| |
|
|
|
|
||||||||||||
| 1 year with sales charge | -6.03 | % | -6.60 | % | -3.90 | % | n/a
|
|||||||||
| |
|
|
|
|
||||||||||||
| 1 year w/o sales charge | -1.35 | % | -2.09 | % | -2.09 | % | -1.11 | % | ||||||||
| |
|
|
|
|
||||||||||||
| 5 years | 3.62 | % | 3.57 | % | 3.84 | % | 4.83 | % | ||||||||
| |
|
|
|
|
||||||||||||
| 10 years | 9.21 | % | 8.89 | % | 8.89 | % | 9.97 | % | ||||||||
| |
|
|
|
|
||||||||||||
| Maximum Sales Charge | 4.75 | % | 5.00 | % | 2.00 | % | n/a
|
|||||||||
| Front End
|
CDSC
|
CDSC
|
||||||||||||||
| |
|
|
|
|
||||||||||||
| 30-day SEC yield | 10.01
|
%
|
9.76
|
%
|
9.76
|
%
|
10.77
|
%
|
||||||||
| |
|
|
|
|
||||||||||||
|
6-month income
|
$0.17 | $0.15 | $0.15 | $0.17 | ||||||||||||
| |
|
|
|
|
||||||||||||
| * Adjusted for maximum applicable sales charge unless noted. | ||||||||||||||||
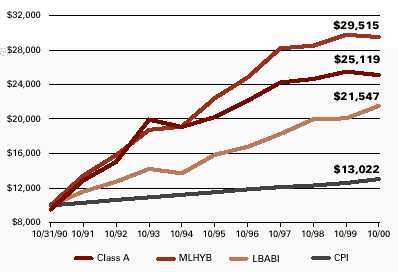
| LONG TERM GROWTH
|
Comparison of a $10,000 investment in Evergreen High Yield Bond Fund, Class B shares2 , versus a similar investment in the Lehman Brothers Aggregate Bond Index (LBABI), the Merrill Lynch High Yield Master Index (MLHYMI) and the Consumer Price Index (CPI).
The LBABI and MLHYMI are unmanaged market indices, which do not include transaction costs associated with buying and selling securities or any mutual fund expenses. The CPI is a commonly used measure of inflation and does not represent an investment return. It is not possible to invest directly in an index.
5
EVERGRE
EN
High Yield Bond Fund
Portfolio Manager I
nterview
| How did the Fund perform? |
The Fund’s Class B Shares returned –3.52% for the six-month period ended October 31 , 2000, before the deduction of any applicable sales charges. In comparison, the Chase Domestic High Yield Index returned –2.07% and the average return of the High Current Yield Funds followed by Lipper, Inc. was –3.83% for the same period. For the same period, the Lehman Brothers Aggregate Bond Index and the Merrill Lynch High Yield Master Index returned 5.80% and –1.04%, respectively. Lipper, Inc. is an independent monitor of mutual fund performance. All of the negative return occurred in the last month of the fiscal period, as high yield bond prices fell sharply in response to the 8.25% decline suffered by the NASDAQ Composite Index.
| Portfolio
|
|||
| Characteristics
|
|||
| |
|||
| Total Net Assets | $449,916,077
|
||
| |
|||
| Average Credit Quality | B+
|
||
| |
|||
| Effective Maturity | 8.5 Years
|
||
| |
|||
| Average Duration | 6.1 Years
|
||
| |
|||
| What was the environment like for the entire period? |
The entire period was challenging, although the dramatic decline of the NASDAQ Composite Index during the final month of the Fund’s fiscal period caused October 2000 to be the most difficult. The combination of higher interest rates slowing the economy, higher energy costs—the price of oil more than doubled over the past year—and the enormous drop in NASDAQ prices caused investors to focus on the possibility of a recession. Further, as bank credit became restricted for many corporations, high yield bond prices fell, with investors demanding higher yields for increasing credit risk. Yield premiums for “B”-rated bonds rose approximately 3.00% during the period, while yield premiums for “A”-rated bonds increased approximately 1.00%.
| PORTFOLIO COMPOSITION
|
|
| (as a percentage
of 10/31/2000 portfolio assets)
|
| What strategies did you use to manage the Fund? |
We monitored credits closely and kept the Fund’s duration short. A short duration minimizes price fluctuations. Expressed in years, duration measures a fund’s sensitivity to changes in interest rates. Shortening duration enhances price stability and conversely, lengthening duration increases price sensitivity to interest rate changes. The Fund’s assets were invested in securities that resulted in an average rating of “B+”, a value generally higher than the majority of high yield funds.
6
EVERGRE
EN
High Yield Bond Fund
Portfolio Manager
Interview
| PORTFOLIO QUALITY
|
|
| (as a percentage of 10/31/2000 market value of bonds)
|
| Do you expect the environment to improve for high yield bonds? |
Yes, we believe high yield bonds are poised for a substantial rebound. The U.S. economy is slowing rapidly—in fact, a consensus is building among investors that the economy is headed for a recession . As market sentiment shifts in that direction, we expect investors to begin to anticipate a more accommodative monetary policy from the Federal Reserve Board. The NASDAQ should then begin to rally, in our opinion, and high yield bond prices should follow. With the extremely attractive yield advantages high yield bonds are offering and the potential for an easing in Federal Reserve policy, we think this sector is a smart place to be right now.
7
EVERGRE
EN
Quality Inc
ome Fund
Fund at a Glance as of October 31, 2000

1 Past performance is no guarantee of future results. The investment return and principal value of an investment will fluctuate so that an investor’s shares, when redeemed, may be worth more or less than their original cost. The performance of each class may vary based on differences in loads, fees and expenses paid by the shareholders investing in each class. Performance includes the reinvestment of income dividends and capital gain distributions.
Historical performance shown for Classes B and Y prior to their inception is based on the performance of Class A, one of the original class offered along with Class C. These historical returns for Classes B and Y have not been adjusted to reflect the effect of each Class’ 12b-1 fees. These fees are 0.25% for Class A and 1.00% for Classes B and C. Class Y does not pay a 12b-1 fee. If these fees had been reflected, returns for Class B would have been lower while returns for Class Y would have been higher. The advisor is waiving a portion of its advisory fee and reimbursing the Fund for other expenses. Had the fee not been waived or the expenses reimbursed, returns would have been lower.
Class Y shares are only offered to persons who owned Class Y shares of an Evergreen Fund on or before 12/31/1994; certain institutional investors; and investment advisory clients of an investment advisor of an Evergreen Fund (or the investment advisor’s affiliates).
The Fund’s investment objective is non-fundamental and may be changed without the vote of the Fund’s shareholders.
Funds that invest in high-yield, lower-rated bonds may contain more risk due to increased possibility of default.
Foreign investments may contain more risk due to the inherent risks associated with changing political climates, foreign market instability and foreign currency fluctuations.
| PERFORMANCE AND RETURNS2
|
||||||||||||||||
| Portfolio Inception Date: 4/29/1992 | Class A
|
Class B
|
Class C
|
Class Y
|
||||||||||||
| Class Inception Date | 4/29/1992
|
10/18/1999
|
4/29/1992
|
11/19/1997
|
||||||||||||
| |
|
|
|
|
||||||||||||
| Average Annual Returns* | ||||||||||||||||
| |
|
|
|
|
||||||||||||
| 6 months with sales charge | -0.11 | % | -0.49 | % | 2.51 | % | n/a
|
|||||||||
| |
|
|
|
|
||||||||||||
| 6 months w/o sales charge | 4.90 | % | 4.51 | % | 4.51 | % | 4.55
|
% | ||||||||
| |
|
|
|
|
||||||||||||
| 1 year with sales charge | -0.13 | % | -0.84 | % | 2.07 | % | n/a
|
|||||||||
| |
|
|
|
|
||||||||||||
| 1 year w/o sales charge | 4.86 | % | 4.05 | % | 4.03 | % | 4.19 | % | ||||||||
| |
|
|
|
|
||||||||||||
| 5 years | 3.78 | % | 4.32 | % | 4.23 | % | 4.63 | % | ||||||||
| |
|
|
|
|
||||||||||||
| Since Portfolio Inception | 4.34 | % | 4.84 | % | 4.39 | % | 4.84 | % | ||||||||
| |
|
|
|
|
||||||||||||
| Maximum Sales Charge | 4.75 | % | 5.00 | % | 2.00 | % | n/a
|
|||||||||
| Front End
|
CDSC
|
CDSC
|
||||||||||||||
| |
|
|
|
|
||||||||||||
| 30-day SEC yield | 6.16
|
%
|
5.68
|
%
|
5.68
|
%
|
6.94
|
%
|
||||||||
| |
|
|
|
|
||||||||||||
|
6-month income
|
$ | 0.39 | $ | 0.34 | $ | 0.34 | $ | 0.42 | ||||||||
| |
|
|
|
|
||||||||||||
| * Adjusted for maximum applicable sales charge unless noted. | ||||||||||||||||
| LONG TERM GROWTH
|
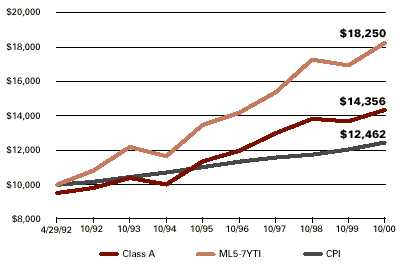
Comparison of a $10,000 investment in Evergreen Quality Income Fund, Class A shares2 , versus a similar investment in the Merrill Lynch 5-7 Year Treasury Index (ML5-7YTI) and the Consumer Price Index (CPI).
The ML5-7YTI is an unmanaged market index which does not include transaction costs associated with buying and selling securities or any mutual fund expenses. The CPI is a commonly used measure of inflation and does not represent an investment return. It is not possible to invest directly in an index.
U.S. government guarantees apply only to the underlying securities of the Fund’s portfolio and not to the Fund’s shares.
All data is as of October 31, 2000 and subject to change.
8
EVERGRE
EN
Quality Inc
ome Fund
Portfolio Manager I
nterview
| How did the Fund perform? |
Evergreen Quality Income Fund Class A shares returned 4.90% for the six-month period ended October 31, 2000. Fund returns are before deduction of any applicable sales charges. During the same period, and the Merrill Lynch 5-7 Year Treasury Index returned 7.73%, and the average return of A-Rated Corporate Bond funds was 4.70%, according to Lipper Inc., an independent monitor of mutual fund performance.
| Portfolio
|
|||
| Characteristics
|
|||
| |
|||
| Total Net Assets | $128,981,015
|
||
| |
|||
| Average Credit Quality | AA
|
||
| |
|||
| Average Maturity | 9.1 Years
|
||
| |
|||
| Average Duration | 5.4 Years
|
||
| |
|||
| What was the investment environment like during the period? |
It was a generally positive period for bonds, especially treasury and government agency securities as interest rates trended lower and prices of high-grade bonds tended to rise. The start of the period marked the peak of fears about the Federal Reserve Board’s effort to slow economic growth by tightening the money supply through increases in short-term interest rates . Investors were worried about how long these rate increases would continue and about the severity of a potential slowdown. However, after the Federal Reserve Board raised short-term rates by 0.50% in May, we saw evidence that economic growth was slowing to moderate levels and that the end of Federal Reserve Board tightening might be near. Soon, interest rates started to go down and the Treasury Bond market began to rally through the end of the period. The yield on the 10-year Treasury began the six-month period at 6.17%, but fell to 5.71% by the end of fiscal period on October 31. The drop in interest rates was more pronounced among shorter-term and intermediate-term securities, and among treasuries and government agency securities.
Other sectors, particularly corporate securities, did not perform as well as government securities. Investors were concerned that an economic slowdown could cut into corporate revenues and affect the ability of corporations to pay their debts. The heightened volatility in the stock market only added to those fears. Both the Standard & Poor’s 500 Index, a gauge of large-company stock performance, and the NASDAQ Composite Index, which is heavily influenced by technology stocks, fell during the six-month period. While investment grade corporate bonds still had positive returns, high-yielding, lower quality corporates had negative returns during the period because of growing concerns about credit quality and the potential risks of defaults.
In contrast to problems in the corporate bond sector, mortgage securities performed very well. Mortgage rates remained high enough to discourage any significant influx of new mortgage loans. Investors were attracted to the relatively safe income of mortgage-backed securities at a time when fears were rising about the credit risks of corporate bonds. Moreover, as investors anticipated an end to the Federal Reserve Board’s tightening policies, volatility in the fixed income markets fell, helping the performance of mortgage securities.
| What were your principal strategies, and how did they affect performance? |
In a rallying market for higher-quality fixed income securities, we extended the Fund’s duration and focused on higher quality sources of income. This led us to emphasize Treasuries, government agency securities, mortgages and corporate securities in defensive sectors such as energy and finance.
9
EVERGRE
EN
Quality Inc
ome Fund
Portfolio Manager
Interview
The Fund’s overweighted position in mortgage-backed securities was the biggest factor driving the strong performance for the fund. Our decision to increase exposure to Treasuries and government agency securities also supported performance.
At the end of the six month period, on October 31, 2000, average credit quality of the portfolio was AA, according to the Standard & Poor’s rating system, and the weighted average life of securities was 9.1 years. Duration was 5.4 years.
| PORTFOLIO QUALITY
|
|
| (as a percentage of 10/31/2000 market value of bonds)
|
| How would you describe your management style? |
We took over portfolio management responsibility for the Quality Income Fund in June. We take a disciplined approach to managing both interest rate and credit quality risks. We start with an analysis of the general economic background, studying the factors that affect both economic growth and inflation. We look at trends to identify any changes that could affect the economy, and we analyze how change could affect the various sectors fixed income markets.
After this analysis, we try to develop an asset allocation plan within the sectors in which the Fund may invest. These sectors include Treasuries, government agencies, mortgage-backed securities, and corporate bonds, including both investment grade and high yield.
In identifying sectors and securities in which to invest, we search for the best relative value and try to find areas where we can gain both competitive income and total return.
| PORTFOLIO COMPOSITION
|
|
| (as a percentage
of 10/31/2000 portfolio assets)
|
| What is your outlook? |
We believe economic growth will continue to slow, and corporations will feel increased pressure on their profit margins. Production costs are likely to rise because of the tight labor supply and increases in the prices of raw materials. However, corporations continue to have very little pricing power and may be unable to pass on their higher production costs to consumers.
While the financial markets have been uneasy and volatile because of the potential effects of an economic slowdown, the effects of a slowdown haven’t yet been felt in the general economy. Eventually, however, the consumer will begin to feel the effects of a slowdown. Any reduction in consumer spending eventually should lead to lower interest rates and even an easing of the money supply by the Federal Reserve Board. This would be favorable to the bond market in general, and high-grade securities in particular.
10
EVERGRE
EN
Strategi
c Income F
und
Fund at a Glance as of October 31, 2000

| CURRENT INVESTMENT STYLE1
|

Morningstar’s Style Box is based on a portfolio date as of 10/31/2000.
The Fixed-Income Style Box placement is based on a fund’s average effective maturity or duration and the average credit rating of the bond portfolio.
1 Source: 2000 Morningstar, Inc.
2 Past performance is no guarantee of future results. The investment return and principal value of an investment will fluctuate so that an investor’s shares, when redeemed, may be worth more or less than their original cost. The performance of each class may vary based on differences in loads, fees and expenses paid by the shareholders investing in each class. Performance includes the reinvestment of income dividends and capital gain distributions.
Historical performance shown for Classes B, C and Y prior to their inception is based on the performance of Class A, the original class offered. These historical returns for Classes B, C and Y have not been adjusted to reflect the effect of each class’ 12b-1 fees. These fees are 0.25% for Class A and 1.00% for Classes B and C. Class Y does not pay a 12b-1 fee. If these fees had been reflected, returns for Classes B and C would have been lower while returns for Class Y would have been higher. The advisor is waiving a portion of its advisory fee. Had the fee not been waived, returns would have been lower.
Class Y shares are only offered to persons who owned Class Y shares of an Evergreen Fund on or before 12/31/1994; certain institutional investors; and investment advisory clients of an investment advisor of an Evergreen Fund (or the investment advisor’s affiliates).
The Fund’s investment objective is non-fundamental and may be changed without the vote of the Fund’s shareholders.
U.S. government guarantees apply only to the underlying securities of the Fund’s portfolio and not to the Fund’s shares.
Funds that invest in high yield, lower-rated bonds may contain more risk due to increased possibility of default.
| PERFORMANCE AND RETURNS2
|
||||||||||||||||
| Portfolio Inception Date: 4/14/1987 | Class A
|
Class B
|
Class C
|
Class Y
|
||||||||||||
| Class Inception Date | 4/14/1987
|
2/1/1993
|
2/1/1993
|
1/13/1997
|
||||||||||||
| |
|
|
|
|
||||||||||||
| Average Annual Returns* | ||||||||||||||||
| |
|
|
|
|
||||||||||||
| 6 months with sales charge | -6.54 | % | -6.85 | % | 4.04 | % | n/a | |||||||||
| |
|
|
|
|
||||||||||||
| 6 months w/o sales charge | -1.80 | % | -2.15 | % | -2.16 | % | -1.61
|
% | ||||||||
| |
|
|
|
|
||||||||||||
| 1 year with sales charge | -6.29 | % | -6.80 | % | -4.12 | % | n/a | |||||||||
| |
|
|
|
|
||||||||||||
| 1 year w/o sales charge | -1.59 | % | -2.30 | % | -2.31 | % | -1.19 | % | ||||||||
| |
|
|
|
|
||||||||||||
| 5 years | 3.41 | % | 3.33 | % | 3.59 | % | 4.38 | % | ||||||||
| |
|
|
|
|
||||||||||||
| 10 years | 9.65 | % | 9.56 | % | 9.55 | % | 10.16 | % | ||||||||
| |
|
|
|
|
||||||||||||
| Maximum Sales Charge | 4.75 | % | 5.00 | % | 2.00 | % | n/a | |||||||||
| Front End
|
CDSC
|
CDSC
|
||||||||||||||
| |
|
|
|
|
||||||||||||
| 30-day SEC yield | 8.92
|
%
|
8.60
|
%
|
8.60
|
%
|
9.65
|
%
|
||||||||
| |
|
|
|
|
||||||||||||
|
6-month income
|
$ | 0.26 | $ | 0.24 | $ | 0.24 | $ | 0.27 | ||||||||
| |
|
|
|
|
||||||||||||
| * Adjusted for maximum applicable sales charge unless noted. | ||||||||||||||||
| LONG TERM GROWTH
|
Comparison of a $10,000 investment in Evergreen Strategic Income Fund, Class A shares2 , versus a similar investment in the Lehman Brothers Aggregate Bond Index (LBABI), the Merrill Lynch High Yield Bond Index (MLHYB), and the Consumer Price Index (CPI).
The LBABI and the MLHYB are unmanaged market indices, which do not include transaction costs associated with buying and selling securities or any mutual fund expenses. The CPI is a commonly used measure of inflation and does not represent an investment return. It is not possible to invest directly in an index.
Foreign investments may contain more risk due to the inherent risks associated with changing political climates, foreign market instability and foreign currency fluctuations.
All data is as of October 31, 2000 and subject to change.
11
EVERGRE
EN
Strategi
c Income F
und
Portfolio Manager I
nterview
| How did the Fund perform? |
The Fund’s Class A Shares returned –1.80% for the six-month period ended October 31, 2000, before the deduction of any applicabl e sales charges. The Lehman Brothers Aggregate Bond Index and the Merrill Lynch High Yield Bond Index returned 5.80% and -1.16%, respectively for the same period. The average return generated by the Multi-Sector Funds followed by Lipper, Inc. was –0.58%. Lipper, Inc. is an independent monitor of mutual fund performance. We attribute the Fund’s performance to its investment in European foreign exchange denominated securities and its heavier allocation to high yield securities. During the period, the U.S. dollar remained strong versus other currencies. Further, while high yield securities produced a positive return in the first five months of the period, prices fell sharply during October 2000 due to the 8.25% monthly decline suffered by the NASDAQ Composite Index.
| Portfolio
|
|||
| Characteristics
|
|||
| |
|||
| Total Net Assets | $223,139,863
|
||
| |
|||
| Average Credit Quality | BBB+
|
||
| |
|||
| Effective Maturity | 11.2 Years
|
||
| |
|||
| Average Duration | 8.0 Years
|
||
| |
|||
| How were the Fund’s assets invested? |
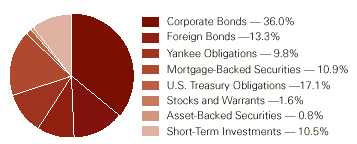
As of October 31, 2000, the Fund was invested as follows: High yield bonds: 48.9%, U.S. government and agency securities: 28% and foreign bonds and yankee securities: 23.1%. The Fund’s foreign investments included the governments of Brazil, Canada, Germany and Mexico, as well as corporate bonds from Brazil, Canada and England. Approximately 15% of the Fund’s net assets were invested in the following foreigncurrencies, as of October 31, 2000: the Canadian dollar, the euro and the Australian dollar.
| PORTFOLIO COMPOSITION
|
|
| (as a percentage
of 10/31/2000 portfolio assets)
|
| What were the investment environments like for each of the Fund’s sectors? |
Market conditions were tough for high yield bonds, but positive for U.S. government securities, due to continued strength in the U.S. dollar, lackluster for non-U.S. dollar investors, particularly those investing in the euro. In the high yield sector, rising energy costs and growing investor sentiment that the economy may be headed toward a recession increased credit concerns and put downward pressure on prices. Concerns rose further as bank credit became restricted for many companies. Finally, high yield prices fell in response to the NASDAQ’s collapse in October. The market’s deteriorating conditions caused investors to demand greater compensation for credit risk. Yield premiums rose 3.00% for “B”-rated bonds and 1.00% for bonds rated “A”.
Higher prices in the U.S. government securities market off-set some of the declines in the high yield sector. Measured by the Lehman Brothers Long-Term Government Bond Index, U.S. government securities returned 6.49% for the six-month period ended October 31, 2000. Investors responded favorably to slower growth, since earlier in the year market sentiment leaned toward concerns that the economy could overheat and stimulate inflation.
12
EVERGRE
EN
Strategi
c Income F
und
Portfolio Manager
Interview
Prices fell in the foreign sector, as European economic growth tracked behind the U.S. economy while the euro currency continued to weaken. Inflation remained low, with the core rate less than 2%. Late in the period, the European Central Bank intervened into the currency markets to actively support the euro by buying euros and selling U.S. dollars and yen, stating it will no longer attempt to manage the currency’s value through interest rate actions. Although the currency continued to probe lower, it seems likely to find a floor and recover in the new year.
| PORTFOLIO QUALITY
|
|
| (as a percentage of 10/31/2000 market value of bonds)
|
| What strategies did you use in managing the Fund? |
We emphasized careful credit analysis and industry selection in high yield bonds and duration management in the Fund’s U.S. government securities investments. In the foreign sector, we adjusted currency positions. Duration measures a fund’s sensitivity to changes in interest rates. Lengthening duration increases a fund’s sensitivity to interest rate changes; and conversely, shortening duration reduces sensitivity, reinforcing price stability.
High yield bond investments focused on gaming, energy, health care and wireless communications industries, all of which are considered to be lower risk sectors. We underweighted the Fund in both wireline communications and cyclical industries—those industries that are more sensitive to the ups and downs of the economy—such as metals and paper.
We limited investments in wireline communications as forecasts regarding sales and earnings growth are likely to be re-evaluated in response to the economy’s slowdown.
In U.S. government securities, we concentrated on securities with longer durations, which improved price appreciation as interest rates fell. The Fund’ s foreign investments also focused on securities with longer durations. We sought to limit the potential for negative moves in the Fund’s foreign currency positions in light of ongoing strength in the U.S. dollar. We used a technique called “hedging”, which reduces risk by engaging in transactions that are designed to immunize the impact of price movement.
| How do you think these markets will perform over the next six months? |
We think the markets can recover well. In our opinion, there are tremendous historical values building in multi-sector investing. Yield premiums in the high-yield bond market have reached extremely attractive levels. As of the close of the fiscal period, high yield bonds provided nearly 8.5% over U.S. Treasuries with similar maturities—and we have seen levels that are approaching the record set in 1990. Currencies are another promising area, in our opinion. The euro has become dramatically undervalued (about 25% on a purchasing-power parity basis) and we believe it is close to initiating a significant rebound; and with the economy continuing to slow, fundamentals remain solid for U.S. government securities. We think this recent period of turbulence may have created significant longer-term opportunities in the high yield bond market and in the foreign currency markets —and we look forward t o employing the Fund’s flexible investment parameters to take advantage of their full potential.
13
EVERGRE
EN
U.S. Gov
ernment Fund
Fund at a Glance as of October 31, 2000

| CURRENT INVESTMENT STYLE1
|

Morningstar’s Style Box is based on a portfolio date as of 10/31/2000.
The Fixed-Income Style Box placement is based on a fund’s average effective maturity or duration and the average credit rating of the bond portfolio.
1 Source: 2000 Morningstar, Inc.
2 Past performance is no guarantee of future results. The investment return and principal value of an investment will fluctuate so that an investor’s shares, when redeemed, may be worth more or less than their original cost. The performance of each class may vary based on differences in loads, fees and expenses paid by the shareholders investing in each class. Performance includes the reinvestment of income dividends and capital gain distributions.
Historical performance shown for Classes C and Y prior to their inception is based on the performance of Class A, one of the original classes offered along with Class B. These historical returns for Classes C and Y have not been adjusted to reflect the effect of each class’ 12b-1 fees. These fees are 0.25% for Class A and 1.00% for Classes B and C. Class Y does not pay a 12b-1 fee. If these fees had been reflected, returns for Class C would have been lower while returns for Class Y would have been higher. Returns reflect expense limits previously in effect, without which returns would have been lower.
Class Y shares are only offered to persons who owned Class Y shares of an Evergreen Fund on or before 12/31/1994; certain institutional investors; and investment advisory clients of an investment advisor of an Evergreen Fund (or the investment advisor’s affiliates).
The Fund’s investment objective is non-fundamental and may be changed without the vote of the Fund’s shareholders.
U.S. government guarantees apply only to the underlying securities of the Fund’s portfolio and not to the Fund’s shares.
All data is as of October 31, 2000 and subject to change.
| PERFORMANCE AND RETURNS2
|
||||||||||||||||
| Portfolio Inception Date: 1/11/1993 | Class A
|
Class B
|
Class C
|
Class Y
|
||||||||||||
| Class Inception Date | 1/11/1993
|
1/11/1993
|
9/02/1994
|
9/02/1993
|
||||||||||||
| |
|
|
|
|
||||||||||||
| Average Annual Returns* | ||||||||||||||||
| |
|
|
|
|
||||||||||||
| 6 months with sales charge | 0.44 | % | 0.09 | % | 3.09 | % | n/a
|
|||||||||
| |
|
|
|
|
||||||||||||
| 6 months w/o sales charge | 5.49 | % | 5.09 | % | 5.09 | % | 5.62
|
% | ||||||||
| |
|
|
|
|
||||||||||||
| 1 year with sales charge | 2.17 | % | 1.44 | % | 4.44 | % | n/a
|
|||||||||
| |
|
|
|
|
||||||||||||
| 1 year w/o sales charge | 7.24 | % | 6.44 | % | 6.44 | % | 7.50 | % | ||||||||
| |
|
|
|
|
||||||||||||
| 5 years | 4.52 | % | 4.44 | % | 4.76 | % | 5.81 | % | ||||||||
| |
|
|
|
|
||||||||||||
| Since Portfolio Inception | 5.10 | % | 5.02 | % | 5.13 | % | 6.00 | % | ||||||||
| |
|
|
|
|
||||||||||||
| Maximum Sales Charge | 4.75 | % | 5.00 | % | 2.00 | % | n/a
|
|||||||||
| Front End
|
CDSC
|
CDSC
|
||||||||||||||
| |
|
|
|
|
||||||||||||
| 30-day SEC yield | 5.61
|
%
|
5.14
|
%
|
5.14
|
%
|
6.15
|
%
|
||||||||
| |
|
|
|
|
||||||||||||
|
6-month income
|
$ | 0.28 | $ | 0.24 | $ | 0.24 | $ | 0.29 | ||||||||
| |
|
|
|
|
||||||||||||
| * Adjusted for maximum applicable sales charge unless noted. | ||||||||||||||||
| LONG TERM GROWTH
|
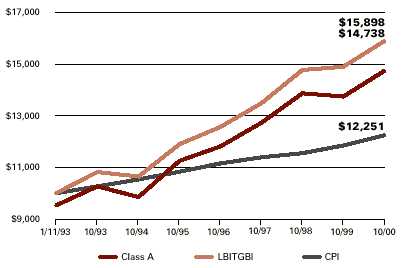
Comparison of a $10,000 investment in Evergreen U.S. Government Fund, Class A shares2 , versus a similar investment in the Lehman Brothers Intermediate Term Government Bond Index (LBITGBI) and the Consumer Price Index (CPI).
The LBITGBI is an unmanaged market index, which does not include transaction costs associated with buying and selling securities or any mutual fund expenses. The CPI is a commonly used measure of inflation and does not represent an investment return. It is not possible to invest directly in an index.
14
EVERGRE
EN
U.S. Gov
ernment Fund
Portfolio Manager I
nterview
| How did the Fund perform? |
The Fund’s Class A Shares returned 5.49% for the six-month period ended October 31, 2000, before the deduction of any applicable sales charges. This surpassed the Lehman Brothers Intermediate Term Government Bond Index which returned 5.31% for the same period. We attribute the difference to the Fund’s ability to invest in mortgage -backed securities and securities with longer durations. Duration measures a Fund’s sensitivity to changes in interest rates. Lengthening duration increases price sensitivity to interest rate changes and conversely, shortening duration enhances price stability. Typically, the Fund’s duration was longer than that of the Lehman Brothers IntermediateTerm Government Bond Index during the period.This enabled the Fund to benefit from the price appreciation associated withthe decline in long-term rates. In addition, mortgage-backed securities outperformed U.S. government securities with comparable average maturities.
| Portfolio
|
|||
| Characteristics
|
|||
| |
|||
| Total Net Assets | $406,077,893
|
||
| |
|||
| Average Credit Quality | AA+
|
||
| |
|||
| Effective Maturity | 9.6 Years
|
||
| |
|||
| Average Duration | 5.3 Years
|
||
| |
|||
| What was the investment environment like during the period? |
The environment was favorable for U.S. government securities and mortgage-backed securities, but challenging for corporate bonds. U.S. government securities prices benefited from a slowdown in economic growth, as well as the on-going reduction in the supply of U.S. government securities. Diminishing supply has had a positive influence on the market since early 2000, when the Federal government announced it would both buy-back U.S. Treasuries and reduce the size of future auctions. Despite reduced supply however, investors had become concerned that the economy’s robust strength would stimulate inflation. Expectations of potentially excessive growth were particularly concerning since the expansion had entered a record setting tenth year, labor markets were tight and energy costs were rising. Bond prices got a significant boost by mid-year, however, when it became increasingly apparent that the Federal Reserve Board had successfully engineered a second “soft landing”. Economic growth slowed, but remained solid—calming concerns about inflation and instilling new confidence that the expansion could continue with limited price pressures.
The environment was less positive in the corporate bond sector, though, as the overall level of credit quality declined. Investors demanded greater compensation for credit risk, bidding cautiously for bonds. As bid prices fell, market liquidity became increasingly restricted and yield premiums rose. By the end of the period, corporate bonds had under-performed U.S . government securities and mortgage-backed securities.
| What strategies did you use in managing the Fund? |
We lengthened the Fund’s duration and emphasized credit quality. We extended duration from 4.78 years on April 30, 2000 to 5.3 years on October 31, 2000. This strategy increased the Fund’s total return potential, enabling the Fund to take advantage of the decline in long-term rates. We also focused on credit quality, carefully analyzing and monitoring bond issuers, as well as building liquidity. We are increasing the number of issuers held in the Fund, and also reducing some of the larger holdings so that no issuer comprises more than 0.5% of net assets. Typically, we are selecting bonds that represent larger holdings in major investment indices. Securities that comprise larger portions of those indices tend to be more liquid.
15
EVERGRE
EN
U.S. Gov
ernment Fund
Portfolio Manager
Interview
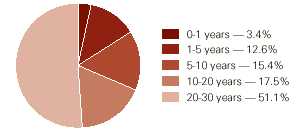
As of October 31, 2000, the Fund was invested as follows: Mortgage-backed securities: 50.7%; U.S . Treasury Obligations: 26.9%; Corporate bonds: 15.0%; U.S. government agency securities: 4.6% and Cash equivalents: 2.8%. The Fund’s effective maturity was 9.6 years, also as of that date.
| MATURITY BREAKDOWN
|
|
| (as a percentage
of 10/31/2000 market value of bonds)
|
| What is your outlook for the next six months? |
We think several of the trends investors witnessed during the fiscal period will remain in place, underscoring the importance of quality, liquidity and diversification. On a positive note, we expect the reduction in the supply of U.S. government securities to be on-going, which should lend support to bond prices. However, we also anticipate further challenges in the corporate bond market . We think the overall level of credit quality will continue to weaken and that as a result, investors will demand greater compensation for credit risk and restricted liquidity. This may cause the yield premiums provided by corporate bonds to continue to increase—a trend that has been in place since 1998. As a result, we expect corporate bonds to underperform their U.S. government security counterparts in the near-term. We also believe lower-rated bonds will comprise a greater portion of major bond market indices because of the overall decline in the level of credit quality. In such an environment, credit analysis will be critical to performance, in our opinion. We will continue to carefully analyze and monitor credits, building solid returns from a portfolio that is well-diversified with high quality, highly liquid securities .
16
| Six Months Ended
October 31, 2000 (Unaudited) |
Year Ended April 30, |
||||||||||||
|---|---|---|---|---|---|---|---|---|---|---|---|---|---|
| 2000 # | 1999 | 1998 (a) (b) # | |||||||||||
| CLASS A SHARES | |||||||||||||
| Net asset value, beginning of period | $ 14.28 | $ 15.48 | $ 15.92 | $ 16.08 | |||||||||
| Income from investment operations | |||||||||||||
| Net investment income | 0.49 | 0.97 | 0.97 | 0.30 | |||||||||
| Net realized and unrealized gains or losses on securities and foreign
currency related transactions |
0.02 | (1.14 | ) | (0.44 | ) | (0.16 | ) | ||||||
| Total from investment operations | 0.51 | (0.17 | ) | 0.53 | 0.14 | ||||||||
| Distributions to shareholders from | |||||||||||||
| Net investment income | (0.50 | ) | (1.03 | ) | (0.97 | ) | (0.30 | ) | |||||
| Net asset value, end of period | $ 14.29 | $ 14.28 | $ 15.48 | $ 15.92 | |||||||||
| Total return* | 3.61 | % | (1.06 | %) | 3.35 | % | 0.85 | % | |||||
| Ratios and supplemental data | |||||||||||||
| Net assets, end of period (thousands) | $320,630 | $344,296 | $444,273 | $501,547 | |||||||||
| Ratios to average net assets | |||||||||||||
| Expenses‡ | 1.14 | %† | 1.19 | % | 1.23 | % | 1.08 | %† | |||||
| Net investment income | 6.88 | %† | 6.65 | % | 6.12 | % | 6.68 | %† | |||||
| Portfolio turnover rate | 96 | % | 175 | % | 141 | % | 109 | % | |||||
| Six Months Ended
October 31, 2000 (Unaudited) |
Year Ended April 30, |
Year Ended August 31 |
|||||||||||||||||
|---|---|---|---|---|---|---|---|---|---|---|---|---|---|---|---|---|---|---|---|
| 2000 # | 1999 | 1998 (c) # | 1997 | 1996 | |||||||||||||||
| CLASS B SHARES | |||||||||||||||||||
| Net asset value, beginning of period | $ 14.28 | $ 15.48 | $ 15.92 | $ 15.42 | $ 14.65 | $ 15.09 | |||||||||||||
| Income from investment operations | |||||||||||||||||||
| Net investment income | 0.44 | 0.84 | 0.86 | 0.61 | 0.91 | 0.95 | |||||||||||||
| Net realized and unrealized gains or losses on
securities and foreign currency related transactions |
0.01 | (1.12 | ) | (0.45 | ) | 0.50 | 0.84 | (0.35 | ) | ||||||||||
| Total from investment operations | 0.45 | (0.28 | ) | 0.41 | 1.11 | 1.75 | 0.60 | ||||||||||||
| Distributions to shareholders from | |||||||||||||||||||
| Net investment income | (0.44 | ) | (0.92 | ) | (0.85 | ) | (0.61 | ) | (0.98 | ) | (0.96 | ) | |||||||
| Tax return of capital | 0 | 0 | 0 | 0 | 0 | (0.08 | ) | ||||||||||||
| Total distributions to shareholders | (0.44 | ) | (0.92 | ) | (0.85 | ) | (0.61 | ) | (0.98 | ) | (1.04 | ) | |||||||
| Net asset value, end of period | $ 14.29 | $ 14.28 | $ 15.48 | $ 15.92 | $ 15.42 | $ 14.65 | |||||||||||||
| Total return* | 3.23 | % | 1.80 | % | 2.57 | % | 7.26 | % | 12.25 | % | 4.03 | % | |||||||
| Ratios and supplemental data | |||||||||||||||||||
| Net assets, end of period (thousands) | $21,467 | $21,694 | $43,729 | $70,113 | $457,701 | $559,792 | |||||||||||||
| Ratios to average net assets | |||||||||||||||||||
| Expenses‡ | 1.88 | %† | 1.94 | % | 1.97 | % | 1.93 | %† | 1.88 | % | 1.84 | % | |||||||
| Net investment income | 6.12 | %† | 5.86 | % | 5.33 | % | 5.74 | %† | 6.07 | % | 6.42 | % | |||||||
| Portfolio turnover rate | 96 | % | 175 | % | 141 | % | 109 | % | 138 | % | 246 | % | |||||||
(a)
|
For the period from January 20, 1998 (commencement of class operations) to April 30, 1998.
|
(b)
|
The per share net realized and unrealized gains or losses is not in accord with the net realized and unrealized gains or losses for the
period due to the timing of sales and redemptions of Fund shares in relation to fluctuating market values for the portfolio.
|
(c)
|
For the eight months ended April 30, 1998. The Fund changed its fiscal year end from August 31 to April 30, effective April 30, 1998.
|
#
|
Net investment income is based on average shares outstanding during the period.
|
*
|
Excluding applicable sales charges.
|
‡
|
The ratio of expenses to average net assets excludes expense reductions but includes fee waivers.
|
†
|
Annualized.
|
| Six Months Ended
October 31, 2000 (Unaudited) |
Year Ended April 30, |
||||||||||||
|---|---|---|---|---|---|---|---|---|---|---|---|---|---|
| 2000 # | 1999 | 1998 (a) (b) # | |||||||||||
| CLASS C SHARES | |||||||||||||
| Net asset value, beginning of period | $14.28 | $15.48 | $15.92 | $16.06 | |||||||||
| Income from investment operations | |||||||||||||
| Net investment income | 0.41 | 0.88 | 0.84 | 0.04 | |||||||||
| Net realized and unrealized gains or losses on securities and foreign
currency related transactions |
0.04 | (1.16 | ) | (0.43 | ) | (0.14 | ) | ||||||
| Total from investment operations | 0.45 | (0.28 | ) | 0.41 | (0.10 | ) | |||||||
| Distributions to shareholders from | |||||||||||||
| Net investment income | (0.44 | ) | (0.92 | ) | (0.85 | ) | (0.04 | ) | |||||
| Net asset value, end of period | $14.29 | $14.28 | $15.48 | $15.92 | |||||||||
| Total return* | 3.23 | % | (1.80 | %) | 2.57 | % | (0.60 | %) | |||||
| Ratios and supplemental data | |||||||||||||
| Net assets, end of period (millions) | $1,294 | $ 603 | $ 499 | $ 23 | |||||||||
| Ratios to average net assets | |||||||||||||
| Expenses‡ | 1.88 | %† | 1.93 | % | 1.98 | % | 1.88 | %† | |||||
| Net investment income | 6.03 | %† | 5.92 | % | 5.33 | % | 6.11 | %† | |||||
| Portfolio turnover rate | 96 | % | 175 | % | 141 | % | 109 | % | |||||
| Six Months Ended
October 31, 2000 (Unaudited) |
Year Ended April 30, |
||||||||||||
|---|---|---|---|---|---|---|---|---|---|---|---|---|---|
| 2000 # | 1999 | 1998 (b) (c) # | |||||||||||
| CLASS Y SHARES | |||||||||||||
| Net asset value, beginning of period | $14.28 | $15.48 | $15.92 | $16.03 | |||||||||
| Income from investment operations | |||||||||||||
| Net investment income | 0.51 | 0.90 | 0.90 | 0.24 | |||||||||
| Net realized and unrealized gains or losses on securities and foreign
currency related transactions |
0.02 | (1.04 | ) | (0.43 | ) | (0.11 | ) | ||||||
| Total from investment operations | 0.53 | (0.14 | ) | 0.47 | 0.13 | ||||||||
| Distributions to shareholders from | |||||||||||||
| Net investment income | (0.52 | ) | (1.06 | ) | (0.91 | ) | (0.24 | ) | |||||
| Net asset value, end of period | $14.29 | $14.28 | $15.48 | $15.92 | |||||||||
| Total return | 3.74 | % | (0.81 | %) | 2.95 | % | 0.80 | % | |||||
| Ratios and supplemental data | |||||||||||||
| Net assets, end of period (millions) | $ 899 | $ 885 | $3,478 | $ 7 | |||||||||
| Ratios to average net assets | |||||||||||||
| Expenses‡ | 0.89 | %† | 0.95 | % | 0.99 | % | 0.83 | %† | |||||
| Net investment income | 7.12 | %† | 6.89 | % | 6.55 | % | 6.89 | %† | |||||
| Portfolio turnover rate | 96 | % | 175 | % | 141 | % | 109 | % | |||||
(a)
|
For the period from April 7, 1998 (commencement of class operations) to April 30, 1998.
|
(b)
|
The per share net realized and unrealized gain/loss is not in accord with the net realized and unrealized gains or losses for the period
due to the timing of sales and redemptions of Fund shares in relation to fluctuating market values for the portfolio.
|
(c)
|
For the period from February 11, 1998 (commencement of class operations) to April 30, 1998.
|
#
|
Net investment income per share is based on average shares outstanding during the period.
|
*
|
Excluding applicable sales charges.
|
‡
|
The ratio of expenses to average net assets excludes expense reductions but includes fee waivers.
|
†
|
Annualized.
|
| Six Months Ended
October 31, 2000 (Unaudited) |
Year Ended April 30, |
||||||||||||
|---|---|---|---|---|---|---|---|---|---|---|---|---|---|
| 2000 | 1999 | 1998 (a)# | |||||||||||
| CLASS A SHARES | |||||||||||||
| Net asset value, beginning of period | $ 3.72 | $ 4.06 | $ 4.53 | $ 4.52 | |||||||||
| Income from investment operations | |||||||||||||
| Net investment income | 0.17 | 0.34 | 0.36 | 0.11 | |||||||||
| Net realized and unrealized gains or losses on securities and foreign
currency related transactions |
(0.28 | ) | (0.32 | ) | (0.46 | ) | 0.01 | ||||||
| Total from investment operations | (0.11 | ) | 0.02 | (0.10 | ) | 0.12 | |||||||
| Distributions to shareholders from | |||||||||||||
| Net investment income | (0.17 | ) | (0.33 | ) | (0.37 | ) | (0.11 | ) | |||||
| Tax return of capital | 0 | (0.03 | ) | 0 | 0 | ||||||||
| Total distributions to shareholders | (0.17 | ) | (0.36 | ) | (0.37 | ) | (0.11 | ) | |||||
| Net asset value, end of period | $ 3.44 | $ 3.72 | $ 4.06 | $ 4.53 | |||||||||
| Total return* | (3.15 | %) | 0.38 | % | (2.05 | %) | 2.57 | % | |||||
| Ratios and supplemental data | |||||||||||||
| Net assets, end of period (thousands) | $339,956 | $291,575 | $353,488 | $420,778 | |||||||||
| Ratios to average net assets | |||||||||||||
| Expenses‡ | 1.24 | %† | 1.27 | % | 1.21 | % | 1.24 | %† | |||||
| Net investment income | 9.38 | %† | 8.57 | % | 8.61 | % | 8.48 | %† | |||||
| Portfolio turnover rate | 62 | % | 107 | % | 170 | % | 155 | % | |||||
| Six Months Ended
October 31, 2000 (Unaudited) |
Year Ended April 30, |
Year Ended July 31, |
|||||||||||||||||
|---|---|---|---|---|---|---|---|---|---|---|---|---|---|---|---|---|---|---|---|
| 2000 # | 1999 | 1998 (b)# | 1997 | 1996 | |||||||||||||||
| CLASS B SHARES | |||||||||||||||||||
| Net asset value, beginning of period | $ 3.72 | $ 4.06 | $ 4.53 | $ 4.37 | $ 4.10 | $ 4.42 | |||||||||||||
| Income from investment operations | |||||||||||||||||||
| Net investment income | 0.16 | 0.31 | 0.27 | 0.25 | 0.32 | 0.32 | |||||||||||||
| Net realized and unrealized gains or losses on
securities and foreign currency related transactions |
(0.29 | ) | (0.32 | ) | (0.40 | ) | 0.16 | 0.28 | (0.27 | ) | |||||||||
| Total from investment operations | (0.13 | ) | (0.01 | ) | (0.13 | ) | 0.41 | 0.60 | 0.05 | ||||||||||
| Distributions to shareholders from | |||||||||||||||||||
| Net investment income | (0.15 | ) | (0.30 | ) | (0.34 | ) | (0.25 | ) | (0.33 | ) | (0.37 | ) | |||||||
| Tax return of capital | 0 | (0.03 | ) | 0 | 0 | 0 | 0 | ||||||||||||
| Total distributions to shareholders | (0.15 | ) | (0.33 | ) | (0.34 | ) | (0.25 | ) | (0.33 | ) | (0.37 | ) | |||||||
| Net asset value, end of period | $ 3.44 | $ 3.72 | $ 4.06 | $ 4.53 | $ 4.37 | $ 4.10 | |||||||||||||
| Total return* | (3.52 | %) | (0.37 | %) | (2.79 | %) | 9.57 | % | 15.32 | % | 1.38 | % | |||||||
| Ratios and supplemental data | |||||||||||||||||||
| Net assets, end of period (millions) | $27,527 | $28,229 | $47,713 | $96,535 | $547,390 | $593,681 | |||||||||||||
| Ratios to average net assets | |||||||||||||||||||
| Expenses‡ | 1.99 | %† | 2.02 | % | 1.95 | % | 1.94 | %† | 1.96 | % | 1.94 | % | |||||||
| Net investment income | 8.63 | %† | 7.79 | % | 7.85 | % | 7.27 | %† | 7.63 | % | 7.92 | % | |||||||
| Portfolio turnover rate | 62 | % | 107 | % | 170 | % | 155 | % | 138 | % | 116 | % | |||||||
(a)
|
For the period from January 20, 1998 (commencement of class operations) to April 30, 1998.
|
(b)
|
For the nine months ended April 30, 1998. The Fund changed its fiscal year end from July 31 to April 30, 1998.
|
#
|
Net investment income per share is based on average shares outstanding during the period.
|
*
|
Excluding applicable sales charges.
|
‡
|
The ratio of expenses to average net assets excludes expense reductions but includes fee waivers.
|
†
|
Annualized.
|
| Six Months Ended
October 31, 2000 (Unaudited) |
Year Ended April 30, |
||||||||||||
|---|---|---|---|---|---|---|---|---|---|---|---|---|---|
| 2000 | 1999 | 1998 (a)# | |||||||||||
| CLASS C SHARES | |||||||||||||
| Net asset value, beginning of period | $ 3.72 | $ 4.06 | $ 4.53 | $ 4.52 | |||||||||
| Income from investment operations | |||||||||||||
| Net investment income | 0.15 | 0.32 | 0.32 | 0.10 | |||||||||
| Net realized and unrealized gains or losses on securities and foreign currency
related transactions |
(0.28 | ) | (0.33 | ) | (0.45 | ) | 0.01 | ||||||
| Total from investment operations | (0.13 | ) | (0.01 | ) | (0.13 | ) | 0.11 | ||||||
| Distributions to shareholders from | |||||||||||||
| Net investment income | (0.15 | ) | (0.30 | ) | (0.34 | ) | (0.10 | ) | |||||
| Tax return of capital | 0 | (0.03 | ) | 0 | 0 | ||||||||
| Total distributions to shareholders | (0.15 | ) | (0.33 | ) | (0.34 | ) | (0.10 | ) | |||||
| Net asset value, end of period | $ 3.44 | $ 3.72 | $ 4.06 | $ 4.53 | |||||||||
| Total return* | (3.52 | %) | (0.37 | %) | 2.79 | % | 2.35 | % | |||||
| Ratios and supplemental data | |||||||||||||
| Net assets, end of period (thousands) | $76,447 | $3,172 | $1,999 | $1,155 | |||||||||
| Ratios to average net assets | |||||||||||||
| Expenses‡ | 1.97 | %† | 2.00 | % | 1.94 | % | 2.04 | %† | |||||
| Net investment income | 8.62 | %† | 7.80 | % | 7.86 | % | 7.51 | %† | |||||
| Portfolio turnover rate | 62 | % | 107 | % | 170 | % | 155 | % | |||||
| Six Months Ended
October 31, 2000 (Unaudited) |
Year Ended April 30, |
||||||||||||
|---|---|---|---|---|---|---|---|---|---|---|---|---|---|
| 2000 | 1999 | 1998 (b)(c) | |||||||||||
| CLASS Y SHARES | |||||||||||||
| Net asset value, beginning of period | $ 3.72 | $ 4.06 | $ 4.53 | $4.56 | |||||||||
| Income from investment operations | |||||||||||||
| Net investment income | 0.18 | 0.35 | 0.36 | 0.02 | |||||||||
| Net realized and unrealized gains or losses on securities and foreign currency
related transactions |
(0.29 | ) | (0.32 | ) | (0.45 | ) | (0.03 | ) | |||||
| Total from investment operations | (0.11 | ) | 0.03 | (0.09 | ) | (0.01 | ) | ||||||
| Distributions to shareholders from | |||||||||||||
| Net investment income | (0.17 | ) | (0.34 | ) | (0.38 | ) | (0.02 | ) | |||||
| Tax return of capital | 0 | (0.03 | ) | 0 | 0 | ||||||||
| Total distributions to shareholders | (0.17 | ) | (0.37 | ) | (0.38 | ) | (0.02 | ) | |||||
| Net asset value, end of period | $ 3.44 | $ 3.72 | $ 4.06 | $4.53 | |||||||||
| Total return | (3.03 | %) | 0.64 | % | (1.81 | %) | (0.27 | %) | |||||
| Ratios and supplemental data | |||||||||||||
| Net assets, end of period (thousands) | $5,986 | $6,153 | $4,244 | $ 20 | |||||||||
| Ratios to average net assets: | |||||||||||||
| Expenses‡ | 0.99 | %† | 1.01 | % | 0.91 | % | 1.09 | %† | |||||
| Net investment income | 9.62 | %† | 8.87 | % | 9.14 | % | 8.21 | %† | |||||
| Portfolio turnover rate | 62 | % | 107 | % | 170 | % | 155 | % | |||||
(a)
|
For the period from January 22, 1998 (commencement of class operations) to April 30, 1998.
|
(b)
|
For the period from April 14, 1998 (commencement of class operations) to April 30, 1998.
|
(c)
|
The per share net realized and unrealized gains or losses is not in accord with the net realized and unrealized gains or losses for the
period due to the timing of sales and redemptions of Fund shares in relation to fluctuating market values for the portfolio.
|
#
|
Net investment income is based on average shares outstanding during the period.
|
*
|
Excluding applicable sales charges.
|
‡
|
The ratio of expenses to average net assets excludes expense reductions but includes fee waivers.
|
†
|
Annualized.
|
| Six Months Ended
October 31, 2000 (Unaudited) |
Year Ended
April 30, 2000 (a) |
Year Ended September 30, |
|||||||||||||||||
|---|---|---|---|---|---|---|---|---|---|---|---|---|---|---|---|---|---|---|---|
| 1999 | 1998 | 1997 | 1996 | ||||||||||||||||
| CLASS A SHARES (b) | |||||||||||||||||||
| Net asset value, beginning of period | $ 11.95 | $ 12.43 | $ 13.61 | $ 13.18 | $ 12.91 | $ 13.29 | |||||||||||||
| Income from investment operations | |||||||||||||||||||
| Net investment income | 0.38 | 0.44 | 0.79 | 0.79 | 0.97 | 0.89 | |||||||||||||
| Net realized and unrealized gains or losses on
securities and foreign currency related transactions |
0.20 | (0.46 | ) | (1.18 | ) | 0.47 | 0.26 | (0.37 | ) | ||||||||||
| Total from investment operations | 0.58 | (0.02 | ) | (0.39 | ) | 1.26 | 1.23 | 0.52 | |||||||||||
| Distributions to shareholders from | |||||||||||||||||||
| Net investment income | (0.39 | ) | (0.43 | ) | (0.79 | ) | (0.83 | ) | (0.96 | ) | (0.90 | ) | |||||||
| Tax return of capital | 0 | (0.03 | ) | 0 | 0 | 0 | 0 | ||||||||||||
| Total distributions to shareholders | (0.39 | ) | (0.46 | ) | (0.79 | ) | (0.83 | ) | (0.96 | ) | (0.90 | ) | |||||||
| Net asset value, end of period | $ 12.14 | $ 11.95 | $ 12.43 | $ 13.61 | $ 13.18 | $ 12.91 | |||||||||||||
| Total return* | 4.90 | % | (0.20 | %) | (2.89 | %) | 9.95 | % | 9.86 | % | 4.09 | % | |||||||
| Ratios and supplemental data | |||||||||||||||||||
| Net assets, end of period (thousands) | $62,387 | $74,822 | $103,794 | $94,279 | $53,176 | $21,092 | |||||||||||||
| Ratios to average net assets | |||||||||||||||||||
| Expenses‡ | 1.18 | %**† | 1.63 | %**† | 1.05 | % | 1.05 | % | 1.05 | % | 1.05 | % | |||||||
| Net investment income | 6.23 | %† | 6.35 | %† | 6.08 | % | 5.73 | % | 7.01 | % | 6.84 | % | |||||||
| Portfolio turnover rate | 56 | % | 89 | % | 171 | % | 114 | % | 100 | % | 254 | % | |||||||
| Six Months Ended
October 31, 2000 (Unaudited) |
Year Ended
April 30, 2000 (c) |
||||||
|---|---|---|---|---|---|---|---|
| CLASS B SHARES | |||||||
| Net asset value, beginning of period | $11.95 | $12.32 | |||||
| Income from investment operations | |||||||
| Net investment income | 0.32 | 0.35 | |||||
| Net realized and unrealized gains or losses on securities and foreign currency related transactions | 0.21 | (0.35 | ) | ||||
| Total from investment operations | 0.53 | 0 | |||||
| Distributions to shareholders from | |||||||
| Net investment income | (0.34 | ) | (0.34 | ) | |||
| Tax return of capital | 0 | (0.03 | ) | ||||
| Total distributions to shareholders | (0.34 | ) | (0.37 | ) | |||
| Net asset value, end of period | $12.14 | $11.95 | |||||
| Total return* | 4.51 | % | 0.02 | % | |||
| Ratios and supplemental data | |||||||
| Net assets, end of period (thousands) | $ 882 | $ 457 | |||||
| Ratios to average net assets | |||||||
| Expenses‡ | 1.92 | %**† | 2.36 | %**† | |||
| Net investment income | 5.36 | %† | 5.60 | %† | |||
| Portfolio turnover rate | 56 | % | 89 | % | |||
(a)
|
For the seven months ended April 30, 2000. The Fund changed its fiscal year end from September 30 to April 30, effective April 30, 2000.
|
(b)
|
Effective October 18, 1999, shareholders of Mentor Quality Income Portfolio Class A, Class B and Class Y shares became owners of that
number of full and fractional shares of Class A, Class C and Class Y shares, respectively, of Evergreen Quality Income Fund.
|
(c)
|
For the period from October 18, 1999 (commencement of class operations) to April 30, 2000.
|
*
|
Excluding applicable sales charges.
|
**
|
Ratio of expenses to average net assets includes interest expense.
|
‡
|
The ratio of expenses to average net assets excludes expense reductions but includes fee waivers.
|
†
|
Annualized.
|
| Six Months Ended
October 31, 2000 (Unaudited) |
Year Ended
April 30, 2000 (a) |
Year Ended September 30, |
|||||||||||||||||
|---|---|---|---|---|---|---|---|---|---|---|---|---|---|---|---|---|---|---|---|
| 1999 | 1998 | 1997 | 1996 | ||||||||||||||||
| CLASS C SHARES (b) | |||||||||||||||||||
| Net asset value, beginning of period | $ 11.95 | $ 12.43 | $ 13.61 | $ 13.18 | $ 12.93 | $ 13.31 | |||||||||||||
| Income from investment operations | |||||||||||||||||||
| Net investment income | 0.33 | 0.37 | 0.71 | 0.72 | 0.86 | 0.84 | |||||||||||||
| Net realized and unrealized gains or losses on
securities and foreign currency related transactions |
0.20 | (0.44 | ) | (1.16 | ) | 0.48 | 0.30 | (0.38 | ) | ||||||||||
| Total from investment operations | 0.53 | (0.07 | ) | (0.45 | ) | 1.20 | 1.16 | 0.46 | |||||||||||
| Distributions to shareholders from | |||||||||||||||||||
| Net investment income | (0.34 | ) | (0.38 | ) | (0.73 | ) | (0.77 | ) | (0.91 | ) | (0.84 | ) | |||||||
| Tax return of capital | 0 | (0.03 | ) | 0 | 0 | 0 | 0 | ||||||||||||
| Total distributions to shareholders | (0.34 | ) | (0.41 | ) | (0.73 | ) | (0.77 | ) | (0.91 | ) | (0.84 | ) | |||||||
| Net asset value, end of period | $ 12.14 | $ 11.95 | $ 12.43 | $ 13.61 | $ 13.18 | $ 12.93 | |||||||||||||
| Total return* | 4.51 | % | (0.62 | %) | (3.34 | %) | 9.46 | % | 9.29 | % | 3.57 | % | |||||||
| Ratios and supplemental data | |||||||||||||||||||
| Net assets, end of period (thousands) | $65,711 | $72,698 | $97,403 | $112,901 | $75,046 | $58,239 | |||||||||||||
| Ratios to average net assets | |||||||||||||||||||
| Expenses‡ | 1.93 | %**† | 2.35 | %**† | 1.55 | % | 1.55 | % | 1.55 | % | 1.55 | % | |||||||
| Net investment income | 5.47 | %† | 5.60 | %† | 5.57 | % | 5.22 | % | 6.51 | % | 6.36 | % | |||||||
| Portfolio turnover rate | 56 | % | 89 | % | 171 | % | 114 | % | 100 | % | 254 | % | |||||||
| Six Months Ended
October 31, 2000 (Unaudited) |
Year Ended
April 30, 2000 (a)# |
Year Ended
September 30, |
|||||||||||
|---|---|---|---|---|---|---|---|---|---|---|---|---|---|
| 1999 | 1998 (c) | ||||||||||||
| CLASS Y SHARES (b) | |||||||||||||
| Net asset value, beginning of period | $12.50 | $13.09 | $13.69 | $13.20 | |||||||||
| Income from investment operations | |||||||||||||
| Net investment income | 0.41 | 0.50 | 0.84 | 0.78 | |||||||||
| Net realized and unrealized gains or losses on securities and foreign
currency related transactions |
0.15 | (0.59 | ) | (1.20 | ) | 0.39 | |||||||
| Total from investment operations | 0.56 | (0.09 | ) | (0.36 | ) | 1.17 | |||||||
| Distributions to shareholders from | |||||||||||||
| Net investment income | (0.42 | ) | (0.47 | ) | (0.24 | ) | (0.68 | ) | |||||
| Tax return of capital | 0 | (0.03 | ) | 0 | 0 | ||||||||
| Total distributions to shareholders | (0.42 | ) | (0.50 | ) | (0.24 | ) | (0.68 | ) | |||||
| Net asset value, end of period | $12.64 | $12.50 | $13.09 | $13.69 | |||||||||
| Total return | 4.55 | % | (0.73 | %) | (2.63 | %) | 8.94 | % | |||||
| Ratios and supplemental data | |||||||||||||
| Net assets, end of period (thousands) | $ 1 | $ 1 | $ 1 | $ 1 | |||||||||
| Ratios to average net assets | |||||||||||||
| Expenses‡ | 0.89 | %**† | 1.18 | %**† | 0.80 | % | 0.80 | %† | |||||
| Net investment income | 6.50 | %† | 6.65 | %† | 6.30 | % | 7.09 | %† | |||||
| Portfolio turnover rate | 56 | % | 89 | % | 171 | % | 114 | % | |||||
(a)
|
For the seven months ended April 30, 2000. The Fund changed its fiscal year end from September 30 to April 30, effective April 30, 2000.
|
(b)
|
Effective October 18, 1999, Shareholders of Mentor Quality Income Portfolio Class A, Class B and Class Y shares became owners of that
number of full and fractional shares of Class A, Class C and Class Y shares, respectively, of Evergreen Quality Income Fund.
|
(c)
|
For the period from November 19, 1997 (commencement of class operations) to September 30, 1998.
|
#
|
Net investment income is based on average shares outstanding during the period.
|
*
|
Excluding applicable sales charges.
|
**
|
Ratio of expenses to average net assets includes interest expense.
|
‡
|
The ratio of expenses to average net assets excludes expense reductions but includes fee waivers.
|
†
|
Annualized.
|
| Six Months Ended
October 31, 2000 (Unaudited) |
Year Ended April 30, |
Year Ended
July 31, 1996 |
|||||||||||||||||
|---|---|---|---|---|---|---|---|---|---|---|---|---|---|---|---|---|---|---|---|
| 2000 | 1999 | 1998 # | 1997 (a) | ||||||||||||||||
| CLASS A SHARES | |||||||||||||||||||
| Net asset value, beginning of period | $ 6.12 | $ 6.79 | $ 7.21 | $ 6.82 | $ 6.77 | $ 6.89 | |||||||||||||
| Income from investment operations | |||||||||||||||||||
| Net investment income | 0.26 | 0.53 | 0.51 | 0.50 | 0.37 | 0.54 | |||||||||||||
| Net realized and unrealized gains or losses on securities
and foreign currency related transactions |
(0.37 | ) | (0.63 | ) | (0.41 | ) | 0.38 | 0.09 | (0.09 | ) | |||||||||
| Total from investment operations | (0.11 | ) | (0.10 | ) | 0.10 | 0.88 | 0.46 | 0.45 | |||||||||||
| Distributions to shareholders from | |||||||||||||||||||
| Net investment income | (0.26 | ) | (0.49 | ) | (0.52 | ) | (0.49 | ) | (0.41 | ) | (0.52 | ) | |||||||
| Tax return of capital | 0 | (0.08 | ) | 0 | 0 | 0 | (0.05 | ) | |||||||||||
| Total distributions to shareholders | (0.26 | ) | (0.57 | ) | (0.52 | ) | (0.49 | ) | (0.41 | ) | (0.57 | ) | |||||||
| Net asset value, end of period | $ 5.75 | $ 6.12 | $ 6.79 | $ 7.21 | $ 6.82 | $ 6.77 | |||||||||||||
| Total return* | (1.80 | %) | (1.58 | %) | 1.58 | % | 13.20 | % | 6.80 | % | 6.84 | % | |||||||
| Ratios and supplemental data | |||||||||||||||||||
| Net assets, end of period (thousands) | $115,173 | $129,885 | $162,192 | $193,618 | $58,725 | $68,118 | |||||||||||||
| Ratios to average net assets | |||||||||||||||||||
| Expenses‡ | 0.75 | %† | 0.72 | % | 1.02 | % | 1.27 | % | 1.28 | %† | 1.30 | % | |||||||
| Net investment income | 8.51 | %† | 8.36 | % | 7.41 | % | 6.80 | % | 7.28 | %† | 8.05 | % | |||||||
| Portfolio turnover rate | 137 | % | 187 | % | 222 | % | 237 | % | 86 | % | 101 | % | |||||||
| Six Months Ended
October 31, 2000 (Unaudited) |
Year Ended April 30, |
Year Ended
July 31, 1996 |
|||||||||||||||||
|---|---|---|---|---|---|---|---|---|---|---|---|---|---|---|---|---|---|---|---|
| 2000 | 1999 | 1998 # | 1997 (a) | ||||||||||||||||
| CLASS B SHARES | |||||||||||||||||||
| Net asset value, beginning of period | $ 6.14 | $ 6.81 | $ 7.25 | $ 6.85 | $ 6.81 | $ 6.92 | |||||||||||||
| Income from investment operations | |||||||||||||||||||
| Net investment income | 0.24 | 0.49 | 0.47 | 0.44 | 0.34 | 0.50 | |||||||||||||
| Net realized and unrealized gains or losses on securities
and foreign currency related transactions |
(0.37 | ) | (0.64 | ) | (0.44 | ) | 0.39 | 0.07 | (0.09 | ) | |||||||||
| Total from investment operations | (0.13 | ) | (0.15 | ) | 0.03 | 0.83 | 0.41 | 0.41 | |||||||||||
| Distributions to shareholders from | |||||||||||||||||||
| Net investment income | (0.24 | ) | (0.44 | ) | (0.47 | ) | (0.43 | ) | (0.37 | ) | (0.47 | ) | |||||||
| Tax return of capital | 0 | (0.08 | ) | 0 | 0 | 0 | (0.05 | ) | |||||||||||
| Total distributions to shareholders | (0.24 | ) | (0.52 | ) | (0.47 | ) | (0.43 | ) | (0.37 | ) | (0.52 | ) | |||||||
| Net asset value, end of period | $ 5.77 | $ 6.14 | $ 6.81 | $ 7.25 | $ 6.85 | $ 6.81 | |||||||||||||
| Total return* | (2.15 | %) | (2.29 | %) | 0.56 | % | 12.47 | % | 6.06 | % | 6.21 | % | |||||||
| Ratios and supplemental data | |||||||||||||||||||
| Net assets, end of period (thousands) | $90,749 | $104,110 | $120,669 | $113,136 | $110,082 | $123,389 | |||||||||||||
| Ratios to average net assets | |||||||||||||||||||
| Expenses‡ | 1.50 | %† | 1.47 | % | 1.76 | % | 2.05 | % | 2.04 | %† | 2.07 | % | |||||||
| Net investment income | 7.76 | %† | 7.60 | % | 6.68 | % | 6.08 | % | 6.52 | %† | 7.28 | % | |||||||
| Portfolio turnover rate | 137 | % | 187 | % | 222 | % | 237 | % | 86 | % | 101 | % | |||||||
(a)
|
For the nine months ended April 30, 1997. The Fund changed its fiscal year end from July 31 to April 30, effective April 30, 1997.
|
#
|
Net investment income per share is based on average shares outstanding during the period.
|
*
|
Excluding applicable sales charges.
|
‡
|
The ratio of expenses to average net assets excludes expense reductions but includes fee waivers.
|
†
|
Annualized.
|
| Six Months Ended
October 31, 2000 (Unaudited) |
Year Ended April 30, |
Year Ended
July 31, 1996 |
|||||||||||||||||
|---|---|---|---|---|---|---|---|---|---|---|---|---|---|---|---|---|---|---|---|
| 2000 | 1999 | 1998 # | 1997 (a) | ||||||||||||||||
| CLASS C SHARES | |||||||||||||||||||
| Net asset value, beginning of period | $ 6.13 | $ 6.80 | $ 7.24 | $ 6.84 | $ 6.80 | $ 6.92 | |||||||||||||
| Income from investment operations | |||||||||||||||||||
| Net investment income | 0.23 | 0.49 | 0.45 | 0.44 | 0.33 | 0.49 | |||||||||||||
| Net realized and unrealized gains or losses on securities and
foreign currency related transactions |
(0.36 | ) | (0.64 | ) | (0.42 | ) | 0.39 | 0.08 | (0.09 | ) | |||||||||
| Total from investment operations | (0.13 | ) | (0.15 | ) | 0.03 | 0.83 | 0.41 | 0.40 | |||||||||||
| Distributions to shareholders from | |||||||||||||||||||
| Net investment income | (0.24 | ) | (0.44 | ) | (0.47 | ) | (0.43 | ) | (0.37 | ) | (0.47 | ) | |||||||
| Tax return of capital | 0 | (0.08 | ) | 0 | 0 | 0 | (0.05 | ) | |||||||||||
| Total distributions to shareholders | (0.24 | ) | (0.52 | ) | (0.47 | ) | (0.43 | ) | (0.37 | ) | (0.52 | ) | |||||||
| Net asset value, end of period | $ 5.76 | $ 6.13 | $ 6.80 | $ 7.24 | $ 6.84 | $ 6.80 | |||||||||||||
| Total return* | (2.16 | %) | (2.30 | %) | 0.55 | % | 12.48 | % | 6.07 | % | 6.07 | % | |||||||
| Ratios and supplemental data | |||||||||||||||||||
| Net assets, end of period (thousands) | $14,535 | $14,655 | $16,265 | $19,639 | $24,304 | $31,816 | |||||||||||||
| Ratios to average net assets | |||||||||||||||||||
| Expenses‡ | 1.50 | %† | 1.47 | % | 1.77 | % | 2.05 | % | 2.04 | %† | 2.07 | % | |||||||
| Net investment income | 7.74 | %† | 7.61 | % | 6.65 | % | 6.10 | % | 6.52 | %† | 7.29 | % | |||||||
| Portfolio turnover rate | 137 | % | 187 | % | 222 | % | 237 | % | 86 | % | 101 | % | |||||||
| Six Months Ended
October 31, 2000 (Unaudited) |
Year Ended April 30, |
|||||||||||||||
|---|---|---|---|---|---|---|---|---|---|---|---|---|---|---|---|---|
| 2000 | 1999 | 1998 # | 1997 (b)(c) | |||||||||||||
| CLASS Y SHARES | ||||||||||||||||
| Net asset value, beginning of period | $ 6.02 | $ 6.63 | $ 7.04 | $ 6.65 | $7.03 | |||||||||||
| Income from investment operations | ||||||||||||||||
| Net investment income | 0.25 | 0.55 | 0.51 | 0.46 | 0 | |||||||||||
| Net realized and unrealized gains or losses on securities and foreign currency
related transactions |
(0.34 | ) | (0.59 | ) | (0.39 | ) | 0.41 | (0.20 | ) | |||||||
| Total from investment operations | (0.09 | ) | (0.04 | ) | 0.12 | 0.87 | (0.20 | ) | ||||||||
| Distributions to shareholders from | ||||||||||||||||
| Net investment income | (0.27 | ) | (0.49 | ) | (0.53 | ) | (0.48 | ) | (0.18 | ) | ||||||
| Tax return of capital | 0 | (0.08 | ) | 0 | 0 | 0 | ||||||||||
| Total distributions to shareholders | (0.27 | ) | (0.57 | ) | (0.53 | ) | (0.48 | ) | (0.18 | ) | ||||||
| Net asset value, end of period | $ 5.66 | $ 6.02 | $ 6.63 | $ 7.04 | $6.65 | |||||||||||
| Total return | (1.61 | %) | (0.61 | %) | 1.83 | % | 13.46 | % | (2.87 | %) | ||||||
| Ratios and supplemental data | ||||||||||||||||
| Net assets, end of period (thousands) | $2,683 | $1,386 | $1,647 | $1,442 | $ 0 | |||||||||||
| Ratios to average net assets | ||||||||||||||||
| Expenses‡ | 0.52 | %† | 0.47 | % | 0.75 | % | 1.01 | % | 0.00 | %† | ||||||
| Net investment income | 8.72 | %† | 8.63 | % | 7.64 | % | 6.83 | % | 0.00 | %† | ||||||
| Portfolio turnover rate | 137 | % | 187 | % | 222 | % | 237 | % | 86 | % | ||||||
(a)
|
For the nine months ended April 30, 1997. The Fund changed its fiscal year end from July 31, to April 30, effective April 30, 1997.
|
(b)
|
For the period from January 13, 1997 (commencement of class operations) to April 30, 1997.
|
(c)
|
The per share net realized and unrealized gains or losses is not in accord with the net realized and unrealized gains or losses for the
period due to the timing of sales and redemptions of Fund shares in relation to fluctuating market values for the portfolio.
|
#
|
Net investment income per share is based on average shares outstanding during the period.
|
*
|
Excluding applicable sales charges.
|
‡
|
The ratio of expenses to average net assets excludes expense reductions but includes fee waivers.
|
†
|
Annualized.
|
| Six Months Ended
October 31, 2000 (Unaudited) # |
Year Ended April 30, |
Year Ended
June 30, 1996 |
|||||||||||||||||
|---|---|---|---|---|---|---|---|---|---|---|---|---|---|---|---|---|---|---|---|
| 2000 | 1999 | 1998 | 1997 (a) | ||||||||||||||||
| CLASS A SHARES | |||||||||||||||||||
| Net asset value, beginning of period | $ 9.15 | $ 9.63 | $ 9.68 | $ 9.39 | $ 9.42 | $ 9.65 | |||||||||||||
| Income from investment operations | |||||||||||||||||||
| Net investment income | 0.27 | 0.55 | 0.56 | 0.61 | 0.52 | 0.63 | |||||||||||||
| Net realized and unrealized gains or losses on
securities and foreign currency related transactions |
0.23 | (0.48 | ) | (0.04 | ) | 0.29 | (0.03 | ) | (0.23 | ) | |||||||||
| Total from investment operations | 0.50 | 0.07 | 0.52 | 0.90 | 0.49 | 0.40 | |||||||||||||
| Distributions to shareholders from | |||||||||||||||||||
| Net investment income | (0.28 | ) | (0.55 | ) | (0.57 | ) | (0.61 | ) | (0.52 | ) | (0.63 | ) | |||||||
| Net asset value, end of period | $ 9.37 | $ 9.15 | $ 9.63 | $ 9.68 | $ 9.39 | $ 9.42 | |||||||||||||
| Total return* | 5.49 | % | 0.79 | % | 5.39 | % | 9.78 | % | 5.30 | % | 4.28 | % | |||||||
| Ratios and supplemental data | |||||||||||||||||||
| Net assets, end of period (thousands) | $89,607 | $91,123 | $48,091 | $40,136 | $17,913 | $20,345 | |||||||||||||
| Ratios to average net assets | |||||||||||||||||||
| Expenses‡ | 1.02 | %† | 0.97 | % | 0.95 | % | 1.03 | % | 0.98 | %† | 0.99 | % | |||||||
| Net investment income | 5.84 | %† | 5.89 | % | 5.68 | % | 6.25 | % | 6.60 | %† | 6.61 | % | |||||||
| Portfolio turnover rate | 31 | % | 58 | % | 98 | % | 21 | % | 12 | % | 23 | % | |||||||
| Six Months Ended
October 31, 2000 (Unaudited) # |
Year Ended April 30, |
Year Ended
June 30, 1996 |
|||||||||||||||||
|---|---|---|---|---|---|---|---|---|---|---|---|---|---|---|---|---|---|---|---|
| 2000 | 1999 | 1998 | 1997 (a) | ||||||||||||||||
| CLASS B SHARES | |||||||||||||||||||
| Net asset value, beginning of period | $ 9.15 | $ 9.63 | $ 9.68 | $ 9.39 | $ 9.42 | $ 9.65 | |||||||||||||
| Income from investment operations | |||||||||||||||||||
| Net investment income | 0.24 | 0.48 | 0.49 | 0.53 | 0.46 | 0.56 | |||||||||||||
| Net realized and unrealized gains or losses on
securities and foreign currency related transactions |
0.22 | (0.48 | ) | (0.05 | ) | 0.29 | (0.03 | ) | (0.23 | ) | |||||||||
| Total from investment operations | 0.46 | 0 | 0.44 | 0.82 | 0.43 | 0.33 | |||||||||||||
| Distributions to shareholders from | |||||||||||||||||||
| Net investment income | (0.24 | ) | (0.48 | ) | (0.49 | ) | (0.53 | ) | (0.46 | ) | (0.56 | ) | |||||||
| Net asset value, end of period | $ 9.37 | $ 9.15 | $ 9.63 | $ 9.68 | $ 9.39 | $ 9.42 | |||||||||||||
| Total return* | 5.09 | % | 0.03 | % | 4.60 | % | 8.96 | % | 4.65 | % | 3.50 | % | |||||||
| Ratios and supplemental data | |||||||||||||||||||
| Net assets, end of period (thousands) | $75,828 | $82,665 | $122,919 | $130,576 | $142,371 | $165,988 | |||||||||||||
| Ratios to average net assets | |||||||||||||||||||
| Expenses‡ | 1.77 | %† | 1.71 | % | 1.71 | % | 1.78 | % | 1.73 | %† | 1.74 | % | |||||||
| Net investment income | 5.11 | %† | 5.11 | % | 4.99 | % | 5.56 | % | 5.85 | %† | 5.85 | % | |||||||
| Portfolio turnover rate | 31 | % | 58 | % | 98 | % | 21 | % | 12 | % | 23 | % | |||||||
(a)
|
For the ten months ended April 30, 1997. The Fund changed its fiscal year end from June 30, to April 30, effictive April 30, 1997.
|
#
|
Net investment income per share is based on average shares outstanding during the period.
|
*
|
Excluding applicable sales charges.
|
‡
|
The ratio of expenses to average net assets excludes expense reductions but includes fee waivers.
|
†
|
Annualized.
|
| Six Months Ended
October 31, 2000 (Unaudited) # |
Year Ended April 30, |
Year Ended
June 30, 1996 |
|||||||||||||||||
|---|---|---|---|---|---|---|---|---|---|---|---|---|---|---|---|---|---|---|---|
| 2000 | 1999 | 1998 | 1997 (a) | ||||||||||||||||
| CLASS C SHARES | |||||||||||||||||||
| Net asset value, beginning of period | $ 9.15 | $ 9.63 | $ 9.68 | $ 9.39 | $ 9.42 | $ 9.65 | |||||||||||||
| Income from investment operations | |||||||||||||||||||
| Net investment income | 0.23 | 0.48 | 0.49 | 0.53 | 0.46 | 0.56 | |||||||||||||
| Net realized and unrealized gains or losses
on securities and foreign currency related transactions |
0.23 | (0.48 | ) | (0.05 | ) | 0.29 | (0.03 | ) | (0.23 | ) | |||||||||
| Total from investment operations | 0.46 | 0 | 0.44 | 0.82 | 0.43 | 0.33 | |||||||||||||
| Distributions to shareholders from | |||||||||||||||||||
| Net investment income | (0.24 | ) | (0.48 | ) | (0.49 | ) | (0.53 | ) | (0.46 | ) | (0.56 | ) | |||||||
| Net asset value, end of period | $ 9.37 | $ 9.15 | $ 9.63 | $ 9.68 | $ 9.39 | $ 9.42 | |||||||||||||
| Total return* | 5.09 | % | 0.03 | % | 4.60 | % | 8.96 | % | 4.65 | % | 3.50 | % | |||||||
| Ratios and supplemental data | |||||||||||||||||||
| Net assets, end of period (thousands) | $ 4,320 | $ 4,740 | $ 5,605 | $ 5,697 | $ 455 | $ 649 | |||||||||||||
| Ratios to average net assets | |||||||||||||||||||
| Expenses‡ | 1.77 | %† | 1.71 | % | 1.70 | % | 1.78 | % | 1.73 | %† | 1.74 | % | |||||||
| Net investment income | 5.07 | %† | 5.12 | % | 4.97 | % | 5.49 | % | 5.85 | %† | 5.87 | % | |||||||
| Portfolio turnover rate | 31 | % | 58 | % | 98 | % | 21 | % | 12 | % | 23 | % | |||||||
| Six Months Ended
October 31, 2000 (Unaudited) # |
Year Ended April 30, |
Year Ended
June 30, 1996 |
|||||||||||||||||
| 2000 | 1999 | 1998 | 1997 (a) | ||||||||||||||||
| CLASS Y SHARES | |||||||||||||||||||
| Net asset value, beginning of period | $ 9.15 | $ 9.63 | $ 9.68 | $ 9.39 | $ 9.42 | $ 9.65 | |||||||||||||
| Income from investment operations | |||||||||||||||||||
| Net investment income | 0.28 | 0.57 | 0.59 | 0.63 | 0.54 | 0.66 | |||||||||||||
| Net realized and unrealized gains or losses
on securities and foreign currency related transactions |
0.23 | (0.48 | ) | (0.05 | ) | 0.29 | (0.03 | ) | (0.23 | ) | |||||||||
| Total from investment operations | 0.51 | 0.09 | 0.54 | 0.92 | 0.51 | 0.43 | |||||||||||||
| Distributions to shareholders from | |||||||||||||||||||
| Net investment income | (0.29 | ) | (0.57 | ) | (0.59 | ) | (0.63 | ) | (0.54 | ) | (0.66 | ) | |||||||
| Net asset value, end of period | $ 9.37 | $ 9.15 | $ 9.63 | $ 9.68 | $ 9.36 | $ 9.42 | |||||||||||||
| Total return | 5.62 | % | 1.04 | % | 5.66 | % | 10.05 | % | 5.52 | % | 4.54 | % | |||||||
| Ratios and supplemental data | |||||||||||||||||||
| Net assets, end of period (thousands) | $236,323 | $231,417 | $222,876 | $155,836 | $127,099 | $121,569 | |||||||||||||
| Ratios to average net assets | |||||||||||||||||||
| Expenses‡ | 0.77 | %† | 0.71 | % | 0.71 | % | 0.78 | % | 0.73 | %† | 0.74 | % | |||||||
| Net investment income | 6.10 | %† | 6.12 | % | 5.96 | % | 6.55 | % | 6.85 | %† | 6.86 | % | |||||||
| Portfolio turnover rate | 31 | % | 58 | % | 98 | % | 21 | % | 12 | % | 23 | % | |||||||
(a)
|
For the ten months ended April 30, 1997. The Fund changed its fiscal year end from June 30, to April 30, 1997.
|
#
|
Net investment income per share is based on averages shares outstanding during the period.
|
*
|
Excluding applicable sales charges.
|
‡
|
The ratio of expenses to average net assets excludes expense reductions but includes fee waivers.
|
†
|
Annualized.
|
| Credit
Rating Ù |
Principal
Amount |
Value | ||||
|---|---|---|---|---|---|---|
| ASSET-BACKED SECURITIES – 3.3% | ||||||
| Credit Suisse First Boston Mtge. Securities Corp.,
Ser. 1996-2, Class A6, 7.18%, 02/25/2018 |
AAA | $ 3,250,000 | $ 3,173,999 | |||
| Merrill Lynch Mtge. Investors, Inc., Ser. 1992-D, Class B,
8.50%, 06/15/2017 |
NR | 2,629,488 | 2,623,637 | |||
| Mid State Trust, Ser. 6, Class A3, 7.54%, 07/01/2035 | AA | 705,461 | 684,759 | |||
| Midwest Generation, LLC, Ser. B, 8.56%, 01/02/2016 144A | A- | 2,250,000 | 2,193,233 | |||
| Railcar Leasing LLC, Ser. 1, Class A2, 7.125%, 01/15/2013
144A |
AAA | 2,500,000 | 2,494,637 | |||
| University Support Svcs., Inc., Ser. 1992-CD, Class D, 9.52%,
11/01/2007 ¨ |
NA | 230,000 | 229,655 | |||
| Total Asset-Backed Securities (cost $11,659,675) | 11,399,920 | |||||
| COLLATERALIZED MORTGAGE OBLIGATIONS – 12.8% | ||||||
| Bear Stearns Comml. Mtge. Securities, Inc., Ser. 2000-WF1,
Class A2, 7.78%, 02/15/2010 |
AAA | 3,300,000 | 3,441,520 | |||
| Criimi Mae Comml. Mtge. Trust, Ser. 1998-C1, Class A2,
7.00%, 03/02/2011 144A |
A | 3,000,000 | 2,758,578 | |||
| Criimi Mae Finl. Corp., Ser. 1, Class A, 7.00%, 01/01/2033 | AAA | 4,231,095 | 3,949,463 | |||
| DLJ Comml. Mtge. Corp.: | ||||||
| 7.18%, 11/01/2010 | BB | 3,000,000 | 3,015,469 | |||
| Ser. 2000-CF1, Class A3, 7.92%, 05/10/2010 | A | 2,000,000 | 2,055,000 | |||
| FFCA Secured Lending Corp., Ser. 1997-1, Class B1,
7.74%, 06/18/2013 144A |
NR | 1,000,000 | 1,002,525 | |||
| Finl. Asset Securitization, Inc., Ser. 1997-NAM2, Class B2,
7.88%, 07/25/2027 |
NR | 2,642,469 | 2,607,344 | |||
| GE Capital Mtge. Svcs., Inc.: | ||||||
| Ser. 1994-27, Class A6, 6.50%, 07/25/2024 | AAA | 3,745,000 | 3,436,056 | |||
| Ser. 1999-H, Class A-7, 6.27%, 04/25/2029 | NA | 2,375,000 | 2,261,762 | |||
| Morgan Stanley Capital I, Inc., Ser. 1997-C1, Class B,
7.69%, 01/15/2007 |
NR | 3,300,000 | 3,371,051 | |||
| Morgan Stanley Dean Witter, Ser. 2000, Class B,
7.78%, 01/15/2010 |
NA | 3,250,000 | 3,324,074 | |||
| Norwest Asset Securities Corp. 6.25%, 09/25/2028 | AA | 2,296,107 | 2,036,704 | |||
| PNC Mtge. Securities Corp.: | ||||||
| Ser. 1997-4, Class 2PP3, 7.25%, 07/25/2027 | AAA | 2,411,519 | 2,329,323 | |||
| Ser. 1999-5, Class CB3, 6.89%, 07/25/2029 | NR | 1,507,454 | 1,366,764 | |||
| Ser. 1999-8, Class CB3, 7.35%, 09/25/2029 | NR | 1,614,649 | 1,502,423 | |||
| Residential Asset Securitization Trust, Ser. 2000-A2, Class
NB1, 8.00%, 04/25/2030 |
AAA | 2,924,438 | 2,950,648 | |||
| Residential Funding Mtge. Securities I, Inc., Ser. 1999-S2,
Class M1, 6.50%, 01/25/2029 |
NR | 2,878,738 | 2,617,248 | |||
| Total Collateralized Mortgage
Obligations (cost
$44,413,586) |
44,025,952 | |||||
| Credit
Rating Ù |
Principal
Amount |
Value | ||||
|---|---|---|---|---|---|---|
| CORPORATE BONDS – 43.0% | ||||||
| CONSUMER DISCRETIONARY – 8.4% | ||||||
| Auto Components – 0.5% | ||||||
| Hayes Wheels Intl., Inc., Ser. B, 9.125%, 07/15/2007 | B | $ 1,000,000 | $ 810,000 | |||
| Lear Corp., Ser. B, 8.11%, 05/15/2009 | BB+ | 1,000,000 | 898,273 | |||
| 1,708,273 | ||||||
| Automobiles – 1.2% | ||||||
| Ford Motor Co., 8.90%, 01/15/2032 | A | 4,000,000 | 4,272,292 | |||
| Hotels, Restaurants & Leisure – 1.7% | ||||||
| Boyd Gaming Corp., 9.50%, 07/15/2007 | B+ | 1,000,000 | 915,000 | |||
| Isle of Capri Casinos, Inc., 8.75%, 04/15/2009 | B | 1,000,000 | 912,500 | |||
| Mohegan Tribal Gaming Auth., 8.75%, 01/01/2009 | BB- | 1,000,000 | 980,000 | |||
| Park Place Entertainment Corp., 8.875%, 09/15/2008 | BB+ | 1,000,000 | 985,000 | |||
| Prime Hospitality Corp., Ser. B, 9.75%, 04/01/2007 | B+ | 1,000,000 | 1,005,000 | |||
| Station Casinos, Inc., 9.875%, 07/01/2010 144A | B+ | 1,000,000 | 1,007,500 | |||
| 5,805,000 | ||||||
| Household Durables – 0.9% | ||||||
| K Hovnanian Enterprises, Inc., 10.50%, 10/01/2007 144A | BB- | 900,000 | 848,250 | |||
| MDC Holdings, Inc., 8.375%, 02/01/2008 | BB | 1,100,000 | 1,017,500 | |||
| Standard Pacific Corp., 8.50%, 04/01/2009 | BB | 1,200,000 | 1,098,000 | |||
| 2,963,750 | ||||||
| Leisure Equipment & Products – 0.7% | ||||||
| CSC Holdings, Inc., Ser. B, 8.125%, 07/15/2009 | BB+ | 2,000,000 | 1,949,660 | |||
| Outboard Marine Corp., Ser. B, 10.75%, 06/01/2008 | CCC+ | 1,000,000 | 365,000 | |||
| 2,314,660 | ||||||
| Media – 3.3% | ||||||
| Ackerley Group, Inc., Ser. B, 9.00%, 01/15/2009 | B | 1,000,000 | 925,000 | |||
| Adelphia Communications Corp., Ser. B, 9.875%,
03/01/2007 |
B+ | 1,000,000 | 905,000 | |||
| American Lawyer Media, Inc., Ser. B, 9.75%, 12/15/2007 | B | 1,000,000 | 910,000 | |||
| Chancellor Media Corp., 8.00%, 11/01/2008 | BBB- | 650,000 | 653,250 | |||
| Echostar DBS Corp., 9.375%, 02/01/2009 | B+ | 1,000,000 | 987,500 | |||
| Hollinger Intl. Publishing, Inc., 9.25%, 02/01/2006 | BB- | 1,000,000 | 995,000 | |||
| Infinity Broadcasting, Inc., 8.875%, 06/15/2007 | BBB | 1,000,000 | 1,033,750 | |||
| K-III Communications Corp., Ser. B, 8.50%, 02/01/2006 | BB- | 1,000,000 | 960,000 | |||
| Sinclair Broadcast Group, Inc., 10.00%, 09/30/2005 | B | 1,000,000 | 952,500 | |||
| Time Warner, Inc., 6.875%, 06/15/2018 | BBB | 2,000,000 | 1,801,104 | |||
| TV Guide, Inc., 8.125%, 03/01/2009 | BB- | 1,250,000 | 1,256,250 | |||
| 11,379,354 | ||||||
| Multi-line Retail – 0.1% | ||||||
| Ames Dept. Stores, Inc., 10.00%, 04/15/2006 | B+ | 1,050,000 | 383,250 | |||
| Credit
Rating Ù |
Principal
Amount |
Value | ||||
|---|---|---|---|---|---|---|
| CORPORATE BONDS – continued | ||||||
| CONSUMER STAPLES – 0.4% | ||||||
| Food Products – 0.4% | ||||||
| Sun World Intl., Inc., Ser. B, 11.25%, 04/15/2004 | B | $ 1,500,000 | $ 1,428,750 | |||
| ENERGY – 4.3% | ||||||
| Energy Equipment & Services – 0.4% | ||||||
| Oslo Seismic Svcs., Inc., 8.28%, 06/01/2011 | BBB | 1,400,200 | 1,422,406 | |||
| Oil & Gas – 3.9% | ||||||
| Alberta Energy Co., Ltd., 7.65%, 09/15/2010 | BBB+ | 1,400,000 | 1,412,230 | |||
| Cross Timbers Oil Co., Ser. B, 9.25%, 04/01/2007 | B | 1,000,000 | 1,000,000 | |||
| Giant Inds., Inc., 9.00%, 09/01/2007 | B+ | 1,300,000 | 1,196,000 | |||
| Golden State Petroleum Trans. Corp., First Mtge.,
8.04%, 02/01/2019 |
Aa2 | 7,000,000 | 6,520,129 | |||
| Nuevo Energy Co., Ser. B, 9.50%, 06/01/2008 | B+ | 1,000,000 | 1,003,750 | |||
| Ocean Energy, Inc., Ser. B, 8.375%, 07/01/2008 | BB- | 1,000,000 | 1,007,500 | |||
| Triton Energy, Ltd., 8.75%, 04/15/2002 | BB- | 1,300,000 | 1,350,700 | |||
| 13,490,309 | ||||||
| FINANCIALS – 18.0% | ||||||
| Banks – 1.1% | ||||||
| GS Escrow Corp., 6.75%, 08/01/2001 | BB+ | 1,850,000 | 1,826,712 | |||
| Wells Fargo & Co., 7.25%, 08/24/2005 | A+ | 2,000,000 | 2,014,660 | |||
| 3,841,372 | ||||||
| Diversified Financials – 8.9% | ||||||
| Barnett Capital I, 8.06%, 12/01/2026 | A- | 3,750,000 | 3,527,044 | |||
| Budget Group, Inc., 9.125%, 04/01/2006 | B+ | 1,000,000 | 390,000 | |||
| Comdisco Inc., 6.00%, 01/30/2002 | BBB | 2,500,000 | 2,132,825 | |||
| Comml. Credit Co., 10.00%, 05/15/2009 | AA- | 5,000,000 | 5,804,330 | |||
| Ford Motor Credit Co., 7.60%, 08/01/2005 | A | 3,500,000 | 3,526,628 | |||
| HSBC Capital Funding, LP, 9.547%, 06/30/2010 144A | NR | 2,000,000 | 2,124,704 | |||
| John Deere Capital Corp., 8.625%, 08/01/2019 | A | 7,850,000 | 8,179,559 | |||
| Limestone Electron Trust, 8.625%, 03/15/2003 144A | BBB- | 1,800,000 | 1,832,504 | |||
| Regl. Diversified Funding, Ltd., 9.25%, 03/15/2030 144A | A+ | 2,500,000 | 2,441,372 | |||
| United Rentals, Inc., Ser. B, 9.25%, 01/15/2009 | BB- | 1,000,000 | 825,000 | |||
| 30,783,966 | ||||||
| Insurance – 8.0% | ||||||
| AMBAC Finl. Group, Inc., 9.375%, 08/01/2011 | AA | 2,500,000 | 2,845,198 | |||
| Merrill Lynch Mtge. Investors, Inc., Ser. 1991-G, Class B,
9.15%, 10/15/2011 |
NA | 1,545,917 | 1,542,756 | |||
| Nationwide CSN Trust, 9.875%, 02/15/2025 144A | A | 10,000,000 | 10,219,940 | |||
| Prudential Properties, 7.125%, 07/01/2007 144A | A+ | 6,300,000 | 6,086,719 | |||
| Sun Life Canada Capital Trust, 8.53%, 05/29/2049 144A | A+ | 7,500,000 | 6,739,110 | |||
| 27,433,723 | ||||||
| Credit
Rating Ù |
Principal
Amount |
Value | ||||
|---|---|---|---|---|---|---|
| CORPORATE BONDS – continued | ||||||
| HEALTH CARE – 0.6% | ||||||
| Health Care Providers & Services – 0.6% | ||||||
| HCA Healthcare Co., 8.75%, 09/01/2010 | BB+ | $ 1,000,000 | $ 1,010,637 | |||
| Tenet Healthcare Corp., Ser. B, 8.125%, 12/01/2008 | BB- | 1,000,000 | 968,750 | |||
| 1,979,387 | ||||||
| INDUSTRIALS – 3.8% | ||||||
| Aerospace & Defense – 0.6% | ||||||
| Lockheed Martin Corp., 7.95%, 12/01/2005 | BBB- | 2,000,000 | 2,057,226 | |||
| Airlines – 0.5% | ||||||
| Continental Airlines, Inc., Passthrough Cert., Ser. 1999,
Class B, 6.795%, 02/02/2020 |
AA- | 1,985,976 | 1,847,901 | |||
| Building Products – 0.3% | ||||||
| American Standard, Inc., 7.375%, 02/01/2008 | BB+ | 1,000,000 | 935,000 | |||
| Chemicals – 0.6% | ||||||
| CK Witco Corp., 8.50%, 03/15/2005 | BBB | 2,000,000 | 2,016,800 | |||
| Commercial Services & Supplies – 1.2% | ||||||
| Republic Services, Inc., 7.125%, 05/15/2009 | BBB | 4,660,000 | 4,305,104 | |||
| Industrial Conglomerates – 0.3% | ||||||
| Nortek, Inc., Ser. B, 8.875%, 08/01/2008 | B+ | 1,000,000 | 875,000 | |||
| Machinery – 0.3% | ||||||
| Eagle-Picher Inds., 9.375%, 03/01/2008 | B- | 1,300,000 | 936,000 | |||
| MATERIALS – 1.9% | ||||||
| Chemicals – 0.6% | ||||||
| Lyondell Chemical Co., Ser. A, 9.625%, 05/01/2007 | BB | 1,000,000 | 972,500 | |||
| Scotts Co., 8.625%, 01/15/2009 144A | B+ | 1,000,000 | 955,000 | |||
| 1,927,500 | ||||||
| Containers & Packaging – 0.5% | ||||||
| Owens-Illinois, Inc., 7.15%, 05/15/2005 | BB | 1,000,000 | 715,000 | |||
| Packaging Corp. of America, 9.625%, 04/01/2009 | B+ | 1,000,000 | 1,025,000 | |||
| 1,740,000 | ||||||
| Metals & Mining – 0.8% | ||||||
| Alcoa, Inc., 7.375%, 08/01/2010 | A+ | 1,000,000 | 1,011,115 | |||
| P&L Coal Holdings Corp., Ser. B, 9.625%, 05/15/2008 | B | 1,000,000 | 977,500 | |||
| WHX Corp., 10.50%, 04/15/2005 | B- | 1,500,000 | 937,500 | |||
| 2,926,115 | ||||||
| TELECOMMUNICATION SERVICES – 3.4% | ||||||
| Diversified Telecommunication Services – 2.2% | ||||||
| Nextel Communications, Inc., 9.375%, 11/15/2009 | B | 1,000,000 | 967,500 | |||
| Qwest Capital Funding, Inc., 7.90%, 08/15/2010 144A | BBB+ | 3,150,000 | 3,203,251 | |||
| Credit
Rating Ù |
Principal
Amount |
Value | ||||
|---|---|---|---|---|---|---|
| CORPORATE BONDS – continued | ||||||
| TELECOMMUNICATION SERVICES – continued | ||||||
| Diversified Telecommunication Services – continued | ||||||
| Sprint Capital Corp., 6.375%, 05/01/2009 | BBB+ | $ 1,000,000 | $ 899,550 | |||
| Telecom De Puerto Rico, Inc., 6.65%, 05/15/2006 | BBB | 2,500,000 | 2,380,080 | |||
| 7,450,381 | ||||||
| Wireless Telecommunications Services – 1.2% | ||||||
| Crown Castle Intl. Corp., 9.00%, 05/15/2011 | B | 1,000,000 | 950,000 | |||
| Price Communications Wireless, Inc.: | ||||||
| 11.75%, 07/15/2007 | B- | 1,000,000 | 1,070,000 | |||
| Ser. B, 9.125%, 12/15/2006 | B+ | 1,000,000 | 1,005,000 | |||
| Voicestream Wireless Corp., 10.375%, 11/15/2009 | B- | 1,000,000 | 1,075,000 | |||
| 4,100,000 | ||||||
| UTILITIES – 2.2% | ||||||
| Electric Utilities – 1.5% | ||||||
| AES Corp., 8.50%, 11/01/2007 | B+ | 1,000,000 | 952,500 | |||
| Calpine Corp., 7.75%, 04/15/2009 | BB+ | 850,000 | 800,361 | |||
| Dominion Resources, Inc., 8.125%, 06/15/2010 | BBB+ | 2,000,000 | 2,066,042 | |||
| Duke Energy Field Svcs., LLC, 7.875%, 08/16/2010 | BBB | 1,500,000 | 1,530,576 | |||
| 5,349,479 | ||||||
| Gas Utilities – 0.7% | ||||||
| Western Gas Resources, Inc., 10.00%, 06/15/2009 | BB- | 850,000 | 888,250 | |||
| Williams Gas Pipelines Co., 7.375%, 11/15/2006 144A | BBB | 1,500,000 | 1,506,658 | |||
| 2,394,908 | ||||||
| Total Corporate Bonds (cost $155,616,553) | 148,067,906 | |||||
| MORTGAGE-BACKED SECURITIES – 17.2% | ||||||
| FNMA: | ||||||
| 6.29%, 03/01/2027 | AAA | 2,254,218 | 2,274,256 | |||
| 6.50%, 10/01/2028-05/01/2029 | AAA | 4,895,840 | 4,711,882 | |||
| 6.625%, 10/15/2007 | Aaa | 24,715,000 | 24,827,601 | |||
| 7.00%, 07/01/2028-08/01/2029 | AAA | 10,012,725 | 9,844,857 | |||
| 7.25%, 05/15/2030 | Aaa | 8,300,000 | 8,800,150 | |||
| 7.30%, 05/25/2010 | AAA | 3,425,000 | 3,507,446 | |||
| 7.35%, 04/01/2028 | AAA | 2,565,378 | 2,600,721 | |||
| 9.50%, 12/01/2024 | AAA | 2,340,634 | 2,457,057 | |||
| Total Mortgage-Backed Securities (cost $59,184,744) | 59,023,970 | |||||
| MUNICIPAL OBLIGATIONS – 0.8% | ||||||
| MUNICIPAL – 0.8% | ||||||
| Los Angeles, CA. Impt. Bond Act, 1915, Assessment Dist. 1,
MTN, 8.48%, 09/02/2015 (cost $2,674,484) |
NR | 2,674,484 | 2,700,961 | |||
| U.S. GOVERNMENT & AGENCY OBLIGATIONS – 1.3% | ||||||
| FHLMC, 6.625%, 09/15/2009 (cost $4,486,446) | AAA | 4,625,000 | 4,598,355 | |||
| Credit
Rating Ù |
Principal
Amount |
Value | ||||
|---|---|---|---|---|---|---|
| U.S. TREASURY OBLIGATIONS – 5.7% | ||||||
| U.S. Treasury Bonds: | ||||||
| 6.25%, 05/15/2030 | AAA | $ 2,500,000 | $ 2,663,672 | |||
| 8.125%, 05/15/2021 | AAA | 7,020,000 | 8,760,588 | |||
| U.S. Treasury Notes: | ||||||
| 5.875%, 11/15/2004 | AAA | 4,150,000 | 4,152,814 | |||
| 6.00%, 09/30/2002 | AAA | 4,050,000 | 4,055,532 | |||
| Total U.S. Treasury Obligations (cost $19,329,444) | 19,632,606 | |||||
| YANKEE OBLIGATIONS – CORPORATE – 6.9% | ||||||
| ENERGY – 2.0% | ||||||
| Oil & Gas – 2.0% | ||||||
| British Gas Intl. Fin. Co., 0.00%, 11/04/2021¤ | A | 4,000,000 | 831,200 | |||
| Gulf Canada Resources, Ltd., 8.35%, 08/01/2006 | BBB- | 1,000,000 | 1,022,500 | |||
| YPF Sociedad Anonima, 7.25%, 03/15/2003 | BBB- | 5,000,000 | 4,885,000 | |||
| 6,738,700 | ||||||
| FINANCIALS – 0.6% | ||||||
| Banks – 0.5% | ||||||
| Skandinaviska Enskilda, 8.11%, 05/26/2033 | NA | 20,000,000 | 1,768,000 | |||
| Diversified Financials – 0.1% | ||||||
| Tembec Fin. Corp., 9.875%, 09/30/2005 | BB+ | 350,000 | 358,750 | |||
| MATERIALS – 1.0% | ||||||
| Metals & Mining – 0.2% | ||||||
| Bulong Operation Property Ltd., 12.50%, 12/15/2008 Ÿ | D | 1,600,000 | 728,000 | |||
| Paper & Forest Products – 0.8% | ||||||
| Domtar, Inc., 8.75%, 08/01/2006 | BBB- | 1,000,000 | 1,045,000 | |||
| Norampac, Inc., 9.50%, 02/01/2008 | BB | 1,000,000 | 1,010,000 | |||
| Tembec Inds., Inc., 8.625%, 06/30/2009 | BB+ | 650,000 | 638,625 | |||
| 2,693,625 | ||||||
| TELECOMMUNICATION SERVICES – 2.4% | ||||||
| Diversified Telecommunication Services – 2.0% | ||||||
| Deutsche Telekom Intl., 8.00%, 06/15/2010 | A- | 2,600,000 | 2,660,221 | |||
| Koninklijke Kpn NV, 8.00%, 10/01/2010 144A | A- | 3,000,000 | 2,951,319 | |||
| Telefonica Europe, 7.75%, 09/15/2010 | A+ | 1,400,000 | 1,408,843 | |||
| 7,020,383 | ||||||
| Wireless Telecommunications Services – 0.4% | ||||||
| Rogers Cantel, Inc., 9.75%, 06/01/2016 | BB+ | 1,150,000 | 1,230,500 | |||
| UTILITIES – 0.9% | ||||||
| Electric Utilities – 0.9% | ||||||
| TXU Eastern Funding Co., 6.75%, 05/15/2009 | BBB+ | 3,500,000 | 3,158,232 | |||
| Total Yankee Obligations – Corporate (cost $25,211,332) | 23,696,190 | |||||
| Credit
Rating Ù |
Principal
Amount |
Value | |||||||||||||||||||||
|---|---|---|---|---|---|---|---|---|---|---|---|---|---|---|---|---|---|---|---|---|---|---|---|
| YANKEE OBLIGATIONS – GOVERNMENT – 2.0% | |||||||||||||||||||||||
| Argentina, 0.00%, 10/15/2003 ¤ | BBB | $ 2,000,000 | $ 1,425,000 | ||||||||||||||||||||
| Canada, 7.50%, 09/15/2029 | A+ | 3,500,000 | 3,551,104 | ||||||||||||||||||||
| Qatar, 9.75%, 06/15/2030 | BBB | 2,000,000 | 1,952,500 | ||||||||||||||||||||
| Total Yankee Obligations – Government (cost $6,939,920) | 6,928,604 | ||||||||||||||||||||||
| Shares | Value | ||||||||||||||||||||||
| SHORT-TERM INVESTMENTS – 9.8% | |||||||||||||||||||||||
| MUTUAL FUND SHARES – 9.8% | |||||||||||||||||||||||
| Evergreen Select Money Market Fund ø | 20,113,072 | 20,113,072 | |||||||||||||||||||||
| Navigator Prime Portfolio p | 13,621,054 | 13,621,054 | |||||||||||||||||||||
| Total Short-Term Investments (cost $33,734,126) | 33,734,126 | ||||||||||||||||||||||
| Total Investments – (cost $363,250,310) – 102.8% | 353,808,590 | ||||||||||||||||||||||
| Other Assets and Liabilities – (2.8%) | (9,518,285 | ) | |||||||||||||||||||||
| Net Assets – 100.0% | $344,290,305 | ||||||||||||||||||||||
| Credit
Rating Ù |
Principal
Amount |
Value | ||||
|---|---|---|---|---|---|---|
| CORPORATE BONDS – 80.8% | ||||||
| CONSUMER DISCRETIONARY – 25.8% | ||||||
| Auto Components – 0.9% | ||||||
| Advance Stores Co., Inc., Ser. B, 10.25%, 04/15/2008 | B- | $4,000,000 | $ 2,830,000 | |||
| Hayes Wheels Intl., Inc., Ser. B, 9.125%, 07/15/2007 | B | 1,500,000 | 1,215,000 | |||
| 4,045,000 | ||||||
| Building Products – 0.5% | ||||||
| Del Webb Corp., 9.375%, 05/01/2009 | B- | 2,500,000 | 2,237,500 | |||
| Hotels, Restaurants & Leisure – 12.7% | ||||||
| Ameristar Casinos, Inc., Ser. B, 10.50%, 08/01/2004 | B- | 4,000,000 | 4,060,000 | |||
| Anchor Gaming, 9.875%, 10/15/2008 144A | B | 3,200,000 | 3,252,000 | |||
| Argosy Gaming Co., 10.75%, 06/01/2009 | B | 6,375,000 | 6,693,750 | |||
| Boyd Gaming Corp., 9.50%, 07/15/2007 | B+ | 5,000,000 | 4,575,000 | |||
| Coast Hotels & Casinos, Inc., 9.50%, 04/01/2009 | B- | 5,000,000 | 4,950,000 | |||
| Hollywood Casino Corp., 11.25%, 05/01/2007 | B | 4,900,000 | 5,059,250 | |||
| Intrawest Corp., 9.75%, 08/15/2008 | B+ | 2,000,000 | 1,960,000 | |||
| Isle of Capri Casinos, Inc., 8.75%, 04/15/2009 | B | 5,550,000 | 5,064,375 | |||
| Mandalay Resort Group, Ser. B, 10.25%, 08/01/2007 | BB- | 2,500,000 | 2,568,750 | |||
| Mohegan Tribal Gaming Auth., 8.75%, 01/01/2009 | BB- | 4,000,000 | 3,920,000 | |||
| Park Place Entertainment Corp., 8.875%, 09/15/2008 | BB+ | 5,000,000 | 4,925,000 | |||
| Station Casinos, Inc., 9.875%, 07/01/2010 144A | B+ | 4,500,000 | 4,533,750 | |||
| Venetian Casino Resort LLC, 12.25%, 11/15/2004 | B- | 5,650,000 | 5,748,875 | |||
| 57,310,750 | ||||||
| Household Durables – 3.2% | ||||||
| K Hovnanian Enterprises, Inc., 10.50%, 10/01/2007 144A | BB- | 4,200,000 | 3,958,500 | |||
| Simmons Co., Ser. B, 10.25%, 03/15/2009 | B- | 6,000,000 | 5,610,000 | |||
| Standard Pacific Corp.: | ||||||
| 8.50%, 06/15/2007 | BB | 2,000,000 | 1,860,000 | |||
| 9.50%, 09/15/2010 | BB | 3,000,000 | 2,895,000 | |||
| 14,323,500 | ||||||
| Leisure Equipment & Products – 0.4% | ||||||
| Outboard Marine Corp., Ser. B, 10.75%, 06/01/2008 | CCC+ | 5,100,000 | 1,861,500 | |||
| Media – 6.6% | ||||||
| Acme Television, LLC, Sr. Disc. Note, Ser. B, Step Bond,
0.00%, 09/30/2004 † |
B- | 5,000,000 | 4,725,000 | |||
| Adelphia Communications Corp., Ser. B,
9.875%, 03/01/2007 |
B+ | 5,000,000 | 4,525,000 | |||
| American Lawyer Media, Inc., Ser. B, 9.75%, 12/15/2007 | B | 5,000,000 | 4,550,000 | |||
| Charter Communications, 8.625%, 04/01/2009 | B+ | 3,300,000 | 2,986,500 | |||
| Echostar DBS Corp., 9.375%, 02/01/2009 | B+ | 5,000,000 | 4,937,500 | |||
| Premier Parks, Inc., Sr. Disc. Note, Step Bond,
0.00%, 04/01/2008 † |
B- | 8,500,000 | 5,631,250 | |||
| XM Satellite Radio, Inc., 14.00%, 03/15/2010 | CCC+ | 3,500,000 | 2,432,500 | |||
| 29,787,750 | ||||||
| Credit
Rating Ù |
Principal
Amount |
Value | ||||
|---|---|---|---|---|---|---|
| CORPORATE BONDS – continued | ||||||
| CONSUMER DISCRETIONARY – continued | ||||||
| Multi-line Retail – 0.4% | ||||||
| Ames Dept. Stores, Inc., 10.00%, 04/15/2006 | B+ | $5,000,000 | $ 1,825,000 | |||
| Specialty Retail – 1.1% | ||||||
| Michaels Stores, Inc., 10.875%, 06/15/2006 | BB | 4,775,000 | 4,703,375 | |||
| Textiles & Apparel – 0.0% | ||||||
| Consoltex Group, Ser. B, 11.00%, 10/01/2003 | B | 200,000 | 143,000 | |||
| CONSUMER STAPLES – 3.2% | ||||||
| Electronic Equipment & Instruments – 1.1% | ||||||
| Flextronics Intl. Ltd., 9.875%, 07/01/2010 144A | B+ | 5,000,000 | 5,075,000 | |||
| Food & Drug Retailing – 1.1% | ||||||
| AFC Enterprises, Inc., 10.25%, 05/15/2007 | B | 4,350,000 | 4,176,000 | |||
| Phar-Mor, Inc., 11.72%, 09/11/2002 | NR | 1,000,000 | 595,000 | |||
| 4,771,000 | ||||||
| Food Products – 1.0% | ||||||
| Sun World Intl., Inc., Ser. B, 11.25%, 04/15/2004 | B | 5,000,000 | 4,762,500 | |||
| ENERGY – 8.7% | ||||||
| Energy Equipment & Services – 0.9% | ||||||
| Parker Drilling Co., Ser. D, 9.75%, 11/15/2006 | B+ | 4,000,000 | 3,940,000 | |||
| Oil & Gas – 7.8% | ||||||
| Benton Oil & Gas Co., 9.375%, 11/01/2007 | B | 4,000,000 | 2,480,000 | |||
| Chesapeake Energy Corp., Ser. B, 9.625%, 05/01/2005 | B | 5,025,000 | 5,068,969 | |||
| Cross Timbers Oil Co., Ser. B: | ||||||
| 8.75%, 11/01/2009 | B | 1,120,000 | 1,086,400 | |||
| 9.25%, 04/01/2007 | B | 3,000,000 | 3,000,000 | |||
| Energy Corp. of America, Ser. A, 9.50%, 05/15/2007 | B- | 4,750,000 | 3,681,250 | |||
| EOTT Energy Partners, LP, 11.00%, 10/01/2009 | BB | 2,300,000 | 2,426,500 | |||
| Giant Inds., Inc., 9.00%, 09/01/2007 | B+ | 5,100,000 | 4,692,000 | |||
| HS Resources, Inc., 9.25%, 11/15/2006 | B+ | 5,400,000 | 5,413,500 | |||
| Nuevo Energy Co., Ser. B, 9.50%, 06/01/2008 | B+ | 2,100,000 | 2,107,875 | |||
| Petsec Energy, Inc., Ser. B, 9.50%, 06/15/2007 Ÿ | D | 2,350,000 | 1,245,500 | |||
| Pride Petroleum Svcs., Inc., 9.375%, 05/01/2007 | BB | 2,000,000 | 2,035,000 | |||
| Tesoro Petroleum Corp., Ser. B, 9.00%, 07/01/2008 | BB- | 1,900,000 | 1,838,250 | |||
| 35,075,244 | ||||||
| FINANCIALS – 2.3% | ||||||
| Banks – 0.2% | ||||||
| Sovereign Bancorp, Inc., 10.50%, 11/15/2006 | BB+ | 1,000,000 | 1,020,000 | |||
| Diversified Financials – 2.1% | ||||||
| Budget Group, Inc., 9.125%, 04/01/2006 | B+ | 4,000,000 | 1,560,000 | |||
| Merrill Corp., Ser. B, 12.00%, 05/01/2009 | B | 3,000,000 | 1,815,000 | |||
| Credit
Rating Ù |
Principal
Amount |
Value | ||||
|---|---|---|---|---|---|---|
| CORPORATE BONDS – continued | ||||||
| FINANCIALS – continued | ||||||
| Diversified Financials – continued | ||||||
| NationsRent, Inc., 10.375%, 12/15/2008 | B | $5,000,000 | $ 2,775,000 | |||
| United Rentals, Inc., Ser. B, 9.25%, 01/15/2009 | BB- | 4,000,000 | 3,300,000 | |||
| |
||||||
| 9,450,000 | ||||||
| |
||||||
| HEALTH CARE – 6.6% | ||||||
| Health Care Providers & Services – 6.1% | ||||||
| Aetna Inds., Inc., 11.875%, 10/01/2006 | B- | 1,500,000 | 903,750 | |||
| Columbia/HCA Healthcare Co., 7.00%, 07/01/2007 | BB+ | 5,000,000 | 4,622,915 | |||
| LifePoint Hosp. Holdings, Inc., Ser. B, 10.75%, 05/15/2009 | B- | 5,870,000 | 6,266,225 | |||
| Owens & Minor, Inc., 10.875%, 06/01/2006 | B+ | 2,000,000 | 2,070,000 | |||
| Oxford Hlth. Plans, Inc., 11.00%, 05/15/2005 | B | 1,500,000 | 1,642,500 | |||
| Tenet Healthcare Corp., Ser. B, 8.125%, 12/01/2008 | BB- | 6,500,000 | 6,296,875 | |||
| Triad Hosp. Holdings, Inc., Ser. B, 11.00%, 05/15/2009 | B- | 5,500,000 | 5,747,500 | |||
| |
||||||
| 27,549,765 | ||||||
| |
||||||
| Pharmaceuticals – 0.5% | ||||||
| King Pharmaceuticals, Inc., 10.75%, 02/15/2009 | B | 2,000,000 | 2,120,000 | |||
| |
||||||
| INDUSTRIALS – 7.9% | ||||||
| Aerospace & Defense – 1.0% | ||||||
| BE Aerospace, Inc., 9.50%, 11/01/2008 | B | 4,850,000 | 4,777,250 | |||
| |
||||||
| Airlines – 0.9% | ||||||
| American Comml. Lines, LLC, Ser. B, 10.25%, 06/30/2008 | B- | 5,000,000 | 4,075,000 | |||
| |
||||||
| Commercial Services & Supplies – 2.2% | ||||||
| Affinity Group Holding, Inc., 11.00%, 04/01/2007 | B | 4,000,000 | 3,340,000 | |||
| Allied Waste, Inc., Ser. B, 10.00%, 08/01/2009 | B+ | 7,500,000 | 6,450,000 | |||
| |
||||||
| 9,790,000 | ||||||
| |
||||||
| Construction & Engineering – 2.6% | ||||||
| Asat Fin., LLC, 12.50%, 11/01/2006 144A | BB- | 975,000 | 989,625 | |||
| Metromedia Fiber Network, Inc., 10.00%, 12/15/2009 | B+ | 1,900,000 | 1,695,750 | |||
| Spectrasite Holdings, Inc.: | ||||||
| 10.75%, 03/15/2010 | B- | 2,000,000 | 1,850,000 | |||
| Sr. Disc. Notes, Step Bond, 0.00%, 04/15/2004 † | B- | 6,575,000 | 3,427,219 | |||
| Transdigm, Inc., 10.375%, 12/01/2008 | B- | 4,000,000 | 3,720,000 | |||
| |
||||||
| 11,682,594 | ||||||
| |
||||||
| Machinery – 1.2% | ||||||
| Acme Metals, Inc., 10.875%, 12/15/2007 Ÿ | NR | 5,000,000 | 600,000 | |||
| Eagle-Picher Inds., 9.375%, 03/01/2008 | B- | 3,250,000 | 2,340,000 | |||
| Holley Performance Products, Inc., Ser. B, 12.25%,
09/15/2007 |
B | 4,000,000 | 2,330,000 | |||
| |
||||||
| 5,270,000 | ||||||
| |
||||||
| Credit
Rating Ù |
Principal
Amount |
Value | ||||
|---|---|---|---|---|---|---|
| CORPORATE BONDS – continued | ||||||
| INFORMATION TECHNOLOGY – 1.9% | ||||||
| Internet Software & Services – 0.7% | ||||||
| PSINet, Inc., 11.50%, 11/01/2008 | B- | $ 6,000,000 | $ 2,985,000 | |||
| Semiconductor Equipment & Products – 1.2% | ||||||
| Fairchild Semiconductor Corp., 10.125%, 03/15/2007 | B | 5,000,000 | 4,875,000 | |||
| Intersil Corp., 13.25%, 08/15/2009 | B | 650,000 | 737,750 | |||
| 5,612,750 | ||||||
| MATERIALS – 4.0% | ||||||
| Chemicals – 1.3% | ||||||
| Lyondell Chemical Co., 10.875%, 05/01/2009 | B+ | 6,000,000 | 5,775,000 | |||
| Containers & Packaging – 2.2% | ||||||
| Owens-Illinois, Inc., 7.15%, 05/15/2005 | BB | 5,000,000 | 3,575,000 | |||
| Riverwood Intl. Corp., 10.875%, 04/01/2008 | CCC+ | 7,000,000 | 6,352,500 | |||
| 9,927,500 | ||||||
| Metals & Mining – 0.5% | ||||||
| NSM Steel, Inc., 12.00%, 02/01/2006 144A Ÿ | D | 5,000,000 | 225,000 | |||
| WHX Corp., 10.50%, 04/15/2005 | B- | 3,000,000 | 1,875,000 | |||
| 2,100,000 | ||||||
| TELECOMMUNICATION SERVICES – 18.4% | ||||||
| Diversified Telecommunication Services – 8.5% | ||||||
| Chippac Intl. Ltd., Ser. B, 12.75%, 08/01/2009 | B- | 1,000,000 | 1,010,000 | |||
| Diamond Cable Communications, Sr. Disc. Note, Step Bond,
0.00%, 12/15/2005 † |
B | 1,500,000 | 1,402,500 | |||
| Intercel, Inc., Sr. Disc. Notes, Step Bond,
0.00%, 02/01/2006 † |
B | 6,000,000 | 5,970,000 | |||
| Level 3 Communications, Inc.: | ||||||
| 9.125%, 05/01/2008 | B | 1,400,000 | 1,137,500 | |||
| Sr. Disc. Note, Step Bond, 0.00%, 03/15/2005 † | B | 4,725,000 | 2,350,688 | |||
| McLeod USA, Inc., 9.25%, 07/15/2007 | B+ | 3,500,000 | 3,263,750 | |||
| Metromedia Fiber Network, Inc., Ser. B, 10.00%, 11/15/2008 | B+ | 4,000,000 | 3,560,000 | |||
| Nextlink Communications, Inc.: | ||||||
| 12.50%, 04/15/2006 | B | 2,600,000 | 2,457,000 | |||
| Sr. Disc. Notes, Step Bond, 0.00%, 12/01/2009 † | B | 2,750,000 | 1,340,625 | |||
| NTL Communications Corp., Sr. Disc. Note, Step Bond,
0.00%, 10/01/2008 † |
B | 2,000,000 | 1,180,000 | |||
| SBA Communications Corp., Sr. Disc. Note, Step Bond,
0.00%, 03/01/2003 † |
NA | 6,375,000 | 4,749,375 | |||
| Startec Global Communications Corp., 12.00%, 05/15/2008 | NA | 1,980,000 | 1,296,900 | |||
| Tritel PCS, Inc., Sr. Disc. Note, Step Bond, 0.00%, 05/15/2004 † | NR | 10,125,000 | 6,606,562 | |||
| Winstar Communications, Inc., Sr. Disc. Note, Step Bond,
0.00%, 04/15/2005 144A † |
B- | 5,450,000 | 1,771,250 | |||
| 38,096,150 | ||||||
| Credit
Rating Ù |
Principal
Amount |
Value | ||||
|---|---|---|---|---|---|---|
| CORPORATE BONDS – continued | ||||||
| TELECOMMUNICATION SERVICES – continued | ||||||
| Wireless Telecommunications Services – 9.9% | ||||||
| Crown Castle Intl. Corp., 10.75%, 08/01/2011 | B | $6,000,000 | $ 6,180,000 | |||
| Echostar Broadband Corp., 10.375%, 10/01/2007 144A | B | 3,600,000 | 3,627,000 | |||
| Motient Corp., Ser. B, 12.25%, 04/01/2008 | NR | 4,500,000 | 3,240,000 | |||
| Nextel Intl., Inc., 12.75%, 08/01/2010 144A | B- | 5,900,000 | 5,501,750 | |||
| Nextel Partners, Inc.: | ||||||
| 11.00%, 03/15/2010 | CCC+ | 4,000,000 | 3,990,000 | |||
| Sr. Disc. Notes, Step Bond, 0.00%, 02/01/2004 † | CCC+ | 1,950,000 | 1,365,000 | |||
| Price Communications Wireless, Inc., 11.75%, 07/15/2007 | B- | 7,000,000 | 7,490,000 | |||
| Triton PCS, Inc., Sr. Disc. Note, Step Bond,
0.00%, 05/01/2003 † |
CCC+ | 4,000,000 | 3,050,000 | |||
| United Pan Europe Communication, Sr. Disc. Note, Step
Bond, 0.00%, 11/01/2009 † |
B | 3,000,000 | 1,185,000 | |||
| Voicestream Wireless Corp.: | ||||||
| 10.375%, 11/15/2009 | B- | 6,125,000 | 6,584,375 | |||
| 11.50%, 09/15/2009 | NA | 2,000,000 | 2,225,000 | |||
| 44,438,125 | ||||||
| UTILITIES – 2.0% | ||||||
| Diversified Telecommunication Services – 0.2% | ||||||
| Level 3 Communications, Inc., 11.25%, 03/15/2010 | B | 1,000,000 | 905,000 | |||
| Electric Utilities – 1.5% | ||||||
| AES Corp., 9.375%, 09/15/2010 | BB | 5,000,000 | 5,100,000 | |||
| AES Drax Energy Ltd., 11.50%, 08/30/2010 144A | BB- | 1,500,000 | 1,582,500 | |||
| 6,682,500 | ||||||
| Gas Utilities – 0.3% | ||||||
| Western Gas Resources, Inc., 10.00%, 06/15/2009 | BB- | 1,500,000 | 1,567,500 | |||
| Total Corporate Bonds (cost $406,618,192) | 363,685,253 | |||||
| FOREIGN BONDS – CORPORATE (PRINCIPAL AMOUNT
DENOMINATED IN CURRENCY INDICATED) – 0.4% |
||||||
| TELECOMMUNICATION SERVICES – 0.4% | ||||||
| Diversified Telecommunication Services – 0.4% | ||||||
| NTL Communications Corp., Sr. Disc. Notes, Step Bond,
0.00%, 04/15/2009, GBP (cost $2,849,951) † |
B | 2,500,000 | 1,668,591 | |||
| MORTGAGE-BACKED SECURITIES – 0.9% | ||||||
| FNMA, 8.00%, 06/01/2030 (cost $3,838,508) | AAA | 3,888,327 | 3,937,981 | |||
| U.S. TREASURY OBLIGATIONS – 0.9% | ||||||
| U.S. Treasury Bonds, 6.125%, 08/15/2029 (cost $4,036,879) | AAA | 4,000,000 | 4,143,752 | |||
| Credit
Rating Ù |
Principal
Amount |
Value | ||||
|---|---|---|---|---|---|---|
| YANKEE OBLIGATIONS – CORPORATE – 8.0% | ||||||
| CONSUMER DISCRETIONARY – 0.7% | ||||||
| Media – 0.7% | ||||||
| Rogers Cablesystems Ltd., Ser. B, 10.00%, 03/15/2005 | BB+ | $1,124,000 | $ 1,191,440 | |||
| United Pan-Europe Communication, Sr. Disc. Note, Step Bond,
0.00%, 08/01/2005 † |
B | 5,250,000 | 1,968,750 | |||
| 3,160,190 | ||||||
| MATERIALS – 2.0% | ||||||
| Metals & Mining – 0.5% | ||||||
| Bulong Operation Property Ltd., 12.50%, 12/15/2008 Ÿ | D | 4,500,000 | 2,047,500 | |||
| Paper & Forest Products – 1.5% | ||||||
| Norampac, Inc., 9.50%, 02/01/2008 | BB | 3,500,000 | 3,535,000 | |||
| Repap New Brunswick, Inc., 11.50%, 06/01/2004 | B- | 3,000,000 | 3,322,500 | |||
| 6,857,500 | ||||||
| TELECOMMUNICATION SERVICES – 5.3% | ||||||
| Diversified Telecommunication Services – 4.7% | ||||||
| Alestra SA de RL de CV, 12.125%, 05/15/2006 | BB- | 4,000,000 | 3,470,000 | |||
| Asia Global Crossing, 13.375%, 10/15/2010 | B+ | 3,500,000 | 3,255,000 | |||
| Clearnet Communications, Inc., Sr. Disc. Notes, Step Bond,
0.00%, 12/15/2000 † |
Ba1 | 8,500,000 | 9,052,500 | |||
| Star Choice Communications, 13.00%, 12/15/2005 | B+ | 5,000,000 | 5,375,000 | |||
| 21,152,500 | ||||||
| Wireless Telecommunications Services – 0.6% | ||||||
| Microcell Telecommunications, Inc., Sr, Disc. Notes, Step
Bond, Ser. B, 0.00%, 10/01/2000 † |
B3 | 2,800,000 | 2,709,000 | |||
| Total Yankee Obligations – Corporate (cost $38,971,079) | 35,926,690 | |||||
| Shares | Value | |||||
| COMMON STOCKS – 1.1% | ||||||
| CONSUMER DISCRETIONARY – 0.4% | ||||||
| Hotels, Restaurants & Leisure – 0.2% | ||||||
| Gold River Hotel & Casino Corp., Class B ¨ | 10,775,000 | $ 0 | ||||
| Isle of Capri Casinos, Inc. | 66,514 | 731,654 | ||||
| Premier Cruise Line, Ltd. | 370,294 | 3,703 | ||||
| 735,357 | ||||||
| Media – 0.2% | ||||||
| Shaw Communications, Class B | 43,425 | 888,400 | ||||
| INDUSTRIALS – 0.0% | ||||||
| Commercial Services & Supplies – 0.0% | ||||||
| Decision One Corp. ¨ | 331,000 | 0 | ||||
| Shares | Value | |||
|---|---|---|---|---|
| COMMON STOCKS – continued | ||||
| INFORMATION TECHNOLOGY – 0.3% | ||||
| Computers & Peripherals – 0.1% | ||||
| Ampex Corp., Class A | 567,618 | $ 425,713 | ||
| Semiconductor Equipment & Products – 0.2% | ||||
| Intersil Holding Corp., Class A * | 18,518 | 887,707 | ||
| TELECOMMUNICATION SERVICES – 0.4% | ||||
| Diversified Telecommunication Services – 0.1% | ||||
| AT&T Canada, Inc. | 2,570 | 79,509 | ||
| McLeod USA, Inc., Class A * | 18,287 | 352,025 | ||
| 431,534 | ||||
| Wireless Telecommunications Services – 0.3% | ||||
| Airgate PCS, Inc. | 3,222 | 125,256 | ||
| Nextel Communications, Inc., Class A | 34,592 | 1,329,630 | ||
| 1,454,886 | ||||
| Total Common Stocks (cost $8,687,951) | 4,823,597 | |||
| CONVERTIBLE PREFERRED STOCKS – 0.5% | ||||
| TELECOMMUNICATION SERVICES – 0.5% | ||||
| Diversified Telecommunication Services – 0.5% | ||||
| Global Crossing, Ltd. 144A (cost $4,000,000) | 16,000 | 2,540,000 | ||
| PREFERRED STOCKS – 3.0% | ||||
| CONSUMER DISCRETIONARY – 1.3% | ||||
| Media – 1.3% | ||||
| Adelphia Communications Corp., Ser. B | 28,500 | 2,728,875 | ||
| Primedia, Inc., Ser. F | 20,000 | 1,785,000 | ||
| Sinclair Capital | 12,800 | 1,155,200 | ||
| 5,669,075 | ||||
| INFORMATION TECHNOLOGY – 1.5% | ||||
| Computers & Peripherals – 1.5% | ||||
| Ampex Corp. ¨ | 7,047 | 6,846,441 | ||
| TELECOMMUNICATION SERVICES – 0.2% | ||||
| Wireless Telecommunication Services – 0.2% | ||||
| Rural Cellular Corp., Ser. B | 12,845 | 1,002,797 | ||
| Total Preferred Stocks (cost $13,845,339) | 13,538,313 | |||
| WARRANTS – 0.3% | ||||
| CONSUMER DISCRETIONARY – 0.1% | ||||
| Media – 0.1% | ||||
| XM Satellite Radio, Inc., Expiring 3/15/2010 * | 3,500 | 420,437 | ||
| Shares | Value | ||||
|---|---|---|---|---|---|
| WARRANTS – continued | |||||
| FINANCIALS – 0.0% | |||||
| Diversified Financials – 0.0% | |||||
| Merrill Corp., Expiring 5/01/2009 144A * ¨ | 3,000 | $ 30 | |||
| Ono Fin., Plc, Expiring 5/31/2009 144A * | 4,500 | 31,500 | |||
| 31,530 | |||||
| INDUSTRIALS – 0.1% | |||||
| Air Freight & Couriers – 0.0% | |||||
| CHC Helicopter Corp., Expiring 12/15/2000 * | 76,000 | 228,000 | |||
| Construction & Engineering – 0.1% | |||||
| Asat Fin., LLC, Expiring 11/01/2006 144A * | 4,000 | 322,000 | |||
| INFORMATION TECHNOLOGY – 0.0% | |||||
| Communications Equipment – 0.0% | |||||
| Metricom, Inc., Expiring 2/15/2010 * | 1,500 | 3,188 | |||
| TELECOMMUNICATION SERVICES – 0.1% | |||||
| Diversified Telecommunication Services – 0.0% | |||||
| Startec Global Communications, Expiring 5/15/2008 * | 2,000 | 2,250 | |||
| Wireless Telecommunications Services – 0.1% | |||||
| Motient Corp., Expiring 4/1/2008 * | 6,500 | 228,312 | |||
| Total Warrants (cost $1,629,890) | 1,235,717 | ||||
| SHORT-TERM INVESTMENTS – 14.5% | |||||
| MUTUAL FUND SHARES – 14.5% | |||||
| Evergreen Select Money Market Fund ø | 1,444,108 | 1,444,108 | |||
| Navigator Prime Portfolio p | 63,581,719 | 63,581,719 | |||
| Total Short-Term Investments (cost $65,025,827) | 65,025,827 | ||||
| Total Investments – (cost $549,503,616) – 110.4% | 496,525,721 | ||||
| Other Assets and Liabilities – (10.4%) | (46,609,644 | ) | |||
| Net Assets – 100.0% | $449,916,077 | ||||
| Credit
Rating Ù |
Principal
Amount |
Value | ||||
|---|---|---|---|---|---|---|
| ASSET-BACKED SECURITIES – 10.4% | ||||||
| Advanta Mtge. Loan Trust: | ||||||
| Ser. 1993-3, Class A-5, 5.55%, 01/25/2025 | AAA | $ 647,580 | $ 599,908 | |||
| Ser. 1993-4, Class A2, 5.55%, 03/25/2010 | AAA | 467,219 | 444,972 | |||
| AFG Receivables Trust, Ser. 1997-B, Class C,
7.00%, 02/15/2003 |
BBB | 274,545 | 274,370 | |||
| Credit Suisse First Boston Mtge. Securities Corp., Ser. 1996-2,
Class A6, 7.18%, 02/25/2018 |
AAA | 3,250,000 | 3,173,999 | |||
| Equifax Credit Corp. Home Equity Loan Trust, Ser. 1994-1,
Class B, 5.75%, 03/15/2009 |
AAA | 758,036 | 738,793 | |||
| Fifth Third Bank Auto Grantor Trust, Ser. 1996, Class A,
6.20%, 09/15/2001 |
AAA | 21,911 | 21,911 | |||
| Green Tree Fin. Corp., Ser. 1999-A, Class A5,
6.13%, 02/15/2019 |
AAA | 3,900,000 | 3,799,979 | |||
| Northwest Airlines Corp., Ser. 1999-2, Class B,
7.95%, 03/01/2015 |
A | 1,981,230 | 1,935,532 | |||
| Saxon Asset Securities Trust, Ser. 1999-2, Class A-6,
6.42%, 03/25/2014 |
Aaa | 2,500,000 | 2,381,362 | |||
| Total Asset-Backed Securities (cost $13,694,321) | 13,370,826 | |||||
| COLLATERALIZED MORTGAGE OBLIGATIONS – 23.6% | ||||||
| Bank America Mtge. Securities, Inc.: | ||||||
| Ser. 1998-3, Class 2B1, 6.50%, 07/25/2013 | NR | 389,830 | 365,222 | |||
| Ser. 1998-3, Class 2M, 6.50%, 07/25/2013 | NA | 601,811 | 569,797 | |||
| Ser. 1999-3, Class B-1, 6.25%, 05/25/2014 | NR | 1,943,656 | 1,831,896 | |||
| Ser. 1999-3, Class B-2, 6.25%, 05/25/2014 | NR | 907,664 | 847,531 | |||
| Bear Stearns Comml. Mtge. Securities, Inc., Ser. 2000-WF1,
Class A2, 7.78%, 02/15/2010 |
AAA | 2,000,000 | 2,085,770 | |||
| Chase Mtge. Fin. Trust, Ser. 1993-L, Class 2-M,
7.00%, 10/25/2024 |
NR | 2,620,936 | 2,528,639 | |||
| DLJ Comml. Mtge. Corp., 7.18%, 11/01/2010 | BB | 1,200,000 | 1,206,188 | |||
| GE Capital Mtge. Svcs., Inc., Ser. 1999-H, Class A-7,
6.27%, 04/25/2029 144A |
Aaa | 2,375,000 | 2,261,762 | |||
| Gen. Elec. Capital Mtge. Svcs., Inc.: | ||||||
| Ser. 1993-18, Class B-1, 6.00%, 02/25/2009 | NR | 1,473,931 | 1,393,535 | |||
| Ser. 1998-1, Class M, 6.75%, 01/25/2013 | AA | 662,557 | 636,628 | |||
| Ser. 1998-11, Class 3-M, 6.50%, 06/25/2013 | AA | 1,042,600 | 988,015 | |||
| Morgan Stanley Dean Witter, Ser. 2000, Class B,
7.58%, 01/15/2010 |
NA | 1,000,000 | 1,022,792 | |||
| Nationsbanc Montgomery Funding, Ser. 1998-4,
6.25%, 10/25/2028 |
NR | 2,538,632 | 2,255,320 | |||
| Norwest Asset Securities Corp.: | ||||||
| 6.50%, 02/25/2028 | AA | 1,631,925 | 1,525,850 | |||
| 7.00%, 09/25/2011 | AA | 1,546,511 | 1,509,434 | |||
| Credit
Rating Ù |
Principal
Amount |
Value | ||||
|---|---|---|---|---|---|---|
| COLLATERALIZED MORTGAGE OBLIGATIONS – continued | ||||||
| Prudential Home Mtge. Securities: | ||||||
| Ser. 1993-18, Class M, 7.00%, 06/25/2023 | AAA | $ 1,277,660 | $ 1,238,136 | |||
| Ser. 1995-5, Class B-1, 7.25%, 09/25/2025 144A | NR | 1,397,261 | 1,337,018 | |||
| Ser. 1995-5, Class M, 7.25%, 09/25/2025 | AA+ | 2,463,836 | 2,383,897 | |||
| Ser. 1995-7, Class M, 7.00%, 11/25/2025 144A | NR | 3,574,131 | 3,440,012 | |||
| Ser. 1996-4, Class B-1, 6.50%, 04/25/2026 | A | 1,102,385 | 1,024,441 | |||
| Total Collateralized Mortgage
Obligations
(cost $31,234,578) |
30,451,883 | |||||
| CORPORATE BONDS – 26.3% | ||||||
| CONSUMER DISCRETIONARY – 4.4% | ||||||
| Hotels, Restaurants & Leisure – 0.9% | ||||||
| Argosy Gaming Co., 10.75%, 06/01/2009 | B | 150,000 | 157,500 | |||
| Aztar Corp., 8.875%, 05/15/2007 | B+ | 150,000 | 146,625 | |||
| Boyd Gaming Corp., 9.50%, 07/15/2007 | B+ | 150,000 | 137,250 | |||
| Horseshoe Gaming Holdings, Ser. B, 8.625%, 05/15/2009 | B+ | 150,000 | 145,500 | |||
| Isle of Capri Casinos, Inc., 8.75%, 04/15/2009 | B | 150,000 | 136,875 | |||
| Mohegan Tribal Gaming Auth., 8.75%, 01/01/2009 | BB- | 150,000 | 147,000 | |||
| Park Place Entertainment Corp., 8.875%, 09/15/2008 | BB+ | 150,000 | 147,750 | |||
| Prime Hospitality Corp., Ser. B, 9.75%, 04/01/2007 | B+ | 150,000 | 150,750 | |||
| 1,169,250 | ||||||
| Household Durables – 0.3% | ||||||
| K Hovnanian Enterprises, Inc., 10.50%, 10/01/2007 144A | BB- | 140,000 | 131,950 | |||
| MDC Holdings, Inc., 8.375%, 02/01/2008 | BB | 150,000 | 138,750 | |||
| Standard Pacific Corp., 8.50%, 04/01/2009 | BB | 150,000 | 137,250 | |||
| 407,950 | ||||||
| Media – 3.2% | ||||||
| Adelphia Communications Corp., Ser. B, 9.875%,
03/01/2007 |
B+ | 150,000 | 135,750 | |||
| American Lawyer Media, Inc., Ser. B, 9.75%, 12/15/2007 | B | 150,000 | 136,500 | |||
| American Media Operations, Inc., 10.25%, 05/01/2009 | B- | 150,000 | 146,250 | |||
| Echostar DBS Corp., 9.375%, 02/01/2009 | B+ | 150,000 | 148,125 | |||
| Emmis Communications Corp., Ser. B, 8.125%, 03/15/2009 | B- | 150,000 | 139,500 | |||
| Infinity Broadcasting, Inc., 8.875%, 06/15/2007 | BBB | 150,000 | 155,063 | |||
| Lamar Media Corp., 9.625%, 12/01/2006 | B | 150,000 | 151,875 | |||
| Lin Televison Corp., 8.375%, 03/01/2008 | B- | 150,000 | 141,750 | |||
| Mediacom LLC, Ser. B, 8.50%, 04/15/2008 | B+ | 150,000 | 139,125 | |||
| Sinclair Broadcast Group, Inc., 10.00%, 09/30/2005 | B | 150,000 | 142,875 | |||
| Times Mirror Co., 7.45%, 10/15/2009 | A | 2,500,000 | 2,489,615 | |||
| Young Broadcasting, Inc., Ser. B, 8.75%, 06/15/2007 | B | 150,000 | 135,750 | |||
| 4,062,178 | ||||||
| Credit
Rating Ù |
Principal
Amount |
Value | ||||
|---|---|---|---|---|---|---|
| CORPORATE BONDS – continued | ||||||
| CONSUMER STAPLES – 1.7% | ||||||
| Food & Drug Retailing – 1.7% | ||||||
| AFC Enterprises, Inc., 10.25%, 05/15/2007 | B | $ 150,000 | $ 144,000 | |||
| Kroger Co., 8.15%, 07/15/2006 | BBB- | 2,000,000 | 2,052,986 | |||
| 2,196,986 | ||||||
| ENERGY – 1.1% | ||||||
| Oil & Gas – 1.1% | ||||||
| Alberta Energy Co., Ltd., 7.65%, 09/15/2010 | BBB+ | 500,000 | 504,368 | |||
| Cross Timbers Oil Co., Ser. B, 9.25%, 04/01/2007 | B | 150,000 | 150,000 | |||
| Nuevo Energy Co., Ser. B, 9.50%, 06/01/2008 | B+ | 150,000 | 150,563 | |||
| Ocean Energy, Inc., Ser. B, 8.375%, 07/01/2008 | BB- | 150,000 | 151,125 | |||
| Pioneer Natural Resources Co., 9.625%, 04/01/2010 | BB+ | 100,000 | 105,242 | |||
| Pride Petroleum Svcs., Inc., 9.375%, 05/01/2007 | BB | 150,000 | 152,625 | |||
| Vintage Petroleum, Inc., 9.00%, 12/15/2005 | BB- | 150,000 | 151,875 | |||
| 1,365,798 | ||||||
| FINANCIALS – 8.6% | ||||||
| Banks – 1.2% | ||||||
| Wells Fargo & Co., 7.25%, 08/24/2005 | A+ | 1,500,000 | 1,510,995 | |||
| Diversified Financials – 7.4% | ||||||
| Avis Rent-A-Car, Inc., 11.00%, 05/01/2009 | BB- | 150,000 | 160,500 | |||
| Barnett Capital I, 8.06%, 12/01/2026 | A- | 2,000,000 | 1,881,090 | |||
| Enterprise Rent-A-Car USA Fin. Co., 7.95%, 12/15/2009
144A |
BBB+ | 2,400,000 | 2,348,985 | |||
| Ford Motor Credit Co.: | ||||||
| 7.375%, 10/28/2009 | A | 2,000,000 | 1,954,500 | |||
| 7.60%, 08/01/2005 | A | 500,000 | 503,804 | |||
| Natl. Rural Util. Coop. Fin., 5.70%, 01/15/2010 | AA | 3,130,000 | 2,772,623 | |||
| 9,621,502 | ||||||
| HEALTH CARE – 0.3% | ||||||
| Health Care Providers & Services – 0.3% | ||||||
| HCA Healthcare Co., 8.75%, 09/01/2010 | BB+ | 150,000 | 151,596 | |||
| Owens & Minor, Inc., 10.875%, 06/01/2006 | B+ | 150,000 | 155,250 | |||
| Tenet Healthcare Corp., Ser. B, 8.125%, 12/01/2008 | BB- | 150,000 | 145,312 | |||
| 452,158 | ||||||
| INDUSTRIALS – 0.4% | ||||||
| Aerospace & Defense – 0.1% | ||||||
| Sequa Corp., 9.00%, 08/01/2009 | BB | 150,000 | 146,250 | |||
| Building Products – 0.1% | ||||||
| American Standard, Inc., 7.375%, 02/01/2008 | BB+ | 150,000 | 140,250 | |||
| Commercial Services & Supplies – 0.1% | ||||||
| Allied Waste, Inc., Ser. B, 7.625%, 01/01/2006 | BB- | 150,000 | 134,250 | |||
| Credit
Rating Ù |
Principal
Amount |
Value | ||||
|---|---|---|---|---|---|---|
| CORPORATE BONDS – continued | ||||||
| INDUSTRIALS – continued | ||||||
| Industrial Conglomerates – 0.1% | ||||||
| Nortek, Inc., Ser. B, 8.875%, 08/01/2008 | B+ | $ 150,000 | $ 131,250 | |||
| MATERIALS – 0.9% | ||||||
| Chemicals – 0.2% | ||||||
| Lyondell Chemical Co., Ser. A, 9.625%, 05/01/2007 | BB | 150,000 | 145,875 | |||
| Sterling Chemicals, Inc., Ser. B, 12.375%, 07/15/2006 | BB- | 150,000 | 144,750 | |||
| 290,625 | ||||||
| Containers & Packaging – 0.2% | ||||||
| Owens-Illinois, Inc., 7.15%, 05/15/2005 | BB | 150,000 | 107,250 | |||
| Packaging Corp. of America, 9.625%, 04/01/2009 | B+ | 150,000 | 153,750 | |||
| 261,000 | ||||||
| Metals & Mining – 0.5% | ||||||
| Alcoa, Inc., 7.375%, 08/01/2010 | A+ | 400,000 | 404,446 | |||
| P&L Coal Holdings Corp., Ser. B, 9.625%, 05/15/2008 | B | 150,000 | 146,625 | |||
| 551,071 | ||||||
| TELECOMMUNICATION SERVICES – 2.5% | ||||||
| Diversified Telecommunication Services – 1.2% | ||||||
| McLeod USA, Inc., 9.25%, 07/15/2007 | B+ | 200,000 | 186,500 | |||
| Metromedia Fiber Network, Inc., Ser. B, 10.00%,
11/15/2008 |
B+ | 150,000 | 133,500 | |||
| Nextel Communications, Inc., 9.375%, 11/15/2009 | B | 150,000 | 145,125 | |||
| Qwest Capital Funding, Inc., 7.90%, 08/15/2010 144A | BBB+ | 600,000 | 610,143 | |||
| Sprint Capital Corp., 6.375%, 05/01/2009 | BBB+ | 500,000 | 449,775 | |||
| 1,525,043 | ||||||
| Wireless Telecommunications Services – 1.3% | ||||||
| Crown Castle Intl. Corp., 9.00%, 05/15/2011 | B | 150,000 | 142,500 | |||
| Price Communications Wireless, Inc., 11.75%, 07/15/2007 | B- | 150,000 | 160,500 | |||
| Rogers Cantel, Inc., 8.80%, 10/01/2007 | BB- | 1,250,000 | 1,243,750 | |||
| Voicestream Wireless Corp., 10.375%, 11/15/2009 | B- | 175,000 | 188,125 | |||
| 1,734,875 | ||||||
| UTILITIES – 6.4% | ||||||
| Electric Utilities – 6.4% | ||||||
| AES Corp., 8.50%, 11/01/2007 | B+ | 150,000 | 142,875 | |||
| Calpine Corp., 7.75%, 04/15/2009 | BB+ | 150,000 | 141,240 | |||
| Central Power & Light Co., Ser. K, 6.625%, 07/01/2005 | A- | 3,000,000 | 2,945,553 | |||
| Duke Capital Corp., 8.00%, 10/01/2019 | A | 2,500,000 | 2,562,810 | |||
| FPL Group Capital, Inc., 7.375%, 06/01/2009 | A+ | 2,450,000 | 2,425,211 | |||
| 8,217,689 | ||||||
| Total Corporate Bonds (cost $34,088,356) | 33,919,120 | |||||
| Credit
Rating Ù |
Principal
Amount |
Value | ||||
|---|---|---|---|---|---|---|
| MORTGAGE-BACKED SECURITIES – 17.9% | ||||||
| FHLMC, Ser. 1647, Class B, 6.50%, 11/15/2008 | AAA | $ 1,586,534 | $ 1,535,347 | |||
| FNMA: | ||||||
| 6.00%, 12/01/2013 | AAA | 2,818,461 | 2,689,178 | |||
| 6.50%, 09/25/2008 | AAA | 2,335,000 | 2,241,009 | |||
| 7.25%, 05/15/2030 | Aaa | 2,925,000 | 3,101,258 | |||
| 7.28%, 06/01/2040 | AAA | 1,987,673 | 1,995,030 | |||
| 7.30%, 05/25/2010 | AAA | 1,450,000 | 1,484,904 | |||
| 7.50%, 04/01/2015-05/01/2015 | AAA | 8,211,965 | 8,275,531 | |||
| GNMA, 7.00%, 12/15/2008 | AAA | 1,790,252 | 1,806,364 | |||
| Total Mortgage-Backed Securities (cost $23,058,484) | 23,128,621 | |||||
| U.S. GOVERNMENT & AGENCY OBLIGATIONS – 3.5% | ||||||
| FHLMC, 6.625%, 09/15/2009 (cost $4,488,030) | AAA | 4,500,000 | 4,474,075 | |||
| U.S. TREASURY OBLIGATIONS – 5.1% | ||||||
| U.S. Treasury Bonds: | ||||||
| 5.25%, 02/15/2029 | AAA | 1,650,000 | 1,504,150 | |||
| 6.125%, 08/15/2029 | AAA | 3,000,000 | 3,107,814 | |||
| 6.25%, 05/15/2030 | AAA | 500,000 | 532,734 | |||
| U.S. Treasury Notes, 6.00%, 09/30/2002 | AAA | 1,500,000 | 1,502,049 | |||
| Total U.S. Treasury Obligations (cost $6,632,570) | 6,646,747 | |||||
| YANKEE OBLIGATIONS – CORPORATE – 7.7% | ||||||
| CONSUMER DISCRETIONARY – 0.9% | ||||||
| Media – 0.9% | ||||||
| Rogers Cablesystems Ltd., Ser. B, 10.00%, 03/15/2005 | BB+ | 1,100,000 | 1,166,000 | |||
| ENERGY – 0.1% | ||||||
| Oil & Gas – 0.1% | ||||||
| Gulf Canada Resources, Ltd., 8.35%, 08/01/2006 | BBB- | 150,000 | 153,375 | |||
| FINANCIALS – 4.0% | ||||||
| Diversified Financials – 4.0% | ||||||
| Ford Capital, 9.875%, 05/15/2002 | A | 2,525,000 | 2,626,775 | |||
| Principal Finl. Group, 8.20%, 08/15/2009 144A | A | 2,500,000 | 2,524,000 | |||
| Tembec Fin. Corp., 9.875%, 09/30/2005 | BB+ | 50,000 | 51,250 | |||
| 5,202,025 | ||||||
| MATERIALS – 0.3% | ||||||
| Paper & Forest Products – 0.3% | ||||||
| Norampac, Inc., 9.50%, 02/01/2008 | BB | 150,000 | 151,500 | |||
| Repap New Brunswick, Inc., 11.50%, 06/01/2004 | B- | 150,000 | 166,125 | |||
| Tembec Inds., Inc., 8.625%, 06/30/2009 | BB+ | 100,000 | 98,250 | |||
| 415,875 | ||||||
| Credit
Rating Ù |
Principal
Amount |
Value | |||||
|---|---|---|---|---|---|---|---|
| YANKEE OBLIGATIONS – CORPORATE – continued | |||||||
| TELECOMMUNICATION SERVICES – 2.4% | |||||||
| Diversified Telecommunication Services – 2.1% | |||||||
| Clearnet Communications, Inc., Sr. Disc. Notes, Step Bond,
0.00%,12/15/2005 † |
Ba1 | $ 550,000 | $ 585,750 | ||||
| Deutsche Telekom Intl., 8.00%, 06/15/2010 | A- | 1,000,000 | 1,023,162 | ||||
| Koninklijke Kpn NV, 8.00%, 10/01/2010 144A | A- | 500,000 | 491,887 | ||||
| Telefonica Europe, 7.75%, 09/15/2010 | A+ | 500,000 | 503,158 | ||||
| 2,603,957 | |||||||
| Wireless Telecommunications Services – 0.3% | |||||||
| Microcell Telecommunications, Inc., Sr. Disc. Notes, Ser. B,
Step Bond, 0.00%, 06/01/2006 † |
B3 | 420,000 | 406,350 | ||||
| Total Yankee Obligations – Corporate (cost $9,978,887) | 9,947,582 | ||||||
| YANKEE OBLIGATIONS – GOVERNMENT – 1.2% | |||||||
| Canada, 7.50%, 09/15/2029 (cost $1,501,047) | A+ | 1,500,000 | 1,521,902 | ||||
| Shares | Value | ||||||
| PREFERRED STOCKS – 2.5% | |||||||
| FINANCIALS – 2.5% | |||||||
| Diversified Financials – 2.5% | |||||||
| Home Ownership Funding 144A (cost $3,279,966) | 4,350,000 | 3,291,928 | |||||
| SHORT-TERM INVESTMENTS – 4.8% | |||||||
| MUTUAL FUND SHARES – 4.8% | |||||||
| Evergreen Select Money Market Fund ø (cost $6,157,303) | 6,157,303 | 6,157,303 | |||||
| Total Investments – (cost $134,113,542) – 103.0% | 132,909,987 | ||||||
| Other Assets and Liabilities – (3.0%) | (3,928,972 | ) | |||||
| Net Assets – 100.0% | $ 128,981,015 | ||||||
| Credit
Rating Ù |
Principal
Amount |
Value | ||||
|---|---|---|---|---|---|---|
| ASSET-BACKED SECURITIES – 0.8% | ||||||
| PNC Student Loan Trust I, Ser. 1997-2, Class A7,
6.73%, 01/25/2007 (cost $1,850,000) |
AAA | $ 1,850,000 | $ 1,854,671 | |||
| CORPORATE BONDS – 39.1% | ||||||
| CONSUMER DISCRETIONARY – 13.0% | ||||||
| Auto Components – 0.7% | ||||||
| Advance Stores Co., Inc., Ser. B, 10.25%, 04/15/2008 | B- | 2,000,000 | 1,415,000 | |||
| Building Products – 0.8% | ||||||
| Del Webb Corp., 9.375%, 05/01/2009 | B- | 2,000,000 | 1,790,000 | |||
| Hotels, Restaurants & Leisure – 6.2% | ||||||
| Ameristar Casinos, Inc., Ser. B, 10.50%, 08/01/2004 | B- | 1,800,000 | 1,827,000 | |||
| Anchor Gaming, 9.875%, 10/15/2008 144A | B | 875,000 | 889,219 | |||
| Argosy Gaming Co., 10.75%, 06/01/2009 | B | 1,100,000 | 1,155,000 | |||
| Boyd Gaming Corp., 9.50%, 07/15/2007 | B+ | 1,100,000 | 1,006,500 | |||
| Coast Hotels & Casinos, Inc., 9.50%, 04/01/2009 | B- | 1,100,000 | 1,089,000 | |||
| Hollywood Casino Corp., 13.00%, 08/01/2006 | B | 1,500,000 | 1,612,500 | |||
| Isle of Capri Casinos, Inc., 8.75%, 04/15/2009 | B | 1,100,000 | 1,003,750 | |||
| Mohegan Tribal Gaming Auth., 8.75%, 01/01/2009 | BB- | 1,100,000 | 1,078,000 | |||
| Park Place Entertainment Corp., 8.875%, 09/15/2008 | BB+ | 1,100,000 | 1,083,500 | |||
| Prime Hospitality Corp., Ser. B, 9.75%, 04/01/2007 | B+ | 1,000,000 | 1,005,000 | |||
| Venetian Casino Resort LLC, 12.25%, 11/15/2004 | B- | 2,000,000 | 2,035,000 | |||
| 13,784,469 | ||||||
| Household Durables – 1.2% | ||||||
| K Hovnanian Enterprises, Inc., 10.50%, 10/01/2007 144A | BB- | 1,800,000 | 1,696,500 | |||
| Simmons Co., Ser. B, 10.25%, 03/15/2009 | B- | 1,100,000 | 1,028,500 | |||
| 2,725,000 | ||||||
| Leisure Equipment & Products – 0.3% | ||||||
| Outboard Marine Corp., Ser. B, 10.75%, 06/01/2008 | CCC+ | 2,000,000 | 730,000 | |||
| Media – 3.5% | ||||||
| Acme Television, LLC, Sr. Disc. Note, Ser. B, Step Bond,
10.875%, 09/30/2004 † |
B- | 1,150,000 | 1,086,750 | |||
| Adelphia Communications Corp., Ser. B,
9.875%, 03/01/2007 |
B+ | 1,100,000 | 995,500 | |||
| American Lawyer Media, Inc., Ser. B, 9.75%, 12/15/2007 | B | 1,100,000 | 1,001,000 | |||
| Charter Communications, 8.625%, 04/01/2009 | B+ | 700,000 | 633,500 | |||
| Echostar DBS Corp., 9.375%, 02/01/2009 | B+ | 1,100,000 | 1,086,250 | |||
| Premier Parks, Inc., Sr. Disc. Note, Step Bond,
0.00%, 04/03/2003 † |
B- | 1,285,000 | 851,312 | |||
| Sinclair Broadcast Group, Inc., 10.00%, 09/30/2005 | B | 1,000,000 | 952,500 | |||
| XM Satellite Radio, Inc., 14.00%, 03/15/2010 | CCC+ | 1,750,000 | 1,216,250 | |||
| 7,823,062 | ||||||
| Credit
Rating Ù |
Principal
Amount |
Value | ||||
|---|---|---|---|---|---|---|
| CORPORATE BONDS – continued | ||||||
| CONSUMER DISCRETIONARY – continued | ||||||
| Multi-line Retail – 0.3% | ||||||
| Ames Dept. Stores, Inc., 10.00%, 04/15/2006 | B+ | $ 2,000,000 | $ 730,000 | |||
| CONSUMER STAPLES – 1.3% | ||||||
| Electronic Equipment & Instruments – 0.5% | ||||||
| Flextronics Intl. Ltd., 9.875%, 07/01/2010 144A | B+ | 1,100,000 | 1,116,500 | |||
| Food & Drug Retailing – 0.4% | ||||||
| AFC Enterprises, Inc., 10.25%, 05/15/2007 | B | 825,000 | 792,000 | |||
| Food Products – 0.4% | ||||||
| Sun World Intl., Inc., Ser. B, 11.25%, 04/15/2004 | B | 1,000,000 | 952,500 | |||
| ENERGY – 3.5% | ||||||
| Energy Equipment & Services – 0.2% | ||||||
| Parker Drilling Co., Ser. D, 9.75%, 11/15/2006 | B+ | 500,000 | 492,500 | |||
| Oil & Gas – 3.3% | ||||||
| Benton Oil & Gas Co., 9.375%, 11/01/2007 | B | 2,000,000 | 1,240,000 | |||
| Chesapeake Energy Corp., Ser. B, 9.625%, 05/01/2005 | B | 1,100,000 | 1,109,625 | |||
| Cross Timbers Oil Co., Ser. B, 9.25%, 04/01/2007 | B | 800,000 | 800,000 | |||
| Energy Corp. of America, Ser. A, 9.50%, 05/15/2007 | B- | 1,000,000 | 775,000 | |||
| HS Resources, Inc., 9.25%, 11/15/2006 | B+ | 1,100,000 | 1,102,750 | |||
| Petsec Energy, Inc., Ser. B, 9.50%, 06/15/2007 Ÿ | D | 2,500,000 | 1,325,000 | |||
| Vintage Petroleum, Inc., 9.00%, 12/15/2005 | BB- | 1,000,000 | 1,012,500 | |||
| 7,364,875 | ||||||
| FINANCIALS – 1.6% | ||||||
| Diversified Financials – 1.6% | ||||||
| Budget Group, Inc., 9.125%, 04/01/2006 | B+ | 2,000,000 | 780,000 | |||
| Merrill Corp., Ser. B, 12.00%, 05/01/2009 | B | 2,000,000 | 1,210,000 | |||
| United Rentals, Inc., Ser. B, 9.25%, 01/15/2009 | BB- | 2,000,000 | 1,650,000 | |||
| 3,640,000 | ||||||
| HEALTH CARE – 2.5% | ||||||
| Health Care Providers & Services – 2.5% | ||||||
| HCA Healthcare Co., 8.75%, 09/01/2010 | BB+ | 1,100,000 | 1,111,701 | |||
| LifePoint Hosp. Holdings, Inc., Ser. B, 10.75%, 05/15/2009 | B- | 2,000,000 | 2,135,000 | |||
| Tenet Healthcare Corp., Ser. B, 8.125%, 12/01/2008 | BB- | 1,100,000 | 1,065,625 | |||
| Triad Hosp. Holdings, Inc., Ser. B, 11.00%, 05/15/2009 | B- | 1,100,000 | 1,149,500 | |||
| 5,461,826 | ||||||
| INDUSTRIALS – 3.0% | ||||||
| Aerospace & Defense – 0.5% | ||||||
| BE Aerospace, Inc., 9.50%, 11/01/2008 | B | 1,050,000 | 1,034,250 | |||
| Airlines – 0.7% | ||||||
| American Comml. Lines, LLC, Ser. B, 10.25%, 06/30/2008 | B- | 2,000,000 | 1,630,000 | |||
| Credit
Rating Ù |
Principal
Amount |
Value | ||||
|---|---|---|---|---|---|---|
| CORPORATE BONDS – continued | ||||||
| INDUSTRIALS – continued | ||||||
| Commercial Services & Supplies – 0.7% | ||||||
| Allied Waste, Inc., Ser. B, 10.00%, 08/01/2009 | B+ | 1,900,000 | $ 1,634,000 | |||
| Construction & Engineering – 0.5% | ||||||
| Spectrasite Holdings, Inc., Sr. Disc. Notes, Step Bond,
0.00%, 04/15/2004 † |
B- | 1,900,000 | 990,375 | |||
| Machinery – 0.6% | ||||||
| Acme Metals, Inc., 10.875%, 12/15/2007 Ÿ | NR | 2,000,000 | 240,000 | |||
| Holley Performance Products, Inc., Ser. B,
12.25%, 09/15/2007 |
B | 2,000,000 | 1,165,000 | |||
| 1,405,000 | ||||||
| INFORMATION TECHNOLOGY – 0.9% | ||||||
| Internet Software & Services – 0.4% | ||||||
| PSINet, Inc., 11.50%, 11/01/2008 | B- | 2,000,000 | 995,000 | |||
| Semiconductor Equipment & Products – 0.5% | ||||||
| Fairchild Semiconductor Corp., 10.125%, 03/15/2007 | B | 1,100,000 | 1,072,500 | |||
| MATERIALS – 3.5% | ||||||
| Chemicals – 1.3% | ||||||
| Huntsman ICI Chemicals LLC, 10.125%, 07/01/2009 | B+ | 2,000,000 | 1,910,000 | |||
| Lyondell Chemical Co., Ser. A, 9.625%, 05/01/2007 | BB | 1,100,000 | 1,069,750 | |||
| 2,979,750 | ||||||
| Containers & Packaging – 2.1% | ||||||
| Owens-Illinois, Inc., 7.15%, 05/15/2005 | BB | 1,100,000 | 786,500 | |||
| Riverwood Intl. Corp., 10.875%, 04/01/2008 | CCC+ | 2,000,000 | 1,815,000 | |||
| Stone Container Fin. Co., 11.50%, 08/15/2006 144A | B | 2,000,000 | 2,050,000 | |||
| 4,651,500 | ||||||
| Metals & Mining – 0.1% | ||||||
| NSM Steel, Inc., 12.00%, 02/01/2006 144A Ÿ | D | 2,000,000 | 90,000 | |||
| TELECOMMUNICATION SERVICES – 8.7% | ||||||
| Diversified Telecommunication Services – 3.7% | ||||||
| Level 3 Communications, Inc., Sr. Disc. Note, Step Bond,
0.00%, 03/15/2005 † |
B | 3,250,000 | 1,616,875 | |||
| McLeod USA, Inc., 9.25%, 07/15/2007 | B+ | 600,000 | 559,500 | |||
| Metromedia Fiber Network, Inc., Ser. B,
10.00%, 11/15/2008 |
B+ | 1,100,000 | 979,000 | |||
| Nextel Communications, Inc., 9.375%, 11/15/2009 | B | 425,000 | 411,187 | |||
| Nextlink Communications, Inc., Sr. Disc. Note, Step Bond,
0.00%, 06/01/2009 † |
B | 2,700,000 | 1,424,250 | |||
| SBA Communications Corp., Sr. Disc. Note, Step Bond,
0.00%, 03/01/2003 † |
NA | 800,000 | 596,000 | |||
| Credit
Rating Ù |
Principal
Amount |
Value | ||||
|---|---|---|---|---|---|---|
| CORPORATE BONDS – continued | ||||||
| TELECOMMUNICATION SERVICES – continued | ||||||
| Diversified Telecommunication Services – continued | ||||||
| Tritel PCS, Inc., Sr. Disc. Note, Step Bond,
0.00%, 05/15/2004 † |
NR | 2,500,000 | $ 1,631,250 | |||
| Winstar Communications, Inc., Sr. Disc. Note, Step Bond,
0.00%, 04/15/2005 144A † |
B- | 3,537,000 | 1,149,525 | |||
| 8,367,587 | ||||||
| Wireless Telecommunications Services – 5.0% | ||||||
| Crown Castle Intl. Corp., 10.75%, 08/01/2011 | B | 1,100,000 | 1,133,000 | |||
| Echostar Broadband Corp., 10.375%, 10/01/2007 144A | B | 1,800,000 | 1,813,500 | |||
| Motient Corp., Ser. B, 12.25%, 04/01/2008 | NR | 2,255,000 | 1,623,600 | |||
| Nextel Intl., Inc., 12.75%, 08/01/2010 144A | B- | 2,500,000 | 2,331,250 | |||
| Price Communications Wireless, Inc., 11.75%, 07/15/2007 | B- | 1,150,000 | 1,230,500 | |||
| Triton PCS, Inc., Sr. Disc. Note, Step Bond,
0.00%, 05/01/2003 † |
CCC+ | 1,100,000 | 838,750 | |||
| Voicestream Wireless Corp., 10.375%, 11/15/2009 | B- | 2,000,000 | 2,150,000 | |||
| 11,120,600 | ||||||
| UTILITIES – 1.1% | ||||||
| Electric Utilities – 1.1% | ||||||
| Tucson Elec. Power Co., Ser. B, 10.21%, 01/01/2009 | NA | 2,218,808 | 2,374,125 | |||
| Total Corporate Bonds (cost $101,679,480) | 87,162,419 | |||||
| FOREIGN BONDS – CORPORATE (PRINCIPAL AMOUNT
DENOMINATED IN CURRENCY INDICATED) – 4.2% |
||||||
| FINANCIALS – 2.9% | ||||||
| Banks – 0.3% | ||||||
| European Investment Bank, 7.625%, 12/07/2006, GBP | AAA | 400,000 | 624,140 | |||
| Diversified Financials – 2.6% | ||||||
| CEI Citicorp Holdings, 11.25%, 02/14/2007, ARS | NA | 3,000,000 | 2,955,621 | |||
| Ono Fin., Plc, 13.00%, 05/01/2009, EUR | CCC+ | 2,000,000 | 1,284,255 | |||
| PTC Intl. Fin., 11.25%, 12/01/2009, EUR | NA | 2,000,000 | 1,547,677 | |||
| 5,787,553 | ||||||
| INFORMATION TECHNOLOGY – 1.3% | ||||||
| Computers & Peripherals – 1.3% | ||||||
| NTL, Inc., Ser. B, Step Bond, 0.00%, 04/01/2008, GBP † | B | 3,500,000 | 2,843,861 | |||
| Total Foreign Bonds – Corporate (cost $11,052,001) | 9,255,554 | |||||
| FOREIGN BONDS – GOVERNMENT (PRINCIPAL AMOUNT
DENOMINATED IN CURRENCY INDICATED) – 10.3% |
||||||
| Germany: | ||||||
| 5.25%, 07/04/2010 | Aaa | 10,500,000 | 8,918,323 | |||
| 6.50%, 10/14/2005 | AAA | 5,000,000 | 4,489,520 | |||
| Credit
Rating Ù |
Principal
Amount |
Value | ||||
|---|---|---|---|---|---|---|
| FOREIGN BONDS – GOVERNMENT (PRINCIPAL AMOUNT
DENOMINATED IN CURRENCY INDICATED) – continued |
||||||
| Quebec Province, 5.50%, 06/01/2009, CAD | A+ | $15,450,000 | $ 9,507,085 | |||
| Spain, 5.00%, 01/31/2001, EUR | NA | 155,301 | 131,723 | |||
| Total Foreign Bonds – Government (cost $24,907,644) | 23,046,651 | |||||
| MORTGAGE-BACKED SECURITIES – 11.8% | ||||||
| FHLMC: | ||||||
| 7.00%, 05/01/2011-12/01/2011 | AAA | 1,380,217 | 1,377,981 | |||
| 8.14%, 04/01/2022 | AAA | 1,372,801 | 1,394,258 | |||
| 8.50%, 05/01/2029 | AAA | 2,793,350 | 2,863,883 | |||
| FNMA: | ||||||
| 6.50%, 08/01/2028-04/01/2030 | AAA | 20,441,993 | 19,676,798 | |||
| 7.00%, 11/01/2027 | AAA | 96,797 | 95,129 | |||
| 7.89%, 09/01/2021 | AAA | 967,807 | 988,072 | |||
| Total Mortgage-Backed Securities (cost $26,907,703) | 26,396,121 | |||||
| U.S. TREASURY OBLIGATIONS – 18.5% | ||||||
| U.S. Treasury Bonds: | ||||||
| 6.125%, 08/15/2029 | AAA | 3,550,000 | 3,677,580 | |||
| 6.25%, 05/15/2030 | AAA | 4,245,000 | 4,522,916 | |||
| U.S. Treasury Notes: | ||||||
| 5.50%, 12/31/2000 | AAA | 6,900,000 | 6,887,056 | |||
| 6.00%, 09/30/2002 | AAA | 6,355,000 | 6,363,681 | |||
| 6.50%, 02/15/2010 | AAA | 19,020,000 | 19,916,051 | |||
| Total U.S. Treasury Obligations (cost $41,062,156) | 41,367,284 | |||||
| YANKEE OBLIGATIONS – CORPORATE – 4.0% | ||||||
| CONSUMER DISCRETIONARY – 0.5% | ||||||
| Diversified Financials – 0.2% | ||||||
| PTC Intl. Fin. BV, Step Bond, 0.00%, 07/01/2002 † | B+ | 800,000 | 538,000 | |||
| Media – 0.3% | ||||||
| United Pan-Europe Communication, Sr. Disc. Note, Step
Bond, 0.00%, 02/01/2005 † |
B | 1,750,000 | 656,250 | |||
| MATERIALS – 2.8% | ||||||
| Metals & Mining – 0.4% | ||||||
| Bulong Operation Property Ltd., 12.50%, 12/15/2008 Ÿ | D | 2,000,000 | 910,000 | |||
| Paper & Forest Products – 2.4% | ||||||
| Grupo Indl. Durango SA de CV, 12.625%, 08/01/2003 | BB- | 2,000,000 | 2,020,000 | |||
| Repap New Brunswick, Inc., 11.50%, 06/01/2004 | B- | 2,900,000 | 3,211,750 | |||
| 5,231,750 | ||||||
| Credit
Rating Ù |
Principal
Amount |
Value | ||||
|---|---|---|---|---|---|---|
| YANKEE OBLIGATIONS – CORPORATE – continued | ||||||
| TELECOMMUNICATION SERVICES – 0.7% | ||||||
| Diversified Telecommunication Services – 0.7% | ||||||
| Alestra SA de RL de CV, 12.125%, 05/15/2006 | BB- | $ 1,000,000 | $ 867,500 | |||
| Asia Global Crossing, 13.375%, 10/15/2010 | B+ | 775,000 | 720,750 | |||
| 1,588,250 | ||||||
| Total Yankee Obligations – Corporate (cost $10,318,529) | 8,924,250 | |||||
| YANKEE OBLIGATIONS – GOVERNMENT – 6.7% | ||||||
| Brazil: | ||||||
| Ser. L 8.00%, 04/15/2014 | B+ | 1,847,115 | 1,374,993 | |||
| 12.25%, 03/06/2030 | B+ | 1,600,000 | 1,392,000 | |||
| Canada, Ser. OA, 7.75%, 03/30/2006 | A+ | 10,300,000 | 7,201,571 | |||
| Qatar, 9.75%, 06/15/2030 | BBB | 4,000,000 | 3,905,000 | |||
| United Mexican States, 11.50%, 05/15/2026 | BB+ | 800,000 | 941,160 | |||
| Total Yankee Obligations –
Government (cost
$15,309,320) |
14,814,724 | |||||
| Shares | Value | |||
|---|---|---|---|---|
| COMMON STOCKS – 0.8% | ||||
| CONSUMER DISCRETIONARY – 0.3% | ||||
| Hotels, Restaurants & Leisure – 0.3% | ||||
| Isle of Capri Casinos, Inc. | 48,486 | 533,346 | ||
| Premier Cruise Line, Ltd. | 74,059 | 740 | ||
| 534,086 | ||||
| INFORMATION TECHNOLOGY – 0.0% | ||||
| Computers & Peripherals – 0.0% | ||||
| Ampex Corp., Class A | 35,452 | 26,589 | ||
| TELECOMMUNICATION SERVICES – 0.5% | ||||
| Wireless Telecommunications Services – 0.5% | ||||
| Nextel Communications, Inc., Class A | 30,196 | 1,160,659 | ||
| Total Common Stocks (cost $1,950,062) | 1,721,334 | |||
| CONVERTIBLE PREFERRED STOCKS – 0.6% | ||||
| TELECOMMUNICATION SERVICES – 0.6% | ||||
| Diversified Telecommunication Services – 0.6% | ||||
| Global Crossing, Ltd. 144A (cost $2,000,000) | 8,000 | 1,270,000 | ||
| PREFERRED STOCKS – 0.2% | ||||
| INFORMATION TECHNOLOGY – 0.2% | ||||
| Computers & Peripherals – 0.2% | ||||
| Ampex Corp. ¨ (cost $528,073) | 554 | 536,355 | ||
| Shares | Value | ||||
|---|---|---|---|---|---|
| WARRANTS – 0.1% | |||||
| CONSUMER DISCRETIONARY – 0.1% | |||||
| Media – 0.1% | |||||
| XM Satellite Radio, Inc., Expiring 3/15/2010 * | 1,750 | $ 210,219 | |||
| FINANCIALS – 0.0% | |||||
| Diversified Financials – 0.0% | |||||
| Merrill Corp., Expiring 5/01/2009 * ¨ | 2,000 | 20 | |||
| Ono Fin., Plc, Expiring 5/31/2009 144A * | 2,000 | 14,000 | |||
| 14,020 | |||||
| TELECOMMUNICATION SERVICES – 0.0% | |||||
| Wireless Telecommunications Services – 0.0% | |||||
| Motient Corp., Expiring 4/01/2008 * | 2,255 | 79,207 | |||
| Total Warrants (cost $490,638) | 303,446 | ||||
| SHORT-TERM INVESTMENTS – 11.5% | |||||
| MUTUAL FUND SHARES – 11.5% | |||||
| Navigator Prime Portfolio p (cost $25,756,972) | 25,756,972 | 25,756,972 | |||
| Total Investments – (cost $263,812,578) – 108.6% | 242,409,781 | ||||
| Other Assets and Liabilities – (8.6%) | (19,269,918 | ) | |||
| Net Assets – 100.0% | $223,139,863 | ||||
| Credit
Rating Ù |
Principal
Amount |
Value | ||||
|---|---|---|---|---|---|---|
| CORPORATE BONDS – 14.1% | ||||||
| CONSUMER DISCRETIONARY – 2.0% | ||||||
| Hotels, Restaurants & Leisure – 0.5% | ||||||
| MGM Mirage, Inc., 8.50%, 09/15/2010 | BBB- | $ 2,000,000 | $ 1,966,410 | |||
| Media – 1.0% | ||||||
| Comcast Cable Communications, 6.20%, 11/15/2008 | BBB | 2,200,000 | 2,033,306 | |||
| Time Warner Entertainment Co., LP, 7.25%, 09/01/2008 | BBB | 2,000,000 | 1,989,230 | |||
| 4,022,536 | ||||||
| Multi-line Retail – 0.5% | ||||||
| Wal-Mart Stores, Inc., 6.875%, 08/10/2009 | AA | 2,000,000 | 1,991,340 | |||
| CONSUMER STAPLES – 0.8% | ||||||
| Beverages – 0.8% | ||||||
| Pepsi Bottling Holdings, Inc., 5.375%, 02/17/2004 144A | A | 3,500,000 | 3,350,984 | |||
| ENERGY – 1.7% | ||||||
| Oil & Gas – 1.7% | ||||||
| Conoco, Inc., 6.95%, 04/15/2029 | A- | 4,975,000 | 4,638,919 | |||
| Phillips Petroleum Co., 8.75%, 05/25/2010 | BBB | 2,000,000 | 2,188,354 | |||
| 6,827,273 | ||||||
| FINANCIALS – 4.5% | ||||||
| Banks – 2.8% | ||||||
| Fleet Natl. Bank, Providence, RI, 5.75%, 01/15/2009 | A | 5,000,000 | 4,449,580 | |||
| Society Natl. Bank, Cleveland, OH, 6.75%, 06/15/2003 | A- | 7,000,000 | 6,947,899 | |||
| 11,397,479 | ||||||
| Diversified Financials – 1.7% | ||||||
| Ford Motor Credit Co., 6.50%, 02/28/2002 | A | 2,000,000 | 1,990,970 | |||
| Goldman Sachs Group, Inc., 7.80%, 01/28/2010 | A+ | 2,000,000 | 2,022,690 | |||
| Williams Holdings Delaware, Inc., 6.125%, 12/01/2003 | BBB- | 3,000,000 | 2,914,467 | |||
| 6,928,127 | ||||||
| INDUSTRIALS – 2.4% | ||||||
| Aerospace & Defense – 0.5% | ||||||
| Lockheed Martin Corp., 7.25%, 05/15/2006 | BBB- | 2,000,000 | 1,996,224 | |||
| Airlines – 0.9% | ||||||
| Continental Airlines, Passthru Certs., Ser. 1999-1, Class C,
6.95%, 02/02/2011 |
A- | 3,772,308 | 3,642,899 | |||
| Road & Rail – 1.0% | ||||||
| Union Pacific Corp., 6.625%, 02/01/2008 | BBB- | 4,250,000 | 4,012,927 | |||
| INFORMATION TECHNOLOGY – 0.6% | ||||||
| Computers & Peripherals – 0.6% | ||||||
| IBM Corp., 6.50%, 01/15/2028 | A+ | 2,850,000 | 2,519,588 | |||
| Credit
Rating Ù |
Principal
Amount |
Value | ||||
|---|---|---|---|---|---|---|
| CORPORATE BONDS – continued | ||||||
| MATERIALS – 0.6% | ||||||
| Food Products – 0.6% | ||||||
| Archer Daniels Midland Co., 7.50%, 03/15/2027 | A+ | $ 2,785,000 | $ 2,599,249 | |||
| TELECOMMUNICATION SERVICES – 1.0% | ||||||
| Diversified Telecommunication Services – 1.0% | ||||||
| GTE Corp., 6.94%, 04/15/2028 | A+ | 4,500,000 | 4,115,898 | |||
| UTILITIES – 0.5% | ||||||
| Gas Utilities – 0.5% | ||||||
| Sonat, Inc., 7.625%, 07/15/2011 | BBB | 1,800,000 | 1,789,779 | |||
| Total Corporate Bonds (cost $59,651,168) | 57,160,713 | |||||
| MORTGAGE-BACKED SECURITIES – 50.7% | ||||||
| FAMC, 7.37%, 08/01/2006 | Aaa | 993,000 | 1,009,531 | |||
| FHLMC: | ||||||
| 6.00%, 02/01/2029 | AAA | 9,336,725 | 8,781,004 | |||
| 6.50%, 09/01/2008-02/01/2029 | AAA | 35,357,597 | 34,306,110 | |||
| 7.00%, 02/01/2028-07/01/2028 | AAA | 22,723,610 | 22,331,987 | |||
| 7.36%, 06/05/2007 | Aaa | 8,500,000 | 8,483,484 | |||
| 7.50%, 05/01/2027-08/01/2028 | AAA | 17,226,646 | 17,252,422 | |||
| 8.00%, 07/01/2017-04/01/2022 | AAA | 1,683,825 | 1,715,447 | |||
| 8.50%, 02/01/2017-10/01/2017 | AAA | 1,458,188 | 1,500,569 | |||
| 9.00%, 01/01/2017-04/01/2021 | AAA | 2,676,321 | 2,785,497 | |||
| 9.50%, 09/01/2020 | AAA | 450,283 | 474,148 | |||
| 10.00%, 12/01/2019-08/01/2021 | AAA | 549,326 | 578,197 | |||
| 10.50%, 12/01/2019 | AAA | 924,141 | 998,017 | |||
| FNMA: | ||||||
| 6.00%, 02/01/2008-05/01/2011 | AAA | 2,019,801 | 1,960,476 | |||
| 6.37%, 03/01/2006 | AAA | 3,848,583 | 3,801,250 | |||
| 6.40%, 12/01/2007 | AAA | 3,500,000 | 3,416,372 | |||
| 6.50%, 01/01/2024 | AAA | 2,829,092 | 2,719,906 | |||
| 7.00%, 04/01/2011-11/01/2026 | AAA | 18,062,945 | 17,859,520 | |||
| 7.50%, 07/01/2023-05/01/2027 | AAA | 8,462,990 | 8,460,986 | |||
| 8.00%, 08/01/2025 | AAA | 3,662,243 | 3,715,346 | |||
| 9.50%, 06/01/2022 | AAA | 592,352 | 615,121 | |||
| 11.00%, 01/01/2016 | AAA | 500,138 | 541,745 | |||
| GNMA: | ||||||
| 6.00%, 02/20/2028-02/20/2029 | AAA | 14,547,338 | 13,697,418 | |||
| 6.50%, 10/15/2025-05/20/2028 | AAA | 12,523,365 | 12,130,610 | |||
| 7.00%, 12/15/2022-03/15/2028 | AAA | 13,530,028 | 13,372,778 | |||
| 7.50%, 02/15/2022-08/15/2023 | AAA | 6,053,003 | 6,085,468 | |||
| 8.00%, 09/15/2009-09/15/2026 | AAA | 8,980,672 | 9,154,066 | |||
| 8.50%, 12/15/2021-07/15/2024 | AAA | 4,039,557 | 4,153,617 | |||
| 9.00%, 01/15/2020-09/15/2021 | AAA | 2,056,421 | 2,130,716 | |||
| 9.50%, 01/15/2019-02/15/2021 | AAA | 1,524,433 | 1,585,886 | |||
| 10.00%, 12/15/2018 | AAA | 415,705 | 436,620 | |||
| Total Mortgage-Backed Securities (cost $210,144,130) | 206,054,314 | |||||
| Credit
Rating Ù |
Principal
Amount |
Value | |||||
|---|---|---|---|---|---|---|---|
| U.S. GOVERNMENT & AGENCY OBLIGATIONS – 4.6% | |||||||
| FNMA: | |||||||
| 5.125%, 02/13/2004 | AAA | $ 2,262,000 | $ 2,179,647 | ||||
| 5.75%, 04/15/2003 | Aaa | 10,000,000 | 9,851,220 | ||||
| 6.16%, 04/03/2001 | AAA | 4,480,000 | 4,473,594 | ||||
| 7.50%, 02/11/2002 | Aaa | 2,000,000 | 2,024,288 | ||||
| Total U.S. Government & Agency
Obligations
(cost $18,577,947) |
18,528,749 | ||||||
| U.S. TREASURY OBLIGATIONS – 26.9% | |||||||
| U.S. Treasury Bonds: | |||||||
| 6.125%, 08/15/2029 | AAA | 5,100,000 | 5,283,284 | ||||
| 6.25%, 05/15/2030 | AAA | 17,385,000 | 18,523,179 | ||||
| 8.50%, 02/15/2020 | AAA | 15,100,000 | 19,352,432 | ||||
| 8.875%, 08/15/2017-02/15/2019 | AAA | 18,310,000 | 23,893,077 | ||||
| 9.25%, 02/15/2016 | AAA | 3,400,000 | 4,495,881 | ||||
| U.S. Treasury Notes: | |||||||
| 5.375%, 02/15/2001 | AAA | 9,000,000 | 8,972,550 | ||||
| 5.75%, 08/15/2003 | AAA | 5,000,000 | 4,982,815 | ||||
| 6.25%, 02/28/2002 | AAA | 4,000,000 | 4,004,788 | ||||
| 6.625%, 05/15/2007 | AAA | 9,750,000 | 10,152,607 | ||||
| 6.75%, 05/15/2005 | AAA | 9,150,000 | 9,488,843 | ||||
| 7.00%, 07/15/2006 | AAA | 300,000 | 316,343 | ||||
| Total U.S. Treasury Obligations (cost $108,162,005) | 109,465,799 | ||||||
| YANKEE OBLIGATIONS – CORPORATE – 0.9% | |||||||
| CONSUMER STAPLES – 0.5% | |||||||
| Beverages – 0.5% | |||||||
| Diageo Capital Plc, 6.125%, 08/15/2005 | A+ | 2,000,000 | 1,925,168 | ||||
| MATERIALS – 0.4% | |||||||
| Paper & Forest Products – 0.4% | |||||||
| Abitibi Cons., Inc., 7.50%, 04/01/2028 | BBB- | 2,000,000 | 1,673,596 | ||||
| Total Yankee Obligations – Corporate (cost $3,584,929) | 3,598,764 | ||||||
| Shares | Value | |||||
|---|---|---|---|---|---|---|
| SHORT-TERM INVESTMENTS – 1.7% | ||||||
| MUTUAL FUND SHARES – 1.7% | ||||||
| Evergreen Select Money Market Fund ø (cost $6,978,986) | 6,978,986 | 6,978,986 | ||||
| Total Investments – (cost $407,099,165) – 98.9% | 401,787,325 | |||||
| Other Assets and Liabilities – 1.1% | 4,290,568 | |||||
| Net Assets – 100.0% | $406,077,893 | |||||
144A
|
Security that may be sold to qualified institutional buyers under Rule 144A of the Securities Act of 1933, as amended. This security has
been determined to be liquid under guidelines established by the Board of Trustees.
|
*
|
Non-income producing security.
|
Ÿ
|
Security which has defaulted on payment of interest and/or principal.
|
ø
|
The advisor of the Fund and the advisor of the money market fund are each a division of First Union.
|
†
|
Security initially issued in zero coupon form which converts to coupon form at a specified rate and date. An effective interest rate is
applied to recognize interest income daily for the bond. This rate is based on total expected interest to be earned over the life of the bond which consists of the aggregate coupon-interest payments and discount at acquisition. The rate shown is the
stated rate at the current period end.
|
¤
|
Security issued in zero coupon form with no periodic interest payments but is acquired at a discount that results in a current yield to
maturity. An effective interest rate is applied to recognize interest income daily for the bond. This rate is based on total expected income to be earned over the life of the bond from amortization of discount at acquisition.
|
p
|
Represents investment of cash collateral received for securities on loan.
|
Ù
|
Credit ratings are unaudited and rated by Moody’s Investors Service where Standard and Poor’s ratings are not available.
|
¨
|
Valued at fair value as determined in good faith under procedures established by the Board of Trustees.
|
ARS
|
Argentine Peso
|
CAD
|
Canadian Dollar
|
EUR
|
Eurodollar
|
FAMC
|
Federal Agricultural Mortgage Corporation
|
FHLMC
|
Federal Home Loan Mortgage Corporation
|
FNMA
|
Federal National Mortgage Association
|
GBP
|
United Kingdom Pound Sterling
|
GNMA
|
Government National Mortgage Association
|
MTN
|
Medium Term Notes
|
| Diversified
Bond Fund |
High Yield
Fund |
Quality
Income Fund |
Strategic
Income Fund |
U.S.
Government Fund |
||||||||||||
|---|---|---|---|---|---|---|---|---|---|---|---|---|---|---|---|---|
| Assets | ||||||||||||||||
| Identified cost of securities | $363,250,310 | $549,503,616 | $134,113,542 | $263,812,578 | $407,099,165 | |||||||||||
| Net unrealized losses on securities | (9,441,720 | ) | (52,977,895 | ) | (1,203,555 | ) | (21,402,797 | ) | (5,311,840 | ) | ||||||
| Market value of securities | 353,808,590 | 496,525,721 | 132,909,987 | 242,409,781 | 401,787,325 | |||||||||||
| Foreign currency, at value (cost $0, $468,442, $0, $0 and
$0 respectively) |
0 | 466,448 | 0 | 0 | 0 | |||||||||||
| Receivable for securities sold | 3,400,580 | 1,864,858 | 2,694,625 | 2,814,934 | 9,797,611 | |||||||||||
| Principal paydown receivable | 0 | 0 | 52,338 | 34,558 | 1,360 | |||||||||||
| Receivable for Fund shares sold | 95,759 | 4,979,009 | 43,020 | 571,527 | 775,554 | |||||||||||
| Dividends and interest receivable | 5,881,270 | 12,129,769 | 1,634,565 | 5,017,728 | 4,675,726 | |||||||||||
| Receivable for closed forward foreign currency exchange
contracts |
0 | 0 | 0 | 162,181 | 0 | |||||||||||
| Unrealized gains on forward foreign currency exchange
contracts |
0 | 0 | 0 | 94,385 | 0 | |||||||||||
| Receivable from investment advisor | 0 | 0 | 0 | 80,952 | 0 | |||||||||||
| Prepaid expenses and other assets | 212,923 | 387,695 | 75,980 | 57,347 | 132,004 | |||||||||||
| Total assets | 363,399,122 | 516,353,500 | 137,410,515 | 251,243,393 | 417,169,580 | |||||||||||
| Liabilities | ||||||||||||||||
| Distributions payable | 791,861 | 1,663,151 | 238,109 | 603,682 | 458,119 | |||||||||||
| Payable for securities purchased | 4,062,573 | 0 | 7,817,903 | 0 | 9,791,308 | |||||||||||
| Payable for Fund shares redeemed | 559,046 | 1,115,849 | 250,878 | 566,664 | 776,618 | |||||||||||
| Payable for securities on loan | 13,621,054 | 63,581,719 | 0 | 25,756,972 | 0 | |||||||||||
| Due to custodian bank | 0 | 0 | 0 | 12,235 | 0 | |||||||||||
| Advisory fee payable | 4,787 | 6,587 | 28,853 | 0 | 4,664 | |||||||||||
| Distribution Plan expenses payable | 2,820 | 5,147 | 2,249 | 3,670 | 2,812 | |||||||||||
| Due to other related parties | 943 | 1,222 | 353 | 611 | 1,110 | |||||||||||
| Accrued expenses and other liabilities | 65,733 | 63,748 | 91,155 | 1,159,696 | 57,056 | |||||||||||
| Total liabilities | 19,108,817 | 66,437,423 | 8,429,500 | 28,103,530 | 11,091,687 | |||||||||||
| Net assets | $344,290,305 | $449,916,077 | $128,981,015 | $223,139,863 | $406,077,893 | |||||||||||
| Net assets represented by | ||||||||||||||||
| Paid-in capital | $453,788,354 | $713,916,177 | $158,813,639 | $347,119,975 | $443,090,789 | |||||||||||
| Overdistributed net investment income | (1,119,560 | ) | (664,702 | ) | (887,997 | ) | (4,442,473 | ) | (259,070 | ) | ||||||
| Accumulated net realized losses on securities and foreign
currency related transactions |
(98,936,769 | ) | (210,355,509 | ) | (27,741,072 | ) | (98,193,509 | ) | (31,441,986 | ) | ||||||
| Net unrealized losses on securities and foreign currency
related transactions |
(9,441,720 | ) | (52,979,889 | ) | (1,203,555 | ) | (21,344,130 | ) | (5,311,840 | ) | ||||||
| Total net assets | $344,290,305 | $449,916,077 | $128,981,015 | $223,139,863 | $406,077,893 | |||||||||||
| Net assets consists of | ||||||||||||||||
| Class A | $320,629,642 | $339,955,990 | $ 62,386,911 | $115,172,896 | $ 89,606,514 | |||||||||||
| Class B | 21,467,188 | 27,526,891 | 881,843 | 90,748,695 | 75,827,912 | |||||||||||
| Class C | 1,294,180 | 76,446,780 | 65,711,161 | 14,535,130 | 4,320,088 | |||||||||||
| Class Y | 899,295 | 5,986,416 | 1,100 | 2,683,142 | 236,323,379 | |||||||||||
| Total net assets | $344,290,305 | $449,916,077 | $128,981,015 | $223,139,863 | $406,077,893 | |||||||||||
| Shares outstanding | ||||||||||||||||
| Class A | 22,443,612 | 98,690,406 | 5,140,491 | 20,019,439 | 9,567,144 | |||||||||||
| Class B | 1,502,682 | 7,990,706 | 72,648 | 15,726,415 | 8,095,612 | |||||||||||
| Class C | 90,588 | 22,190,864 | 5,414,234 | 2,522,629 | 461,218 | |||||||||||
| Class Y | 62,949 | 1,737,791 | 87 | 473,838 | 25,230,284 | |||||||||||
| Net asset value per share | ||||||||||||||||
| Class A | $ 14.29 | $ 3.44 | $ 12.14 | $ 5.75 | $ 9.37 | |||||||||||
| Class A—Offering price (based on sales charge of 4.75%) | $ 15.00 | $ 3.61 | $ 12.75 | $ 6.04 | $ 9.84 | |||||||||||
| Class B | $ 14.29 | $ 3.44 | $ 12.14 | $ 5.77 | $ 9.37 | |||||||||||
| Class C | $ 14.29 | $ 3.44 | $ 12.14 | $ 5.76 | $ 9.37 | |||||||||||
| Class Y | $ 14.29 | $ 3.44 | $ 12.64 | $ 5.66 | $ 9.37 | |||||||||||
| Diversified
Bond |
High Yield
Fund |
Quality
Income Fund |
Strategic
Income Fund |
U.S.
Government Fund |
||||||||||||
|---|---|---|---|---|---|---|---|---|---|---|---|---|---|---|---|---|
| Investment income | ||||||||||||||||
| Interest | $14,322,613 | $21,346,011 | $5,028,883 | $11,069,273 | $14,010,622 | |||||||||||
| Dividends (net of foreign witholdings taxes of $0, $107, $0, $0
and $0, respectively) |
0 | 422,254 | 93,081 | 35,000 | 0 | |||||||||||
| Total investment income | 14,322,613 | 21,768,265 | 5,121,964 | 11,104,273 | 14,010,622 | |||||||||||
| Expenses | ||||||||||||||||
| Advisory fee | 907,603 | 1,114,274 | 415,389 | 673,968 | 856,834 | |||||||||||
| Distribution Plan expenses | 530,720 | 793,287 | 436,617 | 723,947 | 532,163 | |||||||||||
| Administrative services fees | 178,919 | 205,964 | 69,232 | 120,120 | 204,008 | |||||||||||
| Transfer agent fee | 348,398 | 561,562 | 217,714 | 321,599 | 315,786 | |||||||||||
| Trustees’ fees and expenses | 3,683 | 4,153 | 1,401 | 2,406 | 4,104 | |||||||||||
| Printing and postage expenses | 22,353 | 28,914 | 14,964 | 19,287 | 25,512 | |||||||||||
| Custodian fee | 50,477 | 61,280 | 24,371 | 34,775 | 56,929 | |||||||||||
| Registration and filing fees | 52,101 | 28,081 | 60,267 | 17,197 | 86,609 | |||||||||||
| Professional fees | 10,967 | 14,170 | 7,611 | 9,468 | 13,059 | |||||||||||
| Interest expense | 6,254 | 1,156 | 83,924 | 9,819 | 0 | |||||||||||
| Other | 2,654 | 2,846 | 14,338 | 9,377 | 14,043 | |||||||||||
| Total expenses | 2,114,129 | 2,815,687 | 1,345,828 | 1,941,963 | 2,109,047 | |||||||||||
| Less: Expense reductions | (7,856 | ) | (34,040 | ) | (4,986 | ) | (15,531 | ) | (9,127 | ) | ||||||
| Fee waivers | 0 | 0 | (266,449 | ) | (613,176 | ) | 0 | |||||||||
| Net expenses | 2,106,273 | 2,781,647 | 1,074,393 | 1,313,256 | 2,099,920 | |||||||||||
| Net investment income | 12,216,340 | 18,986,618 | 4,047,571 | 9,791,017 | 11,910,702 | |||||||||||
| Net realized and unrealized gains or losses on securities and
foreign currency related transactions |
||||||||||||||||
| Net realized gains or losses on: | ||||||||||||||||
| Securities | (2,902,449 | ) | (18,461,894 | ) | (3,523,671 | ) | (11,564,946 | ) | (1,359,075 | ) | ||||||
| Foreign currency related transactions | 81,919 | (343 | ) | 0 | 804,584 | 0 | ||||||||||
| Net realized losses on securities and foreign currency related
transactions |
(2,820,530 | ) | (18,462,237 | ) | (3,523,671 | ) | (10,760,362 | ) | (1,359,075 | ) | ||||||
| Net change in unrealized gains or losses on securities and
foreign currency related transactions |
3,038,573 | (16,236,155 | ) | 5,769,137 | (3,600,449 | ) | 11,033,910 | |||||||||
| Net realized and unrealized gains or losses on securities and
foreign currency related transactions |
218,043 | (34,698,392 | ) | 2,245,466 | (14,360,811 | ) | 9,674,835 | |||||||||
| Net increase (decrease) in net assets resulting from
operations |
$12,434,383 | $(15,711,774 | ) | $6,293,037 | $ (4,569,794 | ) | $21,585,537 | |||||||||
| Diversified
Bond Fund |
High Yield
Fund |
Quality
Income Fund |
Strategic
Income Fund |
U.S.
Government Fund |
||||||||||||
|---|---|---|---|---|---|---|---|---|---|---|---|---|---|---|---|---|
| Operations | ||||||||||||||||
| Net investment income | $ 12,216,340 | $ 18,986,618 | $ 4,047,571 | $ 9,791,017 | $ 11,910,702 | |||||||||||
| Net realized losses on securities and foreign currency
related transactions |
(2,820,530 | ) | (18,462,237 | ) | (3,523,671 | ) | (10,760,362 | ) | (1,359,075 | ) | ||||||
| Net change in unrealized gains or losses on securities and
foreign currency related transactions |
3,038,573 | (16,236,155 | ) | 5,769,137 | (3,600,449 | ) | 11,033,910 | |||||||||
| Net increase (decrease) in net assets resulting from
operations |
12,434,383 | (15,711,774 | ) | 6,293,037 | (4,569,794 | ) | 21,585,537 | |||||||||
| Distributions to shareholders from | ||||||||||||||||
| Net investment income | ||||||||||||||||
| Class A | (11,590,999 | ) | (15,052,886 | ) | (2,186,425 | ) | (5,434,908 | ) | (2,690,486 | ) | ||||||
| Class B | (671,098 | ) | (1,219,886 | ) | (18,040 | ) | (3,954,622 | ) | (2,050,588 | ) | ||||||
| Class C | (24,812 | ) | (1,996,066 | ) | (1,967,713 | ) | (581,270 | ) | (111,210 | ) | ||||||
| Class Y | (32,700 | ) | (288,015 | ) | (36 | ) | (94,431 | ) | (7,187,195 | ) | ||||||
| Total distributions to shareholders | (12,319,609 | ) | (18,556,853 | ) | (4,172,214 | ) | (10,065,231 | ) | (12,039,479 | ) | ||||||
| Capital share transactions | ||||||||||||||||
| Proceeds from shares sold | 9,230,392 | 79,485,018 | 5,921,444 | 17,214,802 | 53,179,757 | |||||||||||
| Net asset value of shares issued in reinvestment of
distributions |
7,189,862 | 9,622,569 | 3,135,109 | 6,138,689 | 8,942,868 | |||||||||||
| Payment for shares redeemed | (39,722,363 | ) | (117,769,165 | ) | (30,173,948 | ) | (35,614,805 | ) | (75,535,696 | ) | ||||||
| Net asset value of shares issued in acquisition | 0 | 183,717,163 | 0 | 0 | 0 | |||||||||||
| Net increase (decrease) in net assets resulting from
capital share transactions |
(23,302,109 | ) | 155,055,585 | (21,117,395 | ) | (12,261,314 | ) | (13,413,071 | ) | |||||||
| Total increase (decrease) in net assets | (23,187,335 | ) | 120,786,958 | (18,996,572 | ) | (26,896,339 | ) | (3,867,013 | ) | |||||||
| Net assets | ||||||||||||||||
| Beginning of period | 367,477,640 | 329,129,119 | 147,977,587 | 250,036,202 | 409,944,906 | |||||||||||
| End of period | $344,290,305 | $449,916,077 | $128,981,015 | $223,139,863 | $406,077,893 | |||||||||||
| Overdistributed net investment income | $ (1,119,560 | ) | $ (664,702 | ) | $ (887,997 | ) | $ (4,442,473 | ) | $ (259,070 | ) | ||||||
| Diversified
Bond Fund |
High Yield
Fund |
Quality
Income Fund (a) |
Strategic
Income Fund |
U.S.
Government Fund |
||||||||||||
|---|---|---|---|---|---|---|---|---|---|---|---|---|---|---|---|---|
| Operations | ||||||||||||||||
| Net investment income | $27,780,463 | $31,087,378 | $ 6,189,486 | $22,636,914 | $25,433,607 | |||||||||||
| Net realized gains or losses on securities and foreign
currency related transactions |
(18,821,503 | ) | (8,969,981 | ) | (5,271,430 | ) | (20,937,789 | ) | (4,097,300 | ) | ||||||
| Net change in unrealized losses on securities and foreign
currency related transactions |
(15,642,492 | ) | (20,452,438 | ) | (1,369,537 | ) | (6,814,154 | ) | (17,043,503 | ) | ||||||
| Net increase (decrease) in net assets resulting from
operations |
(6,683,532 | ) | 1,664,959 | (451,481 | ) | (5,115,029 | ) | 4,292,804 | ||||||||
| Distributions to shareholders from | ||||||||||||||||
| Net investment income | ||||||||||||||||
| Class A | (26,704,956 | ) | (26,602,486 | ) | (3,273,056 | ) | (11,195,138 | ) | (5,006,277 | ) | ||||||
| Class B | (2,149,481 | ) | (3,139,015 | ) | (6,996 | ) | (8,052,987 | ) | (5,358,379 | ) | ||||||
| Class C | (39,330 | ) | (157,367 | ) | (2,651,977 | )(b) | (1,043,128 | ) | (265,314 | ) | ||||||
| Class Y | (137,130 | ) | (415,631 | ) | (39 | ) | (104,875 | ) | (14,786,473 | ) | ||||||
| Tax basis return of capital | ||||||||||||||||
| Class A | 0 | (2,226,050 | ) | (208,907 | ) | (1,869,096 | ) | 0 | ||||||||
| Class B | 0 | (262,668 | ) | (447 | ) | (1,344,495 | ) | 0 | ||||||||
| Class C | 0 | (13,168 | ) | (169,266 | )(b) | (174,156 | ) | 0 | ||||||||
| Class Y | 0 | (34,779 | ) | (2 | ) | (17,509 | ) | 0 | ||||||||
| Total distributions to shareholders | (29,030,897 | ) | (32,851,164 | ) | (6,310,690 | ) | (23,801,384 | ) | (25,416,443 | ) | ||||||
| Capital share transactions | ||||||||||||||||
| Proceeds from shares sold | 17,572,233 | 132,551,100 | 58,056,307 | 76,866,055 | 103,805,468 | |||||||||||
| Net asset value of shares issued in reinvestment of
distributions |
16,881,832 | 17,577,277 | 3,944,826 | 14,889,465 | 18,664,226 | |||||||||||
| Payment for shares redeemed | (123,241,579 | ) | (197,257,194 | ) | (108,459,191 | ) | (113,575,291 | ) | (225,076,407 | ) | ||||||
| Net asset value of shares issued in acquisition | 0 | 0 | 0 | 0 | 134,184,956 | |||||||||||
| Net increase (decrease) in net assets resulting from
capital share transactions |
(88,787,514 | ) | (47,128,817 | ) | (46,458,058 | ) | (21,819,771 | ) | 31,578,243 | |||||||
| Total increase (decrease) in net assets | (124,501,943 | ) | (78,315,022 | ) | (53,220,229 | ) | (50,736,184 | ) | 10,454,604 | |||||||
| Net assets | ||||||||||||||||
| Beginning of period | 491,979,583 | 407,444,141 | 201,197,816 | 300,772,386 | 399,490,302 | |||||||||||
| End of period | 367,477,640 | 329,129,119 | 147,977,587 | 250,036,202 | 409,944,906 | |||||||||||
| Overdistributed net investment income | (1,016,291 | ) | (1,094,467 | ) | (763,354 | ) | (4,168,259 | ) | (130,293 | ) | ||||||
(a)
|
For the seven months ended April 30, 2000. The Fund changed its fiscal year end from September 30 to April 30, effective April 30, 2000.
|
(b)
|
Effective October 18, 1999, Class B shares of Mentor Quality Income Portfolio were redesignated as Class C shares of Evergreen Quality
Income Fund.
|
| Quality Income
Fund |
||||
|---|---|---|---|---|
| Year Ended
September 30, 1999 |
||||
| Operations | ||||
| Net investment income | $ 12,215,043 | |||
| Net realized gains or losses on securities and futures contracts | (4,889,349 | ) | ||
| Net change in unrealized gains or losses on securities and futures contracts | (14,077,222 | ) | ||
| Net decrease in net assets resulting from operations | (6,751,528 | ) | ||
| Distributions to shareholders from | ||||
| Net investment income | ||||
| Class A | (6,334,342 | ) | ||
| Class B | 0 | |||
| Class C (a) | (6,056,792 | ) | ||
| Class Y | (19 | ) | ||
| Total distributions to shareholders | (12,391,153 | ) | ||
| Capital share transactions | ||||
| Proceeds from shares sold | 111,477,462 | |||
| Net asset value of shares issued in reinvestment of distributions | 8,117,826 | |||
| Payment for shares redeemed | (106,436,056 | ) | ||
| Net increase in net assets resulting from capital share transactions | 13,159,232 | |||
| Total decrease in net assets | (5,983,449 | ) | ||
| Net assets | ||||
| Beginning of period | 207,181,265 | |||
| End of period | $201,197,816 | |||
| Overdistributed net investment income | $ (972,239 | ) | ||
(a)
|
Effective October 18, 1999, Class B shares of Mentor Quality Income Portfolio were redesignated as Class C shares of Evergreen Quality
Income Fund.
|
| Fees
Waived |
% of Average
Net Assets |
||||
|---|---|---|---|---|---|
| Quality Income Fund | $266,449 | 0.38 | % | ||
| Strategic Income Fund | 613,176 | 0.51 | % | ||
| Average Daily
Net Assets |
|||
|---|---|---|---|
| Class A | 0.25 | % | |
| Class B | 1.00 | ||
| Class C | 1.00 | ||
| Class A | Class B | Class C | ||||
|---|---|---|---|---|---|---|
| Diversified Bond Fund | $417,972 | $108,674 | $ 4,074 | |||
| High Yield Fund | 411,884 | 145,738 | 235,665 | |||
| Quality Income Fund | 85,231 | 3,266 | 348,120 | |||
| Strategic Income Fund | 155,592 | 495,462 | 72,893 | |||
| U.S. Government Fund | 113,933 | 396,597 | 21,633 | |||
| Acquiring Fund | Acquired Fund | Value of Net
Assets Acquired |
Number of
Shares Issued |
Unrealized
Appreciation |
Net Assets
After Acquisition |
|||||||
|---|---|---|---|---|---|---|---|---|---|---|---|---|
| High Yield Fund | Evergreen High Income Fund | $183,717,163 | 50,098,508 | $(1,280,669 | ) | $507,838,297 | ||||||
| U.S. Government Fund | Evergreen Intermediate Term Government Securities Fund | 134,184,956 | 14,425,715 | 677,705 | 500,286,037 | |||||||
| DIVERSIFIED
BOND
FUND
|
| Six Months Ended
October 31, 2000 |
Year Ended April 30, 2000 |
||||||||||||
|---|---|---|---|---|---|---|---|---|---|---|---|---|---|
| Shares | Amount | Shares | Amount | ||||||||||
| Class A | |||||||||||||
| Shares sold | 426,644 | $ 6,063,072 | 549,532 | $ 8,100,401 | |||||||||
| Automatic conversion of Class B shares to Class A shares | 1,492 | 21,379 | 866,976 | 12,366,860 | |||||||||
| Shares issued in reinvestment of distributions | 472,495 | 6,741,583 | 1,063,502 | 15,546,816 | |||||||||
| Shares redeemed | (2,569,293 | ) | (36,601,497 | ) | (7,073,000 | ) | (103,768,769 | ) | |||||
| Net decrease | (1,668,662 | ) | (23,775,463 | ) | (4,592,990 | ) | (67,754,692 | ) | |||||
| Class B | |||||||||||||
| Shares sold | 162,739 | 2,326,882 | 513,362 | 7,559,619 | |||||||||
| Automatic conversion of Class B shares to Class A shares | (1,492 | ) | (21,379 | ) | (866,975 | ) | (12,366,860 | ) | |||||
| Shares issued in reinvestment of distributions | 28,389 | 405,140 | 81,671 | 1,197,159 | |||||||||
| Shares redeemed | (206,215 | ) | (2,942,471 | ) | (1,034,036 | ) | (15,183,970 | ) | |||||
| Net decrease | (16,579 | ) | (231,828 | ) | (1,305,978 | ) | (18,794,052 | ) | |||||
| Class C | |||||||||||||
| Shares sold | 58,000 | 829,564 | 61,770 | 916,131 | |||||||||
| Shares issued in reinvestment of distributions | 998 | 14,263 | 1,927 | 28,090 | |||||||||
| Shares redeemed | (10,609 | ) | (151,634 | ) | (53,737 | ) | (791,536 | ) | |||||
| Net increase | 48,389 | 692,193 | 9,960 | 152,685 | |||||||||
| Class Y | |||||||||||||
| Shares sold | 772 | 10,874 | 66,439 | 996,082 | |||||||||
| Shares issued in reinvestment of distributions | 2,024 | 28,876 | 7,501 | 109,767 | |||||||||
| Shares redeemed | (1,867 | ) | (26,761 | ) | (236,639 | ) | (3,497,304 | ) | |||||
| Net increase (decrease) | 929 | $ 12,989 | (162,699 | ) | $ (2,391,455 | ) | |||||||
| HIGH
YIELD
FUND
|
| Six Months Ended
October 31, 2000 |
Year Ended April 30, 2000 |
||||||||||||
|---|---|---|---|---|---|---|---|---|---|---|---|---|---|
| Shares | Amount | Shares | Amount | ||||||||||
| Class A | |||||||||||||
| Shares sold | 19,008,569 | $ 68,881,586 | 29,820,036 | $115,164,997 | |||||||||
| Automatic conversion of Class B shares to Class A shares | 9,364 | 34,155 | 3,064,229 | 11,866,516 | |||||||||
| Shares issued in reinvestment of distributions | 2,254,287 | 8,095,170 | 4,103,775 | 15,918,638 | |||||||||
| Shares issued in acquisition of Evergreen High Income Fund | 27,138,803 | 99,528,448 | 0 | 0 | |||||||||
| Shares redeemed | (28,036,876 | ) | (101,648,462 | ) | (45,779,805 | ) | (177,617,130 | ) | |||||
| Net increase (decrease) | 20,374,147 | 74,890,897 | (8,791,765 | ) | (34,666,979 | ) | |||||||
| Class B | |||||||||||||
| Shares sold | 1,719,363 | 6,210,358 | 2,867,524 | 11,186,409 | |||||||||
| Automatic conversion of Class B shares to Class A shares | (9,364 | ) | (34,155 | ) | (3,064,229 | ) | (11,866,516 | ) | |||||
| Shares issued in reinvestment of distributions | 139,971 | 503,147 | 383,572 | 1,492,352 | |||||||||
| Shares issued in acquisition of Evergreen High Income Fund | 247,539 | 907,822 | 0 | 0 | |||||||||
| Shares redeemed | (1,687,820 | ) | (6,097,471 | ) | (4,362,940 | ) | (16,997,576 | ) | |||||
| Net increase (decrease) | 409,689 | 1,489,701 | (4,176,073 | ) | (16,185,331 | ) | |||||||
| Class C | |||||||||||||
| Shares sold | 1,064,638 | 3,860,068 | 626,615 | 2,419,537 | |||||||||
| Shares issued in reinvestment of distributions | 262,676 | 937,142 | 20,837 | 80,489 | |||||||||
| Shares issued in acquisition of Evergreen High Income Fund | 22,711,887 | 83,279,872 | 0 | 0 | |||||||||
| Shares redeemed | (2,700,471 | ) | (9,713,633 | ) | (287,763 | ) | (1,128,148 | ) | |||||
| Net increase | 21,338,730 | 78,363,449 | 359,689 | 1,371,878 | |||||||||
| Class Y | |||||||||||||
| Shares sold | 146,239 | 533,006 | 969,321 | 3,780,157 | |||||||||
| Shares issued in reinvestment of distributions | 24,239 | 87,110 | 22,359 | 85,798 | |||||||||
| Shares issued in acquisition of Evergreen High Income Fund | 279 | 1,021 | 0 | 0 | |||||||||
| Shares redeemed | (85,582 | ) | (309,599 | ) | (384,996 | ) | (1,514,340 | ) | |||||
| Net increase | 85,175 | $ 311,538 | 606,684 | $ 2,351,615 | |||||||||
| QUALITY
INCOME
FUND
|
| Six Months Ended
October 31, 2000 |
Year Ended
April 30, 2000 (a) (c) |
Year Ended
September 30, 1999 |
|||||||||||||||||
|---|---|---|---|---|---|---|---|---|---|---|---|---|---|---|---|---|---|---|---|
| Shares | Amount | Shares | Amount | Shares | Amount | ||||||||||||||
| Class A | |||||||||||||||||||
| Shares sold | 133,392 | $ 1,585,959 | 1,463,559 | $18,095,721 | 6,870,812 | $86,944,421 | |||||||||||||
| Shares issued in reinvestment of distributions | 133,746 | 1,607,344 | 167,765 | 2,058,340 | 300,159 | 3,883,017 | |||||||||||||
| Shares redeemed | (1,389,458 | ) | (16,664,890 | ) | (3,720,341 | ) | (45,571,203 | ) | (5,746,275 | ) | (71,969,150 | ) | |||||||
| Net increase (decrease) | (1,122,320 | ) | (13,471,587 | ) | (2,089,017 | ) | (25,417,142 | ) | 1,424,696 | 18,858,288 | |||||||||
| Class B | |||||||||||||||||||
| Shares sold | 39,923 | 481,034 | 42,854 | 524,456 | |||||||||||||||
| Shares issued in reinvestment of distributions | 894 | 10,765 | 220 | 2,687 | |||||||||||||||
| Shares redeemed | (6,396 | ) | (77,136 | ) | (4,847 | ) | (58,919 | ) | |||||||||||
| Net increase | 34,421 | 414,663 | 38,227 | 468,224 | |||||||||||||||
| Class C (b) | |||||||||||||||||||
| Shares sold | 321,395 | 3,854,451 | 3,247,735 | 39,436,130 | 1,882,214 | 24,533,041 | |||||||||||||
| Shares issued in reinvestment of distributions | 126,135 | 1,516,959 | 153,598 | 1,883,747 | 327,045 | 4,234,809 | |||||||||||||
| Shares redeemed | (1,118,341 | ) | (13,431,922 | ) | (5,153,798 | ) | (62,829,069 | ) | (2,669,108 | ) | (34,466,906 | ) | |||||||
| Net decrease | (670,811 | ) | (8,060,512 | ) | (1,752,465 | ) | (21,509,192 | ) | (459,849 | ) | (5,699,056 | ) | |||||||
| Class Y | |||||||||||||||||||
| Shares sold | 0 | 0 | 0 | 0 | 0 | 0 | |||||||||||||
| Shares issued in reinvestment of distributions | 3 | 41 | 4 | 52 | 0 | 0 | |||||||||||||
| Shares redeemed | 0 | 0 | 0 | 0 | 0 | 0 | |||||||||||||
| Net increase | 3 | $ 41 | 4 | $ 52 | 0 | $ 0 | |||||||||||||
(a)
|
For the seven months ended April 30, 2000. The Fund changed its fiscal year end from September 30 to April 30, effective April 30, 2000.
|
(b)
|
Effective October 18, 1999, shareholders of Mentor Quality Income Portfolio Class B shares became owners of that number of full and
fractional shares of Class C shares of Quality Income Fund.
|
(c)
|
For the period from October 18, 1999 (commencement of operations) to April 30, 2000 for Class B.
|
| STRATEGIC
INCOME
FUND
|
| Six Months Ended
October 31, 2000 |
Year Ended
April 30, 2000 |
||||||||||||
|---|---|---|---|---|---|---|---|---|---|---|---|---|---|
| Shares | Amount | Shares | Amount | ||||||||||
| Class A | |||||||||||||
| Shares sold | 1,066,489 | $ 6,376,710 | 6,057,821 | $39,422,267 | |||||||||
| Automatic conversion of Class B shares to Class A shares | 0 | 0 | 114,637 | 732,259 | |||||||||
| Shares issued in reinvestment of distributions | 603,661 | 3,590,068 | 1,364,065 | 8,756,623 | |||||||||
| Shares redeemed | (2,863,041 | ) | (17,108,525 | ) | (10,215,301 | ) | (65,915,704 | ) | |||||
| Net decrease | (1,192,891 | ) | (7,141,747 | ) | (2,678,778 | ) | (17,004,555 | ) | |||||
| Class B | |||||||||||||
| Shares sold | 1,107,037 | 6,651,875 | 4,350,494 | 28,377,800 | |||||||||
| Automatic conversion of Class B shares to Class A shares | 0 | 0 | (114,637 | ) | (732,259 | ) | |||||||
| Shares issued in reinvestment of distributions | 373,188 | 2,226,478 | 845,525 | 5,442,688 | |||||||||
| Shares redeemed | (2,705,651 | ) | (16,230,947 | ) | (5,846,184 | ) | (37,742,494 | ) | |||||
| Net decrease | (1,225,426 | ) | (7,352,594 | ) | (764,802 | ) | (4,654,265 | ) | |||||
| Class C | |||||||||||||
| Shares sold | 416,188 | 2,487,322 | 1,293,973 | 8,382,673 | |||||||||
| Shares issued in reinvestment of distributions | 50,618 | 301,349 | 100,060 | 643,931 | |||||||||
| Shares redeemed | (334,009 | ) | (2,004,515 | ) | (1,396,549 | ) | (9,068,924 | ) | |||||
| Net increase (decrease) | 132,797 | 784,156 | (2,516 | ) | (42,320 | ) | |||||||
| Class Y | |||||||||||||
| Shares sold | 286,488 | 1,698,895 | 105,659 | 683,315 | |||||||||
| Shares issued in reinvestment of distributions | 3,549 | 20,794 | 7,348 | 46,223 | |||||||||
| Shares redeemed | (46,300 | ) | (270,818 | ) | (131,334 | ) | (848,169 | ) | |||||
| Net increase (decrease) | 243,737 | $ 1,448,871 | (18,327 | ) | $ (118,631 | ) | |||||||
| U.S. GOVERNMENT
FUND
|
| Six Months Ended
October 31, 2000 |
Year Ended
April 30, 2000 |
||||||||||||
|---|---|---|---|---|---|---|---|---|---|---|---|---|---|
| Shares | Amount | Shares | Amount | ||||||||||
| Class A | |||||||||||||
| Shares sold | 3,056,411 | $28,242,095 | 5,100,621 | $ 47,565,903 | |||||||||
| Automatic conversion of Class B shares to Class A shares | 24 | 185 | 747,325 | 6,758,335 | |||||||||
| Shares issued in reinvestment of distributions | 203,245 | 1,885,468 | 380,352 | 3,503,443 | |||||||||
| Shares issued in acquisition of Intermediate Term Government Securities Fund | 0 | 0 | 6,906,702 | 64,243,013 | |||||||||
| Shares redeemed | (3,655,247 | ) | (33,807,779 | ) | (8,168,619 | ) | (75,869,321 | ) | |||||
| Net increase (decrease) | (395,567 | ) | (3,680,031 | ) | 4,966,381 | 46,201,373 | |||||||
| Class B | |||||||||||||
| Shares sold | 266,654 | 2,466,261 | 1,474,891 | 13,698,769 | |||||||||
| Automatic conversion of Class B shares to Class A shares | (24 | ) | (185 | ) | (747,325 | ) | (6,758,335 | ) | |||||
| Shares issued in reinvestment of distributions | 125,206 | 1,161,401 | 334,355 | 3,092,153 | |||||||||
| Shares issued in acquisition of Intermediate Term Government Securities Fund | 0 | 0 | 264,531 | 2,460,670 | |||||||||
| Shares redeemed | (1,334,482 | ) | (12,326,669 | ) | (5,058,499 | ) | (46,774,988 | ) | |||||
| Net decrease | (942,646 | ) | (8,699,192 | ) | (3,732,047 | ) | (34,281,731 | ) | |||||
| Class C | |||||||||||||
| Shares sold | 191,751 | 1,778,704 | 143,207 | 1,337,987 | |||||||||
| Shares issued in reinvestment of distributions | 7,255 | 67,335 | 16,034 | 148,313 | |||||||||
| Shares issued in acquisition of Intermediate Term Government Securities Fund | 0 | 0 | 29,477 | 274,194 | |||||||||
| Shares redeemed | (256,045 | ) | (2,357,647 | ) | (252,817 | ) | (2,347,750 | ) | |||||
| Net decrease | (57,039 | ) | (511,608 | ) | (64,099 | ) | (587,256 | ) | |||||
| Class Y | |||||||||||||
| Shares sold | 2,229,577 | 20,692,697 | 4,436,632 | 41,202,809 | |||||||||
| Shares issued in reinvestment of distributions | 628,163 | 5,828,664 | 1,291,143 | 11,920,317 | |||||||||
| Shares issued in acquisition of Intermediate Term Government Securities Fund | 0 | 0 | 7,225,005 | 67,207,079 | |||||||||
| Shares redeemed | (2,929,586 | ) | (27,043,601 | ) | (10,806,458 | ) | (100,084,348 | ) | |||||
| Net increase (decrease) | (71,846 | ) | $ (522,240 | ) | 2,146,322 | $ 20,245,857 | |||||||
| Cost of Purchases | Proceeds from Sales | |||||||
|---|---|---|---|---|---|---|---|---|
| U.S.
Government |
Non-U.S.
Government |
U.S.
Government |
Non-U.S.
Government |
|||||
| Diversified Bond Fund | $115,313,219 | $202,306,866 | $149,293,191 | $186,323,289 | ||||
| High Yield Fund | 27,866,526 | 362,308,150 | 20,020,476 | 222,041,827 | ||||
| Quality Income Fund | 21,564,078 | 55,187,947 | 21,848,522 | 94,871,960 | ||||
| Strategic Income Fund | 101,735,904 | 214,463,104 | 79,263,832 | 242,049,600 | ||||
| U.S. Government Fund | 92,750,434 | 32,006,424 | 79,205,556 | 49,915,832 | ||||
| Exchange
Date |
Contracts to
Deliver |
U.S. Value at
October 31, 2000 |
In Exchange
for U.S. $ |
Unrealized
Gain |
|||||
|---|---|---|---|---|---|---|---|---|---|
| 01/17/2001 | 26,000,000 CAD | $17,053,635 | 17,148,020 | $94,385 | |||||
| Average Daily
Balance Outstanding |
Weighted
Average Interest Rate |
Interest
Expense |
% of
Average Net Assets |
Maximum
Amount Outstanding* |
||||||||
|---|---|---|---|---|---|---|---|---|---|---|---|---|
| Diversified Bond Fund | $ 191,858 | 6.38 | % | $6,254 | 0.00 | % | $ 2,718,991 | |||||
| Quality Income Fund | 2,771,878 | 5.97 | % | 83,807 | 0.12 | % | 24,702,231 | |||||
| Strategic Income Fund | 313,227 | 6.13 | % | 9,819 | 0.01 | % | 4,600,790 | |||||
*
|
The Maximum Amount Outstanding under reverse repurchase agreements includes accrued interest.
|
| Value of
Securities on Loan |
Value of
Collateral |
Income
Earned |
||||
|---|---|---|---|---|---|---|
| Diversified Bond Fund | $12,940,935 | $13,621,054 | $ 27,191 | |||
| High Yield Fund | 60,225,133 | 63,581,719 | 100,619 | |||
| Strategic Income Fund | 24,240,751 | 25,756,972 | 50,133 | |||
| Total
Expense Reductions |
% of
Average Net Assets |
|||
|---|---|---|---|---|
| Diversified Bond Fund | $ 7,856 | 0.00% | ||
| High Yield Fund | 34,040 | 0.02% | ||
| Quality Income Fund | 4,986 | 0.01% | ||
| Strategic Income Fund | 15,531 | 0.01% | ||
| U.S. Government Fund | 9,127 | 0.00% | ||
Evergreen Funds
Money Market Funds
Florida Municipal Money
Market Fund
Money Market Fund
Municipal Money Market Fund
New Jersey Municipal Money Market Fund
Pennsylvania Municipal Money Market Fund
Treasury Money Market Fund
State Municipal
Bond Funds
Connecticut Municipal Bond Fund
Florida High Income Municipal
Bond Fund
Florida Municipal Bond Fund
Georgia Municipal Bond Fund
Maryland Municipal Bond Fund
New Jersey Municipal Bond Fund
North Carolina Municipal Bond Fund
Pennsylvania Municipal Bond Fund
South Carolina Municipal Bond Fund
Virginia Municipal Bond Fund
National Municipal
Bond Funds
High Grade Municipal Bond Fund
High Income Municipal Bond Fund
Municipal Bond Fund
Short Intermediate Municipal Bond Fund
Short and Intermediate Bond Funds
Intermediate Term Bond Fund
Short-Duration Income Fund
Intermediate and Long Term Bond Funds
Diversified Bond Fund
High Yield Bond Fund
Quality Income Fund
Strategic Income Fund
U.S. Government Fund
Balanced Funds
Balanced Fund
Foundation Fund
Tax Strategic Foundation Fund
Growth & Income Funds
Blue Chip Fund
Equity Income Fund
Equity Index Fund
Growth and Income Fund
Small Cap Value Fund
Value Fund
Domestic Growth Funds
Aggressive Growth Fund
Capital Growth Fund
Evergreen Fund Growth Fund
Large Company Growth Fund
Masters Fund
Omega Fund
Small Company Growth Fund
Special Equity Fund
Stock Selector Fund
Tax Strategic Equity Fund
Sector Funds
Health Care Fund
Technology Fund
Utility Fund
Global & International Funds
Emerging Markets Growth Fund
Global Leaders Fund
Global Opportunities Fund
International Growth Fund
Latin America Fund
Perpetual Global Fund
Perpetual International Fund
Precious Metals Fund
Express Line
800.346.3858
Investor Services
800.343.2898
www.evergreen-funds.com
60559

200 Berkeley Street
Boston, MA 02116
556796 12/2000

|
|