
|
|
|
|
|
|
|
|
|
|
Previous: OAKWOOD MORTGAGE INVESTORS INC OMI TRUST 1999-D, 10-K, EX-99.3, 2000-12-28 |
Next: VALGRO FUNDS INC, NSAR-B, 2000-12-28 |
This report is not a prospectus. It is intended for current shareholders of the fund, and it is not to be distributed to prospective shareholders without a prospectus. To get a free copy of the prospectus please visit our web site at valgro.com, or e-mail [email protected], or call us collect at (415) 665-5520.
Valgro is a registered service mark of Valgro Investments, Inc.
| Life of Fund | |
|---|---|
| Valgro Fund | -29.61% |
| Nasdaq Composite | -30.00% |
| S&P 500 | +1.73% |
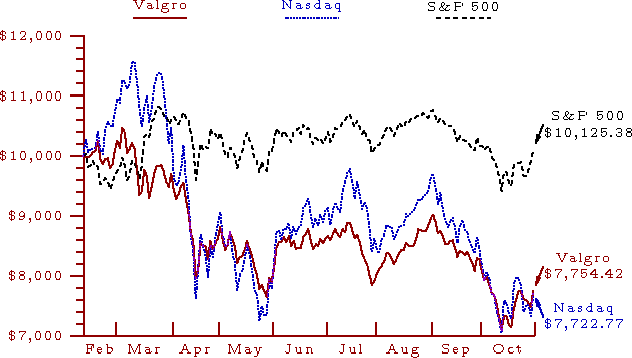
These figures reflect the fund's performance from inception (2/9/00) to the close of its first fiscal year (10/31/00). The graph shows that $10,000 invested in the fund at inception would have shrunk to $7,754.42 on 10/31/00, while the same $10,000 in the Nasdaq Composite would have shrunk even more to $7,722.77, or in the S&P 500 would have grown to $10,125.38.
The table shows the percentage change that would result if the fund and indices continued to perform at the same rate for a whole year. In other words, it projects that by 2/9/01 the fund would have gone down 29.61%, the Nasdaq down 30.00%, and the S&P up 1.73%. Of course, past performance does not predict future performance, and the graph shows how the day-to-day changes are anything but steady.
So the fund beat the Nasdaq a little. This may seem like no big deal, since it didn't beat it by much. But consider that an index fund (which this fund is not) doesn't even equal the performance of its index, let alone beat it. That's because a fund's performance is weighed down by operating expenses, while the raw index itself isn't. So an index fund performs worse than its index, while this fund performed better than the Nasdaq index. On the other hand, the difference is so small, the variability is so large, and the outperformance is mostly at the very end of the period, so not much can be concluded except that the fund performed similarly to the Nasdaq.
The 4/30/00 Semiannual Report compared the fund with the S&P 500 index but not with the Nasdaq Composite. The Nasdaq has been added now because, like the fund, it contains a greater proportion of technology stocks than the S&P 500 does. This makes the comparison more meaningful, so that performance differences between the fund and the index can be due more to the particular stocks picked by the fund rather than merely the fund's concentration in the biotech and computer-related industries.
As can be seen from the graph, the S&P 500 remained roughly unchanged during the period, while the fund shared many of the dips and rises of the Nasdaq. The March-April and September-October declines of the fund and the Nasdaq were primarily due to the market correction in technology stocks, including biotech and computer-related stocks.
It must be stated that S&P 500® is a registered service mark of The McGraw-Hill Companies, Inc. It refers to the Standard & Poor's 500SM Index (symbol SPX), an index of common stocks weighted by market capitalization. The Nasdaq Composite (symbol IXIC) is also an index of common stocks weighted by market capitalization.
| Shares | Value | |
|---|---|---|
| COMPUTER-RELATED INDUSTRIES: 30.6% | ||
| Computer Manufacturing: 7.7% | ||
| Hewlett-Packard Co. | 516 | $23,961.75 |
| International Business Machines Corp. | 261 | 25,708.50 |
| Palm, Inc. | 466 | 24,960.13 |
| Sun Microsystems, Inc. | 291 | 32,264.63 |
| Computer Software: 7.6% | ||
| Adobe Systems Inc. | 452 | 34,380.25 |
| HNC Software Inc. | 1757 | 35,689.06 |
| Microsoft Corporation | 348 | 23,968.50 |
| Red Hat, Inc. | 920 | 11,500.00 |
| Internet: 8.0% | ||
| Amazon.com Inc. | 603 | 22,084.88 |
| CMG Information Services, Inc. | 592 | 9,990.00 |
| DoubleClick Inc. | 859 | 13,958.75 |
| drugstore.com, inc. | 3852 | 10,111.50 |
| Excite@Home Corporation | 1504 | 15,510.00 |
| Priceline.com Inc. | 1598 | 9,188.50 |
| RealNetworks, Inc. | 677 | 13,952.55 |
| Yahoo! Inc. | 269 | 15,770.13 |
| Computer Sales: 3.1 | ||
| CDW Computer Centers, Inc. | 665 | 42,850.94 |
| Computer Chips: 1.9% | ||
| Intel Corporation | 597 | 26,865.00 |
| Computer Networking: 2.2% | ||
| Broadcom Corporation | 137 | 30,465.38 |
| TOTAL COMPUTER-RELATED INDUSTRIES: | 423,180.45 | |
| BIOTECH INDUSTRIES: 31.1% | ||
| Pharmaceuticals: 26.7% | ||
| Amgen Inc. | 422 | 24,449.63 |
| Biogen, Inc. | 394 | 23,713.88 |
| Cell Genesys, Inc. | 920 | 21,217.50 |
| Cell Pathways, Inc. | 1816 | 13,847.00 |
| Chiron Corp. | 609 | 26,377.31 |
| EntreMed, Inc. | 754 | 23,468.25 |
| Genentech Inc. | 344 | 28,380.00 |
| Geron Corporation | 985 | 23,147.50 |
| Human Genome Sciences, Inc. | 402 | 35,533.03 |
| Immune Response Corp. | 3576 | 21,679.50 |
| Merck & Co., Inc. | 384 | 34,536.00 |
| ONYX Pharmaceuticals, Inc. | 1699 | 25,485.00 |
| Pharmacia Corp. | 616 | 33,880.00 |
| Pfizer Inc. | 750 | 32,390.63 |
| Gene Therapy: 2.9% | ||
| Ariad Pharmaceuticals, Inc. | 1885 | 17,200.63 |
| Avigen, Inc. | 589 | 22,823.75 |
| Plant Seed Technology: 1.6% | ||
| Landec Corporation | 4938 | 21,912.38 |
| TOTAL BIOTECH INDUSTRIES: | 430,041.99 | |
| OTHER INDUSTRIES: 38.2% | ||
| Chemicals: 4.4% | ||
| Dow Chemical Co. | 1042 | 31,911.25 |
| DuPont & Co. | 643 | 29,176.13 |
| Cosmetics: 1.8% | ||
| Procter & Gamble Co. | 351 | 25,074.56 |
| Food & Drink: 4.6% | ||
| Coca Cola Co. | 504 | 30,429.00 |
| Starbucks Corporation | 732 | 32,711.25 |
| Automotive: 2.1% | ||
| Toyota Motor Corp. | 365 | 29,247.45 |
| Transportation: 2.1% | ||
| United Parcel Service Inc. | 480 | 29,160.00 |
| Media/Publishing: 1.9% | ||
| Tribune Company | 712 | 26,388.50 |
| Communications: 5.5% | ||
| Lucent Technologies | 772 | 17,997.25 |
| Sprint Corp. | 686 | 17,493.00 |
| Sprint Corp. PCS Group | 695 | 26,496.88 |
| Sycamore Networks, Inc. | 230 | 14,547.50 |
| Electronics: 6.1% | ||
| C-Cube Microsystems Inc. | 1077 | 21,001.50 |
| Honeywell Inc. | 742 | 39,928.88 |
| Sony Corp. | 274 | 22,742.00 |
| Petroleum/Energy: 4.2% | ||
| Chevron Corp. | 336 | 27,594.00 |
| Exxon Mobil Corp. | 347 | 30,948.06 |
| Office Supplies: 1.9% | ||
| Office Depot | 3146 | 26,151.13 |
| Finance: 3.5% | ||
| Bank One Corporation | 891 | 32,521.50 |
| meVC Draper Fisher Jurveston Fund I, Inc. | 1400 | 16,100.00 |
| TOTAL OTHER INDUSTRIES: | 527,619.84 | |
| TOTAL INVESTMENT SECURITIES: 100.0% | ||
| (cost $1,795,450.44) | $1,380,842.28 | |
| ____________ |
The accompanying notes are an integral part of these financial statements.
| Assets: | |
| Investment securities, at fair value (cost $1,795,450.44) | $1,380,842.28 |
| Cash | 71,582.60 |
| Dividends receivable | 317.18 |
| Receivable for investments sold | 0.69 |
| Other assets | 1,888.15 |
| Total assets | 1,454,630.90 |
| Liabilities: | |
| Accrued liabilities | 7,659.47 |
| Total liabilities | 7,659.47 |
| Net Assets | $1,446,971.43 |
| ____________ | |
| Net Assets consists of: | |
| Paid-in capital | $1,857,117.84 |
| Undistributed net investment income (loss) | (25,793.98) |
| Undistributed net realized gain (loss) on: | |
| investments | 30,252.89 |
| foreign currency transactions | 4.04 |
| Net unrealized appreciation (depreciation) on: | |
| investments | (414,608.16) |
| assets & liabilities in foreign currencies | (1.20) |
| Net Assets (for 206,516.961 shares outstanding) | $1,446,971.43 |
| ____________ | |
| Net Asset Value per share | $7.01 |
| ____________ |
The accompanying notes are an integral part of these financial statements.
| Income: | |
| Dividends (net of foreign withholding taxes of $29.26) | $5,666.95 |
| Interest | 1,731.77 |
| Total income | 7,398.72 |
| Expenses: | |
| Management fee | 9,587.60 |
| Franchise taxes | 2,894.18 |
| Registration fees | 1,364.44 |
| Accrued audit fees | 6,000.00 |
| Insurance | 973.33 |
| Interest | 109.79 |
| Miscellaneous | 772.60 |
| Total expenses | 21,701.94 |
| Net investment income (loss) | (14,303.22) |
| Net realized gain (loss) on: | |
| investments | 30,252.89 |
| foreign currency transactions | 4.04 |
| Change in unrealized appreciation on: | |
| investments | (414,608.16) |
| assets & liabilities in foreign currencies | (1.20) |
| Net gain (loss) | (384,352.43) |
| Net increase (decrease) in net assets resulting from operations | $(398,655.65) |
| ____________ |
The accompanying notes are an integral part of these financial statements.
| Operations: | |
| Net investment income (loss) | $(14,303.22) |
| Net realized gain (loss) | 30,256.93 |
| Change in unrealized appreciation | (414,609.36) |
| Net increase (decrease) in net assets resulting from operations | (398,655.65) |
| Distributions to shareholders: | |
| from net investment income | 0.00 |
| from net realized gain | 0.00 |
| Capital share transactions | 1,737,117.84 |
| Total increase (decrease) in net assets | 1,338,462.19 |
| Net assets: | |
| Beginning of period | 108,509.24 |
| End of period (including undistributed net investment income (loss) of $(25,793.98)) | $1,446,971.43 |
| ____________ |
The accompanying notes are an integral part of these financial statements.
| Selected per-share data: | |
| Net asset value, beginning of period | $9.04 |
| Income from investment operations: | |
| Net investment income (loss) | 0.83 |
| Net realized and unrealized gain (loss) | (2.86) |
| Total from investment operations | (2.03) |
| Less distributions: | |
| from net investment income | 0.00 |
| from net realized gain | 0.00 |
| Total distributions | 0.00 |
| Net asset value, end of period | $7.01 |
| _______ | |
| Total return (not annualized): | (22.46)% |
| Ratios (not annualized) and supplemental data: | |
| Net assets, end of period | $1,446,971.43 |
| Ratio of expenses to average net assets | 1.51% |
| Ratio of net investment income to average net assets | (0.99)% |
| Portfolio turnover rate | 28.82% |
The accompanying notes are an integral part of these financial statements.
NOTE 1: SIGNIFICANT ACCOUNTING POLICIES
Everywhere they're used, the terms "Valgro Fund" and "the fund" refer to Valgro Funds, Inc. The fund is an Illinois corporation registered under the Investment Company Act of 1940, as amended, as a diversified, open-end management investment company.
Use of Estimates
The preparation of these financial statements, in conformity with accounting principles generally accepted in the United States of America, may require management to make estimates and assumptions that affect the reported amounts of assets, liablities, and related disclosures. Actual results may differ from these estimates.
Investment Adviser
The management fee is paid to Valgro Investments, Inc., the fund's Investment Adviser. It provides investment management and advisory services to the fund. For its services, the Adviser receives a fee computed daily at a rate of 1/250 of 0.9% of net assets before its fee.
Security Valuation
Investments in securities are stated at the official closing prices during regular-hours trading on the principal US exchange or US market where they are traded, or the average of the closing bid & ask prices when no trades occurred.
Federal income taxes
The fund's policy is to comply with the requirements of the Internal Revenue Code that are applicable to regulated investment companies and to distribute all its taxable income to its shareholders. Therefore, no federal income tax provision is required.
Distributions to shareholders
Dividends to shareholders are recorded on the ex-dividend date. There were none during this period.
Other
The fund follows industry practice and records security transactions on the trade date. Dividend income is recognized on the ex-dividend date, or on the date the dividend is made known, whichever comes first. Interest income is recognized on an accrual basis when material.
NOTE 2: BORROWING ABILITY
The fund has the ability to borrow on margin for the short-term clearance of transactions, in accordance with 15 USC 80a-12(a)(1). As of October 31, 2000, the fund had the ability to borrow up to $690,421.14 at a rate varying with both brokers' call and the amount borrowed. At that time, the fund had no outstanding borrowings. Total interest paid by the fund was $109.79, which was charged at a weighted average annual rate of 7.166% on an average balance of $183,831.99 outstanding for 3 days during the period. Due to offsetting credit balances, this was less than the borrowings on the fund's books, which were an average balance of $186,983.85 outstanding for 11 days, with a maximum borrowing of $396,340.73. No compensating balances are required.
NOTE 3: CAPITAL SHARE TRANSACTIONS
On October 31, 2000, there were 1 quadrillion (1015) shares of common stock authorized, without par value. At that time, 206,516.961 of these shares were outstanding, with paid-in capital of $1,857,117.84.
Transactions in capital stock were as follows:
| Shares | Amount | |
|---|---|---|
| Shares sold | 194,516.961 | $1,737,117.84 |
| Shares issued in reinvestment of dividends | - | - |
| Less shares redeemed | - | - |
| Net increase | 194,516.961 | $1,737,117.84 |
NOTE 4: INVESTMENT TRANSACTIONS
Investments in securities involved gross purchases of $2,140,038.64 and gross sales of $374,841.09.
NOTE 5: FOREIGN CURRENCY
Amounts denominated in or expected to settle in foreign currencies are translated into United States dollars. The conversion rates for any given day are the rates reported by Yahoo at the time of the most recent NAV calculation. The market values of assets and liabilities are translated at the rates on October 31, 2000. Income, expenses, and other transactions are translated at the rates on the transaction date.
The fund does not isolate that portion of the results of operations resulting from changes in foreign exchange rates on investments from the fluctuations arising from changes in market prices of securities held. Such fluctuations are included with the net realized and unrealized gain or loss from investments.
Reported net realized foreign exchange gains or losses arise from the difference between the amounts of dividends and foreign withholding taxes recorded on the Fund's books, and the U.S. dollar amounts actually received or paid. Net unrealized foreign exchange gains and losses arise from changes in the value of assets and liabilities other than investments in securities at the end of the reporting period, resulting from changes in the exchange rate.
Board of Directors and Shareholders
Valgro Funds, Inc.
We have audited the accompanying statement of assets and liabilities, including the schedule of investments in securities, of Valgro Funds, Inc. as of October 31, 2000, and the related statements of operations and changes in net assets for the year then ended, and financial highlights for the period from February 9, 2000 (date of inception) to October 31, 2000. These financial statements and financial highlights are the responsibility of the Fund's management. Our responsibility is to express an opinion on these financial statements and financial highlights based on our audit.
We conducted our audit in accordance with auditing standards generally accepted in the United States of America. Those standards require that we plan and perform the audit to obtain reasonable assurance about whether the financial statements and financial highlights are free of material misstatement. An audit includes examining, on a test basis, evidence supporting the amounts and disclosures in the financial statements. Our procedures included confirmation of securities owned as of October 31, 2000 with the custodian and brokers. An audit also includes assessing the accounting principles used and significant estimates made by management, as well as evaluating the overall financial statement presentation. We believe that our audit provides a reasonable basis for our opinion.
In our opinion, the financial statements and financial highlights referred to above present fairly, in all material respects, the financial position of Valgro Funds, Inc. as, of October 31, 2000, the results of its operations and changes in its net assets for the period from February 9, 2000 (date of inception) to October 31, 2000, and financial highlights for the period from February 9, 2000 (date of inception) to October 31, 2000, in conformity with accounting principles generally accepted in the United States of America.
Grant Thornton LLP
Chicago, Illinois
December 6, 2000
|
|