
|
|
|
|
|
|
|
|
|
|
Previous: CAPITAL RESEARCH & MANAGEMENT CO, SC 13G, 2000-11-13 |
Next: CAPITOL TRANSAMERICA CORP, 10-Q, EX-1, 2000-11-13 |
SECURITIES AND EXCHANGE COMMISSION
Washington, D. C.
FORM 10-Q
ANNUAL REPORT PURSUANT TO SECTION 13 OR 15 (d) OF
THE SECURITIES EXCHANGE ACT
OF l934
For the period ended: September 30, 2000
Commission file number:
0-2047
CAPITOL TRANSAMERICA CORPORATION (CTC)
(Exact name of registrant as
specified in its charter)
A Wisconsin Corporation
39-1052658
| 4610 University Avenue | |
| Madison, Wisconsin | 53705- 0900 |
| (Address of principal executive offices) | (Zip Code) |
Registrant's telephone number, including area code: (608) 231-4450
Securities registered pursuant to Section 12 (g) of the Act:
COMMON STOCK, $1.00 PAR VALUE
(Title of Class)
Indicate by check mark whether the registrant (1) has filed all reports required to be filed by Section 13 or 15 (d) of the Securities Exchange Act of l934 during the preceding twelve months (or for such shorter period that the registrant was required to file such reports), and (2) has been subject to such filing requirements for the past 90 days.
YES X NO
Based on the closing average of the high (11 7/8) and low price (11 1/2), the aggregate market value of voting stock held by non-affiliates of the registrant as of September 30, 2000 was approximately $129,172,576.
Indicate the number of shares of each of the issuer's class of common stock, as of the latest practicable date:
At September 30, 2000
Common Stock, $1.00 Par Value;
| Issued: | 11,558,166 |
| Outstanding: | 11,052,199 |
Total Pages: 18
Securities and Exchange CommissionForm 10-Q
Part I
| Financial Information | Page |
| Consolidated Financial Statements | 3 - 7 |
| Notes to Consolidated Financial Statements | 8 - 10 |
| Management's Discussion and Analysis of Financial Condition and Results of Operations | 11 - 13 |
| Condensed Statutory Financial Statements of Insurance Subsidiaries | 14 |
Part II
| Other Information | |
| Other Disclosures | 16 |
| Officers and Directors | 17 |
| Signatures | 18 |
2
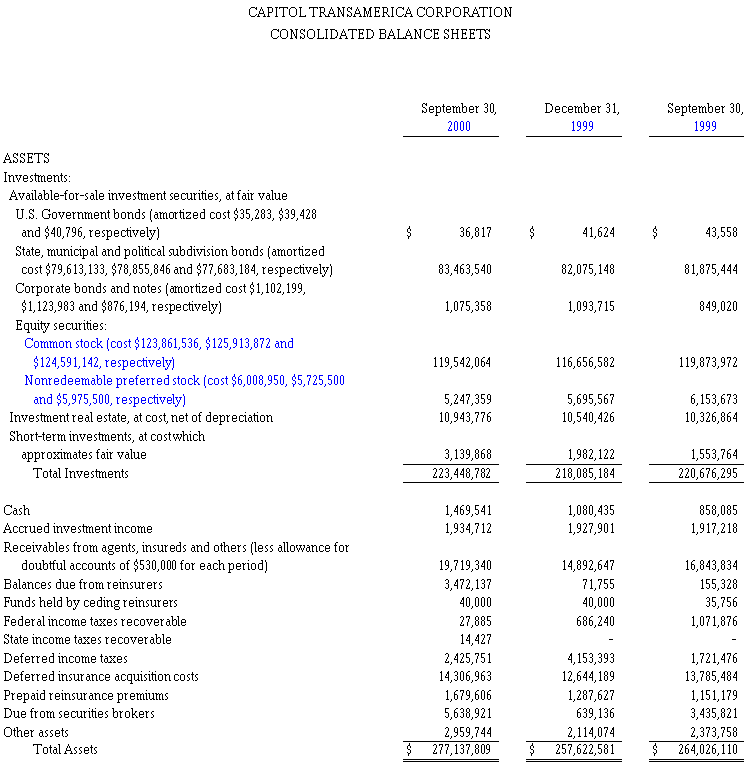
3
4
5
6

7
CAPITOL TRANSAMERICA CORPORATION
NOTES TO
CONSOLIDATED FINANCIAL STATEMENTS
September 30, 2000
(1) Basis of Presentation
The condensed financial statements included
herein of Capitol Transamerica Corporation (the "Company"), other than the Consolidated Balance
Sheet as of December 31, 1999, the Shareholders' Investment in the Company and the Consolidated
Statement of Cash Flows as of December 31, 1999, have been prepared by the Company without audit,
pursuant to the rules and regulations of the Securities and Exchange Commission. Certain
information and footnote disclosures normally included in financial statements prepared in
accordance with generally accepted accounting principles have been condensed or omitted pursuant
to such rules and regulations.
Although the Company believes the disclosures are adequate to make the information presented not misleading, it is suggested that these condensed financial statements be read in conjunction with the financial statements and the notes thereto included in the Company's 1999 annual report on Form 10-K.
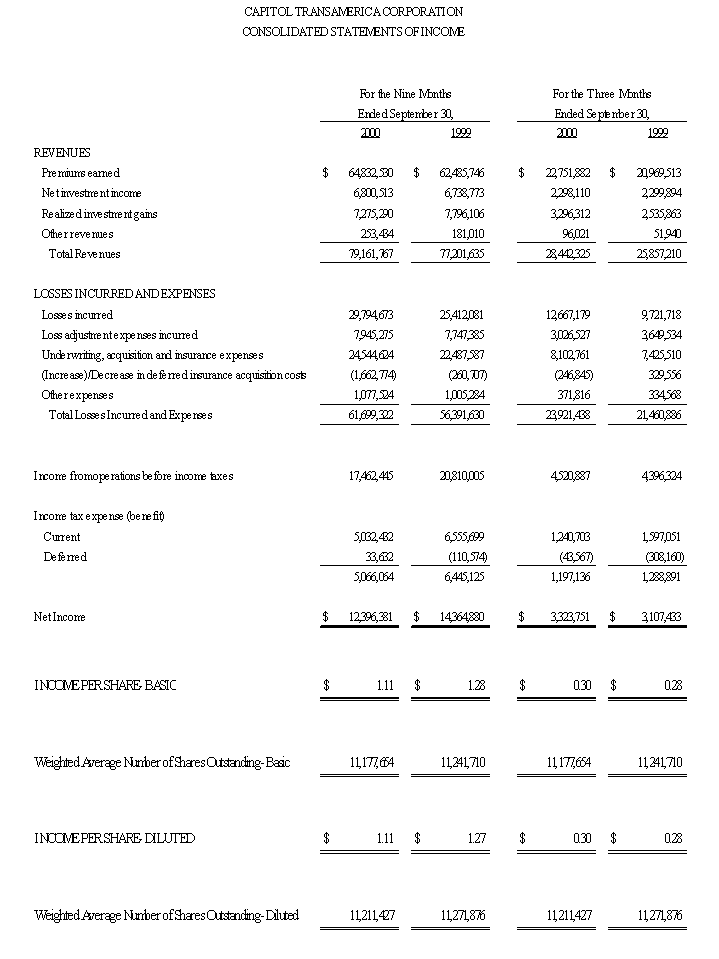
(2) Income Per Share
Basic income per share is computed by dividing
net income by the weighted-average number of shares of stock outstanding during the period.
Diluted income per share is computed by dividing net income by the weighted-average number of
shares of common stock and common stock equivalents from options outstanding. The following table
sets forth the computation of basic and diluted EPS:
| Sept. 30, | Dec. 31, | Sept. 30, | |
| 2000 | 1999 | 1999 | |
| Numerator: | |||
| Consolidated net income | $ 12,396,381 | $ 16,712,463 | $ 14,364,880 |
| Denominator: | |||
| Denominator for basic EPS - weighted average shares | 11,177,654 | 11,252,358 | 11,241,710 |
| Effect of dilutive securities - employee stock options | 33,773 | 44,931 | 30,166 |
| Denominator for diluted EPS - weighted average shares | 11,211,427 | 11,297,289 | 11,271,876 |
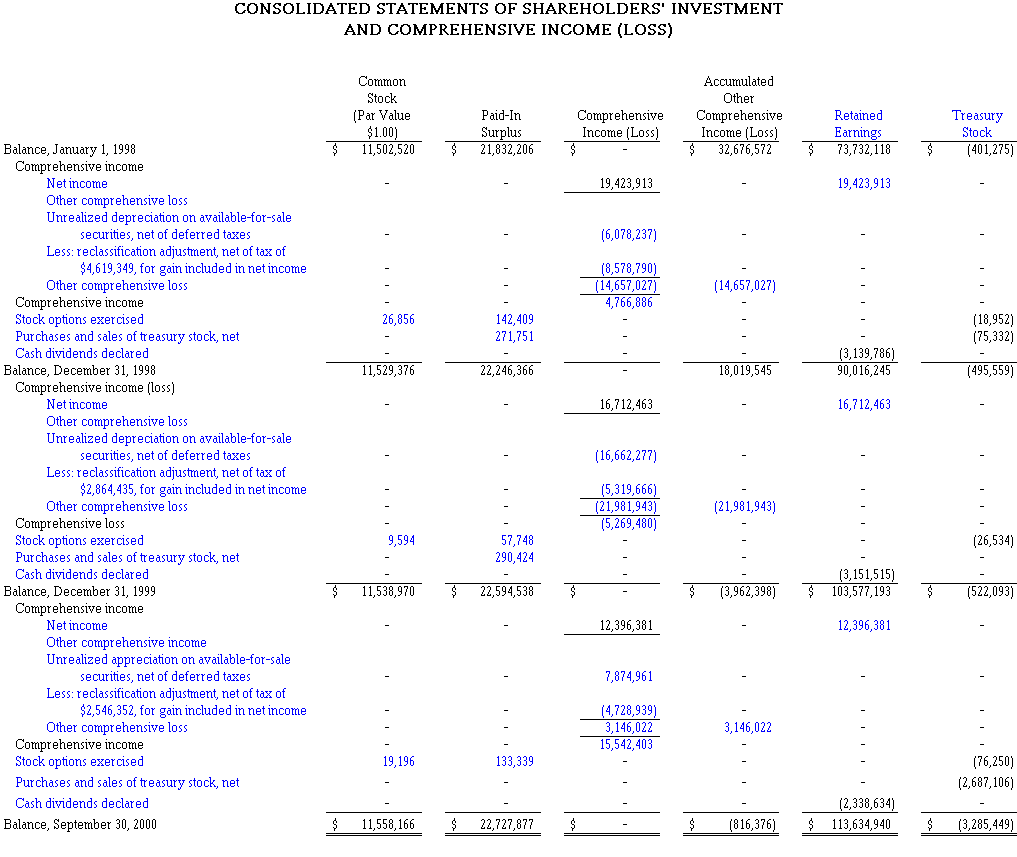
(3) Comprehensive Income (Loss)
Comprehensive income (loss) is defined
as net income plus or minus other comprehensive income (loss), which for the Company, under
existing accounting standards, includes unrealized gains and losses, net of income tax effects,
on certain investments in debt and equity securities. Comprehensive income (loss) is reported by
the Company in the Consolidated Statements of Shareholders' Investment and Comprehensive Income
(Loss).
(4) Income Taxes
Deferred income taxes reflect the net tax effects of
temporary differences between the carrying amounts of assets and liabilities for financial
statement purposes and the amounts used for income taxes.
(5) Common Stock Options
There were 19,196 options exercised during
the nine months ended September 30, 2000 and there were 6,639 options exercised during the nine
months ended September 30, 1999. For further information regarding stock options, refer to Note 6
of Notes to Consolidated Financial Statements included in the Company's 1999 annual report.
8
(6) Dividends
2000
On September 5, 2000, a cash dividend of $.07
per share was declared to shareholders of record September 15, 2000 and paid September 26, 2000
in the amount of $773,993.
On May 30, 2000, a cash dividend of $.07 per share was declared to shareholders of record June 16, 2000 and paid June 28, 2000 in the amount of $775,865.
On February 18, 2000, a cash dividend of $.07 per share was declared to shareholders of record March 10, 2000 and paid March 23, 2000 in the amount of $788,776.
1999
On October 20, 1999, a cash dividend of $.07 per share was
declared to shareholders of record December 9, 1999 and paid December 23, 1999 in the amount of
$788,560.
On July 23, 1999, a cash dividend of $.07 per share was declared to shareholders of record September 10, 1999 and paid September 24, 1999 in the amount of $788,751.
On May 13, 1999, a cash dividend of $.07 per share was declared to shareholders of record June 11, 1999 and paid June 25, 1999 in the amount of $788,708.
On February 26, 1999, a cash dividend of $.07 per share was declared to shareholders of record March 12, 1999 and paid March 26, 1999 in the amount of $785,999.
(7) Investments
Fixed maturities and equity securities are classified
as available-for-sale and accordingly are carried at fair value, with unrealized gains and losses
reported as a separate component of shareholders' investment, net of taxes. The cost of fixed
maturities is adjusted for amortization of premiums and accretion of discounts to maturity.
Fixed maturities and equity securities deemed to have declines in value that are other than
temporary are written down through the statement of income to carrying values equal to their
estimated fair values.
Investment real estate is carried at cost net of accumulated depreciation of $1,488,842, $1,173,643 and $1,047,699 as of September 30, 2000, December 31, 1999 and September 30, 1999, respectively. The real estate is depreciated over the estimated useful life of the asset.
Cost of investments sold is determined under the specific identification method.
(8) Contingent Liabilities
The Company is a defendant in certain
lawsuits involving complaints which demand damages and recoveries for claims and losses allegedly
related to risks insured by the Company. In the opinion of management, such lawsuits are
routine in that they result from the ordinary course of business in the insurance industry. The
reserve for losses includes management's estimates of the probable ultimate cost of settling all
losses involving lawsuits.
9
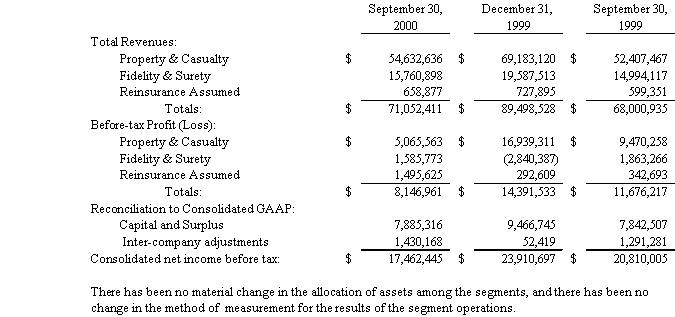
(9) Industry Segment Disclosures
Effective January 1, 1998, the
Company adopted the Financial Accounting Standards Board's Statement of Financial Standards No.
131, "Disclosures about Segments of an Enterprise and Related Information." The adoption of SFAS
No. 131 did not affect results of operations or financial position, but did affect the
disclosures of segment information.
The Company has three business segments, which are segregated based on the types of products and services provided. The segments are (1) property and casualty, (2) fidelity and surety, and (3) discontinued reinsurance assumed operations. These segments constitute 100% of the operations of the Company. Data for each segment as required for interim reporting follows:
10
Management's Discussion and Analysis of Financial Condition and Results of Operations
OVERVIEW
The underwriting cycles of the property-casualty insurance industry have been characterized by peak periods of adequate rates, underwriting profits and lower combined ratios, while the down side of the cycle is characterized by inadequate rates, underwriting losses and, as a result, higher combined ratios. The adequacy of premium rates is affected primarily by the severity and frequency of claims, which, in turn, are affected by natural disasters, regulatory measures and court decisions, which continue to uphold the "deep pocket" theory in awarding against insurance companies. Unfortunately for the insurance industry, the trend of increasing price competition has continued as has the number of significant natural disasters. This combination has resulted in a considerable reduction in underwriting profitability for the industry as a whole.
Adequate premium rates continue to be of concern to the Company and the property-casualty insurance industry as a whole. Management feels strongly that rate regulators have been slow to adjust rates in response to increased claim costs from the factors noted above. This, when combined with increased competition in the Company's' niche market, has presented an unprecedented challenge to management. The Company has responded to this challenge with increased marketing efforts as well as the addition of innovative programs and alliances that should position the Company for continued expansion and profitability.
OPERATING RESULTS
For the nine months ended September 30, 2000, gross premiums written totaled $76,777,047 compared to $65,473,654 for the same period last year. Net premiums followed suit, increasing from $61,432,962 in the first nine months of 1999 to $71,344,856 during 2000, an increase of 16.1%.
Premiums earned are recognized as net revenues after a reduction for reinsurance ceded and after establishment of the provision for a pro-rata unearned portion of premiums written. Net premiums earned totaled $64,832,531 for the first nine months of 2000 compared to $82,841,104 for the year 1999 and $62,485,746 for the first nine months of 1999. The unearned premium reserve was $46,348,561, $39,454,257 and $40,912,754 at the end of each period.
| September 30, | December 31, | September 30, | |
| 2000 | 1999 | 1999 | |
| Gross Premiums Written | $ 76,777,047 | $ 86,002,801 | $ 65,473,654 |
| Reinsurance Ceded | 5,442,191 | 5,809,425 | 4,040,692 |
| Net Premiums Written | $ 71,344,856 | $ 80,193,376 | $ 61,432,962 |
| Net Premiums Earned | $ 64,832,531 | $ 82,841,104 | $ 62,485,746 |
| Net Unearned Premium Reserve | $ 46,348,561 | $ 39,454,257 | $ 40,912,754 |
11
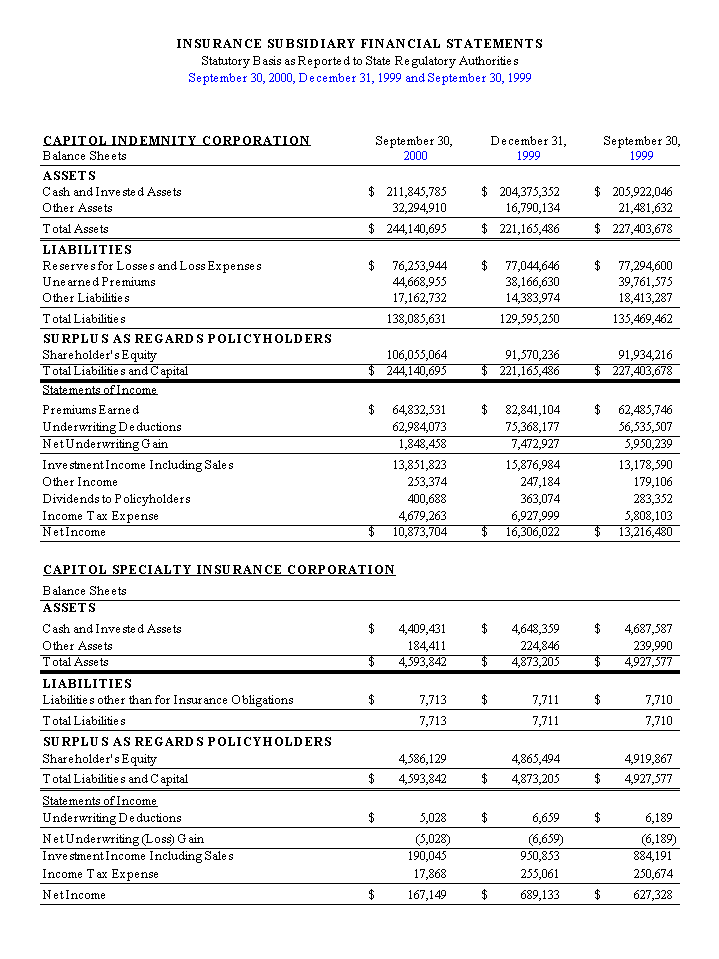
The Company's underwriting results can be measured by reference to the combined loss and expense ratios. The following table includes the operating results of the Company's two subsidiary insurance companies on a statutory basis. Losses and loss adjustment expenses are stated as a ratio of net premiums earned, while underwriting expenses are stated as a ratio of net premiums written. The combined ratios were as follows:
| September 30, | December 31, | September 30, | |
| Insurance Operating Ratios (Statutory Basis): | 2000 | 1999 | 1999 |
| Losses & Loss Adjustment Expenses | 58.4% | 54.9% | 53.3% |
| Underwriting Expenses | 35.1% | 37.0% | 37.5% |
| Combined Ratio | 93.5% | 91.9% | 90.8% |
The Company's combined ratio consistently compares very favorably to the industry average, as indicated by the following chart:
| Year-to-date | Year-end | Year-end | |
| Combined Ratio | 2000 | 1999 | 1998 |
| Company | 93.5% | 91.9% | 95.0% |
| Industry Average * | 108.3% | 110.5% | 107.4% |
* The industry number for YTD 2000 is the ratio for commercial carriers as of June 30, 2000.
REINSURANCE
NET INVESTMENT INCOME AND REALIZED GAINS
Interest and Dividend Income: Interest on fixed maturities is recorded as income when earned and is adjusted for any amortization of purchase premium or accretion of discount. Dividends on equity securities are recorded as income on ex-dividend dates.
| September 30, | December 31, | September 30, | |
| Investments: | 2000 | 1999 | 1999 |
| Invested Assets | $ 223,448,782 | $ 218,085,184 | $ 220,676,295 |
| Net Investment Income | 6,800,513 | 9,136,244 | 6,738,773 |
| Percent of Return to Average Carrying Value | 4.0% | 4.2% | 4.2% |
| Realized Gains | 7,275,290 | 8,184,101 | 7,796,106 |
| Change in Unrealized Gains | $ 3,146,022 | $ (21,981,943) | $ (18,260,793) |
The net unrealized gain of $3,146,022 for the first nine months of 2000 consisted of a $412,017 unrealized gain on fixed maturities and a $2,734,005 unrealized gain on the Company's equity portfolio. Management has begun to increase its tax-free bond holdings and de-emphasize the equity portfolio, but is optimistic that the recent downturn in the value of its equity investments is temporary and that the current market conditions provide an even greater opportunity to invest and build shareholder value over the long term. This appears to be coming to fruition, as evidenced by the current year's increase (decrease) in unrealized gains (losses).
Net investment income in the nine months of 2000 increased $61,740 over the same period last year, an increase of 0.9%. The Company holds a larger percentage of equity investments than is typical for the property-casualty industry, which leads to a comparatively low rate of return on invested assets.
12
INCOME TAXES
LOSS RESERVES
LIQUIDITY AND CAPITAL RESOURCES
YEAR 2000
The Company expensed approximately $90,000 during 1999 in connection with remediating its systems. The Company is not aware of any material problems resulting from year 2000 issues, either with our products, our internal systems or the products and services of third parties. The Company will continue to monitor its mission critical computer applications and those of its agents and vendors throughout the year 2000 to ensure that any latent year 2000 matters that may arise are addressed promptly.
SAFE HARBOR STATEMENT
13
14
PART II
15
Other Disclosures
| Item 1. | Legal Proceedings |
| Reference is made to footnote number 8 "Contingent Liabilities" on page 9 of this report. | |
| Item 2. | Changes in Securities and Use of Proceeds |
| NONE | |
| Item 3. | Defaults Upon Senior Securities |
| NONE | |
| Item 4. | Submission of Matters to a Vote of Security Holders |
| Reference is made to the Notice of Annual Meeting of Shareholders and Proxy Statement for the Annual Meeting of Shareholders which was held May 15, 2000, both of which are dated April 7, 2000 and previously filed with the Securities and Exchange Commission and are incorporated herein as an exhibit by reference. | |
| Item 5. | Other Information |
| NONE | |
| Item 6. | Exhibits and Reports on Form 8-K |
| NONE |
16
CAPITOL TRANSAMERICA CORPORATIONSubsidiaries
Capitol Indemnity Corporation
Capitol Specialty
Insurance Corporation
Capitol Facilities Corporation
Board of Directors
| Paul J. Breitnauer Vice President & Treasurer Capitol Transamerica Corporation Madison, Wisconsin | Michael J. Larson Principal Southwestern Financial Services Madison, Wisconsin |
| Larry Burcalow Owner and President Yahara Materials, Inc. Middleton, Wisconsin | Reinhart H. Postweiler Retired, formerly with Flad Affiliated Corporation Madison, Wisconsin |
| George A. Fait Chairman of the Board & President Capitol Transamerica Corporation Madison, Wisconsin | Kenneth P. Urso Owner and Operator Urso and Associates, LLC Madison, Wisconsin |
Officers
| George A. Fait Chairman of the Board & President |
Virgiline M. Schulte Secretary |
| Paul J. Breitnauer Vice President & Treasurer | Jane
F. Endres Assistant Secretary |
17
SIGNATURES
Pursuant to the requirements of the Securities Exchange Act of 1934, the Registrant has duly caused this report to be signed on its behalf by the undersigned thereunto duly authorized.
| CAPITOL TRANSAMERICA CORPORATION | |
| George A. Fait | |
| Chairman of the Board and President | |
| Paul J. Breitnauer | |
| Vice President and Treasurer |
Date: November 6, 2000
18
|
|