
|
|
|
|
|
|
|
|
|
Fidelity®
Fund
Semiannual Report
October 31, 2000
(2_fidelity_logos)(Registered_Trademark)
|
President's Message |
3 |
Ned Johnson on investing strategies. |
|
Performance |
4 |
How the fund has done over time. |
|
Fund Talk |
7 |
The manager's review of fund performance, strategy and outlook. |
|
Investment Changes |
10 |
A summary of major shifts in the fund's investments over the past six months. |
|
Investments |
11 |
A complete list of the fund's investments with their market values. |
|
Financial Statements |
29 |
Statements of assets and liabilities,
operations, and changes in net assets, |
|
Notes |
33 |
Notes to the financial statements. |
|
|
|
|
To reduce expenses, only one copy of most financial reports and prospectuses may be mailed to households, even if more than one person in the household has an account in the fund. Call Fidelity at 1-800-544-8544 if you need additional copies of financial reports or prospectuses. If you do not want the mailing of these documents to be combined with those for other members of your household, contact Fidelity in writing at P.O. Box 5000, Cincinnati, OH 45273-8692.
Standard & Poor's, S&P and S&P 500 are registered service marks of The McGraw-Hill Companies, Inc. and have been licensed for use by Fidelity Distributors Corporation.
Other third party marks appearing herein are the property of their respective owners.
All other marks appearing herein are registered or unregistered trademarks or service marks of FMR Corp. or an affiliated company.
(Recycle graphic) This report is printed on recycled paper using soy-based inks.
This report and the financial statements contained herein are submitted for the general information of the shareholders of the fund. This report is not authorized for distribution to prospective investors in the fund unless preceded or accompanied by an effective prospectus.
Mutual fund shares are not deposits or obligations of, or guaranteed by, any depository institution. Shares are not insured by the FDIC, Federal Reserve Board or any other agency, and are subject to investment risks, including possible loss of principal amount invested.
Neither the fund nor Fidelity Distributors Corporation is a bank.
For more information on any Fidelity fund, including charges and expenses, call 1-800-544-6666 for a free prospectus. Read it carefully before you invest or send money.
Semiannual Report
(photo_of_Edward_C_Johnson_3d)
Dear Shareholder:
A sixth-straight year of double-digit positive returns for the Dow Jones Industrial Average, NASDAQ and S&P 500® could be in jeopardy unless the U.S. stock market shows marked improvement in the final two months of 2000. Through October, all three indexes had negative year-to-date returns. On the other hand, most fixed-income sectors were solidly in the black. Treasuries and other long-term government securities led the way, returning nearly 14%.
While it's impossible to predict the future direction of the markets with any degree of certainty, there are certain basic principles that can help investors plan for their future needs.
The longer your investment time frame, the less likely it is that you will be affected by short-term market volatility. A 10-year investment horizon appropriate for saving for a college education, for example, enables you to weather market cycles in a long-term fund, which may have a higher risk potential, but also has a higher potential rate of return.
An intermediate-length fund could make sense if your investment horizon is two to four years, while a short-term bond fund could be the right choice if you need your money in one or two years.
If your time horizon is less than a year, you might want to consider moving some of your bond investment into a money market fund. These funds seek income and a stable share price by investing in high-quality, short-term investments. Of course, it's important to remember that an investment in a money market fund is not insured or guaranteed by the Federal Deposit Insurance Corporation or any other government agency. Although money market funds seek to preserve the value of your investment at $1.00 per share, it is possible to lose money by investing in these types of funds.
Finally, no matter what your time horizon or portfolio diversity, it makes good sense to follow a regular investment plan, investing a certain amount of money in a fund at the same time each month or quarter and periodically reviewing your overall portfolio. By doing so, you won't get caught up in the excitement of a rapidly rising market, nor will you buy all your shares at market highs. While this strategy - known as dollar cost averaging - won't assure a profit or protect you from a loss in a declining market, it should help you lower the average cost of your purchases. Of course, you should consider your financial ability to continue your purchases through periods of low price levels before undertaking such a strategy.
If you have questions, please call us at 1-800-544-6666, or visit our web site at www.fidelity.com. We are available 24 hours a day, seven days a week to provide you the information you need to make the investments that are right for you.
Best regards,
/s/Edward C. Johnson 3d
Edward C. Johnson 3d
Semiannual Report
There are several ways to evaluate a fund's historical performance. You can look at the total percentage change in value, the average annual percentage change or the growth of a hypothetical $10,000 investment. Total return reflects the change in the value of an investment, assuming reinvestment of the fund's dividend income and capital gains (the profits earned upon the sale of securities that have grown in value). You can also look at the fund's income, as reflected in the fund's yield, to measure performance. If Fidelity had not reimbursed certain fund expenses, the past 10 year total returns would have been lower.
Cumulative Total Returns
|
Periods ended October 31, 2000 |
Past 6 |
Past 1 |
Past 5 |
Past 10 |
|
Fidelity Intermediate Bond |
5.13% |
6.57% |
31.51% |
99.07% |
|
LB Int Govt/Credit Bond |
5.34% |
6.46% |
33.43% |
102.72% |
|
Short-Intermediate Investment Grade Debt Funds Average |
4.34% |
5.69% |
29.18% |
89.40% |
Cumulative total returns show the fund's performance in percentage terms over a set period - in this case, six months, one year, five years or 10 years. For example, if you had invested $1,000 in a fund that had a 5% return over the past year, the value of your investment would be $1,050. You can compare the fund's returns to the performance of the Lehman Brothers Intermediate Government/Credit Bond Index - a market value-weighted index of government and investment-grade corporate fixed-rate debt issues with maturities between one and 10 years. To measure how the fund's performance stacked up against its peers, you can compare it to the short-intermediate investment grade debt funds average, which reflects the performance of mutual funds with similar objectives tracked by Lipper Inc. The past six months average represents a peer group of 128 mutual funds. These benchmarks reflect reinvestment of dividends and capital gains, if any, and exclude the effect of sales charges.
Average Annual Total Returns
|
Periods ended October 31, 2000 |
Past 1 |
Past 5 |
Past 10 |
|
Fidelity Intermediate Bond |
6.57% |
5.63% |
7.13% |
|
LB Int Govt/Credit Bond |
6.46% |
5.94% |
7.32% |
|
Short-Intermediate Investment Grade Debt |
5.69% |
5.25% |
6.59% |
Average annual total returns take the fund's cumulative return and show you what would have happened if the fund had performed at a constant rate each year. (Note: Lipper calculates average annual total returns by annualizing each fund's total return, then taking an arithmetic average. This may produce a different figure than that obtained by averaging the cumulative total returns and annualizing the result.)
Semiannual Report
Performance - continued
$10,000 Over 10 Years
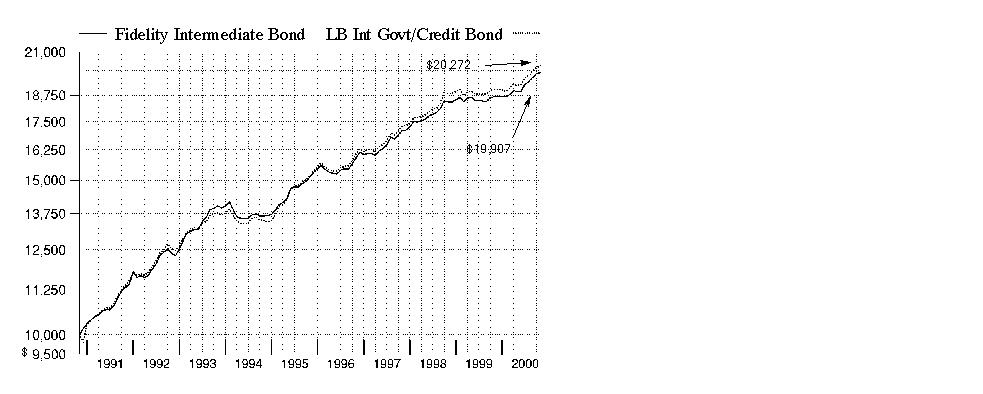
$10,000 Over 10 Years: Let's say hypothetically that $10,000 was invested in Fidelity Intermediate Bond Fund on October 31, 1990. As the chart shows, by October 31, 2000, the value of the investment would have grown to $19,907 - a 99.07% increase on the initial investment. For comparison, look at how the Lehman Brothers Intermediate Government/Credit Bond Index did over the same period. With dividends and capital gains, if any, reinvested, the same $10,000 would have grown to $20,272 - a 102.72% increase.
Understanding
Performance
How a fund did yesterday is no guarantee of how it will do tomorrow. Bond prices, for example, generally move in the opposite direction of interest rates. In turn, the share price, return and yield of a fund that invests in bonds will vary. That means if you sell your shares during a market downturn, you might lose money. But if you can ride out the market's ups and downs, you may have a gain.
3Semiannual Report
Performance - continued
Total Return Components
|
|
Six months ended October 31, |
Years ended April 30, |
||||
|
|
2000 |
2000 |
1999 |
1998 |
1997 |
1996 |
|
Dividend returns |
3.37% |
6.17% |
6.13% |
6.69% |
6.61% |
6.65% |
|
Capital returns |
1.76% |
-4.73% |
-0.10% |
2.01% |
-0.59% |
0.20% |
|
Total returns |
5.13% |
1.44% |
6.03% |
8.70% |
6.02% |
6.85% |
Total return components include both dividend returns and capital returns. A dividend return reflects the actual dividends paid by the fund. A capital return reflects both the amount paid by the fund to shareholders as capital gain distributions and changes in the fund's share price. Both returns assume the dividends or capital gains, if any, paid by the fund are reinvested.
Dividends and Yield
|
Periods ended October 31, 2000 |
Past 1 |
Past 6 |
Past 1 |
|
Dividends per share |
5.41¢ |
31.96¢ |
63.24¢ |
|
Annualized dividend rate |
6.46% |
6.50% |
6.48% |
|
30-day annualized yield |
6.69% |
- |
- |
Dividends per share show the income paid by the fund for a set period. If you annualize this number, based on an average share price of $9.86 over the past one month, $9.76 over the past six months and $9.76 over the past one year, you can compare the fund's income over these three periods. The 30-day annualized yield is a standard formula for all bond funds based on the yields of the bonds in the fund, averaged over the past 30 days. This figure shows you the yield characteristics of the fund's investments at the end of the period. It also helps you compare funds from different companies on an equal basis.
Semiannual Report
Market Recap
Strong technical factors in the market helped most investment-grade bonds overcome unusually volatile market conditions, enabling them to handily outperform most major U.S. equity indexes during the six-month period that ended October 31, 2000. The Lehman Brothers Aggregate Bond Index - a popular measure of taxable-bond performance - returned 5.80% during this time frame. Treasuries continued their hot streak from the beginning of 2000 thanks to a swelling federal surplus and the U.S. government's decision to buy back increasingly larger amounts of outstanding long-term debt. Anticipation that the Fed was finished raising interest rates following a half-point hike in May, combined with persistent flights-to-safety from risk-averse investors concerned about volatility in equity markets, further bolstered the long bond, helping the Lehman Brothers Treasury Index return 5.50% during the period. Mortgage and agency securities rallied back from their period lows in May to post formidable six-month returns. Discount mortgages were boosted by higher-than-normal prepayment activity supported by a strong housing market. Agencies staged a comeback behind reduced political risk surrounding government-sponsored enterprises. During the past six months, the Lehman Brothers Mortgage-Backed Securities and U.S. Agency indexes returned 6.24% and 6.08%, respectively. The corporate sector was the worst-performing segment of the market, plagued by deteriorating credit conditions and growing supply pressures. The Lehman Brothers Credit Bond Index posted a 5.37% return during the six-month period.
(Portfolio Manager photograph)
An interview with Ford O'Neil, Portfolio Manager of Fidelity Intermediate Bond Fund
Q. How did the fund perform, Ford?
A. For the six-month period that ended October 31, 2000, the fund posted a total return of 5.13%, topping the intermediate investment grade debt funds average tracked by Lipper Inc., which returned 4.34%. The Lehman Brothers Intermediate Government/Credit Bond Index returned 5.34% during the same period. For the 12 months that ended October 31, 2000, the fund returned 6.57%, outpacing both the Lipper average and Lehman Brothers index, which returned 5.69% and 6.46%, respectively.
Q. What factors influenced the fund's performance during the six-month period?
A. Favorable sector allocation and security selection were the biggest factors. Assuming a more defensive posture by way of further diversification was a key strategy given the extreme volatility that plagued the bond market during the past six months. With "negative event risk" threatening the credit quality of many corporate bonds during the period, I chose to reposition the fund in higher-quality, shorter-term issues, which suffered the least. This move helped mitigate the effects of our overweighting in corporates relative to the index. While we were able to avoid most of the major blow-ups in the sector during the period, the exposure we did have detracted from relative performance. Although underweighted in Treasuries, we owned longer-dated securities than the Lehman Brothers benchmark, which helped as the prices of these issues jumped in response to the U.S. Treasury's decision to reduce both outstanding and new issue supply of long-term debt. We also benefited by owning some callable Treasuries, which offered us the combination of a higher yield, as well as some price appreciation when the government surprisingly included these bonds in its buyback campaign. Unfortunately, much of what we gained in Treasuries, we gave back by underweighting agencies, a sector that rebounded nicely during the period. The political risk faced by dominant issuers Fannie Mae and Freddie Mac potentially losing their implicit government backing weighed heavily on the sector early on. Since we had little insight into how that outcome would be decided, I felt it prudent to remain underweighted in agencies, while pursuing more attractive opportunities elsewhere.
Semiannual Report
Fund Talk: The Manager's Overview - continued
Q. What was behind the fund's success relative to its peers?
A. A combination of factors led to the fund's success relative to its peers. First off, I believe many of our peers were more highly concentrated in some of the benchmark's largest issuers, which left them more heavily exposed to some of the enormous credit blowups that marked the six-month period. Second, the fund had an insignificant amount of poorly performing non-investment-grade debt, which also boosted relative returns. Finally, having a slightly longer duration - a measure of how sensitive the fund's share price is to changing interest rates - than some of our competitors helped in light of the unique technical backdrop painted by the Treasury buybacks. Under normal circumstances when the Federal Reserve Board is raising interest rates, it's appropriate to be shorter than the index. So basically, anyone who followed conventional wisdom got hurt.
Q. How did some of your other strategies play out for the fund?
A. Having exposure to a few of the bright spots within corporates, namely energy, entertainment and even tobacco, helped offset some of our losses. Although we were heavily invested in telecommunications, our strategy of overweighting strong performing European issuers at the expense of U.S. carriers paid off. An out-of-benchmark position in discount mortgages also worked out nicely for us, as we benefited from a pick-up in prepayment activity related to strong housing turnover. Allocating some assets to high-quality asset-backed and commercial mortgage-backed securities provided the fund with some stability, which was important in a declining credit environment. Their yield spreads widened somewhat during the period, but not enough to fully neutralize the yield advantage they offered relative to Treasuries.
Q. What's your outlook?
A. I remain cautious. We're at a crossroads in that the debt markets are anticipating a significant economic downturn, which is not supported by current economic data. So, given this uncertainty, I believe it's prudent to err on the side of caution, which leads to a very diversified portfolio in terms of sectors as well as individual names. I feel the fund should remain overweighted in the spread sectors, which currently offer historically attractive value opportunities, but it should remain defensively positioned.
Fund Facts
Goal: high current income by investing mainly in investment-grade debt securities while normally maintaining an average maturity between three and 10 years
Fund number: 032
Trading symbol: FTHRX
Start date: May 23, 1975
Size: as of October 31, 2000, more than $3.3 billion
Manager: Ford O'Neil, since 1998; manager, various Fidelity bond funds; joined Fidelity in 1990
3Ford O'Neil on compelling value in today's credit markets:
"The spread sectors are as cheap as they've ever been, especially in light of today's strong economic environment. To begin with, corporates are an extraordinarily cheap sector, with the widest spreads seen in over a decade - double the levels we had at the height of the global economic crisis in 1998. Again, since we feel the economy, although slowing, is not heading toward a severe economic recession, corporates are all the more attractive on a historical basis. Turning to mortgages, one would think that with spreads where they are today, we'd be seeing a refinancing wave coming around the corner. Maybe so, but I certainly don't see that happening any time soon, particularly given the fact that mortgage rates remain approximately 1% above the yield levels that triggered the refinancing wave that hit toward the end of 1998 and beginning of 1999. Finally, agency yield spreads relative to Treasuries hit their widest levels in May at the height of the political controversy surrounding government-sponsored enterprises (GSEs), such as Fannie Mae and Freddie Mac. Although agency spreads tightened a bit toward the end of the six-month period when legislation stalled, they still remain attractive, albeit less so than the corporate and mortgage markets. After the presidential election, legislation could pick up again, which could cause problems for agencies in their quest to possibly replace Treasuries as the benchmark issue. Even though I still view agencies as a core position, I intend to maintain a slight underweighting in the sector overall."
Semiannual Report
Fund Talk: The Manager's Overview - continued
The views expressed in this report reflect those of the portfolio manager only through the end of the period of the report as stated on the cover and do not necessarily represent the views of Fidelity or any other person in the Fidelity organization. Any such views are subject to change at any time based upon market or other conditions and Fidelity disclaims any responsibility to update such views. These views may not be relied on as investment advice and, because investment decisions for a Fidelity fund are based on numerous factors, may not be relied on as an indication of trading intent on behalf of any Fidelity fund.
Semiannual Report
|
Quality Diversification as of October 31, 2000 |
||
|
(Moody's Ratings) |
% of fund's investments |
% of fund's investments |
|
Aaa |
38.3 |
38.2 |
|
Aa |
8.2 |
5.6 |
|
A |
22.2 |
22.6 |
|
Baa |
25.3 |
29.8 |
|
Ba and Below |
0.6 |
1.0 |
|
Not Rated |
1.0 |
1.1 |
|
Table excludes short-term investments. Where Moody's ratings are not available, we have used S&P ® ratings. |
|
Average Years to Maturity as of October 31, 2000 |
||
|
|
|
6 months ago |
|
Years |
6.1 |
5.6 |
|
Average years to maturity is based on the average time remaining until principal payments are expected from each of the fund's bonds, weighted by dollar amount. |
|
Duration as of October 31, 2000 |
||
|
|
|
6 months ago |
|
Years |
3.5 |
3.5 |
|
Duration shows how much a bond fund's price fluctuates with changes in comparable interest rates. If rates rise 1%, for example, a fund with a five-year duration is likely to lose about 5% of its value. Other factors also can influence a bond fund's performance and share price. Accordingly, a bond fund's actual performance may differ from this example. |
|
Asset Allocation (% of fund's net assets) |
|||||||
|
As of October 31, 2000 * |
As of April 30, 2000 ** |
||||||
 |
Corporate Bonds 49.7% |
|
|
Corporate Bonds 51.8% |
|
||
 |
U.S. Government and Government Agency Obligations 28.7% |
|
|
U.S. Government and Government Agency Obligations 29.3% |
|
||
 |
Asset-Backed |
|
|
Asset-Backed |
|
||
 |
CMOs and Other Mortgage Related Securities 5.0% |
|
|
CMOs and Other Mortgage Related Securities 4.0% |
|
||
 |
Other Investments 4.4% |
|
|
Other Investments 4.3% |
|
||
 |
Short-Term |
|
|
Short-Term |
|
||
|
* Foreign investments |
15.2% |
|
** Foreign investments |
13.8% |
|
||

Semiannual Report
(Unaudited)
Showing Percentage of Net Assets
|
Nonconvertible Bonds - 49.7% |
|||||
|
Moody's Ratings |
Principal Amount (000s) |
Value (Note 1) (000s) |
|||
|
AEROSPACE & DEFENSE - 0.3% |
|||||
|
Defense Electronics - 0.3% |
|||||
|
Raytheon Co. 7.9% 3/1/03 |
Baa2 |
|
$ 10,000 |
$ 10,116 |
|
|
BASIC INDUSTRIES - 1.3% |
|||||
|
Chemicals & Plastics - 0.5% |
|||||
|
Pharmacia Corp. 5.75% 12/1/05 |
A1 |
|
16,000 |
15,149 |
|
|
Paper & Forest Products - 0.8% |
|||||
|
Abitibi-Consolidated, Inc. yankee: |
|
|
|
|
|
|
8.3% 8/1/05 |
Baa3 |
|
3,380 |
3,417 |
|
|
8.55% 8/1/10 |
Baa3 |
|
12,285 |
12,114 |
|
|
Fort James Corp.: |
|
|
|
|
|
|
6.5% 9/15/02 |
Baa2 |
|
11,950 |
11,767 |
|
|
6.625% 9/15/04 |
Baa2 |
|
525 |
500 |
|
|
|
27,798 |
||||
|
TOTAL BASIC INDUSTRIES |
42,947 |
||||
|
CONSTRUCTION & REAL ESTATE - 1.7% |
|||||
|
Real Estate - 0.7% |
|||||
|
Arden Realty LP 8.875% 3/1/05 |
Baa3 |
|
4,365 |
4,446 |
|
|
Cabot Industrial Property LP 7.125% 5/1/04 |
Baa2 |
|
6,060 |
5,885 |
|
|
Duke-Weeks Realty LP 6.875% 3/15/05 |
Baa2 |
|
11,700 |
11,422 |
|
|
|
21,753 |
||||
|
Real Estate Investment Trusts - 1.0% |
|||||
|
Avalonbay Communities, Inc.: |
|
|
|
|
|
|
6.58% 2/15/04 |
Baa1 |
|
6,635 |
6,465 |
|
|
8.25% 7/15/08 |
Baa1 |
|
6,500 |
6,605 |
|
|
CenterPoint Properties Trust 7.125% 3/15/04 |
Baa2 |
|
9,000 |
8,768 |
|
|
Equity Office Properties Trust: |
|
|
|
|
|
|
6.5% 1/15/04 |
Baa1 |
|
3,125 |
3,030 |
|
|
6.763% 6/15/07 |
Baa1 |
|
4,700 |
4,410 |
|
|
Spieker Properties LP 6.8% 5/1/04 |
Baa2 |
|
4,705 |
4,575 |
|
|
|
33,853 |
||||
|
TOTAL CONSTRUCTION & REAL ESTATE |
55,606 |
||||
|
Nonconvertible Bonds - continued |
|||||
|
Moody's Ratings |
Principal Amount (000s) |
Value (Note 1) (000s) |
|||
|
DURABLES - 1.2% |
|||||
|
Autos, Tires, & Accessories - 0.7% |
|||||
|
Daimler-Chrysler North America Holding Corp. 7.4% 1/20/05 |
A1 |
|
$ 12,500 |
$ 12,535 |
|
|
Enron Corp. Series A, 8.375% 5/23/05 |
Baa1 |
|
8,915 |
9,273 |
|
|
|
21,808 |
||||
|
Textiles & Apparel - 0.5% |
|||||
|
Jones Apparel Group, Inc./Jones Apparel Group Hldgs., Inc./Jones Apparel Group USA, Inc. 6.25% 10/1/01 |
Baa2 |
|
5,500 |
5,384 |
|
|
Jones Apparel Group, Inc. 7.875% 6/15/06 |
Baa2 |
|
12,580 |
11,617 |
|
|
|
17,001 |
||||
|
TOTAL DURABLES |
38,809 |
||||
|
ENERGY - 2.0% |
|||||
|
Energy Services - 0.5% |
|||||
|
Baker Hughes, Inc. 5.8% 2/15/03 |
A2 |
|
7,800 |
7,583 |
|
|
Petroliam Nasional BHD (Petronas) yankee 7.125% 10/18/06 (c) |
Baa2 |
|
9,300 |
8,868 |
|
|
|
16,451 |
||||
|
Oil & Gas - 1.5% |
|||||
|
Canada Occidental Petroleum Ltd. 7.125% 2/4/04 |
Baa2 |
|
13,450 |
13,279 |
|
|
Occidental Petroleum Corp. 6.35% 11/9/00 |
Baa3 |
|
5,000 |
5,000 |
|
|
Phillips Petroleum Co. 8.5% 5/25/05 |
Baa2 |
|
3,500 |
3,688 |
|
|
Ras Laffan Liquid Natural Gas Co. Ltd. yankee 8.294% 3/15/14 (c) |
Baa3 |
|
9,700 |
9,291 |
|
|
The Coastal Corp. 6.2% 5/15/04 |
Baa2 |
|
8,500 |
8,251 |
|
|
Union Pacific Resources Group, Inc. 7% 10/15/06 |
Baa1 |
|
10,000 |
9,918 |
|
|
|
49,427 |
||||
|
TOTAL ENERGY |
65,878 |
||||
|
FINANCE - 25.9% |
|||||
|
Banks - 10.2% |
|||||
|
Australia & New Zealand Banking Group Ltd. yankee 6.25% 2/1/04 |
A1 |
|
15,995 |
15,569 |
|
|
Banc One Corp. 7.6% 5/1/07 |
A1 |
|
10,000 |
9,944 |
|
|
Bank of America Corp. 7.875% 5/16/05 |
Aa2 |
|
8,750 |
8,986 |
|
|
Bank of Montreal 6.1% 9/15/05 |
A1 |
|
3,000 |
2,857 |
|
|
Nonconvertible Bonds - continued |
|||||
|
Moody's Ratings |
Principal Amount (000s) |
Value (Note 1) (000s) |
|||
|
FINANCE - continued |
|||||
|
Banks - continued |
|||||
|
Bank of New York Co., Inc. 6.625% 6/15/03 |
A1 |
|
$ 7,200 |
$ 7,152 |
|
|
Bank One Capital III 8.75% 9/1/30 |
Aa3 |
|
12,000 |
11,717 |
|
|
Bank One Corp. 7.625% 8/1/05 |
Aa3 |
|
2,000 |
2,023 |
|
|
BankAmerica Corp. 5.75% 3/1/04 |
Aa2 |
|
5,000 |
4,807 |
|
|
BanPonce Financial Corp. 6.75% 8/9/01 |
A3 |
|
3,850 |
3,839 |
|
|
Barclays Bank PLC yankee 8.55% |
Aa2 |
|
6,000 |
6,041 |
|
|
Capital One Bank: |
|
|
|
|
|
|
6.375% 2/15/03 |
Baa2 |
|
9,860 |
9,568 |
|
|
6.48% 6/28/02 |
Baa2 |
|
7,975 |
7,778 |
|
|
6.65% 3/15/04 |
Baa3 |
|
12,500 |
11,983 |
|
|
Chase Manhattan Corp.: |
|
|
|
|
|
|
5.75% 4/15/04 |
Aa3 |
|
7,200 |
6,912 |
|
|
6.375% 4/1/08 |
A1 |
|
3,500 |
3,286 |
|
|
7.25% 6/1/07 |
A1 |
|
6,303 |
6,266 |
|
|
Crestar Finanical Corp. 8.75% 11/15/04 |
A2 |
|
7,100 |
7,453 |
|
|
Den Danske Bank AS 6.375% 6/15/08 (c)(d) |
A1 |
|
15,800 |
15,089 |
|
|
First Chicago Corp. 6.3% 11/1/01 |
Aa3 |
|
2,000 |
1,989 |
|
|
First National Boston Corp. 7.375% 9/15/06 |
A2 |
|
4,950 |
4,950 |
|
|
First Security Corp.: |
|
|
|
|
|
|
5.875% 11/1/03 |
Aa2 |
|
1,750 |
1,686 |
|
|
7.5% 9/1/02 |
Aa3 |
|
5,300 |
5,300 |
|
|
First Tennessee National Corp. 6.75% |
A3 |
|
7,020 |
6,839 |
|
|
Firstar Bank, Milwaukee 6.25% 12/1/02 |
Aa3 |
|
2,500 |
2,462 |
|
|
FleetBoston Financial Corp. 7.25% 9/15/05 |
A2 |
|
8,450 |
8,468 |
|
|
Kansallis-Osake-Pankki (NY Branch) yankee |
A1 |
|
17,415 |
18,083 |
|
|
Key Bank NA 5.8% 4/1/04 |
Aa3 |
|
7,000 |
6,669 |
|
|
Korea Development Bank 7.375% 9/17/04 |
Baa2 |
|
7,890 |
7,705 |
|
|
MBNA Corp. 6.34% 6/2/03 |
Baa2 |
|
2,900 |
2,800 |
|
|
Mellon Financial Co. 9.25% 8/15/01 |
A2 |
|
4,000 |
4,059 |
|
|
Merita Bank Ltd. yankee 6.5% 1/15/06 |
A1 |
|
12,000 |
11,531 |
|
|
Midland Bank PLC 8.625% 12/15/04 |
Aa3 |
|
9,750 |
10,275 |
|
|
National Australia Bank Ltd.: |
|
|
|
|
|
|
yankee 6.4% 12/10/07 (d) |
A1 |
|
9,875 |
9,585 |
|
|
yankee 6.6% 12/10/07 |
A1 |
|
10,000 |
9,428 |
|
|
NationsBank Corp. 6.5% 8/15/03 |
Aa3 |
|
4,000 |
3,953 |
|
|
Norwest Corp. 6.5% 6/1/05 |
Aa2 |
|
5,000 |
4,870 |
|
|
Popular, Inc. 6.2% 4/30/01 |
A3 |
|
7,545 |
7,504 |
|
|
Nonconvertible Bonds - continued |
|||||
|
Moody's Ratings |
Principal Amount (000s) |
Value (Note 1) (000s) |
|||
|
FINANCE - continued |
|||||
|
Banks - continued |
|||||
|
Providian National Bank: |
|
|
|
|
|
|
6.25% 5/7/01 |
Baa3 |
|
$ 8,875 |
$ 8,814 |
|
|
6.75% 3/15/02 |
Baa3 |
|
3,425 |
3,380 |
|
|
Royal Bank of Scotland Group PLC 9.118% 3/31/49 |
A1 |
|
20,205 |
21,046 |
|
|
State Street Corp. 7.65% 6/15/10 |
A1 |
|
3,000 |
3,059 |
|
|
Swiss Bank Corp. 6.75% 7/15/05 |
Aa2 |
|
4,000 |
3,933 |
|
|
Union Planters Corp. 6.75% 11/1/05 |
Baa2 |
|
9,000 |
8,661 |
|
|
Wachovia Corp. 6.925% 10/15/03 |
Aa3 |
|
17,750 |
17,717 |
|
|
Wells Fargo & Co. 7.2% 5/1/03 |
Aa2 |
|
2,250 |
2,265 |
|
|
|
338,301 |
||||
|
Credit & Other Finance - 10.2% |
|||||
|
Abbey National Capital Trust I 8.963% 12/29/49 (d) |
Aa3 |
|
4,050 |
4,034 |
|
|
Aristar, Inc. 6% 5/15/02 |
A3 |
|
11,200 |
11,010 |
|
|
Associates Corp. of North America: |
|
|
|
|
|
|
5.8% 4/20/04 |
A1 |
|
6,750 |
6,484 |
|
|
6% 4/15/03 |
A1 |
|
6,910 |
6,758 |
|
|
CIT Group Holdings, Inc. 6.5% 6/14/02 |
A1 |
|
6,100 |
6,005 |
|
|
CIT Group, Inc. 7.375% 3/15/03 |
A1 |
|
1,700 |
1,703 |
|
|
Citigroup, Inc.: |
|
|
|
|
|
|
7.25% 10/1/10 |
Aa3 |
|
15,000 |
14,881 |
|
|
9.5% 3/1/02 |
Aa2 |
|
2,000 |
2,065 |
|
|
Countrywide Funding Corp. 6.45% 2/27/03 |
A3 |
|
15,900 |
15,682 |
|
|
Duke Capital Corp. 7.5% 10/1/09 |
A3 |
|
14,500 |
14,582 |
|
|
Edison Mission Energy Funding Corp. 6.77% 9/15/03 (c) |
Baa1 |
|
10,258 |
9,964 |
|
|
ERP Operating LP 6.55% 11/15/01 |
A3 |
|
3,150 |
3,125 |
|
|
Ford Motor Credit Co.: |
|
|
|
|
|
|
7.5% 3/15/05 |
A2 |
|
3,500 |
3,511 |
|
|
7.6% 8/1/05 |
A2 |
|
10,000 |
10,053 |
|
|
7.875% 6/15/10 |
A2 |
|
10,000 |
10,028 |
|
|
General Motors Acceptance Corp.: |
|
|
|
|
|
|
5.5% 1/14/02 |
A2 |
|
7,500 |
7,361 |
|
|
5.75% 11/10/03 |
A2 |
|
6,000 |
5,791 |
|
|
7.625% 6/15/04 |
A2 |
|
8,500 |
8,637 |
|
|
9% 10/15/02 |
A2 |
|
9,000 |
9,333 |
|
|
GS Escrow Corp. 7.125% 8/1/05 |
Ba1 |
|
2,500 |
2,293 |
|
|
Heller Financial, Inc. 6.5% 7/22/02 |
A3 |
|
8,200 |
8,083 |
|
|
Household Finance Corp. 8% 5/9/05 |
A2 |
|
6,000 |
6,136 |
|
|
Nonconvertible Bonds - continued |
|||||
|
Moody's Ratings |
Principal Amount (000s) |
Value (Note 1) (000s) |
|||
|
FINANCE - continued |
|||||
|
Credit & Other Finance - continued |
|||||
|
HSBC Capital Funding LP 9.547% 12/31/49 (b)(c) |
A1 |
|
$ 10,000 |
$ 10,520 |
|
|
Norwest Financial, Inc. 5.375% 9/30/03 |
Aa2 |
|
7,050 |
6,747 |
|
|
PNC Funding Corp. 6.95% 9/1/02 |
A2 |
|
12,500 |
12,506 |
|
|
Popular North America, Inc.: |
|
|
|
|
|
|
6.625% 10/27/02 |
A3 |
|
5,000 |
4,958 |
|
|
7.375% 9/15/01 |
A3 |
|
8,420 |
8,404 |
|
|
Qwest Capital Funding, Inc. 7.75% 8/15/06 (c) |
Baa1 |
|
4,000 |
4,056 |
|
|
Scotland International Finance No. 2 BV yankee: |
|
|
|
|
|
|
7.7% 8/15/10 (c) |
A1 |
|
8,000 |
7,938 |
|
|
8.8% 1/27/04 (c) |
A1 |
|
5,250 |
5,449 |
|
|
Sears Roebuck Acceptance Corp.: |
|
|
|
|
|
|
6% 3/20/03 |
A3 |
|
3,425 |
3,338 |
|
|
6.95% 5/15/02 |
A3 |
|
1,730 |
1,723 |
|
|
Spear, Leeds & Kellogg LP/SLK Capital Corp. 8.25% 8/15/05 (c) |
A3 |
|
9,000 |
9,316 |
|
|
Sprint Capital Corp. 6.875% 11/15/28 |
Baa1 |
|
11,500 |
9,394 |
|
|
Textron Financial Corp. 7.125% 12/9/04 |
A2 |
|
12,675 |
12,675 |
|
|
Trizec Finance Ltd. yankee 10.875% 10/15/05 |
Baa3 |
|
14,146 |
14,287 |
|
|
TXU Eastern Funding: |
|
|
|
|
|
|
6.15% 5/15/02 |
Baa1 |
|
12,000 |
11,744 |
|
|
6.75% 5/15/09 |
Baa1 |
|
13,500 |
12,153 |
|
|
U.S. West Capital Funding, Inc. 6.375% 7/15/08 |
Baa1 |
|
15,800 |
14,708 |
|
|
UBS Preferred Funding Trust 1 8.622% 12/29/49 |
Aa2 |
|
7,900 |
7,979 |
|
|
Unicredito Italiano Capital Trust II yankee 9.2% 10/29/49 (b)(c) |
A1 |
|
3,500 |
3,478 |
|
|
Unilever Capital Corp. 6.75% 11/1/03 |
A1 |
|
10,000 |
9,951 |
|
|
|
338,843 |
||||
|
Insurance - 1.6% |
|||||
|
American General Corp. 6.25% 3/15/03 |
A2 |
|
11,000 |
10,787 |
|
|
Metropolitan Life Insurance Co.: |
|
|
|
|
|
|
6.3% 11/1/03 (c) |
A1 |
|
4,500 |
4,404 |
|
|
7% 11/1/05 (c) |
A1 |
|
5,000 |
4,903 |
|
|
New York Life Insurance Co. 6.4% 12/15/03 (c) |
Aa3 |
|
10,000 |
9,808 |
|
|
The Saint Paul Companies, Inc. 7.875% 4/15/05 |
A1 |
|
6,500 |
6,662 |
|
|
Western National Corp. 7.125% 2/15/04 |
A2 |
|
18,430 |
18,320 |
|
|
|
54,884 |
||||
|
Nonconvertible Bonds - continued |
|||||
|
Moody's Ratings |
Principal Amount (000s) |
Value (Note 1) (000s) |
|||
|
FINANCE - continued |
|||||
|
Savings & Loans - 1.4% |
|||||
|
H.F. Ahmanson & Co.: |
|
|
|
|
|
|
7.875% 9/1/04 |
Baa1 |
|
$ 1,250 |
$ 1,262 |
|
|
8.25% 10/1/02 |
A3 |
|
6,400 |
6,520 |
|
|
Home Savings of America FSB 6.5% 8/15/04 |
A3 |
|
9,550 |
9,248 |
|
|
Long Island Savings Bank FSB: |
|
|
|
|
|
|
6.2% 4/2/01 |
Baa3 |
|
7,030 |
6,982 |
|
|
7% 6/13/02 |
Baa3 |
|
10,700 |
10,627 |
|
|
Sovereign Bancorp, Inc. 6.625% 3/15/01 |
Ba3 |
|
10,500 |
10,418 |
|
|
|
45,057 |
||||
|
Securities Industry - 2.5% |
|||||
|
Amvescap PLC yankee: |
|
|
|
|
|
|
6.375% 5/15/03 |
A2 |
|
15,650 |
15,163 |
|
|
6.6% 5/15/05 |
A2 |
|
10,785 |
10,308 |
|
|
Goldman Sachs Group LP: |
|
|
|
|
|
|
6.6% 7/15/02 (c) |
A1 |
|
4,200 |
4,140 |
|
|
7.875% 1/15/03 (c) |
A1 |
|
3,000 |
3,041 |
|
|
Goldman Sachs Group, Inc. 7.625% 8/17/05 |
A1 |
|
4,000 |
4,048 |
|
|
Lehman Brothers Holdings 7% 5/15/03 |
A3 |
|
10,000 |
9,956 |
|
|
Merrill Lynch & Co., Inc. 5.71% 1/15/02 |
Aa3 |
|
15,250 |
15,000 |
|
|
Morgan Stanley Dean Witter & Co. 7.125% 1/15/03 |
Aa3 |
|
12,250 |
12,297 |
|
|
Salomon Smith Barney Holdings, Inc. 7.3% 5/15/02 |
Aa3 |
|
8,000 |
8,037 |
|
|
|
81,990 |
||||
|
TOTAL FINANCE |
859,075 |
||||
|
INDUSTRIAL MACHINERY & EQUIPMENT - 0.9% |
|||||
|
Tyco International Group SA: |
|
|
|
|
|
|
6.875% 9/5/02 |
Baa1 |
|
5,500 |
5,458 |
|
|
yankee: |
|
|
|
|
|
|
6.125% 6/15/01 |
Baa1 |
|
5,250 |
5,203 |
|
|
6.375% 6/15/05 |
Baa1 |
|
19,600 |
18,896 |
|
|
TOTAL INDUSTRIAL MACHINERY & EQUIPMENT |
29,557 |
||||
|
MEDIA & LEISURE - 2.1% |
|||||
|
Broadcasting - 1.2% |
|||||
|
British Sky Broadcasting Group PLC 7.3% 10/15/06 |
Ba1 |
|
9,050 |
8,211 |
|
|
Nonconvertible Bonds - continued |
|||||
|
Moody's Ratings |
Principal Amount (000s) |
Value (Note 1) (000s) |
|||
|
MEDIA & LEISURE - continued |
|||||
|
Broadcasting - continued |
|||||
|
Clear Channel Communications, Inc. 7.875% 6/15/05 |
Baa3 |
|
$ 5,880 |
$ 5,926 |
|
|
Continental Cablevision, Inc. 8.3% 5/15/06 |
A2 |
|
11,501 |
11,779 |
|
|
Cox Communications, Inc. 6.5% 11/15/02 |
Baa2 |
|
1,500 |
1,479 |
|
|
Hearst-Argyle Television, Inc. 7% 11/15/07 |
Baa3 |
|
6,500 |
6,167 |
|
|
TCI Communications, Inc.: |
|
|
|
|
|
|
8% 8/1/05 |
A2 |
|
2,748 |
2,783 |
|
|
8.65% 9/15/04 |
A2 |
|
2,000 |
2,073 |
|
|
|
38,418 |
||||
|
Entertainment - 0.4% |
|||||
|
Viacom, Inc. 6.75% 1/15/03 |
Baa1 |
|
14,398 |
14,295 |
|
|
Publishing - 0.5% |
|||||
|
News America Holdings, Inc. 8.625% 2/1/03 |
Baa3 |
|
4,000 |
4,087 |
|
|
Time Warner Entertainment Co. LP 8.375% 3/15/23 |
Baa2 |
|
11,500 |
11,998 |
|
|
|
16,085 |
||||
|
TOTAL MEDIA & LEISURE |
68,798 |
||||
|
NONDURABLES - 2.3% |
|||||
|
Beverages - 0.2% |
|||||
|
Seagram JE & Sons, Inc. 6.625% 12/15/05 |
Baa3 |
|
5,650 |
5,689 |
|
|
Foods - 0.9% |
|||||
|
ConAgra Foods, Inc.: |
|
|
|
|
|
|
5.5% 10/15/02 |
Baa1 |
|
12,000 |
11,636 |
|
|
7.875% 9/15/10 |
Baa1 |
|
11,750 |
11,924 |
|
|
Nabisco, Inc. 6.85% 6/15/05 |
Baa2 |
|
8,750 |
8,388 |
|
|
|
31,948 |
||||
|
Tobacco - 1.2% |
|||||
|
Imperial Tobacco Overseas Bv 7.125% 4/1/09 |
Baa2 |
|
9,500 |
8,719 |
|
|
Philip Morris Companies, Inc.: |
|
|
|
|
|
|
6.8% 12/1/03 |
A2 |
|
13,370 |
12,973 |
|
|
7% 7/15/05 |
A2 |
|
3,000 |
2,885 |
|
|
7.625% 5/15/02 |
A2 |
|
3,000 |
2,987 |
|
|
Nonconvertible Bonds - continued |
|||||
|
Moody's Ratings |
Principal Amount (000s) |
Value (Note 1) (000s) |
|||
|
NONDURABLES - continued |
|||||
|
Tobacco - continued |
|||||
|
RJ Reynolds Tobacco Holdings, Inc.: |
|
|
|
|
|
|
7.375% 5/15/03 |
Baa2 |
|
$ 5,125 |
$ 4,850 |
|
|
7.75% 5/15/06 |
Baa2 |
|
9,000 |
8,209 |
|
|
|
40,623 |
||||
|
TOTAL NONDURABLES |
78,260 |
||||
|
RETAIL & WHOLESALE - 1.0% |
|||||
|
General Merchandise Stores - 0.8% |
|||||
|
Dayton Hudson Corp. 9.75% 7/1/02 |
A2 |
|
2,200 |
2,288 |
|
|
Federated Department Stores, Inc.: |
|
|
|
|
|
|
6.79% 7/15/27 |
Baa1 |
|
9,300 |
8,746 |
|
|
8.125% 10/15/02 |
Baa1 |
|
6,535 |
6,510 |
|
|
8.5% 6/15/03 |
Baa1 |
|
8,905 |
8,842 |
|
|
|
26,386 |
||||
|
Grocery Stores - 0.2% |
|||||
|
Safeway, Inc. 7% 9/15/02 |
Baa2 |
|
7,500 |
7,483 |
|
|
TOTAL RETAIL & WHOLESALE |
33,869 |
||||
|
TECHNOLOGY - 1.1% |
|||||
|
Communications Equipment - 0.3% |
|||||
|
Marconi PLC yankee 8.375% 9/15/30 |
A3 |
|
11,000 |
10,441 |
|
|
Computers & Office Equipment - 0.8% |
|||||
|
Comdisco, Inc.: |
|
|
|
|
|
|
6% 1/30/02 |
Baa2 |
|
11,850 |
8,769 |
|
|
6.65% 11/13/01 |
Baa2 |
|
3,000 |
2,370 |
|
|
7.25% 9/1/02 |
Baa2 |
|
7,500 |
5,475 |
|
|
Compaq Computer Corp. 7.45% 8/1/02 |
Baa2 |
|
9,200 |
9,186 |
|
|
|
25,800 |
||||
|
TOTAL TECHNOLOGY |
36,241 |
||||
|
TRANSPORTATION - 2.8% |
|||||
|
Air Transportation - 0.9% |
|||||
|
Continental Airlines, Inc. pass thru trust certificates: |
|
|
|
|
|
|
7.42% 10/1/08 |
Baa1 |
|
7,545 |
7,447 |
|
|
7.434% 3/15/06 |
Baa1 |
|
2,665 |
2,614 |
|
|
Nonconvertible Bonds - continued |
|||||
|
Moody's Ratings |
Principal Amount (000s) |
Value (Note 1) (000s) |
|||
|
TRANSPORTATION - continued |
|||||
|
Air Transportation - continued |
|||||
|
Continental Airlines, Inc. pass thru trust certificates: - continued |
|
|
|
|
|
|
7.73% 9/15/12 |
Baa1 |
|
$ 981 |
$ 958 |
|
|
Delta Air Lines, Inc. 7.7% 12/15/05 |
Baa3 |
|
10,500 |
10,139 |
|
|
Qantas Airways Ltd. 7.75% 6/15/09 (c) |
Baa1 |
|
8,500 |
8,557 |
|
|
|
29,715 |
||||
|
Railroads - 1.9% |
|||||
|
Burlington Northern Santa Fe Corp. 6.53% 7/15/37 |
Baa2 |
|
19,000 |
18,668 |
|
|
Canadian National Railway Co. yankee 6.625% 5/15/03 |
Baa2 |
|
8,000 |
7,868 |
|
|
CSX Corp.: |
|
|
|
|
|
|
6.46% 6/22/05 |
Baa2 |
|
5,000 |
4,788 |
|
|
7.05% 5/1/02 |
Baa2 |
|
5,000 |
4,973 |
|
|
7.25% 5/1/04 |
Baa2 |
|
6,000 |
5,978 |
|
|
Union Pacific 6.34% 11/25/03 |
Baa3 |
|
10,300 |
10,021 |
|
|
Wisconsin Central Transportation Corp. 6.625% 4/15/08 |
Baa2 |
|
11,070 |
9,991 |
|
|
|
62,287 |
||||
|
TOTAL TRANSPORTATION |
92,002 |
||||
|
UTILITIES - 7.1% |
|||||
|
Cellular - 0.6% |
|||||
|
Vodafone AirTouch PLC: |
|
|
|
|
|
|
7.625% 2/15/05 (c) |
A2 |
|
7,500 |
7,609 |
|
|
7.75% 2/15/10 (c) |
A2 |
|
13,000 |
13,199 |
|
|
|
20,808 |
||||
|
Electric Utility - 2.4% |
|||||
|
Avon Energy Partners Holdings 6.73% 12/11/02 (c) |
Baa2 |
|
18,500 |
18,072 |
|
|
Commonwealth Edison Co. 7.375% 9/15/02 |
Baa1 |
|
7,500 |
7,533 |
|
|
Dominion Resources, Inc.: |
|
|
|
|
|
|
7.6% 7/15/03 |
Baa1 |
|
5,000 |
5,066 |
|
|
8.125% 6/15/10 |
Baa1 |
|
5,395 |
5,563 |
|
|
Illinois Power Co. 6.25% 7/15/02 |
Baa1 |
|
5,000 |
4,929 |
|
|
Niagara Mohawk Power Corp.: |
|
|
|
|
|
|
5.875% 9/1/02 |
Baa2 |
|
4,800 |
4,690 |
|
|
7.375% 8/1/03 |
Baa2 |
|
2,500 |
2,523 |
|
|
Nonconvertible Bonds - continued |
|||||
|
Moody's Ratings |
Principal Amount (000s) |
Value (Note 1) (000s) |
|||
|
UTILITIES - continued |
|||||
|
Electric Utility - continued |
|||||
|
Niagara Mohawk Power Corp.: - continued |
|
|
|
|
|
|
8% 6/1/04 |
Baa2 |
|
$ 4,269 |
$ 4,375 |
|
|
8.875% 5/15/07 |
Baa3 |
|
2,485 |
2,612 |
|
|
Philadelphia Electric Co.: |
|
|
|
|
|
|
6.5% 5/1/03 |
Baa1 |
|
4,800 |
4,719 |
|
|
6.625% 3/1/03 |
Baa1 |
|
8,980 |
8,861 |
|
|
Public Service Electric & Gas Co. 6.125% 8/1/02 |
A3 |
|
5,800 |
5,705 |
|
|
Texas Utilities Electric Co. 8.125% 2/1/02 |
A3 |
|
6,000 |
6,061 |
|
|
|
80,709 |
||||
|
Gas - 1.3% |
|||||
|
CMS Panhandle Holding Co. 6.125% |
Baa3 |
|
6,250 |
5,897 |
|
|
Consolidated Natural Gas Co. 7.375% |
A2 |
|
5,750 |
5,774 |
|
|
Enserch Corp. 6.25% 1/1/03 |
Baa2 |
|
4,000 |
3,922 |
|
|
Kern River Funding Corp. 6.42% 3/31/01 (c) |
A2 |
|
1,858 |
1,849 |
|
|
Reliant Energy Resources Corp. 8.125% 7/15/05 (c) |
Baa1 |
|
8,000 |
8,096 |
|
|
Sempra Energy 7.95% 3/1/10 |
A2 |
|
10,000 |
10,090 |
|
|
Sonat, Inc. 6.875% 6/1/05 |
Baa2 |
|
2,755 |
2,713 |
|
|
Southwest Gas Corp. 9.75% 6/15/02 |
Baa2 |
|
3,840 |
3,957 |
|
|
|
42,298 |
||||
|
Telephone Services - 2.8% |
|||||
|
Cable & Wireless Optus Ltd. 8% 6/22/10 (c) |
Baa1 |
|
7,900 |
8,158 |
|
|
Deutsche Telekom International Finance BV 8.25% 6/15/30 |
A2 |
|
6,890 |
7,031 |
|
|
Telecomunicaciones de Puerto Rico, Inc.: |
|
|
|
|
|
|
6.15% 5/15/02 |
Baa2 |
|
10,345 |
10,157 |
|
|
6.65% 5/15/06 |
Baa2 |
|
9,110 |
8,658 |
|
|
Telefonica Europe BV: |
|
|
|
|
|
|
7.35% 9/15/05 |
A2 |
|
8,200 |
8,235 |
|
|
8.25% 9/15/30 |
A2 |
|
8,600 |
8,855 |
|
|
Teleglobe Canada, Inc.: |
|
|
|
|
|
|
7.2% 7/20/09 |
Baa1 |
|
19,519 |
18,709 |
|
|
7.7% 7/20/29 |
Baa1 |
|
8,000 |
7,548 |
|
|
Nonconvertible Bonds - continued |
|||||
|
Moody's Ratings |
Principal Amount (000s) |
Value (Note 1) (000s) |
|||
|
UTILITIES - continued |
|||||
|
Telephone Services - continued |
|||||
|
WorldCom, Inc.: |
|
|
|
|
|
|
6.125% 8/15/01 |
A3 |
|
$ 2,345 |
$ 2,322 |
|
|
7.75% 4/1/07 |
A3 |
|
1,950 |
1,973 |
|
|
8.875% 1/15/06 |
A3 |
|
11,326 |
11,687 |
|
|
|
93,333 |
||||
|
TOTAL UTILITIES |
237,148 |
||||
|
TOTAL NONCONVERTIBLE BONDS (Cost $1,672,659) |
1,648,306 |
||||
|
U.S. Government and Government Agency Obligations - 21.3% |
|||||
|
|
|||||
|
U.S. Government Agency Obligations - 8.3% |
|||||
|
Fannie Mae: |
|
|
|
|
|
|
5.125% 2/13/04 |
Aaa |
|
34,720 |
33,320 |
|
|
6.375% 10/15/02 |
Aaa |
|
15,000 |
14,993 |
|
|
6.5% 8/15/04 |
Aaa |
|
43,415 |
43,388 |
|
|
7% 7/15/05 |
Aaa |
|
9,500 |
9,680 |
|
|
Federal Farm Credit Bank 5.54% 9/10/03 |
Aaa |
|
1,000 |
974 |
|
|
Federal Home Loan Bank: |
|
|
|
|
|
|
5.125% 9/15/03 |
Aaa |
|
4,885 |
4,715 |
|
|
6.5% 8/15/07 |
Aaa |
|
20,000 |
19,791 |
|
|
Financing Corp. - coupon STRIPS: |
|
|
|
|
|
|
0% 12/6/03 |
Aaa |
|
2,168 |
1,773 |
|
|
0% 10/5/05 |
Aaa |
|
1,000 |
727 |
|
|
Freddie Mac: |
|
|
|
|
|
|
5.85% 2/21/06 |
Aaa |
|
2,425 |
2,342 |
|
|
6.875% 1/15/05 |
Aaa |
|
6,330 |
6,411 |
|
|
7% 7/15/05 |
Aaa |
|
14,595 |
14,869 |
|
|
Guaranteed Export Trust Certificates (assets of Trust guaranteed by U.S. Government through Export-Import Bank): |
|
|
|
|
|
|
Series 1993-C, 5.2% 10/15/04 |
Aaa |
|
2,973 |
2,886 |
|
|
Series 1993-D, 5.23% 5/15/05 |
Aaa |
|
2,357 |
2,284 |
|
|
Series 1995-A, 6.28% 6/15/04 |
Aaa |
|
16,007 |
15,870 |
|
|
Series 1996-A, 6.55% 6/15/04 |
Aaa |
|
8,212 |
8,180 |
|
|
U.S. Government and Government Agency Obligations - continued |
|||||
|
Moody's Ratings |
Principal Amount (000s) |
Value (Note 1) (000s) |
|||
|
U.S. Government Agency Obligations - continued |
|||||
|
Guaranteed Trade Trust Certificates (assets of Trust guaranteed by U.S. Government through Export-Import Bank): |
|
|
|
|
|
|
Series 1994-B, 7.5% 1/26/06 |
Aaa |
|
$ 2,015 |
$ 2,054 |
|
|
Series 1997-A, 6.104% 7/15/03 |
Aaa |
|
10,000 |
9,915 |
|
|
Overseas Private Investment Corp. U.S. Government guaranteed participation certificate: |
|
|
|
|
|
|
Series 1994-195, 6.08% 8/15/04 (callable) |
Aaa |
|
6,640 |
6,600 |
|
|
Series 1996-A1, 6.726% 9/15/10 (callable) |
- |
|
14,783 |
14,979 |
|
|
Series 1998-196A, 5.926% 6/15/05 (callable) |
- |
|
7,964 |
7,834 |
|
|
Private Export Funding Corp. secured: |
|
|
|
|
|
|
5.31% 11/15/03 (c) |
Aaa |
|
8,115 |
7,821 |
|
|
5.8% 2/1/04 |
Aaa |
|
11,900 |
11,692 |
|
|
6.62% 10/1/05 |
Aaa |
|
10,000 |
10,061 |
|
|
State of Israel (guaranteed by U.S. Government through Agency for International Development): |
|
|
|
|
|
|
5.89% 8/15/05 |
Aaa |
|
2,917 |
2,860 |
|
|
6.625% 8/15/03 |
Aaa |
|
15,800 |
15,848 |
|
|
U.S. Department of Housing and Urban
Development government guaranteed
participation certificates Series 1996-A, |
Aaa |
|
3,715 |
3,711 |
|
|
TOTAL U.S. GOVERNMENT AGENCY OBLIGATIONS |
275,578 |
||||
|
U.S. Treasury Obligations - 13.0% |
|||||
|
U.S. Treasury Bonds: |
|
|
|
|
|
|
10.75% 5/15/03 |
Aaa |
|
42,525 |
47,170 |
|
|
12% 8/15/13 |
Aaa |
|
115,350 |
157,648 |
|
|
14% 11/15/11 |
Aaa |
|
62,800 |
87,861 |
|
|
U.S. Treasury Notes: |
|
|
|
|
|
|
5.5% 2/15/08 |
Aaa |
|
123,675 |
121,047 |
|
|
7% 7/15/06 |
Aaa |
|
15,000 |
15,812 |
|
|
TOTAL U.S. TREASURY OBLIGATIONS |
429,538 |
||||
|
TOTAL U.S. GOVERNMENT AND (Cost $719,312) |
705,116 |
||||
|
U.S. Government Agency - Mortgage Securities - 7.4% |
|||||
|
Moody's Ratings |
Principal Amount (000s) |
Value (Note 1) (000s) |
|||
|
Fannie Mae - 5.5% |
|||||
|
6.5% 3/1/13 to 10/1/30 |
Aaa |
|
$ 67,800 |
$ 65,778 |
|
|
7% 7/1/25 to 11/1/30 |
Aaa |
|
26,551 |
26,030 |
|
|
7.5% 8/1/13 to 8/1/30 |
Aaa |
|
84,362 |
84,289 |
|
|
8% 7/1/30 to 8/1/30 |
Aaa |
|
6,874 |
6,958 |
|
|
12.5% 4/1/14 to 8/1/15 |
Aaa |
|
131 |
148 |
|
|
TOTAL FANNIE MAE |
183,203 |
||||
|
Freddie Mac - 0.8% |
|||||
|
7.5% 9/1/30 to 10/1/30 |
Aaa |
|
26,009 |
25,993 |
|
|
8.5% 6/1/13 |
Aaa |
|
25 |
25 |
|
|
TOTAL FREDDIE MAC |
26,018 |
||||
|
Government National Mortgage Association - 1.1% |
|||||
|
7.5% 3/15/28 to 11/1/30 |
Aaa |
|
533 |
535 |
|
|
8% 7/15/17 to 5/15/22 |
Aaa |
|
35,388 |
36,217 |
|
|
TOTAL GOVERNMENT NATIONAL MORTGAGE ASSOCIATION |
36,752 |
||||
|
TOTAL U.S. GOVERNMENT AGENCY - MORTGAGE SECURITIES (Cost $245,734) |
245,973 |
||||
|
Asset-Backed Securities - 9.1% |
|||||
|
|
|||||
|
American Express Master Trust 5.9% 5/15/03 |
Aaa |
|
12,000 |
11,786 |
|
|
Americredit Automobile Receivables Trust 7.02% 12/15/05 |
Aaa |
|
8,000 |
8,044 |
|
|
ANRC Auto Owner Trust 6.75% 12/15/03 |
Aaa |
|
13,000 |
13,000 |
|
|
BankAmerica Manufacturing Housing Contract Trust V: |
|
|
|
|
|
|
6.11% 1/10/08 |
Aaa |
|
10,500 |
10,438 |
|
|
6.2% 4/10/09 |
Aaa |
|
7,930 |
7,838 |
|
|
Capita Equipment Receivables Trust 6.45% 8/15/02 |
Aa3 |
|
12,420 |
12,342 |
|
|
Caterpillar Financial Asset Trust 6.2% 4/25/04 |
Aaa |
|
6,185 |
6,154 |
|
|
Chase Manhattan Grantor Trust 6.76% 9/15/02 |
A3 |
|
350 |
350 |
|
|
Chevy Chase Auto Receivables Trust 6.2% 3/20/04 |
Aaa |
|
2,907 |
2,885 |
|
|
CIT Marine Trust 5.8% 4/15/10 |
Aaa |
|
6,000 |
5,904 |
|
|
CPS Auto Grantor Trust 6.55% 8/15/02 |
Aaa |
|
1,170 |
1,168 |
|
|
CS First Boston Mortgage Securities Corp. 7% 3/15/27 |
Aaa |
|
2,156 |
2,154 |
|
|
Asset-Backed Securities - continued |
|||||
|
Moody's Ratings |
Principal Amount (000s) |
Value (Note 1) (000s) |
|||
|
Dayton Hudson Credit Card Master Trust 5.9% 5/25/06 |
Aaa |
|
$ 4,500 |
$ 4,415 |
|
|
Discover Card Master Trust I 5.6% 5/15/06 |
Aaa |
|
12,760 |
12,349 |
|
|
Fidelity Funding Auto Trust 6.99% 11/15/02 (c) |
Aaa |
|
573 |
573 |
|
|
Ford Credit Auto Owner Trust: |
|
|
|
|
|
|
6.2% 12/15/02 |
Aa2 |
|
7,080 |
7,017 |
|
|
6.4% 12/15/02 |
Aa2 |
|
3,810 |
3,791 |
|
|
7.03% 11/15/03 |
Aaa |
|
8,612 |
8,681 |
|
|
7.09% 11/17/03 |
Aaa |
|
10,000 |
10,050 |
|
|
Green Tree Financial Corp.: |
|
|
|
|
|
|
6.68% 1/15/29 |
AAA |
|
21,000 |
20,849 |
|
|
7.15% 7/15/27 |
Aaa |
|
542 |
541 |
|
|
Key Auto Finance Trust 6.65% 10/15/03 |
Baa3 |
|
638 |
636 |
|
|
MBNA Master Credit Card Trust II: |
|
|
|
|
|
|
6.4% 1/18/05 |
Aaa |
|
7,000 |
6,976 |
|
|
6.55% 1/15/07 |
Aaa |
|
8,400 |
8,342 |
|
|
6.9% 1/15/08 |
Aaa |
|
8,065 |
8,122 |
|
|
Navistar Financial Owner Trust 7.2% 5/17/04 |
Aaa |
|
7,500 |
7,552 |
|
|
Olympic Automobile Receivables Trust 6.125% 11/15/04 |
Aaa |
|
1,611 |
1,595 |
|
|
Petroleum Enhanced Trust Receivables Offering Petroleum Trust 7.12% 2/5/03 (c)(d) |
Baa2 |
|
5,626 |
5,608 |
|
|
PP&L Transition Bonds LLC: |
|
|
|
|
|
|
Series 1991-1 Class A3, 6.6% 3/25/05 |
Aaa |
|
4,900 |
4,888 |
|
|
Series 1999-1 Class A4, 6.72% 12/26/05 |
Aaa |
|
17,000 |
16,989 |
|
|
Railcar Trust 7.75% 6/1/04 |
Aaa |
|
7,205 |
7,329 |
|
|
Reliance Auto Receivables Corp., Inc. 6.1% 7/15/02 (c) |
Aaa |
|
63 |
63 |
|
|
Sears Credit Account Master Trust II 7% 7/15/08 |
Aaa |
|
26,750 |
26,925 |
|
|
SLMA Student Loan Trust 6.835% 4/25/08 (d) |
Aaa |
|
22,505 |
22,505 |
|
|
Tranex Auto Receivables Owner Trust 6.334% 8/15/03 (c) |
Aaa |
|
2,588 |
2,578 |
|
|
Triad Auto Receivables Owner Trust 5.98% 9/17/05 |
Aaa |
|
3,720 |
3,675 |
|
|
West Penn Funding LLC 6.63% 12/26/05 |
Aaa |
|
4,000 |
3,992 |
|
|
WFS Financial Owner Trust: |
|
|
|
|
|
|
5.7% 11/20/03 |
Aaa |
|
15,500 |
15,224 |
|
|
7.75% 11/20/04 |
Aaa |
|
7,000 |
7,079 |
|
|
TOTAL ASSET-BACKED SECURITIES (Cost $300,717) |
300,407 |
||||
|
Collateralized Mortgage Obligations - 0.3% |
|||||
|
Moody's Ratings |
Principal Amount (000s) |
Value (Note 1) (000s) |
|||
|
U.S. Government Agency - 0.3% |
|||||
|
Freddie Mac sequential pay Series 2122 Class L,
6% 11/15/26 |
Aaa |
|
$ 9,035 |
$ 8,600 |
|
|
Commercial Mortgage Securities - 4.7% |
|||||
|
|
|||||
|
Allied Capital Commercial Mortgage Trust sequential pay Series 1998-1 Class A, 6.31% 1/25/28 (c) |
Aaa |
|
3,788 |
3,750 |
|
|
Bankers Trust II Series 1999-S1A Class D, 8.81% 2/28/14 (c)(d) |
Baa2 |
|
11,499 |
11,524 |
|
|
Commercial Mortgage Asset Trust sequential pay Series 1999-C1 Class A3, 6.64% 9/17/10 |
Aaa |
|
7,500 |
7,394 |
|
|
CS First Boston Mortgage Securities Corp.: |
|
|
|
|
|
|
sequential pay Series 1997-SPICE: |
|
|
|
|
|
|
Class A, 6.653% 8/20/36 (c) |
- |
|
2,712 |
2,701 |
|
|
Class D, 7.332% 4/20/08 |
- |
|
7,500 |
7,377 |
|
|
sequential pay Series 2000-C1 Class A1, 7.325% 4/15/62 |
AAA |
|
9,885 |
10,016 |
|
|
Series 1995-WF1 Class A2, 6.648% 12/21/27 |
AAA |
|
7,268 |
7,166 |
|
|
Series 1998-FL1: |
|
|
|
|
|
|
Class D, 7.1188% 12/10/00 (c)(d) |
Aa1 |
|
10,200 |
10,199 |
|
|
Class E, 7.4688% 1/10/13 (c)(d) |
Baa1 |
|
15,000 |
15,266 |
|
|
Deutsche Mortgage & Asset Receiving Corp. Series 1998-C1 Class D, 7.231% 7/15/12 |
Baa2 |
|
10,000 |
9,247 |
|
|
Federal Deposit Insurance Corp. REMIC Trust sequential pay Series 1996-C1 Class 1A, 6.75% 7/25/26 |
Aaa |
|
5,336 |
5,283 |
|
|
FMAC Loan Receivables Trust sequential pay Series 1998-C Class A1, 5.99% 9/15/20 (c) |
Aaa |
|
3,640 |
3,531 |
|
|
Host Marriot Pool Trust sequential pay Series 1999-HMTA Class A, 6.98% 8/1/15 |
Aaa |
|
7,802 |
7,786 |
|
|
JP Morgan Commercial Mortgage Finance Corp. Series 2000-C10 Class A1, 7.1075% 8/15/32 |
Aaa |
|
7,604 |
7,642 |
|
|
LTC Commercial Mortgage pass through certificates Series 1998-1 Class A, 6.029% 5/30/30 (c) |
AAA |
|
9,290 |
8,818 |
|
|
Midland Realty Acceptance Corp. sequential pay Series 1997-C1 Class A1, 7.315% 4/25/03 |
Aaa |
|
2,293 |
2,287 |
|
|
Prudential Securities Secured Financing Corp. Series 2000-C1 Class A2, 7.727% 2/15/10 |
Aaa |
|
8,000 |
8,345 |
|
|
Commercial Mortgage Securities - continued |
|||||
|
Moody's Ratings |
Principal Amount (000s) |
Value (Note 1) (000s) |
|||
|
Resolution Trust Corp. Series 1995-C2 Class D, 7% 5/25/27 |
Baa2 |
|
$ 2,569 |
$ 2,537 |
|
|
Thirteen Affiliates of General Growth Properties, Inc.: |
|
|
|
|
|
|
sequential pay Series 1 Class A2, 6.602% 12/15/10 (c) |
Aaa |
|
5,000 |
4,922 |
|
|
Series 1 Class C1, 6.762% 12/15/07 (c) |
A2 |
|
20,000 |
19,606 |
|
|
TOTAL COMMERCIAL MORTGAGE SECURITIES (Cost $155,562) |
155,397 |
||||
|
Foreign Government and Government Agency Obligations (e) - 4.4% |
|||||
|
|
|||||
|
Alberta Province 4.875% 10/29/03 |
Aa1 |
|
7,500 |
7,135 |
|
|
Chile Republic 6.875% 4/28/09 |
Baa1 |
|
13,800 |
12,751 |
|
|
Korean Republic yankee 8.875% 4/15/08 |
Baa2 |
|
10,500 |
10,920 |
|
|
Manitoba Province yankee 6.875% 9/15/02 |
Aa3 |
|
26,500 |
26,621 |
|
|
Nova Scotia Province yankee 9.375% 7/15/02 |
A3 |
|
12,033 |
12,494 |
|
|
Ontario Province yankee: |
|
|
|
|
|
|
7.375% 1/27/03 |
Aa3 |
|
7,500 |
7,608 |
|
|
7.75% 6/4/02 |
Aa3 |
|
12,050 |
12,225 |
|
|
Ontario Province 7%, 8/4/05 |
Aa3 |
|
6,000 |
6,071 |
|
|
Quebec Province: |
|
|
|
|
|
|
7% 1/30/07 |
A2 |
|
9,500 |
9,477 |
|
|
yankee 6.5% 1/17/06 |
A2 |
|
10,000 |
9,810 |
|
|
State of Israel (guaranteed by U.S. Government through Agency for International Development) yankee 7.25% 12/15/28 |
A2 |
|
16,000 |
13,336 |
|
|
United Mexican States: |
|
|
|
|
|
|
8.5% 2/1/06 |
Baa3 |
|
11,750 |
11,715 |
|
|
9.875% 2/1/10 |
Baa3 |
|
6,850 |
7,107 |
|
|
TOTAL FOREIGN GOVERNMENT AND (Cost $152,633) |
147,270 |
||||
|
Commercial Paper - 0.7% |
||||
|
|
||||
|
British Telecom PLC 6.8525% 10/9/01 (c)(d) |
|
25,000 |
24,954 |
|
|
Cash Equivalents - 3.7% |
|||
|
Maturity Amount (000s) |
Value (Note 1) (000s) |
||
|
Investments in repurchase agreements: |
|
|
|
|
(U.S. Government Obligations), in a joint trading account at 6.62%, dated 10/31/00 due 11/1/00 |
$ 119,232 |
$ 119,210 |
|
|
(U.S. Treasury Obligations), in a joint trading account at 6.55%, dated 10/31/00 due 11/1/00 |
2,598 |
2,598 |
|
|
TOTAL CASH EQUIVALENTS (Cost $121,808) |
121,808 |
||
|
TOTAL INVESTMENT PORTFOLIO - 101.3% (Cost $3,402,013) |
3,357,831 |
||
|
|
|
|
|
|
NET OTHER ASSETS - (1.3)% |
(44,471) |
||
|
NET ASSETS - 100% |
$ 3,313,360 |
||
|
Legend |
|
(a) S&P credit ratings are used in the absence of a rating by Moody's Investors Service, Inc. |
|
(b) Debt obligation initially issued at one coupon which converts to a higher coupon at a specified date. The rate shown is the rate at period end. |
|
(c) Security exempt from registration under Rule 144A of the Securities Act of 1933. These securities may be resold in transactions exempt from registration, normally to qualified institutional buyers. At the period end, the value of these securities amounted to $303,760,000 or 9.2% of net assets. |
|
(d) The coupon rate shown on floating or adjustable rate securities represents the rate at period end. |
|
(e) For foreign government obligations not individually rated by S&P or Moody's, the ratings listed have been assigned by FMR, the fund's investment adviser, based principally on S&P and Moody's ratings of the sovereign credit of the issuing government. |
|
Other Information |
|
The composition of long-term debt holdings as a percentage of total value of investments in securities, is as follows (ratings are unaudited): |
|
Moody's Ratings |
S&P Ratings |
|||
|
Aaa, Aa, A |
67.3% |
|
AAA, AA, A |
61.1% |
|
Baa |
25.3% |
|
BBB |
24.5% |
|
Ba |
0.6% |
|
BB |
1.6% |
|
B |
0.0% |
|
B |
0.0% |
|
Caa |
0.0% |
|
CCC |
0.0% |
|
Ca, C |
0.0% |
|
CC, C |
0.0% |
|
|
|
|
D |
0.0% |
|
The percentage not rated by Moody's or S&P amounted to 1.0%. |
|
Distribution of investments by country of issue, as a percentage of total net assets, is as follows: |
|
United States of America |
84.8% |
|
United Kingdom |
4.6 |
|
Canada |
4.4 |
|
Australia |
1.1 |
|
Others (individually less than 1%) |
5.1 |
|
|
100.0% |
|
Income Tax Information |
|
At October 31, 2000, the aggregate cost of investment securities for income tax purposes was $3,402,194,000. Net unrealized depreciation aggregated $44,363,000, of which $20,567,000 related to appreciated investment securities and $64,930,000 related to depreciated investment securities. |
|
At April 30, 2000, the fund had a capital loss carryforward of approximately $36,798,000 of which $7,401,000, $5,813,000 and $23,584,000 will expire on April 30, 2005, 2006 and 2008, respectively. |
See accompanying notes which are an integral part of the financial statements.
Semiannual Report
Statement of Assets and Liabilities
|
Amounts in thousands (except per-share amount) |
October 31, 2000 (Unaudited) |
|
|
Assets |
|
|
|
Investment in securities, at value (including repurchase agreements of $121,808) (cost $3,402,013) - |
|
$ 3,357,831 |
|
Cash |
|
88 |
|
Receivable for investments sold |
|
12,794 |
|
Receivable for fund shares sold |
|
5,543 |
|
Interest receivable |
|
52,713 |
|
Other receivables |
|
8 |
|
Total assets |
|
3,428,977 |
|
Liabilities |
|
|
|
Payable for investments purchased |
$ 107,731 |
|
|
Payable for fund shares redeemed |
5,482 |
|
|
Distributions payable |
564 |
|
|
Accrued management fee |
1,170 |
|
|
Other payables and accrued expenses |
670 |
|
|
Total liabilities |
|
115,617 |
|
Net Assets |
|
$ 3,313,360 |
|
Net Assets consist of: |
|
|
|
Paid in capital |
|
$ 3,442,053 |
|
Distributions in excess of net investment income |
|
(1,225) |
|
Accumulated undistributed net realized gain (loss) |
|
(83,286) |
|
Net unrealized appreciation (depreciation) on investments |
|
(44,182) |
|
Net Assets, for 336,838 shares outstanding |
|
$ 3,313,360 |
|
Net Asset Value, offering price and redemption price |
|
$9.84 |
See accompanying notes which are an integral part of the financial statements.
Semiannual Report
Financial Statements - continued
Statement of Operations
|
Amounts in thousands |
Six months ended October 31, 2000 (Unaudited) |
|
|
Investment Income Interest |
|
$ 116,951 |
|
Security lending |
|
29 |
|
Total Income |
|
116,980 |
|
Expenses |
|
|
|
Management fee |
$ 6,856 |
|
|
Transfer agent fees |
3,200 |
|
|
Accounting and security lending fees |
297 |
|
|
Non-interested trustees' compensation |
6 |
|
|
Custodian fees and expenses |
59 |
|
|
Registration fees |
43 |
|
|
Audit |
17 |
|
|
Legal |
7 |
|
|
Miscellaneous |
2 |
|
|
Total expenses before reductions |
10,487 |
|
|
Expense reductions |
(242) |
10,245 |
|
Net investment income |
|
106,735 |
|
Realized and Unrealized Gain (Loss) Net realized gain (loss) on investment securities |
|
(19,954) |
|
Change in net unrealized appreciation (depreciation) |
|
72,133 |
|
Net gain (loss) |
|
52,179 |
|
Net increase (decrease) in net assets resulting |
|
$ 158,914 |
See accompanying notes which are an integral part of the financial statements.
Semiannual Report
Financial Statements - continued
Statement of Changes in Net Assets
|
Amounts in thousands |
Six months ended |
Year ended |
|
Increase (Decrease) in Net Assets |
|
|
|
Operations |
$ 106,735 |
$ 205,419 |
|
Net realized gain (loss) |
(19,954) |
(48,278) |
|
Change in net unrealized appreciation (depreciation) |
72,133 |
(113,100) |
|
Net increase (decrease) in net assets resulting |
158,914 |
44,041 |
|
Distributions to shareholders from net investment income |
(105,481) |
(203,842) |
|
Share transactions |
596,413 |
1,868,049 |
|
Reinvestment of distributions |
101,261 |
195,263 |
|
Cost of shares redeemed |
(637,119) |
(2,218,983) |
|
Net increase (decrease) in net assets resulting |
60,555 |
(155,671) |
|
Total increase (decrease) in net assets |
113,988 |
(315,472) |
|
Net Assets |
|
|
|
Beginning of period |
3,199,372 |
3,514,844 |
|
End of period (including distributions in excess of net investment income of $1,225 and $2,479, respectively) |
$ 3,313,360 |
$ 3,199,372 |
|
Other Information Shares |
|
|
|
Sold |
61,055 |
189,673 |
|
Issued in reinvestment of distributions |
10,356 |
19,885 |
|
Redeemed |
(65,284) |
(225,183) |
|
Net increase (decrease) |
6,127 |
(15,625) |
See accompanying notes which are an integral part of the financial statements.
Semiannual Report
Financial Highlights
|
|
Six months ended October 31, 2000 |
Years ended April 30, |
||||
|
|
(Unaudited) |
2000 |
1999 |
1998 |
1997 |
1996 |
|
Selected Per-Share Data |
|
|
|
|
|
|
|
Net asset value, beginning of period |
$ 9.670 |
$ 10.150 |
$ 10.160 |
$ 9.960 |
$ 10.050 |
$ 10.030 |
|
Income from Investment
Operations |
.323 D |
.623 D |
.613 D |
.646 D |
.647 D |
.684 |
|
Net realized |
.167 |
(.485) |
(.013) |
.200 |
(.060) |
(.004) |
|
Total from investment operations |
.490 |
.138 |
.600 |
.846 |
.587 |
.680 |
|
Less Distributions |
|
|
|
|
|
|
|
From net investment income |
(.320) |
(.618) |
(.610) |
(.646) |
(.647) |
(.660) |
|
From net |
- |
- |
- |
- |
(.030) |
- |
|
Total distributions |
(.320) |
(.618) |
(.610) |
(.646) |
(.677) |
(.660) |
|
Net asset value, |
$ 9.840 |
$ 9.670 |
$ 10.150 |
$ 10.160 |
$ 9.960 |
$ 10.050 |
|
Total Return B, C |
5.13% |
1.44% |
6.03% |
8.70% |
6.02% |
6.85% |
|
Ratios and Supplemental Data |
|
|
|
|
|
|
|
Net assets, end of period (in millions) |
$ 3,313 |
$ 3,199 |
$ 3,515 |
$ 3,092 |
$ 3,083 |
$ 2,881 |
|
Ratio of expenses to average net assets |
.65% A |
.67% |
.66% |
.66% |
.71% |
.73% |
|
Ratio of expenses to average net assets after expense reductions |
.63% A, E |
.66% E |
.65% E |
.65% E |
.69% E |
.71% E |
|
Ratio of net investment income to average net assets |
6.57% A |
6.32% |
6.00% |
6.37% |
6.46% |
6.48% |
|
Portfolio turnover rate |
99% A |
102% |
108% |
90% |
116% |
169% |
A Annualized
B Total returns for periods of less than one year are not annualized.
C The total returns would have been lower had certain expenses not been reduced during the periods shown.
D Net investment income per share has been calculated based on average shares outstanding during the period.
E FMR or the fund has entered into varying arrangements with third parties who either paid or reduced a portion of the fund's expenses.
See accompanying notes which are an integral part of the financial statements.
Semiannual Report
For the period ended October 31, 2000 (Unaudited)
1. Significant Accounting Policies.
Fidelity Intermediate Bond Fund (the fund) is a fund of Fidelity Commonwealth Trust (the trust) and is authorized to issue an unlimited number of shares. The trust is registered under the Investment Company Act of 1940, as amended, as an open-end management investment company organized as a Massachusetts business trust. The financial statements have been prepared in conformity with generally accepted accounting principles which require management to make certain estimates and assumptions at the date of the financial statements. The following summarizes the significant accounting policies of the fund:
Security Valuation. Securities are valued based upon a computerized matrix system and/or appraisals by a pricing service, both of which consider market transactions and dealer-supplied valuations. Securities (including restricted securities) for which market quotations are not readily available are valued at their fair value as determined in good faith under consistently applied procedures under the general supervision of the Board of Trustees. Short-term securities with remaining maturities of sixty days or less for which quotations are not readily available are valued at amortized cost or original cost plus accrued interest, both of which approximate current value. Investments in open-end investment companies are valued at their net asset value each business day.
Foreign Currency Translation. The accounting records of the fund are maintained in U.S. dollars. Investment securities and other assets and liabilities denominated in a foreign currency are translated into U.S. dollars at the prevailing rates of exchange at period end. Purchases and sales of securities, income receipts and expense payments are translated into U.S. dollars at the prevailing exchange rate on the respective dates of the transactions.
Net realized gains and losses on foreign currency transactions represent net gains and losses from sales and maturities of foreign currency contracts, disposition of foreign currencies, the difference between the amount of net investment income accrued and the U.S. dollar amount actually received, and gains and losses between trade and settlement date on purchases and sales of securities. The effects of changes in foreign currency exchange rates on investments in securities are included with the net realized and unrealized gain or loss on investment securities.
Income Taxes. As a qualified regulated investment company under Subchapter M of the Internal Revenue Code, the fund is not subject to income taxes to the extent that it distributes substantially all of its taxable income for its fiscal year. The schedule of investments includes information regarding income taxes under the caption "Income Tax Information."
Investment Income. Interest income, which includes accretion of original issue discount, is accrued as earned.
Semiannual Report
Notes to Financial Statements (Unaudited) - continued
1. Significant Accounting Policies -continued
Expenses. Most expenses of the trust can be directly attributed to a fund. Expenses which cannot be directly attributed are apportioned among the funds in the trust.
Deferred Trustee Compensation. Under a Deferred Compensation Plan (the Plan) non-interested Trustees must defer receipt of a portion of, and may elect to defer receipt of an additional portion of, their annual compensation. Deferred amounts are treated as though equivalent dollar amounts had been invested in a cross-section of other Fidelity funds. Deferred amounts remain in the fund until distributed in accordance with the Plan.
Distributions to Shareholders. Dividends are declared daily and paid monthly from net investment income. Distributions to shareholders from realized capital gains on investments, if any, are recorded on the ex-dividend date.
Income and capital gain distributions are determined in accordance with income tax regulations which may differ from generally accepted accounting principles. These differences, which may result in distribution reclassifications, are primarily due to differing treatments for paydown gains/losses on certain securities, market discount, capital loss carryforwards, and losses deferred due to wash sales and excise tax regulations.
Permanent book and tax basis differences relating to shareholder distributions will result in reclassifications to paid in capital. Distributions in excess of net investment income and accumulated undistributed net realized gain (loss) on investments and foreign currency transactions may include temporary book and tax basis differences which will reverse in a subsequent period. Any taxable income or gain remaining at fiscal year end is distributed in the following year.
Security Transactions. Security transactions are accounted for as of trade date. Gains and losses on securities sold are determined on the basis of identified cost.
2. Operating Policies.
Joint Trading Account. Pursuant to an Exemptive Order issued by the Securities and Exchange Commission (the SEC), the fund, along with other affiliated entities of Fidelity Management & Research Company (FMR), may transfer uninvested cash balances into one or more joint trading accounts. These balances are invested in one or more repurchase agreements for U.S. Treasury or Federal Agency obligations.
Repurchase Agreements. The underlying U.S. Treasury, Federal Agency, or other obligations found to be satisfactory by FMR are transferred to an account of the fund, or to the Joint Trading Account, at a custodian bank. The securities are marked-to-market daily and maintained at a value at least equal to the principal amount of the repurchase agreement (including accrued interest). FMR, the fund's investment adviser, is responsible for determining that the value of the underlying securities remains in accordance with the market value requirements stated above.
Semiannual Report
Notes to Financial Statements (Unaudited) - continued
2. Operating Policies - continued
Interfund Lending Program. Pursuant to an Exemptive Order issued by the SEC, the fund, along with other registered investment companies having management contracts with FMR, may participate in an interfund lending program. This program provides an alternative credit facility allowing the fund to borrow from, or lend money to, other participating funds.
Delayed Delivery Transactions. The fund may purchase or sell securities on a delayed delivery basis. Payment and delivery may take place after the customary settlement period for that security. The price of the underlying securities and the date when the securities will be delivered and paid for are fixed at the time the transaction is negotiated. The fund may receive compensation for interest forgone in the purchase of a delayed delivery security. With respect to purchase commitments, the fund identifies securities as segregated in its records with a value at least equal to the amount of the commitment. Losses may arise due to changes in the market value of the underlying securities or if the counterparty does not perform under the contract.
Restricted Securities. The fund is permitted to invest in securities that are subject to legal or contractual restrictions on resale. These securities generally may be resold in transactions exempt from registration or to the public if the securities
are registered. Disposal of these securities may involve time-consuming negotiations and expense, and prompt sale at an acceptable price may be difficult. At the end of the period, the fund had no investments in restricted securities (excluding 144A issues).
3. Purchases and Sales of Investments.
Purchases and sales of securities, other than short-term securities, aggregated $1,565,748,000 and $1,564,894,000, respectively, of which U.S. government and government agency obligations aggregated $809,990,000 and $815,751,000, respectively.
4. Fees and Other Transactions with Affiliates.
Management Fee. As the fund's investment adviser, FMR receives a monthly fee that is calculated on the basis of a group fee rate plus a fixed individual fund fee rate applied to the average net assets of the fund. The group fee rate is the weighted average of a series of rates and is based on the monthly average net assets of all the mutual funds advised by FMR. The rates ranged from .0920% to .3700% for the period. The annual individual fund fee rate is .30%. In the event that these rates were lower than the contractual rates in effect during the period, FMR voluntarily implemented the above rates, as they resulted in the same or a lower management fee. For the period, the management fee was equivalent to an annualized rate of .43% of average net assets.
Semiannual Report
Notes to Financial Statements (Unaudited) - continued
4. Fees and Other Transactions with Affiliates - continued
Sub-Adviser Fee. FMR, on behalf of the fund, has entered into a sub-advisory agreement with Fidelity Investments Money Management, Inc. (FIMM), a wholly owned subsidiary of FMR. For its services, FIMM receives a fee from FMR of 50% of the management fee payable to FMR. The fee is paid prior to any voluntary expense reimbursements which may be in effect.
Transfer Agent Fees. Fidelity Service Company, Inc. (FSC), an affiliate of FMR, is the fund's transfer, dividend disbursing and shareholder servicing agent. FSC receives account fees and asset-based fees that vary according to account size and type of account. FSC pays for typesetting, printing and mailing of all shareholder reports, except proxy statements. For the period, the transfer agent fees were equivalent to an annualized rate of .20% of average net assets.
Accounting and Security Lending Fees. FSC maintains the fund's accounting records and administers the security lending program. The security lending fee is based on the number and duration of lending transactions. The accounting fee is based on the level of average net assets for the month plus out-of-pocket expenses.
5. Interfund Lending Program.
The fund participated in the interfund lending program as a lender. The average daily loan balance during the period for which the loan was outstanding amounted to $ 9,106,000. The weighted average interest rate was 6.66%. Interest earned from the interfund lending program amounted to $5,000 and is included in interest income on the Statement of Operations. At period end there were no interfund loans outstanding.
6. Security Lending.
The fund lends portfolio securities from time to time in order to earn additional income. The fund receives collateral in the form of U.S. Treasury obligations, letters of credit, and/or cash against the loaned securities, and maintains collateral in an amount not less than 100% of the market value of the loaned securities during the period of the loan. The market value of the loaned securities is determined at the close of business of the fund and any additional required collateral is delivered to the fund on the next business day. If the borrower defaults on its obligation to return the securities loaned because of insolvency or other reasons, the fund could experience delays and costs in recovering the securities loaned or in gaining access to the collateral. At period end there were no security loans outstanding.
7. Expense Reductions.
Through arrangements with the fund's custodian and transfer agent, credits realized as a result of uninvested cash balances were used to reduce a portion of the fund's expenses. During the period, the fund's custodian and transfer agent fees were reduced by $11,000 and $231,000, respectively, under these arrangements.
Semiannual Report
Fidelity offers several ways to conveniently manage your personal investments via your telephone or PC. You can access your account information, conduct trades and research your investments 24 hours a day.
By Phone
Fidelity Automated Service Telephone provides a single toll-free number to access account balances, positions, quotes and trading. It's easy to navigate the service, and on your first call, the system will help you create a personal identification number (PIN) for security.
(phone_graphic)Fidelity Automated
Service Telephone (FAST®)
1-800-544-5555
Press
1 For mutual fund and brokerage trading.
2 For quotes.*
3 For account balances and holdings.
4 To review orders and mutual
fund activity.
5 To change your PIN.
*0 To speak to a Fidelity representative.
By PC
Fidelity's web site on the Internet provides a wide range of information, including daily financial news, fund performance, interactive planning tools and news about Fidelity products and services.
(computer_graphic)Fidelity's Web Site
www.fidelity.com
If you are not currently on the Internet, call EarthLink Sprint at 1-800-288-2967, and be sure to ask for registration number SMD004 to receive a special Fidelity package that includes 30 days of free Internet access. EarthLink is North America's #1 independent Internet access provider.
(computer_graphic)
Fidelity On-line Xpress+®
Fidelity On-line Xpress+ software for Windows combines comprehensive portfolio management capabilities, securities trading and access to research and analysis tools . . . all on your desktop. Call Fidelity at 1-800-544-0240 or visit our web site for more information on how to manage your investments via your PC.
* When you call the quotes line, please remember that a fund's yield and return will vary and, except for money market funds, share price will also vary. This means that you may have a gain or loss when you sell your shares. There is no assurance that money market funds will be able to maintain a stable $1 share price; an investment in a money market fund is not insured or guaranteed by the U.S. government. Total returns are historical and include changes in share price, reinvestment of dividends and capital gains, and the effects of any sales charges.
Semiannual Report
For directions and hours,
please call 1-800-544-9797.
Arizona
7373 N. Scottsdale Road
Scottsdale, AZ
California
815 East Birch Street
Brea, CA
851 East Hamilton Avenue
Campbell, CA
527 North Brand Boulevard
Glendale, CA
19200 Von Karman Avenue
Irvine, CA
10100 Santa Monica Blvd.
Los Angeles, CA
251 University Avenue
Palo Alto, CA
1760 Challenge Way
Sacramento, CA
7676 Hazard Center Drive
San Diego, CA
8 Montgomery Street
San Francisco, CA
950 Northgate Drive
San Rafael, CA
1400 Civic Drive
Walnut Creek, CA
6300 Canoga Avenue
Woodland Hills, CA
Colorado
1625 Broadway
Denver, CO
Connecticut
48 West Putnam Avenue
Greenwich, CT
265 Church Street
New Haven, CT
300 Atlantic Street
Stamford, CT
29 South Main Street
West Hartford, CT
Delaware
222 Delaware Avenue
Wilmington, DE
Florida
4400 N. Federal Highway
Boca Raton, FL
90 Alhambra Plaza
Coral Gables, FL
4090 N. Ocean Boulevard
Ft. Lauderdale, FL
1907 West State Road 434
Longwood, FL
8880 Tamiami Trail, North
Naples, FL
2401 PGA Boulevard
Palm Beach Gardens, FL
8065 Beneva Road
Sarasota, FL
1502 N. Westshore Blvd.
Tampa, FL
Georgia
3445 Peachtree Road, N.E.
Atlanta, GA
1000 Abernathy Road
Atlanta, GA
Illinois
One North Franklin Street
Chicago, IL
1415 West 22nd Street
Oak Brook, IL
1700 East Golf Road
Schaumburg, IL
3232 Lake Avenue
Wilmette, IL
Indiana
4729 East 82nd Street
Indianapolis, IN
Maine
Three Canal Plaza
Portland, ME
Maryland
7401 Wisconsin Avenue
Bethesda, MD
One W. Pennsylvania Ave.
Towson, MD
Massachusetts
801 Boylston Street
Boston, MA
155 Congress Street
Boston, MA
25 State Street
Boston, MA
300 Granite Street
Braintree, MA
44 Mall Road
Burlington, MA
416 Belmont Street
Worcester, MA
Semiannual Report
Michigan
280 Old N. Woodward Ave.
Birmingham, MI
29155 Northwestern Hwy.
Southfield, MI
Minnesota
7600 France Avenue South
Edina, MN
Missouri
700 West 47th Street
Kansas City, MO
8885 Ladue Road
Ladue, MO
New Jersey
150 Essex Street
Millburn, NJ
56 South Street
Morristown, NJ
501 Route 17, South
Paramus, NJ
New York
1055 Franklin Avenue
Garden City, NY
999 Walt Whitman Road
Melville, L.I., NY
1271 Avenue of the Americas
New York, NY
71 Broadway
New York, NY
350 Park Avenue
New York, NY
North Carolina
4611 Sharon Road
Charlotte, NC
Ohio
600 Vine Street
Cincinnati, OH
28699 Chagrin Boulevard
Woodmere Village, OH
Oregon
16850 SW 72nd Avenue
Tigard, OR
Pennsylvania
1735 Market Street
Philadelphia, PA
439 Fifth Avenue
Pittsburgh, PA
Rhode Island
47 Providence Place
Providence, RI
Tennessee
6150 Poplar Avenue
Memphis, TN
Texas
10000 Research Boulevard
Austin, TX
4017 Northwest Parkway
Dallas, TX
1155 Dairy Ashford Street
Houston, TX
2701 Drexel Drive
Houston, TX
400 East Las Colinas Blvd.
Irving, TX
14100 San Pedro
San Antonio, TX
19740 IH 45 North
Spring, TX
Utah
215 South State Street
Salt Lake City, UT
Virginia
1861 International Drive
McLean, VA
Washington
411 108th Avenue, N.E.
Bellevue, WA
511 Pine Street
Seattle, WA
Washington, DC
1900 K Street, N.W.
Washington, DC
Wisconsin
595 North Barker Road
Brookfield, WI
Fidelity Brokerage Services, Inc., 100 Summer St., Boston, MA 02110 Member NYSE/SIPC
Semiannual Report
Investment Adviser
Fidelity Management & Research
Company
Boston, MA
Investment Sub-Advisers
Fidelity Management & Research
(U.K.) Inc.
Fidelity Management & Research
(Far East) Inc.
Fidelity Investments Japan Limited
Fidelity Investments Money
Management, Inc.
Officers
Edward C. Johnson 3d, President
Robert C. Pozen, Senior Vice President
Dwight D. Churchill, Vice President
David L. Murphy, Vice President
Ford E. O'Neil, Vice President
Stanley N. Griffith, Assistant Vice President
Eric D. Roiter, Secretary
Robert A. Dwight, Treasurer
Maria F. Dwyer, Deputy Treasurer
John H. Costello, Assistant Treasurer
Thomas J. Simpson, Assistant Treasurer
Board of Trustees
Ralph F. Cox *
Phyllis Burke Davis *
Robert M. Gates *
Edward C. Johnson 3d
Donald J. Kirk *
Ned C. Lautenbach *
Peter S. Lynch
Marvin L. Mann *
William O. McCoy *
Gerald C. McDonough *
Robert C. Pozen
Thomas R. Williams *
Advisory Board
J. Michael Cook
Marie L. Knowles
* Independent trustees
General Distributor
Fidelity Distributors Corporation
Boston, MA
Transfer and Shareholder
Servicing Agent
Fidelity Service Company, Inc.
Boston, MA
Custodian
The Bank of New York
New York, NY
Fidelity's Taxable Bond Funds
Capital & Income
Ginnie Mae
Government Income
High Income
Intermediate Bond
Intermediate Government Income
International Bond
Investment Grade Bond
New Markets Income
Short-Term Bond
Spartan® Government Income
Spartan Investment Grade Bond
Strategic Income
Target TimelineSM 2001 & 2003
The Fidelity Telephone Connection
Mutual Fund 24-Hour Service
Exchanges/Redemptions
and Account Assistance 1-800-544-6666
Product Information 1-800-544-6666
Retirement Accounts 1-800-544-4774
(8 a.m. - 9 p.m.)
TDD Service 1-800-544-0118
for the deaf and hearing impaired
(9 a.m. - 9 p.m. Eastern time)
Fidelity Automated Service
Telephone (FAST®) (automated graphic) 1-800-544-5555
(automated graphic) Automated line for quickest service
(Fidelity Investment logo)(registered trademark)
Corporate Headquarters
82 Devonshire St., Boston, MA 02109
www.fidelity.com
IBF-SANN-1200 118990
1.538685.103
Fidelity®
Fund
Semiannual Report
October 31, 2000
(2_fidelity_logos)
|
President's Message |
3 |
Ned Johnson on investing strategies. |
|
Performance |
4 |
How the fund has done over time. |
|
Fund Talk |
6 |
The manager's review of fund performance, strategy and outlook. |
|
Investment Changes |
9 |
A summary of major shifts in the fund's investments over the past six months. |
|
Investments |
10 |
A complete list of the fund's investments with their market values. |
|
Financial Statements |
20 |
Statements of assets and liabilities, operations, and changes in net assets, as well as financial highlights. |
|
Notes |
24 |
Notes to the financial statements. |
|
Distributions |
30 |
|
To reduce expenses, only one copy of most financial reports and prospectuses may be mailed to households, even if more than one person in the household has an account in the fund. Call Fidelity at 1-800-544-8544 if you need additional copies of financial reports or prospectuses. If you do not want the mailing of these documents to be combined with those for other members of your household, contact Fidelity in writing at P.O. Box 5000, Cincinnati, OH 45273-8692.
Third party marks appearing herein are the property of their respective owners.
All other marks appearing herein are registered or unregistered trademarks or service marks of FMR Corp. or an affiliated company.
(Recycle graphic) This report is printed on recycled paper using soy-based inks.
This report and the financial statements contained herein are submitted for the general information of the shareholders of the fund. This report is not authorized for distribution to prospective investors in the fund unless preceded or accompanied by an effective prospectus.
Mutual fund shares are not deposits or obligations of, or guaranteed by, any depository institution. Shares are not insured by the FDIC, Federal Reserve Board or any other agency, and are subject to investment risks, including possible loss of principal amount invested.
Neither the fund nor Fidelity Distributors Corporation is a bank.
For more information on any Fidelity fund, including charges and expenses, call 1-800-544-6666 for a free prospectus. Read it carefully before you invest or send money.
Semiannual Report
|
(photo_of_Edward_C_Johnson_3d)
Dear Shareholder:
A sixth-straight year of double-digit positive returns for the Dow Jones Industrial Average, NASDAQ and S&P 500® could be in jeopardy unless the U.S. stock market shows marked improvement in the final two months of 2000. Through October, all three indexes had negative year-to-date returns. On the other hand, most fixed-income sectors were solidly in the black. Treasuries and other long-term government securities led the way, returning nearly 14%.
While it's impossible to predict the future direction of the markets with any degree of certainty, there are certain basic principles that can help investors plan for their future needs.
First, investors are encouraged to take a long-term view of their portfolios. If you can afford to leave your money invested through the inevitable up and down cycles of the financial markets, you will greatly reduce your vulnerability to any single decline. We know from experience, for example, that stock prices have gone up over longer periods of time, have significantly outperformed other types of investments and have stayed ahead of inflation.
Second, you can further manage your investing risk through diversification. A stock mutual fund, for instance, is already diversified, because it invests in many different companies. You can increase your diversification further by investing in a number of different stock funds, or in such other investment categories as bonds. If you have a short investment time horizon, you might want to consider moving some of your investment into a money market fund, which seeks income and a stable share price by investing in high-quality, short-term investments. Of course, it's important to remember that an investment in a money market fund is not insured or guaranteed by the Federal Deposit Insurance Corporation or any other government agency. Although money market funds seek to preserve the value of your investment at $1.00 per share, it is possible to lose money by investing in these types of funds.
Finally, no matter what your time horizon or portfolio diversity, it makes good sense to follow a regular investment plan, investing a certain amount of money in a fund at the same time each month or quarter and periodically reviewing your overall portfolio. By doing so, you won't get caught up in the excitement of a rapidly rising market, nor will you buy all your shares at market highs. While this strategy - known as dollar cost averaging - won't assure a profit or protect you from a loss in a declining market, it should help you lower the average cost of your purchases. Of course, you should consider your financial ability to continue your purchases through periods of low price levels before undertaking such a strategy.
If you have questions, please call us at 1-800-544-6666, or visit our web site at www.fidelity.com. We are available 24 hours a day, seven days a week to provide you the information you need to make the investments that are right for you.
Best regards,
/s/Edward C. Johnson 3d
Edward C. Johnson 3d
Semiannual Report
There are several ways to evaluate a fund's historical performance. You can look at the total percentage change in value, the average annual percentage change or the growth of a hypothetical $10,000 investment. Total return reflects the change in the value of an investment, assuming reinvestment of the fund's dividend income and capital gains (the profits earned upon the sale of securities that have grown in value). If Fidelity had not reimbursed certain fund expenses, the life of fund total returns would have been lower.
Cumulative Total Returns
|
Periods ended October 31, 2000 |
Past 6 |
Past 1 |
Life of |
|
Fidelity Small Cap Stock |
4.96% |
38.80% |
44.56% |
|
Fidelity Small Cap Stock (incl. 2.00% trading fee) |
2.86% |
36.02% |
41.67% |
|
Russell 2000 ® |
-1.11% |
17.41% |
9.87% |
|
Small Cap Funds Average |
2.91% |
28.93% |
n/a* |
Cumulative total returns show the fund's performance in percentage terms over a set period - in this case, six months, one year or since the fund started on March 12, 1998. For example, if you had invested $1,000 in a fund that had a 5% return over the past year, the value of your investment would be $1,050. You can compare the fund's returns to the performance of the Russell 2000 Index - a market capitalization-weighted index of 2,000 small company stocks. To measure how the fund's performance stacked up against its peers, you can compare it to the small cap funds average, which reflects the performance of mutual funds with similar objectives tracked by Lipper Inc. The past six months average represents a peer group of 873 mutual funds. These benchmarks include reinvested dividends and capital gains, if any, and exclude the effect of sales charges. Lipper has created new comparison categories that group funds according to portfolio characteristics and capitalization, as well as by capitalization only. These averages are listed on page 5 of this report.(dagger)
Average Annual Total Returns
|
Periods ended October 31, 2000 |
Past 1 |
Life of |
|
Fidelity Small Cap Stock |
38.80% |
14.97% |
|
Fidelity Small Cap Stock (incl. 2.00% trading fee) |
36.02% |
14.10% |
|
Russell 2000 |
17.41% |
3.63% |
|
Small Cap Funds Average |
28.93% |
n/a* |
Average annual total returns take the fund's cumulative return and show you what would have happened if the fund had performed at a constant rate each year. (Note: Lipper calculates average annual total returns by annualizing each fund's total return, then taking an arithmetic average. This may produce a different figure than that obtained by averaging the cumulative total returns and annualizing the result.)
* Not available
Semiannual Report
$10,000 Over Life of Fund
$10,000 Over Life of Fund: Let's say hypothetically that $10,000 was invested in Fidelity Small Cap Stock Fund on March 12, 1998, when the fund started, and the current 2.00% trading fee was paid. As the chart shows, by October 31, 2000, the value of the investment would have grown to $14,167 - a 41.67% increase on the initial investment. For comparison, look at how the Russell 2000 Index did over the same period. With dividends and capital gains, if any, reinvested, the same $10,000 would have grown to $10,987 - a 9.87% increase.
Understanding
Performance
How a fund did yesterday is no guarantee of how it will do tomorrow. The stock market, for example, has a history of long-term growth and short-term volatility. In turn, the share price and return of a fund that invests in stocks will vary. That means if you sell your shares during a market downturn, you might lose money. But if you can ride out the market's ups and downs, you may have a gain.
3* The Lipper small-cap growth funds average reflects the performance (excluding sales charges) of mutual funds with similar portfolio characteristics and capitalization. The Lipper small-cap supergroup average reflects the performance (excluding sales charges) of mutual funds with similar capitalization. As of October 31, 2000, the six months and one year cumulative total returns for the small-cap growth funds average were 0.22% and 38.47%, respectively. The one year average annual total return was 38.47%. The six months and one year cumulative total returns for the small-cap supergroup average were 3.75% and 28.35%, respectively. The one year average annual total return was 28.35%.
Semiannual Report
Market Recap
The U.S. equity market environment during the six-month period that ended October 31, 2000, will be remembered as one of the most difficult in recent years. Three negative factors - rising interest rates, the highest oil prices in a decade and the declining value of the European currency - collectively hindered the growth of many domestic companies. As a result, investors reacted pessimistically to most stocks, regardless of market capitalization or industry. In May, the tech-heavy NASDAQ Composite Index experienced a sharp decline and failed to recoup the gains it achieved earlier in the year as the period wore on. The NASDAQ ended the six-month period with a -12.64% return. The Standard & Poor's 500SM Index, an index of 500 larger companies, declined 1.03%. Elsewhere, the Russell 2000 ® Index, a benchmark of smaller companies that had gained nearly 19% in the previous six-month period, slumped to a -1.11% return. Only the blue chips' benchmark, the Dow Jones Industrial Average, finished the period with a gain, returning 3.01% in large part because investors favored more established companies in October. For its part, the Federal Reserve Board raised the federal funds rate to 6.50% in May - its highest level in nine years - in an attempt to slow the economy and ward off inflation. Meanwhile, the euro's weakness and higher fuel costs particularly hurt multinational companies, many of which lowered third-quarter earnings targets.
(Portfolio Manager photograph)
An interview with Paul Antico, Portfolio Manager of Fidelity Small Cap Stock Fund
Q. How did the fund perform, Paul?
A. It did well. For the six months that ended October 31, 2000, the fund returned 4.96%. That compared favorably with the Russell 2000 Index's return of -1.11%, and the small cap funds average, which returned 2.91%, according to Lipper Inc. For the 12 months that ended October 31, 2000, the fund returned 38.80%, beating the returns of the Russell 2000 Index and the small cap funds average, which returned 17.41% and 28.93%, respectively.
Q. What accounted for the fund's strong relative performance?
A. I stayed with my strategy of focusing on individual stock selection, pure and simple. The volatile and uncertain market environment actually helped the fund. That's because it was a stock picker's market, where buying the right securities was more important than just being in the right sector. After the NASDAQ correction earlier in the year, I was able to sift through stocks that I had previously deemed overvalued, including many technology stocks, and I found some good companies at bargain prices. Some examples include Jupiter Media Metrix, a company that collects and distributes Internet usage data, and FileNET, which is evolving from an electronic document management software company into a successful Web content management company, leveraging its core base of customers into its new endeavor.
Semiannual Report
Fund Talk: The Manager's Overview - continued
Q. You've been playing the genomics theme for some time now. How did those stocks perform?
A. The fund's genomics positions were one of the largest contributors to relative performance. Last year, the attractive underlying fundamentals of the genomics industry made these stocks a big bet for the fund. I believed that there would be tremendous potential in this area over the next decade as discoveries and developments change the way new drugs are brought to market. I continued to buy genomics companies, even after a substantial pullback in March, but rotated even more selectively into those that I believed were best poised for success. My two biggest genomics holdings, Myriad Genetics and Human Genome Sciences, suffered earlier in the period, but eventually bounced back and performed extremely well for the fund. Myriad is a well-respected, quiet company that has a terrific competitive advantage through its Myriad Diagnostics and Myriad Pharmaceuticals subsidiaries, while Human Genome Sciences is one of the only genomics companies creating a tremendous proprietary pipeline of potential drug candidates.
Q. Which other stocks helped the fund's performance?
A. Health care stocks recovered nicely during the six-month period. Caremark Rx, a pharmacy benefits manager, was helped by corporations' focused attempts to reduce the cost of prescription drugs and from the prospects of increased Medicare funding. An improving retail environment for athletic footwear sales and its close strategic ties to Nike helped Venator, the parent company of Foot Locker.
Q. What about disappointments?
A. IMAX was hurt by the financial difficulties of many movie theater companies, including bankruptcy filings by several of its larger customers. The company also was hurt after unsuccessfully putting itself up for sale. Prosoft, an information technology training company, got caught in the downdraft of dot-com stocks. However, I'm still holding the stock because I think Prosoft's business model is excellent and I believe in the company's long-term prospects. Pinnacle Systems had an unexpected shortfall in its earnings that hurt its stock price. Toward the end of the period, though, the company's earnings were coming back in line, so I remained favorable about its future.
Q. What's your outlook?
A. I continue to be pretty optimistic overall. With so many small-cap companies - approximately 8,500 in the U.S. and 19,000 worldwide - there's a large universe of stocks from which to choose. I'm finding many opportunities domestically, given the recent turbulence in the market, that haven't been available in years. Although I'm holding a bit more cash than usual - as a result of selling some companies late in the period that could be hit by a slowing economy - I'm optimistic about digging through this vast group of stocks and finding the gems that others may be missing.
The views expressed in this report reflect those of the portfolio manager only through the end of the period of the report as stated on the cover and do not necessarily represent the views of Fidelity or any other person in the Fidelity organization. Any such views are subject to change at any time based upon market or other conditions and Fidelity disclaims any responsibility to update such views. These views may not be relied on as investment advice and, because investment decisions for a Fidelity fund are based on numerous factors, may not be relied on as an indication of trading intent on behalf of any Fidelity fund.
Semiannual Report
Fund Talk: The Manager's Overview - continued
Fund Facts
Goal: long-term growth of capital by investing mainly in equity securities of companies with small market capitalizations
Fund number: 340
Trading symbol: FSLCX
Start date: March 12, 1998
Size: as of October 31, 2000, more than $1.1 billion
Manager: Paul Antico, since inception; manager, Fidelity Advisor Consumer Industries Fund, 1997-1998; several Fidelity Select Portfolios, 1993-1998; joined Fidelity in 1991
3Paul Antico on the advantages of Fidelity's small-cap analytical depth:
"For large-cap stocks, a tremendous amount of research and information is readily available. For small caps, discovery and research have proportionately greater importance, because you win by finding the companies that others haven't yet discovered. The name of the game in managing small-cap stocks is constantly scavenging through the thousands of companies in the U.S. and international markets, trying to find the best opportunities. Because of the strength and number of our research resources and personnel, I feel the fund has an excellent opportunity to find those winners. With the industry's largest research team analyzing and monitoring stocks, Fidelity can do much broader and more thorough work to ensure we've made informed stock selections and to find new potential winners. The Securities and Exchange Commission's recently enacted Regulation FD (for Fair Disclosure) limits the amount of information companies may provide directly to investment managers, making labor-intensive, outside research even more important. Given the size and resources I have available to me at Fidelity, I can do that necessary research."
Semiannual Report
|
Top Ten Stocks as of October 31, 2000 |
||
|
|
% of fund's |
% of fund's net assets |
|
CEC Entertainment, Inc. |
4.1 |
3.5 |
|
Venator Group, Inc. |
3.7 |
1.5 |
|
Myriad Genetics, Inc. |
3.5 |
2.8 |
|
Pinnacle Systems |
2.8 |
3.1 |
|
Papa John's International, Inc. |
2.7 |
2.0 |
|
Caremark Rx, Inc. |
2.5 |
0.8 |
|
Ultimate Electronics, Inc. |
2.4 |
0.6 |
|
MapInfo Corp. |
2.0 |
1.9 |
|
Apartment Investment & Management Co. |
1.8 |
1.8 |
|
I-Stat Corp. |
1.7 |
1.2 |
|
|
27.2 |
19.2 |
|
Top Five Market Sectors as of October 31, 2000 |
||
|
|
% of fund's |
% of fund's net assets |
|
Technology |
15.3 |
10.4 |
|
Retail & Wholesale |
14.9 |
10.3 |
|
Media & Leisure |
11.2 |
14.6 |
|
Services |
9.6 |
15.8 |
|
Health |
9.4 |
11.0 |
|
Asset Allocation (% of fund's net assets) |
|||||||
|
As of October 31, 2000 * |
As of April 30, 2000 ** |
||||||
|
Stocks 88.3% |
|
|
Stocks 94.6% |
|
||
 |
Convertible |
|
|
Convertible |
|
||
|
Short-Term |
|
|
Short-Term |
|
||
|
* Foreign investments |
13.9% |
|
** Foreign investments |
19.9% |
|
||

Semiannual Report
(Unaudited)
Showing Percentage of Net Assets
|
Common Stocks - 88.3% |
|||
|
Shares |
Value (Note 1) |
||
|
AEROSPACE & DEFENSE - 1.0% |
|||
|
Aerospace & Defense - 0.8% |
|||
|
Alliant Techsystems, Inc. (a) |
32,600 |
$ 2,931,963 |
|
|
BE Aerospace, Inc. (a) |
201,300 |
3,321,450 |
|
|
Primex Technologies, Inc. |
78,900 |
2,312,756 |
|
|
|
8,566,169 |
||
|
Ship Building & Repair - 0.2% |
|||
|
Newport News Shipbuilding, Inc. |
49,900 |
2,454,456 |
|
|
TOTAL AEROSPACE & DEFENSE |
11,020,625 |
||
|
BASIC INDUSTRIES - 1.9% |
|||
|
Chemicals & Plastics - 0.5% |
|||
|
Millennium Chemicals, Inc. |
182,400 |
2,941,200 |
|
|
Nissan Chemical Industries Co. Ltd. |
325,000 |
2,397,810 |
|
|
|
5,339,010 |
||
|
Metals & Mining - 0.8% |
|||
|
Belden, Inc. |
90,000 |
2,334,375 |
|
|
Draka Holding NV |
52,100 |
3,049,140 |
|
|
Murchison United NL (a)(c) |
4,500,000 |
2,808,810 |
|
|
U.S. Aggregates, Inc. |
88,500 |
1,239,000 |
|
|
|
9,431,325 |
||
|
Packaging & Containers - 0.3% |
|||
|
Ball Corp. |
75,000 |
2,634,375 |
|
|
Paper & Forest Products - 0.3% |
|||
|
Pactiv Corp. (a) |
355,000 |
3,727,500 |
|
|
TOTAL BASIC INDUSTRIES |
21,132,210 |
||
|
CONSTRUCTION & REAL ESTATE - 8.1% |
|||
|
Building Materials - 0.6% |
|||
|
York International Corp. |
245,000 |
6,660,938 |
|
|
Construction - 0.3% |
|||
|
Okumura Corp. |
600,000 |
1,759,692 |
|
|
Volker Wessels Stevin NV (Certificaten Van Aandelen) |
132,812 |
2,339,165 |
|
|
|
4,098,857 |
||
|
Engineering - 0.3% |
|||
|
Bracknell Corp. (a) |
489,700 |
3,345,077 |
|
|
Real Estate - 1.6% |
|||
|
Boardwalk Equities, Inc. (a) |
2,352,139 |
18,307,289 |
|
|
Common Stocks - continued |
|||
|
Shares |
Value (Note 1) |
||
|
CONSTRUCTION & REAL ESTATE - continued |
|||
|
Real Estate Investment Trusts - 5.3% |
|||
|
Alexandria Real Estate Equities, Inc. |
511,300 |
$ 17,320,288 |
|
|
Apartment Investment & Management Co. Class A |
449,300 |
20,527,394 |
|
|
BRE Properties, Inc. Class A |
219,600 |
6,944,850 |
|
|
Correctional Properties Trust |
322,400 |
3,143,400 |
|
|
Cousins Properties, Inc. |
74,250 |
1,930,500 |
|
|
Home Properties of New York, Inc. |
96,003 |
2,610,082 |
|
|
Prentiss Properties Trust (SBI) |
87,600 |
2,222,850 |
|
|
Reckson Associates Realty Corp. |
81,600 |
1,846,200 |
|
|
Summit Properties, Inc. |
144,700 |
3,472,800 |
|
|
|
60,018,364 |
||
|
TOTAL CONSTRUCTION & REAL ESTATE |
92,430,525 |
||
|
DURABLES - 2.0% |
|||
|
Autos, Tires, & Accessories - 0.2% |
|||
|
Kayaba Industry Co. Ltd. (a) |
1,235,000 |
1,980,799 |
|
|
Home Furnishings - 0.6% |
|||
|
Linens'n Things, Inc. (a) |
235,100 |
7,229,325 |
|
|
Textiles & Apparel - 1.2% |
|||
|
Ashworth, Inc. (a)(c) |
774,000 |
5,708,250 |
|
|
Gildan Activewear, Inc. Class A (a) |
45,100 |
1,567,225 |
|
|
Marzotto Spa |
260,000 |
2,522,905 |
|
|
Mohawk Industries, Inc. (a) |
60,040 |
1,309,623 |
|
|
Tropical Sportswear International Corp. (a) |
195,000 |
3,071,250 |
|
|
|
14,179,253 |
||
|
TOTAL DURABLES |
23,389,377 |
||
|
ENERGY - 1.2% |
|||
|
Coal - 0.4% |
|||
|
Aquarius Platinum Ltd. (a) |
1,100,000 |
4,577,320 |
|
|
Energy Services - 0.2% |
|||
|
Canadian Crude Separators, Inc. (a) |
114,400 |
383,212 |
|
|
Pason Systems, Inc. (a) |
297,900 |
1,457,704 |
|
|
|
1,840,916 |
||
|
Oil & Gas - 0.6% |
|||
|
Frontier Oil Corp. (a) |
903,300 |
7,169,944 |
|
|
TOTAL ENERGY |
13,588,180 |
||
|
Common Stocks - continued |
|||
|
Shares |
Value (Note 1) |
||
|
FINANCE - 3.8% |
|||
|
Banks - 0.3% |
|||
|
Commerce Bancorp, Inc. |
35,000 |
$ 2,119,688 |
|
|
Laurentian Bank |
53,800 |
865,747 |
|
|
|
2,985,435 |
||
|
Credit & Other Finance - 1.5% |
|||
|
Federal Agricultural Mortgage Corp. Class C (non-vtg.) (a) |
223,300 |
4,884,688 |
|
|
Medallion Financial Corp. (c) |
828,350 |
12,735,881 |
|
|
|
17,620,569 |
||
|
Insurance - 2.0% |
|||
|
Brown & Brown, Inc. |
94,000 |
3,055,000 |
|
|
Everest Re Group Ltd. |
125,500 |
7,357,438 |
|
|
HCC Insurance Holdings, Inc. |
263,900 |
5,030,594 |
|
|
Hilb, Rogal & Hamilton Co. |
69,800 |
2,765,825 |
|
|
Kingsway Financial Services, Inc. (a) |
554,600 |
1,912,414 |
|
|
RenaissanceRe Holdings Ltd. |
29,600 |
2,147,850 |
|
|
|
22,269,121 |
||
|
TOTAL FINANCE |
42,875,125 |
||
|
HEALTH - 9.4% |
|||
|
Drugs & Pharmaceuticals - 6.8% |
|||
|
ArQule, Inc. (a) |
288,300 |
6,666,938 |
|
|
CIMA Labs, Inc. (a) |
87,000 |
4,785,000 |
|
|
Exelixis, Inc. |
55,600 |
1,226,675 |
|
|
Geneva Proteomics (a)(d) |
43,000 |
236,500 |
|
|
Human Genome Sciences, Inc. (a) |
195,200 |
17,253,850 |
|
|
Myriad Genetics, Inc. (a) |
333,200 |
39,984,000 |
|
|
Twinlab Corp. (a) |
435,700 |
2,287,425 |
|
|
Unigene Laboratories, Inc. (a) |
2,103,300 |
5,159,658 |
|
|
|
77,600,046 |
||
|
Medical Equipment & Supplies - 2.1% |
|||
|
Allscripts, Inc. (a) |
142,300 |
1,707,600 |
|
|
I-Stat Corp. (a)(c) |
1,008,500 |
19,791,813 |
|
|
Nakanishi, Inc. |
4,000 |
68,555 |
|
|
Visible Genetics, Inc. (a) |
70,000 |
2,117,500 |
|
|
|
23,685,468 |
||
|
Common Stocks - continued |
|||
|
Shares |
Value (Note 1) |
||
|
HEALTH - continued |
|||
|
Medical Facilities Management - 0.5% |
|||
|
Davita, Inc. (a) |
295,000 |
$ 3,318,750 |
|
|
Sunrise Assisted Living, Inc. (a) |
110,000 |
2,571,250 |
|
|
|
5,890,000 |
||
|
TOTAL HEALTH |
107,175,514 |
||
|
INDUSTRIAL MACHINERY & EQUIPMENT - 5.2% |
|||
|
Electrical Equipment - 4.4% |
|||
|
Allen Telecom, Inc. (a) |
160,800 |
3,004,950 |
|
|
Baldor Electric Co. |
50,000 |
993,750 |
|
|
C&D Technologies, Inc. |
29,300 |
1,732,363 |
|
|
California Amplifier, Inc. (a) |
97,500 |
2,437,500 |
|
|
Datakey, Inc. (a)(c) |
792,500 |
4,358,750 |
|
|
Pinnacle Systems (a)(c) |
2,560,900 |
32,331,363 |
|
|
TANDBERG Television ASA (a) |
500,000 |
5,058,115 |
|
|
|
49,916,791 |
||
|
Industrial Machinery & Equipment - 0.8% |
|||
|
Badger Daylighting, Inc. (a) |
353,000 |
255,041 |
|
|
BOLDER Technologies Corp. (a) |
146,500 |
567,688 |
|
|
CNH Global NV |
760,900 |
7,371,219 |
|
|
MSC Industrial Direct, Inc. (a) |
100,000 |
1,487,500 |
|
|
|
9,681,448 |
||
|
TOTAL INDUSTRIAL MACHINERY & EQUIPMENT |
59,598,239 |
||
|
MEDIA & LEISURE - 11.2% |
|||
|
Broadcasting - 0.6% |
|||
|
Citadel Communications Corp. (a) |
230,000 |
2,788,750 |
|
|
Radio One, Inc. Class D (non-vtg.) (a) |
102,800 |
824,006 |
|
|
TV Azteca SA de CV sponsored ADR |
225,400 |
2,817,500 |
|
|
|
6,430,256 |
||
|
Entertainment - 0.5% |
|||
|
Astral Media, Inc. Class A (non-vtg.) |
84,700 |
2,300,391 |
|
|
First Choice Holidays PLC |
1,000,000 |
1,696,149 |
|
|
Fitness First PLC (a) |
55,000 |
904,975 |
|
|
Lakes Gaming, Inc. (a) |
177,500 |
1,400,586 |
|
|
|
6,302,101 |
||
|
Common Stocks - continued |
|||
|
Shares |
Value (Note 1) |
||
|
MEDIA & LEISURE - continued |
|||
|
Leisure Durables & Toys - 0.2% |
|||
|
Callaway Golf Co. |
74,700 |
$ 1,195,200 |
|
|
Koala Corp. (a) |
130,200 |
1,302,000 |
|
|
|
2,497,200 |
||
|
Lodging & Gaming - 0.1% |
|||
|
Scandic Hotels AB |
155,100 |
1,582,495 |
|
|
Publishing - 0.3% |
|||
|
Banta Corp. |
130,400 |
3,007,350 |
|
|
Restaurants - 9.5% |
|||
|
CEC Entertainment, Inc. (a)(c) |
1,477,550 |
47,096,894 |
|
|
Main Street and Main, Inc. (a) |
482,500 |
1,507,813 |
|
|
Outback Steakhouse, Inc. (a) |
498,250 |
14,200,125 |
|
|
Papa John's International, Inc. (a)(c) |
1,212,620 |
30,467,078 |
|
|
PJ America, Inc. (a) |
157,200 |
1,188,825 |
|
|
Ruby Tuesday, Inc. |
434,800 |
5,896,975 |
|
|
Sizzler International, Inc. (a)(c) |
2,713,800 |
4,240,313 |
|
|
Sonic Corp. (a) |
85,700 |
3,128,050 |
|
|
|
107,726,073 |
||
|
TOTAL MEDIA & LEISURE |
127,545,475 |
||
|
NONDURABLES - 1.9% |
|||
|
Beverages - 0.6% |
|||
|
Constellation Brands, Inc. Class A (a) |
41,100 |
2,003,625 |
|
|
Grolsch NV |
50,000 |
899,728 |
|
|
H.P. Bulmer Holdings PLC |
245,000 |
1,694,192 |
|
|
NH Hoteles SA |
180,000 |
2,032,027 |
|
|
|
6,629,572 |
||
|
Foods - 1.2% |
|||
|
American Italian Pasta Co. Class A (a) |
43,500 |
872,719 |
|
|
Corn Products International, Inc. |
409,200 |
10,281,150 |
|
|
Goodman Fielder Ltd. |
3,500,000 |
2,275,656 |
|
|
|
13,429,525 |
||
|
Household Products - 0.1% |
|||
|
Aptargroup, Inc. |
94,600 |
1,957,038 |
|
|
TOTAL NONDURABLES |
22,016,135 |
||
|
Common Stocks - continued |
|||
|
Shares |
Value (Note 1) |
||
|
RETAIL & WHOLESALE - 14.9% |
|||
|
Apparel Stores - 7.6% |
|||
|
AnnTaylor Stores Corp. (a) |
493,400 |
$ 14,802,000 |
|
|
Christopher & Banks Corp. (a) |
126,450 |
4,188,656 |
|
|
Genesco, Inc. (a) |
149,400 |
2,651,850 |
|
|
Hibbett Sporting Goods, Inc. (a)(c) |
642,500 |
16,986,094 |
|
|
J. Baker, Inc. |
642,500 |
2,509,766 |
|
|
United Retail Group, Inc. (a) |
602,400 |
3,237,900 |
|
|
Venator Group, Inc. (a) |
3,020,200 |
42,660,325 |
|
|
|
87,036,591 |
||
|
General Merchandise Stores - 1.1% |
|||
|
Ames Department Stores, Inc. (a) |
130,200 |
512,663 |
|
|
Freds, Inc. Class A |
165,200 |
3,489,850 |
|
|
Neiman Marcus Group, Inc. Class A (a) |
103,800 |
3,853,575 |
|
|
T.J. Hughes PLC |
542,100 |
2,630,348 |
|
|
Warehouse Group Ltd. (The) |
810,000 |
2,017,659 |
|
|
|
12,504,095 |
||
|
Grocery Stores - 0.9% |
|||
|
Fleming Companies, Inc. |
221,584 |
3,143,723 |
|
|
Hain Celestial Group, Inc. (a) |
143,874 |
5,709,999 |
|
|
Iceland Group PLC |
325,000 |
1,543,024 |
|
|
|
10,396,746 |
||
|
Retail & Wholesale, Miscellaneous - 5.3% |
|||
|
Advanced Marketing Services, Inc. |
134,650 |
2,423,700 |
|
|
AgriBioTech, Inc. warrants 12/31/01 (a) |
60,000 |
1 |
|
|
Barbeques Galore Ltd. sponsored ADR (a) |
223,200 |
1,395,000 |
|
|
Coldwater Creek, Inc. (a) |
81,263 |
2,412,495 |
|
|
Electronics Boutique PLC |
3,473,150 |
3,121,716 |
|
|
Forzani Group Ltd. Class A (a) |
871,300 |
2,346,358 |
|
|
Future Shop Ltd. (a)(c) |
1,873,700 |
9,845,386 |
|
|
PC Connection, Inc. |
70,000 |
1,908,594 |
|
|
PETsMART, Inc. (a) |
584,600 |
2,594,163 |
|
|
Rex Stores Corp. (a) |
159,700 |
2,934,488 |
|
|
Shop At Home, Inc. (a)(c) |
1,631,900 |
3,263,800 |
|
|
Ultimate Electronics, Inc. (a)(c) |
762,900 |
27,559,763 |
|
|
|
59,805,464 |
||
|
TOTAL RETAIL & WHOLESALE |
169,742,896 |
||
|
Common Stocks - continued |
|||
|
Shares |
Value (Note 1) |
||
|
SERVICES - 9.6% |
|||
|
Advertising - 0.2% |
|||
|
ADVO, Inc. (a) |
45,000 |
$ 1,656,563 |
|
|
Educational Services - 2.1% |
|||
|
Corinthian Colleges, Inc. (a) |
28,000 |
1,935,500 |
|
|
New Horizons Worldwide, Inc. (a)(c) |
593,000 |
8,598,500 |
|
|
ProsoftTraining.com (a)(c) |
1,910,600 |
13,374,200 |
|
|
|
23,908,200 |
||
|
Services - 7.3% |
|||
|
Bright Horizons Family Solutions, Inc. (a) |
245,700 |
6,142,500 |
|
|
Caremark Rx, Inc. (a) |
2,275,000 |
28,437,500 |
|
|
Childtime Learning Centers, Inc. (a)(c) |
399,500 |
2,796,500 |
|
|
Cornell Companies, Inc. (a)(c) |
944,100 |
4,720,500 |
|
|
Harvey Nash Group PLC |
675,500 |
7,569,775 |
|
|
Jupiter Media Metrix, Inc. (a) |
927,600 |
12,638,550 |
|
|
Medialink Worldwide, Inc. (a)(c) |
567,100 |
3,827,925 |
|
|
Plaut AG |
120,000 |
2,240,832 |
|
|
Register.com, Inc. |
117,500 |
822,500 |
|
|
Ritchie Brothers Auctioneers, Inc. (a) |
49,800 |
1,089,375 |
|
|
Source Information Management Co. (a)(c) |
1,753,000 |
9,641,500 |
|
|
Transportes Azkar SA |
191,662 |
1,171,315 |
|
|
Watson Wyatt & Co. Holdings |
129,300 |
2,238,506 |
|
|
|
83,337,278 |
||
|
TOTAL SERVICES |
108,902,041 |
||
|
TECHNOLOGY - 15.3% |
|||
|
Communications Equipment - 0.7% |
|||
|
Cable Design Technologies Corp. (a) |
76,950 |
1,774,659 |
|
|
Eltek ASA |
27,700 |
1,040,390 |
|
|
Filtronic PLC |
150,000 |
1,707,022 |
|
|
Lucent Technologies, Inc. (d) |
1,083 |
18,936 |
|
|
TANDBERG ASA (a) |
115,000 |
3,044,554 |
|
|
|
7,585,561 |
||
|
Computer Services & Software - 7.4% |
|||
|
Activcard SA sponsored ADR |
60,200 |
1,557,675 |
|
|
Affiliated Computer Services, Inc. Class A (a) |
87,700 |
4,883,794 |
|
|
Affymetrix, Inc. (a) |
148,200 |
8,206,575 |
|
|
Black Box Corp. (a) |
120,500 |
7,937,938 |
|
|
Corsair Communictions, Inc. (a) |
267,200 |
1,619,900 |
|
|
Datadesign AG |
51,600 |
948,228 |
|
|
eFunds Corp. |
200,000 |
1,600,000 |
|
|
Common Stocks - continued |
|||
|
Shares |
Value (Note 1) |
||
|
TECHNOLOGY - continued |
|||
|
Computer Services & Software - continued |
|||
|
Himalaya SA (a) |
36,939 |
$ 893,584 |
|
|
HotJobs.com Ltd. (a) |
140,000 |
2,187,500 |
|
|
ICT Automatisering NV |
51,108 |
1,887,050 |
|
|
Information Resources, Inc. (a) |
498,300 |
2,647,219 |
|
|
Interact Commerce Corp. (a) |
169,400 |
1,556,363 |
|
|
J.D. Edwards & Co. (a) |
101,000 |
2,613,375 |
|
|
Mainspring, Inc. |
344,600 |
2,735,263 |
|
|
MapInfo Corp. (a)(c) |
697,050 |
22,784,822 |
|
|
Mentor Graphics Corp. (a) |
154,900 |
3,630,469 |
|
|
Moldflow Corp. |
169,100 |
4,280,344 |
|
|
Numerical Technologies, Inc. |
100,000 |
2,050,000 |
|
|
Ontrack Data International, Inc. (a) |
217,300 |
1,589,006 |
|
|
T/R Systems, Inc. |
174,700 |
1,048,200 |
|
|
Technology Solutions, Inc. |
1,336,000 |
3,173,000 |
|
|
Triad Group PLC (a) |
300,000 |
1,078,577 |
|
|
Tumbleweed Communications Corp. (a) |
150,000 |
2,568,750 |
|
|
VelocityHSI, Inc. (a)(c) |
840,060 |
892,564 |
|
|
|
84,370,196 |
||
|
Computers & Office Equipment - 4.9% |
|||
|
Avocent Corp. (a) |
32,300 |
2,291,281 |
|
|
Ciprico, Inc. (a) |
105,700 |
1,030,575 |
|
|
Coinstar, Inc. (a)(c) |
1,444,500 |
19,049,344 |
|
|
Extended Systems, Inc. (a) |
64,500 |
2,515,500 |
|
|
FileNET Corp. (a) |
370,000 |
9,805,000 |
|
|
Insight Enterprises, Inc. (a) |
330,400 |
10,738,000 |
|
|
Quantum Corp. - Hard Disk Drive Group (a) |
150,000 |
1,715,625 |
|
|
RadiSys Corp. (a) |
137,000 |
3,630,500 |
|
|
ScanSource, Inc. (a) |
27,600 |
1,317,900 |
|
|
Zebra Technologies Corp. Class A (a) |
80,000 |
3,505,000 |
|
|
|
55,598,725 |
||
|
Electronic Instruments - 0.8% |
|||
|
Bruker Daltonics, Inc. |
70,200 |
2,404,350 |
|
|
Caliper Technologies Corp. |
35,000 |
1,973,125 |
|
|
Varian, Inc. (a) |
150,800 |
4,646,525 |
|
|
|
9,024,000 |
||
|
Electronics - 1.1% |
|||
|
MIPS Technologies, Inc. Class A (a) |
38,900 |
1,560,863 |
|
|
Muehlbauer Holding AG & Co. |
47,000 |
4,228,323 |
|
|
Silicon On Insulator TEChnologies SA (SOITEC) (a) |
80,000 |
1,813,037 |
|
|
Common Stocks - continued |
|||
|
Shares |
Value (Note 1) |
||
|
TECHNOLOGY - continued |
|||
|
Electronics - continued |
|||
|
Toko, Inc. |
375,000 |
$ 1,959,032 |
|
|
Virage Logic Corp. |
351,500 |
3,515,000 |
|
|
|
13,076,255 |
||
|
Photographic Equipment - 0.4% |
|||
|
Concord Camera Corp. (a) |
120,000 |
3,712,500 |
|
|
IMAX Corp. (a) |
206,500 |
1,017,241 |
|
|
|
4,729,741 |
||
|
TOTAL TECHNOLOGY |
174,384,478 |
||
|
TRANSPORTATION - 2.7% |
|||
|
Air Transportation - 1.1% |
|||
|
Atlantic Coast Airlines Holdings, Inc. (a) |
281,600 |
10,067,200 |
|
|
CHC Helicopter Corp. Class A (a) |
299,400 |
2,212,315 |
|
|
|
12,279,515 |
||
|
Railroads - 0.2% |
|||
|
Wabtec Corp. |
230,562 |
2,334,440 |
|
|
Shipping - 1.0% |
|||
|
Bergesen dy ASA: |
|
|
|
|
(A Shares) |
26,800 |
533,577 |
|
|
(B Shares) |
122,300 |
2,237,516 |
|
|
Frontline Ltd. (a) |
250,000 |
4,116,444 |
|
|
OMI Corp. (a) |
359,700 |
2,495,419 |
|
|
Teekay Shipping Corp. |
50,900 |
1,902,388 |
|
|
|
11,285,344 |
||
|
Trucking & Freight - 0.4% |
|||
|
Covenant Transport, Inc. Class A (a) |
322,400 |
2,921,750 |
|
|
TDG PLC |
600,000 |
1,617,865 |
|
|
|
4,539,615 |
||
|
TOTAL TRANSPORTATION |
30,438,914 |
||
|
UTILITIES - 0.1% |
|||
|
Cellular - 0.1% |
|||
|
Arch Wireless, Inc. (a) |
250,000 |
750,000 |
|
|
TOTAL COMMON STOCKS (Cost $903,573,703) |
1,004,989,734 |
||
|
Cash Equivalents - 12.9% |
|||
|
Shares |
Value (Note 1) |
||
|
Fidelity Cash Central Fund, 6.61% (b) |
134,923,481 |
$ 134,923,481 |
|
|
Fidelity Securities Lending Cash Central Fund, 6.66% (b) |
11,840,800 |
11,840,800 |
|
|
TOTAL CASH EQUIVALENTS (Cost $146,764,281) |
146,764,281 |
||
|
TOTAL INVESTMENT PORTFOLIO - 101.2% (Cost $1,050,337,984) |
1,151,754,015 |
||
|
NET OTHER ASSETS - (1.2)% |
(13,286,226) |
||
|
NET ASSETS - 100% |
$ 1,138,467,789 |
||
|
Legend |
|
(a) Non-income producing |
|
(b) The rate quoted is the annualized seven-day yield of the fund at period end. A complete listing of the fund's holdings as of its most recent fiscal year end is available upon request. |
|
(c) Affiliated company |
|
(d) Restricted securities - Investment in securities not registered under the Securities Act of 1933. |
|
Additional information on each holding |
|
Security |
Acquisition Date |
Acquisition Cost |
|
Geneva |
7/7/00 |
$ 236,500 |
|
Lucent |
5/19/00 |
$ 8,061 |
|
Distribution of investments by country of issue, as a percentage of total net assets, |
|
United States of America |
86.1% |
|
Canada |
4.4 |
|
United Kingdom |
1.9 |
|
Norway |
1.4 |
|
Netherlands |
1.4 |
|
Bermuda |
1.3 |
|
Others (individually less than 1%) |
3.5 |
|
|
100.0% |
|
Income Tax Information |
|
At October 31, 2000, the aggregate |
See accompanying notes which are an integral part of the financial statements.
Semiannual Report
Statement of Assets and Liabilities
|
|
October 31, 2000 (Unaudited) |
|
|
Assets |
|
|
|
Investment in securities, at value (cost $1,050,337,984) - See accompanying schedule |
|
$ 1,151,754,015 |
|
Cash |
|
466,497 |
|
Receivable for investments sold |
|
9,849,891 |
|
Receivable for fund shares sold |
|
2,372,390 |
|
Dividends receivable |
|
545,872 |
|
Interest receivable |
|
707,327 |
|
Redemption fees receivable |
|
7,075 |
|
Other receivables |
|
173,341 |
|
Total assets |
|
1,165,876,408 |
|
Liabilities |
|
|
|
Payable for investments purchased |
$ 14,025,483 |
|
|
Payable for fund shares redeemed |
566,277 |
|
|
Accrued management fee |
782,898 |
|
|
Other payables and accrued expenses |
193,161 |
|
|
Collateral on securities loaned, at value |
11,840,800 |
|
|
Total liabilities |
|
27,408,619 |
|
Net Assets |
|
$ 1,138,467,789 |
|
Net Assets consist of: |
|
|
|
Paid in capital |
|
$ 1,013,521,578 |
|
Undistributed net investment income |
|
2,296,296 |
|
Accumulated undistributed net realized gain (loss) on investments and foreign currency transactions |
|
21,237,611 |
|
Net unrealized appreciation (depreciation) on investments and assets and liabilities in foreign currencies |
|
101,412,304 |
|
Net Assets, for 80,608,481 shares outstanding |
|
$ 1,138,467,789 |
|
Net Asset Value, offering price and redemption price |
|
$14.12 |
A Redemption price per share is equal to net asset value less any applicable redemption fee.
See accompanying notes which are an integral part of the financial statements.
Semiannual Report
Financial Statements - continued
Statement of Operations
|
|
Six months ended October 31, 2000 (Unaudited) |
|
|
Investment Income Dividends (including $941,592 received from |
|
$ 4,274,506 |
|
Interest |
|
3,329,705 |
|
Security lending |
|
236,237 |
|
Total income |
|
7,840,448 |
|
Expenses |
|
|
|
Management fee |
$ 3,876,255 |
|
|
Performance adjustment |
651,477 |
|
|
Transfer agent fees |
1,041,671 |
|
|
Accounting and security lending fees |
137,553 |
|
|
Non-interested trustees' compensation |
1,748 |
|
|
Custodian fees and expenses |
74,080 |
|
|
Registration fees |
54,395 |
|
|
Audit |
11,698 |
|
|
Legal |
3,001 |
|
|
Miscellaneous |
150 |
|
|
Total expenses before reductions |
5,852,028 |
|
|
Expense reductions |
(263,327) |
5,588,701 |
|
Net investment income |
|
2,251,747 |
|
Realized and Unrealized Gain (Loss) Net realized gain (loss) on: |
|
|
|
Investment securities (including realized gain (loss) of |
29,937,670 |
|
|
Foreign currency transactions |
(81,935) |
|
|
Futures contracts |
101,864 |
29,957,599 |
|
Change in net unrealized appreciation (depreciation) on: |
|
|
|
Investment securities |
12,392,718 |
|
|
Assets and liabilities in foreign currencies |
13,102 |
12,405,820 |
|
Net gain (loss) |
|
42,363,419 |
|
Net increase (decrease) in net assets resulting |
|
$ 44,615,166 |
See accompanying notes which are an integral part of the financial statements.
Semiannual Report
Financial Statements - continued
Statement of Changes in Net Assets
|
|
Six months ended
October 31, 2000 |
Year ended |
|
Increase (Decrease) in Net Assets |
|
|
|
Operations |
$ 2,251,747 |
$ (54,597) |
|
Net realized gain (loss) |
29,957,599 |
139,747,642 |
|
Change in net unrealized appreciation (depreciation) |
12,405,820 |
75,236,081 |
|
Net increase (decrease) in net assets resulting |
44,615,166 |
214,929,126 |
|
Distributions to shareholders from net realized gains |
(20,606,227) |
- |
|
Share transactions |
183,357,519 |
426,546,817 |
|
Reinvestment of distributions |
20,112,614 |
- |
|
Cost of shares redeemed |
(57,454,180) |
(103,396,967) |
|
Net increase (decrease) in net assets resulting |
146,015,953 |
323,149,850 |
|
Redemption fees |
1,055,093 |
2,986,482 |
|
Total increase (decrease) in net assets |
171,079,985 |
541,065,458 |
|
Net Assets |
|
|
|
Beginning of period |
967,387,804 |
426,322,346 |
|
End of period (including undistributed net investment income of $2,296,296 and $44,549, respectively) |
$ 1,138,467,789 |
$ 967,387,804 |
|
Other Information Shares |
|
|
|
Sold |
12,804,952 |
33,983,353 |
|
Issued in reinvestment of distributions |
1,479,950 |
- |
|
Redeemed |
(4,057,754) |
(8,670,441) |
|
Net increase (decrease) |
10,227,148 |
25,312,912 |
See accompanying notes which are an integral part of the financial statements.
Semiannual Report
Financial Highlights
|
|
Six months ended October 31, 2000 |
Years ended April 30, |
||
|
|
(Unaudited) |
2000 |
1999 |
1998 G |
|
Selected Per-Share Data |
|
|
|
|
|
Net asset value, |
$ 13.74 |
$ 9.46 |
$ 10.55 |
$ 10.00 |
|
Income from Investment Operations |
|
|
|
|
|
Net investment income (loss) D |
.03 |
(.00) |
.00 |
.01 |
|
Net realized and |
.63 |
4.22 |
(1.20) |
.54 |
|
Total from investment operations |
.66 |
4.22 |
(1.20) |
.55 |
|
Less Distributions |
|
|
|
|
|
From net investment income |
- |
- |
(.01) |
- |
|
In excess of net investment income |
- |
- |
(.01) |
- |
|
From net realized gain |
(.29) |
- |
- |
- |
|
Total distributions |
(.29) |
- |
(.02) |
- |
|
Redemption fees added to paid |
.01 |
.06 |
.13 |
- |
|
Net asset value, end of period |
$ 14.12 |
$ 13.74 |
$ 9.46 |
$ 10.55 |
|
Total Return B, C |
4.96% |
45.24% |
(10.12)% |
5.50% |
|
Ratios and Supplemental Data |
|
|
|
|
|
Net assets, end of period |
$ 1,138,468 |
$ 967,388 |
$ 426,322 |
$ 737,997 |
|
Ratio of expenses to average net assets |
1.07% A |
1.17% |
1.04% |
1.50% A, E |
|
Ratio of expenses to average net assets after expense reductions |
1.02% A, F |
1.13% F |
.99% F |
1.48% A, F |
|
Ratio of net investment income (loss) to average net assets |
.41% A |
(.01)% |
.01% |
.67% A |
|
Portfolio turnover rate |
116% A |
120% |
170% |
75% A |
A Annualized
B Total returns for periods of less than one year are not annualized.
C The total returns would have been lower had certain expenses not been reduced during the periods shown.
D Net investment income (loss) per share has been calculated based on average shares outstanding during the period.
E FMR agreed to reimburse a portion of the fund's expenses during the period. Without this reimbursement, the fund's expense ratio would have been higher.
F FMR or the fund has entered into varying arrangements with third parties who either paid or reduced a portion of the fund's expenses.
G For the period March 12, 1998 (commencement of operations) to April 30, 1998
See accompanying notes which are an integral part of the financial statements.
Semiannual Report
For the period ended October 31, 2000 (Unaudited)
1. Significant Accounting Policies.
Fidelity Small Cap Stock Fund (the fund) is a fund of Fidelity Commonwealth Trust (the trust) and is authorized to issue an unlimited number of shares. The trust is registered under the Investment Company Act of 1940, as amended, as an open-end management investment company organized as a Massachusetts business trust. The financial statements have been prepared in conformity with generally accepted accounting principles which require management to make certain estimates and assumptions at the date of the financial statements. The following summarizes the significant accounting policies of the fund:
Security Valuation. Securities for which exchange quotations are readily available are valued at the last sale price, or if no sale price, at the closing bid price. Foreign securities are valued based on quotations from the principal market in which such securities are normally traded. If trading or events occurring in other markets after the close of the principal market in which foreign securities are traded, and before the close of business of the fund, are expected to materially affect the value of those securities, then they are valued at their fair value taking this trading or these events into account. Fair value is determined in good faith under consistently applied procedures under the general supervision of the Board of Trustees. Securities (including restricted securities) for which exchange quotations are not readily available (and in certain cases debt securities which trade on an exchange) are valued primarily using dealer-supplied valuations or at their fair value. Short-term securities with remaining maturities of sixty days or less for which quotations are not readily available are valued at amortized cost or original cost plus accrued interest, both of which approximate current value. Investments in open-end investment companies are valued at their net asset value each business day.
Foreign Currency Translation. The accounting records of the fund are maintained in U.S. dollars. Investment securities and other assets and liabilities denominated in a foreign currency are translated into U.S. dollars at the prevailing rates of exchange at period end. Purchases and sales of securities, income receipts and expense payments are translated into U.S. dollars at the prevailing exchange rate on the respective dates of the transactions.
Net realized gains and losses on foreign currency transactions represent net gains and losses from sales and maturities of foreign currency contracts, disposition of foreign currencies, the difference between the amount of net investment income accrued and the U.S. dollar amount actually received, and gains and losses between trade and settlement date on purchases and sales of securities. The effects of changes in foreign currency exchange rates on investments in securities are included with the net realized and unrealized gain or loss on investment securities.
Income Taxes. As a qualified regulated investment company under Subchapter M of the Internal Revenue Code, the fund is not subject to income taxes to the extent that it distributes substantially all of its taxable income for its fiscal year. The
Semiannual Report
Notes to Financial Statements (Unaudited) - continued
1. Significant Accounting Policies - continued
Income Taxes - continued
schedule of investments includes information regarding income taxes under the caption "Income Tax Information."
Investment Income. Dividend income is recorded on the ex-dividend date, except certain dividends from foreign securities where the ex-dividend date may have passed, are recorded as soon as the fund is informed of the ex-dividend date. Non-cash dividends included in dividend income, if any, are recorded at the fair market value of the securities received. Interest income is accrued as earned. Investment income is recorded net of foreign taxes withheld where recovery of such taxes is uncertain.
Expenses. Most expenses of the trust can be directly attributed to a fund. Expenses which cannot be directly attributed are apportioned among the funds in the trust.
Distributions to Shareholders. Distributions are recorded on the ex-dividend date.
Income and capital gain distributions are determined in accordance with income tax regulations which may differ from generally accepted accounting principles. These differences, which may result in distribution reclassifications, are primarily due to differing treatments for litigation proceeds, foreign currency transactions, non-taxable dividends and losses deferred due to wash sales. The fund also utilized earnings and profits distributed to shareholders on redemption of shares as a part of the dividends paid deduction for income tax purposes.
Permanent book and tax basis differences relating to shareholder distributions will result in reclassifications to paid in capital. Undistributed net investment income and accumulated undistributed net realized gain (loss) on investments and foreign currency transactions may include temporary book and tax basis differences which will reverse in a subsequent period. Any taxable income or gain remaining at fiscal year end is distributed in the following year.
Trading (Redemption) Fees. Shares held in the fund less than three years are subject to a trading fee equal to 2.00% of the proceeds of the redeemed shares. The fee, which is retained by the fund, is accounted for as an addition to paid in capital.
Security Transactions. Security transactions are accounted for as of trade date. Gains and losses on securities sold are determined on the basis of identified cost.
2. Operating Policies.
Foreign Currency Contracts. The fund generally uses foreign currency contracts to facilitate transactions in foreign-denominated securities. Losses may arise from changes in the value of the foreign currency or if the counterparties do not perform under the contracts' terms. The U.S. dollar value of foreign currency contracts is determined using contractual currency exchange rates established at the time of each trade.
Semiannual Report
Notes to Financial Statements (Unaudited) - continued
2. Operating Policies - continued
Joint Trading Account. Pursuant to an Exemptive Order issued by the Securities and Exchange Commission (the SEC), the fund, along with other affiliated entities of Fidelity Management & Research Company (FMR), may transfer uninvested cash balances into one or more joint trading accounts. These balances are invested in one or more repurchase agreements for U.S. Treasury or Federal Agency obligations.
Repurchase Agreements. The underlying U.S. Treasury, Federal Agency, or other obligations found to be satisfactory by FMR are transferred to an account of the fund, or to the Joint Trading Account, at a custodian bank. The securities are marked-to-market daily and maintained at a value at least equal to the principal amount of the repurchase agreement (including accrued interest). FMR, the fund's investment adviser, is responsible for determining that the value of the underlying securities remains in accordance with the market value requirements stated above.
Futures Contracts. The fund may use futures contracts to manage its exposure to the stock market. Buying futures tends to increase the fund's exposure to the underlying instrument, while selling futures tends to decrease the fund's exposure to the underlying instrument or hedge other fund investments. Losses may arise from changes in the value of the underlying instruments or if the counterparties do not perform under the contracts' terms. Gains (losses) are realized upon the expiration or closing of the futures contracts. Futures contracts are valued at the settlement price established each day by the board of trade or exchange on which they are traded.
Restricted Securities. The fund is permitted to invest in securities that are subject to legal or contractual restrictions on resale. These securities generally may be resold in transactions exempt from registration or to the public if the securities are registered. Disposal of these securities may involve time-consuming negotiations and expense, and prompt sale at an acceptable price may be difficult. At the end of the period, restricted securities (excluding 144A issues) amounted to $255,436 or .02% of net assets.
3. Purchases and Sales of Investments.
Purchases and sales of securities, other than short-term securities, aggregated $619,335,445 and $575,514,656, respectively.
The market value of futures contracts opened and closed during the period amounted to $20,820,680 and $20,922,544, respectively.
4. Fees and Other Transactions with Affiliates.
Management Fee. As the fund's investment adviser, FMR receives a monthly basic fee that is calculated on the basis of a group fee rate plus a fixed individual fund fee rate applied to the average net assets of the fund. The group fee rate is the weighted average of a series of rates and is based on the monthly average net assets of all the mutual funds advised by FMR.
Semiannual Report
Notes to Financial Statements (Unaudited) - continued
4. Fees and Other Transactions with Affiliates - continued
Management Fee - continued
The rates ranged from .2167% to .5200% for the period. The annual individual fund fee rate is .45%. In the event that these rates were lower than the contractual rates in effect during the period, FMR voluntarily implemented the above rates, as they resulted in the same or a lower management fee. The basic fee is subject to a performance adjustment (up to a maximum of ±.20% of the fund's average net assets over the performance period) based on the fund's investment performance as compared to the appropriate index over a specified period of time. For the period, the management fee was equivalent to an annualized rate of .83% of average net assets after the performance adjustment.
Sub-Adviser Fee. Beginning January 1, 2001, FMR Co.(FMRC) will serve as a sub-adviser for the fund. FMRC is a wholly owned subsidiary of FMR and will receive a fee from FMR of 50% of the management fee payable to FMR with respect to that portion of the fund's assets that will be managed by FMRC.
Transfer Agent Fees. Fidelity Service Company, Inc. (FSC), an affiliate of FMR, is the fund's transfer, dividend disbursing and shareholder servicing agent. FSC receives account fees and asset-based fees that vary according to account size and type of account. FSC pays for typesetting, printing and mailing of all shareholder reports, except proxy statements. For the period, the transfer agent fees were equivalent to an annualized rate of .19% of average net assets.
Accounting and Security Lending Fees. FSC maintains the fund's accounting records and administers the security lending program. The security lending fee is based on the number and duration of lending transactions. The accounting fee is based on the level of average net assets for the month plus out-of-pocket expenses.
Cash Central Funds. Pursuant to an Exemptive Order issued by the SEC, the fund may invest in the Fidelity Cash Central Fund and the Fidelity Securities Lending Cash Central Fund (the Cash Funds) managed by FIMM. The Cash Funds are open-end money market funds available only to investment companies and other accounts managed by FMR and its affiliates. The Cash Funds seek preservation of capital, liquidity, and current income. Income distributions from the Cash Funds are declared daily and paid monthly from net investment income. Income distributions earned by the fund are recorded as either interest income or security lending income in the accompanying financial statements.
Brokerage Commissions. The fund placed a portion of its portfolio transactions with brokerage firms which are affiliates of FMR. The commissions paid to these affiliated firms were $26,411 for the period.
Semiannual Report
Notes to Financial Statements (Unaudited) - continued
5. Security Lending.
The fund lends portfolio securities from time to time in order to earn additional income. The fund receives collateral in the form of U.S. Treasury obligations, letters of credit, and/or cash against the loaned securities, and maintains collateral in an amount not less than 100% of the market value of the loaned securities during the period of the loan. The market value of the loaned securities is determined at the close of business of the fund and any additional required collateral is delivered to the fund on the next business day. If the borrower defaults on its obligation to return the securities loaned because of insolvency or other reasons, the fund could experience delays and costs in recovering the securities loaned or in gaining access to the collateral. At period end, the value of the securities loaned amounted to $11,300,962. The fund received cash collateral of $11,840,800 which was invested in cash equivalents.
6. Expense Reductions.
FMR has directed certain portfolio trades to brokers who paid a portion of the fund's expenses. For the period, the fund's expenses were reduced by $253,124 under this arrangement.
In addition, through arrangements with the fund's custodian and transfer agent, credits realized as a result of uninvested cash balances were used to reduce a portion of the fund's expenses. During the period, the fund's custodian and transfer agent fees were reduced by $5,188, and $5,015, respectively, under these arrangements.
Semiannual Report
Notes to Financial Statements (Unaudited) - continued
7. Transactions with Affiliated Companies.
An affiliated company is a company in which the fund has ownership of at least 5% of the voting securities. Transactions during the period with companies which are or were affiliates are as follows:
|
Summary of Transactions with Affiliated Companies |
||||||||
|
Affiliate |
|
Purchase |
|
Sales |
|
Dividend |
|
Value |
|
Ashworth, Inc. |
|
$ 468,719 |
|
$ - |
|
$ - |
|
$ 5,708,250 |
|
CEC Entertainment, Inc. |
|
2,710,686 |
|
- |
|
- |
|
47,096,894 |
|
Childtime Learning Centers, Inc. |
|
- |
|
2,139,373 |
|
- |
|
2,796,500 |
|
Coinstar, Inc. |
|
820,859 |
|
- |
|
- |
|
19,049,344 |
|
Cornell Companies, Inc. |
|
742,620 |
|
- |
|
- |
|
4,720,500 |
|
Datakey, Inc. |
|
2,741,889 |
|
- |
|
- |
|
4,358,750 |
|
Future Shop Ltd. |
|
2,279,283 |
|
1,640,540 |
|
- |
|
9,845,386 |
|
Hibbett Sporting Goods, Inc. |
|
- |
|
- |
|
- |
|
16,986,094 |
|
I-Stat Corp. |
|
1,769,934 |
|
- |
|
- |
|
19,791,813 |
|
MapInfo Corp. |
|
3,133,236 |
|
8,567,276 |
|
- |
|
22,784,822 |
|
Medallion Financial Corp. |
|
2,480,001 |
|
6,843,546 |
|
941,592 |
|
12,735,881 |
|
Medialink Worldwide, Inc. |
|
102,291 |
|
- |
|
- |
|
3,827,925 |
|
Murchison United NL |
|
326,110 |
|
- |
|
- |
|
2,808,810 |
|
New Horizons Worldwide, Inc. |
|
262,071 |
|
- |
|
- |
|
8,598,500 |
|
Papa John's International, Inc. |
|
- |
|
- |
|
- |
|
30,467,078 |
|
Pinnacle Systems |
|
99,375 |
|
- |
|
- |
|
32,331,363 |
|
ProsoftTraining.com |
|
1,364,032 |
|
- |
|
- |
|
13,374,200 |
|
Shop At Home, Inc. |
|
- |
|
- |
|
- |
|
3,263,800 |
|
Sizzler International, Inc. |
|
180,169 |
|
509,057 |
|
- |
|
4,240,313 |
|
Source Information |
|
3,425,057 |
|
4,321,149 |
|
- |
|
9,641,500 |
|
Ultimate Electronics, Inc. |
|
7,450,285 |
|
- |
|
- |
|
27,559,763 |
|
VelocityHSI, Inc. |
|
1,316,248 |
|
- |
|
- |
|
892,564 |
|
TOTALS |
|
$ 31,672,865 |
|
$ 24,020,941 |
|
$ 941,592 |
|
$ 302,880,050 |
Semiannual Report
The Board of Trustees of Fidelity Small Cap Stock Fund voted to pay on December 11, 2000, to shareholders of record at the opening of business on December 8, 2000, a distribution of $.36 per share derived from capital gains realized from sales of portfolio securities and a dividend of $.04 per share from net investment income.
Semiannual Report
Fidelity offers several ways to conveniently manage your personal investments via your telephone or PC. You can access your account information, conduct trades and research your investments 24 hours a day.
By Phone
Fidelity Automated Service Telephone provides a single toll-free number to access account balances, positions, quotes and trading. It's easy to navigate the service, and on your first call, the system will help you create a personal identification number (PIN) for security.
(phone_graphic)Fidelity Automated
Service Telephone (FAST®)
1-800-544-5555
Press
1 For mutual fund and brokerage trading.
2 For quotes.*
3 For account balances and holdings.
4 To review orders and mutual
fund activity.
5 To change your PIN.
*0 To speak to a Fidelity representative.
By PC
Fidelity's web site on the Internet provides a wide range of information, including daily financial news, fund performance, interactive planning tools and news about Fidelity products and services.
(computer_graphic)Fidelity's Web Site
www.fidelity.com
If you are not currently on the Internet, call EarthLink Sprint at 1-800-288-2967, and be sure to ask for registration number SMD004 to receive a special Fidelity package that includes 30 days of free Internet access. EarthLink is North America's #1 independent Internet access provider.
(computer_graphic)
Fidelity On-line Xpress+®
Fidelity On-line Xpress+ software for Windows combines comprehensive portfolio management capabilities, securities trading and access to research and analysis tools . . . all on your desktop. Call Fidelity at 1-800-544-0240 or visit our web site for more information on how to manage your investments via your PC.
* When you call the quotes line, please remember that a fund's yield and return will vary and, except for money market funds, share price will also vary. This means that you may have a gain or loss when you sell your shares. There is no assurance that money market funds will be able to maintain a stable $1 share price; an investment in a money market fund is not insured or guaranteed by the U.S. government. Total returns are historical and include changes in share price, reinvestment of dividends and capital gains, and the effects of any sales charges.
Semiannual Report
Investment Adviser
Fidelity Management & Research Company
Boston, MA
Investment Sub-Advisers
Fidelity Management & Research
(Far East) Inc.
Fidelity Management & Research
(U.K.) Inc.
Fidelity Investments Japan Limited
Officers
Edward C. Johnson 3d, President
Robert C. Pozen, Senior Vice President
Paul Antico, Vice President
Abigail P. Johnson, Vice President
Eric D. Roiter, Secretary
Robert A. Dwight, Treasurer
Maria F. Dwyer, Deputy Treasurer
John H. Costello, Assistant Treasurer
Thomas J. Simpson, Assistant Treasurer
Board of Trustees
Ralph F. Cox *
Phyllis Burke Davis *
Robert M. Gates *
Edward C. Johnson 3d
Donald J. Kirk *
Ned C. Lautenbach *
Peter S. Lynch
Marvin L. Mann *
William O. McCoy *
Gerald C. McDonough *
Robert C. Pozen
Thomas R. Williams *
Advisory Board
J. Michael Cook
Abigail P. Johnson
Marie L. Knowles
General Distributor
Fidelity Distributors Corporation
Boston, MA
Transfer and Shareholder
Servicing Agent
Fidelity Service Company, Inc.
Boston, MA
* Independent trustees
Custodian
Brown Brothers Harriman & Co.
Boston, MA
Fidelity's Growth Funds
Aggressive Growth Fund
Blue Chip Growth Fund
Capital Appreciation Fund
Contrafund ®
Contrafund ® II
Disciplined Equity Fund
Dividend Growth Fund
Export and Multinational Fund
Fidelity Fifty®
Growth Company Fund
Large Cap Stock Fund
Low-Priced Stock Fund
Magellan® Fund
Mid-Cap Stock Fund
New Millennium Fund®
OTC Portfolio
Retirement Growth Fund
Small Cap Selector
Small Cap Stock Fund
Stock Selector
Tax Managed Stock Fund
TechnoQuant® Growth Fund
Trend Fund
Value Fund
The Fidelity Telephone Connection
Mutual Fund 24-Hour Service
Exchanges/Redemptions
and Account Assistance 1-800-544-6666
Product Information 1-800-544-6666
Retirement Accounts 1-800-544-4774
(8 a.m. - 9 p.m.)
TDD Service 1-800-544-0118
for the deaf and hearing impaired
(9 a.m. - 9 p.m. Eastern time)
Fidelity Automated Service
Telephone (FAST®) (automated graphic) 1-800-544-5555
(automated graphic) Automated line for quickest service
(Fidelity Investment logo)(registered trademark)
Corporate Headquarters
82 Devonshire St., Boston, MA 02109
www.fidelity.com
SLCX-SANN-1200 118657
1.711817.102
Fidelity®
Fund
Semiannual Report
October 31, 2000
(2_fidelity_logos)
|
President's Message |
3 |
Ned Johnson on investing strategies. |
|
Performance |
4 |
How the fund has done over time. |
|
Fund Talk |
6 |
The manager's review of fund performance, strategy and outlook. |
|
Investment Changes |
9 |
A summary of major shifts in the fund's investments over the past six months. |
|
Investments |
10 |
A complete list of the fund's investments with their market values. |
|
Financial Statements |
25 |
Statements of assets and liabilities, operations, and changes in net assets, as well as financial highlights. |
|
Notes |
29 |
Notes to the financial statements. |
|
Distributions |
34 |
|
To reduce expenses, only one copy of most financial reports and prospectuses may be mailed to households, even if more than one person in the household has an account in the fund. Call Fidelity at 1-800-544-8544 if you need additional copies of financial reports or prospectuses. If you do not want the mailing of these documents to be combined with those for other members of your household, contact Fidelity in writing at P.O. Box 5000, Cincinnati, OH 45273-8692.
Standard & Poor's, S&P and S&P 500 are registered service marks of The McGraw-Hill Companies, Inc. and have been licensed for use by Fidelity Distributors Corporation.
Other third party marks appearing herein are the property of their respective owners.
All other marks appearing herein are registered or unregistered trademarks or service marks of FMR Corp. or an affiliated company.
(Recycle graphic) This report is printed on recycled paper using soy-based inks.
This report and the financial statements contained herein are submitted for the general information of the shareholders of the fund. This report is not authorized for distribution to prospective investors in the fund unless preceded or accompanied by an effective prospectus.
Mutual fund shares are not deposits or obligations of, or guaranteed by, any depository institution. Shares are not insured by the FDIC, Federal Reserve Board or any other agency, and are subject to investment risks, including possible loss of principal amount invested.
Neither the fund nor Fidelity Distributors Corporation is a bank.
For more information on any Fidelity fund, including charges and expenses, call 1-800-544-6666 for a free prospectus. Read it carefully before you invest or send money.
Semiannual Report
|
(photo_of_Edward_C_Johnson_3d)
Dear Shareholder:
A sixth-straight year of double-digit positive returns for the Dow Jones Industrial Average, NASDAQ and S&P 500® could be in jeopardy unless the U.S. stock market shows marked improvement in the final two months of 2000. Through October, all three indexes had negative year-to-date returns. On the other hand, most fixed-income sectors were solidly in the black. Treasuries and other long-term government securities led the way, returning nearly 14%.
While it's impossible to predict the future direction of the markets with any degree of certainty, there are certain basic principles that can help investors plan for their future needs.
First, investors are encouraged to take a long-term view of their portfolios. If you can afford to leave your money invested through the inevitable up and down cycles of the financial markets, you will greatly reduce your vulnerability to any single decline. We know from experience, for example, that stock prices have gone up over longer periods of time, have significantly outperformed other types of investments and have stayed ahead of inflation.
Second, you can further manage your investing risk through diversification. A stock mutual fund, for instance, is already diversified, because it invests in many different companies. You can increase your diversification further by investing in a number of different stock funds, or in such other investment categories as bonds. If you have a short investment time horizon, you might want to consider moving some of your investment into a money market fund, which seeks income and a stable share price by investing in high-quality, short-term investments. Of course, it's important to remember that an investment in a money market fund is not insured or guaranteed by the Federal Deposit Insurance Corporation or any other government agency. Although money market funds seek to preserve the value of your investment at $1.00 per share, it is possible to lose money by investing in these types of funds.
Finally, no matter what your time horizon or portfolio diversity, it makes good sense to follow a regular investment plan, investing a certain amount of money in a fund at the same time each month or quarter and periodically reviewing your overall portfolio. By doing so, you won't get caught up in the excitement of a rapidly rising market, nor will you buy all your shares at market highs. While this strategy - known as dollar cost averaging - won't assure a profit or protect you from a loss in a declining market, it should help you lower the average cost of your purchases. Of course, you should consider your financial ability to continue your purchases through periods of low price levels before undertaking such a strategy.
If you have questions, please call us at 1-800-544-6666, or visit our web site at www.fidelity.com. We are available 24 hours a day, seven days a week to provide you the information you need to make the investments that are right for you.
Best regards,
/s/Edward C. Johnson 3d
Edward C. Johnson 3d
Semiannual Report
There are several ways to evaluate a fund's historical performance. You can look at the total percentage change in value, the average annual percentage change or the growth of a hypothetical $10,000 investment. Total return reflects the change in the value of an investment, assuming reinvestment of the fund's dividend income and capital gains (the profits earned upon the sale of securities that have grown in value).
Cumulative Total Returns
|
Periods ended October 31, 2000 |
Past 6 |
Past 1 |
Past 5 |
Life of |
|
Fidelity Mid-Cap Stock |
12.22% |
58.24% |
223.12% |
352.84% |
|
S&P MidCap 400 ® |
8.56% |
31.65% |
164.80% |
228.03% |
|
Mid-Cap Funds Average |
4.50% |
36.18% |
150.45% |
n/a* |
Cumulative total returns show the fund's performance in percentage terms over a set period - in this case, six months, one year, five years or since the fund started on March 29, 1994. For example, if you had invested $1,000 in a fund that had a 5% return over the past year, the value of your investment would be $1,050. You can compare the fund's returns to the performance of the Standard & Poor's MidCap 400 Index - a market capitalization-weighted index of 400 medium-capitalization stocks. To measure how the fund's performance stacked up against its peers, you can compare it to the mid-cap funds average, which reflects the performance of mutual funds with similar objectives tracked by Lipper Inc. The past six month average represents a peer group of 494 mutual funds. These benchmarks include reinvested dividends and capital gains, if any, and exclude the effect of sales charges. Lipper has created new comparison categories that group funds according to portfolio characteristics and capitalization, as well as by capitalization only. These averages are listed on page 5 of this report.(dagger)
Average Annual Total Returns
|
Periods ended October 31, 2000 |
Past 1 |
Past 5 |
Life of |
|
Fidelity Mid-Cap Stock |
58.24% |
26.44% |
25.73% |
|
S&P MidCap 400 |
31.65% |
21.50% |
19.73% |
|
Mid-Cap Funds Average |
36.18% |
19.39% |
n/a* |
Average annual total returns take the fund's cumulative return and show you what would have happened if the fund had performed at a constant rate each year. (Note: Lipper calculates average annual total returns by annualizing each fund's total return, then taking an arithmetic average. This may produce a different figure than that obtained by averaging the cumulative total returns and annualizing the result.)
* Not available
Semiannual Report
$10,000 Over Life of Fund
$10,000 Over Life of Fund: Let's say hypothetically that $10,000 was invested in Fidelity Mid-Cap Stock Fund on March 29, 1994, when the fund started. As the chart shows, by October 31, 2000, the value of the investment would have grown to $45,284 - a 352.84% increase on the initial investment. For comparison, look at how the Standard & Poor's MidCap 400 Index did over the same period. With dividends and capital gains, if any, reinvested, the same $10,000 would have grown to $32,803 - a 228.03% increase.
Understanding
Performance
How a fund did yesterday is no guarantee of how it will do tomorrow. The stock market, for example, has a history of long-term growth and short-term volatility. In turn, the share price and return of a fund that invests in stocks will vary. That means if you sell your shares during a market downturn, you might lose money. But if you can ride out the market's ups and downs, you may have a gain.
3* The Lipper multi-cap growth funds average reflects the performance (excluding sales charges) of mutual funds with similar portfolio characteristics and capitalization. The Lipper multi-cap supergroup average reflects the performance (excluding sales charges) of mutual funds with similar capitalization. As of October 31, 2000, the six months, one year and five year cumulative total returns for the multi-cap growth funds average were -0.99%, 34.32% and 193.90%, respectively. The one year and five year average annual total returns were 34.32% and 23.56%, respectively. The six months, one year and five year cumulative total returns for the multi-cap supergroup average were 2.19%, 19.65%, and 141.87%, respectively. The one year and five year average annual total returns were 19.65% and 18.73%, respectively.
Semiannual Report
Market Recap
The U.S. equity market environment during the six-month period that ended October 31, 2000, will be remembered as one of the most difficult in recent years. Three negative factors - rising interest rates, the highest oil prices in a decade and the declining value of the European currency - collectively hindered the growth of many domestic companies. As a result, investors reacted pessimistically to most stocks, regardless of market capitalization or industry. In May, the tech-heavy NASDAQ Composite Index experienced a sharp decline and failed to recoup the gains it achieved earlier in the year as the period wore on. The NASDAQ ended the six-month period with a -12.64% return. The Standard & Poor's 500SM Index, an index of 500 larger companies, declined 1.03%. Elsewhere, the Russell 2000® Index, a benchmark of smaller companies that had gained nearly 19% in the previous six-month period, slumped to a -1.11% return. Only the blue chips' benchmark, the Dow Jones Industrial Average, finished the period with a gain, returning 3.01% in large part because investors favored more established companies in October. For its part, the Federal Reserve Board raised the federal funds rate to 6.50% in May - its highest level in nine years - in an attempt to slow the economy and ward off inflation. Meanwhile, the euro's weakness and higher fuel costs particularly hurt multinational companies, many of which lowered third-quarter earnings targets.
(Portfolio Manager photograph)
An interview with David Felman, Portfolio Manager of Fidelity Mid-Cap Stock Fund
Q. How did the fund perform, David?
A. For the six-month period that ended October 31, 2000, the fund returned 12.22%, compared to a return of 8.56% for the Standard & Poor's MidCap 400 Index and 4.50% for the mid-cap funds average, as measured by Lipper Inc. For the 12-month period that ended October 31, 2000, the fund returned 58.24%. During the same 12-month period, the Standard & Poor's MidCap 400 Index returned 31.65%, while the Lipper mid-cap funds average returned 36.18%. The decisions early in the six-month period to reduce the emphasis on technology stocks and to raise the weightings in health care helped the fund outperform both the S&P MidCap 400 index and the Lipper peer group average.
Q. What factors affected performance?
A. The biggest factor was the change in investor sentiment about technology. Early in 2000, the growth in both the Internet and wireless communications drove stock market performance. Then, in the middle of the year, we started to see cracks in both trends. The dot-coms started experiencing problems, which hurt technology stocks in general. At the same time, supply in wireless communications started to outpace demand, and telecommunications stocks also began to fall. With 38.9% of net assets in technology on April 30, the fund started the period with an overweighted position in the sector relative to the S&P MidCap 400 index. As I saw slowing growth in both the Internet and wireless, I brought the technology weighting down to 12.1% by October 31. I also began the fiscal period with an overweighted position in energy stocks. Valuations were attractive, OPEC showed discipline in controlling supply and long-delayed capital spending projects were starting up because of the rising energy prices. The energy position helped performance, but I reduced the holdings in the sector from 11.0% of net assets to 7.1% during the six months as stocks hit their target prices and OPEC began showing less discipline in controlling supply.
Semiannual Report
Fund Talk: The Manager's Overview - continued
Q. Why did you increase the fund's health care position, which rose from 12.0% of net assets to 21.3% during the six-month period?
A. As I cut technology and energy, I redeployed assets into health care, which was a positive contributor. Developments in biotechnology were exciting and health maintenance organizations (HMOs) showed improving prospects after a prolonged period of underperformance. In the case of biotechnology, many of the most promising companies were developing products based on genomics, or the science of gene mapping. I believed if these companies were successful, their stocks could perform well regardless of how technology did.
Q. What stocks helped performance?
A. Myriad Genetics, which is developing diagnostic processes for heart disease and cancer, was a very strong performer. Millennium Pharmaceuticals and Protein Design Labs, two biotech research companies, also performed very well. My decision to raise the fund's weighting in financial services boosted the fund's returns, although I continued to underweight the industry. Freddie Mac, with its record of stable earnings growth, was a strong contributor to performance.
Q. Were there any disappointments?
A. While I reduced the technology holdings substantially, I probably should have moved even earlier than I did. Doubleclick, the leader in Internet advertising, fell sharply as the Internet market slowed. Kopin, which produces wafers for wireless handsets, was a successful investment for the fund over the longer term, but it hurt performance during the six-month period. I sold the fund's positions in both Doubleclick and Kopin.
Q. What's your outlook, David?
A. The critical issue I face is whether to continue to de-emphasize technology or whether the sector's outlook will improve and begin to rally. While it's true that consumer-oriented Internet stocks have been weak, corporate spending on data processing and Internet operations continues to expand. A major question will be whether major corporations, both domestic and multinational, continue to spend heavily on information technology or whether their technology spending will slow. This is the key question with which I will be wrestling.
Semiannual Report
Fund Talk: The Manager's Overview - continued
The views expressed in this report reflect those of the portfolio manager only through the end of the period of the report as stated on the cover and do not necessarily represent the views of Fidelity or any other person in the Fidelity organization. Any such views are subject to change at any time based upon market or other conditions and Fidelity disclaims any responsibility to update such views. These views may not be relied on as investment advice and, because investment decisions for a Fidelity fund are based on numerous factors, may not be relied on as an indication of trading intent on behalf of any Fidelity fund.
Fund Facts
Goal: long-term growth of capital by investing mainly in equity securities of companies with medium-sized market capitalizations
Fund number: 337
Trading symbol: FMCSX
Start date: March 29, 1994
Size: as of October 31, 2000, more than $6.3 billion
Manager: David Felman, since 1999; manager, Fidelity Advisor Mid-Cap Fund, since 1999; Fidelity Convertible Securities Fund, 1997-1999; Fidelity Select Telecommunications Portfolio, 1994-1996; joined Fidelity in 1993
3David Felman on the improving prospects for stocks of health maintenance organizations (HMOs):
"In the past, HMOs have had trouble both raising prices and forecasting their actual claims costs, making it difficult to predict their profitability. Recently, however, they have gained more control over their pricing. As a result, revenues have started increasing at annual rates of 10% to 11%. At the same time, they have been able to get a better grip on their costs. At one time, HMOs would raise their prices at the beginning of the year, but it would take a calendar quarter or more before claims would be filed and the companies understood their actual costs. Now, with better data processing systems, claims are filed faster and companies get an earlier understanding of their costs. This improved efficiency enhances their ability to set their prices at profitable levels.
"Despite this improving outlook, HMOs still face some uncertainty because they are vulnerable to political issues, such as proposals to give patients the right to sue them. Government and regulatory issues such as these are major factors affecting HMOs."
Semiannual Report
|
Top Ten Stocks as of October 31, 2000 |
||
|
|
% of fund's |
% of fund's net assets |
|
Freddie Mac |
2.8 |
0.9 |
|
Fannie Mae |
1.1 |
0.0 |
|
Concord EFS, Inc. |
1.1 |
0.1 |
|
CIGNA Corp. |
1.0 |
0.7 |
|
Allegheny Energy, Inc. |
1.0 |
0.0 |
|
Millennium Pharmaceuticals, Inc. |
0.9 |
0.4 |
|
Trigon Healthcare, Inc. |
0.9 |
0.0 |
|
Dynegy, Inc. Class A |
0.8 |
0.8 |
|
National Semiconductor Corp. |
0.8 |
0.5 |
|
Calpine Corp. |
0.8 |
0.9 |
|
|
11.2 |
4.3 |
|
Top Five Market Sectors as of October 31, 2000 |
||
|
|
% of fund's |
% of fund's net assets |
|
Health |
21.3 |
12.0 |
|
Finance |
13.4 |
6.5 |
|
Technology |
12.1 |
38.9 |
|
Utilities |
10.1 |
9.0 |
|
Energy |
7.1 |
11.0 |
|
Asset Allocation (% of fund's net assets) |
|||||||
|
As of October 31, 2000 * |
As of April 30, 2000 ** |
||||||
|
Stocks and |
|
|
Stocks 94.3% |
|
||
|
Short-Term |
|
|
Short-Term |
|
||
|
* Foreign investments |
4.2% |
|
** Foreign investments |
5.0% |
|
||

Semiannual Report
(Unaudited)
Showing Percentage of Net Assets
|
Common Stocks - 86.0% |
|||
|
Shares |
Value (Note 1) (000s) |
||
|
AEROSPACE & DEFENSE - 0.7% |
|||
|
Aerospace & Defense - 0.5% |
|||
|
Honeywell International, Inc. |
517,600 |
$ 27,853 |
|
|
Defense Electronics - 0.0% |
|||
|
Cubic Corp. |
700 |
19 |
|
|
Ship Building & Repair - 0.2% |
|||
|
General Dynamics Corp. |
206,100 |
14,749 |
|
|
TOTAL AEROSPACE & DEFENSE |
42,621 |
||
|
BASIC INDUSTRIES - 4.9% |
|||
|
Chemicals & Plastics - 2.4% |
|||
|
Avery Dennison Corp. |
125,980 |
6,362 |
|
|
Dow Chemical Co. |
721,000 |
22,081 |
|
|
E.I. du Pont de Nemours and Co. |
298,400 |
13,540 |
|
|
FMC Corp. (a) |
214,900 |
16,332 |
|
|
Georgia Gulf Corp. |
269,600 |
3,606 |
|
|
Ivex Packaging Corp. (a) |
279,900 |
2,747 |
|
|
Lyondell Chemical Co. |
615,900 |
8,854 |
|
|
Olin Corp. |
381,200 |
6,766 |
|
|
PolyOne Corp. |
198,600 |
1,564 |
|
|
Praxair, Inc. |
916,700 |
34,147 |
|
|
Rohm & Haas Co. |
106,400 |
3,199 |
|
|
Sealed Air Corp. (a) |
100,000 |
4,813 |
|
|
Solutia, Inc. |
469,900 |
5,991 |
|
|
Union Carbide Corp. |
451,500 |
19,415 |
|
|
|
149,417 |
||
|
Paper & Forest Products - 2.5% |
|||
|
Bowater, Inc. |
257,900 |
13,959 |
|
|
Georgia-Pacific Corp. |
1,019,720 |
27,405 |
|
|
International Paper Co. |
895,600 |
32,801 |
|
|
Kimberly-Clark Corp. |
384,500 |
25,377 |
|
|
Mead Corp. |
480,100 |
13,893 |
|
|
Pactiv Corp. (a) |
1,717,300 |
18,032 |
|
|
Smurfit-Stone Container Corp. (a) |
364,500 |
4,921 |
|
|
Trex Co., Inc. (a) |
93,800 |
3,506 |
|
|
Weyerhaeuser Co. |
156,600 |
7,350 |
|
|
Willamette Industries, Inc. |
402,800 |
14,627 |
|
|
|
161,871 |
||
|
TOTAL BASIC INDUSTRIES |
311,288 |
||
|
Common Stocks - continued |
|||
|
Shares |
Value (Note 1) (000s) |
||
|
CONSTRUCTION & REAL ESTATE - 1.0% |
|||
|
Building Materials - 0.5% |
|||
|
American Standard Companies, Inc. (a) |
400,270 |
$ 18,362 |
|
|
Shaw Group (a) |
26,800 |
2,184 |
|
|
York International Corp. |
451,800 |
12,283 |
|
|
|
32,829 |
||
|
Construction - 0.3% |
|||
|
Centex Corp. |
481,200 |
17,804 |
|
|
Engineering - 0.1% |
|||
|
Tetra Tech, Inc. (a) |
212,300 |
7,377 |
|
|
Real Estate Investment Trusts - 0.1% |
|||
|
Spieker Properties, Inc. |
101,600 |
5,626 |
|
|
TOTAL CONSTRUCTION & REAL ESTATE |
63,636 |
||
|
DURABLES - 1.8% |
|||
|
Autos, Tires, & Accessories - 0.4% |
|||
|
Danaher Corp. |
166,300 |
10,498 |
|
|
Federal Signal Corp. |
286,000 |
6,685 |
|
|
Johnson Controls, Inc. |
52,800 |
3,148 |
|
|
Lear Corp. (a) |
153,600 |
4,186 |
|
|
Superior Industries International, Inc. |
101,700 |
3,464 |
|
|
|
27,981 |
||
|
Consumer Electronics - 0.2% |
|||
|
Gemstar-TV Guide International, Inc. (a) |
70,800 |
4,854 |
|
|
General Motors Corp. Class H |
264,100 |
8,557 |
|
|
|
13,411 |
||
|
Home Furnishings - 0.6% |
|||
|
Herman Miller, Inc. |
201,900 |
5,275 |
|
|
Hillenbrand Industries, Inc. |
489,300 |
22,630 |
|
|
HON Industries, Inc. |
129,900 |
3,126 |
|
|
Leggett & Platt, Inc. |
436,600 |
7,149 |
|
|
|
38,180 |
||
|
Textiles & Apparel - 0.6% |
|||
|
Jones Apparel Group, Inc. (a) |
307,500 |
8,552 |
|
|
Liz Claiborne, Inc. |
274,780 |
11,678 |
|
|
Mohawk Industries, Inc. (a) |
143,600 |
3,132 |
|
|
Common Stocks - continued |
|||
|
Shares |
Value (Note 1) (000s) |
||
|
DURABLES - continued |
|||
|
Textiles & Apparel - continued |
|||
|
Shaw Industries, Inc. |
164,300 |
$ 3,050 |
|
|
Timberland Co. Class A (a) |
170,500 |
8,802 |
|
|
|
35,214 |
||
|
TOTAL DURABLES |
114,786 |
||
|
ENERGY - 7.1% |
|||
|
Energy Services - 4.5% |
|||
|
BJ Services Co. (a) |
469,800 |
24,635 |
|
|
Cal Dive International, Inc. (a) |
88,600 |
4,408 |
|
|
Coflexip SA sponsored ADR |
88,500 |
5,050 |
|
|
Diamond Offshore Drilling, Inc. |
410,300 |
14,181 |
|
|
ENSCO International, Inc. |
677,600 |
22,530 |
|
|
Global Marine, Inc. (a) |
1,262,100 |
33,446 |
|
|
Grey Wolf, Inc. (a) |
1,816,300 |
8,400 |
|
|
Halliburton Co. |
292,300 |
10,833 |
|
|
Hanover Compressor Co. (a) |
347,900 |
11,350 |
|
|
Helmerich & Payne, Inc. |
312,700 |
9,831 |
|
|
Nabors Industries, Inc. (a) |
352,300 |
17,932 |
|
|
Noble Drilling Corp. (a) |
640,300 |
26,612 |
|
|
Pride International, Inc. (a) |
166,400 |
4,212 |
|
|
R&B Falcon Corp. (a) |
599,800 |
14,995 |
|
|
Rowan Companies, Inc. (a) |
78,800 |
1,985 |
|
|
Smith International, Inc. (a) |
143,800 |
10,138 |
|
|
Tidewater, Inc. |
550,500 |
25,426 |
|
|
Transocean Sedco Forex, Inc. |
219,800 |
11,649 |
|
|
Varco International, Inc. (a) |
481,547 |
8,307 |
|
|
Weatherford International, Inc. |
530,700 |
19,371 |
|
|
|
285,291 |
||
|
Oil & Gas - 2.6% |
|||
|
Anadarko Petroleum Corp. |
203,300 |
13,021 |
|
|
Apache Corp. |
199,200 |
11,018 |
|
|
Burlington Resources, Inc. |
127,300 |
4,583 |
|
|
Cooper Cameron Corp. (a) |
195,100 |
10,633 |
|
|
Devon Energy Corp. |
559,546 |
28,201 |
|
|
EOG Resources, Inc. |
134,100 |
5,280 |
|
|
Grant Prideco, Inc. (a) |
310,200 |
5,758 |
|
|
Kerr-McGee Corp. |
51,052 |
3,334 |
|
|
Murphy Oil Corp. |
41,800 |
2,422 |
|
|
Noble Affiliates, Inc. |
136,700 |
5,015 |
|
|
Common Stocks - continued |
|||
|
Shares |
Value (Note 1) (000s) |
||
|
ENERGY - continued |
|||
|
Oil & Gas - continued |
|||
|
Ocean Energy, Inc. (a) |
612,100 |
$ 8,493 |
|
|
Suncor Energy, Inc. |
185,100 |
3,617 |
|
|
Tosco Corp. |
836,819 |
23,954 |
|
|
USX - Marathon Group |
135,500 |
3,684 |
|
|
Valero Energy Corp. |
483,000 |
15,969 |
|
|
Veritas DGC, Inc. (a) |
583,400 |
17,502 |
|
|
|
162,484 |
||
|
TOTAL ENERGY |
447,775 |
||
|
FINANCE - 13.4% |
|||
|
Banks - 0.7% |
|||
|
Bank of New York Co., Inc. |
225,100 |
12,957 |
|
|
Commerce Bancorp, Inc. |
97,200 |
5,887 |
|
|
PNC Financial Services Group, Inc. |
149,400 |
9,991 |
|
|
U.S. Bancorp |
561,400 |
13,579 |
|
|
|
42,414 |
||
|
Credit & Other Finance - 1.1% |
|||
|
Concord EFS, Inc. (a) |
1,649,700 |
68,153 |
|
|
Federal Sponsored Credit - 4.1% |
|||
|
Fannie Mae |
885,800 |
68,207 |
|
|
Freddie Mac |
2,994,800 |
179,689 |
|
|
USA Education, Inc. |
247,600 |
13,835 |
|
|
|
261,731 |
||
|
Insurance - 7.4% |
|||
|
ACE Ltd. |
860,300 |
33,767 |
|
|
AFLAC, Inc. |
131,500 |
9,608 |
|
|
Allmerica Financial Corp. |
199,700 |
12,594 |
|
|
AMBAC Financial Group, Inc. |
625,200 |
49,899 |
|
|
American General Corp. |
75,200 |
6,054 |
|
|
American International Group, Inc. |
265,500 |
26,019 |
|
|
Arthur J. Gallagher & Co. |
114,300 |
7,215 |
|
|
Berkshire Hathaway, Inc. Class B (a) |
11,800 |
24,815 |
|
|
CIGNA Corp. |
517,450 |
63,103 |
|
|
First Health Group Corp. (a) |
236,100 |
9,208 |
|
|
Hartford Financial Services Group, Inc. |
297,600 |
22,153 |
|
|
Hilb, Rogal & Hamilton Co. |
148,600 |
5,888 |
|
|
Jefferson-Pilot Corp. |
62,200 |
4,276 |
|
|
John Hancock Financial Services, Inc. |
410,900 |
12,995 |
|
|
Common Stocks - continued |
|||
|
Shares |
Value (Note 1) (000s) |
||
|
FINANCE - continued |
|||
|
Insurance - continued |
|||
|
Loews Corp. |
216,000 |
$ 19,643 |
|
|
MBIA, Inc. |
222,000 |
16,137 |
|
|
MetLife, Inc. |
1,052,200 |
29,067 |
|
|
Nationwide Financial Services, Inc. Class A |
275,200 |
13,382 |
|
|
Protective Life Corp. |
551,900 |
12,763 |
|
|
The Chubb Corp. |
348,500 |
29,426 |
|
|
The St. Paul Companies, Inc. |
312,200 |
16,000 |
|
|
Torchmark Corp. |
198,600 |
6,616 |
|
|
UnumProvident Corp. |
364,400 |
10,294 |
|
|
XL Capital Ltd. Class A |
334,400 |
25,707 |
|
|
|
466,629 |
||
|
Securities Industry - 0.1% |
|||
|
Lehman Brothers Holdings, Inc. |
102,400 |
6,605 |
|
|
TOTAL FINANCE |
845,532 |
||
|
HEALTH - 21.3% |
|||
|
Drugs & Pharmaceuticals - 13.7% |
|||
|
3 Dimensional Pharmaceuticals, Inc. |
159,300 |
3,803 |
|
|
Abgenix, Inc. (a) |
152,200 |
12,005 |
|
|
Alkermes, Inc. (a) |
288,900 |
10,707 |
|
|
Alliance Pharmaceutical Corp. (a) |
586,100 |
8,279 |
|
|
Alpharma, Inc. Class A |
163,000 |
6,326 |
|
|
ALZA Corp. (a) |
95,800 |
7,754 |
|
|
Aviron (a) |
733,250 |
47,936 |
|
|
Biovail Corp. (a) |
479,000 |
20,450 |
|
|
Bristol-Myers Squibb Co. |
429,540 |
26,175 |
|
|
Celgene Corp. (a) |
633,400 |
40,775 |
|
|
Cell Therapeutics, Inc. (a) |
217,600 |
14,555 |
|
|
Cephalon, Inc. (a) |
243,300 |
13,047 |
|
|
Chiron Corp. (a) |
281,700 |
12,201 |
|
|
CIMA Labs, Inc. (a) |
201,700 |
11,094 |
|
|
COR Therapeutics, Inc. (a) |
788,300 |
44,539 |
|
|
Corixa Corp. (a) |
278,700 |
12,402 |
|
|
CV Therapeutics, Inc. (a) |
112,400 |
8,852 |
|
|
Enzon, Inc. (a) |
324,000 |
23,085 |
|
|
Forest Laboratories, Inc. (a) |
180,200 |
23,877 |
|
|
GelTex Pharmaceuticals, Inc. (a) |
496,400 |
24,634 |
|
|
Genzyme Corp. - General Division (a) |
598,800 |
42,515 |
|
|
Gilead Sciences, Inc. (a) |
302,440 |
26,010 |
|
|
Common Stocks - continued |
|||
|
Shares |
Value (Note 1) (000s) |
||
|
HEALTH - continued |
|||
|
Drugs & Pharmaceuticals - continued |
|||
|
Human Genome Sciences, Inc. (a) |
30,000 |
$ 2,652 |
|
|
IDEC Pharmaceuticals Corp. (a) |
182,600 |
35,812 |
|
|
ImClone Systems, Inc. (a) |
777,400 |
42,514 |
|
|
Incyte Genomics, Inc. (a) |
170,500 |
6,245 |
|
|
Intermune Pharmaceuticals, Inc. |
363,800 |
18,190 |
|
|
IVAX Corp. (a) |
801,300 |
34,857 |
|
|
KV Pharmaceutical Co. Class A (a) |
430,600 |
16,766 |
|
|
Medarex, Inc. (a) |
121,800 |
7,445 |
|
|
Millennium Pharmaceuticals, Inc. (a) |
786,794 |
57,092 |
|
|
Mylan Laboratories, Inc. |
308,600 |
8,641 |
|
|
Myriad Genetics, Inc. (a) |
309,000 |
37,080 |
|
|
Noven Pharmaceuticals, Inc. (a) |
79,100 |
3,525 |
|
|
Protein Design Labs, Inc. (a) |
123,200 |
16,642 |
|
|
QLT, Inc. (a) |
167,400 |
8,356 |
|
|
Schering-Plough Corp. |
142,800 |
7,381 |
|
|
Sepracor, Inc. (a) |
435,000 |
29,634 |
|
|
Shire Pharmaceuticals Group PLC ADR (a) |
232,800 |
14,637 |
|
|
Sigma-Aldrich Corp. |
365,700 |
13,074 |
|
|
Teva Pharmaceutical Industries Ltd. ADR |
506,200 |
29,929 |
|
|
Titan Pharmaceuticals, Inc. (a) |
222,500 |
9,363 |
|
|
United Therapeutics Corp. (d) |
127,700 |
6,832 |
|
|
Vertex Pharmaceuticals, Inc. (a) |
85,800 |
7,989 |
|
|
XOMA Ltd. (a) |
508,100 |
6,192 |
|
|
|
861,869 |
||
|
Medical Equipment & Supplies - 2.6% |
|||
|
Abbott Laboratories |
339,800 |
17,946 |
|
|
Acuson Corp. (a) |
267,500 |
6,102 |
|
|
AmeriSource Health Corp. Class A (a) |
150,700 |
6,546 |
|
|
Biomet, Inc. |
247,000 |
8,938 |
|
|
Cardinal Health, Inc. |
416,900 |
39,501 |
|
|
Cygnus, Inc. (a) |
168,500 |
1,506 |
|
|
Disetronic Holding AG |
6,045 |
5,250 |
|
|
I-Stat Corp. (a) |
262,800 |
5,157 |
|
|
Millipore Corp. |
98,400 |
5,166 |
|
|
Novoste Corp. (a) |
287,700 |
7,264 |
|
|
ORATEC Interventions, Inc. |
35,800 |
358 |
|
|
Steris Corp. (a) |
219,100 |
3,287 |
|
|
Common Stocks - continued |
|||
|
Shares |
Value (Note 1) (000s) |
||
|
HEALTH - continued |
|||
|
Medical Equipment & Supplies - continued |
|||
|
Stryker Corp. |
959,500 |
$ 45,216 |
|
|
Sybron International, Inc. (a) |
370,250 |
9,164 |
|
|
|
161,401 |
||
|
Medical Facilities Management - 5.0% |
|||
|
AmeriPath, Inc. (a) |
708,000 |
12,700 |
|
|
Express Scripts, Inc. Class A (a) |
370,100 |
24,866 |
|
|
HCA - The Healthcare Co. |
631,400 |
25,217 |
|
|
Health Management Associates, Inc. Class A (a) |
1,225,700 |
24,284 |
|
|
HEALTHSOUTH Corp. (a) |
1,283,700 |
15,404 |
|
|
Laboratory Corp. of America Holdings (a) |
80,800 |
10,898 |
|
|
Lincare Holdings, Inc. (a) |
169,300 |
7,121 |
|
|
Oxford Health Plans, Inc. (a) |
1,119,000 |
37,766 |
|
|
Quest Diagnostics, Inc. (a) |
266,900 |
25,689 |
|
|
Tenet Healthcare Corp. |
531,600 |
20,899 |
|
|
Trigon Healthcare, Inc. (a) |
789,900 |
56,626 |
|
|
UnitedHealth Group, Inc. |
410,800 |
44,931 |
|
|
Wellpoint Health Networks, Inc. (a) |
103,700 |
12,126 |
|
|
|
318,527 |
||
|
TOTAL HEALTH |
1,341,797 |
||
|
INDUSTRIAL MACHINERY & EQUIPMENT - 1.4% |
|||
|
Electrical Equipment - 0.7% |
|||
|
California Amplifier, Inc. (a) |
200,600 |
5,015 |
|
|
General Electric Co. |
236,400 |
12,958 |
|
|
L-3 Communications Holdings, Inc. (a) |
40,700 |
2,684 |
|
|
Pace Micro Technology PLC |
779,000 |
5,556 |
|
|
Research in Motion Ltd. (a) |
59,100 |
5,900 |
|
|
Vyyo, Inc. |
498,800 |
11,036 |
|
|
|
43,149 |
||
|
Industrial Machinery & Equipment - 0.7% |
|||
|
Ingersoll-Rand Co. |
352,100 |
13,292 |
|
|
Mettler-Toledo International, Inc. (a) |
382,700 |
17,867 |
|
|
Parker-Hannifin Corp. |
244,200 |
10,104 |
|
|
|
41,263 |
||
|
TOTAL INDUSTRIAL MACHINERY & EQUIPMENT |
84,412 |
||
|
Common Stocks - continued |
|||
|
Shares |
Value (Note 1) (000s) |
||
|
MEDIA & LEISURE - 2.6% |
|||
|
Broadcasting - 1.1% |
|||
|
Comcast Corp. Class A (special) (a) |
143,500 |
$ 5,848 |
|
|
EchoStar Communications Corp. Class A (a) |
148,800 |
6,733 |
|
|
Entercom Communications Corp. Class A (a) |
108,500 |
4,252 |
|
|
LodgeNet Entertainment Corp. (a) |
70,100 |
1,231 |
|
|
Pegasus Communications Corp. (a) |
767,250 |
27,285 |
|
|
Radio One, Inc. Class A (a) |
119,200 |
946 |
|
|
Univision Communications, Inc. Class A (a) |
562,800 |
21,527 |
|
|
|
67,822 |
||
|
Entertainment - 0.6% |
|||
|
Mandalay Resort Group (a) |
457,900 |
9,530 |
|
|
MGM Mirage, Inc. |
440,400 |
15,221 |
|
|
Park Place Entertainment Corp. (a) |
890,000 |
11,348 |
|
|
Six Flags, Inc. (a) |
328,400 |
5,131 |
|
|
|
41,230 |
||
|
Lodging & Gaming - 0.4% |
|||
|
Four Seasons Hotels, Inc. |
111,000 |
8,136 |
|
|
Harrah's Entertainment, Inc. (a) |
358,700 |
10,268 |
|
|
International Game Technology (a) |
188,300 |
6,896 |
|
|
|
25,300 |
||
|
Publishing - 0.0% |
|||
|
Reader's Digest Association, Inc. Class A (non-vtg.) |
28,700 |
1,053 |
|
|
Restaurants - 0.5% |
|||
|
Brinker International, Inc. (a) |
339,100 |
13,310 |
|
|
Jack in the Box, Inc. (a) |
627,520 |
15,374 |
|
|
|
28,684 |
||
|
TOTAL MEDIA & LEISURE |
164,089 |
||
|
NONDURABLES - 4.1% |
|||
|
Agriculture - 0.4% |
|||
|
Delta & Pine Land Co. |
461,200 |
11,271 |
|
|
Nutreco Holding NV |
311,125 |
13,415 |
|
|
|
24,686 |
||
|
Beverages - 0.4% |
|||
|
Pepsi Bottling Group, Inc. |
429,200 |
14,861 |
|
|
The Coca-Cola Co. |
127,300 |
7,686 |
|
|
|
22,547 |
||
|
Common Stocks - continued |
|||
|
Shares |
Value (Note 1) (000s) |
||
|
NONDURABLES - continued |
|||
|
Foods - 2.2% |
|||
|
Keebler Foods Co. |
261,200 |
$ 10,579 |
|
|
McCormick & Co., Inc. (non-vtg.) |
300,500 |
9,522 |
|
|
Nabisco Group Holdings Corp. |
1,000,200 |
28,881 |
|
|
Nabisco Holdings Corp. Class A |
351,300 |
18,992 |
|
|
PepsiCo, Inc. |
485,600 |
23,521 |
|
|
Quaker Oats Co. |
202,900 |
16,549 |
|
|
Sysco Corp. |
595,400 |
31,072 |
|
|
|
139,116 |
||
|
Household Products - 0.2% |
|||
|
Estee Lauder Companies, Inc. Class A |
318,900 |
14,809 |
|
|
Tobacco - 0.9% |
|||
|
Philip Morris Companies, Inc. |
631,100 |
23,114 |
|
|
RJ Reynolds Tobacco Holdings, Inc. |
862,800 |
30,845 |
|
|
|
53,959 |
||
|
TOTAL NONDURABLES |
255,117 |
||
|
PRECIOUS METALS - 0.7% |
|||
|
Agnico-Eagle Mines Ltd. |
261,000 |
1,380 |
|
|
Barrick Gold Corp. |
600,700 |
7,990 |
|
|
Meridian Gold, Inc. (a) |
1,247,140 |
6,307 |
|
|
Newmont Mining Corp. |
35,700 |
484 |
|
|
Placer Dome, Inc. |
1,401,500 |
11,645 |
|
|
Stillwater Mining Co. (a) |
551,098 |
15,982 |
|
|
TOTAL PRECIOUS METALS |
43,788 |
||
|
RETAIL & WHOLESALE - 1.3% |
|||
|
Apparel Stores - 0.3% |
|||
|
Abercrombie & Fitch Co. Class A (a) |
365,600 |
8,614 |
|
|
Venator Group, Inc. (a) |
590,600 |
8,342 |
|
|
|
16,956 |
||
|
Drug Stores - 0.1% |
|||
|
Walgreen Co. |
171,900 |
7,843 |
|
|
General Merchandise Stores - 0.1% |
|||
|
Kohls Corp. (a) |
158,400 |
8,583 |
|
|
Grocery Stores - 0.5% |
|||
|
Kroger Co. (a) |
348,200 |
7,856 |
|
|
Common Stocks - continued |
|||
|
Shares |
Value (Note 1) (000s) |
||
|
RETAIL & WHOLESALE - continued |
|||
|
Grocery Stores - continued |
|||
|
Safeway, Inc. (a) |
231,700 |
$ 12,671 |
|
|
Whole Foods Market, Inc. (a) |
218,600 |
10,110 |
|
|
|
30,637 |
||
|
Retail & Wholesale, Miscellaneous - 0.3% |
|||
|
Staples, Inc. (a) |
429,938 |
6,127 |
|
|
Tiffany & Co., Inc. |
206,600 |
8,819 |
|
|
|
14,946 |
||
|
TOTAL RETAIL & WHOLESALE |
78,965 |
||
|
SERVICES - 1.7% |
|||
|
Advertising - 0.4% |
|||
|
ADVO, Inc. (a) |
508,200 |
18,708 |
|
|
TMP Worldwide, Inc. (a) |
124,800 |
8,687 |
|
|
|
27,395 |
||
|
Services - 1.3% |
|||
|
ACNielsen Corp. (a) |
442,400 |
10,590 |
|
|
Cintas Corp. |
993,500 |
46,074 |
|
|
Convergys Corp. (a) |
63,400 |
2,762 |
|
|
Corporate Executive Board Co. (a) |
198,400 |
9,151 |
|
|
Per-Se Technologies, Inc. warrants 7/8/03 (a) |
10,733 |
0 |
|
|
Professional Detailing, Inc. (a) |
70,800 |
6,275 |
|
|
Robert Half International, Inc. (a) |
223,400 |
6,814 |
|
|
|
81,666 |
||
|
TOTAL SERVICES |
109,061 |
||
|
TECHNOLOGY - 12.1% |
|||
|
Communications Equipment - 1.5% |
|||
|
3Com Corp. |
1,575,600 |
27,967 |
|
|
Ciena Corp. (a) |
2,780 |
292 |
|
|
Cisco Systems, Inc. (a) |
315,300 |
16,987 |
|
|
Comverse Technology, Inc. (a) |
74,874 |
8,367 |
|
|
InterVoice-Brite, Inc. (a) |
203,300 |
1,989 |
|
|
Jabil Circuit, Inc. (a) |
396,600 |
22,631 |
|
|
Natural MicroSystems Corp. (a) |
219,600 |
9,923 |
|
|
Nokia AB sponsored ADR |
154,700 |
6,613 |
|
|
|
94,769 |
||
|
Common Stocks - continued |
|||
|
Shares |
Value (Note 1) (000s) |
||
|
TECHNOLOGY - continued |
|||
|
Computer Services & Software - 5.1% |
|||
|
Affiliated Computer Services, Inc. Class A (a) |
184,300 |
$ 10,263 |
|
|
Affymetrix, Inc. (a) |
88,300 |
4,890 |
|
|
Amazon.com, Inc. (a) |
1,062,000 |
38,896 |
|
|
Avant! Corp. (a) |
28,200 |
474 |
|
|
BEA Systems, Inc. (a) |
97,900 |
7,024 |
|
|
Cadence Design Systems, Inc. (a) |
1,117,600 |
28,708 |
|
|
CMG PLC |
148,800 |
2,455 |
|
|
DST Systems, Inc. (a) |
307,600 |
18,956 |
|
|
Eclipsys Corp. (a) |
408,700 |
10,090 |
|
|
Electronic Arts, Inc. (a) |
258,800 |
12,940 |
|
|
Fiserv, Inc. (a) |
264,200 |
13,854 |
|
|
Informix Corp. (a) |
321,000 |
1,364 |
|
|
Intuit, Inc. (a) |
128,920 |
7,921 |
|
|
J.D. Edwards & Co. (a) |
237,200 |
6,138 |
|
|
Manugistics Group, Inc. (a) |
27,100 |
3,088 |
|
|
PeopleSoft, Inc. (a) |
681,700 |
29,750 |
|
|
Polycom, Inc. (a) |
450,300 |
29,270 |
|
|
Rational Software Corp. (a) |
571,200 |
34,094 |
|
|
Sema Group PLC |
177,000 |
2,232 |
|
|
Sonus Networks, Inc. |
228,300 |
7,876 |
|
|
SunGard Data Systems, Inc. (a) |
517,600 |
26,462 |
|
|
Synopsys, Inc. (a) |
177,400 |
6,187 |
|
|
The BISYS Group, Inc. (a) |
310,000 |
14,609 |
|
|
Yahoo!, Inc. (a) |
116,600 |
6,836 |
|
|
|
324,377 |
||
|
Computers & Office Equipment - 1.4% |
|||
|
Avocent Corp. (a) |
333,800 |
23,679 |
|
|
CDW Computer Centers, Inc. (a) |
182,800 |
11,779 |
|
|
Juniper Networks, Inc. (a) |
4,580 |
893 |
|
|
Network Appliance, Inc. (a) |
36,900 |
4,391 |
|
|
Palm, Inc. |
191,600 |
10,263 |
|
|
SCI Systems, Inc. (a) |
508,200 |
21,853 |
|
|
Symbol Technologies, Inc. |
149,500 |
6,793 |
|
|
Tech Data Corp. (a) |
170,200 |
7,085 |
|
|
|
86,736 |
||
|
Electronic Instruments - 1.7% |
|||
|
FEI Co. (a) |
219,500 |
5,199 |
|
|
PE Corp. - Biosystems Group |
218,300 |
25,541 |
|
|
PerkinElmer, Inc. |
278,800 |
33,317 |
|
|
Common Stocks - continued |
|||
|
Shares |
Value (Note 1) (000s) |
||
|
TECHNOLOGY - continued |
|||
|
Electronic Instruments - continued |
|||
|
Thermo Electron Corp. (a) |
222,900 |
$ 6,464 |
|
|
Varian, Inc. (a) |
122,800 |
3,784 |
|
|
Waters Corp. (a) |
437,600 |
31,753 |
|
|
|
106,058 |
||
|
Electronics - 2.4% |
|||
|
Analog Devices, Inc. (a) |
100,900 |
6,559 |
|
|
Flextronics International Ltd. (a) |
331,200 |
12,586 |
|
|
MIPS Technologies, Inc.: |
|
|
|
|
Class A (a) |
112,200 |
4,502 |
|
|
Class B (a) |
2,200 |
77 |
|
|
National Semiconductor Corp. (a) |
2,047,400 |
53,232 |
|
|
NVIDIA Corp. (a) |
161,700 |
10,048 |
|
|
QLogic Corp. (a) |
79,700 |
7,711 |
|
|
Sanmina Corp. (a) |
359,200 |
41,061 |
|
|
Transwitch Corp. (a) |
69,300 |
4,002 |
|
|
Vitesse Semiconductor Corp. (a) |
155,500 |
10,875 |
|
|
|
150,653 |
||
|
TOTAL TECHNOLOGY |
762,593 |
||
|
TRANSPORTATION - 1.8% |
|||
|
Air Transportation - 0.8% |
|||
|
Continental Airlines, Inc. Class B (a) |
86,000 |
4,515 |
|
|
Northwest Airlines Corp. Class A (a) |
153,300 |
4,369 |
|
|
SkyWest, Inc. |
121,400 |
6,131 |
|
|
Southwest Airlines Co. |
1,273,650 |
36,299 |
|
|
|
51,314 |
||
|
Railroads - 0.5% |
|||
|
Burlington Northern Santa Fe Corp. |
101,800 |
2,704 |
|
|
Canadian National Railway Co. |
493,800 |
15,568 |
|
|
CSX Corp. |
208,000 |
5,265 |
|
|
Norfolk Southern Corp. |
163,100 |
2,304 |
|
|
Union Pacific Corp. |
28,000 |
1,313 |
|
|
|
27,154 |
||
|
Shipping - 0.3% |
|||
|
OMI Corp. (a) |
122,300 |
848 |
|
|
Teekay Shipping Corp. |
534,900 |
19,992 |
|
|
|
20,840 |
||
|
Common Stocks - continued |
|||
|
Shares |
Value (Note 1) (000s) |
||
|
TRANSPORTATION - continued |
|||
|
Trucking & Freight - 0.2% |
|||
|
Forward Air Corp. (a) |
176,000 |
$ 7,238 |
|
|
Landstar System, Inc. (a) |
144,800 |
6,842 |
|
|
|
14,080 |
||
|
TOTAL TRANSPORTATION |
113,388 |
||
|
UTILITIES - 10.1% |
|||
|
Cellular - 0.4% |
|||
|
ALLTEL Corp. |
286,300 |
18,448 |
|
|
Microcell Telecommunications, Inc. Class B (non-vtg.) (a) |
255,400 |
7,171 |
|
|
Telephone & Data Systems, Inc. |
27,932 |
2,947 |
|
|
|
28,566 |
||
|
Electric Utility - 7.5% |
|||
|
AES Corp. (a) |
692,500 |
39,126 |
|
|
Allegheny Energy, Inc. |
1,530,800 |
62,667 |
|
|
Ameren Corp. |
212,200 |
8,435 |
|
|
American Electric Power Co., Inc. |
706,100 |
29,303 |
|
|
Calpine Corp. (a) |
659,810 |
52,084 |
|
|
Cinergy Corp. |
179,700 |
5,503 |
|
|
Citizens Communications Co. (a) |
392,300 |
5,688 |
|
|
Constellation Energy Corp. |
134,400 |
5,603 |
|
|
DPL, Inc. |
1,256,400 |
35,650 |
|
|
Duke Energy Corp. |
296,000 |
25,586 |
|
|
Exelon Corp. |
496,100 |
29,828 |
|
|
IPALCO Enterprises, Inc. |
466,800 |
10,474 |
|
|
NiSource, Inc. |
628,600 |
15,676 |
|
|
NRG Energy, Inc. |
377,500 |
9,815 |
|
|
NSTAR Companies |
275,000 |
10,639 |
|
|
Public Service Enterprise Group, Inc. |
153,600 |
6,374 |
|
|
Reliant Energy, Inc. |
354,300 |
14,637 |
|
|
SCANA Corp. |
596,200 |
15,799 |
|
|
Southern Co. |
948,600 |
27,865 |
|
|
Southern Energy, Inc. |
338,300 |
9,219 |
|
|
TECO Energy, Inc. |
107,000 |
2,983 |
|
|
TNPC, Inc. |
337,500 |
5,611 |
|
|
TXU Corp. |
316,100 |
11,715 |
|
|
Utilicorp United, Inc. |
335,700 |
8,917 |
|
|
XCEL Energy, Inc. |
886,900 |
22,671 |
|
|
|
471,868 |
||
|
Common Stocks - continued |
|||
|
Shares |
Value (Note 1) (000s) |
||
|
UTILITIES - continued |
|||
|
Gas - 1.8% |
|||
|
Columbia Energy Group |
9,200 |
$ 662 |
|
|
Dynegy, Inc. Class A |
1,156,132 |
53,543 |
|
|
Enron Corp. |
127,300 |
10,447 |
|
|
Equitable Resources, Inc. |
310,600 |
18,015 |
|
|
Kinder Morgan, Inc. |
537,900 |
20,743 |
|
|
Questar Corp. |
375,700 |
10,167 |
|
|
|
113,577 |
||
|
Telephone Services - 0.4% |
|||
|
CenturyTel, Inc. |
187,100 |
7,203 |
|
|
TeraBeam Networks (d) |
12,800 |
48 |
|
|
WinStar Communications, Inc. (a) |
877,301 |
17,107 |
|
|
|
24,358 |
||
|
TOTAL UTILITIES |
638,369 |
||
|
TOTAL COMMON STOCKS (Cost $4,472,497) |
5,417,217 |
||
|
Convertible Preferred Stocks - 0.0% |
|||
|
|
|
|
|
|
FINANCE - 0.0% |
|||
|
Credit & Other Finance - 0.0% |
|||
|
Southern Energy, Inc. $3.125 |
24,900 |
1,514 |
|
|
U.S. Treasury Obligations - 0.2% |
|||||
|
Moody's Ratings (unaudited) |
Principal Amount (000s) |
|
|||
|
U.S. Treasury Bills, yield at date of purchase
6.05% to 6.26% 11/16/00 to 1/18/01 (c) |
- |
|
$ 14,750 |
14,604 |
|
|
Cash Equivalents - 17.4% |
|||
|
Shares |
Value (Note 1) |
||
|
Fidelity Cash Central Fund, 6.61% (b) |
1,007,588,343 |
$ 1,007,588 |
|
|
Fidelity Securities Lending Cash Central Fund, 6.66% (b) |
86,510,000 |
86,510 |
|
|
TOTAL CASH EQUIVALENTS (Cost $1,094,098) |
1,094,098 |
||
|
TOTAL INVESTMENT PORTFOLIO - 103.6% (Cost $5,582,443) |
6,527,433 |
||
|
NET OTHER ASSETS - (3.6)% |
(224,420) |
||
|
NET ASSETS - 100% |
$ 6,303,013 |
||
|
Futures Contracts |
|||||
|
|
Expiration Date |
Underlying Face Amount at Value (000s) |
Unrealized
Gain/(Loss) |
||
|
Purchased |
|||||
|
923 S&P 400 Midcap Index Contracts |
Dec. 2000 |
$ 240,557 |
$ (2,554) |
||
|
|
|
The face value of futures purchased as a percentage of net assets - 3.8% |
|
Legend |
|
(a) Non-income producing |
|
(b) The rate quoted is the annualized seven-day yield of the fund at period end. A complete listing of the fund's holdings as of its most recent fiscal year end is available upon request. |
|
(c) Security or a portion of the security was pledged to cover margin requirements for futures contracts. At the period end, the value of securities pledged amounted to $14,604. |
|
(d) Restricted securities - Investment in securities not registered under the Securities Act of 1933. |
|
Additional information on each holding is as follows: |
|
Security |
Acquisition Date |
Acquisition Cost (000s) |
|
TeraBeam |
4/7/00 |
$ 48 |
|
United |
7/13/00 |
$ 14,047 |
|
Income Tax Information |
|
At October 31, 2000, the aggregate |
See accompanying notes which are an integral part of the financial statements.
Semiannual Report
Statement of Assets and Liabilities
|
Amounts in thousands (except per-share amounts) |
October 31, 2000 (Unaudited) |
|
|
Assets |
|
|
|
Investment in securities, at value (cost $5,582,443) - |
|
$ 6,527,433 |
|
Cash |
|
505 |
|
Receivable for investments sold |
|
142,398 |
|
Receivable for fund shares sold |
|
56,104 |
|
Dividends receivable |
|
1,357 |
|
Interest receivable |
|
4,839 |
|
Receivable for daily variation on futures contracts |
|
4,961 |
|
Other receivables |
|
139 |
|
Total assets |
|
6,737,736 |
|
Liabilities |
|
|
|
Payable for investments purchased |
$ 336,638 |
|
|
Payable for fund shares redeemed |
7,425 |
|
|
Accrued management fee |
3,265 |
|
|
Other payables and accrued expenses |
885 |
|
|
Collateral on securities loaned, at value |
86,510 |
|
|
Total liabilities |
|
434,723 |
|
Net Assets |
|
$ 6,303,013 |
|
Net Assets consist of: |
|
|
|
Paid in capital |
|
$ 5,186,598 |
|
Undistributed net investment income |
|
12,302 |
|
Accumulated undistributed net realized gain (loss) on investments and foreign currency transactions |
|
161,682 |
|
Net unrealized appreciation (depreciation) on investments and assets and liabilities in foreign currencies |
|
942,431 |
|
Net Assets, for 239,708 shares outstanding |
|
$ 6,303,013 |
|
Net Asset Value, offering price and redemption price |
|
$26.29 |
See accompanying notes which are an integral part of the financial statements.
Semiannual Report
Financial Statements - continued
Statement of Operations
|
Amounts in thousands |
Six months ended October 31, 2000 (Unaudited) |
|
|
Investment Income Dividends |
|
$ 11,803 |
|
Interest |
|
21,157 |
|
Security lending |
|
800 |
|
Total income |
|
33,760 |
|
Expenses |
|
|
|
Management fee |
$ 14,518 |
|
|
Performance adjustment |
2,209 |
|
|
Transfer agent fees |
4,746 |
|
|
Accounting and security lending fees |
336 |
|
|
Non-interested trustees' compensation |
8 |
|
|
Custodian fees and expenses |
76 |
|
|
Registration fees |
664 |
|
|
Audit |
15 |
|
|
Legal |
10 |
|
|
Interest |
13 |
|
|
Miscellaneous |
1 |
|
|
Total expenses before reductions |
22,596 |
|
|
Expense reductions |
(1,138) |
21,458 |
|
Net investment income |
|
12,302 |
|
Realized and Unrealized Gain (Loss) Net realized gain (loss) on: |
|
|
|
Investment securities |
214,294 |
|
|
Foreign currency transactions |
196 |
|
|
Futures contracts |
15,888 |
230,378 |
|
Change in net unrealized appreciation (depreciation) on: |
|
|
|
Investment securities |
301,977 |
|
|
Assets and liabilities in foreign currencies |
(43) |
|
|
Futures contracts |
(2,554) |
299,380 |
|
Net gain (loss) |
|
529,758 |
|
Net increase (decrease) in net assets resulting |
|
$ 542,060 |
See accompanying notes which are an integral part of the financial statements.
Semiannual Report
Financial Statements - continued
Statement of Changes in Net Assets
|
Amounts in thousands |
Six months ended
October 31, 2000 |
Year ended |
|
Increase (Decrease) in Net Assets |
|
|
|
Operations |
$ 12,302 |
$ (4,648) |
|
Net realized gain (loss) |
230,378 |
422,079 |
|
Change in net unrealized appreciation (depreciation) |
299,380 |
332,703 |
|
Net increase (decrease) in net assets resulting |
542,060 |
750,134 |
|
Distributions to shareholders |
- |
(886) |
|
From net realized gain |
(292,997) |
(238,596) |
|
Total distributions |
(292,997) |
(239,482) |
|
Share transactions |
2,703,637 |
3,197,174 |
|
Reinvestment of distributions |
284,218 |
229,000 |
|
Cost of shares redeemed |
(1,004,953) |
(1,574,354) |
|
Net increase (decrease) in net assets resulting |
1,982,902 |
1,851,820 |
|
Total increase (decrease) in net assets |
2,231,965 |
2,362,472 |
|
Net Assets |
|
|
|
Beginning of period |
4,071,048 |
1,708,576 |
|
End of period (including undistributed net investment income of $12,302 and $0, respectively) |
$ 6,303,013 |
$ 4,071,048 |
|
Other Information Shares |
|
|
|
Sold |
105,678 |
130,995 |
|
Issued in reinvestment of distributions |
11,808 |
12,171 |
|
Redeemed |
(39,786) |
(70,072) |
|
Net increase (decrease) |
77,700 |
73,094 |
See accompanying notes which are an integral part of the financial statements.
Semiannual Report
Financial Highlights
|
|
Six months ended October 31, 2000 |
Years ended April 30, |
||||
|
|
(Unaudited) |
2000 |
1999 |
1998 |
1997 |
1996 |
|
Selected Per-Share Data |
|
|
|
|
|
|
|
Net asset value,
beginning |
$ 25.13 |
$ 19.22 |
$ 18.80 |
$ 14.30 |
$ 14.83 |
$ 12.01 |
|
Income from Invest- |
|
|
|
|
|
|
|
Net investment |
.05 D |
(.04) D |
.01 D |
(.02) D |
.03 D |
.11 F |
|
Net realized |
2.86 |
8.55 |
1.69 |
6.30 |
.73 |
3.49 |
|
Total from invest- |
2.91 |
8.51 |
1.70 |
6.28 |
.76 |
3.60 |
|
Less Distributions |
|
|
|
|
|
|
|
From net investment income |
- |
(.01) |
- |
(.01) |
(.03) |
(.06) |
|
From net |
(1.75) |
(2.59) |
(1.28) |
(1.77) |
(1.26) |
(.72) |
|
Total distributions |
(1.75) |
(2.60) |
(1.28) |
(1.78) |
(1.29) |
(.78) |
|
Net asset value, |
$ 26.29 |
$ 25.13 |
$ 19.22 |
$ 18.80 |
$ 14.30 |
$ 14.83 |
|
Total Return B, C |
12.22% |
49.47% |
9.92% |
46.55% |
5.03% |
30.84% |
|
Ratios and Supplemental Data |
|
|
|
|
|
|
|
Net assets, end |
$ 6,303 |
$ 4,071 |
$ 1,709 |
$ 1,898 |
$ 1,101 |
$ 1,461 |
|
Ratio of expenses |
.88% A |
.89% |
.77% |
.90% |
1.00% |
1.02% |
|
Ratio of expenses |
.83% A, E |
.86% E |
.74% E |
.86% E |
.96% E |
1.00% E |
|
Ratio of net invest- |
.48% A |
(.20)% |
.08% |
(.10)% |
.17% |
1.01% |
|
Portfolio turnover |
240% A |
205% |
121% |
132% |
155% |
179% |
A Annualized
B Total returns for periods of less than one year are not annualized.
C The total returns would have been lower had certain expenses not been reduced during the periods shown.
D Net investment income (loss) per share has been calculated based on average shares outstanding during the period.
E FMR or the fund has entered into varying arrangements with third parties who either paid or reduced a portion of the fund's expenses.
F Investment income per share reflects a special dividend which amounted to $.04 per share.
See accompanying notes which are an integral part of the financial statements.
Semiannual Report
For the period ended October 31, 2000 (Unaudited)
1. Significant Accounting Policies.
Fidelity Mid-Cap Stock Fund (the fund) is a fund of Fidelity Commonwealth Trust (the trust) and is authorized to issue an unlimited number of shares. The trust is registered under the Investment Company Act of 1940, as amended, as an open-end management investment company organized as a Massachusetts business trust. The financial statements have been prepared in conformity with generally accepted accounting principles which require management to make certain estimates and assumptions at the date of the financial statements. The following summarizes the significant accounting policies of the fund:
Security Valuation. Securities for which exchange quotations are readily available are valued at the last sale price, or if no sale price, at the closing bid price. Foreign securities are valued based on quotations from the principal market in which such securities are normally traded. If trading or events occurring in other markets after the close of the principal market in which foreign securities are traded, and before the close of business of the fund, are expected to materially affect the value of those securities, then they are valued at their fair value taking this trading or these events into account. Fair value is determined in good faith under consistently applied procedures under the general supervision of the Board of Trustees. Securities (including restricted securities) for which exchange quotations are not readily available (and in certain cases debt securities which trade on an exchange) are valued primarily using dealer-supplied valuations or at their fair value. Short-term securities with remaining maturities of sixty days or less for which quotations are not readily available are valued at amortized cost or original cost plus accrued interest, both of which approximate current value. Investments in open-ended investment companies are valued at their net asset value each business day
Foreign Currency Translation. The accounting records of the fund are maintained in U.S. dollars. Investment securities and other assets and liabilities denominated in a foreign currency are translated into U.S. dollars at the prevailing rates of exchange at period end. Purchases and sales of securities, income receipts and expense payments are translated into U.S. dollars at the prevailing exchange rate on the respective dates of the transactions.
Net realized gains and losses on foreign currency transactions represent net gains and losses from sales and maturities of foreign currency contracts, disposition of foreign currencies, the difference between the amount of net investment income accrued and the U.S. dollar amount actually received, and gains and losses between trade and settlement date on purchases and sales of securities. The effects of changes in foreign currency exchange rates on investments in securities are included with the net realized and unrealized gain or loss on investment securities.
Income Taxes. As a qualified regulated investment company under Subchapter M of the Internal Revenue Code, the fund is
Semiannual Report
Notes to Financial Statements (Unaudited) - continued
1. Significant Accounting Policies - continued
Income Taxes - continued
not subject to income taxes to the extent that it distributes substantially all of its taxable income for its fiscal year. The schedule of investments includes information regarding income taxes under the caption "Income Tax Information."
Investment Income. Dividend income is recorded on the ex-dividend date, except certain dividends from foreign securities where the ex-dividend date may have passed, are recorded as soon as the fund is informed of the ex-dividend date. Non-cash dividends included in dividend income, if any, are recorded at the fair market value of the securities received. Interest income is accrued as earned. Investment income is recorded net of foreign taxes withheld where recovery of such taxes is uncertain.
Expenses. Most expenses of the trust can be directly attributed to a fund. Expenses which cannot be directly attributed are apportioned among the funds in the trust.
Distributions to Shareholders. Distributions are recorded on the ex-dividend date.
Income and capital gain distributions are determined in accordance with income tax regulations which may differ from generally accepted accounting principles. These differences, which may result in distribution reclassifications, are primarily due to differing treatments for litigation proceeds, foreign currency transactions, non-taxable dividends and losses deferred due to wash sales. The fund also utilized earnings and profits distributed to shareholders on redemption of shares as a part of the dividends paid deduction for income tax purposes.
Permanent book and tax basis differences relating to shareholder distributions will result in reclassifications to paid in capital. Undistributed net investment income and accumulated undistributed net realized gain (loss) on investments and foreign currency transactions may include temporary book and tax basis differences which will reverse in a subsequent period. Any taxable income or gain remaining at fiscal year end is distributed in the following year.
Security Transactions. Security transactions are accounted for as of trade date. Gains and losses on securities sold are determined on the basis of identified cost.
2. Operating Policies.
Foreign Currency Contracts. The fund generally uses foreign currency contracts to facilitate transactions in foreign-denominated securities. Losses may arise from changes in the value of the foreign currency or if the counterparties do not perform under the contracts' terms. The U.S. dollar value of foreign currency contracts is determined using contractual currency exchange rates established at the time of each trade.
Joint Trading Account. Pursuant to an Exemptive Order issued by the Securities and Exchange Commission (the SEC), the fund, along with other affiliated
Semiannual Report
Notes to Financial Statements (Unaudited) - continued
2. Operating Policies - continued
Joint Trading Account - continued
entities of Fidelity Management & Research Company (FMR), may transfer uninvested cash balances into one or more joint trading accounts. These balances are invested in one or more repurchase agreements for U.S. Treasury or Federal Agency obligations.
Repurchase Agreements. The underlying U.S. Treasury, Federal Agency, or other obligations found to be satisfactory by FMR are transferred to an account of the fund, or to the Joint Trading Account, at a custodian bank. The securities are marked-to-market daily and maintained at a value at least equal to the principal amount of the repurchase agreement (including accrued interest). FMR, the fund's investment adviser, is responsible for determining that the value of the underlying securities remains in accordance with the market value requirements stated above.
Futures Contracts. The fund may use futures contracts to manage its exposure to the stock market. Buying futures tends to increase the fund's exposure to the underlying instrument, while selling futures tends to decrease the fund's exposure to the underlying instrument or hedge other fund investments. Futures contracts involve, to varying degrees, risk of loss in excess of the futures variation margin reflected in the Statement of Assets and Liabilities. The underlying face amount at value of any open futures contracts at period end is shown in the schedule of investments under the caption "Futures Contracts." This amount reflects each contract's exposure to the underlying instrument at period end. Losses may arise from changes in the value of the underlying instruments or if the counterparties do not perform under the contracts' terms. Gains (losses) are realized upon the expiration or closing of the futures contracts. Futures contracts are valued at the settlement price established each day by the board of trade or exchange on which they are traded.
Restricted Securities. The fund is permitted to invest in securities that are subject to legal or contractual restrictions on resale. These securities generally may be resold in transactions exempt from registration or to the public if the securities are registered. Disposal of these securities may involve time-consuming negotiations and expense, and prompt sale at an acceptable price may be difficult. At the end of the period, restricted securities (excluding 144A issues) amounted to $6,880,000 or 0.1% of net assets.
3. Purchases and Sales of Investments.
Purchases and sales of securities, other than short-term securities, aggregated $6,560,581,000 and $5,498,561,000, respectively.
The market value of futures contracts opened and closed during the period amounted to $734,019,000 and $506,796,000, respectively.
Semiannual Report
Notes to Financial Statements (Unaudited) - continued
4. Fees and Other Transactions with Affiliates.
Management Fee. As the fund's investment adviser, FMR receives a monthly basic fee that is calculated on the basis of a group fee rate plus a fixed individual fund fee rate applied to the average net assets of the fund. The group fee rate is the weighted average of a series of rates and is based on the monthly average net assets of all the mutual funds advised by FMR. The rates ranged from .2167% to .5200% for the period. The annual individual fund fee rate is .30%. In the event that these rates were lower than the contractual rates in effect during the period, FMR voluntarily implemented the above rates, as they resulted in the same or a lower management fee. The basic fee is subject to a performance adjustment (up to a maximum of ±.20% of the fund's average net assets over the performance period) based on the fund's investment performance as compared to the appropriate index over a specified period of time. For the period, the management fee was equivalent to an annualized rate of .65% of average net assets after the performance adjustment.
Sub-Adviser Fee. Beginning January 1, 2001, FMR Co.(FMRC) will serve as a sub-adviser for the fund. FMRC is a wholly owned subsidiary of FMR and will receive a fee from FMR of 50% of the management fee payable to FMR with respect to that portion of the fund's assets that will be managed by FMRC.
Transfer Agent Fees. Fidelity Service Company, Inc. (FSC), an affiliate of FMR, is the fund's transfer, dividend disbursing and shareholder servicing agent. FSC receives account fees and asset-based fees that vary according to account size and type of account. FSC pays for typesetting, printing and mailing of all shareholder reports, except proxy statements. For the period, the transfer agent fees were equivalent to an annualized rate of .18% of average net assets.
Accounting and Security Lending Fees. FSC maintains the fund's accounting records and administers the security lending program. The security lending fee is based on the number and duration of lending transactions. The accounting fee is based on the level of average net assets for the month plus out-of-pocket expenses.
Cash Central Funds. Pursuant to an Exemptive Order issued by the SEC, the fund may invest in the Fidelity Cash Central Fund and the Fidelity Securities Lending Cash Central Fund (the Cash Funds) managed FIMM. The Cash Funds are open-end money market funds available only to investment companies and other accounts managed by FMR and its affiliates. The Cash Funds seek preservation of capital, liquidity, and current income. Income distributions from the Cash Funds are declared daily and paid monthly from net investment income. Income distributions earned by the fund are recorded as either interest income or security lending income in the accompanying financial statements.
Semiannual Report
Notes to Financial Statements (Unaudited) - continued
4. Fees and Other Transactions with Affiliates - continued
Brokerage Commissions. The fund placed a portion of its portfolio transactions with brokerage firms which are affiliates of FMR. The commissions paid to these affiliated firms were $176,000 for the period.
5. Security Lending.
The fund lends portfolio securities from time to time in order to earn additional income. The fund receives collateral in the form of U.S. Treasury obligations, letters of credit, and/or cash against the loaned securities, and maintains collateral in an amount not less than 100% of the market value of the loaned securities during the period of the loan. The market value of the loaned securities is determined at the close of business of the fund and any additional required collateral is delivered to the fund on the next business day. If the borrower defaults on its obligation to return the securities loaned because of insolvency or other reasons, the fund could experience delays and costs in recovering the securities loaned or in gaining access to the collateral. At period end, the value of the securities loaned amounted to $86,390,000. The fund received cash collateral of $86,510,000 which was invested in cash equivalents.
6. Bank Borrowings.
The fund is permitted to have bank borrowings for temporary or emergency purposes to fund shareholder redemptions. The fund has established borrowing arrangements with certain banks. The interest rate on the borrowings is the bank's base rate, as revised from time to time. The average daily loan balance during the period for which the loan was outstanding amounted to $66,582,000. The weighted average interest rate was 7.06%. At period end there were no bank borrowings outstanding.
7. Expense Reductions.
FMR has directed certain portfolio trades to brokers who paid a portion of the fund's expenses. For the period, the fund's expenses were reduced by $997,000 under this arrangement.
In addition, through arrangements with the fund's custodian and transfer agent, credits realized as a result of uninvested cash balances were used to reduce a portion of the fund's expenses. During the period, the fund's custodian and transfer agent fees were reduced by $132,000 and $9,000, respectively, under these arrangements.
Semiannual Report
The Board of Trustees of Fidelity Mid-Cap Stock Fund voted to pay on December 11, 2000, to shareholders of record at the opening of business on December 8, 2000, a distribution of $.75 per share derived from capital gains realized from sales of portfolio securities and a dividend of $.10 per share from net investment income.
Annual Report
Fidelity offers several ways to conveniently manage your personal investments via your telephone or PC. You can access your account information, conduct trades and research your investments 24 hours a day.
By Phone
Fidelity Automated Service Telephone provides a single toll-free number to access account balances, positions, quotes and trading. It's easy to navigate the service, and on your first call, the system will help you create a personal identification number (PIN) for security.
(phone_graphic)Fidelity Automated
Service Telephone (FAST®)
1-800-544-5555
Press
1 For mutual fund and brokerage trading.
2 For quotes.*
3 For account balances and holdings.
4 To review orders and mutual
fund activity.
5 To change your PIN.
*0 To speak to a Fidelity representative.
By PC
Fidelity's web site on the Internet provides a wide range of information, including daily financial news, fund performance, interactive planning tools and news about Fidelity products and services.
(computer_graphic)Fidelity's Web Site
www.fidelity.com
If you are not currently on the Internet, call EarthLink Sprint at 1-800-288-2967, and be sure to ask for registration number SMD004 to receive a special Fidelity package that includes 30 days of free Internet access. EarthLink is North America's #1 independent Internet access provider.
(computer_graphic)
Fidelity On-line Xpress+®
Fidelity On-line Xpress+ software for Windows combines comprehensive portfolio management capabilities, securities trading and access to research and analysis tools . . . all on your desktop. Call Fidelity at 1-800-544-0240 or visit our web site for more information on how to manage your investments via your PC.
* When you call the quotes line, please remember that a fund's yield and return will vary and, except for money market funds, share price will also vary. This means that you may have a gain or loss when you sell your shares. There is no assurance that money market funds will be able to maintain a stable $1 share price; an investment in a money market fund is not insured or guaranteed by the U.S. government. Total returns are historical and include changes in share price, reinvestment of dividends and capital gains, and the effects of any sales charges.
Semiannual Report
For directions and hours,
please call 1-800-544-9797.
Arizona
7373 N. Scottsdale Road
Scottsdale, AZ
California
815 East Birch Street
Brea, CA
851 East Hamilton Avenue
Campbell, CA
527 North Brand Boulevard
Glendale, CA
19200 Von Karman Avenue
Irvine, CA
10100 Santa Monica Blvd.
Los Angeles, CA
251 University Avenue
Palo Alto, CA
1760 Challenge Way
Sacramento, CA
7676 Hazard Center Drive
San Diego, CA
8 Montgomery Street
San Francisco, CA
950 Northgate Drive
San Rafael, CA
1400 Civic Drive
Walnut Creek, CA
6300 Canoga Avenue
Woodland Hills, CA
Colorado
1625 Broadway
Denver, CO
Connecticut
48 West Putnam Avenue
Greenwich, CT
265 Church Street
New Haven, CT
300 Atlantic Street
Stamford, CT
29 South Main Street
West Hartford, CT
Delaware
222 Delaware Avenue
Wilmington, DE
Florida
4400 N. Federal Highway
Boca Raton, FL
90 Alhambra Plaza
Coral Gables, FL
4090 N. Ocean Boulevard
Ft. Lauderdale, FL
1907 West State Road 434
Longwood, FL
8880 Tamiami Trail, North
Naples, FL
2401 PGA Boulevard
Palm Beach Gardens, FL
8065 Beneva Road
Sarasota, FL
1502 N. Westshore Blvd.
Tampa, FL
Georgia
3445 Peachtree Road, N.E.
Atlanta, GA
1000 Abernathy Road
Atlanta, GA
Illinois
One North Franklin Street
Chicago, IL
1415 West 22nd Street
Oak Brook, IL
1700 East Golf Road
Schaumburg, IL
3232 Lake Avenue
Wilmette, IL
Indiana
4729 East 82nd Street
Indianapolis, IN
Maine
Three Canal Plaza
Portland, ME
Maryland
7401 Wisconsin Avenue
Bethesda, MD
One W. Pennsylvania Ave.
Towson, MD
Massachusetts
801 Boylston Street
Boston, MA
155 Congress Street
Boston, MA
25 State Street
Boston, MA
300 Granite Street
Braintree, MA
44 Mall Road
Burlington, MA
416 Belmont Street
Worcester, MA
Semiannual Report
Michigan
280 Old N. Woodward Ave.
Birmingham, MI
29155 Northwestern Hwy.
Southfield, MI
Minnesota
7600 France Avenue South
Edina, MN
Missouri
700 West 47th Street
Kansas City, MO
8885 Ladue Road
Ladue, MO
New Jersey
150 Essex Street
Millburn, NJ
56 South Street
Morristown, NJ
501 Route 17, South
Paramus, NJ
New York
1055 Franklin Avenue
Garden City, NY
999 Walt Whitman Road
Melville, L.I., NY
1271 Avenue of the Americas
New York, NY
71 Broadway
New York, NY
350 Park Avenue
New York, NY
North Carolina
4611 Sharon Road
Charlotte, NC
Ohio
600 Vine Street
Cincinnati, OH
28699 Chagrin Boulevard
Woodmere Village, OH
Oregon
16850 SW 72nd Avenue
Tigard, OR
Pennsylvania
1735 Market Street
Philadelphia, PA
439 Fifth Avenue
Pittsburgh, PA
Rhode Island
47 Providence Place
Providence, RI
Tennessee
6150 Poplar Avenue
Memphis, TN
Texas
10000 Research Boulevard
Austin, TX
4017 Northwest Parkway
Dallas, TX
1155 Dairy Ashford Street
Houston, TX
2701 Drexel Drive
Houston, TX
400 East Las Colinas Blvd.
Irving, TX
14100 San Pedro
San Antonio, TX
19740 IH 45 North
Spring, TX
Utah
215 South State Street
Salt Lake City, UT
Virginia
1861 International Drive
McLean, VA
Washington
411 108th Avenue, N.E.
Bellevue, WA
511 Pine Street
Seattle, WA
Washington, DC
1900 K Street, N.W.
Washington, DC
Wisconsin
595 North Barker Road
Brookfield, WI
Fidelity Brokerage Services, Inc., 100 Summer St., Boston, MA 02110 Member NYSE/SIPC
Semiannual Report
If more than one address is listed, please locate the address that is closest to you. We'll give your correspondence immediate attention and send you written confirmation upon completion of your request.
(letter_graphic)Making Changes
To Your Account
(such as changing name, address, bank, etc.)
Fidelity Investments
P.O. Box 770001
Cincinnati, OH 45277-0002
(letter_graphic)For Non-Retirement
Accounts
Buying shares
Fidelity Investments
P.O. Box 770001
Cincinnati, OH 45277-0003
Overnight Express
Fidelity Investments
2300 Litton Lane - KH1A
Hebron, KY 41048
Selling shares
Fidelity Investments
P.O. Box 660602
Dallas, TX 75266-0602
Overnight Express
Fidelity Investments
Attn: Redemptions - CP6I
400 East Las Colinas Blvd.
Irving, TX 75039-5587
General Correspondence
Fidelity Investments
P.O. Box 500
Merrimack, NH 03054-0500
(letter_graphic)For Retirement
Accounts
Buying shares
Fidelity Investments
P.O. Box 770001
Cincinnati, OH 45277-0003
Selling shares
Fidelity Investments
P.O. Box 660602
Dallas, TX 75266-0602
Overnight Express
Fidelity Investments
Attn: Redemptions - CP6R
400 East Las Colinas Blvd.
Irving, TX 75039-5587
General Correspondence
Fidelity Investments
P.O. Box 500
Merrimack, NH 03054-0500
Semiannual Report
Semiannual Report
Investment Adviser
Fidelity Management & Research Company
Boston, MA
Investment Sub-Advisers
Fidelity Management & Research
(Far East) Inc.
Fidelity Management & Research
(U.K.) Inc.
Fidelity Investments Japan Limited
Officers
Edward C. Johnson 3d, President
Robert C. Pozen, Senior Vice President
Abigail P. Johnson, Vice President
David Felman, Vice President
Eric D. Roiter, Secretary
Robert A. Dwight, Treasurer
Maria F. Dwyer, Deputy Treasurer
John H. Costello, Assistant Treasurer
Thomas J. Simpson, Assistant Treasurer
Board of Trustees
Ralph F. Cox *
Phyllis Burke Davis *
Robert M. Gates *
Edward C. Johnson 3d
Donald J. Kirk *
Ned C. Lautenbach *
Peter S. Lynch
Marvin L. Mann *
William O. McCoy *
Gerald C. McDonough *
Robert C. Pozen
Thomas R. Williams *
Advisory Board
J. Michael Cook
Abigail P. Johnson
Marie L. Knowles
General Distributor
Fidelity Distributors Corporation
Boston, MA
Transfer and Shareholder
Servicing Agent
Fidelity Service Company, Inc.
Boston, MA
* Independent trustees
Custodian
Chase Manhattan Bank, N.A.
New York, NY
Fidelity's Growth Funds
Aggressive Growth Fund
Blue Chip Growth Fund
Capital Appreciation Fund
Contrafund®
Contrafund® II
Disciplined Equity Fund
Dividend Growth Fund
Export and Multinational Fund
Fidelity Fifty ®
Growth Company Fund
Large Cap Stock Fund
Low-Priced Stock Fund
Magellan® Fund
Mid-Cap Stock Fund
New Millennium Fund®
OTC Portfolio
Retirement Growth Fund
Small Cap Selector
Small Cap Stock Fund
Stock Selector
Tax Managed Stock Fund
TechnoQuant® Growth Fund
Trend Fund
Value Fund
The Fidelity Telephone Connection
Mutual Fund 24-Hour Service
Exchanges/Redemptions
and Account Assistance 1-800-544-6666
Product Information 1-800-544-6666
Retirement Accounts 1-800-544-4774
(8 a.m. - 9 p.m.)
TDD Service 1-800-544-0118
for the deaf and hearing impaired
(9 a.m. - 9 p.m. Eastern time)
Fidelity Automated Service
Telephone (FAST®) (automated graphic) 1-800-544-5555
(automated graphic) Automated line for quickest service
(Fidelity Investment logo)(registered trademark)
Corporate Headquarters
82 Devonshire St., Boston, MA 02109
www.fidelity.com
MCS-SANN-1200 xxxxxx
x.xxxxxx.xxx
Fidelity®
Fund
Semiannual Report
October 31, 2000
(2_fidelity_logos)
|
President's Message |
3 |
Ned Johnson on investing strategies. |
|
Performance |
4 |
How the fund has done over time. |
|
Fund Talk |
6 |
The manager's review of fund performance, strategy and outlook. |
|
Investment Changes |
9 |
A summary of major shifts in the fund's investments over the past six months. |
|
Investments |
10 |
A complete list of the fund's investments with their market values. |
|
Financial Statements |
18 |
Statements of assets and liabilities,
operations, and changes in net assets, |
|
Notes |
22 |
Notes to the financial statements. |
To reduce expenses, only one copy of most financial reports and prospectuses may be mailed to households, even if more than one person in the household has an account in the fund. Call Fidelity at 1-800-544-8544 if you need additional copies of financial reports or prospectuses. If you do not want the mailing of these documents to be combined with those for other members of your household, contact Fidelity in writing at P. O. Box 5000, Cincinnati, OH 45273-8692.
Standard & Poor's, S&P and S&P 500 are registered service marks of The McGraw-Hill Companies, Inc. and have been licensed for use by Fidelity Distributors Corporation.
Other third party marks appearing herein are the property of their respective owners.
All other marks appearing herein are registered or unregistered trademarks or service marks of FMR Corp. or an affiliated company.
(Recycle graphic) This report is printed on recycled paper using soy-based inks. This report and the financial statements contained herein are submitted for the
general information
of the shareholders of the fund. This report is not authorized for distribution to prospective investors
in the fund unless preceded or accompanied by an effective prospectus.
Mutual fund shares are not deposits or obligations of, or guaranteed by, any depository institution. Shares are not insured by the FDIC, Federal Reserve Board or any other agency, and are subject to investment risks, including possible loss of principal amount invested.
Neither the fund nor Fidelity Distributors Corporation is a bank.
For more information on any Fidelity fund, including charges and expenses, call 1-800-544-6666 for a free prospectus. Read it carefully before you invest or send money.
Semiannual Report
|
(photo_of_Edward_C_Johnson_3d)
Dear Shareholder:
A sixth-straight year of double-digit positive returns for the Dow Jones Industrial Average, NASDAQ and S&P 500® could be in jeopardy unless the U.S. stock market shows marked improvement in the final two months of 2000. Through October, all three indexes had negative year-to-date returns. On the other hand, most fixed-income sectors were solidly in the black. Treasuries and other long-term government securities led the way, returning nearly 14%.
While it's impossible to predict the future direction of the markets with any degree of certainty, there are certain basic principles that can help investors plan for their future needs.
First, investors are encouraged to take a long-term view of their portfolios. If you can afford to leave your money invested through the inevitable up and down cycles of the financial markets, you will greatly reduce your vulnerability to any single decline. We know from experience, for example, that stock prices have gone up over longer periods of time, have significantly outperformed other types of investments and have stayed ahead of inflation.
Second, you can further manage your investing risk through diversification. A stock mutual fund, for instance, is already diversified, because it invests in many different companies. You can increase your diversification further by investing in a number of different stock funds, or in such other investment categories as bonds. If you have a short investment time horizon, you might want to consider moving some of your investment into a money market fund, which seeks income and a stable share price by investing in high-quality, short-term investments. Of course, it's important to remember that an investment in a money market fund is not insured or guaranteed by the Federal Deposit Insurance Corporation or any other government agency. Although money market funds seek to preserve the value of your investment at $1.00 per share, it is possible to lose money by investing in these types of funds.
Finally, no matter what your time horizon or portfolio diversity, it makes good sense to follow a regular investment plan, investing a certain amount of money in a fund at the same time each month or quarter and periodically reviewing your overall portfolio. By doing so, you won't get caught up in the excitement of a rapidly rising market, nor will you buy all your shares at market highs. While this strategy - known as dollar cost averaging - won't assure a profit or protect you from a loss in a declining market, it should help you lower the average cost of your purchases. Of course, you should consider your financial ability to continue your purchases through periods of low price levels before undertaking such a strategy.
If you have questions, please call us at 1-800-544-6666, or visit our web site at www.fidelity.com. We are available 24 hours a day, seven days a week to provide you the information you need to make the investments that are right for you.
Best regards,
/s/Edward C. Johnson 3d
Edward C. Johnson 3d
Semiannual Report
There are several ways to evaluate a fund's historical performance. You can look at the total percentage change in value, the average annual percentage change or the growth of a hypothetical $10,000 investment. Total return reflects the change in the value of an investment, assuming reinvestment of the fund's dividend income and capital gains (the profits earned upon the sale of securities that have grown in value).
Cumulative Total Returns
|
Periods ended October 31, 2000 |
Past 6 |
Past 1 |
Past 5 |
Life of |
|
Fidelity Large Cap Stock |
-4.61% |
7.29% |
165.69% |
181.36% |
|
S&P 500 ® |
-1.03% |
6.09% |
166.65% |
183.66% |
|
Growth Funds Average |
-1.09% |
15.32% |
149.69% |
n/a* |
Cumulative total returns show the fund's performance in percentage terms over a set period - in this case, six months, one year, five years or since the fund started on June 22, 1995. For example, if you had invested $1,000 in a fund that had a 5% return over the past year, the value of your investment would be $1,050. You can compare the fund's returns to the performance of the Standard & Poor's 500SM Index - a market capitalization-weighted index of common stocks. To measure how the fund's performance stacked up against its peers, you can compare it to the growth funds average, which reflects the performance of mutual funds with similar objectives tracked by Lipper Inc. The past six months average represents a peer group of 1,606 mutual funds. These benchmarks include reinvested dividends and capital gains, if any, and excludes the effect of sales charges. Lipper has created new comparison categories that group funds according to portfolio characteristics and capitalization, as well as by capitalization only. These averages are listed on Page 5 of this report.(dagger)
Average Annual Total Returns
|
Periods ended October 31, 2000 |
Past 1 |
Past 5 |
Life of |
|
Fidelity Large Cap Stock |
7.29% |
21.58% |
21.27% |
|
S&P 500 |
6.09% |
21.67% |
21.45% |
|
Growth Funds Average |
15.32% |
19.59% |
n/a* |
Average annual total returns take the fund's cumulative return and show you what would have happened if the fund had performed at a constant rate each year. (Note: Lipper calculates average annual total returns by annualizing each fund's total return, then taking an arithmetic average. This may produce a different figure than that obtained by averaging the cumulative total returns and annualizing the result.)
* Not available
Semiannual Report
$10,000 Over Life of Fund
$10,000 Over Life of Fund: Let's say hypothetically that $10,000 was invested in Fidelity Large Cap Stock Fund on June 22, 1995, when the fund started. As the chart shows, by October 31, 2000, the value of the investment would have grown to $28,136 - a 181.36% increase on the initial investment. For comparison, look at how the Standard & Poor's 500 Index did over the same period. With dividends and capital gains, if any, reinvested, the same $10,000 would have grown to $28,366 - a 183.66% increase.
Understanding
Performance
How a fund did yesterday is no guarantee of how it will do tomorrow. The stock market, for example, has a history of long-term growth and short-term volatility. In turn, the share price and return of a fund that invests in stocks will vary. That means if you sell your shares during a market downturn, you might lose money. But if you can ride out the market's ups and downs, you may have a gain.
3* The Lipper large cap growth funds average reflects the performance (excluding sales charges) of mutual funds with similar portfolio characteristics and capitalization. The Lipper large cap supergroup average reflects the performance (excluding sales charges) of mutual funds with similar capitalization. As of October 31, 2000, the six months, one year and five year cumulative total returns for the large cap growth funds average were -4.87%, 15.36% and 175.85%, respectively. The one year and five year average annual total returns were 15.36% and 22.17%, respectively. The six months, one year and five year cumulative total returns for the large cap supergroup average were -1.54%, 11.02% and 150.79%, respectively. The one year and five year average annual total returns were 11.02% and 19.89%, respectively.
Semiannual Report
Market Recap
The U.S. equity market environment during the six-month period that ended October 31, 2000, will be remembered as one of the most difficult in recent years. Three negative factors - rising interest rates, the highest oil prices in a decade and the declining value of the European currency - collectively hindered the growth of many domestic companies. As a result, investors reacted pessimistically to most stocks, regardless of market capitalization or industry. In May, the tech-heavy NASDAQ Composite Index experienced a sharp decline and failed to recoup the gains it achieved earlier in the year as the period wore on. The NASDAQ ended the six-month period with a -12.64% return. The Standard & Poor's 500SM Index, an index of 500 larger companies, declined 1.03%. Elsewhere, the Russell 2000® Index, a benchmark of smaller companies that had gained nearly 19% in the previous six-month period, slumped to a -1.11% return. Only the blue chips' benchmark, the Dow Jones Industrial Average, finished the period with a gain, returning 3.01% in large part because investors favored more established companies in October. For its part, the Federal Reserve Board raised the federal funds rate to 6.50% in May - its highest level in nine years - in an attempt to slow the economy and ward off inflation. Meanwhile, the euro's weakness and higher fuel costs particularly hurt multinational companies, many of which lowered third-quarter earnings targets.
(Portfolio Manager photograph)
An interview with Karen Firestone, Portfolio Manager of Fidelity
Large Cap Stock Fund
Q. How did the fund perform, Karen?
A. For the six months that ended October 31, 2000, the fund returned -4.61%, lagging the Standard & Poor's 500 Index, which returned -1.03%. The growth funds average tracked by Lipper Inc. returned -1.09% during this same time frame. For the 12 months that ended October 31, 2000, the fund returned 7.29%, while the S&P 500 index and Lipper average returned 6.09% and 15.32%, respectively.
Q. Why did the fund trail its index and peer group during the six-month period?
A. The fund's emphasis on growth stocks, particularly technology - at the expense of financial and cyclical, or economically sensitive, stocks - left us overexposed to the downside volatility that plagued the S&P 500 index during the period. Investors collectively turned their backs on growth - despite a pair of short-lived rallies during the summer and a failed breakout in early October - and assumed a more defensive posture. Even though we owned a lot of the large, higher-quality tech names, such as Intel, Cisco and Texas Instruments, momentum for these stocks - along with their price appreciation from earlier in 2000 - vanished as the market grew increasingly concerned about how a slowing economy would affect the earnings of tech firms. Additionally, since we didn't own as many of the smaller-cap tech stocks - a group that produced a number of the period's best performers - as our Lipper peers did on average, we lost ground on a competitive basis.
Semiannual Report
Fund Talk: The Manager's Overview - continued
Q. What other factors influenced performance?
A. The fund's positioning in financial stocks also weighed on relative performance. Remaining underweighted in banks relative to the index hurt, as persistent flights to quality in the market, coupled with reduced interest-rate volatility, boosted the prices of these issues. Concerns about a slowing economy and declining credit quality were strong enough to keep me underexposed for much of the period. We did benefit from our investments elsewhere in the sector, which helped narrow the performance gap a bit. Insurer MetLife and home loan financer Fannie Mae were notable contributors. The fund's media holdings offered no such help, slipping on concerns about a slowdown in advertising spending by dot-com companies. DoubleClick was one of the fund's biggest detractors and was sold off prior to the close of the period. Even traditional firms with considerably less Internet exposure, such as Disney, were dragged down into the mire. Cable stocks felt additional pressure applied by satellite broadcasters, which threatened cable's emergence over local service markets. On a brighter note, the fund's underexposure to traditional telephone utilities, such as AT&T, helped. Many of these stocks drifted lower in response to pricing pressures and increased competition in consumer long distance. Taking profits in some of our energy holdings late in the period also helped, as oil prices proceeded to decline from their highs.
Q. What stocks helped the most? Which hurt?
A. Health stocks offered a safe haven for jittery tech investors during the period. The decision to increase the fund's exposure to the sector early in the period was a good one. Investors shrugged off fears of increased regulation and sustainability of earnings growth, bidding up prices of drug and biotechnology stocks, such as Merck and Human Genome, respectively. Schering-Plough and Millennium Pharmaceuticals also were big winners for us. On the tech front, our emphasis on Internet infrastructure paid off, with Juniper, Brocade and Sun Microsystems posting strong gains. Conversely, we had our share of disappointments including LAM Research, Yahoo!, Dell and Motorola. Retailing heavyweights Home Depot and Wal-Mart also dragged on fund returns.
Q. What's your outlook?
A. The market remains volatile and extremely unforgiving, as seen in the recent declines of stocks that failed to beat the Street's earnings expectations. It's become as important as ever to own the stocks that are expected to make their numbers over not just the following quarter, but two to three quarters down the road. With that said, I'll continue to put a premium on earnings and maintain a focus on uncovering exciting new growth opportunities in the marketplace. By sticking with a balanced approach, which allows us to be aggressive in certain areas and defensive in others, we should be able to smooth out some of the turbulence expected over the coming months.
Semiannual Report
Fund Talk: The Manager's Overview - continued
The views expressed in this report reflect those of the portfolio manager only through the end of the period of the report as stated on the cover and do not necessarily represent the views of Fidelity or any other person in the Fidelity organization. Any such views are subject to change at any time based upon market or other conditions and Fidelity disclaims any responsibility to update such views. These views may not be relied on as investment advice and, because investment decisions for a Fidelity fund are based on numerous factors, may not be relied on as an indication of trading intent on behalf of any Fidelity fund.
Fund Facts
Goal: to seek long-term growth of capital by investing in companies with market capitalizations greater than $1 billion at the time of investment
Fund number: 338
Trading symbol: FLCSX
Start date: June 22, 1995
Size: as of October 31, 2000, more than $985 million
Manager: Karen Firestone, since 1998; manager, Fidelity Destiny I Portfolio, since February 2000; Fidelity Advisor Large Cap Stock Fund, since 1998; several Fidelity Select Portfolios, 1986-1997; joined Fidelity in 1983
3Karen Firestone on finding growth and the importance of flexibility in today's market:
"Part of our strength is searching for future winners. For the past three years, that effort has focused almost exclusively on the technology sector. Today, in a market that's become less enamored with technology, we're forced to look hard in other places for the kinds of growth stories we favor. I feel this is a positive development because, in effect, it levels the playing field among investors such as myself, who have strengths in addition to technology. During the past six months with the broadening of the market, we turned our attention to health care, focusing on generic drug-makers, hospitals and biotech firms, a strategy that paid off nicely for us.
"Remaining nimble and acting quickly in response to changing market conditions is critical to outperforming in an unusually volatile market environment. We gave up some of our flexibility by choosing to stay the course with many of the fund's technology and media holdings that suffered significant losses during the period. I simply couldn't justify selling stocks that I believed in and whose long-term prospects were solid, only to replace them with unknown commodities. Many of the stocks that declined were purchased at a time when there was a lot of euphoria in the market and prices were unusually high. So, today, given the fact that I still like these stocks, I'm willing to hold onto them a bit longer until they bounce back."
Semiannual Report
|
Top Ten Stocks as of October 31, 2000 |
||
|
|
% of fund's |
% of fund's net assets |
|
General Electric Co. |
5.8 |
4.8 |
|
Cisco Systems, Inc. |
4.3 |
5.3 |
|
Intel Corp. |
3.6 |
4.4 |
|
Microsoft Corp. |
3.1 |
2.7 |
|
Pfizer, Inc. |
3.0 |
0.5 |
|
Merck & Co., Inc. |
2.4 |
1.8 |
|
EMC Corp. |
2.2 |
1.4 |
|
Sun Microsystems, Inc. |
2.1 |
1.5 |
|
Fannie Mae |
2.0 |
1.7 |
|
The Coca-Cola Co. |
1.9 |
0.9 |
|
|
30.4 |
25.0 |
|
Top Five Market Sectors as of October 31, 2000 |
||
|
|
% of fund's |
% of fund's net assets |
|
Technology |
32.8 |
37.9 |
|
Health |
18.5 |
12.2 |
|
Finance |
10.4 |
9.5 |
|
Media & Leisure |
8.8 |
9.9 |
|
Nondurables |
7.3 |
4.2 |
|
Asset Allocation (% of fund's net assets) |
|||||||
|
As of October 31, 2000 * |
As of April 30, 2000 ** |
||||||
|
Stocks 97.7% |
|
|
Stocks 96.1% |
|
||
|
Short-Term |
|
|
Short-Term |
|
||
|
* Foreign investments |
6.6% |
|
** Foreign investments |
5.8% |
|
||

Semiannual Report
(Unaudited)
Showing Percentage of Net Assets
|
Common Stocks - 97.7% |
|||
|
Shares |
Value (Note 1) (000s) |
||
|
AEROSPACE & DEFENSE - 0.7% |
|||
|
Rockwell International Corp. |
74,300 |
$ 2,921 |
|
|
United Technologies Corp. |
52,100 |
3,637 |
|
|
TOTAL AEROSPACE & DEFENSE |
6,558 |
||
|
BASIC INDUSTRIES - 0.2% |
|||
|
Chemicals & Plastics - 0.0% |
|||
|
PPG Industries, Inc. |
9,200 |
411 |
|
|
Packaging & Containers - 0.2% |
|||
|
Tupperware Corp. |
84,250 |
1,443 |
|
|
TOTAL BASIC INDUSTRIES |
1,854 |
||
|
DURABLES - 0.8% |
|||
|
Consumer Durables - 0.2% |
|||
|
Minnesota Mining & Manufacturing Co. |
16,400 |
1,585 |
|
|
Consumer Electronics - 0.6% |
|||
|
Sony Corp. sponsored ADR |
36,600 |
3,038 |
|
|
The Swatch Group AG (Reg.) |
11,240 |
3,058 |
|
|
|
6,096 |
||
|
TOTAL DURABLES |
7,681 |
||
|
ENERGY - 4.5% |
|||
|
Energy Services - 2.3% |
|||
|
Global Marine, Inc. (a) |
103,500 |
2,743 |
|
|
Halliburton Co. |
139,300 |
5,163 |
|
|
Noble Drilling Corp. (a) |
118,000 |
4,904 |
|
|
Schlumberger Ltd. (NY Shares) |
136,200 |
10,368 |
|
|
|
23,178 |
||
|
Oil & Gas - 2.2% |
|||
|
Chevron Corp. |
43,100 |
3,540 |
|
|
Devon Energy Corp. |
82,700 |
4,168 |
|
|
Exxon Mobil Corp. |
153,500 |
13,690 |
|
|
|
21,398 |
||
|
TOTAL ENERGY |
44,576 |
||
|
Common Stocks - continued |
|||
|
Shares |
Value (Note 1) (000s) |
||
|
FINANCE - 10.4% |
|||
|
Banks - 1.5% |
|||
|
FleetBoston Financial Corp. |
190,167 |
$ 7,226 |
|
|
Mellon Financial Corp. |
87,900 |
4,241 |
|
|
State Street Corp. |
29,400 |
3,667 |
|
|
|
15,134 |
||
|
Credit & Other Finance - 2.2% |
|||
|
American Express Co. |
113,230 |
6,794 |
|
|
Citigroup, Inc. |
276,100 |
14,530 |
|
|
|
21,324 |
||
|
Federal Sponsored Credit - 2.9% |
|||
|
Fannie Mae |
264,200 |
20,343 |
|
|
Freddie Mac |
144,400 |
8,664 |
|
|
|
29,007 |
||
|
Insurance - 2.9% |
|||
|
American International Group, Inc. |
179,912 |
17,631 |
|
|
MetLife, Inc. |
263,200 |
7,271 |
|
|
The Chubb Corp. |
40,700 |
3,437 |
|
|
|
28,339 |
||
|
Securities Industry - 0.9% |
|||
|
Charles Schwab Corp. |
81,800 |
2,873 |
|
|
Morgan Stanley Dean Witter & Co. |
46,400 |
3,727 |
|
|
Nomura Securities Co. Ltd. |
91,000 |
1,931 |
|
|
|
8,531 |
||
|
TOTAL FINANCE |
102,335 |
||
|
HEALTH - 18.5% |
|||
|
Drugs & Pharmaceuticals - 15.1% |
|||
|
Alkermes, Inc. (a) |
58,300 |
2,161 |
|
|
Amgen, Inc. (a) |
112,200 |
6,501 |
|
|
Andrx Corp. - Andrx Group (a) |
32,900 |
2,369 |
|
|
ARIAD Pharmaceuticals, Inc. (a) |
90,200 |
823 |
|
|
Bristol-Myers Squibb Co. |
247,900 |
15,106 |
|
|
Cambridge Antibody Technology Group PLC (a) |
43,600 |
2,718 |
|
|
Elan Corp. PLC sponsored ADR (a) |
70,500 |
3,662 |
|
|
Eli Lilly & Co. |
143,100 |
12,790 |
|
|
Genentech, Inc. (a) |
25,800 |
2,129 |
|
|
Human Genome Sciences, Inc. (a) |
28,600 |
2,528 |
|
|
ImClone Systems, Inc. (a) |
45,000 |
2,461 |
|
|
Common Stocks - continued |
|||
|
Shares |
Value (Note 1) (000s) |
||
|
HEALTH - continued |
|||
|
Drugs & Pharmaceuticals - continued |
|||
|
Immunex Corp. (a) |
61,100 |
$ 2,601 |
|
|
Merck & Co., Inc. |
267,140 |
24,026 |
|
|
Millennium Pharmaceuticals, Inc. (a) |
37,800 |
2,743 |
|
|
Mylan Laboratories, Inc. |
127,700 |
3,576 |
|
|
PE Corp. - Celera Genomics Group (a) |
35,400 |
2,390 |
|
|
Pfizer, Inc. |
683,418 |
29,515 |
|
|
Protein Design Labs, Inc. (a) |
26,800 |
3,620 |
|
|
QLT, Inc. (a) |
26,100 |
1,303 |
|
|
Schering-Plough Corp. |
266,360 |
13,767 |
|
|
Shire Pharmaceuticals Group PLC ADR (a) |
60,600 |
3,810 |
|
|
Vertex Pharmaceuticals, Inc. (a) |
34,000 |
3,166 |
|
|
Watson Pharmaceuticals, Inc. (a) |
57,900 |
3,622 |
|
|
XOMA Ltd. (a) |
140,200 |
1,709 |
|
|
|
149,096 |
||
|
Medical Equipment & Supplies - 1.8% |
|||
|
Johnson & Johnson |
74,600 |
6,873 |
|
|
Medtronic, Inc. |
181,600 |
9,863 |
|
|
Novoste Corp. (a) |
50,500 |
1,275 |
|
|
|
18,011 |
||
|
Medical Facilities Management - 1.6% |
|||
|
HCA - The Healthcare Co. |
216,000 |
8,627 |
|
|
Tenet Healthcare Corp. |
176,300 |
6,931 |
|
|
|
15,558 |
||
|
TOTAL HEALTH |
182,665 |
||
|
INDUSTRIAL MACHINERY & EQUIPMENT - 7.1% |
|||
|
Electrical Equipment - 6.5% |
|||
|
Emerson Electric Co. |
70,600 |
5,185 |
|
|
General Electric Co. |
1,040,940 |
57,048 |
|
|
Omron Corp. |
67,000 |
1,652 |
|
|
|
63,885 |
||
|
Industrial Machinery & Equipment - 0.6% |
|||
|
Deere & Co. |
49,500 |
1,822 |
|
|
Common Stocks - continued |
|||
|
Shares |
Value (Note 1) (000s) |
||
|
INDUSTRIAL MACHINERY & EQUIPMENT - continued |
|||
|
Industrial Machinery & Equipment - continued |
|||
|
Illinois Tool Works, Inc. |
30,100 |
$ 1,672 |
|
|
Ingersoll-Rand Co. |
56,000 |
2,114 |
|
|
|
5,608 |
||
|
TOTAL INDUSTRIAL MACHINERY & EQUIPMENT |
69,493 |
||
|
MEDIA & LEISURE - 8.8% |
|||
|
Broadcasting - 5.1% |
|||
|
AT&T Corp. - Liberty Media Group Class A (a) |
303,448 |
5,462 |
|
|
Carlton Communications PLC |
171,900 |
1,383 |
|
|
Charter Communications, Inc. |
117,600 |
2,293 |
|
|
Comcast Corp. Class A (special) (a) |
200,600 |
8,174 |
|
|
Cox Communications, Inc. Class A (a) |
119,600 |
5,270 |
|
|
EchoStar Communications Corp. Class A (a) |
76,600 |
3,466 |
|
|
Grupo Televisa SA de CV sponsored GDR |
73,700 |
3,989 |
|
|
Infinity Broadcasting Corp. Class A (a) |
24,900 |
828 |
|
|
Pegasus Communications Corp. (a) |
55,800 |
1,984 |
|
|
RTL Group |
27,500 |
2,381 |
|
|
Time Warner, Inc. |
127,951 |
9,713 |
|
|
Univision Communications, Inc. Class A (a) |
129,400 |
4,950 |
|
|
|
49,893 |
||
|
Entertainment - 3.0% |
|||
|
Fox Entertainment Group, Inc. Class A (a) |
159,800 |
3,436 |
|
|
MGM Mirage, Inc. |
94,500 |
3,266 |
|
|
Ticketmaster Online CitySearch, Inc. Class B (a) |
80,400 |
1,286 |
|
|
Viacom, Inc. Class B (non-vtg.) (a) |
179,684 |
10,220 |
|
|
Walt Disney Co. |
317,400 |
11,367 |
|
|
|
29,575 |
||
|
Publishing - 0.6% |
|||
|
The New York Times Co. Class A |
155,200 |
5,704 |
|
|
Restaurants - 0.1% |
|||
|
McDonald's Corp. |
42,800 |
1,327 |
|
|
TOTAL MEDIA & LEISURE |
86,499 |
||
|
NONDURABLES - 7.3% |
|||
|
Beverages - 3.0% |
|||
|
Anheuser-Busch Companies, Inc. |
169,300 |
7,745 |
|
|
Common Stocks - continued |
|||
|
Shares |
Value (Note 1) (000s) |
||
|
NONDURABLES - continued |
|||
|
Beverages - continued |
|||
|
Heineken NV |
64,200 |
$ 3,488 |
|
|
The Coca-Cola Co. |
302,700 |
18,276 |
|
|
|
29,509 |
||
|
Foods - 1.1% |
|||
|
PepsiCo, Inc. |
102,600 |
4,970 |
|
|
Quaker Oats Co. |
77,400 |
6,313 |
|
|
|
11,283 |
||
|
Household Products - 1.9% |
|||
|
Colgate-Palmolive Co. |
16,900 |
993 |
|
|
Gillette Co. |
137,000 |
4,778 |
|
|
Luxottica Group Spa sponsored ADR |
158,700 |
2,291 |
|
|
Procter & Gamble Co. |
150,200 |
10,730 |
|
|
|
18,792 |
||
|
Tobacco - 1.3% |
|||
|
Philip Morris Companies, Inc. |
350,840 |
12,850 |
|
|
TOTAL NONDURABLES |
72,434 |
||
|
RETAIL & WHOLESALE - 2.8% |
|||
|
Drug Stores - 0.4% |
|||
|
CVS Corp. |
67,300 |
3,563 |
|
|
General Merchandise Stores - 1.2% |
|||
|
Wal-Mart Stores, Inc. |
270,400 |
12,269 |
|
|
Retail & Wholesale, Miscellaneous - 1.2% |
|||
|
Alberto-Culver Co. Class B |
6,700 |
225 |
|
|
Best Buy Co., Inc. (a) |
49,100 |
2,464 |
|
|
Home Depot, Inc. |
217,350 |
9,346 |
|
|
|
12,035 |
||
|
TOTAL RETAIL & WHOLESALE |
27,867 |
||
|
SERVICES - 0.8% |
|||
|
Advertising - 0.8% |
|||
|
TMP Worldwide, Inc. (a) |
50,300 |
3,501 |
|
|
WPP Group PLC sponsored ADR |
72,600 |
4,855 |
|
|
|
8,356 |
||
|
Common Stocks - continued |
|||
|
Shares |
Value (Note 1) (000s) |
||
|
TECHNOLOGY - 32.8% |
|||
|
Communications Equipment - 5.9% |
|||
|
Ciena Corp. (a) |
22,000 |
$ 2,313 |
|
|
Cisco Systems, Inc. (a) |
794,040 |
42,779 |
|
|
Corning, Inc. |
60,200 |
4,605 |
|
|
Lucent Technologies, Inc. |
76,700 |
1,788 |
|
|
Nortel Networks Corp. |
97,200 |
4,423 |
|
|
UTStarcom, Inc. |
94,400 |
1,888 |
|
|
|
57,796 |
||
|
Computer Services & Software - 9.2% |
|||
|
Affymetrix, Inc. (a) |
61,100 |
3,383 |
|
|
Amazon.com, Inc. (a) |
58,900 |
2,157 |
|
|
America Online, Inc. (a) |
255,100 |
12,865 |
|
|
Ariba, Inc. (a) |
13,200 |
1,668 |
|
|
Automatic Data Processing, Inc. |
132,000 |
8,621 |
|
|
BEA Systems, Inc. (a) |
62,300 |
4,470 |
|
|
BMC Software, Inc. (a) |
1,100 |
22 |
|
|
Cadence Design Systems, Inc. (a) |
131,700 |
3,383 |
|
|
Computer Associates International, Inc. |
15,300 |
488 |
|
|
Microsoft Corp. (a) |
451,100 |
31,070 |
|
|
Oracle Corp. (a) |
203,800 |
6,725 |
|
|
Sonus Networks, Inc. |
55,700 |
1,922 |
|
|
Synopsys, Inc. (a) |
23,600 |
823 |
|
|
VeriSign, Inc. (a) |
45,900 |
6,059 |
|
|
VERITAS Software Corp. (a) |
42,100 |
5,937 |
|
|
Yahoo!, Inc. (a) |
26,400 |
1,548 |
|
|
|
91,141 |
||
|
Computers & Office Equipment - 9.3% |
|||
|
Brocade Communications Systems, Inc. (a) |
7,800 |
1,774 |
|
|
CDW Computer Centers, Inc. (a) |
77,000 |
4,962 |
|
|
Dell Computer Corp. (a) |
314,600 |
9,281 |
|
|
EMC Corp. (a) |
247,000 |
21,998 |
|
|
Gateway, Inc. (a) |
28,800 |
1,486 |
|
|
Hewlett-Packard Co. |
136,200 |
6,325 |
|
|
International Business Machines Corp. |
113,400 |
11,170 |
|
|
Juniper Networks, Inc. (a) |
17,200 |
3,354 |
|
|
Lexmark International Group, Inc. Class A (a) |
16,200 |
664 |
|
|
Network Appliance, Inc. (a) |
14,700 |
1,749 |
|
|
Palm, Inc. |
114,900 |
6,154 |
|
|
Common Stocks - continued |
|||
|
Shares |
Value (Note 1) (000s) |
||
|
TECHNOLOGY - continued |
|||
|
Computers & Office Equipment - continued |
|||
|
Sun Microsystems, Inc. (a) |
184,296 |
$ 20,434 |
|
|
Symbol Technologies, Inc. |
55,500 |
2,522 |
|
|
|
91,873 |
||
|
Electronic Instruments - 1.1% |
|||
|
Agilent Technologies, Inc. |
39,182 |
1,815 |
|
|
Applied Materials, Inc. (a) |
40,400 |
2,146 |
|
|
Caliper Technologies Corp. |
27,900 |
1,573 |
|
|
Kudelski SA (a) |
1,650 |
2,221 |
|
|
LAM Research Corp. (a) |
137,900 |
2,672 |
|
|
|
10,427 |
||
|
Electronics - 7.3% |
|||
|
Altera Corp. (a) |
24,100 |
987 |
|
|
Analog Devices, Inc. (a) |
44,200 |
2,873 |
|
|
Chartered Semiconductor Manufacturing Ltd. ADR |
24,100 |
1,121 |
|
|
GlobeSpan, Inc. (a) |
53,900 |
4,147 |
|
|
Intel Corp. |
779,500 |
35,078 |
|
|
International Rectifier Corp. (a) |
64,200 |
2,865 |
|
|
JDS Uniphase Corp. (a) |
19,100 |
1,555 |
|
|
LSI Logic Corp. (a) |
74,900 |
2,462 |
|
|
Micron Technology, Inc. (a) |
49,200 |
1,710 |
|
|
Motorola, Inc. |
31,500 |
786 |
|
|
PMC-Sierra, Inc. (a) |
4,300 |
729 |
|
|
Samsung Electronics Co. Ltd. unit |
18,100 |
1,330 |
|
|
SDL, Inc. (a) |
8,000 |
2,074 |
|
|
Texas Instruments, Inc. |
298,000 |
14,621 |
|
|
|
72,338 |
||
|
TOTAL TECHNOLOGY |
323,575 |
||
|
TRANSPORTATION - 0.3% |
|||
|
Railroads - 0.3% |
|||
|
Canadian Pacific Ltd. |
91,900 |
2,671 |
|
|
UTILITIES - 2.7% |
|||
|
Cellular - 1.3% |
|||
|
QUALCOMM, Inc. (a) |
81,400 |
5,300 |
|
|
Sprint Corp. - PCS Group Series 1 (a) |
100,200 |
3,820 |
|
|
Vodafone Group PLC |
927,717 |
3,949 |
|
|
|
13,069 |
||
|
Common Stocks - continued |
|||
|
Shares |
Value (Note 1) (000s) |
||
|
UTILITIES - continued |
|||
|
Electric Utility - 0.4% |
|||
|
AES Corp. (a) |
46,600 |
$ 2,633 |
|
|
Calpine Corp. (a) |
21,400 |
1,689 |
|
|
|
4,322 |
||
|
Telephone Services - 1.0% |
|||
|
McLeodUSA, Inc. Class A (a) |
139,500 |
2,685 |
|
|
Metromedia Fiber Network, Inc. Class A (a) |
57,600 |
1,094 |
|
|
Qwest Communications International, Inc. (a) |
66,100 |
3,214 |
|
|
WorldCom, Inc. (a) |
96,200 |
2,285 |
|
|
|
9,278 |
||
|
TOTAL UTILITIES |
26,669 |
||
|
TOTAL COMMON STOCKS (Cost $804,095) |
963,233 |
||
|
Cash Equivalents - 2.8% |
|||
|
|
|
|
|
|
Fidelity Cash Central Fund, 6.61% (b) |
19,436,678 |
19,437 |
|
|
Fidelity Securities Lending Cash Central Fund, 6.66% (b) |
7,822,800 |
7,823 |
|
|
TOTAL CASH EQUIVALENTS (Cost $27,260) |
27,260 |
||
|
TOTAL INVESTMENT PORTFOLIO - 100.5% (Cost $831,355) |
990,493 |
||
|
NET OTHER ASSETS - (0.5)% |
(5,062) |
||
|
NET ASSETS - 100% |
$ 985,431 |
||
|
Legend |
|
(a) Non-income producing |
|
(b) The rate quoted is the annualized seven-day yield of the fund at period end. A complete listing of the fund's holdings as of its most recent fiscal year end is available upon request. |
|
Income Tax Information |
|
At October 31, 2000, the aggregate cost of investment securities for income tax purposes was $839,628,000. Net unrealized appreciation aggregated $150,865,000, of which $219,171,000 related to appreciated investment securities and $68,306,000 related to depreciated investment securities. |
See accompanying notes which are an integral part of the financial statements.
Semiannual Report
Statement of Assets and Liabilities
|
Amounts in thousands (except per-share amount) |
October 31, 2000 (Unaudited) |
|
|
Assets |
|
|
|
Investment in securities, at value (cost $831,355) - |
|
$ 990,493 |
|
Receivable for investments sold |
|
22,860 |
|
Receivable for fund shares sold |
|
1,312 |
|
Dividends receivable |
|
302 |
|
Interest receivable |
|
122 |
|
Other receivables |
|
17 |
|
Total assets |
|
1,015,106 |
|
Liabilities |
|
|
|
Payable for investments purchased |
$ 19,420 |
|
|
Payable for fund shares redeemed |
1,659 |
|
|
Accrued management fee |
574 |
|
|
Other payables and accrued expenses |
199 |
|
|
Collateral on securities loaned, at value |
7,823 |
|
|
Total liabilities |
|
29,675 |
|
Net Assets |
|
$ 985,431 |
|
Net Assets consist of: |
|
|
|
Paid in capital |
|
$ 846,897 |
|
Accumulated net investment (loss) |
|
(558) |
|
Accumulated undistributed net realized gain (loss) on investments and foreign currency transactions |
|
(20,044) |
|
Net unrealized appreciation (depreciation) on investments and assets and liabilities in foreign currencies |
|
159,136 |
|
Net Assets, for 50,297 shares outstanding |
|
$ 985,431 |
|
Net Asset Value and redemption price per share ($985,431 ÷ 50,297 shares) |
|
$19.59 |
See accompanying notes which are an integral part of the financial statements.
Semiannual Report
Financial Statements - continued
Statement of Operations
|
Amounts in thousands |
Six months ended October 31, 2000 (Unaudited) |
|
|
Investment Income Dividends |
|
$ 3,369 |
|
Interest |
|
885 |
|
Security lending |
|
116 |
|
Total income |
|
4,370 |
|
Expenses |
|
|
|
Management fee |
$ 3,124 |
|
|
Performance adjustment |
539 |
|
|
Transfer agent fees |
1,155 |
|
|
Accounting and security lending fees |
139 |
|
|
Non-interested trustees' compensation |
2 |
|
|
Custodian fees and expenses |
32 |
|
|
Registration fees |
33 |
|
|
Audit |
12 |
|
|
Legal |
2 |
|
|
Interest |
7 |
|
|
Total expenses before reductions |
5,045 |
|
|
Expense reductions |
(117) |
4,928 |
|
Net investment income (loss) |
|
(558) |
|
Realized and Unrealized Gain (Loss) Net realized gain (loss) on: |
|
|
|
Investment securities |
(11,808) |
|
|
Foreign currency transactions |
(21) |
(11,829) |
|
Change in net unrealized appreciation (depreciation) on: |
|
|
|
Investment securities |
(36,296) |
|
|
Assets and liabilities in foreign currencies |
3 |
(36,293) |
|
Net gain (loss) |
|
(48,122) |
|
Net increase (decrease) in net assets resulting |
|
$ (48,680) |
See accompanying notes which are an integral part of the financial statements.
Semiannual Report
Financial Statements - continued
Statement of Changes in Net Assets
|
Amounts in thousands |
Six months ended
October 31, 2000 |
Year ended |
|
Increase (Decrease) in Net Assets |
|
|
|
Operations |
$ (558) |
$ 547 |
|
Net realized gain (loss) |
(11,829) |
49,992 |
|
Change in net unrealized appreciation (depreciation) |
(36,293) |
108,941 |
|
Net increase (decrease) in net assets resulting |
(48,680) |
159,480 |
|
Distributions to shareholders |
- |
(957) |
|
From net realized gain |
(32,910) |
(19,130) |
|
In excess of net realized gain |
(8,216) |
- |
|
Total distributions |
(41,126) |
(20,087) |
|
Share transactions |
151,486 |
849,804 |
|
Reinvestment of distributions |
38,630 |
19,167 |
|
Cost of shares redeemed |
(229,816) |
(526,476) |
|
Net increase (decrease) in net assets resulting |
(39,700) |
342,495 |
|
Total increase (decrease) in net assets |
(129,506) |
481,888 |
|
Net Assets |
|
|
|
Beginning of period |
1,114,937 |
633,049 |
|
End of period (including undistributed net investment |
$ 985,431 |
$ 1,114,937 |
|
Other Information Shares |
|
|
|
Sold |
7,354 |
43,007 |
|
Issued in reinvestment of distributions |
1,863 |
1,002 |
|
Redeemed |
(11,222) |
(26,131) |
|
Net increase (decrease) |
(2,005) |
17,878 |
See accompanying notes which are an integral part of the financial statements.
Semiannual Report
Financial Highlights
|
|
Six months ended October 31, 2000 |
Years ended April 30, |
||||
|
|
(Unaudited) |
2000 |
1999 |
1998 |
1997 |
1996 E |
|
Selected Per-Share Data |
|
|
|
|
|
|
|
Net asset value,
beginning |
$ 21.32 |
$ 18.39 |
$ 16.45 |
$ 12.81 |
$ 11.72 |
$ 10.00 |
|
Income (loss) from Investment Operations |
|
|
|
|
|
|
|
Net investment income (loss) |
(.01) D |
.01 D |
.02 D |
.06 D |
.09 D |
.05 |
|
Net realized |
(.93) |
3.39 |
4.17 |
4.71 |
1.85 |
1.70 |
|
Total from investment operations |
(.94) |
3.40 |
4.19 |
4.77 |
1.94 |
1.75 |
|
Less Distributions |
|
|
|
|
|
|
|
From net investment income |
- |
(.02) |
(.02) |
(.06) |
(.05) |
(.03) |
|
From net |
(.63) |
(.45) |
(2.23) |
(1.07) |
(.80) |
- |
|
In excess of net realized gain |
(.16) |
- |
- |
- |
- |
- |
|
Total distributions |
(.79) |
(.47) |
(2.25) |
(1.13) |
(.85) |
(.03) |
|
Net asset value, |
$ 19.59 |
$ 21.32 |
$ 18.39 |
$ 16.45 |
$ 12.81 |
$ 11.72 |
|
Total Return B, C |
(4.61)% |
18.82% |
29.48% |
39.03% |
17.35% |
17.52% |
|
Ratios and Supplemental Data |
|
|
|
|
|
|
|
Net assets, |
$ 985 |
$ 1,115 |
$ 633 |
$ 154 |
$ 117 |
$ 88 |
|
Ratio of expenses |
.91% A |
.91% |
.93% |
.86% |
1.01% |
1.31% A |
|
Ratio of expenses |
.89% A, F |
.89% F |
.90% F |
.84% F |
.99% F |
1.30% A, F |
|
Ratio of net invest- |
(.10)% A |
.06% |
.13% |
.39% |
.68% |
.70% A |
|
Portfolio turnover rate |
87% A |
99% |
100% |
159% |
110% |
155% A |
A Annualized
B Total returns for periods of less than one year are not annualized.
C The total returns would have been lower had certain expenses not been reduced during the period(s) shown.
D Net investment income (loss) per share has been calculated based on average shares outstanding during the period.
E For the period June 22, 1995 (commencement of operations) to April 30, 1996.
F FMR or the fund has entered into varying arrangements with third parties who either paid or reduced a portion of the fund's expenses.
See accompanying notes which are an integral part of the financial statements.
Semiannual Report
For the period ended October 31, 2000 (Unaudited)
1. Significant Accounting Policies.
Fidelity Large Cap Stock Fund (the fund) is a fund of Fidelity Commonwealth Trust (the trust) and is authorized to issue an unlimited number of shares. The trust is registered under the Investment Company Act of 1940, as amended, as an open-end management investment company organized as a Massachusetts business trust. The financial statements have been prepared in conformity with generally accepted accounting principles which require management to make certain estimates and assumptions at the date of the financial statements. The following summarizes the significant accounting policies of the fund:
Security Valuation. Securities for which exchange quotations are readily available are valued at the last sale price, or if no sale price, at the closing bid price. Foreign securities are valued based on quotations from the principal market in which such securities are normally traded. If trading or events occurring in other markets after the close of the principal market in which foreign securities are traded, and before the close of business of the fund, are expected to materially affect the value of those securities, then they are valued at their fair value taking this trading or these events into account. Fair value is determined in good faith under consistently applied procedures under the general supervision of the Board of Trustees. Securities for which exchange quotations are not readily available (and in certain cases debt securities which trade on an exchange) are valued primarily using dealer-supplied valuations or at their fair value. Short-term securities with remaining maturities of sixty days or less for which quotations are not readily available are valued at amortized cost or original cost plus accrued interest, both of which approximate current value. Investments in open-end investment companies are valued at their net asset value each business day.
Foreign Currency Translation. The accounting records of the fund are maintained in U.S. dollars. Investment securities and other assets and liabilities denominated in a foreign currency are translated into U.S. dollars at the prevailing rates of exchange at period end. Purchases and sales of securities, income receipts and expense payments are translated into U.S. dollars at the prevailing exchange rate on the respective dates of the transactions.
Net realized gains and losses on foreign currency transactions represent net gains and losses from sales and maturities of foreign currency contracts, disposition of foreign currencies, the difference between the amount of net investment income accrued and the U.S. dollar amount actually received, and gains and losses between trade and settlement date on purchases and sales of securities. The effects of changes in foreign currency exchange rates on investments in securities are included with the net realized and unrealized gain or loss on investment securities.
Semiannual Report
Notes to Financial Statements (Unaudited) - continued
1. Significant Accounting Policies - continued
Income Taxes. As a qualified regulated investment company under Subchapter M of the Internal Revenue Code, the fund is not subject to income taxes to the extent that it distributes substantially all of its taxable income for its fiscal year. The schedule of investments includes information regarding income taxes under the caption "Income Tax Information."
Investment Income. Dividend income is recorded on the ex-dividend date, except certain dividends from foreign securities where the ex-dividend date may have passed, are recorded as soon as the fund is informed of the ex-dividend date. Non-cash dividends included in dividend income, if any, are recorded at the fair market value of the securities received. Interest income is accrued as earned. Investment income is recorded net of foreign taxes withheld where recovery of such taxes is uncertain.
Expenses. Most expenses of the trust can be directly attributed to a fund. Expenses which cannot be directly attributed are apportioned among the funds in the trust.
Distributions to Shareholders. Distributions are recorded on the ex-dividend date.
Income and capital gain distributions are determined in accordance with income tax regulations which may differ from generally accepted accounting principles. These differences, which may result in distribution reclassifications, are primarily due to differing treatments for litigation proceeds, foreign currency transactions, and losses deferred due to wash sales. The fund also utilized earnings and profits distributed to shareholders on redemption of shares as a part of the dividends paid deduction for income tax purposes.
Permanent book and tax basis differences relating to shareholder distributions will result in reclassifications to paid in capital. Accumulated net investment loss and accumulated undistributed net realized gain (loss) on investments and foreign currency transactions may include temporary book and tax basis differences which will reverse in a subsequent period. Any taxable income or gain remaining at fiscal year end is distributed in the following year.
Security Transactions. Security transactions are accounted for as of trade date. Gains and losses on securities sold are determined on the basis of identified cost.
2. Operating Policies.
Foreign Currency Contracts. The fund generally uses foreign currency contracts to facilitate transactions in foreign-denominated securities. Losses may arise from changes in the value of the foreign currency or if the counterparties do not perform under the contracts' terms. The U.S. dollar value of foreign currency contracts is determined using contractual currency exchange rates established at the time of each trade.
Semiannual Report
Notes to Financial Statements (Unaudited) - continued
2. Operating Policies - continued
Joint Trading Account. Pursuant to an Exemptive Order issued by the Securities and Exchange Commission (the SEC), the fund, along with other affiliated entities of Fidelity Management & Research Company (FMR), may transfer uninvested cash balances into one or more joint trading accounts. These balances are invested in one or more repurchase agreements for U.S. Treasury or Federal Agency obligations.
Repurchase Agreements. The underlying U.S. Treasury, Federal Agency, or other obligations found to be satisfactory by FMR are transferred to an account of the fund, or to the Joint Trading Account, at a custodian bank. The securities are marked-to-market daily and maintained at a value at least equal to the principal amount of the repurchase agreement (including accrued interest). FMR, the fund's investment adviser, is responsible for determining that the value of the underlying securities remains in accordance with the market value requirements stated above.
Interfund Lending Program. Pursuant to an Exemptive Order issued by the SEC, the fund, along with other registered investment companies having management contracts with FMR, may participate in an interfund lending program. This program provides an alternative credit facility allowing the fund to borrow from, or lend money to, other participating funds.
3. Purchases and Sales of Investments.
Purchases and sales of securities, other than short-term securities, aggregated $467,939,000 and $527,868,000, respectively.
4. Fees and Other Transactions with Affiliates.
Management Fee. As the fund's investment adviser, FMR receives a monthly basic fee that is calculated on the basis of a group fee rate plus a fixed individual fund fee rate applied to the average net assets of the fund. The group fee rate is the weighted average of a series of rates and is based on the monthly average net assets of all the mutual funds advised by FMR. The rates ranged from .2167% to .5200% for the period. The annual individual fund fee rate is .30%. In the event that these rates were lower than the contractual rates in effect during the period, FMR voluntarily implemented the above rates, as they resulted in the same or a lower management fee. The basic fee is subject to a performance adjustment (up to a maximum of ±.20% of the fund's average net assets over the performance period) based on the fund's investment performance as compared to the appropriate index over a specified period of time. For the period, the management fee was equivalent to an annualized rate of .66% of average net assets after the performance adjustment.
Semiannual Report
Notes to Financial Statements (Unaudited) - continued
4. Fees and Other Transactions with Affiliates - continued
Sub-Adviser Fee. Beginning January 1, 2001, FMR Co.(FMRC) will serve as a sub-adviser for the fund. FMRC is a wholly owned subsidiary of FMR and will receive a fee from FMR of 50% of the management fee payable to FMR with respect to that portion of the fund's assets that will be managed by FMRC.
Transfer Agent Fees. Fidelity Service Company, Inc. (FSC), an affiliate of FMR, is the fund's transfer, dividend disbursing and shareholder servicing agent. FSC receives account fees and asset-based fees that vary according to account size and type of account. FSC pays for typesetting, printing and mailing of all shareholder reports, except proxy statements. For the period, the transfer agent fees were equivalent to an annualized rate of .21% of average net assets.
Accounting and Security Lending Fees. FSC maintains the fund's accounting records and administers the security lending program. The security lending fee is based on the number and duration of lending transactions. The accounting fee is based on the level of average net assets for the month plus out-of-pocket expenses.
Cash Central Funds. Pursuant to an Exemptive Order issued by the the SEC, the fund may invest in the Fidelity Cash Central Fund and the Fidelity Securities Lending Cash Central Fund (the Cash Funds) managed by FIMM. The Cash Funds are open-end money market funds available only to investment companies and other accounts managed by FMR and its affiliates. The Cash Funds seek preservation of capital, liquidity, and current income. Income distributions from the Cash Funds are declared daily and paid monthly from net investment income. Income distributions earned by the fund are recorded as either interest income or security lending income in the accompanying financial statements.
Brokerage Commissions. The fund placed a portion of its portfolio transactions with brokerage firms which are affiliates of FMR. The commissions paid to these affiliated firms were $19,000 for the period.
5. Interfund Lending Program.
The fund participated in the interfund lending program as a borrower. The average daily loan balance during the period for which the loan was outstanding amounted to $18,643,000. The weighted average interest rate was 6.675%. At period end there were no interfund loans outstanding.
6. Security Lending.
The fund lends portfolio securities from time to time in order to earn additional income. The fund receives collateral in the form of U.S. Treasury obligations, letters of credit, and/or cash against the loaned securities, and maintains collateral in an amount not less than 100% of the market value of the loaned securities during the period of the loan. The market value of the loaned securities is determined at the close of business of the fund and any additional required collateral is delivered to the fund on the next business day. If the borrower
Semiannual Report
Notes to Financial Statements (Unaudited) - continued
6. Security Lending - continued
defaults on its obligation to return the securities loaned because of insolvency or other reasons, the fund could experience delays and costs in recovering the securities loaned or in gaining access to the collateral. At period end, the value of the securities loaned amounted to $8,122,000. The fund received cash collateral of $7,823,000 which was invested in cash equivalents.
7. Expense Reductions.
FMR has directed certain portfolio trades to brokers who paid a portion of the fund's expenses. For the period, the fund's expenses were reduced by $104,000 under this arrangement.
In addition, through an arrangement with the fund's transfer agent, credits realized as a result of uninvested cash balances were used to reduce a portion of the fund's expenses. During the period, the fund's transfer agent fees were reduced by $13,000 under this arrangement.
Semiannual Report
Fidelity offers several ways to conveniently manage your personal investments via your telephone or PC. You can access your account information, conduct trades and research your investments 24 hours a day.
By Phone
Fidelity Automated Service Telephone provides a single toll-free number to access account balances, positions, quotes and trading. It's easy to navigate the service, and on your first call, the system will help you create a personal identification number (PIN) for security.
(phone_graphic)Fidelity Automated
Service Telephone (FAST®)
1-800-544-5555
Press
1 For mutual fund and brokerage trading.
2 For quotes.*
3 For account balances and holdings.
4 To review orders and mutual
fund activity.
5 To change your PIN.
*0 To speak to a Fidelity representative.
By PC
Fidelity's web site on the Internet provides a wide range of information, including daily financial news, fund performance, interactive planning tools and news about Fidelity products and services.
(computer_graphic)Fidelity's Web Site
www.fidelity.com
If you are not currently on the Internet, call EarthLink Sprint at 1-800-288-2967, and be sure to ask for registration number SMD004 to receive a special Fidelity package that includes 30 days of free Internet access. EarthLink is North America's #1 independent Internet access provider.
(computer_graphic)
Fidelity On-line Xpress+®
Fidelity On-line Xpress+ software for Windows combines comprehensive portfolio management capabilities, securities trading and access to research and analysis tools . . . all on your desktop. Call Fidelity at 1-800-544-0240 or visit our web site for more information on how to manage your investments via your PC.
* When you call the quotes line, please remember that a fund's yield and return will vary and, except for money market funds, share price will also vary. This means that you may have a gain or loss when you sell your shares. There is no assurance that money market funds will be able to maintain a stable $1 share price; an investment in a money market fund is not insured or guaranteed by the U.S. government. Total returns are historical and include changes in share price, reinvestment of dividends and capital gains, and the effects of any sales charges.
Semiannual Report
For directions and hours,
please call 1-800-544-9797.
Arizona
7373 N. Scottsdale Road
Scottsdale, AZ
California
815 East Birch Street
Brea, CA
851 East Hamilton Avenue
Campbell, CA
527 North Brand Boulevard
Glendale, CA
19200 Von Karman Avenue
Irvine, CA
10100 Santa Monica Blvd.
Los Angeles, CA
251 University Avenue
Palo Alto, CA
1760 Challenge Way
Sacramento, CA
7676 Hazard Center Drive
San Diego, CA
8 Montgomery Street
San Francisco, CA
950 Northgate Drive
San Rafael, CA
1400 Civic Drive
Walnut Creek, CA
6300 Canoga Avenue
Woodland Hills, CA
Colorado
1625 Broadway
Denver, CO
Connecticut
48 West Putnam Avenue
Greenwich, CT
265 Church Street
New Haven, CT
300 Atlantic Street
Stamford, CT
29 South Main Street
West Hartford, CT
Delaware
222 Delaware Avenue
Wilmington, DE
Florida
4400 N. Federal Highway
Boca Raton, FL
90 Alhambra Plaza
Coral Gables, FL
4090 N. Ocean Boulevard
Ft. Lauderdale, FL
1907 West State Road 434
Longwood, FL
8880 Tamiami Trail, North
Naples, FL
2401 PGA Boulevard
Palm Beach Gardens, FL
8065 Beneva Road
Sarasota, FL
1502 N. Westshore Blvd.
Tampa, FL
Georgia
3445 Peachtree Road, N.E.
Atlanta, GA
1000 Abernathy Road
Atlanta, GA
Illinois
One North Franklin Street
Chicago, IL
1415 West 22nd Street
Oak Brook, IL
1700 East Golf Road
Schaumburg, IL
3232 Lake Avenue
Wilmette, IL
Indiana
4729 East 82nd Street
Indianapolis, IN
Maine
Three Canal Plaza
Portland, ME
Maryland
7401 Wisconsin Avenue
Bethesda, MD
One W. Pennsylvania Ave.
Towson, MD
Massachusetts
801 Boylston Street
Boston, MA
155 Congress Street
Boston, MA
25 State Street
Boston, MA
300 Granite Street
Braintree, MA
44 Mall Road
Burlington, MA
416 Belmont Street
Worcester, MA
Semiannual Report
Michigan
280 Old N. Woodward Ave.
Birmingham, MI
29155 Northwestern Hwy.
Southfield, MI
Minnesota
7600 France Avenue South
Edina, MN
Missouri
700 West 47th Street
Kansas City, MO
8885 Ladue Road
Ladue, MO
New Jersey
150 Essex Street
Millburn, NJ
56 South Street
Morristown, NJ
501 Route 17, South
Paramus, NJ
New York
1055 Franklin Avenue
Garden City, NY
999 Walt Whitman Road
Melville, L.I., NY
1271 Avenue of the Americas
New York, NY
71 Broadway
New York, NY
350 Park Avenue
New York, NY
North Carolina
4611 Sharon Road
Charlotte, NC
Ohio
600 Vine Street
Cincinnati, OH
28699 Chagrin Boulevard
Woodmere Village, OH
Oregon
16850 SW 72nd Avenue
Tigard, OR
Pennsylvania
1735 Market Street
Philadelphia, PA
439 Fifth Avenue
Pittsburgh, PA
Rhode Island
47 Providence Place
Providence, RI
Tennessee
6150 Poplar Avenue
Memphis, TN
Texas
10000 Research Boulevard
Austin, TX
4017 Northwest Parkway
Dallas, TX
1155 Dairy Ashford Street
Houston, TX
2701 Drexel Drive
Houston, TX
400 East Las Colinas Blvd.
Irving, TX
14100 San Pedro
San Antonio, TX
19740 IH 45 North
Spring, TX
Utah
215 South State Street
Salt Lake City, UT
Virginia
1861 International Drive
McLean, VA
Washington
411 108th Avenue, N.E.
Bellevue, WA
511 Pine Street
Seattle, WA
Washington, DC
1900 K Street, N.W.
Washington, DC
Wisconsin
595 North Barker Road
Brookfield, WI
Fidelity Brokerage Services, Inc., 100 Summer St., Boston, MA 02110 Member NYSE/SIPC
Semiannual Report
If more than one address is listed, please locate the address that is closest to you. We'll give your correspondence immediate attention and send you written confirmation upon completion of your request.
(letter_graphic)Making Changes
To Your Account
(such as changing name, address, bank, etc.)
Fidelity Investments
P.O. Box 770001
Cincinnati, OH 45277-0002
(letter_graphic)For Non-Retirement
Accounts
Buying shares
Fidelity Investments
P.O. Box 770001
Cincinnati, OH 45277-0003
Overnight Express
Fidelity Investments
2300 Litton Lane - KH1A
Hebron, KY 41048
Selling shares
Fidelity Investments
P.O. Box 660602
Dallas, TX 75266-0602
Overnight Express
Fidelity Investments
Attn: Redemptions - CP6I
400 East Las Colinas Blvd.
Irving, TX 75039-5587
General Correspondence
Fidelity Investments
P.O. Box 500
Merrimack, NH 03054-0500
(letter_graphic)For Retirement
Accounts
Buying shares
Fidelity Investments
P.O. Box 770001
Cincinnati, OH 45277-0003
Selling shares
Fidelity Investments
P.O. Box 660602
Dallas, TX 75266-0602
Overnight Express
Fidelity Investments
Attn: Redemptions - CP6R
400 East Las Colinas Blvd.
Irving, TX 75039-5587
General Correspondence
Fidelity Investments
P.O. Box 500
Merrimack, NH 03054-0500
Semiannual Report
Semiannual Report
Investment Adviser
Fidelity Management & Research Company
Boston, MA
Investment Sub-Advisers
Fidelity Management & Research
(Far East) Inc.
Fidelity Management & Research
(U.K.) Inc.
Fidelity Investments Japan Limited
Officers
Edward C. Johnson 3d, President
Robert C. Pozen, Senior Vice President
Abigail P. Johnson, Vice President
Karen M. Firestone, Vice President
Eric D. Roiter, Secretary
Robert A. Dwight, Treasurer
Maria F. Dwyer, Deputy Treasurer
John H. Costello, Assistant Treasurer
Thomas J. Simpson, Assistant Treasurer
Board of Trustees
Ralph F. Cox *
Phyllis Burke Davis *
Robert M. Gates *
Edward C. Johnson 3d
Donald J. Kirk *
Ned C. Lautenbach *
Peter S. Lynch
Marvin L. Mann *
William O. McCoy *
Gerald C. McDonough *
Robert C. Pozen
Thomas R. Williams *
Advisory Board
J. Michael Cook
Abigail P. Johnson
Marie L. Knowles
General Distributor
Fidelity Distributors Corporation
Boston, MA
Transfer and Shareholder
Servicing Agent
Fidelity Service Company, Inc.
Boston, MA
* Independent trustees
Custodian
Brown Brothers Harriman & Co.
Boston, MA
Fidelity's Growth Funds
Aggressive Growth Fund
Blue Chip Growth Fund
Capital Appreciation Fund
Contrafund®
Contrafund® II
Disciplined Equity Fund
Dividend Growth Fund
Export and Multinational Fund
Fidelity Fifty®
Growth Company Fund
Large Cap Stock Fund
Low-Priced Stock Fund
Magellan® Fund
Mid-Cap Stock Fund
New Millennium Fund®
OTC Portfolio
Retirement Growth Fund
Small Cap Selector
Small Cap Stock Fund
Stock Selector
Tax Managed Stock Fund
TechnoQuant® Growth Fund
Trend Fund
Value Fund
The Fidelity Telephone Connection
Mutual Fund 24-Hour Service
Exchanges/Redemptions
and Account Assistance 1-800-544-6666
Product Information 1-800-544-6666
Retirement Accounts 1-800-544-4774
(8 a.m. - 9 p.m.)
TDD Service 1-800-544-0118
for the deaf and hearing impaired
(9 a.m. - 9 p.m. Eastern time)
Fidelity Automated Service
Telephone (FAST ®) (automated graphic) 1-800-544-5555
(automated graphic) Automated line for quickest service
(Fidelity Investment logo)(registered trademark)
Corporate Headquarters
82 Devonshire St., Boston, MA 02109
www.fidelity.com
LCS-SANN-1200 118653
1.465347.103
Spartan®
Fund
Semiannual Report
October 31, 2000
(2_fidelity_logos)
|
President's Message |
3 |
Ned Johnson on investing strategies. |
|
Performance |
4 |
How the fund has done over time. |
|
Fund Talk |
6 |
The manager's review of fund performance, strategy and outlook. |
|
Investment Changes |
9 |
A summary of major shifts in the fund's investments over the past six months. |
|
Investments |
10 |
A complete list of the fund's investments with their market values. |
|
Financial Statements |
29 |
Statements of assets and liabilities, operations, and changes in net assets, as well as financial highlights. |
|
Notes |
33 |
Notes to the financial statements. |
|
Distributions |
37 |
|
To reduce expenses, only one copy of most financial reports and prospectuses may be mailed to households, even if more than one person in the household has an account in the fund. Call Fidelity at 1-800-544-8544 if you need additional copies of financial reports or prospectuses. If you do not want the mailing of these documents to be combined with those for other members of your household, contact Fidelity in writing at P.O. Box 5000, Cincinnati, OH 45273-8692.
Standard & Poor's, S&P and S&P 500 are registered service marks of The McGraw-Hill Companies, Inc. and have been licensed for use by Fidelity Distributors Corporation.
Other third party marks appearing herein are the property of their respective owners.
All other marks appearing herein are registered or unregistered trademarks or service marks of FMR Corp. or an affiliated company.
(Recycle graphic) This report is printed on recycled paper using soy-based inks.
This report and the financial statements contained herein are submitted for the general information of the shareholders of the fund. This report is not authorized for distribution to prospective investors in the fund unless preceded or accompanied by an effective prospectus.
Mutual fund shares are not deposits or obligations of, or guaranteed by, any depository institution. Shares are not insured by the FDIC, Federal Reserve Board or any other agency, and are subject to investment risks, including possible loss of principal amount invested.
Neither the fund nor Fidelity Distributors Corporation is a bank.
For more information on any Fidelity fund, including charges and expenses, call 1-800-544-6666 for a free prospectus. Read it carefully before you invest or send money.
Semiannual Report
|
(photo_of_Edward_C_Johnson_3d)
Dear Shareholder:
A sixth-straight year of double-digit positive returns for the Dow Jones Industrial Average, NASDAQ and S&P 500® could be in jeopardy unless the U.S. stock market shows marked improvement in the final two months of 2000. Through October, all three indexes had negative year-to-date returns. On the other hand, most fixed-income sectors were solidly in the black. Treasuries and other long-term government securities led the way, returning nearly 14%.
While it's impossible to predict the future direction of the markets with any degree of certainty, there are certain basic principles that can help investors plan for their future needs.
First, investors are encouraged to take a long-term view of their portfolios. If you can afford to leave your money invested through the inevitable up and down cycles of the financial markets, you will greatly reduce your vulnerability to any single decline. We know from experience, for example, that stock prices have gone up over longer periods of time, have significantly outperformed other types of investments and have stayed ahead of inflation.
Second, you can further manage your investing risk through diversification. A stock mutual fund, for instance, is already diversified, because it invests in many different companies. You can increase your diversification further by investing in a number of different stock funds, or in such other investment categories as bonds. If you have a short investment time horizon, you might want to consider moving some of your investment into a money market fund, which seeks income and a stable share price by investing in high-quality, short-term investments. Of course, it's important to remember that an investment in a money market fund is not insured or guaranteed by the Federal Deposit Insurance Corporation or any other government agency. Although money market funds seek to preserve the value of your investment at $1.00 per share, it is possible to lose money by investing in these types of funds.
Finally, no matter what your time horizon or portfolio diversity, it makes good sense to follow a regular investment plan, investing a certain amount of money in a fund at the same time each month or quarter and periodically reviewing your overall portfolio. By doing so, you won't get caught up in the excitement of a rapidly rising market, nor will you buy all your shares at market highs. While this strategy - known as dollar cost averaging - won't assure a profit or protect you from a loss in a declining market, it should help you lower the average cost of your purchases. Of course, you should consider your financial ability to continue your purchases through periods of low price levels before undertaking such a strategy.
If you have questions, please call us at 1-800-544-6666, or visit our web site at www.fidelity.com. We are available 24 hours a day, seven days a week to provide you the information you need to make the investments that are right for you.
Best regards,
/s/Edward C. Johnson 3d
Edward C. Johnson 3d
Semiannual Report
There are several ways to evaluate a fund's historical performance. You can look at the total percentage change in value, the average annual percentage change or the growth of a hypothetical $10,000 investment. Total return reflects the change in the value of an investment, assuming reinvestment of the fund's dividend income and capital gains (the profits earned upon the sale of securities that have grown in value). If Fidelity had not reimbursed certain fund expenses, the total returns would have been lower.
Cumulative Total Returns
|
Periods ended October 31, 2000 |
Past 6 |
Past 1 |
Past 5 |
Past 10 |
|
Spartan ® 500 Index |
-1.04% |
6.01% |
163.70% |
475.31% |
|
S&P 500 ® |
-1.03% |
6.09% |
166.65% |
491.03% |
|
S&P 500 Index Objective Funds Average |
-1.34% |
5.48% |
160.67% |
468.29% |
Cumulative total returns show the fund's performance in percentage terms over a set period - in this case, six months, one year, five years or 10 years. For example, if you had invested $1,000 in a fund that had a 5% return over the past year, the value of your investment would be $1,050. You can compare the fund's returns to the performance of the Standard & Poor's 500SM Index - a market capitalization-weighted index of common stocks. To measure how the fund's performance stacked up against its peers, you can compare it to the S&P 500 Index objective funds average, which reflects the performance of mutual funds with similar objectives tracked by Lipper Inc. The past six month average represents a peer group of 150 mutual funds. These benchmarks include reinvested dividends and capital gains, if any, and exclude the effect of sales charges. Lipper has created new comparison categories that group funds according to portfolio characteristics and capitalization, as well as by capitalization only. These averages are listed on page 5 of this report.(dagger)
Average Annual Total Returns
|
Periods ended October 31, 2000 |
|
Past 1 |
Past 5 |
Past 10 |
|
Spartan 500 Index |
|
6.01% |
21.40% |
19.12% |
|
S&P 500 |
|
6.09% |
21.67% |
19.44% |
|
S&P 500 Index Objective Funds Average |
|
5.48% |
21.12% |
18.97% |
Average annual total returns take the fund's cumulative returns and show you what would have happened if the fund had performed at a constant rate each year. (Note: Lipper calculates average annual total returns by annualizing each fund's total return, then taking an arithmetic average. This may produce a different figure than that obtained by averaging the cumulative total returns and annualizing the result.)
Semiannual Report
$10,000 Over 10 Years
$10,000 Over 10 Years: Let's say hypothetically that $10,000 was invested in Spartan 500 Index Fund on October 31, 1990. As the chart shows, by October 31, 2000, the value of the investment would have grown to $57,531 - a 475.31% increase on the initial investment. For comparison, look at how the Standard & Poor's 500 Index did over the same period. With dividends and capital gains, if any, reinvested, the same $10,000 would have grown to $59,103 - a 491.03% increase.
Understanding
Performance
How a fund did yesterday is no guarantee of how it will do tomorrow. The stock market, for example, has a history of long-term growth and short-term volatility. In turn, the share price and return of a fund that invests in stocks will vary. That means if you sell your shares during a market downturn, you might lose money. But if you can ride out the market's ups and downs, you may have a gain.
3* The Lipper S&P 500 funds average reflects the performance (excluding sales charges) of mutual funds with similar portfolio characteristics and capitalization. As of October 31, 2000, the six month, one year, five year and 10 year cumulative total returns for the S&P 500 funds average were -1.34%, 5.48%, 160.67%, and 468.29%, respectively. The one year, five year and 10 year average annual total returns were 5.48%, 21.12% and 18.97%, respectively.
Semiannual Report
An interview with Dean Barr, who oversees the Spartan 500 Index Fund's investment management personnel as Managing Director for Bankers Trust, sub-adviser of the fund
Q. How did the fund perform, Dean?
A. For the six-month period that ended October 31, 2000, the fund posted a total return of -1.04%, compared to a return of -1.03% for the Standard & Poor's 500 Index. The fund also compares its performance to the S&P 500 index objective funds average tracked by Lipper Inc., which returned -1.34% during the same period. During the 12 months that ended October 31, 2000, the fund returned 6.01%, while the S&P index and the Lipper peer fund average returned 6.09% and 5.48%, respectively.
Q. Since the report to shareholders six months ago, the S&P 500 index has gyrated rather sharply through positive and negative territory. What caused the volatility?
A. Several factors. At the start of the period, the technology sector was in the midst of a correction after several notable Wall Street analysts warned that
valuations had reached unsustainable levels. Technology stocks also faced heightened concerns over the government's break-up plan for S&P 500
component Microsoft, potentially separating the software giant into multiple companies. Shares of Microsoft shed more than 40% of their value from the
beginning of 2000 through early August. Investors also began to conclude that higher interest rates could soon hurt corporate profits. The Federal Reserve
Board increased the federal funds rate by a half-point in May to its highest level in nine years. Collectively, these factors turned the market upside down,
forcing many investors to seek areas of the market typically seen as safe havens, such as large-cap financials and health care stocks. (Portfolio Manager photograph)
Q. What caused the general equity market decline toward the end of the period?
A. Most market sectors swooned sharply after several government reports suggested the U.S. economy was slowing. That negative sentiment proved accurate when several key index components - Dell, Intel and Home Depot, to name a few - issued third-quarter profit warnings or slower sales projections. Further, many large multinational companies in the index - such as Gillette, Colgate-Palmolive and McDonald's - cited the weakening of the European currency as a reason for slower projected growth. Additionally, semiconductor manufacturers such as Analog Devices and Texas Instruments were hurt by overcapacity in the marketplace.
Q. Some of the technology companies represented in the index appeared to be immune from the sector's troubles . . .
A. Most of the technology companies did suffer - at least to some degree - during the sector's correction in the spring. However, those that were leaders in their industries and had a history of meeting earnings expectations rebounded to even higher price levels than before and more quickly than others that lacked earnings consistency. As the period wore on, investors looked more favorably on technology leaders, such as data storage provider EMC and hardware/software provider Sun Microsystems, because their businesses occupied a niche in the marketplace that showed little evidence of declining revenue. As a result, the stock prices of these companies rose, while others, such as Dell and Lucent Technologies, were threatened by slower consumer spending and declined.
Semiannual Report
Fund Talk: The Manager's Overview - continued
Q. After being out of favor for some time, financial stocks performed relatively well during the past six months. Can you tell us why?
A. The performance of financial stocks generally improved as the period moved along in response to a growing consensus that it appeared unlikely the Fed would raise interest rates further. After raising the federal funds rate in May, the Fed voted on three occasions - in June, August and October - to leave rates unchanged as evidence trickled in that the U.S. economy appeared to be slowing. The stabilization of interest rates fueled a rise in financial stocks, which historically perform better in such climates. Meanwhile, stocks of investment banking firms such as Lehman Brothers and Goldman Sachs got a boost from an increase in merger activity. Among the large deals in the period, Chase Manhattan reached a deal to acquire JP Morgan, while Credit Suisse First Boston bought exposure to the high-yield bond and retail online brokerage businesses with its purchase of Donaldson, Lufkin & Jenrette.
Q. What caused the utilities sector to underperform?
A. Telecommunication companies, which make up the largest portion of the S&P 500 index's utilities sector, proved to be the biggest drag on performance due to increased competition and falling prices. Specifically, Worldcom, AT&T and Sprint were hurt by increasing competitive pressures in the long-distance market. Elsewhere, the auctions for licenses to build the next generation of wireless communications were more competitive than expected, causing companies to spend far more than anticipated. As a result, analysts began to question whether or not wireless service providers would have enough capital remaining to build-out their networks.
Q. Which stocks were top contributors? Which disappointed?
A. American International Group, the fund's top performer, benefited from larger-than-expected growth in its core insurance business, as well as a proposed investment in Korean-based Hyundai Securities. Regional Bell operating company SBC Communications was rewarded for its fiscal restraint and strong balance sheet. In terms of disappointments, slowing demand for personal computers hurt sales growth at Intel. Lucent's stock was punished after the company sliced its first-quarter 2001 earnings forecast - its fifth consecutive lowered adjustment.
Q. What is your outlook, Dean?
A. With the economy slowing down, I expect to see more companies revising their quarterly earnings on the downside. These revisions should bring valuations - as well as returns - down closer to historically normal levels. On a positive note, there is little evidence of inflation in the domestic economy and several of the large-cap companies in the fund are still delivering growth, albeit on a more modest level than during the past few years.
Semiannual Report
Fund Talk: The Manager's Overview - continued
The views expressed in this report reflect those of Bankers Trust only through the end of the period of the report as stated on the cover and do not necessarily represent the views of Fidelity or any other person in the Fidelity organization. Any such views are subject to change at any time based upon market or other conditions and Fidelity disclaims any responsibility to update such views. These views may not be relied on as investment advice and, because investment decisions for a Fidelity fund are based on numerous factors, may not be relied on as an indication of trading intent on behalf of any Fidelity fund.
Fund Facts
Goal: seeks total return that corresponds to that of the Standard & Poor's 500 Index
Fund number: 317
Trading symbol: FSMKX
Start date: March 6, 1990
Size: as of October 31, 2000, more than $10.2 billion
Manager: Bankers Trust, since 1997
3Dean Barr on changes to the S&P 500:
"The S&P 500 is an index of 500 stocks chosen to be representative of the broader market. Periodically, companies will be added or deleted from the index. Usually, these changes are based on events such as acquisitions, spin-offs or shifts in asset size."
Here are some recent changes to the index:
Semiannual Report
|
Top Ten Stocks as of October 31, 2000 |
||
|
|
% of fund's |
% of fund's net assets |
|
General Electric Co. |
4.3 |
4.1 |
|
Cisco Systems, Inc. |
3.0 |
3.8 |
|
Microsoft Corp. |
2.9 |
2.9 |
|
Exxon Mobil Corp. |
2.5 |
2.1 |
|
Intel Corp. |
2.4 |
3.4 |
|
Pfizer, Inc. |
2.2 |
1.3 |
|
Citigroup, Inc. |
1.9 |
1.6 |
|
American International Group, Inc. |
1.8 |
1.3 |
|
Merck & Co., Inc. |
1.6 |
1.3 |
|
Wal-Mart Stores, Inc. |
1.6 |
2.0 |
|
|
24.2 |
23.8 |
|
Top Ten Market Sectors as of October 31, 2000 |
||
|
|
% of fund's |
% of fund's net assets |
|
Technology |
28.1 |
32.1 |
|
Finance |
15.6 |
12.7 |
|
Health |
11.3 |
9.6 |
|
Utilities |
10.0 |
10.2 |
|
Industrial Machinery & Equipment |
6.1 |
5.2 |
|
Nondurables |
5.9 |
5.0 |
|
Energy |
5.9 |
5.3 |
|
Retail & Wholesale |
5.1 |
5.8 |
|
Media & Leisure |
4.0 |
4.6 |
|
Basic Industries |
2.8 |
2.8 |
|
Asset Allocation (% of fund's net assets) |
||
To match the Standard & Poor's 500 Index, Spartan 500 Index seeks 100% investment exposure to stocks at all times.
Semiannual Report
(Unaudited)
Showing Percentage of Net Assets
|
Common Stocks - 99.5% |
|||
|
Shares |
Value (Note 1) (000s) |
||
|
AEROSPACE & DEFENSE - 1.6% |
|||
|
Aerospace & Defense - 1.4% |
|||
|
BFGoodrich Co. |
88,220 |
$ 3,612 |
|
|
Boeing Co. |
729,284 |
49,455 |
|
|
Honeywell International, Inc. |
671,677 |
36,145 |
|
|
ITT Industries, Inc. |
71,170 |
2,317 |
|
|
Lockheed Martin Corp. |
320,836 |
11,502 |
|
|
Northrop Grumman Corp. |
56,400 |
4,738 |
|
|
Rockwell International Corp. |
154,100 |
6,058 |
|
|
Textron, Inc. |
115,900 |
5,846 |
|
|
United Technologies Corp. |
378,080 |
26,395 |
|
|
|
146,068 |
||
|
Defense Electronics - 0.1% |
|||
|
Raytheon Co. Class B |
274,240 |
9,376 |
|
|
Ship Building & Repair - 0.1% |
|||
|
General Dynamics Corp. |
162,800 |
11,650 |
|
|
TOTAL AEROSPACE & DEFENSE |
167,094 |
||
|
BASIC INDUSTRIES - 2.8% |
|||
|
Chemicals & Plastics - 1.6% |
|||
|
Air Products & Chemicals, Inc. |
184,940 |
6,901 |
|
|
Armstrong Holdings, Inc. |
32,210 |
93 |
|
|
Ashland, Inc. |
56,230 |
1,842 |
|
|
Avery Dennison Corp. |
89,900 |
4,540 |
|
|
Dow Chemical Co. |
547,310 |
16,761 |
|
|
E.I. du Pont de Nemours and Co. |
841,634 |
38,189 |
|
|
Eastman Chemical Co. |
61,842 |
2,651 |
|
|
Engelhard Corp. |
102,737 |
2,145 |
|
|
FMC Corp. (a) |
24,500 |
1,862 |
|
|
Great Lakes Chemical Corp. |
43,900 |
1,465 |
|
|
Hercules, Inc. |
86,720 |
1,588 |
|
|
Newell Rubbermaid, Inc. |
212,722 |
4,082 |
|
|
Pharmacia Corp. |
1,043,956 |
57,418 |
|
|
PPG Industries, Inc. |
140,300 |
6,261 |
|
|
Praxair, Inc. |
127,400 |
4,746 |
|
|
Rohm & Haas Co. |
174,655 |
5,251 |
|
|
Sealed Air Corp. (a) |
67,498 |
3,248 |
|
|
Union Carbide Corp. |
108,800 |
4,678 |
|
|
W.R. Grace & Co. (a) |
55,000 |
210 |
|
|
|
163,931 |
||
|
Common Stocks - continued |
|||
|
Shares |
Value (Note 1) (000s) |
||
|
BASIC INDUSTRIES - continued |
|||
|
Iron & Steel - 0.1% |
|||
|
Allegheny Technologies, Inc. |
66,412 |
$ 1,345 |
|
|
Bethlehem Steel Corp. (a) |
101,300 |
291 |
|
|
Crane Co. |
53,475 |
1,400 |
|
|
Nucor Corp. |
67,900 |
2,355 |
|
|
USX - U.S. Steel Group |
70,560 |
1,125 |
|
|
Worthington Industries, Inc. |
68,825 |
658 |
|
|
|
7,174 |
||
|
Metals & Mining - 0.3% |
|||
|
Alcan Aluminium Ltd. |
269,390 |
8,502 |
|
|
Alcoa, Inc. |
698,508 |
20,038 |
|
|
Freeport-McMoRan Copper & Gold, Inc. Class B (a) |
115,700 |
918 |
|
|
Inco Ltd. (a) |
145,458 |
2,264 |
|
|
Phelps Dodge Corp. |
63,187 |
2,954 |
|
|
|
34,676 |
||
|
Packaging & Containers - 0.1% |
|||
|
Ball Corp. |
23,675 |
832 |
|
|
Bemis Co., Inc. |
34,700 |
898 |
|
|
Crown Cork & Seal Co., Inc. |
102,280 |
933 |
|
|
Owens-Illinois, Inc. (a) |
118,900 |
706 |
|
|
Tupperware Corp. |
46,100 |
789 |
|
|
|
4,158 |
||
|
Paper & Forest Products - 0.7% |
|||
|
Boise Cascade Corp. |
46,900 |
1,345 |
|
|
Fort James Corp. |
167,300 |
5,510 |
|
|
Georgia-Pacific Corp. |
139,700 |
3,754 |
|
|
International Paper Co. |
388,369 |
14,224 |
|
|
Kimberly-Clark Corp. |
431,230 |
28,461 |
|
|
Louisiana-Pacific Corp. |
87,460 |
743 |
|
|
Mead Corp. |
84,000 |
2,431 |
|
|
Pactiv Corp. (a) |
138,955 |
1,459 |
|
|
Potlatch Corp. |
23,840 |
799 |
|
|
Temple-Inland, Inc. |
44,200 |
1,978 |
|
|
Westvaco Corp. |
74,250 |
2,116 |
|
|
Weyerhaeuser Co. |
176,500 |
8,284 |
|
|
Willamette Industries, Inc. |
86,500 |
3,141 |
|
|
|
74,245 |
||
|
TOTAL BASIC INDUSTRIES |
284,184 |
||
|
Common Stocks - continued |
|||
|
Shares |
Value (Note 1) (000s) |
||
|
CONSTRUCTION & REAL ESTATE - 0.2% |
|||
|
Building Materials - 0.2% |
|||
|
Fortune Brands, Inc. |
126,360 |
$ 3,720 |
|
|
Masco Corp. |
369,600 |
6,907 |
|
|
Sherwin-Williams Co. |
131,280 |
2,847 |
|
|
Vulcan Materials Co. |
81,300 |
3,415 |
|
|
|
16,889 |
||
|
Construction - 0.0% |
|||
|
Centex Corp. |
47,820 |
1,769 |
|
|
Kaufman & Broad Home Corp. |
39,200 |
1,166 |
|
|
Pulte Corp. |
32,900 |
1,096 |
|
|
|
4,031 |
||
|
Engineering - 0.0% |
|||
|
Fluor Corp. |
61,430 |
2,150 |
|
|
TOTAL CONSTRUCTION & REAL ESTATE |
23,070 |
||
|
DURABLES - 1.7% |
|||
|
Autos, Tires, & Accessories - 1.1% |
|||
|
AutoZone, Inc. (a) |
112,100 |
3,006 |
|
|
Cooper Tire & Rubber Co. |
60,700 |
664 |
|
|
Cummins Engine Co., Inc. |
38,600 |
1,312 |
|
|
Dana Corp. |
122,475 |
2,717 |
|
|
Danaher Corp. |
114,900 |
7,253 |
|
|
Delphi Automotive Systems Corp. |
450,677 |
7,070 |
|
|
Eaton Corp. |
60,080 |
4,089 |
|
|
Ford Motor Co. |
1,517,367 |
39,641 |
|
|
General Motors Corp. |
428,256 |
26,605 |
|
|
Genuine Parts Co. |
142,737 |
3,042 |
|
|
Goodyear Tire & Rubber Co. |
125,900 |
2,329 |
|
|
Johnson Controls, Inc. |
68,000 |
4,055 |
|
|
Navistar International Corp. (a) |
50,060 |
1,655 |
|
|
PACCAR, Inc. |
61,576 |
2,590 |
|
|
TRW, Inc. |
97,720 |
4,104 |
|
|
Visteon Corp. |
105,314 |
1,863 |
|
|
|
111,995 |
||
|
Consumer Durables - 0.3% |
|||
|
Minnesota Mining & Manufacturing Co. |
333,420 |
32,217 |
|
|
Snap-On, Inc. |
47,850 |
1,223 |
|
|
|
33,440 |
||
|
Common Stocks - continued |
|||
|
Shares |
Value (Note 1) (000s) |
||
|
DURABLES - continued |
|||
|
Consumer Electronics - 0.1% |
|||
|
Black & Decker Corp. |
67,900 |
$ 2,555 |
|
|
Maytag Corp. |
62,500 |
1,789 |
|
|
Whirlpool Corp. |
58,300 |
2,536 |
|
|
|
6,880 |
||
|
Home Furnishings - 0.0% |
|||
|
Leggett & Platt, Inc. |
158,100 |
2,589 |
|
|
Textiles & Apparel - 0.2% |
|||
|
Liz Claiborne, Inc. |
45,600 |
1,938 |
|
|
NIKE, Inc. Class B |
220,120 |
8,791 |
|
|
Reebok International Ltd. (a) |
45,500 |
981 |
|
|
Russell Corp. |
29,200 |
467 |
|
|
Springs Industries, Inc. Class A |
9,100 |
214 |
|
|
VF Corp. |
94,568 |
2,583 |
|
|
|
14,974 |
||
|
TOTAL DURABLES |
169,878 |
||
|
ENERGY - 5.9% |
|||
|
Energy Services - 0.7% |
|||
|
Baker Hughes, Inc. |
266,918 |
9,175 |
|
|
Halliburton Co. |
361,100 |
13,383 |
|
|
McDermott International, Inc. |
46,500 |
450 |
|
|
Nabors Industries, Inc. (a) |
111,314 |
5,666 |
|
|
Rowan Companies, Inc. (a) |
69,600 |
1,753 |
|
|
Schlumberger Ltd. (NY Shares) |
470,460 |
35,814 |
|
|
Transocean Sedco Forex, Inc. |
169,728 |
8,996 |
|
|
|
75,237 |
||
|
Oil & Gas - 5.2% |
|||
|
Amerada Hess Corp. |
74,340 |
4,609 |
|
|
Anadarko Petroleum Corp. |
208,813 |
13,374 |
|
|
Apache Corp. |
94,800 |
5,244 |
|
|
Burlington Resources, Inc. |
174,456 |
6,280 |
|
|
Chevron Corp. |
524,380 |
43,065 |
|
|
Conoco, Inc. Class B |
504,456 |
13,715 |
|
|
Devon Energy Corp. |
98,700 |
4,974 |
|
|
Exxon Mobil Corp. |
2,811,361 |
250,738 |
|
|
Kerr-McGee Corp. |
72,780 |
4,753 |
|
|
Occidental Petroleum Corp. |
287,400 |
5,712 |
|
|
Phillips Petroleum Co. |
205,000 |
12,659 |
|
|
Common Stocks - continued |
|||
|
Shares |
Value (Note 1) (000s) |
||
|
ENERGY - continued |
|||
|
Oil & Gas - continued |
|||
|
Royal Dutch Petroleum Co. (NY Shares) |
1,727,680 |
$ 102,581 |
|
|
Sunoco, Inc. |
71,880 |
2,152 |
|
|
Texaco, Inc. |
445,780 |
26,329 |
|
|
The Coastal Corp. |
173,800 |
13,111 |
|
|
Tosco Corp. |
119,500 |
3,421 |
|
|
Unocal Corp. |
197,920 |
6,754 |
|
|
USX - Marathon Group |
253,600 |
6,895 |
|
|
|
526,366 |
||
|
TOTAL ENERGY |
601,603 |
||
|
FINANCE - 15.6% |
|||
|
Banks - 5.1% |
|||
|
AmSouth Bancorp. |
311,300 |
4,339 |
|
|
Bank of America Corp. |
1,322,420 |
63,559 |
|
|
Bank of New York Co., Inc. |
592,800 |
34,123 |
|
|
Bank One Corp. |
927,904 |
33,868 |
|
|
BB&T Corp. |
317,000 |
10,104 |
|
|
Capital One Financial Corp. |
157,000 |
9,911 |
|
|
Chase Manhattan Corp. |
1,052,444 |
47,886 |
|
|
Comerica, Inc. |
126,850 |
7,651 |
|
|
Fifth Third Bancorp |
373,250 |
19,176 |
|
|
First Union Corp. |
789,088 |
23,919 |
|
|
Firstar Corp. |
821,493 |
16,173 |
|
|
FleetBoston Financial Corp. |
723,609 |
27,497 |
|
|
Huntington Bancshares, Inc. |
201,230 |
2,893 |
|
|
J.P. Morgan & Co., Inc. |
130,319 |
21,568 |
|
|
KeyCorp |
352,710 |
8,708 |
|
|
Mellon Financial Corp. |
394,652 |
19,042 |
|
|
National City Corp. |
489,450 |
10,462 |
|
|
Northern Trust Corp. |
178,800 |
15,265 |
|
|
PNC Financial Services Group, Inc. |
233,760 |
15,633 |
|
|
Regions Financial Corp. |
176,200 |
4,152 |
|
|
SouthTrust Corp. |
137,200 |
4,442 |
|
|
State Street Corp. |
129,400 |
16,141 |
|
|
Summit Bancorp |
141,600 |
5,310 |
|
|
SunTrust Banks, Inc. |
243,500 |
11,886 |
|
|
Synovus Finanical Corp. |
220,900 |
4,763 |
|
|
U.S. Bancorp |
597,511 |
14,452 |
|
|
Union Planters Corp. |
109,000 |
3,686 |
|
|
Common Stocks - continued |
|||
|
Shares |
Value (Note 1) (000s) |
||
|
FINANCE - continued |
|||
|
Banks - continued |
|||
|
Wachovia Corp. |
163,400 |
$ 8,824 |
|
|
Wells Fargo & Co. |
1,325,240 |
61,375 |
|
|
|
526,808 |
||
|
Credit & Other Finance - 3.4% |
|||
|
American Express Co. |
1,067,016 |
64,021 |
|
|
Associates First Capital Corp. Class A |
603,931 |
22,421 |
|
|
CIT Group, Inc. Class A |
203,500 |
3,549 |
|
|
Citigroup, Inc. |
3,617,815 |
190,388 |
|
|
Countrywide Credit Industries, Inc. |
91,500 |
3,426 |
|
|
Household International, Inc. |
378,404 |
19,038 |
|
|
MBNA Corp. |
677,502 |
25,449 |
|
|
Old Kent Financial Corp. |
103,950 |
2,878 |
|
|
Providian Financial Corp. |
114,130 |
11,870 |
|
|
|
343,040 |
||
|
Federal Sponsored Credit - 1.0% |
|||
|
Fannie Mae |
807,180 |
62,153 |
|
|
Freddie Mac |
555,700 |
33,342 |
|
|
USA Education, Inc. |
125,900 |
7,035 |
|
|
|
102,530 |
||
|
Insurance - 3.8% |
|||
|
Aetna, Inc. |
114,230 |
6,604 |
|
|
AFLAC, Inc. |
214,300 |
15,657 |
|
|
Allstate Corp. |
596,766 |
24,020 |
|
|
American General Corp. |
204,172 |
16,436 |
|
|
American International Group, Inc. |
1,864,135 |
182,685 |
|
|
Aon Corp. |
205,475 |
8,514 |
|
|
CIGNA Corp. |
129,960 |
15,849 |
|
|
Cincinnati Financial Corp. |
130,100 |
4,781 |
|
|
Conseco, Inc. |
265,602 |
1,843 |
|
|
Hartford Financial Services Group, Inc. |
176,040 |
13,104 |
|
|
Jefferson-Pilot Corp. |
83,333 |
5,729 |
|
|
Lincoln National Corp. |
154,420 |
7,470 |
|
|
Loews Corp. |
79,700 |
7,248 |
|
|
Marsh & McLennan Companies, Inc. |
215,430 |
28,167 |
|
|
MBIA, Inc. |
79,700 |
5,793 |
|
|
MGIC Investment Corp. |
85,700 |
5,838 |
|
|
Progressive Corp. |
59,096 |
5,806 |
|
|
SAFECO Corp. |
104,820 |
2,535 |
|
|
The Chubb Corp. |
140,560 |
11,869 |
|
|
Common Stocks - continued |
|||
|
Shares |
Value (Note 1) (000s) |
||
|
FINANCE - continued |
|||
|
Insurance - continued |
|||
|
The St. Paul Companies, Inc. |
172,684 |
$ 8,850 |
|
|
Torchmark Corp. |
103,540 |
3,449 |
|
|
UnumProvident Corp. |
194,913 |
5,506 |
|
|
|
387,753 |
||
|
Savings & Loans - 0.3% |
|||
|
Charter One Financial, Inc. |
177,765 |
4,077 |
|
|
Golden West Financial Corp. |
126,900 |
7,114 |
|
|
Washington Mutual, Inc. |
438,117 |
19,277 |
|
|
|
30,468 |
||
|
Securities Industry - 2.0% |
|||
|
Bear Stearns Companies, Inc. |
91,908 |
5,572 |
|
|
Charles Schwab Corp. |
1,112,700 |
39,084 |
|
|
Franklin Resources, Inc. |
201,400 |
8,628 |
|
|
Lehman Brothers Holdings, Inc. |
195,000 |
12,578 |
|
|
Merrill Lynch & Co., Inc. |
647,600 |
45,332 |
|
|
Morgan Stanley Dean Witter & Co. |
909,792 |
73,068 |
|
|
PaineWebber Group, Inc. |
115,600 |
8,237 |
|
|
Stilwell Financial, Inc. |
179,700 |
8,053 |
|
|
T. Rowe Price Associates, Inc. |
97,000 |
4,541 |
|
|
|
205,093 |
||
|
TOTAL FINANCE |
1,595,692 |
||
|
HEALTH - 11.3% |
|||
|
Drugs & Pharmaceuticals - 7.8% |
|||
|
Allergan, Inc. |
104,700 |
8,801 |
|
|
ALZA Corp. (a) |
100,800 |
8,159 |
|
|
American Home Products Corp. |
1,048,840 |
66,601 |
|
|
Amgen, Inc. (a) |
825,800 |
47,845 |
|
|
Bausch & Lomb, Inc. |
42,340 |
1,633 |
|
|
Biogen, Inc. (a) |
129,100 |
7,770 |
|
|
Bristol-Myers Squibb Co. |
1,582,860 |
96,456 |
|
|
Eli Lilly & Co. |
909,216 |
81,261 |
|
|
King Pharmaceuticals, Inc. (a) |
138,383 |
6,201 |
|
|
Medimmune, Inc. (a) |
178,800 |
11,689 |
|
|
Merck & Co., Inc. |
1,859,980 |
167,282 |
|
|
Pfizer, Inc. |
5,092,165 |
219,918 |
|
|
Quintiles Transnational Corp. (a) |
93,100 |
1,298 |
|
|
Schering-Plough Corp. |
1,178,260 |
60,901 |
|
|
Common Stocks - continued |
|||
|
Shares |
Value (Note 1) (000s) |
||
|
HEALTH - continued |
|||
|
Drugs & Pharmaceuticals - continued |
|||
|
Sigma-Aldrich Corp. |
71,500 |
$ 2,556 |
|
|
Watson Pharmaceuticals, Inc. (a) |
78,800 |
4,930 |
|
|
|
793,301 |
||
|
Medical Equipment & Supplies - 3.0% |
|||
|
Abbott Laboratories |
1,247,940 |
65,907 |
|
|
Baxter International, Inc. |
233,600 |
19,199 |
|
|
Becton, Dickinson & Co. |
201,400 |
6,747 |
|
|
Biomet, Inc. |
138,050 |
4,996 |
|
|
Boston Scientific Corp. (a) |
325,300 |
5,184 |
|
|
C.R. Bard, Inc. |
40,300 |
1,688 |
|
|
Cardinal Health, Inc. |
221,850 |
21,020 |
|
|
Guidant Corp. (a) |
244,600 |
12,949 |
|
|
Johnson & Johnson |
1,120,540 |
103,230 |
|
|
McKesson HBOC, Inc. |
228,669 |
6,417 |
|
|
Medtronic, Inc. |
981,600 |
53,313 |
|
|
Millipore Corp. |
35,400 |
1,859 |
|
|
St. Jude Medical, Inc. (a) |
64,416 |
3,543 |
|
|
|
306,052 |
||
|
Medical Facilities Management - 0.5% |
|||
|
HCA - The Healthcare Co. |
449,980 |
17,971 |
|
|
HEALTHSOUTH Corp. (a) |
312,900 |
3,755 |
|
|
Humana, Inc. (a) |
135,800 |
1,647 |
|
|
Manor Care, Inc. (a) |
83,500 |
1,393 |
|
|
Tenet Healthcare Corp. |
253,600 |
9,970 |
|
|
UnitedHealth Group, Inc. |
130,400 |
14,263 |
|
|
Wellpoint Health Networks, Inc. (a) |
50,500 |
5,905 |
|
|
|
54,904 |
||
|
TOTAL HEALTH |
1,154,257 |
||
|
INDUSTRIAL MACHINERY & EQUIPMENT - 6.1% |
|||
|
Electrical Equipment - 4.7% |
|||
|
American Power Conversion Corp. (a) |
170,600 |
2,207 |
|
|
Avaya, Inc. (a) |
222,659 |
2,992 |
|
|
Emerson Electric Co. |
347,340 |
25,508 |
|
|
General Electric Co. |
7,987,899 |
437,828 |
|
|
Scientific-Atlanta, Inc. |
129,200 |
8,842 |
|
|
Common Stocks - continued |
|||
|
Shares |
Value (Note 1) (000s) |
||
|
INDUSTRIAL MACHINERY & EQUIPMENT - continued |
|||
|
Electrical Equipment - continued |
|||
|
Thomas & Betts Corp. |
58,420 |
$ 884 |
|
|
W.W. Grainger, Inc. |
75,000 |
2,395 |
|
|
|
480,656 |
||
|
Industrial Machinery & Equipment - 1.3% |
|||
|
Briggs & Stratton Corp. |
18,700 |
667 |
|
|
Caterpillar, Inc. |
279,220 |
9,790 |
|
|
Cooper Industries, Inc. |
80,079 |
3,063 |
|
|
Deere & Co. |
198,170 |
7,295 |
|
|
Dover Corp. |
166,740 |
7,076 |
|
|
Illinois Tool Works, Inc. |
243,720 |
13,542 |
|
|
Ingersoll-Rand Co. |
130,110 |
4,912 |
|
|
Pall Corp. |
100,366 |
2,164 |
|
|
Parker-Hannifin Corp. |
90,475 |
3,743 |
|
|
The Stanley Works |
71,200 |
1,896 |
|
|
Timken Co. |
49,075 |
690 |
|
|
Tyco International Ltd. |
1,360,630 |
77,131 |
|
|
|
131,969 |
||
|
Pollution Control - 0.1% |
|||
|
Allied Waste Industries, Inc. (a) |
161,300 |
1,492 |
|
|
Waste Management, Inc. |
502,913 |
10,058 |
|
|
|
11,550 |
||
|
TOTAL INDUSTRIAL MACHINERY & EQUIPMENT |
624,175 |
||
|
MEDIA & LEISURE - 4.0% |
|||
|
Broadcasting - 1.3% |
|||
|
Clear Channel Communications, Inc. (a) |
463,017 |
27,810 |
|
|
Comcast Corp. Class A (special) (a) |
754,100 |
30,730 |
|
|
Time Warner, Inc. |
1,060,798 |
80,525 |
|
|
|
139,065 |
||
|
Entertainment - 1.4% |
|||
|
Carnival Corp. |
500,300 |
12,414 |
|
|
Viacom, Inc. Class B (non-vtg.) (a) |
1,222,290 |
69,518 |
|
|
Walt Disney Co. |
1,668,490 |
59,753 |
|
|
|
141,685 |
||
|
Leisure Durables & Toys - 0.2% |
|||
|
Brunswick Corp. |
70,100 |
1,363 |
|
|
Harley-Davidson, Inc. |
244,100 |
11,763 |
|
|
Common Stocks - continued |
|||
|
Shares |
Value (Note 1) (000s) |
||
|
MEDIA & LEISURE - continued |
|||
|
Leisure Durables & Toys - continued |
|||
|
Hasbro, Inc. |
138,448 |
$ 1,488 |
|
|
Mattel, Inc. |
344,495 |
4,457 |
|
|
|
19,071 |
||
|
Lodging & Gaming - 0.1% |
|||
|
Harrah's Entertainment, Inc. (a) |
83,550 |
2,392 |
|
|
Hilton Hotels Corp. |
300,760 |
2,857 |
|
|
Marriott International, Inc. Class A |
202,000 |
8,181 |
|
|
|
13,430 |
||
|
Publishing - 0.5% |
|||
|
American Greetings Corp. Class A |
60,460 |
1,100 |
|
|
Dow Jones & Co., Inc. |
63,600 |
3,744 |
|
|
Gannett Co., Inc. |
214,000 |
12,412 |
|
|
Harcourt General, Inc. |
50,276 |
2,818 |
|
|
Knight-Ridder, Inc. |
64,760 |
3,254 |
|
|
McGraw-Hill Companies, Inc. |
158,100 |
10,148 |
|
|
Meredith Corp. |
41,600 |
1,321 |
|
|
The New York Times Co. Class A |
139,800 |
5,138 |
|
|
Tribune Co. |
248,303 |
9,203 |
|
|
|
49,138 |
||
|
Restaurants - 0.5% |
|||
|
Darden Restaurants, Inc. |
101,920 |
2,293 |
|
|
McDonald's Corp. |
1,068,100 |
33,111 |
|
|
Starbucks Corp. (a) |
147,800 |
6,605 |
|
|
Tricon Global Restaurants, Inc. (a) |
119,732 |
3,592 |
|
|
Wendy's International, Inc. |
93,800 |
2,040 |
|
|
|
47,641 |
||
|
TOTAL MEDIA & LEISURE |
410,030 |
||
|
NONDURABLES - 5.9% |
|||
|
Beverages - 1.8% |
|||
|
Adolph Coors Co. Class B |
29,300 |
1,866 |
|
|
Anheuser-Busch Companies, Inc. |
729,980 |
33,397 |
|
|
Brown-Forman Corp. Class B (non-vtg.) |
54,280 |
3,304 |
|
|
Coca-Cola Enterprises, Inc. |
337,000 |
6,192 |
|
|
Seagram Co. Ltd. |
354,620 |
20,258 |
|
|
The Coca-Cola Co. |
2,005,180 |
121,063 |
|
|
|
186,080 |
||
|
Common Stocks - continued |
|||
|
Shares |
Value (Note 1) (000s) |
||
|
NONDURABLES - continued |
|||
|
Foods - 1.7% |
|||
|
Archer-Daniels-Midland Co. |
507,450 |
$ 5,582 |
|
|
Campbell Soup Co. |
338,660 |
9,906 |
|
|
ConAgra Foods, Inc. |
428,500 |
9,159 |
|
|
General Mills, Inc. |
233,340 |
9,742 |
|
|
H.J. Heinz Co. |
281,700 |
11,814 |
|
|
Hershey Foods Corp. |
110,120 |
5,981 |
|
|
Kellogg Co. |
325,880 |
8,269 |
|
|
Nabisco Group Holdings Corp. |
262,100 |
7,568 |
|
|
PepsiCo, Inc. |
1,164,320 |
56,397 |
|
|
Quaker Oats Co. |
106,600 |
8,695 |
|
|
Ralston Purina Co. |
244,440 |
5,928 |
|
|
Sara Lee Corp. |
698,300 |
15,057 |
|
|
Sysco Corp. |
268,280 |
14,001 |
|
|
Wm. Wrigley Jr. Co. |
91,380 |
7,236 |
|
|
|
175,335 |
||
|
Household Products - 1.7% |
|||
|
Avon Products, Inc. |
189,440 |
9,188 |
|
|
Clorox Co. |
187,340 |
8,360 |
|
|
Colgate-Palmolive Co. |
477,840 |
28,078 |
|
|
Gillette Co. |
846,420 |
29,519 |
|
|
International Flavors & Fragrances, Inc. |
82,050 |
1,374 |
|
|
Procter & Gamble Co. |
1,054,420 |
75,325 |
|
|
Unilever NV (NY Shares) |
460,646 |
23,407 |
|
|
|
175,251 |
||
|
Tobacco - 0.7% |
|||
|
Philip Morris Companies, Inc. |
1,810,880 |
66,323 |
|
|
UST, Inc. |
131,400 |
3,318 |
|
|
|
69,641 |
||
|
TOTAL NONDURABLES |
606,307 |
||
|
PRECIOUS METALS - 0.1% |
|||
|
Barrick Gold Corp. |
320,200 |
4,259 |
|
|
Homestake Mining Co. |
192,500 |
794 |
|
|
Newmont Mining Corp. |
138,164 |
1,874 |
|
|
Placer Dome, Inc. |
270,000 |
2,243 |
|
|
TOTAL PRECIOUS METALS |
9,170 |
||
|
Common Stocks - continued |
|||
|
Shares |
Value (Note 1) (000s) |
||
|
RETAIL & WHOLESALE - 5.1% |
|||
|
Apparel Stores - 0.3% |
|||
|
Gap, Inc. |
682,715 |
$ 17,623 |
|
|
The Limited, Inc. |
348,962 |
8,811 |
|
|
TJX Companies, Inc. |
247,500 |
6,744 |
|
|
|
33,178 |
||
|
Drug Stores - 0.5% |
|||
|
CVS Corp. |
315,620 |
16,708 |
|
|
Longs Drug Stores Corp. |
31,840 |
697 |
|
|
Walgreen Co. |
810,660 |
36,986 |
|
|
|
54,391 |
||
|
General Merchandise Stores - 2.4% |
|||
|
Consolidated Stores Corp. (a) |
89,800 |
1,066 |
|
|
Costco Wholesale Corp. (a) |
360,090 |
13,188 |
|
|
Dillards, Inc. Class A |
82,660 |
868 |
|
|
Dollar General Corp. |
267,297 |
4,143 |
|
|
Federated Department Stores, Inc. (a) |
170,600 |
5,555 |
|
|
JCPenney Co., Inc. |
212,820 |
2,487 |
|
|
Kmart Corp. (a) |
397,200 |
2,358 |
|
|
Kohls Corp. (a) |
262,100 |
14,203 |
|
|
Nordstrom, Inc. |
110,700 |
1,820 |
|
|
Sears, Roebuck & Co. |
284,510 |
8,458 |
|
|
Target Corp. |
715,100 |
19,755 |
|
|
The May Department Stores Co. |
269,870 |
7,084 |
|
|
Wal-Mart Stores, Inc. |
3,594,620 |
163,106 |
|
|
|
244,091 |
||
|
Grocery Stores - 0.5% |
|||
|
Albertson's, Inc. |
342,606 |
8,115 |
|
|
Kroger Co. (a) |
673,000 |
15,185 |
|
|
Safeway, Inc. (a) |
399,300 |
21,837 |
|
|
SUPERVALU, Inc. |
104,300 |
1,604 |
|
|
Winn-Dixie Stores, Inc. |
111,240 |
2,141 |
|
|
|
48,882 |
||
|
Retail & Wholesale, Miscellaneous - 1.4% |
|||
|
Alberto-Culver Co. Class B |
41,100 |
1,379 |
|
|
Bed Bath & Beyond, Inc. (a) |
227,600 |
5,875 |
|
|
Best Buy Co., Inc. (a) |
165,500 |
8,306 |
|
|
Circuit City Stores, Inc. - Circuit City Group |
164,500 |
2,180 |
|
|
Home Depot, Inc. |
1,864,569 |
80,176 |
|
|
Lowe's Companies, Inc. |
304,120 |
13,894 |
|
|
Office Depot, Inc. (a) |
266,700 |
2,217 |
|
|
Common Stocks - continued |
|||
|
Shares |
Value (Note 1) (000s) |
||
|
RETAIL & WHOLESALE - continued |
|||
|
Retail & Wholesale, Miscellaneous - continued |
|||
|
RadioShack Corp. |
152,164 |
$ 9,073 |
|
|
Staples, Inc. (a) |
380,700 |
5,425 |
|
|
Tiffany & Co., Inc. |
112,000 |
4,781 |
|
|
Toys 'R' Us, Inc. (a) |
183,225 |
3,149 |
|
|
|
136,455 |
||
|
TOTAL RETAIL & WHOLESALE |
516,997 |
||
|
SERVICES - 0.5% |
|||
|
Advertising - 0.2% |
|||
|
Interpublic Group of Companies, Inc. |
247,900 |
10,644 |
|
|
Omnicom Group, Inc. |
143,100 |
13,201 |
|
|
|
23,845 |
||
|
Leasing & Rental - 0.0% |
|||
|
Ryder System, Inc. |
66,100 |
1,305 |
|
|
Printing - 0.1% |
|||
|
Deluxe Corp. |
65,200 |
1,471 |
|
|
R.R. Donnelley & Sons Co. |
104,820 |
2,254 |
|
|
|
3,725 |
||
|
Services - 0.2% |
|||
|
Cendant Corp. (a) |
573,849 |
6,886 |
|
|
Convergys Corp. (a) |
123,700 |
5,389 |
|
|
Ecolab, Inc. |
103,200 |
4,044 |
|
|
H&R Block, Inc. |
79,780 |
2,847 |
|
|
Moodys Corp. |
130,220 |
3,426 |
|
|
National Service Industries, Inc. |
32,500 |
664 |
|
|
|
23,256 |
||
|
TOTAL SERVICES |
52,131 |
||
|
TECHNOLOGY - 28.1% |
|||
|
Communications Equipment - 5.7% |
|||
|
ADC Telecommunications, Inc. (a) |
612,000 |
13,082 |
|
|
Andrew Corp. (a) |
68,612 |
1,805 |
|
|
Cabletron Systems, Inc. (a) |
147,400 |
3,998 |
|
|
Cisco Systems, Inc. (a) |
5,728,700 |
308,634 |
|
|
Comverse Technology, Inc. (a) |
127,800 |
14,282 |
|
|
Corning, Inc. |
709,220 |
54,255 |
|
|
Lucent Technologies, Inc. |
2,686,310 |
62,625 |
|
|
Common Stocks - continued |
|||
|
Shares |
Value (Note 1) (000s) |
||
|
TECHNOLOGY - continued |
|||
|
Communications Equipment - continued |
|||
|
Nortel Networks Corp. |
2,406,660 |
$ 109,503 |
|
|
Tellabs, Inc. (a) |
327,400 |
16,350 |
|
|
|
584,534 |
||
|
Computer Services & Software - 8.1% |
|||
|
Adobe Systems, Inc. |
194,400 |
14,787 |
|
|
America Online, Inc. (a) |
1,879,900 |
94,803 |
|
|
Autodesk, Inc. |
48,340 |
1,067 |
|
|
Automatic Data Processing, Inc. |
506,040 |
33,051 |
|
|
BMC Software, Inc. (a) |
197,700 |
4,016 |
|
|
Ceridian Corp. (a) |
116,200 |
2,905 |
|
|
Citrix Systems, Inc. (a) |
146,200 |
3,235 |
|
|
Computer Associates International, Inc. |
470,287 |
14,990 |
|
|
Computer Sciences Corp. (a) |
135,300 |
8,524 |
|
|
Compuware Corp. (a) |
291,800 |
2,298 |
|
|
Electronic Data Systems Corp. |
376,100 |
17,653 |
|
|
Equifax, Inc. |
114,200 |
3,940 |
|
|
First Data Corp. |
330,000 |
16,541 |
|
|
IMS Health, Inc. |
239,940 |
5,669 |
|
|
Mercury Interactive Corp. (a) |
62,700 |
6,960 |
|
|
Microsoft Corp. (a) |
4,245,600 |
292,416 |
|
|
NCR Corp. (a) |
78,700 |
3,394 |
|
|
Novell, Inc. (a) |
268,700 |
2,418 |
|
|
Oracle Corp. (a) |
4,538,600 |
149,774 |
|
|
Parametric Technology Corp. (a) |
219,600 |
2,704 |
|
|
Paychex, Inc. |
314,300 |
17,817 |
|
|
PeopleSoft, Inc. (a) |
230,200 |
10,046 |
|
|
Sabre Holdings Corp. Class A |
97,469 |
3,259 |
|
|
Sapient Corp. (a) |
96,200 |
3,421 |
|
|
Siebel Systems, Inc. (a) |
339,100 |
35,584 |
|
|
Unisys Corp. (a) |
252,700 |
3,222 |
|
|
VERITAS Software Corp. (a) |
326,600 |
46,056 |
|
|
Yahoo!, Inc. (a) |
457,800 |
26,839 |
|
|
|
827,389 |
||
|
Computers & Office Equipment - 7.1% |
|||
|
Adaptec, Inc. (a) |
83,300 |
1,317 |
|
|
Apple Computer, Inc. (a) |
261,000 |
5,106 |
|
|
Compaq Computer Corp. |
1,371,404 |
41,704 |
|
|
Dell Computer Corp. (a) |
2,087,500 |
61,581 |
|
|
EMC Corp. (a) |
1,760,000 |
156,750 |
|
|
Common Stocks - continued |
|||
|
Shares |
Value (Note 1) (000s) |
||
|
TECHNOLOGY - continued |
|||
|
Computers & Office Equipment - continued |
|||
|
Gateway, Inc. (a) |
259,500 |
$ 13,393 |
|
|
Hewlett-Packard Co. |
1,609,540 |
74,743 |
|
|
International Business Machines Corp. |
1,423,480 |
140,213 |
|
|
Lexmark International Group, Inc. Class A (a) |
104,100 |
4,268 |
|
|
Network Appliance, Inc. (a) |
251,900 |
29,976 |
|
|
Palm, Inc. |
459,650 |
24,620 |
|
|
Pitney Bowes, Inc. |
207,480 |
6,160 |
|
|
Seagate Technology, Inc. (a) |
184,400 |
12,885 |
|
|
Sun Microsystems, Inc. (a) |
1,280,500 |
141,975 |
|
|
Xerox Corp. |
535,200 |
4,516 |
|
|
|
719,207 |
||
|
Electronic Instruments - 1.0% |
|||
|
Agilent Technologies, Inc. |
366,383 |
16,968 |
|
|
Applied Materials, Inc. (a) |
651,300 |
34,600 |
|
|
KLA-Tencor Corp. (a) |
147,700 |
4,994 |
|
|
Novellus Systems, Inc. (a) |
118,800 |
4,863 |
|
|
PE Corp. - Biosystems Group |
168,000 |
19,656 |
|
|
PerkinElmer, Inc. |
38,120 |
4,555 |
|
|
Tektronix, Inc. |
38,300 |
2,729 |
|
|
Teradyne, Inc. (a) |
139,600 |
4,363 |
|
|
Thermo Electron Corp. (a) |
132,400 |
3,840 |
|
|
|
96,568 |
||
|
Electronics - 6.1% |
|||
|
Advanced Micro Devices, Inc. (a) |
242,800 |
5,493 |
|
|
Altera Corp. (a) |
319,400 |
13,075 |
|
|
Analog Devices, Inc. (a) |
283,900 |
18,454 |
|
|
Broadcom Corp. Class A (a) |
178,400 |
39,672 |
|
|
Conexant Systems, Inc. (a) |
176,400 |
4,642 |
|
|
Intel Corp. |
5,416,880 |
243,760 |
|
|
JDS Uniphase Corp. (a) |
753,131 |
61,333 |
|
|
Linear Technology Corp. |
249,700 |
16,121 |
|
|
LSI Logic Corp. (a) |
244,700 |
8,045 |
|
|
Maxim Integrated Products, Inc. (a) |
239,800 |
15,902 |
|
|
Micron Technology, Inc. (a) |
469,000 |
16,298 |
|
|
Molex, Inc. |
161,650 |
8,729 |
|
|
Motorola, Inc. |
1,751,580 |
43,680 |
|
|
National Semiconductor Corp. (a) |
143,000 |
3,718 |
|
|
Power-One, Inc. (a) |
61,100 |
4,334 |
|
|
Sanmina Corp. (a) |
126,600 |
14,472 |
|
|
Common Stocks - continued |
|||
|
Shares |
Value (Note 1) (000s) |
||
|
TECHNOLOGY - continued |
|||
|
Electronics - continued |
|||
|
Solectron Corp. (a) |
481,400 |
$ 21,182 |
|
|
Texas Instruments, Inc. |
1,391,747 |
68,283 |
|
|
Xilinx, Inc. (a) |
269,100 |
19,493 |
|
|
|
626,686 |
||
|
Photographic Equipment - 0.1% |
|||
|
Eastman Kodak Co. |
248,470 |
11,150 |
|
|
Polaroid Corp. |
35,840 |
361 |
|
|
|
11,511 |
||
|
TOTAL TECHNOLOGY |
2,865,895 |
||
|
TRANSPORTATION - 0.6% |
|||
|
Air Transportation - 0.2% |
|||
|
AMR Corp. |
119,940 |
3,928 |
|
|
Delta Air Lines, Inc. |
100,360 |
4,742 |
|
|
Southwest Airlines Co. |
402,687 |
11,477 |
|
|
US Airways Group, Inc. (a) |
56,800 |
2,144 |
|
|
|
22,291 |
||
|
Railroads - 0.3% |
|||
|
Burlington Northern Santa Fe Corp. |
324,629 |
8,623 |
|
|
CSX Corp. |
176,872 |
4,477 |
|
|
Norfolk Southern Corp. |
306,420 |
4,328 |
|
|
Union Pacific Corp. |
201,340 |
9,438 |
|
|
|
26,866 |
||
|
Trucking & Freight - 0.1% |
|||
|
FedEx Corp. (a) |
235,160 |
11,020 |
|
|
TOTAL TRANSPORTATION |
60,177 |
||
|
UTILITIES - 10.0% |
|||
|
Cellular - 1.1% |
|||
|
ALLTEL Corp. |
251,600 |
16,212 |
|
|
Nextel Communications, Inc. Class A (a) |
630,200 |
24,223 |
|
|
QUALCOMM, Inc. (a) |
598,600 |
38,974 |
|
|
Sprint Corp. - PCS Group Series 1 (a) |
742,990 |
28,326 |
|
|
|
107,735 |
||
|
Electric Utility - 2.1% |
|||
|
AES Corp. (a) |
364,000 |
20,566 |
|
|
Common Stocks - continued |
|||
|
Shares |
Value (Note 1) (000s) |
||
|
UTILITIES - continued |
|||
|
Electric Utility - continued |
|||
|
Ameren Corp. |
104,800 |
$ 4,166 |
|
|
American Electric Power Co., Inc. |
268,848 |
11,157 |
|
|
Cinergy Corp. |
120,417 |
3,688 |
|
|
CMS Energy Corp. |
105,593 |
2,851 |
|
|
Consolidated Edison, Inc. |
171,000 |
6,017 |
|
|
Constellation Energy Corp. |
115,050 |
4,796 |
|
|
CP&L Energy, Inc. |
116,300 |
4,688 |
|
|
Dominion Resources, Inc. |
198,369 |
11,815 |
|
|
DTE Energy Co. |
118,300 |
4,274 |
|
|
Duke Energy Corp. |
299,750 |
25,910 |
|
|
Edison International |
268,100 |
6,401 |
|
|
Entergy Corp. |
185,500 |
7,107 |
|
|
Exelon Corp. |
262,362 |
15,775 |
|
|
FirstEnergy Corp. |
173,700 |
4,494 |
|
|
Florida Progress Corp. |
84,000 |
4,468 |
|
|
FPL Group, Inc. |
149,800 |
9,887 |
|
|
GPU, Inc. |
111,500 |
3,686 |
|
|
Niagara Mohawk Holdings, Inc. (a) |
102,900 |
1,646 |
|
|
PG&E Corp. |
321,200 |
8,652 |
|
|
Pinnacle West Capital Corp. |
71,800 |
3,119 |
|
|
PPL Corp. |
108,620 |
4,474 |
|
|
Public Service Enterprise Group, Inc. |
184,300 |
7,648 |
|
|
Reliant Energy, Inc. |
225,225 |
9,305 |
|
|
Southern Co. |
523,400 |
15,375 |
|
|
TXU Corp. |
212,738 |
7,885 |
|
|
XCEL Energy, Inc. |
254,070 |
6,495 |
|
|
|
216,345 |
||
|
Gas - 1.0% |
|||
|
Columbia Energy Group |
64,480 |
4,639 |
|
|
Dynegy, Inc. Class A |
256,902 |
11,898 |
|
|
Eastern Enterprises Co. |
22,300 |
1,436 |
|
|
El Paso Energy Corp. |
187,860 |
11,776 |
|
|
Enron Corp. |
593,980 |
48,743 |
|
|
KeySpan Corp. |
109,000 |
3,835 |
|
|
NICOR, Inc. |
37,740 |
1,333 |
|
|
ONEOK, Inc. |
24,124 |
956 |
|
|
Peoples Energy Corp. |
29,100 |
1,000 |
|
|
Common Stocks - continued |
|||
|
Shares |
Value (Note 1) (000s) |
||
|
UTILITIES - continued |
|||
|
Gas - continued |
|||
|
Sempra Energy |
152,202 |
$ 3,149 |
|
|
Williams Companies, Inc. |
352,200 |
14,726 |
|
|
|
103,491 |
||
|
Telephone Services - 5.8% |
|||
|
AT&T Corp. |
3,026,317 |
70,173 |
|
|
BellSouth Corp. |
1,514,580 |
73,173 |
|
|
CenturyTel, Inc. |
114,900 |
4,424 |
|
|
Global Crossing Ltd. (a) |
705,879 |
16,676 |
|
|
Qwest Communications International, Inc. (a) |
1,338,031 |
65,062 |
|
|
SBC Communications, Inc. |
2,739,539 |
158,037 |
|
|
Sprint Corp. - FON Group |
708,880 |
18,076 |
|
|
Verizon Communications |
2,191,839 |
126,716 |
|
|
WorldCom, Inc. (a) |
2,313,778 |
54,952 |
|
|
|
587,289 |
||
|
TOTAL UTILITIES |
1,014,860 |
||
|
TOTAL COMMON STOCKS (Cost $6,714,242) |
10,155,520 |
||
|
U.S. Treasury Obligations - 0.9% |
|||||
|
|
Principal Amount (000s) |
|
|||
|
U.S. Treasury Bills, yield at date of purchase
5.98% to 6.2% 11/9/00 to 1/4/01 (c) |
|
|
$ 98,069 |
97,509 |
|
|
Cash Equivalents - 3.5% |
|||
|
Shares |
Value (Note 1) |
||
|
Bankers Trust Institutional Daily Assets Fund, 6.66% (b) |
360,248,143 |
$ 360,248 |
|
|
TOTAL INVESTMENT PORTFOLIO - 103.9% (Cost $7,171,987) |
10,613,277 |
||
|
NET OTHER ASSETS - (3.9)% |
(402,742) |
||
|
NET ASSETS - 100% |
$ 10,210,535 |
||
|
Futures Contracts |
|||||
|
|
Expiration Date |
Underlying Face Amount at Value (000s) |
Unrealized Gain/(Loss) (000s) |
||
|
Purchased |
|||||
|
145 S&P 500 Stock Index Contracts |
Dec. 2000 |
$ 52,207 |
$ 1,878 |
||
|
The face value of futures purchased as a percentage of net assets - 0.5% |
|
Legend |
|
(a) Non-income producing |
|
(b) The rate quoted is the annualized seven-day yield of the fund at period end. A complete listing of the fund's holdings as of its most recent fiscal year end is available upon request. |
|
(c) Security or a portion of the security was pledged to cover margin requirements for futures contracts. At the period end, the value of securities pledged amounted to $7,375,000. |
|
Income Tax Information |
|
At October 31, 2000, the aggregate |
See accompanying notes which are an integral part of the financial statements.
Semiannual Report
Statement of Assets and Liabilities
|
Amounts in thousands (except per-share amounts) |
October 31, 2000 (Unaudited) |
|
|
Assets |
|
|
|
Investment in securities, at value (cost $7,171,987) - |
|
$ 10,613,277 |
|
Cash |
|
331 |
|
Receivable for investments sold |
|
2,526 |
|
Receivable for fund shares sold |
|
22,266 |
|
Dividends receivable |
|
6,920 |
|
Redemption fees receivable |
|
3 |
|
Receivable for daily variation on futures contracts |
|
1,975 |
|
Total assets |
|
10,647,298 |
|
Liabilities |
|
|
|
Payable for investments purchased |
$ 74,755 |
|
|
Accrued management fee |
480 |
|
|
Other payables and accrued expenses |
1,280 |
|
|
Collateral on securities loaned, at value |
360,248 |
|
|
Total liabilities |
|
436,763 |
|
Net Assets |
|
$ 10,210,535 |
|
Net Assets consist of: |
|
|
|
Paid in capital |
|
$ 6,788,179 |
|
Undistributed net investment income |
|
50,281 |
|
Accumulated undistributed net realized gain (loss) on investments and foreign currency transactions |
|
(71,093) |
|
Net unrealized appreciation (depreciation) on investments |
|
3,443,168 |
|
Net Assets, for 103,417 shares outstanding |
|
$ 10,210,535 |
|
Net Asset Value, offering price and redemption price |
|
$98.73 |
See accompanying notes which are an integral part of the financial statements.
Semiannual Report
Financial Statements - continued
Statement of Operations
|
Amounts in thousands |
Six months ended October 31, 2000 (Unaudited) |
|
|
Investment Income Dividends |
|
$ 56,733 |
|
Interest |
|
3,344 |
|
Security lending |
|
378 |
|
Total income |
|
60,455 |
|
Expenses |
|
|
|
Management fee |
$ 12,517 |
|
|
Transfer agent fees |
6,269 |
|
|
Accounting fees |
440 |
|
|
Non-interested trustees' compensation |
17 |
|
|
Registration fees |
92 |
|
|
Audit |
32 |
|
|
Legal |
22 |
|
|
Miscellaneous |
2 |
|
|
Total expenses before reductions |
19,391 |
|
|
Expense reductions |
(9,530) |
9,861 |
|
Net investment income |
|
50,594 |
|
Realized and Unrealized Gain (Loss) Net realized gain (loss) on: |
|
|
|
Investment securities |
(8,977) |
|
|
Futures contracts |
1,025 |
(7,952) |
|
Change in net unrealized appreciation (depreciation) on: |
|
|
|
Investment securities |
(139,899) |
|
|
Futures contracts |
(5,116) |
(145,015) |
|
Net gain (loss) |
|
(152,967) |
|
Net increase (decrease) in net assets resulting |
|
$ (102,373) |
See accompanying notes which are an integral part of the financial statements.
Semiannual Report
Financial Statements - continued
Statement of Changes in Net Assets
|
Amounts in thousands |
Six months ended
October 31, 2000 |
Year ended |
|
Increase (Decrease) in Net Assets |
|
|
|
Operations |
$ 50,594 |
$ 106,574 |
|
Net realized gain (loss) |
(7,952) |
(320) |
|
Change in net unrealized appreciation (depreciation) |
(145,015) |
803,487 |
|
Net increase (decrease) in net assets resulting |
(102,373) |
909,741 |
|
Distributions to shareholders |
(30,390) |
(117,819) |
|
From net realized gain |
- |
(8,624) |
|
In excess of net realized gain |
- |
(60,385) |
|
Total distributions |
(30,390) |
(186,828) |
|
Share transactions |
926,619 |
3,360,364 |
|
Reinvestment of distributions |
28,444 |
175,991 |
|
Cost of shares redeemed |
(681,298) |
(2,859,543) |
|
Net increase (decrease) in net assets resulting |
273,765 |
676,812 |
|
Redemption fees |
267 |
1,132 |
|
Total increase (decrease) in net assets |
141,269 |
1,400,857 |
|
Net Assets |
|
|
|
Beginning of period |
10,069,266 |
8,668,409 |
|
End of period (including undistributed net investment income of $50,281 and $35,283, respectively) |
$ 10,210,535 |
$ 10,069,266 |
|
Other Information Shares |
|
|
|
Sold |
9,318 |
35,297 |
|
Issued in reinvestment of distributions |
280 |
1,844 |
|
Redeemed |
(6,816) |
(29,870) |
|
Net increase (decrease) |
2,782 |
7,271 |
See accompanying notes which are an integral part of the financial statements.
Semiannual Report
Financial Highlights
|
|
Six months ended October 31, 2000 |
Years ended April 30, |
||||
|
|
(Unaudited) |
2000 |
1999 |
1998 |
1997 |
1996 |
|
Selected Per-Share Data |
|
|
|
|
|
|
|
Net asset value,
beginning |
$ 100.06 |
$ 92.85 |
$ 78.74 |
$ 57.82 |
$ 48.22 |
$ 38.32 |
|
Income from Invest- |
|
|
|
|
|
|
|
Net investment |
.50 D |
1.07 D |
1.05 D |
1.11 D |
.95 D |
.92 |
|
Net realized and unrealized gain (loss) |
(1.53) |
8.02 |
15.52 |
21.92 |
10.58 |
10.32 |
|
Total from investment operations |
(1.03) |
9.09 |
16.57 |
23.03 |
11.53 |
11.24 |
|
Less Distributions |
|
|
|
|
|
|
|
From net investment income |
(.30) |
(1.19) |
(.79) |
(.75) |
(.90) |
(.99) |
|
From net |
- |
(.09) |
(1.68) |
(1.38) |
(1.05) |
(.37) |
|
In excess of net realized gain |
- |
(.61) |
- |
- |
- |
- |
|
Total distributions |
(.30) |
(1.89) |
(2.47) |
(2.13) |
(1.95) |
(1.36) |
|
Redemption fees
added to paid |
.00 |
.01 |
.01 |
.02 |
.02 |
.02 |
|
Net asset value, |
$ 98.73 |
$ 100.06 |
$ 92.85 |
$ 78.74 |
$ 57.82 |
$ 48.22 |
|
Total Return B, C |
(1.04)% |
9.91% |
21.68% |
40.74% |
24.58% |
29.83% |
|
Ratios and Supplemental Data |
|
|
|
|
|
|
|
Net assets, end of period (in millions) |
$ 10,211 |
$ 10,069 |
$ 8,668 |
$ 5,437 |
$ 2,300 |
$ 1,011 |
|
Ratio of expenses to average net assets |
.19% A, E |
.19% E |
.19% E |
.19% E |
.44% E |
.45% |
|
Ratio of net invest- |
.97% A |
1.12% |
1.30% |
1.61% |
1.82% |
2.11% |
|
Portfolio |
5% A |
8% |
4% |
6% |
6% |
5% |
A Annualized
B Total returns for periods of less than one year are not annualized.
C The total returns would have been lower had certain expenses not been reduced during the periods shown.
D Net investment income per share has been calculated based on average shares outstanding during the period.
E FMR agreed to reimburse a portion of the fund's expenses during the period. Without this reimbursement, the fund's expense ratio would have been higher.
See accompanying notes which are an integral part of the financial statements.
Semiannual Report
For the period ended October 31, 2000 (Unaudited)
1. Significant Accounting Policies.
Spartan 500 Index Fund (the fund) is a fund of Fidelity Commonwealth Trust (the trust) and is authorized to issue an unlimited number of shares. The trust is registered under the Investment Company Act of 1940, as amended, as an open-end management investment company organized as a Massachusetts business trust. The financial statements have been prepared in conformity with generally accepted accounting principles which require management to make certain estimates and assumptions at the date of the financial statements. The following summarizes the significant accounting policies of the fund:
Security Valuation. Securities for which exchange quotations are readily available are valued at the last sale price, or if no sale price, at the closing bid price. Foreign securities are valued based on quotations from the principal market in which such securities are normally traded. If trading or events occurring in other markets after the close of the principal market in which foreign securities are traded, and before the close of business of the fund, are expected to materially affect the value of those securities, then they are valued at their fair value taking this trading or these events into account. Fair value is determined in good faith under consistently applied procedures under the general supervision of the Board of Trustees. Securities for which exchange quotations are not readily available (and in certain cases debt securities which trade on an exchange) are valued primarily using dealer-supplied valuations or at their fair value. Short-term securities with remaining maturities of sixty days or less for which quotations are not readily available are valued at amortized cost or original cost plus accrued interest, both of which approximate current value. Investments in open-end investment companies are valued at their net asset value each business day.
Foreign Currency Translation. The accounting records of the fund are maintained in U.S. dollars. Investment securities and other assets and liabilities denominated in a foreign currency are translated into U.S. dollars at the prevailing rates of exchange at period end. Purchases and sales of securities, income receipts and expense payments are translated into U.S. dollars at the prevailing exchange rate on the respective dates of the transactions.
Net realized gains and losses on foreign currency transactions represent net gains and losses from sales and maturities of foreign currency contracts, disposition of foreign currencies, the difference between the amount of net investment income accrued and the U.S. dollar amount actually received, and gains and losses between trade and settlement date on purchases and sales of securities. The effects of changes in foreign currency exchange rates on investments in securities are included with the net realized and unrealized gain or loss on investment securities.
Income Taxes. As a qualified regulated investment company under Subchapter M of the Internal Revenue Code, the fund is not subject to income taxes to the extent
Semiannual Report
Notes to Financial Statements (Unaudited) - continued
1. Significant Accounting Policies - continued
Income Taxes - continued
that it distributes substantially all of its taxable income for its fiscal year. The schedule of investments includes information regarding income taxes under the caption "Income Tax Information."
Investment Income. Dividend income is recorded on the ex-dividend date, except certain dividends from foreign securities where the ex-dividend date may have passed, are recorded as soon as the fund is informed of the ex-dividend date. Non-cash dividends included in dividend income, if any, are recorded at the fair market value of the securities received. Interest income is accrued as earned. Investment income is recorded net of foreign taxes withheld where recovery of such taxes is uncertain.
Expenses. Most expenses of the trust can be directly attributed to a fund. Expenses which cannot be directly attributed are apportioned among the funds in the trust.
Distributions to Shareholders. Distributions are recorded on the ex-dividend date.
Income and capital gain distributions are determined in accordance with income tax regulations which may differ from generally accepted accounting principles. These differences, which may result in distribution reclassifications, are primarily due to differing treatments for futures transactions, market discount and losses deferred due to wash sales and excise tax regulations. The fund also utilized earnings and profits distributed to shareholders on redemption of shares as a part of the dividends paid deduction for income tax purposes.
Permanent book and tax basis differences relating to shareholder distributions will result in reclassifications to paid in capital. Undistributed net investment income and accumulated undistributed net realized gain (loss) on investments and foreign currency transactions may include temporary book and tax basis differences which will reverse in a subsequent period. Any taxable income or gain remaining at fiscal year end is distributed in the following year.
Short-Term Trading (Redemption) Fees. Shares held in the fund less than 90 days are subject to a short-term trading fee equal to .50% of the proceeds of the redeemed shares. The fee, which is retained by the fund, is accounted for as an addition to paid in capital.
Security Transactions. Security transactions are accounted for as of trade date. Gains and losses on securities sold are determined on the basis of identified cost.
2. Operating Policies.
Foreign Currency Contracts. The fund generally uses foreign currency contracts to facilitate transactions in foreign-denominated securities. Losses may arise from changes in the value of the foreign currency or if the counterparties do not perform under the contracts' terms. The U.S. dollar value of foreign currency contracts is determined using contractual currency exchange rates established at the time of each trade.
Semiannual Report
Notes to Financial Statements (Unaudited) - continued
2. Operating Policies - continued
Futures Contracts. The fund may use futures contracts to manage its exposure to the stock market and to fluctuations in currency values. Buying futures tends to increase the fund's exposure to the underlying instrument, while selling futures tends to decrease the fund's exposure to the underlying instrument or hedge other fund investments. Futures contracts involve, to varying degrees, risk of loss in excess of the futures variation margin reflected in the Statement of Assets and Liabilities. The underlying face amount at value of any open futures contracts at period end is shown in the schedule of investments under the caption "Futures Contracts." This amount reflects each contract's exposure to the underlying instrument at period end. Losses may arise from changes in the value of the underlying instruments or if the counterparties do not perform under the contracts' terms. Gains (losses) are realized upon the expiration or closing of the futures contracts. Futures contracts are valued at the settlement price established each day by the board of trade or exchange on which they are traded.
3. Purchases and Sales of Investments.
Purchases and sales of securities, other than short-term securities, aggregated $676,960,000 and $254,851,000, respectively.
The market value of futures contracts opened and closed during the period amounted to $677,772,000 and $811,274,000, respectively.
4. Fees and Other Transactions with Affiliates.
Management Fee. The fund's investment adviser, Fidelity Management & Research Company (FMR) receives a fee that is computed daily at an annual rate of .24% of the fund's average net assets.
Sub-Adviser and Security Lending Fees. Beginning January 1, 2001, FMR Co.(FMRC) will serve as a sub-adviser for the fund. FMRC may provide investment research and advice and may also provide investment advisory services to the fund.
FMR and the fund have entered into a sub-advisory agreement with Bankers Trust Company (Bankers Trust). Bankers Trust receives a sub-advisory fee for providing investment management and custodial services to the fund. For these services, FMR pays Bankers Trust fees at an annual rate of 0.006% of the fund's average net assets.
Under a separate securities lending agreement with Bankers Trust, the fund receives at least 70% of net income from the securities lending program. Bankers Trust retains no more than 30% of net income under this agreement. For the period, Bankers Trust retained $162,000.
In March 1999, Bankers Trust announced that it had reached an agreement with the U.S. Attorney's office to resolve an investigation concerning inappropriate transfers of unclaimed funds and related recordkeeping problems that occurred between 1994 and 1996. As a result of the plea, absent an order from the Securities and Exchange Commission, Bankers Trust would not have been able to provide investment advisory services to the fund. The SEC previously
Semiannual Report
Notes to Financial Statements (Unaudited) - continued
4. Fees and Other Transactions with Affiliates - continued
Sub-Adviser and Security Lending Fees - continued
granted a temporary order to permit Bankers Trust and its affiliates to provide investment advisory services to registered investment companies. On July 10, 2000, the SEC granted Bankers Trust a permanent order.
Transfer Agent Fees. Fidelity Service Company, Inc. (FSC), an affiliate of FMR, is the fund's transfer, dividend disbursing and shareholder servicing agent. FSC receives account fees and asset-based fees that vary according to account size and type of account. FSC pays for typesetting, printing and mailing of all shareholder reports, except proxy statements. For the period, the transfer agent fees were equivalent to an annualized rate of .12% of average net assets.
Accounting Fees. FSC maintains the fund's accounting records. The fee is based on the level of average net assets for the month plus out-of-pocket expenses.
Brokerage Commissions. The fund placed a portion of its portfolio transactions with brokerage firms which are affiliates of Bankers Trust. The commissions paid to these affiliated firms were $24,000 for the period.
5. Security Lending.
The fund lends portfolio securities from time to time in order to earn additional income. The fund receives collateral in the form of U.S. Treasury obligations, letters of
credit, and/or cash against the loaned securities, and maintains collateral in an amount not less than 100% of the market value of the loaned securities during the period of the loan. The market value of the loaned securities is determined at the close of business of the fund and any additional required collateral is delivered to the fund on the next business day. If the borrower defaults on its obligation to return the securities loaned because of insolvency or other reasons, the fund could experience delays and costs in recovering the securities loaned or in gaining access to the collateral. At period end, the value of the securities loaned amounted to $351,628,000. The fund received cash collateral of $360,248,000 which was invested in cash equivalents.
6. Expense Reductions.
FMR voluntarily agreed to reimburse the fund's operating expenses (excluding interest, taxes, brokerage commissions, extraordinary expenses and sub-advisory fees paid by the fund associated with securities lending) above an annual rate of .19% of average net assets. For the period, the reimbursement reduced expenses by $9,482,000.
In addition, through arrangements with the fund's custodian and transfer agent, credits realized as a result of uninvested cash balances were used to reduce a portion of the fund's expenses. During the period, the fund's custodian and transfer agent fees were reduced by $20,000 and $28,000, respectively, under these arrangements.
Semiannual Report
The Board of Trustees of Spartan 500 Index Fund voted to pay on December 11, 2000, to shareholders of record at the opening of business on December 8, 2000, a dividend of $.67 per share from net investment income.
Semiannual Report
Fidelity offers several ways to conveniently manage your personal investments via your telephone or PC. You can access your account information, conduct trades and research your investments 24 hours a day.
By Phone
Fidelity Automated Service Telephone provides a single toll-free number to access account balances, positions, quotes and trading. It's easy to navigate the service, and on your first call, the system will help you create a personal identification number (PIN) for security.
(phone_graphic)Fidelity Automated
Service Telephone (FAST®)
1-800-544-5555
Press
1 For mutual fund and brokerage trading.
2 For quotes.*
3 For account balances and holdings.
4 To review orders and mutual
fund activity.
5 To change your PIN.
*0 To speak to a Fidelity representative.
By PC
Fidelity's web site on the Internet provides a wide range of information, including daily financial news, fund performance, interactive planning tools and news about Fidelity products and services.
(computer_graphic)Fidelity's Web Site
www.fidelity.com
If you are not currently on the Internet, call EarthLink Sprint at 1-800-288-2967, and be sure to ask for registration number SMD004 to receive a special Fidelity package that includes 30 days of free Internet access. EarthLink is North America's #1 independent Internet access provider.
(computer_graphic)
Fidelity On-line Xpress+®
Fidelity On-line Xpress+ software for Windows combines comprehensive portfolio management capabilities, securities trading and access to research and analysis tools . . . all on your desktop. Call Fidelity at 1-800-544-0240 or visit our web site for more information on how to manage your investments via your PC.
* When you call the quotes line, please remember that a fund's yield and return will vary and, except for money market funds, share price will also vary. This means that you may have a gain or loss when you sell your shares. There is no assurance that money market funds will be able to maintain a stable $1 share price; an investment in a money market fund is not insured or guaranteed by the U.S. government. Total returns are historical and include changes in share price, reinvestment of dividends and capital gains, and the effects of any sales charges.
Semiannual Report
If more than one address is listed, please locate the address that is closest to you. We'll give your correspondence immediate attention and send you written confirmation upon completion of your request.
(letter_graphic)Making Changes
To Your Account
(such as changing name, address, bank, etc.)
Fidelity Investments
P.O. Box 770001
Cincinnati, OH 45277-0002
(letter_graphic)For Non-Retirement
Accounts
Buying shares
Fidelity Investments
P.O. Box 770001
Cincinnati, OH 45277-0003
Overnight Express
Fidelity Investments
2300 Litton Lane - KH1A
Hebron, KY 41048
Selling shares
Fidelity Investments
P.O. Box 660602
Dallas, TX 75266-0602
Overnight Express
Fidelity Investments
Attn: Redemptions - CP6I
400 East Las Colinas Blvd.
Irving, TX 75039-5587
General Correspondence
Fidelity Investments
P.O. Box 500
Merrimack, NH 03054-0500
(letter_graphic)For Retirement
Accounts
Buying shares
Fidelity Investments
P.O. Box 770001
Cincinnati, OH 45277-0003
Selling shares
Fidelity Investments
P.O. Box 660602
Dallas, TX 75266-0602
Overnight Express
Fidelity Investments
Attn: Redemptions - CP6R
400 East Las Colinas Blvd.
Irving, TX 75039-5587
General Correspondence
Fidelity Investments
P.O. Box 500
Merrimack, NH 03054-0500
Semiannual Report
Investment Adviser
Fidelity Management & Research Company
Boston, MA
Investment Sub-Adviser
Bankers Trust Company
Officers
Edward C. Johnson 3d, President
Robert C. Pozen, Senior Vice President
Robert A. Lawrence, Vice President
Eric D. Roiter, Secretary
Robert A. Dwight, Treasurer
Maria F. Dwyer, Deputy Treasurer
John H. Costello, Assistant Treasurer
Thomas J. Simpson, Assistant Treasurer
Board of Trustees
Ralph F. Cox *
Phyllis Burke Davis *
Robert M. Gates *
Edward C. Johnson 3d
Donald J. Kirk *
Ned C. Lautenbach *
Peter S. Lynch
Marvin L. Mann *
William O. McCoy *
Gerald C. McDonough *
Robert C. Pozen
Thomas R. Williams *
Advisory Board
J. Michael Cook
Marie L. Knowles
General Distributor
Fidelity Distributors Corporation
Boston, MA
Transfer and Shareholder
Servicing Agent
Fidelity Service Company, Inc.
Boston, MA
* Independent trustees
Custodian
Bankers Trust Company
New York, New York
Fidelity's Index Funds
Four-In-One Index Fund
Spartan® Extended Market Index Fund
Spartan International Index Fund
Spartan 500 Index Fund
Spartan Total Market Index Fund
The Fidelity Telephone Connection
Mutual Fund 24-Hour Service
Exchanges/Redemptions
and Account Assistance 1-800-544-6666
Product Information 1-800-544-6666
Retirement Accounts 1-800-544-4774
(8 a.m. - 9 p.m.)
TDD Service 1-800-544-0118
for the deaf and hearing impaired
(9 a.m. - 9 p.m. Eastern time)
Fidelity Automated Service
Telephone (FAST®) (automated graphic) 1-800-544-5555
(automated graphic) Automated line for quickest service
(Fidelity Investment logo)(registered trademark)
Corporate Headquarters
82 Devonshire St., Boston, MA 02109
www.fidelity.com
SMI-SANN-1200 118831
1.538467.103
Fidelity®
Fund
Semiannual Report
October 31, 2000
(2_fidelity_logos)
|
President's Message |
3 |
Ned Johnson on investing strategies. |
|
Performance |
4 |
How the fund has done over time. |
|
Fund Talk |
5 |
The manager's review of fund performance, strategy and outlook. |
|
Investment Summary |
8 |
A summary of the fund's investments. |
|
Investments |
9 |
A complete list of the fund's investments with their market values. |
|
Financial Statements |
16 |
Statements of assets and liabilities, operations, and changes in net assets, as well as financial highlights. |
|
Notes |
20 |
Notes to the financial statements. |
Standard & Poor's, S&P and S&P 500 are registered service marks of The McGraw-Hill Companies, Inc. and have been licensed for use by Fidelity Distributors Corporation.
Other third party marks appearing herein are the property of their respective owners.
All other marks appearing herein are registered or unregistered trademarks or service marks of FMR Corp. or an affiliated company.
(Recycle graphic) This report is printed on recycled paper using soy-based inks.
This report and the financial statements contained herein are submitted for the general information of the shareholders of the fund. This report is not authorized for distribution to prospective investors in the fund unless preceded or accompanied by an effective prospectus.
Mutual fund shares are not deposits or obligations of, or guaranteed by, any depository institution. Shares are not insured by the FDIC, Federal Reserve Board or any other agency, and are subject to investment risks, including possible loss of principal amount invested.
Neither the fund nor Fidelity Distributors Corporation is a bank.
For more information on any Fidelity fund, including charges and expenses, call 1-800-544-6666 for a free prospectus. Read it carefully before you invest or send money.
Semiannual Report
|
(photo_of_Edward_C_Johnson_3d)
Dear Shareholder:
A sixth-straight year of double-digit positive returns for the Dow Jones Industrial Average, NASDAQ and S&P 500® could be in jeopardy unless the U.S. stock market shows marked improvement in the final two months of 2000. Through October, all three indexes had negative year-to-date returns. On the other hand, most fixed-income sectors were solidly in the black. Treasuries and other long-term government securities led the way, returning nearly 14%.
While it's impossible to predict the future direction of the markets with any degree of certainty, there are certain basic principles that can help investors plan for their future needs.
First, investors are encouraged to take a long-term view of their portfolios. If you can afford to leave your money invested through the inevitable up and down cycles of the financial markets, you will greatly reduce your vulnerability to any single decline. We know from experience, for example, that stock prices have gone up over longer periods of time, have significantly outperformed other types of investments and have stayed ahead of inflation.
Second, you can further manage your investing risk through diversification. A stock mutual fund, for instance, is already diversified, because it invests in many different companies. You can increase your diversification further by investing in a number of different stock funds, or in such other investment categories as bonds. If you have a short investment time horizon, you might want to consider moving some of your investment into a money market fund, which seeks income and a stable share price by investing in high-quality, short-term investments. Of course, it's important to remember that an investment in a money market fund is not insured or guaranteed by the Federal Deposit Insurance Corporation or any other government agency. Although money market funds seek to preserve the value of your investment at $1.00 per share, it is possible to lose money by investing in these types of funds.
Finally, no matter what your time horizon or portfolio diversity, it makes good sense to follow a regular investment plan, investing a certain amount of money in a fund at the same time each month or quarter and periodically reviewing your overall portfolio. By doing so, you won't get caught up in the excitement of a rapidly rising market, nor will you buy all your shares at market highs. While this strategy - known as dollar cost averaging - won't assure a profit or protect you from a loss in a declining market, it should help you lower the average cost of your purchases. Of course, you should consider your financial ability to continue your purchases through periods of low price levels before undertaking such a strategy.
If you have questions, please call us at 1-800-544-6666, or visit our web site at www.fidelity.com. We are available 24 hours a day, seven days a week to provide you the information you need to make the investments that are right for you.
Best regards,
/s/Edward C. Johnson 3d
Edward C. Johnson 3d
Semiannual Report
There are several ways to evaluate a fund's historical performance. You can look at the total percentage change in value, the average annual percentage change or the growth of a hypothetical $10,000 investment. Total return reflects the change in the value of an investment, assuming reinvestment of the fund's dividend income and capital gains (the profits earned upon the sale of securities that have grown in value). If Fidelity had not reimbursed certain fund expenses, the total returns would have been lower.
Cumulative Total Returns
|
Period ended October 31, 2000 |
|
|
Life of |
|
Fidelity Small Cap Retirement |
|
|
0.70% |
|
Russell 2000® |
|
|
-2.26% |
Cumulative total returns show the fund's performance in percentage terms over a set period - in this case, since the fund started on September 26, 2000. For example, if you had invested $1,000 in a fund that had a 5% return over the past year, the value of your investment would be $1,050. You can compare the fund's returns to the performance of the Russell 2000® Index - a market capitalization-weighted index of 2,000 small company stocks. This benchmark includes reinvested dividends and capital gains, if any.
Average Annual Total Returns
Average annual total returns take the fund's cumulative return and show you what would have happened if the fund had performed at a constant rate each year. These numbers will be reported once the fund is a year old. In addition, the growth of a hypothetical $10,000 investment in the fund will appear in the fund's next report six months from now.
Understanding
Performance
How a fund did yesterday is no guarantee of how it will do tomorrow. The stock market, for example, has a history of long-term growth and short-term volatility. In turn, the share price and return of a fund that invests in stocks will vary. That means if you sell your shares during a market downturn, you might lose money. But if you can ride out the market's ups and downs you may have a gain.
3Annual Report
Market Recap
The U.S. equity market environment during the six-month period that ended October 31, 2000, will be remembered as one of the most difficult in recent years. Three negative factors - rising interest rates, the highest oil prices in a decade and the declining value of the European currency - collectively hindered the growth of many domestic companies. As a result, investors reacted pessimistically to most stocks, regardless of market capitalization or industry. In May, the tech-heavy NASDAQ Composite Index experienced a sharp decline and failed to recoup the gains it achieved earlier in the year as the period wore on. The NASDAQ ended the six-month period with a -12.64% return. The Standard & Poor's 500SM Index, an index of 500 larger companies, declined 1.03%. Elsewhere, the Russell 2000® Index, a benchmark of smaller companies that had gained nearly 19% in the previous six-month period, slumped to a -1.11% return. Only the blue chips' benchmark, the Dow Jones Industrial Average, finished the period with a gain, returning 3.01% in large part because investors favored more established companies in October. For its part, the Federal Reserve Board raised the federal funds rate to 6.50% in May - its highest level in nine years - in an attempt to slow the economy and ward off inflation. Meanwhile, the euro's weakness and higher fuel costs particularly hurt multinational companies, many of which lowered third-quarter earnings targets.
(Portfolio Manager photograph)
An interview with Jamie Harmon, Portfolio Manager of Fidelity Small Cap Retirement Fund
Q. How did the fund perform, Jamie?
A. From its inception on September 26, 2000, through October 31, 2000, the fund returned 0.70%. In comparison, the fund's benchmark, the Russell 2000 Index, returned -2.26%. Going forward, we will look at the fund's performance at six- and 12-month intervals and compare it to its Lipper peer group.
Q. What helped the fund outperform the index during the brief period?
A. Strong stock selection in technology, health care and services was the key. In the technology sector, steady growth companies such as Black Box and Affiliated Computer Services led the way. Among our health care holdings, the fund benefited from generic drug companies such as SICOR. Meanwhile, education companies Corinthian Colleges and New Horizons fueled performance in the services sector.
Q. How would you describe your investment strategy for this fund?
A. I describe my approach as "aggressive value." While this is not an official Lipper fund category, I believe it most accurately describes my investment philosophy. The fund is a "value" fund in that I invest in stocks that I believe are priced below their intrinsic value, or the present value of the future cash flows. A large percentage of the fund's assets are invested in great small companies that are underappreciated by Wall Street, many of them in prosaic businesses such as distribution, post-secondary education and candy manufacturing. I use the term "aggressive value" instead of simply "value" for two reasons. First, my definition of value differs from many people's definition of value. While I care about the traditional metrics such as price/earnings ratios, I try to see the whole picture by also examining the value of intangible assets, management, future growth, etc. I try to look at a stock from a number of angles before investing. The second reason that I call the fund "aggressive" is that it has a higher-than-average turnover rate. Because there is much less research on small cap stocks, the market often overreacts to bad news and sometimes underreacts to good news. In these times of high volatility, I think it is important to try to be diligent about cutting our losses. Additionally, I sometimes make sector bets when I feel the outlook for a particular industry - such as health care or technology - is quite strong or quite weak. It is important to remember that the main disadvantage of high turnover - increased taxes due to more realized gains - does not apply to investors in this fund because it is only marketed to retirement plan participants at this time.
Semiannual Report
Fund Talk: The Manager's Overview - continued
Q. Can you provide an example of a specific stock that was a value?
A. Let's look at Corinthian Colleges, a post-secondary educational firm that specializes in practical degrees such as nursing and information technology. When I first bought the stock it was selling in the $20 range. It was priced at 5-times book value and 15-times earnings - not wildly cheap by traditional valuation measures. However, we live in the information age and workers continuously need to learn new skills. When I evaluated Corinthian Colleges, it was growing quarterly revenues by 20% and quarterly earnings by 80% or more. It possessed strong cash flow because consumers paid in advance for its services. Even better, the company demonstrated the ability to increase prices in a deflationary environment. Despite these many positives, Corinthian's stock was flat for roughly a year after it went public. In my opinion, the market gave us a great opportunity to buy a great company at a reasonable price. As the market began to recognize the company's strengths, the stock performed quite well. Corinthian has been one of the fund's top performers since inception.
Q. Outside of education, were there any other areas you sought to capitalize on?
A. The fund has a large investment in health care because I believe in the sector's growth potential and don't believe it will be hurt by a potential slowdown in technology or the economy. Generally, I prefer the emerging pharmaceutical and medical device companies because they provide products that save lives and improve our quality of life. In many cases, these companies have patents that give them a very strong market position. Many health care services firms also are attractive because they can provide solid growth in any economic environment.
Q. What's your outlook, Jamie?
A. I'm optimistic. Regardless of the market's direction, there are always opportunities for stock picking in small caps. Even better, small caps are very attractive right now. They generally grow faster than larger companies and, at the end of the period, prices for small-cap companies were still very cheap relative to historical averages.
Semiannual Report
Fund Talk: The Manager's Overview - continued
The views expressed in this report reflect those of the portfolio manager only through the end of the period of the report as stated on the cover and do not necessarily represent the views of Fidelity or any other person in the Fidelity organization. Any such views are subject to change at any time based upon market or other conditions and Fidelity disclaims any responsibility to update such views. These views may not be relied on as investment advice and, because investment decisions for a Fidelity fund are based on numerous factors, may not be relied on as an indication of trading intent on behalf of any Fidelity fund.
Fund Facts
Goal: seeks long-term growth of capital
Fund number: 384
Trading symbol: FSLRF
Start date: September 26, 2000
Size: as of October 31, 2000, more than $1 million
Manager: Jamie Harmon, since inception; portfolio assistant, various small-cap portfolios, 1998-2000; manager, Fidelity Select Biotechnology Portfolio, 1997-1998; analyst, various industries, 1995-1997; joined Fidelity in 1995
3Jamie Harmon on opportunities in small-cap companies:
"Historically, the relative performance between small-cap stocks and large-cap stocks has run in cycles that tend to last about five to six years. For roughly the five years leading up to 1999, small caps experienced a period of underperformance relative to large caps. However, during the 12-month period that ended October 31, 2000, small-cap stocks - as represented by the Russell 2000 Index - returned 17.41%, while the large-cap oriented S&P 500 index returned 6.09% and the blue-chips' index, the Dow Jones Industrial Average, advanced 3.82%.
"Given this and other data based on the past year, the U.S. equity market appears to be in the early stages of experiencing another prolonged period of small-cap outperformance relative to larger companies.
"There are two main reasons why small caps could dominate the market during the next few years. To begin with, small-cap stocks are generally at the cheapest levels they've been in 20 years, based on earnings multiples and other fundamental valuations. Second, the average U.S. equity mutual fund today has a much smaller allocation of small-cap stocks than a few years ago. Therefore, as capital appreciation fund managers begin to gradually purchase more small-cap stocks - an event that is currently in progress - the prices of small-cap stocks could increase sharply."
Semiannual Report
|
|
Top Ten Stocks as of October 31, 2000 |
|
|
|
% of fund's |
|
Black Box Corp. |
3.0 |
|
Affiliated Computer Services, Inc. Class A |
2.7 |
|
Hollywood Casino Corp. |
2.3 |
|
Christopher & Banks Corp. |
2.2 |
|
Corinthian Colleges, Inc. |
2.1 |
|
Biomet, Inc. |
2.1 |
|
Amsurg Corp. Class A |
1.9 |
|
Insight Enterprises, Inc. |
1.9 |
|
SICOR, Inc. |
1.8 |
|
ICU Medical, Inc. |
1.7 |
|
|
21.7 |
|
Top Five Market Sectors as of October 31, 2000 |
|
|
|
% of fund's |
|
Health |
19.2 |
|
Technology |
19.1 |
|
Retail & Wholesale |
12.1 |
|
Services |
12.1 |
|
Media & Leisure |
9.5 |
|
Asset Allocation (% of fund's net assets) |
|||
|
As of October 31, 2000 * |
|||
|
Stocks 91.4% |
|
|
|
Short-Term |
|
|
|
* Foreign investments |
1.9% |
|
|

Semiannual Report
(Unaudited)
Showing Percentage of Net Assets
|
Common Stocks - 91.4% |
|||
|
Shares |
Value (Note 1) |
||
|
BASIC INDUSTRIES - 0.8% |
|||
|
Paper & Forest Products - 0.8% |
|||
|
Pactiv Corp. (a) |
940 |
$ 9,870 |
|
|
CONSTRUCTION & REAL ESTATE - 0.9% |
|||
|
Building Materials - 0.5% |
|||
|
Quixote Corp. |
350 |
5,731 |
|
|
Construction - 0.4% |
|||
|
Kaufman & Broad Home Corp. |
100 |
2,975 |
|
|
Toll Brothers, Inc. (a) |
60 |
1,950 |
|
|
|
4,925 |
||
|
TOTAL CONSTRUCTION & REAL ESTATE |
10,656 |
||
|
DURABLES - 2.7% |
|||
|
Consumer Durables - 0.4% |
|||
|
Shuffle Master, Inc. (a) |
200 |
4,488 |
|
|
Consumer Electronics - 0.3% |
|||
|
Harman International Industries, Inc. |
70 |
3,360 |
|
|
Textiles & Apparel - 2.0% |
|||
|
Coach, Inc. |
100 |
2,338 |
|
|
Maxwell Shoe, Inc. Class A (a) |
500 |
5,563 |
|
|
Polo Ralph Lauren Corp. Class A (a) |
360 |
7,065 |
|
|
Timberland Co. Class A (a) |
185 |
9,551 |
|
|
|
24,517 |
||
|
TOTAL DURABLES |
32,365 |
||
|
ENERGY - 0.5% |
|||
|
Energy Services - 0.2% |
|||
|
Carbo Ceramics, Inc. |
100 |
2,994 |
|
|
Oil & Gas - 0.3% |
|||
|
Grant Prideco, Inc. (a) |
40 |
743 |
|
|
Swift Energy Co. (a) |
85 |
2,763 |
|
|
|
3,506 |
||
|
TOTAL ENERGY |
6,500 |
||
|
FINANCE - 7.1% |
|||
|
Insurance - 6.1% |
|||
|
Arthur J. Gallagher & Co. |
260 |
16,413 |
|
|
Brown & Brown, Inc. |
245 |
7,963 |
|
|
Common Stocks - continued |
|||
|
Shares |
Value (Note 1) |
||
|
FINANCE - continued |
|||
|
Insurance - continued |
|||
|
Everest Re Group Ltd. |
120 |
$ 7,035 |
|
|
First Health Group Corp. (a) |
350 |
13,650 |
|
|
Hilb, Rogal & Hamilton Co. |
190 |
7,529 |
|
|
PartnerRe Ltd. |
60 |
3,270 |
|
|
Philadelphia Consolidated Holding Corp. (a) |
320 |
7,140 |
|
|
RenaissanceRe Holdings Ltd. |
95 |
6,893 |
|
|
Wesco Financial Corp. |
10 |
2,678 |
|
|
|
72,571 |
||
|
Securities Industry - 1.0% |
|||
|
Gabelli Asset Management, Inc. Class A (a) |
310 |
11,160 |
|
|
TOTAL FINANCE |
83,731 |
||
|
HEALTH - 19.2% |
|||
|
Drugs & Pharmaceuticals - 5.2% |
|||
|
Alpharma, Inc. Class A |
260 |
10,091 |
|
|
Andrx Corp. - Andrx Group (a) |
80 |
5,760 |
|
|
CIMA Labs, Inc. (a) |
70 |
3,850 |
|
|
Enzon, Inc. (a) |
45 |
3,206 |
|
|
Invitrogen Corp. (a) |
45 |
3,423 |
|
|
KV Pharmaceutical Co. Class A (a) |
80 |
3,115 |
|
|
NaPro BioTherapeutics, Inc. (a) |
400 |
4,450 |
|
|
SICOR, Inc. (a) |
1,695 |
21,717 |
|
|
Watson Pharmaceuticals, Inc. (a) |
95 |
5,943 |
|
|
|
61,555 |
||
|
Medical Equipment & Supplies - 8.0% |
|||
|
AmeriSource Health Corp. Class A (a) |
175 |
7,602 |
|
|
Biomet, Inc. |
675 |
24,427 |
|
|
DENTSPLY International, Inc. |
370 |
12,834 |
|
|
First Horizon Pharmaceutical Corp. |
545 |
11,377 |
|
|
ICU Medical, Inc. (a) |
820 |
20,500 |
|
|
Patterson Dental Co. (a) |
570 |
17,848 |
|
|
|
94,588 |
||
|
Medical Facilities Management - 6.0% |
|||
|
AmeriPath, Inc. (a) |
250 |
4,484 |
|
|
Amsurg Corp. Class A (a) |
1,580 |
23,108 |
|
|
Corvel Corp. (a) |
370 |
11,724 |
|
|
Davita, Inc. (a) |
820 |
9,225 |
|
|
HEALTHSOUTH Corp. (a) |
140 |
1,680 |
|
|
Laboratory Corp. of America Holdings (a) |
25 |
3,372 |
|
|
Common Stocks - continued |
|||
|
Shares |
Value (Note 1) |
||
|
HEALTH - continued |
|||
|
Medical Facilities Management - continued |
|||
|
Manor Care, Inc. (a) |
610 |
$ 10,179 |
|
|
Trigon Healthcare, Inc. (a) |
100 |
7,169 |
|
|
|
70,941 |
||
|
TOTAL HEALTH |
227,084 |
||
|
MEDIA & LEISURE - 9.5% |
|||
|
Broadcasting - 0.8% |
|||
|
BHC Communications, Inc. Class A |
15 |
2,160 |
|
|
Cox Radio, Inc. Class A (a) |
160 |
3,640 |
|
|
Entercom Communications Corp. Class A (a) |
100 |
3,919 |
|
|
|
9,719 |
||
|
Entertainment - 0.2% |
|||
|
MTR Gaming Group, Inc. (a) |
260 |
1,885 |
|
|
Lodging & Gaming - 5.4% |
|||
|
Anchor Gaming (a) |
20 |
1,699 |
|
|
Hollywood Casino Corp. (a) |
2,525 |
26,513 |
|
|
International Game Technology (a) |
170 |
6,226 |
|
|
Penn National Gaming, Inc. (a) |
970 |
16,975 |
|
|
WMS Industries, Inc. (a) |
550 |
12,238 |
|
|
|
63,651 |
||
|
Publishing - 0.8% |
|||
|
Harte-Hanks, Inc. |
360 |
7,965 |
|
|
Playboy Enterprises, Inc. Class B (non-vtg.) (a) |
90 |
1,164 |
|
|
|
9,129 |
||
|
Restaurants - 2.3% |
|||
|
CEC Entertainment, Inc. (a) |
205 |
6,534 |
|
|
Jack in the Box, Inc. (a) |
140 |
3,430 |
|
|
P.F. Chang's China Bistro, Inc. (a) |
225 |
9,225 |
|
|
Papa John's International, Inc. (a) |
340 |
8,543 |
|
|
|
27,732 |
||
|
TOTAL MEDIA & LEISURE |
112,116 |
||
|
NONDURABLES - 2.2% |
|||
|
Foods - 1.5% |
|||
|
J.M. Smucker Co. |
60 |
1,335 |
|
|
Tootsie Roll Industries, Inc. |
415 |
15,926 |
|
|
|
17,261 |
||
|
Common Stocks - continued |
|||
|
Shares |
Value (Note 1) |
||
|
NONDURABLES - continued |
|||
|
Household Products - 0.7% |
|||
|
Church & Dwight Co., Inc. |
415 |
$ 8,196 |
|
|
TOTAL NONDURABLES |
25,457 |
||
|
RETAIL & WHOLESALE - 12.1% |
|||
|
Apparel Stores - 6.7% |
|||
|
Abercrombie & Fitch Co. Class A (a) |
500 |
11,781 |
|
|
American Eagle Outfitters, Inc. (a) |
380 |
13,086 |
|
|
Chico's FAS, Inc. (a) |
145 |
4,694 |
|
|
Christopher & Banks Corp. (a) |
775 |
25,672 |
|
|
Claire's Stores, Inc. |
150 |
3,019 |
|
|
Dress Barn, Inc. (a) |
135 |
3,383 |
|
|
Kenneth Cole Productions, Inc. Class A (a) |
80 |
3,635 |
|
|
Talbots, Inc. |
20 |
1,581 |
|
|
The Men's Wearhouse, Inc. (a) |
300 |
8,775 |
|
|
Venator Group, Inc. (a) |
150 |
2,119 |
|
|
Wilsons Leather Experts, Inc. (a) |
140 |
2,144 |
|
|
|
79,889 |
||
|
General Merchandise Stores - 1.9% |
|||
|
BJ's Wholesale Club, Inc. (a) |
520 |
17,128 |
|
|
Hot Topic, Inc. (a) |
170 |
5,823 |
|
|
|
22,951 |
||
|
Retail & Wholesale, Miscellaneous - 3.5% |
|||
|
Alberto-Culver Co. Class B |
10 |
336 |
|
|
Coldwater Creek, Inc. (a) |
70 |
2,078 |
|
|
PC Connection, Inc. |
410 |
11,179 |
|
|
SCP Pool Corp. (a) |
485 |
12,549 |
|
|
Ultimate Electronics, Inc. (a) |
410 |
14,811 |
|
|
|
40,953 |
||
|
TOTAL RETAIL & WHOLESALE |
143,793 |
||
|
SERVICES - 12.1% |
|||
|
Advertising - 0.5% |
|||
|
ADVO, Inc. (a) |
145 |
5,338 |
|
|
Educational Services - 5.6% |
|||
|
Career Education Corp. (a) |
95 |
3,675 |
|
|
Corinthian Colleges, Inc. (a) |
365 |
25,231 |
|
|
Devry, Inc. (a) |
180 |
6,649 |
|
|
New Horizons Worldwide, Inc. (a) |
1,390 |
20,155 |
|
|
Common Stocks - continued |
|||
|
Shares |
Value (Note 1) |
||
|
SERVICES - continued |
|||
|
Educational Services - continued |
|||
|
ProsoftTraining.com (a) |
1,205 |
$ 8,435 |
|
|
University of Phoenix Online |
90 |
2,363 |
|
|
|
66,508 |
||
|
Services - 6.0% |
|||
|
Caremark Rx, Inc. (a) |
440 |
5,500 |
|
|
Chemed Corp. |
400 |
13,150 |
|
|
Hall Kinion & Associates, Inc. (a) |
120 |
3,173 |
|
|
Kroll-O'Gara Co. (a) |
920 |
5,405 |
|
|
Learning Tree International, Inc. (a) |
400 |
18,100 |
|
|
On Assignment, Inc. (a) |
60 |
1,511 |
|
|
Robert Half International, Inc. (a) |
110 |
3,355 |
|
|
Steiner Leisure Ltd. (a) |
215 |
4,730 |
|
|
Watson Wyatt & Co. Holdings |
925 |
16,014 |
|
|
|
70,938 |
||
|
TOTAL SERVICES |
142,784 |
||
|
TECHNOLOGY - 19.1% |
|||
|
Communications Equipment - 1.1% |
|||
|
Plantronics, Inc. (a) |
280 |
12,775 |
|
|
Computer Services & Software - 11.4% |
|||
|
About.com, Inc. (a) |
120 |
2,880 |
|
|
Affiliated Computer Services, Inc. Class A (a) |
565 |
31,463 |
|
|
American Management Systems, Inc. (a) |
330 |
7,136 |
|
|
Black Box Corp. (a) |
545 |
35,894 |
|
|
Carreker Corp. (a) |
185 |
3,423 |
|
|
Great Plains Software, Inc. (a) |
235 |
9,150 |
|
|
Informatica Corp. (a) |
75 |
7,088 |
|
|
Manugistics Group, Inc. (a) |
60 |
6,836 |
|
|
Moldflow Corp. |
20 |
506 |
|
|
Netegrity, Inc. (a) |
125 |
9,750 |
|
|
NetIQ Corp. (a) |
20 |
1,723 |
|
|
Perot Systems Corp. Class A (a) |
210 |
2,087 |
|
|
TALX Corp. |
205 |
5,151 |
|
|
The BISYS Group, Inc. (a) |
255 |
12,017 |
|
|
|
135,104 |
||
|
Computers & Office Equipment - 5.5% |
|||
|
Avocent Corp. (a) |
230 |
16,316 |
|
|
FileNET Corp. (a) |
670 |
17,755 |
|
|
Common Stocks - continued |
|||
|
Shares |
Value (Note 1) |
||
|
TECHNOLOGY - continued |
|||
|
Computers & Office Equipment - continued |
|||
|
Insight Enterprises, Inc. (a) |
670 |
$ 21,775 |
|
|
RadiSys Corp. (a) |
330 |
8,745 |
|
|
|
64,591 |
||
|
Electronics - 0.3% |
|||
|
Technitrol, Inc. |
30 |
3,326 |
|
|
Photographic Equipment - 0.8% |
|||
|
InFocus Corp. (a) |
220 |
9,721 |
|
|
TOTAL TECHNOLOGY |
225,517 |
||
|
TRANSPORTATION - 1.2% |
|||
|
Trucking & Freight - 1.2% |
|||
|
Expeditors International of Washington, Inc. |
20 |
1,038 |
|
|
Forward Air Corp. (a) |
70 |
2,879 |
|
|
Heartland Express, Inc. (a) |
180 |
3,128 |
|
|
Landstar System, Inc. (a) |
160 |
7,560 |
|
|
|
14,605 |
||
|
UTILITIES - 4.0% |
|||
|
Electric Utility - 3.0% |
|||
|
Black Hills Corp. |
640 |
20,000 |
|
|
NRG Energy, Inc. |
515 |
13,390 |
|
|
Public Service Co. of New Mexico |
100 |
2,756 |
|
|
|
36,146 |
||
|
Telephone Services - 1.0% |
|||
|
Illuminet Holdings, Inc. |
480 |
11,558 |
|
|
TOTAL UTILITIES |
47,704 |
||
|
TOTAL COMMON STOCKS (Cost $1,006,243) |
1,082,182 |
||
|
Cash Equivalents - 16.9% |
|||
|
Maturity Amount |
Value |
||
|
Investments in repurchase agreements (U.S. Treasury Obligations), in a joint trading account at 6.56%, dated 10/31/00 due
11/1/00 |
$ 200,036 |
$ 200,000 |
|
|
TOTAL INVESTMENT PORTFOLIO - 108.3% (Cost $1,206,243) |
1,282,182 |
||
|
NET OTHER ASSETS - (8.3)% |
(98,273) |
||
|
NET ASSETS - 100% |
$ 1,183,909 |
||
|
Legend |
|
(a) Non-income producing |
|
Income Tax Information |
|
At October 31, 2000, the aggregate cost of investment securities for income tax purposes was $1,240,891. Net unrealized appreciation aggregated $41,291, of which $90,238 related to appreciated investment securities and $48,947 related to depreciated investment securities. |
See accompanying notes which are an integral part of the financial statements.
Semiannual Report
Statement of Assets and Liabilities
|
|
October 31, 2000 (Unaudited) |
|
|
Assets |
|
|
|
Investment in securities, at value (including repurchase agreements of $200,000) (cost $1,206,243) - |
|
$ 1,282,182 |
|
Cash |
|
953 |
|
Receivable for investments sold |
|
80,548 |
|
Receivable for fund shares sold |
|
270 |
|
Dividends receivable |
|
43 |
|
Prepaid expenses |
|
28,336 |
|
Receivable from investment adviser for expense reductions |
|
1,362 |
|
Total assets |
|
1,393,694 |
|
Liabilities |
|
|
|
Payable for investments purchased |
$ 165,779 |
|
|
Other payables and accrued expenses |
44,006 |
|
|
Total liabilities |
|
209,785 |
|
Net Assets |
|
$ 1,183,909 |
|
Net Assets consist of: |
|
|
|
Paid in capital |
|
$ 1,172,582 |
|
Undistributed net investment income |
|
11 |
|
Accumulated undistributed net realized gain (loss) |
|
(64,623) |
|
Net unrealized appreciation (depreciation) on investments |
|
75,939 |
|
Net Assets, for 117,598 shares outstanding |
|
$ 1,183,909 |
|
Net Asset Value, offering price and redemption price |
|
$10.07 |
See accompanying notes which are an integral part of the financial statements.
Semiannual Report
Financial Statements - continued
Statement of Operations
|
|
September 26, 2000 (commencement of operations) to October 31, 2000 (Unaudited) |
|
|
Investment Income Dividends |
|
$ 146 |
|
Interest |
|
967 |
|
Total income |
|
1,113 |
|
Expenses |
|
|
|
Management fee |
$ 733 |
|
|
Transfer agent fees |
114 |
|
|
Accounting fees and expenses |
5,750 |
|
|
Custodian fees and expenses |
4,454 |
|
|
Registration fees |
3,579 |
|
|
Audit |
3,357 |
|
|
Total expenses before reductions |
17,987 |
|
|
Expense reductions |
(16,885) |
1,102 |
|
Net investment income |
|
11 |
|
Realized and Unrealized Gain (Loss) Net realized gain (loss) on investment securities |
|
(64,623) |
|
Change in net unrealized appreciation (depreciation) |
|
75,939 |
|
Net gain (loss) |
|
11,316 |
|
Net increase (decrease) in net assets resulting |
|
$ 11,327 |
See accompanying notes which are an integral part of the financial statements.
Semiannual Report
Financial Statements - continued
Statement of Changes in Net Assets
|
|
September 26, 2000
(commencement |
|
Increase (Decrease) in Net Assets |
|
|
Operations |
$ 11 |
|
Net realized gain (loss) |
(64,623) |
|
Change in net unrealized appreciation (depreciation) |
75,939 |
|
Net increase (decrease) in net assets resulting from operations |
11,327 |
|
Share transactions |
1,172,582 |
|
Total increase (decrease) in net assets |
1,183,909 |
|
Net Assets |
|
|
Beginning of period |
- |
|
End of period (including undistributed net investment income of $11) |
$ 1,183,909 |
|
Other Information Shares sold |
117,598 |
See accompanying notes which are an integral part of the financial statements.
Semiannual Report
Financial Highlights
|
|
October 31, 2000 E |
|
|
(Unaudited) |
|
Selected Per-Share Data |
|
|
Net asset value, beginning of period |
$ 10.00 |
|
Income from Investment Operations |
|
|
Net investment income D |
.00 |
|
Net realized and unrealized gain (loss) |
.07 |
|
Total from investment operations |
.07 |
|
Net asset value, end of period |
$ 10.07 |
|
Total Return B, C |
0.70% |
|
Ratios and Supplemental Data |
|
|
Net assets, end of period (000 omitted) |
$ 1,184 |
|
Ratio of expenses to average net assets |
1.05% A, F |
|
Ratio of net investment income to average net assets |
.01% A |
|
Portfolio turnover rate |
1,046% A |
|
A Annualized B Total returns for periods of less than one year are not annualized. C The total returns would have been lower had certain expenses not been reduced during the periods shown. D Net investment income per share has been calculated based on average shares outstanding during the period. E For the period September 26, 2000 (commencement of operations) to October 31, 2000. F FMR agreed to reimburse a portion of the fund's expenses during the period. Without this reimbursement, the fund's |
|
See accompanying notes which are an integral part of the financial statements.
Semiannual Report
For the period ended October 31, 2000 (Unaudited)
1. Significant Accounting Policies.
Fidelity Small Cap Retirement Fund (the fund) is a fund of Fidelity Commonwealth Trust (the trust) and is authorized to issue an unlimited number of shares. The trust is registered under the Investment Company Act of 1940, as amended, as an open-end management investment company organized as a Massachusetts business trust. The financial statements have been prepared in conformity with generally accepted accounting principles which require management to make certain estimates and assumptions at the date of the financial statements. The following summarizes the significant accounting policies of the fund:
Security Valuation. Securities for which exchange quotations are readily available are valued at the last sale price, or if no sale price, at the closing bid price. Foreign securities are valued based on quotations from the principal market in which such securities are normally traded. If trading or events occurring in other markets after the close of the principal market in which foreign securities are traded, and before the close of business of the fund, are expected to materially affect the value of those securities, then they are valued at their fair value taking this trading or these events into account. Fair value is determined in good faith under consistently applied procedures under the general supervision of the Board of Trustees. Securities for which exchange quotations are not readily available (and in certain cases debt securities which trade on an exchange) are valued primarily using dealer-supplied valuations or at their fair value. Short-term securities with remaining maturities of sixty days or less for which quotations are not readily available are valued at amortized cost or original cost plus accrued interest, both of which approximate current value. Investments in open-end investment companies are valued at their net asset value each business day.
Foreign Currency Translation. The accounting records of the fund are maintained in U.S. dollars. Investment securities and other assets and liabilities denominated in a foreign currency are translated into U.S. dollars at the prevailing rates of exchange at period end. Purchases and sales of securities, income receipts and expense payments are translated into U.S. dollars at the prevailing exchange rate on the respective dates of the transactions.
Net realized gains and losses on foreign currency transactions represent net gains and losses from sales and maturities of foreign currency contracts, disposition of foreign currencies, the difference between the amount of net investment income accrued and the U.S. dollar amount actually received, and gains and losses between trade and settlement date on purchases and sales of securities. The effects of changes in foreign currency exchange rates on investments in securities are included with the net realized and unrealized gain or loss on investment securities.
Income Taxes. The fund intends to qualify as a regulated investment company under Subchapter M of the Internal Revenue Code. By so qualifying, the fund will not be subject to income taxes to the extent that it distributes substantially all of its taxable income
Semiannual Report
Notes to Financial Statements (Unaudited) - continued
1. Significant Accounting Policies - continued
Income Taxes - continued
for its fiscal year. The schedule of investments includes information regarding income taxes under the caption "Income Tax Information."
Investment Income. Dividend income is recorded on the ex-dividend date, except certain dividends from foreign securities where the ex-dividend date may have passed, are recorded as soon as the fund is informed of the ex-dividend date. Non-cash dividends included in dividend income, if any, are recorded at the fair market value of the securities received. Interest income is accrued as earned. Investment income is recorded net of foreign taxes withheld where recovery of such taxes is uncertain.
Expenses. Most expenses of the trust can be directly attributed to a fund. Expenses which cannot be directly attributed are apportioned among the funds in the trust.
Prepaid Expenses. Fidelity Management & Research Company (FMR) bears all organizational expenses of the fund except for the cost of registering and qualifying shares of the fund for distribution under federal and state securities law. These registration expenses are borne by the fund and amortized over one year.
Distributions to Shareholders.
Distributions are recorded on the ex-dividend date.
Income and capital gain distributions are determined in accordance with income tax regulations which may differ from generally accepted accounting principles. These differences may result in distribution reclassifications.
Permanent book and tax basis differences relating to shareholder distributions will result in reclassifications to paid in capital. Undistributed net investment income and accumulated undistributed net realized gain (loss) on investments and foreign currency transactions may include temporary book and tax basis differences which will reverse in a subsequent period. Any taxable income or gain remaining at fiscal year end is distributed in the following year.
Short-Term Trading (Redemption) Fees. Shares held in the fund less than 90 days are subject to a short-term trading fee equal to 1.50% of the proceeds of the redeemed shares. The fee, which is retained by the fund, is accounted for as an addition to paid in capital.
Security Transactions. Security transactions are accounted for as of trade date. Gains and losses on securities sold are determined on the basis of identified cost.
2. Operating Policies.
Foreign Currency Contracts. The fund generally uses foreign currency contracts to facilitate transactions in foreign-denominated securities. Losses may arise from changes in the value of the foreign currency or if the counterparties do not perform under the contracts' terms. The U.S. dollar value of foreign currency contracts is determined using contractual currency exchange rates established at the time of each trade.
Semiannual Report
Notes to Financial Statements (Unaudited) - continued
2. Operating Policies - continued
Joint Trading Account. Pursuant to an Exemptive Order issued by the Securities and Exchange Commission, the fund, along with other affiliated entities of FMR, may transfer uninvested cash balances into one or more joint trading accounts. These balances are invested in one or more repurchase agreements for U.S. Treasury or Federal Agency obligations.
Repurchase Agreements. The underlying U.S. Treasury, Federal Agency, or other obligations found to be satisfactory by FMR are transferred to an account of the fund, or to the Joint Trading Account, at a custodian bank. The securities are marked-to-market daily and maintained at a value at least equal to the principal amount of the repurchase agreement (including accrued interest). FMR, the fund's investment adviser, is responsible for determining that the value of the underlying securities remains in accordance with the market value requirements stated above.
3. Purchases and Sales of Investments.
Purchases and sales of securities, other than short-term securities, aggregated $2,173,968 and $1,103,102, respectively.
4. Fees and Other Transactions with Affiliates.
Management Fee. As the fund's investment adviser, FMR receives a monthly basic fee that is calculated on the basis of a group fee rate plus a fixed individual fund fee rate applied to the average net assets of the fund. The group fee rate is the weighted average of a series of rates and is based on the monthly average net assets of all the mutual funds advised by FMR. The rates ranged from .2167% to .5200% for the period. The annual individual fund fee rate is .45%. In the event that these rates were lower than the contractual rates in effect during the period, FMR voluntarily implemented the above rates, as they resulted in the same or a lower management fee. The basic fee is subject to a performance adjustment (up to a maximum of ±.20% of the fund's average net assets over the performance period) based on the fund's investment performance as compared to the appropriate index over a specified period of time. The fund's performance adjustment will not take effect until September 1, 2001. For the period, the management fee was equivalent to an annualized rate of .70% of average net assets.
Sub-Adviser Fee. Beginning January 1, 2001, FMR Co. (FMRC) will serve as a sub-adviser for the fund. FMRC is a wholly owned subsidiary of FMR and will receive a fee from FMR of 50% of the management fee payable to FMR with respect to that portion of the fund's assets that will be managed by FMRC.
Semiannual Report
Notes to Financial Statements (Unaudited) - continued
4. Fees and Other Transactions with Affiliates - continued
Transfer Agent Fees. Fidelity Investments Institutional Operations Company, Inc. (FIIOC), an affiliate of FMR, is the fund's transfer, dividend disbursing and shareholder servicing agent. FIIOC receives account fees and asset-based fees that vary according to account size and type of account. FIIOC pays for typesetting, printing and mailing of all shareholder reports, except proxy statements. For the period, the transfer agent fees were equivalent to an annualized rate of .11% of average net assets.
Accounting Fees. Fidelity Service Company, Inc., an affiliate of FMR, maintains the fund's accounting records. The fee is based on the level of average net assets for the month plus out-of-pocket expenses.
Brokerage Commissions. The fund placed a portion of its portfolio transactions with brokerage firms which are affiliates of FMR. The commissions paid to these affiliated firms were $33 for the period.
5. Expense Reductions.
FMR voluntarily agreed to reimburse the fund's operating expenses (excluding interest, taxes, certain securities lending fees, brokerage commissions and extraordinary expenses, if any) above an annual rate of 1.05% of average net assets. For the period, the reimbursement reduced the expenses by $16,885.
6. Beneficial Interest.
At the end of the period, FMR and its affiliates were record owners of approximately 85% of the total outstanding shares of the fund.
Semiannual Report
Investment Adviser
Fidelity Management & Research Company
Boston, MA
Investment Sub-Advisers
Fidelity Management & Research
(Far East) Inc.
Fidelity Management & Research
(U.K.) Inc.
Fidelity Investments Japan Limited
Officers
Edward C. Johnson 3d, President
Robert C. Pozen, Senior Vice President
Abigail P. Johnson, Vice President
Eric D. Roiter, Secretary
Robert A. Dwight, Treasurer
Maria F. Dwyer, Deputy Treasurer
John H. Costello, Assistant Treasurer
Thomas J. Simpson, Assistant Treasurer
Board of Trustees
Ralph F. Cox *
Phyllis Burke Davis *
Robert M. Gates *
Edward C. Johnson 3d
Donald J. Kirk *
Ned C. Lautenbach *
Peter S. Lynch
Marvin L. Mann *
William O. McCoy *
Gerald C. McDonough *
Robert C. Pozen
Thomas R. Williams *
* Independent trustees
Advisory Board
J. Michael Cook
Marie L. Knowles
General Distributor
Fidelity Distributors Corporation
Boston, MA
Transfer and Shareholder
Servicing Agent
Fidelity Investments Institutional
Operations Company, Inc.
Boston, MA
Custodian
State Street Bank and Trust Company
Quincy, MA
(Fidelity Investment logo)(registered trademark)
Corporate Headquarters
82 Devonshire St., Boston, MA 02109
www.fidelity.com
SMR-SANN-1200 118888
1.749363.100
|
|