
|
|
|
|
|
|
|
|
|
|
Previous: XTRA CORP /DE/, DEF 14A, 2000-12-20 |
Next: ROCK TENN CO, 10-K, 2000-12-20 |
Fidelity®
Fund
Semiannual Report
October 31, 2000
(2_fidelity_logos)(registered_trademark)
|
President's Message |
Ned Johnson on investing strategies. |
|
|
Performance |
How the fund has done over time. |
|
|
Fund Talk |
The manager's review of fund performance, strategy and outlook. |
|
|
Investment Changes |
A summary of major shifts in the fund's investments over the past six months. |
|
|
Investments |
A complete list of the fund's investments with their market values. |
|
|
Financial Statements |
Statements of assets and liabilities,
operations, and changes in net assets, |
|
|
Notes |
Notes to the financial statements. |
|
|
Report of Independent Accountants |
The auditors' opinion. |
To reduce expenses, only one copy of most financial reports and prospectuses may be mailed to households, even if more than one person in the household has an account in the fund. Call Fidelity at 1-800-544-8544 if you need additional copies of financial reports or prospectuses. If you do not want the mailing of these documents to be combined with those for other members of your household, contact Fidelity in writing at P.O. Box 5000, Cincinnati, OH 45273-8692.
Standard & Poor's, S&P and S&P 500 are registered service marks of The McGraw-Hill Companies, Inc. and have been licensed for use by Fidelity Distributors Corporation.
Other third party marks appearing herein are the property of their respective owners.
All other marks appearing herein are registered or unregistered trademarks or service marks of FMR Corp. or an affiliated company.
(Recycle graphic) This report is printed on recycled paper using soy-based inks.
This report and the financial statements contained herein are submitted for the general information of the shareholders of the fund. This report is not authorized for distribution to prospective investors in the fund unless preceded or accompanied by an effective prospectus.
Mutual fund shares are not deposits or obligations of, or guaranteed by, any depository institution. Shares are not insured by the FDIC, Federal Reserve Board or any other agency, and are subject to investment risks, including possible loss of principal amount invested.
Neither the fund nor Fidelity Distributors Corporation is a bank.
For more information on any Fidelity fund, including charges and expenses, call 1-800-544-6666 for a free prospectus. Read it carefully before you invest or send money.
Semiannual Report
(photo_of_Edward_C_Johnson_3d)
Dear Shareholder:
A sixth-straight year of double-digit positive returns for the Dow Jones Industrial Average, NASDAQ and S&P 500® could be in jeopardy unless the U.S. stock market shows marked improvement in the final two months of 2000. Through October, all three indexes had negative year-to-date returns. On the other hand, most fixed-income sectors were solidly in the black. Treasuries and other long-term government securities led the way, returning nearly 14%.
While it's impossible to predict the future direction of the markets with any degree of certainty, there are certain basic principles that can help investors plan for their future needs.
The longer your investment time frame, the less likely it is that you will be affected by short-term market volatility. A 10-year investment horizon appropriate for saving for a college education, for example, enables you to weather market cycles in a long-term fund, which may have a higher risk potential, but also has a higher potential rate of return.
An intermediate-length fund could make sense if your investment horizon is two to four years, while a short-term bond fund could be the right choice if you need your money in one or two years.
If your time horizon is less than a year, you might want to consider moving some of your bond investment into a money market fund. These funds seek income and a stable share price by investing in high-quality, short-term investments. Of course, it's important to remember that an investment in a money market fund is not insured or guaranteed by the Federal Deposit Insurance Corporation or any other government agency. Although money market funds seek to preserve the value of your investment at $1.00 per share, it is possible to lose money by investing in these types of funds.
Finally, no matter what your time horizon or portfolio diversity, it makes good sense to follow a regular investment plan, investing a certain amount of money in a fund at the same time each month or quarter and periodically reviewing your overall portfolio. By doing so, you won't get caught up in the excitement of a rapidly rising market, nor will you buy all your shares at market highs. While this strategy - known as dollar cost averaging - won't assure a profit or protect you from a loss in a declining market, it should help you lower the average cost of your purchases. Of course, you should consider your financial ability to continue your purchases through periods of low price levels before undertaking such a strategy.
If you have questions, please call us at 1-800-544-6666, or visit our web site at www.fidelity.com. We are available 24 hours a day, seven days a week to provide you the information you need to make the investments that are right for you.
Best regards,
/s/Edward C. Johnson 3d
Edward C. Johnson 3d
Semiannual Report
There are several ways to evaluate a fund's historical performance. You can look at the total percentage change in value, the average annual percentage change or the growth of a hypothetical $10,000 investment. Total return reflects the change in the value of an investment, assuming reinvestment of the fund's dividend income and capital gains (the profits earned upon the sale of securities that have grown in value). You can also look at the fund's income, as reflected in the fund's yield, to measure performance. Prior to December 30, 1990, Fidelity Capital & Income Fund operated under a different investment objective. Accordingly, the fund's historical performance may not represent its current investment policies.
Cumulative Total Returns
|
Periods ended October 31, 2000 |
Past 6 |
Past 1 |
Past 5 |
Past 10 |
|
Fidelity Capital & Income |
-4.60% |
-1.70% |
45.52% |
244.58% |
|
ML High Yield Master II |
-1.93% |
-1.68% |
31.76% |
199.32% |
|
High Current Yield Funds Average |
-3.83% |
-2.77% |
25.45% |
173.70% |
Cumulative total returns show the fund's performance in percentage terms over a set period - in this case, six months, one year, five years or 10 years. For example, if you had invested $1,000 in a fund that had a 5% return over the past year, the value of your investment would be $1,050. You can compare the fund's returns to the performance of the Merrill Lynch High Yield Master II Index - a market value-weighted index of all domestic and yankee high-yield bonds, including deferred interest bonds and payment-in-kind securities. Issues included in the index have maturities of one year or more and have a credit rating lower than BBB-/Baa3, but are not in default. To measure how the fund's performance stacked up against its peers, you can compare it to the high current yield funds average, which reflects the performance of mutual funds with similar objectives tracked by Lipper Inc. The past six month average represents a peer group of 382 mutual funds. These benchmarks reflect reinvestment of dividends and capital gains, if any, and exclude the effect of sales charges.
Average Annual Total Returns
|
Periods ended October 31, 2000 |
Past 1 |
Past 5 |
Past 10 |
|
Fidelity Capital & Income |
-1.70% |
7.79% |
13.17% |
|
ML High Yield Master II |
-1.68% |
5.67% |
11.59% |
|
High Current Yield Funds Average |
-2.77% |
4.55% |
10.51% |
Average annual total returns take the fund's cumulative return and show you what would have happened if the fund had performed at a constant rate each year. (Note: Lipper calculates average annual total returns by annualizing each fund's total return, then taking an arithmetic average. This may produce a different figure than that obtained by averaging the cumulative total returns and annualizing the result.)
Semiannual Report
Performance - continued
$10,000 Over 10 Years
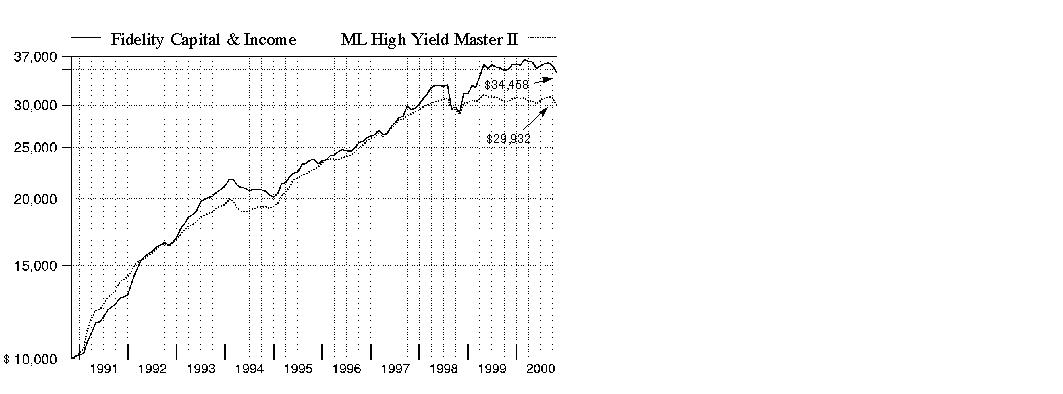
$10,000 Over 10 Years: Let's say hypothetically that $10,000 was invested in Fidelity Capital & Income Fund on October 31, 1990. As the chart shows, by October 31, 2000, the value of the investment would have grown to $34,458 - a 244.58% increase on the initial investment. For comparison, look at how the Merrill Lynch High Yield Master II Index did over the same period. With dividends and capital gains, if any, reinvested, the same $10,000 would have grown to $29,932 - a 199.32% increase.
Understanding
Performance
How a fund did yesterday is no guarantee of how it will do tomorrow. Bond prices, for example, generally move in the opposite direction of interest rates. In turn, the share price, return and yield of a fund that invests in bonds will vary. That means if you sell your shares during a market downturn, you might lose money. But if you can ride out the market's ups and downs, you may have a gain.
3Semiannual Report
Performance - continued
Total Return Components
|
|
Six months |
Years ended April 30, |
||||
|
|
2000 |
2000 |
1999 |
1998 |
1997 |
1996 |
|
Dividend returns |
3.93% |
8.28% |
10.19% |
8.50% |
8.52% |
9.87% |
|
Capital returns |
-8.53% |
-7.34% |
-0.85% |
15.09% |
-0.64% |
1.85% |
|
Total returns |
-4.60% |
0.94% |
9.34% |
23.59% |
7.88% |
11.72% |
Total return components include both dividend returns and capital returns. A dividend return reflects the actual dividends paid by the fund. A capital return reflects both the amount paid by the fund to shareholders as capital gain distributions and changes in the fund's share price. Both returns assume the dividends or capital gains, if any, paid by the fund are reinvested.
Dividends and Yield
|
Periods ended October 31, 2000 |
Past 1 |
Past 6 |
Past 1 |
|
Dividends per share |
6.05¢ |
36.96¢ |
74.61¢ |
|
Annualized dividend rate |
8.41% |
8.30% |
8.22% |
|
30-day annualized yield |
10.89% |
- |
- |
Dividends per share show the income paid by the fund for a set period and do not reflect any tax reclassifications. If you annualize this number, based on an average share price of $8.47 over the past one month, $8.83 over the past six months and $9.08 over the past one year, you can compare the fund's income over these three periods. The 30-day annualized yield is a standard formula based on the yields of the securities in the fund, averaged over the past 30 days. This figure shows you the yield characteristics of the fund's investments at the end of the period. It also helps you compare funds from different companies on an equal basis.
Semiannual Report
Market Recap
While the six-month period ending October 31, 2000, was one that most high-yield investors would just as soon forget, positive signs about the market's prospects emerged toward the end of the period. During the past six months, the Merrill Lynch High Yield Master II Index - a broad measure of high-yield market performance - fell 1.93%. This return lagged the overall U.S. taxable bond market as measured by the Lehman Brothers Aggregate Bond Index, which gained 5.80% during the same time frame. A number of adverse conditions held back high-yield performance, including a struggling telecommunications sector - which makes up a large portion of the high-yield debt market - and an increasing default rate that led to decreasing demand. In a flight to safety, many high-yield investors turned to the relative security of the Treasury market, this year's best-performing fixed-income sector through the end of October. One potential catalyst for improved performance in the high-yield market could be a continued increase in merger and acquisition activity. From July to August, $90 billion in M&A activity took place where the target company was in the high-yield universe. Not only do these deals reduce the supply of high-yield credits, they also establish benchmark valuations for some sectors of the market.
(Portfolio Manager photograph)
An interview with David Glancy, Portfolio Manager of Fidelity
Capital & Income Fund
Q. David, how did the fund perform?
A. For the six months that ended October 31, 2000, the fund had a total return of -4.60%. The high-yield market, as measured by the Merrill Lynch High Yield Master II Index, fell 1.93%, while the high current yield funds average tracked by Lipper Inc. returned -3.83%. During the 12 months that ended October 31, 2000, the fund returned -1.70%, while the Merrill Lynch High Yield Master II Index returned -1.68% and the Lipper high current yield funds average returned -2.77%.
Q. What market factors caused the fund to lag its benchmark and peers during the past six months?
A. It was a tough six-month period for the high-yield market, marked by high interest rates, difficulties encountered by individual companies and very little liquidity in the financial markets. High interest rates sparked by the Federal Reserve Board's desire to head off inflation increased borrowing costs for high-yield companies and slowed economic growth. These developments accelerated the overall default risk in the market. The "tech wreck" that knocked the wind out of the NASDAQ index also hurt the high-yield market, where one finds a significant number of telecommunications companies. These firms' access to capital was constricted at a time when they needed funding to continue building out their networks. The fund's telecom position was the primary reason for its relative underperformance. In addition, the fund was hurt by its large position in the stock of EchoStar, the direct-broadcast satellite company.
Semiannual Report
Fund Talk: The Manager's Overview - continued
Q. What moves did you make with the fund in response to this difficult situation?
A. I sought to insulate the fund from further difficulties by investing in shorter-maturity, higher-quality bonds. In addition, for the first time in quite a while I turned some attention to distressed securities, those that are characterized by uncertain or troubling financial situations. Previously, opportunities were few and far between because the area was characterized by poorly run companies with bad balance sheets and poor prospects. However, with all of the difficulties encountered by the high-yield market, some companies started trading at distressed prices despite favorable prospects and solid management. Because I maintained a fairly significant stake in cash equivalents through this bear market - at the end of the period, for example, more than 12% of the fund's net assets were invested in cash equivalents - I was able to buy some of these securities at very attractive prices. The large cash holdings also enabled me to make other well-timed purchases and insulated the fund somewhat from even further downdrafts. I also maintained a small but important portion of the fund in leveraged equities - common stocks of companies that have high-yield bonds outstanding.
Q. Were there any investments or areas that provided positive performance during the period?
A. There weren't very many areas that performed well during this time frame. Nevertheless, the fund did benefit from the positive performance of some of its holdings in the health care, energy and cable TV industries. Higher energy prices were the force behind the improvement in some energy securities, and the recurring revenues earned by cable TV operators through their monthly fees were an attractive attribute during a period of market instability.
Q. What's your outlook?
A. The high-yield market could be choppy for at least the next couple of months, though it appears that most of the damage to the market has been done. A significant number of bonds are trading at very attractive prices, so I anticipate using the fund's cash position to continue adding bonds of companies with favorable prospects selling at cheap prices. If history is a guide, the high-yield market will ultimately attract buyers from across a broad spectrum and enjoy a recovery like we saw in 1990, after its last protracted period of difficulty.
Semiannual Report
Fund Talk: The Manager's Overview - continued
The views expressed in this report reflect those of the portfolio manager only through the end of the period of the report as stated on the cover and do not necessarily represent the views of Fidelity or any other person in the Fidelity organization. Any such views are subject to change at any time based upon market or other conditions and Fidelity disclaims any responsibility to update such views. These views may not be relied on as investment advice and, because investment decisions for a Fidelity fund are based on numerous factors, may not be relied on as an indication of trading intent on behalf of any Fidelity fund.
Fund Facts
Goal: seeks income and capital growth
Fund number: 038
Trading symbol: FAGIX
Start date: November 1, 1977
Size: as of October 31, 2000, more than $3.0 billion
Manager: David Glancy, since 1996; manager, Fidelity Advisor High Income Fund, since 1999; Spartan High Income Fund, 1993-1996; joined Fidelity in 1990
3David Glancy on
the high-yield market:
"The volatility in the high-yield market doesn't necessarily reflect the underlying fundamentals of the companies in the fund, even though it may temporarily affect the fund's net asset value (NAV). Buyers of high-yield bonds have become so scarce that many attractive securities are trading from 20 to 70 cents on the dollar and therefore offer some upside potential. In contrast, when these bonds are trading at face value, there's no place for them to go but down. With Fidelity's resources and credit skills, we should be able to locate significant opportunities in this market for capital appreciation and earn a very attractive coupon, or interest rate. When things get as bad as they have been within the high-yield market, many investors follow a lemming mentality and seek to get out of it on its way down. My approach is to take advantage of desperate sellers and continue buying until the market eventually reaches the bottom in order to position the fund for a strong rebound when the market turns. In that way, like in 1990, I hope to reap the benefits when the market recovers and the winners start outnumbering the losers."
Semiannual Report
|
Top Five Holdings as of October 31, 2000 |
||
|
(by issuer, excluding cash equivalents) |
% of fund's |
% of fund's net assets |
|
Nextel Communications, Inc. |
8.0 |
8.9 |
|
EchoStar Communications Corp. |
6.1 |
4.7 |
|
XO Communications, Inc. |
3.4 |
3.9 |
|
EchoStar DBS Corp. |
2.8 |
2.8 |
|
CSC Holdings, Inc. |
2.6 |
2.3 |
|
|
22.9 |
22.6 |
|
Top Five Market Sectors as of October 31, 2000 |
||
|
|
% of fund's |
% of fund's net assets |
|
Media & Leisure |
32.5 |
30.5 |
|
Utilities |
28.1 |
31.3 |
|
Technology |
4.6 |
7.2 |
|
Industrial Machinery & Equipment |
3.4 |
4.2 |
|
Finance |
3.2 |
4.3 |
|
Quality Diversification as of October 31, 2000 |
||
|
(Moody's Ratings) |
% of fund's investments |
% of fund's investments |
|
Aaa, Aa, A |
0.0 |
1.0 |
|
Baa |
0.5 |
0.1 |
|
Ba |
6.1 |
4.1 |
|
B |
51.2 |
55.7 |
|
Caa, Ca, C |
5.3 |
9.3 |
|
D |
0.2 |
0.0 |
|
Not Rated |
2.0 |
3.9 |
|
Table excludes short-term investments. Where Moody's ratings are not available, we have used |
|
Asset Allocation (% of fund's net assets) |
|||||||
|
As of October 31, 2000 * |
As of April 30, 2000 * * |
||||||
 |
Nonconvertible |
|
|
Nonconvertible |
|
||
 |
Convertible Bonds, Preferred Stocks 12.4% |
|
|
Convertible Bonds, Preferred Stocks 12.3% |
|
||
 |
Common Stocks 9.9% |
|
|
Common Stocks 8.2% |
|
||
 |
Other Investments 2.1% |
|
|
Other Investments 2.4% |
|
||
 |
Short-Term |
|
|
Short-Term |
|
||
|
* Foreign investments |
10.8% |
|
** Foreign investments |
11.2% |
|
||

Semiannual Report
Showing Percentage of Net Assets
|
Corporate Bonds - 62.1% |
|||||
|
Moody's Ratings (unaudited) (b) |
Principal Amount (000s) (d) |
Value (Note 1) (000s) |
|||
|
Convertible Bonds - 0.9% |
|||||
|
HEALTH - 0.7% |
|||||
|
Medical Facilities Management - 0.7% |
|||||
|
Sunrise Assisted Living, Inc. 5.5% 6/15/02 |
B2 |
|
$ 1,970 |
$ 1,812 |
|
|
Tenet Healthcare Corp. 6% 12/1/05 |
B1 |
|
8,950 |
7,608 |
|
|
Total Renal Care Holdings, Inc.: |
|
|
|
|
|
|
7% 5/15/09 |
B3 |
|
8,890 |
6,579 |
|
|
7% 5/15/09 (g) |
B3 |
|
7,550 |
5,587 |
|
|
|
21,586 |
||||
|
MEDIA & LEISURE - 0.2% |
|||||
|
Lodging & Gaming - 0.2% |
|||||
|
Hilton Hotels Corp. 5% 5/15/06 |
Ba2 |
|
6,920 |
5,605 |
|
|
RETAIL & WHOLESALE - 0.0% |
|||||
|
Apparel Stores - 0.0% |
|||||
|
Merry-Go-Round Enterprises, Inc. 0% 5/16/97 (c)(i) |
- |
|
8,914 |
0 |
|
|
Retail & Wholesale, Miscellaneous - 0.0% |
|||||
|
Sunglass Hut International, Inc. 5.25% 6/15/03 |
B3 |
|
1,880 |
1,441 |
|
|
TOTAL CONVERTIBLE BONDS |
28,632 |
||||
|
Nonconvertible Bonds - 61.2% |
|||||
|
BASIC INDUSTRIES - 1.0% |
|||||
|
Chemicals & Plastics - 0.7% |
|||||
|
Huntsman Corp.: |
|
|
|
|
|
|
9.5% 7/1/07 (g) |
B2 |
|
16,820 |
10,092 |
|
|
9.5% 7/1/07 (g) |
B2 |
|
1,970 |
1,182 |
|
|
Huntsman ICI Holdings LLC 0% 12/31/09 |
B3 |
|
7,490 |
2,172 |
|
|
Lyondell Chemical Co. 9.875% 5/1/07 |
Ba3 |
|
5,815 |
5,670 |
|
|
Sterling Chemicals, Inc. 11.75% 8/15/06 |
Caa3 |
|
2,725 |
1,499 |
|
|
|
20,615 |
||||
|
Metals & Mining - 0.0% |
|||||
|
Better Minerals & Aggregates Co. 13% 9/15/09 |
B3 |
|
2,590 |
2,124 |
|
|
Packaging & Containers - 0.2% |
|||||
|
Gaylord Container Corp.: |
|
|
|
|
|
|
9.375% 6/15/07 |
Caa1 |
|
985 |
640 |
|
|
Corporate Bonds - continued |
|||||
|
Moody's Ratings (unaudited) (b) |
Principal Amount (000s) (d) |
Value (Note 1) (000s) |
|||
|
Nonconvertible Bonds - continued |
|||||
|
BASIC INDUSTRIES - continued |
|||||
|
Packaging & Containers - continued |
|||||
|
Gaylord Container Corp.: - continued |
|
|
|
|
|
|
9.75% 6/15/07 |
Caa1 |
|
$ 8,280 |
$ 5,548 |
|
|
9.875% 2/15/08 |
Caa3 |
|
995 |
299 |
|
|
|
6,487 |
||||
|
Paper & Forest Products - 0.1% |
|||||
|
Container Corp. of America gtd. 11.25% 5/1/04 |
B2 |
|
1,960 |
1,965 |
|
|
Crown Paper Co. 11% 9/1/05 (c) |
Ca |
|
5,450 |
654 |
|
|
|
2,619 |
||||
|
TOTAL BASIC INDUSTRIES |
31,845 |
||||
|
CONSTRUCTION & REAL ESTATE - 1.1% |
|||||
|
Building Materials - 0.3% |
|||||
|
Atrium Companies, Inc. 10.5% 5/1/09 |
B3 |
|
3,940 |
3,339 |
|
|
Building Materials Corp. of America 8% 12/1/08 |
Ba3 |
|
4,955 |
1,487 |
|
|
Nortek, Inc. 9.875% 3/1/04 |
B3 |
|
1,980 |
1,802 |
|
|
Numatics, Inc. 9.625% 4/1/08 |
B3 |
|
4,592 |
3,536 |
|
|
|
10,164 |
||||
|
Construction - 0.1% |
|||||
|
Lennar Corp. 9.95% 5/1/10 |
Ba1 |
|
1,980 |
1,980 |
|
|
Engineering - 0.1% |
|||||
|
Anteon Corp. 12% 5/15/09 |
B3 |
|
3,000 |
2,640 |
|
|
Real Estate - 0.4% |
|||||
|
LNR Property Corp. 9.375% 3/15/08 |
B1 |
|
13,175 |
11,858 |
|
|
Real Estate Investment Trusts - 0.2% |
|||||
|
Ocwen Asset Investment Corp. 11.5% 7/1/05 |
- |
|
10,320 |
8,050 |
|
|
TOTAL CONSTRUCTION & REAL ESTATE |
34,692 |
||||
|
DURABLES - 0.5% |
|||||
|
Autos, Tires, & Accessories - 0.0% |
|||||
|
Federal-Mogul Corp. 7.5% 1/15/09 |
Ba3 |
|
2,955 |
739 |
|
|
Home Furnishings - 0.0% |
|||||
|
Omega Cabinets Ltd. 10.5% 6/15/07 |
B3 |
|
650 |
598 |
|
|
Corporate Bonds - continued |
|||||
|
Moody's Ratings (unaudited) (b) |
Principal Amount (000s) (d) |
Value (Note 1) (000s) |
|||
|
Nonconvertible Bonds - continued |
|||||
|
DURABLES - continued |
|||||
|
Textiles & Apparel - 0.5% |
|||||
|
Levi Strauss & Co. 6.8% 11/1/03 |
Ba3 |
|
$ 675 |
$ 554 |
|
|
Polymer Group, Inc.: |
|
|
|
|
|
|
8.75% 3/1/08 |
B3 |
|
1,400 |
987 |
|
|
9% 7/1/07 |
B3 |
|
8,590 |
6,185 |
|
|
St. John Knits International, Inc. 12.5% 7/1/09 |
B3 |
|
6,235 |
5,767 |
|
|
|
13,493 |
||||
|
TOTAL DURABLES |
14,830 |
||||
|
ENERGY - 1.6% |
|||||
|
Energy Services - 0.5% |
|||||
|
Cliffs Drilling Co.: |
|
|
|
|
|
|
Class B, 10.25% 5/15/03 |
Ba3 |
|
7,120 |
7,280 |
|
|
Class D, 10.25% 5/15/03 |
Ba3 |
|
985 |
1,007 |
|
|
Parker Drilling Co. 9.75% 11/15/06 |
B1 |
|
4,000 |
3,920 |
|
|
R&B Falcon Corp. 9.125% 12/15/03 |
Ba3 |
|
1,970 |
2,004 |
|
|
|
14,211 |
||||
|
Oil & Gas - 1.1% |
|||||
|
Belden & Blake Corp. 9.875% 6/15/07 |
Caa3 |
|
10,000 |
8,400 |
|
|
Chesapeake Energy Corp. 7.875% 3/15/04 |
B2 |
|
7,297 |
6,932 |
|
|
Gothic Production Corp. 11.125% 5/1/05 |
B3 |
|
4,905 |
5,150 |
|
|
Kelley Oil & Gas Corp. 14% 4/15/03 |
B3 |
|
4,413 |
4,590 |
|
|
Nuevo Energy Co. 9.375% 10/1/10 (g) |
B1 |
|
3,000 |
2,985 |
|
|
Petsec Energy, Inc. 9.5% 6/15/07 (c) |
D |
|
14,090 |
7,397 |
|
|
|
35,454 |
||||
|
TOTAL ENERGY |
49,665 |
||||
|
FINANCE - 2.1% |
|||||
|
Credit & Other Finance - 2.1% |
|||||
|
Abraxas Petroleum Corp./Canadian Abraxas Petroleum Ltd. Series A, 11.5% 11/1/04 |
Caa3 |
|
3,500 |
3,045 |
|
|
Delta Financial Corp. 9.5% 8/1/04 |
Caa2 |
|
13,527 |
6,087 |
|
|
GS Escrow Corp.: |
|
|
|
|
|
|
6.75% 8/1/01 |
Ba1 |
|
14,450 |
14,183 |
|
|
7% 8/1/03 |
Ba1 |
|
21,140 |
20,030 |
|
|
7.125% 8/1/05 |
Ba1 |
|
3,985 |
3,656 |
|
|
Corporate Bonds - continued |
|||||
|
Moody's Ratings (unaudited) (b) |
Principal Amount (000s) (d) |
Value (Note 1) (000s) |
|||
|
Nonconvertible Bonds - continued |
|||||
|
FINANCE - continued |
|||||
|
Credit & Other Finance - continued |
|||||
|
Macsaver Financial Services, Inc.: |
|
|
|
|
|
|
7.4% 2/15/02 (c) |
Ca |
|
$ 990 |
$ 119 |
|
|
7.875% 8/1/03 (c) |
Ca |
|
9,650 |
1,158 |
|
|
Metris Companies, Inc.: |
|
|
|
|
|
|
10% 11/1/04 |
Ba3 |
|
9,028 |
8,486 |
|
|
10.125% 7/15/06 |
Ba3 |
|
7,000 |
6,580 |
|
|
|
63,344 |
||||
|
Insurance - 0.0% |
|||||
|
ITT Corp. 6.75% 11/15/03 |
Ba1 |
|
1,480 |
1,371 |
|
|
TOTAL FINANCE |
64,715 |
||||
|
HEALTH - 0.5% |
|||||
|
Medical Facilities Management - 0.5% |
|||||
|
Columbia/HCA Healthcare Co.: |
|
|
|
|
|
|
8.12% 8/4/03 |
Ba2 |
|
4,875 |
4,802 |
|
|
8.125% 8/4/03 |
Ba2 |
|
2,960 |
2,916 |
|
|
Fountain View, Inc. 11.25% 4/15/08 |
Caa1 |
|
9,350 |
1,870 |
|
|
Tenet Healthcare Corp.: |
|
|
|
|
|
|
8.125% 12/1/08 |
Ba3 |
|
1,950 |
1,877 |
|
|
8.625% 1/15/07 |
Ba3 |
|
2,980 |
2,950 |
|
|
|
14,415 |
||||
|
INDUSTRIAL MACHINERY & EQUIPMENT - 3.3% |
|||||
|
Electrical Equipment - 1.2% |
|||||
|
Loral Space & Communications Ltd. 9.5% 1/15/06 |
B1 |
|
52,625 |
37,364 |
|
|
Industrial Machinery & Equipment - 0.6% |
|||||
|
Dunlop Standard Aero Holdings PLC 11.875% 5/15/09 |
B3 |
|
1,000 |
995 |
|
|
Exide Corp. 10% 4/15/05 |
B1 |
|
3,970 |
2,858 |
|
|
Thermadyne Holdings Corp. 0% 6/1/08 (e) |
Caa1 |
|
17,105 |
5,132 |
|
|
Thermadyne Manufacturing LLC 9.875% 6/1/08 |
B3 |
|
12,930 |
9,310 |
|
|
|
18,295 |
||||
|
Corporate Bonds - continued |
|||||
|
Moody's Ratings (unaudited) (b) |
Principal Amount (000s) (d) |
Value (Note 1) (000s) |
|||
|
Nonconvertible Bonds - continued |
|||||
|
INDUSTRIAL MACHINERY & EQUIPMENT - continued |
|||||
|
Pollution Control - 1.5% |
|||||
|
Allied Waste North America, Inc. 10% 8/1/09 |
B2 |
|
$ 37,975 |
$ 32,184 |
|
|
Browning-Ferris Industries, Inc. 6.1% 1/15/03 |
Ba3 |
|
14,440 |
13,285 |
|
|
|
45,469 |
||||
|
TOTAL INDUSTRIAL MACHINERY & EQUIPMENT |
101,128 |
||||
|
MEDIA & LEISURE - 23.4% |
|||||
|
Broadcasting - 22.0% |
|||||
|
360networks, Inc. 13% 5/1/08 |
B3 |
|
20,655 |
16,421 |
|
|
ACME Television LLC/ACME Financial Corp. 10.875% 9/30/04 |
B3 |
|
14,070 |
13,015 |
|
|
Adelphia Communications Corp.: |
|
|
|
|
|
|
7.5% 1/15/04 |
B2 |
|
13,000 |
11,765 |
|
|
9.25% 10/1/02 |
B2 |
|
43,105 |
42,027 |
|
|
10.875% 10/1/10 |
B2 |
|
9,950 |
9,254 |
|
|
Ascent Entertainment Group, Inc. 0% 12/15/04 (e) |
Ba1 |
|
22,490 |
18,554 |
|
|
Century Communications Corp.: |
|
|
|
|
|
|
Series B, 0% 1/15/08 |
B2 |
|
7,070 |
2,687 |
|
|
0% 3/15/03 |
B2 |
|
2,470 |
1,865 |
|
|
9.5% 3/1/05 |
B2 |
|
2,875 |
2,638 |
|
|
9.75% 2/15/02 |
B2 |
|
10,010 |
9,810 |
|
|
Comcast UK Cable Partners Ltd. 0% 11/15/07 (e) |
B2 |
|
13,180 |
11,862 |
|
|
Diamond Cable Communications PLC yankee: |
|
|
|
|
|
|
0% 12/15/05 (e) |
B2 |
|
41,000 |
37,003 |
|
|
0% 2/15/07 (e) |
B2 |
|
9,997 |
7,498 |
|
|
13.25% 9/30/04 |
B2 |
|
14,800 |
15,170 |
|
|
EchoStar DBS Corp.: |
|
|
|
|
|
|
9.25% 2/1/06 |
B1 |
|
27,450 |
26,901 |
|
|
9.375% 2/1/09 |
B1 |
|
60,765 |
59,550 |
|
|
Golden Sky DBS, Inc. 0% 3/1/07 (e) |
Caa1 |
|
24,830 |
16,884 |
|
|
Golden Sky Systems, Inc. 12.375% 8/1/06 |
B3 |
|
12,350 |
13,276 |
|
|
Impsat Fiber Networks, Inc. 13.75% 2/15/05 |
B3 |
|
15,000 |
10,800 |
|
|
International Cabletel, Inc.: |
|
|
|
|
|
|
Series A, 12.75% 4/15/05 |
B2 |
|
23,238 |
23,006 |
|
|
0% 2/1/06 (e) |
B2 |
|
52,493 |
46,194 |
|
|
Knology Holding, Inc. 0% 10/15/07 (e) |
- |
|
4,955 |
1,536 |
|
|
Corporate Bonds - continued |
|||||
|
Moody's Ratings (unaudited) (b) |
Principal Amount (000s) (d) |
Value (Note 1) (000s) |
|||
|
Nonconvertible Bonds - continued |
|||||
|
MEDIA & LEISURE - continued |
|||||
|
Broadcasting - continued |
|||||
|
NTL Communications Corp.: |
|
|
|
|
|
|
0% 10/1/08 (e) |
B3 |
|
$ 10,500 |
$ 6,011 |
|
|
11.5% 10/1/08 |
B3 |
|
10,925 |
9,778 |
|
|
11.875% 10/1/10 (g) |
B2 |
|
4,930 |
4,560 |
|
|
Olympus Communications LP/Olympus Capital Corp. 10.625% 11/15/06 |
B2 |
|
5,990 |
5,601 |
|
|
Pegasus Communications Corp.: |
|
|
|
|
|
|
9.625% 10/15/05 |
B3 |
|
23,995 |
23,395 |
|
|
9.75% 12/1/06 |
B3 |
|
8,200 |
7,995 |
|
|
Pegasus Media & Communications, Inc. 12.5% 7/1/05 |
B3 |
|
3,700 |
3,848 |
|
|
Satelites Mexicanos SA de CV: |
|
|
|
|
|
|
10.125% 11/1/04 |
B3 |
|
79,065 |
49,811 |
|
|
11.28% 6/30/04 (g)(h) |
B1 |
|
30,576 |
26,754 |
|
|
Telewest PLC 11% 10/1/07 |
B1 |
|
79,625 |
71,663 |
|
|
United International Holdings, Inc. 0% 2/15/08 (e) |
B3 |
|
31,455 |
18,244 |
|
|
United Pan-Europe Communications NV: |
|
|
|
|
|
|
0% 2/1/10 (e) |
B2 |
|
38,800 |
14,356 |
|
|
10.875% 11/1/07 |
B2 |
|
4,890 |
3,814 |
|
|
10.875% 8/1/09 |
B2 |
|
10,280 |
7,453 |
|
|
11.25% 2/1/10 |
B2 |
|
3,425 |
2,569 |
|
|
11.5% 2/1/10 |
B2 |
|
23,690 |
18,004 |
|
|
|
671,572 |
||||
|
Entertainment - 0.4% |
|||||
|
Alliance Gaming Corp. 10% 8/1/07 |
Caa1 |
|
7,070 |
3,889 |
|
|
Mandalay Resort Group: |
|
|
|
|
|
|
9.5% 8/1/08 |
Ba2 |
|
3,000 |
3,060 |
|
|
10.25% 8/1/07 |
Ba3 |
|
4,925 |
5,048 |
|
|
|
11,997 |
||||
|
Leisure Durables & Toys - 0.0% |
|||||
|
Hedstrom Corp. 10% 6/1/07 (c) |
Caa3 |
|
9,915 |
198 |
|
|
Lodging & Gaming - 0.8% |
|||||
|
Courtyard by Marriott II LP/Courtyard II Finance Co. 10.75% 2/1/08 |
B- |
|
10,710 |
10,630 |
|
|
Florida Panthers Holdings, Inc. 9.875% 4/15/09 |
B2 |
|
6,650 |
6,268 |
|
|
Corporate Bonds - continued |
|||||
|
Moody's Ratings (unaudited) (b) |
Principal Amount (000s) (d) |
Value (Note 1) (000s) |
|||
|
Nonconvertible Bonds - continued |
|||||
|
MEDIA & LEISURE - continued |
|||||
|
Lodging & Gaming - continued |
|||||
|
International Game Technology 7.875% 5/15/04 |
Ba1 |
|
$ 1,970 |
$ 1,921 |
|
|
ITT Corp. 6.25% 11/15/00 |
Ba1 |
|
7,745 |
7,706 |
|
|
|
26,525 |
||||
|
Publishing - 0.2% |
|||||
|
American Lawyer Media Holdings, Inc. 9.75% 12/15/07 |
B2 |
|
5,915 |
5,264 |
|
|
Maxwell Communication Corp. PLC euro 5% 6/16/10 (c) |
- |
CHF |
4 |
0 |
|
|
|
5,264 |
||||
|
TOTAL MEDIA & LEISURE |
715,556 |
||||
|
NONDURABLES - 0.5% |
|||||
|
Foods - 0.3% |
|||||
|
SFC New Holdings, Inc. 11.25% 8/15/01 |
CCC |
|
9,999 |
9,824 |
|
|
Household Products - 0.2% |
|||||
|
AKI, Inc. 10.5% 7/1/08 |
B2 |
|
4,870 |
3,847 |
|
|
TOTAL NONDURABLES |
13,671 |
||||
|
RETAIL & WHOLESALE - 0.8% |
|||||
|
Apparel Stores - 0.1% |
|||||
|
Merry-Go-Round Enterprises, Inc. |
- |
|
7,500 |
0 |
|
|
Norton McNaughton, Inc. 12.5% 6/1/05 |
B2 |
|
2,995 |
2,688 |
|
|
|
2,688 |
||||
|
Drug Stores - 0.6% |
|||||
|
Rite Aid Corp.: |
|
|
|
|
|
|
6% 12/15/00 (g) |
B3 |
|
19,330 |
18,750 |
|
|
10.5% 9/15/02 (g) |
- |
|
645 |
400 |
|
|
|
19,150 |
||||
|
Retail & Wholesale, Miscellaneous - 0.1% |
|||||
|
National Vision Association Ltd. 12.75% 10/15/05 (c) |
Ca |
|
9,625 |
3,658 |
|
|
TOTAL RETAIL & WHOLESALE |
25,496 |
||||
|
Corporate Bonds - continued |
|||||
|
Moody's Ratings (unaudited) (b) |
Principal Amount (000s) (d) |
Value (Note 1) (000s) |
|||
|
Nonconvertible Bonds - continued |
|||||
|
TECHNOLOGY - 4.3% |
|||||
|
Computer Services & Software - 2.8% |
|||||
|
Colo.com 13.875% 3/15/10 unit (g) |
- |
|
$ 5,000 |
$ 3,750 |
|
|
Concentric Network Corp. 12.75% 12/15/07 |
B |
|
1,780 |
1,771 |
|
|
Covad Communications Group, Inc.: |
|
|
|
|
|
|
0% 3/15/08 (e) |
B3 |
|
18,296 |
4,940 |
|
|
12% 2/15/10 |
B3 |
|
6,875 |
3,197 |
|
|
12.5% 2/15/09 |
B3 |
|
13,190 |
6,463 |
|
|
Exodus Communications, Inc.: |
|
|
|
|
|
|
10.75% 12/15/09 |
B3 |
|
32,270 |
29,688 |
|
|
11.25% 7/1/08 |
B3 |
|
8,060 |
7,617 |
|
|
11.625% 7/15/10 (g) |
B3 |
|
21,215 |
19,942 |
|
|
PSINet, Inc.: |
|
|
|
|
|
|
10% 2/15/05 |
B3 |
|
10,755 |
5,324 |
|
|
10.5% 12/1/06 |
B3 |
|
2,620 |
1,258 |
|
|
|
83,950 |
||||
|
Computers & Office Equipment - 0.7% |
|||||
|
Dictaphone Corp. 11.75% 8/1/05 |
B3 |
|
17,907 |
13,430 |
|
|
Globix Corp. 12.5% 2/1/10 |
B- |
|
15,095 |
8,302 |
|
|
|
21,732 |
||||
|
Electronic Instruments - 0.2% |
|||||
|
Telecommunications Techniques Co. LLC 9.75% 5/15/08 |
B3 |
|
7,855 |
6,991 |
|
|
Electronics - 0.5% |
|||||
|
Aavid Thermal Technologies, Inc. 12.75% 2/1/07 |
B2 |
|
2,420 |
2,105 |
|
|
ChipPAC International Ltd. 12.75% 8/1/09 |
B3 |
|
9,270 |
9,247 |
|
|
Micron Technology, Inc. 6.5% 9/30/05 (i) |
B3 |
|
4,000 |
3,320 |
|
|
|
14,672 |
||||
|
Photographic Equipment - 0.1% |
|||||
|
IMAX Corp. 7.875% 12/1/05 |
Ba2 |
|
4,055 |
2,311 |
|
|
TOTAL TECHNOLOGY |
129,656 |
||||
|
TRANSPORTATION - 1.9% |
|||||
|
Air Transportation - 0.9% |
|||||
|
US Air, Inc. 9.625% 2/1/01 |
B3 |
|
28,522 |
28,237 |
|
|
Corporate Bonds - continued |
|||||
|
Moody's Ratings (unaudited) (b) |
Principal Amount (000s) (d) |
Value (Note 1) (000s) |
|||
|
Nonconvertible Bonds - continued |
|||||
|
TRANSPORTATION - continued |
|||||
|
Railroads - 1.0% |
|||||
|
Transtar Holdings LP/Transtar Capital Corp. 13.375% 12/15/03 |
B- |
|
$ 29,525 |
$ 29,820 |
|
|
TOTAL TRANSPORTATION |
58,057 |
||||
|
UTILITIES - 20.2% |
|||||
|
Cellular - 6.5% |
|||||
|
Echostar Broadband Corp. 10.375% 10/1/07 (g) |
B3 |
|
40,470 |
40,470 |
|
|
Globalstar LP/Globalstar Capital Corp. 11.5% 6/1/05 |
Caa1 |
|
1,970 |
236 |
|
|
Leap Wireless International, Inc.: |
|
|
|
|
|
|
0% 4/15/10 (e) |
- |
|
10,900 |
2,616 |
|
|
12.5% 4/15/10 |
Caa2 |
|
12,465 |
8,227 |
|
|
McCaw International Ltd. 0% 4/15/07 (e) |
Caa1 |
|
38,693 |
27,085 |
|
|
Nextel Communications, Inc.: |
|
|
|
|
|
|
0% 10/31/07 (e) |
B1 |
|
2,000 |
1,525 |
|
|
0% 2/15/08 (e) |
B1 |
|
19,835 |
14,678 |
|
|
9.375% 11/15/09 |
B1 |
|
31,845 |
30,730 |
|
|
12% 11/1/08 |
B1 |
|
12,000 |
12,720 |
|
|
Nextel International, Inc.: |
|
|
|
|
|
|
0% 4/15/08 (e) |
Caa1 |
|
14,260 |
8,556 |
|
|
12.75% 8/1/10 (g) |
Caa1 |
|
24,850 |
22,862 |
|
|
Nextel Partners, Inc.: |
|
|
|
|
|
|
11% 3/15/10 (g) |
B3 |
|
7,275 |
7,275 |
|
|
11% 3/15/10 |
B3 |
|
6,985 |
6,985 |
|
|
Orbital Imaging Corp.: |
|
|
|
|
|
|
11.625% 3/1/05 |
CCC |
|
8,580 |
1,630 |
|
|
11.625% 3/1/05 |
CCC |
|
3,380 |
642 |
|
|
Orion Network Systems, Inc. 11.25% 1/15/07 |
B2 |
|
7,625 |
2,669 |
|
|
Triton PCS, Inc. 0% 5/1/08 (e) |
B3 |
|
1,860 |
1,400 |
|
|
US Unwired, Inc. 0% 11/1/09 (e) |
Caa1 |
|
14,050 |
6,674 |
|
|
|
196,980 |
||||
|
Electric Utility - 0.3% |
|||||
|
CMS Energy Corp. 8.125% 5/15/02 |
Ba3 |
|
8,870 |
8,726 |
|
|
Telephone Services - 13.4% |
|||||
|
Allegiance Telecom, Inc. 0% 2/15/08 (e) |
B3 |
|
23,945 |
16,283 |
|
|
Asia Global Crossing Ltd. 13.375% 10/15/10 (g) |
B2 |
|
15,960 |
14,923 |
|
|
Corporate Bonds - continued |
|||||
|
Moody's Ratings (unaudited) (b) |
Principal Amount (000s) (d) |
Value (Note 1) (000s) |
|||
|
Nonconvertible Bonds - continued |
|||||
|
UTILITIES - continued |
|||||
|
Telephone Services - continued |
|||||
|
FirstWorld Communications, Inc. 0% 4/15/08 (e) |
- |
|
$ 10,160 |
$ 1,727 |
|
|
Flag Telecom Holdings Ltd. 11.625% 3/30/10 |
B2 |
|
3,000 |
2,490 |
|
|
Focal Communications Corp. 11.875% 1/15/10 |
B3 |
|
19,855 |
15,090 |
|
|
Hyperion Telecommunications, Inc.: |
|
|
|
|
|
|
0% 4/15/03 (e) |
B3 |
|
6,835 |
5,195 |
|
|
12.25% 9/1/04 |
B3 |
|
12,370 |
10,267 |
|
|
ICG Services, Inc. 0% 5/1/08 (e) |
Caa1 |
|
19,930 |
3,189 |
|
|
Intermedia Communications, Inc.: |
|
|
|
|
|
|
0% 5/15/06 (e) |
B2 |
|
34,400 |
32,508 |
|
|
0% 7/15/07 (e) |
B2 |
|
17,466 |
14,409 |
|
|
KMC Telecom Holdings, Inc.: |
|
|
|
|
|
|
0% 2/15/08 (e) |
Caa2 |
|
1,500 |
210 |
|
|
13.5% 5/15/09 |
Caa2 |
|
6,870 |
2,130 |
|
|
Level 3 Communications, Inc.: |
|
|
|
|
|
|
0% 12/1/08 (e) |
B3 |
|
9,430 |
5,187 |
|
|
11% 3/15/08 |
B3 |
|
36,955 |
33,352 |
|
|
McLeodUSA, Inc.: |
|
|
|
|
|
|
0% 3/1/07 (e) |
B1 |
|
10,290 |
8,361 |
|
|
8.375% 3/15/08 |
B1 |
|
2,715 |
2,389 |
|
|
9.25% 7/15/07 |
B1 |
|
6,105 |
5,586 |
|
|
Metromedia Fiber Network, Inc.: |
|
|
|
|
|
|
10% 11/15/08 |
B2 |
|
1,190 |
1,047 |
|
|
10% 12/15/09 |
B2 |
|
19,450 |
17,116 |
|
|
NEXTLINK Communications LLC 12.5% 4/15/06 |
B2 |
|
1,980 |
1,871 |
|
|
NEXTLINK Communications, Inc.: |
|
|
|
|
|
|
0% 4/15/08 (e) |
B2 |
|
13,785 |
7,720 |
|
|
0% 6/1/09 (e) |
B2 |
|
32,998 |
17,159 |
|
|
0% 12/1/09 (e) |
B2 |
|
9,645 |
4,533 |
|
|
9.625% 10/1/07 |
B2 |
|
10,000 |
8,450 |
|
|
10.75% 11/15/08 |
B3 |
|
12,175 |
10,714 |
|
|
10.75% 6/1/09 |
B2 |
|
35,345 |
31,104 |
|
|
Qwest Communications International, Inc. 10.875% 4/1/07 |
Baa1 |
|
13,500 |
14,648 |
|
|
Rhythms NetConnections, Inc.: |
|
|
|
|
|
|
Series B, 14% 2/15/10 |
B3 |
|
9,435 |
4,340 |
|
|
0% 5/15/08 (e) |
B3 |
|
3,390 |
746 |
|
|
12.75% 4/15/09 |
B3 |
|
10,725 |
4,934 |
|
|
Rochester Telephone Corp. 8.77% 4/16/01 |
Ba2 |
|
12,900 |
12,803 |
|
|
Corporate Bonds - continued |
|||||
|
Moody's Ratings (unaudited) (b) |
Principal Amount (000s) (d) |
Value (Note 1) (000s) |
|||
|
Nonconvertible Bonds - continued |
|||||
|
UTILITIES - continued |
|||||
|
Telephone Services - continued |
|||||
|
Teligent, Inc. 11.5% 12/1/07 |
Caa1 |
|
$ 23,864 |
$ 9,546 |
|
|
Versatel Telecom International NV: |
|
|
|
|
|
|
11.875% 7/15/09 |
B3 |
|
8,940 |
6,526 |
|
|
13.25% 5/15/08 |
B3 |
|
2,140 |
1,626 |
|
|
Viatel, Inc. 11.5% 3/15/09 |
B3 |
|
2,960 |
1,480 |
|
|
WinStar Communications, Inc.: |
|
|
|
|
|
|
0% 4/15/10 (e) |
B3 |
|
14,711 |
4,708 |
|
|
12.5% 4/15/08 |
B3 |
|
33,375 |
24,531 |
|
|
12.75% 4/15/10 |
B3 |
|
59,874 |
43,109 |
|
|
Worldwide Fiber, Inc. 12% 8/1/09 |
B3 |
|
10,355 |
7,818 |
|
|
|
409,825 |
||||
|
TOTAL UTILITIES |
615,531 |
||||
|
TOTAL NONCONVERTIBLE BONDS |
1,869,257 |
||||
|
TOTAL CORPORATE BONDS (Cost $2,247,466) |
1,897,889 |
||||
|
Asset-Backed Securities - 0.1% |
|||||
|
|
|||||
|
Airplanes pass through trust 10.875% 3/15/19 |
Ba2 |
|
4,869 |
3,603 |
|
|
Commercial Mortgage Securities - 1.2% |
|||||
|
|
|||||
|
Danmall Finance, Inc. Series 1 Class D, 13.12% 10/21/24 |
- |
|
7,232 |
7,260 |
|
|
First Chicago/Lennar Trust I Series 1997-CHL1 Class E, 8.0835% 4/1/39 (h) |
- |
|
9,200 |
7,012 |
|
|
Mortgage Capital Funding, Inc. Series 1998-MC3 Class F, 7.3172% 11/18/31 (g)(h) |
Ba1 |
|
3,000 |
2,321 |
|
|
Nationslink Funding Corp. Series 1998-2 Class F, 7.105% 8/20/30 |
BB |
|
4,500 |
3,481 |
|
|
Nomura Asset Securities Corp. Series 1998-D6 Class B1, 6% 3/15/30 |
BB+ |
|
4,347 |
2,927 |
|
|
Commercial Mortgage Securities - continued |
|||||
|
Moody's Ratings (unaudited) (b) |
Principal Amount (000s) (d) |
Value (Note 1) (000s) |
|||
|
Nomura Depositor Trust: |
|
|
|
|
|
|
floater Series 1998-ST1A Class B2, 10.8713% 1/15/03 (g)(h) |
- |
|
$ 7,171 |
$ 6,658 |
|
|
Series 1998-ST1A Class B1A, 9.3713% 1/15/03 (g)(h) |
- |
|
3,398 |
3,200 |
|
|
Structured Asset Securities Corp. Series 1995-C1 Class F, 7.375% 9/25/24 (g) |
- |
|
5,344 |
4,359 |
|
|
TOTAL COMMERCIAL MORTGAGE SECURITIES (Cost $36,955) |
37,218 |
||||
|
Common Stocks - 9.9% |
|||
|
Shares |
|
||
|
BASIC INDUSTRIES - 0.4% |
|||
|
Chemicals & Plastics - 0.1% |
|||
|
Georgia Gulf Corp. |
14,800 |
198 |
|
|
Lyondell Chemical Co. |
24,700 |
355 |
|
|
Sterling Chemicals Holdings, Inc. warrants 8/15/08 (a) |
6,690 |
40 |
|
|
Trivest 1992 Special Fund Ltd. (j) |
11.4 |
678 |
|
|
|
1,271 |
||
|
Packaging & Containers - 0.3% |
|||
|
Packaging Corp. of America |
656,700 |
9,645 |
|
|
TOTAL BASIC INDUSTRIES |
10,916 |
||
|
CONSTRUCTION & REAL ESTATE - 0.0% |
|||
|
Real Estate Investment Trusts - 0.0% |
|||
|
Swerdlow Real Estate Group, Inc.: |
|
|
|
|
Class A (i) |
79,800 |
0 |
|
|
Class B (i) |
19,817 |
0 |
|
|
|
0 |
||
|
DURABLES - 0.5% |
|||
|
Textiles & Apparel - 0.5% |
|||
|
Arena Brands Holdings Corp. Class B |
659,302 |
16,483 |
|
|
ENERGY - 0.0% |
|||
|
Oil & Gas - 0.0% |
|||
|
Abraxas Petroleum Corp. (a) |
288,092 |
864 |
|
|
FINANCE - 0.5% |
|||
|
Banks - 0.5% |
|||
|
Provident Financial Group, Inc. |
549,168 |
16,612 |
|
|
Common Stocks - continued |
|||
|
Shares |
Value (Note 1) (000s) |
||
|
FINANCE - continued |
|||
|
Credit & Other Finance - 0.0% |
|||
|
Abraxas Petroleum Corp./Canadian Abraxas Petroleum Ltd. rights 6/30/01 (a) |
298,092 |
$ 3 |
|
|
Associates First Capital Corp. (a) |
531,600 |
11 |
|
|
Delta Financial Corp. (a) |
800 |
0 |
|
|
|
14 |
||
|
TOTAL FINANCE |
16,626 |
||
|
INDUSTRIAL MACHINERY & EQUIPMENT - 0.1% |
|||
|
Industrial Machinery & Equipment - 0.0% |
|||
|
Exide Corp. |
20,900 |
210 |
|
|
Pollution Control - 0.1% |
|||
|
Allied Waste Industries, Inc. (a) |
299,100 |
2,767 |
|
|
TOTAL INDUSTRIAL MACHINERY & EQUIPMENT |
2,977 |
||
|
MEDIA & LEISURE - 6.1% |
|||
|
Broadcasting - 6.1% |
|||
|
EchoStar Communications Corp. Class A (a) |
4,095,549 |
185,316 |
|
|
Sirius Satellite Radio, Inc. (a) |
7,000 |
352 |
|
|
UIH Australia/Pacific, Inc. warrants 5/15/06 (a) |
7,450 |
37 |
|
|
|
185,705 |
||
|
Entertainment - 0.0% |
|||
|
Clubhaus PLC (a) |
98,600 |
59 |
|
|
Leisure Durables & Toys - 0.0% |
|||
|
Brunswick Corp. |
4,600 |
89 |
|
|
TOTAL MEDIA & LEISURE |
185,853 |
||
|
RETAIL & WHOLESALE - 2.2% |
|||
|
Apparel Stores - 0.0% |
|||
|
Merry-Go-Round Enterprises, Inc. (a) |
1,258,700 |
0 |
|
|
Grocery Stores - 2.2% |
|||
|
Pathmark Stores, Inc. (a)(f) |
3,995,220 |
62,675 |
|
|
Pathmark Stores, Inc. warrants 9/19/10 (a) |
762,628 |
3,432 |
|
|
TOTAL RETAIL & WHOLESALE |
66,107 |
||
|
Common Stocks - continued |
|||
|
Shares |
Value (Note 1) (000s) |
||
|
TECHNOLOGY - 0.0% |
|||
|
Electronics - 0.0% |
|||
|
Aavid Thermal Technologies, Inc. warrants 2/1/07 (a)(g) |
2,420 |
$ 0 |
|
|
Photographic Equipment - 0.0% |
|||
|
IMAX Corp. (a) |
197,200 |
971 |
|
|
TOTAL TECHNOLOGY |
971 |
||
|
UTILITIES - 0.1% |
|||
|
Cellular - 0.1% |
|||
|
Leap Wireless International, Inc.: |
|
|
|
|
warrants 4/15/10 (CV ratio 2.503) (a)(g) |
12,465 |
125 |
|
|
warrants 4/15/10 (CV ratio 5.146) (a)(g) |
10,900 |
109 |
|
|
Loral Orion Network Systems, Inc.: |
|
|
|
|
warrants 1/15/07 (CV ratio .47) (a) |
10,000 |
23 |
|
|
warrants 1/15/07 (CV ratio .6) (a) |
5,000 |
16 |
|
|
McCaw International Ltd. warrants 4/16/07 (a)(g) |
55,220 |
828 |
|
|
Orbital Imaging Corp. warrants 3/1/05 (a)(g) |
8,580 |
43 |
|
|
|
1,144 |
||
|
Electric Utility - 0.0% |
|||
|
CMS Energy Corp. |
24,700 |
667 |
|
|
Telephone Services - 0.0% |
|||
|
KMC Telecom Holdings, Inc. warrants 4/15/08 (a)(g) |
2,500 |
5 |
|
|
TOTAL UTILITIES |
1,816 |
||
|
TOTAL COMMON STOCKS (Cost $372,146) |
302,613 |
||
|
Preferred Stocks - 11.5% |
|||
|
|
|
|
|
|
Convertible Preferred Stocks - 0.0% |
|||
|
INDUSTRIAL MACHINERY & EQUIPMENT - 0.0% |
|||
|
Electrical Equipment - 0.0% |
|||
|
Loral Space & Communications Ltd. $3.00 (g) |
80,000 |
1,460 |
|
|
Nonconvertible Preferred Stocks - 11.5% |
|||
|
CONSTRUCTION & REAL ESTATE - 0.3% |
|||
|
Real Estate Investment Trusts - 0.3% |
|||
|
Swerdlow Real Estate Group, Inc.: |
|
|
|
|
junior (i) |
19,817 |
0 |
|
|
mezzanine (i) |
79,800 |
29 |
|
|
senior (i) |
79,800 |
8,816 |
|
|
|
8,845 |
||
|
Preferred Stocks - continued |
|||
|
Shares |
Value (Note 1) (000s) |
||
|
Nonconvertible Preferred Stocks - continued |
|||
|
FINANCE - 0.6% |
|||
|
Credit & Other Finance - 0.0% |
|||
|
American Annuity Group Capital Trust I $2.3125 |
72,565 |
$ 1,742 |
|
|
Insurance - 0.6% |
|||
|
American Annuity Group Capital Trust II 8.875% |
18,557 |
17,682 |
|
|
TOTAL FINANCE |
19,424 |
||
|
MEDIA & LEISURE - 2.8% |
|||
|
Broadcasting - 2.8% |
|||
|
CSC Holdings, Inc. Series M, 11.125% pay-in-kind |
735,606 |
77,974 |
|
|
NTL, Inc. 13% pay-in-kind |
7,355 |
6,472 |
|
|
|
84,446 |
||
|
TECHNOLOGY - 0.3% |
|||
|
Computers & Office Equipment - 0.3% |
|||
|
Ampex Corp. 8% non-cumulative |
6,150 |
9,594 |
|
|
UTILITIES - 7.5% |
|||
|
Cellular - 6.0% |
|||
|
Nextel Communications, Inc.: |
|
|
|
|
11.125% pay-in-kind |
173,702 |
160,674 |
|
|
Series D, 13% pay-in-kind |
22,538 |
22,425 |
|
|
|
183,099 |
||
|
Telephone Services - 1.5% |
|||
|
Intermedia Communications, Inc. 13.5% pay-in-kind |
26,233 |
22,298 |
|
|
XO Communications, Inc.: |
|
|
|
|
$7.00 pay-in-kind |
313,668 |
12,547 |
|
|
13% pay-in-kind |
13,841 |
9,966 |
|
|
|
44,811 |
||
|
TOTAL UTILITIES |
227,910 |
||
|
TOTAL NONCONVERTIBLE PREFERRED STOCKS |
350,219 |
||
|
TOTAL PREFERRED STOCKS (Cost $378,595) |
351,679 |
||
|
Floating Rate Loans - 0.8% |
|||||
|
Moody's Ratings (unaudited) (b) |
Principal Amount (000s) (d) |
Value (Note 1) (000s) |
|||
|
BASIC INDUSTRIES - 0.1% |
|||||
|
Chemicals & Plastics - 0.1% |
|||||
|
Lyondell Chemical Co. sr. secured Tranche E term loan 10.515% 5/17/06 (h) |
- |
|
$ 2,343 |
$ 2,413 |
|
|
CONSTRUCTION & REAL ESTATE - 0.2% |
|||||
|
Building Materials - 0.1% |
|||||
|
Flowserve Corp. Tranche B term loan 10.25% 6/30/08 (h) |
- |
|
1,700 |
1,713 |
|
|
Construction - 0.1% |
|||||
|
Blount, Inc. Tranche B term loan 10.7222% 6/30/06 (h) |
B1 |
|
3,961 |
3,941 |
|
|
TOTAL CONSTRUCTION & REAL ESTATE |
5,654 |
||||
|
DURABLES - 0.1% |
|||||
|
Textiles & Apparel - 0.1% |
|||||
|
Synthetic Industries, Inc. term loan 14.9% 12/13/00 (h) |
- |
|
4,000 |
3,680 |
|
|
HEALTH - 0.1% |
|||||
|
Medical Facilities Management - 0.1% |
|||||
|
Total Renal Care Holdings, Inc. term loan 9.9956% 3/31/03 (h) |
- |
|
4,280 |
4,216 |
|
|
RETAIL & WHOLESALE - 0.0% |
|||||
|
Apparel Store - 0.0% |
|||||
|
Merry-Go-Round Enterprises, Inc. trade claim (c) |
- |
|
7,996 |
0 |
|
|
Merry-Go-Round Enterprises, Inc. term loan (c) |
- |
|
4,129 |
0 |
|
|
|
0 |
||||
|
UTILITIES - 0.3% |
|||||
|
Cellular - 0.1% |
|||||
|
Cook Inlet/Voicestream Op Co. LLC Tranche B term loan 10.63% 12/31/08 (h) |
B2 |
|
4,000 |
4,040 |
|
|
Telephone Services - 0.2% |
|||||
|
McLeodUSA, Inc. Tranche B term loan 9.62% 5/31/08 (h) |
Ba2 |
|
4,900 |
4,894 |
|
|
TOTAL UTILITIES |
8,934 |
||||
|
TOTAL FLOATING RATE LOANS (Cost $35,317) |
24,897 |
||||
|
Cash Equivalents - 12.7% |
|||
|
Maturity Amount (000s) |
Value (Note 1) (000s) |
||
|
Investments in repurchase agreements (U.S. Treasury Obligations), in a joint trading account at: |
|
|
|
|
6.55%, dated 10/31/00 due 11/1/00 |
$ 2,216 |
$ 2,216 |
|
|
6.56%, dated 10/31/00 due 11/1/00 |
384,012 |
383,942 |
|
|
TOTAL CASH EQUIVALENTS (Cost $386,158) |
386,158 |
||
|
TOTAL INVESTMENT PORTFOLIO - 98.3% (Cost $3,460,265) |
3,004,057 |
||
|
NET OTHER ASSETS - 1.7% |
50,846 |
||
|
NET ASSETS - 100% |
$ 3,054,903 |
||
|
Currency Abbreviations |
||
|
CHF |
- |
Swiss franc |
|
Legend |
|
(a) Non-income producing |
|
(b) S&P credit ratings are used in the absence of a rating by Moody's Investors Service, Inc. |
|
(c) Non-income producing - issuer filed for protection under the Federal Bankruptcy Code or is in default of interest payment. |
|
(d) Principal amount is stated in United States dollars unless otherwise noted. |
|
(e) Debt obligation initially issued in zero coupon form which converts to coupon form at a specified rate and date. The rate shown is the rate at period end. |
|
(f) Affiliated company |
|
(g) Security exempt from registration under Rule 144A of the Securities Act of 1933. These securities may be resold in transactions exempt from registration, normally to qualified institutional buyers. At the period end, the value of these securities amounted to $198,640,000 or 6.5% of net assets. |
|
(h) The coupon rate shown on floating or adjustable rate securities represents the rate at period end. |
|
(i) Restricted securities - Investment in securities not registered under the Securities Act of 1933. |
|
Additional information on each holding |
|
Security |
Acquisition Date |
Acquisition Cost (000s) |
|
Merry-Go-Round Enterprises, Inc.: 0% 5/16/98 |
3/1/94 - 3/24/94 |
$ 7,680 |
|
7.09% 9/1/03 |
3/21/94 |
$ 6,450 |
|
Micron Technology, Inc. 6.5% 9/30/05 |
3/3/99 |
$ 3,096 |
|
Swerdlow |
1/15/99 |
$ 11 |
|
Class B |
1/15/99 |
$ 3 |
|
junior |
1/15/99 |
$ 3 |
|
mezzanine |
1/15/99 |
$ 79 |
|
senior |
1/15/99 |
$ 7,619 |
|
(j) Share amount represents number of units held. |
|
Other Information |
|
The composition of long-term debt holdings as a percentage of total value of investments in securities, is as follows (ratings are unaudited): |
|
Moody's Ratings |
S&P Ratings |
|||
|
Aaa, Aa, A |
0.0% |
|
AAA, AA, A |
0.0% |
|
Baa |
0.5% |
|
BBB |
0.8% |
|
Ba |
5.9% |
|
BB |
5.0% |
|
B |
49.6% |
|
B |
48.1% |
|
Caa |
4.7% |
|
CCC |
6.8% |
|
Ca, C |
0.2% |
|
CC, C |
0.1% |
|
|
|
|
D |
0.3% |
|
The percentage not rated by Moody's or S&P amounted to 2.0%. FMR has determined that unrated debt securities that are lower quality account for 2.0% of the total value of investment in securities. |
|
Distribution of investments by country of issue, as a percentage of total net assets, is as follows: |
|
United States of America |
89.2% |
|
United Kingdom |
4.2 |
|
Mexico |
2.5 |
|
Bermuda |
1.8 |
|
Netherlands |
1.7 |
|
Others (individually less than 1%) |
0.6 |
|
|
100.0% |
|
Income Tax Information |
|
At October 31, 2000, the aggregate cost of investment securities for income tax purposes was $3,461,503,000. Net unrealized depreciation aggregated $457,446,000, of which $36,102,000 related to appreciated investment securities and $493,548,000 related to depreciated investment securities. |
See accompanying notes which are an integral part of the financial statements.
Semiannual Report
Statement of Assets and Liabilities
|
Amounts in thousands (except per-share amount) |
October 31, 2000 |
|
|
Assets |
|
|
|
Investment in securities, at value (including repurchase agreements of $386,158) (cost $3,460,265) - |
|
$ 3,004,057 |
|
Receivable for investments sold |
|
34,735 |
|
Receivable for fund shares sold |
|
12,385 |
|
Dividends receivable |
|
493 |
|
Interest receivable |
|
48,745 |
|
Redemption fees receivable |
|
2 |
|
Other receivables |
|
673 |
|
Total assets |
|
3,101,090 |
|
Liabilities |
|
|
|
Payable to custodian bank |
$ 1,442 |
|
|
Payable for investments purchased |
9,982 |
|
|
Payable for fund shares redeemed |
26,835 |
|
|
Distributions payable |
2,958 |
|
|
Accrued management fee |
1,495 |
|
|
Other payables and accrued expenses |
3,475 |
|
|
Total liabilities |
|
46,187 |
|
Net Assets |
|
$ 3,054,903 |
|
Net Assets consist of: |
|
|
|
Paid in capital |
|
$ 3,544,726 |
|
Undistributed net investment income |
|
83,303 |
|
Accumulated undistributed net realized gain (loss) on investments and foreign currency transactions |
|
(116,923) |
|
Net unrealized appreciation (depreciation) on investments |
|
(456,203) |
|
Net Assets, for 365,482 shares outstanding |
|
$ 3,054,903 |
|
Net Asset Value, offering price and redemption price |
|
$8.36 |
See accompanying notes which are an integral part of the financial statements.
Semiannual Report
Financial Statements - continued
Statement of Operations
|
Amounts in thousands |
Six months ended October 31, 2000 |
|
|
Investment Income Dividends |
|
$ 19,033 |
|
Interest |
|
147,588 |
|
Security lending |
|
3 |
|
Total income |
|
166,624 |
|
Expenses |
|
|
|
Management fee |
$ 9,097 |
|
|
Transfer agent fees |
2,598 |
|
|
Accounting and security lending fees |
381 |
|
|
Non-interested trustees' compensation |
10 |
|
|
Custodian fees and expenses |
42 |
|
|
Registration fees |
59 |
|
|
Audit |
72 |
|
|
Legal |
73 |
|
|
Interest |
1 |
|
|
Miscellaneous |
40 |
|
|
Total expenses before reductions |
12,373 |
|
|
Expense reductions |
(261) |
12,112 |
|
Net investment income |
|
154,512 |
|
Realized and Unrealized Gain (Loss) Net realized gain (loss) on: |
|
|
|
Investment securities (including realized gain |
(109,425) |
|
|
Foreign currency transactions |
(5) |
(109,430) |
|
Change in net unrealized appreciation (depreciation) on investment securities |
|
(196,620) |
|
Net gain (loss) |
|
(306,050) |
|
Net increase (decrease) in net assets resulting |
|
$ (151,538) |
See accompanying notes which are an integral part of the financial statements.
Semiannual Report
Financial Statements - continued
Statement of Changes in Net Assets
|
Amounts in thousands |
Six months ended
October 31, |
Year ended |
|
Increase (Decrease) in Net Assets |
|
|
|
Operations |
$ 154,512 |
$ 252,756 |
|
Net realized gain (loss) |
(109,430) |
136,088 |
|
Change in net unrealized appreciation (depreciation) |
(196,620) |
(363,597) |
|
Net increase (decrease) in net assets resulting |
(151,538) |
25,247 |
|
Distributions to shareholders |
(132,238) |
(214,705) |
|
From net realized gain |
- |
(137,243) |
|
Total distributions |
(132,238) |
(351,948) |
|
Share transactions |
517,053 |
1,166,434 |
|
Reinvestment of distributions |
115,810 |
313,113 |
|
Cost of shares redeemed |
(474,396) |
(564,990) |
|
Net increase (decrease) in net assets resulting |
158,467 |
914,557 |
|
Redemption fees |
1,421 |
2,149 |
|
Total increase (decrease) in net assets |
(123,888) |
590,005 |
|
Net Assets |
|
|
|
Beginning of period |
3,178,791 |
2,588,786 |
|
End of period (including undistributed net investment income of $83,303 and $61,029, respectively) |
$ 3,054,903 |
$ 3,178,791 |
|
Other Information Shares |
|
|
|
Sold |
58,340 |
122,983 |
|
Issued in reinvestment of distributions |
13,233 |
32,855 |
|
Redeemed |
(54,027) |
(59,531) |
|
Net increase (decrease) |
17,546 |
96,307 |
See accompanying notes which are an integral part of the financial statements.
Semiannual Report
Financial Highlights
|
|
Six months ended October 31, |
Years ended April 30, |
||||
|
|
2000 |
2000 |
1999 |
1998 |
1997 |
1996 |
|
Selected Per-Share Data |
|
|
|
|
|
|
|
Net asset value,
beginning |
$ 9.140 |
$ 10.290 |
$ 10.680 |
$ 9.280 |
$ 9.340 |
$ 9.170 |
|
Income from Invest- |
.432 D |
.872 D |
.863 D |
.721 D |
.605 D |
.902 |
|
Net realized |
(.846) |
(.799) |
(.024) |
1.385 |
.093 |
.119 |
|
Total from investment operations |
(.414) |
.073 |
.839 |
2.106 |
.698 |
1.021 |
|
Less Distributions |
|
|
|
|
|
|
|
From net investment income |
(.370) |
(.743) E |
(.974) |
(.710) |
(.762) |
(.724) |
|
In excess of net
investment |
- |
- |
- |
- |
- |
(.133) |
|
From net |
- |
(.487) E |
(.260) |
- |
- |
- |
|
Total distributions |
(.370) |
(1.230) |
(1.234) |
(.710) |
(.762) |
(.857) |
|
Redemption fees
added to paid |
.004 |
.007 |
.005 |
.004 |
.004 |
.006 |
|
Net asset value, |
$ 8.360 |
$ 9.140 |
$ 10.290 |
$ 10.680 |
$ 9.280 |
$ 9.340 |
|
Total Return B, C |
(4.60)% |
.94% |
9.34% |
23.59% |
7.88% |
11.72% |
|
Ratios and Supplemental Data |
|
|
|
|
|
|
|
Net assets, |
$ 3,055 |
$ 3,179 |
$ 2,589 |
$ 2,356 |
$ 2,041 |
$ 2,270 |
|
Ratio of expenses |
.78% A |
.83% |
.82% |
.83% |
.87% |
.98% |
|
Ratio of expenses |
.76% A, F |
.82% F |
.81% F |
.82% F |
.86% F |
.98% |
|
Ratio of net invest- |
9.70% A |
9.09% |
8.84% |
7.23% |
6.53% |
8.03% |
|
Portfolio turnover rate |
65% A |
88% |
125% |
179% |
309% |
119% |
A Annualized
B Total returns for periods of less than one year are not annualized.
C The total returns would have been lower had certain expenses not been reduced during the periods shown.
D Net investment income per share has been calculated based on average shares outstanding during the period.
E The amounts shown reflect certain reclassifications related to book to tax differences.
F FMR or the fund has entered into varying arrangements with third parties who either paid or reduced a portion of the fund's expenses.
See accompanying notes which are an integral part of the financial statements.
Semiannual Report
For the period ended October 31, 2000
1. Significant Accounting Policies.
Fidelity Capital & Income Fund (the fund) is a fund of Fidelity Summer Street Trust (the trust) and is authorized to issue an unlimited number of shares. The trust is registered under the Investment Company Act of 1940, as amended, as an open-end management investment company organized as a Massachusetts business trust. The financial statements have been prepared in conformity with generally accepted accounting principles which require management to make certain estimates and assumptions at the date of the financial statements. The following summarizes the significant accounting policies of the fund:
Security Valuation. Securities for which quotations are readily available are valued by a pricing service at their market values as determined by their most recent bid prices in the principal market (sales prices if the principal market is an exchange) in which such securities are normally traded. Securities (including restricted securities) for which market quotations are not readily available are valued at their fair value as determined in good faith under consistently applied procedures under the general supervision of the Board of Trustees. Short-term securities with remaining maturities of sixty days or less for which quotations are not readily available are valued at amortized cost or original cost plus accrued interest, both of which approximate current value. Investments in open-end investment companies are valued at their net asset value each business day.
Foreign Currency Translation. The accounting records of the fund are maintained in U.S. dollars. Investment securities and other assets and liabilities denominated in a foreign currency are translated into U.S. dollars at the prevailing rates of exchange at period end. Purchases and sales of securities, income receipts and expense payments are translated into U.S. dollars at the prevailing exchange rate on the respective dates of the transactions.
Net realized gains and losses on foreign currency transactions represent net gains and losses from sales and maturities of foreign currency contracts, disposition of foreign currencies, the difference between the amount of net investment income accrued and the U.S. dollar amount actually received, and gains and losses between trade and settlement date on purchases and sales of securities. The effects of changes in foreign currency exchange rates on investments in securities are included with the net realized and unrealized gain or loss on investment securities.
Income Taxes. As a qualified regulated investment company under Subchapter M of the Internal Revenue Code, the fund is not subject to income taxes to the extent that it distributes substantially all of its taxable income for its fiscal year. The schedule of investments includes information regarding income taxes under the caption "Income Tax Information."
Investment Income. Dividend income is recorded on the ex-dividend date, except certain dividends from foreign securities where the ex-dividend date may have passed, are recorded as soon as the fund is informed of the ex-dividend date. Non-cash dividends included in dividend income, if
Semiannual Report
Notes to Financial Statements - continued
1. Significant Accounting Policies - continued
Investment Income - continued
any, are recorded at the fair market value of the securities received. Interest income, which includes accretion of original issue discount, is accrued as earned. Investment income is recorded net of foreign taxes withheld where recovery of such taxes is uncertain. The fund may place a debt obligation on non-accrual status and reduce related interest income by ceasing current accruals and writing off interest receivables when the collection of all or a portion of interest has become doubtful based on consistently applied procedures, under the general supervision of the Board of Trustees of the fund. A debt obligation is removed from non-accrual status when the issuer resumes interest payments or when collectibility of interest is reasonably assured.
Deferred Trustee Compensation. Under a Deferred Compensation Plan (the Plan) non-interested Trustees must defer receipt of a portion of, and may elect to defer receipt of an additional portion of, their annual compensation. Deferred amounts are treated as though equivalent dollar amounts had been invested in a cross-section of other Fidelity funds. Deferred amounts remain in the fund until distributed in accordance with the Plan.
Distributions to Shareholders. Dividends are declared daily and paid monthly from net investment income. Distributions from realized gains on investments, if any, are recorded on the ex-dividend date.
Income and capital gain distributions are determined in accordance with income tax regulations which may differ from generally accepted accounting principles. These differences, which may result in distribution reclassifications, are primarily due to differing treatments for litigation proceeds, foreign currency transactions, passive foreign investment companies (PFIC), market discount, partnerships, non-taxable dividends, and losses deferred due to wash sales and excise tax regulations.
Permanent book and tax basis differences relating to shareholder distributions will result in reclassifications to paid in capital. Undistributed net investment income and accumulated undistributed net realized gain (loss) on investments and foreign currency transactions may include temporary book and tax basis differences which will reverse in a subsequent period. Any taxable income or gain remaining at fiscal year end is distributed in the following year.
Short-Term Trading (Redemption) Fees. Shares held in the fund less than 270 days are subject to a short-term trading fee equal to 1.00% of the proceeds of the redeemed shares. Redemptions on or prior to September 27, 2000 of shares held less than 365 days were subject to a short-term trading fee equal to 1.50% of the proceeds of the redeemed shares. The fee, which is retained by the fund, is accounted for as an addition to paid in capital.
Security Transactions. Security transactions are accounted for as of trade date. Gains and losses on securities sold are determined on the basis of identified cost.
Semiannual Report
Notes to Financial Statements - continued
2. Operating Policies.
Foreign Currency Contracts. The fund generally uses foreign currency contracts to facilitate transactions in foreign-denominated securities. Losses may arise from changes in the value of the foreign currency or if the counterparties do not perform under the contracts' terms. The U.S. dollar value of foreign currency contracts is determined using contractual currency exchange rates established at the time of each trade.
Joint Trading Account. Pursuant to an Exemptive Order issued by the Securities and Exchange Commission (the SEC), the fund, along with other affiliated entities of Fidelity Management & Research Company (FMR), may transfer uninvested cash balances into one or more joint trading accounts. These balances are invested in one or more repurchase agreements for U.S. Treasury or Federal Agency obligations.
Repurchase Agreements. The underlying U.S. Treasury, Federal Agency, or other obligations found to be satisfactory by FMR are transferred to an account of the fund, or to the Joint Trading Account, at a custodian bank. The securities are marked-to-market daily and maintained at a value at least equal to the principal amount of the repurchase agreement (including accrued interest). FMR, the fund's investment adviser, is responsible for determining that the value of the underlying securities remains in accordance with the market value requirements stated above.
Interfund Lending Program. Pursuant to an Exemptive Order issued by the SEC, the fund, along with other registered investment companies having management contracts with FMR, may participate in an interfund lending program. This program provides an alternative credit facility allowing the fund to borrow from, or lend money to, other participating funds.
Restricted Securities. The fund is permitted to invest in securities that are subject to legal or contractual restrictions on resale. These securities generally may be resold in transactions exempt from registration or to the public if the securities are registered. Disposal of these securities may involve time-consuming negotiations and expense, and prompt sale at an acceptable price may be difficult. At the end of the period, restricted securities (excluding 144A issues) amounted to $12,165,000 or 0.4% of net assets.
Loans and Other Direct Debt Instruments. The fund is permitted to invest in loans and loan participations, trade claims or other receivables. These investments may include standby financing commitments that obligate the fund to supply additional cash to the borrower on demand. Loan participations involve a risk of insolvency of the lending bank or other financial intermediary. At the end of the period, these investments amounted to $24,897,000 or 0.8% of net assets.
3. Purchases and Sales of Investments.
Purchases and sales of securities, other than short-term securities, aggregated $917,115,000 and $991,466,000, respectively.
Semiannual Report
Notes to Financial Statements - continued
4. Fees and Other Transactions with Affiliates.
Management Fee. As the fund's investment adviser, FMR receives a monthly fee that is calculated on the basis of a group fee rate plus a fixed individual fund fee rate applied to the average net assets of the fund. The group fee rate is the weighted average of a series of rates and is based on the monthly average net assets of all the mutual funds advised by FMR. The rates ranged from .0920% to .3700% for the period. The annual individual fund fee rate is .45%. In the event that these rates were lower than the contractual rates in effect during the period, FMR voluntarily implemented the above rates, as they resulted in the same or a lower management fee. For the period, the management fee was equivalent to an annualized rate of .58% of average net assets.
Sub-Adviser Fee. Beginning January 1, 2001, FMR Co.(FMRC) will serve as sub-adviser for the fund. FMRC is a wholly owned subsidiary of FMR and will receive a fee from FMR of 50% of the management fee payable to FMR with respect to that portion of the fund's assets that will be managed by FMRC.
Transfer Agent Fees. Fidelity Service Company, Inc. (FSC), an affiliate of FMR, is the fund's transfer, dividend disbursing and shareholder servicing agent. FSC receives account fees and asset-based fees that vary according to account size and type of account. FSC pays for typesetting, printing and mailing of all shareholder reports, except proxy statements. For the period, the transfer agent fees were equivalent to an annualized rate of .16% of average net assets.
Accounting and Security Lending Fees. FSC maintains the fund's accounting records and administers the security lending program. The security lending fee is based on the number and duration of lending transactions. The accounting fee is based on the level of average net assets for the month plus out-of-pocket expenses.
Brokerage Commissions. The fund placed a portion of its portfolio transactions with brokerage firms which are affiliates of FMR. The commissions paid to these affiliated firms were $13,000 for the period.
5. Interfund Lending Program.
The fund participated in the interfund lending program as a lender. The average daily loan balance during the period for which the loan was outstanding amounted to $66,903,000. The weighted average interest rate was 6.6%. Interest earned from the interfund lending program amounted to $37,000 and is included in interest income on the Statement of Operations. At period end there were no interfund loans outstanding.
6. Security Lending.
The fund lends portfolio securities from time to time in order to earn additional income. The fund receives collateral in the form of U.S. Treasury obligations, letters of credit, and/or cash against the loaned securities, and maintains collateral in an amount not less than 100% of the market value of the loaned securities during the period of the loan. The market value of the loaned securities is determined at the close of business of the fund and any additional required collateral is delivered to the fund on the next business day. If the borrower defaults on its obligation to return the
Semiannual Report
Notes to Financial Statements - continued
6. Security Lending - continued
securities loaned because of insolvency or other reasons, the fund could experience delays and costs in recovering the securities loaned or in gaining access to the collateral. At period end there were no security loans outstanding.
7. Bank Borrowings.
The fund is permitted to have bank borrowings for temporary or emergency purposes to fund shareholder redemptions. The fund has established borrowing arrangements with certain banks. The interest rate on the borrowings is the bank's base rate, as revised from time to time. The average daily loan balance during the period for which the loan was outstanding amounted to $5,300,000. The weighted average interest rate was 7.0%. At period end there were no bank borrowings outstanding.
8. Expense Reductions.
FMR has directed certain portfolio trades to brokers who paid a portion of the fund's expenses. For the period, the fund's expenses were reduced by $201,000 under this arrangement.
In addition, through arrangements with the fund's custodian and transfer agent, credits realized as a result of uninvested cash balances were used to reduce a portion of the fund's expenses. During the period, the fund's custodian and transfer agent fees were reduced by $14,000 and $46,000 respectively, under these arrangements.
9. Transactions with Affiliated Companies.
An affiliated company is a company in which the fund has ownership of at least 5% of the voting securities. Transactions during the period with companies which are or were affiliates are as follows:
|
Summary of Transactions with Affiliated Companies |
||||||||
|
Amounts in thousands Affiliate |
|
Purchase |
|
Sales |
|
Dividend |
|
Value |
|
Chesapeake Energy Corp. |
|
$ - |
|
$ 397 |
|
$ - |
|
$ - |
|
Pathmark Stores, Inc. |
|
- |
|
1,486 |
|
- |
|
62,675 |
|
TOTALS |
|
$ - |
|
$ 1,883 |
|
$ - |
|
$ 62,675 |
Semiannual Report
To the Trustees of Fidelity Summer Street Trust and the Shareholders of Fidelity Capital & Income Fund:
In our opinion, the accompanying statement of assets and liabilities, including the schedule of investments, and the related statements of operations and of changes in net assets and the financial highlights present fairly, in all material respects, the financial position of Fidelity Capital & Income Fund (a fund of Fidelity Summer Street Trust) at October 31, 2000, and the results of its operations, the changes in its net assets and the financial highlights for the periods indicated, in conformity with accounting principles generally accepted in the United States of America. These financial statements and financial highlights (hereafter referred to as "financial statements") are the responsibility of the Fidelity Capital & Income Fund's management; our responsibility is to express an opinion on these financial statements based on our audits. We conducted our audits of these financial statements in accordance with auditing standards generally accepted in the United States of America which require that we plan and perform the audit to obtain reasonable assurance about whether the financial statements are free of material misstatement. An audit includes examining, on a test basis, evidence supporting the amounts and disclosures in the financial statements, assessing the accounting principles used and significant estimates made by management, and evaluating the overall financial statement presentation. We believe that our audits, which included confirmation of securities at October 31, 2000 by correspondence with the custodian and brokers, provide a reasonable basis for our opinion.
PricewaterhouseCoopers LLP
Boston, Massachusetts
December 8, 2000
Annual Report
Fidelity offers several ways to conveniently manage your personal investments via your telephone or PC. You can access your account information, conduct trades and research your investments 24 hours a day.
By Phone
Fidelity Automated Service Telephone provides a single toll-free number to access account balances, positions, quotes and trading. It's easy to navigate the service, and on your first call, the system will help you create a personal identification number (PIN) for security.
(phone_graphic)
Fidelity Automated
Service Telephone (FAST®)
1-800-544-5555
Press
1 For mutual fund and brokerage trading.
2 For quotes.*
3 For account balances and holdings.
4 To review orders and mutual
fund activity.
5 To change your PIN.
*0 To speak to a Fidelity representative.
By PC
Fidelity's web site on the Internet provides a wide range of information, including daily financial news, fund performance, interactive planning tools and news about Fidelity products and services.
(computer_graphic)
Fidelity's Web Site
www.fidelity.com
If you are not currently on the Internet, call EarthLink Sprint at 1-800-288-2967, and be sure to ask for registration number SMD004 to receive a special Fidelity package that includes 30 days of free Internet access. EarthLink is North America's #1 independent Internet access provider.
(computer_graphic)
Fidelity On-line Xpress+®
Fidelity On-line Xpress+ software for Windows combines comprehensive portfolio management capabilities, securities trading and access to research and analysis tools . . . all on your desktop. Call Fidelity at 1-800-544-0240 or visit our web site for more information on how to manage your investments via your PC.
* When you call the quotes line, please remember that a fund's yield and return will vary and, except for money market funds, share price will also vary. This means that you may have a gain or loss when you sell your shares. There is no assurance that money market funds will be able to maintain a stable $1 share price; an investment in a money market fund is not insured or guaranteed by the U.S. government. Total returns are historical and include changes in share price, reinvestment of dividends and capital gains, and the effects of any sales charges.
Semiannual Report
Investment Adviser
Fidelity Management & Research Company
Boston, MA
Investment Sub-Advisers
Fidelity Management & Research (U.K.) Inc.
Fidelity Management & Research
(Far East) Inc.
Fidelity Investments Japan Limited
Officers
Edward C. Johnson 3d, President
Robert C. Pozen, Senior Vice President
Robert A. Lawrence, Vice President
David L. Glancy, Vice President
Eric D. Roiter, Secretary
Robert A. Dwight, Treasurer
Maria F. Dwyer, Deputy Treasurer
John H. Costello, Assistant Treasurer
Thomas J. Simpson, Assistant Treasurer
Board of Trustees
Ralph F. Cox *
Phyllis Burke Davis *
Robert M. Gates *
Edward C. Johnson 3d
Donald J. Kirk *
Ned C. Lautenbach *
Peter S. Lynch
Marvin L. Mann *
William O. McCoy *
Gerald C. McDonough *
Robert C. Pozen
Thomas R. Williams *
Advisory Board
J. Michael Cook
Abigail P. Johnson
Marie L. Knowles
General Distributor
Fidelity Distributors Corporation
Boston, MA
* Independent trustees
Transfer and Shareholder
Servicing Agent
Fidelity Service Company, Inc.
Boston, MA
Custodian
The Bank of New York
New York, NY
Fidelity's Taxable Bond Funds
Capital & Income
Ginnie Mae
Government Income
High Income
Intermediate Bond
Intermediate Government Income
International Bond
Investment Grade Bond
New Markets Income
Short-Term Bond
Spartan® Government Income
Spartan Investment Grade Bond
Strategic Income
Target TimelineSM 2001 & 2003
The Fidelity Telephone Connection
Mutual Fund 24-Hour Service
Exchanges/Redemptions
and Account Assistance 1-800-544-6666
Product Information 1-800-544-6666
Retirement Accounts 1-800-544-4774
(8 a.m. - 9 p.m.)
TDD Service 1-800-544-0118
for the deaf and hearing impaired
(9 a.m. - 9 p.m. Eastern time)
Fidelity Automated Service
Telephone (FAST®) (automated graphic) 1-800-544-5555
(automated graphic) Automated line for quickest service
CAI-SANN-1200 118646
1.538653.103
(Fidelity Investment logo)(registered trademark)
Corporate Headquarters
82 Devonshire St., Boston, MA 02109
www.fidelity.com
|
|