
|
|
|
|
|
|
|
|
|
Fidelity®
Annual Report
October 31, 2000
(2_fidelity_logos)
|
President's Message |
3 |
Ned Johnson on investing strategies. |
|
Performance |
4 |
How the fund has done over time. |
|
Fund Talk |
6 |
The manager's review of fund performance, strategy and outlook. |
|
Investment Changes |
9 |
A summary of major shifts in the fund's investments over the past six months. |
|
Investments |
10 |
A complete list of the fund's investments with their market values. |
|
Financial Statements |
18 |
Statements of assets and liabilities,
operations, and changes in net assets, |
|
Notes |
22 |
Notes to the financial statements. |
|
Independent Auditors' Report |
26 |
The auditors' opinion. |
|
Distributions |
27 |
|
Standard & Poor's, S&P and S&P 500 are registered service marks of The McGraw-Hill Companies, Inc. and have been licensed for use by Fidelity Distributors Corporation.
Other third party marks appearing herein are the property of their respective owners.
All other marks appearing herein are registered or unregistered trademarks or service marks of FMR Corp. or an affiliated company.
(Recycle graphic) This report is printed on recycled paper using soy-based inks.
This report and the financial statements contained herein are submitted for the general information of the shareholders of the fund. This report is not authorized for distribution to prospective investors in the fund unless preceded or accompanied by an effective prospectus.
Mutual fund shares are not deposits or obligations of, or guaranteed by, any depository institution. Shares are not insured by the FDIC, Federal Reserve Board or any other agency, and are subject to investment risks, including possible loss of principal amount invested.
Neither the fund nor Fidelity Distributors Corporation is a bank.
For more information on any Fidelity fund, including charges and expenses, call 1-800-544-6666 for a free prospectus. Read it carefully before you invest or send money.
Annual Report
(Photograph of Edward C. Johnson 3d.)
Dear Shareholder:
A sixth-straight year of double-digit positive returns for the Dow Jones Industrial Average, NASDAQ and S&P 500® could be in jeopardy unless the U.S. stock market shows marked improvement in the final two months of 2000. Through October, all three indexes had negative year-to-date returns. On the other hand, most fixed-income sectors were solidly in the black. Treasuries and other long-term government securities led the way, returning nearly 14%.
While it's impossible to predict the future direction of the markets with any degree of certainty, there are certain basic principles that can help investors plan for their future needs.
First, investors are encouraged to take a long-term view of their portfolios. If you can afford to leave your money invested through the inevitable up and down cycles of the financial markets, you will greatly reduce your vulnerability to any single decline. We know from experience, for example, that stock prices have gone up over longer periods of time, have significantly outperformed other types of investments and have stayed ahead of inflation.
Second, you can further manage your investing risk through diversification. A stock mutual fund, for instance, is already diversified, because it invests in many different companies. You can increase your diversification further by investing in a number of different stock funds, or in such other investment categories as bonds. If you have a short investment time horizon, you might want to consider moving some of your investment into a money market fund, which seeks income and a stable share price by investing in high-quality, short-term investments. Of course, it's important to remember that an investment in a money market fund is not insured or guaranteed by the Federal Deposit Insurance Corporation or any other government agency. Although money market funds seek to preserve the value of your investment at $1.00 per share, it is possible to lose money by investing in these types of funds.
Finally, no matter what your time horizon or portfolio diversity, it makes good sense to follow a regular investment plan, investing a certain amount of money in a fund at the same time each month or quarter and periodically reviewing your overall portfolio. By doing so, you won't get caught up in the excitement of a rapidly rising market, nor will you buy all your shares at market highs. While this strategy - known as dollar cost averaging - won't assure a profit or protect you from a loss in a declining market, it should help you lower the average cost of your purchases. Of course, you should consider your financial ability to continue your purchases through periods of low price levels before undertaking such a strategy.
If you have questions, please call us at 1-800-544-6666, or visit our web site at www.fidelity.com. We are available 24 hours a day, seven days a week to provide you the information you need to make the investments that are right for you.
Best regards,
/s/Edward C. Johnson 3d
Edward C. Johnson 3d
Annual Report
There are several ways to evaluate a fund's historical performance. You can look at the total percentage change in value, the average annual percentage change or the growth of a hypothetical $10,000 investment. Total return reflects the change in the value of an investment, assuming reinvestment of the fund's dividend income and capital gains (the profits earned upon the sale of securities that have grown in value).
Cumulative Total Returns
|
Periods ended October 31, 2000 |
|
Past 1 |
Past 5 |
Past 10 |
|
Fidelity Stock Selector |
|
11.54% |
118.83% |
552.27% |
|
S&P 500 ® |
|
6.09% |
166.65% |
491.03% |
|
Growth Funds Average |
|
15.32% |
149.69% |
469.58% |
Cumulative total returns show the fund's performance in percentage terms over a set period - in this case, one year, five years or 10 years. For example, if you had invested $1,000 in a fund that had a 5% return over the past year, the value of your investment would be $1,050. You can compare the fund's returns to the performance of the Standard & Poor's 500SM Index - a market capitalization-weighted index of common stocks. To measure how the fund's performance stacked up against its peers, you can compare it to the growth funds average, which reflects the performance of mutual funds with similar objectives tracked by Lipper Inc. The past one year average represents a peer group of 1,351 mutual funds. These benchmarks include reinvested dividends and capital gains, if any, and exclude the effect of sales charges. Lipper has created new comparison categories that group funds according to portfolio characteristics and capitalization, as well as by capitalization only. These averages are listed on page 5 of this report.(dagger)
Average Annual Total Returns
|
Periods ended October 31, 2000 |
|
Past 1 |
Past 5 |
Past 10 |
|
Fidelity Stock Selector |
|
11.54% |
16.96% |
20.63% |
|
S&P 500 |
|
6.09% |
21.67% |
19.44% |
|
Growth Funds Average |
|
15.32% |
19.59% |
18.47% |
Average annual total returns take the fund's cumulative return and show you what would have happened if the fund had performed at a constant rate each year. (Note: Lipper calculates average annual total returns by annualizing each fund's total return, then taking an arithmetic average. This may produce a different figure than that obtained by averaging the cumulative total returns and annualizing the result.)
Annual Report
$10,000 Over 10 Years
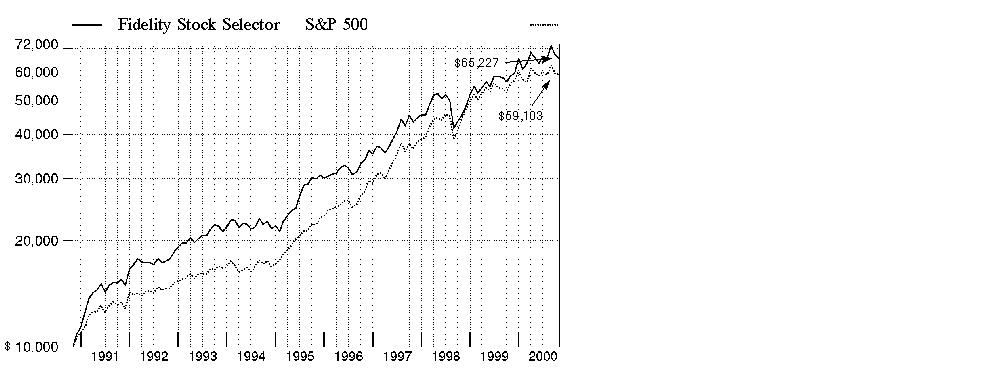
$10,000 Over 10 Years: Let's say hypothetically that $10,000 was invested in Fidelity Stock Selector on October 31, 1990. As the chart shows, by October 31, 2000, the value of the investment would have grown to $65,227 - a 552.27% increase on the initial investment. For comparison, look at how the Standard & Poor's 500 Index did over the same period. With dividends and capital gains, if any, reinvested, the same $10,000 would have grown to $59,103 - a 491.03% increase.
Understanding
Performance
How a fund did yesterday is no guarantee of how it will do tomorrow. The stock market, for example, has a history of long-term growth and short-term volatility. In turn, the share price and return of a fund that invests in stocks will vary. That means if you sell your shares during a market downturn, you might lose money. But if you can ride out the market's ups and downs, you may have a gain.
3* The Lipper multi-cap core funds average reflects the performance (excluding sales charges) of mutual funds with similar portfolio characteristics and capitalization. The Lipper multi-cap supergroup average reflects the performance (excluding sales charges) of mutual funds with similar capitalization. As of October 31, 2000, the one year, five year, and 10 year cumulative total returns for the multi-cap core funds average were 14.61%, 135.22%, and 441.13%, respectively; and the one year, five year, and 10 year average annual total returns were 14.61%, 18.38%, and 17.96%, respectively. The one year, five year, and 10 year cumulative total returns for the multi-cap supergroup average were 19.65%, 141.87%, and 463.06%, respectively; and the one year, five year, and 10 year average annual total returns were 19.65%, 18.73%, and 18.22%, respectively.
Annual Report
Market Recap
The U.S. equity markets went from hot to cold during the 12-month period that ended October 31, 2000. At the period's onset, strong enthusiasm for technology and telecommunication stocks lifted the performance of those and other stocks related to the so-called "new economy." In March and April, a sharp correction in those sectors nudged investors toward more traditional industries, such as pharmaceuticals and financials. However, the broadening of the market was brief. In May, the Federal Reserve Board raised key interest rates to their highest levels in nine years in a move designed to prevent inflation. It was the Fed's fourth consecutive rate hike during the period. Higher rates, coupled with the highest oil prices in a decade and the declining value of the euro, collectively exacted a toll on corporate profits. This slowdown was particularly evident in the third quarter, as many companies revised earnings on the downside. The emergence of these factors during the past six months hampered the one-year returns of the major U.S. equity indices. The NASDAQ Composite Index ended the 12-month period with a 13.81% gain. Small-cap stocks, as represented by the Russell 2000® Index, returned 17.41%. The Standard & Poor's 500SM Index, an index of 500 larger companies, advanced 6.09%. Investors were less enamored with blue-chip industrial stocks, as the Dow Jones Industrial Average rose 3.82%.
(Portfolio Manager photograph)
An interview with Bob Kuo, Portfolio Manager of Fidelity Stock Selector Fund
Q. How did the fund perform, Bob?
A. For the 12 months ending October 31, 2000, the fund returned 11.54%. During the same period, the Standard & Poor's 500 Index returned 6.09% and the growth funds average tracked by Lipper Inc. returned 15.32%.
Q. Why did the fund outperform the S&P 500 but trail its peers?
A. The answer lies in the strong performance of the technology sector during the first half of the period. The fund overweighted technology compared to the index, which led to the fund's outperformance of the S&P 500. During the last six months of the period, when technology stocks were hit hard, the fund made up ground versus the peer group, which overweighted technology stocks relative to the fund. However, the fund was unable to overcome the strong results of its peers during the first six months.
Q. Were there any specific sectors that helped or hurt the fund?
A. Despite the technology sell-off, our strong stock selection in the sector helped performance during the past 12 months. Since the NASDAQ reached a high of over 5000 in March, it dropped more than 30% in about a 10-week period and hasn't really recovered since. In this kind of environment success lies in avoiding the big losers, as opposed to picking the winners. Fortunately, the fund was underweighted or completely out of many of the large technology companies that announced negative earnings surprises, so when the value of those stocks declined dramatically, the fund's downside was limited. In the utilities sector, I overweighted the traditional electric and gas companies, which performed well as demand for electricity skyrocketed during a hot summer and deregulation in some states caused some sources of supply to become disrupted. Within the finance sector, the fund's overweighted positions in brokerage firms added to performance due to a strong capital markets environment and increased trading volumes. In the energy sector, the big story was the increase in oil prices to nearly $40 a barrel by mid-September, which positively affected the sector overall and helped the fund's energy picks.
Annual Report
Fund Talk: The Manager's Overview - continued
Q. Which stocks added to the fund's performance?
A. We overweighted Merrill Lynch, which turned out to be one of the top performers for the fund. The company benefited from its brokerage and trading businesses as a result of heavy stock market activity, strong investment banking revenues and the implementation of a cost-cutting program to improve margins. Qualcomm, which in our report to shareholders six months ago was the fund's top contributor, dropped considerably since then because of concerns about whether its technology would be adopted overseas. I successfully reduced the holding from an overweighted position near the high, and got out of it entirely before the stock went bad. Similarly, Applied Materials, a semiconductor equipment manufacturer, also was a stellar performer for the first six months of the period, at which point I sold most of the stock. As a result, Qualcomm and Applied Materials added to the fund's relative performance over the course of the year.
Q. What stocks detracted from performance?
A. Oracle performed well for most of the year but got caught in the September/October market correction. The company reported good earnings numbers but fell short of growth estimates for licensing its new suite of Internet applications. Likewise, Intel lost about half its value in the same two-month period after being up for most of the year. Both Intel and Hewlett-Packard, another significant detractor from performance, were affected by concerns that demand was slowing for computers and the chips that go in them.
Q. What is your outlook, Bob?
A. I don't expect that the volatility in the stock market will end any time soon. At the end of the third quarter, we saw a large number of companies announce that they would not meet their earnings projections. These reports caused the stocks of those companies to drop, sparking more fear and uncertainty about other companies that will report their earnings later in the season. Adding to the mix is the uncertainty about the outcome of the presidential election and the impact of the next president's fiscal policies on the economy. In the stock market, uncertainty breeds volatility.
The views expressed in this report reflect those of the portfolio manager only through the end of the period of the report as stated on the cover and do not necessarily represent the views of Fidelity or any other person in the Fidelity organization. Any such views are subject to change at any time based upon market or other conditions and Fidelity disclaims any responsibility to update such views. These views may not be relied on as investment advice and, because investment decisions for a Fidelity fund are based on numerous factors, may not be relied on as an indication of trading intent on behalf of any Fidelity fund.
Annual Report
Fund Talk: The Manager's Overview - continued
Fund Facts
Goal: to increase the value of the fund's shares by investing mainly in a diversified portfolio of common stocks that the manager determines, using quantitative and fundamental research, to be undervalued compared to others in their industries
Fund number: 320
Trading symbol: FDSSX
Start date: September 28, 1990
Size: as of October 31, 2000, more than $1.6 billion
Manager: Bob Kuo, since May 2000; subportfolio manager, U.S. equities, 1998-2000; quantitative analyst, 1994-1998; joined Fidelity in 1994
3Bob Kuo on the bursting of the Internet bubble and its effect on the fund:
"During the past few years, we saw a once-in-a-generation phenomenon. Much like railroads, the telegraph and radio before it, the Internet promised to revolutionize all aspects of our lives. Many Internet companies that sprang up were able to attract millions of dollars worth of funding with nothing more than an idea. They were able to go public and become valued at billions of dollars despite having little revenue or profits. Traditional valuation measures flew out the window.
"Then in March, these high-flying companies fell back to earth. Investors began to wonder when, if ever, these companies would become profitable. Many of these companies quickly lost over 90% of their value, as investors realized that their business plans were fundamentally flawed and that traditional valuations did apply after all.
"This return to sanity in the market benefits the fund. Our computer models are based on hundreds of thousands of historical data observations. When the Internet mania hit, our models shunned those stocks because they didn't conform to the picture of a successful company. For a while, as our peers outperformed us by making big bets on the Internet, it seemed as though our models were outmoded. The passage of time has assured us that this is not the case, bringing to mind the old adage, ´The more things change, the more they stay the same.'"
Annual Report
|
Top Ten Stocks as of October 31, 2000 |
||
|
|
% of fund's |
% of fund's net assets |
|
General Electric Co. |
4.7 |
4.4 |
|
Merrill Lynch & Co., Inc. |
3.0 |
2.1 |
|
Cisco Systems, Inc. |
3.0 |
2.5 |
|
Microsoft Corp. |
2.9 |
2.9 |
|
Exxon Mobil Corp. |
2.6 |
2.5 |
|
Citigroup, Inc. |
2.5 |
2.0 |
|
Merck & Co., Inc. |
2.4 |
0.0 |
|
Sun Microsystems, Inc. |
2.3 |
1.4 |
|
Pfizer, Inc. |
2.1 |
0.6 |
|
EMC Corp. |
1.9 |
1.1 |
|
|
27.4 |
19.5 |
|
Top Five Market Sectors as of October 31, 2000 |
||
|
|
% of fund's |
% of fund's net assets |
|
Technology |
27.7 |
37.8 |
|
Health |
16.3 |
3.0 |
|
Finance |
16.1 |
13.8 |
|
Utilities |
8.8 |
2.7 |
|
Energy |
8.6 |
13.1 |
|
Asset Allocation (% of fund's net assets) |
|||||||
|
As of October 31, 2000 * |
As of April 30, 2000 ** |
||||||
 |
Stocks and |
|
|
Stocks and |
|
||
 |
Short-Term |
|
|
Short-Term |
|
||
|
* Foreign investments |
2.5% |
|
** Foreign investments |
5.5% |
|
||

Annual Report
Showing Percentage of Net Assets
|
Common Stocks - 95.5% |
|||
|
Shares |
Value (Note 1) (000s) |
||
|
AEROSPACE & DEFENSE - 2.2% |
|||
|
Aerospace & Defense - 1.9% |
|||
|
Boeing Co. |
160,000 |
$ 10,850 |
|
|
Lockheed Martin Corp. |
210,000 |
7,529 |
|
|
Precision Castparts Corp. |
54,500 |
2,057 |
|
|
United Technologies Corp. |
145,000 |
10,123 |
|
|
|
30,559 |
||
|
Defense Electronics - 0.3% |
|||
|
Anaren Microwave, Inc. (a) |
50,000 |
5,200 |
|
|
TOTAL AEROSPACE & DEFENSE |
35,759 |
||
|
CONSTRUCTION & REAL ESTATE - 0.6% |
|||
|
Construction - 0.6% |
|||
|
Centex Corp. |
160,000 |
5,920 |
|
|
D.R. Horton, Inc. |
100,000 |
1,850 |
|
|
Lennar Corp. |
80,000 |
2,570 |
|
|
|
10,340 |
||
|
DURABLES - 0.0% |
|||
|
Textiles & Apparel - 0.0% |
|||
|
Coach, Inc. |
900 |
21 |
|
|
ENERGY - 8.6% |
|||
|
Energy Services - 1.1% |
|||
|
BJ Services Co. (a) |
68,000 |
3,566 |
|
|
Noble Drilling Corp. (a) |
136,000 |
5,653 |
|
|
Patterson Energy, Inc. (a) |
55,000 |
1,547 |
|
|
Smith International, Inc. (a) |
100,000 |
7,050 |
|
|
|
17,816 |
||
|
Oil & Gas - 7.5% |
|||
|
Amerada Hess Corp. |
149,970 |
9,298 |
|
|
Anadarko Petroleum Corp. |
122,304 |
7,834 |
|
|
Apache Corp. |
75,000 |
4,148 |
|
|
BP Amoco PLC sponsored ADR |
77,060 |
3,925 |
|
|
Devon Energy Corp. |
61,500 |
3,100 |
|
|
EOG Resources, Inc. |
250,000 |
9,844 |
|
|
Exxon Mobil Corp. |
465,000 |
41,472 |
|
|
Louis Dreyfus Natural Gas Corp. (a) |
45,000 |
1,443 |
|
|
Noble Affiliates, Inc. |
45,000 |
1,651 |
|
|
Ocean Energy, Inc. (a) |
110,000 |
1,526 |
|
|
Phillips Petroleum Co. |
135,000 |
8,336 |
|
|
Common Stocks - continued |
|||
|
Shares |
Value (Note 1) (000s) |
||
|
ENERGY - continued |
|||
|
Oil & Gas - continued |
|||
|
Royal Dutch Petroleum Co. (NY Shares) |
225,000 |
$ 13,359 |
|
|
USX - Marathon Group |
261,000 |
7,096 |
|
|
Valero Energy Corp. |
140,000 |
4,629 |
|
|
Vintage Petroleum, Inc. |
100,000 |
2,113 |
|
|
|
119,774 |
||
|
TOTAL ENERGY |
137,590 |
||
|
FINANCE - 16.1% |
|||
|
Banks - 0.0% |
|||
|
UnionBanCal Corp. |
32 |
1 |
|
|
Credit & Other Finance - 3.3% |
|||
|
Citigroup, Inc. |
779,666 |
41,030 |
|
|
Greenpoint Financial Corp. |
100,000 |
2,975 |
|
|
MBNA Corp. |
250,000 |
9,391 |
|
|
|
53,396 |
||
|
Federal Sponsored Credit - 0.8% |
|||
|
Fannie Mae |
90,000 |
6,930 |
|
|
USA Education, Inc. |
90,000 |
5,029 |
|
|
|
11,959 |
||
|
Insurance - 5.9% |
|||
|
AFLAC, Inc. |
348,100 |
25,433 |
|
|
American International Group, Inc. |
300,000 |
29,400 |
|
|
CIGNA Corp. |
200,000 |
24,390 |
|
|
Hartford Financial Services Group, Inc. |
140,000 |
10,421 |
|
|
MGIC Investment Corp. |
80,000 |
5,450 |
|
|
|
95,094 |
||
|
Securities Industry - 6.1% |
|||
|
Bear Stearns Companies, Inc. |
200,000 |
12,125 |
|
|
Lehman Brothers Holdings, Inc. |
260,000 |
16,770 |
|
|
Merrill Lynch & Co., Inc. |
688,000 |
48,160 |
|
|
Morgan Stanley Dean Witter & Co. |
255,000 |
20,480 |
|
|
|
97,535 |
||
|
TOTAL FINANCE |
257,985 |
||
|
Common Stocks - continued |
|||
|
Shares |
Value (Note 1) (000s) |
||
|
HEALTH - 16.3% |
|||
|
Drugs & Pharmaceuticals - 9.8% |
|||
|
Allergan, Inc. |
230,000 |
$ 19,334 |
|
|
Alpharma, Inc. Class A |
130,000 |
5,046 |
|
|
Andrx Corp. - Andrx Group (a) |
60,000 |
4,320 |
|
|
Bristol-Myers Squibb Co. |
250,000 |
15,234 |
|
|
Cell Therapeutics, Inc. (a) |
45,000 |
3,010 |
|
|
Eli Lilly & Co. |
55,000 |
4,916 |
|
|
Forest Laboratories, Inc. (a) |
95,000 |
12,588 |
|
|
IDEC Pharmaceuticals Corp. (a) |
25,000 |
4,903 |
|
|
IVAX Corp. (a) |
250,000 |
10,875 |
|
|
Merck & Co., Inc. |
425,000 |
38,223 |
|
|
Mylan Laboratories, Inc. |
159,400 |
4,463 |
|
|
Pfizer, Inc. |
801,640 |
34,621 |
|
|
|
157,533 |
||
|
Medical Equipment & Supplies - 1.9% |
|||
|
Biomet, Inc. |
150,000 |
5,428 |
|
|
Johnson & Johnson |
200,000 |
18,425 |
|
|
Varian Medical Systems, Inc. (a) |
130,000 |
6,354 |
|
|
|
30,207 |
||
|
Medical Facilities Management - 4.6% |
|||
|
HCA - The Healthcare Co. |
300,000 |
11,981 |
|
|
Oxford Health Plans, Inc. (a) |
210,000 |
7,088 |
|
|
Tenet Healthcare Corp. |
245,000 |
9,632 |
|
|
Trigon Healthcare, Inc. (a) |
60,000 |
4,301 |
|
|
UnitedHealth Group, Inc. |
200,000 |
21,875 |
|
|
Universal Health Services, Inc. Class B (a) |
140,000 |
11,743 |
|
|
Wellpoint Health Networks, Inc. (a) |
55,000 |
6,432 |
|
|
|
73,052 |
||
|
TOTAL HEALTH |
260,792 |
||
|
INDUSTRIAL MACHINERY & EQUIPMENT - 6.3% |
|||
|
Electrical Equipment - 5.5% |
|||
|
C&D Technologies, Inc. |
75,000 |
4,434 |
|
|
General Electric Co. |
1,375,000 |
75,358 |
|
|
Scientific-Atlanta, Inc. |
130,000 |
8,897 |
|
|
|
88,689 |
||
|
Common Stocks - continued |
|||
|
Shares |
Value (Note 1) (000s) |
||
|
INDUSTRIAL MACHINERY & EQUIPMENT - continued |
|||
|
Industrial Machinery & Equipment - 0.8% |
|||
|
Tyco International Ltd. |
209,600 |
$ 11,882 |
|
|
TOTAL INDUSTRIAL MACHINERY & EQUIPMENT |
100,571 |
||
|
MEDIA & LEISURE - 1.1% |
|||
|
Entertainment - 0.3% |
|||
|
MGM Mirage, Inc. |
150,000 |
5,184 |
|
|
Publishing - 0.3% |
|||
|
Reader's Digest Association, Inc. Class A (non-vtg.) |
126,000 |
4,623 |
|
|
Restaurants - 0.5% |
|||
|
Darden Restaurants, Inc. |
375,000 |
8,438 |
|
|
TOTAL MEDIA & LEISURE |
18,245 |
||
|
NONDURABLES - 4.1% |
|||
|
Beverages - 2.0% |
|||
|
Adolph Coors Co. Class B |
77,200 |
4,917 |
|
|
Anheuser-Busch Companies, Inc. |
456,400 |
20,880 |
|
|
Pepsi Bottling Group, Inc. |
200,000 |
6,925 |
|
|
|
32,722 |
||
|
Foods - 2.1% |
|||
|
Keebler Foods Co. |
100,000 |
4,050 |
|
|
PepsiCo, Inc. |
200,000 |
9,688 |
|
|
Quaker Oats Co. |
105,000 |
8,564 |
|
|
Sysco Corp. |
200,000 |
10,438 |
|
|
|
32,740 |
||
|
TOTAL NONDURABLES |
65,462 |
||
|
RETAIL & WHOLESALE - 3.0% |
|||
|
Apparel Stores - 0.8% |
|||
|
Talbots, Inc. |
48,000 |
3,795 |
|
|
The Limited, Inc. |
200,000 |
5,050 |
|
|
The Men's Wearhouse, Inc. (a) |
140,000 |
4,095 |
|
|
|
12,940 |
||
|
Common Stocks - continued |
|||
|
Shares |
Value (Note 1) (000s) |
||
|
RETAIL & WHOLESALE - continued |
|||
|
General Merchandise Stores - 2.2% |
|||
|
Kohls Corp. (a) |
300,000 |
$ 16,256 |
|
|
Wal-Mart Stores, Inc. |
415,000 |
18,831 |
|
|
|
35,087 |
||
|
TOTAL RETAIL & WHOLESALE |
48,027 |
||
|
SERVICES - 0.3% |
|||
|
Robert Half International, Inc. (a) |
150,000 |
4,575 |
|
|
TECHNOLOGY - 27.7% |
|||
|
Communications Equipment - 7.1% |
|||
|
Cable Design Technologies Corp. (a) |
75,000 |
1,730 |
|
|
Cisco Systems, Inc. (a) |
875,000 |
47,141 |
|
|
Comverse Technology, Inc. (a) |
50,000 |
5,588 |
|
|
Corning, Inc. |
360,000 |
27,540 |
|
|
Jabil Circuit, Inc. (a) |
95,000 |
5,421 |
|
|
Natural MicroSystems Corp. (a) |
40,000 |
1,808 |
|
|
Nortel Networks Corp. |
460,000 |
20,930 |
|
|
Tollgrade Communications, Inc. (a) |
40,000 |
3,830 |
|
|
|
113,988 |
||
|
Computer Services & Software - 7.7% |
|||
|
Actuate Software Corp. (a) |
75,000 |
2,114 |
|
|
Adobe Systems, Inc. |
290,000 |
22,058 |
|
|
America Online, Inc. (a) |
94,900 |
4,786 |
|
|
Cerner Corp. (a) |
30,000 |
1,858 |
|
|
Informax, Inc. |
500 |
14 |
|
|
Microsoft Corp. (a) |
670,000 |
46,146 |
|
|
Netegrity, Inc. (a) |
500 |
39 |
|
|
NetIQ Corp. (a) |
400 |
34 |
|
|
Oracle Corp. (a) |
900,000 |
29,700 |
|
|
Rational Software Corp. (a) |
60,000 |
3,581 |
|
|
Siebel Systems, Inc. (a) |
65,000 |
6,821 |
|
|
Sybase, Inc. (a) |
110,000 |
2,303 |
|
|
TIBCO Software, Inc. (a) |
70,000 |
4,410 |
|
|
|
123,864 |
||
|
Computers & Office Equipment - 7.0% |
|||
|
Advanced Switching Communication, Inc. |
800 |
8 |
|
|
Brocade Communications Systems, Inc. (a) |
42,000 |
9,550 |
|
|
EMC Corp. (a) |
350,000 |
31,172 |
|
|
Hewlett-Packard Co. |
310,000 |
14,396 |
|
|
Common Stocks - continued |
|||
|
Shares |
Value (Note 1) (000s) |
||
|
TECHNOLOGY - continued |
|||
|
Computers & Office Equipment - continued |
|||
|
International Business Machines Corp. |
80,000 |
$ 7,880 |
|
|
Juniper Networks, Inc. (a) |
40,000 |
7,800 |
|
|
Sun Microsystems, Inc. (a) |
330,000 |
36,589 |
|
|
Tech Data Corp. (a) |
100,000 |
4,163 |
|
|
|
111,558 |
||
|
Electronic Instruments - 0.5% |
|||
|
Ixia |
500 |
12 |
|
|
KLA-Tencor Corp. (a) |
36,500 |
1,234 |
|
|
Newport Corp. |
20,000 |
2,284 |
|
|
Tektronix, Inc. |
70,000 |
4,988 |
|
|
|
8,518 |
||
|
Electronics - 5.4% |
|||
|
Altera Corp. (a) |
130,000 |
5,322 |
|
|
Arrow Electronics, Inc. (a) |
55,000 |
1,760 |
|
|
Avnet, Inc. |
60,000 |
1,613 |
|
|
AVX Corp. |
175,000 |
5,009 |
|
|
Integrated Device Technology, Inc. (a) |
155,000 |
8,728 |
|
|
Intel Corp. |
510,000 |
22,950 |
|
|
International Rectifier Corp. (a) |
150,000 |
6,694 |
|
|
KEMET Corp. (a) |
150,000 |
4,181 |
|
|
Linear Technology Corp. |
130,000 |
8,393 |
|
|
Oplink Communications, Inc. |
1,500 |
37 |
|
|
PMC-Sierra, Inc. (a) |
42,000 |
7,119 |
|
|
SDL, Inc. (a) |
30,000 |
7,778 |
|
|
Silicon Storage Technology, Inc. (a) |
80,000 |
1,820 |
|
|
Vishay Intertechnology, Inc. (a) |
135,000 |
4,050 |
|
|
|
85,454 |
||
|
TOTAL TECHNOLOGY |
443,382 |
||
|
TRANSPORTATION - 0.4% |
|||
|
Trucking & Freight - 0.4% |
|||
|
Expeditors International of Washington, Inc. |
120,000 |
6,225 |
|
|
UTILITIES - 8.8% |
|||
|
Electric Utility - 3.0% |
|||
|
Ameren Corp. |
165,000 |
6,559 |
|
|
Calpine Corp. (a) |
185,000 |
14,603 |
|
|
Entergy Corp. |
300,000 |
11,494 |
|
|
Common Stocks - continued |
|||
|
Shares |
Value (Note 1) (000s) |
||
|
UTILITIES - continued |
|||
|
Electric Utility - continued |
|||
|
FPL Group, Inc. |
140,000 |
$ 9,240 |
|
|
PPL Corp. |
175,000 |
7,208 |
|
|
TNPC, Inc. |
3,000 |
50 |
|
|
|
49,154 |
||
|
Gas - 4.1% |
|||
|
Columbia Energy Group |
75,000 |
5,395 |
|
|
Dynegy, Inc. Class A |
366,000 |
16,950 |
|
|
El Paso Energy Corp. |
100,000 |
6,269 |
|
|
Enron Corp. |
215,000 |
17,643 |
|
|
KeySpan Corp. |
250,000 |
8,797 |
|
|
Kinder Morgan, Inc. |
45,900 |
1,770 |
|
|
Williams Companies, Inc. |
200,000 |
8,363 |
|
|
|
65,187 |
||
|
Telephone Services - 1.7% |
|||
|
BellSouth Corp. |
115,000 |
5,556 |
|
|
SBC Communications, Inc. |
200,000 |
11,538 |
|
|
Verizon Communications |
170,000 |
9,828 |
|
|
|
26,922 |
||
|
TOTAL UTILITIES |
141,263 |
||
|
TOTAL COMMON STOCKS (Cost $1,294,956) |
1,530,237 |
||
|
Investment Companies - 0.1% |
|||
|
|
|
|
|
|
Kemper International Research Fund Class A |
78,509 |
1,025 |
|
|
Cash Equivalents - 4.4% |
|||
|
Shares |
Value (Note 1) |
||
|
Fidelity Cash Central Fund, 6.61% (b) |
68,585,994 |
$ 68,586 |
|
|
Fidelity Securities Lending Cash Central Fund, 6.66% (b) |
1,656,900 |
1,657 |
|
|
TOTAL CASH EQUIVALENTS (Cost $70,243) |
70,243 |
||
|
TOTAL INVESTMENT PORTFOLIO - 100.0% (Cost $1,366,053) |
1,601,505 |
||
|
NET OTHER ASSETS - 0.0% |
376 |
||
|
NET ASSETS - 100% |
$ 1,601,881 |
||
|
Legend |
|
(a) Non-income producing |
|
(b) The rate quoted is the annualized seven-day yield of the fund at period end. A complete listing of the fund's holdings as of its most recent fiscal year end is available upon request. |
|
Income Tax Information |
|
At October 31, 2000, the aggregate cost of investment securities for income tax purposes was $1,366,614,000. Net unrealized appreciation aggregated $234,891,000, of which $276,832,000 related to appreciated investment securities and $41,941,000 related to depreciated investment securities. |
|
The fund hereby designates approximately $125,196,000 as a capital gain dividend for the purpose of the dividend paid reduction. |
See accompanying notes which are an integral part of the financial statements.
Annual Report
Statement of Assets and Liabilities
|
Amounts in thousands (execpt per-share amount) |
October 31, 2000 |
|
|
Assets |
|
|
|
Investment in securities, at value (cost $1,366,053) - |
|
$ 1,601,505 |
|
Receivable for investments sold |
|
36,698 |
|
Receivable for fund shares sold |
|
925 |
|
Dividends receivable |
|
308 |
|
Interest receivable |
|
536 |
|
Other receivables |
|
233 |
|
Total assets |
|
1,640,205 |
|
Liabilities |
|
|
|
Payable for investments purchased |
$ 34,788 |
|
|
Payable for fund shares redeemed |
1,271 |
|
|
Accrued management fee |
460 |
|
|
Other payables and accrued expenses |
148 |
|
|
Collateral on securities loaned, at value |
1,657 |
|
|
Total liabilities |
|
38,324 |
|
Net Assets |
|
$ 1,601,881 |
|
Net Assets consist of: |
|
|
|
Paid in capital |
|
$ 1,053,704 |
|
Undistributed net investment income |
|
6,042 |
|
Accumulated undistributed net realized gain (loss) on investments and foreign currency transactions |
|
306,686 |
|
Net unrealized appreciation (depreciation) on investments and assets and liabilities in foreign currencies |
|
235,449 |
|
Net Assets, for 50,369 shares outstanding |
|
$ 1,601,881 |
|
Net Asset Value, offering price and redemption price per share ($1,601,881 ÷ 50,369 shares) |
|
$31.80 |
See accompanying notes which are an integral part of the financial statements.
Annual Report
Financial Statements - continued
Statement of Operations
|
Amounts in thousands |
Year ended October 31, 2000 |
|
|
Investment Income Dividends |
|
$ 13,392 |
|
Interest |
|
4,709 |
|
Security lending |
|
79 |
|
Total income |
|
18,180 |
|
Expenses |
|
|
|
Management fee |
$ 9,693 |
|
|
Performance adjustment |
(3,249) |
|
|
Transfer agent fees |
3,083 |
|
|
Accounting and security lending fees |
401 |
|
|
Non-interested trustees' compensation |
6 |
|
|
Custodian fees and expenses |
42 |
|
|
Registration fees |
50 |
|
|
Audit |
34 |
|
|
Legal |
22 |
|
|
Reports to shareholders |
128 |
|
|
Miscellaneous |
2 |
|
|
Total expenses before reductions |
10,212 |
|
|
Expense reductions |
(716) |
9,496 |
|
Net investment income |
|
8,684 |
|
Realized and Unrealized Gain (Loss) Net realized gain (loss) on: |
|
|
|
Investment securities |
304,532 |
|
|
Foreign currency transactions |
48 |
304,580 |
|
Change in net unrealized appreciation (depreciation) on: |
|
|
|
Investment securities |
(128,039) |
|
|
Assets and liabilities in foreign currencies |
(3) |
(128,042) |
|
Net gain (loss) |
|
176,538 |
|
Net increase (decrease) in net assets resulting |
|
$ 185,222 |
See accompanying notes which are an integral part of the financial statements.
Annual Report
Financial Statements - continued
Statement of Changes in Net Assets
|
Amounts in thousands |
Year ended
October 31, |
Year ended
October 31, |
|
Increase (Decrease) in Net Assets |
|
|
|
Operations |
$ 8,684 |
$ 11,194 |
|
Net realized gain (loss) |
304,580 |
239,295 |
|
Change in net unrealized appreciation (depreciation) |
(128,042) |
178,971 |
|
Net increase (decrease) in net assets resulting |
185,222 |
429,460 |
|
Distributions to shareholders |
(6,090) |
(17,339) |
|
From net realized gain |
(194,930) |
(111,551) |
|
Total distributions |
(201,020) |
(128,890) |
|
Share transactions |
206,394 |
271,759 |
|
Reinvestment of distributions |
190,868 |
122,322 |
|
Cost of shares redeemed |
(433,698) |
(650,854) |
|
Net increase (decrease) in net assets resulting |
(36,436) |
(256,773) |
|
Total increase (decrease) in net assets |
(52,234) |
43,797 |
|
Net Assets |
|
|
|
Beginning of period |
1,654,115 |
1,610,318 |
|
End of period (including undistributed net investment income of $6,042 and $6,875, respectively) |
$ 1,601,881 |
$ 1,654,115 |
|
Other Information Shares |
|
|
|
Sold |
6,436 |
8,955 |
|
Issued in reinvestment of distributions |
6,392 |
4,580 |
|
Redeemed |
(13,693) |
(21,746) |
|
Net increase (decrease) |
(865) |
(8,211) |
See accompanying notes which are an integral part of the financial statements.
Annual Report
Financial Highlights
|
Years ended October 31, |
2000 |
1999 |
1998 |
1997 |
1996 |
|
Selected Per-Share Data |
|
|
|
|
|
|
Net asset value, beginning |
$ 32.29 |
$ 27.09 |
$ 29.40 |
$ 24.99 |
$ 24.25 |
|
Income from Investment Operations |
|
|
|
|
|
|
Net investment income |
.16 B |
.20 B |
.32 B |
.33 B |
.24 |
|
Net realized and unrealized gain (loss) |
3.31 |
7.23 |
1.02 |
6.23 |
2.78 |
|
Total from investment operations |
3.47 |
7.43 |
1.34 |
6.56 |
3.02 |
|
|
|
|
|
|
|
|
Less Distributions |
|
|
|
|
|
|
From net investment income |
(.12) |
(.30) |
(.33) |
(.23) |
(.20) |
|
From net realized gain |
(3.84) |
(1.93) |
(3.32) |
(1.92) |
(2.08) |
|
Total distributions |
(3.96) |
(2.23) |
(3.65) |
(2.15) |
(2.28) |
|
Net asset value, end of period |
$ 31.80 |
$ 32.29 |
$ 27.09 |
$ 29.40 |
$ 24.99 |
|
Total Return A |
11.54% |
29.15% |
4.40% |
28.20% |
13.51% |
|
Ratios and Supplemental Data |
|
|
|
|
|
|
Net assets, end of period |
$ 1,602 |
$ 1,654 |
$ 1,610 |
$ 1,827 |
$ 1,586 |
|
Ratio of expenses to average |
.61% |
.62% |
.68% |
.74% |
.89% |
|
Ratio of expenses to average net assets after expense reductions |
.56% C |
.59% C |
.64% C |
.69% C |
.84% C |
|
Ratio of net investment income |
.52% |
.67% |
1.10% |
1.24% |
1.07% |
|
Portfolio turnover rate |
164% |
106% |
122% |
117% |
247% |
|
A The total returns would have been lower had certain expenses not been reduced during the periods shown. B Net investment income per share has been calculated based on average shares outstanding during the period. C FMR or the fund has entered into varying arrangements with third parties who either paid or reduced a portion of the fund's expenses. |
|||||
See accompanying notes which are an integral part of the financial statements.
Annual Report
For the period ended October 31, 2000
1. Significant Accounting Policies.
Fidelity Stock Selector (the fund) is a fund of Fidelity Capital Trust (the trust) and is authorized to issue an unlimited number of shares. The trust is registered under the Investment Company Act of 1940, as amended, as an open-end management investment company organized as a Massachusetts business trust. The financial statements have been prepared in conformity with generally accepted accounting principles which require management to make certain estimates and assumptions at the date of the financial statements. The following summarizes the significant accounting policies of the fund:
Security Valuation. Securities for which exchange quotations are readily available are valued at the last sale price, or if no sale price, at the closing bid price. Foreign securities are valued based on quotations from the principal market in which such securities are normally traded. If trading or events occurring in other markets after the close of the principal market in which foreign securities are traded, and before the close of business of the fund, are expected to materially affect the value of those securities, then they are valued at their fair value taking this trading or these events into account. Fair value is determined in good faith under consistently applied procedures under the general supervision of the Board of Trustees. Securities for which exchange quotations are not readily available (and in certain cases debt securities which trade on an exchange) are valued primarily using dealer-supplied valuations or at their fair value. Short-term securities with remaining maturities of sixty days or less for which quotations are not readily available are valued at amortized cost or original cost plus accrued interest, both of which approximate current value. Investments in open-end investment companies are valued at their net asset value each business day.
Foreign Currency Translation. The accounting records of the fund are maintained in U.S. dollars. Investment securities and other assets and liabilities denominated in a foreign currency are translated into U.S. dollars at the prevailing rates of exchange at period end. Purchases and sales of securities, income receipts and expense payments are translated into U.S. dollars at the prevailing exchange rate on the respective dates of the transactions.
Net realized gains and losses on foreign currency transactions represent net gains and losses from sales and maturities of foreign currency contracts, disposition of foreign currencies, the difference between the amount of net investment income accrued and the U.S. dollar amount actually received, and gains and losses between trade and settlement date on purchases and sales of securities. The effects of changes in foreign currency exchange rates on investments in securities are included with the net realized and unrealized gain or loss on investment securities.
Income Taxes. As a qualified regulated investment company under Subchapter M of the Internal Revenue Code, the fund is not subject to income taxes to the extent
Annual Report
Notes to Financial Statements - continued
1. Significant Accounting Policies - continued
Income Taxes - continued
that it distributes substantially all of its taxable income for its fiscal year. The schedule of investments includes information regarding income taxes under the caption "Income Tax Information."
Investment Income. Dividend income is recorded on the ex-dividend date, except certain dividends from foreign securities where the ex-dividend date may have passed, are recorded as soon as the fund is informed of the ex-dividend date. Non-cash dividends included in dividend income, if any, are recorded at the fair market value of the securities received. Interest income is accrued as earned. Investment income is recorded net of foreign taxes withheld where recovery of such taxes is uncertain.
Expenses. Most expenses of the trust can be directly attributed to a fund. Expenses which cannot be directly attributed are apportioned among the funds in the trust.
Distributions to Shareholders. Distributions are recorded on the ex-dividend date.
Income and capital gain distributions are determined in accordance with income tax regulations which may differ from generally accepted accounting principles. These differences, which may result in distribution reclassifications, are primarily due to differing treatments for litigation proceeds, foreign currency transactions, passive foreign investment companies (PFIC), non-taxable dividends, and losses deferred due to wash sales. The fund also utilized earnings and profits distributed to shareholders on redemption of shares as a part of the dividends paid deduction for income tax purposes.
Permanent book and tax basis differences relating to shareholder distributions will result in reclassifications to paid in capital. Undistributed net investment income and accumulated undistributed net realized gain (loss) on investments and foreign currency transactions may include temporary book and tax basis differences which will reverse in a subsequent period. Any taxable income or gain remaining at fiscal year end is distributed in the following year.
2. Operating Policies.
Foreign Currency Contracts. The fund generally uses foreign currency contracts to facilitate transactions in foreign-denominated securities. Losses may arise from changes in the value of the foreign currency or if the counterparties do not perform under the contracts' terms. The U.S. dollar value of foreign currency contracts is determined using contractual currency exchange rates established at the time of each trade.
Joint Trading Account. Pursuant to an Exemptive Order issued by the Securities and Exchange Commission (the SEC), the fund, along with other affiliated entities of Fidelity Management & Research Company (FMR), may transfer uninvested cash balances into one or more joint trading accounts. These balances are invested in one or more repurchase agreements for U.S. Treasury or Federal Agency obligations.
Annual Report
Notes to Financial Statements - continued
2. Operating Policies - continued
Repurchase Agreements. The underlying U.S. Treasury, Federal Agency, or other obligations found to be satisfactory by FMR are transferred to an account of the fund, or to the Joint Trading Account, at a custodian bank. The securities are marked-to-market daily and maintained at a value at least equal to the principal amount of the repurchase agreement (including accrued interest). FMR, the fund's investment adviser, is responsible for determining that the value of the underlying securities remains in accordance with the market value requirements stated above.
3. Purchases and Sales of Investments.
Purchases and sales of securities, other than short-term securities, aggregated $2,649,273,000 and $2,935,724,000, respectively.
4. Fees and Other Transactions with Affiliates.
Management Fee. As the fund's investment adviser, FMR receives a monthly basic fee that is calculated on the basis of a group fee rate plus a fixed individual fund fee rate applied to the average net assets of the fund. The group fee rate is the weighted average of a series of rates and is based on the monthly average net assets of all the mutual funds advised by FMR. The rates ranged from .2167% to .5200% for the period. The annual individual fund fee rate is .30%. In the event that these rates were lower than the contractual rates in effect during the period, FMR voluntarily implemented the above rates, as they resulted in the same or a lower management fee. The basic fee is subject to a performance adjustment (up to a maximum of ±.20% of the fund's average net assets over the performance period) based on the fund's investment performance as compared to the appropriate index over a specified period of time. For the period, the management fee was equivalent to an annual rate of .38% of average net assets after the performance adjustment.
Sub-Adviser Fee. Beginning January 1, 2001, FMR Co.(FMRC) will serve as sub-adviser for the fund. FMRC is a wholly owned subsidiary of FMR and will receive a fee from FMR of 50% of the management fee payable to FMR with respect to that portion of the funds assets that will be managed by FMRC.
Transfer Agent Fees. Fidelity Service Company, Inc. (FSC), an affiliate of FMR, is the fund's transfer, dividend disbursing and shareholder servicing agent. FSC receives account fees and asset-based fees that vary according to account size and type of account. FSC pays for typesetting, printing and mailing of all shareholder reports, except proxy statements. For the period, the transfer agent fees were equivalent to an annual rate of .18% of average net assets.
Accounting and Security Lending Fees. FSC maintains the fund's accounting records and administers the security lending program. The security lending fee is based on the number and duration of lending
Annual Report
Notes to Financial Statements - continued
4. Fees and Other Transactions with Affiliates - continued
Accounting and Security Lending Fees - continued
transactions. The accounting fee is based on the level of average net assets for the month plus out-of-pocket expenses.
Cash Central Funds. Pursuant to an Exemptive Order issued by the SEC, the fund may invest in the Fidelity Cash Central Fund and the Fidelity Securities Lending Cash Central Fund (the Cash Funds) managed by Fidelity Investments Money Management, Inc., an affiliate of FMR. The Cash Funds are open-end money market funds available only to investment companies and other accounts managed by FMR and its affiliates. The Cash Funds seek preservation of capital, liquidity, and current income. Income distributions from the Cash Funds are declared daily and paid monthly from net investment income. Income distributions earned by the fund are recorded as either interest income or security lending income in the accompanying financial statements.
Brokerage Commissions. The fund placed a portion of its portfolio transactions with brokerage firms which are affiliates of FMR. The commissions paid to these affiliated firms were $97,000 for the period.
5. Security Lending.
The fund lends portfolio securities from time to time in order to earn additional income. The fund receives collateral in the form of U.S. Treasury obligations, letters of credit, and/or cash against the loaned securities, and maintains collateral in an amount not less than 100% of the market value of the loaned securities during the period of the loan. The market value of the loaned securities is determined at the close of business of the fund and any additional required collateral is delivered to the fund on the next business day. If the borrower defaults on its obligation to return the securities loaned because of insolvency or other reasons, the fund could experience delays and costs in recovering the securities loaned or in gaining access to the collateral. At period end, the value of the securities loaned amounted to $1,795,000 . The fund received cash collateral of $1,657,000 which was invested in cash equivalents.
6. Expense Reductions.
FMR has directed certain portfolio trades to brokers who paid a portion of the fund's expenses. For the period, the fund's expenses were reduced by $684,000 under this arrangement.
In addition, through arrangements with the fund's custodian and transfer agent, credits realized as a result of uninvested cash balances were used to reduce a portion of the fund's expenses. During the period, the fund's custodian and transfer agent fees were reduced by $31,000, and $1,000, respectively, under these arrangements.
Annual Report
To the Trustees of Fidelity Capital Trust and Shareholders of Fidelity Stock Selector:
We have audited the accompanying statement of assets and liabilities of Fidelity Stock Selector, (the Fund), a fund of Fidelity Capital Trust (the Trust), including the portfolio of investments, as of October 31, 2000, and the related statements of operations, changes in net assets, and financial highlights for the year then ended. These financial statements and financial highlights are the responsibility of the Fund's management. Our responsibility is to express an opinion on these financial statements and financial highlights based on our audit. The statement of changes in net assets for the year ended October 31, 1999, and the financial highlights for each of the four years in the period then ended were audited by other auditors whose report, dated December 7, 1999, expressed an unqualified opinion on those statements and financial highlights.
We conducted our audit in accordance with auditing standards generally accepted in the United States of America. Those standards require that we plan and perform the audit to obtain reasonable assurance about whether the financial statements and financial highlights are free of material misstatement. An audit includes examining, on a test basis, evidence supporting the amounts and disclosures in the financial statements. Our procedures included confirmation of securities owned as of October 31, 2000 by correspondence with the custodian and brokers; where replies were not received from brokers, we performed other auditing procedures. An audit also includes assessing the accounting principles used and significant estimates made by management, as well as evaluating the overall financial statement presentation. We believe that our audit provides a reasonable basis for our opinion.
In our opinion, the financial statements and financial highlights referred to above present fairly, in all material respects, the financial position of Fidelity Stock Selector as of October 31, 2000, the results of its operations, the changes in its net assets, and its financial highlights for the year then ended, in conformity with accounting principles generally accepted in the United States of America.
/s/DELOITTE & TOUCHE LLP
DELOITTE & TOUCHE LLP
Boston, Massachusetts
December 8, 2000
Annual Report
The Board of Trustees of Fidelity Stock Selector voted to pay on December 11, 2000, to shareholders of record at the opening of business on December 8, 2000, a distribution of $4.94 per share derived from capital gains realized from sales of portfolio securities and a dividend of $.13 per share from net investment income.
A total of 13% of the dividends distributed during the fiscal year qualifies for the dividends-received deduction for corporate shareholders.
The fund hereby designates 100% of the long-term capital gain dividends distributed during the fiscal year as 20%-rate capital gain dividends.
The fund will notify shareholders in January 2001 of amounts for use in preparing 2000 income tax returns.
Annual Report
Fidelity offers several ways to conveniently manage your personal investments via your telephone or PC. You can access your account information, conduct trades and research your investments 24 hours a day.
By Phone
Fidelity Automated Service Telephone provides a single toll-free number to access account balances, positions, quotes and trading. It's easy to navigate the service, and on your first call, the system will help you create a personal identification number (PIN) for security.
(phone_graphic)Fidelity Automated
Service Telephone (FAST®)
1-800-544-5555
Press
1 For mutual fund and brokerage trading.
2 For quotes.*
3 For account balances and holdings.
4 To review orders and mutual
fund activity.
5 To change your PIN.
*0 To speak to a Fidelity representative.
By PC
Fidelity's web site on the Internet provides a wide range of information, including daily financial news, fund performance, interactive planning tools and news about Fidelity products and services.
(computer_graphic)Fidelity's Web Site
www.fidelity.com
If you are not currently on the Internet, call EarthLink Sprint at 1-800-288-2967, and be sure to ask for registration number SMD004 to receive a special Fidelity package that includes 30 days of free Internet access. EarthLink is North America's #1 independent Internet access provider.
(computer_graphic)
Fidelity On-line Xpress+®
Fidelity On-line Xpress+ software for Windows combines comprehensive portfolio management capabilities, securities trading and access to research and analysis tools . . . all on your desktop. Call Fidelity at 1-800-544-0240 or visit our web site for more information on how to manage your investments via your PC.
* When you call the quotes line, please remember that a fund's yield and return will vary and, except for money market funds, share price will also vary. This means that you may have a gain or loss when you sell your shares. There is no assurance that money market funds will be able to maintain a stable $1 share price; an investment in a money market fund is not insured or guaranteed by the U.S. government. Total returns are historical and include changes in share price, reinvestment of dividends and capital gains, and the effects of any sales charges.
Annual Report
If more than one address is listed, please locate the address that is closest to you. We'll give your correspondence immediate attention and send you written confirmation upon completion of your request.
(letter_graphic)Making Changes
To Your Account
(such as changing name, address, bank, etc.)
Fidelity Investments
P.O. Box 770001
Cincinnati, OH 45277-0002
(letter_graphic)For Non-Retirement
Accounts
Buying shares
Fidelity Investments
P.O. Box 770001
Cincinnati, OH 45277-0003
Overnight Express
Fidelity Investments
2300 Litton Lane - KH1A
Hebron, KY 41048
Selling shares
Fidelity Investments
P.O. Box 660602
Dallas, TX 75266-0602
Overnight Express
Fidelity Investments
Attn: Redemptions - CP6I
400 East Las Colinas Blvd.
Irving, TX 75039-5587
General Correspondence
Fidelity Investments
P.O. Box 500
Merrimack, NH 03054-0500
(letter_graphic)For Retirement
Accounts
Buying shares
Fidelity Investments
P.O. Box 770001
Cincinnati, OH 45277-0003
Selling shares
Fidelity Investments
P.O. Box 660602
Dallas, TX 75266-0602
Overnight Express
Fidelity Investments
Attn: Redemptions - CP6R
400 East Las Colinas Blvd.
Irving, TX 75039-5587
General Correspondence
Fidelity Investments
P.O. Box 500
Merrimack, NH 03054-0500
Annual Report
For directions and hours,
please call 1-800-544-9797.
Arizona
7373 N. Scottsdale Road
Scottsdale, AZ
California
815 East Birch Street
Brea, CA
851 East Hamilton Avenue
Campbell, CA
527 North Brand Boulevard
Glendale, CA
19200 Von Karman Avenue
Irvine, CA
10100 Santa Monica Blvd.
Los Angeles, CA
251 University Avenue
Palo Alto, CA
1760 Challenge Way
Sacramento, CA
7676 Hazard Center Drive
San Diego, CA
8 Montgomery Street
San Francisco, CA
950 Northgate Drive
San Rafael, CA
1400 Civic Drive
Walnut Creek, CA
6300 Canoga Avenue
Woodland Hills, CA
Colorado
1625 Broadway
Denver, CO
Connecticut
48 West Putnam Avenue
Greenwich, CT
265 Church Street
New Haven, CT
300 Atlantic Street
Stamford, CT
29 South Main Street
West Hartford, CT
Delaware
222 Delaware Avenue
Wilmington, DE
Florida
4400 N. Federal Highway
Boca Raton, FL
90 Alhambra Plaza
Coral Gables, FL
4090 N. Ocean Boulevard
Ft. Lauderdale, FL
1907 West State Road 434
Longwood, FL
8880 Tamiami Trail, North
Naples, FL
2401 PGA Boulevard
Palm Beach Gardens, FL
8065 Beneva Road
Sarasota, FL
1502 N. Westshore Blvd.
Tampa, FL
Georgia
3445 Peachtree Road, N.E.
Atlanta, GA
1000 Abernathy Road
Atlanta, GA
Illinois
One North Franklin Street
Chicago, IL
1415 West 22nd Street
Oak Brook, IL
1700 East Golf Road
Schaumburg, IL
3232 Lake Avenue
Wilmette, IL
Indiana
4729 East 82nd Street
Indianapolis, IN
Maine
Three Canal Plaza
Portland, ME
Maryland
7401 Wisconsin Avenue
Bethesda, MD
One W. Pennsylvania Ave.
Towson, MD
Massachusetts
801 Boylston Street
Boston, MA
155 Congress Street
Boston, MA
25 State Street
Boston, MA
300 Granite Street
Braintree, MA
44 Mall Road
Burlington, MA
416 Belmont Street
Worcester, MA
Annual Report
Michigan
280 Old N. Woodward Ave.
Birmingham, MI
29155 Northwestern Hwy.
Southfield, MI
Minnesota
7600 France Avenue South
Edina, MN
Missouri
700 West 47th Street
Kansas City, MO
8885 Ladue Road
Ladue, MO
New Jersey
150 Essex Street
Millburn, NJ
56 South Street
Morristown, NJ
501 Route 17, South
Paramus, NJ
New York
1055 Franklin Avenue
Garden City, NY
999 Walt Whitman Road
Melville, L.I., NY
1271 Avenue of the Americas
New York, NY
71 Broadway
New York, NY
350 Park Avenue
New York, NY
North Carolina
4611 Sharon Road
Charlotte, NC
Ohio
600 Vine Street
Cincinnati, OH
28699 Chagrin Boulevard
Woodmere Village, OH
Oregon
16850 SW 72nd Avenue
Tigard, OR
Pennsylvania
1735 Market Street
Philadelphia, PA
439 Fifth Avenue
Pittsburgh, PA
Rhode Island
47 Providence Place
Providence, RI
Tennessee
6150 Poplar Avenue
Memphis, TN
Texas
10000 Research Boulevard
Austin, TX
4017 Northwest Parkway
Dallas, TX
1155 Dairy Ashford Street
Houston, TX
2701 Drexel Drive
Houston, TX
400 East Las Colinas Blvd.
Irving, TX
14100 San Pedro
San Antonio, TX
19740 IH 45 North
Spring, TX
Utah
215 South State Street
Salt Lake City, UT
Virginia
1861 International Drive
McLean, VA
Washington
411 108th Avenue, N.E.
Bellevue, WA
511 Pine Street
Seattle, WA
Washington, DC
1900 K Street, N.W.
Washington, DC
Wisconsin
595 North Barker Road
Brookfield, WI
Fidelity Brokerage Services, Inc., 100 Summer St., Boston, MA 02110 Member NYSE/SIPC
Annual Report
Investment Adviser
Fidelity Management & Research Company
Boston, MA
Investment Sub-Advisers
Fidelity Management & Research
(U.K.) Inc.
Fidelity Management & Research
(Far East) Inc.
Fidelity Investments Japan Limited
Officers
Edward C. Johnson 3d, President
Robert C. Pozen, Senior Vice President
Robert A. Lawrence, Vice President
Eric D. Roiter, Secretary
Robert A. Dwight, Treasurer
Maria F. Dwyer, Deputy Treasurer
John H. Costello, Assistant Treasurer
Board of Trustees
Ralph F. Cox *
Phyllis Burke Davis *
Robert M. Gates *
Edward C. Johnson 3d
Donald J. Kirk *
Ned C. Lautenbach *
Peter S. Lynch
Marvin L. Mann *
William O. McCoy *
Gerald C. McDonough *
Robert C. Pozen
Thomas R. Williams *
Thomas J. Simpson
Advisory Board
J. Michael Cook
Marie L. Knowles
General Distributor
Fidelity Distributors Corporation
Boston, MA
Transfer and Shareholder
Servicing Agent
Fidelity Service Company, Inc.
Boston, MA
* Independent trustees
Custodian
Brown Brothers Harriman & Co.
Boston, MA
Fidelity's Growth Funds
Aggressive Growth Fund
Blue Chip Growth Fund
Capital Appreciation Fund
Contrafund ®
Contrafund ® II
Disciplined Equity Fund
Dividend Growth Fund
Export and Multinational Fund
Fidelity Fifty ®
Growth Company Fund
Large Cap Stock Fund
Low-Priced Stock Fund
Magellan® Fund
Mid-Cap Stock Fund
New Millennium Fund®
OTC Portfolio
Retirement Growth Fund
Small Cap Selector
Small Cap Stock Fund
Stock Selector
Tax Managed Stock Fund
TechnoQuant® Growth Fund
Trend Fund
Value Fund
The Fidelity Telephone Connection
Mutual Fund 24-Hour Service
Exchanges/Redemptions
and Account Assistance 1-800-544-6666
Product Information 1-800-544-6666
Retirement Accounts 1-800-544-4774
(8 a.m. - 9 p.m.)
TDD Service 1-800-544-0118
for the deaf and hearing impaired
(9 a.m. - 9 p.m. Eastern time)
Fidelity Automated Service
Telephone (FAST®) (automated graphic) 1-800-544-5555
(automated graphic) Automated line for quickest service
Fidelity®
Annual Report
October 31, 2000
(2_fidelity_logos)
|
President's Message |
3 |
Ned Johnson on investing strategies. |
|
Performance |
4 |
How the fund has done over time. |
|
Fund Talk |
6 |
The manager's review of fund performance, strategy and outlook. |
|
Investment Changes |
9 |
A summary of major shifts in the fund's investments over the past six months. |
|
Investments |
10 |
A complete list of the fund's investments with their market values. |
|
Financial Statements |
21 |
Statements of assets and liabilities, operations, and changes in net assets, as well as financial highlights. |
|
Notes |
25 |
Notes to the financial statements. |
|
Independent |
30 |
The auditors' opinion. |
|
Distributions |
31 |
|
Standard & Poor's, S&P and S&P 500 are registered service marks of The McGraw-Hill Companies, Inc. and have been licensed for use by Fidelity Distributors Corporation.
Other third party marks appearing herein are the property of their respective owners.
All other marks appearing herein are registered or unregistered trademarks or service marks of FMR Corp. or an affiliated company.
(Recycle graphic) This report is printed on recycled paper using soy-based inks.
This report and the financial statements contained herein are submitted for the general information of the shareholders of the fund. This report is not authorized for distribution to prospective investors in the fund unless preceded or accompanied by an effective prospectus.
Mutual fund shares are not deposits or obligations of, or guaranteed by, any depository institution. Shares are not insured by the FDIC, Federal Reserve Board or any other agency, and are subject to investment risks, including possible loss of principal amount invested.
Neither the fund nor Fidelity Distributors Corporation is a bank.
For more information on any Fidelity fund, including charges and expenses, call 1-800-544-6666 for a free prospectus. Read it carefully before you invest or send money.
Annual Report
(Photograph of Edward C. Johnson 3d.)
Dear Shareholder:
A sixth-straight year of double-digit positive returns for the Dow Jones Industrial Average, NASDAQ and S&P 500® could be in jeopardy unless the U.S. stock market shows marked improvement in the final two months of 2000. Through October, all three indexes had negative year-to-date returns. On the other hand, most fixed-income sectors were solidly in the black. Treasuries and other long-term government securities led the way, returning nearly 14%.
While it's impossible to predict the future direction of the markets with any degree of certainty, there are certain basic principles that can help investors plan for their future needs.
First, investors are encouraged to take a long-term view of their portfolios. If you can afford to leave your money invested through the inevitable up and down cycles of the financial markets, you will greatly reduce your vulnerability to any single decline. We know from experience, for example, that stock prices have gone up over longer periods of time, have significantly outperformed other types of investments and have stayed ahead of inflation.
Second, you can further manage your investing risk through diversification. A stock mutual fund, for instance, is already diversified, because it invests in many different companies. You can increase your diversification further by investing in a number of different stock funds, or in such other investment categories as bonds. If you have a short investment time horizon, you might want to consider moving some of your investment into a money market fund, which seeks income and a stable share price by investing in high-quality, short-term investments. Of course, it's important to remember that an investment in a money market fund is not insured or guaranteed by the Federal Deposit Insurance Corporation or any other government agency. Although money market funds seek to preserve the value of your investment at $1.00 per share, it is possible to lose money by investing in these types of funds.
Finally, no matter what your time horizon or portfolio diversity, it makes good sense to follow a regular investment plan, investing a certain amount of money in a fund at the same time each month or quarter and periodically reviewing your overall portfolio. By doing so, you won't get caught up in the excitement of a rapidly rising market, nor will you buy all your shares at market highs. While this strategy - known as dollar cost averaging - won't assure a profit or protect you from a loss in a declining market, it should help you lower the average cost of your purchases. Of course, you should consider your financial ability to continue your purchases through periods of low price levels before undertaking such a strategy.
If you have questions, please call us at 1-800-544-6666, or visit our web site at www.fidelity.com. We are available 24 hours a day, seven days a week to provide you the information you need to make the investments that are right for you.
Best regards,
/s/Edward C. Johnson 3d
Edward C. Johnson 3d
Annual Report
There are several ways to evaluate a fund's historical performance. You can look at the total percentage change in value, the average annual percentage change or the growth of a hypothetical $10,000 investment. Total return reflects the change in the value of an investment, assuming reinvestment of the fund's dividend income and capital gains (the profits earned upon the sale of securities that have grown in value).
Cumulative Total Returns
|
Periods ended October 31, 2000 |
|
Past 1 |
Past 5 |
Life of |
|
Fidelity Small Cap Selector |
|
18.62% |
57.48% |
113.41% |
|
Russell 2000 ® |
|
17.41% |
79.30% |
137.98% |
|
Small Cap Funds Average |
|
28.93% |
117.10% |
n/a* |
Cumulative total returns show the fund's performance in percentage terms over a set period - in this case, one year, five years or since the fund started on June 28, 1993. For example, if you had invested $1,000 in a fund that had a 5% return over the past year, the value of your investment would be $1,050. You can compare the fund's returns to the performance of the Russell 2000 Index - a market capitalization-weighted index of 2,000 small company stocks. To measure how the fund's performance stacked up against its peers, you can compare it to the small cap funds average, which reflects the performance of mutual funds with similar objectives tracked by Lipper Inc. The past one year average represents a peer group of 821 mutual funds. These benchmarks include reinvested dividends and capital gains, if any, and exclude the effect of sales charges. Lipper has created new comparison categories that group funds according to portfolio characteristics and capitalization, as well as by capitalization only. These averages are listed on page 5 of this report.(dagger)
Average Annual Total Returns
|
Periods ended October 31, 2000 |
Past 1 |
Past 5 |
Life of |
|
Fidelity Small Cap Selector |
18.62% |
9.51% |
10.87% |
|
Russell 2000 |
17.41% |
12.39% |
12.52% |
|
Small Cap Funds Average |
28.93% |
16.14% |
n/a* |
Average annual total returns take the fund's cumulative return and show you what would have happened if the fund had performed at a constant rate each year. (Note: Lipper calculates average annual total returns by annualizing each fund's total return, then taking an arithmetic average. This may produce a different figure than that obtained by averaging the cumulative total returns and annualizing the result.)
* Not available
Annual Report
$10,000 Over Life of Fund
$10,000 Over Life of Fund: Let's say hypothetically that $10,000 was invested in Fidelity Small Cap Selector on June 28, 1993 when the fund started. As the chart shows, by October 31, 2000, the value of the investment would have grown to $21,341 - a 113.41% increase on the initial investment. For comparison, look at how the Russell 2000 Index did over the same period. With dividends and capital gains, if any, reinvested, the same $10,000 would have grown $23,798 - a 137.98% increase.
Understanding
Performance
How a fund did yesterday is no guarantee of how it will do tomorrow. The stock market, for example, has a history of long-term growth and short-term volatility. In turn, the share price and return of a fund that invests in stocks will vary. That means if you sell your shares during a market downturn, you might lose money. But if you can ride out the market's ups and downs, you may have a gain.
3* The Lipper small-cap core funds average reflects the performance (excluding sales charges) of mutual funds with similar portfolio characteristics and capitalization. The Lipper small-cap supergroup average reflects the performance (excluding sales charges) of mutual funds with similar capitalization. As of October 31, 2000, the one year and five year cumulative total returns for the small-cap core funds average were 26.64%, and 97.89%, respectively. The one year and five year average annual total returns were 26.64% and 14.02%, respectively. The one year and five year cumulative total returns for the small-cap supergroup average were 28.35%, and 106.04%, respectively. The one year and five year average annual total returns were 28.35% and 14.88%, respectively.
Annual Report
Market Recap
The U.S. equity markets went from hot to cold during the 12-month period that ended October 31, 2000. At the period's onset, strong enthusiasm for technology and telecommunication stocks lifted the performance of those and other stocks related to the so-called "new economy." In March and April, a sharp correction in those sectors nudged investors toward more traditional industries, such as pharmaceuticals and financials. However, the broadening of the market was brief. In May, the Federal Reserve Board raised key interest rates to their highest levels in nine years in a move designed to prevent inflation. It was the Fed's fourth consecutive rate hike during the period. Higher rates, coupled with the highest oil prices in a decade and the declining value of the euro, collectively exacted a toll on corporate profits. This slowdown was particularly evident in the third quarter, as many companies revised earnings on the downside. The emergence of these factors during the past six months hampered the one-year returns of the major U.S. equity indices. The NASDAQ Composite Index ended the 12-month period with a 13.81% gain. Small-cap stocks, as represented by the Russell 2000® Index, returned 17.41%. The Standard & Poor's 500SM Index, an index of 500 larger companies, advanced 6.09%. Investors were less enamored with blue-chip industrial stocks, as the Dow Jones Industrial Average rose 3.82%.
(Portfolio Manager photograph)
An interview with Tim Krochuk, Portfolio Manager of Fidelity Small Cap Selector
Q. How did the fund perform, Tim?
A. For the 12 months that ended October 31, 2000, the fund returned 18.62%, while the Russell 2000 Index returned 17.41%. The small cap funds average tracked by Lipper Inc. returned 28.93% for the same time period.
Q. Why did the fund outperform the Russell 2000 while underperforming its Lipper peer group during the period?
A. The portfolio outperformed the Russell 2000 by virtue of a relatively larger exposure early in the period to market sectors such as technology and energy, that experienced strong market momentum. Conversely, the fund lagged its peer group by being less concentrated than some of its competitors that owned larger proportions of the same market leaders. In other words, the fund was more concentrated than the broad market, while at the same time it was more diversified - with a lower risk profile - than its peer group.
Annual Report
Fund Talk: The Manager's Overview - continued
Q. What factors did your investment strategy incorporate during the past year?
A. Market volatility was above average, particularly for the smaller-cap stocks that make up the portfolio. Because sectors rotated in and out of favor as often as monthly, it implied that investors were not relying on quarterly fundamental data, such as earnings, but rather were focused on technical data such as money flows and trading volume that were available daily. My models used this data to suggest emphasizing momentum factors that reflected actual market trends. In response, I incorporated several technical models into my stock selection process, which highlighted and acted on short-term shifts in momentum. As a result, I made some well-timed moves in and out and back into some very volatile sectors, particularly technology, which locked in gains during favorable cycles and avoided large losses during weaker cycles.
Q. Which holdings helped the fund's total return?
A. Integrated Device Technology and Cypress Semiconductor, manufacturers of high-performance semiconductors and circuits, benefited from strong demand for semiconductors, particularly early in the period when chip manufacturers were pursuing inventory buildups. I have since reduced these positions. Financial services stocks, which I underweighted during the first half of the year when interest rates were rising, generated some good gains during the second half. In particular, Silicon Valley Bancshares performed well - as a niche lender to technology and biotechnology companies, it represented a diversification play while still maintaining exposure to the outperforming tech sector. In the energy sector, offshore drilling companies such as ENSCO International performed well when high oil prices supported increased rig utilization.
Q. What investments were disappointing?
A. Collectively, specialty retailers generated the weakest performance. Investments in Ross Stores, Ann Taylor Stores, Pacific Sunwear and American Eagle Outfitters all detracted from performance when they disappointed investors looking for stronger comparable sales and higher margins. Bucking that trend was Talbots, which posted strong results and offset some of the losses within this sector. Two small Internet positions, BroadVision and Go2Net, were hit by the sector's fall from favor during the second half of the period. Human Genome Sciences, a biotechnology company, declined dramatically in response to a miswritten patent related to AIDS gene research. Other small-cap biotech stocks soon followed suit. I have since sold many of these stocks.
Q. What's your outlook for the coming months?
A. I expect volatility to continue, which should benefit active stock pickers, particularly as investors seem to be learning that not all stocks in a hot sector are created equal. However, much of the market seems to have been oversold recently, with investors basing sell decisions on factors unrelated to the economic or investment environment. As we move into the final calendar quarter, some of my technical analysis suggests a stronger market tone, particularly for smaller companies experiencing positive fund flows and strong fundamentals. Of course, the outcome of the presidential election may alter the investment landscape ahead, so I will be watching that data closely.
Annual Report
Fund Talk: The Manager's Overview - continued
The views expressed in this report reflect those of the portfolio manager only through the end of the period of the report as stated on the cover and do not necessarily represent the views of Fidelity or any other person in the Fidelity organization. Any such views are subject to change at any time based upon market or other conditions and Fidelity disclaims any responsibility to update such views. These views may not be relied on as investment advice and, because investment decisions for a Fidelity fund are based on numerous factors, may not be relied on as an indication of trading intent on behalf of any Fidelity fund.
Fund Facts
Goal: capital appreciation by investing mainly in equity securities of companies with small market capitalizations, chosen in part by using computer-aided quantitative analysis
Fund number: 336
Trading symbol: FDSCX
Start date: June 28, 1993
Size: as of October 31, 2000, more than $680 million
Manager: Tim Krochuk, since April 2000; manager, Fidelity TechnoQuant Growth Fund, since 1996; quantitative analyst, 1994-1996; equity research associate, 1992-1994; joined Fidelity in 1992
3Tim Krochuk on the computer's role in quantitative investing:
"When I'm asked to explain what quantitative investing is all about, I like to point out that almost every modern industry today uses computers to work better and smarter. So, it stands to reason that financial managers could use computers to try to maximize goal-appropriate, risk-adjusted returns. This is the cornerstone of quantitative investing. As quantitative managers, or ´quants,' we look at the same fundamental and technical data investors have been using for decades - we simply add the computer to the process in order to identify patterns and interrelationships that are invisible to the naked eye. Quite simply, we are using the computer to try to do things better and faster than we could before.
"However, it is important to note that the results of the computer models do not get sent directly to the trading floor. The models' results are reviewed for suitability and consistency by the portfolio manager, and are always double-checked for accuracy. Also, while the computer is great with quantitative data, qualitative data can pose problems. In such instances, it's nice to have Fidelity's vast network of fundamental analysts to provide additional input."
Annual Report
|
Top Ten Stocks as of October 31, 2000 |
||
|
|
% of fund's |
% of fund's net assets |
|
Suiza Foods Corp. |
1.5 |
1.3 |
|
Silicon Valley Bancshares |
1.5 |
0.6 |
|
Talbots, Inc. |
1.3 |
0.8 |
|
ENSCO International, Inc. |
1.2 |
1.5 |
|
Radian Group, Inc. |
1.1 |
0.1 |
|
Downey Financial Corp. |
1.1 |
0.6 |
|
Metris Companies, Inc. |
1.1 |
1.4 |
|
Applied Micro Circuits Corp. |
1.1 |
0.5 |
|
RehabCare Group, Inc. |
1.1 |
0.1 |
|
Newport News Shipbuilding, Inc. |
1.1 |
0.0 |
|
|
12.1 |
6.9 |
|
Top Five Market Sectors as of October 31, 2000 |
||
|
|
% of fund's |
% of fund's net assets |
|
Technology |
18.7 |
37.3 |
|
Health |
14.6 |
4.4 |
|
Finance |
12.8 |
6.9 |
|
Construction & Real Estate |
8.4 |
4.0 |
|
Energy |
7.3 |
6.7 |
|
Asset Allocation (% of fund's net assets) |
|||||||
|
As of October 31, 2000 * |
As of April 30, 2000 * * |
||||||
|
Stocks and Investment Companies 89.5% |
|
|
Stocks and Investment Companies 92.2% |
|
||
|
Short-Term |
|
|
Short-Term |
|
||
|
* Foreign investments |
0.6% |
|
** Foreign investments |
1.4% |
|
||

Annual Report
Showing Percentage of Net Assets
|
Common Stocks - 88.9% |
|||
|
Shares |
Value (Note 1) |
||
|
AEROSPACE & DEFENSE - 1.1% |
|||
|
Ship Building & Repair - 1.1% |
|||
|
Newport News Shipbuilding, Inc. |
148,700 |
$ 7,314,181 |
|
|
BASIC INDUSTRIES - 1.9% |
|||
|
Chemicals & Plastics - 0.5% |
|||
|
Cytec Industries, Inc. (a) |
100,300 |
3,472,888 |
|
|
H.B. Fuller Co. |
83 |
2,806 |
|
|
|
3,475,694 |
||
|
Metals & Mining - 0.9% |
|||
|
Belden, Inc. |
155,000 |
4,020,313 |
|
|
CommScope, Inc. (a) |
93,900 |
2,376,844 |
|
|
|
6,397,157 |
||
|
Paper & Forest Products - 0.5% |
|||
|
Buckeye Technologies, Inc. (a) |
55,000 |
941,875 |
|
|
Pactiv Corp. (a) |
196,800 |
2,066,400 |
|
|
|
3,008,275 |
||
|
TOTAL BASIC INDUSTRIES |
12,881,126 |
||
|
CONSTRUCTION & REAL ESTATE - 8.4% |
|||
|
Building Materials - 0.2% |
|||
|
Shaw Group (a) |
12,600 |
1,026,900 |
|
|
Construction - 1.4% |
|||
|
Kaufman & Broad Home Corp. |
113,900 |
3,388,525 |
|
|
M. D. C. Holdings, Inc. |
89,000 |
2,436,375 |
|
|
M/I Schottenstein Homes, Inc. |
35,000 |
719,688 |
|
|
NVR, Inc. (a) |
28,400 |
2,936,560 |
|
|
|
9,481,148 |
||
|
Engineering - 0.6% |
|||
|
MasTec, Inc. (a) |
46,700 |
1,351,381 |
|
|
Quanta Services, Inc. (a) |
92,800 |
2,882,600 |
|
|
|
4,233,981 |
||
|
Real Estate - 0.3% |
|||
|
Fairfield Communities, Inc. (a) |
42,400 |
537,950 |
|
|
LNR Property Corp. |
40,000 |
865,000 |
|
|
Trendwest Resorts, Inc. (a) |
36,000 |
681,750 |
|
|
|
2,084,700 |
||
|
Real Estate Investment Trusts - 5.9% |
|||
|
Apartment Investment & Management Co. Class A |
46,300 |
2,115,331 |
|
|
Arden Realty Group, Inc. |
91,800 |
2,203,200 |
|
|
Common Stocks - continued |
|||
|
Shares |
Value (Note 1) |
||
|
CONSTRUCTION & REAL ESTATE - continued |
|||
|
Real Estate Investment Trusts - continued |
|||
|
Brandywine Realty Trust |
194,600 |
$ 3,721,725 |
|
|
BRE Properties, Inc. Class A |
70,300 |
2,223,238 |
|
|
Capital Automotive |
40,000 |
515,625 |
|
|
Essex Property Trust, Inc. |
78,700 |
4,092,400 |
|
|
Glenborough Realty Trust, Inc. |
126,100 |
2,025,481 |
|
|
Great Lakes REIT, Inc. |
47,800 |
809,613 |
|
|
Health Care Property Investors, Inc. |
76,800 |
2,256,000 |
|
|
Healthcare Realty Trust, Inc. |
125,200 |
2,496,175 |
|
|
Home Properties of New York, Inc. |
76,779 |
2,087,429 |
|
|
IRT Property Co. |
93,900 |
768,806 |
|
|
Mid-Atlantic Realty Trust |
152,200 |
1,712,250 |
|
|
Nationwide Health Properties, Inc. |
155,000 |
2,315,313 |
|
|
Pacific Gulf Properties, Inc. |
105,900 |
2,812,969 |
|
|
Parkway Properties, Inc. |
29,000 |
830,125 |
|
|
Prentiss Properties Trust (SBI) |
70,800 |
1,796,550 |
|
|
Reckson Associates Realty Corp. |
93,700 |
2,119,963 |
|
|
RFS Hotel Investors, Inc. |
72,000 |
927,000 |
|
|
Summit Properties, Inc. |
103,500 |
2,484,000 |
|
|
|
40,313,193 |
||
|
TOTAL CONSTRUCTION & REAL ESTATE |
57,139,922 |
||
|
DURABLES - 0.4% |
|||
|
Consumer Durables - 0.2% |
|||
|
Simpson Manufacturing Co. Ltd. (a) |
30,000 |
1,278,750 |
|
|
Consumer Electronics - 0.2% |
|||
|
Universal Electronics, Inc. (a) |
58,800 |
1,080,450 |
|
|
TOTAL DURABLES |
2,359,200 |
||
|
ENERGY - 7.3% |
|||
|
Energy Services - 3.3% |
|||
|
ENSCO International, Inc. |
251,600 |
8,365,700 |
|
|
Global Marine, Inc. (a) |
87,500 |
2,318,750 |
|
|
Helmerich & Payne, Inc. |
76,500 |
2,404,969 |
|
|
Maverick Tube Corp. (a) |
60,500 |
941,531 |
|
|
Patterson Energy, Inc. (a) |
99,000 |
2,784,375 |
|
|
Pride International, Inc. (a) |
68,900 |
1,744,031 |
|
|
UTI Energy Corp. (a) |
188,000 |
3,771,750 |
|
|
|
22,331,106 |
||
|
Common Stocks - continued |
|||
|
Shares |
Value (Note 1) |
||
|
ENERGY - continued |
|||
|
Oil & Gas - 4.0% |
|||
|
Chesapeake Energy Corp. (a) |
956,300 |
$ 5,379,188 |
|
|
EOG Resources, Inc. |
93,900 |
3,697,313 |
|
|
Howell Corp. |
158,600 |
1,853,638 |
|
|
Noble Affiliates, Inc. |
98,300 |
3,606,381 |
|
|
Prima Energy Corp. (a) |
56,800 |
2,524,050 |
|
|
Pure Resources, Inc. (a) |
23,232 |
383,328 |
|
|
Swift Energy Co. (a) |
76,600 |
2,489,500 |
|
|
Tom Brown, Inc. (a) |
88,600 |
2,026,725 |
|
|
Valero Energy Corp. |
38,100 |
1,259,681 |
|
|
Western Gas Resources, Inc. |
104,100 |
2,283,694 |
|
|
Williams Clayton Energy, Inc. (a) |
55,000 |
1,529,688 |
|
|
|
27,033,186 |
||
|
TOTAL ENERGY |
49,364,292 |
||
|
FINANCE - 12.8% |
|||
|
Banks - 2.8% |
|||
|
Area Bankshares Corp. |
17,400 |
363,225 |
|
|
BancFirst Corp. |
6,000 |
217,500 |
|
|
Cullen Frost Bankers, Inc. |
44,100 |
1,469,081 |
|
|
First State Bancorp. |
12,900 |
148,350 |
|
|
GBC Bancorp |
67,700 |
2,157,938 |
|
|
Greater Bay Bancorp |
60,800 |
1,979,800 |
|
|
Hamilton Bancorp, Inc. (a) |
12,300 |
184,500 |
|
|
Midwest Banc Holdings, Inc. |
12,100 |
178,475 |
|
|
Riggs National Corp. |
28,000 |
315,000 |
|
|
Silicon Valley Bancshares (a) |
211,000 |
9,758,750 |
|
|
Whitney Holding Corp. |
58,100 |
2,146,069 |
|
|
|
18,918,688 |
||
|
Credit & Other Finance - 1.1% |
|||
|
Metris Companies, Inc. |
235,950 |
7,638,881 |
|
|
NextCard, Inc. (a) |
7,900 |
60,238 |
|
|
|
7,699,119 |
||
|
Insurance - 4.0% |
|||
|
Alfa Corp. |
97,600 |
1,878,800 |
|
|
Amerus Group Co. |
43,000 |
1,134,125 |
|
|
Arthur J. Gallagher & Co. |
86,500 |
5,460,313 |
|
|
INSpire Insurance Solutions, Inc. (a) |
17,300 |
10,813 |
|
|
LandAmerica Financial Group, Inc. |
55,800 |
1,646,100 |
|
|
Liberty Corp. (The) |
48,500 |
1,679,313 |
|
|
Common Stocks - continued |
|||
|
Shares |
Value (Note 1) |
||
|
FINANCE - continued |
|||
|
Insurance - continued |
|||
|
MONY Group, Inc. |
170,700 |
$ 7,020,038 |
|
|
Penn Treaty American Corp. (a) |
8,600 |
164,475 |
|
|
Presidential Life Corp. |
50,000 |
728,125 |
|
|
Radian Group, Inc. |
109,600 |
7,767,900 |
|
|
|
27,490,002 |
||
|
Savings & Loans - 1.9% |
|||
|
Bank United Corp. Class A |
47,600 |
2,698,325 |
|
|
BankUnited Financial Corp. Class A (a) |
10,800 |
83,700 |
|
|
Downey Financial Corp. |
161,300 |
7,702,075 |
|
|
First Indiana Corp. |
13,700 |
315,100 |
|
|
FirstFed Financial Corp. (a) |
18,300 |
466,650 |
|
|
Richmond County Financial Corp. |
55,000 |
1,292,500 |
|
|
|
12,558,350 |
||
|
Securities Industry - 3.0% |
|||
|
A.G. Edwards, Inc. |
34,900 |
1,771,175 |
|
|
Alliance Capital Management Holding LP |
36,400 |
1,747,200 |
|
|
BlackRock, Inc. Class A |
42,000 |
1,790,250 |
|
|
Dain Rauscher Corp. |
54,300 |
5,094,019 |
|
|
DLJdirect, Inc. (a) |
339,100 |
1,716,694 |
|
|
Eaton Vance Corp. (non-vtg.) |
44,100 |
2,196,731 |
|
|
Phoenix Investment Partners Ltd. |
64,900 |
1,014,063 |
|
|
Raymond James Financial, Inc. |
50,100 |
1,694,006 |
|
|
Security Capital Group, Inc. Class B (a) |
53,800 |
1,025,563 |
|
|
Tucker Anthony Sutro Corp. |
104,400 |
2,414,250 |
|
|
|
20,463,951 |
||
|
TOTAL FINANCE |
87,130,110 |
||
|
HEALTH - 14.6% |
|||
|
Drugs & Pharmaceuticals - 7.7% |
|||
|
Accredo Health, Inc. (a) |
48,000 |
2,076,000 |
|
|
Albany Molecular Research, Inc. (a) |
41,600 |
2,418,000 |
|
|
Aviron (a) |
48,200 |
3,151,075 |
|
|
Barr Laboratories, Inc. (a) |
23,500 |
1,483,438 |
|
|
Carter-Wallace, Inc. |
94,600 |
2,595,588 |
|
|
Cell Therapeutics, Inc. (a) |
54,500 |
3,645,539 |
|
|
CIMA Labs, Inc. (a) |
11,600 |
638,000 |
|
|
COR Therapeutics, Inc. (a) |
24,300 |
1,372,950 |
|
|
CuraGen Corp. (a) |
46,700 |
3,017,988 |
|
|
CV Therapeutics, Inc. (a) |
33,700 |
2,653,875 |
|
|
Common Stocks - continued |
|||
|
Shares |
Value (Note 1) |
||
|
HEALTH - continued |
|||
|
Drugs & Pharmaceuticals - continued |
|||
|
Cytyc Corp. (a) |
72,000 |
$ 4,273,875 |
|
|
Enzon, Inc. (a) |
23,900 |
1,702,875 |
|
|
GelTex Pharmaceuticals, Inc. (a) |
64,200 |
3,185,925 |
|
|
Genzyme Transgenics Corp. (a) |
72,700 |
1,558,506 |
|
|
Gilead Sciences, Inc. (a) |
13,700 |
1,178,200 |
|
|
ImmunoGen, Inc. (a) |
34,400 |
1,182,500 |
|
|
Intermune Pharmaceuticals, Inc. |
40,500 |
2,025,000 |
|
|
Miravant Medical Technologies (a) |
190,600 |
2,882,825 |
|
|
Neurogen Corp. (a) |
37,600 |
1,182,050 |
|
|
Noven Pharmaceuticals, Inc. (a) |
84,000 |
3,743,250 |
|
|
Ribozyme Pharmaceuticals, Inc. (a) |
72,900 |
1,544,569 |
|
|
Tanox, Inc. |
1,200 |
44,700 |
|
|
Trimeris, Inc. (a) |
52,300 |
3,700,225 |
|
|
VaxGen, Inc. (a) |
56,200 |
1,541,988 |
|
|
|
52,798,941 |
||
|
Medical Equipment & Supplies - 1.3% |
|||
|
Biomet, Inc. |
65,700 |
2,377,519 |
|
|
Datascope Corp. |
74,000 |
2,562,250 |
|
|
I-Stat Corp. (a) |
70,700 |
1,387,488 |
|
|
Intermagnetics General Corp. |
91,400 |
2,342,125 |
|
|
|
8,669,382 |
||
|
Medical Facilities Management - 5.6% |
|||
|
IMPATH, Inc. (a) |
51,200 |
3,872,000 |
|
|
Lifepoint Hospitals, Inc. (a) |
109,800 |
4,254,750 |
|
|
Manor Care, Inc. (a) |
172,700 |
2,881,931 |
|
|
Mid-Atlantic Medical Services, Inc. (a) |
226,500 |
3,850,500 |
|
|
Quest Diagnostics, Inc. (a) |
40,100 |
3,859,625 |
|
|
RehabCare Group, Inc. (a) |
174,700 |
7,544,856 |
|
|
Syncor International Corp. (a) |
162,200 |
4,166,513 |
|
|
Triad Hospitals, Inc. (a) |
155,700 |
4,320,675 |
|
|
Universal Health Services, Inc. Class B (a) |
39,400 |
3,304,675 |
|
|
|
38,055,525 |
||
|
TOTAL HEALTH |
99,523,848 |
||
|
INDUSTRIAL MACHINERY & EQUIPMENT - 1.1% |
|||
|
Electrical Equipment - 1.1% |
|||
|
Airnet Communications Corp. |
12,700 |
193,278 |
|
|
Anixter International, Inc. (a) |
68,500 |
1,661,125 |
|
|
Common Stocks - continued |
|||
|
Shares |
Value (Note 1) |
||
|
INDUSTRIAL MACHINERY & EQUIPMENT - continued |
|||
|
Electrical Equipment - continued |
|||
|
Littelfuse, Inc. (a) |
14,000 |
$ 406,000 |
|
|
Powerwave Technologies, Inc. (a) |
114,000 |
5,486,250 |
|
|
|
7,746,653 |
||
|
MEDIA & LEISURE - 3.1% |
|||
|
Entertainment - 0.2% |
|||
|
MGM Mirage, Inc. |
40,000 |
1,382,500 |
|
|
Leisure Durables & Toys - 0.0% |
|||
|
Arctic Cat, Inc. |
28,000 |
358,750 |
|
|
Lodging & Gaming - 0.8% |
|||
|
Argosy Gaming Co. (a) |
74,000 |
1,202,500 |
|
|
Aztar Corp. (a) |
194,300 |
2,938,788 |
|
|
WMS Industries, Inc. (a) |
64,100 |
1,426,225 |
|
|
|
5,567,513 |
||
|
Publishing - 0.7% |
|||
|
Harcourt General, Inc. |
36,000 |
2,017,800 |
|
|
Reader's Digest Association, Inc. Class A (non-vtg.) |
70,000 |
2,568,125 |
|
|
|
4,585,925 |
||
|
Restaurants - 1.4% |
|||
|
Bob Evans Farms, Inc. |
108,200 |
2,035,513 |
|
|
CEC Entertainment, Inc. (a) |
147,900 |
4,714,313 |
|
|
P.F. Chang's China Bistro, Inc. (a) |
60,900 |
2,496,900 |
|
|
|
9,246,726 |
||
|
TOTAL MEDIA & LEISURE |
21,141,414 |
||
|
NONDURABLES - 2.2% |
|||
|
Foods - 1.8% |
|||
|
Suiza Foods Corp. (a) |
224,000 |
10,373,978 |
|
|
Tootsie Roll Industries, Inc. |
44,800 |
1,719,200 |
|
|
|
12,093,178 |
||
|
Household Products - 0.4% |
|||
|
Church & Dwight Co., Inc. |
137,000 |
2,705,750 |
|
|
TOTAL NONDURABLES |
14,798,928 |
||
|
RETAIL & WHOLESALE - 6.1% |
|||
|
Apparel Stores - 2.6% |
|||
|
Christopher & Banks Corp. (a) |
128,500 |
4,256,563 |
|
|
Common Stocks - continued |
|||
|
Shares |
Value (Note 1) |
||
|
RETAIL & WHOLESALE - continued |
|||
|
Apparel Stores - continued |
|||
|
Factory 2-U Stores, Inc. (a) |
118,900 |
$ 3,797,369 |
|
|
Genesco, Inc. (a) |
45,000 |
798,750 |
|
|
Talbots, Inc. |
110,000 |
8,696,875 |
|
|
|
17,549,557 |
||
|
General Merchandise Stores - 1.1% |
|||
|
Consolidated Stores Corp. (a) |
127,100 |
1,509,313 |
|
|
Cost Plus, Inc. (a) |
74,150 |
2,076,200 |
|
|
Hot Topic, Inc. (a) |
60,000 |
2,055,000 |
|
|
Michaels Stores, Inc. (a) |
92,300 |
2,244,044 |
|
|
|
7,884,557 |
||
|
Grocery Stores - 0.6% |
|||
|
Krispy Kreme Doughnuts, Inc. |
40,200 |
3,962,213 |
|
|
Retail & Wholesale, Miscellaneous - 1.8% |
|||
|
Handleman Co. (a) |
134,700 |
1,330,163 |
|
|
Pier 1 Imports, Inc. |
381,500 |
5,054,875 |
|
|
SCP Pool Corp. (a) |
126,800 |
3,280,950 |
|
|
Zale Corp. (a) |
77,800 |
2,635,475 |
|
|
|
12,301,463 |
||
|
TOTAL RETAIL & WHOLESALE |
41,697,790 |
||
|
SERVICES - 3.4% |
|||
|
Educational Services - 1.3% |
|||
|
Career Education Corp. (a) |
132,600 |
5,129,963 |
|
|
Corinthian Colleges, Inc. (a) |
29,400 |
2,032,275 |
|
|
University of Phoenix Online Class A (a) |
41,400 |
1,619,775 |
|
|
|
8,782,013 |
||
|
Leasing & Rental - 0.6% |
|||
|
Rent-A-Center, Inc. (a) |
80,000 |
2,335,000 |
|
|
Ryder System, Inc. |
99,100 |
1,957,225 |
|
|
|
4,292,225 |
||
|
Services - 1.5% |
|||
|
Braun Consulting, Inc. (a) |
62,500 |
470,703 |
|
|
Chemed Corp. |
45,900 |
1,508,963 |
|
|
Forrester Research, Inc. (a) |
61,200 |
2,513,025 |
|
|
Korn/Ferry International (a) |
61,500 |
2,152,500 |
|
|
Common Stocks - continued |
|||
|
Shares |
Value (Note 1) |
||
|
SERVICES - continued |
|||
|
Services - continued |
|||
|
Learning Tree International, Inc. (a) |
44,700 |
$ 2,022,675 |
|
|
Robert Half International, Inc. (a) |
49,300 |
1,503,650 |
|
|
|
10,171,516 |
||
|
TOTAL SERVICES |
23,245,754 |
||
|
TECHNOLOGY - 18.7% |
|||
|
Communications Equipment - 1.1% |
|||
|
Advanced Fibre Communications, Inc. (a) |
108,700 |
3,539,544 |
|
|
Cable Design Technologies Corp. (a) |
10,500 |
242,156 |
|
|
Tollgrade Communications, Inc. (a) |
41,400 |
3,964,050 |
|
|
|
7,745,750 |
||
|
Computer Services & Software - 9.8% |
|||
|
Actuate Software Corp. (a) |
87,600 |
2,469,225 |
|
|
Affiliated Computer Services, Inc. Class A (a) |
36,700 |
2,043,731 |
|
|
Black Box Corp. (a) |
78,800 |
5,190,950 |
|
|
Carreker Corp. (a) |
74,900 |
1,385,650 |
|
|
Cerner Corp. (a) |
6,500 |
402,594 |
|
|
Cobalt Networks, Inc. |
45,900 |
2,530,238 |
|
|
Commerce One, Inc. (a) |
48,000 |
3,081,000 |
|
|
Documentum, Inc. (a) |
29,600 |
2,516,000 |
|
|
InfoSpace.com, Inc. (a) |
39,312 |
791,154 |
|
|
IntraNet Solutions, Inc. (a) |
58,300 |
2,710,950 |
|
|
Manhattan Associates, Inc. (a) |
42,200 |
2,701,459 |
|
|
Manugistics Group, Inc. (a) |
19,900 |
2,267,356 |
|
|
MapInfo Corp. (a) |
105,000 |
3,432,187 |
|
|
Nuance Communications, Inc. |
30,300 |
2,613,375 |
|
|
OTG Software, Inc. |
62,700 |
1,975,050 |
|
|
Packeteer, Inc. (a) |
71,800 |
1,786,025 |
|
|
Pegasus Solutions, Inc. (a) |
102,600 |
1,750,613 |
|
|
Proxicom, Inc. (a) |
20,000 |
270,000 |
|
|
PurchasePro.com, Inc. |
98,200 |
2,651,400 |
|
|
Saba Software, Inc. |
154,600 |
3,623,438 |
|
|
SEI Investments Co. |
41,700 |
3,784,275 |
|
|
SERENA Software, Inc. (a) |
102,100 |
5,194,338 |
|
|
Software.com, Inc. (a) |
33,500 |
4,991,500 |
|
|
SPSS, Inc. (a) |
44,400 |
999,000 |
|
|
VelocityHSI, Inc. (a) |
14,060 |
14,939 |
|
|
WatchGuard Technologies, Inc. (a) |
34,600 |
1,730,000 |
|
|
Common Stocks - continued |
|||
|
Shares |
Value (Note 1) |
||
|
TECHNOLOGY - continued |
|||
|
Computer Services & Software - continued |
|||
|
WebEx Communications, Inc. |
41,900 |
$ 1,888,119 |
|
|
WebTrends Corp. (a) |
53,000 |
1,703,453 |
|
|
|
66,498,019 |
||
|
Computers & Office Equipment - 2.2% |
|||
|
Avocent Corp. (a) |
100,000 |
7,093,750 |
|
|
Digital Lightwave, Inc. (a) |
35,700 |
1,809,544 |
|
|
Oak Technology, Inc. (a) |
130,300 |
3,656,544 |
|
|
SanDisk Corp. (a) |
43,900 |
2,358,939 |
|
|
|
14,918,777 |
||
|
Electronic Instruments - 0.9% |
|||
|
Cognex Corp. (a) |
33,000 |
1,105,500 |
|
|
Keithley Instruments, Inc. |
25,200 |
1,348,200 |
|
|
Luminex Corp. |
36,000 |
976,500 |
|
|
Meade Instruments Corp. (a) |
30,000 |
549,375 |
|
|
Nanometrics, Inc. (a) |
25,000 |
575,000 |
|
|
Thermo Electron Corp. (a) |
23,468 |
680,572 |
|
|
Varian, Inc. (a) |
28,600 |
881,238 |
|
|
|
6,116,385 |
||
|
Electronics - 4.0% |
|||
|
Altera Corp. (a) |
37,800 |
1,547,438 |
|
|
Applied Micro Circuits Corp. (a) |
98,824 |
7,553,860 |
|
|
Cypress Semiconductor Corp. (a) |
79,300 |
2,968,794 |
|
|
Dallas Semiconductor Corp. |
44,000 |
1,743,500 |
|
|
Integrated Device Technology, Inc. (a) |
70,600 |
3,975,663 |
|
|
Microtune, Inc. |
35,500 |
998,438 |
|
|
Sanmina Corp. (a) |
32,000 |
3,658,000 |
|
|
Texas Instruments, Inc. |
103,350 |
5,070,609 |
|
|
|
27,516,302 |
||
|
Photographic Equipment - 0.7% |
|||
|
Concord Camera Corp. (a) |
148,300 |
4,588,031 |
|
|
TOTAL TECHNOLOGY |
127,383,264 |
||
|
TRANSPORTATION - 1.9% |
|||
|
Trucking & Freight - 1.9% |
|||
|
Airborne Freight Corp. |
139,500 |
1,412,438 |
|
|
Arkansas Best Corp. (a) |
154,100 |
2,465,600 |
|
|
Expeditors International of Washington, Inc. |
56,500 |
2,930,938 |
|
|
Forward Air Corp. (a) |
76,100 |
3,129,613 |
|
|
Common Stocks - continued |
|||
|
Shares |
Value (Note 1) |
||
|
TRANSPORTATION - continued |
|||
|
Trucking & Freight - continued |
|||
|
Roadway Express, Inc. |
15,000 |
$ 308,438 |
|
|
USFreightways Corp. |
69,100 |
1,779,325 |
|
|
Yellow Corp. (a) |
54,800 |
986,400 |
|
|
|
13,012,752 |
||
|
UTILITIES - 5.9% |
|||
|
Cellular - 0.3% |
|||
|
Leap Wireless International, Inc. (a) |
38,000 |
1,890,500 |
|
|
Electric Utility - 2.6% |
|||
|
Cleco Corp. |
52,300 |
2,487,519 |
|
|
IDACORP, Inc. |
35,300 |
1,740,731 |
|
|
Public Service Co. of New Mexico |
100,000 |
2,756,250 |
|
|
UIL Holdings Corp. |
41,600 |
1,947,400 |
|
|
Unisource Energy Corp. |
422,600 |
6,312,588 |
|
|
WPS Resources Corp. |
78,700 |
2,533,156 |
|
|
|
17,777,644 |
||
|
Gas - 2.7% |
|||
|
AGL Resources, Inc. |
131,200 |
2,673,200 |
|
|
Energen Corp. |
78,300 |
2,241,338 |
|
|
Equitable Resources, Inc. |
108,600 |
6,298,800 |
|
|
Northwest Natural Gas Co. |
96,100 |
2,252,344 |
|
|
Southwestern Energy Co. |
283,000 |
2,264,000 |
|
|
Western Resources, Inc. |
131,200 |
2,804,400 |
|
|
|
18,534,082 |
||
|
Water - 0.3% |
|||
|
Philadelphia Suburban Corp. |
91,900 |
2,153,906 |
|
|
TOTAL UTILITIES |
40,356,132 |
||
|
TOTAL COMMON STOCKS (Cost $496,430,430) |
605,095,366 |
||
|
Investment Companies - 0.6% |
|||
|
|
|
|
|
|
Asia Tigers Fund, Inc. |
100,000 |
706,250 |
|
|
Emerging Markets Infrastructure Fund, Inc. |
90,806 |
811,579 |
|
|
Emerging Markets Telecommunication Fund, Inc. |
140,000 |
1,242,500 |
|
|
Investment Companies - continued |
|||
|
Shares |
Value (Note 1) |
||
|
Morgan Stanley Dean Witter Asia-Pacific Fund, Inc. |
65,000 |
$ 576,875 |
|
|
Singapore Fund, Inc. |
83,000 |
529,125 |
|
|
TOTAL INVESTMENT COMPANIES (Cost $5,173,377) |
3,866,329 |
||
|
Cash Equivalents - 12.3% |
|||
|
|
|
|
|
|
Fidelity Cash Central Fund, 6.61% (b) |
63,943,255 |
63,943,255 |
|
|
Fidelity Securities Lending Cash Central Fund, 6.66% (b) |
20,096,732 |
20,096,732 |
|
|
TOTAL CASH EQUIVALENTS (Cost $84,039,987) |
84,039,987 |
||
|
TOTAL INVESTMENT PORTFOLIO - 101.8% (Cost $585,643,794) |
693,001,682 |
||
|
NET OTHER ASSETS - (1.8)% |
(12,290,715) |
||
|
NET ASSETS - 100% |
$ 680,710,967 |
||
|
Legend |
|
(a) Non-income producing |
|
(b) The rate quoted is the annualized seven-day yield of the fund at period end. A complete listing of the fund's holdings as of its most recent fiscal year end is available upon request. |
|
Income Tax Information |
|
At October 31, 2000, the aggregate |
|
The fund hereby designates approximately $10,046,000 as a capital gain dividend for the purpose of the dividend paid deduction. |
See accompanying notes which are an integral part of the financial statements.
Annual Report
Statement of Assets and Liabilities
|
|
October 31, 2000 |
|
|
Assets |
|
|
|
Investment in securities, at value (cost $585,643,794) - See accompanying schedule |
|
$ 693,001,682 |
|
Cash |
|
121,926 |
|
Receivable for investments sold |
|
14,067,443 |
|
Receivable for fund shares sold |
|
1,173,496 |
|
Dividends receivable |
|
137,706 |
|
Interest receivable |
|
484,484 |
|
Redemption fees receivable |
|
1,613 |
|
Other receivables |
|
421,016 |
|
Total assets |
|
709,409,366 |
|
Liabilities |
|
|
|
Payable for investments purchased |
$ 7,489,113 |
|
|
Payable for fund shares redeemed |
670,254 |
|
|
Accrued management fee |
282,193 |
|
|
Other payables and accrued expenses |
160,107 |
|
|
Collateral on securities loaned, at value |
20,096,732 |
|
|
Total liabilities |
|
28,698,399 |
|
Net Assets |
|
$ 680,710,967 |
|
Net Assets consist of: |
|
|
|
Paid in capital |
|
$ 534,019,752 |
|
Undistributed net investment income |
|
74,461 |
|
Accumulated undistributed net realized gain (loss) on investments and foreign currency transactions |
|
39,258,866 |
|
Net unrealized appreciation (depreciation) on investments |
|
107,357,888 |
|
Net Assets, for 40,346,328 shares outstanding |
|
$ 680,710,967 |
|
Net Asset Value, offering price and redemption price |
|
$16.87 |
See accompanying notes which are an integral part of the financial statements.
Annual Report
Financial Statements - continued
Statement of Operations
|
|
Year ended October 31, 2000 |
|
|
Investment Income Dividends |
|
$ 3,290,586 |
|
Interest |
|
3,305,212 |
|
Security lending |
|
242,986 |
|
Total income |
|
6,838,784 |
|
Expenses |
|
|
|
Management fee |
$ 4,088,819 |
|
|
Performance adjustment |
(698,000) |
|
|
Transfer agent fees |
1,889,936 |
|
|
Accounting and security lending fees |
217,546 |
|
|
Non-interested trustees' compensation |
2,332 |
|
|
Custodian fees and expenses |
30,165 |
|
|
Registration fees |
54,138 |
|
|
Audit |
29,589 |
|
|
Legal |
14,610 |
|
|
Reports to shareholders |
121,689 |
|
|
Miscellaneous |
956 |
|
|
Total expenses before reductions |
5,751,780 |
|
|
Expense reductions |
(250,356) |
5,501,424 |
|
Net investment income |
|
1,337,360 |
|
Realized and Unrealized Gain (Loss) Net realized gain (loss) on: |
|
|
|
Investment securities |
79,776,102 |
|
|
Foreign currency transactions |
(1,787) |
|
|
Futures contracts |
(1,471,847) |
78,302,468 |
|
Change in net unrealized appreciation (depreciation) on investment securities |
|
18,430,748 |
|
Net gain (loss) |
|
96,733,216 |
|
Net increase (decrease) in net assets resulting |
|
$ 98,070,576 |
See accompanying notes which are an integral part of the financial statements.
Annual Report
Financial Statements - continued
Statement of Changes in Net Assets
|
|
Year ended
October 31, |
Six months ended
October 31, |
Year ended |
|
Increase (Decrease) in Net Assets |
|
|
|
|
Operations |
$ 1,337,360 |
$ 455,890 |
$ 3,353,386 |
|
Net realized gain (loss) |
78,302,468 |
56,445,085 |
(95,016,980) |
|
Change in net unrealized |
18,430,748 |
(37,100,153) |
(95,805,403) |
|
Net increase (decrease) in net assets resulting from operations |
98,070,576 |
19,800,822 |
(187,468,997) |
|
Distributions to shareholders |
|
|
|
|
From net investment income |
(767,622) |
(2,935,264) |
(1,778,107) |
|
From net realized gain |
- |
- |
(30,938,619) |
|
Total distributions |
(767,622) |
(2,935,264) |
(32,716,726) |
|
Share transactions |
245,255,488 |
64,140,263 |
332,647,409 |
|
Reinvestment of distributions |
750,509 |
2,869,601 |
32,481,558 |
|
Cost of shares redeemed |
(219,307,706) |
(119,146,239) |
(473,182,473) |
|
Net increase (decrease) in net assets resulting from share transactions |
26,698,291 |
(52,136,375) |
(108,053,506) |
|
Redemption fees |
778,693 |
150,786 |
718,292 |
|
Total increase (decrease) |
124,779,938 |
(35,120,031) |
(327,520,937) |
|
Net Assets |
|
|
|
|
Beginning of period |
555,931,029 |
591,051,060 |
918,571,997 |
|
End of period (including undistributed net investment income of $74,461, $480,924 and $3,718,168, respectively) |
$ 680,710,967 |
$ 555,931,029 |
$ 591,051,060 |
|
Other Information Shares |
|
|
|
|
Sold |
14,496,901 |
4,525,388 |
24,088,575 |
|
Issued in reinvestment of distributions |
49,213 |
204,096 |
1,980,592 |
|
Redeemed |
(13,240,002) |
(8,438,204) |
(34,043,312) |
|
Net increase (decrease) |
1,306,112 |
(3,708,720) |
(7,974,145) |
See accompanying notes which are an integral part of the financial statements.
Annual Report
Financial Highlights
|
Years ended October 31, |
2000 |
1999 F |
1999 G |
1998 G |
1997 G |
1996 G |
|
Selected Per-Share Data |
|
|
|
|
|
|
|
Net asset value, |
$ 14.24 |
$ 13.83 |
$ 18.11 |
$ 13.06 |
$ 13.89 |
$ 10.93 |
|
Income from Invest- |
|
|
|
|
|
|
|
Net investment |
.03 D |
.01 D |
.07 D |
.10 D |
.06 D |
.07 |
|
Net realized |
2.60 |
.47 |
(3.71) |
6.20 |
(.39) |
3.74 |
|
Total from investment operations |
2.63 |
.48 |
(3.64) |
6.30 |
(.33) |
3.81 |
|
Less Distributions |
|
|
|
|
|
|
|
From net investment income |
(.02) |
(.07) |
(.04) |
(.13) |
(.01) |
(.08) |
|
From net |
- |
- |
(.61) |
(1.14) |
(.51) |
(.77) |
|
Total distributions |
(.02) |
(.07) |
(.65) |
(1.27) |
(.52) |
(.85) |
|
Redemption fees added to paid |
.02 |
- |
.01 |
.02 |
.02 |
- |
|
Net asset value, |
$ 16.87 |
$ 14.24 |
$ 13.83 |
$ 18.11 |
$ 13.06 |
$ 13.89 |
|
Total Return B, C |
18.62% |
3.48% |
(20.61)% |
50.21% |
(2.38)% |
35.72% |
|
Ratios and Supplemental Data |
|
|
|
|
|
|
|
Net assets, |
$ 680,711 |
$ 555,931 |
$ 591,051 |
$ 918,572 |
$ 450,666 |
$ 554,573 |
|
Ratio of expenses to average net assets |
.88% |
.86% A |
.89% |
1.01% |
.95% |
1.01% |
|
Ratio of expenses to average net assets after expense reductions |
.84% E |
.82% A, E |
.85% E |
.97% E |
.90% E |
.99% E |
|
Ratio of net invest- |
.20% |
.15% A |
.48% |
.63% |
.41% |
.39% |
|
Portfolio turnover rate |
159% |
173% A |
96% |
88% |
176% |
192% |
A Annualized.
B Total returns do not include the former one time sales charge and for periods of less than one year are not annualized.
C Total returns would have been lower had certain expenses not been reduced during the periods shown.
D Net investment income (loss) per share has been calculated based on average shares outstanding during the period.
E FMR or the fund has entered into varying arrangements with third parties who either paid or reduced a portion of the fund's expenses.
F Six months ended October 31.
G Year ended April 30.
See accompanying notes which are an integral part of the financial statements.
Annual Report
For the period ended October 31, 2000
1. Significant Accounting Policies.
Fidelity Small Cap Selector (the fund) is a fund of Fidelity Capital Trust (the trust) and is authorized to issue an unlimited number of shares. The trust is registered under the Investment Company Act of 1940, as amended, as an open-end management investment company organized as a Massachusetts business trust. The financial statements have been prepared in conformity with generally accepted accounting principles which require management to make certain estimates and assumptions at the date of the financial statements. The following summarizes the significant accounting policies of the fund:
Security Valuation. Securities for which exchange quotations are readily available are valued at the last sale price, or if no sale price, at the closing bid price. Foreign securities are valued based on quotations from the principal market in which such securities are normally traded. If trading or events occurring in other markets after the close of the principal market in which foreign securities are traded, and before the close of business of the fund, are expected to materially affect the value of those securities, then they are valued at their fair value taking this trading or these events into account. Fair value is determined in good faith under consistently applied procedures under the general supervision of the Board of Trustees. Securities for which exchange quotations are not readily available are valued primarily using dealer-supplied valuations or at their fair value. Short-term securities with remaining maturities of sixty days or less for which quotations are not readily available are valued at amortized cost or original cost plus accrued interest, both of which approximate current value. Investments in open-end investment companies are valued at their net asset value each business day.
Foreign Currency Translation. The accounting records of the fund are maintained in U.S. dollars. Investment securities and other assets and liabilities denominated in a foreign currency are translated into U.S. dollars at the prevailing rates of exchange at period end. Purchases and sales of securities, income receipts and expense payments are translated into U.S. dollars at the prevailing exchange rate on the respective dates of the transactions.
Net realized gains and losses on foreign currency transactions represent net gains and losses from sales and maturities of foreign currency contracts, disposition of foreign currencies, the difference between the amount of net investment income accrued and the U.S. dollar amount actually received, and gains and losses between trade and settlement date on purchases and sales of securities. The effects of changes in foreign currency exchange rates on investments in securities are included with the net realized and unrealized gain or loss on investment securities.
Income Taxes. As a qualified regulated investment company under Subchapter M of the Internal Revenue Code, the fund is not subject to income taxes to the extent that it distributes substantially all of its taxable income for its fiscal year. The
Annual Report
Notes to Financial Statements - continued
1. Significant Accounting Policies - continued
Income Taxes - continued
schedule of investments includes information regarding income taxes under the caption "Income Tax Information."
Investment Income. Dividend income is recorded on the ex-dividend date, except certain dividends from foreign securities where the ex-dividend date may have passed, are recorded as soon as the fund is informed of the ex-dividend date. Non-cash dividends included in dividend income, if any, are recorded at the fair market value of the securities received. Interest income is accrued as earned. Investment income is recorded net of foreign taxes withheld where recovery of such taxes is uncertain.
Expenses. Most expenses of the trust can be directly attributed to a fund. Expenses which cannot be directly attributed are apportioned among the funds in the trust.
Distributions to Shareholders. Distributions are recorded on the ex-dividend date.
Income and capital gain distributions are determined in accordance with income tax regulations which may differ from generally accepted accounting principles. These differences, which may result in distribution reclassifications, are primarily due to differing treatments for litigation proceeds, futures transactions, foreign currency transactions, passive foreign investment companies (PFIC), partnerships, non-taxable dividends, capital loss carryforwards and losses deferred due to wash sales. The fund also utilized earnings and profits distributed to shareholders on redemption of shares as a part of the dividends paid deduction for income tax purposes.
Permanent book and tax basis differences relating to shareholder distributions will result in reclassifications to paid in capital. Undistributed net investment income and accumulated undistributed net realized gain (loss) on investments and foreign currency transactions may include temporary book and tax basis differences which will reverse in a subsequent period. Any taxable income or gain remaining at fiscal year end is distributed in the following year.
Short-Term Trading (Redemption) Fees. Shares held in the fund less than 90 days are subject to a short-term trading fee equal to 1.50% of the proceeds of the redeemed shares. The fee, which is retained by the fund, is accounted for as an addition to paid in capital.
Security Transactions. Security transactions are accounted for as of trade date. Gains and losses on securities sold are determined on the basis of identified cost.
2. Operating Policies.
Foreign Currency Contracts. The fund generally uses foreign currency contracts to facilitate transactions in foreign-denominated securities. Losses may arise from changes in the value of the foreign currency or if the counterparties do not perform under the contracts' terms. The U.S. dollar value of foreign currency contracts is determined using contractual currency exchange rates established at the time of each trade.
Joint Trading Account. Pursuant to an Exemptive Order issued by the Securities and Exchange Commission (the SEC),
Annual Report
Notes to Financial Statements - continued
2. Operating Policies - continued
Joint Trading Account - continued
the fund, along with other affiliated entities of Fidelity Management & Research Company (FMR), may transfer uninvested cash balances into one or more joint trading accounts. These balances are invested in one or more repurchase agreements for U.S. Treasury or Federal Agency obligations.
Repurchase Agreements. The underlying U.S. Treasury, Federal Agency, or other obligations found to be satisfactory by FMR are transferred to an account of the fund, or to the Joint Trading Account, at a custodian bank. The securities are marked-to-market daily and maintained at a value at least equal to the principal amount of the repurchase agreement (including accrued interest). FMR, the fund's investment adviser, is responsible for determining that the value of the underlying securities remains in accordance with the market value requirements stated above.
Futures Contracts. The fund may use futures contracts to manage its exposure to the stock market. Buying futures tends to increase the fund's exposure to the underlying instrument, while selling futures tends to decrease the fund's exposure to the underlying instrument or hedge other fund investments. Losses may arise from changes in the value of the underlying instruments or if the counterparties do not perform under the contracts' terms. Gains (losses) are realized upon the expiration or closing of the futures contracts. Futures contract are valued at the settlement price established each day by the board of trade or exchange on which they are traded.
3. Purchases and Sales of Investments.
Purchases and sales of securities, other than short-term securities, aggregated $953,819,581 and $985,866,847, respectively.
The market value of futures contracts opened and closed during the period amounted to $22,146,986 and $20,675,139, respectively.
4. Fees and Other Transactions with Affiliates.
Management Fee. As the fund's investment adviser, FMR receives a monthly basic fee that is calculated on the basis of a group fee rate plus a fixed individual fund fee rate applied to the average net assets of the fund. The group fee rate is the weighted average of a series of rates and is based on the monthly average net assets of all the mutual funds advised by FMR. The rates ranged from .2167% to .5200% for the period. The annual individual fund fee rate is 0.35%. In the event that these rates were lower than the contractual rates in effect during the period, FMR voluntarily implemented the above rates, as they resulted in the same or a lower management fee. The basic fee is subject to a performance adjustment (up to a maximum of ±.20% of the fund's average net assets over the performance period) based on the fund's investment performance as compared to the appropriate index over a specified period of time. For the period, the management fee was equivalent to an annual rate of .52% of average net assets after the performance adjustment.
Annual Report
Notes to Financial Statements - continued
4. Fees and Other Transactions with Affiliates - continued
Sub-Adviser Fee. Beginning January 1, 2001, FMR Co. (FMRC) will serve as sub-adviser for the fund. FMRC is a wholly owned subsidiary of FMR and will receive a fee from FMR of 50% of the management fee payable to FMR with respect to that portion of the fund's assets that will be managed by FMRC.
Transfer Agent Fees. Fidelity Service Company, Inc. (FSC), an affiliate of FMR, is the fund's transfer, dividend disbursing and shareholder servicing agent. FSC receives account fees and asset-based fees that vary according to account size and type of account. FSC pays for typesetting, printing and mailing of all shareholder reports, except proxy statements. For the period, the transfer agent fees were equivalent to an annual rate of .29% of average net assets.
Accounting and Security Lending Fees. FSC maintains the fund's accounting records and administers the security lending program. The security lending fee is based on the number and duration of lending transactions. The accounting fee is based on the level of average net assets for the month plus out-of-pocket expenses.
Cash Central Funds. Pursuant to an Exemptive Order issued by the SEC, the fund may invest in the Fidelity Cash Central Fund and the Fidelity Securities Lending Cash Central Fund (the Cash Funds) managed by Fidelity Investments Money Management, Inc., an affiliate of FMR. The Cash Funds are open-end money market funds available only to investment companies and other accounts managed by FMR and its affiliates. The Cash Funds seek preservation of capital, liquidity, and current income. Income distributions from the Cash Funds are declared daily and paid monthly from net investment income. Income distributions earned by the fund are recorded as either interest income or security lending income in the accompanying financial statements.
Brokerage Commissions. The fund placed a portion of its portfolio transactions with brokerage firms which are affiliates of FMR. The commissions paid to these affiliated firms were $51,791 for the period.
5. Security Lending.
The fund lends portfolio securities from time to time in order to earn additional income. The fund receives collateral in the form of U.S. Treasury obligations, letters of credit, and/or cash against the loaned securities, and maintains collateral in an amount not less than 100% of the market value of the loaned securities during the period of the loan. The market value of the loaned securities is determined at the close of business of the fund and any additional required collateral is delivered to the fund on the next business day. If the borrower defaults on its obligation to return the securities loaned because of insolvency or other reasons, the fund could experience delays and costs in recovering the securities loaned or in gaining access to the collateral. At period end, the value of the securities loaned amounted to $20,726,038. The fund received cash collateral of $20,096,732 which was invested in cash equivalents.
Annual Report
Notes to Financial Statements - continued
6. Expense Reductions.
FMR has directed certain portfolio trades to brokers who paid a portion of the fund's expenses. For the period, the fund's expenses were reduced by $200,272 under this arrangement.
In addition, through arrangements with the fund's custodian and transfer agent, credits realized as a result of uninvested cash balances were used to reduce a portion of the fund's expenses. During the period, the fund's custodian and transfer agent fees were reduced by $2,814, and $47,270, respectively, under these arrangements.
Annual Report
To the Trustees of Fidelity Capital Trust and Shareholders
of Fidelity Small Cap Selector:
We have audited the accompanying statement of assets and liabilities of Fidelity Small Cap Selector, (the fund), a fund of Fidelity Capital Trust (the Trust), including the portfolio of investments, as of October 31, 2000, and the related statement of operations for the year then ended, the statement of changes in net assets for each of the three years in the period then ended, and the financial highlights for each of the six years in the period then ended. These financial statements and financial highlights are the responsibility of the Fund's management. Our responsibility is to express an opinion on these financial statements and financial highlights based on our audits.
We conducted our audits in accordance with auditing standards generally accepted in the United States of America. Those standards require that we plan and perform the audit to obtain reasonable assurance about whether the financial statements and financial highlights are free of material misstatement. An audit includes examining, on a test basis, evidence supporting the amounts and disclosures in the financial statements. Our procedures included confirmation of securities owned as of October 31, 2000, by correspondence with the custodian and brokers; where replies were not received from brokers, we performed other auditing procedures. An audit also includes assessing the accounting principles used and significant estimates made by management, as well as evaluating the overall financial statement presentation. We believe that our audits provide a reasonable basis for our opinion.
In our opinion, the financial statements and financial highlights referred to above present fairly, in all material respects, the financial position of Fidelity Small Cap Selector as of October 31, 2000, the results of its operations, the changes in its net assets, and its financial highlights for the respected stated periods, in conformity with accounting principles generally accepted in the United States of America.
/s/DELOITTE & TOUCHE LLP
DELOITTE & TOUCHE LLP
Boston, Massachusetts
December 8, 2000
Annual Report
The Board of Trustees of Fidelity Small Cap Selector voted to pay on December 11, 2000, to shareholders of record at the opening of business on December 8, 2000, a distribution of $.74 per share derived from capital gains realized from sales of portfolio securities and a dividend of $.03 per share from net investment income.
A total of 67% of the dividends distributed during the fiscal year qualifies for the dividends-received deduction for corporate shareholders.
The fund hereby designates 100% of the long-term capital gain dividends distributed during the fiscal year as 20%-rate capital gain dividends.
The fund will notify shareholders in January 2001 of amounts for use in preparing 2000 income tax returns.
Annual Report
Investment Adviser
Fidelity Management & Research Company
Boston, MA
Investment Sub-Advisers
Fidelity Management & Research
(Far East) Inc.
Fidelity Management & Research
(U.K.) Inc.
Fidelity Investments Japan Limited
Officers
Edward C. Johnson 3d, President
Robert C. Pozen, Senior Vice President
Robert A. Lawrence, Vice President
Tim Krochuk, Vice President
Eric D. Roiter, Secretary
Robert A. Dwight, Treasurer
Maria F. Dwyer, Deputy Treasurer
John H. Costello, Assistant Treasurer
Board of Trustees
Ralph F. Cox *
Phyllis Burke Davis *
Robert M. Gates *
Edward C. Johnson 3d
Donald J. Kirk *
Ned C. Lautenbach *
Peter S. Lynch
Marvin L. Mann *
William O. McCoy *
Gerald C. McDonough *
Robert C. Pozen
Thomas R. Williams *
Advisory Board
J. Michael Cook
Marie L. Knowles
General Distributor
Fidelity Distributors Corporation
Boston, MA
Transfer and Shareholder
Servicing Agent
Fidelity Service Company, Inc.
Boston, MA
* Independent trustees
Custodian
Brown Brothers Harriman & Co.
Boston, MA
Fidelity's Growth Funds
Aggressive Growth Fund
Blue Chip Growth Fund
Capital Appreciation Fund
Contrafund ®
Contrafund ® II
Disciplined Equity Fund
Dividend Growth Fund
Export and Multinational Fund
Fidelity Fifty ®
Growth Company Fund
Large Cap Stock Fund
Low-Priced Stock Fund
Magellan® Fund
Mid-Cap Stock Fund
New Millennium Fund ®
OTC Portfolio
Retirement Growth Fund
Small Cap Selector
Small Cap Stock Fund
Stock Selector
Tax Managed Stock Fund
TechnoQuant® Growth Fund
Trend Fund
Value Fund
The Fidelity Telephone Connection
Mutual Fund 24-Hour Service
Exchanges/Redemptions
and Account Assistance 1-800-544-6666
Product Information 1-800-544-6666
Retirement Accounts 1-800-544-4774
(8 a.m. - 9 p.m.)
TDD Service 1-800-544-0118
for the deaf and hearing impaired
(9 a.m. - 9 p.m. Eastern time)
Fidelity Automated Service
Telephone (FAST®) (automated graphic) 1-800-544-5555
(automated graphic) Automated line for quickest service
(Fidelity Investment logo)(registered trademark)
Corporate Headquarters
82 Devonshire St., Boston, MA 02109
www.fidelity.com
SCS-ANN-1200 118955
1.703160.103
Fidelity®
Fund
Annual Report
October 31, 2000
(2_fidelity_logos)
|
President's Message |
3 |
Ned Johnson on investing strategies. |
|
Performance |
4 |
How the fund has done over time. |
|
Fund Talk |
6 |
The manager's review of fund performance, strategy and outlook. |
|
Investment Changes |
9 |
A summary of major shifts in the fund's investments over the past six months. |
|
Investments |
10 |
A complete list of the fund's investments with their market values. |
|
Financial Statements |
19 |
Statements of assets and liabilities, operations, and changes in net assets, as well as financial highlights. |
|
Notes |
23 |
Notes to the financial statements. |
|
Report of Independent Accountants |
28 |
The auditors' opinion. |
|
Distributions |
29 |
|
Standard & Poor's, S&P and S&P 500 are registered service marks of The McGraw-Hill Companies, Inc. and have been licensed for use by Fidelity Distributors Corporation.
Other third party marks appearing herein are the property of their respective owners.
All other marks appearing herein are registered or unregistered trademarks or service marks of FMR Corp. or an affiliated company.
(Recycle graphic) This report is printed on recycled paper using soy-based inks.
This report and the financial statements contained herein are submitted for the general information of the shareholders of the fund. This report is not authorized for distribution to prospective investors in the fund unless preceded or accompanied by an effective prospectus.
Mutual fund shares are not deposits or obligations of, or guaranteed by, any depository institution. Shares are not insured by the FDIC, Federal Reserve Board or any other agency, and are subject to investment risks, including possible loss of principal amount invested.
Neither the fund nor Fidelity Distributors Corporation is a bank.
For more information on any Fidelity fund, including charges and expenses, call 1-800-544-6666 for a free prospectus. Read it carefully before you invest or send money.
Annual Report
(Photograph of Edward C. Johnson 3d.)
Dear Shareholder:
A sixth-straight year of double-digit positive returns for the Dow Jones Industrial Average, NASDAQ and S&P 500® could be in jeopardy unless the U.S. stock market shows marked improvement in the final two months of 2000. Through October, all three indexes had negative year-to-date returns. On the other hand, most fixed-income sectors were solidly in the black. Treasuries and other long-term government securities led the way, returning nearly 14%.
While it's impossible to predict the future direction of the markets with any degree of certainty, there are certain basic principles that can help investors plan for their future needs.
First, investors are encouraged to take a long-term view of their portfolios. If you can afford to leave your money invested through the inevitable up and down cycles of the financial markets, you will greatly reduce your vulnerability to any single decline. We know from experience, for example, that stock prices have gone up over longer periods of time, have significantly outperformed other types of investments and have stayed ahead of inflation.
Second, you can further manage your investing risk through diversification. A stock mutual fund, for instance, is already diversified, because it invests in many different companies. You can increase your diversification further by investing in a number of different stock funds, or in such other investment categories as bonds. If you have a short investment time horizon, you might want to consider moving some of your investment into a money market fund, which seeks income and a stable share price by investing in high-quality, short-term investments. Of course, it's important to remember that an investment in a money market fund is not insured or guaranteed by the Federal Deposit Insurance Corporation or any other government agency. Although money market funds seek to preserve the value of your investment at $1.00 per share, it is possible to lose money by investing in these types of funds.
Finally, no matter what your time horizon or portfolio diversity, it makes good sense to follow a regular investment plan, investing a certain amount of money in a fund at the same time each month or quarter and periodically reviewing your overall portfolio. By doing so, you won't get caught up in the excitement of a rapidly rising market, nor will you buy all your shares at market highs. While this strategy - known as dollar cost averaging - won't assure a profit or protect you from a loss in a declining market, it should help you lower the average cost of your purchases. Of course, you should consider your financial ability to continue your purchases through periods of low price levels before undertaking such a strategy.
If you have questions, please call us at 1-800-544-6666, or visit our web site at www.fidelity.com. We are available 24 hours a day, seven days a week to provide you the information you need to make the investments that are right for you.
Best regards,
/s/Edward C. Johnson 3d
Edward C. Johnson 3d
Annual Report
There are several ways to evaluate a fund's historical performance. You can look at the total percentage change in value, the average annual percentage change or the growth of a hypothetical $10,000 investment. Total return reflects the change in the value of an investment, assuming reinvestment of the fund's dividend income and capital gains (the profits earned upon the sale of securities that have grown in value). The fund's 3% sales charge was eliminated on January 31, 2000.
Cumulative Total Returns
|
Periods ended October 31, 2000 |
|
Past 1 |
Life of |
|
Fidelity TechnoQuant Growth |
|
18.54% |
95.06% |
|
S&P 500 ® |
|
6.09% |
107.55% |
|
Capital Appreciation Funds Average |
|
21.82% |
n/a* |
Cumulative total returns show the fund's performance in percentage terms over a set period - in this case, one year or since the fund started on November 12, 1996. For example, if you had invested $1,000 in a fund that had a 5% return over the past year, the value of your investment would be $1,050. You can compare the fund's returns to the performance of the Standard & Poor's 500SM Index - a market capitalization-weighted index of common stocks. To measure how the fund's performance stacked up against its peers, you can compare it to the capital appreciation funds average, which reflects the performance of mutual funds with similar objectives tracked by Lipper Inc. The past one year average represents a peer group of 303 mutual funds. These benchmarks include reinvested dividends and capital gains, if any, and exclude the effect of sales charges. Lipper has created new comparison categories that group funds according to portfolio characteristics and capitalization, as well as by capitalization only. These averages are listed on page 5 of this report.(dagger)
Average Annual Total Returns
|
Periods ended October 31, 2000 |
Past 1 |
Life of |
|
Fidelity TechnoQuant Growth |
18.54% |
18.33% |
|
S&P 500 |
6.09% |
20.19% |
|
Capital Appreciation Funds Average |
21.82% |
n/a* |
Average annual total returns take the fund's cumulative return and show you what would have happened if the fund had performed at a constant rate each year. (Note: Lipper calculates average annual total returns by annualizing each fund's total return, then taking an arithmetic average. This may produce a different figure than that obtained by averaging the cumulative total returns and annualizing the result.)
* Not available
Annual Report
$10,000 Over Life of Fund
$10,000 Over Life of Fund: Let's say hypothetically that $10,000 was invested in Fidelity TechnoQuant Growth Fund on November 12, 1996, when the fund started. As the chart shows, by October 31, 2000, the value of the investment would have grown to $19,506 - a 95.06% increase on the initial investment. For comparison, look at how the Standard & Poor's 500 Index did over the same period. With dividends and capital gains, if any, reinvested, the same $10,000 would have grown to $20,755 - a 107.55% increase.
Understanding
Performance
How a fund did yesterday is no guarantee of how it will do tomorrow. The stock market, for example, has a history of long-term growth and short-term volatility. In turn, the share price and return of a fund that invests in stocks will vary. That means if you sell your shares during a market downturn, you might lose money. But if you can ride out the market's ups and downs, you may have a gain.
3* The Lipper multi-cap core funds average reflects the performance (excluding sales charges) of mutual funds with similar portfolio characteristics and capitalization. The Lipper multi-cap supergroup average reflects the performance (excluding sales charges) of mutual funds with similar capitalization. As of October 31, 2000, the one year cumulative and average annual total returns for the multi-cap core funds average was 14.61%. The one year cumulative and average annual total returns for the multi-cap supergroup average was 19.65%.
Annual Report
Market Recap
The U.S. equity markets went from hot to cold during the 12-month period that ended October 31, 2000. At the period's onset, strong enthusiasm for technology and telecommunication stocks lifted the performance of those and other stocks related to the so-called "new economy." In March and April, a sharp correction in those sectors nudged investors toward more traditional industries, such as pharmaceuticals and financials. However, the broadening of the market was brief. In May, the Federal Reserve Board raised key interest rates to their highest levels in nine years in a move designed to prevent inflation. It was the Fed's fourth consecutive rate hike during the period. Higher rates, coupled with the highest oil prices in a decade and the declining value of the euro, collectively exacted a toll on corporate profits. This slowdown was particularly evident in the third quarter, as many companies revised earnings on the downside. The emergence of these factors during the past six months hampered the one-year returns of the major U.S. equity indices. The NASDAQ Composite Index ended the 12-month period with a 13.81% gain. Small-cap stocks, as represented by the Russell 2000® Index, returned 17.41%. The Standard & Poor's 500SM Index, an index of 500 larger companies, advanced 6.09%. Investors were less enamored with blue-chip industrial stocks, as the Dow Jones Industrial Average rose 3.82%.
(Portfolio Manager photograph)
An interview with Tim Krochuk, Portfolio Manager of Fidelity TechnoQuant Growth Fund
Q. How did the fund perform, Tim?
A. For the 12 months that ended October 31, 2000, the fund returned 18.54%, while the Standard & Poor's 500 Index returned 6.09%. The capital appreciation funds average tracked by Lipper Inc. returned 21.82% for the same time period.
Q. Why did the fund outperform the S&P 500 yet trail its peer group during the period?
A. The fund outperformed the S&P 500 by having a higher concentration in certain sectors such as technology and biotechnology, that experienced positive macro trends and strong upward momentum during much of the year. Conversely, the fund underperformed its peer group by being relatively less concentrated than a number of its competitors that maintained larger sector bets. As has happened in the past, my models suggested a portfolio that was less diversified than the index, but more diversified than the peer group.
Q. What drove your quantitative models during the past year?
A. Because market volatility was above average, with sectors rotating in and out of favor frequently, my models emphasized technical data such as money flows, price and trading volume. When trading activity is heavy, using daily technical data can mathematically mimic the "mind" of the market. For example, year to date retail investors have accounted for 66% of all NASDAQ market trades. These same investors held the largest of the NASDAQ stocks for less than 30 days in 1999. The relative infrequency of fundamental data, such as earnings, suggested that these traders might be basing investment decisions on price changes and other technical data. My models used this data to emphasize momentum factors that reflect actual market trends, such as shifting sector preferences. In response, I made some strategic moves in and out and back into certain volatile sectors, such as technology, locking in gains during periods of strength and avoiding losses during periods of disfavor.
Annual Report
Fund Talk: The Manager's Overview - continued
Q. Which holdings benefited the fund's performance?
A. The technology sector generated some of the portfolio's best gains. Rambus, Cisco and Flextronics all performed well, benefiting from favorable macro trends as well as from attractive technical characteristics, particularly when smaller-cap Internet stocks fell out of favor. Biotechnology stocks, such as Vertex Pharmaceuticals, also performed well as the sector gained favor. Positive technicals reflected growing excitement surrounding this industry and its potential, as technology advances have helped biotech companies better manage patient trials from both cost and learning perspectives.
Q. Were there any disappointments?
A. Some technology stocks also detracted from performance. For example, investments in Oracle and Nortel were poorly timed. Although they performed well during part of the past year, the portfolio gave up gains during out-of-favor periods, suggesting that the market is becoming much more stock-driven - investors are learning that they need to pick the right stock, not just any stock - in a hot industry sector. Microsoft also held back returns. Although I underweighted the stock relative to the S&P, its large representation in the index translated into a sizable position in the fund. Despite generally positive technical and fundamental characteristics, Microsoft's stock fell dramatically in response to a negative antitrust decision in the spring. Investments in defensive stocks such as Procter & Gamble, Coors, Quaker Oats and Bristol-Myers Squibb also were disappointing from time to time during the past year. I have since sold most of these stocks.
Q. What's your outlook for the coming months?
A. I generally believe that the market currently is oversold, with investors selling stocks based on arguments unrelated to the economic and investment environment. As we look ahead, my models are suggesting a stronger market tone, particularly in the mid-cap sector, where money flows are positive, fundamentals are strong and primarily domestic businesses are unaffected by the euro's weakness overseas. As a result, I anticipate moving down toward the mid-range of the S&P market cap and moderately reducing the portfolio's exposure to defensive stocks. Of course, the outcome of the presidential election is a wild card that may have an immediate technical impact that could be felt for months to come, and I will be watching that data closely.
The views expressed in this report reflect those of the portfolio manager only through the end of the period of the report as stated on the cover and do not necessarily represent the views of Fidelity or any other person in the Fidelity organization. Any such views are subject to change at any time based upon market or other conditions and Fidelity disclaims any responsibility to update such views. These views may not be relied on as investment advice and, because investment decisions for a Fidelity fund are based on numerous factors, may not be relied on as an indication of trading intent on behalf of any Fidelity fund.
Annual Report
Fund Talk: The Manager's Overview - continued
Fund Facts
Goal: long-term capital appreciation by investing primarily in common stocks, using a quantitative approach that emphasizes technical factors
Fund number: 333
Trading symbol: FTQGX
Start date: November 12, 1996
Size: as of October 31, 2000, more than $72 million
Manager: Tim Krochuk, since inception; manager, Fidelity Advisor TechnoQuant Growth Fund, since 1996; manager, Fidelity Small Cap Selector Fund, since 2000; quantitative analyst, 1994-1996; equity research associate, 1992-1994; joined Fidelity in 1992
3Tim Krochuk on the role of the computer in quantitative investing:
"When I'm asked to explain what quantitative investing is all about, I like to point out that almost every modern industry today uses computers to work better and smarter. So, it stands to reason that financial managers could use computers to try to maximize goal-appropriate, risk-adjusted returns. This is the cornerstone of quantitative investing. As quantitative managers, or ´quants,' we look at the same fundamental and technical data investors have been using for decades - we simply add the computer to the process in order to identify patterns and interrelationships that are invisible to the naked eye. Quite simply, we are using the computer to try to do things better and faster than we could before.
"However, it is important to note that the results of the computer models do not get sent directly to the trading floor. The models' results are reviewed for suitability and consistency by the portfolio manager and are always double-checked for accuracy. Also, while the computer is great with quantitative data, qualitative data can pose problems. In such instances, it's nice to have Fidelity's vast network of fundamental analysts to provide additional input."
Annual Report
|
Top Ten Stocks as of October 31, 2000 |
||
|
|
% of fund's |
% of fund's net assets |
|
General Electric Co. |
4.2 |
4.2 |
|
Microsoft Corp. |
2.6 |
2.8 |
|
Citigroup, Inc. |
2.6 |
2.3 |
|
Exxon Mobil Corp. |
2.5 |
2.3 |
|
Intel Corp. |
1.9 |
2.9 |
|
EMC Corp. |
1.9 |
0.9 |
|
Flextronics International Ltd. |
1.6 |
1.2 |
|
Anadarko Petroleum Corp. |
1.5 |
0.0 |
|
Wal-Mart Stores, Inc. |
1.5 |
1.9 |
|
Corning, Inc. |
1.4 |
1.1 |
|
|
21.7 |
19.6 |
|
Top Five Market Sectors as of October 31, 2000 |
||
|
|
% of fund's |
% of fund's net assets |
|
Technology |
27.3 |
34.2 |
|
Health |
14.6 |
8.4 |
|
Energy |
10.4 |
9.4 |
|
Finance |
9.5 |
7.1 |
|
Utilities |
8.5 |
5.5 |
|
Asset Allocation (% of fund's net assets) |
|||||||
|
As of October 31, 2000 * |
As of April 30, 2000 ** |
||||||
|
Stocks 96.3% |
|
|
Stocks 94.5% |
|
||
|
Short-Term |
|
|
Short-Term |
|
||
|
* Foreign investments |
4.7% |
|
** Foreign investments |
5.3% |
|
||

Annual Report
Showing Percentage of Net Assets
|
Common Stocks - 96.3% |
|||
|
Shares |
Value (Note 1) |
||
|
AEROSPACE & DEFENSE - 1.2% |
|||
|
Boeing Co. |
5,300 |
$ 359,406 |
|
|
Lockheed Martin Corp. |
14,500 |
519,825 |
|
|
TOTAL AEROSPACE & DEFENSE |
879,231 |
||
|
BASIC INDUSTRIES - 2.8% |
|||
|
Chemicals & Plastics - 1.1% |
|||
|
E.I. du Pont de Nemours and Co. |
14,100 |
639,788 |
|
|
Praxair, Inc. |
4,800 |
178,800 |
|
|
|
818,588 |
||
|
Metals & Mining - 0.8% |
|||
|
Alcoa, Inc. |
12,000 |
344,250 |
|
|
Phelps Dodge Corp. |
4,200 |
196,350 |
|
|
|
540,600 |
||
|
Paper & Forest Products - 0.9% |
|||
|
Kimberly-Clark Corp. |
7,100 |
468,600 |
|
|
Weyerhaeuser Co. |
3,800 |
178,363 |
|
|
|
646,963 |
||
|
TOTAL BASIC INDUSTRIES |
2,006,151 |
||
|
CONSTRUCTION & REAL ESTATE - 0.2% |
|||
|
Real Estate Investment Trusts - 0.2% |
|||
|
Brandywine Realty Trust |
7,000 |
133,875 |
|
|
DURABLES - 0.9% |
|||
|
Autos, Tires, & Accessories - 0.4% |
|||
|
AutoZone, Inc. (a) |
6,800 |
182,325 |
|
|
General Motors Corp. |
1,700 |
105,613 |
|
|
|
287,938 |
||
|
Consumer Durables - 0.5% |
|||
|
Minnesota Mining & Manufacturing Co. |
4,000 |
386,500 |
|
|
TOTAL DURABLES |
674,438 |
||
|
ENERGY - 10.4% |
|||
|
Energy Services - 2.1% |
|||
|
Baker Hughes, Inc. |
10,600 |
364,375 |
|
|
ENSCO International, Inc. |
8,700 |
289,275 |
|
|
Halliburton Co. |
5,700 |
211,256 |
|
|
Schlumberger Ltd. (NY Shares) |
3,900 |
296,888 |
|
|
Common Stocks - continued |
|||
|
Shares |
Value (Note 1) |
||
|
ENERGY - continued |
|||
|
Energy Services - continued |
|||
|
Tidewater, Inc. |
6,500 |
$ 300,219 |
|
|
Transocean Sedco Forex, Inc. |
755 |
40,015 |
|
|
|
1,502,028 |
||
|
Oil & Gas - 8.3% |
|||
|
Amerada Hess Corp. |
8,000 |
496,000 |
|
|
Anadarko Petroleum Corp. |
16,748 |
1,072,709 |
|
|
Apache Corp. |
11,000 |
608,438 |
|
|
Burlington Resources, Inc. |
4,300 |
154,800 |
|
|
Chevron Corp. |
4,100 |
336,713 |
|
|
EOG Resources, Inc. |
4,300 |
169,313 |
|
|
Exxon Mobil Corp. |
20,300 |
1,810,506 |
|
|
Kerr-McGee Corp. |
4,000 |
261,250 |
|
|
Texaco, Inc. |
4,100 |
242,156 |
|
|
The Coastal Corp. |
4,000 |
301,750 |
|
|
Tosco Corp. |
12,100 |
346,363 |
|
|
USX - Marathon Group |
7,400 |
201,188 |
|
|
|
6,001,186 |
||
|
TOTAL ENERGY |
7,503,214 |
||
|
FINANCE - 9.5% |
|||
|
Banks - 3.2% |
|||
|
Bank of America Corp. |
9,500 |
456,594 |
|
|
Chase Manhattan Corp. |
6,900 |
313,950 |
|
|
First Union Corp. |
5,668 |
171,811 |
|
|
Firstar Corp. |
14,800 |
291,375 |
|
|
J.P. Morgan & Co., Inc. |
1,000 |
165,500 |
|
|
Northern Trust Corp. |
6,400 |
546,400 |
|
|
SunTrust Banks, Inc. |
3,100 |
151,319 |
|
|
Wells Fargo & Co. |
4,500 |
208,406 |
|
|
|
2,305,355 |
||
|
Credit & Other Finance - 3.6% |
|||
|
American Express Co. |
6,600 |
396,000 |
|
|
Citigroup, Inc. |
35,333 |
1,859,399 |
|
|
MBNA Corp. |
8,800 |
330,550 |
|
|
|
2,585,949 |
||
|
Federal Sponsored Credit - 0.6% |
|||
|
Fannie Mae |
5,400 |
415,800 |
|
|
Common Stocks - continued |
|||
|
Shares |
Value (Note 1) |
||
|
FINANCE - continued |
|||
|
Insurance - 0.5% |
|||
|
Jefferson-Pilot Corp. |
2,700 |
$ 185,625 |
|
|
LandAmerica Financial Group, Inc. |
6,800 |
200,600 |
|
|
|
386,225 |
||
|
Securities Industry - 1.6% |
|||
|
Charles Schwab Corp. |
10,900 |
382,863 |
|
|
DLJdirect, Inc. (a) |
35,100 |
177,694 |
|
|
Legg Mason, Inc. |
3,200 |
166,200 |
|
|
Morgan Stanley Dean Witter & Co. |
6,000 |
481,875 |
|
|
|
1,208,632 |
||
|
TOTAL FINANCE |
6,901,961 |
||
|
HEALTH - 14.6% |
|||
|
Drugs & Pharmaceuticals - 9.9% |
|||
|
Advanced Magnetics, Inc. (a) |
21,100 |
63,300 |
|
|
Allergan, Inc. |
4,400 |
369,875 |
|
|
Amgen, Inc. (a) |
10,100 |
585,169 |
|
|
Barr Laboratories, Inc. (a) |
2,500 |
157,813 |
|
|
Bristol-Myers Squibb Co. |
10,800 |
658,125 |
|
|
Eli Lilly & Co. |
2,200 |
196,625 |
|
|
Genentech, Inc. (a) |
2,600 |
214,500 |
|
|
IDEC Pharmaceuticals Corp. (a) |
3,500 |
686,438 |
|
|
Immunex Corp. (a) |
9,300 |
395,831 |
|
|
IVAX Corp. (a) |
13,950 |
606,825 |
|
|
King Pharmaceuticals, Inc. (a) |
5,737 |
257,089 |
|
|
Merck & Co., Inc. |
4,600 |
413,713 |
|
|
Millennium Pharmaceuticals, Inc. (a) |
4,200 |
304,763 |
|
|
Miravant Medical Technologies (a) |
8,200 |
124,025 |
|
|
Pfizer, Inc. |
16,275 |
702,877 |
|
|
Protein Design Labs, Inc. (a) |
3,400 |
459,266 |
|
|
QIAGEN NV (a) |
4,400 |
189,750 |
|
|
Regeneron Pharmaceuticals, Inc. (a) |
6,400 |
171,200 |
|
|
Vertex Pharmaceuticals, Inc. (a) |
6,800 |
633,144 |
|
|
|
7,190,328 |
||
|
Medical Equipment & Supplies - 2.8% |
|||
|
Biomet, Inc. |
10,800 |
390,825 |
|
|
Johnson & Johnson |
10,300 |
948,888 |
|
|
Medtronic, Inc. |
9,800 |
532,263 |
|
|
Resmed, Inc. (a) |
6,600 |
168,300 |
|
|
|
2,040,276 |
||
|
Common Stocks - continued |
|||
|
Shares |
Value (Note 1) |
||
|
HEALTH - continued |
|||
|
Medical Facilities Management - 1.9% |
|||
|
HCA - The Healthcare Co. |
12,400 |
$ 495,225 |
|
|
HEALTHSOUTH Corp. (a) |
32,000 |
384,000 |
|
|
Lifepoint Hospitals, Inc. (a) |
7,200 |
279,000 |
|
|
Triad Hospitals, Inc. (a) |
6,600 |
183,150 |
|
|
|
1,341,375 |
||
|
TOTAL HEALTH |
10,571,979 |
||
|
INDUSTRIAL MACHINERY & EQUIPMENT - 6.3% |
|||
|
Electrical Equipment - 4.8% |
|||
|
Excel Technology, Inc. (a) |
3,800 |
95,000 |
|
|
General Electric Co. |
55,500 |
3,042,070 |
|
|
Scientific-Atlanta, Inc. |
5,400 |
369,563 |
|
|
|
3,506,633 |
||
|
Industrial Machinery & Equipment - 1.0% |
|||
|
Tyco International Ltd. |
12,900 |
731,269 |
|
|
Pollution Control - 0.5% |
|||
|
Waste Management, Inc. |
17,800 |
356,000 |
|
|
TOTAL INDUSTRIAL MACHINERY & EQUIPMENT |
4,593,902 |
||
|
MEDIA & LEISURE - 3.4% |
|||
|
Broadcasting - 1.0% |
|||
|
Clear Channel Communications, Inc. (a) |
1,598 |
95,980 |
|
|
Time Warner, Inc. |
6,500 |
493,415 |
|
|
Univision Communications, Inc. Class A (a) |
3,800 |
145,350 |
|
|
|
734,745 |
||
|
Entertainment - 1.0% |
|||
|
Walt Disney Co. |
20,700 |
741,319 |
|
|
Leisure Durables & Toys - 0.3% |
|||
|
Callaway Golf Co. |
13,400 |
214,400 |
|
|
Lodging & Gaming - 0.2% |
|||
|
Starwood Hotels & Resorts Worldwide, Inc. unit |
6,100 |
180,713 |
|
|
Publishing - 0.3% |
|||
|
Harcourt General, Inc. |
3,700 |
207,385 |
|
|
Restaurants - 0.6% |
|||
|
Starbucks Corp. (a) |
9,000 |
402,188 |
|
|
TOTAL MEDIA & LEISURE |
2,480,750 |
||
|
Common Stocks - continued |
|||
|
Shares |
Value (Note 1) |
||
|
NONDURABLES - 3.0% |
|||
|
Beverages - 0.7% |
|||
|
Anheuser-Busch Companies, Inc. |
11,200 |
$ 512,400 |
|
|
Foods - 0.7% |
|||
|
Sara Lee Corp. |
7,400 |
159,563 |
|
|
Sysco Corp. |
7,600 |
396,625 |
|
|
|
556,188 |
||
|
Household Products - 0.3% |
|||
|
Colgate-Palmolive Co. |
3,400 |
199,784 |
|
|
Tobacco - 1.3% |
|||
|
Philip Morris Companies, Inc. |
25,300 |
926,613 |
|
|
TOTAL NONDURABLES |
2,194,985 |
||
|
PRECIOUS METALS - 0.3% |
|||
|
Barrick Gold Corp. |
13,600 |
180,887 |
|
|
RETAIL & WHOLESALE - 4.4% |
|||
|
Apparel Stores - 0.3% |
|||
|
The Limited, Inc. |
7,000 |
176,750 |
|
|
General Merchandise Stores - 1.7% |
|||
|
Consolidated Stores Corp. (a) |
15,700 |
186,438 |
|
|
Wal-Mart Stores, Inc. |
23,600 |
1,070,850 |
|
|
|
1,257,288 |
||
|
Grocery Stores - 1.1% |
|||
|
Kroger Co. (a) |
8,400 |
189,525 |
|
|
Safeway, Inc. (a) |
11,300 |
617,969 |
|
|
|
807,494 |
||
|
Retail & Wholesale, Miscellaneous - 1.3% |
|||
|
Best Buy Co., Inc. (a) |
4,200 |
210,788 |
|
|
Home Depot, Inc. |
14,600 |
627,800 |
|
|
Staples, Inc. (a) |
6,300 |
89,775 |
|
|
|
928,363 |
||
|
TOTAL RETAIL & WHOLESALE |
3,169,895 |
||
|
SERVICES - 1.3% |
|||
|
Advertising - 0.9% |
|||
|
Omnicom Group, Inc. |
3,100 |
285,975 |
|
|
TMP Worldwide, Inc. (a) |
5,000 |
348,047 |
|
|
|
634,022 |
||
|
Common Stocks - continued |
|||
|
Shares |
Value (Note 1) |
||
|
SERVICES - continued |
|||
|
Leasing & Rental - 0.4% |
|||
|
Ryder System, Inc. |
16,800 |
$ 331,800 |
|
|
TOTAL SERVICES |
965,822 |
||
|
TECHNOLOGY - 27.3% |
|||
|
Communications Equipment - 3.8% |
|||
|
Cabletron Systems, Inc. (a) |
4,000 |
108,500 |
|
|
Cisco Systems, Inc. (a) |
18,604 |
1,002,291 |
|
|
Corning, Inc. |
13,200 |
1,009,800 |
|
|
Nortel Networks Corp. |
14,700 |
668,850 |
|
|
|
2,789,441 |
||
|
Computer Services & Software - 5.1% |
|||
|
CyberOptics Corp. (a) |
6,600 |
155,100 |
|
|
Microsoft Corp. (a) |
27,100 |
1,866,513 |
|
|
Oracle Corp. (a) |
29,200 |
963,600 |
|
|
Rational Software Corp. (a) |
7,400 |
441,688 |
|
|
StorageNetworks, Inc. |
1,400 |
88,813 |
|
|
TIBCO Software, Inc. (a) |
2,300 |
144,900 |
|
|
|
3,660,614 |
||
|
Computers & Office Equipment - 6.8% |
|||
|
Compaq Computer Corp. |
23,900 |
726,799 |
|
|
EMC Corp. (a) |
15,300 |
1,362,656 |
|
|
Hewlett-Packard Co. |
2,600 |
120,738 |
|
|
International Business Machines Corp. |
9,300 |
916,050 |
|
|
Juniper Networks, Inc. (a) |
3,200 |
624,000 |
|
|
SanDisk Corp. (a) |
4,900 |
263,298 |
|
|
Sun Microsystems, Inc. (a) |
8,300 |
920,263 |
|
|
|
4,933,804 |
||
|
Electronic Instruments - 0.6% |
|||
|
KLA-Tencor Corp. (a) |
3,200 |
108,200 |
|
|
Nanometrics, Inc. (a) |
2,100 |
48,300 |
|
|
Novellus Systems, Inc. (a) |
6,600 |
270,188 |
|
|
|
426,688 |
||
|
Electronics - 11.0% |
|||
|
Altera Corp. (a) |
10,600 |
433,938 |
|
|
Analog Devices, Inc. (a) |
2,400 |
156,000 |
|
|
Applied Micro Circuits Corp. (a) |
8,200 |
626,788 |
|
|
AVX Corp. |
8,000 |
229,000 |
|
|
Broadcom Corp. Class A (a) |
2,800 |
622,650 |
|
|
Common Stocks - continued |
|||
|
Shares |
Value (Note 1) |
||
|
TECHNOLOGY - continued |
|||
|
Electronics - continued |
|||
|
Celestica, Inc. (sub. vtg.) (a) |
10,100 |
$ 721,760 |
|
|
Conexant Systems, Inc. (a) |
5,100 |
134,194 |
|
|
Cree, Inc. (a) |
1,700 |
168,725 |
|
|
Flextronics International Ltd. (a) |
30,200 |
1,147,600 |
|
|
Intel Corp. |
31,400 |
1,413,000 |
|
|
Linear Technology Corp. |
2,200 |
142,038 |
|
|
Micron Technology, Inc. (a) |
8,700 |
302,325 |
|
|
Motorola, Inc. |
17,220 |
429,424 |
|
|
RF Micro Devices, Inc. (a) |
6,600 |
131,588 |
|
|
Solectron Corp. (a) |
7,200 |
316,800 |
|
|
Texas Instruments, Inc. |
8,600 |
421,938 |
|
|
Viasystems Group, Inc. |
10,800 |
153,225 |
|
|
Vishay Intertechnology, Inc. (a) |
7,725 |
231,750 |
|
|
Vitesse Semiconductor Corp. (a) |
2,600 |
181,838 |
|
|
|
7,964,581 |
||
|
TOTAL TECHNOLOGY |
19,775,128 |
||
|
TRANSPORTATION - 2.2% |
|||
|
Air Transportation - 1.2% |
|||
|
Delta Air Lines, Inc. |
4,000 |
189,000 |
|
|
SkyWest, Inc. |
5,700 |
287,850 |
|
|
Southwest Airlines Co. |
6,200 |
176,700 |
|
|
UAL Corp. |
4,900 |
185,894 |
|
|
|
839,444 |
||
|
Railroads - 0.0% |
|||
|
Burlington Northern Santa Fe Corp. |
700 |
18,594 |
|
|
Union Pacific Corp. |
200 |
9,375 |
|
|
|
27,969 |
||
|
Trucking & Freight - 1.0% |
|||
|
FedEx Corp. (a) |
7,500 |
351,450 |
|
|
United Parcel Service, Inc. Class B |
4,300 |
261,225 |
|
|
Yellow Corp. (a) |
5,900 |
106,200 |
|
|
|
718,875 |
||
|
TOTAL TRANSPORTATION |
1,586,288 |
||
|
UTILITIES - 8.5% |
|||
|
Cellular - 0.2% |
|||
|
QUALCOMM, Inc. (a) |
2,300 |
149,752 |
|
|
Common Stocks - continued |
|||
|
Shares |
Value (Note 1) |
||
|
UTILITIES - continued |
|||
|
Electric Utility - 5.1% |
|||
|
AES Corp. (a) |
3,800 |
$ 214,700 |
|
|
Ameren Corp. |
5,400 |
214,650 |
|
|
American Electric Power Co., Inc. |
5,800 |
240,700 |
|
|
Consolidated Edison, Inc. |
4,100 |
144,269 |
|
|
Dominion Resources, Inc. |
2,900 |
172,731 |
|
|
Duke Energy Corp. |
8,800 |
760,650 |
|
|
Entergy Corp. |
5,700 |
218,381 |
|
|
Pinnacle West Capital Corp. |
5,200 |
225,875 |
|
|
PPL Corp. |
10,400 |
428,350 |
|
|
Reliant Energy, Inc. |
3,900 |
161,119 |
|
|
Southern Co. |
7,900 |
232,063 |
|
|
UIL Holdings Corp. |
4,300 |
201,294 |
|
|
Unisource Energy Corp. |
9,200 |
137,425 |
|
|
XCEL Energy, Inc. |
14,700 |
375,769 |
|
|
|
3,727,976 |
||
|
Gas - 1.2% |
|||
|
Enron Corp. |
4,300 |
352,869 |
|
|
Questar Corp. |
5,400 |
146,138 |
|
|
Southwestern Energy Co. |
28,500 |
228,000 |
|
|
Williams Companies, Inc. |
3,800 |
158,888 |
|
|
|
885,895 |
||
|
Telephone Services - 2.0% |
|||
|
AT&T Corp. |
17,700 |
410,419 |
|
|
BellSouth Corp. |
7,000 |
338,188 |
|
|
Global Crossing Ltd. (a) |
6,900 |
163,013 |
|
|
SBC Communications, Inc. |
8,900 |
513,419 |
|
|
|
1,425,039 |
||
|
TOTAL UTILITIES |
6,188,662 |
||
|
TOTAL COMMON STOCKS (Cost $57,816,156) |
69,807,168 |
||
|
Cash Equivalents - 5.3% |
|||
|
Shares |
Value (Note 1) |
||
|
Fidelity Cash Central Fund, 6.61% (b) |
3,470,618 |
$ 3,470,618 |
|
|
Fidelity Securities Lending Cash Central Fund, 6.66% (b) |
352,900 |
352,900 |
|
|
TOTAL CASH EQUIVALENTS (Cost $3,823,518) |
3,823,518 |
||
|
TOTAL INVESTMENT PORTFOLIO - 101.6% (Cost $61,639,674) |
73,630,686 |
||
|
NET OTHER ASSETS - (1.6)% |
(1,164,645) |
||
|
NET ASSETS - 100% |
$ 72,466,041 |
||
|
Legend |
|
(a) Non-income producing |
|
(b) The rate quoted is the annualized seven-day yield of the fund at |
|
Income Tax Information |
|
At October 31, 2000, the aggregate |
|
The fund hereby designates approximately $2,769,000 as a capital gain dividend for the purpose of the dividend paid deduction. |
See accompanying notes which are an integral part of the financial statements.
Annual Report
Statement of Assets and Liabilities
|
|
October 31, 2000 |
|
|
Assets |
|
|
|
Investment in securities, at value (cost $61,639,674) - |
|
$ 73,630,686 |
|
Receivable for investments sold |
|
288,476 |
|
Receivable for fund shares sold |
|
54,735 |
|
Dividends receivable |
|
15,312 |
|
Interest receivable |
|
22,022 |
|
Redemption fees receivable |
|
149 |
|
Other receivables |
|
13,233 |
|
Total assets |
|
74,024,613 |
|
Liabilities |
|
|
|
Payable for investments purchased |
$ 1,073,165 |
|
|
Payable for fund shares redeemed |
66,108 |
|
|
Accrued management fee |
25,201 |
|
|
Other payables and accrued expenses |
41,198 |
|
|
Collateral on securities loaned, at value |
352,900 |
|
|
Total liabilities |
|
1,558,572 |
|
Net Assets |
|
$ 72,466,041 |
|
Net Assets consist of: |
|
|
|
Paid in capital |
|
$ 53,692,422 |
|
Undistributed net investment income |
|
22,521 |
|
Accumulated undistributed net realized gain (loss) on investments and foreign currency transactions |
|
6,760,086 |
|
Net unrealized appreciation (depreciation) on investments |
|
11,991,012 |
|
Net Assets, for 4,552,115 shares outstanding |
|
$ 72,466,041 |
|
Net Asset Value, offering price and redemption price |
|
$15.92 |
See accompanying notes which are an integral part of the financial statements.
Annual Report
Financial Statements - continued
Statement of Operations
|
|
Year ended October 31, 2000 |
|
|
Investment Income Dividends |
|
$ 530,489 |
|
Interest |
|
205,162 |
|
Security lending |
|
5,989 |
|
Total income |
|
741,640 |
|
Expenses |
|
|
|
Management fee |
$ 380,608 |
|
|
Performance adjustment |
(14,953) |
|
|
Transfer agent fees |
184,608 |
|
|
Accounting and security lending fees |
60,571 |
|
|
Non-interested trustees' compensation |
204 |
|
|
Custodian fees and expenses |
9,650 |
|
|
Registration fees |
27,168 |
|
|
Audit |
27,703 |
|
|
Legal |
836 |
|
|
Reports to shareholders |
8,595 |
|
|
Miscellaneous |
140 |
|
|
Total expenses before reductions |
685,130 |
|
|
Expense reductions |
(7,193) |
677,937 |
|
Net investment income |
|
63,703 |
|
Realized and Unrealized Gain (Loss) Net realized gain (loss) on: |
|
|
|
Investment securities |
6,979,584 |
|
|
Foreign currency transactions |
969 |
|
|
Futures contracts |
(96,239) |
6,884,314 |
|
Change in net unrealized appreciation (depreciation) on investment securities |
|
2,357,435 |
|
Net gain (loss) |
|
9,241,749 |
|
Net increase (decrease) in net assets resulting |
|
$ 9,305,452 |
See accompanying notes which are an integral part of the financial statements.
Annual Report
Financial Statements - continued
Statement of Changes in Net Assets
|
|
Year ended
October 31, |
Year ended
October 31, |
|
Increase (Decrease) in Net Assets |
|
|
|
Operations |
$ 63,703 |
$ 110,205 |
|
Net realized gain (loss) |
6,884,314 |
7,901,300 |
|
Change in net unrealized appreciation (depreciation) |
2,357,435 |
5,053,117 |
|
Net increase (decrease) in net assets resulting |
9,305,452 |
13,064,622 |
|
Distributions to shareholders |
(135,426) |
(76,650) |
|
From net realized gain |
(6,734,005) |
(919,712) |
|
Total distributions |
(6,869,431) |
(996,362) |
|
Share transactions |
32,046,844 |
9,062,326 |
|
Reinvestment of distributions |
6,673,904 |
966,965 |
|
Cost of shares redeemed |
(18,982,388) |
(19,839,456) |
|
Net increase (decrease) in net assets resulting |
19,738,360 |
(9,810,165) |
|
Redemption fees |
18,927 |
12,082 |
|
Total increase (decrease) in net assets |
22,193,308 |
2,270,177 |
|
Net Assets |
|
|
|
Beginning of period |
50,272,733 |
48,002,556 |
|
End of period (including undistributed net investment income of $22,521 and $110,107, respectively) |
$ 72,466,041 |
$ 50,272,733 |
|
Other Information Shares |
|
|
|
Sold |
1,998,238 |
635,560 |
|
Issued in reinvestment of distributions |
457,742 |
76,682 |
|
Redeemed |
(1,188,846) |
(1,416,006) |
|
Net increase (decrease) |
1,267,134 |
(703,764) |
See accompanying notes which are an integral part of the financial statements.
Annual Report
Financial Highlights
|
Years ended October 31, |
2000 |
1999 |
1998 |
1997 E |
|
Selected Per-Share Data |
|
|
|
|
|
Net asset value, beginning of period |
$ 15.30 |
$ 12.03 |
$ 12.62 |
$ 10.00 |
|
Income from Investment Operations |
|
|
|
|
|
Net investment income (loss) D |
.02 |
.03 |
.04 |
(.04) |
|
Net realized and unrealized gain (loss) |
2.63 |
3.50 |
(.03) |
2.64 |
|
Total from investment operations |
2.65 |
3.53 |
.01 |
2.60 |
|
Less Distributions |
|
|
|
|
|
From net investment income |
(.04) |
(.02) |
- |
- |
|
From net realized gain |
(1.99) |
(.24) |
(.61) |
- |
|
Total distributions |
(2.03) |
(.26) |
(.61) |
- |
|
Redemption fees added to paid in capital |
.00 |
.00 |
.01 |
.02 |
|
Net asset value, end of period |
$ 15.92 |
$ 15.30 |
$ 12.03 |
$ 12.62 |
|
Total Return B, C |
18.54% |
29.80% |
.45% |
26.20% |
|
Ratios and Supplemental Data |
|
|
|
|
|
Net assets, end of period (000 omitted) |
$ 72,466 |
$ 50,273 |
$ 48,003 |
$ 92,733 |
|
Ratio of expenses to average net assets |
1.03% |
.89% |
.91% |
1.24% A |
|
Ratio of expenses to average net assets |
1.02% F |
.86% F |
.88% F |
1.24% A |
|
Ratio of net investment income (loss) to average net assets |
.10% |
.22% |
.35% |
(.35)% A |
|
Portfolio turnover rate |
94% |
128% |
334% |
296% A |
A Annualized
B The total returns would have been lower had certain expenses not been reduced during the periods shown.
C Total returns do not include the former one time sales charge and for periods of less than one year are not annualized.
D Net investment income (loss) per share has been calculated based on average shares outstanding during the period.
E For the period November 12, 1996 (commencement of operations) to October 31, 1997.
F FMR or the fund has entered into varying arrangements with third parties who either paid or reduced a portion of the fund's expenses.
See accompanying notes which are an integral part of the financial statements.
Annual Report
For the period ended October 31, 2000
1. Significant Accounting Policies.
Fidelity TechnoQuant Growth Fund (the fund) is a fund of Fidelity Capital Trust (the trust) and is authorized to issue an unlimited number of shares. The trust is registered under the Investment Company Act of 1940, as amended, as an open-end management investment company organized as a Massachusetts business trust. The financial statements have been prepared in conformity with generally accepted accounting principles which require management to make certain estimates and assumptions at the date of the financial statements. The following summarizes the significant accounting policies of the fund:
Security Valuation. Securities for which exchange quotations are readily available are valued at the last sale price, or if no sale price, at the closing bid price. Foreign securities are valued based on quotations from the principal market in which such securities are normally traded. If trading or events occurring in other markets after the close of the principal market in which foreign securities are traded, and before the close of business of the fund, are expected to materially affect the value of those securities, then they are valued at their fair value taking this trading or these events into account. Fair value is determined in good faith under consistently applied procedures under the general supervision of the Board of Trustees. Securities for which exchange quotations are not readily available (and in certain cases debt securities which trade on an exchange) are valued primarily using dealer-supplied valuations or at their fair value. Short-term securities with remaining maturities of sixty days or less for which quotations are not readily available are valued at amortized cost or original cost plus accrued interest, both of which approximate current value. Investments in open-end investment companies are valued at their net asset value each business day.
Foreign Currency Translation. The accounting records of the fund are maintained in U.S. dollars. Investment securities and other assets and liabilities denominated in a foreign currency are translated into U.S. dollars at the prevailing rates of exchange at period end. Purchases and sales of securities, income receipts and expense payments are translated into U.S. dollars at the prevailing exchange rate on the respective dates of the transactions.
Net realized gains and losses on foreign currency transactions represent net gains and losses from sales and maturities of foreign currency contracts, disposition of foreign currencies, the difference between the amount of net investment income accrued and the U.S. dollar amount actually received, and gains and losses between trade and settlement date on purchases and sales of securities. The effects of changes in foreign currency exchange rates on investments in securities are included with the net realized and unrealized gain or loss on investment securities.
Income Taxes. As a qualified regulated investment company under Subchapter M of the Internal Revenue Code, the fund is not subject to income taxes to the extent
Annual Report
Notes to Financial Statements - continued
1. Significant Accounting Policies - continued
Income Taxes - continued
that it distributes substantially all of its taxable income for its fiscal year. The schedule of investments includes information regarding income taxes under the caption "Income Tax Information."
Investment Income. Dividend income is recorded on the ex-dividend date, except certain dividends from foreign securities where the ex-dividend date may have passed, are recorded as soon as the fund is informed of the ex-dividend date. Non-cash dividends included in dividend income, if any, are recorded at the fair market value of the securities received. Interest income, which includes accretion of original issue discount, is accrued as earned. Investment income is recorded net of foreign taxes withheld where recovery of such taxes is uncertain.
Expenses. Most expenses of the trust can be directly attributed to a fund. Expenses which cannot be directly attributed are apportioned among the funds in the trust.
Distributions to Shareholders. Distributions are recorded on the ex-dividend date.
Income and capital gain distributions are determined in accordance with income tax regulations which may differ from generally accepted accounting principles. These differences, which may result in distribution reclassifications, are primarily due to differing treatments for futures transactions, foreign currency transactions and losses deferred due to wash sales. The fund also utilized earnings and profits distributed to shareholders on redemption of shares as a part of the dividends paid deduction for income tax purposes.
Permanent book and tax basis differences relating to shareholder distributions will result in reclassifications to paid in capital. Undistributed net investment income and accumulated undistributed net realized gain (loss) on investments and foreign currency transactions may include temporary book and tax basis differences which will reverse in a subsequent period. Any taxable income or gain remaining at fiscal year end is distributed in the following year.
Short-Term Trading (Redemption) Fees. Shares held in the fund less than 30 days are subject to a short-term trading fee equal to .75% of the proceeds of the redeemed shares. Redemptions on or prior to January 31, 2000 of shares held less than 90 days were subject to a short-term trading fee equal to .75% of the proceeds of the redeemed shares. The fee, which is retained by the fund, is accounted for as an addition to paid in capital.
Security Transactions. Security transactions are accounted for as of trade date. Gains and losses on securities sold are determined on the basis of identified cost.
2. Operating Policies.
Foreign Currency Contracts. The fund generally uses foreign currency contracts to facilitate transactions in foreign-denominated securities. Losses may arise from changes in the value of
Annual Report
Notes to Financial Statements - continued
2. Operating Policies - continued
Foreign Currency Contracts - continued
the foreign currency or if the counterparties do not perform under the contracts' terms. The U.S. dollar value of foreign currency contracts is determined using contractual currency exchange rates established at the time of each trade.
Joint Trading Account. Pursuant to an Exemptive Order issued by the Securities and Exchange Commission (the SEC), the fund, along with other affiliated entities of Fidelity Management & Research Company (FMR), may transfer uninvested cash balances into one or more joint trading accounts. These balances are invested in one or more repurchase agreements for U.S. Treasury or Federal Agency obligations.
Repurchase Agreements. The underlying U.S. Treasury, Federal Agency, or other obligations found to be satisfactory by FMR are transferred to an account of the fund, or to the Joint Trading Account, at a custodian bank. The securities are marked-to-market daily and maintained at a value at least equal to the principal amount of the repurchase agreement (including accrued interest). FMR, the fund's investment adviser, is responsible for determining that the value of the underlying securities remains in accordance with the market value requirements stated above.
Futures Contracts. The fund may use futures contracts to manage its exposure to the stock market. Buying futures tends to increase the fund's exposure to the underlying instrument, while selling futures tends to decrease the fund's exposure to the underlying instrument or hedge other fund investments. Losses may arise from changes in the value of the underlying instruments or if the counterparties do not perform under the contracts' terms. Gains (losses) are realized upon the expiration or closing of the futures contracts. Futures contracts are valued at the settlement price established each day by the board of trade or exchange on which they are traded.
3. Purchases and Sales of Investments.
Purchases and sales of securities, other than short-term securities, aggregated $70,767,415 and $58,427,061, respectively.
The market value of futures contracts opened and closed during the period amounted to $3,044,587 and $2,948,348, respectively.
4. Fees and Other Transactions with Affiliates.
Management Fee. As the fund's investment adviser, FMR receives a monthly basic fee that is calculated on the basis of a group fee rate plus a fixed individual fund fee rate applied to the average net assets of the fund. The group fee rate is the weighted average of a series of rates and is based on the monthly average net assets of all the mutual funds advised by FMR. The rates ranged from .2167% to .5200% for the period. The annual individual fund fee rate is .30%. In the event that these rates were lower than the contractual rates in effect during the period, FMR voluntarily
Annual Report
Notes to Financial Statements - continued
4. Fees and Other Transactions with Affiliates - continued
Management Fee - continued
implemented the above rates, as they resulted in the same or a lower management fee. The basic fee is subject to a performance adjustment (up to a maximum of ±.20% of the fund's average net assets over the performance period) based on the fund's investment performance as compared to the appropriate index over a specified period of time. For the period, the management fee was equivalent to an annual rate of .55% of average net assets after the performance adjustment.
Sub-Adviser Fee. Beginning January 1, 2001, FMR Co.(FMRC) will serve as sub-adviser for the fund. FMRC is a wholly owned subsidiary of FMR and will receive a fee from FMR of 50% of the management fee payable to FMR with respect to that portion of the fund's assets that will be managed by FMRC.
Sales Load. For the period, Fidelity Distributors Corporation (FDC), an affiliate of FMR and the general distributor of the fund, received sales charges of $18,054 on sales of shares of the fund all of which was retained. Effective January 31, 2000, the fund's 3% sales charge was eliminated.
Transfer Agent Fees. Fidelity Service Company, Inc. (FSC), an affiliate of FMR, is the fund's transfer, dividend disbursing and shareholder servicing agent. FSC receives account fees and asset-based fees that vary according to account size and type of account. FSC pays for typesetting, printing and mailing of all shareholder reports, except proxy statements. For the period, the transfer agent fees were equivalent to an annual rate of .28% of average net assets.
Accounting and Security Lending Fees. FSC maintains the fund's accounting records and administers the security lending program. The security lending fee is based on the number and duration of lending transactions. The accounting fee is based on the level of average net assets for the month plus out-of-pocket expenses.
Cash Central Funds. Pursuant to an Exemptive Order issued by the SEC, the fund may invest in the Fidelity Cash Central Fund and the Fidelity Securities Lending Cash Central Fund (the Cash Funds) managed by Fidelity Investments Money Management, Inc., an affiliate of FMR. The Cash Funds are open-end money market funds available only to investment companies and other accounts managed by FMR and its affiliates. The Cash Funds seek preservation of capital, liquidity, and current income. Income distributions from the Cash Funds are declared daily and paid monthly from net investment income. Income distributions earned by the fund are recorded as either interest income or security lending income in the accompanying financial statements.
Brokerage Commissions. The fund placed a portion of its portfolio transactions with brokerage firms which are affiliates of FMR. The commissions paid to these affiliated firms were $4,437 for the period.
Annual Report
Notes to Financial Statements - continued
5. Security Lending.
The fund lends portfolio securities from time to time in order to earn additional income. The fund receives collateral in the form of U.S. Treasury obligations, letters of credit, and/or cash against the loaned securities, and maintains collateral in an amount not less than 100% of the market value of the loaned securities during the period of the loan. The market value of the loaned securities is determined at the close of business of the fund and any additional required collateral is delivered to the fund on the next business day. If the borrower defaults on its obligation to return the securities loaned because of insolvency or other reasons, the fund could experience delays and costs in recovering the securities loaned or in gaining access to the collateral. At period end, the value of the securities loaned amounted to $341,363. The fund received cash collateral of $352,900 which was invested in cash equivalents.
6. Expense Reductions.
FMR has directed certain portfolio trades to brokers who paid a portion of the fund's expenses. For the period, the fund's expenses were reduced by $4,716 under this arrangement.
In addition, through an arrangement with the fund's transfer agent, credits realized as a result of uninvested cash balances were used to reduce a portion of the fund's expenses. During the period, the fund's transfer agent fees were reduced by $2,477 under this arrangement.
Annual Report
To the Trustees of Fidelity Capital Trust and the Shareholders of Fidelity TechnoQuant Growth Fund:
In our opinion, the accompanying statement of assets and liabilities, including the schedule of investments, and the related statements of operations and of changes in net assets and the financial highlights present fairly, in all material respects, the financial position of Fidelity TechnoQuant Growth Fund (a fund of Fidelity Capital Trust) at October 31, 2000, and the results of its operations, the changes in its net assets and the financial highlights for the periods indicated, in conformity with accounting principles generally accepted in the United States of America. These financial statements and financial highlights (hereafter referred to as "financial statements") are the responsibility of the Fidelity TechnoQuant Growth Fund's management; our responsibility is to express an opinion on these financial statements based on our audits. We conducted our audits of these financial statements in accordance with auditing standards generally accepted in the United States of America which require that we plan and perform the audit to obtain reasonable assurance about whether the financial statements are free of material misstatement. An audit includes examining, on a test basis, evidence supporting the amounts and disclosures in the financial statements, assessing the accounting principles used and significant estimates made by management, and evaluating the overall financial statement presentation. We believe that our audits, which included confirmation of securities at October 31, 2000 by correspondence with the custodian and brokers, provide a reasonable basis for our opinion.
/s/PricewaterhouseCoopers LLP
PricewaterhouseCoopers LLP
Boston, Massachusetts
December 8, 2000
Annual Report
The Board of Trustees of Fidelity TechnoQuant Growth Fund voted to pay on December 11, 2000, to shareholders of record at the opening of business on December 8, 2000, a distribution of $1.25 per share derived from capital gains realized from sales of portfolio securities and a dividend of $.02 per share from net investment income.
The fund hereby designates 100% of the long-term capital gain dividends distributed during the fiscal year as 20%-rate capital gain dividends.
A total of 9% of the dividends distributed during the fiscal year qualifies for the dividends-received deduction for corporate shareholders.
The fund will notify shareholders in January 2001 of amounts for use in preparing 2000 income tax returns.
Annual Report
Fidelity offers several ways to conveniently manage your personal investments via your telephone or PC. You can access your account information, conduct trades and research your investments 24 hours a day.
By Phone
Fidelity Automated Service Telephone provides a single toll-free number to access account balances, positions, quotes and trading. It's easy to navigate the service, and on your first call, the system will help you create a personal identification number (PIN) for security.
(phone_graphic)Fidelity Automated
Service Telephone (FAST®)
1-800-544-5555
Press
1 For mutual fund and brokerage trading.
2 For quotes.*
3 For account balances and holdings.
4 To review orders and mutual
fund activity.
5 To change your PIN.
*0 To speak to a Fidelity representative.
By PC
Fidelity's web site on the Internet provides a wide range of information, including daily financial news, fund performance, interactive planning tools and news about Fidelity products and services.
(computer_graphic)Fidelity's Web Site
www.fidelity.com
If you are not currently on the Internet, call EarthLink Sprint at 1-800-288-2967, and be sure to ask for registration number SMD004 to receive a special Fidelity package that includes 30 days of free Internet access. EarthLink is North America's #1 independent Internet access provider.
(computer_graphic)
Fidelity On-line Xpress+®
Fidelity On-line Xpress+ software for Windows combines comprehensive portfolio management capabilities, securities trading and access to research and analysis tools . . . all on your desktop. Call Fidelity at 1-800-544-0240 or visit our web site for more information on how to manage your investments via your PC.
* When you call the quotes line, please remember that a fund's yield and return will vary and, except for money market funds, share price will also vary. This means that you may have a gain or loss when you sell your shares. There is no assurance that money market funds will be able to maintain a stable $1 share price; an investment in a money market fund is not insured or guaranteed by the U.S. government. Total returns are historical and include changes in share price, reinvestment of dividends and capital gains, and the effects of any sales charges.
Annual Report
If more than one address is listed, please locate the address that is closest to you. We'll give your correspondence immediate attention and send you written confirmation upon completion of your request.
(letter_graphic)Making Changes
To Your Account
(such as changing name, address, bank, etc.)
Fidelity Investments
P.O. Box 770001
Cincinnati, OH 45277-0002
(letter_graphic)For Non-Retirement
Accounts
Buying shares
Fidelity Investments
P.O. Box 770001
Cincinnati, OH 45277-0003
Overnight Express
Fidelity Investments
2300 Litton Lane - KH1A
Hebron, KY 41048
Selling shares
Fidelity Investments
P.O. Box 660602
Dallas, TX 75266-0602
Overnight Express
Fidelity Investments
Attn: Redemptions - CP6I
400 East Las Colinas Blvd.
Irving, TX 75039-5587
General Correspondence
Fidelity Investments
P.O. Box 500
Merrimack, NH 03054-0500
(letter_graphic)For Retirement
Accounts
Buying shares
Fidelity Investments
P.O. Box 770001
Cincinnati, OH 45277-0003
Selling shares
Fidelity Investments
P.O. Box 660602
Dallas, TX 75266-0602
Overnight Express
Fidelity Investments
Attn: Redemptions - CP6R
400 East Las Colinas Blvd.
Irving, TX 75039-5587
General Correspondence
Fidelity Investments
P.O. Box 500
Merrimack, NH 03054-0500
Annual Report
Investment Adviser
Fidelity Management & Research
Company
Boston, MA
Investment Sub-Advisers
Fidelity Management & Research
(U.K.) Inc.
Fidelity Management & Research
(Far East) Inc.
Fidelity Investments Japan Limited
Officers
Edward C. Johnson 3d, President
Robert C. Pozen, Senior Vice President
Robert A. Lawrence, Vice President
Tim Krochuk, Vice President
Eric D. Roiter, Secretary
Robert A. Dwight, Treasurer
Maria F. Dwyer, Deputy Treasurer
John H. Costello, Assistant Treasurer
Board of Trustees
Ralph F. Cox *
Phyllis Burke Davis *
Robert M. Gates *
Edward C. Johnson 3d
Donald J. Kirk *
Ned C. Lautenbach *
Peter S. Lynch
Marvin L. Mann *
William O. McCoy *
Gerald C. McDonough *
Robert C. Pozen
Thomas R. Williams *
Advisory Board
J. Michael Cook
Marie L. Knowles
General Distributor
Fidelity Distributors Corporation
Boston, MA
Transfer and Shareholder
Servicing Agent
Fidelity Service Company, Inc.
Boston, MA
* Independent trustees
Custodian
The Chase Manhattan Bank
New York, NY
Fidelity's Growth Funds
Aggressive Growth Fund
Blue Chip Growth Fund
Capital Appreciation Fund
Contrafund ®
Contrafund ® II
Disciplined Equity Fund
Dividend Growth Fund
Export and Multinational Fund
Fidelity Fifty ®
Growth Company Fund
Large Cap Stock Fund
Low-Priced Stock Fund
Magellan® Fund
Mid-Cap Stock Fund
New Millennium Fund®
OTC Portfolio
Retirement Growth Fund
Small Cap Selector
Small Cap Stock Fund
Stock Selector
Tax Managed Stock Fund
TechnoQuant® Growth Fund
Trend Fund
Value Fund
The Fidelity Telephone Connection
Mutual Fund 24-Hour Service
Exchanges/Redemptions
and Account Assistance 1-800-544-6666
Product Information 1-800-544-6666
Retirement Accounts 1-800-544-4774
(8 a.m. - 9 p.m.)
TDD Service 1-800-544-0118
for the deaf and hearing impaired
(9 a.m. - 9 p.m. Eastern time)
Fidelity Automated Service
Telephone (FAST®) (automated graphic) 1-800-544-5555
(automated graphic) Automated line for quickest service
(Fidelity Investment logo)(registered trademark)
Corporate Headquarters
82 Devonshire St., Boston, MA 02109
www.fidelity.com
TQG-ANN-1200 118958
1.538682.103
|
|