
|
|
|
|
|
|
|
|
|
|
Previous: BALCOR EQUITY PROPERTIES LTD-VIII, 15-12G/A, 2000-12-18 |
Next: SHORT TERM INCOME FUND INC, 497, 2000-12-18 |
Fidelity®
Fund
Annual Report
October 31, 2000
(2_fidelity_logos)(registered_trademark)
|
President's Message |
Ned Johnson on investing strategies. |
|
|
Performance |
How the fund has done over time. |
|
|
Fund Talk |
The manager's review of fund performance, strategy and outlook. |
|
|
Investment Changes |
A summary of major shifts in the fund's investments over the past six months. |
|
|
Investments |
A complete list of the fund's investments with their market values. |
|
|
Financial Statements |
Statements of assets and liabilities, operations, and changes in net assets, as well as financial highlights. |
|
|
Notes |
Notes to the financial statements. |
|
|
Report of Independent Accountants |
The auditors' opinion. |
|
|
Distributions |
|
Standard & Poor's, S&P and S&P 500 are registered service marks of The McGraw-Hill Companies, Inc. and have been licensed for use by Fidelity Distributors Corporation.
Other third party marks appearing herein are the property of their respective owners.
All other marks appearing herein are registered or unregistered trademarks or service marks of FMR Corp. or an affiliated company.
(recycle graphic) This report is printed on recycled paper using soy-based inks.
This report and the financial statements contained herein are submitted for the general information of the shareholders of the fund. This report is not authorized for distribution to prospective investors in the fund unless preceded or accompanied by an effective prospectus.
Mutual fund shares are not deposits or obligations of, or guaranteed by, any depository institution. Shares are not insured by the FDIC, Federal Reserve Board or any other agency, and are subject to investment risks, including possible loss of principal amount invested.
Neither the fund nor Fidelity Distributors Corporation is a bank.
For more information on any Fidelity fund, including charges and expenses, call 1-800-544-6666 for a free prospectus. Read it carefully before you invest or send money.
Annual Report
(Photograph of Edward C. Johnson 3d.)
Dear Shareholder:
A sixth-straight year of double-digit positive returns for the Dow Jones Industrial Average, NASDAQ and S&P 500® could be in jeopardy unless the U.S. stock market shows marked improvement in the final two months of 2000. Through October, all three indexes had negative year-to-date returns. On the other hand, most fixed-income sectors were solidly in the black. Treasuries and other long-term government securities led the way, returning nearly 14%.
While it's impossible to predict the future direction of the markets with any degree of certainty, there are certain basic principles that can help investors plan for their future needs.
First, investors are encouraged to take a long-term view of their portfolios. If you can afford to leave your money invested through the inevitable up and down cycles of the financial markets, you will greatly reduce your vulnerability to any single decline. We know from experience, for example, that stock prices have gone up over longer periods of time, have significantly outperformed other types of investments and have stayed ahead of inflation.
Second, you can further manage your investing risk through diversification. A stock mutual fund, for instance, is already diversified, because it invests in many different companies. You can increase your diversification further by investing in a number of different stock funds, or in such other investment categories as bonds. If you have a short investment time horizon, you might want to consider moving some of your investment into a money market fund, which seeks income and a stable share price by investing in high-quality, short-term investments. Of course, it's important to remember that an investment in a money market fund is not insured or guaranteed by the Federal Deposit Insurance Corporation or any other government agency. Although money market funds seek to preserve the value of your investment at $1.00 per share, it is possible to lose money by investing in these types of funds.
Finally, no matter what your time horizon or portfolio diversity, it makes good sense to follow a regular investment plan, investing a certain amount of money in a fund at the same time each month or quarter and periodically reviewing your overall portfolio. By doing so, you won't get caught up in the excitement of a rapidly rising market, nor will you buy all your shares at market highs. While this strategy - known as dollar cost averaging - won't assure a profit or protect you from a loss in a declining market, it should help you lower the average cost of your purchases. Of course, you should consider your financial ability to continue your purchases through periods of low price levels before undertaking such a strategy.
If you have questions, please call us at 1-800-544-6666, or visit our web site at www.fidelity.com. We are available 24 hours a day, seven days a week to provide you the information you need to make the investments that are right for you.
Best regards,
/s/Edward C. Johnson 3d
Edward C. Johnson 3d
Annual Report
There are several ways to evaluate a fund's historical performance. You can look at the total percentage change in value, the average annual percentage change or the growth of a hypothetical $10,000 investment. Total return reflects the change in the value of an investment, assuming reinvestment of the fund's dividend income and capital gains (the profits earned upon the sale of securities that have grown in value).
Annual Report
Performance - continued
Cumulative Total Returns (including After-Tax Returns)
|
Periods ended October 31, 2000 |
|
Past 1 |
Life of |
|
Pre-Tax Total Returns |
|
7.79% |
31.50% |
|
Fidelity Tax Managed Stock |
|
6.71% |
30.19% |
|
After-Tax Total Returns |
|
7.72% |
31.42% |
|
Fidelity Tax Managed Stock |
|
4.05% |
24.11% |
|
S&P 500 ® |
|
6.09% |
31.76% |
|
Growth Funds Average |
|
15.32% |
n/a* |
Cumulative total returns show the fund's performance in percentage terms over a set period - in this case, one year or since the fund started on November 2, 1998. For example, if you had invested $1,000 in a fund that had a 5% return over the past year, the value of your investment would be $1,050. For after-tax pre-liquidation returns, the federal tax rate paid on dividends and short-term capital gains is calculated assuming a 39.6% tax rate, and taxes are deducted from distributions prior to reinvestment. The pre-liquidation after-tax returns assume that you continue to hold your shares. For after-tax post-liquidation returns, taxes are paid on distributions as described above and taxes are also paid upon redemption of fund shares. For shares held for one year or less a 39.6% tax rate is assumed (including shares purchased by dividend reinvestment). For shares held for more than one year a 20% tax rate is assumed. State and local tax rates are not included in this analysis. You can compare the fund's returns to the performance of the Standard & Poor's 500SM Index - a market capitalization-weighted index of common stocks. To measure how the fund's performance stacked up against its peers, you can compare it to the growth funds average, which reflects the performance of mutual funds with similar objectives tracked by Lipper Inc. The past one year average represents a peer group of 1,351 mutual funds. These benchmarks include reinvested dividends and capital gains, if any, and excludes the effect of trading fees and taxes. Lipper has created new comparison categories that group funds according to portfolio characteristics and capitalization, as well as by capitalization only. These averages are listed on page 7 of this report.(dagger)
* Not available
Annual Report
Performance - continued
Average Annual Total Returns
|
Periods ended October 31, 2000 |
Past 1 |
Life of |
|
Pre-Tax Total Returns |
7.79% |
14.70% |
|
Fidelity Tax Managed Stock (incl. 1.00% trading fee) |
6.71% |
14.12% |
|
After-Tax Total Returns |
7.72% |
14.66% |
|
Fidelity Tax Managed Stock |
4.05% |
11.42% |
|
S&P 500 ® |
6.09% |
14.81% |
|
Growth Funds Average |
15.32% |
n/a* |
Average annual total returns take the fund's cumulative return and show you what would have happened if the fund had performed at a constant rate each year.
* Not available
Annual Report
Performance - continued
$10,000 Over Life of Fund
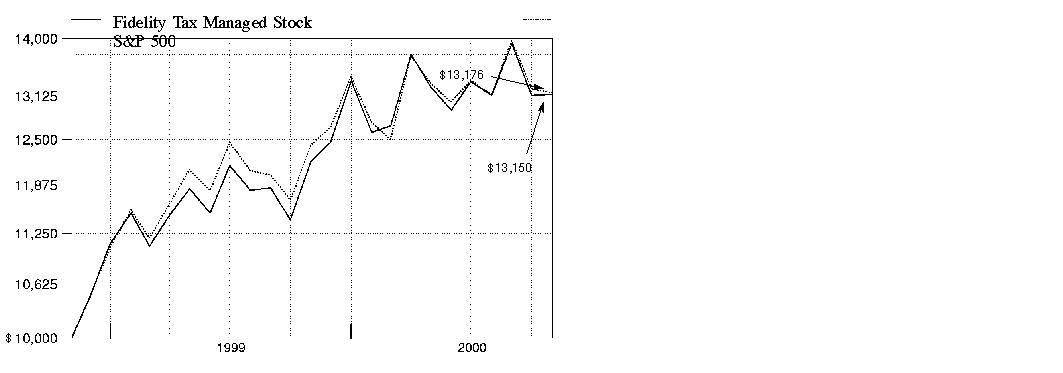
$10,000 Over Life of Fund: Let's say hypothetically that $10,000 was invested in Fidelity Tax Managed Stock Fund on November 2, 1998, when the fund started. As the chart shows, by October 31, 2000, the value of the investment would have grown to $13,150 - a 31.50% increase on the initial investment. For comparison, look at how the Standard & Poor's 500 Index did over the same period. With dividends and capital gains, if any, reinvested, the same $10,000 would have grown to $13,176 - a 31.76% increase.
Understanding
Performance
How a fund did yesterday is no guarantee of how it will do tomorrow. The stock market, for example, has a history of long-term growth and short-term volatility. In turn, the share price and return of a fund that invests in stocks will vary. That means if you sell your shares during a market downturn, you might lose money. But if you can ride out the market's ups and downs, you may have a gain.
3* The Lipper large-cap core funds average reflects the performance (excluding sales charges) of mutual funds with similar portfolio characteristics and capitalization. The Lipper large-cap supergroup average reflects the performance (excluding sales charges) of mutual funds with similar capitalization. As of October 31, 2000, the one year cumulative and average annual total returns for the large-cap core funds average was 9.64%. The one year cumulative and average annual total returns for the large-cap supergroup average was 11.02%.
Annual Report
Market Recap
The U.S. equity markets went from hot to cold during the 12-month period that ended October 31, 2000. At the period's onset, strong enthusiasm for technology and telecommunication stocks lifted the performance of those and other stocks related to the so-called "new economy." In March and April, a sharp correction in those sectors nudged investors toward more traditional industries, such as pharmaceuticals and financials. However, the broadening of the market was brief. In May, the Federal Reserve Board raised key interest rates to their highest levels in nine years in a move designed to prevent inflation. It was the Fed's fourth consecutive rate hike during the period. Higher rates, coupled with the highest oil prices in a decade and the declining value of the euro, collectively exacted a toll on corporate profits. This slowdown was particularly evident in the third quarter, as many companies revised earnings on the downside. The emergence of these factors during the past six months hampered the one-year returns of the major U.S. equity indices. The NASDAQ Composite Index ended the 12-month period with a 13.81% gain. Small-cap stocks, as represented by the Russell 2000® Index, returned 17.41%. The Standard & Poor's 500SM Index, an index of 500 larger companies, advanced 6.09%. Investors were less enamored with blue-chip industrial stocks, as the Dow Jones Industrial Average rose 3.82%.
(Portfolio Manager photograph)
An interview with Tim Heffernan, Portfolio Manager of Fidelity Tax Managed Stock Fund
Q. How did the fund perform, Tim?
A. For the 12-month period that ended October 31, 2000, the fund returned 7.79%. In comparison, the fund's benchmark, the Standard & Poor's 500 Index, returned 6.09%. The fund also compares its performance to the Lipper Inc. growth funds average, which returned 15.32% during the past 12 months.
Q. Why did the fund outperform the index during the past 12 months but lag its Lipper peer group?
A. The fund's performance got a boost from its slight overweighting in financial stocks, which performed particularly well during the latter half of the period as interest rates stabilized. Our stock selection in this sector also was a big factor in the fund's return. Holdings in Fannie Mae, Freddie Mac, Citigroup and American International Group (AIG) were top performers. Our technology weighting remained roughly on par with the benchmark, but our stock selection in leading names such as Cisco Systems, EMC and Oracle - or those with a history of consistent earnings growth - gave the fund a relatively smooth ride through the volatile technology sector during the past eight months. At the same time, not owning underperforming benchmark holding Yahoo! and underweighting other technology-related stocks, such as Qualcomm, helped. Elsewhere, the fund's slight overweighting in the energy sector enhanced returns as the price of oil rose to decade-high levels due to a shortage of supply. The fund's performance lagged its peer group generally because most growth funds held a much higher percentage of technology stocks, which benefited from soaring price appreciation early in the period.
Annual Report
Fund Talk: The Manager's Overview - continued
Q. What caused the fund's weighting in financial stocks to rise significantly during the past six months?
A. I attribute the rise in the fund's weighting of financials to price appreciation, as financial stocks were many of the fund's top performers. Associates First Capital, for example, soared after it was announced that that it would be taken over by financial services giant Citigroup. Shares of AIG surged on growing profits in the company's core insurance business. Additionally, I opportunistically added to our positions in several holdings, such as Fannie Mae and Freddie Mac, which performed quite well.
Q. How did the fund's holdings in the health care sector perform?
A. The fund was marginally underweighted in this sector due in part to the lackluster environment for health stocks in the first six months of the period when investors primarily sought stocks of companies with faster growth rates, such as technology stocks. However, health stocks improved significantly during the past six months after a technology correction spurred investors to look elsewhere for growth. Our stock selection in health care - namely holdings in the medical equipment and medical facilities management industries, such as Cardinal Health and UnitedHealth Group - helped the fund's collective stake in the sector outperform that of the benchmark by four percentage points during the period.
Q. Which specific stocks were top performers?
A. The fund's top performers were networking manufacturer Cisco Systems and data storage provider EMC. Both companies were rewarded for being the leaders in their respective businesses and meeting earnings expectations. Investors also rewarded top holding General Electric for its consistent management leadership and earnings growth.
Q. What were some of the disappointments?
A. Shares of household products provider Procter & Gamble, a multinational company, were hurt by weaker-than-expected earnings, due in part to the weakening of the euro. Shares of Motorola were hurt after management warned of slightly lower profits in the second quarter, citing a trend toward lower-end handsets as the reason for reduced profits.
Q. What's your outlook, Tim?
A. I think the stock market will continue to grow, but at a slower pace than investors have been accustomed to seeing the past few years. Much of what happens during the next six months will depend on the impact of the Fed's recent monetary policy. Should the economy exhibit a "hard landing," I suspect the environment for stocks will remain as weak as it has been for the past few months. Should we see a "soft landing" of the economy, I would expect companies to grow at a steady, but slower pace.
Annual Report
Fund Talk: The Manager's Overview - continued
The views expressed in this report reflect those of the portfolio manager only through the end of the period of the report as stated on the cover and do not necessarily represent the views of Fidelity or any other person in the Fidelity organization. Any such views are subject to change at any time based upon market or other conditions and Fidelity disclaims any responsibility to update such views. These views may not be relied on as investment advice and, because investment decisions for a Fidelity fund are based on numerous factors, may not be relied on as an indication of trading intent on behalf of any Fidelity fund.
Fund Facts
Goal: seeks long-term growth of capital by investing mainly in equity securities and attempting to reduce the impact of federal taxes on shareholder investment returns
Fund number: 343
Trading symbol: FTXMX
Start date: November 2, 1998
Size: as of October 31, 2000, more than $100 million
Manager: Tim Heffernan, since inception; manager, Fidelity Congress Street and Exchange Funds, since 1997; manager, various institutional funds for Fidelity Management Trust Company, 1992-1996; joined Fidelity in 1984
3Tim Heffernan on his investment approach:
"Aside from the benefits that a disciplined investment process has on a fund's tax efficiency, a broadly diversified approach to equity investing has the potential to lower overall portfolio risk during volatile market environments. A key to my strategy is to structure the fund's sector and style characteristics - such as company fundamentals and industry weightings - similar to those of the S&P 500 index. At the same time, I attempt to generate added value through security selection. As a result, the fund's performance relative to the benchmark is driven overwhelmingly by individual stock picking.
"Further, in very volatile markets such as we've experienced in 2000, this approach helps prevent the fund from getting caught off-guard during rapid reversals in certain market sectors. As a recent example, technology stocks came under tremendous selling pressure during the past six months, resulting in rapid repositioning by many of my more-aggressive growth fund peers. During this period, I maintained the fund's disciplined long-term investment approach with limited repositioning.
"This disciplined approach to investing is also central to the tax management aspect of the fund. As expected, one of the largest contributors to a fund's tax inefficiency is frequent portfolio trading, which often triggers higher capital gains. With lower trading activity, the fund is less likely to realize taxable gains."
Annual Report
|
Top Ten Stocks as of October 31, 2000 |
||
|
|
% of fund's |
% of fund's net assets |
|
General Electric Co. |
4.5 |
4.3 |
|
Microsoft Corp. |
3.6 |
2.6 |
|
Cisco Systems, Inc. |
3.1 |
4.0 |
|
Exxon Mobil Corp. |
2.9 |
1.7 |
|
American International Group, Inc. |
2.5 |
2.0 |
|
Pfizer, Inc. |
2.4 |
1.1 |
|
Fannie Mae |
2.3 |
0.4 |
|
Intel Corp. |
2.2 |
3.4 |
|
Citigroup, Inc. |
2.2 |
2.2 |
|
EMC Corp. |
2.0 |
1.7 |
|
|
27.7 |
23.4 |
|
Top Five Market Sectors as of October 31, 2000 |
||
|
|
% of fund's |
% of fund's net assets |
|
Technology |
27.6 |
33.5 |
|
Finance |
18.0 |
12.7 |
|
Health |
12.0 |
9.2 |
|
Energy |
8.4 |
7.2 |
|
Industrial Machinery & Equipment |
7.5 |
5.7 |
|
Asset Allocation (% of fund's net assets) |
|||||||
|
As of October 31, 2000 * |
As of April 30, 2000 ** |
||||||
 |
Stocks and |
|
|
Stocks 100.2% |
|
||
 |
Short-Term |
|
|
Short-Term |
|
||
|
* Foreign investments |
4.5% |
|
** Foreign investments |
8.8% |
|
||

A Short-term investments and net other assets are not included in the pie chart.
Annual Report
Showing Percentage of Net Assets
|
Common Stocks - 97.2% |
|||
|
Shares |
Value (Note 1) |
||
|
AEROSPACE & DEFENSE - 2.4% |
|||
|
Aerospace & Defense - 1.8% |
|||
|
BFGoodrich Co. |
14,700 |
$ 601,781 |
|
|
Boeing Co. |
6,400 |
434,000 |
|
|
Honeywell International, Inc. |
3,200 |
172,200 |
|
|
Northrop Grumman Corp. |
1,800 |
151,200 |
|
|
United Technologies Corp. |
5,600 |
390,950 |
|
|
|
1,750,131 |
||
|
Ship Building & Repair - 0.6% |
|||
|
General Dynamics Corp. |
8,600 |
615,438 |
|
|
TOTAL AEROSPACE & DEFENSE |
2,365,569 |
||
|
BASIC INDUSTRIES - 1.3% |
|||
|
Chemicals & Plastics - 0.7% |
|||
|
Praxair, Inc. |
14,200 |
528,950 |
|
|
Solutia, Inc. |
11,600 |
147,900 |
|
|
|
676,850 |
||
|
Metals & Mining - 0.2% |
|||
|
Alcoa, Inc. |
7,800 |
223,763 |
|
|
Paper & Forest Products - 0.4% |
|||
|
Kimberly-Clark Corp. |
6,700 |
442,200 |
|
|
TOTAL BASIC INDUSTRIES |
1,342,813 |
||
|
CONSTRUCTION & REAL ESTATE - 0.6% |
|||
|
Construction - 0.4% |
|||
|
Centex Corp. |
12,100 |
447,700 |
|
|
Engineering - 0.2% |
|||
|
Fluor Corp. |
4,400 |
154,000 |
|
|
TOTAL CONSTRUCTION & REAL ESTATE |
601,700 |
||
|
DURABLES - 0.5% |
|||
|
Autos, Tires, & Accessories - 0.5% |
|||
|
AutoNation, Inc. |
21,100 |
142,425 |
|
|
Danaher Corp. |
5,300 |
334,563 |
|
|
|
476,988 |
||
|
ENERGY - 8.4% |
|||
|
Energy Services - 1.5% |
|||
|
ENSCO International, Inc. |
7,600 |
252,700 |
|
|
Common Stocks - continued |
|||
|
Shares |
Value (Note 1) |
||
|
ENERGY - continued |
|||
|
Energy Services - continued |
|||
|
Halliburton Co. |
24,500 |
$ 908,031 |
|
|
Nabors Industries, Inc. (a) |
2,500 |
127,250 |
|
|
Schlumberger Ltd. (NY Shares) |
2,400 |
182,700 |
|
|
|
1,470,681 |
||
|
Oil & Gas - 6.9% |
|||
|
Alberta Energy Co. Ltd. |
4,900 |
181,034 |
|
|
Anadarko Petroleum Corp. |
4,600 |
294,630 |
|
|
Apache Corp. |
4,500 |
248,906 |
|
|
Chevron Corp. |
2,700 |
221,738 |
|
|
Conoco, Inc. Class B |
22,500 |
611,719 |
|
|
Devon Energy Corp. |
3,500 |
176,400 |
|
|
Exxon Mobil Corp. |
33,004 |
2,943,544 |
|
|
Grant Prideco, Inc. (a) |
5,800 |
107,663 |
|
|
Royal Dutch Petroleum Co. (NY Shares) |
19,800 |
1,175,625 |
|
|
Sunoco, Inc. |
10,800 |
323,325 |
|
|
TotalFinaElf SA sponsored ADR |
8,737 |
625,788 |
|
|
|
6,910,372 |
||
|
TOTAL ENERGY |
8,381,053 |
||
|
FINANCE - 18.0% |
|||
|
Banks - 2.9% |
|||
|
Bank of America Corp. |
10,100 |
485,431 |
|
|
Bank of New York Co., Inc. |
6,800 |
391,425 |
|
|
Bank One Corp. |
11,600 |
423,400 |
|
|
Chase Manhattan Corp. |
7,850 |
357,175 |
|
|
Summit Bancorp |
17,300 |
648,750 |
|
|
Wells Fargo & Co. |
14,000 |
648,375 |
|
|
|
2,954,556 |
||
|
Credit & Other Finance - 3.5% |
|||
|
American Express Co. |
9,900 |
594,000 |
|
|
Associates First Capital Corp. Class A |
20,000 |
742,500 |
|
|
Citigroup, Inc. |
41,900 |
2,204,988 |
|
|
|
3,541,488 |
||
|
Federal Sponsored Credit - 3.5% |
|||
|
Fannie Mae |
30,000 |
2,310,000 |
|
|
Freddie Mac |
19,500 |
1,170,000 |
|
|
|
3,480,000 |
||
|
Common Stocks - continued |
|||
|
Shares |
Value (Note 1) |
||
|
FINANCE - continued |
|||
|
Insurance - 6.0% |
|||
|
AMBAC Financial Group, Inc. |
9,000 |
$ 718,313 |
|
|
American International Group, Inc. |
25,087 |
2,458,526 |
|
|
CIGNA Corp. |
11,000 |
1,341,450 |
|
|
Hartford Financial Services Group, Inc. |
7,700 |
573,169 |
|
|
MBIA, Inc. |
6,700 |
487,006 |
|
|
UnumProvident Corp. |
15,100 |
426,575 |
|
|
|
6,005,039 |
||
|
Savings & Loans - 0.2% |
|||
|
TCF Financial Corp. |
3,800 |
153,663 |
|
|
Securities Industry - 1.9% |
|||
|
Charles Schwab Corp. |
11,100 |
389,888 |
|
|
Lehman Brothers Holdings, Inc. |
3,600 |
232,200 |
|
|
Merrill Lynch & Co., Inc. |
6,400 |
448,000 |
|
|
Morgan Stanley Dean Witter & Co. |
10,200 |
819,188 |
|
|
|
1,889,276 |
||
|
TOTAL FINANCE |
18,024,022 |
||
|
HEALTH - 12.0% |
|||
|
Drugs & Pharmaceuticals - 8.3% |
|||
|
American Home Products Corp. |
8,500 |
539,750 |
|
|
Amgen, Inc. (a) |
6,400 |
370,800 |
|
|
Bristol-Myers Squibb Co. |
22,300 |
1,358,906 |
|
|
Eli Lilly & Co. |
16,000 |
1,430,000 |
|
|
Merck & Co., Inc. |
17,900 |
1,609,881 |
|
|
Pfizer, Inc. |
56,075 |
2,421,739 |
|
|
Schering-Plough Corp. |
10,100 |
522,044 |
|
|
Watson Pharmaceuticals, Inc. (a) |
1,100 |
68,819 |
|
|
|
8,321,939 |
||
|
Medical Equipment & Supplies - 3.6% |
|||
|
Abbott Laboratories |
14,100 |
744,656 |
|
|
Baxter International, Inc. |
12,400 |
1,019,125 |
|
|
Cardinal Health, Inc. |
8,200 |
776,950 |
|
|
Johnson & Johnson |
9,800 |
902,825 |
|
|
Medtronic, Inc. |
2,020 |
109,711 |
|
|
|
3,553,267 |
||
|
Common Stocks - continued |
|||
|
Shares |
Value (Note 1) |
||
|
HEALTH - continued |
|||
|
Medical Facilities Management - 0.1% |
|||
|
UnitedHealth Group, Inc. |
1,200 |
$ 131,250 |
|
|
TOTAL HEALTH |
12,006,456 |
||
|
INDUSTRIAL MACHINERY & EQUIPMENT - 7.5% |
|||
|
Electrical Equipment - 5.7% |
|||
|
Alcatel SA sponsored ADR |
3,500 |
218,313 |
|
|
Emerson Electric Co. |
7,300 |
536,094 |
|
|
General Electric Co. |
82,900 |
4,543,941 |
|
|
Scientific-Atlanta, Inc. |
5,400 |
369,563 |
|
|
|
5,667,911 |
||
|
Industrial Machinery & Equipment - 1.8% |
|||
|
Caterpillar, Inc. |
9,800 |
343,613 |
|
|
Illinois Tool Works, Inc. |
4,800 |
266,700 |
|
|
Ingersoll-Rand Co. |
4,800 |
181,200 |
|
|
Parker-Hannifin Corp. |
9,200 |
380,650 |
|
|
Tyco International Ltd. |
11,900 |
674,581 |
|
|
|
1,846,744 |
||
|
TOTAL INDUSTRIAL MACHINERY & EQUIPMENT |
7,514,655 |
||
|
MEDIA & LEISURE - 3.2% |
|||
|
Broadcasting - 0.8% |
|||
|
Clear Channel Communications, Inc. (a) |
2,800 |
168,175 |
|
|
Time Warner, Inc. |
8,800 |
668,008 |
|
|
|
836,183 |
||
|
Entertainment - 2.0% |
|||
|
Fox Entertainment Group, Inc. Class A (a) |
11,500 |
247,250 |
|
|
Viacom, Inc. Class B (non-vtg.) (a) |
17,739 |
1,008,906 |
|
|
Walt Disney Co. |
21,600 |
773,550 |
|
|
|
2,029,706 |
||
|
Publishing - 0.3% |
|||
|
McGraw-Hill Companies, Inc. |
4,400 |
282,425 |
|
|
Restaurants - 0.1% |
|||
|
McDonald's Corp. |
3,400 |
105,400 |
|
|
TOTAL MEDIA & LEISURE |
3,253,714 |
||
|
Common Stocks - continued |
|||
|
Shares |
Value (Note 1) |
||
|
NONDURABLES - 6.3% |
|||
|
Beverages - 1.6% |
|||
|
Anheuser-Busch Companies, Inc. |
7,400 |
$ 338,550 |
|
|
The Coca-Cola Co. |
21,000 |
1,267,875 |
|
|
|
1,606,425 |
||
|
Foods - 1.0% |
|||
|
Keebler Foods Co. |
11,700 |
473,850 |
|
|
Quaker Oats Co. |
5,900 |
481,219 |
|
|
|
955,069 |
||
|
Household Products - 2.5% |
|||
|
Avon Products, Inc. |
4,300 |
208,550 |
|
|
Gillette Co. |
13,300 |
463,838 |
|
|
Procter & Gamble Co. |
26,100 |
1,864,519 |
|
|
|
2,536,907 |
||
|
Tobacco - 1.2% |
|||
|
Philip Morris Companies, Inc. |
32,800 |
1,201,300 |
|
|
TOTAL NONDURABLES |
6,299,701 |
||
|
RETAIL & WHOLESALE - 3.8% |
|||
|
Apparel Stores - 0.3% |
|||
|
AnnTaylor Stores Corp. (a) |
2,700 |
81,000 |
|
|
The Limited, Inc. |
9,000 |
227,250 |
|
|
|
308,250 |
||
|
Drug Stores - 0.5% |
|||
|
Walgreen Co. |
9,900 |
451,688 |
|
|
General Merchandise Stores - 1.7% |
|||
|
Target Corp. |
3,500 |
96,688 |
|
|
Wal-Mart Stores, Inc. |
36,500 |
1,656,188 |
|
|
|
1,752,876 |
||
|
Grocery Stores - 0.4% |
|||
|
Safeway, Inc. (a) |
2,100 |
114,844 |
|
|
Whole Foods Market, Inc. (a) |
5,300 |
245,125 |
|
|
|
359,969 |
||
|
Retail & Wholesale, Miscellaneous - 0.9% |
|||
|
Best Buy Co., Inc. (a) |
3,600 |
180,675 |
|
|
Home Depot, Inc. |
17,700 |
761,100 |
|
|
|
941,775 |
||
|
TOTAL RETAIL & WHOLESALE |
3,814,558 |
||
|
Common Stocks - continued |
|||
|
Shares |
Value (Note 1) |
||
|
SERVICES - 0.1% |
|||
|
Ecolab, Inc. |
3,700 |
$ 144,994 |
|
|
TECHNOLOGY - 27.6% |
|||
|
Communications Equipment - 5.8% |
|||
|
Ciena Corp. (a) |
1,800 |
189,225 |
|
|
Cisco Systems, Inc. (a) |
58,700 |
3,162,463 |
|
|
Corning, Inc. |
8,100 |
619,650 |
|
|
Nokia AB sponsored ADR |
18,400 |
786,600 |
|
|
Nortel Networks Corp. |
17,500 |
796,250 |
|
|
Telefonaktiebolaget LM Ericsson sponsored ADR |
22,200 |
308,025 |
|
|
|
5,862,213 |
||
|
Computer Services & Software - 8.1% |
|||
|
America Online, Inc. (a) |
6,000 |
302,580 |
|
|
Art Technology Group, Inc. (a) |
1,100 |
69,025 |
|
|
Ceridian Corp. (a) |
7,900 |
197,500 |
|
|
Computer Sciences Corp. (a) |
2,200 |
138,600 |
|
|
DST Systems, Inc. (a) |
10,600 |
653,225 |
|
|
First Data Corp. |
1,900 |
95,238 |
|
|
IMS Health, Inc. |
8,200 |
193,725 |
|
|
J.D. Edwards & Co. (a) |
9,200 |
238,050 |
|
|
Microsoft Corp. (a) |
52,800 |
3,636,600 |
|
|
Oracle Corp. (a) |
48,000 |
1,584,000 |
|
|
Redback Networks, Inc. (a) |
1,500 |
159,656 |
|
|
Siebel Systems, Inc. (a) |
4,600 |
482,713 |
|
|
VERITAS Software Corp. (a) |
2,600 |
366,641 |
|
|
|
8,117,553 |
||
|
Computers & Office Equipment - 8.7% |
|||
|
Brocade Communications Systems, Inc. (a) |
1,000 |
227,375 |
|
|
CDW Computer Centers, Inc. (a) |
3,600 |
231,975 |
|
|
Compaq Computer Corp. |
11,200 |
340,592 |
|
|
Dell Computer Corp. (a) |
33,900 |
1,000,050 |
|
|
EMC Corp. (a) |
22,800 |
2,030,625 |
|
|
Gateway, Inc. (a) |
4,700 |
242,567 |
|
|
Hewlett-Packard Co. |
16,200 |
752,288 |
|
|
International Business Machines Corp. |
12,900 |
1,270,650 |
|
|
Juniper Networks, Inc. (a) |
2,000 |
390,000 |
|
|
Network Appliance, Inc. (a) |
1,500 |
178,500 |
|
|
SCI Systems, Inc. (a) |
5,000 |
215,000 |
|
|
Sun Microsystems, Inc. (a) |
16,500 |
1,829,438 |
|
|
|
8,709,060 |
||
|
Common Stocks - continued |
|||
|
Shares |
Value (Note 1) |
||
|
TECHNOLOGY - continued |
|||
|
Electronic Instruments - 0.8% |
|||
|
Agilent Technologies, Inc. |
3,100 |
$ 143,569 |
|
|
Thermo Electron Corp. (a) |
17,500 |
507,500 |
|
|
Varian, Inc. (a) |
3,900 |
120,169 |
|
|
|
771,238 |
||
|
Electronics - 4.2% |
|||
|
Analog Devices, Inc. (a) |
2,100 |
136,500 |
|
|
Broadcom Corp. Class A (a) |
1,300 |
289,088 |
|
|
Intel Corp. |
49,400 |
2,223,000 |
|
|
LSI Logic Corp. (a) |
5,000 |
164,375 |
|
|
Motorola, Inc. |
13,300 |
331,669 |
|
|
Sanmina Corp. (a) |
2,700 |
308,644 |
|
|
Texas Instruments, Inc. |
14,800 |
726,125 |
|
|
|
4,179,401 |
||
|
TOTAL TECHNOLOGY |
27,639,465 |
||
|
TRANSPORTATION - 1.2% |
|||
|
Air Transportation - 0.4% |
|||
|
Ryanair Holdings PLC sponsored ADR (a) |
5,400 |
217,688 |
|
|
SkyWest, Inc. |
3,300 |
166,650 |
|
|
|
384,338 |
||
|
Railroads - 0.3% |
|||
|
Burlington Northern Santa Fe Corp. |
12,000 |
318,750 |
|
|
Trucking & Freight - 0.5% |
|||
|
CNF Transportation, Inc. |
17,600 |
469,700 |
|
|
TOTAL TRANSPORTATION |
1,172,788 |
||
|
UTILITIES - 4.3% |
|||
|
Cellular - 1.1% |
|||
|
AT&T Corp. - Wireless Group |
3,400 |
84,788 |
|
|
Nextel Communications, Inc. Class A (a) |
17,200 |
661,125 |
|
|
QUALCOMM, Inc. (a) |
2,100 |
136,730 |
|
|
Vodafone Group PLC |
400 |
1,703 |
|
|
VoiceStream Wireless Corp. (a) |
1,800 |
236,700 |
|
|
|
1,121,046 |
||
|
Electric Utility - 0.2% |
|||
|
AES Corp. (a) |
4,200 |
237,300 |
|
|
Common Stocks - continued |
|||
|
Shares |
Value (Note 1) |
||
|
UTILITIES - continued |
|||
|
Gas - 0.2% |
|||
|
Kinder Morgan, Inc. |
5,300 |
$ 204,381 |
|
|
Telephone Services - 2.8% |
|||
|
AT&T Corp. |
3,113 |
72,183 |
|
|
BellSouth Corp. |
15,200 |
734,350 |
|
|
Qwest Communications International, Inc. (a) |
16,665 |
810,336 |
|
|
SBC Communications, Inc. |
20,406 |
1,177,172 |
|
|
|
2,794,041 |
||
|
TOTAL UTILITIES |
4,356,768 |
||
|
TOTAL COMMON STOCKS (Cost $78,916,965) |
97,395,244 |
||
|
U.S. Treasury Obligations - 0.2% |
|||||
|
Moody's Ratings (unaudited) |
Principal Amount |
|
|||
|
U.S. Treasury Bills, yield at date of purchase
6.06% to 6.16% 12/7/00 to 1/11/01 (c) |
- |
|
$ 200,000 |
198,175 |
|
|
Cash Equivalents - 2.4% |
|||
|
Shares |
|
||
|
Fidelity Cash Central Fund, 6.61% (b) |
2,420,634 |
2,420,634 |
|
|
TOTAL INVESTMENT PORTFOLIO - 99.8% (Cost $81,535,769) |
100,014,053 |
||
|
NET OTHER ASSETS - 0.2% |
239,358 |
||
|
NET ASSETS - 100% |
$ 100,253,411 |
||
|
Futures Contracts |
|||||
|
|
Expiration Date |
Underlying Face Amount at Value |
Unrealized Gain/(Loss) |
||
|
Purchased |
|||||
|
4 S&P 500 Stock Index Contracts |
Dec. 2000 |
$ 1,440,200 |
$ 67,926 |
||
|
|
|
The face value of futures purchased as a percentage of net assets - 1.4% |
|
Legend |
|
(a) Non-income producing |
|
(b) The rate quoted is the annualized seven-day yield of the fund at period end. A complete listing of the fund's holdings as of its most recent fiscal year end is available upon request. |
|
(c) Security or a portion of the security was pledged to cover margin requirements for futures contracts. At the period end, the value of securities pledged amounted to $84,224. |
|
Income Tax Information |
|
At October 31, 2000, the aggregate |
|
At October 31, 2000, the fund had a capital loss carryforward of approximately $7,180,000 of which $2,211,000 and $4,969,000 will expire on October 31, 2007 and October 31, 2008, respectively. |
See accompanying notes which are an integral part of the financial statements.
Annual Report
Statement of Assets and Liabilities
|
|
October 31, 2000 |
|
|
Assets |
|
|
|
Investment in securities, at value (cost $81,535,769) - |
|
$ 100,014,053 |
|
Receivable for fund shares sold |
|
328,000 |
|
Dividends receivable |
|
52,734 |
|
Interest receivable |
|
18,072 |
|
Redemption fees receivable |
|
892 |
|
Receivable for daily variation on futures contracts |
|
29,000 |
|
Total assets |
|
100,442,751 |
|
Liabilities |
|
|
|
Payable for fund shares redeemed |
$ 106,547 |
|
|
Accrued management fee |
44,979 |
|
|
Other payables and accrued expenses |
37,814 |
|
|
Total liabilities |
|
189,340 |
|
Net Assets |
|
$ 100,253,411 |
|
Net Assets consist of: |
|
|
|
Paid in capital |
|
$ 88,960,241 |
|
Accumulated undistributed net realized gain (loss) on investments and foreign currency transactions |
|
(7,253,040) |
|
Net unrealized appreciation (depreciation) on investments |
|
18,546,210 |
|
Net Assets, for 7,637,667 shares outstanding |
|
$ 100,253,411 |
|
Net Asset Value, offering price and redemption price |
|
$13.13 |
A Redemption price per share is equal to net asset value less any applicable redemption fee.
See accompanying notes which are an integral part of the financial statements.
Annual Report
Financial Statements - continued
Statement of Operations
|
|
Year ended October 31, 2000 |
|
|
Investment Income Dividends |
|
$ 751,049 |
|
Interest |
|
95,227 |
|
Total income |
|
846,276 |
|
Expenses |
|
|
|
Management fee |
$ 504,203 |
|
|
Transfer agent fees |
112,564 |
|
|
Accounting fees and expenses |
60,558 |
|
|
Non-interested trustees' compensation |
271 |
|
|
Custodian fees and expenses |
9,244 |
|
|
Registration fees |
42,715 |
|
|
Audit |
23,506 |
|
|
Legal |
94,861 |
|
|
Miscellaneous |
210 |
|
|
Total expenses before reductions |
848,132 |
|
|
Expense reductions |
(3,589) |
844,543 |
|
Net investment income |
|
1,733 |
|
Realized and Unrealized Gain (Loss) Net realized gain (loss) on: |
|
|
|
Investment securities |
(4,818,187) |
|
|
Foreign currency transactions |
2,313 |
|
|
Futures contracts |
(193,838) |
(5,009,712) |
|
Change in net unrealized appreciation (depreciation) on: |
|
|
|
Investment securities |
10,466,814 |
|
|
Futures contracts |
67,926 |
10,534,740 |
|
Net gain (loss) |
|
5,525,028 |
|
Net increase (decrease) in net assets resulting |
|
$ 5,526,761 |
See accompanying notes which are an integral part of the financial statements.
Annual Report
Financial Statements - continued
Statement of Changes in Net Assets
|
|
Year ended
October 31, |
November 2, 1998 |
|
Increase (Decrease) in Net Assets |
|
|
|
Operations |
$ 1,733 |
$ 63,031 |
|
Net realized gain (loss) |
(5,009,712) |
(2,241,083) |
|
Change in net unrealized appreciation (depreciation) |
10,534,740 |
8,011,470 |
|
Net increase (decrease) in net assets resulting |
5,526,761 |
5,833,418 |
|
Distributions to shareholders |
(64,616) |
- |
|
In excess of net investment income |
(49,770) |
- |
|
Total distributions |
(114,386) |
- |
|
Share transactions |
41,906,863 |
66,012,558 |
|
Reinvestment of distributions |
104,431 |
- |
|
Cost of shares redeemed |
(15,946,339) |
(3,257,220) |
|
Net increase (decrease) in net assets resulting |
26,064,955 |
62,755,338 |
|
Redemption fees |
155,479 |
31,846 |
|
Total increase (decrease) in net assets |
31,632,809 |
68,620,602 |
|
Net Assets |
|
|
|
Beginning of period |
68,620,602 |
- |
|
End of period (including undistributed net investment income of $0 and $63,084, respectively) |
$ 100,253,411 |
$ 68,620,602 |
|
Other Information Shares |
|
|
|
Sold |
3,226,942 |
5,907,770 |
|
Issued in reinvestment of distributions |
8,133 |
- |
|
Redeemed |
(1,221,180) |
(283,998) |
|
Net increase (decrease) |
2,013,895 |
5,623,772 |
See accompanying notes which are an integral part of the financial statements.
Annual Report
Financial Highlights
|
Years ended October 31, |
2000 |
1999 E |
|
Selected Per-Share Data |
|
|
|
Net asset value, beginning of period |
$ 12.20 |
$ 10.00 |
|
Income from Investment Operations |
|
|
|
Net investment income D |
.00 |
.02 |
|
Net realized and unrealized gain (loss) |
.93 |
2.17 |
|
Total from investment operations |
.93 |
2.19 |
|
Less Distributions |
|
|
|
From net investment income |
(.01) |
- |
|
In excess of net investment income |
(.01) |
- |
|
Total distributions |
(.02) |
- |
|
Redemption fees added to paid in capital |
.02 |
.01 |
|
Net asset value, end of period |
$ 13.13 |
$ 12.20 |
|
Total Return B, C |
7.79% |
22.00% |
|
Ratios and Supplemental Data |
|
|
|
Net assets, end of period (000 omitted) |
$ 100,253 |
$ 68,621 |
|
Ratio of expenses to average net assets |
.97% |
1.11% A |
|
Ratio of expenses to average net assets after expense reductions |
.96% F |
1.10% A, F |
|
Ratio of net investment income to average net assets |
.00% |
.14% A |
|
Portfolio turnover rate |
58% |
32% A |
A Annualized
B Total returns for periods of less than one year are not annualized.
C The total returns would have been lower had certain expenses not been reduced during the periods shown.
D Net investment income per share has been calculated based on average shares outstanding during the period.
E For the period November 2, 1998 (commencement of operations) to October 31, 1999.
F FMR or the fund has entered into varying arrangements with third parties who either paid or reduced a portion of the fund's expenses.
See accompanying notes which are an integral part of the financial statements.
Annual Report
For the period ended October 31, 2000
1. Significant Accounting Policies.
Fidelity Tax Managed Stock Fund (the fund) is a fund of Fidelity Beacon Street Trust (the trust) and is authorized to issue an unlimited number of shares. The trust is registered under the Investment Company Act of 1940, as amended, as an open-end management investment company organized as a Massachusetts business trust. The financial statements have been prepared in conformity with generally accepted accounting principles which require management to make certain estimates and assumptions at the date of the financial statements. The following summarizes the significant accounting policies of the fund:
Security Valuation. Securities for which exchange quotations are readily available are valued at the last sale price, or if no sale price, at the closing bid price. Foreign securities are valued based on quotations from the principal market in which such securities are normally traded. If trading or events occurring in other markets after the close of the principal market in which foreign securities are traded, and before the close of business of the fund, are expected to materially affect the value of those securities, then they are valued at their fair value taking this trading or these events into account. Fair value is determined in good faith under consistently applied procedures under the general supervision of the Board of Trustees. Securities for which exchange quotations are not readily available (and in certain cases debt securities which trade on an exchange) are valued primarily using dealer-supplied valuations or at their fair value. Short-term securities with remaining maturities of sixty days or less for which quotations are not readily available are valued at amortized cost or original cost plus accrued interest, both of which approximate current value. Investments in open-end investment companies are valued at their net asset value each business day.
Foreign Currency Translation. The accounting records of the fund are maintained in U.S. dollars. Investment securities and other assets and liabilities denominated in a foreign currency are translated into U.S. dollars at the prevailing rates of exchange at period end. Purchases and sales of securities, income receipts and expense payments are translated into U.S. dollars at the prevailing exchange rate on the respective dates of the transactions.
Net realized gains and losses on foreign currency transactions represent net gains and losses from sales and maturities of foreign currency contracts, disposition of foreign currencies, the difference between the amount of net investment income accrued and the U.S. dollar amount actually received, and gains and losses between trade and settlement date on purchases and sales of securities. The effects of changes in foreign currency exchange rates on investments in securities are included with the net realized and unrealized gain or loss on investment securities.
Income Taxes. As a qualified regulated investment company under Subchapter M of the Internal Revenue Code, the fund is not subject to income taxes to the extent that it distributes substantially all of its
Annual Report
Notes to Financial Statements - continued
1. Significant Accounting Policies - continued
Income Taxes - continued
taxable income for its fiscal year. The schedule of investments includes information regarding income taxes under the caption "Income Tax Information."
Investment Income. Dividend income is recorded on the ex-dividend date, except certain dividends from foreign securities where the ex-dividend date may have passed, are recorded as soon as the fund is informed of the ex-dividend date. Non-cash dividends included in dividend income, if any, are recorded at the fair market value of the securities received. Interest income is accrued as earned. Investment income is recorded net of foreign taxes withheld where recovery of such taxes is uncertain.
Distributions to Shareholders. Distributions are recorded on the ex-dividend date.
Income and capital gain distributions are determined in accordance with income tax regulations which may differ from generally accepted accounting principles. These differences, which may result in distribution reclassifications, are primarily due to differing treatments for futures transactions, foreign currency transactions, capital loss carryforwards and losses deferred due to wash sales.
Permanent book and tax basis differences relating to shareholder distributions will result in reclassifications to paid in capital. Accumulated undistributed net realized gain (loss) on investments and foreign currency transactions may include temporary book and tax basis differences which will reverse in a subsequent period. Any taxable income or gain remaining at fiscal year end is distributed in the following year.
Trading (Redemption) Fees. Shares held in the fund less than 2 years are subject to a trading fee equal to 1.00% of the proceeds of the redeemed shares. The fee, which is retained by the fund, is accounted for as an addition to paid in capital.
Security Transactions. Security transactions are accounted for as of trade date. Gains and losses on securities sold are determined on the basis of identified cost.
2. Operating Policies.
Foreign Currency Contracts. The fund generally uses foreign currency contracts to facilitate transactions in foreign-denominated securities. Losses may arise from changes in the value of the foreign currency or if the counterparties do not perform under the contracts' terms. The U.S. dollar value of foreign currency contracts is determined using contractual currency exchange rates established at the time of each trade.
Joint Trading Account. Pursuant to an Exemptive Order issued by the Securities and Exchange Commission (the SEC), the fund, along with other affiliated entities of Fidelity Management & Research Company (FMR), may transfer uninvested cash balances into one or more joint trading accounts. These balances are invested in one or more repurchase agreements for U.S. Treasury or Federal Agency obligations.
Annual Report
Notes to Financial Statements - continued
2. Operating Policies - continued
Repurchase Agreements. The underlying U.S. Treasury, Federal Agency, or other obligations found to be satisfactory by FMR are transferred to an account of the fund, or to the Joint Trading Account, at a custodian bank. The securities are marked-to-market daily and maintained at a value at least equal to the principal amount of the repurchase agreement (including accrued interest). FMR, the fund's investment adviser, is responsible for determining that the value of the underlying securities remains in accordance with the market value requirements stated above.
Futures Contracts. The fund may use futures contracts to manage its exposure to the stock market. Buying futures tends to increase the fund's exposure to the underlying instrument, while selling futures tends to decrease the fund's exposure to the underlying instrument or hedge other fund investments. Futures contracts involve, to varying degrees, risk of loss in excess of the futures variation margin reflected in the Statement of Assets and Liabilities. The underlying face amount at value of any open futures contracts at period end is shown in the schedule of investments under the caption "Futures Contracts." This amount reflects each contract's exposure to the underlying instrument at period end. Losses may arise from changes in the value of the underlying instruments or if the counterparties do not perform under the contracts' terms. Gains (losses) are realized upon the expiration or closing of the futures contracts. Futures contracts are valued at the settlement price established each day by the board of trade or exchange on which they are traded.
3. Purchases and Sales of Investments.
Purchases and sales of securities, other than short-term securities, aggregated $73,466,051 and $49,624,526, respectively.
The market value of futures contracts opened and closed during the period amounted to $19,850,615 and $18,284,503, respectively.
4. Fees and Other Transactions with Affiliates.
Management Fee. As the fund's investment adviser, FMR receives a monthly fee that is calculated on the basis of a group fee rate plus a fixed individual fund fee rate applied to the average net assets of the fund. The group fee rate is the weighted average of a series of rates and is based on the monthly average net assets of all the mutual funds advised by FMR. The rates ranged from .2167% to .5200% for the period. The annual individual fund fee rate is .30%. In the event that these rates were lower than the contractual rates in effect during the period, FMR voluntarily implemented the above rates, as they resulted in the same or a lower management fee. For the period, the management fee was equivalent to an annual rate of .57% of average net assets.
Annual Report
Notes to Financial Statements - continued
4. Fees and Other Transactions with Affiliates - continued
Sub-Adviser Fee. Beginning January 1, 2001, FMR Co.(FMRC) will serve as sub-adviser for the fund. FMRC is a wholly owned subsidiary of FMR and will receive a fee from FMR of 50% of the management fee payable to FMR with respect to that portion of the fund's assets that will be managed by FMRC.
Transfer Agent Fees. Fidelity Service Company, Inc. (FSC), an affiliate of FMR, is the fund's transfer, dividend disbursing and shareholder servicing agent. FSC receives account fees and asset-based fees that vary according to account size and type of account. FSC pays for typesetting, printing and mailing of all shareholder reports, except proxy statements. For the period, the transfer agent fees were equivalent to an annual rate of .13% of average net assets.
Accounting Fees. FSC maintains the fund's accounting records. The fee is based on the level of average net assets for the month plus out-of-pocket expenses.
Fidelity Cash Central Fund. Pursuant to an Exemptive Order issued by the SEC, the fund may invest in the Fidelity Cash Central Fund (the Cash Fund) managed by Fidelity Investments Money Management, Inc., an affiliate of FMR. The Cash Fund is an open-end money market fund available only to investment companies and other accounts managed by FMR and its affiliates. The Cash Fund seeks preservation of capital, liquidity, and current income. Income distributions from the Cash Fund are declared daily and paid monthly from net investment income. Income distributions earned by the fund are recorded as interest income in the accompanying financial statements.
Brokerage Commissions. The fund placed a portion of its portfolio transactions with brokerage firms which are affiliates of FMR. The commissions paid to these affiliated firms were $1,355 for the period.
5. Expense Reductions.
FMR has directed certain portfolio trades to brokers who paid a portion of the fund's expenses. For the period, the fund's expenses were reduced by $3,589 under this arrangement.
Annual Report
To the Trustees of Fidelity Beacon Street Trust and the Shareholders of Fidelity Tax Managed Stock Fund:
In our opinion, the accompanying statement of assets and liabilities, including the schedule of investments, and the related statements of operations and of changes in net assets and the financial highlights present fairly, in all material respects, the financial position of Fidelity Tax Managed Stock Fund (a fund of Fidelity Beacon Street Trust) at October 31, 2000, and the results of its operations, the changes in its net assets and the financial highlights for the periods indicated, in conformity with accounting principles generally accepted in the United States of America. These financial statements and financial highlights (hereafter referred to as "financial statements") are the responsibility of the Fidelity Tax Managed Stock Fund's management; our responsibility is to express an opinion on these financial statements based on our audits. We conducted our audits of these financial statements in accordance with auditing standards generally accepted in the United States of America which require that we plan and perform the audit to obtain reasonable assurance about whether the financial statements are free of material misstatement. An audit includes examining, on a test basis, evidence supporting the amounts and disclosures in the financial statements, assessing the accounting principles used and significant estimates made by management, and evaluating the overall financial statement presentation. We believe that our audits, which included confirmation of securities at October 31, 2000 by correspondence with the custodian and brokers, provide a reasonable basis for our opinion.
/s/PricewaterhouseCoopers LLP
PricewaterhouseCoopers LLP
Boston, Massachusetts
December 8, 2000
Annual Report
A total of 100% of the dividends distributed during the fiscal year qualifies for the dividends-received deduction for corporate shareholders.
The fund will notify shareholders in January 2001 of amounts for use in preparing 2000 income tax returns.
Annual Report
Fidelity offers several ways to conveniently manage your personal investments via your telephone or PC. You can access your account information, conduct trades and research your investments 24 hours a day.
By Phone
Fidelity Automated Service Telephone provides a single toll-free number to access account balances, positions, quotes and trading. It's easy to navigate the service, and on your first call, the system will help you create a personal identification number (PIN) for security.
(phone_graphic)
Fidelity Automated
Service Telephone (FAST®)
1-800-544-5555
Press
1 For mutual fund and brokerage trading.
2 For quotes.*
3 For account balances and holdings.
4 To review orders and mutual
fund activity.
5 To change your PIN.
*0 To speak to a Fidelity representative.
By PC
Fidelity's web site on the Internet provides a wide range of information, including daily financial news, fund performance, interactive planning tools and news about Fidelity products and services.
(computer_graphic)
Fidelity's Web Site
www.fidelity.com
If you are not currently on the Internet, call EarthLink Sprint at 1-800-288-2967, and be sure to ask for registration number SMD004 to receive a special Fidelity package that includes 30 days of free Internet access. EarthLink is North America's #1 independent Internet access provider.
(computer_graphic)
Fidelity On-line Xpress+®
Fidelity On-line Xpress+ software for Windows combines comprehensive portfolio management capabilities, securities trading and access to research and analysis tools . . . all on your desktop. Call Fidelity at 1-800-544-0240 or visit our web site for more information on how to manage your investments via your PC.
* When you call the quotes line, please remember that a fund's yield and return will vary and, except for money market funds, share price will also vary. This means that you may have a gain or loss when you sell your shares. There is no assurance that money market funds will be able to maintain a stable $1 share price; an investment in a money market fund is not insured or guaranteed by the U.S. government. Total returns are historical and include changes in share price, reinvestment of dividends and capital gains, and the effects of any sales charges.
Annual Report
Investment Adviser
Fidelity Management & Research Company
Boston, MA
Investment Sub-Advisers
Fidelity Management & Research
(U.K.) Inc.
Fidelity Management & Research
(Far East) Inc.
Fidelity Investments Japan Limited
Officers
Edward C. Johnson 3d, President
Robert C. Pozen, Senior Vice President
Robert A. Lawrence, Vice President
Tim Heffernan, Vice President
Eric D. Roiter, Secretary
Robert A. Dwight, Treasurer
Maria F. Dwyer, Deputy Treasurer
John H. Costello, Assistant Treasurer
Thomas J. Simpson, Assistant Treasurer
Board of Trustees
Ralph F. Cox *
Phyllis Burke Davis *
Robert M. Gates *
Edward C. Johnson 3d
Donald J. Kirk *
Ned C. Lautenbach *
Peter S. Lynch
Marvin L. Mann *
William O. McCoy *
Gerald C. McDonough *
Robert C. Pozen
Thomas R. Williams *
Advisory Board
J. Michael Cook
Abigail P. Johnson
Marie L. Knowles
General Distributor
Fidelity Distributors Corporation
Boston, MA
Transfer and Shareholder
Servicing Agent
Fidelity Service Company, Inc.
Boston, MA
* Independent trustees
Custodian
State Street Bank and Trust Company
Quincy, MA
Fidelity's Growth Funds
Aggressive Growth Fund
Blue Chip Growth Fund
Capital Appreciation Fund
Contrafund®
Contrafund® II
Disciplined Equity Fund
Dividend Growth Fund
Export and Multinational Fund
Fidelity Fifty ®
Growth Company Fund
Large Cap Stock Fund
Low-Priced Stock Fund
Magellan® Fund
Mid-Cap Stock Fund
New Millennium Fund®
OTC Portfolio
Retirement Growth Fund
Small Cap Selector
Small Cap Stock Fund
Stock Selector
Tax Managed Stock Fund
TechnoQuant® Growth Fund
Trend Fund
Value Fund
The Fidelity Telephone Connection
Mutual Fund 24-Hour Service
Exchanges/Redemptions
and Account Assistance 1-800-544-6666
Product Information 1-800-544-6666
Retirement Accounts 1-800-544-4774
(8 a.m. - 9 p.m.)
TDD Service 1-800-544-0118
for the deaf and hearing impaired
(9 a.m. - 9 p.m. Eastern time)
Fidelity Automated Service
Telephone (FAST®) (automated graphic) 1-800-544-5555
(automated graphic) Automated line for quickest service
TMG-ANN-1200 118666
1.730726.101
(Fidelity Investment logo)(registered trademark)
Corporate Headquarters
82 Devonshire St., Boston, MA 02109
www.fidelity.com
|
|