
|
|
|
|
|
|
|
|
|
|
Previous: PNC MORTGAGE SECURITIES CORP, 424B5, 2000-09-22 |
Next: SHELTER PROPERTIES I LTD PARTNERSHIP, SC TO-T/A, 2000-09-22 |
Class A, Class T, Class B and Class C
Consumer Industries
Cyclical Industries
Financial Services
Health Care
Natural Resources
Technology
Telecommunications &
Utilities Growth (formerly Utilities Growth)
Annual Report
for the year ending
July 31, 2000
and
Prospectus
dated September 28, 2000
|
Performance Overview |
A-4 |
|
|
Consumer Industries |
A-5 |
Performance |
|
|
A-9 |
Fund Talk: The Manager's Overview |
|
|
A-10 |
Investment Summary |
|
|
A-11 |
Ivestments |
|
|
A-14 |
Financial Statements |
|
|
A-18 |
Notes to the Financial Statements |
|
Cyclical Industries |
A-22 |
Performance |
|
|
A-26 |
Fund Talk: The Manager's Overview |
|
|
A-27 |
Investment Summary |
|
|
A-28 |
Ivestments |
|
|
A-31 |
Financial Statements |
|
|
A-35 |
Notes to the Financial Statements |
|
Financial Services |
A-39 |
Performance |
|
|
A-43 |
Fund Talk: The Manager's Overview |
|
|
A-44 |
Investment Summary |
|
|
A-45 |
Ivestments |
|
|
A-47 |
Financial Statements |
|
|
A-51 |
Notes to the Financial Statements |
|
Health Care |
A-55 |
Performance |
|
|
A-59 |
Fund Talk: The Manager's Overview |
|
|
A-60 |
Investment Summary |
|
|
A-61 |
Ivestments |
|
|
A-63 |
Financial Statements |
|
|
A-67 |
Notes to the Financial Statements |
|
Natural Resources |
A-71 |
Performance |
|
|
A-75 |
Fund Talk: The Manager's Overview |
|
|
A-76 |
Investment Summary |
|
|
A-77 |
Ivestments |
|
|
A-79 |
Financial Statements |
|
|
A-83 |
Notes to the Financial Statements |
|
Technology |
A-88 |
Performance |
|
|
A-92 |
Fund Talk: The Manager's Overview |
|
|
A-93 |
Investment Summary |
|
|
A-94 |
Ivestments |
|
|
A-97 |
Financial Statements |
|
|
A-101 |
Notes to the Financial Statements |
|
Telecommunications & |
A-105 |
Performance |
|
|
A-109 |
Fund Talk: The Manager's Overview |
|
|
A-110 |
Investment Summary |
|
|
A-111 |
Ivestments |
|
|
A-113 |
Financial Statements |
|
|
A-117 |
Notes to the Financial Statements |
|
Independent Auditors' Report |
A-121 |
The auditors' opinion. |
|
Distributions |
A-122 |
|
|
Prospectus |
P-1 |
|
Standard & Poor's, S&P and S&P 500 are registered service marks of The McGraw-Hill Companies, Inc. and have been licensed for use by Fidelity Distributors Corporation.
Other third party marks appearing herein are the property of their respective owners.
All other marks appearing herein are registered or unregistered trademarks or service marks of FMR Corp. or an affiliated company.
(Recycle graphic) This report is printed on recycled paper using soy-based inks.
The views expressed in this report reflect those of each fund's portfolio manager only through the end of the period of the report as stated on the cover and do not necessarily represent the views of Fidelity or any other person in the Fidelity organization. Any such views are subject to change at any time based upon market or other conditions and Fidelity disclaims any responsibility to update such views. These views may not be relied on as investment advice and, because investment decisions for a Fidelity fund are based on numerous factors, may not be relied on as an indication of trading intent on behalf of any Fidelity fund.
This report and the financial statements contained herein are submitted for the general information of the shareholders of the funds. This report is not authorized for distribution to prospective investors in the funds unless preceded or accompanied by an effective prospectus.
Mutual fund shares are not deposits or obligations of, or guaranteed by, any depository institution. Shares are not insured by the FDIC, Federal Reserve Board or any other agency, and are subject to investment risks, including possible loss of principal amount invested.
Neither the funds nor Fidelity Distributors Corporation is a bank.
For more information on any Fidelity Advisor fund, including charges and expenses, contact your investment professional for a free prospectus. Read it carefully before you invest or send money.
Annual Report
The majority of sectors in the U.S. equity market experienced a significant turnaround in investor sentiment during the 12-month period that ended July 31, 2000. Throughout the year, investors progressively flirted, chased and then ultimately retreated from sectors of the new economy, such as technology, wireless telecommunications and biotechnology. At the same time, most had turned their backs on more traditional sectors, such as health, financial services, energy and real estate, to start the period, only to renew their confidence in them again later on.
Going into the period, investors clamored for shares of anything tied to the Internet and technology, driving the prices of unprofitable companies to historically high levels and buoying the capital markets with robust demand for initial public offerings. During this Internet stock boom, investors turned phrases such as "dot-com," "B2B" and "cyberspace" into the daily lexicon of everyone from Wall Street strategists to plumbers.
Meanwhile, lacking the price appreciation of technology and telecommunications stocks, investors soured on more traditional companies early on, resulting in the overall poor performance of value stocks during the third and fourth quarters of 1999. Brisk outflows from value-oriented mutual funds and huge inflows to growth funds - many of which had loaded up on technology stocks - exacerbated the trend.
During the second half of the period, however, the equity markets struggled to break free from the grip of the Federal Reserve Board, whose effort to cool the overheated domestic economy was delivered via a series of five interest-rate hikes. With every clench of its fist, the Fed's effort - which raised the federal funds rate by a total of 1.50% during the period - gradually tempered the optimism toward stocks as the period progressed. Most of the effect of the Fed's tightening, coupled with the market's concerns about corporate earnings, took its toll in the first and second quarters of 2000. The Dow Jones Industrial Average - a benchmark of blue chip stocks - returned 0.27% during the past year, but has declined 7.65% in the first seven months of 2000. Similarly, the Standard & Poor's 500 SM Index, an index of 500 larger companies, returned 8.98% for the 12-month period, but feeling the impact of the Fed's action, has lost 1.98% so far in 2000. Even the seemingly invincible NASDAQ Composite Index, which finished the period with a 43.08% gain, has given back 7.33% year to date. Growing concerns about a potential slowdown in the economy during the second half of the period also affected small-cap stocks, as evidenced by the Russell 2000®'s 13.77% advance for the year, compared to its weak -0.28% return so far in 2000.
The equity sector rotation was fueled in part by a correction in technology stocks. After crossing the 5000 mark early in March, the tech-heavy NASDAQ Composite Index gave back nearly all of its year-to-date gains by the end of the month, then tumbled another 25% during a single week in April. The sell-off in technology was due to overvaluation concerns by notable Wall Street analysts, the federal government's evolving antitrust case against software giant Microsoft, and slower growth forecasts for several tech subsectors, such as semiconductors. Despite the sector's troubles in 2000, the Goldman Sachs Technology Index - an index of 221 stocks designed to measure the performance of companies in the tech sector - returned 51.95% during the 12-month period. The ensuing volatility in technology stocks forced many investors to the sidelines, as evidenced by the exceedingly light trading volume in the second quarter of 2000 and the Goldman Sachs Technology Index's 0.72% year-to-date gain. Investors also began to look toward other areas of the market - such as health and real estate - for steadier growth, changing the investing landscape dramatically from earlier in the period.
Among other sectors, the performance of stocks in the consumer industries sector was hurt by rising interest rates and, toward the end of the period, reports of missed earnings estimates and slower growth from some high-profile companies, including Costco and Office Depot. Still, with growth slowing and share prices dropping, many large food companies went on a buying spree. Philip Morris agreed to purchase Nabisco Holdings and Anglo-Dutch group Unilever snapped up Bestfoods, Slim-Fast Foods and Ben & Jerry's.
In the financial services sector, bank stocks suffered from rising interest rates while brokerage stocks rallied on higher trading volumes. Many investors expected a wave of consolidation in the sector after the government leveled the playing field for all financial services firms in late 1999 by making changes to the Depression-era Glass-Steagall Act - which had prohibited banks and brokerages from operating under the same corporate roof - but it never occurred. The Goldman Sachs Financial Services Index rose 3.20% during the 12-month period.
Higher fuel costs and concerns about a slowdown in the economy plagued the cyclical industries sector. A focus on productivity-boosting, cost-cutting technology in business spending, rather than on traditional ways of manufacturing goods, put pricing pressures on commodities and subsequently dampened the earnings growth of cyclical companies.
Growing demand for their products enabled wireless and cable services to stand out as top-performing industries in the utilities sector. Early on, a wave of consolidation and increasing demand for wireless products fueled strong gains in telecommunications stocks, while electric utilities were hurt by rising interest rates and long-term profitability concerns. The Goldman Sachs Utilities Index returned -0.53% during the 12-month period.
On the positive side of the marketplace, several pharmaceutical stocks in the health sector returned to favor in the latter part of the period on positive earnings and new product reports. Additionally, public and private programs to sequence the human genome were completed in the second quarter of 2000, helping to restore investor confidence in biotech stocks. The Goldman Sachs Health Care Index rose 22.57% in the 12-month period.
Overall, the natural resources sector had good results. For the majority of the period, OPEC's decision to maintain lower oil production, combined with increased demand, helped push the price of oil above $30 per barrel for weeks. Higher prices helped energy services stocks as well as large integrated oil producers. A favorable supply and demand environment also helped push natural gas prices to record levels.
Annual Report
Performance
There are several ways to evaluate historical performance. You can look at the total percentage change in value, the average annual percentage change or the growth of a hypothetical $10,000 investment. Total return reflects the change in the value of an investment, assuming reinvestment of dividend income and capital gains (the profits earned upon the sale of securities that have grown in value). If Fidelity had not reimbursed certain class expenses, the total returns would have been lower.
Cumulative Total Returns
|
Periods ended July 31, 2000 |
|
Past 1 |
Life of |
|
Fidelity® Adv Consumer - CL A |
|
-4.48% |
87.51% |
|
Fidelity Adv Consumer - CL A |
|
-9.97% |
76.73% |
|
S&P 500® |
|
8.98% |
131.80% |
|
GS Consumer Industries |
|
-4.55% |
76.30% |
Cumulative total returns show Class A shares' performance in percentage terms over a set period - in this case, one year or since the fund started on September 3, 1996. You can compare Class A shares' returns to the performance of both the Standard & Poor's 500 Index - a market capitalization-weighted index of common stocks - and the Goldman Sachs Consumer Industries Index - a market capitalization-weighted index of 295 stocks designed to measure the performance of companies in the consumer industries sector. Issues in the index include providers of consumer services and products, including producers of beverages - alcoholic and non-alcoholic, food, personal care, household products and tobacco companies. These benchmarks include reinvested dividends and capital gains, if any, and exclude the effect of sales charges.
Average Annual Total Returns
|
Periods ended July 31, 2000 |
|
Past 1 |
Life of |
|
Fidelity Adv Consumer - CL A |
|
-4.48% |
17.44% |
|
Fidelity Adv Consumer - CL A |
|
-9.97% |
15.68% |
|
S&P 500 |
|
8.98% |
23.99% |
|
GS Consumer Industries |
|
-4.55% |
15.61% |
Average annual returns take Class A shares' cumulative return and show you what would have happened if Class A shares had performed at a constant rate each year.
$10,000 Over Life of Fund
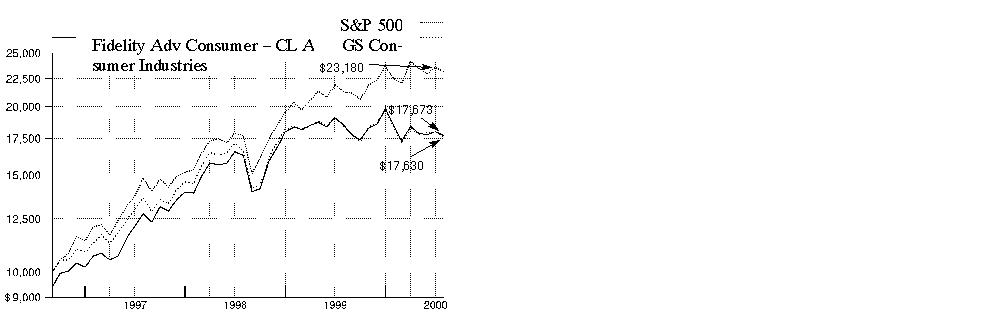
$10,000 Over Life of Fund: Let's say hypothetically that $10,000 was invested in Fidelity Advisor Consumer Industries - Class A on September 3, 1996, when the fund started, and the current 5.75% sales charge was paid. As the chart shows, by July 31, 2000, the value of the investment would have grown to $17,673 - a 76.73% increase on the initial investment. For comparison, look at how the Standard & Poor's 500 Index did over the same period. With dividends and capital gains, if any, reinvested, the same $10,000 investment would have grown to $23,180 - a 131.80% increase. If $10,000 was invested in the Goldman Sachs Consumer Industries Index, it would have grown to $17,630 - a 76.30% increase.
Understanding Performance
How a fund did yesterday is no guarantee of how it will do tomorrow. The stock market, for example, has a history of long-term growth and short-term volatility. Unlike the broader market, however, some sectors may not have a history of growth in the long run. And, as with all stock funds, the share price and return of a fund that invests in a sector will vary.
3Annual Report
Performance
There are several ways to evaluate historical performance. You can look at the total percentage change in value, the average annual percentage change or the growth of a hypothetical $10,000 investment. Total return reflects the change in the value of an investment, assuming reinvestment of dividend income and capital gains (the profits earned upon the sale of securities that have grown in value). If Fidelity had not reimbursed certain class expenses, the total returns would have been lower.
Cumulative Total Returns
|
Periods ended July 31, 2000 |
|
Past 1 |
Life of |
|
Fidelity Adv Consumer - CL T |
|
-4.69% |
85.21% |
|
Fidelity Adv Consumer - CL T |
|
-8.03% |
78.73% |
|
S&P 500 |
|
8.98% |
131.80% |
|
GS Consumer Industries |
|
-4.55% |
76.30% |
Cumulative total returns show Class T shares' performance in percentage terms over a set period - in this case, one year or since the fund started on September 3, 1996. You can compare Class T shares' returns to the performance of both the Standard & Poor's 500 Index - a market capitalization-weighted index of common stocks - and the Goldman Sachs Consumer Industries Index - a market capitalization-weighted index of 295 stocks designed to measure the performance of companies in the consumer industries sector. Issues in the index include providers of consumer services and products, including producers of beverages - alcoholic and non-alcoholic, food, personal care, household products and tobacco companies. These benchmarks include reinvested dividends and capital gains, if any, and exclude the effect of sales charges.
Average Annual Total Returns
|
Periods ended July 31, 2000 |
|
Past 1 |
Life of |
|
Fidelity Adv Consumer - CL T |
|
-4.69% |
17.07% |
|
Fidelity Adv Consumer - CL T |
|
-8.03% |
16.01% |
|
S&P 500 |
|
8.98% |
23.99% |
|
GS Consumer Industries |
|
-4.55% |
15.61% |
Average annual returns take Class T shares' cumulative return and show you what would have happened if Class T shares had performed at a constant rate each year.
$10,000 Over Life of Fund
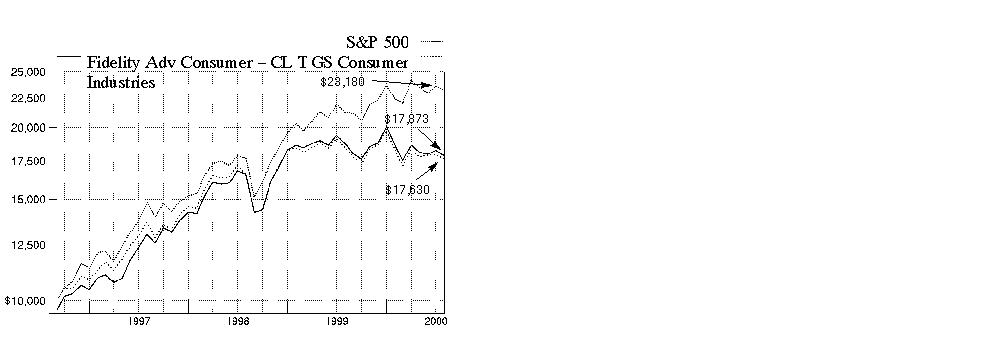
$10,000 Over Life of Fund: Let's say hypothetically that $10,000 was invested in Fidelity Advisor Consumer Industries - Class T on September 3, 1996, when the fund started, and the current 3.50% sales charge was paid. As the chart shows, by July 31, 2000, the value of the investment would have grown to $17,873 - a 78.73% increase on the initial investment. For comparison, look at how the Standard & Poor's 500 Index did over the same period. With dividends and capital gains, if any, reinvested, the same $10,000 investment would have grown to $23,180 - a 131.80% increase. If $10,000 was invested in the Goldman Sachs Consumer Industries Index, it would have grown to $17,630 - a 76.30% increase.
Understanding Performance
How a fund did yesterday is no guarantee of how it will do tomorrow. The stock market, for example, has a history of long-term growth and short-term volatility. Unlike the broader market, however, some sectors may not have a history of growth in the long run. And, as with all stock funds, the share price and return of a fund that invests in a sector will vary.
3Annual Report
Performance
There are several ways to evaluate historical performance. You can look at the total percentage change in value, the average annual percentage change or the growth of a hypothetical $10,000 investment. Total return reflects the change in the value of an investment, assuming reinvestment of dividend income and capital gains (the profits earned upon the sale of securities that have grown in value). The initial offering of Class B shares took place on March 3, 1997. Class B shares bear a 1.00% 12b-1 fee. Returns prior to March 3, 1997 are those of Class T which bears a 0.50% 12b-1 fee. Had Class B shares' 12b-1 fee been reflected, returns prior to March 3, 1997 would have been lower. Class B shares' contingent deferred sales charge included in the past one year and life of fund total return figures are 5% and 3%, respectively. If Fidelity had not reimbursed certain class expenses, the total returns would have been lower.
Cumulative Total Returns
|
Periods ended July 31, 2000 |
|
Past 1 |
Life of |
|
Fidelity Adv Consumer - CL B |
|
-5.19% |
82.13% |
|
Fidelity Adv Consumer - CL B |
|
-9.86% |
79.13% |
|
S&P 500 |
|
8.98% |
131.80% |
|
GS Consumer Industries |
|
-4.55% |
76.30% |
Cumulative total returns show Class B shares' performance in percentage terms over a set period - in this case, one year or since the fund started on September 3, 1996. You can compare Class B shares' returns to both the performance of the Standard & Poor's 500 Index - a market capitalization-weighted index of common stocks - and the Goldman Sachs Consumer Industries Index - a market capitalization-weighted index of 295 stocks designed to measure the performance of companies in the consumer industries sector. Issues in the index include providers of consumer services and products, including producers of beverages - alcoholic and non-alcoholic, food, personal care, household products and tobacco companies. These benchmarks include reinvested dividends and capital gains, if any, and exclude the effect of sales charges.
Average Annual Total Returns
|
Periods ended July 31, 2000 |
Past 1 |
Life of |
|
Fidelity Adv Consumer - CL B |
-5.19% |
16.57% |
|
Fidelity Adv Consumer - CL B |
-9.86% |
16.08% |
|
S&P 500 |
8.98% |
23.99% |
|
GS Consumer Industries |
-4.55% |
15.61% |
Average annual returns take Class B shares' cumulative return and show you what would have happened if Class B shares had performed at a constant rate each year.
$10,000 Over Life of Fund
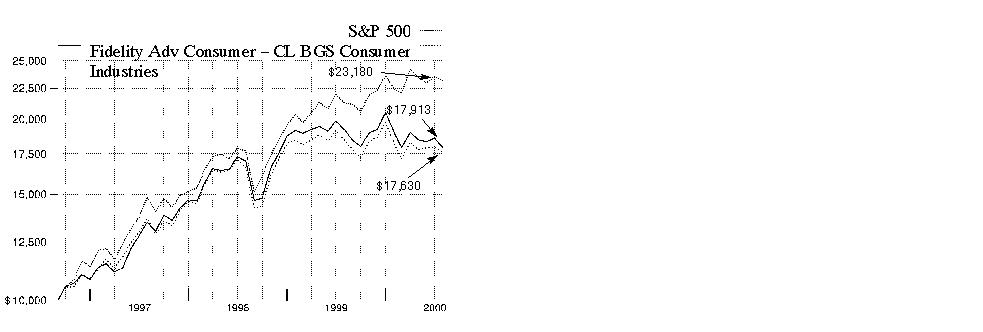
$10,000 Over Life of Fund: Let's say hypothetically that $10,000 was invested in Fidelity Advisor Consumer Industries - Class B on September 3, 1996, when the fund started. As the chart shows, by July 31, 2000, the value of the investment, including the effect of the contingent deferred sales charge, would have grown to $17,913 - a 79.13% increase on the initial investment. For comparison, look at how the Standard & Poor's 500 Index did over the same period. With dividends and capital gains, if any, reinvested, the same $10,000 investment would have grown to $23,180 - a 131.80% increase. If $10,000 was invested in the Goldman Sachs Consumer Industries Index, it would have grown to $17,630 - a 76.30% increase.
Understanding Performance
How a fund did yesterday is no guarantee of how it will do tomorrow. The stock market, for example, has a history of long-term growth and short-term volatility. Unlike the broader market, however, some sectors may not have a history of growth in the long run. And, as with all stock funds, the share price and return of a fund that invests in a sector will vary.
3Annual Report
Performance
There are several ways to evaluate historical performance. You can look at the total percentage change in value, the average annual percentage change or the growth of a hypothetical $10,000 investment. Total return reflects the change in the value of an investment, assuming reinvestment of dividend income and capital gains (the profits earned upon the sale of securities that have grown in value). The initial offering of Class C shares took place on November 3, 1997. Class C shares bear a 1.00% 12b-1 fee. Returns between March 3, 1997 and November 3, 1997 are those of Class B shares and reflect Class B shares' 1.00% 12b-1 fee. Returns prior to March 3, 1997 are those of Class T which bears a 0.50% 12b-1 fee. Had Class C shares' 12b-1 fee been reflected, returns prior to March 3, 1997 would have been lower. Class C shares' contingent deferred sales charge included in the past one year and life of fund total return figures are 1% and 0%, respectively. If Fidelity had not reimbursed certain class expenses, the total returns would have been lower.
Cumulative Total Returns
|
Periods ended July 31, 2000 |
|
Past 1 |
Life of |
|
Fidelity Adv Consumer - CL C |
|
-5.19% |
82.18% |
|
Fidelity Adv Consumer - CL C |
|
-6.12% |
82.18% |
|
S&P 500 |
|
8.98% |
131.80% |
|
GS Consumer Industries |
|
-4.55% |
76.30% |
Cumulative total returns show Class C shares' performance in percentage terms over a set period - in this case, one year or since the fund started
on September 3, 1996. You can compare Class C shares' returns to both the performance of the Standard & Poor's 500 Index - a market
capitalization-weighted index of common stocks
- and the Goldman Sachs Consumer Industries Index - a market capitalization-weighted index of 295 stocks designed to measure the performance of
companies in the consumer industries sector. Issues in the index include providers of consumer services and products, including producers of beverages
- alcoholic and non-alcoholic, food, personal care, household products and tobacco companies. These benchmarks include reinvested dividends
and capital gains, if any, and exclude the effect of sales charges.
Average Annual Total Returns
|
Periods ended July 31, 2000 |
Past 1 |
Life of |
|
Fidelity Adv Consumer - CL C |
-5.19% |
16.58% |
|
Fidelity Adv Consumer - CL C |
-6.12% |
16.58% |
|
S&P 500 |
8.98% |
23.99% |
|
GS Consumer Industries |
-4.55% |
15.61% |
Average annual returns take Class C shares' cumulative return and show you what would have happened if Class C shares had performed at a constant rate each year.
$10,000 Over Life of Fund
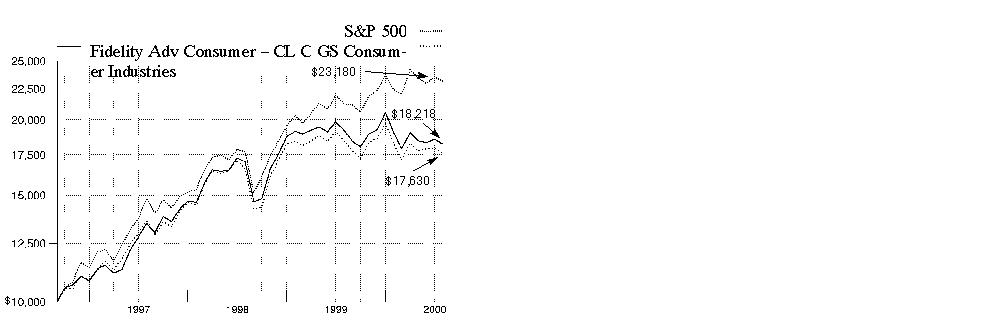
$10,000 Over Life of Fund: Let's say hypothetically that $10,000 was invested in Fidelity Advisor Consumer Industries - Class C on September 3, 1996, when the fund started. As the chart shows, by July 31, 2000, the value of the investment would have grown to $18,218 - an 82.18% increase on the initial investment. For comparison, look at how the Standard & Poor's 500 Index did over the same period. With dividends and capital gains, if any, reinvested, the same $10,000 investment would have grown to $23,180 - a 131.80% increase. If $10,000 was invested in the Goldman Sachs Consumer Industries Index, it would have grown to $17,630 - a 76.30% increase.
Understanding Performance
How a fund did yesterday is no guarantee of how it will do tomorrow. The stock market, for example, has a history of long-term growth and short-term volatility. Unlike the broader market, however, some sectors may not have a history of growth in the long run. And, as with all stock funds, the share price and return of a fund that invests in a sector will vary.
3Annual Report
(Portfolio Manager photograph)
An interview with
John Porter, Portfolio Manager of Fidelity Advisor Consumer Industries Fund
Q. How did the fund perform, John?
A. During the 12-month period that ended July 31, 2000, the fund's Class A, Class T, Class B and Class C shares had returns of -4.48%, -4.69%, -5.19% and -5.19%, respectively. This performance was in line with the performance of the Goldman Sachs Consumer Industries Index - an index of 295 stocks designed to measure the performance of companies in the consumer industries sector - which lost 4.55% during the same 12-month period. The fund lagged the Standard & Poor's 500 Index's return of 8.98% during the same period.
A. During the 12-month period that ended July 31, 2000, the fund's Institutional Class shares returned -4.20. This return was slightly ahead of the performance of the Goldman Sachs Consumer Industries Index-an index of 295 stocks designed to measure the performance of companies in the consumer industries sector -which lost 4.55% during the same 12-month period. The fund lagged the Standard & Poor's 500 Index's return of 8.98% during the same period.
Q. What factors kept the fund in line with the performance of the Goldman Sachs index during the period?
A. I think the main reason the fund's performance generally was in line with or slightly ahead of the index was because there weren't any specific areas to steer the fund toward during the past year that delivered consistent outperformance. I break down the consumer industries sector into three main subsectors: consumer products; media, including entertainment and advertising; and retail. At different points throughout the year, each of those different subsectors performed well, but none of them consistently outperformed the other. As the period progressed, different subsectors would take the spotlight, making it extremely difficult to participate successfully in an overweighted buy-and-hold trend due to the volatility.
Q. Did you make any adjustments to your strategy during the period?
A. During the past three months, I positioned the fund defensively with regard to retail, underweighting that subsector because I believed the economy began to slow. The decline of price-to-earnings multiples of several retail stocks reflected the market's cynicism toward these companies, and we saw some of the retailers, such as Costco, which was sold off entirely during the period, experience growth problems. Meanwhile, the top-tier retailers - such as Wal-Mart and Home Depot - continued to execute very well through the end of the period. Within the retail sector, I marginally added to the fund's positions in supermarkets - such as Safeway - and drug stores - such as Walgreens - to exploit consumers' needs to purchase staple products. At the same time, I began increasing the fund's weighting in consumer products stocks, such as Coca-Cola, Procter & Gamble and Gillette, which are defensive in nature. Additionally, I believed these stocks became attractively valued and could benefit from having a significant multi-national presence should foreign economies improve and currencies strengthen.
Q. How did the fund's investments in other areas of consumer industries influence performance?
A. Our overweighted position in media and advertising stocks throughout the period served us well. The fund's focus on advertising-driven media, such as AMFM and Disney - via its ownership of the ABC network broadcast operation - as well as advertising agencies, remained one of the fund's best growth sectors. Elsewhere, the fund's underweighted position in the soft drink industry, specifically Coca-Cola, made the largest positive contribution to the fund's performance. However, the fund's restaurant positions - including McDonald's, which suffered slower sales and analyst downgrades in May - detracted from performance.
Q. What specific stocks performed well? Which disappointed?
A. Wal-Mart, the fund's largest holding, stood out as the top relative contributor to performance based on solid earnings, steady same-store sales growth and a successful overseas acquisition. Investors reacted favorably to Viacom's acquisition of CBS, as well as the fiscal discipline implemented at its Paramount film unit. On the down side, the fund's overweighting of Procter & Gamble hurt performance after the company pre-announced an earnings shortfall in the first quarter, sparking a sell-off across consumer stocks. Ongoing concerns over product liability suits plagued top-10 holding Philip Morris.
Q. What's your outlook?
A. I don't believe the slowing of the economy is accurately reflected in the prices people are paying for retail and consumer products stocks. Consumer products stocks are beaten down and the market is not rewarding them for the relative stability they can provide. In retail, I don't think the current price multiples reflect how slow things can get in a slowing economy - even for some of the best retailers. Meanwhile, I am very enthusiastic about many of the media-related sectors in which the fund invests. So going forward, I will continue to position the fund defensively to weather an economic slowdown, while keeping an eye on consumer expenditure patterns.
The views expressed in this report reflect those of the portfolio manager only through the end of the period of the report as stated on the cover. The manager's views are subject to change at any time based on market or other conditions. For more information, see page A-3.
Fund Facts
Start date: September 3, 1996
Size: as of July 31, 2000, more than
$30 million
Manager: John Porter, since 1999; joined Fidelity in 1995
3Annual Report
Advisor Consumer Industries Fund
|
Top Ten Stocks as of July 31, 2000 |
|
|
|
% of fund's |
|
Wal-Mart Stores, Inc. |
6.7 |
|
Home Depot, Inc. |
4.9 |
|
The Coca-Cola Co. |
4.8 |
|
Walt Disney Co. |
4.2 |
|
Viacom, Inc. Class B (non-vtg.) |
3.7 |
|
Procter & Gamble Co. |
3.1 |
|
Time Warner, Inc. |
3.0 |
|
Kimberly-Clark Corp. |
2.3 |
|
PepsiCo, Inc. |
2.2 |
|
Philip Morris Companies, Inc. |
2.1 |
|
|
37.0 |
|
Top Industries as of July 31, 2000 |
|
|
% of fund's net assets |
||
 |
Broadcasting |
11.9% |
 |
Household Products |
10.2% |
 |
Entertainment |
10.2% |
 |
General Merchandise Stores |
8.8% |
 |
Beverages |
8.6% |
 |
All Others* |
50.3% |

|
* Includes short-term investments and net other assets. |
Annual Report
Advisor Consumer Industries Fund
Showing Percentage of Net Assets
|
Common Stocks - 91.2% |
|||
|
Shares |
Value (Note 1) |
||
|
ADVERTISING - 1.4% |
|||
|
Omnicom Group, Inc. |
3,850 |
$ 327,250 |
|
|
TMP Worldwide, Inc. (a) |
500 |
36,000 |
|
|
Young & Rubicam, Inc. |
1,100 |
62,150 |
|
|
|
425,400 |
||
|
APPAREL STORES - 2.8% |
|||
|
American Eagle Outfitters, Inc. (a) |
1,100 |
16,363 |
|
|
AnnTaylor Stores Corp. (a) |
1,700 |
48,025 |
|
|
Claire's Stores, Inc. |
1,800 |
30,375 |
|
|
Gap, Inc. |
13,568 |
485,904 |
|
|
Talbots, Inc. |
900 |
45,450 |
|
|
The Limited, Inc. |
7,480 |
152,873 |
|
|
TJX Companies, Inc. |
2,300 |
38,525 |
|
|
Venator Group, Inc. (a) |
2,600 |
36,725 |
|
|
|
854,240 |
||
|
AUTOS, TIRES, & ACCESSORIES - 0.1% |
|||
|
AutoNation, Inc. |
6,400 |
44,400 |
|
|
BEVERAGES - 8.6% |
|||
|
Adolph Coors Co. Class B |
1,400 |
88,200 |
|
|
Anheuser-Busch Companies, Inc. |
6,200 |
499,100 |
|
|
Canandaigua Brands, Inc. Class A (a) |
1,500 |
74,063 |
|
|
Coca-Cola Enterprises, Inc. |
3,600 |
69,075 |
|
|
Panamerican Beverages, Inc. Class A |
1,600 |
29,600 |
|
|
Pepsi Bottling Group, Inc. |
3,300 |
100,856 |
|
|
Seagram Co. Ltd. |
5,200 |
291,528 |
|
|
The Coca-Cola Co. |
23,800 |
1,459,238 |
|
|
|
2,611,660 |
||
|
BROADCASTING - 11.9% |
|||
|
Adelphia Communications Corp. |
750 |
26,438 |
|
|
American Tower Corp. Class A (a) |
2,900 |
124,338 |
|
|
AMFM, Inc. (a) |
6,400 |
457,200 |
|
|
AT&T Corp. - Liberty Media Group |
28,200 |
627,450 |
|
|
Cablevision Systems Corp. Class A (a) |
1,350 |
88,847 |
|
|
Chris-Craft Industries, Inc. |
200 |
13,375 |
|
|
Clear Channel Communications, Inc. (a) |
3,950 |
300,941 |
|
|
Comcast Corp. Class A (special) (a) |
9,700 |
329,952 |
|
|
Cox Communications, Inc. Class A (a) |
3,200 |
118,200 |
|
|
E.W. Scripps Co. Class A |
400 |
19,750 |
|
|
EchoStar Communications Corp. |
2,800 |
110,425 |
|
|
Entercom Communications Corp. |
1,200 |
46,575 |
|
|
Infinity Broadcasting Corp. Class A (a) |
8,300 |
292,575 |
|
|
Time Warner, Inc. |
12,094 |
927,459 |
|
|
UnitedGlobalCom, Inc. Class A (a) |
900 |
44,156 |
|
|
|
|||
|
Shares |
Value (Note 1) |
||
|
Univision Communications, Inc. |
300 |
$ 37,275 |
|
|
USA Networks, Inc. (a) |
3,300 |
69,506 |
|
|
|
3,634,462 |
||
|
CELLULAR - 1.1% |
|||
|
Crown Castle International Corp. (a) |
3,400 |
115,600 |
|
|
Nextel Communications, Inc. Class A (a) |
900 |
50,344 |
|
|
SBA Communications Corp. Class A |
3,200 |
144,400 |
|
|
|
310,344 |
||
|
COMPUTER SERVICES & SOFTWARE - 1.1% |
|||
|
Amazon.com, Inc. (a) |
2,000 |
60,250 |
|
|
America Online, Inc. (a) |
600 |
31,988 |
|
|
Circle.com (a) |
600 |
1,875 |
|
|
CMGI, Inc. (a) |
700 |
26,513 |
|
|
eBay, Inc. (a) |
600 |
30,000 |
|
|
Microsoft Corp. (a) |
2,050 |
143,116 |
|
|
Priceline.com, Inc. (a) |
2,100 |
49,613 |
|
|
|
343,355 |
||
|
COMPUTERS & OFFICE EQUIPMENT - 0.2% |
|||
|
Pitney Bowes, Inc. |
900 |
31,163 |
|
|
Xerox Corp. |
3,100 |
46,113 |
|
|
|
77,276 |
||
|
CONSUMER ELECTRONICS - 0.8% |
|||
|
Black & Decker Corp. |
800 |
29,750 |
|
|
Gemstar-TV Guide International, Inc. (a) |
2,094 |
127,341 |
|
|
General Motors Corp. Class H (a) |
2,900 |
75,038 |
|
|
|
232,129 |
||
|
DRUG STORES - 1.9% |
|||
|
Walgreen Co. |
18,700 |
583,206 |
|
|
ENTERTAINMENT - 10.2% |
|||
|
Carnival Corp. |
6,900 |
128,944 |
|
|
Fox Entertainment Group, Inc. Class A (a) |
4,800 |
147,000 |
|
|
Hollywood Entertainment Corp. (a) |
1,300 |
11,863 |
|
|
Mandalay Resort Group (a) |
3,100 |
75,756 |
|
|
MGM Grand, Inc. |
2,300 |
82,656 |
|
|
Park Place Entertainment Corp. (a) |
2,400 |
30,150 |
|
|
SFX Entertainment, Inc. Class A (a) |
2,150 |
98,900 |
|
|
Viacom, Inc.: |
|
|
|
|
Class A (a) |
1,600 |
106,700 |
|
|
Class B (non-vtg.) (a) |
17,105 |
1,134,275 |
|
|
Walt Disney Co. |
32,900 |
1,272,819 |
|
|
|
3,089,063 |
||
|
Common Stocks - continued |
|||
|
Shares |
Value (Note 1) |
||
|
FOODS - 6.9% |
|||
|
American Italian Pasta Co. Class A (a) |
2,000 |
$ 39,500 |
|
|
Bestfoods |
5,050 |
351,606 |
|
|
Corn Products International, Inc. |
1,789 |
44,725 |
|
|
Dean Foods Co. |
800 |
27,850 |
|
|
Earthgrains Co. |
3,600 |
72,000 |
|
|
H.J. Heinz Co. |
1,800 |
71,888 |
|
|
Hormel Foods Corp. |
1,800 |
29,138 |
|
|
IBP, Inc. |
2,400 |
34,650 |
|
|
Keebler Foods Co. |
3,500 |
154,438 |
|
|
Kellogg Co. |
2,300 |
59,656 |
|
|
Nabisco Group Holdings Corp. |
3,600 |
95,400 |
|
|
Nabisco Holdings Corp. Class A |
1,400 |
74,025 |
|
|
PepsiCo, Inc. |
14,400 |
659,700 |
|
|
Quaker Oats Co. |
3,300 |
221,925 |
|
|
Sysco Corp. |
4,100 |
161,438 |
|
|
|
2,097,939 |
||
|
GENERAL MERCHANDISE STORES - 8.8% |
|||
|
Ames Department Stores, Inc. (a) |
3,100 |
22,088 |
|
|
BJ's Wholesale Club, Inc. (a) |
1,900 |
56,881 |
|
|
Consolidated Stores Corp. (a) |
6,140 |
73,296 |
|
|
Dollar General Corp. |
4,531 |
83,257 |
|
|
Dollar Tree Stores, Inc. (a) |
1,275 |
54,267 |
|
|
JCPenney Co., Inc. |
1,800 |
29,025 |
|
|
Kohls Corp. (a) |
3,900 |
221,325 |
|
|
Neiman Marcus Group, Inc. Class A (a) |
1,400 |
46,200 |
|
|
Target Corp. |
2,000 |
58,000 |
|
|
Wal-Mart Stores, Inc. |
37,100 |
2,038,164 |
|
|
|
2,682,503 |
||
|
GROCERY STORES - 3.1% |
|||
|
Albertson's, Inc. |
2,521 |
76,103 |
|
|
Hain Celestial Group, Inc. (a) |
7,369 |
196,200 |
|
|
Kroger Co. (a) |
10,400 |
215,150 |
|
|
Safeway, Inc. (a) |
8,850 |
398,803 |
|
|
Whole Foods Market, Inc. (a) |
800 |
35,750 |
|
|
Winn-Dixie Stores, Inc. |
600 |
8,588 |
|
|
|
930,594 |
||
|
HOME FURNISHINGS - 0.2% |
|||
|
Linens'n Things, Inc. (a) |
2,500 |
74,844 |
|
|
HOUSEHOLD PRODUCTS - 10.2% |
|||
|
Avon Products, Inc. |
15,250 |
605,234 |
|
|
Clorox Co. |
8,498 |
351,074 |
|
|
Colgate-Palmolive Co. |
6,900 |
384,244 |
|
|
Estee Lauder Companies, Inc. Class A |
7,030 |
309,320 |
|
|
Gillette Co. |
17,000 |
496,188 |
|
|
|
|||
|
Shares |
Value (Note 1) |
||
|
Procter & Gamble Co. |
16,685 |
$ 948,959 |
|
|
Yankee Candle Co., Inc. |
700 |
14,613 |
|
|
|
3,109,632 |
||
|
LEISURE DURABLES & TOYS - 1.0% |
|||
|
Brunswick Corp. |
900 |
16,931 |
|
|
Callaway Golf Co. |
3,100 |
38,944 |
|
|
Harley-Davidson, Inc. |
5,300 |
237,838 |
|
|
|
293,713 |
||
|
LODGING & GAMING - 0.4% |
|||
|
International Game Technology (a) |
1,200 |
35,625 |
|
|
Prime Hospitality Corp. (a) |
2,100 |
19,950 |
|
|
Starwood Hotels & Resorts Worldwide, Inc. unit |
1,600 |
54,600 |
|
|
|
110,175 |
||
|
PACKAGING & CONTAINERS - 0.2% |
|||
|
Tupperware Corp. |
2,700 |
52,481 |
|
|
PAPER & FOREST PRODUCTS - 2.3% |
|||
|
Kimberly-Clark Corp. |
12,300 |
706,481 |
|
|
PHOTOGRAPHIC EQUIPMENT - 0.4% |
|||
|
Eastman Kodak Co. |
2,000 |
109,750 |
|
|
PRINTING - 0.3% |
|||
|
R.R. Donnelley & Sons Co. |
2,400 |
53,400 |
|
|
Valassis Communications, Inc. (a) |
800 |
26,900 |
|
|
|
80,300 |
||
|
PUBLISHING - 2.8% |
|||
|
Dow Jones & Co., Inc. |
500 |
32,969 |
|
|
Gannett Co., Inc. |
1,100 |
59,263 |
|
|
Harcourt General, Inc. |
1,150 |
63,466 |
|
|
Harte Hanks Communications, Inc. |
1,900 |
48,094 |
|
|
Houghton Mifflin Co. |
700 |
33,163 |
|
|
Knight-Ridder, Inc. |
700 |
36,488 |
|
|
McGraw-Hill Companies, Inc. |
3,700 |
219,919 |
|
|
Meredith Corp. |
2,000 |
63,625 |
|
|
Playboy Enterprises, Inc. Class B (non-vtg.) (a) |
2,700 |
32,569 |
|
|
Reader's Digest Association, Inc. Class A (non-vtg.) |
2,200 |
83,188 |
|
|
The New York Times Co. Class A |
2,600 |
107,088 |
|
|
Tribune Co. |
2,400 |
78,000 |
|
|
|
857,832 |
||
|
REAL ESTATE INVESTMENT TRUSTS - 0.6% |
|||
|
Pinnacle Holdings, Inc. (a) |
3,200 |
179,800 |
|
|
RESTAURANTS - 2.2% |
|||
|
Brinker International, Inc. (a) |
1,500 |
42,844 |
|
|
Common Stocks - continued |
|||
|
Shares |
Value (Note 1) |
||
|
RESTAURANTS - CONTINUED |
|||
|
CEC Entertainment, Inc. (a) |
1,350 |
$ 37,631 |
|
|
Darden Restaurants, Inc. |
1,900 |
30,994 |
|
|
Jack in the Box, Inc. (a) |
2,700 |
57,881 |
|
|
McDonald's Corp. |
9,800 |
308,700 |
|
|
Outback Steakhouse, Inc. (a) |
4,150 |
95,191 |
|
|
Papa John's International, Inc. (a) |
600 |
14,288 |
|
|
Starbucks Corp. (a) |
800 |
30,000 |
|
|
Wendy's International, Inc. |
2,500 |
42,344 |
|
|
|
659,873 |
||
|
RETAIL & WHOLESALE, MISCELLANEOUS - 6.6% |
|||
|
Alberto-Culver Co. Class A |
2,800 |
71,050 |
|
|
Bed Bath & Beyond, Inc. (a) |
3,200 |
117,800 |
|
|
Best Buy Co., Inc. (a) |
900 |
65,475 |
|
|
Circuit City Stores, Inc. - |
800 |
18,350 |
|
|
Home Depot, Inc. |
28,600 |
1,480,050 |
|
|
Lowe's Companies, Inc. |
1,400 |
59,063 |
|
|
Office Depot, Inc. (a) |
2,300 |
14,375 |
|
|
Pier 1 Imports, Inc. |
2,900 |
34,619 |
|
|
Staples, Inc. (a) |
7,450 |
102,903 |
|
|
Tiffany & Co., Inc. |
400 |
13,700 |
|
|
Williams-Sonoma, Inc. (a) |
800 |
31,000 |
|
|
Zale Corp. (a) |
400 |
14,950 |
|
|
|
2,023,335 |
||
|
SERVICES - 1.8% |
|||
|
ACNielsen Corp. (a) |
1,800 |
44,100 |
|
|
Cendant Corp. (a) |
5,700 |
73,031 |
|
|
Macrovision Corp. (a) |
400 |
30,200 |
|
|
Manpower, Inc. |
2,400 |
92,850 |
|
|
Modis Professional Services, Inc. (a) |
300 |
2,288 |
|
|
Robert Half International, Inc. (a) |
1,000 |
34,375 |
|
|
True North Communications |
3,500 |
170,844 |
|
|
Viad Corp. |
3,700 |
96,431 |
|
|
|
544,119 |
||
|
TELEPHONE SERVICES - 0.3% |
|||
|
AT&T Corp. |
3,336 |
103,208 |
|
|
TEXTILES & APPAREL - 0.7% |
|||
|
Liz Claiborne, Inc. |
1,200 |
46,800 |
|
|
Mohawk Industries, Inc. (a) |
800 |
21,350 |
|
|
NIKE, Inc. Class B |
3,000 |
131,250 |
|
|
Pacific Sunwear of California, Inc. (a) |
500 |
7,563 |
|
|
|
206,963 |
||
|
|
|||
|
Shares |
Value (Note 1) |
||
|
TOBACCO - 2.3% |
|||
|
Philip Morris Companies, Inc. |
25,200 |
$ 636,300 |
|
|
RJ Reynolds Tobacco Holdings, Inc. |
2,800 |
79,450 |
|
|
|
715,750 |
||
|
TOTAL COMMON STOCKS (Cost $22,860,481) |
27,744,827 |
||
|
Cash Equivalents - 8.4% |
|||
|
|
|
|
|
|
Fidelity Cash Central Fund, 6.57% (b) |
2,115,133 |
2,115,133 |
|
|
Fidelity Securities Lending Cash Central Fund, 6.65% (b) |
434,060 |
434,060 |
|
|
TOTAL CASH EQUIVALENTS (Cost $2,549,193) |
2,549,193 |
||
|
TOTAL INVESTMENT PORTFOLIO - 99.6% (Cost $25,409,674) |
30,294,020 |
||
|
NET OTHER ASSETS - 0.4% |
108,159 |
||
|
NET ASSETS - 100% |
$ 30,402,179 |
||
|
Legend |
|
(a) Non-income producing |
|
(b) The rate quoted is the annualized seven-day yield of the fund at |
|
Income Tax Information |
|
At July 31, 2000, the aggregate cost of investment securities for income |
|
The fund hereby designates approximately $653,000 as a capital gain dividend for the purpose of the dividend paid deduction. |
|
At July 31, 2000, the fund had a capital loss carryforward of approximately $435,000 all of which will expire on July 31, 2008. |
|
The fund intends to elect to defer to its fiscal year ending July 31, 2001 approximately $204,000 of losses recognized during the period |
See accompanying notes which are an integral part of the financial statements.
Consumer Industries
Statement of Assets and Liabilities
|
|
July 31, 2000 |
|
|
Assets |
|
|
|
Investment in securities, at value |
|
$ 30,294,020 |
|
Cash |
|
1,316 |
|
Receivable for investments sold |
|
927,688 |
|
Receivable for fund shares sold |
|
6,528 |
|
Dividends receivable |
|
15,678 |
|
Interest receivable |
|
11,835 |
|
Other receivables |
|
219 |
|
Total assets |
|
31,257,284 |
|
Liabilities |
|
|
|
Payable for investments purchased |
$ 311,873 |
|
|
Payable for fund shares redeemed |
48,326 |
|
|
Accrued management fee |
10,644 |
|
|
Distribution fees payable |
17,008 |
|
|
Other payables and accrued expenses |
33,194 |
|
|
Collateral on securities loaned, |
434,060 |
|
|
Total liabilities |
|
855,105 |
|
Net Assets |
|
$ 30,402,179 |
|
Net Assets consist of: |
|
|
|
Paid in capital |
|
$ 26,500,308 |
|
Accumulated undistributed net realized gain (loss) on investments and foreign currency transactions |
|
(982,312) |
|
Net unrealized appreciation (depreciation) on investments |
|
4,884,183 |
|
Net Assets |
|
$ 30,402,179 |
|
Calculation of Maximum |
|
$15.04 |
|
Maximum offering price per share |
|
$15.96 |
|
Class T: |
|
$14.93 |
|
Maximum offering price per share |
|
$15.47 |
|
Class B: |
|
$14.69 |
|
Class C: |
|
$14.71 |
|
Institutional Class: |
|
$15.18 |
A Redemption price per share is equal to net asset value less any applicable contingent deferred sales charge.
Statement of Operations
|
|
Year ended July 31, 2000 |
|
|
Investment Income Dividends |
|
$ 314,716 |
|
Interest |
|
128,878 |
|
Security lending |
|
1,659 |
|
Total income |
|
445,253 |
|
Expenses |
|
|
|
Management fee |
$ 205,909 |
|
|
Transfer agent fees |
116,996 |
|
|
Distribution fees |
211,231 |
|
|
Accounting and security lending fees |
60,358 |
|
|
Non-interested trustees' compensation |
108 |
|
|
Custodian fees and expenses |
7,791 |
|
|
Registration fees |
71,659 |
|
|
Audit |
23,105 |
|
|
Legal |
315 |
|
|
Miscellaneous |
2,493 |
|
|
Total expenses before reductions |
699,965 |
|
|
Expense reductions |
(46,778) |
653,187 |
|
Net investment income (loss) |
|
(207,934) |
|
Realized and Unrealized Gain (Loss) Net realized gain (loss) on: |
|
|
|
Investment securities |
(840,883) |
|
|
Foreign currency transactions |
(508) |
(841,391) |
|
Change in net unrealized appreciation (depreciation) on: |
|
|
|
Investment securities |
(865,491) |
|
|
Assets and liabilities in |
(167) |
(865,658) |
|
Net gain (loss) |
|
(1,707,049) |
|
Net increase (decrease) in net assets resulting from operations |
|
$ (1,914,983) |
See accompanying notes which are an integral part of the financial statements.
Annual Report
Advisor Consumer Industries Fund
Financial Statements - continued
Statement of Changes in Net Assets
|
Increase (Decrease) in Net Assets |
Year ended |
Year ended |
|
Operations |
$ (207,934) |
$ (162,801) |
|
Net realized gain (loss) |
(841,391) |
807,597 |
|
Change in net unrealized appreciation (depreciation) |
(865,658) |
3,190,674 |
|
Net increase (decrease) in net assets resulting from operations |
(1,914,983) |
3,835,470 |
|
Distributions to shareholders |
|
|
|
From net realized gain |
(498,458) |
(1,579,052) |
|
In excess of net realized gain |
(154,415) |
- |
|
Total distributions |
(652,873) |
(1,579,052) |
|
Share transactions - net increase (decrease) |
(10,822,065) |
13,658,707 |
|
Redemption fees |
29,843 |
14,605 |
|
Total increase (decrease) in net assets |
(13,360,078) |
15,929,730 |
|
Net Assets |
|
|
|
Beginning of period |
43,762,257 |
27,832,527 |
|
End of period |
$ 30,402,179 |
$ 43,762,257 |
Financial Highlights - Class A
|
Years ended July 31, |
2000 |
1999 |
1998 |
1997 E |
|
Selected Per-Share Data |
|
|
|
|
|
Net asset value, beginning of period |
$ 16.01 |
$ 15.08 |
$ 13.48 |
$ 10.00 |
|
Income from Investment Operations |
|
|
|
|
|
Net investment income (loss) D |
(.04) |
(.03) |
(.06) |
(.05) |
|
Net realized and unrealized gain (loss) |
(.68) |
1.80 |
3.31 |
3.60 |
|
Total from investment operations |
(.72) |
1.77 |
3.25 |
3.55 |
|
Less Distributions |
|
|
|
|
|
From net realized gain |
(.20) |
(.85) |
(1.68) |
(.07) |
|
In excess of net realized gain |
(.06) |
- |
- |
- |
|
Total distributions |
(.26) |
(.85) |
(1.68) |
(.07) |
|
Redemption fees added to paid in capital |
.01 |
.01 |
.03 |
- |
|
Net asset value, end of period |
$ 15.04 |
$ 16.01 |
$ 15.08 |
$ 13.48 |
|
Total Return B, C |
(4.48)% |
13.49% |
27.48% |
35.68% |
|
Ratios and Supplemental Data |
|
|
|
|
|
Net assets, end of period (000 omitted) |
$ 3,609 |
$ 3,504 |
$ 2,220 |
$ 944 |
|
Ratio of expenses to average net assets |
1.50% F |
1.55% F |
1.75% F |
1.75% A, F |
|
Ratio of expenses to average net assets after expense reductions |
1.49% G |
1.54% G |
1.73% G |
1.73% A, G |
|
Ratio of net investment income (loss) to average net assets |
(.24)% |
(.19)% |
(.47)% |
(.50)% A |
|
Portfolio turnover |
69% |
80% |
144% |
203% A |
|
A Annualized B The total returns would have been lower had certain expenses not been reduced during the periods shown. C Total returns do not include the one time sales charge and for periods of less than one year are not annualized. D Net investment income (loss) per share has been calculated based on average shares outstanding during the period. E For the period September 3, 1996 (commencement of sale of Class A shares) to July 31, 1997. F FMR agreed to reimburse a portion of the class' expenses during the period. Without this reimbursement, the class' expense ratio would have been higher. G FMR or the fund has entered into varying arrangements with third parties who either paid or reduced a portion of the class' expenses. |
||||
See accompanying notes which are an integral part of the financial statements.
Consumer Industries
Financial Highlights - Class T
|
Years ended July 31, |
2000 |
1999 |
1998 |
1997 E |
|
Net asset value, beginning of period |
$ 15.93 |
$ 15.00 |
$ 13.45 |
$ 10.00 |
|
Income from Investment Operations |
|
|
|
|
|
Net investment income (loss) D |
(.08) |
(.06) |
(.10) |
(.09) |
|
Net realized and unrealized gain (loss) |
(.67) |
1.79 |
3.28 |
3.60 |
|
Total from investment operations |
(.75) |
1.73 |
3.18 |
3.51 |
|
Less Distributions |
|
|
|
|
|
From net realized gain |
(.20) |
(.81) |
(1.66) |
(.06) |
|
In excess of net realized gain |
(.06) |
- |
- |
- |
|
Total distributions |
(.26) |
(.81) |
(1.66) |
(.06) |
|
Redemption fees added to paid in capital |
.01 |
.01 |
.03 |
- |
|
Net asset value, end of period |
$ 14.93 |
$ 15.93 |
$ 15.00 |
$ 13.45 |
|
Total Return B, C |
(4.69)% |
13.20% |
26.93% |
35.25% |
|
Ratios and Supplemental Data |
|
|
|
|
|
Net assets, end of period (000 omitted) |
$ 13,275 |
$ 21,714 |
$ 13,989 |
$ 7,314 |
|
Ratio of expenses to average net assets |
1.75% F |
1.79% F |
2.00% F |
2.00% A, F |
|
Ratio of expenses to average net assets after expense reductions |
1.73% G |
1.77% G |
1.98% G |
1.97% A, G |
|
Ratio of net investment income (loss) to average net assets |
(.49)% |
(.42)% |
(.71)% |
(.83)% A |
|
Portfolio turnover |
69% |
80% |
144% |
203% A |
|
A Annualized B The total returns would have been lower had certain expenses not been reduced during the periods shown. C Total returns do not include the one time sales charge and for periods of less than one year are not annualized. D Net investment income (loss) per share has been calculated based on average shares outstanding during the period. E For the period September 3, 1996 (commencement of sale of Class T shares) to July 31, 1997. F FMR agreed to reimburse a portion of the class' expenses during the period. Without this reimbursement, the class' expense ratio would have been higher. G FMR or the fund has entered into varying arrangements with third parties who either paid or reduced a portion of the class' expenses. |
||||
Financial Highlights - Class B
|
Years ended July 31, |
2000 |
1999 |
1998 |
1997 E |
|
Net asset value, beginning of period |
$ 15.76 |
$ 14.91 |
$ 13.42 |
$ 11.46 |
|
Income from Investment Operations |
|
|
|
|
|
Net investment income (loss) D |
(.15) |
(.14) |
(.17) |
(.08) |
|
Net realized and unrealized gain (loss) |
(.67) |
1.79 |
3.26 |
2.04 |
|
Total from investment operations |
(.82) |
1.65 |
3.09 |
1.96 |
|
Less Distributions |
|
|
|
|
|
From net realized gain |
(.20) |
(.81) |
(1.64) |
- |
|
In excess of net realized gain |
(.06) |
- |
- |
- |
|
Total distributions |
(.26) |
(.81) |
(1.64) |
- |
|
Redemption fees added to paid in capital |
.01 |
.01 |
.04 |
- |
|
Net asset value, end of period |
$ 14.69 |
$ 15.76 |
$ 14.91 |
$ 13.42 |
|
Total Return B, C |
(5.19)% |
12.71% |
26.30% |
17.10% |
|
Ratios and Supplemental Data |
|
|
|
|
|
Net assets, end of period (000 omitted) |
$ 9,021 |
$ 9,832 |
$ 5,419 |
$ 596 |
|
Ratio of expenses to average net assets |
2.25% F |
2.31% F |
2.50% F |
2.50% A, F |
|
Ratio of expenses to average net assets after expense reductions |
2.24% G |
2.30% G |
2.48% G |
2.46% A, G |
|
Ratio of net investment income (loss) to average net assets |
(.99)% |
(.95)% |
(1.23)% |
(1.60)% A |
|
Portfolio turnover |
69% |
80% |
144% |
203% A |
|
A Annualized B The total returns would have been lower had certain expenses not been reduced during the periods shown. C Total returns do not include the contingent deferred sales charge and for periods of less than one year are not annualized. D Net investment income (loss) per share has been calculated based on average shares outstanding during the period. E For the period March 3, 1997 (commencement of sale of Class B shares) to July 31, 1997. F FMR agreed to reimburse a portion of the class' expenses during the period. Without this reimbursement, the class' expense ratio would have been higher. G FMR or the fund has entered into varying arrangements with third parties who either paid or reduced a portion of the class' expenses. |
||||
See accompanying notes which are an integral part of the financial statements.
Annual Report
Financial Highlights - Class C
|
Years ended July 31, |
2000 |
1999 |
1998 E |
|
Net asset value, beginning of period |
$ 15.78 |
$ 14.95 |
$ 12.66 |
|
Income from Investment Operations |
|
|
|
|
Net investment income (loss) D |
(.15) |
(.15) |
(.13) |
|
Net realized and unrealized gain (loss) |
(.67) |
1.80 |
2.87 |
|
Total from investment operations |
(.82) |
1.65 |
2.74 |
|
Less Distributions |
|
|
|
|
From net realized gain |
(.20) |
(.83) |
(.49) |
|
In excess of net realized gain |
(.06) |
- |
- |
|
Total distributions |
(.26) |
(.83) |
(.49) |
|
Redemption fees added to paid in capital |
.01 |
.01 |
.04 |
|
Net asset value, end of period |
$ 14.71 |
$ 15.78 |
$ 14.95 |
|
Total Return B, C |
(5.19)% |
12.72% |
22.67% |
|
Ratios and Supplemental Data |
|
|
|
|
Net assets, end of period (000 omitted) |
$ 3,048 |
$ 2,758 |
$ 1,461 |
|
Ratio of expenses to average net assets |
2.25% F |
2.32% F |
2.50% A, F |
|
Ratio of expenses to average net assets after expense reductions |
2.24% G |
2.30% G |
2.48% A, G |
|
Ratio of net investment income (loss) to average net assets |
(.99)% |
(.95)% |
(1.27)% A |
|
Portfolio turnover |
69% |
80% |
144% |
|
A Annualized B The total returns would have been lower had certain expenses not been reduced during the periods shown. C Total returns do not include the contingent deferred sales charge and for periods of less than one year are not annualized. D Net investment income (loss) per share has been calculated based on average shares outstanding during the period. E For the period November 3, 1997 (commencement of sale of Class C shares) to July 31, 1998. F FMR agreed to reimburse a portion of the class' expenses during the period. Without this reimbursement, the class' expense ratio would have been higher. G FMR or the fund has entered into varying arrangements with third parties who either paid or reduced a portion of the class' expenses. |
|||
Financial Highlights - Institutional Class
|
Years ended July 31, |
2000 |
1999 |
1998 |
1997 E |
|
Net asset value, beginning of period |
$ 16.11 |
$ 15.12 |
$ 13.51 |
$ 10.00 |
|
Income from Investment Operations |
|
|
|
|
|
Net investment income (loss) D |
(.00) |
.02 |
(.03) |
(.01) |
|
Net realized and unrealized gain (loss) |
(.69) |
1.81 |
3.31 |
3.59 |
|
Total from investment operations |
(.69) |
1.83 |
3.28 |
3.58 |
|
Less Distributions |
|
|
|
|
|
From net realized gain |
(.20) |
(.85) |
(1.70) |
(.07) |
|
In excess of net realized gain |
(.06) |
- |
- |
- |
|
Total distributions |
(.26) |
(.85) |
(1.70) |
(.07) |
|
Redemption fees added to paid in capital |
.02 |
.01 |
.03 |
- |
|
Net asset value, end of period |
$ 15.18 |
$ 16.11 |
$ 15.12 |
$ 13.51 |
|
Total Return B, C |
(4.20)% |
13.87% |
27.70% |
35.98% |
|
Ratios and Supplemental Data |
|
|
|
|
|
Net assets, end of period (000 omitted) |
$ 1,449 |
$ 5,954 |
$ 4,745 |
$ 1,333 |
|
Ratio of expenses to average net assets |
1.25% F |
1.26% F |
1.50% F |
1.50% A, F |
|
Ratio of expenses to average net assets after expense reductions |
1.24% G |
1.24% G |
1.48% G |
1.48% A, G |
|
Ratio of net investment income (loss) to average net assets |
.01% |
.11% |
(.20)% |
(.13)% A |
|
Portfolio turnover |
69% |
80% |
144% |
203% A |
|
A Annualized B The total returns would have been lower had certain expenses not been reduced during the periods shown. C Total returns for periods of less than one year are not annualized. D Net investment income (loss) per share has been calculated based on average shares outstanding during the period. E For the period September 3, 1996 (commencement of sale of Institutional Class shares) to July 31, 1997. F FMR agreed to reimburse a portion of the class' expenses during the period. Without this reimbursement, the class' expense ratio would have been higher. G FMR or the fund has entered into varying arrangements with third parties who either paid or reduced a portion of the class' expenses. |
||||
See accompanying notes which are an integral part of the financial statements.
Consumer Industries
For the period ended July 31, 2000
1. Significant Accounting Policies.
Fidelity Advisor Consumer Industries Fund (the fund) is a fund of Fidelity Advisor Series VII (the trust) and is authorized to issue an unlimited number of shares. The trust is registered under the Investment Company Act of 1940, as amended (the 1940 Act), as an open-end management investment company organized as a Massachusetts business trust.
The fund offers Class A, Class T, Class B, Class C, and Institutional Class shares, each of which has equal rights as to assets and voting privileges. Each class has exclusive voting rights with respect to matters that affect that class. Class B shares will automatically convert to Class A shares after a holding period of seven years from the initial date of purchase. Investment income, realized and unrealized capital gains and losses, the common expenses of the fund, and certain fund-level expense reductions, if any, are allocated on a pro rata basis to each class based on the relative net assets of each class to the total net assets of the fund. Each class of shares differs in its respective distribution, transfer agent, and certain other class-specific fees, expenses, and expense reductions.
The financial statements have been prepared in conformity with generally accepted accounting principles which require management to make certain estimates and assumptions at the date of the financial statements. The following summarizes the significant accounting policies of the fund:
Security Valuation. Securities for which exchange quotations are readily available are valued at the last sale price, or if no sale price, at the closing bid price. Foreign securities are valued based on quotations from the principal market in which such securities are normally traded. If trading or events occurring in other markets after the close of the principal market in which foreign securities are traded, and before the close of the business of the fund, are expected to materially affect the value of those securities, then they are valued at their fair value taking this trading or these events into account. Fair value is determined in good faith under consistently applied procedures under the general supervision of the Board of Trustees. Securities for which exchange quotations are not readily available (and in certain cases debt securities which trade on an exchange) are valued primarily using dealer-supplied valuations or at their fair value. Short-term securities with remaining maturities of sixty days or less for which quotations are not readily available are valued at amortized cost or original cost plus accrued interest, both of which approximate current value.
Foreign Currency Translation. The accounting records of the fund are maintained in U.S. dollars. Investment securities and other assets and liabilities denominated in a foreign currency are translated into U.S. dollars at the prevailing rates of exchange at period end. Purchases and sales of securities, income receipts and expense payments are translated into U.S. dollars at the prevailing exchange rate on the respective dates of the transactions.
Net realized gains and losses on foreign currency transactions represent net gains and losses from sales and maturities of foreign currency contracts, disposition of foreign currencies, the difference between the amount of net investment income accrued and the U.S. dollar amount actually received, and gains and losses between trade and settlement date on purchases and sales of securities. The effects of changes in foreign currency exchange rates on investments in securities are included with the net realized and unrealized gain or loss on investment securities.
Income Taxes. As a qualified regulated investment company under Subchapter M of the Internal Revenue Code, the fund is not subject to income taxes to the extent that it distributes substantially all of its taxable income for its fiscal year. The schedule of investments includes information regarding income taxes under the caption "Income Tax Information."
Investment Income. Dividend income is recorded on the ex-dividend date, except certain dividends from foreign securities where the ex-dividend date may have passed, are recorded as soon as the fund is informed of the ex-dividend date. Non-cash dividends included in dividend income, if any, are recorded at the fair market value of the securities received. Interest income is accrued as earned. Investment income is recorded net of foreign taxes withheld where recovery of such taxes is uncertain.
Expenses. Most expenses of the trust can be directly attributed to a fund. Expenses which cannot be directly attributed are apportioned among the funds in the trust.
Distributions to Shareholders. Distributions are recorded on the ex-dividend date. Income dividends and capital gain distributions are declared separately for each class.
Income and capital gain distributions are determined in accordance with income tax regulations which may differ from generally accepted accounting principles. These differences, which may result in distribution reclassifications, are primarily due to differing treatments for foreign currency transactions, net operating losses and losses deferred due to wash sales and excise tax regulations.
Permanent book and tax basis differences relating to shareholder distributions will result in reclassifications to paid in capital. Accumulated undistributed net realized gain (loss) on investments and foreign currency transactions may include temporary book and tax basis differences which will reverse in a subsequent period. Any taxable income or gain remaining at fiscal year end is distributed in the following year.
Annual Report
Notes to Financial Statements - continued
1. Significant Accounting
Policies - continued
Short-Term Trading (Redemption) Fees. Shares held in the fund less than 60 days are subject to a short-term trading fee equal to 1% of the proceeds of the redeemed shares. The fee, which is retained by the fund, is accounted for as an addition to paid in capital.
Security Transactions. Security transactions are accounted for as of trade date. Gains and losses on securities sold are determined on the basis of identified cost.
2. Operating Policies.
Foreign Currency Contracts. The fund generally uses foreign currency contracts to facilitate transactions in foreign-denominated securities. Losses may arise from changes in the value of the foreign currency or if the counterparties do not perform under the contracts' terms. The U.S. dollar value of foreign currency contracts is determined using contractual currency exchange rates established at the time of each trade.
Joint Trading Account. Pursuant to an Exemptive Order issued by the Securities and Exchange Commission (the SEC), the fund, along with other affiliated entities of Fidelity Management & Research Company (FMR), may transfer uninvested cash balances into one or more joint trading accounts. These balances are invested in one or more repurchase agreements for U.S. Treasury or Federal Agency obligations.
Repurchase Agreements. The underlying U.S. Treasury, Federal Agency, or other obligations found to be satisfactory by FMR are transferred to an account of the fund, or to the Joint Trading Account, at a custodian bank. The securities are marked-to-market daily and maintained at a value at least equal to the principal amount of the repurchase agreement (including accrued interest). FMR, the fund's investment adviser, is responsible for determining that the value of the underlying securities remains in accordance with the market value requirements stated above.
Cash Central Funds. Pursuant to an Exemptive Order issued by the SEC, the fund may invest in the Fidelity Cash Central Fund and the Fidelity Securities Lending Cash Central Fund (the Cash Funds) managed by Fidelity Investments Money Management, Inc., an affiliate of FMR. The Cash Funds are open-end money market funds available only to investment companies and other accounts managed by FMR and its affiliates. The Cash Funds seek preservation of capital, liquidity, and current income. Income distributions from the Cash Funds are declared daily and paid monthly from net interest income. Income distributions earned by the fund are recorded as either interest income or security lending income in the accompanying financial statements.
3. Purchases and Sales of Investments.
Purchases and sales of securities, other than short-term securities, aggregated $23,151,520 and $34,476,273, respectively.
4. Fees and Other Transactions with Affiliates.
Management Fee. As the fund's investment adviser, FMR receives a monthly fee that is calculated on the basis of a group fee rate plus a fixed individual fund fee rate applied to the average net assets of the fund. The group fee rate is the weighted average of a series of rates and is based on the monthly average net assets of all the mutual funds advised by FMR. The rates ranged from .2167% to .5200% for the period. The annual individual fund fee rate is .30%. In the event that these rates were lower than the contractual rates in effect during the period, FMR voluntarily implemented the above rates, as they resulted in the same or a lower management fee. For the period, the management fee was equivalent to an annual rate of .58% of average net assets.
Distribution and Service Plan. In accordance with Rule 12b-1 of the 1940 Act, the Board of Trustees have adopted separate Distribution and Service Plans with respect to each class of shares (collectively referred to as "the Plans"). Under certain of the Plans, the class pays Fidelity Distributors Corporation (FDC), an affiliate of FMR, a 12b-1 fee. A portion of this fee may be reallowed to securities dealers, banks and other financial institutions for the distribution of each class of shares and providing shareholder support services. For the period, this fee was based on the following annual rates of the average net assets of each applicable class:
|
Class A |
.25% |
|
Class T |
.50% |
|
Class B |
1.00%* |
|
Class C |
1.00%* |
* .75% represents a distribution fee and .25% represents a shareholder service fee.
For the period, each class paid FDC the following amounts, a portion of which was retained by FDC:
|
|
Paid to |
Retained |
|
Class A |
$ 8,524 |
$ 43 |
|
Class T |
79,553 |
381 |
|
Class B |
95,080 |
71,361 |
|
Class C |
28,074 |
14,469 |
|
|
$ 211,231 |
$ 86,254 |
Sales Load. FDC receives a front-end sales charge of up to 5.75% for selling Class A shares, and 3.50% for selling Class T shares of the fund. FDC receives the proceeds of contingent deferred sales charges levied on Class B share redemptions occurring within six years of purchase and Class C share redemptions occurring within one year of purchase. Contingent deferred sales charges are based on declining rates ranging from 5% to 1% for Class B and 1% for Class C, of the lesser of
Consumer Industries
Notes to Financial Statements - continued
4. Fees and Other Transactions with Affiliates - continued
Sales Load - continued
the cost of shares at the initial date of purchase or the net asset value of the redeemed shares, excluding any reinvested dividends and capital gains. In addition, purchases of Class A and Class T shares that were subject to a finder's fee bear a contingent deferred sales charge on assets that do not remain in the fund for at least one year. The Class A and Class T contingent deferred sales charge is based on 0.25% of the lesser of the cost of shares at the initial date of purchase or the net asset value of the redeemed shares, excluding any reinvested dividends and capital gains. A portion of the sales charges paid to FDC is paid to securities dealers, banks and other financial institutions.
For the period, sales charge amounts paid to and retained by FDC were as follows:
|
|
Paid to |
Retained |
|
Class A |
$ 23,206 |
$ 9,974 |
|
Class T |
25,497 |
8,661 |
|
Class B |
48,560 |
48,560* |
|
Class C |
3,389 |
3,389* |
|
|
$ 100,652 |
$ 70,584 |
* When Class B and Class C shares are initially sold, FDC pays commissions from its own resources to securities dealers,
banks, and other financial institutions through which the sales are made.
Transfer Agent Fees. Fidelity Investments Institutional Operations Company, Inc., (FIIOC), an affiliate of FMR, is the transfer, dividend disbursing and shareholder servicing agent (collectively referred to as the transfer agent) for each class of the fund. FIIOC receives account fees and asset-based fees that vary according to the account size and type of account of the shareholders of the respective classes of the fund. FIIOC pays for typesetting, printing and mailing of all shareholder reports, except proxy statements. For the period, the following amounts were paid to FIIOC:
|
|
Amount |
% of |
|
Class A |
$ 11,164 |
.33 |
|
Class T |
49,516 |
.31 |
|
Class B |
34,766 |
.37 |
|
Class C |
10,709 |
.38 |
|
Institutional Class |
10,841 |
.27 |
|
|
$ 116,996 |
|
Accounting and Security Lending Fees. Fidelity Service Company, Inc., an affiliate of FMR, maintains the fund's accounting records and administers the security lending program. The security lending fee is based on the number and duration of lending transactions. The accounting fee is based on the level of average net assets for the month plus out-of-pocket expenses.
Brokerage Commissions. The fund placed a portion of its portfolio transactions with brokerage firms which are affiliates of FMR. The commissions paid to these affiliated firms were $4,422 for the period.
5. Security Lending.
The fund lends portfolio securities from time to time in order to earn additional income. The fund receives collateral in the form of U.S. Treasury obligations, letters of credit, and/or cash against the loaned securities, and maintains collateral in an amount not less than 100% of the market value of the loaned securities during the period of the loan. The market value of the loaned securities is determined at the close of business of the fund and any additional required collateral is delivered to the fund on the next business day. If the borrower defaults on its obligation to return the securities loaned because of insolvency or other reasons, the fund could experience delays and costs in recovering the securities loaned or in gaining access to the collateral. At period end, the value of the securities loaned amounted to $423,220. The fund received cash collateral of $434,060 which was invested in cash equivalents.
6. Expense Reductions.
FMR voluntarily agreed to reimburse operating expenses (excluding interest, taxes, certain securities lending fees, brokerage commissions and extraordinary expenses, if any) above the following annual rates or range of annual rates of average net assets for each of the following classes:
|
|
FMR |
Reimbursement |
|
Class A |
1.50% |
$ 4,076 |
|
Class T |
1.75% |
16,304 |
|
Class B |
2.25% |
14,995 |
|
Class C |
2.25% |
4,890 |
|
Institutional Class |
1.25% |
2,353 |
|
|
|
$ 42,618 |
FMR has also directed certain portfolio trades to brokers who paid a portion of the fund's expenses. For the period, the fund's expenses were reduced by $3,133 under this arrangement.
In addition, through an arrangement with each class' transfer agent, credits realized as a result of uninvested cash balances were used to reduce a portion of expenses. During the period, each applicable class' expenses were reduced as follows under the transfer agent arrangements:
|
|
Transfer |
|
Class T |
$ 1,027 |
Consumer Industries
Notes to Financial Statements - continued
7. Distributions to Shareholders.
Distributions to shareholders of each class were as follows:
|
|
Years ended July 31, |
|
|
|
2000 |
1999 |
|
From net realized gain |
|
|
|
Class A |
$ 42,252 |
$ 121,205 |
|
Class T |
225,103 |
772,710 |
|
Class B |
124,768 |
327,913 |
|
Class C |
33,851 |
82,950 |
|
Institutional Class |
72,484 |
274,274 |
|
Total |
$ 498,458 |
$ 1,579,052 |
|
In excess of net realized gain |
|
|
|
Class A |
$ 13,089 |
$ - |
|
Class T |
69,734 |
- |
|
Class B |
38,651 |
- |
|
Class C |
10,487 |
- |
|
Institutional Class |
22,454 |
- |
|
Total |
$ 154,415 |
$ - |
|
|
$ 652,873 |
$ 1,579,052 |
8. Share Transactions.
Transactions for each class of shares were as follows:
|
|
Shares |
Dollars |
||
|
|
Year ended |
Year ended |
Year ended |
Year ended |
|
|
2000 |
1999 |
2000 |
1999 |
|
|
|
|
|
|
|
Class A |
175,164 |
115,099 |
$ 2,691,443 |
$ 1,782,025 |
|
Reinvestment of distributions |
3,047 |
9,730 |
47,113 |
119,873 |
|
Shares redeemed |
(157,159) |
(53,179) |
(2,408,041) |
(794,506) |
|
Net increase (decrease) |
21,052 |
71,650 |
$ 330,515 |
$ 1,107,392 |
|
Class T |
258,873 |
836,168 |
$ 3,976,219 |
$ 12,781,566 |
|
Reinvestment of distributions |
17,994 |
59,298 |
276,740 |
728,776 |
|
Shares redeemed |
(750,965) |
(465,170) |
(11,598,163) |
(6,990,735) |
|
Net increase (decrease) |
(474,098) |
430,296 |
$ (7,345,204) |
$ 6,519,607 |
|
Class B |
267,514 |
400,266 |
$ 4,069,631 |
$ 5,949,947 |
|
Reinvestment of distributions |
9,759 |
25,754 |
148,334 |
314,459 |
|
Shares redeemed |
(287,327) |
(165,340) |
(4,326,711) |
(2,389,462) |
|
Net increase (decrease) |
(10,054) |
260,680 |
$ (108,746) |
$ 3,874,944 |
|
Class C |
140,701 |
138,656 |
$ 2,142,602 |
$ 2,101,382 |
|
Reinvestment of distributions |
2,696 |
6,196 |
41,038 |
75,712 |
|
Shares redeemed |
(111,068) |
(67,731) |
(1,685,976) |
(994,371) |
|
Net increase (decrease) |
32,329 |
77,121 |
$ 497,664 |
$ 1,182,723 |
|
Institutional Class |
54,848 |
257,491 |
$ 838,836 |
$ 3,899,578 |
|
Reinvestment of distributions |
4,957 |
21,083 |
77,138 |
260,589 |
|
Shares redeemed |
(333,892) |
(222,900) |
(5,112,268) |
(3,186,126) |
|
Net increase (decrease) |
(274,087) |
55,674 |
$ (4,196,294) |
$ 974,041 |
Consumer Industries
Performance
There are several ways to evaluate historical performance. You can look at the total percentage change in value, the average annual percentage change or the growth of a hypothetical $10,000 investment. Total return reflects the change in the value of an investment, assuming reinvestment of dividend income and capital gains (the profits earned upon the sale of securities that have grown in value). If Fidelity had not reimbursed certain class expenses, the total returns would have been lower.
Cumulative Total Returns
|
Periods ended July 31, 2000 |
|
Past 1 |
Life of |
|
Fidelity Adv Cyclical - CL A |
|
-2.13% |
60.00% |
|
Fidelity Adv Cyclical - CL A |
|
-7.76% |
50.80% |
|
S&P 500 |
|
8.98% |
131.80% |
|
GS Cyclical Industries |
|
-10.98% |
38.17% |
Cumulative total returns show Class A shares' performance in percentage terms over a set period - in this case, one year or since the fund started on September 3, 1996. You can compare Class A shares' returns to both the performance of the Standard & Poor's 500 Index - a market capitalization-weighted index of common stocks - and the Goldman Sachs Cyclical Industries Index - a market capitalization-weighted index of 253 stocks designed to measure the performance of companies in the cyclical industries sector. Issues in the index include providers of consumer and commercial goods and services where performance is influenced by the cyclicality of economy, such as: manufacturers of automobiles and companies involved with construction of residential and commercial properties, producers of chemicals, electrical equipment and components, and providers of environmental services. These benchmarks include reinvested dividends and capital gains, if any, and exclude the effect of sales charges.
Average Annual Total Returns
|
Periods ended July 31, 2000 |
|
Past 1 |
Life of |
|
Fidelity Adv Cyclical - CL A |
|
-2.13% |
12.77% |
|
Fidelity Adv Cyclical - CL A |
|
-7.76% |
11.08% |
|
S&P 500 |
|
8.98% |
23.99% |
|
GS Cyclical Industries |
|
-10.98% |
8.62% |
Average annual returns take Class A shares' cumulative return and show you what would have happened if Class A shares had performed at a constant rate each year.
$10,000 Over Life of Fund
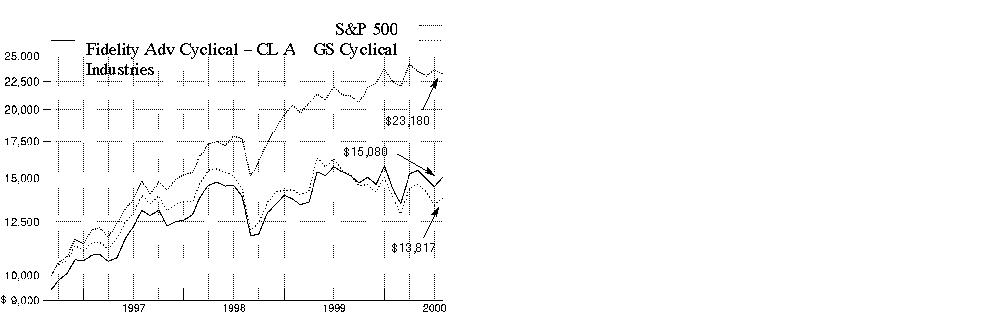
$10,000 Over Life of Fund: Let's say hypothetically that $10,000 was invested in Fidelity Advisor Cyclical Industries - Class A on September 3, 1996, when the fund started, and the current 5.75% sales charge was paid. As the chart shows, by July 31, 2000, the value of the investment would have grown to $15,080 - a 50.80% increase on the initial investment. For comparison, look at how the Standard & Poor's 500 Index did over the same period. With dividends and capital gains, if any, reinvested, the same $10,000 investment would have grown to $23,180 - a 131.80% increase. If $10,000 was invested in the Goldman Sachs Cyclical Industries Index, it would have grown to $13,817 - a 38.17% increase.
Understanding Performance
How a fund did yesterday is no guarantee of how it will do tomorrow. The stock market, for example, has a history of long-term growth and short-term volatility. Unlike the broader market, however, some sectors may not have a history of growth in the long run. And, as with all stock funds, the share price and return of a fund that invests in a sector will vary.
3Annual Report
Performance
There are several ways to evaluate historical performance. You can look at the total percentage change in value, the average annual percentage change or the growth of a hypothetical $10,000 investment. Total return reflects the change in the value of an investment, assuming reinvestment of dividend income and capital gains (the profits earned upon the sale of securities that have grown in value). If Fidelity had not reimbursed certain class expenses, the total returns would have been lower.
Cumulative Total Returns
|
Periods ended July 31, 2000 |
|
Past 1 |
Life of |
|
Fidelity Adv Cyclical - CL T |
|
-2.43% |
58.61% |
|
Fidelity Adv Cyclical - CL T |
|
-5.84% |
53.06% |
|
S&P 500 |
|
8.98% |
131.80% |
|
GS Cyclical Industries |
|
-10.98% |
38.17% |
Cumulative total returns show Class T shares' performance in percentage terms over a set period - in this case, one year or since the fund started on September 3, 1996. You can compare Class T shares' returns to both the performance of the Standard & Poor's 500 Index - a market capitalization-weighted index of common stocks - and the Goldman Sachs Cyclical Industries Index - a market capitalization-weighted index of 253 stocks designed to measure the performance of companies in the cyclical industries sector. Issues in the index include providers of consumer and commercial goods and services where performance is influenced by the cyclicality of economy, such as: manufacturers of automobiles and companies involved with construction of residential and commercial properties, producers of chemicals, electrical equipment and components, and providers of environmental services. These benchmarks include reinvested dividends and capital gains, if any, and exclude the effect of sales charges.
Average Annual Total Returns
|
Periods ended July 31, 2000 |
|
Past 1 |
Life of |
|
Fidelity Adv Cyclical - CL T |
|
-2.43% |
12.52% |
|
Fidelity Adv Cyclical - CL T |
|
-5.84% |
11.50% |
|
S&P 500 |
|
8.98% |
23.99% |
|
GS Cyclical Industries |
|
-10.98% |
8.62% |
Average annual returns take Class T shares' cumulative return and show you what would have happened if Class T shares had performed at a constant rate each year.
$10,000 Over Life of Fund
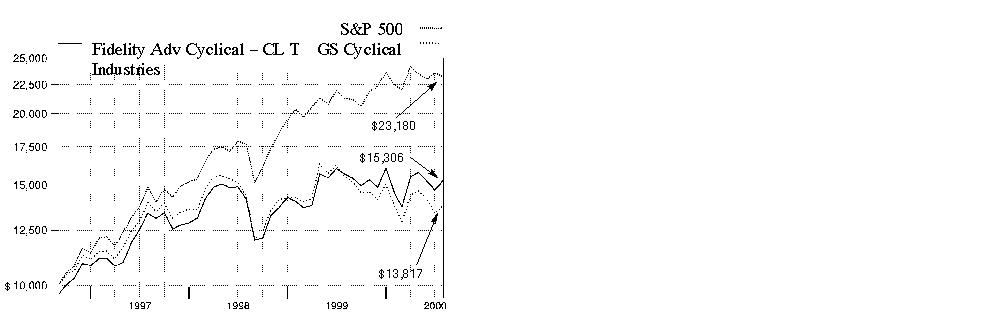
$10,000 Over Life of Fund: Let's say hypothetically that $10,000 was invested in Fidelity Advisor Cyclical Industries - Class T on September 3, 1996, when the fund started, and the current 3.50% sales charge was paid. As the chart shows, by July 31, 2000, the value of the investment would have grown to $15,306 - a 53.06% increase on the initial investment. For comparison, look at how the Standard & Poor's 500 Index did over the same period. With dividends and capital gains, if any, reinvested, the same $10,000 investment would have grown to $23,180 - a 131.80% increase. If $10,000 was invested in the Goldman Sachs Cyclical Industries Index, it would have grown to $13,817 - a 38.17% increase.
Understanding Performance
How a fund did yesterday is no guarantee of how it will do tomorrow. The stock market, for example, has a history of long-term growth and short-term volatility. Unlike the broader market, however, some sectors may not have a history of growth in the long run. And, as with all stock funds, the share price and return of a fund that invests in a sector will vary.
3Annual Report
Performance
There are several ways to evaluate historical performance. You can look at the total percentage change in value, the average annual percentage change or the growth of a hypothetical $10,000 investment. Total return reflects the change in the value of an investment, assuming reinvestment of dividend income and capital gains (the profits earned upon the sale of securities that have grown in value). The initial offering of Class B shares took place on March 3, 1997. Class B shares bear a 1.00% 12b-1 fee. Returns prior to March 3, 1997 are those of Class T which bears a 0.50% 12b-1 fee. Had Class B shares' 12b-1 fee been reflected, returns prior to March 3, 1997 would have been lower. Class B shares' contingent deferred sales charge included in the past one year and life of fund total return figures are 5% and 3%, respectively. If Fidelity had not reimbursed certain class expenses, the total returns would have been lower.
Cumulative Total Returns
|
Periods ended July 31, 2000 |
|
Past 1 |
Life of |
|
Fidelity Adv Cyclical - CL B |
|
-2.90% |
55.80% |
|
Fidelity Adv Cyclical - CL B |
|
-7.67% |
52.80% |
|
S&P 500 |
|
8.98% |
131.80% |
|
GS Cyclical Industries |
|
-10.98% |
38.17% |
Cumulative total returns show Class B shares' performance in percentage terms over a set period - in this case, one year or since the fund started on September 3, 1996. You can compare Class B shares' returns to both the performance of the Standard & Poor's 500 Index - a market capitalization-weighted index of common stocks - and the Goldman Sachs Cyclical Industries Index - a market capitalization-weighted index of 253 stocks designed to measure the performance of companies in the cyclical industries sector. Issues in the index include providers of consumer and commercial goods and services where performance is influenced by the cyclicality of economy, such as: manufacturers of automobiles and companies involved with construction of residential and commercial properties, producers of chemicals, electrical equipment and components, and providers of environmental services. These benchmarks include reinvested dividends and capital gains, if any, and exclude the effect of sales charges.
Average Annual Total Returns
|
Periods ended July 31, 2000 |
Past 1 |
Life of |
|
Fidelity Adv Cyclical - CL B |
-2.90% |
12.01% |
|
Fidelity Adv Cyclical - CL B |
-7.67% |
11.45% |
|
S&P 500 |
8.98% |
23.99% |
|
GS Cyclical Industries |
-10.98% |
8.62% |
Average annual returns take Class B shares' cumulative return and show you what would have happened if Class B shares had performed at a constant rate each year.
$10,000 Over Life of Fund
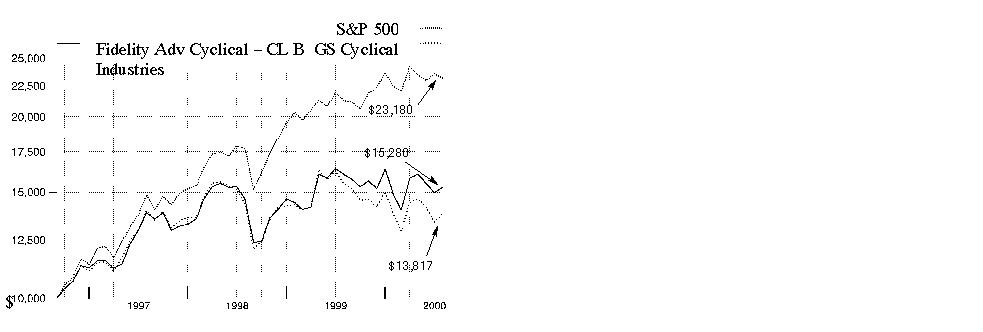
$10,000 Over Life of Fund: Let's say hypothetically that $10,000 was invested in Fidelity Advisor Cyclical Industries - Class B on September 3, 1996, when the fund started. As the chart shows, by July 31, 2000, the value of the investment, including the effect of the contingent deferred sales charge, would have grown to $15,280 - a 52.80% increase on the initial investment. For comparison, look at how the Standard & Poor's 500 Index did over the same period. With dividends and capital gains, if any, reinvested, the same $10,000 investment would have grown to $23,180 - a 131.80% increase. If $10,000 was invested in the Goldman Sachs Cyclical Industries Index, it would have grown to $13,817 - a 38.17% increase.
Understanding Performance
How a fund did yesterday is no guarantee of how it will do tomorrow. The stock market, for example, has a history of long-term growth and short-term volatility. Unlike the broader market, however, some sectors may not have a history of growth in the long run. And, as with all stock funds, the share price and return of a fund that invests in a sector will vary.
3Annual Report
Performance
There are several ways to evaluate historical performance. You can look at the total percentage change in value, the average annual percentage change or the growth of a hypothetical $10,000 investment. Total return reflects the change in the value of an investment, assuming reinvestment of dividend income and capital gains (the profits earned upon the sale of securities that have grown in value). The initial offering of Class C shares took place on November 3, 1997. Class C shares bear a 1.00% 12b-1 fee. Returns between March 3, 1997 and November 3, 1997 are those of Class B shares and reflect Class B shares' 1.00% 12b-1 fee. Returns prior to March 3, 1997 are those of Class T which bears a 0.50% 12b-1 fee. Had Class C shares' 12b-1 fee been reflected, returns prior to March 3, 1997 would have been lower. Class C shares' contingent deferred sales charge included in the past one year and life of fund total return figures are 1% and 0%, respectively. If Fidelity had not reimbursed certain class expenses, the total returns would have been lower.
Cumulative Total Returns
|
Periods ended July 31, 2000 |
|
Past 1 |
Life of |
|
Fidelity Adv Cyclical - CL C |
|
-3.11% |
55.30% |
|
Fidelity Adv Cyclical - CL C |
|
-4.07% |
55.30% |
|
S&P 500 |
|
8.98% |
131.80% |
|
GS Cyclical Industries |
|
-10.98% |
38.17% |
Cumulative total returns show Class C shares' performance in percentage terms over a set period - in this case, one year or since the fund started on September 3, 1996. You can compare Class C shares' returns to the performance of both the Standard & Poor's 500 Index - a market capitalization-weighted index of common stocks - and the Goldman Sachs Cyclical Industries Index - a market capitalization-weighted index of 253 stocks designed to measure the performance of companies in the cyclical industries sector. Issues in the index include providers of consumer and commercial goods and services where performance is influenced by the cyclicality of economy, such as: manufacturers of automobiles and companies involved with construction of residential and commercial properties, producers of chemicals, electrical equipment and components, and providers of environmental services. These benchmarks include reinvested dividends and capital gains, if any, and exclude the effect of sales charges.
Average Annual Total Returns
|
Periods ended July 31, 2000 |
Past 1 |
Life of |
|
|
Fidelity Adv Cyclical - CL C |
-3.11% |
11.92% |
|
|
Fidelity Adv Cyclical - CL C |
-4.07% |
11.92% |
|
|
S&P 500 |
8.98% |
23.99% |
|
|
GS Cyclical Industries |
-10.98% |
8.62% |
|
Average annual returns take Class C shares' cumulative return and show you what would have happened if Class C shares had performed at a constant rate each year.
$10,000 Over Life of Fund
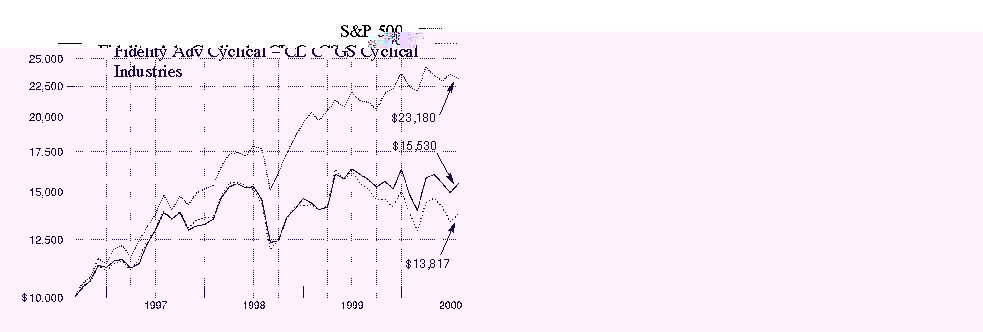
$10,000 Over Life of Fund: Let's say hypothetically that $10,000 was invested in Fidelity Advisor Cyclical Industries - Class C on September 3, 1996, when the fund started. As the chart shows, by July 31, 2000, the value of the investment would have grown to $15,530 - a 55.30% increase on the initial investment. For comparison, look at how the Standard & Poor's 500 Index did over the same period. With dividends and capital gains, if any, reinvested, the same $10,000 investment would have grown to $23,180 - a 131.80% increase. If $10,000 was invested in the Goldman Sachs Cyclical Industries Index, it would have grown to $13,817 - a 38.17% increase.
Understanding Performance
How a fund did yesterday is no guarantee of how it will do tomorrow. The stock market, for example, has a history of long-term growth and short-term volatility. Unlike the broader market, however, some sectors may not have a history of growth in the long run. And, as with all stock funds, the share price and return of a fund that invests in a sector will vary.
3Annual Report
(Portfolio Manager photograph)
An interview with Brian Hogan, Portfolio Manager of Fidelity Advisor Cyclical Industries Fund
Q. How did the fund perform, Brian?
A. For the 12 months that ended July 31, 2000, the fund's Class A, Class T, Class B and Class C shares returned -2.13%, -2.43%, -2.90% and -3.11%, respectively. For the same 12-month period, the Goldman Sachs Cyclical Industries Index - an index of 253 stocks designed to measure the performance of companies in the cyclical industries sector - fell 10.98%, while the Standard & Poor's 500 Index returned 8.98%.
A. For the 12 months that ended July 31, 2000, the fund's Institutional Class shares returned -2.04%. For the same 12-month period, the Goldman Sachs Cyclical Index - an index of 253 stocks designed to measure the performance of companies in the cyclical industries sector - returned -10.98%, while the Standard & Poor's 500 Index returned 8.98%.
Q. What factors drove cyclical industry stocks during the period?
A. Two themes dominated the investment environment - rising interest rates and increasing oil prices. During the 12-month period, the Federal Reserve Board increased short-term interest rates by 150 basis points or 1.50%. Over the same time frame, oil prices rose to as high as $34 per barrel, up from the low $20 range. Both higher interest rates and more expensive oil have the potential to reduce the economy's growth rate. Also, many cyclical industries use petroleum-based resins in the manufacturing processes, and higher raw material prices tend to erode their profit margins. As a result, negative investor sentiment surfaced early in the period and pressured cyclical stock prices. Later, expectations became reality as numerous companies either missed their earnings targets or guided analysts' earnings estimates lower.
Q. How did the fund outperform the Goldman Sachs index in this weak environment?
A. The fund outperformed its benchmark index by virtue of our relatively higher concentration in stocks and sectors that performed well, such as specialty chemicals and diversified conglomerates. The fund's performance also was enhanced by its relatively lower exposure to interest-rate sensitive consumer-oriented stocks, such as auto manufacturers, that performed poorly in the rising interest-rate environment.
Q. Which stocks contributed to the fund's performance?
A. Underweighting automobile manufacturers had a positive impact on the fund's returns. The sector performed poorly in response to rising interest rates, higher prices at the gas pump and a peaking auto production cycle that raised concerns that auto manufacturers would need to offer higher consumer discounts to maintain sales volume. During the 12-month period, specifically underweighting DaimlerChrysler was among the biggest contributors to the fund's performance relative to the Goldman Sachs benchmark index. In addition to the malaise affecting the overall sector, Daimler- Chrysler's stock was further pressured when the merger between Daimler Benz and Chrysler progressed less smoothly than the market expected. General Electric and SPX both performed well. GE, a large, well-diversified old economy stock, successfully adopted the Internet, which facilitated strong revenue growth and accelerating earnings. SPX is a well-managed conglomerate that has profitably shifted its business mix toward higher-growth segments. Tyco International performed well after I began increasing the fund's exposure to it during the second half of the 12-month period. Although allegations of accounting irregularities caused the stock to lose half of its value late in 1999, the stock regained most of these losses as investors gained a better understanding of the issues. The Securities and Exchange Commission subsequently concluded its investigation and issued a report that put claims of financial mismanagement to rest.
Q. Which stocks were disappointing?
A. Honeywell International underperformed as slow revenue growth, mature markets and problems integrating its merger with Allied-Signal pulled the company's stock price down. I reduced the fund's exposure to Honeywell during the period, shifting from an overweighted to an underweighted position relative to the Goldman Sachs index. Textron also fell short of my expectations, suffering from a decline in price-to-earnings multiples that affected almost all defense industry stocks. However, Textron remained a well-managed company with a long track record of achieving its earnings targets, and I remained optimistic that the stock price could recover to reflect the company's good fundamentals and consistent, predictable profitability.
Q. What's your outlook for the coming months?
A. The past few months have demonstrated the market's severe penalties for companies that miss their earnings targets, or otherwise fall short of investors' expectations. Should the investment climate remain unchanged, I expect the fund's performance to be driven as much by avoiding stocks that disappoint as by picking stocks that outperform. Thus, I anticipate maintaining an emphasis on companies with global business opportunities, strong revenue growth and lower-than-average exposure to interest-rate sensitive, consumer-oriented markets.
Fund Facts
Start date: September 3, 1996
Size: as of July 31, 2000, more than $9 million
Manager: Brian Hogan, since February 2000; joined Fidelity in 1994
3The views expressed in this report reflect those of the portfolio manager only through the end of the period of the report as stated on the cover. The manager's views are subject to change at any time based on market and other conditions. For more information see page A-3.
Annual Report
Advisor Cyclical Industries Fund
|
Top Ten Stocks as of July 31, 2000 |
|
|
|
% of fund's |
|
Tyco International Ltd. |
8.3 |
|
General Electric Co. |
7.8 |
|
E.I. du Pont de Nemours and Co. |
4.5 |
|
Minnesota Mining & Manufacturing Co. |
3.8 |
|
Ford Motor Co. |
3.6 |
|
Boeing Co. |
3.4 |
|
United Technologies Corp. |
2.8 |
|
Emerson Electric Co. |
2.6 |
|
Union Carbide Corp. |
2.3 |
|
Honeywell International, Inc. |
2.0 |
|
|
41.1 |
|
Top Industries as of July 31, 2000 |
|
|
% of fund's net assets |
||
|
Chemicals & Plastics |
14.5% |
|
Industrial Machinery & Equipment |
14.1% |
|
Aerospace & Defense |
12.3% |
|
Electrical Equipment |
10.5% |
|
Autos, Tires, & Accessories |
10.4% |
|
All Others* |
38.2% |

|
* Includes short-term investments and net other assets. |
Annual Report
Advisor Cyclical Industries Fund
Showing Percentage of Net Assets
|
Common Stocks - 92.5% |
|||
|
Shares |
Value (Note 1) |
||
|
AEROSPACE & DEFENSE - 12.3% |
|||
|
BFGoodrich Co. |
2,700 |
$ 96,356 |
|
|
Boeing Co. |
6,300 |
308,700 |
|
|
Honeywell International, Inc. |
5,412 |
181,979 |
|
|
Lockheed Martin Corp. |
2,114 |
59,456 |
|
|
Northrop Grumman Corp. |
700 |
49,744 |
|
|
Rockwell International Corp. |
1,400 |
49,088 |
|
|
Textron, Inc. |
2,000 |
114,125 |
|
|
United Technologies Corp. |
4,411 |
257,492 |
|
|
|
1,116,940 |
||
|
AIR TRANSPORTATION - 3.1% |
|||
|
AMR Corp. |
600 |
19,838 |
|
|
Atlas Air, Inc. (a) |
300 |
13,313 |
|
|
Continental Airlines, Inc. Class B (a) |
600 |
31,350 |
|
|
Delta Air Lines, Inc. |
600 |
32,213 |
|
|
Northwest Airlines Corp. Class A (a) |
1,750 |
58,406 |
|
|
Ryanair Holdings PLC sponsored ADR (a) |
700 |
29,488 |
|
|
Southwest Airlines Co. |
3,525 |
83,278 |
|
|
UAL Corp. |
200 |
10,825 |
|
|
|
278,711 |
||
|
AUTOS, TIRES, & ACCESSORIES - 10.4% |
|||
|
AutoNation, Inc. |
3,500 |
24,281 |
|
|
DaimlerChrysler AG (Reg.) |
1,000 |
52,688 |
|
|
Danaher Corp. |
850 |
43,297 |
|
|
Delphi Automotive Systems Corp. |
3,000 |
44,438 |
|
|
Eaton Corp. |
900 |
61,031 |
|
|
Ford Motor Co. |
7,100 |
330,594 |
|
|
General Motors Corp. |
2,706 |
154,073 |
|
|
Johnson Controls, Inc. |
600 |
31,163 |
|
|
Navistar International Corp. (a) |
1,000 |
35,688 |
|
|
SPX Corp. (a) |
800 |
114,550 |
|
|
TRW, Inc. |
1,200 |
53,925 |
|
|
|
945,728 |
||
|
BUILDING MATERIALS - 3.2% |
|||
|
American Standard Companies, Inc. (a) |
1,000 |
44,563 |
|
|
Elcor Corp. |
1,600 |
30,700 |
|
|
Ferro Corp. |
200 |
4,650 |
|
|
Fortune Brands, Inc. |
100 |
2,250 |
|
|
Lafarge Corp. |
1,100 |
24,750 |
|
|
Masco Corp. |
4,200 |
82,950 |
|
|
Shaw Group (a) |
800 |
37,700 |
|
|
Sherwin-Williams Co. |
700 |
14,569 |
|
|
Southdown, Inc. |
200 |
12,450 |
|
|
USG Corp. |
100 |
2,938 |
|
|
|
|||
|
Shares |
Value (Note 1) |
||
|
Vulcan Materials Co. |
400 |
$ 17,125 |
|
|
York International Corp. |
700 |
19,469 |
|
|
|
294,114 |
||
|
CHEMICALS & PLASTICS - 14.5% |
|||
|
Air Products & Chemicals, Inc. |
900 |
30,038 |
|
|
Arch Chemicals, Inc. |
1,400 |
28,000 |
|
|
Avery Dennison Corp. |
2,040 |
110,670 |
|
|
Cabot Corp. |
500 |
16,000 |
|
|
Crompton Corp. |
1,293 |
12,688 |
|
|
Dow Chemical Co. |
400 |
11,500 |
|
|
E.I. du Pont de Nemours and Co. |
8,960 |
406,000 |
|
|
Engelhard Corp. |
700 |
12,644 |
|
|
FMC Corp. (a) |
600 |
36,150 |
|
|
Lyondell Chemical Co. |
3,700 |
51,800 |
|
|
Millennium Chemicals, Inc. |
3,000 |
46,500 |
|
|
Potash Corp. of Saskatchewan |
300 |
16,138 |
|
|
PPG Industries, Inc. |
600 |
24,413 |
|
|
Praxair, Inc. |
3,800 |
150,338 |
|
|
Rohm & Haas Co. |
1,850 |
48,100 |
|
|
Sealed Air Corp. (a) |
210 |
10,579 |
|
|
Solutia, Inc. |
3,000 |
42,938 |
|
|
Spartech Corp. |
1,700 |
45,581 |
|
|
Union Carbide Corp. |
4,700 |
210,619 |
|
|
|
1,310,696 |
||
|
COMPUTER SERVICES & SOFTWARE - 0.0% |
|||
|
Sabre Holdings Corp. Class A |
6 |
147 |
|
|
CONSTRUCTION - 0.8% |
|||
|
Centex Corp. |
500 |
11,969 |
|
|
D.R. Horton, Inc. |
600 |
9,300 |
|
|
Jacobs Engineering Group, Inc. (a) |
300 |
10,706 |
|
|
Kaufman & Broad Home Corp. |
1,300 |
25,431 |
|
|
Lennar Corp. |
600 |
14,400 |
|
|
|
71,806 |
||
|
CONSUMER DURABLES - 3.8% |
|||
|
Minnesota Mining & Manufacturing Co. |
3,800 |
342,238 |
|
|
CONSUMER ELECTRONICS - 0.7% |
|||
|
Black & Decker Corp. |
1,400 |
52,063 |
|
|
General Motors Corp. Class H (a) |
476 |
12,317 |
|
|
|
64,380 |
||
|
DRUGS & PHARMACEUTICALS - 0.2% |
|||
|
Sigma-Aldrich Corp. |
600 |
16,350 |
|
|
ELECTRICAL EQUIPMENT - 10.5% |
|||
|
Emerson Electric Co. |
3,800 |
232,038 |
|
|
General Electric Co. |
13,800 |
709,838 |
|
|
Common Stocks - continued |
|||
|
Shares |
Value (Note 1) |
||
|
ELECTRICAL EQUIPMENT - CONTINUED |
|||
|
Hubbell, Inc. Class B |
400 |
$ 9,650 |
|
|
Plug Power, Inc. |
80 |
4,005 |
|
|
|
955,531 |
||
|
ELECTRONIC INSTRUMENTS - 2.4% |
|||
|
Agilent Technologies, Inc. |
2,500 |
101,875 |
|
|
PerkinElmer, Inc. |
850 |
54,347 |
|
|
Thermo Electron Corp. (a) |
2,900 |
60,175 |
|
|
|
216,397 |
||
|
ELECTRONICS - 0.6% |
|||
|
Molex, Inc. |
200 |
9,409 |
|
|
Molex, Inc. Class A |
1,200 |
41,700 |
|
|
|
51,109 |
||
|
ENERGY SERVICES - 0.1% |
|||
|
Varco International, Inc. (a) |
600 |
10,350 |
|
|
ENGINEERING - 0.9% |
|||
|
Fluor Corp. |
2,700 |
80,494 |
|
|
HOME FURNISHINGS - 0.4% |
|||
|
Leggett & Platt, Inc. |
1,900 |
33,250 |
|
|
HOUSEHOLD PRODUCTS - 0.4% |
|||
|
Aptargroup, Inc. |
1,100 |
27,431 |
|
|
Procter & Gamble Co. |
100 |
5,688 |
|
|
|
33,119 |
||
|
INDUSTRIAL MACHINERY & EQUIPMENT - 14.1% |
|||
|
Ballard Power Systems, Inc. (a) |
400 |
35,207 |
|
|
Caterpillar, Inc. |
3,000 |
102,188 |
|
|
CNH Global NV |
1,100 |
8,594 |
|
|
Deere & Co. |
1,300 |
50,131 |
|
|
Dover Corp. |
1,000 |
45,813 |
|
|
Illinois Tool Works, Inc. |
2,700 |
154,575 |
|
|
Ingersoll-Rand Co. |
1,700 |
66,725 |
|
|
ITT Industries, Inc. |
500 |
16,438 |
|
|
Parker-Hannifin Corp. |
1,300 |
46,231 |
|
|
Tyco International Ltd. |
14,150 |
757,009 |
|
|
|
1,282,911 |
||
|
IRON & STEEL - 0.6% |
|||
|
Bethlehem Steel Corp. (a) |
1,500 |
6,938 |
|
|
Nucor Corp. |
1,000 |
37,750 |
|
|
USX - U.S. Steel Group |
500 |
8,969 |
|
|
|
53,657 |
||
|
LEASING & RENTAL - 0.1% |
|||
|
Ryder System, Inc. |
250 |
5,219 |
|
|
|
|||
|
Shares |
Value (Note 1) |
||
|
MEDICAL EQUIPMENT & SUPPLIES - 0.7% |
|||
|
Millipore Corp. |
1,000 |
$ 62,875 |
|
|
MEDICAL FACILITIES MANAGEMENT - 0.0% |
|||
|
Apria Healthcare Group, Inc. (a) |
100 |
1,494 |
|
|
METALS & MINING - 0.7% |
|||
|
Alcoa, Inc. |
1,440 |
43,560 |
|
|
Martin Marietta Materials, Inc. |
474 |
19,997 |
|
|
|
63,557 |
||
|
OIL & GAS - 0.7% |
|||
|
Cooper Cameron Corp. (a) |
400 |
25,850 |
|
|
Frontier Oil Corp. (a) |
2,000 |
14,000 |
|
|
National-Oilwell, Inc. (a) |
700 |
23,100 |
|
|
|
62,950 |
||
|
PACKAGING & CONTAINERS - 1.2% |
|||
|
Ball Corp. |
2,000 |
69,375 |
|
|
Bemis Co., Inc. |
500 |
17,188 |
|
|
Owens-Illinois, Inc. (a) |
2,000 |
26,625 |
|
|
|
113,188 |
||
|
PAPER & FOREST PRODUCTS - 0.4% |
|||
|
International Paper Co. |
242 |
8,228 |
|
|
Pentair, Inc. |
900 |
27,563 |
|
|
|
35,791 |
||
|
POLLUTION CONTROL - 1.3% |
|||
|
Allied Waste Industries, Inc. (a) |
400 |
3,725 |
|
|
Ogden Corp. |
400 |
4,925 |
|
|
Republic Services, Inc. (a) |
4,400 |
73,700 |
|
|
Waste Management, Inc. |
1,900 |
35,506 |
|
|
|
117,856 |
||
|
RAILROADS - 4.3% |
|||
|
Burlington Northern Santa Fe Corp. |
4,200 |
102,638 |
|
|
Canadian National Railway Co. |
1,500 |
46,396 |
|
|
Canadian Pacific Ltd. |
3,000 |
76,856 |
|
|
CSX Corp. |
1,750 |
43,422 |
|
|
Kansas City Southern Industries, Inc. |
25 |
173 |
|
|
Union Pacific Corp. |
2,800 |
120,925 |
|
|
|
390,410 |
||
|
SERVICES - 1.1% |
|||
|
Ecolab, Inc. |
2,700 |
96,694 |
|
|
SHIP BUILDING & REPAIR - 1.6% |
|||
|
General Dynamics Corp. |
2,600 |
146,738 |
|
|
Common Stocks - continued |
|||
|
Shares |
Value (Note 1) |
||
|
SHIPPING - 0.3% |
|||
|
Frontline Ltd. sponsored ADR (a) |
1,800 |
$ 22,950 |
|
|
Teekay Shipping Corp. |
200 |
7,500 |
|
|
|
30,450 |
||
|
TEXTILES & APPAREL - 0.2% |
|||
|
Polymer Group, Inc. |
1,500 |
11,531 |
|
|
Shaw Industries, Inc. |
500 |
6,406 |
|
|
|
17,937 |
||
|
TRUCKING & FREIGHT - 0.9% |
|||
|
CNF Transportation, Inc. |
400 |
10,175 |
|
|
Expeditors International of |
400 |
20,100 |
|
|
FedEx Corp. (a) |
1,000 |
39,625 |
|
|
USFreightways Corp. |
400 |
11,100 |
|
|
|
81,000 |
||
|
TOTAL COMMON STOCKS (Cost $8,138,338) |
8,384,087 |
||
|
Cash Equivalents - 11.6% |
|||
|
|
|
|
|
|
Fidelity Cash Central Fund, 6.57% (b) |
638,731 |
638,731 |
|
|
Fidelity Securities Lending Cash Central Fund, 6.65% (b) |
417,700 |
417,700 |
|
|
TOTAL CASH EQUIVALENTS (Cost $1,056,431) |
1,056,431 |
||
|
TOTAL INVESTMENT PORTFOLIO - 104.1% (Cost $9,194,769) |
9,440,518 |
|
NET OTHER ASSETS - (4.1)% |
(373,194) |
||
|
NET ASSETS - 100% |
$ 9,067,324 |
||
|
Legend |
|
(a) Non-income producing |
|
(b) The rate quoted is the annualized seven-day yield of the fund at |
|
Income Tax Information |
|
At July 31, 2000, the aggregate cost of investment securities for income |
|
The fund hereby designates approximately $82,000 as a capital gain dividend for the purpose of the dividend paid deduction. |
|
A total of 82%, 92%, 98%, 100% and 75% of Class A's, Class T's, Class B's, Class C's and Institutional Class' dividends distributed during the fiscal year qualifies for the dividends-received deductions for corporate shareholders (unaudited). |
|
The fund will notify shareholders in January 2001 of the applicable percentages for use in preparing 2000 income tax returns. |
See accompanying notes which are an integral part of the financial statements.
Cyclical Industries
Statement of Assets and Liabilities
|
|
July 31, 2000 |
|
|
Assets |
|
|
|
Investment in securities, at value |
|
$ 9,440,518 |
|
Receivable for investments sold |
|
234,873 |
|
Receivable for fund shares sold |
|
689 |
|
Dividends receivable |
|
7,227 |
|
Interest receivable |
|
2,813 |
|
Other receivables |
|
808 |
|
Receivable from investment adviser |
|
3,167 |
|
Total assets |
|
9,690,095 |
|
Liabilities |
|
|
|
Payable to custodian bank |
$ 7,516 |
|
|
Payable for investments purchased |
163,201 |
|
|
Payable for fund shares redeemed |
3,852 |
|
|
Distribution fees payable |
3,932 |
|
|
Other payables and |
26,570 |
|
|
Collateral on securities loaned, at value |
417,700 |
|
|
Total liabilities |
|
622,771 |
|
Net Assets |
|
$ 9,067,324 |
|
Net Assets consist of: |
|
|
|
Paid in capital |
|
$ 8,590,886 |
|
Accumulated undistributed net realized gain (loss) on investments and foreign currency transactions |
|
230,678 |
|
Net unrealized appreciation (depreciation) on investments |
|
245,760 |
|
Net Assets |
|
$ 9,067,324 |
|
Calculation of Maximum |
|
$13.56 |
|
Maximum offering price per share |
|
$14.39 |
|
Class T: |
|
$13.48 |
|
Maximum offering price per share |
|
$13.97 |
|
Class B: |
|
$13.25 |
|
Class C: |
|
$13.26 |
|
Institutional Class: |
|
$13.70 |
A Redemption price per share is equal to net asset value less any applicable contingent deferred sales charge.
Statement of Operations
|
|
Year ended July 31, 2000 |
|
|
Investment Income Dividends |
|
$ 133,468 |
|
Interest |
|
26,441 |
|
Security lending |
|
309 |
|
Total income |
|
160,218 |
|
Expenses |
|
|
|
Management fee |
$ 55,210 |
|
|
Transfer agent fees |
30,871 |
|
|
Distribution fees |
47,811 |
|
|
Accounting and security lending fees |
60,124 |
|
|
Non-interested trustees' compensation |
29 |
|
|
Custodian fees and expenses |
7,944 |
|
|
Registration fees |
70,606 |
|
|
Audit |
23,009 |
|
|
Legal |
80 |
|
|
Miscellaneous |
492 |
|
|
Total expenses before reductions |
296,176 |
|
|
Expense reductions |
(129,753) |
166,423 |
|
Net investment income (loss) |
|
(6,205) |
|
Realized and Unrealized Gain (Loss) Net realized gain (loss) on: |
|
|
|
Investment securities |
388,346 |
|
|
Foreign currency transactions |
242 |
388,588 |
|
Change in net unrealized appreciation (depreciation) on: |
|
|
|
Investment securities |
(709,083) |
|
|
Assets and liabilities in |
13 |
(709,070) |
|
Net gain (loss) |
|
(320,482) |
|
Net increase (decrease) in net assets resulting from operations |
|
$ (326,687) |
See accompanying notes which are an integral part of the financial statements.
Annual Report
Advisor Cyclical Industries Fund
Financial Statements - continued
Statement of Changes in Net Assets
|
Increase (Decrease) in Net Assets |
Year ended |
Year ended |
|
Operations |
$ (6,205) |
$ (11,063) |
|
Net realized gain (loss) |
388,588 |
28,779 |
|
Change in net unrealized appreciation (depreciation) |
(709,070) |
563,364 |
|
Net increase (decrease) in net assets resulting from operations |
(326,687) |
581,080 |
|
Distributions to shareholders |
|
|
|
From net realized gain |
(178,082) |
(287,985) |
|
Share transactions - net increase (decrease) |
(1,671,247) |
4,985,782 |
|
Redemption fees |
5,080 |
6,625 |
|
Total increase (decrease) in net assets |
(2,170,936) |
5,285,502 |
|
Net Assets |
|
|
|
Beginning of period |
11,238,260 |
5,952,758 |
|
End of period |
$ 9,067,324 |
$ 11,238,260 |
Financial Highlights - Class A
|
Years ended July 31, |
2000 |
1999 |
1998 |
1997 E |
|
Selected Per-Share Data |
|
|
|
|
|
Net asset value, beginning of period |
$ 14.13 |
$ 13.56 |
$ 13.80 |
$ 10.00 |
|
Income from Investment Operations |
|
|
|
|
|
Net investment income (loss) D |
.02 |
.01 |
(.03) |
(.01) |
|
Net realized and unrealized gain (loss) |
(.33) |
1.23 |
.76 |
3.89 |
|
Total from investment operations |
(.31) |
1.24 |
.73 |
3.88 |
|
Less Distributions |
|
|
|
|
|
From net investment income |
- H |
- |
- |
(.01) |
|
From net realized gain |
(.27) H |
(.68) |
(.99) |
(.08) |
|
Total distributions |
(.27) |
(.68) |
(.99) |
(.09) |
|
Redemption fees added to paid in capital |
.01 |
.01 |
.02 |
.01 |
|
Net asset value, end of period |
$ 13.56 |
$ 14.13 |
$ 13.56 |
$ 13.80 |
|
Total Return B, C |
(2.13)% |
10.81% |
6.05% |
39.11% |
|
Ratios and Supplemental Data |
|
|
|
|
|
Net assets, end of period (000 omitted) |
$ 973 |
$ 896 |
$ 471 |
$ 365 |
|
Ratio of expenses to average net assets |
1.50% F |
1.56% F |
1.75% F |
1.75% A, F |
|
Ratio of expenses to average net assets after expense reductions |
1.49% G |
1.54% G |
1.75% |
1.73% A, G |
|
Ratio of net investment income (loss) to average net assets |
.18% |
.05% |
(.22)% |
(.09)% A |
|
Portfolio turnover |
111% |
115% |
100% |
155% A |
|
A Annualized B The total returns would have been lower had certain expenses not been reduced during the periods shown. C Total returns do not include the one time sales charge and for periods of less than one year are not annualized. D Net investment income (loss) per share has been calculated based on average shares outstanding during the period. E For the period September 3, 1996 (commencement of sale of Class A shares) to July 31, 1997. F FMR agreed to reimburse a portion of the class' expenses during the period. Without this reimbursement, the class' expense ratio would have been higher. G FMR or the fund has entered into varying arrangements with third parties who either paid or reduced a portion of the class' expenses. H The amounts shown reflect certain reclassifications related to book to tax differences. |
||||
See accompanying notes which are an integral part of the financial statements.
Cyclical Industries
Financial Highlights - Class T
|
Years ended July 31, |
2000 |
1999 |
1998 |
1997 E |
|
Selected Per-Share Data |
|
|
|
|
|
Net asset value, beginning of period |
$ 14.07 |
$ 13.51 |
$ 13.77 |
$ 10.00 |
|
Income from Investment Operations |
|
|
|
|
|
Net investment income (loss) D |
(.01) |
(.03) |
(.06) |
(.04) |
|
Net realized and unrealized gain (loss) |
(.34) |
1.24 |
.77 |
3.89 |
|
Total from investment operations |
(.35) |
1.21 |
.71 |
3.85 |
|
Less Distributions |
|
|
|
|
|
From net investment income |
- |
- |
- |
(.01) |
|
From net realized gain |
(.25) |
(.66) |
(.99) |
(.08) |
|
Total distributions |
(.25) |
(.66) |
(.99) |
(.09) |
|
Redemption fees added to paid in capital |
.01 |
.01 |
.02 |
.01 |
|
Net asset value, end of period |
$ 13.48 |
$ 14.07 |
$ 13.51 |
$ 13.77 |
|
Total Return B, C |
(2.43)% |
10.57% |
5.91% |
38.81% |
|
Ratios and Supplemental Data |
|
|
|
|
|
Net assets, end of period (000 omitted) |
$ 3,885 |
$ 3,471 |
$ 2,973 |
$ 1,920 |
|
Ratio of expenses to average net assets |
1.75% F |
1.83% F |
2.00% F |
2.00% A, F |
|
Ratio of expenses to average net assets after expense reductions |
1.74% G |
1.81% G |
2.00% |
1.97% A, G |
|
Ratio of net investment income (loss) to average net assets |
(.07)% |
(.22)% |
(.47)% |
(.37)% A |
|
Portfolio turnover |
111% |
115% |
100% |
155% A |
|
A Annualized B The total returns would have been lower had certain expenses not been reduced during the periods shown. C Total returns do not include the one time sales charge and for periods of less than one year are not annualized. D Net investment income (loss) per share has been calculated based on average shares outstanding during the period. E For the period September 3, 1996 (commencement of sale of Class T shares) to July 31, 1997. F FMR agreed to reimburse a portion of the class' expenses during the period. Without this reimbursement, the class' expense ratio would have been higher. G FMR or the fund has entered into varying arrangements with third parties who either paid or reduced a portion of the class' expenses. |
||||
Financial Highlights - Class B
|
Years ended July 31, |
2000 |
1999 |
1998 |
1997 E |
|
Selected Per-Share Data |
|
|
|
|
|
Net asset value, beginning of period |
$ 13.89 |
$ 13.40 |
$ 13.75 |
$ 11.56 |
|
Income from Investment Operations |
|
|
|
|
|
Net investment income (loss) D |
(.07) |
(.09) |
(.14) |
(.06) |
|
Net realized and unrealized gain (loss) |
(.34) |
1.22 |
.76 |
2.25 |
|
Total from investment operations |
(.41) |
1.13 |
.62 |
2.19 |
|
Less Distributions |
|
|
|
|
|
From net realized gain |
(.24) |
(.65) |
(.99) |
- |
|
Redemption fees added to paid in capital |
.01 |
.01 |
.02 |
- |
|
Net asset value, end of period |
$ 13.25 |
$ 13.89 |
$ 13.40 |
$ 13.75 |
|
Total Return B, C |
(2.90)% |
10.01% |
5.23% |
18.94% |
|
Ratios and Supplemental Data |
|
|
|
|
|
Net assets, end of period (000 omitted) |
$ 1,879 |
$ 2,043 |
$ 985 |
$ 252 |
|
Ratio of expenses to average net assets |
2.25% F |
2.31% F |
2.50% F |
2.50% A, F |
|
Ratio of expenses to average net assets after expense reductions |
2.24% G |
2.29% G |
2.50% |
2.45% A, G |
|
Ratio of net investment income (loss) to average net assets |
(.57)% |
(.70)% |
(1.03)% |
(1.11)% A |
|
Portfolio turnover |
111% |
115% |
100% |
155% A |
|
A Annualized B The total returns would have been lower had certain expenses not been reduced during the periods shown. C Total returns do not include the contingent deferred sales charge and for periods of less than one year are not annualized. D Net investment income (loss) per share has been calculated based on average shares outstanding during the period. E For the period March 3, 1997 (commencement of sale of Class B shares) to July 31, 1997. F FMR agreed to reimburse a portion of the class' expenses during the period. Without this reimbursement, the class' expense ratio would have been higher. G FMR or the fund has entered into varying arrangements with third parties who either paid or reduced a portion of the class' expenses. |
||||
See accompanying notes which are an integral part of the financial statements.
Annual Report
Financial Highlights - Class C
|
Years ended July 31, |
2000 |
1999 |
1998 E |
|
Selected Per-Share Data |
|
|
|
|
Net asset value, beginning of period |
$ 13.91 |
$ 13.45 |
$ 12.54 |
|
Income from Investment Operations |
|
|
|
|
Net investment income (loss) D |
(.08) |
(.09) |
(.11) |
|
Net realized and unrealized gain (loss) |
(.36) |
1.20 |
1.39 |
|
Total from investment operations |
(.44) |
1.11 |
1.28 |
|
Less Distributions |
|
|
|
|
From net realized gain |
(.22) |
(.67) |
(.38) |
|
Redemption fees added to paid in capital |
.01 |
.02 |
.01 |
|
Net asset value, end of period |
$ 13.26 |
$ 13.91 |
$ 13.45 |
|
Total Return B, C |
(3.11)% |
9.94% |
10.62% |
|
Ratios and Supplemental Data |
|
|
|
|
Net assets, end of period (000 omitted) |
$ 625 |
$ 1,451 |
$ 165 |
|
Ratio of expenses to average net assets |
2.25% F |
2.28% F |
2.50% A, F |
|
Ratio of expenses to average net assets after expense reductions |
2.24% G |
2.27% G |
2.50% A |
|
Ratio of net investment income (loss) to average net assets |
(.57)% |
(.67)% |
(1.06)% A |
|
Portfolio turnover |
111% |
115% |
100% |
|
A Annualized B The total returns would have been lower had certain expenses not been reduced during the periods shown. C Total returns do not include the contingent deferred sales charge and for periods of less than one year are not annualized. D Net investment income (loss) per share has been calculated based on average shares outstanding during the period. E For the period November 3, 1997 (commencement of sale of Class C shares) to July 31, 1998. F FMR agreed to reimburse a portion of the class' expenses during the period. Without this reimbursement, the class' expense ratio would have been higher. G FMR or the fund has entered into varying arrangements with third parties who either paid or reduced a portion of the class' expenses. |
|||
Financial Highlights - Institutional Class
|
Years ended July 31, |
2000 |
1999 |
1998 |
1997 F |
|
Selected Per-Share Data |
|
|
|
|
|
Net asset value, beginning of period |
$ 14.28 |
$ 13.68 |
$ 13.84 |
$ 10.00 |
|
Income from Investment Operations |
|
|
|
|
|
Net investment income D |
.06 |
.04 |
.01 E |
.03 |
|
Net realized and unrealized gain (loss) |
(.36) |
1.25 |
.75 |
3.91 |
|
Total from investment operations |
(.30) |
1.29 |
.76 |
3.94 |
|
Less Distributions |
|
|
|
|
|
From net investment income |
- I |
- |
- |
(.02) |
|
From net realized gain |
(.29) I |
(.70) |
(.95) |
(.08) |
|
Total distributions |
(.29) |
(.70) |
(.95) |
(.10) |
|
Redemption fees added to paid in capital |
.01 |
.01 |
.03 |
- |
|
Net asset value, end of period |
$ 13.70 |
$ 14.28 |
$ 13.68 |
$ 13.84 |
|
Total Return B, C |
(2.04)% |
11.15% |
6.32% |
39.64% |
|
Ratios and Supplemental Data |
|
|
|
|
|
Net assets, end of period (000 omitted) |
$ 1,706 |
$ 3,377 |
$ 1,360 |
$ 1,756 |
|
Ratio of expenses to average net assets |
1.25% G |
1.31% G |
1.50% G |
1.50% A, G |
|
Ratio of expenses to average net assets after expense reductions |
1.24% H |
1.29% H |
1.50% |
1.48% A, H |
|
Ratio of net investment income to average net assets |
.43% |
.31% |
.04% |
.25% A |
|
Portfolio turnover |
111% |
115% |
100% |
155% A |
|
A Annualized B Total returns for periods of less than one year are not annualized. C The total returns would have been lower had certain expenses not been reduced during the periods shown. D Net investment income per share has been calculated based on average shares outstanding during the period. E During the period, a significant shareholder redemption caused an unusually high level of investment income per share. F For the period September 3, 1996 (commencement of sale of Institutional Class shares) to July 31, 1997. G FMR agreed to reimburse a portion of the class' expenses during the period. Without this reimbursement, the class' expense ratio would have been higher. H FMR or the fund has entered into varying arrangements with third parties who either paid or reduced a portion of the class' expenses. I The amounts shown reflect certain reclassifications related to book to tax differences. |
||||
Cyclical Industries
For the period ended July 31, 2000
1. Significant Accounting Policies.
Fidelity Advisor Cyclical Industries Fund (the fund) is a fund of Fidelity Advisor Series VII (the trust) and is authorized to issue an unlimited number of shares. The trust is registered under the Investment Company Act of 1940, as amended (the 1940 Act), as an open-end management investment company organized as a Massachusetts business trust.
The fund offers Class A, Class T, Class B, Class C, and Institutional Class shares, each of which has equal rights as to assets and voting privileges. Each class has exclusive voting rights with respect to matters that affect that class. Class B shares will automatically convert to Class A shares after a holding period of seven years from the initial date of purchase. Investment income, realized and unrealized capital gains and losses, the common expenses of the fund, and certain fund-level expense reductions, if any, are allocated on a pro rata basis to each class based on the relative net assets of each class to the total net assets of the fund. Each class of shares differs in its respective distribution, transfer agent, and certain other class-specific fees, expenses, and expense reductions.
The financial statements have been prepared in conformity with generally accepted accounting principles which require management to make certain estimates and assumptions at the date of the financial statements. The following summarizes the significant accounting policies of the fund:
Security Valuation. Securities for which exchange quotations are readily available are valued at the last sale price, or if no sale price, at the closing bid price. Foreign securities are valued based on quotations from the principal market in which such securities are normally traded. If trading or events occurring in other markets after the close of the principal market in which foreign securities are traded, and before the close of the business of the fund, are expected to materially affect the value of those securities, then they are valued at their fair value taking this trading or these events into account. Fair value is determined in good faith under consistently applied procedures under the general supervision of the Board of Trustees. Securities for which exchange quotations are not readily available (and in certain cases debt securities which trade on an exchange) are valued primarily using dealer-supplied valuations or at their fair value. Short-term securities with remaining maturities of sixty days or less for which quotations are not readily available are valued at amortized cost or original cost plus accrued interest, both of which approximate current value.
Foreign Currency Translation. The accounting records of the fund are maintained in U.S. dollars. Investment securities and other assets and liabilities denominated in a foreign currency are translated into U.S. dollars at the prevailing rates of exchange at period end. Purchases and sales of securities, income receipts and expense payments are translated into U.S. dollars at the prevailing exchange rate on the respective dates of the transactions.
Net realized gains and losses on foreign currency transactions represent net gains and losses from sales and maturities of foreign currency contracts, disposition of foreign currencies, the difference between the amount of net investment income accrued and the U.S. dollar amount actually received, and gains and losses between trade and settlement date on purchases and sales of securities. The effects of changes in foreign currency exchange rates on investments in securities are included with the net realized and unrealized gain or loss on investment securities.
Income Taxes. As a qualified regulated investment company under Subchapter M of the Internal Revenue Code, the fund is not subject to income taxes to the extent that it distributes substantially all of its taxable income for its fiscal year. The schedule of investments includes information regarding income taxes under the caption "Income Tax Information."
Investment Income. Dividend income is recorded on the ex-dividend date, except certain dividends from foreign securities where the ex-dividend date may have passed, are recorded as soon as the fund is informed of the ex-dividend date. Non-cash dividends included in dividend income, if any, are recorded at the fair market value of the securities received. Interest income is accrued as earned. Investment income is recorded net of foreign taxes withheld where recovery of such taxes is uncertain.
Expenses. Most expenses of the trust can be directly attributed to a fund. Expenses which cannot be directly attributed are apportioned among the funds in the trust.
Distributions to Shareholders. Distributions are recorded on the ex-dividend date. Income dividends and capital gain distributions are declared separately for each class.
Income and capital gain distributions are determined in accordance with income tax regulations which may differ from generally accepted accounting principles. These differences, which may result in distribution reclassifications, are primarily due to differing treatments for foreign currency transactions, net operating losses and losses deferred due to wash sales. The fund also utilized earnings and profits distributed to shareholders on redemption of shares as a part of the dividends paid deduction for income tax purposes.
Permanent book and tax basis differences relating to shareholder distributions will result in reclassifications to paid in capital. Accumulated undistributed net realized gain (loss) on investments and foreign currency transactions may include temporary book and tax basis differences which will reverse in a subsequent period. Any taxable income or gain remaining at fiscal year end is distributed in the following year.
Annual Report
Notes to Financial Statements - continued
1. Significant Accounting Policies - continued
Short-Term Trading (Redemption) Fees. Shares held in the fund less than 60 days are subject to a short-term trading fee equal to 1% of the proceeds of the redeemed shares. The fee, which is retained by the fund, is accounted for as an addition to paid in capital.
Security Transactions. Security transactions are accounted for as of trade date. Gains and losses on securities sold are determined on the basis of identified cost.
2. Operating Policies.
Foreign Currency Contracts. The fund generally uses foreign currency contracts to facilitate transactions in foreign-denominated securities. Losses may arise from changes in the value of the foreign currency or if the counterparties do not perform under the contracts' terms. The U.S. dollar value of foreign currency contracts is determined using contractual currency exchange rates established at the time of each trade.
Joint Trading Account. Pursuant to an Exemptive Order issued by the Securities and Exchange Commission (the SEC), the fund, along with other affiliated entities of Fidelity Management & Research Company (FMR), may transfer uninvested cash balances into one or more joint trading accounts. These balances are invested in one or more repurchase agreements for U.S. Treasury or Federal Agency obligations.
Repurchase Agreements. The underlying U.S. Treasury, Federal Agency, or other obligations found to be satisfactory by FMR are transferred to an account of the fund, or to the Joint Trading Account, at a custodian bank. The securities are marked-to-market daily and maintained at a value at least equal to the principal amount of the repurchase agreement (including accrued interest). FMR, the fund's investment adviser, is responsible for determining that the value of the underlying securities remains in accordance with the market value requirements stated above.
Cash Central Funds. Pursuant to an Exemptive Order issued by the SEC, the fund may invest in the Fidelity Cash Central Fund and the Fidelity Securities Lending Cash Central Fund (the Cash Funds) managed by Fidelity Investments Money Management, Inc., an affiliate of FMR. The Cash Funds are open-end money market funds available only to investment companies and other accounts managed by FMR and its affiliates. The Cash Funds seek preservation of capital, liquidity, and current income. Income distributions from the Cash Funds are declared daily and paid monthly from net interest income. Income distributions earned by the fund are recorded as either interest income or security lending income in the accompanying financial statements.
3. Purchases and Sales of Investments.
Purchases and sales of securities, other than short-term securities, aggregated $10,052,419 and $11,742,484, respectively.
4. Fees and Other Transactions with Affiliates.
Management Fee. As the fund's investment adviser, FMR receives a monthly fee that is calculated on the basis of a group fee rate plus a fixed individual fund fee rate applied to the average net assets of the fund. The group fee rate is the weighted average of a series of rates and is based on the monthly average net assets of all the mutual funds advised by FMR. The rates ranged from .2167% to .5200% for the period. The annual individual fund fee rate is .30%. In the event that these rates were lower than the contractual rates in effect during the period, FMR voluntarily implemented the above rates, as they resulted in the same or a lower management fee. For the period, the management fee was equivalent to an annual rate of .58% of average net assets.
Distribution and Service Plan. In accordance with Rule 12b-1 of the 1940 Act, the Board of Trustees have adopted separate Distribution and Service Plans with respect to each class of shares (collectively referred to as "the Plans"). Under certain of the Plans, the class pays Fidelity Distributors Corporation (FDC), an affiliate of FMR, a 12b-1 fee. A portion of this fee may be reallowed to securities dealers, banks and other financial institutions for the distribution of each class of shares and providing shareholder support services. For the period, this fee was based on the following annual rates of the average net assets of each applicable class:
|
Class A |
.25% |
|
Class T |
.50% |
|
Class B |
1.00%* |
|
Class C |
1.00%* |
* .75% represents a distribution fee and .25% represents a shareholder service fee.
For the period, each class paid FDC the following amounts, a portion of which was retained by FDC:
|
|
Paid to |
Retained |
|
Class A |
$ 2,481 |
$ 397 |
|
Class T |
16,915 |
758 |
|
Class B |
19,498 |
14,963 |
|
Class C |
8,917 |
6,628 |
|
|
$ 47,811 |
$ 22,746 |
Sales Load. FDC receives a front-end sales charge of up to 5.75% for selling Class A shares, and 3.50% for selling Class T shares of the fund. FDC receives the proceeds of contingent deferred sales charges levied on Class B share redemptions occurring within six years of purchase and Class C share redemptions occurring within one year of purchase. Contingent deferred sales charges are based on declining rates ranging from 5% to 1% for Class B and 1% for Class C, of the lesser of the cost of shares at the initial date of purchase or the net asset value of the redeemed shares, excluding any reinvested dividends and capital gains. In addition, purchases of Class A and Class T shares that were subject to a finder's fee bear a contingent deferred sales charge on assets that do not remain
Cyclical Industries
Notes to Financial Statements - continued
4. Fees and Other Transactions with
Affiliates - continued
Sales Load - continued
in the fund for at least one year. The Class A and Class T contingent deferred sales charge is based on 0.25% of the lesser of the cost of shares at the initial date of purchase or the net asset value of the redeemed shares, excluding any reinvested dividends and capital gains. A portion of the sales charges paid to FDC is paid to securities dealers, banks and other financial institutions.
For the period, sales charge amounts paid to and retained by FDC were as follows:
|
|
Paid to |
Retained |
|
Class A |
$ 4,529 |
$ 2,335 |
|
Class T |
8,135 |
3,305 |
|
Class B |
11,022 |
11,022* |
|
Class C |
3,704 |
3,704* |
|
|
$ 27,390 |
$ 20,366 |
* When Class B and Class C shares are initially sold, FDC pays commissions from its own resources to securities dealers,
banks, and other financial institutions through which the sales are made.
Transfer Agent Fees. Fidelity Investments Institutional Operations Company, Inc., (FIIOC), an affiliate of FMR, is the transfer, dividend disbursing and shareholder servicing agent (collectively referred to as the transfer agent) for each class of the fund. FIIOC receives account fees and asset-based fees that vary according to the account size and type of account of the shareholders of the respective classes of the fund. FIIOC pays for typesetting, printing and mailing of all shareholder reports, except proxy statements. For the period, the following amounts were paid to FIIOC:
|
|
Amount |
% of |
|
Class A |
$ 3,413 |
.34 |
|
Class T |
11,640 |
.34 |
|
Class B |
7,255 |
.37 |
|
Class C |
3,145 |
.35 |
|
Institutional Class |
5,418 |
.23 |
|
|
$ 30,871 |
|
Accounting and Security Lending Fees. Fidelity Service Company, Inc., an affiliate of FMR, maintains the fund's accounting records and administers the security lending program. The security lending fee is based on the number and duration of lending transactions. The accounting fee is based on the level of average net assets for the month plus out-of-pocket expenses.
Brokerage Commissions. The fund placed a portion of its portfolio transactions with brokerage firms which are affiliates of FMR. The commissions paid to these affiliated firms were $1,155 for the period.
5. Security Lending.
The fund lends portfolio securities from time to time in order to earn additional income. The fund receives collateral in the form of U.S. Treasury obligations, letters of credit, and/or cash against the loaned securities, and maintains collateral in an amount not less than 100% of the market value of the loaned securities during the period of the loan. The market value of the loaned securities is determined at the close of business of the fund and any additional required collateral is delivered to the fund on the next business day. If the borrower defaults on its obligation to return the securities loaned because of insolvency or other reasons, the fund could experience delays and costs in recovering the securities loaned or in gaining access to the collateral. At period end, the value of the securities loaned amounted to $412,391. The fund received cash collateral of $417,700 which was invested in cash equivalents.
6. Expense Reductions.
FMR voluntarily agreed to reimburse operating expenses (excluding interest, taxes, certain securities lending fees, brokerage commissions and extraordinary expenses, if any) above the following annual rates or range of annual rates of average net assets for each of the following classes:
|
|
FMR |
Reimbursement |
|
Class A |
1.50% |
$ 13,557 |
|
Class T |
1.75% |
46,204 |
|
Class B |
2.25% |
27,184 |
|
Class C |
2.25% |
12,260 |
|
Institutional Class |
1.25% |
29,504 |
|
|
|
$ 128,709 |
|
|
|
|
FMR has also directed certain portfolio trades to brokers who paid a portion of the fund's expenses. For the period, the fund's expenses were reduced by $1,044 under this arrangement.
7. Beneficial Interest.
At the end of the period, FMR and its affiliates were record owners of approximately 19% of the total outstanding shares of the fund. In addition, one unaffiliated shareholder was record owner of 12% of the total outstanding shares of the fund.
Cyclical Industries
Notes to Financial Statements - continued
8. Distributions to Shareholders.
Distributions to shareholders of each class were as follows:
|
|
Years ended July 31, |
|
|
|
2000 |
1999 |
|
From net realized gain |
|
|
|
Class A |
$ 20,883 |
$ 23,684 |
|
Class T |
54,397 |
144,300 |
|
Class B |
34,793 |
41,003 |
|
Class C |
14,419 |
9,726 |
|
Institutional Class |
53,590 |
69,272 |
|
Total |
$ 178,082 |
$ 287,985 |
9. Share Transactions.
Transactions for each class of shares were as follows:
|
|
Shares |
Dollars |
||
|
|
Year ended |
Year ended |
Year ended |
Year ended |
|
|
2000 |
1999 |
2000 |
1999 |
|
|
|
|
|
|
|
Class A |
61,024 |
37,470 |
$ 827,020 |
$ 504,717 |
|
Reinvestment of distributions |
1,425 |
2,196 |
19,437 |
23,537 |
|
Shares redeemed |
(54,082) |
(11,006) |
(720,877) |
(149,922) |
|
Net increase (decrease) |
8,367 |
28,660 |
$ 125,580 |
$ 378,332 |
|
Class T |
169,723 |
149,470 |
$ 2,263,379 |
$ 2,008,694 |
|
Reinvestment of distributions |
3,842 |
13,134 |
52,336 |
140,529 |
|
Shares redeemed |
(132,075) |
(135,949) |
(1,771,784) |
(1,711,581) |
|
Net increase (decrease) |
41,490 |
26,655 |
$ 543,931 |
$ 437,642 |
|
Class B |
92,855 |
121,052 |
$ 1,230,975 |
$ 1,640,891 |
|
Reinvestment of distributions |
1,960 |
3,632 |
26,332 |
38,541 |
|
Shares redeemed |
(100,163) |
(51,075) |
(1,324,215) |
(651,249) |
|
Net increase (decrease) |
(5,348) |
73,609 |
$ (66,908) |
$ 1,028,183 |
|
Class C |
44,151 |
106,908 |
$ 584,454 |
$ 1,480,405 |
|
Reinvestment of distributions |
650 |
915 |
8,758 |
9,726 |
|
Shares redeemed |
(102,037) |
(15,704) |
(1,353,255) |
(201,951) |
|
Net increase (decrease) |
(57,236) |
92,119 |
$ (760,043) |
$ 1,288,180 |
|
Institutional Class |
18,068 |
145,280 |
$ 247,803 |
$ 1,976,046 |
|
Reinvestment of distributions |
2,497 |
6,212 |
34,539 |
67,155 |
|
Shares redeemed |
(132,595) |
(14,316) |
(1,796,149) |
(189,756) |
|
Net increase (decrease) |
(112,030) |
137,176 |
$ (1,513,807) |
$ 1,853,445 |
Cyclical Industries
Performance
There are several ways to evaluate historical performance. You can look at the total percentage change in value, the average annual percentage change or the growth of a hypothetical $10,000 investment. Total return reflects the change in the value of an investment, assuming reinvestment of dividend income and capital gains (the profits earned upon the sale of securities that have grown in value). If Fidelity had not reimbursed certain class expenses, the life of fund total returns would have been lower.
Cumulative Total Returns
|
Periods ended July 31, 2000 |
|
Past 1 |
Life of |
|
Fidelity Adv Financial - CL A |
|
5.12% |
102.38% |
|
Fidelity Adv Financial - CL A |
|
-0.92% |
90.74% |
|
S&P 500 |
|
8.98% |
131.80% |
|
GS Financial Services |
|
3.20% |
109.74% |
Cumulative total returns show Class A shares' performance in percentage terms over a set period - in this case, one year or since the fund started on September 3, 1996. You can compare Class A shares' returns to both the performance of the Standard & Poor's 500 Index - a market capitalization-weighted index of common stocks - and the Goldman Sachs Financial Services Index - a market capitalization-weighted index of 256 stocks designed to measure the performance of companies in the financial services sector. Issues in the index include financial institutions providing banking services, brokerage firms and asset managers, insurance companies, and real estate holding and development companies. These benchmarks include reinvested dividends and capital gains, if any, and exclude the effect of sales charges.
Average Annual Total Returns
|
Periods ended July 31, 2000 |
|
Past 1 |
Life of |
|
Fidelity Adv Financial - CL A |
|
5.12% |
19.76% |
|
Fidelity Adv Financial - CL A |
|
-0.92% |
17.96% |
|
S&P 500 |
|
8.98% |
23.99% |
|
GS Financial Services |
|
3.20% |
20.86% |
Average annual returns take Class A shares' cumulative return and show you what would have happened if Class A shares had performed at a constant rate each year.
$10,000 Over Life of Fund
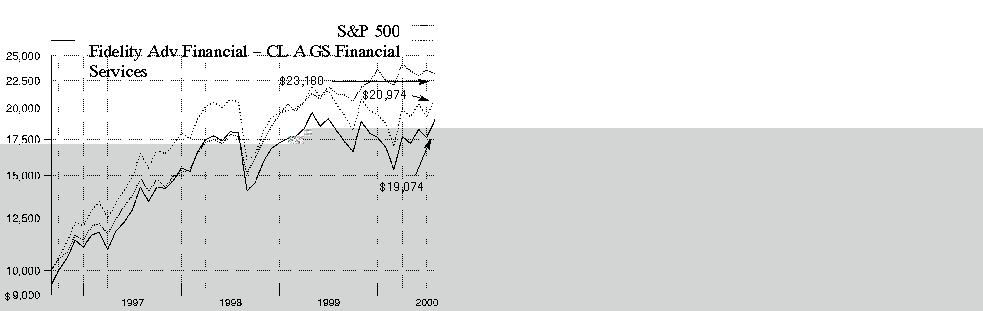
$10,000 Over Life of Fund: Let's say hypothetically that $10,000 was invested in Fidelity Advisor Financial Services - Class A on September 3, 1996, when the fund started, and the current 5.75% sales charge was paid. As the chart shows, by July 31, 2000, the value of the investment would have grown to $19,074 - a 90.74% increase on the initial investment. For comparison, look at how the Standard & Poor's 500 Index did over the same period. With dividends and capital gains, if any, reinvested, the same $10,000 investment would have grown to $23,180 - a 131.80% increase. If $10,000 was invested in the Goldman Sachs Financial Services Index, it would have grown to $20,974 - a 109.74% increase.
Understanding Performance
How a fund did yesterday is no guarantee of how it will do tomorrow. The stock market, for example, has a history of long-term growth and short-term volatility. Unlike the broader market, however, some sectors may not have a history of growth in the long run. And, as with all stock funds, the share price and return of a fund that invests in a sector will vary.
3Annual Report
Performance
There are several ways to evaluate historical performance. You can look at the total percentage change in value, the average annual percentage change or the growth of a hypothetical $10,000 investment. Total return reflects the change in the value of an investment, assuming reinvestment of dividend income and capital gains (the profits earned upon the sale of securities that have grown in value).
Cumulative Total Returns
|
Periods ended July 31, 2000 |
|
Past 1 |
Life of |
|
Fidelity Adv Financial - CL T |
|
4.84% |
100.39% |
|
Fidelity Adv Financial - CL T |
|
1.17% |
93.38% |
|
S&P 500 |
|
8.98% |
131.80% |
|
GS Financial Services |
|
3.20% |
109.74% |
Cumulative total returns show Class T shares' performance in percentage terms over a set period - in this case, one year or since the fund started on September 3, 1996. You can compare Class T shares' returns to both the performance of the Standard & Poor's 500 Index - a market capitalization-weighted index of common stocks - and the Goldman Sachs Financial Services Index - a market capitalization-weighted index of 256 stocks designed to measure the performance of companies in the financial services sector. Issues in the index include financial institutions providing banking services, brokerage firms and asset managers, insurance companies, and real estate holding and development companies. These benchmarks include reinvested dividends and capital gains, if any, and exclude the effect of sales charges.
Average Annual Total Returns
|
Periods ended July 31, 2000 |
|
Past 1 |
Life of |
|
Fidelity Adv Financial - CL T |
|
4.84% |
19.46% |
|
Fidelity Adv Financial - CL T |
|
1.17% |
18.37% |
|
S&P 500 |
|
8.98% |
23.99% |
|
GS Financial Services |
|
3.20% |
20.86% |
Average annual returns take Class T shares' cumulative return and show you what would have happened if Class T shares had performed at a constant rate each year.
$10,000 Over Life of Fund
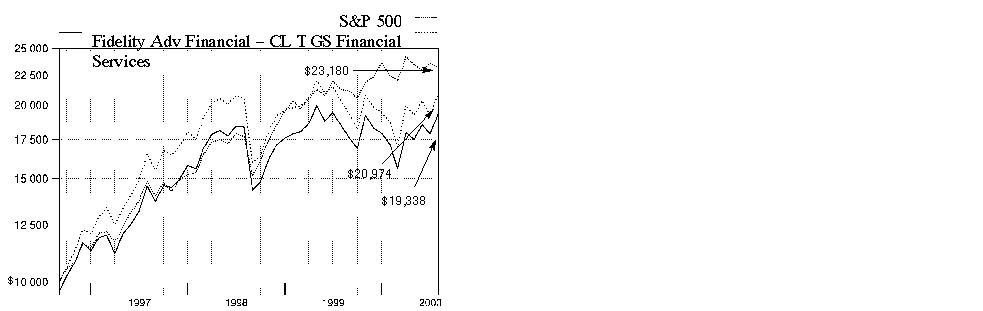
$10,000 Over Life of Fund: Let's say hypothetically that $10,000 was invested in Fidelity Advisor Financial Services - Class T on September 3, 1996, when the fund started, and the current 3.50% sales charge was paid. As the chart shows, by July 31, 2000, the value of the investment would have grown to $19,338 - a 93.38% increase on the initial investment. For comparison, look at how the Standard & Poor's 500 Index did over the same period. With dividends and capital gains, if any, reinvested, the same $10,000 investment would have grown to $23,180 - a 131.80% increase. If $10,000 was invested in the Goldman Sachs Financial Services Index, it would have grown to $20,974 - a 109.74% increase.
Understanding Performance
How a fund did yesterday is no guarantee of how it will do tomorrow. The stock market, for example, has a history of long-term growth and short-term volatility. Unlike the broader market, however, some sectors may not have a history of growth in the long run. And, as with all stock funds, the share price and return of a fund that invests in a sector will vary.
3Annual Report
Performance
There are several ways to evaluate historical performance. You can look at the total percentage change in value, the average annual percentage change or the growth of a hypothetical $10,000 investment. Total return reflects the change in the value of an investment, assuming reinvestment of dividend income and capital gains (the profits earned upon the sale of securities that have grown in value). The initial offering of Class B shares took place on March 3, 1997. Class B shares bear a 1.00% 12b-1 fee. Returns prior to March 3, 1997 are those of Class T which bears a 0.50% 12b-1 fee. Had Class B shares' 12b-1 fee been reflected, returns prior to March 3, 1997 would have been lower. Class B shares' contingent deferred sales charge included in the past one year and life of fund total return figures are 5% and 3%, respectively. If Fidelity had not reimbursed certain class expenses, the life of fund total returns would have been lower.
Cumulative Total Returns
|
Periods ended July 31, 2000 |
|
Past 1 |
Life of |
|
Fidelity Adv Financial - CL B |
|
4.30% |
96.97% |
|
Fidelity Adv Financial - CL B |
|
-0.70% |
93.97% |
|
S&P 500 |
|
8.98% |
131.80% |
|
GS Financial Services |
|
3.20% |
109.74% |
Cumulative total returns show Class B shares' performance in percentage terms over a set period - in this case, one year or since the fund started on September 3, 1996. You can compare Class B shares' returns to both the performance of the Standard & Poor's 500 Index - a market capitalization-weighted index of common stocks - and the Goldman Sachs Financial Services Index - a market capitalization-weighted index of 256 stocks designed to measure the performance of companies in the financial services sector. Issues in the index include financial institutions providing banking services, brokerage firms and asset managers, insurance companies, and real estate holding and development companies. These benchmarks include reinvested dividends and capital gains, if any, and exclude the effect of sales charges.
Average Annual Total Returns
|
Periods ended July 31, 2000 |
|
Past 1 |
Life of |
|
Fidelity Adv Financial - CL B |
|
4.30% |
18.93% |
|
Fidelity Adv Financial - CL B |
|
-0.70% |
18.46% |
|
S&P 500 |
|
8.98% |
23.99% |
|
GS Financial Services |
|
3.20% |
20.86% |
Average annual returns take Class B shares' cumulative return and show you what would have happened if Class B shares had performed at a constant rate each year.
$10,000 Over Life of Fund
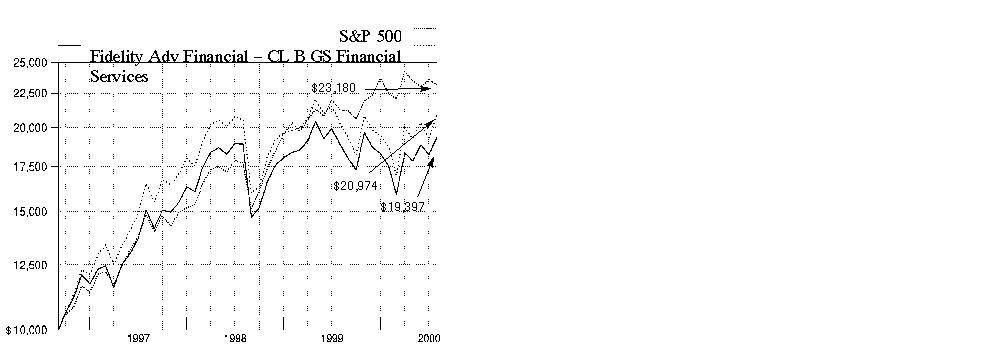
$10,000 Over Life of Fund: Let's say hypothetically that $10,000 was invested in Fidelity Advisor Financial Services - Class B on September 3, 1996, when the fund started. As the chart shows, by July 31, 2000, the value of the investment, including the effect of the contingent deferred sales charge, would have grown to $19,397 - a 93.97% increase on the initial investment. For comparison, look at how the Standard & Poor's 500 Index did over the same period. With dividends and capital gains, if any, reinvested, the same $10,000 investment would have grown to $23,180 - a 131.80% increase. If $10,000 was invested in the Goldman Sachs Financial Services Index, it would have grown to $20,974 - a 109.74% increase.
Understanding Performance
How a fund did yesterday is no guarantee of how it will do tomorrow. The stock market, for example, has a history of long-term growth and short-term volatility. Unlike the broader market, however, some sectors may not have a history of growth in the long run. And, as with all stock funds, the share price and return of a fund that invests in a sector will vary.
3Annual Report
Performance
There are several ways to evaluate historical performance. You can look at the total percentage change in value, the average annual percentage change or the growth of a hypothetical $10,000 investment. Total return reflects the change in the value of an investment, assuming reinvestment of dividend income and capital gains (the profits earned upon the sale of securities that have grown in value). The initial offering of Class C shares took place on November 3, 1997. Class C shares bear a 1.00% 12b-1 fee. Returns between March 3, 1997 and November 3, 1997 are those of Class B shares and reflect Class B shares' 1.00% 12b-1 fee. Returns prior to March 3, 1997 are those of Class T which bears a 0.50% 12b-1 fee. Had Class C shares' 12b-1 fee been reflected, returns prior to March 3, 1997 would have been lower. Class C shares' contingent deferred sales charge included in the past one year and life of fund total return figures are 1% and 0%, respectively. If Fidelity had not reimbursed certain class expenses, the life of fund total returns would have been lower.
Cumulative Total Returns
|
Periods ended July 31, 2000 |
|
Past 1 |
Life of |
|
Fidelity Adv Financial - CL C |
|
4.30% |
96.77% |
|
Fidelity Adv Financial - CL C |
|
3.30% |
96.77% |
|
S&P 500 |
|
8.98% |
131.80% |
|
GS Financial Services |
|
3.20% |
109.74% |
Cumulative total returns show Class C shares' performance in percentage terms over a set period - in this case, one year or since the fund started on September 3, 1996. You can compare Class C shares' returns to both the performance of the Standard & Poor's 500 Index - a market capitalization-weighted index of common stocks - and the Goldman Sachs Financial Services Index - a market capitalization-weighted index of 256 stocks designed to measure the performance of companies in the financial services sector. Issues in the index include financial institutions providing banking services, brokerage firms and asset managers, insurance companies, and real estate holding and development companies. These benchmarks include reinvested dividends and capital gains, if any, and exclude the effect of sales charges.
Average Annual Total Returns
|
Periods ended July 31, 2000 |
Past 1 |
Life of |
|
Fidelity Adv Financial - CL C |
4.30% |
18.90% |
|
Fidelity Adv Financial - CL C |
3.30% |
18.90% |
|
S&P 500 |
8.98% |
23.99% |
|
GS Financial Services |
3.20% |
20.86% |
Average annual returns take Class C shares' cumulative return and show you what would have happened if Class C shares had performed at a constant rate each year.
$10,000 Over Life of Fund
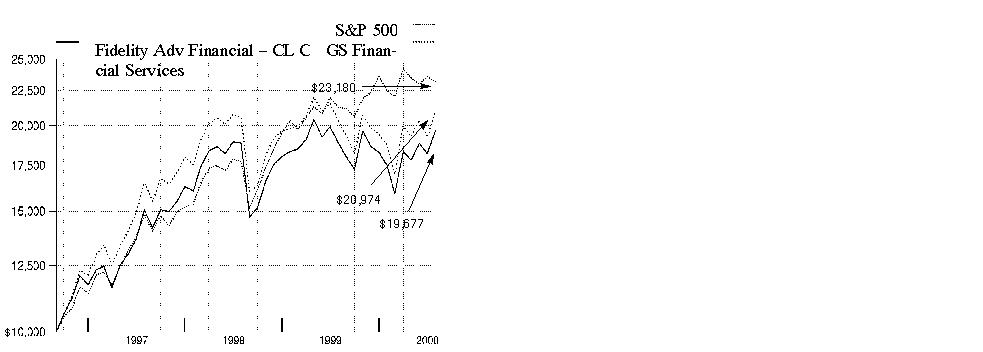
$10,000 Over Life of Fund: Let's say hypothetically that $10,000 was invested in Fidelity Advisor Financial Services - Class C on September 3, 1996, when the fund started. As the chart shows, by July 31, 2000, the value of the investment would have grown to $19,677 - a 96.77% increase on the initial investment. For comparison, look at how the Standard & Poor's 500 Index did over the same period. With dividends and capital gains, if any, reinvested, the same $10,000 investment would have grown to $23,180 - a 131.80% increase. If $10,000 was invested in the Goldman Sachs Financial Services Index, it would have grown to $20,974 - a 109.74% increase.
Understanding Performance
How a fund did yesterday is no guarantee of how it will do tomorrow. The stock market, for example, has a history of long-term growth and short-term volatility. Unlike the broader market, however, some sectors may not have a history of growth in the long run. And, as with all stock funds, the share price and return of a fund that invests in a sector will vary.
3Annual Report
(Portfolio Manager photograph)
An interview with
James Catudal, Portfolio Manager of Fidelity Advisor Financial Services Fund
Q. How did the fund perform, Jim?
A. For the 12 months that ended July 31, 2000, the fund's Class A, Class T, Class B and Class C shares had returns of 5.12%, 4.84%, 4.30% and 4.30%, respectively. During the same 12-month period, the Goldman Sachs Financial Services Index - an index of 256 stocks designed to measure the performance of companies in the financial services sector - had a return of 3.20%, while the Standard & Poor's 500 Index returned 8.98%.
A. For the 12 months that ended July 31, 2000, the fund's Institutional Class shares had a total return of 5.40%. During the same 12-month period, the Goldman Sachs Financial Services Index - an index of 256 stocks designed to measure the performance of companies in the financial services sector - had a return of 3.20%, while the Standard & Poor's 500 Index returned 8.98%.
Q. What factors affected the performance of financial services stocks during the period?
A. The Federal Reserve Board's attempt to slow the rate of economic growth and avoid inflation by raising short-term interest rates was the biggest factor hurting financial services stocks, causing them to underperform the overall stock market. For the most part, large-cap financial services companies did better than mid- and small-cap firms. Companies with economies of scale in a relatively fast-growing business also generally did well. Otherwise, the investments smaller companies had to make to keep up were just too high. Among banks, commercial credit quality started to deteriorate, although consumer credit quality remained strong. A number of banks lowered their earnings expectations, especially in the past six months, hurting the performance of their stocks. In addition, several relatively high-profile banking mergers ran into trouble as the acquiring institutions struggled to integrate the operations of the newly combined companies. Banks and financial services companies that branched into faster-growing businesses had much better results, and investors gravitated toward those companies they saw as winners. As a result, stocks such as American Express and American International Group were selling at price-to-earnings (P/E) ratios of more than 30, while traditional bank stocks such as KeyCorp were selling at P/E ratios of less than 10.
Q. How did financial institutions other than banks perform?
A. Investment management stocks did well, helped by an increase in merger-and-acquisition activity as well as by their high level of recurring fee income and their long-term growth prospects. Investment banks and securities companies performed well, benefiting from strong underwriting of new equity securities. Commercial property-and-casualty insurance companies and life insurance companies also saw improved performance, although personal property-and-casualty companies continued to have problems.
Q. What were your principal strategies?
A. I overweighted consumer finance, investment management and property-and-casualty and life insurance companies. In general, I underweighted traditional banks, although I did emphasize companies such as Bank of New York and State Street that had large securities processing operations. Also, I emphasized successful large-cap financial services companies, including Citigroup, American Express, Morgan Stanley Dean Witter and American International Group. I also overweighted government-sponsored enterprises such as Fannie Mae and Freddie Mac, although they didn't perform well. I liked these stocks because they were selling at very low valuations and tend to do well when the Fed has completed its cycle of interest-rate hikes.
Q. Which other investments helped performance, and which didn't?
A. Morgan Stanley Dean Witter, a diversified financial services company, had very strong performance, helped by its equity underwriting business. Citigroup also performed well as all its businesses reported good results. Kansas City Southern had good performance. Its stock rose in anticipation of its spin-off of Stillwell Financial. Freddie Mac and Fannie Mae were disappointments, although I continued to like their prospects. They were hurt by rising interest rates and political controversies over their size and over the implied government guarantees behind the securities that they issue.
Q. What is your outlook?
A. We are in an unusual period in which we have to assess both the positive effects of a likely end to interest-rate hikes and the negative effects of potential commercial credit quality problems. The prospects for financial services stocks in general will depend on whether the economy has a hard landing, in which growth slows significantly, or a soft landing, in which growth slows to a more moderate level. If it's the former, financial companies will be hurt. If it's a soft landing, they should do relatively well. Therefore, I have tried to position the fund with stocks that have the potential to do well in either scenario.
The views expressed in this report reflect those of the portfolio manager only through the end of the period of the report as stated on the cover. The manager's views are subject to change at any time based on market and other conditions. For more information see page A-3.
Fund Facts
Start date: September 3, 1996
Size: as of July 31, 2000, more than
$471 million
Manager: James Catudal, since February 2000; joined Fidelity in 1997
3
Annual Report
Advisor Financial Services Fund
|
Top Ten Stocks as of July 31, 2000 |
|
|
|
% of fund's |
|
Morgan Stanley Dean Witter & Co. |
5.3 |
|
Citigroup, Inc. |
5.2 |
|
American International Group, Inc. |
4.6 |
|
American Express Co. |
4.0 |
|
Fannie Mae |
3.8 |
|
Bank of America Corp. |
3.2 |
|
Wells Fargo & Co. |
3.2 |
|
Charles Schwab Corp. |
3.1 |
|
Berkshire Hathaway, Inc. Class A |
2.6 |
|
Freddie Mac |
2.5 |
|
|
37.5 |
|
Top Industries as of July 31, 2000 |
|
|
% of fund's net assets |
||
|
Insurance |
24.4% |
|
Banks |
21.8% |
|
Credit & Other Finance |
16.0% |
|
Securities Industry |
15.6% |
|
Federal Sponsored Credit |
6.7% |
|
All Others* |
15.5% |

|
* Includes short-term investments and net other assets. |
Annual Report
Advisor Financial Services Fund
Showing Percentage of Net Assets
|
Common Stocks - 91.8% |
|||
|
Shares |
Value (Note 1) |
||
|
BANKS - 21.8% |
|||
|
Bank of America Corp. |
321,004 |
$ 15,207,565 |
|
|
Bank of New York Co., Inc. |
157,760 |
7,385,140 |
|
|
Bank One Corp. |
128,382 |
4,084,152 |
|
|
Banknorth Group, Inc. |
15,000 |
229,688 |
|
|
Canadian Imperial Bank of Commerce |
45,000 |
1,282,948 |
|
|
Capital One Financial Corp. |
35,000 |
2,051,875 |
|
|
Chase Manhattan Corp. |
118,200 |
5,873,063 |
|
|
Comerica, Inc. |
28,250 |
1,440,750 |
|
|
Fifth Third Bancorp |
37,500 |
1,549,219 |
|
|
First Security Corp. |
80,000 |
1,150,000 |
|
|
First Union Corp. |
72,370 |
1,868,051 |
|
|
Firstar Corp. |
194,550 |
3,842,363 |
|
|
FleetBoston Financial Corp. |
175,676 |
6,291,397 |
|
|
J.P. Morgan & Co., Inc. |
30,000 |
4,005,000 |
|
|
M&T Bank Corp. |
2,400 |
1,133,850 |
|
|
Marshall & Ilsley Corp. |
7,000 |
316,750 |
|
|
Mellon Financial Corp. |
145,000 |
5,464,688 |
|
|
Northern Trust Corp. |
31,000 |
2,321,125 |
|
|
PNC Financial Services Group, Inc. |
103,600 |
5,270,650 |
|
|
Royal Bank of Canada |
65,000 |
3,465,909 |
|
|
Silicon Valley Bancshares (a) |
8,000 |
350,500 |
|
|
State Street Corp. |
39,000 |
3,914,625 |
|
|
SunTrust Banks, Inc. |
65,400 |
3,131,025 |
|
|
Synovus Finanical Corp. |
50,000 |
900,000 |
|
|
Toronto Dominion Bank |
89,000 |
2,115,485 |
|
|
U.S. Bancorp |
109,650 |
2,103,909 |
|
|
UnionBanCal Corp. |
378 |
7,182 |
|
|
Wachovia Corp. |
15,605 |
858,275 |
|
|
Wells Fargo & Co. |
364,400 |
15,054,275 |
|
|
|
102,669,459 |
||
|
COMPUTER SERVICES & SOFTWARE - 0.0% |
|||
|
Intuit, Inc. (a) |
3,600 |
122,400 |
|
|
CREDIT & OTHER FINANCE - 16.0% |
|||
|
American Express Co. |
329,900 |
18,701,206 |
|
|
Associates First Capital Corp. Class A |
364,000 |
9,532,250 |
|
|
Citigroup, Inc. |
350,493 |
24,731,662 |
|
|
Countrywide Credit Industries, Inc. |
25,000 |
879,688 |
|
|
Household International, Inc. |
240,057 |
10,697,540 |
|
|
Indymac Bancorp, Inc. |
24,800 |
424,700 |
|
|
MBNA Corp. |
199,250 |
6,649,969 |
|
|
Metris Companies, Inc. |
7,500 |
219,844 |
|
|
NextCard, Inc. (a) |
25,000 |
221,094 |
|
|
Providian Financial Corp. |
32,107 |
3,272,907 |
|
|
|
75,330,860 |
||
|
FEDERAL SPONSORED CREDIT - 6.7% |
|||
|
Fannie Mae |
354,935 |
17,702,383 |
|
|
|
|||
|
Shares |
Value (Note 1) |
||
|
Freddie Mac |
301,020 |
$ 11,871,476 |
|
|
SLM Holding Corp. |
47,000 |
2,023,938 |
|
|
|
31,597,797 |
||
|
INSURANCE - 24.4% |
|||
|
ACE Ltd. |
145,000 |
5,220,000 |
|
|
AFLAC, Inc. |
74,400 |
3,864,150 |
|
|
Allmerica Financial Corp. |
45,400 |
2,684,275 |
|
|
Allstate Corp. |
130,000 |
3,583,125 |
|
|
AMBAC Financial Group, Inc. |
60,100 |
3,872,694 |
|
|
American General Corp. |
47,500 |
3,167,656 |
|
|
American International Group, Inc. |
245,625 |
21,538,242 |
|
|
Aon Corp. |
20,000 |
720,000 |
|
|
Arthur J. Gallagher & Co. |
14,000 |
686,875 |
|
|
AXA SA de CV sponsored ADR |
5,000 |
378,750 |
|
|
Berkshire Hathaway, Inc.: |
|
|
|
|
Class A (a) |
220 |
12,122,000 |
|
|
Class B (a) |
1,824 |
3,328,800 |
|
|
Commerce Group, Inc. |
8,000 |
222,000 |
|
|
Conseco, Inc. |
120,700 |
950,513 |
|
|
Everest Re Group Ltd. |
40,000 |
1,587,500 |
|
|
Hartford Financial Services Group, Inc. |
117,700 |
7,562,225 |
|
|
HCC Insurance Holdings, Inc. |
33,400 |
684,700 |
|
|
Jefferson-Pilot Corp. |
25,000 |
1,525,000 |
|
|
John Hancock Financial Services, Inc. |
30,000 |
708,750 |
|
|
Lincoln National Corp. |
20,000 |
872,500 |
|
|
Marsh & McLennan Companies, Inc. |
54,950 |
6,703,900 |
|
|
MBIA, Inc. |
45,700 |
2,544,919 |
|
|
MetLife, Inc. |
150,000 |
3,150,000 |
|
|
Nationwide Financial Services, Inc. |
21,300 |
782,775 |
|
|
PartnerRe Ltd. |
36,600 |
1,450,275 |
|
|
PMI Group, Inc. |
21,750 |
1,362,094 |
|
|
Protective Life Corp. |
14,000 |
379,750 |
|
|
Reinsurance Group of America, Inc. |
15,000 |
477,188 |
|
|
Reliastar Financial Corp. |
39,201 |
2,085,003 |
|
|
RenaissanceRe Holdings Ltd. |
43,400 |
2,020,813 |
|
|
SAFECO Corp. |
30,000 |
691,875 |
|
|
Sun Life Financial Services Canada, Inc. |
170,000 |
2,829,142 |
|
|
The Chubb Corp. |
89,500 |
6,623,000 |
|
|
The St. Paul Companies, Inc. |
54,000 |
2,399,625 |
|
|
Torchmark Corp. |
20,000 |
497,500 |
|
|
UnumProvident Corp. |
75,000 |
1,725,000 |
|
|
XL Capital Ltd. Class A |
60,000 |
3,960,000 |
|
|
|
114,962,614 |
||
|
LODGING & GAMING - 0.1% |
|||
|
Starwood Hotels & Resorts |
22,400 |
764,400 |
|
|
RAILROADS - 0.0% |
|||
|
Kansas City Southern Industries, Inc. |
20,500 |
142,219 |
|
|
Common Stocks - continued |
|||
|
Shares |
Value (Note 1) |
||
|
REAL ESTATE INVESTMENT TRUSTS - 4.3% |
|||
|
AMB Property Corp. |
37,900 |
$ 904,863 |
|
|
Apartment Investment & |
47,400 |
2,292,975 |
|
|
Archstone Communities Trust |
45,000 |
1,167,188 |
|
|
Arden Realty Group, Inc. |
15,000 |
397,500 |
|
|
Avalonbay Communities, Inc. |
10,000 |
471,250 |
|
|
BRE Properties, Inc. Class A |
20,000 |
648,750 |
|
|
Cousins Properties, Inc. |
29,500 |
1,286,938 |
|
|
Crescent Real Estate Equities Co. |
56,100 |
1,237,706 |
|
|
Duke-Weeks Realty Corp. |
68,500 |
1,678,250 |
|
|
Equity Office Properties Trust |
63,900 |
1,948,950 |
|
|
Equity Residential Properties Trust (SBI) |
46,500 |
2,319,188 |
|
|
First Industrial Realty Trust, Inc. |
17,000 |
544,000 |
|
|
Host Marriott Corp. |
50,000 |
556,250 |
|
|
Kimco Realty Corp. |
14,100 |
581,625 |
|
|
ProLogis Trust |
55,700 |
1,298,506 |
|
|
Public Storage, Inc. |
37,500 |
960,938 |
|
|
Simon Property Group, Inc. |
21,000 |
548,625 |
|
|
Spieker Properties, Inc. |
25,500 |
1,318,031 |
|
|
|
20,161,533 |
||
|
SAVINGS & LOANS - 2.8% |
|||
|
Astoria Financial Corp. |
20,000 |
582,500 |
|
|
Bank United Corp. Class A |
10,000 |
364,375 |
|
|
Charter One Financial, Inc. |
49,500 |
1,067,344 |
|
|
Dime Bancorp, Inc. |
20,000 |
322,500 |
|
|
Golden State Bancorp, Inc. |
30,000 |
573,750 |
|
|
Golden West Financial Corp. |
48,200 |
2,217,200 |
|
|
TCF Financial Corp. |
76,200 |
2,243,138 |
|
|
Washington Mutual, Inc. |
178,520 |
5,734,955 |
|
|
|
13,105,762 |
||
|
SECURITIES INDUSTRY - 15.6% |
|||
|
A.G. Edwards, Inc. |
25,000 |
1,321,875 |
|
|
Ameritrade Holding Corp. Class A (a) |
22,000 |
281,875 |
|
|
AXA Financial, Inc. |
60,900 |
2,329,425 |
|
|
Bear Stearns Companies, Inc. |
35,625 |
1,919,297 |
|
|
Charles Schwab Corp. |
401,326 |
14,497,903 |
|
|
DLJ, Inc. |
10,000 |
515,625 |
|
|
DLJdirect, Inc. (a) |
17,000 |
114,750 |
|
|
Eaton Vance Corp. (non-vtg.) |
15,000 |
777,188 |
|
|
Federated Investors, Inc. Class B (non-vtg.) |
60,000 |
1,571,250 |
|
|
Franklin Resources, Inc. |
30,000 |
1,076,250 |
|
|
Goldman Sachs Group, Inc. |
13,500 |
1,335,656 |
|
|
Legg Mason, Inc. |
15,000 |
780,000 |
|
|
Lehman Brothers Holdings, Inc. |
41,400 |
4,652,325 |
|
|
Mackenzie Financial Corp. |
30,000 |
438,744 |
|
|
Merrill Lynch & Co., Inc. |
46,600 |
6,023,050 |
|
|
Morgan Stanley Dean Witter & Co. |
272,500 |
24,865,617 |
|
|
Neuberger Berman, Inc. |
15,000 |
744,375 |
|
|
|
|||
|
Shares |
Value (Note 1) |
||
|
PaineWebber Group, Inc. |
15,000 |
$ 1,038,750 |
|
|
Raymond James Financial, Inc. |
10,000 |
250,000 |
|
|
Stilwell Financial, Inc. (a) |
82,000 |
3,613,125 |
|
|
T. Rowe Price Associates, Inc. |
26,000 |
1,062,750 |
|
|
TD Waterhouse Group, Inc. |
46,000 |
839,500 |
|
|
Waddell & Reed Financial, Inc. Class A |
104,767 |
3,431,119 |
|
|
Wit Soundview Group, Inc. |
10,000 |
84,063 |
|
|
|
73,564,512 |
||
|
SERVICES - 0.1% |
|||
|
H&R Block, Inc. |
20,000 |
640,000 |
|
|
TOTAL COMMON STOCKS (Cost $362,827,971) |
433,061,556 |
||
|
Cash Equivalents - 7.8% |
|||
|
Maturity Amount |
|
||
|
Investments in repurchase agreements (U.S. Treasury Obligations), in a joint trading account at 6.56%, dated 7/31/00 due 8/1/00 |
$ 43,008 |
43,000 |
|
|
Shares |
|
||
|
Fidelity Cash Central Fund, 6.57% (b) |
32,582,266 |
32,582,266 |
|
|
Fidelity Securities Lending Cash |
4,214,332 |
4,214,332 |
|
|
TOTAL CASH EQUIVALENTS (Cost $36,839,598) |
36,839,598 |
||
|
TOTAL INVESTMENT PORTFOLIO - 99.6% (Cost $399,667,569) |
469,901,154 |
|
NET OTHER ASSETS - 0.4% |
1,754,979 |
||
|
NET ASSETS - 100% |
$ 471,656,133 |
||
|
Legend |
|
(a) Non-income producing |
|
(b) The rate quoted is the annualized seven-day yield of the fund at |
|
Income Tax Information |
|
At July 31, 2000, the aggregate cost of investment securities for income tax purposes was $403,880,955. Net unrealized appreciation aggregated $66,020,199, of which $88,955,862 related to appreciated investment securities and $22,935,663 related to depreciated investment securities. |
|
At July 31, 2000, the fund had a capital loss carryforward of approximately $7,462,000 of which $4,198,000 and $3,264,000 will expire on July 31, 2007 and 2008, respectively. |
|
The fund intends to elect to defer to its fiscal year ending July 31, 2001 approximately $14,759,000 of losses recognized during the period November 1, 1999 to July 31, 2000. |
|
A total of 100% of Class A's, Class T's, Class C's and Institutional Class' dividends distributed during the fiscal year qualifies for the dividends-received deductions for corporate shareholders (unaudited). |
|
The fund will notify shareholders in January 2001 of the applicable percentage for use in preparing 2000 income tax returns. |
See accompanying notes which are an integral part of the financial statements.
Financial Services
Statement of Assets and Liabilities
|
|
July 31, 2000 |
|
|
Assets |
|
|
|
Investment in securities, at value (including repurchase agreements of $43,000) (cost $399,667,569) - See accompanying schedule |
|
$ 469,901,154 |
|
Cash |
|
187,383 |
|
Receivable for investments sold |
|
9,847,318 |
|
Receivable for fund shares sold |
|
2,737,447 |
|
Dividends receivable |
|
414,499 |
|
Interest receivable |
|
172,903 |
|
Redemption fees receivable |
|
435 |
|
Other receivables |
|
4,826 |
|
Total assets |
|
483,265,965 |
|
Liabilities |
|
|
|
Payable for investments purchased |
$ 6,390,221 |
|
|
Payable for fund shares redeemed |
373,705 |
|
|
Accrued management fee |
216,352 |
|
|
Distribution fees payable |
267,574 |
|
|
Other payables and accrued expenses |
147,648 |
|
|
Collateral on securities loaned, at value |
4,214,332 |
|
|
Total liabilities |
|
11,609,832 |
|
Net Assets |
|
$ 471,656,133 |
|
Net Assets consist of: |
|
|
|
Paid in capital |
|
$ 426,176,905 |
|
Undistributed net investment income |
|
1,705,322 |
|
Accumulated undistributed net realized gain (loss) on investments and foreign currency transactions |
|
(26,459,345) |
|
Net unrealized appreciation (depreciation) on investments |
|
70,233,251 |
|
Net Assets |
|
$ 471,656,133 |
|
Calculation of Maximum |
|
$18.29 |
|
Maximum offering price per share |
|
$19.41 |
|
Class T: |
|
$18.21 |
|
Maximum offering price per share |
|
$18.87 |
|
Class B: |
|
$17.95 |
|
Class C: |
|
$17.96 |
|
Institutional Class: |
|
$18.39 |
A Redemption price per share is equal to net asset value less any applicable contingent deferred sales charge.
Statement of Operations
|
|
Year ended July 31, 2000 |
|
|
Investment Income Dividends |
|
$ 5,814,825 |
|
Interest |
|
1,498,364 |
|
Security lending |
|
15,187 |
|
Total income |
|
7,328,376 |
|
Expenses |
|
|
|
Management fee |
$ 1,974,906 |
|
|
Transfer agent fees |
1,034,853 |
|
|
Distribution fees |
2,385,482 |
|
|
Accounting and security lending fees |
138,087 |
|
|
Non-interested trustees' compensation |
997 |
|
|
Custodian fees and expenses |
13,476 |
|
|
Registration fees |
159,231 |
|
|
Audit |
25,970 |
|
|
Legal |
2,365 |
|
|
Miscellaneous |
7,970 |
|
|
Total expenses before reductions |
5,743,337 |
|
|
Expense reductions |
(98,416) |
5,644,921 |
|
Net investment income |
|
1,683,455 |
|
Realized and Unrealized Gain (Loss) Net realized gain (loss) on: |
|
|
|
Investment securities |
(21,284,132) |
|
|
Foreign currency transactions |
(7,754) |
(21,291,886) |
|
Change in net unrealized appreciation (depreciation) on: |
|
|
|
Investment securities |
41,704,382 |
|
|
Assets and liabilities in |
5 |
41,704,387 |
|
Net gain (loss) |
|
20,412,501 |
|
Net increase (decrease) in net assets resulting from operations |
|
$ 22,095,956 |
See accompanying notes which are an integral part of the financial statements.
Annual Report
Advisor Financial Services Fund
Financial Statements - continued
Statement of Changes in Net Assets
|
Increase (Decrease) in Net Assets |
Year ended |
Year ended |
|
Operations |
$ 1,683,455 |
$ 798,328 |
|
Net realized gain (loss) |
(21,291,886) |
(5,100,835) |
|
Change in net unrealized appreciation (depreciation) |
41,704,387 |
3,565,570 |
|
Net increase (decrease) in net assets resulting from operations |
22,095,956 |
(736,937) |
|
Distributions to shareholders |
(642,372) |
(365,767) |
|
From net realized gain |
- |
(12,710,202) |
|
Total distributions |
(642,372) |
(13,075,969) |
|
Share transactions - net increase (decrease) |
156,543,872 |
75,395,927 |
|
Redemption fees |
278,776 |
103,555 |
|
Total increase (decrease) in net assets |
178,276,232 |
61,686,576 |
|
Net Assets |
|
|
|
Beginning of period |
293,379,901 |
231,693,325 |
|
End of period (including undistributed net investment income of $1,705,322 and $673,045, respectively) |
$ 471,656,133 |
$ 293,379,901 |
Financial Highlights - Class A
|
Years ended July 31, |
2000 |
1999 |
1998 |
1997 E |
|
Selected Per-Share Data |
|
|
|
|
|
Net asset value, beginning of period |
$ 17.49 |
$ 18.74 |
$ 15.11 |
$ 10.00 |
|
Income from Investment Operations |
|
|
|
|
|
Net investment income D |
.15 |
.12 |
.11 |
.06 |
|
Net realized and unrealized gain (loss) |
.73 |
(.31) |
3.80 |
5.06 |
|
Total from investment operations |
.88 |
(.19) |
3.91 |
5.12 |
|
Less Distributions |
|
|
|
|
|
From net investment income |
(.09) |
(.06) |
(.06) |
(.01) |
|
From net realized gain |
- |
(1.01) |
(.23) |
(.01) |
|
Total distributions |
(.09) |
(1.07) |
(.29) |
(.02) |
|
Redemption fees added to paid in capital |
.01 |
.01 |
.01 |
.01 |
|
Net asset value, end of period |
$ 18.29 |
$ 17.49 |
$ 18.74 |
$ 15.11 |
|
Total Return B, C |
5.12% |
.69% |
26.32% |
51.35% |
|
Ratios and Supplemental Data |
|
|
|
|
|
Net assets, end of period (000 omitted) |
$ 48,088 |
$ 27,440 |
$ 21,907 |
$ 6,275 |
|
Ratio of expenses to average net assets |
1.25% |
1.24% |
1.32% |
1.75%A, F |
|
Ratio of expenses to average net assets after expense reductions |
1.22%G |
1.23%G |
1.30%G |
1.73%A, G |
|
Ratio of net investment income to average net assets |
.92% |
.73% |
.63% |
.55%A |
|
Portfolio turnover |
73% |
38% |
54% |
26%A |
|
A Annualized B The total returns would have been lower had certain expenses not been reduced during the periods shown. C Total returns do not include the one time sales charge and for periods of less than one year are not annualized. D Net investment income per share has been calculated based on average shares outstanding during the period. E For the period September 3, 1996 (commencement of sale of Class A shares) to July 31, 1997. F FMR agreed to reimburse a portion of the class' expenses during the period. Without this reimbursement, the class' expense ratio would have been higher. G FMR or the fund has entered into varying arrangements with third parties who either paid or reduced a portion of the class' expenses. |
||||
See accompanying notes which are an integral part of the financial statements.
Financial Services
Financial Highlights - Class T
|
Years ended July 31, |
2000 |
1999 |
1998 |
1997 E |
|
Selected Per-Share Data |
|
|
|
|
|
Net asset value, beginning of period |
$ 17.42 |
$ 18.66 |
$ 15.07 |
$ 10.00 |
|
Income from Investment Operations |
|
|
|
|
|
Net investment income D |
.12 |
.09 |
.07 |
.04 |
|
Net realized and unrealized gain (loss) |
.71 |
(.30) |
3.78 |
5.04 |
|
Total from investment operations |
.83 |
(.21) |
3.85 |
5.08 |
|
Less Distributions |
|
|
|
|
|
From net investment income |
(.05) |
(.03) |
(.04) |
(.01) |
|
From net realized gain |
- |
(1.01) |
(.23) |
(.01) |
|
Total distributions |
(.05) |
(1.04) |
(.27) |
(.02) |
|
Redemption fees added to paid in capital |
.01 |
.01 |
.01 |
.01 |
|
Net asset value, end of period |
$ 18.21 |
$ 17.42 |
$ 18.66 |
$ 15.07 |
|
Total Return B, C |
4.84% |
.53% |
25.96% |
50.95% |
|
Ratios and Supplemental Data |
|
|
|
|
|
Net assets, end of period (000 omitted) |
$ 179,862 |
$ 123,361 |
$ 118,608 |
$ 52,003 |
|
Ratio of expenses to average net assets |
1.47% |
1.47% |
1.52% |
1.94% A |
|
Ratio of expenses to average net assets after expense reductions |
1.44% F |
1.46% F |
1.50% F |
1.91% A, F |
|
Ratio of net investment income to average net assets |
.70% |
.50% |
.44% |
.37% A |
|
Portfolio turnover |
73% |
38% |
54% |
26% A |
|
A Annualized B The total returns would have been lower had certain expenses not been reduced during the periods shown. C Total returns do not include the one time sales charge and for periods of less than one year are not annualized. D Net investment income per share has been calculated based on average shares outstanding during the period. E For the period September 3, 1996 (commencement of sale of Class T shares) to July 31,1997. F FMR or the fund has entered into varying arrangements with third parties who either paid or reduced a portion of the class' expenses. |
Financial Highlights - Class B
|
Years ended July 31, |
2000 |
1999 |
1998 |
1997 E |
|
Selected Per-Share Data |
|
|
|
|
|
Net asset value, beginning of period |
$ 17.21 |
$ 18.52 |
$ 15.04 |
$ 12.56 |
|
Income from Investment Operations |
|
|
|
|
|
Net investment income (loss) D |
.03 |
- |
(.02) |
(.02) |
|
Net realized and unrealized gain (loss) |
.70 |
(.29) |
3.76 |
2.50 |
|
Total from investment operations |
.73 |
(.29) |
3.74 |
2.48 |
|
Less Distributions |
|
|
|
|
|
From net investment income |
- |
(.02) |
(.04) |
- |
|
From net realized gain |
- |
(1.01) |
(.23) |
- |
|
Total distributions |
- |
(1.03) |
(.27) |
- |
|
Redemption fees added to paid in capital |
.01 |
.01 |
.01 |
- |
|
Net asset value, end of period |
$ 17.95 |
$ 17.21 |
$ 18.52 |
$ 15.04 |
|
Total Return B, C |
4.30% |
.05% |
25.29% |
19.75% |
|
Ratios and Supplemental Data |
|
|
|
|
|
Net assets, end of period (000 omitted) |
$ 150,880 |
$ 94,072 |
$ 65,926 |
$ 7,737 |
|
Ratio of expenses to average net assets |
2.01% |
1.99% |
2.06% |
2.50% A, F |
|
Ratio of expenses to average net assets after expense reductions |
1.98% G |
1.98% G |
2.04% G |
2.49% A, G |
|
Ratio of net investment income to average net assets |
.16% |
(.02)% |
(.14)% |
(.37)% A |
|
Portfolio turnover |
73% |
38% |
54% |
26% A |
|
A Annualized B The total returns would have been lower had certain expenses not been reduced during the periods shown. C Total returns do not include the contingent deferred sales charge and for periods of less than one year are not annualized. D Net investment income (loss) per share has been calculated based on average shares outstanding during the period. E For the period March 3, 1997 (commencement of sale of Class B shares) to July 31,1997. F FMR agreed to reimburse a portion of the class' expenses during the period. Without this reimbursement, the class' expense ratio would have been higher. G FMR or the fund has entered into varying arrangements with third parties who either paid or reduced a portion of the class' expenses. |
See accompanying notes which are an integral part of the financial statements.
Annual Report
Financial Highlights - Class C
|
Years ended July 31, |
2000 |
1999 |
1998 E |
|
Selected Per-Share Data |
|
|
|
|
Net asset value, beginning of period |
$ 17.24 |
$ 18.56 |
$ 15.24 |
|
Income from Investment Operations |
|
|
|
|
Net investment income (loss) D |
.03 |
- |
(.03) |
|
Net realized and unrealized gain (loss) |
.70 |
(.29) |
3.57 |
|
Total from investment operations |
.73 |
(.29) |
3.54 |
|
Less Distributions |
|
|
|
|
From net investment income |
(.02) |
(.03) |
(.02) |
|
From net realized gain |
- |
(1.01) |
(.21) |
|
Total distributions |
(.02) |
(1.04) |
(.23) |
|
Redemption fees added to paid in capital |
.01 |
.01 |
.01 |
|
Net asset value, end of period |
$ 17.96 |
$ 17.24 |
$ 18.56 |
|
Total Return B, C |
4.30% |
.07% |
23.56% |
|
Ratios and Supplemental Data |
|
|
|
|
Net assets, end of period (000 omitted) |
$ 83,078 |
$ 36,552 |
$ 19,983 |
|
Ratio of expenses to average net assets |
1.96% |
1.95% |
2.09% A |
|
Ratio of expenses to average net assets after expense reductions |
1.93% F |
1.94% F |
2.07% A, F |
|
Ratio of net investment income to average net assets |
.21% |
.02% |
(.22)% A |
|
Portfolio turnover |
73% |
38% |
54% |
|
A Annualized B The total returns would have been lower had certain expenses not been reduced during the periods shown. C Total returns do not include the contingent deferred sales charge and for periods of less than one year are not annualized. D Net investment income (loss) per share has been calculated based on average shares outstanding during the period. E For the period November 3, 1997 (commencement of sale of Class C shares) to July 31,1998. F FMR or the fund has entered into varying arrangements with third parties who either paid or reduced a portion of the class' expenses. |
Financial Highlights - Institutional Class
|
Years ended July 31, |
2000 |
1999 |
1998 |
1997 E |
|
Selected Per-Share Data |
|
|
|
|
|
Net asset value, beginning of period |
$ 17.60 |
$ 18.80 |
$ 15.14 |
$ 10.00 |
|
Income from Investment Operations |
|
|
|
|
|
Net investment income D |
.21 |
.18 |
.14 |
.10 |
|
Net realized and unrealized gain (loss) |
.72 |
(.30) |
3.79 |
5.06 |
|
Total from investment operations |
.93 |
(.12) |
3.93 |
5.16 |
|
Less Distributions |
|
|
|
|
|
From net investment income |
(.15) |
(.08) |
(.05) |
(.02) |
|
From net realized gain |
- |
(1.01) |
(.23) |
(.01) |
|
Total distributions |
(.15) |
(1.09) |
(.28) |
(.03) |
|
Redemption fees added to paid in capital |
.01 |
.01 |
.01 |
.01 |
|
Net asset value, end of period |
$ 18.39 |
$ 17.60 |
$ 18.80 |
$ 15.14 |
|
Total Return B, C |
5.40% |
1.12% |
26.39% |
51.78% |
|
Ratios and Supplemental Data |
|
|
|
|
|
Net assets, end of period (000 omitted) |
$ 9,749 |
$ 11,956 |
$ 5,270 |
$ 3,758 |
|
Ratio of expenses to average net assets |
.90% |
.93% |
1.14% |
1.50% A, F |
|
Ratio of expenses to average net assets after expense reductions |
.87% G |
.92% G |
1.13% G |
1.47% A, G |
|
Ratio of net investment income to average net assets |
1.27% |
1.04% |
.81% |
.85% A |
|
Portfolio turnover |
73% |
38% |
54% |
26% A |
|
A Annualized B The total returns would have been lower had certain expenses not been reduced during the periods shown. C Total returns for periods of less than one year are not annualized. D Net investment income per share has been calculated based on average shares outstanding during the period. E For the period September 3, 1996 (commencement of sale of Institutional Class shares) to July 31, 1997. F FMR agreed to reimburse a portion of the class' expenses during the period. Without this reimbursement, the class' expense ratio would have been higher. G FMR or the fund has entered into varying arrangements with third parties who either paid or reduced a portion of the class' expenses. |
Financial Services
For the period ended July 31, 2000
1. Significant Accounting Policies.
Fidelity Advisor Financial Services Fund (the fund) is a fund of Fidelity Advisor Series VII (the trust) and is authorized to issue an unlimited number of shares. The trust is registered under the Investment Company Act of 1940, as amended (the 1940 Act), as an open-end management investment company organized as a Massachusetts business trust.
The fund offers Class A, Class T, Class B, Class C, and Institutional Class shares, each of which has equal rights as to assets and voting privileges. Each class has exclusive voting rights with respect to matters that affect that class. Class B shares will automatically convert to Class A shares after a holding period of seven years from the initial date of purchase. Investment income, realized and unrealized capital gains and losses, the common expenses of the fund, and certain fund-level expense reductions, if any, are allocated on a pro rata basis to each class based on the relative net assets of each class to the total net assets of the fund. Each class of shares differs in its respective distribution, transfer agent, and certain other class-specific fees, expenses, and expense reductions.
The financial statements have been prepared in conformity with generally accepted accounting principles which require management to make certain estimates and assumptions at the date of the financial statements. The following summarizes the significant accounting policies of the fund:
Security Valuation. Securities for which exchange quotations are readily available are valued at the last sale price, or if no sale price, at the closing bid price. Foreign securities are valued based on quotations from the principal market in which such securities are normally traded. If trading or events occurring in other markets after the close of the principal market in which foreign securities are traded, and before the close of the business of the fund, are expected to materially affect the value of those securities, then they are valued at their fair value taking this trading or these events into account. Fair value is determined in good faith under consistently applied procedures under the general supervision of the Board of Trustees. Securities for which exchange quotations are not readily available (and in certain cases debt securities which trade on an exchange) are valued primarily using dealer-supplied valuations or at their fair value. Short-term securities with remaining maturities of sixty days or less for which quotations are not readily available are valued at amortized cost or original cost plus accrued interest, both of which approximate current value.
Foreign Currency Translation. The accounting records of the fund are maintained in U.S. dollars. Investment securities and other assets and liabilities denominated in a foreign currency are translated into U.S. dollars at the prevailing rates of exchange at period end. Purchases and sales of securities, income receipts and expense payments are translated into U.S. dollars at the prevailing exchange rate on the respective dates of the transactions.
Net realized gains and losses on foreign currency transactions represent net gains and losses from sales and maturities of foreign currency contracts, disposition of foreign currencies, the difference between the amount of net investment income accrued and the U.S. dollar amount actually received, and gains and losses between trade and settlement date on purchases and sales of securities. The effects of changes in foreign currency exchange rates on investments in securities are included with the net realized and unrealized gain or loss on investment securities.
Income Taxes. As a qualified regulated investment company under Subchapter M of the Internal Revenue Code, the fund is not subject to income taxes to the extent that it distributes substantially all of its taxable income for its fiscal year. The schedule of investments includes information regarding income taxes under the caption "Income Tax Information."
Investment Income. Dividend income is recorded on the ex-dividend date, except certain dividends from foreign securities where the ex-dividend date may have passed, are recorded as soon as the fund is informed of the ex-dividend date. Non-cash dividends included in dividend income, if any, are recorded at the fair market value of the securities received. Interest income is accrued as earned. Investment income is recorded net of foreign taxes withheld where recovery of such taxes is uncertain.
Expenses. Most expenses of the trust can be directly attributed to a fund. Expenses which cannot be directly attributed are apportioned among the funds in the trust.
Distributions to Shareholders. Distributions are recorded on the ex-dividend date. Income dividends and capital gain distributions are declared separately for each class.
Income and capital gain distributions are determined in accordance with income tax regulations which may differ from generally accepted accounting principles. These differences, which may result in distribution reclassifications, are primarily due to differing treatments for foreign currency transactions, and losses deferred due to wash sales and excise tax regulations.
Permanent book and tax basis differences relating to shareholder distributions will result in reclassifications to paid in capital. Undistributed net investment income and accumulated undistributed net realized gain (loss) on investments and foreign currency transactions may include temporary book and tax basis differences which will reverse in a subsequent period. Any taxable income or gain remaining at fiscal year end is distributed in the following year.
Short-Term Trading (Redemption) Fees. Shares held in the fund less than 60 days are subject to a short-term trading fee equal to 1% of the proceeds of the redeemed shares. The fee, which is retained by the fund, is accounted for as an addition to paid in capital.
Annual Report
Notes to Financial Statements - continued
1. Significant Accounting Policies - continued
Security Transactions. Security transactions are accounted for as of trade date. Gains and losses on securities sold are determined on the basis of identified cost.
2. Operating Policies.
Foreign Currency Contracts. The fund generally uses foreign currency contracts to facilitate transactions in foreign-denominated securities. Losses may arise from changes in the value of the foreign currency or if the counterparties do not perform under the contracts' terms. The U.S. dollar value of foreign currency contracts is determined using contractual currency exchange rates established at the time of each trade.
Joint Trading Account. Pursuant to an Exemptive Order issued by the Securities and Exchange Commission (the SEC), the fund, along with other affiliated entities of Fidelity Management & Research Company (FMR), may transfer uninvested cash balances into one or more joint trading accounts. These balances are invested in one or more repurchase agreements for U.S. Treasury or Federal Agency obligations.
Repurchase Agreements. The underlying U.S. Treasury, Federal Agency, or other obligations found to be satisfactory by FMR are transferred to an account of the fund, or to the Joint Trading Account, at a custodian bank. The securities are marked-to-market daily and maintained at a value at least equal to the principal amount of the repurchase agreement (including accrued interest). FMR, the fund's investment adviser, is responsible for determining that the value of the underlying securities remains in accordance with the market value requirements stated above.
Cash Central Funds. Pursuant to an Exemptive Order issued by the SEC, the fund may invest in the Fidelity Cash Central Fund and the Fidelity Securities Lending Cash Central Fund (the Cash Funds) managed by Fidelity Investments Money Management, Inc., an affiliate of FMR. The Cash Funds are open-end money market funds available only to investment companies and other accounts managed by FMR and its affiliates. The Cash Funds seek preservation of capital, liquidity, and current income. Income distributions from the Cash Funds are declared daily and paid monthly from net interest income. Income distributions earned by the fund are recorded as either interest income or security lending income in the accompanying financial statements.
3. Purchases and Sales of Investments.
Purchases and sales of securities, other than short-term securities, aggregated $376,603,279 and $233,760,915, respectively.
4. Fees and Other Transactions with Affiliates.
Management Fee. As the fund's investment adviser, FMR receives a monthly fee that is calculated on the basis of a group fee rate plus a fixed individual fund fee rate applied to the average net assets of the fund. The group fee rate is the weighted average of a series of rates and is based on the monthly average net assets of all the mutual funds advised by FMR. The rates ranged from .2167% to .5200% for the period. The annual individual fund fee rate is .30%. In the event that these rates were lower than the contractual rates in effect during the period, FMR voluntarily implemented the above rates, as they resulted in the same or a lower management fee. For the period, the management fee was equivalent to an annual rate of .58% of average net assets.
Distribution and Service Plan. In accordance with Rule 12b-1 of the 1940 Act, the Board of Trustees have adopted separate Distribution and Service Plans with respect to each class of shares (collectively referred to as "the Plans"). Under certain of the Plans, the class pays Fidelity Distributors Corporation (FDC), an affiliate of FMR, a 12b-1 fee. A portion of this fee may be reallowed to securities dealers, banks and other financial institutions for the distribution of each class of shares and providing shareholder support services. For the period, this fee was based on the following annual rates of the average net assets of each applicable class:
|
Class A |
.25% |
|
Class T |
.50% |
|
Class B |
1.00% * |
|
Class C |
1.00% * |
* .75% represents a distribution fee and .25% represents a shareholder service fee.
For the period, each class paid FDC the following amounts, a portion of which was retained by FDC:
|
|
Paid to |
Retained |
|
Class A |
$ 83,191 |
$ 145 |
|
Class T |
687,848 |
323 |
|
Class B |
1,098,203 |
823,948 |
|
Class C |
516,240 |
340,340 |
|
|
$ 2,385,482 |
$ 1,164,756 |
Sales Load. FDC receives a front-end sales charge of up to 5.75% for selling Class A shares, and 3.50% for selling Class T shares of the fund. FDC receives the proceeds of contingent deferred sales charges levied on Class B share redemptions occurring within six years of purchase and Class C share redemptions occurring within one year of purchase. Contingent deferred sales charges are based on declining rates ranging from 5% to 1% for Class B and 1% for Class C, of the lesser of the cost of shares at the initial date of
Financial Services
Notes to Financial Statements - continued
4. Fees and Other Transactions with Affiliates - continued
Sales Load - continued
purchase or the net asset value of the redeemed shares, excluding any reinvested dividends and capital gains. In addition, purchases of Class A and Class T shares that were subject to a finder's fee bear a contingent deferred sales charge on assets that do not remain in the fund for at least one year. The Class A and Class T contingent deferred sales charge is based on 0.25% of the lesser of the cost of shares at the initial date of purchase or the net asset value of the redeemed shares, excluding any reinvested dividends and capital gains. A portion of the sales charges paid to FDC is paid to securities dealers, banks and other financial institutions.
For the period, sales charge amounts paid to and retained by FDC were as follows:
|
|
Paid to |
Retained |
|
Class A |
$ 210,575 |
$ 142,138 |
|
Class T |
262,927 |
131,358 |
|
Class B |
468,570 |
468,570* |
|
Class C |
78,536 |
78,536* |
|
|
$ 1,020,608 |
$ 820,602 |
* When Class B and Class C shares are initially sold, FDC pays commissions from its own resources to securities dealers,
banks, and other financial institutions through which the sales are made.
Transfer Agent Fees. Fidelity Investments Institutional Operations Company, Inc., (FIIOC), an affiliate of FMR, is the transfer, dividend disbursing and shareholder servicing agent (collectively referred to as the transfer agent) for each class of the fund. FIIOC receives account fees and asset-based fees that vary according to the account size and type of account of the shareholders of the respective classes of the fund. FIIOC pays for typesetting, printing and mailing of all shareholder reports, except proxy statements. For the period, the following amounts were paid to FIIOC:
|
|
Amount |
% of |
|
Class A |
$ 106,332 |
.32 |
|
Class T |
402,877 |
.29 |
|
Class B |
358,118 |
.33 |
|
Class C |
144,946 |
.28 |
|
Institutional Class |
22,580 |
.22 |
|
|
$ 1,034,853 |
|
Accounting and Security Lending Fees. Fidelity Service Company, Inc., an affiliate of FMR, maintains the fund's accounting records and administers the security lending program. The security lending fee is based on the number and duration of lending transactions. The accounting fee is based on the level of average net assets for the month plus out-of-pocket expenses.
Brokerage Commissions. The fund placed a portion of its portfolio transactions with brokerage firms which are affiliates of FMR. The commissions paid to these affiliated firms were $37,725 for the period.
5. Security Lending.
The fund lends portfolio securities from time to time in order to earn additional income. The fund receives collateral in the form of U.S. Treasury obligations, letters of credit, and/or cash against the loaned securities, and maintains collateral in an amount not less than 100% of the market value of the loaned securities during the period of the loan. The market value of the loaned securities is determined at the close of business of the fund and any additional required collateral is delivered to the fund on the next business day. If the borrower defaults on its obligation to return the securities loaned because of insolvency or other reasons, the fund could experience delays and costs in recovering the securities loaned or in gaining access to the collateral. At period end, the value of the securities loaned amounted to $4,271,010. The fund received cash collateral of $4,214,332 which was invested in cash equivalents and U.S. Treasury obligations valued at $214,500.
6. Expense Reductions.
FMR has directed certain portfolio trades to brokers who paid a portion of the fund's expenses. For the period, the fund's expenses were reduced by $96,518 under this arrangement.
In addition, the fund has entered into an arrangement with its custodian whereby credits realized as a result of uninvested cash balances were used to reduce a portion of expenses. During the period, the fund's custodian fees were reduced by $1,898 under the custodian arrangement.
Financial Services
Notes to Financial Statements - continued
7. Distributions to Shareholders.
Distributions to shareholders of each class were as follows:
|
|
Years ended July 31, |
|
|
|
2000 |
1999 |
|
From net investment income |
|
|
|
Class A |
$ 141,474 |
$ 69,817 |
|
Class T |
357,303 |
174,881 |
|
Class B |
- |
68,552 |
|
Class C |
41,770 |
31,424 |
|
Institutional Class |
101,825 |
21,093 |
|
Total |
$ 642,372 |
$ 365,767 |
|
From net realized gain |
|
|
|
Class A |
$ - |
$ 1,212,772 |
|
Class T Class B |
- - |
6,262,898 3,836,369 |
|
Class C |
- |
1,125,444 |
|
Institutional Class |
- |
272,719 |
|
Total |
$ - |
$ 12,710,202 |
|
|
$ 642,372 |
$ 13,075,969 |
8. Share Transactions.
Transactions for each class of shares were as follows:
|
|
Shares |
Dollars |
||
|
|
Year ended |
Year ended |
Year ended |
Year ended |
|
|
2000 |
1999 |
2000 |
1999 |
|
|
|
|
|
|
|
Class A |
1,983,482 |
822,308 |
$ 33,127,709 |
$ 14,081,934 |
|
Reinvestment of distributions |
7,540 |
85,902 |
129,104 |
1,165,695 |
|
Shares redeemed |
(929,902) |
(508,971) |
(15,304,883) |
(8,477,160) |
|
Net increase (decrease) |
1,061,120 |
399,239 |
$ 17,951,930 |
$ 6,770,469 |
|
Class T |
7,477,175 |
3,240,994 |
$ 126,038,053 |
$ 54,768,982 |
|
Reinvestment of distributions |
19,181 |
443,632 |
327,797 |
6,006,779 |
|
Shares redeemed |
(4,700,362) |
(2,959,321) |
(76,396,220) |
(48,376,793) |
|
Net increase (decrease) |
2,795,994 |
725,305 |
$ 49,969,630 |
$ 12,398,968 |
|
Class B |
5,123,537 |
2,867,874 |
$ 84,322,371 |
$ 48,151,991 |
|
Reinvestment of distributions |
- |
235,734 |
- |
3,165,887 |
|
Shares redeemed |
(2,182,214) |
(1,197,148) |
(34,908,649) |
(19,603,788) |
|
Net increase (decrease) |
2,941,323 |
1,906,460 |
$ 49,413,722 |
$ 31,714,090 |
|
Class C |
3,944,800 |
1,453,651 |
$ 64,658,535 |
$ 24,778,214 |
|
Reinvestment of distributions |
1,942 |
57,370 |
32,872 |
771,627 |
|
Shares redeemed |
(1,440,653) |
(467,142) |
(23,274,029) |
(7,840,548) |
|
Net increase (decrease) |
2,506,089 |
1,043,879 |
$ 41,417,378 |
$ 17,709,293 |
|
Institutional Class |
523,400 |
511,162 |
$ 8,779,263 |
$ 8,733,321 |
|
Reinvestment of distributions |
2,415 |
18,075 |
41,473 |
245,820 |
|
Shares redeemed |
(675,136) |
(130,140) |
(11,029,524) |
(2,176,034) |
|
Net increase (decrease) |
(149,321) |
399,097 |
$ (2,208,788) |
$ 6,803,107 |
Financial Services
Performance
There are several ways to evaluate historical performance. You can look at the total percentage change in value, the average annual percentage change or the growth of a hypothetical $10,000 investment. Total return reflects the change in the value of an investment, assuming reinvestment of dividend income and capital gains (the profits earned upon the sale of securities that have grown in value). If Fidelity had not reimbursed certain class expenses, the life of fund total returns would have been lower.
Cumulative Total Returns
|
Periods ended July 31, 2000 |
|
Past 1 |
Life of |
|
Fidelity Adv Health Care - CL A |
|
21.44% |
146.44% |
|
Fidelity Adv Health Care - CL A |
|
14.46% |
132.27% |
|
S&P 500 |
|
8.98% |
131.80% |
|
GS Health Care |
|
22.57% |
152.86% |
Cumulative total returns show Class A shares' performance in percentage terms over a set period - in this case, one year or since the fund started on September 3, 1996. You can compare Class A shares' returns to the performance of the Standard & Poor's 500 Index - a market capitalization-weighted index of common stocks - and the Goldman Sachs Health Care Index - a market capitalization-weighted index of 113 stocks designed to measure the performance of companies in the health care sector. Issues in the index include providers of health care related services including long-term care and hospital facilities, health care management organizations and continuing care services. These benchmarks include reinvested dividends and capital gains, if any, and exclude the effect of sales charges.
Average Annual Total Returns
|
Periods ended July 31, 2000 |
|
Past 1 |
Life of |
|
Fidelity Adv Health Care - CL A |
|
21.44% |
25.95% |
|
Fidelity Adv Health Care - CL A |
|
14.46% |
24.05% |
|
S&P 500 |
|
8.98% |
23.99% |
|
GS Health Care |
|
22.57% |
26.78% |
Average annual returns take Class A shares' cumulative return and show you what would have happened if Class A shares had performed at a constant rate each year.
$10,000 Over Life of Fund
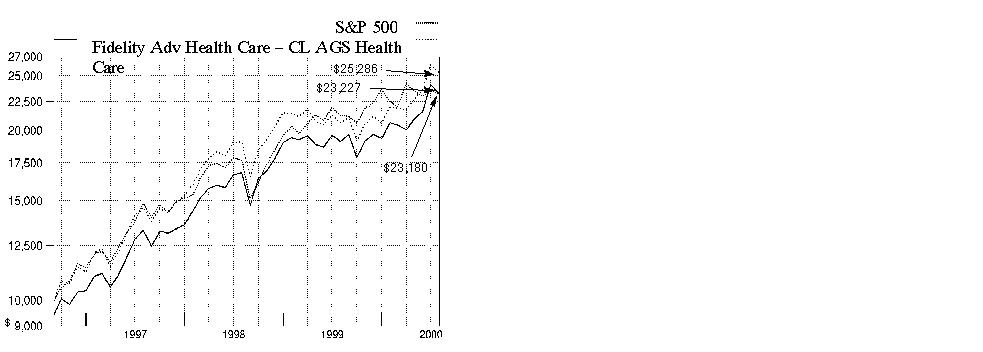
$10,000 Over Life of Fund: Let's say hypothetically that $10,000 was invested in Fidelity Advisor Health Care - Class A on September 3, 1996, when the fund started, and the current 5.75% sales charge was paid. As the chart shows, by July 31, 2000, the value of the investment would have grown to $23,227 - a 132.27% increase on the initial investment. For comparison, look at how the Standard & Poor's 500 Index did over the same period. With dividends and capital gains, if any, reinvested, the same $10,000 investment would have grown to $23,180 - a 131.80% increase. If $10,000 was invested in the Goldman Sachs Health Care Index, it would have grown to $25,286 - a 152.86% increase.
Understanding Performance
How a fund did yesterday is no guarantee of how it will do tomorrow. The stock market, for example, has a history of long-term growth and short-term volatility. Unlike the broader market, however, some sectors may not have a history of growth in the long run. And, as with all stock funds, the share price and return of a fund that invests in a sector will vary.
3Annual Report
Performance
There are several ways to evaluate historical performance. You can look at the total percentage change in value, the average annual percentage change or the growth of a hypothetical $10,000 investment. Total return reflects the change in the value of an investment, assuming reinvestment of dividend income and capital gains (the profits earned upon the sale of securities that have grown in value).
Cumulative Total Returns
|
Periods ended July 31, 2000 |
|
Past 1 |
Life of |
|
Fidelity Adv Health Care - CL T |
|
21.16% |
143.86% |
|
Fidelity Adv Health Care - CL T |
|
16.92% |
135.33% |
|
S&P 500 |
|
8.98% |
131.80% |
|
GS Health Care |
|
22.57% |
152.86% |
Cumulative total returns show Class T shares' performance in percentage terms over a set period - in this case, one year or since the fund started on September 3, 1996. You can compare Class T shares' returns to the performance of the Standard & Poor's 500 Index - a market capitalization-weighted index of common stocks - and the Goldman Sachs Health Care Index - a market capitalization-weighted index of 113 stocks designed to measure the performance of companies in the health care sector. Issues in the index include providers of health care related services including long-term care and hospital facilities, health care management organizations and continuing care services. These benchmarks include reinvested dividends and capital gains, if any, and exclude the effect of sales charges.
Average Annual Total Returns
|
Periods ended July 31, 2000 |
|
Past 1 |
Life of |
|
Fidelity Adv Health Care - CL T |
|
21.16% |
25.61% |
|
Fidelity Adv Health Care - CL T |
|
16.92% |
24.47% |
|
S&P 500 |
|
8.98% |
23.99% |
|
GS Health Care |
|
22.57% |
26.78% |
Average annual returns take Class T shares' cumulative return and show you what would have happened if Class T shares had performed at a constant rate each year.
$10,000 Over Life of Fund
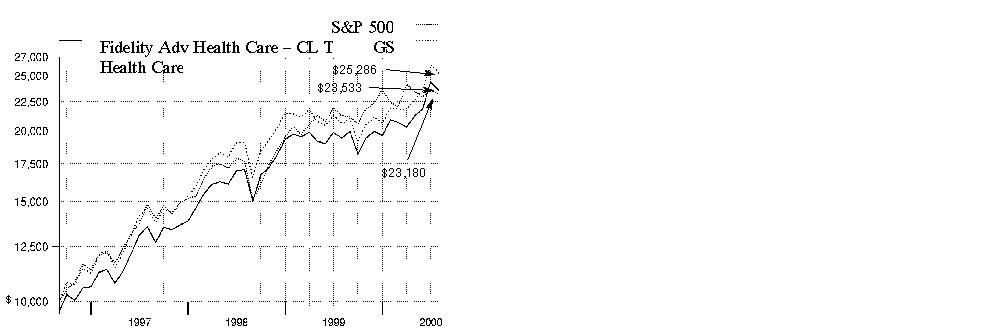
$10,000 Over Life of Fund: Let's say hypothetically that $10,000 was invested in Fidelity Advisor Health Care - Class T on September 3, 1996, when the fund started, and the current 3.50% sales charge was paid. As the chart shows, by July 31, 2000, the value of the investment would have grown to $23,533 - a 135.33% increase on the initial investment. For comparison, look at how the Standard & Poor's 500 Index did over the same period. With dividends and capital gains, if any, reinvested, the same $10,000 investment would have grown to $23,180 - a 131.80% increase. If $10,000 was invested in the Goldman Sachs Health Care Index, it would have grown to $25,286 - a 152.86% increase.
Understanding Performance
How a fund did yesterday is no guarantee of how it will do tomorrow. The stock market, for example, has a history of long-term growth and short-term volatility. Unlike the broader market, however, some sectors may not have a history of growth in the long run. And, as with all stock funds, the share price and return of a fund that invests in a sector will vary.
3Annual Report
Performance
There are several ways to evaluate historical performance. You can look at the total percentage change in the value, the average annual percentage change or the growth of a hypothetical $10,000 investment. Total return reflects the change in the value of an investment, assuming reinvestment of dividend income and capital gains (the profits earned upon the sale of securities that have grown in value). The initial offering of Class B shares took place on March 3, 1997. Class B shares bear a 1.00% 12b-1 fee. Returns prior to March 3, 1997 are those of Class T which bears a 0.50% 12b-1 fee. Had Class B shares' 12b-1 fee been reflected, returns prior to March 3, 1997 would have been lower. Class B shares' contingent deferred sales charge included in the past one year and life of fund total return figures are 5% and 3%, respectively. If Fidelity had not reimbursed certain class expenses, the life of fund total returns would have been lower.
Cumulative Total Returns
|
Periods ended July 31, 2000 |
|
Past 1 |
Life of |
|
Fidelity Adv Health Care - CL B |
|
20.53% |
139.20% |
|
Fidelity Adv Health Care - CL B |
|
15.53% |
136.20% |
|
S&P 500 |
|
8.98% |
131.80% |
|
GS Health Care |
|
22.57% |
152.86% |
Cumulative total returns show Class B shares' performance in percentage terms over a set period - in this case, one year or since the fund started on September 3, 1996. You can compare Class B shares' returns to the performance of the Standard & Poor's 500 Index - a market capitalization-weighted index of common stocks - and the Goldman Sachs Health Care Index - a market capitalization-weighted index of 113 stocks designed to measure the performance of companies in the health care sector. Issues in the index include providers of health care related services including long-term care and hospital facilities, health care management organizations and continuing care services. These benchmarks include reinvested dividends and capital gains, if any, and exclude the effect of sales charges.
Average Annual Total Returns
|
Periods ended July 31, 2000 |
Past 1 |
Life of |
|
Fidelity Adv Health Care - CL B |
20.53% |
24.99% |
|
Fidelity Adv Health Care - CL B |
15.53% |
24.59% |
|
S&P 500 |
8.98% |
23.99% |
|
GS Health Care |
22.57% |
26.78% |
Average annual returns take Class B shares' cumulative return and show you what would have happened if Class B shares had performed at a constant rate each year.
$10,000 Over Life of Fund
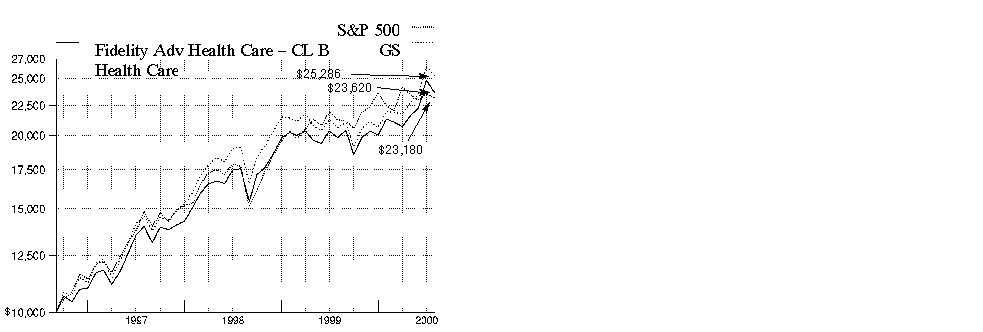
$10,000 Over Life of Fund: Let's say hypothetically that $10,000 was invested in Fidelity Advisor Health Care - Class B on September 3, 1996, when the fund started. As the chart shows, by July 31, 2000, the value of the investment, including the effect of the contingent deferred sales charge, would have grown to $23,620 - a 136.20% increase on the initial investment. For comparison, look at how the Standard & Poor's 500 Index did over the same period. With dividends and capital gains, if any, reinvested, the same $10,000 investment would have grown to $23,180 - a 131.80% increase. If $10,000 was invested in the Goldman Sachs Health Care Index, it would have grown to $25,286 - a 152.86% increase.
Understanding Performance
How a fund did yesterday is no guarantee of how it will do tomorrow. The stock market, for example, has a history of long-term growth and short-term volatility. Unlike the broader market, however, some sectors may not have a history of growth in the long run. And, as with all stock funds, the share price and return of a fund that invests in a sector will vary.
3Annual Report
Performance
There are several ways to evaluate historical performance. You can look at the total percentage change in the value, the average annual percentage change or the growth of a hypothetical $10,000 investment. Total return reflects the change in the value of an investment, assuming reinvestment of dividend income and capital gains (the profits earned upon the sale of securities that have grown in value). The initial offering of Class C shares took place on November 3, 1997. Class C shares bear a 1.00% 12b-1 fee. Returns between March 3, 1997 and November 3, 1997 are those of Class B shares and reflect Class B shares' 1.00% 12b-1 fee. Returns prior to March 3, 1997 are those of Class T which bears a 0.50% 12b-1 fee. Had Class C shares' 12b-1 fee been reflected, returns prior to March 3, 1997 would have been lower. Class C shares' contingent deferred sales charge included in the past one year and life of fund total return figures are 1% and 0%, respectively. If Fidelity had not reimbursed certain class expenses, the life of fund total returns would have been lower.
Cumulative Total Returns
|
Periods ended July 31, 2000 |
|
Past 1 |
Life of |
|
Fidelity Adv Health Care - CL C |
|
20.59% |
139.06% |
|
Fidelity Adv Health Care - CL C |
|
19.59% |
139.06% |
|
S&P 500 |
|
8.98% |
131.80% |
|
GS Health Care |
|
22.57% |
152.86% |
Cumulative total returns show Class C shares' performance in percentage terms over a set period - in this case, one year or since the fund started on September 3, 1996. You can compare Class C shares' returns to the Standard & Poor's 500 Index - a market capitalization-weighted index of common stocks - and the Goldman Sachs Health Care Index - a market capitalization-weighted index of 113 stocks designed to measure the performance of companies in the health care sector. Issues in the index include providers of health care related services including long-term care and hospital facilities, health care management organizations and continuing care services. These benchmarks include reinvested dividends and capital gains, if any, and exclude the effect of sales charges.
Average Annual Total Returns
|
Periods ended July 31, 2000 |
Past 1 |
Life of |
|
|
Fidelity Adv Health Care - CL C |
20.59% |
24.97% |
|
|
Fidelity Adv Health Care - CL C |
19.59% |
24.97% |
|
|
S&P 500 |
8.98% |
23.99% |
|
|
GS Health Care |
|
22.57% |
26.78% |
Average annual returns take Class C shares' cumulative return and show you what would have happened if Class C shares had performed at a constant rate each year.
$10,000 Over Life of Fund
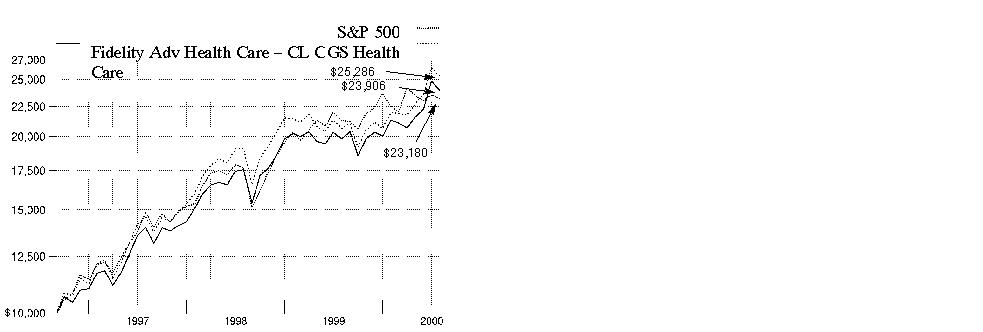
$10,000 Over Life of Fund: Let's say hypothetically that $10,000 was invested in Fidelity Advisor Health Care - Class C on September 3, 1996, when the fund started. As the chart shows, by July 31, 2000, the value of the investment would have grown to $23,906 - a 139.06% increase on the initial investment. For comparison, look at how the Standard & Poor's 500 Index did over the same period. With dividends and capital gains, if any, reinvested, the same $10,000 investment would have grown to $23,180 - a 131.80% increase. If $10,000 was invested in the Goldman Sachs Health Care Index, it would have grown to $25,286 - a 152.86% increase.
Understanding Performance
How a fund did yesterday is no guarantee of how it will do tomorrow. The stock market, for example, has a history of long-term growth and short-term volatility. Unlike the broader market, however, some sectors may not have a history of growth in the long run. And, as with all stock funds, the share price and return of a fund that invests in a sector will vary.
3Annual Report
(Portfolio Manager photograph)
Note to shareholders: Yolanda McGettigan became Portfolio Manager of Fidelity Advisor Health Care Fund on June 1, 2000.
Q. How did the fund perform, Yolanda?
A. For the 12-month period that ended July 31, 2000, the fund's Class A, Class T, Class B and Class C shares returned 21.44%, 21.16%, 20.53% and 20.59%, respectively. These returns slightly underperformed the Goldman Sachs Health Care Index - an index of 113 stocks designed to measure the performance of companies in the health sector - which returned 22.57%. During the same period, the Standard & Poor's 500 Index returned 8.98%.
A. For the 12-month period that ended July 31, 2000, the fund's Institutional Class shares returned 21.77%. This return slightly underperformed the Goldman Sachs Health Care Index - an index of 113 stocks designed to measure the performance of companies in the health sector - which returned 22.57%. During the same period, the Standard & Poor's 500 Index returned 8.98%.
Q. What factors contributed to the fund's performance relative to the Goldman Sachs index during the past year?
A. During the first half of the period - a depressed market for most health stocks - the fund outperformed the benchmark on the strength of strong stock selection among drug companies, health maintenance organizations (HMOs) and coronary medical device manufacturers. Additionally, overweighting biotechnology - the sector's lone bright spot - added to the fund's bottom line as these stocks surged on promising clinical trials for new products and accelerating earnings growth. In the second half of the period, stock picking in selected names in the medical equipment, facilities and devices subsectors hurt relative performance. A sharp pullback in biotech also hurt performance. Our focus on established companies with solid product pipelines and earnings didn't achieve the same performance as more speculative companies. On a more positive note, overweighting pharmaceutical stocks - the fund's largest subsector - helped when these stocks rallied in the spring with the onset of a slowing economy, a weakening technology market and better-than-expected earnings reports.
Q. How have you positioned the fund since taking over in June?
A. At the end of the period, I overweighted drugs and biotechnology stocks, which comprised about two-thirds of the fund's net assets, at the expense of medical devices holdings, which had weaker growth prospects. I overweighted pharmaceuticals for three reasons. First, drug companies have historically outperformed other areas of the market during economic slowdowns, and there are signs the economy is leaning toward that end. If the economy slows and if the change in the earnings growth rate of drug stocks is better than the change in the growth rate of the broader market for the remainder of the year, drug stocks should exhibit superior performance. Second, at the close of the period, drug stocks were fairly valued and had room to move on a price-to-earnings multiple basis. Finally, there were strong pipelines at many companies and some great drug products on the horizon, which should benefit the fund. Turning to biotech, these stocks should gain momentum from the mapping of the human genome, which will considerably expedite the drug discovery and development process.
Q. What specific stocks stood out as top performers? Which disappointed?
A. Warner-Lambert was the fund's top performer, benefiting from being the target of a takeover battle between American Home Products and Pfizer, which was ultimately won by Pfizer. Eli Lilly, the fund's top holding, soared after the company said it had stopped the next phase of a scheduled trial on its sepsis drug Zovant because the results were so favorable - an unusual move. In terms of underachievers, Bristol-Myers Squibb's announcement to delay testing on its promising hypertension drug Vanlev due to safety concerns hurt the stock. Shares of genomics leader PE Celera suffered as investors feared its business model would be damaged by government suggestions to make its human genetic code findings a matter of public information.
Q. What's your outlook for the health sector, Yolanda?
A. Much of what happens in the sector going forward will depend on the economy and the upcoming presidential and congressional elections. If the economy does slow, as some have suspected as a result of the Federal Reserve Board's interest-rate policy, health stocks should generate strong relative earnings growth and could outperform. However, the biggest risk for the sector, particularly among drug companies, remains the government. I will be paying close attention to see how the election process unfolds. Any Democratic victory will be seen as a negative influence on the sector, potentially re-igniting initiatives to reform Medicare and the health care industry.
The views expressed in this report reflect those of the portfolio manager only through the end of the period of the report as stated on the cover. The manager's views are subject to change at any time based on market and other conditions. For more information, see page A-3.
Fund Facts
Start date: September 3, 1996
Size: as of July 31, 2000, more than
$1.0 billion
Manager: Yolanda McGettigan, since
June 2000; joined Fidelity in 1997
Annual Report
Advisor Health Care Fund
|
Top Ten Stocks as of July 31, 2000 |
|
|
|
% of fund's |
|
Eli Lilly & Co. |
9.6 |
|
Pfizer, Inc. |
7.1 |
|
Merck & Co., Inc. |
5.8 |
|
Bristol-Myers Squibb Co. |
5.7 |
|
Abbott Laboratories |
4.9 |
|
Medtronic, Inc. |
4.7 |
|
American Home Products Corp. |
4.7 |
|
Johnson & Johnson |
4.3 |
|
Schering-Plough Corp. |
3.9 |
|
Pharmacia Corp. |
3.9 |
|
|
54.6 |
|
Top Industries as of July 31, 2000 |
|
|
% of fund's net assets |
||
|
Drugs & Pharmaceuticals |
57.1% |
|
Medical Equipment & Supplies |
22.6% |
|
Medical Facilities Management |
5.7% |
|
Chemicals & Plastics |
3.9% |
|
Electronic Instruments |
2.1% |
|
All Others* |
8.6% |

|
* Includes short-term investments and net other assets. |
Annual Report
Advisor Health Care Fund
Showing Percentage of Net Assets
|
Common Stocks - 94.5% |
|||
|
Shares |
Value (Note 1) |
||
|
CHEMICALS & PLASTICS - 3.9% |
|||
|
Pharmacia Corp. |
761,800 |
$ 41,708,550 |
|
|
COMPUTER SERVICES & SOFTWARE - 0.8% |
|||
|
Affymetrix, Inc. (a) |
28,400 |
3,877,931 |
|
|
Healtheon/WebMD Corp. (a) |
105,000 |
1,397,813 |
|
|
IMS Health, Inc. |
196,700 |
3,552,894 |
|
|
|
8,828,638 |
||
|
DRUGS & PHARMACEUTICALS - 57.1% |
|||
|
Abgenix, Inc. (a) |
23,300 |
1,167,913 |
|
|
Alkermes, Inc. (a) |
96,500 |
3,196,563 |
|
|
Allergan, Inc. |
111,100 |
7,436,756 |
|
|
ALZA Corp. (a) |
49,400 |
3,198,650 |
|
|
American Home Products Corp. |
930,500 |
49,374,656 |
|
|
Amgen, Inc. (a) |
476,800 |
30,962,200 |
|
|
Andrx Corp. (a) |
65,200 |
5,089,675 |
|
|
Bausch & Lomb, Inc. |
77,400 |
4,813,313 |
|
|
Biochem Pharma, Inc. (a) |
2,400 |
53,254 |
|
|
Biogen, Inc. (a) |
91,500 |
4,849,500 |
|
|
Biovail Corp. (a) |
29,600 |
1,707,692 |
|
|
Bristol-Myers Squibb Co. |
1,217,800 |
60,433,325 |
|
|
Celgene Corp. (a) |
73,200 |
3,801,825 |
|
|
Cephalon, Inc. (a) |
49,419 |
1,992,203 |
|
|
Chiron Corp. (a) |
30,400 |
1,273,000 |
|
|
COR Therapeutics, Inc. (a) |
16,900 |
1,374,181 |
|
|
CV Therapeutics, Inc. (a) |
31,200 |
1,813,500 |
|
|
Decode Genetics, Inc. |
1,000 |
25,688 |
|
|
Eli Lilly & Co. |
981,000 |
101,901,369 |
|
|
Enzon, Inc. (a) |
30,500 |
1,364,875 |
|
|
Exelixis, Inc. |
81,800 |
3,185,088 |
|
|
Forest Laboratories, Inc. (a) |
108,100 |
11,566,700 |
|
|
Genentech, Inc. |
84,600 |
12,869,775 |
|
|
Geneva Proteomics (d) |
43,000 |
236,500 |
|
|
Genzyme Corp. - General Division (a) |
47,800 |
3,319,113 |
|
|
Human Genome Sciences, Inc. (a) |
48,500 |
5,859,406 |
|
|
ICOS Corp. (a) |
143,100 |
6,528,938 |
|
|
Immunex Corp. (a) |
650,000 |
32,946,875 |
|
|
IVAX Corp. (a) |
107,010 |
5,270,243 |
|
|
King Pharmaceuticals, Inc. (a) |
26,100 |
786,263 |
|
|
Medarex, Inc. (a) |
30,400 |
2,215,400 |
|
|
Medicis Pharmaceutical Corp. Class A (a) |
1,800 |
101,250 |
|
|
Medimmune, Inc. (a) |
188,800 |
11,233,600 |
|
|
Merck & Co., Inc. |
864,000 |
61,938,000 |
|
|
Millennium Pharmaceuticals, Inc. (a) |
94,400 |
9,086,000 |
|
|
Mylan Laboratories, Inc. |
91,600 |
1,946,500 |
|
|
NaPro BioTherapeutics, Inc. (a) |
31,500 |
194,906 |
|
|
PE Corp. - Celera Genomics Group (a) |
67,400 |
5,855,375 |
|
|
Pfizer, Inc. |
1,754,300 |
75,654,188 |
|
|
PRAECIS Pharmaceuticals, Inc. |
86,900 |
2,438,631 |
|
|
Protein Design Labs, Inc. (a) |
30,500 |
3,696,219 |
|
|
QLT, Inc. (a) |
34,700 |
2,286,579 |
|
|
Schering-Plough Corp. |
969,100 |
41,853,006 |
|
|
|
|||
|
Shares |
Value (Note 1) |
||
|
Sepracor, Inc. (a) |
89,100 |
$ 9,422,325 |
|
|
Serono SA sponsored ADR (a) |
75,500 |
2,038,500 |
|
|
SuperGen, Inc. (a) |
1,300 |
36,055 |
|
|
Vertex Pharmaceuticals, Inc. (a) |
42,570 |
4,169,199 |
|
|
Watson Pharmaceuticals, Inc. (a) |
52,300 |
2,889,575 |
|
|
|
605,454,347 |
||
|
ELECTRONIC INSTRUMENTS - 2.1% |
|||
|
Beckman Coulter, Inc. |
15,300 |
1,019,363 |
|
|
PE Corp. - Biosystems Group |
144,800 |
12,624,750 |
|
|
Waters Corp. (a) |
69,800 |
8,280,025 |
|
|
|
21,924,138 |
||
|
HOME FURNISHINGS - 0.1% |
|||
|
Hillenbrand Industries, Inc. |
34,600 |
1,107,200 |
|
|
INSURANCE - 1.9% |
|||
|
Aetna, Inc. |
47,300 |
2,625,150 |
|
|
CIGNA Corp. |
167,000 |
16,679,125 |
|
|
First Health Group Corp. (a) |
25,200 |
771,750 |
|
|
|
20,076,025 |
||
|
MEDICAL EQUIPMENT & SUPPLIES - 22.6% |
|||
|
Abbott Laboratories |
1,243,100 |
51,744,038 |
|
|
Allscripts, Inc. |
500 |
10,688 |
|
|
AmeriSource Health Corp. Class A (a) |
18,100 |
632,369 |
|
|
Baxter International, Inc. |
314,300 |
24,436,825 |
|
|
Becton, Dickinson & Co. |
77,000 |
1,944,250 |
|
|
Biomet, Inc. |
165,100 |
7,388,225 |
|
|
Boston Scientific Corp. (a) |
141,600 |
2,345,250 |
|
|
C.R. Bard, Inc. |
89,200 |
4,465,575 |
|
|
Cardinal Health, Inc. |
314,306 |
23,101,491 |
|
|
DENTSPLY International, Inc. |
105,300 |
3,560,456 |
|
|
Guidant Corp. (a) |
136,800 |
7,712,100 |
|
|
Johnson & Johnson |
492,821 |
45,863,154 |
|
|
Mallinckrodt, Inc. |
700 |
32,025 |
|
|
Medtronic, Inc. |
971,496 |
49,607,014 |
|
|
MiniMed, Inc. (a) |
23,300 |
2,937,256 |
|
|
Novoste Corp. (a) |
40,000 |
2,330,000 |
|
|
Novoste Corp. (a)(c) |
12,500 |
728,125 |
|
|
Patterson Dental Co. (a) |
40,800 |
1,081,200 |
|
|
Resmed, Inc. (a) |
27,100 |
752,025 |
|
|
St. Jude Medical, Inc. (a) |
61,200 |
2,524,500 |
|
|
Stryker Corp. |
72,000 |
3,091,500 |
|
|
Sybron International, Inc. (a) |
112,600 |
2,343,488 |
|
|
VISX, Inc. (a) |
23,400 |
589,388 |
|
|
|
239,220,942 |
||
|
MEDICAL FACILITIES MANAGEMENT - 5.7% |
|||
|
Express Scripts, Inc. Class A (a) |
32,800 |
2,107,400 |
|
|
HCA - The Healthcare Co. |
505,700 |
17,193,800 |
|
|
Common Stocks - continued |
|||
|
Shares |
Value (Note 1) |
||
|
MEDICAL FACILITIES MANAGEMENT - CONTINUED |
|||
|
Health Management Associates, Inc. Class A (a) |
285,400 |
$ 4,477,213 |
|
|
Oxford Health Plans, Inc. (a) |
119,600 |
2,862,925 |
|
|
Tenet Healthcare Corp. |
303,800 |
9,246,913 |
|
|
Trigon Healthcare, Inc. (a) |
42,800 |
2,268,400 |
|
|
UnitedHealth Group, Inc. |
146,500 |
11,985,531 |
|
|
Universal Health Services, Inc. Class B (a) |
23,700 |
1,596,788 |
|
|
Wellpoint Health Networks, Inc. (a) |
92,900 |
8,099,719 |
|
|
|
59,838,689 |
||
|
RETAIL & WHOLESALE, MISCELLANEOUS - 0.0% |
|||
|
Ventro Corp. |
4,200 |
50,663 |
|
|
SERVICES - 0.3% |
|||
|
Caremark Rx, Inc. (a) |
320,500 |
2,704,219 |
|
|
TOTAL COMMON STOCKS (Cost $820,971,553) |
1,000,913,411 |
||
|
Cash Equivalents - 5.9% |
|||
|
|
|
|
|
|
Fidelity Cash Central Fund, 6.57% (b) |
56,930,404 |
56,930,404 |
|
|
Fidelity Securities Lending Cash Central Fund, 6.65% (b) |
5,691,949 |
5,691,949 |
|
|
TOTAL CASH EQUIVALENTS (Cost $62,622,353) |
62,622,353 |
||
|
TOTAL INVESTMENT PORTFOLIO - 100.4% (Cost $883,593,906) |
1,063,535,764 |
||
|
NET OTHER ASSETS - (0.4)% |
(3,938,670) |
||
|
NET ASSETS - 100% |
$ 1,059,597,094 |
||
|
Legend |
|
(a) Non-income producing |
|
(b) The rate quoted is the annualized seven-day yield of the fund at |
|
(c) Security exempt from registration under Rule 144A of the Securities |
|
(d) Restricted securities - Investment in securities not registered under the Securities Act of 1933. |
|
Additional information on each holding is as follows: |
|
Security |
Acquisition Date |
Acquisition Cost |
|
Geneva Proteomics |
7/7/00 |
$ 236,500 |
|
Income Tax Information |
|
At July 31, 2000, the aggregate cost of investment securities for income tax purposes was $888,440,974. Net unrealized appreciation aggregated $175,094,790, of which $224,949,440 related to appreciated investment securities and $49,854,650 related to depreciated investment securities. |
|
The fund hereby designates approximately $6,759,000 as a capital gain dividend for the purpose of the dividend paid deduction. |
|
A total of 45%, 53%, 62%, 56% and 41% of Class A's, Class T's, Class B's, Class C's and Institutional Class' dividends distributed during the fiscal year qualifies for the dividends-received deductions for corporate shareholders (unaudited). |
|
The fund will notify shareholders in January 2001 of the applicable percentages for use in preparing 2000 income tax returns. |
See accompanying notes which are an integral part of the financial statements.
Health Care
Statement of Assets and Liabilities
|
|
July 31, 2000 |
|
|
Assets |
|
|
|
Investment in securities, at value |
|
$ 1,063,535,764 |
|
Receivable for investments sold |
|
10,344,310 |
|
Receivable for fund shares sold |
|
4,217,857 |
|
Dividends receivable |
|
569,733 |
|
Interest receivable |
|
621,052 |
|
Redemption fees receivable |
|
710 |
|
Other receivables |
|
5,746 |
|
Total assets |
|
1,079,295,172 |
|
Liabilities |
|
|
|
Payable for investments purchased |
$ 11,149,125 |
|
|
Payable for fund shares redeemed |
1,391,647 |
|
|
Accrued management fee |
517,357 |
|
|
Distribution fees payable |
642,268 |
|
|
Other payables and accrued expenses |
305,732 |
|
|
Collateral on securities loaned, |
5,691,949 |
|
|
Total liabilities |
|
19,698,078 |
|
Net Assets |
|
$ 1,059,597,094 |
|
Net Assets consist of: |
|
|
|
Paid in capital |
|
$ 842,840,214 |
|
Accumulated undistributed net realized gain (loss) on investments and foreign currency transactions |
|
36,815,653 |
|
Net unrealized appreciation (depreciation) on investments |
|
179,941,227 |
|
Net Assets |
|
$ 1,059,597,094 |
|
Calculation of Maximum |
|
$22.02 |
|
Maximum offering price per share |
|
$23.36 |
|
Class T: |
|
$21.87 |
|
Maximum offering price per share |
|
$22.66 |
|
Class B: |
|
$21.50 |
|
Class C: |
|
$21.50 |
|
Institutional Class: |
|
$22.13 |
A Redemption price per share is equal to net asset value less any applicable contingent deferred sales charge.
Statement of Operations
|
|
Year ended July 31, 2000 |
|
|
Investment Income Dividends |
|
$ 6,448,925 |
|
Interest |
|
3,734,918 |
|
Security lending |
|
26,123 |
|
Total income |
|
10,209,966 |
|
Expenses |
|
|
|
Management fee |
$ 4,709,024 |
|
|
Transfer agent fees |
2,324,877 |
|
|
Distribution fees |
5,814,349 |
|
|
Accounting and security lending fees |
262,804 |
|
|
Non-interested trustees' compensation |
2,368 |
|
|
Custodian fees and expenses |
18,012 |
|
|
Registration fees |
193,905 |
|
|
Audit |
26,921 |
|
|
Legal |
5,496 |
|
|
Miscellaneous |
18,916 |
|
|
Total expenses before reductions |
13,376,672 |
|
|
Expense reductions |
(112,911) |
13,263,761 |
|
Net investment income (loss) |
|
(3,053,795) |
|
Realized and Unrealized Gain (Loss) Net realized gain (loss) on: |
|
|
|
Investment securities |
38,596,548 |
|
|
Foreign currency transactions |
13,082 |
38,609,630 |
|
Change in net unrealized appreciation (depreciation) on: |
|
|
|
Investment securities |
125,938,470 |
|
|
Assets and liabilities in |
(732) |
125,937,738 |
|
Net gain (loss) |
|
164,547,368 |
|
Net increase (decrease) in net assets resulting from operations |
|
$ 161,493,573 |
See accompanying notes which are an integral part of the financial statements.
Annual Report
Advisor Health Care Fund
Financial Statements - continued
Statement of Changes in Net Assets
|
Increase (Decrease) in Net Assets |
Year ended |
Year ended |
|
Operations |
$ (3,053,795) |
$ (1,677,006) |
|
Net realized gain (loss) |
38,609,630 |
16,392,585 |
|
Change in net unrealized appreciation (depreciation) |
125,937,738 |
24,414,060 |
|
Net increase (decrease) in net assets resulting from operations |
161,493,573 |
39,129,639 |
|
Distributions to shareholders |
(55,986) |
- |
|
From net realized gain |
(13,943,374) |
(5,527,534) |
|
Total distributions |
(13,999,360) |
(5,527,534) |
|
Share transactions - net increase (decrease) |
228,829,268 |
416,927,170 |
|
Redemption fees |
336,627 |
201,576 |
|
Total increase (decrease) in net assets |
376,660,108 |
450,730,851 |
|
Net Assets |
|
|
|
Beginning of period |
682,936,986 |
232,206,135 |
|
End of period |
$ 1,059,597,094 |
$ 682,936,986 |
Financial Highlights - Class A
|
Years ended July 31, |
2000 |
1999 |
1998 |
1997 E |
|
Selected Per-Share Data |
|
|
|
|
|
Net asset value, beginning of period |
$ 18.52 |
$ 16.70 |
$ 14.10 |
$ 10.00 |
|
Income from Investment Operations |
|
|
|
|
|
Net investment income (loss) D |
.01 |
.00 |
(.03) |
(.02) |
|
Net realized and unrealized gain (loss) |
3.89 |
2.20 |
3.50 |
4.12 |
|
Total from investment operations |
3.90 |
2.20 |
3.47 |
4.10 |
|
Less Distributions |
|
|
|
|
|
From net realized gain |
(.41) |
(.39) |
(.88) |
- |
|
Redemption fees added to paid in capital |
.01 |
.01 |
.01 |
- |
|
Net asset value, end of period |
$ 22.02 |
$ 18.52 |
$ 16.70 |
$ 14.10 |
|
Total Return B, C |
21.44% |
13.80% |
26.47% |
41.00% |
|
Ratios and Supplemental Data |
|
|
|
|
|
Net assets, end of period (000 omitted) |
$ 108,248 |
$ 66,142 |
$ 20,902 |
$ 5,488 |
|
Ratio of expenses to average net assets |
1.20% |
1.23% |
1.38% |
1.75% A, F |
|
Ratio of expenses to average net assets after expense reductions |
1.18% G |
1.21% G |
1.36% G |
1.74% A, G |
|
Ratio of net investment income (loss) to average net assets |
.07% |
.01% |
(.18)% |
(.18)% A |
|
Portfolio turnover |
51% |
98% |
85% |
67% A |
|
A Annualized B The total returns would have been lower had certain expenses not been reduced during the periods shown. C Total returns do not include the one time sales charge and for periods of less than one year are not annualized. D Net investment income (loss) per share has been calculated based on average shares outstanding during the period. E For the period September 3, 1996 (commencement of sale of Class A shares) to July 31, 1997. F FMR agreed to reimburse a portion of the class' expenses during the period. Without this reimbursement, the class' expense ratio would have been higher. G FMR or the fund has entered into varying arrangements with third parties who either paid or reduced a portion of the class' expenses. |
||||
See accompanying notes which are an integral part of the financial statements.
Health Care
Financial Highlights - Class T
|
Years ended July 31, |
2000 |
1999 |
1998 |
1997 E |
|
Selected Per-Share Data |
|
|
|
|
|
Net asset value, beginning of period |
$ 18.40 |
$ 16.61 |
$ 14.05 |
$ 10.00 |
|
Income from Investment Operations |
|
|
|
|
|
Net investment income (loss) D |
(.03) |
(.04) |
(.05) |
(.04) |
|
Net realized and unrealized gain (loss) |
3.86 |
2.19 |
3.47 |
4.09 |
|
Total from investment operations |
3.83 |
2.15 |
3.42 |
4.05 |
|
Less Distributions |
|
|
|
|
|
From net realized gain |
(.37) |
(.37) |
(.87) |
- |
|
Redemption fees added to paid in capital |
.01 |
.01 |
.01 |
- |
|
Net asset value, end of period |
$ 21.87 |
$ 18.40 |
$ 16.61 |
$ 14.05 |
|
Total Return B, C |
21.16% |
13.54% |
26.17% |
40.50% |
|
Ratios and Supplemental Data |
|
|
|
|
|
Net assets, end of period (000 omitted) |
$ 361,351 |
$ 248,442 |
$ 124,652 |
$ 50,868 |
|
Ratio of expenses to average net assets |
1.42% |
1.46% |
1.54% |
1.97% A |
|
Ratio of expenses to average net assets after expense reductions |
1.40% F |
1.43% F |
1.52% F |
1.96% A, F |
|
Ratio of net investment income (loss) to average net assets |
(.15)% |
(.21)% |
(.31)% |
(.39)% A |
|
Portfolio turnover |
51% |
98% |
85% |
67% A |
|
A Annualized B The total returns would have been lower had certain expenses not been reduced during the periods shown. C Total returns do not include the one time sales charge and for periods of less than one year are not annualized. D Net investment income (loss) per share has been calculated based on average shares outstanding during the period. E For the period September 3, 1996 (commencement of sale of Class T shares) to July 31, 1997. F FMR or the fund has entered into varying arrangements with third parties who either paid or reduced a portion of the class' expenses. |
||||
Financial Highlights - Class B
|
Years ended July 31, |
2000 |
1999 |
1998 |
1997 E |
|
Selected Per-Share Data |
|
|
|
|
|
Net asset value, beginning of period |
$ 18.16 |
$ 16.47 |
$ 14.01 |
$ 11.88 |
|
Income from Investment Operations |
|
|
|
|
|
Net investment income (loss) D |
(.13) |
(.13) |
(.14) |
(.05) |
|
Net realized and unrealized gain (loss) |
3.80 |
2.17 |
3.45 |
2.18 |
|
Total from investment operations |
3.67 |
2.04 |
3.31 |
2.13 |
|
Less Distributions |
|
|
|
|
|
From net realized gain |
(.34) |
(.36) |
(.86) |
- |
|
Redemption fees added to paid in capital |
.01 |
.01 |
.01 |
- |
|
Net asset value, end of period |
$ 21.50 |
$ 18.16 |
$ 16.47 |
$ 14.01 |
|
Total Return B, C |
20.53% |
12.96% |
25.40% |
17.93% |
|
Ratios and Supplemental Data |
|
|
|
|
|
Net assets, end of period (000 omitted) |
$ 366,413 |
$ 225,441 |
$ 57,074 |
$ 6,159 |
|
Ratio of expenses to average net assets |
1.94% |
1.98% |
2.13% |
2.50% A, F |
|
Ratio of expenses to average net assets after expense reductions |
1.93% G |
1.96% G |
2.12% G |
2.49% A, G |
|
Ratio of net investment income (loss) to average net assets |
(.68)% |
(.73)% |
(.95)% |
(.99)% A |
|
Portfolio turnover |
51% |
98% |
85% |
67% A |
|
A Annualized B The total returns would have been lower had certain expenses not been reduced during the periods shown. C Total returns do not include the contingent deferred sales charge and for periods of less than one year are not annualized. D Net investment income (loss) per share has been calculated based on average shares outstanding during the period. E For the period March 3, 1997 (commencement of sale of Class B shares) to July 31, 1997. F FMR agreed to reimburse a portion of the class' expenses during the period. Without this reimbursement, the class' expense ratio would have been higher. G FMR or the fund has entered into varying arrangements with third parties who either paid or reduced a portion of the class' expenses. |
||||
See accompanying notes which are an integral part of the financial statements.
Annual Report
Financial Highlights - Class C
|
Years ended July 31, |
2000 |
1999 |
1998 E |
|
Selected Per-Share Data |
|
|
|
|
Net asset value, beginning of period |
$ 18.17 |
$ 16.49 |
$ 13.85 |
|
Income from Investment Operations |
|
|
|
|
Net investment income (loss) D |
(.12) |
(.12) |
(.12) |
|
Net realized and unrealized gain (loss) |
3.80 |
2.17 |
3.39 |
|
Total from investment operations |
3.68 |
2.05 |
3.27 |
|
Less Distributions |
|
|
|
|
From net realized gain |
(.36) |
(.38) |
(.63) |
|
Redemption fees added to paid in capital |
.01 |
.01 |
- |
|
Net asset value, end of period |
$ 21.50 |
$ 18.17 |
$ 16.49 |
|
Total Return B, C |
20.59% |
13.04% |
24.84% |
|
Ratios and Supplemental Data |
|
|
|
|
Net assets, end of period (000 omitted) |
$ 183,264 |
$ 109,372 |
$ 19,154 |
|
Ratio of expenses to average net assets |
1.91% |
1.95% |
2.18% A |
|
Ratio of expenses to average net assets after expense reductions |
1.89% F |
1.92% F |
2.17% A, F |
|
Ratio of net investment income (loss) to average net assets |
(.64)% |
(.70)% |
(1.06)% A |
|
Portfolio turnover |
51% |
98% |
85% |
|
A Annualized B The total returns would have been lower had certain expenses not been reduced during the periods shown. C Total returns do not include the contingent deferred sales charge and for periods of less than one year are not annualized. D Net investment income (loss) per share has been calculated based on average shares outstanding during the period. E For the period November 3, 1997 (commencement of sale of Class C shares) to July 31, 1998. F FMR or the fund has entered into varying arrangements with third parties who either paid or reduced a portion of the class' expenses. |
|||
Financial Highlights - Institutional Class
|
Years ended July 31, |
2000 |
1999 |
1998 |
1997 E |
|
Selected Per-Share Data |
|
|
|
|
|
Net asset value, beginning of period |
$ 18.59 |
$ 16.73 |
$ 14.12 |
$ 10.00 |
|
Income from Investment Operations |
|
|
|
|
|
Net investment income (loss) D |
.07 |
.05 |
.03 |
.01 |
|
Net realized and unrealized gain (loss) |
3.90 |
2.21 |
3.47 |
4.11 |
|
Total from investment operations |
3.97 |
2.26 |
3.50 |
4.12 |
|
Less Distributions |
|
|
|
|
|
From net investment income |
(.03) |
- |
- |
- |
|
From net realized gain |
(.41) |
(.41) |
(.90) |
- |
|
Total distributions |
(.44) |
(.41) |
(.90) |
- |
|
Redemption fees added to paid in capital |
.01 |
.01 |
.01 |
- |
|
Net asset value, end of period |
$ 22.13 |
$ 18.59 |
$ 16.73 |
$ 14.12 |
|
Total Return B, C |
21.77% |
14.17% |
26.70% |
41.20% |
|
Ratios and Supplemental Data |
|
|
|
|
|
Net assets, end of period (000 omitted) |
$ 40,320 |
$ 33,540 |
$ 10,424 |
$ 6,875 |
|
Ratio of expenses to average net assets |
.93% |
.97% |
1.07% |
1.50% A, F |
|
Ratio of expenses to average net assets after expense reductions |
.92% G |
.95% G |
1.04% G |
1.49% A, G |
|
Ratio of net investment income (loss) to average net assets |
.33% |
.28% |
.17% |
.08% A |
|
Portfolio turnover |
51% |
98% |
85% |
67% A |
|
A Annualized B The total returns would have been lower had certain expenses not been reduced during the periods shown. C Total returns for periods of less than one year are not annualized. D Net investment income (loss) per share has been calculated based on average shares outstanding during the period. E For the period September 3, 1996 (commencement of sale of Institutional Class shares) to July 31, 1997. F FMR agreed to reimburse a portion of the class' expenses during the period. Without this reimbursement, the class' expense ratio would have been higher. G FMR or the fund has entered into varying arrangements with third parties who either paid or reduced a portion of the class' expenses. |
||||
See accompanying notes which are an integral part of the financial statements.
Health Care
For the period ended July 31, 2000
1. Significant Accounting Policies.
Fidelity Advisor Health Care Fund (the fund) is a fund of Fidelity Advisor Series VII (the trust) and is authorized to issue an unlimited number of shares. The trust is registered under the Investment Company Act of 1940, as amended (the 1940 Act), as an open-end management investment company organized as a Massachusetts business trust.
The fund offers Class A, Class T, Class B, Class C, and Institutional Class shares, each of which has equal rights as to assets and voting privileges. Each class has exclusive voting rights with respect to matters that affect that class. Class B shares will automatically convert to Class A shares after a holding period of seven years from the initial date of purchase. Investment income, realized and unrealized capital gains and losses, the common expenses of the fund, and certain fund-level expense reductions, if any, are allocated on a pro rata basis to each class based on the relative net assets of each class to the total net assets of the fund. Each class of shares differs in its respective distribution, transfer agent, and certain other class-specific fees, expenses, and expense reductions.
The financial statements have been prepared in conformity with generally accepted accounting principles which require management to make certain estimates and assumptions at the date of the financial statements. The following summarizes the significant accounting policies of the fund:
Security Valuation. Securities for which exchange quotations are readily available are valued at the last sale price, or if no sale price, at the closing bid price. Foreign securities are valued based on quotations from the principal market in which such securities are normally traded. If trading or events occurring in other markets after the close of the principal market in which foreign securities are traded, and before the close of the business of the fund, are expected to materially affect the value of those securities, then they are valued at their fair value taking this trading or these events into account. Fair value is determined in good faith under consistently applied procedures under the general supervision of the Board of Trustees. Securities (including restricted securities) for which exchange quotations are not readily available (and in certain cases debt securities which trade on an exchange) are valued primarily using dealer-supplied valuations or at their fair value. Short-term securities with remaining maturities of sixty days or less for which quotations are not readily available are valued at amortized cost or original cost plus accrued interest, both of which approximate current value.
Foreign Currency Translation. The accounting records of the fund are maintained in U.S. dollars. Investment securities and other assets and liabilities denominated in a foreign currency are translated into U.S. dollars at the prevailing rates of exchange at period end. Purchases and sales of securities, income receipts and expense payments are translated into U.S. dollars at the prevailing exchange rate on the respective dates of the transactions.
Net realized gains and losses on foreign currency transactions represent net gains and losses from sales and maturities of foreign currency contracts, disposition of foreign currencies, the difference between the amount of net investment income accrued and the U.S. dollar amount actually received, and gains and losses between trade and settlement date on purchases and sales of securities. The effects of changes in foreign currency exchange rates on investments in securities are included with the net realized and unrealized gain or loss on investment securities.
Income Taxes. As a qualified regulated investment company under Subchapter M of the Internal Revenue Code, the fund is not subject to income taxes to the extent that it distributes substantially all of its taxable income for its fiscal year. The schedule of investments includes information regarding income taxes under the caption "Income Tax Information."
Investment Income. Dividend income is recorded on the ex-dividend date, except certain dividends from foreign securities where the ex-dividend date may have passed, are recorded as soon as the fund is informed of the ex-dividend date. Non-cash dividends included in dividend income, if any, are recorded at the fair market value of the securities received. Interest income is accrued as earned. Investment income is recorded net of foreign taxes withheld where recovery of such taxes is uncertain.
Expenses. Most expenses of the trust can be directly attributed to a fund. Expenses which cannot be directly attributed are apportioned among the funds in the trust.
Distributions to Shareholders. Distributions are recorded on the ex-dividend date. Income dividends and capital gain distributions are declared separately for each class.
Income and capital gain distributions are determined in accordance with income tax regulations which may differ from generally accepted accounting principles. These differences, which may result in distribution reclassifications, are primarily due to differing treatments for litigation proceeds, foreign currency transactions, non-taxable dividends, net operating losses and losses deferred due to wash sales. The fund also utilized earnings and profits distributed to shareholders on redemption of shares as a part of the dividends paid deduction for income tax purposes.
Permanent book and tax basis differences relating to shareholder distributions will result in reclassifications to paid in capital. Accumulated undistributed net realized gain (loss) on investments may include temporary book and tax basis differences which will reverse in a subsequent period. Any taxable income or gain remaining at fiscal year end is distributed in the following year.
Short-Term Trading (Redemption) Fees. Shares held in the fund less than 60 days are subject to a short-term trading fee equal to 1% of the proceeds of the redeemed shares. The fee, which is retained by the fund, is accounted for as an addition to paid in capital.
Annual Report
Notes to Financial Statements - continued
1. Significant Accounting Policies - continued
Security Transactions. Security transactions are accounted for as of trade date. Gains and losses on securities sold are determined on the basis of identified cost.
2. Operating Policies.
Foreign Currency Contracts. The fund generally uses foreign currency contracts to facilitate transactions in foreign-denominated securities. Losses may arise from changes in the value of the foreign currency or if the counterparties do not perform under the contracts' terms. The U.S. dollar value of foreign currency contracts is determined using contractual currency exchange rates established at the time of each trade.
Joint Trading Account. Pursuant to an Exemptive Order issued by the Securities and Exchange Commission (the SEC), the fund, along with other affiliated entities of Fidelity Management & Research Company (FMR), may transfer uninvested cash balances into one or more joint trading accounts. These balances are invested in one or more repurchase agreements for U.S. Treasury or Federal Agency obligations.
Repurchase Agreements. The underlying U.S. Treasury, Federal Agency, or other obligations found to be satisfactory by FMR are transferred to an account of the fund, or to the Joint Trading Account, at a custodian bank. The securities are marked-to-market daily and maintained at a value at least equal to the principal amount of the repurchase agreement (including accrued interest). FMR, the fund's investment adviser, is responsible for determining that the value of the underlying securities remains in accordance with the market value requirements stated above.
Cash Central Funds. Pursuant to an Exemptive Order issued by the SEC, the fund may invest in the Fidelity Cash Central Fund and the Fidelity Securities Lending Cash Central Fund (the Cash Funds) managed by Fidelity Investments Money Management, Inc., an affiliate of FMR. The Cash Funds are open-end money market funds available only to investment companies and other accounts managed by FMR and its affiliates. The Cash Funds seek preservation of capital, liquidity, and current income. Income distributions from the Cash Funds are declared daily and paid monthly from net interest income. Income distributions earned by the fund are recorded as either interest income or security lending income in the accompanying financial statements.
Restricted Securities. The fund is permitted to invest in securities that are subject to legal or contractual restrictions on resale. These securities generally may be resold in transactions exempt from registration or to the public if the securities are registered. Disposal of these securities may involve time-consuming negotiations and expense, and prompt sale at an acceptable price may be difficult. At the end of the period, restricted securities (excluding 144A issues) amounted to $236,500 or 0.0% of net assets.
3. Purchases and Sales of Investments.
Purchases and sales of securities, other than short-term securities, aggregated $593,309,110 and $388,988,655, respectively.
4. Fees and Other Transactions with Affiliates.
Management Fee. As the fund's investment adviser, FMR receives a monthly fee that is calculated on the basis of a group fee rate plus a fixed individual fund fee rate applied to the average net assets of the fund. The group fee rate is the weighted average of a series of rates and is based on the monthly average net assets of all the mutual funds advised by FMR. The rates ranged from .2167% to .5200% for the period. The annual individual fund fee rate is .30%. In the event that these rates were lower than the contractual rates in effect during the period, FMR voluntarily implemented the above rates, as they resulted in the same or a lower management fee. For the period, the management fee was equivalent to an annual rate of .58% of average net assets.
Distribution and Service Plan. In accordance with Rule 12b-1 of the 1940 Act, the Board of Trustees have adopted separate Distribution and Service Plans with respect to each class of shares (collectively referred to as "the Plans"). Under certain of the Plans, the class pays Fidelity Distributors Corporation (FDC), an affiliate of FMR, a 12b-1 fee. A portion of this fee may be reallowed to securities dealers, banks and other financial institutions for the distribution of each class of shares and providing shareholder support services. For the period, this fee was based on the following annual rates of the average net assets of each applicable class:
|
Class A |
$ .25% |
|
Class T |
$ .50% |
|
Class B |
$ 1.00% * |
|
Class C |
$ 1.00% * |
* .75% represents a distribution fee and .25% represents a shareholder service fee.
For the period, each class paid FDC the following amounts, a portion of which was retained by FDC:
|
|
Paid to |
Retained |
|
Class A |
$ 203,584 |
$ 195 |
|
Class T |
1,401,803 |
5,774 |
|
Class B |
2,818,907 |
2,115,590 |
|
Class C |
1,390,055 |
940,533 |
|
|
$ 5,814,349 |
$ 3,062,092 |
Sales Load. FDC receives a front-end sales charge of up to 5.75% for selling Class A shares, and 3.50% for selling Class T shares of the fund. FDC receives the proceeds of contingent deferred sales charges levied on Class B share redemptions occurring within six years of purchase and Class C share redemptions occurring within one year of purchase. Contingent deferred sales charges are based on declining rates ranging from 5% to 1% for Class B and 1% for Class C, of the lesser of the cost of shares at the initial date of purchase or the net
Health Care
Notes to Financial Statements - continued
4. Fees and Other Transactions with Affiliates - continued
Sales Load - continued
asset value of the redeemed shares, excluding any reinvested dividends and capital gains. In addition, purchases of Class A and Class T shares that were subject to a finder's fee bear a contingent deferred sales charge on assets that do not remain in the fund for at least one year. The Class A and Class T contingent deferred sales charge is based on 0.25% of the lesser of the cost of shares at the initial date of purchase or the net asset value of the redeemed shares, excluding any reinvested dividends and capital gains. A portion of the sales charges paid to FDC is paid to securities dealers, banks and other financial institutions.
For the period, sales charge amounts paid to and retained by FDC were as follows:
|
|
Paid to |
Retained |
|
Class A |
$ 421,895 |
$ 242,040 |
|
Class T |
529,291 |
223,787 |
|
Class B |
1,039,749 |
1,039,749* |
|
Class C |
134,796 |
134,796* |
|
|
$ 2,125,731 |
$ 1,640,372 |
* When Class B and Class C shares are initially sold, FDC pays commissions from its own resources to securities dealers,
banks, and other financial institutions through which the sales are made.
Transfer Agent Fees. Fidelity Investments Institutional Operations Company, Inc., (FIIOC), an affiliate of FMR, is the transfer, dividend disbursing and shareholder servicing agent (collectively referred to as the transfer agent) for each class of the fund. FIIOC receives account fees and asset-based fees that vary according to the account size and type of account of the shareholders of the respective classes of the fund. FIIOC pays for typesetting, printing and mailing of all shareholder reports, except proxy statements. For the period, the following amounts were paid to FIIOC:
|
|
Amount |
% of |
|
Class A |
$ 246,246 |
.30 |
|
Class T |
767,713 |
.27 |
|
Class B |
848,176 |
.30 |
|
Class C |
364,023 |
.26 |
|
Institutional Class |
98,719 |
.29 |
|
|
$ 2,324,877 |
|
Accounting and Security Lending Fees. Fidelity Service Company, Inc., an affiliate of FMR, maintains the fund's accounting records and administers the security lending program. The security lending fee is based on the number and duration of lending transactions. The accounting fee is based on the level of average net assets for the month plus out-of-pocket expenses.
Brokerage Commissions. The fund placed a portion of its portfolio transactions with brokerage firms which are affiliates of FMR. The commissions paid to these affiliated firms were $17,511 for the period.
5. Security Lending.
The fund lends portfolio securities from time to time in order to earn additional income. The fund receives collateral in the form of U.S. Treasury obligations, letters of credit, and/or cash against the loaned securities, and maintains collateral in an amount not less than 100% of the market value of the loaned securities during the period of the loan. The market value of the loaned securities is determined at the close of business of the fund and any additional required collateral is delivered to the fund on the next business day. If the borrower defaults on its obligation to return the securities loaned because of insolvency or other reasons, the fund could experience delays and costs in recovering the securities loaned or in gaining access to the collateral. At period end, the value of the securities loaned amounted to $5,362,238. The fund received cash collateral of $5,691,949 which was invested in cash equivalents.
6. Expense Reductions.
FMR has directed certain portfolio trades to brokers who paid a portion of the fund's expenses. For the period, the fund's expenses were reduced by $112,294 under this arrangement.
In addition, through an arrangement with the fund's custodian, credits realized as a result of uninvested cash balances were used to reduce a portion of the fund's expenses. During the period, the fund's custodian fees were reduced by $617 under this arrangement.
Health Care
Notes to Financial Statements - continued
7. Distributions to Shareholders.
Distributions to shareholders of each class were as follows:
|
|
Years ended July 31, |
|
|
|
2000 |
1999 |
|
From net investment income |
|
|
|
Institutional Class |
$ 55,986 |
$ - |
|
From net realized gain |
|
|
|
Class A |
$ 1,513,849 |
$ 506,267 |
|
Class T |
5,017,622 |
2,852,284 |
|
Class B |
4,390,652 |
1,389,695 |
|
Class C |
2,255,536 |
512,786 |
|
Institutional Class |
765,715 |
266,502 |
|
Total |
$ 13,943,374 |
$ 5,527,534 |
|
|
$ 13,999,360 |
$ 5,527,534 |
8. Share Transactions.
Transactions for each class of shares were as follows:
|
|
Shares |
Dollars |
||
|
|
Year ended |
Year ended |
Year ended |
Year ended |
|
|
2000 |
1999 |
2000 |
1999 |
|
|
|
|
|
|
|
Class A |
2,976,195 |
2,923,295 |
$ 57,995,930 |
$ 52,957,834 |
|
Reinvestment of distributions |
71,818 |
30,315 |
1,377,514 |
451,389 |
|
Shares redeemed |
(1,703,303) |
(633,263) |
(32,602,744) |
(11,335,392) |
|
Net increase (decrease) |
1,344,710 |
2,320,347 |
$ 26,770,700 |
$ 42,073,831 |
|
Class T |
8,817,982 |
9,152,907 |
$ 171,795,235 |
$ 163,138,613 |
|
Reinvestment of distributions |
246,626 |
182,634 |
4,708,078 |
2,706,621 |
|
Shares redeemed |
(6,044,271) |
(3,336,370) |
(113,414,865) |
(58,873,247) |
|
Net increase (decrease) |
3,020,337 |
5,999,171 |
$ 63,088,448 |
$ 106,971,987 |
|
Class B |
8,402,675 |
10,129,553 |
$ 159,912,025 |
$ 180,199,139 |
|
Reinvestment of distributions |
198,004 |
81,573 |
3,734,363 |
1,199,114 |
|
Shares redeemed |
(3,973,722) |
(1,262,369) |
(73,965,867) |
(22,344,687) |
|
Net increase (decrease) |
4,626,957 |
8,948,757 |
$ 89,680,521 |
$ 159,053,566 |
|
Class C |
4,784,414 |
5,638,208 |
$ 91,120,799 |
$ 101,276,858 |
|
Reinvestment of distributions |
83,910 |
26,607 |
1,581,712 |
391,120 |
|
Shares redeemed |
(2,361,733) |
(807,853) |
(44,212,557) |
(14,456,971) |
|
Net increase (decrease) |
2,506,591 |
4,856,962 |
$ 48,489,954 |
$ 87,211,007 |
|
Institutional Class |
1,215,089 |
1,586,418 |
$ 23,709,203 |
$ 28,856,815 |
|
Reinvestment of distributions |
30,625 |
16,379 |
588,917 |
244,208 |
|
Shares redeemed |
(1,227,964) |
(421,646) |
(23,498,475) |
(7,484,244) |
|
Net increase (decrease) |
17,750 |
1,181,151 |
$ 799,645 |
$ 21,616,779 |
Health Care
Performance
There are several ways to evaluate historical performance. You can look at the total percentage change in value, the average annual percentage change or the growth of a hypothetical $10,000 investment. Total return reflects the change in the value of an investment, assuming reinvestment of dividend income and capital gains (the profits earned upon the sale of securities that have grown in value). The initial offering of Class A shares took place on September 3, 1996. Class A shares bear a 0.25% 12b-1 fee. Returns prior to September 3, 1996 are those of Class T, the original class of the fund, and reflect Class T shares' 0.50% 12b-1 fee (0.65% prior to January 1, 1996). If Fidelity had not reimbursed certain class expenses, the past five year and past 10 year total returns would have been lower.
Cumulative Total Returns
|
Periods ended July 31, 2000 |
Past 1 |
Past 5 |
Past 10 |
|
Fidelity Adv Natural - CL A |
9.92% |
68.18% |
210.59% |
|
Fidelity Adv Natural - CL A |
3.60% |
58.51% |
192.73% |
|
S&P 500 |
8.98% |
177.11% |
408.31% |
|
GS Natural Resources |
1.35% |
n/a* |
n/a* |
Cumulative total returns show Class A shares' performance in percentage terms over a set period - in this case, one year, five years or 10 years. You can compare Class A shares' returns to the performance of both the Standard & Poor's 500 Index - a market capitalization-weighted index of common stocks - and the Goldman Sachs Natural Resources Index - a market capitalization-weighted index of 112 stocks designed to measure the performance of companies in the natural resource sector. Issues in the index include extractive industries including gold and precious metals mining along with other mineral mining, energy companies providing oil and gas services, and owners and operators of timber tracts and forestry services. These benchmarks include reinvested dividends and capital gains, if any, and exclude the effect of sales charges.
Average Annual Total Returns
|
Periods ended July 31, 2000 |
Past 1 |
Past 5 |
Past 10 |
|
Fidelity Adv Natural - CL A |
9.92% |
10.96% |
12.00% |
|
Fidelity Adv Natural - CL A |
3.60% |
9.65% |
11.34% |
|
S&P 500 |
8.98% |
22.61% |
17.65% |
|
GS Natural Resources |
1.35% |
n/a* |
n/a* |
Average annual returns take Class A shares' cumulative return and show you what would have happened if Class A shares had performed at a constant rate each year.
* Not available
$10,000 Over 10 Years
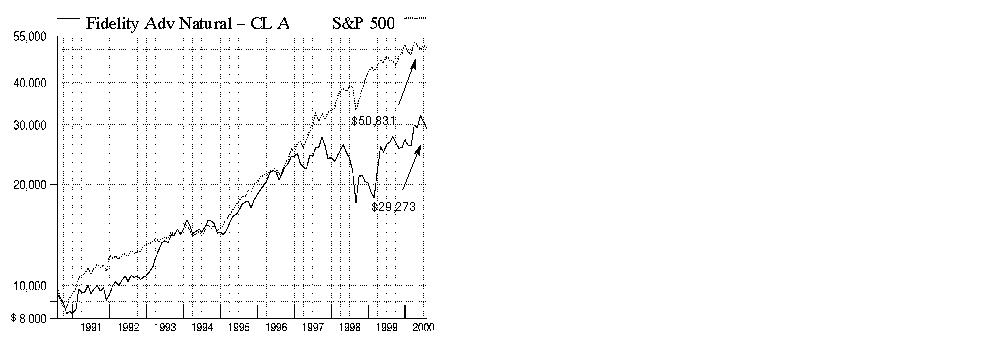
$10,000 Over 10 Years: Let's say hypothetically that $10,000 was invested in Fidelity Advisor Natural Resources - Class A on July 31, 1990, and the current 5.75% sales charge was paid. As the chart shows, by July 31, 2000, the value of the investment would have grown to $29,273 - a 192.73% increase on the initial investment. For comparison, look at how the Standard & Poor's 500 Index did over the same period. With dividends and capital gains, if any, reinvested, the same $10,000 investment would have grown to $50,831 - a 408.31% increase. (The Goldman Sachs Natural Resources Index does not extend as far back as the fund's start date, and therefore cannot be used for this comparison.)
Understanding Performance
How a fund did yesterday is no guarantee of how it will do tomorrow. The stock market, for example, has a history of long-term growth and short-term volatility. Unlike the broader market, however, some sectors may not have a history of growth in the long run. And, as with all stock funds, the share price and return of a fund that invests in a sector will vary.
3Annual Report
Performance
There are several ways to evaluate historical performance. You can look at the total percentage change in value, the average annual percentage change or the growth of a hypothetical $10,000 investment. Total return reflects the change in the value of an investment, assuming reinvestment of dividend income and capital gains (the profits earned upon the sale of securities that have grown in value). If Fidelity had not reimbursed certain class expenses, the past five year and 10 year total returns would have been lower.
Cumulative Total Returns
|
Periods ended July 31, 2000 |
Past 1 |
Past 5 |
Past 10 |
|
Fidelity Adv Natural - CL T |
9.69% |
67.74% |
209.79% |
|
Fidelity Adv Natural - CL T |
5.85% |
61.87% |
198.95% |
|
S&P 500 |
8.98% |
177.11% |
408.31% |
|
GS Natural Resources |
1.35% |
n/a* |
n/a* |
Cumulative total returns show Class T shares' performance in percentage terms over a set period - in this case, one year, five years or 10 years. You can compare Class T shares' returns to the performance of both the Standard & Poor's 500 Index - a market capitalization-weighted index of common stocks - and the Goldman Sachs Natural Resources Index - a market capitalization-weighted index of 112 stocks designed to measure the performance of companies in the natural resource sector. Issues in the index include extractive industries including gold and precious metals mining along with other mineral mining, energy companies providing oil and gas services, and owners and operators of timber tracts and forestry services. These benchmarks include reinvested dividends and capital gains, if any, and exclude the effect of sales charges.
Average Annual Total Returns
|
Periods ended July 31, 2000 |
Past 1 |
Past 5 |
Past 10 |
|
Fidelity Adv Natural - CL T |
9.69% |
10.90% |
11.97% |
|
Fidelity Adv Natural - CL T |
5.85% |
10.11% |
11.57% |
|
S&P 500 |
8.98% |
22.61% |
17.65% |
|
GS Natural Resources |
1.35% |
n/a* |
n/a* |
Average annual returns take Class T shares' cumulative return and show you what would have happened if Class T shares had performed at a constant rate each year.
* Not available
$10,000 Over 10 Years
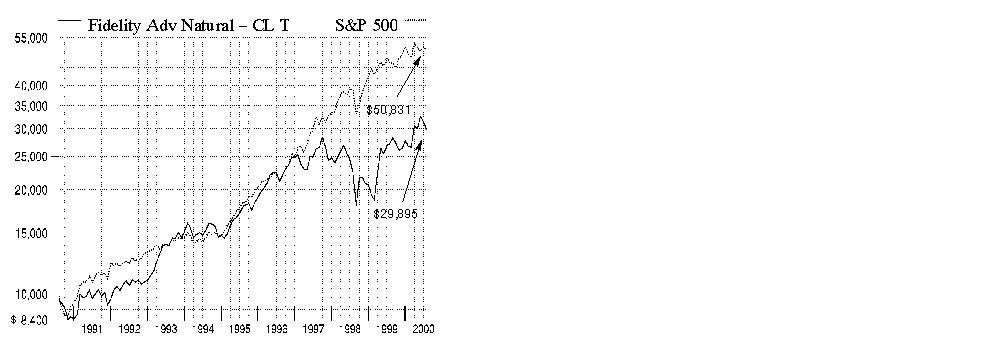
$10,000 Over 10 Years: Let's say hypothetically that $10,000 was invested in Fidelity Advisor Natural Resources - Class T on July 31, 1990, and the current 3.50% sales charge was paid. As the chart shows, by July 31, 2000, the value of the investment would have grown to $29,895 - a 198.95% increase on the initial investment. For comparison, look at how the Standard & Poor's 500 Index did over the same period. With dividends and capital gains, if any, reinvested, the same $10,000 investment would have grown to $50,831 - a 408.31% increase. (The Goldman Sachs Natural Resources Index does not extend as far back as the fund's start date, and therefore cannot be used for this comparison.)
Understanding Performance
How a fund did yesterday is no guarantee of how it will do tomorrow. The stock market, for example, has a history of long-term growth and short-term volatility. Unlike the broader market, however, some sectors may not have a history of growth in the long run. And, as with all stock funds, the share price and return of a fund that invests in a sector will vary.
3Annual Report
Performance
There are several ways to evaluate historical performance. You can look at the total percentage change in value, the average annual percentage change or the growth of a hypothetical $10,000 investment. Total return reflects the change in the value of an investment, assuming reinvestment of dividend income and capital gains (the profits earned upon the sale of securities that have grown in value). The initial offering of Class B shares took place on July 3, 1995. Class B shares bear a 1.00% 12b-1 fee. Returns prior to July 3, 1995 are those of Class T, the original class of the fund, and reflect Class T shares' prior 0.65% 12b-1 fee. Had Class B shares' 12b-1 fee been reflected, returns prior to July 3, 1995 would have been lower. Class B shares' contingent deferred sales charge included in the past one year, past five years and 10 years total return figures are 5%, 2% and 0%, respectively. If Fidelity had not reimbursed certain class expenses, the past five year and 10 year total returns would have been lower.
Cumulative Total Returns
|
Periods ended July 31, 2000 |
|
Past 1 |
Past 5 |
Past 10 |
|
Fidelity Adv Natural - CL B |
|
9.14% |
62.93% |
200.76% |
|
Fidelity Adv Natural - CL B |
|
4.14% |
60.93% |
200.76% |
|
S&P 500 |
|
8.98% |
177.11% |
408.31% |
|
GS Natural Resources |
|
1.35% |
n/a* |
n/a* |
Cumulative total returns show Class B shares' performance in percentage terms over a set period - in this case, one year, five years or 10 years. You can compare Class B shares' returns to the performance of both the Standard & Poor's 500 Index - a market capitalization-weighted index of common stocks - and the Goldman Sachs Natural Resources Index - a market capitalization-weighted index of 112 stocks designed to measure the performance of companies in the natural resource sector. Issues in the index include extractive industries including gold and precious metals mining along with other mineral mining, energy companies providing oil and gas services, and owners and operators of timber tracts and forestry services. These benchmarks include reinvested dividends and capital gains, if any, and exclude the effect of sales charges.
Average Annual Total Returns
|
Periods ended July 31, 2000 |
|
Past 1 |
Past 5 |
Past 10 |
|
Fidelity Adv Natural - CL B |
|
9.14% |
10.26% |
11.64% |
|
Fidelity Adv Natural - CL B |
4.14% |
9.98% |
11.64% |
|
|
S&P 500 |
|
8.98% |
22.61% |
17.65% |
|
GS Natural Resources |
|
1.35% |
n/a* |
n/a* |
Average annual returns take Class B shares' cumulative return and show you what would have happened if Class B shares had performed at a constant rate each year.
* Not available
$10,000 Over 10 Years
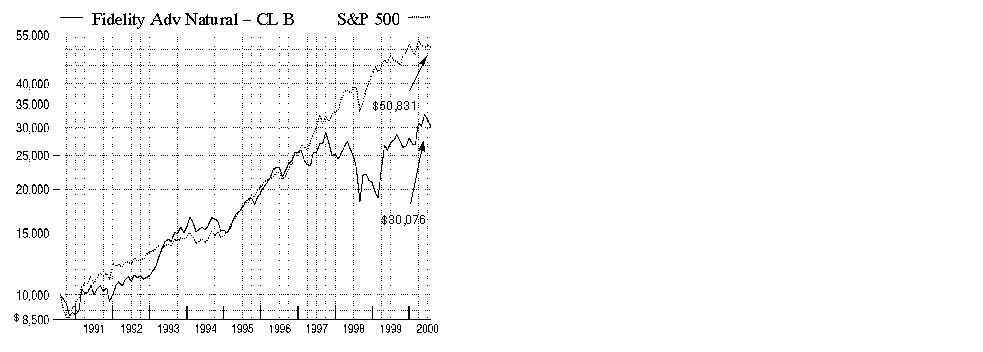
$10,000 Over 10 Years: Let's say hypothetically that $10,000 was invested in Fidelity Advisor Natural Resources - Class B on July 31, 1990. As the chart shows, by July 31, 2000, the value of the investment would have grown to $30,076 - a 200.76% increase on the initial investment. For comparison, look at how the Standard & Poor's 500 Index did over the same period. With dividends and capital gains, if any, reinvested, the same $10,000 investment would have grown to $50,831 - a 408.31% increase. (The Goldman Sachs Natural Resources Index does not extend as far back as the fund's start date, and therefore cannot be used for this comparison.)
Understanding Performance
How a fund did yesterday is no guarantee of how it will do tomorrow. The stock market, for example, has a history of long-term growth and short-term volatility. Unlike the broader market, however, some sectors may not have a history of growth in the long run. And, as with all stock funds, the share price and return of a fund that invests in a sector will vary.
3Annual Report
Performance
There are several ways to evaluate historical performance. You can look at the total percentage change in value, the average annual percentage change or the growth of a hypothetical $10,000 investment. Total return reflects the change in the value of an investment, assuming reinvestment of dividend income and capital gains (the profits earned upon the sale of securities that have grown in value). The initial offering of Class C shares took place on November 3, 1997. Class C shares bear a 1.00% 12b-1 fee. Returns between July 3, 1995 and November 3, 1997 are those of Class B shares and reflect Class B shares' 1.00% 12b-1 fee. Returns prior to July 3, 1995 are those of Class T, the original class of the fund, and reflect Class T shares' prior 0.65% 12b-1 fee. Had Class C shares' 12b-1 fee been reflected, returns prior to July 3, 1995 would have been lower. Class C shares' contingent deferred sales charge included in the past one year, past five year and past 10 year total return figures are 1%, 0% and 0%, respectively. If Fidelity had not reimbursed certain class expenses, the past five year and 10 year total returns would have been lower.
Cumulative Total Returns
|
Periods ended July 31, 2000 |
Past 1 |
Past 5 |
Past 10 |
|
Fidelity Adv Natural - CL C |
9.15% |
62.57% |
200.08% |
|
Fidelity Adv Natural - CL C |
8.15% |
62.57% |
200.08% |
|
S&P 500 |
8.98% |
177.11% |
408.31% |
|
GS Natural Resources |
1.35% |
n/a* |
n/a* |
Cumulative total returns show Class C shares' performance in percentage terms over a set period - in this case, one year, five years or 10 years. You can compare Class C shares' returns to the performance of both the Standard & Poor's 500 Index - a market capitalization-weighted index of common stocks - and the Goldman Sachs Natural Resources Index - a market capitalization-weighted index of 112 stocks designed to measure the performance of companies in the natural resource sector. Issues in the index include extractive industries including gold and precious metals mining along with other mineral mining, energy companies providing oil and gas services, and owners and operators of timber tracts and forestry services. These benchmarks include reinvested dividends and capital gains, if any, and exclude the effect of sales charges.
Average Annual Total Returns
|
Periods ended July 31, 2000 |
Past 1 |
Past 5 |
Past 10 |
|
Fidelity Adv Natural - CL C |
9.15% |
10.21% |
11.62% |
|
Fidelity Adv Natural - CL C |
8.15% |
10.21% |
11.62% |
|
S&P 500 |
8.98% |
22.61% |
17.65% |
|
GS Natural Resources |
1.35% |
n/a* |
n/a* |
Average annual returns take Class C shares' cumulative return and show you what would have happened if Class C shares had performed at a constant rate each year.
* Not available
$10,000 Over 10 Years
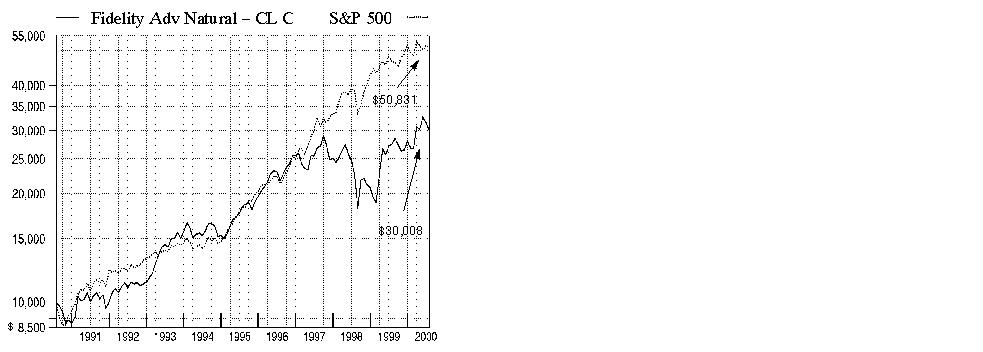
$10,000 Over 10 Years: Let's say hypothetically that $10,000 was invested in Fidelity Advisor Natural Resources - Class C on July 31, 1990. As the chart shows, by July 31, 2000, the value of the investment would have grown to $30,008 - a 200.08% increase on the initial investment. For comparison, look at how the Standard & Poor's 500 Index did over the same period. With dividends and capital gains, if any, reinvested, the same $10,000 investment would have grown to $50,831 - a 408.31% increase. (The Goldman Sachs Natural Resources Index does not extend as far back as the fund's start date, and therefore cannot be used for this comparison.)
Understanding Performance
How a fund did yesterday is no guarantee of how it will do tomorrow. The stock market, for example, has a history of long-term growth and short-term volatility. Unlike the broader market, however, some sectors may not have a history of growth in the long run. And, as with all stock funds, the share price and return of a fund that invests in a sector will vary.
3Annual Report
(Portfolio Manager photograph)
An interview with
Scott Offen, Portfolio
Manager of Fidelity Advisor Natural Resources Fund
Q. Scott, how did the fund perform during the 12 months that ended July 31, 2000?
A. For the 12 months that ended July 31, 2000, the fund's Class A, Class T, Class B and Class C shares returned 9.92%, 9.69%, 9.14% and 9.15%, respectively. To compare, the Goldman Sachs Natural Resources Index - an index of 112 stocks designed to measure the performance of companies in the natural resources sector - returned 1.35%, and the Standard & Poor's 500 Index returned 8.98%.
A. For the 12 months that ended July 31, 2000, the fund's Institutional Class shares returned 10.31%. To compare, the Goldman Sachs Natural Resources Index - an index of 112 stocks designed to measure the performance of companies in the natural resources sector - returned 1.35%, and the Standard & Poor's 500 Index returned 8.98%.
Q. What helped the fund perform better than the natural resources sector, as measured by the Goldman Sachs index?
A. The most significant factor was the fund's industry weightings relative to the index. I overweighted the fund in natural gas and energy services stocks, two areas that performed quite well. The fund also benefited from its stake in two other groups that did well, tankers and refiners. At the same time, I underweighted oil, paper and forest products, and metals stocks, all of which had subpar performance.
Q. Why did natural gas, energy services, tanker and refining stocks perform so well?
A. Natural gas stocks fared well due to a positive demand and supply dynamic that led to rising natural gas prices. Demand was on the rise due to the strong economy and a vibrant housing market. Furthermore, demand for electricity also was on the rise and nearly all new electric power plants coming on line will be powered by natural gas. At the same time, the most readily available supplies of natural gas in North America have been exhausted. Many areas where natural gas might be tapped have been put off-limits due to environmental protection. Even if a pipeline were to be built accessing natural gas in Canada or Alaska, it would be several years before such a project could be completed. On the energy services side, higher oil prices prodded the industry to ramp up its capital spending on drilling, exploration and production after having underinvested in these activities over the past two years. These increased capital expenditures translated directly into improved revenues and increased earnings for energy services firms. Shipping companies - those that provide tankers, in particular - also benefited from this increased energy production, as high-capacity utilization caused shipping rates to skyrocket. Finally, for a time refiners enjoyed record high margins - the difference between the cost of the crude oil they purchase compared to the price they capture for the refined petroleum products they produce - and their stocks enjoyed a nice run-up. While these investments helped the fund's performance over the course of its fiscal year, I pared them back when the story came to an end.
Q. Which stocks performed well? Which disappointed?
A. Nearly all of the fund's top performers were energy services stocks or companies involved in some way with natural gas. On the energy services side, Schlumberger, Noble Drilling, Smith International, ENSCO International, Nabors Industries and Weatherford all provided strong performance. In the natural gas arena, Dynegy, an independent power producer, and Kinder Morgan performed well. Exxon Mobil also provided solid performance, due to the excellent execution of the merger of Exxon and Mobil that provided twice the anticipated cost savings. On the down side, Texaco suffered from difficulties executing its business plans and USX-Marathon had problems finding oil. Surprisingly, while Chevron met its earnings expectations, its stock floundered, probably because investors found more attractive investments elsewhere.
Q. What is your outlook?
A. I'm cautiously optimistic. I believe the natural gas and energy stories will continue to be very strong. There should continue to be a shortage of natural gas supply at a time when demand should continue to rise. Looking at energy services, these stocks may suffer in the short term if the price of oil declines. However, I believe the supply of oil is tight enough that such a decline will not be precipitous, and that oil companies will continue to sustain or increase their capital expenditures on exploration and production. These activities should keep energy services companies' revenues and earnings at healthy levels.
The views expressed in this report reflect those of the portfolio manager only through the end of the period of the report as stated on the cover. The manager's views are subject to change at any time based on market and other conditions. For more information see page A-3.
Fund Facts
Start date: December 29, 1987
Size: as of July 31, 2000, more than $324 million
Manager: Scott Offen, since 1999; joined Fidelity in 1985
3Annual Report
Advisor Natural Resources Fund
|
Top Ten Stocks as of July 31, 2000 |
|
|
|
% of fund's |
|
Exxon Mobil Corp. |
9.0 |
|
Royal Dutch Petroleum Co. (NY Shares) |
7.1 |
|
Chevron Corp. |
7.1 |
|
Schlumberger Ltd. |
4.0 |
|
Halliburton Co. |
3.1 |
|
BP Amoco PLC sponsored ADR |
3.0 |
|
Anadarko Petroleum Corp. |
2.2 |
|
Alcoa, Inc. |
2.1 |
|
Conoco, Inc. Class B |
1.9 |
|
Burlington Resources, Inc. |
1.8 |
|
|
41.3 |
|
Top Industries as of July 31, 2000 |
|
|
% of fund's net assets |
||
|
Oil & Gas |
56.7% |
|
Energy Services |
21.9% |
|
Gas |
6.5% |
|
Paper & Forest Products |
5.4% |
|
Metals & Mining |
2.5% |
|
All Others* |
7.0% |

|
* Includes short-term investments and net other assets. |
Annual Report
Advisor Natural Resources Fund
Showing Percentage of Net Assets
|
Common Stocks - 97.1% |
|||
|
Shares |
Value (Note 1) |
||
|
ELECTRIC UTILITY - 0.4% |
|||
|
Calpine Corp. (a) |
14,000 |
$ 997,500 |
|
|
NRG Energy, Inc. |
18,000 |
421,875 |
|
|
|
1,419,375 |
||
|
ELECTRICAL EQUIPMENT - 0.0% |
|||
|
Capstone Turbine Corp. |
400 |
22,000 |
|
|
ENERGY SERVICES - 21.9% |
|||
|
Baker Hughes, Inc. |
123,150 |
4,264,069 |
|
|
BJ Services Co. (a) |
34,300 |
2,002,263 |
|
|
Diamond Offshore Drilling, Inc. |
68,500 |
2,573,031 |
|
|
ENSCO International, Inc. |
147,500 |
4,978,125 |
|
|
Global Industries Ltd. (a) |
51,800 |
647,500 |
|
|
Global Marine, Inc. (a) |
94,100 |
2,664,206 |
|
|
Grey Wolf, Inc. (a) |
139,000 |
642,875 |
|
|
Halliburton Co. |
214,700 |
9,903,038 |
|
|
Hanover Compressor Co. (a) |
27,900 |
952,088 |
|
|
Helmerich & Payne, Inc. |
26,700 |
854,400 |
|
|
Marine Drilling Companies, Inc. (a) |
32,150 |
699,263 |
|
|
McDermott International, Inc. |
87,900 |
653,756 |
|
|
Nabors Industries, Inc. (a) |
132,500 |
5,515,313 |
|
|
Noble Drilling Corp. (a) |
95,600 |
4,164,575 |
|
|
Precision Drilling Corp. (a) |
18,800 |
638,381 |
|
|
R&B Falcon Corp. (a) |
15,000 |
299,063 |
|
|
Rowan Companies, Inc. (a) |
40,000 |
1,010,000 |
|
|
Santa Fe International Corp. |
58,500 |
2,054,813 |
|
|
Schlumberger Ltd. |
175,500 |
12,976,031 |
|
|
Smith International, Inc. (a) |
39,900 |
2,847,863 |
|
|
Superior Energy Services, Inc. (a) |
60,000 |
600,000 |
|
|
Transocean Sedco Forex, Inc. |
112,879 |
5,587,511 |
|
|
UTI Energy Corp. (a) |
1 |
32 |
|
|
Varco International, Inc. (a) |
42,400 |
731,400 |
|
|
Weatherford International, Inc. |
93,600 |
3,749,850 |
|
|
|
71,009,446 |
||
|
GAS - 6.5% |
|||
|
Dynegy, Inc. Class A |
77,349 |
5,443,436 |
|
|
El Paso Energy Corp. |
14,900 |
720,788 |
|
|
Enron Corp. |
76,400 |
5,624,950 |
|
|
Kinder Morgan, Inc. |
155,200 |
5,276,800 |
|
|
Williams Companies, Inc. |
99,200 |
4,141,600 |
|
|
|
21,207,574 |
||
|
METALS & MINING - 2.5% |
|||
|
Alcoa, Inc. |
226,900 |
6,863,725 |
|
|
Phelps Dodge Corp. |
26,600 |
1,082,288 |
|
|
|
7,946,013 |
||
|
|
|||
|
Shares |
Value (Note 1) |
||
|
OIL & GAS - 56.7% |
|||
|
Alberta Energy Co. Ltd. |
132,200 |
$ 4,777,938 |
|
|
Amerada Hess Corp. |
67,300 |
4,071,650 |
|
|
Anadarko Petroleum Corp. |
149,481 |
7,147,060 |
|
|
Apache Corp. |
79,000 |
3,930,250 |
|
|
BP Amoco PLC sponsored ADR |
187,948 |
9,832,030 |
|
|
Burlington Resources, Inc. |
176,400 |
5,755,050 |
|
|
Cabot Oil & Gas Corp. Class A |
100 |
1,850 |
|
|
Canada Occidental Petroleum Ltd. |
66,500 |
1,654,451 |
|
|
Canadian Hunter Exploration Ltd. (a) |
56,200 |
1,129,895 |
|
|
Chevron Corp. |
291,300 |
23,012,700 |
|
|
Conoco, Inc.: |
|
|
|
|
Class A |
155,600 |
3,481,550 |
|
|
Class B |
266,702 |
6,150,815 |
|
|
Cooper Cameron Corp. (a) |
18,200 |
1,176,175 |
|
|
Crestar Energy, Inc. (a) |
28,900 |
415,855 |
|
|
Devon Energy Corp. |
60,600 |
2,772,450 |
|
|
EEX Corp. (a) |
237,000 |
1,140,563 |
|
|
EOG Resources, Inc. |
105,300 |
3,112,931 |
|
|
Exxon Mobil Corp. |
366,080 |
29,286,391 |
|
|
Frontier Oil Corp. (a) |
102,300 |
716,100 |
|
|
Grant Prideco, Inc. (a) |
93,600 |
1,883,700 |
|
|
Gulf Canada Resources Ltd. (a) |
4,100 |
18,471 |
|
|
Imperial Oil Ltd. |
55,600 |
1,357,101 |
|
|
Kerr-McGee Corp. |
45,900 |
2,518,763 |
|
|
Magnum Hunter Resources, Inc. |
1 |
7 |
|
|
National-Oilwell, Inc. (a) |
88,000 |
2,904,000 |
|
|
Noble Affiliates, Inc. |
20,000 |
600,000 |
|
|
Occidental Petroleum Corp. |
171,500 |
3,472,875 |
|
|
Ocean Energy, Inc. (a) |
125,900 |
1,526,538 |
|
|
Penn West Petroleum Ltd. (a) |
19,800 |
433,358 |
|
|
Petro-Canada |
181,900 |
3,498,077 |
|
|
Phillips Petroleum Co. |
59,700 |
3,033,506 |
|
|
Pioneer Natural Resources Co. (a) |
208,700 |
2,243,525 |
|
|
Pogo Producing Co. |
30,000 |
596,250 |
|
|
Pure Resources, Inc. (a) |
66,700 |
996,331 |
|
|
Rio Alto Exploration Ltd. (a) |
75,300 |
1,321,497 |
|
|
Royal Dutch Petroleum Co. (NY Shares) |
395,400 |
23,032,050 |
|
|
Santa Fe Snyder Corp. (a) |
485,335 |
4,853,350 |
|
|
Suncor Energy, Inc. |
192,800 |
4,018,827 |
|
|
Sunoco, Inc. |
62,300 |
1,518,563 |
|
|
Swift Energy Co. (a) |
1 |
22 |
|
|
Talisman Energy, Inc. (a) |
110,200 |
3,267,765 |
|
|
Tosco Corp. |
58,300 |
1,544,950 |
|
|
TotalFinaElf SA sponsored ADR |
47,970 |
3,528,793 |
|
|
Ultramar Diamond Shamrock Corp. |
54,400 |
1,244,400 |
|
|
Unocal Corp. |
53,700 |
1,624,425 |
|
|
Valero Energy Corp. |
58,400 |
1,514,750 |
|
|
Vastar Resources, Inc. |
20,200 |
1,665,238 |
|
|
Wiser Oil Co. (a) |
1 |
3 |
|
|
|
183,782,839 |
||
|
Common Stocks - continued |
|||
|
Shares |
Value (Note 1) |
||
|
PACKAGING & CONTAINERS - 0.2% |
|||
|
Packaging Corp. of America |
61,700 |
$ 701,838 |
|
|
PAPER & FOREST PRODUCTS - 5.4% |
|||
|
Abitibi-Consolidated, Inc. |
77,800 |
734,999 |
|
|
Boise Cascade Corp. |
49,400 |
1,364,675 |
|
|
Bowater, Inc. |
50,900 |
2,506,825 |
|
|
Domtar, Inc. |
74,900 |
637,093 |
|
|
International Paper Co. |
93,700 |
3,185,800 |
|
|
Sappi Ltd. sponsored ADR |
85,000 |
722,500 |
|
|
Smurfit-Stone Container Corp. (a) |
79,400 |
987,538 |
|
|
Temple-Inland, Inc. |
23,200 |
1,007,750 |
|
|
Westvaco Corp. |
67,900 |
1,863,006 |
|
|
Weyerhaeuser Co. |
68,100 |
3,111,319 |
|
|
Willamette Industries, Inc. |
42,200 |
1,279,188 |
|
|
|
17,400,693 |
||
|
PRECIOUS METALS - 1.9% |
|||
|
Barrick Gold Corp. |
191,400 |
3,043,713 |
|
|
Homestake Mining Co. |
25,000 |
135,938 |
|
|
Meridian Gold, Inc. (a) |
283,900 |
1,698,971 |
|
|
Newmont Mining Corp. |
69,400 |
1,231,850 |
|
|
William Resources, Inc. warrants 2/15/03 (a)(c) |
1,029,000 |
7 |
|
|
|
6,110,479 |
||
|
RETAIL & WHOLESALE, MISCELLANEOUS - 0.3% |
|||
|
Newpark Resources, Inc. (a) |
103,900 |
863,669 |
|
|
SHIPPING - 1.3% |
|||
|
Bergesen dy ASA (A Shares) |
36,150 |
719,835 |
|
|
Frontline Ltd. (a) |
60,900 |
759,206 |
|
|
Knightsbridge Tankers Ltd. |
46,100 |
864,375 |
|
|
OMI Corp. |
120,400 |
647,150 |
|
|
Overseas Shipholding Group, Inc. |
31,300 |
712,075 |
|
|
Teekay Shipping Corp. |
17,800 |
667,500 |
|
|
|
4,370,141 |
||
|
TOTAL COMMON STOCKS (Cost $259,318,302) |
314,834,067 |
||
|
Cash Equivalents - 9.2% |
|||
|
Shares |
Value (Note 1) |
||
|
Fidelity Cash Central Fund, 6.57% (b) |
6,297,721 |
$ 6,297,721 |
|
|
Fidelity Securities Lending Cash Central Fund, 6.65% (b) |
23,700,000 |
23,700,000 |
|
|
TOTAL CASH EQUIVALENTS (Cost $29,997,721) |
29,997,721 |
||
|
TOTAL INVESTMENT PORTFOLIO - 106.3% (Cost $289,316,023) |
344,831,788 |
|
NET OTHER ASSETS - (6.3)% |
(20,560,211) |
||
|
NET ASSETS - 100% |
$ 324,271,577 |
||
|
Legend |
|
(a) Non-income producing |
|
(b) The rate quoted is the annualized seven-day yield of the fund at |
|
(c) Security exempt from registration under Rule 144A of the Securities Act |
|
Distribution of investments by country of issue, as a percentage of total |
|
United States of America |
75.1% |
|
Canada |
8.6 |
|
Netherlands |
7.1 |
|
Netherlands Antilles |
4.0 |
|
United Kingdom |
3.0 |
|
France |
1.1 |
|
Others (individually less than 1%) |
1.1 |
|
|
100.0% |
|
Income Tax Information |
|
At July 31, 2000, the aggregate cost of investment securities for income tax purposes was $290,797,611. Net unrealized appreciation aggregated $54,034,177, of which $61,934,342 related to appreciated investment securities and $7,900,165 related to depreciated investment securities. |
|
At July 31, 2000, the fund had a capital loss carryforward of approximately $27,373,000 of which $21,050,000 and $6,323,000 will expire on July 31, 2007 and 2008, respectively. |
|
A total of 100% of Class A's, Class T's, Class C's and Institutional Class' dividends distributed during the fiscal year qualifies for the dividend- |
|
The fund will notify shareholders in January 2001 of the applicable percentages for use in preparing 2000 income tax returns. |
See accompanying notes which are an integral part of the financial statements.
Natural Resources
Statement of Assets and Liabilities
|
|
July 31, 2000 |
|
|
Assets |
|
|
|
Investment in securities, at value |
|
$ 344,831,788 |
|
Receivable for investments sold |
|
16,445,278 |
|
Receivable for fund shares sold |
|
375,892 |
|
Dividends receivable |
|
130,439 |
|
Interest receivable |
|
68,083 |
|
Redemption fees receivable |
|
430 |
|
Other receivables |
|
60,649 |
|
Total assets |
|
361,912,559 |
|
Liabilities |
|
|
|
Payable for investments purchased |
$ 12,615,311 |
|
|
Payable for fund shares redeemed |
923,247 |
|
|
Accrued management fee |
163,556 |
|
|
Distribution fees payable |
166,363 |
|
|
Other payables and accrued expenses |
72,505 |
|
|
Collateral on securities loaned, |
23,700,000 |
|
|
Total liabilities |
|
37,640,982 |
|
Net Assets |
|
$ 324,271,577 |
|
Net Assets consist of: |
|
|
|
Paid in capital |
|
$ 297,094,860 |
|
Undistributed net investment income |
|
455,505 |
|
Accumulated undistributed net realized gain (loss) on investments and foreign currency transactions |
|
(28,794,048) |
|
Net unrealized appreciation (depreciation) on investments |
|
55,515,260 |
|
Net Assets |
|
$ 324,271,577 |
|
Calculation of Maximum |
|
$24.07 |
|
Maximum offering price per share |
|
$25.54 |
|
Class T: |
|
$24.35 |
|
Maximum offering price per share |
|
$25.23 |
|
Class B: |
|
$23.77 |
|
Class C: |
|
$23.88 |
|
Institutional Class: |
|
$24.43 |
A Redemption price per share is equal to net asset value less any applicable contingent deferred sales charge.
Statement of Operations
|
|
Year ended July 31, 2000 |
|
|
Investment Income Dividends |
|
$ 4,854,052 |
|
Interest |
|
702,559 |
|
Security lending |
|
32,527 |
|
Total income |
|
5,589,138 |
|
Expenses |
|
|
|
Management fee |
$ 1,964,927 |
|
|
Transfer agent fees |
898,246 |
|
|
Distribution fees |
1,966,519 |
|
|
Accounting and security lending fees |
139,282 |
|
|
Non-interested trustees' compensation |
1,168 |
|
|
Custodian fees and expenses |
28,101 |
|
|
Registration fees |
78,663 |
|
|
Audit |
25,224 |
|
|
Legal |
3,182 |
|
|
Miscellaneous |
6,258 |
|
|
Total expenses before reductions |
5,111,570 |
|
|
Expense reductions |
(148,881) |
4,962,689 |
|
Net investment income |
|
626,449 |
|
Realized and Unrealized Gain (Loss) Net realized gain (loss) on: |
|
|
|
Investment securities (including |
22,195,677 |
|
|
Foreign currency transactions |
(20,468) |
22,175,209 |
|
Change in net unrealized appreciation (depreciation) on: |
|
|
|
Investment securities |
4,098,890 |
|
|
Assets and liabilities in |
(469) |
4,098,421 |
|
Net gain (loss) |
|
26,273,630 |
|
Net increase (decrease) in net assets resulting from operations |
|
$ 26,900,079 |
See accompanying notes which are an integral part of the financial statements.
Annual Report
Advisor Natural Resources Fund
Financial Statements - continued
Statement of Changes in Net Assets
|
Increase (Decrease) in Net Assets |
Year ended |
Year ended |
|
Operations |
$ 626,449 |
$ 463,885 |
|
Net realized gain (loss) |
22,175,209 |
(51,289,494) |
|
Change in net unrealized appreciation (depreciation) |
4,098,421 |
105,678,595 |
|
Net increase (decrease) in net assets resulting from operations |
26,900,079 |
54,852,986 |
|
Distributions to shareholders |
(183,357) |
(178,918) |
|
From net realized gain |
- |
(13,935,776) |
|
Total distributions |
(183,357) |
(14,114,694) |
|
Share transactions - net increase (decrease) |
(54,916,981) |
(88,632,291) |
|
Redemption fees |
195,083 |
104,288 |
|
Total increase (decrease) in net assets |
(28,005,176) |
(47,789,711) |
|
Net Assets |
|
|
|
Beginning of period |
352,276,753 |
400,066,464 |
|
End of period (including undistributed net investment income of $455,505 and $28,075, respectively) |
$ 324,271,577 |
$ 352,276,753 |
Financial Highlights - Class A
|
Years ended July 31, |
2000 |
1999 |
1998 |
1997 E |
1996 F |
|
Selected Per-Share Data |
|
|
|
|
|
|
Net asset value, beginning of period |
$ 21.98 |
$ 18.94 |
$ 26.16 |
$ 25.11 |
$ 23.65 |
|
Income from Investment Operations |
|
|
|
|
|
|
Net investment income (loss) D |
.10 |
.07 |
.06 |
(.05) |
(.00) |
|
Net realized and unrealized gain (loss) |
2.06 |
3.71 |
(3.33) |
2.81 |
1.46 |
|
Total from investment operations |
2.16 |
3.78 |
(3.27) |
2.76 |
1.46 |
|
Less Distributions |
|
|
|
|
|
|
From net investment income |
(.08) |
(.04) |
- |
(.10) |
- |
|
In excess of net investment income |
- |
- |
- |
(.04) |
- |
|
From net realized gain |
- |
(.71) |
(3.96) |
(1.57) |
- |
|
Total distributions |
(.08) |
(.75) |
(3.96) |
(1.71) |
- |
|
Redemption fees added to paid in capital |
.01 |
.01 |
.01 |
- |
- |
|
Net asset value, end of period |
$ 24.07 |
$ 21.98 |
$ 18.94 |
$ 26.16 |
$ 25.11 |
|
Total Return B, C |
9.92% |
21.48% |
(14.61)% |
11.45% |
6.17% |
|
Ratios and Supplemental Data |
|
|
|
|
|
|
Net assets, end of period (000 omitted) |
$ 10,381 |
$ 7,801 |
$ 6,474 |
$ 6,372 |
$ 1,609 |
|
Ratio of expenses to average net assets |
1.26% |
1.28% |
1.34% |
1.71% A, G |
1.66% A, G |
|
Ratio of expenses to average net assets after expense reductions |
1.21% H |
1.23% H |
1.30% H |
1.68% A, H |
1.58% A, H |
|
Ratio of net investment income (loss) to average net assets |
.43% |
.38% |
.28% |
(.28)% A |
(.01)% A |
|
Portfolio turnover |
90% |
99% |
97% |
116% A |
137% |
|
A Annualized B The total returns would have been lower had certain expenses not been reduced during the periods shown. C Total returns do not include the one time sales charge and for periods of less than one year are not annualized. D Net investment income (loss) per share has been calculated based on average shares outstanding during the period. E Nine months ended July 31, 1997. F For the period September 3, 1996 (commencement of sale of Class A shares) to October 31, 1996. G FMR agreed to reimburse a portion of the class' expenses during the period. Without this reimbursement, the class' expense ratio would have been higher. H FMR or the fund has entered into varying arrangements with third parties who either paid or reduced a portion of the class' expenses. |
|||||
See accompanying notes which are an integral part of the financial statements.
Natural Resources
Financial Highlights - Class T
|
Years ended July 31, |
2000 |
1999 |
1998 |
1997 E |
1996 F |
1995 F |
|
Selected Per-Share Data |
|
|
|
|
|
|
|
Net asset value, beginning of period |
$ 22.21 |
$ 19.11 |
$ 26.34 |
$ 25.12 |
$ 19.25 |
$ 17.56 |
|
Income from Investment Operations |
|
|
|
|
|
|
|
Net investment income (loss) D |
.06 |
.04 |
.02 |
(.02) |
.00 |
(.05) |
|
Net realized and unrealized gain (loss) |
2.08 |
3.76 |
(3.34) |
2.83 |
6.56 |
2.00 |
|
Total from investment operations |
2.14 |
3.80 |
(3.32) |
2.81 |
6.56 |
1.95 |
|
Less Distributions |
|
|
|
|
|
|
|
From net investment income |
(.01) |
(.01) |
- |
(.01) |
- |
- |
|
In excess of net investment income |
- |
- |
- |
(.01) |
- |
- |
|
From net realized gain |
- |
(.70) |
(3.92) |
(1.57) |
(.69) |
(.26) |
|
Total distributions |
(.01) |
(.71) |
(3.92) |
(1.59) |
(.69) |
(.26) |
|
Redemption fees added to paid in capital |
.01 |
.01 |
.01 |
- |
- |
- |
|
Net asset value, end of period |
$ 24.35 |
$ 22.21 |
$ 19.11 |
$ 26.34 |
$ 25.12 |
$ 19.25 |
|
Total Return B, C |
9.69% |
21.31% |
(14.69)% |
11.62% |
35.01% |
11.40% |
|
Ratios and Supplemental Data |
|
|
|
|
|
|
|
Net assets, end of period (000 omitted) |
$ 245,995 |
$ 283,419 |
$ 342,347 |
$ 618,083 |
$ 602,915 |
$ 272,979 |
|
Ratio of expenses to average net assets |
1.41% |
1.45% |
1.43% |
1.47% A |
1.59% |
1.86% G |
|
Ratio of expenses to average net assets after |
1.37% H |
1.40% H |
1.39% H |
1.44% A, H |
1.56% H |
1.84% H |
|
Ratio of net investment income (loss) to average net assets |
.27% |
.20% |
.10% |
(.12)% A |
.00% |
(.30)% |
|
Portfolio turnover |
90% |
99% |
97% |
116% A |
137% |
161% |
|
A Annualized B The total returns would have been lower had certain expenses not been reduced during the periods shown. C Total returns do not include the one time sales charge and for periods of less than one year are not annualized. D Net investment income (loss) per share has been calculated based on average shares outstanding during the period. E Nine months ended July 31, 1997. F Year ended October 31. G FMR agreed to reimburse a portion of the class' expenses during the period. Without this reimbursement, the class' expense ratio would have been higher. H FMR or the fund has entered into varying arrangements with third parties who either paid or reduced a portion of the class' expenses. |
Financial Highlights - Class B
|
Years ended July 31, |
2000 |
1999 |
1998 |
1997 E |
1996 F |
1995 G |
|
Selected Per-Share Data |
|
|
|
|
|
|
|
Net asset value, beginning of period |
$ 21.78 |
$ 18.81 |
$ 25.99 |
$ 24.88 |
$ 19.23 |
$ 18.87 |
|
Income from Investment Operations |
|
|
|
|
|
|
|
Net investment income (loss) D |
(.06) |
(.06) |
(.09) |
(.12) |
(.15) |
(.03) |
|
Net realized and unrealized gain (loss) |
2.04 |
3.68 |
(3.29) |
2.80 |
6.49 |
.39 |
|
Total from investment operations |
1.98 |
3.62 |
(3.38) |
2.68 |
6.34 |
.36 |
|
Less Distributions |
|
|
|
|
|
|
|
From net realized gain |
- |
(.66) |
(3.81) |
(1.57) |
(.69) |
- |
|
Redemption fees added to paid in capital |
.01 |
.01 |
.01 |
- |
- |
- |
|
Net asset value, end of period |
$ 23.77 |
$ 21.78 |
$ 18.81 |
$ 25.99 |
$ 24.88 |
$ 19.23 |
|
Total Return B, C |
9.14% |
20.57% |
(15.12)% |
11.19% |
33.87% |
1.91% |
|
Ratios and Supplemental Data |
|
|
|
|
|
|
|
Net assets, end of period (000 omitted) |
$ 50,685 |
$ 47,792 |
$ 44,351 |
$ 59,044 |
$ 36,106 |
$ 2,508 |
|
Ratio of expenses to average net assets |
1.96% |
1.99% |
1.98% |
2.04% A |
2.28% |
2.23% A, H |
|
Ratio of expenses to average net assets after |
1.92% I |
1.95% I |
1.94% I |
2.02% A, I |
2.24% I |
2.21% A, I |
|
Ratio of net investment income (loss) to average net assets |
(.28)% |
(.34)% |
(.41)% |
(.67)% A |
(.68)% |
(.67)% A |
|
Portfolio turnover |
90% |
99% |
97% |
116% A |
137% |
161% |
|
A Annualized B The total returns would have been lower had certain expenses not been reduced during the periods shown. C Total returns do not include the contingent deferred sales charge and for periods of less than one year are not annualized. D Net investment income (loss) per share has been calculated based on average shares outstanding during the period. E Nine months ended July 31, 1997. F Year ended October 31. G For the period July 3, 1995 (commencement of sale of Class B shares) to October 31, 1995. H FMR agreed to reimburse a portion of the class' expenses during the period. Without this reimbursement, the class' expense ratio would have been higher. I FMR or the fund has entered into varying arrangements with third parties who either paid or reduced a portion of the class' expenses. |
See accompanying notes which are an integral part of the financial statements.
Annual Report
Financial Highlights - Class C
|
Years ended July 31, |
2000 |
1999 |
1998 E |
|
Selected Per-Share Data |
|
|
|
|
Net asset value, beginning of period |
$ 21.92 |
$ 18.96 |
$ 24.39 |
|
Income from Investment Operations |
|
|
|
|
Net investment income (loss) D |
(.05) |
(.05) |
(.07) |
|
Net realized and unrealized gain (loss) |
2.04 |
3.71 |
(4.15) |
|
Total from investment operations |
1.99 |
3.66 |
(4.22) |
|
Less Distributions |
|
|
|
|
From net investment income |
(.04) |
(.01) |
- |
|
From net realized gain |
- |
(.70) |
(1.22) |
|
Total distributions |
(.04) |
(.71) |
(1.22) |
|
Redemption fees added to paid in capital |
.01 |
.01 |
.01 |
|
Net asset value, end of period |
$ 23.88 |
$ 21.92 |
$ 18.96 |
|
Total Return B, C |
9.15% |
20.72% |
(17.72)% |
|
Ratios and Supplemental Data |
|
|
|
|
Net assets, end of period (000 omitted) |
$ 13,741 |
$ 8,761 |
$ 2,972 |
|
Ratio of expenses to average net assets |
1.91% |
1.94% |
2.50% A, F |
|
Ratio of expenses to average net assets after expense reductions |
1.87% G |
1.89% G |
2.44% A, G |
|
Ratio of net investment income (loss) to average net assets |
(.23)% |
(.28)% |
(.48)% A |
|
Portfolio turnover |
90% |
99% |
97% |
|
A Annualized B The total returns would have been lower had certain expenses not been reduced during the periods shown. C Total returns do not include the contingent deferred sales charge and for periods of less than one year are not annualized. D Net investment income (loss) per share has been calculated based on average shares outstanding during the period. E For the period November 3, 1997 (commencement of sale of Class C shares) to July 31, 1998. F FMR agreed to reimburse a portion of the class' expenses during the period. Without this reimbursement, the class' expense ratio would have been higher. G FMR or the fund has entered into varying arrangements with third parties who either paid or reduced a portion of the class' expenses. |
Financial Highlights - Institutional Class
|
Years ended July 31, |
2000 |
1999 |
1998 |
1997 E |
1996 F |
1995 G |
|
Selected Per-Share Data |
|
|
|
|
|
|
|
Net asset value, beginning of period |
$ 22.28 |
$ 19.15 |
$ 26.42 |
$ 25.17 |
$ 19.27 |
$ 18.87 |
|
Income from Investment Operations |
|
|
|
|
|
|
|
Net investment income (loss) D |
.19 |
.14 |
.13 |
.04 |
.04 |
(.01) |
|
Net realized and unrealized gain (loss) |
2.07 |
3.76 |
(3.35) |
2.85 |
6.55 |
.41 |
|
Total from investment operations |
2.26 |
3.90 |
(3.22) |
2.89 |
6.59 |
.40 |
|
Less Distributions |
|
|
|
|
|
|
|
From net investment income |
(.13) |
(.07) |
(.09) |
(.05) |
- |
- |
|
In excess of net investment income |
- |
- |
- |
(.02) |
- |
- |
|
From net realized gain |
- |
(.71) |
(3.97) |
(1.57) |
(.69) |
- |
|
Total distributions |
(.13) |
(.78) |
(4.06) |
(1.64) |
(.69) |
- |
|
Redemption fees added to paid in capital |
.02 |
.01 |
.01 |
- |
- |
- |
|
Net asset value, end of period |
$ 24.43 |
$ 22.28 |
$ 19.15 |
$ 26.42 |
$ 25.17 |
$ 19.27 |
|
Total Return B, C |
10.31% |
21.95% |
(14.29)% |
11.95% |
35.13% |
2.12% |
|
Ratios and Supplemental Data |
|
|
|
|
|
|
|
Net assets, end of period (000 omitted) |
$ 3,470 |
$ 4,505 |
$ 3,922 |
$ 10,042 |
$ 9,860 |
$ 718 |
|
Ratio of expenses to average net assets |
.86% |
.87% |
.95% |
1.08% A |
1.44% |
1.68% A, H |
|
Ratio of expenses to average net assets after |
.82% I |
.82% I |
.91% I |
1.06% A, I |
1.39% I |
1.66% A, I |
|
Ratio of net investment income (loss) to average net assets |
.82% |
.78% |
.55% |
.24% A |
.17% |
(.13)% A |
|
Portfolio turnover |
90% |
99% |
97% |
116% A |
137% |
161% |
|
A Annualized B The total returns would have been lower had certain expenses not been reduced during the periods shown. C Total returns for periods of less than one year are not annualized. D Net investment income (loss) per share has been calculated based on average shares outstanding during the period. E Nine months ended July 31, 1997. F Year ended October 31. G For the period July 3, 1995 (commencement of sale of Institutional Class shares) to October 31, 1995. H FMR agreed to reimburse a portion of the class' expenses during the period. Without this reimbursement, the class' expense ratio would have been higher. I FMR or the fund has entered into varying arrangements with third parties who either paid or reduced a portion of the class' expenses. |
Natural Resources
For the period ended July 31, 2000
1. Significant Accounting Policies.
Fidelity Advisor Natural Resources Fund (the fund) is a fund of Fidelity Advisor Series VII (the trust) and is authorized to issue an unlimited number of shares. The trust is registered under the Investment Company Act of 1940, as amended (the 1940 Act), as an open-end management investment company organized as a Massachusetts business trust.
The fund offers Class A, Class T, Class B, Class C, and Institutional Class shares, each of which has equal rights as to assets and voting privileges. Each class has exclusive voting rights with respect to matters that affect that class. Class B shares will automatically convert to Class A shares after a holding period of seven years from the initial date of purchase. Investment income, realized and unrealized capital gains and losses, the common expenses of the fund, and certain fund-level expense reductions, if any, are allocated on a pro rata basis to each class based on the relative net assets of each class to the total net assets of the fund. Each class of shares differs in its respective distribution, transfer agent, and certain other class-specific fees, expenses, and expense reductions.
The financial statements have been prepared in conformity with generally accepted accounting principles which require management to make certain estimates and assumptions at the date of the financial statements. The following summarizes the significant accounting policies of the fund:
Security Valuation. Securities for which exchange quotations are readily available are valued at the last sale price, or if no sale price, at the closing bid price. Foreign securities are valued based on quotations from the principal market in which such securities are normally traded. If trading or events occurring in other markets after the close of the principal market in which foreign securities are traded, and before the close of the business of the fund, are expected to materially affect the value of those securities, then they are valued at their fair value taking this trading or these events into account. Fair value is determined in good faith under consistently applied procedures under the general supervision of the Board of Trustees. Securities (including restricted securities) for which exchange quotations are not readily available (and in certain cases debt securities which trade on an exchange) are valued primarily using dealer-supplied valuations or at their fair value. Short-term securities with remaining maturities of sixty days or less for which quotations are not readily available are valued at amortized cost or original cost plus accrued interest, both of which approximate current value.
Foreign Currency Translation. The accounting records of the fund are maintained in U.S. dollars. Investment securities and other assets and liabilities denominated in a foreign currency are translated into U.S. dollars at the prevailing rates of exchange at period end. Purchases and sales of securities, income receipts and expense payments are translated into U.S. dollars at the prevailing exchange rate on the respective dates of the transactions.
Net realized gains and losses on foreign currency transactions represent net gains and losses from sales and maturities of foreign currency contracts, disposition of foreign currencies, the difference between the amount of net investment income accrued and the U.S. dollar amount actually received, and gains and losses between trade and settlement date on purchases and sales of securities. The effects of changes in foreign currency exchange rates on investments in securities are included with the net realized and unrealized gain or loss on investment securities.
Income Taxes. As a qualified regulated investment company under Subchapter M of the Internal Revenue Code, the fund is not subject to income taxes to the extent that it distributes substantially all of its taxable income for its fiscal year. The schedule of investments includes information regarding income taxes under the caption "Income Tax Information."
Investment Income. Dividend income is recorded on the ex-dividend date, except certain dividends from foreign securities where the ex-dividend date may have passed, are recorded as soon as the fund is informed of the ex-dividend date. Non-cash dividends included in dividend income, if any, are recorded at the fair market value of the securities received. Interest income is accrued as earned. Investment income is recorded net of foreign taxes withheld where recovery of such taxes is uncertain.
Expenses. Most expenses of the trust can be directly attributed to a fund. Expenses which cannot be directly attributed are apportioned among the funds in the trust.
Distributions to Shareholders. Distributions are recorded on the ex-dividend date. Income dividends and capital gain distributions are declared separately for each class.
Income and capital gain distributions are determined in accordance with income tax regulations which may differ from generally accepted accounting principles. These differences, which may result in distribution reclassifications, are primarily due to differing treatments for foreign currency transactions, passive foreign investment companies (PFIC) and losses deferred due to wash sales.
Permanent book and tax basis differences relating to shareholder distributions will result in reclassifications to paid in capital. Undistributed net investment income and accumulated undistributed net realized gain (loss) on investments and foreign currency transactions may include temporary book and tax basis differences which will reverse in a subsequent period. Any taxable income or gain remaining at fiscal year end is distributed in the following year.
Short-Term Trading (Redemption) Fees. Shares held in the fund less than 60 days are subject to a short-term trading fee equal to 1% of the proceeds of the redeemed shares. The fee, which is retained by the fund, is accounted for as an addition to paid in capital.
Annual Report
Notes to Financial Statements - continued
1. Significant Accounting Policies - continued
Security Transactions. Security transactions are accounted for as of trade date. Gains and losses on securities sold are determined on the basis of identified cost.
2. Operating Policies.
Foreign Currency Contracts. The fund generally uses foreign currency contracts to facilitate transactions in foreign-denominated securities. Losses may arise from changes in the value of the foreign currency or if the counterparties do not perform under the contracts' terms. The U.S. dollar value of foreign currency contracts is determined using contractual currency exchange rates established at the time of each trade.
Joint Trading Account. Pursuant to an Exemptive Order issued by the Securities and Exchange Commission (the SEC), the fund, along with other affiliated entities of Fidelity Management & Research Company (FMR), may transfer uninvested cash balances into one or more joint trading accounts. These balances are invested in one or more repurchase agreements for U.S. Treasury or Federal Agency obligations.
Repurchase Agreements. The underlying U.S. Treasury, Federal Agency, or other obligations found to be satisfactory by FMR are transferred to an account of the fund, or to the Joint Trading Account, at a custodian bank. The securities are marked-to-market daily and maintained at a value at least equal to the principal amount of the repurchase agreement (including accrued interest). FMR, the fund's investment adviser, is responsible for determining that the value of the underlying securities remains in accordance with the market value requirements stated above.
Cash Central Funds. Pursuant to an Exemptive Order issued by the SEC, the fund may invest in the Fidelity Cash Central Fund and the Fidelity Securities Lending Cash Central Fund (the Cash Funds) managed by Fidelity Investments Money Management, Inc., an affiliate of FMR. The Cash Funds are open-end money market funds available only to investment companies and other accounts managed by FMR and its affiliates. The Cash Funds seek preservation of capital, liquidity, and current income. Income distributions from the Cash Funds are declared daily and paid monthly from net interest income. Income distributions earned by the fund are recorded as either interest income or security lending income in the accompanying financial statements.
Restricted Securities. The fund is permitted to invest in securities that are subject to legal or contractual restrictions on resale. These securities generally may be resold in transactions exempt from registration or to the public if the securities are registered. Disposal of these securities may involve time-consuming negotiations and expense, and prompt sale at an acceptable price may be difficult. At the end of the period, the fund had no investments in restricted securities (excluding 144A issues).
3. Purchases and Sales of Investments.
Purchases and sales of securities, other than short-term securities, aggregated $293,093,141 and $347,895,304, respectively.
4. Fees and Other Transactions with Affiliates.
Management Fee. As the fund's investment adviser, FMR receives a monthly fee that is calculated on the basis of a group fee rate plus a fixed individual fund fee rate applied to the average net assets of the fund. The group fee rate is the weighted average of a series of rates and is based on the monthly average net assets of all the mutual funds advised by FMR. The rates ranged from .2167% to .5200% for the period. The annual individual fund fee rate is .30%. In the event that these rates were lower than the contractual rates in effect during the period, FMR voluntarily implemented the above rates, as they resulted in the same or a lower management fee. For the period, the management fee was equivalent to an annual rate of .58% of average net assets.
Distribution and Service Plan. In accordance with Rule 12b-1 of the 1940 Act, the Board of Trustees have adopted separate Distribution and Service Plans with respect to each class of shares (collectively referred to as "the Plans"). Under certain of the Plans, the class pays Fidelity Distributors Corporation (FDC), an affiliate of FMR, a 12b-1 fee. A portion of this fee may be reallowed to securities dealers, banks and other financial institutions for the distribution of each class of shares and providing shareholder support services. For the period, this fee was based on the following annual rates of the average net assets of each applicable class:
|
Class A |
.25% |
|
Class T |
.50% |
|
Class B |
1.00% * |
|
Class C |
1.00% * |
* .75% represents a distribution fee and .25% represents a shareholder service fee.
For the period, each class paid FDC the following amounts, a portion of which was retained by FDC:
|
|
Paid to |
Retained |
|
Class A |
$ 21,034 |
$ 42 |
|
Class T |
1,340,562 |
14,084 |
|
Class B |
492,384 |
369,835 |
|
Class C |
112,539 |
73,329 |
|
|
$ 1,966,519 |
$ 457,290 |
Sales Load. FDC receives a front-end sales charge of up to 5.75% for selling Class A shares, and 3.50% for selling Class T shares of the fund. FDC receives the proceeds of contingent deferred sales charges levied on Class B share redemptions occurring within six years of purchase and Class C share redemptions occurring within one year of purchase. Contingent deferred sales charges are based on declining rates ranging from 5% to 1% for Class B and 1% for Class C, of the lesser of the cost of shares at the initial date of purchase or the net asset value of the redeemed
Natural Resources
Notes to Financial Statements - continued
4. Fees and Other Transactions with Affiliates - continued
Sales Load - continued
shares, excluding any reinvested dividends and capital gains. In addition, purchases of Class A and Class T shares that were subject to a finder's fee bear a contingent deferred sales charge on assets that do not remain in the fund for at least one year. The Class A and Class T contingent deferred sales charge is based on 0.25% of the lesser of the cost of shares at the initial date of purchase or the net asset value of the redeemed shares, excluding any reinvested dividends and capital gains. A portion of the sales charges paid to FDC is paid to securities dealers, banks and other financial institutions.
For the period, sales charge amounts paid to and retained by FDC were as follows:
|
|
Paid to |
Retained |
|
Class A |
$ 55,886 |
$ 24,404 |
|
Class T |
110,147 |
35,031 |
|
Class B |
225,694 |
225,694* |
|
Class C |
11,501 |
11,501* |
|
|
$ 403,228 |
$ 296,630 |
* When Class B and Class C shares are initially sold, FDC pays commissions from its own resources to securities dealers,
banks, and other financial institutions through which the sales are made.
Transfer Agent Fees. Fidelity Investments Institutional Operations Company, Inc., (FIIOC), an affiliate of FMR, is the transfer, dividend disbursing and shareholder servicing agent (collectively referred to as the transfer agent) for each class of the fund. FIIOC receives account fees and asset-based fees that vary according to the account size and type of account of the shareholders of the respective classes of the fund. FIIOC pays for typesetting, printing and mailing of all shareholder reports, except proxy statements. For the period, the following amounts were paid to FIIOC:
|
|
Amount |
% of |
|
Class A |
$ 29,177 |
.35 |
|
Class T |
685,399 |
.26 |
|
Class B |
148,063 |
.30 |
|
Class C |
28,215 |
.25 |
|
Institutional Class |
7,392 |
.20 |
|
|
$ 898,246 |
|
Accounting and Security Lending Fees. Fidelity Service Company, Inc., an affiliate of FMR, maintains the fund's accounting records and administers the security lending program. The security lending fee is based on the number and duration of lending transactions. The accounting fee is based on the level of average net assets for the month plus out-of-pocket expenses.
Brokerage Commissions. The fund placed a portion of its portfolio transactions with brokerage firms which are affiliates of FMR. The commissions paid to these affiliated firms were $31,436 for the period.
5. Security Lending.
The fund lends portfolio securities from time to time in order to earn additional income. The fund receives collateral in the form of U.S. Treasury obligations, letters of credit, and/or cash against the loaned securities, and maintains collateral in an amount not less than 100% of the market value of the loaned securities during the period of the loan. The market value of the loaned securities is determined at the close of business of the fund and any additional required collateral is delivered to the fund on the next business day. If the borrower defaults on its obligation to return the securities loaned because of insolvency or other reasons, the fund could experience delays and costs in recovering the securities loaned or in gaining access to the collateral. At period end, the value of the securities loaned amounted to $23,008,750. The fund received cash collateral of $23,700,000 which was invested in cash equivalents.
6. Expense Reductions.
FMR has directed certain portfolio trades to brokers who paid a portion of the fund's expenses. For the period, the fund's expenses were reduced by $145,755 under this arrangement.
In addition, through an arrangement with the fund's custodian, credits realized as a result of uninvested cash balances were used to reduce a portion of the fund's expenses. During the period, the fund's custodian fees were reduced by $3,126 under this arrangement.
Natural Resources
Notes to Financial Statements - continued
7. Distributions to Shareholders.
Distributions to shareholders of each class were as follows:
|
|
Years ended July 31, |
|
|
|
2000 |
1999 |
|
From net investment income |
|
|
|
Class A |
$ 28,413 |
$ 14,537 |
|
Class T |
118,452 |
148,852 |
|
Class C |
16,896 |
1,336 |
|
Institutional Class |
19,596 |
14,193 |
|
Total |
$ 183,357 |
$ 178,918 |
|
From net realized gain |
|
|
|
Class A |
$ - |
$ 234,044 |
|
Class T |
- |
11,934,513 |
|
Class B |
- |
1,511,499 |
|
Class C |
- |
111,651 |
|
Institutional Class |
- |
144,069 |
|
Total |
$ - |
$ 13,935,776 |
|
|
$ 183,357 |
$ 14,114,694 |
8. Share Transactions.
Transactions for each class of shares were as follows:
|
|
Shares |
Dollars |
||
|
|
Year ended |
Year ended |
Year ended |
Year ended |
|
|
2000 |
1999 |
2000 |
1999 |
|
|
|
|
|
|
|
Class A |
282,058 |
218,537 |
$ 6,719,862 |
$ 4,009,679 |
|
Reinvestment of distributions |
1,260 |
15,021 |
27,004 |
240,787 |
|
Shares redeemed |
(206,971) |
(220,423) |
(4,734,234) |
(4,042,409) |
|
Net increase (decrease) |
76,347 |
13,135 |
$ 2,012,632 |
$ 208,057 |
|
Class T |
2,815,789 |
3,047,055 |
$ 66,391,275 |
$ 55,714,382 |
|
Reinvestment of distributions |
5,078 |
703,210 |
110,192 |
11,405,418 |
|
Shares redeemed |
(5,482,665) |
(8,897,934) |
(125,788,519) |
(157,418,593) |
|
Net increase (decrease) |
(2,661,798) |
(5,147,669) |
$ (59,287,052) |
$ (90,298,793) |
|
Class B |
804,593 |
979,053 |
$ 18,850,697 |
$ 17,717,381 |
|
Reinvestment of distributions |
- |
80,941 |
- |
1,294,263 |
|
Shares redeemed |
(866,266) |
(1,224,137) |
(19,693,340) |
(21,780,799) |
|
Net increase (decrease) |
(61,673) |
(164,143) |
$ (842,643) |
$ (2,769,155) |
|
Class C |
626,062 |
408,624 |
$ 14,528,135 |
$ 7,488,770 |
|
Reinvestment of distributions |
614 |
5,837 |
13,106 |
93,864 |
|
Shares redeemed |
(450,962) |
(171,451) |
(10,086,666) |
(3,264,239) |
|
Net increase (decrease) |
175,714 |
243,010 |
$ 4,454,575 |
$ 4,318,395 |
|
Institutional Class |
90,473 |
107,128 |
$ 2,172,120 |
$ 1,948,930 |
|
Reinvestment of distributions |
553 |
8,746 |
11,997 |
141,597 |
|
Shares redeemed |
(151,219) |
(118,487) |
(3,438,610) |
(2,181,322) |
|
Net increase (decrease) |
(60,193) |
(2,613) |
$ (1,254,493) |
$ (90,795) |
Natural Resources
Notes to Financial Statements - continued
9. Transactions with Affiliated Companies.
An affiliated company is a company in which the fund has ownership of at least 5% of the voting securities. Transactions during the period with companies which are or were affiliates are as follows:
|
Summary of Transactions with Affiliated Companies |
||||||||
|
Affiliate |
|
Purchase |
|
Sales |
|
Dividend |
|
Value |
|
Camphor |
|
$ - |
|
$ 178,630 |
|
$ - |
|
$ - |
Natural Resources
Performance
There are several ways to evaluate historical performance. You can look at the total percentage change in value, the average annual percentage change or the growth of a hypothetical $10,000 investment. Total return reflects the change in the value of an investment, assuming reinvestment of dividend income and capital gains (the profits earned upon the sale of securities that have grown in value). If Fidelity had not reimbursed certain class expenses, the life of fund total returns would have been lower.
Cumulative Total Returns
|
Periods ended July 31, 2000 |
|
Past 1 |
Life of |
|
Fidelity Adv Technology - CL A |
|
53.76% |
331.47% |
|
Fidelity Adv Technology - CL A |
|
44.91% |
306.66% |
|
S&P 500 |
|
8.98% |
131.80% |
|
GS Technology |
|
51.95% |
380.37% |
Cumulative total returns show Class A shares' performance in percentage terms over a set period - in this case, one year or since the fund started on September 3, 1996. You can compare Class A shares' returns to both the performance of the Standard & Poor's 500 Index - a market capitalization-weighted index of common stocks - and the Goldman Sachs Technology Index - a market capitalization-weighted index of 221 stocks designed to measure the performance of companies in the technology sector. Issues in the index include producers of sophisticated devices, services and software related to the fields of computers, electronics, networking and Internet services. These benchmarks include reinvested dividends and capital gains, if any, and exclude the effect of sales charges.
Average Annual Total Returns
|
Periods ended July 31, 2000 |
|
Past 1 |
Life of |
|
Fidelity Adv Technology - CL A |
|
53.76% |
45.34% |
|
Fidelity Adv Technology - CL A |
|
44.91% |
43.16% |
|
S&P 500 |
|
8.98% |
23.99% |
|
GS Technology |
|
51.95% |
49.39% |
Average annual returns take Class A shares' cumulative return and show you what would have happened if Class A shares had performed at a constant rate each year.
$10,000 Over Life of Fund
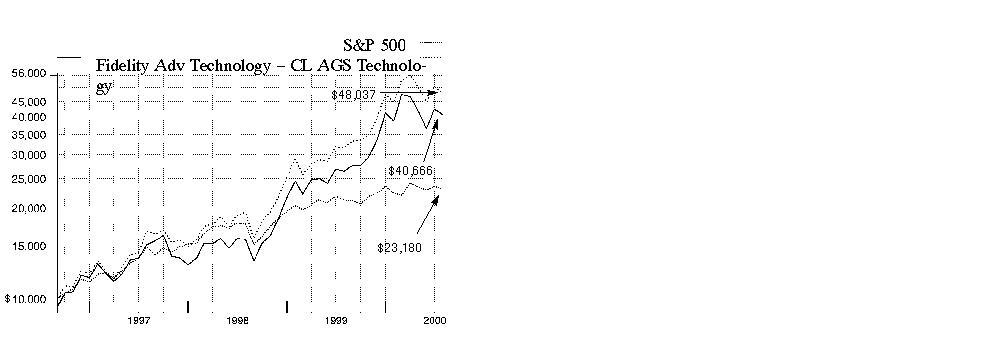
$10,000 Over Life of Fund: Let's say hypothetically that $10,000 was invested in Fidelity Advisor Technology - Class A on September 3, 1996, when the fund started, and the current 5.75% sales charge was paid. As the chart shows, by July 31, 2000, the value of the investment would have grown to $40,666 - a 306.66% increase on the initial investment. For comparison, look at how the Standard & Poor's 500 Index did over the same period. With dividends and capital gains, if any, reinvested, the same $10,000 investment would have grown to $23,180 - a 131.80% increase. If $10,000 was invested in the Goldman Sachs Technology Index, it would have grown to $48,037 - a 380.37% increase.
Understanding Performance
How a fund did yesterday is no guarantee of how it will do tomorrow. The stock market, for example, has a history of long-term growth and short-term volatility. Unlike the broader market, however, some sectors may not have a history of growth in the long run. And, as with all stock funds, the share price and return of a fund that invests in a sector will vary.
3Annual Report
Performance
There are several ways to evaluate historical performance. You can look at the total percentage change in value, the average annual percentage change or the growth of a hypothetical $10,000 investment. Total return reflects the change in the value of an investment, assuming reinvestment of dividend income and capital gains (the profits earned upon the sale of securities that have grown in value).
Cumulative Total Returns
|
Periods ended July 31, 2000 |
|
Past 1 |
Life of |
|
Fidelity Adv Technology - CL T |
|
53.41% |
326.77% |
|
Fidelity Adv Technology - CL T |
|
48.04% |
311.83% |
|
S&P 500 |
|
8.98% |
131.80% |
|
GS Technology |
|
51.95% |
380.37% |
Cumulative total returns show Class T shares' performance in percentage terms over a set period - in this case, one year or since the fund started on September 3, 1996. You can compare Class T shares' returns to both the performance of the Standard & Poor's 500 Index - a market capitalization-weighted index of common stocks - and the Goldman Sachs Technology Index - a market capitalization-weighted index of 221 stocks designed to measure the performance of companies in the technology sector. Issues in the index include producers of sophisticated devices, services and software related to the fields of computers, electronics, networking and Internet services. These benchmarks include reinvested dividends and capital gains, if any, and exclude the effect of sales charges.
Average Annual Total Returns
|
Periods ended July 31, 2000 |
|
Past 1 |
Life of |
|
Fidelity Adv Technology - CL T |
|
53.41% |
44.94% |
|
Fidelity Adv Technology - CL T |
|
48.04% |
43.62% |
|
S&P 500 |
|
8.98% |
23.99% |
|
GS Technology |
|
51.95% |
49.39% |
Average annual returns take Class T shares' cumulative return and show you what would have happened if Class T shares had performed at a constant rate each year.
$10,000 Over Life of Fund
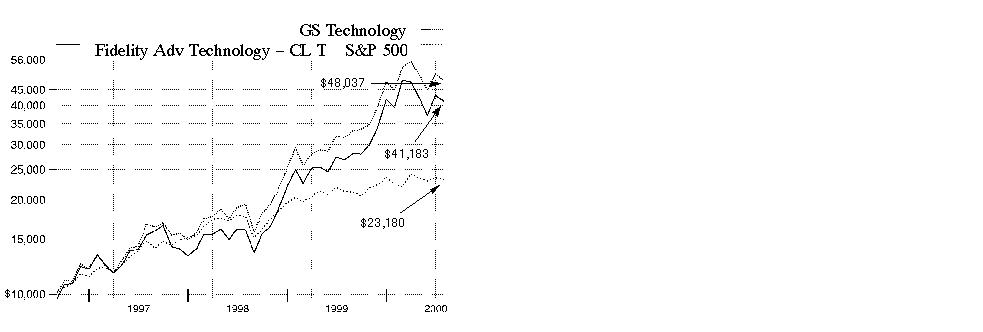
$10,000 Over Life of Fund: Let's say hypothetically that $10,000 was invested in Fidelity Advisor Technology - Class T on September 3, 1996, when the fund started, and the current 3.50% sales charge was paid. As the chart shows, by July 31, 2000, the value of the investment would have grown to $41,183 - a 311.83% increase on the initial investment. For comparison, look at how the Standard & Poor's 500 Index did over the same period. With dividends and capital gains, if any, reinvested, the same $10,000 investment would have grown to $23,180 - a 131.80% increase. If $10,000 was invested in the Goldman Sachs Technology Index, it would have grown to $48,037 - a 380.37% increase.
Understanding Performance
How a fund did yesterday is no guarantee of how it will do tomorrow. The stock market, for example, has a history of long-term growth and short-term volatility. Unlike the broader market, however, some sectors may not have a history of growth in the long run. And, as with all stock funds, the share price and return of a fund that invests in a sector will vary.
3Annual Report
Performance
There are several ways to evaluate historical performance. You can look at the total percentage change in value, the average annual percentage change or the growth of a hypothetical $10,000 investment. Total return reflects the change in the value of an investment, assuming reinvestment of dividend income and capital gains (the profits earned upon the sale of securities that have grown in value). The initial offering of Class B shares took place on March 3, 1997. Class B shares bear a 1.00% 12b-1 fee. Returns prior to March 3, 1997 are those of Class T which bears a 0.50% 12b-1 fee. Had Class B shares' 12b-1 fee been reflected, returns prior to March 3, 1997 would have been lower. Class B shares' contingent deferred sales charge included in the past one year and life of fund total return figures are 5% and 3%, respectively. If Fidelity had not reimbursed certain class expenses, the life of fund total returns would have been lower.
Cumulative Total Returns
|
Periods ended July 31, 2000 |
Past 1 |
Life of |
|
Fidelity Adv Technology - CL B |
52.57% |
319.19% |
|
Fidelity Adv Technology - CL B |
47.57% |
316.19% |
|
S&P 500 |
8.98% |
131.80% |
|
GS Technology |
51.95% |
380.37% |
Cumulative total returns show Class B shares' performance in percentage terms over a set period - in this case, one year or since the fund started on September 3, 1996. You can compare Class B shares' returns to the performance of the Standard & Poor's 500 Index - a market capitalization-weighted index of common stocks - and the Goldman Sachs Technology Index - a market capitalization-weighted index of 221 stocks designed to measure the performance of companies in the technology sector. Issues in the index include producers of sophisticated devices, services and software related to the fields of computers, electronics, networking and Internet services. These benchmarks include reinvested dividends and capital gains, if any, and exclude the effect of sales charges.
Average Annual Total Returns
|
Periods ended July 31, 2000 |
Past 1 |
Life of |
|
Fidelity Adv Technology - CL B |
52.57% |
44.27% |
|
Fidelity Adv Technology - CL B |
47.57% |
44.01% |
|
S&P 500 |
8.98% |
23.99% |
|
GS Technology |
51.95% |
49.39% |
Average annual returns take Class B shares' cumulative return and show you what would have happened if Class B shares had performed at a constant rate each year.
$10,000 Over Life of Fund
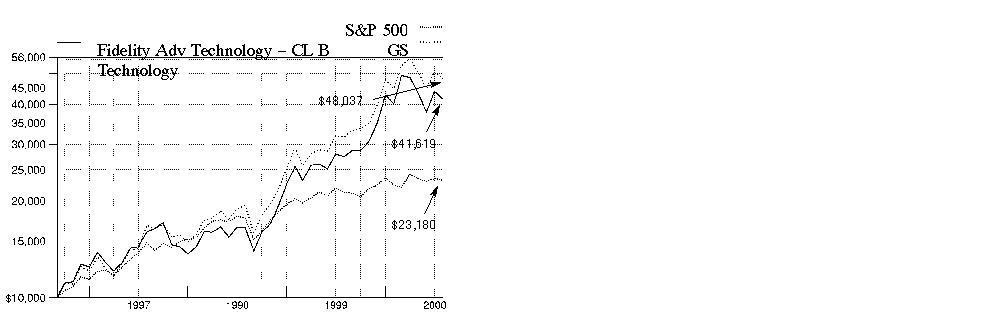
$10,000 Over Life of Fund: Let's say hypothetically that $10,000 was invested in Fidelity Advisor Technology - Class B on September 3, 1996, when the fund started. As the chart shows, by July 31, 2000, the value of the investment, including the effect of the contingent deferred sales charge, would have grown to $41,619 - a 316.19% increase on the initial investment. For comparison, look at how the Standard & Poor's 500 Index did over the same period. With dividends and capital gains, if any, reinvested, the same $10,000 investment would have grown to $23,180 - a 131.80% increase. If $10,000 was invested in the Goldman Sachs Technology Index, it would have grown to $48,037 - a 380.37% increase.
Understanding Performance
How a fund did yesterday is no guarantee of how it will do tomorrow. The stock market, for example, has a history of long-term growth and short-term volatility. Unlike the broader market, however, some sectors may not have a history of growth in the long run. And, as with all stock funds, the share price and return of a fund that invests in a sector will vary.
3Annual Report
Performance
There are several ways to evaluate historical performance. You can look at the total percentage change in value, the average annual percentage change or the growth of a hypothetical $10,000 investment. Total return reflects the change in the value of an investment, assuming reinvestment of dividend income and capital gains (the profits earned upon the sale of securities that have grown in value). The initial offering of Class C shares took place on November 3, 1997. Class C shares bear a 1.00% 12b-1 fee. Returns between March 3, 1997 and November 3, 1997 are those of Class B shares and reflect Class B shares' 1.00% 12b-1 fee. Returns prior to March 3, 1997 are those of Class T which bears a 0.50% 12b-1 fee. Had Class C shares' 12b-1 fee been reflected, returns prior to March 3, 1997 would have been lower. Class C shares' contingent deferred sales charge included in the past one year and life of fund total return figures are 1% and 0%, respectively. If Fidelity had not reimbursed certain class expenses, the life of fund total returns would have been lower.
Cumulative Total Returns
|
Periods ended July 31, 2000 |
Past 1 |
Life of |
|
Fidelity Adv Technology - CL C |
52.60% |
319.00% |
|
Fidelity Adv Technology - CL C |
51.60% |
319.00% |
|
S&P 500 |
8.98% |
131.80% |
|
GS Technology |
51.95% |
380.37% |
Cumulative total returns show Class C shares' performance in percentage terms over a set period - in this case, one year or since the fund started on September 3, 1996. You can compare Class C shares' returns to both the performance of the Standard & Poor's 500 Index - a market capitalization-weighted index of common stocks - and the Goldman Sachs Technology Index - a market capitalization-weighted index of 221 stocks designed to measure the performance of companies in the technology sector. Issues in the index include producers of sophisticated devices, services and software related to the fields of computers, electronics, networking and Internet services. These benchmarks include reinvested dividends and capital gains, if any, and exclude the effect of sales charges.
Average Annual Total Returns
|
Periods ended July 31, 2000 |
Past 1 |
Life of |
|
Fidelity Adv Technology - CL C |
52.60% |
44.26% |
|
Fidelity Adv Technology - CL C |
51.60% |
44.26% |
|
S&P 500 |
8.98% |
23.99% |
|
GS Technology |
51.95% |
49.39% |
Average annual returns take Class C shares' cumulative return and show you what would have happened if Class C shares had performed at a constant rate each year.
$10,000 Over Life of Fund
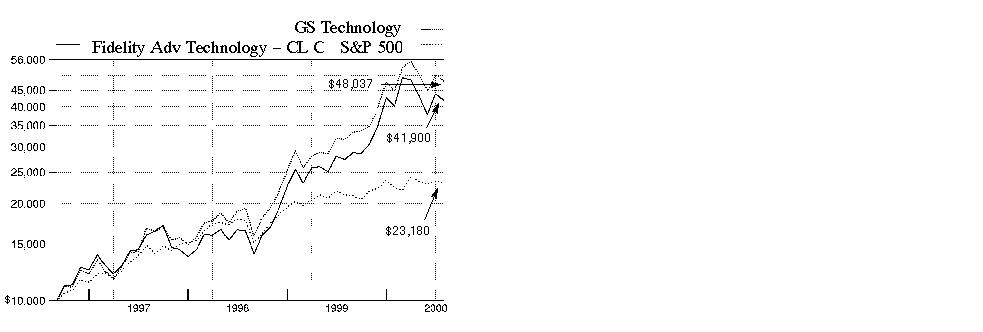
$10,000 Over Life of Fund: Let's say hypothetically that $10,000 was invested in Fidelity Advisor Technology - Class C on September 3, 1996, when the fund started. As the chart shows, by July 31, 2000, the value of the investment would have grown to $41,900 - a 319.00% increase on the initial investment. For comparison, look at how the Standard & Poor's 500 Index did over the same period. With dividends and capital gains, if any, reinvested, the same $10,000 investment would have grown to $23,180 - a 131.80% increase. If $10,000 was invested in the Goldman Sachs Technology Index, it would have grown to $48,037 - a 380.37% increase.
Understanding Performance
How a fund did yesterday is no guarantee of how it will do tomorrow. The stock market, for example, has a history of long-term growth and short-term volatility. Unlike the broader market, however, some sectors may not have a history of growth in the long run. And, as with all stock funds, the share price and return of a fund that invests in a sector will vary.
3Annual Report
(Portfolio Manager photograph)
An interview with
Larry Rakers, Portfolio Manager of Fidelity
Advisor Technology Fund
Q. How did the fund perform, Larry?
A. For the 12 months that ended July 31, 2000, the fund's Class A, Class T, Class B and Class C shares returned 53.76%, 53.41%, 52.57% and 52.60%, respectively. This performance surpassed the 51.95% return of the Goldman Sachs Technology Index - an index of 221 stocks designed to measure the performance of companies in the technology sector - and the Standard & Poor's 500 Index, which returned 8.98%.
A. For the 12 months that ended July 31, 2000, the fund's Institutional Class shares returned 54.16%. This performance surpassed the 51.95% return of the Goldman Sachs Technology Index - an index of 221 stocks designed to measure the performance of companies in the technology sector - and the Standard & Poor's 500 Index, which returned 8.98%.
Q. Why did technology continue to dominate the investment landscape during the 12-month period?
A. The convergence of voice, data and video all onto a single network has opened the doors for a second industrial revolution. Innovations in information technology have reshaped the face of the domestic economy and permanently altered the way business is conducted. Tech-enabled productivity gains have resulted in lower costs for all sectors of the economy, which has put a lid on inflation and helped lift corporate profits. The markets showed their appreciation of this phenomenon and bid up the stocks of those firms expected to lead the revolution. The message resonated clearly in corporate America as well, evidenced by rising tech-related spending as a share of gross domestic product (GDP).
Q. What allowed the fund to outpace its index at this time?
A. The key was our overexposure to those areas involved in the build-out of Internet infrastructure and the resulting formation of a single network - which is central to enabling broadband services. Our biggest victories were from the telecommunications/optical equipment, networking and semiconductor spaces. Having an emphasis on e-commerce software providers, such as BEA Systems, was another infrastructure strategy that paid off. Underweighting computer hardware - namely IBM - was a good choice, as the group faced a Y2K-related slowdown in corporate demand for personal computers and mainframes. Having raised the earnings growth rate of the portfolio after taking over the fund in January, I also was able to improve its risk/return profile, which served us well during the downside volatility of the spring.
Annual Report
Advisor ________ Fund - Class __
Fund Talk: The Manager's Overview - continued
Q. What other factors proved helpful to performance?
A. We were rewarded for making timely cyclical calls on various electronic components, such as capacitors. Within semiconductors, our focus on communications chips was critical to the fund's success, as the market supported our view on this high-growth area. The real winner for us here was Applied Micro Circuits. Data storage and related technology was another important theme for the fund, with names such as Network Appliance, Brocade and Emulex leading the way. Cisco and Juniper - leading makers of networking gear - were significant contributors, thanks to surging demand for routers, the devices that direct traffic over the Internet. More of these electrical devices are now needed to handle increasing amounts of data streaming toward them from higher-capacity fiber-optic lines. JDS Uniphase and Nortel helped us out from the optical space, while Qualcomm and Ericsson offered strong gains on the wireless front. I sold off Ericsson prior to the close of the period. Underweighting Microsoft further aided relative returns, with the software giant slipping on slow adoption of its Windows 2000 operating system, along with its antitrust dispute with the U.S. government.
Q. What moves didn't work out so well?
A. Unfortunately, we were too defensively postured overall in the fourth quarter of 1999, which prevented us from fully participating in the dramatic run-up enjoyed by many stocks in the sector during this time period. Clearly, the fund's underweighting in top dogs Sun Microsystems, Intel, Oracle and Applied Materials was a mistake, as was taking on a handful of problem stocks such as Electronics for Imaging, Motorola, Citrix and DoubleClick. Lucent was by far the fund's largest absolute detractor, although our underexposure to the stock actually boosted relative performance.
Q. What's your outlook?
A. I feel that demand will accelerate behind a continued rise in productivity, with spending in the sector representing an increasing share of GDP. I'm optimistic because tech stocks tend to perform well in this type of environment. It's up for debate as to where we are exactly in the productivity cycle, but if I were to guess, I'd say we're still in the early innings. With that said, I plan to remain fully invested and continue to look for the highest-growth companies at the best prices I can get for shareholders.
The views expressed in this report reflect those of the portfolio manager only through the end of the period of the report as stated on the cover. The manager's views are subject to change at any time based on market or other conditions. For more information, see page A-3.
Fund Facts
Start date: September 3, 1996
Size: as of July 31, 2000, more than
$3.5 billion
Manager: Larry Rakers, since January 2000; joined Fidelity in 1993
3Technology
Advisor Technology Fund
|
Top Ten Stocks as of July 31, 2000 |
|
|
|
% of fund's |
|
Cisco Systems, Inc. |
9.4 |
|
Nortel Networks Corp. |
8.0 |
|
Intel Corp. |
6.8 |
|
SDL, Inc. |
5.5 |
|
EMC Corp. |
3.6 |
|
Oracle Corp. |
2.8 |
|
Sun Microsystems, Inc. |
2.6 |
|
Hewlett-Packard Co. |
2.3 |
|
Dell Computer Corp. |
2.3 |
|
Texas Instruments, Inc. |
1.8 |
|
|
45.1 |
|
Top Industries as of July 31, 2000 |
|
|
% of fund's net assets |
||
|
Electronics |
25.4% |
|
Communications Equipment |
24.0% |
|
Computer Services & Software |
19.1% |
|
Computers & Office Equipment |
18.9% |
|
Electronic Instruments |
1.4% |
|
All Others* |
11.2% |

|
* Includes short-term investments and net other assets. |
Annual Report
Advisor Technology Fund
Showing Percentage of Net Assets
|
Common Stocks - 93.1% |
|||
|
Shares |
Value (Note 1) |
||
|
ADVERTISING - 0.7% |
|||
|
DoubleClick, Inc. (a) |
684,300 |
$ 24,592,031 |
|
|
LifeMinders, Inc. |
76,400 |
1,719,000 |
|
|
|
26,311,031 |
||
|
BROADCASTING - 0.2% |
|||
|
American Tower Corp. Class A (a) |
108,500 |
4,651,938 |
|
|
Wireless Facilities, Inc. |
55,600 |
3,537,550 |
|
|
|
8,189,488 |
||
|
CELLULAR - 1.0% |
|||
|
Crown Castle International Corp. (a) |
105,000 |
3,570,000 |
|
|
LCC International, Inc. (a) |
10,000 |
205,000 |
|
|
QUALCOMM, Inc. (a) |
494,000 |
32,079,125 |
|
|
|
35,854,125 |
||
|
COMMUNICATIONS EQUIPMENT - 24.0% |
|||
|
ADC Telecommunications, Inc. (a) |
450,000 |
18,871,875 |
|
|
Andrew Corp. (a) |
55,000 |
1,550,313 |
|
|
Ciena Corp. (a) |
310,100 |
44,072,963 |
|
|
Cisco Systems, Inc. (a) |
5,157,300 |
337,480,805 |
|
|
Comverse Technology, Inc. (a) |
102,400 |
8,985,600 |
|
|
Corning, Inc. |
275,000 |
64,332,813 |
|
|
Corvis Corp. |
55,000 |
4,528,047 |
|
|
Ditech Communications Corp. |
258,800 |
12,390,050 |
|
|
Jabil Circuit, Inc. (a) |
346,700 |
17,356,669 |
|
|
Lucent Technologies, Inc. |
1,431,538 |
62,629,788 |
|
|
Nortel Networks Corp. |
3,872,640 |
288,027,600 |
|
|
|
860,226,523 |
||
|
COMPUTER SERVICES & SOFTWARE - 19.1% |
|||
|
Adobe Systems, Inc. |
98,400 |
11,266,800 |
|
|
Aether Systems, Inc. |
164,400 |
27,362,325 |
|
|
Affiliated Computer Services, Inc. |
54,800 |
2,469,425 |
|
|
America Online, Inc. (a) |
359,400 |
19,160,513 |
|
|
Ariba, Inc. |
68,000 |
7,883,750 |
|
|
Art Technology Group, Inc. |
340,000 |
29,580,000 |
|
|
BEA Systems, Inc. (a) |
706,600 |
30,427,963 |
|
|
Blue Martini Software, Inc. (a) |
3,100 |
184,256 |
|
|
BroadVision, Inc. (a) |
200,000 |
7,237,500 |
|
|
Cadence Design Systems, Inc. (a) |
300,000 |
6,262,500 |
|
|
Cambridge Technology Partners, Inc. (a) |
284,700 |
2,677,959 |
|
|
Ceridian Corp. (a) |
381,000 |
8,667,750 |
|
|
Citrix Systems, Inc. (a) |
406,000 |
6,191,500 |
|
|
CNET Networks, Inc. (a) |
133,700 |
4,002,644 |
|
|
Commerce One, Inc. |
42,000 |
1,766,625 |
|
|
Computer Sciences Corp. (a) |
29,100 |
1,818,750 |
|
|
Cysive, Inc. |
70,800 |
1,699,200 |
|
|
Data Return Corp. |
61,600 |
1,578,500 |
|
|
Digital Insight Corp. |
184,000 |
5,761,500 |
|
|
|
|||
|
Shares |
Value (Note 1) |
||
|
DST Systems, Inc. (a) |
39,900 |
$ 3,725,663 |
|
|
Electronic Data Systems Corp. |
53,100 |
2,283,300 |
|
|
Electronics for Imaging, Inc. (a) |
142,600 |
3,110,463 |
|
|
Exodus Communications, Inc. (a) |
400,800 |
17,810,550 |
|
|
Great Plains Software, Inc. (a) |
100,000 |
2,337,500 |
|
|
i2 Technologies, Inc. (a) |
121,700 |
15,790,575 |
|
|
Information Architects Corp. (a) |
250,000 |
1,593,750 |
|
|
InfoSpace.com, Inc. (a) |
264,200 |
8,916,750 |
|
|
Infovista SA sponsored ADR (a) |
113,500 |
2,724,000 |
|
|
Inktomi Corp. (a) |
31,400 |
3,359,800 |
|
|
Intertrust Technologies Corp. |
40,000 |
582,500 |
|
|
Kana Communications, Inc. |
96,042 |
3,529,544 |
|
|
Keynote Systems, Inc. |
25,000 |
948,438 |
|
|
Lante Corp. |
99,300 |
1,880,494 |
|
|
Legato Systems, Inc. (a) |
136,900 |
1,330,497 |
|
|
Mercury Interactive Corp. (a) |
55,000 |
5,459,609 |
|
|
Micromuse, Inc. (a) |
277,700 |
36,027,236 |
|
|
Microsoft Corp. (a) |
852,400 |
59,508,175 |
|
|
National Data Corp. |
15,000 |
412,500 |
|
|
Numerical Technologies, Inc. |
35,100 |
1,636,538 |
|
|
Oracle Corp. (a) |
1,322,000 |
99,397,875 |
|
|
Orbotech Ltd. |
25,000 |
2,059,375 |
|
|
Phone.com, Inc. |
444,800 |
35,528,400 |
|
|
Priceline.com, Inc. (a) |
186,000 |
4,394,250 |
|
|
Proxicom, Inc. (a) |
200,000 |
8,262,500 |
|
|
Puma Technology, Inc. (a) |
65,000 |
1,300,000 |
|
|
Rational Software Corp. (a) |
68,000 |
6,919,000 |
|
|
Razorfish, Inc. Class A (a) |
285,000 |
5,165,625 |
|
|
Redback Networks, Inc. (a) |
81,800 |
10,634,000 |
|
|
Scient Corp. (a) |
88,500 |
4,126,313 |
|
|
Siebel Systems, Inc. (a) |
87,600 |
12,702,000 |
|
|
SilverStream Software, Inc. |
175,000 |
6,671,875 |
|
|
Software.com, Inc. |
215,000 |
21,688,125 |
|
|
Support.com, Inc. |
2,400 |
81,900 |
|
|
Synopsys, Inc. (a) |
36,400 |
1,185,275 |
|
|
Technology Solutions, Inc. |
750,000 |
3,750,000 |
|
|
Tumbleweed Communications Corp. |
224,700 |
10,111,500 |
|
|
Unigraphics Solutions, Inc. Class A (a) |
2,100 |
32,681 |
|
|
Unisys Corp. (a) |
293,500 |
2,879,969 |
|
|
VeriSign, Inc. (a) |
163,300 |
25,913,669 |
|
|
VERITAS Software Corp. (a) |
218,875 |
22,311,570 |
|
|
Viant Corp. |
302,400 |
9,979,200 |
|
|
Vignette Corp. (a) |
506,500 |
17,157,688 |
|
|
Yahoo!, Inc. (a) |
192,200 |
24,733,738 |
|
|
|
685,953,870 |
||
|
COMPUTERS & OFFICE EQUIPMENT - 18.9% |
|||
|
Advanced Digital Information Corp. (a) |
218,800 |
3,063,201 |
|
|
Apple Computer, Inc. (a) |
296,400 |
15,060,825 |
|
|
Brocade Communications |
243,000 |
43,405,875 |
|
|
Compaq Computer Corp. |
808,300 |
22,682,919 |
|
|
Dell Computer Corp. (a) |
1,850,400 |
81,301,950 |
|
|
Common Stocks - continued |
|||
|
Shares |
Value (Note 1) |
||
|
COMPUTERS & OFFICE EQUIPMENT - CONTINUED |
|||
|
EMC Corp. (a) |
1,533,200 |
$ 130,513,650 |
|
|
Emulex Corp. (a) |
154,800 |
7,740,000 |
|
|
Extended Systems, Inc. (a) |
52,000 |
3,298,750 |
|
|
Extreme Networks, Inc. (a) |
35,000 |
4,887,422 |
|
|
Finisar Corp. |
145,900 |
3,875,469 |
|
|
Gateway, Inc. (a) |
314,800 |
17,373,025 |
|
|
Hewlett-Packard Co. |
765,800 |
83,615,788 |
|
|
International Business Machines Corp. |
405,600 |
45,604,650 |
|
|
Juniper Networks, Inc. (a) |
140,000 |
19,941,250 |
|
|
Lexmark International Group, Inc. |
335,600 |
15,122,975 |
|
|
MMC Networks, Inc. (a) |
181,500 |
8,972,906 |
|
|
MRV Communications, Inc. (a) |
100,000 |
5,787,500 |
|
|
Network Appliance, Inc. (a) |
527,200 |
45,438,050 |
|
|
Oak Technology, Inc. (a) |
125,000 |
2,875,000 |
|
|
SanDisk Corp. (a) |
17,900 |
1,141,125 |
|
|
SCI Systems, Inc. (a) |
116,800 |
5,358,200 |
|
|
Seagate Technology, Inc. (a) |
250,000 |
12,671,875 |
|
|
Sun Microsystems, Inc. (a) |
895,000 |
94,366,563 |
|
|
Symbol Technologies, Inc. |
38,500 |
1,535,188 |
|
|
|
675,634,156 |
||
|
ELECTRICAL EQUIPMENT - 1.3% |
|||
|
Alcatel SA sponsored ADR |
461,250 |
33,728,906 |
|
|
American Power Conversion Corp. (a) |
85,300 |
2,169,819 |
|
|
Cymer, Inc. (a) |
30,000 |
1,361,250 |
|
|
Pinnacle Systems (a) |
270,200 |
2,068,719 |
|
|
Scientific-Atlanta, Inc. |
92,000 |
7,084,000 |
|
|
|
46,412,694 |
||
|
ELECTRONIC INSTRUMENTS - 1.4% |
|||
|
Agilent Technologies, Inc. |
230,056 |
9,374,782 |
|
|
Applied Materials, Inc. (a) |
21,400 |
1,623,725 |
|
|
Cohu, Inc. |
100,000 |
1,768,750 |
|
|
Credence Systems Corp. (a) |
156,900 |
6,707,475 |
|
|
KLA-Tencor Corp. (a) |
257,000 |
13,685,250 |
|
|
LAM Research Corp. (a) |
132,500 |
3,875,625 |
|
|
LTX Corp. (a) |
114,900 |
2,527,800 |
|
|
PerkinElmer, Inc. |
30,000 |
1,918,125 |
|
|
Teradyne, Inc. (a) |
162,000 |
10,266,750 |
|
|
|
51,748,282 |
||
|
ELECTRONICS - 25.4% |
|||
|
Advanced Energy Industries, Inc. (a) |
94,200 |
4,239,000 |
|
|
Advanced Micro Devices, Inc. (a) |
83,900 |
6,035,556 |
|
|
Altera Corp. (a) |
98,900 |
9,710,744 |
|
|
Amkor Technology, Inc. (a) |
40,000 |
1,100,000 |
|
|
Analog Devices, Inc. (a) |
344,400 |
23,031,750 |
|
|
|
|||
|
Shares |
Value (Note 1) |
||
|
Applied Micro Circuits Corp. (a) |
79,000 |
$ 11,790,750 |
|
|
Atmel Corp. (a) |
55,400 |
1,658,538 |
|
|
Broadcom Corp. Class A (a) |
165,900 |
37,203,075 |
|
|
Chartered Semiconductor Manufacturing Ltd. ADR |
88,600 |
6,379,200 |
|
|
Cree, Inc. (a) |
178,700 |
20,092,581 |
|
|
Dallas Semiconductor Corp. |
47,000 |
1,968,125 |
|
|
Flextronics International Ltd. (a) |
125,400 |
8,877,928 |
|
|
General Semiconductor, Inc. (a) |
257,800 |
3,867,000 |
|
|
GlobeSpan, Inc. |
232,900 |
26,303,144 |
|
|
Infineon Technologies AG |
200 |
13,600 |
|
|
Intel Corp. |
3,641,000 |
243,036,750 |
|
|
International Rectifier Corp. (a) |
128,800 |
7,124,250 |
|
|
JDS Uniphase Corp. (a) |
125,800 |
14,860,125 |
|
|
Linear Technology Corp. |
166,300 |
9,188,075 |
|
|
LSI Logic Corp. (a) |
445,800 |
15,101,475 |
|
|
Marvell Technology Group Ltd. |
177,800 |
8,123,238 |
|
|
Maxim Integrated Products, Inc. (a) |
145,800 |
9,631,913 |
|
|
Micrel, Inc. (a) |
94,000 |
4,705,875 |
|
|
Microchip Technology, Inc. (a) |
37,600 |
2,610,850 |
|
|
Micron Technology, Inc. (a) |
610,400 |
49,747,600 |
|
|
Motorola, Inc. |
240 |
7,935 |
|
|
National Semiconductor Corp. (a) |
3,800 |
137,513 |
|
|
NVIDIA Corp. (a) |
103,800 |
6,228,000 |
|
|
Plexus Corp. (a) |
800 |
90,250 |
|
|
PMC-Sierra, Inc. (a) |
272,200 |
52,755,763 |
|
|
Power-One, Inc. (a) |
40,000 |
4,722,500 |
|
|
QLogic Corp. (a) |
18,400 |
1,370,800 |
|
|
RF Micro Devices, Inc. (a) |
25,000 |
1,884,375 |
|
|
Samsung Electronics Co. Ltd. |
600 |
158,496 |
|
|
Sanmina Corp. (a) |
121,900 |
11,321,463 |
|
|
SDL, Inc. (a) |
570,100 |
197,860,331 |
|
|
Solectron Corp. (a) |
133,400 |
5,377,688 |
|
|
STMicroelectronics NV (NY Shares) |
134,600 |
7,663,788 |
|
|
Texas Instruments, Inc. |
1,119,500 |
65,700,656 |
|
|
TyCom Ltd. |
33,200 |
1,130,875 |
|
|
Vitesse Semiconductor Corp. (a) |
222,000 |
13,236,750 |
|
|
Xilinx, Inc. (a) |
164,460 |
12,344,779 |
|
|
|
908,393,104 |
||
|
INDUSTRIAL MACHINERY & EQUIPMENT - 0.6% |
|||
|
ASM Lithography Holding NV (a) |
270,000 |
10,732,500 |
|
|
Asyst Technologies, Inc. (a) |
75,000 |
1,809,375 |
|
|
Mattson Technology, Inc. (a) |
140,000 |
2,616,250 |
|
|
PRI Automation, Inc. (a) |
38,800 |
1,770,250 |
|
|
Varian Semiconductor Equipment Associates, Inc. (a) |
58,000 |
2,816,625 |
|
|
|
19,745,000 |
||
|
SERVICES - 0.5% |
|||
|
Diamond Technology Partners, Inc. |
101,500 |
9,039,844 |
|
|
Common Stocks - continued |
|||
|
Shares |
Value (Note 1) |
||
|
SERVICES - CONTINUED |
|||
|
Digitas, Inc. |
89,400 |
$ 2,022,675 |
|
|
eLoyalty Corp. |
125,000 |
1,855,469 |
|
|
Media Metrix, Inc. (a) |
170,000 |
4,420,000 |
|
|
Per-Se Technologies, Inc. |
91 |
0 |
|
|
|
17,337,988 |
||
|
TELEPHONE SERVICES - 0.0% |
|||
|
TeraBeam Networks (c) |
10,800 |
40,500 |
|
|
TOTAL COMMON STOCKS (Cost $2,834,073,664) |
3,335,846,761 |
||
|
Cash Equivalents - 10.2% |
|||
|
Maturity Amount |
|
||
|
Investments in repurchase agreements (U.S. Treasury Obligations), in a joint trading account at 6.45%, dated 7/31/00 due 8/1/00 |
$ 4,027,722 |
4,027,000 |
|
|
Shares |
|
||
|
Fidelity Cash Central Fund, |
264,767,287 |
264,767,287 |
|
|
Fidelity Securities Lending Cash |
97,659,109 |
97,659,109 |
|
|
TOTAL CASH EQUIVALENTS (Cost $366,453,396) |
366,453,396 |
||
|
TOTAL INVESTMENT PORTFOLIO - 103.3% (Cost $3,200,527,060) |
3,702,300,157 |
|
|
NET OTHER ASSETS - (3.3)% |
(118,225,878) |
|
|
NET ASSETS - 100% |
$ 3,584,074,279 |
|
|
Legend |
|
(a) Non-income producing |
|
(b) The rate quoted is the annualized seven-day yield of the fund at |
|
(c) Restricted securities - Investment in securities not registered under the Securities Act of 1933. |
|
Additional information on each holding is as follows: |
|
Security |
Acquisition Date |
Acquisition Cost |
|
TeraBeam Networks |
4/7/00 |
$ 40,500 |
|
Other Information |
|
The fund invested in securities that are not registered under the Securities Act of 1933. These securities are subject to legal or contractual restrictions on resale. At the end of the period, restricted securities (excluding Rule 144A issues) amounted to $40,500 or 0.0% of net assets. |
|
Distribution of investments by country of issue, as a percentage of total |
|
United States of America |
89.7% |
|
Canada |
8.0 |
|
France |
1.0 |
|
Others (individually less than 1%) |
1.3 |
|
|
100.0% |
|
Income Tax Information |
|
At July 31, 2000, the aggregate cost of investment securities for income tax purposes was $3,221,424,728. Net unrealized appreciation aggregated $480,875,429, of which $790,884,529 related to appreciated investment securities and $310,009,100 related to depreciated investment securities. |
|
The fund hereby designates approximately $19,613,000 as a capital gain dividend for the purpose of the dividend paid deduction. |
|
A total of 1%, 1%, 2%, 2% and 1% of Class A's, Class T's, Class B's, Class C's and Institutional Class' dividends distributed during the fiscal year qualifies for the dividend-received deductions for corporate shareholders (unaudited). |
|
The fund will notify shareholders in January 2001 of the applicable percentages for use in preparing 2000 income tax returns. |
See accompanying notes which are an integral part of the financial statements.
Technology
Statement of Assets and Liabilities
|
|
July 31, 2000 |
|
|
Assets |
|
|
|
Investment in securities, at value (including repurchase agreements of $4,027,000) (cost $3,200,527,060) - |
|
$ 3,702,300,157 |
|
Cash |
|
859 |
|
Receivable for investments sold |
|
64,845,108 |
|
Receivable for fund shares sold |
|
10,125,072 |
|
Dividends receivable |
|
65,339 |
|
Interest receivable |
|
1,394,478 |
|
Redemption fees receivable |
|
3,128 |
|
Other receivables |
|
74,504 |
|
Total assets |
|
3,778,808,645 |
|
Liabilities |
|
|
|
Payable for investments purchased |
$ 85,879,552 |
|
|
Payable for fund shares redeemed |
5,711,660 |
|
|
Accrued management fee |
1,809,482 |
|
|
Distribution fees payable |
2,272,122 |
|
|
Other payables and |
1,402,441 |
|
|
Collateral on securities loaned, |
97,659,109 |
|
|
Total liabilities |
|
194,734,366 |
|
Net Assets |
|
$ 3,584,074,279 |
|
Net Assets consist of: |
|
|
|
Paid in capital |
|
$ 2,940,445,126 |
|
Accumulated undistributed |
|
141,856,056 |
|
Net unrealized appreciation (depreciation) on investments |
|
501,773,097 |
|
Net Assets |
|
$ 3,584,074,279 |
|
Calculation of Maximum |
|
$36.23 |
|
Maximum offering price per |
|
$38.44 |
|
Class T: |
|
$35.95 |
|
Maximum offering price per share (100/96.50 of $35.95) |
|
$37.25 |
|
Class B: |
|
$35.33 |
|
Class C: |
|
$35.39 |
|
Institutional Class: |
|
$36.43 |
A Redemption price per share is equal to net asset value less any applicable contingent deferred sales charge.
Statement of Operations
|
|
Year ended July 31, 2000 |
|
|
Investment Income Dividends |
|
$ 2,260,119 |
|
Interest |
|
11,660,827 |
|
Security lending |
|
753,691 |
|
Total income |
|
14,674,637 |
|
Expenses |
|
|
|
Management fee |
$ 14,021,602 |
|
|
Transfer agent fees |
6,145,435 |
|
|
Distribution fees |
17,313,403 |
|
|
Accounting and security lending fees |
519,867 |
|
|
Non-interested trustees' compensation |
6,785 |
|
|
Custodian fees and expenses |
83,078 |
|
|
Registration fees |
925,628 |
|
|
Audit |
29,306 |
|
|
Legal |
10,202 |
|
|
Miscellaneous |
20,308 |
|
|
Total expenses before reductions |
39,075,614 |
|
|
Expense reductions |
(169,344) |
38,906,270 |
|
Net investment income (loss) |
|
(24,231,633) |
|
Realized and Unrealized Gain (Loss) Net realized gain (loss) on: |
|
|
|
Investment securities |
186,239,307 |
|
|
Foreign currency transactions |
(530) |
186,238,777 |
|
Change in net unrealized appreciation (depreciation) |
|
380,785,475 |
|
Net gain (loss) |
|
567,024,252 |
|
Net increase (decrease) in net assets resulting from operations |
|
$ 542,792,619 |
See accompanying notes which are an integral part of the financial statements.
Annual Report
Advisor Technology Fund
Financial Statements - continued
Statement of Changes in Net Assets
|
Increase (Decrease) in Net Assets |
Year ended |
Year ended |
|
Operations |
$ (24,231,633) |
$ (3,282,503) |
|
Net realized gain (loss) |
186,238,777 |
51,119,572 |
|
Change in net unrealized appreciation (depreciation) |
380,785,475 |
107,259,307 |
|
Net increase (decrease) in net assets resulting from operations |
542,792,619 |
155,096,376 |
|
Distributions to shareholders from net realized gain |
(61,167,152) |
- |
|
Share transactions - net increase (decrease) |
2,237,686,987 |
557,638,871 |
|
Redemption fees |
998,385 |
259,288 |
|
Total increase (decrease) in net assets |
2,720,310,839 |
712,994,535 |
|
Net Assets |
|
|
|
Beginning of period |
863,763,440 |
150,768,905 |
|
End of period |
$ 3,584,074,279 |
$ 863,763,440 |
Financial Highlights - Class A
|
Years ended July 31, |
2000 |
1999 |
1998 |
1997 E |
|
Selected Per-Share Data |
|
|
|
|
|
Net asset value, beginning of period |
$ 24.95 |
$ 14.88 |
$ 15.96 |
$ 10.00 |
|
Income from Investment Operations |
|
|
|
|
|
Net investment income (loss) D |
(.19) |
(.09) |
(.08) |
(.10) |
|
Net realized and unrealized gain (loss) |
13.04 |
10.15 |
.58 |
6.13 |
|
Total from investment operations |
12.85 |
10.06 |
.50 |
6.03 |
|
Less Distributions |
|
|
|
|
|
From net realized gain |
(1.58) |
- |
(1.14) |
(.08) |
|
In excess of net realized gain |
- |
- |
(.45) |
- |
|
Total distributions |
(1.58) |
- |
(1.59) |
(.08) |
|
Redemption fees added to paid in capital |
.01 |
.01 |
.01 |
.01 |
|
Net asset value, end of period |
$ 36.23 |
$ 24.95 |
$ 14.88 |
$ 15.96 |
|
Total Return B, C |
53.76% |
67.67% |
4.20% |
60.62% |
|
Ratios and Supplemental Data |
|
|
|
|
|
Net assets, end of period (000 omitted) |
$ 388,756 |
$ 94,621 |
$ 15,414 |
$ 7,313 |
|
Ratio of expenses to average net assets |
1.16% |
1.25% |
1.39% |
1.75% A, F |
|
Ratio of expenses to average net assets after expense reductions |
1.15% G |
1.24% G |
1.35% G |
1.70% A, G |
|
Ratio of net investment income (loss) to average net assets |
(.55)% |
(.44)% |
(.59)% |
(.79)% A |
|
Portfolio turnover |
125% |
170% |
348% |
517% A |
|
A Annualized B The total returns would have been lower had certain expenses not been reduced during the periods shown. C Total returns do not include the one time sales charge and for periods of less than one year are not annualized. D Net investment income (loss) per share has been calculated based on average shares outstanding during the period. E For the period September 3, 1996 (commencement of sale of Class A shares) to July 31, 1997. F FMR agreed to reimburse a portion of the class' expenses during the period. Without this reimbursement, the class' expense ratio would have been higher. G FMR or the fund has entered into varying arrangements with third parties who either paid or reduced a portion of the class' expenses. |
||||
See accompanying notes which are an integral part of the financial statements.
Technology
Financial Highlights - Class T
|
Years ended July 31, |
2000 |
1999 |
1998 |
1997 E |
|
Selected Per-Share Data |
|
|
|
|
|
Net asset value, beginning of period |
$ 24.76 |
$ 14.80 |
$ 15.91 |
$ 10.00 |
|
Income from Investment Operations |
|
|
|
|
|
Net investment income (loss) D |
(.27) |
(.14) |
(.11) |
(.11) |
|
Net realized and unrealized gain (loss) |
12.96 |
10.09 |
.56 |
6.09 |
|
Total from investment operations |
12.69 |
9.95 |
.45 |
5.98 |
|
Less Distributions |
|
|
|
|
|
From net realized gain |
(1.51) |
- |
(1.12) |
(.08) |
|
In excess of net realized gain |
- |
- |
(.45) |
- |
|
Total distributions |
(1.51) |
- |
(1.57) |
(.08) |
|
Redemption fees added to paid in capital |
.01 |
.01 |
.01 |
.01 |
|
Net asset value, end of period |
$ 35.95 |
$ 24.76 |
$ 14.80 |
$ 15.91 |
|
Total Return B, C |
53.41% |
67.30% |
3.85% |
60.12% |
|
Ratios and Supplemental Data |
|
|
|
|
|
Net assets, end of period (000 omitted) |
$ 1,286,376 |
$ 349,533 |
$ 90,499 |
$ 57,624 |
|
Ratio of expenses to average net assets |
1.38% |
1.47% |
1.60% |
1.92% A |
|
Ratio of expenses to average net assets after expense reductions |
1.37% F |
1.46% F |
1.56% F |
1.87% A, F |
|
Ratio of net investment income (loss) to average net assets |
(.77)% |
(.65)% |
(.80)% |
(.93)% A |
|
Portfolio turnover |
125% |
170% |
348% |
517% A |
|
A Annualized B The total returns would have been lower had certain expenses not been reduced during the periods shown. C Total returns do not include the one time sales charge and for periods of less than one year are not annualized. D Net investment income (loss) per share has been calculated based on average shares outstanding during the period. E For the period September 3, 1996 (commencement of sale of Class T shares) to July 31, 1997. F FMR or the fund has entered into varying arrangements with third parties who either paid or reduced a portion of the class' expenses. |
||||
Financial Highlights - Class B
|
Years ended July 31, |
2000 |
1999 |
1998 |
1997 E |
|
Selected Per-Share Data |
|
|
|
|
|
Net asset value, beginning of period |
$ 24.44 |
$ 14.68 |
$ 15.88 |
$ 12.88 |
|
Income from Investment Operations |
|
|
|
|
|
Net investment income (loss) D |
(.45) |
(.26) |
(.20) |
(.08) |
|
Net realized and unrealized gain (loss) |
12.78 |
10.01 |
.57 |
3.08 |
|
Total from investment operations |
12.33 |
9.75 |
.37 |
3.00 |
|
Less Distributions |
|
|
|
|
|
From net realized gain |
(1.45) |
- |
(1.13) |
- |
|
In excess of net realized gain |
- |
- |
(.45) |
- |
|
Total distributions |
(1.45) |
- |
(1.58) |
- |
|
Redemption fees added to paid in capital |
.01 |
.01 |
.01 |
- |
|
Net asset value, end of period |
$ 35.33 |
$ 24.44 |
$ 14.68 |
$ 15.88 |
|
Total Return B, C |
52.57% |
66.49% |
3.27% |
23.29% |
|
Ratios and Supplemental Data |
|
|
|
|
|
Net assets, end of period (000 omitted) |
$ 1,372,523 |
$ 298,768 |
$ 31,041 |
$ 5,105 |
|
Ratio of expenses to average net assets |
1.91% |
2.01% |
2.21% |
2.50% A, F |
|
Ratio of expenses to average net assets after expense reductions |
1.91% |
2.00% G |
2.18% G |
2.45% A, G |
|
Ratio of net investment income (loss) to average net assets |
(1.30)% |
(1.19)% |
(1.40)% |
(1.41)% A |
|
Portfolio turnover |
125% |
170% |
348% |
517% A |
|
A Annualized B The total returns would have been lower had certain expenses not been reduced during the periods shown. C Total returns do not include the contingent deferred sales charge and for periods of less than one year are not annualized. D Net investment income (loss) per share has been calculated based on average shares outstanding during the period. E For the period March 3, 1997 (commencement of sale of Class B shares) to July 31, 1997. F FMR agreed to reimburse a portion of the class' expenses during the period. Without this reimbursement, the class' expense ratio would have been higher. G FMR or the fund has entered into varying arrangements with third parties who either paid or reduced a portion of the class' expenses. |
||||
See accompanying notes which are an integral part of the financial statements.
Annual Report
Financial Highlights - Class C
|
Years ended July 31, |
2000 |
1999 |
1998 E |
|
Selected Per-Share Data |
|
|
|
|
Net asset value, beginning of period |
$ 24.49 |
$ 14.70 |
$ 14.28 |
|
Income from Investment Operations |
|
|
|
|
Net investment income (loss) D |
(.44) |
(.25) |
(.17) |
|
Net realized and unrealized gain (loss) |
12.80 |
10.03 |
1.27 |
|
Total from investment operations |
12.36 |
9.78 |
1.10 |
|
Less Distributions |
|
|
|
|
From net realized gain |
(1.47) |
- |
(.49) |
|
In excess of net realized gain |
- |
- |
(.20) |
|
Total distributions |
(1.47) |
- |
(.69) |
|
Redemption fees added to paid in capital |
.01 |
.01 |
.01 |
|
Net asset value, end of period |
$ 35.39 |
$ 24.49 |
$ 14.70 |
|
Total Return B, C |
52.60% |
66.60% |
8.96% |
|
Ratios and Supplemental Data |
|
|
|
|
Net assets, end of period (000 omitted) |
$ 472,462 |
$ 88,120 |
$ 6,754 |
|
Ratio of expenses to average net assets |
1.89% |
1.97% |
2.43% A |
|
Ratio of expenses to average net assets after expense reductions |
1.89% |
1.96% F |
2.41% A, F |
|
Ratio of net investment income (loss) to average net assets |
(1.28)% |
(1.16)% |
(1.64)% A |
|
Portfolio turnover |
125% |
170% |
348% |
|
A Annualized B The total returns would have been lower had certain expenses not been reduced during the periods shown. C Total returns do not include the contingent deferred sales charge and for periods of less than one year are not annualized. D Net investment income (loss) per share has been calculated based on average shares outstanding during the period. E For the period November 3, 1997 (commencement of sale of Class C shares) to July 31, 1998. F FMR or the fund has entered into varying arrangements with third parties who either paid or reduced a portion of the class' expenses. |
|||
Financial Highlights - Institutional Class
|
Years ended July 31, |
2000 |
1999 |
1998 |
1997 E |
|
Selected Per-Share Data |
|
|
|
|
|
Net asset value, beginning of period |
$ 25.05 |
$ 14.89 |
$ 15.98 |
$ 10.00 |
|
Income from Investment Operations |
|
|
|
|
|
Net investment income (loss) D |
(.09) |
(.04) |
(.04) |
(.06) |
|
Net realized and unrealized gain (loss) |
13.08 |
10.19 |
.55 |
6.12 |
|
Total from investment operations |
12.99 |
10.15 |
.51 |
6.06 |
|
Less Distributions |
|
|
|
|
|
From net realized gain |
(1.62) |
- |
(1.15) |
(.09) |
|
In excess of net realized gain |
- |
- |
(.46) |
- |
|
Total distributions |
(1.62) |
- |
(1.61) |
(.09) |
|
Redemption fees added to paid in capital |
.01 |
.01 |
.01 |
.01 |
|
Net asset value, end of period |
$ 36.43 |
$ 25.05 |
$ 14.89 |
$ 15.98 |
|
Total Return B, C |
54.16% |
68.23% |
4.26% |
60.95% |
|
Ratios and Supplemental Data |
|
|
|
|
|
Net assets, end of period (000 omitted) |
$ 63,957 |
$ 32,722 |
$ 7,060 |
$ 3,598 |
|
Ratio of expenses to average net assets |
.87% |
.98% |
1.10% |
1.50% A, F |
|
Ratio of expenses to average net assets after expense reductions |
.87% |
.97% G |
1.07% G |
1.44% A, G |
|
Ratio of net investment income (loss) to average net assets |
(.26)% |
(.17)% |
(.30)% |
(.50)% A |
|
Portfolio turnover |
125% |
170% |
348% |
517% A |
|
A Annualized B The total returns would have been lower had certain expenses not been reduced during the periods shown. C Total returns for periods of less than one year are not annualized. D Net investment income (loss) per share has been calculated based on average shares outstanding during the period. E For the period September 3, 1996 (commencement of sale of Institutional Class shares) to July 31, 1997. F FMR agreed to reimburse a portion of the class' expenses during the period. Without this reimbursement, the class' expense ratio would have been higher. G FMR or the fund has entered into varying arrangements with third parties who either paid or reduced a portion of the class' expenses. |
||||
See accompanying notes which are an integral part of the financial statements.
Technology
For the period ended July 31, 2000
1. Significant Accounting Policies.
Fidelity Advisor Technology Fund (the fund) is a fund of Fidelity Advisor Series VII (the trust) and is authorized to issue an unlimited number of shares. The trust is registered under the Investment Company Act of 1940, as amended (the 1940 Act), as an open-end management investment company organized as a Massachusetts business trust.
The fund offers Class A, Class T, Class B, Class C, and Institutional Class shares, each of which has equal rights as to assets and voting privileges. Each class has exclusive voting rights with respect to matters that affect that class. Class B shares will automatically convert to Class A shares after a holding period of seven years from the initial date of purchase. Investment income, realized and unrealized capital gains and losses, the common expenses of the fund, and certain fund-level expense reductions, if any, are allocated on a pro rata basis to each class based on the relative net assets of each class to the total net assets of the fund. Each class of shares differs in its respective distribution, transfer agent, and certain other class-specific fees, expenses, and expense reductions.
The financial statements have been prepared in conformity with generally accepted accounting principles which require management to make certain estimates and assumptions at the date of the financial statements. The following summarizes the significant accounting policies of the fund:
Security Valuation. Securities for which exchange quotations are readily available are valued at the last sale price, or if no sale price, at the closing bid price. Foreign securities are valued based on quotations from the principal market in which such securities are normally traded. If trading or events occurring in other markets after the close of the principal market in which foreign securities are traded, and before the close of the business of the fund, are expected to materially affect the value of those securities, then they are valued at their fair value taking this trading or these events into account. Fair value is determined in good faith under consistently applied procedures under the general supervision of the Board of Trustees. Securities (including restricted securities) for which exchange quotations are not readily available (and in certain cases debt securities which trade on an exchange) are valued primarily using dealer-supplied valuations or at their fair value. Short-term securities with remaining maturities of sixty days or less for which quotations are not readily available are valued at amortized cost or original cost plus accrued interest, both of which approximate current value.
Foreign Currency Translation. The accounting records of the fund are maintained in U.S. dollars. Investment securities and other assets and liabilities denominated in a foreign currency are translated into U.S. dollars at the prevailing rates of exchange at period end. Purchases and sales of securities, income receipts and expense payments are translated into U.S. dollars at the prevailing exchange rate on the respective dates of the transactions.
Net realized gains and losses on foreign currency transactions represent net gains and losses from sales and maturities of foreign currency contracts, disposition of foreign currencies, the difference between the amount of net investment income accrued and the U.S. dollar amount actually received, and gains and losses between trade and settlement date on purchases and sales of securities. The effects of changes in foreign currency exchange rates on investments in securities are included with the net realized and unrealized gain or loss on investment securities.
Income Taxes. As a qualified regulated investment company under Subchapter M of the Internal Revenue Code, the fund is not subject to income taxes to the extent that it distributes substantially all of its taxable income for its fiscal year. The schedule of investments includes information regarding income taxes under the caption "Income Tax Information."
Investment Income. Dividend income is recorded on the ex-dividend date, except certain dividends from foreign securities where the ex-dividend date may have passed, are recorded as soon as the fund is informed of the ex-dividend date. Non-cash dividends included in dividend income, if any, are recorded at the fair market value of the securities received. Interest income is accrued as earned. Investment income is recorded net of foreign taxes withheld where recovery of such taxes is uncertain.
Expenses. Most expenses of the trust can be directly attributed to a fund. Expenses which cannot be directly attributed are apportioned among the funds in the trust.
Distributions to Shareholders. Distributions are recorded on the ex-dividend date. Income dividends and capital gain distributions are declared separately for each class.
Income and capital gain distributions are determined in accordance with income tax regulations which may differ from generally accepted accounting principles. These differences, which may result in distribution reclassifications, are primarily due to differing treatments for foreign currency transactions, net operating losses and losses deferred due to wash sales. The fund also utilized earnings and profits distributed to shareholders on redemption of shares as a part of the dividends paid deduction for income tax purposes.
Permanent book and tax basis differences relating to shareholder distributions will result in reclassifications to paid in capital. Accumulated undistributed net realized gain (loss) on investments and foreign currency transactions may include temporary book and tax basis differences which will reverse in a subsequent period. Any taxable income or gain remaining at fiscal year end is distributed in the following year.
Short-Term Trading (Redemption) Fees. Shares held in the fund less than 60 days are subject to a short-term trading fee equal to 1% of the proceeds of the redeemed shares. The fee, which is retained by the fund, is accounted for as an addition to paid in capital.
Annual Report
Notes to Financial Statements - continued
1. Significant Accounting
Policies - continued
Security Transactions. Security transactions are accounted for as of trade date. Gains and losses on securities sold are determined on the basis of identified cost.
2. Operating Policies.
Foreign Currency Contracts. The fund generally uses foreign currency contracts to facilitate transactions in foreign-denominated securities. Losses may arise from changes in the value of the foreign currency or if the counterparties do not perform under the contracts' terms. The U.S. dollar value of foreign currency contracts is determined using contractual currency exchange rates established at the time of each trade.
Joint Trading Account. Pursuant to an Exemptive Order issued by the Securities and Exchange Commission (the SEC), the fund, along with other affiliated entities of Fidelity Management & Research Company (FMR), may transfer uninvested cash balances into one or more joint trading accounts. These balances are invested in one or more repurchase agreements for U.S. Treasury or Federal Agency obligations.
Repurchase Agreements. The underlying U.S. Treasury, Federal Agency, or other obligations found to be satisfactory by FMR are transferred to an account of the fund, or to the Joint Trading Account, at a custodian bank. The securities are marked-to-market daily and maintained at a value at least equal to the principal amount of the repurchase agreement (including accrued interest). FMR, the fund's investment adviser, is responsible for determining that the value of the underlying securities remains in accordance with the market value requirements stated above.
Cash Central Funds. Pursuant to an Exemptive Order issued by the SEC, the fund may invest in the Fidelity Cash Central Fund and the Fidelity Securities Lending Cash Central Fund (the Cash Funds) managed by Fidelity Investments Money Management, Inc., an affiliate of FMR. The Cash Funds are open-end money market funds available only to investment companies and other accounts managed by FMR and its affiliates. The Cash Funds seek preservation of capital, liquidity, and current income. Income distributions from the Cash Funds are declared daily and paid monthly from net interest income. Income distributions earned by the fund are recorded as either interest income or security lending income in the accompanying financial statements.
Restricted Securities. The fund is permitted to invest in securities that are subject to legal or contractual restrictions on resale. These securities generally may be resold in transactions exempt from registration or to the public if the securities are registered. Disposal of these securities may involve time-consuming negotiations and expense, and prompt sale at an acceptable price may be difficult. At the end of the period, restricted securities (excluding 144A issues) amounted to $40,500 or 0.0% of net assets.
3. Purchases and Sales of Investments.
Purchases and sales of securities, other than short-term securities, aggregated $4,833,800,913 and $2,779,015,445, respectively.
4. Fees and Other Transactions with Affiliates.
Management Fee. As the fund's investment adviser, FMR receives a monthly fee that is calculated on the basis of a group fee rate plus a fixed individual fund fee rate applied to the average net assets of the fund. The group fee rate is the weighted average of a series of rates and is based on the monthly average net assets of all the mutual funds advised by FMR. The rates ranged from .2167% to .5200% for the period. The annual individual fund fee rate is .30%. In the event that these rates were lower than the contractual rates in effect during the period, FMR voluntarily implemented the above rates, as they resulted in the same or a lower management fee. For the period, the management fee was equivalent to an annual rate of .58% of average net assets.
Distribution and Service Plan. In accordance with Rule 12b-1 of the 1940 Act, the Board of Trustees have adopted separate Distribution and Service Plans with respect to each class of shares (collectively referred to as "the Plans"). Under certain of the Plans, the class pays Fidelity Distributors Corporation (FDC), an affiliate of FMR, a 12b-1 fee. A portion of this fee may be reallowed to securities dealers, banks and other financial institutions for the distribution of each class of shares and providing shareholder support services. For the period, this fee was based on the following annual rates of the average net assets of each applicable class:
|
Class A |
.25% |
|
Class T |
.50% |
|
Class B |
1.00%* |
|
Class C |
1.00%* |
* .75% represents a distribution fee and .25% represents a shareholder service fee.
For the period, each class paid FDC the following amounts, a portion of which was retained by FDC:
|
|
Paid to |
Retained |
|
Class A |
$ 656,285 |
$ 329 |
|
Class T |
4,482,592 |
3,088 |
|
Class B |
9,162,823 |
6,872,976 |
|
Class C |
3,011,703 |
2,259,677 |
|
|
$ 17,313,403 |
$ 9,136,070 |
Sales Load. FDC receives a front-end sales charge of up to 5.75% for selling Class A shares, and 3.50% for selling Class T shares of the fund. FDC receives the proceeds of contingent deferred sales charges levied on Class B share redemptions occurring within six years of purchase and Class C share redemptions occurring within one year of purchase. Contingent deferred sales charges are based on declining rates ranging from 5% to 1% for Class B and 1% for Class C, of the lesser of the cost of shares at the initial date of purchase or the net
Technology
Notes to Financial Statements - continued
4. Fees and Other Transactions with Affiliates - continued
Sales Load - continued
asset value of the redeemed shares, excluding any reinvested dividends and capital gains. In addition, purchases of Class A and Class T shares that were subject to a finder's fee bear a contingent deferred sales charge on assets that do not remain in the fund for at least one year. The Class A and Class T contingent deferred sales charge is based on 0.25% of the lesser of the cost of shares at the initial date of purchase or the net asset value of the redeemed shares, excluding any reinvested dividends and capital gains. A portion of the sales charges paid to FDC is paid to securities dealers, banks and other financial institutions.
For the period, sales charge amounts paid to and retained by FDC were as follows:
|
|
Paid to |
Retained |
|
Class A |
$ 2,815,402 |
$ 1,403,067 |
|
Class T |
3,019,339 |
1,149,922 |
|
Class B |
1,943,039 |
1,943,039* |
|
Class C |
152,798 |
152,798* |
|
|
$ 7,930,578 |
$ 4,648,826 |
* When Class B and Class C shares are initially sold, FDC pays commissions from its own resources to securities dealers,
banks, and other financial institutions through which the sales are made.
Transfer Agent Fees. Fidelity Investments Institutional Operations Company, Inc., (FIIOC), an affiliate of FMR, is the transfer, dividend disbursing and shareholder servicing agent (collectively referred to as the transfer agent) for each class of the fund. FIIOC receives account fees and asset-based fees that vary according to the account size and type of account of the shareholders of the respective classes of the fund. FIIOC pays for typesetting, printing and mailing of all shareholder reports, except proxy statements. For the period, the following amounts were paid to FIIOC:
|
|
Amount |
% of |
|
Class A |
$ 703,903 |
.27 |
|
Class T |
2,101,901 |
.23 |
|
Class B |
2,459,618 |
.27 |
|
Class C |
743,802 |
.25 |
|
Institutional Class |
136,211 |
.23 |
|
|
$ 6,145,435 |
|
Accounting and Security Lending Fees. Fidelity Service Company, Inc., an affiliate of FMR, maintains the fund's accounting records and administers the security lending program. The security lending fee is based on the number and duration of lending transactions. The accounting fee is based on the level of average net assets for the month plus out-of-pocket expenses.
Brokerage Commissions. The fund placed a portion of its portfolio transactions with brokerage firms which are affiliates of FMR. The commissions paid to these affiliated firms were $124,819 for the period.
5. Security Lending.
The fund lends portfolio securities from time to time in order to earn additional income. The fund receives collateral in the form of U.S. Treasury obligations, letters of credit, and/or cash against the loaned securities, and maintains collateral in an amount not less than 100% of the market value of the loaned securities during the period of the loan. The market value of the loaned securities is determined at the close of business of the fund and any additional required collateral is delivered to the fund on the next business day. If the borrower defaults on its obligation to return the securities loaned because of insolvency or other reasons, the fund could experience delays and costs in recovering the securities loaned or in gaining access to the collateral. At period end, the value of the securities loaned amounted to $101,555,965. The fund received cash collateral of $97,659,109 which was invested in cash equivalents.
6. Expense Reductions.
FMR has directed certain portfolio trades to brokers who paid a portion of the fund's expenses. For the period, the fund's expenses were reduced by $166,096 under this arrangement.
In addition, through an arrangement with the fund's custodian, credits realized as a result of uninvested cash balances were used to reduce a portion of the fund's expenses. During the period, the fund's custodian fees were reduced by $3,248 under this arrangement.
Technology
Notes to Financial Statements - continued
7. Distributions to Shareholders.
Distributions to shareholders of each class were as follows:
|
|
Years ended July 31, |
|
|
|
2000 |
1999 |
|
From net realized gain |
|
|
|
Class A |
$ 7,085,822 |
$ - |
|
Class T |
23,787,352 |
- |
|
Class B |
21,305,447 |
- |
|
Class C |
6,504,599 |
- |
|
Institutional Class |
2,483,932 |
- |
|
Total |
$ 61,167,152 |
$ - |
8. Share Transactions.
Transactions for each class of shares were as follows:
|
|
Shares |
Dollars |
||
|
|
Year ended |
Year ended |
Year ended |
Year ended |
|
|
2000 |
1999 |
2000 |
1999 |
|
|
|
|
|
|
|
Class A |
8,424,700 |
3,280,891 |
$ 295,468,953 |
$ 74,375,999 |
|
Reinvestment of distributions |
237,235 |
- |
6,522,431 |
- |
|
Shares redeemed |
(1,723,055) |
(524,386) |
(61,402,666) |
(11,021,514) |
|
Net increase (decrease) |
6,938,880 |
2,756,505 |
$ 240,588,718 |
$ 63,354,485 |
|
Class T |
27,387,834 |
10,904,693 |
$ 953,611,598 |
$ 237,438,732 |
|
Reinvestment of distributions |
830,850 |
- |
22,660,793 |
- |
|
Shares redeemed |
(6,556,121) |
(2,903,454) |
(226,095,777) |
(59,161,752) |
|
Net increase (decrease) |
21,662,563 |
8,001,239 |
$ 750,176,614 |
$ 178,276,980 |
|
Class B |
29,573,993 |
11,234,873 |
$ 1,007,811,583 |
$ 250,482,834 |
|
Reinvestment of distributions |
704,607 |
- |
18,857,957 |
- |
|
Shares redeemed |
(3,655,139) |
(1,122,956) |
(126,658,754) |
(23,194,043) |
|
Net increase (decrease) |
26,623,461 |
10,111,917 |
$ 900,010,786 |
$ 227,288,791 |
|
Class C |
11,070,359 |
3,451,291 |
$ 381,491,987 |
$ 76,473,150 |
|
Reinvestment of distributions |
200,051 |
- |
5,389,654 |
- |
|
Shares redeemed |
(1,519,630) |
(311,910) |
(52,707,538) |
(6,794,753) |
|
Net increase (decrease) |
9,750,780 |
3,139,381 |
$ 334,174,103 |
$ 69,678,397 |
|
Institutional Class |
1,525,017 |
1,121,900 |
$ 50,459,314 |
$ 24,772,786 |
|
Reinvestment of distributions |
67,708 |
- |
1,853,690 |
- |
|
Shares redeemed |
(1,143,598) |
(289,655) |
(39,576,238) |
(5,732,568) |
|
Net increase (decrease) |
449,127 |
832,245 |
$ 12,736,766 |
$ 19,040,218 |
Technology
Performance
There are several ways to evaluate historical performance. You can look at the total percentage change in value, the average annual percentage change or the growth of a hypothetical $10,000 investment. Total return reflects the change in the value of an investment, assuming reinvestment of dividend income and capital gains (the profits earned upon the sale of securities that have grown in value). If Fidelity had not reimbursed certain class expenses, the life of fund total returns would have been lower.
Cumulative Total Returns
|
Periods ended July 31, 2000 |
|
Past 1 |
Life of |
|
Fidelity Adv Telecommunications & Utilities - CL A |
|
9.59% |
169.85% |
|
Fidelity Adv Telecommunications & Utilities - CL A |
|
3.29% |
154.33% |
|
S&P 500 |
|
8.98% |
131.80% |
|
GS Utilities |
|
-0.53% |
117.02% |
Cumulative total returns show Class A shares' performance in percentage terms over a set period - in this case, one year or since the fund started on September 3, 1996. You can compare Class A shares' returns to both the performance of the Standard & Poor's 500 Index - a market capitalization-weighted index of common stocks - and the Goldman Sachs Utilities Index - a market capitalization-weighted index of 139 stocks designed to measure the performance of companies in the utilities sector. Issues in the index include generators and distributors of electricity, distributors of natural gas and water, and providers of telecommunications services. These benchmarks include reinvested dividends and capital gains, if any, and exclude the effect of sales charges.
Average Annual Total Returns
|
Periods ended July 31, 2000 |
|
Past 1 |
Life of |
|
Fidelity Adv Telecommunications & Utilities - CL A |
|
9.59% |
28.90% |
|
Fidelity Adv Telecommunications & Utilities - CL A |
|
3.29% |
26.97% |
|
S&P 500 |
|
8.98% |
23.99% |
|
GS Utilities |
|
-0.53% |
21.92% |
Average annual returns take Class A shares' cumulative return and show you what would have happened if Class A shares had performed at a constant rate each year.
$10,000 Over Life of Fund
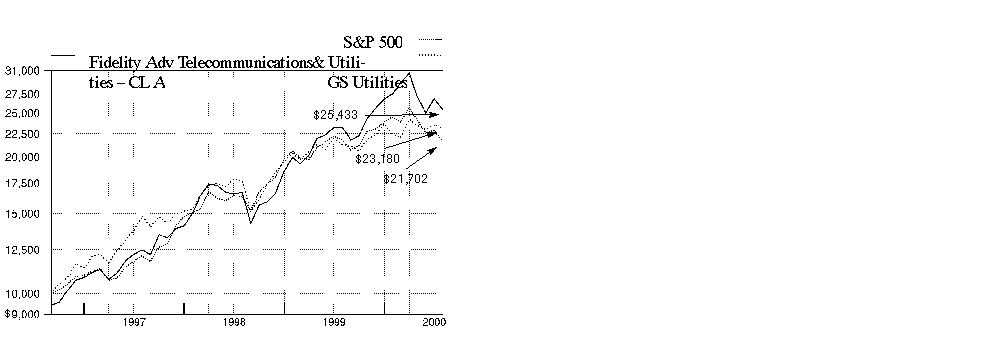
$10,000 Over Life of Fund: Let's say hypothetically that $10,000 was invested in Fidelity Advisor Telecommunications & Utilities Growth - Class A on September 3, 1996, when the fund started, and the current 5.75% sales charge was paid. As the chart shows, by July 31, 2000, the value of the investment would have grown to $25,433 - a 154.33% increase on the initial investment. For comparison, look at how the Standard & Poor's 500 Index did over the same period. With dividends and capital gains, if any, reinvested, the same $10,000 investment would have grown to $23,180 - a 131.80% increase. If $10,000 was invested in the Goldman Sachs Utilities Index, it would have grown to $21,702 - a 117.02% increase.
Understanding Performance
How a fund did yesterday is no guarantee of how it will do tomorrow. The stock market, for example, has a history of long-term growth and short-term volatility. Unlike the broader market, however, some sectors may not have a history of growth in the long run. And, as with all stock funds, the share price and return of a fund that invests in a sector will vary.
3Annual Report
Performance
There are several ways to evaluate historical performance. You can look at the total percentage change in value, the average annual percentage change or the growth of a hypothetical $10,000 investment. Total return reflects the change in the value of an investment, assuming reinvestment of dividend income and capital gains (the profits earned upon the sale of securities that have grown in value). If Fidelity had not reimbursed certain class expenses, the life of fund total returns would have been lower.
Cumulative Total Returns
|
Periods ended July 31, 2000 |
|
Past 1 |
Life of |
|
Fidelity Adv Telecommunications & Utilities - CL T |
|
9.41% |
167.27% |
|
Fidelity Adv Telecommunications & Utilities - CL T |
|
5.58% |
157.92% |
|
S&P 500 |
|
8.98% |
131.80% |
|
GS Utilities |
|
-0.53% |
117.02% |
Cumulative total returns show Class T shares' performance in percentage terms over a set period - in this case, one year or since the fund started on September 3, 1996. You can compare Class T shares' returns to both the performance of the Standard & Poor's 500 Index - a market capitalization-weighted index of common stocks - and the Goldman Sachs Utilities Index - a market capitalization-weighted index of 139 stocks designed to measure the performance of companies in the utilities sector. Issues in the index include generators and distributors of electricity, distributors of natural gas and water, and providers of telecommunications services. These benchmarks include reinvested dividends and capital gains, if any, and exclude the effect of sales charges.
Average Annual Total Returns
|
Periods ended July 31, 2000 |
|
Past 1 |
Life of |
|
Fidelity Adv Telecommunications & Utilities - CL T |
|
9.41% |
28.59% |
|
Fidelity Adv Telecommunications & Utilities - CL T |
|
5.58% |
27.42% |
|
S&P 500 |
|
8.98% |
23.99% |
|
GS Utilities |
|
-0.53% |
21.92% |
Average annual returns take Class T shares' cumulative return and show you what would have happened if Class T shares had performed at a constant rate each year.
$10,000 Over Life of Fund
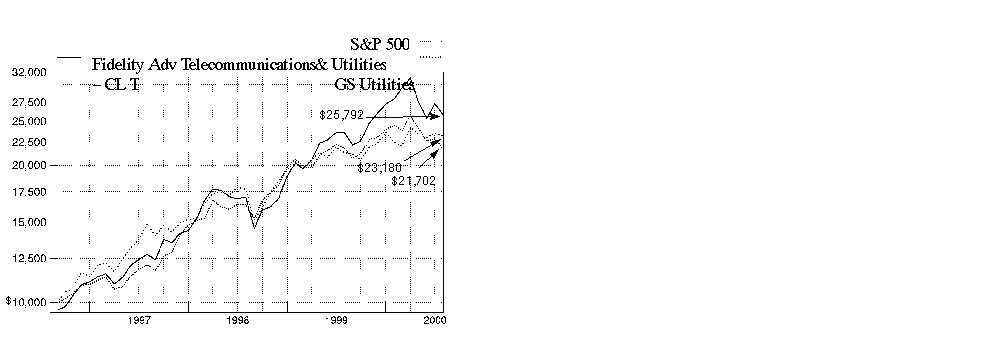
$10,000 Over Life of Fund: Let's say hypothetically that $10,000 was invested in Fidelity Advisor Telecommunications & Utilities Growth - Class T on September 3, 1996, when the fund started, and the current 3.50% sales charge was paid. As the chart shows, by July 31, 2000, the value of the investment would have grown to $25,792 - a 157.92% increase on the initial investment. For comparison, look at how the Standard & Poor's 500 Index did over the same period. With dividends and capital gains, if any, reinvested, the same $10,000 investment would have grown to $23,180 - a 131.80% increase. If $10,000 was invested in the Goldman Sachs Utilities Index, it would have grown to $21,702 - a 117.02% increase.
Understanding Performance
How a fund did yesterday is no guarantee of how it will do tomorrow. The stock market, for example, has a history of long-term growth and short-term volatility. Unlike the broader market, however, some sectors may not have a history of growth in the long run. And, as with all stock funds, the share price and return of a fund that invests in a sector will vary.
3Annual Report
Performance
There are several ways to evaluate historical performance. You can look at the total percentage change in value, the average annual percentage change or the growth of a hypothetical $10,000 investment. Total return reflects the change in the value of an investment, assuming reinvestment of dividend income and capital gains (the profits earned upon the sale of securities that have grown in value). The initial offering of Class B shares took place on March 3, 1997. Class B shares bear a 1.00% 12b-1 fee. Returns prior to March 3, 1997 are those of Class T which bears a 0.50% 12b-1 fee. Had Class B shares' 12b-1 fee been reflected, returns prior to March 3, 1997 would have been lower. Class B shares' contingent deferred sales charge included in the past one year and life of fund total return figures are 5% and 3%, respectively. If Fidelity had not reimbursed certain class expenses, the life of fund total returns would have been lower.
Cumulative Total Returns
|
Periods ended July 31, 2000 |
|
Past 1 |
Life of |
|
Fidelity Adv Telecommunications & Utilities - CL B |
|
8.77% |
162.53% |
|
Fidelity Adv Telecommunications & Utilities - CL B (incl. contingent |
|
3.77% |
159.53% |
|
S&P 500 |
|
8.98% |
131.80% |
|
GS Utilities |
|
-0.53% |
117.02% |
Cumulative total returns show Class B shares' performance in percentage terms over a set period - in this case, one year or since the fund started on September 3, 1996. You can compare Class B shares' returns to both the performance of the Standard & Poor's 500 Index - a market capitalization-weighted index of common stocks - and the Goldman Sachs Utilities Index - a market capitalization-weighted index of 139 stocks designed to measure the performance of companies in the utilities sector. Issues in the index include generators and distributors of electricity, distributors of natural gas and water, and providers of telecommunications services. These benchmarks include reinvested dividends and capital gains, if any, and exclude the effect of sales charges.
Average Annual Total Returns
|
Periods ended July 31, 2000 |
|
Past 1 |
Life of |
|
Fidelity Adv Telecommunications & Utilities - CL B |
|
8.77% |
28.00% |
|
Fidelity Adv Telecommunications & Utilities - CL B (incl. contingent |
|
3.77% |
27.62% |
|
S&P 500 |
|
8.98% |
23.99% |
|
GS Utilities |
|
-0.53% |
21.92% |
Average annual returns take Class B shares' cumulative return and show you what would have happened if Class B shares had performed at a constant rate each year.
$10,000 Over Life of Fund
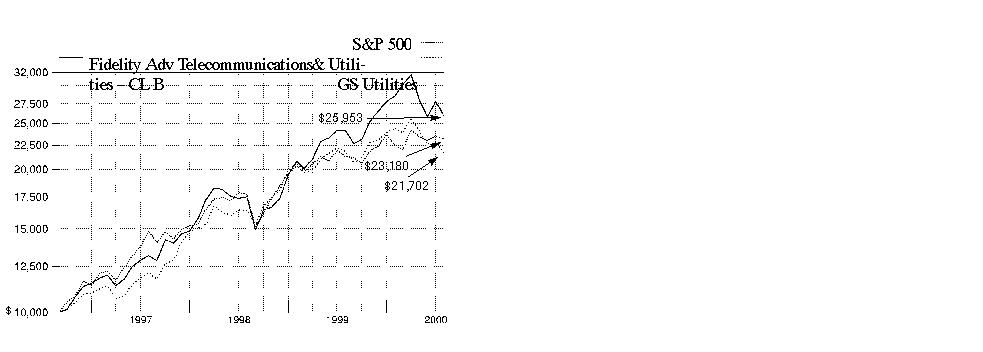
$10,000 Over Life of Fund: Let's say hypothetically that $10,000 was invested in Fidelity Advisor Telecommunications & Utilities Growth - Class B on September 3, 1996, when the fund started. As the chart shows, by July 31, 2000, the value of the investment, including the effect of the contingent deferred sales charge, would have grown to $25,953 - a 159.53% increase on the initial investment. For comparison, look at how the Standard & Poor's 500 Index did over the same period. With dividends and capital gains, if any, reinvested, the same $10,000 investment would have grown to $23,180 - a 131.80% increase. If $10,000 was invested in the Goldman Sachs Utilities Index, it would have grown to $21,702 - a 117.02% increase.
Understanding Performance
How a fund did yesterday is no guarantee of how it will do tomorrow. The stock market, for example, has a history of long-term growth and short-term volatility. Unlike the broader market, however, some sectors may not have a history of growth in the long run. And, as with all stock funds, the share price and return of a fund that invests in a sector will vary.
3Annual Report
Performance
There are several ways to evaluate historical performance. You can look at the total percentage change in value, the average annual percentage change or the growth of a hypothetical $10,000 investment. Total return reflects the change in the value of an investment, assuming reinvestment of dividend income and capital gains (the profits earned upon the sale of securities that have grown in value). The initial offering of Class C shares took place on November 3, 1997. Class C shares bear a 1.00% 12b-1 fee. Returns between March 3, 1997 and November 3, 1997 are those of Class B shares and reflect Class B shares' 1.00% 12b-1 fee. Returns prior to March 3, 1997 are those of Class T which bears a 0.50% 12b-1 fee. Had Class C shares' 12b-1 fee been reflected, returns prior to March 3, 1997 would have been lower. Class C shares' contingent deferred sales charge included in the past one year and life of fund total return figures are 1% and 0%, respectively. If Fidelity had not reimbursed certain class expenses, the life of fund total returns would have been lower.
Cumulative Total Returns
|
Periods ended July 31, 2000 |
|
Past 1 |
Life of |
|
Fidelity Adv Telecommunications & Utilities - CL C |
|
8.84% |
162.69% |
|
Fidelity Adv Telecommunications & Utilities - CL C (incl. contingent deferred sales charge) |
|
7.84% |
162.69% |
|
S&P 500 |
|
8.98% |
131.80% |
|
GS Utilities |
|
-0.53% |
117.02% |
Cumulative total returns show Class C shares' performance in percentage terms over a set period - in this case, one year or since the fund started on September 3, 1996. You can compare Class C shares' returns to both the performance of the Standard & Poor's 500 Index - a market capitalization-weighted index of common stocks - and the Goldman Sachs Utilities Index - a market capitalization-weighted index of 139 stocks designed to measure the performance of companies in the utilities sector. Issues in the index include generators and distributors of electricity, distributors of natural gas and water, and providers of telecommunications services. These benchmarks include reinvested dividends and capital gains, if any, and exclude the effect of sales charges.
Average Annual Total Returns
|
Periods ended July 31, 2000 |
Past 1 |
Life of |
|
|
Fidelity Adv Telecommunications & |
8.84% |
28.02% |
|
|
Fidelity Adv Telecommunications & |
7.84% |
28.02% |
|
|
S&P 500 |
8.98% |
23.99% |
|
|
GS Utilities |
|
-0.53% |
21.92% |
Average annual returns take Class C shares' cumulative return and show you what would have happened if Class C shares had performed at a constant rate each year.
$10,000 Over Life of Fund
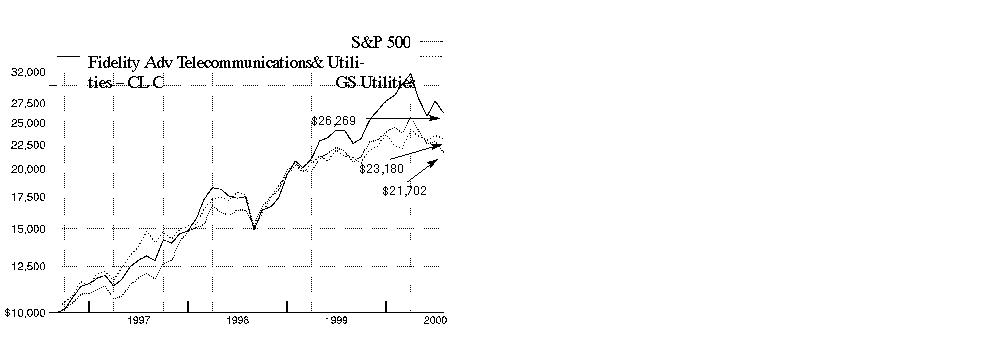
$10,000 Over Life of Fund: Let's say hypothetically that $10,000 was invested in Fidelity Advisor Telecommunications & Utilities Growth - Class C on September 3, 1996, when the fund started. As the chart shows, by July 31, 2000, the value of the investment would have grown to $26,269 - a 162.69% increase on the initial investment. For comparison, look at how the Standard & Poor's 500 Index did over the same period. With dividends and capital gains, if any, reinvested, the same $10,000 investment would have grown to $23,180 - a 131.80% increase. If $10,000 was invested in the Goldman Sachs Utilities Index, it would have grown to $21,702 - a 117.02% increase.
Understanding Performance
How a fund did yesterday is no guarantee of how it will do tomorrow. The stock market, for example, has a history of long-term growth and short-term volatility. Unlike the broader market, however, some sectors may not have a history of growth in the long run. And, as with all stock funds, the share price and return of a fund that invests in a sector will vary.
3Annual Report
(Portfolio Manager photograph)
An interview with
Peter Saperstone, Portfolio Manager of Fidelity Advisor Telecommunications &
Utilities Growth Fund
Q. How did the fund perform, Peter?
A. For the 12-month period that ended July 31, 2000, the fund's Class A, Class T, Class B, and Class C shares returned 9.59%, 9.41%, 8.77%, and 8.84%, respectively. During the same period, the Goldman Sachs Utilities Index - an index of 139 stocks designed to measure the performance of companies in the utilities sector - posted a loss of 0.53%, while the Standard & Poor's 500 Index returned 8.98%.
A. For the 12-month period that ended July 31, 2000, the fund's Institutional Class shares returned 9.93%. During the same period, the Goldman Sachs Utilities Index - an index of 139 stocks designed to measure the performance of companies in the utilities sector - posted a loss of 0.53%, while the Standard & Poor's 500 Index returned 8.98%.
Q. What factors contributed to the fund's outperformance of the Goldman Sachs index?
A. The largest contributor to the fund's performance was its significant underweighting of large-cap telephone companies - regional Bell operating companies and long-distance companies - compared to the Goldman Sachs index. The stocks of those incumbent companies did not perform well during the period in the face of continued competition, deregulation and new technology. Our underweighted position, along with an overweighted position in cellular and wireless companies, led to the fund's outperformance of its benchmark.
Q. What stocks contributed the most to the fund's performance?
A. Nextel Communications, VoiceStream Wireless and Sprint PCS were the strongest contributors to the fund in terms of performance. These all-digital companies have an advantage over the analog regional Bell operating companies and gained market share as the consumer demand for wireless technology continued to grow. Digital technology offers better transmission quality and costs significantly less to operate than analog technology. Metromedia Fiber also made a strong contribution to the fund. Metromedia - a leading provider of fiber-optic cable and end-to-end optical networks - had a competitive advantage as it pursued its strategy of building in the local telephone market and exploiting an area that was previously a domain of long-distance carriers. Finally, Calpine Corporation and AES, two independent electric power companies that continued to gain market share as they took advantage of deregulation in that industry, made positive contributions to the fund.
Annual Report
Advisor Telecommunications & Utilities Growth Fund
Fund Talk: The Manager's Overview - continued
Q. Which stocks had disappointing performance?
A. Larger telecommunications stocks such as AT&T, BellSouth and SBC Communications, posted low returns. AT&T was particularly hard hit as a result of increased competition, new technology and deregulation. Increased competition and the introduction of new technologies has led to a decrease in pricing, which has hurt the company's revenue growth. Additionally, Exodus Communications, a Web-hosting company, performed poorly and detracted from the fund's performance. The stock suffered along with many other companies as a result of the NASDAQ correction that began in mid-March and lasted through much of the remainder of the period. However, I still held Exodus because the company has established data centers throughout the U.S., its fundamentals are good and its business outlook is positive.
Q. Did the stock market's volatility cause you to change your investment strategy?
A. No, it didn't. I continued to run the fund with a higher concentration of assets in telecommunications relative to electric utilities. Within telecommunications, I focused on wireless communication companies because I see continued demand for wireless services in the U.S. At the present time, approximately 35% of U.S. households use wireless communications. This is low when compared to the 55% penetration in Europe and Asia. Within wireless, I tended to favor aggressive companies such as Sprint PCS, Nextel and VoiceStream, all of which are 100% digital networks, have been gaining market share in a rapidly growing arena and should benefit further from this expansion.
Q. What is your outlook, Peter?
A. My outlook continues to be positive. I plan to continue to favor telecommunications stocks over traditional utility stocks because of better long-term growth potential. As deregulation continues and new technologies emerge, the incumbent telephone companies will face increased competition and could suffer further loss of market share.
The views expressed in this report reflect those of the portfolio manager only through the end of the period of the report as stated on the cover. The manager's views are subject to change at any time based on market or other conditions. For more information, see page A-3.
Note to shareholders: Effective September 28, 2000, Tim Cohen became Portfolio Manager of Fidelity Advisor Telecommunications & Utilities Growth Fund.
Fund Facts
Start date: September 3, 1996
Size: as of July 31, 2000, more than
$656 million
Manager: Peter Saperstone, since 1998; joined Fidelity in 1995
3Telecommunications & Utilities Growth
Advisor Telecommunications & Utilities Growth Fund
|
Top Ten Stocks as of July 31, 2000 |
|
|
|
% of fund's |
|
VoiceStream Wireless Corp. |
11.1 |
|
Sprint Corp. - PCS Group Series 1 |
9.1 |
|
Nextel Communications, Inc. Class A |
8.4 |
|
Qwest Communications International, Inc. |
7.2 |
|
BellSouth Corp. |
3.9 |
|
AT&T Corp. - Wireless Group |
3.8 |
|
AT&T Corp. |
3.4 |
|
Nokia AB sponsored ADR |
3.4 |
|
SBC Communications, Inc. |
3.2 |
|
Exodus Communications, Inc. |
2.7 |
|
|
56.2 |
|
Top Industries as of July 31, 2000 |
|
|
% of fund's net assets |
||
|
Cellular |
39.5% |
|
Telephone Services |
30.3% |
|
Communications Equipment |
6.6% |
|
Electric Utility |
5.1% |
|
Computer Services & Software |
4.1% |
|
All Others* |
14.4% |

|
* Includes short-term investments and net other assets. |
Annual Report
Advisor Telecommunications & Utilities Growth Fund
Showing Percentage of Net Assets
|
Common Stocks - 93.9% |
|||
|
Shares |
Value (Note 1) |
||
|
BROADCASTING - 2.0% |
|||
|
Comcast Corp. Class A (special) (a) |
200,000 |
$ 6,803,125 |
|
|
EchoStar Communications Corp. |
47,000 |
1,853,563 |
|
|
Metro One Telecommunications, Inc. (a) |
426,600 |
4,159,350 |
|
|
WorldQuest Networks, Inc. |
24,500 |
122,500 |
|
|
|
12,938,538 |
||
|
CELLULAR - 39.5% |
|||
|
ALLTEL Corp. |
36,600 |
2,255,475 |
|
|
AT&T Corp. - Wireless Group |
900,000 |
24,750,000 |
|
|
China Mobile (Hong Kong) Ltd. (a) |
1,877,000 |
15,649,487 |
|
|
China Unicom Ltd. sponsored ADR (a) |
450,000 |
10,603,125 |
|
|
Crown Castle International Corp. (a) |
101,400 |
3,447,600 |
|
|
Dobson Communications Corp. Class A |
114,700 |
2,509,063 |
|
|
Nextel Communications, Inc. Class A (a) |
990,200 |
55,389,313 |
|
|
SBA Communications Corp. Class A |
165,800 |
7,481,725 |
|
|
Sprint Corp. - PCS Group Series 1 (a) |
1,081,300 |
59,741,825 |
|
|
Telephone & Data Systems, Inc. |
23,000 |
2,561,625 |
|
|
Telesp Celular Participacoes SA ADR |
39,600 |
1,492,425 |
|
|
Triton PCS Holdings, Inc. Class A |
21,200 |
1,063,975 |
|
|
VoiceStream Wireless Corp. (a) |
566,240 |
72,620,276 |
|
|
|
259,565,914 |
||
|
COMMUNICATIONS EQUIPMENT - 6.6% |
|||
|
Comverse Technology, Inc. (a) |
75,000 |
6,581,250 |
|
|
Corvis Corp. |
3,000 |
246,984 |
|
|
Lexent, Inc. |
51,600 |
1,373,850 |
|
|
Nokia AB sponsored ADR |
500,000 |
22,156,250 |
|
|
Nortel Networks Corp. |
173,684 |
12,917,748 |
|
|
|
43,276,082 |
||
|
COMPUTER SERVICES & SOFTWARE - 4.1% |
|||
|
Covad Communications Group, Inc. (a) |
541,400 |
8,933,100 |
|
|
Exodus Communications, Inc. (a) |
400,000 |
17,775,000 |
|
|
|
26,708,100 |
||
|
ELECTRIC UTILITY - 5.1% |
|||
|
AES Corp. (a) |
214,000 |
11,435,625 |
|
|
Calpine Corp. (a) |
60,000 |
4,275,000 |
|
|
Citizens Communications Co. (a) |
898,900 |
15,056,575 |
|
|
IPALCO Enterprises, Inc. |
127,300 |
2,880,163 |
|
|
|
33,647,363 |
||
|
ELECTRICAL EQUIPMENT - 0.6% |
|||
|
Alcatel SA sponsored ADR |
50,000 |
3,656,250 |
|
|
|
|||
|
Shares |
Value (Note 1) |
||
|
ELECTRONICS - 1.6% |
|||
|
Samsung Electronics Co. Ltd. unit |
72,000 |
$ 10,314,000 |
|
|
TyCom Ltd. |
12,200 |
415,563 |
|
|
|
10,729,563 |
||
|
GAS - 1.4% |
|||
|
Dynegy, Inc. Class A |
52,871 |
3,720,796 |
|
|
Kinder Morgan, Inc. |
169,900 |
5,776,600 |
|
|
|
9,497,396 |
||
|
REAL ESTATE INVESTMENT TRUSTS - 2.3% |
|||
|
Pinnacle Holdings, Inc. (a) |
267,400 |
15,024,538 |
|
|
SERVICES - 0.4% |
|||
|
Universal Access, Inc. |
99,100 |
2,737,638 |
|
|
TELEPHONE SERVICES - 30.3% |
|||
|
Alaska Communication Systems |
59,500 |
565,250 |
|
|
Allegiance Telecom, Inc. (a) |
188,800 |
10,490,200 |
|
|
AT&T Corp. |
718,764 |
22,236,761 |
|
|
BCE, Inc. |
110,600 |
2,513,636 |
|
|
BellSouth Corp. |
646,000 |
25,718,875 |
|
|
Global Crossing Ltd. (a) |
451,800 |
10,984,388 |
|
|
ITXC Corp. |
39,800 |
721,375 |
|
|
Level 3 Communications, Inc. (a) |
177,400 |
12,140,813 |
|
|
McLeodUSA, Inc. Class A (a) |
804,400 |
13,624,525 |
|
|
Metromedia Fiber Network, Inc. |
299,200 |
10,509,400 |
|
|
NEXTLINK Communications, Inc. |
42,400 |
1,401,850 |
|
|
Qwest Communications |
1,004,195 |
47,134,403 |
|
|
SBC Communications, Inc. |
499,115 |
21,243,582 |
|
|
Time Warner Telecom, Inc. Class A (a) |
235,300 |
14,573,894 |
|
|
TRICOM SA sponsored ADR (a) |
79,800 |
1,236,900 |
|
|
Z-Tel Technologies, Inc. |
489,000 |
3,636,938 |
|
|
|
198,732,790 |
||
|
TOTAL COMMON STOCKS (Cost $625,039,002) |
616,514,172 |
||
|
Cash Equivalents - 7.7% |
|||
|
Shares |
Value (Note 1) |
||
|
Fidelity Cash Central Fund, 6.57% (b) |
38,764,304 |
$ 38,764,304 |
|
|
Fidelity Securities Lending Cash Central Fund, 6.65% (b) |
11,523,600 |
11,523,600 |
|
|
TOTAL CASH EQUIVALENTS (Cost $50,287,904) |
50,287,904 |
||
|
TOTAL INVESTMENT PORTFOLIO - 101.6% (Cost $675,326,906) |
666,802,076 |
||
|
NET OTHER ASSETS - (1.6)% |
(10,493,567) |
||
|
NET ASSETS - 100% |
$ 656,308,509 |
||
|
Legend |
|
(a) Non-income producing |
|
(b) The rate quoted is the annualized seven-day yield of the fund at |
|
Other Information |
|
Distribution of investments by country of issue, as a percentage of total |
|
United States of America |
85.9% |
|
Hong Kong |
4.0 |
|
Finland |
3.4 |
|
Canada |
2.4 |
|
Bermuda |
1.7 |
|
Korea (South) |
1.6 |
|
Others (individually less than 1%) |
1.0 |
|
|
100.0% |
|
Income Tax Information |
|
At July 31, 2000, the aggregate cost of investment securities for income |
|
The fund hereby designates approximately $3,072,000 as a capital gain dividend for the purpose of the dividend paid deduction. |
|
A total of 21%, 22%, 25%, 26% and 16% of Class A's, Class T's, Class B's, Class C's and Institutional Class' dividends distributed during the fiscal |
|
The fund will notify shareholders in January 2001 of the applicable percentages for use in preparing 2000 income tax returns. |
See accompanying notes which are an integral part of the financial statements.
Telecommunications & Utilities Growth
Statement of Assets and Liabilities
|
|
July 31, 2000 |
|
|
Assets |
|
|
|
Investment in securities, at value |
|
$ 666,802,076 |
|
Receivable for investments sold |
|
12,513,993 |
|
Receivable for fund shares sold |
|
3,601,299 |
|
Dividends receivable |
|
494,474 |
|
Interest receivable |
|
266,069 |
|
Redemption fees receivable |
|
132 |
|
Other receivables |
|
18,147 |
|
Total assets |
|
683,696,190 |
|
Liabilities |
|
|
|
Payable for investments purchased |
$ 13,930,119 |
|
|
Payable for fund shares redeemed |
903,067 |
|
|
Accrued management fee |
336,104 |
|
|
Distribution fees payable |
426,092 |
|
|
Other payables and accrued expenses |
268,699 |
|
|
Collateral on securities loaned, |
11,523,600 |
|
|
Total liabilities |
|
27,387,681 |
|
Net Assets |
|
$ 656,308,509 |
|
Net Assets consist of: |
|
|
|
Paid in capital |
|
$ 653,332,331 |
|
Undistributed net investment income |
|
7,856,163 |
|
Accumulated undistributed net realized gain (loss) on investments and foreign currency transactions |
|
3,644,922 |
|
Net unrealized appreciation (depreciation) on investments |
|
(8,524,907) |
|
Net Assets |
|
$ 656,308,509 |
|
Calculation of Maximum |
|
$21.08 |
|
Maximum offering price per share |
|
$22.37 |
|
Class T: |
|
$21.01 |
|
Maximum offering price per share |
|
$21.77 |
|
Class B: |
|
$20.72 |
|
Class C: |
|
$20.71 |
|
Institutional Class: |
|
$21.19 |
A Redemption price per share is equal to net asset value less any applicable contingent deferred sales charge.
Statement of Operations
|
|
Year ended July 31, 2000 |
|
|
Investment Income Dividends |
|
$ 2,912,905 |
|
Special dividend from BCE, Inc. |
|
9,825,872 |
|
Interest |
|
1,869,586 |
|
Security lending |
|
227,884 |
|
Total income |
|
14,836,247 |
|
Expenses |
|
|
|
Management fee |
$ 2,404,253 |
|
|
Transfer agent fees |
1,040,778 |
|
|
Distribution fees |
3,033,976 |
|
|
Accounting and security lending fees |
154,042 |
|
|
Non-interested trustees' compensation |
1,155 |
|
|
Custodian fees and expenses |
23,250 |
|
|
Registration fees |
268,815 |
|
|
Audit |
23,688 |
|
|
Legal |
1,780 |
|
|
Miscellaneous |
3,725 |
|
|
Total expenses before reductions |
6,955,462 |
|
|
Expense reductions |
(123,730) |
6,831,732 |
|
Net investment income |
|
8,004,515 |
|
Realized and Unrealized Gain (Loss) Net realized gain (loss) on: |
|
|
|
Investment securities |
5,829,494 |
|
|
Foreign currency transactions |
(16,589) |
5,812,905 |
|
Change in net unrealized appreciation (depreciation) on: |
|
|
|
Investment securities |
(29,591,053) |
|
|
Assets and liabilities in |
(77) |
(29,591,130) |
|
Net gain (loss) |
|
(23,778,225) |
|
Net increase (decrease) in net assets resulting from operations |
|
$ (15,773,710) |
See accompanying notes which are an integral part of the financial statements.
Annual Report
Statement of Changes in Net Assets
|
Increase (Decrease) in Net Assets |
Year ended |
Year ended |
|
Operations |
$ 8,004,515 |
$ (97,227) |
|
Net realized gain (loss) |
5,812,905 |
8,970,907 |
|
Change in net unrealized appreciation (depreciation) |
(29,591,130) |
18,386,120 |
|
Net increase (decrease) in net assets resulting from operations |
(15,773,710) |
27,259,800 |
|
Distributions to shareholders |
(131,762) |
- |
|
From net realized gain |
(9,708,813) |
(3,437,371) |
|
Total distributions |
(9,840,575) |
(3,437,371) |
|
Share transactions - net increase (decrease) |
506,119,403 |
108,825,089 |
|
Redemption fees |
184,716 |
29,790 |
|
Total increase (decrease) in net assets |
480,689,834 |
132,677,308 |
|
Net Assets |
|
|
|
Beginning of period |
175,618,675 |
42,941,367 |
|
End of period (including undistributed net investment income of $7,856,163 and $0, respectively) |
$ 656,308,509 |
$ 175,618,675 |
Financial Highlights - Class A
|
Years ended July 31, |
2000 |
1999 |
1998 |
1997 E |
|
Selected Per-Share Data |
|
|
|
|
|
Net asset value, beginning of period |
$ 20.31 |
$ 16.00 |
$ 13.07 |
$ 10.00 |
|
Income from Investment Operations |
|
|
|
|
|
Net investment income (loss) D |
.53 H |
.05 |
(.02) |
.12 |
|
Net realized and unrealized gain (loss) |
1.29 I |
5.45 |
4.19 |
3.09 |
|
Total from investment operations |
1.82 |
5.50 |
4.17 |
3.21 |
|
Less Distributions |
|
|
|
|
|
From net investment income |
(.05) |
- |
(.04) |
(.03) |
|
From net realized gain |
(1.01) |
(1.20) |
(1.21) |
(.11) |
|
Total distributions |
(1.06) |
(1.20) |
(1.25) |
(.14) |
|
Redemption fees added to paid in capital |
.01 |
.01 |
.01 |
- |
|
Net asset value, end of period |
$ 21.08 |
$ 20.31 |
$ 16.00 |
$ 13.07 |
|
Total Return B, C |
9.59% |
38.83% |
33.99% |
32.36% |
|
Ratios and Supplemental Data |
|
|
|
|
|
Net assets, end of period (000 omitted) |
$ 61,610 |
$ 14,400 |
$ 3,186 |
$ 531 |
|
Ratio of expenses to average net assets |
1.20% |
1.34% |
1.75% F |
1.75% A, F |
|
Ratio of expenses to average net assets after expense reductions |
1.17% G |
1.32% G |
1.72% G |
1.75% A |
|
Ratio of net investment income (loss) to average net assets |
2.39% |
.30% |
(.11)% |
1.09% A |
|
Portfolio turnover |
172% |
149% |
151% |
13% A |
|
A Annualized B The total returns would have been lower had certain expenses not been reduced during the periods shown. C Total returns do not include the one time sales charge and for periods of less than one year are not annualized. D Net investment income per share has been calculated based on average shares outstanding during the period. E For the period September 3, 1996 (commencement of sale of Class A shares) to July 31, 1997. F FMR agreed to reimburse a portion of the class' expenses during the period. Without this reimbursement, the class' expense ratio would have been higher. G FMR or the fund has entered into varying arrangements with third parties who either paid or reduced a portion of the class' expenses. H Investment income per share reflects a special dividend (from BCE, Inc.) which amounted to $.52 per share. I The amount shown for a share outstanding does not correspond with the aggregate net loss on investments for the period due to the timing of sales and |
||||
See accompanying notes which are an integral part of the financial statements.
Telecommunications & Utilities Growth
Financial Highlights - Class T
|
Years ended July 31, |
2000 |
1999 |
1998 |
1997 E |
|
Selected Per-Share Data |
|
|
|
|
|
Net asset value, beginning of period |
$ 20.23 |
$ 15.95 |
$ 13.03 |
$ 10.00 |
|
Income from Investment Operations |
|
|
|
|
|
Net investment income (loss) D |
.47 H |
.01 |
(.04) |
.08 |
|
Net realized and unrealized gain (loss) |
1.31 I |
5.43 |
4.17 |
3.09 |
|
Total from investment operations |
1.78 |
5.44 |
4.13 |
3.17 |
|
Less Distributions |
|
|
|
|
|
From net investment income |
(.01) |
- |
(.03) |
(.03) |
|
From net realized gain |
(1.00) |
(1.17) |
(1.19) |
(.11) |
|
Total distributions |
(1.01) |
(1.17) |
(1.22) |
(.14) |
|
Redemption fees added to paid in capital |
.01 |
.01 |
.01 |
- |
|
Net asset value, end of period |
$ 21.01 |
$ 20.23 |
$ 15.95 |
$ 13.03 |
|
Total Return B, C |
9.41% |
38.45% |
33.72% |
31.96% |
|
Ratios and Supplemental Data |
|
|
|
|
|
Net assets, end of period (000 omitted) |
$ 225,415 |
$ 65,085 |
$ 19,918 |
$ 7,085 |
|
Ratio of expenses to average net assets |
1.44% |
1.58% |
1.94% |
2.00% A, F |
|
Ratio of expenses to average net assets after expense reductions |
1.41% G |
1.55% G |
1.90% G |
2.00% A |
|
Ratio of net investment income (loss) to average net assets |
2.16% |
.07% |
(.23)% |
.79% A |
|
Portfolio turnover |
172% |
149% |
151% |
13% A |
|
A Annualized B The total returns would have been lower had certain expenses not been reduced during the periods shown. C Total returns do not include the one time sales charge and for periods of less than one year are not annualized. D Net investment income per share has been calculated based on average shares outstanding during the period. E For the period September 3, 1996 (commencement of sale of Class T shares) to July 31, 1997. F FMR agreed to reimburse a portion of the class' expenses during the period. Without this reimbursement, the class' expense ratio would have been higher. G FMR or the fund has entered into varying arrangements with third parties who either paid or reduced a portion of the class' expenses. H Investment income per share reflects a special dividend (from BCE, Inc.) which amounted to $.52 per share. I The amount shown for a share outstanding does not correspond with the aggregate net loss on investments for the period due to the timing of sales and |
||||
Financial Highlights - Class B
|
Years ended July 31, |
2000 |
1999 |
1998 |
1997 E |
|
Selected Per-Share Data |
|
|
|
|
|
Net asset value, beginning of period |
$ 20.02 |
$ 15.83 |
$ 13.01 |
$ 11.76 |
|
Income from Investment Operations |
|
|
|
|
|
Net investment income (loss) D |
.35 H |
(.08) |
(.13) |
.02 |
|
Net realized and unrealized gain (loss) |
1.29 I |
5.39 |
4.16 |
1.23 |
|
Total from investment operations |
1.64 |
5.31 |
4.03 |
1.25 |
|
Less Distributions |
|
|
|
|
|
From net investment income |
- |
- |
(.03) |
- |
|
From net realized gain |
(.95) |
(1.13) |
(1.19) |
- |
|
Total distributions |
(.95) |
(1.13) |
(1.22) |
- |
|
Redemption fees added to paid in capital |
.01 |
.01 |
.01 |
- |
|
Net asset value, end of period |
$ 20.72 |
$ 20.02 |
$ 15.83 |
$ 13.01 |
|
Total Return B, C |
8.77% |
37.76% |
32.97% |
10.63% |
|
Ratios and Supplemental Data |
|
|
|
|
|
Net assets, end of period (000 omitted) |
$ 242,888 |
$ 65,645 |
$ 12,919 |
$ 2,039 |
|
Ratio of expenses to average net assets |
1.96% |
2.08% |
2.50% F |
2.50% A, F |
|
Ratio of expenses to average net assets after expense reductions |
1.93% G |
2.05% G |
2.47% G |
2.50% A |
|
Ratio of net investment income (loss) to average net assets |
1.63% |
(.43)% |
(.85)% |
.32% A |
|
Portfolio turnover |
172% |
149% |
151% |
13% A |
|
A Annualized B The total returns would have been lower had certain expenses not been reduced during the periods shown. C Total returns do not include the contingent deferred sales charge and for periods of less than one year are not annualized. D Net investment income per share has been calculated based on average shares outstanding during the period. E For the period March 3, 1997 (commencement of sale of Class B shares) to July 31, 1997. F FMR agreed to reimburse a portion of the class' expenses during the period. Without this reimbursement, the class' expense ratio would have been higher. G FMR or the fund has entered into varying arrangements with third parties who either paid or reduced a portion of the class' expenses. H Investment income per share reflects a special dividend (from BCE, Inc.) which amounted to $.52 per share. I The amount shown for a share outstanding does not correspond with the aggregate net loss on investments for the period due to the timing of sales and |
||||
See accompanying notes which are an integral part of the financial statements.
Annual Report
Financial Highlights - Class C
|
Years ended July 31, |
2000 |
1999 |
1998 E |
|
Selected Per-Share Data |
|
|
|
|
Net asset value, beginning of period |
$ 20.01 |
$ 15.85 |
$ 13.90 |
|
Income from Investment Operations |
|
|
|
|
Net investment income (loss) D |
.36 H |
(.08) |
(.10) |
|
Net realized and unrealized gain (loss) |
1.29I |
5.38 |
3.16 |
|
Total from investment operations |
1.65 |
5.30 |
3.06 |
|
Less Distributions |
|
|
|
|
From net investment income |
- |
- |
(.02) |
|
From net realized gain |
(.96) |
(1.15) |
(1.10) |
|
Total distributions |
(.96) |
(1.15) |
(1.12) |
|
Redemption fees added to paid in capital |
.01 |
.01 |
.01 |
|
Net asset value, end of period |
$ 20.71 |
$ 20.01 |
$ 15.85 |
|
Total Return B, C |
8.84% |
37.72% |
23.60% |
|
Ratios and Supplemental Data |
|
|
|
|
Net assets, end of period (000 omitted) |
$ 107,332 |
$ 23,524 |
$ 3,489 |
|
Ratio of expenses to average net assets |
1.93% |
2.07% |
2.50% A, F |
|
Ratio of expenses to average net assets after expense reductions |
1.90% G |
2.04% G |
2.48% A, G |
|
Ratio of net investment income (loss) to average net assets |
1.66% |
(.43)% |
(.91)% A |
|
Portfolio turnover |
172% |
149% |
151% |
|
A Annualized B The total returns would have been lower had certain expenses not been reduced during the periods shown. C Total returns do not include the contingent deferred sales charge and for periods of less than one year are not annualized. D Net investment income per share has been calculated based on average shares outstanding during the period. E For the period November 3, 1997 (commencement of sale of Class C shares) to July 31, 1998. F FMR agreed to reimburse a portion of the class' expenses during the period. Without this reimbursement, the class' expense ratio would have been higher. G FMR or the fund has entered into varying arrangements with third parties who either paid or reduced a portion of the class' expenses. H Investment income per share reflects a special dividend (from BCE, Inc.) which amounted to $.52 per share. I The amount shown for a share outstanding does not correspond with the aggregate net loss on investments for the period due to the timing of sales and |
|||
Financial Highlights - Institutional Class
|
Years ended July 31, |
2000 |
1999 |
1998 |
1997 E |
|
Selected Per-Share Data |
|
|
|
|
|
Net asset value, beginning of period |
$ 20.38 |
$ 16.02 |
$ 13.09 |
$ 10.00 |
|
Income from Investment Operations |
|
|
|
|
|
Net investment income D |
.60H |
.11 |
.04 |
.14 |
|
Net realized and unrealized gain (loss) |
1.29I |
5.46 |
4.17 |
3.10 |
|
Total from investment operations |
1.89 |
5.57 |
4.21 |
3.24 |
|
Less Distributions |
|
|
|
|
|
From net investment income |
(.08) |
- |
(.07) |
(.04) |
|
From net realized gain |
(1.01) |
(1.22) |
(1.22) |
(.11) |
|
Total distributions |
(1.09) |
(1.22) |
(1.29) |
(.15) |
|
Redemption fees added to paid in capital |
.01 |
.01 |
.01 |
- |
|
Net asset value, end of period |
$ 21.19 |
$ 20.38 |
$ 16.02 |
$ 13.09 |
|
Total Return B, C |
9.93% |
39.31% |
34.36% |
32.68% |
|
Ratios and Supplemental Data |
|
|
|
|
|
Net assets, end of period (000 omitted) |
$ 19,064 |
$ 6,963 |
$ 3,430 |
$ 2,246 |
|
Ratio of expenses to average net assets |
.88% |
1.02% |
1.46% |
1.50% A, F |
|
Ratio of expenses to average net assets after expense reductions |
.85% G |
.99% G |
1.43% G |
1.50% A |
|
Ratio of net investment income to average net assets |
2.71% |
.63% |
.30% |
1.29% A |
|
Portfolio turnover |
172% |
149% |
151% |
13% A |
|
A Annualized B The total returns would have been lower had certain expenses not been reduced during the periods shown. C Total returns for periods of less than one year are not annualized. D Net investment income per share has been calculated based on average shares outstanding during the period. E For the period September 3, 1996 (commencement of sale of Institutional Class shares) to July 31, 1997. F FMR agreed to reimburse a portion of the class' expenses during the period. Without this reimbursement, the class' expense ratio would have been higher. G FMR or the fund has entered into varying arrangements with third parties who either paid or reduced a portion of the class' expenses. H Investment income per share reflects a special dividend (from BCE, Inc.) which amounted to $.52 per share. I The amount shown for a share outstanding does not correspond with the aggregate net loss on investments for the period due to the timing of sales and |
||||
See accompanying notes which are an integral part of the financial statements.
Telecommunications & Utilities Growth
For the period ended July 31, 2000
1. Significant Accounting Policies.
Fidelity Advisor Telecommunications & Utilities Growth Fund (formerly Fidelity Advisor Utilities Growth Fund) (the fund) is a fund of Fidelity Advisor Series VII (the trust) and is authorized to issue an unlimited number of shares. The trust is registered under the Investment Company Act of 1940, as amended (the 1940 Act), as an open-end management investment company organized as a Massachusetts business trust.
The fund offers Class A, Class T, Class B, Class C, and Institutional Class shares, each of which has equal rights as to assets and voting privileges. Each class has exclusive voting rights with respect to matters that affect that class. Class B shares will automatically convert to Class A shares after a holding period of seven years from the initial date of purchase. Investment income, realized and unrealized capital gains and losses, the common expenses of the fund, and certain fund-level expense reductions, if any, are allocated on a pro rata basis to each class based on the relative net assets of each class to the total net assets of the fund. Each class of shares differs in its respective distribution, transfer agent, and certain other class-specific fees, expenses, and expense reductions.
The financial statements have been prepared in conformity with generally accepted accounting principles which require management to make certain estimates and assumptions at the date of the financial statements. The following summarizes the significant accounting policies of the fund:
Security Valuation. Securities for which exchange quotations are readily available are valued at the last sale price, or if no sale price, at the closing bid price. Foreign securities are valued based on quotations from the principal market in which such securities are normally traded. If trading or events occurring in other markets after the close of the principal market in which foreign securities are traded, and before the close of the business of the fund, are expected to materially affect the value of those securities, then they are valued at their fair value taking this trading or these events into account. Fair value is determined in good faith under consistently applied procedures under the general supervision of the Board of Trustees. Securities for which exchange quotations are not readily available (and in certain cases debt securities which trade on an exchange) are valued primarily using dealer-supplied valuations or at their fair value. Short-term securities with remaining maturities of sixty days or less for which quotations are not readily available are valued at amortized cost or original cost plus accrued interest, both of which approximate current value.
Foreign Currency Translation. The accounting records of the fund are maintained in U.S. dollars. Investment securities and other assets and liabilities denominated in a foreign currency are translated into U.S. dollars at the prevailing rates of exchange at
period end. Purchases and sales of securities, income receipts and expense payments are translated into U.S. dollars at the prevailing exchange rate on the respective dates of the transactions.
Net realized gains and losses on foreign currency transactions represent net gains and losses from sales and maturities of foreign currency contracts, disposition of foreign currencies, the difference between the amount of net investment income accrued and the U.S. dollar amount actually received, and gains and losses between trade and settlement date on purchases and sales of securities. The effects of changes in foreign currency exchange rates on investments in securities are included with the net realized and unrealized gain or loss on investment securities.
Income Taxes. As a qualified regulated investment company under Subchapter M of the Internal Revenue Code, the fund is not subject to income taxes to the extent that it distributes substantially all of its taxable income for its fiscal year. The schedule of investments includes information regarding income taxes under the caption "Income Tax Information."
Investment Income. Dividend income is recorded on the ex-dividend date, except certain dividends from foreign securities where the ex-dividend date may have passed, are recorded as soon as the fund is informed of the ex-dividend date. Non-cash dividends included in dividend income, if any, are recorded at the fair market value of the securities received. Interest income is accrued as earned. Investment income is recorded net of foreign taxes withheld where recovery of such taxes is uncertain.
Expenses. Most expenses of the trust can be directly attributed to a fund. Expenses which cannot be directly attributed are apportioned among the funds in the trust.
Distributions to Shareholders. Distributions are recorded on the ex-dividend date. Income dividends and capital gain distributions are declared separately for each class.
Income and capital gain distributions are determined in accordance with income tax regulations which may differ from generally accepted accounting principles. These differences, which may result in distribution reclassifications, are primarily due to differing treatments for foreign currency transactions and losses deferred due to wash sales. The fund also utilized earnings and profits distributed to shareholders on redemption of shares as a part of the dividends paid deduction for income tax purposes.
Permanent book and tax basis differences relating to shareholder distributions will result in reclassifications to paid in capital. Undistributed net investment income and accumulated undistributed net realized gain (loss) on investments and foreign currency transactions may include temporary book and tax basis differences which will reverse in a subsequent period. Any taxable income or gain remaining at fiscal year end is distributed in the following year.
Annual Report
Notes to Financial Statements - continued
1. Significant Accounting
Policies - continued
Short-Term Trading (Redemption) Fees. Shares held in the fund less than 60 days are subject to a short-term trading fee equal to 1% of the proceeds of the redeemed shares. The fee, which is retained by the fund, is accounted for as an addition to paid in capital.
Security Transactions. Security transactions are accounted for as of trade date. Gains and losses on securities sold are determined on the basis of identified cost.
2. Operating Policies.
Foreign Currency Contracts. The fund generally uses foreign currency contracts to facilitate transactions in foreign-denominated securities. Losses may arise from changes in the value of the foreign currency or if the counterparties do not perform under the contracts' terms. The U.S. dollar value of foreign currency contracts is determined using contractual currency exchange rates established at the time of each trade.
Joint Trading Account. Pursuant to an Exemptive Order issued by the Securities and Exchange Commission (the SEC), the fund, along with other affiliated entities of Fidelity Management & Research Company (FMR), may transfer uninvested cash balances into one or more joint trading accounts. These balances are invested in one or more repurchase agreements for U.S. Treasury or Federal Agency obligations.
Repurchase Agreements. The underlying U.S. Treasury, Federal Agency, or other obligations found to be satisfactory by FMR are transferred to an account of the fund, or to the Joint Trading Account, at a custodian bank. The securities are marked-to-market daily and maintained at a value at least equal to the principal amount of the repurchase agreement (including accrued interest). FMR, the fund's investment adviser, is responsible for determining that the value of the underlying securities remains in accordance with the market value requirements stated above.
Cash Central Funds. Pursuant to an Exemptive Order issued by the SEC, the fund may invest in the Fidelity Cash Central Fund and the Fidelity Securities Lending Cash Central Fund (the Cash Funds) managed by Fidelity Investments Money Management, Inc., an affiliate of FMR. The Cash Funds are open-end money market funds available only to investment companies and other accounts managed by FMR and its affiliates. The Cash Funds seek preservation of capital, liquidity, and current income. Income distributions from the Cash Funds are declared daily and paid monthly from net interest income. Income distributions earned by the fund are recorded as either interest income or security lending income in the accompanying financial statements.
Restricted Securities. The fund is permitted to invest in securities that are subject to legal or contractual restrictions on resale. These securities generally may be resold in transactions exempt from registration or to the public if the securities are registered. Disposal of these securities may involve time-consuming negotiations and expense, and prompt sale at an acceptable price may be difficult. At the end of the period, the fund had no investments in restricted securities.
3. Purchases and Sales of Investments.
Purchases and sales of securities, other than short-term securities, aggregated $1,144,552,337 and $671,262,517, respectively.
4. Fees and Other Transactions with Affiliates.
Management Fee. As the fund's investment adviser, FMR receives a monthly fee that is calculated on the basis of a group fee rate plus a fixed individual fund fee rate applied to the average net assets of the fund. The group fee rate is the weighted average of a series of rates and is based on the monthly average net assets of all the mutual funds advised by FMR. The rates ranged from .2167% to .5200% for the period. The annual individual fund fee rate is .30%. In the event that these rates were lower than the contractual rates in effect during the period, FMR voluntarily implemented the above rates, as they resulted in the same or a lower management fee. For the period, the management fee was equivalent to an annual rate of .58% of average net assets.
Distribution and Service Plan. In accordance with Rule 12b-1 of the 1940 Act, the Board of Trustees have adopted separate Distribution and Service Plans with respect to each class of shares (collectively referred to as "the Plans"). Under certain of the Plans, the class pays Fidelity Distributors Corporation (FDC), an affiliate of FMR, a 12b-1 fee. A portion of this fee may be reallowed to securities dealers, banks and other financial institutions for the distribution of each class of shares and providing shareholder support services. For the period, this fee was based on the following annual rates of the average net assets of each applicable class:
|
Class A |
.25% |
|
Class T |
.50% |
|
Class B |
1.00% * |
|
Class C |
1.00% * |
* .75% represents a distribution fee and .25% represents a shareholder service fee.
For the period, each class paid FDC the following amounts, a portion of which was retained by FDC:
|
|
Paid to |
Retained |
|
Class A |
$ 94,055 |
$ 40 |
|
Class T |
722,136 |
327 |
|
Class B |
1,556,711 |
1,167,618 |
|
Class C |
661,074 |
519,752 |
|
|
$ 3,033,976 |
$ 1,687,737 |
Sales Load. FDC receives a front-end sales charge of up to 5.75% for selling Class A shares, and 3.50% for selling Class T shares of the fund. FDC receives the proceeds of contingent deferred sales charges levied on Class B share redemptions
Telecommunications & Utilities Growth
Notes to Financial Statements - continued
4. Fees and Other Transactions with Affiliates - continued
Sales Load - continued
occurring within six years of purchase and Class C share redemptions occurring within one year of purchase. Contingent deferred sales charges are based on declining rates ranging from 5% to 1% for Class B and 1% for Class C, of the lesser of the cost of shares at the initial date of purchase or the net asset value of the redeemed shares, excluding any reinvested dividends and capital gains. In addition, purchases of Class A and Class T shares that were subject to a finder's fee bear a contingent deferred sales charge on assets that do not remain in the fund for at least one year. The Class A and Class T contingent deferred sales charge is based on 0.25% of the lesser of the cost of shares at the initial date of purchase or the net asset value of the redeemed shares, excluding any reinvested dividends and capital gains. A portion of the sales charges paid to FDC is paid to securities dealers, banks and other financial institutions.
For the period, sales charge amounts paid to and retained by FDC were as follows:
|
|
Paid to |
Retained |
|
Class A |
$ 533,580 |
$ 273,574 |
|
Class T |
695,524 |
254,546 |
|
Class B |
326,386 |
326,386* |
|
Class C |
28,660 |
28,660* |
|
|
$ 1,584,150 |
$ 883,166 |
* When Class B and Class C shares are initially sold, FDC pays commissions from its own resources to securities dealers,
banks, and other financial institutions through which the sales are made.
Transfer Agent Fees. Fidelity Investments Institutional Operations Company, Inc., (FIIOC), an affiliate of FMR, is the transfer, dividend disbursing and shareholder servicing agent (collectively referred to as the transfer agent) for each class of the fund. FIIOC receives account fees and asset-based fees that vary according to the account size and type of account of the shareholders of the respective classes of the fund. FIIOC pays for typesetting, printing and mailing of all shareholder reports, except proxy statements. For the period, the following amounts were paid to FIIOC:
|
|
Amount |
% of |
|
Class A |
$ 96,455 |
.26 |
|
Class T |
349,316 |
.24 |
|
Class B |
414,578 |
.27 |
|
Class C |
154,269 |
.23 |
|
Institutional Class |
26,160 |
.19 |
|
|
$ 1,040,778 |
|
Accounting and Security Lending Fees. Fidelity Service Company, Inc., an affiliate of FMR, maintains the fund's accounting records and administers the security lending program. The security lending fee is based on the number and duration of lending transactions. The accounting fee is based on the level of average net assets for the month plus out-of-pocket expenses.
Brokerage Commissions. The fund placed a portion of its portfolio transactions with brokerage firms which are affiliates of FMR. The commissions paid to these affiliated firms were $3,979 for the period.
5. Security Lending.
The fund lends portfolio securities from time to time in order to earn additional income. The fund receives collateral in the form of U.S. Treasury obligations, letters of credit, and/or cash against the loaned securities, and maintains collateral in an amount not less than 100% of the market value of the loaned securities during the period of the loan. The market value of the loaned securities is determined at the close of business of the fund and any additional required collateral is delivered to the fund on the next business day. If the borrower defaults on its obligation to return the securities loaned because of insolvency or other reasons, the fund could experience delays and costs in recovering the securities loaned or in gaining access to the collateral. At period end, the value of the securities loaned amounted to $11,481,742. The fund received cash collateral of $11,523,600 which was invested in cash equivalents.
6. Expense Reductions.
FMR has directed certain portfolio trades to brokers who paid a portion of the fund's expenses. For the period, the fund's expenses were reduced by $121,645 under this arrangement.
In addition, through an arrangement with the fund's custodian, credits realized as a result of uninvested cash balances were used to reduce a portion of the fund's expenses. During the period, the fund's custodian fees were reduced by $2,085 under this arrangement.
Telecommunications & Utilities Growth
Notes to Financial Statements - continued
7. Distributions to Shareholders.
Distributions to shareholders of each class were as follows:
|
|
Years ended July 31, |
|
|
|
2000 |
1999 |
|
From net investment income |
|
|
|
Class A |
$ 50,727 |
$ - |
|
Class T |
44,737 |
- |
|
Class B |
- |
- |
|
Class C |
- |
- |
|
Institutional Class |
36,298 |
- |
|
Total |
$ 131,762 |
$ - |
|
From net realized gain |
|
|
|
Class A |
$ 861,222 |
$ 267,451 |
|
Class T |
3,344,354 |
1,516,237 |
|
Class B |
3,638,195 |
1,080,984 |
|
Class C |
1,410,079 |
311,856 |
|
Institutional Class |
454,963 |
260,843 |
|
Total |
$ 9,708,813 |
$ 3,437,371 |
|
|
$ 9,840,575 |
$ 3,437,371 |
8. Share Transactions.
Transactions for each class of shares were as follows:
|
|
Shares |
Dollars |
||
|
|
Year ended |
Year ended |
Year ended |
Year ended |
|
|
2000 |
1999 |
2000 |
1999 |
|
|
|
|
|
|
|
Class A |
2,565,037 |
610,783 |
$ 57,561,045 |
$ 10,991,149 |
|
Reinvestment of distributions |
41,815 |
17,188 |
806,725 |
223,588 |
|
Shares redeemed |
(393,127) |
(117,917) |
(8,744,396) |
(1,971,798) |
|
Net increase (decrease) |
2,213,725 |
510,054 |
$ 49,623,374 |
$ 9,242,939 |
|
Class T |
9,308,596 |
2,535,015 |
$ 208,570,308 |
$ 45,737,017 |
|
Reinvestment of distributions |
164,097 |
110,405 |
3,148,401 |
1,432,350 |
|
Shares redeemed |
(1,959,118) |
(677,022) |
(42,565,130) |
(11,443,758) |
|
Net increase (decrease) |
7,513,575 |
1,968,398 |
$ 169,153,579 |
$ 35,725,609 |
|
Class B |
9,362,252 |
2,681,105 |
$ 206,438,662 |
$ 47,915,404 |
|
Reinvestment of distributions |
148,897 |
65,772 |
2,811,062 |
845,886 |
|
Shares redeemed |
(1,069,319) |
(283,363) |
(23,089,637) |
(4,722,842) |
|
Net increase (decrease) |
8,441,830 |
2,463,514 |
$ 186,160,087 |
$ 44,038,448 |
|
Class C |
4,421,163 |
1,045,991 |
$ 97,339,055 |
$ 19,125,937 |
|
Reinvestment of distributions |
57,275 |
17,797 |
1,081,246 |
228,735 |
|
Shares redeemed |
(472,031) |
(108,216) |
(10,178,423) |
(1,876,189) |
|
Net increase (decrease) |
4,006,407 |
955,572 |
$ 88,241,878 |
$ 17,478,483 |
|
Institutional Class |
769,831 |
170,875 |
$ 17,282,002 |
$ 3,122,693 |
|
Reinvestment of distributions |
17,930 |
18,455 |
342,839 |
240,109 |
|
Shares redeemed |
(230,031) |
(61,672) |
(4,684,356) |
(1,023,192) |
|
Net increase (decrease) |
557,730 |
127,658 |
$ 12,940,485 |
$ 2,339,610 |
Telecommunications & Utilities Growth
To the Trustees and Shareholders of Fidelity Advisor Consumer Industries Fund, Fidelity Advisor Cyclical Industries Fund, Fidelity Advisor Financial Services Fund, Fidelity Advisor Health Care Fund, Fidelity Advisor Natural Resources Fund, Fidelity Advisor Technology Fund and Fidelity Advisor Telecommunications & Utilities Growth Fund:
We have audited the accompanying statements of assets and liabilities of Fidelity Advisor Consumer Industries Fund, Fidelity Advisor Cyclical Industries Fund, Fidelity Advisor Financial Services Fund, Fidelity Advisor Health Care Fund, Fidelity Advisor Natural Resources Fund, Fidelity Advisor Technology Fund and Fidelity Advisor Telecommunications & Utilities Growth Fund (formerly Fidelity Advisor Utilities Growth Fund), (the funds), each a fund of Fidelity Advisor Series VII (the Trust), including the portfolios of investments, as of July 31, 2000, and the related statements of operations for the year then ended, the statements of changes in net assets for each of the two years in the period then ended, and the financial highlights for each of the five years in the period then ended. These financial statements and financial highlights are the responsibility of the Funds' management. Our responsibility is to express an opinion on these financial statements and financial highlights based on our audits.
We conducted our audits in accordance with auditing standards generally accepted in the United States of America. Those standards require that we plan and perform the audit to obtain reasonable assurance about whether the financial statements and financial highlights are free of material misstatement. An audit includes examining, on a test basis, evidence supporting the amounts and disclosures in the financial statements. Our procedures included confirmation of securities owned as of July 31, 2000, by correspondence with the custodian and brokers; where replies were not received from brokers, we performed other auditing procedures. An audit also includes assessing the accounting principles used and significant estimates made by management, as well as evaluating the overall financial statement presentation. We believe that our audits provide a reasonable basis for our opinion.
In our opinion, the financial statements and financial highlights referred to above present fairly, in all material respects, the financial position of Fidelity Advisor Consumer Industries Fund, Fidelity Advisor Cyclical Industries Fund, Fidelity Advisor Financial Services Fund, Fidelity Advisor Health Care Fund, Fidelity Advisor Natural Resources Fund, Fidelity Advisor Technology Fund and Fidelity Advisor Telecommunications & Utilities Growth Fund as of July 31, 2000, the results of their operations for the year then ended, the changes in their net assets for each of the two years in the period then ended, and their financial highlights for each of the five years in the period then ended, in conformity with accounting principles generally accepted in the United States of America.
DELOITTE & TOUCHE LLP
Boston, Massachusetts
September 8, 2000
Annual Report
The Board of Trustees of each fund voted to pay to shareholders of record at the opening of business on record date, the following distributions per share derived from capital gains realized from sales of portfolio securities, and dividends derived from net investment income:
|
Consumer Industries |
|
|
|
|
|
|
Pay Date |
Record Date |
Dividends |
Capital Gains |
|
Class A |
9/11/00 |
9/8/00 |
- |
- |
|
Class T |
9/11/00 |
9/8/00 |
- |
- |
|
Class B |
9/11/00 |
9/8/00 |
- |
- |
|
Class C |
9/11/00 |
9/8/00 |
- |
-
|
|
Cyclical Industries |
|
|
|
|
|
|
Pay Date |
Record Date |
Dividends |
Capital Gains |
|
Class A |
9/11/00 |
9/8/00 |
$0.01 |
$0.33 |
|
Class T |
9/11/00 |
9/8/00 |
- |
$0.32 |
|
Class B |
9/11/00 |
9/8/00 |
- |
$0.30 |
|
Class C |
9/11/00 |
9/8/00 |
- |
$0.28
|
|
Financial Services |
|
|
|
|
|
|
Pay Date |
Record Date |
Dividends |
Capital Gains |
|
Class A |
9/11/00 |
9/8/00 |
$0.12 |
- |
|
Class T |
9/11/00 |
9/8/00 |
$0.08 |
- |
|
Class B |
9/11/00 |
9/8/00 |
$0.02 |
- |
|
Class C |
9/11/00 |
9/8/00 |
$0.05 |
-
|
|
Health Care |
|
|
|
|
|
|
Pay Date |
Record Date |
Dividends |
Capital Gains |
|
Class A |
9/11/00 |
9/8/00 |
- |
$0.81 |
|
Class T |
9/11/00 |
9/8/00 |
- |
$0.81 |
|
Class B |
9/11/00 |
9/8/00 |
- |
$0.81 |
|
Class C |
9/11/00 |
9/8/00 |
- |
$0.81
|
|
Natural Resources |
|
|
|
|
|
|
Pay Date |
Record Date |
Dividends |
Capital Gains |
|
Class A |
9/11/00 |
9/8/00 |
$0.08 |
- |
|
Class T |
9/11/00 |
9/8/00 |
$0.04 |
- |
|
Class B |
9/11/00 |
9/8/00 |
- |
- |
|
Class C |
9/11/00 |
9/8/00 |
$0.02 |
-
|
|
Technology |
|
|
|
|
|
|
Pay Date |
Record Date |
Dividends |
Capital Gains |
|
Class A |
9/11/00 |
9/8/00 |
- |
$1.63 |
|
Class T |
9/11/00 |
9/8/00 |
- |
$1.59 |
|
Class B |
9/11/00 |
9/8/00 |
- |
$1.50 |
|
Class C |
9/11/00 |
9/8/00 |
- |
$1.51
|
|
Telecommunications & Utilities Growth |
|
|
||
|
|
Pay Date |
Record Date |
Dividends |
Capital Gains |
|
Class A |
9/11/00 |
9/8/00 |
$0.28 |
$0.26 |
|
Class T |
9/11/00 |
9/8/00 |
$0.25 |
$0.26 |
|
Class B |
9/11/00 |
9/8/00 |
$0.21 |
$0.26 |
|
Class C |
9/11/00 |
9/8/00 |
$0.21 |
$0.26
|
Each fund hereby designates 100% of the long-term capital gain dividends distributed during the fiscal year as 20%-rate capital gain dividends.
Annual Report
Investment Adviser
Fidelity Management & Research Company
Boston, MA
Investment Sub-Advisers
Fidelity Management & Research (U.K.) Inc.
Fidelity Management & Research (Far East) Inc.
Fidelity Investments Japan Limited
Officers
Edward C. Johnson 3d, President
Robert C. Pozen, Senior Vice President
Eric D. Roiter, Secretary
Robert A. Dwight, Treasurer
Matthew N. Karstetter, Deputy Treasurer
Maria F. Dwyer, Deputy Treasurer
John H. Costello, Assistant Treasurer
Board of Trustees
Ralph F. Cox *
Phyllis Burke Davis *
Robert M. Gates *
Edward C. Johnson 3d
Donald J. Kirk *
Ned C. Lautenbach *
Peter S. Lynch
Marvin L. Mann *
William O. McCoy *
Gerald C. McDonough *
Robert C. Pozen
Thomas R. Williams *
Advisory Board
J. Michael Cook
Abigail P. Johnson
Marie L. Knowles
* Independent trustees
* Custodian for Fidelity Advisor Natural Resources Fund only
General Distributor
Fidelity Distributors Corporation
Boston, MA
Transfer and Shareholder
Servicing Agent
Fidelity Investments Institutional Operations Company, Inc.
Boston, MA
Custodian
The Chase Manhattan Bank
New York, NY
Brown Brothers Harriman & Co. (dagger)
Boston, MA
Focus Funds
Fidelity Advisor Consumer
Industries Fund
Fidelity Advisor Cyclical
Industries Fund
Fidelity Advisor Financial
Services Fund
Fidelity Advisor Health Care Fund
Fidelity Advisor Natural
Resources Fund
Fidelity Advisor Technology Fund
Fidelity Advisor Telecommunications &
Utilities Growth Fund
Growth Funds
Fidelity Advisor Korea Fund
Fidelity Advisor Emerging Asia Fund
Fidelity Advisor Latin America Fund
Fidelity Advisor Japan Fund
Fidelity Advisor Europe Capital
Appreciation Fund
Fidelity Advisor International Capital
Appreciation Fund
Fidelity Advisor Overseas Fund
Fidelity Advisor Diversified International Fund
Fidelity Advisor Global Equity Fund
Fidelity Advisor TechnoQuant ® Growth Fund
Fidelity Advisor Small Cap Fund
Fidelity Advisor Value Strategies Fund
Fidelity Advisor Mid Cap Fund
Fidelity Advisor Dynamic Capital Appreciation Fund
Fidelity Advisor Equity Growth Fund
Fidelity Advisor Large Cap Fund
Fidelity Advisor Dividend Growth Fund
Fidelity Advisor Growth Opportunities Fund
Growth and Income Funds
Fidelity Advisor Growth & Income Fund
Fidelity Advisor Equity Income Fund
Fidelity Advisor Asset Allocation Fund
Fidelity Advisor Balanced Fund
Taxable Income Funds
Fidelity Advisor Emerging Markets Income Fund
Fidelity Advisor High Yield Fund
Fidelity Advisor High Income Fund
Fidelity Advisor Strategic Income Fund
Fidelity Advisor Mortgage Securities Fund
Fidelity Advisor Government Investment Fund
Fidelity Advisor Intermediate Bond Fund
Fidelity Advisor Short Fixed-Income Fund
Municipal Funds
Fidelity Advisor Municipal Income Fund
Money Market Funds
Prime Fund
Treasury Fund
Tax-Exempt Fund
(Fidelity Investment logo)(registered trademark)
Corporate Headquarters
82 Devonshire St., Boston, MA 02109
www.fidelity.com
BULK RATE
U.S. POSTAGE
PAID
FIDELITY
INVESTMENTS
(Recycle graphic) Printed on Recycled Paper
AFOC-ANN-0900 110538
1.536453.103
Institutional Class
Consumer Industries
Cyclical Industries
Financial Services
Health Care
Natural Resources
Technology
Telecommunications &
Utilities Growth (formerly Utilities Growth)
Annual Report
for the year ending
July 31, 2000
and
Prospectus
dated September 28, 2000
|
Performance Overview |
A-4 |
|
|
Consumer Industries |
A-5 |
Performance |
|
|
A-6 |
Fund Talk: The Manager's Overview |
|
|
A-7 |
Investment Summary |
|
|
A-8 |
Investments |
|
|
A-11 |
Financial Statements |
|
|
A-15 |
Notes to the Financial Statements |
|
Cyclical Industries |
A-19 |
Performance |
|
|
A-20 |
Fund Talk: The Manager's Overview |
|
|
A-21 |
Investment Summary |
|
|
A-22 |
Investments |
|
|
A-25 |
Financial Statements |
|
|
A-29 |
Notes to the Financial Statements |
|
Financial Services |
A-33 |
Performance |
|
|
A-34 |
Fund Talk: The Manager's Overview |
|
|
A-35 |
Investment Summary |
|
|
A-36 |
Investments |
|
|
A-28 |
Financial Statements |
|
|
A-42 |
Notes to the Financial Statements |
|
Health Care |
A-46 |
Performance |
|
|
A-47 |
Fund Talk: The Manager's Overview |
|
|
A-48 |
Investment Summary |
|
|
A-49 |
Investments |
|
|
A-51 |
Financial Statements |
|
|
A-55 |
Notes to the Financial Statements |
|
Natural Resources |
A-59 |
Performance |
|
|
A-60 |
Fund Talk: The Manager's Overview |
|
|
A-61 |
Investment Summary |
|
|
A-62 |
Investments |
|
|
A-64 |
Financial Statements |
|
|
A-68 |
Notes to the Financial Statements |
|
Technology |
A-73 |
Performance |
|
|
A-74 |
Fund Talk: The Manager's Overview |
|
|
A-75 |
Investment Summary |
|
|
A-76 |
Investments |
|
|
A-79 |
Financial Statements |
|
|
A-83 |
Notes to the Financial Statements |
|
Telecommunications & |
A-87 |
Performance |
|
|
A-88 |
Fund Talk: The Manager's Overview |
|
|
A-89 |
Investment Summary |
|
|
A-90 |
Investments |
|
|
A-92 |
Financial Statements |
|
|
A-96 |
Notes to the Financial Statements |
|
Independent Auditors' Report |
A-100 |
The auditors' opinion. |
|
Distributions |
A-101 |
|
|
Prospectus |
P-1 |
|
Standard & Poor's, S&P and S&P 500 are registered service marks of The McGraw-Hill Companies, Inc. and have been licensed for use by Fidelity Distributors Corporation.
Other third party marks appearing herein are the property of their respective owners.
All other marks appearing herein are registered or unregistered trademarks or service marks of FMR Corp. or an affiliated company.
(Recycle graphic) This report is printed on recycled paper using soy-based inks.
The views expressed in this report reflect those of each fund's portfolio manager only through the end of the period of the report as stated on the cover and do not necessarily represent the views of Fidelity or any other person in the Fidelity organization. Any such views are subject to change at any time based upon market or other conditions and Fidelity disclaims any responsibility to update such views. These views may not be relied on as investment advice and, because investment decisions for a Fidelity fund are based on numerous factors, may not be relied on as an indication of trading intent on behalf of any Fidelity fund.
This report and the financial statements contained herein are submitted for the general information of the shareholders of the funds. This report is not authorized for distribution to prospective investors in the funds unless preceded or accompanied by an effective prospectus.
Mutual fund shares are not deposits or obligations of, or guaranteed by, any depository institution. Shares are not insured by the FDIC, Federal Reserve Board or any other agency, and are subject to investment risks, including possible loss of principal amount invested.
Neither the funds nor Fidelity Distributors Corporation is a bank.
For more information on any Fidelity Advisor fund, including charges and expenses, contact your investment professional for a free prospectus. Read it carefully before you invest or send money.
Annual Report
The majority of sectors in the U.S. equity market experienced a significant turnaround in investor sentiment during the 12-month period that ended July 31, 2000. Throughout the year, investors progressively flirted, chased and then ultimately retreated from sectors of the new economy, such as technology, wireless telecommunications and biotechnology. At the same time, most had turned their backs on more traditional sectors, such as health, financial services, energy and real estate, to start the period, only to renew their confidence in them again later on.
Going into the period, investors clamored for shares of anything tied to the Internet and technology, driving the prices of unprofitable companies to historically high levels and buoying the capital markets with robust demand for initial public offerings. During this Internet stock boom, investors turned phrases such as "dot-com," "B2B" and "cyberspace" into the daily lexicon of everyone from Wall Street strategists to plumbers.
Meanwhile, lacking the price appreciation of technology and telecommunications stocks, investors soured on more traditional companies early on, resulting in the overall poor performance of value stocks during the third and fourth quarters of 1999. Brisk outflows from value-oriented mutual funds and huge inflows to growth funds - many of which had loaded up on technology stocks - exacerbated the trend.
During the second half of the period, however, the equity markets struggled to break free from the grip of the Federal Reserve Board, whose effort to cool the overheated domestic economy was delivered via a series of five interest-rate hikes. With every clench of its fist, the Fed's effort - which raised the federal funds rate by a total of 1.50% during the period - gradually tempered the optimism toward stocks as the period progressed. Most of the effect of the Fed's tightening, coupled with the market's concerns about corporate earnings, took its toll in the first and second quarters of 2000. The Dow Jones Industrial Average - a benchmark of blue chip stocks - returned 0.27% during the past year, but has declined 7.65% in the first seven months of 2000. Similarly, the Standard & Poor's 500 SM Index, an index of 500 larger companies, returned 8.98% for the 12-month period, but feeling the impact of the Fed's action, has lost 1.98% so far in 2000. Even the seemingly invincible NASDAQ Composite Index, which finished the period with a 43.08% gain, has given back 7.33% year to date. Growing concerns about a potential slowdown in the economy during the second half of the period also affected small-cap stocks, as evidenced by the Russell 2000®'s 13.77% advance for the year, compared to its weak -0.28% return so far in 2000.
The equity sector rotation was fueled in part by a correction in technology stocks. After crossing the 5000 mark early in March, the tech-heavy NASDAQ Composite Index gave back nearly all of its year-to-date gains by the end of the month, then tumbled another 25% during a single week in April. The sell-off in technology was due to overvaluation concerns by notable Wall Street analysts, the federal government's evolving antitrust case against software giant Microsoft, and slower growth forecasts for several tech subsectors, such as semiconductors. Despite the sector's troubles in 2000, the Goldman Sachs Technology Index - an index of 221 stocks designed to measure the performance of companies in the tech sector - returned 51.95% during the 12-month period. The ensuing volatility in technology stocks forced many investors to the sidelines, as evidenced by the exceedingly light trading volume in the second quarter of 2000 and the Goldman Sachs Technology Index's 0.72% year-to-date gain. Investors also began to look toward other areas of the market - such as health and real estate - for steadier growth, changing the investing landscape dramatically from earlier in the period.
Among other sectors, the performance of stocks in the consumer industries sector was hurt by rising interest rates and, toward the end of the period, reports of missed earnings estimates and slower growth from some high-profile companies, including Costco and Office Depot. Still, with growth slowing and share prices dropping, many large food companies went on a buying spree. Philip Morris agreed to purchase Nabisco Holdings and Anglo-Dutch group Unilever snapped up Bestfoods, Slim-Fast Foods and Ben & Jerry's.
In the financial services sector, bank stocks suffered from rising interest rates while brokerage stocks rallied on higher trading volumes. Many investors expected a wave of consolidation in the sector after the government leveled the playing field for all financial services firms in late 1999 by making changes to the Depression-era Glass-Steagall Act - which had prohibited banks and brokerages from operating under the same corporate roof - but it never occurred. The Goldman Sachs Financial Services Index rose 3.20% during the 12-month period.
Higher fuel costs and concerns about a slowdown in the economy plagued the cyclical industries sector. A focus on productivity-boosting, cost-cutting technology in business spending, rather than on traditional ways of manufacturing goods, put pricing pressures on commodities and subsequently dampened the earnings growth of cyclical companies.
Growing demand for their products enabled wireless and cable services to stand out as top-performing industries in the utilities sector. Early on, a wave of consolidation and increasing demand for wireless products fueled strong gains in telecommunications stocks, while electric utilities were hurt by rising interest rates and long-term profitability concerns. The Goldman Sachs Utilities Index returned -0.53% during the 12-month period.
On the positive side of the marketplace, several pharmaceutical stocks in the health sector returned to favor in the latter part of the period on positive earnings and new product reports. Additionally, public and private programs to sequence the human genome were completed in the second quarter of 2000, helping to restore investor confidence in biotech stocks. The Goldman Sachs Health Care Index rose 22.57% in the 12-month period.
Overall, the natural resources sector had good results. For the majority of the period, OPEC's decision to maintain lower oil production, combined with increased demand, helped push the price of oil above $30 per barrel for weeks. Higher prices helped energy services stocks as well as large integrated oil producers. A favorable supply and demand environment also helped push natural gas prices to record levels.
Annual Report
Performance
There are several ways to evaluate historical performance. You can look at the total percentage change in value, the average annual percentage change or the growth of a hypothetical $10,000 investment. Total return reflects the change in the value of an investment, assuming reinvestment of dividend income and capital gains (the profits earned upon the sale of securities that have grown in value). If Fidelity had not reimbursed certain class expenses, the total returns would have been lower.
Cumulative Total Returns
|
Periods ended July 31, 2000 |
|
Past 1 |
Life of |
|
Fidelity® Adv Consumer - Inst CL |
|
-4.20% |
89.43% |
|
S&P 500 ® |
|
8.98% |
131.80% |
|
GS Consumer Industries |
|
-4.55% |
76.30% |
Cumulative total returns show Institutional Class shares' performance in percentage terms over a set period - in this case, one year or since the fund started on September 3, 1996. You can compare Institutional Class shares' returns to the performance of both the Standard & Poor's 500 Index - a market capitalization-weighted index of common stocks - and the Goldman Sachs Consumer Industries Index - a market capitalization-weighted index of 295 stocks designed to measure the performance of companies in the consumer industries sector. Issues in the index include providers of consumer services and products, including producers of beverages - alcoholic and non-alcoholic, food, personal care, household products, and tobacco companies. These benchmarks include reinvested dividends and capital gains, if any, and exclude the effect of sales charges.
Average Annual Total Returns
|
Periods ended July 31, 2000 |
|
Past 1 |
Life of |
|
Fidelity Adv Consumer - Inst CL |
|
-4.20% |
17.75% |
|
S&P 500 |
|
8.98% |
23.99% |
|
GS Consumer Industries |
|
-4.55% |
15.61% |
Average annual returns take Institutional Class shares' cumulative return and show you what would have happened if Institutional Class shares had performed at a constant rate each year.
$10,000 Over Life of Fund
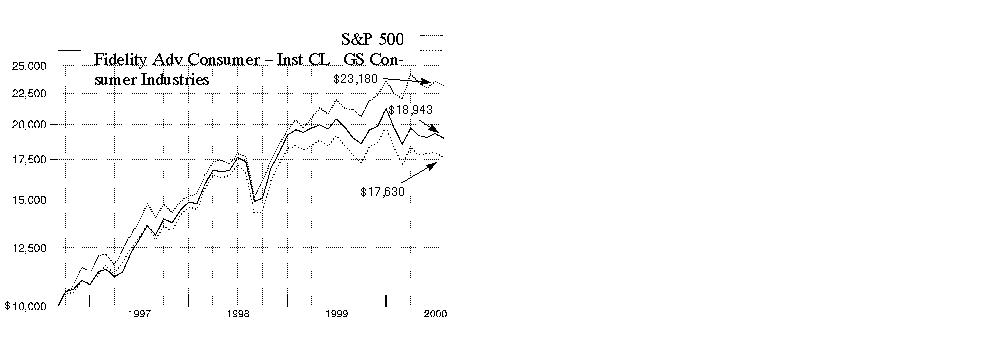
$10,000 Over Life of Fund: Let's say hypothetically that $10,000 was invested in Fidelity Advisor Consumer Industries - Institutional Class on September 3, 1996, when the fund started. As the chart shows, by July 31, 2000, the value of the investment would have grown to $18,943 - an 89.43% increase on the initial investment. For comparison, look at how the Standard & Poor's 500 Index did over the same period. With dividends and capital gains, if any, reinvested, the same $10,000 investment would have grown to $23,180 - a 131.80% increase. If $10,000 was invested in the Goldman Sachs Consumer Industries Index, it would have grown to $17,630 - a 76.30% increase.
Understanding Performance
How a fund did yesterday is no guarantee of how it will do tomorrow. The stock market, for example, has a history of long-term growth and short-term volatility. Unlike the broader market, however, some sectors may not have a history of growth in the long run. And, as with all stock funds, the share price and return of a fund that invests in a sector will vary.
3Annual Report
(Portfolio Manager photograph)
An interview with
John Porter, Portfolio Manager of Fidelity Advisor Consumer Industries Fund
Q. How did the fund perform, John?
A. During the 12-month period that ended July 31, 2000, the fund's Class A, Class T, Class B and Class C shares had returns of -4.48%, -4.69%, -5.19% and -5.19%, respectively. This performance was in line with the performance of the Goldman Sachs Consumer Industries Index - an index of 295 stocks designed to measure the performance of companies in the consumer industries sector - which lost 4.55% during the same 12-month period. The fund lagged the Standard & Poor's 500 Index's return of 8.98% during the same period.
A. During the 12-month period that ended July 31, 2000, the fund's Institutional Class shares returned -4.20. This return was slightly ahead of the performance of the Goldman Sachs Consumer Industries Index-an index of 295 stocks designed to measure the performance of companies in the consumer industries sector -which lost 4.55% during the same 12-month period. The fund lagged the Standard & Poor's 500 Index's return of 8.98% during the same period.
Q. What factors kept the fund in line with the performance of the Goldman Sachs index during the period?
A. I think the main reason the fund's performance generally was in line with or slightly ahead of the index was because there weren't any specific areas to steer the fund toward during the past year that delivered consistent outperformance. I break down the consumer industries sector into three main subsectors: consumer products; media, including entertainment and advertising; and retail. At different points throughout the year, each of those different subsectors performed well, but none of them consistently outperformed the other. As the period progressed, different subsectors would take the spotlight, making it extremely difficult to participate successfully in an overweighted buy-and-hold trend due to the volatility.
Q. Did you make any adjustments to your strategy during the period?
A. During the past three months, I positioned the fund defensively with regard to retail, underweighting that subsector because I believed the economy began to slow. The decline of price-to-earnings multiples of several retail stocks reflected the market's cynicism toward these companies, and we saw some of the retailers, such as Costco, which was sold off entirely during the period, experience growth problems. Meanwhile, the top-tier retailers - such as Wal-Mart and Home Depot - continued to execute very well through the end of the period. Within the retail sector, I marginally added to the fund's positions in supermarkets - such as Safeway - and drug stores - such as Walgreens - to exploit consumers' needs to purchase staple products. At the same time, I began increasing the fund's weighting in consumer products stocks, such as Coca-Cola, Procter & Gamble and Gillette, which are defensive in nature. Additionally, I believed these stocks became attractively valued and could benefit from having a significant multi-national presence should foreign economies improve and currencies strengthen.
Q. How did the fund's investments in other areas of consumer industries influence performance?
A. Our overweighted position in media and advertising stocks throughout the period served us well. The fund's focus on advertising-driven media, such as AMFM and Disney - via its ownership of the ABC network broadcast operation - as well as advertising agencies, remained one of the fund's best growth sectors. Elsewhere, the fund's underweighted position in the soft drink industry, specifically Coca-Cola, made the largest positive contribution to the fund's performance. However, the fund's restaurant positions - including McDonald's, which suffered slower sales and analyst downgrades in May - detracted from performance.
Q. What specific stocks performed well? Which disappointed?
A. Wal-Mart, the fund's largest holding, stood out as the top relative contributor to performance based on solid earnings, steady same-store sales growth and a successful overseas acquisition. Investors reacted favorably to Viacom's acquisition of CBS, as well as the fiscal discipline implemented at its Paramount film unit. On the down side, the fund's overweighting of Procter & Gamble hurt performance after the company pre-announced an earnings shortfall in the first quarter, sparking a sell-off across consumer stocks. Ongoing concerns over product liability suits plagued top-10 holding Philip Morris.
Q. What's your outlook?
A. I don't believe the slowing of the economy is accurately reflected in the prices people are paying for retail and consumer products stocks. Consumer products stocks are beaten down and the market is not rewarding them for the relative stability they can provide. In retail, I don't think the current price multiples reflect how slow things can get in a slowing economy - even for some of the best retailers. Meanwhile, I am very enthusiastic about many of the media-related sectors in which the fund invests. So going forward, I will continue to position the fund defensively to weather an economic slowdown, while keeping an eye on consumer expenditure patterns.
The views expressed in this report reflect those of the portfolio manager only through the end of the period of the report as stated on the cover. The manager's views are subject to change at any time based on market or other conditions. For more information, see page A-3.
Fund Facts
Start date: September 3, 1996
Size: as of July 31, 2000, more than
$30 million
Manager: John Porter, since 1999; joined Fidelity in 1995
3Annual Report
Advisor Consumer Industries Fund
|
Top Ten Stocks as of July 31, 2000 |
|
|
|
% of fund's |
|
Wal-Mart Stores, Inc. |
6.7 |
|
Home Depot, Inc. |
4.9 |
|
The Coca-Cola Co. |
4.8 |
|
Walt Disney Co. |
4.2 |
|
Viacom, Inc. Class B (non-vtg.) |
3.7 |
|
Procter & Gamble Co. |
3.1 |
|
Time Warner, Inc. |
3.0 |
|
Kimberly-Clark Corp. |
2.3 |
|
PepsiCo, Inc. |
2.2 |
|
Philip Morris Companies, Inc. |
2.1 |
|
|
37.0 |
|
Top Industries as of July 31, 2000 |
|
|
% of fund's net assets |
||
|
Broadcasting |
11.9% |
|
Household Products |
10.2% |
|
Entertainment |
10.2% |
|
General Merchandise Stores |
8.8% |
|
Beverages |
8.6% |
|
All Others* |
50.3% |
|
* Includes short-term investments and net other assets. |
Annual Report
Advisor Consumer Industries Fund
Showing Percentage of Net Assets
|
Common Stocks - 91.2% |
|||
|
Shares |
Value (Note 1) |
||
|
ADVERTISING - 1.4% |
|||
|
Omnicom Group, Inc. |
3,850 |
$ 327,250 |
|
|
TMP Worldwide, Inc. (a) |
500 |
36,000 |
|
|
Young & Rubicam, Inc. |
1,100 |
62,150 |
|
|
|
425,400 |
||
|
APPAREL STORES - 2.8% |
|||
|
American Eagle Outfitters, Inc. (a) |
1,100 |
16,363 |
|
|
AnnTaylor Stores Corp. (a) |
1,700 |
48,025 |
|
|
Claire's Stores, Inc. |
1,800 |
30,375 |
|
|
Gap, Inc. |
13,568 |
485,904 |
|
|
Talbots, Inc. |
900 |
45,450 |
|
|
The Limited, Inc. |
7,480 |
152,873 |
|
|
TJX Companies, Inc. |
2,300 |
38,525 |
|
|
Venator Group, Inc. (a) |
2,600 |
36,725 |
|
|
|
854,240 |
||
|
AUTOS, TIRES, & ACCESSORIES - 0.1% |
|||
|
AutoNation, Inc. |
6,400 |
44,400 |
|
|
BEVERAGES - 8.6% |
|||
|
Adolph Coors Co. Class B |
1,400 |
88,200 |
|
|
Anheuser-Busch Companies, Inc. |
6,200 |
499,100 |
|
|
Canandaigua Brands, Inc. Class A (a) |
1,500 |
74,063 |
|
|
Coca-Cola Enterprises, Inc. |
3,600 |
69,075 |
|
|
Panamerican Beverages, Inc. Class A |
1,600 |
29,600 |
|
|
Pepsi Bottling Group, Inc. |
3,300 |
100,856 |
|
|
Seagram Co. Ltd. |
5,200 |
291,528 |
|
|
The Coca-Cola Co. |
23,800 |
1,459,238 |
|
|
|
2,611,660 |
||
|
BROADCASTING - 11.9% |
|||
|
Adelphia Communications Corp. |
750 |
26,438 |
|
|
American Tower Corp. Class A (a) |
2,900 |
124,338 |
|
|
AMFM, Inc. (a) |
6,400 |
457,200 |
|
|
AT&T Corp. - Liberty Media Group |
28,200 |
627,450 |
|
|
Cablevision Systems Corp. Class A (a) |
1,350 |
88,847 |
|
|
Chris-Craft Industries, Inc. |
200 |
13,375 |
|
|
Clear Channel Communications, Inc. (a) |
3,950 |
300,941 |
|
|
Comcast Corp. Class A (special) (a) |
9,700 |
329,952 |
|
|
Cox Communications, Inc. Class A (a) |
3,200 |
118,200 |
|
|
E.W. Scripps Co. Class A |
400 |
19,750 |
|
|
EchoStar Communications Corp. |
2,800 |
110,425 |
|
|
Entercom Communications Corp. |
1,200 |
46,575 |
|
|
Infinity Broadcasting Corp. Class A (a) |
8,300 |
292,575 |
|
|
Time Warner, Inc. |
12,094 |
927,459 |
|
|
UnitedGlobalCom, Inc. Class A (a) |
900 |
44,156 |
|
|
|
|||
|
Shares |
Value (Note 1) |
||
|
Univision Communications, Inc. |
300 |
$ 37,275 |
|
|
USA Networks, Inc. (a) |
3,300 |
69,506 |
|
|
|
3,634,462 |
||
|
CELLULAR - 1.1% |
|||
|
Crown Castle International Corp. (a) |
3,400 |
115,600 |
|
|
Nextel Communications, Inc. Class A (a) |
900 |
50,344 |
|
|
SBA Communications Corp. Class A |
3,200 |
144,400 |
|
|
|
310,344 |
||
|
COMPUTER SERVICES & SOFTWARE - 1.1% |
|||
|
Amazon.com, Inc. (a) |
2,000 |
60,250 |
|
|
America Online, Inc. (a) |
600 |
31,988 |
|
|
Circle.com (a) |
600 |
1,875 |
|
|
CMGI, Inc. (a) |
700 |
26,513 |
|
|
eBay, Inc. (a) |
600 |
30,000 |
|
|
Microsoft Corp. (a) |
2,050 |
143,116 |
|
|
Priceline.com, Inc. (a) |
2,100 |
49,613 |
|
|
|
343,355 |
||
|
COMPUTERS & OFFICE EQUIPMENT - 0.2% |
|||
|
Pitney Bowes, Inc. |
900 |
31,163 |
|
|
Xerox Corp. |
3,100 |
46,113 |
|
|
|
77,276 |
||
|
CONSUMER ELECTRONICS - 0.8% |
|||
|
Black & Decker Corp. |
800 |
29,750 |
|
|
Gemstar-TV Guide International, Inc. (a) |
2,094 |
127,341 |
|
|
General Motors Corp. Class H (a) |
2,900 |
75,038 |
|
|
|
232,129 |
||
|
DRUG STORES - 1.9% |
|||
|
Walgreen Co. |
18,700 |
583,206 |
|
|
ENTERTAINMENT - 10.2% |
|||
|
Carnival Corp. |
6,900 |
128,944 |
|
|
Fox Entertainment Group, Inc. Class A (a) |
4,800 |
147,000 |
|
|
Hollywood Entertainment Corp. (a) |
1,300 |
11,863 |
|
|
Mandalay Resort Group (a) |
3,100 |
75,756 |
|
|
MGM Grand, Inc. |
2,300 |
82,656 |
|
|
Park Place Entertainment Corp. (a) |
2,400 |
30,150 |
|
|
SFX Entertainment, Inc. Class A (a) |
2,150 |
98,900 |
|
|
Viacom, Inc.: |
|
|
|
|
Class A (a) |
1,600 |
106,700 |
|
|
Class B (non-vtg.) (a) |
17,105 |
1,134,275 |
|
|
Walt Disney Co. |
32,900 |
1,272,819 |
|
|
|
3,089,063 |
||
|
Common Stocks - continued |
|||
|
Shares |
Value (Note 1) |
||
|
FOODS - 6.9% |
|||
|
American Italian Pasta Co. Class A (a) |
2,000 |
$ 39,500 |
|
|
Bestfoods |
5,050 |
351,606 |
|
|
Corn Products International, Inc. |
1,789 |
44,725 |
|
|
Dean Foods Co. |
800 |
27,850 |
|
|
Earthgrains Co. |
3,600 |
72,000 |
|
|
H.J. Heinz Co. |
1,800 |
71,888 |
|
|
Hormel Foods Corp. |
1,800 |
29,138 |
|
|
IBP, Inc. |
2,400 |
34,650 |
|
|
Keebler Foods Co. |
3,500 |
154,438 |
|
|
Kellogg Co. |
2,300 |
59,656 |
|
|
Nabisco Group Holdings Corp. |
3,600 |
95,400 |
|
|
Nabisco Holdings Corp. Class A |
1,400 |
74,025 |
|
|
PepsiCo, Inc. |
14,400 |
659,700 |
|
|
Quaker Oats Co. |
3,300 |
221,925 |
|
|
Sysco Corp. |
4,100 |
161,438 |
|
|
|
2,097,939 |
||
|
GENERAL MERCHANDISE STORES - 8.8% |
|||
|
Ames Department Stores, Inc. (a) |
3,100 |
22,088 |
|
|
BJ's Wholesale Club, Inc. (a) |
1,900 |
56,881 |
|
|
Consolidated Stores Corp. (a) |
6,140 |
73,296 |
|
|
Dollar General Corp. |
4,531 |
83,257 |
|
|
Dollar Tree Stores, Inc. (a) |
1,275 |
54,267 |
|
|
JCPenney Co., Inc. |
1,800 |
29,025 |
|
|
Kohls Corp. (a) |
3,900 |
221,325 |
|
|
Neiman Marcus Group, Inc. Class A (a) |
1,400 |
46,200 |
|
|
Target Corp. |
2,000 |
58,000 |
|
|
Wal-Mart Stores, Inc. |
37,100 |
2,038,164 |
|
|
|
2,682,503 |
||
|
GROCERY STORES - 3.1% |
|||
|
Albertson's, Inc. |
2,521 |
76,103 |
|
|
Hain Celestial Group, Inc. (a) |
7,369 |
196,200 |
|
|
Kroger Co. (a) |
10,400 |
215,150 |
|
|
Safeway, Inc. (a) |
8,850 |
398,803 |
|
|
Whole Foods Market, Inc. (a) |
800 |
35,750 |
|
|
Winn-Dixie Stores, Inc. |
600 |
8,588 |
|
|
|
930,594 |
||
|
HOME FURNISHINGS - 0.2% |
|||
|
Linens'n Things, Inc. (a) |
2,500 |
74,844 |
|
|
HOUSEHOLD PRODUCTS - 10.2% |
|||
|
Avon Products, Inc. |
15,250 |
605,234 |
|
|
Clorox Co. |
8,498 |
351,074 |
|
|
Colgate-Palmolive Co. |
6,900 |
384,244 |
|
|
Estee Lauder Companies, Inc. Class A |
7,030 |
309,320 |
|
|
Gillette Co. |
17,000 |
496,188 |
|
|
|
|||
|
Shares |
Value (Note 1) |
||
|
Procter & Gamble Co. |
16,685 |
$ 948,959 |
|
|
Yankee Candle Co., Inc. |
700 |
14,613 |
|
|
|
3,109,632 |
||
|
LEISURE DURABLES & TOYS - 1.0% |
|||
|
Brunswick Corp. |
900 |
16,931 |
|
|
Callaway Golf Co. |
3,100 |
38,944 |
|
|
Harley-Davidson, Inc. |
5,300 |
237,838 |
|
|
|
293,713 |
||
|
LODGING & GAMING - 0.4% |
|||
|
International Game Technology (a) |
1,200 |
35,625 |
|
|
Prime Hospitality Corp. (a) |
2,100 |
19,950 |
|
|
Starwood Hotels & Resorts Worldwide, Inc. unit |
1,600 |
54,600 |
|
|
|
110,175 |
||
|
PACKAGING & CONTAINERS - 0.2% |
|||
|
Tupperware Corp. |
2,700 |
52,481 |
|
|
PAPER & FOREST PRODUCTS - 2.3% |
|||
|
Kimberly-Clark Corp. |
12,300 |
706,481 |
|
|
PHOTOGRAPHIC EQUIPMENT - 0.4% |
|||
|
Eastman Kodak Co. |
2,000 |
109,750 |
|
|
PRINTING - 0.3% |
|||
|
R.R. Donnelley & Sons Co. |
2,400 |
53,400 |
|
|
Valassis Communications, Inc. (a) |
800 |
26,900 |
|
|
|
80,300 |
||
|
PUBLISHING - 2.8% |
|||
|
Dow Jones & Co., Inc. |
500 |
32,969 |
|
|
Gannett Co., Inc. |
1,100 |
59,263 |
|
|
Harcourt General, Inc. |
1,150 |
63,466 |
|
|
Harte Hanks Communications, Inc. |
1,900 |
48,094 |
|
|
Houghton Mifflin Co. |
700 |
33,163 |
|
|
Knight-Ridder, Inc. |
700 |
36,488 |
|
|
McGraw-Hill Companies, Inc. |
3,700 |
219,919 |
|
|
Meredith Corp. |
2,000 |
63,625 |
|
|
Playboy Enterprises, Inc. Class B (non-vtg.) (a) |
2,700 |
32,569 |
|
|
Reader's Digest Association, Inc. Class A (non-vtg.) |
2,200 |
83,188 |
|
|
The New York Times Co. Class A |
2,600 |
107,088 |
|
|
Tribune Co. |
2,400 |
78,000 |
|
|
|
857,832 |
||
|
REAL ESTATE INVESTMENT TRUSTS - 0.6% |
|||
|
Pinnacle Holdings, Inc. (a) |
3,200 |
179,800 |
|
|
RESTAURANTS - 2.2% |
|||
|
Brinker International, Inc. (a) |
1,500 |
42,844 |
|
|
Common Stocks - continued |
|||
|
Shares |
Value (Note 1) |
||
|
RESTAURANTS - CONTINUED |
|||
|
CEC Entertainment, Inc. (a) |
1,350 |
$ 37,631 |
|
|
Darden Restaurants, Inc. |
1,900 |
30,994 |
|
|
Jack in the Box, Inc. (a) |
2,700 |
57,881 |
|
|
McDonald's Corp. |
9,800 |
308,700 |
|
|
Outback Steakhouse, Inc. (a) |
4,150 |
95,191 |
|
|
Papa John's International, Inc. (a) |
600 |
14,288 |
|
|
Starbucks Corp. (a) |
800 |
30,000 |
|
|
Wendy's International, Inc. |
2,500 |
42,344 |
|
|
|
659,873 |
||
|
RETAIL & WHOLESALE, MISCELLANEOUS - 6.6% |
|||
|
Alberto-Culver Co. Class A |
2,800 |
71,050 |
|
|
Bed Bath & Beyond, Inc. (a) |
3,200 |
117,800 |
|
|
Best Buy Co., Inc. (a) |
900 |
65,475 |
|
|
Circuit City Stores, Inc. - |
800 |
18,350 |
|
|
Home Depot, Inc. |
28,600 |
1,480,050 |
|
|
Lowe's Companies, Inc. |
1,400 |
59,063 |
|
|
Office Depot, Inc. (a) |
2,300 |
14,375 |
|
|
Pier 1 Imports, Inc. |
2,900 |
34,619 |
|
|
Staples, Inc. (a) |
7,450 |
102,903 |
|
|
Tiffany & Co., Inc. |
400 |
13,700 |
|
|
Williams-Sonoma, Inc. (a) |
800 |
31,000 |
|
|
Zale Corp. (a) |
400 |
14,950 |
|
|
|
2,023,335 |
||
|
SERVICES - 1.8% |
|||
|
ACNielsen Corp. (a) |
1,800 |
44,100 |
|
|
Cendant Corp. (a) |
5,700 |
73,031 |
|
|
Macrovision Corp. (a) |
400 |
30,200 |
|
|
Manpower, Inc. |
2,400 |
92,850 |
|
|
Modis Professional Services, Inc. (a) |
300 |
2,288 |
|
|
Robert Half International, Inc. (a) |
1,000 |
34,375 |
|
|
True North Communications |
3,500 |
170,844 |
|
|
Viad Corp. |
3,700 |
96,431 |
|
|
|
544,119 |
||
|
TELEPHONE SERVICES - 0.3% |
|||
|
AT&T Corp. |
3,336 |
103,208 |
|
|
TEXTILES & APPAREL - 0.7% |
|||
|
Liz Claiborne, Inc. |
1,200 |
46,800 |
|
|
Mohawk Industries, Inc. (a) |
800 |
21,350 |
|
|
NIKE, Inc. Class B |
3,000 |
131,250 |
|
|
Pacific Sunwear of California, Inc. (a) |
500 |
7,563 |
|
|
|
206,963 |
||
|
|
|||
|
Shares |
Value (Note 1) |
||
|
TOBACCO - 2.3% |
|||
|
Philip Morris Companies, Inc. |
25,200 |
$ 636,300 |
|
|
RJ Reynolds Tobacco Holdings, Inc. |
2,800 |
79,450 |
|
|
|
715,750 |
||
|
TOTAL COMMON STOCKS (Cost $22,860,481) |
27,744,827 |
||
|
Cash Equivalents - 8.4% |
|||
|
|
|
|
|
|
Fidelity Cash Central Fund, 6.57% (b) |
2,115,133 |
2,115,133 |
|
|
Fidelity Securities Lending Cash Central Fund, 6.65% (b) |
434,060 |
434,060 |
|
|
TOTAL CASH EQUIVALENTS (Cost $2,549,193) |
2,549,193 |
||
|
TOTAL INVESTMENT PORTFOLIO - 99.6% (Cost $25,409,674) |
30,294,020 |
||
|
NET OTHER ASSETS - 0.4% |
108,159 |
||
|
NET ASSETS - 100% |
$ 30,402,179 |
||
|
Legend |
|
(a) Non-income producing |
|
(b) The rate quoted is the annualized seven-day yield of the fund at |
|
Income Tax Information |
|
At July 31, 2000, the aggregate cost of investment securities for income |
|
The fund hereby designates approximately $653,000 as a capital gain dividend for the purpose of the dividend paid deduction. |
|
At July 31, 2000, the fund had a capital loss carryforward of approximately $435,000 all of which will expire on July 31, 2008. |
|
The fund intends to elect to defer to its fiscal year ending July 31, 2001 approximately $204,000 of losses recognized during the period |
See accompanying notes which are an integral part of the financial statements.
Consumer Industries
Statement of Assets and Liabilities
|
|
July 31, 2000 |
|
|
Assets |
|
|
|
Investment in securities, at value |
|
$ 30,294,020 |
|
Cash |
|
1,316 |
|
Receivable for investments sold |
|
927,688 |
|
Receivable for fund shares sold |
|
6,528 |
|
Dividends receivable |
|
15,678 |
|
Interest receivable |
|
11,835 |
|
Other receivables |
|
219 |
|
Total assets |
|
31,257,284 |
|
Liabilities |
|
|
|
Payable for investments purchased |
$ 311,873 |
|
|
Payable for fund shares redeemed |
48,326 |
|
|
Accrued management fee |
10,644 |
|
|
Distribution fees payable |
17,008 |
|
|
Other payables and accrued expenses |
33,194 |
|
|
Collateral on securities loaned, |
434,060 |
|
|
Total liabilities |
|
855,105 |
|
Net Assets |
|
$ 30,402,179 |
|
Net Assets consist of: |
|
|
|
Paid in capital |
|
$ 26,500,308 |
|
Accumulated undistributed net realized gain (loss) on investments and foreign currency transactions |
|
(982,312) |
|
Net unrealized appreciation (depreciation) on investments |
|
4,884,183 |
|
Net Assets |
|
$ 30,402,179 |
|
Calculation of Maximum |
|
$15.04 |
|
Maximum offering price per share |
|
$15.96 |
|
Class T: |
|
$14.93 |
|
Maximum offering price per share |
|
$15.47 |
|
Class B: |
|
$14.69 |
|
Class C: |
|
$14.71 |
|
Institutional Class: |
|
$15.18 |
A Redemption price per share is equal to net asset value less any applicable contingent deferred sales charge.
Statement of Operations
|
|
Year ended July 31, 2000 |
|
|
Investment Income Dividends |
|
$ 314,716 |
|
Interest |
|
128,878 |
|
Security lending |
|
1,659 |
|
Total income |
|
445,253 |
|
Expenses |
|
|
|
Management fee |
$ 205,909 |
|
|
Transfer agent fees |
116,996 |
|
|
Distribution fees |
211,231 |
|
|
Accounting and security lending fees |
60,358 |
|
|
Non-interested trustees' compensation |
108 |
|
|
Custodian fees and expenses |
7,791 |
|
|
Registration fees |
71,659 |
|
|
Audit |
23,105 |
|
|
Legal |
315 |
|
|
Miscellaneous |
2,493 |
|
|
Total expenses before reductions |
699,965 |
|
|
Expense reductions |
(46,778) |
653,187 |
|
Net investment income (loss) |
|
(207,934) |
|
Realized and Unrealized Gain (Loss) Net realized gain (loss) on: |
|
|
|
Investment securities |
(840,883) |
|
|
Foreign currency transactions |
(508) |
(841,391) |
|
Change in net unrealized appreciation (depreciation) on: |
|
|
|
Investment securities |
(865,491) |
|
|
Assets and liabilities in |
(167) |
(865,658) |
|
Net gain (loss) |
|
(1,707,049) |
|
Net increase (decrease) in net assets resulting from operations |
|
$ (1,914,983) |
See accompanying notes which are an integral part of the financial statements.
Annual Report
Advisor Consumer Industries Fund
Financial Statements - continued
Statement of Changes in Net Assets
|
Increase (Decrease) in Net Assets |
Year ended |
Year ended |
|
Operations |
$ (207,934) |
$ (162,801) |
|
Net realized gain (loss) |
(841,391) |
807,597 |
|
Change in net unrealized appreciation (depreciation) |
(865,658) |
3,190,674 |
|
Net increase (decrease) in net assets resulting from operations |
(1,914,983) |
3,835,470 |
|
Distributions to shareholders |
|
|
|
From net realized gain |
(498,458) |
(1,579,052) |
|
In excess of net realized gain |
(154,415) |
- |
|
Total distributions |
(652,873) |
(1,579,052) |
|
Share transactions - net increase (decrease) |
(10,822,065) |
13,658,707 |
|
Redemption fees |
29,843 |
14,605 |
|
Total increase (decrease) in net assets |
(13,360,078) |
15,929,730 |
|
Net Assets |
|
|
|
Beginning of period |
43,762,257 |
27,832,527 |
|
End of period |
$ 30,402,179 |
$ 43,762,257 |
Financial Highlights - Class A
|
Years ended July 31, |
2000 |
1999 |
1998 |
1997 E |
|
Selected Per-Share Data |
|
|
|
|
|
Net asset value, beginning of period |
$ 16.01 |
$ 15.08 |
$ 13.48 |
$ 10.00 |
|
Income from Investment Operations |
|
|
|
|
|
Net investment income (loss) D |
(.04) |
(.03) |
(.06) |
(.05) |
|
Net realized and unrealized gain (loss) |
(.68) |
1.80 |
3.31 |
3.60 |
|
Total from investment operations |
(.72) |
1.77 |
3.25 |
3.55 |
|
Less Distributions |
|
|
|
|
|
From net realized gain |
(.20) |
(.85) |
(1.68) |
(.07) |
|
In excess of net realized gain |
(.06) |
- |
- |
- |
|
Total distributions |
(.26) |
(.85) |
(1.68) |
(.07) |
|
Redemption fees added to paid in capital |
.01 |
.01 |
.03 |
- |
|
Net asset value, end of period |
$ 15.04 |
$ 16.01 |
$ 15.08 |
$ 13.48 |
|
Total Return B, C |
(4.48)% |
13.49% |
27.48% |
35.68% |
|
Ratios and Supplemental Data |
|
|
|
|
|
Net assets, end of period (000 omitted) |
$ 3,609 |
$ 3,504 |
$ 2,220 |
$ 944 |
|
Ratio of expenses to average net assets |
1.50% F |
1.55% F |
1.75% F |
1.75% A, F |
|
Ratio of expenses to average net assets after expense reductions |
1.49% G |
1.54% G |
1.73% G |
1.73% A, G |
|
Ratio of net investment income (loss) to average net assets |
(.24)% |
(.19)% |
(.47)% |
(.50)% A |
|
Portfolio turnover |
69% |
80% |
144% |
203% A |
|
A Annualized B The total returns would have been lower had certain expenses not been reduced during the periods shown. C Total returns do not include the one time sales charge and for periods of less than one year are not annualized. D Net investment income (loss) per share has been calculated based on average shares outstanding during the period. E For the period September 3, 1996 (commencement of sale of Class A shares) to July 31, 1997. F FMR agreed to reimburse a portion of the class' expenses during the period. Without this reimbursement, the class' expense ratio would have been higher. G FMR or the fund has entered into varying arrangements with third parties who either paid or reduced a portion of the class' expenses. |
||||
See accompanying notes which are an integral part of the financial statements.
Consumer Industries
Financial Highlights - Class T
|
Years ended July 31, |
2000 |
1999 |
1998 |
1997 E |
|
Net asset value, beginning of period |
$ 15.93 |
$ 15.00 |
$ 13.45 |
$ 10.00 |
|
Income from Investment Operations |
|
|
|
|
|
Net investment income (loss) D |
(.08) |
(.06) |
(.10) |
(.09) |
|
Net realized and unrealized gain (loss) |
(.67) |
1.79 |
3.28 |
3.60 |
|
Total from investment operations |
(.75) |
1.73 |
3.18 |
3.51 |
|
Less Distributions |
|
|
|
|
|
From net realized gain |
(.20) |
(.81) |
(1.66) |
(.06) |
|
In excess of net realized gain |
(.06) |
- |
- |
- |
|
Total distributions |
(.26) |
(.81) |
(1.66) |
(.06) |
|
Redemption fees added to paid in capital |
.01 |
.01 |
.03 |
- |
|
Net asset value, end of period |
$ 14.93 |
$ 15.93 |
$ 15.00 |
$ 13.45 |
|
Total Return B, C |
(4.69)% |
13.20% |
26.93% |
35.25% |
|
Ratios and Supplemental Data |
|
|
|
|
|
Net assets, end of period (000 omitted) |
$ 13,275 |
$ 21,714 |
$ 13,989 |
$ 7,314 |
|
Ratio of expenses to average net assets |
1.75% F |
1.79% F |
2.00% F |
2.00% A, F |
|
Ratio of expenses to average net assets after expense reductions |
1.73% G |
1.77% G |
1.98% G |
1.97% A, G |
|
Ratio of net investment income (loss) to average net assets |
(.49)% |
(.42)% |
(.71)% |
(.83)% A |
|
Portfolio turnover |
69% |
80% |
144% |
203% A |
|
A Annualized B The total returns would have been lower had certain expenses not been reduced during the periods shown. C Total returns do not include the one time sales charge and for periods of less than one year are not annualized. D Net investment income (loss) per share has been calculated based on average shares outstanding during the period. E For the period September 3, 1996 (commencement of sale of Class T shares) to July 31, 1997. F FMR agreed to reimburse a portion of the class' expenses during the period. Without this reimbursement, the class' expense ratio would have been higher. G FMR or the fund has entered into varying arrangements with third parties who either paid or reduced a portion of the class' expenses. |
||||
Financial Highlights - Class B
|
Years ended July 31, |
2000 |
1999 |
1998 |
1997 E |
|
Net asset value, beginning of period |
$ 15.76 |
$ 14.91 |
$ 13.42 |
$ 11.46 |
|
Income from Investment Operations |
|
|
|
|
|
Net investment income (loss) D |
(.15) |
(.14) |
(.17) |
(.08) |
|
Net realized and unrealized gain (loss) |
(.67) |
1.79 |
3.26 |
2.04 |
|
Total from investment operations |
(.82) |
1.65 |
3.09 |
1.96 |
|
Less Distributions |
|
|
|
|
|
From net realized gain |
(.20) |
(.81) |
(1.64) |
- |
|
In excess of net realized gain |
(.06) |
- |
- |
- |
|
Total distributions |
(.26) |
(.81) |
(1.64) |
- |
|
Redemption fees added to paid in capital |
.01 |
.01 |
.04 |
- |
|
Net asset value, end of period |
$ 14.69 |
$ 15.76 |
$ 14.91 |
$ 13.42 |
|
Total Return B, C |
(5.19)% |
12.71% |
26.30% |
17.10% |
|
Ratios and Supplemental Data |
|
|
|
|
|
Net assets, end of period (000 omitted) |
$ 9,021 |
$ 9,832 |
$ 5,419 |
$ 596 |
|
Ratio of expenses to average net assets |
2.25% F |
2.31% F |
2.50% F |
2.50% A, F |
|
Ratio of expenses to average net assets after expense reductions |
2.24% G |
2.30% G |
2.48% G |
2.46% A, G |
|
Ratio of net investment income (loss) to average net assets |
(.99)% |
(.95)% |
(1.23)% |
(1.60)% A |
|
Portfolio turnover |
69% |
80% |
144% |
203% A |
|
A Annualized B The total returns would have been lower had certain expenses not been reduced during the periods shown. C Total returns do not include the contingent deferred sales charge and for periods of less than one year are not annualized. D Net investment income (loss) per share has been calculated based on average shares outstanding during the period. E For the period March 3, 1997 (commencement of sale of Class B shares) to July 31, 1997. F FMR agreed to reimburse a portion of the class' expenses during the period. Without this reimbursement, the class' expense ratio would have been higher. G FMR or the fund has entered into varying arrangements with third parties who either paid or reduced a portion of the class' expenses. |
||||
See accompanying notes which are an integral part of the financial statements.
Annual Report
Financial Highlights - Class C
|
Years ended July 31, |
2000 |
1999 |
1998 E |
|
Net asset value, beginning of period |
$ 15.78 |
$ 14.95 |
$ 12.66 |
|
Income from Investment Operations |
|
|
|
|
Net investment income (loss) D |
(.15) |
(.15) |
(.13) |
|
Net realized and unrealized gain (loss) |
(.67) |
1.80 |
2.87 |
|
Total from investment operations |
(.82) |
1.65 |
2.74 |
|
Less Distributions |
|
|
|
|
From net realized gain |
(.20) |
(.83) |
(.49) |
|
In excess of net realized gain |
(.06) |
- |
- |
|
Total distributions |
(.26) |
(.83) |
(.49) |
|
Redemption fees added to paid in capital |
.01 |
.01 |
.04 |
|
Net asset value, end of period |
$ 14.71 |
$ 15.78 |
$ 14.95 |
|
Total Return B, C |
(5.19)% |
12.72% |
22.67% |
|
Ratios and Supplemental Data |
|
|
|
|
Net assets, end of period (000 omitted) |
$ 3,048 |
$ 2,758 |
$ 1,461 |
|
Ratio of expenses to average net assets |
2.25% F |
2.32% F |
2.50% A, F |
|
Ratio of expenses to average net assets after expense reductions |
2.24% G |
2.30% G |
2.48% A, G |
|
Ratio of net investment income (loss) to average net assets |
(.99)% |
(.95)% |
(1.27)% A |
|
Portfolio turnover |
69% |
80% |
144% |
|
A Annualized B The total returns would have been lower had certain expenses not been reduced during the periods shown. C Total returns do not include the contingent deferred sales charge and for periods of less than one year are not annualized. D Net investment income (loss) per share has been calculated based on average shares outstanding during the period. E For the period November 3, 1997 (commencement of sale of Class C shares) to July 31, 1998. F FMR agreed to reimburse a portion of the class' expenses during the period. Without this reimbursement, the class' expense ratio would have been higher. G FMR or the fund has entered into varying arrangements with third parties who either paid or reduced a portion of the class' expenses. |
|||
Financial Highlights - Institutional Class
|
Years ended July 31, |
2000 |
1999 |
1998 |
1997 E |
|
Net asset value, beginning of period |
$ 16.11 |
$ 15.12 |
$ 13.51 |
$ 10.00 |
|
Income from Investment Operations |
|
|
|
|
|
Net investment income (loss) D |
(.00) |
.02 |
(.03) |
(.01) |
|
Net realized and unrealized gain (loss) |
(.69) |
1.81 |
3.31 |
3.59 |
|
Total from investment operations |
(.69) |
1.83 |
3.28 |
3.58 |
|
Less Distributions |
|
|
|
|
|
From net realized gain |
(.20) |
(.85) |
(1.70) |
(.07) |
|
In excess of net realized gain |
(.06) |
- |
- |
- |
|
Total distributions |
(.26) |
(.85) |
(1.70) |
(.07) |
|
Redemption fees added to paid in capital |
.02 |
.01 |
.03 |
- |
|
Net asset value, end of period |
$ 15.18 |
$ 16.11 |
$ 15.12 |
$ 13.51 |
|
Total Return B, C |
(4.20)% |
13.87% |
27.70% |
35.98% |
|
Ratios and Supplemental Data |
|
|
|
|
|
Net assets, end of period (000 omitted) |
$ 1,449 |
$ 5,954 |
$ 4,745 |
$ 1,333 |
|
Ratio of expenses to average net assets |
1.25% F |
1.26% F |
1.50% F |
1.50% A, F |
|
Ratio of expenses to average net assets after expense reductions |
1.24% G |
1.24% G |
1.48% G |
1.48% A, G |
|
Ratio of net investment income (loss) to average net assets |
.01% |
.11% |
(.20)% |
(.13)% A |
|
Portfolio turnover |
69% |
80% |
144% |
203% A |
|
A Annualized B The total returns would have been lower had certain expenses not been reduced during the periods shown. C Total returns for periods of less than one year are not annualized. D Net investment income (loss) per share has been calculated based on average shares outstanding during the period. E For the period September 3, 1996 (commencement of sale of Institutional Class shares) to July 31, 1997. F FMR agreed to reimburse a portion of the class' expenses during the period. Without this reimbursement, the class' expense ratio would have been higher. G FMR or the fund has entered into varying arrangements with third parties who either paid or reduced a portion of the class' expenses. |
||||
See accompanying notes which are an integral part of the financial statements.
Consumer Industries
For the period ended July 31, 2000
1. Significant Accounting Policies.
Fidelity Advisor Consumer Industries Fund (the fund) is a fund of Fidelity Advisor Series VII (the trust) and is authorized to issue an unlimited number of shares. The trust is registered under the Investment Company Act of 1940, as amended (the 1940 Act), as an open-end management investment company organized as a Massachusetts business trust.
The fund offers Class A, Class T, Class B, Class C, and Institutional Class shares, each of which has equal rights as to assets and voting privileges. Each class has exclusive voting rights with respect to matters that affect that class. Class B shares will automatically convert to Class A shares after a holding period of seven years from the initial date of purchase. Investment income, realized and unrealized capital gains and losses, the common expenses of the fund, and certain fund-level expense reductions, if any, are allocated on a pro rata basis to each class based on the relative net assets of each class to the total net assets of the fund. Each class of shares differs in its respective distribution, transfer agent, and certain other class-specific fees, expenses, and expense reductions.
The financial statements have been prepared in conformity with generally accepted accounting principles which require management to make certain estimates and assumptions at the date of the financial statements. The following summarizes the significant accounting policies of the fund:
Security Valuation. Securities for which exchange quotations are readily available are valued at the last sale price, or if no sale price, at the closing bid price. Foreign securities are valued based on quotations from the principal market in which such securities are normally traded. If trading or events occurring in other markets after the close of the principal market in which foreign securities are traded, and before the close of the business of the fund, are expected to materially affect the value of those securities, then they are valued at their fair value taking this trading or these events into account. Fair value is determined in good faith under consistently applied procedures under the general supervision of the Board of Trustees. Securities for which exchange quotations are not readily available (and in certain cases debt securities which trade on an exchange) are valued primarily using dealer-supplied valuations or at their fair value. Short-term securities with remaining maturities of sixty days or less for which quotations are not readily available are valued at amortized cost or original cost plus accrued interest, both of which approximate current value.
Foreign Currency Translation. The accounting records of the fund are maintained in U.S. dollars. Investment securities and other assets and liabilities denominated in a foreign currency are translated into U.S. dollars at the prevailing rates of exchange at period end. Purchases and sales of securities, income receipts and expense payments are translated into U.S. dollars at the prevailing exchange rate on the respective dates of the transactions.
Net realized gains and losses on foreign currency transactions represent net gains and losses from sales and maturities of foreign currency contracts, disposition of foreign currencies, the difference between the amount of net investment income accrued and the U.S. dollar amount actually received, and gains and losses between trade and settlement date on purchases and sales of securities. The effects of changes in foreign currency exchange rates on investments in securities are included with the net realized and unrealized gain or loss on investment securities.
Income Taxes. As a qualified regulated investment company under Subchapter M of the Internal Revenue Code, the fund is not subject to income taxes to the extent that it distributes substantially all of its taxable income for its fiscal year. The schedule of investments includes information regarding income taxes under the caption "Income Tax Information."
Investment Income. Dividend income is recorded on the ex-dividend date, except certain dividends from foreign securities where the ex-dividend date may have passed, are recorded as soon as the fund is informed of the ex-dividend date. Non-cash dividends included in dividend income, if any, are recorded at the fair market value of the securities received. Interest income is accrued as earned. Investment income is recorded net of foreign taxes withheld where recovery of such taxes is uncertain.
Expenses. Most expenses of the trust can be directly attributed to a fund. Expenses which cannot be directly attributed are apportioned among the funds in the trust.
Distributions to Shareholders. Distributions are recorded on the ex-dividend date. Income dividends and capital gain distributions are declared separately for each class.
Income and capital gain distributions are determined in accordance with income tax regulations which may differ from generally accepted accounting principles. These differences, which may result in distribution reclassifications, are primarily due to differing treatments for foreign currency transactions, net operating losses and losses deferred due to wash sales and excise tax regulations.
Permanent book and tax basis differences relating to shareholder distributions will result in reclassifications to paid in capital. Accumulated undistributed net realized gain (loss) on investments and foreign currency transactions may include temporary book and tax basis differences which will reverse in a subsequent period. Any taxable income or gain remaining at fiscal year end is distributed in the following year.
Annual Report
Notes to Financial Statements - continued
1. Significant Accounting
Policies - continued
Short-Term Trading (Redemption) Fees. Shares held in the fund less than 60 days are subject to a short-term trading fee equal to 1% of the proceeds of the redeemed shares. The fee, which is retained by the fund, is accounted for as an addition to paid in capital.
Security Transactions. Security transactions are accounted for as of trade date. Gains and losses on securities sold are determined on the basis of identified cost.
2. Operating Policies.
Foreign Currency Contracts. The fund generally uses foreign currency contracts to facilitate transactions in foreign-denominated securities. Losses may arise from changes in the value of the foreign currency or if the counterparties do not perform under the contracts' terms. The U.S. dollar value of foreign currency contracts is determined using contractual currency exchange rates established at the time of each trade.
Joint Trading Account. Pursuant to an Exemptive Order issued by the Securities and Exchange Commission (the SEC), the fund, along with other affiliated entities of Fidelity Management & Research Company (FMR), may transfer uninvested cash balances into one or more joint trading accounts. These balances are invested in one or more repurchase agreements for U.S. Treasury or Federal Agency obligations.
Repurchase Agreements. The underlying U.S. Treasury, Federal Agency, or other obligations found to be satisfactory by FMR are transferred to an account of the fund, or to the Joint Trading Account, at a custodian bank. The securities are marked-to-market daily and maintained at a value at least equal to the principal amount of the repurchase agreement (including accrued interest). FMR, the fund's investment adviser, is responsible for determining that the value of the underlying securities remains in accordance with the market value requirements stated above.
Cash Central Funds. Pursuant to an Exemptive Order issued by the SEC, the fund may invest in the Fidelity Cash Central Fund and the Fidelity Securities Lending Cash Central Fund (the Cash Funds) managed by Fidelity Investments Money Management, Inc., an affiliate of FMR. The Cash Funds are open-end money market funds available only to investment companies and other accounts managed by FMR and its affiliates. The Cash Funds seek preservation of capital, liquidity, and current income. Income distributions from the Cash Funds are declared daily and paid monthly from net interest income. Income distributions earned by the fund are recorded as either interest income or security lending income in the accompanying financial statements.
3. Purchases and Sales of Investments.
Purchases and sales of securities, other than short-term securities, aggregated $23,151,520 and $34,476,273, respectively.
4. Fees and Other Transactions with Affiliates.
Management Fee. As the fund's investment adviser, FMR receives a monthly fee that is calculated on the basis of a group fee rate plus a fixed individual fund fee rate applied to the average net assets of the fund. The group fee rate is the weighted average of a series of rates and is based on the monthly average net assets of all the mutual funds advised by FMR. The rates ranged from .2167% to .5200% for the period. The annual individual fund fee rate is .30%. In the event that these rates were lower than the contractual rates in effect during the period, FMR voluntarily implemented the above rates, as they resulted in the same or a lower management fee. For the period, the management fee was equivalent to an annual rate of .58% of average net assets.
Distribution and Service Plan. In accordance with Rule 12b-1 of the 1940 Act, the Board of Trustees have adopted separate Distribution and Service Plans with respect to each class of shares (collectively referred to as "the Plans"). Under certain of the Plans, the class pays Fidelity Distributors Corporation (FDC), an affiliate of FMR, a 12b-1 fee. A portion of this fee may be reallowed to securities dealers, banks and other financial institutions for the distribution of each class of shares and providing shareholder support services. For the period, this fee was based on the following annual rates of the average net assets of each applicable class:
|
Class A |
.25% |
|
Class T |
.50% |
|
Class B |
1.00%* |
|
Class C |
1.00%* |
* .75% represents a distribution fee and .25% represents a shareholder service fee.
For the period, each class paid FDC the following amounts, a portion of which was retained by FDC:
|
|
Paid to |
Retained |
|
Class A |
$ 8,524 |
$ 43 |
|
Class T |
79,553 |
381 |
|
Class B |
95,080 |
71,361 |
|
Class C |
28,074 |
14,469 |
|
|
$ 211,231 |
$ 86,254 |
Sales Load. FDC receives a front-end sales charge of up to 5.75% for selling Class A shares, and 3.50% for selling Class T shares of the fund. FDC receives the proceeds of contingent deferred sales charges levied on Class B share redemptions occurring within six years of purchase and Class C share redemptions occurring within one year of purchase. Contingent deferred sales charges are based on declining rates ranging from 5% to 1% for Class B and 1% for Class C, of the lesser of
Consumer Industries
Notes to Financial Statements - continued
4. Fees and Other Transactions with Affiliates - continued
Sales Load - continued
the cost of shares at the initial date of purchase or the net asset value of the redeemed shares, excluding any reinvested dividends and capital gains. In addition, purchases of Class A and Class T shares that were subject to a finder's fee bear a contingent deferred sales charge on assets that do not remain in the fund for at least one year. The Class A and Class T contingent deferred sales charge is based on 0.25% of the lesser of the cost of shares at the initial date of purchase or the net asset value of the redeemed shares, excluding any reinvested dividends and capital gains. A portion of the sales charges paid to FDC is paid to securities dealers, banks and other financial institutions.
For the period, sales charge amounts paid to and retained by FDC were as follows:
|
|
Paid to |
Retained |
|
Class A |
$ 23,206 |
$ 9,974 |
|
Class T |
25,497 |
8,661 |
|
Class B |
48,560 |
48,560* |
|
Class C |
3,389 |
3,389* |
|
|
$ 100,652 |
$ 70,584 |
* When Class B and Class C shares are initially sold, FDC pays commissions from its own resources to securities dealers,
banks, and other financial institutions through which the sales are made.
Transfer Agent Fees. Fidelity Investments Institutional Operations Company, Inc., (FIIOC), an affiliate of FMR, is the transfer, dividend disbursing and shareholder servicing agent (collectively referred to as the transfer agent) for each class of the fund. FIIOC receives account fees and asset-based fees that vary according to the account size and type of account of the shareholders of the respective classes of the fund. FIIOC pays for typesetting, printing and mailing of all shareholder reports, except proxy statements. For the period, the following amounts were paid to FIIOC:
|
|
Amount |
% of |
|
Class A |
$ 11,164 |
.33 |
|
Class T |
49,516 |
.31 |
|
Class B |
34,766 |
.37 |
|
Class C |
10,709 |
.38 |
|
Institutional Class |
10,841 |
.27 |
|
|
$ 116,996 |
|
Accounting and Security Lending Fees. Fidelity Service Company, Inc., an affiliate of FMR, maintains the fund's accounting records and administers the security lending program. The security lending fee is based on the number and duration of lending transactions. The accounting fee is based on the level of average net assets for the month plus out-of-pocket expenses.
Brokerage Commissions. The fund placed a portion of its portfolio transactions with brokerage firms which are affiliates of FMR. The commissions paid to these affiliated firms were $4,422 for the period.
5. Security Lending.
The fund lends portfolio securities from time to time in order to earn additional income. The fund receives collateral in the form of U.S. Treasury obligations, letters of credit, and/or cash against the loaned securities, and maintains collateral in an amount not less than 100% of the market value of the loaned securities during the period of the loan. The market value of the loaned securities is determined at the close of business of the fund and any additional required collateral is delivered to the fund on the next business day. If the borrower defaults on its obligation to return the securities loaned because of insolvency or other reasons, the fund could experience delays and costs in recovering the securities loaned or in gaining access to the collateral. At period end, the value of the securities loaned amounted to $423,220. The fund received cash collateral of $434,060 which was invested in cash equivalents.
6. Expense Reductions.
FMR voluntarily agreed to reimburse operating expenses (excluding interest, taxes, certain securities lending fees, brokerage commissions and extraordinary expenses, if any) above the following annual rates or range of annual rates of average net assets for each of the following classes:
|
|
FMR |
Reimbursement |
|
Class A |
1.50% |
$ 4,076 |
|
Class T |
1.75% |
16,304 |
|
Class B |
2.25% |
14,995 |
|
Class C |
2.25% |
4,890 |
|
Institutional Class |
1.25% |
2,353 |
|
|
|
$ 42,618 |
FMR has also directed certain portfolio trades to brokers who paid a portion of the fund's expenses. For the period, the fund's expenses were reduced by $3,133 under this arrangement.
In addition, through an arrangement with each class' transfer agent, credits realized as a result of uninvested cash balances were used to reduce a portion of expenses. During the period, each applicable class' expenses were reduced as follows under the transfer agent arrangements:
|
|
Transfer |
|
Class T |
$ 1,027 |
Consumer Industries
Notes to Financial Statements - continued
7. Distributions to Shareholders.
Distributions to shareholders of each class were as follows:
|
|
Years ended July 31, |
|
|
|
2000 |
1999 |
|
From net realized gain |
|
|
|
Class A |
$ 42,252 |
$ 121,205 |
|
Class T |
225,103 |
772,710 |
|
Class B |
124,768 |
327,913 |
|
Class C |
33,851 |
82,950 |
|
Institutional Class |
72,484 |
274,274 |
|
Total |
$ 498,458 |
$ 1,579,052 |
|
In excess of net realized gain |
|
|
|
Class A |
$ 13,089 |
$ - |
|
Class T |
69,734 |
- |
|
Class B |
38,651 |
- |
|
Class C |
10,487 |
- |
|
Institutional Class |
22,454 |
- |
|
Total |
$ 154,415 |
$ - |
|
|
$ 652,873 |
$ 1,579,052 |
8. Share Transactions.
Transactions for each class of shares were as follows:
|
|
Shares |
Dollars |
||
|
|
Year ended |
Year ended |
Year ended |
Year ended |
|
|
2000 |
1999 |
2000 |
1999 |
|
|
|
|
|
|
|
Class A |
175,164 |
115,099 |
$ 2,691,443 |
$ 1,782,025 |
|
Reinvestment of distributions |
3,047 |
9,730 |
47,113 |
119,873 |
|
Shares redeemed |
(157,159) |
(53,179) |
(2,408,041) |
(794,506) |
|
Net increase (decrease) |
21,052 |
71,650 |
$ 330,515 |
$ 1,107,392 |
|
Class T |
258,873 |
836,168 |
$ 3,976,219 |
$ 12,781,566 |
|
Reinvestment of distributions |
17,994 |
59,298 |
276,740 |
728,776 |
|
Shares redeemed |
(750,965) |
(465,170) |
(11,598,163) |
(6,990,735) |
|
Net increase (decrease) |
(474,098) |
430,296 |
$ (7,345,204) |
$ 6,519,607 |
|
Class B |
267,514 |
400,266 |
$ 4,069,631 |
$ 5,949,947 |
|
Reinvestment of distributions |
9,759 |
25,754 |
148,334 |
314,459 |
|
Shares redeemed |
(287,327) |
(165,340) |
(4,326,711) |
(2,389,462) |
|
Net increase (decrease) |
(10,054) |
260,680 |
$ (108,746) |
$ 3,874,944 |
|
Class C |
140,701 |
138,656 |
$ 2,142,602 |
$ 2,101,382 |
|
Reinvestment of distributions |
2,696 |
6,196 |
41,038 |
75,712 |
|
Shares redeemed |
(111,068) |
(67,731) |
(1,685,976) |
(994,371) |
|
Net increase (decrease) |
32,329 |
77,121 |
$ 497,664 |
$ 1,182,723 |
|
Institutional Class |
54,848 |
257,491 |
$ 838,836 |
$ 3,899,578 |
|
Reinvestment of distributions |
4,957 |
21,083 |
77,138 |
260,589 |
|
Shares redeemed |
(333,892) |
(222,900) |
(5,112,268) |
(3,186,126) |
|
Net increase (decrease) |
(274,087) |
55,674 |
$ (4,196,294) |
$ 974,041 |
Consumer Industries
Performance
There are several ways to evaluate historical performance. You can look at the total percentage change in value, the average annual percentage change or the growth of a hypothetical $10,000 investment. Total return reflects the change in the value of an investment, assuming reinvestment of dividend income and capital gains (the profits earned upon the sale of securities that have grown in value). If Fidelity had not reimbursed certain class expenses, the total returns would have been lower.
Cumulative Total Returns
|
Periods ended July 31, 2000 |
|
Past 1 |
Life of |
|
Fidelity Adv Cyclical - Inst CL |
|
-2.04% |
61.65% |
|
S&P 500 |
|
8.98% |
131.80% |
|
GS Cyclical Industries |
|
-10.98% |
38.17% |
Cumulative total returns show Institutional Class shares' performance in percentage terms over a set period - in this case, one year or since the fund started on September 3, 1996. You can compare Institutional Class shares' returns to the performance of both the Standard & Poor's 500 Index - a market capitalization-weighted index of common stocks - and the Goldman Sachs Cyclical Industries Index - a market capitalization-weighted index of 253 stocks designed to measure the performance of companies in the cyclical industries sector. Issues in the index include providers of consumer and commercial goods and services where performance is influenced by the cyclicality of economy, such as: manufacturers of automobiles and companies involved with construction of residential and commercial properties, producers of chemicals, electrical equipment and components, and providers of environmental services. These benchmarks include reinvested dividends and capital gains, if any, and exclude the effect of sales charges.
Average Annual Total Returns
|
Periods ended July 31, 2000 |
|
Past 1 |
Life of |
|
Fidelity Adv Cyclical - Inst CL |
|
-2.04% |
13.07% |
|
S&P 500 |
|
8.98% |
23.99% |
|
GS Cyclical Industries |
|
-10.98% |
8.62% |
Average annual returns take Institutional Class shares' cumulative return and show you what would have happened if Institutional Class shares had performed at a constant rate each year.
$10,000 Over Life of Fund
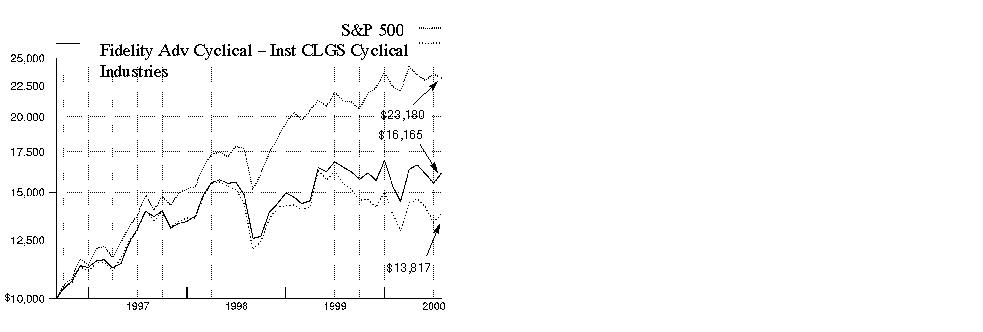
$10,000 Over Life of Fund: Let's say hypothetically that $10,000 was invested in Fidelity Advisor Cyclical Industries - Institutional Class on September 3, 1996, when the fund started. As the chart shows, by July 31, 2000, the value of the investment would have grown to $16,165 - a 61.65% increase on the initial investment. For comparison, look at how the Standard & Poor's 500 Index did over the same period. With dividends and capital gains, if any, reinvested, the same $10,000 investment would have grown to $23,180 - a 131.80% increase. If $10,000 was invested in the Goldman Sachs Cyclical Industries Index, it would have grown to $13,817 - a 38.17% increase.
Annual Report
(Portfolio Manager photograph)
An interview with Brian Hogan, Portfolio Manager of Fidelity Advisor Cyclical Industries Fund
Q. How did the fund perform, Brian?
A. For the 12 months that ended July 31, 2000, the fund's Class A, Class T, Class B and Class C shares returned -2.13%, -2.43%, -2.90% and -3.11%, respectively. For the same 12-month period, the Goldman Sachs Cyclical Industries Index - an index of 253 stocks designed to measure the performance of companies in the cyclical industries sector - fell 10.98%, while the Standard & Poor's 500 Index returned 8.98%.
A. For the 12 months that ended July 31, 2000, the fund's Institutional Class shares returned -2.04%. For the same 12-month period, the Goldman Sachs Cyclical Index - an index of 253 stocks designed to measure the performance of companies in the cyclical industries sector - returned -10.98%, while the Standard & Poor's 500 Index returned 8.98%.
Q. What factors drove cyclical industry stocks during the period?
A. Two themes dominated the investment environment - rising interest rates and increasing oil prices. During the 12-month period, the Federal Reserve Board increased short-term interest rates by 150 basis points or 1.50%. Over the same time frame, oil prices rose to as high as $34 per barrel, up from the low $20 range. Both higher interest rates and more expensive oil have the potential to reduce the economy's growth rate. Also, many cyclical industries use petroleum-based resins in the manufacturing processes, and higher raw material prices tend to erode their profit margins. As a result, negative investor sentiment surfaced early in the period and pressured cyclical stock prices. Later, expectations became reality as numerous companies either missed their earnings targets or guided analysts' earnings estimates lower.
Q. How did the fund outperform the Goldman Sachs index in this weak environment?
A. The fund outperformed its benchmark index by virtue of our relatively higher concentration in stocks and sectors that performed well, such as specialty chemicals and diversified conglomerates. The fund's performance also was enhanced by its relatively lower exposure to interest-rate sensitive consumer-oriented stocks, such as auto manufacturers, that performed poorly in the rising interest-rate environment.
Q. Which stocks contributed to the fund's performance?
A. Underweighting automobile manufacturers had a positive impact on the fund's returns. The sector performed poorly in response to rising interest rates, higher prices at the gas pump and a peaking auto production cycle that raised concerns that auto manufacturers would need to offer higher consumer discounts to maintain sales volume. During the 12-month period, specifically underweighting DaimlerChrysler was among the biggest contributors to the fund's performance relative to the Goldman Sachs benchmark index. In addition to the malaise affecting the overall sector, Daimler- Chrysler's stock was further pressured when the merger between Daimler Benz and Chrysler progressed less smoothly than the market expected. General Electric and SPX both performed well. GE, a large, well-diversified old economy stock, successfully adopted the Internet, which facilitated strong revenue growth and accelerating earnings. SPX is a well-managed conglomerate that has profitably shifted its business mix toward higher-growth segments. Tyco International performed well after I began increasing the fund's exposure to it during the second half of the 12-month period. Although allegations of accounting irregularities caused the stock to lose half of its value late in 1999, the stock regained most of these losses as investors gained a better understanding of the issues. The Securities and Exchange Commission subsequently concluded its investigation and issued a report that put claims of financial mismanagement to rest.
Q. Which stocks were disappointing?
A. Honeywell International underperformed as slow revenue growth, mature markets and problems integrating its merger with Allied-Signal pulled the company's stock price down. I reduced the fund's exposure to Honeywell during the period, shifting from an overweighted to an underweighted position relative to the Goldman Sachs index. Textron also fell short of my expectations, suffering from a decline in price-to-earnings multiples that affected almost all defense industry stocks. However, Textron remained a well-managed company with a long track record of achieving its earnings targets, and I remained optimistic that the stock price could recover to reflect the company's good fundamentals and consistent, predictable profitability.
Q. What's your outlook for the coming months?
A. The past few months have demonstrated the market's severe penalties for companies that miss their earnings targets, or otherwise fall short of investors' expectations. Should the investment climate remain unchanged, I expect the fund's performance to be driven as much by avoiding stocks that disappoint as by picking stocks that outperform. Thus, I anticipate maintaining an emphasis on companies with global business opportunities, strong revenue growth and lower-than-average exposure to interest-rate sensitive, consumer-oriented markets.
The views expressed in this report reflect those of the portfolio manager only through the end of the period of the report as stated on the cover. The manager's views are subject to change at any time based on market and other conditions. For more information see page A-3.
Fund Facts
Start date: September 3, 1996
Size: as of July 31, 2000, more than $9 million
Manager: Brian Hogan, since February 2000; joined Fidelity in 1994
3Annual Report
Advisor Cyclical Industries Fund
|
Top Ten Stocks as of July 31, 2000 |
|
|
|
% of fund's |
|
Tyco International Ltd. |
8.3 |
|
General Electric Co. |
7.8 |
|
E.I. du Pont de Nemours and Co. |
4.5 |
|
Minnesota Mining & Manufacturing Co. |
3.8 |
|
Ford Motor Co. |
3.6 |
|
Boeing Co. |
3.4 |
|
United Technologies Corp. |
2.8 |
|
Emerson Electric Co. |
2.6 |
|
Union Carbide Corp. |
2.3 |
|
Honeywell International, Inc. |
2.0 |
|
|
41.1 |
|
Top Industries as of July 31, 2000 |
|
|
% of fund's net assets |
||
|
Chemicals & Plastics |
14.5% |
|
Industrial Machinery & Equipment |
14.1% |
|
Aerospace & Defense |
12.3% |
|
Electrical Equipment |
10.5% |
|
Autos, Tires, & Accessories |
10.4% |
|
All Others* |
38.2% |
|
* Includes short-term investments and net other assets. |
Annual Report
Advisor Cyclical Industries Fund
Showing Percentage of Net Assets
|
Common Stocks - 92.5% |
|||
|
Shares |
Value (Note 1) |
||
|
AEROSPACE & DEFENSE - 12.3% |
|||
|
BFGoodrich Co. |
2,700 |
$ 96,356 |
|
|
Boeing Co. |
6,300 |
308,700 |
|
|
Honeywell International, Inc. |
5,412 |
181,979 |
|
|
Lockheed Martin Corp. |
2,114 |
59,456 |
|
|
Northrop Grumman Corp. |
700 |
49,744 |
|
|
Rockwell International Corp. |
1,400 |
49,088 |
|
|
Textron, Inc. |
2,000 |
114,125 |
|
|
United Technologies Corp. |
4,411 |
257,492 |
|
|
|
1,116,940 |
||
|
AIR TRANSPORTATION - 3.1% |
|||
|
AMR Corp. |
600 |
19,838 |
|
|
Atlas Air, Inc. (a) |
300 |
13,313 |
|
|
Continental Airlines, Inc. Class B (a) |
600 |
31,350 |
|
|
Delta Air Lines, Inc. |
600 |
32,213 |
|
|
Northwest Airlines Corp. Class A (a) |
1,750 |
58,406 |
|
|
Ryanair Holdings PLC sponsored ADR (a) |
700 |
29,488 |
|
|
Southwest Airlines Co. |
3,525 |
83,278 |
|
|
UAL Corp. |
200 |
10,825 |
|
|
|
278,711 |
||
|
AUTOS, TIRES, & ACCESSORIES - 10.4% |
|||
|
AutoNation, Inc. |
3,500 |
24,281 |
|
|
DaimlerChrysler AG (Reg.) |
1,000 |
52,688 |
|
|
Danaher Corp. |
850 |
43,297 |
|
|
Delphi Automotive Systems Corp. |
3,000 |
44,438 |
|
|
Eaton Corp. |
900 |
61,031 |
|
|
Ford Motor Co. |
7,100 |
330,594 |
|
|
General Motors Corp. |
2,706 |
154,073 |
|
|
Johnson Controls, Inc. |
600 |
31,163 |
|
|
Navistar International Corp. (a) |
1,000 |
35,688 |
|
|
SPX Corp. (a) |
800 |
114,550 |
|
|
TRW, Inc. |
1,200 |
53,925 |
|
|
|
945,728 |
||
|
BUILDING MATERIALS - 3.2% |
|||
|
American Standard Companies, Inc. (a) |
1,000 |
44,563 |
|
|
Elcor Corp. |
1,600 |
30,700 |
|
|
Ferro Corp. |
200 |
4,650 |
|
|
Fortune Brands, Inc. |
100 |
2,250 |
|
|
Lafarge Corp. |
1,100 |
24,750 |
|
|
Masco Corp. |
4,200 |
82,950 |
|
|
Shaw Group (a) |
800 |
37,700 |
|
|
Sherwin-Williams Co. |
700 |
14,569 |
|
|
Southdown, Inc. |
200 |
12,450 |
|
|
USG Corp. |
100 |
2,938 |
|
|
|
|||
|
Shares |
Value (Note 1) |
||
|
Vulcan Materials Co. |
400 |
$ 17,125 |
|
|
York International Corp. |
700 |
19,469 |
|
|
|
294,114 |
||
|
CHEMICALS & PLASTICS - 14.5% |
|||
|
Air Products & Chemicals, Inc. |
900 |
30,038 |
|
|
Arch Chemicals, Inc. |
1,400 |
28,000 |
|
|
Avery Dennison Corp. |
2,040 |
110,670 |
|
|
Cabot Corp. |
500 |
16,000 |
|
|
Crompton Corp. |
1,293 |
12,688 |
|
|
Dow Chemical Co. |
400 |
11,500 |
|
|
E.I. du Pont de Nemours and Co. |
8,960 |
406,000 |
|
|
Engelhard Corp. |
700 |
12,644 |
|
|
FMC Corp. (a) |
600 |
36,150 |
|
|
Lyondell Chemical Co. |
3,700 |
51,800 |
|
|
Millennium Chemicals, Inc. |
3,000 |
46,500 |
|
|
Potash Corp. of Saskatchewan |
300 |
16,138 |
|
|
PPG Industries, Inc. |
600 |
24,413 |
|
|
Praxair, Inc. |
3,800 |
150,338 |
|
|
Rohm & Haas Co. |
1,850 |
48,100 |
|
|
Sealed Air Corp. (a) |
210 |
10,579 |
|
|
Solutia, Inc. |
3,000 |
42,938 |
|
|
Spartech Corp. |
1,700 |
45,581 |
|
|
Union Carbide Corp. |
4,700 |
210,619 |
|
|
|
1,310,696 |
||
|
COMPUTER SERVICES & SOFTWARE - 0.0% |
|||
|
Sabre Holdings Corp. Class A |
6 |
147 |
|
|
CONSTRUCTION - 0.8% |
|||
|
Centex Corp. |
500 |
11,969 |
|
|
D.R. Horton, Inc. |
600 |
9,300 |
|
|
Jacobs Engineering Group, Inc. (a) |
300 |
10,706 |
|
|
Kaufman & Broad Home Corp. |
1,300 |
25,431 |
|
|
Lennar Corp. |
600 |
14,400 |
|
|
|
71,806 |
||
|
CONSUMER DURABLES - 3.8% |
|||
|
Minnesota Mining & Manufacturing Co. |
3,800 |
342,238 |
|
|
CONSUMER ELECTRONICS - 0.7% |
|||
|
Black & Decker Corp. |
1,400 |
52,063 |
|
|
General Motors Corp. Class H (a) |
476 |
12,317 |
|
|
|
64,380 |
||
|
DRUGS & PHARMACEUTICALS - 0.2% |
|||
|
Sigma-Aldrich Corp. |
600 |
16,350 |
|
|
ELECTRICAL EQUIPMENT - 10.5% |
|||
|
Emerson Electric Co. |
3,800 |
232,038 |
|
|
General Electric Co. |
13,800 |
709,838 |
|
|
Common Stocks - continued |
|||
|
Shares |
Value (Note 1) |
||
|
ELECTRICAL EQUIPMENT - CONTINUED |
|||
|
Hubbell, Inc. Class B |
400 |
$ 9,650 |
|
|
Plug Power, Inc. |
80 |
4,005 |
|
|
|
955,531 |
||
|
ELECTRONIC INSTRUMENTS - 2.4% |
|||
|
Agilent Technologies, Inc. |
2,500 |
101,875 |
|
|
PerkinElmer, Inc. |
850 |
54,347 |
|
|
Thermo Electron Corp. (a) |
2,900 |
60,175 |
|
|
|
216,397 |
||
|
ELECTRONICS - 0.6% |
|||
|
Molex, Inc. |
200 |
9,409 |
|
|
Molex, Inc. Class A |
1,200 |
41,700 |
|
|
|
51,109 |
||
|
ENERGY SERVICES - 0.1% |
|||
|
Varco International, Inc. (a) |
600 |
10,350 |
|
|
ENGINEERING - 0.9% |
|||
|
Fluor Corp. |
2,700 |
80,494 |
|
|
HOME FURNISHINGS - 0.4% |
|||
|
Leggett & Platt, Inc. |
1,900 |
33,250 |
|
|
HOUSEHOLD PRODUCTS - 0.4% |
|||
|
Aptargroup, Inc. |
1,100 |
27,431 |
|
|
Procter & Gamble Co. |
100 |
5,688 |
|
|
|
33,119 |
||
|
INDUSTRIAL MACHINERY & EQUIPMENT - 14.1% |
|||
|
Ballard Power Systems, Inc. (a) |
400 |
35,207 |
|
|
Caterpillar, Inc. |
3,000 |
102,188 |
|
|
CNH Global NV |
1,100 |
8,594 |
|
|
Deere & Co. |
1,300 |
50,131 |
|
|
Dover Corp. |
1,000 |
45,813 |
|
|
Illinois Tool Works, Inc. |
2,700 |
154,575 |
|
|
Ingersoll-Rand Co. |
1,700 |
66,725 |
|
|
ITT Industries, Inc. |
500 |
16,438 |
|
|
Parker-Hannifin Corp. |
1,300 |
46,231 |
|
|
Tyco International Ltd. |
14,150 |
757,009 |
|
|
|
1,282,911 |
||
|
IRON & STEEL - 0.6% |
|||
|
Bethlehem Steel Corp. (a) |
1,500 |
6,938 |
|
|
Nucor Corp. |
1,000 |
37,750 |
|
|
USX - U.S. Steel Group |
500 |
8,969 |
|
|
|
53,657 |
||
|
LEASING & RENTAL - 0.1% |
|||
|
Ryder System, Inc. |
250 |
5,219 |
|
|
|
|||
|
Shares |
Value (Note 1) |
||
|
MEDICAL EQUIPMENT & SUPPLIES - 0.7% |
|||
|
Millipore Corp. |
1,000 |
$ 62,875 |
|
|
MEDICAL FACILITIES MANAGEMENT - 0.0% |
|||
|
Apria Healthcare Group, Inc. (a) |
100 |
1,494 |
|
|
METALS & MINING - 0.7% |
|||
|
Alcoa, Inc. |
1,440 |
43,560 |
|
|
Martin Marietta Materials, Inc. |
474 |
19,997 |
|
|
|
63,557 |
||
|
OIL & GAS - 0.7% |
|||
|
Cooper Cameron Corp. (a) |
400 |
25,850 |
|
|
Frontier Oil Corp. (a) |
2,000 |
14,000 |
|
|
National-Oilwell, Inc. (a) |
700 |
23,100 |
|
|
|
62,950 |
||
|
PACKAGING & CONTAINERS - 1.2% |
|||
|
Ball Corp. |
2,000 |
69,375 |
|
|
Bemis Co., Inc. |
500 |
17,188 |
|
|
Owens-Illinois, Inc. (a) |
2,000 |
26,625 |
|
|
|
113,188 |
||
|
PAPER & FOREST PRODUCTS - 0.4% |
|||
|
International Paper Co. |
242 |
8,228 |
|
|
Pentair, Inc. |
900 |
27,563 |
|
|
|
35,791 |
||
|
POLLUTION CONTROL - 1.3% |
|||
|
Allied Waste Industries, Inc. (a) |
400 |
3,725 |
|
|
Ogden Corp. |
400 |
4,925 |
|
|
Republic Services, Inc. (a) |
4,400 |
73,700 |
|
|
Waste Management, Inc. |
1,900 |
35,506 |
|
|
|
117,856 |
||
|
RAILROADS - 4.3% |
|||
|
Burlington Northern Santa Fe Corp. |
4,200 |
102,638 |
|
|
Canadian National Railway Co. |
1,500 |
46,396 |
|
|
Canadian Pacific Ltd. |
3,000 |
76,856 |
|
|
CSX Corp. |
1,750 |
43,422 |
|
|
Kansas City Southern Industries, Inc. |
25 |
173 |
|
|
Union Pacific Corp. |
2,800 |
120,925 |
|
|
|
390,410 |
||
|
SERVICES - 1.1% |
|||
|
Ecolab, Inc. |
2,700 |
96,694 |
|
|
SHIP BUILDING & REPAIR - 1.6% |
|||
|
General Dynamics Corp. |
2,600 |
146,738 |
|
|
Common Stocks - continued |
|||
|
Shares |
Value (Note 1) |
||
|
SHIPPING - 0.3% |
|||
|
Frontline Ltd. sponsored ADR (a) |
1,800 |
$ 22,950 |
|
|
Teekay Shipping Corp. |
200 |
7,500 |
|
|
|
30,450 |
||
|
TEXTILES & APPAREL - 0.2% |
|||
|
Polymer Group, Inc. |
1,500 |
11,531 |
|
|
Shaw Industries, Inc. |
500 |
6,406 |
|
|
|
17,937 |
||
|
TRUCKING & FREIGHT - 0.9% |
|||
|
CNF Transportation, Inc. |
400 |
10,175 |
|
|
Expeditors International of |
400 |
20,100 |
|
|
FedEx Corp. (a) |
1,000 |
39,625 |
|
|
USFreightways Corp. |
400 |
11,100 |
|
|
|
81,000 |
||
|
TOTAL COMMON STOCKS (Cost $8,138,338) |
8,384,087 |
||
|
Cash Equivalents - 11.6% |
|||
|
|
|
|
|
|
Fidelity Cash Central Fund, 6.57% (b) |
638,731 |
638,731 |
|
|
Fidelity Securities Lending Cash Central Fund, 6.65% (b) |
417,700 |
417,700 |
|
|
TOTAL CASH EQUIVALENTS (Cost $1,056,431) |
1,056,431 |
||
|
TOTAL INVESTMENT PORTFOLIO - 104.1% (Cost $9,194,769) |
9,440,518 |
|
NET OTHER ASSETS - (4.1)% |
(373,194) |
||
|
NET ASSETS - 100% |
$ 9,067,324 |
||
|
Legend |
|
(a) Non-income producing |
|
(b) The rate quoted is the annualized seven-day yield of the fund at |
|
Income Tax Information |
|
At July 31, 2000, the aggregate cost of investment securities for income |
|
The fund hereby designates approximately $82,000 as a capital gain dividend for the purpose of the dividend paid deduction. |
|
A total of 82%, 92%, 98%, 100% and 75% of Class A's, Class T's, Class B's, Class C's and Institutional Class' dividends distributed during the fiscal year qualifies for the dividends-received deductions for corporate shareholders (unaudited). |
|
The fund will notify shareholders in January 2001 of the applicable percentages for use in preparing 2000 income tax returns. |
See accompanying notes which are an integral part of the financial statements.
Cyclical Industries
Statement of Assets and Liabilities
|
|
July 31, 2000 |
|
|
Assets |
|
|
|
Investment in securities, at value |
|
$ 9,440,518 |
|
Receivable for investments sold |
|
234,873 |
|
Receivable for fund shares sold |
|
689 |
|
Dividends receivable |
|
7,227 |
|
Interest receivable |
|
2,813 |
|
Other receivables |
|
808 |
|
Receivable from investment adviser |
|
3,167 |
|
Total assets |
|
9,690,095 |
|
Liabilities |
|
|
|
Payable to custodian bank |
$ 7,516 |
|
|
Payable for investments purchased |
163,201 |
|
|
Payable for fund shares redeemed |
3,852 |
|
|
Distribution fees payable |
3,932 |
|
|
Other payables and |
26,570 |
|
|
Collateral on securities loaned, at value |
417,700 |
|
|
Total liabilities |
|
622,771 |
|
Net Assets |
|
$ 9,067,324 |
|
Net Assets consist of: |
|
|
|
Paid in capital |
|
$ 8,590,886 |
|
Accumulated undistributed net realized gain (loss) on investments and foreign currency transactions |
|
230,678 |
|
Net unrealized appreciation (depreciation) on investments |
|
245,760 |
|
Net Assets |
|
$ 9,067,324 |
|
Calculation of Maximum |
|
$13.56 |
|
Maximum offering price per share |
|
$14.39 |
|
Class T: |
|
$13.48 |
|
Maximum offering price per share |
|
$13.97 |
|
Class B: |
|
$13.25 |
|
Class C: |
|
$13.26 |
|
Institutional Class: |
|
$13.70 |
A Redemption price per share is equal to net asset value less any applicable contingent deferred sales charge.
Statement of Operations
|
|
Year ended July 31, 2000 |
|
|
Investment Income Dividends |
|
$ 133,468 |
|
Interest |
|
26,441 |
|
Security lending |
|
309 |
|
Total income |
|
160,218 |
|
Expenses |
|
|
|
Management fee |
$ 55,210 |
|
|
Transfer agent fees |
30,871 |
|
|
Distribution fees |
47,811 |
|
|
Accounting and security lending fees |
60,124 |
|
|
Non-interested trustees' compensation |
29 |
|
|
Custodian fees and expenses |
7,944 |
|
|
Registration fees |
70,606 |
|
|
Audit |
23,009 |
|
|
Legal |
80 |
|
|
Miscellaneous |
492 |
|
|
Total expenses before reductions |
296,176 |
|
|
Expense reductions |
(129,753) |
166,423 |
|
Net investment income (loss) |
|
(6,205) |
|
Realized and Unrealized Gain (Loss) Net realized gain (loss) on: |
|
|
|
Investment securities |
388,346 |
|
|
Foreign currency transactions |
242 |
388,588 |
|
Change in net unrealized appreciation (depreciation) on: |
|
|
|
Investment securities |
(709,083) |
|
|
Assets and liabilities in |
13 |
(709,070) |
|
Net gain (loss) |
|
(320,482) |
|
Net increase (decrease) in net assets resulting from operations |
|
$ (326,687) |
See accompanying notes which are an integral part of the financial statements.
Annual Report
Advisor Cyclical Industries Fund
Financial Statements - continued
Statement of Changes in Net Assets
|
Increase (Decrease) in Net Assets |
Year ended |
Year ended |
|
Operations |
$ (6,205) |
$ (11,063) |
|
Net realized gain (loss) |
388,588 |
28,779 |
|
Change in net unrealized appreciation (depreciation) |
(709,070) |
563,364 |
|
Net increase (decrease) in net assets resulting from operations |
(326,687) |
581,080 |
|
Distributions to shareholders |
|
|
|
From net realized gain |
(178,082) |
(287,985) |
|
Share transactions - net increase (decrease) |
(1,671,247) |
4,985,782 |
|
Redemption fees |
5,080 |
6,625 |
|
Total increase (decrease) in net assets |
(2,170,936) |
5,285,502 |
|
Net Assets |
|
|
|
Beginning of period |
11,238,260 |
5,952,758 |
|
End of period |
$ 9,067,324 |
$ 11,238,260 |
Financial Highlights - Class A
|
Years ended July 31, |
2000 |
1999 |
1998 |
1997 E |
|
Selected Per-Share Data |
|
|
|
|
|
Net asset value, beginning of period |
$ 14.13 |
$ 13.56 |
$ 13.80 |
$ 10.00 |
|
Income from Investment Operations |
|
|
|
|
|
Net investment income (loss) D |
.02 |
.01 |
(.03) |
(.01) |
|
Net realized and unrealized gain (loss) |
(.33) |
1.23 |
.76 |
3.89 |
|
Total from investment operations |
(.31) |
1.24 |
.73 |
3.88 |
|
Less Distributions |
|
|
|
|
|
From net investment income |
- H |
- |
- |
(.01) |
|
From net realized gain |
(.27) H |
(.68) |
(.99) |
(.08) |
|
Total distributions |
(.27) |
(.68) |
(.99) |
(.09) |
|
Redemption fees added to paid in capital |
.01 |
.01 |
.02 |
.01 |
|
Net asset value, end of period |
$ 13.56 |
$ 14.13 |
$ 13.56 |
$ 13.80 |
|
Total Return B, C |
(2.13)% |
10.81% |
6.05% |
39.11% |
|
Ratios and Supplemental Data |
|
|
|
|
|
Net assets, end of period (000 omitted) |
$ 973 |
$ 896 |
$ 471 |
$ 365 |
|
Ratio of expenses to average net assets |
1.50% F |
1.56% F |
1.75% F |
1.75% A, F |
|
Ratio of expenses to average net assets after expense reductions |
1.49% G |
1.54% G |
1.75% |
1.73% A, G |
|
Ratio of net investment income (loss) to average net assets |
.18% |
.05% |
(.22)% |
(.09)% A |
|
Portfolio turnover |
111% |
115% |
100% |
155% A |
|
A Annualized B The total returns would have been lower had certain expenses not been reduced during the periods shown. C Total returns do not include the one time sales charge and for periods of less than one year are not annualized. D Net investment income (loss) per share has been calculated based on average shares outstanding during the period. E For the period September 3, 1996 (commencement of sale of Class A shares) to July 31, 1997. F FMR agreed to reimburse a portion of the class' expenses during the period. Without this reimbursement, the class' expense ratio would have been higher. G FMR or the fund has entered into varying arrangements with third parties who either paid or reduced a portion of the class' expenses. H The amounts shown reflect certain reclassifications related to book to tax differences. |
||||
See accompanying notes which are an integral part of the financial statements.
Cyclical Industries
Financial Highlights - Class T
|
Years ended July 31, |
2000 |
1999 |
1998 |
1997 E |
|
Selected Per-Share Data |
|
|
|
|
|
Net asset value, beginning of period |
$ 14.07 |
$ 13.51 |
$ 13.77 |
$ 10.00 |
|
Income from Investment Operations |
|
|
|
|
|
Net investment income (loss) D |
(.01) |
(.03) |
(.06) |
(.04) |
|
Net realized and unrealized gain (loss) |
(.34) |
1.24 |
.77 |
3.89 |
|
Total from investment operations |
(.35) |
1.21 |
.71 |
3.85 |
|
Less Distributions |
|
|
|
|
|
From net investment income |
- |
- |
- |
(.01) |
|
From net realized gain |
(.25) |
(.66) |
(.99) |
(.08) |
|
Total distributions |
(.25) |
(.66) |
(.99) |
(.09) |
|
Redemption fees added to paid in capital |
.01 |
.01 |
.02 |
.01 |
|
Net asset value, end of period |
$ 13.48 |
$ 14.07 |
$ 13.51 |
$ 13.77 |
|
Total Return B, C |
(2.43)% |
10.57% |
5.91% |
38.81% |
|
Ratios and Supplemental Data |
|
|
|
|
|
Net assets, end of period (000 omitted) |
$ 3,885 |
$ 3,471 |
$ 2,973 |
$ 1,920 |
|
Ratio of expenses to average net assets |
1.75% F |
1.83% F |
2.00% F |
2.00% A, F |
|
Ratio of expenses to average net assets after expense reductions |
1.74% G |
1.81% G |
2.00% |
1.97% A, G |
|
Ratio of net investment income (loss) to average net assets |
(.07)% |
(.22)% |
(.47)% |
(.37)% A |
|
Portfolio turnover |
111% |
115% |
100% |
155% A |
|
A Annualized B The total returns would have been lower had certain expenses not been reduced during the periods shown. C Total returns do not include the one time sales charge and for periods of less than one year are not annualized. D Net investment income (loss) per share has been calculated based on average shares outstanding during the period. E For the period September 3, 1996 (commencement of sale of Class T shares) to July 31, 1997. F FMR agreed to reimburse a portion of the class' expenses during the period. Without this reimbursement, the class' expense ratio would have been higher. G FMR or the fund has entered into varying arrangements with third parties who either paid or reduced a portion of the class' expenses. |
||||
Financial Highlights - Class B
|
Years ended July 31, |
2000 |
1999 |
1998 |
1997 E |
|
Selected Per-Share Data |
|
|
|
|
|
Net asset value, beginning of period |
$ 13.89 |
$ 13.40 |
$ 13.75 |
$ 11.56 |
|
Income from Investment Operations |
|
|
|
|
|
Net investment income (loss) D |
(.07) |
(.09) |
(.14) |
(.06) |
|
Net realized and unrealized gain (loss) |
(.34) |
1.22 |
.76 |
2.25 |
|
Total from investment operations |
(.41) |
1.13 |
.62 |
2.19 |
|
Less Distributions |
|
|
|
|
|
From net realized gain |
(.24) |
(.65) |
(.99) |
- |
|
Redemption fees added to paid in capital |
.01 |
.01 |
.02 |
- |
|
Net asset value, end of period |
$ 13.25 |
$ 13.89 |
$ 13.40 |
$ 13.75 |
|
Total Return B, C |
(2.90)% |
10.01% |
5.23% |
18.94% |
|
Ratios and Supplemental Data |
|
|
|
|
|
Net assets, end of period (000 omitted) |
$ 1,879 |
$ 2,043 |
$ 985 |
$ 252 |
|
Ratio of expenses to average net assets |
2.25% F |
2.31% F |
2.50% F |
2.50% A, F |
|
Ratio of expenses to average net assets after expense reductions |
2.24% G |
2.29% G |
2.50% |
2.45% A, G |
|
Ratio of net investment income (loss) to average net assets |
(.57)% |
(.70)% |
(1.03)% |
(1.11)% A |
|
Portfolio turnover |
111% |
115% |
100% |
155% A |
|
A Annualized B The total returns would have been lower had certain expenses not been reduced during the periods shown. C Total returns do not include the contingent deferred sales charge and for periods of less than one year are not annualized. D Net investment income (loss) per share has been calculated based on average shares outstanding during the period. E For the period March 3, 1997 (commencement of sale of Class B shares) to July 31, 1997. F FMR agreed to reimburse a portion of the class' expenses during the period. Without this reimbursement, the class' expense ratio would have been higher. G FMR or the fund has entered into varying arrangements with third parties who either paid or reduced a portion of the class' expenses. |
||||
See accompanying notes which are an integral part of the financial statements.
Annual Report
Financial Highlights - Class C
|
Years ended July 31, |
2000 |
1999 |
1998 E |
|
Selected Per-Share Data |
|
|
|
|
Net asset value, beginning of period |
$ 13.91 |
$ 13.45 |
$ 12.54 |
|
Income from Investment Operations |
|
|
|
|
Net investment income (loss) D |
(.08) |
(.09) |
(.11) |
|
Net realized and unrealized gain (loss) |
(.36) |
1.20 |
1.39 |
|
Total from investment operations |
(.44) |
1.11 |
1.28 |
|
Less Distributions |
|
|
|
|
From net realized gain |
(.22) |
(.67) |
(.38) |
|
Redemption fees added to paid in capital |
.01 |
.02 |
.01 |
|
Net asset value, end of period |
$ 13.26 |
$ 13.91 |
$ 13.45 |
|
Total Return B, C |
(3.11)% |
9.94% |
10.62% |
|
Ratios and Supplemental Data |
|
|
|
|
Net assets, end of period (000 omitted) |
$ 625 |
$ 1,451 |
$ 165 |
|
Ratio of expenses to average net assets |
2.25% F |
2.28% F |
2.50% A, F |
|
Ratio of expenses to average net assets after expense reductions |
2.24% G |
2.27% G |
2.50% A |
|
Ratio of net investment income (loss) to average net assets |
(.57)% |
(.67)% |
(1.06)% A |
|
Portfolio turnover |
111% |
115% |
100% |
|
A Annualized B The total returns would have been lower had certain expenses not been reduced during the periods shown. C Total returns do not include the contingent deferred sales charge and for periods of less than one year are not annualized. D Net investment income (loss) per share has been calculated based on average shares outstanding during the period. E For the period November 3, 1997 (commencement of sale of Class C shares) to July 31, 1998. F FMR agreed to reimburse a portion of the class' expenses during the period. Without this reimbursement, the class' expense ratio would have been higher. G FMR or the fund has entered into varying arrangements with third parties who either paid or reduced a portion of the class' expenses. |
|||
Financial Highlights - Institutional Class
|
Years ended July 31, |
2000 |
1999 |
1998 |
1997 F |
|
Selected Per-Share Data |
|
|
|
|
|
Net asset value, beginning of period |
$ 14.28 |
$ 13.68 |
$ 13.84 |
$ 10.00 |
|
Income from Investment Operations |
|
|
|
|
|
Net investment income D |
.06 |
.04 |
.01 E |
.03 |
|
Net realized and unrealized gain (loss) |
(.36) |
1.25 |
.75 |
3.91 |
|
Total from investment operations |
(.30) |
1.29 |
.76 |
3.94 |
|
Less Distributions |
|
|
|
|
|
From net investment income |
- I |
- |
- |
(.02) |
|
From net realized gain |
(.29) I |
(.70) |
(.95) |
(.08) |
|
Total distributions |
(.29) |
(.70) |
(.95) |
(.10) |
|
Redemption fees added to paid in capital |
.01 |
.01 |
.03 |
- |
|
Net asset value, end of period |
$ 13.70 |
$ 14.28 |
$ 13.68 |
$ 13.84 |
|
Total Return B, C |
(2.04)% |
11.15% |
6.32% |
39.64% |
|
Ratios and Supplemental Data |
|
|
|
|
|
Net assets, end of period (000 omitted) |
$ 1,706 |
$ 3,377 |
$ 1,360 |
$ 1,756 |
|
Ratio of expenses to average net assets |
1.25% G |
1.31% G |
1.50% G |
1.50% A, G |
|
Ratio of expenses to average net assets after expense reductions |
1.24% H |
1.29% H |
1.50% |
1.48% A, H |
|
Ratio of net investment income to average net assets |
.43% |
.31% |
.04% |
.25% A |
|
Portfolio turnover |
111% |
115% |
100% |
155% A |
|
A Annualized B Total returns for periods of less than one year are not annualized. C The total returns would have been lower had certain expenses not been reduced during the periods shown. D Net investment income per share has been calculated based on average shares outstanding during the period. E During the period, a significant shareholder redemption caused an unusually high level of investment income per share. F For the period September 3, 1996 (commencement of sale of Institutional Class shares) to July 31, 1997. G FMR agreed to reimburse a portion of the class' expenses during the period. Without this reimbursement, the class' expense ratio would have been higher. H FMR or the fund has entered into varying arrangements with third parties who either paid or reduced a portion of the class' expenses. I The amounts shown reflect certain reclassifications related to book to tax differences. |
||||
Cyclical Industries
For the period ended July 31, 2000
1. Significant Accounting Policies.
Fidelity Advisor Cyclical Industries Fund (the fund) is a fund of Fidelity Advisor Series VII (the trust) and is authorized to issue an unlimited number of shares. The trust is registered under the Investment Company Act of 1940, as amended (the 1940 Act), as an open-end management investment company organized as a Massachusetts business trust.
The fund offers Class A, Class T, Class B, Class C, and Institutional Class shares, each of which has equal rights as to assets and voting privileges. Each class has exclusive voting rights with respect to matters that affect that class. Class B shares will automatically convert to Class A shares after a holding period of seven years from the initial date of purchase. Investment income, realized and unrealized capital gains and losses, the common expenses of the fund, and certain fund-level expense reductions, if any, are allocated on a pro rata basis to each class based on the relative net assets of each class to the total net assets of the fund. Each class of shares differs in its respective distribution, transfer agent, and certain other class-specific fees, expenses, and expense reductions.
The financial statements have been prepared in conformity with generally accepted accounting principles which require management to make certain estimates and assumptions at the date of the financial statements. The following summarizes the significant accounting policies of the fund:
Security Valuation. Securities for which exchange quotations are readily available are valued at the last sale price, or if no sale price, at the closing bid price. Foreign securities are valued based on quotations from the principal market in which such securities are normally traded. If trading or events occurring in other markets after the close of the principal market in which foreign securities are traded, and before the close of the business of the fund, are expected to materially affect the value of those securities, then they are valued at their fair value taking this trading or these events into account. Fair value is determined in good faith under consistently applied procedures under the general supervision of the Board of Trustees. Securities for which exchange quotations are not readily available (and in certain cases debt securities which trade on an exchange) are valued primarily using dealer-supplied valuations or at their fair value. Short-term securities with remaining maturities of sixty days or less for which quotations are not readily available are valued at amortized cost or original cost plus accrued interest, both of which approximate current value.
Foreign Currency Translation. The accounting records of the fund are maintained in U.S. dollars. Investment securities and other assets and liabilities denominated in a foreign currency are translated into U.S. dollars at the prevailing rates of exchange at period end. Purchases and sales of securities, income receipts and expense payments are translated into U.S. dollars at the prevailing exchange rate on the respective dates of the transactions.
Net realized gains and losses on foreign currency transactions represent net gains and losses from sales and maturities of foreign currency contracts, disposition of foreign currencies, the difference between the amount of net investment income accrued and the U.S. dollar amount actually received, and gains and losses between trade and settlement date on purchases and sales of securities. The effects of changes in foreign currency exchange rates on investments in securities are included with the net realized and unrealized gain or loss on investment securities.
Income Taxes. As a qualified regulated investment company under Subchapter M of the Internal Revenue Code, the fund is not subject to income taxes to the extent that it distributes substantially all of its taxable income for its fiscal year. The schedule of investments includes information regarding income taxes under the caption "Income Tax Information."
Investment Income. Dividend income is recorded on the ex-dividend date, except certain dividends from foreign securities where the ex-dividend date may have passed, are recorded as soon as the fund is informed of the ex-dividend date. Non-cash dividends included in dividend income, if any, are recorded at the fair market value of the securities received. Interest income is accrued as earned. Investment income is recorded net of foreign taxes withheld where recovery of such taxes is uncertain.
Expenses. Most expenses of the trust can be directly attributed to a fund. Expenses which cannot be directly attributed are apportioned among the funds in the trust.
Distributions to Shareholders. Distributions are recorded on the ex-dividend date. Income dividends and capital gain distributions are declared separately for each class.
Income and capital gain distributions are determined in accordance with income tax regulations which may differ from generally accepted accounting principles. These differences, which may result in distribution reclassifications, are primarily due to differing treatments for foreign currency transactions, net operating losses and losses deferred due to wash sales. The fund also utilized earnings and profits distributed to shareholders on redemption of shares as a part of the dividends paid deduction for income tax purposes.
Permanent book and tax basis differences relating to shareholder distributions will result in reclassifications to paid in capital. Accumulated undistributed net realized gain (loss) on investments and foreign currency transactions may include temporary book and tax basis differences which will reverse in a subsequent period. Any taxable income or gain remaining at fiscal year end is distributed in the following year.
Annual Report
Notes to Financial Statements - continued
1. Significant Accounting Policies - continued
Short-Term Trading (Redemption) Fees. Shares held in the fund less than 60 days are subject to a short-term trading fee equal to 1% of the proceeds of the redeemed shares. The fee, which is retained by the fund, is accounted for as an addition to paid in capital.
Security Transactions. Security transactions are accounted for as of trade date. Gains and losses on securities sold are determined on the basis of identified cost.
2. Operating Policies.
Foreign Currency Contracts. The fund generally uses foreign currency contracts to facilitate transactions in foreign-denominated securities. Losses may arise from changes in the value of the foreign currency or if the counterparties do not perform under the contracts' terms. The U.S. dollar value of foreign currency contracts is determined using contractual currency exchange rates established at the time of each trade.
Joint Trading Account. Pursuant to an Exemptive Order issued by the Securities and Exchange Commission (the SEC), the fund, along with other affiliated entities of Fidelity Management & Research Company (FMR), may transfer uninvested cash balances into one or more joint trading accounts. These balances are invested in one or more repurchase agreements for U.S. Treasury or Federal Agency obligations.
Repurchase Agreements. The underlying U.S. Treasury, Federal Agency, or other obligations found to be satisfactory by FMR are transferred to an account of the fund, or to the Joint Trading Account, at a custodian bank. The securities are marked-to-market daily and maintained at a value at least equal to the principal amount of the repurchase agreement (including accrued interest). FMR, the fund's investment adviser, is responsible for determining that the value of the underlying securities remains in accordance with the market value requirements stated above.
Cash Central Funds. Pursuant to an Exemptive Order issued by the SEC, the fund may invest in the Fidelity Cash Central Fund and the Fidelity Securities Lending Cash Central Fund (the Cash Funds) managed by Fidelity Investments Money Management, Inc., an affiliate of FMR. The Cash Funds are open-end money market funds available only to investment companies and other accounts managed by FMR and its affiliates. The Cash Funds seek preservation of capital, liquidity, and current income. Income distributions from the Cash Funds are declared daily and paid monthly from net interest income. Income distributions earned by the fund are recorded as either interest income or security lending income in the accompanying financial statements.
3. Purchases and Sales of Investments.
Purchases and sales of securities, other than short-term securities, aggregated $10,052,419 and $11,742,484, respectively.
4. Fees and Other Transactions with Affiliates.
Management Fee. As the fund's investment adviser, FMR receives a monthly fee that is calculated on the basis of a group fee rate plus a fixed individual fund fee rate applied to the average net assets of the fund. The group fee rate is the weighted average of a series of rates and is based on the monthly average net assets of all the mutual funds advised by FMR. The rates ranged from .2167% to .5200% for the period. The annual individual fund fee rate is .30%. In the event that these rates were lower than the contractual rates in effect during the period, FMR voluntarily implemented the above rates, as they resulted in the same or a lower management fee. For the period, the management fee was equivalent to an annual rate of .58% of average net assets.
Distribution and Service Plan. In accordance with Rule 12b-1 of the 1940 Act, the Board of Trustees have adopted separate Distribution and Service Plans with respect to each class of shares (collectively referred to as "the Plans"). Under certain of the Plans, the class pays Fidelity Distributors Corporation (FDC), an affiliate of FMR, a 12b-1 fee. A portion of this fee may be reallowed to securities dealers, banks and other financial institutions for the distribution of each class of shares and providing shareholder support services. For the period, this fee was based on the following annual rates of the average net assets of each applicable class:
|
Class A |
.25% |
|
Class T |
.50% |
|
Class B |
1.00%* |
|
Class C |
1.00%* |
* .75% represents a distribution fee and .25% represents a shareholder service fee.
For the period, each class paid FDC the following amounts, a portion of which was retained by FDC:
|
|
Paid to |
Retained |
|
Class A |
$ 2,481 |
$ 397 |
|
Class T |
16,915 |
758 |
|
Class B |
19,498 |
14,963 |
|
Class C |
8,917 |
6,628 |
|
|
$ 47,811 |
$ 22,746 |
Sales Load. FDC receives a front-end sales charge of up to 5.75% for selling Class A shares, and 3.50% for selling Class T shares of the fund. FDC receives the proceeds of contingent deferred sales charges levied on Class B share redemptions occurring within six years of purchase and Class C share redemptions occurring within one year of purchase. Contingent deferred sales charges are based on declining rates ranging from 5% to 1% for Class B and 1% for Class C, of the lesser of the cost of shares at the initial date of purchase or the net asset value of the redeemed shares, excluding any reinvested dividends and capital gains. In addition, purchases of Class A and Class T shares that were subject to a finder's fee bear a contingent deferred sales charge on assets that do not remain
Cyclical Industries
Notes to Financial Statements - continued
4. Fees and Other Transactions with
Affiliates - continued
Sales Load - continued
in the fund for at least one year. The Class A and Class T contingent deferred sales charge is based on 0.25% of the lesser of the cost of shares at the initial date of purchase or the net asset value of the redeemed shares, excluding any reinvested dividends and capital gains. A portion of the sales charges paid to FDC is paid to securities dealers, banks and other financial institutions.
For the period, sales charge amounts paid to and retained by FDC were as follows:
|
|
Paid to |
Retained |
|
Class A |
$ 4,529 |
$ 2,335 |
|
Class T |
8,135 |
3,305 |
|
Class B |
11,022 |
11,022* |
|
Class C |
3,704 |
3,704* |
|
|
$ 27,390 |
$ 20,366 |
* When Class B and Class C shares are initially sold, FDC pays commissions from its own resources to securities dealers,
banks, and other financial institutions through which the sales are made.
Transfer Agent Fees. Fidelity Investments Institutional Operations Company, Inc., (FIIOC), an affiliate of FMR, is the transfer, dividend disbursing and shareholder servicing agent (collectively referred to as the transfer agent) for each class of the fund. FIIOC receives account fees and asset-based fees that vary according to the account size and type of account of the shareholders of the respective classes of the fund. FIIOC pays for typesetting, printing and mailing of all shareholder reports, except proxy statements. For the period, the following amounts were paid to FIIOC:
|
|
Amount |
% of |
|
Class A |
$ 3,413 |
.34 |
|
Class T |
11,640 |
.34 |
|
Class B |
7,255 |
.37 |
|
Class C |
3,145 |
.35 |
|
Institutional Class |
5,418 |
.23 |
|
|
$ 30,871 |
|
Accounting and Security Lending Fees. Fidelity Service Company, Inc., an affiliate of FMR, maintains the fund's accounting records and administers the security lending program. The security lending fee is based on the number and duration of lending transactions. The accounting fee is based on the level of average net assets for the month plus out-of-pocket expenses.
Brokerage Commissions. The fund placed a portion of its portfolio transactions with brokerage firms which are affiliates of FMR. The commissions paid to these affiliated firms were $1,155 for the period.
5. Security Lending.
The fund lends portfolio securities from time to time in order to earn additional income. The fund receives collateral in the form of U.S. Treasury obligations, letters of credit, and/or cash against the loaned securities, and maintains collateral in an amount not less than 100% of the market value of the loaned securities during the period of the loan. The market value of the loaned securities is determined at the close of business of the fund and any additional required collateral is delivered to the fund on the next business day. If the borrower defaults on its obligation to return the securities loaned because of insolvency or other reasons, the fund could experience delays and costs in recovering the securities loaned or in gaining access to the collateral. At period end, the value of the securities loaned amounted to $412,391. The fund received cash collateral of $417,700 which was invested in cash equivalents.
6. Expense Reductions.
FMR voluntarily agreed to reimburse operating expenses (excluding interest, taxes, certain securities lending fees, brokerage commissions and extraordinary expenses, if any) above the following annual rates or range of annual rates of average net assets for each of the following classes:
|
|
FMR |
Reimbursement |
|
Class A |
1.50% |
$ 13,557 |
|
Class T |
1.75% |
46,204 |
|
Class B |
2.25% |
27,184 |
|
Class C |
2.25% |
12,260 |
|
Institutional Class |
1.25% |
29,504 |
|
|
|
$ 128,709 |
|
|
|
|
FMR has also directed certain portfolio trades to brokers who paid a portion of the fund's expenses. For the period, the fund's expenses were reduced by $1,044 under this arrangement.
7. Beneficial Interest.
At the end of the period, FMR and its affiliates were record owners of approximately 19% of the total outstanding shares of the fund. In addition, one unaffiliated shareholder was record owner of 12% of the total outstanding shares of the fund.
Cyclical Industries
Notes to Financial Statements - continued
8. Distributions to Shareholders.
Distributions to shareholders of each class were as follows:
|
|
Years ended July 31, |
|
|
|
2000 |
1999 |
|
From net realized gain |
|
|
|
Class A |
$ 20,883 |
$ 23,684 |
|
Class T |
54,397 |
144,300 |
|
Class B |
34,793 |
41,003 |
|
Class C |
14,419 |
9,726 |
|
Institutional Class |
53,590 |
69,272 |
|
Total |
$ 178,082 |
$ 287,985 |
9. Share Transactions.
Transactions for each class of shares were as follows:
|
|
Shares |
Dollars |
||
|
|
Year ended |
Year ended |
Year ended |
Year ended |
|
|
2000 |
1999 |
2000 |
1999 |
|
|
|
|
|
|
|
Class A |
61,024 |
37,470 |
$ 827,020 |
$ 504,717 |
|
Reinvestment of distributions |
1,425 |
2,196 |
19,437 |
23,537 |
|
Shares redeemed |
(54,082) |
(11,006) |
(720,877) |
(149,922) |
|
Net increase (decrease) |
8,367 |
28,660 |
$ 125,580 |
$ 378,332 |
|
Class T |
169,723 |
149,470 |
$ 2,263,379 |
$ 2,008,694 |
|
Reinvestment of distributions |
3,842 |
13,134 |
52,336 |
140,529 |
|
Shares redeemed |
(132,075) |
(135,949) |
(1,771,784) |
(1,711,581) |
|
Net increase (decrease) |
41,490 |
26,655 |
$ 543,931 |
$ 437,642 |
|
Class B |
92,855 |
121,052 |
$ 1,230,975 |
$ 1,640,891 |
|
Reinvestment of distributions |
1,960 |
3,632 |
26,332 |
38,541 |
|
Shares redeemed |
(100,163) |
(51,075) |
(1,324,215) |
(651,249) |
|
Net increase (decrease) |
(5,348) |
73,609 |
$ (66,908) |
$ 1,028,183 |
|
Class C |
44,151 |
106,908 |
$ 584,454 |
$ 1,480,405 |
|
Reinvestment of distributions |
650 |
915 |
8,758 |
9,726 |
|
Shares redeemed |
(102,037) |
(15,704) |
(1,353,255) |
(201,951) |
|
Net increase (decrease) |
(57,236) |
92,119 |
$ (760,043) |
$ 1,288,180 |
|
Institutional Class |
18,068 |
145,280 |
$ 247,803 |
$ 1,976,046 |
|
Reinvestment of distributions |
2,497 |
6,212 |
34,539 |
67,155 |
|
Shares redeemed |
(132,595) |
(14,316) |
(1,796,149) |
(189,756) |
|
Net increase (decrease) |
(112,030) |
137,176 |
$ (1,513,807) |
$ 1,853,445 |
Cyclical Industries
Performance
There are several ways to evaluate historical performance. You can look at the total percentage change in value, the average annual percentage change or the growth of a hypothetical $10,000 investment. Total return reflects the change in the value of an investment, assuming reinvestment of dividend income and capital gains (the profits earned upon the sale of securities that have grown in value). If Fidelity had not reimbursed certain class expenses, the life of fund total returns would have been lower.
Cumulative Total Returns
|
Periods ended July 31, 2000 |
|
Past 1 |
Life of |
|
Fidelity Adv Financial - Inst CL |
|
5.40% |
104.46% |
|
S&P 500 |
|
8.98% |
131.80% |
|
GS Financial Services |
|
3.20% |
109.74% |
Cumulative total returns show Institutional Class shares' performance in percentage terms over a set period - in this case,
one year or since the fund started on September 3, 1996. You can compare Institutional Class shares' returns to the performance of both the Standard
& Poor's 500 Index - a market capitalization-weighted index of common stocks - and the Goldman Sachs Financial Services Index - a market
capitalization-weighted index of 256 stocks designed to measure the performance of companies in the financial services sector. Issues in the index
include financial institutions providing banking services, brokerage firms and asset managers, insurance companies, and real estate holding and
development companies. These benchmarks include reinvested dividends and capital gains, if any, and exclude the effect of sales charges.
Average Annual Total Returns
|
Periods ended July 31, 2000 |
|
Past 1 |
Life of |
|
Fidelity Adv Financial - Inst CL |
|
5.40% |
20.07% |
|
S&P 500 |
|
8.98% |
23.99% |
|
GS Financial Services |
|
3.20% |
20.86% |
Average annual returns take Institutional Class shares' cumulative return and show you what would have happened if Institutional Class shares had performed at a constant rate each year.
$10,000 Over Life of Fund
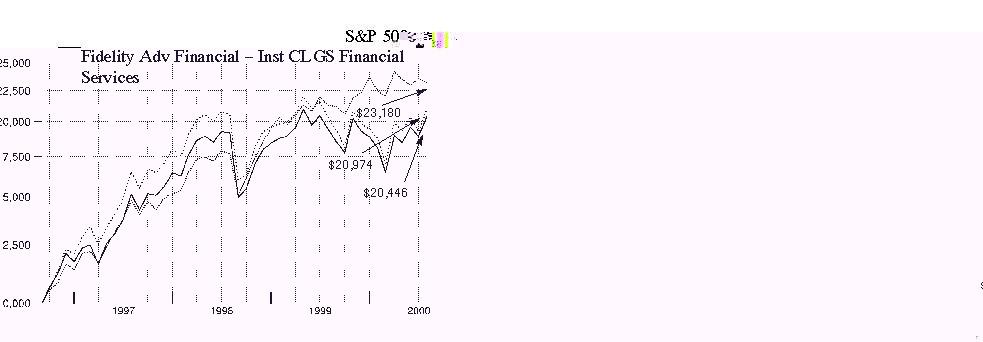
$10,000 Over Life of Fund: Let's say hypothetically that $10,000 was invested in Fidelity Advisor Financial Services - Institutional Class on September 3, 1996, when the fund started. As the chart shows, by July 31, 2000, the value of the investment would have grown to $20,446 - a 104.46% increase on the initial investment. For comparison, look at how the Standard & Poor's 500 Index did over the same period. With dividends and capital gains, if any, reinvested, the same $10,000 investment would have grown to $23,180 - a 131.80% increase. If $10,000 was invested in the Goldman Sachs Financial Services Industries Index, it would have grown to $20,974 - a 109.74% increase.
Understanding Performance
How a fund did yesterday is no guarantee of how it will do tomorrow. The stock market, for example, has a history of long-term growth and short-term volatility. Unlike the broader market, however, some sectors may not have a history of growth in the long run. And, as with all stock funds, the share price and return of a fund that invests in a sector will vary.
3Annual Report
(Portfolio Manager photograph)
An interview with
James Catudal, Portfolio Manager of Fidelity Advisor Financial Services Fund
Q. How did the fund perform, Jim?
A. For the 12 months that ended July 31, 2000, the fund's Class A, Class T, Class B and Class C shares had returns of 5.12%, 4.84%, 4.30% and 4.30%, respectively. During the same 12-month period, the Goldman Sachs Financial Services Index - an index of 256 stocks designed to measure the performance of companies in the financial services sector - had a return of 3.20%, while the Standard & Poor's 500 Index returned 8.98%.
A. For the 12 months that ended July 31, 2000, the fund's Institutional Class shares had a total return of 5.40%. During the same 12-month period, the Goldman Sachs Financial Services Index - an index of 256 stocks designed to measure the performance of companies in the financial services sector - had a return of 3.20%, while the Standard & Poor's 500 Index returned 8.98%.
Q. What factors affected the performance of financial services stocks during the period?
A. The Federal Reserve Board's attempt to slow the rate of economic growth and avoid inflation by raising short-term interest rates was the biggest factor hurting financial services stocks, causing them to underperform the overall stock market. For the most part, large-cap financial services companies did better than mid- and small-cap firms. Companies with economies of scale in a relatively fast-growing business also generally did well. Otherwise, the investments smaller companies had to make to keep up were just too high. Among banks, commercial credit quality started to deteriorate, although consumer credit quality remained strong. A number of banks lowered their earnings expectations, especially in the past six months, hurting the performance of their stocks. In addition, several relatively high-profile banking mergers ran into trouble as the acquiring institutions struggled to integrate the operations of the newly combined companies. Banks and financial services companies that branched into faster-growing businesses had much better results, and investors gravitated toward those companies they saw as winners. As a result, stocks such as American Express and American International Group were selling at price-to-earnings (P/E) ratios of more than 30, while traditional bank stocks such as KeyCorp were selling at P/E ratios of less than 10.
Q. How did financial institutions other than banks perform?
A. Investment management stocks did well, helped by an increase in merger-and-acquisition activity as well as by their high level of recurring fee income and their long-term growth prospects. Investment banks and securities companies performed well, benefiting from strong underwriting of new equity securities. Commercial property-and-casualty insurance companies and life insurance companies also saw improved performance, although personal property-and-casualty companies continued to have problems.
Q. What were your principal strategies?
A. I overweighted consumer finance, investment management and property-and-casualty and life insurance companies. In general, I underweighted traditional banks, although I did emphasize companies such as Bank of New York and State Street that had large securities processing operations. Also, I emphasized successful large-cap financial services companies, including Citigroup, American Express, Morgan Stanley Dean Witter and American International Group. I also overweighted government-sponsored enterprises such as Fannie Mae and Freddie Mac, although they didn't perform well. I liked these stocks because they were selling at very low valuations and tend to do well when the Fed has completed its cycle of interest-rate hikes.
Q. Which other investments helped performance, and which didn't?
A. Morgan Stanley Dean Witter, a diversified financial services company, had very strong performance, helped by its equity underwriting business. Citigroup also performed well as all its businesses reported good results. Kansas City Southern had good performance. Its stock rose in anticipation of its spin-off of Stillwell Financial. Freddie Mac and Fannie Mae were disappointments, although I continued to like their prospects. They were hurt by rising interest rates and political controversies over their size and over the implied government guarantees behind the securities that they issue.
Q. What is your outlook?
A. We are in an unusual period in which we have to assess both the positive effects of a likely end to interest-rate hikes and the negative effects of potential commercial credit quality problems. The prospects for financial services stocks in general will depend on whether the economy has a hard landing, in which growth slows significantly, or a soft landing, in which growth slows to a more moderate level. If it's the former, financial companies will be hurt. If it's a soft landing, they should do relatively well. Therefore, I have tried to position the fund with stocks that have the potential to do well in either scenario.
The views expressed in this report reflect those of the portfolio manager only through the end of the period of the report as stated on the cover. The manager's views are subject to change at any time based on market and other conditions. For more information see page A-3.
Fund Facts
Start date: September 3, 1996
Size: as of July 31, 2000, more than
$471 million
Manager: James Catudal, since February 2000; joined Fidelity in 1997
3
Annual Report
Advisor Financial Services Fund
|
Top Ten Stocks as of July 31, 2000 |
|
|
|
% of fund's |
|
Morgan Stanley Dean Witter & Co. |
5.3 |
|
Citigroup, Inc. |
5.2 |
|
American International Group, Inc. |
4.6 |
|
American Express Co. |
4.0 |
|
Fannie Mae |
3.8 |
|
Bank of America Corp. |
3.2 |
|
Wells Fargo & Co. |
3.2 |
|
Charles Schwab Corp. |
3.1 |
|
Berkshire Hathaway, Inc. Class A |
2.6 |
|
Freddie Mac |
2.5 |
|
|
37.5 |
|
Top Industries as of July 31, 2000 |
|
|
% of fund's net assets |
||
|
Insurance |
24.4% |
|
Banks |
21.8% |
|
Credit & Other Finance |
16.0% |
|
Securities Industry |
15.6% |
|
Federal Sponsored Credit |
6.7% |
|
All Others* |
15.5% |
|
* Includes short-term investments and net other assets. |
Annual Report
Advisor Financial Services Fund
Showing Percentage of Net Assets
|
Common Stocks - 91.8% |
|||
|
Shares |
Value (Note 1) |
||
|
BANKS - 21.8% |
|||
|
Bank of America Corp. |
321,004 |
$ 15,207,565 |
|
|
Bank of New York Co., Inc. |
157,760 |
7,385,140 |
|
|
Bank One Corp. |
128,382 |
4,084,152 |
|
|
Banknorth Group, Inc. |
15,000 |
229,688 |
|
|
Canadian Imperial Bank of Commerce |
45,000 |
1,282,948 |
|
|
Capital One Financial Corp. |
35,000 |
2,051,875 |
|
|
Chase Manhattan Corp. |
118,200 |
5,873,063 |
|
|
Comerica, Inc. |
28,250 |
1,440,750 |
|
|
Fifth Third Bancorp |
37,500 |
1,549,219 |
|
|
First Security Corp. |
80,000 |
1,150,000 |
|
|
First Union Corp. |
72,370 |
1,868,051 |
|
|
Firstar Corp. |
194,550 |
3,842,363 |
|
|
FleetBoston Financial Corp. |
175,676 |
6,291,397 |
|
|
J.P. Morgan & Co., Inc. |
30,000 |
4,005,000 |
|
|
M&T Bank Corp. |
2,400 |
1,133,850 |
|
|
Marshall & Ilsley Corp. |
7,000 |
316,750 |
|
|
Mellon Financial Corp. |
145,000 |
5,464,688 |
|
|
Northern Trust Corp. |
31,000 |
2,321,125 |
|
|
PNC Financial Services Group, Inc. |
103,600 |
5,270,650 |
|
|
Royal Bank of Canada |
65,000 |
3,465,909 |
|
|
Silicon Valley Bancshares (a) |
8,000 |
350,500 |
|
|
State Street Corp. |
39,000 |
3,914,625 |
|
|
SunTrust Banks, Inc. |
65,400 |
3,131,025 |
|
|
Synovus Finanical Corp. |
50,000 |
900,000 |
|
|
Toronto Dominion Bank |
89,000 |
2,115,485 |
|
|
U.S. Bancorp |
109,650 |
2,103,909 |
|
|
UnionBanCal Corp. |
378 |
7,182 |
|
|
Wachovia Corp. |
15,605 |
858,275 |
|
|
Wells Fargo & Co. |
364,400 |
15,054,275 |
|
|
|
102,669,459 |
||
|
COMPUTER SERVICES & SOFTWARE - 0.0% |
|||
|
Intuit, Inc. (a) |
3,600 |
122,400 |
|
|
CREDIT & OTHER FINANCE - 16.0% |
|||
|
American Express Co. |
329,900 |
18,701,206 |
|
|
Associates First Capital Corp. Class A |
364,000 |
9,532,250 |
|
|
Citigroup, Inc. |
350,493 |
24,731,662 |
|
|
Countrywide Credit Industries, Inc. |
25,000 |
879,688 |
|
|
Household International, Inc. |
240,057 |
10,697,540 |
|
|
Indymac Bancorp, Inc. |
24,800 |
424,700 |
|
|
MBNA Corp. |
199,250 |
6,649,969 |
|
|
Metris Companies, Inc. |
7,500 |
219,844 |
|
|
NextCard, Inc. (a) |
25,000 |
221,094 |
|
|
Providian Financial Corp. |
32,107 |
3,272,907 |
|
|
|
75,330,860 |
||
|
FEDERAL SPONSORED CREDIT - 6.7% |
|||
|
Fannie Mae |
354,935 |
17,702,383 |
|
|
|
|||
|
Shares |
Value (Note 1) |
||
|
Freddie Mac |
301,020 |
$ 11,871,476 |
|
|
SLM Holding Corp. |
47,000 |
2,023,938 |
|
|
|
31,597,797 |
||
|
INSURANCE - 24.4% |
|||
|
ACE Ltd. |
145,000 |
5,220,000 |
|
|
AFLAC, Inc. |
74,400 |
3,864,150 |
|
|
Allmerica Financial Corp. |
45,400 |
2,684,275 |
|
|
Allstate Corp. |
130,000 |
3,583,125 |
|
|
AMBAC Financial Group, Inc. |
60,100 |
3,872,694 |
|
|
American General Corp. |
47,500 |
3,167,656 |
|
|
American International Group, Inc. |
245,625 |
21,538,242 |
|
|
Aon Corp. |
20,000 |
720,000 |
|
|
Arthur J. Gallagher & Co. |
14,000 |
686,875 |
|
|
AXA SA de CV sponsored ADR |
5,000 |
378,750 |
|
|
Berkshire Hathaway, Inc.: |
|
|
|
|
Class A (a) |
220 |
12,122,000 |
|
|
Class B (a) |
1,824 |
3,328,800 |
|
|
Commerce Group, Inc. |
8,000 |
222,000 |
|
|
Conseco, Inc. |
120,700 |
950,513 |
|
|
Everest Re Group Ltd. |
40,000 |
1,587,500 |
|
|
Hartford Financial Services Group, Inc. |
117,700 |
7,562,225 |
|
|
HCC Insurance Holdings, Inc. |
33,400 |
684,700 |
|
|
Jefferson-Pilot Corp. |
25,000 |
1,525,000 |
|
|
John Hancock Financial Services, Inc. |
30,000 |
708,750 |
|
|
Lincoln National Corp. |
20,000 |
872,500 |
|
|
Marsh & McLennan Companies, Inc. |
54,950 |
6,703,900 |
|
|
MBIA, Inc. |
45,700 |
2,544,919 |
|
|
MetLife, Inc. |
150,000 |
3,150,000 |
|
|
Nationwide Financial Services, Inc. |
21,300 |
782,775 |
|
|
PartnerRe Ltd. |
36,600 |
1,450,275 |
|
|
PMI Group, Inc. |
21,750 |
1,362,094 |
|
|
Protective Life Corp. |
14,000 |
379,750 |
|
|
Reinsurance Group of America, Inc. |
15,000 |
477,188 |
|
|
Reliastar Financial Corp. |
39,201 |
2,085,003 |
|
|
RenaissanceRe Holdings Ltd. |
43,400 |
2,020,813 |
|
|
SAFECO Corp. |
30,000 |
691,875 |
|
|
Sun Life Financial Services Canada, Inc. |
170,000 |
2,829,142 |
|
|
The Chubb Corp. |
89,500 |
6,623,000 |
|
|
The St. Paul Companies, Inc. |
54,000 |
2,399,625 |
|
|
Torchmark Corp. |
20,000 |
497,500 |
|
|
UnumProvident Corp. |
75,000 |
1,725,000 |
|
|
XL Capital Ltd. Class A |
60,000 |
3,960,000 |
|
|
|
114,962,614 |
||
|
LODGING & GAMING - 0.1% |
|||
|
Starwood Hotels & Resorts |
22,400 |
764,400 |
|
|
RAILROADS - 0.0% |
|||
|
Kansas City Southern Industries, Inc. |
20,500 |
142,219 |
|
|
Common Stocks - continued |
|||
|
Shares |
Value (Note 1) |
||
|
REAL ESTATE INVESTMENT TRUSTS - 4.3% |
|||
|
AMB Property Corp. |
37,900 |
$ 904,863 |
|
|
Apartment Investment & |
47,400 |
2,292,975 |
|
|
Archstone Communities Trust |
45,000 |
1,167,188 |
|
|
Arden Realty Group, Inc. |
15,000 |
397,500 |
|
|
Avalonbay Communities, Inc. |
10,000 |
471,250 |
|
|
BRE Properties, Inc. Class A |
20,000 |
648,750 |
|
|
Cousins Properties, Inc. |
29,500 |
1,286,938 |
|
|
Crescent Real Estate Equities Co. |
56,100 |
1,237,706 |
|
|
Duke-Weeks Realty Corp. |
68,500 |
1,678,250 |
|
|
Equity Office Properties Trust |
63,900 |
1,948,950 |
|
|
Equity Residential Properties Trust (SBI) |
46,500 |
2,319,188 |
|
|
First Industrial Realty Trust, Inc. |
17,000 |
544,000 |
|
|
Host Marriott Corp. |
50,000 |
556,250 |
|
|
Kimco Realty Corp. |
14,100 |
581,625 |
|
|
ProLogis Trust |
55,700 |
1,298,506 |
|
|
Public Storage, Inc. |
37,500 |
960,938 |
|
|
Simon Property Group, Inc. |
21,000 |
548,625 |
|
|
Spieker Properties, Inc. |
25,500 |
1,318,031 |
|
|
|
20,161,533 |
||
|
SAVINGS & LOANS - 2.8% |
|||
|
Astoria Financial Corp. |
20,000 |
582,500 |
|
|
Bank United Corp. Class A |
10,000 |
364,375 |
|
|
Charter One Financial, Inc. |
49,500 |
1,067,344 |
|
|
Dime Bancorp, Inc. |
20,000 |
322,500 |
|
|
Golden State Bancorp, Inc. |
30,000 |
573,750 |
|
|
Golden West Financial Corp. |
48,200 |
2,217,200 |
|
|
TCF Financial Corp. |
76,200 |
2,243,138 |
|
|
Washington Mutual, Inc. |
178,520 |
5,734,955 |
|
|
|
13,105,762 |
||
|
SECURITIES INDUSTRY - 15.6% |
|||
|
A.G. Edwards, Inc. |
25,000 |
1,321,875 |
|
|
Ameritrade Holding Corp. Class A (a) |
22,000 |
281,875 |
|
|
AXA Financial, Inc. |
60,900 |
2,329,425 |
|
|
Bear Stearns Companies, Inc. |
35,625 |
1,919,297 |
|
|
Charles Schwab Corp. |
401,326 |
14,497,903 |
|
|
DLJ, Inc. |
10,000 |
515,625 |
|
|
DLJdirect, Inc. (a) |
17,000 |
114,750 |
|
|
Eaton Vance Corp. (non-vtg.) |
15,000 |
777,188 |
|
|
Federated Investors, Inc. Class B (non-vtg.) |
60,000 |
1,571,250 |
|
|
Franklin Resources, Inc. |
30,000 |
1,076,250 |
|
|
Goldman Sachs Group, Inc. |
13,500 |
1,335,656 |
|
|
Legg Mason, Inc. |
15,000 |
780,000 |
|
|
Lehman Brothers Holdings, Inc. |
41,400 |
4,652,325 |
|
|
Mackenzie Financial Corp. |
30,000 |
438,744 |
|
|
Merrill Lynch & Co., Inc. |
46,600 |
6,023,050 |
|
|
Morgan Stanley Dean Witter & Co. |
272,500 |
24,865,617 |
|
|
Neuberger Berman, Inc. |
15,000 |
744,375 |
|
|
|
|||
|
Shares |
Value (Note 1) |
||
|
PaineWebber Group, Inc. |
15,000 |
$ 1,038,750 |
|
|
Raymond James Financial, Inc. |
10,000 |
250,000 |
|
|
Stilwell Financial, Inc. (a) |
82,000 |
3,613,125 |
|
|
T. Rowe Price Associates, Inc. |
26,000 |
1,062,750 |
|
|
TD Waterhouse Group, Inc. |
46,000 |
839,500 |
|
|
Waddell & Reed Financial, Inc. Class A |
104,767 |
3,431,119 |
|
|
Wit Soundview Group, Inc. |
10,000 |
84,063 |
|
|
|
73,564,512 |
||
|
SERVICES - 0.1% |
|||
|
H&R Block, Inc. |
20,000 |
640,000 |
|
|
TOTAL COMMON STOCKS (Cost $362,827,971) |
433,061,556 |
||
|
Cash Equivalents - 7.8% |
|||
|
Maturity Amount |
|
||
|
Investments in repurchase agreements (U.S. Treasury Obligations), in a joint trading account at 6.56%, dated 7/31/00 due 8/1/00 |
$ 43,008 |
43,000 |
|
|
Shares |
|
||
|
Fidelity Cash Central Fund, 6.57% (b) |
32,582,266 |
32,582,266 |
|
|
Fidelity Securities Lending Cash |
4,214,332 |
4,214,332 |
|
|
TOTAL CASH EQUIVALENTS (Cost $36,839,598) |
36,839,598 |
||
|
TOTAL INVESTMENT PORTFOLIO - 99.6% (Cost $399,667,569) |
469,901,154 |
|
NET OTHER ASSETS - 0.4% |
1,754,979 |
||
|
NET ASSETS - 100% |
$ 471,656,133 |
||
|
Legend |
|
(a) Non-income producing |
|
(b) The rate quoted is the annualized seven-day yield of the fund at |
|
Income Tax Information |
|
At July 31, 2000, the aggregate cost of investment securities for income tax purposes was $403,880,955. Net unrealized appreciation aggregated $66,020,199, of which $88,955,862 related to appreciated investment securities and $22,935,663 related to depreciated investment securities. |
|
At July 31, 2000, the fund had a capital loss carryforward of approximately $7,462,000 of which $4,198,000 and $3,264,000 will expire on July 31, 2007 and 2008, respectively. |
|
The fund intends to elect to defer to its fiscal year ending July 31, 2001 approximately $14,759,000 of losses recognized during the period November 1, 1999 to July 31, 2000. |
|
A total of 100% of Class A's, Class T's, Class C's and Institutional Class' dividends distributed during the fiscal year qualifies for the dividends-received deductions for corporate shareholders (unaudited). |
|
The fund will notify shareholders in January 2001 of the applicable percentage for use in preparing 2000 income tax returns. |
See accompanying notes which are an integral part of the financial statements.
Financial Services
Statement of Assets and Liabilities
|
|
July 31, 2000 |
|
|
Assets |
|
|
|
Investment in securities, at value (including repurchase agreements of $43,000) (cost $399,667,569) - See accompanying schedule |
|
$ 469,901,154 |
|
Cash |
|
187,383 |
|
Receivable for investments sold |
|
9,847,318 |
|
Receivable for fund shares sold |
|
2,737,447 |
|
Dividends receivable |
|
414,499 |
|
Interest receivable |
|
172,903 |
|
Redemption fees receivable |
|
435 |
|
Other receivables |
|
4,826 |
|
Total assets |
|
483,265,965 |
|
Liabilities |
|
|
|
Payable for investments purchased |
$ 6,390,221 |
|
|
Payable for fund shares redeemed |
373,705 |
|
|
Accrued management fee |
216,352 |
|
|
Distribution fees payable |
267,574 |
|
|
Other payables and accrued expenses |
147,648 |
|
|
Collateral on securities loaned, at value |
4,214,332 |
|
|
Total liabilities |
|
11,609,832 |
|
Net Assets |
|
$ 471,656,133 |
|
Net Assets consist of: |
|
|
|
Paid in capital |
|
$ 426,176,905 |
|
Undistributed net investment income |
|
1,705,322 |
|
Accumulated undistributed net realized gain (loss) on investments and foreign currency transactions |
|
(26,459,345) |
|
Net unrealized appreciation (depreciation) on investments |
|
70,233,251 |
|
Net Assets |
|
$ 471,656,133 |
|
Calculation of Maximum |
|
$18.29 |
|
Maximum offering price per share |
|
$19.41 |
|
Class T: |
|
$18.21 |
|
Maximum offering price per share |
|
$18.87 |
|
Class B: |
|
$17.95 |
|
Class C: |
|
$17.96 |
|
Institutional Class: |
|
$18.39 |
A Redemption price per share is equal to net asset value less any applicable contingent deferred sales charge.
Statement of Operations
|
|
Year ended July 31, 2000 |
|
|
Investment Income Dividends |
|
$ 5,814,825 |
|
Interest |
|
1,498,364 |
|
Security lending |
|
15,187 |
|
Total income |
|
7,328,376 |
|
Expenses |
|
|
|
Management fee |
$ 1,974,906 |
|
|
Transfer agent fees |
1,034,853 |
|
|
Distribution fees |
2,385,482 |
|
|
Accounting and security lending fees |
138,087 |
|
|
Non-interested trustees' compensation |
997 |
|
|
Custodian fees and expenses |
13,476 |
|
|
Registration fees |
159,231 |
|
|
Audit |
25,970 |
|
|
Legal |
2,365 |
|
|
Miscellaneous |
7,970 |
|
|
Total expenses before reductions |
5,743,337 |
|
|
Expense reductions |
(98,416) |
5,644,921 |
|
Net investment income |
|
1,683,455 |
|
Realized and Unrealized Gain (Loss) Net realized gain (loss) on: |
|
|
|
Investment securities |
(21,284,132) |
|
|
Foreign currency transactions |
(7,754) |
(21,291,886) |
|
Change in net unrealized appreciation (depreciation) on: |
|
|
|
Investment securities |
41,704,382 |
|
|
Assets and liabilities in |
5 |
41,704,387 |
|
Net gain (loss) |
|
20,412,501 |
|
Net increase (decrease) in net assets resulting from operations |
|
$ 22,095,956 |
See accompanying notes which are an integral part of the financial statements.
Annual Report
Advisor Financial Services Fund
Financial Statements - continued
Statement of Changes in Net Assets
|
Increase (Decrease) in Net Assets |
Year ended |
Year ended |
|
Operations |
$ 1,683,455 |
$ 798,328 |
|
Net realized gain (loss) |
(21,291,886) |
(5,100,835) |
|
Change in net unrealized appreciation (depreciation) |
41,704,387 |
3,565,570 |
|
Net increase (decrease) in net assets resulting from operations |
22,095,956 |
(736,937) |
|
Distributions to shareholders |
(642,372) |
(365,767) |
|
From net realized gain |
- |
(12,710,202) |
|
Total distributions |
(642,372) |
(13,075,969) |
|
Share transactions - net increase (decrease) |
156,543,872 |
75,395,927 |
|
Redemption fees |
278,776 |
103,555 |
|
Total increase (decrease) in net assets |
178,276,232 |
61,686,576 |
|
Net Assets |
|
|
|
Beginning of period |
293,379,901 |
231,693,325 |
|
End of period (including undistributed net investment income of $1,705,322 and $673,045, respectively) |
$ 471,656,133 |
$ 293,379,901 |
Financial Highlights - Class A
|
Years ended July 31, |
2000 |
1999 |
1998 |
1997 E |
|
Selected Per-Share Data |
|
|
|
|
|
Net asset value, beginning of period |
$ 17.49 |
$ 18.74 |
$ 15.11 |
$ 10.00 |
|
Income from Investment Operations |
|
|
|
|
|
Net investment income D |
.15 |
.12 |
.11 |
.06 |
|
Net realized and unrealized gain (loss) |
.73 |
(.31) |
3.80 |
5.06 |
|
Total from investment operations |
.88 |
(.19) |
3.91 |
5.12 |
|
Less Distributions |
|
|
|
|
|
From net investment income |
(.09) |
(.06) |
(.06) |
(.01) |
|
From net realized gain |
- |
(1.01) |
(.23) |
(.01) |
|
Total distributions |
(.09) |
(1.07) |
(.29) |
(.02) |
|
Redemption fees added to paid in capital |
.01 |
.01 |
.01 |
.01 |
|
Net asset value, end of period |
$ 18.29 |
$ 17.49 |
$ 18.74 |
$ 15.11 |
|
Total Return B, C |
5.12% |
.69% |
26.32% |
51.35% |
|
Ratios and Supplemental Data |
|
|
|
|
|
Net assets, end of period (000 omitted) |
$ 48,088 |
$ 27,440 |
$ 21,907 |
$ 6,275 |
|
Ratio of expenses to average net assets |
1.25% |
1.24% |
1.32% |
1.75%A, F |
|
Ratio of expenses to average net assets after expense reductions |
1.22%G |
1.23%G |
1.30%G |
1.73%A, G |
|
Ratio of net investment income to average net assets |
.92% |
.73% |
.63% |
.55%A |
|
Portfolio turnover |
73% |
38% |
54% |
26%A |
|
A Annualized B The total returns would have been lower had certain expenses not been reduced during the periods shown. C Total returns do not include the one time sales charge and for periods of less than one year are not annualized. D Net investment income per share has been calculated based on average shares outstanding during the period. E For the period September 3, 1996 (commencement of sale of Class A shares) to July 31, 1997. F FMR agreed to reimburse a portion of the class' expenses during the period. Without this reimbursement, the class' expense ratio would have been higher. G FMR or the fund has entered into varying arrangements with third parties who either paid or reduced a portion of the class' expenses. |
||||
See accompanying notes which are an integral part of the financial statements.
Financial Services
Financial Highlights - Class T
|
Years ended July 31, |
2000 |
1999 |
1998 |
1997 E |
|
Selected Per-Share Data |
|
|
|
|
|
Net asset value, beginning of period |
$ 17.42 |
$ 18.66 |
$ 15.07 |
$ 10.00 |
|
Income from Investment Operations |
|
|
|
|
|
Net investment income D |
.12 |
.09 |
.07 |
.04 |
|
Net realized and unrealized gain (loss) |
.71 |
(.30) |
3.78 |
5.04 |
|
Total from investment operations |
.83 |
(.21) |
3.85 |
5.08 |
|
Less Distributions |
|
|
|
|
|
From net investment income |
(.05) |
(.03) |
(.04) |
(.01) |
|
From net realized gain |
- |
(1.01) |
(.23) |
(.01) |
|
Total distributions |
(.05) |
(1.04) |
(.27) |
(.02) |
|
Redemption fees added to paid in capital |
.01 |
.01 |
.01 |
.01 |
|
Net asset value, end of period |
$ 18.21 |
$ 17.42 |
$ 18.66 |
$ 15.07 |
|
Total Return B, C |
4.84% |
.53% |
25.96% |
50.95% |
|
Ratios and Supplemental Data |
|
|
|
|
|
Net assets, end of period (000 omitted) |
$ 179,862 |
$ 123,361 |
$ 118,608 |
$ 52,003 |
|
Ratio of expenses to average net assets |
1.47% |
1.47% |
1.52% |
1.94% A |
|
Ratio of expenses to average net assets after expense reductions |
1.44% F |
1.46% F |
1.50% F |
1.91% A, F |
|
Ratio of net investment income to average net assets |
.70% |
.50% |
.44% |
.37% A |
|
Portfolio turnover |
73% |
38% |
54% |
26% A |
|
A Annualized B The total returns would have been lower had certain expenses not been reduced during the periods shown. C Total returns do not include the one time sales charge and for periods of less than one year are not annualized. D Net investment income per share has been calculated based on average shares outstanding during the period. E For the period September 3, 1996 (commencement of sale of Class T shares) to July 31,1997. F FMR or the fund has entered into varying arrangements with third parties who either paid or reduced a portion of the class' expenses. |
Financial Highlights - Class B
|
Years ended July 31, |
2000 |
1999 |
1998 |
1997 E |
|
Selected Per-Share Data |
|
|
|
|
|
Net asset value, beginning of period |
$ 17.21 |
$ 18.52 |
$ 15.04 |
$ 12.56 |
|
Income from Investment Operations |
|
|
|
|
|
Net investment income (loss) D |
.03 |
- |
(.02) |
(.02) |
|
Net realized and unrealized gain (loss) |
.70 |
(.29) |
3.76 |
2.50 |
|
Total from investment operations |
.73 |
(.29) |
3.74 |
2.48 |
|
Less Distributions |
|
|
|
|
|
From net investment income |
- |
(.02) |
(.04) |
- |
|
From net realized gain |
- |
(1.01) |
(.23) |
- |
|
Total distributions |
- |
(1.03) |
(.27) |
- |
|
Redemption fees added to paid in capital |
.01 |
.01 |
.01 |
- |
|
Net asset value, end of period |
$ 17.95 |
$ 17.21 |
$ 18.52 |
$ 15.04 |
|
Total Return B, C |
4.30% |
.05% |
25.29% |
19.75% |
|
Ratios and Supplemental Data |
|
|
|
|
|
Net assets, end of period (000 omitted) |
$ 150,880 |
$ 94,072 |
$ 65,926 |
$ 7,737 |
|
Ratio of expenses to average net assets |
2.01% |
1.99% |
2.06% |
2.50% A, F |
|
Ratio of expenses to average net assets after expense reductions |
1.98% G |
1.98% G |
2.04% G |
2.49% A, G |
|
Ratio of net investment income to average net assets |
.16% |
(.02)% |
(.14)% |
(.37)% A |
|
Portfolio turnover |
73% |
38% |
54% |
26% A |
|
A Annualized B The total returns would have been lower had certain expenses not been reduced during the periods shown. C Total returns do not include the contingent deferred sales charge and for periods of less than one year are not annualized. D Net investment income (loss) per share has been calculated based on average shares outstanding during the period. E For the period March 3, 1997 (commencement of sale of Class B shares) to July 31,1997. F FMR agreed to reimburse a portion of the class' expenses during the period. Without this reimbursement, the class' expense ratio would have been higher. G FMR or the fund has entered into varying arrangements with third parties who either paid or reduced a portion of the class' expenses. |
See accompanying notes which are an integral part of the financial statements.
Annual Report
Financial Highlights - Class C
|
Years ended July 31, |
2000 |
1999 |
1998 E |
|
Selected Per-Share Data |
|
|
|
|
Net asset value, beginning of period |
$ 17.24 |
$ 18.56 |
$ 15.24 |
|
Income from Investment Operations |
|
|
|
|
Net investment income (loss) D |
.03 |
- |
(.03) |
|
Net realized and unrealized gain (loss) |
.70 |
(.29) |
3.57 |
|
Total from investment operations |
.73 |
(.29) |
3.54 |
|
Less Distributions |
|
|
|
|
From net investment income |
(.02) |
(.03) |
(.02) |
|
From net realized gain |
- |
(1.01) |
(.21) |
|
Total distributions |
(.02) |
(1.04) |
(.23) |
|
Redemption fees added to paid in capital |
.01 |
.01 |
.01 |
|
Net asset value, end of period |
$ 17.96 |
$ 17.24 |
$ 18.56 |
|
Total Return B, C |
4.30% |
.07% |
23.56% |
|
Ratios and Supplemental Data |
|
|
|
|
Net assets, end of period (000 omitted) |
$ 83,078 |
$ 36,552 |
$ 19,983 |
|
Ratio of expenses to average net assets |
1.96% |
1.95% |
2.09% A |
|
Ratio of expenses to average net assets after expense reductions |
1.93% F |
1.94% F |
2.07% A, F |
|
Ratio of net investment income to average net assets |
.21% |
.02% |
(.22)% A |
|
Portfolio turnover |
73% |
38% |
54% |
|
A Annualized B The total returns would have been lower had certain expenses not been reduced during the periods shown. C Total returns do not include the contingent deferred sales charge and for periods of less than one year are not annualized. D Net investment income (loss) per share has been calculated based on average shares outstanding during the period. E For the period November 3, 1997 (commencement of sale of Class C shares) to July 31,1998. F FMR or the fund has entered into varying arrangements with third parties who either paid or reduced a portion of the class' expenses. |
Financial Highlights - Institutional Class
|
Years ended July 31, |
2000 |
1999 |
1998 |
1997 E |
|
Selected Per-Share Data |
|
|
|
|
|
Net asset value, beginning of period |
$ 17.60 |
$ 18.80 |
$ 15.14 |
$ 10.00 |
|
Income from Investment Operations |
|
|
|
|
|
Net investment income D |
.21 |
.18 |
.14 |
.10 |
|
Net realized and unrealized gain (loss) |
.72 |
(.30) |
3.79 |
5.06 |
|
Total from investment operations |
.93 |
(.12) |
3.93 |
5.16 |
|
Less Distributions |
|
|
|
|
|
From net investment income |
(.15) |
(.08) |
(.05) |
(.02) |
|
From net realized gain |
- |
(1.01) |
(.23) |
(.01) |
|
Total distributions |
(.15) |
(1.09) |
(.28) |
(.03) |
|
Redemption fees added to paid in capital |
.01 |
.01 |
.01 |
.01 |
|
Net asset value, end of period |
$ 18.39 |
$ 17.60 |
$ 18.80 |
$ 15.14 |
|
Total Return B, C |
5.40% |
1.12% |
26.39% |
51.78% |
|
Ratios and Supplemental Data |
|
|
|
|
|
Net assets, end of period (000 omitted) |
$ 9,749 |
$ 11,956 |
$ 5,270 |
$ 3,758 |
|
Ratio of expenses to average net assets |
.90% |
.93% |
1.14% |
1.50% A, F |
|
Ratio of expenses to average net assets after expense reductions |
.87% G |
.92% G |
1.13% G |
1.47% A, G |
|
Ratio of net investment income to average net assets |
1.27% |
1.04% |
.81% |
.85% A |
|
Portfolio turnover |
73% |
38% |
54% |
26% A |
|
A Annualized B The total returns would have been lower had certain expenses not been reduced during the periods shown. C Total returns for periods of less than one year are not annualized. D Net investment income per share has been calculated based on average shares outstanding during the period. E For the period September 3, 1996 (commencement of sale of Institutional Class shares) to July 31, 1997. F FMR agreed to reimburse a portion of the class' expenses during the period. Without this reimbursement, the class' expense ratio would have been higher. G FMR or the fund has entered into varying arrangements with third parties who either paid or reduced a portion of the class' expenses. |
Financial Services
For the period ended July 31, 2000
1. Significant Accounting Policies.
Fidelity Advisor Financial Services Fund (the fund) is a fund of Fidelity Advisor Series VII (the trust) and is authorized to issue an unlimited number of shares. The trust is registered under the Investment Company Act of 1940, as amended (the 1940 Act), as an open-end management investment company organized as a Massachusetts business trust.
The fund offers Class A, Class T, Class B, Class C, and Institutional Class shares, each of which has equal rights as to assets and voting privileges. Each class has exclusive voting rights with respect to matters that affect that class. Class B shares will automatically convert to Class A shares after a holding period of seven years from the initial date of purchase. Investment income, realized and unrealized capital gains and losses, the common expenses of the fund, and certain fund-level expense reductions, if any, are allocated on a pro rata basis to each class based on the relative net assets of each class to the total net assets of the fund. Each class of shares differs in its respective distribution, transfer agent, and certain other class-specific fees, expenses, and expense reductions.
The financial statements have been prepared in conformity with generally accepted accounting principles which require management to make certain estimates and assumptions at the date of the financial statements. The following summarizes the significant accounting policies of the fund:
Security Valuation. Securities for which exchange quotations are readily available are valued at the last sale price, or if no sale price, at the closing bid price. Foreign securities are valued based on quotations from the principal market in which such securities are normally traded. If trading or events occurring in other markets after the close of the principal market in which foreign securities are traded, and before the close of the business of the fund, are expected to materially affect the value of those securities, then they are valued at their fair value taking this trading or these events into account. Fair value is determined in good faith under consistently applied procedures under the general supervision of the Board of Trustees. Securities for which exchange quotations are not readily available (and in certain cases debt securities which trade on an exchange) are valued primarily using dealer-supplied valuations or at their fair value. Short-term securities with remaining maturities of sixty days or less for which quotations are not readily available are valued at amortized cost or original cost plus accrued interest, both of which approximate current value.
Foreign Currency Translation. The accounting records of the fund are maintained in U.S. dollars. Investment securities and other assets and liabilities denominated in a foreign currency are translated into U.S. dollars at the prevailing rates of exchange at period end. Purchases and sales of securities, income receipts and expense payments are translated into U.S. dollars at the prevailing exchange rate on the respective dates of the transactions.
Net realized gains and losses on foreign currency transactions represent net gains and losses from sales and maturities of foreign currency contracts, disposition of foreign currencies, the difference between the amount of net investment income accrued and the U.S. dollar amount actually received, and gains and losses between trade and settlement date on purchases and sales of securities. The effects of changes in foreign currency exchange rates on investments in securities are included with the net realized and unrealized gain or loss on investment securities.
Income Taxes. As a qualified regulated investment company under Subchapter M of the Internal Revenue Code, the fund is not subject to income taxes to the extent that it distributes substantially all of its taxable income for its fiscal year. The schedule of investments includes information regarding income taxes under the caption "Income Tax Information."
Investment Income. Dividend income is recorded on the ex-dividend date, except certain dividends from foreign securities where the ex-dividend date may have passed, are recorded as soon as the fund is informed of the ex-dividend date. Non-cash dividends included in dividend income, if any, are recorded at the fair market value of the securities received. Interest income is accrued as earned. Investment income is recorded net of foreign taxes withheld where recovery of such taxes is uncertain.
Expenses. Most expenses of the trust can be directly attributed to a fund. Expenses which cannot be directly attributed are apportioned among the funds in the trust.
Distributions to Shareholders. Distributions are recorded on the ex-dividend date. Income dividends and capital gain distributions are declared separately for each class.
Income and capital gain distributions are determined in accordance with income tax regulations which may differ from generally accepted accounting principles. These differences, which may result in distribution reclassifications, are primarily due to differing treatments for foreign currency transactions, and losses deferred due to wash sales and excise tax regulations.
Permanent book and tax basis differences relating to shareholder distributions will result in reclassifications to paid in capital. Undistributed net investment income and accumulated undistributed net realized gain (loss) on investments and foreign currency transactions may include temporary book and tax basis differences which will reverse in a subsequent period. Any taxable income or gain remaining at fiscal year end is distributed in the following year.
Short-Term Trading (Redemption) Fees. Shares held in the fund less than 60 days are subject to a short-term trading fee equal to 1% of the proceeds of the redeemed shares. The fee, which is retained by the fund, is accounted for as an addition to paid in capital.
Annual Report
Notes to Financial Statements - continued
1. Significant Accounting Policies - continued
Security Transactions. Security transactions are accounted for as of trade date. Gains and losses on securities sold are determined on the basis of identified cost.
2. Operating Policies.
Foreign Currency Contracts. The fund generally uses foreign currency contracts to facilitate transactions in foreign-denominated securities. Losses may arise from changes in the value of the foreign currency or if the counterparties do not perform under the contracts' terms. The U.S. dollar value of foreign currency contracts is determined using contractual currency exchange rates established at the time of each trade.
Joint Trading Account. Pursuant to an Exemptive Order issued by the Securities and Exchange Commission (the SEC), the fund, along with other affiliated entities of Fidelity Management & Research Company (FMR), may transfer uninvested cash balances into one or more joint trading accounts. These balances are invested in one or more repurchase agreements for U.S. Treasury or Federal Agency obligations.
Repurchase Agreements. The underlying U.S. Treasury, Federal Agency, or other obligations found to be satisfactory by FMR are transferred to an account of the fund, or to the Joint Trading Account, at a custodian bank. The securities are marked-to-market daily and maintained at a value at least equal to the principal amount of the repurchase agreement (including accrued interest). FMR, the fund's investment adviser, is responsible for determining that the value of the underlying securities remains in accordance with the market value requirements stated above.
Cash Central Funds. Pursuant to an Exemptive Order issued by the SEC, the fund may invest in the Fidelity Cash Central Fund and the Fidelity Securities Lending Cash Central Fund (the Cash Funds) managed by Fidelity Investments Money Management, Inc., an affiliate of FMR. The Cash Funds are open-end money market funds available only to investment companies and other accounts managed by FMR and its affiliates. The Cash Funds seek preservation of capital, liquidity, and current income. Income distributions from the Cash Funds are declared daily and paid monthly from net interest income. Income distributions earned by the fund are recorded as either interest income or security lending income in the accompanying financial statements.
3. Purchases and Sales of Investments.
Purchases and sales of securities, other than short-term securities, aggregated $376,603,279 and $233,760,915, respectively.
4. Fees and Other Transactions with Affiliates.
Management Fee. As the fund's investment adviser, FMR receives a monthly fee that is calculated on the basis of a group fee rate plus a fixed individual fund fee rate applied to the average net assets of the fund. The group fee rate is the weighted average of a series of rates and is based on the monthly average net assets of all the mutual funds advised by FMR. The rates ranged from .2167% to .5200% for the period. The annual individual fund fee rate is .30%. In the event that these rates were lower than the contractual rates in effect during the period, FMR voluntarily implemented the above rates, as they resulted in the same or a lower management fee. For the period, the management fee was equivalent to an annual rate of .58% of average net assets.
Distribution and Service Plan. In accordance with Rule 12b-1 of the 1940 Act, the Board of Trustees have adopted separate Distribution and Service Plans with respect to each class of shares (collectively referred to as "the Plans"). Under certain of the Plans, the class pays Fidelity Distributors Corporation (FDC), an affiliate of FMR, a 12b-1 fee. A portion of this fee may be reallowed to securities dealers, banks and other financial institutions for the distribution of each class of shares and providing shareholder support services. For the period, this fee was based on the following annual rates of the average net assets of each applicable class:
|
Class A |
.25% |
|
Class T |
.50% |
|
Class B |
1.00% * |
|
Class C |
1.00% * |
* .75% represents a distribution fee and .25% represents a shareholder service fee.
For the period, each class paid FDC the following amounts, a portion of which was retained by FDC:
|
|
Paid to |
Retained |
|
Class A |
$ 83,191 |
$ 145 |
|
Class T |
687,848 |
323 |
|
Class B |
1,098,203 |
823,948 |
|
Class C |
516,240 |
340,340 |
|
|
$ 2,385,482 |
$ 1,164,756 |
Sales Load. FDC receives a front-end sales charge of up to 5.75% for selling Class A shares, and 3.50% for selling Class T shares of the fund. FDC receives the proceeds of contingent deferred sales charges levied on Class B share redemptions occurring within six years of purchase and Class C share redemptions occurring within one year of purchase. Contingent deferred sales charges are based on declining rates ranging from 5% to 1% for Class B and 1% for Class C, of the lesser of the cost of shares at the initial date of
Financial Services
Notes to Financial Statements - continued
4. Fees and Other Transactions with Affiliates - continued
Sales Load - continued
purchase or the net asset value of the redeemed shares, excluding any reinvested dividends and capital gains. In addition, purchases of Class A and Class T shares that were subject to a finder's fee bear a contingent deferred sales charge on assets that do not remain in the fund for at least one year. The Class A and Class T contingent deferred sales charge is based on 0.25% of the lesser of the cost of shares at the initial date of purchase or the net asset value of the redeemed shares, excluding any reinvested dividends and capital gains. A portion of the sales charges paid to FDC is paid to securities dealers, banks and other financial institutions.
For the period, sales charge amounts paid to and retained by FDC were as follows:
|
|
Paid to |
Retained |
|
Class A |
$ 210,575 |
$ 142,138 |
|
Class T |
262,927 |
131,358 |
|
Class B |
468,570 |
468,570* |
|
Class C |
78,536 |
78,536* |
|
|
$ 1,020,608 |
$ 820,602 |
* When Class B and Class C shares are initially sold, FDC pays commissions from its own resources to securities dealers,
banks, and other financial institutions through which the sales are made.
Transfer Agent Fees. Fidelity Investments Institutional Operations Company, Inc., (FIIOC), an affiliate of FMR, is the transfer, dividend disbursing and shareholder servicing agent (collectively referred to as the transfer agent) for each class of the fund. FIIOC receives account fees and asset-based fees that vary according to the account size and type of account of the shareholders of the respective classes of the fund. FIIOC pays for typesetting, printing and mailing of all shareholder reports, except proxy statements. For the period, the following amounts were paid to FIIOC:
|
|
Amount |
% of |
|
Class A |
$ 106,332 |
.32 |
|
Class T |
402,877 |
.29 |
|
Class B |
358,118 |
.33 |
|
Class C |
144,946 |
.28 |
|
Institutional Class |
22,580 |
.22 |
|
|
$ 1,034,853 |
|
Accounting and Security Lending Fees. Fidelity Service Company, Inc., an affiliate of FMR, maintains the fund's accounting records and administers the security lending program. The security lending fee is based on the number and duration of lending transactions. The accounting fee is based on the level of average net assets for the month plus out-of-pocket expenses.
Brokerage Commissions. The fund placed a portion of its portfolio transactions with brokerage firms which are affiliates of FMR. The commissions paid to these affiliated firms were $37,725 for the period.
5. Security Lending.
The fund lends portfolio securities from time to time in order to earn additional income. The fund receives collateral in the form of U.S. Treasury obligations, letters of credit, and/or cash against the loaned securities, and maintains collateral in an amount not less than 100% of the market value of the loaned securities during the period of the loan. The market value of the loaned securities is determined at the close of business of the fund and any additional required collateral is delivered to the fund on the next business day. If the borrower defaults on its obligation to return the securities loaned because of insolvency or other reasons, the fund could experience delays and costs in recovering the securities loaned or in gaining access to the collateral. At period end, the value of the securities loaned amounted to $4,271,010. The fund received cash collateral of $4,214,332 which was invested in cash equivalents and U.S. Treasury obligations valued at $214,500.
6. Expense Reductions.
FMR has directed certain portfolio trades to brokers who paid a portion of the fund's expenses. For the period, the fund's expenses were reduced by $96,518 under this arrangement.
In addition, the fund has entered into an arrangement with its custodian whereby credits realized as a result of uninvested cash balances were used to reduce a portion of expenses. During the period, the fund's custodian fees were reduced by $1,898 under the custodian arrangement.
Financial Services
Notes to Financial Statements - continued
7. Distributions to Shareholders.
Distributions to shareholders of each class were as follows:
|
|
Years ended July 31, |
|
|
|
2000 |
1999 |
|
From net investment income |
|
|
|
Class A |
$ 141,474 |
$ 69,817 |
|
Class T |
357,303 |
174,881 |
|
Class B |
- |
68,552 |
|
Class C |
41,770 |
31,424 |
|
Institutional Class |
101,825 |
21,093 |
|
Total |
$ 642,372 |
$ 365,767 |
|
From net realized gain |
|
|
|
Class A |
$ - |
$ 1,212,772 |
|
Class T Class B |
- - |
6,262,898 3,836,369 |
|
Class C |
- |
1,125,444 |
|
Institutional Class |
- |
272,719 |
|
Total |
$ - |
$ 12,710,202 |
|
|
$ 642,372 |
$ 13,075,969 |
8. Share Transactions.
Transactions for each class of shares were as follows:
|
|
Shares |
Dollars |
||
|
|
Year ended |
Year ended |
Year ended |
Year ended |
|
|
2000 |
1999 |
2000 |
1999 |
|
|
|
|
|
|
|
Class A |
1,983,482 |
822,308 |
$ 33,127,709 |
$ 14,081,934 |
|
Reinvestment of distributions |
7,540 |
85,902 |
129,104 |
1,165,695 |
|
Shares redeemed |
(929,902) |
(508,971) |
(15,304,883) |
(8,477,160) |
|
Net increase (decrease) |
1,061,120 |
399,239 |
$ 17,951,930 |
$ 6,770,469 |
|
Class T |
7,477,175 |
3,240,994 |
$ 126,038,053 |
$ 54,768,982 |
|
Reinvestment of distributions |
19,181 |
443,632 |
327,797 |
6,006,779 |
|
Shares redeemed |
(4,700,362) |
(2,959,321) |
(76,396,220) |
(48,376,793) |
|
Net increase (decrease) |
2,795,994 |
725,305 |
$ 49,969,630 |
$ 12,398,968 |
|
Class B |
5,123,537 |
2,867,874 |
$ 84,322,371 |
$ 48,151,991 |
|
Reinvestment of distributions |
- |
235,734 |
- |
3,165,887 |
|
Shares redeemed |
(2,182,214) |
(1,197,148) |
(34,908,649) |
(19,603,788) |
|
Net increase (decrease) |
2,941,323 |
1,906,460 |
$ 49,413,722 |
$ 31,714,090 |
|
Class C |
3,944,800 |
1,453,651 |
$ 64,658,535 |
$ 24,778,214 |
|
Reinvestment of distributions |
1,942 |
57,370 |
32,872 |
771,627 |
|
Shares redeemed |
(1,440,653) |
(467,142) |
(23,274,029) |
(7,840,548) |
|
Net increase (decrease) |
2,506,089 |
1,043,879 |
$ 41,417,378 |
$ 17,709,293 |
|
Institutional Class |
523,400 |
511,162 |
$ 8,779,263 |
$ 8,733,321 |
|
Reinvestment of distributions |
2,415 |
18,075 |
41,473 |
245,820 |
|
Shares redeemed |
(675,136) |
(130,140) |
(11,029,524) |
(2,176,034) |
|
Net increase (decrease) |
(149,321) |
399,097 |
$ (2,208,788) |
$ 6,803,107 |
Financial Services
Performance
There are several ways to evaluate historical performance. You can look at the total percentage change in value, the average annual percentage change or the growth of a hypothetical $10,000 investment. Total return reflects the change in the value of an investment, assuming reinvestment of dividend income and capital gains (the profits earned upon the sale of securities that have grown in value). If Fidelity had not reimbursed certain class expenses, the life of fund total returns would have been lower.
Cumulative Total Returns
|
Periods ended July 31, 2000 |
|
Past 1 |
Life of |
|
Fidelity Adv Health Care - Inst CL |
|
21.77% |
148.71% |
|
S&P 500 |
|
8.98% |
131.80% |
|
GS Health Care |
|
22.57% |
152.86% |
Cumulative total returns show Institutional Class shares' performance in percentage terms over a set period - in this case, one year or since the fund started on September 3, 1996. You can compare Institutional Class shares' returns to the performance of both the Standard & Poor's 500 Index - a market capitalization-weighted index of common stocks - and the Goldman Sachs Health Care Index - a market capitalization-weighted index of 113 stocks designed to measure the performance of companies in the health care sector. Issues in the index include providers of health care related services including long-term care and hospital facilities, health care management organizations and continuing care services. These benchmarks include reinvested dividends and capital gains, if any, and exclude the effect of sales charges.
Average Annual Total Returns
|
Periods ended July 31, 2000 |
|
Past 1 |
Life of |
|
Fidelity Adv Health Care - Inst CL |
|
21.77% |
26.24% |
|
S&P 500 |
|
8.98% |
23.99% |
|
GS Health Care |
|
22.57% |
26.78% |
Average annual returns take Institutional Class shares' cumulative return and show you what would have happened if Institutional Class shares had performed at a constant rate each year.
$10,000 Over Life of Fund
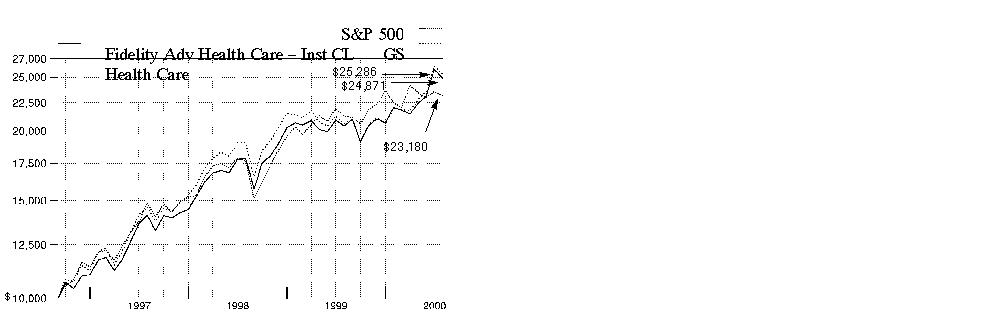
$10,000 Over Life of Fund: Let's say hypothetically that $10,000 was invested in Fidelity Advisor Health Care - Institutional Class on September 3, 1996, when the fund started. As the chart shows, by July 31, 2000, the value of the investment would have grown to $24,871 - a 148.71% increase on the initial investment. For comparison, look at how the Standard & Poor's 500 Index did over the same period. With dividends and capital gains, if any, reinvested, the same $10,000 investment would have grown to $23,180 - a 131.80% increase. If $10,000 was invested in the Goldman Sachs Health Care Index, it would have grown to $25,286 - a 152.86% increase.
Understanding Performance
How a fund did yesterday is no guarantee of how it will do tomorrow. The stock market, for example, has a history of long-term growth and short-term volatility. Unlike the broader market, however, some sectors may not have a history of growth in the long run. And, as with all stock funds, the share price and return of a fund that invests in a sector will vary.
3Annual Report
(Portfolio Manager photograph)
Note to shareholders: Yolanda McGettigan became Portfolio Manager of Fidelity Advisor Health Care Fund on June 1, 2000.
Q. How did the fund perform, Yolanda?
A. For the 12-month period that ended July 31, 2000, the fund's Class A, Class T, Class B and Class C shares returned 21.44%, 21.16%, 20.53% and 20.59%, respectively. These returns slightly underperformed the Goldman Sachs Health Care Index - an index of 113 stocks designed to measure the performance of companies in the health sector - which returned 22.57%. During the same period, the Standard & Poor's 500 Index returned 8.98%.
A. For the 12-month period that ended July 31, 2000, the fund's Institutional Class shares returned 21.77%. This return slightly underperformed the Goldman Sachs Health Care Index - an index of 113 stocks designed to measure the performance of companies in the health sector - which returned 22.57%. During the same period, the Standard & Poor's 500 Index returned 8.98%.
Q. What factors contributed to the fund's performance relative to the Goldman Sachs index during the past year?
A. During the first half of the period - a depressed market for most health stocks - the fund outperformed the benchmark on the strength of strong stock selection among drug companies, health maintenance organizations (HMOs) and coronary medical device manufacturers. Additionally, overweighting biotechnology - the sector's lone bright spot - added to the fund's bottom line as these stocks surged on promising clinical trials for new products and accelerating earnings growth. In the second half of the period, stock picking in selected names in the medical equipment, facilities and devices subsectors hurt relative performance. A sharp pullback in biotech also hurt performance. Our focus on established companies with solid product pipelines and earnings didn't achieve the same performance as more speculative companies. On a more positive note, overweighting pharmaceutical stocks - the fund's largest subsector - helped when these stocks rallied in the spring with the onset of a slowing economy, a weakening technology market and better-than-expected earnings reports.
Q. How have you positioned the fund since taking over in June?
A. At the end of the period, I overweighted drugs and biotechnology stocks, which comprised about two-thirds of the fund's net assets, at the expense of medical devices holdings, which had weaker growth prospects. I overweighted pharmaceuticals for three reasons. First, drug companies have historically outperformed other areas of the market during economic slowdowns, and there are signs the economy is leaning toward that end. If the economy slows and if the change in the earnings growth rate of drug stocks is better than the change in the growth rate of the broader market for the remainder of the year, drug stocks should exhibit superior performance. Second, at the close of the period, drug stocks were fairly valued and had room to move on a price-to-earnings multiple basis. Finally, there were strong pipelines at many companies and some great drug products on the horizon, which should benefit the fund. Turning to biotech, these stocks should gain momentum from the mapping of the human genome, which will considerably expedite the drug discovery and development process.
Q. What specific stocks stood out as top performers? Which disappointed?
A. Warner-Lambert was the fund's top performer, benefiting from being the target of a takeover battle between American Home Products and Pfizer, which was ultimately won by Pfizer. Eli Lilly, the fund's top holding, soared after the company said it had stopped the next phase of a scheduled trial on its sepsis drug Zovant because the results were so favorable - an unusual move. In terms of underachievers, Bristol-Myers Squibb's announcement to delay testing on its promising hypertension drug Vanlev due to safety concerns hurt the stock. Shares of genomics leader PE Celera suffered as investors feared its business model would be damaged by government suggestions to make its human genetic code findings a matter of public information.
Q. What's your outlook for the health sector, Yolanda?
A. Much of what happens in the sector going forward will depend on the economy and the upcoming presidential and congressional elections. If the economy does slow, as some have suspected as a result of the Federal Reserve Board's interest-rate policy, health stocks should generate strong relative earnings growth and could outperform. However, the biggest risk for the sector, particularly among drug companies, remains the government. I will be paying close attention to see how the election process unfolds. Any Democratic victory will be seen as a negative influence on the sector, potentially re-igniting initiatives to reform Medicare and the health care industry.
The views expressed in this report reflect those of the portfolio manager only through the end of the period of the report as stated on the cover. The manager's views are subject to change at any time based on market and other conditions. For more information, see page A-3.
Fund Facts
Start date: September 3, 1996
Size: as of July 31, 2000, more than
$1.0 billion
Manager: Yolanda McGettigan, since
June 2000; joined Fidelity in 1997
Annual Report
Advisor Health Care Fund
|
Top Ten Stocks as of July 31, 2000 |
|
|
|
% of fund's |
|
Eli Lilly & Co. |
9.6 |
|
Pfizer, Inc. |
7.1 |
|
Merck & Co., Inc. |
5.8 |
|
Bristol-Myers Squibb Co. |
5.7 |
|
Abbott Laboratories |
4.9 |
|
Medtronic, Inc. |
4.7 |
|
American Home Products Corp. |
4.7 |
|
Johnson & Johnson |
4.3 |
|
Schering-Plough Corp. |
3.9 |
|
Pharmacia Corp. |
3.9 |
|
|
54.6 |
|
Top Industries as of July 31, 2000 |
|
|
% of fund's net assets |
||
|
Drugs & Pharmaceuticals |
57.1% |
|
Medical Equipment & Supplies |
22.6% |
|
Medical Facilities Management |
5.7% |
|
Chemicals & Plastics |
3.9% |
|
Electronic Instruments |
2.1% |
|
All Others* |
8.6% |
|
* Includes short-term investments and net other assets. |
Annual Report
Advisor Health Care Fund
Showing Percentage of Net Assets
|
Common Stocks - 94.5% |
|||
|
Shares |
Value (Note 1) |
||
|
CHEMICALS & PLASTICS - 3.9% |
|||
|
Pharmacia Corp. |
761,800 |
$ 41,708,550 |
|
|
COMPUTER SERVICES & SOFTWARE - 0.8% |
|||
|
Affymetrix, Inc. (a) |
28,400 |
3,877,931 |
|
|
Healtheon/WebMD Corp. (a) |
105,000 |
1,397,813 |
|
|
IMS Health, Inc. |
196,700 |
3,552,894 |
|
|
|
8,828,638 |
||
|
DRUGS & PHARMACEUTICALS - 57.1% |
|||
|
Abgenix, Inc. (a) |
23,300 |
1,167,913 |
|
|
Alkermes, Inc. (a) |
96,500 |
3,196,563 |
|
|
Allergan, Inc. |
111,100 |
7,436,756 |
|
|
ALZA Corp. (a) |
49,400 |
3,198,650 |
|
|
American Home Products Corp. |
930,500 |
49,374,656 |
|
|
Amgen, Inc. (a) |
476,800 |
30,962,200 |
|
|
Andrx Corp. (a) |
65,200 |
5,089,675 |
|
|
Bausch & Lomb, Inc. |
77,400 |
4,813,313 |
|
|
Biochem Pharma, Inc. (a) |
2,400 |
53,254 |
|
|
Biogen, Inc. (a) |
91,500 |
4,849,500 |
|
|
Biovail Corp. (a) |
29,600 |
1,707,692 |
|
|
Bristol-Myers Squibb Co. |
1,217,800 |
60,433,325 |
|
|
Celgene Corp. (a) |
73,200 |
3,801,825 |
|
|
Cephalon, Inc. (a) |
49,419 |
1,992,203 |
|
|
Chiron Corp. (a) |
30,400 |
1,273,000 |
|
|
COR Therapeutics, Inc. (a) |
16,900 |
1,374,181 |
|
|
CV Therapeutics, Inc. (a) |
31,200 |
1,813,500 |
|
|
Decode Genetics, Inc. |
1,000 |
25,688 |
|
|
Eli Lilly & Co. |
981,000 |
101,901,369 |
|
|
Enzon, Inc. (a) |
30,500 |
1,364,875 |
|
|
Exelixis, Inc. |
81,800 |
3,185,088 |
|
|
Forest Laboratories, Inc. (a) |
108,100 |
11,566,700 |
|
|
Genentech, Inc. |
84,600 |
12,869,775 |
|
|
Geneva Proteomics (d) |
43,000 |
236,500 |
|
|
Genzyme Corp. - General Division (a) |
47,800 |
3,319,113 |
|
|
Human Genome Sciences, Inc. (a) |
48,500 |
5,859,406 |
|
|
ICOS Corp. (a) |
143,100 |
6,528,938 |
|
|
Immunex Corp. (a) |
650,000 |
32,946,875 |
|
|
IVAX Corp. (a) |
107,010 |
5,270,243 |
|
|
King Pharmaceuticals, Inc. (a) |
26,100 |
786,263 |
|
|
Medarex, Inc. (a) |
30,400 |
2,215,400 |
|
|
Medicis Pharmaceutical Corp. Class A (a) |
1,800 |
101,250 |
|
|
Medimmune, Inc. (a) |
188,800 |
11,233,600 |
|
|
Merck & Co., Inc. |
864,000 |
61,938,000 |
|
|
Millennium Pharmaceuticals, Inc. (a) |
94,400 |
9,086,000 |
|
|
Mylan Laboratories, Inc. |
91,600 |
1,946,500 |
|
|
NaPro BioTherapeutics, Inc. (a) |
31,500 |
194,906 |
|
|
PE Corp. - Celera Genomics Group (a) |
67,400 |
5,855,375 |
|
|
Pfizer, Inc. |
1,754,300 |
75,654,188 |
|
|
PRAECIS Pharmaceuticals, Inc. |
86,900 |
2,438,631 |
|
|
Protein Design Labs, Inc. (a) |
30,500 |
3,696,219 |
|
|
QLT, Inc. (a) |
34,700 |
2,286,579 |
|
|
Schering-Plough Corp. |
969,100 |
41,853,006 |
|
|
|
|||
|
Shares |
Value (Note 1) |
||
|
Sepracor, Inc. (a) |
89,100 |
$ 9,422,325 |
|
|
Serono SA sponsored ADR (a) |
75,500 |
2,038,500 |
|
|
SuperGen, Inc. (a) |
1,300 |
36,055 |
|
|
Vertex Pharmaceuticals, Inc. (a) |
42,570 |
4,169,199 |
|
|
Watson Pharmaceuticals, Inc. (a) |
52,300 |
2,889,575 |
|
|
|
605,454,347 |
||
|
ELECTRONIC INSTRUMENTS - 2.1% |
|||
|
Beckman Coulter, Inc. |
15,300 |
1,019,363 |
|
|
PE Corp. - Biosystems Group |
144,800 |
12,624,750 |
|
|
Waters Corp. (a) |
69,800 |
8,280,025 |
|
|
|
21,924,138 |
||
|
HOME FURNISHINGS - 0.1% |
|||
|
Hillenbrand Industries, Inc. |
34,600 |
1,107,200 |
|
|
INSURANCE - 1.9% |
|||
|
Aetna, Inc. |
47,300 |
2,625,150 |
|
|
CIGNA Corp. |
167,000 |
16,679,125 |
|
|
First Health Group Corp. (a) |
25,200 |
771,750 |
|
|
|
20,076,025 |
||
|
MEDICAL EQUIPMENT & SUPPLIES - 22.6% |
|||
|
Abbott Laboratories |
1,243,100 |
51,744,038 |
|
|
Allscripts, Inc. |
500 |
10,688 |
|
|
AmeriSource Health Corp. Class A (a) |
18,100 |
632,369 |
|
|
Baxter International, Inc. |
314,300 |
24,436,825 |
|
|
Becton, Dickinson & Co. |
77,000 |
1,944,250 |
|
|
Biomet, Inc. |
165,100 |
7,388,225 |
|
|
Boston Scientific Corp. (a) |
141,600 |
2,345,250 |
|
|
C.R. Bard, Inc. |
89,200 |
4,465,575 |
|
|
Cardinal Health, Inc. |
314,306 |
23,101,491 |
|
|
DENTSPLY International, Inc. |
105,300 |
3,560,456 |
|
|
Guidant Corp. (a) |
136,800 |
7,712,100 |
|
|
Johnson & Johnson |
492,821 |
45,863,154 |
|
|
Mallinckrodt, Inc. |
700 |
32,025 |
|
|
Medtronic, Inc. |
971,496 |
49,607,014 |
|
|
MiniMed, Inc. (a) |
23,300 |
2,937,256 |
|
|
Novoste Corp. (a) |
40,000 |
2,330,000 |
|
|
Novoste Corp. (a)(c) |
12,500 |
728,125 |
|
|
Patterson Dental Co. (a) |
40,800 |
1,081,200 |
|
|
Resmed, Inc. (a) |
27,100 |
752,025 |
|
|
St. Jude Medical, Inc. (a) |
61,200 |
2,524,500 |
|
|
Stryker Corp. |
72,000 |
3,091,500 |
|
|
Sybron International, Inc. (a) |
112,600 |
2,343,488 |
|
|
VISX, Inc. (a) |
23,400 |
589,388 |
|
|
|
239,220,942 |
||
|
MEDICAL FACILITIES MANAGEMENT - 5.7% |
|||
|
Express Scripts, Inc. Class A (a) |
32,800 |
2,107,400 |
|
|
HCA - The Healthcare Co. |
505,700 |
17,193,800 |
|
|
Common Stocks - continued |
|||
|
Shares |
Value (Note 1) |
||
|
MEDICAL FACILITIES MANAGEMENT - CONTINUED |
|||
|
Health Management Associates, Inc. Class A (a) |
285,400 |
$ 4,477,213 |
|
|
Oxford Health Plans, Inc. (a) |
119,600 |
2,862,925 |
|
|
Tenet Healthcare Corp. |
303,800 |
9,246,913 |
|
|
Trigon Healthcare, Inc. (a) |
42,800 |
2,268,400 |
|
|
UnitedHealth Group, Inc. |
146,500 |
11,985,531 |
|
|
Universal Health Services, Inc. Class B (a) |
23,700 |
1,596,788 |
|
|
Wellpoint Health Networks, Inc. (a) |
92,900 |
8,099,719 |
|
|
|
59,838,689 |
||
|
RETAIL & WHOLESALE, MISCELLANEOUS - 0.0% |
|||
|
Ventro Corp. |
4,200 |
50,663 |
|
|
SERVICES - 0.3% |
|||
|
Caremark Rx, Inc. (a) |
320,500 |
2,704,219 |
|
|
TOTAL COMMON STOCKS (Cost $820,971,553) |
1,000,913,411 |
||
|
Cash Equivalents - 5.9% |
|||
|
|
|
|
|
|
Fidelity Cash Central Fund, 6.57% (b) |
56,930,404 |
56,930,404 |
|
|
Fidelity Securities Lending Cash Central Fund, 6.65% (b) |
5,691,949 |
5,691,949 |
|
|
TOTAL CASH EQUIVALENTS (Cost $62,622,353) |
62,622,353 |
||
|
TOTAL INVESTMENT PORTFOLIO - 100.4% (Cost $883,593,906) |
1,063,535,764 |
||
|
NET OTHER ASSETS - (0.4)% |
(3,938,670) |
||
|
NET ASSETS - 100% |
$ 1,059,597,094 |
||
|
Legend |
|
(a) Non-income producing |
|
(b) The rate quoted is the annualized seven-day yield of the fund at |
|
(c) Security exempt from registration under Rule 144A of the Securities |
|
(d) Restricted securities - Investment in securities not registered under the Securities Act of 1933. |
|
Additional information on each holding is as follows: |
|
Security |
Acquisition Date |
Acquisition Cost |
|
Geneva Proteomics |
7/7/00 |
$ 236,500 |
|
Income Tax Information |
|
At July 31, 2000, the aggregate cost of investment securities for income tax purposes was $888,440,974. Net unrealized appreciation aggregated $175,094,790, of which $224,949,440 related to appreciated investment securities and $49,854,650 related to depreciated investment securities. |
|
The fund hereby designates approximately $6,759,000 as a capital gain dividend for the purpose of the dividend paid deduction. |
|
A total of 45%, 53%, 62%, 56% and 41% of Class A's, Class T's, Class B's, Class C's and Institutional Class' dividends distributed during the fiscal year qualifies for the dividends-received deductions for corporate shareholders (unaudited). |
|
The fund will notify shareholders in January 2001 of the applicable percentages for use in preparing 2000 income tax returns. |
See accompanying notes which are an integral part of the financial statements.
Health Care
Statement of Assets and Liabilities
|
|
July 31, 2000 |
|
|
Assets |
|
|
|
Investment in securities, at value |
|
$ 1,063,535,764 |
|
Receivable for investments sold |
|
10,344,310 |
|
Receivable for fund shares sold |
|
4,217,857 |
|
Dividends receivable |
|
569,733 |
|
Interest receivable |
|
621,052 |
|
Redemption fees receivable |
|
710 |
|
Other receivables |
|
5,746 |
|
Total assets |
|
1,079,295,172 |
|
Liabilities |
|
|
|
Payable for investments purchased |
$ 11,149,125 |
|
|
Payable for fund shares redeemed |
1,391,647 |
|
|
Accrued management fee |
517,357 |
|
|
Distribution fees payable |
642,268 |
|
|
Other payables and accrued expenses |
305,732 |
|
|
Collateral on securities loaned, |
5,691,949 |
|
|
Total liabilities |
|
19,698,078 |
|
Net Assets |
|
$ 1,059,597,094 |
|
Net Assets consist of: |
|
|
|
Paid in capital |
|
$ 842,840,214 |
|
Accumulated undistributed net realized gain (loss) on investments and foreign currency transactions |
|
36,815,653 |
|
Net unrealized appreciation (depreciation) on investments |
|
179,941,227 |
|
Net Assets |
|
$ 1,059,597,094 |
|
Calculation of Maximum |
|
$22.02 |
|
Maximum offering price per share |
|
$23.36 |
|
Class T: |
|
$21.87 |
|
Maximum offering price per share |
|
$22.66 |
|
Class B: |
|
$21.50 |
|
Class C: |
|
$21.50 |
|
Institutional Class: |
|
$22.13 |
A Redemption price per share is equal to net asset value less any applicable contingent deferred sales charge.
Statement of Operations
|
|
Year ended July 31, 2000 |
|
|
Investment Income Dividends |
|
$ 6,448,925 |
|
Interest |
|
3,734,918 |
|
Security lending |
|
26,123 |
|
Total income |
|
10,209,966 |
|
Expenses |
|
|
|
Management fee |
$ 4,709,024 |
|
|
Transfer agent fees |
2,324,877 |
|
|
Distribution fees |
5,814,349 |
|
|
Accounting and security lending fees |
262,804 |
|
|
Non-interested trustees' compensation |
2,368 |
|
|
Custodian fees and expenses |
18,012 |
|
|
Registration fees |
193,905 |
|
|
Audit |
26,921 |
|
|
Legal |
5,496 |
|
|
Miscellaneous |
18,916 |
|
|
Total expenses before reductions |
13,376,672 |
|
|
Expense reductions |
(112,911) |
13,263,761 |
|
Net investment income (loss) |
|
(3,053,795) |
|
Realized and Unrealized Gain (Loss) Net realized gain (loss) on: |
|
|
|
Investment securities |
38,596,548 |
|
|
Foreign currency transactions |
13,082 |
38,609,630 |
|
Change in net unrealized appreciation (depreciation) on: |
|
|
|
Investment securities |
125,938,470 |
|
|
Assets and liabilities in |
(732) |
125,937,738 |
|
Net gain (loss) |
|
164,547,368 |
|
Net increase (decrease) in net assets resulting from operations |
|
$ 161,493,573 |
See accompanying notes which are an integral part of the financial statements.
Annual Report
Advisor Health Care Fund
Financial Statements - continued
Statement of Changes in Net Assets
|
Increase (Decrease) in Net Assets |
Year ended |
Year ended |
|
Operations |
$ (3,053,795) |
$ (1,677,006) |
|
Net realized gain (loss) |
38,609,630 |
16,392,585 |
|
Change in net unrealized appreciation (depreciation) |
125,937,738 |
24,414,060 |
|
Net increase (decrease) in net assets resulting from operations |
161,493,573 |
39,129,639 |
|
Distributions to shareholders |
(55,986) |
- |
|
From net realized gain |
(13,943,374) |
(5,527,534) |
|
Total distributions |
(13,999,360) |
(5,527,534) |
|
Share transactions - net increase (decrease) |
228,829,268 |
416,927,170 |
|
Redemption fees |
336,627 |
201,576 |
|
Total increase (decrease) in net assets |
376,660,108 |
450,730,851 |
|
Net Assets |
|
|
|
Beginning of period |
682,936,986 |
232,206,135 |
|
End of period |
$ 1,059,597,094 |
$ 682,936,986 |
Financial Highlights - Class A
|
Years ended July 31, |
2000 |
1999 |
1998 |
1997 E |
|
Selected Per-Share Data |
|
|
|
|
|
Net asset value, beginning of period |
$ 18.52 |
$ 16.70 |
$ 14.10 |
$ 10.00 |
|
Income from Investment Operations |
|
|
|
|
|
Net investment income (loss) D |
.01 |
.00 |
(.03) |
(.02) |
|
Net realized and unrealized gain (loss) |
3.89 |
2.20 |
3.50 |
4.12 |
|
Total from investment operations |
3.90 |
2.20 |
3.47 |
4.10 |
|
Less Distributions |
|
|
|
|
|
From net realized gain |
(.41) |
(.39) |
(.88) |
- |
|
Redemption fees added to paid in capital |
.01 |
.01 |
.01 |
- |
|
Net asset value, end of period |
$ 22.02 |
$ 18.52 |
$ 16.70 |
$ 14.10 |
|
Total Return B, C |
21.44% |
13.80% |
26.47% |
41.00% |
|
Ratios and Supplemental Data |
|
|
|
|
|
Net assets, end of period (000 omitted) |
$ 108,248 |
$ 66,142 |
$ 20,902 |
$ 5,488 |
|
Ratio of expenses to average net assets |
1.20% |
1.23% |
1.38% |
1.75% A, F |
|
Ratio of expenses to average net assets after expense reductions |
1.18% G |
1.21% G |
1.36% G |
1.74% A, G |
|
Ratio of net investment income (loss) to average net assets |
.07% |
.01% |
(.18)% |
(.18)% A |
|
Portfolio turnover |
51% |
98% |
85% |
67% A |
|
A Annualized B The total returns would have been lower had certain expenses not been reduced during the periods shown. C Total returns do not include the one time sales charge and for periods of less than one year are not annualized. D Net investment income (loss) per share has been calculated based on average shares outstanding during the period. E For the period September 3, 1996 (commencement of sale of Class A shares) to July 31, 1997. F FMR agreed to reimburse a portion of the class' expenses during the period. Without this reimbursement, the class' expense ratio would have been higher. G FMR or the fund has entered into varying arrangements with third parties who either paid or reduced a portion of the class' expenses. |
||||
See accompanying notes which are an integral part of the financial statements.
Health Care
Financial Highlights - Class T
|
Years ended July 31, |
2000 |
1999 |
1998 |
1997 E |
|
Selected Per-Share Data |
|
|
|
|
|
Net asset value, beginning of period |
$ 18.40 |
$ 16.61 |
$ 14.05 |
$ 10.00 |
|
Income from Investment Operations |
|
|
|
|
|
Net investment income (loss) D |
(.03) |
(.04) |
(.05) |
(.04) |
|
Net realized and unrealized gain (loss) |
3.86 |
2.19 |
3.47 |
4.09 |
|
Total from investment operations |
3.83 |
2.15 |
3.42 |
4.05 |
|
Less Distributions |
|
|
|
|
|
From net realized gain |
(.37) |
(.37) |
(.87) |
- |
|
Redemption fees added to paid in capital |
.01 |
.01 |
.01 |
- |
|
Net asset value, end of period |
$ 21.87 |
$ 18.40 |
$ 16.61 |
$ 14.05 |
|
Total Return B, C |
21.16% |
13.54% |
26.17% |
40.50% |
|
Ratios and Supplemental Data |
|
|
|
|
|
Net assets, end of period (000 omitted) |
$ 361,351 |
$ 248,442 |
$ 124,652 |
$ 50,868 |
|
Ratio of expenses to average net assets |
1.42% |
1.46% |
1.54% |
1.97% A |
|
Ratio of expenses to average net assets after expense reductions |
1.40% F |
1.43% F |
1.52% F |
1.96% A, F |
|
Ratio of net investment income (loss) to average net assets |
(.15)% |
(.21)% |
(.31)% |
(.39)% A |
|
Portfolio turnover |
51% |
98% |
85% |
67% A |
|
A Annualized B The total returns would have been lower had certain expenses not been reduced during the periods shown. C Total returns do not include the one time sales charge and for periods of less than one year are not annualized. D Net investment income (loss) per share has been calculated based on average shares outstanding during the period. E For the period September 3, 1996 (commencement of sale of Class T shares) to July 31, 1997. F FMR or the fund has entered into varying arrangements with third parties who either paid or reduced a portion of the class' expenses. |
||||
Financial Highlights - Class B
|
Years ended July 31, |
2000 |
1999 |
1998 |
1997 E |
|
Selected Per-Share Data |
|
|
|
|
|
Net asset value, beginning of period |
$ 18.16 |
$ 16.47 |
$ 14.01 |
$ 11.88 |
|
Income from Investment Operations |
|
|
|
|
|
Net investment income (loss) D |
(.13) |
(.13) |
(.14) |
(.05) |
|
Net realized and unrealized gain (loss) |
3.80 |
2.17 |
3.45 |
2.18 |
|
Total from investment operations |
3.67 |
2.04 |
3.31 |
2.13 |
|
Less Distributions |
|
|
|
|
|
From net realized gain |
(.34) |
(.36) |
(.86) |
- |
|
Redemption fees added to paid in capital |
.01 |
.01 |
.01 |
- |
|
Net asset value, end of period |
$ 21.50 |
$ 18.16 |
$ 16.47 |
$ 14.01 |
|
Total Return B, C |
20.53% |
12.96% |
25.40% |
17.93% |
|
Ratios and Supplemental Data |
|
|
|
|
|
Net assets, end of period (000 omitted) |
$ 366,413 |
$ 225,441 |
$ 57,074 |
$ 6,159 |
|
Ratio of expenses to average net assets |
1.94% |
1.98% |
2.13% |
2.50% A, F |
|
Ratio of expenses to average net assets after expense reductions |
1.93% G |
1.96% G |
2.12% G |
2.49% A, G |
|
Ratio of net investment income (loss) to average net assets |
(.68)% |
(.73)% |
(.95)% |
(.99)% A |
|
Portfolio turnover |
51% |
98% |
85% |
67% A |
|
A Annualized B The total returns would have been lower had certain expenses not been reduced during the periods shown. C Total returns do not include the contingent deferred sales charge and for periods of less than one year are not annualized. D Net investment income (loss) per share has been calculated based on average shares outstanding during the period. E For the period March 3, 1997 (commencement of sale of Class B shares) to July 31, 1997. F FMR agreed to reimburse a portion of the class' expenses during the period. Without this reimbursement, the class' expense ratio would have been higher. G FMR or the fund has entered into varying arrangements with third parties who either paid or reduced a portion of the class' expenses. |
||||
See accompanying notes which are an integral part of the financial statements.
Annual Report
Financial Highlights - Class C
|
Years ended July 31, |
2000 |
1999 |
1998 E |
|
Selected Per-Share Data |
|
|
|
|
Net asset value, beginning of period |
$ 18.17 |
$ 16.49 |
$ 13.85 |
|
Income from Investment Operations |
|
|
|
|
Net investment income (loss) D |
(.12) |
(.12) |
(.12) |
|
Net realized and unrealized gain (loss) |
3.80 |
2.17 |
3.39 |
|
Total from investment operations |
3.68 |
2.05 |
3.27 |
|
Less Distributions |
|
|
|
|
From net realized gain |
(.36) |
(.38) |
(.63) |
|
Redemption fees added to paid in capital |
.01 |
.01 |
- |
|
Net asset value, end of period |
$ 21.50 |
$ 18.17 |
$ 16.49 |
|
Total Return B, C |
20.59% |
13.04% |
24.84% |
|
Ratios and Supplemental Data |
|
|
|
|
Net assets, end of period (000 omitted) |
$ 183,264 |
$ 109,372 |
$ 19,154 |
|
Ratio of expenses to average net assets |
1.91% |
1.95% |
2.18% A |
|
Ratio of expenses to average net assets after expense reductions |
1.89% F |
1.92% F |
2.17% A, F |
|
Ratio of net investment income (loss) to average net assets |
(.64)% |
(.70)% |
(1.06)% A |
|
Portfolio turnover |
51% |
98% |
85% |
|
A Annualized B The total returns would have been lower had certain expenses not been reduced during the periods shown. C Total returns do not include the contingent deferred sales charge and for periods of less than one year are not annualized. D Net investment income (loss) per share has been calculated based on average shares outstanding during the period. E For the period November 3, 1997 (commencement of sale of Class C shares) to July 31, 1998. F FMR or the fund has entered into varying arrangements with third parties who either paid or reduced a portion of the class' expenses. |
|||
Financial Highlights - Institutional Class
|
Years ended July 31, |
2000 |
1999 |
1998 |
1997 E |
|
Selected Per-Share Data |
|
|
|
|
|
Net asset value, beginning of period |
$ 18.59 |
$ 16.73 |
$ 14.12 |
$ 10.00 |
|
Income from Investment Operations |
|
|
|
|
|
Net investment income (loss) D |
.07 |
.05 |
.03 |
.01 |
|
Net realized and unrealized gain (loss) |
3.90 |
2.21 |
3.47 |
4.11 |
|
Total from investment operations |
3.97 |
2.26 |
3.50 |
4.12 |
|
Less Distributions |
|
|
|
|
|
From net investment income |
(.03) |
- |
- |
- |
|
From net realized gain |
(.41) |
(.41) |
(.90) |
- |
|
Total distributions |
(.44) |
(.41) |
(.90) |
- |
|
Redemption fees added to paid in capital |
.01 |
.01 |
.01 |
- |
|
Net asset value, end of period |
$ 22.13 |
$ 18.59 |
$ 16.73 |
$ 14.12 |
|
Total Return B, C |
21.77% |
14.17% |
26.70% |
41.20% |
|
Ratios and Supplemental Data |
|
|
|
|
|
Net assets, end of period (000 omitted) |
$ 40,320 |
$ 33,540 |
$ 10,424 |
$ 6,875 |
|
Ratio of expenses to average net assets |
.93% |
.97% |
1.07% |
1.50% A, F |
|
Ratio of expenses to average net assets after expense reductions |
.92% G |
.95% G |
1.04% G |
1.49% A, G |
|
Ratio of net investment income (loss) to average net assets |
.33% |
.28% |
.17% |
.08% A |
|
Portfolio turnover |
51% |
98% |
85% |
67% A |
|
A Annualized B The total returns would have been lower had certain expenses not been reduced during the periods shown. C Total returns for periods of less than one year are not annualized. D Net investment income (loss) per share has been calculated based on average shares outstanding during the period. E For the period September 3, 1996 (commencement of sale of Institutional Class shares) to July 31, 1997. F FMR agreed to reimburse a portion of the class' expenses during the period. Without this reimbursement, the class' expense ratio would have been higher. G FMR or the fund has entered into varying arrangements with third parties who either paid or reduced a portion of the class' expenses. |
||||
See accompanying notes which are an integral part of the financial statements.
Health Care
For the period ended July 31, 2000
1. Significant Accounting Policies.
Fidelity Advisor Health Care Fund (the fund) is a fund of Fidelity Advisor Series VII (the trust) and is authorized to issue an unlimited number of shares. The trust is registered under the Investment Company Act of 1940, as amended (the 1940 Act), as an open-end management investment company organized as a Massachusetts business trust.
The fund offers Class A, Class T, Class B, Class C, and Institutional Class shares, each of which has equal rights as to assets and voting privileges. Each class has exclusive voting rights with respect to matters that affect that class. Class B shares will automatically convert to Class A shares after a holding period of seven years from the initial date of purchase. Investment income, realized and unrealized capital gains and losses, the common expenses of the fund, and certain fund-level expense reductions, if any, are allocated on a pro rata basis to each class based on the relative net assets of each class to the total net assets of the fund. Each class of shares differs in its respective distribution, transfer agent, and certain other class-specific fees, expenses, and expense reductions.
The financial statements have been prepared in conformity with generally accepted accounting principles which require management to make certain estimates and assumptions at the date of the financial statements. The following summarizes the significant accounting policies of the fund:
Security Valuation. Securities for which exchange quotations are readily available are valued at the last sale price, or if no sale price, at the closing bid price. Foreign securities are valued based on quotations from the principal market in which such securities are normally traded. If trading or events occurring in other markets after the close of the principal market in which foreign securities are traded, and before the close of the business of the fund, are expected to materially affect the value of those securities, then they are valued at their fair value taking this trading or these events into account. Fair value is determined in good faith under consistently applied procedures under the general supervision of the Board of Trustees. Securities (including restricted securities) for which exchange quotations are not readily available (and in certain cases debt securities which trade on an exchange) are valued primarily using dealer-supplied valuations or at their fair value. Short-term securities with remaining maturities of sixty days or less for which quotations are not readily available are valued at amortized cost or original cost plus accrued interest, both of which approximate current value.
Foreign Currency Translation. The accounting records of the fund are maintained in U.S. dollars. Investment securities and other assets and liabilities denominated in a foreign currency are translated into U.S. dollars at the prevailing rates of exchange at period end. Purchases and sales of securities, income receipts and expense payments are translated into U.S. dollars at the prevailing exchange rate on the respective dates of the transactions.
Net realized gains and losses on foreign currency transactions represent net gains and losses from sales and maturities of foreign currency contracts, disposition of foreign currencies, the difference between the amount of net investment income accrued and the U.S. dollar amount actually received, and gains and losses between trade and settlement date on purchases and sales of securities. The effects of changes in foreign currency exchange rates on investments in securities are included with the net realized and unrealized gain or loss on investment securities.
Income Taxes. As a qualified regulated investment company under Subchapter M of the Internal Revenue Code, the fund is not subject to income taxes to the extent that it distributes substantially all of its taxable income for its fiscal year. The schedule of investments includes information regarding income taxes under the caption "Income Tax Information."
Investment Income. Dividend income is recorded on the ex-dividend date, except certain dividends from foreign securities where the ex-dividend date may have passed, are recorded as soon as the fund is informed of the ex-dividend date. Non-cash dividends included in dividend income, if any, are recorded at the fair market value of the securities received. Interest income is accrued as earned. Investment income is recorded net of foreign taxes withheld where recovery of such taxes is uncertain.
Expenses. Most expenses of the trust can be directly attributed to a fund. Expenses which cannot be directly attributed are apportioned among the funds in the trust.
Distributions to Shareholders. Distributions are recorded on the ex-dividend date. Income dividends and capital gain distributions are declared separately for each class.
Income and capital gain distributions are determined in accordance with income tax regulations which may differ from generally accepted accounting principles. These differences, which may result in distribution reclassifications, are primarily due to differing treatments for litigation proceeds, foreign currency transactions, non-taxable dividends, net operating losses and losses deferred due to wash sales. The fund also utilized earnings and profits distributed to shareholders on redemption of shares as a part of the dividends paid deduction for income tax purposes.
Permanent book and tax basis differences relating to shareholder distributions will result in reclassifications to paid in capital. Accumulated undistributed net realized gain (loss) on investments may include temporary book and tax basis differences which will reverse in a subsequent period. Any taxable income or gain remaining at fiscal year end is distributed in the following year.
Short-Term Trading (Redemption) Fees. Shares held in the fund less than 60 days are subject to a short-term trading fee equal to 1% of the proceeds of the redeemed shares. The fee, which is retained by the fund, is accounted for as an addition to paid in capital.
Annual Report
Notes to Financial Statements - continued
1. Significant Accounting Policies - continued
Security Transactions. Security transactions are accounted for as of trade date. Gains and losses on securities sold are determined on the basis of identified cost.
2. Operating Policies.
Foreign Currency Contracts. The fund generally uses foreign currency contracts to facilitate transactions in foreign-denominated securities. Losses may arise from changes in the value of the foreign currency or if the counterparties do not perform under the contracts' terms. The U.S. dollar value of foreign currency contracts is determined using contractual currency exchange rates established at the time of each trade.
Joint Trading Account. Pursuant to an Exemptive Order issued by the Securities and Exchange Commission (the SEC), the fund, along with other affiliated entities of Fidelity Management & Research Company (FMR), may transfer uninvested cash balances into one or more joint trading accounts. These balances are invested in one or more repurchase agreements for U.S. Treasury or Federal Agency obligations.
Repurchase Agreements. The underlying U.S. Treasury, Federal Agency, or other obligations found to be satisfactory by FMR are transferred to an account of the fund, or to the Joint Trading Account, at a custodian bank. The securities are marked-to-market daily and maintained at a value at least equal to the principal amount of the repurchase agreement (including accrued interest). FMR, the fund's investment adviser, is responsible for determining that the value of the underlying securities remains in accordance with the market value requirements stated above.
Cash Central Funds. Pursuant to an Exemptive Order issued by the SEC, the fund may invest in the Fidelity Cash Central Fund and the Fidelity Securities Lending Cash Central Fund (the Cash Funds) managed by Fidelity Investments Money Management, Inc., an affiliate of FMR. The Cash Funds are open-end money market funds available only to investment companies and other accounts managed by FMR and its affiliates. The Cash Funds seek preservation of capital, liquidity, and current income. Income distributions from the Cash Funds are declared daily and paid monthly from net interest income. Income distributions earned by the fund are recorded as either interest income or security lending income in the accompanying financial statements.
Restricted Securities. The fund is permitted to invest in securities that are subject to legal or contractual restrictions on resale. These securities generally may be resold in transactions exempt from registration or to the public if the securities are registered. Disposal of these securities may involve time-consuming negotiations and expense, and prompt sale at an acceptable price may be difficult. At the end of the period, restricted securities (excluding 144A issues) amounted to $236,500 or 0.0% of net assets.
3. Purchases and Sales of Investments.
Purchases and sales of securities, other than short-term securities, aggregated $593,309,110 and $388,988,655, respectively.
4. Fees and Other Transactions with Affiliates.
Management Fee. As the fund's investment adviser, FMR receives a monthly fee that is calculated on the basis of a group fee rate plus a fixed individual fund fee rate applied to the average net assets of the fund. The group fee rate is the weighted average of a series of rates and is based on the monthly average net assets of all the mutual funds advised by FMR. The rates ranged from .2167% to .5200% for the period. The annual individual fund fee rate is .30%. In the event that these rates were lower than the contractual rates in effect during the period, FMR voluntarily implemented the above rates, as they resulted in the same or a lower management fee. For the period, the management fee was equivalent to an annual rate of .58% of average net assets.
Distribution and Service Plan. In accordance with Rule 12b-1 of the 1940 Act, the Board of Trustees have adopted separate Distribution and Service Plans with respect to each class of shares (collectively referred to as "the Plans"). Under certain of the Plans, the class pays Fidelity Distributors Corporation (FDC), an affiliate of FMR, a 12b-1 fee. A portion of this fee may be reallowed to securities dealers, banks and other financial institutions for the distribution of each class of shares and providing shareholder support services. For the period, this fee was based on the following annual rates of the average net assets of each applicable class:
|
Class A |
$ .25% |
|
Class T |
$ .50% |
|
Class B |
$ 1.00% * |
|
Class C |
$ 1.00% * |
* .75% represents a distribution fee and .25% represents a shareholder service fee.
For the period, each class paid FDC the following amounts, a portion of which was retained by FDC:
|
|
Paid to |
Retained |
|
Class A |
$ 203,584 |
$ 195 |
|
Class T |
1,401,803 |
5,774 |
|
Class B |
2,818,907 |
2,115,590 |
|
Class C |
1,390,055 |
940,533 |
|
|
$ 5,814,349 |
$ 3,062,092 |
Sales Load. FDC receives a front-end sales charge of up to 5.75% for selling Class A shares, and 3.50% for selling Class T shares of the fund. FDC receives the proceeds of contingent deferred sales charges levied on Class B share redemptions occurring within six years of purchase and Class C share redemptions occurring within one year of purchase. Contingent deferred sales charges are based on declining rates ranging from 5% to 1% for Class B and 1% for Class C, of the lesser of the cost of shares at the initial date of purchase or the net
Health Care
Notes to Financial Statements - continued
4. Fees and Other Transactions with Affiliates - continued
Sales Load - continued
asset value of the redeemed shares, excluding any reinvested dividends and capital gains. In addition, purchases of Class A and Class T shares that were subject to a finder's fee bear a contingent deferred sales charge on assets that do not remain in the fund for at least one year. The Class A and Class T contingent deferred sales charge is based on 0.25% of the lesser of the cost of shares at the initial date of purchase or the net asset value of the redeemed shares, excluding any reinvested dividends and capital gains. A portion of the sales charges paid to FDC is paid to securities dealers, banks and other financial institutions.
For the period, sales charge amounts paid to and retained by FDC were as follows:
|
|
Paid to |
Retained |
|
Class A |
$ 421,895 |
$ 242,040 |
|
Class T |
529,291 |
223,787 |
|
Class B |
1,039,749 |
1,039,749* |
|
Class C |
134,796 |
134,796* |
|
|
$ 2,125,731 |
$ 1,640,372 |
* When Class B and Class C shares are initially sold, FDC pays commissions from its own resources to securities dealers,
banks, and other financial institutions through which the sales are made.
Transfer Agent Fees. Fidelity Investments Institutional Operations Company, Inc., (FIIOC), an affiliate of FMR, is the transfer, dividend disbursing and shareholder servicing agent (collectively referred to as the transfer agent) for each class of the fund. FIIOC receives account fees and asset-based fees that vary according to the account size and type of account of the shareholders of the respective classes of the fund. FIIOC pays for typesetting, printing and mailing of all shareholder reports, except proxy statements. For the period, the following amounts were paid to FIIOC:
|
|
Amount |
% of |
|
Class A |
$ 246,246 |
.30 |
|
Class T |
767,713 |
.27 |
|
Class B |
848,176 |
.30 |
|
Class C |
364,023 |
.26 |
|
Institutional Class |
98,719 |
.29 |
|
|
$ 2,324,877 |
|
Accounting and Security Lending Fees. Fidelity Service Company, Inc., an affiliate of FMR, maintains the fund's accounting records and administers the security lending program. The security lending fee is based on the number and duration of lending transactions. The accounting fee is based on the level of average net assets for the month plus out-of-pocket expenses.
Brokerage Commissions. The fund placed a portion of its portfolio transactions with brokerage firms which are affiliates of FMR. The commissions paid to these affiliated firms were $17,511 for the period.
5. Security Lending.
The fund lends portfolio securities from time to time in order to earn additional income. The fund receives collateral in the form of U.S. Treasury obligations, letters of credit, and/or cash against the loaned securities, and maintains collateral in an amount not less than 100% of the market value of the loaned securities during the period of the loan. The market value of the loaned securities is determined at the close of business of the fund and any additional required collateral is delivered to the fund on the next business day. If the borrower defaults on its obligation to return the securities loaned because of insolvency or other reasons, the fund could experience delays and costs in recovering the securities loaned or in gaining access to the collateral. At period end, the value of the securities loaned amounted to $5,362,238. The fund received cash collateral of $5,691,949 which was invested in cash equivalents.
6. Expense Reductions.
FMR has directed certain portfolio trades to brokers who paid a portion of the fund's expenses. For the period, the fund's expenses were reduced by $112,294 under this arrangement.
In addition, through an arrangement with the fund's custodian, credits realized as a result of uninvested cash balances were used to reduce a portion of the fund's expenses. During the period, the fund's custodian fees were reduced by $617 under this arrangement.
Health Care
Notes to Financial Statements - continued
7. Distributions to Shareholders.
Distributions to shareholders of each class were as follows:
|
|
Years ended July 31, |
|
|
|
2000 |
1999 |
|
From net investment income |
|
|
|
Institutional Class |
$ 55,986 |
$ - |
|
From net realized gain |
|
|
|
Class A |
$ 1,513,849 |
$ 506,267 |
|
Class T |
5,017,622 |
2,852,284 |
|
Class B |
4,390,652 |
1,389,695 |
|
Class C |
2,255,536 |
512,786 |
|
Institutional Class |
765,715 |
266,502 |
|
Total |
$ 13,943,374 |
$ 5,527,534 |
|
|
$ 13,999,360 |
$ 5,527,534 |
8. Share Transactions.
Transactions for each class of shares were as follows:
|
|
Shares |
Dollars |
||
|
|
Year ended |
Year ended |
Year ended |
Year ended |
|
|
2000 |
1999 |
2000 |
1999 |
|
|
|
|
|
|
|
Class A |
2,976,195 |
2,923,295 |
$ 57,995,930 |
$ 52,957,834 |
|
Reinvestment of distributions |
71,818 |
30,315 |
1,377,514 |
451,389 |
|
Shares redeemed |
(1,703,303) |
(633,263) |
(32,602,744) |
(11,335,392) |
|
Net increase (decrease) |
1,344,710 |
2,320,347 |
$ 26,770,700 |
$ 42,073,831 |
|
Class T |
8,817,982 |
9,152,907 |
$ 171,795,235 |
$ 163,138,613 |
|
Reinvestment of distributions |
246,626 |
182,634 |
4,708,078 |
2,706,621 |
|
Shares redeemed |
(6,044,271) |
(3,336,370) |
(113,414,865) |
(58,873,247) |
|
Net increase (decrease) |
3,020,337 |
5,999,171 |
$ 63,088,448 |
$ 106,971,987 |
|
Class B |
8,402,675 |
10,129,553 |
$ 159,912,025 |
$ 180,199,139 |
|
Reinvestment of distributions |
198,004 |
81,573 |
3,734,363 |
1,199,114 |
|
Shares redeemed |
(3,973,722) |
(1,262,369) |
(73,965,867) |
(22,344,687) |
|
Net increase (decrease) |
4,626,957 |
8,948,757 |
$ 89,680,521 |
$ 159,053,566 |
|
Class C |
4,784,414 |
5,638,208 |
$ 91,120,799 |
$ 101,276,858 |
|
Reinvestment of distributions |
83,910 |
26,607 |
1,581,712 |
391,120 |
|
Shares redeemed |
(2,361,733) |
(807,853) |
(44,212,557) |
(14,456,971) |
|
Net increase (decrease) |
2,506,591 |
4,856,962 |
$ 48,489,954 |
$ 87,211,007 |
|
Institutional Class |
1,215,089 |
1,586,418 |
$ 23,709,203 |
$ 28,856,815 |
|
Reinvestment of distributions |
30,625 |
16,379 |
588,917 |
244,208 |
|
Shares redeemed |
(1,227,964) |
(421,646) |
(23,498,475) |
(7,484,244) |
|
Net increase (decrease) |
17,750 |
1,181,151 |
$ 799,645 |
$ 21,616,779 |
Health Care
Performance
There are several ways to evaluate historical performance. You can look at the total percentage change in value, the average annual percentage change or the growth of a hypothetical $10,000 investment. Total return reflects the change in the value of an investment, assuming reinvestment of dividend income and capital gains (the profits earned upon the sale of securities that have grown in value). The initial offering of Institutional Class shares took place on July 3, 1995. Institutional Class shares are sold to eligible investors without a sales load or 12b-1 fee. Returns prior to July 3, 1995 are those of Class T, the original class of the fund, and reflect Class T shares' prior 0.65% 12b-1 fee. If Fidelity had not reimbursed certain class expenses, the past five year and 10 year total returns would have been lower.
Cumulative Total Returns
|
Periods ended July 31, 2000 |
|
Past 1 |
Past 5 |
Past 10 |
|
Fidelity Adv Natural - |
|
10.31% |
71.12% |
216.20% |
|
S&P 500 |
|
8.98% |
177.11% |
408.31% |
|
GS Natural Resources |
|
1.35% |
n/a* |
n/a* |
Cumulative total returns show Institutional Class' performance in percentage terms over a set period - in this case one year, five years or 10 years. You can compare Institutional Class' returns to the performance of both the Standard & Poor's 500 Index - a market capitalization-weighted index of common stocks - and the Goldman Sachs Natural Resources Index - a market capitalization-weighted index of 112 stocks designed to measure the performance of companies in the natural resource sector. Issues in the index include extractive industries including gold and precious metals mining along with other mineral mining, energy companies providing oil and gas services, and owners and operators of timber tracts and forestry services. These benchmarks include reinvested dividends and capital gains, if any, and exclude the effect of sales charges.
Average Annual Total Returns
|
Periods ended July 31, 2000 |
|
Past 1 |
Past 5 |
Past 10 |
|
Fidelity Adv Natural - |
|
10.31% |
11.34% |
12.20% |
|
S&P 500 |
|
8.98% |
22.61% |
17.65% |
|
GS Natural Resources |
|
1.35% |
n/a* |
n/a* |
Average annual returns take Institutional Class shares' cumulative return and show you what would have happened if Institutional Class shares had performed at a constant rate each year.
* Not available
$10,000 Over 10 Years
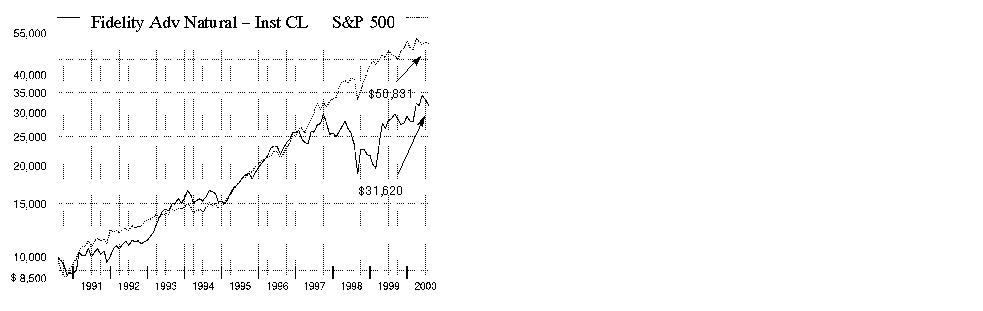
$10,000 Over 10 Years: Let's say hypothetically that $10,000 was invested in Fidelity Advisor Natural Resources - Institutional Class on July 31, 1990. As the chart shows, by July 31, 2000, the value of the investment would have grown to $31,620 - a 216.20% increase on the initial investment. For comparison, look at how the Standard & Poor's 500 Index did over the same period. With dividends and capital gains, if any, reinvested, the same $10,000 investment would have grown to $50,831 - a 408.31% increase. (The Goldman Sachs Natural Resources Index does not extend as far back as the fund's start date, and therefore cannot be used for this comparison.)
Understanding Performance
How a fund did yesterday is no guarantee of how it will do tomorrow. The stock market, for example, has a history of long-term growth and short-term volatility. Unlike the broader market, however, some sectors may not have a history of growth in the long run. And, as with all stock funds, the share price and return of a fund that invests in a sector will vary.
3Annual Report
(Portfolio Manager photograph)
An interview with
Scott Offen, Portfolio
Manager of Fidelity Advisor Natural Resources Fund
Q. Scott, how did the fund perform during the 12 months that ended July 31, 2000?
A. For the 12 months that ended July 31, 2000, the fund's Class A, Class T, Class B and Class C shares returned 9.92%, 9.69%, 9.14% and 9.15%, respectively. To compare, the Goldman Sachs Natural Resources Index - an index of 112 stocks designed to measure the performance of companies in the natural resources sector - returned 1.35%, and the Standard & Poor's 500 Index returned 8.98%.
A. For the 12 months that ended July 31, 2000, the fund's Institutional Class shares returned 10.31%. To compare, the Goldman Sachs Natural Resources Index - an index of 112 stocks designed to measure the performance of companies in the natural resources sector - returned 1.35%, and the Standard & Poor's 500 Index returned 8.98%.
Q. What helped the fund perform better than the natural resources sector, as measured by the Goldman Sachs index?
A. The most significant factor was the fund's industry weightings relative to the index. I overweighted the fund in natural gas and energy services stocks, two areas that performed quite well. The fund also benefited from its stake in two other groups that did well, tankers and refiners. At the same time, I underweighted oil, paper and forest products, and metals stocks, all of which had subpar performance.
Q. Why did natural gas, energy services, tanker and refining stocks perform so well?
A. Natural gas stocks fared well due to a positive demand and supply dynamic that led to rising natural gas prices. Demand was on the rise due to the strong economy and a vibrant housing market. Furthermore, demand for electricity also was on the rise and nearly all new electric power plants coming on line will be powered by natural gas. At the same time, the most readily available supplies of natural gas in North America have been exhausted. Many areas where natural gas might be tapped have been put off-limits due to environmental protection. Even if a pipeline were to be built accessing natural gas in Canada or Alaska, it would be several years before such a project could be completed. On the energy services side, higher oil prices prodded the industry to ramp up its capital spending on drilling, exploration and production after having underinvested in these activities over the past two years. These increased capital expenditures translated directly into improved revenues and increased earnings for energy services firms. Shipping companies - those that provide tankers, in particular - also benefited from this increased energy production, as high-capacity utilization caused shipping rates to skyrocket. Finally, for a time refiners enjoyed record high margins - the difference between the cost of the crude oil they purchase compared to the price they capture for the refined petroleum products they produce - and their stocks enjoyed a nice run-up. While these investments helped the fund's performance over the course of its fiscal year, I pared them back when the story came to an end.
Q. Which stocks performed well? Which disappointed?
A. Nearly all of the fund's top performers were energy services stocks or companies involved in some way with natural gas. On the energy services side, Schlumberger, Noble Drilling, Smith International, ENSCO International, Nabors Industries and Weatherford all provided strong performance. In the natural gas arena, Dynegy, an independent power producer, and Kinder Morgan performed well. Exxon Mobil also provided solid performance, due to the excellent execution of the merger of Exxon and Mobil that provided twice the anticipated cost savings. On the down side, Texaco suffered from difficulties executing its business plans and USX-Marathon had problems finding oil. Surprisingly, while Chevron met its earnings expectations, its stock floundered, probably because investors found more attractive investments elsewhere.
Q. What is your outlook?
A. I'm cautiously optimistic. I believe the natural gas and energy stories will continue to be very strong. There should continue to be a shortage of natural gas supply at a time when demand should continue to rise. Looking at energy services, these stocks may suffer in the short term if the price of oil declines. However, I believe the supply of oil is tight enough that such a decline will not be precipitous, and that oil companies will continue to sustain or increase their capital expenditures on exploration and production. These activities should keep energy services companies' revenues and earnings at healthy levels.
The views expressed in this report reflect those of the portfolio manager only through the end of the period of the report as stated on the cover. The manager's views are subject to change at any time based on market and other conditions. For more information see page A-3.
Fund Facts
Start date: December 29, 1987
Size: as of July 31, 2000, more than $324 million
Manager: Scott Offen, since 1999; joined Fidelity in 1985
3Annual Report
Advisor Natural Resources Fund
|
Top Ten Stocks as of July 31, 2000 |
|
|
|
% of fund's |
|
Exxon Mobil Corp. |
9.0 |
|
Royal Dutch Petroleum Co. (NY Shares) |
7.1 |
|
Chevron Corp. |
7.1 |
|
Schlumberger Ltd. |
4.0 |
|
Halliburton Co. |
3.1 |
|
BP Amoco PLC sponsored ADR |
3.0 |
|
Anadarko Petroleum Corp. |
2.2 |
|
Alcoa, Inc. |
2.1 |
|
Conoco, Inc. Class B |
1.9 |
|
Burlington Resources, Inc. |
1.8 |
|
|
41.3 |
|
Top Industries as of July 31, 2000 |
|
|
% of fund's net assets |
||
|
Oil & Gas |
56.7% |
|
Energy Services |
21.9% |
|
Gas |
6.5% |
|
Paper & Forest Products |
5.4% |
|
Metals & Mining |
2.5% |
|
All Others* |
7.0% |
|
* Includes short-term investments and net other assets. |
Annual Report
Advisor Natural Resources Fund
Showing Percentage of Net Assets
|
Common Stocks - 97.1% |
|||
|
Shares |
Value (Note 1) |
||
|
ELECTRIC UTILITY - 0.4% |
|||
|
Calpine Corp. (a) |
14,000 |
$ 997,500 |
|
|
NRG Energy, Inc. |
18,000 |
421,875 |
|
|
|
1,419,375 |
||
|
ELECTRICAL EQUIPMENT - 0.0% |
|||
|
Capstone Turbine Corp. |
400 |
22,000 |
|
|
ENERGY SERVICES - 21.9% |
|||
|
Baker Hughes, Inc. |
123,150 |
4,264,069 |
|
|
BJ Services Co. (a) |
34,300 |
2,002,263 |
|
|
Diamond Offshore Drilling, Inc. |
68,500 |
2,573,031 |
|
|
ENSCO International, Inc. |
147,500 |
4,978,125 |
|
|
Global Industries Ltd. (a) |
51,800 |
647,500 |
|
|
Global Marine, Inc. (a) |
94,100 |
2,664,206 |
|
|
Grey Wolf, Inc. (a) |
139,000 |
642,875 |
|
|
Halliburton Co. |
214,700 |
9,903,038 |
|
|
Hanover Compressor Co. (a) |
27,900 |
952,088 |
|
|
Helmerich & Payne, Inc. |
26,700 |
854,400 |
|
|
Marine Drilling Companies, Inc. (a) |
32,150 |
699,263 |
|
|
McDermott International, Inc. |
87,900 |
653,756 |
|
|
Nabors Industries, Inc. (a) |
132,500 |
5,515,313 |
|
|
Noble Drilling Corp. (a) |
95,600 |
4,164,575 |
|
|
Precision Drilling Corp. (a) |
18,800 |
638,381 |
|
|
R&B Falcon Corp. (a) |
15,000 |
299,063 |
|
|
Rowan Companies, Inc. (a) |
40,000 |
1,010,000 |
|
|
Santa Fe International Corp. |
58,500 |
2,054,813 |
|
|
Schlumberger Ltd. |
175,500 |
12,976,031 |
|
|
Smith International, Inc. (a) |
39,900 |
2,847,863 |
|
|
Superior Energy Services, Inc. (a) |
60,000 |
600,000 |
|
|
Transocean Sedco Forex, Inc. |
112,879 |
5,587,511 |
|
|
UTI Energy Corp. (a) |
1 |
32 |
|
|
Varco International, Inc. (a) |
42,400 |
731,400 |
|
|
Weatherford International, Inc. |
93,600 |
3,749,850 |
|
|
|
71,009,446 |
||
|
GAS - 6.5% |
|||
|
Dynegy, Inc. Class A |
77,349 |
5,443,436 |
|
|
El Paso Energy Corp. |
14,900 |
720,788 |
|
|
Enron Corp. |
76,400 |
5,624,950 |
|
|
Kinder Morgan, Inc. |
155,200 |
5,276,800 |
|
|
Williams Companies, Inc. |
99,200 |
4,141,600 |
|
|
|
21,207,574 |
||
|
METALS & MINING - 2.5% |
|||
|
Alcoa, Inc. |
226,900 |
6,863,725 |
|
|
Phelps Dodge Corp. |
26,600 |
1,082,288 |
|
|
|
7,946,013 |
||
|
|
|||
|
Shares |
Value (Note 1) |
||
|
OIL & GAS - 56.7% |
|||
|
Alberta Energy Co. Ltd. |
132,200 |
$ 4,777,938 |
|
|
Amerada Hess Corp. |
67,300 |
4,071,650 |
|
|
Anadarko Petroleum Corp. |
149,481 |
7,147,060 |
|
|
Apache Corp. |
79,000 |
3,930,250 |
|
|
BP Amoco PLC sponsored ADR |
187,948 |
9,832,030 |
|
|
Burlington Resources, Inc. |
176,400 |
5,755,050 |
|
|
Cabot Oil & Gas Corp. Class A |
100 |
1,850 |
|
|
Canada Occidental Petroleum Ltd. |
66,500 |
1,654,451 |
|
|
Canadian Hunter Exploration Ltd. (a) |
56,200 |
1,129,895 |
|
|
Chevron Corp. |
291,300 |
23,012,700 |
|
|
Conoco, Inc.: |
|
|
|
|
Class A |
155,600 |
3,481,550 |
|
|
Class B |
266,702 |
6,150,815 |
|
|
Cooper Cameron Corp. (a) |
18,200 |
1,176,175 |
|
|
Crestar Energy, Inc. (a) |
28,900 |
415,855 |
|
|
Devon Energy Corp. |
60,600 |
2,772,450 |
|
|
EEX Corp. (a) |
237,000 |
1,140,563 |
|
|
EOG Resources, Inc. |
105,300 |
3,112,931 |
|
|
Exxon Mobil Corp. |
366,080 |
29,286,391 |
|
|
Frontier Oil Corp. (a) |
102,300 |
716,100 |
|
|
Grant Prideco, Inc. (a) |
93,600 |
1,883,700 |
|
|
Gulf Canada Resources Ltd. (a) |
4,100 |
18,471 |
|
|
Imperial Oil Ltd. |
55,600 |
1,357,101 |
|
|
Kerr-McGee Corp. |
45,900 |
2,518,763 |
|
|
Magnum Hunter Resources, Inc. |
1 |
7 |
|
|
National-Oilwell, Inc. (a) |
88,000 |
2,904,000 |
|
|
Noble Affiliates, Inc. |
20,000 |
600,000 |
|
|
Occidental Petroleum Corp. |
171,500 |
3,472,875 |
|
|
Ocean Energy, Inc. (a) |
125,900 |
1,526,538 |
|
|
Penn West Petroleum Ltd. (a) |
19,800 |
433,358 |
|
|
Petro-Canada |
181,900 |
3,498,077 |
|
|
Phillips Petroleum Co. |
59,700 |
3,033,506 |
|
|
Pioneer Natural Resources Co. (a) |
208,700 |
2,243,525 |
|
|
Pogo Producing Co. |
30,000 |
596,250 |
|
|
Pure Resources, Inc. (a) |
66,700 |
996,331 |
|
|
Rio Alto Exploration Ltd. (a) |
75,300 |
1,321,497 |
|
|
Royal Dutch Petroleum Co. (NY Shares) |
395,400 |
23,032,050 |
|
|
Santa Fe Snyder Corp. (a) |
485,335 |
4,853,350 |
|
|
Suncor Energy, Inc. |
192,800 |
4,018,827 |
|
|
Sunoco, Inc. |
62,300 |
1,518,563 |
|
|
Swift Energy Co. (a) |
1 |
22 |
|
|
Talisman Energy, Inc. (a) |
110,200 |
3,267,765 |
|
|
Tosco Corp. |
58,300 |
1,544,950 |
|
|
TotalFinaElf SA sponsored ADR |
47,970 |
3,528,793 |
|
|
Ultramar Diamond Shamrock Corp. |
54,400 |
1,244,400 |
|
|
Unocal Corp. |
53,700 |
1,624,425 |
|
|
Valero Energy Corp. |
58,400 |
1,514,750 |
|
|
Vastar Resources, Inc. |
20,200 |
1,665,238 |
|
|
Wiser Oil Co. (a) |
1 |
3 |
|
|
|
183,782,839 |
||
|
Common Stocks - continued |
|||
|
Shares |
Value (Note 1) |
||
|
PACKAGING & CONTAINERS - 0.2% |
|||
|
Packaging Corp. of America |
61,700 |
$ 701,838 |
|
|
PAPER & FOREST PRODUCTS - 5.4% |
|||
|
Abitibi-Consolidated, Inc. |
77,800 |
734,999 |
|
|
Boise Cascade Corp. |
49,400 |
1,364,675 |
|
|
Bowater, Inc. |
50,900 |
2,506,825 |
|
|
Domtar, Inc. |
74,900 |
637,093 |
|
|
International Paper Co. |
93,700 |
3,185,800 |
|
|
Sappi Ltd. sponsored ADR |
85,000 |
722,500 |
|
|
Smurfit-Stone Container Corp. (a) |
79,400 |
987,538 |
|
|
Temple-Inland, Inc. |
23,200 |
1,007,750 |
|
|
Westvaco Corp. |
67,900 |
1,863,006 |
|
|
Weyerhaeuser Co. |
68,100 |
3,111,319 |
|
|
Willamette Industries, Inc. |
42,200 |
1,279,188 |
|
|
|
17,400,693 |
||
|
PRECIOUS METALS - 1.9% |
|||
|
Barrick Gold Corp. |
191,400 |
3,043,713 |
|
|
Homestake Mining Co. |
25,000 |
135,938 |
|
|
Meridian Gold, Inc. (a) |
283,900 |
1,698,971 |
|
|
Newmont Mining Corp. |
69,400 |
1,231,850 |
|
|
William Resources, Inc. warrants 2/15/03 (a)(c) |
1,029,000 |
7 |
|
|
|
6,110,479 |
||
|
RETAIL & WHOLESALE, MISCELLANEOUS - 0.3% |
|||
|
Newpark Resources, Inc. (a) |
103,900 |
863,669 |
|
|
SHIPPING - 1.3% |
|||
|
Bergesen dy ASA (A Shares) |
36,150 |
719,835 |
|
|
Frontline Ltd. (a) |
60,900 |
759,206 |
|
|
Knightsbridge Tankers Ltd. |
46,100 |
864,375 |
|
|
OMI Corp. |
120,400 |
647,150 |
|
|
Overseas Shipholding Group, Inc. |
31,300 |
712,075 |
|
|
Teekay Shipping Corp. |
17,800 |
667,500 |
|
|
|
4,370,141 |
||
|
TOTAL COMMON STOCKS (Cost $259,318,302) |
314,834,067 |
||
|
Cash Equivalents - 9.2% |
|||
|
Shares |
Value (Note 1) |
||
|
Fidelity Cash Central Fund, 6.57% (b) |
6,297,721 |
$ 6,297,721 |
|
|
Fidelity Securities Lending Cash Central Fund, 6.65% (b) |
23,700,000 |
23,700,000 |
|
|
TOTAL CASH EQUIVALENTS (Cost $29,997,721) |
29,997,721 |
||
|
TOTAL INVESTMENT PORTFOLIO - 106.3% (Cost $289,316,023) |
344,831,788 |
|
NET OTHER ASSETS - (6.3)% |
(20,560,211) |
||
|
NET ASSETS - 100% |
$ 324,271,577 |
||
|
Legend |
|
(a) Non-income producing |
|
(b) The rate quoted is the annualized seven-day yield of the fund at |
|
(c) Security exempt from registration under Rule 144A of the Securities Act |
|
Distribution of investments by country of issue, as a percentage of total |
|
United States of America |
75.1% |
|
Canada |
8.6 |
|
Netherlands |
7.1 |
|
Netherlands Antilles |
4.0 |
|
United Kingdom |
3.0 |
|
France |
1.1 |
|
Others (individually less than 1%) |
1.1 |
|
|
100.0% |
|
Income Tax Information |
|
At July 31, 2000, the aggregate cost of investment securities for income tax purposes was $290,797,611. Net unrealized appreciation aggregated $54,034,177, of which $61,934,342 related to appreciated investment securities and $7,900,165 related to depreciated investment securities. |
|
At July 31, 2000, the fund had a capital loss carryforward of approximately $27,373,000 of which $21,050,000 and $6,323,000 will expire on July 31, 2007 and 2008, respectively. |
|
A total of 100% of Class A's, Class T's, Class C's and Institutional Class' dividends distributed during the fiscal year qualifies for the dividend- |
|
The fund will notify shareholders in January 2001 of the applicable percentages for use in preparing 2000 income tax returns. |
See accompanying notes which are an integral part of the financial statements.
Natural Resources
Statement of Assets and Liabilities
|
|
July 31, 2000 |
|
|
Assets |
|
|
|
Investment in securities, at value |
|
$ 344,831,788 |
|
Receivable for investments sold |
|
16,445,278 |
|
Receivable for fund shares sold |
|
375,892 |
|
Dividends receivable |
|
130,439 |
|
Interest receivable |
|
68,083 |
|
Redemption fees receivable |
|
430 |
|
Other receivables |
|
60,649 |
|
Total assets |
|
361,912,559 |
|
Liabilities |
|
|
|
Payable for investments purchased |
$ 12,615,311 |
|
|
Payable for fund shares redeemed |
923,247 |
|
|
Accrued management fee |
163,556 |
|
|
Distribution fees payable |
166,363 |
|
|
Other payables and accrued expenses |
72,505 |
|
|
Collateral on securities loaned, |
23,700,000 |
|
|
Total liabilities |
|
37,640,982 |
|
Net Assets |
|
$ 324,271,577 |
|
Net Assets consist of: |
|
|
|
Paid in capital |
|
$ 297,094,860 |
|
Undistributed net investment income |
|
455,505 |
|
Accumulated undistributed net realized gain (loss) on investments and foreign currency transactions |
|
(28,794,048) |
|
Net unrealized appreciation (depreciation) on investments |
|
55,515,260 |
|
Net Assets |
|
$ 324,271,577 |
|
Calculation of Maximum |
|
$24.07 |
|
Maximum offering price per share |
|
$25.54 |
|
Class T: |
|
$24.35 |
|
Maximum offering price per share |
|
$25.23 |
|
Class B: |
|
$23.77 |
|
Class C: |
|
$23.88 |
|
Institutional Class: |
|
$24.43 |
A Redemption price per share is equal to net asset value less any applicable contingent deferred sales charge.
Statement of Operations
|
|
Year ended July 31, 2000 |
|
|
Investment Income Dividends |
|
$ 4,854,052 |
|
Interest |
|
702,559 |
|
Security lending |
|
32,527 |
|
Total income |
|
5,589,138 |
|
Expenses |
|
|
|
Management fee |
$ 1,964,927 |
|
|
Transfer agent fees |
898,246 |
|
|
Distribution fees |
1,966,519 |
|
|
Accounting and security lending fees |
139,282 |
|
|
Non-interested trustees' compensation |
1,168 |
|
|
Custodian fees and expenses |
28,101 |
|
|
Registration fees |
78,663 |
|
|
Audit |
25,224 |
|
|
Legal |
3,182 |
|
|
Miscellaneous |
6,258 |
|
|
Total expenses before reductions |
5,111,570 |
|
|
Expense reductions |
(148,881) |
4,962,689 |
|
Net investment income |
|
626,449 |
|
Realized and Unrealized Gain (Loss) Net realized gain (loss) on: |
|
|
|
Investment securities (including |
22,195,677 |
|
|
Foreign currency transactions |
(20,468) |
22,175,209 |
|
Change in net unrealized appreciation (depreciation) on: |
|
|
|
Investment securities |
4,098,890 |
|
|
Assets and liabilities in |
(469) |
4,098,421 |
|
Net gain (loss) |
|
26,273,630 |
|
Net increase (decrease) in net assets resulting from operations |
|
$ 26,900,079 |
See accompanying notes which are an integral part of the financial statements.
Annual Report
Advisor Natural Resources Fund
Financial Statements - continued
Statement of Changes in Net Assets
|
Increase (Decrease) in Net Assets |
Year ended |
Year ended |
|
Operations |
$ 626,449 |
$ 463,885 |
|
Net realized gain (loss) |
22,175,209 |
(51,289,494) |
|
Change in net unrealized appreciation (depreciation) |
4,098,421 |
105,678,595 |
|
Net increase (decrease) in net assets resulting from operations |
26,900,079 |
54,852,986 |
|
Distributions to shareholders |
(183,357) |
(178,918) |
|
From net realized gain |
- |
(13,935,776) |
|
Total distributions |
(183,357) |
(14,114,694) |
|
Share transactions - net increase (decrease) |
(54,916,981) |
(88,632,291) |
|
Redemption fees |
195,083 |
104,288 |
|
Total increase (decrease) in net assets |
(28,005,176) |
(47,789,711) |
|
Net Assets |
|
|
|
Beginning of period |
352,276,753 |
400,066,464 |
|
End of period (including undistributed net investment income of $455,505 and $28,075, respectively) |
$ 324,271,577 |
$ 352,276,753 |
Financial Highlights - Class A
|
Years ended July 31, |
2000 |
1999 |
1998 |
1997 E |
1996 F |
|
Selected Per-Share Data |
|
|
|
|
|
|
Net asset value, beginning of period |
$ 21.98 |
$ 18.94 |
$ 26.16 |
$ 25.11 |
$ 23.65 |
|
Income from Investment Operations |
|
|
|
|
|
|
Net investment income (loss) D |
.10 |
.07 |
.06 |
(.05) |
(.00) |
|
Net realized and unrealized gain (loss) |
2.06 |
3.71 |
(3.33) |
2.81 |
1.46 |
|
Total from investment operations |
2.16 |
3.78 |
(3.27) |
2.76 |
1.46 |
|
Less Distributions |
|
|
|
|
|
|
From net investment income |
(.08) |
(.04) |
- |
(.10) |
- |
|
In excess of net investment income |
- |
- |
- |
(.04) |
- |
|
From net realized gain |
- |
(.71) |
(3.96) |
(1.57) |
- |
|
Total distributions |
(.08) |
(.75) |
(3.96) |
(1.71) |
- |
|
Redemption fees added to paid in capital |
.01 |
.01 |
.01 |
- |
- |
|
Net asset value, end of period |
$ 24.07 |
$ 21.98 |
$ 18.94 |
$ 26.16 |
$ 25.11 |
|
Total Return B, C |
9.92% |
21.48% |
(14.61)% |
11.45% |
6.17% |
|
Ratios and Supplemental Data |
|
|
|
|
|
|
Net assets, end of period (000 omitted) |
$ 10,381 |
$ 7,801 |
$ 6,474 |
$ 6,372 |
$ 1,609 |
|
Ratio of expenses to average net assets |
1.26% |
1.28% |
1.34% |
1.71% A, G |
1.66% A, G |
|
Ratio of expenses to average net assets after expense reductions |
1.21% H |
1.23% H |
1.30% H |
1.68% A, H |
1.58% A, H |
|
Ratio of net investment income (loss) to average net assets |
.43% |
.38% |
.28% |
(.28)% A |
(.01)% A |
|
Portfolio turnover |
90% |
99% |
97% |
116% A |
137% |
|
A Annualized B The total returns would have been lower had certain expenses not been reduced during the periods shown. C Total returns do not include the one time sales charge and for periods of less than one year are not annualized. D Net investment income (loss) per share has been calculated based on average shares outstanding during the period. E Nine months ended July 31, 1997. F For the period September 3, 1996 (commencement of sale of Class A shares) to October 31, 1996. G FMR agreed to reimburse a portion of the class' expenses during the period. Without this reimbursement, the class' expense ratio would have been higher. H FMR or the fund has entered into varying arrangements with third parties who either paid or reduced a portion of the class' expenses. |
|||||
See accompanying notes which are an integral part of the financial statements.
Natural Resources
Financial Highlights - Class T
|
Years ended July 31, |
2000 |
1999 |
1998 |
1997 E |
1996 F |
1995 F |
|
Selected Per-Share Data |
|
|
|
|
|
|
|
Net asset value, beginning of period |
$ 22.21 |
$ 19.11 |
$ 26.34 |
$ 25.12 |
$ 19.25 |
$ 17.56 |
|
Income from Investment Operations |
|
|
|
|
|
|
|
Net investment income (loss) D |
.06 |
.04 |
.02 |
(.02) |
.00 |
(.05) |
|
Net realized and unrealized gain (loss) |
2.08 |
3.76 |
(3.34) |
2.83 |
6.56 |
2.00 |
|
Total from investment operations |
2.14 |
3.80 |
(3.32) |
2.81 |
6.56 |
1.95 |
|
Less Distributions |
|
|
|
|
|
|
|
From net investment income |
(.01) |
(.01) |
- |
(.01) |
- |
- |
|
In excess of net investment income |
- |
- |
- |
(.01) |
- |
- |
|
From net realized gain |
- |
(.70) |
(3.92) |
(1.57) |
(.69) |
(.26) |
|
Total distributions |
(.01) |
(.71) |
(3.92) |
(1.59) |
(.69) |
(.26) |
|
Redemption fees added to paid in capital |
.01 |
.01 |
.01 |
- |
- |
- |
|
Net asset value, end of period |
$ 24.35 |
$ 22.21 |
$ 19.11 |
$ 26.34 |
$ 25.12 |
$ 19.25 |
|
Total Return B, C |
9.69% |
21.31% |
(14.69)% |
11.62% |
35.01% |
11.40% |
|
Ratios and Supplemental Data |
|
|
|
|
|
|
|
Net assets, end of period (000 omitted) |
$ 245,995 |
$ 283,419 |
$ 342,347 |
$ 618,083 |
$ 602,915 |
$ 272,979 |
|
Ratio of expenses to average net assets |
1.41% |
1.45% |
1.43% |
1.47% A |
1.59% |
1.86% G |
|
Ratio of expenses to average net assets after |
1.37% H |
1.40% H |
1.39% H |
1.44% A, H |
1.56% H |
1.84% H |
|
Ratio of net investment income (loss) to average net assets |
.27% |
.20% |
.10% |
(.12)% A |
.00% |
(.30)% |
|
Portfolio turnover |
90% |
99% |
97% |
116% A |
137% |
161% |
|
A Annualized B The total returns would have been lower had certain expenses not been reduced during the periods shown. C Total returns do not include the one time sales charge and for periods of less than one year are not annualized. D Net investment income (loss) per share has been calculated based on average shares outstanding during the period. E Nine months ended July 31, 1997. F Year ended October 31. G FMR agreed to reimburse a portion of the class' expenses during the period. Without this reimbursement, the class' expense ratio would have been higher. H FMR or the fund has entered into varying arrangements with third parties who either paid or reduced a portion of the class' expenses. |
Financial Highlights - Class B
|
Years ended July 31, |
2000 |
1999 |
1998 |
1997 E |
1996 F |
1995 G |
|
Selected Per-Share Data |
|
|
|
|
|
|
|
Net asset value, beginning of period |
$ 21.78 |
$ 18.81 |
$ 25.99 |
$ 24.88 |
$ 19.23 |
$ 18.87 |
|
Income from Investment Operations |
|
|
|
|
|
|
|
Net investment income (loss) D |
(.06) |
(.06) |
(.09) |
(.12) |
(.15) |
(.03) |
|
Net realized and unrealized gain (loss) |
2.04 |
3.68 |
(3.29) |
2.80 |
6.49 |
.39 |
|
Total from investment operations |
1.98 |
3.62 |
(3.38) |
2.68 |
6.34 |
.36 |
|
Less Distributions |
|
|
|
|
|
|
|
From net realized gain |
- |
(.66) |
(3.81) |
(1.57) |
(.69) |
- |
|
Redemption fees added to paid in capital |
.01 |
.01 |
.01 |
- |
- |
- |
|
Net asset value, end of period |
$ 23.77 |
$ 21.78 |
$ 18.81 |
$ 25.99 |
$ 24.88 |
$ 19.23 |
|
Total Return B, C |
9.14% |
20.57% |
(15.12)% |
11.19% |
33.87% |
1.91% |
|
Ratios and Supplemental Data |
|
|
|
|
|
|
|
Net assets, end of period (000 omitted) |
$ 50,685 |
$ 47,792 |
$ 44,351 |
$ 59,044 |
$ 36,106 |
$ 2,508 |
|
Ratio of expenses to average net assets |
1.96% |
1.99% |
1.98% |
2.04% A |
2.28% |
2.23% A, H |
|
Ratio of expenses to average net assets after |
1.92% I |
1.95% I |
1.94% I |
2.02% A, I |
2.24% I |
2.21% A, I |
|
Ratio of net investment income (loss) to average net assets |
(.28)% |
(.34)% |
(.41)% |
(.67)% A |
(.68)% |
(.67)% A |
|
Portfolio turnover |
90% |
99% |
97% |
116% A |
137% |
161% |
|
A Annualized B The total returns would have been lower had certain expenses not been reduced during the periods shown. C Total returns do not include the contingent deferred sales charge and for periods of less than one year are not annualized. D Net investment income (loss) per share has been calculated based on average shares outstanding during the period. E Nine months ended July 31, 1997. F Year ended October 31. G For the period July 3, 1995 (commencement of sale of Class B shares) to October 31, 1995. H FMR agreed to reimburse a portion of the class' expenses during the period. Without this reimbursement, the class' expense ratio would have been higher. I FMR or the fund has entered into varying arrangements with third parties who either paid or reduced a portion of the class' expenses. |
See accompanying notes which are an integral part of the financial statements.
Annual Report
Financial Highlights - Class C
|
Years ended July 31, |
2000 |
1999 |
1998 E |
|
Selected Per-Share Data |
|
|
|
|
Net asset value, beginning of period |
$ 21.92 |
$ 18.96 |
$ 24.39 |
|
Income from Investment Operations |
|
|
|
|
Net investment income (loss) D |
(.05) |
(.05) |
(.07) |
|
Net realized and unrealized gain (loss) |
2.04 |
3.71 |
(4.15) |
|
Total from investment operations |
1.99 |
3.66 |
(4.22) |
|
Less Distributions |
|
|
|
|
From net investment income |
(.04) |
(.01) |
- |
|
From net realized gain |
- |
(.70) |
(1.22) |
|
Total distributions |
(.04) |
(.71) |
(1.22) |
|
Redemption fees added to paid in capital |
.01 |
.01 |
.01 |
|
Net asset value, end of period |
$ 23.88 |
$ 21.92 |
$ 18.96 |
|
Total Return B, C |
9.15% |
20.72% |
(17.72)% |
|
Ratios and Supplemental Data |
|
|
|
|
Net assets, end of period (000 omitted) |
$ 13,741 |
$ 8,761 |
$ 2,972 |
|
Ratio of expenses to average net assets |
1.91% |
1.94% |
2.50% A, F |
|
Ratio of expenses to average net assets after expense reductions |
1.87% G |
1.89% G |
2.44% A, G |
|
Ratio of net investment income (loss) to average net assets |
(.23)% |
(.28)% |
(.48)% A |
|
Portfolio turnover |
90% |
99% |
97% |
|
A Annualized B The total returns would have been lower had certain expenses not been reduced during the periods shown. C Total returns do not include the contingent deferred sales charge and for periods of less than one year are not annualized. D Net investment income (loss) per share has been calculated based on average shares outstanding during the period. E For the period November 3, 1997 (commencement of sale of Class C shares) to July 31, 1998. F FMR agreed to reimburse a portion of the class' expenses during the period. Without this reimbursement, the class' expense ratio would have been higher. G FMR or the fund has entered into varying arrangements with third parties who either paid or reduced a portion of the class' expenses. |
Financial Highlights - Institutional Class
|
Years ended July 31, |
2000 |
1999 |
1998 |
1997 E |
1996 F |
1995 G |
|
Selected Per-Share Data |
|
|
|
|
|
|
|
Net asset value, beginning of period |
$ 22.28 |
$ 19.15 |
$ 26.42 |
$ 25.17 |
$ 19.27 |
$ 18.87 |
|
Income from Investment Operations |
|
|
|
|
|
|
|
Net investment income (loss) D |
.19 |
.14 |
.13 |
.04 |
.04 |
(.01) |
|
Net realized and unrealized gain (loss) |
2.07 |
3.76 |
(3.35) |
2.85 |
6.55 |
.41 |
|
Total from investment operations |
2.26 |
3.90 |
(3.22) |
2.89 |
6.59 |
.40 |
|
Less Distributions |
|
|
|
|
|
|
|
From net investment income |
(.13) |
(.07) |
(.09) |
(.05) |
- |
- |
|
In excess of net investment income |
- |
- |
- |
(.02) |
- |
- |
|
From net realized gain |
- |
(.71) |
(3.97) |
(1.57) |
(.69) |
- |
|
Total distributions |
(.13) |
(.78) |
(4.06) |
(1.64) |
(.69) |
- |
|
Redemption fees added to paid in capital |
.02 |
.01 |
.01 |
- |
- |
- |
|
Net asset value, end of period |
$ 24.43 |
$ 22.28 |
$ 19.15 |
$ 26.42 |
$ 25.17 |
$ 19.27 |
|
Total Return B, C |
10.31% |
21.95% |
(14.29)% |
11.95% |
35.13% |
2.12% |
|
Ratios and Supplemental Data |
|
|
|
|
|
|
|
Net assets, end of period (000 omitted) |
$ 3,470 |
$ 4,505 |
$ 3,922 |
$ 10,042 |
$ 9,860 |
$ 718 |
|
Ratio of expenses to average net assets |
.86% |
.87% |
.95% |
1.08% A |
1.44% |
1.68% A, H |
|
Ratio of expenses to average net assets after |
.82% I |
.82% I |
.91% I |
1.06% A, I |
1.39% I |
1.66% A, I |
|
Ratio of net investment income (loss) to average net assets |
.82% |
.78% |
.55% |
.24% A |
.17% |
(.13)% A |
|
Portfolio turnover |
90% |
99% |
97% |
116% A |
137% |
161% |
|
A Annualized B The total returns would have been lower had certain expenses not been reduced during the periods shown. C Total returns for periods of less than one year are not annualized. D Net investment income (loss) per share has been calculated based on average shares outstanding during the period. E Nine months ended July 31, 1997. F Year ended October 31. G For the period July 3, 1995 (commencement of sale of Institutional Class shares) to October 31, 1995. H FMR agreed to reimburse a portion of the class' expenses during the period. Without this reimbursement, the class' expense ratio would have been higher. I FMR or the fund has entered into varying arrangements with third parties who either paid or reduced a portion of the class' expenses. |
Natural Resources
For the period ended July 31, 2000
1. Significant Accounting Policies.
Fidelity Advisor Natural Resources Fund (the fund) is a fund of Fidelity Advisor Series VII (the trust) and is authorized to issue an unlimited number of shares. The trust is registered under the Investment Company Act of 1940, as amended (the 1940 Act), as an open-end management investment company organized as a Massachusetts business trust.
The fund offers Class A, Class T, Class B, Class C, and Institutional Class shares, each of which has equal rights as to assets and voting privileges. Each class has exclusive voting rights with respect to matters that affect that class. Class B shares will automatically convert to Class A shares after a holding period of seven years from the initial date of purchase. Investment income, realized and unrealized capital gains and losses, the common expenses of the fund, and certain fund-level expense reductions, if any, are allocated on a pro rata basis to each class based on the relative net assets of each class to the total net assets of the fund. Each class of shares differs in its respective distribution, transfer agent, and certain other class-specific fees, expenses, and expense reductions.
The financial statements have been prepared in conformity with generally accepted accounting principles which require management to make certain estimates and assumptions at the date of the financial statements. The following summarizes the significant accounting policies of the fund:
Security Valuation. Securities for which exchange quotations are readily available are valued at the last sale price, or if no sale price, at the closing bid price. Foreign securities are valued based on quotations from the principal market in which such securities are normally traded. If trading or events occurring in other markets after the close of the principal market in which foreign securities are traded, and before the close of the business of the fund, are expected to materially affect the value of those securities, then they are valued at their fair value taking this trading or these events into account. Fair value is determined in good faith under consistently applied procedures under the general supervision of the Board of Trustees. Securities (including restricted securities) for which exchange quotations are not readily available (and in certain cases debt securities which trade on an exchange) are valued primarily using dealer-supplied valuations or at their fair value. Short-term securities with remaining maturities of sixty days or less for which quotations are not readily available are valued at amortized cost or original cost plus accrued interest, both of which approximate current value.
Foreign Currency Translation. The accounting records of the fund are maintained in U.S. dollars. Investment securities and other assets and liabilities denominated in a foreign currency are translated into U.S. dollars at the prevailing rates of exchange at period end. Purchases and sales of securities, income receipts and expense payments are translated into U.S. dollars at the prevailing exchange rate on the respective dates of the transactions.
Net realized gains and losses on foreign currency transactions represent net gains and losses from sales and maturities of foreign currency contracts, disposition of foreign currencies, the difference between the amount of net investment income accrued and the U.S. dollar amount actually received, and gains and losses between trade and settlement date on purchases and sales of securities. The effects of changes in foreign currency exchange rates on investments in securities are included with the net realized and unrealized gain or loss on investment securities.
Income Taxes. As a qualified regulated investment company under Subchapter M of the Internal Revenue Code, the fund is not subject to income taxes to the extent that it distributes substantially all of its taxable income for its fiscal year. The schedule of investments includes information regarding income taxes under the caption "Income Tax Information."
Investment Income. Dividend income is recorded on the ex-dividend date, except certain dividends from foreign securities where the ex-dividend date may have passed, are recorded as soon as the fund is informed of the ex-dividend date. Non-cash dividends included in dividend income, if any, are recorded at the fair market value of the securities received. Interest income is accrued as earned. Investment income is recorded net of foreign taxes withheld where recovery of such taxes is uncertain.
Expenses. Most expenses of the trust can be directly attributed to a fund. Expenses which cannot be directly attributed are apportioned among the funds in the trust.
Distributions to Shareholders. Distributions are recorded on the ex-dividend date. Income dividends and capital gain distributions are declared separately for each class.
Income and capital gain distributions are determined in accordance with income tax regulations which may differ from generally accepted accounting principles. These differences, which may result in distribution reclassifications, are primarily due to differing treatments for foreign currency transactions, passive foreign investment companies (PFIC) and losses deferred due to wash sales.
Permanent book and tax basis differences relating to shareholder distributions will result in reclassifications to paid in capital. Undistributed net investment income and accumulated undistributed net realized gain (loss) on investments and foreign currency transactions may include temporary book and tax basis differences which will reverse in a subsequent period. Any taxable income or gain remaining at fiscal year end is distributed in the following year.
Short-Term Trading (Redemption) Fees. Shares held in the fund less than 60 days are subject to a short-term trading fee equal to 1% of the proceeds of the redeemed shares. The fee, which is retained by the fund, is accounted for as an addition to paid in capital.
Annual Report
Notes to Financial Statements - continued
1. Significant Accounting Policies - continued
Security Transactions. Security transactions are accounted for as of trade date. Gains and losses on securities sold are determined on the basis of identified cost.
2. Operating Policies.
Foreign Currency Contracts. The fund generally uses foreign currency contracts to facilitate transactions in foreign-denominated securities. Losses may arise from changes in the value of the foreign currency or if the counterparties do not perform under the contracts' terms. The U.S. dollar value of foreign currency contracts is determined using contractual currency exchange rates established at the time of each trade.
Joint Trading Account. Pursuant to an Exemptive Order issued by the Securities and Exchange Commission (the SEC), the fund, along with other affiliated entities of Fidelity Management & Research Company (FMR), may transfer uninvested cash balances into one or more joint trading accounts. These balances are invested in one or more repurchase agreements for U.S. Treasury or Federal Agency obligations.
Repurchase Agreements. The underlying U.S. Treasury, Federal Agency, or other obligations found to be satisfactory by FMR are transferred to an account of the fund, or to the Joint Trading Account, at a custodian bank. The securities are marked-to-market daily and maintained at a value at least equal to the principal amount of the repurchase agreement (including accrued interest). FMR, the fund's investment adviser, is responsible for determining that the value of the underlying securities remains in accordance with the market value requirements stated above.
Cash Central Funds. Pursuant to an Exemptive Order issued by the SEC, the fund may invest in the Fidelity Cash Central Fund and the Fidelity Securities Lending Cash Central Fund (the Cash Funds) managed by Fidelity Investments Money Management, Inc., an affiliate of FMR. The Cash Funds are open-end money market funds available only to investment companies and other accounts managed by FMR and its affiliates. The Cash Funds seek preservation of capital, liquidity, and current income. Income distributions from the Cash Funds are declared daily and paid monthly from net interest income. Income distributions earned by the fund are recorded as either interest income or security lending income in the accompanying financial statements.
Restricted Securities. The fund is permitted to invest in securities that are subject to legal or contractual restrictions on resale. These securities generally may be resold in transactions exempt from registration or to the public if the securities are registered. Disposal of these securities may involve time-consuming negotiations and expense, and prompt sale at an acceptable price may be difficult. At the end of the period, the fund had no investments in restricted securities (excluding 144A issues).
3. Purchases and Sales of Investments.
Purchases and sales of securities, other than short-term securities, aggregated $293,093,141 and $347,895,304, respectively.
4. Fees and Other Transactions with Affiliates.
Management Fee. As the fund's investment adviser, FMR receives a monthly fee that is calculated on the basis of a group fee rate plus a fixed individual fund fee rate applied to the average net assets of the fund. The group fee rate is the weighted average of a series of rates and is based on the monthly average net assets of all the mutual funds advised by FMR. The rates ranged from .2167% to .5200% for the period. The annual individual fund fee rate is .30%. In the event that these rates were lower than the contractual rates in effect during the period, FMR voluntarily implemented the above rates, as they resulted in the same or a lower management fee. For the period, the management fee was equivalent to an annual rate of .58% of average net assets.
Distribution and Service Plan. In accordance with Rule 12b-1 of the 1940 Act, the Board of Trustees have adopted separate Distribution and Service Plans with respect to each class of shares (collectively referred to as "the Plans"). Under certain of the Plans, the class pays Fidelity Distributors Corporation (FDC), an affiliate of FMR, a 12b-1 fee. A portion of this fee may be reallowed to securities dealers, banks and other financial institutions for the distribution of each class of shares and providing shareholder support services. For the period, this fee was based on the following annual rates of the average net assets of each applicable class:
|
Class A |
.25% |
|
Class T |
.50% |
|
Class B |
1.00% * |
|
Class C |
1.00% * |
* .75% represents a distribution fee and .25% represents a shareholder service fee.
For the period, each class paid FDC the following amounts, a portion of which was retained by FDC:
|
|
Paid to |
Retained |
|
Class A |
$ 21,034 |
$ 42 |
|
Class T |
1,340,562 |
14,084 |
|
Class B |
492,384 |
369,835 |
|
Class C |
112,539 |
73,329 |
|
|
$ 1,966,519 |
$ 457,290 |
Sales Load. FDC receives a front-end sales charge of up to 5.75% for selling Class A shares, and 3.50% for selling Class T shares of the fund. FDC receives the proceeds of contingent deferred sales charges levied on Class B share redemptions occurring within six years of purchase and Class C share redemptions occurring within one year of purchase. Contingent deferred sales charges are based on declining rates ranging from 5% to 1% for Class B and 1% for Class C, of the lesser of the cost of shares at the initial date of purchase or the net asset value of the redeemed
Natural Resources
Notes to Financial Statements - continued
4. Fees and Other Transactions with Affiliates - continued
Sales Load - continued
shares, excluding any reinvested dividends and capital gains. In addition, purchases of Class A and Class T shares that were subject to a finder's fee bear a contingent deferred sales charge on assets that do not remain in the fund for at least one year. The Class A and Class T contingent deferred sales charge is based on 0.25% of the lesser of the cost of shares at the initial date of purchase or the net asset value of the redeemed shares, excluding any reinvested dividends and capital gains. A portion of the sales charges paid to FDC is paid to securities dealers, banks and other financial institutions.
For the period, sales charge amounts paid to and retained by FDC were as follows:
|
|
Paid to |
Retained |
|
Class A |
$ 55,886 |
$ 24,404 |
|
Class T |
110,147 |
35,031 |
|
Class B |
225,694 |
225,694* |
|
Class C |
11,501 |
11,501* |
|
|
$ 403,228 |
$ 296,630 |
* When Class B and Class C shares are initially sold, FDC pays commissions from its own resources to securities dealers,
banks, and other financial institutions through which the sales are made.
Transfer Agent Fees. Fidelity Investments Institutional Operations Company, Inc., (FIIOC), an affiliate of FMR, is the transfer, dividend disbursing and shareholder servicing agent (collectively referred to as the transfer agent) for each class of the fund. FIIOC receives account fees and asset-based fees that vary according to the account size and type of account of the shareholders of the respective classes of the fund. FIIOC pays for typesetting, printing and mailing of all shareholder reports, except proxy statements. For the period, the following amounts were paid to FIIOC:
|
|
Amount |
% of |
|
Class A |
$ 29,177 |
.35 |
|
Class T |
685,399 |
.26 |
|
Class B |
148,063 |
.30 |
|
Class C |
28,215 |
.25 |
|
Institutional Class |
7,392 |
.20 |
|
|
$ 898,246 |
|
Accounting and Security Lending Fees. Fidelity Service Company, Inc., an affiliate of FMR, maintains the fund's accounting records and administers the security lending program. The security lending fee is based on the number and duration of lending transactions. The accounting fee is based on the level of average net assets for the month plus out-of-pocket expenses.
Brokerage Commissions. The fund placed a portion of its portfolio transactions with brokerage firms which are affiliates of FMR. The commissions paid to these affiliated firms were $31,436 for the period.
5. Security Lending.
The fund lends portfolio securities from time to time in order to earn additional income. The fund receives collateral in the form of U.S. Treasury obligations, letters of credit, and/or cash against the loaned securities, and maintains collateral in an amount not less than 100% of the market value of the loaned securities during the period of the loan. The market value of the loaned securities is determined at the close of business of the fund and any additional required collateral is delivered to the fund on the next business day. If the borrower defaults on its obligation to return the securities loaned because of insolvency or other reasons, the fund could experience delays and costs in recovering the securities loaned or in gaining access to the collateral. At period end, the value of the securities loaned amounted to $23,008,750. The fund received cash collateral of $23,700,000 which was invested in cash equivalents.
6. Expense Reductions.
FMR has directed certain portfolio trades to brokers who paid a portion of the fund's expenses. For the period, the fund's expenses were reduced by $145,755 under this arrangement.
In addition, through an arrangement with the fund's custodian, credits realized as a result of uninvested cash balances were used to reduce a portion of the fund's expenses. During the period, the fund's custodian fees were reduced by $3,126 under this arrangement.
Natural Resources
Notes to Financial Statements - continued
7. Distributions to Shareholders.
Distributions to shareholders of each class were as follows:
|
|
Years ended July 31, |
|
|
|
2000 |
1999 |
|
From net investment income |
|
|
|
Class A |
$ 28,413 |
$ 14,537 |
|
Class T |
118,452 |
148,852 |
|
Class C |
16,896 |
1,336 |
|
Institutional Class |
19,596 |
14,193 |
|
Total |
$ 183,357 |
$ 178,918 |
|
From net realized gain |
|
|
|
Class A |
$ - |
$ 234,044 |
|
Class T |
- |
11,934,513 |
|
Class B |
- |
1,511,499 |
|
Class C |
- |
111,651 |
|
Institutional Class |
- |
144,069 |
|
Total |
$ - |
$ 13,935,776 |
|
|
$ 183,357 |
$ 14,114,694 |
8. Share Transactions.
Transactions for each class of shares were as follows:
|
|
Shares |
Dollars |
||
|
|
Year ended |
Year ended |
Year ended |
Year ended |
|
|
2000 |
1999 |
2000 |
1999 |
|
|
|
|
|
|
|
Class A |
282,058 |
218,537 |
$ 6,719,862 |
$ 4,009,679 |
|
Reinvestment of distributions |
1,260 |
15,021 |
27,004 |
240,787 |
|
Shares redeemed |
(206,971) |
(220,423) |
(4,734,234) |
(4,042,409) |
|
Net increase (decrease) |
76,347 |
13,135 |
$ 2,012,632 |
$ 208,057 |
|
Class T |
2,815,789 |
3,047,055 |
$ 66,391,275 |
$ 55,714,382 |
|
Reinvestment of distributions |
5,078 |
703,210 |
110,192 |
11,405,418 |
|
Shares redeemed |
(5,482,665) |
(8,897,934) |
(125,788,519) |
(157,418,593) |
|
Net increase (decrease) |
(2,661,798) |
(5,147,669) |
$ (59,287,052) |
$ (90,298,793) |
|
Class B |
804,593 |
979,053 |
$ 18,850,697 |
$ 17,717,381 |
|
Reinvestment of distributions |
- |
80,941 |
- |
1,294,263 |
|
Shares redeemed |
(866,266) |
(1,224,137) |
(19,693,340) |
(21,780,799) |
|
Net increase (decrease) |
(61,673) |
(164,143) |
$ (842,643) |
$ (2,769,155) |
|
Class C |
626,062 |
408,624 |
$ 14,528,135 |
$ 7,488,770 |
|
Reinvestment of distributions |
614 |
5,837 |
13,106 |
93,864 |
|
Shares redeemed |
(450,962) |
(171,451) |
(10,086,666) |
(3,264,239) |
|
Net increase (decrease) |
175,714 |
243,010 |
$ 4,454,575 |
$ 4,318,395 |
|
Institutional Class |
90,473 |
107,128 |
$ 2,172,120 |
$ 1,948,930 |
|
Reinvestment of distributions |
553 |
8,746 |
11,997 |
141,597 |
|
Shares redeemed |
(151,219) |
(118,487) |
(3,438,610) |
(2,181,322) |
|
Net increase (decrease) |
(60,193) |
(2,613) |
$ (1,254,493) |
$ (90,795) |
Natural Resources
Notes to Financial Statements - continued
9. Transactions with Affiliated Companies.
An affiliated company is a company in which the fund has ownership of at least 5% of the voting securities. Transactions during the period with companies which are or were affiliates are as follows:
|
Summary of Transactions with Affiliated Companies |
||||||||
|
Affiliate |
|
Purchase |
|
Sales |
|
Dividend |
|
Value |
|
Camphor |
|
$ - |
|
$ 178,630 |
|
$ - |
|
$ - |
Natural Resources
Performance
There are several ways to evaluate historical performance. You can look at the total percentage change in value, the average annual percentage change or the growth of a hypothetical $10,000 investment. Total return reflects the change in the value of an investment, assuming reinvestment of dividend income and capital gains (the profits earned upon the sale of securities that have grown in value). If Fidelity had not reimbursed certain class expenses, the life of fund total returns would have been lower.
Cumulative Total Returns
|
Periods ended July 31, 2000 |
|
Past 1 |
Life of |
|
Fidelity Adv Technology - Inst CL |
|
54.16% |
335.19% |
|
S&P 500 |
|
8.98% |
131.80% |
|
GS Technology |
|
51.95% |
380.37% |
Cumulative total returns show Institutional Class shares' performance in percentage terms over a set period - in this case, one year or since the fund started on September 3, 1996. You can compare Institutional Class shares' returns to the performance of both the Standard & Poor's 500 Index - a market capitalization-weighted index of common stocks - and the Goldman Sachs Technology Index - a market capitalization-weighted index of 221 stocks designed to measure the performance of companies in the technology sector. Issues in the index include producers of sophisticated devices, services and software related to the fields of computers, electronics, networking and Internet services. These benchmarks include reinvested dividends and capital gains, if any, and exclude the effect of sales charges.
Average Annual Total Returns
|
Periods ended July 31, 2000 |
|
Past 1 |
Life of |
|
Fidelity Adv Technology - Inst CL |
|
54.16% |
45.66% |
|
S&P 500 |
|
8.98% |
23.99% |
|
GS Technology |
|
51.95% |
49.39% |
Average annual returns take Institutional Class shares' cumulative return and show you what would have happened if Institutional Class shares had performed at a constant rate each year.
$10,000 Over Life of Fund
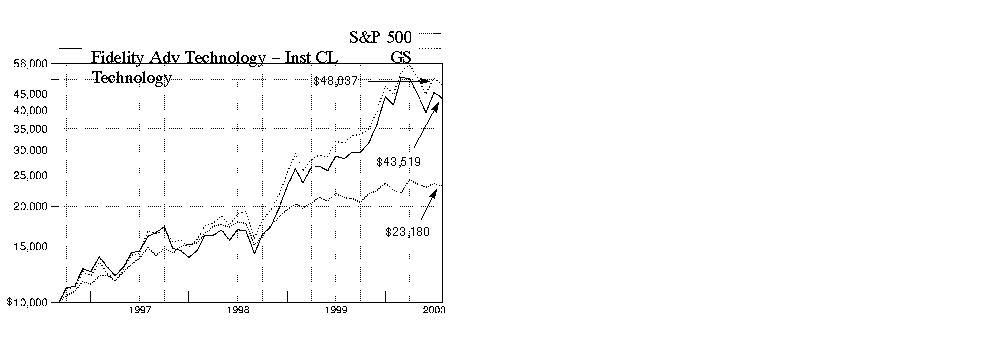
$10,000 Over Life of Fund: Let's say hypothetically that $10,000 was invested in Fidelity Advisor Technology - Institutional Class on September 3, 1996, when the fund started. As the chart shows, by July 31, 2000, the value of the investment would have grown to $43,519 - a 335.19% increase on the initial investment. For comparison, look at how the Standard & Poor's 500 Index did over the same period. With dividends and capital gains, if any, reinvested, the same $10,000 investment would have grown to $23,180 - a 131.80% increase. If $10,000 was invested in the Goldman Sachs Technology Index, it would have grown to $48,037 - a 380.37% increase.
Understanding Performance
How a fund did yesterday is no guarantee of how it will do tomorrow. The stock market, for example, has a history of long-term growth and short-term volatility. Unlike the broader market, however, some sectors may not have a history of growth in the long run. And, as with all stock funds, the share price and return of a fund that invests in a sector will vary.
3Annual Report
(Portfolio Manager photograph)
An interview with
Larry Rakers, Portfolio Manager of Fidelity
Advisor Technology Fund
Q. How did the fund perform, Larry?
A. For the 12 months that ended July 31, 2000, the fund's Class A, Class T, Class B and Class C shares returned 53.76%, 53.41%, 52.57% and 52.60%, respectively. This performance surpassed the 51.95% return of the Goldman Sachs Technology Index - an index of 221 stocks designed to measure the performance of companies in the technology sector - and the Standard & Poor's 500 Index, which returned 8.98%.
A. For the 12 months that ended July 31, 2000, the fund's Institutional Class shares returned 54.16%. This performance surpassed the 51.95% return of the Goldman Sachs Technology Index - an index of 221 stocks designed to measure the performance of companies in the technology sector - and the Standard & Poor's 500 Index, which returned 8.98%.
Q. Why did technology continue to dominate the investment landscape during the 12-month period?
A. The convergence of voice, data and video all onto a single network has opened the doors for a second industrial revolution. Innovations in information technology have reshaped the face of the domestic economy and permanently altered the way business is conducted. Tech-enabled productivity gains have resulted in lower costs for all sectors of the economy, which has put a lid on inflation and helped lift corporate profits. The markets showed their appreciation of this phenomenon and bid up the stocks of those firms expected to lead the revolution. The message resonated clearly in corporate America as well, evidenced by rising tech-related spending as a share of gross domestic product (GDP).
Q. What allowed the fund to outpace its index at this time?
A. The key was our overexposure to those areas involved in the build-out of Internet infrastructure and the resulting formation of a single network - which is central to enabling broadband services. Our biggest victories were from the telecommunications/optical equipment, networking and semiconductor spaces. Having an emphasis on e-commerce software providers, such as BEA Systems, was another infrastructure strategy that paid off. Underweighting computer hardware - namely IBM - was a good choice, as the group faced a Y2K-related slowdown in corporate demand for personal computers and mainframes. Having raised the earnings growth rate of the portfolio after taking over the fund in January, I also was able to improve its risk/return profile, which served us well during the downside volatility of the spring.
Annual Report
Advisor ________ Fund - Class __
Fund Talk: The Manager's Overview - continued
Q. What other factors proved helpful to performance?
A. We were rewarded for making timely cyclical calls on various electronic components, such as capacitors. Within semiconductors, our focus on communications chips was critical to the fund's success, as the market supported our view on this high-growth area. The real winner for us here was Applied Micro Circuits. Data storage and related technology was another important theme for the fund, with names such as Network Appliance, Brocade and Emulex leading the way. Cisco and Juniper - leading makers of networking gear - were significant contributors, thanks to surging demand for routers, the devices that direct traffic over the Internet. More of these electrical devices are now needed to handle increasing amounts of data streaming toward them from higher-capacity fiber-optic lines. JDS Uniphase and Nortel helped us out from the optical space, while Qualcomm and Ericsson offered strong gains on the wireless front. I sold off Ericsson prior to the close of the period. Underweighting Microsoft further aided relative returns, with the software giant slipping on slow adoption of its Windows 2000 operating system, along with its antitrust dispute with the U.S. government.
Q. What moves didn't work out so well?
A. Unfortunately, we were too defensively postured overall in the fourth quarter of 1999, which prevented us from fully participating in the dramatic run-up enjoyed by many stocks in the sector during this time period. Clearly, the fund's underweighting in top dogs Sun Microsystems, Intel, Oracle and Applied Materials was a mistake, as was taking on a handful of problem stocks such as Electronics for Imaging, Motorola, Citrix and DoubleClick. Lucent was by far the fund's largest absolute detractor, although our underexposure to the stock actually boosted relative performance.
Q. What's your outlook?
A. I feel that demand will accelerate behind a continued rise in productivity, with spending in the sector representing an increasing share of GDP. I'm optimistic because tech stocks tend to perform well in this type of environment. It's up for debate as to where we are exactly in the productivity cycle, but if I were to guess, I'd say we're still in the early innings. With that said, I plan to remain fully invested and continue to look for the highest-growth companies at the best prices I can get for shareholders.
The views expressed in this report reflect those of the portfolio manager only through the end of the period of the report as stated on the cover. The manager's views are subject to change at any time based on market or other conditions. For more information, see page A-3.
Fund Facts
Start date: September 3, 1996
Size: as of July 31, 2000, more than
$3.5 billion
Manager: Larry Rakers, since January 2000; joined Fidelity in 1993
3Technology
Advisor Technology Fund
|
Top Ten Stocks as of July 31, 2000 |
|
|
|
% of fund's |
|
Cisco Systems, Inc. |
9.4 |
|
Nortel Networks Corp. |
8.0 |
|
Intel Corp. |
6.8 |
|
SDL, Inc. |
5.5 |
|
EMC Corp. |
3.6 |
|
Oracle Corp. |
2.8 |
|
Sun Microsystems, Inc. |
2.6 |
|
Hewlett-Packard Co. |
2.3 |
|
Dell Computer Corp. |
2.3 |
|
Texas Instruments, Inc. |
1.8 |
|
|
45.1 |
|
Top Industries as of July 31, 2000 |
|
|
% of fund's net assets |
||
|
Electronics |
25.4% |
|
Communications Equipment |
24.0% |
|
Computer Services & Software |
19.1% |
|
Computers & Office Equipment |
18.9% |
|
Electronic Instruments |
1.4% |
|
All Others* |
11.2% |
|
* Includes short-term investments and net other assets. |
Annual Report
Advisor Technology Fund
Showing Percentage of Net Assets
|
Common Stocks - 93.1% |
|||
|
Shares |
Value (Note 1) |
||
|
ADVERTISING - 0.7% |
|||
|
DoubleClick, Inc. (a) |
684,300 |
$ 24,592,031 |
|
|
LifeMinders, Inc. |
76,400 |
1,719,000 |
|
|
|
26,311,031 |
||
|
BROADCASTING - 0.2% |
|||
|
American Tower Corp. Class A (a) |
108,500 |
4,651,938 |
|
|
Wireless Facilities, Inc. |
55,600 |
3,537,550 |
|
|
|
8,189,488 |
||
|
CELLULAR - 1.0% |
|||
|
Crown Castle International Corp. (a) |
105,000 |
3,570,000 |
|
|
LCC International, Inc. (a) |
10,000 |
205,000 |
|
|
QUALCOMM, Inc. (a) |
494,000 |
32,079,125 |
|
|
|
35,854,125 |
||
|
COMMUNICATIONS EQUIPMENT - 24.0% |
|||
|
ADC Telecommunications, Inc. (a) |
450,000 |
18,871,875 |
|
|
Andrew Corp. (a) |
55,000 |
1,550,313 |
|
|
Ciena Corp. (a) |
310,100 |
44,072,963 |
|
|
Cisco Systems, Inc. (a) |
5,157,300 |
337,480,805 |
|
|
Comverse Technology, Inc. (a) |
102,400 |
8,985,600 |
|
|
Corning, Inc. |
275,000 |
64,332,813 |
|
|
Corvis Corp. |
55,000 |
4,528,047 |
|
|
Ditech Communications Corp. |
258,800 |
12,390,050 |
|
|
Jabil Circuit, Inc. (a) |
346,700 |
17,356,669 |
|
|
Lucent Technologies, Inc. |
1,431,538 |
62,629,788 |
|
|
Nortel Networks Corp. |
3,872,640 |
288,027,600 |
|
|
|
860,226,523 |
||
|
COMPUTER SERVICES & SOFTWARE - 19.1% |
|||
|
Adobe Systems, Inc. |
98,400 |
11,266,800 |
|
|
Aether Systems, Inc. |
164,400 |
27,362,325 |
|
|
Affiliated Computer Services, Inc. |
54,800 |
2,469,425 |
|
|
America Online, Inc. (a) |
359,400 |
19,160,513 |
|
|
Ariba, Inc. |
68,000 |
7,883,750 |
|
|
Art Technology Group, Inc. |
340,000 |
29,580,000 |
|
|
BEA Systems, Inc. (a) |
706,600 |
30,427,963 |
|
|
Blue Martini Software, Inc. (a) |
3,100 |
184,256 |
|
|
BroadVision, Inc. (a) |
200,000 |
7,237,500 |
|
|
Cadence Design Systems, Inc. (a) |
300,000 |
6,262,500 |
|
|
Cambridge Technology Partners, Inc. (a) |
284,700 |
2,677,959 |
|
|
Ceridian Corp. (a) |
381,000 |
8,667,750 |
|
|
Citrix Systems, Inc. (a) |
406,000 |
6,191,500 |
|
|
CNET Networks, Inc. (a) |
133,700 |
4,002,644 |
|
|
Commerce One, Inc. |
42,000 |
1,766,625 |
|
|
Computer Sciences Corp. (a) |
29,100 |
1,818,750 |
|
|
Cysive, Inc. |
70,800 |
1,699,200 |
|
|
Data Return Corp. |
61,600 |
1,578,500 |
|
|
Digital Insight Corp. |
184,000 |
5,761,500 |
|
|
|
|||
|
Shares |
Value (Note 1) |
||
|
DST Systems, Inc. (a) |
39,900 |
$ 3,725,663 |
|
|
Electronic Data Systems Corp. |
53,100 |
2,283,300 |
|
|
Electronics for Imaging, Inc. (a) |
142,600 |
3,110,463 |
|
|
Exodus Communications, Inc. (a) |
400,800 |
17,810,550 |
|
|
Great Plains Software, Inc. (a) |
100,000 |
2,337,500 |
|
|
i2 Technologies, Inc. (a) |
121,700 |
15,790,575 |
|
|
Information Architects Corp. (a) |
250,000 |
1,593,750 |
|
|
InfoSpace.com, Inc. (a) |
264,200 |
8,916,750 |
|
|
Infovista SA sponsored ADR (a) |
113,500 |
2,724,000 |
|
|
Inktomi Corp. (a) |
31,400 |
3,359,800 |
|
|
Intertrust Technologies Corp. |
40,000 |
582,500 |
|
|
Kana Communications, Inc. |
96,042 |
3,529,544 |
|
|
Keynote Systems, Inc. |
25,000 |
948,438 |
|
|
Lante Corp. |
99,300 |
1,880,494 |
|
|
Legato Systems, Inc. (a) |
136,900 |
1,330,497 |
|
|
Mercury Interactive Corp. (a) |
55,000 |
5,459,609 |
|
|
Micromuse, Inc. (a) |
277,700 |
36,027,236 |
|
|
Microsoft Corp. (a) |
852,400 |
59,508,175 |
|
|
National Data Corp. |
15,000 |
412,500 |
|
|
Numerical Technologies, Inc. |
35,100 |
1,636,538 |
|
|
Oracle Corp. (a) |
1,322,000 |
99,397,875 |
|
|
Orbotech Ltd. |
25,000 |
2,059,375 |
|
|
Phone.com, Inc. |
444,800 |
35,528,400 |
|
|
Priceline.com, Inc. (a) |
186,000 |
4,394,250 |
|
|
Proxicom, Inc. (a) |
200,000 |
8,262,500 |
|
|
Puma Technology, Inc. (a) |
65,000 |
1,300,000 |
|
|
Rational Software Corp. (a) |
68,000 |
6,919,000 |
|
|
Razorfish, Inc. Class A (a) |
285,000 |
5,165,625 |
|
|
Redback Networks, Inc. (a) |
81,800 |
10,634,000 |
|
|
Scient Corp. (a) |
88,500 |
4,126,313 |
|
|
Siebel Systems, Inc. (a) |
87,600 |
12,702,000 |
|
|
SilverStream Software, Inc. |
175,000 |
6,671,875 |
|
|
Software.com, Inc. |
215,000 |
21,688,125 |
|
|
Support.com, Inc. |
2,400 |
81,900 |
|
|
Synopsys, Inc. (a) |
36,400 |
1,185,275 |
|
|
Technology Solutions, Inc. |
750,000 |
3,750,000 |
|
|
Tumbleweed Communications Corp. |
224,700 |
10,111,500 |
|
|
Unigraphics Solutions, Inc. Class A (a) |
2,100 |
32,681 |
|
|
Unisys Corp. (a) |
293,500 |
2,879,969 |
|
|
VeriSign, Inc. (a) |
163,300 |
25,913,669 |
|
|
VERITAS Software Corp. (a) |
218,875 |
22,311,570 |
|
|
Viant Corp. |
302,400 |
9,979,200 |
|
|
Vignette Corp. (a) |
506,500 |
17,157,688 |
|
|
Yahoo!, Inc. (a) |
192,200 |
24,733,738 |
|
|
|
685,953,870 |
||
|
COMPUTERS & OFFICE EQUIPMENT - 18.9% |
|||
|
Advanced Digital Information Corp. (a) |
218,800 |
3,063,201 |
|
|
Apple Computer, Inc. (a) |
296,400 |
15,060,825 |
|
|
Brocade Communications |
243,000 |
43,405,875 |
|
|
Compaq Computer Corp. |
808,300 |
22,682,919 |
|
|
Dell Computer Corp. (a) |
1,850,400 |
81,301,950 |
|
|
Common Stocks - continued |
|||
|
Shares |
Value (Note 1) |
||
|
COMPUTERS & OFFICE EQUIPMENT - CONTINUED |
|||
|
EMC Corp. (a) |
1,533,200 |
$ 130,513,650 |
|
|
Emulex Corp. (a) |
154,800 |
7,740,000 |
|
|
Extended Systems, Inc. (a) |
52,000 |
3,298,750 |
|
|
Extreme Networks, Inc. (a) |
35,000 |
4,887,422 |
|
|
Finisar Corp. |
145,900 |
3,875,469 |
|
|
Gateway, Inc. (a) |
314,800 |
17,373,025 |
|
|
Hewlett-Packard Co. |
765,800 |
83,615,788 |
|
|
International Business Machines Corp. |
405,600 |
45,604,650 |
|
|
Juniper Networks, Inc. (a) |
140,000 |
19,941,250 |
|
|
Lexmark International Group, Inc. |
335,600 |
15,122,975 |
|
|
MMC Networks, Inc. (a) |
181,500 |
8,972,906 |
|
|
MRV Communications, Inc. (a) |
100,000 |
5,787,500 |
|
|
Network Appliance, Inc. (a) |
527,200 |
45,438,050 |
|
|
Oak Technology, Inc. (a) |
125,000 |
2,875,000 |
|
|
SanDisk Corp. (a) |
17,900 |
1,141,125 |
|
|
SCI Systems, Inc. (a) |
116,800 |
5,358,200 |
|
|
Seagate Technology, Inc. (a) |
250,000 |
12,671,875 |
|
|
Sun Microsystems, Inc. (a) |
895,000 |
94,366,563 |
|
|
Symbol Technologies, Inc. |
38,500 |
1,535,188 |
|
|
|
675,634,156 |
||
|
ELECTRICAL EQUIPMENT - 1.3% |
|||
|
Alcatel SA sponsored ADR |
461,250 |
33,728,906 |
|
|
American Power Conversion Corp. (a) |
85,300 |
2,169,819 |
|
|
Cymer, Inc. (a) |
30,000 |
1,361,250 |
|
|
Pinnacle Systems (a) |
270,200 |
2,068,719 |
|
|
Scientific-Atlanta, Inc. |
92,000 |
7,084,000 |
|
|
|
46,412,694 |
||
|
ELECTRONIC INSTRUMENTS - 1.4% |
|||
|
Agilent Technologies, Inc. |
230,056 |
9,374,782 |
|
|
Applied Materials, Inc. (a) |
21,400 |
1,623,725 |
|
|
Cohu, Inc. |
100,000 |
1,768,750 |
|
|
Credence Systems Corp. (a) |
156,900 |
6,707,475 |
|
|
KLA-Tencor Corp. (a) |
257,000 |
13,685,250 |
|
|
LAM Research Corp. (a) |
132,500 |
3,875,625 |
|
|
LTX Corp. (a) |
114,900 |
2,527,800 |
|
|
PerkinElmer, Inc. |
30,000 |
1,918,125 |
|
|
Teradyne, Inc. (a) |
162,000 |
10,266,750 |
|
|
|
51,748,282 |
||
|
ELECTRONICS - 25.4% |
|||
|
Advanced Energy Industries, Inc. (a) |
94,200 |
4,239,000 |
|
|
Advanced Micro Devices, Inc. (a) |
83,900 |
6,035,556 |
|
|
Altera Corp. (a) |
98,900 |
9,710,744 |
|
|
Amkor Technology, Inc. (a) |
40,000 |
1,100,000 |
|
|
Analog Devices, Inc. (a) |
344,400 |
23,031,750 |
|
|
|
|||
|
Shares |
Value (Note 1) |
||
|
Applied Micro Circuits Corp. (a) |
79,000 |
$ 11,790,750 |
|
|
Atmel Corp. (a) |
55,400 |
1,658,538 |
|
|
Broadcom Corp. Class A (a) |
165,900 |
37,203,075 |
|
|
Chartered Semiconductor Manufacturing Ltd. ADR |
88,600 |
6,379,200 |
|
|
Cree, Inc. (a) |
178,700 |
20,092,581 |
|
|
Dallas Semiconductor Corp. |
47,000 |
1,968,125 |
|
|
Flextronics International Ltd. (a) |
125,400 |
8,877,928 |
|
|
General Semiconductor, Inc. (a) |
257,800 |
3,867,000 |
|
|
GlobeSpan, Inc. |
232,900 |
26,303,144 |
|
|
Infineon Technologies AG |
200 |
13,600 |
|
|
Intel Corp. |
3,641,000 |
243,036,750 |
|
|
International Rectifier Corp. (a) |
128,800 |
7,124,250 |
|
|
JDS Uniphase Corp. (a) |
125,800 |
14,860,125 |
|
|
Linear Technology Corp. |
166,300 |
9,188,075 |
|
|
LSI Logic Corp. (a) |
445,800 |
15,101,475 |
|
|
Marvell Technology Group Ltd. |
177,800 |
8,123,238 |
|
|
Maxim Integrated Products, Inc. (a) |
145,800 |
9,631,913 |
|
|
Micrel, Inc. (a) |
94,000 |
4,705,875 |
|
|
Microchip Technology, Inc. (a) |
37,600 |
2,610,850 |
|
|
Micron Technology, Inc. (a) |
610,400 |
49,747,600 |
|
|
Motorola, Inc. |
240 |
7,935 |
|
|
National Semiconductor Corp. (a) |
3,800 |
137,513 |
|
|
NVIDIA Corp. (a) |
103,800 |
6,228,000 |
|
|
Plexus Corp. (a) |
800 |
90,250 |
|
|
PMC-Sierra, Inc. (a) |
272,200 |
52,755,763 |
|
|
Power-One, Inc. (a) |
40,000 |
4,722,500 |
|
|
QLogic Corp. (a) |
18,400 |
1,370,800 |
|
|
RF Micro Devices, Inc. (a) |
25,000 |
1,884,375 |
|
|
Samsung Electronics Co. Ltd. |
600 |
158,496 |
|
|
Sanmina Corp. (a) |
121,900 |
11,321,463 |
|
|
SDL, Inc. (a) |
570,100 |
197,860,331 |
|
|
Solectron Corp. (a) |
133,400 |
5,377,688 |
|
|
STMicroelectronics NV (NY Shares) |
134,600 |
7,663,788 |
|
|
Texas Instruments, Inc. |
1,119,500 |
65,700,656 |
|
|
TyCom Ltd. |
33,200 |
1,130,875 |
|
|
Vitesse Semiconductor Corp. (a) |
222,000 |
13,236,750 |
|
|
Xilinx, Inc. (a) |
164,460 |
12,344,779 |
|
|
|
908,393,104 |
||
|
INDUSTRIAL MACHINERY & EQUIPMENT - 0.6% |
|||
|
ASM Lithography Holding NV (a) |
270,000 |
10,732,500 |
|
|
Asyst Technologies, Inc. (a) |
75,000 |
1,809,375 |
|
|
Mattson Technology, Inc. (a) |
140,000 |
2,616,250 |
|
|
PRI Automation, Inc. (a) |
38,800 |
1,770,250 |
|
|
Varian Semiconductor Equipment Associates, Inc. (a) |
58,000 |
2,816,625 |
|
|
|
19,745,000 |
||
|
SERVICES - 0.5% |
|||
|
Diamond Technology Partners, Inc. |
101,500 |
9,039,844 |
|
|
Common Stocks - continued |
|||
|
Shares |
Value (Note 1) |
||
|
SERVICES - CONTINUED |
|||
|
Digitas, Inc. |
89,400 |
$ 2,022,675 |
|
|
eLoyalty Corp. |
125,000 |
1,855,469 |
|
|
Media Metrix, Inc. (a) |
170,000 |
4,420,000 |
|
|
Per-Se Technologies, Inc. |
91 |
0 |
|
|
|
17,337,988 |
||
|
TELEPHONE SERVICES - 0.0% |
|||
|
TeraBeam Networks (c) |
10,800 |
40,500 |
|
|
TOTAL COMMON STOCKS (Cost $2,834,073,664) |
3,335,846,761 |
||
|
Cash Equivalents - 10.2% |
|||
|
Maturity Amount |
|
||
|
Investments in repurchase agreements (U.S. Treasury Obligations), in a joint trading account at 6.45%, dated 7/31/00 due 8/1/00 |
$ 4,027,722 |
4,027,000 |
|
|
Shares |
|
||
|
Fidelity Cash Central Fund, |
264,767,287 |
264,767,287 |
|
|
Fidelity Securities Lending Cash |
97,659,109 |
97,659,109 |
|
|
TOTAL CASH EQUIVALENTS (Cost $366,453,396) |
366,453,396 |
||
|
TOTAL INVESTMENT PORTFOLIO - 103.3% (Cost $3,200,527,060) |
3,702,300,157 |
|
|
NET OTHER ASSETS - (3.3)% |
(118,225,878) |
|
|
NET ASSETS - 100% |
$ 3,584,074,279 |
|
|
Legend |
|
(a) Non-income producing |
|
(b) The rate quoted is the annualized seven-day yield of the fund at |
|
(c) Restricted securities - Investment in securities not registered under the Securities Act of 1933. |
|
Additional information on each holding is as follows: |
|
Security |
Acquisition Date |
Acquisition Cost |
|
TeraBeam Networks |
4/7/00 |
$ 40,500 |
|
Other Information |
|
The fund invested in securities that are not registered under the Securities Act of 1933. These securities are subject to legal or contractual restrictions on resale. At the end of the period, restricted securities (excluding Rule 144A issues) amounted to $40,500 or 0.0% of net assets. |
|
Distribution of investments by country of issue, as a percentage of total |
|
United States of America |
89.7% |
|
Canada |
8.0 |
|
France |
1.0 |
|
Others (individually less than 1%) |
1.3 |
|
|
100.0% |
|
Income Tax Information |
|
At July 31, 2000, the aggregate cost of investment securities for income tax purposes was $3,221,424,728. Net unrealized appreciation aggregated $480,875,429, of which $790,884,529 related to appreciated investment securities and $310,009,100 related to depreciated investment securities. |
|
The fund hereby designates approximately $19,613,000 as a capital gain dividend for the purpose of the dividend paid deduction. |
|
A total of 1%, 1%, 2%, 2% and 1% of Class A's, Class T's, Class B's, Class C's and Institutional Class' dividends distributed during the fiscal year qualifies for the dividend-received deductions for corporate shareholders (unaudited). |
|
The fund will notify shareholders in January 2001 of the applicable percentages for use in preparing 2000 income tax returns. |
See accompanying notes which are an integral part of the financial statements.
Technology
Statement of Assets and Liabilities
|
|
July 31, 2000 |
|
|
Assets |
|
|
|
Investment in securities, at value (including repurchase agreements of $4,027,000) (cost $3,200,527,060) - |
|
$ 3,702,300,157 |
|
Cash |
|
859 |
|
Receivable for investments sold |
|
64,845,108 |
|
Receivable for fund shares sold |
|
10,125,072 |
|
Dividends receivable |
|
65,339 |
|
Interest receivable |
|
1,394,478 |
|
Redemption fees receivable |
|
3,128 |
|
Other receivables |
|
74,504 |
|
Total assets |
|
3,778,808,645 |
|
Liabilities |
|
|
|
Payable for investments purchased |
$ 85,879,552 |
|
|
Payable for fund shares redeemed |
5,711,660 |
|
|
Accrued management fee |
1,809,482 |
|
|
Distribution fees payable |
2,272,122 |
|
|
Other payables and |
1,402,441 |
|
|
Collateral on securities loaned, |
97,659,109 |
|
|
Total liabilities |
|
194,734,366 |
|
Net Assets |
|
$ 3,584,074,279 |
|
Net Assets consist of: |
|
|
|
Paid in capital |
|
$ 2,940,445,126 |
|
Accumulated undistributed |
|
141,856,056 |
|
Net unrealized appreciation (depreciation) on investments |
|
501,773,097 |
|
Net Assets |
|
$ 3,584,074,279 |
|
Calculation of Maximum |
|
$36.23 |
|
Maximum offering price per |
|
$38.44 |
|
Class T: |
|
$35.95 |
|
Maximum offering price per share (100/96.50 of $35.95) |
|
$37.25 |
|
Class B: |
|
$35.33 |
|
Class C: |
|
$35.39 |
|
Institutional Class: |
|
$36.43 |
A Redemption price per share is equal to net asset value less any applicable contingent deferred sales charge.
Statement of Operations
|
|
Year ended July 31, 2000 |
|
|
Investment Income Dividends |
|
$ 2,260,119 |
|
Interest |
|
11,660,827 |
|
Security lending |
|
753,691 |
|
Total income |
|
14,674,637 |
|
Expenses |
|
|
|
Management fee |
$ 14,021,602 |
|
|
Transfer agent fees |
6,145,435 |
|
|
Distribution fees |
17,313,403 |
|
|
Accounting and security lending fees |
519,867 |
|
|
Non-interested trustees' compensation |
6,785 |
|
|
Custodian fees and expenses |
83,078 |
|
|
Registration fees |
925,628 |
|
|
Audit |
29,306 |
|
|
Legal |
10,202 |
|
|
Miscellaneous |
20,308 |
|
|
Total expenses before reductions |
39,075,614 |
|
|
Expense reductions |
(169,344) |
38,906,270 |
|
Net investment income (loss) |
|
(24,231,633) |
|
Realized and Unrealized Gain (Loss) Net realized gain (loss) on: |
|
|
|
Investment securities |
186,239,307 |
|
|
Foreign currency transactions |
(530) |
186,238,777 |
|
Change in net unrealized appreciation (depreciation) |
|
380,785,475 |
|
Net gain (loss) |
|
567,024,252 |
|
Net increase (decrease) in net assets resulting from operations |
|
$ 542,792,619 |
See accompanying notes which are an integral part of the financial statements.
Annual Report
Advisor Technology Fund
Financial Statements - continued
Statement of Changes in Net Assets
|
Increase (Decrease) in Net Assets |
Year ended |
Year ended |
|
Operations |
$ (24,231,633) |
$ (3,282,503) |
|
Net realized gain (loss) |
186,238,777 |
51,119,572 |
|
Change in net unrealized appreciation (depreciation) |
380,785,475 |
107,259,307 |
|
Net increase (decrease) in net assets resulting from operations |
542,792,619 |
155,096,376 |
|
Distributions to shareholders from net realized gain |
(61,167,152) |
- |
|
Share transactions - net increase (decrease) |
2,237,686,987 |
557,638,871 |
|
Redemption fees |
998,385 |
259,288 |
|
Total increase (decrease) in net assets |
2,720,310,839 |
712,994,535 |
|
Net Assets |
|
|
|
Beginning of period |
863,763,440 |
150,768,905 |
|
End of period |
$ 3,584,074,279 |
$ 863,763,440 |
Financial Highlights - Class A
|
Years ended July 31, |
2000 |
1999 |
1998 |
1997 E |
|
Selected Per-Share Data |
|
|
|
|
|
Net asset value, beginning of period |
$ 24.95 |
$ 14.88 |
$ 15.96 |
$ 10.00 |
|
Income from Investment Operations |
|
|
|
|
|
Net investment income (loss) D |
(.19) |
(.09) |
(.08) |
(.10) |
|
Net realized and unrealized gain (loss) |
13.04 |
10.15 |
.58 |
6.13 |
|
Total from investment operations |
12.85 |
10.06 |
.50 |
6.03 |
|
Less Distributions |
|
|
|
|
|
From net realized gain |
(1.58) |
- |
(1.14) |
(.08) |
|
In excess of net realized gain |
- |
- |
(.45) |
- |
|
Total distributions |
(1.58) |
- |
(1.59) |
(.08) |
|
Redemption fees added to paid in capital |
.01 |
.01 |
.01 |
.01 |
|
Net asset value, end of period |
$ 36.23 |
$ 24.95 |
$ 14.88 |
$ 15.96 |
|
Total Return B, C |
53.76% |
67.67% |
4.20% |
60.62% |
|
Ratios and Supplemental Data |
|
|
|
|
|
Net assets, end of period (000 omitted) |
$ 388,756 |
$ 94,621 |
$ 15,414 |
$ 7,313 |
|
Ratio of expenses to average net assets |
1.16% |
1.25% |
1.39% |
1.75% A, F |
|
Ratio of expenses to average net assets after expense reductions |
1.15% G |
1.24% G |
1.35% G |
1.70% A, G |
|
Ratio of net investment income (loss) to average net assets |
(.55)% |
(.44)% |
(.59)% |
(.79)% A |
|
Portfolio turnover |
125% |
170% |
348% |
517% A |
|
A Annualized B The total returns would have been lower had certain expenses not been reduced during the periods shown. C Total returns do not include the one time sales charge and for periods of less than one year are not annualized. D Net investment income (loss) per share has been calculated based on average shares outstanding during the period. E For the period September 3, 1996 (commencement of sale of Class A shares) to July 31, 1997. F FMR agreed to reimburse a portion of the class' expenses during the period. Without this reimbursement, the class' expense ratio would have been higher. G FMR or the fund has entered into varying arrangements with third parties who either paid or reduced a portion of the class' expenses. |
||||
See accompanying notes which are an integral part of the financial statements.
Technology
Financial Highlights - Class T
|
Years ended July 31, |
2000 |
1999 |
1998 |
1997 E |
|
Selected Per-Share Data |
|
|
|
|
|
Net asset value, beginning of period |
$ 24.76 |
$ 14.80 |
$ 15.91 |
$ 10.00 |
|
Income from Investment Operations |
|
|
|
|
|
Net investment income (loss) D |
(.27) |
(.14) |
(.11) |
(.11) |
|
Net realized and unrealized gain (loss) |
12.96 |
10.09 |
.56 |
6.09 |
|
Total from investment operations |
12.69 |
9.95 |
.45 |
5.98 |
|
Less Distributions |
|
|
|
|
|
From net realized gain |
(1.51) |
- |
(1.12) |
(.08) |
|
In excess of net realized gain |
- |
- |
(.45) |
- |
|
Total distributions |
(1.51) |
- |
(1.57) |
(.08) |
|
Redemption fees added to paid in capital |
.01 |
.01 |
.01 |
.01 |
|
Net asset value, end of period |
$ 35.95 |
$ 24.76 |
$ 14.80 |
$ 15.91 |
|
Total Return B, C |
53.41% |
67.30% |
3.85% |
60.12% |
|
Ratios and Supplemental Data |
|
|
|
|
|
Net assets, end of period (000 omitted) |
$ 1,286,376 |
$ 349,533 |
$ 90,499 |
$ 57,624 |
|
Ratio of expenses to average net assets |
1.38% |
1.47% |
1.60% |
1.92% A |
|
Ratio of expenses to average net assets after expense reductions |
1.37% F |
1.46% F |
1.56% F |
1.87% A, F |
|
Ratio of net investment income (loss) to average net assets |
(.77)% |
(.65)% |
(.80)% |
(.93)% A |
|
Portfolio turnover |
125% |
170% |
348% |
517% A |
|
A Annualized B The total returns would have been lower had certain expenses not been reduced during the periods shown. C Total returns do not include the one time sales charge and for periods of less than one year are not annualized. D Net investment income (loss) per share has been calculated based on average shares outstanding during the period. E For the period September 3, 1996 (commencement of sale of Class T shares) to July 31, 1997. F FMR or the fund has entered into varying arrangements with third parties who either paid or reduced a portion of the class' expenses. |
||||
Financial Highlights - Class B
|
Years ended July 31, |
2000 |
1999 |
1998 |
1997 E |
|
Selected Per-Share Data |
|
|
|
|
|
Net asset value, beginning of period |
$ 24.44 |
$ 14.68 |
$ 15.88 |
$ 12.88 |
|
Income from Investment Operations |
|
|
|
|
|
Net investment income (loss) D |
(.45) |
(.26) |
(.20) |
(.08) |
|
Net realized and unrealized gain (loss) |
12.78 |
10.01 |
.57 |
3.08 |
|
Total from investment operations |
12.33 |
9.75 |
.37 |
3.00 |
|
Less Distributions |
|
|
|
|
|
From net realized gain |
(1.45) |
- |
(1.13) |
- |
|
In excess of net realized gain |
- |
- |
(.45) |
- |
|
Total distributions |
(1.45) |
- |
(1.58) |
- |
|
Redemption fees added to paid in capital |
.01 |
.01 |
.01 |
- |
|
Net asset value, end of period |
$ 35.33 |
$ 24.44 |
$ 14.68 |
$ 15.88 |
|
Total Return B, C |
52.57% |
66.49% |
3.27% |
23.29% |
|
Ratios and Supplemental Data |
|
|
|
|
|
Net assets, end of period (000 omitted) |
$ 1,372,523 |
$ 298,768 |
$ 31,041 |
$ 5,105 |
|
Ratio of expenses to average net assets |
1.91% |
2.01% |
2.21% |
2.50% A, F |
|
Ratio of expenses to average net assets after expense reductions |
1.91% |
2.00% G |
2.18% G |
2.45% A, G |
|
Ratio of net investment income (loss) to average net assets |
(1.30)% |
(1.19)% |
(1.40)% |
(1.41)% A |
|
Portfolio turnover |
125% |
170% |
348% |
517% A |
|
A Annualized B The total returns would have been lower had certain expenses not been reduced during the periods shown. C Total returns do not include the contingent deferred sales charge and for periods of less than one year are not annualized. D Net investment income (loss) per share has been calculated based on average shares outstanding during the period. E For the period March 3, 1997 (commencement of sale of Class B shares) to July 31, 1997. F FMR agreed to reimburse a portion of the class' expenses during the period. Without this reimbursement, the class' expense ratio would have been higher. G FMR or the fund has entered into varying arrangements with third parties who either paid or reduced a portion of the class' expenses. |
||||
See accompanying notes which are an integral part of the financial statements.
Annual Report
Financial Highlights - Class C
|
Years ended July 31, |
2000 |
1999 |
1998 E |
|
Selected Per-Share Data |
|
|
|
|
Net asset value, beginning of period |
$ 24.49 |
$ 14.70 |
$ 14.28 |
|
Income from Investment Operations |
|
|
|
|
Net investment income (loss) D |
(.44) |
(.25) |
(.17) |
|
Net realized and unrealized gain (loss) |
12.80 |
10.03 |
1.27 |
|
Total from investment operations |
12.36 |
9.78 |
1.10 |
|
Less Distributions |
|
|
|
|
From net realized gain |
(1.47) |
- |
(.49) |
|
In excess of net realized gain |
- |
- |
(.20) |
|
Total distributions |
(1.47) |
- |
(.69) |
|
Redemption fees added to paid in capital |
.01 |
.01 |
.01 |
|
Net asset value, end of period |
$ 35.39 |
$ 24.49 |
$ 14.70 |
|
Total Return B, C |
52.60% |
66.60% |
8.96% |
|
Ratios and Supplemental Data |
|
|
|
|
Net assets, end of period (000 omitted) |
$ 472,462 |
$ 88,120 |
$ 6,754 |
|
Ratio of expenses to average net assets |
1.89% |
1.97% |
2.43% A |
|
Ratio of expenses to average net assets after expense reductions |
1.89% |
1.96% F |
2.41% A, F |
|
Ratio of net investment income (loss) to average net assets |
(1.28)% |
(1.16)% |
(1.64)% A |
|
Portfolio turnover |
125% |
170% |
348% |
|
A Annualized B The total returns would have been lower had certain expenses not been reduced during the periods shown. C Total returns do not include the contingent deferred sales charge and for periods of less than one year are not annualized. D Net investment income (loss) per share has been calculated based on average shares outstanding during the period. E For the period November 3, 1997 (commencement of sale of Class C shares) to July 31, 1998. F FMR or the fund has entered into varying arrangements with third parties who either paid or reduced a portion of the class' expenses. |
|||
Financial Highlights - Institutional Class
|
Years ended July 31, |
2000 |
1999 |
1998 |
1997 E |
|
Selected Per-Share Data |
|
|
|
|
|
Net asset value, beginning of period |
$ 25.05 |
$ 14.89 |
$ 15.98 |
$ 10.00 |
|
Income from Investment Operations |
|
|
|
|
|
Net investment income (loss) D |
(.09) |
(.04) |
(.04) |
(.06) |
|
Net realized and unrealized gain (loss) |
13.08 |
10.19 |
.55 |
6.12 |
|
Total from investment operations |
12.99 |
10.15 |
.51 |
6.06 |
|
Less Distributions |
|
|
|
|
|
From net realized gain |
(1.62) |
- |
(1.15) |
(.09) |
|
In excess of net realized gain |
- |
- |
(.46) |
- |
|
Total distributions |
(1.62) |
- |
(1.61) |
(.09) |
|
Redemption fees added to paid in capital |
.01 |
.01 |
.01 |
.01 |
|
Net asset value, end of period |
$ 36.43 |
$ 25.05 |
$ 14.89 |
$ 15.98 |
|
Total Return B, C |
54.16% |
68.23% |
4.26% |
60.95% |
|
Ratios and Supplemental Data |
|
|
|
|
|
Net assets, end of period (000 omitted) |
$ 63,957 |
$ 32,722 |
$ 7,060 |
$ 3,598 |
|
Ratio of expenses to average net assets |
.87% |
.98% |
1.10% |
1.50% A, F |
|
Ratio of expenses to average net assets after expense reductions |
.87% |
.97% G |
1.07% G |
1.44% A, G |
|
Ratio of net investment income (loss) to average net assets |
(.26)% |
(.17)% |
(.30)% |
(.50)% A |
|
Portfolio turnover |
125% |
170% |
348% |
517% A |
|
A Annualized B The total returns would have been lower had certain expenses not been reduced during the periods shown. C Total returns for periods of less than one year are not annualized. D Net investment income (loss) per share has been calculated based on average shares outstanding during the period. E For the period September 3, 1996 (commencement of sale of Institutional Class shares) to July 31, 1997. F FMR agreed to reimburse a portion of the class' expenses during the period. Without this reimbursement, the class' expense ratio would have been higher. G FMR or the fund has entered into varying arrangements with third parties who either paid or reduced a portion of the class' expenses. |
||||
See accompanying notes which are an integral part of the financial statements.
Technology
For the period ended July 31, 2000
1. Significant Accounting Policies.
Fidelity Advisor Technology Fund (the fund) is a fund of Fidelity Advisor Series VII (the trust) and is authorized to issue an unlimited number of shares. The trust is registered under the Investment Company Act of 1940, as amended (the 1940 Act), as an open-end management investment company organized as a Massachusetts business trust.
The fund offers Class A, Class T, Class B, Class C, and Institutional Class shares, each of which has equal rights as to assets and voting privileges. Each class has exclusive voting rights with respect to matters that affect that class. Class B shares will automatically convert to Class A shares after a holding period of seven years from the initial date of purchase. Investment income, realized and unrealized capital gains and losses, the common expenses of the fund, and certain fund-level expense reductions, if any, are allocated on a pro rata basis to each class based on the relative net assets of each class to the total net assets of the fund. Each class of shares differs in its respective distribution, transfer agent, and certain other class-specific fees, expenses, and expense reductions.
The financial statements have been prepared in conformity with generally accepted accounting principles which require management to make certain estimates and assumptions at the date of the financial statements. The following summarizes the significant accounting policies of the fund:
Security Valuation. Securities for which exchange quotations are readily available are valued at the last sale price, or if no sale price, at the closing bid price. Foreign securities are valued based on quotations from the principal market in which such securities are normally traded. If trading or events occurring in other markets after the close of the principal market in which foreign securities are traded, and before the close of the business of the fund, are expected to materially affect the value of those securities, then they are valued at their fair value taking this trading or these events into account. Fair value is determined in good faith under consistently applied procedures under the general supervision of the Board of Trustees. Securities (including restricted securities) for which exchange quotations are not readily available (and in certain cases debt securities which trade on an exchange) are valued primarily using dealer-supplied valuations or at their fair value. Short-term securities with remaining maturities of sixty days or less for which quotations are not readily available are valued at amortized cost or original cost plus accrued interest, both of which approximate current value.
Foreign Currency Translation. The accounting records of the fund are maintained in U.S. dollars. Investment securities and other assets and liabilities denominated in a foreign currency are translated into U.S. dollars at the prevailing rates of exchange at period end. Purchases and sales of securities, income receipts and expense payments are translated into U.S. dollars at the prevailing exchange rate on the respective dates of the transactions.
Net realized gains and losses on foreign currency transactions represent net gains and losses from sales and maturities of foreign currency contracts, disposition of foreign currencies, the difference between the amount of net investment income accrued and the U.S. dollar amount actually received, and gains and losses between trade and settlement date on purchases and sales of securities. The effects of changes in foreign currency exchange rates on investments in securities are included with the net realized and unrealized gain or loss on investment securities.
Income Taxes. As a qualified regulated investment company under Subchapter M of the Internal Revenue Code, the fund is not subject to income taxes to the extent that it distributes substantially all of its taxable income for its fiscal year. The schedule of investments includes information regarding income taxes under the caption "Income Tax Information."
Investment Income. Dividend income is recorded on the ex-dividend date, except certain dividends from foreign securities where the ex-dividend date may have passed, are recorded as soon as the fund is informed of the ex-dividend date. Non-cash dividends included in dividend income, if any, are recorded at the fair market value of the securities received. Interest income is accrued as earned. Investment income is recorded net of foreign taxes withheld where recovery of such taxes is uncertain.
Expenses. Most expenses of the trust can be directly attributed to a fund. Expenses which cannot be directly attributed are apportioned among the funds in the trust.
Distributions to Shareholders. Distributions are recorded on the ex-dividend date. Income dividends and capital gain distributions are declared separately for each class.
Income and capital gain distributions are determined in accordance with income tax regulations which may differ from generally accepted accounting principles. These differences, which may result in distribution reclassifications, are primarily due to differing treatments for foreign currency transactions, net operating losses and losses deferred due to wash sales. The fund also utilized earnings and profits distributed to shareholders on redemption of shares as a part of the dividends paid deduction for income tax purposes.
Permanent book and tax basis differences relating to shareholder distributions will result in reclassifications to paid in capital. Accumulated undistributed net realized gain (loss) on investments and foreign currency transactions may include temporary book and tax basis differences which will reverse in a subsequent period. Any taxable income or gain remaining at fiscal year end is distributed in the following year.
Short-Term Trading (Redemption) Fees. Shares held in the fund less than 60 days are subject to a short-term trading fee equal to 1% of the proceeds of the redeemed shares. The fee, which is retained by the fund, is accounted for as an addition to paid in capital.
Annual Report
Notes to Financial Statements - continued
1. Significant Accounting
Policies - continued
Security Transactions. Security transactions are accounted for as of trade date. Gains and losses on securities sold are determined on the basis of identified cost.
2. Operating Policies.
Foreign Currency Contracts. The fund generally uses foreign currency contracts to facilitate transactions in foreign-denominated securities. Losses may arise from changes in the value of the foreign currency or if the counterparties do not perform under the contracts' terms. The U.S. dollar value of foreign currency contracts is determined using contractual currency exchange rates established at the time of each trade.
Joint Trading Account. Pursuant to an Exemptive Order issued by the Securities and Exchange Commission (the SEC), the fund, along with other affiliated entities of Fidelity Management & Research Company (FMR), may transfer uninvested cash balances into one or more joint trading accounts. These balances are invested in one or more repurchase agreements for U.S. Treasury or Federal Agency obligations.
Repurchase Agreements. The underlying U.S. Treasury, Federal Agency, or other obligations found to be satisfactory by FMR are transferred to an account of the fund, or to the Joint Trading Account, at a custodian bank. The securities are marked-to-market daily and maintained at a value at least equal to the principal amount of the repurchase agreement (including accrued interest). FMR, the fund's investment adviser, is responsible for determining that the value of the underlying securities remains in accordance with the market value requirements stated above.
Cash Central Funds. Pursuant to an Exemptive Order issued by the SEC, the fund may invest in the Fidelity Cash Central Fund and the Fidelity Securities Lending Cash Central Fund (the Cash Funds) managed by Fidelity Investments Money Management, Inc., an affiliate of FMR. The Cash Funds are open-end money market funds available only to investment companies and other accounts managed by FMR and its affiliates. The Cash Funds seek preservation of capital, liquidity, and current income. Income distributions from the Cash Funds are declared daily and paid monthly from net interest income. Income distributions earned by the fund are recorded as either interest income or security lending income in the accompanying financial statements.
Restricted Securities. The fund is permitted to invest in securities that are subject to legal or contractual restrictions on resale. These securities generally may be resold in transactions exempt from registration or to the public if the securities are registered. Disposal of these securities may involve time-consuming negotiations and expense, and prompt sale at an acceptable price may be difficult. At the end of the period, restricted securities (excluding 144A issues) amounted to $40,500 or 0.0% of net assets.
3. Purchases and Sales of Investments.
Purchases and sales of securities, other than short-term securities, aggregated $4,833,800,913 and $2,779,015,445, respectively.
4. Fees and Other Transactions with Affiliates.
Management Fee. As the fund's investment adviser, FMR receives a monthly fee that is calculated on the basis of a group fee rate plus a fixed individual fund fee rate applied to the average net assets of the fund. The group fee rate is the weighted average of a series of rates and is based on the monthly average net assets of all the mutual funds advised by FMR. The rates ranged from .2167% to .5200% for the period. The annual individual fund fee rate is .30%. In the event that these rates were lower than the contractual rates in effect during the period, FMR voluntarily implemented the above rates, as they resulted in the same or a lower management fee. For the period, the management fee was equivalent to an annual rate of .58% of average net assets.
Distribution and Service Plan. In accordance with Rule 12b-1 of the 1940 Act, the Board of Trustees have adopted separate Distribution and Service Plans with respect to each class of shares (collectively referred to as "the Plans"). Under certain of the Plans, the class pays Fidelity Distributors Corporation (FDC), an affiliate of FMR, a 12b-1 fee. A portion of this fee may be reallowed to securities dealers, banks and other financial institutions for the distribution of each class of shares and providing shareholder support services. For the period, this fee was based on the following annual rates of the average net assets of each applicable class:
|
Class A |
.25% |
|
Class T |
.50% |
|
Class B |
1.00%* |
|
Class C |
1.00%* |
* .75% represents a distribution fee and .25% represents a shareholder service fee.
For the period, each class paid FDC the following amounts, a portion of which was retained by FDC:
|
|
Paid to |
Retained |
|
Class A |
$ 656,285 |
$ 329 |
|
Class T |
4,482,592 |
3,088 |
|
Class B |
9,162,823 |
6,872,976 |
|
Class C |
3,011,703 |
2,259,677 |
|
|
$ 17,313,403 |
$ 9,136,070 |
Sales Load. FDC receives a front-end sales charge of up to 5.75% for selling Class A shares, and 3.50% for selling Class T shares of the fund. FDC receives the proceeds of contingent deferred sales charges levied on Class B share redemptions occurring within six years of purchase and Class C share redemptions occurring within one year of purchase. Contingent deferred sales charges are based on declining rates ranging from 5% to 1% for Class B and 1% for Class C, of the lesser of the cost of shares at the initial date of purchase or the net
Technology
Notes to Financial Statements - continued
4. Fees and Other Transactions with Affiliates - continued
Sales Load - continued
asset value of the redeemed shares, excluding any reinvested dividends and capital gains. In addition, purchases of Class A and Class T shares that were subject to a finder's fee bear a contingent deferred sales charge on assets that do not remain in the fund for at least one year. The Class A and Class T contingent deferred sales charge is based on 0.25% of the lesser of the cost of shares at the initial date of purchase or the net asset value of the redeemed shares, excluding any reinvested dividends and capital gains. A portion of the sales charges paid to FDC is paid to securities dealers, banks and other financial institutions.
For the period, sales charge amounts paid to and retained by FDC were as follows:
|
|
Paid to |
Retained |
|
Class A |
$ 2,815,402 |
$ 1,403,067 |
|
Class T |
3,019,339 |
1,149,922 |
|
Class B |
1,943,039 |
1,943,039* |
|
Class C |
152,798 |
152,798* |
|
|
$ 7,930,578 |
$ 4,648,826 |
* When Class B and Class C shares are initially sold, FDC pays commissions from its own resources to securities dealers,
banks, and other financial institutions through which the sales are made.
Transfer Agent Fees. Fidelity Investments Institutional Operations Company, Inc., (FIIOC), an affiliate of FMR, is the transfer, dividend disbursing and shareholder servicing agent (collectively referred to as the transfer agent) for each class of the fund. FIIOC receives account fees and asset-based fees that vary according to the account size and type of account of the shareholders of the respective classes of the fund. FIIOC pays for typesetting, printing and mailing of all shareholder reports, except proxy statements. For the period, the following amounts were paid to FIIOC:
|
|
Amount |
% of |
|
Class A |
$ 703,903 |
.27 |
|
Class T |
2,101,901 |
.23 |
|
Class B |
2,459,618 |
.27 |
|
Class C |
743,802 |
.25 |
|
Institutional Class |
136,211 |
.23 |
|
|
$ 6,145,435 |
|
Accounting and Security Lending Fees. Fidelity Service Company, Inc., an affiliate of FMR, maintains the fund's accounting records and administers the security lending program. The security lending fee is based on the number and duration of lending transactions. The accounting fee is based on the level of average net assets for the month plus out-of-pocket expenses.
Brokerage Commissions. The fund placed a portion of its portfolio transactions with brokerage firms which are affiliates of FMR. The commissions paid to these affiliated firms were $124,819 for the period.
5. Security Lending.
The fund lends portfolio securities from time to time in order to earn additional income. The fund receives collateral in the form of U.S. Treasury obligations, letters of credit, and/or cash against the loaned securities, and maintains collateral in an amount not less than 100% of the market value of the loaned securities during the period of the loan. The market value of the loaned securities is determined at the close of business of the fund and any additional required collateral is delivered to the fund on the next business day. If the borrower defaults on its obligation to return the securities loaned because of insolvency or other reasons, the fund could experience delays and costs in recovering the securities loaned or in gaining access to the collateral. At period end, the value of the securities loaned amounted to $101,555,965. The fund received cash collateral of $97,659,109 which was invested in cash equivalents.
6. Expense Reductions.
FMR has directed certain portfolio trades to brokers who paid a portion of the fund's expenses. For the period, the fund's expenses were reduced by $166,096 under this arrangement.
In addition, through an arrangement with the fund's custodian, credits realized as a result of uninvested cash balances were used to reduce a portion of the fund's expenses. During the period, the fund's custodian fees were reduced by $3,248 under this arrangement.
Technology
Notes to Financial Statements - continued
7. Distributions to Shareholders.
Distributions to shareholders of each class were as follows:
|
|
Years ended July 31, |
|
|
|
2000 |
1999 |
|
From net realized gain |
|
|
|
Class A |
$ 7,085,822 |
$ - |
|
Class T |
23,787,352 |
- |
|
Class B |
21,305,447 |
- |
|
Class C |
6,504,599 |
- |
|
Institutional Class |
2,483,932 |
- |
|
Total |
$ 61,167,152 |
$ - |
8. Share Transactions.
Transactions for each class of shares were as follows:
|
|
Shares |
Dollars |
||
|
|
Year ended |
Year ended |
Year ended |
Year ended |
|
|
2000 |
1999 |
2000 |
1999 |
|
|
|
|
|
|
|
Class A |
8,424,700 |
3,280,891 |
$ 295,468,953 |
$ 74,375,999 |
|
Reinvestment of distributions |
237,235 |
- |
6,522,431 |
- |
|
Shares redeemed |
(1,723,055) |
(524,386) |
(61,402,666) |
(11,021,514) |
|
Net increase (decrease) |
6,938,880 |
2,756,505 |
$ 240,588,718 |
$ 63,354,485 |
|
Class T |
27,387,834 |
10,904,693 |
$ 953,611,598 |
$ 237,438,732 |
|
Reinvestment of distributions |
830,850 |
- |
22,660,793 |
- |
|
Shares redeemed |
(6,556,121) |
(2,903,454) |
(226,095,777) |
(59,161,752) |
|
Net increase (decrease) |
21,662,563 |
8,001,239 |
$ 750,176,614 |
$ 178,276,980 |
|
Class B |
29,573,993 |
11,234,873 |
$ 1,007,811,583 |
$ 250,482,834 |
|
Reinvestment of distributions |
704,607 |
- |
18,857,957 |
- |
|
Shares redeemed |
(3,655,139) |
(1,122,956) |
(126,658,754) |
(23,194,043) |
|
Net increase (decrease) |
26,623,461 |
10,111,917 |
$ 900,010,786 |
$ 227,288,791 |
|
Class C |
11,070,359 |
3,451,291 |
$ 381,491,987 |
$ 76,473,150 |
|
Reinvestment of distributions |
200,051 |
- |
5,389,654 |
- |
|
Shares redeemed |
(1,519,630) |
(311,910) |
(52,707,538) |
(6,794,753) |
|
Net increase (decrease) |
9,750,780 |
3,139,381 |
$ 334,174,103 |
$ 69,678,397 |
|
Institutional Class |
1,525,017 |
1,121,900 |
$ 50,459,314 |
$ 24,772,786 |
|
Reinvestment of distributions |
67,708 |
- |
1,853,690 |
- |
|
Shares redeemed |
(1,143,598) |
(289,655) |
(39,576,238) |
(5,732,568) |
|
Net increase (decrease) |
449,127 |
832,245 |
$ 12,736,766 |
$ 19,040,218 |
Technology
Performance
There are several ways to evaluate historical performance. You can look at the total percentage change in value, the average annual percentage change or the growth of a hypothetical $10,000 investment. Total return reflects the change in the value of an investment, assuming reinvestment of dividend income and capital gains (the profits earned upon the sale of securities that have grown in value). If Fidelity had not reimbursed certain class expenses, the life of fund total returns would have been lower.
Cumulative Total Returns
|
Periods ended July 31, 2000 |
|
Past 1 |
Life of |
|
Fidelity Adv Telecommunications & Utilities - Inst CL |
|
9.93% |
173.00% |
|
S&P 500 |
|
8.98% |
131.80% |
|
GS Utilities |
|
-0.53% |
117.02% |
Cumulative total returns show Institutional Class shares' performance in percentage terms over a set period - in this case, one year or since the fund started on September 3, 1996. You can compare Institutional Class shares' returns to the performance of both the Standard & Poor's 500 Index - a market capitalization-weighted index of common stocks - and the Goldman Sachs Utilities Index - a market capitalization-weighted index of 139 stocks designed to measure the performance of companies in the utilities sector. Issues in the index include generators and distributors of electricity, distributors of natural gas and water, and providers of telecommunications services. These benchmarks include reinvested dividends and capital gains, if any, and exclude the effect of sales charges.
Average Annual Total Returns
|
Periods ended July 31, 2000 |
|
Past 1 |
Life of |
|
Fidelity Adv Telecommunications & Utilities - Inst CL |
|
9.93% |
29.29% |
|
S&P 500 |
|
8.98% |
23.99% |
|
GS Utilities |
|
-0.53% |
21.92% |
Average annual returns take Institutional Class shares' cumulative return and show you what would have happened if Institutional Class shares had performed at a constant rate each year.
$10,000 Over Life of Fund
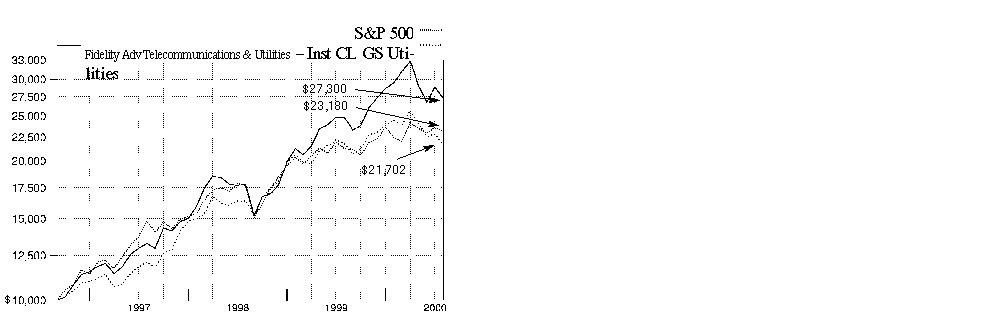
$10,000 Over Life of Fund: Let's say hypothetically that $10,000 was invested in Fidelity Advisor Telecommunications & Utilities Growth - Institutional Class on September 3, 1996, when the fund started. As the chart shows, by July 31, 2000, the value of the investment would have grown to $27,300 - a 173.00% increase on the initial investment. For comparison, look at how the Standard & Poor's 500 Index did over the same period. With dividends and capital gains, if any, reinvested, the same $10,000 investment would have grown to $23,180 - a 131.80% increase. If $10,000 was invested in the Goldman Sachs Utilities Index, it would have grown to $21,702 - a 117.02% increase.
Understanding Performance
How a fund did yesterday is no guarantee of how it will do tomorrow. The stock market, for example, has a history of long-term growth and short-term volatility. Unlike the broader market, however, some sectors may not have a history of growth in the long run. And, as with all stock funds, the share price and return of a fund that invests in a sector will vary.
3Annual Report
(Portfolio Manager photograph)
An interview with
Peter Saperstone, Portfolio Manager of Fidelity Advisor Telecommunications &
Utilities Growth Fund
Q. How did the fund perform, Peter?
A. For the 12-month period that ended July 31, 2000, the fund's Class A, Class T, Class B, and Class C shares returned 9.59%, 9.41%, 8.77%, and 8.84%, respectively. During the same period, the Goldman Sachs Utilities Index - an index of 139 stocks designed to measure the performance of companies in the utilities sector - posted a loss of 0.53%, while the Standard & Poor's 500 Index returned 8.98%.
A. For the 12-month period that ended July 31, 2000, the fund's Institutional Class shares returned 9.93%. During the same period, the Goldman Sachs Utilities Index - an index of 139 stocks designed to measure the performance of companies in the utilities sector - posted a loss of 0.53%, while the Standard & Poor's 500 Index returned 8.98%.
Q. What factors contributed to the fund's outperformance of the Goldman Sachs index?
A. The largest contributor to the fund's performance was its significant underweighting of large-cap telephone companies - regional Bell operating companies and long-distance companies - compared to the Goldman Sachs index. The stocks of those incumbent companies did not perform well during the period in the face of continued competition, deregulation and new technology. Our underweighted position, along with an overweighted position in cellular and wireless companies, led to the fund's outperformance of its benchmark.
Q. What stocks contributed the most to the fund's performance?
A. Nextel Communications, VoiceStream Wireless and Sprint PCS were the strongest contributors to the fund in terms of performance. These all-digital companies have an advantage over the analog regional Bell operating companies and gained market share as the consumer demand for wireless technology continued to grow. Digital technology offers better transmission quality and costs significantly less to operate than analog technology. Metromedia Fiber also made a strong contribution to the fund. Metromedia - a leading provider of fiber-optic cable and end-to-end optical networks - had a competitive advantage as it pursued its strategy of building in the local telephone market and exploiting an area that was previously a domain of long-distance carriers. Finally, Calpine Corporation and AES, two independent electric power companies that continued to gain market share as they took advantage of deregulation in that industry, made positive contributions to the fund.
Annual Report
Advisor Telecommunications & Utilities Growth Fund
Fund Talk: The Manager's Overview - continued
Q. Which stocks had disappointing performance?
A. Larger telecommunications stocks such as AT&T, BellSouth and SBC Communications, posted low returns. AT&T was particularly hard hit as a result of increased competition, new technology and deregulation. Increased competition and the introduction of new technologies has led to a decrease in pricing, which has hurt the company's revenue growth. Additionally, Exodus Communications, a Web-hosting company, performed poorly and detracted from the fund's performance. The stock suffered along with many other companies as a result of the NASDAQ correction that began in mid-March and lasted through much of the remainder of the period. However, I still held Exodus because the company has established data centers throughout the U.S., its fundamentals are good and its business outlook is positive.
Q. Did the stock market's volatility cause you to change your investment strategy?
A. No, it didn't. I continued to run the fund with a higher concentration of assets in telecommunications relative to electric utilities. Within telecommunications, I focused on wireless communication companies because I see continued demand for wireless services in the U.S. At the present time, approximately 35% of U.S. households use wireless communications. This is low when compared to the 55% penetration in Europe and Asia. Within wireless, I tended to favor aggressive companies such as Sprint PCS, Nextel and VoiceStream, all of which are 100% digital networks, have been gaining market share in a rapidly growing arena and should benefit further from this expansion.
Q. What is your outlook, Peter?
A. My outlook continues to be positive. I plan to continue to favor telecommunications stocks over traditional utility stocks because of better long-term growth potential. As deregulation continues and new technologies emerge, the incumbent telephone companies will face increased competition and could suffer further loss of market share.
The views expressed in this report reflect those of the portfolio manager only through the end of the period of the report as stated on the cover. The manager's views are subject to change at any time based on market or other conditions. For more information, see page A-3.
Note to shareholders: Effective September 28, 2000, Tim Cohen became Portfolio Manager of Fidelity Advisor Telecommunications & Utilities Growth Fund.
Fund Facts
Start date: September 3, 1996
Size: as of July 31, 2000, more than
$656 million
Manager: Peter Saperstone, since 1998; joined Fidelity in 1995
3Telecommunications & Utilities Growth
Advisor Telecommunications & Utilities Growth Fund
|
Top Ten Stocks as of July 31, 2000 |
|
|
|
% of fund's |
|
VoiceStream Wireless Corp. |
11.1 |
|
Sprint Corp. - PCS Group Series 1 |
9.1 |
|
Nextel Communications, Inc. Class A |
8.4 |
|
Qwest Communications International, Inc. |
7.2 |
|
BellSouth Corp. |
3.9 |
|
AT&T Corp. - Wireless Group |
3.8 |
|
AT&T Corp. |
3.4 |
|
Nokia AB sponsored ADR |
3.4 |
|
SBC Communications, Inc. |
3.2 |
|
Exodus Communications, Inc. |
2.7 |
|
|
56.2 |
|
Top Industries as of July 31, 2000 |
|
|
% of fund's net assets |
||
|
Cellular |
39.5% |
|
Telephone Services |
30.3% |
|
Communications Equipment |
6.6% |
|
Electric Utility |
5.1% |
|
Computer Services & Software |
4.1% |
|
All Others* |
14.4% |
|
* Includes short-term investments and net other assets. |
Annual Report
Advisor Telecommunications & Utilities Growth Fund
Showing Percentage of Net Assets
|
Common Stocks - 93.9% |
|||
|
Shares |
Value (Note 1) |
||
|
BROADCASTING - 2.0% |
|||
|
Comcast Corp. Class A (special) (a) |
200,000 |
$ 6,803,125 |
|
|
EchoStar Communications Corp. |
47,000 |
1,853,563 |
|
|
Metro One Telecommunications, Inc. (a) |
426,600 |
4,159,350 |
|
|
WorldQuest Networks, Inc. |
24,500 |
122,500 |
|
|
|
12,938,538 |
||
|
CELLULAR - 39.5% |
|||
|
ALLTEL Corp. |
36,600 |
2,255,475 |
|
|
AT&T Corp. - Wireless Group |
900,000 |
24,750,000 |
|
|
China Mobile (Hong Kong) Ltd. (a) |
1,877,000 |
15,649,487 |
|
|
China Unicom Ltd. sponsored ADR (a) |
450,000 |
10,603,125 |
|
|
Crown Castle International Corp. (a) |
101,400 |
3,447,600 |
|
|
Dobson Communications Corp. Class A |
114,700 |
2,509,063 |
|
|
Nextel Communications, Inc. Class A (a) |
990,200 |
55,389,313 |
|
|
SBA Communications Corp. Class A |
165,800 |
7,481,725 |
|
|
Sprint Corp. - PCS Group Series 1 (a) |
1,081,300 |
59,741,825 |
|
|
Telephone & Data Systems, Inc. |
23,000 |
2,561,625 |
|
|
Telesp Celular Participacoes SA ADR |
39,600 |
1,492,425 |
|
|
Triton PCS Holdings, Inc. Class A |
21,200 |
1,063,975 |
|
|
VoiceStream Wireless Corp. (a) |
566,240 |
72,620,276 |
|
|
|
259,565,914 |
||
|
COMMUNICATIONS EQUIPMENT - 6.6% |
|||
|
Comverse Technology, Inc. (a) |
75,000 |
6,581,250 |
|
|
Corvis Corp. |
3,000 |
246,984 |
|
|
Lexent, Inc. |
51,600 |
1,373,850 |
|
|
Nokia AB sponsored ADR |
500,000 |
22,156,250 |
|
|
Nortel Networks Corp. |
173,684 |
12,917,748 |
|
|
|
43,276,082 |
||
|
COMPUTER SERVICES & SOFTWARE - 4.1% |
|||
|
Covad Communications Group, Inc. (a) |
541,400 |
8,933,100 |
|
|
Exodus Communications, Inc. (a) |
400,000 |
17,775,000 |
|
|
|
26,708,100 |
||
|
ELECTRIC UTILITY - 5.1% |
|||
|
AES Corp. (a) |
214,000 |
11,435,625 |
|
|
Calpine Corp. (a) |
60,000 |
4,275,000 |
|
|
Citizens Communications Co. (a) |
898,900 |
15,056,575 |
|
|
IPALCO Enterprises, Inc. |
127,300 |
2,880,163 |
|
|
|
33,647,363 |
||
|
ELECTRICAL EQUIPMENT - 0.6% |
|||
|
Alcatel SA sponsored ADR |
50,000 |
3,656,250 |
|
|
|
|||
|
Shares |
Value (Note 1) |
||
|
ELECTRONICS - 1.6% |
|||
|
Samsung Electronics Co. Ltd. unit |
72,000 |
$ 10,314,000 |
|
|
TyCom Ltd. |
12,200 |
415,563 |
|
|
|
10,729,563 |
||
|
GAS - 1.4% |
|||
|
Dynegy, Inc. Class A |
52,871 |
3,720,796 |
|
|
Kinder Morgan, Inc. |
169,900 |
5,776,600 |
|
|
|
9,497,396 |
||
|
REAL ESTATE INVESTMENT TRUSTS - 2.3% |
|||
|
Pinnacle Holdings, Inc. (a) |
267,400 |
15,024,538 |
|
|
SERVICES - 0.4% |
|||
|
Universal Access, Inc. |
99,100 |
2,737,638 |
|
|
TELEPHONE SERVICES - 30.3% |
|||
|
Alaska Communication Systems |
59,500 |
565,250 |
|
|
Allegiance Telecom, Inc. (a) |
188,800 |
10,490,200 |
|
|
AT&T Corp. |
718,764 |
22,236,761 |
|
|
BCE, Inc. |
110,600 |
2,513,636 |
|
|
BellSouth Corp. |
646,000 |
25,718,875 |
|
|
Global Crossing Ltd. (a) |
451,800 |
10,984,388 |
|
|
ITXC Corp. |
39,800 |
721,375 |
|
|
Level 3 Communications, Inc. (a) |
177,400 |
12,140,813 |
|
|
McLeodUSA, Inc. Class A (a) |
804,400 |
13,624,525 |
|
|
Metromedia Fiber Network, Inc. |
299,200 |
10,509,400 |
|
|
NEXTLINK Communications, Inc. |
42,400 |
1,401,850 |
|
|
Qwest Communications |
1,004,195 |
47,134,403 |
|
|
SBC Communications, Inc. |
499,115 |
21,243,582 |
|
|
Time Warner Telecom, Inc. Class A (a) |
235,300 |
14,573,894 |
|
|
TRICOM SA sponsored ADR (a) |
79,800 |
1,236,900 |
|
|
Z-Tel Technologies, Inc. |
489,000 |
3,636,938 |
|
|
|
198,732,790 |
||
|
TOTAL COMMON STOCKS (Cost $625,039,002) |
616,514,172 |
||
|
Cash Equivalents - 7.7% |
|||
|
Shares |
Value (Note 1) |
||
|
Fidelity Cash Central Fund, 6.57% (b) |
38,764,304 |
$ 38,764,304 |
|
|
Fidelity Securities Lending Cash Central Fund, 6.65% (b) |
11,523,600 |
11,523,600 |
|
|
TOTAL CASH EQUIVALENTS (Cost $50,287,904) |
50,287,904 |
||
|
TOTAL INVESTMENT PORTFOLIO - 101.6% (Cost $675,326,906) |
666,802,076 |
||
|
NET OTHER ASSETS - (1.6)% |
(10,493,567) |
||
|
NET ASSETS - 100% |
$ 656,308,509 |
||
|
Legend |
|
(a) Non-income producing |
|
(b) The rate quoted is the annualized seven-day yield of the fund at |
|
Other Information |
|
Distribution of investments by country of issue, as a percentage of total |
|
United States of America |
85.9% |
|
Hong Kong |
4.0 |
|
Finland |
3.4 |
|
Canada |
2.4 |
|
Bermuda |
1.7 |
|
Korea (South) |
1.6 |
|
Others (individually less than 1%) |
1.0 |
|
|
100.0% |
|
Income Tax Information |
|
At July 31, 2000, the aggregate cost of investment securities for income |
|
The fund hereby designates approximately $3,072,000 as a capital gain dividend for the purpose of the dividend paid deduction. |
|
A total of 21%, 22%, 25%, 26% and 16% of Class A's, Class T's, Class B's, Class C's and Institutional Class' dividends distributed during the fiscal |
|
The fund will notify shareholders in January 2001 of the applicable percentages for use in preparing 2000 income tax returns. |
See accompanying notes which are an integral part of the financial statements.
Telecommunications & Utilities Growth
Statement of Assets and Liabilities
|
|
July 31, 2000 |
|
|
Assets |
|
|
|
Investment in securities, at value |
|
$ 666,802,076 |
|
Receivable for investments sold |
|
12,513,993 |
|
Receivable for fund shares sold |
|
3,601,299 |
|
Dividends receivable |
|
494,474 |
|
Interest receivable |
|
266,069 |
|
Redemption fees receivable |
|
132 |
|
Other receivables |
|
18,147 |
|
Total assets |
|
683,696,190 |
|
Liabilities |
|
|
|
Payable for investments purchased |
$ 13,930,119 |
|
|
Payable for fund shares redeemed |
903,067 |
|
|
Accrued management fee |
336,104 |
|
|
Distribution fees payable |
426,092 |
|
|
Other payables and accrued expenses |
268,699 |
|
|
Collateral on securities loaned, |
11,523,600 |
|
|
Total liabilities |
|
27,387,681 |
|
Net Assets |
|
$ 656,308,509 |
|
Net Assets consist of: |
|
|
|
Paid in capital |
|
$ 653,332,331 |
|
Undistributed net investment income |
|
7,856,163 |
|
Accumulated undistributed net realized gain (loss) on investments and foreign currency transactions |
|
3,644,922 |
|
Net unrealized appreciation (depreciation) on investments |
|
(8,524,907) |
|
Net Assets |
|
$ 656,308,509 |
|
Calculation of Maximum |
|
$21.08 |
|
Maximum offering price per share |
|
$22.37 |
|
Class T: |
|
$21.01 |
|
Maximum offering price per share |
|
$21.77 |
|
Class B: |
|
$20.72 |
|
Class C: |
|
$20.71 |
|
Institutional Class: |
|
$21.19 |
A Redemption price per share is equal to net asset value less any applicable contingent deferred sales charge.
Statement of Operations
|
|
Year ended July 31, 2000 |
|
|
Investment Income Dividends |
|
$ 2,912,905 |
|
Special dividend from BCE, Inc. |
|
9,825,872 |
|
Interest |
|
1,869,586 |
|
Security lending |
|
227,884 |
|
Total income |
|
14,836,247 |
|
Expenses |
|
|
|
Management fee |
$ 2,404,253 |
|
|
Transfer agent fees |
1,040,778 |
|
|
Distribution fees |
3,033,976 |
|
|
Accounting and security lending fees |
154,042 |
|
|
Non-interested trustees' compensation |
1,155 |
|
|
Custodian fees and expenses |
23,250 |
|
|
Registration fees |
268,815 |
|
|
Audit |
23,688 |
|
|
Legal |
1,780 |
|
|
Miscellaneous |
3,725 |
|
|
Total expenses before reductions |
6,955,462 |
|
|
Expense reductions |
(123,730) |
6,831,732 |
|
Net investment income |
|
8,004,515 |
|
Realized and Unrealized Gain (Loss) Net realized gain (loss) on: |
|
|
|
Investment securities |
5,829,494 |
|
|
Foreign currency transactions |
(16,589) |
5,812,905 |
|
Change in net unrealized appreciation (depreciation) on: |
|
|
|
Investment securities |
(29,591,053) |
|
|
Assets and liabilities in |
(77) |
(29,591,130) |
|
Net gain (loss) |
|
(23,778,225) |
|
Net increase (decrease) in net assets resulting from operations |
|
$ (15,773,710) |
See accompanying notes which are an integral part of the financial statements.
Annual Report
Statement of Changes in Net Assets
|
Increase (Decrease) in Net Assets |
Year ended |
Year ended |
|
Operations |
$ 8,004,515 |
$ (97,227) |
|
Net realized gain (loss) |
5,812,905 |
8,970,907 |
|
Change in net unrealized appreciation (depreciation) |
(29,591,130) |
18,386,120 |
|
Net increase (decrease) in net assets resulting from operations |
(15,773,710) |
27,259,800 |
|
Distributions to shareholders |
(131,762) |
- |
|
From net realized gain |
(9,708,813) |
(3,437,371) |
|
Total distributions |
(9,840,575) |
(3,437,371) |
|
Share transactions - net increase (decrease) |
506,119,403 |
108,825,089 |
|
Redemption fees |
184,716 |
29,790 |
|
Total increase (decrease) in net assets |
480,689,834 |
132,677,308 |
|
Net Assets |
|
|
|
Beginning of period |
175,618,675 |
42,941,367 |
|
End of period (including undistributed net investment income of $7,856,163 and $0, respectively) |
$ 656,308,509 |
$ 175,618,675 |
Financial Highlights - Class A
|
Years ended July 31, |
2000 |
1999 |
1998 |
1997 E |
|
Selected Per-Share Data |
|
|
|
|
|
Net asset value, beginning of period |
$ 20.31 |
$ 16.00 |
$ 13.07 |
$ 10.00 |
|
Income from Investment Operations |
|
|
|
|
|
Net investment income (loss) D |
.53 H |
.05 |
(.02) |
.12 |
|
Net realized and unrealized gain (loss) |
1.29 I |
5.45 |
4.19 |
3.09 |
|
Total from investment operations |
1.82 |
5.50 |
4.17 |
3.21 |
|
Less Distributions |
|
|
|
|
|
From net investment income |
(.05) |
- |
(.04) |
(.03) |
|
From net realized gain |
(1.01) |
(1.20) |
(1.21) |
(.11) |
|
Total distributions |
(1.06) |
(1.20) |
(1.25) |
(.14) |
|
Redemption fees added to paid in capital |
.01 |
.01 |
.01 |
- |
|
Net asset value, end of period |
$ 21.08 |
$ 20.31 |
$ 16.00 |
$ 13.07 |
|
Total Return B, C |
9.59% |
38.83% |
33.99% |
32.36% |
|
Ratios and Supplemental Data |
|
|
|
|
|
Net assets, end of period (000 omitted) |
$ 61,610 |
$ 14,400 |
$ 3,186 |
$ 531 |
|
Ratio of expenses to average net assets |
1.20% |
1.34% |
1.75% F |
1.75% A, F |
|
Ratio of expenses to average net assets after expense reductions |
1.17% G |
1.32% G |
1.72% G |
1.75% A |
|
Ratio of net investment income (loss) to average net assets |
2.39% |
.30% |
(.11)% |
1.09% A |
|
Portfolio turnover |
172% |
149% |
151% |
13% A |
|
A Annualized B The total returns would have been lower had certain expenses not been reduced during the periods shown. C Total returns do not include the one time sales charge and for periods of less than one year are not annualized. D Net investment income per share has been calculated based on average shares outstanding during the period. E For the period September 3, 1996 (commencement of sale of Class A shares) to July 31, 1997. F FMR agreed to reimburse a portion of the class' expenses during the period. Without this reimbursement, the class' expense ratio would have been higher. G FMR or the fund has entered into varying arrangements with third parties who either paid or reduced a portion of the class' expenses. H Investment income per share reflects a special dividend (from BCE, Inc.) which amounted to $.52 per share. I The amount shown for a share outstanding does not correspond with the aggregate net loss on investments for the period due to the timing of sales and |
||||
See accompanying notes which are an integral part of the financial statements.
Telecommunications & Utilities Growth
Financial Highlights - Class T
|
Years ended July 31, |
2000 |
1999 |
1998 |
1997 E |
|
Selected Per-Share Data |
|
|
|
|
|
Net asset value, beginning of period |
$ 20.23 |
$ 15.95 |
$ 13.03 |
$ 10.00 |
|
Income from Investment Operations |
|
|
|
|
|
Net investment income (loss) D |
.47 H |
.01 |
(.04) |
.08 |
|
Net realized and unrealized gain (loss) |
1.31 I |
5.43 |
4.17 |
3.09 |
|
Total from investment operations |
1.78 |
5.44 |
4.13 |
3.17 |
|
Less Distributions |
|
|
|
|
|
From net investment income |
(.01) |
- |
(.03) |
(.03) |
|
From net realized gain |
(1.00) |
(1.17) |
(1.19) |
(.11) |
|
Total distributions |
(1.01) |
(1.17) |
(1.22) |
(.14) |
|
Redemption fees added to paid in capital |
.01 |
.01 |
.01 |
- |
|
Net asset value, end of period |
$ 21.01 |
$ 20.23 |
$ 15.95 |
$ 13.03 |
|
Total Return B, C |
9.41% |
38.45% |
33.72% |
31.96% |
|
Ratios and Supplemental Data |
|
|
|
|
|
Net assets, end of period (000 omitted) |
$ 225,415 |
$ 65,085 |
$ 19,918 |
$ 7,085 |
|
Ratio of expenses to average net assets |
1.44% |
1.58% |
1.94% |
2.00% A, F |
|
Ratio of expenses to average net assets after expense reductions |
1.41% G |
1.55% G |
1.90% G |
2.00% A |
|
Ratio of net investment income (loss) to average net assets |
2.16% |
.07% |
(.23)% |
.79% A |
|
Portfolio turnover |
172% |
149% |
151% |
13% A |
|
A Annualized B The total returns would have been lower had certain expenses not been reduced during the periods shown. C Total returns do not include the one time sales charge and for periods of less than one year are not annualized. D Net investment income per share has been calculated based on average shares outstanding during the period. E For the period September 3, 1996 (commencement of sale of Class T shares) to July 31, 1997. F FMR agreed to reimburse a portion of the class' expenses during the period. Without this reimbursement, the class' expense ratio would have been higher. G FMR or the fund has entered into varying arrangements with third parties who either paid or reduced a portion of the class' expenses. H Investment income per share reflects a special dividend (from BCE, Inc.) which amounted to $.52 per share. I The amount shown for a share outstanding does not correspond with the aggregate net loss on investments for the period due to the timing of sales and |
||||
Financial Highlights - Class B
|
Years ended July 31, |
2000 |
1999 |
1998 |
1997 E |
|
Selected Per-Share Data |
|
|
|
|
|
Net asset value, beginning of period |
$ 20.02 |
$ 15.83 |
$ 13.01 |
$ 11.76 |
|
Income from Investment Operations |
|
|
|
|
|
Net investment income (loss) D |
.35 H |
(.08) |
(.13) |
.02 |
|
Net realized and unrealized gain (loss) |
1.29 I |
5.39 |
4.16 |
1.23 |
|
Total from investment operations |
1.64 |
5.31 |
4.03 |
1.25 |
|
Less Distributions |
|
|
|
|
|
From net investment income |
- |
- |
(.03) |
- |
|
From net realized gain |
(.95) |
(1.13) |
(1.19) |
- |
|
Total distributions |
(.95) |
(1.13) |
(1.22) |
- |
|
Redemption fees added to paid in capital |
.01 |
.01 |
.01 |
- |
|
Net asset value, end of period |
$ 20.72 |
$ 20.02 |
$ 15.83 |
$ 13.01 |
|
Total Return B, C |
8.77% |
37.76% |
32.97% |
10.63% |
|
Ratios and Supplemental Data |
|
|
|
|
|
Net assets, end of period (000 omitted) |
$ 242,888 |
$ 65,645 |
$ 12,919 |
$ 2,039 |
|
Ratio of expenses to average net assets |
1.96% |
2.08% |
2.50% F |
2.50% A, F |
|
Ratio of expenses to average net assets after expense reductions |
1.93% G |
2.05% G |
2.47% G |
2.50% A |
|
Ratio of net investment income (loss) to average net assets |
1.63% |
(.43)% |
(.85)% |
.32% A |
|
Portfolio turnover |
172% |
149% |
151% |
13% A |
|
A Annualized B The total returns would have been lower had certain expenses not been reduced during the periods shown. C Total returns do not include the contingent deferred sales charge and for periods of less than one year are not annualized. D Net investment income per share has been calculated based on average shares outstanding during the period. E For the period March 3, 1997 (commencement of sale of Class B shares) to July 31, 1997. F FMR agreed to reimburse a portion of the class' expenses during the period. Without this reimbursement, the class' expense ratio would have been higher. G FMR or the fund has entered into varying arrangements with third parties who either paid or reduced a portion of the class' expenses. H Investment income per share reflects a special dividend (from BCE, Inc.) which amounted to $.52 per share. I The amount shown for a share outstanding does not correspond with the aggregate net loss on investments for the period due to the timing of sales and |
||||
See accompanying notes which are an integral part of the financial statements.
Annual Report
Financial Highlights - Class C
|
Years ended July 31, |
2000 |
1999 |
1998 E |
|
Selected Per-Share Data |
|
|
|
|
Net asset value, beginning of period |
$ 20.01 |
$ 15.85 |
$ 13.90 |
|
Income from Investment Operations |
|
|
|
|
Net investment income (loss) D |
.36 H |
(.08) |
(.10) |
|
Net realized and unrealized gain (loss) |
1.29I |
5.38 |
3.16 |
|
Total from investment operations |
1.65 |
5.30 |
3.06 |
|
Less Distributions |
|
|
|
|
From net investment income |
- |
- |
(.02) |
|
From net realized gain |
(.96) |
(1.15) |
(1.10) |
|
Total distributions |
(.96) |
(1.15) |
(1.12) |
|
Redemption fees added to paid in capital |
.01 |
.01 |
.01 |
|
Net asset value, end of period |
$ 20.71 |
$ 20.01 |
$ 15.85 |
|
Total Return B, C |
8.84% |
37.72% |
23.60% |
|
Ratios and Supplemental Data |
|
|
|
|
Net assets, end of period (000 omitted) |
$ 107,332 |
$ 23,524 |
$ 3,489 |
|
Ratio of expenses to average net assets |
1.93% |
2.07% |
2.50% A, F |
|
Ratio of expenses to average net assets after expense reductions |
1.90% G |
2.04% G |
2.48% A, G |
|
Ratio of net investment income (loss) to average net assets |
1.66% |
(.43)% |
(.91)% A |
|
Portfolio turnover |
172% |
149% |
151% |
|
A Annualized B The total returns would have been lower had certain expenses not been reduced during the periods shown. C Total returns do not include the contingent deferred sales charge and for periods of less than one year are not annualized. D Net investment income per share has been calculated based on average shares outstanding during the period. E For the period November 3, 1997 (commencement of sale of Class C shares) to July 31, 1998. F FMR agreed to reimburse a portion of the class' expenses during the period. Without this reimbursement, the class' expense ratio would have been higher. G FMR or the fund has entered into varying arrangements with third parties who either paid or reduced a portion of the class' expenses. H Investment income per share reflects a special dividend (from BCE, Inc.) which amounted to $.52 per share. I The amount shown for a share outstanding does not correspond with the aggregate net loss on investments for the period due to the timing of sales and |
|||
Financial Highlights - Institutional Class
|
Years ended July 31, |
2000 |
1999 |
1998 |
1997 E |
|
Selected Per-Share Data |
|
|
|
|
|
Net asset value, beginning of period |
$ 20.38 |
$ 16.02 |
$ 13.09 |
$ 10.00 |
|
Income from Investment Operations |
|
|
|
|
|
Net investment income D |
.60H |
.11 |
.04 |
.14 |
|
Net realized and unrealized gain (loss) |
1.29I |
5.46 |
4.17 |
3.10 |
|
Total from investment operations |
1.89 |
5.57 |
4.21 |
3.24 |
|
Less Distributions |
|
|
|
|
|
From net investment income |
(.08) |
- |
(.07) |
(.04) |
|
From net realized gain |
(1.01) |
(1.22) |
(1.22) |
(.11) |
|
Total distributions |
(1.09) |
(1.22) |
(1.29) |
(.15) |
|
Redemption fees added to paid in capital |
.01 |
.01 |
.01 |
- |
|
Net asset value, end of period |
$ 21.19 |
$ 20.38 |
$ 16.02 |
$ 13.09 |
|
Total Return B, C |
9.93% |
39.31% |
34.36% |
32.68% |
|
Ratios and Supplemental Data |
|
|
|
|
|
Net assets, end of period (000 omitted) |
$ 19,064 |
$ 6,963 |
$ 3,430 |
$ 2,246 |
|
Ratio of expenses to average net assets |
.88% |
1.02% |
1.46% |
1.50% A, F |
|
Ratio of expenses to average net assets after expense reductions |
.85% G |
.99% G |
1.43% G |
1.50% A |
|
Ratio of net investment income to average net assets |
2.71% |
.63% |
.30% |
1.29% A |
|
Portfolio turnover |
172% |
149% |
151% |
13% A |
|
A Annualized B The total returns would have been lower had certain expenses not been reduced during the periods shown. C Total returns for periods of less than one year are not annualized. D Net investment income per share has been calculated based on average shares outstanding during the period. E For the period September 3, 1996 (commencement of sale of Institutional Class shares) to July 31, 1997. F FMR agreed to reimburse a portion of the class' expenses during the period. Without this reimbursement, the class' expense ratio would have been higher. G FMR or the fund has entered into varying arrangements with third parties who either paid or reduced a portion of the class' expenses. H Investment income per share reflects a special dividend (from BCE, Inc.) which amounted to $.52 per share. I The amount shown for a share outstanding does not correspond with the aggregate net loss on investments for the period due to the timing of sales and |
||||
See accompanying notes which are an integral part of the financial statements.
Telecommunications & Utilities Growth
For the period ended July 31, 2000
1. Significant Accounting Policies.
Fidelity Advisor Telecommunications & Utilities Growth Fund (formerly Fidelity Advisor Utilities Growth Fund) (the fund) is a fund of Fidelity Advisor Series VII (the trust) and is authorized to issue an unlimited number of shares. The trust is registered under the Investment Company Act of 1940, as amended (the 1940 Act), as an open-end management investment company organized as a Massachusetts business trust.
The fund offers Class A, Class T, Class B, Class C, and Institutional Class shares, each of which has equal rights as to assets and voting privileges. Each class has exclusive voting rights with respect to matters that affect that class. Class B shares will automatically convert to Class A shares after a holding period of seven years from the initial date of purchase. Investment income, realized and unrealized capital gains and losses, the common expenses of the fund, and certain fund-level expense reductions, if any, are allocated on a pro rata basis to each class based on the relative net assets of each class to the total net assets of the fund. Each class of shares differs in its respective distribution, transfer agent, and certain other class-specific fees, expenses, and expense reductions.
The financial statements have been prepared in conformity with generally accepted accounting principles which require management to make certain estimates and assumptions at the date of the financial statements. The following summarizes the significant accounting policies of the fund:
Security Valuation. Securities for which exchange quotations are readily available are valued at the last sale price, or if no sale price, at the closing bid price. Foreign securities are valued based on quotations from the principal market in which such securities are normally traded. If trading or events occurring in other markets after the close of the principal market in which foreign securities are traded, and before the close of the business of the fund, are expected to materially affect the value of those securities, then they are valued at their fair value taking this trading or these events into account. Fair value is determined in good faith under consistently applied procedures under the general supervision of the Board of Trustees. Securities for which exchange quotations are not readily available (and in certain cases debt securities which trade on an exchange) are valued primarily using dealer-supplied valuations or at their fair value. Short-term securities with remaining maturities of sixty days or less for which quotations are not readily available are valued at amortized cost or original cost plus accrued interest, both of which approximate current value.
Foreign Currency Translation. The accounting records of the fund are maintained in U.S. dollars. Investment securities and other assets and liabilities denominated in a foreign currency are translated into U.S. dollars at the prevailing rates of exchange at
period end. Purchases and sales of securities, income receipts and expense payments are translated into U.S. dollars at the prevailing exchange rate on the respective dates of the transactions.
Net realized gains and losses on foreign currency transactions represent net gains and losses from sales and maturities of foreign currency contracts, disposition of foreign currencies, the difference between the amount of net investment income accrued and the U.S. dollar amount actually received, and gains and losses between trade and settlement date on purchases and sales of securities. The effects of changes in foreign currency exchange rates on investments in securities are included with the net realized and unrealized gain or loss on investment securities.
Income Taxes. As a qualified regulated investment company under Subchapter M of the Internal Revenue Code, the fund is not subject to income taxes to the extent that it distributes substantially all of its taxable income for its fiscal year. The schedule of investments includes information regarding income taxes under the caption "Income Tax Information."
Investment Income. Dividend income is recorded on the ex-dividend date, except certain dividends from foreign securities where the ex-dividend date may have passed, are recorded as soon as the fund is informed of the ex-dividend date. Non-cash dividends included in dividend income, if any, are recorded at the fair market value of the securities received. Interest income is accrued as earned. Investment income is recorded net of foreign taxes withheld where recovery of such taxes is uncertain.
Expenses. Most expenses of the trust can be directly attributed to a fund. Expenses which cannot be directly attributed are apportioned among the funds in the trust.
Distributions to Shareholders. Distributions are recorded on the ex-dividend date. Income dividends and capital gain distributions are declared separately for each class.
Income and capital gain distributions are determined in accordance with income tax regulations which may differ from generally accepted accounting principles. These differences, which may result in distribution reclassifications, are primarily due to differing treatments for foreign currency transactions and losses deferred due to wash sales. The fund also utilized earnings and profits distributed to shareholders on redemption of shares as a part of the dividends paid deduction for income tax purposes.
Permanent book and tax basis differences relating to shareholder distributions will result in reclassifications to paid in capital. Undistributed net investment income and accumulated undistributed net realized gain (loss) on investments and foreign currency transactions may include temporary book and tax basis differences which will reverse in a subsequent period. Any taxable income or gain remaining at fiscal year end is distributed in the following year.
Annual Report
Notes to Financial Statements - continued
1. Significant Accounting
Policies - continued
Short-Term Trading (Redemption) Fees. Shares held in the fund less than 60 days are subject to a short-term trading fee equal to 1% of the proceeds of the redeemed shares. The fee, which is retained by the fund, is accounted for as an addition to paid in capital.
Security Transactions. Security transactions are accounted for as of trade date. Gains and losses on securities sold are determined on the basis of identified cost.
2. Operating Policies.
Foreign Currency Contracts. The fund generally uses foreign currency contracts to facilitate transactions in foreign-denominated securities. Losses may arise from changes in the value of the foreign currency or if the counterparties do not perform under the contracts' terms. The U.S. dollar value of foreign currency contracts is determined using contractual currency exchange rates established at the time of each trade.
Joint Trading Account. Pursuant to an Exemptive Order issued by the Securities and Exchange Commission (the SEC), the fund, along with other affiliated entities of Fidelity Management & Research Company (FMR), may transfer uninvested cash balances into one or more joint trading accounts. These balances are invested in one or more repurchase agreements for U.S. Treasury or Federal Agency obligations.
Repurchase Agreements. The underlying U.S. Treasury, Federal Agency, or other obligations found to be satisfactory by FMR are transferred to an account of the fund, or to the Joint Trading Account, at a custodian bank. The securities are marked-to-market daily and maintained at a value at least equal to the principal amount of the repurchase agreement (including accrued interest). FMR, the fund's investment adviser, is responsible for determining that the value of the underlying securities remains in accordance with the market value requirements stated above.
Cash Central Funds. Pursuant to an Exemptive Order issued by the SEC, the fund may invest in the Fidelity Cash Central Fund and the Fidelity Securities Lending Cash Central Fund (the Cash Funds) managed by Fidelity Investments Money Management, Inc., an affiliate of FMR. The Cash Funds are open-end money market funds available only to investment companies and other accounts managed by FMR and its affiliates. The Cash Funds seek preservation of capital, liquidity, and current income. Income distributions from the Cash Funds are declared daily and paid monthly from net interest income. Income distributions earned by the fund are recorded as either interest income or security lending income in the accompanying financial statements.
Restricted Securities. The fund is permitted to invest in securities that are subject to legal or contractual restrictions on resale. These securities generally may be resold in transactions exempt from registration or to the public if the securities are registered. Disposal of these securities may involve time-consuming negotiations and expense, and prompt sale at an acceptable price may be difficult. At the end of the period, the fund had no investments in restricted securities.
3. Purchases and Sales of Investments.
Purchases and sales of securities, other than short-term securities, aggregated $1,144,552,337 and $671,262,517, respectively.
4. Fees and Other Transactions with Affiliates.
Management Fee. As the fund's investment adviser, FMR receives a monthly fee that is calculated on the basis of a group fee rate plus a fixed individual fund fee rate applied to the average net assets of the fund. The group fee rate is the weighted average of a series of rates and is based on the monthly average net assets of all the mutual funds advised by FMR. The rates ranged from .2167% to .5200% for the period. The annual individual fund fee rate is .30%. In the event that these rates were lower than the contractual rates in effect during the period, FMR voluntarily implemented the above rates, as they resulted in the same or a lower management fee. For the period, the management fee was equivalent to an annual rate of .58% of average net assets.
Distribution and Service Plan. In accordance with Rule 12b-1 of the 1940 Act, the Board of Trustees have adopted separate Distribution and Service Plans with respect to each class of shares (collectively referred to as "the Plans"). Under certain of the Plans, the class pays Fidelity Distributors Corporation (FDC), an affiliate of FMR, a 12b-1 fee. A portion of this fee may be reallowed to securities dealers, banks and other financial institutions for the distribution of each class of shares and providing shareholder support services. For the period, this fee was based on the following annual rates of the average net assets of each applicable class:
|
Class A |
.25% |
|
Class T |
.50% |
|
Class B |
1.00% * |
|
Class C |
1.00% * |
* .75% represents a distribution fee and .25% represents a shareholder service fee.
For the period, each class paid FDC the following amounts, a portion of which was retained by FDC:
|
|
Paid to |
Retained |
|
Class A |
$ 94,055 |
$ 40 |
|
Class T |
722,136 |
327 |
|
Class B |
1,556,711 |
1,167,618 |
|
Class C |
661,074 |
519,752 |
|
|
$ 3,033,976 |
$ 1,687,737 |
Sales Load. FDC receives a front-end sales charge of up to 5.75% for selling Class A shares, and 3.50% for selling Class T shares of the fund. FDC receives the proceeds of contingent deferred sales charges levied on Class B share redemptions
Telecommunications & Utilities Growth
Notes to Financial Statements - continued
4. Fees and Other Transactions with Affiliates - continued
Sales Load - continued
occurring within six years of purchase and Class C share redemptions occurring within one year of purchase. Contingent deferred sales charges are based on declining rates ranging from 5% to 1% for Class B and 1% for Class C, of the lesser of the cost of shares at the initial date of purchase or the net asset value of the redeemed shares, excluding any reinvested dividends and capital gains. In addition, purchases of Class A and Class T shares that were subject to a finder's fee bear a contingent deferred sales charge on assets that do not remain in the fund for at least one year. The Class A and Class T contingent deferred sales charge is based on 0.25% of the lesser of the cost of shares at the initial date of purchase or the net asset value of the redeemed shares, excluding any reinvested dividends and capital gains. A portion of the sales charges paid to FDC is paid to securities dealers, banks and other financial institutions.
For the period, sales charge amounts paid to and retained by FDC were as follows:
|
|
Paid to |
Retained |
|
Class A |
$ 533,580 |
$ 273,574 |
|
Class T |
695,524 |
254,546 |
|
Class B |
326,386 |
326,386* |
|
Class C |
28,660 |
28,660* |
|
|
$ 1,584,150 |
$ 883,166 |
* When Class B and Class C shares are initially sold, FDC pays commissions from its own resources to securities dealers,
banks, and other financial institutions through which the sales are made.
Transfer Agent Fees. Fidelity Investments Institutional Operations Company, Inc., (FIIOC), an affiliate of FMR, is the transfer, dividend disbursing and shareholder servicing agent (collectively referred to as the transfer agent) for each class of the fund. FIIOC receives account fees and asset-based fees that vary according to the account size and type of account of the shareholders of the respective classes of the fund. FIIOC pays for typesetting, printing and mailing of all shareholder reports, except proxy statements. For the period, the following amounts were paid to FIIOC:
|
|
Amount |
% of |
|
Class A |
$ 96,455 |
.26 |
|
Class T |
349,316 |
.24 |
|
Class B |
414,578 |
.27 |
|
Class C |
154,269 |
.23 |
|
Institutional Class |
26,160 |
.19 |
|
|
$ 1,040,778 |
|
Accounting and Security Lending Fees. Fidelity Service Company, Inc., an affiliate of FMR, maintains the fund's accounting records and administers the security lending program. The security lending fee is based on the number and duration of lending transactions. The accounting fee is based on the level of average net assets for the month plus out-of-pocket expenses.
Brokerage Commissions. The fund placed a portion of its portfolio transactions with brokerage firms which are affiliates of FMR. The commissions paid to these affiliated firms were $3,979 for the period.
5. Security Lending.
The fund lends portfolio securities from time to time in order to earn additional income. The fund receives collateral in the form of U.S. Treasury obligations, letters of credit, and/or cash against the loaned securities, and maintains collateral in an amount not less than 100% of the market value of the loaned securities during the period of the loan. The market value of the loaned securities is determined at the close of business of the fund and any additional required collateral is delivered to the fund on the next business day. If the borrower defaults on its obligation to return the securities loaned because of insolvency or other reasons, the fund could experience delays and costs in recovering the securities loaned or in gaining access to the collateral. At period end, the value of the securities loaned amounted to $11,481,742. The fund received cash collateral of $11,523,600 which was invested in cash equivalents.
6. Expense Reductions.
FMR has directed certain portfolio trades to brokers who paid a portion of the fund's expenses. For the period, the fund's expenses were reduced by $121,645 under this arrangement.
In addition, through an arrangement with the fund's custodian, credits realized as a result of uninvested cash balances were used to reduce a portion of the fund's expenses. During the period, the fund's custodian fees were reduced by $2,085 under this arrangement.
Telecommunications & Utilities Growth
Notes to Financial Statements - continued
7. Distributions to Shareholders.
Distributions to shareholders of each class were as follows:
|
|
Years ended July 31, |
|
|
|
2000 |
1999 |
|
From net investment income |
|
|
|
Class A |
$ 50,727 |
$ - |
|
Class T |
44,737 |
- |
|
Class B |
- |
- |
|
Class C |
- |
- |
|
Institutional Class |
36,298 |
- |
|
Total |
$ 131,762 |
$ - |
|
From net realized gain |
|
|
|
Class A |
$ 861,222 |
$ 267,451 |
|
Class T |
3,344,354 |
1,516,237 |
|
Class B |
3,638,195 |
1,080,984 |
|
Class C |
1,410,079 |
311,856 |
|
Institutional Class |
454,963 |
260,843 |
|
Total |
$ 9,708,813 |
$ 3,437,371 |
|
|
$ 9,840,575 |
$ 3,437,371 |
8. Share Transactions.
Transactions for each class of shares were as follows:
|
|
Shares |
Dollars |
||
|
|
Year ended |
Year ended |
Year ended |
Year ended |
|
|
2000 |
1999 |
2000 |
1999 |
|
|
|
|
|
|
|
Class A |
2,565,037 |
610,783 |
$ 57,561,045 |
$ 10,991,149 |
|
Reinvestment of distributions |
41,815 |
17,188 |
806,725 |
223,588 |
|
Shares redeemed |
(393,127) |
(117,917) |
(8,744,396) |
(1,971,798) |
|
Net increase (decrease) |
2,213,725 |
510,054 |
$ 49,623,374 |
$ 9,242,939 |
|
Class T |
9,308,596 |
2,535,015 |
$ 208,570,308 |
$ 45,737,017 |
|
Reinvestment of distributions |
164,097 |
110,405 |
3,148,401 |
1,432,350 |
|
Shares redeemed |
(1,959,118) |
(677,022) |
(42,565,130) |
(11,443,758) |
|
Net increase (decrease) |
7,513,575 |
1,968,398 |
$ 169,153,579 |
$ 35,725,609 |
|
Class B |
9,362,252 |
2,681,105 |
$ 206,438,662 |
$ 47,915,404 |
|
Reinvestment of distributions |
148,897 |
65,772 |
2,811,062 |
845,886 |
|
Shares redeemed |
(1,069,319) |
(283,363) |
(23,089,637) |
(4,722,842) |
|
Net increase (decrease) |
8,441,830 |
2,463,514 |
$ 186,160,087 |
$ 44,038,448 |
|
Class C |
4,421,163 |
1,045,991 |
$ 97,339,055 |
$ 19,125,937 |
|
Reinvestment of distributions |
57,275 |
17,797 |
1,081,246 |
228,735 |
|
Shares redeemed |
(472,031) |
(108,216) |
(10,178,423) |
(1,876,189) |
|
Net increase (decrease) |
4,006,407 |
955,572 |
$ 88,241,878 |
$ 17,478,483 |
|
Institutional Class |
769,831 |
170,875 |
$ 17,282,002 |
$ 3,122,693 |
|
Reinvestment of distributions |
17,930 |
18,455 |
342,839 |
240,109 |
|
Shares redeemed |
(230,031) |
(61,672) |
(4,684,356) |
(1,023,192) |
|
Net increase (decrease) |
557,730 |
127,658 |
$ 12,940,485 |
$ 2,339,610 |
Telecommunications & Utilities Growth
To the Trustees and Shareholders of Fidelity Advisor Consumer Industries Fund, Fidelity Advisor Cyclical Industries Fund, Fidelity Advisor Financial Services Fund, Fidelity Advisor Health Care Fund, Fidelity Advisor Natural Resources Fund, Fidelity Advisor Technology Fund and Fidelity Advisor Telecommunications & Utilities Growth Fund:
We have audited the accompanying statements of assets and liabilities of Fidelity Advisor Consumer Industries Fund, Fidelity Advisor Cyclical Industries Fund, Fidelity Advisor Financial Services Fund, Fidelity Advisor Health Care Fund, Fidelity Advisor Natural Resources Fund, Fidelity Advisor Technology Fund and Fidelity Advisor Telecommunications & Utilities Growth Fund (formerly Fidelity Advisor Utilities Growth Fund), (the funds), each a fund of Fidelity Advisor Series VII (the Trust), including the portfolios of investments, as of July 31, 2000, and the related statements of operations for the year then ended, the statements of changes in net assets for each of the two years in the period then ended, and the financial highlights for each of the five years in the period then ended. These financial statements and financial highlights are the responsibility of the Funds' management. Our responsibility is to express an opinion on these financial statements and financial highlights based on our audits.
We conducted our audits in accordance with auditing standards generally accepted in the United States of America. Those standards require that we plan and perform the audit to obtain reasonable assurance about whether the financial statements and financial highlights are free of material misstatement. An audit includes examining, on a test basis, evidence supporting the amounts and disclosures in the financial statements. Our procedures included confirmation of securities owned as of July 31, 2000, by correspondence with the custodian and brokers; where replies were not received from brokers, we performed other auditing procedures. An audit also includes assessing the accounting principles used and significant estimates made by management, as well as evaluating the overall financial statement presentation. We believe that our audits provide a reasonable basis for our opinion.
In our opinion, the financial statements and financial highlights referred to above present fairly, in all material respects, the financial position of Fidelity Advisor Consumer Industries Fund, Fidelity Advisor Cyclical Industries Fund, Fidelity Advisor Financial Services Fund, Fidelity Advisor Health Care Fund, Fidelity Advisor Natural Resources Fund, Fidelity Advisor Technology Fund and Fidelity Advisor Telecommunications & Utilities Growth Fund as of July 31, 2000, the results of their operations for the year then ended, the changes in their net assets for each of the two years in the period then ended, and their financial highlights for each of the five years in the period then ended, in conformity with accounting principles generally accepted in the United States of America.
DELOITTE & TOUCHE LLP
Boston, Massachusetts
September 8, 2000
Annual Report
The Board of Trustees of each fund voted to pay to shareholders of record at the opening of business on record date, the following distributions per share derived from capital gains realized from sales of portfolio securities, and dividends derived from net investment income:
|
Institutional Class |
|
|
|
|
|
Fund |
Pay Date |
Record Date |
Dividends |
Capital Gains |
|
Consumer Industries |
9/11/00 |
9/8/00 |
- |
- |
|
Cyclical Industries |
9/11/00 |
9/8/00 |
$0.03 |
$0.33 |
|
Financial Services |
9/11/00 |
9/8/00 |
$0.15 |
- |
|
Health Care |
9/11/00 |
9/8/00 |
- |
$0.81 |
|
Natural Resources |
9/11/00 |
9/8/00 |
$0.13 |
- |
|
Technology |
9/11/00 |
9/8/00 |
- |
$1.67 |
|
Telecommunications & Utilities Growth |
9/11/00 |
9/8/00 |
$0.30 |
$0.26 |
Each fund hereby designates 100% of the long-term capital gain dividends distributed during the fiscal year as 20%-rate capital gain dividends.
Annual Report
Annual Report
Investment Adviser
Fidelity Management & Research Company
Boston, MA
Investment Sub-Advisers
Fidelity Management & Research
(U.K.) Inc.
Fidelity Management & Research
(Far East) Inc.
Fidelity Investments Japan Limited
Officers
Edward C. Johnson 3d, President
Robert C. Pozen, Senior Vice President
Eric D. Roiter, Secretary
Robert A. Dwight, Treasurer
Matthew N. Karstetter, Deputy Treasurer
Maria F. Dwyer, Deputy Treasurer
John H. Costello, Assistant Treasurer
Board of Trustees
Ralph F. Cox *
Phyllis Burke Davis *
Robert M. Gates *
Edward C. Johnson 3d
Donald J. Kirk *
Ned C. Lautenbach *
Peter S. Lynch
Marvin L. Mann *
William O. McCoy *
Gerald C. McDonough *
Robert C. Pozen
Thomas R. Williams *
Advisory Board
J. Michael Cook
Abigail P. Johnson
Marie L. Knowles
* Independent trustees
* Custodian for Fidelity Advisor Natural Resources Fund only
General Distributor
Fidelity Distributors Corporation
Boston, MA
Transfer and Shareholder
Servicing Agent
Fidelity Investments Institutional Operations Company, Inc.
Boston, MA
Custodian
The Chase Manhattan Bank
New York, NY
Brown Brothers Harriman & Co. (dagger)
Boston, MA
Focus Funds
Fidelity Advisor Consumer
Industries Fund
Fidelity Advisor Cyclical
Industries Fund
Fidelity Advisor Financial
Services Fund
Fidelity Advisor Health Care Fund
Fidelity Advisor Natural
Resources Fund
Fidelity Advisor Technology Fund
Fidelity Advisor Telecommunications &
Utilities Growth Fund
Growth Funds
Fidelity Advisor Korea Fund
Fidelity Advisor Emerging Asia Fund
Fidelity Advisor Latin America Fund
Fidelity Advisor Japan Fund
Fidelity Advisor Europe Capital
Appreciation Fund
Fidelity Advisor International Capital
Appreciation Fund
Fidelity Advisor Overseas Fund
Fidelity Advisor Diversified International Fund
Fidelity Advisor Global Equity Fund
Fidelity Advisor TechnoQuant ® Growth Fund
Fidelity Advisor Small Cap Fund
Fidelity Advisor Value Strategies Fund
Fidelity Advisor Mid Cap Fund
Fidelity Advisor Dynamic Capital Appreciation Fund
Fidelity Advisor Equity Growth Fund
Fidelity Advisor Large Cap Fund
Fidelity Advisor Dividend Growth Fund
Fidelity Advisor Growth Opportunities Fund
Growth and Income Funds
Fidelity Advisor Growth & Income Fund
Fidelity Advisor Equity Income Fund
Fidelity Advisor Asset Allocation Fund
Fidelity Advisor Balanced Fund
Taxable Income Funds
Fidelity Advisor Emerging Markets Income Fund
Fidelity Advisor High Yield Fund
Fidelity Advisor High Income Fund
Fidelity Advisor Strategic Income Fund
Fidelity Advisor Mortgage Securities Fund
Fidelity Advisor Government Investment Fund
Fidelity Advisor Intermediate Bond Fund
Fidelity Advisor Short Fixed-Income Fund
Municipal Funds
Fidelity Advisor Municipal Income Fund
Money Market Funds
Prime Fund
Treasury Fund
Tax-Exempt Fund
(Fidelity Investment logo)(registered trademark)
Corporate Headquarters
82 Devonshire St., Boston, MA 02109
www.fidelity.com
BULK RATE
U.S. POSTAGE
PAID
FIDELITY
INVESTMENTS
(Recycle graphic) Printed on Recycled Paper
AFOCI-ANN-0900 110540
1.536455.103
|
|