
|
|
|
|
|
|
|
|
|
|
Previous: DEERE & CO, S-8 POS, 2000-09-27 |
Next: FIDELITY ADVISOR SERIES VII, 485BPOS, EX-99.DADVSRCONTR, 2000-09-27 |
|
SECURITIES AND EXCHANGE COMMISSION |
||||
|
Washington, D.C. 20549 |
||||
|
FORM N-1A |
||||
|
|
||||
|
REGISTRATION STATEMENT (No. 2-67004) |
||||
|
|
UNDER THE SECURITIES ACT OF 1933 |
[X] |
||
|
|
Pre-Effective Amendment No. |
[ ] |
||
|
|
Post-Effective Amendment No. 43 |
[X] |
||
|
and |
||||
|
REGISTRATION STATEMENT (No. 811-3010) |
||||
|
|
UNDER THE INVESTMENT COMPANY ACT OF 1940 |
[X] |
||
|
|
Amendment No. 43 |
[X] |
||
|
|
||||
|
Fidelity Advisor Series VII |
||||
|
(Exact Name of Registrant as Specified in Charter) |
||||
|
|
||||
|
82 Devonshire St., Boston, Massachusetts 02109 |
||||
|
(Address Of Principal Executive Offices) (Zip Code) |
||||
|
|
||||
|
Registrant's Telephone Number: 617-563-7000 |
||||
|
|
||||
|
Eric D. Roiter, Secretary |
||||
|
82 Devonshire Street |
||||
|
Boston, Massachusetts 02109 |
||||
|
(Name and Address of Agent for Service) |
||||
|
|
||||
|
It is proposed that this filing will become effective |
||||
|
|
( ) |
immediately upon filing pursuant to paragraph (b). |
||
|
|
(X) |
on September 28, 2000 pursuant to paragraph (b). |
||
|
|
( ) |
60 days after filing pursuant to paragraph (a)(1). |
||
|
|
( ) |
on ( ) pursuant to paragraph (a)(1) of Rule 485. |
||
|
|
( ) |
75 days after filing pursuant to paragraph (a)(2). |
||
|
|
( ) |
on ( ) pursuant to paragraph (a)(2) of Rule 485. |
||
|
|
||||
|
If appropriate, check the following box: |
||||
|
|
( ) |
this post-effective amendment designates a new effective date for a previously filed post-effective amendment. |
||
Like securities of all mutual funds, these securities have not been approved or disapproved by the Securities and Exchange Commission, and the Securities and Exchange Commission has not determined if this prospectus is accurate or complete. Any representation to the contrary is a criminal offense.
Class A, Class T, Class B, and Class C
Fidelity® Advisor Consumer Industries Fund
Fidelity Advisor Cyclical Industries Fund
Fidelity Advisor Financial Services Fund
Fidelity Advisor Health Care Fund
Fidelity Advisor Natural Resources Fund
Fidelity Advisor Technology Fund
Fidelity Advisor <R>Telecommunications & </R>Utilities Growth Fund (formerly Fidelity Advisor Utilities Growth Fund)
Prospectus
<R>September 28, 2000
(fidelity_logo_graphic)
82 Devonshire Street, Boston, MA 02109</R>
|
Fund Summary |
Investment Summary |
|
|
|
Performance |
|
|
|
Fee Table |
|
|
Fund Basics |
Investment Details |
|
|
|
Valuing Shares |
|
|
Shareholder Information |
Buying and Selling Shares |
|
|
|
Exchanging Shares |
|
|
|
Account Features and Policies |
|
|
|
Dividends and Capital Gain Distributions |
|
|
|
Tax Consequences |
|
|
Fund Services |
Fund Management |
|
|
|
Fund Distribution |
|
|
Appendix |
Financial Highlights |
Prospectus
Investment Objective
Advisor Consumer Industries Fund seeks capital appreciation.
Principal Investment Strategies
Fidelity Management & Research Company (FMR)'s principal investment strategies include:
Principal Investment Risks
The fund is subject to the following principal investment risks:
In addition, the fund is considered non-diversified and can invest a greater portion of assets in securities of individual issuers than a diversified fund. As a result, changes in the market value of a single issuer could cause greater fluctuations in share price than would occur in a more diversified fund.
An investment in the fund is not a deposit of a bank and is not insured or guaranteed by the Federal Deposit Insurance Corporation or any other government agency.
When you sell your shares of the fund, they could be worth more or less than what you paid for them.
Investment Objective
Advisor Cyclical Industries Fund seeks capital appreciation.
Principal Investment Strategies
FMR's principal investment strategies include:
Principal Investment Risks
The fund is subject to the following principal investment risks:
In addition, the fund is considered non-diversified and can invest a greater portion of assets in securities of individual issuers than a diversified fund. As a result, changes in the market value of a single issuer could cause greater fluctuations in share price than would occur in a more diversified fund.
An investment in the fund is not a deposit of a bank and is not insured or guaranteed by the Federal Deposit Insurance Corporation or any other government agency.
When you sell your shares of the fund, they could be worth more or less than what you paid for them.
Prospectus
Fund Summary - continued
Investment Objective
Advisor Financial Services Fund seeks capital appreciation.
Principal Investment Strategies
FMR's principal investment strategies include:
Principal Investment Risks
The fund is subject to the following principal investment risks:
An investment in the fund is not a deposit of a bank and is not insured or guaranteed by the Federal Deposit Insurance Corporation or any other government agency.
When you sell your shares of the fund, they could be worth more or less than what you paid for them.
Investment Objective
Advisor Health Care Fund seeks capital appreciation.
Principal Investment Strategies
FMR's principal investment strategies include:
Principal Investment Risks
The fund is subject to the following principal investment risks:
In addition, the fund is considered non-diversified and can invest a greater portion of assets in securities of individual issuers than a diversified fund. As a result, changes in the market value of a single issuer could cause greater fluctuations in share price than would occur in a more diversified fund.
An investment in the fund is not a deposit of a bank and is not insured or guaranteed by the Federal Deposit Insurance Corporation or any other government agency.
When you sell your shares of the fund, they could be worth more or less than what you paid for them.
Investment Objective
Advisor Natural Resources Fund seeks long-term growth of capital and protection of the purchasing power of shareholders' capital.
Principal Investment Strategies
FMR's principal investment strategies include:
Prospectus
Fund Summary - continued
Principal Investment Risks
The fund is subject to the following principal investment risks:
In addition, the fund is considered non-diversified and can invest a greater portion of assets in securities of individual issuers than a diversified fund. As a result, changes in the market value of a single issuer could cause greater fluctuations in share price than would occur in a more diversified fund.
An investment in the fund is not a deposit of a bank and is not insured or guaranteed by the Federal Deposit Insurance Corporation or any other government agency.
When you sell your shares of the fund, they could be worth more or less than what you paid for them.
Investment Objective
Advisor Technology Fund seeks capital appreciation.
Principal Investment Strategies
FMR's principal investment strategies include:
Principal Investment Risks
The fund is subject to the following principal investment risks:
In addition, the fund is considered non-diversified and can invest a greater portion of assets in securities of individual issuers than a diversified fund. As a result, changes in the market value of a single issuer could cause greater fluctuations in share price than would occur in a more diversified fund.
An investment in the fund is not a deposit of a bank and is not insured or guaranteed by the Federal Deposit Insurance Corporation or any other government agency.
When you sell your shares of the fund, they could be worth more or less than what you paid for them.
Investment Objective
Advisor Telecommunications & Utilities Growth Fund seeks capital appreciation.
Principal Investment Strategies
FMR's principal investment strategies include:
Prospectus
Fund Summary - continued
Principal Investment Risks
The fund is subject to the following principal investment risks:
In addition, the fund is considered non-diversified and can invest a greater portion of assets in securities of individual issuers than a diversified fund. As a result, changes in the market value of a single issuer could cause greater fluctuations in share price than would occur in a more diversified fund.
An investment in the fund is not a deposit of a bank and is not insured or guaranteed by the Federal Deposit Insurance Corporation or any other government agency.
When you sell your shares of the fund, they could be worth more or less than what you paid for them.
The following information illustrates the changes in each fund's performance from year to year, as represented by the performance of Class T, and compares <R>each class's</R> performance to the performance of a market index and an additional index over various periods of time. Returns are based on past results and are not an indication of future performance.
Year-by-Year Returns
The returns in the charts do not include the effect of Class T's front-end sales charge. If the effect of the sales charge were reflected, returns would be lower than those shown.
|
Advisor Consumer Industries - Class T |
||||||||||
|
<R>Calendar Years |
|
|
|
|
|
|
|
1997 |
1998 |
1999</R> |
|
<R> |
|
|
|
|
|
|
|
36.22% |
28.42% |
9.88%</R> |
<R>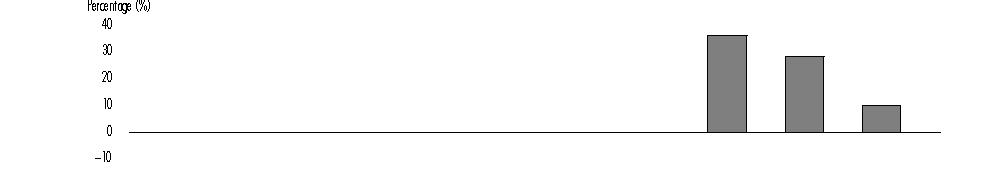
</R>
During the periods shown in the chart for Class T of Advisor Consumer Industries, the highest return for a quarter was <R>26.98% (quarter ended </R>December 31, 1998<R>) </R>and the lowest return for a quarter was -<R>14.41% (quarter ended </R>September 30, 1998).
The year-to-date return as of June 30, <R>2000</R> for Class T of Advisor Consumer Industries was -9.24%.
Prospectus
Fund Summary - continued
|
Advisor Cyclical Industries - Class T |
||||||||||
|
<R>Calendar Years |
|
|
|
|
|
|
|
1997 |
1998 |
1999</R> |
|
<R> |
|
|
|
|
|
|
|
18.60% |
10.93% |
12.50%</R> |
<R>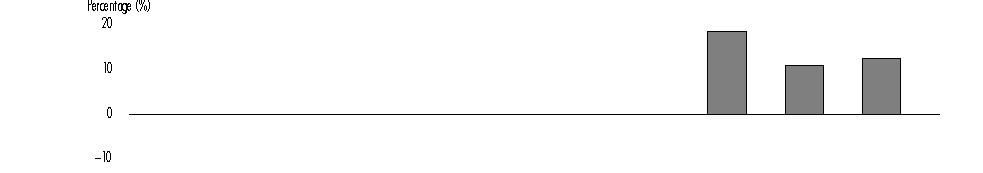
</R>
<R>During the periods shown in the chart for Class T of Advisor Cyclical Industries, the highest return for a quarter was </R>17.86%<R> (quarter ended </R>December 31, 1998<R>) and the lowest return for a quarter was </R>-18.69%<R> (quarter ended </R>September 30, 1998).
The year-to-date return as of June 30, <R>2000</R> for Class T of Advisor Cyclical Industries was -8.42%.
|
Advisor Financial Services - Class T |
||||||||||
|
<R>Calendar Years |
|
|
|
|
|
|
|
1997 |
1998 |
1999</R> |
|
<R> |
|
|
|
|
|
|
|
39.75% |
11.30% |
1.86%</R> |
<R>
</R>
During the periods shown in the chart for Class T of Advisor Financial Services, the highest return for a quarter was 18.66% <R>(quarter ended December 31, 1998)</R> and the lowest return for a quarter was -19.61% <R>(quarter ended </R>September 30, 1998<R>)</R>.<R></R><R></R>
The year-to-date return as of June 30, <R>2000 </R>for Class T of Advisor Financial Services was -0.06%.
|
Advisor Health Care - Class T |
||||||||||
|
<R>Calendar Years |
|
|
|
|
|
|
|
1997 |
1998 |
1999</R> |
|
<R> |
|
|
|
|
|
|
|
30.57% |
39.40% |
1.55%</R> |
<R>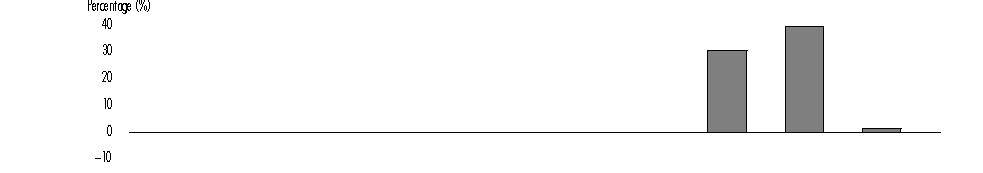
</R>
During the periods shown in the chart for Class T of Advisor Health Care, the highest return for a quarter was 2<R>1.31% (quarter ended </R>June 30, 1997) and the lowest return for a quarter was -<R>8.61 % (quarter ended </R>September 30, 1999).
The year-to-date return as of June 30, <R>2000 </R>for Class T of Advisor Health Care was 24.49%.
Prospectus
Fund Summary - continued
|
Advisor Natural Resources - Class T |
||||||||||
|
<R>Calendar Years |
1990 |
1991 |
1992 |
1993 |
1994 |
1995 |
1996 |
1997 |
1998 |
1999</R> |
|
<R> |
-5.28% |
14.47% |
13.33% |
37.94% |
-2.28% |
28.67% |
30.52% |
-0.79% |
-16.29% |
34.39%</R> |
<R>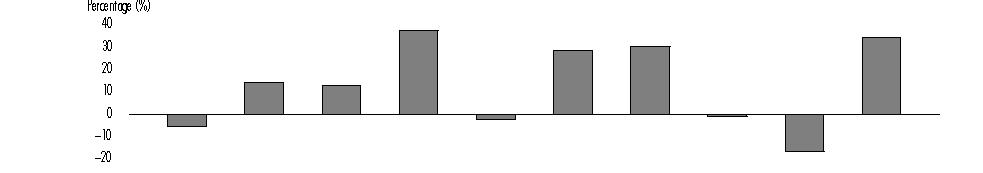
</R>
During the periods shown in the chart for Class T of Advisor Natural Resources, the highest return for a quarter was 19.32% (quarter ended June 30, 1999) and the lowest return for a quarter was -13.22% (quart<R>er ended </R>December 31, 1997).<R></R>
The year-to-date return as of June 30, <R>2000</R> for Class T of Advisor Natural Resources was 13.24%.
|
Advisor Technology - Class T |
||||||||||
|
<R>Calendar Years |
|
|
|
|
|
|
|
1997 |
1998 |
1999</R> |
|
<R> |
|
|
|
|
|
|
|
10.20% |
66.78% |
89.44%</R> |
<R>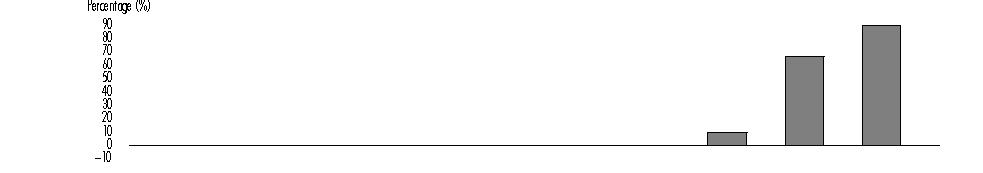
</R>
During the periods shown in the chart for Class T of Advisor Technology, the highest return for a quar<R>ter was </R>49.22%<R> (quarter ended </R>December 31, 1999<R>) and the lowest return for a quarter was </R>-20.02%<R> (quarter ended </R>December 31, 1997).
The year-to-date return as of June 30, <R>2000 </R>for Class T of Advisor Technology was 2.87%.
|
<R>Advisor Telecommunications & Utilities Growth - Class T</R> |
||||||||||
|
<R>Calendar Years |
|
|
|
|
|
|
|
1997 |
1998 |
1999</R> |
|
<R> |
|
|
|
|
|
|
|
29.53% |
32.01% |
43.37%</R> |
<R>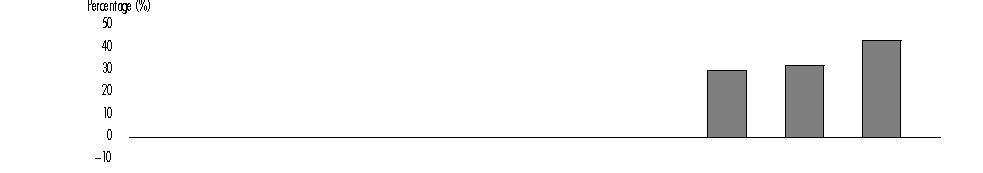
</R>
During the periods shown in the chart for Class T of Advisor <R>Telecommunications & Utilities Growth, the highest return for a quarter was </R>23.31% (quarter ended March 31, 1998) and the lowest return for a quarter w<R>as </R>-5.58% (quarter ended September 30, 1998).<R></R><R></R>
The year-to-date return as of June 30, <R>2000</R> for Class T of Advisor <R>Telecommunications &</R> Utilities Growth was 0.18%.
Prospectus
Fund Summary - continued
Average Annual Returns
The returns in the following table include the effect of Class A's and Class T's maximum applicable front-end sales charge and Class B's and Class C's maximum applicable contingent deferred sales charge (CDSC).
|
<R>For the periods ended |
Past 1 |
Past 5 |
Past 10 |
|
<R>Advisor Consumer Industries - Class A |
3.83% |
E |
22.86%A</R> |
|
<R>Advisor Consumer Industries - Class T |
6.03% |
E |
23.33%A</R> |
|
<R>Advisor Consumer Industries - Class B |
4.37% |
E |
21.90%B</R> |
|
<R>Advisor Consumer Industries - Class C |
8.36% |
E |
19.82%C</R> |
|
<R>S&P 500® |
21.04% |
E |
29.53%A</R> |
|
<R>Goldman Sachs Consumer Industries Index |
8.32% |
E |
22.69%A</R> |
|
<R>Advisor Cyclical Industries - Class A |
6.31% |
E |
14.70%A</R> |
|
<R>Advisor Cyclical Industries - Class T |
8.57% |
E |
15.30%A</R> |
|
<R>Advisor Cyclical Industries - Class B |
6.99% |
E |
11.96%B</R> |
|
<R>Advisor Cyclical Industries - Class C |
10.97% |
E |
10.57%C</R> |
|
<R>S&P 500 |
21.04% |
E |
29.53%A</R> |
|
<R>Goldman Sachs Cyclical Industries Index |
5.54% |
E |
13.04%A</R> |
|
<R>Advisor Financial Services - Class A |
-3.78% |
E |
18.60%A</R> |
|
<R>Advisor Financial Services - Class T |
-1.70% |
E |
19.14%A</R> |
|
<R>Advisor Financial Services - Class B |
-3.66% |
E |
13.30%B</R> |
|
<R>Advisor Financial Services - Class C |
0.39% |
E |
8.71%C</R> |
|
<R>S&P 500 |
21.04% |
E |
29.53%A</R> |
|
<R>Goldman Sachs Financial Services Index |
-0.94% |
E |
22.13%A</R> |
|
<R>Advisor Health Care - Class A |
-4.10% |
E |
21.96%A</R> |
|
<R>Advisor Health Care - Class T |
-2.01% |
E |
22.50%A</R> |
|
<R>Advisor Health Care - Class B |
-3.94% |
E |
19.50%B</R> |
|
<R>Advisor Health Care - Class C |
0.08% |
E |
17.81%C</R> |
|
<R>S&P 500 |
21.04% |
E |
29.53%A</R> |
|
<R>Goldman Sachs Health Care Index |
-4.04% |
E |
24.31%A</R> |
|
<R>Advisor Natural Resources - Class A |
26.88% |
E |
5.04%A</R> |
|
<R>Advisor Natural Resources - Class T |
29.68% |
12.58% |
11.60%</R> |
|
<R>Advisor Natural Resources - Class B |
28.68% |
12.54% |
11.70%D</R> |
|
<R>Advisor Natural Resources - Class C |
32.66% |
E |
0.36%C</R> |
|
<R>S&P 500 |
21.04% |
28.56% |
18.21%D</R> |
|
<R>Goldman Sachs Natural Resources Index |
27.23% |
E |
E</R> |
|
<R>Advisor Technology - Class A |
78.96% |
E |
53.16%A</R> |
|
<R>Advisor Technology - Class T |
82.81% |
E |
53.80%A</R> |
|
<R>Advisor Technology - Class B |
83.48% |
E |
51.94%B</R> |
|
<R>Advisor Technology - Class C |
87.58% |
E |
61.77%C</R> |
|
<R>S&P 500 |
21.04% |
E |
29.53%A</R> |
|
<R>Goldman Sachs Technology Index |
88.87% |
E |
59.95%A</R> |
|
<R>For the periods ended |
Past 1 |
Past 5 |
Past 10 |
|
<R>Advisor Telecommunications & Utilities Growth - Class A |
35.33% |
E |
34.51%A</R> |
|
<R>Advisor Telecommunications & Utilities Growth - Class T |
38.35% |
E |
35.12%A</R> |
|
<R>Advisor Telecommunications & Utilities Growth - Class B |
37.60% |
E |
34.92%B</R> |
|
<R>Advisor Telecommunications & Utilities Growth - Class C |
41.64% |
E |
36.60%C</R> |
|
<R>S&P 500 |
21.04% |
E |
29.53%A</R> |
|
<R>Goldman Sachs Utilities Index |
20.25% |
E |
29.95%A</R> |
A From September 3, 1996.
B From March 3, 1997.
C From November 3, 1997.
D From July 3, 1995.
<R>E Not applicable.</R>
If FMR had not reimbursed certain class expenses during these periods, each <R>class's </R>returns would have been lower, except for Class T and Class C of Advisor Financial Services, Advisor Health Care, and Advisor Technology.
Standard & Poor's 500 SM Index (S&P 500®) is a market capitalization-weighted index of common stocks.
Goldman Sachs Consumer Industries Index is a market capitalization-weighted index of<R> 290</R> stocks designed to measure the performance of companies in the consumer industries sector.
Goldman Sachs Cyclical Industries Index is a market capitalization-weighted index of <R>265</R> stocks designed to measure the performance of companies in the cyclical industries sector.
Goldman Sachs Financial Services Index is a market capitalization-weighted index of <R>251</R> stocks designed to measure the performance of companies in the financial services sector.
Goldman Sachs Health Care Index is a market capitalization-weighted index of <R>86 </R>stocks designed to measure the performance of companies in the health care sector.
Goldman Sachs Natural Resources Index is a market capitalization-weighted index of <R>84</R> stocks designed to measure the performance of companies in the natural resources sector.
Goldman Sachs Technology Index is a market capitalization-weighted index of <R>159 </R>stocks designed to measure the performance of companies in the technology sector.
Goldman Sachs Utilities Index is a market capitalization-weighted index of <R>130</R> stocks designed to measure the performance of companies in the utilities sector.
The following table describes the fees and expenses that are incurred when you buy, hold, or sell Class A, Class T, Class B, and Class C shares of a fund. The annual class operating expenses provided below for each class do not reflect the effect of any expense reimbursements or reduction of certain expenses during the period.
Shareholder fees (paid by the investor directly)
|
|
Class A |
Class T |
Class B |
Class C |
|
Maximum sales charge (load) on purchases (as a % of offering price) |
5.75%A |
3.50%B |
None |
None |
|
Maximum CDSC (as a % of the lesser of original purchase price or redemption proceeds) |
NoneC |
NoneC |
5.00%D |
1.00%E |
|
Sales charge (load) on reinvested distributions |
None |
None |
None |
None |
|
Redemption fee on shares held less than 60 days (as a % of amount redeemed) |
1.00% |
1.00% |
1.00% |
1.00% |
A Lower front-end sales charges for Class A may be available with purchase of $50,000 or more.
B Lower front-end sales charges for Class T may be available with purchase of $50,000 or more.
C A contingent deferred sales charge of 0.25% is assessed on certain redemptions of Class A and Class T shares on which a finder's fee was paid.
D Declines over 6 years from 5.00% to 0%.
E On Class C shares redeemed within one year of purchase.
Prospectus
Fund Summary - continued
Annual class operating expenses (paid from class assets)
|
|
|
Class A |
Class T |
Class B |
Class C |
|
<R>Advisor Consumer Industries |
Management fee |
0.58% |
0.58% |
0.58% |
0.58%</R> |
|
|
Distribution and Service (12b-1) fee (including 0.25% Service fee only for Class B and Class C) |
0.25% |
0.50% |
1.00% |
1.00% |
|
<R> |
Other expenses |
0.79% |
0.77% |
0.83% |
0.84%</R> |
|
<R> |
Total annual class operating expensesA |
1.62% |
1.85% |
2.41% |
2.42%</R> |
|
<R>Advisor Cyclical Industries |
Management fee |
0.58% |
0.58% |
0.58% |
0.58%</R> |
|
|
Distribution and Service (12b-1) fee (including 0.25% Service fee only for Class B and Class C) |
0.25% |
0.50% |
1.00% |
1.00% |
|
<R> |
Other expenses |
2.04% |
2.04% |
2.06% |
2.04%</R> |
|
<R> |
Total annual class operating expensesA |
2.87% |
3.12% |
3.64% |
3.62%</R> |
|
<R>Advisor Financial Services |
Management fee |
0.58% |
0.58% |
0.58% |
0.58%</R> |
|
|
Distribution and Service (12b-1) fee (including 0.25% Service fee only for Class B and Class C) |
0.25% |
0.50% |
1.00% |
1.00% |
|
<R> |
Other expenses |
0.42% |
0.39% |
0.43% |
0.38%</R> |
|
<R> |
Total annual class operating expensesA |
1.25% |
1.47% |
2.01% |
1.96%</R> |
|
<R>Advisor Health Care |
Management fee |
0.58% |
0.58% |
0.58% |
0.58%</R> |
|
|
Distribution and Service (12b-1) fee (including 0.25% Service fee only for Class B and Class C) |
0.25% |
0.50% |
1.00% |
1.00% |
|
<R> |
Other expenses |
0.37% |
0.34% |
0.36% |
0.33%</R> |
|
<R> |
Total annual class operating expensesA |
1.20% |
1.42% |
1.94% |
1.91%</R> |
|
<R>Advisor Natural Resources |
Management fee |
0.58% |
0.58% |
0.58% |
0.58%</R> |
|
|
Distribution and Service (12b-1) fee (including 0.25% Service fee only for Class B and Class C) |
0.25% |
0.50% |
1.00% |
1.00% |
|
<R> |
Other expenses |
0.43% |
0.33% |
0.38% |
0.33%</R> |
|
<R> |
Total annual class operating expensesA |
1.26% |
1.41% |
1.96% |
1.91%</R> |
|
<R>Advisor Technology |
Management fee |
0.58% |
0.58% |
0.58% |
0.58%</R> |
|
|
Distribution and Service (12b-1) fee (including 0.25% Service fee only for Class B and Class C) |
0.25% |
0.50% |
1.00% |
1.00% |
|
<R> |
Other expenses |
0.33% |
0.30% |
0.33% |
0.31%</R> |
|
<R> |
Total annual class operating expensesA |
1.16% |
1.38% |
1.91% |
1.89%</R> |
|
<R>Advisor Telecommunications & |
Management fee |
0.58% |
0.58% |
0.58% |
0.58%</R> |
|
|
Distribution and Service (12b-1) fee (including 0.25% Service fee only for Class B and Class C) |
0.25% |
0.50% |
1.00% |
1.00% |
|
<R> |
Other expenses |
0.37% |
0.36% |
0.38% |
0.35%</R> |
|
<R> |
Total annual class operating expensesA |
1.20% |
1.44% |
1.96% |
1.93%</R> |
A FMR has voluntarily agreed to reimburse Class A, Class T, Class B, and Class C of each fund to the extent that total operating expenses (excluding interest, taxes, <R>certain</R> securities lending <R>costs</R>, brokerage commissions, and extraordinary expenses), as a percentage of their respective average net assets, exceed the following rates:
Prospectus
Fund Summary - continued
|
|
Class A |
Effective |
Class T |
Effective |
Class B |
Effective |
Class C |
Effective |
|
Advisor Consumer Industries |
1.50% |
12/1/98 |
1.75% |
12/1/98 |
2.25% |
12/1/98 |
2.25% |
12/1/98 |
|
Advisor Cyclical Industries |
1.50% |
12/1/98 |
1.75% |
12/1/98 |
2.25% |
12/1/98 |
2.25% |
12/1/98 |
|
Advisor Financial Services |
1.50% |
12/1/98 |
1.75% |
12/1/98 |
2.25% |
12/1/98 |
2.25% |
12/1/98 |
|
Advisor Health Care |
1.50% |
12/1/98 |
1.75% |
12/1/98 |
2.25% |
12/1/98 |
2.25% |
12/1/98 |
|
Advisor Natural Resources |
1.50% |
12/1/98 |
1.75% |
12/1/98 |
2.25% |
12/1/98 |
2.25% |
12/1/98 |
|
Advisor Technology |
1.50% |
12/1/98 |
1.75% |
12/1/98 |
2.25% |
12/1/98 |
2.25% |
12/1/98 |
|
<R>Advisor Telecommunications & Utilities Growth |
1.50% |
12/1/98 |
1.75% |
12/1/98 |
2.25% |
12/1/98 |
2.25% |
12/1/98</R> |
These arrangements can be discontinued by FMR at any time.
<R>A portion of the brokerage commissions that a fund pays is used to reduce that fund's expenses. In addition, through arrangements with each fund's custodian and transfer agent, credits realized as a result of uninvested cash balances are used to reduce custodian and transfer agent expenses. Including these reductions, the total Class A, Class T, Class B, and Class C operating expenses are shown in the table below.</R>
|
|
Class A |
|
Class T |
|
Class B |
|
Class C |
|
<R>Advisor Consumer IndustriesA |
1.49% |
|
1.73% |
|
2.24% |
|
2.24%</R> |
|
<R>Advisor Cyclical IndustriesA |
1.49% |
|
1.74% |
|
2.24% |
|
2.24%</R> |
|
<R>Advisor Financial Services |
1.22% |
|
1.44% |
|
1.98% |
|
1.93%</R> |
|
<R>Advisor Health Care |
1.18% |
|
1.40% |
|
1.93% |
|
1.89%</R> |
|
<R>Advisor Natural Resources |
1.21% |
|
1.37% |
|
1.92% |
|
1.87%</R> |
|
<R>Advisor Technology |
1.15% |
|
1.37% |
|
1.91% |
|
1.89%</R> |
|
<R>Advisor Telecommunications & Utilities Growth |
1.17% |
|
1.41% |
|
1.93% |
|
1.90%</R> |
A After reimbursement.
This example helps you compare the cost of investing in the funds with the cost of investing in other mutual funds.
Let's say, hypothetically, that each class's annual return is 5% and that your shareholder fees and each class's annual operating expenses are exactly as described in the fee table. This example illustrates the effect of fees and expenses, but is not meant to suggest actual or expected fees and expenses or returns, all of which may vary. For every $10,000 you invested, here's how much you would pay in total expenses if you close your account <R>at the end of each time period </R>indicated and if you leave your account open:
|
|
|
Class A |
Class T |
Class B |
Class C |
||||
|
|
|
Account open |
Account closed |
Account open |
Account closed |
Account open |
Account closed |
Account open |
Account closed |
|
<R>Advisor Consumer Industries |
1 year |
$ 730 |
$ 730 |
$ 531 |
$ 531 |
$ 244 |
$ 744 |
$ 245 |
$ 345</R> |
|
<R> |
3 years |
$ 1,057 |
$ 1,057 |
$ 911 |
$ 911 |
$ 751 |
$ 1,051 |
$ 755 |
$ 755</R> |
|
<R> |
5 years |
$ 1,406 |
$ 1,406 |
$ 1,316 |
$ 1,316 |
$ 1,285 |
$ 1,485 |
$ 1,291 |
$ 1,291</R> |
|
<R> |
10 years |
$ 2,386 |
$ 2,386 |
$ 2,443 |
$ 2,443 |
$ 2,459A |
$ 2,459A |
$ 2,756 |
$ 2,756</R> |
|
<R>Advisor Cyclical Industries |
1 year |
$ 848 |
$ 848 |
$ 654 |
$ 654 |
$ 366 |
$ 866 |
$ 364 |
$ 464</R> |
|
<R> |
3 years |
$ 1,413 |
$ 1,413 |
$ 1,279 |
$ 1,279 |
$ 1,114 |
$ 1,414 |
$ 1,109 |
$ 1,109</R> |
|
<R> |
5 years |
$ 2,001 |
$ 2,001 |
$ 1,928 |
$ 1,928 |
$ 1,883 |
$ 2,083 |
$ 1,873 |
$ 1,873</R> |
|
<R> |
10 years |
$ 3,586 |
$ 3,586 |
$ 3,660 |
$ 3,660 |
$ 3,649A |
$ 3,649A |
$ 3,880 |
$ 3,880</R> |
|
Advisor Financial Services |
1 year |
$ 695 |
$ 695 |
$ 494 |
$ 494 |
$ 204 |
$ 704 |
$ 199 |
$ 299 |
|
|
3 years |
$ 949 |
$ 949 |
$ 799 |
$ 799 |
$ 630 |
$ 930 |
$ 615 |
$ 615 |
|
|
5 years |
$ 1,222 |
$ 1,222 |
$ 1,125 |
$ 1,125 |
$ 1,083 |
$ 1,283 |
$ 1,057 |
$ 1,057 |
|
|
10 years |
$ 1,999 |
$ 1,999 |
$ 2,046 |
$ 2,046 |
$ 2,050A |
$ 2,050A |
$ 2,285 |
$ 2,285 |
|
Advisor Health Care |
1 year |
$ 690 |
$ 690 |
$ 489 |
$ 489 |
$ 197 |
$ 697 |
$ 194 |
$ 294 |
|
|
3 years |
$ 934 |
$ 934 |
$ 784 |
$ 784 |
$ 609 |
$ 909 |
$ 600 |
$ 600 |
|
|
5 years |
$ 1,197 |
$ 1,197 |
$ 1,099 |
$ 1,099 |
$ 1,047 |
$ 1,247 |
$ 1,032 |
$ 1,032 |
|
|
10 years |
$ 1,946 |
$ 1,946 |
$ 1,992 |
$ 1,992 |
$ 1,982A |
$ 1,982A |
$ 2,233 |
$ 2,233 |
|
Advisor Natural Resources |
1 year |
$ 696 |
$ 696 |
$ 489 |
$ 489 |
$ 199 |
$ 699 |
$ 194 |
$ 294 |
|
|
3 years |
$ 952 |
$ 952 |
$ 781 |
$ 781 |
$ 615 |
$ 915 |
$ 600 |
$ 600 |
|
|
5 years |
$ 1,227 |
$ 1,227 |
$ 1,094 |
$ 1,094 |
$ 1,057 |
$ 1,257 |
$ 1,032 |
$ 1,032 |
|
|
10 years |
$ 2,010 |
$ 2,010 |
$ 1,982 |
$ 1,982 |
$ 2,019A |
$ 2,019A |
$ 2,233 |
$ 2,233 |
|
Advisor Technology |
1 year |
$ 686 |
$ 686 |
$ 486 |
$ 486 |
$ 194 |
$ 694 |
$ 192 |
$ 292 |
|
|
3 years |
$ 922 |
$ 922 |
$ 772 |
$ 772 |
$ 600 |
$ 900 |
$ 594 |
$ 594 |
|
|
5 years |
$ 1,177 |
$ 1,177 |
$ 1,079 |
$ 1,079 |
$ 1,032 |
$ 1,232 |
$ 1,021 |
$ 1,021 |
|
|
10 years |
$ 1,903 |
$ 1,903 |
$ 1,949 |
$ 1,949 |
$ 1,946A |
$ 1,946A |
$ 2,212 |
$ 2,212 |
|
<R>Advisor Telecommunications & |
1 year |
$ 690 |
$ 690 |
$ 491 |
$ 491 |
$ 199 |
$ 699 |
$ 196 |
$ 296</R> |
|
|
3 years |
$ 934 |
$ 934 |
$ 790 |
$ 790 |
$ 615 |
$ 915 |
$ 606 |
$ 606 |
|
|
5 years |
$ 1,197 |
$ 1,197 |
$ 1,109 |
$ 1,109 |
$ 1,057 |
$ 1,257 |
$ 1,042 |
$ 1,042 |
|
|
10 years |
$ 1,946 |
$ 1,946 |
$ 2,014 |
$ 2,014 |
$ 1,996A |
$ 1,996A |
$ 2,254 |
$ 2,254 |
A Reflects conversion to Class A shares after<R> a maximum of </R>seven years.
Prospectus
Investment Objective
Advisor Consumer Industries Fund seeks capital appreciation.
Principal Investment Strategies
FMR normally invests the fund's assets primarily in common stocks.
FMR invests the fund's assets primarily in companies engaged in the manufacture and distribution of goods to consumers both domestically and internationally.
FMR normally invests at least 80% of the fund's assets in securities of companies principally engaged in the business activities of the consumer industries sector. These companies may include, for example, companies that manufacture or sell durable goods such as homes, cars, boats, furniture, major appliances, and personal computers; and companies that manufacture, wholesale, or retail non-durable goods such as food, beverages, tobacco, health care products, household and personal care products, apparel, and entertainment products (e.g., books, magazines, TV, cable, movies, music, gaming, and sports). They may also include companies that provide consumer services such as lodging, child care, convenience stores, and car rentals.
FMR may invest the fund's assets in securities of foreign issuers in addition to securities of domestic issuers.
Because the fund is considered non-diversified, FMR may invest a significant percentage of the fund's assets in a single issuer.
In buying and selling securities for the fund, FMR relies on fundamental analysis of each issuer and its potential for success in light of its current financial condition, its industry position, and economic and market conditions. Factors considered include growth potential, earnings estimates, and management.
FMR may lend the fund's securities to broker-dealers or other institutions to earn income for the fund.
FMR may use various techniques, such as buying and selling futures contracts, to increase or decrease the fund's exposure to changing security prices or other factors that affect security values. If FMR's strategies do not work as intended, the fund may not achieve its objective.
Investment Objective
Advisor Cyclical Industries Fund seeks capital appreciation.
Principal Investment Strategies
FMR normally invests the fund's assets primarily in common stocks.
FMR invests the fund's assets primarily in companies engaged in the research, development, manufacture, distribution, supply, or sale of materials, equipment, products, or services related to cyclical industries.
FMR normally invests at least 80% of the fund's assets in securities of companies principally engaged in the business activities of the cyclical industries sector. These companies may include, for example, companies in the automotive, chemical, construction and housing, defense and aerospace, environmental services, industrial equipment and materials, paper and forest products, and transportation industries.
FMR may invest the fund's assets in securities of foreign issuers in addition to securities of domestic issuers.
Because the fund is considered non-diversified, FMR may invest a significant percentage of the fund's assets in a single issuer.
In buying and selling securities for the fund, FMR relies on fundamental analysis of each issuer and its potential for success in light of its current financial condition, its industry position, and economic and market conditions. Factors considered include growth potential, earnings estimates, and management.
FMR may lend the fund's securities to broker-dealers or other institutions to earn income for the fund.
FMR may use various techniques, such as buying and selling futures contracts, to increase or decrease the fund's exposure to changing security prices or other factors that affect security values. If FMR's strategies do not work as intended, the fund may not achieve its objective.
Investment Objective
Advisor Financial Services Fund seeks capital appreciation.
Principal Investment Strategies
FMR normally invests the fund's assets primarily in common stocks.
FMR invests the fund's assets primarily in companies providing financial services to consumers and industry.
FMR normally invests at least 80% of the fund's assets in securities of companies principally engaged in the business activities of the financial services sector. These companies may include, for example, commercial banks, savings and loan associations, brokerage companies, insurance companies, real estate-related companies, leasing companies, and consumer and industrial finance companies.
FMR may invest the fund's assets in securities of foreign issuers in addition to securities of domestic issuers.
In buying and selling securities for the fund, FMR relies on fundamental analysis of each issuer and its potential for success in light of its current financial condition, its industry position, and economic and market conditions. Factors considered include growth potential, earnings estimates, and management.
FMR may lend the fund's securities to broker-dealers or other institutions to earn income for the fund.
FMR may use various techniques, such as buying and selling futures contracts, to increase or decrease the fund's exposure to changing security prices or other factors that affect security values. If FMR's strategies do not work as intended, the fund may not achieve its objective.
Prospectus
Fund Basics - continued
Investment Objective
Advisor Health Care Fund seeks capital appreciation.
Principal Investment Strategies
FMR normally invests the fund's assets primarily in common stocks.
FMR invests the fund's assets primarily in companies engaged in the design, manufacture, or sale of products or services used for or in connection with health care or medicine.
FMR normally invests at least 80% of the fund's assets in securities of companies principally engaged in the business activities of the health care sector. These companies may include, for example, pharmaceutical companies; companies involved in biotechnology, medical diagnostic, biochemical, or other health care research and development; companies involved in the operation of health care facilities; and other companies involved in the design, manufacture, or sale of health care-related products or services, such as medical, dental, and optical products, hardware, or services.
FMR may invest the fund's assets in securities of foreign issuers in addition to securities of domestic issuers.
Because the fund is considered non-diversified, FMR may invest a significant percentage of the fund's assets in a single issuer.
In buying and selling securities for the fund, FMR relies on fundamental analysis of each issuer and its potential for success in light of its current financial condition, its industry position, and economic and market conditions. Factors considered include growth potential, earnings estimates, and management.
FMR may lend the fund's securities to broker-dealers or other institutions to earn income for the fund.
FMR may use various techniques, such as buying and selling futures contracts, to increase or decrease the fund's exposure to changing security prices or other factors that affect security values. If FMR's strategies do not work as intended, the fund may not achieve its objective.
Investment Objective
Advisor Natural Resources Fund seeks long-term growth of capital and protection of the purchasing power of shareholders' capital.
Principal Investment Strategies
FMR normally invests the fund's assets primarily in common stocks and in certain precious metals.
FMR invests the fund's assets primarily in companies that own or develop natural resources, or supply goods and services to such companies, or in physical commodities.
FMR normally invests at least 80% of the fund's assets in securities of companies principally engaged in the business activities of the natural resources sector. These companies may include, for example, companies involved either directly or through subsidiaries in exploring, mining, refining, processing, transporting, fabricating, dealing in, or owning natural resources. Natural resources include precious metals (e.g., gold, platinum, and silver), ferrous and nonferrous metals (e.g., iron, aluminum, and copper), strategic metals (e.g., uranium and titanium), hydrocarbons (e.g., coal, oil, and natural gases), chemicals, forest products, real estate, food, textile and tobacco products, and other basic commodities. FMR treats investments in instruments whose value is linked to the price of precious metals as investments in precious metals.
FMR may invest the fund's assets in securities of foreign issuers in addition to securities of domestic issuers.
Because the fund is considered non-diversified, FMR may invest a significant percentage of the fund's assets in a single issuer.
In buying and selling securities for the fund, FMR relies on fundamental analysis of each issuer and its potential for success in light of its current financial condition, its industry position, and economic and market conditions. Factors considered include growth potential, earnings estimates, and management.
FMR may lend the fund's securities to broker-dealers or other institutions to earn income for the fund.
FMR may use various techniques, such as buying and selling futures contracts, to increase or decrease the fund's exposure to changing security prices or other factors that affect security values. If FMR's strategies do not work as intended, the fund may not achieve its objective.
Investment Objective
Advisor Technology Fund seeks capital appreciation.
Principal Investment Strategies
FMR normally invests the fund's assets primarily in common stocks.
FMR invests the fund's assets primarily in companies which have, or will develop, products, processes, or services that will provide or will benefit significantly from technological advances and improvements.
FMR normally invests at least 80% of the fund's assets in securities of companies principally engaged in the business activities of the technology sector. These companies may include, for example, companies that develop, produce, or distribute products or services in the computer, semi-conductor, electronics, communications, health care, and biotechnology sectors.
FMR may invest the fund's assets in securities of foreign issuers in addition to securities of domestic issuers.
Because the fund is considered non-diversified, FMR may invest a significant percentage of the fund's assets in a single issuer.
Prospectus
Fund Basics - continued
In buying and selling securities for the fund, FMR relies on fundamental analysis of each issuer and its potential for success in light of its current financial condition, its industry position, and economic and market conditions. Factors considered include growth potential, earnings estimates, and management.
FMR may lend the fund's securities to broker-dealers or other institutions to earn income for the fund.
FMR may use various techniques, such as buying and selling futures contracts, to increase or decrease the fund's exposure to changing security prices or other factors that affect security values. If FMR's strategies do not work as intended, the fund may not achieve its objective.
Investment Objective
Advisor <R>Telecommunications &</R> Utilities Growth Fund seeks capital appreciation.
Principal Investment Strategies
FMR normally invests the fund's assets primarily in common stocks.
FMR invests the fund's assets primarily in companies in the public utilities industry and companies deriving a majority of their revenues from their public utility operations.
FMR normally invests at least 80% of the fund's assets in securities of companies principally engaged in the business activities of the utilities sector. These companies may include, for example, companies that manufacture, produce, generate, transmit, or sell gas or electric energy; water supply, waste disposal and sewerage, and sanitary service companies; and companies involved in the communication field, including telephone, telegraph, satellite, microwave, and the provision of other communication facilities for the public benefit.
FMR may invest the fund's assets in securities of foreign issuers in addition to securities of domestic issuers.
Because the fund is considered non-diversified, FMR may invest a significant percentage of the fund's assets in a single issuer.
In buying and selling securities for the fund, FMR relies on fundamental analysis of each issuer and its potential for success in light of its current financial condition, its industry position, and economic and market conditions. Factors considered include growth potential, earnings estimates, and management.
FMR may lend the fund's securities to broker-dealers or other institutions to earn income for the fund.
FMR may use various techniques, such as buying and selling futures contracts, to increase or decrease the fund's exposure to changing security prices or other factors that affect security values. If FMR's strategies do not work as intended, the fund may not achieve its objective.
Description of Principal Security Types
Equity securities represent an ownership interest, or the right to acquire an ownership interest, in an issuer. Different types of equity securities provide different voting and dividend rights and priority in the event of the bankruptcy of the issuer. Equity securities include common stocks, preferred stocks, convertible securities, and warrants.
Principal Investment Risks
Many factors affect each fund's performance. A fund's share price changes daily based on changes in market conditions and interest rates and in response to other economic, political, or financial developments. A fund's reaction to these events will be affected by the types of securities in which the fund invests, the financial condition, industry and economic sector, and geographic location of an issuer, and the fund's level of investment in the securities of that issuer. Because FMR concentrates each fund's investments in a particular <R>group of industries, the f</R>und's <R>performance could depend heavily on the</R> performance of that <R>group of industries and could</R> be more volatile than the performance of less concentrated funds. In addition, because FMR may invest a significant percentage of the assets of each fund (except Advisor Financial Services) in a single issuer, the fund's performance could be closely tied to the market value of that one issuer and could be more volatile than the performance of more diversified funds. When you sell your shares of a fund, they could be worth more or less than what you paid for them.
The following factors can significantly affect a fund's performance:
Stock Market Volatility. The value of equity securities fluctuates in response to issuer, political, market, and economic developments. In the short term, equity prices can fluctuate dramatically in response to these developments. Different parts of the market and different types of equity securities can react differently to these developments. For example, large cap stocks can react differently from small cap stocks, and "growth" stocks can react differently from "value" stocks. Issuer, political, or economic developments can affect a single issuer, issuers within an industry or economic sector or geographic region, or the market as a whole.
Foreign Exposure. Foreign securities, foreign currencies, and securities issued by U.S. entities with substantial foreign operations can involve additional risks relating to political, economic, or regulatory conditions in foreign countries. These risks include fluctuations in foreign currencies; withholding or other taxes; trading, settlement, custodial, and other operational risks; and the less stringent investor protection and disclosure standards of some foreign markets. All of these factors can make foreign investments, especially those in emerging markets, more volatile and potentially less liquid than U.S. investments. In addition, foreign markets can perform differently from the U.S. market.
Industry Concentration. Market conditions, interest rates, and economic, regulatory, or financial developments could significantly affect a <R>group of related industries</R>, and the securities of companies in that <R>group of related industries</R> could react similarly to these or other developments.
The consumer industries can be significantly affected by the performance of the overall economy, interest rates, competition, and consumer confidence. Success can depend heavily on disposable household income and consumer spending. Changes in demographics and consumer tastes can also affect the demand for, and success of, consumer products.
Prospectus
Fund Basics - continued
The cyclical industries can be significantly affected by general economic trends, including employment, economic growth, and interest rates, changes in consumer sentiment and spending, commodity prices, legislation, government regulation and spending, import controls, and worldwide competition. For example, commodity price declines and unit volume reductions resulting from an over-supply of materials used in cyclical industries can adversely affect those industries. Furthermore, a company in the cyclical industries can be subject to liability for environmental damage, depletion of resources, and mandated expenditures for safety and pollution control.
<R>The financial services industries are subject to extensive government regulation which can limit both the amounts and types of loans and other financial commitments they can make, and the interest rates and fees they can charge. Profitability can be largely dependent on the availability and cost of capital funds, and can fluctuate significantly when interest rates change. Credit losses resulting from financial difficulties of borrowers can negatively affect the financial services industries. Insurance companies can be subject to severe price competition. The financial services industries are currently undergoing relatively rapid change as existing distinctions between financial service segments become less clear. For example, recent business combinations have included insurance, finance, and securities brokerage under single ownership. Some primarily retail corporations have expanded into securities and insurance industries.</R>
The health care industries are subject to government regulation and <R>reimbursement rates, as well as</R> government approval of products and services, which could have a significant effect on price and availability. Furthermore, the types of products or services produced or provided by health care companies quickly can become obsolete. In addition, pharmaceutical companies and other companies in the health care industries can be significantly affected by patent expirations.
The natural resources industries can be significantly affected by events relating to international political and economic developments, energy conservation, the success of exploration projects, and tax and other government regulations.
The technology industries can be significantly affected by obsolescence of existing technology, short product cycles, falling prices and profits, and competition from new market entrants.
The utilities industries can be significantly affected by government regulation, financing difficulties, supply and demand of services or fuel, and natural resource conservation.
Issuer-Specific Changes. Changes in the financial condition of an issuer, changes in specific economic or political conditions that affect a particular type of security or issuer, and changes in general economic or political conditions can affect the value of an issuer's securities. The value of securities of smaller, less well-known issuers can be more volatile than that of larger issuers. Smaller issuers can have more limited product lines, markets, or financial resources.
In response to market, economic, political, or other conditions, FMR may temporarily use a different investment strategy for defensive purposes. If FMR does so, different factors could affect a fund's performance and the fund may not achieve its investment objective.
Fundamental Investment Policies
The policies discussed below are fundamental, that is, subject to change only by shareholder approval.
Advisor Consumer Industries Fund invests primarily in companies engaged in the manufacture and distribution of goods to consumers both domestically and internationally.
Advisor Cyclical Industries Fund invests primarily in companies engaged in the research, development, manufacture, distribution, supply or sale of materials, equipment, products or services related to cyclical industries.
Advisor Financial Services Fund invests primarily in companies providing financial services to consumers and industry.
Advisor Health Care Fund invests primarily in companies engaged in the design, manufacture, or sale of products or services used for or in connection with health care or medicine.
Advisor Natural Resources Fund seeks long-term growth of capital and protection of the purchasing power of shareholders' capital by investing primarily in securities of foreign and domestic companies that own or develop natural resources, or supply goods and services to such companies, or in physical commodities.
Advisor Technology Fund invests primarily in companies which have, or will develop, products, processes or services that will provide or will benefit significantly from technological advances and improvements.
Advisor <R>Telecommunications &</R> Utilities Growth Fund invests primarily in companies in the public utilities industry and companies deriving a majority of their revenues from their public utility operations.
Each of Advisor Consumer Industries, Advisor Cyclical Industries, Advisor Financial Services, Advisor Health Care, Advisor Technology and Advisor <R>Telecommunications & </R>Utilities Growth seeks capital appreciation.
Each fund is open for business each day the New York Stock Exchange (NYSE) is open.
A class's net asset value per share (NAV) is the value of a single share. Fidelity normally calculates each class's NAV as of the close of business of the NYSE, normally 4:00 p.m. Eastern time. However, NAV may be calculated earlier if trading on the NYSE is restricted or as permitted by the Securities and Exchange Commission (SEC). Each fund's assets are valued as of this time for the purpose of computing each class's NAV.
Prospectus
Fund Basics - continued
To the extent that each fund's assets are traded in other markets on days when the NYSE is closed, the value of the fund's assets may be affected on days when the fund is not open for business. In addition, trading in some of a fund's assets may not occur on days when the fund is open for business.
Each fund's assets are valued primarily on the basis of market quotations. Certain short-term securities are valued on the basis of amortized cost. If market quotations are not readily available <R>or do not accurately reflect fair value</R> for a security or if a security's value has been materially affected by events occurring after the close of the exchange or market on which the security is principally traded (for example, a foreign exchange or market), that security may be valued by another method that the Board of Trustees believes accurately reflects fair value. A security's valuation may differ depending on the method used for determining value.
Prospectus
General Information
For account, product, and service information, please use the following phone numbers:
Please use the following addresses:
Buying or Selling Shares
Fidelity Investments
P.O. Box 770002
Cincinnati, OH 45277-0081
Overnight Express
Fidelity Investments
2300 Litton Lane - KH2A
Hebron, KY 41048
You may buy or sell Class A, Class T, Class B, and Class C shares of the funds through a retirement account or an investment professional. When you invest through a retirement account or an investment professional, the procedures for buying, selling, and exchanging Class A, Class T, Class B, and Class C shares of a fund and the account features and policies may differ. Additional fees may also apply to your investment in Class A, Class T, Class B, and Class C shares of a fund, including a transaction fee if you buy or sell Class A, Class T, Class B, and Class C shares of the fund through a broker or other investment professional.
Certain methods of contacting Fidelity, such as by telephone, may be unavailable or delayed (for example, during periods of unusual market activity).
The different ways to set up (register) your account with Fidelity are listed in the following table.
|
Ways to Set Up Your Account |
|
Individual or Joint Tenant For your general investment needs |
|
Retirement For tax-advantaged retirement savings |
|
|
|
|
|
|
|
|
|
Gifts or Transfers to a Minor (UGMA, UTMA) To invest for a child's education or other future needs |
|
Trust For money being invested by a trust |
|
Business or Organization For investment needs of corporations, associations, partnerships, or other groups |
Buying Shares
The price to buy one share of Class A or Class T is the class's offering price or the class's NAV, depending on whether you pay a front-end sales charge.
For Class B and Class C, the price to buy one share is the class's NAV. Class B and Class C shares are sold without a front-end sales charge, but may be subject to a CDSC upon redemption.
If you pay a front-end sales charge, your price will be Class A's or Class T's offering price. When you buy Class A or Class T shares at the offering price, Fidelity deducts the appropriate sales charge and invests the rest in Class A or Class T shares of the fund. If you qualify for a front-end sales charge waiver, your price will be Class A's or Class T's NAV.
The offering price of Class A or Class T is its NAV divided by the difference between one and the applicable front-end sales charge percentage. Class A has a maximum front-end sales charge of 5.75% of the offering price. Class T has a maximum front-end sales charge of 3.50% of the offering price.
Your shares will be bought at the next offering price or NAV, as applicable, calculated after your order is received in proper form.
It is the responsibility of your investment professional to transmit your order to buy shares to Fidelity before the close of business on the day you place your order.
Short-term or excessive trading into and out of a fund may harm performance by disrupting portfolio management strategies and by increasing expenses. Accordingly, a fund may reject any purchase orders, including exchanges, particularly from market timers or investors who, in FMR's opinion, have a pattern of short-term or excessive trading or whose trading has been or may be disruptive to that fund. For these purposes, FMR may consider an investor's trading history in that fund or other Fidelity funds, and accounts under common ownership or control.
Each fund may stop offering shares completely or may offer shares only on a limited basis, for a period of time or permanently.
When you place an order to buy shares, note the following:
Prospectus
Shareholder Information - continued
Shares can be bought or sold through investment professionals using an automated order placement and settlement system that guarantees payment for orders on a specified date.
Certain financial institutions that meet creditworthiness criteria established by Fidelity Distributors Corporation (FDC) may enter confirmed purchase orders on behalf of customers by phone, with payment to follow no later than close of business on the next business day. If payment is not received by that time, the order will be canceled and the financial institution will be liable for any losses.
Minimums
|
To Open an Account |
$2,500 |
|
For certain Fidelity Advisor retirement accountsA |
$500 |
|
Through regular investment plansB |
$100 |
|
To Add to an Account |
$100 |
|
Minimum Balance |
$1,000 |
|
For certain Fidelity Advisor retirement accountsA |
None |
A Fidelity Advisor Traditional IRA, Roth IRA, Rollover IRA, SEP-IRA, and Keogh accounts.
B An account may be opened with a minimum of $100, provided that a regular investment plan is established at the time the account is opened.
There is no minimum account balance or initial or subsequent purchase minimum for certain Fidelity retirement accounts funded through salary deduction, or accounts opened with the proceeds of distributions from such retirement accounts. In addition, each fund may waive or lower purchase minimums in other circumstances.
Purchase and account minimums are waived for purchases of Class T shares with distributions from a Fidelity Defined Trust account.
Purchase amounts of more than $250,000 will not be accepted for Class B shares.
Purchase amounts of more than $1 million will not be accepted for Class C shares. This limit does not apply to purchases of Class C shares made by an employee benefit plan (as defined in the Employee Retirement Income Security Act), 403(b) program or plan covering a sole-proprietor (formerly Keogh/H.R. 10 plan).
|
Key Information |
|
|
Phone |
To Open an Account
To Add to an Account
|
|
Mail |
To Open an Account
To Add to an Account
|
|
In Person |
To Open an Account
To Add to an Account
|
|
Wire |
To Open an Account
To Add to an Account
|
|
Automatically |
To Open an Account
To Add to an Account
|
Selling Shares
The price to sell one share of Class A, Class T, Class B, or Class C is the class's NAV, minus the redemption fee (short-term trading fee), if applicable, and any applicable CDSC.
Each fund will deduct a short-term trading fee of 1.00% from the redemption amount if you sell your shares after holding them less than 60 days. <R>Trading fees are</R> paid to the fund<R>s</R> rather than Fidelity, and are designed to offset the brokerage commissions, market impact, and other costs associated with fluctuations in fund asset levels and cash flow caused by short-term shareholder trading.
If you bought shares on different days, the shares you held longest will be redeemed first for purposes of determining whether the short-term trading fee applies. The short-term trading fee does not apply to shares that were acquired through reinvestment of distributions.
Any applicable CDSC is calculated based on your original redemption amount.
Your shares will be sold at the next NAV calculated after your order is received in proper form, minus the short-term trading fee, if applicable, and any applicable CDSC.
It is the responsibility of your investment professional to transmit your order to sell shares to Fidelity before the close of business on the day you place your order.
Certain requests must include a signature guarantee. It is designed to protect you and Fidelity from fraud. Your request must be made in writing and include a signature guarantee if any of the following situations apply:
You should be able to obtain a signature guarantee from a bank, broker, dealer, credit union (if authorized under state law), securities exchange or association, clearing agency, or savings association. A notary public cannot provide a signature guarantee.
When you place an order to sell shares, note the following:
Prospectus
Shareholder Information - continued
|
Key Information |
|
|
Phone |
|
|
Mail |
Individual, Joint Tenant, Sole Proprietorship, UGMA, UTMA
Retirement Account
Trust
Business or Organization
Executor, Administrator, Conservator, Guardian
|
|
In Person |
Individual, Joint Tenant, Sole Proprietorship, UGMA, UTMA
Retirement Account
Trust
Business or Organization
Executor, Administrator, Conservator, Guardian
|
|
Automatically |
|
An exchange involves the redemption of all or a portion of the shares of one fund and the purchase of shares of another fund.
As a Class A shareholder, you have the privilege of exchanging Class A shares of a fund for the same class of shares of other Fidelity Advisor funds at NAV or for Daily Money Class shares of Treasury Fund, Prime Fund, or Tax-Exempt Fund.
As a Class T shareholder, you have the privilege of exchanging Class T shares of a fund for the same class of shares of other Fidelity Advisor funds at NAV or for Daily Money Class shares of Treasury Fund, Prime Fund, or Tax-Exempt Fund. If you purchased your Class T shares through certain investment professionals that have signed an agreement with FDC, you also have the privilege of exchanging your Class T shares for shares of Fidelity Capital Appreciation Fund.
As a Class B shareholder, you have the privilege of exchanging Class B shares of a fund for the same class of shares of other Fidelity Advisor funds or for Advisor B Class shares of Treasury Fund.
As a Class C shareholder, you have the privilege of exchanging Class C shares of a fund for the same class of shares of other Fidelity Advisor funds or for Advisor C Class shares of Treasury Fund.
However, you should note the following policies and restrictions governing exchanges:
Prospectus
Shareholder Information - continued
The funds may terminate or modify the exchange privileges in the future.
Other funds may have different exchange restrictions, and may impose trading fees of up to 1.00% of the amount exchanged. Check each fund's prospectus for details.
Features
The following features are available to buy and sell shares of the funds.
Automatic Investment and Withdrawal Programs. Fidelity offers convenient services that let you automatically transfer money into your account, between accounts, or out of your account. While automatic investment programs do not guarantee a profit and will not protect you against loss in a declining market, they can be an excellent way to invest for retirement, a home, educational expenses, and other long-term financial goals. Automatic withdrawal or exchange programs can be a convenient way to provide a consistent income flow or to move money between your investments.
|
Fidelity Advisor Systematic Investment Program |
|||
|
Minimum Initial $100 |
Minimum Additional $100 |
Frequency Monthly, bimonthly, quarterly, |
Procedures
|
|
To direct distributions from a Fidelity Defined Trust to Class T of a Fidelity Advisor fund. |
|||
|
Minimum Initial Not Applicable |
Minimum Additional Not Applicable |
|
Procedures
|
|
Fidelity Advisor Systematic Exchange Program |
|||
|
Minimum $100 |
Frequency Monthly, quarterly, |
Procedures
|
|
|
Fidelity Advisor Systematic Withdrawal Program |
|
Minimum $100 |
Maximum $50,000 |
Frequency Class A and Class T: Monthly,
quarterly, or semi-annually |
Procedures
|
Other Features. The following other feature is also available to buy and sell shares of the funds.
|
Wire |
|
Policies
The following policies apply to you as a shareholder.
Statements and reports that Fidelity sends to you include the following:
To reduce expenses, only one copy of most financial reports and prospectuses will be mailed, even if you have more than one account in a fund. Call Fidelity at 1-888-622-3175 if you need additional copies of financial reports or prospectuses.
You may initiate many transactions by telephone or electronically. Fidelity will not be responsible for any losses resulting from unauthorized transactions if it follows reasonable security procedures designed to verify the identity of the investor. Fidelity will request personalized security codes or other information, and may also record calls. For transactions conducted through the Internet, Fidelity recommends the use of an Internet browser with 128-bit encryption. You should verify the accuracy of your confirmation statements immediately after you receive them. If you do not want the ability to sell and exchange by telephone, call Fidelity for instructions. Additional documentation may be required from corporations, associations, and certain fiduciaries.
When you sign your account application, you will be asked to certify that your social security or taxpayer identification number is correct and that you are not subject to 31% backup withholding for failing to report income to the IRS. If you violate IRS regulations, the IRS can require a fund to withhold 31% of your taxable distributions and redemptions.
If your account balance falls below $1,000 (except accounts not subject to account minimums), you will be given 30 days' notice to reestablish the minimum balance. If you do not increase your balance, Fidelity may close your account and send the proceeds to you. Your shares will be sold at the NAV, minus the short-term trading fee, if applicable, and any applicable CDSC, on the day your account is closed.
Fidelity may charge a fee for certain services, such as providing historical account documents.
Prospectus
Shareholder Information - continued
Dividends and Capital Gain Distributions
Each fund earns dividends, interest, and other income from its investments, and distributes this income (less expenses) to shareholders as dividends. Each fund also realizes capital gains from its investments, and distributes these gains (less any losses) to shareholders as capital gain distributions.
Each fund normally pays dividends and capital gain distributions in September and December.
Distribution Options
When you open an account, specify on your application how you want to receive your distributions. The following options may be available for each class's distributions:
1. Reinvestment Option. Your dividends and capital gain distributions will be automatically reinvested in additional shares of the same class of the fund. If you do not indicate a choice on your application, you will be assigned this option.
2. Income-Earned Option. Your capital gain distributions will be automatically reinvested in additional shares of the same class of the fund. Your dividends will be paid in cash.
3. Cash Option. Your dividends and capital gain distributions will be paid in cash.
4. Directed Dividends® Option. Your dividends will be automatically invested in the same class of shares of another identically registered Fidelity Advisor fund or shares of certain identically registered Fidelity funds. Your capital gain distributions will be automatically invested in the same class of shares of another identically registered Fidelity Advisor fund or shares of certain identically registered Fidelity funds, automatically reinvested in additional shares of the same class of the fund, or paid in cash.
Not all distribution options are available for every account. If the option you prefer is not listed on your account application, or if you want to change your current option, contact your investment professional directly or call Fidelity.
If you elect to receive distributions paid in cash by check and the U.S. Postal Service does not deliver your checks, your distribution option may be converted to the Reinvestment Option. You will not receive interest on amounts represented by uncashed distribution checks.
As with any investment, your investment in a fund could have tax consequences for you. If you are not investing through a tax-advantaged retirement account, you should consider these tax consequences.
Taxes on distributions. Distributions you receive from each fund are subject to federal income tax, and may also be subject to state or local taxes.
For federal tax purposes, each fund's dividends and distributions of short-term capital gains are taxable to you as ordinary <R>income, while each</R> fund's distributions of long-term capital gains are taxable to you generally as capital gains.
If you buy shares when a fund has realized but not yet distributed income or capital gains, you will be "buying a dividend" by paying the full price for the shares and then receiving a portion of the price back in the form of a taxable distribution.
Any taxable distributions you receive from a fund will normally be taxable to you when you receive them, regardless of your distribution option.
Taxes on transactions. Your redemptions, including exchanges, may result in a capital gain or loss for federal tax purposes. A capital gain or loss on your investment in a fund <R>generally</R> is the difference between the cost of your shares and the price you receive when you sell them.
Prospectus
Each fund is a mutual fund, an investment that pools shareholders' money and invests it toward a specified goal.
FMR is each fund's manager.
As of <R>March 31, 2000</R>, FMR had approximately $<R>639.1</R> billion in discretionary assets under management.
As the manager, FMR is responsible for choosing each fund's investments and handling its business affairs.
Affiliates assist FMR with foreign investments:
<R>Beginning January 1, 2001, FMR Co., Inc. (FMRC) will serve as a sub-adviser for each fund. FMRC will be primarily responsible for choosing investments for each fund. FMRC is a wholly-owned subsidiary of FMR.</R>
<R>James Catudal is manager of Advisor Financial Services Fund, which he has managed since February 2000. He also manages another Fidelity fund. Since joining Fidelity in 1997, Mr. Catudal has worked as an analyst and manager. Previously, he was an equity analyst with State Street Research & Management. He received an MBA from the Amos Tuck School at Dartmouth College in 1995.</R>
<R>Brian Hogan is manager of Fidelity Advisor Cyclical Industries Fund, which he has managed since February 2000. He also manages other Fidelity funds. Since joining Fidelity in 1994, Mr. Hogan has worked as a fixed-income analyst, research analyst and manager. </R>
<R>Yolanda McGettigan is the manager of Fidelity Advisor Health Care Fund, which she has managed since June 2000. She also manages other Fidelity Funds. Since joining Fidelity in 1997, Ms. McGettigan has worked as an analyst and portfolio manager.</R>
Scott Offen is manager of Fidelity Advisor Natural Resources Fund, which he has managed since September 1999. He also manages other Fidelity funds. Since joining Fidelity in 1985, Mr. Offen has worked as a research analyst and portfolio manager.
John Porter is manager of Fidelity Advisor Consumer Industries Fund, which he has managed since September 1999. He also manages another Fidelity fund. Mr. Porter joined Fidelity as an analyst in 1995, after receiving his MBA from the University of Chicago.
<R>Lawrence Rakers is manager of Fidelity Advisor Technology Fund, which he has managed since January 2000. He also manages other Fidelity funds. Mr. Rakers joined Fidelity as an analyst in 1993.</R>
<R>Tim Cohen is manager of Fidelity Advisor Telecommunications & Utilities Growth Fund, which he has managed since September 2000. He also manages other Fidelity funds. Since joining Fidelity in 1996, Mr. Cohen has worked as a research analyst and portfolio manager.</R>
<R>From time to time a manager, analyst, or other Fidelity employee may express views regarding a particular company, security, industry, or market sector. The views expressed by any such person are the views of only that individual as of the time expressed and do not necessarily represent the views of Fidelity or any other person in the Fidelity organization. Any such views are subject to change at any time based upon market or other conditions and Fidelity disclaims any responsibility to update such views. These views may not be relied on as investment advice and, because investment decisions for a Fidelity fund are based on numerous factors, may not be relied on as an indication of trading intent on behalf of any Fidelity fund.</R>
<R>Ea</R>ch fund pays a management fee to FMR. The management fee is calculated and paid to FMR every month. The fee is calculated by adding a group fee rate to an individual fund fee rate, dividing by twelve, and multiplying the result by the fund's average net assets throughout the month.
The group fee rate is based on the average net assets of all the mutual funds advised by FMR. This rate cannot rise above 0.52%, and it drops as total assets under management increase.
For <R>July 2000</R>, the group fee rate was <R>0.2740</R>% for <R>each fund</R>. The individual fund fee rate is <R>0.30</R>% for <R>each fund</R>.
The total management fee, <R>as a percentage of a fund's average net assets</R>, for the fiscal year ended July 31, <R>2000, </R>for each fund is shown in the table below.
|
<R> |
Total Management Fee</R> |
|
<R>Advisor Consumer Industries |
0.58%</R> |
|
<R>Advisor Cyclical Industries |
0.58%</R> |
|
<R>Advisor Financial Services |
0.58%</R> |
|
<R>Advisor Health Care |
0.58%</R> |
|
<R>Advisor Natural Resources |
0.58%</R> |
|
<R>Advisor Technology |
0.58%</R> |
|
<R>Advisor Telecommunications & Utilities Growth |
0.58%</R> |
<R>FMR pays FMR U.K. and FMR Far East for providing sub-advisory services. FMR Far East in turn pays FIJ for providing sub-advisory services.</R>
<R>FMR will pay FMRC for providing sub-advisory services.</R>
Prospectus
Fund Services - continued
FMR may, from time to time, agree to reimburse a class for management fees and other expenses above a specified limit. FMR retains the ability to be repaid by a class if expenses fall below the specified limit prior to the end of the fiscal year. Reimbursement arrangements, which may be discontinued by FMR at any time, can decrease a class's expenses and boost its performance.
Each fund is composed of multiple classes of shares. All classes of a fund have a common investment objective and investment portfolio.
FDC distributes each class's shares.
You may pay a sales charge when you buy or sell your shares.
FDC collects the sales charge.
The front-end sales charge will be reduced for purchases of Class A and Class T shares according to the sales charge schedules below.
Sales Charges and Concessions - Class A
|
|
Sales Charge |
Investment |
|
|
|
As a % of |
As an |
|
|
Up to $49,999 |
5.75% |
6.10% |
5.00% |
|
$50,000 to $99,999 |
4.50% |
4.71% |
3.75% |
|
$100,000 to $249,999 |
3.50% |
3.63% |
2.75% |
|
$250,000 to $499,999 |
2.50% |
2.56% |
2.00% |
|
$500,000 to $999,999 |
2.00% |
2.04% |
1.75% |
|
$1,000,000 to $24,999,999 |
1.00% |
1.01% |
0.75% |
|
$25,000,000 or more |
NoneA |
NoneA |
A |
A See "Finder's Fee" section on page 34.
Sales Charges and Concessions - Class T
|
|
Sales Charge |
Investment |
|
|
|
As a % of |
As an |
|
|
Up to $49,999 |
3.50% |
3.63% |
3.00% |
|
$50,000 to $99,999 |
3.00% |
3.09% |
2.50% |
|
$100,000 to $249,999 |
2.50% |
2.56% |
2.00% |
|
$250,000 to $499,999 |
1.50% |
1.52% |
1.25% |
|
$500,000 to $999,999 |
1.00% |
1.01% |
0.75% |
|
$1,000,000 or more |
NoneA |
NoneA |
A |
A See "Finder's Fee" section on page 34 .
Class A or Class T shares purchased by an individual or company through the Combined Purchase, Rights of Accumulation, or Letter of Intent program may receive a reduced front-end sales charge according to the sales charge schedules above. To qualify for a Class A or Class T front-end sales charge reduction under one of these programs, you must notify Fidelity in advance of your purchase. More detailed information about these programs is contained in the statement of additional information (SAI).
Combined Purchase. To receive a Class A or Class T front-end sales charge reduction, if you are a new shareholder, you may combine your purchase of Class A or Class T shares with purchases of: (i) Class A, Class T, Class B, and Class C shares of any Fidelity Advisor fund and (ii) Advisor B Class shares and Advisor C Class shares of Treasury Fund.
Rights of Accumulation. To receive a Class A or Class T front-end sales charge reduction, if you are an existing shareholder, you may add to your purchase of Class A or Class T shares the current value of your holdings in: (i) Class A, Class T, Class B, and Class C shares of any Fidelity Advisor fund, (ii) Advisor B Class shares and Advisor C Class shares of Treasury Fund, and (iii) Daily Money Class shares of Treasury Fund, Prime Fund, or Tax-Exempt Fund acquired by exchange from any Fidelity Advisor fund.
Letter of Intent. You may receive a Class A or Class T front-end sales charge reduction on your purchases of Class A and Class T shares made during a 13-month period by signing a Letter of Intent (Letter). Each Class A or Class T purchase you make after you sign the Letter will be entitled to the reduced front-end sales charge applicable to the total investment indicated in the Letter. Purchases of the following may be aggregated for the purpose of completing your Letter: (i) Class A and Class T shares of any Fidelity Advisor fund (except those acquired by exchange from Daily Money Class shares of Treasury Fund, Prime Fund, or Tax-Exempt Fund that had been previously exchanged from a Fidelity Advisor fund), (ii) Class B and Class C shares of any Fidelity Advisor fund, and (iii) Advisor B Class shares and Advisor C Class shares of Treasury Fund. Reinvested income and capital gain distributions will not be considered purchases for the purpose of completing your Letter.
Class B shares may, upon redemption, be assessed a CDSC based on the following schedule:
|
From Date |
Contingent Deferred |
|
Less than 1 year |
5% |
|
1 year to less than 2 years |
4% |
|
2 years to less than 3 years |
3% |
|
3 years to less than 4 years |
3% |
|
4 years to less than 5 years |
2% |
|
5 years to less than 6 years |
1% |
|
6 years to less than 7 yearsA |
0% |
A After <R>a maximum of </R>seven years, Class B shares will convert automatically to Class A shares of the same Fidelity Advisor fund.
When exchanging Class B shares of one fund for Class B shares of another Fidelity Advisor fund or Advisor B Class shares of Treasury Fund, your Class B shares retain the CDSC schedule in effect when they were originally bought.
Except as provided below, investment professionals receive as compensation from FDC, at the time of sale, a concession equal to 4.00% of your purchase of Class B shares. For purchases of Class B shares through reinvested dividends or capital gain distributions, investment professionals do not receive a concession at the time of sale.
Prospectus
Fund Services - continued
Class C shares may, upon redemption within one year of purchase, be assessed a CDSC of 1.00%.
Except as provided below, investment professionals will receive as compensation from FDC, at the time of the sale, a concession equal to 1.00% of your purchase of Class C shares. For purchases of Class C shares made for an employee benefit plan, 403(b) program or plan covering a sole-proprietor (formerly Keogh/H.R. 10 plan) or through reinvested dividends or capital gain distributions, investment professionals do not receive a concession at the time of sale.
The CDSC for Class B and Class C shares will be calculated based on the lesser of the cost of the Class B or Class C shares, as applicable, at the initial date of purchase or the value of those Class B or Class C shares, as applicable, at redemption, not including any reinvested dividends or capital gains. Class B and Class C shares acquired through reinvestment of dividends or capital gain distributions will not be subject to a CDSC. In determining the applicability and rate of any CDSC at redemption, Class B or Class C shares representing reinvested dividends and capital gains will be redeemed first, followed by those Class B or Class C shares that have been held for the longest period of time.
A front-end sales charge will not apply to the following Class A shares:
1. Purchased for an employee benefit plan (except a SIMPLE IRA, SEP, or SARSEP plan or a plan covering self-employed individuals and their employees (formerly Keogh/H.R. 10 plans)) or a 403(b) program with at least $25 million or more in plan assets;
2. Purchased for an employee benefit plan (except a SIMPLE IRA, SEP, or SARSEP plan or a plan covering self-employed individuals and their employees (formerly Keogh/H.R. 10 plans)) or a 403(b) program investing through an insurance company separate account used to fund annuity contracts;
3. Purchased for an employee benefit plan (except a SIMPLE IRA, SEP, or SARSEP plan or a plan covering self-employed individuals and their employees (formerly Keogh/H.R. 10 plans)) or a 403(b) program investing through a trust institution, bank trust department or insurance company, or any such institution's broker-dealer affiliate that is not part of an organization primarily engaged in the brokerage business. Employee benefit plans (except SIMPLE IRA, SEP, and SARSEP plans and plans covering self-employed individuals and their employees (formerly Keogh/H.R. 10 plans)) and 403(b) programs that participate in the Advisor Retirement Connection do not qualify for this waiver;
4. Purchased for an employee benefit plan (except a SIMPLE IRA, SEP, or SARSEP plan or a plan covering self-employed individuals and their employees (formerly Keogh/H.R. 10 plans)) or a 403(b) program investing through an investment professional sponsored program that requires the participating employee benefit plan to invest initially in Class C or Class B shares and, upon meeting certain criteria, subsequently requires the plan to invest in Class A shares;
5. Purchased by a trust institution or bank trust department for a managed account that is charged an asset-based fee. Employee benefit plans (except SIMPLE IRA, SEP, and SARSEP plans and plans covering self-employed individuals and their employees (formerly Keogh/H.R. 10 plans)), 403(b) programs, and accounts managed by third parties do not qualify for this waiver;
6. Purchased by a broker-dealer for a managed account that is charged an asset-based fee. Employee benefit plans (except SIMPLE IRA, SEP, and SARSEP plans and plans covering self-employed individuals and their employees (formerly Keogh/H.R. 10 plans)) and 403(b) programs do not qualify for this waiver;
7. Purchased by a registered investment adviser that is not part of an organization primarily engaged in the brokerage business for an account that is managed on a discretionary basis and is charged an asset-based fee. Employee benefit plans (except SIMPLE IRA, SEP, and SARSEP plans and plans covering self-employed individuals and their employees (formerly Keogh/H.R. 10 plans)) and 403(b) programs do not qualify for this waiver;
8. Purchased with proceeds from the sale of front-end load shares of a non-Advisor mutual fund for an account participating in the FundSelect by Nationwide program;
9. Purchased by a bank trust officer, registered representative, or other employee (or a member of one of their immediate families) of investment professionals having agreements with FDC. <R>A member of the immediate family of a bank trust officer, a registered representative, or other employee of investment professionals having agreements with FDC, is a spouse of one of those individuals, an account for which one of those individuals is acting as custodian for a minor child, and a trust account that is registered for the sole benefit of a minor child of one of those individuals;</R> or
10. Purchased by the Fidelity Investments Charitable Gift Fund.
A front-end sales charge will not apply to the following Class T shares:
1. Purchased for an insurance company separate account used to fund annuity contracts for employee benefit plans (except SIMPLE IRA, SEP, and SARSEP plans and plans covering self-employed individuals and their employees (formerly Keogh/H.R. 10 plans)) or 403(b) programs;
2. Purchased by a trust institution or bank trust department for a managed account that is charged an asset-based fee. Accounts managed by third parties do not qualify for this waiver;
3. Purchased by a broker-dealer for a managed account that is charged an asset-based fee;
4. Purchased by a registered investment adviser that is not part of an organization primarily engaged in the brokerage business for an account that is managed on a discretionary basis and is charged an asset-based fee;
5. Purchased for an employee benefit plan (except a SIMPLE IRA, SEP, or SARSEP plan or a plan covering self-employed individuals and their employees (formerly Keogh/H.R. 10 plans)) or a 403(b) program;
Prospectus
Fund Services - continued
6. Purchased for a Fidelity or Fidelity Advisor account with the proceeds of a distribution from (i) an insurance company separate account used to fund annuity contracts for employee benefit plans, 403(b) programs, or plans covering sole-proprietors (formerly Keogh/H.R. 10 plans) that are invested in Fidelity Advisor or Fidelity funds, or (ii) an employee benefit plan, 403(b) program, or plan covering a sole-proprietor (formerly Keogh/H.R. 10 plan) that is invested in Fidelity Advisor or Fidelity funds. (Distributions other than those transferred to an IRA account must be transferred directly into a Fidelity account.);
7. Purchased for any state, county, or city, or any governmental instrumentality, department, authority or agency;
8. Purchased with redemption proceeds from other mutual fund complexes on which you have previously paid a front-end sales charge or CDSC;
9. Purchased by a current or former trustee or officer of a Fidelity fund or a current or retired officer, director or regular employee of FMR Corp. or Fidelity International Limited or their direct or indirect subsidiaries (a Fidelity trustee or employee), the spouse of a Fidelity trustee or employee, a Fidelity trustee or employee acting as custodian for a minor child, or a person acting as trustee of a trust for the sole benefit of the minor child of a Fidelity trustee or employee;
10. Purchased by a charitable organization (as defined for purposes of Section 501(c)(3) of the Internal Revenue Code, but excluding the Fidelity Investments Charitable Gift Fund) investing $100,000 or more;
<R>11. Purchased by a bank trust officer, registered representative, or other employee (or a member of one of their immediate families) of investment professionals having agreements with FDC. A member of the immediate family of a bank trust officer, a registered representative, or other employee of investment professionals having agreements with FDC, is a spouse of one of those individuals, an account for which one of those individuals is acting as custodian for a minor child, and a trust account that is registered for the sole benefit of a minor child of one of those individuals;</R>
12. Purchased for a charitable remainder trust or life income pool established for the benefit of a charitable organization (as defined for purposes of Section 501(c)(3) of the Internal Revenue Code);
13. Purchased with distributions of income, principal, and capital gains from Fidelity Defined Trusts; or
14. Purchased by the Fidelity Investments Charitable Gift Fund.
The Class B or Class C CDSC will not apply to the redemption of shares:
1. For disability or death, provided that the shares are sold within one year following the death or the initial determination of disability;
2. That are permitted without penalty at age 70 1/2 pursuant to the Internal Revenue Code from retirement plans or accounts (other than of shares purchased on or after February 11, 1999 for Traditional IRAs, Roth IRAs and Rollover IRAs);
3. For disability, payment of death benefits, or minimum required distributions starting at age 70 1/2 from Traditional IRAs, Roth IRAs and Rollover IRAs purchased on or after February 11, 1999;
4. Through the Fidelity Advisor Systematic Withdrawal Program; or
5. (Applicable to Class C only) From an employee benefit plan, 403(b) program, or plan covering a sole-proprietor (formerly Keogh/H.R. 10 plan).
To qualify for a Class A or Class T front-end sales charge reduction or waiver, you must notify Fidelity in advance of your purchase.
To qualify for a Class B or Class C CDSC waiver, you must notify Fidelity in advance of your redemption.
Finder's Fee. On eligible purchases of (i) Class A shares in amounts of $1 million or more that qualify for a Class A load waiver, (ii) Class A shares in amounts of $25 million or more, and (iii) Class T shares in amounts of $1 million or more, investment professionals will be compensated with a fee at the rate of 0.25% of the purchase amount.
Shares held by an insurance company separate account will be aggregated at the client (e.g., the contract holder or plan sponsor) level, not at the separate account level. Upon request, anyone claiming eligibility for the 0.25% fee with respect to shares held by an insurance company separate account must provide Fidelity access to records detailing purchases at the client level.
Except as provided below, any assets on which a finder's fee has been paid will bear a contingent deferred sales charge (Class A or Class T CDSC) if they do not remain in Class A or Class T shares of the Fidelity Advisor funds, or Daily Money Class shares of Treasury Fund, Prime Fund, or Tax-Exempt Fund for a period of at least one uninterrupted year. The Class A or Class T CDSC will be 0.25% of the lesser of the cost of the Class A or Class T shares, as applicable, at the initial date of purchase or the value of those Class A or Class T shares, as applicable, at redemption, not including any reinvested dividends or capital gains. Class A and Class T shares acquired through reinvestment of dividends or capital gain distributions will not be subject to a Class A or Class T CDSC. In determining the applicability and rate of any Class A or Class T CDSC at redemption, Class A or Class T shares representing reinvested dividends and capital gains will be redeemed first, followed by those Class A or Class T CDSC shares that have been held for the longest period of time.
The Class A or Class T CDSC will not apply to the redemption of shares:
1. Held by insurance company separate accounts;
2. For plan loans or distributions or exchanges to non-Advisor fund investment options from employee benefit plans (except shares of SIMPLE IRA, SEP, and SARSEP plans and plans covering self-employed individuals and their employees (formerly Keogh/H.R. 10 plans) purchased on or after February 11, 1999) and 403(b) programs; or
Prospectus
Fund Services - continued
3. For disability, payment of death benefits, or minimum required distributions starting at age 70 1/2 from Traditional IRAs, Roth IRAs, SIMPLE IRAs, SEPs, SARSEPs, and plans covering a sole-proprietor or self-employed individuals and their employees (formerly Keogh/H.R. 10 plans).
To qualify for a Class A or Class T finder's fee or CDSC waiver, you must notify Fidelity in advance of your purchase or redemption, respectively.
Reinstatement Privilege. If you have sold all or part of your Class A, Class T, Class B, or Class C shares of a fund, you may reinvest an amount equal to all or a portion of the redemption proceeds in the same class of the fund or another Fidelity Advisor fund, at the NAV next determined after receipt in proper form of your investment order, provided that such reinvestment is made within 90 days of redemption. Under these circumstances, the dollar amount of the CDSC you paid, if any, on shares will be reimbursed to you by reinvesting that amount in Class A, Class T, Class B, or Class C shares, as applicable. You must reinstate your Class A, Class T, Class B, or Class C shares into an account with the same registration. This privilege may be exercised only once by a shareholder with respect to a fund and certain restrictions may apply. For purposes of the CDSC schedule, the holding period will continue as if the Class A, Class T, Class B, or Class C shares had not been redeemed.
<R>To qualify for the reinstatement privilege, you must notify Fidelity in writing in advance of your reinvestment.</R>
Conversion Feature. After a<R> maximum o</R>f seven years from the initial date of purchase, Class B shares and any capital appreciation associated with those shares convert automatically to Class A shares of the same Fidelity Advisor fund. Conversion to Class A shares will be made at NAV. At the time of conversion, a portion of the Class B shares bought through the reinvestment of dividends or capital gains (Dividend Shares) will also convert to Class A shares. The portion of Dividend Shares that will convert is determined by the ratio of your converting Class B non-Dividend Shares to your total Class B non-Dividend Shares.
Class A of each fund has adopted a Distribution and Service Plan pursuant to Rule 12b-1 under the Investment Company Act of 1940. Under the plan, Class A of each fund is authorized to pay FDC a monthly 12b-1 fee as compensation for providing services intended to result in the sale of Class A shares and/or shareholder support services. Class A of each fund may pay FDC a 12b-1 fee at an annual rate of 0.75% of its average net assets, or such lesser amount as the Trustees may determine from time to time. Class A of each fund currently pays FDC a monthly 12b-1 fee at an annual rate of 0.25% of its average net assets throughout the month. Class A's 12b-1 fee rate may be increased only when the Trustees believe that it is in the best interests of Class A shareholders to do so.
Class T of each fund has adopted a Distribution and Service Plan pursuant to Rule 12b-1 under the Investment Company Act of 1940. Under the plan, Class T of each fund is authorized to pay FDC a monthly 12b-1 fee as compensation for providing services intended to result in the sale of Class T shares and/or shareholder support services. Class T of Advisor Natural Resources may pay FDC a 12b-1 fee at an annual rate of 0.65% of its average net assets, or such lesser amount as the Trustees may determine from time to time. Class T of Advisor Consumer Industries, Advisor Cyclical Industries, Advisor Financial Services, Advisor Health Care, Advisor Technology, and Advisor <R>Telecommunications &</R> Utilities Growth may pay FDC a 12b-1 fee at an annual rate of 0.75% of its average net assets, or such lesser amount as the Trustees may determine from time to time. Class T of each fund currently pays FDC a monthly 12b-1 fee at an annual rate of 0.50% of its average net assets throughout the month. Class T's 12b-1 fee rate may be increased only when the Trustees believe that it is in the best interests of Class T shareholders to do so.
FDC may reallow to intermediaries (such as banks, broker-dealers, and other service-providers), <R>including its affiliates</R>, up to the full amount of the Class A and Class T 12b-1 fee, for providing services intended to result in the sale of Class A or Class T shares and/or shareholder support services.
Class B of each fund has adopted a Distribution and Service Plan pursuant to Rule 12b-1 under the Investment Company Act of 1940. Under the plan, Class B of each fund is authorized to pay FDC a monthly 12b-1 (distribution) fee as compensation for providing services intended to result in the sale of Class B shares. Class B of each fund currently pays FDC a monthly 12b-1 (distribution) fee at an annual rate of 0.75% of its average net assets throughout the month.
In addition, pursuant to each Class B plan, Class B of each fund pays FDC a monthly 12b-1 (service) fee at an annual rate of 0.25% of Class B's average net assets throughout the month for providing shareholder support services.
FDC may reallow up to the full amount of the Class B 12b-1 (service) fee to intermediaries (such as banks, broker-dealers, and other service-providers), <R>including its affiliates,</R> for providing shareholder support services.
Class C of each fund has adopted a Distribution and Service Plan pursuant to Rule 12b-1 under the Investment Company Act of 1940. Under the plan, Class C of each fund is authorized to pay FDC a monthly 12b-1 (distribution) fee as compensation for providing services intended to result in the sale of Class C shares. Class C of each fund currently pays FDC a monthly 12b-1 (distribution) fee at an annual rate of 0.75% of its average net assets throughout the month.
In addition, pursuant to each Class C plan, Class C of each fund pays FDC a monthly 12b-1 (service) fee at an annual rate of 0.25% of Class C's average net assets throughout the month for providing shareholder support services.
Prospectus
Fund Services - continued
Normally, after the first year of investment, FDC may reallow up to the full amount of the Class C 12b-1 (distribution) fees to intermediaries (such as banks, broker-dealers, and other service-providers), including its affiliates, for providing services intended to result in the sale of Class C shares and may reallow up to the full amount of the Class C 12b-1 (service) fee to intermediaries,<R> including its affiliates, </R>for providing shareholder support services.<R></R>
For purchases of Class C shares made for an employee benefit plan, 403(b) program or plan covering a sole-proprietor (formerly Keogh/H.R. 10 plan) or through reinvestment of dividends or capital gain distributions, during the first year of investment and thereafter, FDC may reallow up to the full amount of the Class C 12b-1 (distribution) fee paid by such shares to intermediaries, including its affiliates, for providing services intended to result in the sale of Class C shares and may reallow up to the full amount of the Class C 12b-1 (service) fee paid by such shares to intermediaries, including its affiliates, for providing shareholder support services.
In addition, each plan specifically recognizes that FMR may make payments from its management fee revenue, past profits, or other resources to FDC for expenses incurred in connection with providing services intended to result in the sale of the applicable class's shares and/or shareholder support services, including payments of significant amounts made to intermediaries that provide those services. Currently, the Board of Trustees of each fund has authorized such payments for Class A, Class T, Class B, and Class C.
Because 12b-1 fees are paid out of each class's assets on an ongoing basis, they will increase the cost of your investment and may cost you more than paying other types of sales charges.
To receive sales concessions, finder's fees, and payments made pursuant to a Distribution and Service Plan, intermediaries must sign the appropriate agreement with FDC in advance.
FMR may allocate brokerage transactions in a manner that takes into account the sale of shares of the Fidelity Advisor funds, provided that a fund receives brokerage services and commission rates comparable to those of other broker-dealers.
No dealer, sales representative, or any other person has been authorized to give any information or to make any representations, other than those contained in this prospectus and in the related SAI, in connection with the offer contained in this prospectus. If given or made, such other information or representations must not be relied upon as having been authorized by the funds or FDC. This prospectus and the related SAI do not constitute an offer by the funds or by FDC to sell shares of the funds to or to buy shares of the funds from any person to whom it is unlawful to make such offer.
Prospectus
The financial highlights tables are intended to help you understand each class's financial history for the past 5 years or, if shorter, the period of the class's operations. Certain information reflects financial results for a single class share. The total returns in the table represent the rate that an investor would have earned (or lost) on an investment in the class (assuming reinvestment of all dividends and distributions). This information has been audited by Deloitte & Touche LLP, independent accountants, whose report, along with each fund's financial highlights and financial statements, are included in each fund's annual report. A free copy of <R>the</R> annual report is available upon request.
Prospectus
Appendix - continued
<R>Consumer Industries - Class A</R>
|
<R>Years ended July 31, |
2000 |
1999 |
1998 |
1997 E</R> |
|
<R>Selected Per-Share Data |
|
|
|
</R> |
|
<R>Net asset value, beginning of period |
$ 16.01 |
$ 15.08 |
$ 13.48 |
$ 10.00</R> |
|
<R>Income from Investment Operations |
|
|
|
</R> |
|
<R> Net investment income (loss) D |
(.04) |
(.03) |
(.06) |
(.05)</R> |
|
<R> Net realized and unrealized gain (loss) |
(.68) |
1.80 |
3.31 |
3.60</R> |
|
<R> Total from investment operations |
(.72) |
1.77 |
3.25 |
3.55</R> |
|
<R>Less Distributions |
|
|
|
</R> |
|
<R> From net realized gain |
(.20) |
(.85) |
(1.68) |
(.07)</R> |
|
<R> In excess of net realized gain |
(.06) |
- |
- |
-</R> |
|
<R> Total distributions |
(.26) |
(.85) |
(1.68) |
(.07)</R> |
|
<R>Redemption fees added to paid in capital |
.01 |
.01 |
.03 |
-</R> |
|
<R>Net asset value, end of period |
$ 15.04 |
$ 16.01 |
$ 15.08 |
$ 13.48</R> |
|
<R>Total Return B, C |
(4.48)% |
13.49% |
27.48% |
35.68%</R> |
|
<R>Ratios and Supplemental Data |
|
|
</R> |
|
|
<R>Net assets, end of period (000 omitted) |
$ 3,609 |
$ 3,504 |
$ 2,220 |
$ 944</R> |
|
<R>Ratio of expenses to average net assets |
1.50% F |
1.55% F |
1.75% F |
1.75% A, F</R> |
|
<R>Ratio of expenses to average net assets after expense reductions |
1.49% G |
1.54% G |
1.73% G |
1.73% A, G</R> |
|
<R>Ratio of net investment income (loss) to average net assets |
(.24)% |
(.19)% |
(.47)% |
(.50)% A</R> |
|
<R>Portfolio turnover |
69% |
80% |
144% |
203% A</R> |
<R>A Annualized</R>
<R>B The total returns would have been lower had certain expenses not been reduced during the periods shown.</R>
<R>C Total returns do not include the one time sales charge and for periods of less than one year are not annualized.</R>
<R>D Net investment income (loss) per share has been calculated based on average shares outstanding during the period.</R>
<R>E For the period September 3, 1996 (commencement of sale of Class A shares) to July 31, 1997.</R>
<R>F FMR agreed to reimburse a portion of the class' expenses during the period. Without this reimbursement, the class' expense ratio would have been higher.</R>
<R>G FMR or the fund has entered into varying arrangements with third parties who either paid or reduced a portion of the class' expenses.</R>
<R>Consumer Industries - Class T</R>
|
<R>Years ended July 31, |
2000 |
1999 |
1998 |
1997 E</R> |
|
<R>Net asset value, beginning of period |
$ 15.93 |
$ 15.00 |
$ 13.45 |
$ 10.00</R> |
|
<R>Income from Investment Operations |
|
|
|
</R> |
|
<R> Net investment income (loss) D |
(.08) |
(.06) |
(.10) |
(.09)</R> |
|
<R> Net realized and unrealized gain (loss) |
(.67) |
1.79 |
3.28 |
3.60</R> |
|
<R> Total from investment operations |
(.75) |
1.73 |
3.18 |
3.51</R> |
|
<R>Less Distributions |
|
|
|
</R> |
|
<R> From net realized gain |
(.20) |
(.81) |
(1.66) |
(.06)</R> |
|
<R> In excess of net realized gain |
(.06) |
- |
- |
-</R> |
|
<R> Total distributions |
(.26) |
(.81) |
(1.66) |
(.06)</R> |
|
<R>Redemption fees added to paid in capital |
.01 |
.01 |
.03 |
-</R> |
|
<R>Net asset value, end of period |
$ 14.93 |
$ 15.93 |
$ 15.00 |
$ 13.45</R> |
|
<R>Total Return B, C |
(4.69)% |
13.20% |
26.93% |
35.25%</R> |
|
<R>Ratios and Supplemental Data |
|
|
</R> |
|
|
<R>Net assets, end of period (000 omitted) |
$ 13,275 |
$ 21,714 |
$ 13,989 |
$ 7,314</R> |
|
<R>Ratio of expenses to average net assets |
1.75% F |
1.79% F |
2.00% F |
2.00% A, F</R> |
|
<R>Ratio of expenses to average net assets after expense reductions |
1.73% G |
1.77% G |
1.98% G |
1.97% A, G</R> |
|
<R>Ratio of net investment income (loss) to average net assets |
(.49)% |
(.42)% |
(.71)% |
(.83)% A</R> |
|
<R>Portfolio turnover |
69% |
80% |
144% |
203% A</R> |
<R>A Annualized</R>
<R>B The total returns would have been lower had certain expenses not been reduced during the periods shown.</R>
<R>C Total returns do not include the one time sales charge and for periods of less than one year are not annualized.</R>
<R>D Net investment income (loss) per share has been calculated based on average shares outstanding during the period.</R>
<R>E For the period September 3, 1996 (commencement of sale of Class T shares) to July 31, 1997.</R>
<R>F FMR agreed to reimburse a portion of the class' expenses during the period. Without this reimbursement, the class' expense ratio would have been higher.</R>
<R>G FMR or the fund has entered into varying arrangements with third parties who either paid or reduced a portion of the class' expenses.</R>
Prospectus
Appendix - continued
<R>Consumer Industries - Class B</R>
|
<R>Years ended July 31, |
2000 |
1999 |
1998 |
1997 E</R> |
|
<R>Net asset value, beginning of period |
$ 15.76 |
$ 14.91 |
$ 13.42 |
$ 11.46</R> |
|
<R>Income from Investment Operations |
|
|
|
</R> |
|
<R> Net investment income (loss) D |
(.15) |
(.14) |
(.17) |
(.08)</R> |
|
<R> Net realized and unrealized gain (loss) |
(.67) |
1.79 |
3.26 |
2.04</R> |
|
<R> Total from investment operations |
(.82) |
1.65 |
3.09 |
1.96</R> |
|
<R>Less Distributions |
|
|
|
</R> |
|
<R> From net realized gain |
(.20) |
(.81) |
(1.64) |
-</R> |
|
<R> In excess of net realized gain |
(.06) |
- |
- |
-</R> |
|
<R> Total distributions |
(.26) |
(.81) |
(1.64) |
-</R> |
|
<R>Redemption fees added to paid in capital |
.01 |
.01 |
.04 |
-</R> |
|
<R>Net asset value, end of period |
$ 14.69 |
$ 15.76 |
$ 14.91 |
$ 13.42</R> |
|
<R>Total Return B, C |
(5.19)% |
12.71% |
26.30% |
17.10%</R> |
|
<R>Ratios and Supplemental Data |
|
|
</R> |
|
|
<R>Net assets, end of period (000 omitted) |
$ 9,021 |
$ 9,832 |
$ 5,419 |
$ 596</R> |
|
<R>Ratio of expenses to average net assets |
2.25% F |
2.31% F |
2.50% F |
2.50% A, F</R> |
|
<R>Ratio of expenses to average net assets after expense reductions |
2.24% G |
2.30% G |
2.48% G |
2.46% A, G</R> |
|
<R>Ratio of net investment income (loss) to average net assets |
(.99)% |
(.95)% |
(1.23)% |
(1.60)% A</R> |
|
<R>Portfolio turnover |
69% |
80% |
144% |
203% A</R> |
<R>A Annualized</R>
<R>B The total returns would have been lower had certain expenses not been reduced during the periods shown.</R>
<R>C Total returns do not include the contingent deferred sales charge and for periods of less than one year are not annualized.</R>
<R>D Net investment income (loss) per share has been calculated based on average shares outstanding during the period.</R>
<R>E For the period March 3, 1997 (commencement of sale of Class B shares) to July 31, 1997.</R>
<R>F FMR agreed to reimburse a portion of the class' expenses during the period. Without this reimbursement, the class' expense ratio would have been higher.</R>
<R>G FMR or the fund has entered into varying arrangements with third parties who either paid or reduced a portion of the class' expenses.</R>
<R>Consumer Industries - Class C</R>
|
<R>Years ended July 31, |
2000 |
1999 |
1998 E</R> |
|
<R>Net asset value, beginning of period |
$ 15.78 |
$ 14.95 |
$ 12.66</R> |
|
<R>Income from Investment Operations |
|
|
</R> |
|
<R> Net investment income (loss) D |
(.15) |
(.15) |
(.13)</R> |
|
<R> Net realized and unrealized gain (loss) |
(.67) |
1.80 |
2.87</R> |
|
<R> Total from investment operations |
(.82) |
1.65 |
2.74</R> |
|
<R>Less Distributions |
|
|
</R> |
|
<R> From net realized gain |
(.20) |
(.83) |
(.49)</R> |
|
<R> In excess of net realized gain |
(.06) |
- |
-</R> |
|
<R> Total distributions |
(.26) |
(.83) |
(.49)</R> |
|
<R>Redemption fees added to paid in capital |
.01 |
.01 |
.04</R> |
|
<R>Net asset value, end of period |
$ 14.71 |
$ 15.78 |
$ 14.95</R> |
|
<R>Total Return B, C |
(5.19)% |
12.72% |
22.67%</R> |
|
<R>Ratios and Supplemental Data |
|
|
</R> |
|
<R>Net assets, end of period (000 omitted) |
$ 3,048 |
$ 2,758 |
$ 1,461</R> |
|
<R>Ratio of expenses to average net assets |
2.25% F |
2.32% F |
2.50% A, F</R> |
|
<R>Ratio of expenses to average net assets after expense reductions |
2.24% G |
2.30% G |
2.48% A, G</R> |
|
<R>Ratio of net investment income (loss) to average net assets |
(.99)% |
(.95)% |
(1.27)% A</R> |
|
<R>Portfolio turnover |
69% |
80% |
144%</R> |
<R>A Annualized</R>
<R>B The total returns would have been lower had certain expenses not been reduced during the periods shown.</R>
<R>C Total returns do not include the contingent deferred sales charge and for periods of less than one year are not annualized.</R>
<R>D Net investment income (loss) per share has been calculated based on average shares outstanding during the period.</R>
<R>E For the period November 3, 1997 (commencement of sale of Class C shares) to July 31, 1998.</R>
<R>F FMR agreed to reimburse a portion of the class' expenses during the period. Without this reimbursement, the class' expense ratio would have been higher.</R>
<R>G FMR or the fund has entered into varying arrangements with third parties who either paid or reduced a portion of the class' expenses.</R>
Prospectus
Appendix - continued
<R>Cyclical Industries - Class A</R>
|
<R>Years ended July 31, |
2000 |
1999 |
1998 |
1997 E</R> |
|
<R>Selected Per-Share Data |
|
|
|
</R> |
|
<R>Net asset value, beginning of period |
$ 14.13 |
$ 13.56 |
$ 13.80 |
$ 10.00</R> |
|
<R>Income from Investment Operations |
|
|
|
</R> |
|
<R> Net investment income (loss) D |
.02 |
.01 |
(.03) |
(.01)</R> |
|
<R> Net realized and unrealized gain (loss) |
(.33) |
1.23 |
.76 |
3.89</R> |
|
<R> Total from investment operations |
(.31) |
1.24 |
.73 |
3.88</R> |
|
<R>Less Distributions |
|
|
|
</R> |
|
<R> From net investment income |
- H |
- |
- |
(.01)</R> |
|
<R> From net realized gain |
(.27) H |
(.68) |
(.99) |
(.08)</R> |
|
<R> Total distributions |
(.27) |
(.68) |
(.99) |
(.09)</R> |
|
<R>Redemption fees added to paid in capital |
.01 |
.01 |
.02 |
.01</R> |
|
<R>Net asset value, end of period |
$ 13.56 |
$ 14.13 |
$ 13.56 |
$ 13.80</R> |
|
<R>Total Return B, C |
(2.13)% |
10.81% |
6.05% |
39.11%</R> |
|
<R>Ratios and Supplemental Data |
|
|
|
</R> |
|
<R>Net assets, end of period (000 omitted) |
$ 973 |
$ 896 |
$ 471 |
$ 365</R> |
|
<R>Ratio of expenses to average net assets |
1.50% F |
1.56% F |
1.75% F |
1.75% A, F</R> |
|
<R>Ratio of expenses to average net assets after expense reductions |
1.49% G |
1.54% G |
1.75% |
1.73% A, G</R> |
|
<R>Ratio of net investment income (loss) to average net assets |
.18% |
.05% |
(.22)% |
(.09)% A</R> |
|
<R>Portfolio turnover |
111% |
115% |
100% |
155% A</R> |
<R>A Annualized</R>
<R>B The total returns would have been lower had certain expenses not been reduced during the periods shown.</R>
<R>C Total returns do not include the one time sales charge and for periods of less than one year are not annualized.</R>
<R>D Net investment income (loss) per share has been calculated based on average shares outstanding during the period.</R>
<R>E For the period September 3, 1996 (commencement of sale of Class A shares) to July 31, 1997.</R>
<R>F FMR agreed to reimburse a portion of the class' expenses during the period. Without this reimbursement, the class' expense ratio would have been higher.</R>
<R>G FMR or the fund has entered into varying arrangements with third parties who either paid or reduced a portion of the class' expenses.</R>
<R>H The amounts shown reflect certain reclassifications related to book to tax differences.</R>
<R>Cyclical Industries - Class T</R>
|
<R>Years ended July 31, |
2000 |
1999 |
1998 |
1997 E</R> |
|
<R>Selected Per-Share Data |
|
|
|
</R> |
|
<R>Net asset value, beginning of period |
$ 14.07 |
$ 13.51 |
$ 13.77 |
$ 10.00</R> |
|
<R>Income from Investment Operations |
|
|
|
</R> |
|
<R> Net investment income (loss) D |
(.01) |
(.03) |
(.06) |
(.04)</R> |
|
<R> Net realized and unrealized gain (loss) |
(.34) |
1.24 |
.77 |
3.89</R> |
|
<R> Total from investment operations |
(.35) |
1.21 |
.71 |
3.85</R> |
|
<R>Less Distributions |
|
|
|
</R> |
|
<R> From net investment income |
- |
- |
- |
(.01)</R> |
|
<R> From net realized gain |
(.25) |
(.66) |
(.99) |
(.08)</R> |
|
<R> Total distributions |
(.25) |
(.66) |
(.99) |
(.09)</R> |
|
<R>Redemption fees added to paid in capital |
.01 |
.01 |
.02 |
.01</R> |
|
<R>Net asset value, end of period |
$ 13.48 |
$ 14.07 |
$ 13.51 |
$ 13.77</R> |
|
<R>Total Return B, C |
(2.43)% |
10.57% |
5.91% |
38.81%</R> |
|
<R>Ratios and Supplemental Data |
|
|
|
</R> |
|
<R>Net assets, end of period (000 omitted) |
$ 3,885 |
$ 3,471 |
$ 2,973 |
$ 1,920</R> |
|
<R>Ratio of expenses to average net assets |
1.75% F |
1.83% F |
2.00% F |
2.00% A, F</R> |
|
<R>Ratio of expenses to average net assets after expense reductions |
1.74% G |
1.81% G |
2.00% |
1.97% A, G</R> |
|
<R>Ratio of net investment income (loss) to average net assets |
(.07)% |
(.22)% |
(.47)% |
(.37)% A</R> |
|
<R>Portfolio turnover |
111% |
115% |
100% |
155% A</R> |
<R>A Annualized</R>
<R>B The total returns would have been lower had certain expenses not been reduced during the periods shown.</R>
<R>C Total returns do not include the one time sales charge and for periods of less than one year are not annualized.</R>
<R>D Net investment income (loss) per share has been calculated based on average shares outstanding during the period.</R>
<R>E For the period September 3, 1996 (commencement of sale of Class T shares) to July 31, 1997.</R>
<R>F FMR agreed to reimburse a portion of the class' expenses during the period. Without this reimbursement, the class' expense ratio would have been higher.</R>
<R>G FMR or the fund has entered into varying arrangements with third parties who either paid or reduced a portion of the class' expenses.</R>
Prospectus
Appendix - continued
<R>Cyclical Industries - Class B</R>
|
<R>Years ended July 31, |
2000 |
1999 |
1998 |
1997 E</R> |
|
<R>Selected Per-Share Data |
|
|
|
</R> |
|
<R>Net asset value, beginning of period |
$ 13.89 |
$ 13.40 |
$ 13.75 |
$ 11.56</R> |
|
<R>Income from Investment Operations |
|
|
|
</R> |
|
<R> Net investment income (loss) D |
(.07) |
(.09) |
(.14) |
(.06)</R> |
|
<R> Net realized and unrealized gain (loss) |
(.34) |
1.22 |
.76 |
2.25</R> |
|
<R> Total from investment operations |
(.41) |
1.13 |
.62 |
2.19</R> |
|
<R>Less Distributions |
|
|
|
</R> |
|
<R> From net realized gain |
(.24) |
(.65) |
(.99) |
-</R> |
|
<R>Redemption fees added to paid in capital |
.01 |
.01 |
.02 |
-</R> |
|
<R>Net asset value, end of period |
$ 13.25 |
$ 13.89 |
$ 13.40 |
$ 13.75</R> |
|
<R>Total Return B, C |
(2.90)% |
10.01% |
5.23% |
18.94%</R> |
|
<R>Ratios and Supplemental Data |
|
|
|
</R> |
|
<R>Net assets, end of period (000 omitted) |
$ 1,879 |
$ 2,043 |
$ 985 |
$ 252</R> |
|
<R>Ratio of expenses to average net assets |
2.25% F |
2.31% F |
2.50% F |
2.50% A, F</R> |
|
<R>Ratio of expenses to average net assets after expense reductions |
2.24% G |
2.29% G |
2.50% |
2.45% A, G</R> |
|
<R>Ratio of net investment income (loss) to average net assets |
(.57)% |
(.70)% |
(1.03)% |
(1.11)% A</R> |
|
<R>Portfolio turnover |
111% |
115% |
100% |
155% A</R> |
<R>A Annualized</R>
<R>B The total returns would have been lower had certain expenses not been reduced during the periods shown.</R>
<R>C Total returns do not include the contingent deferred sales charge and for periods of less than one year are not annualized.</R>
<R>D Net investment income (loss) per share has been calculated based on average shares outstanding during the period.</R>
<R>E For the period March 3, 1997 (commencement of sale of Class B shares) to July 31, 1997.</R>
<R>F FMR agreed to reimburse a portion of the class' expenses during the period. Without this reimbursement, the class' expense ratio would have been higher.</R>
<R>G FMR or the fund has entered into varying arrangements with third parties who either paid or reduced a portion of the class' expenses.</R>
<R>Cyclical Industries - Class C</R>
|
<R>Years ended July 31, |
2000 |
1999 |
1998 E</R> |
|
<R>Selected Per-Share Data |
|
|
</R> |
|
<R>Net asset value, beginning of period |
$ 13.91 |
$ 13.45 |
$ 12.54</R> |
|
<R>Income from Investment Operations |
|
|
</R> |
|
<R> Net investment income (loss) D |
(.08) |
(.09) |
(.11)</R> |
|
<R> Net realized and unrealized gain (loss) |
(.36) |
1.20 |
1.39</R> |
|
<R> Total from investment operations |
(.44) |
1.11 |
1.28</R> |
|
<R>Less Distributions |
|
|
</R> |
|
<R> From net realized gain |
(.22) |
(.67) |
(.38)</R> |
|
<R>Redemption fees added to paid in capital |
.01 |
.02 |
.01</R> |
|
<R>Net asset value, end of period |
$ 13.26 |
$ 13.91 |
$ 13.45</R> |
|
<R>Total Return B, C |
(3.11)% |
9.94% |
10.62%</R> |
|
<R>Ratios and Supplemental Data |
|
|
</R> |
|
<R>Net assets, end of period (000 omitted) |
$ 625 |
$ 1,451 |
$ 165</R> |
|
<R>Ratio of expenses to average net assets |
2.25% F |
2.28% F |
2.50% A, F</R> |
|
<R>Ratio of expenses to average net assets after expense reductions |
2.24% G |
2.27% G |
2.50% A</R> |
|
<R>Ratio of net investment income (loss) to average net assets |
(.57)% |
(.67)% |
(1.06)% A</R> |
|
<R>Portfolio turnover |
111% |
115% |
100%</R> |
<R>A Annualized</R>
<R>B The total returns would have been lower had certain expenses not been reduced during the periods shown.</R>
<R>C Total returns do not include the contingent deferred sales charge and for periods of less than one year are not annualized.</R>
<R>D Net investment income (loss) per share has been calculated based on average shares outstanding during the period.</R>
<R>E For the period November 3, 1997 (commencement of sale of Class C shares) to July 31, 1998.</R>
<R>F FMR agreed to reimburse a portion of the class' expenses during the period. Without this reimbursement, the class' expense ratio would have been higher.</R>
<R>G FMR or the fund has entered into varying arrangements with third parties who either paid or reduced a portion of the class' expenses.</R>
Prospectus
Appendix - continued
<R>Financial Services - Class A</R>
|
<R>Years ended July 31, |
2000 |
1999 |
1998 |
1997 E</R> |
|
<R>Selected Per-Share Data |
|
|
|
</R> |
|
<R>Net asset value, beginning of period |
$ 17.49 |
$ 18.74 |
$ 15.11 |
$ 10.00</R> |
|
<R>Income from Investment Operations |
|
|
|
</R> |
|
<R> Net investment income D |
.15 |
.12 |
.11 |
.06</R> |
|
<R> Net realized and unrealized gain (loss) |
.73 |
(.31) |
3.80 |
5.06</R> |
|
<R> Total from investment operations |
.88 |
(.19) |
3.91 |
5.12</R> |
|
<R>Less Distributions |
|
|
|
</R> |
|
<R> From net investment income |
(.09) |
(.06) |
(.06) |
(.01)</R> |
|
<R> From net realized gain |
- |
(1.01) |
(.23) |
(.01)</R> |
|
<R> Total distributions |
(.09) |
(1.07) |
(.29) |
(.02)</R> |
|
<R>Redemption fees added to paid in capital |
.01 |
.01 |
.01 |
.01</R> |
|
<R>Net asset value, end of period |
$ 18.29 |
$ 17.49 |
$ 18.74 |
$ 15.11</R> |
|
<R>Total Return B, C |
5.12% |
.69% |
26.32% |
51.35%</R> |
|
<R>Ratios and Supplemental Data |
|
|
|
</R> |
|
<R>Net assets, end of period (000 omitted) |
$ 48,088 |
$ 27,440 |
$ 21,907 |
$ 6,275</R> |
|
<R>Ratio of expenses to average net assets |
1.25% |
1.24% |
1.32% |
1.75%A, F</R> |
|
<R>Ratio of expenses to average net assets after expense reductions |
1.22%G |
1.23%G |
1.30%G |
1.73%A, G</R> |
|
<R>Ratio of net investment income to average net assets |
.92% |
.73% |
.63% |
.55%A</R> |
|
<R>Portfolio turnover |
73% |
38% |
54% |
26%A</R> |
<R>A Annualized</R>
<R>B The total returns would have been lower had certain expenses not been reduced during the periods shown.</R>
<R>C Total returns do not include the one time sales charge and for periods of less than one year are not annualized.</R>
<R>D Net investment income per share has been calculated based on average shares outstanding during the period.</R>
<R>E For the period September 3, 1996 (commencement of sale of Class A shares) to July 31, 1997.</R>
<R>F FMR agreed to reimburse a portion of the class' expenses during the period. Without this reimbursement, the class' expense ratio would have been higher.</R>
<R>G FMR or the fund has entered into varying arrangements with third parties who either paid or reduced a portion of the class' expenses.</R>
<R>Financial Services - Class T</R>
|
<R>Years ended July 31, |
2000 |
1999 |
1998 |
1997 E</R> |
|
<R>Selected Per-Share Data |
|
|
|
</R> |
|
<R>Net asset value, beginning of period |
$ 17.42 |
$ 18.66 |
$ 15.07 |
$ 10.00</R> |
|
<R>Income from Investment Operations |
|
|
|
</R> |
|
<R> Net investment income D |
.12 |
.09 |
.07 |
.04</R> |
|
<R> Net realized and unrealized gain (loss) |
.71 |
(.30) |
3.78 |
5.04</R> |
|
<R> Total from investment operations |
.83 |
(.21) |
3.85 |
5.08</R> |
|
<R>Less Distributions |
|
|
|
</R> |
|
<R> From net investment income |
(.05) |
(.03) |
(.04) |
(.01)</R> |
|
<R> From net realized gain |
- |
(1.01) |
(.23) |
(.01)</R> |
|
<R> Total distributions |
(.05) |
(1.04) |
(.27) |
(.02)</R> |
|
<R>Redemption fees added to paid in capital |
.01 |
.01 |
.01 |
.01</R> |
|
<R>Net asset value, end of period |
$ 18.21 |
$ 17.42 |
$ 18.66 |
$ 15.07</R> |
|
<R>Total Return B, C |
4.84% |
.53% |
25.96% |
50.95%</R> |
|
<R>Ratios and Supplemental Data |
|
|
|
</R> |
|
<R>Net assets, end of period (000 omitted) |
$ 179,862 |
$ 123,361 |
$ 118,608 |
$ 52,003</R> |
|
<R>Ratio of expenses to average net assets |
1.47% |
1.47% |
1.52% |
1.94% A</R> |
|
<R>Ratio of expenses to average net assets after expense reductions |
1.44% F |
1.46% F |
1.50% F |
1.91% A, F</R> |
|
<R>Ratio of net investment income to average net assets |
.70% |
.50% |
.44% |
.37% A</R> |
|
<R>Portfolio turnover |
73% |
38% |
54% |
26% A</R> |
<R>A Annualized</R>
<R>B The total returns would have been lower had certain expenses not been reduced during the periods shown.</R>
<R>C Total returns do not include the one time sales charge and for periods of less than one year are not annualized.</R>
<R>D Net investment income per share has been calculated based on average shares outstanding during the period.</R>
<R>E For the period September 3, 1996 (commencement of sale of Class T shares) to July 31,1997.</R>
<R>F FMR or the fund has entered into varying arrangements with third parties who either paid or reduced a portion of the class' expenses.</R>
Prospectus
Appendix - continued
<R>Financial Services - Class B</R>
|
<R>Years ended July 31, |
2000 |
1999 |
1998 |
1997 E</R> |
|
<R>Selected Per-Share Data |
|
|
|
</R> |
|
<R>Net asset value, beginning of period |
$ 17.21 |
$ 18.52 |
$ 15.04 |
$ 12.56</R> |
|
<R>Income from Investment Operations |
|
|
|
</R> |
|
<R> Net investment income (loss) D |
.03 |
- |
(.02) |
(.02)</R> |
|
<R> Net realized and unrealized gain (loss) |
.70 |
(.29) |
3.76 |
2.50</R> |
|
<R> Total from investment operations |
.73 |
(.29) |
3.74 |
2.48</R> |
|
<R>Less Distributions |
|
|
|
</R> |
|
<R> From net investment income |
- |
(.02) |
(.04) |
-</R> |
|
<R> From net realized gain |
- |
(1.01) |
(.23) |
-</R> |
|
<R> Total distributions |
- |
(1.03) |
(.27) |
-</R> |
|
<R>Redemption fees added to paid in capital |
.01 |
.01 |
.01 |
-</R> |
|
<R>Net asset value, end of period |
$ 17.95 |
$ 17.21 |
$ 18.52 |
$ 15.04</R> |
|
<R>Total Return B, C |
4.30% |
.05% |
25.29% |
19.75%</R> |
|
<R>Ratios and Supplemental Data |
|
|
|
</R> |
|
<R>Net assets, end of period (000 omitted) |
$ 150,880 |
$ 94,072 |
$ 65,926 |
$ 7,737</R> |
|
<R>Ratio of expenses to average net assets |
2.01% |
1.99% |
2.06% |
2.50% A, F</R> |
|
<R>Ratio of expenses to average net assets after expense reductions |
1.98% G |
1.98% G |
2.04% G |
2.49% A, G</R> |
|
<R>Ratio of net investment income to average net assets |
.16% |
(.02)% |
(.14)% |
(.37)% A</R> |
|
<R>Portfolio turnover |
73% |
38% |
54% |
26% A</R> |
<R>A Annualized</R>
<R>B The total returns would have been lower had certain expenses not been reduced during the periods shown.</R>
<R>C Total returns do not include the contingent deferred sales charge and for periods of less than one year are not annualized.</R>
<R>D Net investment income (loss) per share has been calculated based on average shares outstanding during the period.</R>
<R>E For the period March 3, 1997 (commencement of sale of Class B shares) to July 31,1997.</R>
<R>F FMR agreed to reimburse a portion of the class' expenses during the period. Without this reimbursement, the class' expense ratio would have been higher.</R>
<R>G FMR or the fund has entered into varying arrangements with third parties who either paid or reduced a portion of the class' expenses.</R>
<R>Financial Services - Class C</R>
|
<R>Years ended July 31, |
2000 |
1999 |
1998 E</R> |
|
<R>Selected Per-Share Data |
|
|
</R> |
|
<R>Net asset value, beginning of period |
$ 17.24 |
$ 18.56 |
$ 15.24</R> |
|
<R>Income from Investment Operations |
|
|
</R> |
|
<R> Net investment income (loss) D |
.03 |
- |
(.03)</R> |
|
<R> Net realized and unrealized gain (loss) |
.70 |
(.29) |
3.57</R> |
|
<R> Total from investment operations |
.73 |
(.29) |
3.54</R> |
|
<R>Less Distributions |
|
|
</R> |
|
<R> From net investment income |
(.02) |
(.03) |
(.02)</R> |
|
<R> From net realized gain |
- |
(1.01) |
(.21)</R> |
|
<R> Total distributions |
(.02) |
(1.04) |
(.23)</R> |
|
<R>Redemption fees added to paid in capital |
.01 |
.01 |
.01</R> |
|
<R>Net asset value, end of period |
$ 17.96 |
$ 17.24 |
$ 18.56</R> |
|
<R>Total Return B, C |
4.30% |
.07% |
23.56%</R> |
|
<R>Ratios and Supplemental Data |
|
|
</R> |
|
<R>Net assets, end of period (000 omitted) |
$ 83,078 |
$ 36,552 |
$ 19,983</R> |
|
<R>Ratio of expenses to average net assets |
1.96% |
1.95% |
2.09% A</R> |
|
<R>Ratio of expenses to average net assets after expense reductions |
1.93% F |
1.94% F |
2.07% A, F</R> |
|
<R>Ratio of net investment income to average net assets |
.21% |
.02% |
(.22)% A</R> |
|
<R>Portfolio turnover |
73% |
38% |
54% </R> |
<R>A Annualized</R>
<R>B The total returns would have been lower had certain expenses not been reduced during the periods shown.</R>
<R>C Total returns do not include the contingent deferred sales charge and for periods of less than one year are not annualized.</R>
<R>D Net investment income (loss) per share has been calculated based on average shares outstanding during the period.</R>
<R>E For the period November 3, 1997 (commencement of sale of Class C shares) to July 31,1998.</R>
<R>F FMR or the fund has entered into varying arrangements with third parties who either paid or reduced a portion of the class' expenses.</R>
Prospectus
Appendix - continued
<R>Health Care - Class A</R>
|
<R>Years ended July 31, |
2000 |
1999 |
1998 |
1997 E </R> |
|
<R>Selected Per-Share Data |
|
|
|
</R> |
|
<R>Net asset value, beginning of period |
$ 18.52 |
$ 16.70 |
$ 14.10 |
$ 10.00</R> |
|
<R>Income from Investment Operations |
|
|
|
</R> |
|
<R> Net investment income (loss) D |
.01 |
.00 |
(.03) |
(.02)</R> |
|
<R> Net realized and unrealized gain (loss) |
3.89 |
2.20 |
3.50 |
4.12</R> |
|
<R> Total from investment operations |
3.90 |
2.20 |
3.47 |
4.10</R> |
|
<R>Less Distributions |
|
|
|
</R> |
|
<R> From net realized gain |
(.41) |
(.39) |
(.88) |
-</R> |
|
<R>Redemption fees added to paid in capital |
.01 |
.01 |
.01 |
-</R> |
|
<R>Net asset value, end of period |
$ 22.02 |
$ 18.52 |
$ 16.70 |
$ 14.10</R> |
|
<R>Total Return B, C |
21.44% |
13.80% |
26.47% |
41.00%</R> |
|
<R>Ratios and Supplemental Data |
|
|
</R> |
|
|
<R>Net assets, end of period (000 omitted) |
$ 108,248 |
$ 66,142 |
$ 20,902 |
$ 5,488</R> |
|
<R>Ratio of expenses to average net assets |
1.20% |
1.23% |
1.38% |
1.75% A, F</R> |
|
<R>Ratio of expenses to average net assets after expense reductions |
1.18% G |
1.21% G |
1.36% G |
1.74% A, G</R> |
|
<R>Ratio of net investment income (loss) to average net assets |
.07% |
.01% |
(.18)% |
(.18)% A</R> |
|
<R>Portfolio turnover |
51% |
98% |
85% |
67% A</R> |
<R>A Annualized</R>
<R>B The total returns would have been lower had certain expenses not been reduced during the periods shown.</R>
<R>C Total returns do not include the one time sales charge and for periods of less than one year are not annualized.</R>
<R>D Net investment income (loss) per share has been calculated based on average shares outstanding during the period.</R>
<R>E For the period September 3, 1996 (commencement of sale of Class A shares) to July 31, 1997.</R>
<R>F FMR agreed to reimburse a portion of the class' expenses during the period. Without this reimbursement, the class' expense ratio would have been higher.</R>
<R>G FMR or the fund has entered into varying arrangements with third parties who either paid or reduced a portion of the class' expenses.</R>
<R>Health Care - Class T</R>
|
<R>Years ended July 31, |
2000 |
1999 |
1998 |
1997 E</R> |
|
<R>Selected Per-Share Data |
|
|
|
</R> |
|
<R>Net asset value, beginning of period |
$ 18.40 |
$ 16.61 |
$ 14.05 |
$ 10.00</R> |
|
<R>Income from Investment Operations |
|
|
|
</R> |
|
<R> Net investment income (loss) D |
(.03) |
(.04) |
(.05) |
(.04)</R> |
|
<R> Net realized and unrealized gain (loss) |
3.86 |
2.19 |
3.47 |
4.09</R> |
|
<R> Total from investment operations |
3.83 |
2.15 |
3.42 |
4.05</R> |
|
<R>Less Distributions |
|
|
|
</R> |
|
<R> From net realized gain |
(.37) |
(.37) |
(.87) |
-</R> |
|
<R>Redemption fees added to paid in capital |
.01 |
.01 |
.01 |
-</R> |
|
<R>Net asset value, end of period |
$ 21.87 |
$ 18.40 |
$ 16.61 |
$ 14.05</R> |
|
<R>Total Return B, C |
21.16% |
13.54% |
26.17% |
40.50%</R> |
|
<R>Ratios and Supplemental Data |
|
|
</R> |
|
|
<R>Net assets, end of period (000 omitted) |
$ 361,351 |
$ 248,442 |
$ 124,652 |
$ 50,868</R> |
|
<R>Ratio of expenses to average net assets |
1.42% |
1.46% |
1.54% |
1.97% A</R> |
|
<R>Ratio of expenses to average net assets after expense reductions |
1.40% F |
1.43% F |
1.52% F |
1.96% A, F</R> |
|
<R>Ratio of net investment income (loss) to average net assets |
(.15)% |
(.21)% |
(.31)% |
(.39)% A</R> |
|
<R>Portfolio turnover |
51% |
98% |
85% |
67% A</R> |
<R>A Annualized</R>
<R>B The total returns would have been lower had certain expenses not been reduced during the periods shown.</R>
<R>C Total returns do not include the one time sales charge and for periods of less than one year are not annualized.</R>
<R>D Net investment income (loss) per share has been calculated based on average shares outstanding during the period.</R>
<R>E For the period September 3, 1996 (commencement of sale of Class T shares) to July 31, 1997.</R>
<R>F FMR or the fund has entered into varying arrangements with third parties who either paid or reduced a portion of the class' expenses.</R>
Prospectus
Appendix - continued
<R>Health Care - Class B</R>
|
<R>Years ended July 31, |
2000 |
1999 |
1998 |
1997 E</R> |
|
<R>Selected Per-Share Data |
|
|
|
</R> |
|
<R>Net asset value, beginning of period |
$ 18.16 |
$ 16.47 |
$ 14.01 |
$ 11.88</R> |
|
<R>Income from Investment Operations |
|
|
|
</R> |
|
<R> Net investment income (loss) D |
(.13) |
(.13) |
(.14) |
(.05)</R> |
|
<R> Net realized and unrealized gain (loss) |
3.80 |
2.17 |
3.45 |
2.18</R> |
|
<R> Total from investment operations |
3.67 |
2.04 |
3.31 |
2.13</R> |
|
<R>Less Distributions |
|
|
|
</R> |
|
<R> From net realized gain |
(.34) |
(.36) |
(.86) |
-</R> |
|
<R>Redemption fees added to paid in capital |
.01 |
.01 |
.01 |
-</R> |
|
<R>Net asset value, end of period |
$ 21.50 |
$ 18.16 |
$ 16.47 |
$ 14.01</R> |
|
<R>Total Return B, C |
20.53% |
12.96% |
25.40% |
17.93%</R> |
|
<R>Ratios and Supplemental Data |
|
|
</R> |
|
|
<R>Net assets, end of period (000 omitted) |
$ 366,413 |
$ 225,441 |
$ 57,074 |
$ 6,159</R> |
|
<R>Ratio of expenses to average net assets |
1.94% |
1.98% |
2.13% |
2.50% A, F</R> |
|
<R>Ratio of expenses to average net assets after expense reductions |
1.93% G |
1.96% G |
2.12% G |
2.49% A, G</R> |
|
<R>Ratio of net investment income (loss) to average net assets |
(.68)% |
(.73)% |
(.95)% |
(.99)% A</R> |
|
<R>Portfolio turnover |
51% |
98% |
85% |
67% A</R> |
<R>A Annualized</R>
<R>B The total returns would have been lower had certain expenses not been reduced during the periods shown.</R>
<R>C Total returns do not include the contingent deferred sales charge and for periods of less than one year are not annualized.</R>
<R>D Net investment income (loss) per share has been calculated based on average shares outstanding during the period.</R>
<R>E For the period March 3, 1997 (commencement of sale of Class B shares) to July 31, 1997.</R>
<R>F FMR agreed to reimburse a portion of the class' expenses during the period. Without this reimbursement, the class' expense ratio would have been higher.</R>
<R>G FMR or the fund has entered into varying arrangements with third parties who either paid or reduced a portion of the class' expenses.</R>
<R>Health Care - Class C</R>
|
<R>Years ended July 31, |
2000 |
1999 |
1998 E</R> |
|
<R>Selected Per-Share Data |
|
|
</R> |
|
<R>Net asset value, beginning of period |
$ 18.17 |
$ 16.49 |
$ 13.85</R> |
|
<R>Income from Investment Operations |
|
|
</R> |
|
<R> Net investment income (loss) D |
(.12) |
(.12) |
(.12)</R> |
|
<R> Net realized and unrealized gain (loss) |
3.80 |
2.17 |
3.39</R> |
|
<R> Total from investment operations |
3.68 |
2.05 |
3.27</R> |
|
<R>Less Distributions |
|
|
</R> |
|
<R> From net realized gain |
(.36) |
(.38) |
(.63)</R> |
|
<R>Redemption fees added to paid in capital |
.01 |
.01 |
-</R> |
|
<R>Net asset value, end of period |
$ 21.50 |
$ 18.17 |
$ 16.49</R> |
|
<R>Total Return B, C |
20.59% |
13.04% |
24.84%</R> |
|
<R>Ratios and Supplemental Data |
|
|
</R> |
|
<R>Net assets, end of period (000 omitted) |
$ 183,264 |
$ 109,372 |
$ 19,154</R> |
|
<R>Ratio of expenses to average net assets |
1.91% |
1.95% |
2.18% A</R> |
|
<R>Ratio of expenses to average net assets after expense reductions |
1.89% F |
1.92% F |
2.17% A, F</R> |
|
<R>Ratio of net investment income (loss) to average net assets |
(.64)% |
(.70)% |
(1.06)% A</R> |
|
<R>Portfolio turnover |
51% |
98% |
85%</R> |
<R>A Annualized</R>
<R>B The total returns would have been lower had certain expenses not been reduced during the periods shown.</R>
<R>C Total returns do not include the contingent deferred sales charge and for periods of less than one year are not annualized.</R>
<R>D Net investment income (loss) per share has been calculated based on average shares outstanding during the period.</R>
<R>E For the period November 3, 1997 (commencement of sale of Class C shares) to July 31, 1998.</R>
<R>F FMR or the fund has entered into varying arrangements with third parties who either paid or reduced a portion of the class' expenses.</R>
Prospectus
Appendix - continued
<R>Natural Resources - Class A</R>
|
<R>Years ended July 31, |
2000 |
1999 |
1998 |
1997 E |
1996 F</R> |
|
<R>Selected Per-Share Data |
|
|
|
|
</R> |
|
<R>Net asset value, beginning of period |
$ 21.98 |
$ 18.94 |
$ 26.16 |
$ 25.11 |
$ 23.65</R> |
|
<R>Income from Investment Operations |
|
|
|
|
</R> |
|
<R> Net investment income (loss) D |
.10 |
.07 |
.06 |
(.05) |
(.00)</R> |
|
<R> Net realized and unrealized gain (loss) |
2.06 |
3.71 |
(3.33) |
2.81 |
1.46</R> |
|
<R> Total from investment operations |
2.16 |
3.78 |
(3.27) |
2.76 |
1.46</R> |
|
<R>Less Distributions |
|
|
|
|
</R> |
|
<R> From net investment income |
(.08) |
(.04) |
- |
(.10) |
-</R> |
|
<R> In excess of net investment income |
- |
- |
- |
(.04) |
-</R> |
|
<R> From net realized gain |
- |
(.71) |
(3.96) |
(1.57) |
-</R> |
|
<R> Total distributions |
(.08) |
(.75) |
(3.96) |
(1.71) |
-</R> |
|
<R>Redemption fees added to paid in capital |
.01 |
.01 |
.01 |
- |
-</R> |
|
<R>Net asset value, end of period |
$ 24.07 |
$ 21.98 |
$ 18.94 |
$ 26.16 |
$ 25.11</R> |
|
<R>Total Return B, C |
9.92% |
21.48% |
(14.61)% |
11.45% |
6.17%</R> |
|
<R>Ratios and Supplemental Data |
|
|
|
|
</R> |
|
<R>Net assets, end of period (000 omitted) |
$ 10,381 |
$ 7,801 |
$ 6,474 |
$ 6,372 |
$ 1,609</R> |
|
<R>Ratio of expenses to average net assets |
1.26% |
1.28% |
1.34% |
1.71% A, G |
1.66% A, G</R> |
|
<R>Ratio of expenses to average net assets after expense reductions |
1.21% H |
1.23% H |
1.30% H |
1.68% A, H |
1.58% A, H</R> |
|
<R>Ratio of net investment income (loss) to average net assets |
.43% |
.38% |
.28% |
(.28)% A |
(.01)% A</R> |
|
<R>Portfolio turnover |
90% |
99% |
97% |
116% A |
137%</R> |
<R>A Annualized</R>
<R>B The total returns would have been lower had certain expenses not been reduced during the periods shown.</R>
<R>C Total returns do not include the one time sales charge and for periods of less than one year are not annualized.</R>
<R>D Net investment income (loss) per share has been calculated based on average shares outstanding during the period.</R>
<R>E Nine months ended July 31, 1997.</R>
<R>F For the period September 3, 1996 (commencement of sale of Class A shares) to October 31, 1996.</R>
<R>G FMR agreed to reimburse a portion of the class' expenses during the period. Without this reimbursement, the class' expense ratio would have been higher.</R>
<R>H FMR or the fund has entered into varying arrangements with third parties who either paid or reduced a portion of the class' expenses.</R>
<R>Natural Resources - Class T</R>
|
<R>Years ended July 31, |
2000 |
1999 |
1998 |
1997 E |
1996 F |
1995 F</R> |
|
<R>Selected Per-Share Data |
|
|
|
|
|
</R> |
|
<R>Net asset value, beginning of period |
$ 22.21 |
$ 19.11 |
$ 26.34 |
$ 25.12 |
$ 19.25 |
$ 17.56</R> |
|
<R>Income from Investment Operations |
|
|
|
|
|
</R> |
|
<R> Net investment income (loss) D |
.06 |
.04 |
.02 |
(.02) |
.00 |
(.05)</R> |
|
<R> Net realized and unrealized gain (loss) |
2.08 |
3.76 |
(3.34) |
2.83 |
6.56 |
2.00</R> |
|
<R> Total from investment operations |
2.14 |
3.80 |
(3.32) |
2.81 |
6.56 |
1.95</R> |
|
<R>Less Distributions |
|
|
|
|
|
</R> |
|
<R> From net investment income |
(.01) |
(.01) |
- |
(.01) |
- |
-</R> |
|
<R> In excess of net investment income |
- |
- |
- |
(.01) |
- |
-</R> |
|
<R> From net realized gain |
- |
(.70) |
(3.92) |
(1.57) |
(.69) |
(.26)</R> |
|
<R> Total distributions |
(.01) |
(.71) |
(3.92) |
(1.59) |
(.69) |
(.26)</R> |
|
<R>Redemption fees added to paid in capital |
.01 |
.01 |
.01 |
- |
- |
-</R> |
|
<R>Net asset value, end of period |
$ 24.35 |
$ 22.21 |
$ 19.11 |
$ 26.34 |
$ 25.12 |
$ 19.25</R> |
|
<R>Total Return B, C |
9.69% |
21.31% |
(14.69)% |
11.62% |
35.01% |
11.40%</R> |
|
<R>Ratios and Supplemental Data |
|
|
|
|
|
</R> |
|
<R>Net assets, end of period (000 omitted) |
$ 245,995 |
$ 283,419 |
$ 342,347 |
$ 618,083 |
$ 602,915 |
$ 272,979</R> |
|
<R>Ratio of expenses to average net assets |
1.41% |
1.45% |
1.43% |
1.47% A |
1.59% |
1.86% G</R> |
|
<R>Ratio of expenses to average net assets after expense reductions |
1.37% H |
1.40% H |
1.39% H |
1.44% A, H |
1.56% H |
1.84% H</R> |
|
<R>Ratio of net investment income (loss) to average net assets |
.27% |
.20% |
.10% |
(.12)% A |
.00% |
(.30)%</R> |
|
<R>Portfolio turnover |
90% |
99% |
97% |
116% A |
137% |
161%</R> |
<R>A Annualized</R>
<R>B The total returns would have been lower had certain expenses not been reduced during the periods shown.</R>
<R>C Total returns do not include the one time sales charge and for periods of less than one year are not annualized.</R>
<R>D Net investment income (loss) per share has been calculated based on average shares outstanding during the period.</R>
<R>E Nine months ended July 31, 1997.</R>
<R>F Year ended October 31.</R>
<R>G FMR agreed to reimburse a portion of the class' expenses during the period. Without this reimbursement, the class' expense ratio would have been higher.</R>
<R>H FMR or the fund has entered into varying arrangements with third parties who either paid or reduced a portion of the class' expenses.</R>
Prospectus
Appendix - continued
<R>Natural Resources - Class B </R>
|
<R>Years ended July 31, |
2000 |
1999 |
1998 |
1997 E |
1996 F |
1995 G</R> |
|
<R>Selected Per-Share Data |
|
|
|
|
|
</R> |
|
<R>Net asset value, beginning of period |
$ 21.78 |
$ 18.81 |
$ 25.99 |
$ 24.88 |
$ 19.23 |
$ 18.87</R> |
|
<R>Income from Investment Operations |
|
|
|
|
|
</R> |
|
<R> Net investment income (loss) D |
(.06) |
(.06) |
(.09) |
(.12) |
(.15) |
(.03)</R> |
|
<R> Net realized and unrealized gain (loss) |
2.04 |
3.68 |
(3.29) |
2.80 |
6.49 |
.39</R> |
|
<R> Total from investment operations |
1.98 |
3.62 |
(3.38) |
2.68 |
6.34 |
.36</R> |
|
<R>Less Distributions |
|
|
|
|
|
</R> |
|
<R> From net realized gain |
- |
(.66) |
(3.81) |
(1.57) |
(.69) |
-</R> |
|
<R>Redemption fees added to paid in capital |
.01 |
.01 |
.01 |
- |
- |
-</R> |
|
<R>Net asset value, end of period |
$ 23.77 |
$ 21.78 |
$ 18.81 |
$ 25.99 |
$ 24.88 |
$ 19.23</R> |
|
<R>Total Return B, C |
9.14% |
20.57% |
(15.12)% |
11.19% |
33.87% |
1.91%</R> |
|
<R>Ratios and Supplemental Data |
|
|
|
|
|
</R> |
|
<R>Net assets, end of period (000 omitted) |
$ 50,685 |
$ 47,792 |
$ 44,351 |
$ 59,044 |
$ 36,106 |
$ 2,508</R> |
|
<R>Ratio of expenses to average net assets |
1.96% |
1.99% |
1.98% |
2.04% A |
2.28% |
2.23% A, H</R> |
|
<R>Ratio of expenses to average net assets after expense reductions |
1.92% I |
1.95% I |
1.94% I |
2.02% A, I |
2.24% I |
2.21% A, I</R> |
|
<R>Ratio of net investment income (loss) to average net assets |
(.28)% |
(.34)% |
(.41)% |
(.67)% A |
(.68)% |
(.67)% A</R> |
|
<R>Portfolio turnover |
90% |
99% |
97% |
116% A |
137% |
161%</R> |
<R>A Annualized</R>
<R>B The total returns would have been lower had certain expenses not been reduced during the periods shown.</R>
<R>C Total returns do not include the contingent deferred sales charge and for periods of less than one year are not annualized.</R>
<R>D Net investment income (loss) per share has been calculated based on average shares outstanding during the period.</R>
<R>E Nine months ended July 31, 1997.</R>
<R>F Year ended October 31.</R>
<R>G For the period July 3, 1995 (commencement of sale of Class B shares) to October 31, 1995.</R>
<R>H FMR agreed to reimburse a portion of the class' expenses during the period. Without this reimbursement, the class' expense ratio would have been higher.</R>
<R>I FMR or the fund has entered into varying arrangements with third parties who either paid or reduced a portion of the class' expenses.</R>
<R>Natural Resources - Class C</R>
|
<R>Years ended July 31, |
2000 |
1999 |
1998 E</R> |
|
<R>Selected Per-Share Data |
|
|
</R> |
|
<R>Net asset value, beginning of period |
$ 21.92 |
$ 18.96 |
$ 24.39</R> |
|
<R>Income from Investment Operations |
|
|
</R> |
|
<R> Net investment income (loss) D |
(.05) |
(.05) |
(.07)</R> |
|
<R> Net realized and unrealized gain (loss) |
2.04 |
3.71 |
(4.15)</R> |
|
<R> Total from investment operations |
1.99 |
3.66 |
(4.22)</R> |
|
<R>Less Distributions |
|
|
</R> |
|
<R> From net investment income |
(.04) |
(.01) |
-</R> |
|
<R> From net realized gain |
- |
(.70) |
(1.22)</R> |
|
<R> Total distributions |
(.04) |
(.71) |
(1.22)</R> |
|
<R>Redemption fees added to paid in capital |
.01 |
.01 |
.01</R> |
|
<R>Net asset value, end of period |
$ 23.88 |
$ 21.92 |
$ 18.96</R> |
|
<R>Total Return B, C |
9.15% |
20.72% |
(17.72)%</R> |
|
<R>Ratios and Supplemental Data |
|
|
</R> |
|
<R>Net assets, end of period (000 omitted) |
$ 13,741 |
$ 8,761 |
$ 2,972</R> |
|
<R>Ratio of expenses to average net assets |
1.91% |
1.94% |
2.50% A, F</R> |
|
<R>Ratio of expenses to average net assets after expense reductions |
1.87% G |
1.89% G |
2.44% A, G</R> |
|
<R>Ratio of net investment income (loss) to average net assets |
(.23)% |
(.28)% |
(.48)% A</R> |
|
<R>Portfolio turnover |
90% |
99% |
97%</R> |
<R>A Annualized</R>
<R>B The total returns would have been lower had certain expenses not been reduced during the periods shown.</R>
<R>C Total returns do not include the contingent deferred sales charge and for periods of less than one year are not annualized.</R>
<R>D Net investment income (loss) per share has been calculated based on average shares outstanding during the period.</R>
<R>E For the period November 3, 1997 (commencement of sale of Class C shares) to July 31, 1998.</R>
<R>F FMR agreed to reimburse a portion of the class' expenses during the period. Without this reimbursement, the class' expense ratio would have been higher.</R>
<R>G FMR or the fund has entered into varying arrangements with third parties who either paid or reduced a portion of the class' expenses.</R>
Prospectus
Appendix - continued
<R>Technology - Class A</R>
|
<R>Years ended July 31, |
2000 |
1999 |
1998 |
1997 E</R> |
|
<R>Selected Per-Share Data |
|
|
|
</R> |
|
<R>Net asset value, beginning of period |
$ 24.95 |
$ 14.88 |
$ 15.96 |
$ 10.00</R> |
|
<R>Income from Investment Operations |
|
|
|
</R> |
|
<R> Net investment income (loss) D |
(.19) |
(.09) |
(.08) |
(.10)</R> |
|
<R> Net realized and unrealized gain (loss) |
13.04 |
10.15 |
.58 |
6.13</R> |
|
<R> Total from investment operations |
12.85 |
10.06 |
.50 |
6.03</R> |
|
<R>Less Distributions |
|
|
|
</R> |
|
<R> From net realized gain |
(1.58) |
- |
(1.14) |
(.08)</R> |
|
<R> In excess of net realized gain |
- |
- |
(.45) |
-</R> |
|
<R> Total distributions |
(1.58) |
- |
(1.59) |
(.08)</R> |
|
<R>Redemption fees added to paid in capital |
.01 |
.01 |
.01 |
.01</R> |
|
<R>Net asset value, end of period |
$ 36.23 |
$ 24.95 |
$ 14.88 |
$ 15.96</R> |
|
<R>Total Return B, C |
53.76% |
67.67% |
4.20% |
60.62%</R> |
|
<R>Ratios and Supplemental Data |
|
|
|
</R> |
|
<R>Net assets, end of period (000 omitted) |
$ 388,756 |
$ 94,621 |
$ 15,414 |
$ 7,313</R> |
|
<R>Ratio of expenses to average net assets |
1.16% |
1.25% |
1.39% |
1.75% A, F</R> |
|
<R>Ratio of expenses to average net assets after expense reductions |
1.15% G |
1.24% G |
1.35% G |
1.70% A, G</R> |
|
<R>Ratio of net investment income (loss) to average net assets |
(.55)% |
(.44)% |
(.59)% |
(.79)% A</R> |
|
<R>Portfolio turnover |
125% |
170% |
348% |
517% A</R> |
<R>A Annualized</R>
<R>B The total returns would have been lower had certain expenses not been reduced during the periods shown.</R>
<R>C Total returns do not include the one time sales charge and for periods of less than one year are not annualized.</R>
<R>D Net investment income (loss) per share has been calculated based on average shares outstanding during the period.</R>
<R>E For the period September 3, 1996 (commencement of sale of Class A shares) to July 31, 1997.</R>
<R>F FMR agreed to reimburse a portion of the class' expenses during the period. Without this reimbursement, the class' expense ratio would have been higher.</R>
<R>G FMR or the fund has entered into varying arrangements with third parties who either paid or reduced a portion of the class' expenses.</R>
<R>Technology - Class T</R>
|
<R>Years ended July 31, |
2000 |
1999 |
1998 |
1997 E</R> |
|
<R>Selected Per-Share Data |
|
|
|
</R> |
|
<R>Net asset value, beginning of period |
$ 24.76 |
$ 14.80 |
$ 15.91 |
$ 10.00</R> |
|
<R>Income from Investment Operations |
|
|
|
</R> |
|
<R> Net investment income (loss) D |
(.27) |
(.14) |
(.11) |
(.11)</R> |
|
<R> Net realized and unrealized gain (loss) |
12.96 |
10.09 |
.56 |
6.09</R> |
|
<R> Total from investment operations |
12.69 |
9.95 |
.45 |
5.98</R> |
|
<R>Less Distributions |
|
|
|
</R> |
|
<R> From net realized gain |
(1.51) |
- |
(1.12) |
(.08)</R> |
|
<R> In excess of net realized gain |
- |
- |
(.45) |
-</R> |
|
<R> Total distributions |
(1.51) |
- |
(1.57) |
(.08)</R> |
|
<R>Redemption fees added to paid in capital |
.01 |
.01 |
.01 |
.01</R> |
|
<R>Net asset value, end of period |
$ 35.95 |
$ 24.76 |
$ 14.80 |
$ 15.91</R> |
|
<R>Total Return B, C |
53.41% |
67.30% |
3.85% |
60.12%</R> |
|
<R>Ratios and Supplemental Data |
|
|
|
</R> |
|
<R>Net assets, end of period (000 omitted) |
$ 1,286,376 |
$ 349,533 |
$ 90,499 |
$ 57,624</R> |
|
<R>Ratio of expenses to average net assets |
1.38% |
1.47% |
1.60% |
1.92% A</R> |
|
<R>Ratio of expenses to average net assets after expense reductions |
1.37% F |
1.46% F |
1.56% F |
1.87% A, F</R> |
|
<R>Ratio of net investment income (loss) to average net assets |
(.77)% |
(.65)% |
(.80)% |
(.93)% A</R> |
|
<R>Portfolio turnover |
125% |
170% |
348% |
517% A</R> |
<R>A Annualized</R>
<R>B The total returns would have been lower had certain expenses not been reduced during the periods shown.</R>
<R>C Total returns do not include the one time sales charge and for periods of less than one year are not annualized.</R>
<R>D Net investment income (loss) per share has been calculated based on average shares outstanding during the period.</R>
<R>E For the period September 3, 1996 (commencement of sale of Class T shares) to July 31, 1997.</R>
<R>F FMR or the fund has entered into varying arrangements with third parties who either paid or reduced a portion of the class' expenses.</R>
Prospectus
Appendix - continued
<R>Technology - Class B</R>
|
<R>Years ended July 31, |
2000 |
1999 |
1998 |
1997 E</R> |
|
<R>Selected Per-Share Data |
|
|
|
</R> |
|
<R>Net asset value, beginning of period |
$ 24.44 |
$ 14.68 |
$ 15.88 |
$ 12.88</R> |
|
<R>Income from Investment Operations |
|
|
|
</R> |
|
<R> Net investment income (loss) D |
(.45) |
(.26) |
(.20) |
(.08)</R> |
|
<R> Net realized and unrealized gain (loss) |
12.78 |
10.01 |
.57 |
3.08</R> |
|
<R> Total from investment operations |
12.33 |
9.75 |
.37 |
3.00</R> |
|
<R>Less Distributions |
|
|
|
</R> |
|
<R> From net realized gain |
(1.45) |
- |
(1.13) |
-</R> |
|
<R> In excess of net realized gain |
- |
- |
(.45) |
-</R> |
|
<R> Total distributions |
(1.45) |
- |
(1.58) |
-</R> |
|
<R>Redemption fees added to paid in capital |
.01 |
.01 |
.01 |
-</R> |
|
<R>Net asset value, end of period |
$ 35.33 |
$ 24.44 |
$ 14.68 |
$ 15.88</R> |
|
<R>Total Return B, C |
52.57% |
66.49% |
3.27% |
23.29%</R> |
|
<R>Ratios and Supplemental Data |
|
|
|
</R> |
|
<R>Net assets, end of period (000 omitted) |
$ 1,372,523 |
$ 298,768 |
$ 31,041 |
$ 5,105</R> |
|
<R>Ratio of expenses to average net assets |
1.91% |
2.01% |
2.21% |
2.50% A, F</R> |
|
<R>Ratio of expenses to average net assets after expense reductions |
1.91% |
2.00% G |
2.18% G |
2.45% A, G</R> |
|
<R>Ratio of net investment income (loss) to average net assets |
(1.30)% |
(1.19)% |
(1.40)% |
(1.41)% A</R> |
|
<R>Portfolio turnover |
125% |
170% |
348% |
517% A</R> |
<R>A Annualized</R>
<R>B The total returns would have been lower had certain expenses not been reduced during the periods shown.</R>
<R>C Total returns do not include the contingent deferred sales charge and for periods of less than one year are not annualized.</R>
<R>D Net investment income (loss) per share has been calculated based on average shares outstanding during the period.</R>
<R>E For the period March 3, 1997 (commencement of sale of Class B shares) to July 31, 1997.</R>
<R>F FMR agreed to reimburse a portion of the class' expenses during the period. Without this reimbursement, the class' expense ratio would have been higher.</R>
<R>G FMR or the fund has entered into varying arrangements with third parties who either paid or reduced a portion of the class' expenses.</R>
<R>Technology - Class C</R>
|
<R>Years ended July 31, |
2000 |
1999 |
1998 E</R> |
|
<R>Selected Per-Share Data |
|
|
</R> |
|
<R>Net asset value, beginning of period |
$ 24.49 |
$ 14.70 |
$ 14.28</R> |
|
<R>Income from Investment Operations |
|
|
</R> |
|
<R> Net investment income (loss) D |
(.44) |
(.25) |
(.17)</R> |
|
<R> Net realized and unrealized gain (loss) |
12.80 |
10.03 |
1.27</R> |
|
<R> Total from investment operations |
12.36 |
9.78 |
1.10</R> |
|
<R>Less Distributions |
|
|
</R> |
|
<R> From net realized gain |
(1.47) |
- |
(.49)</R> |
|
<R> In excess of net realized gain |
- |
- |
(.20)</R> |
|
<R> Total distributions |
(1.47) |
- |
(.69)</R> |
|
<R>Redemption fees added to paid in capital |
.01 |
.01 |
.01</R> |
|
<R>Net asset value, end of period |
$ 35.39 |
$ 24.49 |
$ 14.70</R> |
|
<R>Total Return B, C |
52.60% |
66.60% |
8.96%</R> |
|
<R>Ratios and Supplemental Data |
|
|
</R> |
|
<R>Net assets, end of period (000 omitted) |
$ 472,462 |
$ 88,120 |
$ 6,754</R> |
|
<R>Ratio of expenses to average net assets |
1.89% |
1.97% |
2.43% A</R> |
|
<R>Ratio of expenses to average net assets after expense reductions |
1.89% |
1.96% F |
2.41% A, F</R> |
|
<R>Ratio of net investment income (loss) to average net assets |
(1.28)% |
(1.16)% |
(1.64)% A</R> |
|
<R>Portfolio turnover |
125% |
170% |
348%</R> |
<R>A Annualized</R>
<R>B The total returns would have been lower had certain expenses not been reduced during the periods shown.</R>
<R>C Total returns do not include the contingent deferred sales charge and for periods of less than one year are not annualized.</R>
<R>D Net investment income (loss) per share has been calculated based on average shares outstanding during the period.</R>
<R>E For the period November 3, 1997 (commencement of sale of Class C shares) to July 31, 1998.</R>
<R>F FMR or the fund has entered into varying arrangements with third parties who either paid or reduced a portion of the class' expenses.</R>
Prospectus
Appendix - continued
<R>Telecommunications & Utilities Growth - Class A</R>
|
<R>Years ended July 31, |
2000 |
1999 |
1998 |
1997 E</R> |
|
<R>Selected Per-Share Data |
|
|
|
</R> |
|
<R>Net asset value, beginning of period |
$ 20.31 |
$ 16.00 |
$ 13.07 |
$ 10.00</R> |
|
<R>Income from Investment Operations |
|
|
|
</R> |
|
<R> Net investment income (loss) D |
.53 H |
.05 |
(.02) |
.12</R> |
|
<R> Net realized and unrealized gain (loss) |
1.29 |
5.45 |
4.19 |
3.09</R> |
|
<R> Total from investment operations |
1.82 |
5.50 |
4.17 |
3.21</R> |
|
<R>Less Distributions |
|
|
|
</R> |
|
<R> From net investment income |
(.05) |
- |
(.04) |
(.03)</R> |
|
<R> From net realized gain |
(1.01) |
(1.20) |
(1.21) |
(.11)</R> |
|
<R> Total distributions |
(1.06) |
(1.20) |
(1.25) |
(.14)</R> |
|
<R>Redemption fees added to paid in capital |
.01 |
.01 |
.01 |
-</R> |
|
<R>Net asset value, end of period |
$ 21.08 |
$ 20.31 |
$ 16.00 |
$ 13.07</R> |
|
<R>Total Return B, C |
9.59% |
38.83% |
33.99% |
32.36%</R> |
|
<R>Ratios and Supplemental Data |
|
|
</R> |
|
|
<R>Net assets, end of period (000 omitted) |
$ 61,610 |
$ 14,400 |
$ 3,186 |
$ 531</R> |
|
<R>Ratio of expenses to average net assets |
1.20% |
1.34% |
1.75% F |
1.75% A, F</R> |
|
<R>Ratio of expenses to average net assets after expense reductions |
1.17% G |
1.32% G |
1.72% G |
1.75% A</R> |
|
<R>Ratio of net investment income (loss) to average net assets |
2.39% |
.30% |
(.11)% |
1.09% A</R> |
|
<R>Portfolio turnover |
172% |
149% |
151% |
13% A</R> |
<R>A Annualized</R>
<R>B The total returns would have been lower had certain expenses not been reduced during the periods shown.</R>
<R>C Total returns do not include the one time sales charge and for periods of less than one year are not annualized.</R>
<R>D Net investment income per share has been calculated based on average shares outstanding during the period.</R>
<R>E For the period September 3, 1996 (commencement of sale of Class A shares) to July 31, 1997.</R>
<R>F FMR agreed to reimburse a portion of the class' expenses during the period. Without this reimbursement, the class' expense ratio would have been higher.</R>
<R>G FMR or the fund has entered into varying arrangements with third parties who either paid or reduced a portion of the class' expenses.</R>
<R>H Investment income per share reflects a special dividend (from BCE, Inc.) which amounted to $.52 per share.</R>
<R>Telecommunications & Utilities Growth - Class T</R>
|
<R>Years ended July 31, |
2000 |
1999 |
1998 |
1997 E</R> |
|
<R>Selected Per-Share Data |
|
|
|
</R> |
|
<R>Net asset value, beginning of period |
$ 20.23 |
$ 15.95 |
$ 13.03 |
$ 10.00</R> |
|
<R>Income from Investment Operations |
|
|
|
</R> |
|
<R> Net investment income (loss) D |
.47 H |
.01 |
(.04) |
.08</R> |
|
<R> Net realized and unrealized gain (loss) |
1.31 |
5.43 |
4.17 |
3.09</R> |
|
<R> Total from investment operations |
1.78 |
5.44 |
4.13 |
3.17</R> |
|
<R>Less Distributions |
|
|
|
</R> |
|
<R> From net investment income |
(.01) |
- |
(.03) |
(.03)</R> |
|
<R> From net realized gain |
(1.00) |
(1.17) |
(1.19) |
(.11)</R> |
|
<R> Total distributions |
(1.01) |
(1.17) |
(1.22) |
(.14)</R> |
|
<R>Redemption fees added to paid in capital |
.01 |
.01 |
.01 |
-</R> |
|
<R>Net asset value, end of period |
$ 21.01 |
$ 20.23 |
$ 15.95 |
$ 13.03</R> |
|
<R>Total Return B, C |
9.41% |
38.45% |
33.72% |
31.96%</R> |
|
<R>Ratios and Supplemental Data |
|
|
</R> |
|
|
<R>Net assets, end of period (000 omitted) |
$ 225,415 |
$ 65,085 |
$ 19,918 |
$ 7,085</R> |
|
<R>Ratio of expenses to average net assets |
1.44% |
1.58% |
1.94% |
2.00% A, F</R> |
|
<R>Ratio of expenses to average net assets after expense reductions |
1.41% G |
1.55% G |
1.90% G |
2.00% A</R> |
|
<R>Ratio of net investment income (loss) to average net assets |
2.16% |
.07% |
(.23)% |
.79% A</R> |
|
<R>Portfolio turnover |
172% |
149% |
151% |
13% A</R> |
<R>A Annualized</R>
<R>B The total returns would have been lower had certain expenses not been reduced during the periods shown.</R>
<R>C Total returns do not include the one time sales charge and for periods of less than one year are not annualized.</R>
<R>D Net investment income per share has been calculated based on average shares outstanding during the period.</R>
<R>E For the period September 3, 1996 (commencement of sale of Class T shares) to July 31, 1997.</R>
<R>F FMR agreed to reimburse a portion of the class' expenses during the period. Without this reimbursement, the class' expense ratio would have been higher.</R>
<R>G FMR or the fund has entered into varying arrangements with third parties who either paid or reduced a portion of the class' expenses.</R>
<R>H Investment income per share reflects a special dividend (from BCE, Inc.) which amounted to $.52 per share.</R>
Prospectus
Appendix - continued
<R>Telecommunications & Utilities Growth - Class B</R>
|
<R>Years ended July 31, |
2000 |
1999 |
1998 |
1997 E</R> |
|
<R>Selected Per-Share Data |
|
|
|
</R> |
|
<R>Net asset value, beginning of period |
$ 20.02 |
$ 15.83 |
$ 13.01 |
$ 11.76</R> |
|
<R>Income from Investment Operations |
|
|
|
</R> |
|
<R> Net investment income (loss) D |
.35 H |
(.08) |
(.13) |
.02</R> |
|
<R> Net realized and unrealized gain (loss) |
1.29 |
5.39 |
4.16 |
1.23</R> |
|
<R> Total from investment operations |
1.64 |
5.31 |
4.03 |
1.25</R> |
|
<R>Less Distributions |
|
|
|
</R> |
|
<R> From net investment income |
- |
- |
(.03) |
-</R> |
|
<R> From net realized gain |
(.95) |
(1.13) |
(1.19) |
-</R> |
|
<R> Total distributions |
(.95) |
(1.13) |
(1.22) |
-</R> |
|
<R>Redemption fees added to paid in capital |
.01 |
.01 |
.01 |
-</R> |
|
<R>Net asset value, end of period |
$ 20.72 |
$ 20.02 |
$ 15.83 |
$ 13.01</R> |
|
<R>Total Return B, C |
8.77% |
37.76% |
32.97% |
10.63%</R> |
|
<R>Ratios and Supplemental Data |
|
|
</R> |
|
|
<R>Net assets, end of period (000 omitted) |
$ 242,888 |
$ 65,645 |
$ 12,919 |
$ 2,039</R> |
|
<R>Ratio of expenses to average net assets |
1.96% |
2.08% |
2.50% F |
2.50% A, F</R> |
|
<R>Ratio of expenses to average net assets after expense reductions |
1.93% G |
2.05% G |
2.47% G |
2.50% A</R> |
|
<R>Ratio of net investment income (loss) to average net assets |
1.63% |
(.43)% |
(.85)% |
.32% A</R> |
|
<R>Portfolio turnover |
172% |
149% |
151% |
13% A</R> |
<R>A Annualized</R>
<R>B The total returns would have been lower had certain expenses not been reduced during the periods shown.</R>
<R>C Total returns do not include the contingent deferred sales charge and for periods of less than one year are not annualized.</R>
<R>D Net investment income per share has been calculated based on average shares outstanding during the period.</R>
<R>E For the period March 3, 1997 (commencement of sale of Class B shares) to July 31, 1997.</R>
<R>F FMR agreed to reimburse a portion of the class' expenses during the period. Without this reimbursement, the class' expense ratio would have been higher.</R>
<R>G FMR or the fund has entered into varying arrangements with third parties who either paid or reduced a portion of the class' expenses.</R>
<R>H Investment income per share reflects a special dividend (from BCE, Inc.) which amounted to $.52 per share.</R>
<R>Telecommunications & Utilities Growth - Class C</R>
|
<R>Years ended July 31, |
2000 |
1999 |
1998 E</R> |
|
<R>Selected Per-Share Data |
|
|
</R> |
|
<R>Net asset value, beginning of period |
$ 20.01 |
$ 15.85 |
$ 13.90</R> |
|
<R>Income from Investment Operations |
|
|
</R> |
|
<R> Net investment income (loss) D |
.36 H |
(.08) |
(.10)</R> |
|
<R> Net realized and unrealized gain (loss) |
1.29 |
5.38 |
3.16</R> |
|
<R> Total from investment operations |
1.65 |
5.30 |
3.06</R> |
|
<R>Less Distributions |
|
|
</R> |
|
<R> From net investment income |
- |
- |
(.02)</R> |
|
<R> From net realized gain |
(.96) |
(1.15) |
(1.10)</R> |
|
<R> Total distributions |
(.96) |
(1.15) |
(1.12)</R> |
|
<R>Redemption fees added to paid in capital |
.01 |
.01 |
.01</R> |
|
<R>Net asset value, end of period |
$ 20.71 |
$ 20.01 |
$ 15.85</R> |
|
<R>Total Return B, C |
8.84% |
37.72% |
23.60%</R> |
|
<R>Ratios and Supplemental Data |
|
|
</R> |
|
<R>Net assets, end of period (000 omitted) |
$ 107,332 |
$ 23,524 |
$ 3,489</R> |
|
<R>Ratio of expenses to average net assets |
1.93% |
2.07% |
2.50% A, F</R> |
|
<R>Ratio of expenses to average net assets after expense reductions |
1.90% G |
2.04% G |
2.48% A, G</R> |
|
<R>Ratio of net investment income (loss) to average net assets |
1.66% |
(.43)% |
(.91)% A</R> |
|
<R>Portfolio turnover |
172% |
149% |
151%</R> |
<R>A Annualized</R>
<R>B The total returns would have been lower had certain expenses not been reduced during the periods shown.</R>
<R>C Total returns do not include the contingent deferred sales charge and for periods of less than one year are not annualized.</R>
<R>D Net investment income per share has been calculated based on average shares outstanding during the period.</R>
<R>E For the period November 3, 1997 (commencement of sale of Class C shares) to July 31, 1998.</R>
<R>F FMR agreed to reimburse a portion of the class' expenses during the period. Without this reimbursement, the class' expense ratio would have been higher.</R>
<R>G FMR or the fund has entered into varying arrangements with third parties who either paid or reduced a portion of the class' expenses.</R>
<R>H Investment income per share reflects a special dividend (from BCE, Inc.) which amounted to $.52 per share.</R>
Prospectus
Notes
You can obtain additional information about the funds. The funds' SAI includes more detailed information about each fund and its investments. The SAI is incorporated herein by reference (legally forms a part of the prospectus). Each fund's annual and semi-annual reports include a discussion of the fund's holdings and recent market conditions and the fund's investment strategies that affected performance.
For a free copy of any of these documents or to request other information or ask questions about a fund, call Fidelity at 1-888-622-3175.
|
<R>The SAI, the funds' annual and semi-annual reports and other related materials are available from the Electronic Data Gathering, Analysis, and Retrieval (EDGAR) Database on the SEC's web site (http://www.sec.gov). You can obtain copies of this information, after paying a duplicating fee, by sending a request by e-mail to [email protected] or by writing the Public Reference Section of the SEC, Washington, D.C. 20549-0102. You can also review and copy information about the funds, including the funds' SAI, at the SEC's Public Reference Room in Washington, D.C. Call 1-202-942-8090 for information on the operation of the SEC's Public Reference Room.</R> Investment Company Act of 1940, File Number, 811-3010 |
<R>Fidelity Advisor Focus Funds, Fidelity, Fidelity Investments & (Pyramid) Design, and Directed Dividends are regiestered trademarks of FMR Corp.</R>
The third party marks appearing above are the marks of their respective owners.
<R>1.704309.103</R> AFOC-pro-0900
Like securities of all mutual funds, these securities have not been approved or disapproved by the Securities and Exchange Commission, and the Securities and Exchange Commission has not determined if this prospectus is accurate or complete. Any representation to the contrary is a criminal offense.
Institutional Class
Fidelity® Advisor Consumer Industries Fund
Fidelity Advisor Cyclical Industries Fund
Fidelity Advisor Financial Services Fund
Fidelity Advisor Health Care Fund
Fidelity Advisor Natural Resources Fund
Fidelity Advisor Technology Fund
Fidelity Advisor <R>Telecommunications & </R>Utilities Growth Fund (formerly Fidelity Advisor Utilities Growth Fund)
Prospectus
<R>September 28, 2000
(fidelity_logo_graphic)
82 Devonshire Street, Boston, MA 02109</R>
|
Fund Summary |
Investment Summary |
|
|
|
Performance |
|
|
|
Fee Table |
|
|
Fund Basics |
Investment Details |
|
|
|
Valuing Shares |
|
|
Shareholder Information |
Buying and Selling Shares |
|
|
|
Exchanging Shares |
|
|
|
Account Features and Policies |
|
|
|
Dividends and Capital Gain Distributions |
|
|
|
Tax Consequences |
|
|
Fund Services |
Fund Management |
|
|
|
Fund Distribution |
|
|
Appendix |
Financial Highlights |
Prospectus
<R>Investment Objective</R>
Advisor Consumer Industries Fund seeks capital appreciation.
Principal Investment Strategies
Fidelity Management & Research Company (FMR)'s principal investment strategies include:
Principal Investment Risks
The fund is subject to the following principal investment risks:
In addition, the fund is considered non-diversified and can invest a greater portion of assets in securities of individual issuers than a diversified fund. As a result, changes in the market value of a single issuer could cause greater fluctuations in share price than would occur in a more diversified fund.
An investment in the fund is not a deposit of a bank and is not insured or guaranteed by the Federal Deposit Insurance Corporation or any other government agency.
When you sell your shares of the fund, they could be worth more or less than what you paid for them.
Investment Objective
Advisor Cyclical Industries Fund seeks capital appreciation.
Principal Investment Strategies
FMR's principal investment strategies include:
Principal Investment Risks
The fund is subject to the following principal investment risks:
In addition, the fund is considered non-diversified and can invest a greater portion of assets in securities of individual issuers than a diversified fund. As a result, changes in the market value of a single issuer could cause greater fluctuations in share price than would occur in a more diversified fund.
An investment in the fund is not a deposit of a bank and is not insured or guaranteed by the Federal Deposit Insurance Corporation or any other government agency.
When you sell your shares of the fund, they could be worth more or less than what you paid for them.
Prospectus
Fund Summary - continued
Investment Objective
Advisor Financial Services Fund seeks capital appreciation.
Principal Investment Strategies
FMR's principal investment strategies include:
Principal Investment Risks
The fund is subject to the following principal investment risks:
An investment in the fund is not a deposit of a bank and is not insured or guaranteed by the Federal Deposit Insurance Corporation or any other government agency.
When you sell your shares of the fund, they could be worth more or less than what you paid for them.
Investment Objective
Advisor Health Care Fund seeks capital appreciation.
Principal Investment Strategies
FMR's principal investment strategies include:
Principal Investment Risks
The fund is subject to the following principal investment risks:
In addition, the fund is considered non-diversified and can invest a greater portion of assets in securities of individual issuers than a diversified fund. As a result, changes in the market value of a single issuer could cause greater fluctuations in share price than would occur in a more diversified fund.
An investment in the fund is not a deposit of a bank and is not insured or guaranteed by the Federal Deposit Insurance Corporation or any other government agency.
When you sell your shares of the fund, they could be worth more or less than what you paid for them.
Investment Objective
Advisor Natural Resources Fund seeks long-term growth of capital and protection of the purchasing power of shareholders' capital.
Principal Investment Strategies
FMR's principal investment strategies include:
Prospectus
Fund Summary - continued
Principal Investment Risks
The fund is subject to the following principal investment risks:
In addition, the fund is considered non-diversified and can invest a greater portion of assets in securities of individual issuers than a diversified fund. As a result, changes in the market value of a single issuer could cause greater fluctuations in share price than would occur in a more diversified fund.
An investment in the fund is not a deposit of a bank and is not insured or guaranteed by the Federal Deposit Insurance Corporation or any other government agency.
When you sell your shares of the fund, they could be worth more or less than what you paid for them.
Investment Objective
Advisor Technology Fund seeks capital appreciation.
Principal Investment Strategies
FMR's principal investment strategies include:
Principal Investment Risks
The fund is subject to the following principal investment risks:
In addition, the fund is considered non-diversified and can invest a greater portion of assets in securities of individual issuers than a diversified fund. As a result, changes in the market value of a single issuer could cause greater fluctuations in share price than would occur in a more diversified fund.
An investment in the fund is not a deposit of a bank and is not insured or guaranteed by the Federal Deposit Insurance Corporation or any other government agency.
When you sell your shares of the fund, they could be worth more or less than what you paid for them.
Investment Objective
Advisor <R>Telecommunications &</R> Utilities Growth Fund seeks capital appreciation.
Principal Investment Strategies
FMR's principal investment strategies include:
Prospectus
Fund Summary - continued
Principal Investment Risks
The fund is subject to the following principal investment risks:
In addition, the fund is considered non-diversified and can invest a greater portion of assets in securities of individual issuers than a diversified fund. As a result, changes in the market value of a single issuer could cause greater fluctuations in share price than would occur in a more diversified fund.
An investment in the fund is not a deposit of a bank and is not insured or guaranteed by the Federal Deposit Insurance Corporation or any other government agency.
When you sell your shares of the fund, they could be worth more or less than what you paid for them.
The following information illustrates the changes in each fund's performance from year to year and compares Institutional Class's performance to the performance of a market index and an additional index over various periods of time. Returns are based on past results and are not an indication of future performance.
|
Advisor Consumer Industries - Institutional Class |
||||||||||
|
Calendar Years |
|
|
|
|
|
|
|
1997 |
1998 |
1999 |
|
|
|
|
|
|
|
|
|
36.94% |
29.16% |
10.51% |
<R>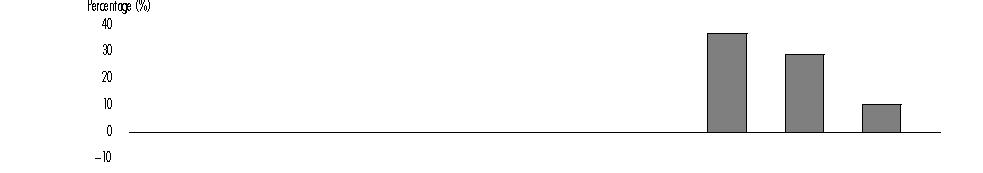
</R>
During the periods shown in the chart for Institutional Class of Advisor Consumer Industries, the highest return for a quarter was 27.24% (quarter ended D<R>ecember 31, 1998) and the lowest return for a quarter was </R>-14.36% (quarter ended <R>September 30, 1998</R>).
The year-to-date return as of June 30, 2000 for Institutional Class of Advisor Consumer Industries was<R> -8.99</R>%.
Prospectus
Fund Summary - continued
|
Advisor Cyclical Industries - Institutional Class |
||||||||||
|
Calendar Years |
|
|
|
|
|
|
|
1997 |
1998 |
1999 |
|
|
|
|
|
|
|
|
|
19.23% |
11.47% |
13.15% |
<R>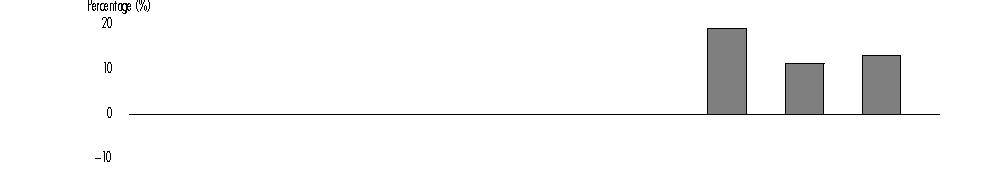
</R>
During the periods shown in the chart for Institutional Class of Advisor Cyclical Industries, the highest return for a quarter was 1<R>7.94%</R> (quarter ended <R>December 31, 1998</R>) and the lowest return for a quarter was -<R>18.59%</R> (quarter ended <R>September 30, 1998).</R>
The year-to-date return as of June 30, 2000 for Institutional Class of Advisor Cyclical Industries was -<R>8.22</R>%.
|
Advisor Financial Services - Institutional Class |
||||||||||
|
Calendar Years |
|
|
|
|
|
|
|
1997 |
1998 |
1999 |
|
|
|
|
|
|
|
|
|
40.32%% |
11.97% |
2.38% |
<R>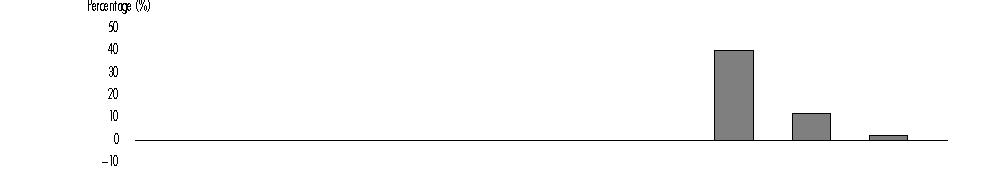
</R>
During the periods shown in the chart for Institutional Class of Advisor Financial Services, the highest return for a quarter was 18.92% (quarter ended <R>December 31, 1998) and the lowest return for a quarter was </R>-<R>19.48%</R> (quarter ended S<R>eptember 30, 1998</R>).
The year-to-date return as of June 30, 2000 for Institutional Class of Advisor Financial Services was <R>0.18</R>%.
|
Advisor Health Care - Institutional Class |
||||||||||
|
Calendar Years |
|
|
|
|
|
|
|
1997 |
1998 |
1999 |
|
|
|
|
|
|
|
|
|
31.17% |
40.19% |
2.07% |
<R>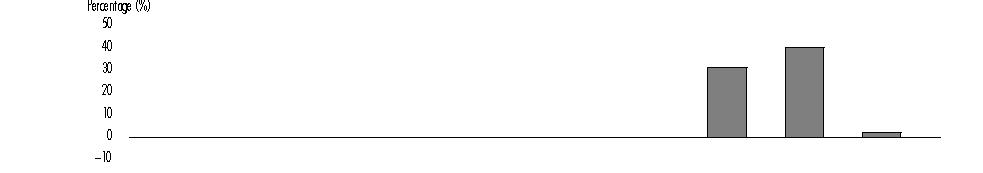
</R>
During the periods shown in the chart for Institutional Class of Advisor Health Care, the highest return for a quarter was 21.50% (quarter ended June 30,1997) and the lowest return for a quarter was -8.51% (quarter ended S<R>eptember 30,1999</R>).
The year-to-date return as of June 30, 2000 for Institutional Class of Advisor Health Care was 2<R>4.76</R>%.
Prospectus
Fund Summary - continued
|
Advisor Natural Resources - Institutional Class |
||||||||||
|
Calendar Years |
1990 |
1991 |
1992 |
1993 |
1994 |
1995 |
1996 |
1997 |
1998 |
1999 |
|
<R> |
-5.28% |
14.47% |
13.33% |
37.94% |
-2.28% |
28.86% |
30.72% |
-0.44% |
-15.86% |
35.07%</R> |
<R>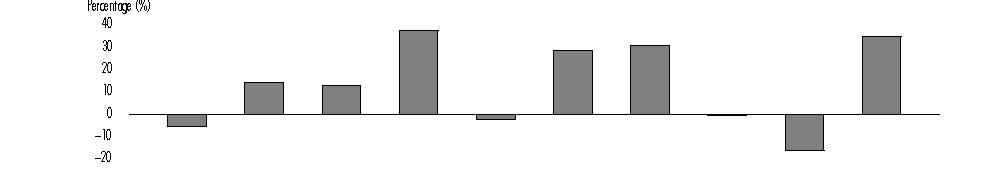
</R>
During the periods shown in the chart for Institutional Class of Advisor Natural Resources, the highest return for a quarter was <R>19.46%</R> (quarter ended <R>June 30, 1999</R>) and the lowest return for a quarter was <R>-13.16%</R> (quarter ended <R>December 31,1997).</R>
The year-to-date return as of June 30, 2000 for Institutional Class of Advisor Natural Resources was <R>13.60%</R>.
|
Advisor Technology - Institutional Class |
||||||||||
|
Calendar Years |
|
|
|
|
|
|
|
1997 |
1998 |
1999 |
|
<R> |
|
|
|
|
|
|
|
10.72% |
67.70% |
90.35%</R> |
<R>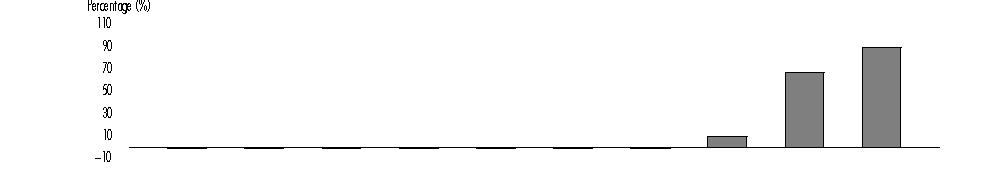
</R>
During the periods shown in the chart for Institutional Class of Advisor Technology, the highest return for a quarter was <R>49.42%</R> (quarter ended <R>December 31,1999</R>) and the lowest return for a quarter was <R>-19.95% (quarter ended December 31,1997).</R>
The year-to-date return as of June 30, 2000 for Institutional Class of Advisor Technology was <R>3.11</R>%.
|
Advisor Telecommunications & Utilities Growth - Institutional Class |
||||||||||
|
Calendar Years |
|
|
|
|
|
|
|
1997 |
1998 |
1999 |
|
<R> |
|
|
|
|
|
|
|
30.25% |
32.72% |
44.14%%</R> |
<R>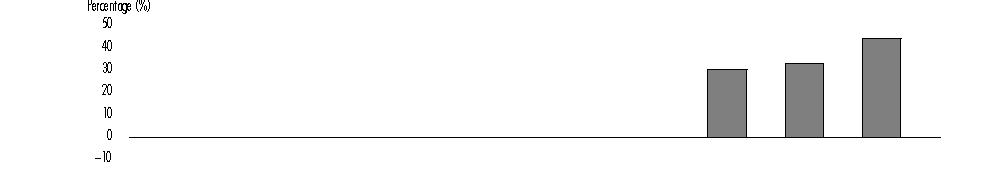
</R>
During the periods shown in the chart for Institutional Class of Advisor Telecommunications & Utilities Growth, the highest return for a quarter was <R>23.42%</R> (quarter ended <R>March 31,1998< /R>) and the lowest return for a quarter was -5.42% (quarter ended <R>September 31, 1998).</R>
The year-to-date return as of June 30, 2000 for Institutional Class of Advisor Telecommunications & Utilities Growth was <R>0.45</R>%.
Prospectus
Fund Summary - continued
|
For the periods ended |
Past 1 |
Past 5 |
Life of |
|
<R>Advisor Consumer Industries - Institutional Class |
10.51% |
C |
25.40%A</R> |
|
<R>S&P 500® |
21.04% |
C |
29.53%A</R> |
|
<R>Goldman Sachs Consumer Industries Index |
8.32% |
C |
22.69%A</R> |
|
<R>Advisor Cyclical Industries - Institutional Class |
13.15% |
C |
17.16%A</R> |
|
<R>S&P 500 |
21.04% |
C |
29.53%A</R> |
|
<R>Goldman Sachs Cyclical Industries Index |
5.54% |
C |
13.04%A</R> |
|
<R>Advisor Financial Services - Institutional Class |
2.38% |
C |
21.03%A</R> |
|
<R>S&P 500 |
21.04% |
C |
29.53%A</R> |
|
<R>Goldman Sachs Financial Services Index |
-0.94% |
C |
22.13%A</R> |
|
<R>Advisor Health Care - Institutional Class |
2.07% |
C |
24.45%A</R> |
|
<R>S&P 500 |
21.04% |
C |
29.53%A</R> |
|
<R>Goldman Sachs Health Care Index |
-4.04% |
C |
24.31%A </R> |
|
Advisor Natural Resources - Institutional Class |
35.07% |
13.77% |
11.71%B |
|
S&P 500 |
21.04% |
28.56% |
26.78%B |
|
<R>Goldman Sachs Natural Resources Index |
27.23% |
C |
C</R> |
|
<R>Advisor Technology - Institutional Class |
90.35% |
C |
56.23%A</R> |
|
<R>S&P 500 |
21.04% |
C |
29.53%A</R> |
|
<R>Goldman Sachs Technology Index |
88.87% |
C |
59.95%A</R> |
|
<R>Advisor Telecommunications & Utilities Growth - Institutional Class |
44.14% |
C |
37.32%A</R> |
|
<R>S&P 500 |
21.04% |
C |
29.53%A</R> |
|
<R>Goldman Sachs Utilities Index |
20.25% |
C |
29.95%A</R> |
A From September 3, 1996.
B From July 3, 1995.
C Not applicable.
If FMR had not reimbursed certain class expenses during these periods, <R>Institutional Class's</R> returns would have been lower.
Standard & Poor's 500 SM Index (S&P 500®) is a market capitalization-weighted index of common stocks.
Goldman Sachs Consumer Industries Index is a market capitalization-weighted index of <R>290</R> stocks designed to measure the performance of companies in the consumer industries sector.
Goldman Sachs Cyclical Industries Index is a market capitalization-weighted index of <R>265 </R>stocks designed to measure the performance of companies in the cyclical industries sector.
Goldman Sachs Financial Services Index is a market capitalization-weighted index of <R>251 </R>stocks designed to measure the performance of companies in the financial services sector.
Goldman Sachs Health Care Index is a market capitalization-weighted index of <R>86 </R>stocks designed to measure the performance of companies in the health care sector.
Goldman Sachs Natural Resources Index is a market capitalization-weighted index of <R>84 </R>stocks designed to measure the performance of companies in the natural resources sector.
Goldman Sachs Technology Index is a market capitalization-weighted index of <R>159 </R>stocks designed to measure the performance of companies in the technology sector.
Goldman Sachs Utilities Index is a market capitalization-weighted index of <R>130 </R>stocks designed to measure the performance of companies in the utilities sector.
The following table describes the fees and expenses that are incurred when you buy, hold, or sell Institutional Class shares of a fund. The annual class operating expenses provided below for Institutional Class do not reflect the effect of any expense reimbursements or reduction of certain expenses during the period.
Prospectus
Fund Summary - continued
Shareholder fees (paid by the investor directly)
|
|
Institutional Class |
|
Sales charge (load) on purchases and reinvested distributions |
None |
|
Deferred sales charge (load) on redemptions |
None |
|
Redemption fee on shares held less than 60 days (as a % of amount redeemed) |
1.00% |
Annual class operating expenses (paid from class assets)
|
|
|
Institutional Class |
|
<R>Advisor Consumer Industries |
Management fee |
0.58%</R> |
|
|
Distribution and Service (12b-1) fee |
None |
|
<R> |
Other expenses |
0.73%</R> |
|
<R> |
Total annual class operating expensesA |
1.31%</R> |
|
<R>Advisor Cyclical Industries |
Management fee |
0.58%</R> |
|
|
Distribution and Service (12b-1) fee |
None |
|
<R> |
Other expenses |
1.92%</R> |
|
<R> |
Total annual class operating expensesA |
2.50%</R> |
|
<R>Advisor Financial Services |
Management fee |
0.58%</R> |
|
|
Distribution and Service (12b-1) fee |
None |
|
<R> |
Other expenses |
0.32%</R> |
|
<R> |
Total annual class operating expensesA |
0.90%</R> |
|
<R>Advisor Health Care |
Management fee |
0.58%</R> |
|
|
Distribution and Service (12b-1) fee |
None |
|
<R> |
Other expenses |
0.35%</R> |
|
<R> |
Total annual class operating expensesA |
0.93%</R> |
|
<R>Advisor Natural Resources |
Management fee |
0.58%</R> |
|
|
Distribution and Service (12b-1) fee |
None |
|
<R> |
Other expenses |
0.28%</R> |
|
<R> |
Total annual class operating expensesA |
0.86%</R> |
|
<R>Advisor Technology |
Management fee |
0.58%</R> |
|
|
Distribution and Service (12b-1) fee |
None |
|
<R> |
Other expenses |
0.29%</R> |
|
<R> |
Total annual class operating expensesA |
0.87%</R> |
|
<R>Advisor Telecommunications & Utilities Growth |
Management fee |
0.58%</R> |
|
|
Distribution and Service (12b-1) fee |
None |
|
<R> |
Other expenses |
0.30%</R> |
|
<R> |
Total annual class operating expensesA |
0.88%</R> |
A <R>Effective December 1, 1998, </R>FMR has voluntarily agreed to reimburse Institutional Class of the funds to the extent that total operating expenses (excluding interest, taxes, <R> certain</R> securities lending <R>costs,</R> brokerage commissions, and extraordinary expenses), as a percentage of its average net assets, exceed 1.25%. This arrangement can be discontinued by FMR at any time.
Prospectus
Fund Summary - continued
A portion of the brokerage commissions that a fund pays is used to reduce that fund's expenses. In addition, through arrangements with each fund's custodian and transfer agent, credits realized as a result of uninvested cash balances are used to reduce custodian and transfer agent expenses. Including these reductions, the total <R>Institutional Class</R> operating expenses are shown in the table below.
|
<R> |
Total Operating Expenses</R> |
|
<R>Advisor Consumer Industries - Institutional Class |
1.24%</R> |
|
<R>Advisor Cyclical Industries - Institutional Class |
1.24%</R> |
|
<R>Advisor Financial Services - Institutional Class |
0.87%</R> |
|
<R>Advisor Health Care - Institutional Class |
0.92%</R> |
|
<R>Advisor Natural Resources - Institutional Class |
0.82%</R> |
|
<R>Advisor Technology - Institutional Class |
0.87%</R> |
|
<R>Advisor Telecommunications & Utilities Growth - Institutional Class |
0.85%</R> |
This example helps you compare the cost of investing in the funds with the cost of investing in other mutual funds.
Let's say, hypothetically, that Institutional Class's annual return is 5% and that your shareholder fees and Institutional Class's annual operating expenses are exactly as described in the fee table. This example illustrates the effect of fees and expenses, but is not meant to suggest actual or expected fees and expenses or returns, all of which may vary. For every $10,000 you invested, here's how much you would pay in total expenses if you close your account <R>at the end of each time period</R> indicated:
|
|
|
Institutional Class |
|
|
|
|
Account |
Account |
|
<R>Advisor Consumer Industries |
1 year |
$ 133 |
$ 133</R> |
|
<R> |
3 years |
$ 415 |
$ 415</R> |
|
<R> |
5 years |
$ 718 |
$ 718</R> |
|
<R> |
10 years |
$ 1,579 |
$ 1,579</R> |
|
<R>Advisor Cyclical Industries |
1 year |
$ 253 |
$ 253</R> |
|
<R> |
3 years |
$ 779 |
$ 779</R> |
|
<R> |
5 years |
$ 1,331 |
$ 1,331</R> |
|
<R> |
10 years |
$ 2,836 |
$ 2,836</R> |
|
<R>Advisor Financial Services |
1 year |
$ 92 |
$ 92</R> |
|
<R> |
3 years |
$ 287 |
$ 287</R> |
|
<R> |
5 years |
$ 498 |
$ 498</R> |
|
<R> |
10 years |
$ 1,108 |
$ 1,108</R> |
|
<R>Advisor Health Care |
1 year |
$ 95 |
$ 95</R> |
|
<R> |
3 years |
$ 296 |
$ 296</R> |
|
<R> |
5 years |
$ 515 |
$ 515</R> |
|
<R> |
10 years |
$ 1,143 |
$ 1,143</R> |
|
<R>Advisor Natural Resources |
1 year |
$ 88 |
$ 88</R> |
|
<R> |
3 years |
$ 274 |
$ 274</R> |
|
<R> |
5 years |
$ 477 |
$ 477</R> |
|
<R> |
10 years |
$ 1,061 |
$ 1,061</R> |
|
<R>Advisor Technology |
1 year |
$ 89 |
$ 89</R> |
|
<R> |
3 years |
$ 278 |
$ 278</R> |
|
<R> |
5 years |
$ 482 |
$ 482</R> |
|
<R> |
10 years |
$ 1,073 |
$ 1,073</R> |
|
<R>Advisor Telecommunications & Utilities Growth |
1 year |
$ 90 |
$ 90</R> |
|
<R> |
3 years |
$ 281 |
$ 281</R> |
|
<R> |
5 years |
$ 488 |
$ 488</R> |
|
<R> |
10 years |
$ 1,084 |
$ 1,084</R> |
Prospectus
Investment Objective
Advisor Consumer Industries Fund seeks capital appreciation.
Principal Investment Strategies
FMR normally invests the fund's assets primarily in common stocks.
FMR invests the fund's assets primarily in companies engaged in the manufacture and distribution of goods to consumers both domestically and internationally.
FMR normally invests at least 80% of the fund's assets in securities of companies principally engaged in the business activities of the consumer industries sector. These companies may include, for example, companies that manufacture or sell durable goods such as homes, cars, boats, furniture, major appliances, and personal computers; and companies that manufacture, wholesale, or retail non-durable goods such as food, beverages, tobacco, health care products, household and personal care products, apparel, and entertainment products (e.g., books, magazines, TV, cable, movies, music, gaming, and sports). They may also include companies that provide consumer services such as lodging, child care, convenience stores, and car rentals.
FMR may invest the fund's assets in securities of foreign issuers in addition to securities of domestic issuers.
Because the fund is considered non-diversified, FMR may invest a significant percentage of the fund's assets in a single issuer.
In buying and selling securities for the fund, FMR relies on fundamental analysis of each issuer and its potential for success in light of its current financial condition, its industry position, and economic and market conditions. Factors considered include growth potential, earnings estimates, and management.
FMR may lend the fund's securities to broker-dealers or other institutions to earn income for the fund.
FMR may use various techniques, such as buying and selling futures contracts, to increase or decrease the fund's exposure to changing security prices or other factors that affect security values. If FMR's strategies do not work as intended, the fund may not achieve its objective.
Investment Objective
Advisor Cyclical Industries Fund seeks capital appreciation.
Principal Investment Strategies
FMR normally invests the fund's assets primarily in common stocks.
FMR invests the fund's assets primarily in companies engaged in the research, development, manufacture, distribution, supply, or sale of materials, equipment, products, or services related to cyclical industries.
FMR normally invests at least 80% of the fund's assets in securities of companies principally engaged in the business activities of the cyclical industries sector. These companies may include, for example, companies in the automotive, chemical, construction and housing, defense and aerospace, environmental services, industrial equipment and materials, paper and forest products, and transportation industries.
FMR may invest the fund's assets in securities of foreign issuers in addition to securities of domestic issuers.
Because the fund is considered non-diversified, FMR may invest a significant percentage of the fund's assets in a single issuer.
In buying and selling securities for the fund, FMR relies on fundamental analysis of each issuer and its potential for success in light of its current financial condition, its industry position, and economic and market conditions. Factors considered include growth potential, earnings estimates, and management.
FMR may lend the fund's securities to broker-dealers or other institutions to earn income for the fund.
FMR may use various techniques, such as buying and selling futures contracts, to increase or decrease the fund's exposure to changing security prices or other factors that affect security values. If FMR's strategies do not work as intended, the fund may not achieve its objective.
Investment Objective
Advisor Financial Services Fund seeks capital appreciation.
Principal Investment Strategies
FMR normally invests the fund's assets primarily in common stocks.
FMR invests the fund's assets primarily in companies providing financial services to consumers and industry.
FMR normally invests at least 80% of the fund's assets in securities of companies principally engaged in the business activities of the financial services sector. These companies may include, for example, commercial banks, savings and loan associations, brokerage companies, insurance companies, real estate-related companies, leasing companies, and consumer and industrial finance companies.
FMR may invest the fund's assets in securities of foreign issuers in addition to securities of domestic issuers.
In buying and selling securities for the fund, FMR relies on fundamental analysis of each issuer and its potential for success in light of its current financial condition, its industry position, and economic and market conditions. Factors considered include growth potential, earnings estimates, and management.
FMR may lend the fund's securities to broker-dealers or other institutions to earn income for the fund.
FMR may use various techniques, such as buying and selling futures contracts, to increase or decrease the fund's exposure to changing security prices or other factors that affect security values. If FMR's strategies do not work as intended, the fund may not achieve its objective.
Prospectus
Fund Basics - continued
Investment Objective
Advisor Health Care Fund seeks capital appreciation.
Principal Investment Strategies
FMR normally invests the fund's assets primarily in common stocks.
FMR invests the fund's assets primarily in companies engaged in the design, manufacture, or sale of products or services used for or in connection with health care or medicine.
FMR normally invests at least 80% of the fund's assets in securities of companies principally engaged in the business activities of the health care sector. These companies may include, for example, pharmaceutical companies; companies involved in biotechnology, medical diagnostic, biochemical, or other health care research and development; companies involved in the operation of health care facilities; and other companies involved in the design, manufacture, or sale of health care-related products or services, such as medical, dental, and optical products, hardware, or services.
FMR may invest the fund's assets in securities of foreign issuers in addition to securities of domestic issuers.
Because the fund is considered non-diversified, FMR may invest a significant percentage of the fund's assets in a single issuer.
In buying and selling securities for the fund, FMR relies on fundamental analysis of each issuer and its potential for success in light of its current financial condition, its industry position, and economic and market conditions. Factors considered include growth potential, earnings estimates, and management.
FMR may lend the fund's securities to broker-dealers or other institutions to earn income for the fund.
FMR may use various techniques, such as buying and selling futures contracts, to increase or decrease the fund's exposure to changing security prices or other factors that affect security values. If FMR's strategies do not work as intended, the fund may not achieve its objective.
Investment Objective
Advisor Natural Resources Fund seeks long-term growth of capital and protection of the purchasing power of shareholders' capital.
Principal Investment Strategies
FMR normally invests the fund's assets primarily in common stocks and in certain precious metals.
FMR invests the fund's assets primarily in companies that own or develop natural resources, or supply goods and services to such companies, or in physical commodities.
FMR normally invests at least 80% of the fund's assets in securities of companies principally engaged in the business activities of the natural resources sector. These companies may include, for example, companies involved either directly or through subsidiaries in exploring, mining, refining, processing, transporting, fabricating, dealing in, or owning natural resources. Natural resources include precious metals (e.g., gold, platinum, and silver), ferrous and nonferrous metals (e.g., iron, aluminum, and copper), strategic metals (e.g., uranium and titanium), hydrocarbons (e.g., coal, oil, and natural gases), chemicals, forest products, real estate, food, textile and tobacco products, and other basic commodities. FMR treats investments in instruments whose value is linked to the price of precious metals as investments in precious metals.
FMR may invest the fund's assets in securities of foreign issuers in addition to securities of domestic issuers.
Because the fund is considered non-diversified, FMR may invest a significant percentage of the fund's assets in a single issuer.
In buying and selling securities for the fund, FMR relies on fundamental analysis of each issuer and its potential for success in light of its current financial condition, its industry position, and economic and market conditions. Factors considered include growth potential, earnings estimates, and management.
FMR may lend the fund's securities to broker-dealers or other institutions to earn income for the fund.
FMR may use various techniques, such as buying and selling futures contracts, to increase or decrease the fund's exposure to changing security prices or other factors that affect security values. If FMR's strategies do not work as intended, the fund may not achieve its objective.
Investment Objective
Advisor Technology Fund seeks capital appreciation.
Principal Investment Strategies
FMR normally invests the fund's assets primarily in common stocks.
FMR invests the fund's assets primarily in companies which have, or will develop, products, processes, or services that will provide or will benefit significantly from technological advances and improvements.
FMR normally invests at least 80% of the fund's assets in securities of companies principally engaged in the business activities of the technology sector. These companies may include, for example, companies that develop, produce, or distribute products or services in the computer, semi-conductor, electronics, communications, health care, and biotechnology sectors.
FMR may invest the fund's assets in securities of foreign issuers in addition to securities of domestic issuers.
Because the fund is considered non-diversified, FMR may invest a significant percentage of the fund's assets in a single issuer.
In buying and selling securities for the fund, FMR relies on fundamental analysis of each issuer and its potential for success in light of its current financial condition, its industry position, and economic and market conditions. Factors considered include growth potential, earnings estimates, and management.
Prospectus
Fund Basics - continued
FMR may lend the fund's securities to broker-dealers or other institutions to earn income for the fund.
FMR may use various techniques, such as buying and selling futures contracts, to increase or decrease the fund's exposure to changing security prices or other factors that affect security values. If FMR's strategies do not work as intended, the fund may not achieve its objective.
Investment Objective
Advisor <R>Telecommunications &</R> Utilities Growth Fund seeks capital appreciation.
Principal Investment Strategies
FMR normally invests the fund's assets primarily in common stocks.
FMR invests the fund's assets primarily in companies in the public utilities industry and companies deriving a majority of their revenues from their public utility operations.
FMR normally invests at least 80% of the fund's assets in securities of companies principally engaged in the business activities of the utilities sector. These companies may include, for example, companies that manufacture, produce, generate, transmit, or sell gas or electric energy; water supply, waste disposal and sewerage, and sanitary service companies; and companies involved in the communication field, including telephone, telegraph, satellite, microwave, and the provision of other communication facilities for the public benefit.
FMR may invest the fund's assets in securities of foreign issuers in addition to securities of domestic issuers.
Because the fund is considered non-diversified, FMR may invest a significant percentage of the fund's assets in a single issuer.
In buying and selling securities for the fund, FMR relies on fundamental analysis of each issuer and its potential for success in light of its current financial condition, its industry position, and economic and market conditions. Factors considered include growth potential, earnings estimates, and management.
FMR may lend the fund's securities to broker-dealers or other institutions to earn income for the fund.
FMR may use various techniques, such as buying and selling futures contracts, to increase or decrease the fund's exposure to changing security prices or other factors that affect security values. If FMR's strategies do not work as intended, the fund may not achieve its objective.
Description of Principal Security Types
Equity securities represent an ownership interest, or the right to acquire an ownership interest, in an issuer. Different types of equity securities provide different voting and dividend rights and priority in the event of the bankruptcy of the issuer. Equity securities include common stocks, preferred stocks, convertible securities, and warrants.
Principal Investment Risks
Many factors affect each fund's performance. A fund's share price changes daily based on changes in market conditions and interest rates and in response to other economic, political, or financial developments. A fund's reaction to these events will be affected by the types of securities in which the fund invests, the financial condition, industry and economic sector, and geographic location of an issuer, and the fund's level of investment in the securities of that issuer. Because FMR concentrates each fund's investments in a particular <R>group of industries, the fund's performance could depend heavily on the performance of that group of industries and could</R> be more volatile than the performance of less concentrated funds. In addition, because FMR may invest a significant percentage of the assets of each fund (except Advisor Financial Services) in a single issuer, the fund's performance could be closely tied to the market value of that one issuer and could be more volatile than the performance of more diversified funds. When you sell your shares of a fund, they could be worth more or less than what you paid for them.
The following factors can significantly affect a fund's performance:
Stock Market Volatility. The value of equity securities fluctuates in response to issuer, political, market, and economic developments. In the short term, equity prices can fluctuate dramatically in response to these developments. Different parts of the market and different types of equity securities can react differently to these developments. For example, large cap stocks can react differently from small cap stocks, and "growth" stocks can react differently from "value" stocks. Issuer, political, or economic developments can affect a single issuer, issuers within an industry or economic sector or geographic region, or the market as a whole.
Foreign Exposure. Foreign securities, foreign currencies, and securities issued by U.S. entities with substantial foreign operations can involve additional risks relating to political, economic, or regulatory conditions in foreign countries. These risks include fluctuations in foreign currencies; withholding or other taxes; trading, settlement, custodial, and other operational risks; and the less stringent investor protection and disclosure standards of some foreign markets. All of these factors can make foreign investments, especially those in emerging markets, more volatile and potentially less liquid than U.S. investments. In addition, foreign markets can perform differently from the U.S. market.
Industry Concentration. Market conditions, interest rates, and economic, regulatory, or financial developments could significantly affect a <R>group of related industries</R>, and the securities of companies in that <R>group of related industries</R> could react similarly to these or other developments.
The consumer industries can be significantly affected by the performance of the overall economy, interest rates, competition, and consumer confidence. Success can depend heavily on disposable household income and consumer spending. Changes in demographics and consumer tastes can also affect the demand for, and success of, consumer products.
Prospectus
Fund Basics - continued
The cyclical industries can be significantly affected by general economic trends, including employment, economic growth, and interest rates, changes in consumer sentiment and spending, commodity prices, legislation, government regulation and spending, import controls, and worldwide competition. For example, commodity price declines and unit volume reductions resulting from an over-supply of materials used in cyclical industries can adversely affect those industries. Furthermore, a company in the cyclical industries can be subject to liability for environmental damage, depletion of resources, and mandated expenditures for safety and pollution control.
<R>The financial services industries are subject to extensive government regulation which can limit both the amounts and types of loans and other financial commitments they can make, and the interest rates and fees they can charge. Profitability can be largely dependent on the availability and cost of capital funds, and can fluctuate significantly when interest rates change. Credit losses resulting from financial difficulties of borrowers can negatively affect the financial services industries. Insurance companies can be subject to severe price competition. The financial services industries are currently undergoing relatively rapid change as existing distinctions between financial service segments become less clear. For example, recent business combinations have included insurance, finance, and securities brokerage under single ownership. Some primarily retail corporations have expanded into securities and insurance industries.</R>
The health care industries are subject to government regulation and <R>reimbursement rates, as well as</R> government approval of products and services, which could have a significant effect on price and availability. Furthermore, the types of products or services produced or provided by health care companies quickly can become obsolete. In addition, pharmaceutical companies and other companies in the health care industries can be significantly affected by patent expirations.
The natural resources industries can be significantly affected by events relating to international political and economic developments, energy conservation, the success of exploration projects, and tax and other government regulations.
The technology industries can be significantly affected by obsolescence of existing technology, short product cycles, falling prices and profits, and competition from new market entrants.
The utilities industries can be significantly affected by government regulation, financing difficulties, supply and demand of services or fuel, and natural resource conservation.
Issuer-Specific Changes. Changes in the financial condition of an issuer, changes in specific economic or political conditions that affect a particular type of security or issuer, and changes in general economic or political conditions can affect the value of an issuer's securities. The value of securities of smaller, less well-known issuers can be more volatile than that of larger issuers. Smaller issuers can have more limited product lines, markets, or financial resources.
In response to market, economic, political, or other conditions, FMR may temporarily use a different investment strategy for defensive purposes. If FMR does so, different factors could affect a fund's performance and the fund may not achieve its investment objective.
Fundamental Investment Policies
The policies discussed below are fundamental, that is, subject to change only by shareholder approval.
Advisor Consumer Industries Fund invests primarily in companies engaged in the manufacture and distribution of goods to consumers both domestically and internationally.
Advisor Cyclical Industries Fund invests primarily in companies engaged in the research, development, manufacture, distribution, supply or sale of materials, equipment, products or services related to cyclical industries.
Advisor Financial Services Fund invests primarily in companies providing financial services to consumers and industry.
Advisor Health Care Fund invests primarily in companies engaged in the design, manufacture, or sale of products or services used for or in connection with health care or medicine.
Advisor Natural Resources Fund seeks long-term growth of capital and protection of the purchasing power of shareholders' capital by investing primarily in securities of foreign and domestic companies that own or develop natural resources, or supply goods and services to such companies, or in physical commodities.
Advisor Technology Fund invests primarily in companies which have, or will develop, products, processes or services that will provide or will benefit significantly from technological advances and improvements.
Advisor <R>Telecommunications &</R> Utilities Growth Fund invests primarily in companies in the public utilities industry and companies deriving a majority of their revenues from their public utility operations.
Each of Advisor Consumer Industries, Advisor Cyclical Industries, Advisor Financial Services, Advisor Health Care, Advisor Technology and Advisor <R>Telecommunications &</R> Utilities Growth seeks capital appreciation.
Each fund is open for business each day the New York Stock Exchange (NYSE) is open.
A class's net asset value per share (NAV) is the value of a single share. Fidelity normally calculates Institutional Class's NAV as of the close of business of the NYSE, normally 4:00 p.m. Eastern time. However, NAV may be calculated earlier if trading on the NYSE is restricted or as permitted by the Securities and Exchange Commission (SEC). Each fund's assets are valued as of this time for the purpose of computing Institutional Class's NAV.
To the extent that each fund's assets are traded in other markets on days when the NYSE is closed, the value of the fund's assets may be affected on days when the fund is not open for business. In addition, trading in some of a fund's assets may not occur on days when the fund is open for business.
Prospectus
Fund Basics - continued
Each fund's assets are valued primarily on the basis of market quotations. Certain short-term securities are valued on the basis of amortized cost. If market quotations are not readily available <R>or do not accurately reflect fair value</R> for a security or if a security's value has been materially affected by events occurring after the close of the exchange or market on which the security is principally traded (for example, a foreign exchange or market), that security may be valued by another method that the Board of Trustees believes accurately reflects fair value. A security's valuation may differ depending on the method used for determining value.
Prospectus
For account, product, and service information, please use the following phone numbers:
Please use the following addresses:
Buying or Selling Shares
Fidelity Investments
P.O. Box 770002
Cincinnati, OH 45277-0081
Overnight Express
Fidelity Investments
2300 Litton Lane - KH2A
Hebron, KY 41048
You may buy or sell Institutional Class shares of the funds through a retirement account or an investment professional. When you invest through a retirement account or an investment professional, the procedures for buying, selling, and exchanging Institutional Class shares of a fund and the account features and policies may differ. Additional fees may also apply to your investment in Institutional Class shares of a fund, including a transaction fee if you buy or sell Institutional Class shares of the fund through a broker or other investment professional.
Certain methods of contacting Fidelity, such as by telephone, may be unavailable or delayed (for example, during periods of unusual market activity).
The different ways to set up (register) your account with Fidelity are listed in the following table.
|
Ways to Set Up Your Account |
|
Individual or Joint Tenant For your general investment needs |
|
Retirement For tax-advantaged retirement savings |
|
|
|
|
|
|
|
|
|
Gifts or Transfers to a Minor (UGMA, UTMA) To invest for a child's education or other future needs |
|
Trust For money being invested by a trust |
|
Business or Organization For investment needs of corporations, associations, partnerships, or other groups |
Institutional Class shares are offered to:
1. Broker-dealer managed account programs that (i) charge an asset-based fee and (ii) will have at least $1 million invested in the Institutional Class of the Advisor funds. In addition, employee benefit plans (as defined in the Employee Retirement Income Security Act), 403(b) programs, and plans covering sole-proprietors (formerly Keogh/H.R. 10 plans) must have at least $50 million in plan assets;
2. Registered investment adviser managed account programs, provided the registered investment adviser is not part of an organization primarily engaged in the brokerage business, and the program (i) charges an asset-based fee and (ii) will have at least $1 million invested in the Institutional Class of the Advisor funds. In addition, accounts other than an employee benefit plan, 403(b) program, or plan covering a sole-proprietor (formerly a Keogh/H.R. 10 plan) in the program must be managed on a discretionary basis;
3. Trust institution and bank trust department managed account programs that (i) charge an asset-based fee and (ii) will have at least $1 million invested in the Institutional Class of the Advisor funds. Accounts managed by third parties are not eligible to purchase Institutional Class shares;
4. Insurance company separate accounts that will have at least $1 million invested in the Institutional Class of the Advisor funds;
5. Fidelity Trustees and employees; and
6. Insurance company programs for employee benefit plans, 403(b) programs, or plans covering sole-proprietors (formerly Keogh/H.R. 10 plans) that (i) charge an asset-based fee and (ii) will have at least $1 million invested in the Institutional Class of the Advisor funds. Insurance company programs for employee benefit plans, 403(b) programs, and plans covering sole-proprietors (formerly Keogh/H.R. 10 plans) include such programs offered by a broker-dealer affiliate of an insurance company, provided that the affiliate is not part of an organization primarily engaged in the brokerage business.
For purchases made by managed account programs, insurance company separate accounts or insurance company programs for employee benefit plans, 403(b) programs, or plans covering sole-proprietors (formerly Keogh/H.R. 10 plans), Fidelity may waive the requirement that $1 million be invested in the Institutional Class of the Advisor funds.
Prospectus
Shareholder Information - continued
The price to buy one share of Institutional Class is the class's NAV. Institutional Class shares are sold without a sales charge.
Your shares will be bought at the next NAV calculated after your order is received in proper form.
It is the responsibility of your investment professional to transmit your order to buy shares to Fidelity before the close of business on the day you place your order.
Short-term or excessive trading into and out of a fund may harm performance by disrupting portfolio management strategies and by increasing expenses. Accordingly, a fund may reject any purchase orders, including exchanges, particularly from market timers or investors who, in FMR's opinion, have a pattern of short-term or excessive trading or whose trading has been or may be disruptive to that fund. For these purposes, FMR may consider an investor's trading history in that fund or other Fidelity funds, and accounts under common ownership or control.
Each fund may stop offering shares completely or may offer shares only on a limited basis, for a period of time or permanently.
When you place an order to buy shares, note the following:
Shares can be bought or sold through investment professionals using an automated order placement and settlement system that guarantees payment for orders on a specified date.
Certain financial institutions that meet creditworthiness criteria established by Fidelity Distributors Corporation (FDC) may enter confirmed purchase orders on behalf of customers by phone, with payment to follow no later than close of business on the next business day. If payment is not received by that time, the order will be canceled and the financial institution will be liable for any losses.
Minimums
|
To Open an Account |
$2,500 |
|
For certain Fidelity Advisor retirement accountsA |
$500 |
|
Through regular investment plansB |
$100 |
|
To Add to an Account |
$100 |
|
Minimum Balance |
$1,000 |
|
For certain Fidelity Advisor retirement accountsA |
None |
A Fidelity Advisor Traditional IRA, Roth IRA, Rollover IRA, SEP-IRA, and Keogh accounts.
B An account may be opened with a minimum of $100, provided that a regular investment plan is established at the time the account is opened.
There is no minimum account balance or initial or subsequent purchase minimum for <R>investments through Fidelity Portfolio Advisory Services SM,</R> certain Fidelity retirement accounts funded through salary deduction, or accounts opened with the proceeds of distributions from such retirement accounts. In addition, each fund may waive or lower purchase minimums in other circumstances.
|
Key Information |
|
|
Phone |
To Open an Account
To Add to an Account
|
|
Mail |
To Open an Account
To Add to an Account
|
|
In Person |
To Open an Account
To Add to an Account
|
|
Wire |
To Open an Account
To Add to an Account
|
|
Automatically |
To Open an Account
To Add to an Account
|
The price to sell one share of Institutional Class is the class's NAV, minus the redemption fee (short-term trading fee), if applicable.
Each fund will deduct a short-term trading fee of 1.00% from the redemption amount if you sell your shares after holding them less than 60 days. <R>Trading fees</R> are paid to the funds rather than Fidelity, and <R>are</R> designed to offset the brokerage commissions, market impact, and other costs associated with fluctuations in fund asset levels and cash flow caused by short-term shareholder trading.
If you bought shares on different days, the shares you held longest will be redeemed first for purposes of determining whether the short-term trading fee applies. The short-term trading fee does not apply to shares that were acquired through reinvestment of distributions.
Your shares will be sold at the next NAV calculated after your order is received in proper form, minus the short-term trading fee, if applicable.
It is the responsibility of your investment professional to transmit your order to sell shares to Fidelity before the close of business on the day you place your order.
Certain requests must include a signature guarantee. It is designed to protect you and Fidelity from fraud. Your request must be made in writing and include a signature guarantee if any of the following situations apply:
You should be able to obtain a signature guarantee from a bank, broker, dealer, credit union (if authorized under state law), securities exchange or association, clearing agency, or savings association. A notary public cannot provide a signature guarantee.
When you place an order to sell shares, note the following:
Prospectus
Shareholder Information - continued
|
Key Information |
|
|
Phone |
|
|
Mail |
Individual, Joint Tenant, Sole Proprietorship, UGMA, UTMA
Retirement Account
Trust
Business or Organization
Executor, Administrator, Conservator, Guardian
|
|
In Person |
Individual, Joint Tenant, Sole Proprietorship, UGMA, UTMA
Retirement Account
Trust
Business or Organization
Executor, Administrator, Conservator, Guardian
|
|
Automatically |
|
An exchange involves the redemption of all or a portion of the shares of one fund and the purchase of shares of another fund.
As an Institutional Class shareholder, you have the privilege of exchanging your Institutional Class shares for Institutional Class shares of other Fidelity Advisor funds or for shares of Fidelity funds.
However, you should note the following policies and restrictions governing exchanges:
Prospectus
Shareholder Information - continued
The funds may terminate or modify the exchange privileges in the future.
Other funds may have different exchange restrictions, and may impose trading fees of up to <R>2.00% </R>of the amount exchanged. Check each fund's prospectus for details.
The following features are available to buy and sell shares of the funds.
Automatic Investment and Withdrawal Programs. Fidelity offers convenient services that let you automatically transfer money into your account, between accounts, or out of your account. While automatic investment programs do not guarantee a profit and will not protect you against loss in a declining market, they can be an excellent way to invest for retirement, a home, educational expenses, and other long-term financial goals. Automatic withdrawal or exchange programs can be a convenient way to provide a consistent income flow or to move money between your investments.
|
Fidelity Advisor Systematic Investment Program |
|||
|
Minimum Initial $100 |
Minimum Additional $100 |
Frequency Monthly, bimonthly, quarterly, |
Procedures
|
|
Fidelity Advisor Systematic Withdrawal Program |
|||
|
Minimum $100 |
Maximum $50,000 |
Frequency Monthly, quarterly, |
Procedures
|
Other Features. The following other feature is also available to buy and sell shares of the funds.
|
Wire |
|
The following policies apply to you as a shareholder.
Statements and reports that Fidelity sends to you include the following:
Prospectus
Shareholder Information - continued
To reduce expenses, only one copy of most financial reports and prospectuses will be mailed, even if you have more than one account in a fund. Call Fidelity at 1-888-622-3175 if you need additional copies of financial reports or prospectuses.
You may initiate many transactions by telephone or electronically. Fidelity will not be responsible for any losses resulting from unauthorized transactions if it follows reasonable security procedures designed to verify the identity of the investor. Fidelity will request personalized security codes or other information, and may also record calls. For transactions conducted through the Internet, Fidelity recommends the use of an Internet browser with 128-bit encryption. You should verify the accuracy of your confirmation statements immediately after you receive them. If you do not want the ability to sell and exchange by telephone, call Fidelity for instructions. Additional documentation may be required from corporations, associations, and certain fiduciaries.
When you sign your account application, you will be asked to certify that your social security or taxpayer identification number is correct and that you are not subject to 31% backup withholding for failing to report income to the IRS. If you violate IRS regulations, the IRS can require a fund to withhold 31% of your taxable distributions and redemptions.
If your account balance falls below $1,000 (except accounts not subject to account minimums), you will be given 30 days' notice to reestablish the minimum balance. If you do not increase your balance, Fidelity may close your account and send the proceeds to you. Your shares will be sold at the NAV, minus the short-term trading fee, if applicable, on the day your account is closed.
Fidelity may charge a fee for certain services, such as providing historical account documents.
Dividends and Capital Gain Distributions
Each fund earns dividends, interest, and other income from its investments, and distributes this income (less expenses) to shareholders as dividends. Each fund also realizes capital gains from its investments, and distributes these gains (less any losses) to shareholders as capital gain distributions.
Each fund normally pays dividends and capital gain distributions in September and December.
When you open an account, specify on your application how you want to receive your distributions. The following options may be available for Institutional Class's distributions:
1. Reinvestment Option. Your dividends and capital gain distributions will be automatically reinvested in additional Institutional Class shares of the fund. If you do not indicate a choice on your application, you will be assigned this option.
2. Income-Earned Option. Your capital gain distributions will be automatically reinvested in additional Institutional Class shares of the fund. Your dividends will be paid in cash.
3. Cash Option. Your dividends and capital gain distributions will be paid in cash.
4. Directed Dividends® Option. Your dividends will be automatically invested in Institutional Class shares of another identically registered Fidelity Advisor fund or shares of identically registered Fidelity funds. Your capital gain distributions will be automatically invested in Institutional Class shares of another identically registered Fidelity Advisor fund or shares of identically registered Fidelity funds, automatically reinvested in additional Institutional Class shares of the fund, or paid in cash.
Not all distribution options are available for every account. If the option you prefer is not listed on your account application, or if you want to change your current option, contact your investment professional directly or call Fidelity.
If you elect to receive distributions paid in cash by check and the U.S. Postal Service does not deliver your checks, your distribution option may be converted to the Reinvestment Option. You will not receive interest on amounts represented by uncashed distribution checks.
As with any investment, your investment in a fund could have tax consequences for you. If you are not investing through a tax-advantaged retirement account, you should consider these tax consequences.
Taxes on distributions. Distributions you receive from each fund are subject to federal income tax, and may also be subject to state or local taxes.
For federal tax purposes, each fund's dividends and distributions of short-term capital gains are taxable to you as ordinary <R>income, while each </R>fund's distributions of long-term capital gains are taxable to you generally as capital gains.
If you buy shares when a fund has realized but not yet distributed income or capital gains, you will be "buying a dividend" by paying the full price for the shares and then receiving a portion of the price back in the form of a taxable distribution.
Any taxable distributions you receive from a fund will normally be taxable to you when you receive them, regardless of your distribution option.
Taxes on transactions. Your redemptions, including exchanges, may result in a capital gain or loss for federal tax purposes. A capital gain or loss on your investment in a fund <R>generally</R> is the difference between the cost of your shares and the price you receive when you sell them.
Prospectus
Each fund is a mutual fund, an investment that pools shareholders' money and invests it toward a specified goal.
FMR is each fund's manager.
As of <R>March 31, 2000</R>, FMR had approximately <R>$639.1</R> billion in discretionary assets under management.
As the manager, FMR is responsible for choosing each fund's investments and handling its business affairs.
Affiliates assist FMR with foreign investments:
<R>Beginning January 1, 2001, FMR Co., Inc. (FMRC) will serve as a sub-adviser for each fund. FMRC will be primarily responsible for choosing investments for each fund. FMRC is a wholly-owned subsidiary of FMR.</R>
<R>James Catudal is manager of Advisor Financial Services Fund, which he has managed since February 2000. He also manages another Fidelity fund. Since joining Fidelity in 1997, Mr. Catudal has worked as an analyst and manager. Previously, he was an equity analyst with State Street Research & Management. He received an MBA from the Amos Tuck School at Dartmouth College in 1995.</R>
<R>Brian Hogan is manager of Fidelity Advisor Cyclical Industries Fund, which he has managed since February 2000. He also manages other Fidelity funds. Since joining Fidelity in 1994, Mr. Hogan has worked as a fixed-income analyst, research analyst and manager. </R>
<R>Yolanda McGettigan is the manager of Fidelity Advisor Health Care Fund, which she has managed since June 2000. She also manages other Fidelity Funds. Since joining Fidelity in 1997, Ms. McGettigan has worked as an analyst and portfolio manager.</R>
Scott Offen is manager of Fidelity Advisor Natural Resources Fund, which he has managed since September 1999. He also manages other Fidelity funds. Since joining Fidelity in 1985, Mr. Offen has worked as a research analyst and portfolio manager.
John Porter is manager of Fidelity Advisor Consumer Industries Fund, which he has managed since September 1999. He also manages another Fidelity fund. Mr. Porter joined Fidelity as an analyst in 1995, after receiving his MBA from the University of Chicago.
<R>Lawrence Rakers is manager of Fidelity Advisor Technology Fund, which he has managed since January 2000. He also manages other Fidelity funds. Mr. Rakers joined Fidelity as an analyst in 1993.</R>
<R>Tim Cohen is manager of Fidelity Advisor Telecommunications & Utilities Growth Fund, which he has managed since September 2000. He also manages other Fidelity funds. Since joining Fidelity in 1996, Mr. Cohen has worked as a research analyst and portfolio manager.</R>
<R>From time to time a manager, analyst, or other Fidelity employee may express views regarding a particular company, security, industry, or market sector. The views expressed by any such person are the views of only that individual as of the time expressed and do not necessarily represent the views of Fidelity or any other person in the Fidelity organization. Any such views are subject to change at any time based upon market or other conditions and Fidelity disclaims any responsibility to update such views. These views may not be relied on as investment advice and, because investment decisions for a Fidelity fund are based on numerous factors, may not be relied on as an indication of trading intent on behalf of any Fidelity fund.</R>
<R>E</R>ach fund pays a management fee to FMR. The management fee is calculated and paid to FMR every month. The fee is calculated by adding a group fee rate to an individual fund fee rate, dividing by twelve, and multiplying the result by the fund's average net assets throughout the month.
The group fee rate is based on the average net assets of all the mutual funds advised by FMR. This rate cannot rise above 0.52%, and it drops as total assets under management increase.
For <R>July 2000</R>, the group fee rate was 0<R>.2740</R>% for each fund. The individual fund fee rate is <R>0.30</R>% for each fund.
The total management fee,<R> as a percentage of a fund's average net assets,</R> for the fiscal year ended July 31, <R>2000</R>, for each fund is shown in the table below.
|
<R> |
Total Management Fee</R> |
|
<R>Advisor Consumer Industries |
0.58%</R> |
|
<R>Advisor Cyclical Industries |
0.58%</R> |
|
<R>Advisor Financial Services |
0.58%</R> |
|
<R>Advisor Health Care |
0.58%</R> |
|
<R>Advisor Natural Resources |
0.58%</R> |
|
<R>Advisor Technology |
0.58%</R> |
|
<R>Advisor Telecommunications & Utilities Growth |
0.58%</R> |
<R>FMR pays FMR U.K. and FMR Far East for providing sub-advisory services. FMR Far East in turn pays FIJ for providing sub-advisory services.</R>
<R>FMR will pay FMRC for providing sub-advisory services.</R>
Prospectus
Fund Services - continued
FMR may, from time to time, agree to reimburse a class for management fees and other expenses above a specified limit. FMR retains the ability to be repaid by a class if expenses fall below the specified limit prior to the end of the fiscal year. Reimbursement arrangements, which may be discontinued by FMR at any time, can decrease a class's expenses and boost its performance.
Each fund is composed of multiple classes of shares. All classes of a fund have a common investment objective and investment portfolio.
FDC distributes Institutional Class's shares.
Institutional Class of each fund has adopted a Distribution and Service Plan pursuant to Rule 12b-1 under the Investment Company Act of 1940 that recognizes that FMR may use its management fee revenues, as well as its past profits or its resources from any other source, to pay FDC for expenses incurred in connection with providing services intended to result in the sale of Institutional Class shares and/or shareholder support services. FMR, directly or through FDC, may pay <R>significant amounts to</R> intermediaries, such as banks, broker-dealers, and other service-providers, that provide those services. Currently, the Board of Trustees of each fund has authorized such payments for Institutional Class.
<R>If payments made by FMR to FDC or to intermediaries under a Distribution and Service Plan were considered to be paid out of Institutional Class's assets on an ongoing basis, they might increase the cost of your investment and might cost you more than paying other types of sales charges.</R>
To receive payments made pursuant to a Distribution and Service Plan, intermediaries must sign the appropriate agreement with FDC in advance.
FMR may allocate brokerage transactions in a manner that takes into account the sale of shares of the Fidelity Advisor funds, provided that a fund receives brokerage services and commission rates comparable to those of other broker-dealers.
No dealer, sales representative, or any other person has been authorized to give any information or to make any representations, other than those contained in this prospectus and in the related statement of additional information (SAI), in connection with the offer contained in this prospectus. If given or made, such other information or representations must not be relied upon as having been authorized by the funds or FDC. This prospectus and the related SAI do not constitute an offer by the funds or by FDC to sell shares of the funds to or to buy shares of the funds from any person to whom it is unlawful to make such offer.
Prospectus
The financial highlights tables are intended to help you understand Institutional Class's financial history for the<R> past 5 years or, if shorter,</R> the period of the class's operations. Certain information reflects financial results for a single class share. The total returns in the table represent the rate that an investor would have earned (or lost) on an investment in the class (assuming reinvestment of all dividends and distributions). This information has been audited by Deloitte & Touche LLP, independent accountants, whose report, along with each fund's financial highlights and financial statements, are included in each fund's annual report. A free copy of <R>the</R> annual report is available upon request.
<R>Consumer Industries Fund</R>
|
<R>Years ended July 31, |
2000 |
1999 |
1998 |
1997 E</R> |
|
<R>Net asset value, beginning of period |
$ 16.11 |
$ 15.12 |
$ 13.51 |
$ 10.00</R> |
|
<R>Income from Investment Operations |
|
|
|
</R> |
|
<R> Net investment income (loss) D |
(.00) |
.02 |
(.03) |
(.01)</R> |
|
<R> Net realized and unrealized gain (loss) |
(.69) |
1.81 |
3.31 |
3.59</R> |
|
<R> Total from investment operations |
(.69) |
1.83 |
3.28 |
3.58</R> |
|
<R>Less Distributions |
|
|
|
</R> |
|
<R> From net realized gain |
(.20) |
(.85) |
(1.70) |
(.07)</R> |
|
In excess of net realized gain |
$ (.06) |
$ - |
$ - |
$ - |
|
Total distributions |
$ (.26) |
$ (.85) |
$ (1.70) |
$ (.07) |
|
<R>Redemption fees added to paid in capital |
.02 |
.01 |
.03 |
-</R> |
|
<R>Net asset value, end of period |
$ 15.18 |
$ 16.11 |
$ 15.12 |
$ 13.51</R> |
|
<R>Total Return B, C |
(4.20)% |
13.87% |
27.70% |
35.98%</R> |
|
<R>Ratios and Supplemental Data |
|
|
|
</R> |
|
<R>Net assets, end of period (000 omitted) |
$ 1,449 |
$ 5,954 |
$ 4,745 |
$ 1,333</R> |
|
<R>Ratio of expenses to average net assets |
1.25% F |
1.26% F |
1.50% F |
1.50% A, F</R> |
|
<R>Ratio of expenses to average net assets after expense reductions |
1.24% G |
1.24% G |
1.48% G |
1.48% A, G</R> |
|
<R>Ratio of net investment income (loss) to average net assets |
.01% |
.11% |
(.20)% |
(.13)% A</R> |
|
<R>Portfolio turnover |
69% |
80% |
144% |
203% A</R> |
<R>A Annualized</R>
<R>B The total returns would have been lower had certain expenses not been reduced during the periods shown.</R>
<R>C Total returns for periods of less than one year are not annualized.</R>
<R>D Net investment income (loss) per share has been calculated based on average shares outstanding during the period.</R>
<R>E For the period September 3, 1996 (commencement of sale of Institutional Class shares) to July 31, 1997.</R>
<R>F FMR agreed to reimburse a portion of the class' expenses during the period. Without this reimbursement, the class' expense ratio would have been higher.</R>
<R>G FMR or the fund has entered into varying arrangements with third parties who either paid or reduced a portion of the class' expenses.</R>
Prospectus
Appendix - continued
<R>Cyclical Industries Fund</R>
|
<R>Years ended July 31, |
2000 |
1999 |
1998 |
1997 F</R> |
|
<R>Selected Per-Share Data |
|
|
|
</R> |
|
<R>Net asset value, beginning of period |
$ 14.28 |
$ 13.68 |
$ 13.84 |
$ 10.00</R> |
|
<R>Income from Investment Operations |
|
|
|
</R> |
|
<R> Net investment income D |
.06 |
.04 |
.01E |
.03</R> |
|
<R> Net realized and unrealized gain (loss) |
(.36) |
1.25 |
.75 |
3.91</R> |
|
<R> Total from investment operations |
(.30) |
1.29 |
.76 |
3.94</R> |
|
<R>Less Distributions |
|
|
|
</R> |
|
<R> From net investment income |
-I |
- |
- |
(.02)</R> |
|
<R> From net realized gain |
(.29)I |
(.70) |
(.95) |
(.08)</R> |
|
<R> Total distributions |
(.29) |
(.70) |
(.95) |
(.10)</R> |
|
<R>Redemption fees added to paid in capital |
.01 |
.01 |
.03 |
-</R> |
|
<R>Net asset value, end of period |
$ 13.70 |
$ 14.28 |
$ 13.68 |
$ 13.84</R> |
|
<R>Total Return B, C |
(2.04)% |
11.15% |
6.32% |
39.64%</R> |
|
<R>Ratios and Supplemental Data |
|
|
|
</R> |
|
<R>Net assets, end of period (000 omitted) |
$ 1,706 |
$ 3,377 |
$ 1,360 |
$ 1,756</R> |
|
<R>Ratio of expenses to average net assets |
1.25% G |
1.31% G |
1.50% G |
1.50% A, G</R> |
|
<R>Ratio of expenses to average net assets after expense reductions |
1.24% H |
1.29% H |
1.50% |
1.48% A, H</R> |
|
<R>Ratio of net investment income to average net assets |
.43% |
.31% |
.04% |
.25% A</R> |
|
<R>Portfolio turnover |
111% |
115% |
100% |
155% A</R> |
<R>A Annualized</R>
<R>B Total returns for periods of less than one year are not annualized.</R>
<R>C The total returns would have been lower had certain expenses not been reduced during the periods shown.</R>
<R>D Net investment income per share has been calculated based on average shares outstanding during the period.</R>
<R>E During the period, a significant shareholder redemption caused an unusually high level of investment income per share.</R>
<R>F For the period September 3, 1996 (commencement of sale of Institutional Class shares) to July 31, 1997.</R>
<R>G FMR agreed to reimburse a portion of the class' expenses during the period. Without this reimbursement, the class' expense ratio would have been higher.</R>
<R>H FMR or the fund has entered into varying arrangements with third parties who either paid or reduced a portion of the class' expenses.</R>
<R>I The amounts shown reflect certain reclassifications related to book to tax differences.</R>
Prospectus
Appendix - continued
<R>Financial Services Fund</R>
|
<R>Years ended July 31, |
2000 |
1999 |
1998 |
1997 E</R> |
|
<R>Selected Per-Share Data |
|
|
|
</R> |
|
<R>Net asset value, beginning of period |
$ 17.60 |
$ 18.80 |
$ 15.14 |
$ 10.00</R> |
|
<R>Income from Investment Operations |
|
|
|
</R> |
|
<R> Net investment income D |
.21 |
.18 |
.14 |
.10</R> |
|
<R> Net realized and unrealized gain (loss) |
.72 |
(.30) |
3.79 |
5.06</R> |
|
<R> Total from investment operations |
.93 |
(.12) |
3.93 |
5.16</R> |
|
<R>Less Distributions |
|
|
|
</R> |
|
<R> From net investment income |
(.15) |
(.08) |
(.05) |
(.02)</R> |
|
<R> From net realized gain |
- |
(1.01) |
(.23) |
(.01)</R> |
|
<R> Total distributions |
(.15) |
(1.09) |
(.28) |
(.03)</R> |
|
<R>Redemption fees added to paid in capital |
.01 |
.01 |
.01 |
.01</R> |
|
<R>Net asset value, end of period |
$ 18.39 |
$ 17.60 |
$ 18.80 |
$ 15.14</R> |
|
<R>Total Return B, C |
5.40% |
1.12% |
26.39% |
51.78%</R> |
|
<R>Ratios and Supplemental Data |
|
|
|
</R> |
|
<R>Net assets, end of period (000 omitted) |
$ 9,749 |
$ 11,956 |
$ 5,270 |
$ 3,758</R> |
|
<R>Ratio of expenses to average net assets |
.90% |
.93% |
1.14% |
1.50% A, F</R> |
|
<R>Ratio of expenses to average net assets after expense reductions |
.87% G |
.92% G |
1.13% G |
1.47% A, G</R> |
|
<R>Ratio of net investment income to average net assets |
1.27% |
1.04% |
.81% |
.85% A</R> |
|
<R>Portfolio turnover |
73% |
38% |
54% |
26% A</R> |
<R>A Annualized</R>
<R>B The total returns would have been lower had certain expenses not been reduced during the periods shown.</R>
<R>C Total returns for periods of less than one year are not annualized.</R>
<R>D Net investment income per share has been calculated based on average shares outstanding during the period.</R>
<R>E For the period September 3, 1996 (commencement of sale of Institutional Class shares) to July 31, 1997.</R>
<R>F FMR agreed to reimburse a portion of the class' expenses during the period. Without this reimbursement, the class' expense ratio would have been higher.</R>
<R>G FMR or the fund has entered into varying arrangements with third parties who either paid or reduced a portion of the class' expenses.</R>
Prospectus
Appendix - continued
<R>Health Care Fund</R>
|
<R>Years ended July 31, |
2000 |
1999 |
1998 |
1997 E</R> |
|
<R>Selected Per-Share Data |
|
|
|
</R> |
|
<R>Net asset value, beginning of period |
$ 18.59 |
$ 16.73 |
$ 14.12 |
$ 10.00</R> |
|
<R>Income from Investment Operations |
|
|
|
</R> |
|
<R> Net investment income (loss) D |
.07 |
.05 |
.03 |
.01</R> |
|
<R> Net realized and unrealized gain (loss) |
3.90 |
2.21 |
3.47 |
4.11</R> |
|
<R> Total from investment operations |
3.97 |
2.26 |
3.50 |
4.12</R> |
|
<R>Less Distributions |
|
|
|
</R> |
|
<R> From net investment income |
(.03) |
- |
- |
-</R> |
|
<R> From net realized gain |
(.41) |
(.41) |
(.90) |
-</R> |
|
<R> Total distributions |
(.44) |
(.41) |
(.90) |
-</R> |
|
<R>Redemption fees added to paid in capital |
.01 |
.01 |
.01 |
-</R> |
|
<R>Net asset value, end of period |
$ 22.13 |
$ 18.59 |
$ 16.73 |
$ 14.12</R> |
|
<R>Total Return B, C |
21.77% |
14.17% |
26.70% |
41.20%</R> |
|
<R>Ratios and Supplemental Data |
|
|
</R> |
|
|
<R>Net assets, end of period (000 omitted) |
$ 40,320 |
$ 33,540 |
$ 10,424 |
$ 6,875</R> |
|
<R>Ratio of expenses to average net assets |
.93% |
.97% |
1.07% |
1.50% A, F</R> |
|
<R>Ratio of expenses to average net assets after expense reductions |
.92%G |
.95%G |
1.04%G |
1.49% A, G</R> |
|
<R>Ratio of net investment income (loss) to average net assets |
.33% |
.28% |
.17% |
.08% A</R> |
|
<R>Portfolio turnover |
51% |
98% |
85% |
67% A</R> |
<R>A Annualized</R>
<R>B The total returns would have been lower had certain expenses not been reduced during the periods shown.</R>
<R>C Total returns for periods of less than one year are not annualized.</R>
<R>D Net investment income (loss) per share has been calculated based on average shares outstanding during the period.</R>
<R>E For the period September 3, 1996 (commencement of sale of Institutional Class shares) to July 31, 1997.</R>
<R>F FMR agreed to reimburse a portion of the class' expenses during the period. Without this reimbursement, the class' expense ratio would have been higher.</R>
<R>G FMR or the fund has entered into varying arrangements with third parties who either paid or reduced a portion of the class' expenses.</R>
Prospectus
Appendix - continued
<R>Natural Resources Fund</R>
|
<R>Years ended July 31, |
2000 |
1999 |
1998 |
1997 E |
1996 F |
1995 G</R> |
|
<R>Selected Per-Share Data |
|
|
|
|
|
</R> |
|
<R>Net asset value, beginning of period |
$ 22.28 |
$ 19.15 |
$ 26.42 |
$ 25.17 |
$ 19.27 |
$ 18.87</R> |
|
<R>Income from Investment Operations |
|
|
|
|
|
</R> |
|
<R> Net investment income (loss) D |
.19 |
.14 |
.13 |
.04 |
.04 |
(.01)</R> |
|
<R> Net realized and unrealized gain (loss) |
2.07 |
3.76 |
(3.35) |
2.85 |
6.55 |
.41</R> |
|
<R> Total from investment operations |
2.26 |
3.90 |
(3.22) |
2.89 |
6.59 |
.40</R> |
|
<R>Less Distributions |
|
|
|
|
|
</R> |
|
<R> From net investment income |
(.13) |
(.07) |
(.09) |
(.05) |
- |
-</R> |
|
<R> In excess of net investment income |
- |
- |
- |
(.02) |
- |
-</R> |
|
<R> From net realized gain |
- |
(.71) |
(3.97) |
(1.57) |
(.69) |
-</R> |
|
<R> Total distributions |
(.13) |
(.78) |
(4.06) |
(1.64) |
(.69) |
-</R> |
|
<R>Redemption fees added to paid in capital |
.02 |
.01 |
.01 |
- |
- |
-</R> |
|
<R>Net asset value, end of period |
$ 24.43 |
$ 22.28 |
$ 19.15 |
$ 26.42 |
$ 25.17 |
$ 19.27</R> |
|
<R>Total Return B, C |
10.31% |
21.95% |
(14.29)% |
11.95% |
35.13% |
2.12%</R> |
|
<R>Ratios and Supplemental Data |
|
|
|
|
|
</R> |
|
<R>Net assets, end of period (000 omitted) |
$ 3,470 |
$ 4,505 |
$ 3,922 |
$ 10,042 |
$ 9,860 |
$ 718</R> |
|
<R>Ratio of expenses to average net assets |
.86% |
.87% |
.95% |
1.08% A |
1.44% |
1.68% A, H</R> |
|
<R>Ratio of expenses to average net assets after expense reductions |
.82% I |
.82% I |
.91% I |
1.06% A, I |
1.39% I |
1.66% A, I</R> |
|
<R>Ratio of net investment income (loss) to average net assets |
.82% |
.78% |
.55% |
.24% A |
.17% |
(.13)% A</R> |
|
<R>Portfolio turnover |
90% |
99% |
97% |
116% A |
137% |
161%</R> |
<R>A Annualized</R>
<R>B The total returns would have been lower had certain expenses not been reduced during the periods shown.</R>
<R>C Total returns for periods of less than one year are not annualized.</R>
<R>D Net investment income (loss) per share has been calculated based on average shares outstanding during the period.</R>
<R>E Nine months ended July 1997.</R>
<R>F Year ended October 31.</R>
<R>G For the period July 3, 1995 (commencement of sale of Institutional Class shares) to October 31, 1995.</R>
<R>H FMR agreed to reimburse a portion of the class' expenses during the period. Without this reimbursement, the class' expense ratio would have been higher.</R>
<R>I FMR or the fund has entered into varying arrangements with third parties who either paid or reduced a portion of the class' expenses.</R>
Prospectus
Appendix - continued
<R>Technology Fund</R>
|
<R>Years ended July 31, |
2000 |
1999 |
1998 |
1997 E</R> |
|
<R>Selected Per-Share Data |
|
|
|
</R> |
|
<R>Net asset value, beginning of period |
$ 25.05 |
$ 14.89 |
$ 15.98 |
$ 10.00</R> |
|
<R>Income from Investment Operations |
|
|
|
</R> |
|
<R> Net investment income (loss) D |
(.09) |
(.04) |
(.04) |
(.06)</R> |
|
<R> Net realized and unrealized gain (loss) |
13.08 |
10.19 |
.55 |
6.12</R> |
|
<R> Total from investment operations |
12.99 |
10.15 |
.51 |
6.06</R> |
|
<R>Less Distributions |
|
|
|
</R> |
|
<R> From net realized gain |
(1.62) |
- |
(1.15) |
(.09)</R> |
|
<R> In excess of net realized gain |
- |
- |
(.46) |
-</R> |
|
<R> Total distributions |
(1.62) |
- |
(1.61) |
(.09)</R> |
|
<R>Redemption fees added to paid in capital |
.01 |
.01 |
.01 |
.01</R> |
|
<R>Net asset value, end of period |
$ 36.43 |
$ 25.05 |
$ 14.89 |
$ 15.98</R> |
|
<R>Total Return B, C |
54.16% |
68.23% |
4.26% |
60.95%</R> |
|
<R>Ratios and Supplemental Data |
|
|
|
</R> |
|
<R>Net assets, end of period (000 omitted) |
$ 63,957 |
$ 32,722 |
$ 7,060 |
$ 3,598</R> |
|
<R>Ratio of expenses to average net assets |
.87% |
.98% |
1.10% |
1.50% A, F</R> |
|
<R>Ratio of expenses to average net assets after expense reductions |
.87% |
.97% G |
1.07% G |
1.44% A, G</R> |
|
<R>Ratio of net investment income (loss) to average net assets |
(.26)% |
(.17)% |
(.30)% |
(.50)% A</R> |
|
<R>Portfolio turnover |
125% |
170% |
348% |
517% A</R> |
<R>A Annualized</R>
<R>B The total returns would have been lower had certain expenses not been reduced during the periods shown.</R>
<R>C Total returns for periods of less than one year are not annualized.</R>
<R>D Net investment income (loss) per share has been calculated based on average shares outstanding during the period.</R>
<R>E For the period September 3, 1996 (commencement of sale of Institutional Class shares) to July 31, 1997.</R>
<R>F FMR agreed to reimburse a portion of the class' expenses during the period. Without this reimbursement, the class' expense ratio would have been higher.</R>
<R>G FMR or the fund has entered into varying arrangements with third parties who either paid or reduced a portion of the class' expenses.</R>
Prospectus
Appendix - continued
<R>Telecommunications & Utilities Growth Fund</R>
|
<R>Years ended July 31, |
2000 |
1999 |
1998 |
1997 E</R> |
|
<R>Selected Per-Share Data |
|
|
|
</R> |
|
<R>Net asset value, beginning of period |
$ 20.38 |
$ 16.02 |
$ 13.09 |
$ 10.00</R> |
|
<R>Income from Investment Operations |
|
|
|
</R> |
|
<R> Net investment income D |
.60H |
.11 |
.04 |
.14</R> |
|
<R> Net realized and unrealized gain (loss) |
1.29 |
5.46 |
4.17 |
3.10</R> |
|
<R> Total from investment operations |
1.89 |
5.57 |
4.21 |
3.24</R> |
|
<R>Less Distributions |
|
|
|
</R> |
|
<R> From net investment income |
(.08) |
- |
(.07) |
(.04)</R> |
|
<R> From net realized gain |
(1.01) |
(1.22) |
(1.22) |
(.11)</R> |
|
<R> Total distributions |
(1.09) |
(1.22) |
(1.29) |
(.15)</R> |
|
<R>Redemption fees added to paid in capital |
.01 |
.01 |
.01 |
-</R> |
|
<R>Net asset value, end of period |
$ 21.19 |
$ 20.38 |
$ 16.02 |
$ 13.09</R> |
|
<R>Total Return B, C |
9.93% |
39.31% |
34.36% |
32.68%</R> |
|
<R>Ratios and Supplemental Data |
|
|
</R> |
|
|
<R>Net assets, end of period (000 omitted) |
$ 19,064 |
$ 6,963 |
$ 3,430 |
$ 2,246</R> |
|
<R>Ratio of expenses to average net assets |
.88% |
1.02% |
1.46% |
1.50% A, F</R> |
|
<R>Ratio of expenses to average net assets after expense reductions |
.85% G |
.99% G |
1.43% G |
1.50% A</R> |
|
<R>Ratio of net investment income to average net assets |
2.71% |
.63% |
.30% |
1.29% A</R> |
|
<R>Portfolio turnover |
172% |
149% |
151% |
13% A</R> |
<R>A Annualized</R>
<R>B The total returns would have been lower had certain expenses not been reduced during the periods shown.</R>
<R>C Total returns for periods of less than one year are not annualized.</R>
<R>D Net investment income per share has been calculated based on average shares outstanding during the period.</R>
<R>E For the period September 3, 1996 (commencement of sale of Institutional Class shares) to July 31, 1997.</R>
<R>F FMR agreed to reimburse a portion of the class' expenses during the period. Without this reimbursement, the class' expense ratio would have been higher.</R>
<R>G FMR or the fund has entered into varying arrangements with third parties who either paid or reduced a portion of the class' expenses.</R>
<R>H Investment income per share reflects a special dividend (from BCE, Inc.) which amounted to $.52 per share.</R>
Prospectus
Notes
Notes
You can obtain additional information about the funds. The funds' SAI includes more detailed information about each fund and its investments. The SAI is incorporated herein by reference (legally forms a part of the prospectus). Each fund's annual and semi-annual reports include a discussion of the fund's holdings and recent market conditions and the fund's investment strategies that affected performance.
For a free copy of any of these documents or to request other information or ask questions about a fund, call Fidelity at 1-888-622-3175.
|
<R>The SAI, the funds' annual and semi-annual reports and other related materials are available from the Electronic Data Gathering, Analysis, and Retrieval (EDGAR) Database on the SEC's web site (http://www.sec.gov). You can obtain copies of this information, after paying a duplicating fee, by sending a request by e-mail to [email protected] or by writing the Public Reference Section of the SEC, Washington, D.C. 20549-0102. You can also review and copy information about the funds, including the funds' SAI, at the SEC's Public Reference Room in Washington, D.C. Call 1-202-942-8090 for information on the operation of the SEC's Public Reference Room.</R> Investment Company Act of 1940, File Number, 811-3010 |
<R>Fidelity Advisor Focus Funds</R>, Fidelity, Fidelity Investments & (Pyramid) Design, and Directed Dividends are registered trademarks of FMR Corp.
<R>Portfolio Advisory Services is a service mark of FMR Corp.</R>
The third party marks appearing above are the marks of their respective owners.
<R>1.705177.103</R> AFOCI-pro-0900
FIDELITY ADVISOR FOCUS FUNDS®
FIDELITY® ADVISOR CONSUMER INDUSTRIES FUND,
FIDELITY ADVISOR CYCLICAL INDUSTRIES FUND,
FIDELITY ADVISOR FINANCIAL SERVICES FUND,
FIDELITY ADVISOR HEALTH CARE FUND,
FIDELITY ADVISOR NATURAL RESOURCES FUND,
FIDELITY ADVISOR TECHNOLOGY FUND,<R> </R>AND <R>
</R>FIDELITY ADVISOR <R>TELECOMMUNICATIONS & </R>UTILITIES GROWTH FUND
(formerly FIDELITY ADVISOR UTILITIES GROWTH FUND)
<R>Funds of Fidelity Advisor Series VII</R>
<R>Class A, Class T, Class B, Class C, and Institutional Class</R>
STATEMENT OF ADDITIONAL INFORMATION
<R>September 28, 2000</R>
This statement of additional information (SAI) is not a prospectus. Portions of each fund's annual report are incorporated herein. The annual reports are supplied with this SAI.
To obtain a free additional copy of a prospectus, dated <R>September 28, 2000, </R>or an annual report for each fund, please call Fidelity at 1-888-622-3175.
|
TABLE OF CONTENTS |
PAGE |
|
Investment Policies and Limitations |
|
|
Portfolio Transactions |
|
|
Valuation |
|
|
Performance |
|
|
Additional Purchase, Exchange and Redemption Information |
|
|
Distributions and Taxes |
|
|
Trustees and Officers |
|
|
Control of Investment Advisers |
|
|
Management Contracts |
|
|
Distribution Services |
|
|
Transfer and Service Agent Agreements |
|
|
Description of the Trust |
|
|
Financial Statements |
|
|
Appendix |
<R>AFOC/AFOCI-ptb-0900
1.473507.103</R>
(fidelity_logo_graphic)
82 Devonshire Street, Boston, MA 02109
<R></R>INVESTMENT POLICIES AND LIMITATIONS
The following policies and limitations supplement those set forth in the prospectus. Unless otherwise noted, whenever an investment policy or limitation states a maximum percentage of a fund's assets that may be invested in any security or other asset, or sets forth a policy regarding quality standards, such standard or percentage limitation will be determined immediately after and as a result of the fund's acquisition of such security or other asset. Accordingly, any subsequent change in values, net assets, or other circumstances will not be considered when determining whether the investment complies with the fund's investment policies and limitations.
A fund's fundamental investment policies and limitations cannot be changed without approval by a "majority of the outstanding voting securities" (as defined in the Investment Company Act of 1940 (the 1940 Act)) of the fund. However, except for the fundamental investment limitations listed below, the investment policies and limitations described in this SAI are not fundamental and may be changed without shareholder approval.
Investment Limitations of <R>Advisor</R> Consumer Industries Fund
The following are the fund's fundamental investment limitations set forth in their entirety. The fund may not:
(1) issue senior securities, except in connection with the insurance program established by the fund pursuant to an exemptive order issued by the Securities and Exchange Commission or as otherwise permitted under the Investment Company Act of 1940;
(2) borrow money, except that each fund may borrow money for temporary or emergency purposes (not for leveraging or investment) in an amount not exceeding 33 1/3% of its total assets (including the amount borrowed) less liabilities (other than borrowings). Any borrowings that come to exceed this amount will be reduced within three days (not including Sundays and holidays) to the extent necessary to comply with the 33 1/3% limitation;
(3) underwrite securities issued by others, except to the extent that a fund may be considered an underwriter within the meaning of the Securities Act of 1933 in the disposition of restricted securities;
(4) purchase the securities of any issuer if, as a result, less than 25% of the fund's total assets would be invested in the securities of issuers principally engaged in the business activities of the industries in the consumer industries sector;
(5) purchase or sell real estate unless acquired as a result of ownership of securities or other instruments (but this shall not prevent a fund from investing in securities or other instruments backed by real estate or securities of companies engaged in the real estate business);
(6) purchase or sell physical commodities unless acquired as a result of ownership of securities or other instruments (but this shall not prevent each fund from purchasing or selling options and futures contracts or from investing in securities or other instruments backed by physical commodities); or
(7) lend any security or make any other loan if, as a result, more than 33 1/3% of its total assets would be lent to other parties, but this limitation does not apply to purchases of debt securities or to repurchase agreements.
(8) The fund may, notwithstanding any other fundamental investment policy or limitation, invest all of its assets in the securities of a single open-end management investment company managed by Fidelity Management & Research Company or an affiliate or successor with substantially the same fundamental investment objective, policies, and limitations as the fund.
The following investment limitations are not fundamental and may be changed without shareholder approval.
(i) In order to qualify as a "regulated investment company" under Subchapter M of the Internal Revenue Code of 1986, as amended, the fund currently intends to comply with certain diversification limits imposed by Subchapter M.
(ii) The fund does not currently intend to sell securities short, unless it owns or has the right to obtain securities equivalent in kind and amount to the securities sold short, and provided that transactions in futures contracts and options are not deemed to constitute selling securities short.
(iii) The fund does not currently intend to purchase securities on margin, except that the fund may obtain such short-term credits as are necessary for the clearance of transactions, and provided that margin payments in connection with futures contracts and options on futures contracts shall not constitute purchasing securities on margin.
(iv) The fund does not currently intend to hedge more than 40% of its total assets with short sales against the box under normal conditions.
(v) The fund may borrow money only (a) from a bank or from a registered investment company or portfolio for which FMR or an affiliate serves as investment adviser or (b) by engaging in reverse repurchase agreements with any party (reverse repurchase agreements are treated as borrowings for purposes of fundamental investment limitation (2)).
(vi) The fund does not currently intend to purchase any security if, as a result, more than 10% of its net assets would be invested in securities that are deemed to be illiquid because they are subject to legal or contractual restrictions on resale or because they cannot be sold or disposed of in the ordinary course of business at approximately the prices at which they are valued.
(vii) The fund does not currently intend to lend assets other than securities to other parties, except by (a) lending money up to 15% of the fund's net assets to a registered investment company or portfolio for which FMR or an affiliate serves as investment adviser or (b) acquiring loans, loan participations, or other forms of direct debt instruments and, in connection therewith, assuming any associated unfunded commitments of the sellers. (This limitation does not apply to purchases of debt securities or to repurchase agreements.)
(viii) The fund does not currently intend to invest all of its assets in the securities of a single open-end management investment company managed by Fidelity Management & Research Company or an affiliate or successor with substantially the same fundamental investment objective, policies, and limitations as the fund.
For purposes of limitation (i), Subchapter M generally requires the fund to invest no more than 25% of its total assets in securities of any one issuer and to invest at least 50% of its total assets so that no more than 5% of the fund's total assets are invested in securities of any one issuer. However, Subchapter M allows unlimited investments in cash, cash items, government securities (as defined in Subchapter M) and securities of other investment companies. These tax requirements are generally applied at the end of each quarter of the fund's taxable year.
With respect to limitation (vi), if through a change in values, net assets, or other circumstances, the fund were in a position where more than 10% of its net assets were invested in illiquid securities, it would consider appropriate steps to protect liquidity.
For purposes of limitation (4), FMR considers an issuer to be principally engaged in a business activity if: (i) at least 50% of an issuer's assets, income, sales or profits are committed to, or derived from, the business activity, or (ii) a third party has given the issuer an industry or sector classification consistent with the designated business activity.
For the fund's limitations on futures and options transactions, see the section entitled "Limitations on Futures and Options Transactions" on page <R><Click Here></R>.
Investment Limitations of <R>Advisor</R> Cyclical Industries Fund
The following are the fund's fundamental investment limitations set forth in their entirety. The fund may not:
(1) issue senior securities, except in connection with the insurance program established by the fund pursuant to an exemptive order issued by the Securities and Exchange Commission or as otherwise permitted under the Investment Company Act of 1940;
(2) borrow money, except that each fund may borrow money for temporary or emergency purposes (not for leveraging or investment) in an amount not exceeding 33 1/3% of its total assets (including the amount borrowed) less liabilities (other than borrowings). Any borrowings that come to exceed this amount will be reduced within three days (not including Sundays and holidays) to the extent necessary to comply with the 33 1/3% limitation;
(3) underwrite securities issued by others, except to the extent that a fund may be considered an underwriter within the meaning of the Securities Act of 1933 in the disposition of restricted securities;
(4) purchase the securities of any issuer if, as a result, less than 25% of the fund's total assets would be invested in the securities of issuers principally engaged in the business activities of the industries in the cyclical industries sector;
(5) purchase or sell real estate unless acquired as a result of ownership of securities or other instruments (but this shall not prevent a fund from investing in securities or other instruments backed by real estate or securities of companies engaged in the real estate business);
(6) purchase or sell physical commodities unless acquired as a result of ownership of securities or other instruments (but this shall not prevent each fund from purchasing or selling options and futures contracts or from investing in securities or other instruments backed by physical commodities); or
(7) lend any security or make any other loan if, as a result, more than 33 1/3% of its total assets would be lent to other parties, but this limitation does not apply to purchases of debt securities or to repurchase agreements.
(8) The fund may, notwithstanding any other fundamental investment policy or limitation, invest all of its assets in the securities of a single open-end management investment company managed by Fidelity Management & Research Company or an affiliate or successor with substantially the same fundamental investment objective, policies, and limitations as the fund.
The following investment limitations are not fundamental and may be changed without shareholder approval.
(i) In order to qualify as a "regulated investment company" under Subchapter M of the Internal Revenue Code of 1986, as amended, the fund currently intends to comply with certain diversification limits imposed by Subchapter M.
(ii) The fund does not currently intend to sell securities short, unless it owns or has the right to obtain securities equivalent in kind and amount to the securities sold short, and provided that transactions in futures contracts and options are not deemed to constitute selling securities short.
(iii) The fund does not currently intend to purchase securities on margin, except that the fund may obtain such short-term credits as are necessary for the clearance of transactions, and provided that margin payments in connection with futures contracts and options on futures contracts shall not constitute purchasing securities on margin.
(iv) The fund does not currently intend to hedge more than 40% of its total assets with short sales against the box under normal conditions.
(v) The fund may borrow money only (a) from a bank or from a registered investment company or portfolio for which FMR or an affiliate serves as investment adviser or (b) by engaging in reverse repurchase agreements with any party (reverse repurchase agreements are treated as borrowings for purposes of fundamental investment limitation (2)).
(vi) The fund does not currently intend to purchase any security if, as a result, more than 10% of its net assets would be invested in securities that are deemed to be illiquid because they are subject to legal or contractual restrictions on resale or because they cannot be sold or disposed of in the ordinary course of business at approximately the prices at which they are valued.
(vii) The fund does not currently intend to lend assets other than securities to other parties, except by (a) lending money up to 15% of the fund's net assets to a registered investment company or portfolio for which FMR or an affiliate serves as investment adviser or (b) acquiring loans, loan participations, or other forms of direct debt instruments and, in connection therewith, assuming any associated unfunded commitments of the sellers. (This limitation does not apply to purchases of debt securities or to repurchase agreements.)
(viii) The fund does not currently intend to invest all of its assets in the securities of a single open-end management investment company managed by Fidelity Management & Research Company or an affiliate or successor with substantially the same fundamental investment objective, policies, and limitations as the fund.
For purposes of limitation (i), Subchapter M generally requires the fund to invest no more than 25% of its total assets in securities of any one issuer and to invest at least 50% of its total assets so that no more than 5% of the fund's total assets are invested in securities of any one issuer. However, Subchapter M allows unlimited investments in cash, cash items, government securities (as defined in Subchapter M) and securities of other investment companies. These tax requirements are generally applied at the end of each quarter of the fund's taxable year.
With respect to limitation (vi), if through a change in values, net assets, or other circumstances, the fund were in a position where more than 10% of its net assets were invested in illiquid securities, it would consider appropriate steps to protect liquidity.
For purposes of limitation (4), FMR considers an issuer to be principally engaged in a business activity if: (i) at least 50% of an issuer's assets, income, sales or profits are committed to, or derived from, the business activity, or (ii) a third party has given the issuer an industry or sector classification consistent with the designated business activity.
For the fund's limitations on futures and options transactions, see the section entitled "Limitations on Futures and Options Transactions" on page <R><Click Here></R>.
Investment Limitations of <R>Advisor</R> Financial Services Fund
The following are the fund's fundamental investment limitations set forth in their entirety. The fund may not:
(1) with respect to 75% of the fund's total assets, purchase the securities of any issuer (other than securities issued or guaranteed by the U.S. Government or any of its agencies or instrumentalities, or securities of other investment companies) if, as a result, (a) more than 5% of the fund's total assets would be invested in the securities of that issuer or (b) the fund would hold more than 10% of the outstanding voting securities of that issuer.
(2) issue senior securities, except in connection with the insurance program established by the fund pursuant to an exemptive order issued by the Securities and Exchange Commission or as otherwise permitted under the Investment Company Act of 1940;
(3) borrow money, except that the fund may borrow money for temporary or emergency purposes (not for leveraging or investment) in an amount not exceeding 33 1/3% of its total assets (including the amount borrowed) less liabilities (other than borrowings). Any borrowings that come to exceed this amount will be reduced within three days (not including Sundays and holidays) to the extent necessary to comply with the 33 1/3% limitation;
(4) underwrite securities issued by others, except to the extent that the fund may be considered an underwriter within the meaning of the Securities Act of 1933 in the disposition of restricted securities;
(5) purchase the securities of any issuer if, as a result, less than 25% of the fund's total assets would be invested in the securities of issuers principally engaged in the business activities of the industries in the financial services sector;
(6) purchase or sell real estate unless acquired as a result of ownership of securities or other instruments (but this shall not prevent the fund from investing in securities or other instruments backed by real estate or securities of companies engaged in the real estate business);
(7) purchase or sell physical commodities unless acquired as a result of ownership of securities or other instruments (but this shall not prevent the fund from purchasing or selling options and futures contracts or from investing in securities or other instruments backed by physical commodities); or
(8) lend any security or make any other loan if, as a result, more than 33 1/3% of its total assets would be lent to other parties, but this limitation does not apply to purchases of debt securities or to repurchase agreements.
(9) The fund may, notwithstanding any other fundamental investment policy or limitation, invest all of its assets in the securities of a single open-end management investment company managed by Fidelity Management & Research Company or an affiliate or successor with substantially the same fundamental investment objective, policies, and limitations as the fund.
The following investment limitations are not fundamental and may be changed without shareholder approval.
(i) The fund does not currently intend to sell securities short, unless it owns or has the right to obtain securities equivalent in kind and amount to the securities sold short, and provided that transactions in futures contracts and options are not deemed to constitute selling securities short.
(ii) The fund does not currently intend to purchase securities on margin, except that the fund may obtain such short-term credits as are necessary for the clearance of transactions, and provided that margin payments in connection with futures contracts and options on futures contracts shall not constitute purchasing securities on margin.
(iii) The fund does not currently intend to hedge more than 40% of its total assets with short sales against the box under normal conditions.
(iv) The fund may borrow money only (a) from a bank or from a registered investment company or portfolio for which FMR or an affiliate serves as investment adviser or (b) by engaging in reverse repurchase agreements with any party (reverse repurchase agreements are treated as borrowings for purposes of fundamental investment limitation (3)).
(v) The fund does not currently intend to purchase any security if, as a result, more than 10% of its net assets would be invested in securities that are deemed to be illiquid because they are subject to legal or contractual restrictions on resale or because they cannot be sold or disposed of in the ordinary course of business at approximately the prices at which they are valued.
(vi) The fund does not currently intend to lend assets other than securities to other parties, except by (a) lending money up to 15% of the fund's net assets to a registered investment company or portfolio for which FMR or an affiliate serves as investment adviser or (b) acquiring loans, loan participations, or other forms of direct debt instruments and, in connection therewith, assuming any associated unfunded commitments of the sellers. (This limitation does not apply to purchases of debt securities or to repurchase agreements.)
(vii) The fund does not currently intend to invest all of its assets in the securities of a single open-end management investment company managed by Fidelity Management & Research Company or an affiliate or successor with substantially the same fundamental investment objective, policies, and limitations as the fund.
With respect to limitation (v), if through a change in values, net assets, or other circumstances, the fund were in a position where more than 10% of its net assets were invested in illiquid securities, it would consider appropriate steps to protect liquidity.
For purposes of limitation (5), FMR considers an issuer to be principally engaged in a business activity if: (i) at least 50% of an issuer's assets, income, sales or profits are committed to, or derived from, the business activity, or (ii) a third party has given the issuer an industry or sector classification consistent with the designated business activity. For <R>Advisor</R> Financial Services, an issuer that derives more than 15% of revenues or profits from brokerage or investment management activities is considered to be principally engaged in the business activities of its named market sector.
For the fund's limitations on futures and options transactions, see the section entitled "Limitations on Futures and Options Transactions" on page <R><Click Here></R>.
Investment Limitations of <R>Advisor</R> Health Care Fund
The following are the fund's fundamental investment limitations set forth in their entirety. The fund may not:
(1) issue senior securities, except in connection with the insurance program established by the fund pursuant to an exemptive order issued by the Securities and Exchange Commission or as otherwise permitted under the Investment Company Act of 1940;
(2) borrow money, except that each fund may borrow money for temporary or emergency purposes (not for leveraging or investment) in an amount not exceeding 33 1/3% of its total assets (including the amount borrowed) less liabilities (other than borrowings). Any borrowings that come to exceed this amount will be reduced within three days (not including Sundays and holidays) to the extent necessary to comply with the 33 1/3% limitation;
(3) underwrite securities issued by others, except to the extent that a fund may be considered an underwriter within the meaning of the Securities Act of 1933 in the disposition of restricted securities;
(4) purchase the securities of any issuer if, as a result, less than 25% of the fund's total assets would be invested in the securities of issuers principally engaged in the business activities of the industries in the health care sector;
(5) purchase or sell real estate unless acquired as a result of ownership of securities or other instruments (but this shall not prevent a fund from investing in securities or other instruments backed by real estate or securities of companies engaged in the real estate business);
(6) purchase or sell physical commodities unless acquired as a result of ownership of securities or other instruments (but this shall not prevent each fund from purchasing or selling options and futures contracts or from investing in securities or other instruments backed by physical commodities); or
(7) lend any security or make any other loan if, as a result, more than 33 1/3% of its total assets would be lent to other parties, but this limitation does not apply to purchases of debt securities or to repurchase agreements.
(8) The fund may, notwithstanding any other fundamental investment policy or limitation, invest all of its assets in the securities of a single open-end management investment company managed by Fidelity Management & Research Company or an affiliate or successor with substantially the same fundamental investment objective, policies, and limitations as the fund.
The following investment limitations are not fundamental and may be changed without shareholder approval.
(i) In order to qualify as a "regulated investment company" under Subchapter M of the Internal Revenue Code of 1986, as amended, the fund currently intends to comply with certain diversification limits imposed by Subchapter M.
(ii) The fund does not currently intend to sell securities short, unless it owns or has the right to obtain securities equivalent in kind and amount to the securities sold short, and provided that transactions in futures contracts and options are not deemed to constitute selling securities short.
(iii) The fund does not currently intend to purchase securities on margin, except that the fund may obtain such short-term credits as are necessary for the clearance of transactions, and provided that margin payments in connection with futures contracts and options on futures contracts shall not constitute purchasing securities on margin.
(iv) The fund does not currently intend to hedge more than 40% of its total assets with short sales against the box under normal conditions.
(v) The fund may borrow money only (a) from a bank or from a registered investment company or portfolio for which FMR or an affiliate serves as investment adviser or (b) by engaging in reverse repurchase agreements with any party (reverse repurchase agreements are treated as borrowings for purposes of fundamental investment limitation (2)).
(vi) The fund does not currently intend to purchase any security if, as a result, more than 10% of its net assets would be invested in securities that are deemed to be illiquid because they are subject to legal or contractual restrictions on resale or because they cannot be sold or disposed of in the ordinary course of business at approximately the prices at which they are valued.
(vii) The fund does not currently intend to lend assets other than securities to other parties, except by (a) lending money up to 15% of the fund's net assets to a registered investment company or portfolio for which FMR or an affiliate serves as investment adviser or (b) acquiring loans, loan participations, or other forms of direct debt instruments and, in connection therewith, assuming any associated unfunded commitments of the sellers. (This limitation does not apply to purchases of debt securities or to repurchase agreements.)
(viii) The fund does not currently intend to invest all of its assets in the securities of a single open-end management investment company managed by Fidelity Management & Research Company or an affiliate or successor with substantially the same fundamental investment objective, policies, and limitations as the fund.
For purposes of limitation (i), Subchapter M generally requires the fund to invest no more than 25% of its total assets in securities of any one issuer and to invest at least 50% of its total assets so that no more than 5% of the fund's total assets are invested in securities of any one issuer. However, Subchapter M allows unlimited investments in cash, cash items, government securities (as defined in Subchapter M) and securities of other investment companies. These tax requirements are generally applied at the end of each quarter of the fund's taxable year.
With respect to limitation (vi), if through a change in values, net assets, or other circumstances, the fund were in a position where more than 10% of its net assets were invested in illiquid securities, it would consider appropriate steps to protect liquidity.
For purposes of limitation (4), FMR considers an issuer to be principally engaged in a business activity if: (i) at least 50% of an issuer's assets, income, sales or profits are committed to, or derived from, the business activity, or (ii) a third party has given the issuer an industry or sector classification consistent with the designated business activity.
For the fund's limitations on futures and options transactions, see the section entitled "Limitations on Futures and Options Transactions" on page <R><Click Here></R>.
Investment Limitations of <R>Advisor</R> Natural Resources Fund
The following are the fund's fundamental investment limitations set forth in their entirety. The fund may not:
(1) issue senior securities, except in connection with the insurance program established by the fund pursuant to an exemptive order issued by the Securities and Exchange Commission or as otherwise permitted under the Investment Company Act of 1940;
(2) borrow money, except that the fund may borrow money for temporary or emergency purposes (not for leveraging or investment) in an amount not exceeding 33 1/3% of its total assets (including the amount borrowed) less liabilities (other than borrowings). Any borrowings that come to exceed this amount will be reduced within three days (not including Sundays and holidays) to the extent necessary to comply with the 33 1/3% limitation;
(3) underwrite securities issued by others, except to the extent that the fund may be considered an underwriter within the meaning of the Securities Act of 1933 in the disposition of restricted securities;
(4) purchase the securities of any issuer if, as a result, less than 25% of the fund's total assets would be invested in the securities of issuers principally engaged in the business activity of the industries in the natural resources sector;
(5) purchase or sell real estate unless acquired as a result of ownership of securities or other instruments (but this shall not prevent the fund from investing in securities or other instruments backed by real estate or securities of companies engaged in the real estate business); or
(6) lend any security or make any other loan if, as a result, more than 33 1/3% of its total assets would be lent to other parties, but this limitation does not apply to purchases of debt securities or to repurchase agreements.
(7) The fund may, notwithstanding any other fundamental investment policy or limitation, invest all of its assets in the securities of a single open-end management investment company with substantially the same fundamental investment objective, policies, and limitations as the fund.
(8) The fund is authorized to invest up to 50% of its assets in physical commodities.
The following limitations are not fundamental and may be changed without shareholder approval.
(i) In order to qualify as a "regulated investment company" under Subchapter M of the Internal Revenue Code of 1986, as amended, the fund currently intends to comply with certain diversification limits imposed by Subchapter M.
(ii) The fund does not currently intend to sell securities short, unless it owns or has the right to obtain securities equivalent in kind and amount to the securities sold short, and provided that transactions in futures contracts and options are not deemed to constitute selling securities short.
(iii) The fund does not currently intend to purchase securities on margin, except that the fund may obtain such short-term credits as are necessary for the clearance of transactions, and provided that margin payments in connection with futures contracts and options on futures contracts shall not constitute purchasing securities on margin.
(iv) The fund does not currently intend to hedge more than 40% of its total assets with short sales against the box under normal conditions.
(v) The fund may borrow money only (a) from a bank or from a registered investment company or portfolio for which FMR or an affiliate serves as investment adviser or (b) by engaging in reverse repurchase agreements with any party (reverse repurchase agreements are treated as borrowings for purposes of fundamental investment limitation (2)).
(vi) The fund does not currently intend to purchase any security if, as a result, more than 10% of its net assets would be invested in securities that are deemed to be illiquid because they are subject to legal or contractual restrictions on resale or because they cannot be sold or disposed of in the ordinary course of business at approximately the prices at which they are valued.
(vii) The fund does not currently intend to lend assets other than securities to other parties, except by (a) lending money up to 15% of the fund's net assets to a registered investment company or portfolio for which FMR or an affiliate serves as investment adviser or (b) acquiring loans, loan participations, or other forms of direct debt instruments and, in connection therewith, assuming any associated unfunded commitments of the sellers. (This limitation does not apply to purchases of debt securities or to repurchase agreements.)
(viii) The fund does not currently intend to invest all of its assets in the securities of a single open-end management investment company with substantially the same fundamental investment objective, policies, and limitations as the fund.
For purposes of limitation (i), Subchapter M generally requires the fund to invest no more than 25% of its total assets in securities of any one issuer and to invest at least 50% of its total assets so that no more than 5% of the fund's total assets are invested in securities of any one issuer. However, Subchapter M allows unlimited investments in cash, cash items, government securities (as defined in Subchapter M) and securities of other investment companies. These tax requirements are generally applied at the end of each quarter of the fund's taxable year.
With respect to limitation (vi), if through a change in values, net assets, or other circumstances, the fund were in a position where more than 10% of its net assets were invested in illiquid securities, it would consider appropriate steps to protect liquidity.
For purposes of limitation (4), FMR considers an issuer to be principally engaged in a business activity if: (i) at least 50% of an issuer's assets, income, sales or profits are committed to, or derived from, the business activity, or (ii) a third party has given the issuer an industry or sector classification consistent with the designated business activity.
For the fund's limitations on futures and options transactions, see the section entitled "Limitations on Futures and Options Transactions" on page <R><Click Here></R>.
Investment Limitations of <R>Advisor</R> Technology Fund
The following are the fund's fundamental investment limitations set forth in their entirety. The fund may not:
(1) issue senior securities, except in connection with the insurance program established by the fund pursuant to an exemptive order issued by the Securities and Exchange Commission or as otherwise permitted under the Investment Company Act of 1940;
(2) borrow money, except that each fund may borrow money for temporary or emergency purposes (not for leveraging or investment) in an amount not exceeding 33 1/3% of its total assets (including the amount borrowed) less liabilities (other than borrowings). Any borrowings that come to exceed this amount will be reduced within three days (not including Sundays and holidays) to the extent necessary to comply with the 33 1/3% limitation;
(3) underwrite securities issued by others, except to the extent that a fund may be considered an underwriter within the meaning of the Securities Act of 1933 in the disposition of restricted securities;
(4) purchase the securities of any issuer if, as a result, less than 25% of the fund's total assets would be invested in the securities of issuers principally engaged in the business activities of the industries in the technology sector;
(5) purchase or sell real estate unless acquired as a result of ownership of securities or other instruments (but this shall not prevent a fund from investing in securities or other instruments backed by real estate or securities of companies engaged in the real estate business);
(6) purchase or sell physical commodities unless acquired as a result of ownership of securities or other instruments (but this shall not prevent each fund from purchasing or selling options and futures contracts or from investing in securities or other instruments backed by physical commodities); or
(7) lend any security or make any other loan if, as a result, more than 33 1/3% of its total assets would be lent to other parties, but this limitation does not apply to purchases of debt securities or to repurchase agreements.
(8) The fund may, notwithstanding any other fundamental investment policy or limitation, invest all of its assets in the securities of a single open-end management investment company managed by Fidelity Management & Research Company or an affiliate or successor with substantially the same fundamental investment objective, policies, and limitations as the fund.
The following investment limitations are not fundamental and may be changed without shareholder approval.
(i) In order to qualify as a "regulated investment company" under Subchapter M of the Internal Revenue Code of 1986, as amended, the fund currently intends to comply with certain diversification limits imposed by Subchapter M.
(ii) The fund does not currently intend to sell securities short, unless it owns or has the right to obtain securities equivalent in kind and amount to the securities sold short, and provided that transactions in futures contracts and options are not deemed to constitute selling securities short.
(iii) The fund does not currently intend to purchase securities on margin, except that the fund may obtain such short-term credits as are necessary for the clearance of transactions, and provided that margin payments in connection with futures contracts and options on futures contracts shall not constitute purchasing securities on margin.
(iv) The fund does not currently intend to hedge more than 40% of its total assets with short sales against the box under normal conditions.
(v) The fund may borrow money only (a) from a bank or from a registered investment company or portfolio for which FMR or an affiliate serves as investment adviser or (b) by engaging in reverse repurchase agreements with any party (reverse repurchase agreements are treated as borrowings for purposes of fundamental investment limitation (2)).
(vi) The fund does not currently intend to purchase any security if, as a result, more than 10% of its net assets would be invested in securities that are deemed to be illiquid because they are subject to legal or contractual restrictions on resale or because they cannot be sold or disposed of in the ordinary course of business at approximately the prices at which they are valued.
(vii) The fund does not currently intend to lend assets other than securities to other parties, except by (a) lending money up to 15% of the fund's net assets to a registered investment company or portfolio for which FMR or an affiliate serves as investment adviser or (b) acquiring loans, loan participations, or other forms of direct debt instruments and, in connection therewith, assuming any associated unfunded commitments of the sellers. (This limitation does not apply to purchases of debt securities or to repurchase agreements.)
(viii) The fund does not currently intend to invest all of its assets in the securities of a single open-end management investment company managed by Fidelity Management & Research Company or an affiliate or successor with substantially the same fundamental investment objective, policies, and limitations as the fund.
For purposes of limitation (i), Subchapter M generally requires the fund to invest no more than 25% of its total assets in securities of any one issuer and to invest at least 50% of its total assets so that no more than 5% of the fund's total assets are invested in securities of any one issuer. However, Subchapter M allows unlimited investments in cash, cash items, government securities (as defined in Subchapter M) and securities of other investment companies. These tax requirements are generally applied at the end of each quarter of the fund's taxable year.
With respect to limitation (vi), if through a change in values, net assets, or other circumstances, the fund were in a position where more than 10% of its net assets were invested in illiquid securities, it would consider appropriate steps to protect liquidity.
For purposes of limitation (4), FMR considers an issuer to be principally engaged in a business activity if: (i) at least 50% of an issuer's assets, income, sales or profits are committed to, or derived from, the business activity, or (ii) a third party has given the issuer an industry or sector classification consistent with the designated business activity.
For the fund's limitations on futures and options transactions, see the section entitled "Limitations on Futures and Options Transactions" on page <R><Click Here></R>.
Investment Limitations of <R>Advisor Telecommunications &</R> Utilities Growth Fund
The following are the fund's fundamental investment limitations set forth in their entirety. The fund may not:
(1) issue senior securities, except in connection with the insurance program established by the fund pursuant to an exemptive order issued by the Securities and Exchange Commission or as otherwise permitted under the Investment Company Act of 1940;
(2) borrow money, except that each fund may borrow money for temporary or emergency purposes (not for leveraging or investment) in an amount not exceeding 33 1/3% of its total assets (including the amount borrowed) less liabilities (other than borrowings). Any borrowings that come to exceed this amount will be reduced within three days (not including Sundays and holidays) to the extent necessary to comply with the 33 1/3% limitation;
(3) underwrite securities issued by others, except to the extent that a fund may be considered an underwriter within the meaning of the Securities Act of 1933 in the disposition of restricted securities;
(4) purchase the securities of any issuer if, as a result, less than 25% of the fund's total assets would be invested in the securities of issuers principally engaged in the business activities of the industries in the utilities sector;
(5) purchase or sell real estate unless acquired as a result of ownership of securities or other instruments (but this shall not prevent a fund from investing in securities or other instruments backed by real estate or securities of companies engaged in the real estate business);
(6) purchase or sell physical commodities unless acquired as a result of ownership of securities or other instruments (but this shall not prevent each fund from purchasing or selling options and futures contracts or from investing in securities or other instruments backed by physical commodities); or
(7) lend any security or make any other loan if, as a result, more than 33 1/3% of its total assets would be lent to other parties, but this limitation does not apply to purchases of debt securities or to repurchase agreements.
(8) The fund may, notwithstanding any other fundamental investment policy or limitation, invest all of its assets in the securities of a single open-end management investment company managed by Fidelity Management & Research Company or an affiliate or successor with substantially the same fundamental investment objective, policies, and limitations as the fund.
The following investment limitations are not fundamental and may be changed without shareholder approval.
(i) In order to qualify as a "regulated investment company" under Subchapter M of the Internal Revenue Code of 1986, as amended, the fund currently intends to comply with certain diversification limits imposed by Subchapter M.
(ii) The fund does not currently intend to sell securities short, unless it owns or has the right to obtain securities equivalent in kind and amount to the securities sold short, and provided that transactions in futures contracts and options are not deemed to constitute selling securities short.
(iii) The fund does not currently intend to purchase securities on margin, except that the fund may obtain such short-term credits as are necessary for the clearance of transactions, and provided that margin payments in connection with futures contracts and options on futures contracts shall not constitute purchasing securities on margin.
(iv) The fund does not currently intend to hedge more than 40% of its total assets with short sales against the box under normal conditions.
(v) The fund may borrow money only (a) from a bank or from a registered investment company or portfolio for which FMR or an affiliate serves as investment adviser or (b) by engaging in reverse repurchase agreements with any party (reverse repurchase agreements are treated as borrowings for purposes of fundamental investment limitation (2)).
(vi) The fund does not currently intend to purchase any security if, as a result, more than 10% of its net assets would be invested in securities that are deemed to be illiquid because they are subject to legal or contractual restrictions on resale or because they cannot be sold or disposed of in the ordinary course of business at approximately the prices at which they are valued.
(vii) The fund does not currently intend to lend assets other than securities to other parties, except by (a) lending money up to 15% of the fund's net assets to a registered investment company or portfolio for which FMR or an affiliate serves as investment adviser or (b) acquiring loans, loan participations, or other forms of direct debt instruments and, in connection therewith, assuming any associated unfunded commitments of the sellers. (This limitation does not apply to purchases of debt securities or to repurchase agreements.)
(viii) The fund does not currently intend to invest all of its assets in the securities of a single open-end management investment company managed by Fidelity Management & Research Company or an affiliate or successor with substantially the same fundamental investment objective, policies, and limitations as the fund.
For purposes of limitation (i), Subchapter M generally requires the fund to invest no more than 25% of its total assets in securities of any one issuer and to invest at least 50% of its total assets so that no more than 5% of the fund's total assets are invested in securities of any one issuer. However, Subchapter M allows unlimited investments in cash, cash items, government securities (as defined in Subchapter M) and securities of other investment companies. These tax requirements are generally applied at the end of each quarter of the fund's taxable year.
With respect to limitation (vi), if through a change in values, net assets, or other circumstances, the fund were in a position where more than 10% of its net assets were invested in illiquid securities, it would consider appropriate steps to protect liquidity.
For purposes of limitation (4), FMR considers an issuer to be principally engaged in a business activity if: (i) at least 50% of an issuer's assets, income, sales or profits are committed to, or derived from, the business activity, or (ii) a third party has given the issuer an industry or sector classification consistent with the designated business activity.
For the fund's limitations on futures and options transactions, see the section entitled "Limitations on Futures and Options Transactions" on page <R><Click Here></R>.
Advisor Financial Services Fund. The extent to which the fund may invest in a company that engages in securities-related activities is limited by federal securities laws.
The following pages contain more detailed information about types of instruments in which a fund may invest, strategies Fidelity Management & Research Company (FMR) may employ in pursuit of a fund's investment objective, and a summary of related risks. FMR may not buy all of these instruments or use all of these techniques unless it believes that doing so will help a fund achieve its goal.
Affiliated Bank Transactions. A fund may engage in transactions with financial institutions that are, or may be considered to be, "affiliated persons" of the fund under the 1940 Act. These transactions may involve repurchase agreements with custodian banks; short-term obligations of, and repurchase agreements with, the 50 largest U.S. banks (measured by deposits); municipal securities; U.S. Government securities with affiliated financial institutions that are primary dealers in these securities; short-term currency transactions; and short-term borrowings. In accordance with exemptive orders issued by the Securities and Exchange Commission (SEC), the Board of Trustees has established and periodically reviews procedures applicable to transactions involving affiliated financial institutions.
Borrowin<R>g.</R> Each fund may borrow from banks or from other funds advised by FMR or its affiliates, or through reverse repurchase agreements. If a fund borrows money, its share price may be subject to greater fluctuation until the borrowing is paid off. If a fund makes additional investments while borrowings are outstanding, this may be considered a form of leverage.
Cash Management. A fund can hold uninvested cash or can invest it in cash equivalents such as money market securities, repurchase agreements or shares of money market funds. Generally, these securities offer less potential for gains than other types of securities.
Central Cash Funds are money market funds managed by FMR or its affiliates that seek to earn a high level of current income (free from federal income tax in the case of a municipal money market fund) while maintaining a stable $1.00 share price. The funds comply with industry-standard requirements for money market funds regarding the quality, maturity, and diversification of their investments.
Common Stock represents an equity or ownership interest in an issuer. In the event an issuer is liquidated or declares bankruptcy, the claims of owners of bonds and preferred stock take precedence over the claims of those who own common stock.
Convertible Securities are bonds, debentures, notes, preferred stocks or other securities that may be converted or exchanged (by the holder or by the issuer) into shares of the underlying common stock (or cash or securities of equivalent value) at a stated exchange ratio. A convertible security may also be called for redemption or conversion by the issuer after a particular date and under certain circumstances (including a specified price) established upon issue. If a convertible security held by a fund is called for redemption or conversion, the fund could be required to tender it for redemption, convert it into the underlying common stock, or sell it to a third party.
Convertible securities generally have less potential for gain or loss than common stocks. Convertible securities generally provide yields higher than the underlying common stocks, but generally lower than comparable non-convertible securities. Because of this higher yield, convertible securities generally sell at prices above their "conversion value," which is the current market value of the stock to be received upon conversion. The difference between this conversion value and the price of convertible securities will vary over time depending on changes in the value of the underlying common stocks and interest rates. When the underlying common stocks decline in value, convertible securities will tend not to decline to the same extent because of the interest or dividend payments and the repayment of principal at maturity for certain types of convertible securities. However, securities that are convertible other than at the option of the holder generally do not limit the potential for loss to the same extent as securities convertible at the option of the holder. When the underlying common stocks rise in value, the value of convertible securities may also be expected to increase. At the same time, however, the difference between the market value of convertible securities and their conversion value will narrow, which means that the value of convertible securities will generally not increase to the same extent as the value of the underlying common stocks. Because convertible securities may also be interest-rate sensitive, their value may increase as interest rates fall and decrease as interest rates rise. Convertible securities are also subject to credit risk, and are often lower-quality securities.
Companies "Principally Engaged" in a Designated Business Activity. <R>Fo</R>r purposes of each fund's policy of investing at least 80% of its assets in securities of companies principally engaged in the business activities of its named market sector, FMR considers a company to be principally engaged in a designated business activity if: (i) at least 50% of a company's assets, income, sales or profits are committed to, or derived from, the business activity, or (ii) a third party has given the company an industry or sector classification consistent with the designated business activity. For Advisor Financial Services, an issuer that derives more than 15% of revenues or profits from brokerage or investment management activities is considered to be principally engaged in the business activities of its named market sector.<R></R><R></R>
Debt Securities are used by issuers to borrow money. The issuer usually pays a fixed, variable or floating rate of interest, and must repay the amount borrowed at the maturity of the security. Some debt securities, such as zero coupon bonds, do not pay interest but are sold at a deep discount from their face values. Debt securities include corporate bonds, government securities, and mortgage and other asset-backed securities.
Exposure to Foreign Market<R>s.</R> Foreign securities, foreign currencies, and securities issued by U.S. entities with substantial foreign operations may involve significant risks in addition to the risks inherent in U.S. investments.
Foreign investments involve risks relating to local political, economic, regulatory, or social instability, military action or unrest, or adverse diplomatic developments, and may be affected by actions of foreign governments adverse to the interests of U.S. investors. Such actions may include expropriation or nationalization of assets, confiscatory taxation, restrictions on U.S. investment or on the ability to repatriate assets or convert currency into U.S. dollars, or other government intervention. Additionally, governmental issuers of foreign debt securities may be unwilling to pay interest and repay principal when due and may require that the conditions for payment be renegotiated. There is no assurance that FMR will be able to anticipate these potential events or counter their effects. In addition, the value of securities denominated in foreign currencies and of dividends and interest paid with respect to such securities will fluctuate based on the relative strength of the U.S. dollar.
It is anticipated that in most cases the best available market for foreign securities will be on an exchange or in over-the-counter (OTC) markets located outside of the United States. Foreign stock markets, while growing in volume and sophistication, are generally not as developed as those in the United States, and securities of some foreign issuers may be less liquid and more volatile than securities of comparable U.S. issuers. Foreign security trading, settlement and custodial practices (including those involving securities settlement where fund assets may be released prior to receipt of payment) are often less developed than those in U.S. markets, and may result in increased risk or substantial delays in the event of a failed trade or the insolvency of, or breach of duty by, a foreign broker-dealer, securities depository or foreign subcustodian<R>. In </R>addition, the costs associated with foreign investments, including withholding taxes, brokerage commissions and custodial costs, are generally higher than with U.S. investments.
Foreign markets may offer less protection to investors than U.S. markets. Foreign issuers are generally not bound by uniform accounting, auditing, and financial reporting requirements and standards of practice comparable to those applicable to U.S. issuers. Adequate public information on foreign issuers may not be available, and it may be difficult to secure dividends and information regarding corporate actions on a timely basis. In general, there is less overall governmental supervision and regulation of securities exchanges, brokers, and listed companies than in the United States. OTC markets tend to be less regulated than stock exchange markets and, in certain countries, may be totally unregulated. Regulatory enforcement may be influenced by economic or political concerns, and investors may have difficulty enforcing their legal rights in foreign countries.
Some foreign securities impose restrictions on transfer within the United States or to U.S. persons. Although securities subject to such transfer restrictions may be marketable abroad, they may be less liquid than foreign securities of the same class that are not subject to such restrictions.
American Depositary Receipts (ADRs) as well as other "hybrid" forms of ADRs, including European Depositary Receipts (EDRs) and Global Depositary Receipts (GDRs), are certificates evidencing ownership of shares of a foreign issuer. These certificates are issued by depository banks and generally trade on an established market in the United States or elsewhere. The underlying shares are held in trust by a custodian bank or similar financial institution in the issuer's home country. The depository bank may not have physical custody of the underlying securities at all times and may charge fees for various services, including forwarding dividends and interest and corporate actions. ADRs are alternatives to directly purchasing the underlying foreign securities in their national markets and currencies. However, ADRs continue to be subject to many of the risks associated with investing directly in foreign securities. These risks include foreign exchange risk as well as the political and economic risks of the underlying issuer's country.
The risks of foreign investing may be magnified for investments in emerging markets. Security prices in emerging markets can be significantly more volatile than those in more developed markets, reflecting the greater uncertainties of investing in less established markets and economies. In particular, countries with emerging markets may have relatively unstable governments, may present the risks of nationalization of businesses, restrictions on foreign ownership and prohibitions on the repatriation of assets, and may have less protection of property rights than more developed countries. The economies of countries with emerging markets may be based on only a few industries, may be highly vulnerable to changes in local or global trade conditions, and may suffer from extreme and volatile debt burdens or inflation rates. Local securities markets may trade a small number of securities and may be unable to respond effectively to increases in trading volume, potentially making prompt liquidation of holdings difficult or impossible at times.
Foreign Currency Transaction<R>s.</R> A fund may conduct foreign currency transactions on a spot (i.e., cash) or forward basis (i.e., by entering into forward contracts to purchase or sell foreign currencies). Although foreign exchange dealers generally do not charge a fee for such conversions, they do realize a profit based on the difference between the prices at which they are buying and selling various currencies. Thus, a dealer may offer to sell a foreign currency at one rate, while offering a lesser rate of exchange should the counterparty desire to resell that currency to the dealer. Forward contracts are customized transactions that require a specific amount of a currency to be delivered at a specific exchange rate on a specific date or range of dates in the future. Forward contracts are generally traded in an interbank market directly between currency traders (usually large commercial banks) and their customers. The parties to a forward contract may agree to offset or terminate the contract before its maturity, or may hold the contract to maturity and complete the contemplated currency exchange.
The following discussion summarizes the principal currency management strategies involving forward contracts that could be used by a fund. A fund may also use swap agreements, indexed securities, and options and futures contracts relating to foreign currencies for the same purposes.
A "settlement hedge" or "transaction hedge" is designed to protect a fund against an adverse change in foreign currency values between the date a security is purchased or sold and the date on which payment is made or received. Entering into a forward contract for the purchase or sale of the amount of foreign currency involved in an underlying security transaction for a fixed amount of U.S. dollars "locks in" the U.S. dollar price of the security. Forward contracts to purchase or sell a foreign currency may also be used by a fund in anticipation of future purchases or sales of securities denominated in foreign currency, even if the specific investments have not yet been selected by FMR.
A fund may also use forward contracts to hedge against a decline in the value of existing investments denominated in foreign currency. For example, if a fund owned securities denominated in pounds sterling, it could enter into a forward contract to sell pounds sterling in return for U.S. dollars to hedge against possible declines in the pound's value. Such a hedge, sometimes referred to as a "position hedge," would tend to offset both positive and negative currency fluctuations, but would not offset changes in security values caused by other factors. A fund could also hedge the position by selling another currency expected to perform similarly to the pound sterling. This type of hedge, sometimes referred to as a "proxy hedge," could offer advantages in terms of cost, yield, or efficiency, but generally would not hedge currency exposure as effectively as a direct hedge into U.S. dollars. Proxy hedges may result in losses if the currency used to hedge does not perform similarly to the currency in which the hedged securities are denominated.
A fund may enter into forward contracts to shift its investment exposure from one currency into another. This may include shifting exposure from U.S. dollars to a foreign currency, or from one foreign currency to another foreign currency. This type of strategy, sometimes known as a "cross-hedge," will tend to reduce or eliminate exposure to the currency that is sold, and increase exposure to the currency that is purchased, much as if a fund had sold a security denominated in one currency and purchased an equivalent security denominated in another. Cross-hedges protect against losses resulting from a decline in the hedged currency, but will cause a fund to assume the risk of fluctuations in the value of the currency it purchases.
Successful use of currency management strategies will depend on FMR's skill in analyzing currency values. Currency management strategies may substantially change a fund's investment exposure to changes in currency exchange rates and could result in losses to a fund if currencies do not perform as FMR anticipates. For example, if a currency's value rose at a time when FMR had hedged a fund by selling that currency in exchange for dollars, a fund would not participate in the currency's appreciation. If FMR hedges currency exposure through proxy hedges, a fund could realize currency losses from both the hedge and the security position if the two currencies do not move in tandem. Similarly, if FMR increases a fund's exposure to a foreign currency and that currency's value declines, a fund will realize a loss. There is no assurance that FMR's use of currency management strategies will be advantageous to a fund or that it will hedge at appropriate times.
Funds' Rights as Shareholders. The funds do not intend to direct or administer the day-to-day operations of any company. A fund, however, may exercise its rights as a shareholder and may communicate its views on important matters of policy to management, the Board of Directors, and shareholders of a company when FMR determines that such matters could have a significant effect on the value of the fund's investment in the company. The activities in which a fund may engage, either individually or in conjunction with others, may include, among others, supporting or opposing proposed changes in a company's corporate structure or business activities; seeking changes in a company's directors or management; seeking changes in a company's direction or policies; seeking the sale or reorganization of the company or a portion of its assets; or supporting or opposing third-party takeover efforts. This area of corporate activity is increasingly prone to litigation and it is possible that a fund could be involved in lawsuits related to such activities. FMR will monitor such activities with a view to mitigating, to the extent possible, the risk of litigation against a fund and the risk of actual liability if a fund is involved in litigation. No guarantee can be made, however, that litigation against a fund will not be undertaken or liabilities incurred.
Futures and Options. The following paragraphs pertain to futures and options: Combined Positions, Correlation of Price Changes, Futures Contracts, Futures Margin Payments, Limitations on Futures and Options Transactions, Liquidity of Options and Futures Contracts, Options and Futures Relating to Foreign Currencies, OTC Options, Purchasing Put and Call Options, and Writing Put and Call Options.
Combined Positions involve purchasing and writing options in combination with each other, or in combination with futures or forward contracts, to adjust the risk and return characteristics of the overall position. For example, purchasing a put option and writing a call option on the same underlying instrument would construct a combined position whose risk and return characteristics are similar to selling a futures contract. Another possible combined position would involve writing a call option at one strike price and buying a call option at a lower price, to reduce the risk of the written call option in the event of a substantial price increase. Because combined options positions involve multiple trades, they result in higher transaction costs and may be more difficult to open and close out.
Correlation of Price Changes. Because there are a limited number of types of exchange-traded options and futures contracts, it is likely that the standardized contracts available will not match a fund's current or anticipated investments exactly. A fund may invest in options and futures contracts based on securities with different issuers, maturities, or other characteristics from the securities in which the fund typically invests, which involves a risk that the options or futures position will not track the performance of the fund's other investments.
Options and futures prices can also diverge from the prices of their underlying instruments, even if the underlying instruments match a fund's investments well. Options and futures prices are affected by such factors as current and anticipated short-term interest rates, changes in volatility of the underlying instrument, and the time remaining until expiration of the contract, which may not affect security prices the same way. Imperfect correlation may also result from differing levels of demand in the options and futures markets and the securities markets, from structural differences in how options and futures and securities are traded, or from imposition of daily price fluctuation limits or trading halts. A fund may purchase or sell options and futures contracts with a greater or lesser value than the securities it wishes to hedge or intends to purchase in order to attempt to compensate for differences in volatility between the contract and the securities, although this may not be successful in all cases. If price changes in a fund's options or futures positions are poorly correlated with its other investments, the positions may fail to produce anticipated gains or result in losses that are not offset by gains in other investments.
Futures Contracts. In purchasing a futures contract, the buyer agrees to purchase a specified underlying instrument at a specified future date. In selling a futures contract, the seller agrees to sell a specified underlying instrument at a specified future date. The price at which the purchase and sale will take place is fixed when the buyer and seller enter into the contract. Some currently available futures contracts are based on specific securities, such as U.S. Treasury bonds or notes, and some are based on indices of securities prices, such as the Standard & Poor's 500 SM Index (S&P 500®). Futures can be held until their delivery dates, or can be closed out before then if a liquid secondary market is available.
The value of a futures contract tends to increase and decrease in tandem with the value of its underlying instrument. Therefore, purchasing futures contracts will tend to increase a fund's exposure to positive and negative price fluctuations in the underlying instrument, much as if it had purchased the underlying instrument directly. When a fund sells a futures contract, by contrast, the value of its futures position will tend to move in a direction contrary to the market. Selling futures contracts, therefore, will tend to offset both positive and negative market price changes, much as if the underlying instrument had been sold.
Futures Margin Payments. The purchaser or seller of a futures contract is not required to deliver or pay for the underlying instrument unless the contract is held until the delivery date. However, both the purchaser and seller are required to deposit "initial margin" with a futures broker, known as a futures commission merchant (FCM), when the contract is entered into. Initial margin deposits are typically equal to a percentage of the contract's value. If the value of either party's position declines, that party will be required to make additional "variation margin" payments to settle the change in value on a daily basis. The party that has a gain may be entitled to receive all or a portion of this amount. Initial and variation margin payments do not constitute purchasing securities on margin for purposes of a fund's investment limitations. In the event of the bankruptcy of an FCM that holds margin on behalf of a fund, the fund may be entitled to return of margin owed to it only in proportion to the amount received by the FCM's other customers, potentially resulting in losses to the fund.
Limitations on Futures and Options Transactions. Each fund has filed a notice of eligibility for exclusion from the definition of the term "commodity pool operator" with the Commodity Futures Trading Commission (CFTC) and the National Futures Association, which regulate trading in the futures markets. The funds intend to comply with Rule 4.5 under the Commodity Exchange Act, which limits the extent to which the funds can commit assets to initial margin deposits and option premiums.
In addition, each fund will not: (a) sell futures contracts, purchase put options, or write call options if, as a result, more than 25% of the fund's total assets would be hedged with futures and options under normal conditions; (b) purchase futures contracts or write put options if, as a result, the fund's total obligations upon settlement or exercise of purchased futures contracts and written put options would exceed 25% of its total assets under normal conditions; or (c) purchase call options if, as a result, the current value of option premiums for call options purchased by the fund would exceed 5% of the fund's total assets. These limitations do not apply to options attached to or acquired or traded together with their underlying securities, and do not apply to securities that incorporate features similar to options.
The above limitations on the funds' investments in futures contracts and options, and the funds' policies regarding futures contracts and options discussed elsewhere in this SAI may be changed as regulatory agencies permit.
Liquidity of Options and Futures Contracts. There is no assurance a liquid secondary market will exist for any particular options or futures contract at any particular time. Options may have relatively low trading volume and liquidity if their strike prices are not close to the underlying instrument's current price. In addition, exchanges may establish daily price fluctuation limits for options and futures contracts, and may halt trading if a contract's price moves upward or downward more than the limit in a given day. On volatile trading days when the price fluctuation limit is reached or a trading halt is imposed, it may be impossible to enter into new positions or close out existing positions. If the secondary market for a contract is not liquid because of price fluctuation limits or otherwise, it could prevent prompt liquidation of unfavorable positions, and potentially could require a fund to continue to hold a position until delivery or expiration regardless of changes in its value. As a result, a fund's access to other assets held to cover its options or futures positions could also be impaired.
Options and Futures Relating to Foreign Currencies. Currency futures contracts are similar to forward currency exchange contracts, except that they are traded on exchanges (and have margin requirements) and are standardized as to contract size and delivery date. Most currency futures contracts call for payment or delivery in U.S. dollars. The underlying instrument of a currency option may be a foreign currency, which generally is purchased or delivered in exchange for U.S. dollars, or may be a futures contract. The purchaser of a currency call obtains the right to purchase the underlying currency, and the purchaser of a currency put obtains the right to sell the underlying currency.
The uses and risks of currency options and futures are similar to options and futures relating to securities or indices, as discussed above. A fund may purchase and sell currency futures and may purchase and write currency options to increase or decrease its exposure to different foreign currencies. Currency options may also be purchased or written in conjunction with each other or with currency futures or forward contracts. Currency futures and options values can be expected to correlate with exchange rates, but may not reflect other factors that affect the value of a fund's investments. A currency hedge, for example, should protect a Yen-denominated security from a decline in the Yen, but will not protect a fund against a price decline resulting from deterioration in the issuer's creditworthiness. Because the value of a fund's foreign-denominated investments changes in response to many factors other than exchange rates, it may not be possible to match the amount of currency options and futures to the value of the fund's investments exactly over time.
OTC Options. Unlike exchange-traded options, which are standardized with respect to the underlying instrument, expiration date, contract size, and strike price, the terms of OTC options (options not traded on exchanges) generally are established through negotiation with the other party to the option contract. While this type of arrangement allows the purchaser or writer greater flexibility to tailor an option to its needs, OTC options generally involve greater credit risk than exchange-traded options, which are guaranteed by the clearing organization of the exchanges where they are traded.
Purchasing Put and Call Options. By purchasing a put option, the purchaser obtains the right (but not the obligation) to sell the option's underlying instrument at a fixed strike price. In return for this right, the purchaser pays the current market price for the option (known as the option premium). Options have various types of underlying instruments, including specific securities, indices of securities prices, and futures contracts. The purchaser may terminate its position in a put option by allowing it to expire or by exercising the option. If the option is allowed to expire, the purchaser will lose the entire premium. If the option is exercised, the purchaser completes the sale of the underlying instrument at the strike price. A purchaser may also terminate a put option position by closing it out in the secondary market at its current price, if a liquid secondary market exists.
The buyer of a typical put option can expect to realize a gain if security prices fall substantially. However, if the underlying instrument's price does not fall enough to offset the cost of purchasing the option, a put buyer can expect to suffer a loss (limited to the amount of the premium, plus related transaction costs).
The features of call options are essentially the same as those of put options, except that the purchaser of a call option obtains the right to purchase, rather than sell, the underlying instrument at the option's strike price. A call buyer typically attempts to participate in potential price increases of the underlying instrument with risk limited to the cost of the option if security prices fall. At the same time, the buyer can expect to suffer a loss if security prices do not rise sufficiently to offset the cost of the option.
Writing Put and Call Options. The writer of a put or call option takes the opposite side of the transaction from the option's purchaser. In return for receipt of the premium, the writer assumes the obligation to pay the strike price for the option's underlying instrument if the other party to the option chooses to exercise it. The writer may seek to terminate a position in a put option before exercise by closing out the option in the secondary market at its current price. If the secondary market is not liquid for a put option, however, the writer must continue to be prepared to pay the strike price while the option is outstanding, regardless of price changes. When writing an option on a futures contract, a fund will be required to make margin payments to an FCM as described above for futures contracts.
If security prices rise, a put writer would generally expect to profit, although its gain would be limited to the amount of the premium it received. If security prices remain the same over time, it is likely that the writer will also profit, because it should be able to close out the option at a lower price. If security prices fall, the put writer would expect to suffer a loss. This loss should be less than the loss from purchasing the underlying instrument directly, however, because the premium received for writing the option should mitigate the effects of the decline.
Writing a call option obligates the writer to sell or deliver the option's underlying instrument, in return for the strike price, upon exercise of the option. The characteristics of writing call options are similar to those of writing put options, except that writing calls generally is a profitable strategy if prices remain the same or fall. Through receipt of the option premium, a call writer mitigates the effects of a price decline. At the same time, because a call writer must be prepared to deliver the underlying instrument in return for the strike price, even if its current value is greater, a call writer gives up some ability to participate in security price increases.
Illiquid Securities cannot be sold or disposed of in the ordinary course of business at approximately the prices at which they are valued. Difficulty in selling securities may result in a loss or may be costly to a fund. Under the supervision of the Board of Trustees, FMR determines the liquidity of a fund's investments and, through reports from FMR, the Board monitors investments in illiquid securities. In determining the liquidity of a fund's investments, FMR may consider various factors, including (1) the frequency and volume of trades and quotations, (2) the number of dealers and prospective purchasers in the marketplace, (3) dealer undertakings to make a market, and (4) the nature of the security and the market in which it trades (including any demand, put or tender features, the mechanics and other requirements for transfer, any letters of credit or other credit enhancement features, any ratings, the number of holders, the method of soliciting offers, the time required to dispose of the security, and the ability to assign or offset the rights and obligations of the security).
Indexed Securities are instruments whose prices are indexed to the prices of other securities, securities indices, currencies, precious metals or other commodities, or other financial indicators. Indexed securities typically, but not always, are debt securities or deposits whose value at maturity or coupon rate is determined by reference to a specific instrument or statistic.
Gold-indexed securities typically provide for a maturity value that depends on the price of gold, resulting in a security whose price tends to rise and fall together with gold prices. Currency-indexed securities typically are short-term to intermediate-term debt securities whose maturity values or interest rates are determined by reference to the values of one or more specified foreign currencies, and may offer higher yields than U.S. dollar-denominated securities. Currency-indexed securities may be positively or negatively indexed; that is, their maturity value may increase when the specified currency value increases, resulting in a security that performs similarly to a foreign-denominated instrument, or their maturity value may decline when foreign currencies increase, resulting in a security whose price characteristics are similar to a put on the underlying currency. Currency-indexed securities may also have prices that depend on the values of a number of different foreign currencies relative to each other.
The performance of indexed securities depends to a great extent on the performance of the security, currency, or other instrument to which they are indexed, and may also be influenced by interest rate changes in the United States and abroad. Indexed securities may be more volatile than the underlying instruments. Indexed securities are also subject to the credit risks associated with the issuer of the security, and their values may decline substantially if the issuer's creditworthiness deteriorates. Recent issuers of indexed securities have included banks, corporations, and certain U.S. Government agencies.
Advisor Natural Resources may purchase securities indexed to the price of precious metals as an alternative to direct investment in precious metals. Because the value of these securities is directly linked to the price of gold or other precious metals, they involve risks and pricing characteristics similar to direct investments in precious metals. The fund will purchase precious metals-indexed securities only when FMR is satisfied with the creditworthiness of the issuers liable for payment. The securities generally will earn a nominal rate of interest while held by the fund, and may have maturities of one year or more. In addition, the securities may be subject to being put by the fund to the issuer, with payment to be received on no more than seven days' notice. The put feature would ensure the liquidity of the notes in the absence of an active secondary market.
Interfund Borrowing and Lending Program. Pursuant to an exemptive order issued by the SEC, a fund may lend money to, and borrow money from, other funds advised by FMR or its affiliates. A fund will lend through the program only when the returns are higher than those available from an investment in repurchase agreements, and will borrow through the program only when the costs are equal to or lower than the cost of bank loans. Interfund loans and borrowings normally extend overnight, but can have a maximum duration of seven days. Loans may be called on one day's notice. A fund may have to borrow from a bank at a higher interest rate if an interfund loan is called or not renewed. Any delay in repayment to a lending fund could result in a lost investment opportunity or additional borrowing costs.
Investment-Grade Debt Securities. Investment-grade debt securities are medium and high-quality securities. Some may possess speculative characteristics and may be more sensitive to economic changes and to changes in the financial conditions of issuers. A debt <R>security is considered to be investment-grade if it is rated investment-grade by Moody's Investors Service, Standard & Poor's®, or Fitch Inc., or is unrated</R> but considered to be of equivalent quality by FMR.
Loans and Other Direct Debt Instruments. Direct debt instruments are interests in amounts owed by a corporate, governmental, or other borrower to lenders or lending syndicates (loans and loan participations), to suppliers of goods or services (trade claims or other receivables), or to other parties. Direct debt instruments involve a risk of loss in case of default or insolvency of the borrower and may offer less legal protection to the purchaser in the event of fraud or misrepresentation, or there may be a requirement that a fund supply additional cash to a borrower on demand.
Purchasers of loans and other forms of direct indebtedness depend primarily upon the creditworthiness of the borrower for payment of interest and repayment of principal. If scheduled interest or principal payments are not made, the value of the instrument may be adversely affected. Loans that are fully secured provide more protections than an unsecured loan in the event of failure to make scheduled interest or principal payments. However, there is no assurance that the liquidation of collateral from a secured loan would satisfy the borrower's obligation, or that the collateral could be liquidated. Indebtedness of borrowers whose creditworthiness is poor involves substantially greater risks and may be highly speculative. Borrowers that are in bankruptcy or restructuring may never pay off their indebtedness, or may pay only a small fraction of the amount owed. Direct indebtedness of developing countries also involves a risk that the governmental entities responsible for the repayment of the debt may be unable, or unwilling, to pay interest and repay principal when due.
Investments in loans through direct assignment of a financial institution's interests with respect to a loan may involve additional risks. For example, if a loan is foreclosed, the purchaser could become part owner of any collateral, and would bear the costs and liabilities associated with owning and disposing of the collateral. In addition, it is conceivable that under emerging legal theories of lender liability, a purchaser could be held liable as a co-lender. Direct debt instruments may also involve a risk of insolvency of the lending bank or other intermediary.
A loan is often administered by a bank or other financial institution that acts as agent for all holders. The agent administers the terms of the loan, as specified in the loan agreement. Unless, under the terms of the loan or other indebtedness, the purchaser has direct recourse against the borrower, the purchaser may have to rely on the agent to apply appropriate credit remedies against a borrower. If assets held by the agent for the benefit of a purchaser were determined to be subject to the claims of the agent's general creditors, the purchaser might incur certain costs and delays in realizing payment on the loan or loan participation and could suffer a loss of principal or interest.
Direct indebtedness may include letters of credit, revolving credit facilities, or other standby financing commitments that obligate purchasers to make additional cash payments on demand. These commitments may have the effect of requiring a purchaser to increase its investment in a borrower at a time when it would not otherwise have done so, even if the borrower's condition makes it unlikely that the amount will ever be repaid.
Each fund limits the amount of total assets that it will invest in any one issuer or in issuers within the same industry (see each fund's investment limitations). For purposes of these limitations, a fund generally will treat the borrower as the "issuer" of indebtedness held by the fund. In the case of loan participations where a bank or other lending institution serves as financial intermediary between a fund and the borrower, if the participation does not shift to the fund the direct debtor-creditor relationship with the borrower, SEC interpretations require a fund, in appropriate circumstances, to treat both the lending bank or other lending institution and the borrower as "issuers" for these purposes. Treating a financial intermediary as an issuer of indebtedness may restrict a fund's ability to invest in indebtedness related to a single financial intermediary, or a group of intermediaries engaged in the same industry, even if the underlying borrowers represent many different companies and industries.
Lower-Quality Debt Securities. Lower-quality debt securities have poor protection with respect to the payment of interest and repayment of principal, or may be in default. These securities are often considered to be speculative and involve greater risk of loss or price changes due to changes in the issuer's capacity to pay. The market prices of lower-quality debt securities may fluctuate more than those of higher-quality debt securities and may decline significantly in periods of general economic difficulty, which may follow periods of rising interest rates.
The market for lower-quality debt securities may be thinner and less active than that for higher-quality debt securities, which can adversely affect the prices at which the former are sold. Adverse publicity and changing investor perceptions may affect the liquidity of lower-quality debt securities and the ability of outside pricing services to value lower-quality debt securities.
Because the risk of default is higher for lower-quality debt securities, FMR's research and credit analysis are an especially important part of managing securities of this type. FMR will attempt to identify those issuers of high-yielding securities whose financial condition is adequate to meet future obligations, has improved, or is expected to improve in the future. FMR's analysis focuses on relative values based on such factors as interest or dividend coverage, asset coverage, earnings prospects, and the experience and managerial strength of the issuer.
A fund may choose, at its expense or in conjunction with others, to pursue litigation or otherwise to exercise its rights as a security holder to seek to protect the interests of security holders if it determines this to be in the best interest of the fund's shareholders.
Precious Metals. Precious metals, such as gold, silver, platinum and palladium, at times have been subject to substantial price fluctuations over short periods of time and may be affected by unpredictable monetary and political policies such as currency devaluations or revaluations, economic and social conditions within a country, trade imbalances, or trade or currency restrictions between countries. The prices of gold and other precious metals, however, are less subject to local and company-specific factors than securities of individual companies. As a result, precious metals may be more or less volatile in price than securities of companies engaged in precious metals-related businesses. Investments in precious metals can present concerns such as delivery, storage and maintenance, possible illiquidity, and the unavailability of accurate market valuations. Although precious metals can be purchased in any form, including bullion and coins, FMR intends to purchase only those forms of precious metals that are readily marketable and that can be stored in accordance with custody regulations applicable to mutual funds. A fund may incur higher custody and transaction costs for precious metals than for securities. Also, precious metals investments do not pay income.
For a fund to qualify as a regulated investment company under current federal tax law, gains from selling precious metals may not exceed 10% of the fund's gross income for its taxable year. This tax requirement could cause a fund to hold or sell precious metals or securities when it would not otherwise do so.
Preferred Stock represents an equity or ownership interest in an issuer that pays dividends at a specified rate and that has precedence over common stock in the payment of dividends. In the event an issuer is liquidated or declares bankruptcy, the claims of owners of bonds take precedence over the claims of those who own preferred and common stock.
Real Estate Investment Trusts. Equity real estate investment trusts own real estate properties, while mortgage real estate investment trusts make construction, development, and long-term mortgage loans. Their value may be affected by changes in the value of the underlying property of the trusts, the creditworthiness of the issuer, property taxes, interest rates, and tax and regulatory requirements, such as those relating to the environment. Both types of trusts are dependent upon management skill, are not diversified, and are subject to heavy cash flow dependency, defaults by borrowers, self-liquidation, and the possibility of failing to qualify for tax-free status of income under the Internal Revenue Code and failing to maintain exemption from the 1940 Act.
Repurchase Agreements involve an agreement to purchase a security and to sell that security back to the original seller at an agreed-upon price. The resale price reflects the purchase price plus an agreed-upon incremental amount which is unrelated to the coupon rate or maturity of the purchased security. As protection against the risk that the original seller will not fulfill its obligation, the securities are held in a separate account at a bank, marked-to-market daily, and maintained at a value at least equal to the sale price plus the accrued incremental amount. The value of the security purchased may be more or less than the price at which the counterparty has agreed to purchase the security. In addition, delays or losses could result if the other party to the agreement defaults or becomes insolvent. The funds will engage in repurchase agreement transactions with parties whose creditworthiness has been reviewed and found satisfactory by FMR.
Restricted Securities are subject to legal restrictions on their sale. Difficulty in selling securities may result in a loss or be costly to a fund. Restricted securities generally can be sold in privately negotiated transactions, pursuant to an exemption from registration under the Securities Act of 1933, or in a registered public offering. Where registration is required, the holder of a registered security may be obligated to pay all or part of the registration expense and a considerable period may elapse between the time it decides to seek registration and the time it may be permitted to sell a security under an effective registration statement. If, during such a period, adverse market conditions were to develop, the holder might obtain a less favorable price than prevailed when it decided to seek registration of the security.
Reverse Repurchase Agreements. In a reverse repurchase agreement, a fund sells a security to another party, such as a bank or broker-dealer, in return for cash and agrees to repurchase that security at an agreed-upon price and time. The funds will enter into reverse repurchase agreements with parties whose creditworthiness has been reviewed and found satisfactory by FMR. Such transactions may increase fluctuations in the market value of fund assets and may be viewed as a form of leverage.
Securities of Other Investment Companies, including shares of closed-end investment companies, unit investment trusts, and open-end investment companies, represent interests in professionally managed portfolios that may invest in any type of instrument. Investing in other investment companies involves substantially the same risks as investing directly in the underlying instruments, but may involve additional expenses at the investment company-level, such as portfolio management fees and operating expenses. Certain types of investment companies, such as closed-end investment companies, issue a fixed number of shares that trade on a stock exchange or over-the-counter at a premium or a discount to their net asset value. Others are continuously offered at net asset value, but may also be traded in the secondary market.
The extent to which a fund can invest in securities of other investment companies is limited by federal securities laws.
Securities Lending. A fund may lend securities to parties such as broker-dealers or other institutions, including Fidelity Brokerage Services<R> LLC (FBS LLC). FBS LLC</R> is a member of the New York Stock Exchange (NYSE) and a<R>n indirect</R> subsidiary of FMR Corp.
Securities lending allows a fund to retain ownership of the securities loaned and, at the same time, earn additional income. The borrower provides the fund with collateral in an amount at least equal to the value of the securities loaned. The fund maintains the ability to obtain the right to vote or consent on proxy proposals involving material events affecting securities loaned. If the borrower defaults on its obligation to return the securities loaned because of insolvency or other reasons, a fund could experience delays and costs in recovering the securities loaned or in gaining access to the collateral. These delays and costs could be greater for foreign securities. If a fund is not able to recover the securities loaned, a fund may sell the collateral and purchase a replacement investment in the market. The value of the collateral could decrease below the value of the replacement investment by the time the replacement investment is purchased. Loans will be made only to parties deemed by FMR to be in good standing and when, in FMR's judgment, the income earned would justify the risks.
Cash received as collateral through loan transactions may be invested in other eligible securities. Investing this cash subjects that investment, as well as the securities loaned, to market appreciation or depreciation.
Short Sales "Against the Box" are short sales of securities that a fund owns or has the right to obtain (equivalent in kind or amount to the securities sold short). If a fund enters into a short sale against the box, it will be required to set aside securities equivalent in kind and amount to the securities sold short (or securities convertible or exchangeable into such securities) and will be required to hold such securities while the short sale is outstanding. The fund will incur transaction costs, including interest expenses, in connection with opening, maintaining, and closing short sales against the box.
Swap Agreements can be individually negotiated and structured to include exposure to a variety of different types of investments or market factors. Depending on their structure, swap agreements may increase or decrease a fund's exposure to long- or short-term interest rates (in the United States or abroad), foreign currency values, mortgage securities, corporate borrowing rates, or other factors such as security prices or inflation rates. Swap agreements can take many different forms and are known by a variety of names.
In a typical cap or floor agreement, one party agrees to make payments only under specified circumstances, usually in return for payment of a fee by the other party. For example, the buyer of an interest rate cap obtains the right to receive payments to the extent that a specified interest rate exceeds an agreed-upon level, while the seller of an interest rate floor is obligated to make payments to the extent that a specified interest rate falls below an agreed-upon level. An interest rate collar combines elements of buying a cap and selling a floor.
Swap agreements will tend to shift a fund's investment exposure from one type of investment to another. For example, if the fund agreed to exchange payments in dollars for payments in foreign currency, the swap agreement would tend to decrease the fund's exposure to U.S. interest rates and increase its exposure to foreign currency and interest rates. Caps and floors have an effect similar to buying or writing options. Depending on how they are used, swap agreements may increase or decrease the overall volatility of a fund's investments and its share price.
The most significant factor in the performance of swap agreements is the change in the specific interest rate, currency, or other factors that determine the amounts of payments due to and from a fund. If a swap agreement calls for payments by the fund, the fund must be prepared to make such payments when due. In addition, if the counterparty's creditworthiness declined, the value of a swap agreement would be likely to decline, potentially resulting in losses. A fund may be able to eliminate its exposure under a swap agreement either by assignment or other disposition, or by entering into an offsetting swap agreement with the same party or a similarly creditworthy party.
Temporary Defensive Policies. Each fund reserves the right to invest without limitation in preferred stocks and investment-grade debt instruments for temporary, defensive purposes.
Warrants. Warrants are instruments which entitle the holder to buy an equity security at a specific price for a specific period of time. Changes in the value of a warrant do not necessarily correspond to changes in the value of its underlying security. The price of a warrant may be more volatile than the price of its underlying security, and a warrant may offer greater potential for capital appreciation as well as capital loss.
Warrants do not entitle a holder to dividends or voting rights with respect to the underlying security and do not represent any rights in the assets of the issuing company. A warrant ceases to have value if it is not exercised prior to its expiration date. These factors can make warrants more speculative than other types of investments.
Zero Coupon Bonds do not make interest payments; instead, they are sold at a discount from their face value and are redeemed at face value when they mature. Because zero coupon bonds do not pay current income, their prices can be more volatile than other types of fixed-income securities when interest rates change. In calculating a fund's dividend, a portion of the difference between a zero coupon bond's purchase price and its face value is considered income.
All orders for the purchase or sale of portfolio securities are placed on behalf of each fund by FMR pursuant to authority contained in the management contract. FMR is also responsible for the placement of transaction orders for other investment companies and investment accounts for which it or its affiliates act as investment adviser. In selecting broker-dealers, subject to applicable limitations of the federal securities laws, FMR considers various relevant factors, including, but not limited to: the size and type of the transaction; the nature and character of the markets for the security to be purchased or sold; the execution efficiency, settlement capability, and financial condition of the broker-dealer firm; the broker-dealer's execution services rendered on a continuing basis; the reasonableness of any commissions; and, if applicable, arrangements for payment of fund expenses.
If FMR grants investment management authority to a sub-adviser (see the section entitled "Management Contracts"), that sub-adviser is authorized to place orders for the purchase and sale of portfolio securities, and will do so in accordance with the policies described above.
Generally, commissions for investments traded on foreign exchanges will be higher than for investments traded on U.S. exchanges and may not be subject to negotiation.
Futures transactions are executed and cleared through FCMs who receive commissions for their services.
Each fund may execute portfolio transactions with broker-dealers who provide research and execution services to the fund or other investment accounts over which FMR or its affiliates exercise investment discretion. Such services may include advice concerning the value of securities; the advisability of investing in, purchasing, or selling securities; and the availability of securities or the purchasers or sellers of securities. In addition, such broker-dealers may furnish analyses and reports concerning issuers, industries, securities, economic factors and trends, portfolio strategy, and performance of investment accounts; and effect securities transactions and perform functions incidental thereto (such as clearance and settlement).
The selection of such broker-dealers for transactions in equity securities is generally made by FMR (to the extent possible consistent with execution considerations) in accordance with a ranking of broker-dealers determined periodically by FMR's investment staff based upon the quality of research and execution services provided.
For transactions in fixed-income securities, FMR's selection of broker-dealers is generally based on the availability of a security and its price and, to a lesser extent, on the overall quality of execution and other services, including research, provided by the broker-dealer.
The receipt of research from broker-dealers that execute transactions on behalf of a fund may be useful to FMR in rendering investment management services to that fund or its other clients, and conversely, such research provided by broker-dealers who have executed transaction orders on behalf of other FMR clients may be useful to FMR in carrying out its obligations to a fund. The receipt of such research has not reduced FMR's normal independent research activities; however, it enables FMR to avoid the additional expenses that could be incurred if FMR tried to develop comparable information through its own efforts.
Fixed-income securities are generally purchased from an issuer or underwriter acting as principal for the securities, on a net basis with no brokerage commission paid. However, the dealer is compensated by a difference between the security's original purchase price and the selling price, the so-called "bid-asked spread." Securities may also be purchased from underwriters at prices that include underwriting fees.
Subject to applicable limitations of the federal securities laws, a fund may pay a broker-dealer commissions for agency transactions that are in excess of the amount of commissions charged by other broker-dealers in recognition of their research and execution services. In order to cause a fund to pay such higher commissions, FMR must determine in good faith that such commissions are reasonable in relation to the value of the brokerage and research services provided by such executing broker-dealers, viewed in terms of a particular transaction or FMR's overall responsibilities to that fund or its other clients. In reaching this determination, FMR will not attempt to place a specific dollar value on the brokerage and research services provided, or to determine what portion of the compensation should be related to those services.
To the extent permitted by applicable law, FMR is authorized to allocate portfolio transactions in a manner that takes into account assistance received in the distribution of shares of the funds or other Fidelity funds and to use the research services of brokerage and other firms that have provided such assistance. FMR may use research services provided by and place agency transactions with National Financial Services <R>LLC</R> (<R>NFS</R>) and Fidelity Brokerage Services Japan LLC (FBSJ), indirect subsidiaries of FMR Corp., if the commissions are fair, reasonable, and comparable to commissions charged by non-affiliated, qualified brokerage firms for similar services. <R>FMR may also place agency transactions with REDIBook ECN LLC (REDIBook), an electronic communication network (ECN) in which a wholly-owned subsidiary of FMR Corp. has an equity ownership interest, if the commissions are fair, reasonable, and comparable to commissions charged by non-affiliated, qualified brokerage firms for similar services. Prior to August 28, 2000, FMR used research services provided by and placed agency transactions with National Financial Services Corporation (NFSC), an indirect subsidiary of FMR Corp.</R> Prior to December 9, 1997, FMR used research services provided by and placed agency transactions with Fidelity Brokerage Services (FBS), an indirect subsidiary of FMR Corp.
FMR may allocate brokerage transactions to broker-dealers (including affiliates of FMR) who have entered into arrangements with FMR under which the broker-dealer allocates a portion of the commissions paid by a fund toward the reduction of that fund's expenses. The transaction quality must, however, be comparable to <R>that</R> of other qualified broker-dealers.
Section 11(a) of the Securities Exchange Act of 1934 prohibits members of national securities exchanges from executing exchange transactions for investment accounts which they or their affiliates manage, unless certain requirements are satisfied. Pursuant to such requirements, the Board of Trustees has authorized NFS to execute portfolio transactions on national securities exchanges in accordance with approved procedures and applicable SEC rules.
The Trustees of each fund periodically review FMR's performance of its responsibilities in connection with the placement of portfolio transactions on behalf of the fund and review the commissions paid by the fund over representative periods of time to determine if they are reasonable in relation to the benefits to the fund.
For the fiscal periods ended July 31,<R> 2000 and 1999</R>, the portfolio turnover rates for each fund are presented in the table below. Variations in turnover rate may be due to a fluctuating volume of shareholder purchase and redemption orders, market conditions, or changes in FMR's investment outlook.
|
<R>Turnover Rates |
2000 |
1999</R> |
|
<R>Advisor Consumer Industries |
69% |
80%</R> |
|
<R>Advisor Cyclical Industries |
111% |
115%</R> |
|
<R>Advisor Financial Services |
73% |
38%</R> |
|
<R>Advisor Health Care |
51% |
98%</R> |
|
<R>Advisor Natural Resources |
90% |
99%</R> |
|
<R>Advisor Technology |
125% |
170%</R> |
|
<R>Advisor Telecommunications & Utilities Growth |
172% |
149%</R> |
<R>A fund may pay both commissions and spreads in connection with the placement of portfolio transactions. </R>The following tables show the brokerage commissions paid by <R>each</R> fund. Significant changes in brokerage commissions paid by a fund from year to year may result from changing asset levels throughout the year.
The following table shows the total amount of brokerage commissions paid by each fund.
|
|
Fiscal Year |
Total |
|
<R>Advisor Consumer Industries |
July 31 |
</R> |
|
<R>2000 |
|
$ 34,951</R> |
|
<R>1999 |
|
$ 39,783</R> |
|
<R>1998 |
|
$ 27,151</R> |
|
<R>Advisor Cyclical Industries |
July 31 |
</R> |
|
<R>2000 |
|
$ 9,087</R> |
|
<R>1999 |
|
$ 12,426</R> |
|
<R>1998 |
|
$ 5,532</R> |
|
<R>Advisor Financial Services |
July 31 |
</R> |
|
<R>2000 |
|
$ 532,041</R> |
|
<R>1999 |
|
$ 178,281</R> |
|
<R>1998 |
|
$ 131,749</R> |
|
<R>Advisor Health Care |
July 31 |
</R> |
|
<R>2000 |
|
$ 641,616</R> |
|
<R>1999 |
|
$ 789,876</R> |
|
<R>1998 |
|
$ 175,518</R> |
|
<R>Advisor Natural Resources |
July 31 |
</R> |
|
<R>2000 |
|
$ 856,382</R> |
|
<R>1999 |
|
$ 1,008,405</R> |
|
<R>1998 |
|
$ 1,439,851</R> |
|
<R>Advisor Technology |
July 31 |
</R> |
|
<R>2000 |
|
$ 1,720,397</R> |
|
<R>1999 |
|
$ 503,119</R> |
|
<R>1998 |
|
$ 299,227</R> |
|
<R>Advisor Telecommunications & Utilities Growth |
July 31 |
</R> |
|
<R>2000 |
|
$ 895,094</R> |
|
<R>1999 |
|
$ 221,415</R> |
|
<R>1998 |
|
$ 62,090</R> |
The first table below shows the total amount of brokerage commissions paid by each fund to <R>NFSC, FBS, </R>FBSJ,<R> </R>and<R> </R>REDIBook, as applicable, for the past three fiscal years. The second table shows the approximate percentage of aggregate brokerage commissions paid by a fund to <R>NFSC</R>, FBS, FBSJ,<R> </R>and REDIBook for transactions involving the approximate percentage of the aggregate dollar amount of transactions for which the fund paid brokerage commissions for the fiscal year ended 2000.<R> NFSC, </R>FBS, FBSJ,<R> </R>and REDIBook are paid on a commission basis.
|
|
Total Amount Paid |
||||
|
<R> |
Fiscal Year |
To NFSC |
To FBS |
To FBSJ |
To REDIBook</R> |
|
<R>Advisor Consumer Industries |
July 31 |
|
|
|
</R> |
|
<R>2000 |
|
$ 4,422 |
$ 0 |
$ 0 |
$ 0</R> |
|
<R>1999 |
|
$ 5,940 |
$ 0 |
$ 0 |
$ 0</R> |
|
<R>1998 |
|
$ 3,349 |
$ 0 |
$ 0 |
$ 0</R> |
|
<R>Advisor Cyclical Industries |
July 31 |
|
|
|
</R> |
|
<R>2000 |
|
$ 1,155 |
$ 0 |
$ 0 |
$ 0</R> |
|
<R>1999 |
|
$ 2,025 |
$ 0 |
$ 0 |
$ 0</R> |
|
<R>1998 |
|
$ 806 |
$ 0 |
$ 0 |
$ 0</R> |
|
<R>Advisor Financial Services |
July 31 |
|
|
|
</R> |
|
<R>2000 |
|
$ 37,725 |
$ 0 |
$ 0 |
$ 0</R> |
|
<R>1999 |
|
$ 12,796 |
$ 0 |
$ 0 |
$ 0</R> |
|
<R>1998 |
|
$ 24,154 |
$ 0 |
$ 0 |
$ 0</R> |
|
<R>Advisor Health Care |
July 31 |
|
|
|
</R> |
|
<R>2000 |
|
$ 17,511 |
$ 0 |
$ 0 |
$ 0</R> |
|
<R>1999 |
|
$ 48,795 |
$ 0 |
$ 0 |
$ 0</R> |
|
<R>1998 |
|
$ 26,935 |
$ 492 |
$ 0 |
$ 0</R> |
|
<R>Advisor Natural Resources |
July 31 |
|
|
|
</R> |
|
<R>2000 |
|
$ 31,436 |
$ 0 |
$ 0 |
$ 0</R> |
|
<R>1999 |
|
$ 77,714 |
$ 0 |
$ 0 |
$ 0</R> |
|
<R>1998 |
|
$ 135,628 |
$ 0 |
$ 0 |
$ 0</R> |
|
<R>Advisor Technology |
July 31 |
|
|
|
</R> |
|
<R>2000 |
|
$ 119,674 |
$ 0 |
$ 0 |
$ 5,145</R> |
|
<R>1999 |
|
$ 48,057 |
$ 0 |
$ 0 |
$ 0</R> |
|
<R>1998 |
|
$ 46,656 |
$ 0 |
$ 0 |
$ 0</R> |
|
<R>Advisor Telecommunications & Utilities Growth |
July 31 |
|
|
|
</R> |
|
<R>2000 |
|
$ 1,939 |
$ 0 |
$ 1,905 |
$ 135</R> |
|
<R>1999 |
|
$ 11,168 |
$ 0 |
$ 0 |
$ 0</R> |
|
<R>1998 |
|
$ 6,775 |
$ 0 |
$ 0 |
$ 0</R> |
|
<R> |
Fiscal
Year |
% of |
% of |
% of |
% of |
% of |
% of |
% of |
% of |
|
<R>Advisor Consumer Industries |
July 31 |
12.65%(dagger) |
24.06% |
0% |
0% |
0% |
0% |
0% |
0%</R> |
|
<R>Advisor Cyclical Industries |
July 31 |
12.71%(dagger) |
18.41% |
0% |
0% |
0% |
0% |
0% |
0%</R> |
|
<R>Advisor Financial Services |
July 31 |
7.09%(dagger) |
17.09% |
0% |
0% |
0% |
0% |
0% |
0%</R> |
|
<R>Advisor Health Care |
July 31 |
2.73%(dagger) |
7.93% |
0% |
0% |
0% |
0% |
0% |
0%</R> |
|
<R>Advisor Natural Resources |
July 31 |
3.67%(dagger) |
12.82% |
0% |
0% |
0% |
0% |
0% |
0%</R> |
|
<R>Advisor Technology |
July 31 |
6.96%(dagger) |
10.90% |
0% |
0% |
0% |
0% |
0.30%(dagger) |
3.24%</R> |
|
<R>Advisor Telecommunications & Utilities Growth |
July 31 |
0.22% |
0.59% |
0% |
0% |
0.21% |
0.24% |
0.02% |
0.02%</R> |
(dagger) The difference between the percentage of aggregate brokerage commissions paid to, and the percentage of the aggregate dollar amount of transactions effected through, NFSC,<R> </R>FBS, FBSJ,<R> </R>and REDIBook is a result of the low commission rates charged by<R> </R>NFSC, FBS, FBSJ,<R> </R>and REDIBook.
The following table shows the dollar amount of brokerage commissions paid to firms for providing research services and the approximate dollar amount of the transactions involved for the fiscal year ended 2000.
|
<R> |
Fiscal Year |
$ Amount of |
$ Amount of |
|
<R>Advisor Consumer Industries |
July 31 |
$ 24,855 |
$ 19,799,010</R> |
|
<R>Advisor Cyclical Industries |
July 31 |
$ 4,806 |
$ 4,874,028</R> |
|
<R>Advisor Financial Services |
July 31 |
$ 489,378 |
$ 474,774,409</R> |
|
<R>Advisor Health Care |
July 31 |
$ 627,765 |
$ 501,091,930</R> |
|
<R>Advisor Natural Resources |
July 31 |
$ 829,371 |
$ 536,359,659</R> |
|
<R>Advisor Technology |
July 31 |
$ 1,445,153 |
$ 1,902,621,018</R> |
|
<R>Advisor Telecommunications & Utilities Growth |
July 31 |
$ 739,008 |
$ 746,782,285</R> |
* The provision of research services was not necessarily a factor in the placement of all this business with such firms.
The Trustees of each fund have approved procedures in conformity with Rule 10f-3 under the 1940 Act whereby a fund may purchase securities that are offered in underwritings in which an affiliate of FMR participates. These procedures prohibit the funds from directly or indirectly benefiting an FMR affiliate in connection with such underwritings. In addition, for underwritings where an FMR affiliate participates as a principal underwriter, certain restrictions may apply that could, among other things, limit the amount of securities that the funds could purchase in the underwritings.
From time to time the Trustees will review whether the recapture for the benefit of the funds of some portion of the brokerage commissions or similar fees paid by the funds on portfolio transactions is legally permissible and advisable. Each fund seeks to recapture soliciting broker-dealer fees on the tender of portfolio securities, but at present no other recapture arrangements are in effect. The Trustees intend to continue to review whether recapture opportunities are available and are legally permissible and, if so, to determine in the exercise of their business judgment whether it would be advisable for each fund to seek such recapture.
Although the Trustees and officers of each fund are substantially the same as those of other funds managed by FMR or its affiliates, investment decisions for each fund are made independently from those of other funds or investment accounts managed by FMR or its affiliates. It sometimes happens that the same security is held in the portfolio of more than one of these funds or investment accounts. Simultaneous transactions are inevitable when several funds and investment accounts are managed by the same investment adviser, particularly when the same security is suitable for the investment objective of more than one fund or investment account.
When two or more funds are simultaneously engaged in the purchase or sale of the same security, the prices and amounts are allocated in accordance with procedures believed to be appropriate and equitable for each fund. In some cases this system could have a detrimental effect on the price or value of the security as far as each fund is concerned. In other cases, however, the ability of the funds to participate in volume transactions will produce better executions and prices for the funds. It is the current opinion of the Trustees that the desirability of retaining FMR as investment adviser to each fund outweighs any disadvantages that may be said to exist from exposure to simultaneous transactions.
Each class's net asset value per share (NAV) is the value of a single share. The NAV of each class is computed by adding the class's pro rata share of the value of the applicable fund's investments, cash, and other assets, subtracting the class's pro rata share of the applicable funds liabilities, subtracting the liabilities allocated to the class, and dividing the result by the number of shares of that class that are outstanding.
Portfolio securities are valued by various methods depending on the primary market or exchange on which they trade. Most equity securities for which the primary market is the United States are valued at last sale price or, if no sale has occurred, at the closing bid price. Most equity securities for which the primary market is outside the United States are valued using the official closing price or the last sale price in the principal market in which they are traded. If the last sale price (on the local exchange) is unavailable, the last evaluated quote or closing bid price normally is used. Securities of other open-end investment companies are valued at their respective NAVs.
Fixed-income securities and other assets for which market quotations are readily available may be valued at market values determined by such securities' most recent bid prices (sales prices if the principal market is an exchange) in the principal market in which they normally are traded, as furnished by recognized dealers in such securities or assets. Or, fixed-income securities and convertible securities may be valued on the basis of information furnished by a pricing service that uses a valuation matrix which incorporates both dealer-supplied valuations and electronic data processing techniques. Use of pricing services has been approved by the Board of Trustees. A number of pricing services are available, and the funds may use various pricing services or discontinue the use of any pricing service.
Futures contracts and options are valued on the basis of market quotations, if available.
Independent brokers or quotation services provide prices of foreign securities in their local currency. Fidelity Service Company, Inc. (FSC) gathers all exchange rates daily at the close of the NYSE using the last quoted price on the local currency and then translates the value of foreign securities from their local currencies into U.S. dollars. Any changes in the value of forward contracts due to exchange rate fluctuations and days to maturity are included in the calculation of NAV. If an event that is expected to materially affect the value of a portfolio security occurs after the close of an exchange or market on which that security is traded, then that security will be valued in good faith by a committee appointed by the Board of Trustees.
Short-term securities with remaining maturities of sixty days or less for which market quotations and information furnished by a pricing service are not readily available are valued either at amortized cost or at original cost plus accrued interest, both of which approximate current value.
The procedures set forth above need not be used to determine the value of the securities owned by a fund if, in the opinion of a committee appointed by the Board of Trustees, some other method would more accurately reflect the fair value of such securities. For example, securities and other assets for which there is no readily available market value may be valued in good faith by a committee appointed by the Board of Trustees. In making a good faith determination of the value of a security, the committee may review price movements in futures contracts and ADRs, market and trading trends, the bid/ask quotes of brokers and off-exchange institutional trading.
A class may quote performance in various ways. All performance information supplied by the funds in advertising is historical and is not intended to indicate future returns. Each class's share price and return fluctuate in response to market conditions and other factors, and the value of fund shares when redeemed may be more or less than their original cost.
Return Calculations. Returns quoted in advertising reflect all aspects of a class's return, including the effect of reinvesting dividends and capital gain distributions, and any change in a class's NAV over a stated period. A class's return may be calculated by using the performance data of a previously existing class prior to the date that the new class commenced operations, adjusted to reflect differences in sales charges but not 12b-1 fees. A cumulative return reflects actual performance over a stated period of time. Average annual returns are calculated by determining the growth or decline in value of a hypothetical historical investment in a class over a stated period, and then calculating the annually compounded percentage rate that would have produced the same result if the rate of growth or decline in value had been constant over the period. For example, a cumulative return of 100% over ten years would produce an average annual return of 7.18%, which is the steady annual rate of return that would equal 100% growth on a compounded basis in ten years. While average annual returns are a convenient means of comparing investment alternatives, investors should realize that a class's performance is not constant over time, but changes from year to year, and that average annual returns represent averaged figures as opposed to the actual year-to-year performance of a class.
In addition to average annual returns, a class may quote unaveraged or cumulative returns reflecting the simple change in value of an investment over a stated period. Average annual and cumulative returns may be quoted as a percentage or as a dollar amount, and may be calculated for a single investment, a series of investments, or a series of redemptions, over any time period. Returns may be broken down into their components of income and capital (including capital gains and changes in share price) to illustrate the relationship of these factors and their contributions to return. Returns may be quoted on a before-tax or after-tax basis. <R>After-tax returns reflect the return of a hypothetical account after payment of federal and/or state taxes using assumed tax rates. After-tax returns may assume that taxes are paid at the time of distribution or once a year or are paid in cash or by selling shares, that shares are held through the entire period, sold on the last day of the period, or sold at a future date, and distributions are reinvested or paid in cash. </R>Returns may or may not include the effect of a <R>fund's short-term trading fee</R> or the effect of a class's maximum sales charge. Excluding a fund's short-term trading fee or a class's sales charge from a return calculation produces a higher return figure. Returns and other performance information may be quoted numerically or in a table, graph, or similar illustration.
Net Asset Value. Charts and graphs using a class's NAVs, adjusted NAVs, and benchmark indexes may be used to exhibit performance. An adjusted NAV includes any distributions paid by a fund and reflects all elements of a class's return. Unless otherwise indicated, a class's adjusted NAVs are not adjusted for sales charges, if any.
Moving Averages. A fund may illustrate performance using moving averages. A long-term moving average is the average of each week's adjusted closing NAV for a specified period. A short-term moving average is the average of each day's adjusted closing NAV for a specified period. Moving Average Activity Indicators combine adjusted closing NAVs from the last business day of each week with moving averages for a specified period to produce indicators showing when an NAV has crossed, stayed above, or stayed below its moving average. The 13-week and 39-week short-term moving averages for each class of each fund are shown in the table below.
|
Fund |
13-Week Short-Term |
39-Week Short-Term |
|
<R>Advisor Consumer Industries - Class A* |
$ 15.23 |
$ 15.53</R> |
|
<R>Advisor Consumer Industries - Class T* |
$ 15.12 |
$ 15.43</R> |
|
<R>Advisor Consumer Industries - Class B* |
$ 14.89 |
$ 15.20</R> |
|
<R>Advisor Consumer Industries - Class C* |
$ 14.91 |
$ 15.22</R> |
|
<R>Advisor Consumer Industries - Institutional Class* |
$ 15.36 |
$ 15.65</R> |
|
<R>Advisor Cyclical Industries - Class A* |
$ 13.53 |
$ 13.38</R> |
|
<R>Advisor Cyclical Industries - Class T* |
$ 13.47 |
$ 13.32</R> |
|
<R>Advisor Cyclical Industries - Class B* |
$ 13.25 |
$ 13.12</R> |
|
<R>Advisor Cyclical Industries - Class C* |
$ 13.29 |
$ 13.16</R> |
|
<R>Advisor Cyclical Industries - Institutional Class* |
$ 13.70 |
$ 13.53</R> |
|
<R>Advisor Financial Services - Class A* |
$ 17.45 |
$ 16.75</R> |
|
<R>Advisor Financial Services - Class T* |
$ 17.38 |
$ 16.70</R> |
|
<R>Advisor Financial Services - Class B* |
$ 17.14 |
$ 16.49</R> |
|
<R>Advisor Financial Services - Class C* |
$ 17.15 |
$ 16.50</R> |
|
<R>Advisor Financial Services - Institutional Class* |
$ 17.54 |
$ 16.83</R> |
|
<R>Advisor Health Care - Class A* |
$ 21.52 |
$ 19.84</R> |
|
<R>Advisor Health Care - Class T* |
$ 21.38 |
$ 19.73</R> |
|
<R>Advisor Health Care - Class B* |
$ 21.03 |
$ 19.43</R> |
|
<R>Advisor Health Care - Class C* |
$ 21.03 |
$ 19.43</R> |
|
<R>Advisor Health Care - Institutional Class* |
$ 21.62 |
$ 19.93</R> |
|
<R>Advisor Natural Resources - Class A* |
$ 25.36 |
$ 23.30</R> |
|
<R>Advisor Natural Resources - Class T* |
$ 25.67 |
$ 23.59</R> |
|
<R>Advisor Natural Resources - Class B* |
$ 25.07 |
$ 23.07</R> |
|
<R>Advisor Natural Resources - Class C* |
$ 25.19 |
$ 23.17</R> |
|
<R>Advisor Natural Resources - Institutional Class* |
$ 25.73 |
$ 23.61</R> |
|
<R>Advisor Technology - Class A* |
$ 36.32 |
$ 36.52</R> |
|
<R>Advisor Technology - Class T* |
$ 36.05 |
$ 36.27</R> |
|
<R>Advisor Technology - Class B* |
$ 35.45 |
$ 35.71</R> |
|
<R>Advisor Technology - Class C* |
$ 35.51 |
$ 35.77</R> |
|
<R>Advisor Technology - Institutional Class* |
$ 36.51 |
$ 36.69</R> |
|
<R>Advisor Telecommunications & Utilities Growth - Class A* |
$ 22.20 |
$ 22.60</R> |
|
<R>Advisor Telecommunications & Utilities Growth - Class T* |
$ 22.13 |
$ 22.54</R> |
|
<R>Advisor Telecommunications & Utilities Growth - Class B* |
$ 21.84 |
$ 22.28</R> |
|
<R>Advisor Telecommunications & Utilities Growth - Class C* |
$ 21.83 |
$ 22.26</R> |
|
<R>Advisor Telecommunications & Utilities Growth - Institutional Class* |
$ 22.31 |
$ 22.69</R> |
<R>* On July 31, 2000.</R>
Historical Fund Results. The following table shows each class's returns for the fiscal periods ended July 31, <R>2000</R>.
Class A and Class T have a maximum front-end sales charge of 5.75% and 3.50%, respectively, which is included in the average annual and cumulative returns. Class B and Class C have a maximum CDSC of 5.00% and 1.00%, respectively, which is included in the average annual and cumulative returns.
Class A, Class T, Class B, and Class C have a 12b-1 fee of 0.25%, 0.50%, 1.00%, and 1.00%, respectively, which is included in the average annual and cumulative returns.
Returns do not include the effect of the fund's 1.00% short-term trading fee, applicable to shares held less than 60 days.
|
<R> |
Average Annual Returns |
Cumulative Returns</R> |
||||
|
<R> |
One Year |
Five Years |
Ten
Years/ |
One Year |
Five Years |
Ten Years/ |
|
<R>Advisor Consumer Industries - Class A |
-9.97% |
N/A |
15.68% |
-9.97% |
N/A |
76.73%</R> |
|
<R>Advisor Consumer Industries - Class T |
-8.03% |
N/A |
16.01% |
-8.03% |
N/A |
78.73%</R> |
|
<R>Advisor Consumer Industries - Class B |
-9.86% |
N/A |
16.08% |
-9.86% |
N/A |
79.13%</R> |
|
<R>Advisor Consumer Industries - Class C |
-6.12% |
N/A |
16.58% |
-6.12% |
N/A |
82.18%</R> |
|
<R>Advisor Consumer Industries - Institutional Class |
-4.20% |
N/A |
17.75% |
-4.20% |
N/A |
89.43%</R> |
|
<R>Advisor Cyclical Industries - Class A |
-7.76% |
N/A |
11.08% |
-7.76% |
N/A |
50.80%</R> |
|
<R>Advisor Cyclical Industries - Class T |
-5.84% |
N/A |
11.50% |
-5.84% |
N/A |
53.06%</R> |
|
<R>Advisor Cyclical Industries - Class B |
-7.67% |
N/A |
11.45% |
-7.67% |
N/A |
52.80%</R> |
|
<R>Advisor Cyclical Industries - Class C |
-4.07% |
N/A |
11.92% |
-4.07% |
N/A |
55.30%</R> |
|
<R>Advisor Cyclical Industries - Institutional Class |
-2.04% |
N/A |
13.07% |
-2.04% |
N/A |
61.65%</R> |
|
<R>Advisor Financial Services - Class A |
-0.92% |
N/A |
17.96% |
-0.92% |
N/A |
90.74%</R> |
|
<R>Advisor Financial Services - Class T |
1.17% |
N/A |
18.37% |
1.17% |
N/A |
93.38%</R> |
|
<R>Advisor Financial Services - Class B |
-0.70% |
N/A |
18.46% |
-0.70% |
N/A |
93.97%</R> |
|
<R>Advisor Financial Services - Class C |
3.30% |
N/A |
18.90% |
3.30% |
N/A |
96.77%</R> |
|
<R>Advisor Financial Services - Institutional Class |
5.40% |
N/A |
20.07% |
5.40% |
N/A |
104.46%</R> |
|
<R>Advisor Health Care - Class A |
14.46% |
N/A |
24.05% |
14.46% |
N/A |
132.27%</R> |
|
<R>Advisor Health Care - Class T |
16.92% |
N/A |
24.47% |
16.92% |
N/A |
135.33%</R> |
|
<R>Advisor Health Care - Class B |
15.53% |
N/A |
24.59% |
15.53% |
N/A |
136.20%</R> |
|
<R>Advisor Health Care - Class C |
19.59% |
N/A |
24.97% |
19.59% |
N/A |
139.06%</R> |
|
<R>Advisor Health Care - Institutional Class |
21.77% |
N/A |
26.24% |
21.77% |
N/A |
148.71%</R> |
|
<R>Advisor Natural Resources - Class A |
3.60% |
9.65% |
11.34% |
3.60% |
58.51% |
192.73%</R> |
|
<R>Advisor Natural Resources - Class T |
5.85% |
10.11% |
11.57% |
5.85% |
61.87% |
198.95%</R> |
|
<R>Advisor Natural Resources - Class B |
4.14% |
9.98% |
11.64% |
4.14% |
60.93% |
200.76%</R> |
|
<R>Advisor Natural Resources - Class C |
8.15% |
10.21% |
11.62% |
8.15% |
62.57% |
200.08%</R> |
|
<R>Advisor Natural Resources - Institutional Class |
10.31% |
11.34% |
12.20% |
10.31% |
71.12% |
216.20%</R> |
|
<R>Advisor Technology - Class A |
44.91% |
N/A |
43.16% |
44.91% |
N/A |
306.66%</R> |
|
<R>Advisor Technology - Class T |
48.04% |
N/A |
43.62% |
48.04% |
N/A |
311.83%</R> |
|
<R>Advisor Technology - Class B |
47.57% |
N/A |
44.01% |
47.57% |
N/A |
316.19%</R> |
|
<R>Advisor Technology - Class C |
51.60% |
N/A |
44.26% |
51.60% |
N/A |
319.00%</R> |
|
<R>Advisor Technology - Institutional Class |
54.16% |
N/A |
45.66% |
54.16% |
N/A |
335.19%</R> |
|
<R>Advisor Telecommunications & Utilities Growth - Class A |
3.29% |
N/A |
26.97% |
3.29% |
N/A |
154.33%</R> |
|
<R>Advisor Telecommunications & Utilities Growth - Class T |
5.58% |
N/A |
27.42% |
5.58% |
N/A |
157.92%</R> |
|
<R>Advisor Telecommunications & Utilities Growth - Class B |
3.77% |
N/A |
27.62% |
3.77% |
N/A |
159.53%</R> |
|
<R>Advisor Telecommunications & Utilities Growth - Class C |
7.84% |
N/A |
28.02% |
7.84% |
N/A |
162.69%</R> |
|
<R>Advisor Telecommunications & Utilities Growth - Institutional Class |
9.93% |
N/A |
29.29% |
9.93% |
N/A |
173.00%</R> |
* From September 3, 1996 (commencement of operations) for Advisor Consumer Industries, Advisor Cyclical Industries, Advisor Financial Services, Advisor Health Care, Advisor Technology, and Advisor Telecommunications & Utilities Growth.
Initial offering of Class A of each fund took place on September 3, 1996. For Advisor Natural Resources, Class A returns prior to September 3, 1996 are those of Class T which reflect a 12b-1 fee of 0.50% (0.65% prior to January 1, 1996). If Class A's 12b-1 fee had been reflected, total returns prior to September 3, 1996 would have been higher.
Initial offering of Class B of each fund (except Advisor Natural Resources) took place on March 3, 1997. Class B returns prior to March 3, 1997 are those of Class T which reflect a 12b-1 fee of 0.50%. If Class B's 12b-1 fee had been reflected, total returns prior to March 3, 1997 would have been lower.
Initial offering of Class B of Advisor Natural Resources took place on July 3, 1995. Class B returns prior to July 3, 1995 are those of Class T which reflect a 12b-1 fee of 0.65%. If Class B's 12b-1 fee had been reflected, total returns prior to July 3, 1995 would have been lower.
Initial offering of Class C of each fund took place on November 3, 1997. Class C returns for each fund (except Advisor Natural Resources) from November 3, 1997 through March 3, 1997 are those of Class B which reflect a 12b-1 fee of 1.00%. Class C returns prior to March 3, 1997 are those of Class T which reflect a 12b-1 fee of 0.50%. If Class C's 12b-1 fee had been reflected, total returns prior to March 3, 1997 would have been lower.
Class C returns for Advisor Natural Resources from November 3, 1997 through July 3, 1995 are those of Class B which reflect a 12b-1 fee of 1.00%. Class C returns prior to July 3, 1995 are those of Class T which reflect a 12b-1 fee of 0.65%. If Class C's 12b-1 fee had been reflected, total returns prior to July 3, 1995 would have been lower.
Initial offering of Institutional Class of Advisor Natural Resources took place on July 3, 1995. Institutional Class returns prior to July 3, 1995 are those of Class T which reflect a 12b-1 fee of 0.65%. If Class T's 12b-1 fee had not been reflected, total returns prior to July 3, 1995 would have been higher.
<R> Note: If FMR had not reimbursed certain class expenses during these periods, each class's returns would have been lower, except for Class T of Advisor Financial Services, Advisor Health Care, and Advisor Technology.</R>
The following tables show the income and capital elements of each class's cumulative return. The tables compare each class's return to the record of the S&P 500, the Dow Jones Industrial Average (DJIA), and the cost of living, as measured by the Consumer Price Index (CPI), over the same period. The S&P 500 and DJIA comparisons are provided to show how each class's return compared to the record of a market capitalization-weighted index of common stocks and a narrower set of stocks of major industrial companies, respectively, over the same period. Each fund has the ability to invest in securities not included in either index, and its investment portfolio may or may not be similar in composition to the indexes. The S&P 500 and DJIA returns are based on the prices of unmanaged groups of stocks and, unlike each class's returns, do not include the effect of brokerage commissions or other costs of investing.
The following tables show the growth in value of a hypothetical $10,000 investment in each class of each fund during the 10-year period ended July 31, <R>2000</R> or life of fund, as applicable, assuming all distributions were reinvested. Returns are based on past results and are not an indication of future performance. Tax consequences of different investments have not been factored into the figures below.
During the period from September 3, 1996 (commencement of operations) to July 31, 2000, a hypothetical $10,000 investment in Class A of Advisor Consumer Industries would have grown to $<R>17,673</R>, including the effect of Class A's maximum sales charge.<R></R>
|
ADVISOR CONSUMER INDUSTRIES - CLASS A |
INDEXES |
||||||
|
Fiscal Year Ended |
Value of |
Value of |
Value of |
Total |
S&P 500 |
DJIA |
Cost of |
|
<R>2000 |
$ 14,175 |
$ 25 |
$ 3,473 |
$ 17,673 |
$ 23,180 |
$ 19,891 |
$ 10,973</R> |
|
<R>1999 |
$ 15,089 |
$ 27 |
$ 3,385 |
$ 18,501 |
$ 21,270 |
$ 19,837 |
$ 10,598</R> |
|
<R>1998 |
$ 14,213 |
$ 25 |
$ 2,064 |
$ 16,302 |
$ 17,695 |
$ 16,274 |
$ 10,375</R> |
|
<R>1997* |
$ 12,705 |
$ 12 |
$ 71 |
$ 12,788 |
$ 14,835 |
$ 14,816 |
$ 10,203</R> |
* From September 3, 1996 (commencement of operations).
** From month-end closest to initial investment date.
Explanatory Notes: With an initial investment of $10,000 in Class A of Advisor Consumer Industries on September 3, 1996, assuming the maximum sales charge had been in effect, the net amount invested in Class A shares was $9,425. The cost of the initial investment ($10,000) together with the aggregate cost of reinvested dividends and capital gain distributions for the period covered (their cash value at the time they were reinvested) amounted to $<R>12,925</R>. If distributions had not been reinvested, the amount of distributions earned from the class over time would have been smaller, and cash payments for the period would have amounted to $<R>19</R> for dividends and $<R>2,677</R> for capital gain distributions. The figures in the table do not include the effect of the fund's 1.00% short-term trading fee applicable to shares held less than 60 days.<R></R>
During the period from September 3, 1996 (commencement of operations) to July 31, 2000, a hypothetical $10,000 investment in Class T of Advisor Consumer Industries would have grown to $<R>17,873</R>, including the effect of Class T's maximum sales charge.
|
ADVISOR CONSUMER INDUSTRIES - CLASS T |
INDEXES |
||||||
|
Fiscal Year Ended |
Value of |
Value of |
Value of |
Total |
S&P 500 |
DJIA |
Cost of |
|
<R>2000 |
$ 14,407 |
$ 0 |
$ 3,466 |
$ 17,873 |
$ 23,180 |
$ 19,891 |
$ 10,973</R> |
|
<R>1999 |
$ 15,372 |
$ 0 |
$ 3,381 |
$ 18,753 |
$ 21,270 |
$ 19,837 |
$ 10,598</R> |
|
<R>1998 |
$ 14,475 |
$ 0 |
$ 2,092 |
$ 16,567 |
$ 17,695 |
$ 16,274 |
$ 10,375</R> |
|
<R>1997* |
$ 12,979 |
$ 0 |
$ 73 |
$ 13,052 |
$ 14,835 |
$ 14,816 |
$ 10,203</R> |
* From September 3, 1996 (commencement of operations).
** From month-end closest to initial investment date.
Explanatory Notes: With an initial investment of $10,000 in Class T of Advisor Consumer Industries on September 3, 1996, assuming the maximum sales charge had been in effect, the net amount invested in Class T shares was $9,650. The cost of the initial investment ($10,000) together with the aggregate cost of reinvested dividends and capital gain distributions for the period covered (their cash value at the time they were reinvested) amounted to $1<R>2,915</R>. If distributions had not been reinvested, the amount of distributions earned from the class over time would have been smaller, and cash payments for the period would have amounted to $<R>0</R> for dividends and $<R>2,692</R> for capital gain distributions. The figures in the table do not include the effect of the fund's 1.00% short-term trading fee applicable to shares held less than 60 days.<R></R>
During the period from September 3, 1996 (commencement of operations) to July 31, <R>2000</R>, a hypothetical $10,000 investment in Class B of Advisor Consumer Industries would have grown to $17,913, including the effect of Class B's maximum CDSC.
|
ADVISOR CONSUMER INDUSTRIES - CLASS B |
INDEXES |
||||||
|
Fiscal Year Ended |
Value of |
Value of |
Value of |
Total |
S&P 500 |
DJIA |
Cost of |
|
<R>2000 |
$ 14,690 |
$ 0 |
$ 3,523 |
$ 17,913 |
$ 23,180 |
$ 19,891 |
$ 10,973</R> |
|
<R>1999 |
$ 15,760 |
$ 0 |
$ 3,451 |
$ 19,211 |
$ 21,270 |
$ 19,837 |
$ 10,598</R> |
|
<R>1998 |
$ 14,910 |
$ 0 |
$ 2,134 |
$ 17,044 |
$ 17,695 |
$ 16,274 |
$ 10,375</R> |
|
<R>1997* |
$ 13,420 |
$ 0 |
$ 75 |
$ 13,495 |
$ 14,835 |
$ 14,816 |
$ 10,203</R> |
* From September 3, 1996 (commencement of operations).
** From month-end closest to initial investment date.
Explanatory Notes: With an initial investment of $10,000 in Class B of Advisor Consumer Industries on September 3, 1996, the net amount invested in Class B shares was $10,000. The cost of the initial investment ($10,000) together with the aggregate cost of reinvested dividends and capital gain distributions for the period covered (their cash value at the time they were reinvested) amounted to $<R>12,997</R>. If distributions had not been reinvested, the amount of distributions earned from the class over time would have been smaller, and cash payments for the period would have amounted to $<R>0</R> for dividends and $<R>2,770</R> for capital gain distributions. The figures in the table do not include the effect of the fund's 1.00% short-term trading fee applicable to shares held less than 60 days. Initial offering of Class B took place on March 3, 1997. Class B returns prior to March 3, 1997 are those of Class T which reflect a 12b-1 fee of 0.50%. If Class B's 12b-1 fee had been reflected, total returns prior to March 3, 1997 would have been lower.
During the period from September 3, 1996 (commencement of operations) to July 31, 2000, a hypothetical $10,000 investment in Class C of Advisor Consumer Industries would have grown to $<R>18,218</R>.<R></R>
|
ADVISOR CONSUMER INDUSTRIES - CLASS C |
INDEXES |
||||||
|
Fiscal Year Ended |
Value of |
Value of |
Value of |
Total |
S&P 500 |
DJIA |
Cost of |
|
<R>2000 |
$ 14,652 |
$ 0 |
$ 3,566 |
$ 18,218 |
$ 23,180 |
$ 19,891 |
$ 10,973</R> |
|
<R>1999 |
$ 15,718 |
$ 0 |
$ 3,497 |
$ 19,215 |
$ 21,270 |
$ 19,837 |
$ 10,598</R> |
|
<R>1998 |
$ 14,891 |
$ 0 |
$ 2,156 |
$ 17,047 |
$ 17,695 |
$ 16,274 |
$ 10,375</R> |
|
<R>1997* |
$ 13,420 |
$ 0 |
$ 75 |
$ 13,495 |
$ 14,835 |
$ 14,816 |
$ 10,203</R> |
* From September 3, 1996 (commencement of operations).
** From month-end closest to initial investment date.
Explanatory Notes: With an initial investment of $10,000 in Class C of Advisor Consumer Industries on September 3, 1996, the net amount invested in Class C shares was $10,000. The cost of the initial investment ($10,000) together with the aggregate cost of reinvested dividends and capital gain distributions for the period covered (their cash value at the time they were reinvested) amounted to $<R>13,037</R>. If distributions had not been reinvested, the amount of distributions earned from the class over time would have been smaller, and cash payments for the period would have amounted to $<R>0</R> for dividends and $<R>2,804</R> for capital gain distributions. The figures in the table do not include the effect of the fund's 1.00% short-term trading fee applicable to shares held less than 60 days. Initial offering of Class C took place on November 3, 1997. Class C returns from November 3, 1997 through March 3, 1997 are those of Class B which reflect a 12b-1 fee of 1.00%. Class C returns prior to March 3, 1997 are those of Class T which reflect a 12b-1 fee of 0.50%. If Class C's 12b-1 fee had been reflected, total returns prior to March 3, 1997 would have been lower.
During the period from September 3, 1996 (commencement of operations) to July 31,<R> 2000</R>, a hypothetical $10,000 investment in Institutional Class of Advisor Consumer Industries would have grown to $<R>18,943</R>.
|
ADVISOR CONSUMER INDUSTRIES - INSTITUTIONAL CLASS |
INDEXES |
||||||
|
Fiscal Year Ended |
Value of |
Value of |
Value of |
Total |
S&P 500 |
DJIA |
Cost of |
|
<R>2000 |
$ 15,180 |
$ 39 |
$ 3,724 |
$ 18,943 |
$ 23,180 |
$ 19,891 |
$ 10,973</R> |
|
<R>1999 |
$ 16,110 |
$ 41 |
$ 3,622 |
$ 19,773 |
$ 21,270 |
$ 19,837 |
$ 10,598</R> |
|
<R>1998 |
$ 15,120 |
$ 39 |
$ 2,205 |
$ 17,364 |
$ 17,695 |
$ 16,274 |
$ 10,375</R> |
|
<R>1997* |
$ 13,510 |
$ 13 |
$ 75 |
$ 13,598 |
$ 14,835 |
$ 14,816 |
$ 10,203</R> |
* From September 3, 1996 (commencement of operations).
** From month-end closest to initial investment date.
Explanatory Notes: With an initial investment of $10,000 in Institutional Class of Advisor Consumer Industries on September 3, 1996, the net amount invested in Institutional Class shares was $10,000. The cost of the initial investment ($10,000) together with the aggregate cost of reinvested dividends and capital gain distributions for the period covered (their cash value at the time they were reinvested) amounted to $<R>13,126</R>. If distributions had not been reinvested, the amount of distributions earned from the class over time would have been smaller, and cash payments for the period would have amounted to $<R>30</R> for dividends and $<R>2,850</R> for capital gain distributions. The figures in the table do not include the effect of the fund's 1.00% short-term trading fee applicable to shares held less than 60 days.
During the period from September 3, 1996 (commencement of operations) to July 31,<R> 2000</R>, a hypothetical $10,000 investment in Class A of Advisor Cyclical Industries would have grown to $<R>15,080</R>, including the effect of Class A's maximum sales charge.
|
ADVISOR CYCLICAL INDUSTRIES - CLASS A |
INDEXES |
||||||
|
Fiscal Year Ended |
Value of |
Value of |
Value of |
Total |
S&P 500 |
DJIA |
Cost of |
|
<R>2000 |
$ 12,780 |
$ 23 |
$ 2,277 |
$ 15,080 |
$ 23,180 |
$ 19,891 |
$ 10,973</R> |
|
<R>1999 |
$ 13,318 |
$ 12 |
$ 2,079 |
$ 15,409 |
$ 21,270 |
$ 19,837 |
$ 10,598</R> |
|
<R>1998 |
$ 12,780 |
$ 12 |
$ 1,113 |
$ 13,905 |
$ 17,695 |
$ 16,274 |
$ 10,375</R> |
|
<R>1997* |
$ 13,007 |
$ 11 |
$ 93 |
$ 13,111 |
$ 14,835 |
$ 14,816 |
$ 10,203</R> |
* From September 3, 1996 (commencement of operations).
** From month-end closest to initial investment date.
Explanatory Notes: With an initial investment of $10,000 in Class A of Advisor Cyclical Industries on September 3, 1996, assuming the maximum sales charge had been in effect, the net amount invested in Class A shares was $9,425. The cost of the initial investment ($10,000) together with the aggregate cost of reinvested dividends and capital gain distributions for the period covered (their cash value at the time they were reinvested) amounted to $<R>12,035</R>. If distributions had not been reinvested, the amount of distributions earned from the class over time would have been smaller, and cash payments for the period would have amounted to $<R>19</R> for dividends and $<R>1,894</R> for capital gain distributions. The figures in the table do not include the effect of the fund's 1.00% short-term trading fee applicable to shares held less than 60 days.<R></R>
During the period from September 3, 1996 (commencement of operations) to July 31,<R> 2000</R>, a hypothetical $10,000 investment in Class T of Advisor Cyclical Industries would have grown to $<R>15,306</R>, including the effect of Class T's maximum sales charge.
|
ADVISOR CYCLICAL INDUSTRIES - CLASS T |
INDEXES |
||||||
|
Fiscal Year Ended |
Value of |
Value of |
Value of |
Total |
S&P 500 |
DJIA |
Cost of |
|
<R>2000 |
$ 13,008 |
$ 12 |
$ 2,286 |
$ 15,306 |
$ 23,180 |
$ 19,891 |
$ 10,973</R> |
|
<R>1999 |
$ 13,578 |
$ 12 |
$ 2,097 |
$ 15,687 |
$ 21,270 |
$ 19,837 |
$ 10,598</R> |
|
<R>1998 |
$ 13,037 |
$ 12 |
$ 1,138 |
$ 14,187 |
$ 17,695 |
$ 16,274 |
$ 10,375</R> |
|
<R>1997* |
$ 13,288 |
$ 12 |
$ 95 |
$ 13,395 |
$ 14,835 |
$ 14,816 |
$ 10,203</R> |
* From September 3, 1996 (commencement of operations).
** From month-end closest to initial investment date.
Explanatory Notes: With an initial investment of $10,000 in Class T of Advisor Cyclical Industries on September 3, 1996, assuming the maximum sales charge had been in effect, the net amount invested in Class T shares was $<R>9,650</R>. The cost of the initial investment ($10,000) together with the aggregate cost of reinvested dividends and capital gain distributions for the period covered (their cash value at the time they were reinvested) amounted to $<R>12,040</R>. If distributions had not been reinvested, the amount of distributions earned from the class over time would have been smaller, and cash payments for the period would have amounted to $<R>10</R> for dividends and <R>$1,911</R> for capital gain distributions. The figures in the table do not include the effect of the fund's 1.00% short-term trading fee applicable to shares held less than 60 days.
During the period from September 3, 1996 (commencement of operations) to July 31, 2000, a hypothetical $10,000 investment in Class B of Advisor Cyclical Industries would have grown to $<R>15,280</R>, including the effect of Class B's maximum CDSC.<R></R>
|
ADVISOR CYCLICAL INDUSTRIES - CLASS B |
INDEXES |
||||||
|
Fiscal Year Ended |
Value of |
Value of |
Value of |
Total |
S&P 500 |
DJIA |
Cost of |
|
<R>2000 |
$ 13,250 |
$ 12 |
$ 2,318 |
$ 15,280 |
$ 23,180 |
$ 19,891 |
$ 10,973</R> |
|
<R>1999 |
$ 13,890 |
$ 12 |
$ 2,143 |
$ 16,045 |
$ 21,270 |
$ 19,837 |
$ 10,598</R> |
|
<R>1998 |
$ 13,400 |
$ 12 |
$ 1,174 |
$ 14,586 |
$ 17,695 |
$ 16,274 |
$ 10,375</R> |
|
<R>1997* |
$ 13,750 |
$ 12 |
$ 99 |
$ 13,861 |
$ 14,835 |
$ 14,816 |
$ 10,203</R> |
* From September 3, 1996 (commencement of operations).
** From month-end closest to initial investment date.
Explanatory Notes: With an initial investment of $10,000 in Class B of Advisor Cyclical Industries on September 3, 1996, the net amount invested in Class B shares was $10,000. The cost of the initial investment ($10,000) together with the aggregate cost of reinvested dividends and capital gain distributions for the period covered (their cash value at the time they were reinvested) amounted to $<R>12,091</R>. If distributions had not been reinvested, the amount of distributions earned from the class over time would have been smaller, and cash payments for the period would have amounted to $<R>10</R> for dividends and $<R>1,960</R> for capital gain distributions. The figures in the table do not include the effect of the fund's 1.00% short-term trading fee applicable to shares held less than 60 days. Initial offering of Class B took place on March 3, 1997. Class B returns prior to March 3, 1997 are those of Class T which reflect a 12b-1 fee of 0.50%. If Class B's 12b-1 fee had been reflected, total returns prior to March 3, 1997 would have been lower.
During the period from September 3, 1996 (commencement of operations) to July 31, 2000, a hypothetical $10,000 investment in Class C of Advisor Cyclical Industries would have grown to $<R>15,530</R>.<R></R>
|
ADVISOR CYCLICAL INDUSTRIES - CLASS C |
INDEXES |
||||||
|
Fiscal Year Ended |
Value of |
Value of |
Value of |
Total |
S&P 500 |
DJIA |
Cost of |
|
<R>2000 |
$ 13,207 |
$ 12 |
$ 2,311 |
$ 15,530 |
$ 23,180 |
$ 19,891 |
$ 10,973</R> |
|
<R>1999 |
$ 13,855 |
$ 13 |
$ 2,161 |
$ 16,029 |
$ 21,270 |
$ 19,837 |
$ 10,598</R> |
|
<R>1998 |
$ 13,396 |
$ 12 |
$ 1,172 |
$ 14,580 |
$ 17,695 |
$ 16,274 |
$ 10,375</R> |
|
<R>1997* |
$ 13,750 |
$ 12 |
$ 99 |
$ 13,861 |
$ 14,835 |
$ 14,816 |
$ 10,203</R> |
* From September 3, 1996 (commencement of operations).
** From month-end closest to initial investment date.
Explanatory Notes: With an initial investment of $10,000 in Class C of Advisor Cyclical Industries on September 3, 1996, the net amount invested in Class C shares was $10,000. The cost of the initial investment ($10,000) together with the aggregate cost of reinvested dividends and capital gain distributions for the period covered (their cash value at the time they were reinvested) amounted to $<R>12,085</R>. If distributions had not been reinvested, the amount of distributions earned from the class over time would have been smaller, and cash payments for the period would have amounted to $<R>10</R> for dividends and $<R>1,955</R> for capital gain distributions. The figures in the table do not include the effect of the fund's 1.00% short-term trading fee applicable to shares held less than 60 days. Initial offering of Class C took place on November 3, 1997. Class C returns from November 3, 1997 through March 3, 1997 are those of Class B which reflect a 12b-1 fee of 1.00%. Class C returns prior to March 3, 1997 are those of Class T which reflect a 12b-1 fee of 0.50%. If Class C's 12b-1 fee had been reflected, total returns prior to March 3, 1997 would have been lower.
During the period from September 3, 1996 (commencement of operations) to July 31, 2000, a hypothetical $10,000 investment in Institutional Class of Advisor Cyclical Industries would have grown to $<R>16,165</R>.<R></R>
|
ADVISOR CYCLICAL INDUSTRIES - INSTITUTIONAL CLASS |
INDEXES |
||||||
|
Fiscal Year Ended |
Value of |
Value of |
Value of |
Total |
S&P 500 |
DJIA |
Cost of |
|
<R>2000 |
$ 13,700 |
$ 60 |
$ 2,405 |
$ 16,165 |
$ 23,180 |
$ 19,891 |
$ 10,973</R> |
|
<R>1999 |
$ 14,280 |
$ 25 |
$ 2,196 |
$ 16,501 |
$ 21,270 |
$ 19,837 |
$ 10,598</R> |
|
<R>1998 |
$ 13,680 |
$ 25 |
$ 1,142 |
$ 14,847 |
$ 17,695 |
$ 16,274 |
$ 10,375</R> |
|
<R>1997* |
$ 13,840 |
$ 25 |
$ 99 |
$ 13,964 |
$ 14,835 |
$ 14,816 |
$ 10,203</R> |
* From September 3, 1996 (commencement of operations).
** From month-end closest to initial investment date.
Explanatory Notes: With an initial investment of $10,000 in Institutional Class of Advisor Cyclical Industries on September 3, 1996, the net amount invested in Institutional Class shares was $10,000. The cost of the initial investment ($10,000) together with the aggregate cost of reinvested dividends and capital gain distributions for the period covered (their cash value at the time they were reinvested) amounted to $<R>12,171</R>. If distributions had not been reinvested, the amount of distributions earned from the class over time would have been smaller, and cash payments for the period would have amounted to $<R>50</R> for dividends and $<R>1,990</R> for capital gain distributions. The figures in the table do not include the effect of the fund's 1.00% short-term trading fee applicable to shares held less than 60 days.
During the period from September 3, 1996 (commencement of operations) to July 31, <R>2000</R>, a hypothetical $10,000 investment in Class A of Advisor Financial Services would have grown to $<R>19,074</R>, including the effect of Class A's maximum sales charge.
|
ADVISOR FINANCIAL SERVICES - CLASS A |
INDEXES |
||||||
|
Fiscal Year Ended |
Value of |
Value of |
Value of |
Total |
S&P 500 |
DJIA |
Cost of |
|
<R>2000 |
$ 17,238 |
$ 247 |
$ 1,589 |
$ 19,074 |
$ 23,180 |
$ 19,891 |
$ 10,973</R> |
|
<R>1999 |
$ 16,484 |
$ 140 |
$ 1,520 |
$ 18,144 |
$ 21,270 |
$ 19,837 |
$ 10,598</R> |
|
<R>1998 |
$ 17,662 |
$ 84 |
$ 274 |
$ 18,020 |
$ 17,695 |
$ 16,274 |
$ 10,375</R> |
|
<R>1997* |
$ 14,241 |
$ 12 |
$ 12 |
$ 14,265 |
$ 14,835 |
$ 14,816 |
$ 10,203</R> |
* From September 3, 1996 (commencement of operations).
** From month-end closest to initial investment date.
Explanatory Notes: With an initial investment of $10,000 in Class A of Advisor Financial Services on September 3, 1996, assuming the maximum sales charge had been in effect, the net amount invested in Class A shares was $9,425. The cost of the initial investment ($10,000) together with the aggregate cost of reinvested dividends and capital gain distributions for the period covered (their cash value at the time they were reinvested) amounted to $<R>11,416</R>. If distributions had not been reinvested, the amount of distributions earned from the class over time would have been smaller, and cash payments for the period would have amounted to $<R>198</R> for dividends and $<R>1,188</R> for capital gain distributions. The figures in the table do not include the effect of the fund's 1.00% short-term trading fee applicable to shares held less than 60 days.<R></R>
During the period from September 3, 1996 (commencement of operations) to July 31,<R> 2000</R>, a hypothetical $10,000 investment in Class T of Advisor Financial Services would have grown to $<R>19,338</R>, including the effect of Class T's maximum sales charge.
|
ADVISOR FINANCIAL SERVICES - CLASS T |
INDEXES |
||||||
|
Fiscal Year Ended |
Value of |
Value of |
Value of |
Total |
S&P 500 |
DJIA |
Cost of |
|
<R>2000 |
$ 17,573 |
$ 143 |
$ 1,622 |
$ 19,338 |
$ 23,180 |
$ 19,891 |
$ 10,973</R> |
|
<R>1999 |
$ 16,810 |
$ 83 |
$ 1,552 |
$ 18,445 |
$ 21,270 |
$ 19,837 |
$ 10,598</R> |
|
<R>1998 |
$ 18,007 |
$ 61 |
$ 280 |
$ 18,348 |
$ 17,695 |
$ 16,274 |
$ 10,375</R> |
|
<R>1997* |
$ 14,543 |
$ 12 |
$ 12 |
$ 14,567 |
$ 14,835 |
$ 14,816 |
$ 10,203</R> |
* From September 3, 1996 (commencement of operations).
** From month-end closest to initial investment date.
Explanatory Notes: With an initial investment of $10,000 in Class T of Advisor Financial Services on September 3, 1996, assuming the maximum sales charge had been in effect, the net amount invested in Class T shares was $9,650. The cost of the initial investment ($10,000) together with the aggregate cost of reinvested dividends and capital gain distributions for the period covered (their cash value at the time they were reinvested) amounted to $<R>11,356</R>. If distributions had not been reinvested, the amount of distributions earned from the class over time would have been smaller, and cash payments for the period would have amounted to $<R>116</R> for dividends and $<R>1,216</R> for capital gain distributions. The figures in the table do not include the effect of the fund's 1.00% short-term trading fee applicable to shares held less than 60 days.<R></R>
During the period from September 3, 1996 (commencement of operations) to July 31, 2000, a hypothetical $10,000 investment in Class B of Advisor Financial Services would have grown to $<R>19,397</R>, including the effect of Class B's maximum CDSC.<R></R>
|
ADVISOR FINANCIAL SERVICES - CLASS B |
INDEXES |
||||||
|
Fiscal Year Ended |
Value of |
Value of |
Value of |
Total |
S&P 500 |
DJIA |
Cost of |
|
<R>2000 |
$ 17,950 |
$ 77 |
$ 1,670 |
$ 19,397 |
$ 23,180 |
$ 19,891 |
$ 10,973</R> |
|
<R>1999 |
$ 17,210 |
$ 74 |
$ 1,601 |
$ 18,885 |
$ 21,270 |
$ 19,837 |
$ 10,598</R> |
|
<R>1998 |
$ 18,520 |
$ 66 |
$ 289 |
$ 18,875 |
$ 17,695 |
$ 16,274 |
$ 10,375</R> |
|
<R>1997* |
$ 15,040 |
$ 12 |
$ 13 |
$ 15,065 |
$ 14,835 |
$ 14,816 |
$ 10,203</R> |
* From September 3, 1996 (commencement of operations).
** From month-end closest to initial investment date.
Explanatory Notes: With an initial investment of $10,000 in Class B of Advisor Financial Services on September 3, 1996, the net amount invested in Class B shares was $10,000. The cost of the initial investment ($10,000) together with the aggregate cost of reinvested dividends and capital gain distributions for the period covered (their cash value at the time they were reinvested) amounted to $<R>11,341</R>. If distributions had not been reinvested, the amount of distributions earned from the class over time would have been smaller, and cash payments for the period would have amounted to $<R>60</R> for dividends and $<R>1,260</R> for capital gain distributions. The figures in the table do not include the effect of the fund's 1.00% short-term trading fee applicable to shares held less than 60 days. Initial offering of Class B took place on March 3, 1997. Class B returns prior to March 3, 1997 are those of Class T which reflect a 12b-1 fee of 0.50%. If Class B's 12b-1 fee had been reflected, total returns prior to March 3, 1997 would have been lower.
During the period from September 3, 1996 (commencement of operations) to July 31, <R>2000</R>, a hypothetical $10,000 investment in Class C of Advisor Financial Services would have grown to $<R>19,677</R>.
|
ADVISOR FINANCIAL SERVICES - CLASS C |
INDEXES |
||||||
|
Fiscal Year Ended |
Value of |
Value of |
Value of |
Total |
S&P 500 |
DJIA |
Cost of |
|
<R>2000 |
$ 17,889 |
$ 126 |
$ 1,662 |
$ 19,677 |
$ 23,180 |
$ 19,891 |
$ 10,973</R> |
|
<R>1999 |
$ 17,172 |
$ 99 |
$ 1,595 |
$ 18,866 |
$ 21,270 |
$ 19,837 |
$ 10,598</R> |
|
<R>1998 |
$ 18,487 |
$ 77 |
$ 288 |
$ 18,852 |
$ 17,695 |
$ 16,274 |
$ 10,375</R> |
|
<R>1997* |
$ 15,040 |
$ 12 |
$ 13 |
$ 15,065 |
$ 14,835 |
$ 14,816 |
$ 10,203</R> |
* From September 3, 1996 (commencement of operations).
** From month-end closest to initial investment date.
Explanatory Notes: With an initial investment of $10,000 in Class C of Advisor Financial Services on September 3, 1996, the net amount invested in Class C shares was $10,000. The cost of the initial investment ($10,000) together with the aggregate cost of reinvested dividends and capital gain distributions for the period covered (their cash value at the time they were reinvested) amounted to $<R>11,379</R>. If distributions had not been reinvested, the amount of distributions earned from the class over time would have been smaller, and cash payments for the period would have amounted to $<R>100</R> for dividends and $<R>1,255</R> for capital gain distributions. The figures in the table do not include the effect of the fund's 1.00% short-term trading fee applicable to shares held less than 60 days. Initial offering of Class C took place on November 3, 1997. Class C returns from November 3, 1997 through March 3, 1997 are those of Class B which reflect a 12b-1 fee of 1.00%. Class C returns prior to March 3, 1997 are those of Class T which reflect a 12b-1 fee of 0.50%. If Class C's 12b-1 fee had been reflected, total returns prior to March 3, 1997 would have been lower.
During the period from September 3, 1996 (commencement of operations) to July 31,<R> 2000</R>, a hypothetical $10,000 investment in Institutional Class of Advisor Financial Services would have grown to $<R>20,446</R>.
|
ADVISOR FINANCIAL SERVICES - INSTITUTIONAL CLASS |
INDEXES |
||||||
|
Fiscal Year Ended |
Value of |
Value of |
Value of |
Total |
S&P 500 |
DJIA |
Cost of |
|
<R>2000 |
$ 18,390 |
$ 364 |
$ 1,692 |
$ 20,446 |
$ 23,180 |
$ 19,891 |
$ 10,973</R> |
|
<R>1999 |
$ 17,600 |
$ 178 |
$ 1,620 |
$ 19,398 |
$ 21,270 |
$ 19,837 |
$ 10,598</R> |
|
<R>1998 |
$ 18,800 |
$ 92 |
$ 291 |
$ 19,183 |
$ 17,695 |
$ 16,274 |
$ 10,375</R> |
|
<R>1997* |
$ 15,140 |
$ 25 |
$ 13 |
$ 15,178 |
$ 14,835 |
$ 14,816 |
$ 10,203</R> |
* From September 3, 1996 (commencement of operations).
** From month-end closest to initial investment date.
Explanatory Notes: With an initial investment of $10,000 in Institutional Class of Advisor Financial Services on September 3, 1996, the net amount invested in Institutional Class shares was $10,000. The cost of the initial investment ($10,000) together with the aggregate cost of reinvested dividends and capital gain distributions for the period covered (their cash value at the time they were reinvested) amounted to $<R>11,589</R>. If distributions had not been reinvested, the amount of distributions earned from the class over time would have been smaller, and cash payments for the period would have amounted to $<R>290</R> for dividends and $<R>1,260</R> for capital gain distributions. The figures in the table do not include the effect of the fund's 1.00% short-term trading fee applicable to shares held less than 60 days.
During the period from September 3, 1996 (commencement of operations) to July 31, <R>2000</R>, a hypothetical $10,000 investment in Class A of Advisor Health Care would have grown to $<R>23,227</R>, including the effect of Class A's maximum sales charge.
|
ADVISOR HEALTH CARE - CLASS A |
INDEXES |
||||||
|
Fiscal Year Ended |
Value of |
Value of |
Value of |
Total |
S&P 500 |
DJIA |
Cost of |
|
<R>2000 |
$ 20,754 |
$ 0 |
$ 2,473 |
$ 23,227 |
$ 23,180 |
$ 19,891 |
$ 10,973</R> |
|
<R>1999 |
$ 17,455 |
$ 0 |
$ 1,672 |
$ 19,127 |
$ 21,270 |
$ 19,837 |
$ 10,598</R> |
|
<R>1998 |
$ 15,740 |
$ 0 |
$ 1,067 |
$ 16,807 |
$ 17,695 |
$ 16,274 |
$ 10,375</R> |
|
<R>1997* |
$ 13,289 |
$ 0 |
$ 0 |
$ 13,289 |
$ 14,835 |
$ 14,816 |
$ 10,203</R> |
* From September 3, 1996 (commencement of operations).
** From month-end closest to initial investment date.
Explanatory Notes: With an initial investment of $10,000 in Class A of Advisor Health Care on September 3, 1996, assuming the maximum sales charge had been in effect, the net amount invested in Class A shares was $9,425. The cost of the initial investment ($10,000) together with the aggregate cost of reinvested dividends and capital gain distributions for the period covered (their cash value at the time they were reinvested) amounted to $<R>11,657</R>. If distributions had not been reinvested, the amount of distributions earned from the class over time would have been smaller, and cash payments for the period would have amounted to $<R>0</R> for dividends and $<R>1,583</R> for capital gain distributions. The figures in the table do not include the effect of the fund's 1.00% short-term trading fee applicable to shares held less than 60 days.<R></R>
During the period from September 3, 1996 (commencement of operations) to July 31,<R> 2000</R>, a hypothetical $10,000 investment in Class T of Advisor Health Care would have grown to $<R>23,533</R>, including the effect of Class T's maximum sales charge.
|
ADVISOR HEALTH CARE - CLASS T |
INDEXES |
||||||
|
Fiscal Year Ended |
Value of |
Value of |
Value of |
Total |
S&P 500 |
DJIA |
Cost of |
|
<R>2000 |
$ 21,104 |
$ 0 |
$ 2,429 |
$ 23,533 |
$ 23,180 |
$ 19,891 |
$ 10,973</R> |
|
<R>1999 |
$ 17,756 |
$ 0 |
$ 1,667 |
$ 19,423 |
$ 21,270 |
$ 19,837 |
$ 10,598</R> |
|
<R>1998 |
$ 16,029 |
$ 0 |
$ 1,077 |
$ 17,106 |
$ 17,695 |
$ 16,274 |
$ 10,375</R> |
|
<R>1997* |
$ 13,558 |
$ 0 |
$ 0 |
$ 13,558 |
$ 14,835 |
$ 14,816 |
$ 10,203</R> |
* From September 3, 1996 (commencement of operations).
** From month-end closest to initial investment date.
Explanatory Notes: With an initial investment of $10,000 in Class T of Advisor Health Care on September 3, 1996, assuming the maximum sales charge had been in effect, the net amount invested in Class T shares was $9,650. The cost of the initial investment ($10,000) together with the aggregate cost of reinvested dividends and capital gain distributions for the period covered (their cash value at the time they were reinvested) amounted to $<R>11,622</R>. If distributions had not been reinvested, the amount of distributions earned from the class over time would have been smaller, and cash payments for the period would have amounted to $<R>0</R> for dividends and $<R>1,554</R> for capital gain distributions. The figures in the table do not include the effect of the fund's 1.00% short-term trading fee applicable to shares held less than 60 days.<R></R>
During the period from September 3, 1996 (commencement of operations) to July 31, 2000, a hypothetical $10,000 investment in Class B of Advisor Health Care would have grown to $<R>23,620</R>, including the effect of Class B's maximum CDSC.<R></R>
|
ADVISOR HEALTH CARE - CLASS B |
INDEXES |
||||||
|
Fiscal Year Ended |
Value of |
Value of |
Value of |
Total |
S&P 500 |
DJIA |
Cost of |
|
<R>2000 |
$ 21,500 |
$ 0 |
$ 2,420 |
$ 23,620 |
$ 23,180 |
$ 19,891 |
$ 10,973</R> |
|
<R>1999 |
$ 18,160 |
$ 0 |
$ 1,686 |
$ 19,846 |
$ 21,270 |
$ 19,837 |
$ 10,598</R> |
|
<R>1998 |
$ 16,470 |
$ 0 |
$ 1,099 |
$ 17,569 |
$ 17,695 |
$ 16,274 |
$ 10,375</R> |
|
<R>1997* |
$ 14,010 |
$ 0 |
$ 0 |
$ 14,010 |
$ 14,835 |
$ 14,816 |
$ 10,203</R> |
* From September 3, 1996 (commencement of operations).
** From month-end closest to initial investment date.
Explanatory Notes: With an initial investment of $10,000 in Class B of Advisor Health Care on September 3, 1996, the net amount invested in Class B shares was $10,000. The cost of the initial investment ($10,000) together with the aggregate cost of reinvested dividends and capital gain distributions for the period covered (their cash value at the time they were reinvested) amounted to $<R>11,628</R>. If distributions had not been reinvested, the amount of distributions earned from the class over time would have been smaller, and cash payments for the period would have amounted to $<R>0</R> for dividends and $<R>1,560</R> for capital gain distributions. The figures in the table do not include the effect of the fund's 1.00% short-term trading fee applicable to shares held less than 60 days. Initial offering of Class B took place on March 3, 1997. Class B returns prior to March 3, 1997 are those of Class T which reflect a 12b-1 fee of 0.50%. If Class B's 12b-1 fee had been reflected, total returns prior to March 3, 1997 would have been lower.
During the period from September 3, 1996 (commencement of operations) to July 31, 2000, a hypothetical $10,000 investment in Class C of Advisor Health Care would have grown to $<R>23,906</R>.<R></R>
|
ADVISOR HEALTH CARE - CLASS C |
INDEXES |
||||||
|
Fiscal Year Ended |
Value of |
Value of |
Value of |
Total |
S&P 500 |
DJIA |
Cost of |
|
<R>2000 |
$ 21,376 |
$ 0 |
$ 2,530 |
$ 23,906 |
$ 23,180 |
$ 19,891 |
$ 10,973</R> |
|
<R>1999 |
$ 18,065 |
$ 0 |
$ 1,759 |
$ 19,824 |
$ 21,270 |
$ 19,837 |
$ 10,598</R> |
|
<R>1998 |
$ 16,395 |
$ 0 |
$ 1,143 |
$ 17,538 |
$ 17,695 |
$ 16,274 |
$ 10,375</R> |
|
<R>1997* |
$ 14,010 |
$ 0 |
$ 0 |
$ 14,010 |
$ 14,835 |
$ 14,816 |
$ 10,203</R> |
* From September 3, 1996 (commencement of operations).
** From month-end closest to initial investment date.
Explanatory Notes: With an initial investment of $10,000 in Class C of Advisor Health Care on September 3, 1996, the net amount invested in Class C shares was $10,000. The cost of the initial investment ($10,000) together with the aggregate cost of reinvested dividends and capital gain distributions for the period covered (their cash value at the time they were reinvested) amounted to $<R>11,706</R>. If distributions had not been reinvested, the amount of distributions earned from the class over time would have been smaller, and cash payments for the period would have amounted to $<R>0</R> for dividends and $<R>1,632</R> for capital gain distributions. The figures in the table do not include the effect of the fund's 1.00% short-term trading fee applicable to shares held less than 60 days. Initial offering of Class C took place on November 3, 1997. Class C returns from November 3, 1997 through March 3, 1997 are those of Class B which reflect a 12b-1 fee of 1.00%. Class C returns prior to March 3, 1997 are those of Class T which reflect a 12b-1 fee of 0.50%. If Class C's 12b-1 fee had been reflected, total returns prior to March 3, 1997 would have been lower.
During the period from September 3, 1996 (commencement of operations) to July 31, 2000, a hypothetical $10,000 investment in Institutional Class of Advisor Health Care would have grown to $<R>24,871</R>.<R></R>
|
ADVISOR HEALTH CARE - INSTITUTIONAL CLASS |
INDEXES |
||||||
|
Fiscal Year Ended |
Value of |
Value of |
Value of |
Total |
S&P 500 |
DJIA |
Cost of |
|
<R>2000 |
$ 22,130 |
$ 38 |
$ 2,703 |
$ 24,871 |
$ 23,180 |
$ 19,891 |
$ 10,973</R> |
|
<R>1999 |
$ 18,590 |
$ 0 |
$ 1,835 |
$ 20,425 |
$ 21,270 |
$ 19,837 |
$ 10,598</R> |
|
<R>1998 |
$ 16,730 |
$ 0 |
$ 1,159 |
$ 17,889 |
$ 17,695 |
$ 16,274 |
$ 10,375</R> |
|
<R>1997* |
$ 14,120 |
$ 0 |
$ 0 |
$ 14,120 |
$ 14,835 |
$ 14,816 |
$ 10,203</R> |
* From September 3, 1996 (commencement of operations).
** From month-end closest to initial investment date.
Explanatory Notes: With an initial investment of $10,000 in Institutional Class of Advisor Health Care on September 3, 1996, the net amount invested in Institutional Class shares was $10,000. The cost of the initial investment ($10,000) together with the aggregate cost of reinvested dividends and capital gain distributions for the period covered (their cash value at the time they were reinvested) amounted to $<R>11,834</R>. If distributions had not been reinvested, the amount of distributions earned from the class over time would have been smaller, and cash payments for the period would have amounted to $<R>30</R> for dividends and $<R>1,720</R> for capital gain distributions. The figures in the table do not include the effect of the fund's 1.00% short-term trading fee applicable to shares held less than 60 days.
During the 10-year period ended July 31,<R> 2000</R>, a hypothetical $10,000 investment in Class A of Advisor Natural Resources would have grown to $<R>29,273</R>, including the effect of Class A's maximum sales charge.
|
ADVISOR NATURAL RESOURCES - CLASS A |
INDEXES |
||||||
|
Fiscal Year Ended |
Value of |
Value of |
Value of |
Total |
S&P 500 |
DJIA |
Cost of |
|
<R>2000 |
$ 16,147 |
$ 321 |
$ 12,805 |
$ 29,273 |
$ 50,831 |
$ 45,998 |
$ 13,236</R> |
|
<R>1999 |
$ 14,745 |
$ 194 |
$ 11,693 |
$ 26,632 |
$ 46,645 |
$ 45,874 |
$ 12,784</R> |
|
<R>1998 |
$ 12,705 |
$ 100 |
$ 9,118 |
$ 21,923 |
$ 38,805 |
$ 37,633 |
$ 12,515</R> |
|
<R>1997 |
$ 17,549 |
$ 137 |
$ 7,988 |
$ 25,674 |
$ 32,531 |
$ 34,261 |
$ 12,308</R> |
|
<R>1996 |
$ 15,093 |
$ 0 |
$ 5,548 |
$ 20,641 |
$ 21,383 |
$ 22,591 |
$ 12,040</R> |
|
<R>1995 |
$ 13,168 |
$ 0 |
$ 4,238 |
$ 17,406 |
$ 18,344 |
$ 18,819 |
$ 11,695</R> |
|
<R>1994 |
$ 11,464 |
$ 0 |
$ 3,448 |
$ 14,912 |
$ 14,546 |
$ 14,660 |
$ 11,380</R> |
|
<R>1993 |
$ 10,733 |
$ 0 |
$ 2,672 |
$ 13,405 |
$ 13,833 |
$ 13,412 |
$ 11,074</R> |
|
<R>1992 |
$ 9,559 |
$ 0 |
$ 1,168 |
$ 10,727 |
$ 12,720 |
$ 12,485 |
$ 10,775</R> |
|
<R>1991 |
$ 9,385 |
$ 0 |
$ 391 |
$ 9,776 |
$ 11,276 |
$ 10,801 |
$ 10,445</R> |
Explanatory Notes: With an initial investment of $10,000 in Class A of Advisor Natural Resources on August 1, 1990, assuming the maximum sales charge had been in effect, the net amount invested in Class A shares was $9,425. The cost of the initial investment ($10,000) together with the aggregate cost of reinvested dividends and capital gain distributions for the period covered (their cash value at the time they were reinvested) amounted to $<R>20,006</R>. If distributions had not been reinvested, the amount of distributions earned from the class over time would have been smaller, and cash payments for the period would have amounted to $<R>181</R> for dividends and $<R>7,171</R> for capital gain distributions. The figures in the table do not include the effect of the fund's 1.00% short-term trading fee applicable to shares held less than 60 days. Initial offering of Class A took place on September 3, 1996. Class A returns prior to September 3, 1996 are those of Class T which reflect a 12b-1 fee of 0.50% (0.65% prior to January 1, 1996). If Class A's 12b-1 fee had been reflected, total returns prior to September 3, 1996 would have been higher.<R></R>
During the 10-year period ended July 31, 2000, a hypothetical $10,000 investment in Class T of Advisor Natural Resources would have grown to $<R>29,895</R>, including the effect of Class T's maximum sales charge.<R></R>
|
ADVISOR NATURAL RESOURCES - CLASS T |
INDEXES |
||||||
|
Fiscal Year Ended |
Value of |
Value of |
Value of |
Total |
S&P 500 |
DJIA |
Cost of |
|
<R>2000 |
$ 16,724 |
$ 50 |
$ 13,121 |
$ 29,895 |
$ 50,831 |
$ 45,998 |
$ 13,236</R> |
|
<R>1999 |
$ 15,255 |
$ 33 |
$ 11,967 |
$ 27,255 |
$ 46,645 |
$ 45,874 |
$ 12,784</R> |
|
<R>1998 |
$ 13,125 |
$ 15 |
$ 9,327 |
$ 22,467 |
$ 38,805 |
$ 37,633 |
$ 12,515</R> |
|
<R>1997 |
$ 18,091 |
$ 21 |
$ 8,226 |
$ 26,338 |
$ 32,531 |
$ 34,261 |
$ 12,308</R> |
|
<R>1996 |
$ 15,454 |
$ 0 |
$ 5,680 |
$ 21,134 |
$ 21,383 |
$ 22,591 |
$ 12,040</R> |
|
<R>1995 |
$ 13,483 |
$ 0 |
$ 4,339 |
$ 17,822 |
$ 18,344 |
$ 18,819 |
$ 11,695</R> |
|
<R>1994 |
$ 11,738 |
$ 0 |
$ 3,530 |
$ 15,268 |
$ 14,546 |
$ 14,660 |
$ 11,380</R> |
|
<R>1993 |
$ 10,989 |
$ 0 |
$ 2,736 |
$ 13,725 |
$ 13,833 |
$ 13,412 |
$ 11,074</R> |
|
<R>1992 |
$ 9,787 |
$ 0 |
$ 1,196 |
$ 10,983 |
$ 12,720 |
$ 12,485 |
$ 10,775</R> |
|
<R>1991 |
$ 9,609 |
$ 0 |
$ 401 |
$ 10,010 |
$ 11,276 |
$ 10,801 |
$ 10,445</R> |
Explanatory Notes: With an initial investment of $10,000 in Class T of Advisor Natural Resources on August 1, 1990, assuming the maximum sales charge had been in effect, the net amount invested in Class T shares was $9,650. The cost of the initial investment ($10,000) together with the aggregate cost of reinvested dividends and capital gain distributions for the period covered (their cash value at the time they were reinvested) amounted to $<R>19,926</R>. If distributions had not been reinvested, the amount of distributions earned from the class over time would have been smaller, and cash payments for the period would have amounted to $<R>27</R> for dividends and $<R>7,315</R> for capital gain distributions. The figures in the table do not include the effect of the fund's 1.00% short-term trading fee applicable to shares held less than 60 days.<R></R>
During the 10-year period ended July 31, <R>2000</R>, a hypothetical $10,000 investment in Class B of Advisor Natural Resources would have grown to <R>$30,076</R>.
|
ADVISOR NATURAL RESOURCES - CLASS B |
INDEXES |
||||||
|
Fiscal Year Ended |
Value of |
Value of |
Value of |
Total |
S&P 500 |
DJIA |
Cost of |
|
<R>2000 |
$ 16,918 |
$ 0 |
$ 13,158 |
$ 30,076 |
$ 50,831 |
$ 45,998 |
$ 13,236</R> |
|
<R>1999 |
$ 15,502 |
$ 0 |
$ 12,056 |
$ 27,558 |
$ 46,645 |
$ 45,874 |
$ 12,784</R> |
|
<R>1998 |
$ 13,388 |
$ 0 |
$ 9,468 |
$ 22,856 |
$ 38,805 |
$ 37,633 |
$ 12,515</R> |
|
<R>1997 |
$ 18,498 |
$ 0 |
$ 8,430 |
$ 26,928 |
$ 32,531 |
$ 34,261 |
$ 12,308</R> |
|
<R>1996 |
$ 15,886 |
$ 0 |
$ 5,841 |
$ 21,727 |
$ 21,383 |
$ 22,591 |
$ 12,040</R> |
|
<R>1995 |
$ 13,964 |
$ 0 |
$ 4,495 |
$ 18,459 |
$ 18,344 |
$ 18,819 |
$ 11,695</R> |
|
<R>1994 |
$ 12,164 |
$ 0 |
$ 3,658 |
$ 15,822 |
$ 14,546 |
$ 14,660 |
$ 11,380</R> |
|
<R>1993 |
$ 11,388 |
$ 0 |
$ 2,835 |
$ 14,223 |
$ 13,833 |
$ 13,412 |
$ 11,074</R> |
|
<R>1992 |
$ 10,142 |
$ 0 |
$ 1,240 |
$ 11,382 |
$ 12,720 |
$ 12,485 |
$ 10,775</R> |
|
<R>1991 |
$ 9,957 |
$ 0 |
$ 416 |
$ 10,373 |
$ 11,276 |
$ 10,801 |
$ 10,445</R> |
Explanatory Notes: With an initial investment of $10,000 in Class B of Advisor Natural Resources on August 1, 1990, the net amount invested in Class B shares was $10,000. The cost of the initial investment ($10,000) together with the aggregate cost of reinvested dividends and capital gain distributions for the period covered (their cash value at the time they were reinvested) amounted to $<R>20,070</R>. If distributions had not been reinvested, the amount of distributions earned from the class over time would have been smaller, and cash payments for the period would have amounted to $<R>0</R> for dividends and $<R>7,473</R> for capital gain distributions. The figures in the table do not include the effect of the fund's 1.00% short-term trading fee applicable to shares held less than 60 days. Initial offering of Class B took place on July 3, 1995. Class B returns prior to July 3, 1995 are those of Class T which reflect a 12b-1 fee of 0.65%. If Class B's 12b-1 fee had been reflected, total returns prior to July 3, 1995 would have been lower.
During the 10-year period ended July 31,<R> 2000</R>, a hypothetical $10,000 investment in Class C of Advisor Natural Resources would have grown to $<R>30,008</R>.
|
ADVISOR NATURAL RESOURCES - CLASS C |
INDEXES |
||||||
|
Fiscal Year Ended |
Value of |
Value of |
Value of |
Total |
S&P 500 |
DJIA |
Cost of |
|
<R>2000 |
$ 16,766 |
$ 74 |
$ 13,168 |
$ 30,008 |
$ 50,831 |
$ 45,998 |
$ 13,236</R> |
|
<R>1999 |
$ 15,390 |
$ 16 |
$ 12,088 |
$ 27,494 |
$ 46,645 |
$ 45,874 |
$ 12,784</R> |
|
<R>1998 |
$ 13,312 |
$ 0 |
$ 9,464 |
$ 22,776 |
$ 38,805 |
$ 37,633 |
$ 12,515</R> |
|
<R>1997 |
$ 18,498 |
$ 0 |
$ 8,430 |
$ 26,928 |
$ 32,531 |
$ 34,261 |
$ 12,308</R> |
|
<R>1996 |
$ 15,886 |
$ 0 |
$ 5,841 |
$ 21,727 |
$ 21,383 |
$ 22,591 |
$ 12,040</R> |
|
<R>1995 |
$ 13,964 |
$ 0 |
$ 4,495 |
$ 18,459 |
$ 18,344 |
$ 18,819 |
$ 11,695</R> |
|
<R>1994 |
$ 12,164 |
$ 0 |
$ 3,658 |
$ 15,822 |
$ 14,546 |
$ 14,660 |
$ 11,380</R> |
|
<R>1993 |
$ 11,388 |
$ 0 |
$ 2,835 |
$ 14,223 |
$ 13,833 |
$ 13,412 |
$ 11,074</R> |
|
<R>1992 |
$ 10,142 |
$ 0 |
$ 1,240 |
$ 11,382 |
$ 12,720 |
$ 12,485 |
$ 10,775</R> |
|
<R>1991 |
$ 9,957 |
$ 0 |
$ 416 |
$ 10,373 |
$ 11,276 |
$ 10,801 |
$ 10,445</R> |
Explanatory Notes: With an initial investment of $10,000 in Class C of Advisor Natural Resources on August 1, 1990, the net amount invested in Class C shares was $10,000. The cost of the initial investment ($10,000) together with the aggregate cost of reinvested dividends and capital gain distributions for the period covered (their cash value at the time they were reinvested) amounted to $<R>20,221</R>. If distributions had not been reinvested, the amount of distributions earned from the class over time would have been smaller, and cash payments for the period would have amounted to $<R>35</R> for dividends and $<R>7,526</R> for capital gain distributions. The figures in the table do not include the effect of the fund's 1.00% short-term trading fee applicable to shares held less than 60 days. Initial offering of Class C took place on November 3, 1997. Class C returns from November 3, 1997 through July 3, 1995 are those of Class B which reflect a 12b-1 fee of 1.00%. Class C returns prior to July 3, 1995 are those of Class T which reflect a 12b-1 fee of 0.65%. If Class C's 12b-1 fee had been reflected, total returns prior to July 3, 1995 would have been lower.
During the 10-year period ended July 31, <R>2000</R>, a hypothetical $10,000 investment in Institutional Class of Advisor Natural Resources would have grown to $<R>31,620</R>.
|
ADVISOR NATURAL RESOURCES - INSTITUTIONAL CLASS |
INDEXES |
||||||
|
Fiscal Year Ended |
Value of |
Value of |
Value of |
Total |
S&P 500 |
DJIA |
Cost of |
|
<R>2000 |
$ 17,388 |
$ 511 |
$ 13,721 |
$ 31,620 |
$ 50,831 |
$ 45,998 |
$ 13,236</R> |
|
<R>1999 |
$ 15,858 |
$ 293 |
$ 12,514 |
$ 28,665 |
$ 46,645 |
$ 45,874 |
$ 12,784</R> |
|
<R>1998 |
$ 13,630 |
$ 136 |
$ 9,740 |
$ 23,506 |
$ 38,805 |
$ 37,633 |
$ 12,515</R> |
|
<R>1997 |
$ 18,804 |
$ 73 |
$ 8,548 |
$ 27,425 |
$ 32,531 |
$ 34,261 |
$ 12,308</R> |
|
<R>1996 |
$ 16,028 |
$ 0 |
$ 5,891 |
$ 21,919 |
$ 21,383 |
$ 22,591 |
$ 12,040</R> |
|
<R>1995 |
$ 13,979 |
$ 0 |
$ 4,499 |
$ 18,478 |
$ 18,344 |
$ 18,819 |
$ 11,695</R> |
|
<R>1994 |
$ 12,164 |
$ 0 |
$ 3,658 |
$ 15,822 |
$ 14,546 |
$ 14,660 |
$ 11,380</R> |
|
<R>1993 |
$ 11,388 |
$ 0 |
$ 2,835 |
$ 14,223 |
$ 13,833 |
$ 13,412 |
$ 11,074</R> |
|
<R>1992 |
$ 10,142 |
$ 0 |
$ 1,240 |
$ 11,382 |
$ 12,720 |
$ 12,485 |
$ 10,775</R> |
|
<R>1991 |
$ 9,957 |
$ 0 |
$ 416 |
$ 10,373 |
$ 11,276 |
$ 10,801 |
$ 10,445</R> |
Explanatory Notes: With an initial investment of $10,000 in Institutional Class of Advisor Natural Resources on September 3, 1996, the net amount invested in Institutional Class shares was $10,000. The cost of the initial investment ($10,000) together with the aggregate cost of reinvested dividends and capital gain distributions for the period covered (their cash value at the time they were reinvested) amounted to $<R>20,746</R>. If distributions had not been reinvested, the amount of distributions earned from the class over time would have been smaller, and cash payments for the period would have amounted to $<R>263</R> for dividends and $<R>7,616</R> for capital gain distributions. The figures in the table do not include the effect of the fund's 1.00% short-term trading fee applicable to shares held less than 60 days. Initial offering of Institutional Class took place on July 3, 1995. Institutional Class returns prior to July 3, 1995 are those of Class T which reflect a 0.65% 12b-1 fee. If Class T's 12b-1 fee had not been reflected, total returns prior to July 3, 1995 would have been higher.
During the period from September 3, 1996 (commencement of operations) to July 31, <R>2000,</R> a hypothetical $10,000 investment in Class A of Advisor Technology would have grown to $<R>40,666</R>, including the effect of Class A's maximum sales charge.
|
ADVISOR TECHNOLOGY - CLASS A |
INDEXES |
||||||
|
Fiscal Year Ended |
Value of |
Value of |
Value of |
Total |
S&P 500 |
DJIA |
Cost of |
|
<R>2000 |
$ 34,147 |
$ 0 |
$ 6,519 |
$ 40,666 |
$ 23,180 |
$ 19,891 |
$ 10,973</R> |
|
<R>1999 |
$ 23,515 |
$ 0 |
$ 2,934 |
$ 26,449 |
$ 21,270 |
$ 19,837 |
$ 10,598</R> |
|
<R>1998 |
$ 14,024 |
$ 0 |
$ 1,750 |
$ 15,774 |
$ 17,695 |
$ 16,274 |
$ 10,375</R> |
|
<R>1997* |
$ 15,042 |
$ 0 |
$ 96 |
$ 15,138 |
$ 14,835 |
$ 14,816 |
$ 10,203</R> |
* From September 3, 1996 (commencement of operations).
** From month-end closest to initial investment date.
Explanatory Notes: With an initial investment of $10,000 in Class A of Advisor Technology on September 3, 1996, assuming the maximum sales charge had been in effect, the net amount invested in Class A shares was $9,425. The cost of the initial investment ($10,000) together with the aggregate cost of reinvested dividends and capital gain distributions for the period covered (their cash value at the time they were reinvested) amounted to $<R>13,312</R>. If distributions had not been reinvested, the amount of distributions earned from the class over time would have been smaller, and cash payments for the period would have amounted to $<R>0</R> for dividends and $<R>3,063</R> for capital gain distributions. The figures in the table do not include the effect of the fund's 1.00% short-term trading fee applicable to shares held less than 60 days.<R></R>
During the period from September 3, 1996 (commencement of operations) to July 31,<R> 2000</R>, a hypothetical $10,000 investment in Class T of Advisor Technology would have grown to $<R>41,183</R>, including the effect of Class T's maximum sales charge.
|
ADVISOR TECHNOLOGY - CLASS T |
INDEXES |
||||||
|
Fiscal Year Ended |
Value of |
Value of |
Value of |
Total |
S&P 500 |
DJIA |
Cost of |
|
<R>2000 |
$ 34,692 |
$ 0 |
$ 6,491 |
$ 41,183 |
$ 23,180 |
$ 19,891 |
$ 10,973</R> |
|
<R>1999 |
$ 23,893 |
$ 0 |
$ 2,952 |
$ 26,845 |
$ 21,270 |
$ 19,837 |
$ 10,598</R> |
|
<R>1998 |
$ 14,282 |
$ 0 |
$ 1,764 |
$ 16,046 |
$ 17,695 |
$ 16,274 |
$ 10,375</R> |
|
<R>1997* |
$ 15,353 |
$ 0 |
$ 98 |
$ 15,451 |
$ 14,835 |
$ 14,816 |
$ 10,203</R> |
* From September 3, 1996 (commencement of operations).
** From month-end closest to initial investment date.
Explanatory Notes: With an initial investment of $10,000 in Class T of Advisor Technology on September 3, 1996, assuming the maximum sales charge had been in effect, the net amount invested in Class T shares was $9,650. The cost of the initial investment ($10,000) together with the aggregate cost of reinvested dividends and capital gain distributions for the period covered (their cash value at the time they were reinvested) amounted to $<R>13,291</R>. If distributions had not been reinvested, the amount of distributions earned from the class over time would have been smaller, and cash payments for the period would have amounted to $<R>0</R> for dividends and $<R>3,049</R> for capital gain distributions. The figures in the table do not include the effect of the fund's 1.00% short-term trading fee applicable to shares held less than 60 days.<R></R>
During the period from September 3, 1996 (commencement of operations) to July 31,<R> 2000</R>, a hypothetical $10,000 investment in Class B of Advisor Technology would have grown to $<R>41,619</R>, including the effect of Class B's maximum CDSC.
|
ADVISOR TECHNOLOGY - CLASS B |
INDEXES |
||||||
|
Fiscal Year Ended |
Value of |
Value of |
Value of |
Total |
S&P 500 |
DJIA |
Cost of |
|
<R>2000 |
$ 35,330 |
$ 0 |
$ 6,589 |
$ 41,619 |
$ 23,180 |
$ 19,891 |
$ 10,973</R> |
|
<R>1999 |
$ 24,440 |
$ 0 |
$ 3,036 |
$ 27,476 |
$ 21,270 |
$ 19,837 |
$ 10,598</R> |
|
<R>1998 |
$ 14,680 |
$ 0 |
$ 1,823 |
$ 16,503 |
$ 17,695 |
$ 16,274 |
$ 10,375</R> |
|
<R>1997* |
$ 15,880 |
$ 0 |
$ 101 |
$ 15,981 |
$ 14,835 |
$ 14,816 |
$ 10,203</R> |
* From September 3, 1996 (commencement of operations).
** From month-end closest to initial investment date.
Explanatory Notes: With an initial investment of $10,000 in Class B of Advisor Technology on September 3, 1996, the net amount invested in Class B shares was $10,000. The cost of the initial investment ($10,000) together with the aggregate cost of reinvested dividends and capital gain distributions for the period covered (their cash value at the time they were reinvested) amounted to $<R>13,352</R>. If distributions had not been reinvested, the amount of distributions earned from the class over time would have been smaller, and cash payments for the period would have amounted to $<R>0</R> for dividends and $<R>3,110</R> for capital gain distributions. The figures in the table do not include the effect of the fund's 1.00% short-term trading fee applicable to shares held less than 60 days. Initial offering of Class B took place on March 3, 1997. Class B returns prior to March 3, 1997 are those of Class T which reflect a 12b-1 fee of 0.50%. If Class B's 12b-1 fee had been reflected, total returns prior to March 3, 1997 would have been lower.
During the period from September 3, 1996 (commencement of operations) to July 31, <R>2000</R>, a hypothetical $10,000 investment in Class C of Advisor Technology would have grown to $<R>41,900</R>.
|
ADVISOR TECHNOLOGY - CLASS C |
INDEXES |
||||||
|
Fiscal Year Ended |
Value of |
Value of |
Value of |
Total |
S&P 500 |
DJIA |
Cost of |
|
<R>2000 |
$ 35,241 |
$ 0 |
$ 6,659 |
$ 41,900 |
$ 23,180 |
$ 19,891 |
$ 10,973</R> |
|
<R>1999 |
$ 24,387 |
$ 0 |
$ 3,069 |
$ 27,456 |
$ 21,270 |
$ 19,837 |
$ 10,598</R> |
|
<R>1998 |
$ 14,638 |
$ 0 |
$ 1,843 |
$ 16,481 |
$ 17,695 |
$ 16,274 |
$ 10,375</R> |
|
<R>1997* |
$ 15,880 |
$ 0 |
$ 101 |
$ 15,981 |
$ 14,835 |
$ 14,816 |
$ 10,203</R> |
* From September 3, 1996 (commencement of operations).
** From month-end closest to initial investment date.
Explanatory Notes: With an initial investment of $10,000 in Class C of Advisor Technology on September 3, 1996, the net amount invested in Class C shares was $10,000. The cost of the initial investment ($10,000) together with the aggregate cost of reinvested dividends and capital gain distributions for the period covered (their cash value at the time they were reinvested) amounted to $<R>13,389</R>. If distributions had not been reinvested, the amount of distributions earned from the class over time would have been smaller, and cash payments for the period would have amounted to $<R>0</R> for dividends and $<R>3,141</R> for capital gain distributions. The figures in the table do not include the effect of the fund's 1.00% short-term trading fee applicable to shares held less than 60 days. Initial offering of Class C took place on November 3, 1997. Class C returns from November 3, 1997 through March 3, 1997 are those of Class B which reflect a 12b-1 fee of 1.00%. Class C returns prior to March 3, 1997 are those of Class T which reflect a 12b-1 fee of 0.50%. If Class C's 12b-1 fee had been reflected, total returns prior to March 3, 1997 would have been lower.
During the period from September 3, 1996 (commencement of operations) to July 31, 2000, a hypothetical $10,000 investment in Institutional Class of Advisor Technology would have grown to $<R>43,519</R>.<R></R>
|
ADVISOR TECHNOLOGY - INSTITUTIONAL CLASS |
INDEXES |
||||||
|
Fiscal Year Ended |
Value of |
Value of |
Value of |
Total |
S&P 500 |
DJIA |
Cost of |
|
<R>2000 |
$ 36,430 |
$ 0 |
$ 7,089 |
$ 43,519 |
$ 23,180 |
$ 19,891 |
$ 10,973</R> |
|
<R>1999 |
$ 25,050 |
$ 0 |
$ 3,180 |
$ 28,230 |
$ 21,270 |
$ 19,837 |
$ 10,598</R> |
|
<R>1998 |
$ 14,890 |
$ 0 |
$ 1,890 |
$ 16,780 |
$ 17,695 |
$ 16,274 |
$ 10,375</R> |
|
<R>1997* |
$ 15,980 |
$ 0 |
$ 115 |
$ 16,095 |
$ 14,835 |
$ 14,816 |
$ 10,203</R> |
* From September 3, 1996 (commencement of operations).
** From month-end closest to initial investment date.
Explanatory Notes: With an initial investment of $10,000 in Institutional Class of Advisor Technology on September 3, 1996, the net amount invested in Institutional Class shares was $10,000. The cost of the initial investment ($10,000) together with the aggregate cost of reinvested dividends and capital gain distributions for the period covered (their cash value at the time they were reinvested) amounted to $<R>13,596</R>. If distributions had not been reinvested, the amount of distributions earned from the class over time would have been smaller, and cash payments for the period would have amounted to $<R>0</R> for dividends and $<R>3,320</R> for capital gain distributions. The figures in the table do not include the effect of the fund's 1.00% short-term trading fee applicable to shares held less than 60 days.
During the period from September 3, 1996 (commencement of operations) to July 31<R>, 2000</R>, a hypothetical $10,000 investment in Class A of <R>Advisor Telecommunications &</R> Utilities Growth would have grown to $<R>25,433</R>, including the effect of Class A's maximum sales charge.
|
<R>ADVISOR TELECOMMUNICATIONS & UTILITIES GROWTH - CLASS A |
INDEXES</R> |
||||||
|
Fiscal Year Ended |
Value of |
Value of |
Value of |
Total |
S&P 500 |
DJIA |
Cost of |
|
<R>2000 |
$ 19,868 |
$ 192 |
$ 5,373 |
$ 25,433 |
$ 23,180 |
$ 19,891 |
$ 10,973</R> |
|
<R>1999 |
$ 19,142 |
$ 127 |
$ 3,938 |
$ 23,207 |
$ 21,270 |
$ 19,837 |
$ 10,598</R> |
|
<R>1998 |
$ 15,080 |
$ 100 |
$ 1,536 |
$ 16,716 |
$ 17,695 |
$ 16,274 |
$ 10,375</R> |
|
<R>1997* |
$ 12,318 |
$ 34 |
$ 123 |
$ 12,475 |
$ 14,835 |
$ 14,816 |
$ 10,203</R> |
* From September 3, 1996 (commencement of operations).
** From month-end closest to initial investment date.
Explanatory Notes: With an initial investment of $10,000 in Class A of Advisor Telecommunications & Utilities Growth on September 3, 1996, assuming the maximum sales charge had been in effect, the net amount invested in Class A shares was $9,425. The cost of the initial investment ($10,000) together with the aggregate cost of reinvested dividends and capital gain distributions for the period covered (their cash value at the time they were reinvested) amounted to $<R>13,829</R>. If distributions had not been reinvested, the amount of distributions earned from the class over time would have been smaller, and cash payments for the period would have amounted to $<R>123</R> for dividends and $<R>3,318</R> for capital gain distributions. The figures in the table do not include the effect of the fund's 1.00% short-term trading fee applicable to shares held less than 60 days.<R></R><R></R>
During the period from September 3, 1996 (commencement of operations) to July 31,<R> 2000</R>, a hypothetical $10,000 investment in Class T of <R>Advisor Telecommunications &</R> Utilities Growth would have grown to $<R>25,792</R>, including the effect of Class T's maximum sales charge.
|
<R>ADVISOR TELECOMMUNICATIONS & UTILITIES GROWTH - CLASS T |
INDEXES</R> |
||||||
|
Fiscal Year Ended |
Value of |
Value of |
Value of |
Total |
S&P 500 |
DJIA |
Cost of |
|
<R>2000 |
$ 20,275 |
$ 115 |
$ 5,402 |
$ 25,792 |
$ 23,180 |
$ 19,891 |
$ 10,973</R> |
|
<R>1999 |
$ 19,522 |
$ 100 |
$ 3,953 |
$ 23,575 |
$ 21,270 |
$ 19,837 |
$ 10,598</R> |
|
<R>1998 |
$ 15,392 |
$ 78 |
$ 1,557 |
$ 17,027 |
$ 17,695 |
$ 16,274 |
$ 10,375</R> |
|
<R>1997* |
$ 12,574 |
$ 34 |
$ 126 |
$ 12,734 |
$ 14,835 |
$ 14,816 |
$ 10,203</R> |
* From September 3, 1996 (commencement of operations).
** From month-end closest to initial investment date.
Explanatory Notes: With an initial investment of $10,000 in Class T of Advisor Telecommunications & Utilities Growth on September 3, 1996, assuming the maximum sales charge had been in effect, the net amount invested in Class T shares was $9,650. The cost of the initial investment ($10,000) together with the aggregate cost of reinvested dividends and capital gain distributions for the period covered (their cash value at the time they were reinvested) amounted to $<R>13,790</R>. If distributions had not been reinvested, the amount of distributions earned from the class over time would have been smaller, and cash payments for the period would have amounted to $<R>68</R> for dividends and $<R>3,349</R> for capital gain distributions. The figures in the table do not include the effect of the fund's 1.00% short-term trading fee applicable to shares held less than 60 days.<R></R><R></R>
During the period from September 3, 1996 (commencement of operations) to July 31,<R> 2000</R>, a hypothetical $10,000 investment in Class B of <R>Advisor Telecommunications &</R> Utilities Growth would have grown to $<R>26,253</R>, including the effect of Class B's maximum CDSC.
|
<R>ADVISOR TELECOMMUNICATIONS & UTILITIES GROWTH - CLASS B |
INDEXES</R> |
||||||
|
Fiscal Year Ended |
Value of |
Value of |
Value of |
Total |
S&P 500 |
DJIA |
Cost of |
|
<R>2000 |
$ 20,720 |
$ 122 |
$ 5,411 |
$ 26,253 |
$ 23,180 |
$ 19,891 |
$ 10,973</R> |
|
<R>1999 |
$ 20,020 |
$ 117 |
$ 3,998 |
$ 24,135 |
$ 21,270 |
$ 19,837 |
$ 10,598</R> |
|
<R>1998 |
$ 15,830 |
$ 93 |
$ 1,597 |
$ 17,520 |
$ 17,695 |
$ 16,274 |
$ 10,375</R> |
|
<R>1997* |
$ 13,010 |
$ 35 |
$ 130 |
$ 13,175 |
$ 14,835 |
$ 14,816 |
$ 10,203</R> |
* From September 3, 1996 (commencement of operations).
** From month-end closest to initial investment date.
Explanatory Notes: With an initial investment of $10,000 in Class B of Advisor Telecommunications & Utilities Growth on September 3, 1996, the net amount invested in Class B shares was $10,000. The cost of the initial investment ($10,000) together with the aggregate cost of reinvested dividends and capital gain distributions for the period covered (their cash value at the time they were reinvested) amounted to $<R>13,805</R>. If distributions had not been reinvested, the amount of distributions earned from the class over time would have been smaller, and cash payments for the period would have amounted to $<R>70</R> for dividends and $<R>3,370</R> for capital gain distributions. The figures in the table do not include the effect of the fund's 1.00% short-term trading fee applicable to shares held less than 60 days. Initial offering of Class B took place on March 3, 1997. Class B returns prior to March 3, 1997 are those of Class T which reflect a 12b-1 fee of 0.50%. If Class B's 12b-1 fee had been reflected, total returns prior to March 3, 1997 would have been lower.<R></R>
During the period from September 3, 1996 (commencement of operations) to July 31, 2000, a hypothetical $10,000 investment in Class C of Advisor Telecommunications & Utilities Growth would have grown to $<R>26,269</R>.<R></R><R></R>
|
<R>ADVISOR TELECOMMUNICATIONS & UTILITIES GROWTH - CLASS C |
INDEXES</R> |
||||||
|
Fiscal Year Ended |
Value of |
Value of |
Value of |
Total |
S&P 500 |
DJIA |
Cost of |
|
<R>2000 |
$ 20,636 |
$ 152 |
$ 5,481 |
$ 26,269 |
$ 23,180 |
$ 19,891 |
$ 10,973</R> |
|
<R>1999 |
$ 19,938 |
$ 147 |
$ 4,051 |
$ 24,136 |
$ 21,270 |
$ 19,837 |
$ 10,598</R> |
|
<R>1998 |
$ 15,793 |
$ 117 |
$ 1,615 |
$ 17,525 |
$ 17,695 |
$ 16,274 |
$ 10,375</R> |
|
<R>1997* |
$ 13,010 |
$ 35 |
$ 130 |
$ 13,175 |
$ 14,835 |
$ 14,816 |
$ 10,203</R> |
* From September 3, 1996 (commencement of operations).
** From month-end closest to initial investment date.
Explanatory Notes: With an initial investment of $10,000 in Class C of Advisor Telecommunications & Utilities Growth on September 3, 1996, the net amount invested in Class C shares was $10,000. The cost of the initial investment ($10,000) together with the aggregate cost of reinvested dividends and capital gain distributions for the period covered (their cash value at the time they were reinvested) amounted to $<R>13,876</R>. If distributions had not been reinvested, the amount of distributions earned from the class over time would have been smaller, and cash payments for the period would have amounted to $<R>90</R> for dividends and $<R>3,408</R> for capital gain distributions. The figures in the table do not include the effect of the fund's 1.00% short-term trading fee applicable to shares held less than 60 days. Initial offering of Class C took place on November 3, 1997. Class C returns from November 3, 1997 through March 3, 1997 are those of Class B which reflect a 12b-1 fee of 1.00%. Class C returns prior to March 3, 1997 are those of Class T which reflect a 12b-1 fee of 0.50%. If Class C's 12b-1 fee had been reflected, total returns prior to March 3, 1997 would have been lower.<R></R>
During the period from September 3, 1996 (commencement of operations) to July 31, 2000, a hypothetical $10,000 investment in Institutional Class of Advisor Telecommunications & Utilities Growth would have grown to $<R>27,301</R>.<R></R><R></R>
|
<R>ADVISOR TELECOMMUNICATIONS & UTILITIES GROWTH - INSTITUTIONAL CLASS |
INDEXES</R> |
||||||
|
Fiscal Year Ended |
Value of |
Value of |
Value of |
Total |
S&P 500 |
DJIA |
Cost of |
|
<R>2000 |
$ 21,190 |
$ 366 |
$ 5,745 |
$ 27,301 |
$ 23,180 |
$ 19,891 |
$ 10,973</R> |
|
<R>1999 |
$ 20,380 |
$ 251 |
$ 4,203 |
$ 24,834 |
$ 21,270 |
$ 19,837 |
$ 10,598</R> |
|
<R>1998 |
$ 16,020 |
$ 170 |
$ 1,636 |
$ 17,826 |
$ 17,695 |
$ 16,274 |
$ 10,375</R> |
|
<R>1997* |
$ 13,090 |
$ 47 |
$ 131 |
$ 13,268 |
$ 14,835 |
$ 14,816 |
$ 10,203</R> |
* From September 3, 1996 (commencement of operations).
** From month-end closest to initial investment date.
Explanatory Notes: With an initial investment of $10,000 in Institutional Class of Advisor Telecommunications & Utilities Growth on September 3, 1996, the net amount invested in Institutional Class shares was $10,000. The cost of the initial investment ($10,000) together with the aggregate cost of reinvested dividends and capital gain distributions for the period covered (their cash value at the time they were reinvested) amounted to $<R>14,190</R>. If distributions had not been reinvested, the amount of distributions earned from the class over time would have been smaller, and cash payments for the period would have amounted to $<R>230</R> for dividends and $<R>3,520</R> for capital gain distributions. The figures in the table do not include the effect of the fund's 1.00% short-term trading fee applicable to shares held less than 60 days.<R></R>
Performance Comparisons. A class's performance may be compared to the performance of other mutual funds in general, or to the performance of particular types of mutual funds. These comparisons may be expressed as mutual fund rankings prepared by Lipper Inc. (Lipper), an independent service located in Summit, New Jersey that monitors the performance of mutual funds. Generally, Lipper rankings are based on return, assume reinvestment of distributions, do not take sales charges or trading fees into consideration, and are prepared without regard to tax consequences. In addition to the mutual fund rankings, a class's performance may be compared to stock, bond, and money market mutual fund performance indexes prepared by Lipper or other organizations. When comparing these indexes, it is important to remember the risk and return characteristics of each type of investment. For example, while stock mutual funds may offer higher potential returns, they also carry the highest degree of share price volatility. Likewise, money market funds may offer greater stability of principal, but generally do not offer the higher potential returns available from stock mutual funds.
From time to time, a class's performance may also be compared to other mutual funds tracked by financial or business publications and periodicals. For example, a class may quote Morningstar, Inc. in its advertising materials. Morningstar, Inc. is a mutual fund rating service that rates mutual funds on the basis of risk-adjusted performance. Rankings that compare the performance of Fidelity funds to one another in appropriate categories over specific periods of time may also be quoted in advertising.
A class's performance may also be compared to that of each index representing the universe of securities in which the fund may invest. The return of each index reflects reinvestment of all dividends and capital gains paid by securities included in each index. Unlike a class's returns, however, each index's returns do not reflect brokerage commissions, transaction fees, or other costs of investing directly in the securities included in the index.
Each fund may compare its performance to that of the Standard & Poor's 500 Index, a market capitalization-weighted index of common stocks.
Advisor Consumer Industries may also compare its performance to that of the Goldman Sachs Consumer Industries Index, a market capitalization-weighted index of <R>295</R> stocks designed to measure the performance of companies in the consumer industries sector. Issues in the index include providers of consumer services and products, including producers of beverages-alcoholic and non-alcoholic, food, personal care, household products and tobacco companies.
Advisor Cyclical Industries may also compare its performance to that of the Goldman Sachs Cyclical Industries Index, a market capitalization-weighted index of <R>253</R> stocks designed to measure the performance of companies in the cyclical industries sector. Issues in the index include providers of consumer and commercial goods and services where performance is influenced by the cyclicality of economy, such as: manufacturers of automobiles and companies involved with construction of residential and commercial properties, producers of chemicals, electrical equipment and components, and providers of environmental services.
Advisor Financial Services may also compare its performance to that of the Goldman Sachs Financial Services Index, a market capitalization-weighted index of <R>256</R> stocks designed to measure the performance of companies in the financial services sector. Issues in the index include financial institutions providing banking services, brokerage firms and asset managers, insurance companies, and real estate holding and development companies.
Advisor Health Care may also compare its performance to that of the Goldman Sachs Health Care Index, a market capitalization-weighted index of <R>113 </R>stocks designed to measure the performance of companies in the health care sector. Issues in the index include providers of health care related services including long-term care and hospital facilities, health care management organizations and continuing care services.
Advisor Natural Resources may also compare its performance to that of the Goldman Sachs Natural Resources Index, a market capitalization-weighted index of <R>112</R> stocks designed to measure the performance of companies in the natural resources sector. Issues in the index include extractive industries including gold & precious metals mining along with other mineral mining, energy companies providing oil & gas services, and owners and operators of timber tracts and forestry services.
Advisor Technology may also compare its performance to that of the Goldman Sachs Technology Index, a market capitalization-weighted index of <R>221 </R>stocks designed to measure the performance of companies in the technology sector. Issues in the index include producers of sophisticated devices, services and software related to the fields of computers, electronics, networking and Internet services.
<R>Advisor Telecommunications &</R> Utilities Growth may also compare its performance to that of the Goldman Sachs Utilities Index, a market capitalization-weighted index of <R>139</R> stocks designed to measure the performance of companies in the utilities sector. Issues in the index include generators and distributors of electricity, distributors of natural gas and water, and providers of telecommunications services.
A class may be compared in advertising to Certificates of Deposit (CDs) or other investments issued by banks or other depository institutions. Mutual funds differ from bank investments in several respects. For example, a fund may offer greater liquidity or higher potential returns than CDs, a fund does not guarantee<R> an investor's</R> principal or return, and fund shares are not FDIC insured.
Fidelity may provide information designed to help individuals understand their investment goals and explore various financial strategies. Such information may include information about current economic, market, and political conditions; materials that describe general principles of investing, such as asset allocation, diversification, risk tolerance, and goal setting; questionnaires designed to help create a personal financial profile; worksheets used to project savings needs based on assumed rates of inflation and hypothetical rates of return; and action plans offering investment alternatives. Materials may also include discussions of Fidelity's asset allocation funds and other Fidelity funds, products, and services.
Ibbotson Associates of Chicago, Illinois (Ibbotson) provides historical returns of the capital markets in the United States, including common stocks, small capitalization stocks, long-term corporate bonds, intermediate-term government bonds, long-term government bonds, Treasury bills, the U.S. rate of inflation (based on the CPI), and combinations of various capital markets. The performance of these capital markets is based on the returns of different indexes.
Fidelity funds may use the performance of these capital markets in order to demonstrate general risk-versus-reward investment scenarios. Performance comparisons may also include the value of a hypothetical investment in any of these capital markets. The risks associated with the security types in any capital market may or may not correspond directly to those of the funds. Ibbotson calculates returns in the same method as the funds. The funds may also compare performance to that of other compilations or indexes that may be developed and made available in the future.
In advertising materials, Fidelity may reference or discuss its products and services, which may include other Fidelity funds; retirement investing; model portfolios or allocations; and saving for college or other goals. In addition, Fidelity may quote or reprint financial or business publications and periodicals, as they relate to current economic and political conditions, fund management, portfolio composition, investment philosophy, investment techniques, the desirability of owning a particular mutual fund, and Fidelity services and products.
Each fund may be advertised as part of certain asset allocation programs involving other Fidelity or non-Fidelity mutual funds. These asset allocation programs may advertise a model portfolio and its performance results.
Each fund may be advertised as part of a no transaction fee (NTF) program in which Fidelity and non-Fidelity mutual funds are offered. An NTF program may advertise performance results.
A class may present its fund number, Quotron(TM) number, and CUSIP number, and discuss or quote the fund's current portfolio manager.
Volatility. A class may quote various measures of volatility and benchmark correlation in advertising. In addition, the class may compare these measures to those of other funds. Measures of volatility seek to compare a class's historical share price fluctuations or returns to those of a benchmark. Measures of benchmark correlation indicate how valid a comparative benchmark may be. All measures of volatility and correlation are calculated using averages of historical data.
Momentum Indicators indicate a class's price movements over specific periods of time. Each point on the momentum indicator represents a class's percentage change in price movements over that period.
A fund may advertise examples of the effects of periodic investment plans, including the principle of dollar cost averaging. In such a program, an investor invests a fixed dollar amount in a fund at periodic intervals, thereby purchasing fewer shares when prices are high and more shares when prices are low. While such a strategy does not assure a profit or guard against loss in a declining market, the investor's average cost per share can be lower than if fixed numbers of shares are purchased at the same intervals. In evaluating such a plan, investors should consider their ability to continue purchasing shares during periods of low price levels.
As of July 31<R>, 2000</R>, FMR advised over $<R>36</R> billion in municipal fund assets, $<R>146</R> billion in taxable fixed-income fund assets, $<R>153</R> billion in money market fund assets, $<R>628</R> billion in equity fund assets, $<R>20</R> billion in international fund assets, and $<R>43 billion in Spartan fund assets. The funds may reference the growth and variety of money market mutual funds and the adviser's inno</R>vation and participation in the industry. The equity funds under management figure represents the largest amount of equity fund assets under management by a mutual fund investment adviser in the United States, making FMR America's leading equity (stock) fund manager. FMR, its subsidiaries, and affiliates maintain a worldwide information and communications network for the purpose of researching and managing investments abroad.
ADDITIONAL PURCHASE, EXCHANGE AND REDEMPTION INFORMATION
Pursuant to Rule 22d-1 under the 1940 Act, Fidelity Distributors Corporation (FDC) exercises its right to waive Class A's and Class T's front-end sales charge on shares acquired through reinvestment of dividends and capital gain distributions or in connection with a fund's merger with or acquisition of any investment company or trust. In addition, FDC has chosen to waive Class A's and Class T's front-end sales charge in certain instances due to sales efficiencies and competitive considerations. The sales charge will not apply:
Class A Shares Only
1. to shares purchased for an employee benefit plan (as defined in the Employee Retirement Income Security Act) (except a SIMPLE IRA, SEP, or SARSEP plan or a plan covering self-employed individuals and their employees (formerly Keogh/H.R. 10 plans)) or a 403(b) program with at least $25 million or more in plan assets;
2. to shares purchased for an employee benefit plan (except a SIMPLE IRA, SEP, or SARSEP plan or a plan covering self-employed individuals and their employees (formerly Keogh/H.R. 10 plans)) or a 403(b) program investing through an insurance company separate account used to fund annuity contracts;
3. to shares purchased for an employee benefit plan (except a SIMPLE IRA, SEP, or SARSEP plan or a plan covering self-employed individuals and their employees (formerly Keogh/H.R. 10 plans)) or a 403(b) program investing through a trust institution, bank trust department or insurance company, or any such institution's broker-dealer affiliate that is not part of an organization primarily engaged in the brokerage business. Employee benefit plans (except SIMPLE IRA, SEP, and SARSEP plans and plans covering self-employed individuals and their employees (formerly Keogh/H.R. 10 plans)) and 403(b) programs that participate in the Advisor Retirement Connection do not qualify for this waiver;
4. to shares purchased for an employee benefit plan (except a SIMPLE IRA, SEP, or SARSEP plan or a plan covering self-employed individuals and their employees (formerly Keogh/H.R. 10 plans)) or a 403(b) program investing through an investment professional sponsored program that requires the participating employee benefit plan to initially invest in Class C or Class B shares and, upon meeting certain criteria, subsequently requires the plan to invest in Class A shares;
5. to shares purchased by a trust institution or bank trust department for a managed account that is charged an asset-based fee. Employee benefit plans (except SIMPLE IRA, SEP, and SARSEP plans and plans covering self-employed individuals and their employees (formerly Keogh/H.R. 10 plans)), 403(b) programs and accounts managed by third parties do not qualify for this waiver;
6. to shares purchased by a broker-dealer for a managed account that is charged an asset-based fee. Employee benefit plans (except SIMPLE IRA, SEP, and SARSEP plans and plans covering self-employed individuals and their employees (formerly Keogh/H.R. 10 plans)) and 403(b) programs do not qualify for this waiver;
7. to shares purchased by a registered investment adviser that is not part of an organization primarily engaged in the brokerage business for an account that is managed on a discretionary basis and is charged an asset-based fee. Employee benefit plans (except SIMPLE IRA, SEP, and SARSEP plans and plans covering self-employed individuals and their employees (formerly Keogh/H.R. 10 plans)) and 403(b) programs do not qualify for this waiver;
8. to shares purchased with proceeds from the sale of front-end load shares of a non-Advisor mutual fund for an account participating in the FundSelect by Nationwide program;
9. to shares purchased by a bank trust officer, registered representative, or other employee (or a member of one of their immediate families) of investment professionals having agreements with FDC.<R> A member of the immediate family of a bank trust officer, a registered representative or other employee of investment professionals having agreements with FDC, is a spouse of one of those individuals, an account for which one of those individuals is acting as custodian for a minor child, and a trust account that is registered for the sole benefit of a minor child of one of those individuals; </R>or
10. to shares purchased by the Fidelity Investments Charitable Gift Fund.
A sales load waiver form must accompany these transactions.
Class T Shares Only
1. to shares purchased for an insurance company separate account used to fund annuity contracts for employee benefit plans (except SIMPLE IRA, SEP, and SARSEP plans and plans covering self-employed individuals and their employees (formerly Keogh/H.R. 10 plans)) or 403(b) programs;
2. to shares purchased by a trust institution or bank trust department for a managed account that is charged an asset-based fee. Accounts managed by third parties do not qualify for this waiver;
3. to shares purchased by a broker-dealer for a managed account that is charged an asset-based fee;
4. to shares purchased by a registered investment adviser that is not part of an organization primarily engaged in the brokerage business for an account that is managed on a discretionary basis and is charged an asset-based fee;
5. to shares purchased for an employee benefit plan (except a SIMPLE IRA, SEP, or SARSEP plan or a plan covering self-employed individuals and their employees (formerly Keogh/H.R. 10 plans)) or a 403(b) program;
6. to shares purchased for a Fidelity or Fidelity Advisor account (including purchases by exchange) with the proceeds of a distribution from (i) an insurance company separate account used to fund annuity contracts for employee benefit plans, 403(b) programs or plans covering sole-proprietors (formerly Keogh/H.R. 10 plans) that are invested in Fidelity Advisor or Fidelity funds or (ii) an employee benefit plan, 403(b) program or plan covering a sole-proprietor (formerly Keogh/H.R. 10 plan) that is invested in Fidelity Advisor or Fidelity funds. (Distributions other than those transferred to an IRA account must be transferred directly into a Fidelity account.);
7. to shares purchased for any state, county, or city, or any governmental instrumentality, department, authority or agency;
8. to shares purchased with redemption proceeds from other mutual fund complexes on which the investor has paid a front-end or contingent deferred sales charge (CDSC);
9. to shares purchased by a current or former Trustee or officer of a Fidelity fund or a current or retired officer, director, or regular employee of FMR Corp. or Fidelity International Limited (FIL) or their direct or indirect subsidiaries (a Fidelity Trustee or employee), the spouse of a Fidelity Trustee or employee, a Fidelity Trustee or employee acting as custodian for a minor child, or a person acting as trustee of a trust for the sole benefit of the minor child of a Fidelity Trustee or employee;
10. to shares purchased by a charitable organization (as defined for purposes of Section 501(c)(3) of the Internal Revenue Code, but excluding the Fidelity Investments Charitable Gift Fund) investing $100,000 or more;
<R>11. to shares purchased by a bank trust officer, registered representative, or other employee (or a member of one of their immediate families) of investment professionals having agreements with FDC. A member of the immediate family of a bank trust officer, a registered representative or other employee of investment professionals having agreements with FDC, is a spouse of one of those individuals, an account for which one of those individuals is acting as custodian for a minor child, and a trust account that is registered for the sole benefit of a minor child of one of those individuals;</R>
12. to shares purchased for a charitable remainder trust or life income pool established for the benefit of a charitable organization (as defined for purposes of Section 501(c)(3) of the Internal Revenue Code);
13. to shares purchased with distributions of income, principal, and capital gains from Fidelity Defined Trusts; or
14. to shares purchased by the Fidelity Investments Charitable Gift Fund.
A sales load waiver form must accompany these transactions.
Class B and Class C Shares Only
The Class B or Class C contingent deferred sales charge (CDSC) will not apply to the redemption of shares:
1. For disability or death, provided that the shares are sold within one year following the death or the initial determination of disability;
2. That are permitted without penalty at age 70 1/2 pursuant to the Internal Revenue Code from retirement plans or accounts (other than of shares purchased on or after February 11, 1999 for Traditional IRAs, Roth IRAs and Rollover IRAs);
3. For disability, payment of death benefits, or minimum required distributions starting at age 70 1/2 from Traditional IRAs, Roth IRAs and Rollover IRAs purchased on or after February 11, 1999;
4. Through the Fidelity Advisor Systematic Withdrawal Program; or
5. (Applicable to Class C only) From an employee benefit plan, 403(b) program or plan covering a sole-proprietor (formerly Keogh/H.R. 10 plan).
A waiver form must accompany these transactions.
Institutional Class Shares Only
Institutional Class shares are offered to:
1. Broker-dealer managed account programs that (i) charge an asset-based fee and (ii) will have at least $1 million invested in the Institutional Class of the Advisor funds. In addition, employee benefit plans, 403(b) programs and plans covering sole-proprietors (formerly Keogh/H.R. 10 plans) must have at least $50 million in plan assets;
2. Registered investment adviser managed account programs, provided the registered investment adviser is not part of an organization primarily engaged in the brokerage business and the program (i) charges an asset-based fee and (ii) will have at least $1 million invested in the Institutional Class of the Advisor funds. In addition, accounts other than an employee benefit plan, 403(b) program or plan covering a sole-proprietor (formerly a Keogh/H.R. 10 plan) in the program must be managed on a discretionary basis;
3. Trust institution and bank trust department managed account programs that (i) charge an asset-based fee and (ii) will have at least $1 million invested in the Institutional Class of the Advisor funds. Accounts managed by third parties are not eligible to purchase Institutional Class shares;
4. Insurance company separate accounts that will have at least $1 million invested in the Institutional Class of the Advisor funds;
5. Current or former Trustees or officers of a Fidelity fund or current or retired officers, directors, or regular employees of FMR Corp. or FIL or their direct or indirect subsidiaries (Fidelity Trustee or employee), spouses of Fidelity Trustees or employees, Fidelity Trustees or employees acting as a custodian for a minor child, or persons acting as trustee of a trust for the sole benefit of the minor child of a Fidelity Trustee or employee; and
6. Insurance company programs for employee benefit plans, 403(b) programs or plans covering sole-proprietors (formerly Keogh/H.R. 10 plans) that (i) charge an asset-based fee and (ii) will have at least $1 million invested in the Institutional Class of the Advisor funds. Insurance company programs for employee benefit plans, 403(b) programs and plans covering sole-proprietors (formerly Keogh/H.R. 10 plans) include such programs offered by a broker-dealer affiliate of an insurance company, provided that the affiliate is not part of an organization primarily engaged in the brokerage business.
For purchases made by managed account programs, insurance company separate accounts or insurance company programs for employee benefit plans, 403(b) programs or plans covering sole-proprietors (formerly Keogh/H.R. 10 plans), Fidelity reserves the right to waive the requirement that $1 million be invested in the Institutional Class of the Advisor funds.
For Class A and Class T Shares Only
Finder's Fee. For all funds, on eligible purchases of (i) Class A shares in amounts of $1 million or more that qualify for a Class A load waiver, (ii) Class A shares in amounts of $25 million or more, or (iii) Class T shares in amounts of $1 million or more, investment professionals will be compensated with a fee at the rate of 0.25% of the purchase amount. Except as provided below, Class A eligible purchases are the following purchases made through broker-dealers and banks: an individual trade of $25 million or more; an individual trade of $1 million or more that is load waived; a trade which brings the value of the accumulated account(s) of an investor (including an employee benefit plan (except a SEP or SARSEP plan or a plan covering self-employed individuals and their employees (formerly a Keogh/H.R. 10 plan)) or 403(b) program) past $25 million; a load waived trade that brings the value of the accumulated account(s) of an investor (including an employee benefit plan (except a SEP or SARSEP plan or a plan covering self-employed individuals and their employees (formerly a Keogh/H.R. 10 plan)) or 403(b) program) past $1 million; a trade for an investor with an accumulated account value of $25 million or more; a load waived trade for an investor with an accumulated account value of $1 million or more; an incremental trade toward an investor's $25 million "Letter of Intent;" and an incremental load waived trade toward an investor's $1 million "Letter of Intent." Except as provided below, Class T eligible purchases are the following purchases made through broker-dealers and banks: an individual trade of $1 million or more; a trade which brings the value of the accumulated account(s) of an investor (including an employee benefit plan (except a SEP or SARSEP plan or a plan covering self-employed individuals and their employees (formerly a Keogh/H.R. 10 plan)) or 403(b) program) past $1 million; a trade for an investor with an accumulated account value of $1 million or more; and an incremental trade toward an investor's $1 million "Letter of Intent."
Shares held by an insurance company separate account will be aggregated at the client (e.g., the contract holder or plan sponsor) level, not at the separate account level. Upon request, anyone claiming eligibility for the 0.25% fee with respect to shares held by an insurance company separate account must provide FDC access to records detailing purchases at the client level.
For the purpose of determining the availability of Class A or Class T finder's fees, purchases of Class A or Class T shares made (i) with the proceeds from the redemption of shares of any Fidelity fund or (ii) by the Fidelity Investments Charitable Gift Fund, will not be considered "eligible purchases."
Except as provided below, any assets on which a finder's fee has been paid will bear a contingent deferred sales charge (Class A or Class T CDSC) if they do not remain in Class A or Class T shares of the Fidelity Advisor Funds®, or Daily Money Class shares of Treasury Fund, Prime Fund or Tax-Exempt Fund, for a period of at least one uninterrupted year. The Class A or Class T CDSC will be 0.25% of the lesser of the cost of the Class A or Class T shares, as applicable, at the initial date of purchase or the value of those Class A or Class T shares, as applicable, at redemption, not including any reinvested dividends or capital gains. Class A and Class T shares acquired through distributions (dividends or capital gains) will not be subject to a Class A or Class T CDSC. In determining the applicability and rate of any Class A or Class T CDSC at redemption, Class A or Class T shares representing reinvested dividends and capital gains will be redeemed first, followed by those Class A or Class T shares that have been held for the longest period of time.
Investment professionals must notify FDC in advance of a purchase eligible for a finder's fee, and may be required to enter into an agreement with FDC in order to receive the finder's fee.
The Class A or Class T CDSC will not apply to the redemption of shares:
1. Held by insurance company separate accounts;
2. For plan loans or distributions or exchanges to non-Advisor fund investment options from employee benefit plans (except shares of SIMPLE IRA, SEP, and SARSEP plans and plans covering self-employed individuals and their employees (formerly Keogh/H.R. 10 plans) purchased on or after February 11, 1999) and 403(b) programs; or
3. For disability, payment of death benefits, or minimum required distributions starting at age 70 1/2 from Traditional IRAs, Roth IRAs, SIMPLE IRAs, SEPs, SARSEPS and plans covering a sole proprietor or self-employed individuals and their employees (formerly Keogh/H.R. 10 plans).
A waiver form must accompany these transactions.
Class A and Class T Shares Only
Combined Purchase, Rights of Accumulation and Letter of Intent Programs. The following qualify as an "individual" or "company" for the purposes of determining eligibility for the Combined Purchase, Rights of Accumulation or Letter of Intent program: an individual, spouse and their children under age 21 purchasing for his/her or their own account; a trustee, administrator or other fiduciary purchasing for a single trust estate or a single fiduciary account or for a single or parent-subsidiary group of "employee benefit plans" (except SEP and SARSEP plans and plans covering self-employed individuals and their employees (formerly Keogh/H.R. 10 plans)) and 403(b) programs; and tax-exempt organizations (as defined in Section 501(c)(3) of the Internal Revenue Code).
Combined Purchase. For your purchases to be aggregated for the purpose of qualifying for the Combined Purchase program, they must be made on the same day through one investment professional.
Rights of Accumulation. The current value of your holdings is determined at the NAV at the close of business on the day you purchase the Class A or Class T shares to which the current value of your holdings will be added. For your purchases and holdings to be aggregated for the purpose of qualifying for the Rights of Accumulation program, they must have been made through one investment professional.
Letter of Intent. You must file your Letter of Intent (Letter) with Fidelity within 90 days of the start of your purchases toward completing your Letter. For your purchases to be aggregated for the purpose of completing your Letter, they must be made through one investment professional. Your initial purchase toward completing your Letter must be at least 5% of the total investment specified in your Letter. Class A and Class T shares acquired through an employee benefit plan, a Traditional IRA, a Roth IRA, a rollover IRA, a 403(b) program, or a plan covering a sole proprietor (formerly Keogh/H.R. 10 plan) will be included for purposes of completing your Letter but may not be used to meet the initial investment minimum of 5% of the total investment specified in your Letter. Fidelity will register Class A or Class T shares equal to 5% of the total investment specified in your Letter in your name and will hold those shares in escrow. You will earn income, dividends and capital gain distributions on escrowed Class A and Class T shares. The escrow will be released when you complete your Letter. You are not obligated to complete your Letter. If you do not complete your Letter, <R>you must</R> pay the increased front-end sales charges due. If you do not pay the increased front-end sales charges within <R>20 days after the date your Letter expires,</R> Fidelity will redeem sufficient escrowed Class A or Class T shares to pay any applicable front-end sales charges. If you purchase more than the amount specified in your Letter and qualify for additional Class A or Class T front-end sales charge reductions, the front-end sales charge will be adjusted to reflect your total purchase at the end of 13 months and the surplus amount will be applied to your purchase of additional Class A or Class T shares at the then-current offering price applicable to the total investment.<R></R>
All Classes
<R>A fund may</R> make <R>redemption payments in whole or in part in readily marketable</R> securities or other property, valued for this purpose as they are valued in computing each class's NAV, <R>if FMR determines it is in the best interests of the fund.</R> Shareholders <R>that receive </R>securities or other property on redemption may realize a gain or loss for tax purposes, and will incur any costs of sale, as well as the associated inconveniences.
Dividends. A portion of each fund's income may qualify for the dividends-received deduction available to corporate shareholders to the extent that the fund's income is derived from qualifying dividends. Because each fund may earn other types of income, such as interest, short-term capital gains, and non-qualifying dividends, the percentage of dividends from the fund that qualifies for the deduction generally will be less than 100%. A portion of each fund's dividends derived from certain U.S. Government securities and securities of certain other investment companies may be exempt from state and local taxation.
Capital Gain Distributions. Each fund's long-term capital gain distributions are federally taxable to shareholders generally as capital gains.
<R>As of </R>July 31, 2000, Advisor Consumer Industries had an aggregate capital loss carryforward of approximately $435,000. This loss carryforward, all of which will expire on July 31, 2008, is available to offset future capital gains.
<R>As of </R>July 31<R>, 2000, Advisor Financial Services had an aggregate capital loss carryforward of approximately $7,462,000. This loss carryforward, of which $4,198,000 and $3,264,000 will expire on </R>July 31, 2007 and 2008, respectively, is available to offset future capital gains.
<R>As of </R>July 31<R>, 2000, Advisor Natural Resources had an aggregate capital loss carryforward of approximately $27,373,000. This loss carryforward, of which $21,050,000 and $6,323,000 will expire on </R>July 31, 2007 and 2008, respectively, is available to offset future capital gains.
Returns of Capital. If a fund's distributions exceed its taxable income and capital gains realized during a taxable year, all or a portion of the distributions made in the same taxable year may be recharacterized as a return of capital to shareholders. A return of capital distribution will generally not be taxable, but will reduce each shareholder's cost basis in the fund and result in a higher reported capital gain or lower reported capital loss when those shares on which the distribution was received are sold.
Foreign Tax Credit or Deduction. Foreign governments may withhold taxes on dividends and interest earned by a fund with respect to foreign securities. Foreign governments may also impose taxes on other payments or gains with respect to foreign securities. If, at the close of its fiscal year, more than 50% of a fund's total assets is invested in securities of foreign issuers, the fund may elect to pass through eligible foreign taxes paid and thereby allow shareholders to take a deduction or, if they meet certain holding period requirements with respect to fund shares, a credit on their individual tax returns.
Tax Status of the Funds. Each fund intends to qualify each year as a "regulated investment company" under Subchapter M of the Internal Revenue Code so that it will not be liable for federal tax on income and capital gains distributed to shareholders. In order to qualify as a regulated investment company, and avoid being subject to federal income or excise taxes at the fund level, each fund intends to distribute substantially all of its net investment income and net realized capital gains within each calendar year as well as on a fiscal year basis, and intends to comply with other tax rules applicable to regulated investment companies.
Other Tax Information. The information above is only a summary of some of the tax consequences generally affecting each fund and its shareholders, and no attempt has been made to discuss individual tax consequences. It is up to you or your tax preparer to determine whether the sale of shares of a fund resulted in a capital gain or loss or other tax consequence to you. In addition to federal income taxes, shareholders may be subject to state and local taxes on fund distributions, and shares may be subject to state and local personal property taxes. Investors should consult their tax advisers to determine whether a fund is suitable to their particular tax situation.
The Trustees, Members of the Advisory Board, and executive officers of the trust <R>and funds, as applicable,</R> are listed below. The Board of Trustees governs each fund and is responsible for protecting the interests of shareholders. The Trustees are experienced executives who meet periodically throughout the year to oversee each fund's activities, review contractual arrangements with companies that provide services to each fund, and review each fund's performance. Except as indicated, each individual has held the office shown or other offices in the same company for the past five years <R>or, if shorter, the period of a fund's operations</R>. All persons named as Trustees and Members of the Advisory Board also serve in similar capacities for other funds advised by FMR or its affiliates. The business address of each Trustee, Member of the Advisory Board, and officer who is an "interested person" (as defined in the 1940 Act) is 82 Devonshire Street, Boston, Massachusetts 02109, which is also the address of FMR. The business address of all the other Trustees is Fidelity Investments, P.O. Box 9235, Boston, Massachusetts 02205-9235. Those Trustees who are "interested persons" by virtue of their affiliation with either the trust or FMR are indicated by an asterisk (*).
*EDWARD C. JOHNSON 3d <R>(70), Trustee, is President of Advisor Consumer Industries, Advisor Cyclical Industries, Advisor Financial Services, Advisor Health Care, Advisor Natural Resources, Advisor Technology, and Advisor Telecommunications & Utilities Growth. Mr. Johnson also serves as President of other Fidelity funds. He is Chief Executive Officer, Chairman</R>, and a Director of FMR Corp.; a Director and Chairman of the Board and of the Executive Committee of FMR; Chairman and a Director of Fidelity Management & Research (U.K.) Inc. and of Fidelity Management & Research (Far East) Inc.; <R>Chairman (1998) and a Director (1997) of Fidelity Investments Money Management, Inc.; Chairman and Representative Director of Fidelity Investments Japan Limited (1997); and a Director of FDC and of FMR Co., Inc. (2000).</R> Abigail Johnson, Member of the Advisory Board of Advisor Series VII, is Mr. Johnson's daughter.
ABIGAIL P. JOHNSON <R>(38)</R>, Member of the Advisory Board of Advisor Series VII (1999), is Vice President of certain Equity Funds (1997), and is a Director of FMR Corp. (1994). Before assuming her current responsibilities, Ms. Johnson managed a number of Fidelity funds. Edward C. Johnson 3d, Trustee and President of the Funds, is Ms. Johnson's father.
<R>J. MICHAEL COOK (57), Member of the Advisory Board (2000). Prior to Mr. Cook's retirement in May 1999, he served as Chairman and Chief Executive Officer of Deloitte & Touche LLP, Chairman of the Deloitte & Touche Foundation, and a member of the Board of Deloitte Touche Tohmatsu. He currently serves as an Executive in Residence of the Columbia Business School and as a Director of Dow Chemical Company (2000), HCA - The Healthcare Company (1999), and Children First (1999). He is a member of the Executive Committee of the Securities Regulation Institute, a member of the Advisory Board of Boardroom Consultants, past chairman and a member of the Board of Catalyst (a leading organization for the advancement of women in business), and a Director of the STAR Foundation (Society to Advance the Retarded and Handicapped). He also serves as a member of the Board and Executive Committee and as Co-Chairman of the Audit and Finance Committee of the Center for Strategic & International Studies, a member of the Board of Overseers of the Columbia Business School, and a Member of the Advisory Board of the Graduate School of Business of the University of Florida.</R>
RALPH F. COX (<R>68</R>), Trustee, is President of RABAR Enterprises (management consulting-<R>petroleum</R> industry, 1994). Prior to February 1994, he was President of Greenhill Petroleum Corporation (petroleum exploration and production). Until March 1990, Mr. Cox was President and Chief Operating Officer of Union Pacific Resources Company (exploration and production). He is a Director of <R>Waste Management Inc.</R> (non-hazardous waste, 1993), CH2M Hill Companies (engineering), and <R>Abraxas Petroleum (petroleum exploration and production, 1999).</R> In addition, he is a member of advisory boards of Texas A&M University and the University of Texas at Austin.
PHYLLIS BURKE DAVIS (<R>68</R>), Trustee. Mrs. Davis<R> is retired from Avon Products, Inc. where she held various positions including</R> Senior Vice President of Corporate Affairs <R>and Group Vice President</R> of <R>U.S. sales, distribution, and manufacturing.</R> She is currently a Director of BellSouth Corporation (telecommunications), Eaton Corporation (manufacturing), and the TJX Companies, Inc. (retail stores), and previously served as a Director of Hallmark Cards, Inc., Nabisco Brands, Inc., and <R>Standard Brands, Inc. In addition, she is a member of the Board of Directors of the Southampton Hospital in Southampton, N.Y. (1998)</R>.
ROBERT M. GATES (<R>56</R>), Trustee (1997), is a consultant, author, and lecturer (1993). Mr. Gates was Director of the Central Intelligence Agency (CIA) from 1991-1993. From 1989 to 1991, Mr. Gates served as Assistant to the President of the United States and Deputy National Security Advisor. Mr. Gates is a Director of Charles Stark Draper Laboratory (non-profit), NACCO Industries, Inc. (mining and manufacturing), and TRW Inc. (automotive, space, defense, and information technology). <R>Mr. Gates previously served as a Director of LucasVarity PLC (automotive components and diesel engines). He is currently serving as Dean of the George Bush School of Government and Public Service at Texas A&M University (1999-2001). </R>Mr. Gates also is a Trustee of the Forum for International Policy and of the Endowment Association of the College of William and Mary.
DONALD J. KIRK (<R>67</R>), Trustee, is Chairman of the Board of Directors of National Arts Stabilization Inc., Chairman of the Board of Trustees of the Greenwich Hospital Association, Director of the Yale-New Haven Health Services Corp. (1998), <R>Vice Chairman</R> of the Public Oversight Board of the American Institute of Certified Public Accountants' SEC Practice Section (1995), and a Public Governor of the National Association of Securities Dealers, Inc. (1996). Mr. Kirk was an Executive-in-Residence (1995-2000) and a Professor (1987-1995) at Columbia University Graduate School of Business. Prior to 1987, he was Chairman of the Financial Accounting Standards Board. Mr. Kirk previously served as a Director of General Re Corporation (reinsurance, 1987-1998) and as a Director of Valuation Research Corp. (appraisals and valuations, 1993-1995).
<R>MARIE L. KNOWLES (53), Member of the Advisory Board (2000). Beginning in 1972, Ms. Knowles served in various positions with Atlantic Richfield Company (ARCO) (diversified energy) including Executive Vice President and Chief Financial Officer (1996-2000); Director (1996-1998); and Senior Vice President (1993-1996). In addition, Ms. Knowles served as President of ARCO Transportation Company (1993-1996). She currently serves as a Director of Phelps Dodge Corporation (copper mining and manufacturing), URS Corporation (multidisciplinary engineering, 1999), and America West Holdings Corporation (aviation and travel services, 1999). Ms. Knowles also serves as a member of the National Board of the Smithsonian Institution and she is a trustee of the Brookings Institution.</R>
<R>NED C. LAUTENBACH (56), Trustee (2000), has been a partner of Clayton, Dubilier & Rice, Inc. (private equity investment firm) since September 1998. Mr. Lautenbach was Senior Vice President of IBM Corporation from 1992 until his retirement in July 1998. From 1993 to 1995, he was Chairman of IBM World Trade Corporation. He also was a member of IBM's Corporate Executive Committee from 1994 to July 1998. Mr. Lautenbach has served as Chairman, President, and Chief Executive Officer of Dynatech Corporation (global communications equipment) since 1999 and as a Director since 1998. He is also a Director of PPG Industries Inc. (glass, coating and chemical manufacturer), Eaton Corporation (global manufacturer of highly engineered products), Axcelis Technologies, Inc. (semi-conductors, 2000), and the Philharmonic Center for the Arts in Naples, Florida. He also serves on the Board of Trustees of Fairfield University.</R>
*PETER S. LYNCH (<R>57</R>), Trustee, is Vice Chairman and<R> a Director of FMR; and a Director of FMR Co., Inc. (2000).</R> Prior to May 31, 1990, he was a Director of FMR and Executive Vice President of FMR (a position he held until March 31, 1991); Vice President of Fidelity® Magellan® Fund and FMR Growth Group Leader; and Managing Director of FMR Corp. Mr. Lynch was also Vice President of Fidelity Investments Corporate Services (1991-1992). In addition, he serves as a Trustee of Boston College, Massachusetts Eye & Ear Infirmary, Historic Deerfield (1989) and Society for the Preservation of New England Antiquities, and as an Overseer of the Museum of Fine Arts of Boston.
<R>WILLIAM O. McCOY (66), Trustee (1997). Prior to his retirement in December 1994, Mr. McCoy was Vice Chairman of the Board of BellSouth Corporation (telecommunications) and President of BellSouth Enterprises. He is currently a Director of Liberty Corporation (holding company), Duke-Weeks Realty Corporation (real estate, 1994), Carolina Power and Light Company (electric utility, 1996), the Kenan Transport Company (trucking, 1996), and Dynatech Corporation (electronics, 1999). He is also a partner of Franklin Street Partners (private investment management firm, 1997). Previously, he was a Director of First American Corporation (bank holding company, 1979-1996). In addition, Mr. McCoy served as the Interim Chancellor (1999-2000) and a member of the Board of Visitors (1994-1998) for the University of North Carolina at Chapel Hill and currently serves on the Board of Directors of the University of North Carolina Health Care System and the Board of Visitors of the Kenan-Flager Business School (University of North Carolina at Chapel Hill). He also served as Vice President of Finance for the University of North Carolina (16-school system, 1995-1998).</R>
GERALD C. McDONOUGH (<R>72</R>), Trustee and Chairman of the non-interested Trustees, is Chairman of G.M. Management Group (strategic advisory services). Mr. McDonough is a Director <R>and Chairman of the Board </R>of York International Corp. (air conditioning and refrigeration)<R>, a Director of</R> Associated Estates Realty Corporation (a real estate investment trust<R>), and a Director of Barpoint.com (online and wireless product information service, 2000</R>). Mr. McDonough served as a Director of ACME-Cleveland Corp. (metal working, telecommunications, and electronic products) from 1987-1996 and Brush-Wellman Inc. (metal refining) from 1983-1997. He also served as a Director of Commercial Intertech Corp. (hydraulic systems, building systems, and metal products) from 1992-2000 and CUNO, Inc. (liquid and gas filtration products) from 1996-2000.
MARVIN L. MANN (<R>67)</R>, Trustee, is Chairman <R>Emeritus</R> of Lexmark International, Inc. (office machines, 1991) <R>where he remains a member of the Board</R>. Prior to 1991, he held the positions of Vice President of International Business Machines Corporation ("IBM") and President and General Manager of various IBM divisions and subsidiaries. Mr. Mann is a Director of M.A. Hanna Company (chemicals, 1993), Imation Corp. (imaging and information storage, 1997). He is a Board member of Dynatech Corporation (electronics, 1999).
*ROBERT C. POZEN (<R>53</R>), Trustee (1997), <R>is Senior Vice President of Advisor Consumer Industries, Advisor Cyclical Industries, Advisor Financial Services, Advisor Health Care, Advisor Natural Resources, Advisor Technology, and Advisor Telecommunications & Utilities Growth (1997). Mr. Pozen also serves</R> as Senior Vice President <R>of other Fidelity funds (1997)</R>. He is President and a Director of FMR (1997), Fidelity Management & Research (U.K.) Inc. (1997), Fidelity Management & Research (Far East) Inc. (1997), Fidelity Investments Money Management, Inc. (1998), <R>and FMR Co., Inc. (2000); a Director of Strategic Advisers, Inc. (1999); and Vice Chairman of Fidelity Investments (2000).</R> Previously, Mr. Pozen served as General Counsel, Managing Director, and Senior Vice President of FMR Corp.
THOMAS R. WILLIAMS (<R>71</R>), Trustee, is President of The Wales Group, Inc. (management and financial advisory services). Prior to retiring in 1987, Mr. Williams served as Chairman of the Board of First Wachovia Corporation (bank holding company), and Chairman and Chief Executive Officer of The First National Bank of Atlanta and First Atlanta Corporation (bank holding company). He is currently a Director of <R>National Life Insurance Company of Vermont and American Software, Inc. Mr. Williams was previously a Director of</R> ConAgra, Inc. (agricultural products), Georgia Power Company (electric utility), and Avado, Inc. (restaurants).
ERIC D. ROITER (<R>51</R>), <R>is Secretary of Advisor Consumer Industries, Advisor Cyclical Industries, Advisor Financial Services, Advisor Health Care, Advisor Natural Resources, Advisor Technology, and Advisor Telecommunications & Utilities Growth (1998). He also serves as Secretary of other Fidelity funds (1998)</R>; Vice President, General Counsel, and Clerk of FMR (1998); and Vice President and <R>Clerk</R> of FDC (1998). Prior to joining Fidelity, Mr. Roiter was with the law firm of Debevoise & Plimpton, as an associate (1981-1984) and as a partner (1985-1997), and served as an Assistant General Counsel of the U.S. Securities and Exchange Commission (1979-1981). Mr. Roiter was an Adjunct Member, Faculty of Law, at Columbia University Law School (1996-1997).
<R>ROBERT A. DWIGHT (42), is Treasurer of Advisor Consumer Industries, Advisor Cyclical Industries, Advisor Financial Services, Advisor Health Care, Advisor Natural Resources, Advisor Technology, and Advisor Telecommunications & Utilities Growth (2000). Mr. Dwight also serves as Treasurer of other Fidelity funds (2000) and is an employee of FMR. Prior to becoming Treasurer of the Fidelity funds, he served as President of Fidelity Accounting and Custody Services (FACS). Before joining Fidelity, Mr. Dwight was Senior Vice President of fund accounting operations for The Boston Company.</R>
<R>MARIA F. DWYER (41), is Deputy Treasurer of Advisor Consumer Industries, Advisor Cyclical Industries, Advisor Financial Services, Advisor Health Care, Advisor Natural Resources, Advisor Technology, and Advisor Telecommunications & Utilities Growth (2000). She also serves as Deputy Treasurer of other Fidelity funds (2000) and is a Vice President (1999) and an employee (1996) of FMR. Prior to joining Fidelity, Ms. Dwyer served as Director of Compliance for MFS Investment Management.</R>
JOHN H. COSTELLO (<R>53</R>), is Assistant Treasurer <R>of Advisor Consumer Industries, Advisor Cyclical Industries, Advisor Financial Services, Advisor Health Care, Advisor Natural Resources, Advisor Technology, and Advisor Telecommunications & Utilities Growth. Mr. Costello also serves as Assistant Treasurer of other Fidelity funds</R> and is an employee of FMR.
<R>THOMAS J. SIMPSON (42), is Assistant Treasurer of Advisor Consumer Industries, Advisor Cyclical Industries, Advisor Financial Services, Advisor Health Care, Advisor Natural Resources, Advisor Technology, and Advisor Telecommunications & Utilities Growth (2000). Mr. Simpson is Assistant Treasurer of other Fidelity funds (2000) and an employee of FMR (1996). Prior to joining FMR, Mr. Simpson was Vice President and Fund Controller of Liberty Investment Services (1987-1995).</R>
The following table sets forth information describing the compensation of each Trustee and Member of the Advisory Board of each fund for his or her services for the fiscal year ended July 31, <R>2000</R>, or calendar year ended December 31, <R>1999</R>, as applicable.
|
<R>Compensation Table</R> |
||||||||
|
<R> |
AGGREGATE COMPENSATION FROM A FUND |
</R> |
||||||
|
<R>Trustees and |
Advisor |
Advisor |
Advisor |
Advisor |
Advisor |
Advisor TechnologyB |
Advisor
Telecommunications |
Total |
|
<R>Edward C. Johnson 3d** |
$ 0 |
$ 0 |
$ 0 |
$ 0 |
$ 0 |
$ 0 |
$ 0 |
$ 0</R> |
|
<R>Abigail P. Johnson** |
$ 0 |
$ 0 |
$ 0 |
$ 0 |
$ 0 |
$ 0 |
$ 0 |
$ 0</R> |
|
<R>J. Michael Cook***** |
$ 4 |
$ 1 |
$ 45 |
$ 106 |
$ 41 |
$ 405 |
$ 69 |
$ 0</R> |
|
<R>Ralph F. Cox |
$ 10 |
$ 3 |
$ 92 |
$ 220 |
$ 95 |
$ 622 |
$ 106 |
$ 217,500</R> |
|
<R>Phyllis Burke Davis |
$ 10 |
$ 3 |
$ 94 |
$ 222 |
$ 96 |
$ 630 |
$ 107 |
$ 211,500</R> |
|
<R>Robert M. Gates |
$ 10 |
$ 3 |
$ 92 |
$ 220 |
$ 95 |
$ 623 |
$ 106 |
$ 217,500</R> |
|
<R>E. Bradley Jones**** |
$ 4 |
$ 1 |
$ 32 |
$ 78 |
$ 39 |
$ 116 |
$ 21 |
$ 217,500</R> |
|
<R>Donald J. Kirk |
$ 10 |
$ 3 |
$ 92 |
$ 220 |
$ 96 |
$ 618 |
$ 105 |
$ 217,500</R> |
|
<R>Marie L. Knowles****** |
$ 1 |
$ 0 |
$ 10 |
$ 23 |
$ 9 |
$ 85 |
$ 15 |
$ 0</R> |
|
<R>Ned C. Lautenbach*** |
$ 8 |
$ 2 |
$ 79 |
$ 189 |
$ 79 |
$ 581 |
$ 98 |
$ 54,000</R> |
|
<R>Peter S. Lynch** |
$ 0 |
$ 0 |
$ 0 |
$ 0 |
$ 0 |
$ 0 |
$ 0 |
$ 0</R> |
|
<R>William O. McCoy |
$ 10 |
$ 3 |
$ 91 |
$ 217 |
$ 94 |
$ 618 |
$ 105 |
$ 214,500</R> |
|
<R>Gerald C. McDonough |
$ 13 |
$ 3 |
$ 115 |
$ 274 |
$ 119 |
$ 773 |
$ 131 |
$ 269,000</R> |
|
<R>Marvin L. Mann |
$ 10 |
$ 3 |
$ 93 |
$ 221 |
$ 96 |
$ 626 |
$ 106 |
$ 217,500</R> |
|
<R>Robert C. Pozen** |
$ 0 |
$ 0 |
$ 0 |
$ 0 |
$ 0 |
$ 0 |
$ 0 |
$ 0</R> |
|
<R>Thomas R. Williams |
$ 10 |
$ 3 |
$ 92 |
$ 220 |
$ 95 |
$ 622 |
$ 106 |
$ 213,000</R> |
* Information is for the calendar year ended December 31, <R>1999</R> for <R>236</R> funds in the complex.
** Interested Trustees of the <R>funds and </R>Ms. Johnson are compensated by FMR.
<R>*** During the period from October 14, 1999 through December 31, 1999, Mr. Lautenbach served as a Member of the Advisory Board. Effective January 1, 2000, Mr. Lautenbach serves as a Member of the Board of Trustees.</R>
<R>**** Mr. Jones served on the Board of Trustees through December 31, 1999.</R>
<R>***** Effective March 16, 2000, Mr. Cook serves as a Member of the Advisory Board.</R>
<R>****** Effective June 15, 2000, Ms. Knowles serves as a Member of the Advisory Board.</R>
A Compensation figures include cash, amounts required to be deferred, and may include amounts deferred at the election of Trustees. For the calendar year ended December 31, <R>1999</R>, the Trustees accrued required deferred compensation from the funds as follows: Ralph F. Cox, $75,000; Phyllis Burke Davis, $75,000; Robert M. Gates, $75,000; E. Bradley Jones, $75,000; Donald J. Kirk, $75,000; William O. McCoy, $75,000; Gerald C. McDonough, $87,500; Marvin L. Mann, $75,000; and Thomas R. Williams, $75,000. Certain of the non-interested Trustees elected voluntarily to defer a portion of their compensation as follows: Ralph F. Cox, <R>$53,735</R>; William O. McCoy,<R> $53,735</R>; and Thomas R. Williams, <R>$62,319</R>.
B Compensation figures include cash, and may include amounts required to be deferred and amounts deferred at the election of Trustees.
Under a deferred compensation plan adopted in September 1995 and amended in November 1996 and <R>January 2000 </R>(the Plan), non-interested Trustees must defer receipt of a portion of, and may elect to defer receipt of an additional portion of, their annual fees. Amounts deferred under the Pla<R>n a</R>re treated as though equivalent dollar amounts had been invested in shares of a cross-section of Fidelity funds including funds in each major investment discipline and representing a majority of Fidelity's assets under management (the Reference Funds). The amounts ultimately received by the Trustees under the Plan will be directly linked to the investment performance of the Reference Funds. Deferral of fees in accordance with the Plan will have a negligible effect on a fund's assets, liabilities, and net income per share, and will not obligate a fund to retain the services of any Trustee or to pay any particular level of compensation to the Trustee. A fund may invest in the Reference Funds under the Plan without shareholder approval.
<R>As of July 31, 2000, approximately 19.26% of Fidelity Advisor Cyclical Industries' total outstanding shares and approximately 1.35% of Fidelity Advisor Financial Services' total outstanding shares were held by FMR affiliates. FMR Corp. is the ultimate parent company of these FMR affiliates. By virtue of their ownership interest in FMR Corp., as described in the "Control of Investment Advisers" section on page <Click Here>, Mr. Edward C. Johnson 3d, Trustee and President of the funds, and Ms. Abigail P. Johnson, Member of the Advisory Board of Fidelity Advisor Series VII, may be deemed to be a beneficial owner of these shares. As of the above date, with the exception of Mr. Johnson 3d's and Ms. Johnson's deemed ownership of Fidelity Advisor Cyclical Industries' and Fidelity Advisor Financial Services' shares, the Trustees, Members of the Advisory Board, and officers of the funds owned, in the aggregate, less than 1% of each fund's total outstanding shares.</R>
<R>As of July 31, 2000, the following owned of record or beneficially 5% or more of each class's outstanding shares:</R>
<R>Consumer Industries Class A: G. W. & Wade Asset Management Co., Wellesley, MA (12.17%); PNC Bank Corporation, Pittsburgh, PA (9.47%).</R>
<R>Consumer Industries Class T: SunAmerica, New York, NY (13.40%); PaineWebber, Inc., Jersey City, NJ (6.92%); US Bancorp, Minneapolis, MN (6.70%); A. G. Edwards & Sons Inc., Saint Louis, MO (5.31%).</R>
<R>Consumer Industries Class B: First Union Corp., Roanoke, VA (9.48%); Merrill Lynch, Pierce, Fenner & Smith Inc., Jacksonville, FL (6.45%).</R>
<R>Consumer Industries Class C: Prudential, New York, NY (7.70%); Securities Corporation of Iowa, Cedar Rapids, IA (6.50%); Merrill Lynch, Pierce, Fenner & Smith Inc., Jacksonville, FL (5.75%).</R>
<R>Consumer Industries Institutional Class: Charles Schwab & Co., Inc., San Francisco, CA (72.39%); Aetna Inc., Torrance, CA (8.07%).</R>
<R>Cyclical Industries Class A: G. W. & Wade Asset Management Co., Wellesley, MA (18.36%); Fidelity Investments Distributors Corp., Boston, MA (16.12%); Lincoln, Fort Wayne, IN (9.12%); A. G. Edwards & Sons Inc., Saint Louis, MO (5.67%); Legg Mason Wood Walker, Inc., Baltimore, MD (5.10%).</R>
<R>Cyclical Industries Class T: Sutro & Co. Inc., San Francisco, CA (28.25%); SunAmerica, New York, NY (13.31%); G. W. & Wade Asset Management Co., Wellesley, MA (5.56%).</R>
<R>Cyclical Industries Class B: Merrill Lynch, Pierce, Fenner & Smith Inc., Jacksonville, FL (26.27%); Fidelity Brokerage Services Ltd., Boston, MA (7.12%); PaineWebber, Inc., Jersey City, NJ (5.80%).</R>
<R>Cyclical Industries Class C: Merrill Lynch, Pierce, Fenner & Smith Inc., Jacksonville, FL (26.63%); Scott & Stringfellow, Inc., Richmond, VA (14.36%); SunAmerica, New York, NY (10.15%); Prudential, New York, NY (6.83%); Jackson National Life, Menasha, WI (5.48%).</R>
<R>Cyclical Industries Institutional Class: Fidelity Investments Distributors Corp., Boston, MA (75.82%); Charles Schwab & Co., Inc., San Francisco, CA (9.16%).</R>
<R>Financial Services Class A: Citigroup, Inc., Long Island City, NY (5.66%); Prudential, New York, NY (5.10%); Dain Rauscher Inc., Minneapolis, MN (5.07%).</R>
<R>Financial Services Class T: A.G. Edwards & Sons Inc., Saint Louis, MO (5.55%); Securities America, Omaha, NE (5.48%).</R>
<R>Financial Services Class B: Merrill Lynch, Pierce, Fenner & Smith Inc., Jacksonville, FL (11.59%); Prudential, New York, NY (5.46%); BankAmerica Corp., Charlotte, NC (5.37%).</R>
<R>Financial Services Class C: Merrill Lynch, Pierce, Fenner & Smith Inc., Jacksonville, FL (16.94%); Prudential, New York, NY (9.84%); Citigroup, Inc., New York, NY (9.28%).</R>
<R>Financial Services Institutional Class: Merrill Lynch, Pierce, Fenner & Smith Inc., Jacksonville, FL (32.74%); Charles Schwab & Co., Inc., San Francisco, CA (24.19%); Aetna Inc., Torrance, CA (8.36%).</R>
<R>Health Care Class A: 1-800-Mutuals, Dallas, TX (5.61%).</R>
<R>Health Care Class T: A. G. Edwards & Sons Inc., Saint Louis, MO (5.99%); Securities America, Omaha, NE (5.93%).</R>
<R>Health Care Class B: Merrill Lynch, Pierce, Fenner & Smith Inc., Jacksonville, FL (11.25%); Prudential, New York, NY (5.06%).</R>
<R>Health Care Class C: Merrill Lynch, Pierce, Fenner & Smith Inc., Jacksonville, FL (22.54%); Prudential, New York, NY (8.85%); Citigroup, Inc., New York, NY (8.73%).</R>
<R>Health Care Institutional Class: Merrill Lynch, Pierce, Fenner & Smith Inc., Jacksonville, FL (22.84%); Charles Schwab & Co., Inc., San Francisco, CA (18.15%); Aetna Inc., Torrance, CA (7.50%).</R>
<R>Natural Resources Class A: Merrill Lynch, Pierce, Fenner & Smith Inc., Jacksonville, FL (11.10%); A. G. Edwards & Sons Inc.; Saint Louis, MO (8.64%).</R>
<R>Natural Resources Class T: Citigroup, Inc., New York, NY (6.59%).</R>
<R>Natural Resources Class B: Merrill Lynch, Pierce, Fenner & Smith Inc., Jacksonville, FL (10.83%); Prudential, New York, NY (8.27%); Citigroup, Inc., New York, NY (5.54%).</R>
<R>Natural Resources Class C: Merrill Lynch, Pierce, Fenner & Smith Inc., Jacksonville, FL (23.11%); Citigroup, Inc., New York, NY (7.42%).</R>
<R>Natural Resources Institutional Class: Merrill Lynch, Pierce, Fenner & Smith Inc., Jacksonville, FL (17.55%); CLS Brokerage Service Inc.; Omaha, NE (14.08%); First Financial Trust, Tampa, FL (13.78%); Charles Schwab & Co., Inc., San Francisco, CA (9.18%); Cambridge Investment Research Inc., Littleton, CO (7.50%); Aetna Inc., Torrance, CA (6.43%).</R>
<R>Technology Class A: Citigroup, Inc., Long Island City, NY (10.82%).</R>
<R>Technology Class T: A. G. Edwards & Sons Inc., Saint Louis, MO (7.44%); Citigroup, Inc., New York, NY (5.67%).</R>
<R>Technology Class B: Citigroup, Inc., Long Island City, NY (13.36%); Merrill Lynch, Pierce, Fenner & Smith Inc., Jacksonville, FL (6.74%).</R>
<R>Technology Class C: Merrill Lynch, Pierce, Fenner & Smith Inc., Jacksonville, FL (13.43%); Citigroup, Inc., New York, NY (9.46%); A. G. Edwards & Sons Inc., Saint Louis, MO (5.31%).</R>
<R>Technology Institutional Class: Charles Schwab & Co., Inc., San Francisco, CA (26.64%); Merrill Lynch, Pierce, Fenner & Smith Inc., Jacksonville, FL (21.47%); SEI Investments Distribution Co., Oaks, PA (8.31%).</R>
<R>Telecommunications and Utilities Growth Class A: Citigroup, Inc., Long Island City, NY (6.13%).</R>
<R>Telecommunications and Utilities Growth Class T: Securities America, Omaha, NE (9.28%); A. G. Edwards & Sons Inc., Saint Louis, MO (5.22%).</R>
<R>Telecommunications and Utilities Growth Class B: Merrill Lynch, Pierce, Fenner & Smith Inc., Jacksonville, FL (12.31%); Citigroup, Inc., Long Island City, NY (7.17%).</R>
<R>Telecommunications and Utilities Growth Class C: Merrill Lynch, Pierce, Fenner & Smith Inc., Jacksonville, FL (14.50%); Citigroup, Inc., New York, NY (6.61%).</R>
<R>Telecommunications and Utilities Growth Institutional Class: Charles Schwab & Co., Inc., San Francisco, CA (38.06%); Merrill Lynch, Pierce, Fenner & Smith Inc., Jacksonville, FL (35.20%); First Financial Trust, Tampa, FL (5.00%).</R>
CONTROL OF INVESTMENT ADVISERS
FMR Corp., organized in 1972, is the ultimate parent company of FMR, Fidelity Management & Research (U.K.) Inc. (FMR U.K.), Fidelity Management & Research (Far East) Inc. (FMR Far East)<R> and FMR Co., Inc. (FMRC)</R>. The voting common stock of FMR Corp. is divided into two classes. Class B is held predominantly by members of the Edward C. Johnson 3d family and is entitled to 49% of the vote on any matter acted upon by the voting common stock. Class A is held predominantly by non-Johnson family member employees of FMR Corp. and its affiliates and is entitled to 51% of the vote on any such matter. The Johnson family group and all other Class B shareholders have entered into a shareholders' voting agreement under which all Class B shares will be voted in accordance with the majority vote of Class B shares. Under the 1940 Act, control of a company is presumed where one individual or group of individuals owns more than 25% of the voting stock of that company. Therefore, through their ownership of voting common stock and the execution of the shareholders' voting agreement, members of the Johnson family may be deemed, under the 1940 Act, to form a controlling group with respect to FMR Corp.
At present, the principal operating activities of FMR Corp. are those conducted by its division, Fidelity Investments Retail Marketing Company, which provides marketing services to various companies within the Fidelity organization.
<R>Fidelity International Limited (FIL), a Bermuda company formed in 1968, is the ultimate parent company of Fidelity Investments Japan Limited (FIJ). Edward C. Johnson 3d, Johnson family members, and various trusts for the benefit of the Johnson family own, directly or indirectly, more than 25% of the voting common stock of FIL. FIL provides investment advisory services to non-U.S. investment companies and institutional investors investing in securities throughout the world.</R>
<R>The funds, FMR, FMRC, FMR U.K., FMR Far East, FIJ, and FDC have adopted a code of ethics under Rule 17j-1 of the 1940 Act</R> that sets forth employees' fiduciary responsibilities regarding the funds, establishes procedures for personal investing, and restricts certain transactions. Employees subject to the code of ethics, including Fidelity investment personnel, may invest in securities for their own investment accounts, including securities that may be purchased or held by the funds.
Each fund has entered into a management contract with FMR, pursuant to which FMR furnishes investment advisory and other services.
Management Services. Under the terms of its management contract with each fund, FMR acts as investment adviser and, subject to the supervision of the Board of Trustees, directs the investments of the fund in accordance with its investment objective, policies and limitations. FMR also provides each fund with all necessary office facilities and personnel for servicing the fund's investments, compensates all officers of each fund and all Trustees who are "interested persons" of the trust or of FMR, and all personnel of each fund or FMR performing services relating to research, statistical and investment activities.
In addition, FMR or its affiliates, subject to the supervision of the Board of Trustees, provide the management and administrative services necessary for the operation of each fund. These services include providing facilities for maintaining each fund's organization; supervising relations with custodians, transfer and pricing agents, accountants, underwriters and other persons dealing with each fund; preparing all general shareholder communications and conducting shareholder relations; maintaining each fund's records and the registration of each fund's shares under federal securities laws and making necessary filings under state securities laws; developing management and shareholder services for each fund; and furnishing reports, evaluations and analyses on a variety of subjects to the Trustees.
Management-Related Expenses. In addition to the management fee payable to FMR and the fees payable to the transfer, dividend disbursing, and shareholder servicing agent, pricing and bookkeeping agent, and <R>the costs associated with </R>securities <R>lending</R>, as applicable, each fund or each class thereof, as applicable, pays all of its expenses that are not assumed by those parties. Each fund pays for the typesetting, printing, and mailing of its proxy materials to shareholders, legal expenses, and the fees of the custodian, auditor, and non-interested Trustees. Each fund's management contract further provides that the fund will pay for typesetting, printing, and mailing prospectuses, statements of additional information, notices, and reports to shareholders; however, under the terms of each fund's transfer agent agreement, the transfer agent bears the costs of providing these services to existing shareholders of the applicable classes. Other expenses paid by each fund include interest, taxes, brokerage commissions, the fund's proportionate share of insurance premiums and Investment Company Institute dues, and the costs of registering shares under federal securities laws and making necessary filings under state securities laws. Each fund is also liable for such non-recurring expenses as may arise, including costs of any litigation to which the fund may be a party, and any obligation it may have to indemnify its officers and Trustees with respect to litigation.
Management Fees. For the services of FMR under the management contract, each fund pays FMR a monthly management fee which has two components: a group fee rate and an individual fund fee rate.
The group fee rate is based on the monthly average net assets of all of the registered investment companies with which FMR has management contracts.
|
GROUP FEE RATE SCHEDULE |
EFFECTIVE ANNUAL FEE RATES |
||
|
Average Group |
Annualized |
Group Net |
Effective Annual Fee |
|
0 - $3 billion |
.5200% |
$ 1 billion |
.5200% |
|
3 - 6 |
.4900 |
50 |
.3823 |
|
6 - 9 |
.4600 |
100 |
.3512 |
|
9 - 12 |
.4300 |
150 |
.3371 |
|
12 - 15 |
.4000 |
200 |
.3284 |
|
15 - 18 |
.3850 |
250 |
.3219 |
|
18 - 21 |
.3700 |
300 |
.3163 |
|
21 - 24 |
.3600 |
350 |
.3113 |
|
24 - 30 |
.3500 |
400 |
.3067 |
|
30 - 36 |
.3450 |
450 |
.3024 |
|
36 - 42 |
.3400 |
500 |
.2982 |
|
42 - 48 |
.3350 |
550 |
.2942 |
|
48 - 66 |
.3250 |
600 |
.2904 |
|
66 - 84 |
.3200 |
650 |
.2870 |
|
84 - 102 |
.3150 |
700 |
.2838 |
|
102 - 138 |
.3100 |
750 |
.2809 |
|
138 - 174 |
.3050 |
800 |
.2782 |
|
174 - 210 |
.3000 |
850 |
.2756 |
|
210 - 246 |
.2950 |
900 |
.2732 |
|
246 - 282 |
.2900 |
950 |
.2710 |
|
282 - 318 |
.2850 |
1,000 |
.2689 |
|
318 - 354 |
.2800 |
1,050 |
.2669 |
|
354 - 390 |
.2750 |
1,100 |
.2649 |
|
390 - 426 |
.2700 |
1,150 |
.2631 |
|
426 - 462 |
.2650 |
1,200 |
.2614 |
|
462 - 498 |
.2600 |
1,250 |
.2597 |
|
498 - 534 |
.2550 |
1,300 |
.2581 |
|
534 - 587 |
.2500 |
1,350 |
.2566 |
|
587 - 646 |
.2463 |
1,400 |
.2551 |
|
646 - 711 |
.2426 |
|
|
|
711 - 782 |
.2389 |
|
|
|
782 - 860 |
.2352 |
|
|
|
860 - 946 |
.2315 |
|
|
|
946 - 1,041 |
.2278 |
|
|
|
1,041 - 1,145 |
.2241 |
|
|
|
1,145 - 1,260 |
.2204 |
|
|
|
Over 1,260 |
.2167 |
|
|
The group fee rate is calculated on a cumulative basis pursuant to the graduated fee rate schedule shown above on the left. The schedule above on the right shows the effective annual group fee rate at various asset levels, which is the result of cumulatively applying the annualized rates on the left. For example, the effective annual fee rate at $<R>884</R> billion of group net assets - the approximate level for July <R>2000</R> - was <R>0.2740</R>%, which is the weighted average of the respective fee rates for each level of group net assets up to $<R>884</R> billion.
Each fund's individual fund fee rate is <R>0.30</R>%. Based on the average group net assets of the funds advised by FMR for July <R>2000</R>, each fund's annual management fee rate would be calculated as follows:
|
|
Group Fee Rate |
|
Individual Fund Fee Rate |
|
Management Fee Rate |
|
<R>Advisor Consumer Industries |
0.2740% |
+ |
0.30% |
= |
0.574%</R> |
|
<R>Advisor Cyclical Industries |
0.2740% |
+ |
0.30% |
= |
0.574%</R> |
|
<R>Advisor Financial Services |
0.2740% |
+ |
0.30% |
= |
0.574%</R> |
|
<R>Advisor Health Care |
0.2740% |
+ |
0.30% |
= |
0.574%</R> |
|
<R>Advisor Natural Resources |
0.2740% |
+ |
0.30% |
= |
0.574%</R> |
|
<R>Advisor Technology |
0.2740% |
+ |
0.30% |
= |
0.574%</R> |
|
<R>Advisor Telecommunications & Utilities Growth |
0.2740% |
+ |
0.30% |
= |
0.574%</R> |
One-twelfth of the management fee rate is applied to each fund's average net assets for the month, giving a dollar amount which is the fee for that month.
The following table shows the amount of management fees paid by each fund to FMR for the past three fiscal years.
|
Fund |
Fiscal Years Ended |
Management Fees |
|
<R>Advisor Consumer Industries |
2000 |
$ 205,909</R> |
|
<R> |
1999 |
$ 201,981</R> |
|
<R> |
1998 |
$ 101,756</R> |
|
<R>Advisor Cyclical Industries |
2000 |
$ 55,210</R> |
|
<R> |
1999 |
$ 40,341</R> |
|
<R> |
1998 |
$ 30,832</R> |
|
<R>Advisor Financial Services |
2000 |
$ 1,974,906</R> |
|
<R> |
1999 |
$ 1,430,657</R> |
|
<R> |
1998 |
$ 797,075</R> |
|
<R>Advisor Health Care |
2000 |
$ 4,709,024</R> |
|
<R> |
1999 |
$ 2,532,771</R> |
|
<R> |
1998 |
$ 727,332</R> |
|
<R>Advisor Natural Resources |
2000 |
$ 1,964,927</R> |
|
<R> |
1999 |
$ 1,929,614</R> |
|
<R> |
1998 |
$ 3,365,961</R> |
|
<R>Advisor Technology |
2000 |
$ 14,021,602</R> |
|
<R> |
1999 |
$ 2,356,443</R> |
|
<R> |
1998 |
$ 667,737</R> |
|
<R>Advisor Telecommunications & Utilities Growth |
2000 |
$ 2,404,253</R> |
|
<R> |
1999 |
$ 480,763</R> |
|
<R> |
1998 |
$ 154,189</R> |
FMR may, from time to time, voluntarily reimburse all or a portion of a class's operating expenses (exclusive of interest, taxes, <R>certain</R> securities lending <R>costs,</R> brokerage commissions, and extraordinary expenses) , which is subject to revision or discontinuance. FMR retains the ability to be repaid for these expense reimbursements in the amount that expenses fall below the limit prior to the end of the fiscal year.
Expense reimbursements by FMR will increase a class's returns, and repayment of the reimbursement by a class will lower its returns.
<R>Sub-Advisers. On January 1, 2001, FMR will enter into a sub-advisory agreement with FMRC on behalf of each fund pursuant to which FMRC will have primary responsibility for choosing investments for each fund.</R>
<R>Under the terms of the sub-advisory agreements for each fund, FMR will pay FMRC fees equal to 50% of the management fee payable to FMR under its management contract with each fund. The fees paid to FMRC will not be reduced by any voluntary or mandatory expense reimbursements that may be in effect from time to time.</R>
On behalf of each fund, FMR <R>has entered into sub-advisory agreements</R> with FMR U.K. and FMR Far East. <R>Pursuant to the sub-advisory agreements, FMR may receive from the sub-advisers investment research and advice on issuers outside the United States and FMR may grant the sub-advisers </R>investment management authority as well as the authority to buy and sell securities if FMR believes it would be beneficial to the funds.
<R>On behalf of each fund, FMR Far East has entered into a sub-advisory agreement with FIJ pursuant to which FMR Far East may receive from FIJ investment research and advice relating to Japanese issuers (and such other Asian issuers as FMR Far East may designate).</R>
<R>For providing non-discretionary investment advice and research services the sub-advisers are compensated as follows:</R>
<R>For providing discretionary investment management and executing portfolio transactions, the sub-advisers are compensated as follows:</R>
For providing investment advice and research services, fees paid to FMR U.K.<R>,</R> FMR Far East<R>, and FIJ</R> for the past three fiscal years are shown in the table below.
|
<R>Fiscal Year Ended |
FMR U.K. |
FMR Far East |
FIJ</R> |
|
<R>Advisor Consumer Industries |
|
|
</R> |
|
<R>2000 |
$ 374 |
$ 0 |
$ 0</R> |
|
<R>1999 |
$ 561 |
$ 364 |
$ 0</R> |
|
<R>1998 |
$ 209 |
$ 198 |
$ 0</R> |
|
<R>Advisor Cyclical Industries |
|
|
</R> |
|
<R>2000 |
$ 22 |
$ 2 |
$ 1</R> |
|
<R>1999 |
$ 25 |
$ 17 |
$ 0</R> |
|
<R>1998 |
$ 22 |
$ 21 |
$ 0</R> |
|
<R>Advisor Financial Services |
|
|
</R> |
|
<R>2000 |
$ 283 |
$ 0 |
$ 0</R> |
|
<R>1999 |
$ 584 |
$ 429 |
$ 0</R> |
|
<R>1998 |
$ 558 |
$ 540 |
$ 0</R> |
|
<R>Advisor Health Care |
|
|
</R> |
|
<R>2000 |
$ 168 |
$ 3,858 |
$ 0</R> |
|
<R>1999 |
$ 23,497 |
$ 14,364 |
$ 0</R> |
|
<R>1998 |
$ 3,800 |
$ 3,572 |
$ 0</R> |
|
<R>Advisor Natural Resources |
|
|
</R> |
|
<R>2000 |
$ 10,817 |
$ 427 |
$ 206</R> |
|
<R>1999 |
$ 48,444 |
$ 33,467 |
$ 0</R> |
|
<R>1998 |
$ 54,559 |
$ 51,612 |
$ 0</R> |
|
<R>Advisor Technology |
|
|
</R> |
|
<R>2000 |
$ 82,936 |
$ 26,166 |
$ 11,868</R> |
|
<R>1999 |
$ 42,958 |
$ 25,785 |
$ 0</R> |
|
<R>1998 |
$ 4,853 |
$ 4,633 |
$ 0</R> |
|
<R>Advisor Telecommunications & Utilities Growth |
|
|
</R> |
|
<R>2000 |
$ 21,503 |
$ 17,744 |
$ 8,571</R> |
|
<R>1999 |
$ 3,102 |
$ 1,909 |
$ 0</R> |
|
<R>1998 |
$ 88 |
$ 87 |
$ 0</R> |
For discretionary investment management and execution of portfolio transactions, no fees were paid to <R>FMR U.K. and FMR Far East</R> on behalf of the funds for the past three fiscal years.
Each fund has entered into a distribution agreement with FDC, an affiliate of FMR. FDC is a broker-dealer registered under the Securities Exchange Act of 1934 and a member of the National Association of Securities Dealers, Inc. The distribution agreements call for FDC to use all reasonable efforts, consistent with its other business, to secure purchasers for shares of <R>the </R>fund<R>s</R>, which are continuously offered. Promotional and administrative expenses in connection with the offer and sale of shares are paid by FMR.
Sales charge revenues collected and retained by FDC for the past three fiscal years are shown in the table below.
|
|
|
Sales Charge Revenue |
CDSC Revenue |
||
|
|
Fiscal Year Ended |
Amount Paid |
Amount
Retained |
Amount Paid |
Amount
Retained |
|
<R>Advisor Consumer Industries - Class A |
July 31, 2000 |
$ 23,206 |
$ 9,974 |
$ 0 |
$ 0</R> |
|
<R> |
1999 |
$ 26,463 |
$ 9,732 |
$ 0 |
$ 0</R> |
|
<R> |
1998 |
$ 17,058 |
$ 5,788 |
$ 0 |
$ 0</R> |
|
<R>Advisor Consumer Industries - Class T |
July 31, 2000 |
$ 25,258 |
$ 8,422 |
$ 239 |
$ 239</R> |
|
<R> |
1999 |
$ 49,305 |
$ 13,689 |
$ 0 |
$ 0</R> |
|
<R> |
1998 |
$ 42,495 |
$ 12,506 |
$ 0 |
$ 0</R> |
|
<R>Advisor Consumer Industries - Class B |
July 31, 2000 |
$ 0 |
$ 0 |
$ 48,560 |
$ 48,560</R> |
|
<R> |
1999 |
$ 0 |
$ 0 |
$ 24,515 |
$ 24,515</R> |
|
<R> |
1998 |
$ 0 |
$ 0 |
$ 3,503 |
$ 3,503</R> |
|
<R>Advisor Consumer Industries - Class C |
July 31, 2000 |
$ 0 |
$ 0 |
$ 3,389 |
$ 3,389</R> |
|
<R> |
1999 |
$ 0 |
$ 0 |
$ 4,208 |
$ 4,208</R> |
|
<R> |
1998 |
$ 0 |
$ 0 |
$ 38 |
$ 38</R> |
|
<R>Advisor Consumer Industries - Institutional Class |
July 31, 2000 |
$ 0 |
$ 0 |
$ 0 |
$ 0</R> |
|
<R> |
1999 |
$ 0 |
$ 0 |
$ 0 |
$ 0</R> |
|
<R> |
1998 |
$ 0 |
$ 0 |
$ 0 |
$ 0</R> |
|
<R>Advisor Cyclical Industries - |
July 31, 2000 |
$ 4,529 |
$ 2,335 |
$ 0 |
$ 0</R> |
|
<R> |
1999 |
$ 4,343 |
$ 1,348 |
$ 0 |
$ 0</R> |
|
<R> |
1998 |
$ 1,572 |
$ 758 |
$ 0 |
$ 0</R> |
|
<R>Advisor Cyclical Industries - |
July 31, 2000 |
$ 7,440 |
$ 2,610 |
$ 695 |
$ 695</R> |
|
<R> |
1999 |
$ 9,332 |
$ 2,595 |
$ 223 |
$ 223</R> |
|
<R> |
1998 |
$ 8,776 |
$ 2,902 |
$ 0 |
$ 0</R> |
|
<R>Advisor Cyclical Industries - |
July 31, 2000 |
$ 0 |
$ 0 |
$ 11,022 |
$ 11,022</R> |
|
<R> |
1999 |
$ 0 |
$ 0 |
$ 7,352 |
$ 7,352</R> |
|
<R> |
1998 |
$ 0 |
$ 0 |
$ 328 |
$ 328</R> |
|
<R>Advisor Cyclical Industries - |
July 31, 2000 |
$ 0 |
$ 0 |
$ 3,704 |
$ 3,704</R> |
|
<R> |
1999 |
$ 0 |
$ 0 |
$ 805 |
$ 805</R> |
|
<R> |
1998 |
$ 0 |
$ 0 |
$ 61 |
$ 61</R> |
|
<R>Advisor Cyclical Industries - Institutional Class |
July 31, 2000 |
$ 0 |
$ 0 |
$ 0 |
$ 0</R> |
|
<R> |
1999 |
$ 0 |
$ 0 |
$ 0 |
$ 0</R> |
|
<R> |
1998 |
$ 0 |
$ 0 |
$ 0 |
$ 0</R> |
|
<R>Advisor Financial Services - |
July 31, 2000 |
$ 208,719 |
$ 140,282 |
$ 1,856 |
$ 1,856</R> |
|
<R> |
1999 |
$ 168,394 |
$ 73,369 |
$ 676 |
$ 676</R> |
|
<R> |
1998 |
$ 225,919 |
$ 96,375 |
$ 0 |
$ 0</R> |
|
<R>Advisor Financial Services - |
July 31, 2000 |
$ 257,411 |
$ 125,842 |
$ 5,516 |
$ 5,516</R> |
|
<R> |
1999 |
$ 255,657 |
$ 88,448 |
$ 760 |
$ 760</R> |
|
<R> |
1998 |
$ 375,688 |
$ 137,727 |
$ 0 |
$ 0</R> |
|
<R>Advisor Financial Services - |
July 31, 2000 |
$ 0 |
$ 0 |
$ 468,570 |
$ 468,570</R> |
|
<R> |
1999 |
$ 0 |
$ 0 |
$ 320,166 |
$ 320,166</R> |
|
<R> |
1998 |
$ 0 |
$ 0 |
$ 49,800 |
$ 49,800</R> |
|
<R>Advisor Financial Services - |
July 31, 2000 |
$ 0 |
$ 0 |
$ 78,536 |
$ 78,536</R> |
|
<R> |
1999 |
$ 0 |
$ 0 |
$ 23,912 |
$ 23,912</R> |
|
<R> |
1998 |
$ 0 |
$ 0 |
$ 6,588 |
$ 6,588</R> |
|
<R>Advisor Financial Services - |
July 31, 2000 |
$ 0 |
$ 0 |
$ 0 |
$ 0</R> |
|
<R> |
1999 |
$ 0 |
$ 0 |
$ 0 |
$ 0</R> |
|
<R> |
1998 |
$ 0 |
$ 0 |
$ 0 |
$ 0</R> |
|
<R>Advisor Health Care - Class A |
July 31, 2000 |
$ 419,293 |
$ 239,438 |
$ 2,602 |
$ 2,602</R> |
|
<R> |
1999 |
$ 550,975 |
$ 279,574 |
$ 197 |
$ 197</R> |
|
<R> |
1998 |
$ 193,119 |
$ 86,859 |
$ 0 |
$ 0</R> |
|
<R>Advisor Health Care - Class T |
July 31, 2000 |
$ 520,672 |
$ 215,168 |
$ 8,619 |
$ 8,619</R> |
|
<R> |
1999 |
$ 799,232 |
$ 309,540 |
$ 1,215 |
$ 1,215</R> |
|
<R> |
1998 |
$ 403,740 |
$ 153,952 |
$ 0 |
$ 0</R> |
|
<R>Advisor Health Care - Class B |
July 31, 2000 |
$ 0 |
$ 0 |
$ 1,039,749 |
$ 1,039,749</R> |
|
<R> |
1999 |
$ 0 |
$ 0 |
$ 321,313 |
$ 321,313</R> |
|
<R> |
1998 |
$ 0 |
$ 0 |
$ 31,102 |
$ 31,102</R> |
|
<R>Advisor Health Care - Class C |
July 31, 2000 |
$ 0 |
$ 0 |
$ 134,796 |
$ 134,796</R> |
|
<R> |
1999 |
$ 0 |
$ 0 |
$ 43,426 |
$ 43,426</R> |
|
<R> |
1998 |
$ 0 |
$ 0 |
$ 3,519 |
$ 3,519</R> |
|
<R>Advisor Health Care - |
July 31, 2000 |
$ 0 |
$ 0 |
$ 0 |
$ 0</R> |
|
<R> |
1999 |
$ 0 |
$ 0 |
$ 0 |
$ 0</R> |
|
<R> |
1998 |
$ 0 |
$ 0 |
$ 0 |
$ 0</R> |
|
<R>Advisor Natural Resources - |
July 31, 2000 |
$ 55,886 |
$ 24,404 |
$ 0 |
$ 0</R> |
|
<R> |
1999 |
$ 45,741 |
$ 22,233 |
$ 0 |
$ 0</R> |
|
<R> |
1998 |
$ 61,964 |
$ 20,495 |
$ 0 |
$ 0</R> |
|
<R>Advisor Natural Resources - |
July 31, 2000 |
$ 109,800 |
$ 34,684 |
$ 347 |
$ 347</R> |
|
<R> |
1999 |
$ 143,564 |
$ 48,622 |
$ 1,035 |
$ 1,035</R> |
|
<R> |
1998 |
$ 310,088 |
$ 98,963 |
$ 0 |
$ 0</R> |
|
<R>Advisor Natural Resources - |
July 31, 2000 |
$ 0 |
$ 0 |
$ 225,694 |
$ 225,694</R> |
|
<R> |
1999 |
$ 0 |
$ 0 |
$ 243,263 |
$ 243,263</R> |
|
<R> |
1998 |
$ 0 |
$ 0 |
$ 220,346 |
$ 220,346</R> |
|
<R>Advisor Natural Resources - |
July 31, 2000 |
$ 0 |
$ 0 |
$ 11,501 |
$ 11,501</R> |
|
<R> |
1999 |
$ 0 |
$ 0 |
$ 10,097 |
$ 10,097</R> |
|
<R> |
1998 |
$ 0 |
$ 0 |
$ 1,202 |
$ 1,202</R> |
|
<R>Advisor Natural Resources - |
July 31, 2000 |
$ 0 |
$ 0 |
$ 0 |
$ 0</R> |
|
<R> |
1999 |
$ 0 |
$ 0 |
$ 0 |
$ 0</R> |
|
<R> |
1998 |
$ 0 |
$ 0 |
$ 0 |
$ 0</R> |
|
<R>Advisor Technology - Class A |
July 31, 2000 |
$ 2,812,484 |
$ 1,400,149 |
$ 2,918 |
$ 2,918</R> |
|
<R> |
1999 |
$ 794,303 |
$ 408,361 |
$ 590 |
$ 590</R> |
|
<R> |
1998 |
$ 172,036 |
$ 65,577 |
$ 0 |
$ 0</R> |
|
<R>Advisor Technology - Class T |
July 31, 2000 |
$ 2,982,048 |
$ 1,112,631 |
$ 37,291 |
$ 37,291</R> |
|
<R> |
1999 |
$ 1,084,550 |
$ 422,494 |
$ 3,329 |
$ 3,329</R> |
|
<R> |
1998 |
$ 341,738 |
$ 124,571 |
$ 0 |
$ 0</R> |
|
<R>Advisor Technology - Class B |
July 31, 2000 |
$ 0 |
$ 0 |
$ 1,943,039 |
$ 1,943,039</R> |
|
<R> |
1999 |
$ 0 |
$ 0 |
$ 279,672 |
$ 279,672</R> |
|
<R> |
1998 |
$ 0 |
$ 0 |
$ 46,822 |
$ 46,822</R> |
|
<R>Advisor Technology - Class C |
July 31, 2000 |
$ 0 |
$ 0 |
$ 152,798 |
$ 152,798</R> |
|
<R> |
1999 |
$ 0 |
$ 0 |
$ 25,814 |
$ 25,814</R> |
|
<R> |
1998 |
$ 0 |
$ 0 |
$ 3,066 |
$ 3,066</R> |
|
<R>Advisor Technology - |
July 31, 2000 |
$ 0 |
$ 0 |
$ 0 |
$ 0</R> |
|
<R> |
1999 |
$ 0 |
$ 0 |
$ 0 |
$ 0</R> |
|
<R> |
1998 |
$ 0 |
$ 0 |
$ 0 |
$ 0</R> |
|
<R>Advisor Telecommunications & Utilities Growth - Class A |
July 31, 2000 |
$ 531,557 |
$ 271,551 |
$ 2,023 |
$ 2,023</R> |
|
<R> |
1999 |
$ 114,076 |
$ 55,950 |
$ 199 |
$ 199</R> |
|
<R> |
1998 |
$ 43,487 |
$ 16,090 |
$ 0 |
$ 0</R> |
|
<R>Advisor Telecommunications & Utilities Growth - Class T |
July 31, 2000 |
$ 693,078 |
$ 252,100 |
$ 2,446 |
$ 2,446</R> |
|
<R> |
1999 |
$ 177,771 |
$ 58,245 |
$ 55 |
$ 55</R> |
|
<R> |
1998 |
$ 57,287 |
$ 21,339 |
$ 0 |
$ 0</R> |
|
<R>Advisor Telecommunications & Utilities Growth - Class B |
July 31, 2000 |
$ 0 |
$ 0 |
$ 326,386 |
$ 326,386</R> |
|
<R> |
1999 |
$ 0 |
$ 0 |
$ 58,521 |
$ 58,521</R> |
|
<R> |
1998 |
$ 0 |
$ 0 |
$ 7,417 |
$ 7,417</R> |
|
<R>Advisor Telecommunications & Utilities Growth - Class C |
July 31, 2000 |
$ 0 |
$ 0 |
$ 28,660 |
$ 28,660</R> |
|
<R> |
1999 |
$ 0 |
$ 0 |
$ 6,350 |
$ 6,350</R> |
|
<R> |
1998 |
$ 0 |
$ 0 |
$ 803 |
$ 803</R> |
|
<R>Advisor Telecommunications & Utilities Growth - Institutional Class |
July 31, 2000 |
$ 0 |
$ 0 |
$ 0 |
$ 0</R> |
|
<R> |
1999 |
$ 0 |
$ 0 |
$ 0 |
$ 0</R> |
|
<R> |
1998 |
$ 0 |
$ 0 |
$ 0 |
$ 0</R> |
The Trustees have approved Distribution and Service Plans on behalf of <R>Class A, Class T, Class B, Class C, and Institutional Class of</R> each fund (the Plans) pursuant to Rule 12b-1 under the 1940 Act (the Rule). The Rule provides in substance that a mutual fund may not engage directly or indirectly in financing any activity that is primarily intended to result in the sale of shares of the fund except pursuant to a plan approved on behalf of the fund under the Rule. The Plans, as approved by the Trustees, allow Class A, Class T, Class B, Class C, and Institutional Class and FMR to incur certain expenses that might be considered to constitute direct or indirect payment by the funds of distribution expenses.
Pursuant to the Class A Plan for each fund, FDC is paid a monthly 12b-1 fee at an annual rate of up to 0.75% of Class A's average net assets determined at the close of business on each day throughout the month. Currently, the Trustees have approved a monthly 12b-1 fee for Class A of each of Advisor Consumer Industries, Advisor Cyclical Industries, Advisor Financial Services, Advisor Health Care, Advisor Natural Resources, Advisor Technology, and Advisor Telecommunications & Utilities Growth at an annual rate of 0.25% of its average net assets. This fee rate may be increased only when, in the opinion of the Trustees, it is in the best interests of the shareholders of the applicable class to do so.
Currently, FDC may reallow to intermediaries (such as banks, broker-dealers and other service-providers), including its affiliates, up to the full amount of 12b-1 fees paid by Class A for providing services intended to result in the sale of Class A shares and/or shareholder support services.
Pursuant to the Class T Plan for each fund, FDC is paid a monthly 12b-1 fee at an annual rate of up to 0.75% of Class T's average net assets (except for Advisor Natural Resources) determined at the close of business on each day throughout the month. Pursuant to the Class T Plan for Advisor Natural Resources, FDC is paid a monthly 12b-1 fee at an annual rate of up to 0.65% of Class T's average net assets. Currently, the Trustees have approved a monthly 12b-1 fee for Class T of each of Advisor Consumer Industries, Advisor Cyclical Industries, Advisor Financial Services, Advisor Health Care, Advisor Natural Resources, Advisor Technology, and Advisor Telecommunications & Utilities Growth at an annual rate of 0.50% of its average net assets. This fee rate may be increased only when, in the opinion of the Trustees, it is in the best interests of the shareholders of the applicable class to do so.
Currently, FDC may reallow to intermediaries (such as banks, broker-dealers and other service-providers), including its affiliates, up to the full amount of 12b-1 fees paid by Class T for providing services intended to result in the sale of Class T shares and/or shareholder support services.
Pursuant to the Class B Plan for each fund, FDC is paid a monthly 12b-1 (distribution) fee at an annual rate of 0.75% of Class B's average net assets determined at the close of business on each day throughout the month.
Pursuant to the Class B Plan for each fund, FDC is also paid a monthly 12b-1 (service) fee at an annual rate of 0.25% of Class B's average net assets determined at the close of business on each day throughout the month.
Currently, FDC retains the full amount of 12b-1 (distribution) fees paid by Class B as compensation for providing services intended to result in the sale of Class B shares, and FDC may reallow up to the full amount of 12b-1 (service) fees paid by Class B to intermediaries (such as banks, broker-dealers, and other service-providers),<R> including its affiliates,</R> for providing shareholder support services.
Pursuant to the Class C Plan for each fund, FDC is paid a monthly 12b-1 (distribution) fee at an annual rate of 0.75% of Class C's average net assets determined at the close of business on each day throughout the month.
Pursuant to the Class C Plan for each fund, FDC is also paid a monthly 12b-1 (service) fee at an annual rate of 0.25% of Class C's average net assets determined at the close of business on each day throughout the month.
Currently and except as provided below, for the first year of investment, FDC retains the full amount of 12b-1 (distribution) fees paid by Class C as compensation for providing services intended to result in the sale of Class C shares and retains the full amount of 12b-1 (service) fees paid by Class C for providing shareholder support services. Normally, after the first year of investment, FDC may reallow up to the full amount of 12b-1 (distribution) fees paid by Class C to intermediaries (such as banks, broker-dealers, and other service-providers), including its affiliates, for providing services intended to result in the sale of Class C shares and may reallow up to the full amount of 12b-1 (service) fees paid by Class C to intermediaries, including its affiliates, for providing shareholder support services. For purchases of Class C shares made for an employee benefit plan, 403(b) program or plan covering a sole-proprietor (formerly Keogh/H.R. 10 plan) or through reinvestment of dividends or capital gain distributions, during the first year of investment and thereafter, FDC may reallow up to the full amount of 12b-1 (distribution) fees paid by such Class C shares to intermediaries,<R> including its affiliates,</R> for providing services intended to result in the sale of Class C shares and may reallow up to the full amount of 12b-1 (service) fees paid by such Class C shares to intermediaries, including its affiliates, for providing shareholder support services.
CLASS A DISTRIBUTION FEES
The table below shows the distribution fees paid for Class A shares of each fund for the fiscal year ended July 31, <R>2000</R>.
|
<R> |
2000 |
</R> |
|
|
Fund |
Paid to Investment Professionals |
Retained by FDC* |
Total |
|
<R>Advisor Consumer Industries |
$ 8,481 |
$ 43 |
$ 8,524</R> |
|
<R>Advisor Cyclical Industries |
$ 2,084 |
$ 397 |
$ 2,481</R> |
|
<R>Advisor Financial Services |
$ 83,046 |
$ 145 |
$ 83,191</R> |
|
<R>Advisor Health Care |
$ 203,389 |
$ 195 |
$ 203,584</R> |
|
<R>Advisor Natural Resources |
$ 20,992 |
$ 42 |
$ 21,034</R> |
|
<R>Advisor Technology |
$ 655,956 |
$ 329 |
$ 656,285</R> |
|
<R>Advisor Telecommunications & Utilities Growth |
$ 94,015 |
$ 40 |
$ 94,055</R> |
CLASS T DISTRIBUTION FEES
<R>The table below shows the distribution fees paid for Class T shares of each fund for the fiscal year ended July 31, 2000.</R>
|
<R> |
2000</R> |
||
|
Fund |
Paid to Investment Professionals |
Retained by FDC* |
Total |
|
<R>Advisor Consumer Industries |
$ 79,172 |
$ 381 |
$ 79,553</R> |
|
<R>Advisor Cyclical Industries |
$ 16,157 |
$ 758 |
$ 16,915</R> |
|
<R>Advisor Financial Services |
$ 687,525 |
$ 323 |
$ 687,848</R> |
|
<R>Advisor Health Care |
$ 1,396,030 |
$ 5,774 |
$ 1,401,803</R> |
|
<R>Advisor Natural Resources |
$ 1,326,478 |
$ 14,084 |
$ 1,340,562</R> |
|
<R>Advisor Technology |
$ 4,479,504 |
$ 3,088 |
$ 4,482,592</R> |
|
<R>Advisor Telecommunications & Utilities Growth |
$ 721,809 |
$ 327 |
$ 722,136</R> |
CLASS B DISTRIBUTION AND SERVICE FEES
The table below shows the distribution and shareholder service fees paid for Class B shares of each fund for the fiscal year ended July 31, <R>2000</R>.
|
<R> |
2000</R> |
|||
|
Fund |
Distribution |
Retained by |
Shareholder Service Fees |
Retained by |
|
<R>Advisor Consumer Industries |
$ 71,310 |
$ 71,310 |
$ 23,770 |
$ 51</R> |
|
<R>Advisor Cyclical Industries |
$ 14,624 |
$ 14,624 |
$ 4,874 |
$ 339</R> |
|
<R>Advisor Financial Services |
$ 823,652 |
$ 823,652 |
$ 274,551 |
$ 296</R> |
|
<R>Advisor Health Care |
$ 2,114,180 |
$ 2,114,180 |
$ 704,727 |
$ 1,410</R> |
|
<R>Advisor Natural Resources |
$ 369,288 |
$ 369,288 |
$ 123,096 |
$ 547</R> |
|
<R>Advisor Technology |
$ 6,872,117 |
$ 6,872,117 |
$ 2,290,706 |
$ 859</R> |
|
<R>Advisor Telecommunications & Utilities Growth |
$ 1,167,533 |
$ 1,167,533 |
$ 389,178 |
$ 85</R> |
CLASS C DISTRIBUTION AND SERVICE FEES
The table below shows the distribution and shareholder service fees paid for Class C shares of each fund for the fiscal year ended July 31,<R> 2000</R>.
|
<R> |
2000</R> |
|||
|
Fund |
Distribution |
Retained by |
Shareholder Service Fees |
Retained by |
|
<R>Advisor Consumer Industries |
$ 21,056 |
$ 10,852 |
$ 7,018 |
$ 3,617</R> |
|
<R>Advisor Cyclical Industries |
$ 6,688 |
$ 4,971 |
$ 2,229 |
$ 1,657</R> |
|
<R>Advisor Financial Services |
$ 387,180 |
$ 255,255 |
$ 129,060 |
$ 85,085</R> |
|
<R>Advisor Health Care |
$ 1,042,541 |
$ 705,400 |
$ 347,514 |
$ 235,133</R> |
|
<R>Advisor Natural Resources |
$ 84,404 |
$ 54,997 |
$ 28,134 |
$ 18,332</R> |
|
<R>Advisor Technology |
$ 2,258,778 |
$ 1,694,758 |
$ 752,925 |
$ 564,919</R> |
|
<R>Advisor Telecommunications & Utilities Growth |
$ 495,805 |
$ 389,814 |
$ 165,269 |
$ 129,938</R> |
* Amounts retained by FDC represent fees paid to FDC but not yet reallowed to intermediaries as of the close of the period reported and fees paid to FDC that are not eligible to be reallowed to intermediaries. Amounts not eligible for reallowance are retained by FDC for use in its capacity as distributor.
** These amounts are retained by FDC for use in its capacity as distributor.
Under each Institutional Class Plan, if the payment of management fees by the fund to FMR is deemed to be indirect financing by the fund of the distribution of its shares, such payment is authorized by the Plan. Each Institutional Class Plan specifically recognizes that FMR may use its management fee revenue, as well as its past profits or its other resources, to pay FDC for expenses incurred in connection with providing services intended to result in the sale of Institutional <R>C</R>lass shares and/or shareholder support services. In addition, each Institutional Class Plan provides that FMR, directly or through FDC, may pay <R>significant amounts to</R> intermediaries, such as banks, broker-dealers and other service-providers, that provide those services. Currently, the Board of Trustees has authorized such payments for Institutional Class shares.
Under each Class A, Class T, Class B, and Class C Plan, if the payment of management fees by the fund to FMR is deemed to be indirect financing by the fund of the distribution of its shares, such payment is authorized by the Plan. Each Class A, Class T, Class B, and Class C Plan specifically recognizes that FMR may use its management fee revenue, as well as its past profits or its other resources, to pay FDC for expenses incurred in connection with providing services intended to result in the sale of Class A, Class T, Class B, and Class C shares and/or shareholder support services, including payments <R>of significant amounts</R> made to intermediaries that provide those services. Currently, the Board of Trustees has authorized such payments for Class A, Class T, Class B, and Class C shares.
Prior to approving each Plan, the Trustees carefully considered all pertinent factors relating to the implementation of the Plan, and determined that there is a reasonable likelihood that the Plan will benefit the applicable class of the fund and its shareholders. In particular, the Trustees noted that each Institutional Class Plan does not authorize payments by Institutional Class of the fund other than those made to FMR under its management contract with the fund. To the extent that each Plan gives FMR and FDC greater flexibility in connection with the distribution of shares of the applicable class, additional sales of fund shares or stabilization of cash flows may result. Furthermore, certain shareholder support services may be provided more effectively under the Plans by local entities with whom shareholders have other relationships.
Each Class A, Class T, Class B, and Class C Plan does not provide for specific payments by the applicable class of any of the expenses of FDC, or obligate FDC or FMR to perform any specific type or level of distribution activities or incur any specific level of expense in connection with distribution activities.
The Glass-Steagall Act generally prohibits federally and state chartered or supervised banks from <R>directly</R> engaging in the business of underwriting, selling or distributing securities.<R> F</R>DC believes that the Glass-Steagall Act should not preclude a bank from performing shareholder support services, or servicing and recordkeeping functions. FDC intends to engage banks only to perform such functions. However, changes in federal or state statutes and regulations pertaining to the permissible activities of bank<R>s, </R>as well as further judicial or administrative decisions or interpretations, could prevent a bank from continuing to perform all or a part of the contemplated services. If a bank were prohibited from so acting, the Trustees would consider what actions, if any, would be necessary to continue to provide efficient and effective shareholder services. In such event, changes in the operation of the funds might occur, including possible termination of any automatic investment or redemption or other services then provided by the bank. It is not expected that shareholders would suffer any adverse financial consequences as a result of any of these occurrences. In addition, state securities laws on this issue may differ from the interpretations of federal law expressed herein, and banks and other financial institutions may be required to register as dealers pursuant to state law.
Each fund may execute portfolio transactions with, and purchase securities issued by, depository institutions that receive payments under the Plans. No preference for the instruments of such depository institutions will be shown in the selection of investments.
FDC may compensate intermediaries that satisfy certain criteria established from time to time by FDC relating to the level or type of services provided by the intermediary, the sale or expected sale of significant amounts of shares, or other factors.
TRANSFER AND SERVICE AGENT AGREEMENTS
Each class of each fund has entered into a transfer agent agreement with FIIOC, an affiliate of FMR. Under the terms of the agreements, FIIOC performs transfer agency, dividend disbursing, and shareholder services for each class of each fund.
For providing transfer agency services, FIIOC receives an account fee and an asset-based fee each paid monthly with respect to each account in a fund. For retail accounts and certain institutional accounts, these fees are based on account size and fund type. For certain institutional retirement accounts, these fees are based on fund type. For certain other institutional retirement accounts, these fees are based on account type and fund type. The account fees are subject to increase based on postage rate changes.
The asset-based fees are subject to adjustment if the year-to-date total return of the S&P 500 exceeds a positive or negative 15%.
FIIOC pays out-of-pocket expenses associated with providing transfer agent services. In addition, FIIOC bears the expense of typesetting, printing, and mailing prospectuses, statements of additional information, and all other reports, notices, and statements to existing shareholders, with the exception of proxy statements.
Each fund has also entered into a service agent agreement with FSC, an affiliate of FMR. Under the terms of the agreements, FSC calculates the NAV and dividends for each class of each fund, maintains each fund's portfolio and general accounting records, and administers each fund's securities lending program.
For providing pricing and bookkeeping services, FSC receives a monthly fee based on each fund's average daily net assets throughout the month.
The annual rates for pricing and bookkeeping services for the funds are <R>0.0365%</R> of the first $500 million of average net assets, <R>0.0155% </R>of average net assets between $500 million and $3 billion, <R>0.0040% of average net assets between $3 billion and $25 billion,</R> and<R> 0.00075%</R> of average net assets in excess of <R>$25</R> billion. The fee, not including reimbursement for out-of-pocket expenses, is limited to a minimum of $60,000 per year.
Pricing and bookkeeping fees, including reimbursement for out-of-pocket expenses, paid by the funds to FSC for the past three fiscal years are shown in the table below.
|
<R>Fund |
2000 |
1999 |
1998</R> |
|
<R>Advisor Consumer Industries |
$ 60,342 |
$ 60,273 |
$ 60,446</R> |
|
<R>Advisor Cyclical Industries |
$ 60,121 |
$ 60,011 |
$ 60,218</R> |
|
<R>Advisor Financial Services |
$ 138,037 |
$ 124,777 |
$ 86,010</R> |
|
<R>Advisor Health Care |
$ 262,626 |
$ 206,426 |
$ 79,943</R> |
|
<R>Advisor Natural Resources |
$ 138,705 |
$ 192,837 |
$ 396,771</R> |
|
<R>Advisor Technology |
$ 517,162 |
$ 181,834 |
$ 70,851</R> |
|
<R>Advisor Telecommunications & Utilities Growth |
$ 152,293 |
$ 62,475 |
$ 60,324</R> |
For administering each fund's securities lending program, FSC is paid based on the number and duration of individual securities loans.
Payments made by the funds to FSC for securities lending for the past three fiscal years are shown in the table below.
|
<R>Fund |
2000 |
1999 |
1998</R> |
|
<R>Advisor Consumer Industries |
$ 16 |
$ 0 |
$ 0</R> |
|
<R>Advisor Cyclical Industries |
$ 3 |
$ 0 |
$ 0</R> |
|
<R>Advisor Financial Services |
$ 50 |
$ 0 |
$ 0</R> |
|
<R>Advisor Health Care |
$ 178 |
$ 0 |
$ 0</R> |
|
<R>Advisor Natural Resources |
$ 577 |
$ 0 |
$ 0</R> |
|
<R>Advisor Technology |
$ 2,705 |
$ 0 |
$ 0</R> |
|
<R>Advisor Telecommunications & Utilities Growth |
$ 1,749 |
$ 0 |
$ 0</R> |
Trust Organization. Fidelity Advisor Consumer Industries Fund, Fidelity Advisor Cyclical Industries Fund, Fidelity Advisor Financial Services Fund, Fidelity Advisor Health Care Fund, Fidelity Advisor Natural Resources Fund, Fidelity Advisor Technology Fund, and Fidelity Advisor <R>Telecommunications & </R>Utilities Growth Fund are funds of Fidelity Advisor Series VII, an open-end management investment company organized as a Massachusetts business trust on March 21, 1980. <R>On May 26, 2000, Fidelity Advisor Telecommunications & Utilities Growth Fund changed its name from Fidelity Advisor Utilities Growth Fund to Fidelity Advisor Telecommunications & Utilities Growth Fund.</R> Currently, there are 7 funds in Fidelity Advisor Series VII: Fidelity Advisor Consumer Industries Fund, Fidelity Advisor Cyclical Industries Fund, Fidelity Advisor Financial Services Fund, Fidelity Advisor Health Care Fund, Fidelity Advisor Natural Resources Fund, Fidelity Advisor Technology Fund, and Fidelity Advisor <R>Telecommunications & </R>Utilities Growth Fund. The Trustees are permitted to create additional funds in the trust and to create additional classes of the funds.
The assets of the trust received for the issue or sale of shares of each fund and all income, earnings, profits, and proceeds thereof, subject to the rights of creditors, are allocated to such fund, and constitute the underlying assets of such fund. The underlying assets of each fund in the trust shall be charged with the liabilities and expenses attributable to such fund, except that liabilities and expenses may be allocated to a particular class. Any general expenses of the trust shall be allocated between or among any one or more of the funds or classes.
Shareholder Liability. The trust is an entity commonly known as a "Massachusetts business trust." Under Massachusetts law, shareholders of such a trust may, under certain circumstances, be held personally liable for the obligations of the trust.
The Declaration of Trust provides that the trust shall not have any claim against shareholders except for the payment of the purchase price of shares and requires that each agreement, obligation, or instrument entered into or executed by the trust or the Trustees relating to the trust shall include a provision limiting the obligations created thereby to the trust and its assets.
The Declaration of Trust provides for indemnification out of each fund's property of any shareholder or former shareholder held personally liable for the obligations of the fund solely by reason of his or her being or having been a shareholder and not because of his or her acts or omissions or for some other reason. The Declaration of Trust also provides that each fund shall, upon request, assume the defense of any claim made against any shareholder for any act or obligation of the fund and satisfy any judgment thereon. Thus, the risk of a shareholder incurring financial loss on account of shareholder liability is limited to circumstances in which a fund itself would be unable to meet its obligations. FMR believes that, in view of the above, the risk of personal liability to shareholders is remote. Claims asserted against one class of shares may subject holders of another class of shares to certain liabilities.
Voting Rights. Each fund's capital consists of shares of beneficial interest. As a shareholder, you are entitled to one vote for each dollar of net asset value you own. The voting rights of shareholders can be changed only by a shareholder vote. Shares may be voted in the aggregate, by fund, and by class.
The shares have no preemptive or, for Class A, Class T, Class C, and Institutional Class shares, conversion rights. Shares are fully paid and nonassessable, except as set forth under the heading "Shareholder Liability" above.
The trust or <R>a fund </R>may be terminated upon the sale of its assets to another open-end management investment company, or upon liquidation and distribution of its assets, if approved by a vote of shareholders of the trust or the fund. In the event of the dissolution or liquidation of the trust, shareholders of each of its funds are entitled to receive the underlying assets of such fund available for distribution. In the event of the dissolution or liquidation of a fund, shareholders of that fund are entitled to receive the underlying assets of the fund available for distribution.
Custodians. Brown Brothers Harriman & Co., 40 Water Street, Boston, Massachusetts, is custodian of the assets of Advisor Natural Resources. The Chase Manhattan Bank, 1 Chase Manhattan Plaza, New York, New York, is custodian of the assets of Advisor Consumer Industries, Advisor Cyclical Industries, Advisor Financial Services, Advisor Health Care, Advisor Technology, and Advisor <R>Telecommunications & Utilities Growth. Each custodian is responsible for the safekeeping of a fund's assets and the appointment of any subcustodian banks and clearing agencies. </R>For Advisor Natural Resources, The Chase Manhattan Bank, <R>headquartered in New York, also may serve as a special purpose custodian of certain assets in connection with repurchase agreement transactions. For Advisor Consumer Industries, Advisor Cyclical Industries, Advisor Financial Services, Advisor Health Care, Advisor Technology, and Advisor Telecommunications & Utilities Growth, The Bank of New York, headquartered in New York, also may serve as a special purpose custodian of certain assets in connection with repurchase agreement transactions.</R>
FMR, its officers and directors, its affiliated companies, <R>Members of the Advisory Board,</R> and Members of the Board of Trustees may, from time to time, conduct transactions with various banks, including banks serving as custodians for certain funds advised by FMR. The Boston branch of Advisor Natural Resources' custodian leases its office space from an affiliate of FMR at a lease payment which, when entered into, was consistent with prevailing market rates. Transactions that have occurred to date include mortgages and personal and general business loans. In the judgment of FMR, the terms and conditions of those transactions were not influenced by existing or potential custodial or other fund relationships.
Auditor. Deloitte & Touche LLP, 200 Berkeley Street, Boston, Massachusetts, serves as independent accountant for each fund. The auditor examines financial statements for the funds and provides other audit, tax, and related services.
Each fund's financial statements and financial highlights for the fiscal year ended July 31, <R>2000,</R> and report of the auditor, are included in the fund's annual report and are incorporated herein by reference.
Fidelity Advisor Focus Funds, Fidelity, Fidelity Investments & (Pyramid) Design, <R>Fidelity Advisor Funds</R>, and Magellan are registered trademarks of FMR Corp.
The third party marks appearing above are the marks of their respective owners.
PART C. OTHER INFORMATION
Item 23. Exhibits
(a) (1) Amended and Restated Declaration of Trust dated October 12, 1987 was filed and is incorporated herein by reference to Exhibit 1(a) of Post-Effective Amendment No. 31.
(2) Amendment to the Declaration of Trust, dated December 20, 1991, was filed and is incorporated herein by reference to Exhibit 1(b) of Post-Effective Amendment No. 31.
(3) Amendment to the Declaration of Trust, dated April 15, 1993, was filed and is incorporated herein by reference to Exhibit 1(c) of Post-Effective Amendment No. 31.
(4) Amendment to the Declaration of Trust, dated September 30, 1997 was filed and is incorporated herein by reference to Exhibit 1(d) of Post-Effective Amendment No. 38.
(b) Bylaws of the Trust, as amended and dated May 19, 1994, are incorporated herein by reference to Exhibit 2(a) of Fidelity Union Street Trust's (File No. 2-50318) Post-Effective Amendment No. 87.
(c) Not applicable.
(d) (1) Management Contract between Fidelity Advisor Natural Resources Fund and Fidelity Management & Research Co., dated October 31, 1997, is incorporated herein by reference to Exhibit 5(a) of Post-Effective Amendment No. 38.
(2) Management Contract between Fidelity Advisor Consumer Industries Fund and Fidelity Management & Research Co., dated July, 18, 1996, is incorporated herein by reference to Exhibit 5(f) of Post-Effective Amendment No. 33.
(3) Management Contract between Fidelity Advisor Cyclical Industries Fund and Fidelity Management & Research Co., dated July 18, 1996, is incorporated herein by reference to Exhibit 5(g) of Post-Effective Amendment No. 33.
(4) Management Contract between Fidelity Advisor Financial Services Fund and Fidelity Management & Research Co., dated July 18, 1996, is incorporated herein by reference to Exhibit 5(h) of Post-Effective Amendment No. 33.
(5) Management Contract between Fidelity Advisor Health Care Fund and Fidelity Management & Research Co., dated July 18, 1996, is incorporated herein by reference to Exhibit 5(i) of Post-Effective Amendment No. 33.
(6) Management Contract between Fidelity Advisor Technology Fund and Fidelity Management & Research Co., dated July 18, 1996, is incorporated herein by reference to Exhibit 5(j) of Post-Effective Amendment No. 33.
(7) Management Contract between Fidelity Advisor Telecommunications & Utilities Growth Fund (formerly Fidelity Advisor Utilities Growth Fund) and Fidelity Management & Research Co., dated July 18, 1996, is incorporated herein by reference to Exhibit 5(k) of Post-Effective Amendment No. 33.
(8) Sub-Advisory Agreement between Fidelity Management & Research Co., on behalf of Fidelity Advisor Natural Resources Fund, and Fidelity Management & Research (U.K.) Inc., dated October 31, 1997, is incorporated herein by reference to Exhibit 5(b) of Post-Effective Amendment No. 38.
(9) Sub-Advisory Agreement between Fidelity Management and Research Co., on behalf of Fidelity Advisor Natural Resources Fund, and Fidelity Management & Research (Far East) Inc., dated October 31, 1997, is incorporated herein by reference to Exhibit 5(c) of Post-Effective Amendment No. 38.
(10) Sub-Advisory Agreement between Fidelity Management & Research Co., on behalf of Fidelity Advisor Consumer Industries Fund, and Fidelity Management & Research (U.K.) Inc., dated July 18, 1996, is incorporated herein by reference to Exhibit 5(l) of Post-Effective Amendment No. 33.
(11) Sub-Advisory Agreement between Fidelity Management & Research Co., on behalf of Fidelity Advisor Cyclical Industries Fund, and Fidelity Management & Research (U.K.) Inc., dated July 18, 1996, is incorporated herein by reference to Exhibit 5(m) of Post-Effective Amendment No. 33.
(12) Sub-Advisory Agreement between Fidelity Management & Research Co., on behalf of Fidelity Advisor Financial Services Fund, and Fidelity Management & Research (U.K.) Inc., dated July 18, 1996, is incorporated herein by reference to Exhibit 5(n) of Post-Effective Amendment No. 33.
(13) Sub-Advisory Agreement between Fidelity Management & Research Co., on behalf of Fidelity Advisor Health Care Fund, and Fidelity Management & Research (U.K.) Inc., dated July 18, 1996, is incorporated herein by reference to Exhibit 5(o) of Post-Effective Amendment No. 33.
(14) Sub-Advisory Agreement between Fidelity Management & Research Co., on behalf of Fidelity Advisor Technology Fund, and Fidelity Management & Research (U.K.) Inc., dated July 18, 1996, is incorporated herein by reference to Exhibit 5(p) of Post-Effective Amendment No. 33.
(15) Sub-Advisory Agreement between Fidelity Management & Research Co., on behalf of Fidelity Advisor Telecommunications & Utilities Growth Fund (formerly Fidelity Advisor Utilities Growth Fund), and Fidelity Management & Research (U.K.) Inc., dated July 18, 1996, is incorporated herein by reference to Exhibit 5(q) of Post-Effective Amendment No. 33.
(16) Sub-Advisory Agreement between Fidelity Management and Research Co., on behalf of Fidelity Advisor Consumer Industries Fund, and Fidelity Management & Research (Far East) Inc., dated July 18, 1996, is incorporated herein by reference to Exhibit 5(r) of Post-Effective Amendment No. 33.
(17) Sub-Advisory Agreement between Fidelity Management and Research Co., on behalf of Fidelity Advisor Cyclical Industries Fund, and Fidelity Management & Research (Far East) Inc., dated July 18, 1996, is incorporated herein by reference to Exhibit 5(s) of Post-Effective Amendment No. 33.
(18) Sub-Advisory Agreement between Fidelity Management and Research Co., on behalf of Fidelity Advisor Financial Services Fund, and Fidelity Management & Research (Far East) Inc., dated July 18, 1996, is incorporated herein by reference to Exhibit 5(t) of Post-Effective Amendment No. 33.
(19) Sub-Advisory Agreement between Fidelity Management and Research Co., on behalf of Fidelity Advisor Health Care Fund, and Fidelity Management & Research (Far East) Inc., dated July 18, 1996, is incorporated herein by reference to Exhibit 5(u) of Post-Effective Amendment No. 33.
(20) Sub-Advisory Agreement between Fidelity Management and Research Co., on behalf of Fidelity Advisor Technology Fund, and Fidelity Management & Research (Far East) Inc., dated July 18, 1996, is incorporated herein by reference to Exhibit 5(v) of Post-Effective Amendment No. 33.
(21) Sub-Advisory Agreement between Fidelity Management and Research Co., on behalf of Fidelity Advisor Telecommunications & Utilities Growth Fund (formerly Fidelity Advisor Utilities Growth Fund), and Fidelity Management & Research (Far East) Inc., dated July 18, 1996, is incorporated herein by reference to Exhibit 5(w) of Post-Effective Amendment No. 33.
(22) Research Agreement between Fidelity Management & Research (Far East) Inc. and Fidelity Investments Japan Limited, on behalf of Fidelity Advisor Consumer Industries Fund, dated January 1, 2000, is filed herein as Exhibit d(22).
(23) Research Agreement between Fidelity Management & Research (Far East) Inc. and Fidelity Investments Japan Limited, on behalf of Fidelity Advisor Cyclical Industries Fund, dated January 1, 2000, is filed herein as Exhibit d(23).
(24) Research Agreement between Fidelity Management & Research (Far East) Inc. and Fidelity Investments Japan Limited, on behalf of Fidelity Advisor Financial Services Fund, dated January 1, 2000, is filed herein as Exhibit d(24).
(25) Research Agreement between Fidelity Management & Research (Far East) Inc. and Fidelity Investments Japan Limited, on behalf of Fidelity Advisor Health Care Fund, dated January 1, 2000, is filed herein as Exhibit d(25).
(26) Research Agreement between Fidelity Management & Research (Far East) Inc. and Fidelity Investments Japan Limited, on behalf of Fidelity Advisor Natural Resources Fund, dated January 1, 2000, is filed herein as Exhibit d(26).
(27) Research Agreement between Fidelity Management & Research (Far East) Inc. and Fidelity Investments Japan Limited, on behalf of Fidelity Advisor Technology Fund, dated January 1, 2000, is filed herein as Exhibit d(27).
(28) Research Agreement between Fidelity Management & Research (Far East) Inc. and Fidelity Investments Japan Limited, on behalf of Fidelity Advisor Telecommunications & Utilities Growth Fund (formerly Fidelity Advisor Utilities Growth Fund), dated January 1, 2000, is filed herein as Exhibit d(28).
(29) Form of Sub-Advisory Agreement between Fidelity Management & Research Company, on behalf of Fidelity Advisor Consumer Industries Fund, and FMR Co., Inc., is filed herein as Exhibit d(29).
(30) Form of Sub-Advisory Agreement between Fidelity Management & Research Company, on behalf of Fidelity Advisor Cyclical Industries Fund, and FMR Co., Inc., is filed herein as Exhibit d(30).
(31) Form of Sub-Advisory Agreement between Fidelity Management & Research Company, on behalf of Fidelity Advisor Financial Services Fund, and FMR Co., Inc., is filed herein as Exhibit d(31).
(32) Form of Sub-Advisory Agreement between Fidelity Management & Research Company, on behalf of Fidelity Advisor Health Care Fund, and FMR Co., Inc., is filed herein as Exhibit d(32).
(33) Form of Sub-Advisory Agreement between Fidelity Management & Research Company, on behalf of Fidelity Advisor Natural Resources Fund, and FMR Co., Inc., is filed herein as Exhibit d(33).
(34) Form of Sub-Advisory Agreement between Fidelity Management & Research Company, on behalf of Fidelity Advisor Technology Fund, and FMR Co., Inc., is filed herein as Exhibit d(34).
(35) Form of Sub-Advisory Agreement between Fidelity Management & Research Company, on behalf of Fidelity Advisor Telecommunications & Utilities Growth Fund, and FMR Co., Inc., is filed herein as Exhibit d(35).
(e) (1) General Distribution Agreement between Fidelity Advisor Natural Resources Fund and Fidelity Distributors Corporation, dated October 31, 1997, is incorporated herein by reference to Exhibit 6(a) of Post-Effective Amendment No. 39.
(2) General Distribution Agreement between Fidelity Advisor Consumer Industries Fund and Fidelity Distributors Corporation, dated July 18, 1996, is incorporated herein by reference to Exhibit 6(f) of Post-Effective Amendment No. 33.
(3) General Distribution Agreement between Fidelity Advisor Cyclical Industries Fund and Fidelity Distributors Corporation, dated July 18, 1996, is incorporated herein by reference to Exhibit 6(g) of Post-Effective Amendment No. 33.
(4) General Distribution Agreement between Fidelity Advisor Financial Services Fund and Fidelity Distributors Corporation, dated July 18, 1996, is incorporated herein by reference to Exhibit 6(h) of Post-Effective Amendment No. 33.
(5) General Distribution Agreement between Fidelity Advisor Health Care Fund and Fidelity Distributors Corporation, dated July 18, 1996, is incorporated herein by reference to Exhibit 6(i) of Post-Effective Amendment No. 33.
(6) General Distribution Agreement between Fidelity Advisor Technology Fund and Fidelity Distributors Corporation, dated July 18, 1996, is incorporated herein by reference to Exhibit 6(j) of Post-Effective Amendment No. 33.
(7) General Distribution Agreement between Fidelity Advisor Telecommunications & Utilities Growth Fund (formerly Fidelity Advisor Utilities Growth Fund) and Fidelity Distributors Corporation, dated July 18, 1996, is incorporated herein by reference to Exhibit 6(k) of Post-Effective Amendment No. 33.
(8) Bank Agency Agreement (most recently revised January, 1997) is incorporated herein by reference to Exhibit 6(h) of Post-Effective Amendment No. 40.
(9) Selling Dealer Agreement (most recently revised January, 1997) is incorporated herein by reference to Exhibit 6(i) of Post-Effective Amendment No. 40.
(10) Selling Dealer Agreement for Bank-Related Transactions (most recently revised January, 1997) is incorporated herein by reference to Exhibit 6(j) of Post-Effective Amendment No. 40.
(f) The Fee Deferral Plan for Non-Interested Person Directors and Trustees of the Fidelity Funds, effective as of September 15, 1995 and amended through January 1, 2000, is incorporated herein by reference to Exhibit (f)(1) of Fidelity Massachusetts Municipal Trust's (File No. 2-75537) Post-Effective Amendment No. 39.
(g) (1) Custodian Agreement and Appendix C, dated August 1, 1994, between The Chase Manhattan Bank, N.A. and Fidelity Advisor Series VII on behalf of Fidelity Advisor Consumer Industries Fund, Fidelity Advisor Cyclical Industries Fund, Fidelity Advisor Financial Services Fund, Fidelity Advisor Health Care Fund, Fidelity Advisor Technology Fund, and Fidelity Advisor Telecommunications & Utilities Growth Fund (formerly Fidelity Advisor Utilities Growth Fund) are incorporated herein by reference to Exhibit 8(a) of Fidelity Investment Trust's (File No. 2-90649) Post-Effective Amendment No. 59.
(2) Appendix A, dated July 24, 2000, to the Custodian Agreement, dated August 1, 1994, between The Chase Manhattan Bank, N.A. and Fidelity Advisor Series VII on behalf of Fidelity Advisor Consumer Industries Fund, Fidelity Advisor Cyclical Industries Fund, Fidelity Advisor Financial Services Fund, Fidelity Advisor Health Care Fund, Fidelity Advisor Technology Fund, and Fidelity Advisor Telecommunications & Utilities Growth Fund (formerly Fidelity Advisor Utilities Growth Fund) is incorporated herein by reference to Exhibit g(6) of Fidelity Commonwealth Trust's (File No. 2-52322) Post-Effective Amendment No. 72.
(3) Appendix B, dated March 16, 2000, to the Custodian Agreement, dated August 1, 1994, between The Chase Manhattan Bank, N.A. and Fidelity Advisor Series VII on behalf of Fidelity Advisor Consumer Industries Fund, Fidelity Advisor Cyclical Industries Fund, Fidelity Advisor Financial Services Fund, Fidelity Advisor Health Care Fund, Fidelity Advisor Technology Fund, and Fidelity Advisor Telecommunications & Utilities Growth Fund (formerly Fidelity Advisor Utilities Growth Fund) is incorporated herein by reference to Exhibit g(7) of Fidelity Commonwealth Trust's (File No. 2-52322) Post-Effective Amendment No. 69.
(4) Addendum, dated October 21, 1996, to the Custodian Agreement, dated August 1, 1994, between The Chase Manhattan Bank, N.A. and Fidelity Advisor Series VII on behalf of Fidelity Advisor Consumer Industries Fund, Fidelity Advisor Cyclical Industries Fund, Fidelity Advisor Financial Services Fund, Fidelity Advisor Health Care Fund, Fidelity Advisor Technology Fund, and Fidelity Advisor Telecommunications & Utilities Growth Fund (formerly Fidelity Advisor Utilities Growth Fund) is incorporated herein by reference to Exhibit g(4) of Fidelity Charles Street Trust's (File No. 2-73133) Post-Effective Amendment No. 65.
(5) Custodian Agreement and Appendix C, dated September 1, 1994, between Brown Brothers Harriman & Company and Fidelity Advisor Series VII on behalf of Fidelity Advisor Natural Resources Fund are incorporated herein by reference to Exhibit 8(a) of Fidelity Commonwealth Trust's (File No. 2-52322) Post-Effective Amendment No. 56.
(6) Appendix A, dated August 11, 1999, to the Custodian Agreement, dated September 1, 1994, between Brown Brothers Harriman & Company and Fidelity Advisor Series VII on behalf of Fidelity Advisor Natural Resources Fund is incorporated herein by reference to Exhibit g(6) of Fidelity Advisor Series I's (File No. 2-84776) Post-Effective Amendment No. 50.
(7) Appendix B, dated March 16, 2000, to the Custodian Agreement, dated September 1, 1994, between Brown Brothers Harriman & Company and Fidelity Advisor Series VII on behalf of Fidelity Advisor Natural Resources Fund is incorporated herein by reference to Exhibit g(3) of Fidelity Commonwealth Trust's (File No. 2-52322) Post-Effective Amendment No. 69.
(8) Addendum, dated October 21, 1996, to the Custodian Agreement, dated September 1, 1994, between Brown Brothers Harriman & Company and Fidelity Advisor Series VII on behalf of Fidelity Advisor Natural Resources Fund is incorporated herein by reference to Exhibit g(4) of Fidelity Commonwealth Trust's (File No. 2-52322) Post-Effective Amendment No. 68.
(9) Fidelity Group Repo Custodian Agreement among The Bank of New York, J. P. Morgan Securities, Inc., and the Registrant, dated February 12, 1996, is incorporated herein by reference to Exhibit 8(d) of Fidelity Institutional Cash Portfolios' (File No. 2-74808) Post-Effective Amendment No. 31.
(10) Schedule 1 to the Fidelity Group Repo Custodian Agreement between The Bank of New York and the Registrant, dated February 12, 1996, is incorporated herein by reference to Exhibit 8(e) of Fidelity Institutional Cash Portfolios' (File No. 2-74808) Post-Effective Amendment No. 31.
(11) Fidelity Group Repo Custodian Agreement between Chemical Bank, Greenwich Capital Markets, Inc., and the Registrant, dated November 13, 1995, is incorporated herein by reference to Exhibit 8(f) of Fidelity Institutional Cash Portfolios' (File No. 2-74808) Post-Effective Amendment No. 31.
(12) Schedule 1 to the Fidelity Group Repo Custodian Agreement between Chemical Bank and the Registrant, dated November 13, 1995, is incorporated herein by reference to Exhibit 8(g) of Fidelity Institutional Cash Portfolios' (File No. 2-74808) Post-Effective Amendment No. 31.
(13) Joint Trading Account Custody Agreement between the The Bank of New York and the Registrant, dated May 11, 1995, is incorporated herein by reference to Exhibit 8(h) of Fidelity Institutional Cash Portfolios' (File No. 2-74808) Post-Effective Amendment No. 31.
(14) First Amendment to Joint Trading Account Custody Agreement between the The Bank of New York and the Registrant, dated July 14, 1995, is incorporated herein by reference to Exhibit 8(i) of Fidelity Institutional Cash Portfolios' (File No. 2-74808) Post-Effective Amendment No. 31.
(15) Schedule A-1, dated March 29, 2000, the the Fidelity Group Repo Custodian Agreements, Schedule 1s to the Fidelity Group Repo Custodian Agreements, Joint Trading Account Custody Agreement, and First Amendment to the Joint Trading Account Custody Agreement, between the respective parties and the Registrant, is incorporated herein by reference to Exhibit g(11) of Fidelity Magellan Fund's (File No. 2-21461) Post-Effective Amendment No. 48.
(h) Not applicable.
(i) (1) Legal Opinion of Kirkpatrick & Lockhart LLP for Fidelity Advisor Consumer Industries Fund, Fidelity Advisor Cyclical Industries Fund, Fidelity Advisor Financial Services Fund, Fidelity Advisor Health Care Fund, Fidelity Advisor Natural Resources Fund, Fidelity Advisor Technology Fund and Fidelity Advisor Telecommunications & Utilities Growth Fund (formerly Fidelity Advisor Utilities Growth Fund), dated September 29, 1999, is incorporated herein by reference to Exhibit i(1) of Post-Effective Amendment No. 42.
(j) (1) Consent of Deloitte & Touche LLP, dated September 25, 2000, is filed herein as Exhibit j(1).
(k) Not applicable.
(l) Not applicable.
(m) (1) Distribution and Service Plan pursuant to Rule 12b-1 for Fidelity Advisor Consumer Industries Fund: Class A is incorporated herein by reference to Exhibit m(1) of Post-Effective Amendment No. 42.
(2) Distribution and Service Plan pursuant to Rule 12b-1 for Fidelity Advisor Cyclical Industries Fund: Class A is incorporated herein by reference to Exhibit m(2) of Post-Effective Amendment No. 42.
(3) Distribution and Service Plan pursuant to Rule 12b-1 for Fidelity Advisor Financial Services Fund: Class A is incorporated herein by reference to Exhibit m(3) of Post-Effective Amendment No. 42.
(4) Distribution and Service Plan pursuant to Rule 12b-1 for Fidelity Advisor Health Care Fund: Class A is incorporated herein by reference to Exhibit m(4) of Post-Effective Amendment No. 42.
(5) Distribution and Service Plan pursuant to Rule 12b-1 for Fidelity Advisor Technology Fund: Class A is incorporated herein by reference to Exhibit m(5) of Post-Effective Amendment No. 42.
(6) Distribution and Service Plan pursuant to Rule 12b-1 for Fidelity Advisor Telecommunications & Utilities Growth Fund (formerly Fidelity Advisor Utilities Growth Fund): Class A is incorporated herein by reference to Exhibit m(6) of Post-Effective Amendment No. 42.
(7) Distribution and Service Plan pursuant to Rule 12b-1 for Fidelity Advisor Consumer Industries Fund: Class T is incorporated herein by reference to Exhibit m(7) of Post-Effective Amendment No. 42.
(8) Distribution and Service Plan pursuant to Rule 12b-1 for Fidelity Advisor Cyclical Industries Fund: Class T is incorporated herein by reference to Exhibit m(8) of Post-Effective Amendment No. 42.
(9) Distribution and Service Plan pursuant to Rule 12b-1 for Fidelity Advisor Financial Services Fund: Class T is incorporated herein by reference to Exhibit m(9) of Post-Effective Amendment No. 42.
(10) Distribution and Service Plan pursuant to Rule 12b-1 for Fidelity Advisor Health Care Fund: Class T is incorporated herein by reference to Exhibit m(10) of Post-Effective Amendment No. 42.
(11) Distribution and Service Plan pursuant to Rule 12b-1 for Fidelity Advisor Technology Fund: Class T is incorporated herein by reference to Exhibit m(11) of Post-Effective Amendment No. 42.
(12) Distribution and Service Plan pursuant to Rule 12b-1 for Fidelity Advisor Telecommunications & Utilities Growth Fund (formerly Fidelity Advisor Utilities Growth Fund): Class T is incorporated herein by reference to Exhibit m(12) of Post-Effective Amendment No. 42.
(13) Distribution and Service Plan pursuant to Rule 12b-1 for Fidelity Advisor Consumer Industries Fund: Institutional Class is incorporated herein by reference to Exhibit m(13) of Post-Effective Amendment No. 42.
(14) Distribution and Service Plan pursuant to Rule 12b-1 for Fidelity Advisor Cyclical Industries Fund: Institutional Class is incorporated herein by reference to Exhibit m(14) of Post-Effective Amendment No. 42.
(15) Distribution and Service Plan pursuant to Rule 12b-1 for Fidelity Advisor Financial Services Fund: Institutional Class is incorporated herein by reference to Exhibit m(15) of Post-Effective Amendment No. 42.
(16) Distribution and Service Plan pursuant to Rule 12b-1 for Fidelity Advisor Health Care Fund: Institutional Class is incorporated herein by reference to Exhibit m(16) of Post-Effective Amendment No. 42.
(17) Distribution and Service Plan pursuant to Rule 12b-1 for Fidelity Advisor Technology Fund: Institutional Class is incorporated herein by reference to Exhibit m(17) of Post-Effective Amendment No. 42.
(18) Distribution and Service Plan pursuant to Rule 12b-1 for Fidelity Advisor Telecommunications & Utilities Growth Fund (formerly Fidelity Advisor Utilities Growth Fund): Institutional Class is incorporated herein by reference to Exhibit m(18) of Post-Effective Amendment No. 42.
(19) Distribution and Service Plan pursuant to Rule 12b-1 for Fidelity Advisor Consumer Industries Fund: Class B is incorporated herein by reference to Exhibit m(19) of Post-Effective Amendment No. 42.
(20) Distribution and Service Plan pursuant to Rule 12b-1 for Fidelity Advisor Cyclical Industries Fund: Class B is incorporated herein by reference to Exhibit m(20) of Post-Effective Amendment No. 42.
(21) Distribution and Service Plan pursuant to Rule 12b-1 for Fidelity Advisor Financial Services Fund: Class B is incorporated herein by reference to Exhibit m(21) of Post-Effective Amendment No. 42.
(22) Distribution and Service Plan pursuant to Rule 12b-1 for Fidelity Advisor Health Care Fund: Class B is incorporated herein by reference to Exhibit m(22) of Post-Effective Amendment No. 42.
(23) Distribution and Service Plan pursuant to Rule 12b-1 for Fidelity Advisor Technology Fund: Class B is incorporated herein by reference to Exhibit m(23) of Post-Effective Amendment No. 42.
(24) Distribution and Service Plan pursuant to Rule 12b-1 for Fidelity Advisor Telecommunications & Utilities Growth Fund (formerly Fidelity Advisor Utilities Growth Fund): Class B is incorporated herein by reference to Exhibit m(24) of Post-Effective Amendment No. 42.
(25) Distribution and Service Plan pursuant to Rule 12b-1 for Fidelity Advisor Consumer Industries Fund: Class C is incorporated herein by reference to Exhibit m(25) of Post-Effective Amendment No. 42.
(26) Distribution and Service Plan pursuant to Rule 12b-1 for Fidelity Advisor Cyclical Industries Fund: Class C is incorporated herein by reference to Exhibit m(26) of Post-Effective Amendment No. 42.
(27) Distribution and Service Plan pursuant to Rule 12b-1 for Fidelity Advisor Financial Services Fund: Class C is incorporated herein by reference to Exhibit m(27) of Post-Effective Amendment No. 42.
(28) Distribution and Service Plan pursuant to Rule 12b-1 for Fidelity Advisor Health Care Fund: Class C is incorporated herein by reference to Exhibit m(28) of Post-Effective Amendment No. 42.
(29) Distribution and Service Plan pursuant to Rule 12b-1 for Fidelity Advisor Natural Resources Fund: Class C is incorporated herein by reference to Exhibit m(29) of Post-Effective Amendment No. 42.
(30) Distribution and Service Plan pursuant to Rule 12b-1 for Fidelity Advisor Technology Fund: Class C is incorporated herein by reference to Exhibit m(30) of Post-Effective Amendment No. 42.
(31) Distribution and Service Plan pursuant to Rule 12b-1 for Fidelity Advisor Telecommunications & Utilities Growth Fund (formerly Fidelity Advisor Utilities Growth Fund): Class C is incorporated herein by reference to Exhibit m(31) of Post-Effective Amendment No. 42.
(32) Distribution and Service Plan pursuant to Rule 12b-1 for Fidelity Advisor Natural Resources Fund: Class A is incorporated herein by reference to Exhibit m(32) of Post-Effective Amendment No. 42.
(33) Distribution and Service Plan pursuant to Rule 12b-1 for Fidelity Advisor Natural Resources Fund: Class T is incorporated herein by reference to Exhibit m(33) of Post-Effective Amendment No. 42.
(34) Distribution and Service Plan pursuant to Rule 12b-1 for Fidelity Advisor Natural Resources Fund: Class B is incorporated herein by reference to Exhibit m(34) of Post-Effective Amendment No. 42.
(35) Distribution and Service Plan pursuant to Rule 12b-1 for Fidelity Advisor Natural Resources Fund: Institutional Class is incorporated herein by reference to Exhibit m(35) of Post-Effective Amendment No. 42.
(n) (1) Rule 18f-3 Plan, dated March 19, 1998, is incorporated herein by reference to Exhibit 18 of Post-Effective Amendment No. 39.
(2) Schedule 1 to Multiple Class of Shares Plan pursuant to Rule 18f-3 on behalf of the registrant, dated August 30, 1999, is incorporated herein by reference to Exhibit o(2) of Post-Effective Amendment No. 42.
(p)(1) Code of Ethics, dated July 20, 2000, adopted by each funds, Fidelity Management & Research Company, FMR Co., Inc., Fidelity Management & Research (U.K.) Inc., Fidelity Management & Research (Far East) Inc., Fidelity Investments Japan Limited, and Fidelity Distributors Corporation pursuant to Rule 17j-1 is incorporated herein by reference to Exhibit (p)(1) of Fidelity Hastings Street Trust's (File No. 2-11517) Post-Effective Amendment No. 107.
Item 24. Trusts Controlled by or under Common Control with this Trust
The Board of Trustees of the Trust is the same as the board of other Fidelity funds, each of which has Fidelity Management & Research Company, or an affiliate, as its investment adviser. In addition, the officers of the Trust are substantially identical to those of the other Fidelity funds. Nonetheless, the Trust takes the position that it is not under common control with other Fidelity funds because the power residing in the respective boards and officers arises as the result of an official position with the respective trusts.
Item 25. Indemnification
Article XI, Section 2 of the Declaration of Trust sets forth the reasonable and fair means for determining whether indemnification shall be provided to any past or present Trustee or officer. It states that the Trust shall indemnify any present or past trustee or officer to the fullest extent permitted by law against liability, and all expenses reasonably incurred by him or her in connection with any claim, action, suit or proceeding in which he or she is involved by virtue of his or her service as a trustee or officer and against any amount incurred in settlement thereof. Indemnification will not be provided to a person adjudged by a court or other adjudicatory body to be liable to the Trust or its shareholders by reason of willful misfeasance, bad faith, gross negligence or reckless disregard of his or her duties (collectively, "disabling conduct"), or not to have acted in good faith in the reasonable belief that his or her action was in the best interest of the Trust. In the event of a settlement, no indemnification may be provided unless there has been a determination, as specified in the Declaration of Trust, that the officer or trustee did not engage in disabling conduct.
Pursuant to Section 11 of the Distribution Agreement, the Trust agrees to indemnify and hold harmless the Distributor and each of its directors and officers and each person, if any, who controls the Distributor within the meaning of Section 15 of the 1933 Act against any loss, liability, claim, damages or expense (including the reasonable cost of investigating or defending any alleged loss, liability, claim, damages, or expense and reasonable counsel fees incurred in connection therewith) arising by reason of any person acquiring any shares, based upon the ground that the registration statement, Prospectus, Statement of Additional Information, shareholder reports or other information filed or made public by the Trust (as from time to time amended) included an untrue statement of a material fact or omitted to state a material fact required to be stated or necessary in order to make the statements not misleading under the 1933 Act, or any other statute or the common law. However, the Trust does not agree to indemnify the Distributor or hold it harmless to the extent that the statement or omission was made in reliance upon, and in conformity with, information furnished to the Trust by or on behalf of the Distributor. In no case is the indemnity of the Trust in favor of the Distributor or any person indemnified to be deemed to protect the Distributor or any person against any liability to the Issuer or its security holders to which the Distributor or such person would otherwise be subject by reason of willful misfeasance, bad faith or gross negligence in the performance of its duties or by reason of its reckless disregard of its obligations and duties under this Agreement.
Pursuant to the agreement by which Fidelity Investments Institutional Operations Company, Inc. ("FIIOC") is appointed transfer agent, the Registrant agrees to indemnify and hold FIIOC harmless against any losses, claims, damages, liabilities or expenses (including reasonable counsel fees and expenses) resulting from:
(1) any claim, demand, action or suit brought by any person other than the Registrant, including by a shareholder, which names FIIOC and/or the Registrant as a party and is not based on and does not result from FIIOC's willful misfeasance, bad faith or negligence or reckless disregard of duties, and arises out of or in connection with FIIOC's performance under the Transfer Agency Agreement; or
(2) any claim, demand, action or suit (except to the extent contributed to by FIIOC's willful misfeasance, bad faith or negligence or reckless disregard of duties) which results from the negligence of the Registrant, or from FIIOC's acting upon any instruction(s) reasonably believed by it to have been executed or communicated by any person duly authorized by the Registrant, or as a result of FIIOC's acting in reliance upon advice reasonably believed by FIIOC to have been given by counsel for the Registrant, or as a result of FIIOC's acting in reliance upon any instrument or stock certificate reasonably believed by it to have been genuine and signed, countersigned or executed by the proper person.
Item 26. Business and Other Connections of Investment Advisers
(1) FIDELITY MANAGEMENT & RESEARCH COMPANY (FMR)
82 Devonshire Street, Boston, MA 02109
FMR serves as investment adviser to a number of other investment companies. The directors and officers of the Adviser have held, during the past two fiscal years, the following positions of a substantial nature.
|
Edward C. Johnson 3d |
Chairman of the Board and Director of FMR; Chief Executive Officer, Chairman of the Board, and Director of FMR Corp.; Chairman of the Board and Director of Fidelity Investments Money Management, Inc. (FIMM), Fidelity Management & Research (U.K.) Inc. (FMR U.K.), and Fidelity Management & Research (Far East) Inc. (FMR Far East); Director of Fidelity Management & Research Co., Inc. (FMRC); Chairman of the Executive Committee of FMR; President and Trustee of funds advised by FMR. |
|
|
|
|
|
|
Robert C. Pozen |
President and Director of FMR; Senior Vice President and Trustee of funds advised by FMR; President and Director of FIMM, FMRC, FMR U.K., and FMR Far East; Director of Strategic Advisers, Inc.; Previously, General Counsel, Managing Director, and Senior Vice President of FMR Corp. |
|
|
|
|
|
|
Paul Antico |
Vice President of FMR and of a fund advised by FMR. |
|
|
|
|
|
|
John Avery |
Vice President of FMR and of funds advised by FMR. |
|
|
|
|
|
|
Robert Bertelson |
Vice President of FMR and of a fund advised by FMR. |
|
|
|
|
|
|
William Bower |
Vice President of FMR and of a fund advised by FMR. |
|
|
|
|
|
|
Steve Buller |
Vice President of FMR and of a fund advised by FMR. |
|
|
|
|
|
|
John H. Carlson |
Vice President of FMR and of funds advised by FMR. |
|
|
|
|
|
|
Robert C. Chow |
Vice President of FMR and of a fund advised by FMR. |
|
|
|
|
|
|
Dwight D. Churchill |
Senior Vice President of FMR and Vice President of Fixed-Income Funds advised by FMR; Senior Vice President of FIMM and President of Fidelity Investments Fixed Income Division. |
|
|
|
|
|
|
Barry Coffman |
Vice President of FMR and of a fund advised by FMR. |
|
|
|
|
|
|
Michael Connolly |
Vice President of FMR. |
|
|
|
|
|
|
Frederic G. Corneel |
Tax Counsel of FMR. |
|
|
|
|
|
|
Laura B. Cronin |
Vice President of FMR and Treasurer of FMR, FIMM, FMR U.K., FMRC and FMR Far East. |
|
|
|
|
|
|
William Danoff |
Senior Vice President of FMR and Vice President of funds advised by FMR. |
|
|
|
|
|
|
Scott E. DeSano |
Vice President of FMR. |
|
|
|
|
|
|
Penelope Dobkin |
Vice President of FMR and of a fund advised by FMR. |
|
|
|
|
|
|
Walter C. Donovan |
Vice President of FMR. |
|
|
|
|
|
|
Bettina Doulton |
Senior Vice President of FMR and of funds advised by FMR. |
|
|
|
|
|
|
Stephen DuFour |
Vice President of FMR and of a fund advised by FMR. |
|
|
|
|
|
|
Robert Dwight |
Vice President of FMR and Treasurer of funds advised by FMR. |
|
|
|
|
|
|
Margaret L. Eagle |
Vice President of FMR. |
|
|
|
|
|
|
William R. Ebsworth |
Senior Vice President of FMR. |
|
|
|
|
|
|
Bahaa Fam |
Vice President of FMR. |
|
|
|
|
|
|
David Felman |
Vice President of FMR and of funds advised by FMR. |
|
|
|
|
|
|
Richard B. Fentin |
Senior Vice President of FMR and Vice President of a fund advised by FMR. |
|
|
|
|
|
|
Karen Firestone |
Vice President of FMR and of funds advised by FMR. |
|
|
|
|
|
|
Michael B. Fox |
Assistant Treasurer of FMR, FIMM, FMR U.K., and FMR Far East; Vice President and Treasurer of FMR Corp. and Strategic Advisers, Inc.; Vice President of FMR U.K., FMR Far East, and FIMM. |
|
|
|
|
|
|
Gregory Fraser |
Vice President of FMR and of funds advised by FMR. |
|
|
|
|
|
|
Jay Freedman |
Assistant Clerk of FMR; Clerk of FMR Corp., FMR U.K., FMR Far East, FMRC, and Strategic Advisers, Inc.; Secretary of FIMM; Vice President and Deputy General Counsel of FMR Corp. |
|
|
|
|
|
|
David L. Glancy |
Vice President of FMR and of funds advised by FMR. |
|
|
|
|
|
|
Boyce I. Greer |
Senior Vice President of FMR and Vice President of Money Market Funds and Municipal Bond Funds advised by FMR; Vice President of FIMM and Executive Vice President of Fidelity Investments Fixed Income Division. |
|
|
|
|
|
|
Bart A. Grenier |
Senior Vice President of FMR and Vice President of funds advised by FMR. |
|
|
|
|
|
|
Robert J. Haber |
Vice President of FMR. |
|
|
|
|
|
|
Richard C. Habermann |
Senior Vice President of FMR and Vice President of funds advised by FMR. |
|
|
|
|
|
|
Thomas Hense |
Vice President of FMR. |
|
|
|
|
|
|
Bruce T. Herring |
Vice President of FMR. |
|
|
|
|
|
|
Adam Hetnarski |
Vice President of FMR and of funds advised by FMR. |
|
|
|
|
|
|
Frederick Hoff |
Vice President of FMR. |
|
|
|
|
|
|
Abigail P. Johnson |
Senior Vice President of FMR and Vice President of certain Equity Funds advised by FMR; Director of FMR Corp. |
|
|
|
|
|
|
David B. Jones |
Vice President of FMR. |
|
|
|
|
|
|
Steven Kaye |
Senior Vice President of FMR and of a fund advised by FMR. |
|
|
|
|
|
|
William Kennedy |
Vice President of FMR and of funds advised by FMR. |
|
|
|
|
|
|
Francis V. Knox |
Vice President of FMR; Compliance Officer of FMR U.K. and FMR Far East. |
|
|
|
|
|
|
Timothy Krochuk |
Vice President of FMR and of funds advised by FMR. |
|
|
|
|
|
|
Harry W. Lange |
Vice President of FMR and of funds advised by FMR. |
|
|
|
|
|
|
Robert Lawrence |
Senior Vice President of FMR and Vice President of certain Equity and High Income Funds advised by FMR. |
|
|
|
|
|
|
Harris Leviton |
Vice President of FMR and of a fund advised by FMR. |
|
|
|
|
|
|
Peter S. Lynch |
Vice Chairman of the Board and Director of FMR and FMRC. |
|
|
|
|
|
|
Richard R. Mace Jr. |
Vice President of FMR and of funds advised by FMR. |
|
|
|
|
|
|
Shigeki Makino |
Vice President of FMR. |
|
|
|
|
|
|
Charles A. Mangum |
Vice President of FMR and of funds advised by FMR. |
|
|
|
|
|
|
Kevin McCarey |
Vice President of FMR and of funds advised by FMR. |
|
|
|
|
|
|
John McDowell |
Senior Vice President of FMR and of a fund advised by FMR. |
|
|
|
|
|
|
Neal P. Miller |
Vice President of FMR and of a fund advised by FMR. |
|
|
|
|
|
|
John Muresianu |
Vice President of FMR and of funds advised by FMR. |
|
|
|
|
|
|
David L. Murphy |
Vice President of FMR and Vice President of Taxable Bond Funds advised by FMR; Vice President of FIMM; and Senior Vice President of Fidelity Investments Fixed Income Division. |
|
|
|
|
|
|
Jacques Perold |
Vice President of FMR. |
|
|
|
|
|
|
Stephen Petersen |
Senior Vice President of FMR and Vice President of funds advised by FMR. |
|
|
|
|
|
|
Alan Radlo |
Vice President of FMR. |
|
|
|
|
|
|
Eric D. Roiter |
Vice President, General Counsel, and Clerk of FMR and Secretary of funds advised by FMR. |
|
|
|
|
|
|
Louis Salemy |
Vice President of FMR and of a fund advised by FMR. |
|
|
|
|
|
|
Lee H. Sandwen |
Vice President of FMR. |
|
|
|
|
|
|
Patricia A. Satterthwaite |
Vice President of FMR and of funds advised by FMR. |
|
|
|
|
|
|
Michael Seay |
Vice President of FMR. |
|
|
|
|
|
|
Fergus Shiel |
Vice President of FMR and of funds advised by FMR. |
|
|
|
|
|
|
Beso Sikharulidze |
Vice President of FMR and of a fund advised by FMR. |
|
|
|
|
|
|
Carol A. Smith-Fachetti |
Vice President of FMR. |
|
|
|
|
|
|
Steven J. Snider |
Vice President of FMR and of funds advised by FMR. |
|
|
|
|
|
|
Thomas T. Soviero |
Vice President of FMR and of a fund advised by FMR. |
|
|
|
|
|
|
Richard A. Spillane, Jr. |
Senior Vice President of FMR; Vice President of certain Equity Funds advised by FMR; Previously, Senior Vice President and Director of Operations and Compliance of FMR U.K. |
|
|
|
|
|
|
Thomas M. Sprague |
Vice President of FMR and of funds advised by FMR. |
|
|
|
|
|
|
Robert E. Stansky |
Senior Vice President of FMR and Vice President of a fund advised by FMR. |
|
|
|
|
|
|
Scott D. Stewart |
Vice President of FMR. |
|
|
|
|
|
|
Nick Thakore |
Vice President of FMR and of a fund advised by FMR. |
|
|
|
|
|
|
Yoko Tilley |
Vice President of FMR. |
|
|
|
|
|
|
Joel C. Tillinghast |
Vice President of FMR and of a fund advised by FMR. |
|
|
|
|
|
|
Robert Tuckett |
Vice President of FMR. |
|
|
|
|
|
|
Jennifer Uhrig |
Vice President of FMR and of funds advised by FMR. |
|
|
|
|
|
|
George A. Vanderheiden |
Senior Vice President of FMR. |
|
|
|
|
|
|
Judy Verhave |
Vice President of FMR. |
|
|
|
|
|
|
William P. Wall |
Vice President of FMR. |
|
|
|
|
|
|
Jason Weiner |
Vice President of FMR and of a fund advised by FMR. |
|
|
|
|
|
|
Steven S. Wymer |
Vice President of FMR and of a fund advised by FMR. |
|
|
|
|
|
(2) FMR CO., INC. (FMRC)
82 Devonshire Street, Boston, MA 02109
FMRC provides investment advisory services to Fidelity Management & Research Company. The directors and officers of the Sub-Adviser have held the following positions of a substantial nature during the past two fiscal years.
|
Edward C. Johnson 3d |
Director of FMRC; Chairman of the Board and Director of FMR U.K., FMR, FMR Corp., FIMM, and FMR Far East; President and Chief Executive Officer of FMR Corp.; Chairman of the Executive Committee of FMR; and President and Trustee of funds advised by FMR. |
|
|
|
|
Robert C. Pozen |
President and Director of FMRC, FIMM, FMR, FMR U.K., and FMR Far East; Senior Vice President and Trustee of funds advised by FMR; Director of Strategic Advisers, Inc.; Previously, General Counsel, Managing Director, and Senior Vice President of FMR Corp. |
|
|
|
|
Brian Clancy |
Vice President of FMRC. |
|
|
|
|
Laura B. Cronin |
Treasurer of FMRC, FMR U.K., FMR Far East, FMR, and FIMM and Vice President of FMR. |
|
|
|
|
Jay Freedman |
Clerk of FMRC, FMR Corp., FMR U.K., FMR Far East, and Strategic Advisers, Inc.; Assistant Clerk of FMR;Secretary of FIMM; Vice President and Deputy General Counsel of FMR Corp. |
|
|
|
|
Peter S. Lynch |
Director of FMRC; Vice Chairman of the Board and Director of FMR. |
(3) FIDELITY MANAGEMENT & RESEARCH (U.K.) INC. (FMR U.K.)
25 Lovat Lane, London, EC3R 8LL, England
FMR U.K. provides investment advisory services to Fidelity Management & Research Company and Fidelity Management Trust Company. The directors and officers of the Sub-Adviser have held the following positions of a substantial nature during the past two fiscal years.
|
Edward C. Johnson 3d |
Chairman of the Board and Director of FMR U.K., FMR, FMR Corp., FIMM, and FMR Far East; Director of FMRC; President and Chief Executive Officer of FMR Corp.; Chairman of the Executive Committee of FMR; and President and Trustee of funds advised by FMR. |
|
|
|
|
Robert C. Pozen |
President and Director of FMR U.K.; Senior Vice President and Trustee of funds advised by FMR; President and Director of FIMM, FMR, FMRC, and FMR Far East; Director of Strategic Advisers, Inc.; Previously, General Counsel, Managing Director, and Senior Vice President of FMR Corp. |
|
|
|
|
Laura B. Cronin |
Treasurer of FMR U.K., FMR Far East, FMR, FMRC, and FIMM and Vice President of FMR. |
|
|
|
|
Michael B. Fox |
Assistant Treasurer of FMR U.K., FMR, FMR Far East, and FIMM; Vice President of FMR U.K., FMR Far East, and FIMM; Vice President and Treasurer of FMR Corp. and Strategic Advisers, Inc. |
|
|
|
|
Simon Fraser |
Senior Vice President of FMR U.K.; Director and President of FIIA and FIIA(U.K.)L. |
|
|
|
|
Jay Freedman |
Clerk of FMR U.K., FMR Far East, FMR Corp., FMRC, and Strategic Advisers, Inc.; Assistant Clerk of FMR; Secretary of FIMM; Vice President and Deputy General Counsel of FMR Corp. |
|
|
|
|
Susan Englander Hislop |
Assistant Clerk of FMR U.K., FMR Far East, and Strategic Advisers, Inc.; Assistant Secretary of FIMM. |
|
|
|
|
Francis V. Knox |
Compliance Officer of FMR U.K. and FMR Far East; Vice President of FMR. |
(4) FIDELITY MANAGEMENT & RESEARCH (Far East) INC. (FMR Far East)
Shiroyama JT Mori Bldg., 4-3-1 Toranomon Minato-ku, Tokyo 105, Japan
FMR Far East provides investment advisory services to Fidelity Management & Research Company and Fidelity Management Trust Company. The directors and officers of the Sub-Adviser have held the following positions of a substantial nature during the past two fiscal years.
|
Edward C. Johnson 3d |
Chairman of the Board and Director of FMR Far East, FMR, FMR Corp., FIMM, and FMR U.K.; Director of FMRC; Chairman of the Executive Committee of FMR; Chief Executive Officer of FMR Corp.; and President and Trustee of funds advised by FMR. |
|
|
|
|
Robert C. Pozen |
President and Director of FMR Far East; Senior Vice President and Trustee of funds advised by FMR; President and Director of FIMM, FMR U.K., FMRC, and FMR; Director of Strategic Advisers, Inc.; Previously, General Counsel, Managing Director, and Senior Vice President of FMR Corp. |
|
|
|
|
Robert H. Auld |
Senior Vice President of FMR Far East. |
|
|
|
|
Laura B. Cronin |
Treasurer of FMR Far East, FMR U.K., FMR, FMRC, and FIMM and Vice President of FMR. |
|
|
|
|
Michael B. Fox |
Assistant Treasurer of FMR Far East, FMR, FMR U.K., and FIMM; Vice President of FMR Far East, FMR U.K. and FIMM; Vice President and Treasurer of FMR Corp., and Strategic Advisers, Inc. |
|
|
|
|
Jay Freedman |
Clerk of FMR Far East, FMR U.K., FMR Corp., FMRC, and Strategic Advisers, Inc.; Assistant Clerk of FMR; Secretary of FIMM; Vice President and Deputy General Counsel of FMR Corp. |
|
|
|
|
Susan Englander Hislop |
Assistant Clerk of FMR Far East, FMR U.K., and Strategic Advisers, Inc.; Assistant Secretary of FIMM. |
|
|
|
|
Francis V. Knox |
Compliance Officer of FMR Far East and FMR U.K.; Vice President of FMR. |
|
|
|
|
Billy Wilder |
Vice President of FMR Far East; President and Representative Director of FIJ. |
|
|
|
(8) FIDELITY INVESTMENTS JAPAN LIMITED (FIJ)
1-8-8 Shinkawa, Chuo-ku, Tokyo 104-0033, Japan
The directors and officers of FIJ have held, during the past two fiscal years, the following positions of a substantial nature.
|
Simon Haslam |
Director of FIJ; Director and Chief Financial Officer of FIIA, FISL (U.K.), and FII; Director and Secretary of FIIA(U.K.)L; Previously, Chief Financial Officer of FIL; Company Secretary of Fidelity Investments Group of Companies (U.K.). |
|
|
|
|
Noboru Kawai |
Director and General Manager of Administration of FIJ. |
|
|
|
|
Yasuo Kuramoto |
Vice Chairman and Representative Director of FIJ. |
|
|
|
|
Edward Moore |
Statutory Auditor of FIJ. |
|
|
|
|
Tetsuzo Nishimura |
Director and Vice President of Wholesales/ Broker Distribution of FIJ. |
|
|
|
|
Takeshi Okazaki |
Director and Head of Institutional Sales of FIJ. |
|
|
|
|
Billy Wilder |
President and Representative Director of FIJ; Vice President of FMR Far East. |
|
|
|
|
Hiroshi Yamashita |
Senior Managing Director of FIJ. |
|
|
|
Item 27. Principal Underwriters
(a) Fidelity Distributors Corporation (FDC) acts as distributor for all funds advised by FMR or an affiliate.
|
(b) |
|
|
|
Name and Principal |
Positions and Offices |
Positions and Offices |
|
Business Address* |
with Underwriter |
with Fund |
|
Edward L. McCartney |
Director and President |
None |
|
Jay Freedman |
Assistant Clerk |
None |
|
Paul J. Gallagher |
Director |
None |
|
Daniel T. Geraci |
Executive Vice President |
None |
|
Jane Greene |
Treasurer and Controller |
None |
|
Linda Capps Holland |
Assistant Clerk and Compliance Officer |
None |
|
Kevin J. Kelly |
Director |
None |
|
Gail McGovern |
Director |
None |
|
Jean Raymond |
Chief Financial Officer |
None |
|
J. Gregory Wass |
Assistant Treasurer |
None |
* 82 Devonshire Street, Boston, MA
(c) Not applicable.
Item 28. Location of Accounts and Records
All accounts, books, and other documents required to be maintained by Section 31(a) of the 1940 Act and the Rules promulgated thereunder are maintained by Fidelity Management & Research Company, Fidelity Service Company, Inc. or Fidelity Investments Institutional Operations Company, Inc., 82 Devonshire Street, Boston, MA 02109, or the funds' respective custodians, The Chase Manhattan Bank, 1 Chase Manhattan Plaza, New York, NY and Brown Brothers Harriman & Co., 40 Water Street, Boston, MA.
Item 29. Management Services
Not applicable.
Item 30. Undertakings
Not applicable.
SIGNATURES
Pursuant to the requirements of the Securities Act of 1933 and the Investment Company Act of 1940, the Registrant certifies that it meets all of the requirements for the effectiveness of this Registration Statement pursuant to Rule 485(b) under the Securities Act of 1933 and has duly caused this Post-Effective Amendment No. 43 to the Registration Statement to be signed on its behalf by the undersigned, thereunto duly authorized, in the City of Boston, and Commonwealth of Massachusetts, on the 25th day of September 2000.
|
|
Fidelity Advisor Series VII |
||
|
|
By |
/s/Edward C. Johnson 3d |
(dagger) |
|
|||||||||||||||||||||||||||||||||||||||||||||||||||||||||||||||||||||||||||||||||||||||||||||||||||||||| |
|
Edward C. Johnson 3d, President |
|
Pursuant to the requirements of the Securities Act of 1933, this Registration Statement has been signed below by the following persons in the capacities and on the dates indicated.
|
(Signature) |
|
(Title) |
(Date) |
|
|
|
|
|
|
/s/Edward C. Johnson 3d |
(dagger) |
President and Trustee |
September 25, 2000 |
|
Edward C. Johnson 3d |
|
(Principal Executive Officer) |
|
|
|
|
|
|
|
/s/Robert A. Dwight |
|
Treasurer |
September 25, 2000 |
|
Robert A. Dwight |
|
|
|
|
|
|
|
|
|
/s/Robert C. Pozen |
|
Trustee |
September 25, 2000 |
|
Robert C. Pozen |
|
|
|
|
|
|
|
|
|
/s/Ralph F. Cox |
* |
Trustee |
September 25, 2000 |
|
Ralph F. Cox |
|
|
|
|
|
|
|
|
|
/s/Phyllis Burke Davis |
* |
Trustee |
September 25, 2000 |
|
Phyllis Burke Davis |
|
|
|
|
|
|
|
|
|
/s/Robert M. Gates |
* |
Trustee |
September 25, 2000 |
|
Robert M. Gates |
|
|
|
|
|
|
|
|
|
/s/Donald J. Kirk |
* |
Trustee |
September 25, 2000 |
|
Donald J. Kirk |
|
|
|
|
|
|
|
|
|
/s/Ned C. Lautenbach |
* |
Trustee |
September 25, 2000 |
|
Ned C. Lautenbach |
|
|
|
|
|
|
|
|
|
/s/Peter S. Lynch |
* |
Trustee |
September 25, 2000 |
|
Peter S. Lynch |
|
|
|
|
|
|
|
|
|
/s/Marvin L. Mann |
* |
Trustee |
September 25, 2000 |
|
Marvin L. Mann |
|
|
|
|
|
|
|
|
|
/s/William O. McCoy |
* |
Trustee |
September 25, 2000 |
|
William O. McCoy |
|
|
|
|
|
|
|
|
|
/s/Gerald C. McDonough |
* |
Trustee |
September 25, 2000 |
|
Gerald C. McDonough |
|
|
|
|
|
|
|
|
|
/s/Thomas R. Williams |
* |
Trustee |
September 25, 2000 |
|
Thomas R. Williams |
|
|
|
(dagger) Signatures affixed by Robert C. Pozen pursuant to a power of attorney dated July 17, 1997 and filed herewith.
* Signature affixed by Alan C. Porter pursuant to a power of attorney dated July 20, 2000 and filed herewith.
POWER OF ATTORNEY
We, the undersigned Directors, Trustees, or General Partners, as the case may be, of the following investment companies:
|
Colchester Street Trust Fidelity Aberdeen Street Trust Fidelity Advisor Series I Fidelity Advisor Series II Fidelity Advisor Series III Fidelity Advisor Series IV Fidelity Advisor Series VI Fidelity Advisor Series VII Fidelity Advisor Series VIII Fidelity Beacon Street Trust Fidelity Boston Street Trust Fidelity California Municipal Trust Fidelity California Municipal Trust II Fidelity Capital Trust Fidelity Charles Street Trust Fidelity Commonwealth Trust Fidelity Concord Street Trust Fidelity Congress Street Fund Fidelity Contrafund Fidelity Court Street Trust Fidelity Court Street Trust II Fidelity Covington Trust Fidelity Destiny Portfolios Fidelity Devonshire Trust Fidelity Exchange Fund Fidelity Financial Trust Fidelity Fixed-Income Trust Fidelity Garrison Street Trust Fidelity Government Securities Fund Fidelity Hastings Street Trust |
Fidelity Hereford Street Trust Fidelity Income Fund Fidelity Institutional Tax-Exempt Cash Portfolios Fidelity Investment Trust Fidelity Magellan Fund Fidelity Massachusetts Municipal Trust Fidelity Money Market Trust Fidelity Mt. Vernon Street Trust Fidelity Municipal Trust Fidelity Municipal Trust II Fidelity New York Municipal Trust Fidelity New York Municipal Trust II Fidelity Oxford Street Trust Fidelity Phillips Street Trust Fidelity Puritan Trust Fidelity Revere Street Trust Fidelity School Street Trust Fidelity Securities Fund Fidelity Select Portfolios Fidelity Summer Street Trust Fidelity Trend Fund Fidelity U.S. Investments-Bond Fund, L.P. Fidelity U.S. Investments-Government Securities Fund, L.P. Fidelity Union Street Trust Fidelity Union Street Trust II Newbury Street Trust Variable Insurance Products Fund Variable Insurance Products Fund II Variable Insurance Products Fund III |
plus any other investment company for which Fidelity Management & Research Company or an affiliate acts as investment adviser and for which the undersigned individual serves as Directors, Trustees, or General Partners (collectively, the "Funds"), hereby constitute and appoint Arthur J. Brown, Arthur C. Delibert, Robert C. Hacker, Thomas M. Leahey, Richard M. Phillips, Dana L. Platt, and Alan C. Porter, each of them singly, our true and lawful attorneys-in-fact, with full power of substitution, and with full power to each of them, to sign for us and in our names in the appropriate capacities, all Registration Statements of the Funds on Form N-1A, Form N-8A or any successor thereto, any and all subsequent Amendments, Pre-Effective Amendments, or Post-Effective Amendments to said Registration Statements on Form N-1A or any successor thereto, any Registration Statements on Form N-14, and any supplements or other instruments in connection therewith, and generally to do all such things in our names and behalf in connection therewith as said attorneys-in-fact deem necessary or appropriate, to comply with the provisions of the Securities Act of 1933 and the Investment Company Act of 1940, and all related requirements of the Securities and Exchange Commission. I hereby ratify and confirm all that said attorneys-in-fact or their substitutes may do or cause to be done by virtue hereof. This power of attorney is effective for all documents filed on or after August 1, 2000.
WITNESS our hands on this twentieth day of July, 2000.
|
/s/Edward C. Johnson 3d |
/s/Peter S. Lynch |
|
Edward C. Johnson 3d |
Peter S. Lynch |
|
|
|
|
/s/Ralph F. Cox |
/s/Marvin L. Mann |
|
Ralph F. Cox |
Marvin L. Mann |
|
|
|
|
/s/Phyllis Burke Davis |
/s/William O. McCoy |
|
Phyllis Burke Davis |
William O. McCoy |
|
|
|
|
/s/Robert M. Gates |
/s/Gerald C. McDonough |
|
Robert M. Gates |
Gerald C. McDonough |
|
|
|
|
/s/Donald J. Kirk |
/s/Robert C. Pozen |
|
Donald J. Kirk |
Robert C. Pozen |
|
|
|
|
/s/Ned C. Lautenbach |
/s/Thomas R. Williams |
|
Ned C. Lautenbach |
Thomas R. Williams |
POWER OF ATTORNEY
I, the undersigned President and Director, Trustee, or General Partner, as the case may be, of the following investment companies:
|
Fidelity Aberdeen Street Trust Fidelity Advisor Series I Fidelity Advisor Series II Fidelity Advisor Series III Fidelity Advisor Series IV Fidelity Advisor Series V Fidelity Advisor Series VI Fidelity Advisor Series VII Fidelity Advisor Series VIII Fidelity Beacon Street Trust Fidelity Boston Street Trust Fidelity California Municipal Trust Fidelity California Municipal Trust II Fidelity Capital Trust Fidelity Charles Street Trust Fidelity Commonwealth Trust Fidelity Concord Street Trust Fidelity Congress Street Fund Fidelity Contrafund Fidelity Corporate Trust Fidelity Court Street Trust Fidelity Court Street Trust II Fidelity Covington Trust Fidelity Daily Money Fund Fidelity Destiny Portfolios Fidelity Deutsche Mark Performance Portfolio, L.P. Fidelity Devonshire Trust Fidelity Exchange Fund Fidelity Financial Trust Fidelity Fixed-Income Trust Fidelity Government Securities Fund Fidelity Hastings Street Trust |
Fidelity Hereford Street Trust Fidelity Income Fund Fidelity Institutional Cash Portfolios Fidelity Institutional Tax-Exempt Cash Portfolios Fidelity Investment Trust Fidelity Magellan Fund Fidelity Massachusetts Municipal Trust Fidelity Money Market Trust Fidelity Mt. Vernon Street Trust Fidelity Municipal Trust Fidelity Municipal Trust II Fidelity New York Municipal Trust Fidelity New York Municipal Trust II Fidelity Phillips Street Trust Fidelity Puritan Trust Fidelity Revere Street Trust Fidelity School Street Trust Fidelity Securities Fund Fidelity Select Portfolios Fidelity Sterling Performance Portfolio, L.P. Fidelity Summer Street Trust Fidelity Trend Fund Fidelity U.S. Investments-Bond Fund, L.P. Fidelity U.S. Investments-Government Securities Fund, L.P. Fidelity Union Street Trust Fidelity Union Street Trust II Fidelity Yen Performance Portfolio, L.P. Newbury Street Trust Variable Insurance Products Fund Variable Insurance Products Fund II Variable Insurance Products Fund III |
in addition to any other investment company for which Fidelity Management & Research Company or an affiliate acts as investment adviser and for which the undersigned individual serves as President and Director, Trustee, or General Partner (collectively, the "Funds"), hereby constitute and appoint Robert C. Pozen my true and lawful attorney-in-fact, with full power of substitution, and with full power to him to sign for me and in my name in the appropriate capacity, all Registration Statements of the Funds on Form N-1A, Form N-8A, or any successor thereto, any and all subsequent Amendments, Pre-Effective Amendments, or Post-Effective Amendments to said Registration Statements on Form N-1A, Form N-8A, or any successor thereto, any Registration Statements on Form N-14, and any supplements or other instruments in connection therewith, and generally to do all such things in my name and on my behalf in connection therewith as said attorney-in-fact deems necessary or appropriate, to comply with the provisions of the Securities Act of 1933 and the Investment Company Act of 1940, and all related requirements of the Securities and Exchange Commission. I hereby ratify and confirm all that said attorney-in-fact or his substitutes may do or cause to be done by virtue hereof. This power of attorney is effective for all documents filed on or after August 1, 1997.
WITNESS my hand on the date set forth below.
|
/s/Edward C. Johnson 3d |
July 17, 1997 |
|
Edward C. Johnson 3d |
|
|
|