
|
|
|
|
|
|
|
|
|
|
Previous: CENTENNIAL TAX EXEMPT TRUST /CO/, 497, 2000-10-31 |
Next: SOUTH TEXAS DRILLING & EXPLORATION INC, 8-K/A, 2000-10-31 |
Fidelity®
Portfolios®
Air Transportation
Automotive
Banking
Biotechnology
Brokerage and Investment Management
Business Services and Outsourcing
Chemicals
Computers
Construction and Housing
Consumer Industries
Cyclical Industries
Defense and Aerospace
Developing Communications
Electronics
Energy
Energy Service
Environmental Services
Financial Services
Food and Agriculture
Gold
Health Care
Home Finance
Industrial Equipment
Industrial Materials
Insurance
Leisure
Medical Delivery
Medical Equipment and Systems
Money Market
Multimedia
Natural Gas
Natural Resources
Paper and Forest Products
Retailing
Software and Computer Services
Technology
Telecommunications
Transportation
Utilities Growth
Semiannual Report
August 31, 2000
(2_fidelity_logos) (Registered_Trademark)
|
Contents Performance Overview |
4 |
|
|
Fund Updates* |
|
|
|
Consumer Sector |
7 |
Consumer Industries |
|
|
14 |
Food and Agriculture |
|
|
20 |
Leisure |
|
|
26 |
Multimedia |
|
|
32 |
Retailing |
|
Cyclicals Sector |
37 |
Air Transportation |
|
|
43 |
Automotive |
|
|
48 |
Chemicals |
|
|
53 |
Construction and Housing |
|
|
59 |
Cyclical Industries |
|
|
66 |
Defense and Aerospace |
|
|
72 |
Environmental Services |
|
|
77 |
Industrial Equipment |
|
|
83 |
Industrial Materials |
|
|
89 |
Paper and Forest Products |
|
|
94 |
Transportation |
|
Financial Services Sector |
100 |
Banking |
|
|
105 |
Brokerage and Investment Management |
|
|
111 |
Financial Services |
|
|
117 |
Home Finance |
|
|
112 |
Insurance |
|
Health Care Sector |
127 |
Biotechnology |
|
|
133 |
Health Care |
|
|
139 |
Medical Delivery |
|
|
145 |
Medical Equipment and Systems |
|
Natural Resources Sector |
150 |
Energy |
|
|
156 |
Energy Service |
|
|
161 |
Gold |
|
|
167 |
Natural Resources |
|
|
|
|
* Fund updates for each Select Portfolio include: Performance and Investment Summary, Manager's Overview, Investments, and Financial Statements.
|
Technology Sector |
173 |
Business Services and Outsourcing |
|
|
179 |
Computers |
|
|
185 |
Developing Communications |
|
|
191 |
Electronics |
|
|
197 |
Software and Computer Services |
|
|
203 |
Technology |
|
Utilities Sector |
210 |
Natural Gas |
|
|
216 |
Telecommunications |
|
|
222 |
Utilities Growth |
|
|
228 |
Money Market |
|
Notes to Financial Statements |
235 |
Footnotes to the Financial Statements |
Standard & Poor's, S&P and S&P 500 are registered service marks of The McGraw-Hill Companies, Inc. and have been licensed for use by
Fidelity Distributors Corporation.
Other third party marks appearing herein are the property of their respective owners.
All other marks appearing herein are registered or unregistered trademarks or service marks of FMR Corp. or an affiliated company.
(Recycle graphic) This report is printed on recycled paper using soy-based inks.
The views expressed in this report reflect those of each fund's portfolio manager only through the end of the period of the report as stated on the cover and do not necessarily represent the views of Fidelity or any other person in the Fidelity organization. Any such views are subject to change at any time based upon market or other conditions and Fidelity disclaims any responsibility to update such views. These views may not be relied on as investment advice and, because investment decisions for a Fidelity fund are based on numerous factors, may not be relied on as an indication of trading intent on behalf of any Fidelity fund.
Because of their narrow focus, sector funds tend to be more volatile than funds that diversify across many sectors and companies.
This report and the financial statements contained herein are submitted for the general information of the shareholders of the funds. This report is not authorized for distribution to prospective investors in the funds unless preceded or accompanied by an effective prospectus.
Mutual fund shares are not deposits or obligations of, or guaranteed by, any depository institution. Shares are not insured by the FDIC, Federal Reserve Board or any other agency, and are subject to investment risks, including possible loss of principal amount invested.
Neither the funds nor Fidelity Distributors Corporation is a bank.
Dear Shareholder:
Market leadership changed hands during the six-month period ending August 31, 2000, as the leaders of the "new economy" - technology, wireless and biotechnology stocks - gave way to the "old economy" financial services, natural resources and health care sectors. The technology sector reached its apex shortly after the period began, on March 10, when the NASDAQ Composite Index closed at a record high 5048.62. But that was followed by a 10-week, 30% freefall in the index - a decline sparked in large part by excessive valuations and the Federal Reserve Board's preemptive strikes against inflation. For the overall six-month period, the NASDAQ fell 10.36%. As the Fed's series of rate hikes began to take hold, investors flocked to sectors such as health care that traditionally deliver consistent, proven earnings in a more moderate-growth economy. The finance sector also emerged as a winner, thanks in part to strong capital markets activity. The natural resources sector benefited from rising oil and gas prices due to limited supplies of the commodities and heightened demand. The Standard & Poor's 500SM Index - a large-capitalization index of 500 widely held stocks - returned 11.73% during the six-month period. Blue chips, as measured by the Dow Jones Industrial Average, returned 11.60%. A heavy concentration in technology hurt the small-cap oriented Russell 2000® Index, which declined 6.38% during the period.
Amidst the period's volatility, more than half of the 38 Select equity portfolios beat their sector benchmarks. Twenty topped the S&P 500's six-month return, while 21 beat their respective Goldman Sachs indexes - which are performance measurements of companies in the Select Portfolios' sector concentrations. The best performer was Select Insurance, which gained 54.78%. Select Telecommunications posted the lowest return, falling 15.23%. On September 26, after the end of the period covered by this report, two new Fidelity Select Portfolios were launched: Fidelity Select Wireless Portfolio and Fidelity Select Networking and Infrastructure Portfolio.
Turning to individual sectors, the Fed's rate hikes and the decelerating U.S. economy had varying effects on Select Portfolios in the consumer sector. Food and Agriculture did well, as cautious investors turned to the defensive nature of food and supermarket stocks. Conversely, both Leisure and Multimedia posted negative returns as stocks in these sectors typically underperform in an economic slowdown. Retail and Consumer Industries were hurt by the same trend of potential moderation in consumer spending.
The healthy U.S. economy was generally a positive factor for the cyclical sector, although fears of a slowdown tempered gains later in the period. Air Transportation recorded the largest return of the 11 Select cyclical Portfolios, as strong demand and slower growth in seating capacity boosted airline stocks. Transportation benefited from the same circumstances. Defense and Aerospace prospered as projected federal defense budget increases were greeted enthusiastically by investors. Improved fundamentals for solid waste stocks keyed the strong return of Environmental Services , while good stock selection and low exposure to interest-rate sensitive stocks spurred Cyclical Industries . Automotive had a solid six months, thanks in part to the stabilization of interest rates in the latter half of the period. The performance of Construction and Housing was right in line with its Goldman Sachs benchmark, although higher raw material and labor costs detracted from the industry's profit margins. The prospect of a slowing economy was a significant factor in the single-digit returns of Industrial Materials and Industrial Equipment . A weak euro and rising commodity prices held back Chemicals , while Paper and Forest Products also underperformed due in part to a high inventory/low demand imbalance.
The financial services sector posted its best six-month performance in recent memory, and each of the five Select Portfolios in this segment had strong returns. Insurance had the best performance based on improvements in the property and casualty industry's ability to command higher prices. Attractive stock valuations and strong capital markets activity helped Brokerage and Investment Management best the Goldman Sachs index. Financial Services and Home Finance each returned more than 30%, boosted by the perception that the Fed's rate hikes were at an end. The Banking Portfolio, despite strong absolute performance, trailed its benchmark due to increased credit risk in the banking sector.
It was a good period for the health care sector with the exception of the spring biotechnology sell-off, which tempered Select Biotechnology 's return. Medical Delivery was an outperformer, as improving fundamentals in the field and steady earnings streams enhanced performance. Medical Equipment and Systems similarly benefited to beat the Goldman Sachs Health Care Index. On the other hand, the Health Care Portfolio's overweighing in biotech caused it to marginally underperform the benchmark.
The natural resources sector continued to rally behind higher oil and natural gas prices, increased exploration and demand, and restricted supply. Natural Resources , Energy and Energy Service all benefited from this environment, and each outperformed the Goldman Sachs Natural Resources Index. Gold , however, underperformed as the price of the precious metal continued to be weak.
Technology, the top-performing sector six months ago, fell from grace for much of the past six months. Still, Business Services and Outsourcing had a solid return. Its lack of exposure to poor-performing Internet stocks was a prime contributor; Computers profited from the same lack of exposure. Electronics topped the Goldman Sachs Technology Index by way of solid picks in the semiconductor arena. An emphasis on higher quality names helped Software and Computer Services also edge the benchmark. But valuation concerns and earnings worries held back Technology , while exposure to the slumping wireless sector restrained Developing Communications.
Within the utilities sector, the Natural Gas Portfolio was the best performer, as limited supplies of and robust demand for the fuel boosted stock prices in the sector. Utilities Growth 's emphasis on strong-performing independent power producers helped it beat its benchmark. Telecommunications struggled as deregulation and increased competition pervaded the market segment.
In the pages that follow, you'll find detailed summaries for each of the Select Portfolios. We hope that you find them informative and useful for evaluating your investments. Thank you very much for your continued interest in the Fidelity Select Portfolios.
Sincerely,
/s/ William R. Ebsworth
William R. Ebsworth
Group Leader, FMR Research
Select Group Leader
Semiannual Report
Cumulative Total Returns
For the six months ended August 31, 2000
Past performance is no guarantee of future results. Total returns include changes in a fund's share price, plus reinvestment of any dividends and capital gains but do not include Select's 3% sales charge, and certain fees paid by shareholders upon exchange or redemption. Figures for the Standard & Poor's 500 Index, a market capitalization-weighted index of common stocks, include reinvestment of dividends. S&P 500 is a registered trademark of Standard & Poor's. All performance numbers are historical; each equity fund's share price and return will vary and shareholders may have a gain or loss when they sell their shares. If FMR had not reimbursed certain fund expenses for some of the funds, those returns would have been lower.
Semiannual Report
Performance
There are several ways to evaluate a fund's historical performance. You can look at the total percentage change in value, the average annual percentage change or the growth of a hypothetical $10,000 investment. Total return reflects the change in the value of an investment, assuming reinvestment of the fund's dividend income and capital gains (the profits earned upon the sale of securities that have grown in value). Load adjusted returns include a 3.00% sales charge and the effect of a $7.50 long-term trading fee for shares held 30 days or more. Effective September 28, 2000, the $7.50 long-term trading fee was eliminated. If Fidelity had not reimbursed certain fund expenses, the past five year and 10 year total returns would have been lower.
Cumulative Total Returns
|
Periods ended |
Past 6 |
Past 1 |
Past 5 |
Past 10 |
|
|
Select Consumer Industries |
0.81% |
-1.75% |
119.96% |
363.77% |
|
|
Select Consumer Industries (load adj.) |
-2.29% |
-4.77% |
113.29% |
349.78% |
|
|
S&P 500 |
11.73% |
16.32% |
193.58% |
493.54% |
|
|
GS Consumer Industries |
1.71% |
-1.83% |
n/a** |
n/a** |
|
Cumulative total returns show the fund's performance in percentage terms over a set period - in this case, six months, one year, five years or 10 years. You can compare the fund's returns to the performance of both the Standard & Poor's 500SM Index - a market capitalization-weighted index of common stocks - and the Goldman Sachs Consumer Industries Index - a market capitalization-weighted index of 295 stocks designed to measure the performance of companies in the consumer industries sector. These benchmarks include reinvestment of dividends and capital gains, if any, and exclude the effect of sales charges.
Average Annual Total Returns
|
Periods ended |
Past 1 |
Past 5 |
Past 10 |
|
Select Consumer Industries |
-1.75% |
17.08% |
16.58% |
|
Select Consumer Industries |
-4.77% |
16.36% |
16.23% |
|
S&P 500 |
16.32% |
24.04% |
19.49% |
|
GS Consumer Industries |
-1.83% |
n/a** |
n/a** |
Average annual returns take the fund's cumulative return and show you what would have happened if the fund had performed at a constant rate each year.
** Not available
Understanding Performance
How a fund did yesterday is no guarantee of how it will do tomorrow. The stock market, for example, has a history of long-term growth and short-term volatility. Unlike the broader market, however, some sectors may not have a history of growth in the long run. And, as with all stock funds, the share price and return of a fund that invests in a sector will vary.
3$10,000 Over 10 Years
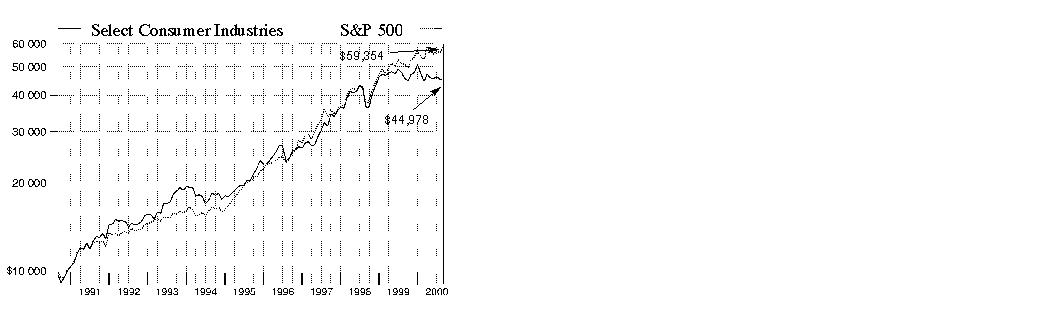
$10,000 Over 10 Years: Let's say hypothetically that $10,000 was invested in Fidelity Select Consumer Industries Portfolio on August 31, 1990, and the current 3.00% sales charge was paid. As the chart shows, by August 31, 2000, the value of the investment would have grown to $44,978 - a 349.78% increase on the initial investment - and includes the effect of a $7.50 long-term trading fee. For comparison, look at how the Standard & Poor's 500 Index did over the same period. With dividends and capital gains, if any, reinvested, the same $10,000 investment would have grown to $59,354 - a 493.54% increase.
Investment Summary
|
Top Ten Stocks as of August 31, 2000 |
|
|
|
% of fund's |
|
Wal-Mart Stores, Inc. |
6.0 |
|
Home Depot, Inc. |
4.7 |
|
The Coca-Cola Co. |
4.4 |
|
Walt Disney Co. |
4.4 |
|
Procter & Gamble Co. |
4.4 |
|
Viacom, Inc. Class B (non-vtg.) |
3.9 |
|
Philip Morris Companies, Inc. |
3.3 |
|
Time Warner, Inc. |
3.0 |
|
Clear Channel Communications, Inc. |
2.8 |
|
Kimberly-Clark Corp. |
2.5 |
|
|
39.4 |
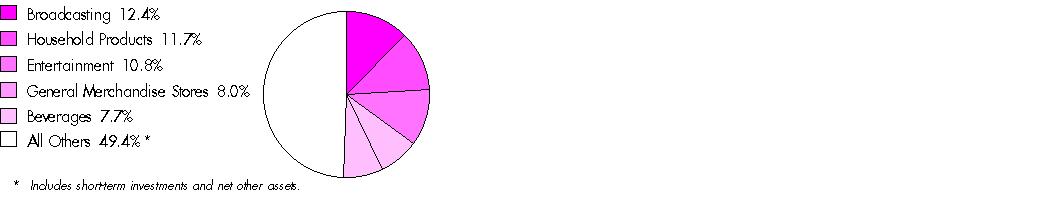
Top Industries as of August 31, 2000
% of fund's net assets
Semiannual Report
(Portfolio Manager photograph)
John Porter,
Portfolio Manager of
Fidelity Select Consumer
Industries Portfolio
Q. How did the fund perform, John?
A. During the six-month period that ended August 31, 2000, the fund returned 0.81%. In comparison, the Goldman Sachs Consumer Industries Index - an index of 295 stocks designed to measure the performance of companies in the consumer industries sector - gained 1.71%. During the same period, the Standard & Poor's 500 Index returned 11.73%. For the 12-month period that ended August 31, 2000, the fund returned -1.75%, while the Goldman Sachs index and the S&P 500 index returned -1.83% and 16.32%, respectively.
Q. What factors kept the fund's performance roughly in line with its Goldman Sachs benchmark during the six-month period?
A. I think the main reason the fund's performance was generally on par with the index was because there weren't any specific areas to steer the fund toward during the past six months that delivered consistent outperformance. I break down the consumer industries sector into three main subsectors: consumer products; media, including entertainment and advertising; and retail. At different points throughout the year, each of those different subsectors performed well, but none consistently outperformed the other. As the period progressed, different subsectors would take the spotlight, making it extremely difficult to participate successfully in an overweighted buy-and-hold strategy due to the volatility.
Q. Did you make any adjustments to your strategy during the period?
A. In the second half of the period, I positioned the fund defensively with regard to retail, underweighting that subsector because I believed the economy began to slow. The decline of the price-to-earnings multiples of several retail stocks reflected the market's cynicism toward these companies, and we saw some of the retailers, such as Costco, experience growth problems. Within the retail sector, I marginally added to the fund's weighting in supermarkets - such as Safeway - to exploit consumers' needs to purchase staple products. At the same time, I began increasing the fund's weighting in consumer products stocks, such as Gillette. I believed these stocks became attractively valued and could benefit from their significant multinational presence.
Q. How did the fund's investments in other areas of consumer industries influence performance?
A. Our overweighted position in media and advertising stocks throughout the period served us well. Advertising-driven media, such as AMFM and Walt Disney - via its ownership of the ABC network broadcast operation - as well as advertising agencies, remained among the fund's best growth sectors. Elsewhere, the fund's underweighted position in the soft drink industry hurt performance when these stocks rebounded in the summer. An overweighted position in retail home centers, such as Home Depot, also detracted from performance.
Q. What specific stocks performed well? Which disappointed?
A. Shares of top-10 holding Philip Morris, the fund's top contributor, rose sharply in August as investor concerns about litigation issues subsided and business fundamentals improved. Philip Morris also said it would increase its quarterly dividend by 10% during the month. Investors reacted favorably to Viacom's acquisition of CBS, as well as the fiscal discipline implemented by its Paramount film unit. On the down side, overweighting Procter & Gamble hurt performance after the company pre-announced an earnings shortfall, sparking a sell-off among consumer stocks. A slowdown in sales and a weaker-than-expected earnings report hurt the performance of retail fashion outlet, Gap.
Q. What's your outlook?
A. I don't believe the slowing of the economy is accurately reflected in the prices investors are paying for consumer products and retail stocks, but for different reasons. On the one hand, consumer products stocks are beaten down and the market is not rewarding them for the relative stability they can provide. On the other hand, I don't think the current price multiples of retail stocks reflect how slow things can get in a slowing economy - even for some of the best retailers. At the same time, I am very enthusiastic about many of the media-related sectors in which the fund invests. So going forward, I will continue to position the fund defensively to weather an economic slowdown, while keeping an eye on consumer expenditure patterns.
The views expressed in this report reflect those of the portfolio manager only through the end of the period of the report as stated on the cover. The manager's views are subject to change at any time based on market or other conditions. For more information, see page 3.
Fund Facts
Start date: June 29, 1990
Fund number: 517
Trading symbol: FSCPX
Size: as of August 31, 2000, more than
$19 million
Manager: John Porter, since 1999; manager, Fidelity Advisor Consumer Industries Fund, since 1999; several Fidelity Select Portfolios, 1996-1999; joined Fidelity in 1995
3Semiannual Report
Consumer Industries Portfolio
(Unaudited)
Showing Percentage of Net Assets
|
Common Stocks - 93.5% |
|||
|
Shares |
Value (Note 1) |
||
|
ADVERTISING - 1.3% |
|||
|
Omnicom Group, Inc. |
2,800 |
$ 233,625 |
|
|
TMP Worldwide, Inc. (a) |
300 |
20,756 |
|
|
TOTAL ADVERTISING |
254,381 |
||
|
APPAREL STORES - 2.3% |
|||
|
American Eagle Outfitters, Inc. (a) |
900 |
26,831 |
|
|
AnnTaylor Stores Corp. (a) |
1,200 |
43,200 |
|
|
Claire's Stores, Inc. |
1,400 |
27,563 |
|
|
Gap, Inc. |
7,037 |
157,893 |
|
|
Talbots, Inc. |
600 |
40,163 |
|
|
The Limited, Inc. |
5,102 |
102,040 |
|
|
TJX Companies, Inc. |
1,800 |
33,863 |
|
|
Venator Group, Inc. (a) |
1,900 |
26,600 |
|
|
TOTAL APPAREL STORES |
458,153 |
||
|
AUTOS, TIRES, & ACCESSORIES - 0.1% |
|||
|
AutoNation, Inc. |
4,500 |
29,250 |
|
|
BEVERAGES - 7.7% |
|||
|
Adolph Coors Co. Class B |
900 |
53,606 |
|
|
Anheuser-Busch Companies, Inc. |
3,800 |
299,488 |
|
|
Panamerican Beverages, Inc. Class A |
1,200 |
22,275 |
|
|
Pepsi Bottling Group, Inc. |
2,300 |
73,025 |
|
|
Seagram Co. Ltd. |
3,500 |
210,656 |
|
|
The Coca-Cola Co. |
16,900 |
889,363 |
|
|
Whitman Corp. |
1 |
13 |
|
|
TOTAL BEVERAGES |
1,548,426 |
||
|
BROADCASTING - 12.4% |
|||
|
Adelphia Communications Corp. |
500 |
16,750 |
|
|
American Tower Corp. Class A (a) |
2,000 |
72,625 |
|
|
AT&T Corp. - Liberty Media Group |
19,700 |
421,088 |
|
|
Cablevision Systems Corp. Class A (a) |
700 |
47,075 |
|
|
Clear Channel Communications, Inc. (a) |
7,650 |
553,669 |
|
|
Comcast Corp. Class A (special) (a) |
6,600 |
245,850 |
|
|
Cox Communications, Inc. Class A (a) |
2,200 |
78,238 |
|
|
E.W. Scripps Co. Class A |
300 |
15,206 |
|
|
EchoStar Communications Corp. |
2,000 |
97,500 |
|
|
Entercom Communications Corp. |
800 |
33,050 |
|
|
Infinity Broadcasting Corp. Class A (a) |
6,500 |
246,188 |
|
|
Time Warner, Inc. |
7,090 |
606,195 |
|
|
UnitedGlobalCom, Inc. Class A (a) |
600 |
22,988 |
|
|
Univision Communications, Inc. |
400 |
17,650 |
|
|
TOTAL BROADCASTING |
2,474,072 |
||
|
|
|||
|
Shares |
Value (Note 1) |
||
|
CELLULAR - 1.1% |
|||
|
Crown Castle International Corp. (a) |
2,400 |
$ 83,250 |
|
|
Nextel Communications, Inc. Class A (a) |
600 |
33,263 |
|
|
SBA Communications Corp. Class A (a) |
2,200 |
98,175 |
|
|
TOTAL CELLULAR |
214,688 |
||
|
COMPUTER SERVICES & SOFTWARE - 1.1% |
|||
|
Amazon.com, Inc. (a) |
1,500 |
62,250 |
|
|
Circle.com (a) |
400 |
1,350 |
|
|
eBay, Inc. (a) |
400 |
24,800 |
|
|
Microsoft Corp. (a) |
1,350 |
94,247 |
|
|
Priceline.com, Inc. (a) |
1,500 |
40,781 |
|
|
TOTAL COMPUTER SERVICES & SOFTWARE |
223,428 |
||
|
COMPUTERS & OFFICE EQUIPMENT - 0.3% |
|||
|
Pitney Bowes, Inc. |
700 |
25,594 |
|
|
Xerox Corp. |
2,200 |
35,338 |
|
|
TOTAL COMPUTERS & OFFICE EQUIPMENT |
60,932 |
||
|
CONSUMER ELECTRONICS - 1.1% |
|||
|
Black & Decker Corp. |
600 |
24,038 |
|
|
Gemstar-TV Guide International, Inc. (a) |
1,428 |
128,877 |
|
|
General Motors Corp. Class H |
2,000 |
66,250 |
|
|
TOTAL CONSUMER ELECTRONICS |
219,165 |
||
|
DRUG STORES - 2.1% |
|||
|
Walgreen Co. |
12,700 |
417,513 |
|
|
ENTERTAINMENT - 10.8% |
|||
|
Carnival Corp. |
4,700 |
93,706 |
|
|
Fox Entertainment Group, Inc. Class A (a) |
4,200 |
121,538 |
|
|
Mandalay Resort Group (a) |
2,800 |
77,875 |
|
|
MGM Grand, Inc. |
2,400 |
82,500 |
|
|
Park Place Entertainment Corp. (a) |
1,800 |
26,438 |
|
|
Six Flags, Inc. (a) |
2,300 |
34,356 |
|
|
Viacom, Inc.: |
|
|
|
|
Class A (a) |
1,100 |
74,525 |
|
|
Class B (non-vtg.) (a) |
11,610 |
781,498 |
|
|
Walt Disney Co. |
22,400 |
872,200 |
|
|
TOTAL ENTERTAINMENT |
2,164,636 |
||
|
FOODS - 6.4% |
|||
|
Bestfoods |
3,400 |
240,125 |
|
|
Corn Products International, Inc. |
1,250 |
31,406 |
|
|
Earthgrains Co. |
2,400 |
42,300 |
|
|
H.J. Heinz Co. |
2,600 |
99,125 |
|
|
Keebler Foods Co. |
2,400 |
109,950 |
|
|
Kellogg Co. |
1,600 |
37,100 |
|
|
PepsiCo, Inc. |
10,300 |
439,038 |
|
|
Common Stocks - continued |
|||
|
Shares |
Value (Note 1) |
||
|
FOODS - CONTINUED |
|||
|
Quaker Oats Co. |
2,400 |
$ 163,050 |
|
|
Sysco Corp. |
2,900 |
122,706 |
|
|
TOTAL FOODS |
1,284,800 |
||
|
GENERAL MERCHANDISE STORES - 8.0% |
|||
|
Ames Department Stores, Inc. (a) |
2,400 |
12,150 |
|
|
BJ's Wholesale Club, Inc. (a) |
1,400 |
47,425 |
|
|
Consolidated Stores Corp. (a) |
4,128 |
56,244 |
|
|
Dollar General Corp. |
3,168 |
65,142 |
|
|
Dollar Tree Stores, Inc. (a) |
900 |
36,506 |
|
|
Kohls Corp. (a) |
2,200 |
123,200 |
|
|
Neiman Marcus Group, Inc. Class A (a) |
1,000 |
33,563 |
|
|
Target Corp. |
1,400 |
32,550 |
|
|
Wal-Mart Stores, Inc. |
25,200 |
1,195,409 |
|
|
TOTAL GENERAL MERCHANDISE STORES |
1,602,189 |
||
|
GROCERY STORES - 2.7% |
|||
|
Albertson's, Inc. |
1,823 |
39,195 |
|
|
Kroger Co. (a) |
7,100 |
161,081 |
|
|
Safeway, Inc. (a) |
6,000 |
295,875 |
|
|
Whole Foods Market, Inc. (a) |
500 |
25,250 |
|
|
Winn-Dixie Stores, Inc. |
600 |
8,363 |
|
|
TOTAL GROCERY STORES |
529,764 |
||
|
HOME FURNISHINGS - 0.2% |
|||
|
Linens'n Things, Inc. (a) |
1,800 |
48,600 |
|
|
HOUSEHOLD PRODUCTS - 11.7% |
|||
|
Avon Products, Inc. |
10,900 |
427,144 |
|
|
Clorox Co. |
3,156 |
114,208 |
|
|
Colgate-Palmolive Co. |
5,300 |
269,969 |
|
|
Estee Lauder Companies, Inc. Class A |
4,800 |
196,500 |
|
|
Gillette Co. |
15,100 |
453,000 |
|
|
Procter & Gamble Co. |
14,100 |
871,556 |
|
|
TOTAL HOUSEHOLD PRODUCTS |
2,332,377 |
||
|
LEISURE DURABLES & TOYS - 1.2% |
|||
|
Brunswick Corp. |
1,100 |
20,625 |
|
|
Callaway Golf Co. |
2,300 |
33,206 |
|
|
Harley-Davidson, Inc. |
3,600 |
179,325 |
|
|
TOTAL LEISURE DURABLES & TOYS |
233,156 |
||
|
LODGING & GAMING - 0.4% |
|||
|
Harrah's Entertainment, Inc. (a) |
600 |
17,025 |
|
|
International Game Technology (a) |
800 |
23,200 |
|
|
Starwood Hotels & Resorts |
1,200 |
38,400 |
|
|
TOTAL LODGING & GAMING |
78,625 |
||
|
|
|||
|
Shares |
Value (Note 1) |
||
|
PACKAGING & CONTAINERS - 0.2% |
|||
|
Tupperware Corp. |
1,900 |
$ 38,356 |
|
|
PAPER & FOREST PRODUCTS - 2.5% |
|||
|
Kimberly-Clark Corp. |
8,700 |
508,950 |
|
|
PHOTOGRAPHIC EQUIPMENT - 1.0% |
|||
|
Eastman Kodak Co. |
3,100 |
192,975 |
|
|
PRINTING - 0.2% |
|||
|
R.R. Donnelley & Sons Co. |
1,700 |
43,775 |
|
|
PUBLISHING - 2.5% |
|||
|
Gannett Co., Inc. |
700 |
39,638 |
|
|
Harcourt General, Inc. |
800 |
47,450 |
|
|
Harte Hanks Communications, Inc. |
1,300 |
32,663 |
|
|
Houghton Mifflin Co. |
500 |
24,594 |
|
|
McGraw-Hill Companies, Inc. |
2,500 |
154,844 |
|
|
Meredith Corp. |
1,400 |
38,238 |
|
|
Playboy Enterprises, Inc. Class B (non-vtg.) (a) |
2,000 |
29,375 |
|
|
Reader's Digest Association, Inc. Class A (non-vtg.) |
1,500 |
57,750 |
|
|
The New York Times Co. Class A |
1,900 |
74,456 |
|
|
TOTAL PUBLISHING |
499,008 |
||
|
REAL ESTATE INVESTMENT TRUSTS - 0.7% |
|||
|
Pinnacle Holdings, Inc. (a) |
3,300 |
132,825 |
|
|
RESTAURANTS - 2.4% |
|||
|
Brinker International, Inc. (a) |
1,000 |
31,750 |
|
|
CEC Entertainment, Inc. (a) |
1,000 |
28,875 |
|
|
Darden Restaurants, Inc. |
1,400 |
24,763 |
|
|
Jack in the Box, Inc. (a) |
1,800 |
39,713 |
|
|
McDonald's Corp. |
9,000 |
268,875 |
|
|
Outback Steakhouse, Inc. (a) |
1,200 |
27,525 |
|
|
Papa John's International, Inc. (a) |
500 |
11,313 |
|
|
Starbucks Corp. (a) |
500 |
18,313 |
|
|
Wendy's International, Inc. |
1,700 |
32,088 |
|
|
TOTAL RESTAURANTS |
483,215 |
||
|
RETAIL & WHOLESALE, MISCELLANEOUS - 6.7% |
|||
|
Alberto-Culver Co. Class A |
1,900 |
45,600 |
|
|
Bed Bath & Beyond, Inc. (a) |
4,600 |
80,788 |
|
|
Best Buy Co., Inc. (a) |
600 |
37,050 |
|
|
Circuit City Stores, Inc. - |
600 |
15,563 |
|
|
Home Depot, Inc. |
19,400 |
932,413 |
|
|
Lowe's Companies, Inc. |
1,000 |
44,813 |
|
|
Office Depot, Inc. (a) |
5,550 |
40,584 |
|
|
Pier 1 Imports, Inc. |
2,100 |
24,675 |
|
|
Staples, Inc. (a) |
5,075 |
78,028 |
|
|
Common Stocks - continued |
|||
|
Shares |
Value (Note 1) |
||
|
RETAIL & WHOLESALE, MISCELLANEOUS - CONTINUED |
|||
|
Tiffany & Co., Inc. |
200 |
$ 8,325 |
|
|
Williams-Sonoma, Inc. (a) |
600 |
21,563 |
|
|
TOTAL RETAIL & WHOLESALE, MISCELLANEOUS |
1,329,402 |
||
|
SERVICES - 2.0% |
|||
|
ACNielsen Corp. (a) |
1,300 |
31,281 |
|
|
Cendant Corp. (a) |
4,000 |
52,750 |
|
|
Macrovision Corp. (a) |
300 |
31,988 |
|
|
Manpower, Inc. |
1,700 |
61,519 |
|
|
Modis Professional Services, Inc. (a) |
300 |
2,063 |
|
|
Robert Half International, Inc. (a) |
600 |
19,088 |
|
|
Snyder Communications, Inc. (SNC) |
1 |
27 |
|
|
True North Communications |
2,800 |
129,850 |
|
|
Viad Corp. |
2,600 |
76,213 |
|
|
TOTAL SERVICES |
404,779 |
||
|
TELEPHONE SERVICES - 0.4% |
|||
|
AT&T Corp. |
2,377 |
74,876 |
|
|
TEXTILES & APPAREL - 0.4% |
|||
|
NIKE, Inc. Class B |
2,000 |
79,125 |
|
|
TOBACCO - 3.6% |
|||
|
Philip Morris Companies, Inc. |
22,000 |
651,750 |
|
|
RJ Reynolds Tobacco Holdings, Inc. |
2,000 |
71,750 |
|
|
TOTAL TOBACCO |
723,500 |
||
|
TOTAL COMMON STOCKS (Cost $14,374,407) |
18,684,941 |
||
|
Cash Equivalents - 6.6% |
|||
|
|
|
|
|
|
Fidelity Cash Central Fund, 6.59% (b) |
1,284,724 |
1,284,724 |
|
|
Fidelity Securities Lending Cash Central Fund, 6.64% (b) |
40,600 |
40,600 |
|
|
TOTAL CASH EQUIVALENTS (Cost $1,325,324) |
1,325,324 |
||
|
TOTAL INVESTMENT PORTFOLIO - 100.1% (Cost $15,699,731) |
20,010,265 |
||
|
NET OTHER ASSETS - (0.1)% |
(16,663) |
||
|
NET ASSETS - 100% |
$ 19,993,602 |
||
|
Legend |
|
(a) Non-income producing |
|
(b) The rate quoted is the annualized seven-day yield of the fund at |
|
Other Information |
|
Purchases and sales of securities, other than short-term securities, aggregated $10,287,831 and $51,048,975, respectively. |
|
The fund placed a portion of its portfolio transactions with brokerage firms which are affiliates of Fidelity Management & Research Company. The commissions paid to these affiliated firms were $5,133 for the period. |
|
The fund participated in the security lending program. At period end, the value of securities loaned amounted to $38,063. The fund received cash collateral of $40,600 which was invested in cash equivalents. |
|
Income Tax Information |
|
At August 31, 2000, the aggregate cost of investment securities for income tax purposes was $16,033,013. Net unrealized appreciation aggregated $3,977,252, of which $5,134,850 related to appreciated investment securities and $1,157,598 related to depreciated investment securities. |
See accompanying notes which are an integral part of the financial statements.
Consumer Sector
Statement of Assets and Liabilities
|
|
August 31, 2000 (Unaudited) |
|
|
Assets |
|
|
|
Investment in securities, at value |
|
$ 20,010,265 |
|
Receivable for investments sold |
|
82,845 |
|
Receivable for fund shares sold |
|
29,285 |
|
Dividends receivable |
|
13,097 |
|
Interest receivable |
|
7,915 |
|
Redemption fees receivable |
|
45 |
|
Other receivables |
|
7,630 |
|
Total assets |
|
20,151,082 |
|
Liabilities |
|
|
|
Payable for investments purchased |
$ 2,830 |
|
|
Payable for fund shares redeemed |
72,116 |
|
|
Accrued management fee |
10,067 |
|
|
Other payables and accrued expenses |
31,867 |
|
|
Collateral on securities loaned, |
40,600 |
|
|
Total liabilities |
|
157,480 |
|
Net Assets |
|
$ 19,993,602 |
|
Net Assets consist of: |
|
|
|
Paid in capital |
|
$ 12,429,944 |
|
Accumulated net investment (loss) |
|
(59,687) |
|
Accumulated undistributed net realized gain (loss) on investments and foreign currency transactions |
|
3,312,811 |
|
Net unrealized appreciation (depreciation) on investments |
|
4,310,534 |
|
Net Assets, for 696,962 shares outstanding |
|
$ 19,993,602 |
|
Net Asset Value and redemption price per share ($19,993,602 ÷ 696,962 shares) |
|
$28.69 |
|
Maximum offering price per share (100/97.00 of $28.69) |
|
$29.58 |
Statement of Operations
|
|
Six months ended August 31, 2000 (Unaudited) |
|
|
Investment Income Dividends |
|
$ 122,128 |
|
Interest |
|
47,329 |
|
Security lending |
|
1,291 |
|
Total income |
|
170,748 |
|
Expenses |
|
|
|
Management fee |
$ 73,885 |
|
|
Transfer agent fees |
88,803 |
|
|
Accounting and security lending fees |
30,453 |
|
|
Non-interested trustees' compensation |
62 |
|
|
Custodian fees and expenses |
12,712 |
|
|
Registration fees |
16,479 |
|
|
Audit |
10,949 |
|
|
Legal |
142 |
|
|
Miscellaneous |
34 |
|
|
Total expenses before reductions |
233,519 |
|
|
Expense reductions |
(3,084) |
230,435 |
|
Net investment income (loss) |
|
(59,687) |
|
Realized and Unrealized Gain (Loss) Net realized gain (loss) on: |
|
|
|
Investment securities |
3,905,681 |
|
|
Foreign currency transactions |
(393) |
3,905,288 |
|
Change in net unrealized appreciation (depreciation) on: |
|
|
|
Investment securities |
(5,052,358) |
|
|
Assets and liabilities in |
89 |
(5,052,269) |
|
Net gain (loss) |
|
(1,146,981) |
|
Net increase (decrease) in net assets resulting from operations |
|
$ (1,206,668) |
|
Other Information |
|
|
|
Sales charges paid to FDC |
|
$ 32,278 |
|
Deferred sales charges withheld by FDC |
|
$ 72 |
|
Exchange fees withheld by FSC |
|
$ 2,970 |
|
Expense reductions |
|
|
|
Directed brokerage arrangements |
|
$ 3,084 |
See accompanying notes which are an integral part of the financial statements.
Semiannual Report
Consumer Industries Portfolio
Financial Statements - continued
Statement of Changes in Net Assets
|
Increase (Decrease) in Net Assets |
Six months ended |
Year ended |
|
Operations |
$ (59,687) |
$ 41,337 |
|
Net realized gain (loss) |
3,905,288 |
4,505,335 |
|
Change in net unrealized appreciation (depreciation) |
(5,052,269) |
(7,292,511) |
|
Net increase (decrease) in net assets resulting from operations |
(1,206,668) |
(2,745,839) |
|
Distributions to shareholders |
- |
(42,261) |
|
From net realized gain |
- |
(4,852,121) |
|
Total distributions |
- |
(4,894,382) |
|
Share transactions |
9,012,662 |
32,937,853 |
|
Reinvestment of distributions |
- |
4,772,156 |
|
Cost of shares redeemed |
(51,198,854) |
(49,036,030) |
|
Net increase (decrease) in net assets resulting from share transactions |
(42,186,192) |
(11,326,021) |
|
Redemption fees |
55,812 |
52,792 |
|
Total increase (decrease) in net assets |
(43,337,048) |
(18,913,450) |
|
Net Assets |
|
|
|
Beginning of period |
63,330,650 |
82,244,100 |
|
End of period (including accumulated net investment loss of $59,687 and $0, respectively) |
$ 19,993,602 |
$ 63,330,650 |
|
Other Information Shares |
|
|
|
Sold |
306,654 |
1,041,150 |
|
Issued in reinvestment of distributions |
- |
149,653 |
|
Redeemed |
(1,834,626) |
(1,551,354) |
|
Net increase (decrease) |
(1,527,972) |
(360,551) |
Financial Highlights
|
|
Six months ended |
Years ended February 28, |
||||
|
Selected Per-Share Data |
(Unaudited) |
2000 H |
1999 |
1998 |
1997 |
1996 H |
|
Net asset value, beginning of period |
$ 28.46 |
$ 31.81 |
$ 27.31 |
$ 20.66 |
$ 17.84 |
$ 13.91 |
|
Income from Investment Operations |
|
|
|
|
|
|
|
Net investment income (loss) D |
(.07) |
.02 E |
(.04) |
(.22) |
(.22) |
.08 |
|
Net realized and unrealized gain (loss) |
.24 I |
(1.29) |
5.41 |
8.34 |
2.93 |
3.97 |
|
Total from investment operations |
.17 |
(1.27) |
5.37 |
8.12 |
2.71 |
4.05 |
|
Less Distributions |
|
|
|
|
|
|
|
From net investment income |
- |
(.02) |
- |
- |
- |
(.02) |
|
From net realized gain |
- |
(2.08) |
(.90) |
(1.52) |
- |
(.01) |
|
In excess of net realized gain |
- |
- |
- |
- |
- |
(.20) |
|
Total distributions |
- |
(2.10) |
(.90) |
(1.52) |
- |
(.23) |
|
Redemption fees added to paid in capital |
.06 |
.02 |
.03 |
.05 |
.11 |
.11 |
|
Net asset value, end of period |
$ 28.69 |
$ 28.46 |
$ 31.81 |
$ 27.31 |
$ 20.66 |
$ 17.84 |
|
Total Return B, C |
0.81% |
(4.55)% |
20.18% |
40.36% |
15.81% |
30.01% |
|
Ratios and Supplemental Data |
|
|
|
|
|
|
|
Net assets, end of period (000 omitted) |
$ 19,994 |
$ 63,331 |
$ 82,244 |
$ 72,152 |
$ 18,392 |
$ 22,362 |
|
Ratio of expenses to average net assets |
1.77% A |
1.27% |
1.34% |
2.01% |
2.49% |
1.53% F |
|
Ratio of expenses to average net assets after |
1.74% A, G |
1.25% G |
1.32% G |
1.97% G |
2.44% G |
1.48% G |
|
Ratio of net investment income (loss) to average net assets |
(.45)% A |
.06% |
(.15)% |
(.90)% |
(1.13)% |
.46% |
|
Portfolio turnover rate |
74% A |
96% |
150% |
199% |
340% |
601% |
|
A Annualized B The total returns would have been lower had certain expenses not been reduced during the periods shown. C Total returns do not include the one time sales
charge and for periods of less than one year are not annualized. D Net investment income (loss) per share has
been calculated based on average shares outstanding during the period. E Investment income per share reflects a special dividend which amounted to $.04 per share. F FMR agreed to reimburse a portion of the fund's
expenses during the period. Without this reimbursement,
the fund's expense ratio would have been higher. G FMR or the fund has entered into varying arrangements with third parties who either paid or reduced a portion of the fund's expenses. |
||||||
See accompanying notes which are an integral part of the financial statements.
Consumer Sector
Performance
There are several ways to evaluate a fund's historical performance. You can look at the total percentage change in value, the average annual percentage change or the growth of a hypothetical $10,000 investment. Total return reflects the change in the value of an investment, assuming reinvestment of the fund's dividend income and capital gains (the profits earned upon the sale of securities that have grown in value). Load adjusted returns include a 3.00% sales charge and the effect of a $7.50 long-term trading fee for shares held 30 days or more. Effective September 28, 2000, the $7.50 long-term trading fee was eliminated.
Cumulative Total Returns
|
Periods ended |
Past 6 |
Past 1 |
Past 5 |
Past 10 |
|
Select Food and |
24.50% |
-3.91% |
67.64% |
250.69% |
|
Select Food and |
20.69% |
-6.86% |
62.54% |
240.10% |
|
S&P 500 |
11.73% |
16.32% |
193.58% |
493.54% |
|
GS Consumer Industries |
1.71% |
-1.83% |
n/a** |
n/a** |
Cumulative total returns show the fund's performance in percentage terms over a set period - in this case, six months, one year, five years or 10 years. You can compare the fund's returns to the performance of both the Standard & Poor's 500 Index - a market capitalization-weighted index of common stocks - and the Goldman Sachs Consumer Industries Index - a market capitalization-weighted index of 295 stocks designed to measure the performance of companies in the consumer industries sector. These benchmarks include reinvestment of dividends and capital gains, if any, and exclude the effect of sales charges.
Average Annual Total Returns
|
Periods ended |
Past 1 |
Past 5 |
Past 10 |
|
Select Food and Agriculture |
-3.91% |
10.89% |
13.37% |
|
Select Food and Agriculture |
-6.86% |
10.20% |
13.02% |
|
S&P 500 |
16.32% |
24.04% |
19.49% |
|
GS Consumer Industries |
-1.83% |
n/a** |
n/a** |
Average annual returns take the fund's cumulative return and show you what would have happened if the fund had performed at a constant rate each year.
** Not available
Understanding Performance
How a fund did yesterday is no guarantee of how it will do tomorrow. The stock market, for example, has a history of long-term growth and short-term volatility. Unlike the broader market, however, some sectors may not have a history of growth in the long run. And, as with all stock funds, the share price and return of a fund that invests in a sector will vary.
3$10,000 Over 10 Years

$10,000 Over 10 Years: Let's say hypothetically that $10,000 was invested in Fidelity Select Food and Agriculture Portfolio on August 31, 1990, and the current 3.00% sales charge was paid. As the chart shows, by August 31, 2000, the value of the investment would have grown to $34,010 - a 240.10% increase on the initial investment - and includes the effect of a $7.50 long-term trading fee. For comparison - look at how the Standard & Poor's 500 Index did over the same period. With dividends and capital gains, if any, reinvested, the same $10,000 investment would have grown to $59,354 - a 493.54% increase.
Investment Summary
|
Top Ten Stocks as of August 31, 2000 |
|
|
|
% of fund's |
|
Safeway, Inc. |
7.3 |
|
Anheuser-Busch Companies, Inc. |
6.3 |
|
Philip Morris Companies, Inc. |
5.7 |
|
Kroger Co. |
5.4 |
|
The Coca-Cola Co. |
5.2 |
|
PepsiCo, Inc. |
4.2 |
|
Quaker Oats Co. |
3.9 |
|
McDonald's Corp. |
3.7 |
|
Keebler Foods Co. |
3.5 |
|
Sara Lee Corp. |
3.0 |
|
|
48.2 |
Top Industries as of August 31, 2000
% of fund's net assets

Semiannual Report
(Portfolio Manager photograph)
Matthew Fruhan,
Portfolio Manager of Fidelity Select Food and Agriculture Portfolio
Q. How did the fund perform, Matthew?
A. For the six months that ended August 31, 2000, the fund returned 24.50%. By comparison, the Goldman Sachs Consumer Industries Index - an index of 295 stocks designed to measure the performance of companies in the consumer industries sector - returned 1.71%. During the same period, the Standard & Poor's 500 Index returned 11.73%. For the 12 months that ended August 31, 2000, the fund lost 3.91%, while the Goldman Sachs index lost 1.83% and the S&P 500 returned 16.32%.
Q. How was the fund able to outpace both indexes and generate such strong returns during the six-month period?
A. Food and agriculture stocks rebounded sharply during the past six months. Investors sought defensive, "safe haven" names - such as food companies and supermarket stocks - when the technology-laden NASDAQ index plunged beginning in March. As a result, many of the fund's holdings that were beaten down in 1999 skyrocketed in the second quarter of 2000. Strong stock picking within these industries also boosted the fund's returns versus its benchmarks.
Q. What market factors affected the performance of food and agriculture stocks?
A. A flurry of merger and acquisition activity bolstered the prices of many food stocks during the period. The fund held a large position in companies with good business fundamentals that I thought would be attractive acquisition candidates. Supermarkets overcame many of their acquisition-integration problems of 1999 and have rallied this year. In addition, the tide turned in the battle between traditional supermarkets and e-commerce grocers. Investors turned their backs on e-commerce grocers during the period as they began to question the viability of their economic models. As those stock prices fell, many e-commerce grocers were hurt further because their growth plans are predicated on raising capital from the stock market.
Q. Which of the fund's holdings performed well over
the past six months?
A. Bestfoods, which signed an agreement to be acquired by Unilever, and Nabisco, which agreed to be purchased by Philip Morris, were both beneficiaries of industry consolidation and helped the fund's returns. Acceleration in the sales growth of supermarkets, along with the market factors I mentioned earlier, helped boost the returns of Safeway and Kroger, two of the fund's top-10 holdings. Another big contributor was Keebler Foods, whose stock price rallied when it was put on the selling block. In addition, Anheuser-Busch benefited from strong pricing, PepsiCo enjoyed rising sales of its Frito-Lay brand and Quaker Oats benefited from the popularity of its Gatorade sports drinks. Finally, Philip Morris fared better this period as a result of some favorable tobacco rulings.
Q. Which stocks were the most disappointing?
A. One of the biggest disappointments was Coca-Cola Enterprises. The bottling company did not realize the sales volume growth that the market had anticipated. Another detractor was McDonald's. The company had trouble with its sales line and its exposure to the weak euro. Finally, Albertson's was one supermarket stock that performed poorly during the period. The company, which had been raising prices for years to mask declining volume growth, witnessed a deterioration of its customer base and lowered its long-term earnings growth targets.
Q. What's your outlook?
A. Although many packaged food stocks soared during the period as investors sought safe havens, I think the honeymoon may be over. Acquisition activity slowed and weak business fundamentals had not improved by the end of the period. As a result, I think valuations in this sector may begin to drift back down. I also think growth among supermarket stocks may begin to slow as Wal-Mart becomes more aggressive in the food industry. However, I expect brewers to continue increasing prices, which may help their future earnings growth. Finally, I think restaurant stocks may perform well because valuations at the end of the period were quite low based on fears of a recession. Overall, I expect a mixed bag for food and agriculture stocks, and I don't think we'll see many of the dramatic rallies that we saw during the past six months.
The views expressed in this report reflect those of the portfolio manager only through the end of the period of the report as stated on the cover. The manager's views are subject to change at any time based on market or other conditions. For more information, see page 3.
Fund Facts
Start date: July 29, 1985
Fund number: 009
Trading symbol: FDFAX
Size: as of August 31, 2000, more than
$100 million
Manager: Matthew Fruhan, since 1999; analyst, food industry, since 1999; joined Fidelity in 1995
3Semiannual Report
Food and Agriculture Portfolio
(Unaudited)
Showing Percentage of Net Assets
|
Common Stocks - 94.1% |
|||
|
Shares |
Value (Note 1) |
||
|
BEVERAGES - 19.5% |
|||
|
Adolph Coors Co. Class B |
47,400 |
$ 2,823,263 |
|
|
Anheuser-Busch Companies, Inc. |
80,600 |
6,352,288 |
|
|
Brown-Forman Corp. Class B (non-vtg.) |
12,100 |
641,300 |
|
|
Canandaigua Brands, Inc. Class A (a) |
24,300 |
1,309,163 |
|
|
Coca-Cola Enterprises, Inc. |
84,400 |
1,571,950 |
|
|
Panamerican Beverages, Inc. Class A |
24,700 |
458,494 |
|
|
Pepsi Bottling Group, Inc. |
32,600 |
1,035,050 |
|
|
The Coca-Cola Co. |
99,554 |
5,239,029 |
|
|
Whitman Corp. |
6,500 |
85,719 |
|
|
TOTAL BEVERAGES |
19,516,256 |
||
|
CHEMICALS & PLASTICS - 0.5% |
|||
|
IMC Global, Inc. |
21,000 |
308,438 |
|
|
Scotts Co. Class A (a) |
6,500 |
201,500 |
|
|
TOTAL CHEMICALS & PLASTICS |
509,938 |
||
|
FOODS - 37.8% |
|||
|
Archer-Daniels-Midland Co. |
62,637 |
551,989 |
|
|
Bestfoods |
37,600 |
2,655,500 |
|
|
ConAgra, Inc. |
85,979 |
1,574,490 |
|
|
Corn Products International, Inc. |
16,975 |
426,497 |
|
|
Dean Foods Co. |
2,300 |
71,875 |
|
|
Earthgrains Co. |
24,600 |
433,575 |
|
|
Flowers Industries, Inc. |
21,000 |
456,750 |
|
|
General Mills, Inc. |
43,500 |
1,397,438 |
|
|
H.J. Heinz Co. |
65,200 |
2,485,750 |
|
|
Hershey Foods Corp. |
16,500 |
704,344 |
|
|
Hormel Foods Corp. |
11,400 |
175,988 |
|
|
IBP, Inc. |
4,200 |
67,463 |
|
|
Interstate Bakeries Corp. |
13,600 |
243,950 |
|
|
Keebler Foods Co. |
77,400 |
3,545,888 |
|
|
Kellogg Co. |
31,500 |
730,406 |
|
|
McCormick & Co., Inc. (non-vtg.) |
7,400 |
215,988 |
|
|
Nabisco Group Holdings Corp. |
61,500 |
1,725,844 |
|
|
Nestle SA ADR (Reg.) |
25,200 |
2,709,000 |
|
|
PepsiCo, Inc. |
98,900 |
4,215,613 |
|
|
Quaker Oats Co. |
57,900 |
3,933,581 |
|
|
Ralston Purina Co. |
64,600 |
1,461,575 |
|
|
Sara Lee Corp. |
161,900 |
3,015,388 |
|
|
Smithfield Foods, Inc. (a) |
23,700 |
629,531 |
|
|
Suiza Foods Corp. (a) |
4,400 |
220,000 |
|
|
Sysco Corp. |
68,900 |
2,915,331 |
|
|
Tootsie Roll Industries, Inc. |
4,078 |
164,140 |
|
|
Universal Foods Corp. |
9,000 |
184,500 |
|
|
Wm. Wrigley Jr. Co. |
14,000 |
1,036,875 |
|
|
TOTAL FOODS |
37,949,269 |
||
|
GENERAL MERCHANDISE STORES - 0.3% |
|||
|
Wal-Mart Stores, Inc. |
6,000 |
284,625 |
|
|
|
|||
|
Shares |
Value (Note 1) |
||
|
GROCERY STORES - 18.2% |
|||
|
Albertson's, Inc. |
70,886 |
$ 1,524,049 |
|
|
Hain Celestial Group, Inc. (a) |
24,718 |
772,438 |
|
|
Koninklijke Ahold NV sponsored ADR |
64,000 |
1,824,000 |
|
|
Kroger Co. (a) |
237,600 |
5,390,550 |
|
|
Ruddick Corp. |
8,000 |
98,000 |
|
|
Safeway, Inc. (a) |
148,200 |
7,308,104 |
|
|
SUPERVALU, Inc. |
17,800 |
265,888 |
|
|
Weis Markets, Inc. |
9,700 |
329,800 |
|
|
Whole Foods Market, Inc. (a) |
12,900 |
651,450 |
|
|
Wild Oats Markets, Inc. (a) |
11,500 |
123,625 |
|
|
TOTAL GROCERY STORES |
18,287,904 |
||
|
HOUSEHOLD PRODUCTS - 1.9% |
|||
|
Unilever NV (NY Shares) |
40,278 |
1,903,136 |
|
|
RESTAURANTS - 9.7% |
|||
|
Brinker International, Inc. (a) |
7,000 |
222,250 |
|
|
CEC Entertainment, Inc. (a) |
64,800 |
1,871,100 |
|
|
Darden Restaurants, Inc. |
27,700 |
489,944 |
|
|
Jack in the Box, Inc. (a) |
12,700 |
280,194 |
|
|
McDonald's Corp. |
123,400 |
3,686,575 |
|
|
Outback Steakhouse, Inc. (a) |
56,300 |
1,291,381 |
|
|
Papa John's International, Inc. (a) |
13,400 |
303,175 |
|
|
Tricon Global Restaurants, Inc. (a) |
30,200 |
879,575 |
|
|
Wendy's International, Inc. |
36,300 |
685,163 |
|
|
TOTAL RESTAURANTS |
9,709,357 |
||
|
TOBACCO - 6.2% |
|||
|
Philip Morris Companies, Inc. |
192,200 |
5,693,925 |
|
|
RJ Reynolds Tobacco Holdings, Inc. |
14,700 |
527,363 |
|
|
TOTAL TOBACCO |
6,221,288 |
||
|
TOTAL COMMON STOCKS (Cost $86,364,101) |
94,381,773 |
||
|
Cash Equivalents - 10.9% |
|||
|
Shares |
Value (Note 1) |
||
|
Fidelity Cash Central Fund, 6.59% (b) |
6,504,019 |
$ 6,504,019 |
|
|
Fidelity Securities Lending Cash Central Fund, 6.64% (b) |
4,417,900 |
4,417,900 |
|
|
TOTAL CASH EQUIVALENTS (Cost $10,921,919) |
10,921,919 |
||
|
TOTAL INVESTMENT PORTFOLIO - 105.0% (Cost $97,286,020) |
105,303,692 |
|
NET OTHER ASSETS - (5.0)% |
(5,025,341) |
||
|
NET ASSETS - 100% |
$ 100,278,351 |
||
|
Legend |
|
(a) Non-income producing |
|
(b) The rate quoted is the annualized seven-day yield of the fund at |
|
Other Information |
|
Purchases and sales of securities, other than short-term securities, aggregated $41,754,648 and $41,208,450, respectively. |
|
The fund placed a portion of its portfolio transactions with brokerage firms which are affiliates of Fidelity Management & Research Company. The commissions paid to these affiliated firms were $8,493 for the period. |
|
The fund participated in the security lending program. At period end, the value of securities loaned amounted to $4,195,338. The fund received cash collateral of $4,417,900 which was invested in cash equivalents. |
|
Income Tax Information |
|
At August 31, 2000, the aggregate cost of investment securities for income tax purposes was $97,773,067. Net unrealized appreciation aggregated $7,530,625, of which $15,179,028 related to appreciated investment securities and $7,648,403 related to depreciated investment securities. |
|
The fund intends to elect to defer to its fiscal year ending February 28, 2001 approximately $1,232,000 of losses recognized during the period November 1, 1999 to February 29, 2000. |
See accompanying notes which are an integral part of the financial statements.
Consumer Sector
Statement of Assets and Liabilities
|
|
August 31, 2000 (Unaudited) |
|
|
Assets |
|
|
|
Investment in securities, at value |
|
$ 105,303,692 |
|
Receivable for investments sold |
|
635,809 |
|
Receivable for fund shares sold |
|
107,996 |
|
Dividends receivable |
|
140,561 |
|
Interest receivable |
|
41,107 |
|
Redemption fees receivable |
|
485 |
|
Other receivables |
|
2,104 |
|
Total assets |
|
106,231,754 |
|
Liabilities |
|
|
|
Payable for investments purchased |
$ 607,420 |
|
|
Payable for fund shares redeemed |
814,470 |
|
|
Accrued management fee |
49,989 |
|
|
Other payables and accrued expenses |
63,624 |
|
|
Collateral on securities loaned, |
4,417,900 |
|
|
Total liabilities |
|
5,953,403 |
|
Net Assets |
|
$ 100,278,351 |
|
Net Assets consist of: |
|
|
|
Paid in capital |
|
$ 93,254,304 |
|
Undistributed net investment income |
|
596,856 |
|
Accumulated undistributed net realized gain (loss) on investments and foreign currency transactions |
|
(1,589,432) |
|
Net unrealized appreciation (depreciation) on investments |
|
8,016,623 |
|
Net Assets, for 2,526,351 |
|
$ 100,278,351 |
|
Net Asset Value and redemption price per share ($100,278,351 ÷ 2,526,351 shares) |
|
$39.69 |
|
Maximum offering price per share (100/97.00 of $39.69) |
|
$40.92 |
Statement of Operations
|
|
Six months ended August 31, 2000 (Unaudited) |
|
|
Investment Income Dividends |
|
$ 985,998 |
|
Interest |
|
251,882 |
|
Security lending |
|
18,267 |
|
Total income |
|
1,256,147 |
|
Expenses |
|
|
|
Management fee |
$ 287,935 |
|
|
Transfer agent fees |
311,583 |
|
|
Accounting and security lending fees |
34,128 |
|
|
Non-interested trustees' compensation |
223 |
|
|
Custodian fees and expenses |
6,507 |
|
|
Registration fees |
22,600 |
|
|
Audit |
7,033 |
|
|
Legal |
175 |
|
|
Miscellaneous |
49 |
|
|
Total expenses before reductions |
670,233 |
|
|
Expense reductions |
(10,941) |
659,292 |
|
Net investment income |
|
596,855 |
|
Realized and Unrealized Gain (Loss) Net realized gain (loss) on: |
|
|
|
Investment securities |
(62,703) |
|
|
Foreign currency transactions |
(3,296) |
(65,999) |
|
Change in net unrealized appreciation (depreciation) on: |
|
|
|
Investment securities |
19,123,625 |
|
|
Assets and liabilities in |
189 |
19,123,814 |
|
Net gain (loss) |
|
19,057,815 |
|
Net increase (decrease) in net assets resulting from operations |
|
$ 19,654,670 |
|
Other Information |
|
|
|
Sales charges paid to FDC |
|
$ 87,215 |
|
Deferred sales charges withheld by FDC |
|
$ 1,382 |
|
Exchange fees withheld by FSC |
|
$ 4,800 |
|
Expense reductions |
|
|
|
Directed brokerage arrangements |
|
$ 10,692 |
|
Custodian credits |
|
38 |
|
Transfer agent credits |
|
211 |
|
|
|
$ 10,941 |
See accompanying notes which are an integral part of the financial statements.
Semiannual Report
Food and Agriculture Portfolio
Financial Statements - continued
Statement of Changes in Net Assets
|
Increase (Decrease) in Net Assets |
Six months ended |
Year ended |
|
Operations |
$ 596,855 |
$ 1,514,152 |
|
Net realized gain (loss) |
(65,999) |
2,903,853 |
|
Change in net unrealized appreciation (depreciation) |
19,123,814 |
(45,267,235) |
|
Net increase (decrease) in net assets resulting from operations |
19,654,670 |
(40,849,230) |
|
Distributions to shareholders |
- |
(1,366,746) |
|
From net realized gain |
- |
(6,551,980) |
|
In excess of net realized gain |
- |
(752,061) |
|
Total distributions |
- |
(8,670,787) |
|
Share transactions |
60,914,668 |
25,160,713 |
|
Reinvestment of distributions |
- |
8,301,729 |
|
Cost of shares redeemed |
(58,700,164) |
(111,774,157) |
|
Net increase (decrease) in net assets resulting from share transactions |
2,214,504 |
(78,311,715) |
|
Redemption fees |
121,385 |
112,538 |
|
Total increase (decrease) in net assets |
21,990,559 |
(127,719,194) |
|
Net Assets |
|
|
|
Beginning of period |
78,287,792 |
206,006,986 |
|
End of period (including undistributed net investment income of $596,856 and $381,112, respectively) |
$ 100,278,351 |
$ 78,287,792 |
|
Other Information Shares |
|
|
|
Sold |
1,624,368 |
602,218 |
|
Issued in reinvestment of distributions |
- |
205,962 |
|
Redeemed |
(1,553,438) |
(2,743,334) |
|
Net increase (decrease) |
70,930 |
(1,935,154) |
Financial Highlights
|
|
Six months ended |
Years ended February 28, |
||||
|
Selected Per-Share Data |
(Unaudited) |
2000 F |
1999 |
1998 |
1997 |
1996 F |
|
Net asset value, beginning of period |
$ 31.88 |
$ 46.92 |
$ 48.81 |
$ 44.53 |
$ 42.15 |
$ 32.53 |
|
Income from Investment Operations |
|
|
|
|
|
|
|
Net investment income D |
.22 |
.42 G |
.21 |
.33 |
.42 |
.37 |
|
Net realized and unrealized gain (loss) |
7.54 |
(13.07) |
3.50 |
9.22 |
4.91 |
11.61 |
|
Total from investment operations |
7.76 |
(12.65) |
3.71 |
9.55 |
5.33 |
11.98 |
|
Less Distributions |
|
|
|
|
|
|
|
From net investment income |
- |
(.42) |
(.16) |
(.37) |
(.24) |
(.20) |
|
From net realized gain |
- |
(1.79) |
(5.47) |
(4.95) |
(2.77) |
(2.20) |
|
In excess of net realized gain |
- |
(.21) |
- |
- |
- |
- |
|
Total distributions |
- |
(2.42) |
(5.63) |
(5.32) |
(3.01) |
(2.40) |
|
Redemption fees added to paid in capital |
.05 |
.03 |
.03 |
.05 |
.06 |
.04 |
|
Net asset value, end of period |
$ 39.69 |
$ 31.88 |
$ 46.92 |
$ 48.81 |
$ 44.53 |
$ 42.15 |
|
Total Return B, C |
24.50% |
(27.86)% |
7.83% |
23.58% |
13.59% |
37.92% |
|
Ratios and Supplemental Data |
|
|
|
|
|
|
|
Net assets, end of period (000 omitted) |
$ 100,278 |
$ 78,288 |
$ 206,007 |
$ 250,567 |
$ 223,423 |
$ 301,102 |
|
Ratio of expenses to average net assets |
1.31% A |
1.31% |
1.31% |
1.49% |
1.52% |
1.43% |
|
Ratio of expenses to average net assets after |
1.29% A, E |
1.29% E |
1.29% E |
1.48% E |
1.50% E |
1.42% E |
|
Ratio of net investment income to average net assets |
1.16% A |
1.00% |
.45% |
.73% |
1.01% |
.99% |
|
Portfolio turnover rate |
88% A |
38% |
68% |
74% |
91% |
124% |
|
A Annualized B The total returns would have been lower had certain expenses not been reduced during the periods shown. C Total returns do not include the one time sales
charge and for periods of less than one year are not annualized. |
||||||
See accompanying notes which are an integral part of the financial statements.
Consumer Sector
Performance
There are several ways to evaluate a fund's historical performance. You can look at the total percentage change in value, the average annual percentage change or the growth of a hypothetical $10,000 investment. Total return reflects the change in the value of an investment, assuming reinvestment of the fund's dividend income and capital gains (the profits earned upon the sale of securities that have grown in value). Load adjusted returns include a 3.00% sales charge and the effect of a $7.50 long-term trading fee for shares held 30 days or more. Effective September 28, 2000, the $7.50 long-term trading fee was eliminated.
Cumulative Total Returns
|
Periods ended |
Past 6 |
Past 1 |
Past 5 |
Past 10 |
|
Select Leisure |
-3.14% |
6.95% |
159.57% |
576.51% |
|
Select Leisure |
-6.12% |
3.67% |
151.71% |
556.15% |
|
S&P 500 |
11.73% |
16.32% |
193.58% |
493.54% |
|
GS Consumer Industries |
1.71% |
-1.83% |
n/a** |
n/a** |
Cumulative total returns show the fund's performance in percentage terms over a set period - in this case, six months, one year, five years or 10 years. You can compare the fund's returns to the performance of both the Standard & Poor's 500 Index - a market capitalization-weighted index of common stocks - and the Goldman Sachs Consumer Industries Index - a market capitalization-weighted index of 295 stocks designed to measure the performance of companies in the consumer industries sector. These benchmarks include reinvestment of dividends and capital gains, if any, and exclude the effect of sales charges.
Average Annual Total Returns
|
Periods ended |
Past 1 |
Past 5 |
Past 10 |
|
Select Leisure |
6.95% |
21.02% |
21.07% |
|
Select Leisure |
3.67% |
20.28% |
20.70% |
|
S&P 500 |
16.32% |
24.04% |
19.49% |
|
GS Consumer Industries |
-1.83% |
n/a** |
n/a** |
Average annual returns take the fund's cumulative return and show you what would have happened if the fund had performed at a constant rate each year.
** Not available
Understanding Performance
How a fund did yesterday is no guarantee of how it will do tomorrow. The stock market, for example, has a history of long-term growth and short-term volatility. Unlike the broader market, however, some sectors may not have a history of growth in the long run. And, as with all stock funds, the share price and return of a fund that invests in a sector will vary.
3$10,000 Over 10 Years

$10,000 Over 10 Years: Let's say hypothetically that $10,000 was invested in Fidelity Select Leisure Portfolio on August 31, 1990, and the current 3.00% sales charge was paid. As the chart shows, by August 31, 2000, the value of the investment would have grown to $65,615 - a 556.15% increase on the initial investment - and includes the effect of a $7.50 long-term trading fee. For comparison, look at how the Standard & Poor's 500 Index did over the same period. With dividends and capital gains, if any, reinvested, the same $10,000 investment would have grown to $59,354 - a 493.54% increase.
Investment Summary
|
Top Ten Stocks as of August 31, 2000 |
|
|
|
% of fund's |
|
Viacom, Inc. Class B (non-vtg.) |
7.7 |
|
Walt Disney Co. |
6.5 |
|
Fox Entertainment Group, Inc. Class A |
5.4 |
|
AT&T Corp. - Liberty Media Group Class A |
4.5 |
|
Seagram Co. Ltd. |
4.3 |
|
Time Warner, Inc. |
4.0 |
|
Clear Channel Communications, Inc. |
3.3 |
|
Travelocity.com, Inc. |
2.6 |
|
Comcast Corp. Class A (special) |
2.6 |
|
Omnicom Group, Inc. |
2.5 |
|
|
43.4 |
Top Industries as of August 31, 2000
% of fund's net assets

Semiannual Report
(Portfolio Manager photograph)
Michael Tarlowe,
Portfolio Manager
of Fidelity Select
Leisure Portfolio
Q. How did the fund perform, Michael?
A. For the six- and 12-month periods ending August 31, 2000, the fund returned -3.14% and 6.95%, respectively. In comparison, the Goldman Sachs Consumer Industries Index - an index of 295 stocks designed to measure the performance of companies in the consumer industries sector - returned 1.71% and -1.83%, respectively, for the same time periods. The Standard & Poor's 500 Index returned 11.73% and 16.32% for the six- and 12-month periods, respectively.
Q. Why did the fund underperform the Goldman Sachs index during the six-month period?
A. The fund has a much narrower focus than the index, which invests in a much broader array of stocks. Typically, the performance of leisure stocks is fueled by consumers' disposable-income spending; these stocks tend to be affected disproportionately whenever there's concern about the possibility of rising inflation. The cable sector also was particularly weak during the period. Although I modestly lowered the fund's exposure to cable companies, while increasing its emphasis on satellite television companies - which had become much more competitive than in the past - the fund's cable holdings hurt performance. Additionally, my holdings in Internet stocks detracted from performance during the period.
Q. Entertainment and broadcasting stocks were the fund's main focus during the period. How did they do?
A. Most of these companies benefited from very robust advertising activity during the past six months. Television networks enjoyed particularly good performance, stemming from sales of their advertising inventories for next season at double-digit price increases. I pursued those companies that appeared to be reasonably valued and poised for this significant growth opportunity. Viacom, the fund's top holding, continued to report strong earnings growth driven by the robust advertising market. The company also completed its acquisition of CBS, potentially leading to significant revenues and cost synergies by creating a one-stop shopping platform for advertisers. Disney, the fund's No. 2 holding, came back strong, driven mainly by subsidiary ABC's terrific ratings and increased advertising revenues. Seagram enjoyed strong earnings growth from its music division, gaining market share in the U.S. and achieving cost savings from its merger with Polygram. Seagram also announced its intention to merge with French company Vivendi - at a higher price than the stock's current trading level - to create a global media venture.
Q. Cable stocks were high fliers six months ago. Why did they have such a tough time?
A. As I mentioned before, cable stocks had a difficult period due to concerns about the loss of subscribers and market share to satellite providers. Increased competition from phone companies further resulted in disappointing earnings and cash flow growth. Concerns about new regulations that could force cable companies to open their communications pipelines to any data service providers also hurt their performance. Comcast, Cox Communications, MediaOne and AT&T - though cable is a small part of its business - were all negatively affected by these issues. In response to the changing environment, I significantly reduced positions in these holdings, and I sold MediaOne from the portfolio.
Q. Were there any other disappointments?
A. America Online and Yahoo! were hurt by the correction in Internet stocks earlier in the year. However, these companies differ from other Internet companies in that they are market leaders and profitable. Although I sold America Online from the portfolio, I still hold Yahoo!.
Q. What's your outlook, Michael?
A. I intend to focus on well-positioned companies that are market leaders with the potential to create greater pricing. With a slowing economy, investors are becoming more selective about the companies in which they invest and, with valuations on many of these market leaders more attractive than they were six months ago, I'm upbeat about the near-term outlook for these leisure stocks. I also will continue to selectively purchase companies that could be good candidates for turnaround situations or that have assets they can leverage onto the Internet to develop new revenue streams or to accelerate the growth of their business.
The views expressed in this report reflect those of the portfolio manager only through the end of the period of the report as stated on the cover. The manager's views are subject to change at any time based on market or other conditions. For more information, see page 3.
Fund Facts
Start date: May 8, 1984
Fund number: 062
Trading symbol: FDLSX
Size: as of August 31, 2000, more than
$273 million
Manager: Michael Tarlowe, since January 2000; manager, Fidelity Select Multimedia, since January, 2000; Fidelity Select Business Services and Outsourcing Portfolio, 1998-2000; research analyst, various industries, 1994-1998; joined Fidelity in 1994
3Semiannual Report
Leisure Portfolio
(Unaudited)
Showing Percentage of Net Assets
|
Common Stocks - 90.6% |
|||
|
Shares |
Value (Note 1) |
||
|
ADVERTISING - 3.8% |
|||
|
Interpublic Group of Companies, Inc. |
46,400 |
$ 1,774,800 |
|
|
Lamar Advertising Co. Class A (a) |
16,500 |
766,219 |
|
|
Omnicom Group, Inc. |
81,600 |
6,808,500 |
|
|
Young & Rubicam, Inc. |
16,000 |
936,000 |
|
|
TOTAL ADVERTISING |
10,285,519 |
||
|
APPAREL STORES - 0.2% |
|||
|
Intimate Brands, Inc. Class A |
40,870 |
659,029 |
|
|
BEVERAGES - 6.2% |
|||
|
Anheuser-Busch Companies, Inc. |
65,300 |
5,146,456 |
|
|
Seagram Co. Ltd. |
196,300 |
11,814,807 |
|
|
TOTAL BEVERAGES |
16,961,263 |
||
|
BROADCASTING - 23.6% |
|||
|
Adelphia Communications Corp. |
14,100 |
472,350 |
|
|
American Tower Corp. Class A (a) |
14,000 |
508,375 |
|
|
AT&T Corp. - Liberty Media Group |
579,688 |
12,390,831 |
|
|
Cablevision Systems Corp. Class A (a) |
33,300 |
2,239,425 |
|
|
Clear Channel Communications, Inc. (a) |
124,241 |
8,991,942 |
|
|
Comcast Corp. Class A (special) (a) |
189,400 |
7,055,150 |
|
|
Cox Communications, Inc. Class A (a) |
120,187 |
4,274,150 |
|
|
E.W. Scripps Co. Class A |
57,500 |
2,914,531 |
|
|
EchoStar Communications Corp. |
96,300 |
4,694,625 |
|
|
Infinity Broadcasting Corp. Class A (a) |
136,050 |
5,152,894 |
|
|
Time Warner, Inc. |
126,636 |
10,827,378 |
|
|
Univision Communications, Inc. |
39,800 |
1,756,175 |
|
|
USA Networks, Inc. (a) |
93,600 |
2,252,250 |
|
|
Westwood One, Inc. (a) |
34,400 |
956,750 |
|
|
TOTAL BROADCASTING |
64,486,826 |
||
|
CELLULAR - 0.3% |
|||
|
SBA Communications Corp. Class A (a) |
15,000 |
669,375 |
|
|
COMPUTER SERVICES & SOFTWARE - 7.5% |
|||
|
ARTISTdirect, Inc. |
260,000 |
633,750 |
|
|
At Plan, Inc. |
230,000 |
1,394,375 |
|
|
Ceridian Corp. (a) |
191,500 |
4,631,906 |
|
|
Lycos, Inc. (a) |
26,200 |
1,860,200 |
|
|
Pegasus Solutions, Inc. (a) |
95,000 |
1,888,125 |
|
|
RealNetworks, Inc. (a) |
31,100 |
1,514,181 |
|
|
Travelocity.com, Inc. (a) |
525,300 |
7,222,875 |
|
|
Yahoo!, Inc. (a) |
11,000 |
1,336,500 |
|
|
TOTAL COMPUTER SERVICES & SOFTWARE |
20,481,912 |
||
|
|
|||
|
Shares |
Value (Note 1) |
||
|
CONSUMER ELECTRONICS - 3.5% |
|||
|
Gemstar-TV Guide International, Inc. (a) |
31,900 |
$ 2,878,975 |
|
|
General Motors Corp. Class H |
173,900 |
5,760,438 |
|
|
Sony Corp. sponsored ADR |
7,000 |
799,750 |
|
|
TOTAL CONSUMER ELECTRONICS |
9,439,163 |
||
|
ELECTRICAL EQUIPMENT - 0.5% |
|||
|
Scientific-Atlanta, Inc. |
17,500 |
1,363,906 |
|
|
ENTERTAINMENT - 26.0% |
|||
|
Carnival Corp. |
151,100 |
3,012,556 |
|
|
EMI Group PLC |
96,200 |
890,972 |
|
|
Fox Entertainment Group, Inc. Class A (a) |
507,300 |
14,679,994 |
|
|
Metro-Goldwyn-Mayer, Inc. (a) |
45,500 |
1,165,938 |
|
|
MGM Grand, Inc. |
41,500 |
1,426,563 |
|
|
News Corp. Ltd. sponsored ADR |
84,800 |
4,462,600 |
|
|
Park Place Entertainment Corp. (a) |
70,000 |
1,028,125 |
|
|
Royal Caribbean Cruises Ltd. |
55,800 |
1,276,425 |
|
|
Six Flags, Inc. (a) |
94,200 |
1,407,113 |
|
|
Ticketmaster Online CitySearch, Inc. Class B (a) |
125,000 |
3,007,813 |
|
|
Viacom, Inc. Class B (non-vtg.) (a) |
314,681 |
21,181,959 |
|
|
Walt Disney Co. |
455,856 |
17,749,893 |
|
|
TOTAL ENTERTAINMENT |
71,289,951 |
||
|
HOUSEHOLD PRODUCTS - 1.6% |
|||
|
Avon Products, Inc. |
26,600 |
1,042,388 |
|
|
Estee Lauder Companies, Inc. Class A |
18,000 |
736,875 |
|
|
Gillette Co. |
90,600 |
2,718,000 |
|
|
TOTAL HOUSEHOLD PRODUCTS |
4,497,263 |
||
|
LEISURE DURABLES & TOYS - 1.4% |
|||
|
Callaway Golf Co. |
14,500 |
209,344 |
|
|
Harley-Davidson, Inc. |
65,000 |
3,237,813 |
|
|
Hasbro, Inc. |
40,000 |
492,500 |
|
|
TOTAL LEISURE DURABLES & TOYS |
3,939,657 |
||
|
LODGING & GAMING - 0.3% |
|||
|
Starwood Hotels & Resorts Worldwide, Inc. unit |
24,500 |
784,000 |
|
|
PRINTING - 0.4% |
|||
|
R.R. Donnelley & Sons Co. |
38,900 |
1,001,675 |
|
|
PUBLISHING - 7.7% |
|||
|
Gannett Co., Inc. |
48,200 |
2,729,325 |
|
|
Harcourt General, Inc. |
13,000 |
771,063 |
|
|
Harte Hanks Communications, Inc. |
108,700 |
2,731,088 |
|
|
Knight-Ridder, Inc. |
16,700 |
912,238 |
|
|
McGraw-Hill Companies, Inc. |
58,700 |
3,635,731 |
|
|
Meredith Corp. |
24,300 |
663,694 |
|
|
Playboy Enterprises, Inc. Class B (non-vtg.) (a) |
115,300 |
1,693,469 |
|
|
Common Stocks - continued |
|||
|
Shares |
Value (Note 1) |
||
|
PUBLISHING - CONTINUED |
|||
|
PRIMEDIA, Inc. (a) |
48,000 |
$ 858,000 |
|
|
Reader's Digest Association, Inc. Class A (non-vtg.) |
65,500 |
2,521,750 |
|
|
The New York Times Co. Class A |
70,100 |
2,747,044 |
|
|
Tribune Co. |
51,200 |
1,827,200 |
|
|
TOTAL PUBLISHING |
21,090,602 |
||
|
RESTAURANTS - 4.5% |
|||
|
Brinker International, Inc. (a) |
41,100 |
1,304,925 |
|
|
CEC Entertainment, Inc. (a) |
34,650 |
1,000,519 |
|
|
Cheesecake Factory, Inc. (a) |
43,750 |
1,577,734 |
|
|
Darden Restaurants, Inc. |
83,000 |
1,468,063 |
|
|
McDonald's Corp. |
175,200 |
5,234,100 |
|
|
Outback Steakhouse, Inc. (a) |
56,750 |
1,301,703 |
|
|
Starbucks Corp. (a) |
14,000 |
512,750 |
|
|
TOTAL RESTAURANTS |
12,399,794 |
||
|
SERVICES - 1.3% |
|||
|
ACNielsen Corp. (a) |
60,000 |
1,443,750 |
|
|
Dun & Bradstreet Corp. |
36,300 |
1,197,900 |
|
|
True North Communications |
21,500 |
997,063 |
|
|
TOTAL SERVICES |
3,638,713 |
||
|
TELEPHONE SERVICES - 1.0% |
|||
|
AT&T Corp. |
87,693 |
2,762,330 |
|
|
TEXTILES & APPAREL - 0.8% |
|||
|
NIKE, Inc. Class B |
57,300 |
2,266,931 |
|
|
TOTAL COMMON STOCKS (Cost $191,052,063) |
248,017,909 |
||
|
Cash Equivalents - 16.5% |
|||
|
|
|
|
|
|
Fidelity Cash Central Fund, 6.59% (b) |
26,389,282 |
26,389,282 |
|
|
Fidelity Securities Lending Cash Central Fund, 6.64% (b) |
18,874,100 |
18,874,100 |
|
|
TOTAL CASH EQUIVALENTS (Cost $45,263,382) |
45,263,382 |
||
|
TOTAL INVESTMENT PORTFOLIO - 107.1% (Cost $236,315,445) |
293,281,291 |
||
|
NET OTHER ASSETS - (7.1)% |
(19,510,878) |
||
|
NET ASSETS - 100% |
$ 273,770,413 |
||
|
Legend |
|
(a) Non-income producing |
|
(b) The rate quoted is the annualized seven-day yield of the fund at |
|
Other Information |
|
Purchases and sales of securities, other than short-term securities, aggregated $76,031,987 and $111,654,815, respectively. |
|
The fund placed a portion of its portfolio transactions with brokerage firms which are affiliates of Fidelity Management & Research Company. The commissions paid to these affiliated firms were $12,723 for the period. |
|
The fund participated in the security lending program. At period end, the value of securities loaned amounted to $17,682,368. The fund received cash collateral of $18,874,100 which was invested in cash equivalents. |
|
Income Tax Information |
|
At August 31, 2000, the aggregate cost of investment securities for income tax purposes was $236,640,067. Net unrealized appreciation aggregated $56,641,224, of which $72,324,830 related to appreciated investment securities and $15,683,606 related to depreciated investment securities. |
See accompanying notes which are an integral part of the financial statements.
Consumer Sector
Statement of Assets and Liabilities
|
|
August 31, 2000 (Unaudited) |
|
|
Assets |
|
|
|
Investment in securities, at value |
|
$ 293,281,291 |
|
Receivable for investments sold |
|
1,038,311 |
|
Receivable for fund shares sold |
|
207,870 |
|
Dividends receivable |
|
182,187 |
|
Interest receivable |
|
158,983 |
|
Redemption fees receivable |
|
280 |
|
Other receivables |
|
14,747 |
|
Total assets |
|
294,883,669 |
|
Liabilities |
|
|
|
Payable for investments purchased |
$ 1,314,728 |
|
|
Payable for fund shares redeemed |
669,924 |
|
|
Accrued management fee |
132,278 |
|
|
Other payables and |
122,226 |
|
|
Collateral on securities loaned, |
18,874,100 |
|
|
Total liabilities |
|
21,113,256 |
|
Net Assets |
|
$ 273,770,413 |
|
Net Assets consist of: |
|
|
|
Paid in capital |
|
$ 216,246,147 |
|
Accumulated net investment (loss) |
|
(241,197) |
|
Accumulated undistributed net realized gain (loss) on investments and foreign currency transactions |
|
800,127 |
|
Net unrealized appreciation (depreciation) on investments |
|
56,965,336 |
|
Net Assets, for 3,754,198 shares outstanding |
|
$ 273,770,413 |
|
Net Asset Value and redemption price per share ($273,770,413 ÷ 3,754,198 shares) |
|
$72.92 |
|
Maximum offering price per share (100/97.00 of $72.92) |
|
$75.18 |
Statement of Operations
|
|
Six months ended August 31, 2000 (Unaudited) |
|
|
Investment Income Dividends |
|
$ 567,504 |
|
Interest |
|
760,131 |
|
Security lending |
|
37,133 |
|
Total income |
|
1,364,768 |
|
Expenses |
|
|
|
Management fee |
$ 828,039 |
|
|
Transfer agent fees |
640,165 |
|
|
Accounting and security lending fees |
94,872 |
|
|
Non-interested trustees' compensation |
322 |
|
|
Custodian fees and expenses |
5,651 |
|
|
Registration fees |
32,253 |
|
|
Audit |
9,817 |
|
|
Legal |
654 |
|
|
Miscellaneous |
90 |
|
|
Total expenses before reductions |
1,611,863 |
|
|
Expense reductions |
(5,898) |
1,605,965 |
|
Net investment income (loss) |
|
(241,197) |
|
Realized and Unrealized Gain (Loss) Net realized gain (loss) on: |
|
|
|
Investment securities |
2,022,840 |
|
|
Foreign currency transactions |
(201) |
2,022,639 |
|
Change in net unrealized appreciation (depreciation) on: |
|
|
|
Investment securities |
(11,704,913) |
|
|
Assets and liabilities in |
(131) |
(11,705,044) |
|
Net gain (loss) |
|
(9,682,405) |
|
Net increase (decrease) in net assets resulting from operations |
|
$ (9,923,602) |
|
Other Information |
|
|
|
Sales charges paid to FDC |
|
$ 187,220 |
|
Deferred sales charges withheld by FDC |
|
$ 6,565 |
|
Exchange fees withheld by FSC |
|
$ 8,678 |
|
Expense reductions |
|
|
|
Directed brokerage arrangements |
|
$ 5,106 |
|
Custodian credits |
|
745 |
|
Transfer agent credits |
|
47 |
|
|
|
$ 5,898 |
See accompanying notes which are an integral part of the financial statements.
Semiannual Report
Leisure Portfolio
Financial Statements - continued
Statement of Changes in Net Assets
|
Increase (Decrease) in Net Assets |
Six months ended |
Year ended |
|
Operations |
$ (241,197) |
$ (1,270,384) |
|
Net realized gain (loss) |
2,022,639 |
84,105,033 |
|
Change in net unrealized appreciation (depreciation) |
(11,705,044) |
(32,145,268) |
|
Net increase (decrease) in net assets resulting from operations |
(9,923,602) |
50,689,381 |
|
Distributions to shareholders from net realized gains |
(35,092,771) |
(34,566,142) |
|
Share transactions |
45,294,400 |
342,207,955 |
|
Reinvestment of distributions |
33,599,839 |
33,284,316 |
|
Cost of shares redeemed |
(74,546,262) |
(424,039,556) |
|
Net increase (decrease) in net assets resulting from share transactions |
4,347,977 |
(48,547,285) |
|
Redemption fees |
91,164 |
632,323 |
|
Total increase (decrease) in net assets |
(40,577,232) |
(31,791,723) |
|
Net Assets |
|
|
|
Beginning of period |
314,347,645 |
346,139,368 |
|
End of period (including accumulated net investment loss of $241,197 and $0, respectively) |
$ 273,770,413 |
$ 314,347,645 |
|
Other Information Shares |
|
|
|
Sold |
578,724 |
3,958,787 |
|
Issued in reinvestment of distributions |
424,938 |
381,645 |
|
Redeemed |
(959,590) |
(4,880,345) |
|
Net increase (decrease) |
44,072 |
(539,913) |
Financial Highlights
|
|
Six months ended |
Years ended February 28, |
||||
|
Selected Per-Share Data |
(Unaudited) |
2000 H |
1999 |
1998 |
1997 |
1996 H |
|
Net asset value, beginning of period |
$ 84.73 |
$ 81.44 |
$ 62.30 |
$ 47.83 |
$ 46.17 |
$ 40.71 |
|
Income from Investment Operations |
|
|
|
|
|
|
|
Net investment income (loss) D |
(.06) |
(.28) E |
(.27) |
(.25) |
(.06) F |
(.21) |
|
Net realized and unrealized gain (loss) |
(1.85) |
11.58 |
22.78 |
21.10 |
4.47 |
10.97 |
|
Total from investment operations |
(1.91) |
11.30 |
22.51 |
20.85 |
4.41 |
10.76 |
|
Less Distributions |
|
|
|
|
|
|
|
From net realized gain |
(9.92) |
(8.15) |
(3.44) |
(6.46) |
(2.83) |
(5.32) |
|
Redemption fees added to paid in capital |
.02 |
.14 |
.07 |
.08 |
.08 |
.02 |
|
Net asset value, end of period |
$ 72.92 |
$ 84.73 |
$ 81.44 |
$ 62.30 |
$ 47.83 |
$ 46.17 |
|
Total Return B, C |
(3.14)% |
13.89% |
37.54% |
47.29% |
10.14% |
27.61% |
|
Ratios and Supplemental Data |
|
|
|
|
|
|
|
Net assets, end of period (000 omitted) |
$ 273,770 |
$ 314,348 |
$ 346,139 |
$ 257,199 |
$ 98,133 |
$ 85,013 |
|
Ratio of expenses to average net assets |
1.09% A |
1.15% |
1.26% |
1.44% |
1.56% |
1.64% |
|
Ratio of expenses to average net assets after |
1.09% A |
1.12% G |
1.24% G |
1.39% G |
1.54% G |
1.63% G |
|
Ratio of net investment income (loss) to average net assets |
(.16)% A |
(.32)% |
(.40)% |
(.46)% |
(.12)% |
(.46)% |
|
Portfolio turnover rate |
56% A |
120% |
107% |
209% |
127% |
141% |
|
A Annualized B The total returns would have been lower had certain expenses not been reduced during the periods shown. C Total returns do not include the one time sales
charge and for periods of less than one year are not annualized. |
||||||
See accompanying notes which are an integral part of the financial statements.
Consumer Sector
Performance
There are several ways to evaluate a fund's historical performance. You can look at the total percentage change in value, the average annual percentage change or the growth of a hypothetical $10,000 investment. Total return reflects the change in the value of an investment, assuming reinvestment of the fund's dividend income and capital gains (the profits earned upon the sale of securities that have grown in value). Load adjusted returns include a 3.00% sales charge and the effect of a $7.50 long-term trading fee for shares held 30 days or more. Effective September 28, 2000, the $7.50 long-term trading fee was eliminated. If Fidelity had not reimbursed certain fund expenses, the past 10 year total returns would have been lower.
Cumulative Total Returns
|
Periods ended |
Past 6 |
Past 1 |
Past 5 |
Past 10 |
|
Select Multimedia |
-2.34% |
17.95% |
146.33% |
702.09% |
|
Select Multimedia |
-5.34% |
14.34% |
138.87% |
677.95% |
|
S&P 500 |
11.73% |
16.32% |
193.58% |
493.54% |
|
GS Consumer Industries |
1.71% |
-1.83% |
n/a** |
n/a** |
Cumulative total returns show the fund's performance in percentage terms over a set period - in this case, six months, one year, five years or 10 years. You can compare the fund's returns to the performance of both the Standard & Poor's 500 Index - a market capitalization-weighted index of common stocks - and the Goldman Sachs Consumer Industries Index - a market capitalization-weighted index of 295 stocks designed to measure the performance of companies in the consumer industries sector. These benchmarks include reinvestment of dividends and capital gains, if any, and exclude the effect of sales charges.
Average Annual Total Returns
|
Periods ended |
Past 1 |
Past 5 |
Past 10 |
|
Select Multimedia |
17.95% |
19.76% |
23.15% |
|
Select Multimedia |
14.34% |
19.02% |
22.77% |
|
S&P 500 |
16.32% |
24.04% |
19.49% |
|
GS Consumer Industries |
-1.83% |
n/a** |
n/a** |
Average annual returns take the fund's cumulative return and show you what would have happened if the fund had performed at a constant rate each year.
** Not available
Understanding Performance
How a fund did yesterday is no guarantee of how it will do tomorrow. The stock market, for example, has a history of long-term growth and short-term volatility. Unlike the broader market, however, some sectors may not have a history of growth in the long run. And, as with all stock funds, the share price and return of a fund that invests in a sector will vary.
3$10,000 Over 10 Years
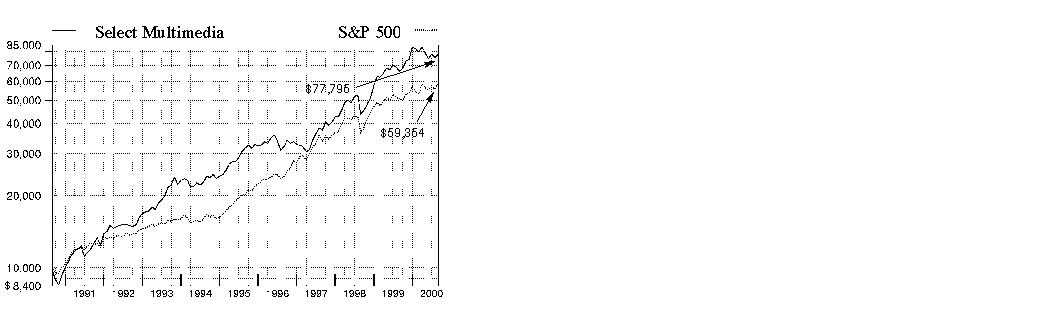
$10,000 Over 10 Years: Let's say hypothetically that $10,000 was invested in Fidelity Select Multimedia Portfolio on August 31, 1990 and the current 3.00% sales charge was paid. As the chart shows, by August 31, 2000, the value of the investment would have grown to $77,795 - a 677.95% increase on the initial investment - and includes the effect of a $7.50 long-term trading fee. For comparison, look at how the Standard & Poor's 500 Index did over the same period. With dividends and capital gains, if any, reinvested, the same $10,000 investment would have grown to $59,354 - a 493.54% increase.
Investment Summary
|
Top Ten Stocks as of August 31, 2000 |
|
|
|
% of fund's |
|
Viacom, Inc. Class B (non-vtg.) |
8.4 |
|
Seagram Co. Ltd. |
6.9 |
|
Walt Disney Co. |
6.1 |
|
Clear Channel Communications, Inc. |
5.5 |
|
Fox Entertainment Group, Inc. Class A |
5.5 |
|
AT&T Corp. - Liberty Media Group Class A |
4.5 |
|
Time Warner, Inc. |
4.0 |
|
Omnicom Group, Inc. |
3.6 |
|
Comcast Corp. Class A (special) |
3.1 |
|
Cox Communications, Inc. Class A |
2.9 |
|
|
50.5 |
Top Industries as of August 31, 2000
% of fund's net assets

Semiannual Report
(Portfolio Manager photograph)
Michael Tarlowe, Portfolio Manager of Fidelity Select Multimedia Portfolio
Q. How did the fund perform, Michael?
A. For the six- and 12-month periods ending August 31, 2000, the fund returned -2.34% and 17.95%, respectively. In comparison, the Goldman Sachs Consumer Industries Index - an index of 295 stocks designed to measure the performance of companies in the consumer industries sector - returned 1.71% and -1.83%, respectively, for the same time periods. The Standard & Poor's 500 Index returned 11.73% and 16.32%, respectively, for the six- and 12-month periods.
Q. Why did the fund underperform the Goldman Sachs index during the six-month period?
A. The fund has a much narrower focus than the index, which invests in a broader array of stocks. A positive factor for the fund was the performance of broadcasting, entertainment and media companies, fueled by very robust advertising spending. The fund's focus on these advertising-driven companies helped its performance during the period. However, cable companies - which account for a sizable portion of this sector - were particularly weak. Although I reduced our exposure to cable companies, while increasing our emphasis on satellite television companies - which had become much more competitive than in the past - the fund's cable holdings hurt performance. I also selectively added to the fund's technology holdings, particularly Internet stocks, which hurt performance.
Q. Why did cable stocks have a tough time?
A. Concerns about the loss of subscribers and market share to satellite providers and increased competition from phone companies resulted in disappointing earnings and cash flow growth. The possibility of new regulations that could force cable companies to open their communications pipelines to any data service providers also hurt their performance. Comcast, Cox Communications, MediaOne and AT&T - which branched out into the cable arena - were all hurt by these issues. In response to the changing environment, I significantly reduced positions in all of these holdings. UnitedGlobalCom, an international cable operator, suffered from investor concerns over its ability to raise capital for additional acquisitions, following the downturn among cable stocks and the high-yield bond market.
Q. How did the fund's broadcasting and entertainment holdings do?
A. Broadcasting and entertainment - the fund's main focus - generally performed well. These companies enjoyed strong demand for their advertising inventories, which were sold at significant price increases. Viacom, the fund's largest holding, reported strong earnings growth driven by the robust advertising market. The company also completed its acquisition of CBS, opening the door for significant revenues and cost synergies by creating a one-stop shopping platform for advertisers. Disney, the fund's third-largest holding, made a strong comeback during the period, due mainly to the success of its subsidiary network ABC, which had terrific ratings and increased its advertising revenues. Seagram's music division delivered strong earnings growth and gained market share in the U.S., while achieving cost savings from its merger with Polygram. Seagram also announced its intention to merge with French company Vivendi - at a higher price than its stock's current trading level - to create a global media venture.
Q. Were there any other good performers?
A. AMFM, a company that owns radio stations across the nation, benefited from a strong advertising market and gained market share from newspaper and television competitors. The company was recently acquired by Clear Channel Communications at a premium, also helping its performance
Q. What's your outlook, Michael?
A. I remain very optimistic about continued strength in the advertising environment during the next 12 months. I will focus on well-positioned companies that have strong leadership positions in their industries and the ability to capitalize on the opportunities offered by a strong advertising market. As the economy slows, investors are becoming more selective about the companies in which they invest and, with valuations on many of these market leaders more attractive than they were six months ago, I'm upbeat about the near-term outlook for these stocks. I also will continue to selectively purchase companies that could be good candidates for turnaround situations, or that have assets they can leverage onto the Internet to develop new revenue streams or to accelerate the growth of their businesses.
The views expressed in this report reflect those of the portfolio manager only through the end of the period of the report as stated on the cover. The manager's views are subject to change at any time based on market or other conditions. For more information, see page 3.
Fund Facts
Start date: June 30, 1986
Fund number: 503
Trading symbol: FBMPX
Size: as of August 31, 2000, more than
$229 million
Manager: Michael Tarlowe, since January 2000; manager, Fidelity Select Leisure Portfolio, since January 2000; Fidelity Select Business Services and Outsourcing Portfolio, 1998-2000; research analyst, various industries, 1994-1998; joined Fidelity in 1994
3Semiannual Report
Multimedia Portfolio
(Unaudited)
Showing Percentage of Net Assets
|
Common Stocks - 90.7% |
|||
|
Shares |
Value (Note 1) |
||
|
ADVERTISING - 6.0% |
|||
|
ADVO, Inc. (a) |
31,400 |
$ 1,285,438 |
|
|
Interpublic Group of Companies, Inc. |
57,100 |
2,184,075 |
|
|
Lamar Advertising Co. Class A (a) |
34,500 |
1,602,094 |
|
|
Omnicom Group, Inc. |
99,500 |
8,302,031 |
|
|
Young & Rubicam, Inc. |
7,300 |
427,050 |
|
|
TOTAL ADVERTISING |
13,800,688 |
||
|
BEVERAGES - 6.9% |
|||
|
Seagram Co. Ltd. |
264,600 |
15,925,613 |
|
|
BROADCASTING - 27.8% |
|||
|
AT&T Corp. - Liberty Media Group |
487,992 |
10,430,829 |
|
|
Cablevision Systems Corp. Class A (a) |
44,400 |
2,985,900 |
|
|
Clear Channel Communications, Inc. (a) |
175,226 |
12,681,982 |
|
|
Comcast Corp. Class A (special) (a) |
193,500 |
7,207,875 |
|
|
Cox Communications, Inc. Class A (a) |
188,260 |
6,694,996 |
|
|
Crown Media Holdings, Inc. |
30,000 |
481,875 |
|
|
E.W. Scripps Co. Class A |
54,000 |
2,737,125 |
|
|
EchoStar Communications Corp. |
91,800 |
4,475,250 |
|
|
Infinity Broadcasting Corp. Class A (a) |
46,075 |
1,745,091 |
|
|
Time Warner, Inc. |
108,217 |
9,252,554 |
|
|
UnitedGlobalCom, Inc. Class A (a) |
27,100 |
1,038,269 |
|
|
Univision Communications, Inc. |
11,000 |
485,375 |
|
|
USA Networks, Inc. (a) |
112,500 |
2,707,031 |
|
|
Westwood One, Inc. (a) |
35,600 |
990,125 |
|
|
TOTAL BROADCASTING |
63,914,277 |
||
|
COMPUTER SERVICES & SOFTWARE - 5.8% |
|||
|
At Plan, Inc. |
240,000 |
1,455,000 |
|
|
Ceridian Corp. (a) |
165,000 |
3,990,938 |
|
|
Information Resources, Inc. (a) |
100,000 |
681,250 |
|
|
Pegasus Solutions, Inc. (a) |
61,600 |
1,224,300 |
|
|
RealNetworks, Inc. (a) |
18,400 |
895,850 |
|
|
TALX Corp. (a) |
25,000 |
425,000 |
|
|
Travelocity.com, Inc. (a) |
331,906 |
4,563,708 |
|
|
TOTAL COMPUTER SERVICES & SOFTWARE |
13,236,046 |
||
|
CONSUMER ELECTRONICS - 3.6% |
|||
|
Gemstar-TV Guide International, Inc. (a) |
27,000 |
2,436,750 |
|
|
General Motors Corp. Class H |
151,700 |
5,025,063 |
|
|
Sony Corp. sponsored ADR |
6,600 |
754,050 |
|
|
TOTAL CONSUMER ELECTRONICS |
8,215,863 |
||
|
|
|||
|
Shares |
Value (Note 1) |
||
|
ENGINEERING - 0.3% |
|||
|
Jupiter Communications, Inc. |
31,400 |
$ 747,713 |
|
|
ENTERTAINMENT - 23.4% |
|||
|
EMI Group PLC |
89,300 |
827,067 |
|
|
Fox Entertainment Group, Inc. Class A (a) |
438,100 |
12,677,519 |
|
|
Metro-Goldwyn-Mayer, Inc. (a) |
27,000 |
691,875 |
|
|
News Corp. Ltd. sponsored ADR |
93,200 |
4,904,650 |
|
|
Ticketmaster Online CitySearch, Inc. Class B (a) |
56,500 |
1,359,531 |
|
|
Viacom, Inc. Class B (non-vtg.) (a) |
286,560 |
19,289,064 |
|
|
Walt Disney Co. |
360,500 |
14,036,969 |
|
|
TOTAL ENTERTAINMENT |
53,786,675 |
||
|
PRINTING - 0.6% |
|||
|
R.R. Donnelley & Sons Co. |
54,300 |
1,398,225 |
|
|
PUBLISHING - 12.7% |
|||
|
Dow Jones & Co., Inc. |
17,000 |
1,063,563 |
|
|
Gannett Co., Inc. |
107,700 |
6,098,513 |
|
|
Harcourt General, Inc. |
17,400 |
1,032,038 |
|
|
Harte Hanks Communications, Inc. |
90,600 |
2,276,325 |
|
|
Knight-Ridder, Inc. |
34,900 |
1,906,413 |
|
|
McGraw-Hill Companies, Inc. |
92,200 |
5,710,638 |
|
|
Meredith Corp. |
21,300 |
581,756 |
|
|
Playboy Enterprises, Inc. |
98,800 |
1,451,125 |
|
|
PRIMEDIA, Inc. (a) |
25,000 |
446,875 |
|
|
Reader's Digest Association, Inc. |
56,100 |
2,159,850 |
|
|
The New York Times Co. Class A |
89,600 |
3,511,200 |
|
|
Tribune Co. |
80,100 |
2,858,569 |
|
|
TOTAL PUBLISHING |
29,096,865 |
||
|
SERVICES - 2.5% |
|||
|
ACNielsen Corp. (a) |
33,200 |
798,875 |
|
|
Dun & Bradstreet Corp. |
55,700 |
1,838,100 |
|
|
Gartner Group, Inc. Class B (a) |
119,500 |
1,344,375 |
|
|
Marketing Services Group, Inc. (a) |
70,000 |
358,750 |
|
|
True North Communications |
32,200 |
1,493,275 |
|
|
TOTAL SERVICES |
5,833,375 |
||
|
TELEPHONE SERVICES - 1.1% |
|||
|
AT&T Corp. |
73,732 |
2,322,558 |
|
|
SBC Communications, Inc. |
7,500 |
313,125 |
|
|
TOTAL TELEPHONE SERVICES |
2,635,683 |
||
|
TOTAL COMMON STOCKS (Cost $153,482,493) |
208,591,023 |
||
|
Cash Equivalents - 21.7% |
|||
|
Shares |
Value (Note 1) |
||
|
Fidelity Cash Central Fund, 6.59% (b) |
20,957,545 |
$ 20,957,545 |
|
|
Fidelity Securities Lending Cash |
28,894,000 |
28,894,000 |
|
|
TOTAL CASH EQUIVALENTS (Cost $49,851,545) |
49,851,545 |
||
|
TOTAL INVESTMENT PORTFOLIO - 112.4% (Cost $203,334,038) |
258,442,568 |
||
|
NET OTHER ASSETS - (12.4)% |
(28,604,485) |
||
|
NET ASSETS - 100% |
$ 229,838,083 |
||
|
Legend |
|
(a) Non-income producing |
|
(b) The rate quoted is the annualized seven-day yield of the fund at |
|
Other Information |
|
Purchases and sales of securities, other than short-term securities, |
|
The fund placed a portion of its portfolio transactions with brokerage firms which are affiliates of Fidelity Management & Research Company. The commissions paid to these affiliated firms were $3,447 for the period. |
|
The fund participated in the security lending program. At period end, the value of securities loaned amounted to $27,077,980. The fund received cash collateral of $28,894,000 which was invested in cash equivalents. |
|
Income Tax Information |
|
At August 31, 2000, the aggregate cost of investment securities for income tax purposes was $203,574,049. Net unrealized appreciation aggregated $54,868,519, of which $61,545,163 related to appreciated investment securities and $6,676,644 related to depreciated investment securities. |
See accompanying notes which are an integral part of the financial statements.
Consumer Sector
Statement of Assets and Liabilities
|
|
August 31, 2000 (Unaudited) |
|
|
Assets |
|
|
|
Investment in securities, at value |
|
$ 258,442,568 |
|
Receivable for investments sold |
|
714,086 |
|
Receivable for fund shares sold |
|
102,770 |
|
Dividends receivable |
|
141,349 |
|
Interest receivable |
|
133,539 |
|
Redemption fees receivable |
|
253 |
|
Other receivables |
|
5,415 |
|
Total assets |
|
259,539,980 |
|
Liabilities |
|
|
|
Payable for investments purchased |
$ 74,041 |
|
|
Payable for fund shares redeemed |
521,445 |
|
|
Accrued management fee |
111,418 |
|
|
Other payables and |
100,993 |
|
|
Collateral on securities loaned, |
28,894,000 |
|
|
Total liabilities |
|
29,701,897 |
|
Net Assets |
|
$ 229,838,083 |
|
Net Assets consist of: |
|
|
|
Paid in capital |
|
$ 168,520,021 |
|
Accumulated net investment (loss) |
|
(128,219) |
|
Accumulated undistributed net realized gain (loss) on investments and foreign currency transactions |
|
6,337,970 |
|
Net unrealized appreciation (depreciation) on investments |
|
55,108,311 |
|
Net Assets, for 4,636,543 shares outstanding |
|
$ 229,838,083 |
|
Net Asset Value and redemption price per share ($229,838,083 ÷ 4,636,543 shares) |
|
$49.57 |
|
Maximum offering price per share (100/97.00 of $49.57) |
|
$51.10 |
Statement of Operations
|
|
Six months ended August 31, 2000 (Unaudited) |
|
|
Investment Income Dividends |
|
$ 460,207 |
|
Interest |
|
676,203 |
|
Security lending |
|
43,882 |
|
Total income |
|
1,180,292 |
|
Expenses |
|
|
|
Management fee |
$ 670,464 |
|
|
Transfer agent fees |
504,430 |
|
|
Accounting and security lending fees |
77,481 |
|
|
Non-interested trustees' compensation |
387 |
|
|
Custodian fees and expenses |
5,948 |
|
|
Registration fees |
39,651 |
|
|
Audit |
7,706 |
|
|
Legal |
478 |
|
|
Miscellaneous |
57 |
|
|
Total expenses before reductions |
1,306,602 |
|
|
Expense reductions |
(15,186) |
1,291,416 |
|
Net investment income (loss) |
|
(111,124) |
|
Realized and Unrealized Gain (Loss) Net realized gain (loss) on: |
|
|
|
Investment securities |
7,112,148 |
|
|
Foreign currency transactions |
540 |
7,112,688 |
|
Change in net unrealized appreciation (depreciation) on: |
|
|
|
Investment securities |
(12,944,040) |
|
|
Assets and liabilities in |
(54) |
(12,944,094) |
|
Net gain (loss) |
|
(5,831,406) |
|
Net increase (decrease) in net assets resulting from operations |
|
$ (5,942,530) |
|
Other Information |
|
|
|
Sales charges paid to FDC |
|
$ 305,568 |
|
Deferred sales charges withheld by FDC |
|
$ 456 |
|
Exchange fees withheld by FSC |
|
$ 5,048 |
|
Expense reductions |
|
|
|
Directed brokerage arrangements |
|
$ 13,259 |
|
Custodian credits |
|
715 |
|
Transfer agent credits |
|
1,212 |
|
|
|
$ 15,186 |
See accompanying notes which are an integral part of the financial statements.
Semiannual Report
Multimedia Portfolio
Financial Statements - continued
Statement of Changes in Net Assets
|
Increase (Decrease) in Net Assets |
Six months ended |
Year ended |
|
Operations |
$ (111,124) |
$ (686,842) |
|
Net realized gain (loss) |
7,112,688 |
19,900,511 |
|
Change in net unrealized appreciation (depreciation) |
(12,944,094) |
24,798,931 |
|
Net increase (decrease) in net assets resulting from operations |
(5,942,530) |
44,012,600 |
|
Distributions to shareholders from net realized gains |
(10,845,949) |
(6,716,257) |
|
Share transactions |
68,171,558 |
211,032,647 |
|
Reinvestment of distributions |
10,543,358 |
6,530,741 |
|
Cost of shares redeemed |
(70,770,145) |
(176,372,310) |
|
Net increase (decrease) in net assets resulting from share transactions |
7,944,771 |
41,191,078 |
|
Redemption fees |
70,091 |
394,751 |
|
Total increase (decrease) in net assets |
(8,773,617) |
78,882,172 |
|
Net Assets |
|
|
|
Beginning of period |
238,611,700 |
159,729,528 |
|
End of period (including accumulated net investment loss of $128,219 and $17,095, respectively) |
$ 229,838,083 |
$ 238,611,700 |
|
Other Information Shares |
|
|
|
Sold |
1,340,716 |
4,212,974 |
|
Issued in reinvestment of distributions |
218,924 |
127,825 |
|
Redeemed |
(1,392,721) |
(3,574,961) |
|
Net increase (decrease) |
166,919 |
765,838 |
Financial Highlights
|
|
Six months ended |
Years ended February 28, |
||||
|
Selected Per-Share Data |
(Unaudited) |
2000 G |
1999 |
1998 |
1997 |
1996 G |
|
Net asset value, beginning of period |
$ 53.39 |
$ 43.13 |
$ 33.58 |
$ 24.91 |
$ 27.18 |
$ 22.35 |
|
Income from Investment Operations |
|
|
|
|
|
|
|
Net investment income (loss) D |
(.02) |
(.16) |
(.19) |
(.17) |
.35 E |
.02 |
|
Net realized and unrealized gain (loss) |
(1.32) |
11.90 |
11.85 |
10.30 |
(1.58) |
7.00 |
|
Total from investment operations |
(1.34) |
11.74 |
11.66 |
10.13 |
(1.23) |
7.02 |
|
Less Distributions |
|
|
|
|
|
|
|
From net investment income |
- |
- |
- |
- |
- |
(.02) |
|
From net realized gain |
(2.50) |
(1.57) |
(2.19) |
(1.52) |
(1.07) |
(2.19) |
|
Total distributions |
(2.50) |
(1.57) |
(2.19) |
(1.52) |
(1.07) |
(2.21) |
|
Redemption fees added to paid in capital |
.02 |
.09 |
.08 |
.06 |
.03 |
.02 |
|
Net asset value, end of period |
$ 49.57 |
$ 53.39 |
$ 43.13 |
$ 33.58 |
$ 24.91 |
$ 27.18 |
|
Total Return B, C |
(2.34)% |
27.62% |
36.68% |
42.42% |
(4.52)% |
31.98% |
|
Ratios and Supplemental Data |
|
|
|
|
|
|
|
Net assets, end of period (000 omitted) |
$ 229,838 |
$ 238,612 |
$ 159,730 |
$ 115,485 |
$ 54,171 |
$ 94,970 |
|
Ratio of expenses to average net assets |
1.09% A |
1.17% |
1.35% |
1.75% |
1.60% |
1.56% |
|
Ratio of expenses to average net assets after |
1.08% A, F |
1.15% F |
1.33% F |
1.71% F |
1.56% F |
1.54% F |
|
Ratio of net investment income (loss) to average net assets |
(.09)% A |
(.32)% |
(.52)% |
(.59)% |
1.33% |
.08% |
|
Portfolio turnover rate |
61% A |
76% |
109% |
219% |
99% |
223% |
|
A Annualized B The total returns would have been lower had certain expenses not been reduced during the periods shown. C Total returns do not include the one time sales
charge and for periods of less than one year are not annualized. |
||||||
See accompanying notes which are an integral part of the financial statements.
Consumer Sector
Performance
There are several ways to evaluate a fund's historical performance. You can look at the total percentage change in value, the average annual percentage change or the growth of a hypothetical $10,000 investment. Total return reflects the change in the value of an investment, assuming reinvestment of the fund's dividend income and capital gains (the profits earned upon the sale of securities that have grown in value). Load adjusted returns include a 3.00% sales charge and the effect of a $7.50 long-term trading fee for shares held 30 days or more. Effective September 28, 2000, the $7.50 long-term trading fee was eliminated. If Fidelity had not reimbursed certain fund expenses, the past 10 year total returns would have been lower.
Cumulative Total Returns
|
Periods ended |
Past 6 |
Past 1 |
Past 5 |
Past 10 |
|
Select Retailing |
2.54% |
0.83% |
137.81% |
486.88% |
|
Select Retailing |
-0.61% |
-2.27% |
130.60% |
469.20% |
|
S&P 500 |
11.73% |
16.32% |
193.58% |
493.54% |
|
GS Consumer Industries |
1.71% |
-1.83% |
n/a** |
n/a** |
Cumulative total returns show the fund's performance in percentage terms over a set period - in this case, six months, one year, five years or 10 years. You can compare the fund's returns to the performance of both the Standard & Poor's 500 Index - a market capitalization-weighted index of common stocks - and the Goldman Sachs Consumer Industries Index - a market capitalization-weighted index of 295 stocks designed to measure the performance of companies in the consumer industries sector. These benchmarks include reinvestment of dividends and capital gains, if any, and exclude the effect of sales charges.
Average Annual Total Returns
|
Periods ended |
Past 1 |
Past 5 |
Past 10 |
|
Select Retailing |
0.83% |
18.92% |
19.36% |
|
Select Retailing |
-2.27% |
18.19% |
18.99% |
|
S&P 500 |
16.32% |
24.04% |
19.49% |
|
GS Consumer Industries |
-1.83% |
n/a** |
n/a** |
Average annual returns take the fund's cumulative return and show you what would have happened if the fund had performed at a constant rate each year.
** Not available
Understanding Performance
How a fund did yesterday is no guarantee of how it will do tomorrow. The stock market, for example, has a history of long-term growth and short-term volatility. Unlike the broader market, however, some sectors may not have a history of growth in the long run. And, as with all stock funds, the share price and return of a fund that invests in a sector will vary.
3$10,000 Over 10 Years
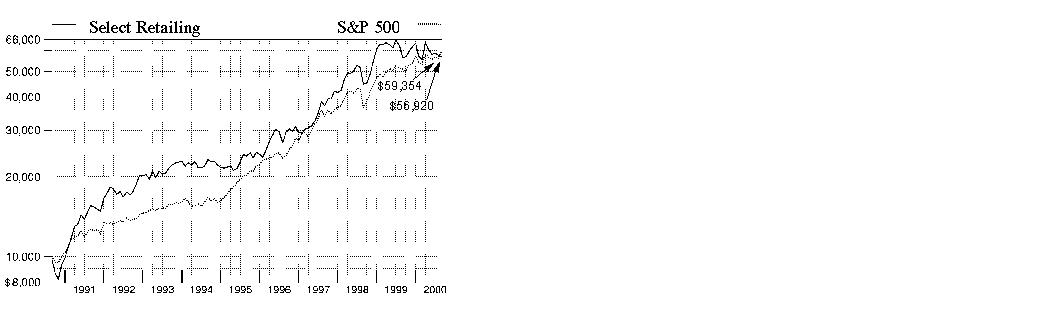
$10,000 Over 10 Years: Let's say hypothetically that $10,000 was invested in Fidelity Select Retailing Portfolio on August 31, 1990, and the current 3.00% sales charge was paid. As the chart shows, by August 31, 2000, the value of the investment would have grown to $56,920 - a 469.20% increase on the initial investment - and includes the effect of a $7.50 long-term trading fee. For comparison, look at how the Standard & Poor's 500 Index did over the same period. With dividends and capital gains, if any, reinvested, the same $10,000 investment would have grown to $59,354 - a 493.54% increase.
Investment Summary
|
Top Ten Stocks as of August 31, 2000 |
|
|
|
% of fund's |
|
Kohls Corp. |
10.2 |
|
Walgreen Co. |
10.1 |
|
Wal-Mart Stores, Inc. |
9.7 |
|
Home Depot, Inc. |
9.1 |
|
Safeway, Inc. |
5.1 |
|
BJ's Wholesale Club, Inc. |
4.5 |
|
RadioShack Corp. |
3.5 |
|
CDW Computer Centers, Inc. |
3.2 |
|
Best Buy Co., Inc. |
3.2 |
|
Target Corp. |
2.8 |
|
|
61.4 |
Top Industries as of August 31, 2000
% of fund's net assets
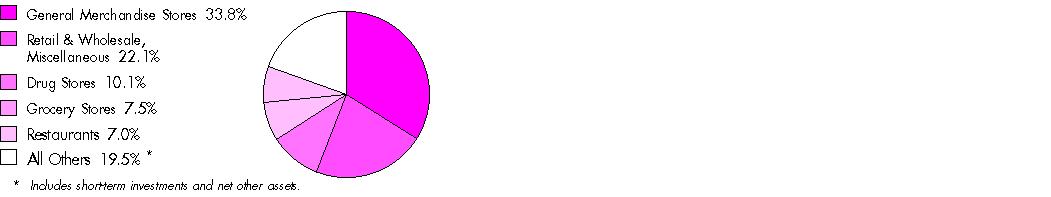
Semiannual Report
(Portfolio Manager photograph)
Steve Calhoun,
Portfolio Manager
of Fidelity Select
Retailing Portfolio
Q. How did the fund perform, Steve ?
A. During the six-month period that ended August 31, 2000, the fund returned 2.54%. This performance bettered the Goldman Sachs Consumer Industries Index - an index of 295 stocks designed to measure the performance of companies in the consumer industries sector - which gained 1.71%. The Standard & Poor's 500 Index returned 11.73% during the same six-month period. For the 12 months that ended August 31, 2000, the fund's 0.83% return compares favorably to the -1.83% return for the Goldman Sachs index. The Standard & Poor's 500 Index returned 16.32% during the same 12-month period.
Q. What market factors affected performance during the past
six months, and how did this affect your investment strategy?
A. The market environment continued to be affected by rising interest rates coupled with increasing oil prices. Adding to this backdrop was the prospect of even greater energy costs during the winter season. This scenario has led to a moderation in consumer spending. Given this environment, I chose to focus on retailers with different concepts - that is, companies with the ability to draw in consumers in a variety of economic conditions. Although I continued to choose holdings for the fund using a stock-by-stock selection criterion, I did not alter my overall approach, which emphasized companies with above-average earnings growth and market leadership.
Q. What stocks helped the fund's performance?
A. Safeway was a positive contributor to performance. The company is a leader within the supermarket industry and demonstrated good store growth and above-average investment returns on capital. Unlike other grocers, Safeway faces limited competition from super-centers that have taken away market share from other grocery chains. Kohls - the fund's largest holding - remained a standout among department stores. The company continued to increase market share, and its product lines continued to gain consumer acceptance. Walgreen also was a positive contributor to performance as it continued to show impressive growth.
Q. Were there any other bright prospects within the industry?
A. Yes, there were. There's a digital upgrade phenomenon occurring with consumers, with people upgrading their equipment to digital cameras and audio. This emerging upgrade cycle is in its early stages and several companies are poised to benefit from the trend, especially during the upcoming holiday season. I believe companies such as Best Buy and Radio Shack are well-positioned to leverage their growth from this cycle.
Q. What stocks were disappointing?
A. Apparel stores, such as Gap, and department stores, with the exception of Kohls, struggled throughout the period. Consumers were not drawn to the stores' new fashions and, as a result, year-over-year same store sales were disappointing. The fund also was affected by dramatic swings in retail stock prices during the past year. The fourth quarter of 1999 was a good one for retailing stocks with impressive and sometimes excessive increases in their valuations. But during the six-month period, we witnessed a significant correction in these prices. In some cases, the correction was overdone. As a result, companies such as Wal-Mart and Home Depot saw declines of 20% or more in their stock prices since the period's inception.
Q. What's your outlook for the coming months?
A. I remain cautiously optimistic about the next six months. Hopefully, we are at the end of the interest-rate increases and nearing a short-term peak in oil prices. If this happens, retail stocks may be well-positioned for future growth. However this scenario may change if energy prices continue to increase. Higher energy prices could place additional pressures on the economy and retailers in general.
The views expressed in this report reflect those of the portfolio manager only through the end of the period of the report as stated on the cover. The manager's views are subject to change at any time based on market or other conditions. For more information, see page 3.
Fund Facts
Start date: December 16, 1985
Fund number: 046
Trading symbol: FSRPX
Size: as of August 31, 2000, more than $66 million
Manager: Steve Calhoun, since 1999; director of associate research, 1997-1999; equity research associate, 1994-1997; joined Fidelity in 1994
3Semiannual Report
Retailing Portfolio
(Unaudited)
Showing Percentage of Net Assets
|
Common Stocks - 92.8% |
|||
|
Shares |
Value (Note 1) |
||
|
APPAREL STORES - 4.5% |
|||
|
AnnTaylor Stores Corp. (a) |
24,200 |
$ 871,200 |
|
|
Gap, Inc. |
55,800 |
1,252,013 |
|
|
Venator Group, Inc. (a) |
61,100 |
855,400 |
|
|
TOTAL APPAREL STORES |
2,978,613 |
||
|
COMPUTERS & OFFICE EQUIPMENT - 5.1% |
|||
|
CDW Computer Centers, Inc. (a) |
29,300 |
2,153,550 |
|
|
Tech Data Corp. (a) |
24,600 |
1,269,975 |
|
|
TOTAL COMPUTERS & OFFICE EQUIPMENT |
3,423,525 |
||
|
DRUG STORES - 10.1% |
|||
|
Walgreen Co. |
204,600 |
6,726,225 |
|
|
GENERAL MERCHANDISE STORES - 33.8% |
|||
|
BJ's Wholesale Club, Inc. (a) |
88,600 |
3,001,325 |
|
|
Consolidated Stores Corp. (a) |
69,158 |
942,278 |
|
|
Costco Wholesale Corp. (a) |
800 |
27,550 |
|
|
Dollar General Corp. |
34,300 |
705,294 |
|
|
Dollar Tree Stores, Inc. (a) |
27,150 |
1,101,272 |
|
|
Kohls Corp. (a) |
121,300 |
6,792,797 |
|
|
Neiman Marcus Group, Inc. Class A (a) |
48,100 |
1,614,356 |
|
|
Target Corp. |
81,700 |
1,899,525 |
|
|
Wal-Mart Stores, Inc. |
136,800 |
6,489,450 |
|
|
TOTAL GENERAL MERCHANDISE STORES |
22,573,847 |
||
|
GROCERY STORES - 7.5% |
|||
|
Safeway, Inc. (a) |
69,600 |
3,432,150 |
|
|
Whole Foods Market, Inc. (a) |
31,200 |
1,575,600 |
|
|
TOTAL GROCERY STORES |
5,007,750 |
||
|
HOME FURNISHINGS - 1.4% |
|||
|
Linens'n Things, Inc. (a) |
35,900 |
969,300 |
|
|
RESTAURANTS - 7.0% |
|||
|
Jack in the Box, Inc. (a) |
40,700 |
897,944 |
|
|
Outback Steakhouse, Inc. (a) |
43,300 |
993,194 |
|
|
Starbucks Corp. (a) |
46,700 |
1,710,388 |
|
|
Wendy's International, Inc. |
57,600 |
1,087,200 |
|
|
TOTAL RESTAURANTS |
4,688,726 |
||
|
RETAIL & WHOLESALE, MISCELLANEOUS - 22.1% |
|||
|
Bed Bath & Beyond, Inc. (a) |
79,400 |
1,394,463 |
|
|
Best Buy Co., Inc. (a) |
34,700 |
2,142,725 |
|
|
Future Shop Ltd. (a) |
10,100 |
129,725 |
|
|
Home Depot, Inc. |
127,350 |
6,120,759 |
|
|
Lowe's Companies, Inc. |
23,100 |
1,035,169 |
|
|
Pier 1 Imports, Inc. |
77,300 |
908,275 |
|
|
|
|||
|
Shares |
Value (Note 1) |
||
|
RadioShack Corp. |
39,700 |
$ 2,342,300 |
|
|
Ultimate Electronics, Inc. (a) |
20,700 |
725,794 |
|
|
TOTAL RETAIL & WHOLESALE, MISCELLANEOUS |
14,799,210 |
||
|
TEXTILES & APPAREL - 1.3% |
|||
|
Timberland Co. Class A (a) |
21,500 |
876,125 |
|
|
TOTAL COMMON STOCKS (Cost $47,400,763) |
62,043,321 |
||
|
Cash Equivalents - 7.4% |
|||
|
|
|
|
|
|
Fidelity Cash Central Fund, 6.59% (b) |
4,954,169 |
4,954,169 |
|
|
TOTAL INVESTMENT PORTFOLIO - 100.2% (Cost $52,354,932) |
66,997,490 |
|
NET OTHER ASSETS - (0.2)% |
(144,413) |
||
|
NET ASSETS - 100% |
$ 66,853,077 |
||
|
Legend |
|
(a) Non-income producing |
|
(b) The rate quoted is the annualized seven-day yield of the fund at |
|
Other Information |
|
Purchases and sales of securities, other than short-term securities, |
|
The fund placed a portion of its portfolio transactions with brokerage firms which are affiliates of Fidelity Management & Research Company. The commissions paid to these affiliated firms were $7,400 for the period. |
|
Income Tax Information |
|
At August 31, 2000, the aggregate cost of investment securities for income tax purposes was $52,697,268. Net unrealized appreciation aggregated $14,300,222, of which $15,822,661 related to appreciated investment securities and $1,522,439 related to depreciated investment securities. |
See accompanying notes which are an integral part of the financial statements.
Semiannual Report
Statement of Assets and Liabilities
|
|
August 31, 2000 (Unaudited) |
|
|
Assets |
|
|
|
Investment in securities, at value |
|
$ 66,997,490 |
|
Receivable for investments sold |
|
2,255,383 |
|
Receivable for fund shares sold |
|
454,873 |
|
Dividends receivable |
|
24,817 |
|
Interest receivable |
|
26,365 |
|
Redemption fees receivable |
|
1,842 |
|
Other receivables |
|
176,672 |
|
Total assets |
|
69,937,442 |
|
Liabilities |
|
|
|
Payable for investments purchased |
$ 27,934 |
|
|
Payable for fund shares redeemed |
2,981,121 |
|
|
Accrued management fee |
35,061 |
|
|
Other payables and |
40,249 |
|
|
Total liabilities |
|
3,084,365 |
|
Net Assets |
|
$ 66,853,077 |
|
Net Assets consist of: |
|
|
|
Paid in capital |
|
$ 47,366,387 |
|
Accumulated net investment (loss) |
|
(219,208) |
|
Accumulated undistributed net realized gain (loss) on investments and foreign currency transactions |
|
5,061,320 |
|
Net unrealized appreciation (depreciation) on investments |
|
14,644,578 |
|
Net Assets, for 1,428,744 |
|
$ 66,853,077 |
|
Net Asset Value and redemption price per share ($66,853,077 ÷ 1,428,744 shares) |
|
$46.79 |
|
Maximum offering price per share (100/97.00 of $46.79) |
|
$48.24 |
Statement of Operations
|
|
Six months ended August 31, 2000 (Unaudited) |
|
|
Investment Income Dividends |
|
$ 120,811 |
|
Interest |
|
182,529 |
|
Security lending |
|
3,544 |
|
Total income |
|
306,884 |
|
Expenses |
|
|
|
Management fee |
$ 230,548 |
|
|
Transfer agent fees |
248,430 |
|
|
Accounting and security lending fees |
30,993 |
|
|
Non-interested trustees' compensation |
58 |
|
|
Custodian fees and expenses |
5,782 |
|
|
Registration fees |
23,650 |
|
|
Audit |
7,082 |
|
|
Legal |
1,098 |
|
|
Miscellaneous |
55 |
|
|
Total expenses before reductions |
547,696 |
|
|
Expense reductions |
(21,604) |
526,092 |
|
Net investment income (loss) |
|
(219,208) |
|
Realized and Unrealized Gain (Loss) Net realized gain (loss) on: |
|
|
|
Investment securities |
5,449,842 |
|
|
Foreign currency transactions |
6,255 |
5,456,097 |
|
Change in net unrealized appreciation (depreciation) on: |
|
|
|
Investment securities |
(5,222,046) |
|
|
Assets and liabilities in |
2,007 |
(5,220,039) |
|
Net gain (loss) |
|
236,058 |
|
Net increase (decrease) in net assets resulting from operations |
|
$ 16,850 |
|
Other Information |
|
|
|
Sales charges paid to FDC |
|
$ 107,573 |
|
Deferred sales charges withheld by FDC |
|
$ 726 |
|
Exchange fees withheld by FSC |
|
$ 4,770 |
|
Expense reductions |
|
|
|
Directed brokerage arrangements |
|
$ 21,604 |
See accompanying notes which are an integral part of the financial statements.
Semiannual Report
Retailing Portfolio
Financial Statements - continued
Statement of Changes in Net Assets
|
Increase (Decrease) in Net Assets |
Six months ended |
Year ended |
|
Operations |
$ (219,208) |
$ (1,089,993) |
|
Net realized gain (loss) |
5,456,097 |
63,320,946 |
|
Change in net unrealized appreciation (depreciation) |
(5,220,039) |
(80,761,548) |
|
Net increase (decrease) in net assets resulting from operations |
16,850 |
(18,530,595) |
|
Distributions to shareholders from net realized gains |
(10,009,192) |
(21,286,354) |
|
Share transactions |
63,691,655 |
165,337,107 |
|
Reinvestment of distributions |
9,544,557 |
20,405,937 |
|
Cost of shares redeemed |
(72,397,447) |
(408,057,115) |
|
Net increase (decrease) in net assets resulting from share transactions |
838,765 |
(222,314,071) |
|
Redemption fees |
184,959 |
439,543 |
|
Total increase (decrease) in net assets |
(8,968,618) |
(261,691,477) |
|
Net Assets |
|
|
|
Beginning of period |
75,821,695 |
337,513,172 |
|
End of period (including accumulated net investment loss of $219,208 and $0, respectively) |
$ 66,853,077 |
$ 75,821,695 |
|
Other Information Shares |
|
|
|
Sold |
1,183,720 |
2,486,363 |
|
Issued in reinvestment of distributions |
186,857 |
354,639 |
|
Redeemed |
(1,445,501) |
(6,337,585) |
|
Net increase (decrease) |
(74,924) |
(3,496,583) |
Financial Highlights
|
|
Six months ended |
Years ended February 28, |
||||
|
Selected Per-Share Data |
(Unaudited) |
2000 F |
1999 |
1998 |
1997 |
1996 F |
|
Net asset value, beginning of period |
$ 50.42 |
$ 67.50 |
$ 50.04 |
$ 33.25 |
$ 27.87 |
$ 23.91 |
|
Income from Investment Operations |
|
|
|
|
|
|
|
Net investment income (loss) D |
(.14) |
(.39) |
(.28) |
(.27) |
(.13) |
(.14) |
|
Net realized and unrealized gain (loss) |
1.75 |
(6.72) |
18.27 |
17.14 |
5.49 |
4.07 |
|
Total from investment operations |
1.61 |
(7.11) |
17.99 |
16.87 |
5.36 |
3.93 |
|
Less Distributions |
|
|
|
|
|
|
|
From net realized gain |
(5.36) |
(10.13) |
(.39) |
(.51) |
(.08) |
- |
|
In excess of net realized gain |
- |
- |
(.30) |
- |
- |
- |
|
Total distributions |
(5.36) |
(10.13) |
(.69) |
(.51) |
(.08) |
- |
|
Redemption fees added to paid in capital |
.12 |
.16 |
.16 |
.43 |
.10 |
.03 |
|
Net asset value, end of period |
$ 46.79 |
$ 50.42 |
$ 67.50 |
$ 50.04 |
$ 33.25 |
$ 27.87 |
|
Total Return B, C |
2.54% |
(12.15)% |
36.66% |
52.61% |
19.59% |
16.56% |
|
Ratios and Supplemental Data |
|
|
|
|
|
|
|
Net assets, end of period (000 omitted) |
$ 66,853 |
$ 75,822 |
$ 337,513 |
$ 192,861 |
$ 59,348 |
$ 44,051 |
|
Ratio of expenses to average net assets |
1.34% A |
1.25% |
1.25% |
1.63% |
1.45% |
1.94% |
|
Ratio of expenses to average net assets after |
1.29% A, E |
1.20% E |
1.22% E |
1.55% E |
1.39% E |
1.92% E |
|
Ratio of net investment income (loss) to average net assets |
(.54)% A |
(.60)% |
(.50)% |
(.67)% |
(.39)% |
(.53)% |
|
Portfolio turnover rate |
202% A |
88% |
165% |
308% |
278% |
235% |
|
A Annualized B The total returns would have been lower had certain expenses not been reduced during the periods shown. C Total returns do not include the one time sales
charge and for periods of less than one year are not annualized. |
||||||
See accompanying notes which are an integral part of the financial statements.
Consumer Sector
Performance
There are several ways to evaluate a fund's historical performance. You can look at the total percentage change in value, the average annual percentage change or the growth of a hypothetical $10,000 investment. Total return reflects the change in the value of an investment, assuming reinvestment of the fund's dividend income and capital gains (the profits earned upon the sale of securities that have grown in value). Load adjusted returns include a 3.00% sales charge and the effect of a $7.50 long-term trading fee for shares held 30 days or more. Effective September 28, 2000, the $7.50 long-term trading fee was eliminated. If Fidelity had not reimbursed certain fund expenses, the past 10 year total returns would have been lower.
Cumulative Total Returns
|
Periods ended |
Past 6 |
Past 1 |
Past 5 |
Past 10 |
|
Select Air Transportation |
42.47% |
34.59% |
160.70% |
464.33% |
|
Select Air Transportation |
38.12% |
30.47% |
152.81% |
447.33% |
|
S&P 500 |
11.73% |
16.32% |
193.58% |
493.54% |
|
GS Cyclical Industries |
12.70% |
-3.99% |
n/a** |
n/a** |
Cumulative total returns show the fund's performance in percentage terms over a set period - in this case, six months, one year, five years or 10 years. You can compare the fund's returns to the performance of both the Standard & Poor's 500 Index - a market capitalization-weighted index of common stocks - and the Goldman Sachs Cyclical Industries Index - a market capitalization-weighted index of 253 stocks designed to measure the performance of companies in the cyclical industries sector. These benchmarks include reinvestment of dividends and capital gains, if any, and exclude the effect of sales charges.
Average Annual Total Returns
|
Periods ended |
Past 1 |
Past 5 |
Past 10 |
|
Select Air Transportation |
34.59% |
21.12% |
18.89% |
|
Select Air Transportation |
30.47% |
20.38% |
18.53% |
|
S&P 500 |
16.32% |
24.04% |
19.49% |
|
GS Cyclical Industries |
-3.99% |
n/a** |
n/a** |
Average annual returns take the fund's cumulative return and show you what would have happened if the fund had performed at a constant rate each year.
** Not available
Understanding Performance
How a fund did yesterday is no guarantee of how it will do tomorrow. The stock market, for example, has a history of long-term growth and short-term volatility. Unlike the broader market, however, some sectors may not have a history of growth in the long run. And, as with all stock funds, the share price and return of a fund that invests in a sector will vary.
3$10,000 Over 10 Years
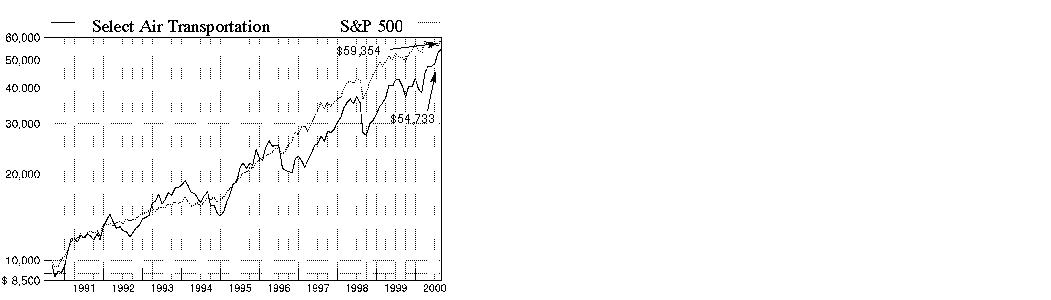
$10,000 Over 10 Years: Let's say hypothetically that $10,000 was invested in Fidelity Select Air Transportation Portfolio on August 31, 1990, and the current 3.00% sales charge was paid. As the chart shows, by August 31, 2000, the value of the investment would have grown to $54,733 - a 447.33% increase on the initial investment - and includes the effect of a $7.50 long-term trading fee. For comparison, look at how the Standard & Poor's 500 Index did over the same period. With dividends and capital gains, if any, reinvested, the same $10,000 investment would have grown to $59,354 - a 493.54% increase.
Investment Summary
|
Top Ten Stocks as of August 31, 2000 |
|
|
|
% of fund's |
|
BFGoodrich Co. |
8.2 |
|
General Dynamics Corp. |
6.7 |
|
United Technologies Corp. |
6.7 |
|
Southwest Airlines Co. |
5.3 |
|
Boeing Co. |
4.8 |
|
Lockheed Martin Corp. |
4.6 |
|
Honeywell International, Inc. |
4.4 |
|
Continental Airlines, Inc. Class B |
4.2 |
|
Northwest Airlines Corp. Class A |
4.1 |
|
Bombardier, Inc. Class B (non-vtg.) |
4.0 |
|
|
53.0 |
Top Industries as of August 31, 2000
% of fund's net assets

Semiannual Report
(Portfolio Manager photograph)
Jeff Feingold,
Portfolio Manager
of Fidelity Select
Air Transportation Portfolio
Q. How did the fund perform, Jeff?
A. Quite well. For the six-month period that ended August 31, 2000, the fund returned 42.47%. In comparison, the Goldman Sachs Cyclical Industries Index - an index of 253 stocks designed to measure the performance of companies in the cyclical industries sector - returned 12.70%. During the same period, the Standard & Poor's 500 Index returned 11.73%. For the 12-month period that ended August 31, 2000, the fund returned 34.59%, while the Goldman Sachs index and the S&P 500 index returned -3.99% and 16.32%, respectively.
Q. What factors helped the fund outperform the Goldman Sachs index during the six-month period?
A. The fund outperformed for several reasons. First, an improved outlook in the commercial aerospace industry benefited the fund's positions in stocks of aerospace suppliers. Our overweighted holdings in stocks such as BFGoodrich, Cordant Technologies and General Dynamics were positive contributors. Second, the potential for consolidation within the airline industry lifted the performance of stocks such as Northwest and Continental, which were seen as acquisition targets. Additionally, a strong economic environment and the moderation of airline seating capacity presented a more favorable environment for airline stocks, particularly during the first half of the period.
Q. Fuel costs started and ended the period at record-high levels. How did this affect the fund's performance?
A. The impact of rising fuel costs is best understood by examining the supply and demand of airline seating capacity. Fuel costs matter most when seating capacity supply is greater than demand, which makes it difficult for an airline to weather the fuel increases and pass the increases along to the consumer. However, during the past six months, airlines were able to pass along the price increases to help offset the higher costs because demand remained strong. While the industry couldn't offset all of the fuel cost increases, which hurt the airlines to some degree, having the seating capacity supply/demand equation in the airlines' favor made it easier.
Q. How did UAL's - the parent company of United Airlines - recent agreement to purchase US Airways affect the fund and the market for domestic airline stocks?
A. The deal sparked a wave of other airline consolidation speculation, which boosted prices. If approved, this would be the first merger of two large American airlines since the early 1980s. More importantly, I think consolidation could benefit the industry over time by giving it the potential to achieve better control over seating capacity growth, and possibly improve the industry's supply/demand equation and pricing. Overall, our positions in stocks such as US Airways and other potential takeover targets helped, while concerns about the struggles of integrating two airlines' operations, as well as the price to acquire an airline, hurt stocks such as UAL.
Q. What stocks stood out as top performers? Which disappointed?
A. Aerospace supplier BFGoodrich, the fund's top performer, benefited from the potential for an increase in demand for its products as expectations continued that commercial jet production would recover in 2001. Northwest Airlines outperformed on speculation it would be an attractive takeover candidate for another major airline. On the down side, Sabre Holdings, which operates the world's largest airline reservation system, and Travelocity, an online ticket broker, underperformed due to fears about increasing competition in the reservation and Internet travel space.
Q. What's the near future look like for air transportation stocks?
A. I'm generally cautious about airlines as a group. During the past year or so, the supply/demand equation has improved. Going forward, however, there are some risks. First, with demand for air transportation closely correlated to gross domestic product (GDP) growth, any cooling of the economy could weaken demand for air travel and hurt the fund. The rise in fuel prices also is a factor, increasing airlines' costs and offsetting what was a very positive demand equation at period end. I will continue to monitor how these and other factors affect the supply and demand fundamentals of the industry.
The views expressed in this report reflect those of the portfolio manager only through the end of the period of the report as stated on the cover. The manager's views are subject to change at any time based on market or other conditions. For more information, see page 3.
Fund Facts
Start date: December 16, 1985
Fund number: 034
Trading symbol: FSAIX
Size: as of August 31, 2000, more than
$66 million
Manager: Jeff Feingold, since February 2000; manager, Fidelity Select Defense and Aerospace Portfolio, since 1998; Fidelity Select Transportation Portfolio, February 2000-September 2000; equity analyst, various industries, 1997-1998; joined Fidelity in 1997
3Semiannual Report
Air Transportation Portfolio
(Unaudited)
Showing Percentage of Net Assets
|
Common Stocks - 99.3% |
|||
|
Shares |
Value (Note 1) |
||
|
AEROSPACE & DEFENSE - 34.0% |
|||
|
BFGoodrich Co. |
133,400 |
$ 5,444,384 |
|
|
Boeing Co. |
59,300 |
3,179,963 |
|
|
Bombardier, Inc. Class B (non-vtg.) |
163,400 |
2,698,349 |
|
|
Honeywell International, Inc. |
76,100 |
2,934,606 |
|
|
Lockheed Martin Corp. |
107,300 |
3,044,638 |
|
|
Precision Castparts Corp. |
11,900 |
904,400 |
|
|
United Technologies Corp. |
71,500 |
4,464,281 |
|
|
TOTAL AEROSPACE & DEFENSE |
22,670,621 |
||
|
AIR TRANSPORTATION - 38.0% |
|||
|
Air Canada (a) |
5,000 |
62,691 |
|
|
Air France Compagnie (Reg. D) (a) |
37,400 |
717,070 |
|
|
AirTran Holdings, Inc. (a) |
144,900 |
597,713 |
|
|
Alaska Air Group, Inc. (a) |
18,600 |
483,600 |
|
|
America West Holding Corp. Class B (a) |
26,200 |
383,175 |
|
|
AMR Corp. |
60,700 |
1,991,719 |
|
|
Atlantic Coast Airlines Holdings, Inc. (a) |
40,900 |
1,298,575 |
|
|
Atlas Air, Inc. (a) |
28,200 |
1,219,650 |
|
|
Cathay Pacific Airways Ltd. |
446,000 |
866,353 |
|
|
Continental Airlines, Inc. Class B (a) |
58,600 |
2,820,125 |
|
|
Delta Air Lines, Inc. |
38,500 |
1,905,750 |
|
|
Frontier Airlines, Inc. (a) |
50,500 |
864,813 |
|
|
Japan Airlines Co. Ltd. ADR |
108,700 |
767,694 |
|
|
Midwest Express Holdings, Inc. (a) |
6,700 |
151,588 |
|
|
Northwest Airlines Corp. Class A (a) |
86,900 |
2,721,056 |
|
|
Ryanair Holdings PLC sponsored ADR (a) |
23,800 |
874,650 |
|
|
SkyWest, Inc. |
39,700 |
1,972,594 |
|
|
Southwest Airlines Co. |
156,850 |
3,548,731 |
|
|
UAL Corp. |
6,900 |
329,475 |
|
|
US Airways Group, Inc. (a) |
14,900 |
506,600 |
|
|
WestJet Airlines Ltd. (a) |
66,200 |
1,237,173 |
|
|
TOTAL AIR TRANSPORTATION |
25,320,795 |
||
|
COMPUTER SERVICES & SOFTWARE - 0.2% |
|||
|
Travelocity.com, Inc. (a) |
8,900 |
122,375 |
|
|
ELECTRICAL EQUIPMENT - 3.3% |
|||
|
General Electric Co. |
37,500 |
2,200,781 |
|
|
INDUSTRIAL MACHINERY & EQUIPMENT - 1.6% |
|||
|
Tyco International Ltd. |
18,100 |
1,031,700 |
|
|
IRON & STEEL - 1.1% |
|||
|
Carpenter Technology Corp. |
22,800 |
741,000 |
|
|
SERVICES - 0.5% |
|||
|
Pittston Co. - Brinks Group |
20,400 |
317,475 |
|
|
SHIP BUILDING & REPAIR - 6.7% |
|||
|
General Dynamics Corp. |
71,200 |
4,481,150 |
|
|
SHIPPING - 1.6% |
|||
|
Frontline Ltd. (a) |
71,700 |
1,073,129 |
|
|
|
|||
|
Shares |
Value (Note 1) |
||
|
TRUCKING & FREIGHT - 12.3% |
|||
|
EGL, Inc. (a) |
15,350 |
$ 551,641 |
|
|
Expeditors International of |
44,400 |
2,175,600 |
|
|
FedEx Corp. (a) |
47,800 |
1,928,730 |
|
|
Forward Air Corp. (a) |
17,000 |
779,875 |
|
|
Fritz Companies, Inc. (a) |
18,700 |
276,994 |
|
|
United Parcel Service, Inc. Class B |
44,300 |
2,455,881 |
|
|
TOTAL TRUCKING & FREIGHT |
8,168,721 |
||
|
TOTAL COMMON STOCKS (Cost $55,192,948) |
66,127,747 |
||
|
Cash Equivalents - 2.3% |
|||
|
|
|
|
|
|
Fidelity Cash Central Fund, 6.59% (b) |
698,342 |
698,342 |
|
|
Fidelity Securities Lending Cash |
812,500 |
812,500 |
|
|
TOTAL CASH EQUIVALENTS (Cost $1,510,842) |
1,510,842 |
||
|
TOTAL INVESTMENT PORTFOLIO - 101.6% (Cost $56,703,790) |
67,638,589 |
||
|
NET OTHER ASSETS - (1.6)% |
(1,054,671) |
||
|
NET ASSETS - 100% |
$ 66,583,918 |
||
|
Legend |
|
(a) Non-income producing |
|
(b) The rate quoted is the annualized seven-day yield of the fund at |
|
Other Information |
|
Purchases and sales of securities, other than short-term securities, |
|
The fund placed a portion of its portfolio transactions with brokerage |
|
The fund participated in the security lending program. At period end, |
|
Distribution of investments by country of issue, as a percentage of total |
|
United States of America |
87.6% |
|
Canada |
6.0 |
|
Norway |
1.6 |
|
Ireland |
1.3 |
|
Hong Kong |
1.3 |
|
Japan |
1.1 |
|
France |
1.1 |
|
|
100.0% |
|
Income Tax Information |
|
At August 31, 2000, the aggregate cost of investment securities for income tax purposes was $57,006,938. Net unrealized appreciation aggregated $10,631,651, of which $12,076,007 related to appreciated investment securities and $1,444,356 related to depreciated investment securities. |
See accompanying notes which are an integral part of the financial statements.
Cyclicals Sector
Statement of Assets and Liabilities
|
|
August 31, 2000 (Unaudited) |
|
|
Assets |
|
|
|
Investment in securities, at value |
|
$ 67,638,589 |
|
Foreign currency held at value |
|
683,659 |
|
Receivable for fund shares sold |
|
149,482 |
|
Dividends receivable |
|
102,550 |
|
Interest receivable |
|
28,299 |
|
Redemption fees receivable |
|
344 |
|
Other receivables |
|
5,091 |
|
Total assets |
|
68,608,014 |
|
Liabilities |
|
|
|
Payable for investments purchased |
$ 683,659 |
|
|
Payable for fund shares redeemed |
455,748 |
|
|
Accrued management fee |
32,284 |
|
|
Other payables and |
39,905 |
|
|
Collateral on securities loaned, |
812,500 |
|
|
Total liabilities |
|
2,024,096 |
|
Net Assets |
|
$ 66,583,918 |
|
Net Assets consist of: |
|
|
|
Paid in capital |
|
$ 53,593,816 |
|
Undistributed net investment income |
|
33,253 |
|
Accumulated undistributed net realized gain (loss) on investments and foreign currency transactions |
|
2,013,173 |
|
Net unrealized appreciation (depreciation) on investments |
|
10,943,676 |
|
Net Assets, for 1,910,460 shares outstanding |
|
$ 66,583,918 |
|
Net Asset Value and redemption price per share ($66,583,918 ÷ 1,910,460 shares) |
|
$34.85 |
|
Maximum offering price per share (100/97.00 of $34.85) |
|
$35.93 |
Statement of Operations
|
|
Six months ended August 31, 2000 (Unaudited) |
|
|
Investment Income Dividends |
|
$ 251,159 |
|
Interest |
|
102,321 |
|
Security lending |
|
4,146 |
|
Total income |
|
357,626 |
|
Expenses |
|
|
|
Management fee |
$ 139,941 |
|
|
Transfer agent fees |
130,151 |
|
|
Accounting and security lending fees |
30,456 |
|
|
Non-interested trustees' compensation |
67 |
|
|
Custodian fees and expenses |
8,354 |
|
|
Registration fees |
18,519 |
|
|
Audit |
8,125 |
|
|
Legal |
90 |
|
|
Miscellaneous |
32 |
|
|
Total expenses before reductions |
335,735 |
|
|
Expense reductions |
(11,362) |
324,373 |
|
Net investment income |
|
33,253 |
|
Realized and Unrealized Gain (Loss) Net realized gain (loss) on: |
|
|
|
Investment securities |
2,714,922 |
|
|
Foreign currency transactions |
(9,973) |
2,704,949 |
|
Change in net unrealized appreciation (depreciation) on: |
|
|
|
Investment securities |
10,829,917 |
|
|
Assets and liabilities in |
8,877 |
10,838,794 |
|
Net gain (loss) |
|
13,543,743 |
|
Net increase (decrease) in net assets resulting from operations |
|
$ 13,576,996 |
|
Other Information |
|
|
|
Sales charges paid to FDC |
|
$ 107,745 |
|
Deferred sales charges withheld by FDC |
|
$ 296 |
|
Exchange fees withheld by FSC |
|
$ 1,995 |
|
Expense reductions |
|
|
|
Directed brokerage arrangements |
|
$ 11,362 |
|
|
|
|
See accompanying notes which are an integral part of the financial statements.
Semiannual Report
Air Transportation Portfolio
Financial Statements - continued
Statement of Changes in Net Assets
|
Increase (Decrease) in Net Assets |
Six months ended |
Year ended |
|
Operations |
$ 33,253 |
$ (266,215) |
|
Net realized gain (loss) |
2,704,949 |
14,639,365 |
|
Change in net unrealized appreciation (depreciation) |
10,838,794 |
(7,111,771) |
|
Net increase (decrease) in net assets resulting from operations |
13,576,996 |
7,261,379 |
|
Distributions to shareholders from net realized gains |
(3,254,210) |
(5,518,710) |
|
Share transactions |
85,446,411 |
85,072,471 |
|
Reinvestment of distributions |
3,130,396 |
5,319,847 |
|
Cost of shares redeemed |
(56,925,156) |
(133,856,898) |
|
Net increase (decrease) in net assets resulting from share transactions |
31,651,651 |
(43,464,580) |
|
Redemption fees |
146,732 |
235,249 |
|
Total increase (decrease) in net assets |
42,121,169 |
(41,486,662) |
|
Net Assets |
|
|
|
Beginning of period |
24,462,749 |
65,949,411 |
|
End of period (including undistributed net investment income of $33,253 and $0, respectively) |
$ 66,583,918 |
$ 24,462,749 |
|
Other Information Shares |
|
|
|
Sold |
2,725,996 |
2,797,655 |
|
Issued in reinvestment of distributions |
106,476 |
186,721 |
|
Redeemed |
(1,846,995) |
(4,434,782) |
|
Net increase (decrease) |
985,477 |
(1,450,406) |
Financial Highlights
|
|
Six months ended |
Years ended February 28, |
||||
|
Selected Per-Share Data |
(Unaudited) |
2000 F |
1999 |
1998 |
1997 |
1996 F |
|
Net asset value, beginning of period |
$ 26.45 |
$ 27.76 |
$ 26.86 |
$ 17.72 |
$ 21.11 |
$ 13.93 |
|
Income from Investment Operations |
|
|
|
|
|
|
|
Net investment income (loss) D |
.02 |
(.15) |
(.14) |
(.19) |
(.22) |
(.01) |
|
Net realized and unrealized gain (loss) |
10.68 |
2.59 |
1.06 |
10.59 |
(3.12) |
7.47 |
|
Total from investment operations |
10.70 |
2.44 |
.92 |
10.40 |
(3.34) |
7.46 |
|
Less Distributions |
|
|
|
|
|
|
|
From net realized gain |
(2.39) |
(3.88) |
(.21) |
(1.43) |
(.07) |
(.46) |
|
In excess of net realized gain |
- |
- |
- |
- |
(.20) |
- |
|
Total distributions |
(2.39) |
(3.88) |
(.21) |
(1.43) |
(.27) |
(.46) |
|
Redemption fees added to paid in capital |
.09 |
.13 |
.19 |
.17 |
.22 |
.18 |
|
Net asset value, end of period |
$ 34.85 |
$ 26.45 |
$ 27.76 |
$ 26.86 |
$ 17.72 |
$ 21.11 |
|
Total Return B, C |
42.47% |
8.50% |
4.11% |
61.10% |
(15.06)% |
54.91% |
|
Ratios and Supplemental Data |
|
|
|
|
|
|
|
Net assets, end of period (000 omitted) |
$ 66,584 |
$ 24,463 |
$ 65,949 |
$ 181,185 |
$ 35,958 |
$ 75,359 |
|
Ratio of expenses to average net assets |
1.35% A |
1.40% |
1.35% |
1.93% |
1.89% |
1.47% |
|
Ratio of expenses to average net assets after |
1.30% A, E |
1.35% E |
1.27% E |
1.87% E |
1.80% E |
1.41% E |
|
Ratio of net investment income (loss) to average net assets |
.13% A |
(.48)% |
(.50)% |
(.84)% |
(1.10)% |
(.07)% |
|
Portfolio turnover rate |
169% A |
252% |
260% |
294% |
469% |
504% |
|
A Annualized B The total returns would have been lower had certain expenses not been reduced during the periods shown. C Total returns do not include the one time sales
charge and for periods of less than one year are not annualized. |
||||||
See accompanying notes which are an integral part of the financial statements.
Cyclicals Sector
Performance
There are several ways to evaluate a fund's historical performance. You can look at the total percentage change in value, the average annual percentage change or the growth of a hypothetical $10,000 investment. Total return reflects the change in the value of an investment, assuming reinvestment of the fund's dividend income and capital gains (the profits earned upon the sale of securities that have grown in value). Load adjusted returns include a 3.00% sales charge and the effect of a $7.50 long-term trading fee for shares held 30 days or more. Effective September 28, 2000, the $7.50 long-term trading fee was eliminated. If Fidelity had not reimbursed certain fund expenses, the past 10 year total returns would have been lower.
Cumulative Total Returns
|
Periods ended |
Past 6 |
Past 1 |
Past 5 |
Past 10 |
|
Select Automotive |
14.66% |
-8.32% |
28.24% |
223.92% |
|
Select Automotive |
-11.15% |
-11.14% |
24.32% |
214.13% |
|
S&P 500 |
11.73% |
16.32% |
193.58% |
493.54% |
|
GS Cyclical Industries |
12.70% |
-3.99% |
n/a** |
n/a** |
Cumulative total returns show the fund's performance in percentage terms over a set period - in this case, six months, one year, five years or 10 years. You can compare the fund's returns to the performance of both the Standard & Poor's 500 Index - a market capitalization-weighted index of common stocks - and the Goldman Sachs Cyclical Industries Index - a market capitalization-weighted index of 253 stocks designed to measure the performance of companies in the cyclical industries sector. These benchmarks include reinvestment of dividends and capital gains, if any, and exclude the effect of sales charges.
Average Annual Total Returns
|
Periods ended |
Past 1 |
Past 5 |
Past 10 |
|
Select Automotive |
-8.32% |
5.10% |
12.47% |
|
Select Automotive |
-11.14% |
4.45% |
12.13% |
|
S&P 500 |
16.32% |
24.04% |
19.49% |
|
GS Cyclical Industries |
-3.99% |
n/a** |
n/a** |
Average annual returns take the fund's cumulative return and show you what would have happened if the fund had performed at a constant rate each year.
** Not available
Understanding Performance
How a fund did yesterday is no guarantee of how it will do tomorrow. The stock market, for example, has a history of long-term growth and short-term volatility. Unlike the broader market, however, some sectors may not have a history of growth in the long run. And, as with all stock funds, the share price and return of a fund that invests in a sector will vary.
3$10,000 Over 10 Years
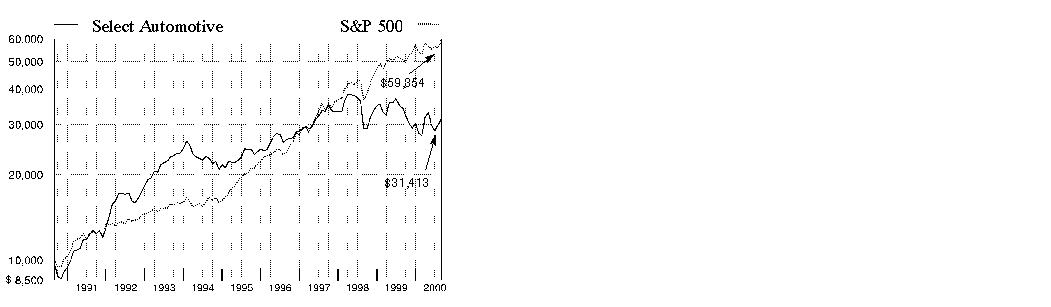
$10,000 Over 10 Years: Let's say hypothetically that $10,000 was invested in Fidelity Select Automotive Portfolio on August 31, 1990, and the current 3.00% sales charge was paid. As the chart shows, by August 31, 2000, the value of the investment would have grown to $31,413 - a 214.13% increase on the initial investment - and includes the effect of a $7.50 long-term trading fee. For comparison, look at how the Standard & Poor's 500 Index did over the same period. With dividends and capital gains, if any, reinvested, the same $10,000 investment would have grown to $59,354 - a 493.54% increase.
Investment Summary
|
Top Ten Stocks as of August 31, 2000 |
|
|
|
% of fund's |
|
Honda Motor Co. Ltd. |
8.7 |
|
Toyota Motor Corp. |
8.1 |
|
Danaher Corp. |
7.7 |
|
SPX Corp. |
7.6 |
|
General Motors Corp. |
7.2 |
|
TRW, Inc. |
6.4 |
|
Navistar International Corp. |
5.1 |
|
Eaton Corp. |
4.3 |
|
Johnson Controls, Inc. |
3.8 |
|
Delphi Automotive Systems Corp. |
3.7 |
|
|
62.6 |
Top Industries as of August 31, 2000
% of fund's net assets

Semiannual Report
(Portfolio Manager photograph)
Douglas Nigen, Portfolio Manager of Fidelity Select Automotive Portfolio
Q. How did the fund perform, Doug?
A. For the six-month period ending August 31, 2000, the fund returned 14.66%. The Goldman Sachs Cyclical Industries Index - an index of 253 stocks designed to measure the performance of companies in the cyclical industries sector - returned 12.70%, and the Standard & Poor's 500 Index returned 11.73% for the same period. For the 12-month period ending August 31, 2000, the fund returned -8.32%, while the Goldman Sachs index and the S&P 500 returned -3.99% and 16.32%, respectively.
Q. Why did the fund outperform its indexes during the period?
A. There were a number of reasons. First off, back in March and April of this year, investor sentiment reversed and the market's previous stars - technology stocks - suffered while cyclical and industrial stocks benefited. Additionally, there was a feeling late in the period that interest rates were finally leveling off. Since auto stocks generally underperform in a rising interest-rate environment, this perceived stabilization helped performance. And finally, relative to the Goldman Sachs index, the fund benefited from a few significant individual stock picks.
Q. What fund holdings performed particularly well?
A. The largest contributor to the fund's performance was SPX, a diversified vehicle component, industrial product and specialty tools producer. Plans to partially spin off its fiber-optic switch division, INRANGE Technologies, helped the company's share price outperform during the period. Also, the fund's underweighting of European auto manufacturers, specifically given the poor performance of DaimlerChrysler, helped performance significantly.
Q. Were there any disappointments?
A. The fund briefly owned Goodyear Tire in hopes of catching the beginning of a turnaround. However, the stock suffered from its inability to pass on to consumers the rising cost of petroleum - a major raw material in tire products - and from its exposure to the European market. Gentex, an automotive supply company, also had a rough few months. Its share price was hurt by sluggish sales and a delay in some anticipated announcements about its new LED (light-emitting diode) technology. Fears of a downturn in heavy truck manufacturing, which has since come to pass, detracted from Eaton's share price.
Q. In the report to shareholders six months ago, you mentioned that you were looking at opportunities among Japanese auto manufacturers. Did you act on this interest?
A. Yes, I did. I began to focus on Japanese auto manufacturers such as Honda and Toyota. The result for the fund was mixed, with some gains and some losses. However, I still remain positive about the group's prospects in their two primary markets - Japan and North America. With the likely bottoming of the Japanese economy, domestic auto sales for these companies should be brighter than those of their North American and European counterparts. Additionally, they are increasing sales and gaining market share in the highly profitable sport utility vehicle (SUV) and minivan product lines in the North American market.
Q. Was the fund affected by the Firestone tire recall at all?
A. The fund emerged from this story relatively unscathed. Ford, whose share price suffered because it used the recalled tires on its popular Explorer SUVs, was a relatively small position in the fund. In addition, the fund did not own Bridgestone, Firestone's parent company, whose share price was severely hurt by the recall. As a result, there was minimal impact on the fund.
Q. What's your outlook?
A. I remain cautious about the sector overall. Auto sales in North America continue to run at unprecedented levels and, even though there has been a controlled slowdown over the past six months, I am skeptical about the long-term sustainability of this trend. In addition, interest rates always bear watching, especially in this sector. If the Federal Reserve Board has generated an economic soft landing with its previous rate hikes, the fund may benefit. However, if the economy slows too quickly, the fund could be hurt. With that in mind, I will continue to overweight Japanese auto manufacturers and also will continue to look for companies that are not purely dependent on the auto industry for their profits and stock performance.
The views expressed in this report reflect those of the portfolio manager only through the end of the period of the report as stated on the cover. The manager's views are subject to change at any time based on market or other conditions. For more information, see page 3.
Fund Facts
Start date: June 30, 1986
Fund number: 502
Trading symbol: FSAVX
Size: as of August 31, 2000, more than $11 million
Manager: Douglas Nigen, since 1999; analyst, automotive industry, 1999-present; joined Fidelity in 1997
3Semiannual Report
Automotive Portfolio
(Unaudited)
Showing Percentage of Net Assets
|
Common Stocks - 92.7% |
|||
|
Shares |
Value (Note 1) |
||
|
AUTOS, TIRES, & ACCESSORIES - 85.9% |
|||
|
AutoNation, Inc. |
59,700 |
$ 388,050 |
|
|
Danaher Corp. |
15,400 |
865,288 |
|
|
Delphi Automotive Systems Corp. |
25,224 |
414,620 |
|
|
Eaton Corp. |
7,250 |
481,219 |
|
|
Federal Signal Corp. |
5,700 |
122,906 |
|
|
Ford Motor Co. |
6,437 |
155,695 |
|
|
Fuji Heavy Industries Ltd. |
41,000 |
271,360 |
|
|
General Motors Corp. |
11,300 |
815,719 |
|
|
Gentex Corp. (a) |
14,000 |
362,250 |
|
|
Honda Motor Co. Ltd. (a) |
27,000 |
978,746 |
|
|
IMPCO Technologies, Inc. (a) |
700 |
16,844 |
|
|
Johnson Controls, Inc. |
7,950 |
424,828 |
|
|
Lear Corp. (a) |
6,250 |
134,766 |
|
|
Lithia Motors, Inc. Class A (a) |
12,000 |
147,000 |
|
|
Mazda Motor Corp. |
23,000 |
54,767 |
|
|
Navistar International Corp. (a) |
15,400 |
577,500 |
|
|
Oshkosh Truck Co. |
2,100 |
74,550 |
|
|
Sonic Automotive, Inc. Class A (a) |
12,745 |
134,619 |
|
|
SPX Corp. (a) |
5,200 |
852,800 |
|
|
Superior Industries International, Inc. |
2,400 |
77,850 |
|
|
Toyoda Gosei Co. Ltd. |
4,000 |
232,493 |
|
|
Toyota Motor Corp. |
21,100 |
917,821 |
|
|
TRW, Inc. |
15,800 |
721,863 |
|
|
Visteon Corp. |
15,400 |
241,588 |
|
|
Yamaha Motor Co. Ltd. |
29,000 |
206,619 |
|
|
TOTAL AUTOS, TIRES, & ACCESSORIES |
9,671,761 |
||
|
CONSUMER DURABLES - 3.6% |
|||
|
Snap-On, Inc. |
13,100 |
403,644 |
|
|
CONSUMER ELECTRONICS - 1.8% |
|||
|
General Motors Corp. Class H |
6,258 |
207,296 |
|
|
ELECTRONIC INSTRUMENTS - 0.4% |
|||
|
Lernout & Hauspie Speech Products NV (a) |
1,700 |
49,619 |
|
|
LEASING & RENTAL - 0.6% |
|||
|
Avis Group Holdings, Inc. Class A (a) |
2,330 |
71,648 |
|
|
SERVICES - 0.4% |
|||
|
Insurance Auto Auctions, Inc. (a) |
2,400 |
39,600 |
|
|
TOTAL COMMON STOCKS (Cost $9,286,449) |
10,443,568 |
||
|
Nonconvertible Preferred Stocks - 0.6% |
|||
|
|
|
|
|
|
AUTOS, TIRES, & ACCESSORIES - 0.6% |
|||
|
Porsche AG (non-vtg.) |
20 |
68,913 |
|
|
Cash Equivalents - 6.4% |
|||
|
Shares |
Value (Note 1) |
||
|
Fidelity Cash Central Fund, 6.59% (b) |
716,084 |
$ 716,084 |
|
|
TOTAL INVESTMENT PORTFOLIO - 99.7% (Cost $10,070,634) |
11,228,565 |
|
NET OTHER ASSETS - 0.3% |
35,686 |
||
|
NET ASSETS - 100% |
$ 11,264,251 |
||
|
Legend |
|
(a) Non-income producing |
|
(b) The rate quoted is the annualized seven-day yield of the fund at |
|
Other Information |
|
Purchases and sales of securities, other than short-term securities, aggregated $13,121,721 and $13,765,783, respectively. |
|
The fund placed a portion of its portfolio transactions with brokerage firms which are affiliates of Fidelity Management & Research Company. The commissions paid to these affiliated firms were $4,825 for the period. |
|
Distribution of investments by country of issue, as a percentage of total |
|
United States of America |
75.4% |
|
Japan |
23.6 |
|
Others (individually less than 1%) |
1.0 |
|
|
100.0% |
|
Income Tax Information |
|
At August 31, 2000, the aggregate cost of investment securities for income tax purposes was $10,151,941. Net unrealized appreciation aggregated $1,076,624, of which $1,585,556 related to appreciated investment securities and $508,932 related to depreciated investment securities. |
|
At February 29, 2000, the fund had a capital loss carryforward of approximately $7,479,000 of which $1,009,000 and $6,470,000 |
|
The fund intends to elect to defer to its fiscal year ending February 28, 2001 approximately $866,000 of losses recognized during the period |
See accompanying notes which are an integral part of the financial statements.
Semiannual Report
Statement of Assets and Liabilities
|
|
August 31, 2000 (Unaudited) |
|
|
Assets |
|
|
|
Investment in securities, at value |
|
$ 11,228,565 |
|
Cash |
|
26 |
|
Receivable for investments sold |
|
220,538 |
|
Dividends receivable |
|
12,694 |
|
Interest receivable |
|
7,092 |
|
Redemption fees receivable |
|
38 |
|
Other receivables |
|
4,471 |
|
Total assets |
|
11,473,424 |
|
Liabilities |
|
|
|
Payable for investments purchased |
$ 74,295 |
|
|
Payable for fund shares redeemed |
107,868 |
|
|
Accrued management fee |
5,469 |
|
|
Other payables and accrued expenses |
21,541 |
|
|
Total liabilities |
|
209,173 |
|
Net Assets |
|
$ 11,264,251 |
|
Net Assets consist of: |
|
|
|
Paid in capital |
|
$ 18,693,705 |
|
Accumulated net investment (loss) |
|
(39,922) |
|
Accumulated undistributed net realized gain (loss) on investments and foreign currency transactions |
|
(8,547,346) |
|
Net unrealized appreciation (depreciation) on investments |
|
1,157,814 |
|
Net Assets, for 510,786 |
|
$ 11,264,251 |
|
Net Asset Value and redemption price per share ($11,264,251 ÷ 510,786 shares) |
|
$22.05 |
|
Maximum offering price per share (100/97.00 of $22.05) |
|
$22.73 |
Statement of Operations
|
|
Six months ended August 31, 2000 (Unaudited) |
|
|
Investment Income Dividends |
|
$ 76,563 |
|
Interest |
|
37,935 |
|
Security lending |
|
4 |
|
Total income |
|
114,502 |
|
Expenses |
|
|
|
Management fee |
$ 37,862 |
|
|
Transfer agent fees |
56,724 |
|
|
Accounting and security lending fees |
30,387 |
|
|
Non-interested trustees' compensation |
21 |
|
|
Custodian fees and expenses |
10,269 |
|
|
Registration fees |
13,715 |
|
|
Audit |
6,329 |
|
|
Legal |
48 |
|
|
Total expenses before reductions |
155,355 |
|
|
Expense reductions |
(931) |
154,424 |
|
Net investment income (loss) |
|
(39,922) |
|
Realized and Unrealized Gain (Loss) Net realized gain (loss) on: |
|
|
|
Investment securities |
(74,180) |
|
|
Foreign currency transactions |
(2,313) |
(76,493) |
|
Change in net unrealized appreciation (depreciation) on: |
|
|
|
Investment securities |
1,517,383 |
|
|
Assets and liabilities in |
(145) |
1,517,238 |
|
Net gain (loss) |
|
1,440,745 |
|
Net increase (decrease) in net assets resulting from operations |
|
$ 1,400,823 |
|
Other Information |
|
|
|
Sales charges paid to FDC |
|
$ 13,515 |
|
Deferred sales charges withheld by FDC |
|
$ 175 |
|
Exchange fees withheld by FSC |
|
$ 795 |
|
Expense reductions |
|
|
|
Directed brokerage arrangements |
|
$ 931 |
See accompanying notes which are an integral part of the financial statements.
Semiannual Report
Automotive Portfolio
Financial Statements - continued
Statement of Changes in Net Assets
|
Increase (Decrease) in Net Assets |
Six months ended |
Year ended |
|
Operations |
$ (39,922) |
$ (112,682) |
|
Net realized gain (loss) |
(76,493) |
(3,869,990) |
|
Change in net unrealized appreciation (depreciation) |
1,517,238 |
764,829 |
|
Net increase (decrease) in net assets resulting from operations |
1,400,823 |
(3,217,843) |
|
Share transactions |
13,096,107 |
17,054,337 |
|
Cost of shares redeemed |
(13,823,446) |
(67,890,860) |
|
Net increase (decrease) in net assets resulting from share transactions |
(727,339) |
(50,836,523) |
|
Redemption fees |
29,284 |
74,755 |
|
Total increase (decrease) in net assets |
702,768 |
(53,979,611) |
|
Net Assets |
|
|
|
Beginning of period |
10,561,483 |
64,541,094 |
|
End of period (including accumulated net investment loss of $39,922 and $0, respectively) |
$ 11,264,251 |
$ 10,561,483 |
|
Other Information Shares |
|
|
|
Sold |
591,944 |
717,103 |
|
Redeemed |
(630,244) |
(2,940,612) |
|
Net increase (decrease) |
(38,300) |
(2,223,509) |
Financial Highlights
|
|
Six months ended |
Years ended February 28, |
||||
|
Selected Per-Share Data |
(Unaudited) |
2000 F |
1999 |
1998 |
1997 |
1996 F |
|
Net asset value, beginning of period |
$ 19.23 |
$ 23.28 |
$ 27.50 |
$ 25.38 |
$ 21.85 |
$ 19.84 |
|
Income from Investment Operations |
|
|
|
|
|
|
|
Net investment income (loss) D |
(.07) |
(.12) |
.03 |
.05 |
.13 |
.03 |
|
Net realized and unrealized gain (loss) |
2.84 |
(4.01) |
(2.09) |
5.21 |
4.28 |
1.95 |
|
Total from investment operations |
2.77 |
(4.13) |
(2.06) |
5.26 |
4.41 |
1.98 |
|
Less Distributions |
|
|
|
|
|
|
|
From net investment income |
- |
- |
(.01) |
(.08) |
(.17) |
- |
|
From net realized gain |
- |
- |
(2.17) |
(3.09) |
(.75) |
- |
|
Total distributions |
- |
- |
(2.18) |
(3.17) |
(.92) |
- |
|
Redemption fees added to paid in capital |
.05 |
.08 |
.02 |
.03 |
.04 |
.03 |
|
Net asset value, end of period |
$ 22.05 |
$ 19.23 |
$ 23.28 |
$ 27.50 |
$ 25.38 |
$ 21.85 |
|
Total Return B, C |
14.66% |
(17.40)% |
(8.52)% |
22.78% |
20.60% |
10.13% |
|
Ratios and Supplemental Data |
|
|
|
|
|
|
|
Net assets, end of period (000 omitted) |
$ 11,264 |
$ 10,561 |
$ 64,541 |
$ 32,489 |
$ 86,347 |
$ 55,753 |
|
Ratio of expenses to average net assets |
2.31% A |
1.94% |
1.45% |
1.60% |
1.56% |
1.81% |
|
Ratio of expenses to average net assets after |
2.30% A, E |
1.91% E |
1.41% E |
1.56% E |
1.52% E |
1.80% E |
|
Ratio of net investment income (loss) to average net assets |
(.59)% A |
(.49)% |
.11% |
.17% |
.54% |
.13% |
|
Portfolio turnover rate |
219% A |
29% |
96% |
153% |
175% |
61% |
|
A Annualized B The total returns would have been lower had certain expenses not been reduced during the periods shown. C Total returns do not include the one time sales
charge and for periods of less than one year are not annualized. |
||||||
See accompanying notes which are an integral part of the financial statements.
Cyclicals Sector
Performance
There are several ways to evaluate a fund's historical performance. You can look at the total percentage change in value, the average annual percentage change or the growth of a hypothetical $10,000 investment. Total return reflects the change in the value of an investment, assuming reinvestment of the fund's dividend income and capital gains (the profits earned upon the sale of securities that have grown in value). Load adjusted returns include a 3.00% sales charge and the effect of a $7.50 long-term trading fee for shares held 30 days or more. Effective September 28, 2000, the $7.50 long-term trading fee was eliminated. If Fidelity had not reimbursed certain fund expenses, the past 10 year total returns would have been lower.
Cumulative Total Returns
|
Periods ended |
Past 6 |
Past 1 |
Past 5 |
Past 10 |
|
Select Chemicals |
3.57% |
-1.71% |
35.37% |
231.68% |
|
Select Chemicals |
0.39% |
-4.73% |
31.23% |
221.65% |
|
S&P 500 |
11.73% |
16.32% |
193.58% |
493.54% |
|
GS Cyclical Industries |
12.70% |
-3.99% |
n/a** |
n/a** |
Cumulative total returns show the fund's performance in percentage terms over a set period - in this case, six months, one year, five years or 10 years. You can compare the fund's returns to the performance of both the Standard & Poor's 500 Index - a market capitalization-weighted index of common stocks - and the Goldman Sachs Cyclical Industries Index - a market capitalization-weighted index of 253 stocks designed to measure the performance of companies in the cyclical industries sector. These benchmarks include reinvestment of dividends and capital gains, if any, and exclude the effect of sales charges.
Average Annual Total Returns
|
Periods ended |
Past 1 |
Past 5 |
Past 10 |
|
Select Chemicals |
-1.71% |
6.24% |
12.74% |
|
Select Chemicals |
-4.73% |
5.59% |
12.39% |
|
S&P 500 |
16.32% |
24.04% |
19.49% |
|
GS Cyclical Industries |
-3.99% |
n/a** |
n/a** |
Average annual returns take the fund's cumulative return and show you what would have happened if the fund had performed at a constant rate each year.
** Not available
Understanding Performance
How a fund did yesterday is no guarantee of how it will do tomorrow. The stock market, for example, has a history of long-term growth and short-term volatility. Unlike the broader market, however, some sectors may not have a history of growth in the long run. And, as with all stock funds, the share price and return of a fund that invests in a sector will vary.
3$10,000 Over 10 Years
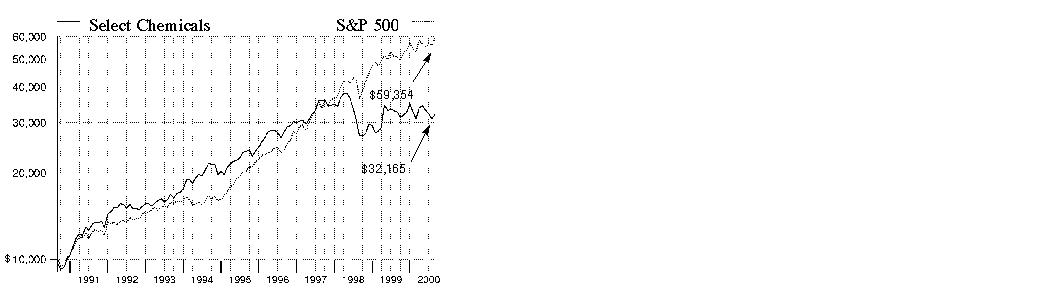
$10,000 Over 10 Years: Let's say hypothetically that $10,000 was invested in Fidelity Select Chemicals Portfolio on August 31, 1990, and the current 3.00% sales charge was paid. As the chart shows, by August 31, 2000, the value of the investment would have grown to $32,165 - a 221.65% increase on the initial investment - and includes the effect of a $7.50 long-term trading fee. For comparison, look at how the Standard & Poor's 500 Index did over the same period. With dividends and capital gains, if any, reinvested, the same $10,000 investment would have grown to $59,354 - a 493.54% increase.
Investment Summary
|
Top Ten Stocks as of August 31, 2000 |
|
|
|
% of fund's |
|
Praxair, Inc. |
11.7 |
|
Minnesota Mining & Manufacturing Co. |
9.6 |
|
Avery Dennison Corp. |
9.4 |
|
E.I. du Pont de Nemours and Co. |
8.5 |
|
FMC Corp. |
6.6 |
|
Millennium Chemicals, Inc. |
5.2 |
|
Ecolab, Inc. |
5.2 |
|
Lyondell Chemical Co. |
4.9 |
|
Rohm & Haas Co. |
4.6 |
|
Solutia, Inc. |
4.6 |
|
|
70.3 |
Top Industries as of August 31, 2000
% of fund's net assets

Semiannual Report
(Portfolio Manager photograph)
Jonathan Zang,
Portfolio Manager
of Fidelity Select
Chemicals Portfolio
Q. How did the fund perform, Jonathan?
A. For the six-month period that ended August 31, 2000, the fund returned 3.57%. In comparison, the Goldman Sachs Cyclical Industries Index - an index of 253 stocks designed to measure the performance of companies in the cyclical industries sector - returned 12.70%, while the Standard & Poor's 500 Index returned 11.73%. For the 12 months ending August 31, 2000, the fund returned -1.71%, while the Goldman Sachs Cyclical Industries Index returned -3.99% and the S&P 500 index had a return of 16.32%.
Q. What factors caused the fund to lag its benchmarks during the six-month period?
A. The broader indexes are more diversified, with a much smaller exposure to chemical stocks, which were hurt during the period by a combination of factors. First, there was ongoing cost pressure on raw materials, brought about mainly by the high cost of oil and natural gas. A second negative factor was a disadvantageous foreign exchange environment, particularly for the weak euro, which hurt results in Europe, where the industry derives about 20% to 25% of its sales and profits. A third factor was fears of slowing economic growth in both North America and Europe. This caused analysts to reduce their volume growth estimates, which tended to be reflected in lower stock prices. Another contributing factor was the expectation of significant new supplies of ethylene coming on the market over the next 12 months. With anticipated excess capacity of this "building block" of many other chemical products, coupled with fears of a slowing economy, companies that produce the more commodity-like products at the front end of the ethylene chain generally suffered.
Q. What holdings hurt the fund's performance?
A. Union Carbide, one of the fund's larger positions during the period, was a big drag on performance, largely due to concerns about how well the company could absorb the overabundance of ethylene during a period of slower economic growth. Rohm & Haas, a maker of adhesives and sealants, was caught in the raw materials price squeeze and, unable to raise its prices fast enough to offset the increase in its raw materials costs, the company missed earnings estimates for two quarters. Avery Dennison, a manufacturer of paper products, also was disappointing. Expectations for the company's earnings growth began to fall during the period, which caused the market to regard its stock price as too highly valued.
Q. What stocks were the most helpful to overall
fund performance?
A. Praxair, a manufacturer of carbon dioxide and oxygen for industrial production, appreciated significantly during the period and was a big positive contributor to the fund. Although the market had concerns about Praxair's use of cash flow and new CEO, as well as about how the company would fare in a slowing economic environment, some of these concerns were dispelled by the end of the period. Air Products, another industrial gasses producer, also helped performance, thanks to a bounce in its share price following the dissolution of a potentially dilutive acquisition. Monsanto also helped when its stock increased on prospects of its eventual acquisition by Pharmacia.
Q. Did you make any significant changes in strategy during the period?
A. The changes I made were mainly related to concerns of a slowing economy and rising raw material costs. I shifted the fund's exposure more toward companies where I expect to see margin improvement in the future as raw material cost pressures ease. I lengthened exposure in the gas segment, which tends to be more aligned with the industrial economy than the consumer economy. And I shortened exposure to companies whose end markets are automobiles and housing construction.
Q. What's your outlook over the next six months, Jonathan?
A. I'm expecting a continuation of the current tough environment for chemicals, with currency exchange, raw materials costs and slowing demand all exerting drags on performance. I'm focusing on companies where these negatives are already factored into their stock prices and de-emphasizing companies whose end markets are slowing more than the overall economy.
The views expressed in this report reflect those of the portfolio manager only through the end of the period of the report as stated on the cover. The manager's views are subject to change at any time based on market or other conditions. For more information, see page 3.
Fund Facts
Start date: July 29, 1985
Fund number: 069
Trading symbol: FSCHX
Size: as of August 31, 2000, more than $24 million
Manager: Jonathan Zang, since 1999; manager, Select Utilities Growth Portfolio, 1998-1999; analyst, electric and gas utilities and independent power producers, 1997-1999; joined Fidelity in 1997
3Semiannual Report
Chemicals Portfolio
(Unaudited)
Showing Percentage of Net Assets
|
Common Stocks - 93.1% |
|||
|
Shares |
Value (Note 1) |
||
|
AGRICULTURE - 1.6% |
|||
|
Delta & Pine Land Co. |
15,900 |
$ 388,556 |
|
|
BUILDING MATERIALS - 1.3% |
|||
|
Sherwin-Williams Co. |
14,200 |
326,600 |
|
|
CHEMICALS & PLASTICS - 75.4% |
|||
|
Air Products & Chemicals, Inc. |
16,600 |
602,788 |
|
|
Arch Chemicals, Inc. |
13,750 |
250,078 |
|
|
Avery Dennison Corp. |
43,200 |
2,335,500 |
|
|
Cabot Corp. |
11,500 |
425,500 |
|
|
Crompton Corp. |
33,449 |
301,041 |
|
|
Dow Chemical Co. |
37,400 |
979,413 |
|
|
E.I. du Pont de Nemours and Co. |
47,237 |
2,119,760 |
|
|
Engelhard Corp. |
30,100 |
564,375 |
|
|
FMC Corp. (a) |
24,100 |
1,634,281 |
|
|
Lyondell Chemical Co. |
93,700 |
1,223,956 |
|
|
Millennium Chemicals, Inc. |
78,400 |
1,293,600 |
|
|
NOVA Chemicals Corp. |
14,300 |
286,680 |
|
|
PPG Industries, Inc. |
14,500 |
587,250 |
|
|
Praxair, Inc. |
65,400 |
2,893,950 |
|
|
Rohm & Haas Co. |
39,843 |
1,152,957 |
|
|
Solutia, Inc. |
75,000 |
1,129,688 |
|
|
Union Carbide Corp. |
23,600 |
945,475 |
|
|
TOTAL CHEMICALS & PLASTICS |
18,726,292 |
||
|
CONSUMER DURABLES - 9.6% |
|||
|
Minnesota Mining & Manufacturing Co. |
25,600 |
2,380,800 |
|
|
SERVICES - 5.2% |
|||
|
Ecolab, Inc. |
33,100 |
1,288,831 |
|
|
TOTAL COMMON STOCKS (Cost $22,616,127) |
23,111,079 |
||
|
Cash Equivalents - 5.7% |
|||
|
|
|
|
|
|
Fidelity Cash Central Fund, 6.59% (b) |
1,422,755 |
1,422,755 |
|
|
TOTAL INVESTMENT PORTFOLIO - 98.8% (Cost $24,038,882) |
24,533,834 |
||
|
NET OTHER ASSETS - 1.2% |
294,749 |
||
|
NET ASSETS - 100% |
$ 24,828,583 |
||
|
Legend |
|
(a) Non-income producing |
|
(b) The rate quoted is the annualized seven-day yield of the fund at |
|
Other Information |
|
Purchases and sales of securities, other than short-term securities, |
|
The fund placed a portion of its portfolio transactions with brokerage |
|
Income Tax Information |
|
At August 31, 2000, the aggregate cost of investment securities for income tax purposes was $24,325,315. Net unrealized appreciation aggregated $208,519, of which $1,801,818 related to appreciated investment securities and $1,593,299 related to depreciated investment securities. |
|
The fund intends to elect to defer to its fiscal year ending February 28, 2001 approximately $613,000 of losses recognized during the period November 1, 1999 to February 29, 2000. |
See accompanying notes which are an integral part of the financial statements.
Semiannual Report
Statement of Assets and Liabilities
|
|
August 31, 2000 (Unaudited) |
|
|
Assets |
|
|
|
Investment in securities, at value |
|
$ 24,533,834 |
|
Cash |
|
21,260 |
|
Receivable for investments sold |
|
298,973 |
|
Receivable for fund shares sold |
|
12,717 |
|
Dividends receivable |
|
88,636 |
|
Interest receivable |
|
9,598 |
|
Redemption fees receivable |
|
201 |
|
Total assets |
|
24,965,219 |
|
Liabilities |
|
|
|
Payable for fund shares redeemed |
$ 96,936 |
|
|
Accrued management fee |
12,132 |
|
|
Other payables and |
27,568 |
|
|
Total liabilities |
|
136,636 |
|
Net Assets |
|
$ 24,828,583 |
|
Net Assets consist of: |
|
|
|
Paid in capital |
|
$ 26,200,011 |
|
Undistributed net investment income |
|
90,407 |
|
Accumulated undistributed net realized gain (loss) on investments and foreign currency transactions |
|
(1,956,787) |
|
Net unrealized appreciation (depreciation) on investments |
|
494,952 |
|
Net Assets, for 709,819 shares outstanding |
|
$ 24,828,583 |
|
Net Asset Value and redemption price per share ($24,828,583 ÷ 709,819 shares) |
|
$34.98 |
|
Maximum offering price per share (100/97.00 of $34.98) |
|
$36.06 |
Statement of Operations
|
|
Six months ended August 31, 2000 (Unaudited) |
|
|
Investment Income Dividends |
|
$ 270,614 |
|
Interest |
|
61,327 |
|
Security lending |
|
74 |
|
Total income |
|
332,015 |
|
Expenses |
|
|
|
Management fee |
$ 82,881 |
|
|
Transfer agent fees |
99,328 |
|
|
Accounting and security lending fees |
30,413 |
|
|
Non-interested trustees' compensation |
11 |
|
|
Custodian fees and expenses |
6,614 |
|
|
Registration fees |
16,873 |
|
|
Audit |
5,349 |
|
|
Legal |
58 |
|
|
Miscellaneous |
1,754 |
|
|
Total expenses before reductions |
243,281 |
|
|
Expense reductions |
(5,694) |
237,587 |
|
Net investment income |
|
94,428 |
|
Realized and Unrealized Gain (Loss) Net realized gain (loss) on: |
|
|
|
Investment securities |
(764,129) |
|
|
Foreign currency transactions |
1,101 |
(763,028) |
|
Change in net unrealized appreciation (depreciation) on investment securities |
|
1,364,176 |
|
Net gain (loss) |
|
601,148 |
|
Net increase (decrease) in net assets resulting from operations |
|
$ 695,576 |
|
Other Information |
|
|
|
Sales charges paid to FDC |
|
$ 24,771 |
|
Deferred sales charges withheld by FDC |
|
$ 1,836 |
|
Exchange fees withheld by FSC |
|
$ 1,770 |
|
Expense reductions |
|
|
|
Directed brokerage arrangements |
|
$ 5,694 |
See accompanying notes which are an integral part of the financial statements.
Semiannual Report
Chemicals Portfolio
Financial Statements - continued
Statement of Changes in Net Assets
|
Increase (Decrease) in Net Assets |
Six months ended |
Year ended |
|
Operations |
$ 94,428 |
$ 155,729 |
|
Net realized gain (loss) |
(763,028) |
2,021,962 |
|
Change in net unrealized appreciation (depreciation) |
1,364,176 |
755,351 |
|
Net increase (decrease) in net assets resulting from operations |
695,576 |
2,933,042 |
|
Distributions to shareholders |
(23,988) |
(75,847) |
|
From net realized gain |
- |
(615,000) |
|
Total distributions |
(23,988) |
(690,847) |
|
Share transactions |
18,416,203 |
60,660,224 |
|
Reinvestment of distributions |
22,505 |
656,447 |
|
Cost of shares redeemed |
(20,651,322) |
(69,265,144) |
|
Net increase (decrease) in net assets resulting from share transactions |
(2,212,614) |
(7,948,473) |
|
Redemption fees |
62,156 |
151,992 |
|
Total increase (decrease) in net assets |
(1,478,870) |
(5,554,286) |
|
Net Assets |
|
|
|
Beginning of period |
26,307,453 |
31,861,739 |
|
End of period (including undistributed net investment income of $90,407 and $81,847, respectively) |
$ 24,828,583 |
$ 26,307,453 |
|
Other Information Shares |
|
|
|
Sold |
497,128 |
1,623,343 |
|
Issued in reinvestment of distributions |
600 |
18,089 |
|
Redeemed |
(566,378) |
(1,887,294) |
|
Net increase (decrease) |
(68,650) |
(245,862) |
Financial Highlights
|
|
Six months ended |
Years ended February 28, |
||||
|
Selected Per-Share Data |
(Unaudited) |
2000 F |
1999 |
1998 |
1997 |
1996 F |
|
Net asset value, beginning of period |
$ 33.79 |
$ 31.10 |
$ 45.90 |
$ 42.53 |
$ 39.53 |
$ 33.91 |
|
Income from Investment Operations |
|
|
|
|
|
|
|
Net investment income (loss) D |
.12 |
.15 |
.17 |
(.02) |
.28 |
.01 |
|
Net realized and unrealized gain (loss) |
1.02 |
3.22 |
(10.77) |
7.88 |
5.49 |
8.89 |
|
Total from investment operations |
1.14 |
3.37 |
(10.60) |
7.86 |
5.77 |
8.90 |
|
Less Distributions |
|
|
|
|
|
|
|
From net investment income |
(.03) |
(.09) |
(.05) |
- |
(.12) |
(.08) |
|
From net realized gain |
- |
(.73) |
(3.52) |
(4.54) |
(2.74) |
(3.22) |
|
In excess of net realized gain |
- |
- |
(.68) |
- |
- |
- |
|
Total distributions |
(.03) |
(.82) |
(4.25) |
(4.54) |
(2.86) |
(3.30) |
|
Redemption fees added to paid in capital |
.08 |
.14 |
.05 |
.05 |
.09 |
.02 |
|
Net asset value, end of period |
$ 34.98 |
$ 33.79 |
$ 31.10 |
$ 45.90 |
$ 42.53 |
$ 39.53 |
|
Total Return B, C |
3.57% |
11.10% |
(23.66)% |
19.47% |
15.06% |
27.48% |
|
Ratios and Supplemental Data |
|
|
|
|
|
|
|
Net assets, end of period (000 omitted) |
$ 24,829 |
$ 26,307 |
$ 31,862 |
$ 69,349 |
$ 111,409 |
$ 89,230 |
|
Ratio of expenses to average net assets |
1.65% A |
1.64% |
1.58% |
1.68% |
1.83% |
1.99% |
|
Ratio of expenses to average net assets after |
1.61% A, E |
1.63% E |
1.51% E |
1.67% E |
1.81% E |
1.97% E |
|
Ratio of net investment income (loss) to average net assets |
.64% A |
.40% |
.44% |
(.05)% |
.67% |
.04% |
|
Portfolio turnover rate |
180% A |
132% |
141% |
31% |
207% |
87% |
|
A Annualized B The total returns would have been lower had certain expenses not been reduced during the periods shown. C Total returns do not include the one time sales
charge and for periods of less than one year are not annualized. |
||||||
See accompanying notes which are an integral part of the financial statements.
Cyclicals Sector
Performance
There are several ways to evaluate a fund's historical performance. You can look at the total percentage change in value, the average annual percentage change or the growth of a hypothetical $10,000 investment. Total return reflects the change in the value of an investment, assuming reinvestment of the fund's dividend income and capital gains (the profits earned upon the sale of securities that have grown in value). Load adjusted returns include a 3.00% sales charge and the effect of a $7.50 long-term trading fee for shares held 30 days or more. Effective September 28, 2000, the $7.50 long-term trading fee was eliminated. If Fidelity had not reimbursed certain fund expenses, the past six month, past one year, past five year and past 10 year total returns would have been lower.
Cumulative Total Returns
|
Periods ended |
Past 6 |
Past 1 |
Past 5 |
Past 10 |
|
Select Construction |
12.29% |
-2.71% |
60.78% |
273.96% |
|
Select Construction |
8.85% |
-5.70% |
55.88% |
262.67% |
|
S&P 500 |
11.73% |
16.32% |
193.58% |
493.54% |
|
GS Cyclical Industries |
12.70% |
-3.99% |
n/a** |
n/a** |
Cumulative total returns show the fund's performance in percentage terms over a set period - in this case, six months, one year, five years or 10 years. You can compare the fund's returns to the performance of both the Standard & Poor's 500 Index - a market capitalization-weighted index of common stocks - and the Goldman Sachs Cyclical Industries Index - a market capitalization-weighted index of 253 stocks designed to measure the performance of companies in the cyclical industries sector. These benchmarks include reinvestment of dividends and capital gains, if any, and exclude the effect of sales charges.
Average Annual Total Returns
|
Periods ended |
Past 1 |
Past 5 |
Past 10 |
|
Select Construction |
-2.71% |
9.96% |
14.10% |
|
Select Construction |
-5.70% |
9.28% |
13.75% |
|
S&P 500 |
16.32% |
24.04% |
19.49% |
|
GS Cyclical Industries |
-3.99% |
n/a** |
n/a** |
Average annual returns take the fund's cumulative return and show you what would have happened if the fund had performed at a constant rate each year.
** Not available
Understanding Performance
How a fund did yesterday is no guarantee of how it will do tomorrow. The stock market, for example, has a history of long-term growth and short-term volatility. Unlike the broader market, however, some sectors may not have a history of growth in the long run. And, as with all stock funds, the share price and return of a fund that invests in a sector will vary.
3$10,000 Over 10 Years
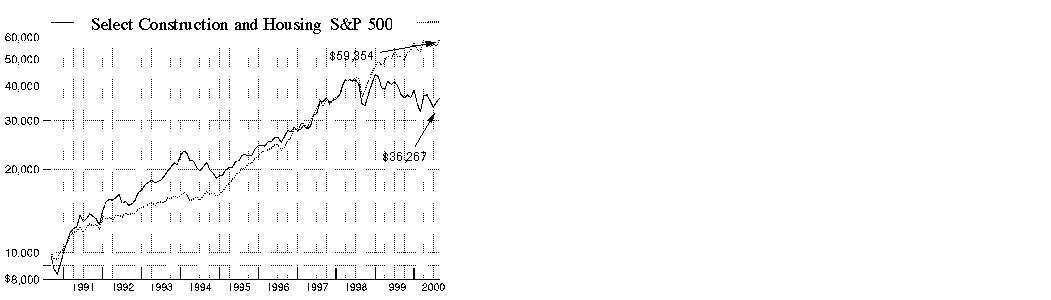
$10,000 Over 10 Years: Let's say hypothetically that $10,000 was invested in Fidelity Select Construction and Housing Portfolio on August 31, 1990, and the current 3.00% sales charge was paid. As the chart shows, by August 31, 2000, the value of the investment would have grown to $36,267 - a 262.67% increase on the initial investment - and includes the effect of a $7.50 long-term trading fee. For comparison, look at how the Standard & Poor's 500 Index did over the same period. With dividends and capital gains, if any, reinvested, the same $10,000 investment would have grown to $59,354 - a 493.54% increase.
Investment Summary
|
Top Ten Stocks as of August 31, 2000 |
|
|
|
% of fund's |
|
Home Depot, Inc. |
6.4 |
|
Fannie Mae |
5.9 |
|
Masco Corp. |
5.8 |
|
Caterpillar, Inc. |
5.5 |
|
Danaher Corp. |
5.2 |
|
Lowe's Companies, Inc. |
5.1 |
|
Deere & Co. |
4.0 |
|
PPG Industries, Inc. |
3.1 |
|
Georgia-Pacific Corp. |
2.9 |
|
American Standard Companies, Inc. |
2.7 |
|
|
46.6 |
Top Industries as of August 31, 2000
% of fund's net assets

Semiannual Report
(Portfolio Manager photograph)
Brian Hogan,
Portfolio Manager of Fidelity Select Construction and Housing Portfolio
Q. How did the fund perform, Brian?
A. For the six months that ended August 31, 2000, the fund returned 12.29%. For the same six-month period, the Goldman Sachs Cyclical Industries Index - an index of 253 stocks designed to measure the performance of companies in the cyclical industries sector - returned 12.70%, while the Standard & Poor's 500 Index returned 11.73%. For the 12 months that ended August 31, 2000, the fund returned -2.71%, while the Goldman Sachs index and the S&P 500 returned -3.99% and 16.32%, respectively. The fund underperformed the Goldman Sachs index because the index has greater exposure to sectors that are not represented in the construction and housing universe, several of which outperformed construction and housing stocks during the period.
Q. What factors drove construction and housing stock performance during the period?
A. Two factors were prominent. First, the Federal Reserve Board increased interest rates by 75 basis points, or 0.75%, during the first three months of the period, following four rate hikes totaling 1.00% over the previous 12 months. Second, oil prices continued rising, reaching as high as $34 per barrel. Like higher interest rates, higher oil prices have the potential to slow down economic growth. In addition, many building materials incorporate petroleum-based raw materials, and higher costs compressed the sector's profit margins. By the period's end, deteriorating fundamentals, such as higher prices and declining housing starts, led numerous companies to miss their earnings targets.
Q. What was your strategy in this environment?
A. In general, I underweighted stocks that were closely tied to consumer spending and the residential housing market, usually early casualties during an economic slowdown. For example, I underweighted manufacturers of carpet and flooring, as well as manufacturers of building materials such as wallboard, shingles and roofing. In turn, I overweighted manufacturing companies whose profitability is tied to commodity-based expansion worldwide, such as engineering and construction companies. Two strategic exceptions were homebuilders and retail home centers, both sectors that I emphasized despite their ties to the consumer and housing markets. Homebuilder stocks represented a value strategy, while home centers represented a play on retail category dominance and accelerating revenue growth.
Q. Which holdings benefited performance?
A. A top contributor was Lennar, a well-managed and attractively valued homebuilding company that benefited from an opportunistic acquisition of USHomes earlier in the year. Equity Residential Properties, a real estate investment trust invested primarily in apartments, performed well as investors anticipated fewer people would purchase new homes, opting instead for rental properties until interest rates and the economy were more favorable. Underweighting poorly performing building materials stocks also benefited the fund's returns. For example, I underemphasized Armstrong World, which suffered from having too much of the company's revenue stream linked to a declining vinyl flooring market, as well as from uncertainty related to asbestos liability. Similarly, I underweighted USG and Owens Corning, both heavily exposed to asbestos liability uncertainty.
Q. Were there any disappointments?
A. Two of the fund's largest holdings, Home Depot and Lowe's, underperformed. Both companies were affected by negative investor sentiment despite meeting earnings expectations. In addition, modestly higher inventory levels and a rich valuation pressured Home Depot, while lower-than-expected comparable store sales hurt Lowe's. Although I have a positive outlook for both companies, I recently altered the mix in favor of Home Depot based on greater confidence in its ability to weather a slowdown.
Q. What's your outlook for the coming months?
A. I'm cautiously optimistic. Because it appears that we are near the end of the Fed's tightening, I expect the recent strength in homebuilders to expand to include retail home centers and government-sponsored enterprises (GSEs), such as Fannie Mae and Freddie Mac. The fund is well-positioned to take advantage of a positive move in those sectors. In the meantime, I've increased the fund's diversification by adding more stocks, including conglomerates that operate businesses in sectors related to construction and housing. Because these companies have diversified earnings streams, they may cushion the fund's sensitivity to the volatility associated with construction and housing market cycles.
The views expressed in this report reflect those of the portfolio manager only through the end of the period of the report as stated on the cover. The manager's views are subject to change at any time based on market or other conditions. For more information, see page 3.
Fund Facts
Start date: September 29, 1986
Fund number: 511
Trading symbol: FSHOX
Size: as of August 31, 2000, more than
$8 million
Manager: Brian Hogan, since 1999; manager, Fidelity Select Cyclical Industries Portfolio, since February 2000; equity analyst, various industries, since 1998; high-yield analyst and portfolio manager, 1995-1998; fixed-income analyst, 1994; joined Fidelity in 1994
3Semiannual Report
Construction and Housing Portfolio
(Unaudited)
Showing Percentage of Net Assets
|
Common Stocks - 94.6% |
|||
|
Shares |
Value (Note 1) |
||
|
AUTOS, TIRES, & ACCESSORIES - 5.2% |
|||
|
Danaher Corp. |
8,100 |
$ 455,119 |
|
|
BUILDING MATERIALS - 18.8% |
|||
|
American Standard Companies, Inc. (a) |
5,100 |
236,194 |
|
|
Carlisle Companies, Inc. |
1,400 |
64,138 |
|
|
Elcor Corp. |
2,650 |
43,559 |
|
|
Johns Manville Corp. |
2,600 |
32,500 |
|
|
Lafarge Corp. |
4,881 |
118,974 |
|
|
Masco Corp. |
25,900 |
505,050 |
|
|
Owens Corning |
1,000 |
5,188 |
|
|
Shaw Group (a) |
600 |
33,413 |
|
|
Sherwin-Williams Co. |
4,500 |
103,500 |
|
|
Southdown, Inc. |
1,840 |
115,460 |
|
|
USG Corp. |
2,000 |
64,375 |
|
|
Vulcan Materials Co. |
5,100 |
225,994 |
|
|
York International Corp. |
3,800 |
94,525 |
|
|
TOTAL BUILDING MATERIALS |
1,642,870 |
||
|
CHEMICALS & PLASTICS - 3.2% |
|||
|
Armstrong Holdings, Inc. |
700 |
11,156 |
|
|
PPG Industries, Inc. |
6,600 |
267,300 |
|
|
TOTAL CHEMICALS & PLASTICS |
278,456 |
||
|
COMPUTER SERVICES & SOFTWARE - 0.0% |
|||
|
VelocityHSI, Inc. (a) |
100 |
350 |
|
|
CONSTRUCTION - 8.0% |
|||
|
Centex Corp. |
5,700 |
164,588 |
|
|
Clayton Homes, Inc. |
6,800 |
66,300 |
|
|
D.R. Horton, Inc. |
3,500 |
68,688 |
|
|
Jacobs Engineering Group, Inc. (a) |
1,200 |
45,600 |
|
|
Kaufman & Broad Home Corp. |
5,300 |
131,506 |
|
|
Lennar Corp. |
4,900 |
135,363 |
|
|
M/I Schottenstein Homes, Inc. |
1,500 |
29,531 |
|
|
Pulte Corp. |
1,900 |
62,581 |
|
|
TOTAL CONSTRUCTION |
704,157 |
||
|
CONSUMER ELECTRONICS - 4.7% |
|||
|
Black & Decker Corp. |
4,500 |
180,281 |
|
|
Maytag Corp. |
3,700 |
141,063 |
|
|
Whirlpool Corp. |
2,300 |
87,400 |
|
|
TOTAL CONSUMER ELECTRONICS |
408,744 |
||
|
CREDIT & OTHER FINANCE - 1.9% |
|||
|
Countrywide Credit Industries, Inc. |
4,426 |
167,635 |
|
|
ELECTRICAL EQUIPMENT - 0.6% |
|||
|
General Electric Co. |
900 |
52,819 |
|
|
ENGINEERING - 4.3% |
|||
|
Fluor Corp. |
6,200 |
185,613 |
|
|
|
|||
|
Shares |
Value (Note 1) |
||
|
MasTec, Inc. (a) |
2,900 |
$ 104,400 |
|
|
Quanta Services, Inc. (a) |
1,900 |
88,825 |
|
|
TOTAL ENGINEERING |
378,838 |
||
|
FEDERAL SPONSORED CREDIT - 6.7% |
|||
|
Fannie Mae |
9,700 |
521,375 |
|
|
Freddie Mac |
1,600 |
67,400 |
|
|
TOTAL FEDERAL SPONSORED CREDIT |
588,775 |
||
|
HOME FURNISHINGS - 4.7% |
|||
|
Ethan Allen Interiors, Inc. |
2,300 |
61,956 |
|
|
Furniture Brands International, Inc. (a) |
2,300 |
37,088 |
|
|
Herman Miller, Inc. |
3,900 |
124,556 |
|
|
Leggett & Platt, Inc. |
10,600 |
187,488 |
|
|
TOTAL HOME FURNISHINGS |
411,088 |
||
|
INDUSTRIAL MACHINERY & EQUIPMENT - 13.3% |
|||
|
Caterpillar, Inc. |
13,200 |
485,100 |
|
|
CNH Global NV |
1,000 |
9,813 |
|
|
Deere & Co. |
10,700 |
352,431 |
|
|
Ingersoll-Rand Co. |
700 |
31,894 |
|
|
Parker-Hannifin Corp. |
2,000 |
69,625 |
|
|
Pentair, Inc. |
2,200 |
71,500 |
|
|
The Stanley Works |
3,900 |
104,325 |
|
|
Tyco International Ltd. |
700 |
39,900 |
|
|
TOTAL INDUSTRIAL MACHINERY & EQUIPMENT |
1,164,588 |
||
|
LEASING & RENTAL - 0.7% |
|||
|
United Rentals, Inc. (a) |
2,900 |
60,175 |
|
|
METALS & MINING - 1.8% |
|||
|
Martin Marietta Materials, Inc. |
3,900 |
156,000 |
|
|
PACKAGING & CONTAINERS - 0.2% |
|||
|
Gaylord Container Corp. Class A (a) |
5,300 |
14,575 |
|
|
PAPER & FOREST PRODUCTS - 4.5% |
|||
|
Georgia-Pacific Corp. |
9,500 |
254,125 |
|
|
Mercer International, Inc. (SBI) (a) |
2,100 |
20,738 |
|
|
The St. Joe Co. |
2,200 |
64,488 |
|
|
Trex Co., Inc. (a) |
1,800 |
55,800 |
|
|
TOTAL PAPER & FOREST PRODUCTS |
395,151 |
||
|
REAL ESTATE - 1.0% |
|||
|
Catellus Development Corp. (a) |
3,300 |
58,988 |
|
|
LNR Property Corp. |
1,200 |
25,500 |
|
|
TOTAL REAL ESTATE |
84,488 |
||
|
REAL ESTATE INVESTMENT TRUSTS - 1.8% |
|||
|
Avalonbay Communities, Inc. |
400 |
17,875 |
|
|
BRE Properties, Inc. Class A |
500 |
14,594 |
|
|
Equity Office Properties Trust |
400 |
11,550 |
|
|
Common Stocks - continued |
|||
|
Shares |
Value (Note 1) |
||
|
REAL ESTATE INVESTMENT TRUSTS - CONTINUED |
|||
|
Equity Residential Properties Trust (SBI) |
700 |
$ 33,600 |
|
|
Mack-Cali Realty Corp. |
1,700 |
44,519 |
|
|
Post Properties, Inc. |
400 |
16,925 |
|
|
Reckson Associates Realty Corp. |
800 |
19,450 |
|
|
TOTAL REAL ESTATE INVESTMENT TRUSTS |
158,513 |
||
|
RETAIL & WHOLESALE, MISCELLANEOUS - 11.5% |
|||
|
Home Depot, Inc. |
11,650 |
559,922 |
|
|
Lowe's Companies, Inc. |
9,900 |
443,644 |
|
|
TOTAL RETAIL & WHOLESALE, MISCELLANEOUS |
1,003,566 |
||
|
TEXTILES & APPAREL - 1.7% |
|||
|
Mohawk Industries, Inc. (a) |
2,850 |
67,688 |
|
|
Shaw Industries, Inc. |
6,300 |
78,356 |
|
|
TOTAL TEXTILES & APPAREL |
146,044 |
||
|
TOTAL COMMON STOCKS (Cost $8,577,610) |
8,271,951 |
||
|
Cash Equivalents - 5.4% |
|||
|
|
|
|
|
|
Fidelity Cash Central Fund, 6.59% (b) |
473,201 |
473,201 |
|
|
TOTAL INVESTMENT PORTFOLIO - 100.0% (Cost $9,050,811) |
8,745,152 |
||
|
NET OTHER ASSETS - 0.0% |
11 |
||
|
NET ASSETS - 100% |
$ 8,745,163 |
||
|
Legend |
|
(a) Non-income producing |
|
(b) The rate quoted is the annualized seven-day yield of the fund at |
|
Other Information |
|
Purchases and sales of securities, other than short-term securities, aggregated $5,750,674 and $5,777,157, respectively. |
|
The fund placed a portion of its portfolio transactions with brokerage firms which are affiliates of Fidelity Management & Research Company. The commissions paid to these affiliated firms were $1,327 for the period. |
|
Income Tax Information |
|
At August 31, 2000, the aggregate cost of investment securities for income tax purposes was $9,188,566. Net unrealized depreciation aggregated $443,414, of which $697,313 related to appreciated investment securities and $1,140,727 related to depreciated investment securities. |
See accompanying notes which are an integral part of the financial statements.
Cyclicals Sector
Statement of Assets and Liabilities
|
|
August 31, 2000 (Unaudited) |
|
|
Assets |
|
|
|
Investment in securities, at value |
|
$ 8,745,152 |
|
Receivable for investments sold |
|
134,981 |
|
Receivable for fund shares sold |
|
43,022 |
|
Dividends receivable |
|
11,069 |
|
Interest receivable |
|
3,833 |
|
Redemption fees receivable |
|
870 |
|
Other receivables |
|
6,978 |
|
Total assets |
|
8,945,905 |
|
Liabilities |
|
|
|
Payable to custodian bank |
$ 31,736 |
|
|
Payable for investments purchased |
8,535 |
|
|
Payable for fund shares redeemed |
134,212 |
|
|
Accrued management fee |
7,117 |
|
|
Other payables and |
19,142 |
|
|
Total liabilities |
|
200,742 |
|
Net Assets |
|
$ 8,745,163 |
|
Net Assets consist of: |
|
|
|
Paid in capital |
|
$ 8,994,525 |
|
Undistributed net investment income |
|
11,486 |
|
Accumulated undistributed net realized gain (loss) on investments and foreign currency transactions |
|
44,811 |
|
Net unrealized appreciation (depreciation) on investments |
|
(305,659) |
|
Net Assets, for 456,564 shares outstanding |
|
$ 8,745,163 |
|
Net Asset Value and redemption price per share ($8,745,163 ÷ 456,564 shares) |
|
$19.15 |
|
Maximum offering price per share (100/97.00 of $19.15) |
|
$19.74 |
Statement of Operations
|
|
Six months ended August 31, 2000 (Unaudited) |
|
|
Investment Income Dividends |
|
$ 99,198 |
|
Interest |
|
17,712 |
|
Security lending |
|
331 |
|
Total income |
|
117,241 |
|
Expenses |
|
|
|
Management fee |
$ 25,634 |
|
|
Transfer agent fees |
36,967 |
|
|
Accounting and security lending fees |
30,397 |
|
|
Non-interested trustees' compensation |
14 |
|
|
Custodian fees and expenses |
7,378 |
|
|
Registration fees |
16,137 |
|
|
Audit |
5,458 |
|
|
Legal |
58 |
|
|
Miscellaneous |
24 |
|
|
Total expenses before reductions |
122,067 |
|
|
Expense reductions |
(8,414) |
113,653 |
|
Net investment income |
|
3,588 |
|
Realized and Unrealized Gain (Loss) Net realized gain (loss) on: |
|
|
|
Investment securities |
67,238 |
|
|
Foreign currency transactions |
206 |
67,444 |
|
Change in net unrealized appreciation (depreciation) on investment securities |
|
694,586 |
|
Net gain (loss) |
|
762,030 |
|
Net increase (decrease) in net assets resulting from operations |
|
$ 765,618 |
|
Other Information |
|
$ 9,156 |
|
Deferred sales charges withheld |
|
$ 128 |
|
Exchange fees withheld by FSC |
|
$ 630 |
|
Expense reductions |
|
$ 150 |
|
FMR reimbursement |
|
8,264 |
|
|
|
$ 8,414 |
See accompanying notes which are an integral part of the financial statements.
Semiannual Report
Construction and Housing Portfolio
Financial Statements - continued
Statement of Changes in Net Assets
|
Increase (Decrease) in Net Assets |
Six months ended |
Year ended |
|
Operations |
$ 3,588 |
$ (86,108) |
|
Net realized gain (loss) |
67,444 |
4,516,401 |
|
Change in net unrealized appreciation (depreciation) |
694,586 |
(6,580,475) |
|
Net increase (decrease) in net assets resulting from operations |
765,618 |
(2,150,182) |
|
Distributions to shareholders from net realized gains |
(258,513) |
(1,685,140) |
|
Share transactions |
7,677,966 |
6,797,348 |
|
Reinvestment of distributions |
236,125 |
1,553,985 |
|
Cost of shares redeemed |
(7,624,806) |
(48,295,592) |
|
Net increase (decrease) in net assets resulting from share transactions |
289,285 |
(39,944,259) |
|
Redemption fees |
23,868 |
52,861 |
|
Total increase (decrease) in net assets |
820,258 |
(43,726,720) |
|
Net Assets |
|
|
|
Beginning of period |
7,924,905 |
51,651,625 |
|
End of period (including undistributed net investment income of $11,486 and $7,898, respectively) |
$ 8,745,163 |
$ 7,924,905 |
|
Other Information Shares |
|
|
|
Sold |
386,491 |
272,449 |
|
Issued in reinvestment of distributions |
11,895 |
78,282 |
|
Redeemed |
(396,218) |
(1,961,021) |
|
Net increase (decrease) |
2,168 |
(1,610,290) |
Financial Highlights
|
|
Six months ended |
Years ended February 28, |
||||
|
Selected Per-Share Data |
(Unaudited) |
2000 G |
1999 |
1998 |
1997 |
1996 G |
|
Net asset value, beginning of period |
$ 17.44 |
$ 25.02 |
$ 25.63 |
$ 22.00 |
$ 19.56 |
$ 16.79 |
|
Income from Investment Operations |
|
|
|
|
|
|
|
Net investment income (loss) D |
.01 |
(.13) |
(.06) |
(.25) |
.06 |
.07 |
|
Net realized and unrealized gain (loss) |
2.10 |
(4.11) |
(.53) |
7.67 |
3.38 |
3.55 |
|
Total from investment operations |
2.11 |
(4.24) |
(.59) |
7.42 |
3.44 |
3.62 |
|
Less Distributions |
|
|
|
|
|
|
|
From net investment income |
- |
- |
- |
(.02) |
(.02) |
(.07) |
|
From net realized gain |
(.45) |
(3.42) |
(.06) |
(3.87) |
(1.03) |
(.81) |
|
Total distributions |
(.45) |
(3.42) |
(.06) |
(3.89) |
(1.05) |
(.88) |
|
Redemption fees added to paid in capital |
.05 |
.08 |
.04 |
.10 |
.05 |
.03 |
|
Net asset value, end of period |
$ 19.15 |
$ 17.44 |
$ 25.02 |
$ 25.63 |
$ 22.00 |
$ 19.56 |
|
Total Return B, C |
12.29% |
(18.28)% |
(2.16)% |
40.04% |
18.64% |
21.77% |
|
Ratios and Supplemental Data |
|
|
|
|
|
|
|
Net assets, end of period (000 omitted) |
$ 8,745 |
$ 7,925 |
$ 51,652 |
$ 57,484 |
$ 30,581 |
$ 42,668 |
|
Ratio of expenses to average net assets |
2.50% A, E |
2.42% |
1.43% |
2.50% E |
1.41% |
1.43% |
|
Ratio of expenses to average net assets after |
2.50% A |
2.34% F |
1.37% F |
2.43% F |
1.35% F |
1.40% F |
|
Ratio of net investment income (loss) to average net assets |
.08% A |
(.53)% |
(.23)% |
(1.10)% |
.27% |
.39% |
|
Portfolio turnover rate |
139% A |
34% |
226% |
404% |
270% |
139% |
|
A Annualized B The total returns would have been lower had certain expenses not been reduced during the periods shown. C Total returns do not include the one time sales
charge and for periods of less than one year are not annualized. |
||||||
See accompanying notes which are an integral part of the financial statements.
Cyclicals Sector
Performance
There are several ways to evaluate a fund's historical performance. You can look at the total percentage change in value, the average annual percentage change or the growth of a hypothetical $10,000 investment. Total return reflects the change in the value of an investment, assuming reinvestment of the fund's dividend income and capital gains (the profits earned upon the sale of securities that have grown in value). Load adjusted returns include a 3.00% sales charge and the effect of a $7.50 long-term trading fee for shares held 30 days or more. Effective September 28, 2000, the $7.50 long-term trading fee was eliminated. If Fidelity had not reimbursed certain fund expenses, the total returns would have been lower.
Cumulative Total Returns
|
Periods ended |
Past 6 |
Past 1 |
Life of |
|
Select Cyclical Industries |
20.48% |
8.63% |
46.03% |
|
Select Cyclical Industries |
16.79% |
5.30% |
41.57% |
|
S&P 500 |
11.73% |
16.32% |
100.63% |
|
GS Cyclical Industries |
12.70% |
-3.99% |
25.83% |
Cumulative total returns show the fund's performance in percentage terms over a set period - in this case, six months, one year or since the fund started on March 3, 1997. You can compare the fund's returns to the performance of both the Standard & Poor's 500 Index - a market capitalization-weighted index of common stocks and the Goldman Sachs Cyclical Industries Index - a market capitalization-weighted index of 253 stocks designed to measure the performance of companies in the cyclical industries sector. These benchmarks include reinvestment of dividends and capital gains, if any, and exclude the effect of sales charges.
Average Annual Total Returns
|
Periods ended |
|
|
Past 1 |
Life of |
|
Select Cyclical Industries |
|
|
8.63% |
11.43% |
|
Select Cyclical Industries |
|
|
5.30% |
10.45% |
|
S&P 500 |
|
|
16.32% |
22.02% |
|
GS Cyclical Industries |
|
|
-3.99% |
6.79% |
Average annual returns take the fund's cumulative return and show you what would have happened if the fund had performed at a constant rate each year.
Understanding Performance
How a fund did yesterday is no guarantee of how it will do tomorrow. The stock market, for example, has a history of long-term growth and short-term volatility. Unlike the broader market, however, some sectors may not have a history of growth in the long run. And, as with all stock funds, the share price and return of a fund that invests in a sector will vary.
3$10,000 Over Life of Fund
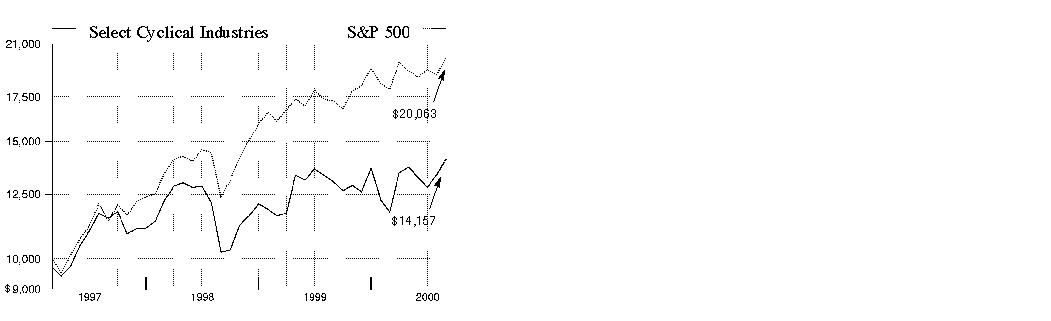
$10,000 Over Life of Fund: Let's say hypothetically that $10,000 was invested in Fidelity Select Cyclical Industries Portfolio on March 3, 1997, when the fund started, and the current 3.00% sales charge was paid. As the chart shows, by August 31, 2000, the value of the investment would have grown to $14,157 - a 41.57% increase on the initial investment - and includes the effect of a $7.50 long-term trading fee. For comparison, look at how the Standard & Poor's 500 Index did over the same period. With dividends and capital gains, if any, reinvested, the same $10,000 investment would have grown to $20,063 - a 100.63% increase.
Investment Summary
|
Top Ten Stocks as of August 31, 2000 |
|
|
|
% of fund's |
|
General Electric Co. |
8.4 |
|
Tyco International Ltd. |
8.4 |
|
E.I. du Pont de Nemours and Co. |
4.2 |
|
General Motors Corp. |
3.7 |
|
Minnesota Mining & Manufacturing Co. |
3.5 |
|
Boeing Co. |
3.3 |
|
United Technologies Corp. |
2.9 |
|
Ford Motor Co. |
2.7 |
|
Emerson Electric Co. |
2.6 |
|
Union Carbide Corp. |
2.2 |
|
|
41.9 |
Top Industries as of August 31, 2000
% of fund's net assets

Semiannual Report
(Portfolio Manager photograph)
Brian Hogan,
Portfolio Manager of
Fidelity Select Cyclical
Industries Portfolio
Q. How did the fund perform, Brian?
A. For the six months that ended August 31, 2000, the fund returned 20.48%. For the same six-month period, the Goldman Sachs Cyclical Industries Index - an index of 253 stocks designed to measure the performance of companies in the cyclical industries sector - returned 12.70%, while the Standard & Poor's 500 Index returned 11.73%. For the 12 months that ended August 31, 2000, the fund returned 8.63%, while the Goldman Sachs index and the S&P 500 returned -3.99% and 16.32%, respectively.
Q. What factors drove cyclical industry stocks during the period?
A. The fund performed well despite two dominant themes - rising interest rates and increasing oil prices. During the six-month period, the Federal Reserve Board increased short-term interest rates by 75 basis points, or 0.75%, following four rate hikes totaling 1.00% during the previous 12 months. At the same time, oil prices rose to as high as $34 per barrel. Both higher interest rates and more expensive oil have the potential to reduce the economy's growth rate. Also, many cyclical industries use petroleum-based resins in their manufacturing processes, and higher raw material prices tend to erode their profit margins. As a result, negative investor sentiment prevailed early in the period, pressuring cyclical stock prices. Later, expectations became reality as numerous companies either missed their earnings targets or guided analysts' earnings estimates lower.
Q. How did the fund outperform the Goldman Sachs index?
A. The fund outperformed its benchmark index by virtue of our relatively higher concentration in stocks and sectors that performed well, such as specialty chemicals and diversified conglomerates. The fund's performance also was enhanced by its relatively lower exposure to interest-rate sensitive consumer-oriented stocks, such as auto manufacturers, that performed poorly in the rising interest-rate environment.
Q. Which specific stocks contributed to the fund's performance?
A. Underweighting automobile manufacturers had a positive impact on the fund's returns. The sector performed poorly in response to rising interest rates, higher prices at the gas pump and a peaking auto production cycle that raised concerns that auto manufacturers would need to offer higher consumer discounts to maintain sales volume. During the period, underweighting DaimlerChrysler was among the biggest contributors to the fund's performance relative to the Goldman Sachs index. In addition to the malaise affecting the overall sector, DaimlerChrysler's stock was further pressured when the merger between Daimler Benz and Chrysler progressed less smoothly than the market expected. General Electric and SPX both performed well. GE, a large, well-diversified old economy stock, successfully integrated the Internet into its operations, resulting in strong revenue growth and accelerated earnings. SPX is a well-managed conglomerate that has profitably shifted its business mix toward higher-growth segments. Tyco International performed well after I began increasing the fund's exposure to it early in the period. Although allegations of accounting irregularities caused the stock to lose half of its value late in 1999, the stock regained most of these losses as investors gained a better understanding of the issues. The Securities and Exchange Commission concluded its inquiry and issued a report that put claims of financial mismanagement to rest.
Q. Which stocks were disappointing?
A. Honeywell International underperformed as slow revenue growth, mature markets and problems integrating its merger with Allied-Signal pulled the company's stock price down. I reduced the fund's exposure to Honeywell during the period, shifting from an overweighted to an underweighted position relative to the Goldman Sachs index. Union Carbide also fell short of my expectations, suffering from higher raw material prices and a delay in gaining the necessary approvals to consummate its proposed merger with Dow Chemical.
Q. What's your outlook for the coming months?
A. The past few months have demonstrated the market's severe penalties for companies that miss their earnings targets, or otherwise fall short of investors' expectations. High oil prices continue to pressure margins, and the weak euro is further handicapping many cyclical companies. Looking ahead, I expect much of the fund's performance to be driven by avoiding stocks that disappoint. Thus, I anticipate maintaining an emphasis on companies with strong revenue growth and global business opportunities that lessen their dependence on U.S. markets.
The views expressed in this report reflect those of the portfolio manager only through the end of the period of the report as stated on the cover. The manager's views are subject to change at any time based on market or other conditions. For more information, see page 3.
3
Fund Facts
Start date: March 3, 1997
Fund number: 515
Trading symbol: FCYIX
Size: as of August 31, 2000, more than
$5 million
Manager: Brian Hogan, since February 2000; manager, Fidelity Select Construction and Housing Portfolio, since 1999; equity analyst, various industries, since 1998; high-yield analyst and portfolio manager, 1995-1998; fixed-income analyst, 1994; joined Fidelity in 1994
Semiannual Report
Cyclical Industries Portfolio
(Unaudited)
Showing Percentage of Net Assets
|
Common Stocks - 92.8% |
|||
|
Shares |
Value (Note 1) |
||
|
AEROSPACE & DEFENSE - 12.6% |
|||
|
BFGoodrich Co. |
1,600 |
$ 65,300 |
|
|
Boeing Co. |
3,640 |
195,195 |
|
|
Honeywell International, Inc. |
3,200 |
123,400 |
|
|
ITT Industries, Inc. |
430 |
14,459 |
|
|
Lockheed Martin Corp. |
1,480 |
41,995 |
|
|
Northrop Grumman Corp. |
360 |
28,012 |
|
|
Rockwell International Corp. |
830 |
33,563 |
|
|
Textron, Inc. |
1,210 |
67,836 |
|
|
United Technologies Corp. |
2,681 |
167,395 |
|
|
TOTAL AEROSPACE & DEFENSE |
737,155 |
||
|
AGRICULTURE - 0.1% |
|||
|
Delta & Pine Land Co. |
300 |
7,331 |
|
|
AIR TRANSPORTATION - 2.3% |
|||
|
AMR Corp. |
390 |
12,797 |
|
|
Atlas Air, Inc. (a) |
60 |
2,595 |
|
|
Continental Airlines, Inc. Class B (a) |
350 |
16,844 |
|
|
Delta Air Lines, Inc. |
480 |
23,760 |
|
|
Northwest Airlines Corp. Class A (a) |
690 |
21,606 |
|
|
Ryanair Holdings PLC sponsored ADR (a) |
300 |
11,025 |
|
|
Southwest Airlines Co. |
2,140 |
48,418 |
|
|
TOTAL AIR TRANSPORTATION |
137,045 |
||
|
AUTOS, TIRES, & ACCESSORIES - 10.9% |
|||
|
AutoNation, Inc. |
1,900 |
12,350 |
|
|
DaimlerChrysler AG (Reg.) |
540 |
28,114 |
|
|
Danaher Corp. |
770 |
43,264 |
|
|
Delphi Automotive Systems Corp. |
1,510 |
24,821 |
|
|
Eaton Corp. |
360 |
23,895 |
|
|
Ford Motor Co. |
6,504 |
157,315 |
|
|
General Motors Corp. |
2,952 |
213,098 |
|
|
Johnson Controls, Inc. |
350 |
18,703 |
|
|
Mascotech, Inc. |
850 |
14,078 |
|
|
Navistar International Corp. (a) |
600 |
22,500 |
|
|
SPX Corp. (a) |
300 |
49,200 |
|
|
TRW, Inc. |
600 |
27,412 |
|
|
TOTAL AUTOS, TIRES, & ACCESSORIES |
634,750 |
||
|
BUILDING MATERIALS - 3.0% |
|||
|
American Standard Companies, Inc. (a) |
680 |
31,493 |
|
|
Elcor Corp. |
360 |
5,918 |
|
|
Ferro Corp. |
120 |
2,475 |
|
|
Lafarge Corp. |
670 |
16,331 |
|
|
Masco Corp. |
2,550 |
49,725 |
|
|
Shaw Group (a) |
250 |
13,922 |
|
|
Sherwin-Williams Co. |
380 |
8,740 |
|
|
Southdown, Inc. |
120 |
7,530 |
|
|
USG Corp. |
60 |
1,931 |
|
|
|
|||
|
Shares |
Value (Note 1) |
||
|
Vulcan Materials Co. |
540 |
$ 23,929 |
|
|
York International Corp. |
610 |
15,174 |
|
|
TOTAL BUILDING MATERIALS |
177,168 |
||
|
CHEMICALS & PLASTICS - 14.0% |
|||
|
Air Products & Chemicals, Inc. |
520 |
18,883 |
|
|
Arch Chemicals, Inc. |
780 |
14,186 |
|
|
Avery Dennison Corp. |
1,240 |
67,038 |
|
|
Cabot Corp. |
290 |
10,730 |
|
|
Crompton Corp. |
476 |
4,284 |
|
|
Dow Chemical Co. |
220 |
5,761 |
|
|
E.I. du Pont de Nemours and Co. |
5,434 |
243,851 |
|
|
Engelhard Corp. |
390 |
7,313 |
|
|
FMC Corp. (a) |
360 |
24,413 |
|
|
Lyondell Chemical Co. |
2,140 |
27,954 |
|
|
Millennium Chemicals, Inc. |
2,210 |
36,465 |
|
|
Potash Corp. of Saskatchewan |
170 |
9,023 |
|
|
PPG Industries, Inc. |
330 |
13,365 |
|
|
Praxair, Inc. |
2,490 |
110,183 |
|
|
Rohm & Haas Co. |
1,340 |
38,776 |
|
|
Sealed Air Corp. (a) |
344 |
17,651 |
|
|
Solutia, Inc. |
1,210 |
18,226 |
|
|
Spartech Corp. |
980 |
24,255 |
|
|
Union Carbide Corp. |
3,150 |
126,197 |
|
|
TOTAL CHEMICALS & PLASTICS |
818,554 |
||
|
CONSTRUCTION - 1.1% |
|||
|
Centex Corp. |
930 |
26,854 |
|
|
D.R. Horton, Inc. |
330 |
6,476 |
|
|
Jacobs Engineering Group, Inc. (a) |
160 |
6,080 |
|
|
Kaufman & Broad Home Corp. |
640 |
15,880 |
|
|
Lennar Corp. |
350 |
9,669 |
|
|
TOTAL CONSTRUCTION |
64,959 |
||
|
CONSUMER DURABLES - 3.5% |
|||
|
Minnesota Mining & Manufacturing Co. |
2,170 |
201,810 |
|
|
CONSUMER ELECTRONICS - 0.6% |
|||
|
Black & Decker Corp. |
690 |
27,643 |
|
|
General Motors Corp. Class H |
272 |
9,010 |
|
|
TOTAL CONSUMER ELECTRONICS |
36,653 |
||
|
DEFENSE ELECTRONICS - 0.6% |
|||
|
Raytheon Co. Class A |
1,350 |
35,859 |
|
|
DRUGS & PHARMACEUTICALS - 0.2% |
|||
|
Sigma-Aldrich Corp. |
330 |
9,591 |
|
|
ELECTRIC UTILITY - 0.1% |
|||
|
Ogden Corp. (a) |
230 |
3,996 |
|
|
ELECTRICAL EQUIPMENT - 11.2% |
|||
|
Emerson Electric Co. |
2,310 |
152,893 |
|
|
General Electric Co. |
8,370 |
491,208 |
|
|
Common Stocks - continued |
|||
|
Shares |
Value (Note 1) |
||
|
ELECTRICAL EQUIPMENT - CONTINUED |
|||
|
Hubbell, Inc. Class B |
230 |
$ 5,951 |
|
|
Plug Power, Inc. |
60 |
2,685 |
|
|
TOTAL ELECTRICAL EQUIPMENT |
652,737 |
||
|
ELECTRONIC INSTRUMENTS - 2.5% |
|||
|
Agilent Technologies, Inc. |
1,520 |
91,675 |
|
|
PerkinElmer, Inc. |
90 |
8,094 |
|
|
Thermo Electron Corp. (a) |
2,090 |
48,593 |
|
|
TOTAL ELECTRONIC INSTRUMENTS |
148,362 |
||
|
ELECTRONICS - 0.7% |
|||
|
Molex, Inc. |
110 |
5,809 |
|
|
Molex, Inc. Class A |
840 |
33,705 |
|
|
TOTAL ELECTRONICS |
39,514 |
||
|
ENERGY SERVICES - 0.1% |
|||
|
Varco International, Inc. (a) |
320 |
6,460 |
|
|
ENGINEERING - 0.8% |
|||
|
Fluor Corp. |
1,570 |
47,002 |
|
|
HOME FURNISHINGS - 0.3% |
|||
|
Leggett & Platt, Inc. |
1,080 |
19,103 |
|
|
HOUSEHOLD PRODUCTS - 0.3% |
|||
|
Aptargroup, Inc. |
640 |
14,920 |
|
|
Procter & Gamble Co. |
60 |
3,709 |
|
|
TOTAL HOUSEHOLD PRODUCTS |
18,629 |
||
|
INDUSTRIAL MACHINERY & EQUIPMENT - 14.7% |
|||
|
Ballard Power Systems, Inc. (a) |
240 |
24,359 |
|
|
Caterpillar, Inc. |
1,820 |
66,885 |
|
|
CNH Global NV |
610 |
5,986 |
|
|
Deere & Co. |
830 |
27,338 |
|
|
Dover Corp. |
900 |
43,988 |
|
|
Illinois Tool Works, Inc. |
1,550 |
86,897 |
|
|
Ingersoll-Rand Co. |
990 |
45,107 |
|
|
Parker-Hannifin Corp. |
1,030 |
35,857 |
|
|
Pentair, Inc. |
1,100 |
35,750 |
|
|
Tyco International Ltd. |
8,580 |
489,060 |
|
|
TOTAL INDUSTRIAL MACHINERY & EQUIPMENT |
861,227 |
||
|
IRON & STEEL - 0.7% |
|||
|
Bethlehem Steel Corp. (a) |
3,300 |
11,550 |
|
|
Nucor Corp. |
580 |
21,315 |
|
|
USX - U.S. Steel Group |
290 |
5,039 |
|
|
TOTAL IRON & STEEL |
37,904 |
||
|
|
|||
|
Shares |
Value (Note 1) |
||
|
LEASING & RENTAL - 0.0% |
|||
|
Ryder System, Inc. |
130 |
$ 2,494 |
|
|
MEDICAL EQUIPMENT & SUPPLIES - 0.8% |
|||
|
Millipore Corp. |
720 |
43,830 |
|
|
MEDICAL FACILITIES MANAGEMENT - 0.0% |
|||
|
Apria Healthcare Group, Inc. (a) |
70 |
1,041 |
|
|
METALS & MINING - 0.6% |
|||
|
Alcoa, Inc. |
836 |
27,797 |
|
|
Martin Marietta Materials, Inc. |
160 |
6,400 |
|
|
TOTAL METALS & MINING |
34,197 |
||
|
OIL & GAS - 0.7% |
|||
|
Cooper Cameron Corp. (a) |
230 |
17,897 |
|
|
Frontier Oil Corp. (a) |
1,160 |
8,265 |
|
|
National-Oilwell, Inc. (a) |
380 |
13,181 |
|
|
TOTAL OIL & GAS |
39,343 |
||
|
PACKAGING & CONTAINERS - 1.1% |
|||
|
Ball Corp. |
1,160 |
40,165 |
|
|
Bemis Co., Inc. |
290 |
9,715 |
|
|
Owens-Illinois, Inc. (a) |
1,170 |
15,283 |
|
|
TOTAL PACKAGING & CONTAINERS |
65,163 |
||
|
PAPER & FOREST PRODUCTS - 0.3% |
|||
|
Pactiv Corp. (a) |
1,820 |
20,020 |
|
|
POLLUTION CONTROL - 1.1% |
|||
|
Allied Waste Industries, Inc. (a) |
240 |
2,205 |
|
|
Republic Services, Inc. (a) |
1,730 |
25,301 |
|
|
Waste Management, Inc. |
1,880 |
35,603 |
|
|
TOTAL POLLUTION CONTROL |
63,109 |
||
|
RAILROADS - 4.1% |
|||
|
Burlington Northern Santa Fe Corp. |
2,550 |
57,056 |
|
|
Canadian National Railway Co. |
1,150 |
33,410 |
|
|
Canadian Pacific Ltd. |
1,820 |
49,473 |
|
|
CSX Corp. |
1,020 |
24,353 |
|
|
Kansas City Southern Industries, Inc. |
180 |
1,665 |
|
|
Union Pacific Corp. |
1,870 |
74,333 |
|
|
TOTAL RAILROADS |
240,290 |
||
|
SERVICES - 1.0% |
|||
|
Ecolab, Inc. |
1,450 |
56,459 |
|
|
SHIP BUILDING & REPAIR - 1.4% |
|||
|
General Dynamics Corp. |
1,270 |
79,931 |
|
|
Common Stocks - continued |
|||
|
Shares |
Value (Note 1) |
||
|
SHIPPING - 0.3% |
|||
|
Frontline Ltd. sponsored ADR (a) |
840 |
$ 13,440 |
|
|
Teekay Shipping Corp. |
110 |
5,088 |
|
|
TOTAL SHIPPING |
18,528 |
||
|
TEXTILES & APPAREL - 0.2% |
|||
|
Polymer Group, Inc. |
870 |
6,090 |
|
|
Shaw Industries, Inc. |
360 |
4,478 |
|
|
TOTAL TEXTILES & APPAREL |
10,568 |
||
|
TRUCKING & FREIGHT - 0.9% |
|||
|
CNF Transportation, Inc. |
230 |
5,635 |
|
|
Expeditors International of |
300 |
14,700 |
|
|
FedEx Corp. (a) |
580 |
23,403 |
|
|
USFreightways Corp. |
230 |
7,173 |
|
|
TOTAL TRUCKING & FREIGHT |
50,911 |
||
|
TOTAL COMMON STOCKS (Cost $4,975,437) |
5,421,693 |
||
|
Cash Equivalents - 8.1% |
||
|
|
|
|
|
Fidelity Cash Central Fund, 6.59% (b) |
473,124 |
473,124 |
|
TOTAL INVESTMENT PORTFOLIO - 100.9% (Cost $5,448,561) |
5,894,817 |
|
NET OTHER ASSETS - (0.9)% |
(50,811) |
|
|
NET ASSETS - 100% |
$ 5,844,006 |
|
|
Legend |
|
(a) Non-income producing |
|
(b) The rate quoted is the annualized seven-day yield of the fund at |
|
Other Information |
|
Purchases and sales of securities, other than short-term securities, aggregated $6,747,000 and $5,860,651, respectively. |
|
The fund placed a portion of its portfolio transactions with brokerage firms which are affiliates of Fidelity Management & Research Company. The commissions paid to these affiliated firms were $1,505 for the period. |
|
Income Tax Information |
|
At August 31, 2000, the aggregate cost of investment securities for income tax purposes was $5,517,407. Net unrealized appreciation aggregated $377,410, of which $768,545 related to appreciated investment securities and $391,135 related to depreciated investment securities. |
|
The fund intends to elect to defer to its fiscal year ending February 28, 2001 approximately $7,000 of losses recognized during the period November 1, 1999 to February 29, 2000. |
See accompanying notes which are an integral part of the financial statements.
Cyclicals Sector
Statement of Assets and Liabilities
|
|
August 31, 2000 (Unaudited) |
|
|
Assets |
|
|
|
Investment in securities, at value |
|
$ 5,894,817 |
|
Cash |
|
26 |
|
Receivable for investments sold |
|
21,639 |
|
Receivable for fund shares sold |
|
9,454 |
|
Dividends receivable |
|
13,200 |
|
Interest receivable |
|
2,177 |
|
Redemption fees receivable |
|
195 |
|
Other receivables |
|
620 |
|
Receivable from investment adviser for expense reductions |
|
1,097 |
|
Total assets |
|
5,943,225 |
|
Liabilities |
|
|
|
Payable for investments purchased |
$ 42,606 |
|
|
Payable for fund shares redeemed |
39,406 |
|
|
Other payables and |
17,207 |
|
|
Total liabilities |
|
99,219 |
|
Net Assets |
|
$ 5,844,006 |
|
Net Assets consist of: |
|
|
|
Paid in capital |
|
$ 5,425,915 |
|
Accumulated net investment (loss) |
|
(14,763) |
|
Accumulated undistributed net realized gain (loss) on investments and foreign currency transactions |
|
(13,387) |
|
Net unrealized appreciation (depreciation) on investments |
|
446,241 |
|
Net Assets, for 423,932 |
|
$ 5,844,006 |
|
Net Asset Value and redemption price per share ($5,844,006 ÷ 423,932 shares) |
|
$13.79 |
|
Maximum offering price per share (100/97.00 of $13.79) |
|
$14.22 |
Statement of Operations
|
|
Six months ended August 31, 2000 (Unaudited) |
|
|
Investment Income Dividends |
|
$ 46,536 |
|
Interest |
|
12,292 |
|
Security lending |
|
17 |
|
Total income |
|
58,845 |
|
Expenses |
|
|
|
Management fee |
$ 16,662 |
|
|
Transfer agent fees |
18,757 |
|
|
Accounting and security lending fees |
30,265 |
|
|
Custodian fees and expenses |
12,974 |
|
|
Registration fees |
10,578 |
|
|
Audit |
6,118 |
|
|
Legal |
12 |
|
|
Miscellaneous |
21 |
|
|
Total expenses before reductions |
95,387 |
|
|
Expense reductions |
(21,779) |
73,608 |
|
Net investment income (loss) |
|
(14,763) |
|
Realized and Unrealized Gain (Loss) Net realized gain (loss) on: |
|
|
|
Investment securities |
63,550 |
|
|
Foreign currency transactions |
(365) |
63,185 |
|
Change in net unrealized appreciation (depreciation) on: |
|
|
|
Investment securities |
625,940 |
|
|
Assets and liabilities in |
(13) |
625,927 |
|
Net gain (loss) |
|
689,112 |
|
Net increase (decrease) in net assets resulting from operations |
|
$ 674,349 |
|
Other Information |
|
|
|
Sales charges paid to FDC |
|
$ 8,825 |
|
Exchange fees withheld by FSC |
|
$ 225 |
|
Expense reductions |
|
|
|
Directed brokerage arrangements |
|
$ 448 |
|
FMR reimbursement |
|
21,331 |
|
|
|
$ 21,779 |
See accompanying notes which are an integral part of the financial statements.
Semiannual Report
Cyclical Industries Portfolio
Financial Statements - continued
Statement of Changes in Net Assets
|
Increase (Decrease) in Net Assets |
Six months ended |
Year ended |
|
Operations |
$ (14,763) |
$ (65,173) |
|
Net realized gain (loss) |
63,185 |
168,947 |
|
Change in net unrealized appreciation (depreciation) |
625,927 |
(441,299) |
|
Net increase (decrease) in net assets resulting from operations |
674,349 |
(337,525) |
|
Distributions to shareholders from net realized gains |
(67,291) |
- |
|
Share transactions |
6,749,642 |
16,676,868 |
|
Reinvestment of distributions |
66,238 |
- |
|
Cost of shares redeemed |
(5,706,733) |
(15,352,529) |
|
Net increase (decrease) in net assets resulting from share transactions |
1,109,147 |
1,324,339 |
|
Redemption fees |
15,861 |
38,142 |
|
Total increase (decrease) in net assets |
1,732,066 |
1,024,956 |
|
Net Assets |
|
|
|
Beginning of period |
4,111,940 |
3,086,984 |
|
End of period (including accumulated net investment loss of $14,763 and $0, respectively) |
$ 5,844,006 |
$ 4,111,940 |
|
Other Information Shares |
|
|
|
Sold |
504,662 |
1,274,489 |
|
Issued in reinvestment of distributions |
5,007 |
- |
|
Redeemed |
(441,663) |
(1,189,555) |
|
Net increase (decrease) |
68,006 |
84,934 |
Financial Highlights
|
|
Six months ended |
Years ended February 28, |
||
|
Selected Per-Share Data |
(Unaudited) |
2000 H |
1999 |
1998 E |
|
Net asset value, beginning of period |
$ 11.55 |
$ 11.39 |
$ 12.07 |
$ 10.00 |
|
Income from Investment Operations |
|
|
|
|
|
Net investment income (loss) D |
(.03) |
(.13) |
(.13) |
(.11) |
|
Net realized and unrealized gain (loss) |
2.35 |
.21 |
(.49) |
2.59 |
|
Total from investment operations |
2.32 |
.08 |
(.62) |
2.48 |
|
Less Distributions |
|
|
|
|
|
From net realized gain |
(.12) |
- |
(.09) |
(.46) |
|
Redemption fees added to paid in capital |
.04 |
.08 |
.03 |
.05 |
|
Net asset value, end of period |
$ 13.79 |
$ 11.55 |
$ 11.39 |
$ 12.07 |
|
Total Return B, C |
20.48% |
1.40% |
(4.96)% |
25.77% |
|
Ratios and Supplemental Data |
|
|
|
|
|
Net assets, end of period (000 omitted) |
$ 5,844 |
$ 4,112 |
$ 3,087 |
$ 3,965 |
|
Ratio of expenses to average net assets |
2.50% A, F |
2.50% F |
2.50% F |
2.50% A, F |
|
Ratio of expenses to average net assets after expense reductions |
2.49% A, G |
2.49% G |
2.49% G |
2.50% A |
|
Ratio of net investment income (loss) to average net assets |
(.50)% A |
(1.00)% |
(1.09)% |
(.93)% A |
|
Portfolio turnover rate |
214% A |
211% |
103% |
140% A |
|
A Annualized B The total returns would have been lower had certain expenses not been reduced during the periods shown. C Total returns do not include the one time sales
charge and for periods of less than one year are not annualized. |
See accompanying notes which are an integral part of the financial statements.
Cyclicals Sector
Performance
There are several ways to evaluate a fund's historical performance. You can look at the total percentage change in value, the average annual percentage change or the growth of a hypothetical $10,000 investment. Total return reflects the change in the value of an investment, assuming reinvestment of the fund's dividend income and capital gains (the profits earned upon the sale of securities that have grown in value). Load adjusted returns include a 3.00% sales charge and the effect of a $7.50 long-term trading fee for shares held 30 days or more. Effective September 28, 2000, the $7.50 long-term trading fee was eliminated. If Fidelity had not reimbursed certain fund expenses, the past five year and past 10 year total returns would have been lower.
Cumulative Total Returns
|
Periods ended |
Past 6 |
Past 1 |
Past 5 |
Past 10 |
|
|
Select Defense and |
29.59% |
17.44% |
129.94% |
451.48% |
|
|
Select Defense and |
25.63% |
13.85% |
122.97% |
434.86% |
|
|
S&P 500 |
11.73% |
16.32% |
193.58% |
493.54% |
|
|
GS Cyclical Industries |
12.70% |
-3.99% |
n/a** |
n/a** |
|
Cumulative total returns show the fund's performance in percentage terms over a set period - in this case, six months, one year, five years or 10 years. You can compare the fund's returns to the performance of both the Standard & Poor's 500 Index - a market capitalization-weighted index of common stocks - and the Goldman Sachs Cyclical Industries Index - a market capitalization-weighted index of 253 stocks designed to measure the performance of companies in the cyclical industries sector. These benchmarks include reinvestment of dividends and capital gains, if any, and exclude the effect of sales charges.
Average Annual Total Returns
|
Periods ended |
Past 1 |
Past 5 |
Past 10 |
|
Select Defense and Aerospace |
17.44% |
18.12% |
18.62% |
|
Select Defense and Aerospace |
13.85% |
17.39% |
18.26% |
|
S&P 500 |
16.32% |
24.04% |
19.49% |
|
GS Cyclical Industries |
-3.99% |
n/a** |
n/a** |
Average annual returns take the fund's cumulative return and show you what would have happened if the fund had performed at a constant rate each year.
** Not available
Understanding Performance
How a fund did yesterday is no guarantee of how it will do tomorrow. The stock market, for example, has a history of long-term growth and short-term volatility. Unlike the broader market, however, some sectors may not have a history of growth in the long run. And, as with all stock funds, the share price and return of a fund that invests in a sector will vary.
3$10,000 Over 10 Years
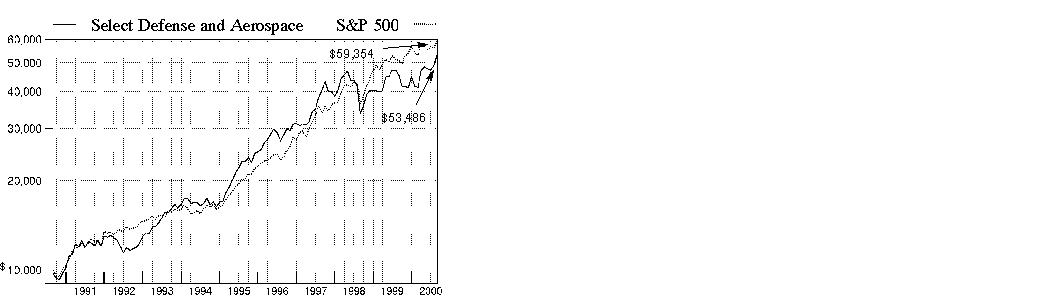
$10,000 Over 10 Years: Let's say hypothetically that $10,000 was invested in Fidelity Select Defense and Aerospace Portfolio on August 31, 1990, and the current 3.00% sales charge was paid. As the chart shows, by August 31, 2000, the value of the investment would have grown to $53,486 - a 434.86% increase on the initial investment - and includes the effect of a $7.50 long-term trading fee. For comparison, look at how the Standard & Poor's 500 Index did over the same period. With dividends and capital gains, if any, reinvested, the same $10,000 investment would have grown to $59,354 - a 493.54% increase.
Investment Summary
|
Top Ten Stocks as of August 31, 2000 |
|
|
|
% of fund's |
|
United Technologies Corp. |
7.5 |
|
General Dynamics Corp. |
7.4 |
|
BFGoodrich Co. |
7.4 |
|
General Electric Co. |
5.4 |
|
Northrop Grumman Corp. |
5.3 |
|
General Motors Corp. Class H |
5.3 |
|
Rockwell International Corp. |
4.8 |
|
Boeing Co. |
4.2 |
|
Raytheon Co. Class A |
4.1 |
|
Lockheed Martin Corp. |
3.9 |
|
|
55.3 |
Top Industries as of August 31, 2000
% of fund's net assets

Semiannual Report
(Portfolio Manager photograph)
Jeff Feingold,
Portfolio Manager of Fidelity Select Defense and Aerospace Portfolio
Q. How did the fund perform, Jeff?
A. For the six-month period that ended August 31, 2000, the fund returned 29.59%. In comparison, the Goldman Sachs Cyclical Industries Index - an index of 253 stocks designed to measure the performance of companies in the cyclical industries sector - returned 12.70%. During the same period, the Standard & Poor's 500 Index returned 11.73%. For the 12-month period that ended August 31, 2000, the fund returned 17.44%, while the Goldman Sachs index and the S&P 500 index returned -3.99% and 16.32%, respectively.
Q. Can you describe the market environment for defense and aerospace stocks during the past six months?
A. Generally, it improved from the prior period. Defense contractors, whose largest customer is the Department of Defense, benefited from a projected increase in the department's budget by roughly 2%-4% annually over the next five years. This shift in spending was welcomed by investors, particularly after several years of a decline in spending. An increase in defense orders was particularly helpful to the largest defense contractors. Lockheed Martin, for instance, was able to stabilize its business and put together a string of quarterly earnings results that met or beat Wall Street's expectations. Elsewhere, a projected 5%-15% increase in commercial jet production over the next couple of years at Boeing gave a boost to the performance of aerospace suppliers. Coming off a sharp decline in commercial aircraft production in 2000, most of these stocks have bottomed out and could be poised to bounce as production increases.
Q. What investment strategies did you pursue?
A. I generally kept to my approach of looking for superior management teams in reasonably valued companies - such as General Dynamics and United Technologies - that consistently meet earnings targets, even in difficult market environments. Beyond that, I sought out companies that were undervalued and could benefit from a change in the marketplace. Another major strategy I maintained was to keep the majority of the fund invested in a diversified group of my best ideas, including aerospace manufacturers, defense contractors, suppliers to both of those industries, and air transportation companies.
Q. Can you tell us about a holding that was once undervalued and benefited from some sort of change in the marketplace?
A. Aerospace supplier BFGoodrich is a good example. The company was hurt by the prospects of reduced jet deliveries this year, compared to 1999, particularly the slowdown in orders at Boeing, its largest customer and the largest U.S. aircraft producer. However, when orders for jet deliveries were projected to increase at Boeing, I added to the fund's position in BFGoodrich. This turned out to be a positive move as other investors also realized that the pickup in aircraft production would increase orders for BFGoodrich's products and improve profits.
Q. What stocks stood out as top performers?
A. Aerospace supplier Cordant Technologies was the fund's top performer. Shares of Cordant, which had been trading in the $30-$40 per share price range, benefited when Alcoa agreed to pay $57 per share to buy the company. Additionally, investors looked positively on aerospace supplier Northrup Grumman's ability to deliver cash flow and earnings performance that met or beat expectations.
Q. What stocks disappointed?
A. The fund's positions in the commercial satellite market, such as Globalstar Telecommunications, Loral Space & Communications and PanAmSat, were the biggest detractors from performance. Although I underweighted these positions, the fund was hurt as the fundamentals in the satellite market turned out weaker than expected. Demand for satellite services remained weak and the companies had little pricing power due to excess supply.
Q. What's your outlook for the remainder of the year?
A. I am generally optimistic. The upcoming presidential and congressional elections should provide enough positive rhetoric from both parties to generate more interest in defense and aerospace stocks. In addition, the continued possibility of stable-to-rising defense spending, as well as improved production rates in the commercial jet cycle, should bode well for the fund. However, company-specific issues, such as production costs and declines in budgeting for specific programs, continue to be important factors affecting earnings, cash flow and stock performance.
The views expressed in this report reflect those of the portfolio manager only through the end of the period of the report as stated on the cover. The manager's views are subject to change at any time based on market or other conditions. For more information, see page 3.
Fund Facts
Start date: May 8, 1984
Fund number: 067
Trading symbol: FSDAX
Size: as of August 31, 2000, more than
$33 million
Manager: Jeff Feingold, since 1998; manager, Fidelity Select Air Transportation Portfolio, since February 2000; Fidelity Select Transportation Portfolio, February 2000-September 2000; equity analyst, various industries, 1997-1998; joined Fidelity in 1997
3Semiannual Report
Defense and Aerospace Portfolio
(Unaudited)
Showing Percentage of Net Assets
|
Common Stocks - 92.7% |
|||
|
Shares |
Value (Note 1) |
||
|
AEROSPACE & DEFENSE - 36.9% |
|||
|
Alliant Techsystems, Inc. (a) |
2,800 |
$ 215,775 |
|
|
BAE SYSTEMS PLC |
47,300 |
294,108 |
|
|
BE Aerospace, Inc. (a) |
9,300 |
150,544 |
|
|
BFGoodrich Co. |
61,300 |
2,501,806 |
|
|
Boeing Co. |
26,600 |
1,426,425 |
|
|
Ladish, Inc. (a) |
16,600 |
208,538 |
|
|
Lockheed Martin Corp. |
46,600 |
1,322,275 |
|
|
Northrop Grumman Corp. |
23,000 |
1,789,688 |
|
|
Precision Castparts Corp. |
4,200 |
319,200 |
|
|
Primex Technologies, Inc. |
2,700 |
65,475 |
|
|
Rockwell International Corp. |
40,000 |
1,617,500 |
|
|
United Technologies Corp. |
40,500 |
2,528,715 |
|
|
TOTAL AEROSPACE & DEFENSE |
12,440,049 |
||
|
AIR TRANSPORTATION - 2.2% |
|||
|
Continental Airlines, Inc. Class B (a) |
4,900 |
235,813 |
|
|
Northwest Airlines Corp. Class A (a) |
7,500 |
234,844 |
|
|
Southwest Airlines Co. |
12,000 |
271,500 |
|
|
TOTAL AIR TRANSPORTATION |
742,157 |
||
|
AUTOS, TIRES, & ACCESSORIES - 2.8% |
|||
|
General Motors Corp. |
13,000 |
938,438 |
|
|
BROADCASTING - 2.6% |
|||
|
EchoStar Communications Corp. |
12,300 |
599,625 |
|
|
PanAmSat Corp. (a) |
8,500 |
275,719 |
|
|
TOTAL BROADCASTING |
875,344 |
||
|
COMMUNICATIONS EQUIPMENT - 0.3% |
|||
|
P-Com, Inc. (a) |
15,700 |
98,125 |
|
|
COMPUTER SERVICES & SOFTWARE - 3.4% |
|||
|
Corsair Communictions, Inc. (a) |
14,600 |
160,600 |
|
|
Litton Industries, Inc. (a) |
9,200 |
508,875 |
|
|
Titan Corp. (a) |
19,600 |
482,650 |
|
|
TOTAL COMPUTER SERVICES & SOFTWARE |
1,152,125 |
||
|
COMPUTERS & OFFICE EQUIPMENT - 1.4% |
|||
|
SBS Technologies, Inc. (a) |
3,800 |
195,938 |
|
|
Silicon Graphics, Inc. |
62,700 |
293,906 |
|
|
TOTAL COMPUTERS & OFFICE EQUIPMENT |
489,844 |
||
|
CONSUMER ELECTRONICS - 5.3% |
|||
|
General Motors Corp. Class H |
53,800 |
1,782,125 |
|
|
|
|||
|
Shares |
Value (Note 1) |
||
|
DEFENSE ELECTRONICS - 4.7% |
|||
|
Raytheon Co. Class A |
52,352 |
$ 1,390,600 |
|
|
REMEC, Inc. (a) |
7,050 |
200,925 |
|
|
TOTAL DEFENSE ELECTRONICS |
1,591,525 |
||
|
ELECTRICAL EQUIPMENT - 13.6% |
|||
|
Adaptive Broadband Corp. (a) |
4,800 |
150,000 |
|
|
General Electric Co. |
30,800 |
1,807,575 |
|
|
Harris Corp. |
22,800 |
685,425 |
|
|
L-3 Communications Holdings, Inc. (a) |
8,200 |
484,825 |
|
|
Loral Space & Communications Ltd. (a) |
18,200 |
139,913 |
|
|
Powerwave Technologies, Inc. (a) |
9,900 |
476,438 |
|
|
Teleflex, Inc. |
12,800 |
456,000 |
|
|
ViaSat, Inc. (a) |
6,400 |
383,200 |
|
|
TOTAL ELECTRICAL EQUIPMENT |
4,583,376 |
||
|
ELECTRONIC INSTRUMENTS - 1.0% |
|||
|
Trimble Navigation Ltd. (a) |
8,100 |
336,656 |
|
|
ELECTRONICS - 2.2% |
|||
|
DMC Stratex Networks, Inc. (a) |
17,700 |
452,456 |
|
|
Esterline Technologies Corp. (a) |
15,700 |
304,188 |
|
|
TOTAL ELECTRONICS |
756,644 |
||
|
INDUSTRIAL MACHINERY & EQUIPMENT - 5.6% |
|||
|
Parker-Hannifin Corp. |
26,100 |
908,606 |
|
|
Tyco International Ltd. |
17,200 |
980,400 |
|
|
TOTAL INDUSTRIAL MACHINERY & EQUIPMENT |
1,889,006 |
||
|
SHIP BUILDING & REPAIR - 8.8% |
|||
|
General Dynamics Corp. |
39,800 |
2,504,913 |
|
|
Newport News Shipbuilding, Inc. |
11,300 |
480,250 |
|
|
TOTAL SHIP BUILDING & REPAIR |
2,985,163 |
||
|
SHIPPING - 1.9% |
|||
|
Frontline Ltd. (a) |
42,000 |
628,611 |
|
|
TOTAL COMMON STOCKS (Cost $25,523,711) |
31,289,188 |
||
|
Cash Equivalents - 10.2% |
|||
|
Shares |
Value (Note 1) |
||
|
Fidelity Cash Central Fund, 6.59% (b) |
3,431,824 |
$ 3,431,824 |
|
|
TOTAL INVESTMENT PORTFOLIO - 102.9% (Cost $28,955,535) |
34,721,012 |
||
|
NET OTHER ASSETS - (2.9)% |
(986,585) |
||
|
NET ASSETS - 100% |
$ 33,734,427 |
||
|
Legend |
|
(a) Non-income producing |
|
(b) The rate quoted is the annualized seven-day yield of the fund at |
|
Other Information |
|
Purchases and sales of securities, other than short-term securities, aggregated $22,484,933 and $17,366,519, respectively. |
|
The fund placed a portion of its portfolio transactions with brokerage firms which are affiliates of Fidelity Management & Research Company. The commissions paid to these affiliated firms were $1,221 for the period. |
|
Income Tax Information |
|
At August 31, 2000, the aggregate cost of investment securities for income tax purposes was $29,396,362. Net unrealized appreciation aggregated $5,324,650, of which $6,223,235 related to appreciated investment securities and $898,585 related to depreciated investment securities. |
See accompanying notes which are an integral part of the financial statements.
Cyclicals Sector
Statement of Assets and Liabilities
|
|
August 31, 2000 (Unaudited) |
|
|
Assets |
|
|
|
Investment in securities, at value |
|
$ 34,721,012 |
|
Receivable for fund shares sold |
|
433,414 |
|
Dividends receivable |
|
56,908 |
|
Interest receivable |
|
15,176 |
|
Redemption fees receivable |
|
374 |
|
Other receivables |
|
4,046 |
|
Total assets |
|
35,230,930 |
|
Liabilities |
|
|
|
Payable for investments purchased |
$ 1,284,265 |
|
|
Payable for fund shares redeemed |
170,123 |
|
|
Accrued management fee |
13,619 |
|
|
Other payables and |
28,496 |
|
|
Total liabilities |
|
1,496,503 |
|
Net Assets |
|
$ 33,734,427 |
|
Net Assets consist of: |
|
|
|
Paid in capital |
|
$ 26,867,357 |
|
Undistributed net investment income |
|
6,750 |
|
Accumulated undistributed net realized gain (loss) on investments and foreign currency transactions |
|
1,094,842 |
|
Net unrealized appreciation (depreciation) on investments |
|
5,765,478 |
|
Net Assets, for 772,246 |
|
$ 33,734,427 |
|
Net Asset Value and redemption price per share ($33,734,427 ÷ 772,246 shares) |
|
$43.68 |
|
Maximum offering price per share (100/97.00 of $43.68) |
|
$45.03 |
Statement of Operations
|
|
Six months ended August 31, 2000 (Unaudited) |
|
|
Investment Income Dividends |
|
$ 158,500 |
|
Interest |
|
59,213 |
|
Security lending |
|
10,201 |
|
Total income |
|
227,914 |
|
Expenses |
|
|
|
Management fee |
$ 75,335 |
|
|
Transfer agent fees |
89,529 |
|
|
Accounting and security lending fees |
30,461 |
|
|
Non-interested trustees' compensation |
40 |
|
|
Custodian fees and expenses |
6,280 |
|
|
Registration fees |
19,637 |
|
|
Audit |
5,280 |
|
|
Legal |
68 |
|
|
Miscellaneous |
29 |
|
|
Total expenses before reductions |
226,659 |
|
|
Expense reductions |
(5,495) |
221,164 |
|
Net investment income |
|
6,750 |
|
Realized and Unrealized Gain (Loss) Net realized gain (loss) on: |
|
|
|
Investment securities |
1,437,254 |
|
|
Foreign currency transactions |
(569) |
1,436,685 |
|
Change in net unrealized appreciation (depreciation) on: |
|
|
|
Investment securities |
4,857,467 |
|
|
Assets and liabilities in |
1 |
4,857,468 |
|
Net gain (loss) |
|
6,294,153 |
|
Net increase (decrease) in net assets resulting from operations |
|
$ 6,300,903 |
|
Other Information |
|
|
|
Sales charges paid to FDC |
|
$ 68,353 |
|
Deferred sales charges withheld by FDC |
|
$ 252 |
|
Exchange fees withheld by FSC |
|
$ 1,035 |
|
Expense reductions |
|
|
|
Directed brokerage arrangements |
|
$ 5,495 |
See accompanying notes which are an integral part of the financial statements.
Semiannual Report
Defense and Aerospace Portfolio
Financial Statements - continued
Statement of Changes in Net Assets
|
Increase (Decrease) in Net Assets |
Six months ended |
Year ended |
|
Operations |
$ 6,750 |
$ (145,579) |
|
Net realized gain (loss) |
1,436,685 |
2,474,558 |
|
Change in net unrealized appreciation (depreciation) |
4,857,468 |
(1,520,748) |
|
Net increase (decrease) in net assets resulting from operations |
6,300,903 |
808,231 |
|
Distributions to shareholders from net realized gains |
(530,300) |
(436,796) |
|
Share transactions |
22,992,465 |
56,172,571 |
|
Reinvestment of distributions |
510,293 |
420,257 |
|
Cost of shares redeemed |
(16,980,405) |
(64,155,432) |
|
Net increase (decrease) in net assets resulting from share transactions |
6,522,353 |
(7,562,604) |
|
Redemption fees |
35,950 |
99,858 |
|
Total increase (decrease) in net assets |
12,328,906 |
(7,091,311) |
|
Net Assets |
|
|
|
Beginning of period |
21,405,521 |
28,496,832 |
|
End of period (including undistributed net investment income of $6,750 and $0, respectively) |
$ 33,734,427 |
$ 21,405,521 |
|
Other Information Shares |
|
|
|
Sold |
577,304 |
1,490,942 |
|
Issued in reinvestment of distributions |
13,220 |
12,111 |
|
Redeemed |
(441,231) |
(1,721,904) |
|
Net increase (decrease) |
149,293 |
(218,851) |
Financial Highlights
|
|
Six months ended |
Years ended February 28, |
||||
|
Selected Per-Share Data |
(Unaudited) |
2000 G |
1999 |
1998 |
1997 |
1996 G |
|
Net asset value, beginning of period |
$ 34.36 |
$ 33.85 |
$ 37.57 |
$ 28.94 |
$ 26.97 |
$ 19.64 |
|
Income from Investment Operations |
|
|
|
|
|
|
|
Net investment income (loss) F |
.01 |
(.15) |
(.19) |
(.29) |
(.11) |
(.05) |
|
Net realized and unrealized gain (loss) |
10.01 |
1.14 |
(3.61) |
11.84 |
4.18 |
9.09 |
|
Total from investment operations |
10.02 |
.99 |
(3.80) |
11.55 |
4.07 |
9.04 |
|
Less Distributions |
|
|
|
|
|
|
|
From net realized gain |
(.75) |
(.59) |
- |
(3.04) |
(2.17) |
(1.82) |
|
Redemption fees added to paid in capital |
.05 |
.11 |
.08 |
.12 |
.07 |
.11 |
|
Net asset value, end of period |
$ 43.68 |
$ 34.36 |
$ 33.85 |
$ 37.57 |
$ 28.94 |
$ 26.97 |
|
Total Return B, C |
29.59% |
3.24% |
(9.90)% |
42.68% |
15.87% |
47.40% |
|
Ratios and Supplemental Data |
|
|
|
|
|
|
|
Net assets, end of period (000 omitted) |
$ 33,734 |
$ 21,406 |
$ 28,497 |
$ 101,805 |
$ 68,803 |
$ 26,648 |
|
Ratio of expenses to average net assets |
1.69% A |
1.61% |
1.48% |
1.77% |
1.84% |
1.77% E |
|
Ratio of expenses to average net assets after |
1.65% A, D |
1.59% D |
1.42% D |
1.71% D |
1.81% D |
1.75% D |
|
Ratio of net investment income (loss) to average net assets |
.05% A |
(.42)% |
(.53)% |
(.85)% |
(.39)% |
(.20)% |
|
Portfolio turnover rate |
138% A |
146% |
221% |
311% |
219% |
267% |
|
A Annualized B The total returns would have been lower had certain expenses not been reduced during the periods shown. C Total returns do not include the one time sales charge and for periods of less than one year are not annualized. D FMR or the fund has entered into varying arrangements with third parties who either paid or reduced a portion of the fund's expenses. E FMR agreed to reimburse a portion of the fund's expenses, or expenses were limited in accordance with a state expense limitation. Without this reimbursement, the fund's expense ratio would have been higher. F Net investment income (loss) per share has been calculated based on average shares outstanding during the period. G For the year ended February 29 |
||||||
See accompanying notes which are an integral part of the financial statements.
Cyclicals Sector
Performance
There are several ways to evaluate a fund's historical performance. You can look at the total percentage change in value, the average annual percentage change or the growth of a hypothetical $10,000 investment. Total return reflects the change in the value of an investment, assuming reinvestment of the fund's dividend income and capital gains (the profits earned upon the sale of securities that have grown in value). Load adjusted returns include a 3.00% sales charge and the effect of a $7.50 long-term trading fee for shares held 30 days or more. Effective September 28, 2000, the $7.50 long-term trading fee was eliminated.
Cumulative Total Returns
|
Periods ended |
Past 6 |
Past 1 |
Past 5 |
Past 10 |
|
Select Environmental |
22.99% |
3.61% |
-2.83% |
19.88% |
|
Select Environmental |
19.23% |
0.43% |
-5.82% |
16.21% |
|
S&P 500 |
11.73% |
16.32% |
193.58% |
493.54% |
|
GS Cyclical Industries |
12.70% |
-3.99% |
n/a** |
n/a** |
Cumulative total returns show the fund's performance in percentage terms over a set period - in this case, six months, one year, five years or 10 years. You can compare the fund's returns to the performance of both the Standard & Poor's 500 Index - a market capitalization-weighted index of common stocks - and the Goldman Sachs Cyclical Industries Index - a market capitalization-weighted index of 253 stocks designed to measure the performance of companies in the cyclical industries sector. These benchmarks include reinvestment of dividends and capital gains, if any, and exclude the effect of sales charges.
Average Annual Total Returns
|
Periods ended |
Past 1 |
Past 5 |
Past 10 |
|
Select Environmental Services |
3.61% |
-0.57% |
1.83% |
|
Select Environmental Services |
0.43% |
-1.19% |
1.51% |
|
S&P 500 |
16.32% |
24.04% |
19.49% |
|
GS Cyclical Industries |
-3.99% |
n/a** |
n/a** |
Average annual returns take the fund's cumulative return and show you what would have happened if the fund had performed at a constant rate each year.
** Not available
Understanding Performance
How a fund did yesterday is no guarantee of how it will do tomorrow. The stock market, for example, has a history of long-term growth and short-term volatility. Unlike the broader market, however, some sectors may not have a history of growth in the long run. And, as with all stock funds, the share price and return of a fund that invests in a sector will vary.
3$10,000 Over 10 Years
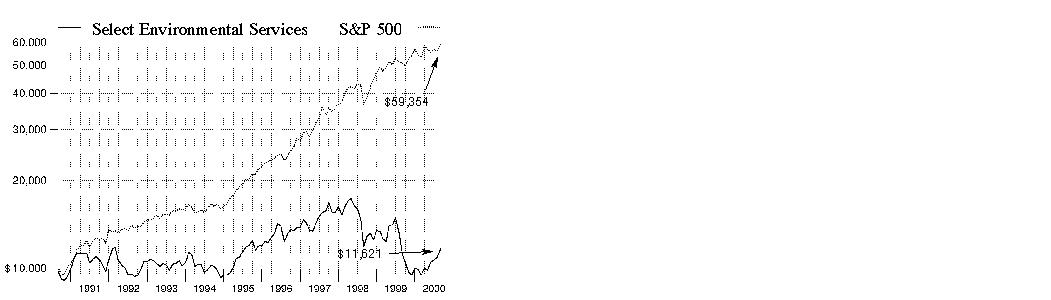
$10,000 Over 10 Years: Let's say hypothetically that $10,000 was invested in Fidelity Select Environmental Services Portfolio on August 31, 1990, and the current 3.00% sales charge was paid. As the chart shows, by August 31, 2000, the value of the investment would have grown to $11,621 - a 16.21% increase on the initial investment - and includes the effect of a $7.50 long-term trading fee. For comparison, look at how the Standard & Poor's 500 Index did over the same period. With dividends and capital gains, if any, reinvested, the same $10,000 investment would have grown to $59,354 - a 493.54% increase.
Investment Summary
|
Top Ten Stocks as of August 31, 2000 |
|
|
|
% of fund's |
|
Thermo Electron Corp. |
12.1 |
|
Insituform Technologies, Inc. Class A |
7.1 |
|
Tetra Tech, Inc. |
7.1 |
|
Waste Connections, Inc. |
6.8 |
|
Millipore Corp. |
6.2 |
|
Ecolab, Inc. |
6.0 |
|
Republic Services, Inc. |
5.9 |
|
Ogden Corp. |
5.1 |
|
Newpark Resources, Inc. |
5.0 |
|
Waste Management, Inc. |
4.6 |
|
|
65.9 |
Top Industries as of August 31, 2000
% of fund's net assets

Semiannual Report
(Portfolio Manager photograph)
Ian Gutterman,
Portfolio Manager of
Fidelity Select Environ-
mental Services Portfolio
Q. How did the fund perform, Ian?
A. For the six-month period that ended August 31, 2000, the fund returned 22.99%. In comparison, the Goldman Sachs Cyclical Industries Index - an index of 253 stocks designed to measure the performance of companies in the cyclical industries sector - returned 12.70%. During the same period, the Standard & Poor's 500 Index returned 11.73%. For the 12-month period that ended August 31, 2000, the fund returned 3.61%, while the Goldman Sachs index and the S&P 500 index returned -3.99% and 16.32%, respectively.
Q. What factors helped the fund outperform the Goldman Sachs index during the six-month period?
A. The fund's overweighted positions in selected strong-performing solid waste stocks gave us our biggest advantage over the broader index. Solid waste stocks, which were beaten up pretty badly last year, bounced back as a result of improved fundamentals. Elsewhere, our growth-oriented holdings, such as Thermo Electron and water-related stocks Tetra Tech and Insituform, continued to meet earnings expectations. Finally, the fund also benefited significantly from its underweighted positions in two major underperformers - Safety-Kleen and Azurix - during a sharp tailspin for each stock. I sold off our position in Safety-Kleen before the market fully realized that company-specific problems would severely hurt performance.
Q. What was the catalyst for the positive change in market sentiment toward solid waste stocks?
A. Basically, these companies fulfilled lower expectations. The fund's larger solid waste stocks, such as Waste Management, Allied Waste and Republic Services, were hurt in the prior period by earnings disappointments following a series of mergers and acquisitions, as well as integration issues concerning those mergers. During the past six months, these companies stabilized their businesses and most were able to meet Wall Street's lower earnings targets. Some slightly beat expectations.
Q. It seems the market continued to react favorably to Thermo Electron's reorganization . . .
A. I think people have more confidence in the company now. By centralizing its operations - bringing all of its independent subsidiary businesses under one operating company - and selling off its underperforming units, the company is now focused more on its higher growth areas, such as life sciences and semiconductors, than it was before. Thermo Electron, which primarily manufactures measurement instruments that monitor, collect and analyze information for several industries, was the fund's largest holding at the end of the period and its top performer.
Q. Yet despite that optimism, Thermo Fibertek, one of the companies owned by Thermo Electron, underperformed significantly. Can you tell us why?
A. Thermo Electron owns about 85% of Thermo Fibertek, a company that makes paper processing equipment. Under its reorganization plan, Thermo Electron said it plans to spin off its ownership stake in Thermo Fibertek at some point in the near future, primarily because Thermo Fibertek is a very thinly traded stock - meaning its daily trading volume is very low. With thinly traded stocks, large blocks of trades can have a major impact on price. During the period, a few large investors sold off their positions in Thermo Fibertek, which put downward pressure on its price. Thermo Electron is hoping to avoid these low-float problems by selling off its interest in Thermo Fibertek and other thinly traded subsidiaries.
Q. What other stocks performed well? Were there any additional disappointments?
A. Investors rewarded waste-to-energy company Ogden for its own restructuring. The company's decision to focus more on its core business of energy, via selling off its non-core businesses such as stadium concessions, helped boost the stock. Two smaller solid waste companies - Waste Connections and Casella Waste - rallied in part from the sector's overall improved outlook. In terms of underperformers, Safety-Kleen's accounting and billing problems helped send the company into bankruptcy. Azurix missed its earnings target and had problems executing a new global water business model.
Q. What's your outlook for this sector going forward?
A. I'm generally optimistic. I don't foresee any major problems for any of the companies in the portfolio in the near future. Those that were in trouble during 1999 and earlier this year have put their problems behind them, I believe. Looking ahead, I will continue to focus the majority of the fund on companies offering growth at a reasonable price.
The views expressed in this report reflect those of the portfolio manager only through the end of the period of the report as stated on the cover. The manager's views are subject to change at any time based on market or other conditions. For more information, see page 3.
Fund Facts
Start date: June 29, 1989
Fund number: 516
Trading symbol: FSLEX
Size: as of August 31, 2000, more than $20 million
Manager: Ian Gutterman, since 1999; manager, Fidelity Select Transportation Portfolio, since September 2000; analyst, air freight, railroad and waste industries, 1999-present; joined Fidelity in 1999
3Semiannual Report
Environmental Services Portfolio
(Unaudited)
Showing Percentage of Net Assets
|
Common Stocks - 93.1% |
|||
|
Shares |
Value (Note 1) |
||
|
CHEMICALS & PLASTICS - 4.2% |
|||
|
Sealed Air Corp. (a) |
17,000 |
$ 872,313 |
|
|
DRUGS & PHARMACEUTICALS - 1.3% |
|||
|
Catalytica, Inc. (a) |
20,000 |
266,250 |
|
|
ELECTRIC UTILITY - 5.4% |
|||
|
Calpine Corp. (a) |
500 |
49,500 |
|
|
Ogden Corp. (a) |
61,000 |
1,059,875 |
|
|
TOTAL ELECTRIC UTILITY |
1,109,375 |
||
|
ELECTRONIC INSTRUMENTS - 12.1% |
|||
|
Thermo Electron Corp. (a) |
107,150 |
2,491,235 |
|
|
ENGINEERING - 7.1% |
|||
|
Tetra Tech, Inc. (a) |
54,037 |
1,465,754 |
|
|
INDUSTRIAL MACHINERY & EQUIPMENT - 14.3% |
|||
|
Donaldson Co., Inc. |
44,000 |
929,500 |
|
|
Ionics, Inc. (a) |
14,800 |
441,225 |
|
|
Pall Corp. |
42,400 |
906,300 |
|
|
Thermo Fibertek, Inc. (a) |
166,400 |
686,400 |
|
|
TOTAL INDUSTRIAL MACHINERY & EQUIPMENT |
2,963,425 |
||
|
MEDICAL EQUIPMENT & SUPPLIES - 6.2% |
|||
|
Millipore Corp. |
21,200 |
1,290,550 |
|
|
POLLUTION CONTROL - 29.6% |
|||
|
Allied Waste Industries, Inc. (a) |
82,660 |
759,439 |
|
|
Casella Waste Systems, Inc. Class A (a) |
24,605 |
241,437 |
|
|
Insituform Technologies, Inc. Class A (a) |
48,000 |
1,473,000 |
|
|
Republic Services, Inc. (a) |
83,200 |
1,216,800 |
|
|
Waste Connections, Inc. (a) |
60,600 |
1,408,950 |
|
|
Waste Industries, Inc. (a) |
6,600 |
69,300 |
|
|
Waste Management, Inc. |
50,693 |
959,999 |
|
|
TOTAL POLLUTION CONTROL |
6,128,925 |
||
|
RETAIL & WHOLESALE, MISCELLANEOUS - 5.0% |
|||
|
Newpark Resources, Inc. (a) |
100,100 |
1,026,025 |
|
|
SERVICES - 6.0% |
|||
|
Ecolab, Inc. |
31,800 |
1,238,213 |
|
|
WATER - 1.9% |
|||
|
Azurix Corp. (a) |
83,200 |
395,200 |
|
|
TOTAL COMMON STOCKS (Cost $20,736,924) |
19,247,265 |
||
|
Cash Equivalents - 9.5% |
|||
|
Shares |
Value (Note 1) |
||
|
Fidelity Cash Central Fund, 6.59% (b) |
1,968,596 |
$ 1,968,596 |
|
|
TOTAL INVESTMENT PORTFOLIO - 102.6% (Cost $22,705,520) |
21,215,861 |
||
|
NET OTHER ASSETS - (2.6)% |
(544,473) |
||
|
NET ASSETS - 100% |
$ 20,671,388 |
||
|
Legend |
|
(a) Non-income producing |
|
(b) The rate quoted is the annualized seven-day yield of the fund at |
|
Other Information |
|
Purchases and sales of securities, other than short-term securities, |
|
The fund placed a portion of its portfolio transactions with brokerage firms which are affiliates of Fidelity Management & Research Company. The commissions paid to these affiliated firms were $7,357 for the period. |
|
Income Tax Information |
|
At August 31, 2000, the aggregate cost of investment securities for income tax purposes was $23,864,619. Net unrealized depreciation aggregated $2,648,758, of which $1,665,849 related to appreciated investment securities and $4,314,607 related to depreciated investment securities. |
|
At February 29, 2000, the fund had a capital loss carryforward of approximately $635,000 all of which will expire on February 29, 2008. |
See accompanying notes which are an integral part of the financial statements.
Semiannual Report
Statement of Assets and Liabilities
|
|
August 31, 2000 (Unaudited) |
|
|
Assets |
|
|
|
Investment in securities, at value |
|
$ 21,215,861 |
|
Receivable for investments sold |
|
188,000 |
|
Receivable for fund shares sold |
|
273,801 |
|
Dividends receivable |
|
2,905 |
|
Interest receivable |
|
7,563 |
|
Redemption fees receivable |
|
30 |
|
Other receivables |
|
39,790 |
|
Total assets |
|
21,727,950 |
|
Liabilities |
|
|
|
Payable for investments purchased |
$ 967,005 |
|
|
Payable for fund shares redeemed |
62,193 |
|
|
Accrued management fee |
9,304 |
|
|
Other payables and |
18,060 |
|
|
Total liabilities |
|
1,056,562 |
|
Net Assets |
|
$ 20,671,388 |
|
Net Assets consist of: |
|
|
|
Paid in capital |
|
$ 25,106,401 |
|
Accumulated net investment (loss) |
|
(120,841) |
|
Accumulated undistributed net realized gain (loss) on investments and foreign currency transactions |
|
(2,824,513) |
|
Net unrealized appreciation (depreciation) on investments |
|
(1,489,659) |
|
Net Assets, for 1,755,968 shares outstanding |
|
$ 20,671,388 |
|
Net Asset Value and redemption price per share ($20,671,388 ÷ 1,755,968 shares) |
|
$11.77 |
|
Maximum offering price per share (100/97.00 of $11.77) |
|
$12.13 |
Statement of Operations
|
|
Six months ended August 31, 2000 (Unaudited) |
|
|
Investment Income Dividends |
|
$ 12,431 |
|
Interest |
|
40,734 |
|
Security lending |
|
73 |
|
Total income |
|
53,238 |
|
Expenses |
|
|
|
Management fee |
$ 49,952 |
|
|
Transfer agent fees |
82,802 |
|
|
Accounting and security lending fees |
30,391 |
|
|
Non-interested trustees' compensation |
58 |
|
|
Custodian fees and expenses |
4,323 |
|
|
Registration fees |
14,596 |
|
|
Audit |
5,078 |
|
|
Legal |
239 |
|
|
Miscellaneous |
25 |
|
|
Total expenses before reductions |
187,464 |
|
|
Expense reductions |
(13,385) |
174,079 |
|
Net investment income (loss) |
|
(120,841) |
|
Realized and Unrealized Gain (Loss) Net realized gain (loss) on |
|
(1,245,456) |
|
Change in net unrealized appreciation (depreciation) on investment securities |
|
4,950,722 |
|
Net gain (loss) |
|
3,705,266 |
|
Net increase (decrease) in net assets resulting from operations |
|
$ 3,584,425 |
|
Other Information |
|
|
|
Sales charges paid to FDC |
|
$ 36,927 |
|
Deferred sales charges withheld by FDC |
|
$ 1,500 |
|
Exchange fees withheld by FSC |
|
$ 1,178 |
|
Expense reductions |
|
|
|
Directed brokerage arrangements |
|
$ 13,259 |
|
Custodian credits |
|
126 |
|
|
|
$ 13,385 |
See accompanying notes which are an integral part of the financial statements.
Semiannual Report
Environmental Services Portfolio
Financial Statements - continued
Statement of Changes in Net Assets
|
Increase (Decrease) in Net Assets |
Six months ended |
Year ended |
|
Operations |
$ (120,841) |
$ (281,563) |
|
Net realized gain (loss) |
(1,245,456) |
(576,637) |
|
Change in net unrealized appreciation (depreciation) |
4,950,722 |
(3,731,086) |
|
Net increase (decrease) in net assets resulting from operations |
3,584,425 |
(4,589,286) |
|
Distributions to shareholders in excess of net realized gain |
- |
(11,275) |
|
Share transactions |
11,420,351 |
36,121,444 |
|
Reinvestment of distributions |
- |
10,778 |
|
Cost of shares redeemed |
(11,916,318) |
(29,576,762) |
|
Net increase (decrease) in net assets resulting from share transactions |
(495,967) |
6,555,460 |
|
Redemption fees |
29,791 |
64,679 |
|
Total increase (decrease) in net assets |
3,118,249 |
2,019,578 |
|
Net Assets |
|
|
|
Beginning of period |
17,553,139 |
15,533,561 |
|
End of period (including accumulated net investment loss of $120,841 and $0, respectively) |
$ 20,671,388 |
$ 17,553,139 |
|
Other Information Shares |
|
|
|
Sold |
1,081,224 |
2,977,437 |
|
Issued in reinvestment of distributions |
- |
885 |
|
Redeemed |
(1,159,270) |
(2,361,044) |
|
Net increase (decrease) |
(78,046) |
617,278 |
Financial Highlights
|
|
Six months ended |
Years ended February 28, |
||||
|
Selected Per-Share Data |
(Unaudited) |
2000 F |
1999 |
1998 |
1997 |
1996 F |
|
Net asset value, beginning of period |
$ 9.57 |
$ 12.77 |
$ 16.46 |
$ 14.50 |
$ 12.42 |
$ 10.27 |
|
Income from Investment Operations |
|
|
|
|
|
|
|
Net investment income (loss) D |
(.07) |
(.21) |
(.18) |
(.13) |
(.08) |
(.17) |
|
Net realized and unrealized gain (loss) |
2.25 |
(3.03) |
(3.50) |
2.07 |
2.04 |
2.95 |
|
Total from investment operations |
2.18 |
(3.24) |
(3.68) |
1.94 |
1.96 |
2.78 |
|
Less Distributions |
|
|
|
|
|
|
|
From net realized gain |
- |
- |
- |
- |
- |
(.65) |
|
In excess of net realized gain |
- |
(.01) |
(.03) |
- |
(.02) |
- |
|
Total distributions |
- |
(.01) |
(.03) |
- |
(.02) |
(.65) |
|
Redemption fees added to paid in capital |
.02 |
.05 |
.02 |
.02 |
.14 |
.02 |
|
Net asset value, end of period |
$ 11.77 |
$ 9.57 |
$ 12.77 |
$ 16.46 |
$ 14.50 |
$ 12.42 |
|
Total Return B, C |
22.99% |
(25.00)% |
(22.23)% |
13.52% |
16.93% |
27.49% |
|
Ratios and Supplemental Data |
|
|
|
|
|
|
|
Net assets, end of period (000 omitted) |
$ 20,671 |
$ 17,553 |
$ 15,534 |
$ 25,183 |
$ 32,525 |
$ 27,587 |
|
Ratio of expenses to average net assets |
2.10% A |
2.47% |
2.20% |
2.23% |
2.18% |
2.36% |
|
Ratio of expenses to average net assets after |
1.95% A, E |
2.39% E |
2.16% E |
2.22% E |
2.11% E |
2.32% E |
|
Ratio of net investment income (loss) to average net assets |
(1.36)% A |
(1.76)% |
(1.23)% |
(.84)% |
(.59)% |
(1.43)% |
|
Portfolio turnover rate |
174% A |
206% |
123% |
59% |
252% |
138% |
|
A Annualized B The total returns would have been lower had certain expenses not been reduced during the periods shown. C Total returns do not include the one time sales
charge and for periods of less than one year are not annualized. |
||||||
See accompanying notes which are an integral part of the financial statements.
Cyclicals Sector
Performance
There are several ways to evaluate a fund's historical performance. You can look at the total percentage change in value, the average annual percentage change or the growth of a hypothetical $10,000 investment. Total return reflects the change in the value of an investment, assuming reinvestment of the fund's dividend income and capital gains (the profits earned upon the sale of securities that have grown in value). Load adjusted returns include a 3.00% sales charge and the effect of a $7.50 long-term trading fee for shares held 30 days or more. Effective September 28, 2000, the $7.50 long-term trading fee was eliminated. If Fidelity had not reimbursed certain fund expenses, the past 10 year total returns would have been lower.
Cumulative Total Returns
|
Periods ended |
Past 6 |
Past 1 |
Past 5 |
Past 10 |
|
Select Industrial Equipment |
8.82% |
9.96% |
106.62% |
412.19% |
|
Select Industrial Equipment |
5.48% |
6.59% |
100.35% |
396.75% |
|
S&P 500 |
11.73% |
16.32% |
193.58% |
493.54% |
|
GS Cyclical Industries |
12.70% |
-3.99% |
n/a** |
n/a** |
Cumulative total returns show the fund's performance in percentage terms over a set period - in this case, six months, one year, five years or 10 years. You can compare the fund's returns to the performance of both the Standard & Poor's 500 Index - a market capitalization-weighted index of common stocks - and the Goldman Sachs Cyclical Industries Index - a market capitalization-weighted index of 253 stocks designed to measure the performance of companies in the cyclical industries sector. These benchmarks include reinvestment of dividends and capital gains, if any, and exclude the effect of sales charges.
Average Annual Total Returns
|
Periods ended |
Past 1 |
Past 5 |
Past 10 |
|
Select Industrial Equipment |
9.96% |
15.62% |
17.75% |
|
Select Industrial Equipment |
6.59% |
14.91% |
17.39% |
|
S&P 500 |
16.32% |
24.04% |
19.49% |
|
GS Cyclical Industries |
-3.99% |
n/a** |
n/a** |
Average annual returns take the fund's cumulative return and show you what would have happened if the fund had performed at a constant rate each year.
** Not available
Understanding Performance
How a fund did yesterday is no guarantee of how it will do tomorrow. The stock market, for example, has a history of long-term growth and short-term volatility. Unlike the broader market, however, some sectors may not have a history of growth in the long run. And, as with all stock funds, the share price and return of a fund that invests in a sector will vary.
3$10,000 Over 10 Years
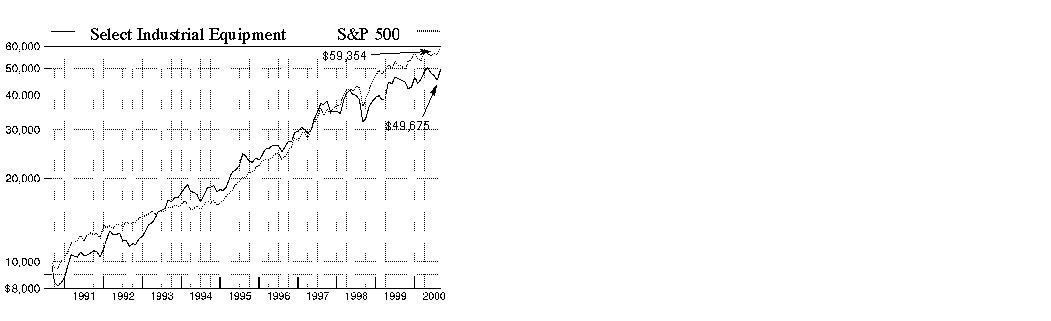
$10,000 Over 10 Years: Let's say hypothetically that $10,000 was invested in Fidelity Select Industrial Equipment Portfolio on August 31, 1990, and the current 3.00% sales charge was paid. As the chart shows, by August 31, 2000, the value of the investment would have grown to $49,675 - a 396.75% increase on the initial investment - and includes the effect of a $7.50 long-term trading fee. For comparison, look at how the Standard & Poor's 500 Index did over the same period. With dividends and capital gains, if any, reinvested, the same $10,000 investment would have grown to $59,354 - a 493.54% increase.
Investment Summary
|
Top Ten Stocks as of August 31, 2000 |
|
|
|
% of fund's |
|
Tyco International Ltd. |
7.8 |
|
Emerson Electric Co. |
6.4 |
|
Applied Materials, Inc. |
5.4 |
|
General Electric Co. |
5.2 |
|
Illinois Tool Works, Inc. |
5.2 |
|
Ingersoll-Rand Co. |
4.5 |
|
Caterpillar, Inc. |
3.9 |
|
Millipore Corp. |
3.5 |
|
Halliburton Co. |
3.4 |
|
KLA-Tencor Corp. |
3.3 |
|
|
48.6 |
Top Industries as of August 31, 2000
% of fund's net assets

Semiannual Report
(Portfolio Manager photograph)
Praveen Abichandani, Portfolio Manager of
Fidelity Select Industrial Equipment Portfolio
Q. How did the fund perform, Praveen?
A. For the six months that ended August 31, 2000, the fund returned 8.82%. In comparison, the Goldman Sachs Cyclical Industries Index - an index of 253 stocks designed to measure the performance of companies in the cyclical industries sector - returned 12.70%, while the Standard & Poor's 500 Index returned 11.73%. For the 12 months ending August 31, 2000, the fund returned 9.96%, while the Goldman Sachs index returned -3.99% and the S&P 500 index had a return of 16.32%.
Q. What factors affected performance?
A. The potential of a slowing economy held back the performance of many industrial equipment companies, particularly heavy equipment manufacturers such as Caterpillar and Deere. Semiconductor equipment stocks performed well through April and then suddenly fell, as investors anticipated a downturn in the semiconductor cycle. However, opportunities developed because of the increased need for power generation equipment, the rapidly growing demand for oil services equipment and the development of new technologies for telecommunications equipment. In recent years, investments in power generating equipment have lagged, while the development of new, power-hungry technologies and appliances boosted demand. Similarly, the oil and gas industries did not invest in drilling and services equipment when energy prices were low. Now, with rising oil and gas prices, the demand for oil services equipment is increasing. Finally, the expansion of telecommunications services has generated greater demand for equipment, especially fiber-optic components. The fund underperformed the Goldman Sachs Cyclical Industries Index primarily because I had little exposure to defense and aerospace stocks, which did quite well.
Q. What were your principal strategies during the six-month period?
A. I tried to balance growth and value, with an eye toward stocks with reasonable valuations. I wanted to to find companies that were benefiting from the power generation, energy services and fiber-optic themes. I also tried to take advantage of the sell-off in technology-related stocks in April to increase the fund's emphasis on growth. For example, I held on to semiconductor equipment stocks during the tech slump because I felt another growth leg was coming. However, I de-emphasized companies that produce equipment that tests and measures semiconductor chips.
Q. What stocks supported the fund's performance?
A. General Electric and Emerson Electric were two stocks that did very well, helped by the increased demand for power equipment. In energy services, Halliburton and Weatherford Industries helped performance as investments in oil- and gas-related equipment reached record levels. Corning and PerkinElmer performed very well as they reoriented their research-and-development skills toward newer growth applications. Ingersoll-Rand, which manufactures construction equipment, also helped, as did i2 Technologies, with its supply-chain software. I sold the position in i2 before the end of the period. NEC Corp., an aggressive player in the Japanese technology market, also performed well.
Q. What stocks were disappointments?
A. Kulicke & Soffa and Teradyne, two semiconductor test equipment manufacturers, had disappointing performance. I reduced the Teradyne position and eliminated Kulicke & Soffa. Pitney Bowes and Electronics for Imaging both performed poorly in a weak market for office automation equipment. Honeywell was another disappointment, as it missed second quarter earnings estimates.
Q. What is your outlook?
A. The economy appears to be slowing. Many industrial equipment stocks still are selling at deeply discounted levels that reflect expectations that the economy will fall into a recession. This is particularly true of heavy equipment companies such as Caterpillar and Ingersoll-Rand. Similarly, many semiconductor equipment stock prices reflect the fear that we may be nearing an end to the current semiconductor cycle. At current prices, many of these stocks have reasonable valuations unless the very worst fears turn out to be true. The big question facing these companies is the extent to which economic growth will slow. In this environment, I will continue to look at individual companies that can provide growth and that also have some defensive characteristics, such as defense, aerospace and software stocks.
The views expressed in this report reflect those of the portfolio manager only through the end of the period of the report as stated on the cover. The manager's views are subject to change at any time based on market or other conditions. For more information, see page 3.
Fund Facts
Start date: September 29, 1986
Fund number: 510
Trading symbol: FSCGX
Size: as of August 31, 2000, more than $27 million
Manager: Praveen Abichandani, since January 2000; equity analyst, cable services and equipment, 1998-2000; joined Fidelity in 1998
3Semiannual Report
Industrial Equipment Portfolio
(Unaudited)
Showing Percentage of Net Assets
|
Common Stocks - 94.3% |
|||
|
Shares |
Value (Note 1) |
||
|
AEROSPACE & DEFENSE - 6.3% |
|||
|
Honeywell International, Inc. |
14,025 |
$ 540,839 |
|
|
Rockwell International Corp. |
14,400 |
582,300 |
|
|
Textron, Inc. |
10,700 |
599,869 |
|
|
TOTAL AEROSPACE & DEFENSE |
1,723,008 |
||
|
AUTOS, TIRES, & ACCESSORIES - 0.5% |
|||
|
TRW, Inc. |
3,100 |
141,631 |
|
|
BUILDING MATERIALS - 2.1% |
|||
|
American Standard Companies, Inc. (a) |
6,200 |
287,138 |
|
|
Fastenal Co. |
1,700 |
108,588 |
|
|
York International Corp. |
7,500 |
186,563 |
|
|
TOTAL BUILDING MATERIALS |
582,289 |
||
|
CELLULAR - 0.9% |
|||
|
Nextel Communications, Inc. Class A (a) |
4,500 |
249,469 |
|
|
COMMUNICATIONS EQUIPMENT - 4.5% |
|||
|
Corning, Inc. |
2,050 |
672,272 |
|
|
NEC Corp. ADR |
3,800 |
550,525 |
|
|
TOTAL COMMUNICATIONS EQUIPMENT |
1,222,797 |
||
|
COMPUTER SERVICES & SOFTWARE - 2.7% |
|||
|
Adobe Systems, Inc. |
1,500 |
195,000 |
|
|
Computer Associates International, Inc. |
3,500 |
111,125 |
|
|
Electronics for Imaging, Inc. (a) |
11,000 |
286,000 |
|
|
Intertrust Technologies Corp. |
5,000 |
80,313 |
|
|
Rational Software Corp. (a) |
500 |
64,344 |
|
|
TOTAL COMPUTER SERVICES & SOFTWARE |
736,782 |
||
|
COMPUTERS & OFFICE EQUIPMENT - 4.5% |
|||
|
International Business Machines Corp. |
2,850 |
376,200 |
|
|
Pitney Bowes, Inc. |
16,600 |
606,938 |
|
|
Xerox Corp. |
15,000 |
240,938 |
|
|
TOTAL COMPUTERS & OFFICE EQUIPMENT |
1,224,076 |
||
|
ELECTRICAL EQUIPMENT - 12.3% |
|||
|
Emerson Electric Co. |
26,100 |
1,727,494 |
|
|
General Electric Co. |
24,150 |
1,417,303 |
|
|
Hubbell, Inc. Class B |
200 |
5,175 |
|
|
Roper Industries, Inc. |
6,000 |
194,250 |
|
|
W.W. Grainger, Inc. |
300 |
8,663 |
|
|
TOTAL ELECTRICAL EQUIPMENT |
3,352,885 |
||
|
ELECTRONIC INSTRUMENTS - 13.5% |
|||
|
Applied Materials, Inc. (a) |
17,000 |
1,467,313 |
|
|
KLA-Tencor Corp. (a) |
13,700 |
899,063 |
|
|
|
|||
|
Shares |
Value (Note 1) |
||
|
LAM Research Corp. (a) |
14,785 |
$ 445,398 |
|
|
Novellus Systems, Inc. (a) |
6,000 |
369,375 |
|
|
PerkinElmer, Inc. |
1,800 |
161,888 |
|
|
Teradyne, Inc. (a) |
5,100 |
330,544 |
|
|
TOTAL ELECTRONIC INSTRUMENTS |
3,673,581 |
||
|
ELECTRONICS - 3.2% |
|||
|
International Rectifier Corp. (a) |
3,500 |
220,281 |
|
|
Linear Technology Corp. |
2,500 |
179,844 |
|
|
Power-One, Inc. (a) |
3,000 |
475,313 |
|
|
TOTAL ELECTRONICS |
875,438 |
||
|
ENERGY SERVICES - 7.4% |
|||
|
Baker Hughes, Inc. |
4,100 |
149,906 |
|
|
Halliburton Co. |
17,300 |
916,900 |
|
|
Smith International, Inc. (a) |
3,400 |
270,300 |
|
|
Weatherford International, Inc. |
14,200 |
666,513 |
|
|
TOTAL ENERGY SERVICES |
2,003,619 |
||
|
INDUSTRIAL MACHINERY & EQUIPMENT - 30.0% |
|||
|
AGCO Corp. |
3,600 |
37,800 |
|
|
Caterpillar, Inc. |
29,200 |
1,073,100 |
|
|
CNH Global NV |
34,800 |
341,475 |
|
|
Deere & Co. |
10,300 |
339,256 |
|
|
Dover Corp. |
16,300 |
796,663 |
|
|
Illinois Tool Works, Inc. |
25,100 |
1,407,169 |
|
|
Ingersoll-Rand Co. |
26,600 |
1,211,963 |
|
|
Kennametal, Inc. |
21 |
538 |
|
|
Milacron, Inc. |
7,300 |
112,694 |
|
|
MSC Industrial Direct, Inc. (a) |
10,000 |
162,500 |
|
|
Pall Corp. |
1,800 |
38,475 |
|
|
Parker-Hannifin Corp. |
14,700 |
511,744 |
|
|
Tyco International Ltd. |
37,100 |
2,114,690 |
|
|
TOTAL INDUSTRIAL MACHINERY & EQUIPMENT |
8,148,067 |
||
|
MEDICAL EQUIPMENT & SUPPLIES - 3.5% |
|||
|
Millipore Corp. |
15,700 |
955,738 |
|
|
OIL & GAS - 1.3% |
|||
|
Grant Prideco, Inc. (a) |
15,200 |
357,200 |
|
|
PAPER & FOREST PRODUCTS - 0.0% |
|||
|
Trex Co., Inc. (a) |
1 |
31 |
|
|
RETAIL & WHOLESALE, MISCELLANEOUS - 0.1% |
|||
|
Stamps.com, Inc. (a) |
1,800 |
11,813 |
|
|
SERVICES - 0.9% |
|||
|
Ritchie Bros. Auctioneers, Inc. (a) |
12,500 |
253,125 |
|
|
TELEPHONE SERVICES - 0.6% |
|||
|
Illuminet Holdings, Inc. |
3,750 |
149,063 |
|
|
TOTAL COMMON STOCKS (Cost $19,201,372) |
25,660,612 |
||
|
Cash Equivalents - 5.3% |
|||
|
Shares |
Value (Note 1) |
||
|
Fidelity Cash Central Fund, 6.59% (b) |
1,448,841 |
$ 1,448,841 |
|
|
TOTAL INVESTMENT PORTFOLIO - 99.6% (Cost $20,650,213) |
27,109,453 |
||
|
NET OTHER ASSETS - 0.4% |
100,771 |
||
|
NET ASSETS - 100% |
$ 27,210,224 |
||
|
Legend |
|
(a) Non-income producing |
|
(b) The rate quoted is the annualized seven-day yield of the fund at |
|
Other Information |
|
Purchases and sales of securities, other than short-term securities, |
|
The fund placed a portion of its portfolio transactions with brokerage firms which are affiliates of Fidelity Management & Research Company. The commissions paid to these affiliated firms were $451 for the period. |
|
Income Tax Information |
|
At August 31, 2000, the aggregate cost of investment securities for income tax purposes was $20,732,397. Net unrealized appreciation aggregated $6,377,056, of which $8,533,126 related to appreciated investment securities and $2,156,070 related to depreciated investment securities. |
See accompanying notes which are an integral part of the financial statements.
Cyclicals Sector
Statement of Assets and Liabilities
|
|
August 31, 2000 (Unaudited) |
|
|
Assets |
|
|
|
Investment in securities, at value |
|
$ 27,109,453 |
|
Receivable for investments sold |
|
222,619 |
|
Receivable for fund shares sold |
|
124,944 |
|
Dividends receivable |
|
35,151 |
|
Interest receivable |
|
4,155 |
|
Redemption fees receivable |
|
296 |
|
Other receivables |
|
8,000 |
|
Total assets |
|
27,504,618 |
|
Liabilities |
|
|
|
Payable for investments purchased |
$ 97,556 |
|
|
Payable for fund shares redeemed |
161,505 |
|
|
Accrued management fee |
12,392 |
|
|
Other payables and |
22,941 |
|
|
Total liabilities |
|
294,394 |
|
Net Assets |
|
$ 27,210,224 |
|
Net Assets consist of: |
|
|
|
Paid in capital |
|
$ 18,391,265 |
|
Accumulated net investment (loss) |
|
(31,656) |
|
Accumulated undistributed net realized gain (loss) on investments and foreign currency transactions |
|
2,391,375 |
|
Net unrealized appreciation (depreciation) on investments |
|
6,459,240 |
|
Net Assets, for 960,529 shares outstanding |
|
$ 27,210,224 |
|
Net Asset Value and redemption price per share ($27,210,224 ÷ 960,529 shares) |
|
$28.33 |
|
Maximum offering price per share (100/97.00 of $28.33) |
|
$29.21 |
Statement of Operations
|
|
Six months ended August 31, 2000 (Unaudited) |
|
|
Investment Income Dividends |
|
$ 155,136 |
|
Interest |
|
17,270 |
|
Security lending |
|
686 |
|
Total income |
|
173,092 |
|
Expenses |
|
|
|
Management fee |
$ 79,138 |
|
|
Transfer agent fees |
66,522 |
|
|
Accounting and security lending fees |
30,441 |
|
|
Non-interested trustees' compensation |
44 |
|
|
Custodian fees and expenses |
4,769 |
|
|
Registration fees |
18,589 |
|
|
Audit |
5,337 |
|
|
Legal |
94 |
|
|
Miscellaneous |
29 |
|
|
Total expenses before reductions |
204,963 |
|
|
Expense reductions |
(215) |
204,748 |
|
Net investment income (loss) |
|
(31,656) |
|
Realized and Unrealized Gain (Loss) Net realized gain (loss) on: |
|
|
|
Investment securities |
2,483,224 |
|
|
Foreign currency transactions |
438 |
2,483,662 |
|
Change in net unrealized appreciation (depreciation) on investment securities |
|
(303,761) |
|
Net gain (loss) |
|
2,179,901 |
|
Net increase (decrease) in net assets resulting from operations |
|
$ 2,148,245 |
|
Other Information |
|
|
|
Sales charges paid to FDC |
|
$ 21,955 |
|
Deferred sales charges withheld by FDC |
|
$ 158 |
|
Exchange fees withheld by FSC |
|
$ 660 |
|
Expense reductions |
|
|
|
Directed brokerage arrangements |
|
$ 194 |
|
Transfer agent credits |
|
21 |
|
|
|
$ 215 |
See accompanying notes which are an integral part of the financial statements.
Semiannual Report
Industrial Equipment Portfolio
Financial Statements - continued
Statement of Changes in Net Assets
|
Increase (Decrease) in Net Assets |
Six months ended |
Year ended |
|
Operations |
$ (31,656) |
$ 21,840 |
|
Net realized gain (loss) |
2,483,662 |
4,990,892 |
|
Change in net unrealized appreciation (depreciation) |
(303,761) |
629,706 |
|
Net increase (decrease) in net assets resulting from operations |
2,148,245 |
5,642,438 |
|
Distributions to shareholders |
- |
(10,963) |
|
From net realized gain |
(386,550) |
(3,692,055) |
|
Total distributions |
(386,550) |
(3,703,018) |
|
Share transactions |
7,894,498 |
27,153,867 |
|
Reinvestment of distributions |
369,599 |
3,534,052 |
|
Cost of shares redeemed |
(8,948,368) |
(38,134,454) |
|
Net increase (decrease) in net assets resulting from share transactions |
(684,271) |
(7,446,535) |
|
Redemption fees |
15,656 |
51,097 |
|
Total increase (decrease) in net assets |
1,093,080 |
(5,456,018) |
|
Net Assets |
|
|
|
Beginning of period |
26,117,144 |
31,573,162 |
|
End of period (including undistributed net investment income (loss) of $(31,656) and $11,392, respectively) |
$ 27,210,224 |
$ 26,117,144 |
|
Other Information Shares |
|
|
|
Sold |
284,555 |
949,014 |
|
Issued in reinvestment of distributions |
13,659 |
142,239 |
|
Redeemed |
(327,689) |
(1,352,644) |
|
Net increase (decrease) |
(29,475) |
(261,391) |
Financial Highlights
|
|
Six months ended |
Years ended February 28, |
||||
|
Selected Per-Share Data |
(Unaudited) |
2000 F |
1999 |
1998 |
1997 |
1996 F |
|
Net asset value, beginning of period |
$ 26.38 |
$ 25.23 |
$ 25.91 |
$ 25.51 |
$ 25.11 |
$ 20.04 |
|
Income from Investment Operations |
|
|
|
|
|
|
|
Net investment income (loss) D |
(.03) |
.02 |
(.04) |
(.08) |
.06 |
.04 |
|
Net realized and unrealized gain (loss) |
2.32 |
4.44 |
.25 |
5.73 |
4.15 |
7.10 |
|
Total from investment operations |
2.29 |
4.46 |
.21 |
5.65 |
4.21 |
7.14 |
|
Less Distributions |
|
|
|
|
|
|
|
From net investment income |
- |
(.01) |
- |
(.02) |
(.04) |
(.05) |
|
From net realized gain |
(.36) |
(3.34) |
(.92) |
(5.26) |
(3.84) |
(2.05) |
|
Total distributions |
(.36) |
(3.35) |
(.92) |
(5.28) |
(3.88) |
(2.10) |
|
Redemption fees added to paid in capital |
.02 |
.04 |
.03 |
.03 |
.07 |
.03 |
|
Net asset value, end of period |
$ 28.33 |
$ 26.38 |
$ 25.23 |
$ 25.91 |
$ 25.51 |
$ 25.11 |
|
Total Return B, C |
8.82% |
18.98% |
1.00% |
25.76% |
18.25% |
36.86% |
|
Ratios and Supplemental Data |
|
|
|
|
|
|
|
Net assets, end of period (000 omitted) |
$ 27,210 |
$ 26,117 |
$ 31,573 |
$ 50,428 |
$ 102,882 |
$ 137,520 |
|
Ratio of expenses to average net assets |
1.46% A |
1.43% |
1.43% |
1.67% |
1.51% |
1.54% |
|
Ratio of expenses to average net assets after |
1.45% A, E |
1.41% E |
1.41% E |
1.60% E |
1.44% E |
1.53% E |
|
Ratio of net investment income (loss) to average net assets |
(.22)% A |
.06% |
(.16)% |
(.32)% |
.25% |
.19% |
|
Portfolio turnover rate |
47% A |
119% |
84% |
115% |
261% |
115% |
|
A Annualized B The total returns would have been lower had certain expenses not been reduced during the periods shown. C Total returns do not include the one time sales
charge and for periods of less than one year are not annualized. |
||||||
See accompanying notes which are an integral part of the financial statements.
Cyclicals Sector
Performance
There are several ways to evaluate a fund's historical performance. You can look at the total percentage change in value, the average annual percentage change or the growth of a hypothetical $10,000 investment. Total return reflects the change in the value of an investment, assuming reinvestment of the fund's dividend income and capital gains (the profits earned upon the sale of securities that have grown in value). Load adjusted returns include a 3.00% sales charge and the effect of a $7.50 long-term trading fee for shares held 30 days or more. Effective September 28, 2000, the $7.50 long-term trading fee was eliminated. If Fidelity had not reimbursed certain fund expenses, the past 10 year total returns would have been lower.
Cumulative Total Returns
|
Periods ended |
Past 6 |
Past 1 |
Past 5 |
Past 10 |
|
Select Industrial Materials |
4.63% |
-10.27% |
-2.66% |
138.32% |
|
Select Industrial Materials |
1.42% |
-13.03% |
-5.65% |
131.10% |
|
S&P 500 |
11.73% |
16.32% |
193.58% |
493.54% |
|
GS Cyclical Industries |
12.70% |
-3.99% |
n/a** |
n/a** |
Cumulative total returns show the fund's performance in percentage terms over a set period - in this case, six months, one year, five years or 10 years. You can compare the fund's returns to the performance of both the Standard & Poor's 500 Index - a market capitalization-weighted index of common stocks - and the Goldman Sachs Cyclical Industries Index - a market capitalization-weighted index of 253 stocks designed to measure the performance of companies in the cyclical industries sector. These benchmarks include reinvestment of dividends and capital gains, if any, and exclude the effect of sales charges.
Average Annual Total Returns
|
Periods ended |
Past 1 |
Past 5 |
Past 10 |
|
Select Industrial Materials |
-10.27% |
-0.54% |
9.07% |
|
Select Industrial Materials |
-13.03% |
-1.16% |
8.74% |
|
S&P 500 |
16.32% |
24.04% |
19.49% |
|
GS Cyclical Industries |
-3.99% |
n/a** |
n/a** |
Average annual returns take the fund's cumulative return and show you what would have happened if the fund had performed at a constant rate each year.
** Not available
Understanding Performance
How a fund did yesterday is no guarantee of how it will do tomorrow. The stock market, for example, has a history of long-term growth and short-term volatility. Unlike the broader market, however, some sectors may not have a history of growth in the long run. And, as with all stock funds, the share price and return of a fund that invests in a sector will vary.
3$10,000 Over 10 Years
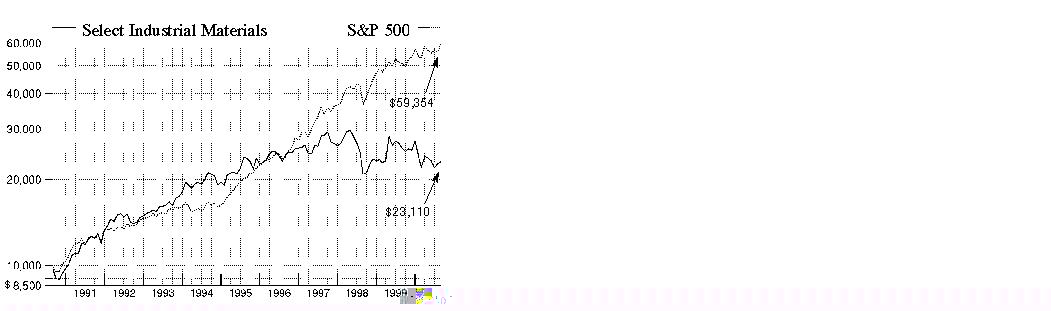
$10,000 Over 10 Years: Let's say hypothetically that $10,000 was invested in Fidelity Select Industrial Materials Portfolio on August 31, 1990, and the current 3.00% sales charge was paid. As the chart shows, by August 31, 2000, the value of the investment would have grown to $23,110 - a 131.10% increase on the initial investment - and includes the effect of a $7.50 long-term trading fee. For comparison, look at how the Standard & Poor's 500 Index did over the same period. With dividends and capital gains, if any, reinvested, the same $10,000 investment would have grown to $59,354 - a 493.54% increase.
Investment Summary
|
Top Ten Stocks as of August 31, 2000 |
|
|
|
% of fund's |
|
Minnesota Mining & Manufacturing Co. |
6.3 |
|
Alcoa, Inc. |
5.6 |
|
E.I. du Pont de Nemours and Co. |
5.2 |
|
Kimberly-Clark Corp. |
5.2 |
|
Canadian Pacific Ltd. |
4.6 |
|
Dow Chemical Co. |
3.9 |
|
International Paper Co. |
2.4 |
|
Burlington Northern Santa Fe Corp. |
2.2 |
|
Union Pacific Corp. |
2.2 |
|
FedEx Corp. |
2.0 |
|
|
39.6 |
Top Industries as of August 31, 2000
% of fund's net assets

Semiannual Report
(Portfolio Manager photograph)
Note to shareholders: Niel Marotta became Portfolio Manager of Fidelity Select Industrial Materials Portfolio on April 1, 2000.
Q. How did the fund perform, Niel?
A. The fund's returns lagged those of its benchmarks. For the six months that ended August 31, 2000, the fund returned 4.63%, compared with 12.70% for the Goldman Sachs Cyclical Industries Index - an index of 253 stocks designed to measure the performance of companies in the cyclical industries sector. The fund also fell short of the 11.73% return posted by the Standard & Poor's 500 Index during the same period. For the 12 months that ended August 31, 2000, the fund returned -10.27%, compared with -3.99% and 16.32% for the Goldman Sachs index and the S&P 500, respectively.
Q. Why did the fund underperform the indexes during the six-month period.
A. Commodity prices trended lower in a number of key market segments in which the fund was overweighted relative to the indexes, including chemicals, non-ferrous metals, and paper and forest products. For example, the prices of non-ferrous metals such as nickel and aluminum declined, dimming the earnings prospects of companies that mine those metals. Higher oil and gas prices also were a negative for industrial materials stocks because energy costs make up a high percentage of the overall cost of doing business for many companies in the sector. Another negative influence was the fact that a number of chemical holdings had exposure to the euro, which declined steadily during the period. A weaker euro hurts U.S. companies with euro-based revenues because those revenues are worth less when converted back into U.S. dollars. Finally, rising interest rates hurt industrial materials stocks because of the latter's cyclical nature - that is, they tend to underperform other market sectors when the economy is slowing.
Q. What is your management style?
A. I select positions for the fund using a stock-by-stock, bottom-up process rather than trying to base investment decisions on what the economy is going to do. I attempt to focus on companies with above-average returns on capital, healthy cash flows and high-quality managements. In addition, I try to select stocks that might benefit from consolidation activity such as leveraged buyouts or mergers.
Q. What stocks did well for the fund?
A. Kansas City Southern was one of the fund's most positive contributors. Investors reacted favorably when the company spun off subsidiary Stillwell Financial. Monsanto also helped performance. The company, primarily a manufacturer of agricultural chemicals and pharmaceuticals, benefited from the rotation back into pharmaceutical stocks that occurred in the wake of the sharp correction in biotechnology and technology stocks last spring. I liquidated the fund's position in Monsanto during that rotation. Another positive contributor, Fort James, had a nice rally in July due to a takeover bid by Georgia-Pacific. Canadian Pacific benefited from strength across all of its divisions. In particular, the company's oil and gas exploration and production assets enabled it to reap the benefits of higher energy prices.
Q. What about holdings that underperformed?
A. Dow Chemical and DuPont both turned in lackluster performances because of their European exposure, which made their revenues vulnerable to euro weakness. Higher raw materials prices also were a factor in the deteriorating earnings outlooks for both companies. International Paper and Georgia-Pacific were hurt by lower lumber prices.
Q. What's your outlook, Niel?
A. Stock valuations in the industrial materials sector are very modest at present. In fact, in many cases investors seem to be assuming a worst-case scenario for the economy. At this point, however, a soft landing - that is, slowing growth without recession - seems one possible outcome of the Fed's campaign to increase interest rates. Nonetheless, the combination of higher interest rates, low inflation and skyrocketing energy costs has made life difficult for industrial materials stocks. A reversal of one or more of these trends will probably be necessary to generate more interest in the sector. I will do my best to position the fund in the most promising stocks by emphasizing fundamental research and close contact with key management personnel.
The views expressed in this report reflect those of the portfolio manager only through the end of the period of the report as stated on the cover. The manager's views are subject to change at any time based on market or other conditions. For more information, see page 3.
Fund Facts
Start date: September 29, 1986
Fund number: 509
Trading symbol: FSDPX
Size: as of August 31, 2000, more than
$16 million
Manager: Niel Marotta, since April 2000; manager, Fidelity Select Gold Portfolio, since April 2000; analyst, Canadian companies, 1997-2000; joined Fidelity in 1997
3Semiannual Report
Industrial Materials Portfolio
(Unaudited)
Showing Percentage of Net Assets
|
Common Stocks - 93.2% |
|||
|
Shares |
Value (Note 1) |
||
|
AEROSPACE & DEFENSE - 1.0% |
|||
|
BFGoodrich Co. |
4,000 |
$ 163,250 |
|
|
BUILDING MATERIALS - 5.6% |
|||
|
Carlisle Companies, Inc. |
1,500 |
68,719 |
|
|
Lafarge Corp. |
2,741 |
66,812 |
|
|
Masco Corp. |
16,900 |
329,550 |
|
|
Sherwin-Williams Co. |
6,400 |
147,200 |
|
|
Southdown, Inc. |
1,200 |
75,300 |
|
|
USG Corp. |
2,000 |
64,375 |
|
|
Vulcan Materials Co. |
3,700 |
163,956 |
|
|
TOTAL BUILDING MATERIALS |
915,912 |
||
|
CHEMICALS & PLASTICS - 24.6% |
|||
|
Air Products & Chemicals, Inc. |
8,900 |
323,181 |
|
|
Avery Dennison Corp. |
4,200 |
227,063 |
|
|
Cabot Corp. |
2,600 |
96,200 |
|
|
Crompton Corp. |
5,095 |
45,855 |
|
|
Cytec Industries, Inc. (a) |
1,500 |
50,063 |
|
|
Dow Chemical Co. |
24,400 |
638,975 |
|
|
E.I. du Pont de Nemours and Co. |
19,100 |
857,113 |
|
|
Eastman Chemical Co. |
2,900 |
125,063 |
|
|
Engelhard Corp. |
4,500 |
84,375 |
|
|
FMC Corp. (a) |
1,100 |
74,594 |
|
|
Great Lakes Chemical Corp. |
2,300 |
77,625 |
|
|
Hercules, Inc. |
4,700 |
62,275 |
|
|
Lubrizol Corp. |
2,800 |
60,725 |
|
|
Lyondell Chemical Co. |
3,800 |
49,638 |
|
|
Millennium Chemicals, Inc. |
400 |
6,600 |
|
|
NOVA Chemicals Corp. |
1,800 |
36,086 |
|
|
PPG Industries, Inc. |
6,800 |
275,400 |
|
|
Praxair, Inc. |
5,800 |
256,650 |
|
|
Rohm & Haas Co. |
7,900 |
228,606 |
|
|
Sealed Air Corp. (a) |
2,900 |
148,806 |
|
|
Solutia, Inc. |
3,700 |
55,731 |
|
|
Spartech Corp. |
1,300 |
32,175 |
|
|
Union Carbide Corp. |
4,800 |
192,300 |
|
|
Valspar Corp. |
1,500 |
44,250 |
|
|
TOTAL CHEMICALS & PLASTICS |
4,049,349 |
||
|
CONSUMER DURABLES - 6.3% |
|||
|
Minnesota Mining & Manufacturing Co. |
11,200 |
1,041,594 |
|
|
DRUGS & PHARMACEUTICALS - 0.7% |
|||
|
Sigma-Aldrich Corp. |
3,700 |
107,531 |
|
|
HOUSEHOLD PRODUCTS - 0.2% |
|||
|
Aptargroup, Inc. |
1,500 |
34,969 |
|
|
IRON & STEEL - 2.0% |
|||
|
AK Steel Holding Corp. |
5,400 |
58,725 |
|
|
Allegheny Technologies, Inc. |
3,650 |
79,388 |
|
|
|
|||
|
Shares |
Value (Note 1) |
||
|
Nucor Corp. |
3,300 |
$ 121,275 |
|
|
USX - U.S. Steel Group |
3,700 |
64,288 |
|
|
TOTAL IRON & STEEL |
323,676 |
||
|
LEASING & RENTAL - 0.4% |
|||
|
Ryder System, Inc. |
3,100 |
59,481 |
|
|
METALS & MINING - 11.1% |
|||
|
Alcan Aluminium Ltd. |
8,000 |
262,317 |
|
|
Alcoa, Inc. |
27,908 |
927,941 |
|
|
Cominco Ltd. |
3,682 |
52,046 |
|
|
Falconbridge Ltd. |
19,700 |
255,036 |
|
|
Inco Ltd. (a) |
6,500 |
115,511 |
|
|
Martin Marietta Materials, Inc. |
1,900 |
76,000 |
|
|
Noranda, Inc. |
8,200 |
81,916 |
|
|
Phelps Dodge Corp. |
1,400 |
62,300 |
|
|
TOTAL METALS & MINING |
1,833,067 |
||
|
PACKAGING & CONTAINERS - 2.0% |
|||
|
Ball Corp. |
6 |
208 |
|
|
Bemis Co., Inc. |
2,100 |
70,350 |
|
|
Crown Cork & Seal Co., Inc. |
4,700 |
60,806 |
|
|
Owens-Illinois, Inc. (a) |
6,300 |
82,294 |
|
|
Packaging Corp. of America |
3,500 |
40,906 |
|
|
Sonoco Products Co. |
3,800 |
73,388 |
|
|
TOTAL PACKAGING & CONTAINERS |
327,952 |
||
|
PAPER & FOREST PRODUCTS - 19.2% |
|||
|
Abitibi-Consolidated, Inc. |
4,600 |
51,580 |
|
|
Boise Cascade Corp. |
2,287 |
68,324 |
|
|
Bowater, Inc. |
1,900 |
97,613 |
|
|
Consolidated Papers, Inc. |
3,300 |
129,731 |
|
|
Domtar, Inc. |
6,900 |
61,662 |
|
|
Fort James Corp. |
8,200 |
259,325 |
|
|
Georgia-Pacific Corp. |
6,500 |
173,875 |
|
|
International Paper Co. |
12,515 |
398,916 |
|
|
Kimberly-Clark Corp. |
14,600 |
854,100 |
|
|
Louisiana-Pacific Corp. |
5,400 |
57,038 |
|
|
Mead Corp. |
4,000 |
107,250 |
|
|
Pactiv Corp. (a) |
5,300 |
58,300 |
|
|
Potlatch Corp. |
1,700 |
57,163 |
|
|
Rayonier, Inc. |
1,700 |
70,656 |
|
|
Smurfit-Stone Container Corp. (a) |
8,100 |
106,313 |
|
|
Temple-Inland, Inc. |
1,900 |
80,631 |
|
|
Westvaco Corp. |
3,800 |
104,025 |
|
|
Weyerhaeuser Co. |
6,600 |
305,663 |
|
|
Willamette Industries, Inc. |
4,200 |
128,100 |
|
|
TOTAL PAPER & FOREST PRODUCTS |
3,170,265 |
||
|
PRECIOUS METALS - 2.5% |
|||
|
Agnico-Eagle Mines Ltd. |
8,300 |
49,072 |
|
|
Barrick Gold Corp. |
14,000 |
222,630 |
|
|
Common Stocks - continued |
|||
|
Shares |
Value (Note 1) |
||
|
PRECIOUS METALS - CONTINUED |
|||
|
Goldcorp, Inc. Class A (a) |
7,100 |
$ 50,421 |
|
|
Homestake Mining Co. |
4,200 |
23,363 |
|
|
Stillwater Mining Co. (a) |
1,850 |
62,900 |
|
|
TOTAL PRECIOUS METALS |
408,386 |
||
|
RAILROADS - 12.0% |
|||
|
Burlington Northern Santa Fe Corp. |
16,400 |
366,950 |
|
|
Canadian National Railway Co. |
8,000 |
232,416 |
|
|
Canadian Pacific Ltd. |
28,100 |
763,846 |
|
|
CSX Corp. |
7,900 |
188,613 |
|
|
Kansas City Southern Industries, Inc. |
2,100 |
19,425 |
|
|
Norfolk Southern Corp. |
3,400 |
54,613 |
|
|
Union Pacific Corp. |
9,000 |
357,750 |
|
|
TOTAL RAILROADS |
1,983,613 |
||
|
SECURITIES INDUSTRY - 0.4% |
|||
|
Franco Nevada Mining Corp. Ltd. |
5,942 |
62,590 |
|
|
SERVICES - 1.0% |
|||
|
Ecolab, Inc. |
4,400 |
171,325 |
|
|
SHIPPING - 0.2% |
|||
|
Teekay Shipping Corp. |
900 |
41,625 |
|
|
TRUCKING & FREIGHT - 4.0% |
|||
|
CNF Transportation, Inc. |
2,000 |
49,000 |
|
|
FedEx Corp. (a) |
8,200 |
330,870 |
|
|
Swift Transportation Co., Inc. (a) |
3,600 |
61,425 |
|
|
United Parcel Service, Inc. Class B |
3,000 |
166,313 |
|
|
USFreightways Corp. |
1,600 |
49,900 |
|
|
TOTAL TRUCKING & FREIGHT |
657,508 |
||
|
TOTAL COMMON STOCKS (Cost $15,981,562) |
15,352,093 |
||
|
Cash Equivalents - 12.6% |
|||
|
|
|
|
|
|
Fidelity Cash Central Fund, 6.59% (b) |
2,077,279 |
2,077,279 |
|
|
TOTAL INVESTMENT PORTFOLIO - 105.8% (Cost $18,058,841) |
17,429,372 |
|
NET OTHER ASSETS - (5.8)% |
(960,928) |
||
|
NET ASSETS - 100% |
$ 16,468,444 |
||
|
Legend |
|
(a) Non-income producing |
|
(b) The rate quoted is the annualized seven-day yield of the fund at |
|
Other Information |
|
Purchases and sales of securities, other than short-term securities, |
|
The fund placed a portion of its portfolio transactions with brokerage |
|
Distribution of investments by country of issue, as a percentage of total |
|
United States of America |
85.9% |
|
Canada |
13.9 |
|
Others (individually less than 1%) |
0.2 |
|
|
100.0% |
|
Income Tax Information |
|
At August 31, 2000, the aggregate cost of investment securities for income tax purposes was $18,326,202. Net unrealized depreciation aggregated $896,830, of which $1,264,619 related to appreciated investment securities and $2,161,449 related to depreciated investment securities. |
|
At February 29, 2000, the fund had a capital loss carryforward of approximately $2,206,000 of which $840,000 and $1,366,000 will |
See accompanying notes which are an integral part of the financial statements.
Cyclicals Sector
Statement of Assets and Liabilities
|
|
August 31, 2000 (Unaudited) |
|
|
Assets |
|
|
|
Investment in securities, at value |
|
$ 17,429,372 |
|
Foreign currency held at value |
|
6,405 |
|
Receivable for investments sold |
|
239,743 |
|
Receivable for fund shares sold |
|
43,279 |
|
Dividends receivable |
|
42,491 |
|
Interest receivable |
|
9,980 |
|
Redemption fees receivable |
|
344 |
|
Other receivables |
|
63,552 |
|
Total assets |
|
17,835,166 |
|
Liabilities |
|
|
|
Payable for investments purchased |
$ 1,102,811 |
|
|
Payable for fund shares redeemed |
232,670 |
|
|
Accrued management fee |
8,186 |
|
|
Other payables and |
23,055 |
|
|
Total liabilities |
|
1,366,722 |
|
Net Assets |
|
$ 16,468,444 |
|
Net Assets consist of: |
|
|
|
Paid in capital |
|
$ 20,999,277 |
|
Undistributed net investment income |
|
55,482 |
|
Accumulated undistributed net realized gain (loss) on investments and foreign currency transactions |
|
(3,956,885) |
|
Net unrealized appreciation (depreciation) on investments |
|
(629,430) |
|
Net Assets, for 802,262 |
|
$ 16,468,444 |
|
Net Asset Value and redemption price per share ($16,468,444 ÷ 802,262 shares) |
|
$20.53 |
|
Maximum offering price per share (100/97.00 of $20.53) |
|
$21.16 |
Statement of Operations
|
|
Six months ended August 31, 2000 (Unaudited) |
|
|
Investment Income Dividends |
|
$ 216,527 |
|
Interest |
|
49,610 |
|
Security lending |
|
373 |
|
Total income |
|
266,510 |
|
Expenses |
|
|
|
Management fee |
$ 62,524 |
|
|
Transfer agent fees |
73,690 |
|
|
Accounting and security lending fees |
30,415 |
|
|
Non-interested trustees' compensation |
50 |
|
|
Custodian fees and expenses |
13,450 |
|
|
Registration fees |
19,584 |
|
|
Audit |
5,157 |
|
|
Legal |
379 |
|
|
Miscellaneous |
24 |
|
|
Total expenses before reductions |
205,273 |
|
|
Expense reductions |
(1,698) |
203,575 |
|
Net investment income |
|
62,935 |
|
Realized and Unrealized Gain (Loss) Net realized gain (loss) on: |
|
|
|
Investment securities |
(895,104) |
|
|
Foreign currency transactions |
1,090 |
(894,014) |
|
Change in net unrealized appreciation (depreciation) on: |
|
|
|
Investment securities |
1,727,603 |
|
|
Assets and liabilities in |
35 |
1,727,638 |
|
Net gain (loss) |
|
833,624 |
|
Net increase (decrease) in net assets resulting from operations |
|
$ 896,559 |
|
Other Information |
|
|
|
Sales charges paid to FDC |
|
$ 68,491 |
|
Deferred sales charges withheld by FDC |
|
$ 283 |
|
Exchange fees withheld by FSC |
|
$ 2,430 |
|
Expense reductions |
|
|
|
Directed brokerage arrangements |
|
$ 1,698 |
See accompanying notes which are an integral part of the financial statements.
Semiannual Report
Industrial Materials Portfolio
Financial Statements - continued
Statement of Changes in Net Assets
|
Increase (Decrease) in Net Assets |
Six months ended |
Year ended |
|
Operations |
$ 62,935 |
$ 48,274 |
|
Net realized gain (loss) |
(894,014) |
(1,013,141) |
|
Change in net unrealized appreciation (depreciation) |
1,727,638 |
(2,555,778) |
|
Net increase (decrease) in net assets resulting from operations |
896,559 |
(3,520,645) |
|
Distributions to shareholders from net investment income |
(26,756) |
(28,030) |
|
Share transactions |
13,817,336 |
84,117,245 |
|
Reinvestment of distributions |
25,251 |
27,010 |
|
Cost of shares redeemed |
(18,916,460) |
(71,316,023) |
|
Net increase (decrease) in net assets resulting from share transactions |
(5,073,873) |
12,828,232 |
|
Redemption fees |
45,789 |
184,925 |
|
Total increase (decrease) in net assets |
(4,158,281) |
9,464,482 |
|
Net Assets |
|
|
|
Beginning of period |
20,626,725 |
11,162,243 |
|
End of period (including undistributed net investment income of $55,482 and $19,303, respectively) |
$ 16,468,444 |
$ 20,626,725 |
|
Other Information Shares |
|
|
|
Sold |
661,061 |
3,507,863 |
|
Issued in reinvestment of distributions |
1,155 |
1,180 |
|
Redeemed |
(910,116) |
(3,008,070) |
|
Net increase (decrease) |
(247,900) |
500,973 |
Financial Highlights
|
|
Six months ended |
Years ended February 28, |
||||
|
Selected Per-Share Data |
(Unaudited) |
2000 F |
1999 |
1998 |
1997 |
1996 F |
|
Net asset value, beginning of period |
$ 19.64 |
$ 20.32 |
$ 25.00 |
$ 27.66 |
$ 26.07 |
$ 23.13 |
|
Income from Investment Operations |
|
|
|
|
|
|
|
Net investment income (loss) D |
.06 |
.05 |
(.12) |
(.11) |
.06 |
.12 |
|
Net realized and unrealized gain (loss) |
.81 |
(.89) |
(4.60) |
1.43 |
3.12 |
2.92 |
|
Total from investment operations |
.87 |
(.84) |
(4.72) |
1.32 |
3.18 |
3.04 |
|
Less Distributions |
|
|
|
|
|
|
|
From net investment income |
(.02) |
(.03) |
- |
(.03) |
(.06) |
(.15) |
|
From net realized gain |
- |
- |
- |
(4.00) |
(1.57) |
- |
|
Total distributions |
(.02) |
(.03) |
- |
(4.03) |
(1.63) |
(.15) |
|
Redemption fees added to paid in capital |
.04 |
.19 |
.04 |
.05 |
.04 |
.05 |
|
Net asset value, end of period |
$ 20.53 |
$ 19.64 |
$ 20.32 |
$ 25.00 |
$ 27.66 |
$ 26.07 |
|
Total Return B, C |
4.63% |
(3.22)% |
(18.72)% |
6.59% |
12.69% |
13.38% |
|
Ratios and Supplemental Data |
|
|
|
|
|
|
|
Net assets, end of period (000 omitted) |
$ 16,468 |
$ 20,627 |
$ 11,162 |
$ 22,582 |
$ 66,462 |
$ 86,338 |
|
Ratio of expenses to average net assets |
1.85% A |
1.92% |
2.07% |
1.98% |
1.54% |
1.64% |
|
Ratio of expenses to average net assets |
1.83% A, E |
1.89% E |
2.04% E |
1.94% E |
1.51% E |
1.61% E |
|
Ratio of net investment income (loss) to average net assets |
.57% A |
.21% |
(.52)% |
(.42)% |
.23% |
.49% |
|
Portfolio turnover rate |
128% A |
257% |
82% |
118% |
105% |
138% |
|
A Annualized B The total returns would have been lower had certain expenses not been reduced during the periods shown. C Total returns do not include the one time sales
charge and for periods of less than one year are not annualized. |
See accompanying notes which are an integral part of the financial statements.
Cyclicals Sector
Performance
There are several ways to evaluate a fund's historical performance. You can look at the total percentage change in value, the average annual percentage change or the growth of a hypothetical $10,000 investment. Total return reflects the change in the value of an investment, assuming reinvestment of the fund's dividend income and capital gains (the profits earned upon the sale of securities that have grown in value). Load adjusted returns include a 3.00% sales charge and the effect of a $7.50 long-term trading fee for shares held 30 days or more. Effective September 28, 2000, the $7.50 long-term trading fee was eliminated. If Fidelity had not reimbursed certain fund expenses, the past 10 year total returns would have been lower.
Cumulative Total Returns
|
Periods ended |
Past 6 |
Past 1 |
Past 5 |
Past 10 |
|
Select Paper and |
2.29% |
-1.06% |
23.16% |
229.40% |
|
Select Paper and |
-0.85% |
-4.10% |
19.39% |
219.45% |
|
S&P 500 |
11.73% |
16.32% |
193.58% |
493.54% |
|
GS Cyclical Industries |
12.70% |
-3.99% |
n/a** |
n/a** |
Cumulative total returns show the fund's performance in percentage terms over a set period - in this case, six months, one year,
five years or 10 years. You can compare the fund's returns to the performance of both the Standard & Poor's 500 Index - a market capitalization-weighted index
of common stocks - and the Goldman Sachs Cyclical Industries Index - a market capitalization-weighted index of 253 stocks designed to measure the
performance of companies in the cyclical industries sector. These benchmarks include reinvestment of dividends and capital gains, if any, and exclude the effect
of sales charges.
Average Annual Total Returns
|
Periods ended |
Past 1 |
Past 5 |
Past 10 |
|
Select Paper and Forest Products |
-1.06% |
4.25% |
12.66% |
|
Select Paper and Forest Products |
-4.10% |
3.61% |
12.32% |
|
S&P 500 |
16.32% |
24.04% |
19.49% |
|
GS Cyclical Industries |
-3.99% |
n/a** |
n/a** |
Average annual returns take the fund's cumulative return and show you what would have happened if the fund had performed at a constant rate each year
** Not available
Understanding Performance
How a fund did yesterday is no guarantee of how it will do tomorrow. The stock market, for example, has a history of long-term growth and short-term volatility. Unlike the broader market, however, some sectors may not have a history of growth in the long run. And, as with all stock funds, the share price and return of a fund that invests in a sector will vary.
3$10,000 Over 10 Years
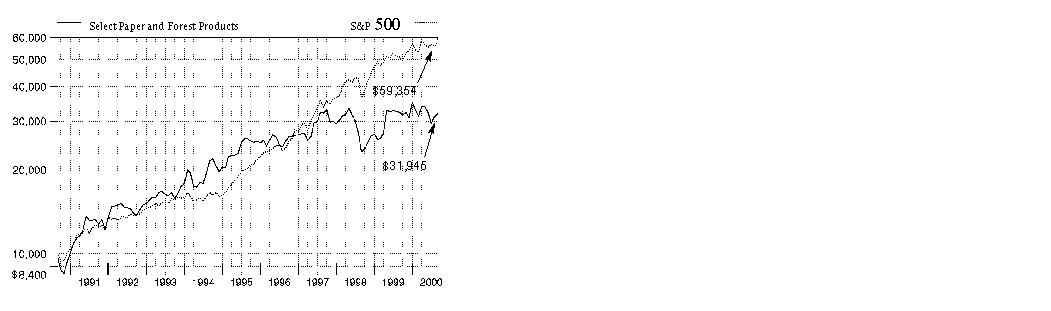
$10,000 Over 10 Years: Let's say hypothetically that $10,000 was invested in Fidelity Select Paper and Forest Products Portfolio on August 31, 1990, and the current 3.00% sales charge was paid. As the chart shows, by August 31, 2000, the value of the investment would have grown to $31,945 - a 219.45% increase on the initial investment - and includes the effect of a $7.50 long-term trading fee. For comparison, look at how the Standard & Poor's 500 Index did over the same period. With dividends and capital gains, if any, reinvested, the same $10,000 investment would have grown to $59,354 - a 493.54% increase.
Investment Summary
|
Top Ten Stocks as of August 31, 2000 |
|
|
|
% of fund's |
|
Fort James Corp. |
7.0 |
|
Georgia-Pacific Corp. |
5.5 |
|
International Paper Co. |
5.1 |
|
Bowater, Inc. |
5.0 |
|
Willamette Industries, Inc. |
4.9 |
|
Smurfit-Stone Container Corp. |
4.7 |
|
Georgia-Pacific Corp. - Timber Group |
4.7 |
|
Consolidated Papers, Inc. |
4.5 |
|
Mead Corp. |
4.2 |
|
Westvaco Corp. |
4.1 |
|
|
49.7 |
Top Industries as of August 31, 2000
% of fund's net assets

Semiannual Report
(Portfolio Manager photograph)
Adam Segel,
Portfolio Manager of Fidelity Select Paper & Forest Products Portfolio
Q. How did the fund perform, Adam?
A. For the six months that ended August 31, 2000, the fund returned 2.29%. The Goldman Sachs Cyclical Industries Index - an index of 253 stocks designed to measure the performance of companies in the cyclical industries sector - returned 12.70% during the period, while the Standard & Poor's 500 Index returned 11.73%. For the 12 months that ended August 31, 2000, the fund returned -1.06%. The Goldman Sachs index and S&P 500 returned -3.99% and 16.32%, respectively.
Q. What factors influenced the fund's performance?
A. The overall environment simply wasn't conducive to strong performance for the paper sector. Rising interest rates put a crimp in demand, as did the strength of the U.S. dollar versus overseas currencies. We also witnessed a slowdown in new home construction, which curtailed sales of lumber and other building products. On a positive note, a pickup in consolidation within the industry helped and the newsprint sub-group performed pretty well during the period.
Q. What trends occurred within the different paper grade groups, and how did they affect the fund's performance?
A. One general trend - and a negative one at that - was that inventories were high in most grades due to weak demand. This hurt groups such as containerboard and printing and writing papers. Pulp, the lead commodity for paper, was an exception during the period as we witnessed the lowest inventory levels for pulp since 1995. The newsprint grade - including stocks such as Bowater and Abitibi - performed well due to good supply/demand dynamics.
Q. What type of role did consolidation play during the period?
A. Consolidation was a big factor that mostly benefited the sector. By reducing the number of suppliers, producers can gain better control over prices, as well as capacity growth. In fact, the fund's two best performers during the period - Fort James and Champion International - were either acquired or in the process of being acquired at substantial premiums above their trading prices. The flip side of this was that the buying companies - Georgia-Pacific and International Paper - saw their stock values decline.
Q. Which other stocks performed well? Which proved disappointing?
A. Kimberly-Clark performed well relative to the sector. Because the company is a leading provider of tissue - and therefore more consumer product-oriented - its stock enjoyed a more attractive valuation than many other paper-related stocks. Buckeye Technologies - a leading manufacturer of cellulose-based specialty products - also performed well. In terms of disappointments, Canadian-based lumber companies Domtar and Tembec lagged, mainly due to the slowdown in home construction.
Q. What's your outlook for the next few months, Adam?
A. There are some catalysts in place for a potential rebound. Valuations, for instance, are at extremely low levels and this could provide a good impetus to own the stocks. Regarding interest rates, the Federal Reserve Board seems to have put the brakes on additional increases. If the Fed switches gears and decides to lower rates, paper stocks could get a nice boost. The supply outlook for the sector is relatively positive, and there isn't a lot of new capacity coming on. In fact, some companies may take some down time - or close down existing capacity altogether - to help offset the lack of demand. Lastly, there's always more room for consolidation. If demand can somehow pick up, it should alleviate some of the pressure on pulp prices.
The views expressed in this report reflect those of the portfolio manager only through the end of the period of the report as stated on the cover. The manager's views are subject to change at any time based on market or other conditions. For more information, see page 3.
Fund Facts
Start date: June 30, 1986
Fund number: 506
Trading symbol: FSPFX
Size: as of August 31, 2000, more than
$11 million
Manager: Adam Segel, since March 2000; analyst, cellular and wireless industries; furniture and appliance industries, since 1997; joined Fidelity in 1997
3Semiannual Report
Paper and Forest Products Portfolio
(Unaudited)
Showing Percentage of Net Assets
|
Common Stocks - 92.6% |
|||
|
Shares |
Value (Note 1) |
||
|
COMPUTERS & OFFICE EQUIPMENT - 3.6% |
|||
|
A.T. Cross & Co. Class A (a) |
77,389 |
$ 425,640 |
|
|
PACKAGING & CONTAINERS - 3.3% |
|||
|
Gaylord Container Corp. Class A (a) |
2,600 |
7,150 |
|
|
Longview Fibre Co. |
4,900 |
55,738 |
|
|
Packaging Corp. of America |
6,600 |
77,138 |
|
|
Sonoco Products Co. |
12,900 |
249,131 |
|
|
TOTAL PACKAGING & CONTAINERS |
389,157 |
||
|
PAPER & FOREST PRODUCTS - 84.5% |
|||
|
Abitibi-Consolidated, Inc. |
38,353 |
430,054 |
|
|
Alliance Forest Products, Inc. (a) |
2,100 |
25,831 |
|
|
Boise Cascade Corp. |
9,860 |
294,567 |
|
|
Bowater, Inc. |
11,417 |
586,548 |
|
|
Buckeye Technologies, Inc. (a) |
3,400 |
84,788 |
|
|
Canfor Corp. |
5,900 |
44,907 |
|
|
Caraustar Industries, Inc. |
3,529 |
54,479 |
|
|
Cascades, Inc. |
3,700 |
19,110 |
|
|
Chesapeake Corp. |
1,705 |
40,707 |
|
|
Consolidated Papers, Inc. |
13,384 |
526,159 |
|
|
Domtar, Inc. |
28,050 |
250,668 |
|
|
Fletcher Challenge Canada Ltd. |
14,500 |
174,907 |
|
|
Fort James Corp. |
26,244 |
829,961 |
|
|
Georgia-Pacific Corp. |
24,163 |
646,360 |
|
|
Georgia-Pacific Corp. - Timber Group |
18,853 |
552,629 |
|
|
International Paper Co. |
18,874 |
601,609 |
|
|
Jefferson Smurfit Group PLC |
700 |
1,355 |
|
|
Kimberly-Clark Corp. |
7,292 |
426,582 |
|
|
Louisiana-Pacific Corp. |
13,882 |
146,629 |
|
|
Mead Corp. |
18,411 |
493,645 |
|
|
Mercer International, Inc. (SBI) (a) |
48,713 |
481,041 |
|
|
Nexfor, Inc. |
4,100 |
22,151 |
|
|
P.H. Glatfelter Co. |
5,900 |
61,950 |
|
|
Potlatch Corp. |
4,100 |
137,863 |
|
|
Rayonier, Inc. |
3,700 |
153,781 |
|
|
Slocan Forest Products Ltd. |
5,400 |
34,862 |
|
|
Smurfit-Stone Container Corp. (a) |
42,300 |
555,188 |
|
|
Stora Enso Oyj |
5,323 |
48,689 |
|
|
Svenska Cellulosa AB (SCA) (B Shares) |
700 |
13,289 |
|
|
Tembec, Inc. Class A (a) |
7,400 |
76,690 |
|
|
Temple-Inland, Inc. |
8,977 |
380,961 |
|
|
UPM-Kymmene Corp. |
3,574 |
90,297 |
|
|
Wausau-Mosinee Paper Corp. |
5,100 |
45,263 |
|
|
West Fraser Timber Co. Ltd. |
3,500 |
68,977 |
|
|
Westvaco Corp. |
17,769 |
486,426 |
|
|
Weyerhaeuser Co. |
10,418 |
482,484 |
|
|
Willamette Industries, Inc. |
19,000 |
579,500 |
|
|
TOTAL PAPER & FOREST PRODUCTS |
9,950,907 |
||
|
PUBLISHING - 0.6% |
|||
|
Playboy Enterprises, Inc. Class B (non-vtg.) (a) |
5,300 |
77,844 |
|
|
|
|||
|
Shares |
Value (Note 1) |
||
|
REAL ESTATE INVESTMENT TRUSTS - 0.6% |
|||
|
Plum Creek Timber Co., Inc. (REIT) |
2,850 |
$ 69,113 |
|
|
TOTAL COMMON STOCKS (Cost $10,685,345) |
10,912,661 |
||
|
Cash Equivalents - 4.3% |
|||
|
|
|
|
|
|
Fidelity Cash Central Fund, 6.59% (b) |
438,822 |
438,822 |
|
|
Fidelity Securities Lending Cash Central Fund, 6.64% (b) |
65,000 |
65,000 |
|
|
TOTAL CASH EQUIVALENTS (Cost $503,822) |
503,822 |
||
|
TOTAL INVESTMENT PORTFOLIO - 96.9% (Cost $11,189,167) |
11,416,483 |
||
|
NET OTHER ASSETS - 3.1% |
360,077 |
||
|
NET ASSETS - 100% |
$ 11,776,560 |
||
|
Legend |
|
(a) Non-income producing |
|
(b) The rate quoted is the annualized seven-day yield of the fund at |
|
Other Information |
|
Purchases and sales of securities, other than short-term securities, aggregated $14,178,992 and $15,626,800, respectively. |
|
The fund placed a portion of its portfolio transactions with brokerage firms which are affiliates of Fidelity Management & Research Company. The commissions paid to these affiliated firms were $3,673 for the period. |
|
The fund participated in the security lending program. At period end, the value of securities loaned amounted to $63,050. The fund received cash collateral of $65,000 which was invested in cash equivalents. |
|
Distribution of investments by country of issue, as a percentage of total |
|
United States of America |
84.7% |
|
Canada |
14.0 |
|
Finland |
1.2 |
|
Others (individually less than 1%) |
0.1 |
|
|
100.0% |
|
Income Tax Information |
|
At August 31, 2000, the aggregate cost of investment securities for income tax purposes was $11,560,084. Net unrealized depreciation aggregated $143,601, of which $968,609 related to appreciated investment securities and $1,112,210 related to depreciated investment securities. |
|
At February 29, 2000, the fund had a capital loss carryforward of approximately $1,444,000 all of which will expire on February 28, 2007. |
|
The fund intends to elect to defer to its fiscal year ending February 28, 2001 approximately $1,496,000 of losses recognized during the period November 1, 1999 to February 29, 2000. |
See accompanying notes which are an integral part of the financial statements.
Semiannual Report
Statement of Assets and Liabilities
|
|
August 31, 2000 (Unaudited) |
|
|
Assets |
|
|
|
Investment in securities, at value |
|
$ 11,416,483 |
|
Receivable for investments sold |
|
726,098 |
|
Receivable for fund shares sold |
|
50,138 |
|
Dividends receivable |
|
25,633 |
|
Interest receivable |
|
6,909 |
|
Redemption fees receivable |
|
59 |
|
Other receivables |
|
1,148 |
|
Total assets |
|
12,226,468 |
|
Liabilities |
|
|
|
Payable for investments purchased |
$ 311,853 |
|
|
Payable for fund shares redeemed |
47,059 |
|
|
Accrued management fee |
6,093 |
|
|
Other payables and |
19,903 |
|
|
Collateral on securities loaned, |
65,000 |
|
|
Total liabilities |
|
449,908 |
|
Net Assets |
|
$ 11,776,560 |
|
Net Assets consist of: |
|
|
|
Paid in capital |
|
$ 15,196,357 |
|
Undistributed net investment income |
|
38,652 |
|
Accumulated undistributed net realized gain (loss) on investments and foreign currency transactions |
|
(3,686,553) |
|
Net unrealized appreciation (depreciation) on investments |
|
228,104 |
|
Net Assets, for 520,278 |
|
$ 11,776,560 |
|
Net Asset Value and redemption price per share ($11,776,560 ÷ 520,278 shares) |
|
$22.64 |
|
Maximum offering price per share (100/97.00 of $22.64) |
|
$23.34 |
Statement of Operations
|
|
Six months ended August 31, 2000 (Unaudited) |
|
|
Investment Income Dividends |
|
$ 164,788 |
|
Interest |
|
33,127 |
|
Security lending |
|
2,405 |
|
Total income |
|
200,320 |
|
Expenses |
|
|
|
Management fee |
$ 37,386 |
|
|
Transfer agent fees |
55,135 |
|
|
Accounting and security lending fees |
30,394 |
|
|
Non-interested trustees' compensation |
22 |
|
|
Custodian fees and expenses |
9,902 |
|
|
Registration fees |
18,728 |
|
|
Audit |
5,081 |
|
|
Legal |
31 |
|
|
Miscellaneous |
24 |
|
|
Total expenses before reductions |
156,703 |
|
|
Expense reductions |
(6,311) |
150,392 |
|
Net investment income |
|
49,928 |
|
Realized and Unrealized Gain (Loss) Net realized gain (loss) on: |
|
|
|
Investment securities |
(441,777) |
|
|
Foreign currency transactions |
(1,209) |
(442,986) |
|
Change in net unrealized appreciation (depreciation) on: |
|
|
|
Investment securities |
537,039 |
|
|
Assets and liabilities in |
2,053 |
539,092 |
|
Net gain (loss) |
|
96,106 |
|
Net increase (decrease) in net assets resulting from operations |
|
$ 146,034 |
|
Other Information |
|
$ 31,556 |
|
Deferred sales charges withheld |
|
$ 197 |
|
Exchange fees withheld by FSC |
|
$ 3,113 |
|
Expense reductions |
|
$ 6,311 |
See accompanying notes which are an integral part of the financial statements.
Semiannual Report
Statement of Changes in Net Assets
|
Increase (Decrease) in Net Assets |
Six months ended |
Year ended |
|
Operations |
$ 49,928 |
$ 179,999 |
|
Net realized gain (loss) |
(442,986) |
111,172 |
|
Change in net unrealized appreciation (depreciation) |
539,092 |
(311,659) |
|
Net increase (decrease) in net assets resulting from operations |
146,034 |
(20,488) |
|
Distributions to shareholders from net investment income |
(26,332) |
- |
|
Share transactions |
13,100,135 |
88,259,011 |
|
Reinvestment of distributions |
25,313 |
- |
|
Cost of shares redeemed |
(13,925,730) |
(86,313,272) |
|
Net increase (decrease) in net assets resulting from share transactions |
(800,282) |
1,945,739 |
|
Redemption fees |
45,343 |
239,998 |
|
Total increase (decrease) in net assets |
(635,237) |
2,165,249 |
|
Net Assets |
|
|
|
Beginning of period |
12,411,797 |
10,246,548 |
|
End of period (including undistributed net investment income of $38,652 and $15,056, respectively) |
$ 11,776,560 |
$ 12,411,797 |
|
Other Information Shares |
|
|
|
Sold |
564,354 |
3,705,982 |
|
Issued in reinvestment of distributions |
1,061 |
- |
|
Redeemed |
(605,032) |
(3,701,544) |
|
Net increase (decrease) |
(39,617) |
4,438 |
Financial Highlights
|
|
Six months ended |
Years ended February 28, |
||||
|
Selected Per-Share Data |
(Unaudited) |
2000 F |
1999 |
1998 |
1997 |
1996 F |
|
Net asset value, beginning of period |
$ 22.17 |
$ 18.45 |
$ 22.66 |
$ 21.63 |
$ 20.78 |
$ 21.14 |
|
Income from Investment Operations |
|
|
|
|
|
|
|
Net investment income (loss) D |
.09 |
.20 |
(.03) |
(.12) |
.01 |
.08 |
|
Net realized and unrealized gain (loss) |
.34 |
3.26 G |
(3.87) |
3.13 |
2.08 |
1.83 |
|
Total from investment operations |
.43 |
3.46 |
(3.90) |
3.01 |
2.09 |
1.91 |
|
Less Distributions |
|
|
|
|
|
|
|
From net investment income |
(.04) |
- |
- |
- |
(.03) |
(.08) |
|
In excess of net investment income |
- |
- |
- |
(.04) |
(.07) |
- |
|
From net realized gain |
- |
- |
- |
(2.07) |
(1.25) |
(2.27) |
|
In excess of net realized gain |
- |
- |
(.44) |
- |
- |
- |
|
Total distributions |
(.04) |
- |
(.44) |
(2.11) |
(1.35) |
(2.35) |
|
Redemption fees added to paid in capital |
.08 |
.26 |
.13 |
.13 |
.11 |
.08 |
|
Net asset value, end of period |
$ 22.64 |
$ 22.17 |
$ 18.45 |
$ 22.66 |
$ 21.63 |
$ 20.78 |
|
Total Return B, C |
2.29% |
20.16% |
(17.01)% |
15.53% |
10.87% |
9.18% |
|
Ratios and Supplemental Data |
|
|
|
|
|
|
|
Net assets, end of period (000 omitted) |
$ 11,777 |
$ 12,412 |
$ 10,247 |
$ 31,384 |
$ 19,484 |
$ 27,270 |
|
Ratio of expenses to average net assets |
2.36% A |
1.89% |
2.30% |
2.18% |
2.19% |
1.91% |
|
Ratio of expenses to average net assets after |
2.26% A, E |
1.74% E |
2.21% E |
2.15% E |
2.16% E |
1.90% E |
|
Ratio of net investment income (loss) to average net assets |
.75% A |
.85% |
(.13)% |
(.50)% |
.04% |
.34% |
|
Portfolio turnover rate |
234% A |
383% |
338% |
235% |
180% |
78% |
|
A Annualized B The total returns would have been lower had certain expenses not been reduced during the periods shown. C Total returns do not include the one time sales charge and for periods of less than one year are not annualized. D Net investment income (loss) per share has been calculated based on average shares outstanding during the period. E FMR or the fund has entered into varying arrangements with third parties who either paid or reduced a portion of the fund's expenses. F For the year ended February 29 G The amount shown for a share outstanding does not correspond with the aggregate net loss on investments for the period due to the timing of sales and purchases of fund shares in relation to fluctuating market values of the investments of the fund. |
||||||
See accompanying notes which are an integral part of the financial statements.
Cyclicals Sector
Performance
There are several ways to evaluate a fund's historical performance. You can look at the total percentage change in value, the average annual percentage change or the growth of a hypothetical $10,000 investment. Total return reflects the change in the value of an investment, assuming reinvestment of the fund's dividend income and capital gains (the profits earned upon the sale of securities that have grown in value). Load adjusted returns include a 3.00% sales charge and the effect of a $7.50 long-term trading fee for shares held 30 days or more. Effective September 28, 2000, the $7.50 long-term trading fee was eliminated. If Fidelity had not reimbursed certain fund expenses, the past five year and past 10 year total returns would have been lower.
Cumulative Total Returns
|
Periods ended |
Past 6 |
Past 1 |
Past 5 |
Past 10 |
|
Select Transportation |
20.79% |
5.46% |
88.98% |
410.40% |
|
Select Transportation |
17.09% |
2.22% |
83.24% |
395.02% |
|
S&P 500 |
11.73% |
16.32% |
193.58% |
493.54% |
|
GS Cyclical Industries |
12.70% |
-3.99% |
n/a** |
n/a** |
Cumulative total returns show the fund's performance in percentage terms over a set period - in this case, six months, one year, five years or 10 years. You can compare the fund's returns to the performance of both the Standard & Poor's 500 Index - a market capitalization-weighted index of common stocks - and the Goldman Sachs Cyclical Industries Index - a market capitalization-weighted index of 253 stocks designed to measure the performance of companies in the cyclical industries sector. These benchmarks include reinvestment of dividends and capital gains, if any, and exclude the effect of sales charges.
Average Annual Total Returns
|
Periods ended |
Past 1 |
Past 5 |
Past 10 |
|
Select Transportation |
5.46% |
13.58% |
17.70% |
|
Select Transportation |
2.22% |
12.88% |
17.34% |
|
S&P 500 |
16.32% |
24.04% |
19.49% |
|
GS Cyclical Industries |
-3.99% |
n/a** |
n/a** |
Average annual returns take the fund's cumulative return and show you what would have happened if the fund had performed at a constant rate each year.
** Not available
Understanding Performance
How a fund did yesterday is no guarantee of how it will do tomorrow. The stock market, for example, has a history of long-term growth and short-term volatility. Unlike the broader market, however, some sectors may not have a history of growth in the long run. And, as with all stock funds, the share price and return of a fund that invests in a sector will vary.
3$10,000 Over 10 Years
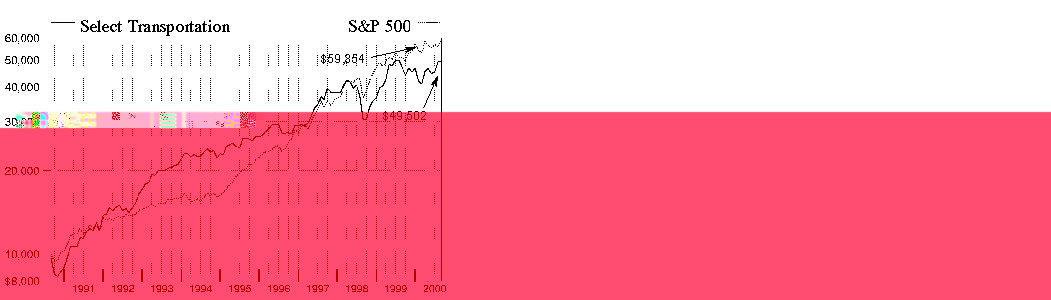
$10,000 Over 10 Years: Let's say hypothetically that $10,000 was invested in Fidelity Select Transportation Portfolio on August 31, 1990, and the current 3.00% sales charge was paid. As the chart shows, by August 31, 2000, the value of the investment would have grown to $49,502 - a 395.02% increase on the initial investment - and includes the effect of a $7.50 long-term trading fee. For comparison, look at how the Standard & Poor's 500 Index did over the same period. With dividends and capital gains, if any, reinvested, the same $10,000 investment would have grown to $59,354 - a 493.54% increase.
Investment Summary
|
Top Ten Stocks as of August 31, 2000 |
|
|
|
% of fund's |
|
Union Pacific Corp. |
6.1 |
|
Southwest Airlines Co. |
5.7 |
|
Canadian Pacific Ltd. |
5.6 |
|
Burlington Northern Santa Fe Corp. |
5.0 |
|
BFGoodrich Co. |
4.5 |
|
Bombardier, Inc. Class A |
4.3 |
|
Canadian National Railway Co. |
4.2 |
|
CSX Corp. |
3.8 |
|
General Electric Co. |
3.4 |
|
United Parcel Service, Inc. Class B |
3.3 |
|
|
45.9 |
Top Industries as of August 31, 2000
% of fund's net assets

Semiannual Report
(Portfolio Manager photograph)
(Portfolio Manager photograph)
Note to shareholders: The following is an interview with Jeff Feingold (left), who managed Fidelity Select Transportation Portfolio for the period covered by this report, with additional comments from Ian Gutterman (right), who became Portfolio Manager of the fund on September 1, 2000.
Q. How did the fund perform, Jeff?
J.F. For the six-month period that ended August 31, 2000, the fund returned 20.79%. In comparison, the Goldman Sachs Cyclical Industries Index - an index of 253 stocks designed to measure the performance of companies in the cyclical industries sector - returned 12.70%. During the same period, the Standard & Poor's 500 Index returned 11.73%. For the 12-month period that ended August 31, 2000, the fund returned 5.46%, while the Goldman Sachs index and the S&P 500 index returned -3.99% and 16.32%, respectively.
Q. What factors helped the fund outperform the Goldman Sachs index during the six-month period?
J.F. The fund's heavy concentration of airline and freight stocks, which outperformed most other cyclical industries in the broader index, made the largest contribution to performance. We also got a boost from a sharp correction in the technology sector in the spring, which sent investors fleeing to other areas of the market. During the second quarter of 2000, the fund delivered a negative return but still outperformed the index. Air freight and airline stocks stood out as the strongest performers, while weakness in auto and truck industry stocks detracted from returns. Still, the fund finished strong, led by improved airline stocks during the past three months.
Q. What was the catalyst for the surge in airline stocks?
J.F. The big driver was the moderation of the growth rate for seating capacity, which took place earlier this year. This slowdown helped put the supply and demand of seating capacity more in balance. When seating capacity supply gets out of hand, as it did in 1999, airline stocks historically have done poorly. But earlier in this period, seating capacity growth slowed to a more reasonable level, while at the same time demand remained high. Generally, demand for airline travel rises and falls with the strength of the economy, which remained fairly strong for most of the period. As a result, investors reacted favorably to this change in the supply/demand equation, and that put upward pressure on airline stock prices. In addition, airline consolidation speculation helped potential acquisition targets, such as Northwest and Continental.
Q. Fuel costs rose to historically high levels at the beginning and end of the period. How did this affect the market for transportation stocks?
J.F. Airlines generally were able to pass a portion of the fuel price increases on to their customers because of the favorable supply/demand equation. However, profits were still tempered by the rise in fuel costs - the one black cloud hanging over a market environment for airline stocks that was as good as it's been for a very long time. Shipping companies - such as United Parcel Service - and freight forwarders - such as Expeditors International - also were able to pass along higher rates. On the other hand, steep price competition and a poor supply/demand equation prevented railroad companies from passing along the fuel spikes.
Q. What stocks stood out as top performers? Which disappointed?
J.F. Kansas City Southern Industries, the fund's top performer, was helped by the rapid growth of its Janus mutual fund subsidiary. AMR, the parent company of American Airlines, rebounded nicely after concerns subsided about the competitive aspect of rival UAL, which owns United Airlines, and UAL's deal to acquire U.S. Airways. Among detractors, Sabre Holdings, which operates the world's largest airline reservation system, and Travelocity, an online ticket broker, underperformed due to fears about increasing competition in the reservation and Internet travel space.
Q. Turning to you Ian, what's your outlook?
I.G. If fuel prices remain at record-high levels, I will continue to remain underweighted in those areas - such as trucking - that have the highest exposure to fuel costs. If fuel prices retract a bit, our exposure to trucking could increase at the expense of our overweighted holdings in airlines and freight. The other factor affecting transportation stocks will be the economy. If it continues at a robust rate, the outlook should remain positive. Toward period end, however, there were some signs the economy had begun to slow. I will be watching for further evidence of this trend going forward.
The views expressed in this report reflect those of the portfolio managers only through the end of the period of the report as stated on the cover. The managers' views are subject to change at any time based on market or other conditions. For more information, see page 3.
Fund Facts
Start date: September 29, 1986
Fund number: 512
Trading symbol: FSRFX
Size: as of August 31, 2000, more than
$13 million
Manager: Ian Gutterman, since September 2000; manager, Fidelity Select Environmental Services Portfolio, since 1999; analyst, air freight, railroad and waste industries, 1999-present; joined Fidelity in 1999
3Semiannual Report
Transportation Portfolio
(Unaudited)
Showing Percentage of Net Assets
|
Common Stocks - 99.1% |
|||
|
Shares |
Value (Note 1) |
||
|
AEROSPACE & DEFENSE - 8.8% |
|||
|
BFGoodrich Co. |
14,400 |
$ 587,700 |
|
|
Bombardier, Inc. Class A |
34,000 |
566,089 |
|
|
TOTAL AEROSPACE & DEFENSE |
1,153,789 |
||
|
AIR TRANSPORTATION - 22.0% |
|||
|
AirTran Holdings, Inc. (a) |
22,900 |
94,463 |
|
|
Alaska Air Group, Inc. (a) |
2,100 |
54,600 |
|
|
America West Holding Corp. Class B (a) |
1,700 |
24,863 |
|
|
AMR Corp. |
8,700 |
285,469 |
|
|
Atlantic Coast Airlines Holdings, Inc. (a) |
3,900 |
123,825 |
|
|
Atlas Air, Inc. (a) |
3,700 |
160,025 |
|
|
Continental Airlines, Inc. Class B (a) |
7,200 |
346,500 |
|
|
Delta Air Lines, Inc. |
7,000 |
346,500 |
|
|
Frontier Airlines, Inc. (a) |
7,100 |
121,588 |
|
|
Northwest Airlines Corp. Class A (a) |
12,200 |
382,013 |
|
|
SkyWest, Inc. |
2,800 |
139,125 |
|
|
Southwest Airlines Co. |
33,025 |
747,191 |
|
|
UAL Corp. |
1,400 |
66,850 |
|
|
TOTAL AIR TRANSPORTATION |
2,893,012 |
||
|
AUTOS, TIRES, & ACCESSORIES - 12.9% |
|||
|
AutoNation, Inc. |
25,200 |
163,800 |
|
|
Cummins Engine Co., Inc. |
2,700 |
95,850 |
|
|
Eaton Corp. |
6,100 |
404,888 |
|
|
Federal Signal Corp. |
4,600 |
99,188 |
|
|
General Motors Corp. |
3,800 |
274,313 |
|
|
Honda Motor Co. Ltd. (a) |
3,000 |
108,750 |
|
|
Navistar International Corp. (a) |
10,300 |
386,250 |
|
|
PACCAR, Inc. |
3,600 |
152,775 |
|
|
TOTAL AUTOS, TIRES, & ACCESSORIES |
1,685,814 |
||
|
COMPUTER SERVICES & SOFTWARE - 2.1% |
|||
|
Sabre Holdings Corp. Class A |
6,280 |
175,055 |
|
|
Travelocity.com, Inc. (a) |
7,000 |
96,250 |
|
|
TOTAL COMPUTER SERVICES & SOFTWARE |
271,305 |
||
|
ELECTRICAL EQUIPMENT - 3.4% |
|||
|
General Electric Co. |
7,500 |
440,156 |
|
|
INDUSTRIAL MACHINERY & EQUIPMENT - 1.7% |
|||
|
Parker-Hannifin Corp. |
6,400 |
222,800 |
|
|
LEASING & RENTAL - 0.8% |
|||
|
Ryder System, Inc. |
5,700 |
109,369 |
|
|
RAILROADS - 27.3% |
|||
|
Burlington Northern Santa Fe Corp. |
29,400 |
657,825 |
|
|
Canadian National Railway Co. |
19,000 |
551,988 |
|
|
Canadian Pacific Ltd. |
27,000 |
733,945 |
|
|
CSX Corp. |
20,800 |
496,600 |
|
|
Kansas City Southern Industries, Inc. |
1,950 |
18,038 |
|
|
|
|||
|
Shares |
Value (Note 1) |
||
|
Norfolk Southern Corp. |
20,800 |
$ 334,100 |
|
|
Union Pacific Corp. |
20,000 |
794,996 |
|
|
TOTAL RAILROADS |
3,587,492 |
||
|
SECURITIES INDUSTRY - 1.8% |
|||
|
Stilwell Financial, Inc. (a) |
4,902 |
237,134 |
|
|
SHIP BUILDING & REPAIR - 2.1% |
|||
|
General Dynamics Corp. |
4,400 |
276,925 |
|
|
SHIPPING - 3.1% |
|||
|
Frontline Ltd. (a) |
14,500 |
217,020 |
|
|
Overseas Shipholding Group, Inc. |
2,700 |
79,481 |
|
|
Teekay Shipping Corp. |
2,500 |
115,625 |
|
|
TOTAL SHIPPING |
412,126 |
||
|
TRUCKING & FREIGHT - 13.1% |
|||
|
CNF Transportation, Inc. |
7,400 |
181,300 |
|
|
Covenant Transport, Inc. Class A (a) |
5,000 |
52,500 |
|
|
EGL, Inc. (a) |
1,300 |
46,719 |
|
|
Expeditors International of |
4,930 |
241,570 |
|
|
FedEx Corp. (a) |
8,700 |
351,045 |
|
|
Forward Air Corp. (a) |
3,600 |
165,150 |
|
|
J.B. Hunt Transport Services, Inc. |
2,500 |
33,750 |
|
|
Landstar System, Inc. (a) |
2,700 |
137,700 |
|
|
United Parcel Service, Inc. Class B |
7,900 |
437,956 |
|
|
Werner Enterprises, Inc. |
5,000 |
67,500 |
|
|
TOTAL TRUCKING & FREIGHT |
1,715,190 |
||
|
TOTAL COMMON STOCKS (Cost $12,013,759) |
13,005,112 |
||
|
Cash Equivalents - 6.2% |
|||
|
|
|
|
|
|
Fidelity Cash Central Fund, |
816,243 |
816,243 |
|
|
TOTAL INVESTMENT PORTFOLIO - 105.3% (Cost $12,830,002) |
13,821,355 |
||
|
NET OTHER ASSETS - (5.3)% |
(694,300) |
||
|
NET ASSETS - 100% |
$ 13,127,055 |
||
|
Legend |
|
(a) Non-income producing |
|
(b) The rate quoted is the annualized seven-day yield of the fund at |
|
Other Information |
|
Purchases and sales of securities, other than short-term securities, |
|
The fund placed a portion of its portfolio transactions with brokerage firms which are affiliates of Fidelity Management & Research Company. The commissions paid to these affiliated firms were $1,737 for the period. |
|
Distribution of investments by country of issue, as a percentage of total |
|
United States of America |
82.6% |
|
Canada |
14.1 |
|
Norway |
1.6 |
|
Others (individually less than 1%) |
1.7 |
|
|
100.0% |
|
Income Tax Information |
|
At August 31, 2000, the aggregate cost of investment securities for income tax purposes was $12,937,218. Net unrealized appreciation aggregated $884,137, of which $1,670,573 related to appreciated investment securities and $786,436 related to depreciated investment securities. |
See accompanying notes which are an integral part of the financial statements.
Cyclicals Sector
Statement of Assets and Liabilities
|
|
August 31, 2000 (Unaudited) |
|
|
Assets |
|
|
|
Investment in securities, at value |
|
$ 13,821,355 |
|
Cash |
|
10,709 |
|
Receivable for fund shares sold |
|
6,487 |
|
Dividends receivable |
|
22,338 |
|
Interest receivable |
|
6,337 |
|
Redemption fees receivable |
|
177 |
|
Other receivables |
|
27 |
|
Total assets |
|
13,867,430 |
|
Liabilities |
|
|
|
Payable for investments purchased |
$ 18,655 |
|
|
Payable for fund shares redeemed |
692,537 |
|
|
Accrued management fee |
6,672 |
|
|
Other payables and |
22,511 |
|
|
Total liabilities |
|
740,375 |
|
Net Assets |
|
$ 13,127,055 |
|
Net Assets consist of: |
|
|
|
Paid in capital |
|
$ 12,493,375 |
|
Accumulated net investment (loss) |
|
(55,727) |
|
Accumulated undistributed net realized gain (loss) on investments and foreign currency transactions |
|
(301,946) |
|
Net unrealized appreciation (depreciation) on investments |
|
991,353 |
|
Net Assets, for 522,700 shares outstanding |
|
$ 13,127,055 |
|
Net Asset Value and redemption price per share ($13,127,055 ÷ 522,700 shares) |
|
$25.11 |
|
Maximum offering price per share (100/97.00 of $25.11) |
|
$25.89 |
Statement of Operations
|
|
Six months ended August 31, 2000 (Unaudited) |
|
|
Investment Income Dividends |
|
$ 59,870 |
|
Interest |
|
24,651 |
|
Security lending |
|
269 |
|
Total income |
|
84,790 |
|
Expenses |
|
|
|
Management fee |
$ 34,900 |
|
|
Transfer agent fees |
44,346 |
|
|
Accounting and security lending fees |
30,389 |
|
|
Non-interested trustees' compensation |
21 |
|
|
Custodian fees and expenses |
7,783 |
|
|
Registration fees |
18,123 |
|
|
Audit |
7,660 |
|
|
Legal |
22 |
|
|
Miscellaneous |
26 |
|
|
Total expenses before reductions |
143,270 |
|
|
Expense reductions |
(2,753) |
140,517 |
|
Net investment income (loss) |
|
(55,727) |
|
Realized and Unrealized Gain (Loss) Net realized gain (loss) on: |
|
|
|
Investment securities |
(136,560) |
|
|
Foreign currency transactions |
1,328 |
(135,232) |
|
Change in net unrealized appreciation (depreciation) on: |
|
|
|
Investment securities |
2,222,995 |
|
|
Assets and liabilities in |
7 |
2,223,002 |
|
Net gain (loss) |
|
2,087,770 |
|
Net increase (decrease) in net assets resulting from operations |
|
$ 2,032,043 |
|
Other Information |
|
|
|
Sales charges paid to FDC |
|
$ 26,752 |
|
Deferred sales charges withheld by FDC |
|
$ 13 |
|
Exchange fees withheld by FSC |
|
$ 420 |
|
Expense reductions |
|
|
|
Directed brokerage arrangements |
|
$ 2,753 |
See accompanying notes which are an integral part of the financial statements.
Semiannual Report
Transportation Portfolio
Financial Statements - continued
Statement of Changes in Net Assets
|
Increase (Decrease) in Net Assets |
Six months ended |
Year ended |
|
Operations |
$ (55,727) |
$ (112,921) |
|
Net realized gain (loss) |
(135,232) |
3,816,618 |
|
Change in net unrealized appreciation (depreciation) |
2,223,002 |
(2,492,345) |
|
Net increase (decrease) in net assets resulting from operations |
2,032,043 |
1,211,352 |
|
Distributions to shareholders |
- |
(3,020,619) |
|
In excess of net realized gain |
(105,905) |
- |
|
Total distributions |
(105,905) |
(3,020,619) |
|
Share transactions |
10,125,834 |
38,904,845 |
|
Reinvestment of distributions |
97,367 |
2,884,955 |
|
Cost of shares redeemed |
(9,246,182) |
(49,710,711) |
|
Net increase (decrease) in net assets resulting from share transactions |
977,019 |
(7,920,911) |
|
Redemption fees |
22,379 |
76,905 |
|
Total increase (decrease) in net assets |
2,925,536 |
(9,653,273) |
|
Net Assets |
|
|
|
Beginning of period |
10,201,519 |
19,854,792 |
|
End of period (including accumulated net investment loss of $55,727 and $0, respectively) |
$ 13,127,055 |
$ 10,201,519 |
|
Other Information Shares |
|
|
|
Sold |
425,874 |
1,445,730 |
|
Issued in reinvestment of distributions |
4,219 |
121,282 |
|
Redeemed |
(394,025) |
(1,873,381) |
|
Net increase (decrease) |
36,068 |
(306,369) |
Financial Highlights
|
|
Six months ended |
Years ended February 28, |
||||
|
Selected Per-Share Data |
(Unaudited) |
2000 H |
1999 |
1998 |
1997 |
1996 H |
|
Net asset value, beginning of period |
$ 20.96 |
$ 25.04 |
$ 28.34 |
$ 22.23 |
$ 21.92 |
$ 20.53 |
|
Income from Investment Operations |
|
|
|
|
|
|
|
Net investment income (loss) D |
(.11) |
(.14) |
(.18) |
(.02) |
(.13) |
(.09) E |
|
Net realized and unrealized gain (loss) |
4.41 |
.93 |
(.58) |
8.85 |
1.06 |
2.60 |
|
Total from investment operations |
4.30 |
.79 |
(.76) |
8.83 |
.93 |
2.51 |
|
Less Distributions |
|
|
|
|
|
|
|
From net realized gain |
- |
(4.97) |
(2.64) |
(2.80) |
(.71) |
(1.22) |
|
In excess of net realized gain |
(.19) |
- |
- |
- |
- |
- |
|
Total distributions |
(.19) |
(4.97) |
(2.64) |
(2.80) |
(.71) |
(1.22) |
|
Redemption fees added to paid in capital |
.04 |
.10 |
.10 |
.08 |
.09 |
.10 |
|
Net asset value, end of period |
$ 25.11 |
$ 20.96 |
$ 25.04 |
$ 28.34 |
$ 22.23 |
$ 21.92 |
|
Total Return B, C |
20.79% |
2.15% |
(1.73)% |
41.15% |
4.67% |
12.95% |
|
Ratios and Supplemental Data |
|
|
|
|
|
|
|
Net assets, end of period (000 omitted) |
$ 13,127 |
$ 10,202 |
$ 19,855 |
$ 64,282 |
$ 8,890 |
$ 11,445 |
|
Ratio of expenses to average net assets |
2.30% A |
1.77% |
1.96% |
1.58% |
2.50% F |
2.47% F |
|
Ratio of expenses to average net assets after |
2.26% A, G |
1.71% G |
1.90% G |
1.54% G |
2.48% G |
2.44% G |
|
Ratio of net investment income (loss) to average net assets |
(.90)% A |
(.54)% |
(.68)% |
(.06)% |
(.58)% |
(.43)% |
|
Portfolio turnover rate |
168% A |
318% |
182% |
210% |
148% |
175% |
|
A Annualized B The total returns would have been lower had certain expenses not been reduced during the periods shown. C Total returns do not include the one time sales
charge and for periods of less than one year are not annualized. |
||||||
See accompanying notes which are an integral part of the financial statements.
Cyclicals Sector
Performance
There are several ways to evaluate a fund's historical performance. You can look at the total percentage change in value, the average annual percentage change or the growth of a hypothetical $10,000 investment. Total return reflects the change in the value of an investment, assuming reinvestment of the fund's dividend income and capital gains (the profits earned upon the sale of securities that have grown in value). Load adjusted returns include a 3.00% sales charge and the effect of a $7.50 long-term trading fee for shares held 30 days or more. Effective September 28, 2000, the $7.50 long-term trading fee was eliminated. If Fidelity had not reimbursed certain fund expenses, the past 10 year total returns would have been lower.
Cumulative Total Returns
|
Periods ended |
Past 6 |
Past 1 |
Past 5 |
Past 10 |
|
|
Select Banking |
27.45% |
4.41% |
135.26% |
792.35% |
|
|
Select Banking |
23.55% |
1.21% |
128.13% |
765.50% |
|
|
S&P 500 |
11.73% |
16.32% |
193.58% |
493.54% |
|
|
GS Financial Services |
35.48% |
19.10% |
n/a** |
n/a** |
|
Cumulative total returns show the fund's performance in percentage terms over a set period - in this case, six months, one year, five years or 10 years. You can compare the fund's returns to the performance of both the Standard & Poor's 500 Index - a market capitalization-weighted index of common stocks - and the Goldman Sachs Financial Services Index - a market capitalization-weighted index of 256 stocks designed to measure the performance of companies in the financial services sector. These benchmarks include reinvestment of dividends and capital gains, if any, and exclude the effect of sales charges.
Average Annual Total Returns
|
Periods ended |
Past 1 |
Past 5 |
Past 10 |
|
Select Banking |
4.41% |
18.66% |
24.47% |
|
Select Banking |
1.21% |
17.93% |
24.09% |
|
S&P 500 |
16.32% |
24.04% |
19.49% |
|
GS Financial Services |
19.10% |
n/a** |
n/a** |
Average annual returns take the fund's cumulative return and show you what would have happened if the fund had performed at a constant rate each year.
** Not available
Understanding Performance
How a fund did yesterday is no guarantee of how it will do tomorrow. The stock market, for example, has a history of long-term growth and short-term volatility. Unlike the broader market, however, some sectors may not have a history of growth in the long run. And, as with all stock funds, the share price and return of a fund that invests in a sector will vary.
3$10,000 Over 10 Years
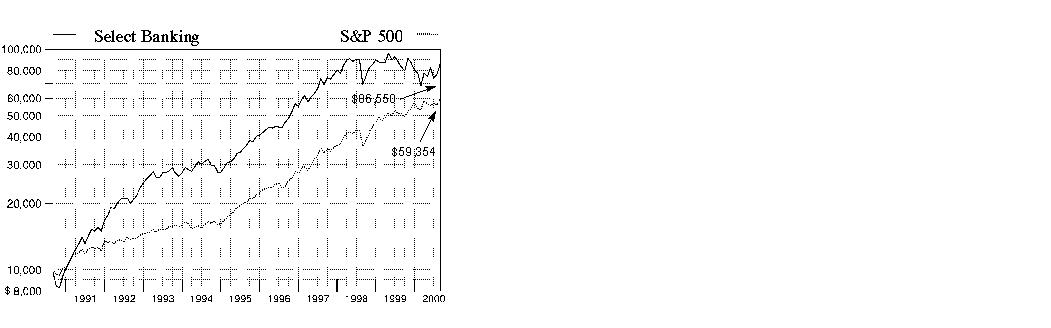
$10,000 Over 10 Years: Let's say hypothetically that $10,000 was invested in Fidelity Select Banking Portfolio on August 31, 1990, and the current 3.00% sales charge was paid. As the chart shows, by August 31, 2000, the value of the investment would have grown to $86,550 - a 765.50% increase on the initial investment - and includes the effect of a $7.50 long-term trading fee. For comparison, look at how the Standard & Poor's 500 Index did over the same period. With dividends and capital gains, if any, reinvested, the same $10,000 investment would have grown to $59,354 - a 493.54% increase.
Investment Summary
|
Top Ten Stocks as of August 31, 2000 |
|
|
|
% of fund's |
|
Bank of New York Co., Inc. |
6.9 |
|
Mellon Financial Corp. |
6.4 |
|
Firstar Corp. |
5.9 |
|
Wells Fargo & Co. |
5.6 |
|
FleetBoston Financial Corp. |
5.5 |
|
Bank One Corp. |
5.3 |
|
Citigroup, Inc. |
5.2 |
|
PNC Financial Services Group, Inc. |
4.7 |
|
Chase Manhattan Corp. |
4.5 |
|
Bank of America Corp. |
3.5 |
|
|
53.5 |
Top Industries as of August 31, 2000
% of fund's net assets

Semiannual Report
(Portfolio Manager photograph)
Samuel Peters,
Portfolio Manager
of Fidelity Select
Banking Portfolio
Q. How did the fund perform, Sam?
A. For the six months that ended August 31, 2000, the fund returned 27.45%. The Goldman Sachs Financial Services Index - an index of 256 stocks designed to measure the performance of companies in the financial services sector - returned 35.48% during this period, while the Standard & Poor's 500 Index returned 11.73%. For the 12-month period that ended August 31, 2000, the fund returned 4.41%, while the Goldman Sachs index and S&P 500 returned 19.10% and 16.32%, respectively.
Q. What factors influenced the fund's performance during the period?
A. Back in March, bank stocks as a group were in a funk, mostly due to rising interest rates, increased credit risk and difficulty in growing deposits. As a result, I focused my efforts less on banks that were dependent on loan-related income and more on high-quality banks with some sort of processing component to their business. These stocks - including names such as Bank of New York and Mellon Financial - had fallen with the rest of the group, but bounced back on the strength of good fundamentals.
Q. Why did the fund trail the Goldman Sachs index?
A. I stayed true to the fund's name by investing primarily in bank stocks. The Goldman index, on the other hand, includes brokerage stocks, which performed exceptionally well during this period.
Q. Market perception seems to be that interest-rate hikes are on hold for the time being. Are there any economic concerns that could hold bank stocks back?
A. Interest-rate worries have indeed subsided, but there's plenty to worry about on the credit side. Commercial credit is rising, albeit from unsustainably low levels. Many companies - perhaps feeling invincible from the long economic expansion we've seen - have become overleveraged. There's a lot of pressure for companies to post good earnings numbers and, in some cases, the pressure results in risky operating strategies that backfire. A great example of this involved movie theaters. Companies were so busy investing heavily in their elaborate, 24-screen multiplexes that they forgot about their older, smaller theaters. Those theaters got to the point of being outdated, so the companies had to throw more dollars into updating them. Since much of this funding came in the form of leveraged loans, this trend hurt a number of bank stocks, including fund holding Wachovia.
Q. How would you define a money-center bank? Did they play a role during the period?
A. Historically, money-center banks were large, wholesale banks that did business on both national and international levels. That's all changing today. For example, Citigroup is now a global financial conglomerate, while Chase Manhattan has become more of an investment bank. The fund counted three money-center banks among its top-10 holdings at the end of the period, including Citigroup, Chase Manhattan and Bank of America. Among these, Citigroup was its best performer.
Q. Which other stocks performed well during the period? Which performed poorly?
A. Mellon and PNC Financial performed well, as both continued to transition their business models to become more processing-oriented. On a disappointing note, First Security stumbled after its planned merger with Zions Bancorp fell through. Digital Insight - a company that helps smaller banks establish a presence on the Internet - was another disappointment as the stock fell in conjunction with the technology meltdown we witnessed in the spring. The fund no longer owned First Security and Digital Insight at the end of the period.
Q. What's your outlook for the next few months, Sam?
A. I think the credit-risk cloud is going to make for some choppy performance within the banking sector. As such, I plan to stick with the high-quality processing banks for the near-term. Many of these stocks are less exposed to credit problems and tend to have the revenue growth to overcome potential credit-related losses.
The views expressed in this report reflect those of the portfolio manager only through the end of the period of the report as stated on the cover. The manager's views are subject to change at any time based on market or other conditions. For more information, see page 3.
Fund Facts
Start date: June 30, 1986
Fund number: 507
Trading symbol: FSRBX
Size: as of August 31, 2000, more than
$446 million
Manager: Samuel Peters, since February 2000; analyst, retail and office furniture industries, since 1998; joined Fidelity in 1998
3Semiannual Report
Banking Portfolio
(Unaudited)
Showing Percentage of Net Assets
|
Common Stocks - 93.6% |
|||
|
Shares |
Value (Note 1) |
||
|
BANKS - 85.1% |
|||
|
AmSouth Bancorp. |
240,500 |
$ 4,389,125 |
|
|
Associated Banc-Corp. |
55,000 |
1,381,016 |
|
|
Bank of America Corp. |
288,606 |
15,458,459 |
|
|
Bank of New York Co., Inc. |
590,996 |
30,990,348 |
|
|
Bank One Corp. |
673,526 |
23,741,792 |
|
|
BB&T Corp. |
242,342 |
6,558,380 |
|
|
Cathay Bancorp, Inc. |
10,000 |
498,750 |
|
|
Chase Manhattan Corp. |
360,800 |
20,159,700 |
|
|
City National Corp. |
20,000 |
781,250 |
|
|
Comerica, Inc. |
240,500 |
13,543,156 |
|
|
Commerce Bancorp, Inc. |
77,000 |
3,979,938 |
|
|
Commerce Bancshares, Inc. |
65,000 |
2,340,000 |
|
|
Compass Bancshares, Inc. |
100,000 |
1,825,000 |
|
|
East West Bancorp, Inc. |
40,000 |
682,500 |
|
|
Fifth Third Bancorp |
303,000 |
13,994,813 |
|
|
First Union Corp. |
384,800 |
11,135,150 |
|
|
First Virginia Banks, Inc. |
50,000 |
2,137,500 |
|
|
Firstar Corp. |
1,100,000 |
26,262,500 |
|
|
FleetBoston Financial Corp. |
577,954 |
24,671,411 |
|
|
Huntington Bancshares, Inc. |
231,770 |
3,911,119 |
|
|
Imperial Bancorp |
20,000 |
435,000 |
|
|
KeyCorp |
46,000 |
928,625 |
|
|
M&T Bank Corp. |
12,000 |
5,816,250 |
|
|
Marshall & Ilsley Corp. |
25,000 |
1,218,750 |
|
|
Mellon Financial Corp. |
630,000 |
28,507,500 |
|
|
Mercantile Bankshares Corp. |
55,000 |
1,896,641 |
|
|
National City Corp. |
179,000 |
3,747,813 |
|
|
National Commmerce Bancorp |
100,000 |
1,931,250 |
|
|
North Fork Bancorp, Inc. |
44,700 |
799,013 |
|
|
Northern Trust Corp. |
125,100 |
10,547,494 |
|
|
PNC Financial Services Group, Inc. |
354,200 |
20,875,663 |
|
|
Popular, Inc. |
125,100 |
2,580,188 |
|
|
Silicon Valley Bancshares (a) |
47,000 |
2,708,375 |
|
|
SouthTrust Corp. |
155,000 |
4,369,063 |
|
|
State Street Corp. |
79,900 |
9,408,225 |
|
|
Summit Bancorp |
144,300 |
3,995,306 |
|
|
SunTrust Banks, Inc. |
250,747 |
12,380,633 |
|
|
Synovus Finanical Corp. |
260,000 |
5,118,750 |
|
|
U.S. Bancorp |
600,000 |
13,050,000 |
|
|
UnionBanCal Corp. |
140,218 |
3,479,159 |
|
|
Wachovia Corp. |
150,000 |
8,596,875 |
|
|
Wells Fargo & Co. |
577,300 |
24,932,144 |
|
|
Westamerica Bancorp. |
20,000 |
606,250 |
|
|
Zions Bancorp |
77,000 |
3,445,750 |
|
|
TOTAL BANKS |
379,816,624 |
||
|
COMPUTERS & OFFICE EQUIPMENT - 0.2% |
|||
|
Tidel Technologies, Inc. (a) |
100,000 |
793,750 |
|
|
|
|||
|
Shares |
Value (Note 1) |
||
|
CREDIT & OTHER FINANCE - 5.9% |
|||
|
Citigroup, Inc. |
400,000 |
$ 23,350,000 |
|
|
Investors Financial Services Corp. |
30,000 |
1,846,875 |
|
|
Old Kent Financial Corp. |
42,000 |
1,231,125 |
|
|
TOTAL CREDIT & OTHER FINANCE |
26,428,000 |
||
|
FEDERAL SPONSORED CREDIT - 1.6% |
|||
|
Fannie Mae |
64,400 |
3,461,500 |
|
|
Freddie Mac |
86,600 |
3,648,025 |
|
|
TOTAL FEDERAL SPONSORED CREDIT |
7,109,525 |
||
|
SAVINGS & LOANS - 0.4% |
|||
|
TCF Financial Corp. |
50,000 |
1,640,625 |
|
|
SECURITIES INDUSTRY - 0.4% |
|||
|
Bear Stearns Companies, Inc. |
25,000 |
1,676,563 |
|
|
TOTAL COMMON STOCKS (Cost $319,639,175) |
417,465,087 |
||
|
Cash Equivalents - 6.2% |
|||
|
|
|
|
|
|
Fidelity Cash Central Fund, 6.59% (b) |
27,918,438 |
27,918,438 |
|
|
TOTAL INVESTMENT PORTFOLIO - 99.8% (Cost $347,557,613) |
445,383,525 |
||
|
NET OTHER ASSETS - 0.2% |
791,916 |
||
|
NET ASSETS - 100% |
$ 446,175,441 |
||
|
Legend |
|
(a) Non-income producing |
|
(b) The rate quoted is the annualized seven-day yield of the fund at |
|
Other Information |
|
Purchases and sales of securities, other than short-term securities, |
|
The fund placed a portion of its portfolio transactions with brokerage firms which are affiliates of Fidelity Management & Research Company. The commissions paid to these affiliated firms were $19,877 for the period. |
|
Income Tax Information |
|
At August 31, 2000, the aggregate cost of investment securities for income tax purposes was $350,490,983. Net unrealized appreciation aggregated $94,892,542, of which $108,651,416 related to appreciated investment securities and $13,758,874 related to depreciated investment securities. |
See accompanying notes which are an integral part of the financial statements.
Semiannual Report
Statement of Assets and Liabilities
|
|
August 31, 2000 (Unaudited) |
|
|
Assets |
|
|
|
Investment in securities, at value |
|
$ 445,383,525 |
|
Receivable for investments sold |
|
1,977,527 |
|
Receivable for fund shares sold |
|
1,170,758 |
|
Dividends receivable |
|
1,023,671 |
|
Interest receivable |
|
163,853 |
|
Redemption fees receivable |
|
3,694 |
|
Other receivables |
|
10,145 |
|
Total assets |
|
449,733,173 |
|
Liabilities |
|
|
|
Payable for fund shares redeemed |
$ 3,113,728 |
|
|
Accrued management fee |
209,267 |
|
|
Other payables and |
234,737 |
|
|
Total liabilities |
|
3,557,732 |
|
Net Assets |
|
$ 446,175,441 |
|
Net Assets consist of: |
|
|
|
Paid in capital |
|
$ 365,690,824 |
|
Undistributed net investment income |
|
4,344,378 |
|
Accumulated undistributed net realized gain (loss) on investments and foreign currency transactions |
|
(21,685,673) |
|
Net unrealized appreciation (depreciation) on investments |
|
97,825,912 |
|
Net Assets, for 14,456,010 |
|
$ 446,175,441 |
|
Net Asset Value and redemption price per share ($446,175,441 ÷ 14,456,010 shares) |
|
$30.86 |
|
Maximum offering price per share (100/97.00 of $30.86) |
|
$31.81 |
Statement of Operations
|
|
Six months ended August 31, 2000 (Unaudited) |
|
|
Investment Income Dividends |
|
$ 5,907,947 |
|
Interest |
|
1,016,523 |
|
Security lending |
|
3,149 |
|
Total income |
|
6,927,619 |
|
Expenses |
|
|
|
Management fee |
$ 1,219,752 |
|
|
Transfer agent fees |
1,189,098 |
|
|
Accounting and security lending fees |
138,932 |
|
|
Non-interested trustees' compensation |
490 |
|
|
Custodian fees and expenses |
6,359 |
|
|
Registration fees |
73,668 |
|
|
Audit |
18,459 |
|
|
Legal |
854 |
|
|
Miscellaneous |
152 |
|
|
Total expenses before reductions |
2,647,764 |
|
|
Expense reductions |
(64,523) |
2,583,241 |
|
Net investment income |
|
4,344,378 |
|
Realized and Unrealized Gain (Loss) Net realized gain (loss) on |
|
(16,065,062) |
|
Change in net unrealized appreciation (depreciation) on investment securities |
|
98,116,852 |
|
Net gain (loss) |
|
82,051,790 |
|
Net increase (decrease) in net assets resulting from operations |
|
$ 86,396,168 |
|
Other Information |
|
|
|
Sales charges paid to FDC |
|
$ 603,096 |
|
Deferred sales charges withheld by FDC |
|
$ 1,461 |
|
Exchange fees withheld by FSC |
|
$ 19,703 |
|
Expense reductions |
|
|
|
Directed brokerage arrangements |
|
$ 62,300 |
|
Transfer agent credits |
|
2,223 |
|
|
|
$ 64,523 |
See accompanying notes which are an integral part of the financial statements.
Semiannual Report
Banking Portfolio
Financial Statements - continued
Statement of Changes in Net Assets
|
Increase (Decrease) in Net Assets |
Six months ended |
Year ended |
|
Operations |
$ 4,344,378 |
$ 6,999,703 |
|
Net realized gain (loss) |
(16,065,062) |
170,152,158 |
|
Change in net unrealized appreciation (depreciation) |
98,116,852 |
(293,422,297) |
|
Net increase (decrease) in net assets resulting from operations |
86,396,168 |
(116,270,436) |
|
Distributions to shareholders |
(1,508,459) |
(6,587,083) |
|
From net realized gain |
(31,788,294) |
(127,472,407) |
|
In excess of net realized gain |
(5,620,611) |
- |
|
Total distributions |
(38,917,364) |
(134,059,490) |
|
Share transactions |
257,388,817 |
233,488,860 |
|
Reinvestment of distributions |
36,957,085 |
127,608,941 |
|
Cost of shares redeemed |
(260,048,495) |
(673,927,965) |
|
Net increase (decrease) in net assets resulting from share transactions |
34,297,407 |
(312,830,164) |
|
Redemption fees |
862,223 |
868,559 |
|
Total increase (decrease) in net assets |
82,638,434 |
(562,291,531) |
|
Net Assets |
|
|
|
Beginning of period |
363,537,007 |
925,828,538 |
|
End of period (including undistributed net investment income of $4,344,378 and $3,725,496, respectively) |
$ 446,175,441 |
$ 363,537,007 |
|
Other Information Shares |
|
|
|
Sold |
8,663,591 |
6,263,157 |
|
Issued in reinvestment of distributions |
1,334,578 |
3,483,815 |
|
Redeemed |
(9,274,183) |
(18,286,774) |
|
Net increase (decrease) |
723,986 |
(8,539,802) |
Financial Highlights
|
|
Six months ended |
Years ended February 28, |
||||
|
Selected Per-Share Data |
(Unaudited) |
2000 F |
1999 |
1998 |
1997 |
1996 F |
|
Net asset value, beginning of period |
$ 26.47 |
$ 41.57 |
$ 43.18 |
$ 32.82 |
$ 24.37 |
$ 18.01 |
|
Income from Investment Operations |
|
|
|
|
|
|
|
Net investment income D |
.29 |
.39 |
.39 |
.40 |
.37 |
.52 |
|
Net realized and unrealized gain (loss) |
6.62 |
(7.74) |
.91 |
11.41 |
9.70 |
6.78 |
|
Total from investment operations |
6.91 |
(7.35) |
1.30 |
11.81 |
10.07 |
7.30 |
|
Less Distributions |
|
|
|
|
|
|
|
From net investment income |
(.10) |
(.36) |
(.28) |
(.28) |
(.27) |
(.25) |
|
From net realized gain |
(2.11) |
(7.44) |
(2.66) |
(1.23) |
(1.40) |
(.72) |
|
In excess of net realized gain |
(.37) |
- |
- |
- |
- |
- |
|
Total distributions |
(2.58) |
(7.80) |
(2.94) |
(1.51) |
(1.67) |
(.97) |
|
Redemption fees added to paid in capital |
.06 |
.05 |
.03 |
.06 |
.05 |
.03 |
|
Net asset value, end of period |
$ 30.86 |
$ 26.47 |
$ 41.57 |
$ 43.18 |
$ 32.82 |
$ 24.37 |
|
Total Return B, C |
27.45% |
(22.07)% |
3.10% |
36.64% |
43.33% |
40.94% |
|
Ratios and Supplemental Data |
|
|
|
|
|
|
|
Net assets, end of period (000 omitted) |
$ 446,175 |
$ 363,537 |
$ 925,829 |
$ 1,338,896 |
$ 837,952 |
$ 315,178 |
|
Ratio of expenses to average net assets |
1.22% A |
1.23% |
1.17% |
1.25% |
1.46% |
1.41% |
|
Ratio of expenses to average net assets after |
1.19% A, E |
1.19% E |
1.16% E |
1.24% E |
1.45% E |
1.40% E |
|
Ratio of net investment income to average net assets |
2.00% A |
1.00% |
.91% |
1.07% |
1.36% |
2.42% |
|
Portfolio turnover rate |
77% A |
94% |
22% |
25% |
43% |
103% |
|
A Annualized B The total returns would have been lower had certain expenses not been reduced during the periods shown. C Total returns do not include the one time sales
charge and for periods of less than one year are not annualized. |
||||||
See accompanying notes which are an integral part of the financial statements.
Financial Services Sector
Performance
There are several ways to evaluate a fund's historical performance. You can look at the total percentage change in value, the average annual percentage change or the growth of a hypothetical $10,000 investment. Total return reflects the change in the value of an investment, assuming reinvestment of the fund's dividend income and capital gains (the profits earned upon the sale of securities that have grown in value). Load adjusted returns include a 3.00% sales charge and the effect of a $7.50 long-term trading fee for shares held 30 days or more. Effective September 28, 2000, the $7.50 long-term trading fee was eliminated. If Fidelity had not reimbursed certain fund expenses, the past five year and past 10 year total returns would have been lower.
Cumulative Total Returns
|
Periods ended |
Past 6 |
Past 1 |
Past 5 |
Past 10 |
|
Select Brokerage and |
42.65% |
66.04% |
335.79% |
1,137.36% |
|
Select Brokerage and |
38.30% |
60.98% |
322.64% |
1,100.16% |
|
S&P 500 |
11.73% |
16.32% |
193.58% |
493.54% |
|
GS Financial Services |
35.48% |
19.10% |
n/a** |
n/a** |
Cumulative total returns show the fund's performance in percentage terms over a set period - in this case, six months, one year, five years or 10 years. You can compare the fund's returns to the performance of both the Standard & Poor's 500 Index - a market capitalization-weighted index of common stocks - and the Goldman Sachs Financial Services Index - a market capitalization-weighted index of 256 stocks designed to measure the performance of companies in the financial services sector. These benchmarks include reinvestment of dividends and capital gains, if any, and exclude the effect of sales charges.
Average Annual Total Returns
|
Periods ended |
Past 1 |
Past 5 |
Past 10 |
|
Select Brokerage and |
66.04% |
34.23% |
28.60% |
|
Select Brokerage and |
60.98% |
33.41% |
28.21% |
|
S&P 500 |
16.32% |
24.04% |
19.49% |
|
GS Financial Services |
19.10% |
n/a** |
n/a** |
Average annual returns take the fund's cumulative return and show you what would have happened if the fund had performed at a constant rate each year.
** Not available
Understanding Performance
How a fund did yesterday is no guarantee of how it will do tomorrow. The stock market, for example, has a history of long-term growth and short-term volatility. Unlike the broader market, however, some sectors may not have a history of growth in the long run. And, as with all stock funds, the share price and return of a fund that invests in a sector will vary.
3$10,000 Over 10 Years
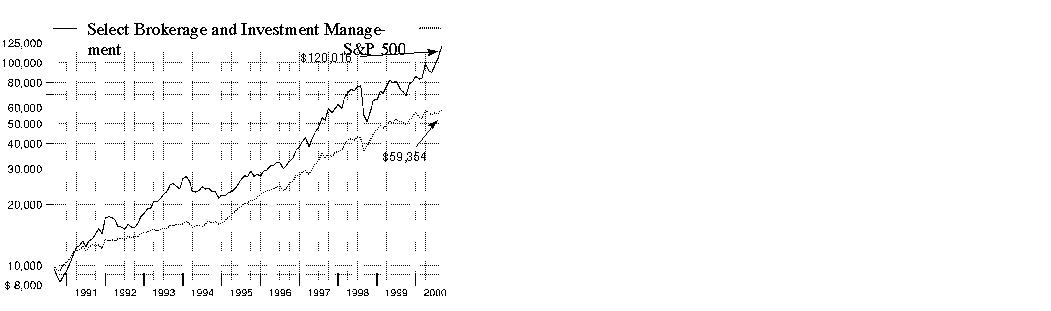
$10,000 Over 10 Years: Let's say hypothetically that $10,000 was invested in Fidelity Select Brokerage and Investment Management Portfolio on August 31, 1990, and the current 3.00% sales charge was paid. As the chart shows, by August 31, 2000, the value of the investment would have grown to $120,016 - a 1,100.16% increase on the initial investment - and includes the effect of a $7.50 long-term trading fee. For comparison, look at how the Standard & Poor's 500 Index did over the same period. With dividends and capital gains, if any, reinvested, the same $10,000 investment would have grown to $59,354 - a 493.54% increase.
Investment Summary
|
Top Ten Stocks as of August 31, 2000 |
|
|
|
% of fund's |
|
Morgan Stanley Dean Witter & Co. |
6.8 |
|
Lehman Brothers Holdings, Inc. |
6.5 |
|
Bear Stearns Companies, Inc. |
5.0 |
|
Charles Schwab Corp. |
4.9 |
|
Goldman Sachs Group, Inc. |
4.7 |
|
Merrill Lynch & Co., Inc. |
4.5 |
|
Citigroup, Inc. |
4.4 |
|
Stilwell Financial, Inc. |
3.9 |
|
DLJ, Inc. |
3.0 |
|
American Express Co. |
2.9 |
|
|
46.6 |
Top Industries as of August 31, 2000
% of fund's net assets

Semiannual Report
(Portfolio Manager photograph)
Ted Orenstein,
Portfolio Manager of Fidelity Select Brokerage and Investment Management Portfolio
Q. How did the fund perform, Ted?
A. The fund did very well. For the six months that ended August 31, 2000, the fund returned 42.65%. Meanwhile, the Goldman Sachs Financial Services Index - an index of 256 stocks designed to measure the performance of companies in the financial services sector - returned 35.48%, and the Standard & Poor's 500 Index returned 11.73%. For the 12 months ending August 31, 2000, the fund gained 66.04%, while the Goldman Sachs index returned 19.10% and the S&P 500 gained 16.32%.
Q. How did the fund beat its benchmarks so resoundingly?
A. The fund was heavily weighted toward high-margin, large-cap capital markets firms. There were three reasons why these stocks did so well. The first was valuation - these stocks were relatively cheap compared to other financial stocks and industry sectors, while displaying above-average growth rates and return on equity. The second reason was the exceptionally strong capital markets environment, which was fueled by both domestic and European activity, combined with good liquidity in the market. Capital markets companies continued to maintain good balance sheet control, industry pricing was solid, and a robust pipeline and backlog of business were maintained. The third factor that drove these stocks was consolidation, fueled by the perceived need for scale and size to compete in today's financial marketplace.
Q. What was your focus during the past six months?
A. In addition to the capital markets firms, I focused on the asset management industry, which benefited from positive asset flows, good valuations and improved profitability. Private market valuations were higher than public market valuations, meaning they were worth more than they traded for on the market. I thought they were attractive investment opportunities and took advantage of that. I also selectively invested in life insurance companies, looking for those with good earnings growth and the potential to be involved in a consolidation move.
Q. Which stocks helped the performance of the fund?
A. Lehman Brothers, Morgan Stanley Dean Witter and Bear Stearns all had strong performance during the six-month period. Lehman had the most attractive valuation and was the best performer among the financial capital markets firms. It was only a matter of time before the market realized how much its business improved as the company transitioned from its traditional fixed-income oriented businesses to a focus on equity trading, underwriting and advisory services. Its balance sheet leverage also improved and expenses were managed well - the result of an excellent management team. Lehman also was the subject of takeover speculation, which, when added to the other factors, made it a significant outperformer for the fund. Morgan Stanley has a well-diversified business mix with leading market shares in its high-margin businesses - advisory and underwriting services. It also made improvements in its asset management business and benefited from growth in its credit card business. Bear Stearns came back from a disappointing 1999 to have much better performance thus far in 2000. The company experienced less volatility in its earnings stream compared to many of its peers, which was not reflected in its valuation. Its clearing business was a consistent performer, its valuation was attractive and the outlook for the stock remained positive.
Q. Were there any detractors from performance?
A. Unfortunately, Daiwa, Nikko and Nomura each hurt performance. These three Japanese brokerage firms suffered as the Japanese economy contracted. After significantly outperforming the market last year and contributing to the fund's return, the Japanese brokers underperformed during the past six months. However, their long-term outlook is good given current valuation levels and business pipelines.
Q. What's your outlook?
A. It's positive. Interest rates seem to have stabilized and capital markets are healthy. Swap - an arrangement where two companies lend to each other - and credit spreads have declined, which should lead to increased issuance and an improved outlook for fixed-income markets. The capital markets environment remains strong both domestically and internationally, balance sheets and expenses are under control, and the business pipelines are robust. These factors bode well for continued positive stock performance, considering current valuations that look reasonable based on earnings growth.
The views expressed in this report reflect those of the portfolio manager only through the end of the period of the report as stated on the cover. The manager's views are subject to change at any time based on market or other conditions. For more information, see page 3.
Note to shareholders: Effective September 28, 2000, Jennifer Nettesheim became Portfolio Manager of Fidelity Select Brokerage and Investment Management Portfolio.
Fund Facts
Start date: July 29, 1985
Fund number: 068
Trading symbol: FSLBX
Size: as of August 31, 2000, more than
$745 million
Manager: Ted Orenstein, since 1999; equity analyst for securities brokerage industry, 1998-1999; joined Fidelity in 1998
3Semiannual Report
Brokerage and Investment Management Portfolio
(Unaudited)
Showing Percentage of Net Assets
|
Common Stocks - 91.4% |
|||
|
Shares |
Value (Note 1) |
||
|
BANKS - 9.9% |
|||
|
Bank of America Corp. |
27,800 |
$ 1,489,038 |
|
|
Bank of New York Co., Inc. |
21,000 |
1,101,188 |
|
|
Bank Sarasin & Compagnie Series B (Reg.) |
1 |
3,102 |
|
|
Chase Manhattan Corp. |
229,500 |
12,823,313 |
|
|
Credit Suisse Group (Reg.) |
89,900 |
18,800,184 |
|
|
J.P. Morgan & Co., Inc. |
104,900 |
17,537,969 |
|
|
Julius Baer Holding AG |
1,600 |
7,905,320 |
|
|
Mellon Financial Corp. |
63,200 |
2,859,800 |
|
|
Northern Trust Corp. |
20,900 |
1,762,131 |
|
|
PNC Financial Services Group, Inc. |
76,000 |
4,479,250 |
|
|
Royal Bank of Canada |
29,900 |
1,750,516 |
|
|
State Street Corp. |
8,400 |
989,100 |
|
|
Toronto Dominion Bank |
79,300 |
2,266,099 |
|
|
TOTAL BANKS |
73,767,010 |
||
|
COMPUTER SERVICES & SOFTWARE - 2.8% |
|||
|
DST Systems, Inc. (a) |
225,400 |
21,187,600 |
|
|
CREDIT & OTHER FINANCE - 8.2% |
|||
|
American Express Co. |
362,200 |
21,415,075 |
|
|
Citigroup, Inc. |
566,566 |
33,073,290 |
|
|
Providian Financial Corp. |
58,900 |
6,769,819 |
|
|
TOTAL CREDIT & OTHER FINANCE |
61,258,184 |
||
|
FEDERAL SPONSORED CREDIT - 0.2% |
|||
|
Freddie Mac |
31,900 |
1,343,788 |
|
|
INSURANCE - 4.8% |
|||
|
AFLAC, Inc. |
70,800 |
3,823,200 |
|
|
AMBAC Financial Group, Inc. |
23,400 |
1,512,225 |
|
|
American International Group, Inc. |
27,487 |
2,449,779 |
|
|
Kingsway Financial Services, Inc. (a) |
174,700 |
706,398 |
|
|
Liberty Financial Companies, Inc. |
59,100 |
1,396,238 |
|
|
Marsh & McLennan Companies, Inc. |
112,100 |
13,311,875 |
|
|
MBIA, Inc. |
11,600 |
762,700 |
|
|
Nationwide Financial Services, Inc. |
95,200 |
3,796,100 |
|
|
Protective Life Corp. |
26,800 |
770,500 |
|
|
Reinsurance Group of America, Inc. |
61,950 |
1,765,575 |
|
|
Reliastar Financial Corp. |
76,558 |
4,119,777 |
|
|
Sun Life Financial Services Canada, Inc. |
50,000 |
1,053,347 |
|
|
UICI (a) |
16,200 |
107,325 |
|
|
TOTAL INSURANCE |
35,575,039 |
||
|
|
|||
|
Shares |
Value (Note 1) |
||
|
RAILROADS - 0.2% |
|||
|
Kansas City Southern Industries, Inc. |
149,600 |
$ 1,383,800 |
|
|
REAL ESTATE INVESTMENT TRUSTS - 0.0% |
|||
|
AMRESCO Capital Trust, Inc. |
33,500 |
360,125 |
|
|
SECURITIES INDUSTRY - 65.3% |
|||
|
A.G. Edwards, Inc. |
85,900 |
4,466,800 |
|
|
Affiliated Managers Group, Inc. (a) |
96,500 |
5,379,875 |
|
|
AGF Management Ltd. Class B (non-vtg.) |
24,760 |
415,611 |
|
|
AXA Financial, Inc. |
213,700 |
11,058,975 |
|
|
Bear Stearns Companies, Inc. |
559,286 |
37,507,117 |
|
|
BlackRock, Inc. Class A |
156,400 |
6,412,400 |
|
|
Charles Schwab Corp. |
962,600 |
36,759,288 |
|
|
CI Fund Management, Inc. |
49,300 |
904,587 |
|
|
Dain Rauscher Corp. |
96,750 |
7,782,328 |
|
|
Daiwa Securities Group, Inc. |
905,000 |
11,283,866 |
|
|
DLJ, Inc. |
254,500 |
22,523,250 |
|
|
E*Trade Group, Inc. (a) |
542,600 |
9,631,150 |
|
|
Eaton Vance Corp. (non-vtg.) |
69,100 |
3,347,031 |
|
|
eSpeed, Inc. Class A |
58,700 |
1,805,025 |
|
|
Federated Investors, Inc. Class B (non-vtg.) |
720,250 |
16,880,859 |
|
|
Franklin Resources, Inc. |
341,300 |
12,969,400 |
|
|
Goldman Sachs Group, Inc. |
271,700 |
34,794,581 |
|
|
Investment Technology Group, Inc. (a) |
27,800 |
1,334,400 |
|
|
Investors Group, Inc. |
67,700 |
943,153 |
|
|
Jefferies Group, Inc. |
95,400 |
2,903,738 |
|
|
John Nuveen Co. (The) Class A |
23,600 |
1,070,850 |
|
|
Knight Trading Group, Inc. (a) |
236,900 |
7,432,738 |
|
|
Legg Mason, Inc. |
234,932 |
12,392,663 |
|
|
Lehman Brothers Holdings, Inc. |
335,100 |
48,589,500 |
|
|
Mackenzie Financial Corp. |
119,400 |
1,931,172 |
|
|
Merrill Lynch & Co., Inc. |
229,400 |
33,263,000 |
|
|
Morgan Keegan, Inc. |
69,325 |
1,390,833 |
|
|
Morgan Stanley Dean Witter & Co. |
470,730 |
50,632,894 |
|
|
Neuberger Berman, Inc. |
66,200 |
3,918,213 |
|
|
Nikko Securities Co. Ltd. |
924,000 |
8,913,434 |
|
|
Nomura Securities Co. Ltd. |
411,000 |
9,613,246 |
|
|
PaineWebber Group, Inc. |
266,600 |
19,061,900 |
|
|
Pioneer Group, Inc. (a) |
35,400 |
1,544,325 |
|
|
Raymond James Financial, Inc. |
25,125 |
716,063 |
|
|
Stilwell Financial, Inc. (a) |
608,400 |
29,431,350 |
|
|
T. Rowe Price Associates, Inc. |
93,600 |
4,235,400 |
|
|
TD Waterhouse Group, Inc. (a) |
269,100 |
5,449,275 |
|
|
Waddell & Reed Financial, Inc.: |
|
|
|
|
Class A |
427,454 |
14,907,458 |
|
|
Class B |
88,241 |
2,967,104 |
|
|
Wit Soundview Group, Inc. (a) |
20,800 |
192,400 |
|
|
TOTAL SECURITIES INDUSTRY |
486,757,252 |
||
|
TOTAL COMMON STOCKS (Cost $399,705,593) |
681,632,798 |
||
|
Cash Equivalents - 12.3% |
|||
|
Shares |
Value (Note 1) |
||
|
Fidelity Cash Central Fund, 6.59% (b) |
89,462,720 |
$ 89,462,720 |
|
|
Fidelity Securities Lending Cash Central Fund, 6.64% (b) |
2,409,000 |
2,409,000 |
|
|
TOTAL CASH EQUIVALENTS (Cost $91,871,720) |
91,871,720 |
||
|
TOTAL INVESTMENT PORTFOLIO - 103.7% (Cost $491,577,313) |
773,504,518 |
|
NET OTHER ASSETS - (3.7)% |
(27,739,808) |
||
|
NET ASSETS - 100% |
$ 745,764,710 |
||
|
Legend |
|
(a) Non-income producing |
|
(b) The rate quoted is the annualized seven-day yield of the fund at |
|
Other Information |
|
Purchases and sales of securities, other than short-term securities, aggregated $195,094,328 and $115,173,759, respectively. |
|
The fund placed a portion of its portfolio transactions with brokerage firms which are affiliates of Fidelity Management & Research Company. The commissions paid to these affiliated firms were $17,355 for the period. |
|
The fund participated in the security lending program. At period end, the value of securities loaned amounted to $2,290,375. The fund received cash collateral of $2,409,000 which was invested in cash equivalents. |
|
Income Tax Information |
|
At August 31, 2000, the aggregate cost of investment securities for income tax purposes was $492,652,283. Net unrealized appreciation aggregated $280,852,235, of which $287,633,052 related to appreciated investment securities and $6,780,817 related to depreciated investment securities. |
See accompanying notes which are an integral part of the financial statements.
Financial Services Sector
Statement of Assets and Liabilities
|
|
August 31, 2000 (Unaudited) |
|
|
Assets |
|
|
|
Investment in securities, at value |
|
$ 773,504,518 |
|
Receivable for fund shares sold |
|
8,241,288 |
|
Dividends receivable |
|
233,254 |
|
Interest receivable |
|
496,092 |
|
Redemption fees receivable |
|
1,184 |
|
Other receivables |
|
192 |
|
Total assets |
|
782,476,528 |
|
Liabilities |
|
|
|
Payable for investments purchased |
$ 32,406,347 |
|
|
Payable for fund shares redeemed |
1,317,885 |
|
|
Accrued management fee |
311,715 |
|
|
Other payables and accrued expenses |
266,871 |
|
|
Collateral on securities loaned, |
2,409,000 |
|
|
Total liabilities |
|
36,711,818 |
|
Net Assets |
|
$ 745,764,710 |
|
Net Assets consist of: |
|
|
|
Paid in capital |
|
$ 449,274,613 |
|
Undistributed net investment income |
|
891,818 |
|
Accumulated undistributed net realized gain (loss) on investments and foreign currency transactions |
|
13,686,652 |
|
Net unrealized appreciation (depreciation) on investments |
|
281,911,627 |
|
Net Assets, for 11,645,269 |
|
$ 745,764,710 |
|
Net Asset Value and redemption price per share ($745,764,710 ÷ 11,645,269 shares) |
|
$64.04 |
|
Maximum offering price per share (100/97.00 of $64.04) |
|
$66.02 |
Statement of Operations
|
|
Six months ended August 31, 2000 (Unaudited) |
|
|
Investment Income Dividends |
|
$ 2,447,552 |
|
Interest |
|
1,404,764 |
|
Security lending |
|
22,191 |
|
Total income |
|
3,874,507 |
|
Expenses |
|
|
|
Management fee |
$ 1,516,448 |
|
|
Transfer agent fees |
1,222,516 |
|
|
Accounting and security lending fees |
168,343 |
|
|
Non-interested trustees' compensation |
779 |
|
|
Custodian fees and expenses |
17,912 |
|
|
Registration fees |
58,229 |
|
|
Audit |
10,085 |
|
|
Legal |
900 |
|
|
Miscellaneous |
17,634 |
|
|
Total expenses before reductions |
3,012,846 |
|
|
Expense reductions |
(30,157) |
2,982,689 |
|
Net investment income |
|
891,818 |
|
Realized and Unrealized Gain (Loss) Net realized gain (loss) on: |
|
|
|
Investment securities |
16,353,035 |
|
|
Foreign currency transactions |
(199,888) |
16,153,147 |
|
Change in net unrealized appreciation (depreciation) on: |
|
|
|
Investment securities |
161,240,901 |
|
|
Assets and liabilities in |
407 |
161,241,308 |
|
Net gain (loss) |
|
177,394,455 |
|
Net increase (decrease) in net assets resulting from operations |
|
$ 178,286,273 |
|
Other Information |
|
|
|
Sales charges paid to FDC |
|
$ 1,284,848 |
|
Deferred sales charges withheld by FDC |
|
$ 2,176 |
|
Exchange fees withheld by FSC |
|
$ 11,070 |
|
Expense reductions |
|
|
|
Directed brokerage arrangements |
|
$ 28,156 |
|
Custodian credits |
|
1,303 |
|
Transfer agent credits |
|
698 |
|
|
|
$ 30,157 |
See accompanying notes which are an integral part of the financial statements.
Semiannual Report
Brokerage and Investment Management Portfolio
Financial Statements - continued
Statement of Changes in Net Assets
|
Increase (Decrease) in Net Assets |
Six months ended |
Year ended |
|
Operations |
$ 891,818 |
$ (430,856) |
|
Net realized gain (loss) |
16,153,147 |
56,881,968 |
|
Change in net unrealized appreciation (depreciation) |
161,241,308 |
14,521,134 |
|
Net increase (decrease) in net assets resulting from operations |
178,286,273 |
70,972,246 |
|
Distributions to shareholders |
- |
(594,460) |
|
From net realized gain |
(9,935,568) |
(29,239,962) |
|
Total distributions |
(9,935,568) |
(29,834,422) |
|
Share transactions |
379,168,752 |
461,837,909 |
|
Reinvestment of distributions |
9,567,198 |
28,620,298 |
|
Cost of shares redeemed |
(235,422,785) |
(591,672,937) |
|
Net increase (decrease) in net assets resulting from share transactions |
153,313,165 |
(101,214,730) |
|
Redemption fees |
528,950 |
1,123,789 |
|
Total increase (decrease) in net assets |
322,192,820 |
(58,953,117) |
|
Net Assets |
|
|
|
Beginning of period |
423,571,890 |
482,525,007 |
|
End of period (including undistributed net investment income of $891,818 and $0, respectively) |
$ 745,764,710 |
$ 423,571,890 |
|
Other Information Shares |
|
|
|
Sold |
6,907,793 |
10,180,475 |
|
Issued in reinvestment of distributions |
184,731 |
654,132 |
|
Redeemed |
(4,717,746) |
(13,287,958) |
|
Net increase (decrease) |
2,374,778 |
(2,453,351) |
Financial Highlights
|
|
Six months ended |
Years ended February 28, |
||||
|
Selected Per-Share Data |
(Unaudited) |
2000 G |
1999 |
1998 |
1997 |
1996 G |
|
Net asset value, beginning of period |
$ 45.69 |
$ 41.16 |
$ 39.78 |
$ 25.76 |
$ 18.49 |
$ 15.51 |
|
Income from Investment Operations |
|
|
|
|
|
|
|
Net investment income (loss) D |
.09 |
(.04) |
.10 |
.16 |
.08 |
.09 |
|
Net realized and unrealized gain (loss) |
19.13 |
7.64 |
1.72 |
14.46 |
7.80 |
4.29 |
|
Total from investment operations |
19.22 |
7.60 |
1.82 |
14.62 |
7.88 |
4.38 |
|
Less Distributions |
|
|
|
|
|
|
|
From net investment income |
- |
(.05) |
(.01) |
(.09) |
(.06) |
(.04) |
|
From net realized gain |
(.92) |
(3.13) |
(.52) |
(.61) |
(.65) |
(1.09) |
|
In excess of net realized gain |
- |
- |
- |
- |
- |
(.35) |
|
Total distributions |
(.92) |
(3.18) |
(.53) |
(.70) |
(.71) |
(1.48) |
|
Redemption fees added to paid in capital |
.05 |
.11 |
.09 |
.10 |
.10 |
.08 |
|
Net asset value, end of period |
$ 64.04 |
$ 45.69 |
$ 41.16 |
$ 39.78 |
$ 25.76 |
$ 18.49 |
|
Total Return B, C |
42.65% |
19.14% |
4.76% |
57.56% |
44.27% |
29.85% |
|
Ratios and Supplemental Data |
|
|
|
|
|
|
|
Net assets, end of period (000 omitted) |
$ 745,765 |
$ 423,572 |
$ 482,525 |
$ 676,067 |
$ 458,787 |
$ 38,382 |
|
Ratio of expenses to average net assets |
1.11% A |
1.29% |
1.26% |
1.33% |
1.94% |
1.64% E |
|
Ratio of expenses to average net assets after |
1.10% A, F |
1.28% F |
1.24% F |
1.29% F |
1.93% F |
1.61% F |
|
Ratio of net investment income to average net assets |
.33% A |
(.09)% |
.26% |
.49% |
.37% |
.50% |
|
Portfolio turnover rate |
45% A |
47% |
59% |
100% |
16% |
166% |
|
A Annualized B The total returns would have been lower had certain expenses not been reduced during the periods shown. C Total returns do not include the one time sales
charge and for periods of less than one year are not annualized. |
||||||
See accompanying notes which are an integral part of the financial statements.
Financial Services Sector
Performance
There are several ways to evaluate a fund's historical performance. You can look at the total percentage change in value, the average annual percentage change or the growth of a hypothetical $10,000 investment. Total return reflects the change in the value of an investment, assuming reinvestment of the fund's dividend income and capital gains (the profits earned upon the sale of securities that have grown in value). Load adjusted returns include a 3.00% sales charge and the effect of a $7.50 long-term trading fee for shares held 30 days or more. Effective September 28, 2000, the $7.50 long-term trading fee was eliminated.
Cumulative Total Returns
|
Periods ended |
Past 6 |
Past 1 |
Past 5 |
Past 10 |
|
Select Financial Services |
35.07% |
18.82% |
178.47% |
838.22% |
|
Select Financial Services |
30.94% |
15.18% |
170.04% |
810.00% |
|
S&P 500 |
11.73% |
16.32% |
193.58% |
493.54% |
|
GS Financial Services |
35.48% |
19.10% |
n/a** |
n/a** |
Cumulative total returns show the fund's performance in percentage terms over a set period - in this case, six months, one year, five years or 10 years. You can compare the fund's returns to the performance of both the Standard & Poor's 500 Index - a market capitalization-weighted index of common stocks - and the Goldman Sachs Financial Services Index - a market capitalization-weighted index of 256 stocks designed to measure the performance of companies in the financial services sector. These benchmarks include reinvestment of dividends and capital gains, if any, and exclude the effect of sales charges.
Average Annual Total Returns
|
Periods ended |
Past 1 |
Past 5 |
Past 10 |
|
Select Financial Services |
18.82% |
22.73% |
25.09% |
|
Select Financial Services |
15.18% |
21.98% |
24.71% |
|
S&P 500 |
16.32% |
24.04% |
19.49% |
|
GS Financial Services |
19.10% |
n/a** |
n/a** |
Average annual returns take the fund's cumulative return and show you what would have happened if the fund had performed at a constant rate each year.
** Not available
Understanding Performance
How a fund did yesterday is no guarantee of how it will do tomorrow. The stock market, for example, has a history of long-term growth and short-term volatility. Unlike the broader market, however, some sectors may not have a history of growth in the long run. And, as with all stock funds, the share price and return of a fund that invests in a sector will vary.
3$10,000 Over 10 Years
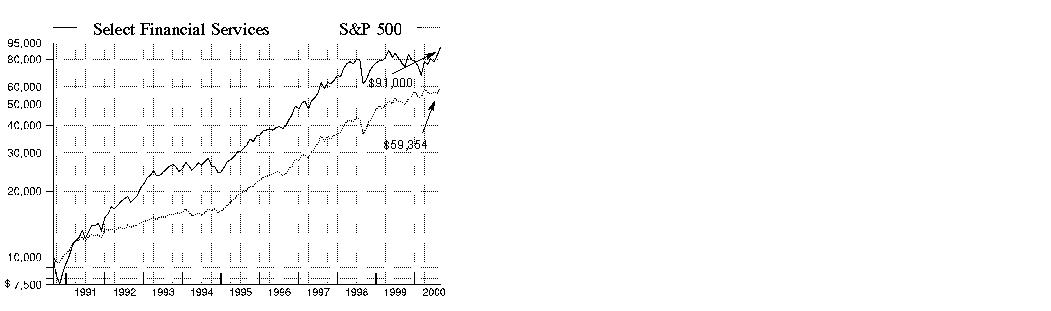
$10,000 Over 10 Years: Let's say hypothetically that $10,000 was invested in Fidelity Select Financial Services Portfolio on August 31, 1990, and the current 3.00% sales charge was paid. As the chart shows, by August 31, 2000, the value of the investment would have grown to $91,000 - an 810.00% increase on the initial investment - and includes the effect of a $7.50 long-term trading fee. For comparison, look at how the Standard & Poor's 500 Index did over the same period. With dividends and capital gains, if any, reinvested, the same $10,000 investment would have grown to $59,354 - a 493.54% increase.
Investment Summary
|
Top Ten Stocks as of August 31, 2000 |
|
|
|
% of fund's |
|
Morgan Stanley Dean Witter & Co. |
5.3 |
|
Citigroup, Inc. |
5.2 |
|
American International Group, Inc. |
4.4 |
|
American Express Co. |
4.1 |
|
Fannie Mae |
3.7 |
|
Wells Fargo & Co. |
3.4 |
|
Charles Schwab Corp. |
2.8 |
|
Berkshire Hathaway, Inc. Class A |
2.8 |
|
Bank of America Corp. |
2.5 |
|
Merrill Lynch & Co., Inc. |
2.3 |
|
|
36.5 |
Top Industries as of August 31, 2000
% of fund's net assets

Semiannual Report
(Portfolio Manager photograph)
James Catudal,
Portfolio Manager of Fidelity Select Financial Services Portfolio
Q. How did the fund perform, Jim?
A. For the six months that ended August 31, 2000, the fund returned 35.07%. In comparison, the Goldman Sachs Financial Services Index - an index of 256 stocks designed to measure the performance of companies in the financial services industry - returned 35.48%, while the Standard & Poor's 500 Index returned 11.73%. For the 12 months ending August 31, 2000, the fund returned 18.82%, while the Goldman Sachs Financial Services Index returned 19.10% and the S&P 500 index had a return of 16.32%.
Q. What factors affected the performance of financial services stocks during the six-month period?
A. After a difficult period in the previous 12 months caused by fears of inflation and rising interest rates, the environment for financial services stocks improved as the six-month period progressed. Financial services stocks were helped by the widening perception that the Federal Reserve Board was nearing the completion of its interest-rate hikes. For the most part, large-cap financial services companies did better than mid-cap and small-cap companies. Among banks, commercial credit quality started to deteriorate, although consumer credit quality remained good. A number of banks lowered their earnings expectations, especially in the past six months, which negatively affected the performance of their stocks. In addition, several relatively high-profile banking mergers ran into trouble as the acquiring institutions struggled to integrate the operations of the newly combined companies. Increasingly, the traditional plain-vanilla bank became recognized in the market as a slow-growth business. The banks and financial services companies that branched into faster-growing businesses had much better results, and investors gravitated toward the companies they saw as winners.
Q. How did financial institutions other than banks perform?
A. Investment management companies did well, helped by an increase in merger-and-acquisition activity, their high level of recurring fee income and their long-term growth prospects. Investment banks and securities companies had poor performance early in the period, but rebounded in July and August after reporting better-than-expected earnings. Their stocks also were helped by the separate announcements that PaineWebber and DLJ were to be acquired by European institutions. Commercial property-and-casualty insurance companies and life insurance companies also saw improved performance, although personal property-and-casualty companies continued to have problems.
Q. What were your principal strategies?
A. I overweighted consumer finance, investment management and property-and-casualty and life insurance companies. I also increased the weighting in brokerage stocks late in the period. In general, I underweighted traditional banks, although I emphasized companies such as Bank of New York and State Street that had large data-processing operations for the securities business. Also, I emphasized successful large-cap financial services companies such as Citigroup, American Express, Morgan Stanley Dean Witter and American International Group. I also overweighted government-sponsored enterprises such as Fannie Mae and Freddie Mac, although they were disappointing performers. I liked them because their stocks were selling at very low valuations and they tend to do well when the Federal Reserve has completed its cycle of interest-rate hikes.
Q. What investments helped performance, and what investments hurt?
A. Morgan Stanley Dean Witter, a diversified financial services company, had very strong performance, helped by its equity underwriting business. Citigroup also performed well as all its businesses reported good results. Freddie Mac and Fannie Mae were disappointments, although I continued to like their prospects. They were hurt by rising interest rates and political controversies over their size and over the implied government guarantees behind the securities they issue.
Q. What is your outlook?
A. We are in an unusual period in which we have to assess both the positive effects of a likely end to interest-rate increases and the negative effects of potential commercial credit quality problems. The prospects for financial services stocks in general will depend on whether the economy has a hard landing, in which growth slows significantly, or a soft landing, in which growth slows to a more moderate level. If we suffer a hard landing, financial companies will be hurt. If it's a soft landing, they should do relatively well. I have tried to position the fund with stocks that have the potential to do well in either scenario.
The views expressed in this report reflect those of the portfolio manager only through the end of the period of the report as stated on the cover. The manager's views are subject to change at any time based on market or other conditions. For more information, see page 3.
Fund Facts
Start date: December 10, 1981
Fund number: 066
Trading symbol: FIDSX
Size: as of August 31, 2000, more than
$553 million
Manager: James Catudal, since February 2000; manager, Fidelity Select Energy Service Portfolio, 1998-2000; Fidelity Select Industrial Materials Portfolio, 1997-1998; joined Fidelity in 1997
3Semiannual Report
Financial Services Portfolio
(Unaudited)
Showing Percentage of Net Assets
|
Common Stocks - 92.8% |
|||
|
Shares |
Value (Note 1) |
||
|
BANKS - 22.9% |
|||
|
Bank of America Corp. |
256,079 |
$ 13,716,231 |
|
|
Bank of New York Co., Inc. |
188,736 |
9,896,844 |
|
|
Bank One Corp. |
127,519 |
4,495,045 |
|
|
Canadian Imperial Bank of Commerce |
50,000 |
1,532,450 |
|
|
Capital One Financial Corp. |
64,000 |
3,860,000 |
|
|
Chase Manhattan Corp. |
106,550 |
5,953,481 |
|
|
Comerica, Inc. |
31,167 |
1,755,092 |
|
|
Commerce Bancorp, Inc. |
10,000 |
516,875 |
|
|
Fifth Third Bancorp |
45,000 |
2,078,438 |
|
|
First Security Corp. |
70,000 |
1,067,500 |
|
|
First Union Corp. |
61,327 |
1,774,650 |
|
|
Firstar Corp. |
205,000 |
4,894,375 |
|
|
FleetBoston Financial Corp. |
221,234 |
9,443,926 |
|
|
J.P. Morgan & Co., Inc. |
50,000 |
8,359,375 |
|
|
M&T Bank Corp. |
2,500 |
1,211,719 |
|
|
Marshall & Ilsley Corp. |
8,000 |
390,000 |
|
|
Mellon Financial Corp. |
170,000 |
7,692,500 |
|
|
Northern Trust Corp. |
4,000 |
337,250 |
|
|
PNC Financial Services Group, Inc. |
103,500 |
6,100,031 |
|
|
Royal Bank of Canada |
64,000 |
3,746,925 |
|
|
Silicon Valley Bancshares (a) |
7,000 |
403,375 |
|
|
State Street Corp. |
53,000 |
6,240,750 |
|
|
SunTrust Banks, Inc. |
90,000 |
4,443,750 |
|
|
Synovus Finanical Corp. |
55,000 |
1,082,813 |
|
|
Toronto Dominion Bank |
123,000 |
3,514,883 |
|
|
U.S. Bancorp |
87,089 |
1,894,186 |
|
|
UnionBanCal Corp. |
20,476 |
508,061 |
|
|
Wachovia Corp. |
9,000 |
515,813 |
|
|
Wells Fargo & Co. |
442,200 |
19,097,513 |
|
|
TOTAL BANKS |
126,523,851 |
||
|
COMPUTER SERVICES & SOFTWARE - 0.1% |
|||
|
Network Engines, Inc. |
100 |
3,913 |
|
|
SEI Investments Co. |
13,000 |
825,500 |
|
|
TOTAL COMPUTER SERVICES & SOFTWARE |
829,413 |
||
|
CREDIT & OTHER FINANCE - 15.6% |
|||
|
American Express Co. |
385,900 |
22,816,338 |
|
|
Associates First Capital Corp. Class A |
342,200 |
9,624,375 |
|
|
Citigroup, Inc. |
491,333 |
28,681,564 |
|
|
Countrywide Credit Industries, Inc. |
25,071 |
949,564 |
|
|
Household International, Inc. |
209,046 |
10,034,208 |
|
|
Indymac Bancorp, Inc. |
37,000 |
624,375 |
|
|
MBNA Corp. |
276,500 |
9,763,906 |
|
|
Metris Companies, Inc. |
9,000 |
323,438 |
|
|
NextCard, Inc. (a) |
9,000 |
73,969 |
|
|
Providian Financial Corp. |
32,500 |
3,735,469 |
|
|
TOTAL CREDIT & OTHER FINANCE |
86,627,206 |
||
|
|
|||
|
Shares |
Value (Note 1) |
||
|
FEDERAL SPONSORED CREDIT - 6.5% |
|||
|
Fannie Mae |
384,500 |
$ 20,666,875 |
|
|
Freddie Mac |
282,600 |
11,904,525 |
|
|
USA Education, Inc. |
90,000 |
3,526,875 |
|
|
TOTAL FEDERAL SPONSORED CREDIT |
36,098,275 |
||
|
GENERAL MERCHANDISE STORES - 0.2% |
|||
|
Federated Department Stores, Inc. (a) |
40,000 |
1,105,000 |
|
|
INSURANCE - 22.5% |
|||
|
ACE Ltd. |
137,000 |
4,812,125 |
|
|
AFLAC, Inc. |
93,000 |
5,022,000 |
|
|
Allmerica Financial Corp. |
53,200 |
3,238,550 |
|
|
Allstate Corp. |
97,000 |
2,819,063 |
|
|
AMBAC Financial Group, Inc. |
27,400 |
1,770,725 |
|
|
American General Corp. |
51,000 |
3,713,438 |
|
|
American International Group, Inc. |
272,043 |
24,245,832 |
|
|
Aon Corp. |
20,000 |
746,250 |
|
|
Arthur J. Gallagher & Co. |
24,000 |
1,176,000 |
|
|
AXA SA de CV sponsored ADR |
13,000 |
914,063 |
|
|
Berkshire Hathaway, Inc.: |
|
|
|
|
Class A (a) |
269 |
15,521,300 |
|
|
Class B (a) |
1,700 |
3,252,100 |
|
|
Commerce Group, Inc. |
7,000 |
182,000 |
|
|
Conseco, Inc. |
125,900 |
1,062,281 |
|
|
Everest Re Group Ltd. |
30,000 |
1,207,500 |
|
|
Hartford Financial Services Group, Inc. |
101,000 |
6,729,125 |
|
|
HCC Insurance Holdings, Inc. |
60,000 |
1,267,500 |
|
|
Jefferson-Pilot Corp. |
32,000 |
2,118,000 |
|
|
John Hancock Financial Services, Inc. |
60,000 |
1,515,000 |
|
|
Lincoln National Corp. |
15,000 |
810,000 |
|
|
Loews Corp. |
25,000 |
2,023,438 |
|
|
Marsh & McLennan Companies, Inc. |
52,500 |
6,234,375 |
|
|
MBIA, Inc. |
52,400 |
3,445,300 |
|
|
MetLife, Inc. |
150,000 |
3,646,875 |
|
|
Nationwide Financial Services, Inc. |
50,000 |
1,993,750 |
|
|
PartnerRe Ltd. |
22,000 |
922,625 |
|
|
PMI Group, Inc. |
19,600 |
1,215,200 |
|
|
Protective Life Corp. |
17,000 |
488,750 |
|
|
Reliastar Financial Corp. |
40,636 |
2,186,725 |
|
|
RenaissanceRe Holdings Ltd. |
15,000 |
718,125 |
|
|
SAFECO Corp. |
25,000 |
657,813 |
|
|
Sun Life Financial Services Canada, Inc. |
205,000 |
4,318,722 |
|
|
The Chubb Corp. |
95,000 |
7,273,438 |
|
|
The St. Paul Companies, Inc. |
60,000 |
2,857,500 |
|
|
UnumProvident Corp. |
35,000 |
759,063 |
|
|
XL Capital Ltd. Class A |
50,000 |
3,446,875 |
|
|
TOTAL INSURANCE |
124,311,426 |
||
|
LODGING & GAMING - 0.1% |
|||
|
Starwood Hotels & Resorts Worldwide, Inc. unit |
25,000 |
800,000 |
|
|
Common Stocks - continued |
|||
|
Shares |
Value (Note 1) |
||
|
RAILROADS - 0.0% |
|||
|
Kansas City Southern Industries, Inc. |
11,500 |
$ 106,375 |
|
|
REAL ESTATE INVESTMENT TRUSTS - 3.3% |
|||
|
AMB Property Corp. |
41,000 |
991,688 |
|
|
Apartment Investment & Management Co. Class A |
25,000 |
1,121,875 |
|
|
Archstone Communities Trust |
40,000 |
985,000 |
|
|
Arden Realty Group, Inc. |
5,000 |
127,500 |
|
|
Avalonbay Communities, Inc. |
20,000 |
893,750 |
|
|
BRE Properties, Inc. Class A |
10,000 |
291,875 |
|
|
Cousins Properties, Inc. |
25,000 |
1,028,125 |
|
|
Crescent Real Estate Equities Co. |
80,000 |
1,770,000 |
|
|
Duke-Weeks Realty Corp. |
40,000 |
950,000 |
|
|
Equity Office Properties Trust |
70,000 |
2,021,250 |
|
|
Equity Residential Properties Trust (SBI) |
46,200 |
2,217,600 |
|
|
First Industrial Realty Trust, Inc. |
8,000 |
237,500 |
|
|
Host Marriott Corp. |
50,000 |
534,375 |
|
|
Kimco Realty Corp. |
30,000 |
1,218,750 |
|
|
ProLogis Trust |
40,000 |
915,000 |
|
|
Public Storage, Inc. |
55,000 |
1,340,625 |
|
|
Simon Property Group, Inc. |
15,000 |
342,188 |
|
|
Spieker Properties, Inc. |
25,000 |
1,365,625 |
|
|
TOTAL REAL ESTATE INVESTMENT TRUSTS |
18,352,726 |
||
|
SAVINGS & LOANS - 3.1% |
|||
|
Astoria Financial Corp. |
20,000 |
702,500 |
|
|
Charter One Financial, Inc. |
57,750 |
1,371,563 |
|
|
Commercial Federal Corp. |
50,000 |
903,125 |
|
|
Golden State Bancorp, Inc. |
75,000 |
1,509,375 |
|
|
Golden West Financial Corp. |
44,000 |
2,095,500 |
|
|
TCF Financial Corp. |
100,000 |
3,281,250 |
|
|
Washington Mutual, Inc. |
208,880 |
7,310,800 |
|
|
TOTAL SAVINGS & LOANS |
17,174,113 |
||
|
SECURITIES INDUSTRY - 18.3% |
|||
|
A.G. Edwards, Inc. |
25,000 |
1,300,000 |
|
|
AXA Financial, Inc. |
88,200 |
4,564,350 |
|
|
Bear Stearns Companies, Inc. |
48,387 |
3,244,953 |
|
|
Charles Schwab Corp. |
410,186 |
15,663,978 |
|
|
DLJ, Inc. |
22,000 |
1,947,000 |
|
|
DLJdirect, Inc. (a) |
5,000 |
40,625 |
|
|
Eaton Vance Corp. (non-vtg.) |
20,000 |
968,750 |
|
|
Federated Investors, Inc. Class B (non-vtg.) |
64,950 |
1,522,266 |
|
|
Franklin Resources, Inc. |
25,000 |
950,000 |
|
|
Goldman Sachs Group, Inc. |
74,700 |
9,566,269 |
|
|
Legg Mason, Inc. |
15,000 |
791,250 |
|
|
Lehman Brothers Holdings, Inc. |
34,700 |
5,031,500 |
|
|
Mackenzie Financial Corp. |
45,000 |
727,829 |
|
|
Merrill Lynch & Co., Inc. |
89,000 |
12,905,000 |
|
|
Morgan Stanley Dean Witter & Co. |
272,200 |
29,278,502 |
|
|
Neuberger Berman, Inc. |
15,000 |
887,813 |
|
|
|
|||
|
Shares |
Value (Note 1) |
||
|
PaineWebber Group, Inc. |
15,000 |
$ 1,072,500 |
|
|
Raymond James Financial, Inc. |
10,000 |
285,000 |
|
|
Stilwell Financial, Inc. (a) |
71,000 |
3,434,625 |
|
|
T. Rowe Price Associates, Inc. |
27,000 |
1,221,750 |
|
|
TD Waterhouse Group, Inc. (a) |
60,000 |
1,215,000 |
|
|
Waddell & Reed Financial, Inc. Class A |
124,802 |
4,352,470 |
|
|
Wit Soundview Group, Inc. (a) |
10,000 |
92,500 |
|
|
TOTAL SECURITIES INDUSTRY |
101,063,930 |
||
|
SERVICES - 0.2% |
|||
|
H&R Block, Inc. |
25,000 |
896,875 |
|
|
TOTAL COMMON STOCKS (Cost $361,637,760) |
513,889,190 |
||
|
Cash Equivalents - 7.4% |
|||
|
|
|
|
|
|
Fidelity Cash Central Fund, 6.59% (b) |
39,168,935 |
39,168,935 |
|
|
Fidelity Securities Lending Cash Central Fund, 6.64% (b) |
1,496,700 |
1,496,700 |
|
|
TOTAL CASH EQUIVALENTS (Cost $40,665,635) |
40,665,635 |
||
|
TOTAL INVESTMENT PORTFOLIO - 100.2% (Cost $402,303,395) |
554,554,825 |
||
|
NET OTHER ASSETS - (0.2)% |
(918,046) |
||
|
NET ASSETS - 100% |
$ 553,636,779 |
||
|
Legend |
|
(a) Non-income producing |
|
(b) The rate quoted is the annualized seven-day yield of the fund at |
|
Other Information |
|
Purchases and sales of securities, other than short-term securities, aggregated $286,332,596 and $220,585,861, respectively. |
|
The fund placed a portion of its portfolio transactions with brokerage firms which are affiliates of Fidelity Management & Research Company. The commissions paid to these affiliated firms were $34,287 for the period. |
|
The fund participated in the security lending program. At period end, the value of securities loaned amounted to $1,377,844. The fund received cash collateral of $1,496,700 which was invested in cash equivalents. |
|
Income Tax Information |
|
At August 31, 2000, the aggregate cost of investment securities for income tax purposes was $406,960,498. Net unrealized appreciation aggregated $147,594,327, of which $155,972,131 related to appreciated investment securities and $8,377,804 related to depreciated investment securities. |
See accompanying notes which are an integral part of the financial statements.
Financial Services Sector
Statement of Assets and Liabilities
|
|
August 31, 2000 (Unaudited) |
|
|
Assets |
|
|
|
Investment in securities, at value |
|
$ 554,554,825 |
|
Receivable for investments sold |
|
4,728,462 |
|
Receivable for fund shares sold |
|
5,656,816 |
|
Dividends receivable |
|
601,336 |
|
Interest receivable |
|
210,527 |
|
Redemption fees receivable |
|
2,184 |
|
Other receivables |
|
870 |
|
Total assets |
|
565,755,020 |
|
Liabilities |
|
|
|
Payable for investments purchased |
$ 8,575,293 |
|
|
Payable for fund shares redeemed |
1,595,880 |
|
|
Accrued management fee |
248,985 |
|
|
Other payables and |
201,383 |
|
|
Collateral on securities loaned, |
1,496,700 |
|
|
Total liabilities |
|
12,118,241 |
|
Net Assets |
|
$ 553,636,779 |
|
Net Assets consist of: |
|
|
|
Paid in capital |
|
$ 399,837,016 |
|
Undistributed net investment income |
|
2,679,457 |
|
Accumulated undistributed net realized gain (loss) on investments and foreign currency transactions |
|
(1,131,241) |
|
Net unrealized appreciation (depreciation) on investments |
|
152,251,547 |
|
Net Assets, for 5,137,555 |
|
$ 553,636,779 |
|
Net Asset Value and redemption price per share ($553,636,779 ÷ 5,137,555 shares) |
|
$107.76 |
|
Maximum offering price per share (100/97.00 of $107.76) |
|
$111.09 |
Statement of Operations
|
|
Six months ended August 31, 2000 (Unaudited) |
|
|
Investment Income Dividends |
|
$ 4,082,280 |
|
Interest |
|
971,607 |
|
Security lending |
|
7,728 |
|
Total income |
|
5,061,615 |
|
Expenses |
|
|
|
Management fee |
$ 1,278,153 |
|
|
Transfer agent fees |
1,012,123 |
|
|
Accounting and security lending fees |
145,151 |
|
|
Non-interested trustees' compensation |
653 |
|
|
Custodian fees and expenses |
12,139 |
|
|
Registration fees |
50,050 |
|
|
Audit |
11,389 |
|
|
Legal |
759 |
|
|
Miscellaneous |
116 |
|
|
Total expenses before reductions |
2,510,533 |
|
|
Expense reductions |
(112,855) |
2,397,678 |
|
Net investment income |
|
2,663,937 |
|
Realized and Unrealized Gain (Loss) Net realized gain (loss) on: |
|
|
|
Investment securities |
108,517 |
|
|
Foreign currency transactions |
9,614 |
118,131 |
|
Change in net unrealized appreciation (depreciation) on: |
|
|
|
Investment securities |
121,168,519 |
|
|
Assets and liabilities in |
117 |
121,168,636 |
|
Net gain (loss) |
|
121,286,767 |
|
Net increase (decrease) in net assets resulting from operations |
|
$ 123,950,704 |
|
Other Information |
|
$ 644,267 |
|
Deferred sales charges withheld |
|
$ 5,517 |
|
Exchange fees withheld by FSC |
|
$ 11,963 |
|
Expense reductions Directed brokerage arrangements |
|
$ 110,814 |
|
Custodian credits |
|
508 |
|
Transfer agent credits |
|
1,533 |
|
|
|
$ 112,855 |
See accompanying notes which are an integral part of the financial statements.
Semiannual Report
Financial Services Portfolio
Financial Statements - continued
Statement of Changes in Net Assets
|
Increase (Decrease) in Net Assets |
Six months ended |
Year ended |
|
Operations |
$ 2,663,937 |
$ 3,404,646 |
|
Net realized gain (loss) |
118,131 |
39,254,789 |
|
Change in net unrealized appreciation (depreciation) |
121,168,636 |
(106,918,398) |
|
Net increase (decrease) in net assets resulting from operations |
123,950,704 |
(64,258,963) |
|
Distributions to shareholders |
(563,383) |
(3,318,425) |
|
From net realized gain |
(6,606,735) |
(25,466,741) |
|
In excess of net realized gain |
(1,131,241) |
- |
|
Total distributions |
(8,301,359) |
(28,785,166) |
|
Share transactions |
288,540,243 |
375,427,486 |
|
Reinvestment of distributions |
7,952,247 |
27,476,805 |
|
Cost of shares redeemed |
(203,226,728) |
(513,506,187) |
|
Net increase (decrease) in net assets resulting from share transactions |
93,265,762 |
(110,601,896) |
|
Redemption fees |
569,986 |
798,200 |
|
Total increase (decrease) in net assets |
209,485,093 |
(202,847,825) |
|
Net Assets |
|
|
|
Beginning of period |
344,151,686 |
546,999,511 |
|
End of period (including undistributed net investment income of $2,679,457 and $1,570,371, respectively) |
$ 553,636,779 |
$ 344,151,686 |
|
Other Information Shares |
|
|
|
Sold |
3,016,148 |
3,739,478 |
|
Issued in reinvestment of distributions |
86,045 |
281,965 |
|
Redeemed |
(2,197,192) |
(5,214,250) |
|
Net increase (decrease) |
905,001 |
(1,192,807) |
Financial Highlights
|
|
Six months ended |
Years ended February 28, |
||||
|
Selected Per-Share Data |
(Unaudited) |
2000 F |
1999 |
1998 |
1997 |
1996 F |
|
Net asset value, beginning of period |
$ 81.31 |
$ 100.82 |
$ 103.28 |
$ 82.94 |
$ 65.70 |
$ 48.23 |
|
Income from Investment Operations |
|
|
|
|
|
|
|
Net investment income D |
.57 |
.67 |
.56 |
.70 |
.74 |
1.03 |
|
Net realized and unrealized gain (loss) |
27.53 |
(14.61) |
7.88 |
30.65 |
21.55 |
17.56 |
|
Total from investment operations |
28.10 |
(13.94) |
8.44 |
31.35 |
22.29 |
18.59 |
|
Less Distributions |
|
|
|
|
|
|
|
From net investment income |
(.12) |
(.64) |
(.19) |
(.64) |
(.63) |
(.37) |
|
From net realized gain |
(1.41) |
(5.09) |
(10.81) |
(10.51) |
(4.56) |
(.91) |
|
In excess of net realized gain |
(.24) |
- |
- |
- |
- |
- |
|
Total distributions |
(1.77) |
(5.73) |
(11.00) |
(11.15) |
(5.19) |
(1.28) |
|
Redemption fees added to paid in capital |
.12 |
.16 |
.10 |
.14 |
.14 |
.16 |
|
Net asset value, end of period |
$ 107.76 |
$ 81.31 |
$ 100.82 |
$ 103.28 |
$ 82.94 |
$ 65.70 |
|
Total Return B, C |
35.07% |
(14.53)% |
8.42% |
41.08% |
35.54% |
39.05% |
|
Ratios and Supplemental Data |
|
|
|
|
|
|
|
Net assets, end of period (000 omitted) |
$ 553,637 |
$ 344,152 |
$ 547,000 |
$ 604,908 |
$ 426,424 |
$ 270,466 |
|
Ratio of expenses to average net assets |
1.10% A |
1.19% |
1.20% |
1.31% |
1.45% |
1.42% |
|
Ratio of expenses to average net assets after |
1.05% A, E |
1.17% E |
1.18% E |
1.29% E |
1.43% E |
1.41% E |
|
Ratio of net investment income to average net assets |
1.17% A |
.66% |
.58% |
.78% |
1.03% |
1.78% |
|
Portfolio turnover rate |
104% A |
57% |
60% |
84% |
80% |
125% |
|
A Annualized B The total returns would have been lower had certain expenses not been reduced during the periods shown. C Total returns do not include the one time sales
charge and for periods of less than one year are not annualized. |
||||||
See accompanying notes which are an integral part of the financial statements.
Financial Services Sector
Performance
There are several ways to evaluate a fund's historical performance. You can look at the total percentage change in value, the average annual percentage change or the growth of a hypothetical $10,000 investment. Total return reflects the change in the value of an investment, assuming reinvestment of the fund's dividend income and capital gains (the profits earned upon the sale of securities that have grown in value). Load adjusted returns include a 3.00% sales charge and the effect of a $7.50 long-term trading fee for shares held 30 days or more. Effective September 28, 2000, the $7.50 long-term trading fee was eliminated. If Fidelity had not reimbursed certain fund expenses, the past 10 year total returns would have been lower.
Cumulative Total Returns
|
Periods ended |
Past 6 |
Past 1 |
Past 5 |
Past 10 |
|
|
Select Home Finance |
30.87% |
3.31% |
74.08% |
768.73% |
|
|
Select Home Finance |
26.87% |
0.14% |
68.78% |
742.60% |
|
|
S&P 500 |
11.73% |
16.32% |
193.58% |
493.54% |
|
|
GS Financial Services |
35.48% |
19.10% |
n/a** |
n/a** |
|
Cumulative total returns show the fund's performance in percentage terms over a set period - in this case, six months, one year, five years or 10 years. You can compare the fund's returns to the performance of both the Standard & Poor's 500 Index - a market capitalization-weighted index of common stocks - and the Goldman Sachs Financial Services Index - a market capitalization-weighted index of 256 stocks designed to measure the performance of companies in the financial services sector. These benchmarks include reinvestment of dividends and capital gains, if any, and exclude the effect of sales charges.
Average Annual Total Returns
|
Periods ended |
Past 1 |
Past 5 |
Past 10 |
|
Select Home Finance |
3.31% |
11.72% |
24.13% |
|
Select Home Finance |
0.14% |
11.04% |
23.75% |
|
S&P 500 |
16.32% |
24.04% |
19.49% |
|
GS Financial Services |
19.10% |
n/a** |
n/a** |
Average annual returns take the fund's cumulative return and show you what would have happened if the fund had performed at a constant rate each year.
** Not available
Understanding Performance
How a fund did yesterday is no guarantee of how it will do tomorrow. The stock market, for example, has a history of long-term growth and short-term volatility. Unlike the broader market, however, some sectors may not have a history of growth in the long run. And, as with all stock funds, the share price and return of a fund that invests in a sector will vary.
3$10,000 Over 10 Years
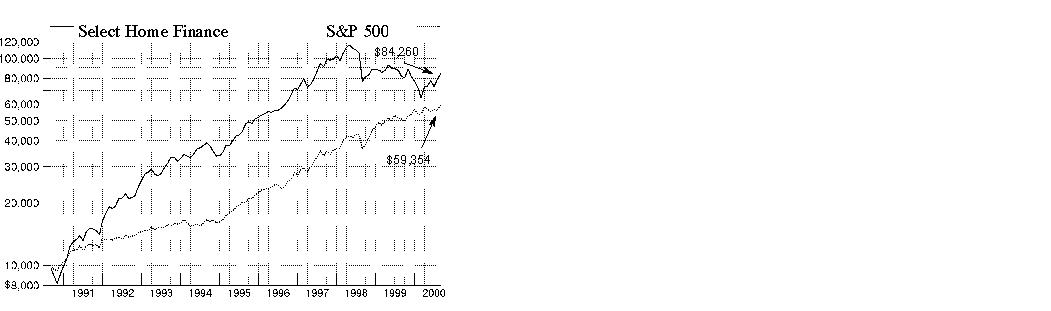
$10,000 Over 10 Years: Let's say hypothetically that $10,000 was invested in Fidelity Select Home Finance Portfolio on August 31, 1990, and the current 3.00% sales charge was paid. As the chart shows, by August 31, 2000, the value of the investment would have grown to $84,260 - a 742.60% increase on the initial investment - and includes the effect of a $7.50 long-term trading fee. For comparison, look at how the Standard & Poor's 500 Index did over the same period. With dividends and capital gains, if any, reinvested, the same $10,000 investment would have grown to $59,354 - a 493.54% increase.
Investment Summary
|
Top Ten Stocks as of August 31, 2000 |
|
|
|
% of fund's |
|
Freddie Mac |
10.1 |
|
Fannie Mae |
9.7 |
|
PMI Group, Inc. |
5.6 |
|
Golden West Financial Corp. |
5.3 |
|
TCF Financial Corp. |
4.7 |
|
Washington Mutual, Inc. |
4.2 |
|
Astoria Financial Corp. |
4.2 |
|
PNC Financial Services Group, Inc. |
4.1 |
|
Charter One Financial, Inc. |
4.1 |
|
Household International, Inc. |
4.0 |
|
|
56.0 |
Top Industries as of August 31, 2000
% of fund's net assets

Semiannual Report
(Portfolio Manager photograph)
Victor Thay,
Portfolio Manager
of Fidelity Select
Home Finance Portfolio
Q. How did the fund perform, Victor?
A. The fund did very well on an absolute basis and compared with the overall market, although performance lagged some other components of the strong financial services sector. For the six months that ended August 31, 2000, the fund returned 30.87%. By comparison, the Goldman Sachs Financial Services Index - an index of 256 stocks designed to measure the performance of companies in the financial services sector - returned 35.48%, while the Standard & Poor's 500 Index posted a return of 11.73% over the same period. For the 12 months that ended August 31, 2000, the fund returned 3.31%, while the Goldman Sachs index and the S&P 500 returned 19.10% and 16.32%, respectively.
Q. Why did the fund beat the S&P 500 but underperform the Goldman Sachs index during the six-month period?
A. Versus the overall market, as represented by the S&P 500, the fund was helped by investors' belief that the Federal Reserve Board might be finished raising interest rates. The general market's returns also were tempered by a stiff correction last spring that hit the technology sector particularly hard. On the other hand, strength in brokerage stocks, due in part to a series of high-profile takeover announcements, helped boost the returns of the Goldman Sachs index. In addition, insurance stocks, which typically are much more heavily weighted in the Goldman Sachs index than in the fund, did well, as many of them were perceived to offer attractive values compared with other financial services stocks.
Q. What made investors think that the Fed might be finished raising interest rates?
A. There were two more interest-rate hikes during the period - one in March and one in May. The latter featured a 0.50% increase in both the federal funds target rate and the discount rate. The size of that last increase and the fact that we've seen six tightening moves in just a year's time led many investors to wonder if the Fed would take a breather after the May increase. It normally takes 12 to 18 months for changes in interest rates to be fully reflected in the economy, and over the summer data on employment and economic growth began to suggest that the economy might be slowing. Accordingly, the Fed held rates steady at its June and August meetings.
Q. What stocks performed well during the period?
A. Golden West Financial was the fund's best performer. When interest rates rise, adjustable-rate mortgages become a more popular financing vehicle, and Golden West was well positioned to increase its portfolio of adjustable loans. Another beneficial holding was mortgage insurer PMI Group. The mortgage insurance group had been depressed when it appeared that Freddie Mac and Fannie Mae - both government-sponsored enterprises - might enter the mortgage insurance market and provide more competition for existing players. However, that scenario did not come to pass, and PMI Group continued to post impressive earnings during the period. Lender TCF Financial also performed well, as the company effectively pursued its strategy of marketing through branches in supermarkets.
Q. What stocks detracted from performance?
A. Intuit, the maker of personal finance and tax software, was the fund's worst performer. The stock declined early in the period on news that design flaws in the company's Web site caused it to leak confidential information to Internet advertiser DoubleClick. Homestore.com, an Internet portal for those looking for homes or home loans, was a victim of the sharp technology sell-off last spring. Finally, Microsoft retreated due to disappointing Windows 2000 sales figures as well as negative publicity regarding the U.S. Justice Department's antitrust suit against the company. I sold all three stocks.
Q. What's your outlook, Victor?
A. The key question regarding the near-term outlook is whether the Fed can be successful in engineering a so-called soft landing - that is, slower growth without a recession. Things look promising so far, but I will continue to monitor the economic data for clues about where the economy is headed. My central focus, however, is to identify home finance companies with the best business models and most savvy management teams - companies that can prosper in a variety of economic environments.
The views expressed in this report reflect those of the portfolio manager only through the end of the period of the report as stated on the cover. The manager's views are subject to change at any time based on market or other conditions. For more information, see page 3.
Fund Facts
Start date: December 16, 1985
Fund number: 098
Trading symbol: FSVLX
Size: as of August 31, 2000, more than
$267 million
Manager: Victor Thay, since 1999; manager, Fidelity Select Natural Gas Portfolio, 1997-1999; analyst, U.S. and Canadian exploration and production industry, 1996-1999; analyst, Canadian equities, 1995-1996; joined Fidelity in 1995
3Semiannual Report
Home Finance Portfolio
(Unaudited)
Showing Percentage of Net Assets
|
Common Stocks - 93.8% |
|||
|
Shares |
Value (Note 1) |
||
|
BANKS - 12.5% |
|||
|
Banknorth Group, Inc. |
464,875 |
$ 7,612,328 |
|
|
North Fork Bancorp, Inc. |
120,900 |
2,161,088 |
|
|
PNC Financial Services Group, Inc. |
186,800 |
11,009,525 |
|
|
Seacoast Financial Services Corp. |
213,200 |
2,158,650 |
|
|
Wells Fargo & Co. |
243,400 |
10,511,838 |
|
|
TOTAL BANKS |
33,453,429 |
||
|
CREDIT & OTHER FINANCE - 10.4% |
|||
|
Countrywide Credit Industries, Inc. |
210,801 |
7,984,088 |
|
|
Greenpoint Financial Corp. |
327,300 |
8,550,713 |
|
|
Household International, Inc. |
224,100 |
10,756,800 |
|
|
Indymac Bancorp, Inc. |
43,000 |
725,625 |
|
|
TOTAL CREDIT & OTHER FINANCE |
28,017,226 |
||
|
FEDERAL SPONSORED CREDIT - 19.8% |
|||
|
Fannie Mae |
484,800 |
26,058,000 |
|
|
Freddie Mac |
641,300 |
27,014,758 |
|
|
TOTAL FEDERAL SPONSORED CREDIT |
53,072,758 |
||
|
INSURANCE - 14.7% |
|||
|
MGIC Investment Corp. |
129,200 |
7,598,575 |
|
|
Old Republic International Corp. |
325,000 |
7,779,688 |
|
|
PMI Group, Inc. |
242,610 |
15,041,820 |
|
|
Radian Group, Inc. |
142,800 |
8,871,450 |
|
|
TOTAL INSURANCE |
39,291,533 |
||
|
SAVINGS & LOANS - 36.4% |
|||
|
Astoria Financial Corp. |
318,500 |
11,187,313 |
|
|
Charter One Financial, Inc. |
462,870 |
10,993,163 |
|
|
Commercial Federal Corp. |
167,325 |
3,022,308 |
|
|
Dime Bancorp, Inc. |
125,000 |
2,296,875 |
|
|
Downey Financial Corp. |
80,300 |
2,690,050 |
|
|
First Federal Savings & Loan Association of East Hartford |
35,300 |
1,041,350 |
|
|
FirstFed Financial Corp. (a) |
92,000 |
1,656,000 |
|
|
Golden State Bancorp, Inc. |
436,792 |
8,790,439 |
|
|
Golden West Financial Corp. |
300,700 |
14,320,838 |
|
|
Quaker City Bancorp, Inc. (a) |
73,825 |
1,273,481 |
|
|
Richmond County Financial Corp. |
68,000 |
1,368,500 |
|
|
Roslyn Bancorp, Inc. |
201,415 |
3,990,535 |
|
|
TCF Financial Corp. |
382,900 |
12,563,906 |
|
|
Washington Federal, Inc. |
277,170 |
5,751,278 |
|
|
Washington Mutual, Inc. |
319,880 |
11,195,800 |
|
|
Webster Financial Corp. |
219,300 |
5,407,116 |
|
|
TOTAL SAVINGS & LOANS |
97,548,952 |
||
|
TOTAL COMMON STOCKS (Cost $199,403,119) |
251,383,898 |
||
|
Cash Equivalents - 5.9% |
|||
|
Shares |
Value (Note 1) |
||
|
Fidelity Cash Central Fund, 6.59% (b) |
15,809,286 |
$ 15,809,286 |
|
|
TOTAL INVESTMENT PORTFOLIO - 99.7% (Cost $215,212,405) |
267,193,184 |
|
NET OTHER ASSETS - 0.3% |
763,851 |
||
|
NET ASSETS - 100% |
$ 267,957,035 |
||
|
Legend |
|
(a) Non-income producing |
|
(b) The rate quoted is the annualized seven-day yield of the fund at |
|
Other Information |
|
Purchases and sales of securities, other than short-term securities, aggregated $98,327,425 and $106,680,353, respectively. |
|
The fund placed a portion of its portfolio transactions with brokerage firms which are affiliates of Fidelity Management & Research Company. The commissions paid to these affiliated firms were $15,893 for the period. |
|
Income Tax Information |
|
At August 31, 2000, the aggregate cost of investment securities for income tax purposes was $215,851,372. Net unrealized appreciation aggregated $51,341,812, of which $60,028,917 related to appreciated investment securities and $8,687,105 related to depreciated investment securities. |
|
The fund intends to elect to defer to its fiscal year ending February 28, |
See accompanying notes which are an integral part of the financial statements.
Semiannual Report
Statement of Assets and Liabilities
|
|
August 31, 2000 (Unaudited) |
|
|
Assets |
|
|
|
Investment in securities, at value |
|
$ 267,193,184 |
|
Receivable for investments sold |
|
1,936,007 |
|
Receivable for fund shares sold |
|
175,457 |
|
Dividends receivable |
|
364,229 |
|
Interest receivable |
|
100,517 |
|
Redemption fees receivable |
|
1,352 |
|
Other receivables |
|
6,161 |
|
Total assets |
|
269,776,907 |
|
Liabilities |
|
|
|
Payable for fund shares redeemed |
$ 1,520,371 |
|
|
Accrued management fee |
125,911 |
|
|
Other payables and |
173,590 |
|
|
Total liabilities |
|
1,819,872 |
|
Net Assets |
|
$ 267,957,035 |
|
Net Assets consist of: |
|
|
|
Paid in capital |
|
$ 221,160,606 |
|
Undistributed net investment income |
|
1,121,294 |
|
Accumulated undistributed net realized gain (loss) on investments and foreign currency transactions |
|
(6,302,278) |
|
Net unrealized appreciation (depreciation) on investments |
|
51,977,413 |
|
Net Assets, for 6,640,760 |
|
$ 267,957,035 |
|
Net Asset Value and redemption price per share ($267,957,035 ÷ 6,640,760 shares) |
|
$40.35 |
|
Maximum offering price per share (100/97.00 of $40.35) |
|
$41.60 |
Statement of Operations
|
|
Six months ended August 31, 2000 (Unaudited) |
|
|
Investment Income Dividends |
|
$ 2,294,378 |
|
Interest |
|
511,600 |
|
Security lending |
|
18,750 |
|
Total income |
|
2,824,728 |
|
Expenses |
|
|
|
Management fee |
$ 694,638 |
|
|
Transfer agent fees |
890,751 |
|
|
Accounting and security lending fees |
79,938 |
|
|
Non-interested trustees' compensation |
378 |
|
|
Custodian fees and expenses |
4,820 |
|
|
Registration fees |
23,390 |
|
|
Audit |
12,473 |
|
|
Legal |
521 |
|
|
Miscellaneous |
116 |
|
|
Total expenses before reductions |
1,707,025 |
|
|
Expense reductions |
(48,842) |
1,658,183 |
|
Net investment income |
|
1,166,545 |
|
Realized and Unrealized Gain (Loss) Net realized gain (loss) on |
|
3,237,589 |
|
Change in net unrealized appreciation (depreciation) on: |
|
|
|
Investment securities |
54,720,214 |
|
|
Assets and liabilities in |
(925) |
54,719,289 |
|
Net gain (loss) |
|
57,956,878 |
|
Net increase (decrease) in net assets resulting from operations |
|
$ 59,123,423 |
|
Other Information |
|
|
|
Sales charges paid to FDC |
|
$ 157,944 |
|
Deferred sales charges withheld by FDC |
|
$ 1,584 |
|
Exchange fees withheld by FSC |
|
$ 15,546 |
|
Expense reductions |
|
|
|
Directed brokerage arrangements |
|
$ 45,894 |
|
Custodian credits |
|
349 |
|
Transfer agent credits |
|
2,599 |
|
|
|
$ 48,842 |
See accompanying notes which are an integral part of the financial statements.
Semiannual Report
Home Finance Portfolio
Financial Statements - continued
Statement of Changes in Net Assets
|
Increase (Decrease) in Net Assets |
Six months ended |
Year ended |
|
Operations |
$ 1,166,545 |
$ 3,600,499 |
|
Net realized gain (loss) |
3,237,589 |
5,414,103 |
|
Change in net unrealized appreciation (depreciation) |
54,719,289 |
(94,930,098) |
|
Net increase (decrease) in net assets resulting from operations |
59,123,423 |
(85,915,496) |
|
Distributions to shareholders |
(208,379) |
(2,523,487) |
|
From net realized gain |
(486,376) |
(8,694,427) |
|
Total distributions |
(694,755) |
(11,217,914) |
|
Share transactions |
123,862,054 |
119,654,192 |
|
Reinvestment of distributions |
659,544 |
10,658,735 |
|
Cost of shares redeemed |
(128,456,152) |
(561,225,441) |
|
Net increase (decrease) in net assets resulting from share transactions |
(3,934,554) |
(430,912,514) |
|
Redemption fees |
404,952 |
663,676 |
|
Total increase (decrease) in net assets |
54,899,066 |
(527,382,248) |
|
Net Assets |
|
|
|
Beginning of period |
213,057,969 |
740,440,217 |
|
End of period (including undistributed net investment income of $1,121,294 and $2,868,182, respectively) |
$ 267,957,035 |
$ 213,057,969 |
|
Other Information Shares |
|
|
|
Sold |
3,335,102 |
2,834,768 |
|
Issued in reinvestment of distributions |
18,700 |
267,110 |
|
Redeemed |
(3,603,251) |
(13,801,852) |
|
Net increase (decrease) |
(249,449) |
(10,699,974) |
Financial Highlights
|
|
Six months ended |
Years ended February 28, |
||||
|
Selected Per-Share Data |
(Unaudited) |
2000 F |
1999 |
1998 |
1997 |
1996 F |
|
Net asset value, beginning of period |
$ 30.92 |
$ 42.09 |
$ 53.36 |
$ 46.00 |
$ 33.30 |
$ 23.92 |
|
Income from Investment Operations |
|
|
|
|
|
|
|
Net investment income D |
.18 |
.30 |
.28 |
.33 |
.53 |
.53 |
|
Net realized and unrealized gain (loss) |
9.29 |
(10.64) |
(10.16) |
13.10 |
14.60 |
9.72 |
|
Total from investment operations |
9.47 |
(10.34) |
(9.88) |
13.43 |
15.13 |
10.25 |
|
Less Distributions |
|
|
|
|
|
|
|
From net investment income |
(.03) |
(.19) |
(.07) |
(.29) |
(.32) |
(.19) |
|
From net realized gain |
(.07) |
(.69) |
(1.38) |
(5.84) |
(2.16) |
(.73) |
|
Total distributions |
(.10) |
(.88) |
(1.45) |
(6.13) |
(2.48) |
(.92) |
|
Redemption fees added to paid in capital |
.06 |
.05 |
.06 |
.06 |
.05 |
.05 |
|
Net asset value, end of period |
$ 40.35 |
$ 30.92 |
$ 42.09 |
$ 53.36 |
$ 46.00 |
$ 33.30 |
|
Total Return B, C |
30.87% |
(24.88)% |
(19.12)% |
32.39% |
47.50% |
43.24% |
|
Ratios and Supplemental Data |
|
|
|
|
|
|
|
Net assets, end of period (000 omitted) |
$ 267,957 |
$ 213,058 |
$ 740,440 |
$ 1,668,610 |
$ 1,176,828 |
$ 617,035 |
|
Ratio of expenses to average net assets |
1.38% A |
1.39% |
1.19% |
1.21% |
1.38% |
1.35% |
|
Ratio of expenses to average net assets after |
1.34% A, E |
1.37% E |
1.18% E |
1.19% E |
1.34% E |
1.32% E |
|
Ratio of net investment income to average net assets |
.94% A |
.72% |
.57% |
.67% |
1.41% |
1.80% |
|
Portfolio turnover rate |
86% A |
91% |
18% |
54% |
78% |
81% |
|
A Annualized B The total returns would have been lower had certain expenses not been reduced during the periods shown. C Total returns do not include the one time sales
charge and for periods of less than one year are not annualized. |
||||||
See accompanying notes which are an integral part of the financial statements.
Financial Services Sector
Performance
There are several ways to evaluate a fund's historical performance. You can look at the total percentage change in value, the average annual percentage change or the growth of a hypothetical $10,000 investment. Total return reflects the change in the value of an investment, assuming reinvestment of the fund's dividend income and capital gains (the profits earned upon the sale of securities that have grown in value). Load adjusted returns include a 3.00% sales charge and the effect of a $7.50 long-term trading fee for shares held 30 days or more. Effective September 28, 2000, the $7.50 long-term trading fee was eliminated. If Fidelity had not reimbursed certain fund expenses, the past 10 year total returns would have been lower.
Cumulative Total Returns
|
Periods ended |
Past 6 |
Past 1 |
Past 5 |
Past 10 |
|
Select Insurance |
54.78% |
22.36% |
174.16% |
525.03% |
|
Select Insurance |
50.06% |
18.62% |
165.86% |
506.21% |
|
S&P 500 |
11.73% |
16.32% |
193.58% |
493.54% |
|
GS Financial Services |
35.48% |
19.10% |
n/a** |
n/a** |
Cumulative total returns show the fund's performance in percentage terms over a set period - in this case, six months, one year, five years or 10 years. You can compare the fund's returns to the performance of both the Standard & Poor's 500 Index - a market capitalization-weighted index of common stocks - and the Goldman Sachs Financial Services Index - a market capitalization-weighted index of 256 stocks designed to measure the performance of companies in the financial services sector. These benchmarks include reinvestment of dividends and capital gains, if any, and exclude the effect of sales charges.
Average Annual Total Returns
|
Periods ended |
Past 1 |
Past 5 |
Past 10 |
|
Select Insurance |
22.36% |
22.35% |
20.11% |
|
Select Insurance |
18.62% |
21.60% |
19.75% |
|
S&P 500 |
16.32% |
24.04% |
19.49% |
|
GS Financial Services |
19.10% |
n/a** |
n/a** |
Average annual returns take the fund's cumulative return and show you what would have happened if the fund had performed at a constant rate each year.
** Not available
Understanding Performance
How a fund did yesterday is no guarantee of how it will do tomorrow. The stock market, for example, has a history of long-term growth and short-term volatility. Unlike the broader market, however, some sectors may not have a history of growth in the long run. And, as with all stock funds, the share price and return of a fund that invests in a sector will vary.
3$10,000 Over 10 Years
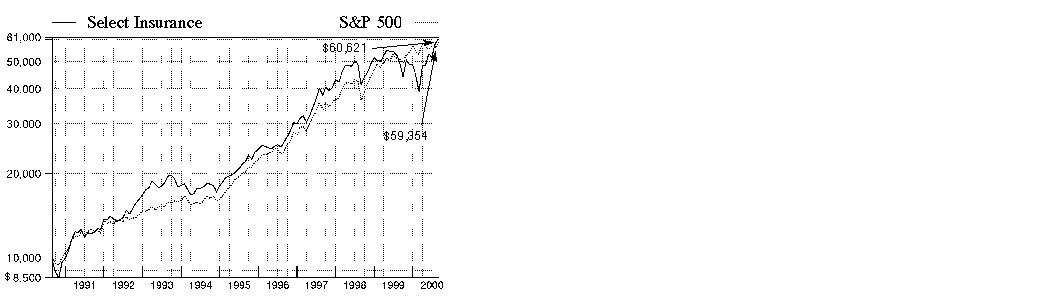
$10,000 Over 10 Years: Let's say hypothetically that $10,000 was invested in Fidelity Select Insurance Portfolio on August 31, 1990, and the current 3.00% sales charge was paid. As the chart shows, by August 31, 2000, the value of the investment would have grown to $60,621 - a 506.21% increase on the initial investment - and includes the effect of a $7.50 long-term trading fee. For comparison, look at how the Standard & Poor's 500 Index did over the same period. With dividends and capital gains, if any, reinvested, the same $10,000 investment would have grown to $59,354 - a 493.54% increase.
Investment Summary
|
Top Ten Stocks as of August 31, 2000 |
|
|
|
% of fund's |
|
American International Group, Inc. |
5.3 |
|
ACE Ltd. |
5.2 |
|
XL Capital Ltd. Class A |
5.0 |
|
AXA Financial, Inc. |
4.9 |
|
AFLAC, Inc. |
4.5 |
|
The St. Paul Companies, Inc. |
4.5 |
|
Hartford Financial Services Group, Inc. |
4.4 |
|
The Chubb Corp. |
4.4 |
|
Berkshire Hathaway, Inc. Class A |
4.3 |
|
CIGNA Corp. |
3.8 |
|
|
46.3 |
Top Industries as of August 31, 2000
% of fund's net assets

Semiannual Report
(Portfolio Manager photograph)
Timothy Cohen,
Portfolio Manager
of Fidelity Select
Insurance Portfolio
Q. How did the fund perform, Tim?
A. It did very well. For the six months that ended August 31, 2000, the fund returned 54.78%. In comparison, the Goldman Sachs Financial Services Index - an index of 256 stocks designed to measure the performance of companies in the financial services industry - returned 35.48%, while the Standard & Poor's 500 Index returned 11.73%. For the 12 months ending August 31, 2000, the fund returned 22.36%, while the Goldman Sachs index returned 19.10% and the S&P 500 index returned 16.32%.
Q. What factors contributed to the fund's outperformance of the Goldman Sachs index?
A. Nearly all financial stocks benefited from a better interest-rate environment. However, the insurance group outperformed financial services companies primarily because of the improved pricing power of commercial property-and-casualty companies. For the first time in more than a decade, commercial property-and-casualty companies were able to raise their prices, and this helped the stocks of both the commercial carriers and the re-insurance companies. Previously, during an extended period of intense price competition among commercial carriers, the smarter companies had stopped writing new policies. Eventually, the weaker companies that had been writing policies at low prices started running into trouble, with some even going out of business. With restricted supply, pricing power eventually returned to the industry and the stronger companies showed improved earnings. Personal property-and-casualty companies, which write automobile and homeowners insurance, also had improved stock performance, although not as strong as the commercial companies. Personal lines are being affected by changes in distribution and the emergence of strong competition by companies that market directly to the consumer, rather than through agents. Life insurance companies also performed well, with fundamentals continuing to be driven by the strong growth in retirement savings products such as annuities.
Q. What were your principal strategies during the past six months?
A. I de-emphasized personal property-and-casualty lines in favor of commercial property-and-casualty insurers because the pricing story became so compelling. I also maintained an emphasis on selected life insurance companies and bond insurance companies. Even though the stocks of bond insurers had declined in value because of rising interest rates, they still enjoyed strong earnings growth and had excellent fundamentals.
Q. What stocks were major contributors to performance? Were there any disappointments?
A. Most of the biggest contributors were companies benefiting from the improved pricing for commercial underwriters. These included underwriters Hartford Financial, ACE and Chubb Corp., as well as brokers, including Marsh & McLennan, the world's largest insurance broker. Bond insurance companies such as AMBAC also had very strong performance. AMBAC had a consistent record of earnings growth of 15%-to-20% a year, and yet its stock was selling at a very attractive price. E.W. Blanch, an insurance broker formerly held by the fund, did not perform well. This former fast-growing company failed to meet earnings expectations and its stock was punished.
Q. What is your outlook, Tim?
A. I think the outlook still is very good, especially for the commercial property-and-casualty companies. Their stocks were beaten up for years, and now the companies are at an early stage of an improved pricing cycle that has the potential to persist. I think financial services stocks in general look good as evidence accumulates that economic growth has begun to slow and interest rates may start going down. Unlike banks, insurance companies don't make loans, so they don't have the credit problems of banks. I am not optimistic about personal property-and-casualty companies, however. They don't have very much pricing power, and their claims costs are rising. Life insurance companies continue to have a strong long-term outlook. An aging population makes it likely that retirement savings will continue to grow and life insurance companies are well-positioned to capture a major share of this growth.
The views expressed in this report reflect those of the portfolio manager only through the end of the period of the report as stated on the cover. The manager's views are subject to change at any time based on market or other conditions. For more information, see page 3.
Note to shareholders: Effective September 28, 2000, Forrest Fontana became Portfolio Manager of Fidelity Select Insurance Portfolio.
Fund Facts
Start date: December 16, 1985
Fund number: 045
Trading symbol: FSPCX
Size: as of August 31, 2000, more than
$102 million
Manager: Timothy Cohen, since 1999;
equity analyst, business and consumer services,
1996-1998; joined Fidelity in 1996
Semiannual Report
Insurance Portfolio
(Unaudited)
Showing Percentage of Net Assets
|
Common Stocks - 93.1% |
|||
|
Shares |
Value (Note 1) |
||
|
INSURANCE - 87.0% |
|||
|
ACE Ltd. |
151,300 |
$ 5,314,413 |
|
|
Aetna, Inc. |
20,400 |
1,141,125 |
|
|
AFLAC, Inc. |
85,900 |
4,638,600 |
|
|
Allmerica Financial Corp. |
41,173 |
2,506,406 |
|
|
AMBAC Financial Group, Inc. |
53,700 |
3,470,363 |
|
|
American General Corp. |
38,000 |
2,766,875 |
|
|
American International Group, Inc. |
61,155 |
5,450,436 |
|
|
Arthur J. Gallagher & Co. |
10,200 |
499,800 |
|
|
Berkshire Hathaway, Inc. Class A (a) |
76 |
4,385,200 |
|
|
Brown & Brown, Inc. |
48,200 |
1,286,338 |
|
|
CIGNA Corp. |
40,700 |
3,958,075 |
|
|
Commerce Group, Inc. |
33,000 |
858,000 |
|
|
Conseco, Inc. |
99,400 |
838,688 |
|
|
Everest Re Group Ltd. |
68,200 |
2,745,050 |
|
|
Hartford Financial Services Group, Inc. |
68,600 |
4,570,475 |
|
|
HCC Insurance Holdings, Inc. |
92,500 |
1,954,063 |
|
|
Hilb, Rogal & Hamilton Co. |
31,700 |
1,268,000 |
|
|
HSB Group, Inc. |
45,200 |
1,805,175 |
|
|
Jefferson-Pilot Corp. |
40,300 |
2,667,356 |
|
|
John Hancock Financial Services, Inc. |
47,300 |
1,194,325 |
|
|
Lincoln National Corp. |
26,500 |
1,431,000 |
|
|
Marsh & McLennan Companies, Inc. |
32,600 |
3,871,250 |
|
|
MBIA, Inc. |
25,400 |
1,670,050 |
|
|
MetLife, Inc. |
56,900 |
1,383,381 |
|
|
MGIC Investment Corp. |
5,500 |
323,469 |
|
|
Nationwide Financial Services, Inc. |
5,300 |
211,338 |
|
|
PartnerRe Ltd. |
65,200 |
2,734,325 |
|
|
PMI Group, Inc. |
21,850 |
1,354,700 |
|
|
Protective Life Corp. |
31,700 |
911,375 |
|
|
Reliastar Financial Corp. |
24,648 |
1,326,371 |
|
|
RenaissanceRe Holdings Ltd. |
54,200 |
2,594,825 |
|
|
SAFECO Corp. |
40,800 |
1,073,550 |
|
|
The Chubb Corp. |
59,200 |
4,532,500 |
|
|
The St. Paul Companies, Inc. |
96,300 |
4,586,288 |
|
|
UnumProvident Corp. |
140,335 |
3,043,515 |
|
|
XL Capital Ltd. Class A |
74,600 |
5,142,738 |
|
|
TOTAL INSURANCE |
89,509,438 |
||
|
MEDICAL FACILITIES MANAGEMENT - 1.2% |
|||
|
Wellpoint Health Networks, Inc. (a) |
14,600 |
1,260,163 |
|
|
SECURITIES INDUSTRY - 4.9% |
|||
|
AXA Financial, Inc. |
97,500 |
5,045,625 |
|
|
TOTAL COMMON STOCKS (Cost $77,329,932) |
95,815,226 |
||
|
Cash Equivalents - 5.8% |
|||
|
Shares |
Value (Note 1) |
||
|
Fidelity Cash Central Fund, 6.59% (b) |
5,270,680 |
$ 5,270,680 |
|
|
Fidelity Securities Lending Cash Central Fund, 6.64% (b) |
701,100 |
701,100 |
|
|
TOTAL CASH EQUIVALENTS (Cost $5,971,780) |
5,971,780 |
||
|
TOTAL INVESTMENT PORTFOLIO - 98.9% (Cost $83,301,712) |
101,787,006 |
||
|
NET OTHER ASSETS - 1.1% |
1,118,660 |
||
|
NET ASSETS - 100% |
$ 102,905,666 |
||
|
Legend |
|
(a) Non-income producing |
|
(b) The rate quoted is the annualized seven-day yield of the fund at |
|
Other Information |
|
Purchases and sales of securities, other than short-term securities, |
|
The fund placed a portion of its portfolio transactions with brokerage |
|
The fund participated in the security lending program. At period end, the value of securities loaned amounted to $657,281. The fund received cash collateral of $701,100 which was invested in cash equivalents. |
|
Distribution of investments by country of issue, as a percentage of total |
|
United States of America |
81.9% |
|
Bermuda |
13.1 |
|
Cayman Islands |
5.0 |
|
|
100.0% |
|
Income Tax Information |
|
At August 31, 2000, the aggregate cost of investment securities for income tax purposes was $84,971,120. Net unrealized appreciation aggregated $16,815,886, of which $18,812,496 related to appreciated investment securities and $1,996,610 related to depreciated investment securities. |
|
The fund intends to elect to defer to its fiscal year ending February 28, |
See accompanying notes which are an integral part of the financial statements.
Semiannual Report
Statement of Assets and Liabilities
|
|
August 31, 2000 (Unaudited) |
|
|
Assets |
|
|
|
Investment in securities, at value |
|
$ 101,787,006 |
|
Receivable for investments sold |
|
2,461,942 |
|
Receivable for fund shares sold |
|
943,600 |
|
Dividends receivable |
|
132,287 |
|
Interest receivable |
|
44,129 |
|
Redemption fees receivable |
|
2,706 |
|
Other receivables |
|
242 |
|
Total assets |
|
105,371,912 |
|
Liabilities |
|
|
|
Payable for fund shares redeemed |
$ 1,672,103 |
|
|
Accrued management fee |
46,527 |
|
|
Other payables and |
46,516 |
|
|
Collateral on securities loaned, |
701,100 |
|
|
Total liabilities |
|
2,466,246 |
|
Net Assets |
|
$ 102,905,666 |
|
Net Assets consist of: |
|
|
|
Paid in capital |
|
$ 84,579,990 |
|
Undistributed net investment income |
|
208,557 |
|
Accumulated undistributed net realized gain (loss) on investments and foreign currency transactions |
|
(368,175) |
|
Net unrealized appreciation (depreciation) on investments |
|
18,485,294 |
|
Net Assets, for 2,405,233 |
|
$ 102,905,666 |
|
Net Asset Value and redemption price per share ($102,905,666 ÷ 2,405,233 shares) |
|
$42.78 |
|
Maximum offering price per share (100/97.00 of $42.78) |
|
$44.10 |
Statement of Operations
|
|
Six months ended August 31, 2000 (Unaudited) |
|
|
Investment Income Dividends |
|
$ 483,603 |
|
Interest |
|
149,965 |
|
Security lending |
|
554 |
|
Total income |
|
634,122 |
|
Expenses |
|
|
|
Management fee |
$ 189,223 |
|
|
Transfer agent fees |
171,779 |
|
|
Accounting and security lending fees |
30,709 |
|
|
Non-interested trustees' compensation |
88 |
|
|
Custodian fees and expenses |
16,290 |
|
|
Registration fees |
23,375 |
|
|
Audit |
5,818 |
|
|
Legal |
86 |
|
|
Miscellaneous |
33 |
|
|
Total expenses before reductions |
437,401 |
|
|
Expense reductions |
(11,836) |
425,565 |
|
Net investment income |
|
208,557 |
|
Realized and Unrealized Gain (Loss) Net realized gain (loss) on: |
|
|
|
Investment securities |
343,821 |
|
|
Foreign currency transactions |
163 |
343,984 |
|
Change in net unrealized appreciation (depreciation) |
|
21,545,482 |
|
Net gain (loss) |
|
21,889,466 |
|
Net increase (decrease) in net assets resulting from operations |
|
$ 22,098,023 |
|
Other Information |
|
|
|
Sales charges paid to FDC |
|
$ 188,810 |
|
Deferred sales charges withheld by FDC |
|
$ 415 |
|
Exchange fees withheld by FSC |
|
$ 3,390 |
|
Expense reductions |
|
|
|
Directed brokerage arrangements |
|
$ 11,750 |
|
Custodian credits |
|
86 |
|
|
|
$ 11,836 |
See accompanying notes which are an integral part of the financial statements.
Semiannual Report
Insurance Portfolio
Financial Statements - continued
Statement of Changes in Net Assets
|
Increase (Decrease) in Net Assets |
Six months ended |
Year ended |
|
Operations |
$ 208,557 |
$ (77,804) |
|
Net realized gain (loss) |
343,984 |
9,100,781 |
|
Change in net unrealized appreciation (depreciation) |
21,545,482 |
(18,366,238) |
|
Net increase (decrease) in net assets resulting from operations |
22,098,023 |
(9,343,261) |
|
Distributions to shareholders from net realized gains |
- |
(11,006,673) |
|
Share transactions |
132,335,813 |
39,337,528 |
|
Reinvestment of distributions |
- |
10,527,687 |
|
Cost of shares redeemed |
(81,296,420) |
(82,991,526) |
|
Net increase (decrease) in net assets resulting from share transactions |
51,039,393 |
(33,126,311) |
|
Redemption fees |
247,657 |
117,358 |
|
Total increase (decrease) in net assets |
73,385,073 |
(53,358,887) |
|
Net Assets |
|
|
|
Beginning of period |
29,520,593 |
82,879,480 |
|
End of period (including undistributed net investment income of $208,557 and $0, respectively) |
$ 102,905,666 |
$ 29,520,593 |
|
Other Information Shares |
|
|
|
Sold |
3,585,151 |
1,020,932 |
|
Issued in reinvestment of distributions |
- |
282,466 |
|
Redeemed |
(2,247,797) |
(2,202,457) |
|
Net increase (decrease) |
1,337,354 |
(899,059) |
Financial Highlights
|
|
Six months ended |
Years ended February 28, |
||||
|
Selected Per-Share Data |
(Unaudited) |
2000 F |
1999 |
1998 |
1997 |
1996 F |
|
Net asset value, beginning of period |
$ 27.64 |
$ 42.14 |
$ 42.10 |
$ 32.62 |
$ 26.77 |
$ 21.31 |
|
Income from Investment Operations |
|
|
|
|
|
|
|
Net investment income (loss) D |
.11 |
(.05) |
(.04) |
.01 |
.01 |
.06 |
|
Net realized and unrealized gain (loss) |
14.89 |
(7.92) |
4.01 |
12.93 |
7.21 |
6.15 |
|
Total from investment operations |
15.00 |
(7.97) |
3.97 |
12.94 |
7.22 |
6.21 |
|
Less Distributions |
|
|
|
|
|
|
|
From net investment income |
- |
- |
- |
- |
(.03) |
(.07) |
|
From net realized gain |
- |
(6.60) |
(3.98) |
(3.54) |
(1.45) |
(.72) |
|
Total distributions |
- |
(6.60) |
(3.98) |
(3.54) |
(1.48) |
(.79) |
|
Redemption fees added to paid in capital |
.14 |
.07 |
.05 |
.08 |
.11 |
.04 |
|
Net asset value, end of period |
$ 42.78 |
$ 27.64 |
$ 42.14 |
$ 42.10 |
$ 32.62 |
$ 26.77 |
|
Total Return B, C |
54.78% |
(22.12)% |
9.84% |
42.81% |
28.28% |
29.51% |
|
Ratios and Supplemental Data |
|
|
|
|
|
|
|
Net assets, end of period (000 omitted) |
$ 102,906 |
$ 29,521 |
$ 82,879 |
$ 125,151 |
$ 42,367 |
$ 38,994 |
|
Ratio of expenses to average net assets |
1.29% A |
1.39% |
1.33% |
1.45% |
1.82% |
1.77% |
|
Ratio of expenses to average net assets after |
1.26% A, E |
1.36% E |
1.31% E |
1.43% E |
1.77% E |
1.74% E |
|
Ratio of net investment income (loss) to average net assets |
.62% A |
(.12)% |
(.10)% |
.02% |
.05% |
.26% |
|
Portfolio turnover rate |
190% A |
107% |
72% |
157% |
142% |
164% |
|
A Annualized B The total returns would have been lower had certain expenses not been reduced during the periods shown. C Total returns do not include the one time sales
charge and for periods of less than one year are not annualized. |
||||||
See accompanying notes which are an integral part of the financial statements.
Financial Services Sector
Performance
There are several ways to evaluate a fund's historical performance. You can look at the total percentage change in value, the average annual percentage change or the growth of a hypothetical $10,000 investment. Total return reflects the change in the value of an investment, assuming reinvestment of the fund's dividend income and capital gains (the profits earned upon the sale of securities that have grown in value). Load adjusted returns include a 3.00% sales charge and the effect of a $7.50 long-term trading fee for shares held 30 days or more. Effective September 28, 2000, the $7.50 long-term trading fee was eliminated. If Fidelity had not reimbursed certain fund expenses, the past five year and past 10 year total returns would have been lower.
Cumulative Total Returns
|
Periods ended |
Past 6 |
Past 1 |
Past 5 |
Past 10 |
|
Select Biotechnology |
-6.52% |
93.21% |
385.95% |
947.28% |
|
Select Biotechnology |
-9.40% |
87.34% |
371.30% |
915.79% |
|
S&P 500 |
11.73% |
16.32% |
193.58% |
493.54% |
|
GS Health Care |
19.68% |
24.58% |
n/a** |
n/a** |
Cumulative total returns show the fund's performance in percentage terms over a set period - in this case, six months, one year, five years or 10 years. You can compare the fund's returns to the performance of both the Standard & Poor's 500 Index - a market capitalization-weighted index of common stocks - and the Goldman Sachs Health Care Index - a market capitalization-weighted index of 113 stocks designed to measure the performance of companies in the health care sector. These benchmarks include reinvestment of dividends and capital gains, if any, and exclude the effect of sales charges.
Average Annual Total Returns
|
Periods ended |
Past 1 |
Past 5 |
Past 10 |
|
Select Biotechnology |
93.21% |
37.19% |
26.48% |
|
Select Biotechnology |
87.34% |
36.35% |
26.09% |
|
S&P 500 |
16.32% |
24.04% |
19.49% |
|
GS Health Care |
24.58% |
n/a** |
n/a** |
Average annual returns take the fund's cumulative return and show you what would have happened if the fund had performed at a constant rate each year.
** Not available
Understanding Performance
How a fund did yesterday is no guarantee of how it will do tomorrow. The stock market, for example, has a history of long-term growth and short-term volatility. Unlike the broader market, however, some sectors may not have a history of growth in the long run. And, as with all stock funds, the share price and return of a fund that invests in a sector will vary.
3$10,000 Over 10 Years
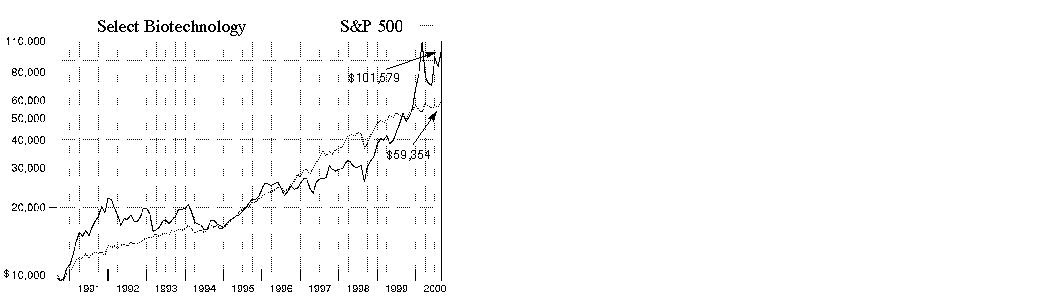
$10,000 Over 10 Years: Let's say hypothetically that $10,000 was invested in Fidelity Select Biotechnology Portfolio on August 31, 1990, and the current 3.00% sales charge was paid. As the chart shows, by August 31, 2000, the value of the investment would have grown to $101,579 - a 915.79% increase on the initial investment - and includes the effect of a $7.50 long-term trading fee. For comparison, look at how the Standard & Poor's 500 Index did over the same period. With dividends and capital gains, if any, reinvested, the same $10,000 investment would have grown to $59,354 - a 493.54% increase.
Investment Summary
|
Top Ten Stocks as of August 31, 2000 |
|
|
|
% of fund's |
|
Genentech, Inc. |
6.3 |
|
Medimmune, Inc. |
6.0 |
|
Immunex Corp. |
5.9 |
|
Millennium Pharmaceuticals, Inc. |
5.7 |
|
Schering-Plough Corp. |
4.1 |
|
Human Genome Sciences, Inc. |
3.8 |
|
Merck & Co., Inc. |
3.7 |
|
Amgen, Inc. |
3.1 |
|
Biogen, Inc. |
3.1 |
|
ALZA Corp. |
3.0 |
|
|
44.7 |
Top Industries as of August 31, 2000
% of fund's net assets

Semiannual Report
(Portfolio Manager photograph)
Yolanda McGettigan, Portfolio Manager of Fidelity Select Biotechnology Portfolio
Q. How did the fund perform, Yolanda?
A. For the six-month period that ended August 31, 2000, the fund returned -6.52%. By comparison, the Goldman Sachs Health Care Index - an index of 113 stocks designed to measure the performance of companies in the health care sector - returned 19.68%. During the same period, the Standard & Poor's 500 Index returned 11.73%. For the 12-month period that ended August 31, 2000, the fund returned 93.21%, while the Goldman Sachs index and the S&P 500 index returned 24.58% and 16.32%, respectively.
Q. What factors contributed to the fund's underperformance relative to the Goldman Sachs index during the six-month period?
A. Although the fund was focused on larger biotechnology companies with existing product pipelines and strong fundamentals, it underperformed because the index had greater exposure to more defensive areas of the health sector, such as pharmaceuticals, in the face of rising interest rates. During the first half of the period, the fund struggled as biotechnology stocks suffered a pullback after a year of strong performance. Warnings of overpriced stocks from several notable Wall Street analysts sent the NASDAQ Composite Index - which includes many biotechnology stocks - into a correction. The fund rallied in June, however, as investors reacted positively to biotechnology stocks after PE Corp.-Celera completed its program to map the human genome - a historic step in the understanding of human biology and a powerful new tool to find cures for diseases. However, the fund's approximately 33% gain during the month wasn't enough to offset earlier losses in the sector.
Q. What was your strategy in terms of reaping the benefits of the human genome findings?
A. The stocks of companies involved in mapping the human genome and finding the target genes for new drugs already have experienced exceptional growth. Toward the end of the period, I began to focus on those companies that analyze all of the data and figure out what each gene actually does - a process known as target analysis. For example, fund holding Human Genome Sciences focuses solely on genomic information to spur new drug development. In June, the company said it received Food and Drug Administration (FDA) approval to begin human tests of a protein that stimulates the production of antibodies, one of the body's primary natural weapons against infections. These types of companies could benefit the most from the completion of sequencing the human genetic code.
Q. By most traditional methods of analysis, many biotechnology stocks still appeared expensive at the end of the period. How do you discern which ones to own?
A. It's tough to value biotech stocks. I try to find companies that possess three ingredients: products in the later stage of development, a robust product pipeline and an existing technology platform. Very often the companies possessing all three of those characteristics - such as Immunex, Celgene and Sepracor - are large-cap, more profitable companies, so the portfolio tends to lean in that direction. In terms of valuation, I focus on a company's product pipeline and its projected peak sales, while evaluating the probability that the drugs will be approved by the FDA. Then I project how the sales of those potential new drugs will affect the company's earnings. By doing this, you get prices that actually look cheap.
Q. What specific stocks stood out as top performers?
Which disappointed?
A. The fund got a boost from Medimmune, our second-largest holding, which rose 26% during the period, in part due to its addition to the S&P 500 index in June. Investors reacted positively to Millennium Pharmaceuticals, which continued to aggressively build out its in-house drug development capabilities. On the down side, Immunex suffered later in the period after several analysts cut the company's future earnings projections, citing a temporary supply shortage of its strong-selling rheumatoid arthritis drug, Embrel. Another big detractor was Affymetrix, whose stock was severely damaged during the biotechnology sell-off in the spring.
Q. What's your outlook for the biotech sector, Yolanda?
A. While biotech has great long-term fundamentals, I expect volatility to continue in the short term as investors rush in and out of the sector on positive and negative news reports. In this environment, I intend to remain focused on established companies with products in the late stage of development.
The views expressed in this report reflect those of the portfolio manager only through the end of the period of the report as stated on the cover. The manager's views are subject to change at any time based on market or other conditions. For more information, see page 3.
Note to shareholders: Effective September 28, 2000, Brian Younger became Portfolio Manager of Fidelity Select Biotechnology Portfolio.
Fund Facts
Start date: December 16, 1985
Fund number: 042
Trading symbol: FBIOX
Size: as of August 31, 2000, more than
$4.9 billion
Manager: Yolanda McGettigan, since February 2000; manager, Fidelity Select Health Care Portfolio, since June 2000; Fidelity Select Banking Portfolio, 1999-January 2000; Fidelity Select Construction and Housing Portfolio, 1997-1999; joined Fidelity in 1997
3Semiannual Report
Biotechnology Portfolio
(Unaudited)
Showing Percentage of Net Assets
|
Common Stocks - 92.7% |
|||
|
Shares |
Value (Note 1) |
||
|
AGRICULTURE - 0.4% |
|||
|
Charles River Labs International, Inc. |
642,000 |
$ 17,614,875 |
|
|
COMPUTER SERVICES & SOFTWARE - 2.6% |
|||
|
Affymetrix, Inc. (a) |
1,581,500 |
124,938,500 |
|
|
Healtheon/WebMD Corp. (a) |
200,000 |
3,525,000 |
|
|
TOTAL COMPUTER SERVICES & SOFTWARE |
128,463,500 |
||
|
DRUGS & PHARMACEUTICALS - 87.4% |
|||
|
Abgenix, Inc. (a) |
733,000 |
55,100,984 |
|
|
Alkermes, Inc. (a) |
1,405,500 |
65,004,375 |
|
|
Alliance Pharmaceutical Corp. (a) |
754,300 |
11,503,075 |
|
|
ALZA Corp. (a) |
1,930,400 |
145,986,500 |
|
|
Amgen, Inc. (a) |
2,013,400 |
152,640,888 |
|
|
Amylin Pharmaceuticals, Inc. (a) |
795,900 |
10,794,394 |
|
|
Atherogenics, Inc. |
300,000 |
2,962,500 |
|
|
Biochem Pharma, Inc. (a) |
1,824,300 |
38,494,404 |
|
|
Biogen, Inc. (a) |
2,172,600 |
150,180,975 |
|
|
Biotransplant, Inc. (a) |
502,100 |
6,433,156 |
|
|
Bristol-Myers Squibb Co. |
825,400 |
43,746,200 |
|
|
Celgene Corp. (a) |
1,764,520 |
130,574,480 |
|
|
Cell Genesys, Inc. (a) |
260,000 |
8,011,250 |
|
|
Cephalon, Inc. (a) |
996,400 |
50,131,375 |
|
|
Cerus Corp. (a) |
247,500 |
13,132,969 |
|
|
Chiron Corp. (a) |
2,309,700 |
124,868,156 |
|
|
COR Therapeutics, Inc. (a) |
1,825,480 |
102,683,250 |
|
|
CV Therapeutics, Inc. (a) |
700,400 |
52,530,000 |
|
|
CYTOGEN Corp. (a) |
654,500 |
5,808,688 |
|
|
Decode Genetics, Inc. |
171,700 |
4,743,213 |
|
|
Dyax Corp. (a) |
8,300 |
290,500 |
|
|
Enzo Biochem, Inc. (a) |
523,200 |
31,392,000 |
|
|
Exelixis, Inc. |
785,000 |
35,325,000 |
|
|
Genentech, Inc. |
1,625,700 |
309,695,843 |
|
|
Geneva Proteomics (c) |
180,000 |
990,000 |
|
|
Genome Therapeutics Corp. (a) |
108,900 |
2,736,113 |
|
|
Genzyme Corp. - General Division (a) |
1,314,200 |
98,647,138 |
|
|
Gilead Sciences, Inc. (a) |
860,745 |
92,960,460 |
|
|
Human Genome Sciences, Inc. (a) |
1,131,400 |
188,873,088 |
|
|
ICOS Corp. (a) |
1,369,800 |
80,390,138 |
|
|
IDEC Pharmaceuticals Corp. (a) |
890,380 |
124,319,308 |
|
|
Ilex Oncology, Inc. (a) |
346,500 |
11,434,500 |
|
|
ImClone Systems, Inc. (a) |
1,287,200 |
124,053,900 |
|
|
Immunex Corp. (a) |
5,807,650 |
291,834,413 |
|
|
Immunomedics, Inc. (a) |
844,900 |
21,122,500 |
|
|
Inhale Therapeutic Systems, Inc. (a) |
546,400 |
27,593,200 |
|
|
Invitrogen Corp. (a) |
400,000 |
25,250,000 |
|
|
Ligand Pharmaceuticals, Inc. Class B (a) |
797,500 |
10,367,500 |
|
|
Medarex, Inc. (a) |
1,135,200 |
125,439,600 |
|
|
Medimmune, Inc. (a) |
3,513,300 |
295,556,363 |
|
|
Merck & Co., Inc. |
2,597,300 |
181,486,338 |
|
|
Millennium Pharmaceuticals, Inc. (a) |
1,977,382 |
283,012,799 |
|
|
Miravant Medical Technologies (a) |
160,800 |
4,030,050 |
|
|
Myriad Genetics, Inc. (a) |
150,800 |
21,093,150 |
|
|
|
|||
|
Shares |
Value (Note 1) |
||
|
Neurogen Corp. (a) |
50,800 |
$ 1,939,925 |
|
|
OSI Pharmaceuticals, Inc. (a) |
349,700 |
17,479,536 |
|
|
Pain Therapeutics, Inc. |
469,600 |
9,039,800 |
|
|
PE Corp. - Celera Genomics Group (a) |
748,900 |
81,208,844 |
|
|
PRAECIS Pharmaceuticals, Inc. |
545,000 |
23,877,813 |
|
|
Protein Design Labs, Inc. (a) |
1,391,800 |
105,776,800 |
|
|
Regeneron Pharmaceuticals, Inc. (a) |
73,500 |
2,604,656 |
|
|
Sangstat Medical Corp. (a) |
392,300 |
7,944,075 |
|
|
Schering-Plough Corp. |
4,975,900 |
199,657,988 |
|
|
Sepracor, Inc. (a) |
1,130,100 |
124,311,000 |
|
|
Serono SA sponsored ADR (a) |
311,400 |
8,913,825 |
|
|
SICOR, Inc. (a) |
1,375,500 |
13,325,156 |
|
|
SuperGen, Inc. (a) |
233,200 |
4,591,125 |
|
|
Titan Pharmaceuticals, Inc. (a) |
286,000 |
13,424,125 |
|
|
Versicor, Inc. |
380,000 |
4,441,250 |
|
|
Vertex Pharmaceuticals, Inc. (a) |
1,001,260 |
85,107,100 |
|
|
Vical, Inc. (a) |
312,300 |
7,651,350 |
|
|
ViroLogic, Inc. |
500,000 |
10,187,500 |
|
|
XOMA Ltd. (a) |
1,600,300 |
19,403,638 |
|
|
TOTAL DRUGS & PHARMACEUTICALS |
4,304,110,239 |
||
|
ELECTRONIC INSTRUMENTS - 1.9% |
|||
|
PE Corp. - Biosystems Group |
951,800 |
93,633,325 |
|
|
Transgenomic, Inc. |
2,100 |
44,100 |
|
|
TOTAL ELECTRONIC INSTRUMENTS |
93,677,425 |
||
|
MEDICAL EQUIPMENT & SUPPLIES - 0.1% |
|||
|
Cygnus, Inc. (a) |
517,900 |
6,311,906 |
|
|
MEDICAL FACILITIES MANAGEMENT - 0.3% |
|||
|
Neurocrine Biosciences, Inc. (a) |
320,600 |
13,264,825 |
|
|
TOTAL COMMON STOCKS (Cost $2,771,857,750) |
4,563,442,770 |
||
|
Cash Equivalents - 16.1% |
|||
|
|
|
|
|
|
Fidelity Cash Central Fund, 6.59% (b) |
319,557,841 |
319,557,841 |
|
|
Fidelity Securities Lending Cash Central Fund, 6.64% (b) |
474,200,700 |
474,200,700 |
|
|
TOTAL CASH EQUIVALENTS (Cost $793,758,541) |
793,758,541 |
||
|
TOTAL INVESTMENT PORTFOLIO - 108.8% (Cost $3,565,616,291) |
5,357,201,311 |
||
|
NET OTHER ASSETS - (8.8)% |
(431,623,193) |
||
|
NET ASSETS - 100% |
$ 4,925,578,118 |
||
|
Legend |
|
(a) Non-income producing |
|
(b) The rate quoted is the annualized seven-day yield of the fund at |
|
(c) Restricted securities - Investment in securities not registered under the Securities Act of 1933. |
|
Additional information on each holding is as follows: |
|
Security |
Acquisition Date |
Acquisition Cost |
|
Geneva Proteomics |
7/7/00 |
$ 990,000 |
|
Other Information |
|
Purchases and sales of securities, other than short-term securities, aggregated $1,779,001,543 and $1,478,075,900, respectively. |
|
The fund placed a portion of its portfolio transactions with brokerage firms which are affiliates of Fidelity Management & Research Company. The commissions paid to these affiliated firms were $1,050 for the period. |
|
The fund invested in securities that are not registered under the Securities Act of 1933. These securities are subject to legal or contractual restrictions on resale. At the end of the period, restricted securities (excluding Rule 144A issues) amounted to $990,000 or 0.0% of net assets. |
|
The fund participated in the security lending program. At period end, the value of securities loaned amounted to $474,234,770. The fund received cash collateral of $474,200,700 which was invested in cash equivalents. |
|
Transactions during the period with companies which are or were affiliates are as follows: |
|
|
Purchases |
Sales |
Dividend |
Value |
|
Affiliate |
Cost |
Cost |
Income |
|
|
COR Therapeutics |
$65,570,096 |
$89,233,141 |
$- |
$- |
|
Income Tax Information |
|
At August 31, 2000, the aggregate cost of investment securities for income tax purposes was $3,588,942,925. Net unrealized appreciation aggregated $1,768,258,386, of which $1,945,301,477 related to appreciated investment securities and $177,043,091 related to depreciated investment securities. |
See accompanying notes which are an integral part of the financial statements.
Health Care Sector
Statement of Assets and Liabilities
|
|
August 31, 2000 (Unaudited) |
|
|
Assets |
|
|
|
Investment in securities, at value |
|
$ 5,357,201,311 |
|
Receivable for investments sold |
|
67,948,653 |
|
Receivable for fund shares sold |
|
24,123,838 |
|
Dividends receivable |
|
1,085,673 |
|
Interest receivable |
|
1,347,623 |
|
Redemption fees receivable |
|
11,233 |
|
Other receivables |
|
459,803 |
|
Total assets |
|
5,452,178,134 |
|
Liabilities |
|
|
|
Payable for investments purchased |
$ 39,242,707 |
|
|
Payable for fund shares redeemed |
9,524,374 |
|
|
Accrued management fee |
2,098,118 |
|
|
Other payables and |
1,534,117 |
|
|
Collateral on securities loaned, |
474,200,700 |
|
|
Total liabilities |
|
526,600,016 |
|
Net Assets |
|
$ 4,925,578,118 |
|
Net Assets consist of: |
|
|
|
Paid in capital |
|
$ 3,301,352,402 |
|
Accumulated net investment (loss) |
|
(6,832,294) |
|
Accumulated undistributed net realized gain (loss) on investments and foreign currency transactions |
|
(160,527,010) |
|
Net unrealized appreciation (depreciation) on investments |
|
1,791,585,020 |
|
Net Assets, for 50,428,724 |
|
$ 4,925,578,118 |
|
Net Asset Value and redemption price per share ($4,925,578,118 ÷ 50,428,724 shares) |
|
$97.67 |
|
Maximum offering price per share (100/97.00 of $97.67) |
|
$100.69 |
Statement of Operations
|
|
Six months ended August 31, 2000 (Unaudited) |
|
|
Investment Income Dividends |
|
$ 3,697,479 |
|
Interest |
|
8,320,432 |
|
Security lending |
|
1,282,325 |
|
Total income |
|
13,300,236 |
|
Expenses |
|
|
|
Management fee |
$ 11,372,618 |
|
|
Transfer agent fees |
7,611,982 |
|
|
Accounting and security lending fees |
685,938 |
|
|
Non-interested trustees' compensation |
7,314 |
|
|
Custodian fees and expenses |
43,289 |
|
|
Registration fees |
503,801 |
|
|
Audit |
19,489 |
|
|
Legal |
6,517 |
|
|
Miscellaneous |
174 |
|
|
Total expenses before reductions |
20,251,122 |
|
|
Expense reductions |
(118,592) |
20,132,530 |
|
Net investment income (loss) |
|
(6,832,294) |
|
Realized and Unrealized Gain (Loss) Net realized gain (loss) on |
|
(142,069,909) |
|
Change in net unrealized appreciation (depreciation) |
|
(327,346,537) |
|
Net gain (loss) |
|
(469,416,446) |
|
Net increase (decrease) in net assets resulting from operations |
|
$ (476,248,740) |
|
Other Information |
|
$ 18,656,883 |
|
Deferred sales charges withheld |
|
$ 15,347 |
|
Exchange fees withheld by FSC |
|
$ 90,368 |
|
Expense reductions Directed brokerage arrangements |
|
$ 100,007 |
|
Custodian credits |
|
3,062 |
|
Transfer agent credits |
|
15,523 |
|
|
|
$ 118,592 |
See accompanying notes which are an integral part of the financial statements.
Semiannual Report
Biotechnology Portfolio
Financial Statements - continued
Statement of Changes in Net Assets
|
Increase (Decrease) in Net Assets |
Six months ended |
Year ended |
|
Operations |
$ (6,832,294) |
$ (6,676,423) |
|
Net realized gain (loss) |
(142,069,909) |
163,252,232 |
|
Change in net unrealized appreciation (depreciation) |
(327,346,537) |
1,933,491,690 |
|
Net increase (decrease) in net assets resulting from operations |
(476,248,740) |
2,090,067,499 |
|
Distributions to shareholders |
|
|
|
From net realized gain |
(77,023,585) |
(60,923,524) |
|
In excess of net realized gain |
(18,457,101) |
- |
|
Total distributions |
(95,480,686) |
(60,923,524) |
|
Share transactions |
2,267,124,074 |
3,361,002,098 |
|
Reinvestment of distributions |
92,251,048 |
58,575,624 |
|
Cost of shares redeemed |
(2,159,229,740) |
(900,425,402) |
|
Net increase (decrease) in net assets resulting from share transactions |
200,145,382 |
2,519,152,320 |
|
Redemption fees |
4,812,331 |
2,524,013 |
|
Total increase (decrease) in net assets |
(366,771,713) |
4,550,820,308 |
|
Net Assets |
|
|
|
Beginning of period |
5,292,349,831 |
741,529,523 |
|
End of period (including accumulated net investment loss of $6,832,294 and $0, respectively) |
$ 4,925,578,118 |
$ 5,292,349,831 |
|
Other Information Shares |
|
|
|
Sold |
25,551,430 |
45,451,966 |
|
Issued in reinvestment of distributions |
1,166,111 |
1,100,383 |
|
Redeemed |
(25,627,421) |
(15,147,699) |
|
Net increase (decrease) |
$ 1,090,120 |
$ 31,404,650 |
Financial Highlights
|
|
Six months ended |
Years ended February 28, |
||||
|
Selected Per-Share Data |
(Unaudited) |
2000 G |
1999 |
1998 |
1997 |
1996 G |
|
Net asset value, beginning of period |
$ 107.27 |
$ 41.35 |
$ 34.52 |
$ 34.24 |
$ 36.60 |
$ 25.30 |
|
Income from Investment Operations |
|
|
|
|
|
|
|
Net investment income (loss) D |
(.14) |
(.30) |
(.26) |
(.27) |
(.20) |
.11 |
|
Net realized and unrealized gain (loss) |
(7.45) |
68.93 |
9.15 |
5.20 |
1.89 |
11.21 |
|
Total from investment operations |
(7.59) |
68.63 |
8.89 |
4.93 |
1.69 |
11.32 |
|
Less Distributions |
|
|
|
|
|
|
|
From net investment income |
- |
- |
- |
- |
(.03) |
(.07) |
|
From net realized gain |
(1.70) |
(2.82) |
(2.09) |
(4.71) |
(4.06) |
- |
|
In excess of net realized gain |
(.41) |
- |
- |
- |
- |
- |
|
Total distributions |
(2.11) |
(2.82) |
(2.09) |
(4.71) |
(4.09) |
(.07) |
|
Redemption fees added to paid in capital |
.10 |
.11 |
.03 |
.06 |
.04 |
.05 |
|
Net asset value, end of period |
$ 97.67 |
$ 107.27 |
$ 41.35 |
$ 34.52 |
$ 34.24 |
$ 36.60 |
|
Total Return B, C |
(6.52)% |
173.22% |
27.13% |
16.11% |
5.85% |
44.97% |
|
Ratios and Supplemental Data |
|
|
|
|
|
|
|
Net assets, end of period (000 omitted) |
$ 4,925,578 |
$ 5,292,350 |
$ 741,530 |
$ 579,542 |
$ 674,902 |
$ 1,096,864 |
|
Ratio of expenses to average net assets |
.99% A |
1.16% |
1.34% |
1.49% |
1.57% |
1.44% E |
|
Ratio of expenses to average net assets after |
.99% A |
1.15% F |
1.30% F |
1.47% F |
1.56% F |
1.43% F |
|
Ratio of net investment income (loss) to average net assets |
(.34)% A |
(.51)% |
(.75)% |
(.81)% |
(.59)% |
.35% |
|
Portfolio turnover rate |
77% A |
72% |
86% |
162% |
41% |
67% |
|
A Annualized B The total returns would have been lower had certain expenses not been reduced during the periods shown. C Total returns do not include the one time sales
charge and for periods of less than one year are not annualized. |
||||||
See accompanying notes which are an integral part of the financial statements.
Health Care Sector
Performance
There are several ways to evaluate a fund's historical performance. You can look at the total percentage change in value, the average annual percentage change or the growth of a hypothetical $10,000 investment. Total return reflects the change in the value of an investment, assuming reinvestment of the fund's dividend income and capital gains (the profits earned upon the sale of securities that have grown in value). Load adjusted returns include a 3.00% sales charge and the effect of a $7.50 long-term trading fee for shares held 30 days or more. Effective September 28, 2000, the $7.50 long-term trading fee was eliminated.
Cumulative Total Returns
|
Periods ended |
Past 6 |
Past 1 |
Past 5 |
Past 10 |
|
Select Health Care |
18.27% |
22.10% |
196.54% |
697.29% |
|
Select Health Care |
14.65% |
18.37% |
187.57% |
673.29% |
|
S&P 500 |
11.73% |
16.32% |
193.58% |
493.54% |
|
GS Health Care |
19.68% |
24.58% |
n/a** |
n/a** |
Cumulative total returns show the fund's performance in percentage terms over a set period - in this case, six months, one year, five years, or 10 years. You can compare the fund's returns to the performance of both the Standard & Poor's 500 Index - a market capitalization-weighted index of common stocks - and the Goldman Sachs Health Care Index - a market capitalization-weighted index of 113 stocks designed to measure the performance of companies in the health care sector. These benchmarks include reinvestment of dividends and capital gains, if any, and exclude the effect of sales charges.
Average Annual Total Returns
|
Periods ended |
Past 1 |
Past 5 |
Past 10 |
|
Select Health Care |
22.10% |
24.28% |
23.07% |
|
Select Health Care |
18.37% |
23.52% |
22.70% |
|
S&P 500 |
16.32% |
24.04% |
19.49% |
|
GS Health Care |
24.58% |
n/a** |
n/a** |
Average annual returns take the fund's cumulative return and show you what would have happened if the fund had performed at a constant rate each year.
** Not available
Understanding Performance
How a fund did yesterday is no guarantee of how it will do tomorrow. The stock market, for example, has a history of long-term growth and short-term volatility. Unlike the broader market, however, some sectors may not have a history of growth in the long run. And, as with all stock funds, the share price and return of a fund that invests in a sector will vary.
3$10,000 Over 10 Years
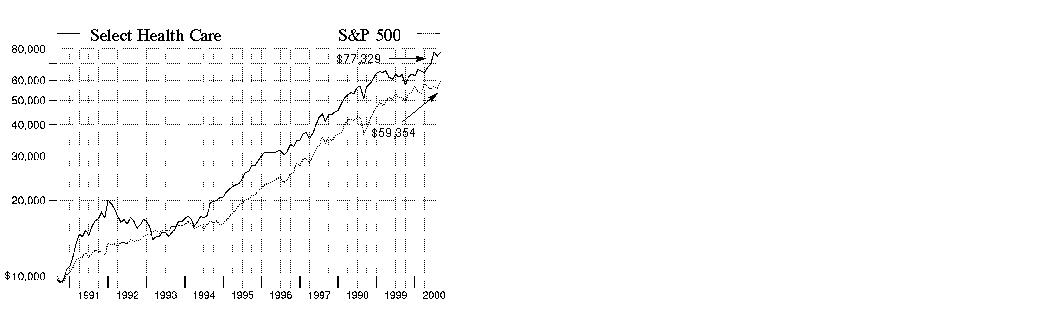
$10,000 Over 10 Years: Let's say hypothetically that $10,000 was invested in Fidelity Select Health Care Portfolio on August 31, 1990, and the current 3.00% sales charge was paid. As the chart shows, by August 31, 2000, the value of the investment would have grown to $77,329 - a 673.29% increase on the initial investment - and includes the effect of a $7.50 long-term trading fee. For comparison, look at how the Standard & Poor's 500 Index did over the same period. With dividends and capital gains, if any, reinvested, the same $10,000 investment would have grown to $59,354 - a 493.54% increase.
Investment Summary
|
Top Ten Stocks as of August 31, 2000 |
|
|
|
% of fund's |
|
Bristol-Myers Squibb Co. |
8.4 |
|
Pfizer, Inc. |
6.6 |
|
Merck & Co., Inc. |
6.3 |
|
Eli Lilly & Co. |
5.3 |
|
Abbott Laboratories |
4.8 |
|
Pharmacia Corp. |
4.6 |
|
Medtronic, Inc. |
4.4 |
|
Johnson & Johnson |
4.0 |
|
Schering-Plough Corp. |
3.7 |
|
Genentech, Inc. |
3.1 |
|
|
51.2 |
Top Industries as of August 31, 2000
% of fund's net assets

Semiannual Report
(Portfolio Manager photograph)
Note to shareholders: Yolanda McGettigan became Portfolio Manager of Fidelity Select Health Care Portfolio on June 1, 2000.
Q. How did the fund perform, Yolanda?
A. For the six-month period that ended August 31, 2000, the fund returned 18.27%. By comparison, the Goldman Sachs Health Care Index - an index of 113 stocks designed to measure the performance of companies in the health care sector - returned 19.68%. During the same period, the Standard & Poor's 500 Index returned 11.73%. For the 12-month period that ended August 31, 2000, the fund returned 22.10%, while the Goldman Sachs and S&P 500 indexes returned 24.58% and 16.32%, respectively.
Q. What factors contributed to the fund's performance relative to the Goldman Sachs index during the past six months?
A. The fund slightly underperformed the benchmark as a result of our overweighting in biotechnology stocks, which suffered a sharp pullback during March and April. During the latter half of the six-month period, however, the fund's biotechnology weighting helped relative performance, but the rebound wasn't enough to offset earlier losses. Security selection in the medical equipment, facilities and devices subsectors also hurt relative performance. On a more positive note, our stock selection in drug company stocks provided the biggest boost to performance in the second quarter. A slowing economy and a weakening technology market caused investors to seek the steady earnings growth that pharmaceutical companies historically have delivered.
Q. How have you positioned the fund since taking over in June?
A. I overweighted drug and pharmaceutical stocks, which made up about two-thirds of the fund's net assets, at the expense of medical devices holdings, which had weaker growth prospects. There were three reasons I overweighted pharmaceuticals. First, these companies historically outperform other areas of the market during economic slowdowns, and there are signs the economy is leaning toward that end. If the economy continues to slow, and if the change in the earnings growth rate of drug stocks is better than the change in the growth rate of the broader market for the remainder of the year, drug stocks could exhibit superior performance. Second, at the close of the period, drug stocks were fairly valued and had room to move on a price-to-earnings multiple basis. Finally, there were strong pipelines at many companies and some great drug products on the horizon, which should benefit the fund. Turning to biotech, these stocks should gain momentum from the mapping of the human genome, which will considerably expedite the drug discovery and development process.
Q. What specific stocks stood out as top performers? Which disappointed?
A. Warner-Lambert was the fund's top performer, benefiting from being the target of a takeover battle between American Home Products and Pfizer, which was ultimately won by Pfizer. Eli Lilly, another top-10 holding, soared after the company said it had stopped the next phase of a scheduled trial of its sepsis drug, Zovant, because the results were so favorable - an unusual move. In terms of underachievers, Bristol-Myers Squibb's decision to delay testing on its promising hypertension drug, Vanlev, due to safety concerns hurt the stock. In addition, Bristol-Myers' stock was hurt by recent court decisions that made it likely that the company's cancer treatment drug, Taxol, would begin to face competition from generic drugs in the U.S. as early as this year. Shares of genomics leader PE Celera suffered as investors feared its business model would be damaged by government suggestions to make its human genetic code findings a matter of public information.
Q. What's your outlook for the health sector, Yolanda?
A. Much of what happens in the sector going forward will depend on the economy and the upcoming presidential and congressional elections. If the economy does slow, as some have suspected as a result of the Federal Reserve Board's interest-rate policy, health stocks should generate strong relative earnings growth and could outperform. However, the biggest risk for the sector, particularly among drug companies, remains the government. Any Democratic victory could be seen as a negative influence on the sector, potentially re-igniting initiatives to reform Medicare and the health care industry. I will be paying close attention to see how the election process unfolds.
The views expressed in this report reflect those of the portfolio manager only through the end of the period of the report as stated on the cover. The manager's views are subject to change at any time based on market or other conditions. For more information, see page 3.
Fund Facts
Start date: July 14, 1981
Fund number: 063
Trading symbol: FSPHX
Size: as of August 31, 2000, more than
$2.6 billion
Manager: Yolanda McGettigan, since June 2000; manager, Fidelity Select Biotechnology Portfolio, since February 2000; Fidelity Select Banking Portfolio, 1999-January 2000; Fidelity Select Construction and Housing Portfolio, 1997-1999; joined Fidelity in 1997
3Semiannual Report
Health Care Portfolio
(Unaudited)
Showing Percentage of Net Assets
|
Common Stocks - 94.3% |
|||
|
Shares |
Value (Note 1) |
||
|
CHEMICALS & PLASTICS - 4.6% |
|||
|
Pharmacia Corp. |
2,100,500 |
$ 123,010,531 |
|
|
COMPUTER SERVICES & SOFTWARE - 0.9% |
|||
|
Affymetrix, Inc. (a) |
136,200 |
10,759,800 |
|
|
Healtheon/WebMD Corp. (a) |
251,000 |
4,423,875 |
|
|
IMS Health, Inc. |
455,600 |
8,599,450 |
|
|
TOTAL COMPUTER SERVICES & SOFTWARE |
23,783,125 |
||
|
DRUGS & PHARMACEUTICALS - 57.5% |
|||
|
Abgenix, Inc. (a) |
55,700 |
4,187,073 |
|
|
Alkermes, Inc. (a) |
223,500 |
10,336,875 |
|
|
American Home Products Corp. |
1,462,200 |
79,232,963 |
|
|
Amgen, Inc. (a) |
1,053,500 |
79,868,469 |
|
|
Andrx Corp. (a) |
384,960 |
33,491,520 |
|
|
Bausch & Lomb, Inc. |
179,300 |
6,409,975 |
|
|
Biochem Pharma, Inc. (a) |
6,700 |
141,376 |
|
|
Biogen, Inc. (a) |
214,600 |
14,834,225 |
|
|
Biovail Corp. (a) |
70,800 |
4,539,572 |
|
|
Bristol-Myers Squibb Co. |
4,245,700 |
225,022,093 |
|
|
Celgene Corp. (a) |
204,200 |
15,110,800 |
|
|
Cephalon, Inc. (a) |
346,881 |
17,452,450 |
|
|
Chiron Corp. (a) |
55,700 |
3,011,281 |
|
|
COR Therapeutics, Inc. (a) |
83,800 |
4,713,750 |
|
|
CV Therapeutics, Inc. (a) |
8,600 |
645,000 |
|
|
Decode Genetics, Inc. |
2,500 |
69,063 |
|
|
Deltagen, Inc. |
12,500 |
360,938 |
|
|
Eli Lilly & Co. |
1,968,652 |
143,711,596 |
|
|
Enzon, Inc. (a) |
72,900 |
4,437,788 |
|
|
Exelixis, Inc. |
286,600 |
12,897,000 |
|
|
Genentech, Inc. |
434,400 |
82,753,200 |
|
|
Geneva Proteomics (c) |
111,000 |
610,500 |
|
|
Genzyme Corp. - General Division (a) |
110,700 |
8,309,419 |
|
|
Human Genome Sciences, Inc. (a) |
96,300 |
16,076,081 |
|
|
ICOS Corp. (a) |
367,900 |
21,591,131 |
|
|
IDEC Pharmaceuticals Corp. (a) |
68,100 |
9,508,463 |
|
|
ImClone Systems, Inc. (a) |
127,200 |
12,258,900 |
|
|
Immunex Corp. (a) |
1,094,660 |
55,006,665 |
|
|
King Pharmaceuticals, Inc. (a) |
64,700 |
2,078,488 |
|
|
Medarex, Inc. (a) |
189,800 |
20,972,900 |
|
|
Medicis Pharmaceutical Corp. Class A (a) |
5,100 |
328,631 |
|
|
Medimmune, Inc. (a) |
444,600 |
37,401,975 |
|
|
Merck & Co., Inc. |
2,412,200 |
168,552,475 |
|
|
Millennium Pharmaceuticals, Inc. (a) |
165,400 |
23,672,875 |
|
|
Mylan Laboratories, Inc. |
566,600 |
15,050,313 |
|
|
NaPro BioTherapeutics, Inc. (a) |
81,300 |
640,238 |
|
|
PE Corp. - Celera Genomics Group (a) |
161,100 |
17,469,281 |
|
|
Pfizer, Inc. |
4,131,500 |
178,687,375 |
|
|
PRAECIS Pharmaceuticals, Inc. |
201,300 |
8,819,456 |
|
|
Protein Design Labs, Inc. (a) |
148,300 |
11,270,800 |
|
|
QLT, Inc. (a) |
82,900 |
6,273,133 |
|
|
Schering-Plough Corp. |
2,503,000 |
100,432,875 |
|
|
|
|||
|
Shares |
Value (Note 1) |
||
|
Sepracor, Inc. (a) |
176,000 |
$ 19,360,000 |
|
|
Serono SA sponsored ADR (a) |
180,500 |
5,166,813 |
|
|
SuperGen, Inc. (a) |
3,600 |
70,875 |
|
|
Vertex Pharmaceuticals, Inc. (a) |
396,060 |
33,665,100 |
|
|
Watson Pharmaceuticals, Inc. (a) |
376,400 |
23,219,175 |
|
|
XOMA Ltd. (a) |
581,300 |
7,048,263 |
|
|
TOTAL DRUGS & PHARMACEUTICALS |
1,546,769,207 |
||
|
ELECTRONIC INSTRUMENTS - 2.3% |
|||
|
Beckman Coulter, Inc. |
37,900 |
2,885,138 |
|
|
PE Corp. - Biosystems Group |
340,900 |
33,536,038 |
|
|
Waters Corp. (a) |
328,500 |
26,136,281 |
|
|
TOTAL ELECTRONIC INSTRUMENTS |
62,557,457 |
||
|
HOME FURNISHINGS - 0.1% |
|||
|
Hillenbrand Industries, Inc. |
82,700 |
2,878,994 |
|
|
INSURANCE - 1.5% |
|||
|
CIGNA Corp. |
378,900 |
36,848,025 |
|
|
First Health Group Corp. (a) |
60,200 |
1,869,963 |
|
|
TOTAL INSURANCE |
38,717,988 |
||
|
MEDICAL EQUIPMENT & SUPPLIES - 21.6% |
|||
|
Abbott Laboratories |
2,927,600 |
128,082,500 |
|
|
Allscripts, Inc. |
1,400 |
40,863 |
|
|
AmeriSource Health Corp. Class A (a) |
44,900 |
1,560,275 |
|
|
Baxter International, Inc. |
740,100 |
61,613,325 |
|
|
Becton, Dickinson & Co. |
184,100 |
5,546,013 |
|
|
Biomet, Inc. |
583,400 |
19,726,213 |
|
|
Boston Scientific Corp. (a) |
338,500 |
6,410,344 |
|
|
C.R. Bard, Inc. |
206,500 |
10,079,781 |
|
|
Cardinal Health, Inc. |
740,105 |
60,549,840 |
|
|
DENTSPLY International, Inc. |
243,800 |
8,136,825 |
|
|
Guidant Corp. (a) |
323,620 |
21,783,671 |
|
|
Johnson & Johnson |
1,160,615 |
106,704,042 |
|
|
Mallinckrodt, Inc. |
1,900 |
85,619 |
|
|
Medtronic, Inc. |
2,287,904 |
117,255,080 |
|
|
MiniMed, Inc. (a) |
108,100 |
7,761,242 |
|
|
Patterson Dental Co. (a) |
97,500 |
2,315,625 |
|
|
Resmed, Inc. (a) |
64,800 |
2,385,450 |
|
|
St. Jude Medical, Inc. (a) |
146,300 |
5,797,138 |
|
|
Stryker Corp. |
166,900 |
7,479,206 |
|
|
Sybron International, Inc. (a) |
269,200 |
6,124,300 |
|
|
VISX, Inc. (a) |
58,000 |
1,598,625 |
|
|
TOTAL MEDICAL EQUIPMENT & SUPPLIES |
581,035,977 |
||
|
MEDICAL FACILITIES MANAGEMENT - 5.5% |
|||
|
Express Scripts, Inc. Class A (a) |
78,400 |
5,581,100 |
|
|
HCA - The Healthcare Co. |
1,197,100 |
41,299,950 |
|
|
Health Management Associates, Inc. Class A (a) |
661,200 |
10,785,825 |
|
|
Common Stocks - continued |
|||
|
Shares |
Value (Note 1) |
||
|
MEDICAL FACILITIES MANAGEMENT - CONTINUED |
|||
|
Oxford Health Plans, Inc. (a) |
156,800 |
$ 4,782,400 |
|
|
Tenet Healthcare Corp. |
865,600 |
26,833,600 |
|
|
Trigon Healthcare, Inc. (a) |
102,300 |
5,281,238 |
|
|
UnitedHealth Group, Inc. |
345,200 |
32,621,400 |
|
|
Universal Health Services, Inc. Class B (a) |
56,700 |
4,011,525 |
|
|
Wellpoint Health Networks, Inc. (a) |
188,100 |
16,235,381 |
|
|
TOTAL MEDICAL FACILITIES MANAGEMENT |
147,432,419 |
||
|
RETAIL & WHOLESALE, MISCELLANEOUS - 0.0% |
|||
|
Ventro Corp. |
11,700 |
166,725 |
|
|
SERVICES - 0.3% |
|||
|
Caremark Rx, Inc. (a) |
766,200 |
7,518,338 |
|
|
TOTAL COMMON STOCKS (Cost $1,672,623,804) |
2,533,870,761 |
||
|
Cash Equivalents - 5.8% |
|||
|
|
|
|
|
|
Fidelity Cash Central Fund, 6.59% (b) |
132,824,391 |
132,824,391 |
|
|
Fidelity Securities Lending Cash Central Fund, 6.64% (b) |
24,061,100 |
24,061,100 |
|
|
TOTAL CASH EQUIVALENTS (Cost $156,885,491) |
156,885,491 |
||
|
TOTAL INVESTMENT PORTFOLIO - 100.1% (Cost $1,829,509,295) |
2,690,756,252 |
||
|
NET OTHER ASSETS - (0.1)% |
(2,075,650) |
||
|
NET ASSETS - 100% |
$ 2,688,680,602 |
||
|
Legend |
|
(a) Non-income producing |
|
(b) The rate quoted is the annualized seven-day yield of the fund at |
|
(c) Restricted securities - Investment in securities not registered under the Securities Act of 1933. |
|
Additional information on each holding is as follows: |
|
Security |
Acquisition Date |
Acquisition Cost |
|
Geneva Proteomics |
7/7/00 |
$ 610,500 |
|
Other Information |
|
Purchases and sales of securities, other than short-term securities, aggregated $995,569,520 and $1,109,982,268, respectively. |
|
The fund placed a portion of its portfolio transactions with brokerage firms which are affiliates of Fidelity Management & Research Company. The commissions paid to these affiliated firms were $14,798 for the period. |
|
The fund invested in securities that are not registered under the Securities Act of 1933. These securities are subject to legal or contractual restrictions on resale. At the end of the period, restricted securities (excluding Rule 144A issues) amounted to $610,500 or 0.0% of net assets. |
|
The fund participated in the security lending program. At period end, the value of securities loaned amounted to $23,202,531. The fund received |
|
Income Tax Information |
|
At August 31, 2000, the aggregate cost of investment securities for income tax purposes was $1,837,306,808. Net unrealized appreciation aggregated $853,449,444, of which $917,956,599 related to appreciated investment securities and $64,507,155 related to depreciated investment securities. |
See accompanying notes which are an integral part of the financial statements.
Health Care Sector
Statement of Assets and Liabilities
|
|
August 31, 2000 (Unaudited) |
|
|
Assets |
|
|
|
Investment in securities, at value |
|
$ 2,690,756,252 |
|
Receivable for investments sold |
|
34,646,099 |
|
Receivable for fund shares sold |
|
2,751,634 |
|
Dividends receivable |
|
3,037,654 |
|
Interest receivable |
|
765,441 |
|
Redemption fees receivable |
|
2,329 |
|
Other receivables |
|
154,438 |
|
Total assets |
|
2,732,113,847 |
|
Liabilities |
|
|
|
Payable for investments purchased |
$ 12,803,539 |
|
|
Payable for fund shares redeemed |
4,409,685 |
|
|
Accrued management fee |
1,291,622 |
|
|
Other payables and |
867,299 |
|
|
Collateral on securities loaned, |
24,061,100 |
|
|
Total liabilities |
|
43,433,245 |
|
Net Assets |
|
$ 2,688,680,602 |
|
Net Assets consist of: |
|
|
|
Paid in capital |
|
$ 1,560,345,210 |
|
Undistributed net investment income |
|
3,525,785 |
|
Accumulated undistributed net realized gain (loss) on investments and foreign currency transactions |
|
263,577,525 |
|
Net unrealized appreciation (depreciation) on investments |
|
861,232,082 |
|
Net Assets, for 17,916,225 shares outstanding |
|
$ 2,688,680,602 |
|
Net Asset Value and redemption price per share ($2,688,680,602 ÷ 17,916,225 shares) |
|
$150.07 |
|
Maximum offering price per share (100/97.00 of $150.07) |
|
$154.71 |
Statement of Operations
|
|
Six months ended August 31, 2000 (Unaudited) |
|
|
Investment Income Dividends |
|
$ 10,567,128 |
|
Interest |
|
5,171,699 |
|
Security lending |
|
52,973 |
|
Total income |
|
15,791,800 |
|
Expenses |
|
|
|
Management fee |
$ 7,171,219 |
|
|
Transfer agent fees |
4,536,096 |
|
|
Accounting and security lending fees |
566,417 |
|
|
Non-interested trustees' compensation |
9,431 |
|
|
Custodian fees and expenses |
26,511 |
|
|
Registration fees |
86,581 |
|
|
Audit |
42,683 |
|
|
Legal |
5,108 |
|
|
Miscellaneous |
516 |
|
|
Total expenses before reductions |
12,444,562 |
|
|
Expense reductions |
(244,800) |
12,199,762 |
|
Net investment income |
|
3,592,038 |
|
Realized and Unrealized Gain (Loss) Net realized gain (loss) on: |
|
|
|
Investment securities |
265,268,201 |
|
|
Foreign currency transactions |
(869) |
265,267,332 |
|
Change in net unrealized appreciation (depreciation) on: |
|
|
|
Investment securities |
139,763,197 |
|
|
Assets and liabilities in |
(5,236) |
139,757,961 |
|
Net gain (loss) |
|
405,025,293 |
|
Net increase (decrease) in net assets resulting from operations |
|
$ 408,617,331 |
|
Other Information |
|
$ 1,548,935 |
|
Deferred sales charges withheld |
|
$ 38,460 |
|
Exchange fees withheld by FSC |
|
$ 40,305 |
|
Expense reductions |
|
$ 229,322 |
|
Custodian credits |
|
1,875 |
|
Transfer agent credits |
|
13,603 |
|
|
|
$ 244,800 |
See accompanying notes which are an integral part of the financial statements.
Semiannual Report
Health Care Portfolio
Financial Statements - continued
Statement of Changes in Net Assets
|
Increase (Decrease) in Net Assets |
Six months ended |
Year ended |
|
Operations |
$ 3,592,038 |
$ 3,255,519 |
|
Net realized gain (loss) |
265,267,332 |
204,617,182 |
|
Change in net unrealized appreciation (depreciation) |
139,757,961 |
(209,767,191) |
|
Net increase (decrease) in net assets resulting from operations |
408,617,331 |
(1,894,490) |
|
Distributions to shareholders |
(1,567,096) |
(1,677,421) |
|
From net realized gain |
(68,834,679) |
(163,613,261) |
|
Total distributions |
(70,401,775) |
(165,290,682) |
|
Share transactions |
402,249,976 |
762,183,703 |
|
Reinvestment of distributions |
67,052,586 |
158,184,675 |
|
Cost of shares redeemed |
(484,580,217) |
(1,535,337,928) |
|
Net increase (decrease) in net assets resulting from share transactions |
(15,277,655) |
(614,969,550) |
|
Redemption fees |
679,663 |
1,393,204 |
|
Total increase (decrease) in net assets |
323,617,564 |
(780,761,518) |
|
Net Assets |
|
|
|
Beginning of period |
2,365,063,038 |
3,145,824,556 |
|
End of period (including undistributed net investment income of $3,525,785 and $2,230,397, respectively) |
$ 2,688,680,602 |
$ 2,365,063,038 |
|
Other Information Shares |
|
|
|
Sold |
2,853,594 |
5,768,494 |
|
Issued in reinvestment of distributions |
509,673 |
1,257,783 |
|
Redeemed |
(3,529,433) |
(11,805,281) |
|
Net increase (decrease) |
(166,166) |
(4,779,004) |
Financial Highlights
|
|
Six months ended |
Years ended February 28, |
||||
|
Selected Per-Share Data |
(Unaudited) |
2000 F |
1999 |
1998 |
1997 |
1996 F |
|
Net asset value, beginning of period |
$ 130.79 |
$ 137.60 |
$ 113.84 |
$ 102.45 |
$ 100.47 |
$ 76.13 |
|
Income from Investment Operations |
|
|
|
|
|
|
|
Net investment income D |
.20 |
.15 |
.17 |
.33 |
.52 |
.95 |
|
Net realized and unrealized gain (loss) |
23.09 |
.90 G |
29.85 |
31.94 |
18.01 |
28.85 |
|
Total from investment operations |
23.29 |
1.05 |
30.02 |
32.27 |
18.53 |
29.80 |
|
Less Distributions |
|
|
|
|
|
|
|
From net investment income |
(.09) |
(.08) |
(.19) |
(.25) |
(.65) |
(.59) |
|
From net realized gain |
(3.96) |
(7.85) |
(6.17) |
(20.73) |
(15.95) |
(4.92) |
|
Total distributions |
(4.05) |
(7.93) |
(6.36) |
(20.98) |
(16.60) |
(5.51) |
|
Redemption fees added to paid in capital |
.04 |
.07 |
.10 |
.10 |
.05 |
.05 |
|
Net asset value, end of period |
$ 150.07 |
$ 130.79 |
$ 137.60 |
$ 113.84 |
$ 102.45 |
$ 100.47 |
|
Total Return B, C |
18.27% |
1.15% |
27.20% |
36.47% |
20.41% |
39.68% |
|
Ratios and Supplemental Data |
|
|
|
|
|
|
|
Net assets, end of period (000 omitted) |
$ 2,688,681 |
$ 2,365,063 |
$ 3,145,825 |
$ 2,224,019 |
$ 1,372,554 |
$ 1,525,910 |
|
Ratio of expenses to average net assets |
.97% A |
1.07% |
1.07% |
1.20% |
1.33% |
1.31% |
|
Ratio of expenses to average net assets after |
.95% A, E |
1.05% E |
1.05% E |
1.18% E |
1.32% E |
1.30% E |
|
Ratio of net investment income to average net assets |
.28% A |
.12% |
.14% |
.31% |
.52% |
1.06% |
|
Portfolio turnover rate |
83% A |
70% |
66% |
79% |
59% |
54% |
|
A Annualized B The total returns would have been lower had certain expenses not been reduced during the periods shown. C Total returns do not include the one time sales
charge and for periods of less than one year are not annualized. |
||||||
See accompanying notes which are an integral part of the financial statements.
Health Care Sector
Performance
There are several ways to evaluate a fund's historical performance. You can look at the total percentage change in value, the average annual percentage change or the growth of a hypothetical $10,000 investment. Total return reflects the change in the value of an investment, assuming reinvestment of the fund's dividend income and capital gains (the profits earned upon the sale of securities that have grown in value). Load adjusted returns include a 3.00% sales charge and the effect of a $7.50 long-term trading fee for shares held 30 days or more. Effective September 28, 2000, the $7.50 long-term trading fee was eliminated.
Cumulative Total Returns
|
Periods ended |
Past 6 |
Past 1 |
Past 5 |
Past 10 |
|
Select Medical Delivery |
34.22% |
19.85% |
23.05% |
224.37% |
|
Select Medical Delivery |
30.12% |
16.18% |
19.29% |
214.57% |
|
S&P 500 |
11.73% |
16.32% |
193.58% |
493.54% |
|
GS Health Care |
19.68% |
24.58% |
n/a** |
n/a** |
Cumulative total returns show the fund's performance in percentage terms over a set period - in this case, six months, one year, five years or 10 years. You can compare the fund's returns to the performance of both the Standard & Poor's 500 Index - a market capitalization-weighted index of common stocks - and the Goldman Sachs Health Care Index - a market capitalization-weighted index of 113 stocks designed to measure the performance of companies in the health care sector. These benchmarks include reinvestment of dividends and capital gains, if any, and exclude the effect of sales charges.
Average Annual Total Returns
|
Periods ended |
Past 1 |
Past 5 |
Past 10 |
|
Select Medical Delivery |
19.85% |
4.24% |
12.49% |
|
Select Medical Delivery |
16.18% |
3.59% |
12.14% |
|
S&P 500 |
16.32% |
24.04% |
19.49% |
|
GS Health Care |
24.58% |
n/a** |
n/a** |
Average annual returns take the fund's cumulative return and show you what would have happened if the fund had performed at a constant rate each year.
** Not available
Understanding Performance
How a fund did yesterday is no guarantee of how it will do tomorrow. The stock market, for example, has a history of long-term growth and short-term volatility. Unlike the broader market, however, some sectors may not have a history of growth in the long run. And, as with all stock funds, the share price and return of a fund that invests in a sector will vary.
3$10,000 Over 10 Years
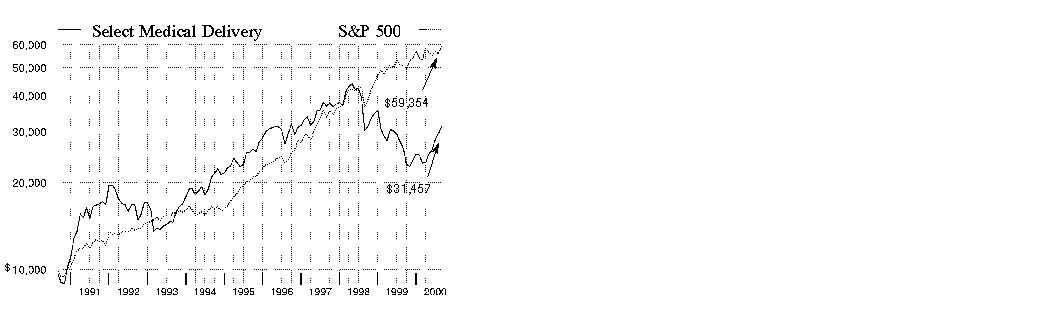
$10,000 Over 10 Years: Let's say hypothetically that $10,000 was invested in Fidelity Select Medical Delivery Portfolio on August 31, 1990, and the current 3.00% sales charge was paid. As the chart shows, by August 31, 2000, the value of the investment would have grown to $31,457 - a 214.57% increase on the initial investment - and includes the effect of a $7.50 long-term trading fee. For comparison, look at how the Standard & Poor's 500 Index did over the same period. With dividends and capital gains, if any, reinvested, the same $10,000 investment would have grown to $59,354 - a 493.54% increase.
Investment Summary
|
Top Ten Stocks as of August 31, 2000 |
|
|
|
% of fund's |
|
HCA - The Healthcare Co. |
8.2 |
|
CIGNA Corp. |
8.2 |
|
UnitedHealth Group, Inc. |
7.9 |
|
Wellpoint Health Networks, Inc. |
7.8 |
|
Tenet Healthcare Corp. |
7.3 |
|
Cardinal Health, Inc. |
5.6 |
|
Health Management Associates, Inc. Class A |
4.4 |
|
Caremark Rx, Inc. |
3.6 |
|
McKesson HBOC, Inc. |
3.5 |
|
Express Scripts, Inc. Class A |
3.2 |
|
|
59.7 |
Top Industries as of August 31, 2000
% of fund's net assets
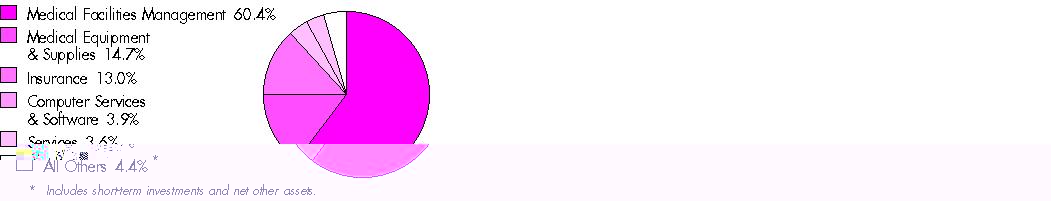
Semiannual Report
(Portfolio Manager photograph)
Pratima Abichandani, Portfolio Manager of
Fidelity Select Medical
Delivery Portfolio
Q. How did the fund perform, Pratima?
A. Very well. For the six- and 12-month periods ending August 31, 2000, the fund returned 34.22% and 19.85%, respectively. In comparison, the Goldman Sachs Health Care Index - an index of 113 stocks designed to measure the performance of companies in the health care sector - returned 19.68% and 24.58%, respectively. The Standard & Poor's 500 Index returned 11.73% and 16.32%, respectively, during the six- and 12-month periods.
Q. How did the fund beat the performance of the Goldman Sachs index during the six-month period?
A. The Goldman Sachs index invests in a much broader array of stocks than the fund. Most of the stocks in the fund's narrower universe are defensive in nature, so signs of a slowing economy meant good news for many of our holdings. Specifically, my focus on hospitals, HMOs and pharmacy benefit management companies - sponsors or managers of prescription drug benefit plans - helped performance relative to the Goldman Sachs index. In contrast, biotechnology issues, which represent a significant proportion of the index, were quite volatile during the six-month period, as were some pharmaceutical stocks.
Q. What was your strategy in this environment?
A. I increased the fund's positions in HMOs, for-profit hospitals and pharmacy benefit management companies. Previously, the stocks of these companies had performed relatively poorly, despite improving fundamentals. But as investors became increasingly concerned about a possible slowdown in the economy, they focused on the strong performance of these companies, most of which met or beat consensus earnings estimates. I also reduced the fund's positions in information technology and e-health companies, which were vulnerable to a shrinking customer base of not-for-profit hospitals, many of which have cut back or delayed their technology spending.
Q. Which stocks helped the fund's performance?
A. UnitedHealth Group, CIGNA and Wellpoint all did very well. These three dominant managed care companies showed strong volume growth, successfully priced their products ahead of costs and benefited from an industry win of a key class-action suit. Fund holdings HCA Healthcare and Tenet, both for-profit hospital companies, also enjoyed strong performance. Each successfully negotiated price increases with managed care companies, managed labor costs through productivity improvements, contained supply costs by using the Internet, reinvested in facilities and took market share from their not-for-profit competitors. Pharmacy benefit managers Caremark and Express Scripts saw sales volumes increase, as health care managers tried to rein in their pharmacy costs.
Q. Which stocks detracted from performance?
A. Most of the disappointments were information technology and e-health companies. These companies had a difficult time during the past six months, as health care providers and not-for-profit hospitals cut back on their investments in technology because of pricing pressures from managed care and Medicare cuts. Ventro, which formed a business-to-business marketplace for life sciences and health care companies that allow organizations to buy medical equipment and supplies over the Internet, was hurt by those cutbacks. Other casualties included Healtheon/WebMD, which helps streamline the administrative process by enabling the sending of electronic claims over the Internet, and CareInsite, which puts best practices on a doctor's desktop computer to provide information that assists with diagnoses and treatment protocols. IDX had disappointing performance resulting from its reliance on older client-server information technology, making the company vulnerable to competitors with newer technology and lower costs.
Q. What's your outlook for the next few months?
A. I'm optimistic about the prospects for medical delivery stocks. The U.S. government plans to increase Medicare funding to hospitals beginning as early as October 2000, through the Balanced Budget Refinement Act. This would increase Medicare payments to hospitals, and could translate into $20 billion to $40 billion in additional funding to the provider sector over the next five years. On the managed care side, the pricing cycle continues to be positive, but we will monitor progress on a possible Patients' Bill of Rights, which could have an adverse effect on managed care companies.
The views expressed in this report reflect those of the portfolio manager only through the end of the period of the report as stated on the cover. The manager's views are subject to change at any time based on market or other conditions. For more information, see page 3.
Fund Facts
Start date: June 30, 1986
Fund number: 505
Trading symbol: FSHCX
Size: as of August 31, 2000, more than $87 million
Manager: Pratima Abichandani, since February 2000; manager, several Fidelity international funds, 1997-2000; sector leader, Asian telecommunications sector, 1998-2000; analyst, India and Singapore, 1995-1997; joined Fidelity in 1994
3Semiannual Report
Medical Delivery Portfolio
(Unaudited)
Showing Percentage of Net Assets
|
Common Stocks - 98.2% |
|||
|
Shares |
Value (Note 1) |
||
|
CHEMICALS & PLASTICS - 0.2% |
|||
|
Medical Manager Corp. (a) |
3,500 |
$ 153,125 |
|
|
COMPUTER SERVICES & SOFTWARE - 3.9% |
|||
|
CareInsite, Inc. (a) |
32,500 |
727,188 |
|
|
Cerner Corp. (a) |
16,000 |
609,000 |
|
|
Eclipsys Corp. (a) |
7,900 |
113,563 |
|
|
Healtheon/WebMD Corp. (a) |
76,300 |
1,344,788 |
|
|
IDX Systems Corp. (a) |
7,500 |
127,500 |
|
|
IMS Health, Inc. |
12,500 |
235,938 |
|
|
National Data Corp. |
8,100 |
237,938 |
|
|
SciQuest.com, Inc. |
1,700 |
16,363 |
|
|
TOTAL COMPUTER SERVICES & SOFTWARE |
3,412,278 |
||
|
DRUGS & PHARMACEUTICALS - 2.0% |
|||
|
Bristol-Myers Squibb Co. |
4,600 |
243,800 |
|
|
Cephalon, Inc. (a) |
3,400 |
171,063 |
|
|
Eli Lilly & Co. |
4,500 |
328,500 |
|
|
Immunex Corp. (a) |
2,500 |
125,625 |
|
|
Millennium Pharmaceuticals, Inc. (a) |
1,100 |
157,438 |
|
|
Pfizer, Inc. |
5,500 |
237,875 |
|
|
Quintiles Transnational Corp. (a) |
28,900 |
402,794 |
|
|
Schering-Plough Corp. |
2,700 |
108,338 |
|
|
TOTAL DRUGS & PHARMACEUTICALS |
1,775,433 |
||
|
ELECTRONIC INSTRUMENTS - 0.4% |
|||
|
Fisher Scientific International, Inc. (a) |
14,900 |
326,869 |
|
|
INSURANCE - 13.0% |
|||
|
Aetna, Inc. |
43,800 |
2,450,063 |
|
|
CIGNA Corp. |
73,200 |
7,118,700 |
|
|
First Health Group Corp. (a) |
55,900 |
1,736,394 |
|
|
TOTAL INSURANCE |
11,305,157 |
||
|
MEDICAL EQUIPMENT & SUPPLIES - 14.7% |
|||
|
Abbott Laboratories |
5,600 |
245,000 |
|
|
Allscripts, Inc. |
5,200 |
151,775 |
|
|
AmeriSource Health Corp. Class A (a) |
45,600 |
1,584,600 |
|
|
Bindley Western Industries, Inc. |
21,100 |
607,944 |
|
|
Biomet, Inc. |
3,600 |
121,725 |
|
|
Cardinal Health, Inc. |
60,050 |
4,912,841 |
|
|
Johnson & Johnson |
2,200 |
202,263 |
|
|
McKesson HBOC, Inc. |
121,200 |
3,022,425 |
|
|
Omnicare, Inc. |
42,200 |
577,613 |
|
|
Patterson Dental Co. (a) |
49,000 |
1,163,750 |
|
|
PSS World Medical, Inc. (a) |
12,500 |
78,125 |
|
|
Sybron International, Inc. (a) |
5,500 |
125,125 |
|
|
TOTAL MEDICAL EQUIPMENT & SUPPLIES |
12,793,186 |
||
|
|
|||
|
Shares |
Value (Note 1) |
||
|
MEDICAL FACILITIES MANAGEMENT - 60.4% |
|||
|
Advance Paradigm, Inc. (a) |
28,300 |
$ 753,488 |
|
|
Apria Healthcare Group, Inc. (a) |
33,300 |
495,338 |
|
|
Community Health Systems, Inc. (a) |
26,100 |
619,875 |
|
|
Coventry Health Care, Inc. (a) |
27,500 |
440,000 |
|
|
Express Scripts, Inc. Class A (a) |
39,500 |
2,811,906 |
|
|
Foundation Health Systems, Inc. |
74,500 |
1,308,406 |
|
|
HCA - The Healthcare Co. |
208,123 |
7,180,233 |
|
|
Health Management Associates, Inc. Class A (a) |
236,917 |
3,864,709 |
|
|
HEALTHSOUTH Corp. (a) |
251,200 |
1,538,600 |
|
|
Lifepoint Hospitals, Inc. (a) |
9,900 |
298,238 |
|
|
Lincare Holdings, Inc. (a) |
35,300 |
900,150 |
|
|
Manor Care, Inc. (a) |
61,400 |
821,225 |
|
|
Medquist, Inc. (a) |
9,030 |
174,956 |
|
|
Mid-Atlantic Medical Services, Inc. (a) |
10,300 |
166,088 |
|
|
Orthodontic Centers of America, Inc. (a) |
37,900 |
1,241,225 |
|
|
Oxford Health Plans, Inc. (a) |
72,900 |
2,223,450 |
|
|
Province Healthcare Co. (a) |
4,600 |
206,425 |
|
|
Quest Diagnostics, Inc. (a) |
1,400 |
173,250 |
|
|
Quorum Health Group, Inc. (a) |
55,200 |
710,700 |
|
|
RehabCare Group, Inc. (a) |
7,000 |
261,625 |
|
|
Renal Care Group, Inc. (a) |
34,650 |
701,663 |
|
|
Sunrise Assisted Living, Inc. (a) |
6,600 |
131,175 |
|
|
Syncor International Corp. (a) |
27,000 |
1,080,000 |
|
|
Tenet Healthcare Corp. |
206,200 |
6,392,200 |
|
|
Triad Hospitals, Inc. (a) |
25,300 |
730,538 |
|
|
Trigon Healthcare, Inc. (a) |
44,500 |
2,297,313 |
|
|
UnitedHealth Group, Inc. |
72,700 |
6,870,150 |
|
|
Universal Health Services, Inc. Class B (a) |
20,300 |
1,436,225 |
|
|
Wellpoint Health Networks, Inc. (a) |
79,100 |
6,827,318 |
|
|
TOTAL MEDICAL FACILITIES MANAGEMENT |
52,656,469 |
||
|
RETAIL & WHOLESALE, MISCELLANEOUS - 0.0% |
|||
|
PlanetRx.com, Inc. |
10,500 |
8,203 |
|
|
Ventro Corp. |
1,700 |
24,225 |
|
|
TOTAL RETAIL & WHOLESALE, MISCELLANEOUS |
32,428 |
||
|
SERVICES - 3.6% |
|||
|
Caremark Rx, Inc. (a) |
321,140 |
3,151,186 |
|
|
TOTAL COMMON STOCKS (Cost $69,599,040) |
85,606,131 |
||
|
Cash Equivalents - 11.1% |
|||
|
Shares |
Value (Note 1) |
||
|
Fidelity Cash Central Fund, 6.59% (b) |
2,141,965 |
$ 2,141,965 |
|
|
Fidelity Securities Lending Cash Central Fund, 6.64% (b) |
7,535,975 |
7,535,975 |
|
|
TOTAL CASH EQUIVALENTS (Cost $9,677,940) |
9,677,940 |
||
|
TOTAL INVESTMENT PORTFOLIO - 109.3% (Cost $79,276,980) |
95,284,071 |
||
|
NET OTHER ASSETS - (9.3)% |
(8,113,017) |
||
|
NET ASSETS - 100% |
$ 87,171,054 |
||
|
Legend |
|
(a) Non-income producing |
|
(b) The rate quoted is the annualized seven-day yield of the fund at |
|
Other Information |
|
Purchases and sales of securities, other than short-term securities, |
|
The fund placed a portion of its portfolio transactions with brokerage firms which are affiliates of Fidelity Management & Research Company. The commissions paid to these affiliated firms were $3,489 for the period. |
|
The fund participated in the security lending program. At period end, the value of securities loaned amounted to $7,410,021. The fund received cash collateral of $7,535,975 which was invested in cash equivalents. |
|
Income Tax Information |
|
At August 31, 2000, the aggregate cost of investment securities for income tax purposes was $80,119,543. Net unrealized appreciation aggregated $15,164,528, of which $19,859,567 related to appreciated investment securities and $4,695,039 related to depreciated investment securities. |
|
At February 29, 2000, the fund had a capital loss carryforward of approximately $38,668,000 of which $10,988,000 and $27,680,000 |
|
The fund intends to elect to defer to its fiscal year ending February 28, |
See accompanying notes which are an integral part of the financial statements.
Health Care Sector
Statement of Assets and Liabilities
|
|
August 31, 2000 (Unaudited) |
|
|
Assets |
|
|
|
Investment in securities, at value |
|
$ 95,284,071 |
|
Receivable for fund shares sold |
|
417,822 |
|
Dividends receivable |
|
14,235 |
|
Interest receivable |
|
39,283 |
|
Redemption fees receivable |
|
1,412 |
|
Other receivables |
|
4,832 |
|
Total assets |
|
95,761,655 |
|
Liabilities |
|
|
|
Payable for fund shares redeemed |
$ 955,636 |
|
|
Accrued management fee |
41,135 |
|
|
Other payables and |
57,855 |
|
|
Collateral on securities loaned, |
7,535,975 |
|
|
Total liabilities |
|
8,590,601 |
|
Net Assets |
|
$ 87,171,054 |
|
Net Assets consist of: |
|
|
|
Paid in capital |
|
$ 114,514,066 |
|
Accumulated net investment (loss) |
|
(208,765) |
|
Accumulated undistributed net realized gain (loss) on investments and foreign currency transactions |
|
(43,141,338) |
|
Net unrealized appreciation (depreciation) on investments |
|
16,007,091 |
|
Net Assets, for 4,233,709 shares outstanding |
|
$ 87,171,054 |
|
Net Asset Value and redemption price per share ($87,171,054 ÷ 4,233,709 shares) |
|
$20.59 |
|
Maximum offering price per share (100/97.00 of $20.59) |
|
$21.23 |
Statement of Operations
|
|
Six months ended August 31, 2000 (Unaudited) |
|
|
Investment Income Dividends |
|
$ 90,360 |
|
Interest |
|
144,534 |
|
Security lending |
|
11,860 |
|
Total income |
|
246,754 |
|
Expenses |
|
|
|
Management fee |
$ 175,953 |
|
|
Transfer agent fees |
214,818 |
|
|
Accounting and security lending fees |
30,544 |
|
|
Non-interested trustees' compensation |
36 |
|
|
Custodian fees and expenses |
6,820 |
|
|
Registration fees |
29,180 |
|
|
Audit |
5,997 |
|
|
Legal |
111 |
|
|
Miscellaneous |
32 |
|
|
Total expenses before reductions |
463,491 |
|
|
Expense reductions |
(7,972) |
455,519 |
|
Net investment income (loss) |
|
(208,765) |
|
Realized and Unrealized Gain (Loss) Net realized gain (loss) on |
|
65,278 |
|
Change in net unrealized appreciation (depreciation) on investment securities |
|
17,676,121 |
|
Net gain (loss) |
|
17,741,399 |
|
Net increase (decrease) in net assets resulting from operations |
|
$ 17,532,634 |
|
Other Information |
|
|
|
Sales charges paid to FDC |
|
$ 78,289 |
|
Deferred sales charges withheld by FDC |
|
$ 924 |
|
Exchange fees withheld by FSC |
|
$ 5,723 |
|
Expense reductions |
|
|
|
Directed brokerage arrangements |
|
$ 5,049 |
|
Transfer agent credits |
|
2,923 |
|
|
|
$ 7,972 |
See accompanying notes which are an integral part of the financial statements.
Semiannual Report
Medical Delivery Portfolio
Financial Statements - continued
Statement of Changes in Net Assets
|
Increase (Decrease) in Net Assets |
Six months ended |
Year ended |
|
Operations |
$ (208,765) |
$ (642,984) |
|
Net realized gain (loss) |
65,278 |
(12,937,981) |
|
Change in net unrealized appreciation (depreciation) |
17,676,121 |
(1,057,478) |
|
Net increase (decrease) in net assets resulting from operations |
17,532,634 |
(14,638,443) |
|
Share transactions |
78,773,881 |
81,001,356 |
|
Cost of shares redeemed |
(54,424,461) |
(98,291,380) |
|
Net increase (decrease) in net assets resulting from share transactions |
24,349,420 |
(17,290,024) |
|
Redemption fees |
183,097 |
192,090 |
|
Total increase (decrease) in net assets |
42,065,151 |
(31,736,377) |
|
Net Assets |
|
|
|
Beginning of period |
45,105,903 |
76,842,280 |
|
End of period (including accumulated net investment loss of $208,765 and $0, respectively) |
$ 87,171,054 |
$ 45,105,903 |
|
Other Information Shares |
|
|
|
Sold |
4,327,597 |
4,531,558 |
|
Redeemed |
(3,035,002) |
(5,618,803) |
|
Net increase (decrease) |
1,292,595 |
(1,087,245) |
Financial Highlights
|
|
Six months ended |
Years ended February 28, |
||||
|
Selected Per-Share Data |
(Unaudited) |
2000 G |
1999 |
1998 |
1997 |
1996 G |
|
Net asset value, beginning of period |
$ 15.34 |
$ 19.08 |
$ 28.32 |
$ 28.29 |
$ 29.00 |
$ 23.18 |
|
Income from Investment Operations |
|
|
|
|
|
|
|
Net investment income (loss) D |
(.06) |
(.18) |
(.06) E |
(.24) |
(.23) |
(.03) |
|
Net realized and unrealized gain (loss) |
5.26 |
(3.61) |
(7.88) |
5.45 |
2.92 |
7.72 |
|
Total from investment operations |
5.20 |
(3.79) |
(7.94) |
5.21 |
2.69 |
7.69 |
|
Less Distributions |
|
|
|
|
|
|
|
From net realized gain |
- |
- |
(1.21) |
(5.23) |
(3.45) |
(1.91) |
|
In excess of net realized gain |
- |
- |
(.13) |
- |
- |
- |
|
Total distributions |
- |
- |
(1.34) |
(5.23) |
(3.45) |
(1.91) |
|
Redemption fees added to paid in capital |
.05 |
.05 |
.04 |
.05 |
.05 |
.04 |
|
Net asset value, end of period |
$ 20.59 |
$ 15.34 |
$ 19.08 |
$ 28.32 |
$ 28.29 |
$ 29.00 |
|
Total Return B, C |
34.22% |
(19.60)% |
(29.47)% |
21.97% |
10.50% |
34.15% |
|
Ratios and Supplemental Data |
|
|
|
|
|
|
|
Net assets, end of period (000 omitted) |
$ 87,171 |
$ 45,106 |
$ 76,842 |
$ 155,542 |
$ 192,385 |
$ 295,489 |
|
Ratio of expenses to average net assets |
1.47% A |
1.73% |
1.40% |
1.57% |
1.57% |
1.65% |
|
Ratio of expenses to average net assets after |
1.45% A, F |
1.67% F |
1.37% F |
1.53% F |
1.53% F |
1.62% F |
|
Ratio of net investment income (loss) to average net assets |
(.66)% A |
(1.02)% |
(.25)% |
(.88)% |
(.84)% |
(.13)% |
|
Portfolio turnover rate |
27% A |
154% |
67% |
109% |
78% |
132% |
|
A Annualized B The total returns would have been lower had certain expenses not been reduced during the periods shown. C Total returns do not include the one time sales
charge and for periods of less than one year are not annualized. |
||||||
See accompanying notes which are an integral part of the financial statements.
Health Care Sector
Performance
There are several ways to evaluate a fund's historical performance. You can look at the total percentage change in value, the average annual percentage change or the growth of a hypothetical $10,000 investment. Total return reflects the change in the value of an investment, assuming reinvestment of the fund's dividend income and capital gains (the profits earned upon the sale of securities that have grown in value). Load adjusted returns include a 3.00% sales charge and the effect of a $7.50 long-term trading fee for shares held 30 days or more. Effective September 28, 2000, the $7.50 long-term trading fee was eliminated.
Cumulative Total Returns
|
Periods ended |
Past 6 |
Past 1 |
Life of |
|
Select Medical Equipment and Systems |
26.26% |
44.90% |
92.01% |
|
Select Medical Equipment and Systems |
22.40% |
40.48% |
86.17% |
|
S&P 500 |
11.73% |
16.32% |
44.24% |
|
GS Health Care |
19.68% |
24.58% |
47.83% |
Cumulative total returns show the fund's performance in percentage terms over a set period - in this case, six months, one year or since the fund started on April 28, 1998. You can compare the fund's returns to the performance of both the Standard & Poor's 500 Index - a market capitalization-weighted index of common stocks - and the Goldman Sachs Health Care Index - a market capitalization-weighted index of 113 stocks designed to measure the performance of companies in the health care sector. These benchmarks include reinvestment of dividends and capital gains, if any, and exclude the effect of sales charges.
Average Annual Total Returns
|
Periods ended |
Past 1 |
Life of |
|
Select Medical Equipment and Systems |
44.90% |
32.07% |
|
Select Medical Equipment and Systems |
40.48% |
30.35% |
|
S&P 500 |
16.32% |
16.91% |
|
GS Health Care |
24.58% |
18.14% |
Average annual returns take the fund's cumulative return and show you what would have happened if the fund had performed at a constant rate each year.
Understanding Performance
How a fund did yesterday is no guarantee of how it will do tomorrow. The stock market, for example, has a history of long-term growth and short-term volatility. Unlike the broader market, however, some sectors may not have a history of growth in the long run. And, as with all stock funds, the share price and return of a fund that invests in a sector will vary.
3$10,000 Over Life of Fund
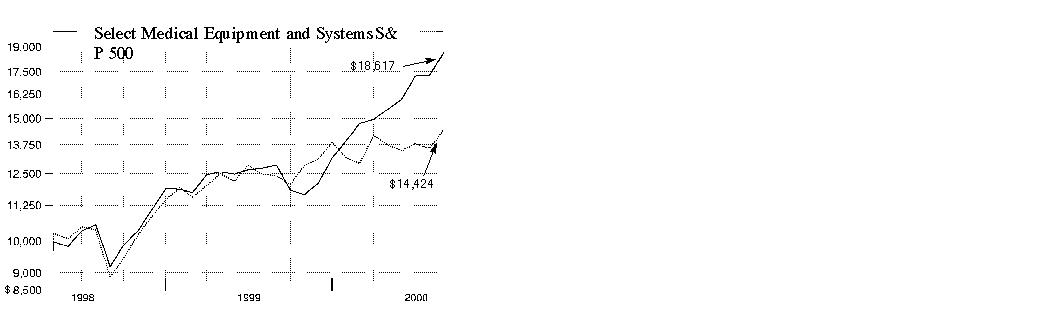
$10,000 Over Life of Fund: Let's say hypothetically that $10,000 was invested in Fidelity Select Medical Equipment and Systems Portfolio on April 28, 1998, when the fund started, and the current 3.00% sales charge was paid. As the chart shows, by August 31, 2000, the value of the investment would have grown to $18,617 - an 86.17% increase on the initial investment - and includes the effect of a $7.50 long-term trading fee. For comparison, look at how the Standard & Poor's 500 Index did over the same period. With dividends and capital gains, if any, reinvested, the same $10,000 investment would have been $14,424 - a 44.24% increase.
Investment Summary
|
Top Ten Stocks as of August 31, 2000 |
|
|
|
% of fund's |
|
Guidant Corp. |
6.8 |
|
Abbott Laboratories |
5.9 |
|
Cardinal Health, Inc. |
5.7 |
|
Baxter International, Inc. |
5.5 |
|
Medtronic, Inc. |
5.2 |
|
Allergan, Inc. |
4.5 |
|
Stryker Corp. |
4.4 |
|
Johnson & Johnson |
4.4 |
|
Chiron Corp. |
4.1 |
|
Waters Corp. |
4.1 |
|
|
50.6 |
Top Industries as of August 31, 2000
% of fund's net assets

Semiannual Report
(Portfolio Manager photograph)
(Portfolio Manager photograph)
Note to shareholders: The following is an interview with Kerry Nelson (left), who managed Fidelity Select Medical Equipment and Systems Portfolio for the period covered by this report, with additional comments from Christine Schaulat (right), who became manager of the fund on September 1, 2000.
Q. How did the fund perform, Kerry?
K.N. It performed well. For the six-month period that ended August 31, 2000, the fund returned 26.26%. In comparison, the Goldman Sachs Health Care Index - an index of 113 stocks designed to measure the performance of companies in the health care sector - returned 19.68%, while the Standard & Poor's 500 Index returned 11.73%. For the 12 months ending August 31, 2000, the fund returned 44.90%, while the Goldman Sachs Health Care Index returned 24.58% and the S&P 500 index had a return of 16.32%.
Q. What factors caused the fund to outperform these benchmarks?
K.N. Last spring, when the technology sector began its fall from favor, the market broadened out quite a lot as investors started seeking safer havens that would give them more stable and consistent growth. Health care, a service that tends to be in constant demand, was one of the industries that benefited from that trend, and I increased the fund's positions in some of the faster growing companies within the sector. So it was really the difference between accelerating earnings growth for these companies and decelerating growth for the broader market that helped the fund beat the indexes.
Q. What holdings did the most to help overall performance?
K.N. Quest Diagnostics, which performs medical diagnostic testing, did especially well. The company was well-positioned to take advantage of the potential for growth in the field of genomics. Additionally, its earnings growth was strong and accelerating. Baxter International, a hospital supply company and one of the fund's top-10 holdings, appreciated during the period, based mainly on the prospect of accelerating earnings growth from its biotech business. Biomet and Stryker, both among the fund's largest holdings, performed well on the back of consistent earnings growth in the orthopedic business. The orthopedics segment went through a period of consolidation about a year ago and, since that time, has benefited from positive pricing. Cardinal Health, a drug distribution company, also helped performance, as the prospect for more generic drugs coming on the market improved its profitability outlook.
Q. Were there any disappointing performers?
K.N. Boston Scientific continued to perform poorly, although the fund held an underweighted position in this stock during the period. Earnings estimates came under pressure as the company lost share in one of its key vascular device businesses. Its product development pipeline also has slipped dramatically in the last 12 months. Becton, Dickinson, a broad-based hospital supplier, also disappointed as it struggled to keep expenses down while attempting to accelerate revenue growth. This caused the company to miss earnings expectations for three successive quarters.
Q. Did you make any major strategy changes during the period?
K.N. I generally felt comfortable with how the fund was positioned, so I didn't make any major changes. I did increase positions in a few cardiovascular companies - most notably Guidant, partly because its stock was relatively inexpensive and also because it was expected to launch two new products in the second half of the year. I also increased positions in biotechnology, again on the expectation of new product launches. I reduced exposure somewhat to companies with exposure to pharmaceuticals, mainly because of concerns about the effects of election-year political pressure on drug pricing.
Q. Christine, you've just taken over managing the fund.
What's your outlook for the next six months?
C.S. I think Kerry and I have similar investment styles. I will continue to focus on companies with strong earnings growth and strong pipelines of promising new products that can help them gain market share or create new markets. The principal risk factors on the horizon are the presidential election and concerns over whether new political policies could exert pricing pressure on the health care industry.
The views expressed in this report reflect those of the portfolio managers only through the end of the period of the report as stated on the cover. The managers' views are subject to change at any time based on market or other conditions. For more information, see page 3.
Fund Facts
Start date: April 28, 1998
Fund number: 354
Trading symbol: FSMEX
Size: as of August 31, 2000, more than $107 million
Manager: Christine Schaulat, since September 2000; analyst, Internet securities, 1999-2000; manager, Fidelity Select Banking Portfolio, 1998-1999; joined Fidelity in 1997
3Semiannual Report
Medical Equipment and Systems Portfolio
(Unaudited)
Showing Percentage of Net Assets
|
Common Stocks - 88.9% |
|||
|
Shares |
Value (Note 1) |
||
|
COMPUTER SERVICES & SOFTWARE - 0.2% |
|||
|
Affymetrix, Inc. (a) |
1,400 |
$ 110,600 |
|
|
Healtheon/WebMD Corp. (a) |
7,000 |
123,375 |
|
|
TOTAL COMPUTER SERVICES & SOFTWARE |
233,975 |
||
|
DRUGS & PHARMACEUTICALS - 12.6% |
|||
|
Allergan, Inc. |
66,100 |
4,833,563 |
|
|
Bausch & Lomb, Inc. |
27,280 |
975,260 |
|
|
Chiron Corp. (a) |
81,900 |
4,427,719 |
|
|
Cytyc Corp. (a) |
24,100 |
1,123,663 |
|
|
Eli Lilly & Co. |
4,400 |
321,200 |
|
|
Exelixis, Inc. |
16,000 |
720,000 |
|
|
Human Genome Sciences, Inc. (a) |
1,700 |
283,794 |
|
|
IDEXX Laboratories, Inc. (a) |
15,400 |
402,325 |
|
|
Millennium Pharmaceuticals, Inc. (a) |
3,300 |
472,313 |
|
|
Sepracor, Inc. (a) |
300 |
33,000 |
|
|
TOTAL DRUGS & PHARMACEUTICALS |
13,592,837 |
||
|
ELECTRONIC INSTRUMENTS - 7.2% |
|||
|
Aclara Biosciences, Inc. |
8,600 |
335,400 |
|
|
Beckman Coulter, Inc. |
14,400 |
1,096,200 |
|
|
PE Corp. - Biosystems Group |
6,060 |
596,153 |
|
|
Varian, Inc. (a) |
27,700 |
1,350,375 |
|
|
Waters Corp. (a) |
55,440 |
4,410,945 |
|
|
TOTAL ELECTRONIC INSTRUMENTS |
7,789,073 |
||
|
HOME FURNISHINGS - 2.0% |
|||
|
Hillenbrand Industries, Inc. |
60,000 |
2,088,750 |
|
|
INDUSTRIAL MACHINERY & EQUIPMENT - 0.9% |
|||
|
Mettler-Toledo International, Inc. (a) |
19,810 |
937,261 |
|
|
MEDICAL EQUIPMENT & SUPPLIES - 63.0% |
|||
|
Abbott Laboratories |
144,620 |
6,327,125 |
|
|
Baxter International, Inc. |
71,360 |
5,940,720 |
|
|
Becton, Dickinson & Co. |
106,560 |
3,210,120 |
|
|
Biomet, Inc. |
127,365 |
4,306,529 |
|
|
Boston Scientific Corp. (a) |
168,600 |
3,192,863 |
|
|
C.R. Bard, Inc. |
43,330 |
2,115,046 |
|
|
Cardinal Health, Inc. |
75,600 |
6,185,025 |
|
|
CONMED Corp. (a) |
11,800 |
159,300 |
|
|
Cyberonics, Inc. (a) |
21,900 |
359,981 |
|
|
DENTSPLY International, Inc. |
33,900 |
1,131,413 |
|
|
Dionex Corp. (a) |
200 |
5,900 |
|
|
Guidant Corp. (a) |
108,820 |
7,324,940 |
|
|
Johnson & Johnson |
51,250 |
4,711,797 |
|
|
Mallinckrodt, Inc. |
35,000 |
1,577,188 |
|
|
Medtronic, Inc. |
109,516 |
5,612,695 |
|
|
MiniMed, Inc. (a) |
31,800 |
2,283,141 |
|
|
Novoste Corp. (a) |
23,300 |
1,258,200 |
|
|
ORATEC Interventions, Inc. |
8,700 |
309,394 |
|
|
|
|||
|
Shares |
Value (Note 1) |
||
|
Orthofix International NV (a) |
8,170 |
$ 156,251 |
|
|
Resmed, Inc. (a) |
16,300 |
600,044 |
|
|
Respironics, Inc. (a) |
33,200 |
628,725 |
|
|
St. Jude Medical, Inc. (a) |
63,100 |
2,500,338 |
|
|
Steris Corp. (a) |
98,500 |
1,009,625 |
|
|
Stryker Corp. |
106,580 |
4,776,116 |
|
|
Sybron International, Inc. (a) |
42,660 |
970,515 |
|
|
Techne Corp. (a) |
3,300 |
315,150 |
|
|
Varian Medical Systems, Inc. (a) |
12,500 |
574,219 |
|
|
VISX, Inc. (a) |
11,400 |
314,213 |
|
|
TOTAL MEDICAL EQUIPMENT & SUPPLIES |
67,856,573 |
||
|
MEDICAL FACILITIES MANAGEMENT - 3.0% |
|||
|
Quest Diagnostics, Inc. (a) |
25,600 |
3,168,000 |
|
|
TOTAL COMMON STOCKS (Cost $82,314,826) |
95,666,469 |
||
|
Cash Equivalents - 13.8% |
|||
|
|
|
|
|
|
Fidelity Cash Central Fund, 6.59% (b) |
11,854,523 |
11,854,523 |
|
|
Fidelity Securities Lending Cash Central Fund, 6.64% (b) |
3,035,600 |
3,035,600 |
|
|
TOTAL CASH EQUIVALENTS (Cost $14,890,123) |
14,890,123 |
||
|
TOTAL INVESTMENT PORTFOLIO - 102.7% (Cost $97,204,949) |
110,556,592 |
||
|
NET OTHER ASSETS - (2.7)% |
(2,908,217) |
||
|
NET ASSETS - 100% |
$ 107,648,375 |
||
|
Legend |
|
(a) Non-income producing |
|
(b) The rate quoted is the annualized seven-day yield of the fund at |
|
Other Information |
|
Purchases and sales of securities, other than short-term securities, |
|
The fund placed a portion of its portfolio transactions with brokerage firms which are affiliates of Fidelity Management & Research Company. The commissions paid to these affiliated firms were $2,707 for the period. |
|
The fund participated in the security lending program. At period end, the value of securities loaned amounted to $2,834,338. The fund received cash collateral of $3,035,600 which was invested in cash equivalents. |
|
Income Tax Information |
|
At August 31, 2000, the aggregate cost of investment securities for income tax purposes was $97,852,801. Net unrealized appreciation aggregated $12,703,791, of which $16,253,236 related to appreciated investment securities and $3,549,445 related to depreciated investment securities. |
See accompanying notes which are an integral part of the financial statements.
Semiannual Report
Statement of Assets and Liabilities
|
|
August 31, 2000 (Unaudited) |
|
|
Assets |
|
|
|
Investment in securities, at value |
|
$ 110,556,592 |
|
Receivable for investments sold |
|
1,176,514 |
|
Receivable for fund shares sold |
|
1,290,708 |
|
Dividends receivable |
|
33,718 |
|
Interest receivable |
|
46,206 |
|
Redemption fees receivable |
|
574 |
|
Other receivables |
|
1,125 |
|
Total assets |
|
113,105,437 |
|
Liabilities |
|
|
|
Payable for investments purchased |
$ 1,972,310 |
|
|
Payable for fund shares redeemed |
337,977 |
|
|
Accrued management fee |
48,295 |
|
|
Other payables and |
62,880 |
|
|
Collateral on securities loaned, |
3,035,600 |
|
|
Total liabilities |
|
5,457,062 |
|
Net Assets |
|
$ 107,648,375 |
|
Net Assets consist of: |
|
|
|
Paid in capital |
|
$ 87,829,617 |
|
Undistributed net investment income |
|
3,531 |
|
Accumulated undistributed net realized gain (loss) on investments and foreign currency transactions |
|
6,463,584 |
|
Net unrealized appreciation (depreciation) on investments |
|
13,351,643 |
|
Net Assets, for 6,491,316 |
|
$ 107,648,375 |
|
Net Asset Value and redemption price per share ($107,648,375 ÷ 6,491,316 shares) |
|
$16.58 |
|
Maximum offering price per share (100/97.00 of $16.58) |
|
$17.09 |
Statement of Operations
|
|
Six months ended August 31, 2000 (Unaudited) |
|
|
Investment Income Dividends |
|
$ 207,484 |
|
Interest |
|
245,504 |
|
Security lending |
|
7,886 |
|
Total income |
|
460,874 |
|
Expenses |
|
|
|
Management fee |
$ 204,655 |
|
|
Transfer agent fees |
199,570 |
|
|
Accounting and security lending fees |
31,008 |
|
|
Non-interested trustees' compensation |
99 |
|
|
Custodian fees and expenses |
6,556 |
|
|
Registration fees |
19,307 |
|
|
Audit |
4,815 |
|
|
Legal |
93 |
|
|
Miscellaneous |
28 |
|
|
Total expenses before reductions |
466,131 |
|
|
Expense reductions |
(8,788) |
457,343 |
|
Net investment income |
|
3,531 |
|
Realized and Unrealized Gain (Loss) Net realized gain (loss) on |
|
6,762,227 |
|
Change in net unrealized appreciation (depreciation) on investment securities |
|
9,830,176 |
|
Net gain (loss) |
|
16,592,403 |
|
Net increase (decrease) in net assets resulting from operations |
|
$ 16,595,934 |
|
Other Information |
|
$ 319,067 |
|
Deferred sales charges withheld |
|
$ 115 |
|
Exchange fees withheld by FSC |
|
$ 1,860 |
|
Expense reductions |
|
$ 8,782 |
|
Custodian credits |
|
6 |
|
|
|
$ 8,788 |
See accompanying notes which are an integral part of the financial statements.
Semiannual Report
Statement of Changes in Net Assets
|
Increase (Decrease) in Net Assets |
Six months ended |
Year ended |
|
Operations |
$ 3,531 |
$ (241,028) |
|
Net realized gain (loss) |
6,762,227 |
7,168,011 |
|
Change in net unrealized appreciation (depreciation) |
9,830,176 |
1,927,877 |
|
Net increase (decrease) in net assets resulting from operations |
16,595,934 |
8,854,860 |
|
Distributions to shareholders from net realized gains |
(5,806,850) |
(1,173,170) |
|
Share transactions |
82,475,768 |
58,510,274 |
|
Reinvestment of distributions |
5,600,013 |
1,142,384 |
|
Cost of shares redeemed |
(43,321,032) |
(43,972,480) |
|
Net increase (decrease) in net assets resulting from share transactions |
44,754,749 |
15,680,178 |
|
Redemption fees |
74,247 |
74,009 |
|
Total increase (decrease) in net assets |
55,618,080 |
23,435,877 |
|
Net Assets |
|
|
|
Beginning of period |
52,030,295 |
28,594,418 |
|
End of period (including undistributed net investment income of $3,531 and $0, respectively) |
$ 107,648,375 |
$ 52,030,295 |
|
Other Information Shares |
|
|
|
Sold |
5,432,428 |
4,477,921 |
|
Issued in reinvestment of distributions |
412,980 |
91,548 |
|
Redeemed |
(2,890,815) |
(3,396,782) |
|
Net increase (decrease) |
2,954,593 |
1,172,687 |
Financial Highlights
|
|
Six months ended |
Years ended February 28, |
|
|
Selected Per-Share Data |
(Unaudited) |
2000 G |
1999 E |
|
Net asset value, beginning of period |
$ 14.71 |
$ 12.10 |
$ 10.00 |
|
Income from Investment Operations |
|
|
|
|
Net investment income (loss) D |
.00 |
(.08) |
(.11) |
|
Net realized and unrealized gain (loss) |
3.48 |
3.09 |
2.18 |
|
Total from investment operations |
3.48 |
3.01 |
2.07 |
|
Less Distributions |
|
|
|
|
From net realized gain |
(1.63) |
(.42) |
- |
|
Redemption fees added to paid in capital |
.02 |
.02 |
.03 |
|
Net asset value, end of period |
$ 16.58 |
$ 14.71 |
$ 12.10 |
|
Total Return B, C |
26.26% |
25.68% |
21.00% |
|
Ratios and Supplemental Data |
|
|
|
|
Net assets, end of period (000 omitted) |
$ 107,648 |
$ 52,030 |
$ 28,594 |
|
Ratio of expenses to average net assets |
1.28% A |
1.66% |
2.39% A |
|
Ratio of expenses to average net assets after expense reductions |
1.25% A, F |
1.65% F |
2.38% A, F |
|
Ratio of net investment income (loss) to average net assets |
.01% A |
(.61)% |
(1.21)% A |
|
Portfolio turnover rate |
105% A |
101% |
85% A |
|
A Annualized B The total returns would have been lower had certain expenses not been reduced during the periods shown. C Total returns do not include the one time sales
charge and for periods of less than one year are not annualized. |
|||
See accompanying notes which are an integral part of the financial statements.
Health Care Sector
Performance
There are several ways to evaluate a fund's historical performance. You can look at the total percentage change in value, the average annual percentage change or the growth of a hypothetical $10,000 investment. Total return reflects the change in the value of an investment, assuming reinvestment of the fund's dividend income and capital gains (the profits earned upon the sale of securities that have grown in value). Load adjusted returns include a 3.00% sales charge and the effect of a $7.50 long-term trading fee for shares held 30 days or more. Effective September 28, 2000, the $7.50 long-term trading fee was eliminated.
Cumulative Total Returns
|
Periods ended |
Past 6 |
Past 1 |
Past 5 |
Past 10 |
|
Select Energy |
28.73% |
20.69% |
131.69% |
169.00% |
|
Select Energy |
24.80% |
17.00% |
124.66% |
160.86% |
|
S&P 500 |
11.73% |
16.32% |
193.58% |
493.54% |
|
GS Natural Resources |
22.21% |
8.91% |
n/a** |
n/a** |
Cumulative total returns show the fund's performance in percentage terms over a set period - in this case, six months, one year, five years or 10 years. You can compare the fund's returns to the performance of both the Standard & Poor's 500 Index - a market capitalization-weighted index of common stocks - and the Goldman Sachs Natural Resources Index - a market capitalization-weighted index of 112 stocks designed to measure the performance of companies in the natural resources sector. These benchmarks include reinvestment of dividends and capital gains, if any, and exclude the effect of sales charges.
Average Annual Total Returns
|
Periods ended |
Past 1 |
Past 5 |
Past 10 |
|
Select Energy |
20.69% |
18.30% |
10.40% |
|
Select Energy |
17.00% |
17.57% |
10.06% |
|
S&P 500 |
16.32% |
24.04% |
19.49% |
|
GS Natural Resources |
8.91% |
n/a** |
n/a** |
Average annual returns take the fund's cumulative return and show you what would have happened if the fund had performed at a constant rate each year.
** Not available
Understanding Performance
How a fund did yesterday is no guarantee of how it will do tomorrow. The stock market, for example, has a history of long-term growth and short-term volatility. Unlike the broader market, however, some sectors may not have a history of growth in the long run. And, as with all stock funds, the share price and return of a fund that invests in a sector will vary.
3$10,000 Over 10 Years

$10,000 Over 10 Years: Let's say hypothetically that $10,000 was invested in Fidelity Select Energy Portfolio on August 31, 1990, and the current 3.00% sales charge was paid. As the chart shows, by August 31, 2000, the value of the investment would have grown to $26,086 - a 160.86% increase on the initial investment - and includes the effect of a $7.50 long-term trading fee. For comparison, look at how the Standard & Poor's 500 Index did over the same period. With dividends and capital gains, if any, reinvested, the same $10,000 investment would have grown to $59,354 - a 493.54% increase.
Investment Summary
|
Top Ten Stocks as of August 31, 2000 |
|
|
|
% of fund's |
|
Exxon Mobil Corp. |
9.1 |
|
Royal Dutch Petroleum Co. (NY Shares) |
7.8 |
|
Chevron Corp. |
7.3 |
|
Enron Corp. |
5.7 |
|
Schlumberger Ltd. |
4.5 |
|
Halliburton Co. |
2.9 |
|
Devon Energy Corp. |
2.5 |
|
Williams Companies, Inc. |
2.4 |
|
Anadarko Petroleum Corp. |
2.4 |
|
BP Amoco PLC sponsored ADR |
2.2 |
|
|
46.8 |
Top Industries as of August 31, 2000
% of fund's net assets

Semiannual Report
(Portfolio Manager photograph)
Scott Offen,
Portfolio Manager
of Fidelity Select
Energy Portfolio
Q. Scott, how did the fund perform during the past six months that ended August 31, 2000?
A. For the six months that ended August 31, 2000, the fund returned 28.73%, while the Goldman Sachs Natural Resources Index - an index of 112 stocks designed to measure the performance of companies in the natural resources sector - returned 22.21%. During the same period, the Standard & Poor's 500 Index returned 11.73%. For the 12 months that ended August 31, 2000, the fund returned 20.69%, while the Goldman Sachs Natural Resources Index returned 8.91% and the S&P 500 returned 16.32%.
Q. What factors helped the fund's performance during the past six months?
A. Energy stocks generally enjoyed solid performance during the six-month period. Rising energy prices helped propel two areas that I focused on: natural gas and energy services stocks. Diversified energy companies also performed well. The fund beat the Goldman Sachs index because the index includes stocks from other industries within the natural resources sector, such as paper and forest products and metals, that did not perform nearly as well as energy stocks during the six months covered by this report.
Q. What helped natural gas and energy services stocks post such strong gains?
A. A favorable supply/demand dynamic helped send natural gas prices soaring. Robust economic growth in the U.S. and a strong housing market helped boost demand. Increasing demand for electricity also helped natural gas stocks, because most new electric power plants will be powered by natural gas. On the other side of the equation, the most easily accessible supplies of natural gas in North America have been depleted. Further, many areas of Alaska and Canada where natural gas can be found have been put off-limits due to environmental concerns. Not only that, but even if construction of pipelines to the North was started immediately, it would be several years before the pipelines could carry natural gas to where it is needed. Looking at energy services, prospects for companies in this industry are dramatically affected by the price of crude oil. With oil prices on the rise, diversified oil companies increased their drilling, exploration and production expenditures. This was a significant change, because the oil companies had not invested very much in these activities during the past two years because the price of oil was much lower. When energy companies up their spending in these areas, the revenues and earnings of energy services firms improve dramatically. That improvement has helped their stocks.
Q. Which stocks were the top contributors to the fund's performance? Were there any disappointments?
A. Anadarko Petroleum, an exploration and production (E&P) firm, proved to be the top contributor to the fund's performance. When energy prices rise, particularly natural gas, E&P stocks tend to do quite well. As I said, energy services stocks and companies with businesses related to natural gas also helped quite a bit. Two energy service stocks, Schlumberger and Halliburton, rose nicely. Looking at natural gas, Dynegy, an independent power producer, also aided performance. Finally, fund performance was boosted by several integrated oil companies, including Royal Dutch Petroleum, BP Amoco, Chevron and Amerada Hess. Looking to disappointments, this was a period when the energy sector performed so well that it was hard to find any stocks that significantly detracted from performance. None of the bottom-10 performers made up more than 0.1% of the fund.
Q. What is your outlook?
A. It's cautiously optimistic. There's nothing on the horizon that looks as if it will disrupt the positive trends for natural gas and energy services. It appears natural gas supply will remain tight, while demand should continue to increase. If oil prices come back down, energy services stocks might struggle over the near term. But I think that the supply of oil is so tight that any price declines would be short-lived and minor. As a result, I expect capital spending for E&P by oil companies will remain the same or even rise. If that happens, revenues and earnings for energy services companies should remain strong.
The views expressed in this report reflect those of the portfolio manager only through the end of the period of the report as stated on the cover. The manager's views are subject to change at any time based on market or other conditions. For more information, see page 3.
Fund Facts
Start date: July 14, 1981
Fund number: 060
Trading symbol: FSENX
Size: as of August 31, 2000, more than
$248 million
Manager: Scott Offen, since 1999; manager, Fidelity Select Natural Resources Portfolio and Fidelity Advisor Natural Resources Portfolio, since 1999; several Fidelity Select Portfolios, 1988-1999; joined Fidelity in 1985
3Semiannual Report
Energy Portfolio
(Unaudited)
Showing Percentage of Net Assets
|
Common Stocks - 89.8% |
|||
|
Shares |
Value (Note 1) |
||
|
ELECTRIC UTILITY - 0.2% |
|||
|
NRG Energy, Inc. |
13,000 |
$ 341,250 |
|
|
ENERGY SERVICES - 20.2% |
|||
|
Baker Hughes, Inc. |
72,350 |
2,645,297 |
|
|
BJ Services Co. (a) |
24,500 |
1,641,500 |
|
|
ENSCO International, Inc. |
79,700 |
3,178,038 |
|
|
Global Industries Ltd. (a) |
72,100 |
896,744 |
|
|
Global Marine, Inc. (a) |
73,600 |
2,378,200 |
|
|
Halliburton Co. |
134,900 |
7,149,700 |
|
|
Hanover Compressor Co. (a) |
200 |
6,350 |
|
|
Helmerich & Payne, Inc. |
18,700 |
690,731 |
|
|
Marine Drilling Companies, Inc. (a) |
22,500 |
611,719 |
|
|
McDermott International, Inc. |
100 |
769 |
|
|
Nabors Industries, Inc. (a) |
80,300 |
3,819,269 |
|
|
Noble Drilling Corp. (a) |
37,800 |
1,833,300 |
|
|
Precision Drilling Corp. (a) |
13,100 |
446,014 |
|
|
R&B Falcon Corp. (a) |
11,000 |
313,500 |
|
|
Rowan Companies, Inc. (a) |
31,300 |
970,300 |
|
|
Santa Fe International Corp. |
45,700 |
1,796,581 |
|
|
Schlumberger Ltd. |
130,480 |
11,131,575 |
|
|
Smith International, Inc. (a) |
28,700 |
2,281,650 |
|
|
Superior Energy Services, Inc. (a) |
1,100 |
12,100 |
|
|
Transocean Sedco Forex, Inc. |
78,268 |
4,676,513 |
|
|
Varco International, Inc. (a) |
30,500 |
615,719 |
|
|
Weatherford International, Inc. |
66,325 |
3,113,130 |
|
|
TOTAL ENERGY SERVICES |
50,208,699 |
||
|
GAS - 12.5% |
|||
|
Dynegy, Inc. Class A |
116,030 |
5,221,350 |
|
|
El Paso Energy Corp. |
10,700 |
623,275 |
|
|
Enron Corp. |
168,000 |
14,259,000 |
|
|
Kinder Morgan, Inc. |
121,300 |
4,465,356 |
|
|
Questar Corp. |
22,300 |
483,631 |
|
|
Williams Companies, Inc. |
129,500 |
5,965,094 |
|
|
TOTAL GAS |
31,017,706 |
||
|
INDUSTRIAL MACHINERY & EQUIPMENT - 0.0% |
|||
|
Capstone Turbine Corp. |
300 |
27,694 |
|
|
METALS & MINING - 0.0% |
|||
|
Alcoa, Inc. |
2 |
67 |
|
|
OIL & GAS - 56.4% |
|||
|
Alberta Energy Co. Ltd. |
103,400 |
3,808,549 |
|
|
Amerada Hess Corp. |
40,100 |
2,744,344 |
|
|
Anadarko Petroleum Corp. |
90,507 |
5,952,645 |
|
|
Apache Corp. |
59,300 |
3,735,900 |
|
|
|
|||
|
Shares |
Value (Note 1) |
||
|
BP Amoco PLC sponsored ADR |
99,900 |
$ 5,519,475 |
|
|
Burlington Resources, Inc. |
92,225 |
3,625,595 |
|
|
Cabot Oil & Gas Corp. Class A |
100 |
2,000 |
|
|
Canada Occidental Petroleum Ltd. |
49,900 |
1,312,355 |
|
|
Canadian Hunter Exploration Ltd. (a) |
39,800 |
987,224 |
|
|
Chevron Corp. |
214,700 |
18,142,150 |
|
|
Conoco, Inc.: |
|
|
|
|
Class A |
121,600 |
3,062,800 |
|
|
Class B |
208,511 |
5,447,350 |
|
|
Crestar Energy, Inc. (a) |
18,100 |
282,909 |
|
|
Devon Energy Corp. |
105,856 |
6,199,192 |
|
|
EOG Resources, Inc. |
63,000 |
2,409,750 |
|
|
Exxon Mobil Corp. |
276,455 |
22,565,636 |
|
|
Grant Prideco, Inc. (a) |
118,825 |
2,792,388 |
|
|
Imperial Oil Ltd. |
43,500 |
1,086,391 |
|
|
Magnum Hunter Resources, Inc. (a) |
1 |
8 |
|
|
National-Oilwell, Inc. (a) |
66,000 |
2,289,375 |
|
|
Newfield Exploration Co. (a) |
22,600 |
977,450 |
|
|
Noble Affiliates, Inc. |
14,000 |
542,500 |
|
|
Nuevo Energy Co. (a) |
64,700 |
1,241,431 |
|
|
Occidental Petroleum Corp. |
103,700 |
2,242,513 |
|
|
Ocean Energy, Inc. (a) |
98,400 |
1,494,450 |
|
|
Petro-Canada |
142,200 |
3,019,878 |
|
|
Phillips Petroleum Co. |
46,700 |
2,889,563 |
|
|
Pioneer Natural Resources Co. (a) |
93,000 |
1,290,375 |
|
|
Pogo Producing Co. |
19,900 |
534,813 |
|
|
Rio Alto Exploration Ltd. (a) |
58,900 |
1,172,796 |
|
|
Royal Dutch Petroleum Co. (NY Shares) |
317,900 |
19,451,506 |
|
|
Suncor Energy, Inc. |
150,700 |
3,405,216 |
|
|
Sunoco, Inc. |
24,800 |
674,250 |
|
|
Talisman Energy, Inc. (a) |
77,900 |
2,617,842 |
|
|
Texaco, Inc. |
46,200 |
2,379,300 |
|
|
Tosco Corp. |
25,400 |
774,700 |
|
|
TotalFinaElf SA sponsored ADR |
37,511 |
2,794,570 |
|
|
Ultramar Diamond Shamrock Corp. |
19,500 |
457,031 |
|
|
Valero Energy Corp. |
17,600 |
530,200 |
|
|
TOTAL OIL & GAS |
140,456,420 |
||
|
RETAIL & WHOLESALE, MISCELLANEOUS - 0.3% |
|||
|
Newpark Resources, Inc. (a) |
74,800 |
766,700 |
|
|
SHIPPING - 0.2% |
|||
|
Teekay Shipping Corp. |
12,700 |
587,375 |
|
|
TOTAL COMMON STOCKS (Cost $169,609,617) |
223,405,911 |
||
|
Cash Equivalents - 19.3% |
|||
|
Shares |
Value (Note 1) |
||
|
Fidelity Cash Central Fund, 6.59% (b) |
24,127,524 |
$ 24,127,524 |
|
|
Fidelity Securities Lending Cash Central Fund, 6.64% (b) |
24,014,100 |
24,014,100 |
|
|
TOTAL CASH EQUIVALENTS (Cost $48,141,624) |
48,141,624 |
||
|
TOTAL INVESTMENT PORTFOLIO - 109.1% (Cost $217,751,241) |
271,547,535 |
|
NET OTHER ASSETS - (9.1)% |
(22,647,447) |
||
|
NET ASSETS - 100% |
$ 248,900,088 |
||
|
Legend |
|
(a) Non-income producing |
|
(b) The rate quoted is the annualized seven-day yield of the fund at |
|
Other Information |
|
Purchases and sales of securities, other than short-term securities, aggregated $116,141,342 and $16,153,319, respectively. |
|
The fund placed a portion of its portfolio transactions with brokerage firms which are affiliates of Fidelity Management & Research Company. The commissions paid to these affiliated firms were $9,333 for the period. |
|
The fund participated in the security lending program. At period end, the value of securities loaned amounted to $20,088,248. The fund received cash collateral of $24,014,100 which was invested in cash equivalents. Cash collateral includes $3,115,000 received for unsettled security loans. |
|
Distribution of investments by country of issue, as a percentage of total |
|
United States of America |
77.0% |
|
Netherlands |
7.8 |
|
Canada |
7.2 |
|
Netherlands Antilles |
4.5 |
|
United Kingdom |
2.2 |
|
France |
1.1 |
|
Others (individually less than 1%) |
0.2 |
|
|
100.0% |
|
Income Tax Information |
|
At August 31, 2000, the aggregate cost of investment securities for income tax purposes was $218,612,213. Net unrealized appreciation aggregated $52,935,322, of which $54,285,433 related to appreciated investment securities and $1,350,111 related to depreciated investment securities. |
See accompanying notes which are an integral part of the financial statements.
Natural Resources Sector
Statement of Assets and Liabilities
|
|
August 31, 2000 (Unaudited) |
|
|
Assets |
|
|
|
Investment in securities, at value |
|
$ 271,547,535 |
|
Receivable for investments sold |
|
90,472 |
|
Receivable for fund shares sold |
|
1,771,586 |
|
Dividends receivable |
|
627,711 |
|
Interest receivable |
|
87,840 |
|
Redemption fees receivable |
|
1,474 |
|
Other receivables |
|
4,267 |
|
Total assets |
|
274,130,885 |
|
Liabilities |
|
|
|
Payable for fund shares redeemed |
$ 997,383 |
|
|
Accrued management fee |
111,995 |
|
|
Other payables and |
107,319 |
|
|
Collateral on securities loaned, |
24,014,100 |
|
|
Total liabilities |
|
25,230,797 |
|
Net Assets |
|
$ 248,900,088 |
|
Net Assets consist of: |
|
|
|
Paid in capital |
|
$ 179,241,667 |
|
Undistributed net investment income |
|
859,364 |
|
Accumulated undistributed net realized gain (loss) on investments and foreign currency transactions |
|
15,002,621 |
|
Net unrealized appreciation (depreciation) on investments |
|
53,796,436 |
|
Net Assets, for 8,696,950 |
|
$ 248,900,088 |
|
Net Asset Value and redemption price per share ($248,900,088 ÷ 8,696,950 shares) |
|
$28.62 |
|
Maximum offering price per share (100/97.00 of $28.62) |
|
$29.51 |
Statement of Operations
|
|
Six months ended August 31, 2000 (Unaudited) |
|
|
Investment Income Dividends |
|
$ 1,729,674 |
|
Interest |
|
400,128 |
|
Security lending |
|
13,948 |
|
Total income |
|
2,143,750 |
|
Expenses |
|
|
|
Management fee |
$ 646,891 |
|
|
Transfer agent fees |
539,312 |
|
|
Accounting and security lending fees |
74,041 |
|
|
Non-interested trustees' compensation |
559 |
|
|
Custodian fees and expenses |
9,962 |
|
|
Registration fees |
48,655 |
|
|
Audit |
9,295 |
|
|
Legal |
375 |
|
|
Miscellaneous |
58 |
|
|
Total expenses before reductions |
1,329,148 |
|
|
Expense reductions |
(44,762) |
1,284,386 |
|
Net investment income |
|
859,364 |
|
Realized and Unrealized Gain (Loss) Net realized gain (loss) on: |
|
|
|
Investment securities |
17,221,308 |
|
|
Foreign currency transactions |
(10,616) |
17,210,692 |
|
Change in net unrealized appreciation (depreciation) on: |
|
|
|
Investment securities |
33,165,221 |
|
|
Assets and liabilities in |
142 |
33,165,363 |
|
Net gain (loss) |
|
50,376,055 |
|
Net increase (decrease) in net assets resulting from operations |
|
$ 51,235,419 |
|
Other Information |
|
|
|
Sales charges paid to FDC |
|
$ 396,192 |
|
Deferred sales charges withheld |
|
$ 5,919 |
|
Exchange fees withheld by FSC |
|
$ 6,855 |
|
Expense reductions |
|
|
|
Directed brokerage arrangements |
|
$ 41,953 |
|
Custodian credits |
|
2,051 |
|
Transfer agent credits |
|
758 |
|
|
|
$ 44,762 |
See accompanying notes which are an integral part of the financial statements.
Semiannual Report
Energy Portfolio
Financial Statements - continued
Statement of Changes in Net Assets
|
Increase (Decrease) in Net Assets |
Six months ended |
Year ended |
|
Operations |
$ 859,364 |
$ 935,089 |
|
Net realized gain (loss) |
17,210,692 |
23,280,737 |
|
Change in net unrealized appreciation (depreciation) |
33,165,363 |
34,688,428 |
|
Net increase (decrease) in net assets resulting from operations |
51,235,419 |
58,904,254 |
|
Distributions to shareholders |
(326,627) |
(786,455) |
|
From net realized gain |
(7,839,244) |
(2,442,218) |
|
Total distributions |
(8,165,871) |
(3,228,673) |
|
Share transactions |
130,024,854 |
235,865,753 |
|
Reinvestment of distributions |
7,751,648 |
3,080,231 |
|
Cost of shares redeemed |
(107,846,927) |
(239,412,583) |
|
Net increase (decrease) in net assets resulting from share transactions |
29,929,575 |
(466,599) |
|
Redemption fees |
229,158 |
458,349 |
|
Total increase (decrease) in net assets |
73,228,281 |
55,667,331 |
|
Net Assets |
|
|
|
Beginning of period |
175,671,807 |
120,004,476 |
|
End of period (including undistributed net investment income of $859,364 and $458,754, respectively) |
$ 248,900,088 |
$ 175,671,807 |
|
Other Information Shares |
|
|
|
Sold |
4,885,884 |
10,521,938 |
|
Issued in reinvestment of distributions |
305,906 |
141,927 |
|
Redeemed |
(4,097,184) |
(10,457,389) |
|
Net increase (decrease) |
1,094,606 |
206,476 |
Financial Highlights
|
|
Six months ended |
Years ended February 28, |
||||
|
Selected Per-Share Data |
(Unaudited) |
2000 F |
1999 |
1998 |
1997 |
1996 F |
|
Net asset value, beginning of period |
$ 23.11 |
$ 16.23 |
$ 21.20 |
$ 21.31 |
$ 18.97 |
$ 16.10 |
|
Income from Investment Operations |
|
|
|
|
|
|
|
Net investment income D |
.10 |
.10 |
.13 |
.11 |
.13 |
.18 |
|
Net realized and unrealized gain (loss) |
6.38 |
7.11 |
(4.71) |
3.93 |
3.59 |
3.13 |
|
Total from investment operations |
6.48 |
7.21 |
(4.58) |
4.04 |
3.72 |
3.31 |
|
Less Distributions |
|
|
|
|
|
|
|
From net investment income |
(.04) |
(.09) |
(.02) |
(.09) |
(.13) |
(.11) |
|
From net realized gain |
(.96) |
(.29) |
(.40) |
(4.09) |
(1.31) |
(.36) |
|
Total distributions |
(1.00) |
(.38) |
(.42) |
(4.18) |
(1.44) |
(.47) |
|
Redemption fees added to paid in capital |
.03 |
.05 |
.03 |
.03 |
.06 |
.03 |
|
Net asset value, end of period |
$ 28.62 |
$ 23.11 |
$ 16.23 |
$ 21.20 |
$ 21.31 |
$ 18.97 |
|
Total Return B, C |
28.73% |
44.89% |
(22.00)% |
20.40% |
20.35% |
20.92% |
|
Ratios and Supplemental Data |
|
|
|
|
|
|
|
Net assets, end of period (000 omitted) |
$ 248,900 |
$ 175,672 |
$ 120,004 |
$ 147,023 |
$ 203,265 |
$ 119,676 |
|
Ratio of expenses to average net assets |
1.15% A |
1.29% |
1.46% |
1.58% |
1.57% |
1.63% |
|
Ratio of expenses to average net assets after |
1.11% A, E |
1.25% E |
1.42% E |
1.53% E |
1.55% E |
1.63% |
|
Ratio of net investment income to average net assets |
.75% A |
.45% |
.68% |
.47% |
.62% |
1.04% |
|
Portfolio turnover rate |
108% A |
124% |
138% |
115% |
87% |
97% |
|
A Annualized B The total returns would have been lower had certain expenses not been reduced during the periods shown. CTotal returns do not include the one time sales
charge and for periods of less than one year are not annualized. |
See accompanying notes which are an integral part of the financial statements.
Natural Resources Sector
Performance
There are several ways to evaluate a fund's historical performance. You can look at the total percentage change in value, the average annual percentage change or the growth of a hypothetical $10,000 investment. Total return reflects the change in the value of an investment, assuming reinvestment of the fund's dividend income and capital gains (the profits earned upon the sale of securities that have grown in value). Load adjusted returns include a 3.00% sales charge and the effect of a $7.50 long-term trading fee for shares held 30 days or more. Effective September 28, 2000, the $7.50 long-term trading fee was eliminated.
Cumulative Total Returns
|
Periods ended |
Past 6 |
Past 1 |
Past 5 |
Past 10 |
|
Select Energy Service |
31.49% |
58.27% |
224.27% |
241.43% |
|
Select Energy Service |
27.47% |
53.45% |
214.46% |
231.12% |
|
S&P 500 |
11.73% |
16.32% |
193.58% |
493.54% |
|
GS Natural Resources |
22.21% |
8.91% |
n/a** |
n/a** |
Cumulative total returns show the fund's performance in percentage terms over a set period - in this case, six months, one year, five years or 10 years. You can compare the fund's returns to the performance of the Standard & Poor's 500 Index - a market capitalization-weighted index of common stocks - and the Goldman Sachs Natural Resources Index - a market capitalization-weighted index of 112 stocks designed to measure the performance of companies in the natural resources sector. These benchmarks include reinvestment of dividends and capital gains, if any, and exclude the effect of sales charges.
Average Annual Total Returns
|
Periods ended |
Past 1 |
Past 5 |
Past 10 |
|
Select Energy Service |
58.27% |
26.53% |
13.07% |
|
Select Energy Service |
53.45% |
25.75% |
12.72% |
|
S&P 500 |
16.32% |
24.04% |
19.49% |
|
GS Natural Resources |
8.91% |
n/a** |
n/a** |
Average annual returns take the fund's cumulative return and show you what would have happened if the fund had performed at a constant rate each year.
** Not available
Understanding Performance
How a fund did yesterday is no guarantee of how it will do tomorrow. The stock market, for example, has a history of long-term growth and short-term volatility. Unlike the broader market, however, some sectors may not have a history of growth in the long run. And, as with all stock funds, the share price and return of a fund that invests in a sector will vary.
3$10,000 Over 10 Years

$10,000 Over 10 Years: Let's say hypothetically that $10,000 was invested in Fidelity Select Energy Service Portfolio on August 31, 1990, and the current 3.00% sales charge was paid. As the chart shows, by August 31, 2000, the value of the investment would have grown to $33,112 - a 231.12% increase on the initial investment - and includes the effect of a $7.50 long-term trading fee. For comparison, look at how the Standard & Poor's 500 Index did over the same period. With dividends and capital gains, if any, reinvested, the same $10,000 investment would have grown to $59,354 - a 493.54% increase.
Investment Summary
|
Top Ten Stocks as of August 31, 2000 |
|
|
|
% of fund's |
|
Nabors Industries, Inc. |
7.9 |
|
ENSCO International, Inc. |
6.9 |
|
Weatherford International, Inc. |
6.5 |
|
Smith International, Inc. |
5.7 |
|
Global Marine, Inc. |
5.2 |
|
Noble Drilling Corp. |
5.0 |
|
Santa Fe International Corp. |
4.4 |
|
Halliburton Co. |
4.2 |
|
Grant Prideco, Inc. |
4.2 |
|
Transocean Sedco Forex, Inc. |
4.2 |
|
|
54.2 |
Top Industries as of August 31, 2000
% of fund's net assets

Semiannual Report
(Portfolio Manager photograph)
Nick Tiller,
Portfolio Manager
of Fidelity Select
Energy Service Portfolio
Q. How did the fund perform, Nick?
A. It was a good period. For the six months that ended August 31, 2000, the fund returned 31.49%, compared with 22.21% for the Goldman Sachs Natural Resources Index - an index of 112 stocks designed to measure the performance of companies in the natural resources sector. The fund's performance also compared favorably with that of the Standard & Poor's 500 Index, which returned 11.73% during the same period. For the 12 months that ended August 31, 2000, the fund returned 58.27%, compared with 8.91% and 16.32% for the Goldman Sachs index and the S&P 500, respectively.
Q. Why did the fund outperform the indexes by such wide margins?
A. Surging prices for crude oil and natural gas were the primary reason. From the beginning of March through the end of August, oil climbed from around $26 to approximately $34 per barrel, while natural gas experienced an even larger percentage gain, rising from roughly $2.75 to around $4.75 per thousand cubic feet. When energy prices are strong, exploration for oil and gas picks up, boosting the prospects for drillers and other energy services providers. In contrast, the Goldman Sachs index includes a heavier weighting of integrated energy stocks, which tend to be less volatile than energy services shares. When oil and gas prices are rising, energy services companies benefit more than integrateds. Furthermore, the Goldman Sachs index includes precious metals and paper stocks, which did comparatively poorly during the period. Versus the S&P 500, the fund was helped by a dramatic improvement in the earnings growth of energy services companies compared with the earnings growth of the average S&P 500 stock.
Q. What changes did you make to the fund's positioning
during the period?
A. I increased the fund's weighting of drilling stocks because drillers tend to be the segment of the energy services sector that has the most leverage to rising energy prices. In addition, I began to build positions in late-cycle stocks. For example, I increased the fund's weighting of equipment manufacturers of drilling rigs, which normally see their business increase substantially only later in the business cycle, when there is greater demand for repairs, upgrades and new construction. Finally, I added positions in oil tanker stocks because there was a shortage of tanker capacity during the period, causing those companies' revenues and profits to rise dramatically. Offsetting these increases were reductions in some of the fund's large-capitalization integrated energy holdings.
Q. What stocks did well for the fund?
A. Weatherford International, Smith International and Cooper Cameron all are energy services companies with significant exposure to North America, where the biggest increase in oil exploration occurred during the period. In the case of Weatherford, another contributing factor was its spinoff of drill pipe manufacturer Grant Prideco. Investors began to recognize that the remaining company was undervalued versus its peers. Two offshore drillers, Ensco International and Noble Drilling, benefited from the favorable outlook for that market segment. Nabors Industries, a North American land driller, was attractive to investors because of its exposure to the exceptionally strong natural gas market.
Q. What stocks detracted from performance?
A. Varco International, one of the late-cycle drilling rig equipment manufacturers in which I increased the fund's exposure, was one detractor. The typical late-cycle catalysts had yet to kick in as of the end of the period, but I was confident that the longer-term outlook for the stock remained favorable. McDermott International's performance suffered when it appeared that the asbestos litigation in which it was involved might be more protracted than previously expected. I reduced the fund's holdings in McDermott.
Q. What's your outlook, Nick?
A. Going forward, I will be watching how much money is allocated to the exploration budgets of the major integrated energy and exploration companies. OPEC's stated target range for crude oil prices is $22 to $28 per barrel, so it would not be surprising to see oil decline from its current price of around $34 per barrel. However, energy services companies could still do very well even with oil prices in OPEC's range. With winter approaching and natural gas supplies extremely tight, weather likely will be a key factor in determining the direction of gas prices.
The views expressed in this report reflect those of the portfolio manager only through the end of the period of the report as stated on the cover. The manager's views are subject to change at any time based on market or other conditions. For more information, see page 3.
Fund Facts
Start date: December 16, 1985
Fund number: 043
Trading symbol: FSESX
Size: as of August 31, 2000, more than
$880 million
Manager: Nicholas Tiller, since February 2000; analyst, various industries, since 1998; joined Fidelity in 1998
3Semiannual Report
Energy Service Portfolio
(Unaudited)
Showing Percentage of Net Assets
|
Common Stocks - 93.7% |
|||
|
Shares |
Value (Note 1) |
||
|
ELECTRICAL EQUIPMENT - 0.0% |
|||
|
NQL Drilling Tools, Inc. Class A (a) |
60,600 |
$ 329,460 |
|
|
ENERGY SERVICES - 80.3% |
|||
|
Baker Hughes, Inc. |
806,336 |
29,481,660 |
|
|
BJ Services Co. (a) |
511,076 |
34,242,092 |
|
|
Carbo Ceramics, Inc. |
166,600 |
6,049,663 |
|
|
Coflexip SA sponsored ADR |
107,300 |
6,374,291 |
|
|
Diamond Offshore Drilling, Inc. |
89,700 |
4,019,681 |
|
|
ENSCO International, Inc. |
1,514,100 |
60,374,738 |
|
|
Ensign Resource Service Group, Inc. |
163,100 |
5,647,261 |
|
|
Global Industries Ltd. (a) |
1,454,400 |
18,089,100 |
|
|
Global Marine, Inc. (a) |
1,419,400 |
45,864,363 |
|
|
Grey Wolf, Inc. (a) |
1,525,000 |
8,387,500 |
|
|
Halliburton Co. |
700,567 |
37,130,051 |
|
|
Helmerich & Payne, Inc. |
474,900 |
17,541,619 |
|
|
Key Energy Group, Inc. (a) |
400,000 |
4,150,000 |
|
|
Lone Star Technologies, Inc. (a) |
189,500 |
9,522,375 |
|
|
Marine Drilling Companies, Inc. (a) |
1,090,800 |
29,656,125 |
|
|
Maverick Tube Corp. (a) |
300,000 |
8,418,750 |
|
|
McDermott International, Inc. |
264,100 |
2,030,269 |
|
|
Nabors Industries, Inc. (a) |
1,470,177 |
69,925,290 |
|
|
Noble Drilling Corp. (a) |
900,150 |
43,657,275 |
|
|
Oceaneering International, Inc. (a) |
115,400 |
2,012,288 |
|
|
Parker Drilling Co. (a) |
315,800 |
2,269,813 |
|
|
Precision Drilling Corp. (a) |
146,800 |
4,998,084 |
|
|
R&B Falcon Corp. (a) |
160,000 |
4,560,000 |
|
|
Rowan Companies, Inc. (a) |
634,600 |
19,672,600 |
|
|
Santa Fe International Corp. |
980,000 |
38,526,250 |
|
|
Schlumberger Ltd. (NY Shares) |
407,645 |
34,777,214 |
|
|
Smith International, Inc. (a) |
633,000 |
50,323,500 |
|
|
Superior Energy Services, Inc. (a) |
143,300 |
1,576,300 |
|
|
Transocean Sedco Forex, Inc. |
620,027 |
37,046,613 |
|
|
Varco International, Inc. (a) |
685,698 |
13,842,528 |
|
|
Weatherford International, Inc. |
1,215,205 |
57,038,685 |
|
|
TOTAL ENERGY SERVICES |
707,205,978 |
||
|
OIL & GAS - 11.3% |
|||
|
Cooper Cameron Corp. (a) |
369,476 |
28,749,851 |
|
|
Friede Goldman Halter, Inc. (a) |
200,000 |
1,125,000 |
|
|
Grant Prideco, Inc. (a) |
1,579,405 |
37,116,018 |
|
|
National-Oilwell, Inc. (a) |
932,100 |
32,332,219 |
|
|
TOTAL OIL & GAS |
99,323,088 |
||
|
RETAIL & WHOLESALE, MISCELLANEOUS - 0.6% |
|||
|
Newpark Resources, Inc. (a) |
474,300 |
4,861,575 |
|
|
|
|||
|
Shares |
Value (Note 1) |
||
|
SHIPPING - 1.5% |
|||
|
Frontline Ltd. (a) |
405,000 |
$ 6,061,607 |
|
|
Teekay Shipping Corp. |
164,100 |
7,589,625 |
|
|
TOTAL SHIPPING |
13,651,232 |
||
|
TOTAL COMMON STOCKS (Cost $480,802,242) |
825,371,333 |
||
|
Cash Equivalents - 7.1% |
|||
|
|
|
|
|
|
Fidelity Cash Central Fund, 6.59% (b) |
51,158,100 |
51,158,100 |
|
|
Fidelity Securities Lending Cash Central Fund, 6.64% (b) |
11,385,000 |
11,385,000 |
|
|
TOTAL CASH EQUIVALENTS (Cost $62,543,100) |
62,543,100 |
||
|
TOTAL INVESTMENT PORTFOLIO - 100.8% (Cost $543,345,342) |
887,914,433 |
||
|
NET OTHER ASSETS - (0.8)% |
(7,359,834) |
||
|
NET ASSETS - 100% |
$ 880,554,599 |
||
|
Legend |
|
(a) Non-income producing |
|
(b) The rate quoted is the annualized seven-day yield of the fund at |
|
Other Information |
|
Purchases and sales of securities, other than short-term securities, |
|
The fund placed a portion of its portfolio transactions with brokerage firms which are affiliates of Fidelity Management & Research Company. The commissions paid to these affiliated firms were $52,275 for the period. |
|
The fund participated in the security lending program. At period end, the value of securities loaned amounted to $11,147,813. The fund received cash collateral of $11,385,000 which was invested in cash equivalents. |
|
Income Tax Information |
|
At August 31, 2000, the aggregate cost of investment securities for income tax purposes was $547,878,526. Net unrealized appreciation aggregated $340,035,907, of which $344,906,617 related to appreciated investment securities and $4,870,710 related to depreciated investment securities. |
|
At February 29, 2000, the fund had a capital loss carryforward of approximately $162,650,000 of which $85,150,000 and $77,500,000 will expire on February 28, 2007 and February 29, 2008, respectively. |
See accompanying notes which are an integral part of the financial statements.
Semiannual Report
Statement of Assets and Liabilities
|
|
August 31, 2000 (Unaudited) |
|
|
Assets |
|
|
|
Investment in securities, at value |
|
$ 887,914,433 |
|
Receivable for investments sold |
|
10,014,930 |
|
Receivable for fund shares sold |
|
4,832,214 |
|
Dividends receivable |
|
133,516 |
|
Interest receivable |
|
301,611 |
|
Redemption fees receivable |
|
10,186 |
|
Other receivables |
|
4,128 |
|
Total assets |
|
903,211,018 |
|
Liabilities |
|
|
|
Payable for investments purchased |
$ 5,453,278 |
|
|
Payable for fund shares redeemed |
5,160,944 |
|
|
Accrued management fee |
391,177 |
|
|
Other payables and |
266,020 |
|
|
Collateral on securities loaned, |
11,385,000 |
|
|
Total liabilities |
|
22,656,419 |
|
Net Assets |
|
$ 880,554,599 |
|
Net Assets consist of: |
|
|
|
Paid in capital |
|
$ 673,210,777 |
|
Accumulated net investment (loss) |
|
(1,584,688) |
|
Accumulated undistributed net realized gain (loss) on investments and foreign currency transactions |
|
(135,640,581) |
|
Net unrealized appreciation (depreciation) on investments |
|
344,569,091 |
|
Net Assets, for 23,123,880 |
|
$ 880,554,599 |
|
Net Asset Value and redemption price per share ($880,554,599 ÷ 23,123,880 shares) |
|
$38.08 |
|
Maximum offering price per share (100/97.00 of $38.08) |
|
$39.26 |
Statement of Operations
|
Six months ended August 31, 2000 (Unaudited) |
||
|
Investment Income Dividends |
|
$ 1,015,901 |
|
Interest |
|
1,397,435 |
|
Security lending |
|
13,410 |
|
Total income |
|
2,426,746 |
|
Expenses |
|
|
|
Management fee |
$ 2,242,194 |
|
|
Transfer agent fees |
1,585,221 |
|
|
Accounting and security lending fees |
220,185 |
|
|
Non-interested trustees' compensation |
1,596 |
|
|
Custodian fees and expenses |
14,612 |
|
|
Registration fees |
92,797 |
|
|
Audit |
12,307 |
|
|
Legal |
1,255 |
|
|
Miscellaneous |
145 |
|
|
Total expenses before reductions |
4,170,312 |
|
|
Expense reductions |
(158,878) |
4,011,434 |
|
Net investment income (loss) |
|
(1,584,688) |
|
Realized and Unrealized Gain (Loss) Net realized gain (loss) on: |
|
|
|
Investment securities |
33,556,281 |
|
|
Foreign currency transactions |
(11,388) |
33,544,893 |
|
Change in net unrealized appreciation (depreciation) |
|
152,223,470 |
|
Net gain (loss) |
|
185,768,363 |
|
Net increase (decrease) in net assets resulting from operations |
|
$ 184,183,675 |
|
Other Information |
|
|
|
Sales charges paid to FDC |
|
$ 1,884,546 |
|
Deferred sales charges withheld by FDC |
|
$ 3,951 |
|
Exchange fees withheld by FSC |
|
$ 26,183 |
|
Expense reductions |
|
|
|
Directed brokerage arrangements |
|
$ 152,763 |
|
Custodian credits |
|
870 |
|
Transfer agent credits |
|
5,245 |
|
|
|
$ 158,878 |
See accompanying notes which are an integral part of the financial statements.
Semiannual Report
Energy Service Portfolio
Financial Statements - continued
Statement of Changes in Net Assets
|
Increase (Decrease) in Net Assets |
Six months ended |
Year ended |
|
Operations |
$ (1,584,688) |
$ (2,713,337) |
|
Net realized gain (loss) |
33,544,893 |
17,432,005 |
|
Change in net unrealized appreciation (depreciation) |
152,223,470 |
413,309,116 |
|
Net increase (decrease) in net assets resulting from operations |
184,183,675 |
428,027,784 |
|
Share transactions |
686,711,356 |
1,103,932,587 |
|
Cost of shares redeemed |
(623,929,014) |
(1,270,153,739) |
|
Net increase (decrease) in net assets resulting from share transactions |
62,782,342 |
(166,221,152) |
|
Redemption fees |
1,702,596 |
3,182,982 |
|
Total increase (decrease) in net assets |
248,668,613 |
264,989,614 |
|
Net Assets |
|
|
|
Beginning of period |
631,885,986 |
366,896,372 |
|
End of period (including accumulated net investment loss of $1,584,688 and $0, respectively) |
$ 880,554,599 |
$ 631,885,986 |
|
Other Information Shares |
|
|
|
Sold |
19,920,650 |
52,841,715 |
|
Redeemed |
(18,613,561) |
(59,047,414) |
|
Net increase (decrease) |
1,307,089 |
(6,205,699) |
Financial Highlights
|
|
Six months ended |
Years ended February 28, |
||||
|
Selected Per-Share Data |
(Unaudited) |
2000 G |
1999 |
1998 |
1997 |
1996 G |
|
Net asset value, beginning of period |
$ 28.96 |
$ 13.09 |
$ 28.02 |
$ 20.46 |
$ 16.09 |
$ 11.97 |
|
Income from Investment Operations |
|
|
|
|
|
|
|
Net investment income (loss) D |
(.07) |
(.09) |
(.10) |
(.10) |
(.01) |
.08 E |
|
Net realized and unrealized gain (loss) |
9.12 |
15.86 |
(13.26) |
9.36 |
5.05 |
4.49 |
|
Total from investment operations |
9.05 |
15.77 |
(13.36) |
9.26 |
5.04 |
4.57 |
|
Less Distributions |
|
|
|
|
|
|
|
From net investment income |
- |
- |
- |
- |
- |
(.04) |
|
From net realized gain |
- |
- |
(1.71) |
(1.85) |
(.79) |
(.48) |
|
Total distributions |
- |
- |
(1.71) |
(1.85) |
(.79) |
(.52) |
|
Redemption fees added to paid in capital |
.07 |
.10 |
.14 |
.15 |
.12 |
.07 |
|
Net asset value, end of period |
$ 38.08 |
$ 28.96 |
$ 13.09 |
$ 28.02 |
$ 20.46 |
$ 16.09 |
|
Total Return B, C |
31.49% |
121.24% |
(50.57)% |
48.43% |
32.26% |
39.15% |
|
Ratios and Supplemental Data |
|
|
|
|
|
|
|
Net assets, end of period (000 omitted) |
$ 880,555 |
$ 631,886 |
$ 366,896 |
$ 919,002 |
$ 439,504 |
$ 273,805 |
|
Ratio of expenses to average net assets |
1.04% A |
1.23% |
1.39% |
1.25% |
1.47% |
1.59% |
|
Ratio of expenses to average net assets after |
1.00% A, F |
1.20% F |
1.35% F |
1.22% F |
1.45% F |
1.58% F |
|
Ratio of net investment income (loss) to average net assets |
(.40)% A |
(.40)% |
(.49)% |
(.35)% |
(.07)% |
.60% |
|
Portfolio turnover rate |
75% A |
69% |
75% |
78% |
167% |
223% |
|
A Annualized B The total returns would have been lower had certain expenses not been reduced during the periods shown. C Total returns do not include the one time sales
charge and for periods of less than one year are not annualized. |
||||||
See accompanying notes which are an integral part of the financial statements.
Natural Resources Sector
Performance
There are several ways to evaluate a fund's historical performance. You can look at the total percentage change in value, the average annual percentage change or the growth of a hypothetical $10,000 investment. Total return reflects the change in the value of an investment, assuming reinvestment of the fund's dividend income and capital gains (the profits earned upon the sale of securities that have grown in value). Load adjusted returns include a 3.00% sales charge and the effect of a $7.50 long-term trading fee for shares held 30 days or more. Effective September 28, 2000, the $7.50 long-term trading fee was eliminated.
Cumulative Total Returns
|
Periods ended |
Past 6 |
Past 1 |
Past 5 |
Past 10 |
|
Select Gold |
-7.06% |
-3.02% |
-40.30% |
-17.23% |
|
Select Gold |
-9.92% |
-6.00% |
-42.16% |
-19.79% |
|
S&P 500 |
11.73% |
16.32% |
193.58% |
493.54% |
|
GS Natural Resources |
22.21% |
8.91% |
n/a** |
n/a** |
Cumulative total returns show the fund's performance in percentage terms over a set period - in this case, six months, one year, five years or 10 years. You can compare the fund's returns to the performance of both the Standard & Poor's 500 index - a market capitalization-weighted index of common stocks - and the Goldman Sachs Natural Resources Index - a market capitalization-weighted index of 112 stocks designed to measure the performance of companies in the natural resources sector. These benchmarks include reinvestment of dividends and capital gains, if any, and exclude the effect of sales charges.
Average Annual Total Returns
|
Periods ended |
Past 1 |
Past 5 |
Past 10 |
|
Select Gold |
-3.02% |
-9.80% |
-1.87% |
|
Select Gold |
-6.00% |
-10.37% |
-2.18% |
|
S&P 500 |
16.32% |
24.04% |
19.49% |
|
GS Natural Resources |
8.91% |
n/a** |
n/a** |
Average annual returns take the fund's cumulative return and show you what would have happened if the fund had performed at a constant rate each year.
** Not available
Understanding Performance
How a fund did yesterday is no guarantee of how it will do tomorrow. The stock market, for example, has a history of long-term growth and short-term volatility. Unlike the broader market, however, some sectors may not have a history of growth in the long run. And, as with all stock funds, the share price and return of a fund that invests in a sector will vary.
3$10,000 Over 10 Years
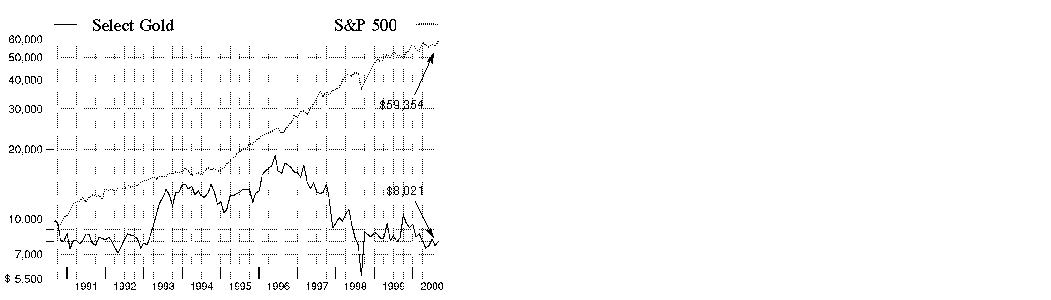
$10,000 Over 10 Years: Let's say hypothetically that $10,000 was invested in Fidelity Select Gold Portfolio on August 31, 1990, and the current 3.00% sales charge was paid. As the chart shows, by August 31, 2000, the value of the investment would have been $8,021 - a 19.79% decrease on the initial investment - and includes the effect of a $7.50 long-term trading fee. For comparison, look at how the Standard & Poor's 500 Index did over the same period. With dividends and capital gains, if any, reinvested, the same $10,000 investment would have grown to $59,354 - a 493.54% increase.
Investment Summary
|
Top Ten Stocks as of August 31, 2000 |
|
|
|
% of fund's |
|
Meridian Gold, Inc. |
11.0 |
|
Anglogold Ltd. |
8.1 |
|
Goldcorp, Inc. Class A |
6.7 |
|
Compania de Minas Buenaventura SA Series B |
6.6 |
|
Newcrest Mining Ltd. |
6.0 |
|
Normandy Mining Ltd. |
5.7 |
|
Agnico-Eagle Mines Ltd. |
5.0 |
|
Barrick Gold Corp. |
4.7 |
|
Gold Fields Ltd. |
4.2 |
|
Placer Dome, Inc. |
3.8 |
|
|
61.8 |
Top Industries as of August 31, 2000
% of fund's net assets

Semiannual Report
(Portfolio Manager photograph)
Note to shareholders: Niel Marotta became Portfolio Manager of Fidelity Select Gold Portfolio on April 1, 2000.
Q. How did the fund perform, Niel?
A. Performance was disappointing by both absolute and relative measures. For the six months that ended August 31, 2000, the fund returned -7.06%. In comparison, the Goldman Sachs Natural Resources Index - an index of 112 stocks designed to measure the performance of companies in the natural resources sector - returned 22.21%. The fund also trailed the 11.73% return of the Standard & Poor's 500 Index during the same period. For the 12 months that ended August 31, 2000, the fund returned -3.02%, compared to 8.91% and 16.32% for the Goldman Sachs index and S&P 500, respectively.
Q. Why did the fund underperform its benchmarks?
A. The fund's performance was once again undermined by the price of gold, which trended downward to around $270 per ounce at the end of August. Stable demand for gold jewelry continued to be offset by central bank selling and the hedging activities of gold producers. Furthermore, the most recent U.K.-sponsored auction of gold in July saw relatively weak demand, although that could have been partly attributable to seasonal factors. In contrast, crude oil and gas prices were extremely strong during the period, helping to boost the Goldman Sachs index. In addition, the U.S. economy continued to benefit from strong but slowing growth, low inflation and interest rates that, although rising, were still low by historical standards, contributing to the relatively favorable performance of the S&P 500.
Q. What stocks helped the fund's performance?
A. Goldcorp was the most positive contributor, helped by better-than-expected grades of ore at its Red Lake mine in Canada and the settlement of a multi-year labor strike. Meridian, the fund's largest holding, also helped performance, as the company continued to achieve good results at its El Penon mine in Chile. Another core holding, Australia-based Normandy Mining, firmed toward the end of the period on speculation that it might be a takeover target.
Q. What stocks detracted from performance?
A. Anglogold, the world's largest gold producer, struggled under the weight of declining gold prices and no major improvement in the South African company's production or cost structure. Another disappointment was Australian holding Delta Gold, a victim of political unrest in the Solomon Islands. U.S.-based Newmont Mining also underperformed. The company does not hedge its production and is therefore relatively unprotected from the effects of falling gold prices.
Q. Can you comment on your management style?
A. My feeling is that the criteria for a good gold stock shouldn't be significantly different from the criteria for good stocks in other sectors. That is, I look for healthy returns on capital and the potential for strong earnings growth. It all starts with selecting companies that have low production costs. Even with the price of gold at $270 per ounce, companies with total production costs well below $200 an ounce should be able to earn healthy profits under normal circumstances. I also look for companies with a proven ability to expand production and reserves, which, in the absence of rising gold prices, is the primary method for mining companies to grow their earnings. My focus on companies with relatively low production costs led me to increase the fund's exposure to companies that mine palladium and platinum. The production costs of those two metals are normally only slightly higher than those of gold, but the market prices of platinum and palladium were significantly higher than that of the yellow metal, providing potentially higher profit margins.
Q. What's your outlook, Niel?
A. Central bank selling and active hedging on the part of many producers continue to depress gold prices. Furthermore, the U.S. dollar, which weakened temporarily in June, has recovered, and a strong dollar is normally bad for gold. Additionally, inflation - which typically helps gold prices - remains subdued. On the positive side, mining companies appear to be more selective about the projects they bring on line. There is a lower tolerance for marginally profitable mines. This trend should ultimately lead to a greater supply of profitable investment opportunities, especially if gold prices stabilize.
The views expressed in this report reflect those of the portfolio manager only through the end of the period of the report as stated on the cover. The manager's views are subject to change at any time based on market or other conditions. For more information, see page 3.
Fund Facts
Start date: December 16, 1985
Fund number: 041
Trading symbol: FSAGX
Size: as of August 31, 2000, more than
$257 million
Manager: Niel Marotta, since April 2000; manager, Fidelity Select Industrial Materials Portfolio, since April 2000; analyst, Canadian companies, 1997-2000; joined Fidelity in 1997
3Semiannual Report
Gold Portfolio
(Unaudited)
Showing Percentage of Net Assets
|
Common Stocks - 89.8% |
|||
|
Shares |
Value (Note 1) |
||
|
Australia - 17.2% |
|||
|
PRECIOUS METALS - 17.2% |
|||
|
Gold & Silver Ores - 7.9% |
|||
|
Normandy Mining Ltd. |
24,957,664 |
$ 14,688,584 |
|
|
Sons of Gwalia NL |
1,817,653 |
5,506,125 |
|
|
|
20,194,709 |
||
|
Gold Ores - 9.3% |
|||
|
Delta Gold NL |
8,212,228 |
6,444,300 |
|
|
Lihir Gold Ltd. (a) |
5,503,920 |
2,096,003 |
|
|
Newcrest Mining Ltd. |
6,600,562 |
15,451,183 |
|
|
|
23,991,486 |
||
|
TOTAL PRECIOUS METALS |
44,186,195 |
||
|
Canada - 40.7% |
|||
|
METALS & MINING - 1.4% |
|||
|
Metal Mining - 0.0% |
|||
|
Ivanhoe Mines Ltd. (a) |
100,000 |
65,240 |
|
|
Metal Mining Services - 0.2% |
|||
|
Minefinders Corp. Ltd. (a) |
497,800 |
409,336 |
|
|
Minefinders Corp. Ltd. (a)(d) |
200,000 |
164,458 |
|
|
|
573,794 |
||
|
Miscellaneous Nonmetallic Minerals - 1.2% |
|||
|
DIA Metropolitan Minerals Ltd.: |
|
|
|
|
Class A (sub-vtg.) (a) |
50,650 |
557,615 |
|
|
Class B (multi-vtg.) (a) |
204,400 |
2,528,087 |
|
|
|
3,085,702 |
||
|
TOTAL METALS & MINING |
3,724,736 |
||
|
OIL & GAS - 0.4% |
|||
|
Oil & Gas Field Exploration Services - 0.4% |
|||
|
Southwestern Gold Corp. (a) |
362,500 |
1,083,928 |
|
|
PRECIOUS METALS - 35.3% |
|||
|
Gold & Silver Ores - 24.0% |
|||
|
Glamis Gold Ltd. (a) |
1,760,800 |
2,812,015 |
|
|
Goldcorp, Inc. Class A (a) |
2,427,800 |
17,241,257 |
|
|
Meridian Gold, Inc. (a)(c) |
4,231,900 |
28,327,700 |
|
|
Placer Dome, Inc. |
1,110,252 |
9,921,722 |
|
|
Richmont Mines, Inc. (a) |
206,300 |
252,355 |
|
|
Teck Corp. Class B (sub. vtg.) |
465,300 |
3,335,994 |
|
|
|
61,891,043 |
||
|
Gold Ores - 11.3% |
|||
|
Agnico-Eagle Mines Ltd. |
2,169,500 |
12,826,809 |
|
|
Barrick Gold Corp. |
765,500 |
12,173,089 |
|
|
Francisco Gold Corp. (a) |
221,400 |
962,936 |
|
|
Francisco Gold Corp. (a)(d) |
199,000 |
865,511 |
|
|
High River Gold Mines Ltd. (a) |
120,000 |
32,620 |
|
|
IAMGOLD Corp. (a) |
335,000 |
626,062 |
|
|
|
|||
|
Shares |
Value (Note 1) |
||
|
IAMGOLD Corp. (a)(d) |
60,000 |
$ 112,130 |
|
|
Metallica Resources, Inc. (a)(c) |
1,490,800 |
425,509 |
|
|
Metallica Resources, Inc. (a)(d) |
200,000 |
57,085 |
|
|
Repadre Capital Corp. (a) |
576,000 |
685,015 |
|
|
Repadre Capital Corp. (a)(d) |
155,000 |
184,336 |
|
|
|
28,951,102 |
||
|
TOTAL PRECIOUS METALS |
90,842,145 |
||
|
SECURITIES INDUSTRY - 3.6% |
|||
|
Mineral Royalty Traders - 3.6% |
|||
|
Franco Nevada Mining Corp. Ltd. |
678,094 |
7,142,682 |
|
|
Franco Nevada Mining Corp. Ltd. (d) |
187,100 |
1,970,812 |
|
|
Franco Nevada Mining Corp. Ltd. Class B warrants 9/15/03 (a)(d) |
58,334 |
198,213 |
|
|
|
9,311,707 |
||
|
TOTAL CANADA |
104,962,516 |
||
|
Cayman Islands - 0.1% |
|||
|
PRECIOUS METALS - 0.1% |
|||
|
Silver Ores - 0.1% |
|||
|
Apex Silver Mines Ltd. (a) |
14,800 |
155,400 |
|
|
Peru - 6.6% |
|||
|
PRECIOUS METALS - 6.6% |
|||
|
Silver Ores - 6.6% |
|||
|
Compania de Minas Buenaventura SA: |
|
|
|
|
Series B |
1,265,864 |
10,377,878 |
|
|
Series B sponsored ADR |
400,600 |
6,609,900 |
|
|
|
16,987,778 |
||
|
South Africa - 15.5% |
|||
|
METALS & MINING - 1.2% |
|||
|
Miscellaneous Metal Ores, NEC - 1.2% |
|||
|
Anglo American Platinum Corp. Ltd. |
34,200 |
1,336,045 |
|
|
Impala Platinum Holdings Ltd. |
32,600 |
1,541,702 |
|
|
Northam Platinum Ltd. |
110,124 |
166,496 |
|
|
|
3,044,243 |
||
|
PRECIOUS METALS - 14.3% |
|||
|
Gold & Silver Ores - 12.3% |
|||
|
Anglogold Ltd. |
251,086 |
9,949,283 |
|
|
Anglogold Ltd. sponsored ADR |
547,528 |
10,847,899 |
|
|
Gold Fields Ltd. |
2,954,701 |
10,882,175 |
|
|
|
31,679,357 |
||
|
Gold Ores - 2.0% |
|||
|
Avgold Ltd. (a) |
45,000 |
19,024 |
|
|
Gold Fields of South Africa Ltd. (a) |
85,600 |
8,832 |
|
|
Common Stocks - continued |
|||
|
Shares |
Value (Note 1) |
||
|
South Africa - continued |
|||
|
PRECIOUS METALS - CONTINUED |
|||
|
Gold Ores - continued |
|||
|
Gold Fields of South Africa Ltd. sponsored ADR |
73,700 |
$ 9,213 |
|
|
Harmony Gold Mining Co. Ltd. |
963,200 |
5,134,858 |
|
|
|
5,171,927 |
||
|
TOTAL PRECIOUS METALS |
36,851,284 |
||
|
TOTAL SOUTH AFRICA |
39,895,527 |
||
|
United States of America - 9.7% |
|||
|
INVESTMENT COMPANIES - 1.9% |
|||
|
Registered Investment Companies - 1.9% |
|||
|
ASA Ltd. |
288,000 |
4,878,000 |
|
|
PRECIOUS METALS - 7.6% |
|||
|
Gold Ores - 7.6% |
|||
|
Homestake Mining Co. |
300,006 |
1,668,783 |
|
|
Newmont Mining Corp. |
477,465 |
8,862,944 |
|
|
Stillwater Mining Co. (a) |
170,950 |
5,812,300 |
|
|
Stillwater Mining Co. (a)(d) |
93,900 |
3,192,600 |
|
|
|
19,536,627 |
||
|
SERVICES - 0.2% |
|||
|
Jewelry, Precious Metal - 0.2% |
|||
|
Lazare Kaplan International, Inc. (a) |
110,300 |
689,375 |
|
|
TOTAL UNITED STATES OF AMERICA |
25,104,002 |
||
|
TOTAL COMMON STOCKS (Cost $298,991,472) |
231,291,418 |
||
|
Cash Equivalents - 10.2% |
|||
|
|
|
|
|
|
Fidelity Cash Central Fund, 6.59% (b) |
26,288,453 |
26,288,453 |
|
|
TOTAL INVESTMENT PORTFOLIO - 100.0% (Cost $325,279,925) |
257,579,871 |
||
|
NET OTHER ASSETS - 0.0% |
84,524 |
||
|
NET ASSETS - 100% |
$ 257,664,395 |
||
|
Legend |
|
(a) Non-income producing |
|
(b) The rate quoted is the annualized seven-day yield of the fund at |
|
(c) Affiliated company |
|
(d) Security exempt from registration under Rule 144A of the Securities Act of 1933. These securities may be resold in transactions exempt from registration, normally to qualified institutional buyers. At the period end, the value of these securities amounted to $6,745,145 or 2.6% of net assets. |
|
Other Information |
|
Purchases and sales of securities, other than short-term securities, aggregated $10,549,897 and $37,228,498, respectively. |
|
The fund placed a portion of its portfolio transactions with brokerage firms which are affiliates of Fidelity Management & Research Company. The commissions paid to these affiliated firms were $41 for the period. |
|
Transactions during the period with companies which are or were affiliates are as follows: |
|
Affiliate |
|
Purchase |
|
Sales |
|
Dividend |
|
Value |
|
Meridian Gold, Inc. |
|
$ - |
|
$ 7,919,713 |
|
$ - |
|
$ 28,327,700 |
|
Metallica |
|
- |
|
- |
|
- |
|
425,509 |
|
TOTALS |
|
$ - |
|
$ 7,919,713 |
|
$ - |
|
$ 28,753,209 |
|
Income Tax Information |
|
At August 31, 2000, the aggregate cost of investment securities for income tax purposes was $328,004,308. Net unrealized depreciation aggregated $70,424,437, of which $21,897,431 related to appreciated investment securities and $92,321,868 related to depreciated investment securities. |
|
At February 29, 2000, the fund had a capital loss carryforward of approximately $173,233,000 of which $1,376,000, $91,543,000, $37,334,000 and $42,980,000 will expire on February 28, 2001, 2006, 2007 and February 29, 2008, respectively. Approximately $92,589,000, of which $1,376,000, $55,694,000, $20,723,000 and $14,796,000 will expire on February 28, 2001, 2006, 2007 and February 29, 2008, respectively, was acquired in the merger with Fidelity Select Precious Metals and Minerals Portfolio and is available to offset future capital gains of the fund to the extent provided by regulations. |
See accompanying notes which are an integral part of the financial statements.
Natural Resources Sector
Statement of Assets and Liabilities
|
|
August 31, 2000 (Unaudited) |
|
|
Assets |
|
|
|
Investment in securities, at value |
|
$ 257,579,871 |
|
Receivable for fund shares sold |
|
3,565,113 |
|
Dividends receivable |
|
726,444 |
|
Interest receivable |
|
139,364 |
|
Redemption fees receivable |
|
645 |
|
Other receivables |
|
10,482 |
|
Total assets |
|
262,021,919 |
|
Liabilities |
|
|
|
Payable for investments purchased |
$ 2,645,701 |
|
|
Payable for fund shares redeemed |
1,395,665 |
|
|
Accrued management fee |
119,893 |
|
|
Other payables and |
196,265 |
|
|
Total liabilities |
|
4,357,524 |
|
Net Assets |
|
$ 257,664,395 |
|
Net Assets consist of: |
|
|
|
Paid in capital |
|
$ 408,692,051 |
|
Undistributed net investment income |
|
949,854 |
|
Accumulated undistributed net realized gain (loss) on investments and foreign currency transactions |
|
(84,274,211) |
|
Net unrealized appreciation (depreciation) on investments |
|
(67,703,299) |
|
Net Assets, for 20,666,254 |
|
$ 257,664,395 |
|
Net Asset Value and redemption price per share ($257,664,395 ÷ 20,666,254 shares) |
|
$12.47 |
|
Maximum offering price per share (100/97.00 of $12.47) |
|
$12.86 |
Statement of Operations
|
|
Six months ended August 31, 2000 (Unaudited) |
|
|
Investment Income Dividends |
|
$ 1,652,061 |
|
Interest |
|
547,323 |
|
Security lending |
|
19,233 |
|
Total income |
|
2,218,617 |
|
Expenses |
|
|
|
Management fee |
$ 743,176 |
|
|
Transfer agent fees |
936,866 |
|
|
Accounting and security lending fees |
84,876 |
|
|
Non-interested trustees' compensation |
43 |
|
|
Custodian fees and expenses |
61,424 |
|
|
Registration fees |
54,197 |
|
|
Audit |
16,220 |
|
|
Legal |
777 |
|
|
Miscellaneous |
16,943 |
|
|
Total expenses before reductions |
1,914,522 |
|
|
Expense reductions |
(46,624) |
1,867,898 |
|
Net investment income |
|
350,719 |
|
Realized and Unrealized Gain (Loss) Net realized gain (loss) on: |
|
|
|
Investment securities (including realized gain of $5,075,326 |
(714,731) |
|
|
Foreign currency transactions |
(29,866) |
(744,597) |
|
Change in net unrealized appreciation (depreciation) on: |
|
|
|
Investment securities |
(20,348,992) |
|
|
Assets and liabilities in |
7,275 |
(20,341,717) |
|
Net gain (loss) |
|
(21,086,314) |
|
Net increase (decrease) in net assets resulting from operations |
|
$ (20,735,595) |
|
Other Information |
|
$ 174,294 |
|
Deferred sales charges withheld |
|
$ 9,892 |
|
Exchange fees withheld by FSC |
|
$ 11,813 |
|
Expense reductions Directed brokerage arrangements |
|
$ 45,856 |
|
Transfer agent credits |
|
768 |
|
|
|
$ 46,624 |
See accompanying notes which are an integral part of the financial statements.
Semiannual Report
Gold Portfolio
Financial Statements - continued
Statement of Changes in Net Assets
|
Increase (Decrease) in Net Assets |
Six months ended |
Year ended |
|
Operations |
$ 350,719 |
$ 1,299,385 |
|
Net realized gain (loss) |
(744,597) |
(5,393,976) |
|
Change in net unrealized appreciation (depreciation) |
(20,341,717) |
7,849,287 |
|
Net increase (decrease) in net assets resulting from operations |
(20,735,595) |
3,754,696 |
|
Distributions to shareholders from net investment income |
(623,877) |
- |
|
Share transactions |
134,286,650 |
349,062,624 |
|
Net asset value of shares issued in exchange for the net assets |
- |
104,054,922 |
|
Reinvestment of distributions |
599,142 |
- |
|
Cost of shares redeemed |
(140,439,785) |
(354,065,350) |
|
Net increase (decrease) in net assets resulting from share transactions |
(5,553,993) |
99,052,196 |
|
Redemption fees |
611,656 |
1,539,985 |
|
Total increase (decrease) in net assets |
(26,301,809) |
104,346,877 |
|
Net Assets |
|
|
|
Beginning of period |
283,966,204 |
179,619,327 |
|
End of period (including undistributed net investment income of $949,854 and $1,223,012, respectively) |
$ 257,664,395 |
$ 283,966,204 |
|
Other Information Shares |
|
|
|
Sold |
10,758,617 |
24,108,341 |
|
Issued in exchange for the shares of Fidelity Select Precious Metals and Minerals Portfolio |
- |
7,736,425 |
|
Issued in reinvestment of distributions |
48,671 |
- |
|
Redeemed |
(11,248,090) |
(24,782,701) |
|
Net increase (decrease) |
(440,802) |
7,062,065 |
Financial Highlights
|
|
Six months ended |
Years ended February 28, |
||||
|
Selected Per-Share Data |
(Unaudited) |
2000 F |
1999 |
1998 |
1997 |
1996 F |
|
Net asset value, beginning of period |
$ 13.45 |
$ 12.79 |
$ 15.17 |
$ 28.21 |
$ 27.11 |
$ 18.44 |
|
Income from Investment Operations |
|
|
|
|
|
|
|
Net investment income (loss) D |
.02 |
.09 E |
(.08) |
(.13) |
(.16) |
(.06) |
|
Net realized and unrealized gain (loss) |
(1.00) |
.46 |
(2.43) |
(11.78) |
1.60 |
8.62 |
|
Total from investment operations |
(.98) |
.55 |
(2.51) |
(11.91) |
1.44 |
8.56 |
|
Less Distributions |
|
|
|
|
|
|
|
From net investment income |
(.03) |
- |
- |
- |
- |
- |
|
From net realized gain |
- |
- |
- |
(1.29) |
(.50) |
- |
|
Total distributions |
(.03) |
- |
- |
(1.29) |
(.50) |
- |
|
Redemption fees added to paid in capital |
.03 |
.11 |
.13 |
.16 |
.16 |
.11 |
|
Net asset value, end of period |
$ 12.47 |
$ 13.45 |
$ 12.79 |
$ 15.17 |
$ 28.21 |
$ 27.11 |
|
Total Return B, C |
(7.06)% |
5.16% |
(15.69)% |
(43.15)% |
6.10% |
47.02% |
|
Ratios and Supplemental Data |
|
|
|
|
|
|
|
Net assets, end of period (000 omitted) |
$ 257,664 |
$ 283,966 |
$ 179,619 |
$ 219,668 |
$ 428,103 |
$ 451,493 |
|
Ratio of expenses to average net assets |
1.44% A |
1.49% |
1.57% |
1.55% |
1.44% |
1.39% |
|
Ratio of expenses to average net assets after |
1.41% A, G |
1.41% G |
1.54% G |
1.48% G |
1.42% G |
1.39% |
|
Ratio of net investment income (loss) to average net assets |
.26% A |
.68% |
(.59)% |
(.67)% |
(.59)% |
(.27)% |
|
Portfolio turnover rate |
9% A |
71% H |
59% |
89% |
63% |
56% |
|
A Annualized B The total returns would have been lower had certain expenses not been reduced during the periods shown. C Total returns do not include the one time sales
charge and for periods of less than one year are not annualized. |
||||||
See accompanying notes which are an integral part of the financial statements.
Natural Resources Sector
Performance
There are several ways to evaluate a fund's historical performance. You can look at the total percentage change in value, the average annual percentage change or the growth of a hypothetical $10,000 investment. Total return reflects the change in the value of an investment, assuming reinvestment of the fund's dividend income and capital gains (the profits earned upon the sale of securities that have grown in value). Load adjusted returns include a 3.00% sales charge and the effect of a $7.50 long-term trading fee for shares held 30 days or more. Effective September 28, 2000, the $7.50 long-term trading fee was eliminated. If Fidelity had not reimbursed certain fund expenses, the life of fund total returns would have been lower.
Cumulative Total Returns
|
Periods ended |
|
Past 6 |
Past 1 |
Life of |
|
Select Natural Resources |
|
27.03% |
23.24% |
52.60% |
|
Select Natural Resources |
|
23.15% |
19.47% |
47.94% |
|
S&P 500 |
|
11.73% |
16.32% |
100.63% |
|
GS Natural Resources |
|
22.21% |
8.91% |
44.63% |
Cumulative total returns show the fund's performance in percentage terms over a set period - in this case, six months, one year or since the fund started on March 3, 1997. You can compare the fund's returns to the performance of both the Standard & Poor's 500 Index - a market capitalization-weighted index of common stocks - and the Goldman Sachs Natural Resources Index - a market capitalization-weighted index of 112 stocks designed to measure the performance of companies in the natural resources sector. These benchmarks include reinvestment of dividends and capital gains, if any, and exclude the effect of sales charges.
Average Annual Total Returns
|
Periods ended |
|
|
Past 1 |
Life of |
|
Select Natural Resources |
|
|
23.24% |
12.84% |
|
Select Natural Resources |
|
|
19.47% |
11.84% |
|
S&P 500 |
|
|
16.32% |
22.02% |
|
GS Natural Resources |
|
|
8.91% |
11.12% |
Average annual returns take the fund's cumulative return and show you what would have happened if the fund had performed at a constant rate each year.
Understanding Performance
How a fund did yesterday is no guarantee of how it will do tomorrow. The stock market, for example, has a history of long-term growth and short-term volatility. Unlike the broader market, however, some sectors may not have a history of growth in the long run. And, as with all stock funds, the share price and return of a fund that invests in a sector will vary.
3$10,000 Over Life of Fund
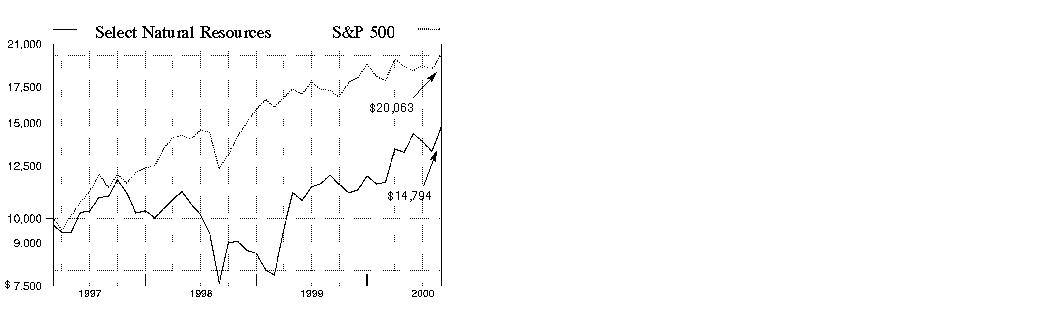
$10,000 Over Life of Fund: Let's say hypothetically that $10,000 was invested in Fidelity Select Natural Resources Portfolio on March 3, 1997 when the fund started, and the current 3.00% sales charge was paid. As the chart shows, by August 31, 2000, the value of the investment would have been $14,794 - a 47.94% increase on the initial investment - and includes the effect of a $7.50 long-term trading fee. For comparison, look at how the Standard & Poor's 500 Index did over the same period. With dividends and capital gains, if any, reinvested, the same $10,000 investment would have grown to $20,063 - a 100.63% increase.
Investment Summary
|
Top Ten Stocks as of August 31, 2000 |
|
|
|
% of fund's |
|
Exxon Mobil Corp. |
8.2 |
|
Royal Dutch Petroleum Co. (NY Shares) |
7.1 |
|
Chevron Corp. |
6.6 |
|
Enron Corp. |
5.2 |
|
Schlumberger Ltd. (NY Shares) |
4.0 |
|
Alcoa, Inc. |
3.1 |
|
Halliburton Co. |
2.6 |
|
Devon Energy Corp. |
2.3 |
|
Williams Companies, Inc. |
2.2 |
|
Anadarko Petroleum Corp. |
2.1 |
|
|
43.4 |
Top Industries as of August 31, 2000
% of fund's net assets

Semiannual Report
(Portfolio Manager photograph)
Scott Offen,
Portfolio Manager of Fidelity Select Natural
Resources Portfolio
Q. Scott, how did the fund perform during the six months that ended August 31, 2000?
A. For the six months that ended August 31, 2000, the fund returned 27.03%, while the Goldman Sachs Natural Resources Index - an index of 112 stocks designed to measure the performance of companies in the natural resources sector - returned 22.21%. The Standard & Poor's 500 Index returned 11.73% during the same time frame. For the 12 months that ended August 31, 2000, the fund returned 23.24%, while the Goldman Sachs Natural Resources Index returned 8.91% and the S&P 500 returned 16.32%.
Q. What helped the fund perform better than the natural resources sector - as measured by the Goldman Sachs index - over the past six months?
A. The fund's outperformance was, for the most part, a reflection of its industry weightings relative to the index. Specifically, I overweighted the fund in natural gas and energy services stocks, two areas that posted strong performance. I simultaneously underweighted metal stocks and paper and forest stocks, two areas that suffered from poor performance. The fund also benefited from its stake in shipping tanker stocks.
Q. What propelled natural gas, energy services and tanker stocks?
A. For natural gas stocks, it was the forces of supply and demand that helped increase natural gas prices. On the one hand, the strong economy and a robust housing market fed demand. So did additional demand for electricity, because most new electric power plants are powered by natural gas. On the other hand, the most readily available supplies of natural gas in North America have been exhausted, while environmental restrictions have put off-limits many areas of Alaska and Canada, where natural gas is found. Even if pipelines to these regions were approved, they wouldn't be on line for several years. The energy services industry is highly sensitive to the price of crude oil. Rising oil prices forced oil companies to increase their capital spending on drilling, exploration and production, after having underinvested in these activities over the past two years. Increased capital spending by energy companies directly improved the revenues and increased the earnings for energy services companies. Shipping companies - in particular those that provide tankers - also profited from increased energy production. With most shipping capacity being utilized, shipping rates skyrocketed.
Q. Which stocks contributed most to performance? Which were disappointments?
A. The top contributor to the fund's performance was Anadarko Petroleum, an exploration and production (E&P) firm. E&P stocks tend to do well when energy prices rise, particularly natural gas. Other top performers were energy services stocks or companies with businesses related to natural gas. Schlumberger and Halliburton were two energy services stocks that did well. Within natural gas, Dynegy, an independent power producer, performed admirably. Finally, several integrated oil companies contributed solidly to the fund, including Royal Dutch Petroleum, BP Amoco, Chevron and Amerada Hess. On the down side, the fund's investment in Weyerhaeuser detracted from performance, as did its stake in Alcoa. Both of these stocks are found in sectors - paper and forest products and metals - that lagged because they are cyclical, or move in concert with the economy. Investors were generally wary of cyclicals during the period, because they feared that interest-rate hikes by the Federal Reserve Board would dampen economic growth and hurt cyclical company earnings.
Q. What is your outlook?
A. I remain cautiously optimistic. It looks as if the natural gas and energy services stories should continue to be very compelling. Natural gas supply looks as if it will remain tight, while demand should continue to rise. If oil prices recede, energy services companies may have a rough go of it in the near future. However, I believe the supply of oil is tight enough that any such oil price decline would be negligible. Therefore, oil companies will most probably sustain or even increase their capital spending on exploration and production. If that's the case, then energy services company revenues and earnings should remain healthy.
The views expressed in this report reflect those of the portfolio manager only through the end of the period of the report as stated on the cover. The manager's views are subject to change at any time based on market or other conditions. For more information, see page 3.
Fund Facts
Start date: March 3, 1997
Fund number: 514
Trading symbol: FNARX
Size: as of August 31, 2000, more than
$20 million
Manager: Scott Offen, since 1999; manager, Fidelity Select Energy Portfolio, since 1999; Fidelity Advisor Natural Resources Portfolio, since 1999; several Fidelity Select Portfolios, 1988-1999; joined Fidelity in 1985
3Semiannual Report
Natural Resources Portfolio
(Unaudited)
Showing Percentage of Net Assets
|
Common Stocks - 90.9% |
|||
|
Shares |
Value (Note 1) |
||
|
ELECTRIC UTILITY - 0.5% |
|||
|
Calpine Corp. (a) |
800 |
$ 79,200 |
|
|
NRG Energy, Inc. |
1,000 |
26,250 |
|
|
TOTAL ELECTRIC UTILITY |
105,450 |
||
|
ENERGY SERVICES - 18.0% |
|||
|
Baker Hughes, Inc. |
5,190 |
189,759 |
|
|
BJ Services Co. (a) |
1,700 |
113,900 |
|
|
ENSCO International, Inc. |
5,900 |
235,263 |
|
|
Global Industries Ltd. (a) |
5,000 |
62,188 |
|
|
Global Marine, Inc. (a) |
5,200 |
168,025 |
|
|
Halliburton Co. |
9,900 |
524,700 |
|
|
Helmerich & Payne, Inc. |
1,400 |
51,713 |
|
|
Marine Drilling Companies, Inc. (a) |
1,800 |
48,938 |
|
|
Nabors Industries, Inc. (a) |
5,900 |
280,619 |
|
|
Noble Drilling Corp. (a) |
2,800 |
135,800 |
|
|
Precision Drilling Corp. (a) |
1,000 |
34,047 |
|
|
R&B Falcon Corp. (a) |
700 |
19,950 |
|
|
Rowan Companies, Inc. (a) |
2,100 |
65,100 |
|
|
Santa Fe International Corp. |
3,200 |
125,800 |
|
|
Schlumberger Ltd. (NY Shares) |
9,626 |
821,218 |
|
|
Smith International, Inc. (a) |
2,000 |
159,000 |
|
|
Superior Energy Services, Inc. (a) |
100 |
1,100 |
|
|
Transocean Sedco Forex, Inc. |
5,731 |
342,427 |
|
|
Varco International, Inc. (a) |
2,200 |
44,413 |
|
|
Weatherford International, Inc. |
4,895 |
229,759 |
|
|
TOTAL ENERGY SERVICES |
3,653,719 |
||
|
GAS - 11.3% |
|||
|
Dynegy, Inc. Class A |
8,880 |
399,600 |
|
|
El Paso Energy Corp. |
800 |
46,600 |
|
|
Enron Corp. |
12,400 |
1,052,450 |
|
|
Kinder Morgan, Inc. |
8,900 |
327,631 |
|
|
Questar Corp. |
1,600 |
34,700 |
|
|
Williams Companies, Inc. |
9,600 |
442,200 |
|
|
TOTAL GAS |
2,303,181 |
||
|
INDUSTRIAL MACHINERY & EQUIPMENT - 0.0% |
|||
|
Capstone Turbine Corp. |
100 |
9,231 |
|
|
METALS & MINING - 3.5% |
|||
|
Alcoa, Inc. |
18,600 |
618,450 |
|
|
Phelps Dodge Corp. |
2,000 |
89,000 |
|
|
TOTAL METALS & MINING |
707,450 |
||
|
OIL & GAS - 49.5% |
|||
|
Alberta Energy Co. Ltd. |
7,600 |
279,932 |
|
|
Amerada Hess Corp. |
3,000 |
205,313 |
|
|
Anadarko Petroleum Corp. |
6,639 |
436,647 |
|
|
Apache Corp. |
4,500 |
283,500 |
|
|
BP Amoco PLC sponsored ADR |
7,404 |
409,071 |
|
|
|
|||
|
Shares |
Value (Note 1) |
||
|
Burlington Resources, Inc. |
6,600 |
$ 259,463 |
|
|
Canada Occidental Petroleum Ltd. |
3,700 |
97,309 |
|
|
Canadian Hunter Exploration Ltd. (a) |
3,100 |
76,894 |
|
|
Chevron Corp. |
15,800 |
1,335,100 |
|
|
Conoco, Inc.: |
|
|
|
|
Class A |
9,000 |
226,688 |
|
|
Class B |
15,351 |
401,045 |
|
|
Crestar Energy, Inc. (a) |
1,400 |
21,882 |
|
|
Devon Energy Corp. |
8,094 |
474,005 |
|
|
EOG Resources, Inc. |
4,700 |
179,775 |
|
|
Exxon Mobil Corp. |
20,398 |
1,664,978 |
|
|
Grant Prideco, Inc. (a) |
8,295 |
194,933 |
|
|
Gulf Canada Resources Ltd. (a) |
200 |
1,108 |
|
|
Imperial Oil Ltd. |
3,100 |
77,421 |
|
|
Magnum Hunter Resources, Inc. warrants 7/1/02 (a) |
3,966 |
7,932 |
|
|
National-Oilwell, Inc. (a) |
4,900 |
169,969 |
|
|
Newfield Exploration Co. (a) |
1,600 |
69,200 |
|
|
Noble Affiliates, Inc. |
1,000 |
38,750 |
|
|
Occidental Petroleum Corp. |
7,700 |
166,513 |
|
|
Ocean Energy, Inc. (a) |
6,900 |
104,794 |
|
|
Petro-Canada |
10,500 |
222,987 |
|
|
Phillips Petroleum Co. |
3,300 |
204,188 |
|
|
Pioneer Natural Resources Co. (a) |
6,600 |
91,575 |
|
|
Pogo Producing Co. |
1,600 |
43,000 |
|
|
Rio Alto Exploration Ltd. (a) |
4,000 |
79,647 |
|
|
Royal Dutch Petroleum Co. (NY Shares) |
23,500 |
1,437,906 |
|
|
Suncor Energy, Inc. |
11,100 |
250,816 |
|
|
Sunoco, Inc. |
1,700 |
46,219 |
|
|
Talisman Energy, Inc. (a) |
5,500 |
184,828 |
|
|
Tosco Corp. |
1,800 |
54,900 |
|
|
TotalFinaElf SA sponsored ADR |
2,659 |
198,096 |
|
|
Ultramar Diamond Shamrock Corp. |
1,400 |
32,813 |
|
|
Valero Energy Corp. |
1,200 |
36,150 |
|
|
TOTAL OIL & GAS |
10,065,347 |
||
|
PACKAGING & CONTAINERS - 0.2% |
|||
|
Packaging Corp. of America |
3,400 |
39,738 |
|
|
PAPER & FOREST PRODUCTS - 4.7% |
|||
|
Abitibi-Consolidated, Inc. |
4,300 |
48,216 |
|
|
Boise Cascade Corp. |
2,800 |
83,650 |
|
|
Bowater, Inc. |
2,100 |
107,888 |
|
|
Domtar, Inc. |
3,900 |
34,852 |
|
|
International Paper Co. |
6,900 |
219,938 |
|
|
Sappi Ltd. sponsored ADR |
4,300 |
37,088 |
|
|
Smurfit-Stone Container Corp. (a) |
4,000 |
52,500 |
|
|
Temple-Inland, Inc. |
1,200 |
50,925 |
|
|
Westvaco Corp. |
2,200 |
60,225 |
|
|
Weyerhaeuser Co. |
3,800 |
175,988 |
|
|
Willamette Industries, Inc. |
2,400 |
73,200 |
|
|
TOTAL PAPER & FOREST PRODUCTS |
944,470 |
||
|
Common Stocks - continued |
|||
|
Shares |
Value (Note 1) |
||
|
PRECIOUS METALS - 1.7% |
|||
|
Barrick Gold Corp. |
10,600 |
$ 168,563 |
|
|
Homestake Mining Co. |
1,200 |
6,675 |
|
|
Meridian Gold, Inc. (a) |
15,600 |
104,424 |
|
|
Newmont Mining Corp. |
4,000 |
74,250 |
|
|
TOTAL PRECIOUS METALS |
353,912 |
||
|
RETAIL & WHOLESALE, MISCELLANEOUS - 0.3% |
|||
|
Newpark Resources, Inc. (a) |
5,300 |
54,325 |
|
|
SECURITIES INDUSTRY - 0.0% |
|||
|
William Multi-Tech, Inc. warrants 2/15/03 (a)(c) |
15,750 |
0 |
|
|
SHIPPING - 1.2% |
|||
|
Bergesen dy ASA (A Shares) |
1,600 |
35,216 |
|
|
Frontline Ltd. (a) |
3,100 |
46,397 |
|
|
Knightsbridge Tankers Ltd. |
1,400 |
33,600 |
|
|
OMI Corp. (a) |
6,100 |
45,750 |
|
|
Overseas Shipholding Group, Inc. |
1,400 |
41,213 |
|
|
Teekay Shipping Corp. |
900 |
41,625 |
|
|
TOTAL SHIPPING |
243,801 |
||
|
TOTAL COMMON STOCKS (Cost $14,717,873) |
18,480,624 |
||
|
Cash Equivalents - 14.7% |
|||
|
|
|
|
|
|
Fidelity Cash Central Fund, 6.59% (b) |
1,764,648 |
1,764,648 |
|
|
Fidelity Securities Lending Cash Central Fund, 6.64% (b) |
1,216,000 |
1,216,000 |
|
|
TOTAL CASH EQUIVALENTS (Cost $2,980,648) |
2,980,648 |
||
|
TOTAL INVESTMENT PORTFOLIO - 105.6% (Cost $17,698,521) |
21,461,272 |
||
|
NET OTHER ASSETS - (5.6)% |
(1,136,222) |
||
|
NET ASSETS - 100% |
$ 20,325,050 |
||
|
Legend |
|
(a) Non-income producing |
|
(b) The rate quoted is the annualized seven-day yield of the fund at |
|
(c) Security exempt from registration under Rule 144A of the Securities Act |
|
Other Information |
|
Purchases and sales of securities, other than short-term securities, aggregated $13,041,334 and $11,774,502, respectively. |
|
The fund placed a portion of its portfolio transactions with brokerage firms which are affiliates of Fidelity Management & Research Company. The commissions paid to these affiliated firms were $1,959 for the period. |
|
The fund participated in the security lending program. At period end, the value of securities loaned amounted to $1,162,563. The fund received cash collateral of $1,216,000 which was invested in cash equivalents. |
|
Distribution of investments by country of issue, as a percentage of total |
|
United States of America |
76.6% |
|
Canada |
8.3 |
|
Netherlands |
7.1 |
|
Netherlands Antilles |
4.0 |
|
United Kingdom |
2.0 |
|
France |
1.0 |
|
Others (individually less than 1%) |
1.0 |
|
|
100.0% |
|
Income Tax Information |
|
At August 31, 2000, the aggregate cost of investment securities for income tax purposes was $17,773,185. Net unrealized appreciation aggregated $3,688,087, of which $3,936,898 related to appreciated investment securities and $248,811 related to depreciated investment securities. |
See accompanying notes which are an integral part of the financial statements.
Natural Resources Sector
Statement of Assets and Liabilities
|
|
August 31, 2000 (Unaudited) |
|
|
Assets |
|
|
|
Investment in securities, at value |
|
$ 21,461,272 |
|
Receivable for fund shares sold |
|
160,620 |
|
Dividends receivable |
|
46,282 |
|
Interest receivable |
|
7,628 |
|
Redemption fees receivable |
|
377 |
|
Other receivables |
|
271 |
|
Total assets |
|
21,676,450 |
|
Liabilities |
|
|
|
Payable for fund shares redeemed |
$ 103,939 |
|
|
Accrued management fee |
8,958 |
|
|
Other payables and |
22,503 |
|
|
Collateral on securities loaned, |
1,216,000 |
|
|
Total liabilities |
|
1,351,400 |
|
Net Assets |
|
$ 20,325,050 |
|
Net Assets consist of: |
|
|
|
Paid in capital |
|
$ 15,383,249 |
|
Undistributed net investment income |
|
14,460 |
|
Accumulated undistributed net realized gain (loss) on investments and foreign currency transactions |
|
1,164,579 |
|
Net unrealized appreciation (depreciation) on investments |
|
3,762,762 |
|
Net Assets, for 1,370,731 |
|
$ 20,325,050 |
|
Net Asset Value and redemption price per share ($20,325,050 ÷ 1,370,731 shares) |
|
$14.83 |
|
Maximum offering price per share (100/97.00 of $14.83) |
|
$15.29 |
Statement of Operations
|
|
Six months ended August 31, 2000 (Unaudited) |
|
|
Investment Income Dividends |
|
$ 134,195 |
|
Interest |
|
33,207 |
|
Security lending |
|
311 |
|
Total income |
|
167,713 |
|
Expenses |
|
|
|
Management fee |
$ 50,126 |
|
|
Transfer agent fees |
44,589 |
|
|
Accounting and security lending fees |
30,649 |
|
|
Non-interested trustees' compensation |
27 |
|
|
Custodian fees and expenses |
13,051 |
|
|
Registration fees |
10,759 |
|
|
Audit |
7,675 |
|
|
Legal |
29 |
|
|
Miscellaneous |
24 |
|
|
Total expenses before reductions |
156,929 |
|
|
Expense reductions |
(3,676) |
153,253 |
|
Net investment income |
|
14,460 |
|
Realized and Unrealized Gain (Loss) Net realized gain (loss) on: |
|
|
|
Investment securities |
1,309,294 |
|
|
Foreign currency transactions |
(791) |
1,308,503 |
|
Change in net unrealized appreciation (depreciation) on: |
|
|
|
Investment securities |
2,365,828 |
|
|
Assets and liabilities in |
11 |
2,365,839 |
|
Net gain (loss) |
|
3,674,342 |
|
Net increase (decrease) in net assets resulting from operations |
|
$ 3,688,802 |
|
Other Information |
|
$ 43,071 |
|
Exchange fees withheld by FSC |
|
$ 608 |
|
Expense reductions |
|
$ 3,676 |
See accompanying notes which are an integral part of the financial statements.
Semiannual Report
Natural Resources Portfolio
Financial Statements - continued
Statement of Changes in Net Assets
|
Increase (Decrease) in Net Assets |
Six months ended |
Year ended |
|
Operations |
$ 14,460 |
$ (28,902) |
|
Net realized gain (loss) |
1,308,503 |
1,134,956 |
|
Change in net unrealized appreciation (depreciation) |
2,365,839 |
2,141,582 |
|
Net increase (decrease) in net assets resulting from operations |
3,688,802 |
3,247,636 |
|
Distributions to shareholders from net realized gains |
(47,774) |
- |
|
Share transactions |
13,245,633 |
32,389,849 |
|
Reinvestment of distributions |
46,771 |
- |
|
Cost of shares redeemed |
(10,692,927) |
(26,769,375) |
|
Net increase (decrease) in net assets resulting from share transactions |
2,599,477 |
5,620,474 |
|
Redemption fees |
27,073 |
55,216 |
|
Total increase (decrease) in net assets |
6,267,578 |
8,923,326 |
|
Net Assets |
|
|
|
Beginning of period |
14,057,472 |
5,134,146 |
|
End of period (including undistributed net investment income of $14,460 and $0, respectively) |
$ 20,325,050 |
$ 14,057,472 |
|
Other Information Shares |
|
|
|
Sold |
953,736 |
2,913,758 |
|
Issued in reinvestment of distributions |
3,554 |
- |
|
Redeemed |
(786,811) |
(2,364,245) |
|
Net increase (decrease) |
170,479 |
549,513 |
Financial Highlights
|
|
Six months ended |
Years ended February 28, |
||
|
Selected Per-Share Data |
(Unaudited) |
2000 H |
1999 |
1998 E |
|
Net asset value, beginning of period |
$ 11.71 |
$ 7.89 |
$ 10.46 |
$ 10.00 |
|
Income from Investment Operations |
|
|
|
|
|
Net investment income (loss) D |
.01 |
(.02) |
(.05) |
(.09) |
|
Net realized and unrealized gain (loss) |
3.13 |
3.80 |
(2.54) |
.76 |
|
Total from investment operations |
3.14 |
3.78 |
(2.59) |
.67 |
|
Less Distributions |
|
|
|
|
|
From net realized gain |
(.04) |
- |
- |
(.26) |
|
Redemption fees added to paid in capital |
.02 |
.04 |
.02 |
.05 |
|
Net asset value, end of period |
$ 14.83 |
$ 11.71 |
$ 7.89 |
$ 10.46 |
|
Total Return B, C |
27.03% |
48.42% |
(24.57)% |
7.30% |
|
Ratios and Supplemental Data |
|
|
|
|
|
Net assets, end of period (000 omitted) |
$ 20,325 |
$ 14,057 |
$ 5,134 |
$ 7,520 |
|
Ratio of expenses to average net assets |
1.75% A |
1.89% |
2.50% F |
2.50% A, F |
|
Ratio of expenses to average net assets after expense reductions |
1.71% A, G |
1.85% G |
2.47% G |
2.48% A, G |
|
Ratio of net investment income (loss) to average net assets |
.16% A |
(.17)% |
(.54)% |
(.86)% A |
|
Portfolio turnover rate |
141% A |
164% |
155% |
165% A |
|
A Annualized B The total returns would have been lower had certain expenses not been reduced during the periods shown. C Total returns do not include the one time sales
charge and for periods of less than one year are not annualized. |
||||
See accompanying notes which are an integral part of the financial statements.
Natural Resources Sector
Performance
There are several ways to evaluate a fund's historical performance. You can look at the total percentage change in value, the average annual percentage change or the growth of a hypothetical $10,000 investment. Total return reflects the change in the value of an investment, assuming reinvestment of the fund's dividend income and capital gains (the profits earned upon the sale of securities that have grown in value). Load adjusted returns include a 3.00% sales charge and the effect of a $7.50 long-term trading fee for shares held 30 days or more. Effective September 28, 2000, the $7.50 long-term trading fee was eliminated. If Fidelity had not reimbursed certain fund expenses, the life of fund total returns would have been lower.
Cumulative Total Returns
|
Periods ended |
Past 6 |
Past 1 |
Life of |
|
Select Business Services |
5.28% |
8.79% |
62.31% |
|
Select Business Services |
2.05% |
5.46% |
57.37% |
|
S&P 500 |
11.73% |
16.32% |
55.98% |
|
GS Technology |
2.68% |
63.21% |
228.80% |
Cumulative total returns show the fund's performance in percentage terms over a set period - in this case, six months, one year or since the fund started on February 4, 1998. You can compare the fund's returns to the performance of both the Standard & Poor's 500 Index - a market capitalization-weighted index of common stocks - and the Goldman Sachs Technology Index - a market capitalization-weighted index of 221 stocks designed to measure the performance of companies in the technology sector. These benchmarks include reinvestment of dividends and capital gains, if any, and exclude the effect of sales charges.
Average Annual Total Returns
|
Periods ended |
|
Past 1 |
Life of |
|
Select Business Services |
|
8.79% |
20.71% |
|
Select Business Services |
|
5.46% |
19.27% |
|
S&P 500 |
|
16.32% |
18.86% |
|
GS Technology |
|
63.21% |
58.82% |
Average annual returns take the fund's cumulative return and show you what would have happened if the fund had performed at a constant rate each year.
Understanding Performance
How a fund did yesterday is no guarantee of how it will do tomorrow. The stock market, for example, has a history of long-term growth and short-term volatility. Unlike the broader market, however, some sectors may not have a history of growth in the long run. And, as with all stock funds, the share price and return of a fund that invests in a sector will vary.
3
$10,000 Over Life of Fund
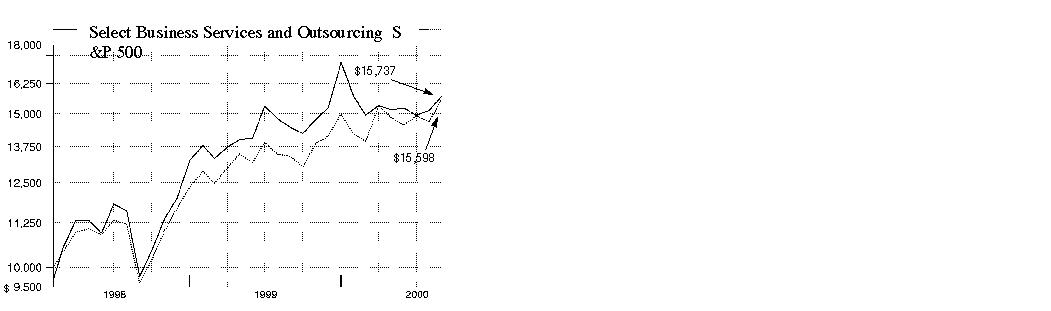
$10,000 Over Life of Fund: Let's say hypothetically that $10,000 was invested in Fidelity Select Business Services and Outsourcing Portfolio on February 4, 1998, when the fund started, and the current 3.00% sales charge was paid. As the chart shows, by August 31, 2000, the value of the investment would have been $15,737 - a 57.37% increase on the initial investment - and includes the effect of a $7.50 long-term trading fee. For comparison, look at how the Standard & Poor's 500 Index did over the same period. With dividends and capital gains, if any, reinvested, the same $10,000 investment would have been $15,598 - a 55.98% increase.
Investment Summary
|
Top Ten Stocks as of August 31, 2000 |
|
|
|
% of fund's |
|
Ceridian Corp. |
7.8 |
|
Computer Sciences Corp. |
7.7 |
|
IMS Health, Inc. |
6.4 |
|
Automatic Data Processing, Inc. |
6.1 |
|
DST Systems, Inc. |
5.3 |
|
Omnicom Group, Inc. |
5.1 |
|
Electronic Data Systems Corp. |
5.0 |
|
Paychex, Inc. |
4.8 |
|
First Data Corp. |
4.7 |
|
Affiliated Computer Services, Inc. Class A |
4.4 |
|
|
57.3 |
Top Industries as of August 31, 2000
% of fund's net assets

Semiannual Report
(Portfolio Manager photograph)
Simon Wolf,
Portfolio Manager
of Fidelity Select
Business Services and
Outsourcing Portfolio
Q. How did the fund perform, Simon?
A. For the six-month period that ended August 31, 2000, the fund posted a gain of 5.28%. The Goldman Sachs Technology Index - an index of 221 stocks designed to measure the performance of companies in the technology sector - returned 2.68%, while the Standard & Poor's 500 Index returned 11.73% for the same time period. For the 12 months ending August 31, 2000, the fund returned 8.79%. Meanwhile, the Goldman Sachs Technology Index returned 63.21% and the S&P 500 returned 16.32% during the same 12-month period.
Q. Why was the fund able to outperform its Goldman Sachs benchmark for the six-month period?
A. The fund's sector weightings were very different from those found in the Goldman Sachs index. More specifically, the fund had a lower exposure to high valuation technology and concept stocks than the index. Earnings uncertainty and a deterioration of the macroeconomic backdrop, including higher interest rates, higher oil prices and a weaker euro, brought higher-multiple technology and concept stocks under pressure during the past six months. Fortunately, the fund had little to no exposure to this group. Instead, the fund focused on more-established, higher-quality companies whose earnings growth tends to be less affected by the macroeconomic backdrop, helping them outperform in times of market uncertainty.
Q. Can you give us an example of a stock that managed to avoid the technology sector's volatility during the past six months?
A. Automatic Data Processing (ADP) - the fund's fourth-largest position at the end of the period - performed very well. This payroll and benefits outsourcing company benefited from a flight to quality as investors sought companies with consistent earnings growth and stability during the recent stock market volatility. Additionally, ADP's stock was buoyed by higher prospective earnings growth than the company had experienced over the past several years.
Q. What other stocks were strong performers for the fund?
A. DST Systems also added to the fund's return. This mutual fund recordkeeping, information processing and billing company profited from an increase in mutual fund accounts and greater demand for its outsourcing services in the U.S. and abroad. Fiserv, a provider of data processing and information management services to the financial services and brokerage industries, also performed well. Increased retail investor trading volumes translated into higher revenues for the firm. In addition, Fiserv's profits were augmented by an increase in the number of banks that outsourced accounting and back-office functions. Affiliated Computer Services (ACS) added to the fund's performance, as it was able to consistently grow earnings through a difficult period for information technology outsourcing companies. While other companies experienced earnings and growth shortfalls, ACS posted results in-line with expectations. Ceridian benefited the fund as it stabilized its payroll business under new management and announced its intention to spin-off Arbitron, a radio ratings company, which helped to highlight the value of the company's distinct parts.
Q. Which stocks detracted from the fund's performance?
A. Electronic Data Systems was the largest detractor from the fund's return. The information technology outsourcing company's stock declined after it pushed out, or delayed, revenue recognition from large contracts it had signed. It also suffered as a result of the lingering effect of Y2K spending freezes on enterprise resource planning software implementation and outsourcing. Other detractors included Scient Corporation and Razor Fish. Each experienced difficulty as a result of a slowdown in spending in the e-services market - the Internet electronic implementation market. TriZetto Group, a health care Internet service provider and processor of insurance claims, also hurt performance. The stock suffered as Internet health care service providers came under pressure during the period, as well as from an ill-timed deal with IMS Health.
Q. What's your outlook, Simon?
A. I'm cautiously optimistic that quality growth companies can overcome the difficult macroeconomic environment, and that it could lead to higher valuations and continued outperformance. I'll continue to manage the fund by focusing on high-quality names and by utilizing Fidelity's extensive equity research capabilities to look for companies that have good prospects for revenue growth and earnings acceleration.
The views expressed in this report reflect those of the portfolio manager only through the end of the period of the report as stated on the cover. The manager's views are subject to change at any time based on market or other conditions. For more information, see page 3.
Fund Facts
Start date: February 4, 1998
Fund number: 353
Trading symbol: FBSOX
Size: as of August 31, 2000, more than
$40 million
Manager: Simon Wolf, since January 2000; manager, Fidelity Select Industrial Equipment Portfolio, 1997-2000; joined Fidelity in 1996
3Semiannual Report
Business Services and Outsourcing Portfolio
(Unaudited)
Showing Percentage of Net Assets
|
Common Stocks - 95.9% |
|||
|
Shares |
Value (Note 1) |
||
|
ADVERTISING - 6.4% |
|||
|
ADVO, Inc. (a) |
1,600 |
$ 65,500 |
|
|
Interpublic Group of Companies, Inc. |
100 |
3,825 |
|
|
Lamar Advertising Co. Class A (a) |
9,450 |
438,834 |
|
|
Omnicom Group, Inc. |
24,939 |
2,080,848 |
|
|
TOTAL ADVERTISING |
2,589,007 |
||
|
BANKS - 0.3% |
|||
|
Marshall & Ilsley Corp. |
2,200 |
107,250 |
|
|
COMPUTER SERVICES & SOFTWARE - 70.8% |
|||
|
Affiliated Computer Services, Inc. |
38,100 |
1,774,031 |
|
|
Amdocs Ltd. (a) |
18,884 |
1,349,026 |
|
|
Automatic Data Processing, Inc. |
41,400 |
2,468,475 |
|
|
Black Box Corp. (a) |
2,100 |
124,950 |
|
|
Cambridge Technology Partners, Inc. (a) |
13,200 |
81,263 |
|
|
Ceridian Corp. (a) |
129,800 |
3,139,530 |
|
|
Cognizant Technology Solutions Corp. (a) |
1,600 |
68,400 |
|
|
Computer Sciences Corp. (a) |
39,300 |
3,107,156 |
|
|
Dendrite International, Inc. (a) |
7,100 |
188,594 |
|
|
Digex, Inc. Class A |
1,500 |
127,031 |
|
|
DST Systems, Inc. (a) |
23,000 |
2,162,000 |
|
|
eFunds Corp. |
9,400 |
84,013 |
|
|
Electronic Data Systems Corp. |
40,200 |
2,002,463 |
|
|
Equifax, Inc. |
24,700 |
628,306 |
|
|
First Data Corp. |
39,900 |
1,902,731 |
|
|
Fiserv, Inc. (a) |
16,675 |
903,577 |
|
|
IMS Health, Inc. |
137,000 |
2,585,875 |
|
|
InfoUSA, Inc. (a) |
3,200 |
19,800 |
|
|
Lante Corp. |
8,200 |
76,875 |
|
|
Metasolv Software, Inc. |
2,900 |
118,538 |
|
|
National Data Corp. |
7,400 |
217,375 |
|
|
Paychex, Inc. |
43,387 |
1,936,145 |
|
|
Pegasus Solutions, Inc. (a) |
4,600 |
91,425 |
|
|
Portal Software, Inc. (a) |
3,300 |
182,325 |
|
|
Proxicom, Inc. (a) |
6,400 |
154,800 |
|
|
PSINet, Inc. (a) |
13,900 |
244,119 |
|
|
Sabre Holdings Corp. Class A |
24,500 |
682,938 |
|
|
Sapient Corp. (a) |
12,202 |
640,605 |
|
|
Scient Corp. |
8,400 |
227,325 |
|
|
SunGard Data Systems, Inc. (a) |
23,900 |
860,400 |
|
|
Tanning Technology Corp. |
7,900 |
128,869 |
|
|
The Bisys Group (a) |
3,800 |
286,188 |
|
|
The TriZetto Group, Inc. |
5,300 |
54,325 |
|
|
Travelocity.com, Inc. (a) |
70 |
963 |
|
|
Viant Corp. (a) |
100 |
1,388 |
|
|
TOTAL COMPUTER SERVICES & SOFTWARE |
28,621,824 |
||
|
COMPUTERS & OFFICE EQUIPMENT - 0.4% |
|||
|
Pitney Bowes, Inc. |
4,500 |
164,531 |
|
|
|
|||
|
Shares |
Value (Note 1) |
||
|
CREDIT & OTHER FINANCE - 3.1% |
|||
|
Concord EFS, Inc. (a) |
38,700 |
$ 1,243,238 |
|
|
INSURANCE - 0.4% |
|||
|
ChoicePoint, Inc. (a) |
3,100 |
145,313 |
|
|
PRINTING - 0.6% |
|||
|
Valassis Communications, Inc. (a) |
9,200 |
265,650 |
|
|
PUBLISHING - 0.8% |
|||
|
Harte Hanks Communications, Inc. |
13,200 |
331,650 |
|
|
SERVICES - 13.0% |
|||
|
ACNielsen Corp. (a) |
10,800 |
259,875 |
|
|
Cintas Corp. |
20,700 |
860,344 |
|
|
Diamond Technology Partners, Inc. |
2,050 |
130,816 |
|
|
Digitas, Inc. |
1,900 |
26,125 |
|
|
Dun & Bradstreet Corp. |
32,600 |
1,075,800 |
|
|
eLoyalty Corp. |
15,500 |
211,188 |
|
|
Gartner Group, Inc.: |
|
|
|
|
Class A (a) |
7,000 |
92,750 |
|
|
Class B (a) |
53,383 |
600,559 |
|
|
Manpower, Inc. |
11,700 |
423,394 |
|
|
Modem Media Poppe Tyson, Inc. (a) |
2,500 |
26,406 |
|
|
National Processing, Inc. (a) |
7,500 |
88,594 |
|
|
Robert Half International, Inc. (a) |
23,900 |
760,319 |
|
|
True North Communications |
10,800 |
500,850 |
|
|
Viad Corp. |
7,500 |
219,844 |
|
|
TOTAL SERVICES |
5,276,864 |
||
|
TELEPHONE SERVICES - 0.1% |
|||
|
McLeodUSA, Inc. Class A (a) |
2,200 |
34,788 |
|
|
TOTAL COMMON STOCKS (Cost $32,720,817) |
38,780,115 |
||
|
Cash Equivalents - 5.4% |
|||
|
|
|
|
|
|
Fidelity Cash Central Fund, |
2,165,076 |
2,165,076 |
|
|
TOTAL INVESTMENT PORTFOLIO - 101.3% (Cost $34,885,893) |
40,945,191 |
|
NET OTHER ASSETS - (1.3)% |
(520,496) |
|
|
NET ASSETS - 100% |
$ 40,424,695 |
|
|
Legend |
|
(a) Non-income producing |
|
(b) The rate quoted is the annualized seven-day yield of the fund at |
|
Other Information |
|
Purchases and sales of securities, other than short-term securities, |
|
The fund placed a portion of its portfolio transactions with brokerage firms which are affiliates of Fidelity Management & Research Company. The commissions paid to these affiliated firms were $3,580 for the period. |
|
Income Tax Information |
|
At August 31, 2000, the aggregate cost of investment securities for income tax purposes was $35,129,341. Net unrealized appreciation aggregated $5,815,850, of which $9,430,018 related to appreciated investment securities and $3,614,168 related to depreciated investment securities. |
See accompanying notes which are an integral part of the financial statements.
Technology Sector
Statement of Assets and Liabilities
|
|
August 31, 2000 (Unaudited) |
|
|
Assets |
|
|
|
Investment in securities, at value |
|
$ 40,945,191 |
|
Receivable for investments sold |
|
163,076 |
|
Receivable for fund shares sold |
|
116,029 |
|
Dividends receivable |
|
20,761 |
|
Interest receivable |
|
11,412 |
|
Redemption fees receivable |
|
322 |
|
Other receivables |
|
647 |
|
Total assets |
|
41,257,438 |
|
Liabilities |
|
|
|
Payable for investments purchased |
$ 215,938 |
|
|
Payable for fund shares redeemed |
557,847 |
|
|
Accrued management fee |
19,974 |
|
|
Other payables and |
38,984 |
|
|
Total liabilities |
|
832,743 |
|
Net Assets |
|
$ 40,424,695 |
|
Net Assets consist of: |
|
|
|
Paid in capital |
|
$ 31,751,034 |
|
Accumulated net investment (loss) |
|
(153,700) |
|
Accumulated undistributed net realized gain (loss) on investments and foreign currency transactions |
|
2,768,063 |
|
Net unrealized appreciation (depreciation) on investments |
|
6,059,298 |
|
Net Assets, for 2,925,889 |
|
$ 40,424,695 |
|
Net Asset Value and redemption price per share ($40,424,695 ÷ 2,925,889 shares) |
|
$13.82 |
|
Maximum offering price per share (100/97.00 of $13.82) |
|
$14.25 |
Statement of Operations
|
|
Six months ended August 31, 2000 (Unaudited) |
|
|
Investment Income Dividends |
|
$ 84,019 |
|
Interest |
|
106,405 |
|
Security lending |
|
3,993 |
|
Total income |
|
194,417 |
|
Expenses |
|
|
|
Management fee |
$ 130,745 |
|
|
Transfer agent fees |
170,668 |
|
|
Accounting and security lending fees |
30,495 |
|
|
Non-interested trustees' compensation |
76 |
|
|
Custodian fees and expenses |
6,278 |
|
|
Registration fees |
11,897 |
|
|
Audit |
5,823 |
|
|
Legal |
100 |
|
|
Miscellaneous |
33 |
|
|
Total expenses before reductions |
356,115 |
|
|
Expense reductions |
(7,998) |
348,117 |
|
Net investment income (loss) |
|
(153,700) |
|
Realized and Unrealized Gain (Loss) Net realized gain (loss) on |
|
3,120,485 |
|
Change in net unrealized appreciation (depreciation) |
|
(776,817) |
|
Net gain (loss) |
|
2,343,668 |
|
Net increase (decrease) in net assets resulting from operations |
|
$ 2,189,968 |
|
Other Information |
|
|
|
Sales charges paid to FDC |
|
$ 50,551 |
|
Deferred sales charges withheld by FDC |
|
$ 52 |
|
Exchange fees withheld by FSC |
|
$ 3,563 |
|
Expense reductions |
|
|
|
Directed brokerage arrangements |
|
$ 7,878 |
|
Custodian credits |
|
120 |
|
|
|
$ 7,998 |
See accompanying notes which are an integral part of the financial statements.
Semiannual Report
Business Services and Outsourcing Portfolio
Financial Statements - continued
Statement of Changes in Net Assets
|
Increase (Decrease) in Net Assets |
Six months ended |
Year ended |
|
Operations |
$ (153,700) |
$ (240,345) |
|
Net realized gain (loss) |
3,120,485 |
9,010,305 |
|
Change in net unrealized appreciation (depreciation) |
(776,817) |
(934,194) |
|
Net increase (decrease) in net assets resulting from operations |
2,189,968 |
7,835,766 |
|
Distributions to shareholders from net realized gains |
(2,756,697) |
(5,476,884) |
|
Share transactions |
10,699,068 |
45,241,050 |
|
Reinvestment of distributions |
2,650,536 |
5,296,143 |
|
Cost of shares redeemed |
(24,685,444) |
(64,818,931) |
|
Net increase (decrease) in net assets resulting from share transactions |
(11,335,840) |
(14,281,738) |
|
Redemption fees |
48,884 |
78,625 |
|
Total increase (decrease) in net assets |
(11,853,685) |
(11,844,231) |
|
Net Assets |
|
|
|
Beginning of period |
52,278,380 |
64,122,611 |
|
End of period (including accumulated net investment loss of $153,700 and $0, respectively) |
$ 40,424,695 |
$ 52,278,380 |
|
Other Information Shares |
|
|
|
Sold |
793,000 |
3,100,058 |
|
Issued in reinvestment of distributions |
214,966 |
368,258 |
|
Redeemed |
(1,815,325) |
(4,461,537) |
|
Net increase (decrease) |
(807,359) |
(993,221) |
Financial Highlights
|
|
Six months ended |
Years ended February 28, |
||
|
Selected Per-Share Data |
(Unaudited) |
2000 I |
1999 |
1998 F |
|
Net asset value, beginning of period |
$ 14.00 |
$ 13.57 |
$ 10.89 |
$ 10.00 |
|
Income from Investment Operations |
|
|
|
|
|
Net investment income (loss) D |
(.05) |
(.05) E |
(.11) |
- |
|
Net realized and unrealized gain (loss) |
.68 |
1.69 |
2.92 |
.89 |
|
Total from investment operations |
.63 |
1.64 |
2.81 |
.89 |
|
Less Distributions |
|
|
|
|
|
From net realized gain |
(.82) |
(1.23) |
(.16) |
- |
|
Redemption fees added to paid in capital |
.01 |
.02 |
.03 |
- |
|
Net asset value, end of period |
$ 13.82 |
$ 14.00 |
$ 13.57 |
$ 10.89 |
|
Total Return B, C |
5.28% |
12.15% |
26.23% |
8.90% |
|
Ratios and Supplemental Data |
|
|
|
|
|
Net assets, end of period (000 omitted) |
$ 40,425 |
$ 52,278 |
$ 64,123 |
$ 15,915 |
|
Ratio of expenses to average net assets |
1.53% A |
1.50% |
1.66% |
2.50% A, G |
|
Ratio of expenses to average net assets after expense reductions |
1.49% A, H |
1.48% H |
1.64% H |
2.50% A |
|
Ratio of net investment income (loss) to average net assets |
(.66)% A |
(.37)% |
(.91)% |
(.49)% A |
|
Portfolio turnover rate |
101% A |
54% |
115% |
36% A |
|
A Annualized B The total returns would have been lower had certain expenses not been reduced during the periods shown. CTotal returns do not include the one time sales
charge and for periods of less than one year are not annualized. |
||||
See accompanying notes which are an integral part of the financial statements.
Technology Sector
Performance
There are several ways to evaluate a fund's historical performance. You can look at the total percentage change in value, the average annual percentage change or the growth of a hypothetical $10,000 investment. Total return reflects the change in the value of an investment, assuming reinvestment of the fund's dividend income and capital gains (the profits earned upon the sale of securities that have grown in value). Load adjusted returns include a 3.00% sales charge and the effect of a $7.50 long-term trading fee for shares held 30 days or more. Effective September 28, 2000, the $7.50 long-term trading fee was eliminated.
Cumulative Total Returns
|
Periods ended |
Past 6 |
Past 1 |
Past 5 |
Past 10 |
|
Select Computers |
4.52% |
76.35% |
458.95% |
2,532.86% |
|
Select Computers |
1.31% |
70.99% |
442.11% |
2,453.80% |
|
S&P 500 |
11.73% |
16.32% |
193.58% |
493.54% |
|
GS Technology |
2.68% |
63.21% |
n/a** |
n/a** |
Cumulative total returns show the fund's performance in percentage terms over a set period - in this case, six months, one year, five years or 10 years. You can compare the fund's returns to the performance of both the Standard & Poor's 500 Index - a market capitalization-weighted index of common stocks - and the Goldman Sachs Technology Index - a market capitalization-weighted index of 221 stocks designed to measure the performance of companies in the technology sector. These benchmarks include reinvestment of dividends and capital gains, if any, and exclude the effect of sales charges.
Average Annual Total Returns
|
Periods ended |
Past 1 |
Past 5 |
Past 10 |
|
Select Computers |
76.35% |
41.08% |
38.69% |
|
Select Computers |
70.99% |
40.22% |
38.27% |
|
S&P 500 |
16.32% |
24.04% |
19.49% |
|
GS Technology |
63.21% |
n/a** |
n/a** |
Average annual returns take the fund's cumulative return and show you what would have happened if the fund had performed at a constant rate each year.
** Not available
Understanding Performance
How a fund did yesterday is no guarantee of how it will do tomorrow. The stock market, for example, has a history of long-term growth and short-term volatility. Unlike the broader market, however, some sectors may not have a history of growth in the long run. And, as with all stock funds, the share price and return of a fund that invests in a sector will vary.
3$10,000 Over 10 Years
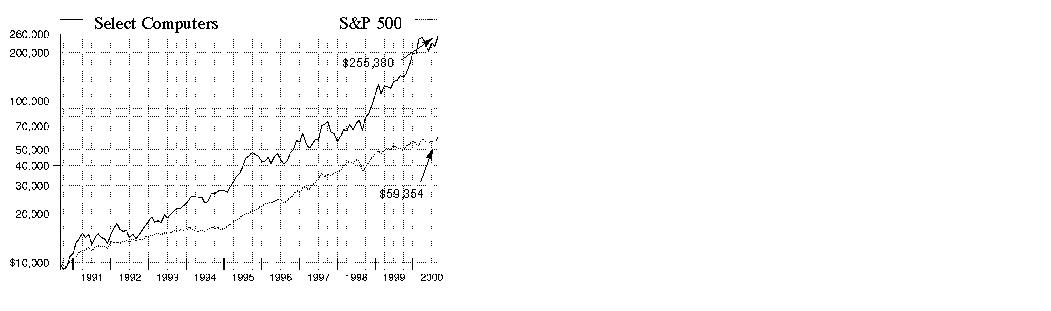
$10,000 Over 10 Years: Let's say hypothetically that $10,000 was invested in Fidelity Select Computers Portfolio on August 31, 1990, and the current 3.00% sales charge was paid. As the chart shows, by August 31, 2000, the value of the investment would have grown to $255,380 - a 2,453.80% increase on the initial investment - and includes the effect of a $7.50 long-term trading fee. For comparison, look at how the Standard & Poor's 500 Index did over the same period. With dividends and capital gains, if any, reinvested, the same $10,000 investment would have grown to $59,354 - a 493.54% increase.
Investment Summary
|
Top Ten Stocks as of August 31, 2000 |
|
|
|
% of fund's |
|
EMC Corp. |
7.5 |
|
Cisco Systems, Inc. |
6.3 |
|
Texas Instruments, Inc. |
4.5 |
|
Analog Devices, Inc. |
4.2 |
|
Micron Technology, Inc. |
4.0 |
|
Dell Computer Corp. |
3.8 |
|
Network Appliance, Inc. |
3.4 |
|
Sun Microsystems, Inc. |
3.2 |
|
Gateway, Inc. |
2.6 |
|
International Business Machines Corp. |
2.5 |
|
|
42.0 |
Top Industries as of August 31, 2000
% of fund's net assets

Semiannual Report
(Portfolio Manager photograph)
Larry Rakers, Portfolio Manager of Fidelity Select Computers Portfolio
Q. How did the fund perform, Larry?
A. For the six-month period that ended August 31, 2000, the fund returned 4.52%, outpacing the Goldman Sachs Technology Index - an index of 221 stocks designed to measure the performance of companies in the technology sector - which returned 2.68%. The Standard & Poor's 500 Index returned 11.73% during the same time period. For the 12-month period that ended August 31, 2000, the fund returned 76.35%, while the Goldman Sachs and S&P 500 indexes returned 63.21% and 16.32%, respectively.
Q. What factors enabled the fund to outperform its Goldman Sachs benchmark during the six-month period?
A. The fund benefited from having ample exposure to high-growth areas providing infrastructure for next-generation communications networks. With computer hardware stocks struggling to recover from Y2K-related shortfalls, it was critical we hedge our bet on PCs and mainframes by holding stakes in telecommunications/optical equipment, networking and data storage providers. We had our share of winners from these areas and held more of them than the index. Smaller positions in microcomputer retailers and various electronic component manufacturers also helped widen our lead over the index. Additionally, the decision to underweight Microsoft was a big plus, with the software giant slipping on slow adoption of its Windows 2000 operating system and its antitrust dispute with the U.S. government. The fund no longer held Microsoft at the close of the period. Having raised the earnings growth rate of the fund after taking over in January, I also was able to improve its risk/return profile, which helped shelter us a bit during the market's downturn in the spring. Finally, avoiding Internet-related stocks, many with unproven business models, served us well as investors began to focus more intently than ever on quality of earnings.
Q. Even though computer hardware stocks struggled early
in the period, you increased the fund's exposure to them.
What was behind that decision?
A. After a period of prolonged underperformance, I felt that hardware stocks - which were attractive on a risk/reward basis - were poised for a breakout heading into 2001. The fact is, the future of the Internet is largely dependent on the rollout of infrastructure, which requires hardware. As the period wore on, I began to see signs that many companies were beginning to implement their Internet strategies. As they do, they're likely to call on hardware providers, such as Sun Microsystems, to help them make it happen. On top of that, I felt a pickup in demand for PCs was imminent behind the further penetration of Windows 2000 and the potential launch of Intel's Pentium IV chip. All of these signs told me that these stocks had the potential to do just as well, but with considerably less downside risk, than the juicier tech stocks.
Q. What stocks helped the most? Which hurt?
A. EMC, Brocade and Network Appliance benefited the most from the growing need for data storage solutions. Networking giant Juniper rose sharply behind surging demand for routers, the devices that direct traffic over the Internet. Unfortunately, we paid the price for focusing on higher-priced semiconductor stocks, which got hit the hardest during the correction. Still we were able to offset some of those losses with gains from red-hot communications chipmakers Analog Devices, Altera and Linear Technology. Computer chip stocks, such as Micron Technology, had a rough time early on, but recovered nicely during the second half of the period. However, others that we held, including National Semiconductor, LSI Logic and Texas Instruments, weren't so lucky. The fund further suffered from its overexposure to a handful of problem stocks - most notably Motorola, Emulex and Electronics for Imaging. I sold off Motorola and Emulex prior to the close of the period. Remaining underweighted in market leaders Intel and IBM also hurt, as these big-cap stocks held up better than their smaller-cap counterparts amid the correction.
Q. What's your outlook?
A. I feel that demand is likely to remain strong behind a continued rise in productivity, with spending in the sector representing an increasing share of gross domestic product. I'm optimistic because tech stocks tend to perform well in this type of economic environment. I'm especially optimistic about computer hardware stocks for the reasons I mentioned earlier. It's up for debate as to where we are exactly in the productivity cycle, but if I were to guess I'd say we're still in the early innings. With that said, I plan to remain fully invested and to continue to look for the highest-growth companies at the best prices.
The views expressed in this report reflect those of the portfolio manager only through the end of the period of the report as stated on the cover. The manager's views are subject to change at any time based on market or other conditions. For more information, see page 3.
Fund Facts
Start date: July 29, 1985
Fund number: 007
Trading symbol: FDCPX
Size: as of August 31, 2000, more than $3.9 billion
Manager: Larry Rakers, since January 2000; manager, Fidelity Select Technology Portfolio, since February 2000; Fidelity Advisor Technology Fund, since January 2000; Fidelity Advisor Natural Resources Fund, 1997-1999; several Fidelity Select Portfolios, 1995-1999; joined Fidelity in 1993
3Semiannual Report
Computers Portfolio
(Unaudited)
Showing Percentage of Net Assets
|
Common Stocks - 94.3% |
|||
|
Shares |
Value (Note 1) |
||
|
BROADCASTING - 0.2% |
|||
|
Netro Corp. |
75,000 |
$ 6,196,875 |
|
|
COMMUNICATIONS EQUIPMENT - 12.8% |
|||
|
3Com Corp. |
750,000 |
12,468,750 |
|
|
Cabletron Systems, Inc. (a) |
279,200 |
10,452,550 |
|
|
Ciena Corp. (a) |
60,700 |
13,456,431 |
|
|
Cisco Systems, Inc. (a) |
3,583,600 |
245,924,550 |
|
|
Comverse Technology, Inc. (a) |
335,400 |
30,835,838 |
|
|
Corning, Inc. |
289,500 |
94,937,906 |
|
|
Corvis Corp. |
53,000 |
5,502,063 |
|
|
Ditech Communications Corp. (a) |
77,400 |
4,566,600 |
|
|
Nortel Networks Corp. |
790,000 |
64,434,365 |
|
|
Peco II, Inc. |
1,600 |
62,400 |
|
|
Sycamore Networks, Inc. |
25,000 |
3,437,500 |
|
|
Tekelec (a) |
110,000 |
4,345,000 |
|
|
Terayon Communication Systems, Inc. (a) |
136,400 |
7,570,200 |
|
|
Zoom Telephonics, Inc. (a) |
175,000 |
1,476,563 |
|
|
TOTAL COMMUNICATIONS EQUIPMENT |
499,470,716 |
||
|
COMPUTER SERVICES & SOFTWARE - 4.1% |
|||
|
Aether Systems, Inc. |
20,000 |
2,770,000 |
|
|
Citrix Systems, Inc. (a) |
135,000 |
2,970,000 |
|
|
Electronics for Imaging, Inc. (a) |
45,400 |
1,180,400 |
|
|
Exodus Communications, Inc. (a) |
500,000 |
34,218,750 |
|
|
Foundry Networks, Inc. |
275,000 |
25,592,188 |
|
|
Intertrust Technologies Corp. |
125,200 |
2,011,025 |
|
|
J.D. Edwards & Co. (a) |
150,000 |
3,721,875 |
|
|
National Instrument Corp. (a) |
175,000 |
7,557,813 |
|
|
Redback Networks, Inc. (a) |
140,900 |
21,046,938 |
|
|
Software.com, Inc. (a) |
97,600 |
14,206,900 |
|
|
Sybase, Inc. (a) |
315,000 |
8,642,813 |
|
|
Synopsys, Inc. (a) |
118,200 |
4,380,788 |
|
|
Technology Solutions, Inc. |
600,000 |
1,856,250 |
|
|
Unisys Corp. (a) |
436,000 |
5,668,000 |
|
|
VeriSign, Inc. (a) |
25,000 |
4,971,875 |
|
|
VERITAS Software Corp. (a) |
59,550 |
7,179,497 |
|
|
Vignette Corp. (a) |
350,000 |
13,343,750 |
|
|
TOTAL COMPUTER SERVICES & SOFTWARE |
161,318,862 |
||
|
COMPUTERS & OFFICE EQUIPMENT - 40.1% |
|||
|
Alteon Websystems, Inc. |
90,000 |
13,320,000 |
|
|
Apple Computer, Inc. (a) |
1,280,000 |
78,000,000 |
|
|
Avici Systems, Inc. |
47,300 |
7,086,131 |
|
|
Avocent Corp. (a) |
272,500 |
13,250,313 |
|
|
Brocade Communications |
203,900 |
46,043,169 |
|
|
CDW Computer Centers, Inc. (a) |
430,000 |
31,605,000 |
|
|
Comdisco, Inc. |
546,000 |
13,104,000 |
|
|
Compaq Computer Corp. |
2,406,350 |
81,966,297 |
|
|
Dell Computer Corp. (a) |
3,385,000 |
147,670,625 |
|
|
EMC Corp. (a) |
3,001,000 |
294,097,990 |
|
|
Extended Systems, Inc. (a) |
45,000 |
2,064,375 |
|
|
|
|||
|
Shares |
Value (Note 1) |
||
|
Extreme Networks, Inc. (a) |
200,000 |
$ 18,612,500 |
|
|
Gateway, Inc. (a) |
1,493,700 |
101,720,970 |
|
|
Hewlett-Packard Co. |
550,000 |
66,412,500 |
|
|
Insight Enterprises, Inc. (a) |
353,875 |
17,782,219 |
|
|
International Business Machines Corp. |
750,000 |
99,000,000 |
|
|
Juniper Networks, Inc. (a) |
361,800 |
77,334,750 |
|
|
Lexmark International Group, Inc. |
875,000 |
59,335,938 |
|
|
MRV Communications, Inc. (a) |
80,000 |
6,165,000 |
|
|
Network Appliance, Inc. (a) |
1,150,000 |
134,550,000 |
|
|
Oak Technology, Inc. (a) |
150,000 |
4,368,750 |
|
|
Palm, Inc. |
999,486 |
43,977,384 |
|
|
Quantum Corp. - DLT & Storage Systems Group (a) |
230,000 |
3,119,375 |
|
|
RadiSys Corp. (a) |
60,000 |
3,356,250 |
|
|
Seagate Technology, Inc. (a) |
905,000 |
53,734,375 |
|
|
Sun Microsystems, Inc. (a) |
985,000 |
125,033,438 |
|
|
Symbol Technologies, Inc. |
165,550 |
6,849,631 |
|
|
Tech Data Corp. (a) |
325,000 |
16,778,125 |
|
|
TOTAL COMPUTERS & OFFICE EQUIPMENT |
1,566,339,105 |
||
|
CONSUMER ELECTRONICS - 0.2% |
|||
|
Gemstar-TV Guide International, Inc. (a) |
100,000 |
9,025,000 |
|
|
DRUGS & PHARMACEUTICALS - 0.2% |
|||
|
SpeechWorks International, Inc. |
82,900 |
6,352,213 |
|
|
ELECTRICAL EQUIPMENT - 0.5% |
|||
|
Alcatel SA sponsored ADR |
190,000 |
15,746,250 |
|
|
C&D Technologies, Inc. |
40,000 |
2,210,000 |
|
|
Pinnacle Systems (a) |
245,000 |
3,093,125 |
|
|
TOTAL ELECTRICAL EQUIPMENT |
21,049,375 |
||
|
ELECTRONIC INSTRUMENTS - 1.5% |
|||
|
Agilent Technologies, Inc. |
973,318 |
58,703,242 |
|
|
Micro Component Technology, Inc. (a) |
100,000 |
912,500 |
|
|
TOTAL ELECTRONIC INSTRUMENTS |
59,615,742 |
||
|
ELECTRONICS - 33.8% |
|||
|
Advanced Micro Devices, Inc. (a) |
1,001,600 |
37,685,200 |
|
|
Altera Corp. (a) |
835,800 |
54,170,288 |
|
|
Analog Devices, Inc. (a) |
1,650,000 |
165,825,000 |
|
|
Applied Micro Circuits Corp. (a) |
110,000 |
22,323,125 |
|
|
Atmel Corp. (a) |
984,200 |
19,684,000 |
|
|
Broadcom Corp. Class A (a) |
55,000 |
13,750,000 |
|
|
Centillium Communications, Inc. |
2,900 |
216,050 |
|
|
Cree, Inc. (a) |
106,800 |
14,711,700 |
|
|
Cypress Semiconductor Corp. (a) |
250,000 |
12,359,375 |
|
|
Dallas Semiconductor Corp. |
165,000 |
6,826,875 |
|
|
Fairchild Semiconduct International, Inc. Class A |
100,000 |
3,975,000 |
|
|
GlobeSpan, Inc. (a) |
15,000 |
1,806,563 |
|
|
Integrated Device Technology, Inc. (a) |
225,000 |
19,743,750 |
|
|
Common Stocks - continued |
|||
|
Shares |
Value (Note 1) |
||
|
ELECTRONICS - CONTINUED |
|||
|
Intel Corp. |
1,042,000 |
$ 78,019,750 |
|
|
International Rectifier Corp. (a) |
130,000 |
8,181,875 |
|
|
Intersil Holding Corp. Class A |
35,000 |
1,890,000 |
|
|
JDS Uniphase Corp. (a) |
684,900 |
85,259,352 |
|
|
Linear Technology Corp. |
1,083,200 |
77,922,700 |
|
|
LSI Logic Corp. (a) |
1,840,000 |
66,125,000 |
|
|
Marvell Technology Group Ltd. |
212,800 |
15,188,600 |
|
|
Maxim Integrated Products, Inc. (a) |
599,000 |
52,524,813 |
|
|
Microchip Technology, Inc. (a) |
270,000 |
18,376,875 |
|
|
Micron Technology, Inc. (a) |
1,905,200 |
155,750,100 |
|
|
MIPS Technologies, Inc. Class B (a) |
200,003 |
10,350,155 |
|
|
National Semiconductor Corp. (a) |
585,000 |
26,032,500 |
|
|
NVIDIA Corp. (a) |
410,000 |
32,543,750 |
|
|
PMC-Sierra, Inc. (a) |
150,000 |
35,400,000 |
|
|
Power-One, Inc. (a) |
55,000 |
8,714,063 |
|
|
Samsung Electronics Co. Ltd. |
12,500 |
3,083,429 |
|
|
SDL, Inc. (a) |
195,600 |
77,714,325 |
|
|
Texas Instruments, Inc. |
2,651,300 |
177,471,394 |
|
|
Virage Logic Corp. |
83,800 |
1,576,488 |
|
|
Vitesse Semiconductor Corp. (a) |
135,000 |
11,989,688 |
|
|
TOTAL ELECTRONICS |
1,317,191,783 |
||
|
PHOTOGRAPHIC EQUIPMENT - 0.1% |
|||
|
InFocus Corp. (a) |
90,000 |
4,353,750 |
|
|
RETAIL & WHOLESALE, MISCELLANEOUS - 0.8% |
|||
|
Best Buy Co., Inc. (a) |
295,000 |
18,216,250 |
|
|
PC Connection, Inc. |
25,000 |
1,618,750 |
|
|
RadioShack Corp. |
195,000 |
11,505,000 |
|
|
TOTAL RETAIL & WHOLESALE, MISCELLANEOUS |
31,340,000 |
||
|
TELEPHONE SERVICES - 0.0% |
|||
|
TeraBeam Networks (d) |
11,600 |
43,500 |
|
|
TOTAL COMMON STOCKS (Cost $1,972,051,365) |
3,682,296,921 |
||
|
Convertible Bonds - 0.0% |
|||||
|
Moody's Ratings (unaudited) |
Principal Amount |
|
|||
|
COMPUTER SERVICES & SOFTWARE - 0.0% |
|||||
|
Cyras Systems, Inc. 4.5% 8/15/05 (c) |
- |
|
$ 845,000 |
988,650 |
|
|
Cash Equivalents - 9.0% |
|||
|
Shares |
Value (Note 1) |
||
|
Fidelity Cash Central Fund, 6.59% (b) |
208,695,680 |
$ 208,695,680 |
|
|
Fidelity Securities Lending Cash Central Fund, 6.64% (b) |
140,495,200 |
140,495,200 |
|
|
TOTAL CASH EQUIVALENTS (Cost $349,190,880) |
349,190,880 |
||
|
TOTAL INVESTMENT PORTFOLIO - 103.3% (Cost $2,322,087,245) |
4,032,476,451 |
|
NET OTHER ASSETS - (3.3)% |
(128,809,423) |
||
|
NET ASSETS - 100% |
$ 3,903,667,028 |
||
|
Legend |
|
(a) Non-income producing |
|
(b) The rate quoted is the annualized seven-day yield of the fund at |
|
(c) Security exempt from registration under Rule 144A of the Securities |
|
(d) Restricted securities - Investment in securities not registered under the Securities Act of 1933. |
|
Additional information on each holding is as follows: |
|
Security |
Acquisition Date |
Acquisition Cost |
|
TeraBeam Networks |
4/7/00 |
$ 43,500 |
|
Other Information |
|
Purchases and sales of securities, other than short-term securities, aggregated $1,459,531,295 and $1,567,103,426, respectively. |
|
The fund placed a portion of its portfolio transactions with brokerage firms which are affiliates of Fidelity Management & Research Company. The commissions paid to these affiliated firms were $57,689 for the period. |
|
The fund invested in securities that are not registered under the Securities Act of 1933. These securities are subject to legal or contractual restrictions on resale. At the end of the period, restricted securities (excluding Rule 144A issues) amounted to $43,500 or 0.0% of net assets. |
|
The fund participated in the security lending program. At period end, the value of securities loaned amounted to $144,068,604. The fund received cash collateral of $140,495,200 which was invested in cash equivalents. |
|
Income Tax Information |
|
At August 31, 2000, the aggregate cost of investment securities for |
See accompanying notes which are an integral part of the financial statements.
Technology Sector
Statement of Assets and Liabilities
|
|
August 31, 2000 (Unaudited) |
|
|
Assets |
|
|
|
Investment in securities, at value |
|
$ 4,032,476,451 |
|
Receivable for investments sold |
|
74,982,291 |
|
Receivable for fund shares sold |
|
3,365,184 |
|
Dividends receivable |
|
199,209 |
|
Interest receivable |
|
1,038,667 |
|
Redemption fees receivable |
|
2,141 |
|
Other receivables |
|
122,504 |
|
Total assets |
|
4,112,186,447 |
|
Liabilities |
|
|
|
Payable for investments purchased |
$ 60,284,056 |
|
|
Payable for fund shares redeemed |
4,995,869 |
|
|
Accrued management fee |
1,698,374 |
|
|
Other payables and |
1,045,920 |
|
|
Collateral on securities loaned, |
140,495,200 |
|
|
Total liabilities |
|
208,519,419 |
|
Net Assets |
|
$ 3,903,667,028 |
|
Net Assets consist of: |
|
|
|
Paid in capital |
|
$ 1,765,476,719 |
|
Accumulated net investment (loss) |
|
(8,844,829) |
|
Accumulated undistributed net realized gain (loss) on investments and foreign currency transactions |
|
436,645,814 |
|
Net unrealized appreciation (depreciation) on investments |
|
1,710,389,324 |
|
Net Assets, for 30,072,303 |
|
$ 3,903,667,028 |
|
Net Asset Value and redemption price per share ($3,903,667,028 ÷ 30,072,303 shares) |
|
$129.81 |
|
Maximum offering price per share (100/97.00 of $129.81) |
|
$133.82 |
Statement of Operations
|
|
Six months ended August 31, 2000 (Unaudited) |
|
|
Investment Income Dividends |
|
$ 1,345,582 |
|
Interest |
|
6,030,619 |
|
Security lending |
|
412,052 |
|
Total income |
|
7,788,253 |
|
Expenses |
|
|
|
Management fee |
$ 10,290,727 |
|
|
Transfer agent fees |
5,508,660 |
|
|
Accounting and security lending fees |
679,120 |
|
|
Non-interested trustees' compensation |
6,070 |
|
|
Custodian fees and expenses |
42,152 |
|
|
Registration fees |
135,065 |
|
|
Audit |
39,410 |
|
|
Legal |
6,955 |
|
|
Miscellaneous |
51,438 |
|
|
Total expenses before reductions |
16,759,597 |
|
|
Expense reductions |
(126,515) |
16,633,082 |
|
Net investment income (loss) |
|
(8,844,829) |
|
Realized and Unrealized Gain (Loss) Net realized gain (loss) on: |
|
|
|
Investment securities |
463,589,506 |
|
|
Foreign currency transactions |
(5,713) |
463,583,793 |
|
Change in net unrealized appreciation (depreciation) on: |
|
|
|
Investment securities |
(311,883,966) |
|
|
Assets and liabilities in |
118 |
(311,883,848) |
|
Net gain (loss) |
|
151,699,945 |
|
Net increase (decrease) in net assets resulting from operations |
|
$ 142,855,116 |
|
Other Information |
|
|
|
Sales charges paid to FDC |
|
$ 3,771,403 |
|
Deferred sales charges withheld by FDC |
|
$ 4,284 |
|
Exchange fees withheld by FSC |
|
$ 34,328 |
|
Expense reductions |
|
|
|
Directed brokerage arrangements |
|
$ 115,366 |
|
Transfer agent credits |
|
11,149 |
|
|
|
$ 126,515 |
See accompanying notes which are an integral part of the financial statements.
Semiannual Report
Computers Portfolio
Financial Statements - continued
Statement of Changes in Net Assets
|
Increase (Decrease) in Net Assets |
Six months ended |
Year ended |
|
Operations |
$ (8,844,829) |
$ (11,221,339) |
|
Net realized gain (loss) |
463,583,793 |
459,371,250 |
|
Change in net unrealized appreciation (depreciation) |
(311,883,848) |
1,653,265,607 |
|
Net increase (decrease) in net assets resulting from operations |
142,855,116 |
2,101,415,518 |
|
Distributions to shareholders from net realized gains |
(113,651,437) |
(403,921,111) |
|
Share transactions |
492,581,191 |
1,163,982,244 |
|
Reinvestment of distributions |
110,200,949 |
392,677,083 |
|
Cost of shares redeemed |
(553,344,277) |
(1,262,885,832) |
|
Net increase (decrease) in net assets resulting from share transactions |
49,437,863 |
293,773,495 |
|
Redemption fees |
810,133 |
1,512,642 |
|
Total increase (decrease) in net assets |
79,451,675 |
1,992,780,544 |
|
Net Assets |
|
|
|
Beginning of period |
3,824,215,353 |
1,831,434,809 |
|
End of period (including accumulated net investment loss of $8,844,829 and $0, respectively) |
$ 3,903,667,028 |
$ 3,824,215,353 |
|
Other Information Shares |
|
|
|
Sold |
4,034,934 |
13,611,310 |
|
Issued in reinvestment of distributions |
878,274 |
4,388,872 |
|
Redeemed |
(4,728,520) |
(14,898,647) |
|
Net increase (decrease) |
184,688 |
3,101,535 |
Financial Highlights
|
|
Six months ended |
Years ended February 28, |
||||
|
Selected Per-Share Data |
(Unaudited) |
2000 F |
1999 |
1998 |
1997 |
1996 F |
|
Net asset value, beginning of period |
$ 127.95 |
$ 68.37 |
$ 41.08 |
$ 48.25 |
$ 41.03 |
$ 30.67 |
|
Income from Investment Operations |
|
|
|
|
|
|
|
Net investment income (loss) D |
(.29) |
(.41) |
(.29) |
(.32) |
(.36) |
(.23) |
|
Net realized and unrealized gain (loss) |
5.91 |
74.86 |
27.39 |
6.42 |
9.94 |
16.10 |
|
Total from investment operations |
5.62 |
74.45 |
27.10 |
6.10 |
9.58 |
15.87 |
|
Less Distributions |
|
|
|
|
|
|
|
From net realized gain |
(3.79) |
(14.92) |
- |
(10.64) |
(2.47) |
(5.61) |
|
In excess of net realized gain |
- |
- |
- |
(2.75) |
- |
- |
|
Total distributions |
(3.79) |
(14.92) |
- |
(13.39) |
(2.47) |
(5.61) |
|
Redemption fees added to paid in capital |
.03 |
.05 |
.19 |
.12 |
.11 |
.10 |
|
Net asset value, end of period |
$ 129.81 |
$ 127.95 |
$ 68.37 |
$ 41.08 |
$ 48.25 |
$ 41.03 |
|
Total ReturnB, C |
4.52% |
119.58% |
66.43% |
20.33% |
23.97% |
52.79% |
|
Ratios and Supplemental Data |
|
|
|
|
|
|
|
Net assets, end of period (000 omitted) |
$ 3,903,667 |
$ 3,824,215 |
$ 1,831,435 |
$ 785,465 |
$ 604,286 |
$ 527,337 |
|
Ratio of expenses to average net assets |
.91% A |
1.07% |
1.25% |
1.40% |
1.48% |
1.40% |
|
Ratio of expenses to average net assets after |
.91% A |
1.05% E |
1.23% E |
1.34% E |
1.44% E |
1.38% E |
|
Ratio of net investment income (loss) to average net assets |
(.48)% A |
(.47)% |
(.54)% |
(.67)% |
(.83)% |
(.56)% |
|
Portfolio turnover rate |
83% A |
129% |
133% |
333% |
255% |
129% |
|
A Annualized B The total returns would have been lower had certain expenses not been reduced during the periods shown. CTotal returns do not include the one time sales
charge and for periods of less than one year are not annualized. |
See accompanying notes which are an integral part of the financial statements.
Technology Sector
Performance
There are several ways to evaluate a fund's historical performance. You can look at the total percentage change in value, the average annual percentage change or the growth of a hypothetical $10,000 investment. Total return reflects the change in the value of an investment, assuming reinvestment of the fund's dividend income and capital gains (the profits earned upon the sale of securities that have grown in value). Load adjusted returns include a 3.00% sales charge and the effect of a $7.50 long-term trading fee for shares held 30 days or more. Effective September 28, 2000, the $7.50 long-term trading fee was eliminated. If Fidelity had not reimbursed certain fund expenses, the past 10 year total returns would have been lower.
Cumulative Total Returns
|
Periods ended |
Past 6 |
Past 1 |
Past 5 |
Past 10 |
|
Select Developing |
-5.34% |
105.50% |
393.02% |
1,993.17% |
|
Select Developing |
-8.25% |
99.27% |
378.15% |
1,930.31% |
|
S&P 500 |
11.73% |
16.32% |
193.58% |
493.54% |
|
GS Technology |
2.68% |
63.21% |
n/a** |
n/a** |
Cumulative total returns show the fund's performance in percentage terms over a set period - in this case, six months, one year, five years or 10 years. You can compare the fund's returns to the performance of both the Standard & Poor's 500 Index - a market capitalization-weighted index of common stocks - and the Goldman Sachs Technology Index - a market capitalization-weighted index of 221 stocks designed to measure the performance of companies in the technology sector. These benchmarks include reinvestment of dividends and capital gains, if any, and exclude the effect of sales charges.
Average Annual Total Returns
|
Periods ended |
Past 1 |
Past 5 |
Past 10 |
|
Select Developing Communications |
105.50% |
37.59% |
35.54% |
|
Select Developing Communications |
99.27% |
36.75% |
35.13% |
|
S&P 500 |
16.32% |
24.04% |
19.49% |
|
GS Technology |
63.21% |
n/a** |
n/a** |
Average annual returns take the fund's cumulative return and show you what would have happened if the fund had performed at a constant rate each year.
** Not available
Understanding Performance
How a fund did yesterday is no guarantee of how it will do tomorrow. The stock market, for example, has a history of long-term growth and short-term volatility. Unlike the broader market, however, some sectors may not have a history of growth in the long run. And, as with all stock funds, the share price and return of a fund that invests in a sector will vary.
3$10,000 Over 10 Years
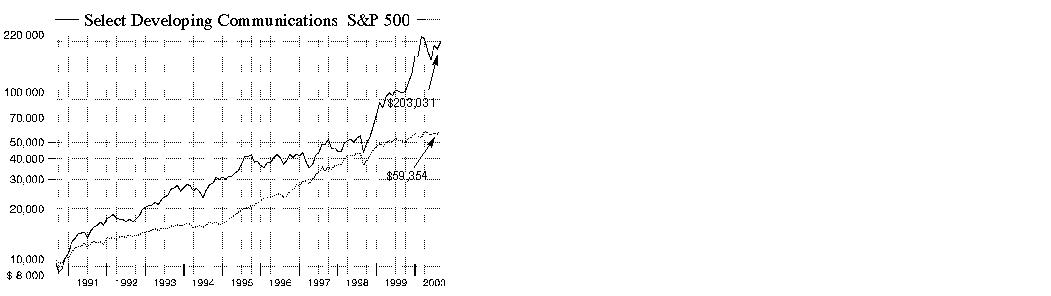
$10,000 Over 10 Years: Let's say hypothetically that $10,000 was invested in Fidelity Select Developing Communications Portfolio on August 31, 1990, and the current 3.00% sales charge was paid. As the chart shows, by August 31, 2000, the value of the investment would have grown to $203,031 - a 1,930.31% increase on the initial investment - and includes the effect of a $7.50 long-term trading fee. For comparison, look at how the Standard & Poor's 500 Index did over the same period. With dividends and capital gains, if any, reinvested, the same $10,000 investment would have grown to $59,354 - a 493.54% increase.
Investment Summary
|
Top Ten Stocks as of August 31, 2000 |
|
|
|
% of fund's |
|
Cisco Systems, Inc. |
8.5 |
|
Juniper Networks, Inc. |
8.5 |
|
Corning, Inc. |
7.1 |
|
Nortel Networks Corp. |
6.6 |
|
Alcatel SA |
6.0 |
|
Ciena Corp. |
5.2 |
|
JDS Uniphase Corp. |
4.8 |
|
Scientific-Atlanta, Inc. |
4.0 |
|
Nextel Communications, Inc. Class A |
2.9 |
|
ADC Telecommunications, Inc. |
2.8 |
|
|
56.4 |
Top Industries as of August 31, 2000
% of fund's net assets

Semiannual Report
(automated graphic)
Rajiv Kaul, Portfolio Manager of Fidelity Select Developing Communications Portfolio
Q. How did the fund perform, Rajiv?
A. For the six months that ended August 31, 2000, the fund returned -5.34%, lagging the Goldman Sachs Technology Index - an index of 221 stocks designed to measure the performance of companies in the technology sector - and the Standard & Poor's 500 Index, which returned 2.68% and 11.73%, respectively. For the 12 months that ended August 31, 2000, the fund returned 105.50%, while the Goldman Sachs and S&P 500 indexes returned 63.21% and 16.32%, respectively.
Q. Why did the fund fall short of the Goldman Sachs index during the six-month period?
A. Maintaining an emphasis on wireless stocks early on - a stance I have since retreated from - took its toll on relative performance. It was double trouble for fund holdings Nokia, Nextel and Motorola, which endured a valuation correction along with technology stocks during the spring, and faced the daunting prospect of declining profit growth heading into the summer. Slowing handset penetration and turnover, coupled with increased competition, seasonal declines and problematic timing of product releases, spelled trouble for players in this space. Many wireless-related semiconductor stocks didn't escape unscathed either, edging lower during the period. The decision to focus on names such as Qualcomm and LSI Logic at the expense of PC chipmakers, such as Intel, worked against us, as PC stocks rebounded nicely late in the period. An uncertain outlook for PC demand kept me on the sidelines for chips as well as computer hardware, and we paid the price for not owning benchmark heavyweights Sun Microsystems and IBM. Poor stock picking among Internet-related stocks, which suffered the most during the correction, further detracted from returns.
Q. How did some of your other strategies play out for the fund?
A. By reducing the fund's exposure to wireless, I was able to increase our holdings in networking and optics, areas providing the infrastructure for communications networks of the future that will enable the delivery of broadband services. The fund benefited from focusing on the leading suppliers of optical components and networking equipment - namely Corning, Ciena, SDL, Cisco, Juniper and Nortel - representing some of the period's finest performers. Unfortunately, since the fund tended to own the more volatile pure-play infrastructure names at the expense of industry stalwarts, such as EMC, we gave up more than the index during the spring tech correction. With companies moving online in increasing numbers and Internet traffic doubling every 100 days, the demand for communications bandwidth continued to grow exponentially. Those companies capable of providing the means to handle all the data traffic - that is, intelligently move it at faster speeds - reaped the rewards. We had our share of winners in the telecom equipment space during the period, including ADC Telecommunications, which helped narrow the performance gap relative to the Goldman Sachs index. ADC, among others, was well-positioned to respond to the needs of cable and phone carriers that were actively seeking to install or upgrade to Internet-based networks.
Q. What other stocks helped or hurt performance?
A. GlobeSpan is a semiconductor play in the telecom space that worked out well for us. The company benefited from surging demand for digital subscriber
line (DSL) chips, which enable high-speed data transmission over existing networks of copper phone lines. Interestingly enough, relative performance had
just as much to do with what we didn't own. Underweighting Texas Instruments based on its wireless exposure helped quite a bit, as did the fund's underexposure to
Microsoft, which slipped on execution problems and concerns about ongoing anti-
trust litigation. In terms of what we owned that hurt, Lucent struggled after missing a key product cycle in the fiber-optics space and losing further ground to chief
rival Nortel. Internet stocks that detracted included CMGI and Vignette. Out-of-benchmark stakes in wireless players Audiovox and Wireless Facilities also dragged
on returns.
Q. What's your outlook?
A. It could be a bumpy ride as we navigate through these cyclical periods where the short-term forecasts for PC, chip and wireless demand remain cloudy. Moreover, there are still some big concerns about overcapacity and the potential impact on the optics segment of the market. However, my longer-term outlook is still quite bullish. Right now, I think we're just going through a transition period where old-generation voice networks continue to decline and the data-rich next-generation communications networks prepare to take off. When data finally does take center stage, the fund should be poised to benefit.
The views expressed in this report reflect those of the portfolio manager only through the end of the period of the report as stated on the cover. The manager's views are subject to change at any time based on market or other conditions. For more information, see page 3.
Fund Facts
Start date: June 29, 1990
Fund number: 518
Trading symbol: FSDCX
Size: as of August 31, 2000, more than $3.2 billion
Manager: Rajiv Kaul, since February 2000; manager, Fidelity Select Biotechnology Portfolio, 1998-February 2000; equity research associate, health care industry, 1996-1998; joined Fidelity in 1996
3Semiannual Report
Developing Communications Portfolio
(Unaudited)
Showing Percentage of Net Assets
|
Common Stocks - 95.3% |
|||
|
Shares |
Value (Note 1) |
||
|
BROADCASTING - 1.1% |
|||
|
Netro Corp. |
442,300 |
$ 36,545,038 |
|
|
CELLULAR - 5.2% |
|||
|
China Mobile (Hong Kong) Ltd. sponsored ADR (a) |
852,400 |
32,870,675 |
|
|
Nextel Communications, Inc. Class A (a) |
1,700,000 |
94,243,750 |
|
|
QUALCOMM, Inc. (a) |
700,000 |
41,912,500 |
|
|
TOTAL CELLULAR |
169,026,925 |
||
|
COMMUNICATIONS EQUIPMENT - 41.9% |
|||
|
3Com Corp. |
250,000 |
4,156,250 |
|
|
ADC Telecommunications, Inc. (a) |
2,218,000 |
90,799,375 |
|
|
Andrew Corp. (a) |
500,000 |
14,812,500 |
|
|
Cabletron Systems, Inc. (a) |
1,200,000 |
44,925,000 |
|
|
Ciena Corp. (a) |
750,000 |
166,265,625 |
|
|
Cisco Systems, Inc. (a) |
4,000,000 |
274,499,995 |
|
|
Comverse Technology, Inc. (a) |
379,200 |
34,862,700 |
|
|
Corning, Inc. |
695,000 |
227,916,563 |
|
|
Corvis Corp. |
163,000 |
16,921,438 |
|
|
Ditech Communications Corp. (a) |
176,700 |
10,425,300 |
|
|
Lucent Technologies, Inc. |
1,400,000 |
58,537,500 |
|
|
MCK Communications, Inc. |
35,300 |
1,014,875 |
|
|
Next Level Communications, Inc. |
200,000 |
8,825,000 |
|
|
Nokia AB sponsored ADR |
1,500,000 |
67,406,250 |
|
|
Nortel Networks Corp. |
2,600,000 |
212,062,467 |
|
|
ONI Systems Corp. |
484,200 |
46,150,313 |
|
|
Sycamore Networks, Inc. |
215,000 |
29,562,500 |
|
|
Telefonaktiebolaget LM Ericsson sponsored ADR |
2,100,000 |
43,050,000 |
|
|
TOTAL COMMUNICATIONS EQUIPMENT |
1,352,193,651 |
||
|
COMPUTER SERVICES & SOFTWARE - 11.4% |
|||
|
America Online, Inc. (a) |
1,500,000 |
87,937,500 |
|
|
Clarent Corp. |
320,000 |
15,280,000 |
|
|
Foundry Networks, Inc. |
25,000 |
2,326,563 |
|
|
InfoSpace.com, Inc. (a) |
506,000 |
19,734,000 |
|
|
Microsoft Corp. (a) |
500,000 |
34,906,250 |
|
|
Redback Networks, Inc. (a) |
550,000 |
82,156,250 |
|
|
Sonus Networks, Inc. |
51,400 |
8,551,675 |
|
|
VeriSign, Inc. (a) |
252,460 |
50,207,983 |
|
|
Yahoo!, Inc. (a) |
550,000 |
66,825,000 |
|
|
TOTAL COMPUTER SERVICES & SOFTWARE |
367,925,221 |
||
|
COMPUTERS & OFFICE EQUIPMENT - 12.5% |
|||
|
Avici Systems, Inc. |
3,200 |
479,400 |
|
|
Copper Mountain Networks, Inc. (a) |
250,000 |
14,984,375 |
|
|
Extreme Networks, Inc. (a) |
500,000 |
46,531,250 |
|
|
|
|||
|
Shares |
Value (Note 1) |
||
|
Juniper Networks, Inc. (a) |
1,280,000 |
$ 273,600,000 |
|
|
Palm, Inc. |
1,510,202 |
66,448,888 |
|
|
TOTAL COMPUTERS & OFFICE EQUIPMENT |
402,043,913 |
||
|
CONSUMER ELECTRONICS - 1.6% |
|||
|
Gemstar-TV Guide International, Inc. (a) |
550,000 |
49,637,500 |
|
|
ELECTRICAL EQUIPMENT - 10.0% |
|||
|
Alcatel SA sponsored ADR |
2,350,000 |
194,756,250 |
|
|
Scientific-Atlanta, Inc. |
1,646,200 |
128,300,713 |
|
|
TOTAL ELECTRICAL EQUIPMENT |
323,056,963 |
||
|
ELECTRONICS - 10.5% |
|||
|
Centillium Communications, Inc. |
100,000 |
7,450,000 |
|
|
GlobeSpan, Inc. (a) |
373,300 |
44,959,319 |
|
|
JDS Uniphase Corp. (a) |
1,250,000 |
155,605,475 |
|
|
Marvell Technology Group Ltd. |
344,900 |
24,617,238 |
|
|
Micron Technology, Inc. (a) |
100,000 |
8,175,000 |
|
|
Motorola, Inc. |
1,500,000 |
54,093,750 |
|
|
PMC-Sierra, Inc. (a) |
188,700 |
44,533,200 |
|
|
TOTAL ELECTRONICS |
339,433,982 |
||
|
TELEPHONE SERVICES - 1.1% |
|||
|
Metromedia Fiber Network, Inc. |
500,000 |
19,968,750 |
|
|
NEXTLINK Communications, Inc. |
433,000 |
15,182,063 |
|
|
TOTAL TELEPHONE SERVICES |
35,150,813 |
||
|
TOTAL COMMON STOCKS (Cost $2,257,259,857) |
3,075,014,006 |
||
|
Cash Equivalents - 6.8% |
|||
|
|
|
|
|
|
Fidelity Cash Central Fund, 6.59% (b) |
177,160,899 |
177,160,899 |
|
|
Fidelity Securities Lending Cash |
41,131,300 |
41,131,300 |
|
|
TOTAL CASH EQUIVALENTS (Cost $218,292,199) |
218,292,199 |
||
|
TOTAL INVESTMENT PORTFOLIO - 102.1% (Cost $2,475,552,056) |
3,293,306,205 |
|
NET OTHER ASSETS - (2.1)% |
(66,263,811) |
||
|
NET ASSETS - 100% |
$ 3,227,042,394 |
||
|
Legend |
|
(a) Non-income producing |
|
(b) The rate quoted is the annualized seven-day yield of the fund at |
|
Other Information |
|
Purchases and sales of securities, other than short-term securities, |
|
The fund placed a portion of its portfolio transactions with brokerage firms which are affiliates of Fidelity Management & Research Company. The commissions paid to these affiliated firms were $111,057 for the period. |
|
The fund participated in the security lending program. At period end, the value of securities loaned amounted to $39,901,844. The fund received |
|
The fund participated in the bank borrowing program. The average daily loan balance during the period for which loans were outstanding amounted to $2,342,000. The weighted average interest rate was 6.85%. |
|
Transactions during the period with companies which are or were affiliates are as follows: |
|
|
Purchases |
Sales |
Dividend |
Value |
|
Affiliate |
Cost |
Cost |
Income |
|
|
DSET Corp |
$ - |
$ 2,462,215 |
$ - |
$ - |
|
Distribution of investments by country of issue, as a percentage of total |
|
United States of America |
82.2% |
|
Canada |
6.6 |
|
France |
6.0 |
|
Finland |
2.1 |
|
Sweden |
1.3 |
|
Hong Kong |
1.0 |
|
Others (individually less than 1%) |
0.8 |
|
|
100.0% |
|
Income Tax Information |
|
At August 31, 2000, the aggregate cost of investment securities for income tax purposes was $2,525,140,779. Net unrealized appreciation aggregated $768,165,426, of which $906,944,726 related to appreciated investment securities and $138,779,300 related to depreciated investment securities. |
See accompanying notes which are an integral part of the financial statements.
Technology Sector
Statement of Assets and Liabilities
|
|
August 31, 2000 (Unaudited) |
|
|
Assets |
|
|
|
Investment in securities, at value |
|
$ 3,293,306,205 |
|
Receivable for investments sold |
|
102,472,844 |
|
Receivable for fund shares sold |
|
6,540,102 |
|
Dividends receivable |
|
242,787 |
|
Interest receivable |
|
613,079 |
|
Redemption fees receivable |
|
4,504 |
|
Other receivables |
|
119,394 |
|
Total assets |
|
3,403,298,915 |
|
Liabilities |
|
|
|
Payable for investments purchased |
$ 124,943,573 |
|
|
Payable for fund shares redeemed |
7,814,567 |
|
|
Accrued management fee |
1,435,795 |
|
|
Other payables and |
931,286 |
|
|
Collateral on securities loaned, |
41,131,300 |
|
|
Total liabilities |
|
176,256,521 |
|
Net Assets |
|
$ 3,227,042,394 |
|
Net Assets consist of: |
|
|
|
Paid in capital |
|
$ 1,799,430,284 |
|
Accumulated net investment (loss) |
|
(7,809,105) |
|
Accumulated undistributed |
|
617,666,678 |
|
Net unrealized appreciation (depreciation) on investments |
|
817,754,537 |
|
Net Assets, for 42,931,063 |
|
$ 3,227,042,394 |
|
Net Asset Value and |
|
$75.17 |
|
Maximum offering price per share (100/97.00 of $75.17) |
|
$77.49 |
Statement of Operations
|
|
Six months ended August 31, 2000 (Unaudited) |
|
|
Investment Income Dividends |
|
$ 1,839,858 |
|
Interest |
|
4,043,669 |
|
Security lending |
|
798,072 |
|
Total income |
|
6,681,599 |
|
Expenses |
|
|
|
Management fee |
$ 8,690,740 |
|
|
Transfer agent fees |
5,161,980 |
|
|
Accounting and security lending fees |
654,891 |
|
|
Non-interested trustees' compensation |
5,220 |
|
|
Custodian fees and expenses |
53,563 |
|
|
Registration fees |
190,282 |
|
|
Audit |
22,806 |
|
|
Legal |
6,284 |
|
|
Interest |
446 |
|
|
Miscellaneous |
228 |
|
|
Total expenses before reductions |
14,786,440 |
|
|
Expense reductions |
(295,736) |
14,490,704 |
|
Net investment income (loss) |
|
(7,809,105) |
|
Realized and Unrealized Gain (Loss) Net realized gain (loss) on: |
|
|
|
Investment securities (including |
621,157,846 |
|
|
Foreign currency transactions |
161,364 |
621,319,210 |
|
Change in net unrealized appreciation (depreciation) on: |
|
|
|
Investment securities |
(859,937,860) |
|
|
Assets and liabilities in |
388 |
(859,937,472) |
|
Net gain (loss) |
|
(238,618,262) |
|
Net increase (decrease) in net assets resulting from operations |
|
$ (246,427,367) |
|
Other Information |
|
|
|
Sales charges paid to FDC |
|
$ 7,551,169 |
|
Deferred sales charges withheld by FDC |
|
$ 5,488 |
|
Exchange fees withheld by FSC |
|
$ 44,250 |
|
Expense reductions |
|
|
|
Directed brokerage arrangements |
|
$ 284,541 |
|
Custodian credits |
|
3,328 |
|
Transfer agent credits |
|
7,867 |
|
|
|
$ 295,736 |
See accompanying notes which are an integral part of the financial statements.
Semiannual Report
Developing Communications Portfolio
Financial Statements - continued
Statement of Changes in Net Assets
|
Increase (Decrease) in Net Assets |
Six months ended |
Year ended |
|
Operations |
$ (7,809,105) |
$ (6,645,637) |
|
Net realized gain (loss) |
621,319,210 |
171,898,837 |
|
Change in net unrealized appreciation (depreciation) |
(859,937,472) |
1,553,733,537 |
|
Net increase (decrease) in net assets resulting from operations |
(246,427,367) |
1,718,986,737 |
|
Distributions to shareholders from net realized gains |
(74,252,900) |
(92,564,065) |
|
Share transactions |
1,057,202,926 |
2,222,798,318 |
|
Reinvestment of distributions |
71,865,788 |
90,014,100 |
|
Cost of shares redeemed |
(1,035,722,466) |
(1,100,728,465) |
|
Net increase (decrease) in net assets resulting from share transactions |
93,346,248 |
1,212,083,953 |
|
Redemption fees |
1,649,859 |
2,158,711 |
|
Total increase (decrease) in net assets |
(225,684,160) |
2,840,665,336 |
|
Net Assets |
|
|
|
Beginning of period |
3,452,726,554 |
612,061,218 |
|
End of period (including accumulated net investment loss of $7,809,105 and $0, respectively) |
$ 3,227,042,394 |
$ 3,452,726,554 |
|
Other Information Shares |
|
|
|
Sold |
14,447,607 |
46,122,962 |
|
Issued in reinvestment of distributions |
1,241,205 |
1,814,211 |
|
Redeemed |
(14,959,564) |
(24,438,881) |
|
Net increase (decrease) |
729,248 |
23,498,292 |
Financial Highlights
|
|
Six months ended |
Years ended February 28, |
||||
|
Selected Per-Share Data |
(Unaudited) |
2000 F |
1999 |
1998 |
1997 |
1996 F |
|
Net asset value, beginning of period |
$ 81.81 |
$ 32.72 |
$ 20.14 |
$ 19.68 |
$ 19.42 |
$ 20.40 |
|
Income from Investment Operations |
|
|
|
|
|
|
|
Net investment income (loss) D |
(.18) |
(.22) |
(.16) |
(.18) |
(.18) |
(.17) |
|
Net realized and unrealized gain (loss) |
(4.75) |
52.31 |
12.72 |
4.95 |
.42 |
4.17 |
|
Total from investment operations |
(4.93) |
52.09 |
12.56 |
4.77 |
.24 |
4.00 |
|
Less Distributions |
|
|
|
|
|
|
|
From net realized gain |
(1.75) |
(3.07) |
(.07) |
(4.35) |
- |
(5.00) |
|
Redemption fees added to paid in capital |
.04 |
.07 |
.09 |
.04 |
.02 |
.02 |
|
Net asset value, end of period |
$ 75.17 |
$ 81.81 |
$ 32.72 |
$ 20.14 |
$ 19.68 |
$ 19.42 |
|
Total Return B, C |
(5.34)% |
166.12% |
63.01% |
28.17% |
1.34% |
21.84% |
|
Ratios and Supplemental Data |
|
|
|
|
|
|
|
Net assets, end of period (000 omitted) |
$ 3,227,042 |
$ 3,452,727 |
$ 612,061 |
$ 238,356 |
$ 220,360 |
$ 333,185 |
|
Ratio of expenses to average net assets |
.95% A |
1.11% |
1.38% |
1.61% |
1.64% |
1.53% |
|
Ratio of expenses to average net assets after |
.93% A, E |
1.11% |
1.34% E |
1.55% E |
1.62% E |
1.51% E |
|
Ratio of net investment income (loss) to average net assets |
(.50)% A |
(.47)% |
(.64)% |
(.82)% |
(.86)% |
(.78)% |
|
Portfolio turnover rate |
329% A |
112% |
299% |
383% |
202% |
249% |
|
A Annualized B The total returns would have been lower had certain expenses not been reduced during the periods shown. C Total returns do not include the one time sales
charge and for periods of less than one year are not annualized. |
See accompanying notes which are an integral part of the financial statements.
Technology Sector
Performance
There are several ways to evaluate a fund's historical performance. You can look at the total percentage change in value, the average annual percentage change or the growth of a hypothetical $10,000 investment. Total return reflects the change in the value of an investment, assuming reinvestment of the fund's dividend income and capital gains (the profits earned upon the sale of securities that have grown in value). Load adjusted returns include a 3.00% sales charge and the effect of a $7.50 long-term trading fee for shares held 30 days or more. Effective September 28, 2000, the $7.50 long-term trading fee was eliminated.
Cumulative Total Returns
|
Periods ended |
Past 6 |
Past 1 |
Past 5 |
Past 10 |
|
Select Electronics |
8.60% |
108.75% |
574.05% |
3,140.95% |
|
Select Electronics |
5.27% |
102.41% |
553.76% |
3,043.65% |
|
S&P 500 |
11.73% |
16.32% |
193.58% |
493.54% |
|
GS Technology |
2.68% |
63.21% |
n/a** |
n/a** |
Cumulative total returns show the fund's performance in percentage terms over a set period - in this case, six months, one year, five years or 10 years. You can compare the fund's returns to the performance of both the Standard & Poor's 500 Index - a market capitalization-weighted index of common stocks - and the Goldman Sachs Technology Index - a market capitalization-weighted index of 221 stocks designed to measure the performance of companies in the technology sector. These benchmarks include reinvestment of dividends and capital gains, if any, and exclude the effect of sales charges.
Average Annual Total Returns
|
Periods ended |
Past 1 |
Past 5 |
Past 10 |
|
Select Electronics |
108.75% |
46.47% |
41.60% |
|
Select Electronics |
102.41% |
45.57% |
41.17% |
|
S&P 500 |
16.32% |
24.04% |
19.49% |
|
GS Technology |
63.21% |
n/a** |
n/a** |
Average annual returns take the fund's cumulative return and show you what would have happened if the fund had performed at a constant rate each year.
** Not available
Understanding Performance
How a fund did yesterday is no guarantee of how it will do tomorrow. The stock market, for example, has a history of long-term growth and short-term volatility. Unlike the broader market, however, some sectors may not have a history of growth in the long run. And, as with all stock funds, the share price and return of a fund that invests in a sector will vary.
3$10,000 Over 10 Years
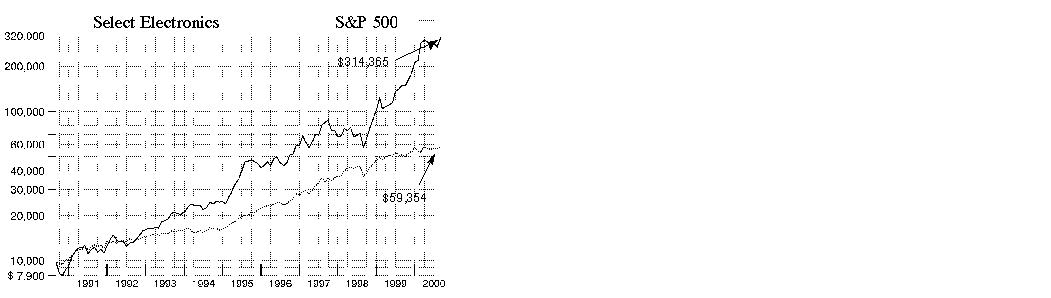
$10,000 Over 10 Years: Let's say hypothetically that $10,000 was invested in Fidelity Select Electronics Portfolio on August 31, 1990, and the current 3.00% sales charge was paid. As the chart shows, by August 31, 2000, the value of the investment would have grown to $314,365 - a 3,043.65% increase on the initial investment - and includes the effect of a $7.50 long-term trading fee. For comparison, look at how the Standard & Poor's 500 Index did over the same period. With dividends and capital gains, if any, reinvested, the same $10,000 investment would have grown to $59,354 - a 493.54% increase.
Investment Summary
|
Top Ten Stocks as of August 31, 2000 |
|
|
|
% of fund's |
|
Micron Technology, Inc. |
7.7 |
|
Intel Corp. |
6.5 |
|
Texas Instruments, Inc. |
6.0 |
|
Analog Devices, Inc. |
5.4 |
|
PMC-Sierra, Inc. |
4.6 |
|
Linear Technology Corp. |
3.5 |
|
Solectron Corp. |
3.1 |
|
Motorola, Inc. |
2.5 |
|
Sanmina Corp. |
2.5 |
|
LSI Logic Corp. |
2.3 |
|
|
44.1 |
Top Industries as of August 31, 2000
% of fund's net assets

Semiannual Report
(Portfolio Manager photograph)
Brian Hanson,
Portfolio Manager
of Fidelity Select
Electronics Portfolio
Q. How did the fund perform, Brian?
A. The fund performed very well relative to its Goldman Sachs benchmark. For the six months that ended August 31, 2000, the fund returned 8.60%. The Goldman Sachs Technology Index - an index of 221 stocks designed to measure the performance of companies in the technology sector - returned 2.68% for the same period, while the Standard & Poor's 500 Index returned 11.73%. For the 12-month period ending August 31, 2000, the fund had a return of 108.75%. Meanwhile, the Goldman Sachs index returned 63.21% for the 12-month period, while the S&P 500 returned 16.32%.
Q. Why did the fund outperform the Goldman Sachs index during the six-month period?
A. It was a combination of being in the right stocks at the right time. In addition, the fund was heavily weighted toward the semiconductor industry, which led the technology sector and was the biggest contributor to the fund's success. I avoided Internet companies, because many of those stocks had been bid up to unsustainable levels and were then sold off. I also stayed away from some other areas within the technology sector, including information technology services, because those companies were growing at a very slow pace and did not keep up with the rest of the sector.
Q. Why were semiconductor stocks such strong performers?
A. Semiconductors continued to be one of the most critical pieces for enabling the exciting technology revolution we are experiencing right now. The more obvious this became to investors, the more semiconductor stocks moved higher. There were a couple of factors that drove the boom for semiconductors, the first being a mega-trend to build the Internet infrastructure, which I talk about a little later in this report, and the second being the demand for more chips driven by a strong global economy.
Q. Which stocks helped the performance of the fund?
A. PMC-Sierra is one of the semiconductor companies best-positioned to take advantage of the build-out of a communications infrastructure - which is the backbone of the Internet and provides the ability to send voice, video and data at high speeds throughout the world. The company delivered superior results during the past six months and was a great stock to own. Micron Technology likewise had a strong six months. After experiencing some difficulty in 1999, the company took advantage of improved pricing for DRAM - dynamic random access memory, a type of semiconductor that goes into personal computers and servers - which caused the company's earnings to accelerate. Altera Corporation also helped the fund's performance. The company derives approximately 70% of its sales from communications infrastructure companies and experienced strong demand for its products during the past few quarters.
Q. Were there any areas that detracted from performance?
A. Agilent Technologies, a diversified technology company that provides semiconductors as well as other electronics to the communications industry, hurt performance. LSI Logic, a semiconductor firm, also detracted from the fund's returns. The two companies each saw excellent demand for their products and had the potential to be successful, but both misexecuted on product delivery. As a result, they reported a shortfall on earnings that hurt the performance of their stocks.
Q. Brian, what is your outlook?
A. I expect that stock market volatility will continue to be a factor in the next few months, and that industry and stock selection will remain important to the fund's ongoing success. If the global economy continues to be strong, it should provide a good environment for the electronics and technology sectors. A healthy economy is important because it gives businesses and consumers the ability to update and replace their old technologies as new and improved versions become available.
The views expressed in this report reflect those of the portfolio manager only through the end of the period of the report as stated on the cover. The manager's views are subject to change at any time based on market or other conditions. For more information, see page 3.
Fund Facts
Start date: July 29, 1985
Fund number: 008
Trading symbol: FSELX
Size: as of August 31, 2000, more than $12.0 billion
Manager: Brian Hanson, since February 2000; analyst, semiconductor equipment, 1998-present; health care industry, 1996-1998; joined Fidelity in 1996
3Semiannual Report
Electronics Portfolio
(Unaudited)
Showing Percentage of Net Assets
|
Common Stocks - 92.7% |
|||
|
Shares |
Value (Note 1) |
||
|
BROADCASTING - 0.7% |
|||
|
Netro Corp. |
1,000,000 |
$ 82,625,000 |
|
|
CELLULAR - 0.1% |
|||
|
AT&T Corp. - Wireless Group |
750,000 |
19,640,625 |
|
|
COMMUNICATIONS EQUIPMENT - 4.7% |
|||
|
Cabletron Systems, Inc. (a) |
1,400,000 |
52,412,500 |
|
|
Cisco Systems, Inc. (a) |
1,500,000 |
102,937,500 |
|
|
Jabil Circuit, Inc. (a) |
3,300,000 |
210,581,250 |
|
|
Lucent Technologies, Inc. |
200,000 |
8,362,500 |
|
|
Nokia AB sponsored ADR |
1,637,850 |
73,600,884 |
|
|
Nortel Networks Corp. |
700,000 |
57,093,741 |
|
|
Telefonaktiebolaget LM Ericsson sponsored ADR |
3,000,000 |
61,500,000 |
|
|
TOTAL COMMUNICATIONS EQUIPMENT |
566,488,375 |
||
|
COMPUTER SERVICES & SOFTWARE - 2.7% |
|||
|
America Online, Inc. (a) |
500,000 |
29,312,500 |
|
|
Cadence Design Systems, Inc. (a) |
7,970,300 |
169,368,875 |
|
|
Mentor Graphics Corp. (a) |
200,000 |
3,775,000 |
|
|
Microsoft Corp. (a) |
1,100,000 |
76,793,750 |
|
|
Redback Networks, Inc. (a) |
75,000 |
11,203,125 |
|
|
Synopsys, Inc. (a) |
905,300 |
33,552,681 |
|
|
TOTAL COMPUTER SERVICES & SOFTWARE |
324,005,931 |
||
|
COMPUTERS & OFFICE EQUIPMENT - 7.0% |
|||
|
Adaptec, Inc. (a) |
2,785,100 |
68,234,950 |
|
|
Brocade Communications Systems, Inc. (a) |
31,900 |
7,203,419 |
|
|
Compaq Computer Corp. |
6,000,000 |
204,375,000 |
|
|
Dell Computer Corp. (a) |
3,500,000 |
152,687,500 |
|
|
Juniper Networks, Inc. (a) |
700,000 |
149,625,000 |
|
|
Palm, Inc. |
250,000 |
11,000,000 |
|
|
SCI Systems, Inc. (a) |
4,038,300 |
249,365,025 |
|
|
TOTAL COMPUTERS & OFFICE EQUIPMENT |
842,490,894 |
||
|
CONSUMER ELECTRONICS - 0.6% |
|||
|
Gemstar-TV Guide International, Inc. (a) |
700,000 |
63,175,000 |
|
|
General Motors Corp. Class H |
500,000 |
16,562,500 |
|
|
TOTAL CONSUMER ELECTRONICS |
79,737,500 |
||
|
ELECTRICAL EQUIPMENT - 0.5% |
|||
|
Scientific-Atlanta, Inc. |
775,000 |
60,401,563 |
|
|
ELECTRONIC INSTRUMENTS - 10.3% |
|||
|
Agilent Technologies, Inc. |
3,700,000 |
223,156,250 |
|
|
Applied Materials, Inc. (a) |
2,075,629 |
179,152,728 |
|
|
ASM International NV (a) |
400,000 |
10,050,000 |
|
|
Cohu, Inc. |
400,000 |
8,200,000 |
|
|
KLA-Tencor Corp. (a) |
4,206,200 |
276,031,875 |
|
|
Kulicke & Soffa Industries, Inc. (a) |
464,360 |
8,445,548 |
|
|
|
|||
|
Shares |
Value (Note 1) |
||
|
LAM Research Corp. (a)(c) |
6,478,781 |
$ 195,173,278 |
|
|
Novellus Systems, Inc. (a) |
3,203,200 |
197,197,000 |
|
|
Teradyne, Inc. (a) |
2,280,700 |
147,817,869 |
|
|
TOTAL ELECTRONIC INSTRUMENTS |
1,245,224,548 |
||
|
ELECTRONICS - 65.2% |
|||
|
Advanced Micro Devices, Inc. (a) |
1,900,000 |
71,487,500 |
|
|
Altera Corp. (a) |
3,800,000 |
246,287,500 |
|
|
Analog Devices, Inc. (a) |
6,475,600 |
650,797,800 |
|
|
Applied Micro Circuits Corp. (a) |
140,000 |
28,411,250 |
|
|
ARM Holdings PLC sponsored ADR (a) |
569,500 |
23,278,313 |
|
|
Atmel Corp. (a) |
2,350,000 |
47,000,000 |
|
|
Avnet, Inc. |
221,000 |
13,232,375 |
|
|
AVX Corp. |
2,600,000 |
77,837,500 |
|
|
Broadcom Corp. Class A (a) |
200,000 |
50,000,000 |
|
|
Celestica, Inc. (sub. vtg.) (a) |
711,200 |
55,339,721 |
|
|
Chartered Semiconductor Manufacturing Ltd. ADR |
275,400 |
23,374,575 |
|
|
Cree, Inc. (a) |
130,000 |
17,907,500 |
|
|
Cypress Semiconductor Corp. (a) |
1,200,000 |
59,325,000 |
|
|
Dallas Semiconductor Corp. |
1,482,800 |
61,350,850 |
|
|
Fairchild Semiconduct International, Inc. Class A |
400,000 |
15,900,000 |
|
|
Flextronics International Ltd. (a) |
3,193,117 |
266,026,560 |
|
|
GlobeSpan, Inc. (a) |
186,700 |
22,485,681 |
|
|
Infineon Technologies AG |
443,000 |
29,454,318 |
|
|
Integrated Device Technology, Inc. (a) |
1,292,500 |
113,416,875 |
|
|
Intel Corp. |
10,558,000 |
790,530,250 |
|
|
Intersil Holding Corp. Class A |
476,800 |
25,747,200 |
|
|
JDS Uniphase Corp. (a) |
1,500,000 |
186,726,570 |
|
|
KEMET Corp. (a) |
2,139,800 |
64,194,000 |
|
|
Lattice Semiconductor Corp. (a) |
798,200 |
62,159,825 |
|
|
Linear Technology Corp. |
5,917,740 |
425,707,421 |
|
|
LSI Logic Corp. (a) |
7,886,100 |
283,406,719 |
|
|
Marvell Technology Group Ltd. |
452,500 |
32,297,188 |
|
|
Maxim Integrated Products, Inc. (a) |
3,000,000 |
263,062,500 |
|
|
Methode Electronics, Inc. Class A |
75,000 |
4,509,375 |
|
|
Microchip Technology, Inc. (a) |
1,200,075 |
81,680,105 |
|
|
Micron Technology, Inc. (a) |
11,364,700 |
929,064,222 |
|
|
Motorola, Inc. |
8,500,000 |
306,531,250 |
|
|
National Semiconductor Corp. (a) |
4,000,000 |
178,000,000 |
|
|
NVIDIA Corp. (a) |
100,000 |
7,937,500 |
|
|
PMC-Sierra, Inc. (a) |
2,378,000 |
561,208,000 |
|
|
Rambus, Inc. (a) |
100 |
8,169 |
|
|
RF Micro Devices, Inc. (a) |
200,000 |
8,925,000 |
|
|
Samsung Electronics Co. Ltd. |
228,150 |
56,278,741 |
|
|
Sanmina Corp. (a) |
2,565,000 |
302,670,000 |
|
|
Silicon Laboratories, Inc. |
2,100 |
126,788 |
|
|
Solectron Corp. (a) |
8,206,800 |
371,870,625 |
|
|
Texas Instruments, Inc. |
10,830,000 |
724,933,125 |
|
|
Transwitch Corp. (a) |
200,000 |
12,037,500 |
|
|
Common Stocks - continued |
|||
|
Shares |
Value (Note 1) |
||
|
ELECTRONICS - CONTINUED |
|||
|
Vitesse Semiconductor Corp. (a) |
1,030,000 |
$ 91,476,875 |
|
|
Xilinx, Inc. (a) |
2,752,100 |
244,592,888 |
|
|
TOTAL ELECTRONICS |
7,888,595,154 |
||
|
INDUSTRIAL MACHINERY & EQUIPMENT - 0.9% |
|||
|
ASM Lithography Holding NV (a) |
629,300 |
23,992,063 |
|
|
PRI Automation, Inc. (a) |
1,056,600 |
54,546,975 |
|
|
Varian Semiconductor Equipment Associates, Inc. (a) |
456,900 |
26,100,413 |
|
|
TOTAL INDUSTRIAL MACHINERY & EQUIPMENT |
104,639,451 |
||
|
TOTAL COMMON STOCKS (Cost $6,372,116,940) |
11,213,849,041 |
||
|
Cash Equivalents - 8.0% |
|||
|
|
|
|
|
|
Fidelity Cash Central Fund, 6.59% (b) |
939,699,505 |
939,699,505 |
|
|
Fidelity Securities Lending Cash Central Fund, 6.64% (b) |
31,707,800 |
31,707,800 |
|
|
TOTAL CASH EQUIVALENTS (Cost $971,407,305) |
971,407,305 |
||
|
TOTAL INVESTMENT PORTFOLIO - 100.7% (Cost $7,343,524,245) |
12,185,256,346 |
|
|
NET OTHER ASSETS - (0.7)% |
(86,253,667) |
||
|
NET ASSETS - 100% |
$ 12,099,002,679 |
||
|
Legend |
|
(a) Non-income producing |
|
(b) The rate quoted is the annualized seven-day yield of the fund at |
|
(c) Affiliated company |
|
Other Information |
|
Purchases and sales of securities, other than short-term securities, |
|
The fund placed a portion of its portfolio transactions with brokerage |
|
The fund participated in the security lending program. At period end, the value of securities loaned amounted to $32,546,263. The fund received |
|
Transactions during the period with companies which are or were affiliates are as follows: |
|
Affiliate |
Purchase |
Sales |
Dividend |
Value |
|
DII Group, Inc. |
$ - |
$ 14,356,958 |
$ - |
$ - |
|
LAM Research |
- |
24,071,680 |
- |
195,173,278 |
|
TOTALS |
$ - |
$ 38,428,638 |
$ - |
$ 195,173,278 |
|
Income Tax Information |
|
At August 31, 2000, the aggregate cost of investment securities for |
See accompanying notes which are an integral part of the financial statements.
Technology Sector
Statement of Assets and Liabilities
|
|
August 31, 2000 (Unaudited) |
|
|
Assets |
|
|
|
Investment in securities, at value |
|
$ 12,185,256,346 |
|
Receivable for investments sold |
|
69,084,650 |
|
Receivable for fund shares sold |
|
25,883,592 |
|
Dividends receivable |
|
274,346 |
|
Interest receivable |
|
4,450,464 |
|
Redemption fees receivable |
|
13,314 |
|
Other receivables |
|
563,277 |
|
Total assets |
|
12,285,525,989 |
|
Liabilities |
|
|
|
Payable to custodian bank |
$ 6,954,817 |
|
|
Payable for investments purchased |
121,831,780 |
|
|
Payable for fund shares redeemed |
17,889,337 |
|
|
Accrued management fee |
5,233,217 |
|
|
Other payables and |
2,906,359 |
|
|
Collateral on securities loaned, |
31,707,800 |
|
|
Total liabilities |
|
186,523,310 |
|
Net Assets |
|
$ 12,099,002,679 |
|
Net Assets consist of: |
|
|
|
Paid in capital |
|
$ 6,156,425,562 |
|
Accumulated net investment (loss) |
|
(16,624,043) |
|
Accumulated undistributed |
|
1,117,471,050 |
|
Net unrealized appreciation (depreciation) on investments |
|
4,841,730,110 |
|
Net Assets, for 96,614,543 |
|
$ 12,099,002,679 |
|
Net Asset Value and |
|
$125.23 |
|
Maximum offering price per share (100/97.00 of $125.23) |
|
$129.10 |
Statement of Operations
|
|
Six months ended August 31, 2000 (Unaudited) |
|
|
Investment Income Dividends |
|
$ 2,878,245 |
|
Interest |
|
24,255,909 |
|
Security lending |
|
1,608,974 |
|
Total income |
|
28,743,128 |
|
Expenses |
|
|
|
Management fee |
$ 30,425,612 |
|
|
Transfer agent fees |
13,264,474 |
|
|
Accounting and security lending fees |
760,541 |
|
|
Non-interested trustees' compensation |
15,804 |
|
|
Custodian fees and expenses |
131,909 |
|
|
Registration fees |
1,005,972 |
|
|
Audit |
71,228 |
|
|
Legal |
19,514 |
|
|
Miscellaneous |
83,089 |
|
|
Total expenses before reductions |
45,778,143 |
|
|
Expense reductions |
(410,972) |
45,367,171 |
|
Net investment income (loss) |
|
(16,624,043) |
|
Realized and Unrealized Gain (Loss) Net realized gain (loss) on: |
|
|
|
Investment securities (including |
1,143,934,912 |
|
|
Foreign currency transactions |
9,291 |
1,143,944,203 |
|
Change in net unrealized appreciation (depreciation) on: |
|
|
|
Investment securities |
(283,786,423) |
|
|
Assets and liabilities in |
398 |
(283,786,025) |
|
Net gain (loss) |
|
860,158,178 |
|
Net increase (decrease) in net assets resulting from operations |
|
$ 843,534,135 |
|
Other Information |
|
|
|
Sales charges paid to FDC |
|
$ 23,945,338 |
|
Deferred sales charges withheld by FDC |
|
$ 5,714 |
|
Exchange fees withheld by FSC |
|
$ 73,260 |
|
Expense reductions |
|
|
|
Directed brokerage arrangements |
|
$ 364,131 |
|
Custodian credits |
|
9,962 |
|
Transfer agent credits |
|
36,879 |
|
|
|
$ 410,972 |
See accompanying notes which are an integral part of the financial statements.
Semiannual Report
Electronics Portfolio
Financial Statements - continued
Statement of Changes in Net Assets
|
Increase (Decrease) in Net Assets |
Six months ended |
Year ended |
|
Operations |
$ (16,624,043) |
$ (21,255,786) |
|
Net realized gain (loss) |
1,143,944,203 |
1,262,114,523 |
|
Change in net unrealized appreciation (depreciation) |
(283,786,025) |
4,435,234,109 |
|
Net increase (decrease) in net assets resulting from operations |
843,534,135 |
5,676,092,846 |
|
Distributions to shareholders from net realized gains |
(562,371,732) |
(461,593,652) |
|
Share transactions |
3,764,983,011 |
3,828,731,759 |
|
Reinvestment of distributions |
544,868,579 |
446,827,109 |
|
Cost of shares redeemed |
(2,458,886,188) |
(2,418,702,252) |
|
Net increase (decrease) in net assets resulting from share transactions |
1,850,965,402 |
1,856,856,616 |
|
Redemption fees |
5,991,045 |
3,980,086 |
|
Total increase (decrease) in net assets |
2,138,118,850 |
7,075,335,896 |
|
Net Assets |
|
|
|
Beginning of period |
9,960,883,829 |
2,885,547,933 |
|
End of period (including accumulated net investment loss of $16,624,043 and $0, respectively) |
$ 12,099,002,679 |
$ 9,960,883,829 |
|
Other Information Shares |
|
|
|
Sold |
32,035,589 |
50,589,405 |
|
Issued in reinvestment of distributions |
4,534,113 |
5,580,487 |
|
Redeemed |
(21,885,479) |
(35,189,966) |
|
Net increase (decrease) |
14,684,223 |
20,979,926 |
Financial Highlights
|
|
Six months ended |
Years ended February 28, |
||||
|
Selected Per-Share Data |
(Unaudited) |
2000 F |
1999 |
1998 |
1997 |
1996 F |
|
Net asset value, beginning of period |
$ 121.58 |
$ 47.34 |
$ 34.99 |
$ 37.95 |
$ 28.18 |
$ 19.80 |
|
Income from Investment Operations |
|
|
|
|
|
|
|
Net investment income (loss) D |
(.18) |
(.33) |
(.23) |
(.17) |
(.17) |
(.08) |
|
Net realized and unrealized gain (loss) |
10.30 |
81.13 |
12.53 |
7.32 |
9.80 |
13.51 |
|
Total from investment operations |
10.12 |
80.80 |
12.30 |
7.15 |
9.63 |
13.43 |
|
Less Distributions |
|
|
|
|
|
|
|
From net realized gain |
(6.53) |
(6.62) |
- |
(7.60) |
- |
(5.25) |
|
In excess of net realized gain |
- |
- |
- |
(2.60) |
- |
- |
|
Total distributions |
(6.53) |
(6.62) |
- |
(10.20) |
- |
(5.25) |
|
Redemption fees added to paid in capital |
.06 |
.06 |
.05 |
.09 |
.14 |
.20 |
|
Net asset value, end of period |
$ 125.23 |
$ 121.58 |
$ 47.34 |
$ 34.99 |
$ 37.95 |
$ 28.18 |
|
Total Return B, C |
8.60% |
178.06% |
35.30% |
24.15% |
34.67% |
72.75% |
|
Ratios and Supplemental Data |
|
|
|
|
|
|
|
Net assets, end of period (000 omitted) |
$ 12,099,003 |
$ 9,960,884 |
$ 2,885,548 |
$ 2,668,750 |
$ 1,744,017 |
$ 1,133,362 |
|
Ratio of expenses to average net assets |
.84% A |
.99% |
1.18% |
1.18% |
1.33% |
1.25% |
|
Ratio of expenses to average net assets after |
.84% A |
.98% E |
1.15% E |
1.12% E |
1.29% E |
1.22% E |
|
Ratio of net investment income (loss) to average net assets |
(.31)% A |
(.46)% |
(.62)% |
(.42)% |
(.54)% |
(.28)% |
|
Portfolio turnover rate |
81% A |
125% |
160% |
435% |
341% |
366% |
|
A Annualized B The total returns would have been lower had certain expenses not been reduced during the periods shown. C Total returns do not include the one time sales
charge and for periods of less than one year are not annualized. |
||||||
See accompanying notes which are an integral part of the financial statements.
Technology Sector
Performance
There are several ways to evaluate a fund's historical performance. You can look at the total percentage change in value, the average annual percentage change or the growth of a hypothetical $10,000 investment. Total return reflects the change in the value of an investment, assuming reinvestment of the fund's dividend income and capital gains (the profits earned upon the sale of securities that have grown in value). Load adjusted returns include a 3.00% sales charge and the effect of a $7.50 long-term trading fee for shares held 30 days or more. Effective September 28, 2000, the $7.50 long-term trading fee was eliminated. If Fidelity had not reimbursed certain fund expenses, the past 10 year total returns would have been lower.
Cumulative Total Returns
|
Periods ended |
Past 6 |
Past 1 |
Past 5 |
Past 10 |
|
Select Software and |
3.83% |
87.79% |
368.60% |
1,768.26% |
|
Select Software and |
0.64% |
82.09% |
354.47% |
1,712.14% |
|
S&P 500 |
11.73% |
16.32% |
193.58% |
493.54% |
|
GS Technology |
2.68% |
63.21% |
n/a** |
n/a** |
Cumulative total returns show the fund's performance in percentage terms over a set period - in this case, six months, one year, five years or 10 years. You can compare the fund's returns to the performance of both the Standard & Poor's 500 Index - a market capitalization-weighted index of common stocks - and the Goldman Sachs Technology Index - a market capitalization-weighted index of 221 stocks designed to measure the performance of companies in the technology sector. These benchmarks include reinvestment of dividends and capital gains, if any, and exclude the effect of sales charges.
Average Annual Total Returns
|
Periods ended |
Past 1 |
Past 5 |
Past 10 |
|
Select Software and |
87.79% |
36.19% |
34.01% |
|
Select Software and |
82.09% |
35.36% |
33.60% |
|
S&P 500 |
16.32% |
24.04% |
19.49% |
|
GS Technology |
63.21% |
n/a** |
n/a** |
Average annual returns take the fund's cumulative return and show you what would have happened if the fund had performed at a constant rate each year.
** Not available
Understanding Performance
How a fund did yesterday is no guarantee of how it will do tomorrow. The stock market, for example, has a history of long-term growth and short-term volatility. Unlike the broader market, however, some sectors may not have a history of growth in the long run. And, as with all stock funds, the share price and return of a fund that invests in a sector will vary.
3$10,000 Over 10 Years
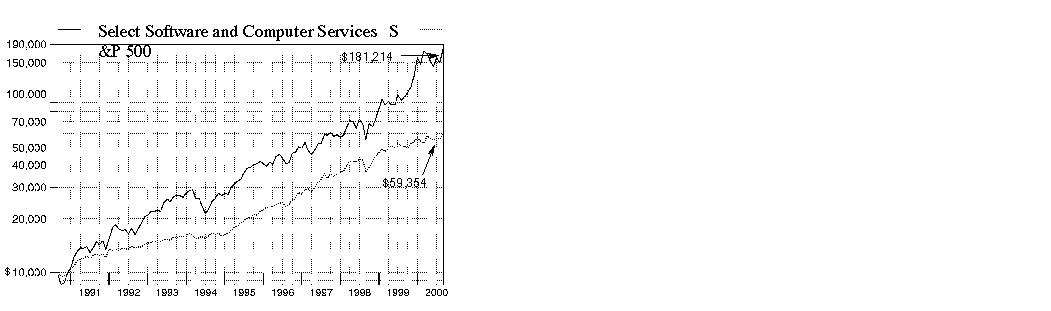
$10,000 Over 10 Years: Let's say hypothetically that $10,000 was invested in Fidelity Select Software and Computer Services Portfolio on August 31, 1990, and the current 3.00% sales charge was paid. As the chart shows, by August 31, 2000, the value of the investment would have grown to $181,214 - a 1,712.14% increase on the initial investment - and includes the effect of a $7.50 long-term trading fee. For comparison, look at how the Standard & Poor's 500 Index did over the same period. With dividends and capital gains, if any, reinvested, the same $10,000 investment would have grown to $59,354 - a 493.54% increase.
Investment Summary
|
Top Ten Stocks as of August 31, 2000 |
|
|
|
% of fund's |
|
Oracle Corp. |
7.3 |
|
Sun Microsystems, Inc. |
5.8 |
|
Computer Associates International, Inc. |
5.1 |
|
VeriSign, Inc. |
4.8 |
|
Siebel Systems, Inc. |
4.7 |
|
VERITAS Software Corp. |
4.3 |
|
Rational Software Corp. |
3.9 |
|
Apple Computer, Inc. |
3.8 |
|
Adobe Systems, Inc. |
3.5 |
|
BEA Systems, Inc. |
3.1 |
|
|
46.3 |
Top Industries as of August 31, 2000
% of fund's net assets

Semiannual Report
(Portfolio Manager photograph)
Telis Bertsekas, Portfolio Manager of Fidelity Select Software and Computer
Services Portfolio
Q. How did the fund perform, Telis?
A. For the six-month period that ended August 31, 2000, the fund returned 3.83%. In comparison, the Goldman Sachs Technology Index - an index of 221 stocks designed to measure the performance of companies in the technology sector - returned 2.68%. During the same period, the Standard & Poor's 500 Index returned 11.73%. For the 12-month period that ended August 31, 2000, the fund returned 87.79%, while the Goldman Sachs index and the S&P 500 index returned 63.21% and 16.32%, respectively.
Q. What factors helped the fund outperform the Goldman Sachs index during the six-month period?
A. The fund's narrower focus on software and services stocks, which tended to outperform other areas of the technology sector, helped it surpass the performance of the index. During the first half of the six-month period, performance was negatively affected by a correction in the technology sector amid worries of resurfacing inflation. The fund also was hurt by its exposure to Internet portals, Microsoft and various high-multiple enterprise software stocks. As inflation fears subsided and strong second-quarter earnings highlighted fundamental strength in the sector during the last three months of the period, the fund rallied. Our overweighted positions in database, enterprise application and software security areas were key contributors.
Q. Did you make any adjustments to the fund after taking over in March?
A. Yes, I did. I reduced large positions in some stocks with extremely rich valuations and generally positioned the fund somewhat more conservatively during March and April. This strategy boosted relative performance during the technology correction in the spring, as the more aggressive names in the sector were hurt the most. Additionally, I reduced the number of holdings in the portfolio, from nearly 90 stocks to about 65 names, to focus more on the industry leaders with the best growth prospects, such as Sun Microsystems and BEA Systems. Emphasizing higher-quality names, which rebounded faster when the technology sector rallied during the second half of the period, and taking advantage of some opportunities in smaller cap stocks, also helped.
Q. Why did Internet business-to-business e-commerce stocks bounce back so strongly after the second-quarter correction?
A. Though hurt by the pullback in technology, investors were quick to recognize the large marketplace opportunity and leadership positions of enterprise software providers such as Siebel Systems, i2 Technologies and Verisign, once the market environment stabilized. When the second-quarter earnings came in better than expected for many of the key business-to-business players, expectations for improving fundamental prospects throughout the remainder of the year fueled a rally through August.
Q. What stocks stood out as top performers?
A. Investors responded well to Sun Microsystems, the fund's top contributor, recognizing its server technology as a key Internet infrastructure component. Oracle, the fund's largest holding at the end of the period, was rewarded for being a key beneficiary of the migration to the Internet in both its core database business and its suite of e-business applications. The perception of accelerating growth prospects helped the stock continue its strong run.
Q. What were some of the disappointments?
A. Top-10 holding Computer Associates suffered a negative earnings report when the shift away from post-Y2K mainframe software spending turned out worse than expected. Citrix Systems, which also missed earnings expectations, was hurt by its transition to a direct-selling model and by questions about its sustainable growth rate. I sold the fund's entire position in Citrix by the end of the period.
Q. What's your outlook, Telis?
A. My outlook for overall company fundamentals is positive. The migration from a PC-based client/server environment to an Internet-based world is driving accelerated and reallocated spending for many large corporations. This trend presents many exciting opportunities for the fund to participate in via large, well-established companies, as well as rapidly emerging smaller firms. However, despite the market correction, many software stocks remain near record-high valuations and this makes careful stock selection more important than ever. I also remain cognizant of the impact a potential economic slowdown could have on corporate information technology spending, which in turn could reduce demand for software and computer services.
The views expressed in this report reflect those of the portfolio manager only through the end of the period of the report as stated on the cover. The manager's views are subject to change at any time based on market or other conditions. For more information, see page 3.
Fund Facts
Start date: July 29, 1985
Fund number: 028
Trading symbol: FSCSX
Size: as of August 31, 2000, more than
$1.5 billion
Manager: Telis Bertsekas, since March 2000;
analyst, beverage and tobacco industries,
since 1997; joined Fidelity in 1997
Semiannual Report
Software and Computer Services Portfolio
(Unaudited)
Showing Percentage of Net Assets
|
Common Stocks - 90.9% |
|||
|
Shares |
Value (Note 1) |
||
|
COMMUNICATIONS EQUIPMENT - 0.3% |
|||
|
Brooktrout, Inc. (a) |
125,000 |
$ 4,250,000 |
|
|
COMPUTER SERVICES & SOFTWARE - 73.3% |
|||
|
Activision, Inc. (a) |
121,700 |
1,703,800 |
|
|
Adobe Systems, Inc. |
409,953 |
53,293,890 |
|
|
Advent Software, Inc. (a) |
50,000 |
3,081,250 |
|
|
Aether Systems, Inc. |
52,000 |
7,202,000 |
|
|
Agile Software Corp. |
129,000 |
8,957,438 |
|
|
America Online, Inc. (a) |
150,100 |
8,799,613 |
|
|
Automatic Data Processing, Inc. |
183,500 |
10,941,188 |
|
|
BEA Systems, Inc. (a) |
691,064 |
47,035,544 |
|
|
BMC Software, Inc. (a) |
449,725 |
12,142,575 |
|
|
Cadence Design Systems, Inc. (a) |
777,800 |
16,528,250 |
|
|
Computer Associates International, Inc. |
2,452,880 |
77,878,940 |
|
|
Computer Sciences Corp. (a) |
362,932 |
28,694,311 |
|
|
Electronic Data Systems Corp. |
841,000 |
41,892,313 |
|
|
First Data Corp. |
153,000 |
7,296,188 |
|
|
i2 Technologies, Inc. (a) |
119,486 |
20,215,538 |
|
|
Infovista SA sponsored ADR (a) |
250,000 |
8,343,750 |
|
|
J.D. Edwards & Co. (a) |
1,863,200 |
46,230,650 |
|
|
Keynote Systems, Inc. |
266,200 |
8,052,550 |
|
|
Macromedia, Inc. (a) |
382,000 |
26,399,781 |
|
|
Manugistics Group, Inc. (a) |
17,000 |
1,491,750 |
|
|
Mercury Interactive Corp. (a) |
199,000 |
24,315,313 |
|
|
Micromuse, Inc. (a) |
149,000 |
22,629,375 |
|
|
Microsoft Corp. (a) |
425,700 |
29,719,181 |
|
|
MicroStrategy, Inc. Class A (a) |
685,000 |
19,094,375 |
|
|
Opnet Technologies, Inc. |
600 |
18,000 |
|
|
Oracle Corp. (a) |
1,222,668 |
111,186,364 |
|
|
PeopleSoft, Inc. (a) |
710,500 |
22,913,625 |
|
|
Phone.com, Inc. (a) |
309,000 |
28,563,188 |
|
|
Pivotal Corp. |
135,000 |
6,075,000 |
|
|
Precise Software Solutions Ltd. |
159,400 |
4,303,800 |
|
|
Proxicom, Inc. (a) |
167,500 |
4,051,406 |
|
|
Quest Software, Inc. |
345,000 |
17,810,625 |
|
|
Radview Software Ltd. |
200,000 |
1,762,500 |
|
|
Rational Software Corp. (a) |
467,000 |
60,097,063 |
|
|
Siebel Systems, Inc. (a) |
362,040 |
71,616,038 |
|
|
Sybase, Inc. (a) |
1,450,000 |
39,784,375 |
|
|
Synopsys, Inc. (a) |
123,200 |
4,566,100 |
|
|
Technology Solutions, Inc. |
420,000 |
1,299,375 |
|
|
Tumbleweed Communications Corp. |
191,800 |
12,011,475 |
|
|
VeriSign, Inc. (a) |
368,914 |
73,367,772 |
|
|
VERITAS Software Corp. (a) |
540,800 |
65,200,200 |
|
|
Vignette Corp. (a) |
406,700 |
15,505,438 |
|
|
Vitria Technology, Inc. |
272,700 |
12,816,900 |
|
|
webMethods, Inc. |
104,154 |
11,190,045 |
|
|
Wind River Systems, Inc. (a) |
45,000 |
1,833,750 |
|
|
Yahoo!, Inc. (a) |
171,508 |
20,838,223 |
|
|
TOTAL COMPUTER SERVICES & SOFTWARE |
1,118,750,825 |
||
|
|
|||
|
Shares |
Value (Note 1) |
||
|
COMPUTERS & OFFICE EQUIPMENT - 14.4% |
|||
|
Apple Computer, Inc. (a) |
941,800 |
$ 57,390,938 |
|
|
Compaq Computer Corp. |
385,000 |
13,114,063 |
|
|
Dell Computer Corp. (a) |
372,000 |
16,228,500 |
|
|
International Business Machines Corp. |
153,100 |
20,209,200 |
|
|
Network Appliance, Inc. (a) |
100,000 |
11,700,000 |
|
|
Sun Microsystems, Inc. (a) |
704,400 |
89,414,775 |
|
|
Tech Data Corp. (a) |
240,000 |
12,390,000 |
|
|
TOTAL COMPUTERS & OFFICE EQUIPMENT |
220,447,476 |
||
|
ELECTRICAL EQUIPMENT - 0.3% |
|||
|
Pinnacle Systems (a) |
419,700 |
5,298,713 |
|
|
ELECTRONIC INSTRUMENTS - 0.7% |
|||
|
Lernout & Hauspie Speech Products NV (a) |
353,000 |
10,303,188 |
|
|
ELECTRONICS - 1.5% |
|||
|
Micron Technology, Inc. (a) |
157,000 |
12,834,750 |
|
|
NVIDIA Corp. (a) |
131,000 |
10,398,125 |
|
|
TOTAL ELECTRONICS |
23,232,875 |
||
|
LODGING & GAMING - 0.1% |
|||
|
WMS Industries, Inc. (a) |
48,700 |
779,200 |
|
|
SERVICES - 0.3% |
|||
|
ACNielsen Corp. (a) |
178,200 |
4,287,938 |
|
|
TOTAL COMMON STOCKS (Cost $958,670,677) |
1,387,350,215 |
||
|
Cash Equivalents - 13.1% |
|||
|
|
|
|
|
|
Fidelity Cash Central Fund, 6.59% (b) |
120,794,062 |
120,794,062 |
|
|
Fidelity Securities Lending Cash Central Fund, 6.64% (b) |
78,471,500 |
78,471,500 |
|
|
TOTAL CASH EQUIVALENTS (Cost $199,265,562) |
199,265,562 |
||
|
TOTAL INVESTMENT PORTFOLIO - 104.0% (Cost $1,157,936,239) |
1,586,615,777 |
||
|
NET OTHER ASSETS - (4.0)% |
(61,127,752) |
||
|
NET ASSETS - 100% |
$ 1,525,488,025 |
||
|
Legend |
|
(a) Non-income producing |
|
(b) The rate quoted is the annualized seven-day yield of the fund at |
|
Other Information |
|
Purchases and sales of securities, other than short-term securities, aggregated $1,538,699,756 and $1,584,238,861, respectively. |
|
The fund placed a portion of its portfolio transactions with brokerage firms which are affiliates of Fidelity Management & Research Company. The commissions paid to these affiliated firms were $28,383 for the period. |
|
The fund participated in the security lending program. At period end, the value of securities loaned amounted to $79,422,250. The fund received cash collateral of $78,471,500 which was invested in cash equivalents. |
|
Income Tax Information |
|
At August 31, 2000, the aggregate cost of investment securities for income tax purposes was $1,168,722,705. Net unrealized appreciation aggregated $417,893,072, of which $483,789,671 related to appreciated investment securities and $65,896,599 related to depreciated investment securities. |
See accompanying notes which are an integral part of the financial statements.
Technology Sector
Statement of Assets and Liabilities
|
|
August 31, 2000 (Unaudited) |
|
|
Assets |
|
|
|
Investment in securities, at value |
|
$ 1,586,615,777 |
|
Cash |
|
679,250 |
|
Receivable for investments sold |
|
30,407,406 |
|
Receivable for fund shares sold |
|
4,789,456 |
|
Dividends receivable |
|
194,613 |
|
Interest receivable |
|
533,173 |
|
Redemption fees receivable |
|
2,472 |
|
Other receivables |
|
444,551 |
|
Total assets |
|
1,623,666,698 |
|
Liabilities |
|
|
|
Payable for investments purchased |
$ 16,357,866 |
|
|
Payable for fund shares redeemed |
2,214,092 |
|
|
Accrued management fee |
651,249 |
|
|
Other payables and |
483,966 |
|
|
Collateral on securities loaned, |
78,471,500 |
|
|
Total liabilities |
|
98,178,673 |
|
Net Assets |
|
$ 1,525,488,025 |
|
Net Assets consist of: |
|
|
|
Paid in capital |
|
$ 698,330,891 |
|
Accumulated net investment (loss) |
|
(2,083,822) |
|
Accumulated undistributed net realized gain (loss) on investments and foreign currency transactions |
|
400,561,418 |
|
Net unrealized appreciation (depreciation) on investments |
|
428,679,538 |
|
Net Assets, for 14,763,954 |
|
$ 1,525,488,025 |
|
Net Asset Value and redemption price per share ($1,525,488,025 ÷ 14,763,954 shares) |
|
$103.33 |
|
Maximum offering price per share (100/97.00 of $103.33) |
|
$106.53 |
Statement of Operations
|
|
Six months ended August 31, 2000 (Unaudited) |
|
|
Investment Income Dividends |
|
$ 560,042 |
|
Interest |
|
3,334,517 |
|
Security lending |
|
441,289 |
|
Total income |
|
4,335,848 |
|
Expenses |
|
|
|
Management fee |
$ 3,790,491 |
|
|
Transfer agent fees |
2,312,558 |
|
|
Accounting and security lending fees |
332,440 |
|
|
Non-interested trustees' compensation |
2,064 |
|
|
Custodian fees and expenses |
22,922 |
|
|
Registration fees |
66,932 |
|
|
Audit |
19,003 |
|
|
Legal |
5,681 |
|
|
Miscellaneous |
153 |
|
|
Total expenses before reductions |
6,552,244 |
|
|
Expense reductions |
(132,574) |
6,419,670 |
|
Net investment income (loss) |
|
(2,083,822) |
|
Realized and Unrealized Gain (Loss) Net realized gain (loss) on: |
|
|
|
Investment securities |
400,658,179 |
|
|
Foreign currency transactions |
166 |
400,658,345 |
|
Change in net unrealized appreciation (depreciation) on investment securities |
|
(345,655,923) |
|
Net gain (loss) |
|
55,002,422 |
|
Net increase (decrease) in net assets resulting from operations |
|
$ 52,918,600 |
|
Other Information |
|
|
|
Sales charges paid to FDC |
|
$ 1,426,720 |
|
Deferred sales charges withheld by FDC |
|
$ 2,462 |
|
Exchange fees withheld by FSC |
|
$ 16,995 |
|
Expense reductions |
|
|
|
Directed brokerage arrangements |
|
$ 127,032 |
|
Custodian credits |
|
2,282 |
|
Transfer agent credits |
|
3,260 |
|
|
|
$ 132,574 |
See accompanying notes which are an integral part of the financial statements.
Semiannual Report
Software and Computer Services Portfolio
Financial Statements - continued
Statement of Changes in Net Assets
|
Increase (Decrease) in Net Assets |
Six months ended |
Year ended |
|
Operations |
$ (2,083,822) |
$ (4,493,210) |
|
Net realized gain (loss) |
400,658,345 |
149,967,319 |
|
Change in net unrealized appreciation (depreciation) |
(345,655,923) |
551,761,848 |
|
Net increase (decrease) in net assets resulting from operations |
52,918,600 |
697,235,957 |
|
Distributions to shareholders from net realized gains |
(72,605,580) |
(78,865,404) |
|
Share transactions |
277,115,676 |
637,476,790 |
|
Reinvestment of distributions |
69,808,818 |
76,024,721 |
|
Cost of shares redeemed |
(249,816,575) |
(576,132,935) |
|
Net increase (decrease) in net assets resulting from share transactions |
97,107,919 |
137,368,576 |
|
Redemption fees |
381,205 |
1,094,752 |
|
Total increase (decrease) in net assets |
77,802,144 |
756,833,881 |
|
Net Assets |
|
|
|
Beginning of period |
1,447,685,881 |
690,852,000 |
|
End of period (including accumulated net investment loss of $2,083,822 and $0, respectively) |
$ 1,525,488,025 |
$ 1,447,685,881 |
|
Other Information Shares |
|
|
|
Sold |
2,930,389 |
8,519,859 |
|
Issued in reinvestment of distributions |
734,136 |
1,062,841 |
|
Redeemed |
(2,676,682) |
(7,907,224) |
|
Net increase (decrease) |
987,843 |
1,675,476 |
Financial Highlights
|
|
Six months ended |
Years ended February 28, |
||||
|
Selected Per-Share Data |
(Unaudited) |
2000 F |
1999 |
1998 |
1997 |
1996 F |
|
Net asset value, beginning of period |
$ 105.09 |
$ 57.09 |
$ 44.26 |
$ 38.58 |
$ 36.20 |
$ 29.07 |
|
Income from Investment Operations |
|
|
|
|
|
|
|
Net investment income (loss) D |
(.15) |
(.36) G |
(.39) |
(.33) |
(.25) |
(.19) |
|
Net realized and unrealized gain (loss) |
3.68 |
54.60 |
14.46 |
12.57 |
5.87 |
11.85 |
|
Total from investment operations |
3.53 |
54.24 |
14.07 |
12.24 |
5.62 |
11.66 |
|
Less Distributions |
|
|
|
|
|
|
|
From net realized gain |
(5.32) |
(6.33) |
(1.32) |
(6.61) |
(3.31) |
(4.60) |
|
Redemption fees added to paid in capital |
.03 |
.09 |
.08 |
.05 |
.07 |
.07 |
|
Net asset value, end of period |
$ 103.33 |
$ 105.09 |
$ 57.09 |
$ 44.26 |
$ 38.58 |
$ 36.20 |
|
Total Return B, C |
3.83% |
100.83% |
32.57% |
35.50% |
16.14% |
40.17% |
|
Ratios and Supplemental Data |
|
|
|
|
|
|
|
Net assets, end of period (000 omitted) |
$ 1,525,488 |
$ 1,447,686 |
$ 690,852 |
$ 503,367 |
$ 389,699 |
$ 337,633 |
|
Ratio of expenses to average net assets |
.97% A |
1.11% |
1.28% |
1.44% |
1.54% |
1.48% |
|
Ratio of expenses to average net assets after |
.95% A, E |
1.11% |
1.27% E |
1.42% E |
1.51% E |
1.47% E |
|
Ratio of net investment income (loss) to average net assets |
(.31)% A |
(.51)% |
(.82)% |
(.81)% |
(.66)% |
(.54)% |
|
Portfolio turnover rate |
243% A |
59% |
72% |
145% |
279% |
183% |
|
A Annualized B The total returns would have been lower had certain expenses not been reduced during the periods shown. C Total returns do not include the one time sales
charge and for periods of less than one year are not annualized. |
||||||
See accompanying notes which are an integral part of the financial statements.
Technology Sector
Performance
There are several ways to evaluate a fund's historical performance. You can look at the total percentage change in value, the average annual percentage change or the growth of a hypothetical $10,000 investment. Total return reflects the change in the value of an investment, assuming reinvestment of the fund's dividend income and capital gains (the profits earned upon the sale of securities that have grown in value). Load adjusted returns include a 3.00% sales charge and the effect of a $7.50 long-term trading fee for shares held 30 days or more. Effective September 28, 2000, the $7.50 long-term trading fee was eliminated.
Cumulative Total Returns
|
Periods ended |
Past 6 |
Past 1 |
Past 5 |
Past 10 |
|
Select Technology |
-4.44% |
98.99% |
509.64% |
2,483.90% |
|
Select Technology |
-7.38% |
92.95% |
491.27% |
2,406.31% |
|
S&P 500 |
11.73% |
16.32% |
193.58% |
493.54% |
|
GS Technology |
2.68% |
63.21% |
n/a** |
n/a** |
Cumulative total returns show the fund's performance in percentage terms over a set period - in this case, six months, one year, five years or 10 years. You can compare the fund's returns to the performance of both the Standard & Poor's 500 Index - a market capitalization-weighted index of common stocks - and the Goldman Sachs Technology Index - a market capitalization-weighted index of 221 stocks designed to measure the performance of companies in the technology sector. These benchmarks include reinvestment of dividends and capital gains, if any, and exclude the effect of sales charges.
Average Annual Total Returns
|
Periods ended |
Past 1 |
Past 5 |
Past 10 |
|
Select Technology |
98.99% |
43.55% |
38.43% |
|
Select Technology |
92.95% |
42.68% |
38.01% |
|
S&P 500 |
16.32% |
24.04% |
19.49% |
|
GS Technology |
63.21% |
n/a** |
n/a** |
Average annual returns take the fund's cumulative return and show you what would have happened if the fund had performed at a constant rate each year.
** Not available
Understanding Performance
How a fund did yesterday is no guarantee of how it will do tomorrow. The stock market, for example, has a history of long-term growth and short-term volatility. Unlike the broader market, however, some sectors may not have a history of growth in the long run. And, as with all stock funds, the share price and return of a fund that invests in a sector will vary.
3$10,000 Over 10 Years
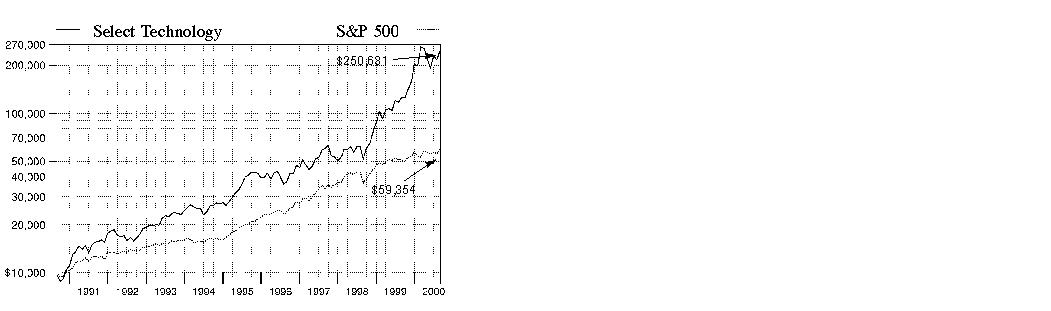
$10,000 Over 10 Years: Let's say hypothetically that $10,000 was invested in Fidelity Select Technology Portfolio on August 31, 1990, and the current 3.00% sales charge was paid. As the chart shows, by August 31, 2000, the value of the investment would have grown to $250,631 - a 2,406.31% increase on the initial investment - and includes the effect of a $7.50 long-term trading fee. For comparison, look at how the Standard & Poor's 500 Index did over the same period. With dividends and capital gains, if any, reinvested, the same $10,000 investment would have grown to $59,354 - a 493.54% increase.
Investment Summary
|
Top Ten Stocks as of August 31, 2000 |
|
|
|
% of fund's |
|
Cisco Systems, Inc. |
8.4 |
|
Juniper Networks, Inc. |
6.7 |
|
Nortel Networks Corp. |
5.9 |
|
Intel Corp. |
3.8 |
|
EMC Corp. |
3.8 |
|
JDS Uniphase Corp. |
3.2 |
|
Corning, Inc. |
2.6 |
|
SDL, Inc. |
2.3 |
|
Texas Instruments, Inc. |
2.0 |
|
Vignette Corp. |
2.0 |
|
|
40.7 |
|
Top Industries as of August 31, 2000 |
|
% of fund's net assets

Semiannual Report
(Portfolio Manager photograph)
Larry Rakers,
Portfolio Manager
of Fidelity Select
Technology Portfolio
Q. How did the fund perform, Larry?
A. For the six months that ended August 31, 2000, the fund returned -4.44%, trailing the Goldman Sachs Technology Index -
an index of 221 stocks designed to measure the performance of companies in the technology sector - and the Standard & Poor's 500 Index, which returned
2.68% and 11.73%, respectively. For the 12-month period that ended August 31, 2000, the fund returned 98.99%, while the Goldman Sachs and S&P 500
indexes returned 63.21% and 16.32%, respectively.
Q. It was a bumpy ride for tech stocks during the six-month period. What factors contributed to the sector's extreme volatility?
A. Valuations were the main culprit early on, as unbridled speculation gave way to serious concerns about rising interest rates and a potential economic slowdown. Historically, economic growth is tied to technology spending, so the prospect of a deceleration sent investors fleeing for the exits, erasing most of the gains that had taken months to accumulate. Y2K-related shortfalls and summer seasonal weakness further plagued the market, with hardware stocks feeling most of the pain. Earnings jitters made for a volatile summer, as investors grappled with the prospects of a hard landing - that is, an economic slowdown that results in recession. These concerns dissipated in August, sparking a strong "relief rally." Throughout the volatility, fundamentals remained reasonably strong for tech stocks overall, thanks to a boom in tech-related spending triggered by companies looking to stay ahead by improving productivity.
Q. Why did the fund trail the Goldman Sachs benchmark during the past six months?
A. Since the fund tends to emphasize the fastest-growing names in the sector, it is apt to outperform the index during a strong tech market, and underperform in a down market. Over the past six months, we lost ground by focusing on higher-priced semiconductor stocks, which suffered the most during the correction. Disappointing stock selection in names such as Emulex and QLogic, which suffered earnings setbacks, further compounded our problem. I sold off both of these stocks during the period in an effort to minimize the damage. Our overexposure to e-commerce software providers Vignette and BroadVision also hurt. Finally, the decision to underweight market heavyweights Intel, Oracle, Hewlett-Packard and IBM - which held up better during the downturn - effectively sealed our fate relative to the index.
Q. Were there any bright spots?
A. The fund benefited from maintaining a positive bet on those high-
growth areas involved in the build-out of Internet infrastructure and the resulting formation of a single network - which is central to enabling broadband
services. Most of our wins were concentrated in the telecommunications/optical equipment and networking spaces. Juniper and Cisco - leading makers of
networking gear - were significant contributors, thanks to surging demand for routers, the devices that direct traffic over the Internet. Corning, Nortel and Ciena
contributed from the optics area, while Brocade and EMC offered strong gains on the data storage front. Underweighting Microsoft further aided relative returns,
with the software giant slipping on slow adoption of its Windows 2000 operating system and its antitrust dispute with the U.S. government. Having raised the
earnings growth rate of the fund after taking over in February, I also was able to improve its risk/return profile, which prevented us from falling further during
the market's downturn.
Q. What other factors influenced performance?
A. Our focus on communications chips was another infrastructure strategy that worked, with Altera, GlobeSpan and PMC-Sierra leading the way. We also were rewarded for making timely cyclical calls on various electronic components, such as flash memory - specialty chips used mainly in PDAs and laptops. Unfortunately, for every gainer, there was an even bigger loser. The fund was overexposed to a handful of problem stocks - namely DoubleClick, Motorola, Citrix and Silknet - which detracted further from relative returns. The fund no longer held Silknet at the close of the period.
Q. What's your outlook?
A. I feel that demand will accelerate behind a continued rise in productivity, with spending in the sector representing an increasing share of GDP. I'm optimistic because tech stocks tend to perform well in this type of environment. It's up for debate as to where we are exactly in the productivity cycle, but if I were to guess I'd say we're still in the early innings. With that said, I plan to remain fully invested and to continue to look for the highest-growth companies at the best prices I can get for shareholders.
The views expressed in this report reflect those of the portfolio manager only through the end of the period of the report as stated on the cover. The manager's views are subject to change at any time based on market or other conditions. For more information, see page 3.
Fund Facts
Start date: July 14, 1981
Fund number: 064
Trading symbol: FSPTX
Size: as of August 31, 2000, more than
$8.0 billion
Manager: Larry Rakers, since February 2000; manager, Fidelity Select Computers Portfolio and Fidelity Advisor Technology Fund, since January 2000; Fidelity Advisor Natural Resources Fund, 1997-1999; several Fidelity Select Portfolios, 1995-1999; joined Fidelity in 1993
3Semiannual Report
Technology Portfolio
(Unaudited)
Showing Percentage of Net Assets
|
Common Stocks - 94.7% |
|||
|
Shares |
Value (Note 1) |
||
|
ADVERTISING - 1.3% |
|||
|
DoubleClick, Inc. (a) |
2,531,100 |
$ 102,984,131 |
|
|
BROADCASTING - 0.4% |
|||
|
American Tower Corp. Class A (a) |
163,600 |
5,940,725 |
|
|
Netro Corp. |
275,000 |
22,721,875 |
|
|
TOTAL BROADCASTING |
28,662,600 |
||
|
CELLULAR - 0.1% |
|||
|
Crown Castle International Corp. (a) |
325,000 |
11,273,438 |
|
|
CHEMICALS & PLASTICS - 0.1% |
|||
|
Peak International Ltd. (a)(c) |
701,000 |
6,089,938 |
|
|
COMMUNICATIONS EQUIPMENT - 23.5% |
|||
|
3Com Corp. |
900,000 |
14,962,500 |
|
|
ADC Telecommunications, Inc. (a) |
500,000 |
20,468,750 |
|
|
Cabletron Systems, Inc. (a) |
450,000 |
16,846,875 |
|
|
Ciena Corp. (a) |
510,000 |
113,060,625 |
|
|
Cisco Systems, Inc. (a) |
9,783,800 |
671,413,257 |
|
|
Comverse Technology, Inc. (a) |
1,294,600 |
119,022,288 |
|
|
Corning, Inc. |
644,480 |
211,349,160 |
|
|
Corvis Corp. |
105,000 |
10,900,313 |
|
|
Ditech Communications Corp. (a) |
920,000 |
54,280,000 |
|
|
Efficient Networks, Inc. (a) |
35,000 |
1,880,703 |
|
|
Jabil Circuit, Inc. (a) |
450,000 |
28,715,625 |
|
|
Lucent Technologies, Inc. |
1,482,205 |
61,974,697 |
|
|
Natural MicroSystems Corp. (a) |
80,200 |
5,979,913 |
|
|
Nokia AB sponsored ADR |
661,300 |
29,717,169 |
|
|
Nortel Networks Corp. |
5,777,400 |
471,219,114 |
|
|
Peco II, Inc. |
3,200 |
124,800 |
|
|
Sycamore Networks, Inc. |
144,200 |
19,827,500 |
|
|
Telefonaktiebolaget LM Ericsson sponsored ADR |
978,000 |
20,049,000 |
|
|
Terayon Communication Systems, Inc. (a) |
262,600 |
14,574,300 |
|
|
TOTAL COMMUNICATIONS EQUIPMENT |
1,886,366,589 |
||
|
COMPUTER SERVICES & SOFTWARE - 16.9% |
|||
|
Accrue Software, Inc. |
50,000 |
1,065,625 |
|
|
Adobe Systems, Inc. |
203,800 |
26,494,000 |
|
|
Aether Systems, Inc. |
83,900 |
11,620,150 |
|
|
Amazon.com, Inc. (a) |
50,000 |
2,075,000 |
|
|
Amdocs Ltd. (a) |
70,000 |
5,000,625 |
|
|
Ariba, Inc. |
204,600 |
32,198,925 |
|
|
Art Technology Group, Inc. |
290,000 |
29,561,875 |
|
|
Be Free, Inc. |
450,100 |
2,728,731 |
|
|
BEA Systems, Inc. (a) |
553,000 |
37,638,563 |
|
|
BroadVision, Inc. (a) |
124,200 |
4,284,900 |
|
|
Cadence Design Systems, Inc. (a) |
600,000 |
12,750,000 |
|
|
Cambridge Technology Partners, Inc. (a) |
484,600 |
2,983,319 |
|
|
Citrix Systems, Inc. (a) |
1,157,200 |
25,458,400 |
|
|
CNET Networks, Inc. (a) |
137,100 |
4,592,850 |
|
|
|
|||
|
Shares |
Value (Note 1) |
||
|
Computer Associates International, Inc. |
270,000 |
$ 8,572,500 |
|
|
Computer Sciences Corp. (a) |
100,000 |
7,906,250 |
|
|
Digital Insight Corp. |
125,000 |
3,312,500 |
|
|
DST Systems, Inc. (a) |
135,000 |
12,690,000 |
|
|
Electronic Data Systems Corp. |
150,000 |
7,471,875 |
|
|
Exodus Communications, Inc. (a) |
1,144,960 |
78,358,200 |
|
|
Foundry Networks, Inc. |
300,000 |
27,918,750 |
|
|
InfoSpace.com, Inc. (a) |
282,800 |
11,029,200 |
|
|
Internap Network Services Corp. |
90,000 |
3,240,000 |
|
|
Intertrust Technologies Corp. |
544,500 |
8,746,031 |
|
|
J.D. Edwards & Co. (a) |
1,299,100 |
32,233,919 |
|
|
Kana Communications, Inc. |
144,158 |
5,784,340 |
|
|
Legato Systems, Inc. (a) |
6,500 |
78,813 |
|
|
Macromedia, Inc. (a) |
150,000 |
10,366,406 |
|
|
Manugistics Group, Inc. (a) |
77,500 |
6,800,625 |
|
|
Mercury Interactive Corp. (a) |
125,000 |
15,273,438 |
|
|
Metasolv Software, Inc. |
377,400 |
15,426,225 |
|
|
Micromuse, Inc. (a) |
100,000 |
15,187,500 |
|
|
Microsoft Corp. (a) |
1,118,280 |
78,069,923 |
|
|
National Instrument Corp. (a) |
100,000 |
4,318,750 |
|
|
Netegrity, Inc. (a) |
75,000 |
6,600,000 |
|
|
Nuance Communications, Inc. |
115,000 |
15,136,875 |
|
|
Numerical Technologies, Inc. |
350,000 |
13,693,750 |
|
|
OpenTV Corp. |
150,000 |
8,325,000 |
|
|
Oracle Corp. (a) |
825,000 |
75,023,438 |
|
|
Orbotech Ltd. |
20,000 |
1,936,250 |
|
|
Phone.com, Inc. (a) |
210,400 |
19,448,850 |
|
|
Polycom, Inc. (a) |
149,700 |
16,822,538 |
|
|
Proxicom, Inc. (a) |
375,000 |
9,070,313 |
|
|
Quest Software, Inc. |
75,000 |
3,871,875 |
|
|
Rational Software Corp. (a) |
100,000 |
12,868,750 |
|
|
Redback Networks, Inc. (a) |
524,900 |
78,406,938 |
|
|
Siebel Systems, Inc. (a) |
75,000 |
14,835,938 |
|
|
Software.com, Inc. (a) |
557,800 |
81,194,763 |
|
|
Support.com, Inc. |
540,200 |
16,754,641 |
|
|
Sybase, Inc. (a) |
730,000 |
20,029,375 |
|
|
Synopsys, Inc. (a) |
387,000 |
14,343,188 |
|
|
SynQuest, Inc. |
300,000 |
2,353,125 |
|
|
Technology Solutions, Inc. |
1,300,000 |
4,021,875 |
|
|
TIBCO Software, Inc. |
115,000 |
11,722,813 |
|
|
Tumbleweed Communications Corp. |
110,000 |
6,888,750 |
|
|
Unisys Corp. (a) |
200,000 |
2,600,000 |
|
|
VeriSign, Inc. (a) |
325,000 |
64,634,375 |
|
|
VERITAS Software Corp. (a) |
504,000 |
60,763,500 |
|
|
Vignette Corp. (a) |
4,240,680 |
161,675,925 |
|
|
WatchGuard Technologies, Inc. |
124,800 |
6,130,800 |
|
|
Yahoo!, Inc. (a) |
631,900 |
76,775,850 |
|
|
TOTAL COMPUTER SERVICES & SOFTWARE |
1,357,167,703 |
||
|
COMPUTERS & OFFICE EQUIPMENT - 22.6% |
|||
|
Alteon Websystems, Inc. |
513,600 |
76,012,800 |
|
|
Apple Computer, Inc. (a) |
538,400 |
32,808,750 |
|
|
Common Stocks - continued |
|||
|
Shares |
Value (Note 1) |
||
|
COMPUTERS & OFFICE EQUIPMENT - CONTINUED |
|||
|
Avici Systems, Inc. |
127,400 |
$ 19,086,113 |
|
|
Brocade Communications Systems, Inc. (a) |
345,000 |
77,905,313 |
|
|
CacheFlow, Inc. |
107,500 |
11,757,813 |
|
|
Compaq Computer Corp. |
2,550,000 |
86,859,375 |
|
|
Dell Computer Corp. (a) |
3,052,900 |
133,182,763 |
|
|
EMC Corp. (a) |
3,077,800 |
301,624,400 |
|
|
Extended Systems, Inc. (a) |
155,000 |
7,110,625 |
|
|
Extreme Networks, Inc. (a) |
250,000 |
23,265,625 |
|
|
Gateway, Inc. (a) |
575,000 |
39,157,500 |
|
|
Hewlett-Packard Co. |
476,600 |
57,549,450 |
|
|
International Business Machines Corp. |
674,200 |
88,994,400 |
|
|
Juniper Networks, Inc. (a) |
2,515,400 |
537,666,750 |
|
|
Lexmark International Group, Inc. |
704,400 |
47,767,125 |
|
|
MMC Networks, Inc. (a) |
100,000 |
12,181,250 |
|
|
MRV Communications, Inc. (a) |
405,000 |
31,210,313 |
|
|
Network Appliance, Inc. (a) |
170,000 |
19,890,000 |
|
|
Palm, Inc. |
889,925 |
39,156,700 |
|
|
SanDisk Corp. (a) |
77,700 |
6,487,950 |
|
|
SCI Systems, Inc. (a) |
120,000 |
7,410,000 |
|
|
Seagate Technology, Inc. (a) |
300,000 |
17,812,500 |
|
|
Sun Microsystems, Inc. (a) |
1,120,000 |
142,170,000 |
|
|
TOTAL COMPUTERS & OFFICE EQUIPMENT |
1,817,067,515 |
||
|
CONSUMER ELECTRONICS - 0.5% |
|||
|
Gemstar-TV Guide International, Inc. (a) |
400,000 |
36,100,000 |
|
|
DRUGS & PHARMACEUTICALS - 0.1% |
|||
|
SpeechWorks International, Inc. |
97,600 |
7,478,600 |
|
|
ELECTRICAL EQUIPMENT - 2.1% |
|||
|
Alcatel SA sponsored ADR |
1,415,000 |
117,268,125 |
|
|
C&D Technologies, Inc. |
50,000 |
2,762,500 |
|
|
Pinnacle Systems (a) |
489,800 |
6,183,725 |
|
|
Scientific-Atlanta, Inc. |
512,600 |
39,950,763 |
|
|
TOTAL ELECTRICAL EQUIPMENT |
166,165,113 |
||
|
ELECTRONIC INSTRUMENTS - 2.3% |
|||
|
Agilent Technologies, Inc. |
552,502 |
33,322,777 |
|
|
Applied Materials, Inc. (a) |
550,000 |
47,471,875 |
|
|
KLA-Tencor Corp. (a) |
775,000 |
50,859,375 |
|
|
LAM Research Corp. (a) |
192,000 |
5,784,000 |
|
|
LTX Corp. (a) |
297,400 |
7,602,288 |
|
|
Novellus Systems, Inc. (a) |
150,000 |
9,234,375 |
|
|
Teradyne, Inc. (a) |
475,000 |
30,785,938 |
|
|
TOTAL ELECTRONIC INSTRUMENTS |
185,060,628 |
||
|
ELECTRONICS - 24.3% |
|||
|
Advanced Energy Industries, Inc. (a) |
125,000 |
7,140,625 |
|
|
|
|||
|
Shares |
Value (Note 1) |
||
|
Advanced Micro Devices, Inc. (a) |
357,000 |
$ 13,432,125 |
|
|
Altera Corp. (a) |
706,000 |
45,757,625 |
|
|
Amkor Technology, Inc. (a) |
190,000 |
6,483,750 |
|
|
Applied Micro Circuits Corp. (a) |
165,000 |
33,484,688 |
|
|
Atmel Corp. (a) |
505,400 |
10,108,000 |
|
|
Broadcom Corp. Class A (a) |
85,000 |
21,250,000 |
|
|
Celestica, Inc. (sub. vtg.) (a) |
50,000 |
3,890,588 |
|
|
Centillium Communications, Inc. |
5,900 |
439,550 |
|
|
ChipPac, Inc. |
925,000 |
16,881,250 |
|
|
Cree, Inc. (a) |
1,139,030 |
156,901,383 |
|
|
Cypress Semiconductor Corp. (a) |
100,000 |
4,943,750 |
|
|
Dallas Semiconductor Corp. |
85,000 |
3,516,875 |
|
|
Fairchild Semiconductor |
100,000 |
3,975,000 |
|
|
Flextronics International Ltd. (a) |
350,100 |
29,167,706 |
|
|
GlobeSpan, Inc. (a) |
450,500 |
54,257,094 |
|
|
Hyundai Electronics |
375,000 |
6,865,843 |
|
|
Integrated Device Technology, Inc. (a) |
135,000 |
11,846,250 |
|
|
Intel Corp. |
4,120,000 |
308,485,000 |
|
|
International Rectifier Corp. (a) |
85,000 |
5,349,688 |
|
|
Intersil Holding Corp. Class A |
100,000 |
5,400,000 |
|
|
JDS Uniphase Corp. (a) |
2,073,200 |
258,081,017 |
|
|
Kyocera Corp. |
31,000 |
5,638,125 |
|
|
LSI Logic Corp. (a) |
1,125,000 |
40,429,688 |
|
|
Marvell Technology Group Ltd. |
480,600 |
34,302,825 |
|
|
Methode Electronics, Inc. Class A |
70,000 |
4,208,750 |
|
|
Micron Technology, Inc. (a) |
1,271,600 |
103,953,300 |
|
|
Motorola, Inc. |
1,977,600 |
71,317,200 |
|
|
National Semiconductor Corp. (a) |
204,400 |
9,095,800 |
|
|
NVIDIA Corp. (a) |
650,200 |
51,609,625 |
|
|
Plexus Corp. (a) |
35,000 |
5,416,250 |
|
|
PMC-Sierra, Inc. (a) |
495,000 |
116,820,000 |
|
|
Power-One, Inc. (a) |
75,000 |
11,882,813 |
|
|
RF Micro Devices, Inc. (a) |
200,000 |
8,925,000 |
|
|
Samsung Electronics Co. Ltd. |
175,300 |
43,242,005 |
|
|
Sanmina Corp. (a) |
221,400 |
26,125,200 |
|
|
SDL, Inc. (a) |
456,500 |
181,373,156 |
|
|
Semtech Corp. (a) |
31,400 |
3,718,938 |
|
|
Silicon Laboratories, Inc. |
53,200 |
3,211,950 |
|
|
Solectron Corp. (a) |
550,000 |
24,921,875 |
|
|
Taiwan Semiconductor Manufacturing Co. Ltd. sponsored ADR (a) |
266,880 |
9,340,800 |
|
|
Texas Instruments, Inc. |
2,428,500 |
162,557,719 |
|
|
Virage Logic Corp. |
170,000 |
3,198,125 |
|
|
Vitesse Semiconductor Corp. (a) |
230,000 |
20,426,875 |
|
|
TOTAL ELECTRONICS |
1,949,373,826 |
||
|
INDUSTRIAL MACHINERY & EQUIPMENT - 0.3% |
|||
|
ASM Lithography Holding NV (a) |
300,000 |
11,437,500 |
|
|
Mattson Technology, Inc. (a) |
115,400 |
2,524,375 |
|
|
Common Stocks - continued |
|||
|
Shares |
Value (Note 1) |
||
|
INDUSTRIAL MACHINERY & EQUIPMENT - CONTINUED |
|||
|
PRI Automation, Inc. (a) |
100,000 |
$ 5,162,500 |
|
|
Varian Semiconductor Equipment Associates, Inc. (a) |
130,000 |
7,426,250 |
|
|
TOTAL INDUSTRIAL MACHINERY & EQUIPMENT |
26,550,625 |
||
|
REAL ESTATE INVESTMENT TRUSTS - 0.1% |
|||
|
Pinnacle Holdings, Inc. (a) |
135,000 |
5,433,750 |
|
|
SERVICES - 0.1% |
|||
|
Diamond Technology Partners, Inc. Class A (a) |
82,700 |
5,277,294 |
|
|
eLoyalty Corp. |
215,000 |
2,929,375 |
|
|
Media Metrix, Inc. (a) |
96,000 |
2,376,000 |
|
|
Per-Se Technologies, Inc. warrants 7/8/03 (a) |
3,258 |
0 |
|
|
TOTAL SERVICES |
10,582,669 |
||
|
TELEPHONE SERVICES - 0.0% |
|||
|
TeraBeam Networks (e) |
23,600 |
88,500 |
|
|
TOTAL COMMON STOCKS (Cost $5,297,572,764) |
7,596,445,625 |
||
|
Convertible Bonds - 0.0% |
|||||
|
Moody's Ratings (unaudited) |
Principal Amount |
|
|||
|
COMPUTER SERVICES & SOFTWARE - 0.0% |
|||||
|
Cyras Systems, Inc. 4.5% 8/15/05 (d) |
- |
|
$ 1,750,000 |
2,047,500 |
|
|
Cash Equivalents - 9.1% |
|||
|
Shares |
|
||
|
Fidelity Cash Central Fund, 6.59% (b) |
441,150,804 |
441,150,804 |
|
|
Fidelity Securities Lending Cash Central Fund, 6.64% (b) |
286,445,300 |
286,445,300 |
|
|
TOTAL CASH EQUIVALENTS (Cost $727,596,104) |
727,596,104 |
||
|
TOTAL INVESTMENT PORTFOLIO - 103.8% (Cost $6,026,918,868) |
8,326,089,229 |
|
NET OTHER ASSETS - (3.8)% |
(302,128,708) |
||
|
NET ASSETS - 100% |
$ 8,023,960,521 |
||
|
Legend |
|
(a) Non-income producing |
|
(b) The rate quoted is the annualized seven-day yield of the fund at |
|
(c) Affiliated company |
|
(d) Security exempt from registration under Rule 144A of the Securities |
|
(e) Restricted securities - Investment in securities not registered under the Securities Act of 1933. |
|
Additional information on each holding is as follows: |
|
Security |
Acquisition Date |
Acquisition Cost |
|
TeraBeam Networks |
4/7/00 |
$ 88,500 |
|
Other Information |
|
Purchases and sales of securities, other than short-term securities, aggregated $4,204,012,914 and $3,490,415,639, respectively. |
|
The fund placed a portion of its portfolio transactions with brokerage firms which are affiliates of Fidelity Management & Research Company. The commissions paid to these affiliated firms were $82,028 for the period. |
|
The fund invested in securities that are not registered under the Securities Act of 1933. These securities are subject to legal or contractual restrictions on resale. At the end of the period, restricted securities (excluding Rule 144A issues) amounted to $88,500 or 0.0% of net assets. |
|
The fund participated in the security lending program. At period end, the value of securities loaned amounted to $287,121,613. The fund received cash collateral of $286,445,300 which was invested in cash equivalents. |
|
Transactions during the period with companies which are or were affiliates are as follows: |
|
|
Purchases |
Sales |
Dividend |
Value |
|
Affiliate |
Cost |
Cost |
Income |
|
|
Peak International Ltd |
$ - |
$ - |
$ - |
$ 6,089,938 |
|
Distribution of investments by country of issue, as a percentage of total |
|
United States of America |
90.0% |
|
Canada |
5.9 |
|
France |
1.5 |
|
Others (individually less than 1%) |
2.6 |
|
|
100.0% |
|
Income Tax Information |
|
At August 31, 2000, the aggregate cost of investment securities for income tax purposes was $6,045,479,524. Net unrealized appreciation aggregated $2,280,609,705, of
which $2,621,857,287 related to appreciated investment securities and $341,247,582 related to depreciated |
See accompanying notes which are an integral part of the financial statements.
Technology Sector
Statement of Assets and Liabilities
|
|
August 31, 2000 (Unaudited) |
|
|
Assets |
|
|
|
Investment in securities, at value |
|
$ 8,326,089,229 |
|
Receivable for investments sold |
|
79,369,303 |
|
Receivable for fund shares sold |
|
14,711,727 |
|
Dividends receivable |
|
455,861 |
|
Interest receivable |
|
2,512,688 |
|
Redemption fees receivable |
|
10,250 |
|
Other receivables |
|
345,569 |
|
Total assets |
|
8,423,494,627 |
|
Liabilities |
|
|
|
Payable for investments purchased |
$ 91,034,069 |
|
|
Payable for fund shares redeemed |
16,270,126 |
|
|
Accrued management fee |
3,512,070 |
|
|
Other payables and |
2,272,541 |
|
|
Collateral on securities loaned, |
286,445,300 |
|
|
Total liabilities |
|
399,534,106 |
|
Net Assets |
|
$ 8,023,960,521 |
|
Net Assets consist of: |
|
|
|
Paid in capital |
|
$ 5,113,043,923 |
|
Accumulated net investment (loss) |
|
(16,404,036) |
|
Accumulated undistributed net realized gain (loss) on investments and foreign currency transactions |
|
628,149,411 |
|
Net unrealized appreciation (depreciation) on investments |
|
2,299,171,223 |
|
Net Assets, for 45,163,672 |
|
$ 8,023,960,521 |
|
Net Asset Value and redemption price per share ($8,023,960,521 ÷ 45,163,672 shares) |
|
$177.66 |
|
Maximum offering price per share (100/97.00 of $177.66) |
|
$183.15 |
Statement of Operations
|
|
Six months ended August 31, 2000 (Unaudited) |
|
|
Investment Income Dividends |
|
$ 2,413,593 |
|
Interest |
|
14,087,315 |
|
Security lending |
|
816,598 |
|
Total income |
|
17,317,506 |
|
Expenses |
|
|
|
Management fee |
$ 21,096,290 |
|
|
Transfer agent fees |
11,428,351 |
|
|
Accounting and security lending fees |
729,493 |
|
|
Non-interested trustees' compensation |
12,227 |
|
|
Custodian fees and expenses |
126,276 |
|
|
Registration fees |
623,277 |
|
|
Audit |
48,159 |
|
|
Legal |
13,908 |
|
|
Miscellaneous |
387 |
|
|
Total expenses before reductions |
34,078,368 |
|
|
Expense reductions |
(356,826) |
33,721,542 |
|
Net investment income (loss) |
|
(16,404,036) |
|
Realized and Unrealized Gain (Loss) Net realized gain (loss) on: |
|
|
|
Investment securities |
658,708,858 |
|
|
Foreign currency transactions |
28,478 |
658,737,336 |
|
Change in net unrealized appreciation (depreciation) on: |
|
|
|
Investment securities |
(1,120,964,406) |
|
|
Assets and liabilities in |
11,390 |
(1,120,953,016) |
|
Net gain (loss) |
|
(462,215,680) |
|
Net increase (decrease) in net assets resulting from operations |
|
$ (478,619,716) |
|
Other Information |
|
|
|
Sales charges paid to FDC |
|
$ 21,082,952 |
|
Deferred sales charges withheld by FDC |
|
$ 28,987 |
|
Exchange fees withheld by FSC |
|
$ 83,610 |
|
Expense reductions |
|
|
|
Directed brokerage arrangements |
|
$ 318,488 |
|
Custodian credits |
|
4,799 |
|
Transfer agent credits |
|
33,539 |
|
|
|
$ 356,826 |
See accompanying notes which are an integral part of the financial statements.
Semiannual Report
Technology Portfolio
Financial Statements - continued
Statement of Changes in Net Assets
|
Increase (Decrease) in Net Assets |
Six months ended |
Year ended |
|
Operations |
$ (16,404,036) |
$ (10,064,518) |
|
Net realized gain (loss) |
658,737,336 |
770,063,599 |
|
Change in net unrealized appreciation (depreciation) |
(1,120,953,016) |
3,216,728,716 |
|
Net increase (decrease) in net assets resulting from operations |
(478,619,716) |
3,976,727,797 |
|
Distributions to shareholders from net realized gains |
(407,299,911) |
(459,113,578) |
|
Share transactions |
2,686,036,280 |
4,214,973,000 |
|
Reinvestment of distributions |
395,186,139 |
444,041,082 |
|
Cost of shares redeemed |
(2,095,848,897) |
(1,626,839,777) |
|
Net increase (decrease) in net assets resulting from share transactions |
985,373,522 |
3,032,174,305 |
|
Redemption fees |
4,555,782 |
3,014,809 |
|
Total increase (decrease) in net assets |
104,009,677 |
6,552,803,333 |
|
Net Assets |
|
|
|
Beginning of period |
7,919,950,844 |
1,367,147,511 |
|
End of period (including accumulated net investment loss of $16,404,036 and $0, respectively) |
$ 8,023,960,521 |
$ 7,919,950,844 |
|
Other Information Shares |
|
|
|
Sold |
15,211,402 |
33,612,582 |
|
Issued in reinvestment of distributions |
2,247,761 |
4,064,032 |
|
Redeemed |
(12,718,985) |
(13,784,852) |
|
Net increase (decrease) |
4,740,178 |
23,891,762 |
Financial Highlights
|
|
Six months ended |
Years ended February 28, |
||||
|
Selected Per-Share Data |
(Unaudited) |
2000 G |
1999 |
1998 |
1997 |
1996 G |
|
Net asset value, beginning of period |
$ 195.92 |
$ 82.70 |
$ 53.13 |
$ 57.70 |
$ 54.67 |
$ 42.05 |
|
Income from Investment Operations |
|
|
|
|
|
|
|
Net investment income (loss) D |
(.37) |
(.40) E |
(.34) |
(.25) |
(.39) |
(.28) |
|
Net realized and unrealized gain (loss) |
(8.53) |
133.30 |
29.79 |
11.29 |
6.95 |
20.83 |
|
Total from investment operations |
(8.90) |
132.90 |
29.45 |
11.04 |
6.56 |
20.55 |
|
Less Distributions |
|
|
|
|
|
|
|
From net realized gain |
(9.46) |
(19.80) |
- |
(12.39) |
(3.68) |
(8.05) |
|
In excess of net realized gain |
- |
- |
- |
(3.30) |
- |
- |
|
Total distributions |
(9.46) |
(19.80) |
- |
(15.69) |
(3.68) |
(8.05) |
|
Redemption fees added to paid in capital |
.10 |
.12 |
.12 |
.08 |
.15 |
.12 |
|
Net asset value, end of period |
$ 177.66 |
$ 195.92 |
$ 82.70 |
$ 53.13 |
$ 57.70 |
$ 54.67 |
|
Total Return B, C |
(4.44)% |
184.11% |
55.66% |
24.92% |
12.64% |
50.71% |
|
Ratios and Supplemental Data |
|
|
|
|
|
|
|
Net assets, end of period (000 omitted) |
$ 8,023,961 |
$ 7,919,951 |
$ 1,367,148 |
$ 691,924 |
$ 478,444 |
$ 483,026 |
|
Ratio of expenses to average net assets |
.90% A |
1.05% |
1.24% |
1.38% |
1.49% |
1.40% |
|
Ratio of expenses to average net assets after |
.90% A |
1.04% F |
1.20% F |
1.30% F |
1.44% F |
1.39% F |
|
Ratio of net investment income (loss) to average net assets |
(.44)% A |
(.34)% |
(.54)% |
(.45)% |
(.72)% |
(.52)% |
|
Portfolio turnover rate |
98% A |
210% |
339% |
556% |
549% |
112% |
|
A Annualized B The total returns would have been lower had certain expenses not been reduced during the periods shown. C Total returns do not include the one time sales
charge and for periods of less than one year are not annualized. |
||||||
See accompanying notes which are an integral part of the financial statements.
Technology Sector
Performance
There are several ways to evaluate a fund's historical performance. You can look at the total percentage change in value, the average annual percentage change or the growth of a hypothetical $10,000 investment. Total return reflects the change in the value of an investment, assuming reinvestment of the fund's dividend income and capital gains (the profits earned upon the sale of securities that have grown in value). Load adjusted returns include a 3.00% sales charge and the effect of a $7.50 long-term trading fee for shares held 30 days or more. Effective September 28, 2000, the $7.50 long-term trading fee was eliminated.
Cumulative Total Returns
|
Periods ended |
Past 6 |
Past 1 |
Past 5 |
Life of |
|
Select Natural Gas |
46.81% |
42.14% |
137.51% |
143.66% |
|
Select Natural Gas |
42.34% |
37.80% |
130.31% |
136.28% |
|
S&P 500 |
11.73% |
16.32% |
193.58% |
297.35% |
|
GS Utilities |
-6.15% |
8.07% |
n/a** |
n/a** |
Cumulative total returns show the fund's performance in percentage terms over a set period - in this case, six months, one year, five years or since the fund started on April 21, 1993. You can compare the fund's returns to the performance of both the Standard & Poor's 500 Index - a market capitalization-weighted index of common stocks - and the Goldman Sachs Utilities Index - a market capitalization-weighted index of 141 stocks designed to measure the performance of companies in the utilities sector. These benchmarks include reinvestment of dividends and capital gains, if any, and exclude the effect of sales charges.
Average Annual Total Returns
|
Periods ended |
Past 1 |
Past 5 |
Life of |
|
Select Natural Gas |
42.14% |
18.89% |
12.85% |
|
Select Natural Gas |
37.80% |
18.16% |
12.38% |
|
S&P 500 |
16.32% |
24.04% |
20.60% |
|
GS Utilities |
8.07% |
n/a** |
n/a** |
Average annual returns take the fund's cumulative return and show you what would have happened if the fund had performed at a constant rate each year.
** Not available
Understanding Performance
How a fund did yesterday is no guarantee of how it will do tomorrow. The stock market, for example, has a history of long-term growth and short-term volatility. Unlike the broader market, however, some sectors may not have a history of growth in the long run. And, as with all stock funds, the share price and return of a fund that invests in a sector will vary.
3$10,000 Over Life of Fund
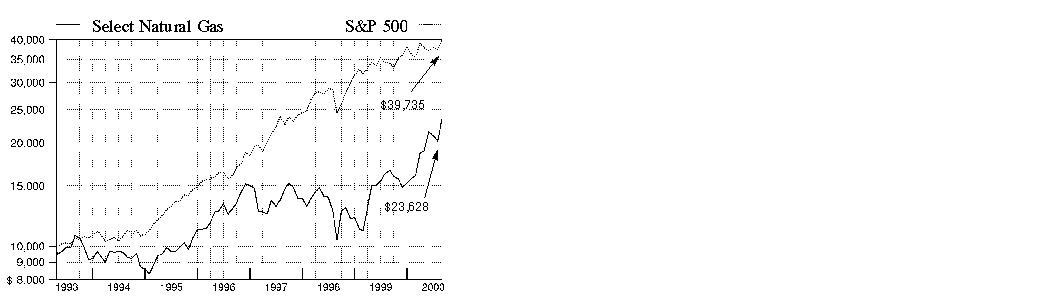
$10,000 Over Life of Fund: Let's say hypothetically that $10,000 was invested in Fidelity Select Natural Gas Portfolio on April 21, 1993, when the fund started, and the current 3.00% sales charge was paid. As the chart shows, by August 31, 2000, the value of the investment would have grown to $23,628 - a 136.28% increase on the initial investment - and includes the effect of a $7.50 long-term trading fee. For comparison, look at how the Standard & Poor's 500 Index did over the same period. With dividends and capital gains, if any, reinvested, the same $10,000 investment would have grown to $39,735 - a 297.35% increase.
Investment Summary
|
Top Ten Stocks as of August 31, 2000 |
|
|
|
% of fund's |
|
Duke Energy Corp. |
5.5 |
|
The Coastal Corp. |
5.3 |
|
Anadarko Petroleum Corp. |
4.3 |
|
Williams Companies, Inc. |
3.6 |
|
Kinder Morgan, Inc. |
3.4 |
|
Apache Corp. |
3.2 |
|
Devon Energy Corp. |
3.1 |
|
Enron Corp. |
3.1 |
|
Dynegy, Inc. Class A |
3.0 |
|
Burlington Resources, Inc. |
2.9 |
|
|
37.4 |
Top Industries as of August 31, 2000
% of fund's net assets

Semiannual Report
(Portfolio Manager photograph)
Christian Zann,
Portfolio Manager
of Fidelity Select
Natural Gas Portfolio
Q. How did the fund perform, Christian?
A. It did very well. For the six months that ended August 31, 2000, the fund returned 46.81%, far surpassing the -6.15% return of the Goldman Sachs Utilities Index - an index of 141 stocks designed to measure the performance of companies in the utilities sector. The fund also beat the Standard & Poor's 500 Index, which returned 11.73% during the same period. For the 12 months that ended August 31, 2000, the fund's return was 42.14%, compared with 8.07% and 16.32% for the Goldman Sachs index and the S&P 500, respectively.
Q. What factors enabled the fund to outperform the indexes by such wide margins?
A. Healthy demand and limited supplies of natural gas and crude oil continued to drive the prices of those two commodities higher, boosting the share prices of companies positioned to benefit from that scenario. In the case of gas, higher prices led to a dramatic increase in the number of rigs used to drill for gas, but production did not increase proportionately. With supplies of natural gas near five-year lows, prices surged from around $2.75 per thousand cubic feet at the beginning of the period to approximately $4.75 per thousand cubic feet by the end of August. On the crude oil side, effective production curbs by the Organization of Petroleum Exporting Countries (OPEC) and robust worldwide demand kept oil prices high. Although there were two modest production hikes by OPEC during the period, these increases did little to alleviate the tightness in crude oil supplies, which hovered near 24-year lows. The Goldman Sachs index, on the other hand, contains a greater exposure to electric and gas utilities, which normally do not benefit from increases in commodity prices. The S&P 500's positive but more restrained performance reflected a fundamentally favorable economic backdrop that was tempered by rising interest rates and a spring correction in technology stocks.
Q. How was the fund positioned during the period?
A. I continued to overweight gas and oil exploration and production (E&P) companies since they tend to benefit most from rising energy prices. Gas pipeline companies were another area of emphasis because of the worldwide trend toward natural gas as the fuel of choice for new power plants. Finally, I continued to overweight independent power producers (IPPs) because they were favorably positioned to exploit the power shortages that existed in many areas. On the other hand, I underweighted utilities and integrated energy companies because of their lower sensitivity to changes in gas and oil prices.
Q. What stocks helped the fund's performance?
A. Coastal, one of the fund's largest holdings, helped performance the most. The company has a sizable gas exposure, but another factor driving the stock was a takeover bid by El Paso Energy. Burlington Resources, Anadarko Petroleum and Apache all are E&P companies that benefited from higher energy prices. Calpine, an IPP, continued to see robust earnings growth stemming from the company's existing operations and its new plants that recently came on line. Vastar was purchased by BP Amoco, which lifted the former's stock, while Santa Fe Snyder benefited from being acquired by Devon Energy.
Q. What stocks detracted from performance?
A. Independent Energy, a U.K. power company, encountered billing problems arising from the company's extremely rapid growth. I sold the stock. Nuevo Energy suffered from investor disenchantment when the company reduced production estimates.
Q. What's your outlook, Christian?
A. In the short term, gas prices should be determined by how quickly production increases in response to higher prices. Historically, a significant surge in rig activity has led to meaningful production increases, but there is no easy way to gauge when those increases will occur. What kind of winter we have also will be important because a cold winter could significantly increase demand for both natural gas and heating oil. Although energy prices tend to be cyclical in nature, we should keep in mind that there is a long-term trend toward gas-fired power plants - and away from coal and oil - a bullish factor for natural gas prices. In the oil market, we will have to see how supply and demand respond to higher prices and carefully monitor OPEC's activities.
The views expressed in this report reflect those of the portfolio manager only through the end of the period of the report as stated on the cover. The manager's views are subject to change at any time based on market or other conditions. For more information, see page 3.
Fund Facts
Start date: April 21, 1993
Fund number: 513
Trading symbol: FSNGX
Size: as of August 31, 2000, more than $264 million
Manager: Christian Zann, since 1999; analyst, oil and natural gas companies, since 1999; analyst, retail and consumer products companies, 1996-1999; joined Fidelity in 1996
3Semiannual Report
Natural Gas Portfolio
(Unaudited)
Showing Percentage of Net Assets
|
Common Stocks - 92.0% |
|||
|
Shares |
Value (Note 1) |
||
|
ELECTRIC UTILITY - 10.0% |
|||
|
AES Corp. (a) |
39,600 |
$ 2,524,500 |
|
|
Calpine Corp. (a) |
38,200 |
3,781,800 |
|
|
CMS Energy Corp. |
3 |
78 |
|
|
Dominion Resources, Inc. |
73,000 |
3,869,000 |
|
|
Duke Energy Corp. |
194,000 |
14,513,619 |
|
|
Entergy Corp. |
51,600 |
1,570,575 |
|
|
NRG Energy, Inc. |
8,000 |
210,000 |
|
|
TOTAL ELECTRIC UTILITY |
26,469,572 |
||
|
ENERGY SERVICES - 18.3% |
|||
|
Diamond Offshore Drilling, Inc. |
11,400 |
510,863 |
|
|
ENSCO International, Inc. |
120,600 |
4,808,925 |
|
|
Ensign Resource Service Group, Inc. |
1,800 |
62,324 |
|
|
Global Industries Ltd. (a) |
1,900 |
23,631 |
|
|
Global Marine, Inc. (a) |
103,000 |
3,328,188 |
|
|
Helmerich & Payne, Inc. |
27,800 |
1,026,863 |
|
|
Marine Drilling Companies, Inc. (a) |
200,000 |
5,437,500 |
|
|
Nabors Industries, Inc. (a) |
135,577 |
6,448,381 |
|
|
Noble Drilling Corp. (a) |
106,200 |
5,150,700 |
|
|
Patterson Energy, Inc. (a) |
16,400 |
514,550 |
|
|
Precision Drilling Corp. (a) |
57,200 |
1,947,482 |
|
|
Pride International, Inc. (a) |
32,100 |
790,463 |
|
|
R&B Falcon Corp. (a) |
82,000 |
2,337,000 |
|
|
Rowan Companies, Inc. (a) |
71,300 |
2,210,300 |
|
|
Santa Fe International Corp. |
133,100 |
5,232,494 |
|
|
Transocean Sedco Forex, Inc. |
108,100 |
6,458,975 |
|
|
Varco International, Inc. (a) |
110,500 |
2,230,719 |
|
|
TOTAL ENERGY SERVICES |
48,519,358 |
||
|
GAS - 20.6% |
|||
|
Columbia Energy Group |
25,200 |
1,768,725 |
|
|
Dynegy, Inc. Class A |
176,182 |
7,928,190 |
|
|
El Paso Energy Corp. |
32,200 |
1,875,650 |
|
|
Enbridge, Inc. |
96,000 |
2,205,097 |
|
|
Energen Corp. |
73,600 |
1,909,000 |
|
|
Enron Corp. |
97,200 |
8,249,850 |
|
|
Equitable Resources, Inc. |
59,700 |
3,361,856 |
|
|
Kinder Morgan, Inc. |
242,700 |
8,934,394 |
|
|
MDU Resources Group, Inc. |
55,500 |
1,387,500 |
|
|
Mitchell Energy & Development Corp. Class A |
22,300 |
892,000 |
|
|
National Fuel Gas Co. |
23,400 |
1,227,038 |
|
|
New Jersey Resources Corp. |
15,500 |
620,000 |
|
|
Northwest Natural Gas Co. |
22,900 |
526,700 |
|
|
ONEOK, Inc. |
10,900 |
348,119 |
|
|
Questar Corp. |
44,000 |
954,250 |
|
|
Southern Union Co. |
11,100 |
199,106 |
|
|
TransCanada Pipelines Ltd. |
218,600 |
2,124,349 |
|
|
|
|||
|
Shares |
Value (Note 1) |
||
|
Westcoast Energy, Inc. |
27,800 |
$ 538,430 |
|
|
Williams Companies, Inc. |
203,360 |
9,367,270 |
|
|
TOTAL GAS |
54,417,524 |
||
|
INDUSTRIAL MACHINERY & EQUIPMENT - 0.6% |
|||
|
Active Power, Inc. |
22,100 |
1,552,525 |
|
|
OIL & GAS - 42.3% |
|||
|
Alberta Energy Co. Ltd. |
144,767 |
5,332,227 |
|
|
Anadarko Petroleum Corp. |
174,470 |
11,474,892 |
|
|
Anderson Exploration Ltd. (a) |
161,221 |
3,379,999 |
|
|
Apache Corp. |
132,525 |
8,349,075 |
|
|
Barrett Resources Corp. (a) |
50,000 |
1,731,250 |
|
|
Baytex Energy Ltd. (a) |
11,800 |
117,880 |
|
|
Bonavista Petroleum Ltd. (a) |
24,400 |
463,459 |
|
|
BP Amoco PLC sponsored ADR |
108,138 |
5,974,625 |
|
|
Burlington Resources, Inc. |
194,072 |
7,629,456 |
|
|
Cabot Oil & Gas Corp. Class A |
29,000 |
580,000 |
|
|
Canada Occidental Petroleum Ltd. |
124,300 |
3,269,052 |
|
|
Canadian Hunter Exploration Ltd. (a) |
78,100 |
1,937,241 |
|
|
Canadian Hunter Exploration Ltd. (a)(c) |
15,100 |
374,550 |
|
|
Canadian Natural Resources Ltd. (a) |
82,500 |
2,663,099 |
|
|
Chevron Corp. |
4,500 |
380,250 |
|
|
Comstock Resources, Inc. (a) |
1,300 |
12,919 |
|
|
Crestar Energy, Inc. (a) |
25,600 |
400,136 |
|
|
Cross Timbers Oil Co. |
24,400 |
645,075 |
|
|
Devon Energy Corp. |
142,115 |
8,322,610 |
|
|
Encal Energy Ltd. (a) |
36,800 |
232,579 |
|
|
EOG Resources, Inc. |
71,300 |
2,727,225 |
|
|
Forcenergy, Inc. (a) |
106,800 |
2,583,225 |
|
|
Grant Prideco, Inc. (a) |
108,000 |
2,538,000 |
|
|
HS Resources, Inc. (a) |
22,600 |
716,138 |
|
|
Kerr-McGee Corp. |
20,512 |
1,296,102 |
|
|
Louis Dreyfus Natural Gas Corp. (a) |
25,400 |
882,650 |
|
|
National-Oilwell, Inc. (a) |
27,200 |
943,500 |
|
|
Newfield Exploration Co. (a) |
46,800 |
2,024,100 |
|
|
Noble Affiliates, Inc. |
48,700 |
1,887,125 |
|
|
Nuevo Energy Co. (a) |
35,100 |
673,481 |
|
|
Ocean Energy, Inc. (a) |
84,300 |
1,280,306 |
|
|
Paramount Resources Ltd. |
166,100 |
1,439,195 |
|
|
Patina Oil & Gas Corp. |
41,700 |
886,125 |
|
|
Penn Virginia Corp. |
18,400 |
502,550 |
|
|
Penn West Petroleum Ltd. (a) |
84,000 |
1,997,961 |
|
|
Pioneer Natural Resources Co. (a) |
47,700 |
661,838 |
|
|
Plains Resources, Inc. (a) |
45,400 |
805,850 |
|
|
Pogo Producing Co. |
22,700 |
610,063 |
|
|
Purcell Energy Ltd. (a) |
172,500 |
441,947 |
|
|
Rio Alto Exploration Ltd. (a) |
155,900 |
3,104,227 |
|
|
Talisman Energy, Inc. (a) |
81,400 |
2,735,460 |
|
|
The Coastal Corp. |
202,570 |
13,952,009 |
|
|
Tom Brown, Inc. (a) |
15,200 |
330,600 |
|
|
TotalFinaElf SA sponsored ADR |
11,100 |
826,950 |
|
|
Common Stocks - continued |
|||
|
Shares |
Value (Note 1) |
||
|
OIL & GAS - CONTINUED |
|||
|
Unocal Corp. |
71,200 |
$ 2,376,300 |
|
|
Western Gas Resources, Inc. |
21,701 |
476,066 |
|
|
TOTAL OIL & GAS |
111,969,367 |
||
|
SHIP BUILDING & REPAIR - 0.2% |
|||
|
Dril-Quip, Inc. (a) |
13,700 |
622,494 |
|
|
TOTAL COMMON STOCKS (Cost $195,961,251) |
243,550,840 |
||
|
Cash Equivalents - 14.7% |
|||
|
|
|
|
|
|
Fidelity Cash Central Fund, 6.59% (b) |
28,655,437 |
28,655,437 |
|
|
Fidelity Securities Lending Cash Central Fund, 6.64% (b) |
10,098,000 |
10,098,000 |
|
|
TOTAL CASH EQUIVALENTS (Cost $38,753,437) |
38,753,437 |
||
|
TOTAL INVESTMENT PORTFOLIO - 106.7% (Cost $234,714,688) |
282,304,277 |
|
NET OTHER ASSETS - (6.7)% |
(17,607,905) |
||
|
NET ASSETS - 100% |
$ 264,696,372 |
||
|
Legend |
|
(a) Non-income producing |
|
(b) The rate quoted is the annualized seven-day yield of the fund at |
|
(c) Security exempt from registration under Rule 144A of the Securities Act |
|
Other Information |
|
Purchases and sales of securities, other than short-term securities, aggregated $191,026,432 and $41,058,798, respectively. |
|
The fund placed a portion of its portfolio transactions with brokerage firms which are affiliates of Fidelity Management & Research Company. The commissions paid to these affiliated firms were $17,360 for the period. |
|
The fund participated in the security lending program. At period end, the value of securities loaned amounted to $10,062,810. The fund received cash collateral of $10,098,000 which was invested in cash equivalents. |
|
Distribution of investments by country of issue, as a percentage of total |
|
United States of America |
84.4% |
|
Canada |
13.0 |
|
United Kingdom |
2.3 |
|
Others (individually less than 1%) |
0.3 |
|
|
100.0% |
|
Income Tax Information |
|
At August 31, 2000, the aggregate cost of investment securities for income tax purposes was $235,609,201. Net unrealized appreciation aggregated $46,695,076, of which $49,188,531 related to appreciated investment securities and $2,493,455 related to depreciated investment securities. |
See accompanying notes which are an integral part of the financial statements.
Utilities Sector
Statement of Assets and Liabilities
|
|
August 31, 2000 (Unaudited) |
|
|
Assets |
|
|
|
Investment in securities, at value |
|
$ 282,304,277 |
|
Receivable for fund shares sold |
|
6,133,825 |
|
Dividends receivable |
|
254,967 |
|
Interest receivable |
|
110,871 |
|
Redemption fees receivable |
|
9,979 |
|
Other receivables |
|
2,257 |
|
Total assets |
|
288,816,176 |
|
Liabilities |
|
|
|
Payable for investments purchased |
$ 11,652,803 |
|
|
Payable for fund shares redeemed |
2,157,631 |
|
|
Accrued management fee |
97,310 |
|
|
Other payables and accrued expenses |
114,060 |
|
|
Collateral on securities loaned, |
10,098,000 |
|
|
Total liabilities |
|
24,119,804 |
|
Net Assets |
|
$ 264,696,372 |
|
Net Assets consist of: |
|
|
|
Paid in capital |
|
$ 214,502,341 |
|
Undistributed net investment income |
|
239,645 |
|
Accumulated undistributed net realized gain (loss) on investments and foreign currency transactions |
|
2,366,875 |
|
Net unrealized appreciation (depreciation) on investments |
|
47,587,511 |
|
Net Assets, for 11,900,839 |
|
$ 264,696,372 |
|
Net Asset Value and redemption price per share ($264,696,372 ÷ 11,900,839 shares) |
|
$22.24 |
|
Maximum offering price per share (100/97.00 of $22.24) |
|
$22.93 |
Statement of Operations
|
|
Six months ended August 31, 2000 (Unaudited) |
|
|
Investment Income Dividends |
|
$ 684,179 |
|
Interest |
|
358,728 |
|
Security lending |
|
8,906 |
|
Total income |
|
1,051,813 |
|
Expenses |
|
|
|
Management fee |
$ 382,394 |
|
|
Transfer agent fees |
308,337 |
|
|
Accounting and security lending fees |
46,189 |
|
|
Non-interested trustees' compensation |
172 |
|
|
Custodian fees and expenses |
11,955 |
|
|
Registration fees |
88,128 |
|
|
Audit |
8,100 |
|
|
Legal |
126 |
|
|
Miscellaneous |
32 |
|
|
Total expenses before reductions |
845,433 |
|
|
Expense reductions |
(33,263) |
812,170 |
|
Net investment income |
|
239,643 |
|
Realized and Unrealized Gain (Loss) Net realized gain (loss) on: |
|
|
|
Investment securities |
2,531,118 |
|
|
Foreign currency transactions |
957 |
2,532,075 |
|
Change in net unrealized appreciation (depreciation) on: |
|
|
|
Investment securities |
39,284,533 |
|
|
Assets and liabilities in |
(2,059) |
39,282,474 |
|
Net gain (loss) |
|
41,814,549 |
|
Net increase (decrease) in net assets resulting from operations |
|
$ 42,054,192 |
|
Other Information |
|
|
|
Sales charges paid to FDC |
|
$ 939,012 |
|
Deferred sales charges withheld by FDC |
|
$ 580 |
|
Exchange fees withheld by FSC |
|
$ 4,275 |
|
Expense reductions |
|
|
|
Directed brokerage arrangements |
|
$ 31,234 |
|
Custodian credits |
|
1,102 |
|
Transfer agent credits |
|
927 |
|
|
|
$ 33,263 |
See accompanying notes which are an integral part of the financial statements.
Semiannual Report
Natural Gas Portfolio
Financial Statements - continued
Statement of Changes in Net Assets
|
Increase (Decrease) in Net Assets |
Six months ended |
Year ended |
|
Operations |
$ 239,643 |
$ 19,749 |
|
Net realized gain (loss) |
2,532,075 |
5,626,952 |
|
Change in net unrealized appreciation (depreciation) |
39,282,474 |
10,320,785 |
|
Net increase (decrease) in net assets resulting from operations |
42,054,192 |
15,967,486 |
|
Distributions to shareholders |
|
|
|
From net investment income |
- |
(330,540) |
|
From net realized gain |
(305,744) |
- |
|
Total distributions |
(305,744) |
(330,540) |
|
Share transactions |
268,548,057 |
78,842,639 |
|
Reinvestment of distributions |
289,997 |
314,409 |
|
Cost of shares redeemed |
(100,107,300) |
(77,779,879) |
|
Net increase (decrease) in net assets resulting from share transactions |
168,730,754 |
1,377,169 |
|
Redemption fees |
240,790 |
133,839 |
|
Total increase (decrease) in net assets |
210,719,992 |
17,147,954 |
|
Net Assets |
|
|
|
Beginning of period |
53,976,380 |
36,828,426 |
|
End of period (including undistributed net investment income of $239,645 and $9,147, respectively) |
$ 264,696,372 |
$ 53,976,380 |
|
Other Information Shares |
|
|
|
Sold |
13,508,512 |
5,386,067 |
|
Issued in reinvestment of distributions |
16,831 |
26,049 |
|
Redeemed |
(5,172,320) |
(5,342,363) |
|
Net increase (decrease) |
8,353,023 |
69,753 |
Financial Highlights
|
|
Six months ended |
Years ended February 28, |
||||
|
Selected Per-Share Data |
(Unaudited) |
2000 G |
1999 |
1998 |
1997 |
1996 G |
|
Net asset value, beginning of period |
$ 15.21 |
$ 10.59 |
$ 13.22 |
$ 12.50 |
$ 11.36 |
$ 8.98 |
|
Income from Investment Operations |
|
|
|
|
|
|
|
Net investment income (loss) D |
.03 |
.00 |
.12 E |
(.05) |
(.06) |
.05 |
|
Net realized and unrealized gain (loss) |
7.04 |
4.68 |
(2.68) |
1.06 |
1.30 |
2.36 |
|
Total from investment operations |
7.07 |
4.68 |
(2.56) |
1.01 |
1.24 |
2.41 |
|
Less Distributions |
|
|
|
|
|
|
|
From net investment income |
- |
(.09) |
(.10) |
- |
(.01) |
(.05) |
|
From net realized gain |
(.07) |
- |
- |
(.30) |
(.29) |
- |
|
In excess of net realized gain |
- |
- |
- |
(.03) |
- |
- |
|
Total distributions |
(.07) |
(.09) |
(.10) |
(.33) |
(.30) |
(.05) |
|
Redemption fees added to paid in capital |
.03 |
.03 |
.03 |
.04 |
.20 |
.02 |
|
Net asset value, end of period |
$ 22.24 |
$ 15.21 |
$ 10.59 |
$ 13.22 |
$ 12.50 |
$ 11.36 |
|
Total Return B, C |
46.81% |
44.70% |
(19.17)% |
8.74% |
12.45% |
27.10% |
|
Ratios and Supplemental Data |
|
|
|
|
|
|
|
Net assets, end of period (000 omitted) |
$ 264,696 |
$ 53,976 |
$ 36,828 |
$ 59,866 |
$ 81,566 |
$ 60,228 |
|
Ratio of expenses to average net assets |
1.23% A |
1.42% |
1.57% |
1.82% |
1.70% |
1.68% |
|
Ratio of expenses to average net assets after |
1.19% A, F |
1.39% F |
1.52% F |
1.78% F |
1.66% F |
1.67% F |
|
Ratio of net investment income (loss) to average net assets |
.35% A |
.03% |
.93% |
(.37)% |
(.46)% |
.46% |
|
Portfolio turnover rate |
63% A |
85% |
107% |
118% |
283% |
79% |
|
A Annualized B The total returns would have been lower had certain expenses not been reduced during the periods shown. C Total returns do not include the one time sales
charge and for periods of less than one year are not annualized. |
||||||
See accompanying notes which are an integral part of the financial statements.
Utilities Sector
Performance
There are several ways to evaluate a fund's historical performance. You can look at the total percentage change in value, the average annual percentage change or the growth of a hypothetical $10,000 investment. Total return reflects the change in the value of an investment, assuming reinvestment of the fund's dividend income and capital gains (the profits earned upon the sale of securities that have grown in value). Load adjusted returns include a 3.00% sales charge and the effect of a $7.50 long-term trading fee for shares held 30 days or more. Effective September 28, 2000, the $7.50 long-term trading fee was eliminated.
Cumulative Total Returns
|
Periods ended |
Past 6 |
Past 1 |
Past 5 |
Past 10 |
|
Select Telecommunications |
-15.23% |
34.63% |
209.34% |
751.11% |
|
Select Telecommunications |
-17.84% |
30.52% |
199.99% |
725.51% |
|
S&P 500 |
11.73% |
16.32% |
193.58% |
493.54% |
|
GS Utilities |
-6.15% |
8.07% |
n/a** |
n/a** |
Cumulative total returns show the fund's performance in percentage terms over a set period - in this case, six months, one year, five years or 10 years. You can compare the fund's returns to the performance of both the Standard & Poor's 500 Index - a market capitalization-weighted index of common stocks - and the Goldman Sachs Utilities Index - a market capitalization-weighted index of 141 stocks designed to measure the performance of companies in the utilities sector. These benchmarks include reinvestment of dividends and capital gains, if any, and exclude the effect of sales charges.
Average Annual Total Returns
|
Periods ended |
Past 1 |
Past 5 |
Past 10 |
|
Select Telecommunications |
34.63% |
25.34% |
23.88% |
|
Select Telecommunications |
30.52% |
24.57% |
23.50% |
|
S&P 500 |
16.32% |
24.04% |
19.49% |
|
GS Utilities |
8.07% |
n/a** |
n/a** |
Average annual returns take the fund's cumulative return and show you what would have happened if the fund had performed at a constant rate each year.
** Not available
Understanding Performance
How a fund did yesterday is no guarantee of how it will do tomorrow. The stock market, for example, has a history of long-term growth and short-term volatility. Unlike the broader market, however, some sectors may not have a history of growth in the long run. And, as with all stock funds, the share price and return of a fund that invests in a sector will vary.
3$10,000 Over 10 Years
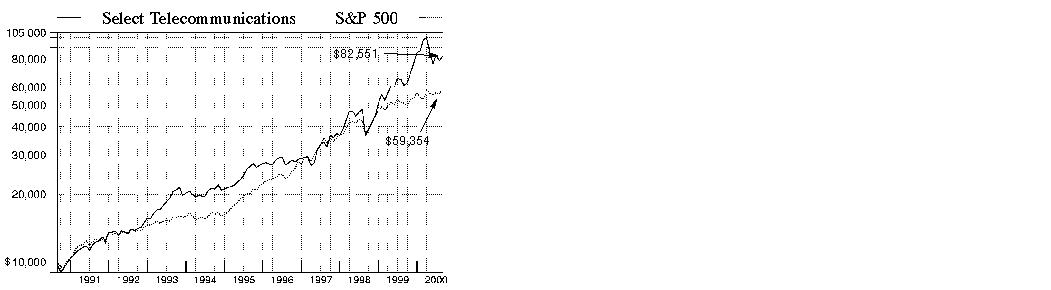
$10,000 Over 10 Years: Let's say hypothetically that $10,000 was invested in Fidelity Select Telecommunications Portfolio on August 31, 1990, and the current 3.00% sales charge was paid. As the chart shows, by August 31, 2000, the value of the investment would have grown to $82,551 - a 725.51% increase on the initial investment - and includes the effect of a $7.50 long-term trading fee. For comparison, look at how the Standard & Poor's 500 Index did over the same period. With dividends and capital gains, if any, reinvested, the same $10,000 investment would have grown to $59,354 - a 493.54% increase.
Investment Summary
|
Top Ten Stocks as of August 31, 2000 |
|
|
|
% of fund's |
|
Sprint Corp. - PCS Group Series 1 |
9.5 |
|
Nextel Communications, Inc. Class A |
8.5 |
|
Nortel Networks Corp. |
6.2 |
|
SDL, Inc. |
6.2 |
|
Qwest Communications International, Inc. |
5.8 |
|
VoiceStream Wireless Corp. |
5.5 |
|
Exodus Communications, Inc. |
5.5 |
|
China Mobile (Hong Kong) Ltd. |
4.3 |
|
Juniper Networks, Inc. |
3.7 |
|
Level 3 Communications, Inc. |
3.5 |
|
|
58.7 |
Top Industries as of August 31, 2000
% of fund's net assets

Semiannual Report
(Portfolio Manager photograph)
Peter Saperstone,
Portfolio Manager
of Fidelity Select Telecommunications Portfolio
Q. How did the fund perform, Peter?
A. It was a disappointing period. For the six months that ended August 31, 2000, the fund returned -15.23%, compared to -6.15% for the Goldman Sachs Utilities Index - an index of 141 stocks designed to measure the performance of companies in the utilities sector. The fund also trailed the 11.73% return of the Standard & Poor's 500 Index during the same period. For the 12 months that ended August 31, 2000, the fund returned 34.63%, well ahead of the 8.07% and 16.32% marks posted by the Goldman Sachs index and the S&P 500, respectively.
Q. Why did the fund trail the two indexes during the
six-month period?
A. More intense competition in the telecommunications services market - especially among companies that deliver their services through telephone lines - led to underperformance in those stocks, which made up a larger portion of the fund than of the Goldman Sachs index. In addition, wireless stocks, which served the fund extremely well in the past, got ahead of themselves, retreating substantially during the spring correction in technology stocks. Furthermore, the Goldman Sachs index includes defensive stocks such as electric and gas utilities, which firmed when investors looked for safer places to put their money as a result of the market's volatility. In contrast, the fund owned no utilities during the period. In the case of the broadly based S&P 500, its performance edge was due to strength in some sectors, such as financial services, in which the fund had no investments.
Q. Did the recent weakness cause you to reconsider the fund's basic composition?
A. Not at all. The areas I overweighted remained the market segments with the best growth prospects, in my opinion. For example, although there were short-term fluctuations in the demand for cellular phones, it's important to remember that by the end of 2000, the estimated penetration of wireless voice technology in the U.S. will still be only about 38%, compared to nearly 60% in Europe. That leaves lots of room for growth.
Q. What stocks performed well for the fund?
A. Nortel Networks was the best contributor, benefiting from continued strong growth in the demand for switching devices and other equipment used to build the infrastructure of the Internet and fiber-optic telephone networks. Also boosting performance was Exodus Communications, a provider of Web-hosting capabilities for Internet service providers. Exodus exemplified investors' preference for business-to-business Internet plays over business-to-consumer investments. Broadband provider Qwest Communications acquired telephone company U.S. West, causing the stock of the combined company to firm in response to its increased market share and more favorable prospects for revenue and earnings growth. SBC Communications, a regional Bell operating company, strengthened when the Justice Department recommended that the company be allowed to offer long-distance service in Texas, potentially clearing the way for SBC to enter the huge long-distance market.
Q. What stocks detracted from performance?
A. Qualcomm headed the list of disappointments. The stock declined sharply during the spring correction, when worries concerning licensing its CDMA (code division multiple access) wireless technology in China and South Korea came to a head. The fund did not hold Qualcomm at the end of the period. Another holding that hurt performance was Motorola, which fell after revising its second quarter earnings estimates downward, in part because of component shortages. AT&T also was a negative influence on the fund's returns, as the stock reflected increasing competitive pressures on the company's core long-distance business.
Q. What's your outlook, Peter?
A. Six months ago, after a period of stellar performance, I warned the fund's shareholders not to expect those kinds of returns on a regular basis. We have encountered what appears to be a normal correction in many of the fund's holdings, but I believe that the favorable long-term outlook for stocks in the data, wireless and competitive local exchange carrier (CLEC) segments of the market remains intact. The new technology and dramatically different regulatory environment that made these investments attractive in the past should point the way to the most dynamic earnings growth in the telecommunications sector for the foreseeable future.
The views expressed in this report reflect those of the portfolio manager only through the end of the period of the report as stated on the cover. The manager's views are subject to change at any time based on market or other conditions. For more information, see page 3.
Note to shareholders: Effective September 28, 2000, Tim Cohen became Portfolio Manager of Fidelity Select Telecommunications Portfolio.
Fund Facts
Start date: July 29, 1985
Fund number: 096
Trading symbol: FSTCX
Size: as of August 31, 2000, more than
$1.4 billion
Manager: Peter Saperstone, since 1998; manager, Fidelity Utilities Fund and Fidelity Advisor Utilities Growth Fund, since 1998; several Fidelity Select Portfolios, 1996-1998; joined Fidelity in 1995
3Semiannual Report
Telecommunications Portfolio
(Unaudited)
Showing Percentage of Net Assets
|
Common Stocks - 96.4% |
|||
|
Shares |
Value (Note 1) |
||
|
BROADCASTING - 1.2% |
|||
|
AlphaNet Telecom, Inc. (a)(c) |
1,196,200 |
$ 8 |
|
|
EchoStar Communications Corp. |
123,800 |
6,035,250 |
|
|
Metro One Telecommunications, Inc. (a)(c) |
848,311 |
11,452,199 |
|
|
WorldQuest Networks, Inc. |
37,100 |
178,544 |
|
|
TOTAL BROADCASTING |
17,666,001 |
||
|
CELLULAR - 33.5% |
|||
|
AT&T Corp. - Wireless Group |
1,705,600 |
44,665,400 |
|
|
China Mobile (Hong Kong) Ltd. (a) |
8,238,000 |
63,535,580 |
|
|
China Unicom Ltd. sponsored ADR (a) |
300,000 |
6,975,000 |
|
|
Crown Castle International Corp. (a) |
329,400 |
11,426,063 |
|
|
Dobson Communications Corp. Class A |
313,200 |
6,753,375 |
|
|
Nextel Communications, Inc. Class A (a) |
2,289,400 |
126,918,613 |
|
|
SBA Communications Corp. Class A (a) |
323,000 |
14,413,875 |
|
|
Sprint Corp. - PCS Group Series 1 (a) |
2,800,500 |
140,550,090 |
|
|
VoiceStream Wireless Corp. (a) |
730,696 |
82,248,969 |
|
|
TOTAL CELLULAR |
497,486,965 |
||
|
COMMUNICATIONS EQUIPMENT - 11.4% |
|||
|
ADC Telecommunications, Inc. (a) |
138,200 |
5,657,563 |
|
|
Ciena Corp. (a) |
125,000 |
27,710,938 |
|
|
Comverse Technology, Inc. (a) |
100,000 |
9,193,750 |
|
|
Corning, Inc. |
50,000 |
16,396,875 |
|
|
Corvis Corp. |
3,000 |
311,438 |
|
|
Lexent, Inc. |
186,700 |
6,266,119 |
|
|
Nortel Networks Corp. |
1,128,400 |
92,035,111 |
|
|
Telefonaktiebolaget LM Ericsson sponsored ADR |
600,000 |
12,300,000 |
|
|
TOTAL COMMUNICATIONS EQUIPMENT |
169,871,794 |
||
|
COMPUTER SERVICES & SOFTWARE - 9.4% |
|||
|
Covad Communications Group, Inc. (a) |
811,400 |
13,235,963 |
|
|
Exodus Communications, Inc. (a) |
1,200,000 |
82,125,000 |
|
|
InfoSpace.com, Inc. (a) |
400,000 |
15,600,000 |
|
|
Polycom, Inc. (a) |
100,000 |
11,237,500 |
|
|
Yahoo!, Inc. (a) |
150,000 |
18,225,000 |
|
|
TOTAL COMPUTER SERVICES & SOFTWARE |
140,423,463 |
||
|
COMPUTERS & OFFICE EQUIPMENT - 3.7% |
|||
|
Juniper Networks, Inc. (a) |
260,400 |
55,660,500 |
|
|
ELECTRICAL EQUIPMENT - 1.7% |
|||
|
Alcatel SA sponsored ADR |
150,000 |
12,431,250 |
|
|
Globecomm Systems, Inc. (a) |
539,600 |
5,665,800 |
|
|
Powerwave Technologies, Inc. (a) |
140,200 |
6,747,125 |
|
|
TOTAL ELECTRICAL EQUIPMENT |
24,844,175 |
||
|
|
|||
|
Shares |
Value (Note 1) |
||
|
ELECTRONICS - 12.3% |
|||
|
GlobeSpan, Inc. (a) |
150,000 |
$ 18,065,625 |
|
|
Motorola, Inc. |
1,050,000 |
37,865,625 |
|
|
Samsung Electronics Co. Ltd. |
141,000 |
34,781,076 |
|
|
SDL, Inc. (a) |
230,000 |
91,381,875 |
|
|
TOTAL ELECTRONICS |
182,094,201 |
||
|
METALS & MINING - 0.1% |
|||
|
Tycom Ltd. |
27,800 |
1,157,175 |
|
|
REAL ESTATE INVESTMENT TRUSTS - 3.5% |
|||
|
Pinnacle Holdings, Inc. (a) |
1,285,000 |
51,721,250 |
|
|
SERVICES - 0.3% |
|||
|
Universal Access, Inc. |
242,000 |
3,826,625 |
|
|
TELEPHONE SERVICES - 19.3% |
|||
|
Alaska Communication Systems |
218,300 |
1,766,866 |
|
|
Allegiance Telecom, Inc. (a) |
143,390 |
7,142,614 |
|
|
AT&T Corp. |
699,992 |
22,049,748 |
|
|
BellSouth Corp. |
271,500 |
10,130,344 |
|
|
Global Crossing Ltd. (a) |
1,000,045 |
30,063,853 |
|
|
Level 3 Communications, Inc. (a) |
600,000 |
52,340,625 |
|
|
McLeodUSA, Inc. Class A (a) |
614,100 |
9,710,456 |
|
|
Metromedia Fiber Network, Inc. |
753,900 |
30,108,881 |
|
|
Qwest Communications International, Inc. (a) |
1,668,444 |
86,133,421 |
|
|
SBC Communications, Inc. |
315,700 |
13,180,475 |
|
|
TeraBeam Networks (d) |
5,600 |
21,000 |
|
|
Time Warner Telecom, Inc. Class A (a) |
224,300 |
14,565,481 |
|
|
TRICOM SA sponsored ADR (a) |
246,800 |
3,933,375 |
|
|
Z-Tel Technologies, Inc. |
650,200 |
5,282,875 |
|
|
TOTAL TELEPHONE SERVICES |
286,430,014 |
||
|
TOTAL COMMON STOCKS (Cost $1,268,275,634) |
1,431,182,163 |
||
|
Cash Equivalents - 13.2% |
|||
|
Shares |
Value (Note 1) |
||
|
Fidelity Cash Central Fund, 6.59% (b) |
58,034,418 |
$ 58,034,418 |
|
|
Fidelity Securities Lending Cash Central Fund, 6.64% (b) |
137,810,000 |
137,810,000 |
|
|
TOTAL CASH EQUIVALENTS (Cost $195,844,418) |
195,844,418 |
||
|
TOTAL INVESTMENT PORTFOLIO - 109.6% (Cost $1,464,120,052) |
1,627,026,581 |
||
|
NET OTHER ASSETS - (9.6)% |
(142,090,270) |
||
|
NET ASSETS - 100% |
$ 1,484,936,311 |
||
|
Legend |
|
(a) Non-income producing |
|
(b) The rate quoted is the annualized seven-day yield of the fund at |
|
(c) Affiliated company |
|
(d) Restricted securities - Investment in securities not registered under the Securities Act of 1933. |
|
Additional information on each holding is as follows: |
|
Security |
Acquisition Date |
Acquisition Cost |
|
TeraBeam Networks |
4/7/00 |
$ 21,000 |
|
Other Information |
|
Purchases and sales of securities, other than short-term securities, aggregated $2,631,896,725 and $2,713,408,854, respectively. |
|
The fund placed a portion of its portfolio transactions with brokerage firms which are affiliates of Fidelity Management & Research Company. The commissions paid to these affiliated firms were $66,821 for the period. |
|
The fund invested in securities that are not registered under the Securities Act of 1933. These securities are subject to legal or contractual restrictions on resale. At the end of the period, restricted securities (excluding Rule 144A issues) amounted to $21,000 or 0% of net assets. |
|
The fund participated in the security lending program. At period end, the value of securities loaned amounted to $137,128,575. The fund received cash collateral of $137,810,000 which was invested in cash equivalents. |
|
The fund participated in the bank borrowing program. The average daily loan balance during the period for which loans were outstanding amounted to $12,384,000. The weighted average interest rate was 5.92%. |
|
Distribution of investments by country of issue, as a percentage of total |
|
United States of America |
82.7% |
|
Canada |
6.2 |
|
Hong Kong |
4.8 |
|
Korea (South) |
2.3 |
|
Bermuda |
2.1 |
|
Others (individually less than 1%) |
1.9 |
|
|
100.0% |
Transactions during the period with companies which are or were affiliates are
as follows:
|
|
Purchases |
Sales |
Dividend |
Value |
|
Affiliate |
Cost |
Cost |
Income |
|
|
AlphaNet Telecom, Inc. |
$- |
$- |
$- |
$8 |
|
California Ampliphier, Inc. |
- |
961,631 |
- |
- |
|
Metro One Telecommunications, Inc. |
- |
2,997,046 |
- |
1,452,199 |
|
Totals |
$ |
$3,958,677 |
$- |
$11,452,207 |
|
Income Tax Information |
|
At August 31, 2000, the aggregate cost of investment securities for income tax purposes was $1,489,655,927. Net unrealized appreciation aggregated $137,370,654, of which $258,793,119 related to appreciated investment securities and $121,422,465 related to depreciated investment securities. |
See accompanying notes which are an integral part of the financial statements.
Utilities Sector
Statement of Assets and Liabilities
|
|
August 31, 2000 (Unaudited) |
|
|
Assets |
|
|
|
Investment in securities, at value |
|
$ 1,627,026,581 |
|
Receivable for investments sold |
|
838,929 |
|
Receivable for fund shares sold |
|
1,620,484 |
|
Dividends receivable |
|
28,489 |
|
Interest receivable |
|
448,074 |
|
Redemption fees receivable |
|
1,929 |
|
Other receivables |
|
69,603 |
|
Total assets |
|
1,630,034,089 |
|
Liabilities |
|
|
|
Payable for fund shares redeemed |
$ 6,088,884 |
|
|
Accrued management fee |
699,190 |
|
|
Other payables and |
499,704 |
|
|
Collateral on securities loaned, |
137,810,000 |
|
|
Total liabilities |
|
145,097,778 |
|
Net Assets |
|
$ 1,484,936,311 |
|
Net Assets consist of: |
|
|
|
Paid in capital |
|
$ 1,176,831,837 |
|
Accumulated net investment (loss) |
|
(1,616,996) |
|
Accumulated undistributed |
|
146,816,330 |
|
Net unrealized appreciation (depreciation) on investments |
|
162,905,140 |
|
Net Assets, for 19,008,760 |
|
$ 1,484,936,311 |
|
Net Asset Value and redemption price per share ($1,484,936,311 ÷ 19,008,760 shares) |
|
$78.12 |
|
Maximum offering price per share (100/97.00 of $78.12) |
|
$80.54 |
Statement of Operations
|
|
Six months ended August 31, 2000 (Unaudited) |
|
|
Investment Income Dividends |
|
$ 3,183,674 |
|
Interest |
|
2,323,968 |
|
Security lending |
|
915,318 |
|
Total income |
|
6,422,960 |
|
Expenses |
|
|
|
Management fee |
$ 4,727,185 |
|
|
Transfer agent fees |
3,115,219 |
|
|
Accounting and security lending fees |
403,227 |
|
|
Non-interested trustees' compensation |
2,542 |
|
|
Custodian fees and expenses |
68,235 |
|
|
Registration fees |
83,740 |
|
|
Audit |
22,657 |
|
|
Legal |
3,327 |
|
|
Interest |
2,036 |
|
|
Miscellaneous |
207 |
|
|
Total expenses before reductions |
8,428,375 |
|
|
Expense reductions |
(388,419) |
8,039,956 |
|
Net investment income (loss) |
|
(1,616,996) |
|
Realized and Unrealized Gain (Loss) Net realized gain (loss) on: |
|
|
|
Investment securities |
152,471,384 |
|
|
Foreign currency transactions |
30,275 |
152,501,659 |
|
Change in net unrealized appreciation (depreciation) on: |
|
|
|
Investment securities |
(452,342,229) |
|
|
Assets and liabilities in |
(612) |
(452,342,841) |
|
Net gain (loss) |
|
(299,841,182) |
|
Net increase (decrease) in net assets resulting from operations |
|
$ (301,458,178) |
|
Other Information |
|
$ 2,633,286 |
|
Deferred sales charges withheld |
|
$ 7,741 |
|
Exchange fees withheld by FSC |
|
$ 26,085 |
|
Expense reductions Directed brokerage arrangements |
|
$ 378,747 |
|
Custodian credits |
|
3,455 |
|
Transfer agent credits |
|
6,217 |
|
|
|
$ 388,419 |
See accompanying notes which are an integral part of the financial statements.
Semiannual Report
Telecommunications Portfolio
Financial Statements - continued
Statement of Changes in Net Assets
|
Increase (Decrease) in Net Assets |
Six months ended |
Year ended |
|
Operations |
$ (1,616,996) |
$ (1,807,753) |
|
Net realized gain (loss) |
152,501,659 |
341,350,270 |
|
Change in net unrealized appreciation (depreciation) |
(452,342,841) |
428,705,277 |
|
Net increase (decrease) in net assets resulting from operations |
(301,458,178) |
768,247,794 |
|
Distributions to shareholders from net realized gains |
(163,876,178) |
(158,958,797) |
|
Share transactions |
305,473,307 |
805,565,488 |
|
Reinvestment of distributions |
158,049,642 |
152,949,500 |
|
Cost of shares redeemed |
(401,905,097) |
(504,407,282) |
|
Net increase (decrease) in net assets resulting from share transactions |
61,617,852 |
454,107,706 |
|
Redemption fees |
435,374 |
645,425 |
|
Total increase (decrease) in net assets |
(403,281,130) |
1,064,042,128 |
|
Net Assets |
|
|
|
Beginning of period |
1,888,217,441 |
824,175,313 |
|
End of period (including accumulated net investment loss of $1,616,996 and $0, respectively) |
$ 1,484,936,311 |
$ 1,888,217,441 |
|
Other Information Shares |
|
|
|
Sold |
3,387,335 |
9,915,113 |
|
Issued in reinvestment of distributions |
1,740,994 |
1,909,440 |
|
Redeemed |
(4,838,809) |
(6,431,551) |
|
Net increase (decrease) |
289,520 |
5,393,002 |
Financial Highlights
|
|
Six months ended |
Years ended February 28, |
||||
|
Selected Per-Share Data |
(Unaudited) |
2000 G |
1999 |
1998 |
1997 |
1996 G |
|
Net asset value, beginning of period |
$ 100.87 |
$ 61.85 |
$ 53.37 |
$ 41.80 |
$ 44.87 |
$ 38.34 |
|
Income from Investment Operations |
|
|
|
|
|
|
|
Net investment income (loss) D |
(.08) |
(.12) |
(.06) |
(.25) |
.12 E |
.51 |
|
Net realized and unrealized gain (loss) |
(14.10) |
49.58 |
11.43 |
18.20 |
2.92 |
9.15 |
|
Total from investment operations |
(14.18) |
49.46 |
11.37 |
17.95 |
3.04 |
9.66 |
|
Less Distributions |
|
|
|
|
|
|
|
From net investment income |
- |
- |
- |
- |
(.16) |
(.39) |
|
From net realized gain |
(8.59) |
(10.48) |
(2.96) |
(6.44) |
(5.98) |
(2.75) |
|
Total distributions |
(8.59) |
(10.48) |
(2.96) |
(6.44) |
(6.14) |
(3.14) |
|
Redemption fees added to paid in capital |
.02 |
.04 |
.07 |
.06 |
.03 |
.01 |
|
Net asset value, end of period |
$ 78.12 |
$ 100.87 |
$ 61.85 |
$ 53.37 |
$ 41.80 |
$ 44.87 |
|
Total Return B, C |
(15.23)% |
84.89% |
22.21% |
46.52% |
7.85% |
25.79% |
|
Ratios and Supplemental Data |
|
|
|
|
|
|
|
Net assets, end of period (000 omitted) |
$ 1,484,936 |
$ 1,888,217 |
$ 824,175 |
$ 643,449 |
$ 388,535 |
$ 468,300 |
|
Ratio of expenses to average net assets |
1.00% A |
1.12% |
1.27% |
1.51% |
1.51% |
1.52% |
|
Ratio of expenses to average net assets after |
.95% A, F |
1.09% F |
1.25% F |
1.48% F |
1.47% F |
1.52% |
|
Ratio of net investment income (loss) to average net assets |
(.19)% A |
(.15)% |
(.11)% |
(.53)% |
.27% |
1.17% |
|
Portfolio turnover rate |
329% A |
173% |
150% |
157% |
175% |
89% |
|
A Annualized B The total returns would have been lower had certain expenses not been reduced during the periods shown. C Total returns do not include the one time sales
charge and for periods of less than one year are not annualized. |
||||||
See accompanying notes which are an integral part of the financial statements.
Utilities Sector
Performance
There are several ways to evaluate a fund's historical performance. You can look at the total percentage change in value, the average annual percentage change or the growth of a hypothetical $10,000 investment. Total return reflects the change in the value of an investment, assuming reinvestment of the fund's dividend income and capital gains (the profits earned upon the sale of securities that have grown in value). Load adjusted returns include a 3.00% sales charge and the effect of a $7.50 long-term trading fee for shares held 30 days or more. Effective September 28, 2000, the $7.50 long-term trading fee was eliminated.
Cumulative Total Returns
|
Periods ended |
Past 6 |
Past 1 |
Past 5 |
Past 10 |
|
Select Utilities Growth |
4.22% |
21.10% |
222.50% |
483.27% |
|
Select Utilities Growth |
1.02% |
17.40% |
212.76% |
465.70% |
|
S&P 500 |
11.73% |
16.32% |
193.58% |
493.54% |
|
GS Utilities |
-6.15% |
8.07% |
n/a** |
n/a** |
Cumulative total returns show the fund's performance in percentage terms over a set period - in this case, six months, one year, five years or 10 years. You can compare the fund's returns to the performance of both the Standard & Poor's 500 Index - a market capitalization-weighted index of common stocks - and the Goldman Sachs Utilities Index - a market capitalization-weighted index of 141 stocks designed to measure the performance of companies in the utilities sector. These benchmarks include reinvestment of dividends and capital gains, if any, and exclude the effect of sales charges.
Average Annual Total Returns
|
Periods ended |
Past 1 |
Past 5 |
Past 10 |
|
Select Utilities Growth |
21.10% |
26.39% |
19.29% |
|
Select Utilities Growth |
17.40% |
25.61% |
18.92% |
|
S&P 500 |
16.32% |
24.04% |
19.49% |
|
GS Utilities |
8.07% |
n/a** |
n/a** |
Average annual returns take the fund's cumulative return and show you what would have happened if the fund had performed at a constant rate each year.
** Not available
Understanding Performance
How a fund did yesterday is no guarantee of how it will do tomorrow. The stock market, for example, has a history of long-term growth and short-term volatility. Unlike the broader market, however, some sectors may not have a history of growth in the long run. And, as with all stock funds, the share price and return of a fund that invests in a sector will vary.
3$10,000 Over 10 Years
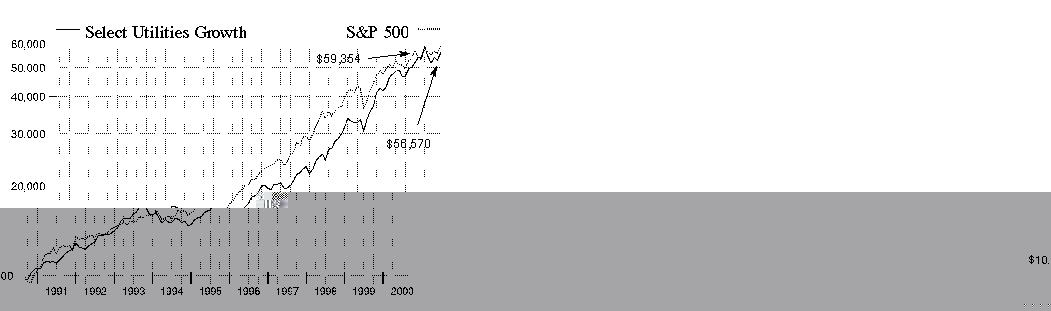
$10,000 Over 10 Years: Let's say hypothetically that $10,000 was invested in Fidelity Select Utilities Growth Portfolio on August 31, 1990, and the current 3.00% sales charge was paid. As the chart shows, by August 31, 2000, the value of the investment would have grown to $56,570 - a 465.70% increase on the initial investment - and includes the effect of a $7.50 long-term trading fee. For comparison, look at how the Standard & Poor's 500 Index did over the same period. With dividends and capital gains, if any, reinvested, the same $10,000 investment would have grown to $59,354 - a 493.54% increase.
Investment Summary
|
Top Ten Stocks as of August 31, 2000 |
|
|
|
% of fund's |
|
Calpine Corp. |
7.7 |
|
Qwest Communications International, Inc. |
7.5 |
|
AES Corp. |
6.5 |
|
Dynegy, Inc. Class A |
6.0 |
|
SBC Communications, Inc. |
4.7 |
|
WorldCom, Inc. |
4.3 |
|
Sprint Corp. - PCS Group Series 1 |
4.2 |
|
Nortel Networks Corp. |
4.1 |
|
Nextel Communications, Inc. Class A |
3.8 |
|
AT&T Corp. |
3.1 |
|
|
51.9 |
Top Industries as of August 31, 2000
% of fund's net assets

Semiannual Report
(Portfolio Manager photograph)
John Roth,
Portfolio Manager
of Fidelity Select
Utilities Growth Portfolio
Q. How did the fund perform, John?
A. The fund's performance versus its benchmarks was mixed. For the six months that ended August 31, 2000, the fund returned 4.22%, bettering the -6.15% mark posted by the Goldman Sachs Utilities Index - an index of 141 stocks designed to measure the performance of companies in the utilities sector. However, the fund trailed the 11.73% return of the Standard & Poor's 500 Index during the same period. For the 12 months that ended August 31, 2000, the fund returned 21.10%, beating the 8.07% and 16.32% returns of the Goldman Sachs index and the S&P 500, respectively.
Q. Why did the fund beat the Goldman Sachs index but trail the S&P 500 during the six-month period?
A. The fund's overweighting of independent power producers (IPPs) helped it relative to the Goldman Sachs index, as IPPs continued to benefit from their ability to meet the demand for additional power in certain areas of the country. Compared with the Goldman Sachs index, the fund also underweighted long-distance telephone service companies and regional Bell operating companies (RBOCs), both of which performed poorly during the period. However, compared with the S&P 500, the fund had a heavier weighting of telecommunications investments, which exerted a drag on its performance relative to that index.
Q. How did you position the fund during the period?
A. I added to the fund's IPP holdings. Over the summer, power shortages in California were so severe that power prices doubled and, in some cases, tripled over what they had been during the previous summer. Because of their flexibility and entrepreneurial mindset, IPPs were in the best position to benefit from those shortages. In addition, I increased the fund's weighting of electric utilities, which rallied in part because they were perceived as relatively safe investments during the increased volatility experienced by stocks in the spring. Furthermore, some traditional electric utilities have IPP subsidiaries that performed well during the period. To fund these purchases, I decreased the fund's exposure to RBOCs, long-distance service providers and competitive local exchange carriers (CLECs).
Q. What stocks did well for the fund?
A. Two IPPs, Calpine and AES, once again made substantial contributions to the fund's returns for the reasons mentioned earlier. While Calpine is primarily a domestic play, AES is a global company positioned to benefit from the trend toward increasing privatization abroad. Dynegy, a diversified power company, has interests in power generation, natural gas processing, and gas and power trading. On the telecom side, Nortel Networks was a strong performer, boosted by continued strong demand for optical switching components and other equipment necessary for telephone system upgrades and Internet expansion.
Q. What stocks detracted from performance?
A. AT&T and Sprint both suffered from concerns about decreased pricing power and slowing revenue growth in the long-distance market. McLeodUSA, a CLEC that was one of the fund's strongest performers six months ago, retreated on worries over lower access rates paid to the company by long-distance providers for use of its network. There also were concerns about the ability of CLECs to continue funding their growth by borrowing money in the high-yield market.
Q. What's your outlook, John?
A. With only about 60% of the U.S. population living in states that have passed legislation or taken regulatory action to open their retail power markets to competition, the future looks bright for progressive power companies. In particular, the development of the wholesale power market bears close watching because it will enable companies to routinely sell power to each other as well as directly to consumers. Although the telecommunications portion of the fund turned in a disappointing performance during the period, the factors driving that sector's outperformance in the past - technological advancement, deregulation and consumer demand for bandwidth - appear very much intact and should benefit the fund going forward.
The views expressed in this report reflect those of the portfolio manager only through the end of the period of the report as stated on the cover. The manager's views are subject to change at any time based on market or other conditions. For more information, see page 3.
Fund Facts
Start date: December 10, 1981
Fund number: 065
Trading symbol: FSUTX
Size: as of August 31, 2000, more than $722 million
Manager: John Roth, since 1999; analyst, utilities industry, 1999-present; joined Fidelity in 1999
3Semiannual Report
Utilities Growth Portfolio
(Unaudited)
Showing Percentage of Net Assets
|
Common Stocks - 93.8% |
|||
|
Shares |
Value (Note 1) |
||
|
BROADCASTING - 0.9% |
|||
|
American Tower Corp. Class A (a) |
39,100 |
$ 1,419,819 |
|
|
EchoStar Communications Corp. |
108,200 |
5,274,750 |
|
|
TOTAL BROADCASTING |
6,694,569 |
||
|
CELLULAR - 17.0% |
|||
|
ALLTEL Corp. |
73,700 |
3,726,456 |
|
|
AT&T Corp. - Wireless Group |
508,400 |
13,313,725 |
|
|
China Mobile (Hong Kong) Ltd. (a) |
794,200 |
6,125,268 |
|
|
Crown Castle International Corp. (a) |
294,000 |
10,198,125 |
|
|
Nextel Communications, Inc. Class A (a) |
497,700 |
27,591,244 |
|
|
SBA Communications Corp. Class A (a) |
171,300 |
7,644,263 |
|
|
Sprint Corp. - PCS Group Series 1 (a) |
610,100 |
30,619,394 |
|
|
TeleCorp PCS, Inc. Class A |
12,300 |
433,575 |
|
|
Triton PCS Holdings, Inc. Class A |
39,800 |
2,203,925 |
|
|
Vodafone Group PLC sponsored ADR |
57,900 |
2,370,281 |
|
|
VoiceStream Wireless Corp. (a) |
163,522 |
18,406,445 |
|
|
TOTAL CELLULAR |
122,632,701 |
||
|
COMMUNICATIONS EQUIPMENT - 5.6% |
|||
|
Comverse Technology, Inc. (a) |
100,000 |
9,193,750 |
|
|
Lexent, Inc. |
46,800 |
1,570,725 |
|
|
Nortel Networks Corp. |
359,132 |
29,291,699 |
|
|
TOTAL COMMUNICATIONS EQUIPMENT |
40,056,174 |
||
|
COMPUTER SERVICES & SOFTWARE - 0.2% |
|||
|
Covad Communications Group, Inc. (a) |
72,600 |
1,184,287 |
|
|
CONSUMER ELECTRONICS - 2.6% |
|||
|
General Motors Corp. Class H |
576,900 |
19,109,813 |
|
|
ELECTRIC UTILITY - 19.3% |
|||
|
AES Corp. (a) |
737,350 |
47,006,063 |
|
|
Allegheny Energy, Inc. |
268,700 |
9,639,613 |
|
|
Calpine Corp. (a) |
558,000 |
55,241,996 |
|
|
DPL, Inc. |
351,200 |
9,592,150 |
|
|
IPALCO Enterprises, Inc. |
258,000 |
6,014,625 |
|
|
Niagara Mohawk Holdings, Inc. (a) |
283,700 |
3,652,638 |
|
|
NRG Energy, Inc. |
316,900 |
8,318,625 |
|
|
TOTAL ELECTRIC UTILITY |
139,465,710 |
||
|
GAS - 9.6% |
|||
|
Dynegy, Inc. Class A |
966,494 |
43,492,230 |
|
|
Enron Corp. |
175,492 |
14,894,884 |
|
|
Kinder Morgan, Inc. |
299,700 |
11,032,706 |
|
|
TOTAL GAS |
69,419,820 |
||
|
|
|||
|
Shares |
Value (Note 1) |
||
|
INDUSTRIAL MACHINERY & EQUIPMENT - 1.1% |
|||
|
Active Power, Inc. |
14,500 |
$ 1,018,625 |
|
|
Capstone Turbine Corp. |
76,300 |
7,043,444 |
|
|
TOTAL INDUSTRIAL MACHINERY & EQUIPMENT |
8,062,069 |
||
|
REAL ESTATE INVESTMENT TRUSTS - 0.7% |
|||
|
Pinnacle Holdings, Inc. (a) |
119,400 |
4,805,850 |
|
|
TELEPHONE SERVICES - 36.8% |
|||
|
Allegiance Telecom, Inc. (a) |
31,650 |
1,576,566 |
|
|
AT&T Corp. |
711,739 |
22,419,779 |
|
|
BellSouth Corp. |
513,500 |
19,159,969 |
|
|
CenturyTel, Inc. |
52,700 |
1,518,419 |
|
|
Global Crossing Ltd. (a) |
459,700 |
13,819,731 |
|
|
Level 3 Communications, Inc. (a) |
230,500 |
20,107,523 |
|
|
McLeodUSA, Inc. Class A (a) |
576,900 |
9,122,231 |
|
|
Metromedia Fiber Network, Inc. |
499,000 |
19,928,813 |
|
|
NEXTLINK Communications, Inc. |
128,700 |
4,512,544 |
|
|
Qwest Communications International, Inc. (a) |
1,049,606 |
54,185,910 |
|
|
SBC Communications, Inc. |
821,661 |
34,304,347 |
|
|
Sprint Corp. - FON Group |
164,900 |
5,524,150 |
|
|
Time Warner Telecom, Inc. Class A (a) |
110,500 |
7,175,594 |
|
|
Verizon Communications |
494,066 |
21,553,629 |
|
|
WorldCom, Inc. (a) |
852,924 |
31,131,725 |
|
|
TOTAL TELEPHONE SERVICES |
266,040,930 |
||
|
TOTAL COMMON STOCKS (Cost $487,939,297) |
677,471,923 |
||
|
Cash Equivalents - 12.0% |
|||
|
|
|
|
|
|
Fidelity Cash Central Fund, 6.59% (b) |
47,647,292 |
47,647,292 |
|
|
Fidelity Securities Lending Cash Central Fund, 6.64% (b) |
39,054,400 |
39,054,400 |
|
|
TOTAL CASH EQUIVALENTS (Cost $86,701,692) |
86,701,692 |
||
|
TOTAL INVESTMENT PORTFOLIO - 105.8% (Cost $574,640,989) |
764,173,615 |
||
|
NET OTHER ASSETS - (5.8)% |
(42,014,120) |
||
|
NET ASSETS - 100% |
$ 722,159,495 |
||
|
Legend |
|
(a) Non-income producing |
|
(b) The rate quoted is the annualized seven-day yield of the fund at |
|
Other Information |
|
Purchases and sales of securities, other than short-term securities, |
|
The fund placed a portion of its portfolio transactions with brokerage firms which are affiliates of Fidelity Management & Research Company. The commissions paid to these affiliated firms were $7,937 for the period. |
|
The fund participated in the security lending program. At period end, the value of securities loaned amounted to $38,513,405. The fund received |
|
Income Tax Information |
|
At August 31, 2000, the aggregate cost of investment securities for income tax purposes was $575,061,372. Net unrealized appreciation aggregated $189,112,243, of which $223,800,365 related to appreciated investment securities and $34,688,122 related to depreciated investment securities. |
See accompanying notes which are an integral part of the financial statements.
Utilities Sector
Statement of Assets and Liabilities
|
|
August 31, 2000 (Unaudited) |
|
|
Assets |
|
|
|
Investment in securities, at value |
|
$ 764,173,615 |
|
Cash |
|
1,070 |
|
Receivable for investments sold |
|
766,298 |
|
Receivable for fund shares sold |
|
2,044,701 |
|
Dividends receivable |
|
180,541 |
|
Interest receivable |
|
268,323 |
|
Redemption fees receivable |
|
921 |
|
Other receivables |
|
34,492 |
|
Total assets |
|
767,469,961 |
|
Liabilities |
|
|
|
Payable for investments purchased |
$ 4,031,125 |
|
|
Payable for fund shares redeemed |
1,647,576 |
|
|
Accrued management fee |
332,316 |
|
|
Other payables and |
245,049 |
|
|
Collateral on securities loaned, |
39,054,400 |
|
|
Total liabilities |
|
45,310,466 |
|
Net Assets |
|
$ 722,159,495 |
|
Net Assets consist of: |
|
|
|
Paid in capital |
|
$ 513,094,066 |
|
Undistributed net investment income |
|
23,688,769 |
|
Accumulated undistributed net realized gain (loss) on investments and foreign currency transactions |
|
(4,156,020) |
|
Net unrealized appreciation (depreciation) on investments |
|
189,532,680 |
|
Net Assets, for 10,154,280 |
|
$ 722,159,495 |
|
Net Asset Value and redemption price per share ($722,159,495 ÷ 10,154,280 shares) |
|
$71.12 |
|
Maximum offering price per share (100/97.00 of $71.12) |
|
$73.32 |
Statement of Operations
|
|
Six months ended August 31, 2000 (Unaudited) |
|
|
Investment Income Dividends |
|
$ 2,545,761 |
|
Special dividend from BCE, Inc. |
|
22,823,470 |
|
Interest |
|
1,357,844 |
|
Security lending |
|
306,923 |
|
Total income |
|
27,033,998 |
|
Expenses |
|
|
|
Management fee |
$ 1,941,928 |
|
|
Transfer agent fees |
1,147,372 |
|
|
Accounting and security lending fees |
202,419 |
|
|
Non-interested trustees' compensation |
645 |
|
|
Custodian fees and expenses |
12,362 |
|
|
Registration fees |
67,366 |
|
|
Audit |
13,060 |
|
|
Legal |
1,219 |
|
|
Miscellaneous |
128 |
|
|
Total expenses before reductions |
3,386,499 |
|
|
Expense reductions |
(44,036) |
3,342,463 |
|
Net investment income |
|
23,691,535 |
|
Realized and Unrealized Gain (Loss) Net realized gain (loss) on: |
|
|
|
Investment securities |
(4,037,454) |
|
|
Foreign currency transactions |
(17,194) |
(4,054,648) |
|
Change in net unrealized appreciation (depreciation) on: |
|
|
|
Investment securities |
7,215,410 |
|
|
Assets and liabilities in |
54 |
7,215,464 |
|
Net gain (loss) |
|
3,160,816 |
|
Net increase (decrease) in net assets resulting from operations |
|
$ 26,852,351 |
|
Other Information |
|
|
|
Sales charges paid to FDC |
|
$ 658,232 |
|
Deferred sales charges withheld by FDC |
|
$ 7,391 |
|
Exchange fees withheld by FSC |
|
$ 7,740 |
|
Expense reductions |
|
|
|
Directed brokerage arrangements |
|
$ 42,483 |
|
Custodian credits |
|
208 |
|
Transfer agent credits |
|
1,345 |
|
|
|
$ 44,036 |
See accompanying notes which are an integral part of the financial statements.
Semiannual Report
Utilities Growth Portfolio
Financial Statements - continued
Statement of Changes in Net Assets
|
Increase (Decrease) in Net Assets |
Six months ended |
Year ended |
|
Operations |
$ 23,691,535 |
$ 4,329,789 |
|
Net realized gain (loss) |
(4,054,648) |
65,394,093 |
|
Change in net unrealized appreciation (depreciation) |
7,215,464 |
79,862,180 |
|
Net increase (decrease) in net assets resulting from operations |
26,852,351 |
149,586,062 |
|
Distributions to shareholders |
(663,904) |
(3,616,937) |
|
From net realized gain |
(5,216,554) |
(79,551,544) |
|
Total distributions |
(5,880,458) |
(83,168,481) |
|
Share transactions |
159,575,741 |
251,824,406 |
|
Reinvestment of distributions |
5,601,324 |
79,235,957 |
|
Cost of shares redeemed |
(109,294,193) |
(260,445,004) |
|
Net increase (decrease) in net assets resulting from share transactions |
55,882,872 |
70,615,359 |
|
Redemption fees |
199,635 |
231,048 |
|
Total increase (decrease) in net assets |
77,054,400 |
137,263,988 |
|
Net Assets |
|
|
|
Beginning of period |
645,105,095 |
507,841,107 |
|
End of period (including undistributed net investment income of $23,688,769 and $1,726,687, respectively) |
$ 722,159,495 |
$ 645,105,095 |
|
Other Information Shares |
|
|
|
Sold |
2,287,891 |
3,779,328 |
|
Issued in reinvestment of distributions |
78,264 |
1,263,812 |
|
Redeemed |
(1,584,235) |
(3,917,845) |
|
Net increase (decrease) |
781,920 |
1,125,295 |
Financial Highlights
|
|
Six months ended |
Years ended February 28, |
||||
|
Selected Per-Share Data |
(Unaudited) |
2000 G |
1999 |
1998 |
1997 |
1996 G |
|
Net asset value, beginning of period |
$ 68.83 |
$ 61.58 |
$ 53.50 |
$ 45.97 |
$ 43.03 |
$ 34.88 |
|
Income from Investment Operations |
|
|
|
|
|
|
|
Net investment income D |
2.43 E |
.48 |
.44 |
.54 |
.73 |
1.10 |
|
Net realized and unrealized gain (loss) |
.46 |
16.46 |
15.77 |
14.83 |
6.41 |
7.86 |
|
Total from investment operations |
2.89 |
16.94 |
16.21 |
15.37 |
7.14 |
8.96 |
|
Less Distributions |
|
|
|
|
|
|
|
From net investment income |
(.07) |
(.42) |
(.25) |
(.58) |
(.70) |
(.84) |
|
From net realized gain |
(.55) |
(9.30) |
(7.93) |
(7.30) |
(3.54) |
- |
|
Total distributions |
(.62) |
(9.72) |
(8.18) |
(7.88) |
(4.24) |
(.84) |
|
Redemption fees added to paid in capital |
.02 |
.03 |
.05 |
.04 |
.04 |
.03 |
|
Net asset value, end of period |
$ 71.12 |
$ 68.83 |
$ 61.58 |
$ 53.50 |
$ 45.97 |
$ 43.03 |
|
Total Return B, C |
4.22% |
29.76% |
32.17% |
36.20% |
18.13% |
25.82% |
|
Ratios and Supplemental Data |
|
|
|
|
|
|
|
Net assets, end of period (000 omitted) |
$ 722,159 |
$ 645,105 |
$ 507,841 |
$ 401,927 |
$ 256,844 |
$ 266,768 |
|
Ratio of expenses to average net assets |
.98% A |
1.07% |
1.18% |
1.33% |
1.47% |
1.39% |
|
Ratio of expenses to average net assets |
.97% A, F |
1.04% F |
1.16% F |
1.30% F |
1.46% F |
1.38% F |
|
Ratio of net investment income to average net assets |
6.85% A |
.72% |
.77% |
1.11% |
1.73% |
2.76% |
|
Portfolio turnover rate |
56% A |
93% |
113% |
78% |
31% |
65% |
|
A Annualized B The total returns would have been lower had certain expenses not been reduced during the periods shown. C Total returns do not include the one time sales
charge and for periods of less than one year are not annualized. |
||||||
See accompanying notes which are an integral part of the financial statements.
Utilities Sector
To evaluate a money market fund's historical performance, you can look at either total return or yield. Total return reflects the change in the value of an investment, assuming reinvestment of the fund's dividend income. Yield measures the income paid by a fund. Since a money market fund tries to maintain a $1 share price, yield is an important measure of performance. Load adjusted returns include a 3.00% sales charge.
Cumulative Total Returns
|
Periods ended |
Past 6 |
Past 1 |
Past 5 |
Past 10 |
|
Select Money Market |
3.04% |
5.79% |
29.08% |
60.31% |
|
Select Money Market |
-0.05% |
2.61% |
25.21% |
55.50% |
|
All Taxable |
2.91% |
5.49% |
28.18% |
58.58% |
Cumulative total returns show the fund's performance in percentage terms over a set period - in this case, six months, one year, five years or 10 years. For example, if you had invested $1,000 in a fund that had a 5% return over the past year, the value of your investment would be $1,050 without including the effect of the 3.00% sales charge. To measure how the fund's performance stacked up against its peers, you can compare it to the all taxable money market funds average, which reflects the performance of 974 taxable money market funds with similar objectives tracked by iMoneyNet, Inc. over the past six months.
Average Annual Total Returns
|
Periods ended |
Past 1 |
Past 5 |
Past 10 |
|
Select Money Market |
5.79% |
5.24% |
4.83% |
|
Select Money Market |
2.61% |
4.60% |
4.51% |
|
All Taxable |
5.49% |
5.08% |
4.71% |
Average annual total returns take the fund's cumulative return and show you what would have happened if the fund had performed at a constant rate each year.
Yields
|
|
8/29/00 |
5/30/00 |
2/29/00 |
11/30/99 |
8/31/99 |
|
Select Money Market |
6.28% |
6.11% |
5.53% |
5.18% |
4.99% |
|
All Taxable Money Market Funds Average |
6.00% |
5.76% |
5.27% |
5.03% |
4.64% |
|
|
8/30/00 |
5/31/00 |
3/1/00 |
12/1/99 |
9/1/99 |
|
MMDA |
2.12% |
2.10% |
2.09% |
2.07% |
2.06% |

Yield refers to the income paid by the fund over a given period. Yields for money market funds are usually for seven-day periods, expressed as annual percentage rates. A yield that assumes income earned is reinvested or compounded is called an effective yield. The chart above shows the fund's current seven-day yield at quarterly intervals over the past year. You can compare these yields to the all taxable money market funds average and the bank money market deposit account average (MMDA). Figures for the all taxable money market funds average are from iMoneyNet, Inc. The MMDA average is supplied by BANK RATE MONITOR.(TM)
Comparing Performance
There are some important differences between a bank money market deposit account (MMDA) and a money market fund. First, the U.S. government neither insures nor guarantees a money market fund. In fact, there is no assurance that a money market fund will maintain a $1 share price. Second, a money market fund returns to its shareholders income earned by the fund's investments after expenses. This is in contrast to banks, which set their MMDA rates periodically based on current interest rates, competitors' rates, and internal criteria.
3Semiannual Report
(Portfolio Manager photograph)
John Todd,
Portfolio Manager
of Fidelity Select
Money Market Portfolio
Q. John, what was the investment environment like during the six months that ended August 31, 2000?
A. It remained virtually unchanged from what we've seen for some time. Economic growth was robust, beyond what the Federal Reserve Board has historically considered to be sustainable without sparking inflationary pressures. In the past, the Fed felt that growth in the gross domestic product (GDP) above an annual pace of 2% to 2.5% would kindle inflation. However, during the past several years GDP growth has risen at much higher rates without inciting inflation. The reason? Improvements in productivity. In fact, productivity has improved to such a degree that the Fed and those in the economic profession have altered their view, believing that the sustainable rate of growth is now more in the 4% range.
Q. What's been driving the economy's strong growth, and how has the Fed reacted to it?
A. One of the linchpins of the U.S. economy's vibrant growth has been capital investment in computerization, which has driven the increase in productivity. In a "virtuous cycle," productivity increases made the economy grow faster, and the stronger economy helped put more money in the pockets of individuals and corporations, which was then invested in computers to help them become more productive. With core inflation numbers remaining moderate, the Fed was able to be a little more permissive with the growth rate, allowing it to remain above 2.5% without drastically seeking to restrict growth through dramatic interest-rate hikes. Nevertheless, the Fed did see fit to raise the rate banks charge each other for overnight loans - known as the fed funds target rate - two times during the period, in March and May, in an attempt to slow growth and head off inflation. Since that time, emerging economic data has indicated that the Fed's rate-hike program - which dates back to June 1999 - has succeeded in moderating growth. Therefore, the Fed has remained on the sideline, keeping rates unchanged since May.
Q. What was your strategy with the fund?
A. The past six months have been marked by uncertainty over the direction of the economy, interest rates and Fed policy. As a result, I pursued a strategy that kept the fund in a neutral position. Most market participants believe the Fed will stand pat through the rest of the year and perhaps well into the first quarter of 2001. That sentiment is currently reflected in a flat money market yield curve. In other words, very little difference exists between the yields offered by short-term money market securities and long-term instruments. With little benefit of investing longer term, I rolled over maturing assets into selective short-term opportunities that appeared periodically as a result of short-term market dislocations.
Q. How did the fund perform?
A. The fund's seven-day yield on August 31, 2000, was 6.28%, compared to 5.53% six months ago. For the six months that ended August 31, 2000, the fund had a total return of 3.04%, compared to 2.91% for the all taxable money market funds average, according to iMoneyNet, Inc.
Q. What is your outlook?
A. For now, it looks as if the Fed will remain on hold as long as the balance between higher growth rates and benign inflation remains. Another reason the Fed probably won't implement any changes in the near future is its desire to remain out of the picture given the proximity of the presidential election. One wild card is the price of oil, which is spiking and may result in financial and/or political stresses not seen since the 1970s. Alternatively, higher oil prices may feed into core inflation, thereby prompting the Fed to respond with higher interest rates. However, oil price increases to date have not influenced core inflation.
The views expressed in this report reflect those of the portfolio manager only through the end of the period of the report as stated on the cover. The manager's views are subject to change at any time based on market or other conditions. For more information, see page 3.
Fund Facts
Start date: August 30, 1985
Fund number: 085
Trading symbol: FSLXX
Size: as of August 31, 2000, more than $1.0 billion
Manager: John Todd, since 1991; manager, various Fidelity and Spartan money market funds; joined Fidelity in 1981
3Semiannual Report
Money Market Portfolio
(Unaudited)
Showing Percentage of Net Assets
|
Certificates of Deposit - 19.0% |
||||
|
Due Date |
Annualized Yield at Time of Purchase |
Principal Amount |
Value |
|
|
London Branch, Eurodollar, Foreign Banks - 7.1% |
||||
|
Abbey National Treasury Services PLC |
||||
|
11/6/00 |
6.75% |
$ 15,000,000 |
$ 15,000,000 |
|
|
Barclays Bank PLC |
||||
|
10/23/00 |
6.58 |
10,000,000 |
10,000,000 |
|
|
Bayerische Hypo-und Vereinsbank AG |
||||
|
11/1/00 |
6.70 |
10,000,000 |
10,000,000 |
|
|
12/11/00 |
6.50 |
25,000,000 |
25,000,000 |
|
|
Northern Rock PLC |
||||
|
10/17/00 |
6.59 |
5,000,000 |
5,000,000 |
|
|
RaboBank Nederland Coop. Central |
||||
|
11/6/00 |
6.83 |
10,000,000 |
10,000,000 |
|
|
|
75,000,000 |
|||
|
New York Branch, Yankee Dollar, Foreign Banks - 11.9% |
||||
|
Bayerische Hypo-und Vereinsbank AG |
||||
|
9/6/00 |
6.57 |
10,000,000 |
9,999,979 |
|
|
Commerzbank AG |
||||
|
3/23/01 |
6.75 |
10,000,000 |
10,000,000 |
|
|
Deutsche Bank AG |
||||
|
11/16/00 |
7.01 |
10,000,000 |
10,000,000 |
|
|
Dresdner Bank AG |
||||
|
9/6/00 |
6.55 |
40,000,000 |
40,000,000 |
|
|
12/29/00 |
7.05 |
10,000,000 |
10,000,000 |
|
|
Norddeutsche Landesbank Girozentrale |
||||
|
5/8/01 |
7.15 |
10,000,000 |
9,998,711 |
|
|
Royal Bank of Canada |
||||
|
5/3/01 |
7.10 |
10,000,000 |
9,998,103 |
|
|
Societe Generale |
||||
|
9/11/00 |
6.60 (b) |
5,000,000 |
4,999,230 |
|
|
Svenska Handelsbanken AB |
||||
|
5/2/01 |
7.01 |
20,000,000 |
19,998,740 |
|
|
|
124,994,763 |
|||
|
TOTAL CERTIFICATES OF DEPOSIT |
199,994,763 |
|||
|
Commercial Paper - 62.0% |
||||
|
|
||||
|
Amsterdam Funding Corp. |
||||
|
9/22/00 |
6.55 |
15,000,000 |
14,943,038 |
|
|
Asset Securitization Coop. Corp. |
||||
|
9/14/00 |
6.55 |
5,000,000 |
4,988,255 |
|
|
9/25/00 |
6.56 (b) |
10,000,000 |
9,999,519 |
|
|
AT&T Corp. |
||||
|
9/19/00 |
6.65 (b) |
5,000,000 |
5,000,000 |
|
|
BBL North America Funding Corp. |
||||
|
9/20/00 |
6.54 |
25,000,000 |
24,914,236 |
|
|
Centric Capital Corp. |
||||
|
9/6/00 |
6.57 |
16,000,000 |
15,985,489 |
|
|
|
||||
|
Due Date |
Annualized Yield at Time of Purchase |
Principal Amount |
Value |
|
|
CIT Group, Inc. |
||||
|
9/13/00 |
6.56% |
$ 50,000,000 |
$ 49,891,498 |
|
|
Citibank Credit Card Master Trust I (Dakota Certificate Program) |
||||
|
9/11/00 |
6.60 |
27,000,000 |
26,950,950 |
|
|
11/9/00 |
6.64 |
15,000,000 |
14,812,263 |
|
|
ConAgra, Inc. |
||||
|
9/15/00 |
6.69 |
5,000,000 |
4,987,069 |
|
|
9/15/00 |
6.73 |
5,000,000 |
4,987,031 |
|
|
Corporate Receivables Corp. |
||||
|
9/15/00 |
6.55 |
20,000,000 |
19,949,367 |
|
|
11/9/00 |
6.65 |
8,980,000 |
8,867,608 |
|
|
Deutsche Bank Financial, Inc. |
||||
|
9/27/00 |
6.54 |
15,000,000 |
14,929,692 |
|
|
Dominion Resources, Inc. |
||||
|
9/21/00 |
6.75 |
10,000,000 |
9,962,722 |
|
|
Edison Asset Securitization LLC |
||||
|
9/15/00 |
6.54 |
20,000,000 |
19,949,406 |
|
|
Enterprise Funding Corp. |
||||
|
9/6/00 |
6.58 |
24,030,000 |
24,008,206 |
|
|
11/14/00 |
6.63 |
5,328,000 |
5,256,593 |
|
|
Falcon Asset Securitization Corp. |
||||
|
9/11/00 |
6.52 |
10,000,000 |
9,981,944 |
|
|
9/26/00 |
6.56 |
15,000,000 |
14,932,292 |
|
|
General Electric Capital Corp. |
||||
|
11/7/00 |
6.88 |
20,000,000 |
19,752,472 |
|
|
Montauk Funding Corp. |
||||
|
9/27/00 |
6.56 |
20,000,000 |
19,905,822 |
|
|
New Center Asset Trust |
||||
|
9/12/00 |
6.59 |
40,000,000 |
39,920,067 |
|
|
Newport Funding Corp. |
||||
|
9/7/00 |
6.56 |
5,000,000 |
4,994,567 |
|
|
9/18/00 |
6.35 |
5,000,000 |
4,985,479 |
|
|
Park Avenue Receivables Corp. |
||||
|
9/11/00 |
6.54 |
41,000,000 |
40,925,922 |
|
|
PHH Corp. |
||||
|
9/6/00 |
6.72 |
30,000,000 |
29,972,208 |
|
|
Phillips Petroleum Co. |
||||
|
9/29/00 |
6.75 |
10,000,000 |
9,947,889 |
|
|
Preferred Receivables Funding Corp. |
||||
|
9/15/00 |
6.55 |
20,000,000 |
19,949,328 |
|
|
10/6/00 |
6.55 |
18,350,000 |
18,234,038 |
|
|
Salomon Smith Barney Holdings, Inc. |
||||
|
10/12/00 |
6.59 |
10,000,000 |
9,925,858 |
|
|
Societe Generale NA |
||||
|
9/5/00 |
6.57 |
35,000,000 |
34,974,644 |
|
|
2/28/01 |
6.72 |
10,000,000 |
9,675,250 |
|
|
Three Rivers Funding Corp. |
||||
|
9/5/00 |
6.57 |
34,000,000 |
33,975,331 |
|
|
9/18/00 |
6.55 |
15,000,000 |
14,953,888 |
|
|
Commercial Paper - continued |
||||
|
Due Date |
Annualized Yield at Time of Purchase |
Principal Amount |
Value |
|
|
Triple-A One Funding Corp. |
||||
|
9/14/00 |
6.54% |
$ 15,625,000 |
$ 15,588,268 |
|
|
10/5/00 |
6.59 |
5,976,000 |
5,939,201 |
|
|
Tyco International Group SA |
||||
|
9/21/00 |
6.78 |
5,000,000 |
4,981,278 |
|
|
WorldCom, Inc. |
||||
|
9/5/00 |
6.69 |
5,000,000 |
4,996,306 |
|
|
9/15/00 |
6.68 |
5,000,000 |
4,987,089 |
|
|
TOTAL COMMERCIAL PAPER |
653,882,083 |
|||
|
Bank Notes - 4.7% |
||||
|
|
||||
|
Bank of America NA |
||||
|
11/2/00 |
6.63 |
10,000,000 |
10,000,000 |
|
|
11/20/00 |
7.00 |
5,000,000 |
5,000,000 |
|
|
2/20/01 |
6.72 |
25,000,000 |
25,000,000 |
|
|
Bank One NA, Chicago |
||||
|
10/23/00 |
6.70 (b) |
5,000,000 |
4,999,364 |
|
|
First Union National Bank, North Carolina |
||||
|
10/4/00 |
6.86 (b) |
5,000,000 |
5,000,000 |
|
|
TOTAL BANK NOTES |
49,999,364 |
|||
|
Master Notes - 2.9% |
||||
|
|
||||
|
Goldman Sachs Group, Inc. |
||||
|
9/29/00 |
6.62 (c) |
20,000,000 |
20,000,000 |
|
|
10/16/00 |
6.65 (c) |
10,000,000 |
10,000,000 |
|
|
TOTAL MASTER NOTES |
30,000,000 |
|||
|
Medium-Term Notes - 1.4% |
||||
|
|
||||
|
CIT Group, Inc. |
||||
|
9/1/00 |
6.61 (b) |
5,000,000 |
4,997,802 |
|
|
General Motors Acceptance Corp. |
||||
|
9/28/00 |
6.56 (b) |
5,000,000 |
4,998,546 |
|
|
Merrill Lynch & Co., Inc. |
||||
|
9/5/00 |
6.59 (b) |
5,000,000 |
4,999,707 |
|
|
TOTAL MEDIUM-TERM NOTES |
14,996,055 |
|||
|
Short-Term Notes - 1.7% |
||||
|
|
||||
|
RACERS Series 00 10MM, |
||||
|
9/22/00 |
6.64 (a)(b) |
5,000,000 |
5,000,000 |
|
|
Strategic Money Market Trust Series 2000 B, |
||||
|
9/13/00 |
6.81 (a)(b) |
3,000,000 |
3,000,000 |
|
|
|
||||
|
Due Date |
Annualized Yield at Time of Purchase |
Principal Amount |
Value |
|
|
Strategic Money Market Trust Series 2000 E, |
||||
|
9/14/00 |
6.64% (a)(b) |
$ 10,000,000 |
$ 10,000,000 |
|
|
TOTAL SHORT-TERM NOTES |
18,000,000 |
|||
|
Repurchase Agreements - 8.9% |
|||
|
Maturity Amount |
|
||
|
In a joint trading account (U.S. Government Obligations) dated 8/31/00 due 9/1/00 At 6.67% |
$ 644,119 |
644,000 |
|
|
With: |
|
|
|
|
Morgan Stanley & Co. At 6.75%, dated 8/31/00 due 9/1/00 (Commercial Paper |
51,009,563 |
51,000,000 |
|
|
Salomon Smith Barney At 6.76%, dated 8/31/00 due 9/1/00 (Commercial Paper Obligations) (principal amount $42,981,000) 0%, 9/5/00 - 10/6/00 |
42,007,884 |
42,000,000 |
|
|
TOTAL REPURCHASE AGREEMENTS |
93,644,000 |
||
|
TOTAL INVESTMENT PORTFOLIO - 100.6% |
1,060,516,265 |
||
|
NET OTHER ASSETS - (0.6)% |
(6,363,411) |
||
|
NET ASSETS - 100% |
$ 1,054,152,854 |
||
|
Total Cost for Income Tax Purposes $ 1,060,516,265 |
|
|
|
Legend |
|
(a) Security exempt from registration under Rule 144A of the Securities |
|
(b) The coupon rate shown on floating or adjustable rate securities represents the rate at period end. The due dates on these types of securities |
|
(c) Restricted securities - Investment in securities not registered under the Securities Act of 1933. |
|
Additional information on each holding is as follows: |
|
Security |
Acquisition Date |
Cost |
|
Goldman Sachs Group, Inc.: |
8/30/00 |
$ 20,000,000 |
|
6.65%, 10/16/00 |
8/9/00 |
$ 10,000,000 |
|
Other Information |
|
The fund invested in securities that are not registered under the Securities Act of 1933. These securities are subject to legal or contractual restrictions on resale. At the end of the period, restricted securities (excluding Rule 144A issues) amounted to $30,000,000 or 2.9% of net assets. |
|
The fund participated in the interfund lending program as a lender. The average daily loan balance during the period for which loans were outstanding amounted to $14,156,333. The weighted average interest rate was 6.16%. Interest earned from the interfund lending program amounted to $14,523 and is included in interest income on the Statement of Operations. |
|
Income Tax Information |
|
At February 29, 2000, the fund had a capital loss carryforward of approximately $6,000 all of which will expire on February 29, 2008. |
See accompanying notes which are an integral part of the financial statements.
Money Market
Statement of Assets and Liabilities
|
|
August 31, 2000 (Unaudited) |
|
|
Assets |
|
|
|
Investment in securities, at value (including repurchase agreements of $93,644,000) - |
|
$ 1,060,516,265 |
|
Receivable for fund shares sold |
|
20,544,939 |
|
Interest receivable |
|
3,878,046 |
|
Prepaid expenses |
|
16,622 |
|
Total assets |
|
1,084,955,872 |
|
Liabilities |
|
|
|
Payable to custodian bank |
$ 480 |
|
|
Payable for investments purchased |
53,737 |
|
|
Payable for fund shares redeemed |
29,989,254 |
|
|
Distributions payable |
294,470 |
|
|
Accrued management fee |
246,941 |
|
|
Other payables and |
218,136 |
|
|
Total liabilities |
|
30,803,018 |
|
Net Assets |
|
$ 1,054,152,854 |
|
Net Assets consist of: |
|
|
|
Paid in capital |
|
$ 1,054,191,803 |
|
Accumulated undistributed |
|
(38,949) |
|
Net Assets, for 1,054,124,913 shares outstanding |
|
$ 1,054,152,854 |
|
Net Asset Value and redemption price per share ($1,054,152,854 ÷ 1,054,124,913 shares) |
|
$1.00 |
|
Maximum offering price per share (100/97.00 of $1.00) |
|
$1.03 |
Statement of Operations
|
|
Six months ended August 31, 2000 (Unaudited) |
|
|
Interest Income |
|
$ 36,270,081 |
|
Expenses |
|
|
|
Management fee |
$ 1,362,551 |
|
|
Transfer agent fees |
980,789 |
|
|
Accounting fees and expenses |
62,005 |
|
|
Non-interested trustees' compensation |
1,866 |
|
|
Custodian fees and expenses |
11,793 |
|
|
Registration fees |
391,716 |
|
|
Audit |
16,593 |
|
|
Legal |
1,858 |
|
|
Miscellaneous |
25,116 |
|
|
Total expenses before reductions |
2,854,287 |
|
|
Expense reductions |
(15,909) |
2,838,378 |
|
Net interest income |
|
33,431,703 |
|
Net Realized Gain (Loss) |
|
(33,030) |
|
Net increase in net assets resulting from operations |
|
$ 33,398,673 |
|
Other Information |
|
|
|
Sales charges paid to FDC |
|
$ 918,390 |
|
Deferred sales charges withheld by FDC |
|
$ 23,215 |
|
Expense reductions |
|
|
|
Transfer agent credits |
|
$ 15,909 |
See accompanying notes which are an integral part of the financial statements.
Semiannual Report
Money Market Portfolio
Financial Statements - continued
Statement of Changes in Net Assets
|
Increase (Decrease) in Net Assets |
Six months ended |
Year ended |
|
Operations |
$ 33,431,703 |
$ 51,802,262 |
|
Net realized gain (loss) |
(33,030) |
(5,919) |
|
Net increase (decrease) in net assets resulting from operations |
33,398,673 |
51,796,343 |
|
Distributions to shareholders from net interest income |
(33,431,703) |
(51,802,262) |
|
Share transactions at net asset value of $1.00 per share |
3,074,223,356 |
4,948,605,084 |
|
Reinvestment of distributions from net interest income |
30,897,709 |
47,380,569 |
|
Cost of shares redeemed |
(2,939,804,339) |
(5,233,284,138) |
|
Net increase (decrease) in net assets and shares resulting from share transactions |
165,316,726 |
(237,298,485) |
|
Total increase (decrease) in net assets |
165,283,696 |
(237,304,404) |
|
Net Assets |
|
|
|
Beginning of period |
888,869,158 |
1,126,173,562 |
|
End of period |
$ 1,054,152,854 |
$ 888,869,158 |
Financial Highlights
|
|
Six months ended |
Years ended February 28, |
||||
|
Selected Per-Share Data |
(Unaudited) |
2000 E |
1999 |
1998 |
1997 |
1996 E |
|
Net asset value, beginning of period |
$ 1.000 |
$ 1.000 |
$ 1.000 |
$ 1.000 |
$ 1.000 |
$ 1.000 |
|
Income from Investment Operations |
.030 |
.050 |
.050 |
.051 |
.049 |
.054 |
|
Less Distributions |
|
|
|
|
|
|
|
From net interest income |
(.030) |
(.050) |
(.050) |
(.051) |
(.049) |
(.054) |
|
Net asset value, end of period |
$ 1.000 |
$ 1.000 |
$ 1.000 |
$ 1.000 |
$ 1.000 |
$ 1.000 |
|
Total Return B, C |
3.04% |
5.08% |
5.08% |
5.26% |
5.02% |
5.56% |
|
Ratios and Supplemental Data |
|
|
|
|
|
|
|
Net assets, end of period (000 omitted) |
$ 1,054,153 |
$ 888,869 |
$ 1,126,174 |
$ 584,919 |
$ 848,168 |
$ 610,821 |
|
Ratio of expenses to average net assets |
.51% A |
.48% |
.50% |
.56% |
.56% |
.59% |
|
Ratio of expenses to average net assets after |
.50% A, D |
.48% |
.49% D |
.56% |
.56% |
.59% |
|
Ratio of net interest income to average net assets |
5.94% A |
4.95% |
5.03% |
5.13% |
4.92% |
5.39% |
|
A Annualized B Total returns for periods of less than one year are not annualized. C The total returns would have been lower had certain expenses not been reduced during
the periods shown. D FMR or the fund has entered into varying |
||||||
See accompanying notes which are an integral part of the financial statements.
Money Market
For the period ended August 31, 2000 (Unaudited)
1. Significant Accounting Policies.
Fidelity Select Portfolios (the trust) is registered under the Investment Company Act of 1940, as amended (the 1940 Act), as an open-end management investment company organized as a Massachusetts business trust. The trust has thirty-eight equity funds (the fund or the funds) which invest primarily in securities of companies whose principal business activities fall within specific industries, and a money market fund which invests in high quality money market instruments. Each fund is authorized to issue an unlimited number of shares. The Gold Portfolio and Natural Resources Portfolio may also invest in certain precious metals. The financial statements have been prepared in conformity with generally accepted accounting principles which require management to make certain estimates and assumptions at the date of the financial statements. The following summarizes the significant accounting policies of the funds:
Security Valuation:
Equity Funds. Securities for which exchange quotations are readily available are valued at the last sale price, or if no sale price, at the closing bid price. Foreign securities are valued based on quotations from the principal market in which such securities are normally traded. If trading or events occurring in other markets after the close of the principal market in which foreign securities are traded, and before the close of the business of the fund, are expected to materially affect the value of those securities, then they are valued at their fair value taking this trading or these events into account. Fair value is determined in good faith under consistently applied procedures under the general supervision of the Board of Trustees. Securities (including restricted securities) for which exchange quotations are not readily available (and in certain cases debt securities which trade on an exchange) are valued primarily using dealer-supplied valuations or at their fair value. Short-term securities with remaining maturities of sixty days or less for which quotations are not readily available are valued at amortized cost or original cost plus accrued interest, both of which approximate current value. Direct investments in precious metals in the form of bullion are valued at the most recent bid price quoted by a major bank on the New York Commodities Exchange.
Money Market Fund. As permitted under Rule 2a-7 of the 1940 Act, and certain conditions therein, securities are valued initially at cost and thereafter assume a constant amortization to maturity of any discount or premium.
Foreign Currency Translation. The accounting records of the funds are maintained in U.S. dollars. Investment securities and other assets and liabilities denominated in a foreign currency are translated into U.S. dollars at the prevailing rates of exchange at period end. Purchases and sales of securities, income receipts and expense payments are translated into U.S. dollars at the prevailing exchange rate on the respective dates of the transactions.
Net realized gains and losses on foreign currency transactions represent net gains and losses from sales and maturities of foreign currency contracts, disposition of foreign currencies, the difference between the amount of net investment income accrued and the U.S. dollar amount actually received, and gains and losses between trade and settlement date on purchases and sales of securities. The effects of changes in foreign currency exchange rates on investments in securities are included with the net realized and unrealized gain or loss on investment securities.
Income Taxes. As a qualified regulated investment company under Subchapter M of the Internal Revenue Code, each fund is not subject to U.S. federal income taxes to the extent that it distributes substantially all of its taxable income for its fiscal year. Each fund may be subject to foreign taxes on income and gains on investments which are accrued based upon each fund's understanding of the tax rules and regulations that exist in the markets in which they invest. Foreign governments may also impose taxes on other payments or transactions with respect to foreign securities. Each fund accrues such taxes as applicable. The schedules of investments include information regarding income taxes under the caption "Income Tax Information."
Investment Income:
Equity Funds. Dividend income is recorded on the ex-dividend date, except certain dividends from foreign securities where the ex-dividend date may have passed, are recorded as soon as the funds are informed of the ex-dividend date. Non-cash dividends included in dividend income, if any, are recorded at the fair market value of the securities received. Interest income is accrued as earned. Investment income is recorded net of foreign taxes withheld where recovery of such taxes is uncertain.
Money Market Fund. Interest income, which includes amortization of premium and accretion of discount, is accrued as earned.
Expenses. Most expenses of the trust can be directly attributed to a fund. Expenses which cannot be directly attributed are apportioned among the funds in the trust.
Deferred Trustee Compensation. Under a Deferred Compensation Plan (the Plan) non-interested Trustees must defer receipt of a portion of, and may elect to defer receipt of an additional portion of, their annual compensation. Deferred amounts are treated as though equivalent dollar amounts had been invested in shares of the fund or are invested in a cross-section of other Fidelity funds. Deferred amounts remain in the fund until distributed in accordance with the Plan.
Distributions to Shareholders. Dividends are declared daily and paid monthly from net interest income for the money market fund. Distributions are recorded on the ex-dividend date for all other funds.
Semiannual Report
Notes to Financial Statements (Unaudited) - continued
1. Significant Accounting Policies - continued
Distributions to Shareholders - continued
Income and capital gain distributions are determined in accordance with income tax regulations which may differ from generally accepted accounting principles. These differences, which may result in distribution reclassifications, are primarily due to differing treatments for litigation proceeds, foreign currency transactions, passive foreign investment companies (PFIC), market discount, partnerships, non-taxable dividends, net operating losses, capital loss carryforwards, and losses deferred due to wash sales and excise tax regulations. Certain funds also utilized earnings and profits distributed to shareholders on redemption of shares as a part of the dividends paid deduction for income tax purposes.
Permanent book and tax basis differences relating to shareholder distributions will result in reclassifications to paid in capital. Undistributed net investment income, distributions in excess of net investment income, accumulated net investment loss and accumulated undistributed net realized gain (loss) on investments and foreign currency transactions may include temporary book and tax basis differences which will reverse in a subsequent period. Any taxable income or gain remaining at fiscal year end is distributed in the following year.
Trading (Redemption) Fees. Shares redeemed (including exchanges) from an equity fund are subject to trading fees. Shares held less than 30 days are subject to a trading fee equal to .75% of the net asset value of shares redeemed. Shares held 30 days or more are subject to a trading fee equal to the lesser of $7.50 or .75% of the net asset value of shares redeemed. Effective September 28, 2000, shares held 30 days or more are no longer subject to this trading fee. The fees, which are retained by the fund, are accounted for as an addition to paid in capital. Shareholders are also subject to an additional $7.50 fee for shares exchanged into another Fidelity fund (see Note 4).
Security Transactions. Security transactions are accounted for as of trade date. Gains and losses on securities sold are determined on the basis of identified cost.
2. Operating Policies.
Foreign Currency Contracts. Certain funds use foreign currency contracts to facilitate transactions in foreign-denominated securities. Losses may arise from changes in the value of the foreign currency or if the counterparties do not perform under the contracts' terms. The U.S. dollar value of foreign currency contracts is determined using contractual currency exchange rates established at the time of each trade.
Joint Trading Account. Pursuant to an Exemptive Order issued by the Securities and Exchange Commission (the SEC), the funds, along with other affiliated entities of Fidelity Management & Research Company (FMR), may transfer uninvested cash balances into one or more joint trading accounts. These balances are invested in one or more repurchase agreements for U.S. Treasury or Federal Agency obligations.
Repurchase Agreements. The underlying U.S. Treasury, Federal Agency, or other obligations found to be satisfactory by FMR are transferred to an account of the funds, or to the Joint Trading Account, at a custodian bank. The securities are marked-to-market daily and maintained at a value at least equal to the principal amount of the repurchase agreement (including accrued interest). FMR, the funds' investment adviser, is responsible for determining that the value of the underlying securities remains in accordance with the market value requirements stated above.
Cash Central Funds. Pursuant to an Exemptive Order issued by the SEC, the funds may invest in the Fidelity Cash Central Fund and the Fidelity Securities Lending Cash Central Fund (the Cash Funds) managed by Fidelity Investments Money Management, Inc. (FIMM), an affiliate of FMR. The Cash Funds are open-end money market funds available only to investment companies and other accounts managed by FMR and its affiliates. The Cash Funds seek preservation of capital, liquidity, and current income. Income distributions from the Cash Funds are declared daily and paid monthly from net interest income. Income distributions earned by the funds are recorded as either interest income or security lending income in the accompanying financial statements.
Interfund Lending Program. Pursuant to an Exemptive Order issued by the SEC, the funds, along with other registered investment companies having management contracts with FMR, may participate in an interfund lending program. This program provides an alternative credit facility allowing the funds to borrow from, or lend money to, other participating funds. Information regarding each fund's participation in the program is included under the caption "Other Information" at the end of each applicable fund's schedule of investments.
Restricted Securities. Certain funds are permitted to invest in securities that are subject to legal or contractual restrictions on resale. These securities generally may be resold in transactions exempt from registration or to the public if the securities are registered. Disposal of these securities may involve time-consuming negotiations and expense, and prompt sale at an acceptable price may be difficult. Information regarding restricted securities is included under the caption "Other Information" at the end of each applicable fund's schedule of investments.
3. Purchases and Sales of Investments.
Information regarding purchases and sales of securities (other than short-term securities), is included under the caption "Other Information" at the end of each applicable fund's schedule of investments.
Semiannual Report
Notes to Financial Statements (Unaudited) - continued
4. Fees and Other Transactions with Affiliates.
Management Fee. As each fund's investment adviser, FMR receives a monthly fee.
For each equity fund, the monthly fee is calculated on the basis of a group fee rate plus a fixed individual fund fee rate applied to the average net assets of each fund. The group fee rate is the weighted average of a series of rates and is based on the monthly average net assets of all the mutual funds advised by FMR. The rates ranged from .2167% to .5200% for the period for the funds. The annual individual fund fee rate is .30%. In the event that these rates were lower than the contractual rates in effect during the period, FMR voluntarily implemented the above rates, as they resulted in the same or a lower management fee. For the period, the management fees were equivalent to an annualized rate of .57% of average net assets for the equity funds.
For the money market fund, FMR receives a monthly fee that is calculated on the basis of a group fee rate plus a fixed individual fund fee rate applied to the average net assets of the fund and an income-based fee. The group fee rate is the weighted average of a series of rates and is based on the monthly average net assets of all the mutual funds advised by FMR. The rates ranged from .0920% to .3700% for the period. The annual individual fund fee rate is .03%. In the event that these rates were lower than the contractual rates in effect during the period, FMR voluntarily implemented the above rates, as they resulted in the same or a lower management fee. The income-based fee is added only when the fund's gross yield exceeds 5%. At that time the income-based fee would equal 6% of that portion of the fund's gross income that represents a gross yield of more than 5% per year. The maximum income-based component is .24% of average net assets. For the period, the total management fee was equivalent to an annualized rate of .24%. The income-based portion of this fee was equal to $487,231, or an annualized rate of .09% of the fund's average net assets.
Sub-Adviser Fee. As the money market fund's investment sub-adviser, FIMM, a wholly owned subsidiary of FMR, receives a fee from FMR of 50% of the management fee payable to FMR. The fee is paid prior to any voluntary expense reimbursements which may be in effect.
Sales Load. Fidelity Distributors Corporation (FDC), an affiliate of FMR, is the general distributor of the fund. FDC receives a sales charge of up to 3% for selling shares of each fund. Prior to October 12, 1990, FDC received a sales charge of up to 2% and a 1% deferred sales charge. Shares purchased prior to October 12, 1990, are subject to a 1% deferred sales charge upon redemption or exchange to any other Fidelity Fund (other than Select funds). All sales charges are retained by FDC. The amounts received by FDC for sales charges and deferred sales charges are shown under the caption "Other Information" on each fund's Statement of Operations.
Transfer Agent Fees. Fidelity Service Company, Inc. (FSC), an affiliate of FMR, is the funds' transfer, dividend disbursing and shareholder servicing agent. FSC receives account fees and asset-based fees that vary according to account size and type of account. FSC pays for typesetting, printing and mailing of all shareholder reports, except proxy statements.
Accounting and Security Lending Fees. FSC, maintains each fund's accounting records and administers the security lending program. The security lending fee is based on the number and duration of lending transactions. The accounting fee is based on the level of average net assets for the month plus out-of-pocket expenses.
Money Market Insurance. Pursuant to an Exemptive Order issued by the SEC, the money market fund, along with other money market funds advised by FMR or its affiliates, has, entered into insurance agreements with FIDFUNDS Mutual Limited (FIDFUNDS), an affiliated mutual insurance company. FIDFUNDS provides limited coverage for certain loss events including issuer default as to payment of principal or interest and bankruptcy or insolvency of a credit enhancement provider. The insurance does not cover losses resulting from changes in interest rates, ratings downgrades or other market conditions. The fund may be subject to a special assessment of up to approximately 2.5 times the fund's annual gross premium if covered losses exceed certain levels. The fund paid premiums of $49,866 for the calendar year 2000 to FIDFUNDS, which are being amortized over one year.
Exchange Fees. FSC receives the proceeds of $7.50 to cover administrative costs associated with exchanges out of an equity fund to any other Fidelity Select fund or to any other Fidelity fund. The exchange fees retained by FSC are shown under the caption "Other Information" on each fund's Statement of Operations.
Brokerage Commissions. Certain funds placed a portion of their portfolio transactions with brokerage firms which are affiliates of FMR. The commissions paid to these affiliated firms are shown under the caption "Other Information" at the end of each applicable fund's schedule of investments.
5. Security Lending.
Certain funds lend portfolio securities from time to time in order to earn additional income. Each applicable fund receives collateral (in the form of U.S. Treasury obligations, letters of credit and/or cash) against the loaned securities and maintains collateral in an amount not less than 100% of the market value of the loaned securities during the period of the loan. The market value of the loaned securities is determined at the close of business of the funds and any additional required collateral is delivered to the funds on the next business day. If the borrower defaults on
Semiannual Report
Notes to Financial Statements (Unaudited) - continued
5. Security Lending - continued
its obligation to return the securities loaned because of insolvency or other reasons, a fund could experience delays and costs in recovering the securities loaned or in gaining access to the collateral. Information regarding the value of securities loaned and the value of collateral at period end is included under the caption "Other Information" at the end of each applicable fund's schedule of investments.
6. Bank Borrowings.
Each fund is permitted to have bank borrowings for temporary or emergency purposes to fund shareholder redemptions. Each fund has established borrowing arrangements with certain banks. The interest rate on the borrowings is the bank's base rate, as revised from time to time. Information regarding a fund's participation in the program is included under the caption "Other Information" at the end of each applicable fund's schedule of investments.
7. Expense Reductions.
FMR voluntarily agreed to reimburse the funds' operating expenses (excluding interest, taxes, certain securities lending fees, brokerage commissions and extraordinary expenses, if any) above an annual rate of 2.50% of average net assets. FMR retains the ability to be repaid by the funds for these expense reductions in the amount that expenses fall below the limit prior to the end of the fiscal year. For the period, the reimbursements reduced the expenses by $21,331 and $8,264 for the Cyclical Industries Portfolio and the Construction and Housing Portfolio, respectively.
FMR has directed certain portfolio trades to brokers who paid a portion of certain equity funds' expenses. In addition, certain funds have entered into arrangements with their custodian and transfer agent whereby credits realized on uninvested cash balances were used to offset a portion of certain funds' expenses.
For the period, the reductions under these arrangements are shown under the caption "Other Information" on each applicable fund's Statement of Operations.
8. Beneficial Interest.
At the end of the period, FMR and its affiliates were record owners of more than 5% of the outstanding shares, and certain unaffiliated shareholders were each record owners of 10% or more of the total outstanding shares of the following funds:
|
Beneficial Interest |
|||
|
Fund |
FMR% of |
Number of |
% of Unaffiliated |
|
Cyclical |
dd45.1 |
1 |
13.6 |
|
Multimedia |
-sss- |
1 |
13.3 |
|
Natural |
3330.7 |
- |
- |
9. Transactions with Affiliated Companies.
An affiliated company is a company which the fund has ownership of at least 5% of the voting securities. Information regarding transactions with affiliated companies is included in "Other Information" at the end of each applicable fund's schedule of investments.
10. Merger Information.
On February 29, 2000, Fidelity Select Gold Portfolio acquired all of the assets and assumed all of the liabilities of Fidelity Select Precious Metals and Minerals Portfolio. The acquisition, which was approved by the shareholders of Fidelity Select Precious Metals and Minerals Portfolio on February 16, 2000, was accomplished by an exchange of 7,736,425 shares of the Fidelity Select Gold Portfolio for the 10,907,225 shares then outstanding (each valued at $9.54) of Fidelity Select Precious Metals and Minerals Portfolio. Based on the opinion of fund counsel, the reorganization qualified as a tax-free reorganization for federal income tax purposes with no gain or loss recognized to the funds or their shareholders. Fidelity Select Precious Metals and Minerals Portfolio's net assets, including $14,545,376 of unrealized depreciation, were combined with Fidelity Select Gold Portfolio's net assets for total net assets after the acquisition of $283,966,204. In addition, FMR agreed to reimburse Fidelity Select Gold Portfolio's operating expenses (excluding interest, taxes, certain securities lending costs, brokerage commissions and extraordinary expenses, if any) above an annual rate of 1.54% of average net assets. This arrangement with Fidelity Select Gold Portfolio was effective March 1, 2000 and will remain in effect through February 28, 2001.
Semiannual Report
Annual Report
Investment Adviser
Fidelity Management & Research Company
Boston, MA
Investment Sub-Advisers
Fidelity Investments Money Management, Inc.,
Money Market Fund
Fidelity Management & Research
(U.K.) Inc.
Fidelity Management & Research
(Far East) Inc.
Fidelity Investments Japan Limited
Officers
Edward C. Johnson 3d, President
Robert C. Pozen, Senior Vice President
Eric D. Roiter, Secretary
Robert A. Dwight, Treasurer
Maria F. Dwyer, Deputy Treasurer
Boyce I. Greer, Vice President, Money Market Fund
John Todd, Vice President, Money Market Fund
Stanley N. Griffith, Assistant Vice President, Money Market Fund
Dwight D. Churchill, Vice President, Money Market Fund
John H. Costello, Assistant Treasurer
Thomas J. Simpson, Assistant Treasurer
Board of Trustees
Ralph F. Cox *
Phyllis Burke Davis *
Robert M. Gates *
Edward C. Johnson 3d
Donald J. Kirk *
Ned C. Lautenbach *
Peter S. Lynch
Marvin L. Mann *
William O. McCoy *
Gerald C. McDonough *
Robert C. Pozen
Thomas R. Williams *
Advisory Board
J. Michael Cook
Abigail P. Johnson
Marie L. Knowles
General Distributor
Fidelity Distributors Corporation
Boston, MA
Transfer and Shareholder
Servicing Agent
Fidelity Service Company, Inc.
Boston, MA
Custodians
Brown Brothers Harriman & Co.
Boston, MA
and
The Bank of New York
New York, NY
Corporate Headquarters
82 Devonshire Street
Boston, MA 02109
1-800-544-8888
* Independent trustees
Fidelity Select Portfolios
Consumer Sector
Consumer Industries
Food and Agriculture
Leisure
Multimedia
Retailing
Cyclicals Sector
Air Transportation
Automotive
Chemicals
Construction and Housing
Cyclical Industries
Defense and Aerospace
Environmental Services
Industrial Equipment
Industrial Materials
Paper and Forest Products
Transportation
Financial Services Sector
Banking
Brokerage and Investment Management
Financial Services
Home Finance
Insurance
Health Care Sector
Biotechnology
Health Care
Medical Delivery
Medical Equipment and Systems
Natural Resources Sector
Energy
Energy Service
Gold
Natural Resources
Technology Sector
Business Services and Outsourcing
Computers
Developing Communications
Electronics
Software and Computer Services
Technology
Utilities Sector
Natural Gas
Telecommunications
Utilities Growth
Money Market
The Fidelity Telephone Connection
Mutual Fund 24-Hour Service
Exchanges/Redemptions
and Account Assistance 1-800-544-6666
Product Information 1-800-544-6666
Retirement Accounts 1-800-544-4774
(8 a.m. - 9 p.m.)
TDD Service 1-800-544-0111
for the deaf and hearing impaired
(9 a.m. - 9 p.m. Eastern time)
Fidelity Automated Service
Telephone (FAST®) (automated graphic) 1-800-544-5555
(automated graphic) Automated line for quickest service
(fidelity logo graphic)(registered trademark)
P.O. Box 193
Boston, MA 02101
SEL-SANN-1000 114060
1.536823.103
(Recycle graphic) Printed on Recycled Paper
|
|