
|
|
|
|
|
|
|
|
|
|
Previous: ESTERLINE TECHNOLOGIES CORP, 10-K, EX-23.3, 2001-01-19 |
Next: ESTERLINE TECHNOLOGIES CORP, S-3, EX-1.1, 2001-01-19 |
As filed with the Securities and Exchange Commission on January 19, 2001
Registration No. 333-
SECURITIES AND EXCHANGE COMMISSION
Washington, D.C. 20549
FORM S-3
REGISTRATION STATEMENT
UNDER
THE SECURITIES ACT OF 1933
Esterline Technologies Corporation
(Exact name of registrant as specified in its charter)
| Delaware | 13-2595091 | |
| (State or other jurisdiction of incorporation or organization) |
(I.R.S. Employer Identification Number) |
10800 NE 8th Street
Bellevue, Washington 98004
(425) 453-9400
(Address, including zip code, and telephone number, including area code, of registrant's principal executive offices)
Robert W. Cremin
Chairman, President and Chief Executive Officer
Esterline Technologies Corporation
10800 NE 8th Street
Bellevue, Washington 98004
(425) 453-9400
(Name, address, including zip code, and telephone number, including area code, of agent for service)
Copies to:
| Andrew Bor Perkins Coie LLP 1201 Third Avenue, Suite 4800 Seattle, Washington 98101-3099 (206) 583-8888 |
Jonathan I. Mark Cahill Gordon & Reindel 80 Pine Street New York, New York 10005 (212) 701-3000 |
Approximate date of commencement of proposed sale to the public: As soon as practicable after this Registration Statement becomes effective.
If the only securities being registered on this Form are being offered pursuant to dividend or interest reinvestment plans, please check the following box. / /
If any of the securities being registered on this Form are to be offered on a delayed or continuous basis pursuant to Rule 415 under the Securities Act of 1933, other than securities offered only in connection with dividend or interest reinvestment plans, check the following box. / /
If this Form is filed to register additional securities for an offering pursuant to Rule 462(b) under the Securities Act, please check the following box and list the Securities Act registration statement number of the earlier effective registration statement for the same offering. / /
If this Form is a post-effective amendment filed pursuant to Rule 462(c) under the Securities Act, check the following box and list the Securities Act registration statement number of the earlier effective registration statement for the same offering. / /
If delivery of the prospectus is expected to be made pursuant to Rule 434, please check the following box. / /
CALCULATION OF REGISTRATION FEE
| Title of Each Class of Securities to Be Registered |
Amount to Be Registered (1) |
Proposed Maximum Aggregate Price Per Share (2) |
Proposed Maximum Aggregate Offering Price |
Amount of Registration Fee |
|||||||
|---|---|---|---|---|---|---|---|---|---|---|---|
| Common Stock, $0.20 par value per share (3) | 3,220,000 | $ | 25.03 | $ | 80,596,600 | $ | 20,149.15 | ||||
The information in this preliminary prospectus is not complete and may be changed. We may not sell these securities until the registration statement filed with the Securities and Exchange Commission is effective. This preliminary prospectus is not an offer to sell these securities and it is not soliciting an offer to buy these securities in any state where the offer or sale is not permitted.
| PRELIMINARY PROSPECTUS | Subject to Completion | January 19, 2001 |
2,800,000 Shares
![]()
Esterline Technologies Corporation
Common Stock
We are offering 2,800,000 shares of our common stock to be sold in this offering.
Our common stock is traded on the New York Stock Exchange under the symbol "ESL." On January 18, 2001, the last reported sale price of our common stock was $27.19 per share.
Investing in our common stock involves risk. See "Risk Factors" beginning on page 7.
Neither the Securities and Exchange Commission nor any state securities commission has approved or disapproved of these securities or determined if this prospectus is truthful or complete. Any representation to the contrary is a criminal offense.
| |
Per Share |
Total |
||
|---|---|---|---|---|
| Public offering price | $ | $ | ||
| Underwriting discounts and commissions | $ | $ | ||
| Proceeds, before expenses, to us | $ | $ | ||
The underwriters may also purchase up to an additional 420,000 shares of common stock from us at the public offering price, less the underwriting discounts and commissions, within 30 days from the date of this prospectus to cover over-allotments, if any. If the underwriters exercise the option in full, the total underwriting discounts and commissions will be $ , and the total proceeds, before expenses, to us will be $ .
The underwriters are offering the common stock as set forth under "Underwriting." Delivery of the shares will be made in New York, New York on or about , 2001.
UBS Warburg LLC First Union Securities, Inc.
The date of this prospectus is , 2001

You should rely only on information contained in or incorporated by reference into this prospectus. We have not and the underwriters have not authorized anyone to provide you with information that is different. We are offering to sell and seeking offers to buy shares of common stock only in jurisdictions where offers and sales are permitted. The information contained in this prospectus is accurate only as of the date of this prospectus, regardless of the time of delivery of this prospectus or of any sale of our common stock.
Table of contents
| Forward-looking statements | 2 | |
| Prospectus summary | 3 | |
| Risk factors | 7 | |
| Use of proceeds | 14 | |
| Price range of common stock | 14 | |
| Dividend policy | 14 | |
| Capitalization | 15 | |
| Selected consolidated financial data | 16 | |
Management's discussion and analysis of financial condition and results of operations |
18 |
|
| Business | 24 | |
| Management | 35 | |
| Principal shareholders | 38 | |
| Underwriting | 40 | |
| Legal matters | 42 | |
| Experts | 42 | |
| Where you can find more information | 42 | |
| Information incorporated by reference | 42 | |
| Financial statements | F-1 |
Forward-looking statements
This prospectus contains forward-looking statements. These statements relate to future events or our future financial performance. In some cases, you can identify forward-looking statements by terminology such as "anticipate," "believe," "continue," "could," "estimate," "expect," "intend," "may," "might," "plan," "potential," "predict," "should" or "will" or the negative of such terms or other comparable terminology. These statements are only predictions and involve known and unknown risks, uncertainties and other factors, including the risks outlined under "Risk Factors," that may cause our or our industry's actual results, performance or achievements to be materially different from any future results, performance or achievements expressed or implied by such forward-looking statements. You should not place undue reliance on these forward-looking statements. Although we believe that the expectations reflected in the forward-looking statements are reasonable, we cannot guarantee future results, performance or achievements.
2
This summary highlights selected information contained elsewhere in this prospectus. This summary may not contain all the information that you should consider before investing in our common stock. You should read the entire prospectus carefully, including "Risk Factors" and the consolidated financial statements included, and incorporated by reference, into this prospectus, before making an investment decision. Except where we state otherwise, the information we present in this prospectus assumes no exercise of the underwriters' over-allotment option. References in this prospectus to "Esterline", "we", "our" and "us" refer to Esterline Technologies Corporation. Our principal executive offices are located at 10800 NE 8th Street, Bellevue, Washington 98004 and our telephone number is (425) 453-9400. Our Internet address is www.esterline.com. Information contained on our Web site does not constitute part of this prospectus.
ESTERLINE TECHNOLOGIES CORPORATION
Overview
Esterline, a Delaware corporation formed in 1967, is a specialized manufacturing company principally serving aerospace and defense customers and electronic equipment manufacturers. We design, manufacture and market highly engineered products and systems for applications within the industries we serve. Our strategic growth plan revolves around the development of three key technologies—sensors and controls, illuminated displays and specialized high-performance materials.
As part of our long-term strategic direction, we strive to anticipate the global needs of our customers and to respond with comprehensive solutions worldwide. This effort has resulted in establishing strategic realignments of operations providing the capability to offer a more extensive product line to each customer through a single contact.
We view and operate our business in three different segments: Aerospace, Advanced Materials and Automation. We primarily serve aerospace and defense customers with manufactured products such as high-end components for avionics, propulsion and guidance systems, and high-performance elastomers and other complex materials in the Aerospace and Advanced Materials segments. The Automation segment serves electronic equipment customers with printed circuit board, PCB, drilling equipment and heavy equipment manufacturing customers with automated machine tools for cutting and punching plate metal.
Market Overview
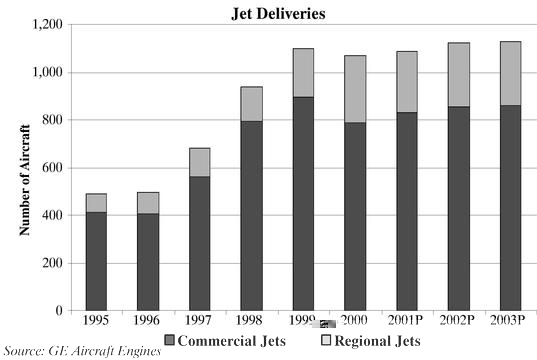
Suppliers to the commercial aerospace industry serve a large and growing market. Over the long term, demand for aircraft is driven by economic growth supporting the demand for air travel and the need to replace aircraft that are removed from service due to age or other concerns. Boeing's publicly released Current Market Outlook 2000 currently estimates that the market for aircraft is
3
approximately $1.5 trillion over 20 years and that the number of aircraft in service is expected to more than double to 31,755 aircraft by 2019. Over this period, Boeing estimates that over 23,100 new aircraft will enter service in order to accommodate this demand. Additionally, orders, deliveries and manufacturers' backlogs of regional jets currently stand at record levels.
The near term outlook for the commercial aerospace industry is also positive, driven by the significant increase in orders at Boeing during 2000, and continued growth at Airbus. Recent activity has been supported by increased orders from Asia, several years of stronger airline operating profits and the retirement of older aircraft. Replacements are being driven by regulations that required noisier aircraft to be replaced or modified by 2000 in the United States and that will require replacement by 2002 in Europe. Pending noise regulations could cause another wave of aircraft replacements. Higher fuel prices also provide incentives to replace older aircraft with newer, more fuel-efficient aircraft.
The outlook for defense spending is positive, driven in large measure by the availability of funds due to the projected surplus and broad political support. Key trends include a continued focus on upgrades and modifications of existing weapons systems and the increased use of electronics and technology generally.
The US Department of Defense, DoD, fiscal 2001 budget of approximately $291 billion includes over $60 billion for procurement and over $37 billion for research and development. Both procurement and research and development spending represent the principal source of funds for most defense contractors. The DoD fiscal 2001 budget amount continues the increases that began in 1996.
Business Strategy
One of Esterline's strengths is the proven capability to deliver specialized products designed to perform in demanding applications and in harsh environments. We intend to capitalize on our reputation as a leading supplier of highly engineered products for the aerospace and defense industry. We will take advantage of our strong, specialized niche market positions in a consolidating industry to build shareholder value by growing the business and gaining critical mass, increasing our profitability by offering higher value-added products to our customers and consolidating our position within the aerospace and defense industry. Our strategy for profitable growth includes the following:
4
The offering
The following information assumes that the underwriters do not exercise the over-allotment option we granted to them to purchase additional shares in the offering.
| Common stock we are offering | 2,800,000 shares | |
| Common stock to be outstanding after this offering | 20,227,301 shares | |
| New York Stock Exchange symbol | ESL | |
| Use of proceeds | For general corporate purposes, including potential future acquisitions. |
The number of shares of common stock to be outstanding after this offering is based on the number of shares outstanding as of January 2, 2001, excluding:
5
Summary consolidated financial data
| |
For Fiscal Years |
|||||||||||||||||
|---|---|---|---|---|---|---|---|---|---|---|---|---|---|---|---|---|---|---|
| |
1996 |
1997 |
1998 |
1999 |
2000 |
|||||||||||||
| Statement of operations data | (in thousands, except per share amounts) | |||||||||||||||||
| Sales | $ | 352,843 | $ | 390,958 | $ | 453,902 | $ | 460,969 | $ | 490,966 | ||||||||
| Cost of sales | 215,015 | 243,197 | 281,539 | 286,410 | 311,242 | |||||||||||||
| Gross margin | 137,828 | 147,761 | 172,363 | 174,559 | 179,724 | |||||||||||||
| Operating expenses: | ||||||||||||||||||
| Selling, general and administrative | 88,042 | 90,918 | 102,361 | 106,239 | 105,532 | |||||||||||||
| Research, development and engineering | 15,373 | 17,556 | 20,846 | 24,022 | 20,839 | |||||||||||||
| Total expenses | 103,415 | 108,474 | 123,207 | 130,261 | 126,371 | |||||||||||||
| Operating earnings | 34,413 | 39,287 | 49,156 | 44,298 | 53,353 | |||||||||||||
| Other operating (income) expenses: | ||||||||||||||||||
| Gain on sale of business (1) | — | — | — | (7,956 | ) | (2,591 | ) | |||||||||||
| Interest income | (1,989 | ) | (2,397 | ) | (1,594 | ) | (2,859 | ) | (2,205 | ) | ||||||||
| Interest expense | 4,328 | 3,603 | 3,803 | 9,011 | 8,124 | |||||||||||||
| Net other (income) expense | 2,339 | 1,206 | 2,209 | (1,804 | ) | 3,328 | ||||||||||||
| Earnings before income taxes | 32,074 | 38,081 | 46,947 | 46,102 | 50,025 | |||||||||||||
| Income tax expense | 10,720 | 12,760 | 16,863 | 16,240 | 17,438 | |||||||||||||
| Net earnings | $ | 21,354 | $ | 25,321 | $ | 30,084 | $ | 29,862 | $ | 32,587 | ||||||||
| Net income per common share—basic | $ | 1.35 | $ | 1.48 | $ | 1.74 | $ | 1.72 | $ | 1.88 | ||||||||
| Net income per common share—diluted | $ | 1.31 | $ | 1.44 | $ | 1.70 | $ | 1.69 | $ | 1.85 | ||||||||
| Weighted-average common shares outstanding—basic | 15,842 | 17,124 | 17,290 | 17,337 | 17,375 | |||||||||||||
| Weighted-average common shares outstanding—diluted | 16,334 | 17,608 | 17,718 | 17,658 | 17,654 | |||||||||||||
| |
2000 Actual |
As Adjusted(2) |
||||
|---|---|---|---|---|---|---|
| Balance sheet data | (in thousands) | |||||
| Cash and cash equivalents and short-term investments | $ | 50,888 | $ | 122,112 | ||
| Working capital | 121,621 | 192,845 | ||||
| Total assets | 474,339 | 545,563 | ||||
| Long-term debt, net of current maturities | 108,172 | 108,172 | ||||
| Shareholders' equity | 249,695 | 320,919 | ||||
| |
For Fiscal Years |
|||||||||
|---|---|---|---|---|---|---|---|---|---|---|
| |
1996 |
1997 |
1998 |
1999 |
2000 |
|||||
| Other selected data | (in thousands) | |||||||||
| EBITDA (3) | $50,682 | $56,691 | $67,472 | $65,094 | $75,062 | |||||
| Depreciation and amortization | 16,269 | 17,404 | 18,316 | 20,796 | 21,709 | |||||
| Capital expenditures | 17,203 | 17,390 | 29,773 | 15,641 | 15,489 | |||||
6
You should carefully consider the risks described below together with all of the other information included in or incorporated by reference into this prospectus before making an investment decision. If any of the following risks actually occurs, our business, financial condition or results of operations could be harmed. In such an event, the trading price of our common stock could decline due to any of these risks, and you may lose all or part of your investment.
RISKS RELATED TO OUR BUSINESS
Our operating results are subject to fluctuations that may cause our stock price to decline.
Our business is susceptible to economic cycles and therefore our operating results have fluctuated widely in the past and are likely to continue to do so. Our revenue is unpredictable and tends to fluctuate based on a number of factors, including domestic and foreign economic conditions and developments affecting the specific industries and customers served. Certain products sold represent capital investment or support for capital investment by either the initial customer or the ultimate end-user. Also, a significant portion of the sales and profitability of some of our businesses is derived from the aerospace, defense, telecommunications, computer and heavy equipment markets as well as government contracts. It is possible that in the future our operating results in a particular quarter or quarters will not meet the expectations of securities analysts or investors, causing the market price of our common stock to decline. We believe that quarter-to-quarter comparisons of our operating results are not a good indication of our future performance and should not be relied upon to predict the future performance of our stock price.
The loss of a significant customer or defense program could have a material adverse effect on our operating results.
Certain segments of our operations are dependent on a relatively small number of customers and defense programs, which change from time to time. Our most significant customers in fiscal 2000, of which sales to any such customer was less than 10.0%, included Boeing, General Dynamics, Snecma and the US Army. There can be no assurance that our current significant customers will continue to buy products at their current levels. Moreover, orders included in backlog are generally subject to cancellation by our customers. The loss of a significant customer or defense program could have a material adverse effect on our operating results if we were unable to replace the related sales.
Our manufacturing operations in California may be adversely affected by power outages in that state.
We have substantial manufacturing operations in California principally related to our Advanced Materials segment, and to a lesser extent to our Automation segment. Recently, our plants have experienced electric power outages due to the difficulties being experienced by the electric utility industry in California. If our California operations were to shut down due to the lack of electric power for extended periods, they might be unable to meet customers' delivery schedules, thereby adversely affecting our revenue. In addition, it is likely that these operations will incur increased electric power costs when they do operate. We are unable to predict how long the difficulties faced by the electric utility industry in California will continue, or how such difficulties will be resolved. To the extent they do continue and our plants experience additional power outages and/or increases in their cost of electric power, our business could be adversely affected.
7
Political and economic instability in foreign markets may have a material adverse effect on our operating results.
Foreign sales represented approximately 31.8% of our total sales in fiscal 2000. Foreign sales are subject to numerous risks, including political and economic instability in foreign markets, restrictive trade policies of foreign governments, economic conditions in local markets, inconsistent product regulation by foreign agencies or governments, the imposition of product tariffs and the burdens of complying with a wide variety of international and US export laws and differing regulatory requirements. To the extent that foreign sales are transacted in a foreign currency, we are subject to the risk of losses due to foreign currency fluctuations. In addition, we have substantial assets denominated in foreign currencies that are not offset by liabilities denominated in such foreign currencies. These net foreign currency investments are subject to material changes in the event of fluctuations in foreign currencies against the US dollar.
The unsuccessful integration of a business or business segment we acquire could have a material adverse effect on our operating results.
One of our key operating strategies is to pursue selective acquisitions. We are reviewing and actively pursuing many possible acquisitions, including some outside our current markets. We do not currently have any commitments, agreements or understandings to acquire any specific businesses or other material assets. Our acquisition strategy will require additional debt or equity financing, resulting in additional leverage and dilution of ownership. We may not be able to finance acquisitions on terms that are satisfactory to us. We cannot assure you that any future acquisition will be consummated, or that if consummated, that we will be able to integrate such acquisition successfully without a material adverse effect on our financial condition or results of operations.
If we are unable to protect our intellectual property rights adequately, the value of our products could be diminished.
Our success is dependent in part on obtaining, maintaining and enforcing our patents and other proprietary rights and our ability to avoid infringing on the proprietary rights of others. While we take precautionary steps to protect our technological advantages and intellectual property and rely in part on patent, trademark, trade secret and copyright laws, we cannot assure you that the precautionary steps we have taken will completely protect our intellectual property rights. Because patent applications in the United States are maintained in secrecy until a patent is issued, there may be third-party patents, patent applications and other intellectual property relevant to our potential products that may block or compete with our products and processes. In the event a competitor successfully challenges our patents or licenses, we could incur substantial litigation costs that could have a material adverse effect on our operating results and financial condition.
In addition to our patent rights, we also rely on unpatented technology, trade secrets and confidential information. Others may independently develop substantially equivalent information and techniques or otherwise gain access to or disclose our technology. We may not be able to protect our rights in unpatented technology, trade secrets and confidential information effectively. We require our new employees, consultants and corporate partners to execute a confidentiality agreement at the commencement of their employment or consulting relationship with us. However, these agreements may not provide effective protection of our information or, in the event of unauthorized use or disclosure, they may not provide adequate remedies.
The market for our products may be affected by our ability to adapt to technological change.
The rapid change of technology continually affects our product applications and may directly impact the performance of any particular product. To succeed in the future, we will need to design, develop,
8
manufacture, assemble, test, market and support new products, and enhancements to our existing products, in a timely and cost-effective manner. Historically, our technology has been developed through both internal research and development expenditures, as well as customer funded research and development programs. There is no guarantee that we will continue to maintain, or benefit from, comparable levels of research and development in the future. We can give you no assurances that our existing products will not require significant modifications in the future in order to maintain their effectiveness, nor can we assure you that we will successfully identify new opportunities and continue to have the needed financial resources to develop new products in a timely or cost-effective manner.
Fixed-price contracts are common in some of our markets and may increase risks of cost overruns or losses on our contracts.
Our customers set demanding specifications for product performance, reliability and cost. Some of our government contracts and subcontracts are firm, fixed-price contracts providing for a predetermined fixed price for the products we make regardless of the costs we incur. Thus, we must make pricing commitments to our customers based on our expectation that we will achieve more cost-effective product designs and automate more of our manufacturing operations. The manufacture of our products requires a complex integration of demanding processes involving unique technical skill sets. We face risks of cost overruns or order cancellations if we fail to achieve forecasted product design and manufacturing efficiencies or if products cost more to produce than expected. The expense of producing products can rise due to increased costs of materials, components, labor, capital equipment or other factors. We may have cost overruns or problems with the performance or reliability of our products in the future, which could result in us incurring losses on contracts which we would have otherwise expected to be profitable.
We depend on the continued contributions of our executive officers and other key management, each of whom would be difficult to replace.
The loss of any of our executive officers or key management personnel would disrupt our operations and divert the time and attention of our remaining personnel. We do not have employment contracts with our key executives nor have we purchased "key-person" insurance on the lives of any of our executive officers or key management personnel to reduce the impact to our company that the loss of any of them would cause.
Our charter documents contain certain provisions that could make a merger, tender offer or proxy contest difficult.
Our Restated Certificate of Incorporation, as amended, and Bylaws, as amended, provide for a classified board of directors and restrict the ability of shareholders to call special meetings. These provisions could delay or impede the removal of incumbent directors and could make it more difficult to effect a merger, tender offer or proxy contest, even if such events might be favorable to our shareholders. In addition, certain agreements to which we are a party, including loan and executive officer agreements, contain provisions that impose increased costs in the event of a change of control.
We are party to a Shareholder Rights Plan designed to cause substantial dilution to any "Acquiring Person" that attempts to merge or consolidate with us, or that takes certain other actions affecting us on terms that are not approved by our board of directors. We are also subject to the "business combination" statute of the Delaware General Corporation Law, that generally prohibits a publicly held Delaware corporation from engaging in various "business combination" transactions with any "interested stockholder" for a period of three years after the date of the transaction in which such
9
person became an "interested stockholder," unless the business combination is approved in a specific manner. These provisions could discourage or make it more difficult to effect a merger, tender offer or other similar transaction, even if it were favorable to our shareholders.
RISKS RELATED TO OUR INDUSTRY
Our business is subject to various laws and regulations that are more restrictive because we are a contractor and subcontractor to the US Government.
As a contractor and subcontractor to the US Government, we are subject to various laws and regulations that are more restrictive than those applicable to non-government contractors. Although only 5.0% of our sales were made directly to the US Government in fiscal 2000, we estimate that our subcontracting activities accounted for an additional 15.0% of sales. Therefore, approximately 20.0% of our sales during that fiscal year were governed by rules favoring the government's contractual position. As a consequence, such contracts may be subject to protest or challenge by unsuccessful bidders or to termination, reduction or modification in the event of changes in government requirements, reductions in federal spending or other factors. The accuracy and appropriateness of certain costs and expenses used to substantiate our direct and indirect costs for the US Government under both cost-plus and fixed-price contracts are subject to extensive regulation and audit by the Defense Contract Audit Agency, an arm of the DoD. Responding to governmental audits, inquiries or investigations may involve significant expense and divert management attention. Also, an adverse finding in any such audit, inquiry or investigation could involve fines, injunctions or other sanctions.
Rapid changes in technology and industry standards could render certain of our products obsolete or noncompetitive.
We are engaged in a field characterized by product performance, which requires extensive research efforts, rapid technological development and service. New developments and product improvements in our field are accelerating. Our competitors may develop technologies and products that are more effective than any we develop or that render our technology and products obsolete or noncompetitive. In addition, our products could become unmarketable if new industry standards emerge. To be successful, we will need to enhance our products and design, develop and market new and improved products that keep pace with new technological and industry developments; however, we cannot assure you that we will be successful in competing against new technologies and keeping up with industry developments.
A downturn in the aircraft market could adversely affect our business.
The aircraft industry is cyclical in nature and affected by many factors beyond our control which could have a material adverse effect on our business, financial condition and operating results.
The principal markets for manufacturers of commercial aircraft are the commercial and regional airlines which are cyclical and adversely affected by a number of factors, including increased fuel and labor costs and intense price competition, all of which can be volatile and are outside our control. Commercial aircraft production may increase or decrease in response to changes in customer demand caused by general economic conditions.
The military aircraft industry is dependent upon the level of equipment expenditures by the armed forces of countries throughout the world, and especially those of the United States. In recent years, this industry has been adversely affected by a number of factors, including the reduction in military spending since the end of the Cold War. Additional decreases in military spending could further depress demand for military aircraft.
10
Any decrease in demand for new aircraft will likely result in a decrease in demand of our products and services, and correspondingly, our revenues, thereby adversely affecting our business, financial condition and results of operations.
Our business is subject to governmental authorizations and approvals.
Governmental agencies throughout the world, including the US Federal Aviation Administration, FAA, highly regulate the repair and overhaul of aircraft engines. Guidelines established by OEMs supplement governmental regulation and generally require that aircraft operators overhaul engines and replace specified engine parts after a certain number of flight hours or cycles (take-offs and landings).
We include with the replacement parts that we sell to our customers documentation certifying that each part complies with applicable regulatory requirements and meets applicable standards of airworthiness established by the FAA or the equivalent regulatory agencies in other countries. Specific regulations vary from country to country, although compliance with FAA requirements generally satisfies regulatory requirements in other countries. The revocation or suspension of any of our material authorizations or approvals would have an adverse effect on our business, financial condition and results of operations. In addition, new and more stringent government regulations, if adopted and enacted, could have a material adverse effect on our business, financial condition and results of operations.
Intense competition among technology companies for experienced engineers and other personnel may affect our ability to sustain our growth expectations.
We depend on, and must attract and retain, competent personnel in all areas of our business, including management, engineering, manufacturing, quality assurance, finance, marketing and support. Our development efforts especially depend on hiring and retaining qualified engineers, that we believe are in high demand. We may not be able to hire and retain these personnel at compensation levels consistent with our existing compensation and salary structure. If we are unable to hire a sufficient number of engineering personnel, we may be unable to support the growth of our business, and as a result, our sales may suffer.
We may be required to defend lawsuits or pay damages in connection with the alleged or actual harm caused by our products.
We face an inherent business risk of exposure to product liability claims in the event that the use of our products is alleged to have resulted in harm to others or to property. Although we maintain general liability and product liability insurance, we may incur significant liability if product liability lawsuits against us are successful. We cannot assure you that such coverage will be adequate to cover all claims that may arise or that it will continue to be available to us on acceptable terms.
We may incur substantial environmental liability arising from our activities involving the use of hazardous materials.
Our business is subject to certain federal, state, local and foreign laws, regulations and ordinances governing the use, manufacture, storage, handling and disposal of hazardous materials and certain waste products. From time to time, our operations have resulted or may result in noncompliance with environmental laws or liability for the costs of investigating and cleaning up, and certain damages resulting from, sites of past spills, disposals or other releases of hazardous materials. In addition, we have been identified as a potentially responsible party pursuant to the federal Comprehensive Environmental Response, Compensation, and Liability Act of 1980, as amended, or under analogous state environmental laws, for the cleanup of contamination resulting from past disposals of hazardous
11
materials at certain sites where we, with others, sent waste in the past. We cannot assure you that such matters, or any similar liabilities that arise in the future, will not exceed our resources, nor can we completely eliminate the risk of accidental contamination or injury from these materials.
We cannot guarantee the accuracy and completeness of the industry and market data included in this prospectus.
Industry and market data used throughout this prospectus is based on the good faith estimates of our management, which estimates are based primarily upon the internal management information and, to the extent available, independent industry publications and other publicly available information. However, the nature of the aerospace industry and competition in our markets results in limited availability of reliable, independent data. Although we believe that the sources we have used are reliable, we do not guarantee, and have not independently verified, the accuracy and completeness of the information.
RISKS RELATED TO THIS OFFERING
Lower trading volume and lower public ownership of our common stock may contribute to its price volatility.
The stock market has from time to time experienced significant price and volume fluctuations that may be unrelated to the operating performance of particular companies. In addition, the market price of our common stock, like that of our competitors, has been and may continue to be volatile. In particular, the volatility of our shares is influenced by lower trading volume and lower public ownership relative to other publicly held competitors. For example, our stock price has ranged from $9.25 per share to $28.38 per share since January 1, 2000. Our average weekly dollar trading volume for the twelve months ended October 27, 2000 was approximately $4.8 million. Having a relatively significant percentage of our shares owned by long-term institutional holders means that our stock is relatively less liquid and thus more susceptible to large price fluctuations.
The following factors, among others, may have a significant impact on the market price of our common stock:
Sales of a substantial number of our shares of common stock in the public market following this offering could adversely affect the market price of our common stock.
Upon completion of this offering, we will have 20,227,301 shares of common stock outstanding (based upon shares outstanding as of January 2, 2001), or 20,647,301 if the underwriters exercise their over-allotment option in full. All of these shares, including the 2,800,000 shares offered hereby (or approximately 3,220,000 shares if the underwriters' over-allotment option is exercised in full) will be freely tradable without restriction or further registration under the Securities Act.
Our executive officers and directors, who together hold 233,258 shares of common stock (all of which are eligible for sale under Rule 144 on the date of this offering), have entered into lock-up agreements with the underwriters pursuant to which the holders have agreed not to offer, sell, contract to sell, grant any option to purchase or otherwise dispose of, directly or indirectly, any of their shares of
12
Common Stock, or any shares that they may acquire through the exercise of stock options or warrants, or to exercise any of their registration rights in respect of their shares of common stock, for a period of 90 days beginning on the date of this offering without the prior written consent of UBS Warburg LLC on behalf of each of the underwriters. This restriction shall not apply to the transfer of any shares of our common stock, or any securities convertible into or exchangeable for common stock, to a broker-dealer for the purpose of sale as permitted by Regulation FD not earlier than 90 days after the date of this Prospectus. See "Underwriting."
As of January 2, 2001, options to purchase a total of 1,519,500 shares of common stock were outstanding under our stock option plans, of which options for a total of 1,022,625 shares were then exercisable. Of the total options exercisable, options for 822,875 shares were held by executive officers and directors subject to the lock-up agreements described above.
We have a Shareholder Rights Plan providing for the distribution of one preferred stock purchase right for each share of common stock held. Each such right entitles the holder to purchase one one-hundredth of a share of our Series A Serial Preferred Stock at an exercise price of $56. These rights are exercisable and transferable apart from the common stock only if a person or group acquires beneficial ownership of 10.0% or more of our common stock or commences a tender offer or exchange offer which would result in a person or group beneficially owning 10.0% or more of our common stock. We can redeem the rights for $0.01 each at any time prior to the tenth day after an announcement that a person or group beneficially owns 10.0% or more of our common stock. When certain events occur, the holder of such a right can purchase, for the then current exercise price of the right, shares of our common stock (or under certain circumstances, as determined by our board of directors, cash, other securities or property) having a value of twice the exercise price of the right. When certain other events occur, the holder of each right would be entitled to purchase, at the exercise price of the right, shares of common stock of a corporation or other entity acquiring us or engaging in certain transactions with us, having a market value of twice the exercise price of the right.
13
We expect to receive approximately $71,230,000 in net proceeds from the sale of the 2,800,000 shares of common stock offered by us in this offering, assuming a public offering price of $27.19 per share (approximately $82,065,000 if the underwriters exercise their over-allotment option in full), after deducting underwriting discounts and commissions and estimated offering expenses payable by us.
We expect to use the net proceeds from this offering for general corporate purposes and potential future acquisitions. Pending use of the net proceeds of this offering, we intend to invest the net proceeds in short-term interest-bearing investment-grade instruments.
Price range of common stock
Our common stock trades on the New York Stock Exchange under the symbol "ESL." The following table sets forth, for the periods indicated, the high and low sale prices per share of our common stock as reported on the New York Stock Exchange.
| |
High |
Low |
|||||
|---|---|---|---|---|---|---|---|
| Fiscal year ended October 31, 1999 | |||||||
| First quarter | $ | 24.13 | $ | 18.25 | |||
| Second quarter | 19.63 | 12.13 | |||||
| Third quarter | 16.75 | 12.38 | |||||
| Fourth quarter | 16.63 | 13.25 | |||||
Fiscal year ended October 27, 2000 |
|||||||
| First quarter | $ | 14.00 | $ | 10.25 | |||
| Second quarter | 13.19 | 9.25 | |||||
| Third quarter | 16.13 | 12.06 | |||||
| Fourth quarter | 22.50 | 14.75 | |||||
Fiscal year ending October 26, 2001 |
|||||||
| First quarter (through January 18, 2001) | $ | 28.38 | $ | 19.38 | |||
On January 18, 2001, the last reported sale price of our common stock on the New York Stock Exchange was $27.19 per share. As of January 18, 2001, there were 793 holders of record of our common stock. Because many of these shares are held by brokers and other institutions on behalf of stockholders, we are unable to estimate the total number of stockholders represented by these record holders.
Dividend policy
We did not declare or pay any dividends on our capital stock during the 1999 and 2000 fiscal years. We currently intend to retain all future earnings for use to expand our business and retire debt obligations. We are restricted from paying dividends under our current credit facility and do not anticipate paying any dividends in the foreseeable future.
14
Capitalization
The following table sets forth our capitalization as of October 27, 2000:
The information set forth below should be read in conjunction with our consolidated financial statements and notes included, and incorporated by reference, into this prospectus.
| |
Actual |
As Adjusted |
||||||||
|---|---|---|---|---|---|---|---|---|---|---|
| |
(in thousands) |
|||||||||
| Cash and cash equivalents and short-term investments | $ | 50,888 | $ | 122,112 | ||||||
| Long-term debt, net of current maturities | 108,172 | 108,172 | ||||||||
| Shareholders' equity: | ||||||||||
| Common stock, par value $0.20 per share; 60,000,000 shares authorized; 17,424,853 shares issued and outstanding, actual; 20,224,853 shares issued and outstanding, as adjusted | 3,485 | 4,045 | ||||||||
| Additional paid in capital | 46,952 | 117,616 | ||||||||
| Retained earnings | 211,540 | 211,540 | ||||||||
| Accumulated other comprehensive loss | (12,282 | ) | (12,282 | ) | ||||||
| Total shareholders' equity | 249,695 | 320,919 | ||||||||
| Total capitalization | $ | 357,867 | $ | 429,091 | ||||||
This information does not include 1,574,750 shares reserved for issuance as of October 27, 2000 upon exercise of stock options outstanding under our stock option plans, of which 921,500 options were exercisable at a weighted-average exercise price of $10.199 per share based on the fair market value of our common stock on the date of grant.
15
Selected consolidated financial data
The selected consolidated statement of operations data set forth below for the fiscal years ended October 31, 1998, 1999 and October 27, 2000 as well as the selected consolidated balance sheet data set forth below as of October 31, 1999 and October 27, 2000 are derived from our audited consolidated financial statements, which are included, and incorporated by reference, into this prospectus. The selected consolidated statement of operations data set forth below for the fiscal years ended October 31, 1996 and 1997 as well as the selected consolidated balance sheet data set forth below as of October 31, 1996, 1997 and 1998 are derived from our audited consolidated financial statements, which are not included in this prospectus. The following selected consolidated financial data should be read in conjunction with "Management's Discussion and Analysis of Financial Condition and Results of Operations" included in this prospectus and the consolidated financial statements and related notes in our annual report on Form 10-K for the fiscal year ended October 27, 2000 which is included, and incorporated by reference, into this prospectus.
| |
For Fiscal Years |
|||||||||||||||||
|---|---|---|---|---|---|---|---|---|---|---|---|---|---|---|---|---|---|---|
| |
1996 |
1997 |
1998 |
1999 |
2000 |
|||||||||||||
| Statement of operations data | (in thousands, except per share amounts) | |||||||||||||||||
| Sales | $ | 352,843 | $ | 390,958 | $ | 453,902 | $ | 460,969 | $ | 490,966 | ||||||||
| Cost of sales | 215,015 | 243,197 | 281,539 | 286,410 | 311,242 | |||||||||||||
| Gross margin | 137,828 | 147,761 | 172,363 | 174,559 | 179,724 | |||||||||||||
| Operating expenses: | ||||||||||||||||||
| Selling, general and administrative | 88,042 | 90,918 | 102,361 | 106,239 | 105,532 | |||||||||||||
| Research, development and engineering | 15,373 | 17,556 | 20,846 | 24,022 | 20,839 | |||||||||||||
| Total expenses | 103,415 | 108,474 | 123,207 | 130,261 | 126,371 | |||||||||||||
| Operating earnings | 34,413 | 39,287 | 49,156 | 44,298 | 53,353 | |||||||||||||
| Other operating (income) expenses: | ||||||||||||||||||
| Gain on sale of business (1) | — | — | — | (7,956 | ) | (2,591 | ) | |||||||||||
| Interest income | (1,989 | ) | (2,397 | ) | (1,594 | ) | (2,859 | ) | (2,205 | ) | ||||||||
| Interest expense | 4,328 | 3,603 | 3,803 | 9,011 | 8,124 | |||||||||||||
| Net other (income) expense | 2,339 | 1,206 | 2,209 | (1,804 | ) | 3,328 | ||||||||||||
| Earnings before income taxes | 32,074 | 38,081 | 46,947 | 46,102 | 50,025 | |||||||||||||
| Income tax expense | 10,720 | 12,760 | 16,863 | 16,240 | 17,438 | |||||||||||||
| Net earnings | $ | 21,354 | $ | 25,321 | $ | 30,084 | $ | 29,862 | $ | 32,587 | ||||||||
| Net income per common share—basic | $ | 1.35 | $ | 1.48 | $ | 1.74 | $ | 1.72 | $ | 1.88 | ||||||||
| Net income per common share—diluted | $ | 1.31 | $ | 1.44 | $ | 1.70 | $ | 1.69 | $ | 1.85 | ||||||||
| Weighted-average common shares outstanding—basic | 15,842 | 17,124 | 17,290 | 17,337 | 17,375 | |||||||||||||
| Weighted-average common shares outstanding—diluted | 16,334 | 17,608 | 17,718 | 17,658 | 17,654 | |||||||||||||
16
| |
For Fiscal Years |
|||||||||
|---|---|---|---|---|---|---|---|---|---|---|
| Balance sheet |
1996 |
1997 |
1998 |
1999 |
2000 |
|||||
| data (at period end) | (in thousands) | |||||||||
| Cash and cash equivalents and short-term investments | $ 46,436 | $ 56,045 | $ 8,897 | $ 80,980 | $ 50,888 | |||||
| Working capital | 73,445 | 99,419 | 70,099 | 140,908 | 121,621 | |||||
| Total assets | 276,646 | 289,847 | 387,179 | 453,082 | 474,339 | |||||
| Long-term debt, net of current maturities | 29,007 | 27,218 | 74,043 | 116,966 | 108,172 | |||||
| Retained earnings | 93,686 | 119,007 | 149,091 | 178,953 | 211,540 | |||||
| Shareholders' equity | 142,304 | 165,718 | 196,376 | 224,620 | 249,695 | |||||
Other selected data |
||||||||||
| EBITDA (2) | $ 50,682 | $ 56,691 | $ 67,472 | $ 65,094 | $ 75,062 | |||||
| Depreciation and amortization | 16,269 | 17,404 | 18,316 | 20,796 | 21,709 | |||||
| Capital expenditures | 17,203 | 17,390 | 29,773 | 15,641 | 15,489 | |||||
17
Management's discussion and analysis of financial condition and results of operations
The following discussion of our financial condition and results of operations should be read in conjunction with the "Selected consolidated financial data" and our financial statements and the notes of those statements included elsewhere in this prospectus. This discussion may contain forward-looking statements that involve risks, uncertainties and assumptions. As a result of many factors, such as those set forth under "Risk factors" and elsewhere in this prospectus, our actual results may differ materially from those anticipated in these forward-looking statements.
OVERVIEW
Our strategic growth plan revolves around the development of three key technologies—sensors and controls, specialized high-performance materials and illuminated displays. We are concentrating our efforts to selectively expand our capabilities in these markets. Our goal is to meet the evolving needs of our customers by providing a broad array of products and services through a single point of contact. We plan to accomplish this through internal development and strategic acquisitions. Internally, we are increasing our market presence by uniting sales forces, combining marketing opportunities and blending manufacturing knowledge and technological expertise.
Over the past several years we have focused on a selective acquisition and divestiture program supporting our long-term strategy to be a leading supplier to aerospace and defense customers throughout the world. Late in fiscal 1999, as a strategic addition to our European aerospace operation, we purchased the aerospace group of Muirhead Vactric and Norcroft Dynamics, Muirhead, a manufacturer of micro motors and motion control components located in the United Kingdom. Also, late in fiscal 1999, we divested Federal Products, an operation not aligned with our long-term direction. In December 1999, we acquired a manufacturer of custom keyboards and other multifunction data input subsystems, Advanced Input Devices Co., A.I.D. This acquisition expanded our high-end illuminated displays and custom panels operations.
We view and operate our business in three different segments: Aerospace, Advanced Materials and Automation. We primarily serve aerospace and defense customers with manufactured products such as high-end components for avionics, propulsion and guidance systems, high-performance elastomers and other complex materials in the Aerospace and Advanced Materials segments. The Automation segment serves electronic equipment customers with PCB drilling equipment and heavy equipment customers with automated machine tools for cutting and punching plate metal for heavy equipment applications.
RESULTS OF OPERATIONS
Fiscal 2000 compared with fiscal 1999
Sales for fiscal 2000 grew 6.5% when compared with the prior year. Sales by segment, were as follows:
| |
1999 |
2000 |
Increase (decrease) from prior year |
|||||||
|---|---|---|---|---|---|---|---|---|---|---|
| |
(dollars in thousands) |
|
||||||||
| Aerospace | $ | 183,783 | $ | 236,269 | 28.6% | |||||
| Advanced Materials | 127,920 | 129,386 | 1.1% | |||||||
| Automation | 149,266 | 125,311 | (16.0% | ) | ||||||
| Total | $ | 460,969 | $ | 490,966 | ||||||
18
Aerospace provided our key area of growth in fiscal 2000. Substantially all of this growth was attributable to the acquisitions of Muirhead and A.I.D. Muirhead was included for a full year in fiscal 2000 and only three months in the prior year. In addition, the timing of the A.I.D. acquisition resulted in the inclusion of approximately three quarters of its sales in fiscal 2000. Sales growth in Advanced Materials was affected by customer programs designed to rebalance inventory levels. We believe those inventory levels have been normalized. Order placement activity improved over the last two quarters of fiscal 2000.
The decrease in Automation sales was primarily a result of our October 1999 divestiture of Federal Products. Excluding Federal Products on a comparative basis, Automation sales increased 15.6% due to improved PCB manufacturing equipment business, driven largely by strong performance in the second half of the year. Performance in this area has been difficult to predict and current trends indicate that the improvement may not continue through fiscal 2001. In addition, equipment sales to the heavy equipment markets remained weak throughout fiscal 2000 and are not expected to improve during fiscal 2001.
Sales to foreign customers, including export sales by domestic operations, totaled $156.2 million and $137.3 million, and accounted for 31.8% and 29.8% of our sales for fiscal 2000 and 1999, respectively.
Overall, gross margin as a percentage of sales was 36.6% and 37.9% for fiscal 2000 and 1999, respectively. Gross margin by segment ranged from 35.0% to 37.6% in fiscal 2000, compared with 33.7% to 40.4% in the prior year. Gross margin ranges for fiscal 2000 were lower when compared to fiscal 1999 due to a combination of factors, including lower margins on some recent acquisitions in the Aerospace segment; customer-related inventory rebalancing during the first part of fiscal 2000 in Advanced Materials; and a non-recurring inventory charge in Advanced Materials.
Automation gross margin improved when compared with the prior year primarily due to the PCB equipment revenue increases and cost cutting measures that have been implemented in the operations serving the heavy equipment markets.
Selling, general and administrative expenses (which include corporate expenses) decreased to $105.5 million in fiscal 2000 compared with $106.2 million in the prior year. As a percentage of sales, selling, general and administrative expenses were 21.5% and 23.0% in fiscal 2000 and 1999, respectively. Overall sales volume was weak throughout fiscal 1999 into the first quarter of fiscal 2000 and we focused on tightening selling, general and administrative expenses. In the second quarter of fiscal 2000, sales nearly matched the highest quarter in the prior year and continued to improve throughout the rest of the year. We believe our efficiency improvements have facilitated the absorption of business without significant increases in expenses. However, as an upward trend in sales continues, selling, general and administrative expenses will gradually increase. Long-term selling, general and administrative expense as a percentage of sales is unlikely to remain as low as the 21.5% in fiscal 2000.
Research, development and related engineering spending was $20.8 million, or 4.2% of sales, in fiscal 2000 compared with $24.0 million, or 5.2% of sales, in the prior year. During the year, several projects transitioned from prototype to production and accounted for the lower level of spending in the current fiscal year.
Segment earnings (excluding corporate expenses) increased 14.8% during fiscal year 2000 to $65.4 million compared with $56.9 million in the prior year. By segment, Aerospace earnings increased 31.6% to $32.7 million for fiscal 2000 compared with $24.8 million in the prior year, primarily due to acquisitions. Advanced Materials earnings were $24.8 million for fiscal 2000 compared with
19
$29.2 million for the prior year. The decrease in earnings for Advanced Materials was attributable to the customer-related inventory rebalancing and the write-down of inventory. Automation earnings improved to $7.9 million for fiscal 2000 compared with $2.9 million for the prior year. For fiscal 1999, Automation earnings were attributable to Federal Products—sold at the end of that fiscal year. Excluding Federal Products in a year-over-year comparison, the increase in Automation earnings was primarily related to improvements in business related to PCB markets.
The $2.6 million gain on sale of business relates to the curtailment of retirement benefits for certain Federal Products employees resulting from the October 28, 1999 sale of that operation. This gain was reported during the third quarter when it was first estimable. For purposes of the benefit calculations, credited service under the plan was frozen as of the date of sale. We do not anticipate any further adjustments related to the curtailment.
Interest income decreased to $2.2 million during fiscal 2000 compared with $2.9 million in the prior year. Interest expense decreased to $8.1 million during fiscal 2000 compared with $9.0 million in the prior year.
The effective income tax rate for fiscal 2000 was 34.9% compared with fiscal 1999 at 35.2%. Both years benefited from certain tax credits.
Net earnings in fiscal 2000 were $32.6 million, or $1.85 per share on a diluted basis, compared with $29.9 million, or $1.69 per share, in the prior year.
Orders received in fiscal 2000 increased 12.7% to $536.1 million from $475.7 million in the prior year. The increase is primarily attributable to Aerospace and Advanced Materials. Backlog at the end of fiscal 2000 was $228.3 million compared with $183.2 million at the end of the prior year. Approximately $46.1 million of backlog is scheduled to be delivered after fiscal 2001. Backlog is subject to cancellation until delivery.
Fiscal 1999 compared with fiscal 1998
Sales for fiscal 1999 grew 1.6% when compared with the prior year. Sales by segment were as follows:
| |
1998 |
1999 |
Increase (decrease) from prior year |
|||||||
|---|---|---|---|---|---|---|---|---|---|---|
| |
(dollars in thousands) |
|
||||||||
| Aerospace | $ | 171,028 | $ | 183,783 | 7.5% | |||||
| Advanced Materials | 91,498 | 127,920 | 39.8% | |||||||
| Automation | 191,376 | 149,266 | (22.0% | ) | ||||||
| Total | $ | 453,902 | $ | 460,969 | ||||||
Sales in Advanced Materials grew substantially in fiscal 1999. This growth was primarily attributable to Kirkhill Rubber Co., Kirkhill, acquired in August 1998. Kirkhill was included in Advanced Materials for a full year during fiscal 1999 and three months in fiscal 1998. Aerospace continued to see improvements although at a slower rate than in the previous year. Sales in Aerospace were positively impacted by the acquisition of Muirhead. Revenues for this entity were included for the last quarter of the year.
Sales in Automation declined due to a variety of unfavorable market conditions during the year. These included continuing poor worldwide demand for PCB manufacturing equipment as well as soft agriculture and automotive markets. The sale of Tulon Co., Tulon, in late fiscal 1998 also impacted Automation in the year-over-year comparison.
20
Sales to foreign customers, including export sales by domestic operations, totaled $137.3 million and $120.2 million, and accounted for 29.8% and 26.5% of our sales for fiscal 1999 and 1998, respectively.
Gross margin as a percentage of sales was 37.9% and 38.0% for fiscal 1999 and 1998, respectively. Gross margins by segment ranged from 33.7% to 40.4% in fiscal 1999, compared with 33.2% to 42.4% in the prior year. Gross margin in Aerospace decreased slightly due to volumes that were lower than expected. Gross margin for Advanced Materials decreased during the year due to volume decreases and new business included for a full year, primarily Kirkhill. An increase in Automation margin was related primarily to improvements at Federal Products relative to the prior year, and the divestiture of Tulon late in fiscal 1998.
Selling, general and administrative expenses (which include corporate expenses) increased to $106.2 million in fiscal 1999 compared with $102.4 million in the prior year. As a percentage of sales, selling, general and administrative expenses were 23.0% and 22.6% in fiscal 1999 and 1998, respectively.
Research, development and related engineering spending increased to $24.0 million in fiscal 1999 from $20.8 million in fiscal 1998, and as a percentage of sales was 5.2% compared with 4.6% in the prior year. Developments continued in laser technology for Automation; sensors and controls for Aerospace; and fireproofing elastomer for Advanced Materials during fiscal 1999.
Segment earnings (excluding corporate expenses) decreased 5.3% during fiscal 1999 to $56.9 million compared with $60.1 million in the prior year. Aerospace earnings were essentially flat with the prior year. Advanced Materials posted earnings of $29.2 million in fiscal 1999 compared with $24.7 million in fiscal 1998. The improvement was primarily due to Kirkhill's full year of earnings. Automation earnings decreased to $2.9 million in fiscal 1999 compared with $10.7 million in the prior year. This reduction was primarily due to the continued effects of a depressed worldwide PCB equipment market and was compounded in the second half of the year by a significant decline in the agriculture and heavy equipment sector.
Prior to the close of fiscal 1999, we completed the sale of Federal Products to Mahr GmbH. Federal Products was our only measurement business and accounted for less than 10.0% of our sales during fiscal 1999. We recognized an $8.0 million gain on the sale for fiscal 1999.
Interest income increased to $2.9 million during fiscal 1999 compared with $1.6 million in the prior year. Interest expense increased to $9.0 million during fiscal 1999 compared with $3.8 million in the prior year. In November 1998, we completed a $100.0 million private placement of senior notes (1999 Senior Notes). The proceeds of this placement were used to retire an outstanding bridge facility arising from the Kirkhill acquisition. The remainder was invested and utilized to fund other internal expansion and acquisition activities.
The effective income tax rate decreased to 35.2% in fiscal 1999 from 35.9% in fiscal 1998, primarily due to a one-time benefit related to state tax refunds.
Net earnings in fiscal 1999 were $29.9 million, or $1.69 per share on a diluted basis, compared with $30.1 million, or $1.70 per share, in the prior year.
Orders received in fiscal 1999 increased 6.1% to $475.7 million from $448.5 million in the prior year. Backlog at October 31, 1999 was $183.2 million compared with $168.4 million at the end of the prior year.
21
LIQUIDITY AND CAPITAL RESOURCES
Cash and cash equivalents at the end of fiscal 2000 totaled $50.9 million, a decrease of $4.2 million from the prior year. No short-term investments were held at the end of fiscal 2000 compared with $25.9 million at the end of fiscal 1999. Net working capital decreased to $121.6 million at the end of fiscal 2000 from $140.9 million at the end of the prior year. These decreases were primarily attributable to the acquisitions completed during late 1999.
Net accounts receivable were $83.3 million at the end of fiscal 2000 compared with $69.6 million at the end of the prior year. Sales increased $15.1 million when compared with the prior year fourth quarter, resulting in a significant increase in net accounts receivable. Accounts payable were $25.0 million at the end of fiscal 2000 compared with $16.9 million at the end of the prior year. The increase was primarily due to the timing of payments in Automation. Net accounts receivable and accounts payable were also higher due to the inclusion of A.I.D. for the current year. Federal and foreign income taxes payable were $5.5 million at the end of fiscal 2000 compared with $6.3 million at the end of fiscal 1999.
Net property, plant and equipment was $87.4 million at the end of fiscal 2000 compared with $89.3 million at the end of the prior year. Goodwill increased to $138.0 million at the end of fiscal 2000 compared with $105.4 million at the end of the prior year, due to acquisitions completed during the year.
Capital expenditures for fiscal 2000 were $15.5 million (excluding acquisitions) and included machinery and equipment and enhancements to information technology systems. Capital expenditures are anticipated to approximate $21.0 million for fiscal 2001. We will continue to support expansion through investments in infrastructure including machinery, equipment, buildings and information systems.
Total debt decreased $12.0 million from the prior year to $117.4 million at the end of fiscal 2000, principally due to a reduction in outstanding short-term credit facilities and repayment of debt. Total debt outstanding at the end of fiscal 2000 consisted of $100.0 million under our 1999 Senior Notes, $11.4 million under our 8.75% Senior Notes, and $6.0 million under various foreign currency debt agreements, including capital lease obligations. The 8.75% Senior Notes have a scheduled annual payment of $5.7 million, which will continue until maturity on July 30, 2002. The 1999 Senior Notes have maturities ranging from 5 to 10 years and interest rates from 6.00% to 6.77%. Management believes cash on hand, funds generated from operations and other available debt facilities are sufficient to fund operating cash requirements and capital expenditures through fiscal 2001.
SEASONALITY
The timing of our revenues is impacted by the purchasing patterns of our customers and as a result we do not generate revenues evenly throughout the year. Moreover, our first fiscal quarter, November through January, includes significant holiday and vacation periods in both Europe and North America. This leads to decreased order and shipment activity, consequently first quarter results are typically weaker than other quarters and not necessarily indicative of our performance in subsequent quarters.
22
MARKET RISK EXPOSURE
We have financial instruments that are subject to interest rate risk, principally debt obligations issued at a fixed rate. To the extent that sales are transacted in a foreign currency, we are also subject to foreign currency fluctuation risk. Furthermore, we have assets denominated in foreign currencies that are not offset by liabilities in such foreign currencies. Historically, we have not experienced material gains or losses due to interest rate or foreign exchange fluctuations. We own a significant operation in France. During the year, the foreign exchange rate for this country decreased significantly relative to the US dollar, which resulted in an increase in accumulated other comprehensive loss, as a result of the foreign currency translation adjustment.
RECENT ACCOUNTING PRONOUNCEMENTS
In June 1998, the Financial Accounting Standards Board, FASB, issued Statement of Financial Accounting Standards, FAS, No. 133, "Accounting for Derivative Instruments and Hedging Activities." FAS No. 133 establishes standards for derivative instruments and requires an entity to recognize all derivatives as either assets or liabilities and measure those instruments at fair value. In June 1999, the FASB issued FAS No. 137 which deferred the effective date of FAS No. 133. This standard will be effective for us beginning in fiscal 2001. We utilize foreign currency forward contracts primarily to reduce our exposure to fluctuations between the US dollar and the French Franc. At the end of fiscal 2000, we held foreign currency contracts totaling a notional amount of $8.5 million. If FAS No 133 was in effect at the end of fiscal 2000, this would have resulted in a gain of approximately $600,000. We anticipate that future similar foreign currency transactions will qualify for hedge accounting treatment under FAS No. 133.
In December 1999, the Securities and Exchange Commission issued Staff Accounting Bulletin No. 101, SAB No. 101, "Revenue Recognition in Financial Statements." In SAB No. 101, the Commission's staff expressed its views regarding the appropriate recognition of revenue with regard to a variety of circumstances. We will be required to adopt SAB No. 101 for the fourth quarter of fiscal 2001. We are currently evaluating SAB No. 101, however, we believe it will not have a material impact on our consolidated financial statements.
In March 2000, the FASB issued Interpretation No. 44, "Accounting for Certain Transactions Involving Stock Compensation," an interpretation of Accounting Principles Board Opinion 25, "Stock Issued to Employees." We adopted the Interpretation effective July 1, 2000, and it did not have a material impact on the consolidated financial statements.
23
OVERVIEW
Esterline is a specialized manufacturing company principally serving aerospace and defense customers and electronic equipment manufacturers. We design, manufacture and market highly engineered products and systems for applications within the industries we serve. Our strategic growth plan revolves around the development of three key technologies—sensors and controls, illuminated displays and specialized high-performance materials.
As part of our long-term strategic direction, we strive to anticipate the global needs of our customers and to respond with comprehensive solutions worldwide. This effort has resulted in establishing strategic realignments of operations providing the capability to offer a more extensive product line to each customer through a single contact.
We view and operate our business in three different segments: Aerospace, Advanced Materials and Automation. We primarily serve aerospace and defense customers with manufactured products such as high-end components for avionics, propulsion and guidance systems, and high-performance elastomers and other complex materials in the Aerospace and Advanced Materials segments. The Automation segment serves electronic equipment customers with PCB drilling equipment and heavy equipment manufacturing customers with automated machine tools for cutting and punching plate metal.
Sales by segment for the 1998, 1999 and 2000 fiscal years were as follows:
| |
1998 |
|
1999 |
|
2000 |
|
|||||||||||
|---|---|---|---|---|---|---|---|---|---|---|---|---|---|---|---|---|---|
| |
Sales |
% |
Sales |
% |
Sales |
% |
|||||||||||
| |
(dollars in thousands) |
||||||||||||||||
| Aerospace | $ | 171,028 | 38 | % | $ | 183,783 | 40 | % | $ | 236,269 | 48 | % | |||||
| Advanced Materials | 91,498 | 20 | 127,920 | 28 | 129,386 | 26 | |||||||||||
| Automation | 191,376 | 42 | 149,266 | 32 | 125,311 | 26 | |||||||||||
| Total | $ | 453,902 | 100 | % | $ | 460,969 | 100 | % | $ | 490,966 | 100 | % | |||||
MARKET OVERVIEW
- Aerospace and Defense. The ongoing wave of consolidations in the aerospace and defense industry is significantly reshaping the face of the industry. Suppliers in both the commercial aerospace and defense industries are in the midst of a consolidation process that is expected to continue for several more years. Component suppliers are focusing on becoming suppliers of systems and subsystems in an attempt to provide higher value-added solutions. Consolidation pressure is also coming from industry OEMs as they strive to reduce cycle times, decrease inventories and reduce costs by, among other things, reducing the total number of suppliers with whom they do business. For example, Boeing has publicly stated that one of its long-term goals is to bring down the number of suppliers it uses from approximately 29,000 to approximately 18,000. Successful suppliers will be required to offer a broader range of value-added products and services and to deliver them more cost efficiently. Due to the thousands of suppliers with only a small number of customers, continued industry-wide consolidation is likely.
Suppliers to the commercial aerospace industry serve a large and growing market. In the long term, the demand for aircraft is driven by economic growth supporting the demand for air travel and the need to replace aircraft that are removed from service due to age or other concerns. Boeing's publicly released Current Market Outlook 2000 currently estimates that the market for aircraft is
24
approximately $1.5 trillion over 20 years and that the number of aircraft in service is expected to more than double to 31,755 aircraft by 2019. Over this period, Boeing estimates that over 23,100 new aircraft will enter service in order to accommodate this demand. Additionally, orders, deliveries and manufactures' backlogs of regional jets currently stand at record levels.
The near term outlook for the commercial aerospace industry is also positive, driven by the significant increase in orders at Boeing during 2000, and continued growth at Airbus. Recent activity has been supported by increased orders from Asia, several years of stronger airline operating profits and the retirement of older aircraft. Replacements are being driven by regulations that required noisier aircraft to be replaced or modified by 2000 in the United States and that will require replacement by 2002 in Europe. Pending noise regulations could cause another wave of aircraft replacements. Higher fuel prices also provide incentives to replace older aircraft with newer, more fuel efficient aircraft.
The outlook for defense spending is positive, driven in large measure by the availability of funds due to the projected surplus and broad political support. Key trends include a continued focus on upgrades and modifications of existing weapons systems and the increased use of electronics and technology generally.
25
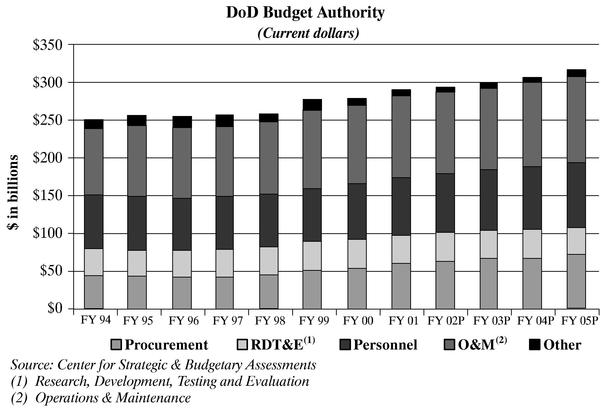
The DoD fiscal 2001 budget of approximately $291 billion includes over $60 billion for procurement and over $37 billion for research and development. Both these procurement and research and development spending categories represent the principal source of funds for most defense contractors. The DoD fiscal 2001 budget amount continues the increases that began in 1996.
- Automation. Automation equipment suppliers are subject to many global, macroeconomic trends which drive capital spending in the manufacturing industry. In the electronic equipment market, PCBs are used widely in applications ranging from consumer products to high-end commercial electronic equipment. This industry segment is characterized by high growth, rapid technological change and short product life cycles. In the heavy equipment market, spending on construction and agricultural equipment has been hurt by bumper crops, low exports and a weakening in the housing construction arena. Overall, Automation will continue to follow the global, cyclical trends of the end markets it serves.
OUR BUSINESS SEGMENTS
- Aerospace. Principal operations for our Aerospace business segment are conducted through Auxitrol which specializes in the development and manufacture of sensors and controls, and Korry which specializes in cockpit components.
- Sensors and controls
We have important market positions in both the United States and Europe in the manufacture of high-precision temperature and pressure sensing devices, hydraulic controls, micro-motors and motion control sensors used primarily in aerospace applications. In addition, we are the sole source supplier of exhaust gas temperature probes for use on all versions of the GE/Snecma CFM 56 jet engines (over 10,000 of which are currently in use on all new generation Boeing 737 aircraft and most Airbus models). The principal customers for our sensors and controls are jet
26
engine manufacturers, airframe manufacturers, shipbuilders, petroleum companies and electric utilities. Customers for our products include Aerospatiale, Airbus, Aircraft Braking Systems, British Ministry of Defence, General Electric, Honeywell, Parker Hannifin and Snecma.
- Cockpit components
We are a market leader in the development, marketing and manufacturing of sophisticated high reliability components and subsystems. These products include illuminated push button switches, indicators, panels and keyboards that are used in a broad variety of control and display applications. They have been integrated into many existing aircraft designs, including every Boeing commercial aircraft currently in production. This large installed base provides us with a significant spare parts and retrofit business. In addition, we manufacture control sticks, grips and wheels, as well as specialized switching systems. In this area, we primarily serve commercial and military aviation, and airborne and ground-based military equipment manufacturing markets.
Our proprietary products provide customers with significant technological advantages in such areas as night vision, a critical operational requirement, and backlighting for active-matrix liquid-crystal displays, a technology enabling pilots to read display screens in a variety of light conditions as well as from extreme angles. Our products are incorporated in a wide variety of programs including the Apache and Black Hawk helicopters and the F-117 Stealth, C-17, F-14, F-15, F-16 and F-18 fixed wing military aircraft, as well as Canadair, Cessna, Gulfstream and Saab business jets. Customers for our products include Boeing, Bombardier, Embraer Aircraft, Honeywell, Lockheed Martin, Raytheon Aircraft, Rockwell, Sikorsky, Smiths Industries and the DoD.
- Advanced Materials. Principal operations for our Advanced Materials business segment are conducted through Kirkhill-TA which specializes in the design and manufacture of high-performance elastomer products, and Armtec which specializes in the manufacture of molded fiber cartridge cases, mortar increments, igniter tubes and other combustible ammunition components.
- Specialized high-performance applications
We specialize in the development of proprietary formulations for silicon rubber and other elastomer products. Our elastomer products are engineered to address specific customer problems where superior performance in high temperature, high pressure, caustic, abrasive and other difficult environments is critical. These products include specialty clamps, seals, tubing and coverings, which are designed in custom molded shapes. Our primary customers for these products are jet and rocket engine manufacturers, commercial and military airframe manufacturers, as well as commercial airlines. Some of the products include proprietary elastomers that are specifically designed for use on or near a jet engine. Customers for our products include BF Goodrich, Boeing, General Electric, Honeywell, Kapco, Pratt & Whitney and Thiokol.
- Other defense applications
We manufacture molded fiber cartridge cases, mortar increments, igniter tubes and other combustible ammunition components for the US Armed Forces, in addition to licensing such technology to foreign defense contractors and governments. Through sales to prime contractors, Alliant Techsystems and General Dynamics, we are currently the only supplier of combustible casings utilized by the US Army. These products include the 120mm combustible case used with the main armament system on the US Army's M-1A1 and M-1A2 tanks and the 60mm, 81mm and 120mm combustible mortar increments. As the sole source supplier of combustible casings, we recently received the initial production order for the US Army's new generation 155mm Modular Artillery Charge System.
27
- Automation. Principal operations for our Automation business segment are conducted through Excellon which manufactures automated drilling systems for fabrication of PCBs, and W.A. Whitney which designs and builds automated machine tools for cutting and punching plate and structural steel.
- Printed circuit board applications
We are a leading manufacturer of highly efficient automated drilling systems for the PCB manufacturing industry. Our advanced mechanical drilling technology addresses the unique requirements for circuit boards and multi-chip modules used in, among other things, internet infrastructure and wireless communications equipment. We recently introduced laser technology to respond to customer requirements for increasingly higher specification PCBs. Our state-of-the-art lasers are able to produce holes as small as two mils in diameter and at speeds of up to 60,000 holes per minute. Customers for our products include Litton, Multek, Sanmina, Tyco and ViaSystems.
- Precision metal cutting and punching applications
We are a leading manufacturer of high precision, computer controlled machine tools for cutting and punching plate and structural steel ranging from approximately three-eighths of an inch to one and a quarter inches in thickness for construction, transportation, agricultural and mining equipment manufacturers and independent steel fabrication centers. Our products are specifically designed for mid- to heavy-plate metal that enables manufacturers to meet rigid cut quality and accuracy standards. In recent years, we have introduced laser technology into our line of products which increases the accuracy of cuts and reduces the number of required finishing operations. In this niche market, we are a leading supplier in the United States, in addition to serving markets in both Europe and Asia. Customers for our products include Caterpillar, Case New Holland, Deere, FMC, Genie Industries, Heil and Thrall Rail Car.
BUSINESS STRATEGY
One of Esterline's strengths is the proven capability to deliver specialized products designed to perform in demanding applications and in harsh environments. We intend to capitalize on our reputation as a leading supplier of highly engineered products in the aerospace and defense markets. We will take advantage of our strong, specialized niche market positions in a consolidating industry to build shareholder value by growing the business and gaining critical mass, increasing our profitability by offering higher value-added products to our customers and consolidating our position within the aerospace and defense industry. Our strategy for profitable growth includes the following:
We have developed highly specialized product lines that have enabled us to capture leading market positions in the business segments we serve. We believe that this is one of many areas which sets us apart from our competition. By focusing on highly engineered and more value-added products, we are able to maintain strong market shares while providing solutions to our customer base. For example, a customer approached us with a persistent visibility problem with active-matrix liquid-crystal displays in the cockpit. As a direct result of our niche expertise in optics, we were able to deliver a highly engineered backlight solution to the customer and, at the same time, develop a new market opportunity in cockpit components. This focus is evident in our commitment to provide funding for research and development along with many research and development efforts we conduct in conjunction with our customers. This discipline has been acknowledged by many of our customers as we find ourselves being the supplier of choice due to our technological leadership.
28
In response to the needs of the markets we serve, we utilize acquisitions for many purposes, including gaining economies of scale in manufacturing, broadening our product base and acquiring new technologies or strategic assets. As a part of the global consolidation of the aerospace and defense industry, we believe that there are and will continue to be numerous opportunities to achieve our objectives through strategic acquisitions. We maintain acquisition criteria based on a target's size, historical performance, products, markets, management and customers. These targets should be among the leaders in the markets they serve, possess growth potential, offer competitive advantages and provide attractive rates of return on investment.
Consistent with our deliberate and focused strategy of selectively making business acquisitions that promote our long-term growth objectives, we have completed 13 acquisitions since July 1996. The following table provides a summary of these acquisitions, which have allowed us to expand and strengthen our product line capabilities:
| Acquired Company |
Product Line |
Segment |
Date of Acquisition |
|||
|---|---|---|---|---|---|---|
| Aerospace knobs and indicator operations of Dupree, Inc. | Manufacturer of lighted control knobs and indicators; night vision filters and lamps | Aerospace—cockpit components | January 2001 | |||
| Surftech Finishes Co. | Metal-finishing company specializing in aerospace aluminum products | Advanced Materials—specialized high-performance applications | April 2000 | |||
| Advanced Input Devices Co. | Manufacturer of custom-made keyboard and other multifunction data input subsystems | Aerospace—cockpit components | December 1999 | |||
| Muirhead Aerospace (Norcroft Dynamics and Muirhead Vactric) | Manufacturers of micro-motors and motion controls | Aerospace—sensors and controls | October 1999 | |||
| Kirkhill Rubber Co. | Manufacturer of specialty rubber and elastomer products | Advanced Materials—specialized high-performance applications | August 1998 | |||
| ATI | Manufacturer of PCB routers | Automation—PCB applications | August 1998 | |||
| Memtron Technologies, Co. | Manufacturer of membrane switches | Aerospace—cockpit components | May 1998 | |||
| Kai R. Kuhl Co. | Manufacturer of high-performance seals for aerospace | Advanced Materials—specialized high-performance applications | January 1998 | |||
| Aerospace switch operations of Illinois Tool Works | Manufacturer of Boeing 777 cockpit switch | Aerospace—cockpit components | November 1997 | |||
| Pressure Sensor Division of Sagem S.A. | Manufacturer of pressure sensors | Aerospace—sensors and controls | November 1997 | |||
| Fluid Regulators Co. | Manufacturer of hydraulic controls for aerospace markets | Aerospace—sensors and controls | November 1997 | |||
| Kennard Engineering Co. | Manufacturer of PCB routers | Automation—PCB applications | November 1996 | |||
| Mason Electric Co. | Manufacturer of flight controls and specialized switching products | Aerospace—cockpit components | August 1996 | |||
29
Ongoing communication with our long-standing customers enables us to identify new product applications. This, combined with our strong technical capabilities and continued emphasis on product development allows us to offer a broader range of products.
One current example of broadening applications for our technologies is the thermal fire barrier product developed in our Advanced Materials segment. This elastomeric compound was initially developed for use in high temperature specialty clamping applications. In subsequent research and development efforts, we learned that in liquid, paste or spray form this compound provides fireproof sealing protection and thermal insulation, which is particularly effective in high vibration and high temperature zones in and around jet engines. Similar examples of expansion in the cockpit components platform include night vision products and active-matrix liquid-crystal display backlights and panels, while in the sensors and controls platform, our current efforts are directed at extending our technology into total air temperature measurement and advanced pressure sensing.
Aftermarket sales, including retrofits, are generally more profitable and less volatile than OEM sales. In addition, the safety and regulatory requirements of the commercial and military aerospace sectors generate recurring repair and replacement activity. We therefore aggressively market spares, parts and repair services directly to our customers and end-users. We are increasing our aftermarket exposure in order to mitigate the effects of cyclical declines in our other operations. Given our large and growing installed base of products, we anticipate our aftermarket sales will be an increasing portion of our business. For fiscal 2000, aftermarket sales represented approximately 20% of our total revenues.
MARKETING AND DISTRIBUTION
As businesses globalize, we believe that a key to continued success is our ability to meet customer requirements worldwide. In order to accomplish this, we have and will continue to optimize our operations in order to provide a wider variety of products through single business segments. These adjustments include combining sales and marketing forces where appropriate, cross-training our sales representatives on multiple product lines, and cross-stocking our spare parts and components. For example, our sensors and controls platform operations, previously three independent organizations in the United States, England and France, are being integrated to provide a single point of contact for global sales of temperature and pressure sensors, fluid regulating devices and motion control components.
In the technical and highly engineered product segments in which we compete, relationship selling is particularly appropriate in targeted marketing segments where customer and supplier design and engineering inputs need to be tightly integrated. Participation in industry trade shows is an effective method of meeting customers, introducing new products and exchanging technical specifications. In addition to technical and industry conferences, our products are supported through direct internal global sales efforts, particularly important in the Automation segment, as well as through manufacturer representatives and selected distributors. Currently, we have 186 sales people, 222 representatives and 27 distributors supporting our operations globally.
30
BACKLOG
Backlog at the end of fiscal 2000 was $228.3 million compared with $183.2 million at the end of fiscal 1999. Approximately $46.1 million of backlog is scheduled to be shipped after fiscal 2001.
Our backlog provides us with a useful tool to project sales and plan our business on an on-going basis; however, since it is subject to cancellation until delivered, we cannot be assured that the backlog will be converted into revenue in any particular period or at all. Backlog does not include the total contract value of cost-plus reimbursable contracts, which are funded as we incur the costs. Backlog also does not include fixed-price multi-year contracts, except for the released portion.
COMPETITION
Our products and services are affected by varying degrees of competition. We compete with other companies in most markets we serve, many of which have far greater sales volumes and financial resources. The principal competitive factors in the commercial markets in which we participate are product performance, service and price. The market for many of our products may be affected by rapid and significant technological changes and new product introduction. Therefore, part of product performance requires expenditures in research and development that lead to rapid product improvement. Our principal competitors include: Ametek, BF Goodrich-Rosemount, Eaton-MSC and ECE in our Aerospace segment; Adel, Burke Industries, Dunlop and Meggitt in our Advanced Materials segment; and Amada America, ESI, Hitachi, Pluritec Italia, Mazak, Schmoll Maschinen, Tanaka and Trumpf in our Automation segment.
RESEARCH AND DEVELOPMENT
Currently, our product development and design programs utilize an extensive base of professional engineers, technicians and support personnel, supplemented by outside engineering and consulting firms when needed. In fiscal 2000, approximately $20.8 million was expended for research, development and engineering, compared with $24.0 million in fiscal 1999 and $20.8 million in fiscal 1998. As we believe that continued product development is key to our long-term growth, we consistently invest in research and development, as well as participating in customer funded research and development programs, including flight controls and instrumentation on the Joint Strike Fighter and Eurofighter, Gulfstream V flight controls, deicing probes for next generation GE engines, ice detectors for the Rafale fighter, smoke and pollution concentration measurement devices and LED lighted cockpit switches for Airbus.
31
PROPERTIES
The following table summarizes our principal properties that are greater than 50,000 square feet, including identification of the business segment, as of October 27, 2000:
| Location |
Type of Facility |
Business Segment |
Approximate Square Footage |
Owned or Leased |
||||
|---|---|---|---|---|---|---|---|---|
| Brea, CA | Office, Plant & Warehouse | Advanced Materials | 429,000 | Owned | ||||
| Rockford, IL | Office & Plant | Automation | 294,000 | Owned | ||||
| Seattle, WA | Office & Plant | Aerospace | 152,000 | Leased | ||||
| Torrance, CA | Office & Plant | Automation | 150,000 | Leased | ||||
| Coachella, CA | Office & Plant | Advanced Materials | 111,000 | Owned | ||||
| Bourges, France | Plant | Aerospace | 102,000 | Leased | ||||
| Kent, WA | Office & Plant | Advanced Materials | 93,000 | Owned | ||||
| Joplin, MO | Office & Plant | Aerospace | 92,000 | Owned | ||||
| Valencia, CA | Office & Plant | Advanced Materials | 88,000 | Owned | ||||
| Coeur d'Alene, ID | Office & Plant | Aerospace | 85,000 | Leased | ||||
| London, England | Office & Plant | Aerospace | 70,000 | Leased | ||||
| San Fernando, CA | Office & Plant | Aerospace | 50,000 | Leased | ||||
| Painesville, OH | Office & Plant | Aerospace | 50,000 | Owned | ||||
In total, we own approximately 1,400,000 square feet and lease approximately 700,000 square feet of manufacturing facilities and properties.
FOREIGN OPERATIONS
Our principal foreign operations consist of manufacturing facilities located in France and the United Kingdom. We also maintain offices in the United Kingdom, France, Germany, Hong Kong, Japan and Spain that provide a variety of functions including sales, service, distribution and/or purchasing. For further information regarding foreign operations, reference is made to the Consolidated Financial Statements included elsewhere in this prospectus.
EMPLOYEES
We had approximately 4,300 employees at October 27, 2000, of which 3,500 were based in the United States and 800 were based in our United Kingdom and European operations. Fewer than 3.0% of the US-based employees were represented by a labor union. In addition, the European operations are subject to national trade union agreements and to local regulations governing employment.
GOVERNMENT CONTRACTS AND SUBCONTRACTS
As a contractor and subcontractor to the US Government, we are subject to various laws and regulations that are more restrictive than those applicable to non-government contractors. Although only 5.0% of our sales were made directly to the US Government in fiscal 2000, we estimate that our subcontracting activities accounted for an additional 15.0% of sales. Therefore, approximately 20.0% of our sales during that fiscal year were governed by rules favoring the government's contractual position. As a consequence, such contracts may be subject to termination, reduction or modification in the event of changes in government requirements, reductions in federal spending and other factors. Although our fixed-price contracts generally permit us to keep profits if costs are less than projected, we do bear the risk that increased or unexpected costs may reduce profits or cause us to sustain losses on the contracts. Generally, firm fixed-price contracts offer higher margins than cost-plus type
32
contracts. The accuracy and appropriateness of certain costs and expenses used to substantiate our direct and indirect costs for the US Government under both cost-plus and fixed-price contracts are subject to extensive regulation and audit by the Defense Contract Audit Agency, an arm of the DoD. The contracts and subcontracts to which we are a party are also subject to profit and cost controls and standard provisions for termination at the convenience of the US Government. Upon termination, other than for our default, we will normally be entitled to reimbursement for allowable costs and to an allowance for profit. To date, none of our significant fixed-price contracts have been terminated.
PATENTS AND LICENSES
Although we hold a number of patents and licenses, we do not believe that our operations are dependent on our patents and licenses. In general, we rely on technical superiority, continual product improvement, exclusive product features, superior lead time, on-time delivery performance and quality and customer relationships to maintain competitive advantage.
SOURCES AND AVAILABILITY OF RAW MATERIALS AND COMPONENTS
Due to our diversification, the sources and availability of raw materials and components are not nearly as important as they would be for a company that manufactures a single product. However, certain components, supplies and raw materials for other operations are purchased from single sources. In such instances, we strive to develop alternative sources and design modifications to minimize the effect of business interruptions.
LEGAL PROCEEDINGS
From time to time we are involved in legal proceedings arising in the ordinary course of our business. We believe we have adequately reserved for these liabilities and that there is no litigation pending that could have a material adverse effect on our results of operations and financial condition.
ENVIRONMENTAL MATTERS
We are subject to extensive, evolving and increasingly stringent federal, state, local and foreign laws, regulations and ordinances that (i) govern activities or operations that may have adverse environmental effects, such as discharges of hazardous materials to air and water, as well as handling and disposal practices for solid and hazardous materials, and (ii) impose liability for the costs of cleaning up, and certain damages resulting from, sites of past spills, disposals or other releases of hazardous materials.
From time to time, our operations have resulted or may result in noncompliance with environmental laws or liability for the costs of investigating and cleaning up, and certain damages resulting from, sites of past spills, disposals or other releases of hazardous materials. As a result, we have been, and may become, subject to orders from environmental agencies to investigate and cleanup potential contamination at certain of our facilities. We believe that we have adequately accrued for the estimated costs associated with such matters.
In addition, we have been identified as a potentially responsible party pursuant to the Comprehensive Environmental Response, Compensation, and Liability Act of 1980, CERCLA, and analogous state environmental laws, for the cleanup of contamination resulting from past disposals of hazardous materials at certain sites to which we, among others, sent wastes in the past. CERCLA requires potentially responsible parties to pay for cleanup of sites from which there has been a release or threatened release of hazardous materials. Courts have interpreted CERCLA to impose strict, and
33
under certain circumstances, joint and several liability upon all parties liable for cleanup costs. As a practical matter, however, at sites where there are multiple potentially responsible parties, the costs of cleanup typically are allocated among the parties according to a volumetric or other standard. Although there can be no assurance, we believe, based on, among other things, a review of the data currently available to us regarding each such site, including, where relevant, the minor volumes of waste which we are alleged to have contributed at multi-party sites, and a comparison of our liability at each such site to settlements we have previously reached in similar cases, that we have adequately accrued for the estimated costs associated with such matters.
Liabilities have been accrued for environmental cleanup costs expected to be incurred in connection with the disposition of manufacturing facilities. No provision has been recorded for environmental cleanup costs that could result from changes in laws or other circumstances we have not currently contemplated.
34
EXECUTIVE OFFICERS AND DIRECTORS
The following table sets forth information regarding our executive officers and directors as of January 19, 2001:
| Name |
Age |
Position |
||
|---|---|---|---|---|
| Robert W. Cremin (1)(2) | 60 | Chairman, President and Chief Executive Officer | ||
| James J. Cich, Jr. | 39 | Group Vice President | ||
| Robert D. George | 44 | Vice President and Chief Financial Officer | ||
| Marcia J. M. Greenberg | 48 | Vice President, Human Relations | ||
| Larry A. Kring | 60 | Group Vice President | ||
| Stephen R. Larson | 56 | Vice President, Strategy & Technology | ||
| Richard R. Albrecht (1)(3) | 68 | Director | ||
| Ross J. Centanni (3) | 55 | Director | ||
| John F. Clearman (3) | 63 | Director | ||
| Robert S. Cline (2)(3) | 63 | Director | ||
| E. John Finn (1)(2)(4) | 69 | Director | ||
| Robert F. Goldhammer (1)(4) | 69 | Director | ||
| Wendell P. Hurlbut (1) | 69 | Director | ||
| Jerry D. Leitman (4) | 58 | Director | ||
| Paul G. Schloemer (2)(3) | 72 | Director | ||
Robert W. Cremin became Chairman as of January 19, 2001. He has been Chief Executive Officer since January 1999 and President since September 1997. From January 1991 to September 1997, he served in various executive positions including Chief Operating Officer, Executive Vice President, Senior Vice President and Group Executive. He is also the Chairman of the President's Council of Manufacturers Alliance/MAPI. Mr. Cremin has an M.B.A. from the Harvard Business School and a B.S. degree in Metallurgical Engineering from Polytechnic Institute of Brooklyn. He has been one of our board members since 1998.
James J. Cich, Jr. has been Group Vice President since March 1998. Previously, he was Group Executive from February 1997 to February 1998. From June 1995 to February 1997, he was President, Chief Executive Officer and a director for WFI Industries, Ltd. From June 1988 to May 1995, he was President of Patton Electric Company, Inc. Mr. Cich has an M.B.A. from the Harvard Business School and a B.S. degree in Industrial Engineering from the University of Washington.
Robert D. George has been Vice President, Chief Financial Officer and Secretary since July 1999, and Treasurer and Controller since June 1997. From October 1995 to June 1997, he was Group Vice President Finance for Zurn Power Systems Group. Previously, he served as Vice President Finance for the Energy Division of Zurn Industries from March 1989 until October 1995. Mr. George has an M.B.A. from the Fuqua School of Business at Duke University and a B.A. degree in Economics from Drew University.
35
Marcia J. M. Greenberg has been Vice President, Human Resources since March 1993. Previously, she was a Partner at the law firm of Bogle & Gates from January 1992 through February 1993 and an associate attorney from August 1984 through December 1991. Ms. Greenberg has a J.D. degree from Northwestern University School of Law and a B.A. degree in Political Science from Portland State University.
Larry A. Kring has been Group Vice President since August 1993. From November 1978 to July 1993, he was President and Chief Executive Officer of Heath Tecna Aerospace Co., a unit of Ciba Composites Division, Anaheim, California. He is a director of Everlast Worldwide, Inc. Mr. Kring has an M.B.A. from California State University at Northridge and a B.S. degree in Aeronautical Engineering from Purdue University.
Stephen R. Larson has been Vice President, Strategy & Technology since January 2000. Previously, he was Group Vice President from April 1991 through December 1999. From February 1978 to March 1991, he held various executive positions with Korry Electronics, a subsidiary of Esterline, including President and Executive Vice President, Marketing. Mr. Larson has an M.B.A. from the University of Chicago and a B.S. degree in Electrical Engineering from Northwestern University.
Richard R. Albrecht has been one of our board members since 1997. Prior to August 1997, Mr. Albrecht was Executive Vice President of the Commercial Airplane Group for Boeing (an aerospace company), having held such position from 1984 to 1997.
Ross J. Centanni has been one of our board members since 1999. He is the Chairman, President and Chief Executive Officer of Gardner Denver, Inc. (a manufacturer of industrial compressors and blowers). He was elected Chairman in November 1998 and has served as President and Chief Executive Officer since November 1993. He is also a director of Denman Services, Inc., Petroleum Equipment Suppliers Association and Quincy University.
John F. Clearman has been one of our board members since 1989. He has been the Chief Financial Officer of Milliman & Robertson (an actuarial consulting firm) since October 1998. He is the former President and Chief Executive Officer of NC Machinery Co., having held such positions from 1986 through 1994. He is also a director for several other companies including Oberto Sausage, Inc., Washington Federal Savings, Inc., Barclay Dean Interiors, GT Development, Lang Manufacturing and Pinnacle Publishing.
Robert S. Cline has been one of our board members since 1999. He is the Chairman and Chief Executive Officer of Airborne Freight Corporation (an air express company), having held such positions since 1984. He is also a director of Safeco Corporation.
E. John Finn has been one of our board members since 1989. He is the retired Chairman and Partner of Dorr-Oliver Incorporated (a process engineering and equipment company), having held such positions from 1988 to 1995. He is also a director of Advanced Refractory Technologies, Inc., Pro Air, Inc. and Stantec, Inc.
Robert F. Goldhammer has been one of our board members since 1974. He has been the Chairman of ImClone Systems, Incorporated (a biotechnology company) since 1984. Previously, he was a Partner and Vice Chairman of the Executive Committee of Kidder, Peabody & Co. Incorporated. He is also President and a Partner at Concord International Investments Group L.L.P.
36
Wendell P. Hurlbut has been one of our board members since 1989. Mr. Hurlbut served as Chairman from January 1993 through January 2001. Previously, he served as Chief Executive Officer of Esterline from September 1997 through January 1999 and President and Chief Executive Officer from January 1993 through September 1997. Mr. Hurlbut is a retired member of the board of directors of the National Association of Manufacturers.
Jerry D. Leitman has been one of our board members since 1998. He has served as President and Chief Executive Officer of Fuel Cell Energy, Inc. (a fuel cell company) since August 1997. Previously, he was President of Jaydell, Inc. from January 1995 through August 1997, and President of ABB Air Pollution Control from October 1992 through December 1994. He is also Chairman of Evercel, Inc.
Paul G. Schloemer has been one of our board members since 1993. He is the retired President and Chief Executive Officer of Parker Hannifin Corporation (a manufacturer of motion control products), having held such positions from 1984 to 1993. He is also a director of Source Capital, Inc.
37
The following table sets forth information concerning the beneficial ownership of our outstanding common stock as of January 2, 2001, adjusted to reflect the sale of 2,800,000 the shares of common stock in this offering for:
The term "beneficial ownership" includes shares over which the indicated beneficial owner exercises voting and/or investment power. The rules of the Securities Exchange Act of 1934, as amended, also deem common stock subject to options or warrants currently exercisable, or exercisable within 60 days, to be outstanding for purposes of computing the percentage ownership of the person holding the options or warrants, but they do not deem that stock to be outstanding for purposes of computing the percentage ownership of any other person. The applicable percentage of ownership for each shareholder is based on 20,227,301 shares of common stock outstanding as of January 2, 2001, together with applicable options and warrants for that shareholder. Except as otherwise indicated, we believe the beneficial owners of the common stock listed below, based on information furnished by them, have sole voting and investment power over the number of shares listed opposite their names, subject to applicable community property laws. The information provided in the table below assumes no exercise of the underwriters' over-allotment option.
| Name and address of beneficial owner (1) |
Amount and nature of beneficial ownership (2) |
Percent of class |
|
|---|---|---|---|
| Alliance Capital Management, L.P. 1345 Avenue of the Americas, New York, NY 10105 |
1,334,837 | (3) | 6.6% |
| J. L. Kaplan Associates, LLC 222 Berkeley Street, Suite 2010, Boston, MA 02116 |
1,296,630 | (4) | 6.4% |
| Dimensional Fund Advisors Inc. 1299 Ocean Avenue, 11th Floor, Santa Monica, CA 90401 |
1,162,600 | (5) | 5.7% |
| Robert W. Cremin | 278,431 | (6) | 1.4% |
| Larry A. Kring | 269,775 | (6) | 1.3% |
| Stephen R. Larson | 155,500 | (6) | * |
| Wendell P. Hurlbut | 129,625 | (6) | * |
| James J. Cich, Jr. | 105,950 | (6) | * |
| E. John Finn | 38,880 | * | |
| Robert D. George. | 38,250 | (6) | * |
| Robert F. Goldhammer | 29,380 | * | |
| John F. Clearman | 12,880 | * | |
| Paul G. Schloemer | 4,880 | (7) | * |
| Richard R. Albrecht | 3,370 | * | |
| Robert S. Cline | 2,838 | * | |
| Jerry D. Leitman | 1,136 | * | |
| Ross J. Centanni | 838 | * | |
| Directors and executive officers as a group (15 persons) | 1,134,133 | (6)(7) | 5.4% |
38
39
We and the underwriters for the offering named below have entered into an underwriting agreement concerning the shares being offered. The underwriters' obligations are several, which means that each underwriter is required to purchase a specified number of shares, but is not responsible for the commitment of any other underwriter to purchase shares. Subject to the terms and conditions of the underwriting agreement, each underwriter has severally agreed to purchase the number of shares of common stock set forth opposite its name below.
| Underwriters |
Number of Shares |
||
|---|---|---|---|
| UBS Warburg LLC | |||
| First Union Securities, Inc. | |||
| Total | 2,800,000 | ||
The underwriting agreement provides that the obligations of the underwriters are conditional and may be terminated at their discretion based on their assessment of the state of the financial markets. The obligations of the underwriters may also be terminated upon the occurrence of the events specified in the underwriting agreement. The underwriters are severally committed to purchase all of the common stock being offered if any shares are purchased, other than those covered by the over-allotment option described below.
We have granted the underwriters an option to purchase up to 420,000 additional shares of common stock at the public offering price, less the underwriting discounts and commission, set forth on the cover of this prospectus to cover over-allotments, if any. This option is exercisable for a period of 30 days. If the underwriters exercise their over-allotment option, the underwriters have severally agreed, subject to conditions, to purchase shares in approximately the same proportion as set forth in the table above.
The following table shows the per share and total underwriting discounts and commissions we will pay to the underwriters. These amounts are shown assuming both no exercise and full exercise of the underwriters' option to purchase up to an additional 420,000 shares.
| |
No Exercise |
Full Exercise |
||||
|---|---|---|---|---|---|---|
| Per share | $ | $ | ||||
| Total | $ | $ | ||||
40
We estimate that the total expenses of the offering payable by us, excluding underwriting discounts and commissions, will be approximately $ .
The underwriters propose to offer the common stock directly to the public initially at the offering price set forth on the cover page of this prospectus. The underwriters may offer the common stock to securities dealers at that price less a concession not in excess of $ per share. Securities dealers may reallow a concession not in excess of $ per share on sales to certain other brokers or dealers. The underwriters reserve the right to reject any order for the purchase of shares. If all of the shares are not sold at the public offering price, the underwriters may vary the offering price and other selling terms from time to time.
We have agreed in the underwriting agreement to indemnify the several underwriters against certain liabilities, including liabilities under the Securities Exchange Act of 1934, as amended, and to contribute to payments that the underwriters may be required to make in respect thereof.
We, and each of our directors and executive officers who collectively beneficially hold an aggregate of 256,705 shares, have agreed with the underwriters that for a period of 90 days following the date of this prospectus that, without the prior written consent of UBS Warburg LLC, our directors and executive officers and such stockholders will not offer, sell, contract to sell, hedge or otherwise dispose of, directly or indirectly, any of our shares of common stock or any securities convertible into or exchangeable for common stock. This restriction shall not apply to the transfer of any shares of our common stock, or any securities convertible into or exchangeable for common stock, to a broker-dealer for the purpose of sale as permitted by Regulation FD not earlier than 90 days after the date of this Prospectus.
The underwriters may engage in over-allotment, stabilizing transactions, syndicate covering transactions, penalty bids, and passive market making in accordance with Regulation M under the Securities Exchange Act of 1934, as amended. Over-allotment involves syndicate sales in excess of the offering size, which creates a syndicate short position. Stabilizing transactions permit bids to purchase the underlying securities so long as the stabilizing bids do not exceed a specified maximum. Syndicate covering transactions involve purchases of the common stock in the open market after the distribution has been completed in order to cover syndicate short positions. Penalty bids permit the underwriters to reclaim a selling concession from a syndicate member when the common stock originally sold by such syndicate member is purchased in a syndicate covering transaction to cover syndicate short positions. These stabilizing transactions, syndicate covering transactions and penalty bids may cause the price of the common stock to be higher than it would otherwise be in the absence of these transactions. These transactions may be effected on the New York Stock Exchange or otherwise and, if commenced, may be discontinued at any time.
One or more of the underwriters will be facilitating Internet distribution for this offering to certain of their Internet subscription customers and may allocate a number of shares for sale to their online brokerage customers. An electronic prospectus may be available on the websites maintained by one or more of the underwriters. Other than the prospectus in electronic format, the information contained on the websites maintained by any of the underwriters relating to this offering is not part of this prospectus.
From time to time, certain of the underwriters and their affiliates may be customers of, engage in transactions with, and perform services for, Esterline and its subsidiaries, in the ordinary course of business.
41
Legal matters
We are being represented by Perkins Coie LLP, Seattle, Washington, and the underwriters are being represented by Cahill Gordon & Reindel, New York, New York. The validity of the common stock offered by this prospectus will be passed on by Perkins Coie LLP for us. Certain legal matters relating to the offering will be passed upon for the underwriters by Cahill Gordon & Reindel.
Experts
Ernst & Young LLP, independent auditors, have audited our consolidated financial statements and schedule included or incorporated by reference in our Annual Report on Form 10-K for the year ended October 27, 2000, as set forth in their report, which is incorporated by reference in this prospectus and elsewhere in the registration statement. Our financial statements and schedule are incorporated by reference in reliance on Ernst & Young LLP's report, given on their authority as experts in accounting and auditing.
The consolidated financial statements and the related consolidated financial statement schedules incorporated in this prospectus by reference from Esterline Technologies Corporation's Annual Report on Form 10-K for the year ended October 31, 1999, have been audited by Deloitte & Touche LLP, independent auditors, as stated in their report on the consolidated financial statements (which report expresses an unqualified opinion), and in their report on the consolidated financial statement schedules, which are incorporated herein by reference, and have been so incorporated in reliance upon the reports of such firm given upon their authority as experts in accounting and auditing.
Where you can find more information
We file annual, quarterly and special reports, as well as registration and proxy statements and other information, with the Securities and Exchange Commission. These documents may be read and copied at the Public Reference Room at 450 Fifth Street, N.W., Washington, D.C. 20549, or at the Commission's regional offices located at 7 World Trade Center, Suite 1300, New York, New York 10048, and at Citicorp Center, 500 West Madison Street, Suite 1400, Chicago, Illinois 60661. You can get further information about the Commission's Public Reference Room by calling 1-800-SEC-0330. The Commission also maintains a Web site at http://www.sec.gov that contains reports, registration statements and other information regarding registrants like us that file electronically with the Commission.
This prospectus is part of a registration statement on Form S-3 filed by us with the Commission under the Securities Act of 1933, with respect to this offering of common stock. As permitted by the Commission, this prospectus does not contain all the information in the registration statement filed with the Commission. For a fuller understanding of this offering, you should refer to the complete registration statement on Form S-3 that may be obtained from the locations described above.
Information incorporated by reference
The Securities and Exchange Commission allows us to "incorporate by reference" the information we file with the Commission, which means that we can disclose important information to you by referring you to documents we have filed with the Commission. We incorporate by reference the documents listed below, and any additional documents filed by us with the Commission under Section 13(a), 13(c), 14 or 15(d) of the Securities Exchange Act of 1934, as amended, prior to the termination of this
42
offering. The information we incorporate by reference is part of this prospectus, and any later information that we file with the Commission will automatically update and supersede this information.
The documents we incorporate by reference are:
Documents incorporated by reference, excluding exhibits, are available from us without charge to each person, including any beneficial owner to whom this prospectus is delivered. You may obtain documents incorporated by reference by requesting them in writing from Esterline Technologies Corporation, 10800 NE 8th Street, Bellevue, Washington 98004, Attention: Investor Relations Department, or by calling (425) 453-9400.
43
INDEX TO CONSOLIDATED FINANCIAL STATEMENTS
| |
Page |
|
|---|---|---|
| Report of Ernst & Young LLP, Independent Auditors | F-2 | |
| Consolidated Statement of Operations | F-3 | |
| Consolidated Balance Sheet | F-4 | |
| Consolidated Statement of Cash Flows | F-5 | |
| Consolidated Statement of Shareholders' Equity and Comprehensive Income | F-6 | |
| Notes to Consolidated Financial Statements | F-7 | |
F-1
| |
|
|
|---|
REPORT OF INDEPENDENT AUDITORS
To the Shareholders and the Board of Directors
Esterline Technologies Corporation
Bellevue, Washington
We have audited the accompanying consolidated balance sheet of Esterline Technologies Corporation and subsidiaries as of October 27, 2000, and the related consolidated statements of operations, shareholders' equity and comprehensive income, and cash flows for the fiscal year then ended. These financial statements are the responsibility of the Company's management. Our responsibility is to express an opinion on these financial statements based on our audit. The financial statements of the Company for the two fiscal years ended October 31, 1999, were audited by other auditors whose report dated December 9, 1999, expressed an unqualified opinion on those statements.
We conducted our audit in accordance with auditing standards generally accepted in the United States. Those standards require that we plan and perform the audit to obtain reasonable assurance about whether the financial statements are free of material misstatement. An audit includes examining, on a test basis, evidence supporting the amounts and disclosures in the financial statements. An audit also includes assessing the accounting principles used and significant estimates made by management, as well as evaluating the overall financial statement presentation. We believe that our audit provides a reasonable basis for our opinion.
In our opinion, the fiscal 2000 financial statements referred to above present fairly, in all material respects, the consolidated financial position of Esterline Technologies Corporation and subsidiaries at October 27, 2000 and the consolidated results of their operations and their cash flows for the fiscal year then ended in conformity with accounting principles generally accepted in the United States.
Ernst
& Young LLP
Seattle, Washington
December 6, 2000
F-2
Esterline Technologies Corporation
CONSOLIDATED STATEMENT OF OPERATIONS
in thousands, except per share amounts
| for each of the three fiscal years in the period ended October 27, 2000 |
2000 |
1999 |
1998 |
|||||||||
|---|---|---|---|---|---|---|---|---|---|---|---|---|
| Sales | $ | 490,966 | $ | 460,969 | $ | 453,902 | ||||||
| Cost of Sales | 311,242 | 286,410 | 281,539 | |||||||||
| 179,724 | 174,559 | 172,363 | ||||||||||
| Expenses | ||||||||||||
| Selling, general and administrative | 105,532 | 106,239 | 102,361 | |||||||||
| Research, development and engineering | 20,839 | 24,022 | 20,846 | |||||||||
| Total Expenses | 126,371 | 130,261 | 123,207 | |||||||||
| Operating Earnings | 53,353 | 44,298 | 49,156 | |||||||||
| Gain on sale of business | (2,591 | ) | (7,956 | ) | — | |||||||
| Interest income | (2,205 | ) | (2,859 | ) | (1,594 | ) | ||||||
| Interest expense | 8,124 | 9,011 | 3,803 | |||||||||
| Net Other (Income) Expense | 3,328 | (1,804 | ) | 2,209 | ||||||||
| Earnings Before Income Taxes | 50,025 | 46,102 | 46,947 | |||||||||
| Income Tax Expense | 17,438 | 16,240 | 16,863 | |||||||||
| Net Earnings | $ | 32,587 | $ | 29,862 | $ | 30,084 | ||||||
| Net Earnings Per Share—Basic | $ | 1.88 | $ | 1.72 | $ | 1.74 | ||||||
| Net Earnings Per Share—Diluted | $ | 1.85 | $ | 1.69 | $ | 1.70 | ||||||
See notes to consolidated financial statements.
F-3
Esterline Technologies Corporation
CONSOLIDATED BALANCE SHEET
in thousands, except share and per share amounts
| as of October 27, 2000 and October 31, 1999 |
2000 |
1999 |
||||||||
|---|---|---|---|---|---|---|---|---|---|---|
| Assets | ||||||||||
| Current Assets | ||||||||||
| Cash and cash equivalents | $ | 50,888 | $ | 55,047 | ||||||
| Short-term investments | — | 25,933 | ||||||||
| Accounts receivable, net of allowances of $2,423 and $2,233 | 83,336 | 69,613 | ||||||||
| Inventories | 73,984 | 71,430 | ||||||||
| Deferred income tax benefits | 16,053 | 16,212 | ||||||||
| Prepaid expenses | 4,282 | 4,251 | ||||||||
| Total Current Assets | 228,543 | 242,486 | ||||||||
| Property, Plant and Equipment | ||||||||||
| Land | 12,950 | 13,159 | ||||||||
| Buildings | 64,007 | 62,561 | ||||||||
| Machinery and equipment | 123,611 | 117,555 | ||||||||
| 200,568 | 193,275 | |||||||||
| Accumulated depreciation | 113,158 | 103,936 | ||||||||
| 87,410 | 89,339 | |||||||||
| Other Non-Current Assets | ||||||||||
| Goodwill, net | 137,952 | 105,383 | ||||||||
| Intangibles, net and other assets | 20,434 | 15,874 | ||||||||
| Total Assets | $ | 474,339 | $ | 453,082 | ||||||
Liabilities and Shareholders' Equity |
||||||||||
| Current Liabilities | ||||||||||
| Accounts payable | $ | 25,014 | $ | 16,918 | ||||||
| Accrued liabilities | 67,211 | 65,974 | ||||||||
| Credit facilities | 2,654 | 5,138 | ||||||||
| Current maturities of long-term debt | 6,525 | 7,249 | ||||||||
| Federal and foreign income taxes | 5,518 | 6,299 | ||||||||
| Total current liabilities | 106,922 | 101,578 | ||||||||
| Long-Term Liabilities | ||||||||||
| Long-term debt, net of current maturities | 108,172 | 116,966 | ||||||||
| Deferred income taxes | 9,550 | 9,918 | ||||||||
| Commitments and contingencies | — | — | ||||||||
| Shareholders' Equity | ||||||||||
| Common stock, par value $.20 per share, authorized 60,000,000 shares, issued and outstanding 17,424,853 and 17,342,374 shares | 3,485 | 3,468 | ||||||||
| Additional paid in capital | 46,952 | 46,824 | ||||||||
| Retained earnings | 211,540 | 178,953 | ||||||||
| Accumulated other comprehensive loss | (12,282 | ) | (4,625 | ) | ||||||
| Total Shareholders' Equity | 249,695 | 224,620 | ||||||||
| Total Liabilities and Shareholders' Equity | $ | 474,339 | $ | 453,082 | ||||||
See notes to consolidated financial statements.
F-4
Esterline Technologies Corporation
CONSOLIDATED STATEMENT OF CASH FLOWS
in thousands
| for each of the three fiscal years in the period ended October 27, 2000 |
2000 |
1999 |
1998 |
|||||||||
|---|---|---|---|---|---|---|---|---|---|---|---|---|
| Cash Flows Provided (Used) by Operating Activities | ||||||||||||
| Net earnings | $ | 32,587 | $ | 29,862 | $ | 30,084 | ||||||
| Gain on sale of business | (2,591 | ) | (7,956 | ) | — | |||||||
| Depreciation and amortization | 21,709 | 20,796 | 18,316 | |||||||||
| Deferred income taxes | 112 | 497 | (447 | ) | ||||||||
| Working capital changes, net of effect of acquisitions | ||||||||||||
| Accounts receivable | (12,377 | ) | 4,778 | (2,344 | ) | |||||||
| Inventories | (1,394 | ) | (2,640 | ) | (4,920 | ) | ||||||
| Prepaid expenses | (472 | ) | 98 | (222 | ) | |||||||
| Accounts payable | 6,773 | (7,805 | ) | 167 | ||||||||
| Accrued liabilities | 275 | (5,795 | ) | (1,557 | ) | |||||||
| Federal and foreign income taxes | (701 | ) | 5,643 | (1,542 | ) | |||||||
| Other, net | (3,114 | ) | 1,684 | (2,420 | ) | |||||||
| 40,807 | 39,162 | 35,115 | ||||||||||
| Cash Flows Provided (Used) by Investing Activities | ||||||||||||
| Purchases of capital assets | (15,489 | ) | (15,641 | ) | (29,773 | ) | ||||||
| Capital dispositions | 1,618 | 28,995 | 9,421 | |||||||||
| Sales (Purchases) of short-term investments | 25,933 | (25,933 | ) | — | ||||||||
| Acquisitions of businesses, net of cash acquired | (45,998 | ) | (20,860 | ) | (113,304 | ) | ||||||
| (33,936 | ) | (33,439 | ) | (133,656 | ) | |||||||
| Cash Flows Provided (Used) by Financing Activities | ||||||||||||
| Net change in credit facilities | (1,922 | ) | (3,649 | ) | 6,579 | |||||||
| Repayment of long-term obligations | (8,655 | ) | (6,287 | ) | (5,079 | ) | ||||||
| Proceeds from sale of senior notes | — | 100,000 | — | |||||||||
| Proceeds (Repayment) of bridge facility | — | (50,000 | ) | 50,000 | ||||||||
| (10,577 | ) | 40,064 | 51,500 | |||||||||
Effect of foreign exchange rates on cash |
(453 |
) |
363 |
(107 |
) |
|||||||
| Net increase (decrease) in cash and cash equivalents | (4,159 | ) | 46,150 | (47,148 | ) | |||||||
| Cash and cash equivalents—beginning of year | 55,047 | 8,897 | 56,045 | |||||||||
| Cash and cash equivalents—end of year | $ | 50,888 | $ | 55,047 | $ | 8,897 | ||||||
| Supplemental Cash Flow Information | ||||||||||||
| Cash paid during the fiscal year for | ||||||||||||
| Interest | $ | 8,366 | $ | 6,805 | $ | 3,244 | ||||||
| Income taxes | 17,521 | 8,779 | 17,517 | |||||||||
See notes to consolidated financial statements.
F-5
Esterline Technologies Corporation
CONSOLIDATED STATEMENT OF SHAREHOLDERS' EQUITY AND COMPREHENSIVE INCOME
in thousands, except per share amounts
| for each of the three fiscal years in the period ended October 27, 2000 |
2000 |
1999 |
1998 |
|||||||||
|---|---|---|---|---|---|---|---|---|---|---|---|---|
| Common Stock, Par Value $.20 Per Share | ||||||||||||
| Beginning of year | $ | 3,468 | $ | 3,463 | $ | 3,457 | ||||||
| Shares issued under stock option plans | 17 | 5 | 6 | |||||||||
| End of year | 3,485 | 3,468 | 3,463 | |||||||||
| Additional Paid-in Capital | ||||||||||||
| Beginning of year | 46,824 | 46,793 | 46,831 | |||||||||
| Shares issued under stock option plans | 128 | 31 | (38 | ) | ||||||||
| End of year | 46,952 | 46,824 | 46,793 | |||||||||
| Retained Earnings | ||||||||||||
| Beginning of year | 178,953 | 149,091 | 119,007 | |||||||||
| Net earnings | 32,587 | 29,862 | 30,084 | |||||||||
| End of year | 211,540 | 178,953 | 149,091 | |||||||||
| Accumulated Other Comprehensive Loss | ||||||||||||
| Beginning of year | (4,625 | ) | (2,971 | ) | (3,577 | ) | ||||||
| Foreign currency translation adjustment | (7,657 | ) | (1,654 | ) | 606 | |||||||
| End of year | (12,282 | ) | (4,625 | ) | (2,971 | ) | ||||||
| Total shareholders' equity | $ | 249,695 | $ | 224,620 | $ | 196,376 | ||||||
Comprehensive Income |
||||||||||||
| Net earnings | $ | 32,587 | $ | 29,862 | $ | 30,084 | ||||||
| Foreign currency translation adjustment | (7,657 | ) | (1,654 | ) | 606 | |||||||
| Comprehensive Income | $ | 24,930 | $ | 28,208 | $ | 30,690 | ||||||
See notes to consolidated financial statements.
F-6
Esterline Technologies Corporation
NOTES TO CONSOLIDATED FINANCIAL STATEMENTS
(1) Accounting Policies
Nature of Operations
Esterline Technologies (the "Company") designs, manufactures and markets highly engineered products. The Company principally serves the aerospace and defense industry and electronic equipment manufacturers throughout the world, primarily in the United States and Europe.
Principles of Consolidation and Basis of Presentation
The consolidated financial statements include the accounts of the Company and all subsidiaries. All significant intercompany accounts and transactions have been eliminated. Classifications have been changed for certain amounts in prior periods to conform with the current year's presentation.
The Company closes its books for reporting purposes on the last Friday of October and has changed its fiscal year in 2000 to coincide with that date.
Management Estimates
To prepare financial statements in conformity with generally accepted accounting principles, management is required to make estimates and assumptions that affect the reported amounts of assets and liabilities, disclosure of contingent assets and liabilities at the date of the financial statements, and the reported amounts of revenues and expenses during the reporting period. Actual results could differ from those estimates.
Foreign Currency Translation
Foreign currency assets and liabilities are translated into their U.S. dollar equivalents based on year-end exchange rates. Revenue and expense accounts are generally translated at average exchange rates. Aggregate exchange gains and losses arising from the translation of foreign assets and liabilities are included in shareholders' equity as a component of comprehensive loss. Foreign currency transaction gains and losses are included in income and have not been significant in amount.
Cash Equivalents
Cash equivalents consist of highly liquid investments with maturities of three months or less at the date of purchase. Fair value of cash equivalents approximates carrying value.
Short-Term Investments
Short-term investments, consisting principally of local government obligations, are classified as available-for-sale. These investments are carried at amortized cost which approximates the fair market value.
Inventories
Inventories are stated at the lower of cost or market. One subsidiary determines the cost of its inventories under the last-in, first-out (LIFO) method while the remainder use the first-in, first-out (FIFO) method. Inventory cost includes material, labor and factory overhead.
Property, Plant and Equipment, and Depreciation
Property, plant and equipment is carried at cost and includes expenditures for major improvements. Depreciation is generally provided on the straight-line method based upon estimated useful lives ranging from 3 to 30 years. Depreciation expense was $15,763,000, $16,297,000, and $15,126,000 for fiscal 2000, 1999, and 1998, respectively.
F-7
Asset Valuation
The carrying amount of long-lived assets, including goodwill attributable to those assets, is reviewed periodically for impairment. An asset is considered impaired when estimated future cash flows are less than the carrying amount of the asset. In the event the carrying amount of such asset is not deemed recoverable, the asset is adjusted to its estimated fair value. Fair value is generally determined based upon discounted future cash flow.
Goodwill and Intangibles
Intangible assets and the excess purchase price paid over the fair value of net assets of businesses acquired are amortized on a straight-line basis over the period of expected benefit which ranges from 5 to 40 years. Accumulated amortization of goodwill and intangibles was $38,173,000 and $33,355,000, respectively, at the end of fiscal years 2000 and 1999.
Environmental
Environmental exposures are provided for at the time they are known to exist or are considered reasonably probable and estimable. No provision has been recorded for environmental remediation costs which could result from changes in laws or other circumstances currently not contemplated by the Company. Costs provided for future expenditures on environmental remediation are not discounted to present value.
Revenue Recognition
Sales are generally recorded at the time of shipment of products or performance of services and are presented net of sales returns and allowances.
Earnings Per Share
Basic earnings per share is computed on the basis of the weighted average number of common shares outstanding during the year. Diluted earnings per share also includes the dilutive effect of stock options. The weighted average number of shares outstanding used to compute basic earnings per share were 17,375,000, 17,337,000, and 17,290,000 for the fiscal years ending 2000, 1999, and 1998, respectively. The weighted average number of shares outstanding used to compute diluted earnings per share were 17,654,000, 17,658,000, and 17,718,000 for the fiscal years ending 2000, 1999, and 1998, respectively.
Recent Accounting Pronouncements
In June 1998, the Financial Accounting Standards Board ("FASB") issued Statement of Financial Accounting Standards ("FAS") No. 133, "Accounting for Derivative Instruments and Hedging Activities." FAS No. 133 establishes standards for derivative instruments and requires an entity to recognize all derivatives as either assets or liabilities and measure those instruments at fair value. In June 1999, the FASB issued FAS No. 137 which deferred the effective date of FAS No. 133. This standard will be effective for the Company beginning in fiscal 2001. The Company utilizes foreign currency forward contracts primarily to reduce its exposure to fluctuations between the U.S. dollar and the French Franc. At the end of fiscal 2000, the Company held foreign currency forward contracts totaling a notional amount of $8.5 million. If FAS No. 133 was in effect at the end of fiscal 2000, this would have resulted in a gain of approximately $600,000. The Company anticipates that future similar foreign currency transactions will qualify for hedge accounting treatment under FAS No. 133.
In December 1999, the Securities and Exchange Commission ("SEC") issued Staff Accounting Bulletin ("SAB") No. 101, "Revenue Recognition in Financial Statements." In SAB No. 101, the SEC staff
F-8
expressed its views regarding the appropriate recognition of revenue with regard to a variety of circumstances. The Company will be required to adopt SAB No. 101 for the fourth quarter of fiscal 2001. The Company is currently evaluating SAB No. 101, however, the Company believes that it will not have a material impact on the consolidated financial statements.
In March 2000, the FASB issued Interpretation No. 44, "Accounting for Certain Transactions Involving Stock Compensation," an interpretation of Accounting Principles Board ("APB") Opinion No. 25, "Stock Issued to Employees." The Interpretation was adopted by the Company effective July 1, 2000 and did not have a material impact on the consolidated financial statements.
(2) Inventory
Inventories at the end of the fiscal year consisted of the following:
| in thousands |
2000 |
1999 |
|||
|---|---|---|---|---|---|
| Raw materials and purchased parts | $ | 31,693 | $ | 30,014 | |
| Work in process | 27,264 | 27,803 | |||
| Finished goods | 15,027 | 13,613 | |||
| $ | 73,984 | $ | 71,430 | ||
Inventories stated under the last-in, first-out method totaled $6,666,000 and $6,118,000 at the end of fiscal 2000 and 1999, respectively. Had the first-in, first-out method been used, these inventories would have been $421,000 and $524,000 higher than reported at the end of fiscal 2000 and 1999, respectively.
(3) Accrued Liabilities
Accrued liabilities at the end of the fiscal year consisted of the following:
| in thousands |
2000 |
1999 |
|||
|---|---|---|---|---|---|
| Payroll and other compensation | $ | 24,614 | $ | 21,135 | |
| Casualty and medical | 6,988 | 5,642 | |||
| Interest | 3,204 | 3,446 | |||
| Warranties | 7,946 | 7,440 | |||
| State and other tax accruals | 9,785 | 9,396 | |||
| Other | 14,674 | 18,915 | |||
| $ | 67,211 | $ | 65,974 | ||
F-9
(4) Retirement Benefits
Pension benefits are provided for substantially all U.S. employees under a noncontributory pension plan and are based on years of service and five-year average compensation. The Company makes actuarially computed contributions as necessary to adequately fund benefits. The actuarial computations assumed discount rates for benefit obligations on plan assets of 7.5%, 7.25%, and 6.5% for fiscal 2000, 1999, and 1998, respectively, and annual compensation increases of 5%. The expected long-term rate of return on plan assets was assumed at 8.5% for fiscal 2000, 1999, and 1998. Plan assets primarily consist of publicly traded common stocks, bonds and government securities. The Company also has an unfunded supplemental retirement plan for key executives providing for periodic payments upon retirement.
Total pension expense (benefit) for all benefit plans, including defined benefit plans, was ($3,334,000), $902,000, and ($971,000) for the fiscal years ending 2000, 1999, and 1998, respectively. The Company recorded a curtailment gain resulting from the October 1999 sale of Federal Products Co. This amount is reported as a gain on sale of business in fiscal 2000. Net periodic pension benefit for the Company's defined benefit plans at the end of the fiscal year consisted of the following:
| in thousands |
2000 |
1999 |
1998 |
|||||||||
|---|---|---|---|---|---|---|---|---|---|---|---|---|
| Components of Net Periodic Benefit Cost | ||||||||||||
| Service cost | $ | 2,268 | $ | 3,351 | $ | 2,639 | ||||||
| Interest cost | 6,463 | 5,726 | 5,645 | |||||||||
| Expected return on plan assets | (10,069 | ) | (9,122 | ) | (8,895 | ) | ||||||
| Amortization of transition asset | (401 | ) | (400 | ) | (405 | ) | ||||||
| Amortization of prior service cost | 92 | 105 | 105 | |||||||||
| Amortization of actuarial loss (gain) | (116 | ) | 4 | (1,157 | ) | |||||||
| Recognition of gain due to curtailment | (2,591 | ) | — | — | ||||||||
| Net periodic benefit | $ | (4,354 | ) | $ | (336 | ) | $ | (2,068 | ) | |||
F-10
The funded status of the defined benefit pension plan at the end of each fiscal year was as follows:
| in thousands |
2000 |
1999 |
||||
|---|---|---|---|---|---|---|
| Benefit Obligation | ||||||
| Beginning balance | $ 84,161 | $ 92,509 | ||||
| Service cost | 2,268 | 3,351 | ||||
| Interest cost | 6,463 | 5,726 | ||||
| Curtailment gain | (2,692 | ) | — | |||
| Actuarial loss (gain) | 7,713 | (8,717 | ) | |||
| Benefits paid | (5,552 | ) | (8,708 | ) | ||
| Ending balance | $ 92,361 | $ 84,161 | ||||
| Plan Assets—Fair Value | ||||||
| Beginning balance | $121,012 | $109,663 | ||||
| Actual return on plan assets | 10,704 | 16,299 | ||||
| Company contributions | 981 | 3,758 | ||||
| Benefits paid | (5,552 | ) | (8,708 | ) | ||
| Ending balance | $127,145 | $121,012 | ||||
| Reconciliation of Funded Status to Net Amount Recognized | ||||||
| Funded status—plan assets in excess of benefit obligation | $ 34,784 | $ 36,851 | ||||
| Unrecognized net actuarial gain | (16,635 | ) | (23,830 | ) | ||
| Unrecognized prior service costs | 680 | 874 | ||||
| Unrecognized net transition obligations (assets) | 239 | (162 | ) | |||
| Net amount recognized | $ 19,068 | $ 13,733 | ||||
| Amount Recognized in the Consolidated Balance Sheet | ||||||
| Prepaid benefit cost | 19,231 | 14,279 | ||||
| Accrued benefit liability | (163 | ) | (546 | ) | ||
| Net amount recognized | $ 19,068 | $ 13,733 | ||||
(5) Income Taxes
Income tax expense for each of the fiscal years consisted of:
| in thousands |
2000 |
1999 |
1998 |
|||||||
|---|---|---|---|---|---|---|---|---|---|---|
| Current | ||||||||||
| U.S. federal | $ | 14,011 | $ | 13,530 | $ | 14,799 | ||||
| State | 650 | 160 | 1,295 | |||||||
| Foreign | 2,665 | 2,053 | 1,216 | |||||||
| 17,326 | 15,743 | 17,310 | ||||||||
Deferred |
||||||||||
| U.S. federal | (564 | ) | 684 | (429 | ) | |||||
| State | (48 | ) | 20 | (18 | ) | |||||
| Foreign | 724 | (207 | ) | — | ||||||
| 112 | 497 | (447 | ) | |||||||
| Income tax expense | $ | 17,438 | $ | 16,240 | $ | 16,863 | ||||
F-11
U.S. and foreign components of earnings before income taxes for each of the fiscal years were:
| in thousands |
2000 |
1999 |
1998 |
|||||
|---|---|---|---|---|---|---|---|---|
| U.S. | $ | 42,794 | $ | 42,518 | $ | 45,608 | ||
| Foreign | 7,231 | 3,584 | 1,339 | |||||
| Earnings before income taxes | $ | 50,025 | $ | 46,102 | $ | 46,947 | ||
Primary components of the Company's deferred tax assets (liabilities) at the end of the fiscal year resulted from temporary tax differences associated with the following:
| in thousands |
2000 |
1999 |
|||
|---|---|---|---|---|---|
| Reserves and liabilities | $ 17,054 | $ 17,339 | |||
| Employee benefits | 5,494 | 4,425 | |||
| Total deferred tax assets | 22,548 | 21,764 | |||
Depreciation and amortization |
(8,378 |
) |
(9,720 |
) |
|
| Retirement benefits | (6,960 | ) | (5,013 | ) | |
| Other | (706 | ) | (737 | ) | |
| Total deferred tax liabilities | (16,044 | ) | (15,470 | ) | |
| $ 6,504 | $ 6,294 | ||||
No valuation allowance was considered necessary on deferred tax assets.
A reconciliation of the U.S. federal statutory income tax rate to the effective income tax rate for each of the fiscal years was as follows:
| |
2000 |
1999 |
1998 |
||||
|---|---|---|---|---|---|---|---|
| U.S. statutory income tax rate | 35.0 | % | 35.0 | % | 35.0 | % | |
| State income taxes | 0.8 | 0.2 | 1.8 | ||||
| Foreign taxes | 1.2 | 1.2 | 1.3 | ||||
| Foreign sales corporation | (1.0 | ) | (1.1 | ) | (1.5 | ) | |
| Tax exempt interest | (0.6 | ) | (0.8 | ) | (0.3 | ) | |
| Non-deductible goodwill | 2.5 | 1.7 | 0.9 | ||||
| Research & development credits | (3.9 | ) | — | — | |||
| Other, net | 0.9 | (1.0 | ) | (1.3 | ) | ||
| Effective income tax rate | 34.9 | % | 35.2 | % | 35.9 | % | |
No provision for federal income taxes has been made on accumulated earnings of foreign subsidiaries, since such earnings were considered permanently reinvested or would be substantially offset by foreign tax credits, if repatriated.
F-12
(6) Debt
Long-term debt at the end of the fiscal year consisted of the following:
| in thousands |
2000 |
1999 |
|
|---|---|---|---|
| 6.77% Senior notes, due 2008 | $ 40,000 | $ 40,000 | |
| 6.40% Senior notes, due 2005 | 30,000 | 30,000 | |
| 6.00% Senior notes, due 2003 | 30,000 | 30,000 | |
| 8.75% Senior notes, due 2002 | 11,428 | 17,143 | |
| Other | 3,269 | 7,072 | |
| 114,697 | 124,215 | ||
| Less current maturities | 6,525 | 7,249 | |
| $108,172 | $116,966 | ||
The 1999 Senior Notes are payable in full in 2003, 2005 and 2008 and require semi-annual interest payments in November and May of each year. The 8.75% Senior Notes are due in 2002, are payable in equal annual installments and interest is payable semi-annually in January and July. All Senior Notes are unsecured.
Maturities of long-term debt at the end of the fiscal year were as follows:
| |
|
|
|---|---|---|
| in thousands |
||
| 2001 | $ | 6,525 |
| 2002 | 6,236 | |
| 2003 | 30,302 | |
| 2004 | 285 | |
| 2005 | 30,274 | |
| 2006 and thereafter | 41,075 | |
| $114,697 | ||
Short-term credit facilities at the end of the fiscal year consisted of the following:
| in thousands |
2000 |
|
1999 |
|
|||||
|---|---|---|---|---|---|---|---|---|---|
| |
Outstanding Borrowings |
Interest Rate |
Outstanding Borrowings |
Interest Rate |
|||||
U.S. dollar |
$ — |
— |
$ — |
— |
|||||
| Foreign | 2,654 | 5.70 | % | 5,138 | 5.60 | % | |||
| $2,654 | $5,138 | ||||||||
During the fourth quarter of fiscal 2000, the Company's primary U.S. dollar credit facility was renewed and increased from $35,000,000 to $50,000,000. This credit facility is offered through a group of banks, is unsecured with interest based on standard inter-bank offering rates and will be up for renewal during fiscal 2005. An additional $8,600,000 of unsecured foreign currency credit facilities has been extended by foreign banks for a total of $58,600,000 available companywide.
F-13
A number of underlying agreements contain various covenant restrictions which include maintenance of net worth, payment of dividends, interest coverage and limitations on additional borrowings. The Company was in compliance with these covenants at the end of the fiscal year. Available credit under the above credit facilities was $53,577,000 at fiscal 2000 year-end, when reduced by outstanding borrowings of $2,654,000 and letters of credit of $2,369,000.
The fair market value of the Company's long-term debt and short-term borrowings was estimated at $110,000,000 and $121,000,000 at fiscal year-end 2000 and 1999, respectively. These estimates were derived using discounted cash flow with interest rates currently available to the Company for issuance of debt with similar terms and remaining maturities.
(7) Commitments and Contingencies
Rental expense for operating leases totaled $5,871,000, $4,647,000, and $4,628,000 in fiscal 2000, 1999, and 1998, respectively.
At the end of the fiscal year, the Company's rental commitments for noncancelable operating leases with a duration in excess of one year were as follows:
| in thousands |
|
||
|---|---|---|---|
| 2001 | $ | 5,696 | |
| 2002 | 5,414 | ||
| 2003 | 5,337 | ||
| 2004 | 4,535 | ||
| 2005 | 3,873 | ||
| 2006 and thereafter | 14,486 | ||
| $ | 39,341 | ||
The Company is a party to various lawsuits and claims, both as plaintiff and defendant, and has contingent liabilities arising from the conduct of business, none of which, in the opinion of management, is expected to have a material effect on the Company's financial position or results of operations. The Company believes that it has made appropriate and adequate provisions for contingent liabilities.
(8) Stock Option Plans
The Company provides a nonqualified stock option plan for officers and key employees. At the end of fiscal 2000, the Company had 1,574,750 shares reserved for issuance to officers and key employees, of which 93,500 shares were available to be granted in the future. The Board of Directors has approved a proposal to solicit shareholder approval to amend the Stock Option Plan at the March 7, 2001 shareholders' meeting. The proposed amendment will authorize an additional 500,000 shares to be available for grant.
The Board of Directors authorized the Compensation and Stock Option Committee to administer option grants and their terms. Awards under the plan may be granted to eligible employees of the Company over the 10-year period ending March 4, 2007. Options granted become exercisable over a period of four years following the date of grant and expire on the tenth anniversary of the grant. Option exercise prices are equal to the fair market value of the Company's common stock on the date of grant.
F-14
The following table summarizes the changes in outstanding options granted under the Company's stock option plans:
| |
2000 |
|
1999 |
|
1998 |
|
|||||||||
|---|---|---|---|---|---|---|---|---|---|---|---|---|---|---|---|
| |
Shares Subject to Option |
Weighted Average Exercise Price |
Shares Subject to Option |
Weighted Average Exercise Price |
Shares Subject to Option |
Weighted Average Exercise Price |
|||||||||
| Outstanding, beginning of year | 1,355,250 | $ | 11.046 | 1,313,250 | $ | 10.125 | 1,190,000 | $ | 8.472 | ||||||
| Granted | 316,500 | 13.216 | 202,000 | 18.973 | 187,000 | 18.644 | |||||||||
| Exercised | (185,500 | ) | 6.286 | (47,500 | ) | 5.016 | (63,750 | ) | 4.261 | ||||||
| Cancelled | (5,000 | ) | 19.625 | (112,500 | ) | 17.070 | — | — | |||||||
| Outstanding, end of year | 1,481,250 | $ | 12.077 | 1,355,250 | $ | 11.046 | 1,313,250 | $ | 10.125 | ||||||
| Exercisable, end of year | 921,500 | $ | 10.199 | 925,500 | $ | 8.413 | 741,500 | $ | 6.893 | ||||||
The Company accounts for its stock-based compensation plans in accordance with Accounting Principles Board Opinion No. 25. Additional disclosures as required under FAS No. 123, "Accounting for Stock-Based Compensation," are included below. The Black-Scholes option-pricing model was used to calculate the estimated compensation expense that would have been recognized under these guidelines.
If only options granted after fiscal 1995 were included, as prescribed by FAS No. 123, pro forma net income would have been $31,573,000, $28,920,000, and $28,971,000 for fiscal 2000, 1999, and 1998, respectively. Basic earnings per share for fiscal 2000, 1999, and 1998 would have been $1.82, $1.67, and $1.68, respectively. Diluted earnings per share for fiscal 2000, 1999, and 1998 would have been $1.79, $1.64, and $1.64, respectively.
The pro forma disclosures presented below include the fair value compensation expense for all options that would have been amortized during fiscal 2000, 1999, and 1998:
| in thousands, except per share amounts |
2000 |
1999 |
1998 |
||||||
|---|---|---|---|---|---|---|---|---|---|
| Net earnings as reported | $ | 32,587 | $ | 29,862 | $ | 30,084 | |||
| Pro forma net earnings | $ | 31,573 | $ | 28,915 | $ | 28,928 | |||
Basic earnings per share as reported |
$ |
1.88 |
$ |
1.72 |
$ |
1.74 |
|||
| Pro forma basic earnings per share | $ | 1.82 | $ | 1.67 | $ | 1.67 | |||
Diluted earnings per share as reported |
$ |
1.85 |
$ |
1.69 |
$ |
1.70 |
|||
| Pro forma diluted earnings per share | $ | 1.79 | $ | 1.63 | $ | 1.63 | |||
The weighted average Black-Scholes value of options granted during fiscal 2000, 1999, and 1998 was $8.516, $12.109, and $10.870, respectively. The assumptions used in the Black-Scholes option-pricing model for fiscal 2000, 1999, and 1998 were as follows:
| |
2000 |
1999 |
1998 |
||||
|---|---|---|---|---|---|---|---|
| Volatility | 62.3 | % | 60.5 | % | 55.3 | % | |
| Risk-free interest rate | 5.75 - 5.83 | % | 5.99 - 6.23 | % | 4.10 - 4.57 | % | |
| Expected life (years) | 5 - 8 | 5 - 8 | 5 - 8 | ||||
| Dividends | — | — | — | ||||
F-15
The following table summarizes information for stock options outstanding at the end of the fiscal year:
| Range of Exercise Prices |
Shares |
Average Remaining Life (years) |
Weighted Average Price |
Shares |
Weighted Average Price |
|||||||
|---|---|---|---|---|---|---|---|---|---|---|---|---|
| $ 3.6875 - 4.1875 | 218,000 | 2.89 | $ | 4.0453 | 218,000 | $ | 4.0453 | |||||
| 4.3750 - 11.1250 | 293,000 | 4.37 | 8.1113 | 283,000 | 8.0446 | |||||||
| 11.3750 - 11.6875 | 285,750 | 7.49 | 11.5021 | 116,250 | 11.6875 | |||||||
| 13.2500 - 14.7500 | 330,250 | 7.51 | 13.7920 | 159,000 | 13.3502 | |||||||
| 16.7500 - 20.6875 | 354,250 | 7.79 | 19.1647 | 145,250 | 18.9883 | |||||||
(9) Capital Stock
The authorized capital stock of the Company consists of 500,000 shares of preferred stock, including 25,000 shares ($100 par value) and 475,000 shares ($1.00 par value) issuable in series, and 60,000,000 shares of common stock ($.20 par value). At the end of fiscal 2000, there were no shares of preferred stock outstanding.
The Company has a Shareholder Rights Plan providing for the distribution of one Preferred Stock Purchase Right ("Right") for each share of common stock held. Each Right entitles the holder to purchase one one-hundredth of a share of Series A Serial Preferred Stock at an exercise price of $56. The Rights expire December 23, 2002.
The Rights will be exercisable and transferable apart from the common stock only if a person or group acquires beneficial ownership of 10% or more of the Company's common stock or commences a tender offer or exchange offer which would result in a person or group beneficially owning 10% or more of the Company's common stock. The Rights will be redeemable by the Company for $.01 each at any time prior to the tenth day after an announcement that a person or group beneficially owns 10% or more of the common stock. Upon the occurrence of certain events, the holder of a Right can purchase, for the then current exercise price of the Right, shares of common stock of the Company (or under certain circumstances, as determined by the Board of Directors, cash, other securities or property) having a value of twice the Right's exercise price. Upon the occurrence of certain other events, the holder of each Right would be entitled to purchase, at the exercise price of the Right, shares of common stock of a corporation or other entity acquiring the Company or engaging in certain transactions involving the Company, that has a market value of twice the Right's exercise price.
F-16
(10) Acquisitions
In December 1999, the Company purchased Advanced Input Devices Co. ("A.I.D."). A.I.D. is a strategic purchase for the Company's growth platform around high-end illuminated displays and custom panels. The total purchase price, including closing and other direct costs of the acquisition, was approximately $43,100,000. The acquisition resulted in an excess of cost over identifiable tangible assets of approximately $37,100,000. This goodwill is being amortized over a 30-year period.
The Company also purchased Surftech Finishes Co., a small metal-finishing operation, in April 2000. This acquisition resulted in an excess of cost over identifiable tangible assets of approximately $2,100,000.
Both transactions were accounted for under the purchase method of accounting and funded with available cash. The results of operations were included from the effective date of each acquisition.
(11) Business Segment Information
The Company's businesses are organized and managed in three operating segments: Aerospace, Advanced Materials and Automation. Aerospace operations produce high-precision components for avionics, propulsion and guidance systems. Advanced Materials operations formulate specialized materials such as high-temperature elastomers, molded-fiber compounds and certain finishings and coatings. Both segments principally serve aerospace and defense markets. Automation operations manufacture products that enhance the fabrication efficiency of manufactured goods. Sales in all segments are worldwide, and include military, defense and commercial customers.
Geographic sales information is based on product origin. The Company evaluates these segments based on segment profits prior to net interest, other income/expense, corporate expenses and federal/foreign income taxes.
F-17
Details of the Company's operations by business segment for the last three fiscal years were as follows:
| in thousands |
2000 |
1999 |
1998 |
|||||||||
|---|---|---|---|---|---|---|---|---|---|---|---|---|
| Sales | ||||||||||||
| Aerospace | $ | 236,269 | $ | 183,783 | $ | 171,028 | ||||||
| Advanced materials | 129,386 | 127,920 | 91,498 | |||||||||
| Automation | 125,311 | 149,266 | 191,376 | |||||||||
| $ | 490,966 | $ | 460,969 | $ | 453,902 | |||||||
| Earnings Before Income Taxes | ||||||||||||
| Aerospace | $ | 32,661 | $ | 24,822 | $ | 24,766 | ||||||
| Advanced materials | 24,819 | 29,186 | 24,683 | |||||||||
| Automation | 7,894 | 2,924 | 10,694 | |||||||||
| Segment earnings | 65,374 | 56,932 | 60,143 | |||||||||
Corporate expense |
(12,021 |
) |
(12,634 |
) |
(10,987 |
) |
||||||
| Gain on sale of business | 2,591 | 7,956 | — | |||||||||
| Interest of income | 2,205 | 2,859 | 1,594 | |||||||||
| Interest expense | (8,124 | ) | (9,011 | ) | (3,803 | ) | ||||||
| $ | 50,025 | $ | 46,102 | $ | 46,947 | |||||||
| Identifiable Assets | ||||||||||||
| Aerospace | $ | 192,496 | $ | 144,836 | $ | 123,346 | ||||||
| Advanced materials | 140,028 | 135,907 | 142,902 | |||||||||
| Automation | 62,611 | 62,868 | 87,227 | |||||||||
| Corporate(1) | 79,204 | 109,471 | 33,704 | |||||||||
| $ | 474,339 | $ | 453,082 | $ | 387,179 | |||||||
| Capital Expenditures | ||||||||||||
| Aerospace | $ | 8,368 | $ | 6,029 | $ | 9,103 | ||||||
| Advanced materials | 3,822 | 3,866 | 11,997 | |||||||||
| Automation | 2,758 | 5,518 | 7,748 | |||||||||
| Corporate | 541 | 228 | 925 | |||||||||
| $ | 15,489 | $ | 15,641 | $ | 29,773 | |||||||
| Depreciation and Amortization | ||||||||||||
| Aerospace | $ | 10,305 | $ | 6,961 | $ | 6,065 | ||||||
| Advanced materials | 6,938 | 6,814 | 4,579 | |||||||||
| Automation | 3,686 | 6,270 | 7,084 | |||||||||
| Corporate | 780 | 751 | 588 | |||||||||
| $ | 21,709 | $ | 20,796 | $ | 18,316 | |||||||
F-18
The Company's operations by geographic area for the last three fiscal years were as follows:
| in thousands |
2000 |
1999 |
1998 |
|||||||||
|---|---|---|---|---|---|---|---|---|---|---|---|---|
| Sales | ||||||||||||
| Domestic: | ||||||||||||
| Unaffiliated customers—U.S. | $ | 334,768 | $ | 323,702 | $ | 333,678 | ||||||
| Unaffiliated customers—export | 66,205 | 57,776 | 58,926 | |||||||||
| Intercompany | 5,591 | 8,670 | 11,042 | |||||||||
| 406,564 | 390,148 | 403,646 | ||||||||||
| France: | ||||||||||||
| Unaffiliated customers | 44,368 | 58,871 | 47,056 | |||||||||
| Intercompany | 6,494 | 10,694 | 9,552 | |||||||||
| 50,862 | 69,565 | 56,608 | ||||||||||
| All other foreign: | ||||||||||||
| Unaffiliated customers | 45,625 | 20,620 | 14,242 | |||||||||
| Intercompany | 194 | 843 | 1,761 | |||||||||
| 45,819 | 21,463 | 16,003 | ||||||||||
Eliminations |
(12,279 |
) |
(20,207 |
) |
(22,355 |
) |
||||||
| $ | 490,966 | $ | 460,969 | $ | 453,902 | |||||||
| Segment Earnings(1) | ||||||||||||
| Domestic | $ | 57,119 | $ | 52,585 | $ | 58,579 | ||||||
| France | 6,701 | 5,233 | 2,485 | |||||||||
| All other foreign | 1,263 | (625 | ) | (1,025 | ) | |||||||
| Eliminations | 291 | (261 | ) | 104 | ||||||||
| $ | 65,374 | $ | 56,932 | $ | 60,143 | |||||||
| Identifiable Assets(2) | ||||||||||||
| Domestic | $ | 328,006 | $ | 269,860 | $ | 302,977 | ||||||
| France | 32,165 | 35,758 | 39,343 | |||||||||
| All other foreign | 34,964 | 37,993 | 11,155 | |||||||||
| $ | 395,135 | $ | 343,611 | $ | 353,475 | |||||||
The Company's principal foreign operations consist of manufacturing facilities located in France, the United Kingdom and Spain, and include sales and service operations located in Germany, Italy, Hong Kong and France. Intercompany sales are at prices comparable with sales to unaffiliated customers. Sales to any single customer or government entity did not exceed 10% of consolidated sales.
F-19
Product lines contributing sales of 10% or more of total sales in any of the last three fiscal years were as follows:
| |
2000 |
1999 |
1998 |
||||
|---|---|---|---|---|---|---|---|
| Elastomeric products | 13 | % | 14 | % | 5 | % | |
| Printed circuit board drilling equipment | 16 | % | 12 | % | 16 | % | |
| Aerospace switches and indicators | 9 | % | 10 | % | 13 | % | |
| Gauge products | — | 9 | % | 10 | % | ||
(12) Quarterly Financial Data (Unaudited)
The following is a summary of unaudited quarterly financial information:
| in thousands, except per share amounts |
Fourth |
Third |
Second |
First |
||||||||
|---|---|---|---|---|---|---|---|---|---|---|---|---|
| Fiscal year 2000 | ||||||||||||
| Sales | $ | 138,539 | $ | 126,033 | $ | 122,146 | $ | 104,248 | ||||
| Gross margin | 50,963 | 45,791 | 44,962 | 38,008 | ||||||||
| Net earnings | 11,130 | 9,694 | (1) | 6,937 | 4,826 | |||||||
| Net earnings per share—basic | $ | .64 | $ | .56 | $ | .40 | $ | .28 | ||||
| Net earnings per share—diluted | $ | .63 | $ | .55 | $ | .40 | $ | .27 | ||||
| Fiscal year 1999 | ||||||||||||
| Sales | $ | 123,402 | $ | 112,748 | $ | 116,121 | $ | 108,698 | ||||
| Gross margin | 46,053 | 43,425 | 44,957 | 40,124 | ||||||||
| Net earnings | 11,711 | (2) | 5,952 | 7,142 | 5,057 | |||||||
| Net earnings per share—basic | $ | .68 | $ | .34 | $ | .41 | $ | .29 | ||||
| Net earnings per share—diluted | $ | .66 | $ | .34 | $ | .40 | $ | .29 | ||||
F-20


Part II
INFORMATION NOT REQUIRED IN PROSPECTUS
Item 14. Other Expenses of Issuance and Distribution
The following table sets forth the costs and expenses, other than underwriting discounts and commissions, payable by the registrant in connection with the sale of common stock being registered. All amounts are estimates except the Securities and Exchange Commission registration fee and the New York Stock Exchange additional listing fee.
| Securities and Exchange Commission registration fee | $ | |||
| New York Stock Exchange additional listing fee | ||||
| Blue Sky fees and expenses | ||||
| Printing and engraving expenses | ||||
| Legal fees and expenses | ||||
| Accounting fees and expenses | ||||
| Transfer Agent and Registrar fees | ||||
| Miscellaneous fees and expenses | ||||
| Total | $ | |||
Item 15. Indemnification of Directors and Officers
Section 145(a) of the Delaware General Corporation Law provides that a Delaware corporation may indemnify any person who was or is a party or is threatened to be made a party to any threatened, pending or completed action, suit or proceeding, whether civil, criminal, administrative or investigative (other than an action by or in the right of the corporation) by reason of the fact that such person is or was a director, officer, employee or agent of the corporation or is or was serving at the request of the corporation as a director, officer, employee or agent of another corporation or enterprise, against expenses, judgments, fines and amounts paid in settlement actually and reasonably incurred by such person in connection with such action, suit or proceeding if such person acted in good faith and in a manner he or she reasonably believed to be in or not opposed to the best interests of the corporation, and, with respect to any criminal action or proceeding, had no cause to believe his or her conduct was unlawful.
Section 145(b) of the DGCL provides that a Delaware corporation may indemnify any person who was or is a party or is threatened to be made a party to any threatened, pending or completed action or suit by or in the right of the corporation to procure a judgment in its favor by reason of the fact that such person acted in any of the capacities set forth above, against expenses actually and reasonably incurred by such person in connection with the defense or settlement of such action or suit if such person acted under standards set forth above, except that no indemnification may be made in respect of any claim, issue or matter as to which such person shall have been adjudged to be liable to the corporation, unless and only to the extent that the Court of Chancery or the court in which such action or suit was brought shall determine, that despite the adjudication of liability, such person is fairly and reasonably entitled to be indemnified for such expenses which the Court of Chancery or such other court shall deem proper.
Section 145 of the DGCL further provides that, to the extent a director or officer of a Delaware corporation has been successful in the defense of any action, suit or proceeding referred to in subsections 145(a) and (b) or in the defense of any claim, issue or matter therein, such person shall be indemnified against expenses actually and reasonably incurred by such person in connection therewith;
II-1
that indemnification provided for by Section 145 shall not be deemed exclusive of any other rights to which the indemnified party may be entitled; and that the corporation may purchase and maintain insurance on behalf of a director or officer of the corporation against any liability asserted against such person or incurred by him or her in any such capacity or arising out of his or her status as such whether or not the corporation would have the power to indemnify such person against such liabilities under Section 145.
Section 102(b)(7) of the DGCL permits a corporation to provide in its certificate of incorporation that a director of the corporation shall not be personally liable to the corporation or its stockholders for monetary damages for breach of fiduciary duty as a director, except for liability for (i) any breach of the director's duty of loyalty to the corporation or its stockholders, (ii) acts or omissions not in good faith or that involve intentional misconduct or a knowing violation of law, (iii) payments of unlawful dividends or unlawful stock repurchases or redemptions, or (iv) any transaction from which the director derived an improper personal benefit.
Article Eighth, Section 1 of Esterline's Certificate of Incorporation provides that, to the fullest extent that the DGCL, as it now exists or may hereafter be amended, permits, the limitation or elimination of the liability of directors, a director of Esterline shall not be liable to Esterline or its stockholders for monetary damages for breach of fiduciary duty as a director. Any amendment to or repeal of such Article Eighth shall not adversely affect any right or protection of a director of Esterline for or with respect to any acts or omissions of such director occurring prior to such amendment or repeal.
Article Eighth, Section 2 of Esterline's Certificate of Incorporation requires indemnification of officers and directors to the fullest extent permitted under Delaware law. Subject to any restrictions imposed by Delaware law, the Certificate of Incorporation provides an unconditional right to indemnification for all expense, liability and loss (including attorneys' fees, judgments, fines, ERISA excise taxes or penalties and amounts paid in settlement) actually and reasonably incurred or suffered by any person entitled to indemnification in connection with any actual or threatened action, suit or proceeding, whether civil, criminal, administrative or investigative, by reason of the fact that such person is or was serving as a director or officer of Esterline or that, being or having been a director or officer or an employee of Esterline, such person is or was serving at the request of Esterline as a director, officer, employee or agent of another corporation, partnership, joint venture, trust or other enterprise, including an employee benefit plan. However, board approval is required with respect to indemnification for any proceeding initiated by a person entitled to indemnification. Section 2 of Article Eighth also provides that Esterline may, by action of its board of directors, provide indemnification to its employees and agents with the same scope and effect as the foregoing indemnification of directors and officers.
Esterline's officers and directors are covered by insurance (with certain exceptions and limitations) that indemnifies them against losses for which Esterline grants them indemnification and for which they become legally obligated to pay on account of claims made against them for wrongful acts committed before or during the policy period. Additionally, Esterline's outside directors are covered by a similar insurance policy.
II-2
Item 16. Exhibits and Financial Statement Schedules
| Exhibit Number |
Description |
|
|---|---|---|
| 1.1 | Form of Underwriting Agreement | |
| 5.1 | Opinion of Perkins Coie LLP | |
| 23.1 | Consent of Ernst & Young LLP, independent auditors | |
| 23.2 | Consent of Deloitte & Touche LLP, independent auditors | |
| 23.3 | Consent of Perkins Coie LLP (contained in Exhibit 5.1) | |
| 24.1 | Power of Attorney (contained on the signature page hereof) | |
Item 17. Undertakings
Insofar as indemnification for liabilities arising under the Securities Act of 1933 may be permitted to directors, officers and controlling persons of the registrant pursuant to the foregoing provisions, or otherwise, the registrant has been advised that, in the opinion of the Securities and Exchange Commission, such indemnification is against public policy as expressed in the Securities Act of 1933 and is, therefore, unenforceable. In the event that a claim for indemnification against such liabilities (other than the payment by the registrant of expenses incurred or paid by a director, officer or controlling person of the registrant in the successful defense of any action, suit or proceeding) is asserted by such director, officer or controlling person in connection with the securities being registered, the registrant will, unless in the opinion of its counsel the matter has been settled by controlling precedent, submit to a court of appropriate jurisdiction the question of whether such indemnification by it is against public policy as expressed in the Securities Act of 1933 and will be governed by the final adjudication of such issue.
The undersigned registrant hereby undertakes that:
II-3
Signatures
Pursuant to the requirements of the Securities Act of 1933, the registrant certifies that it has reasonable grounds to believe that it meets all the requirements for filing on Form S-3 and has duly caused this registration statement to be signed on its behalf by the undersigned, thereunder duly authorized, in the City of Bellevue, State of Washington, on the 19th day of January, 2001.
| ESTERLINE TECHNOLOGIES CORPORATION | |
By: |
/s/ ROBERT W. CREMIN Name: Robert W. Cremin Title: Chairman, President and Chief Executive Officer |
POWER OF ATTORNEY
Each person whose individual signature appears below hereby authorizes and appoints Robert W. Cremin and Robert D. George, and each of them, with full power of substitution and resubstitution and full power to act without the other, as his true and lawful attorney-in-fact and agent to act in his name, place and stead and to execute in the name and on behalf of each person, individually and in each capacity stated below, and to file any and all amendments to this registration statement, including any and all post-effective amendments and amendments thereto, and any registration statement relating to the same offering as this registration statement that is to be effective upon filing pursuant to Rule 462(b) under the Securities Act of 1933, as amended, and to file the same, with all exhibits thereto, and other documents in connection therewith, with the Securities and Exchange Commission, granting unto said attorneys-in-fact and agents, and each of them, full power and authority to do and perform each and every act and thing, ratifying and confirming all that said attorneys-in-fact and agents or any of them or their or his substitute or substitutes may lawfully do or cause to be done by virtue thereof.
Pursuant to the requirements of the Securities Act of 1933, as amended, this registration statement has been signed by the following persons in the capacities indicated below on the 19th day of January, 2001.
| Signature |
Title |
|
|---|---|---|
| /s/ ROBERT W. CREMIN Robert W. Cremin |
Chairman, President and Chief Executive Officer (Principal Executive Officer) | |
/s/ ROBERT D. GEORGE Robert D. George |
Vice President, Chief Financial Officer, Secretary and Treasurer (Principal Financial and Accounting Officer) |
|
/s/ RICHARD R. ALBRECHT Richard R. Albrecht |
Director |
|
II-4
| Signature |
Title |
|
|---|---|---|
| /s/ ROSS J. CENTANNI Ross J. Centanni |
Director | |
/s/ JOHN F. CLEARMAN John F. Clearman |
Director |
|
/s/ ROBERT S. CLINE Robert S. Cline |
Director |
|
/s/ E. JOHN FINN E. John Finn |
Director |
|
/s/ ROBERT F. GOLDHAMMER Robert F. Goldhammer |
Director |
|
/s/ WENDELL R. HURLBUT Wendell R. Hurlbut |
Director |
|
/s/ JERRY D. LEITMAN Jerry D. Leitman |
Director |
|
/s/ PAUL G. SCHLOEMER Paul G. Schloemer |
Director |
|
II-5
Exhibit index
| Exhibit Number |
Description |
|
|---|---|---|
| 1.1 | Form of Underwriting Agreement | |
| 5.1 | Opinion of Perkins Coie LLP* | |
| 23.1 | Consent of Ernst & Young LLP, independent auditors | |
| 23.2 | Consent of Deloitte & Touche LLP, independent auditors | |
| 23.3 | Consent of Perkins Coie LLP (contained in Exhibit 5.1)* | |
| 24.1 | Power of Attorney (contained on the signature page hereof) | |
|
|