
|
|
|
|
|
|
|
|
|
Fidelity®
Fund
Semiannual Report
October 31, 2000
(2_fidelity_logos)
|
President's Message |
Ned Johnson on investing strategies. |
|
|
Performance |
How the fund has done over time. |
|
|
Fund Talk |
The manager's review of fund performance, strategy and outlook. |
|
|
Investment Changes |
A summary of major shifts in the fund's investments over the past six months. |
|
|
Investments |
A complete list of the fund's investments with their market values. |
|
|
Financial Statements |
Statements of assets and liabilities, operations, and changes in net assets, as well as financial highlights. |
|
|
Notes |
Notes to the financial statements. |
To reduce expenses, only one copy of most financial reports and prospectuses may be mailed to households, even if more than one person in the household has an account in the fund. Call Fidelity at 1-800-544-8544 if you need additional copies of financial reports or prospectuses. If you do not want the mailing of these documents to be combined with those for other members of your household, contact Fidelity in writing at P.O. Box 5000, Cincinnati, OH 45273-8692.
Standard & Poor's, S&P and S&P 500 are registered service marks of The McGraw-Hill Companies, Inc. and have been licensed for use by Fidelity Distributors Corporation.
Other third party marks appearing herein are the property of their respective owners.
All other marks appearing herein are registered or unregistered trademarks or service marks of FMR Corp. or an affiliated company.
(recycle graphic) This report is printed on recycled paper using soy-based inks.
This report and the financial statements contained herein are submitted for the general information of the shareholders of the fund. This report is not authorized for distribution to prospective investors in the fund unless preceded or accompanied by an effective prospectus.
Mutual fund shares are not deposits or obligations of, or guaranteed by, any depository institution. Shares are not insured by the FDIC, Federal Reserve Board or any other agency, and are subject to investment risks, including possible loss of principal amount invested.
Neither the fund nor Fidelity Distributors Corporation is a bank.
For more information on any Fidelity fund, including charges and expenses, call 1-800-544-6666 for a free prospectus. Read it carefully before you invest or send money.
Semiannual Report
(photo_of_Edward_C_Johnson_3d)
Dear Shareholder:
A sixth-straight year of double-digit positive returns for the Dow Jones Industrial Average, NASDAQ and S&P 500® could be in jeopardy unless the U.S. stock market shows marked improvement in the final two months of 2000. Through October, all three indexes had negative year-to-date returns. On the other hand, most fixed-income sectors were solidly in the black. Treasuries and other long-term government securities led the way, returning nearly 14%.
While it's impossible to predict the future direction of the markets with any degree of certainty, there are certain basic principles that can help investors plan for their future needs.
The longer your investment time frame, the less likely it is that you will be affected by short-term market volatility. A 10-year investment horizon appropriate for saving for a college education, for example, enables you to weather market cycles in a long-term fund, which may have a higher risk potential, but also has a higher potential rate of return.
An intermediate-length fund could make sense if your investment horizon is two to four years, while a short-term bond fund could be the right choice if you need your money in one or two years.
If your time horizon is less than a year, you might want to consider moving some of your bond investment into a money market fund. These funds seek income and a stable share price by investing in high-quality, short-term investments. Of course, it's important to remember that an investment in a money market fund is not insured or guaranteed by the Federal Deposit Insurance Corporation or any other government agency. Although money market funds seek to preserve the value of your investment at $1.00 per share, it is possible to lose money by investing in these types of funds.
Finally, no matter what your time horizon or portfolio diversity, it makes good sense to follow a regular investment plan, investing a certain amount of money in a fund at the same time each month or quarter and periodically reviewing your overall portfolio. By doing so, you won't get caught up in the excitement of a rapidly rising market, nor will you buy all your shares at market highs. While this strategy - known as dollar cost averaging - won't assure a profit or protect you from a loss in a declining market, it should help you lower the average cost of your purchases. Of course, you should consider your financial ability to continue your purchases through periods of low price levels before undertaking such a strategy.
If you have questions, please call us at 1-800-544-6666, or visit our web site at www.fidelity.com. We are available 24 hours a day, seven days a week to provide you the information you need to make the investments that are right for you.
Best regards,
/s/Edward C. Johnson 3d
Edward C. Johnson 3d
Semiannual Report
There are several ways to evaluate a fund's historical performance. You can look at the total percentage change in value, the average annual percentage change or the growth of a hypothetical $10,000 investment. Total return reflects the change in the value of an investment, assuming reinvestment of the fund's dividend income and capital gains (the profits earned upon the sale of securities that have grown in value). You can also look at the fund's income, as reflected in the fund's yield, to measure performance.
Cumulative Total Returns
|
Periods ended October 31, 2000 |
Past 6 |
Past 1 |
Past 5 |
Past 10 |
|
Fidelity High Income |
-7.12% |
-8.32% |
35.70% |
239.61% |
|
ML High Yield Master II |
-1.93% |
-1.68% |
31.76% |
199.32% |
|
High Current Yield Funds Average |
-3.83% |
-2.77% |
25.45% |
173.70% |
Cumulative total returns show the fund's performance in percentage terms over a set period - in this case, six months, one year, five years or 10 years. For example, if you had invested $1,000 in a fund that had a 5% return over the past year, the value of your investment would be $1,050. You can compare the fund's returns to the performance of the Merrill Lynch High Yield Master II Index - a market value-weighted index of all domestic and yankee high-yield bonds, including deferred interest bonds and payment-in-kind securities. Issues included in the index have maturities of one year or more and have a credit rating lower than BBB-/Baa3, but are not in default. To measure how the fund's performance stacked up against its peers, you can compare it to the high current yield funds average, which reflects the performance of mutual funds with similar objectives tracked by Lipper Inc. The past six months average represents a peer group of 382 mutual funds. These benchmarks reflect reinvestment of dividends and capital gains, if any, and exclude the effect of sales charges.
Average Annual Total Returns
|
Periods ended October 31, 2000 |
Past 1 |
Past 5 |
Past 10 |
|
Fidelity High Income |
-8.32% |
6.30% |
13.01% |
|
ML High Yield Master II |
-1.68% |
5.67% |
11.59% |
|
High Current Yield Funds Average |
-2.77% |
4.55% |
10.51% |
Average annual total returns take the fund's cumulative return and show you what would have happened if the fund had performed at a constant rate each year. (Note: Lipper calculates average annual total returns by annualizing each fund's total return, then taking an arithmetic average. This may produce a different figure than that obtained by averaging the cumulative total returns and annualizing the result.)
Semiannual Report
Performance - continued
$10,000 Over 10 Years
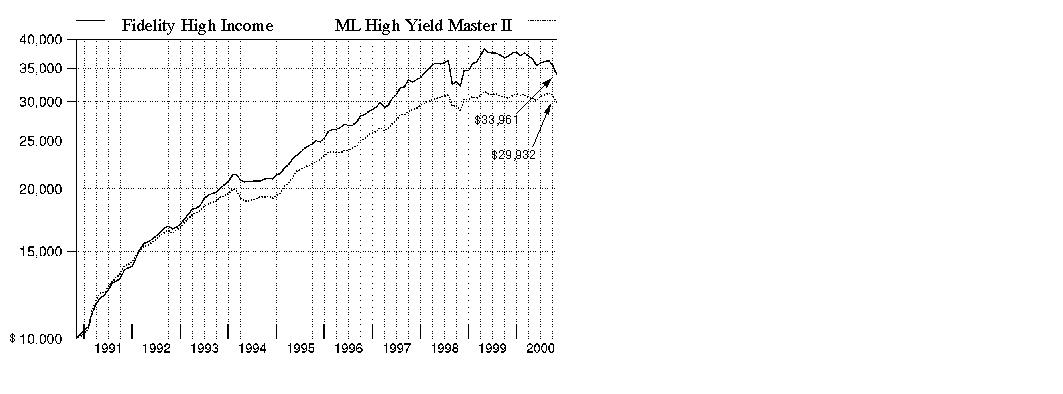
$10,000 Over 10 Years: Let's say hypothetically that $10,000 was invested in Fidelity High Income Fund on October 31, 1990. As the chart shows, by October 31, 2000, the value of the investment would have grown to $33,961 - a 239.61% increase on the initial investment. For comparison, look at how the Merrill Lynch High Yield Master II Index did over the same period. With dividends and capital gains, if any, reinvested, the same $10,000 would have grown to $29,932 - a 199.32% increase.
Understanding
Performance
How a fund did yesterday is no guarantee of how it will do tomorrow. Bond prices, for example, generally move in the opposite direction of interest rates. In turn, the share price, return and yield of a fund that invests in bonds will vary. That means if you sell your shares during a market downturn, you might lose money. But if you can ride out the market's ups and downs, you may have a gain.
3Semiannual Report
Performance - continued
Total Return Components
|
|
Six months
ended |
Years ended April 30, |
||||
|
|
2000 |
2000 |
1999 |
1998 |
1997 |
1996 |
|
Dividend returns |
3.83% |
8.98% |
8.83% |
9.64% |
8.76% |
10.66% |
|
Capital returns |
-10.95% |
-13.46% |
-1.92% |
11.98% |
1.81% |
5.40% |
|
Total returns |
-7.12% |
-4.48% |
6.91% |
21.62% |
10.57% |
16.06% |
Total return components include both dividend returns and capital returns. A dividend return reflects the actual dividends paid by the fund. A capital return reflects both the amount paid by the fund to shareholders as capital gain distributions and changes in the fund's share price. Both returns assume the dividends or capital gains, if any, paid by the fund are reinvested.
Dividends and Yield
|
Periods ended October 31, 2000 |
Past 1 |
Past 6 |
Past 1 |
|
Dividends per share |
7.65¢ |
45.45¢ |
92.93¢ A |
|
Annualized dividend rate |
8.74% |
8.30% |
8.21% |
|
30-day annualized yield |
11.98% |
- |
- |
Dividends per share show the income paid by the fund for a set period, and do not reflect any tax reclassifications. If you annualize this number, based on an average share price of $10.30 over the past one month, $10.86 over the past six months and $11.32 over the past one year, you can compare the fund's income over these three periods. The 30-day annualized yield is a standard formula based on the yields of the securities in the fund, averaged over the past 30 days. This figure shows you the yield characteristics of the fund's investments at the end of the period. It also helps you compare funds from different companies on an equal basis.
A Non-taxable dividends: Dividends paid are based on the fund's investment income at the time of distribution. Dividends of approximately 8.8¢ per share paid during 2000 were a non-taxable return of capital. The exact non-taxable amount to use in preparing your income tax return will depend upon your share activity and will be reported to you in January 2001.
Semiannual Report
Market Recap
While the six-month period ending October 31, 2000, was one that most high-yield investors would just as soon forget, positive signs about the market's prospects emerged toward the end of the period. During the past six months, the Merrill Lynch High Yield Master II Index - a broad measure of high-yield market performance - fell 1.93%. This return lagged the overall U.S. taxable bond market as measured by the Lehman Brothers Aggregate Bond Index, which gained 5.80% during the same time frame. A number of adverse conditions held back high-yield performance, including a struggling telecommunications sector - which makes up a large portion of the high-yield debt market - and an increasing default rate that led to decreasing demand. In a flight to safety, many high-yield investors turned to the relative security of the Treasury market, this year's best-performing fixed-income sector through the end of October. One potential catalyst for improved performance in the high-yield market could be a continued increase in merger and acquisition activity. From July to August, $90 billion in M&A activity took place where the target company was in the high-yield universe. Not only do these deals reduce the supply of high-yield credits, they also establish benchmark valuations for some sectors of the market.
(Portfolio Manager photograph)
Note to shareholders: Frederick Hoff became Portfolio Manager of Fidelity High Income Fund on June 1, 2000.
Q. How did the fund perform, Fred?
A. Rather poorly. For the six-month period that ended October 31, 2000, the fund had a total return of -7.12%. To get a sense of how the fund did relative to its competitors, the high current yield funds average returned -3.83% for the same six-month period, according to Lipper Inc. The overall high-yield market, as measured by the Merrill Lynch High Yield Master II Index, returned -1.93%. For the 12-month period that ended October 31, 2000, the fund had a total return of -8.32%. In comparison, the high current yield funds average returned -2.77% and the Merrill Lynch index returned -1.68% for the same 12-month period.
Q. Can you give us some perspective about the factors that affected fund performance during the past six months?
A. Credit quality - especially for lower-rated high-yield bonds - deteriorated during the past six months as short-term interest rates rose and liquidity fell. Essentially, rising rates slowed economic activity and created increasingly difficult conditions, causing more companies to miss earnings targets. The lack of liquidity - meaning how easily investors could buy and sell bonds - stifled demand. Furthermore, the market suffered outflows from high-yield mutual funds in favor of more defensive investments. Even though there was a significant drop in new issue supply, it wasn't enough to offset the gloom that settled over the market. Against this negative backdrop, the fund had several disappointments that caused it to lag both the index and the peer group.
Semiannual Report
Fund Talk: The Manager's Overview - continued
Q. Which investments caused the fund to underperform?
A. The biggest disappointment was an investment in Macsaver Financial, the financing arm of the country's largest furniture retailer, Heilig-Meyers. Macsaver filed for Chapter 11 bankruptcy protection during the period due to slowing sales and customer collection problems. The fund's comparatively large weighting in telecommunications holdings also detracted from performance. Following several earnings disappointments from companies such as Call-Net and ICG Communications, investors became increasingly concerned with the industry's ability to raise additional capital. Even telecommunications companies that continued to meet their business plans - such as Adelphia Business Solutions, NEXTLINK and WinStar - eventually succumbed to market pressures. Finally, the fund was overweighted relative to the Merrill Lynch index in securities rated B and CCC, and in deferred pay securities, such as zero coupon bonds and payment-in-kind preferred stocks. These types of securities - which tend to be quite volatile - significantly underperformed during the period.
Q. Which holdings held up well and helped the fund's performance?
A. Our bond holdings in EchoStar, the second-largest participant in satellite television transmission, performed well. Investors remained optimistic about the company's ability to expand its subscriber base and increase revenue. Our equity holdings in Intersil, which we received as part of our original debt investment in the company, posted strong gains following the company's initial public offering of stock. The fund also benefited from several takeovers, including Federal Data, which was bought by Northrop Grumman; Gothic Energy, which was purchased by Chesapeake Energy; and Verio, which was acquired by NTT.
Q. What's ahead for the high-yield market and the fund?
A. Market sentiment is extremely negative right now, and investors are pricing high-yield securities at a significant discount to par assuming a worst-case scenario. My view is that by applying Fidelity's expertise in research, we will be able to identify companies that have been unfairly punished and will do well when the market recovers. Furthermore, I expect the pace of merger and acquisition activity to remain solid and will likely continue to be a positive for the fund. Telecommunications companies in particular now face more limited access to capital, which may force them to sell out to better-funded companies. Across a number of other industries, good companies are available at very cheap prices and also are likely acquisition targets as a result.
The views expressed in this report reflect those of the portfolio manager only through the end of the period of the report as stated on the cover and do not necessarily represent the views of Fidelity or any other person in the Fidelity organization. Any such views are subject to change at any time based upon market or other conditions and Fidelity disclaims any responsibility to update such views. These views may not be relied on as investment advice and, because investment decisions for a Fidelity fund are based on numerous factors, may not be relied on as an indication of trading intent on behalf of any Fidelity fund.
Semiannual Report
Fund Talk: The Manager's Overview - continued
Fund Facts
Goal: high current income; growth of capital may also be considered
Fund number: 455
Trading symbol: SPHIX
Start date: August 29, 1990
Size: as of October 31, 2000, more than $2.4 billion
Manager: Fred Hoff, since June 2000; high-yield subportfolio manager, several Fidelity asset allocation funds, 1997-present; high-yield analyst, 1991-2000; joined Fidelity in 1991
3Frederick Hoff on recent changes in the fund:
"Drawing on my previous experience as a research analyst, I select investments for the fund by starting with company fundamentals. With the help of Fidelity's research team, I do incredibly in-depth research and spend a lot of time communicating with the management teams of the companies in which we invest. Since taking over the fund in June, I've made a couple of changes that reflect our research efforts. For example, I've reduced the fund's exposure to ´turnaround' situations. Based on a risk/reward tradeoff, I'd rather emphasize companies that already have exhibited good positive momentum. I also reduced the fund's stake in ´cyclical' companies whose performance is dependent on the strength of the economy. I cut back on investments in the paper, chemical and auto supply industries in response to more signs that the economy is slowing."
Semiannual Report
|
Top Five Holdings as of October 31, 2000 |
||
|
(by issuer, excluding cash equivalents) |
% of fund's |
% of fund's net assets |
|
Nextel Communications, Inc. |
8.1 |
9.5 |
|
CSC Holdings, Inc. |
5.3 |
4.3 |
|
XO Communications, Inc. |
2.5 |
2.2 |
|
EchoStar Communications Corp. |
2.4 |
2.9 |
|
WinStar Communications, Inc. |
2.2 |
0.2 |
|
|
20.5 |
19.1 |
|
Top Five Market Sectors as of October 31, 2000 |
||
|
|
% of fund's |
% of fund's net assets |
|
Media & Leisure |
33.6 |
28.3 |
|
Utilities |
26.2 |
26.8 |
|
Technology |
7.1 |
8.1 |
|
Basic Industries |
5.3 |
8.3 |
|
Construction & Real Estate |
3.8 |
3.9 |
|
Quality Diversification as of October 31, 2000 |
||
|
(Moody's Ratings) |
% of fund's investments |
% of fund's investments |
|
Aaa, Aa, A |
0.0 |
0.0 |
|
Baa |
1.2 |
1.6 |
|
Ba |
9.4 |
6.1 |
|
B |
48.5 |
41.8 |
|
Caa, Ca, C |
10.8 |
15.1 |
|
D |
0.1 |
0.0 |
|
Not Rated |
1.6 |
5.0 |
|
Table excludes short-term investments. Where Moody's ratings are not available, we have used S&P ® ratings. Unrated debt securities that are equivalent to Ba and below at October 31, 2000 and April 30, 2000 account for 1.6% and 5.0% respectively of the fund's investments. |
|
Asset Allocation (% of fund's net assets) |
|||||||
|
As of October 31, 2000 * |
As of April 30, 2000 ** |
||||||
 |
Nonconvertible |
|
|
Nonconvertible |
|
||
 |
Convertible Bonds, Preferred Stocks 21.3% |
|
|
Convertible Bonds, Preferred Stocks 25.2% |
|
||
 |
Common Stocks 4.2% |
|
|
Common Stocks 4.9% |
|
||
 |
Other Investments 1.1% |
|
|
Other Investments 0.8% |
|
||
 |
Short-Term |
|
|
Short-Term |
|
||
|
* Foreign investments |
7.6% |
|
** Foreign investments |
10.4% |
|
||

Semiannual Report
(Unaudited)
Showing Percentage of Net Assets
|
Corporate Bonds - 69.2% |
|||||
|
Moody's Ratings (unaudited) (b) |
Principal Amount (000s) |
Value (Note 1) (000s) |
|||
|
Convertible Bonds - 2.4% |
|||||
|
CONSTRUCTION & REAL ESTATE - 0.1% |
|||||
|
Building Materials - 0.1% |
|||||
|
Hexcel Corp. 7% 8/1/03 |
B3 |
|
$ 1,210 |
$ 1,101 |
|
|
FINANCE - 0.1% |
|||||
|
Credit & Other Finance - 0.1% |
|||||
|
HIH Capital Ltd. euro 7.5% 9/25/06 |
- |
|
5,500 |
2,090 |
|
|
HEALTH - 0.6% |
|||||
|
Medical Facilities Management - 0.6% |
|||||
|
Tenet Healthcare Corp. 6% 12/1/05 |
B1 |
|
5,260 |
4,471 |
|
|
Total Renal Care Holdings, Inc.: |
|
|
|
|
|
|
7% 5/15/09 |
B3 |
|
5,900 |
4,366 |
|
|
7% 5/15/09 (e) |
B3 |
|
9,360 |
6,926 |
|
|
|
15,763 |
||||
|
MEDIA & LEISURE - 0.8% |
|||||
|
Broadcasting - 0.5% |
|||||
|
EchoStar Communications Corp. 4.875% 1/1/07 (e) |
Caa2 |
|
10,240 |
12,032 |
|
|
Lodging & Gaming - 0.3% |
|||||
|
Hilton Hotels Corp. 5% 5/15/06 |
Ba2 |
|
9,530 |
7,719 |
|
|
TOTAL MEDIA & LEISURE |
19,751 |
||||
|
RETAIL & WHOLESALE - 0.8% |
|||||
|
Retail & Wholesale, Miscellaneous - 0.8% |
|||||
|
Sunglass Hut International, Inc.: |
|
|
|
|
|
|
5.25% 6/15/03 (e) |
B2 |
|
19,730 |
15,118 |
|
|
5.25% 6/15/03 |
B3 |
|
5,780 |
4,429 |
|
|
|
19,547 |
||||
|
TOTAL CONVERTIBLE BONDS |
58,252 |
||||
|
Nonconvertible Bonds - 66.8% |
|||||
|
AEROSPACE & DEFENSE - 0.0% |
|||||
|
Ship Building & Repair - 0.0% |
|||||
|
Newport News Shipbuilding, Inc. 9.25% 12/1/06 |
Ba3 |
|
370 |
374 |
|
|
Corporate Bonds - continued |
|||||
|
Moody's Ratings (unaudited) (b) |
Principal Amount (000s) |
Value (Note 1) (000s) |
|||
|
Nonconvertible Bonds - continued |
|||||
|
BASIC INDUSTRIES - 5.3% |
|||||
|
Chemicals & Plastics - 3.2% |
|||||
|
Avecia Group PLC 11% 7/1/09 |
B2 |
|
$ 750 |
$ 713 |
|
|
Geo Specialty Chemicals, Inc. 10.125% 8/1/08 |
B3 |
|
5,390 |
4,312 |
|
|
Huntsman Corp. 9.5% 7/1/07 (e) |
B2 |
|
34,320 |
20,592 |
|
|
Lyondell Chemical Co.: |
|
|
|
|
|
|
9.875% 5/1/07 |
Ba3 |
|
19,825 |
19,329 |
|
|
10.875% 5/1/09 |
B2 |
|
4,775 |
4,584 |
|
|
Sterling Chemicals, Inc.: |
|
|
|
|
|
|
11.25% 4/1/07 |
Caa3 |
|
6,460 |
3,424 |
|
|
11.75% 8/15/06 |
Caa3 |
|
9,310 |
5,121 |
|
|
12.375% 7/15/06 |
B3 |
|
21,725 |
20,747 |
|
|
|
78,822 |
||||
|
Metals & Mining - 0.4% |
|||||
|
Better Minerals & Aggregates Co. 13% 9/15/09 |
B3 |
|
11,480 |
9,414 |
|
|
Packaging & Containers - 1.2% |
|||||
|
Gaylord Container Corp.: |
|
|
|
|
|
|
9.375% 6/15/07 |
Caa1 |
|
23,515 |
15,285 |
|
|
9.75% 6/15/07 |
Caa1 |
|
9,665 |
6,476 |
|
|
9.875% 2/15/08 |
Caa3 |
|
25,060 |
7,518 |
|
|
|
29,279 |
||||
|
Paper & Forest Products - 0.5% |
|||||
|
Container Corp. of America gtd. 9.75% 4/1/03 |
B2 |
|
7,380 |
7,380 |
|
|
Stone Container Corp. 12.58% 8/1/16 (f) |
B2 |
|
3,990 |
3,990 |
|
|
|
11,370 |
||||
|
TOTAL BASIC INDUSTRIES |
128,885 |
||||
|
CONSTRUCTION & REAL ESTATE - 2.3% |
|||||
|
Building Materials - 1.3% |
|||||
|
American Standard Companies, Inc. 8.25% 6/1/09 |
Ba2 |
|
6,860 |
6,654 |
|
|
American Standard Companies, Inc.: |
|
|
|
|
|
|
7.375% 2/1/08 |
Ba2 |
|
6,140 |
5,710 |
|
|
7.625% 2/15/10 |
Ba2 |
|
3,660 |
3,404 |
|
|
Corporate Bonds - continued |
|||||
|
Moody's Ratings (unaudited) (b) |
Principal Amount (000s) |
Value (Note 1) (000s) |
|||
|
Nonconvertible Bonds - continued |
|||||
|
CONSTRUCTION & REAL ESTATE - continued |
|||||
|
Building Materials - continued |
|||||
|
Atrium Companies, Inc. 10.5% 5/1/09 |
B3 |
|
$ 12,690 |
$ 10,755 |
|
|
Numatics, Inc. 9.625% 4/1/08 |
B3 |
|
5,971 |
4,598 |
|
|
|
31,121 |
||||
|
Construction - 0.4% |
|||||
|
Blount, Inc. 13% 8/1/09 |
B3 |
|
12,105 |
10,168 |
|
|
Engineering - 0.6% |
|||||
|
Anteon Corp. 12% 5/15/09 |
B3 |
|
8,000 |
7,040 |
|
|
Morrison Knudsen Corp. 11% 7/1/10 (e) |
Ba2 |
|
7,980 |
6,584 |
|
|
|
13,624 |
||||
|
Real Estate - 0.0% |
|||||
|
LNR Property Corp. 9.375% 3/15/08 |
B1 |
|
1,000 |
900 |
|
|
TOTAL CONSTRUCTION & REAL ESTATE |
55,813 |
||||
|
DURABLES - 0.4% |
|||||
|
Autos, Tires, & Accessories - 0.0% |
|||||
|
Cambridge Industries, Inc. 10.25% 7/15/07 (c) |
- |
|
2,230 |
624 |
|
|
Home Furnishings - 0.4% |
|||||
|
Omega Cabinets Ltd. 10.5% 6/15/07 |
B3 |
|
10,810 |
9,945 |
|
|
TOTAL DURABLES |
10,569 |
||||
|
ENERGY - 2.4% |
|||||
|
Energy Services - 0.6% |
|||||
|
R&B Falcon Corp.: |
|
|
|
|
|
|
6.5% 4/15/03 |
Ba3 |
|
10,080 |
9,576 |
|
|
6.75% 4/15/05 |
Ba3 |
|
5,942 |
5,526 |
|
|
|
15,102 |
||||
|
Oil & Gas - 1.8% |
|||||
|
Chesapeake Energy Corp. 9.625% 5/1/05 |
B2 |
|
1,995 |
1,995 |
|
|
Gothic Production Corp. 11.125% 5/1/05 |
B3 |
|
28,858 |
30,301 |
|
|
Nuevo Energy Co. 9.375% 10/1/10 (e) |
B1 |
|
2,625 |
2,612 |
|
|
Petsec Energy, Inc. 9.5% 6/15/07 (c) |
D |
|
5,270 |
2,767 |
|
|
Western Gas Resources, Inc. 10% 6/15/09 |
Ba3 |
|
5,480 |
5,699 |
|
|
|
43,374 |
||||
|
TOTAL ENERGY |
58,476 |
||||
|
Corporate Bonds - continued |
|||||
|
Moody's Ratings (unaudited) (b) |
Principal Amount (000s) |
Value (Note 1) (000s) |
|||
|
Nonconvertible Bonds - continued |
|||||
|
FINANCE - 1.1% |
|||||
|
Credit & Other Finance - 1.1% |
|||||
|
GS Escrow Corp. 7% 8/1/03 |
Ba1 |
|
$ 25,000 |
$ 23,688 |
|
|
Macsaver Financial Services, Inc.: |
|
|
|
|
|
|
7.4% 2/15/02 (c) |
Ca |
|
2,090 |
251 |
|
|
7.6% 8/1/07 (c) |
Ca |
|
14,010 |
1,681 |
|
|
7.875% 8/1/03 (c) |
Ca |
|
15,180 |
1,822 |
|
|
|
27,442 |
||||
|
HEALTH - 2.5% |
|||||
|
Drugs & Pharmaceuticals - 0.3% |
|||||
|
Warner Chilcott, Inc. 12.625% 2/15/08 (e) |
B2 |
|
6,600 |
6,666 |
|
|
Medical Facilities Management - 2.2% |
|||||
|
Dynacare, Inc. 10.75% 1/15/06 |
B2 |
|
7,210 |
6,922 |
|
|
Everest Healthcare Services, Inc. 9.75% 5/1/08 |
B3 |
|
5,130 |
4,822 |
|
|
Fountain View, Inc. 11.25% 4/15/08 |
Caa1 |
|
17,360 |
3,472 |
|
|
Oxford Health Plans, Inc. 11% 5/15/05 |
B2 |
|
26,260 |
28,623 |
|
|
Tenet Healthcare Corp. 8.125% 12/1/08 |
Ba3 |
|
2,670 |
2,570 |
|
|
Unilab Corp. 12.75% 10/1/09 |
B3 |
|
8,395 |
8,983 |
|
|
|
55,392 |
||||
|
TOTAL HEALTH |
62,058 |
||||
|
INDUSTRIAL MACHINERY & EQUIPMENT - 3.4% |
|||||
|
Industrial Machinery & Equipment - 1.8% |
|||||
|
Dunlop Standard Aero Holdings PLC 11.875% 5/15/09 |
B3 |
|
18,150 |
18,059 |
|
|
International Knife & Saw, Inc. 11.375% 11/15/06 |
Caa1 |
|
5,280 |
2,482 |
|
|
Roller Bearing Co. of America, Inc. 9.625% 6/15/07 |
B- |
|
7,550 |
6,644 |
|
|
Roller Bearing Holding, Inc. 0% 6/15/09 (d)(e) |
- |
|
22,220 |
12,443 |
|
|
Tenneco Automotive, Inc. 11.625% 10/15/09 |
B2 |
|
5,805 |
3,367 |
|
|
|
42,995 |
||||
|
Pollution Control - 1.6% |
|||||
|
Allied Waste North America, Inc.: |
|
|
|
|
|
|
7.375% 1/1/04 |
Ba3 |
|
2,570 |
2,339 |
|
|
Corporate Bonds - continued |
|||||
|
Moody's Ratings (unaudited) (b) |
Principal Amount (000s) |
Value (Note 1) (000s) |
|||
|
Nonconvertible Bonds - continued |
|||||
|
INDUSTRIAL MACHINERY & EQUIPMENT - continued |
|||||
|
Pollution Control - continued |
|||||
|
Allied Waste North America, Inc.: - continued |
|
|
|
|
|
|
7.625% 1/1/06 |
Ba2 |
|
$ 18,995 |
$ 16,811 |
|
|
10% 8/1/09 |
B2 |
|
25,070 |
21,247 |
|
|
|
40,397 |
||||
|
TOTAL INDUSTRIAL MACHINERY & EQUIPMENT |
83,392 |
||||
|
MEDIA & LEISURE - 23.2% |
|||||
|
Broadcasting - 17.4% |
|||||
|
360networks, Inc. 13% 5/1/08 |
B3 |
|
2,690 |
2,139 |
|
|
Adelphia Communications Corp.: |
|
|
|
|
|
|
7.75% 1/15/09 |
B2 |
|
10,060 |
7,847 |
|
|
10.875% 10/1/10 |
B2 |
|
9,000 |
8,370 |
|
|
Ascent Entertainment Group, Inc. 0% 12/15/04 (d) |
Ba1 |
|
22,890 |
18,884 |
|
|
Cable Satisfaction International, Inc. 12.75% 3/1/10 |
Caa1 |
|
13,120 |
9,184 |
|
|
Century Communications Corp. Series B, 0% 1/15/08 |
B2 |
|
32,355 |
12,295 |
|
|
Charter Communications Holdings LLC/Charter Communications Holdings Capital Corp. 8.625% 4/1/09 |
B2 |
|
32,540 |
29,286 |
|
|
Comcast UK Cable Partners Ltd. 0% 11/15/07 (d) |
B2 |
|
27,900 |
25,110 |
|
|
Diamond Cable Communications PLC yankee: |
|
|
|
|
|
|
0% 12/15/05 (d) |
B2 |
|
3,260 |
2,942 |
|
|
0% 2/15/07 (d) |
B2 |
|
18,920 |
14,190 |
|
|
Earthwatch, Inc. 0% 7/15/07 (d) |
- |
|
14,990 |
7,795 |
|
|
Fox Family Worldwide, Inc. 9.25% 11/1/07 |
B1 |
|
2,500 |
2,369 |
|
|
FrontierVision Holdings LP/FrontierVision Holdings Capital Corp. 0% 9/15/07 (d) |
B2 |
|
24,990 |
20,804 |
|
|
FrontierVision Holdings LP/FrontierVision Holdings Capital II Corp. 0% 9/15/07 (d) |
Caa1 |
|
5,000 |
4,163 |
|
|
Golden Sky DBS, Inc. 0% 3/1/07 (d) |
Caa1 |
|
9,610 |
6,535 |
|
|
Golden Sky Systems, Inc. 12.375% 8/1/06 |
B3 |
|
18,345 |
19,721 |
|
|
Impsat Fiber Networks, Inc. 12.375% 6/15/08 |
B3 |
|
10,630 |
7,122 |
|
|
International Cabletel, Inc. 0% 2/1/06 (d) |
B2 |
|
52,390 |
46,103 |
|
|
NorthPoint Communication Holdings, Inc. 12.875% 2/15/10 |
Caa1 |
|
10,550 |
9,917 |
|
|
Corporate Bonds - continued |
|||||
|
Moody's Ratings (unaudited) (b) |
Principal Amount (000s) |
Value (Note 1) (000s) |
|||
|
Nonconvertible Bonds - continued |
|||||
|
MEDIA & LEISURE - continued |
|||||
|
Broadcasting - continued |
|||||
|
NTL Communications Corp. 11.5% 10/1/08 |
B3 |
|
$ 32,740 |
$ 29,302 |
|
|
NTL, Inc.: |
|
|
|
|
|
|
0% 4/1/08 (d) |
B3 |
|
51,395 |
28,781 |
|
|
10% 2/15/07 |
B2 |
|
3,070 |
2,671 |
|
|
Pegasus Communications Corp.: |
|
|
|
|
|
|
9.625% 10/15/05 |
B3 |
|
2,620 |
2,555 |
|
|
12.5% 8/1/17 |
B3 |
|
19,250 |
20,020 |
|
|
Satelites Mexicanos SA de CV 10.125% 11/1/04 |
B3 |
|
7,960 |
5,015 |
|
|
Spectrasite Holdings, Inc.: |
|
|
|
|
|
|
0% 4/15/09 (d) |
B3 |
|
10,420 |
5,366 |
|
|
10.75% 3/15/10 |
B3 |
|
11,810 |
10,865 |
|
|
Telewest Communications PLC: |
|
|
|
|
|
|
0% 4/15/09 (d) |
B1 |
|
5,400 |
2,403 |
|
|
11.25% 11/1/08 |
B1 |
|
3,930 |
3,537 |
|
|
Telewest PLC: |
|
|
|
|
|
|
yankee 9.625% 10/1/06 |
B1 |
|
2,560 |
2,099 |
|
|
11% 10/1/07 |
B1 |
|
13,767 |
12,390 |
|
|
United Pan-Europe Communications NV: |
|
|
|
|
|
|
0% 11/1/09 (d) |
B2 |
|
31,670 |
11,876 |
|
|
10.875% 11/1/07 |
B2 |
|
13,390 |
10,444 |
|
|
10.875% 8/1/09 |
B2 |
|
31,665 |
22,957 |
|
|
|
425,057 |
||||
|
Entertainment - 1.8% |
|||||
|
AMC Entertainment, Inc. 9.5% 2/1/11 |
Caa3 |
|
5,450 |
2,562 |
|
|
Bally Total Fitness Holding Corp. 9.875% 10/15/07 |
B3 |
|
21,810 |
20,283 |
|
|
Cinemark USA, Inc. 8.5% 8/1/08 |
B2 |
|
7,465 |
3,061 |
|
|
Mandalay Resort Group: |
|
|
|
|
|
|
9.5% 8/1/08 |
Ba2 |
|
3,385 |
3,453 |
|
|
10.25% 8/1/07 |
Ba3 |
|
5,450 |
5,586 |
|
|
MGM Mirage, Inc. 9.75% 6/1/07 |
Ba2 |
|
4,300 |
4,456 |
|
|
Premier Parks, Inc. 9.75% 6/15/07 |
B3 |
|
5,500 |
5,115 |
|
|
|
44,516 |
||||
|
Lodging & Gaming - 2.2% |
|||||
|
HMH Properties, Inc. 7.875% 8/1/08 |
Ba2 |
|
22,315 |
20,530 |
|
|
Hollywood Casino Corp. 11.25% 5/1/07 |
B3 |
|
9,680 |
9,922 |
|
|
Corporate Bonds - continued |
|||||
|
Moody's Ratings (unaudited) (b) |
Principal Amount (000s) |
Value (Note 1) (000s) |
|||
|
Nonconvertible Bonds - continued |
|||||
|
MEDIA & LEISURE - continued |
|||||
|
Lodging & Gaming - continued |
|||||
|
Horseshoe Gaming LLC 8.625% 5/15/09 |
B2 |
|
$ 12,750 |
$ 12,431 |
|
|
Host Marriott LP 8.375% 2/15/06 |
Ba2 |
|
12,040 |
11,558 |
|
|
|
54,441 |
||||
|
Publishing - 0.8% |
|||||
|
Advanstar Communications, Inc. 9.25% 5/1/08 |
B2 |
|
14,960 |
15,110 |
|
|
Von Hoffman Press, Inc. 10.875% 5/15/07 (e) |
B3 |
|
4,660 |
4,194 |
|
|
|
19,304 |
||||
|
Restaurants - 1.0% |
|||||
|
Domino's, Inc. 10.375% 1/15/09 |
B3 |
|
16,190 |
14,409 |
|
|
NE Restaurant, Inc. 10.75% 7/15/08 |
B3 |
|
12,280 |
9,456 |
|
|
|
23,865 |
||||
|
TOTAL MEDIA & LEISURE |
567,183 |
||||
|
NONDURABLES - 0.2% |
|||||
|
Foods - 0.2% |
|||||
|
Del Monte Foods Co. 0% 12/15/07 (d) |
Caa1 |
|
7,611 |
5,651 |
|
|
RETAIL & WHOLESALE - 1.3% |
|||||
|
Drug Stores - 0.7% |
|||||
|
Rite Aid Corp.: |
|
|
|
|
|
|
6% 12/15/00 (e) |
B3 |
|
8,000 |
7,760 |
|
|
10.5% 9/15/02 (e) |
- |
|
15,150 |
9,393 |
|
|
|
17,153 |
||||
|
General Merchandise Stores - 0.6% |
|||||
|
Kmart Corp.: |
|
|
|
|
|
|
7.95% 2/1/23 |
Baa3 |
|
5,190 |
3,218 |
|
|
8.375% 7/1/22 |
Baa3 |
|
4,502 |
2,926 |
|
|
12.5% 3/1/05 |
Baa3 |
|
9,880 |
9,386 |
|
|
|
15,530 |
||||
|
TOTAL RETAIL & WHOLESALE |
32,683 |
||||
|
Corporate Bonds - continued |
|||||
|
Moody's Ratings (unaudited) (b)) |
Principal Amount (000s) |
Value (Note 1) (000s) |
|||
|
Nonconvertible Bonds - continued |
|||||
|
SERVICES - 1.2% |
|||||
|
Printing - 1.1% |
|||||
|
American Color Graphics, Inc. 12.75% 8/1/05 |
Caa1 |
|
$ 16,420 |
$ 15,517 |
|
|
World Color Press, Inc. 7.75% 2/15/09 |
Baa3 |
|
13,500 |
12,353 |
|
|
|
27,870 |
||||
|
Services - 0.1% |
|||||
|
Spin Cycle, Inc. 0% 5/1/05 (d) |
- |
|
15,960 |
1,915 |
|
|
TOTAL SERVICES |
29,785 |
||||
|
TECHNOLOGY - 6.6% |
|||||
|
Computer Services & Software - 2.6% |
|||||
|
Colo.com 13.875% 3/15/10 unit (e) |
- |
|
6,000 |
4,500 |
|
|
Concentric Network Corp. 12.75% 12/15/07 |
B |
|
2,460 |
2,448 |
|
|
Covad Communications Group, Inc.: |
|
|
|
|
|
|
0% 3/15/08 (d) |
B3 |
|
8,240 |
2,225 |
|
|
12% 2/15/10 |
B3 |
|
14,450 |
6,719 |
|
|
12.5% 2/15/09 |
B3 |
|
2,621 |
1,284 |
|
|
Exodus Communications, Inc.: |
|
|
|
|
|
|
10.75% 12/15/09 |
B3 |
|
10,000 |
9,200 |
|
|
11.625% 7/15/10 (e) |
B3 |
|
15,000 |
14,100 |
|
|
Federal Data Corp. 10.125% 8/1/05 |
B3 |
|
9,170 |
9,812 |
|
|
InterAct Operating Co., Inc. 14% 8/1/03 pay-in-kind |
- |
|
3,234 |
420 |
|
|
PSINet, Inc.: |
|
|
|
|
|
|
10% 2/15/05 |
B3 |
|
4,726 |
2,339 |
|
|
10.5% 12/1/06 |
B3 |
|
19,820 |
9,514 |
|
|
|
62,561 |
||||
|
Computers & Office Equipment - 0.2% |
|||||
|
Globix Corp. 12.5% 2/1/10 |
B- |
|
10,000 |
5,500 |
|
|
Electronic Instruments - 0.2% |
|||||
|
Telecommunications Techniques Co. LLC 9.75% 5/15/08 |
B3 |
|
6,960 |
6,194 |
|
|
Electronics - 3.6% |
|||||
|
ChipPAC International Ltd. 12.75% 8/1/09 |
B3 |
|
21,520 |
21,466 |
|
|
Fairchild Semiconductor Corp. 10.125% 3/15/07 |
B2 |
|
17,430 |
16,907 |
|
|
Intersil Corp. 13.25% 8/15/09 |
B1 |
|
6,552 |
7,535 |
|
|
Knowles Electronics Holdings, Inc. 13.125% 10/15/09 |
B3 |
|
5,120 |
4,710 |
|
|
Corporate Bonds - continued |
|||||
|
Moody's Ratings (unaudited) (b) |
Principal Amount (000s) |
Value (Note 1) (000s) |
|||
|
Nonconvertible Bonds - continued |
|||||
|
TECHNOLOGY - continued |
|||||
|
Electronics - continued |
|||||
|
Micron Technology, Inc. 6.5% 9/30/05 (g) |
B3 |
|
$ 21,000 |
$ 17,430 |
|
|
Viasystems, Inc. 9.75% 6/1/07 |
B3 |
|
21,523 |
19,263 |
|
|
|
87,311 |
||||
|
TOTAL TECHNOLOGY |
161,566 |
||||
|
TRANSPORTATION - 0.7% |
|||||
|
Railroads - 0.6% |
|||||
|
TFM SA de CV: |
|
|
|
|
|
|
0% 6/15/09 (d) |
B2 |
|
7,605 |
5,590 |
|
|
10.25% 6/15/07 |
B2 |
|
8,980 |
8,262 |
|
|
|
13,852 |
||||
|
Shipping - 0.1% |
|||||
|
MC Shipping, Inc. 11.25% 3/1/08 |
B3 |
|
3,840 |
2,688 |
|
|
TOTAL TRANSPORTATION |
16,540 |
||||
|
UTILITIES - 16.2% |
|||||
|
Cellular - 8.8% |
|||||
|
Crown Castle International Corp. 10.75% 8/1/11 |
B3 |
|
7,885 |
8,043 |
|
|
CTI Holdings SA 0% 4/15/08 (d) |
B1 |
|
13,000 |
6,630 |
|
|
Echostar Broadband Corp. 10.375% 10/1/07 (e) |
B3 |
|
30,000 |
30,000 |
|
|
McCaw International Ltd. 0% 4/15/07 (d) |
Caa1 |
|
65,360 |
45,752 |
|
|
Millicom International Cellular SA 0% 6/1/06 (d) |
Caa1 |
|
35,924 |
28,739 |
|
|
Nextel Communications, Inc.: |
|
|
|
|
|
|
9.375% 11/15/09 |
B1 |
|
30,000 |
28,950 |
|
|
12% 11/1/08 |
B1 |
|
18,610 |
19,727 |
|
|
Nextel International, Inc.: |
|
|
|
|
|
|
0% 4/15/08 (d) |
Caa1 |
|
33,720 |
20,232 |
|
|
12.75% 8/1/10 (e) |
Caa1 |
|
24,865 |
22,876 |
|
|
TeleCorp PCS, Inc. 10.625% 7/15/10 |
B3 |
|
4,870 |
4,833 |
|
|
|
215,782 |
||||
|
Electric Utility - 0.6% |
|||||
|
AES Corp.: |
|
|
|
|
|
|
8.5% 11/1/07 |
Ba3 |
|
4,425 |
4,160 |
|
|
Corporate Bonds - continued |
|||||
|
Moody's Ratings (unaudited) (b) |
Principal Amount (000s) |
Value (Note 1) (000s) |
|||
|
Nonconvertible Bonds - continued |
|||||
|
UTILITIES - continued |
|||||
|
Electric Utility - continued |
|||||
|
AES Corp.: - continued |
|
|
|
|
|
|
9.5% 6/1/09 |
Ba1 |
|
$ 2,000 |
$ 2,040 |
|
|
CMS Energy Corp.: |
|
|
|
|
|
|
8.125% 5/15/02 |
Ba3 |
|
3,370 |
3,315 |
|
|
9.875% 10/15/07 |
Ba3 |
|
4,330 |
4,362 |
|
|
|
13,877 |
||||
|
Telephone Services - 6.8% |
|||||
|
Alestra SA de RL de CV 12.625% 5/15/09 |
B2 |
|
8,950 |
7,563 |
|
|
Call-Net Enterprises, Inc.: |
|
|
|
|
|
|
0% 5/15/09 (d) |
B2 |
|
14,450 |
3,468 |
|
|
8% 8/15/08 |
B2 |
|
14,845 |
5,938 |
|
|
Focal Communications Corp. 11.875% 1/15/10 |
B3 |
|
2,375 |
1,805 |
|
|
Global Crossing Holdings Ltd. 9.125% 11/15/06 |
Ba2 |
|
7,000 |
6,720 |
|
|
Hermes Europe Railtel BV 10.375% 1/15/09 |
B3 |
|
4,000 |
2,000 |
|
|
Hyperion Telecommunications, Inc.: |
|
|
|
|
|
|
12% 11/1/07 |
Caa1 |
|
4,000 |
2,200 |
|
|
12.25% 9/1/04 |
B3 |
|
2,000 |
1,660 |
|
|
ICG Holdings, Inc.: |
|
|
|
|
|
|
0% 5/1/06 (d) |
Caa1 |
|
3,180 |
477 |
|
|
13.5% 9/15/05 |
Caa1 |
|
4,800 |
816 |
|
|
ICG Services, Inc. 0% 2/15/08 (d) |
Caa1 |
|
5,940 |
950 |
|
|
Intermedia Communications, Inc. 0% 7/15/07 (d) |
B2 |
|
2,000 |
1,650 |
|
|
KMC Telecom Holdings, Inc.: |
|
|
|
|
|
|
0% 2/15/08 (d) |
Caa2 |
|
3,950 |
553 |
|
|
13.5% 5/15/09 |
Caa2 |
|
17,860 |
5,537 |
|
|
Level 3 Communications, Inc. 11% 3/15/08 |
B3 |
|
21,490 |
19,395 |
|
|
McLeodUSA, Inc. 8.125% 2/15/09 |
B2 |
|
3,800 |
3,306 |
|
|
NEXTLINK Communications, Inc.: |
|
|
|
|
|
|
10.5% 12/1/09 |
B2 |
|
10,290 |
8,901 |
|
|
10.75% 6/1/09 |
B2 |
|
16,240 |
14,291 |
|
|
Ono Finance PLC 13% 5/1/09 |
Caa1 |
|
7,460 |
5,744 |
|
|
Rhythms NetConnections, Inc.: |
|
|
|
|
|
|
Series B, 14% 2/15/10 |
B3 |
|
10,000 |
4,600 |
|
|
12.75% 4/15/09 |
B3 |
|
4,820 |
2,217 |
|
|
Teligent, Inc.: |
|
|
|
|
|
|
0% 3/1/08 (d) |
Caa1 |
|
23,095 |
5,312 |
|
|
Corporate Bonds - continued |
|||||
|
Moody's Ratings (unaudited) (b) |
Principal Amount (000s) |
Value (Note 1) (000s) |
|||
|
Nonconvertible Bonds - continued |
|||||
|
UTILITIES - continued |
|||||
|
Telephone Services - continued |
|||||
|
Teligent, Inc.: - continued |
|
|
|
|
|
|
11.5% 12/1/07 |
Caa1 |
|
$ 18,510 |
$ 7,404 |
|
|
WinStar Communications, Inc.: |
|
|
|
|
|
|
0% 4/15/10 (d) |
B3 |
|
13,000 |
4,160 |
|
|
12.5% 4/15/08 |
B3 |
|
7,750 |
5,696 |
|
|
12.75% 4/15/10 |
B3 |
|
60,240 |
43,373 |
|
|
|
165,736 |
||||
|
TOTAL UTILITIES |
395,395 |
||||
|
TOTAL NONCONVERTIBLE BONDS |
1,635,812 |
||||
|
TOTAL CORPORATE BONDS (Cost $1,983,965) |
1,694,064 |
||||
|
Asset-Backed Securities - 0.6% |
|||||
|
|
|||||
|
Airplanes pass through trust 10.875% 3/15/19 |
Ba2 |
|
18,184 |
13,456 |
|
|
Commercial Mortgage Securities - 0.5% |
|||||
|
|
|||||
|
Structured Asset Securities Corp. Series
1996-CFL Class G, 7.75% 2/25/28 (e) |
BB |
|
13,040 |
12,135 |
|
|
Common Stocks - 4.2% |
|||
|
Shares |
|
||
|
BASIC INDUSTRIES - 0.0% |
|||
|
Chemicals & Plastics - 0.0% |
|||
|
Trivest 1992 Special Fund Ltd. (h) |
13.7 |
813 |
|
|
Metals & Mining - 0.0% |
|||
|
Metals USA, Inc. |
47,100 |
132 |
|
|
TOTAL BASIC INDUSTRIES |
945 |
||
|
Common Stocks - continued |
|||
|
Shares |
Value (Note 1) (000s) |
||
|
CONSTRUCTION & REAL ESTATE - 0.5% |
|||
|
Building Materials - 0.5% |
|||
|
American Standard Companies, Inc. (a) |
242,100 |
$ 11,106 |
|
|
Real Estate Investment Trusts - 0.0% |
|||
|
Swerdlow Real Estate Group, Inc.: |
|
|
|
|
Class A (g) |
79,800 |
0 |
|
|
Class B (g) |
19,817 |
0 |
|
|
|
0 |
||
|
TOTAL CONSTRUCTION & REAL ESTATE |
11,106 |
||
|
DURABLES - 0.1% |
|||
|
Textiles & Apparel - 0.1% |
|||
|
Arena Brands Holdings Corp. Class B |
143,778 |
3,594 |
|
|
FINANCE - 0.0% |
|||
|
Savings & Loans - 0.0% |
|||
|
Golden State Bancorp, Inc. litigation warrants 12/31/00 (a) |
87,800 |
115 |
|
|
Securities Industry - 0.0% |
|||
|
ECM Corp. LP (a)(e) |
5,400 |
454 |
|
|
TOTAL FINANCE |
569 |
||
|
INDUSTRIAL MACHINERY & EQUIPMENT - 0.2% |
|||
|
Terex Corp. (a) |
349,500 |
4,303 |
|
|
MEDIA & LEISURE - 1.9% |
|||
|
Broadcasting - 1.9% |
|||
|
Cable Satisfaction International, Inc. warrants 3/1/10 (a) |
13,120 |
0 |
|
|
EchoStar Communications Corp. Class A (a) |
1,000,360 |
45,266 |
|
|
|
45,266 |
||
|
RETAIL & WHOLESALE - 0.8% |
|||
|
Grocery Stores - 0.8% |
|||
|
Pathmark Stores, Inc. (a) |
1,115,028 |
17,492 |
|
|
Pathmark Stores, Inc. warrants 9/19/10 (a) |
548,674 |
2,469 |
|
|
|
19,961 |
||
|
SERVICES - 0.0% |
|||
|
Spin Cycle, Inc. warrants 5/1/05 (a)(e) |
15,960 |
0 |
|
|
Common Stocks - continued |
|||
|
Shares |
Value (Note 1) (000s) |
||
|
TECHNOLOGY - 0.5% |
|||
|
Computer Services & Software - 0.0% |
|||
|
Interact Systems, Inc.: |
|
|
|
|
warrants 8/1/03 (a)(e) |
5,650 |
$ 0 |
|
|
warrants 12/21/09 (a) |
5,650 |
0 |
|
|
|
0 |
||
|
Electronics - 0.5% |
|||
|
Fairchild Semiconductor International, Inc. Class A (a) |
333,000 |
7,014 |
|
|
Intersil Holding Corp. Class A |
128,678 |
6,169 |
|
|
|
13,183 |
||
|
TOTAL TECHNOLOGY |
13,183 |
||
|
UTILITIES - 0.2% |
|||
|
Cellular - 0.1% |
|||
|
Loral Orion Network Systems, Inc. warrants 1/15/07 |
15,350 |
35 |
|
|
McCaw International Ltd. warrants 4/16/07 (a)(e) |
64,950 |
974 |
|
|
|
1,009 |
||
|
Telephone Services - 0.1% |
|||
|
AT&T Latin America Corp. (a) |
298,900 |
2,130 |
|
|
Ono Finance PLC rights 5/31/09 (a)(e) |
7,460 |
52 |
|
|
WinStar Communications, Inc. (a) |
25,000 |
488 |
|
|
|
2,670 |
||
|
TOTAL UTILITIES |
3,679 |
||
|
TOTAL COMMON STOCKS (Cost $123,433) |
102,606 |
||
|
Preferred Stocks - 18.9% |
|||
|
|
|
|
|
|
Convertible Preferred Stocks - 0.1% |
|||
|
FINANCE - 0.1% |
|||
|
Credit & Other Finance - 0.1% |
|||
|
Host Marriott Financial Trust $3.375 QUIPS (e) |
23,200 |
841 |
|
|
MEDIA & LEISURE - 0.0% |
|||
|
Broadcasting - 0.0% |
|||
|
Earthwatch, Inc. $8.50 (e) |
735,935 |
184 |
|
|
Preferred Stocks - continued |
|||
|
Shares |
Value (Note 1) (000s) |
||
|
Convertible Preferred Stocks - continued |
|||
|
TECHNOLOGY - 0.0% |
|||
|
Computer Services & Software - 0.0% |
|||
|
Interact Systems, Inc. 14.00% |
5,650 |
$ 45 |
|
|
TOTAL CONVERTIBLE PREFERRED STOCKS |
1,070 |
||
|
Nonconvertible Preferred Stocks - 18.8% |
|||
|
CONSTRUCTION & REAL ESTATE - 0.9% |
|||
|
Real Estate Investment Trusts - 0.9% |
|||
|
California Federal Preferred Capital Corp. $2.2812 |
566,190 |
12,598 |
|
|
Swerdlow Real Estate Group, Inc.: |
|
|
|
|
junior (g) |
19,817 |
0 |
|
|
mezzanine (g) |
79,800 |
29 |
|
|
senior (g) |
79,800 |
8,816 |
|
|
|
21,443 |
||
|
FINANCE - 0.4% |
|||
|
Insurance - 0.4% |
|||
|
American Annuity Group Capital Trust II 8.875% |
10,430 |
9,938 |
|
|
MEDIA & LEISURE - 7.7% |
|||
|
Broadcasting - 6.3% |
|||
|
Adelphia Communications Corp. $13.00 |
46,066 |
4,146 |
|
|
Benedek Communications Corp. $11.50 pay-in-kind |
11,330 |
5,665 |
|
|
Citadel Broadcasting Co. Series B, 13.25% pay-in-kind |
52,182 |
5,009 |
|
|
CSC Holdings, Inc.: |
|
|
|
|
Series H, 11.75% pay-in-kind |
421,836 |
45,558 |
|
|
Series M, 11.125% pay-in-kind |
799,033 |
84,697 |
|
|
Granite Broadcasting Corp. 12.75% pay-in-kind |
18,662 |
9,704 |
|
|
|
154,779 |
||
|
Publishing - 1.4% |
|||
|
PRIMEDIA, Inc.: |
|
|
|
|
$9.20 |
108,856 |
8,926 |
|
|
8.625% |
97,102 |
7,865 |
|
|
Series D, $10.00 |
193,670 |
16,849 |
|
|
|
33,640 |
||
|
TOTAL MEDIA & LEISURE |
188,419 |
||
|
Preferred Stocks - continued |
|||
|
Shares |
Value (Note 1) (000s) |
||
|
Nonconvertible Preferred Stocks - continued |
|||
|
TECHNOLOGY - 0.0% |
|||
|
Computers & Office Equipment - 0.0% |
|||
|
Ampex Corp. 8% non-cumulative |
698 |
$ 1,089 |
|
|
UTILITIES - 9.8% |
|||
|
Cellular - 6.1% |
|||
|
Nextel Communications, Inc.: |
|
|
|
|
11.125% pay-in-kind |
103,122 |
95,385 |
|
|
Series D, 13% pay-in-kind |
54,347 |
54,075 |
|
|
|
149,460 |
||
|
Telephone Services - 3.7% |
|||
|
Adelphia Business Solution, Inc. Series B, $12.875 pay-in-kind |
23,097 |
9,239 |
|
|
Broadwing Communications, Inc. Series B, $12.50 pay-in-kind |
44,048 |
43,608 |
|
|
Intermedia Communications, Inc. 13.5% pay-in-kind |
3,649 |
3,102 |
|
|
XO Communications, Inc. $7.00 pay-in-kind |
858,669 |
34,347 |
|
|
|
90,296 |
||
|
TOTAL UTILITIES |
239,756 |
||
|
TOTAL NONCONVERTIBLE PREFERRED STOCKS |
460,645 |
||
|
TOTAL PREFERRED STOCKS (Cost $509,067) |
461,715 |
||
|
Cash Equivalents - 4.7% |
||
|
Maturity Amount (000s) |
Value (Note 1) (000s) |
|
|
Investments in repurchase agreements (U.S. Treasury Obligations), in a joint trading account at: |
|
|
|
6.55%, dated 10/31/00 due 11/1/00 |
$ 2,266 |
$ 2,266 |
|
6.56%, dated 10/31/00 due 11/1/00 |
113,530 |
113,509 |
|
TOTAL CASH EQUIVALENTS (Cost $115,775) |
115,775 |
|
|
TOTAL INVESTMENT PORTFOLIO - 98.1% (Cost $2,760,258) |
2,399,751 |
|
|
NET OTHER ASSETS - 1.9% |
46,902 |
|
|
NET ASSETS - 100% |
$ 2,446,653 |
|
|
Security Type Abbreviations |
||
|
QUIPS |
- |
Quarterly
Income |
|
Legend |
|
(a) Non-income producing |
|
(b) S&P credit ratings are used in the absence of a rating by Moody's Investors Service, Inc. |
|
(c) Non-income producing - issuer filed for protection under the Federal Bankruptcy Code or is in default of interest payment. |
|
(d) Debt obligation initially issued in zero coupon form which converts to coupon form at a specified rate and date. The rate shown is the rate at period end. |
|
(e) Security exempt from registration under Rule 144A of the Securities Act of 1933. These securities may be resold in transactions exempt from registration, normally to qualified institutional buyers. At the period end, the value of these securities amounted to $190,436,000 or 7.8% of net assets. |
|
(f) The coupon rate shown on floating or adjustable rate securities represents the rate at period end. |
|
(g) Restricted securities - Investment in securities not registered under the Securities Act of 1933. |
|
Additional information on each holding |
|
Security |
Acquisition Date |
Acquisition Cost (000s) |
|
Micron |
3/3/99 - 7/15/99 |
$ 16,635 |
|
Swerdlow Real |
1/15/99 |
$ 11 |
|
Swerdlow Real |
1/15/99 |
$ 3 |
|
Swerdlow Real |
1/15/99 |
$ 3 |
|
Swerdlow Real |
1/15/99 |
$ 79 |
|
Swerdlow Real |
1/15/99 |
$ 7,619 |
|
(h) Share amount represents number of units held. |
|
Other Information |
|
The composition of long-term debt holdings as a percentage of total value of investments in securities, is as follows (ratings are unaudited): |
|
Moody's Ratings |
S&P Ratings |
|||
|
Aaa, Aa, A |
0.0% |
|
AAA, AA, A |
0.0% |
|
Baa |
1.2% |
|
BBB |
0.8% |
|
Ba |
8.9% |
|
BB |
10.2% |
|
B |
47.9% |
|
B |
48.7% |
|
Caa |
10.7% |
|
CCC |
6.5% |
|
Ca, C |
0.2% |
|
CC, C |
0.0% |
|
|
|
|
D |
0.1% |
|
The percentage not rated by Moody's |
|
Income Tax Information |
|
At October 31, 2000, the aggregate |
|
The fund intends to elect to defer to its |
See accompanying notes which are an integral part of the financial statements.
Semiannual Report
Statement of Assets and Liabilities
|
Amounts in thousands (except per-share amount) |
October 31, 2000 (Unaudited) |
|
|
Assets |
|
|
|
Investment in securities, at value (including repurchase agreements of $115,775) (cost $2,760,258) - |
|
$ 2,399,751 |
|
Cash |
|
18 |
|
Receivable for investments sold |
|
30,257 |
|
Receivable for fund shares sold |
|
1,702 |
|
Dividends receivable |
|
3,273 |
|
Interest receivable |
|
46,936 |
|
Redemption fees receivable |
|
4 |
|
Other receivables |
|
139 |
|
Total assets |
|
2,482,080 |
|
Liabilities |
|
|
|
Payable for investments purchased |
$ 21,473 |
|
|
Payable for fund shares redeemed |
7,524 |
|
|
Distributions payable |
4,833 |
|
|
Accrued management fee |
1,222 |
|
|
Other payables and accrued expenses |
375 |
|
|
Total liabilities |
|
35,427 |
|
Net Assets |
|
$ 2,446,653 |
|
Net Assets consist of: |
|
|
|
Paid in capital |
|
$ 3,062,813 |
|
Undistributed net investment income |
|
134,989 |
|
Accumulated undistributed net realized gain (loss) on investments and foreign currency transactions |
|
(390,642) |
|
Net unrealized appreciation (depreciation) on investments and assets and liabilities in foreign currencies |
|
(360,507) |
|
Net Assets, for 242,652 shares outstanding |
|
$ 2,446,653 |
|
Net Asset Value, offering price and redemption price |
|
$10.08 |
See accompanying notes which are an integral part of the financial statements.
Semiannual Report
Financial Statements - continued
Statement of Operations
|
Amounts in thousands |
Six months ended October 31, 2000 (Unaudited) |
|
|
Investment Income Dividends |
|
$ 28,831 |
|
Interest |
|
128,524 |
|
Total income |
|
157,355 |
|
Expenses |
|
|
|
Management fee |
$ 7,987 |
|
|
Transfer agent fees |
1,730 |
|
|
Accounting fees and expenses |
356 |
|
|
Non-interested trustees' compensation |
5 |
|
|
Custodian fees and expenses |
39 |
|
|
Registration fees |
23 |
|
|
Audit |
21 |
|
|
Legal |
11 |
|
|
Miscellaneous |
1 |
|
|
Total expenses before reductions |
10,173 |
|
|
Expense reductions |
(32) |
10,141 |
|
Net investment income |
|
147,214 |
|
Realized and Unrealized Gain (Loss) Net realized gain (loss) on investment securities |
|
(313,880) |
|
Change in net unrealized appreciation (depreciation) on: |
|
|
|
Investment securities |
(29,956) |
|
|
Assets and liabilities in foreign currencies |
(1) |
(29,957) |
|
Net gain (loss) |
|
(343,837) |
|
Net increase (decrease) in net assets resulting |
|
$ (196,623) |
See accompanying notes which are an integral part of the financial statements.
Semiannual Report
Financial Statements - continued
Statement of Changes in Net Assets
|
Amounts in thousands |
Six months ended
October 31, 2000 |
Year ended |
|
Increase (Decrease) in Net Assets |
|
|
|
Operations |
$ 147,214 |
$ 317,511 |
|
Net realized gain (loss) |
(313,880) |
(44,324) |
|
Change in net unrealized appreciation (depreciation) |
(29,957) |
(424,763) |
|
Net increase (decrease) in net assets resulting |
(196,623) |
(151,576) |
|
Distributions to shareholders |
(115,982) |
(270,396) |
|
In excess of net realized gain |
- |
(24,187) |
|
Return of capital |
- |
(23,280) |
|
Total distributions |
(115,982) |
(317,863) |
|
Share transactions |
220,063 |
1,041,729 |
|
Reinvestment of distributions |
84,106 |
237,134 |
|
Cost of shares redeemed |
(535,861) |
(1,195,890) |
|
Net increase (decrease) in net assets resulting |
(231,692) |
82,973 |
|
Redemption fees |
737 |
2,436 |
|
Total increase (decrease) in net assets |
(543,560) |
(384,030) |
|
Net Assets |
|
|
|
Beginning of period |
2,990,213 |
3,374,243 |
|
End of period (including undistributed net investment income of $134,989 and $103,757, respectively) |
$ 2,446,653 |
$ 2,990,213 |
|
Other Information Shares |
|
|
|
Sold |
20,212 |
86,188 |
|
Issued in reinvestment of distributions |
7,831 |
19,618 |
|
Redeemed |
(49,609) |
(99,571) |
|
Net increase (decrease) |
(21,566) |
6,235 |
See accompanying notes which are an integral part of the financial statements.
Semiannual Report
Financial Highlights
|
|
Six months ended October 31, 2000 |
Years ended April 30, |
||||
|
|
(Unaudited) |
2000 |
1999 |
1998 |
1997 |
1996 |
|
Selected Per-Share Data |
|
|
|
|
|
|
|
Net asset value,
beginning |
$ 11.320 |
$ 13.080 |
$ 13.640 |
$ 12.480 |
$ 12.510 |
$ 11.990 |
|
Income from Invest- |
.577 D |
1.192D |
1.153D |
1.133D |
1.054D |
1.099 |
|
Net realized |
(1.365) |
(1.763) |
(.344) |
1.431 |
.192 |
.723 |
|
Total from investment operations |
(.788) |
(.571) |
.809 |
2.564 |
1.246 |
1.822 |
|
Less Distributions |
|
|
|
|
|
|
|
From net investment income |
(.455) |
(1.017) F |
(1.083) |
(1.100) |
(1.033) |
(1.190) |
|
From net |
- |
- |
(.300) |
(.310) |
(.250) |
(.087) |
|
In excess of net realized gain |
- |
(.093) F |
- |
- |
- |
(.033) |
|
Return of capital |
- |
(.088) |
- |
- |
- |
- |
|
Total distributions |
(.455) |
(1.198) |
(1.383) |
(1.410) |
(1.283) |
(1.310) |
|
Redemption fees
added to paid |
.003 |
.009 |
.014 |
.006 |
.007 |
.008 |
|
Net asset value, |
$ 10.080 |
$ 11.320 |
$ 13.080 |
$ 13.640 |
$ 12.480 |
$ 12.510 |
|
Total Return B, C |
(7.12)% |
(4.48)% |
6.91% |
21.62% |
10.57% |
16.06% |
|
Ratios and Supplemental Data |
|
|
|
|
|
|
|
Net assets, end of period (in millions) |
$ 2,447 |
$ 2,990 |
$ 3,374 |
$ 3,139 |
$ 1,890 |
$ 1,355 |
|
Ratio of expenses to average net assets |
.73% A |
.75% |
.80% |
.80% |
.80% |
.80% |
|
Ratio of expenses to average net assets after expense reductions |
.72% A, E |
.74% E |
.80% |
.80% |
.80% |
.79% E |
|
Ratio of net invest- |
10.52% A |
9.85% |
9.20% |
8.57% |
8.51% |
8.85% |
|
Portfolio turnover |
61% A |
50% |
68% |
85% |
102% |
170% |
A Annualized
B The total returns would have been lower had certain expenses not been reduced during the periods shown.
C Total returns for periods of less than one year are not annualized.
D Net investment income per share has been calculated based on average shares outstanding during the period.
E FMR or the fund has entered into varying arrangements with third parties who either paid or reduced a portion of the fund's expenses.
F The amounts shown reflect certain reclassifications related to book to tax differences.
See accompanying notes which are an integral part of the financial statements.
Semiannual Report
For the period ended October 31, 2000 (Unaudited)
1. Significant Accounting Policies.
Fidelity High Income Fund (the fund) is a fund of Fidelity Fixed-Income Trust (the trust) and is authorized to issue an unlimited number of shares. The trust is registered under the Investment Company Act of 1940, as amended, as an open-end management investment company organized as a Massachusetts business trust. The financial statements have been prepared in conformity with generally accepted accounting principles which require management to make certain estimates and assumptions at the date of the financial statements. The following summarizes the significant accounting policies of the fund:
Security Valuation. Securities for which quotations are readily available are valued by a pricing service at their market values as determined by their most recent bid prices in the principal market (sales prices if the principal market is an exchange) in which such securities are normally traded. Securities (including restricted securities) for which market quotations are not readily available are valued at their fair value as determined in good faith under consistently applied procedures under the general supervision of the Board of Trustees. Short-term securities with remaining maturities of sixty days or less for which quotations are not readily available are valued at amortized cost or original cost plus accrued interest, both of which approximate current value. Investments in open-end investment companies are valued at their net asset value each business day.
Foreign Currency Translation. The accounting records of the fund are maintained in U.S. dollars. Investment securities and other assets and liabilities denominated in a foreign currency are translated into U.S. dollars at the prevailing rates of exchange at period end. Purchases and sales of securities, income receipts and expense payments are translated into U.S. dollars at the prevailing exchange rate on the respective dates of the transactions.
Net realized gains and losses on foreign currency transactions represent net gains and losses from sales and maturities of foreign currency contracts, disposition of foreign currencies, the difference between the amount of net investment income accrued and the U.S. dollar amount actually received, and gains and losses between trade and settlement date on purchases and sales of securities. The effects of changes in foreign currency exchange rates on investments in securities are included with the net realized and unrealized gain or loss on investment securities.
Income Taxes. As a qualified regulated investment company under Subchapter M of the Internal Revenue Code, the fund is not subject to income taxes to the extent that it distributes substantially all of its taxable income for its fiscal year. The schedule of investments includes information regarding income taxes under the caption "Income Tax Information."
Semiannual Report
Notes to Financial Statements (Unaudited) - continued
1. Significant Accounting Policies - continued
Investment Income. Dividend income is recorded on the ex-dividend date, except certain dividends from foreign securities where the ex-dividend date may have passed, are recorded as soon as the fund is informed of the ex-dividend date. Non-cash dividends included in dividend income, if any, are recorded at the fair market value of the securities received. Interest income, which includes accretion of original issue discount, is accrued as earned. Investment income is recorded net of foreign taxes withheld where recovery of such taxes is uncertain. The fund may place a debt obligation on non-accrual status and reduce related interest income by ceasing current accruals and writing off interest receivables when the collection of all or a portion of interest has become doubtful based on consistently applied procedures, under the general supervision of the Board of Trustees of the fund. A debt obligation is removed from non-accrual status when the issuer resumes interest payments or when collectibility of interest is reasonably assured.
Expenses. Most expenses of the trust can be directly attributed to a fund. Expenses which cannot be directly attributed are apportioned among the funds in the trust.
Distributions to Shareholders. Dividends are declared daily and paid monthly from net investment income. Distributions to shareholders from realized capital gains on investments, if any, are recorded on the ex-dividend date.
Income and capital gain distributions are determined in accordance with income tax regulations which may differ from generally accepted accounting principles. These differences, which may result in distribution reclassifications, are primarily due to differing treatments for litigation proceeds, paydown gains/losses on certain securities, market discount, partnerships, non-taxable dividends, capital loss carryforwards, and losses deferred due to wash sales and excise tax regulations.
Permanent book and tax basis differences relating to shareholder distributions will result in reclassifications to paid in capital. Undistributed net investment income and accumulated undistributed net realized gain (loss) on investments and foreign currency transactions may include temporary book and tax basis differences which will reverse in a subsequent period. Any taxable income or gain remaining at fiscal year end is distributed in the following year.
For the period ended April 30, 2000, the fund's distributions exceeded the aggregate amount of taxable income and net realized gains resulting in a return of capital. This was due to reductions in taxable income available for distribution after certain distributions had been made.
Short-Term Trading (Redemption) Fees. Shares held in the fund less than 270 days are subject to a short-term trading fee equal to 1% of the proceeds of the redeemed shares. The fee, which is retained by the fund, is accounted for as an addition to paid in capital.
Semiannual Report
Notes to Financial Statements (Unaudited) - continued
1. Significant Accounting Policies - continued
Security Transactions. Security transactions are accounted for as of trade date. Gains and losses on securities sold are determined on the basis of identified cost.
2. Operating Policies.
Foreign Currency Contracts. The fund generally uses foreign currency contracts to facilitate transactions in foreign-denominated securities. Losses may arise from changes in the value of the foreign currency or if the counterparties do not perform under the contracts' terms. The U.S. dollar value of foreign currency contracts is determined using contractual currency exchange rates established at the time of each trade.
Joint Trading Account. Pursuant to an Exemptive Order issued by the Securities and Exchange Commission (the SEC), the fund, along with other affiliated entities of Fidelity Management & Research Company (FMR), may transfer uninvested cash balances into one or more joint trading accounts. These balances are invested in one or more repurchase agreements for U.S. Treasury or Federal Agency obligations.
Repurchase Agreements. The underlying U.S. Treasury, Federal Agency, or other obligations found to be satisfactory by FMR are transferred to an account of the fund, or to the Joint Trading Account, at a custodian bank. The securities are marked-to-market daily and maintained at a value at least equal to the principal amount of the repurchase agreement (including accrued interest). FMR, the fund's investment adviser, is responsible for determining that the value of the underlying securities remains in accordance with the market value requirements stated above.
Interfund Lending Program. Pursuant to an Exemptive Order issued by the SEC, the fund, along with other registered investment companies having management contracts with FMR, may participate in an interfund lending program. This program provides an alternative credit facility allowing the fund to borrow from, or lend money to, other participating funds.
Restricted Securities. The fund is permitted to invest in securities that are subject to legal or contractual restrictions on resale. These securities generally may be resold in transactions exempt from registration or to the public if the securities are registered. Disposal of these securities may involve time-consuming negotiations and expense, and prompt sale at an acceptable price may be difficult. At the end of the period, restricted securities (excluding 144A issues) amounted to $26,275,000 or 1.1% of net assets.
3. Purchases and Sales of Investments.
Purchases and sales of securities, other than short-term securities, aggregated $807,862,000 and $1,099,616,000, respectively.
Semiannual Report
Notes to Financial Statements (Unaudited) - continued
4. Fees and Other Transactions with Affiliates.
Management Fee. As the fund's investment adviser, FMR receives a monthly fee that is calculated on the basis of a group fee rate plus a fixed individual fund fee rate applied to the average net assets of the fund. The group fee rate is the weighted average of a series of rates and is based on the monthly average net assets of all the mutual funds advised by FMR. The rates ranged from .0920% to .3700% for the period. The annual individual fund fee rate is .45%. In the event that these rates were lower than the contractual rates in effect during the period, FMR voluntarily implemented the above rates, as they resulted in the same or a lower management fee. For the period, the management fee was equivalent to an annualized rate of .58% of average net assets.
Sub-Adviser Fee. Beginning January 1, 2001, FMR Co. (FMRC) will serve as sub-adviser for the fund. FMRC is a wholly owned subsidiary of FMR and will receive a fee from FMR of 50% of the management fee payable to FMR with respect to that portion of the fund's assets that will be managed by FMRC.
Transfer Agent Fees. Fidelity Service Company, Inc. (FSC), an affiliate of FMR, is the fund's transfer, dividend disbursing and shareholder servicing agent. FSC receives account fees and asset-based fees that vary according to account size and type of account. FSC pays for typesetting, printing and mailing of all shareholder reports, except proxy statements. For the period, the transfer agent fees were equivalent to an annualized rate of .12% of average net assets.
Accounting Fees. FSC maintains the fund's accounting records. The fee is based on the level of average net assets for the month plus out-of-pocket expenses.
Brokerage Commissions. The fund placed a portion of its portfolio transactions with brokerage firms which are affiliates of FMR. The commissions paid to these affiliated firms were $23,000 for the period.
5. Interfund Lending Program.
The fund participated in the interfund lending program as a lender. The average daily loan balance during the period for which loans were outstanding amounted to $4,546,000. The weighted average interest rate was 6.62%. Interest earned from the interfund lending program amounted to $7,000 and is included in interest income on the Statement of Operations. At period end there were no interfund loans outstanding.
6. Expense Reductions.
FMR has directed certain portfolio trades to brokers who paid a portion of the fund's expenses. For the period, the fund's expenses were reduced by $16,000 under this arrangement.
In addition, through an arrangement with the fund's transfer agent, credits realized as a result of uninvested cash balances were used to reduce a portion of the fund's expenses. During the period, the fund's transfer agent fees were reduced by $16,000 under this arrangement.
Semiannual Report
For directions and hours,
please call 1-800-544-9797.
Arizona
7373 N. Scottsdale Road
Scottsdale, AZ
California
815 East Birch Street
Brea, CA
851 East Hamilton Avenue
Campbell, CA
527 North Brand Boulevard
Glendale, CA
19200 Von Karman Avenue
Irvine, CA
10100 Santa Monica Blvd.
Los Angeles, CA
251 University Avenue
Palo Alto, CA
1760 Challenge Way
Sacramento, CA
7676 Hazard Center Drive
San Diego, CA
8 Montgomery Street
San Francisco, CA
950 Northgate Drive
San Rafael, CA
1400 Civic Drive
Walnut Creek, CA
6300 Canoga Avenue
Woodland Hills, CA
Colorado
1625 Broadway
Denver, CO
Connecticut
48 West Putnam Avenue
Greenwich, CT
265 Church Street
New Haven, CT
300 Atlantic Street
Stamford, CT
29 South Main Street
West Hartford, CT
Delaware
222 Delaware Avenue
Wilmington, DE
Florida
4400 N. Federal Highway
Boca Raton, FL
90 Alhambra Plaza
Coral Gables, FL
4090 N. Ocean Boulevard
Ft. Lauderdale, FL
1907 West State Road 434
Longwood, FL
8880 Tamiami Trail, North
Naples, FL
2401 PGA Boulevard
Palm Beach Gardens, FL
8065 Beneva Road
Sarasota, FL
1502 N. Westshore Blvd.
Tampa, FL
Georgia
3445 Peachtree Road, N.E.
Atlanta, GA
1000 Abernathy Road
Atlanta, GA
Illinois
One North Franklin Street
Chicago, IL
1415 West 22nd Street
Oak Brook, IL
1700 East Golf Road
Schaumburg, IL
3232 Lake Avenue
Wilmette, IL
Indiana
4729 East 82nd Street
Indianapolis, IN
Maine
Three Canal Plaza
Portland, ME
Maryland
7401 Wisconsin Avenue
Bethesda, MD
One W. Pennsylvania Ave.
Towson, MD
Massachusetts
801 Boylston Street
Boston, MA
155 Congress Street
Boston, MA
25 State Street
Boston, MA
300 Granite Street
Braintree, MA
44 Mall Road
Burlington, MA
416 Belmont Street
Worcester, MA
Semiannual Report
Michigan
280 Old N. Woodward Ave.
Birmingham, MI
29155 Northwestern Hwy.
Southfield, MI
Minnesota
7600 France Avenue South
Edina, MN
Missouri
700 West 47th Street
Kansas City, MO
8885 Ladue Road
Ladue, MO
New Jersey
150 Essex Street
Millburn, NJ
56 South Street
Morristown, NJ
501 Route 17, South
Paramus, NJ
New York
1055 Franklin Avenue
Garden City, NY
999 Walt Whitman Road
Melville, L.I., NY
1271 Avenue of the Americas
New York, NY
71 Broadway
New York, NY
350 Park Avenue
New York, NY
North Carolina
4611 Sharon Road
Charlotte, NC
Ohio
600 Vine Street
Cincinnati, OH
28699 Chagrin Boulevard
Woodmere Village, OH
Oregon
16850 SW 72nd Avenue
Tigard, OR
Pennsylvania
1735 Market Street
Philadelphia, PA
439 Fifth Avenue
Pittsburgh, PA
Rhode Island
47 Providence Place
Providence, RI
Tennessee
6150 Poplar Avenue
Memphis, TN
Texas
10000 Research Boulevard
Austin, TX
4017 Northwest Parkway
Dallas, TX
1155 Dairy Ashford Street
Houston, TX
2701 Drexel Drive
Houston, TX
400 East Las Colinas Blvd.
Irving, TX
14100 San Pedro
San Antonio, TX
19740 IH 45 North
Spring, TX
Utah
215 South State Street
Salt Lake City, UT
Virginia
1861 International Drive
McLean, VA
Washington
411 108th Avenue, N.E.
Bellevue, WA
511 Pine Street
Seattle, WA
Washington, DC
1900 K Street, N.W.
Washington, DC
Wisconsin
595 North Barker Road
Brookfield, WI
Fidelity Brokerage Services, Inc., 100 Summer St., Boston, MA 02110 Member NYSE/SIPC
Semiannual Report
Fidelity offers several ways to conveniently manage your personal investments via your telephone or PC. You can access your account information, conduct trades and research your investments 24 hours a day.
By Phone
Fidelity Automated Service Telephone provides a single toll-free number to access account balances, positions, quotes and trading. It's easy to navigate the service, and on your first call, the system will help you create a personal identification number (PIN) for security.
(phone_graphic)
Fidelity Automated
Service Telephone (FAST®)
1-800-544-5555
Press
1 For mutual fund and brokerage trading.
2 For quotes.*
3 For account balances and holdings.
4 To review orders and mutual
fund activity.
5 To change your PIN.
*0 To speak to a Fidelity representative.
By PC
Fidelity's web site on the Internet provides a wide range of information, including daily financial news, fund performance, interactive planning tools and news about Fidelity products and services.
(computer_graphic)
Fidelity's Web Site
www.fidelity.com
If you are not currently on the Internet, call EarthLink Sprint at 1-800-288-2967, and be sure to ask for registration number SMD004 to receive a special Fidelity package that includes 30 days of free Internet access. EarthLink is North America's #1 independent Internet access provider.
(computer_graphic)
Fidelity On-line Xpress+®
Fidelity On-line Xpress+ software for Windows combines comprehensive portfolio management capabilities, securities trading and access to research and analysis tools . . . all on your desktop. Call Fidelity at 1-800-544-0240 or visit our web site for more information on how to manage your investments via your PC.
* When you call the quotes line, please remember that a fund's yield and return will vary and, except for money market funds, share price will also vary. This means that you may have a gain or loss when you sell your shares. There is no assurance that money market funds will be able to maintain a stable $1 share price; an investment in a money market fund is not insured or guaranteed by the U.S. government. Total returns are historical and include changes in share price, reinvestment of dividends and capital gains, and the effects of any sales charges.
Semiannual Report
If more than one address is listed, please locate the address that is closest to you. We'll give your correspondence immediate attention and send you written confirmation upon completion of your request.
(letter_graphic)
Making Changes
To Your Account
(such as changing name, address, bank, etc.)
Fidelity Investments
P.O. Box 770001
Cincinnati, OH 45277-0002
(letter_graphic)
For Non-Retirement
Accounts
Buying shares
Fidelity Investments
P.O. Box 770001
Cincinnati, OH 45277-0003
Overnight Express
Fidelity Investments
2300 Litton Lane - KH1A
Hebron, KY 41048
Selling shares
Fidelity Investments
P.O. Box 660602
Dallas, TX 75266-0602
Overnight Express
Fidelity Investments
Attn: Redemptions - CP6I
400 East Las Colinas Blvd.
Irving, TX 75039-5587
General Correspondence
Fidelity Investments
P.O. Box 500
Merrimack, NH 03054-0500
(letter_graphic)
For Retirement
Accounts
Buying shares
Fidelity Investments
P.O. Box 770001
Cincinnati, OH 45277-0003
Selling shares
Fidelity Investments
P.O. Box 660602
Dallas, TX 75266-0602
Overnight Express
Fidelity Investments
Attn: Redemptions - CP6R
400 East Las Colinas Blvd.
Irving, TX 75039-5587
General Correspondence
Fidelity Investments
P.O. Box 500
Merrimack, NH 03054-0500
Semiannual Report
Investment Adviser
Fidelity Management & Research Company Boston, MA
Investment Sub-Advisers
Fidelity Management & Research (U.K.) Inc.
Fidelity Management & Research
(Far East) Inc.
Fidelity Investments Japan Limited
Officers
Edward C. Johnson 3d, President
Robert C. Pozen, Senior Vice President
Frederick D. Hoff Jr., Vice President
Robert A. Lawrence, Vice President
Eric D. Roiter, Secretary
Robert A. Dwight, Treasurer
Maria F. Dwyer, Deputy Treasurer
John H. Costello, Assistant Treasurer
Thomas J. Simpson, Assistant Treasurer
Board of Trustees
Ralph F. Cox *
Phyllis Burke Davis *
Robert M. Gates *
Edward C. Johnson 3d
Donald J. Kirk *
Ned C. Lautenbach *
Peter S. Lynch
Marvin L. Mann *
William O. McCoy *
Gerald C. McDonough *
Robert C. Pozen
Thomas R. Williams *
Advisory Board
J. Michael Cook
Abigail P. Johnson
Marie L. Knowles
General Distributor
Fidelity Distributors Corporation
Boston, MA
* Independent trustees
Transfer and Shareholder
Servicing Agent
Fidelity Service Company, Inc.
Boston, MA
Custodian
The Bank of New York
New York, NY
Fidelity's Taxable Bond Funds
Capital & Income
Ginnie Mae
Government Income
High Income
Intermediate Bond
Intermediate Government Income
International Bond
Investment Grade Bond
New Markets Income
Short-Term Bond
Spartan® Government Income
Spartan Investment Grade Bond
Strategic Income
Target TimelineSM 2001 & 2003
The Fidelity Telephone Connection
Mutual Fund 24-Hour Service
Exchanges/Redemptions
and Account Assistance 1-800-544-6666
Product Information 1-800-544-6666
Retirement Accounts 1-800-544-4774
(8 a.m. - 9 p.m.)
TDD Service 1-800-544-0118
for the deaf and hearing impaired
(9 a.m. - 9 p.m. Eastern time)
Fidelity Automated Service
Telephone (FAST®) (automated graphic) 1-800-544-5555
(automated graphic) Automated line for quickest service
SPH-SANN-1200 118642
1.538299.103
(Fidelity Investment logo)(registered trademark)
Corporate Headquarters
82 Devonshire St., Boston, MA 02109
www.fidelity.com
|
|