
|
|
|
|
|
|
|
|
|
Fidelity®
Fund
Semiannual Report
October 31, 2000
(2_fidelity_logos)
|
President's Message |
3 |
Ned Johnson on investing strategies. |
|
Performance |
4 |
How the fund has done over time. |
|
Fund Talk |
7 |
The manager's review of fund performance, strategy and outlook. |
|
Investment Changes |
10 |
A summary of major shifts in the fund's investments over the past six months. |
|
Investments |
11 |
A complete list of the fund's investments with their market values. |
|
Financial Statements |
23 |
Statements of assets and liabilities,
operations, and changes in net assets, |
|
Notes |
27 |
Notes to the financial statements. |
|
|
|
|
To reduce expenses, only one copy of most financial reports and prospectuses may be mailed to households, even if more than one person in the household has an account in the fund. Call Fidelity at 1-800-544-8544 if you need additional copies of financial reports or prospectuses. If you do not want the mailing of these documents to be combined with those for other members of your household, contact Fidelity in writing at P.O. Box 5000, Cincinnati, OH 45273-8692.
Standard & Poor's, S&P and S&P 500 are registered service marks of The McGraw-Hill Companies, Inc. and have been licensed for use by Fidelity Distributors Corporation.
Third party marks appearing herein are the property of their respective owners.
All other marks appearing herein are registered or unregistered trademarks or service marks of FMR Corp. or an affiliated company.
(Recycle graphic) This report is printed on recycled paper using soy-based inks.
This report and the financial statements contained herein are submitted for the general information of the shareholders of the fund. This report is not authorized for distribution to prospective investors in the fund unless preceded or accompanied by an effective prospectus.
Mutual fund shares are not deposits or obligations of, or guaranteed by, any depository institution. Shares are not insured by the FDIC, Federal Reserve Board or any other agency, and are subject to investment risks, including possible loss of principal amount invested.
Neither the fund nor Fidelity Distributors Corporation is a bank.
For more information on any Fidelity fund, including charges and expenses, call 1-800-544-6666 for a free prospectus. Read it carefully before you invest or send money.
Semiannual Report
(photo_of_Edward_C_Johnson_3d)
Dear Shareholder:
A sixth-straight year of double-digit positive returns for the Dow Jones Industrial Average, NASDAQ and S&P 500® could be in jeopardy unless the U.S. stock market shows marked improvement in the final two months of 2000. Through October, all three indexes had negative year-to-date returns. On the other hand, most fixed-income sectors were solidly in the black. Treasuries and other long-term government securities led the way, returning nearly 14%.
While it's impossible to predict the future direction of the markets with any degree of certainty, there are certain basic principles that can help investors plan for their future needs.
The longer your investment time frame, the less likely it is that you will be affected by short-term market volatility. A 10-year investment horizon appropriate for saving for a college education, for example, enables you to weather market cycles in a long-term fund, which may have a higher risk potential, but also has a higher potential rate of return.
An intermediate-length fund could make sense if your investment horizon is two to four years, while a short-term bond fund could be the right choice if you need your money in one or two years.
If your time horizon is less than a year, you might want to consider moving some of your bond investment into a money market fund. These funds seek income and a stable share price by investing in high-quality, short-term investments. Of course, it's important to remember that an investment in a money market fund is not insured or guaranteed by the Federal Deposit Insurance Corporation or any other government agency. Although money market funds seek to preserve the value of your investment at $1.00 per share, it is possible to lose money by investing in these types of funds.
Finally, no matter what your time horizon or portfolio diversity, it makes good sense to follow a regular investment plan, investing a certain amount of money in a fund at the same time each month or quarter and periodically reviewing your overall portfolio. By doing so, you won't get caught up in the excitement of a rapidly rising market, nor will you buy all your shares at market highs. While this strategy - known as dollar cost averaging - won't assure a profit or protect you from a loss in a declining market, it should help you lower the average cost of your purchases. Of course, you should consider your financial ability to continue your purchases through periods of low price levels before undertaking such a strategy.
If you have questions, please call us at 1-800-544-6666, or visit our web site at www.fidelity.com. We are available 24 hours a day, seven days a week to provide you the information you need to make the investments that are right for you.
Best regards,
/s/Edward C. Johnson 3d
Edward C. Johnson 3d
Semiannual Report
There are several ways to evaluate a fund's historical performance. You can look at the total percentage change in value, the average annual percentage change or the growth of a hypothetical $10,000 investment. Total return reflects the change in the value of an investment, assuming reinvestment of the fund's dividend income and capital gains (the profits earned upon the sale of securities that have grown in value). You can also look at the fund's income, as reflected in the fund's yield, to measure performance.
Cumulative Total Returns
|
Periods ended October 31, 2000 |
Past 6 |
Past 1 |
Past 5 |
Past 10 |
|
Fidelity Investment Grade Bond |
5.26% |
6.80% |
31.88% |
118.24% |
|
LB Aggregate Bond |
5.80% |
7.30% |
35.94% |
115.51% |
|
Intermediate Investment Grade Debt |
4.82% |
5.84% |
29.74% |
107.58% |
Cumulative total returns show the fund's performance in percentage terms over a set period - in this case, six months, one year, five years or 10 years. For example, if you had invested $1,000 in a fund that had a 5% return over the past year, the value of your investment would be $1,050. You can compare the fund's returns to the performance of the Lehman Brothers Aggregate Bond Index - a market value-weighted index of investment-grade fixed-rate debt issues, including government, corporate, asset-backed and mortgage-backed securities, with maturities of one year or more. To measure how the fund's performance stacked up against its peers, you can compare it to the intermediate investment grade debt funds average, which reflects the performance of mutual funds with similar objectives tracked by Lipper Inc. The past six months average represents a peer group of 302 mutual funds. These benchmarks reflect reinvestment of dividends and capital gains, if any, and exclude the effect of sales charges.
Average Annual Total Returns
|
Periods ended October 31, 2000 |
Past 1 |
Past 5 |
Past 10 |
|
Fidelity Investment Grade Bond |
6.80% |
5.69% |
8.12% |
|
LB Aggregate Bond |
7.30% |
6.33% |
7.98% |
|
Intermediate Investment Grade Debt |
5.84% |
5.34% |
7.55% |
Average annual total returns take the fund's cumulative return and show you what would have happened if the fund had performed at a constant rate each year. (Note: Lipper calculates average annual total returns by annualizing each fund's total return, then taking an arithmetic average. This may produce a different figure than that obtained by averaging the cumulative total returns and annualizing the result.)
Semiannual Report
Performance - continued
$10,000 Over 10 Years
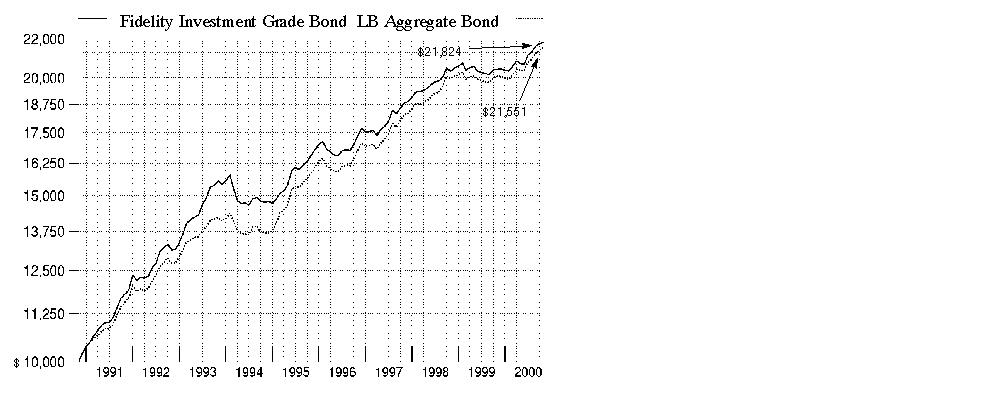
$10,000 Over 10 Years: Let's say hypothetically that $10,000 was invested in Fidelity Investment Grade Bond Fund on October 31, 1990. As the chart shows, by October 31, 2000, the value of the investment would have grown to $21,824 - a 118.24% increase on the initial investment. For comparison, look at how the Lehman Brothers Aggregate Bond Index did over the same period. With dividends and capital gains, if any, reinvested, the same $10,000 would have grown to $21,551 - a 115.51% increase.
Understanding
Performance
How a fund did yesterday is no guarantee of how it will do tomorrow. Bond prices, for example, generally move in the opposite direction of interest rates. In turn, the share price, return and yield of a fund that invests in bonds will vary. That means if you sell your shares during a market downturn, you might lose money. But if you can ride out the market's ups and downs, you may have a gain.
3Semiannual Report
Performance - continued
Total Return Components
|
|
Six months ended October 31, |
Years ended April 30, |
||||
|
|
2000 |
2000 |
1999 |
1998 |
1997 |
1996 |
|
Dividend returns |
3.36% |
6.09% |
5.85% |
6.55% |
6.70% |
6.77% |
|
Capital returns |
1.90% |
-5.38% |
-0.27% |
3.99% |
-0.28% |
0.85% |
|
Total returns |
5.26% |
0.71% |
5.58% |
10.54% |
6.42% |
7.62% |
Total return components include both dividend returns and capital returns. A dividend return reflects the actual dividends paid by the fund. A capital return reflects both the amount paid by the fund to shareholders as capital gain distributions and changes in the fund's share price. Both returns assume the dividends or capital gains, if any, paid by the fund are reinvested.
Dividends and Yield
|
Periods ended October 31, 2000 |
Past 1 |
Past 6 |
Past 1 |
|
Dividends per share |
3.82¢ |
22.65¢ |
44.64¢ |
|
Annualized dividend rate |
6.42% |
6.48% |
6.45% |
|
30-day annualized yield |
6.61% |
- |
- |
Dividends per share show the income paid by the fund for a set period and do not reflect any tax reclassifications. If you annualize this number, based on an average share price of $7.01 over the past one month, $6.93 over the past six months and $6.92 over the past one year, you can compare the fund's income over these three periods. The 30-day annualized yield is a standard formula for all bond funds based on the yields of the bonds in the fund, averaged over the past 30 days. This figure shows you the yield characteristics of the fund's investments at the end of the period. It also helps you compare funds from different companies on an equal basis.
Semiannual Report
Market Recap
Strong technical factors in the market helped most investment-grade bonds overcome unusually volatile market conditions, enabling them to handily outperform most major U.S. equity indexes during the six-month period that ended October 31, 2000. The Lehman Brothers Aggregate Bond Index - a popular measure of taxable-bond performance - returned 5.80% during this time frame. Treasuries continued their hot streak from the beginning of 2000 thanks to a swelling federal surplus and the U.S. government's decision to buy back increasingly larger amounts of outstanding long-term debt. Anticipation that the Fed was finished raising interest rates following a half-point hike in May, combined with persistent flights-to-safety from risk-averse investors concerned about volatility in equity markets, further bolstered the long bond, helping the Lehman Brothers Treasury Index return 5.50% during the period. Mortgage and agency securities rallied back from their period lows in May to post formidable six-month returns. Discount mortgages were boosted by higher-than-normal prepayment activity supported by a strong housing market. Agencies staged a comeback behind reduced political risk surrounding government-sponsored enterprises. During the past six months, the Lehman Brothers Mortgage-Backed Securities and U.S. Agency indexes returned 6.24% and 6.08%, respectively. The corporate sector was the worst-performing segment of the market, plagued by deteriorating credit conditions and growing supply pressures. The Lehman Brothers Credit Bond Index posted a 5.37% return during the six-month period.
(Portfolio Manager photograph)
An interview with Kevin Grant, Portfolio Manager of Fidelity Investment Grade Bond Fund
Q. How did the fund perform, Kevin?
A. For the six months that ended October 31, 2000, the fund returned 5.26%, outpacing the intermediate investment grade debt funds average tracked by Lipper Inc., which returned 4.82%. The Lehman Brothers Aggregate Bond Index returned 5.80% during this same time frame. For the 12 months that ended October 31, 2000, the fund returned 6.80%, while the Lipper average and Lehman Brothers index returned 5.84% and 7.30%, respectively.
Q. What factors had the most influence on fund performance?
A. The fund's underexposure to agencies hurt, as these securities rebounded nicely during the period after struggling in the spring under a political cloud in Washington that threatened to strip Fannie Mae and Freddie Mac of their implicit government backing. Clearly, owning more agencies would have been a positive for the fund, but I felt there were better opportunities elsewhere. On the plus side, the fund's positioning in Treasuries helped us gain ground on the index. Treasuries led the market during the first half of 2000, spurred by the U.S. government's decision to repurchase outstanding debt as a result of the growing federal surplus. Even though we were underweighted relative to the index at this time, we managed to narrow the performance gap by way of security selection. We benefited by positioning the fund ahead of the buybacks in long-term Treasuries and callable Treasuries. This was an effective strategy for us.
Semiannual Report
Fund Talk: The Manager's Overview - continued
Q. What other strategies worked?
A. Anticipating interest rates rising further earlier in the year, I reduced the fund's overweighting in corporates, particularly its long-standing emphasis on banks - a posture that worked out well for us in the past - because I felt that it would be extremely difficult for these securities to outperform in a more difficult credit environment. This strategy paid off as the market proceeded to punish the group during the spring and early fall. Overall, I became much more defensive in terms of our corporate holdings, reducing our risk exposure through increased diversification. Although we weren't immune to a handful of issues that imploded during the period, the fact that we owned smaller positions than the index - even avoiding some entirely - helped limit our downside. Despite the fact that most corporates lagged the rest of the market, tactical allocations into various subsectors, such as energy, aided relative performance. The fund benefited from buying bonds from high-quality issuers when oil was trading at around $11 per barrel, which offered a tremendous value opportunity, and selling some of them as oil eclipsed the $30 plateau. Owning Yankee bonds - dollar-denominated securities issued by foreign entities - at the expense of banks also helped. Moreover, by investing in other defensive issues, including commercial mortgage-backed securities, we were able to further diversify the portfolio while providing the fund with some additional yield. In hindsight, I wish I had sold all of our credit risk earlier in the year. I trimmed positions as prudently as possible, but I wanted to maintain some sort of yield in the fund. Still, we maintained an edge over our Lipper peers by holding fewer long-term, lower-quality corporate bonds, which underperformed all sectors of the investment-grade market during the period.
Q. How did the fund's mortgage holdings fare?
A. We were rewarded for our emphasis on seasoned discount bonds - mortgages created in 1996 and 1997 - which benefited from strong housing turnover fueled by a robust economy. A red-hot housing market meant higher-than-normal prepayment activity, which resulted in a steady windfall for us as we got prepaid at par, or face value, while market prices were at discounts.
Q. What's your outlook?
A. I feel that investment-grade bonds should continue to produce reasonably attractive absolute returns in the coming months. I think there's a lot of value in non-Treasury markets, especially in the corporate segment where prices haven't been this low in over a decade. By historical standards, investors are currently paid handsomely for taking on additional risk. Since it seems like it will be tougher to make money on Treasuries going forward, I plan to maintain an overweighting in corporate bonds - focusing on the more defensive sectors and adding to the fund's positions while valuations appear attractive.
Semiannual Report
Fund Talk: The Manager's Overview - continued
The views expressed in this report reflect those of the portfolio manager only through the end of the period of the report as stated on the cover and do not necessarily represent the views of Fidelity or any other person in the Fidelity organization. Any such views are subject to change at any time based upon market or other conditions and Fidelity disclaims any responsibility to update such views. These views may not be relied on as investment advice and, because investment decisions for a Fidelity fund are based on numerous factors, may not be relied on as an indication of trading intent on behalf of any Fidelity fund.
Fund Facts
Goal: high current income by investing mainly in investment-grade securities
Fund number: 026
Trading symbol: FBNDX
Start date: August 6, 1971
Size: as of October 31, 2000, more than $2.3 billion
Manager: Kevin Grant, since 1997; manager, several Fidelity investment-grade taxable bond funds; joined Fidelity in 1993
3Kevin Grant on the importance of diversification in today's market:
"Diversification has been an important theme for me for quite some time now. The idea is that it's a very tough environment for corporations these days, and it's become increasingly difficult to predict random credit events that besiege companies. The only way, I feel, to truly protect yourself from negative event risk is through diversification.
"It's important to note that diversification works differently for bonds than it does for stocks. Concentrated stock portfolios can work because stocks are capable of doubling, tripling or even rising tenfold. When this happens, it can cover up a lot of duds, or issues that go to zero. However, it's not that easy for bonds, which don't have the luxury of growing in price exponentially. So, if a company gets into trouble, bondholders are left holding the bag. On the other hand, if things work out well, investors are limited to the yield on the bond and, if they're fortunate, a bit of price appreciation to go along with it.
"As a money manager, I want the advantages of owning corporate bonds without being heavily exposed to a small number of issuers. The only way to do that is to own a lot of names. By leveraging the research strength and trading capabilities of Fidelity, we're able to do just that, which gives us the opportunity to succeed."
Semiannual Report
|
Quality Diversification as of October 31, 2000 |
||
|
(Moody's Ratings) |
% of fund's investments |
% of fund's investments |
|
Aaa |
58.0 |
61.1 |
|
Aa |
2.1 |
1.9 |
|
A |
10.7 |
10.5 |
|
Baa |
17.4 |
20.0 |
|
Ba and Below |
0.1 |
0.9 |
|
Table excludes short-term investments. Where Moody's ratings are not available, we have used S&P ® ratings. |
|
Average Years to Maturity as of October 31, 2000 |
||
|
|
|
6 months ago |
|
Years |
9.5 |
8.8 |
|
Average years to maturity is based on the average time remaining until principal payments are expected from each of the fund's bonds, weighted by dollar amount. |
|
Duration as of October 31, 2000 |
||
|
|
|
6 months ago |
|
Years |
4.7 |
5.1 |
|
Duration shows how much a bond fund's price fluctuates with changes in comparable interest rates. If rates rise 1%, for example, a fund with a five-year duration is likely to lose about 5% of its value. Other factors also can influence a bond fund's performance and share price. Accordingly, a bond fund's actual performance may differ from this example. |
|
Asset Allocation (% of fund's net assets) |
|||||||
|
As of October 31, 2000 * |
As of April 30, 2000 ** |
||||||
 |
Corporate Bonds 27.1% |
|
|
Corporate Bonds 29.7% |
|
||
 |
U.S. Government and Government Agency Obligations 55.4% |
|
|
U.S. Government and Government Agency Obligations 58.6% |
|
||
 |
Asset-Backed |
|
|
Asset-Backed |
|
||
 |
CMOs and Other Mortgage Related Securities 3.6% |
|
|
CMOs and Other Mortgage Related Securities 2.0% |
|
||
 |
Other Investments 1.9% |
|
|
Other Investments 2.7% |
|
||
 |
Short-Term |
|
|
Short-Term |
|
||
|
* Foreign investments |
7.5% |
|
** Foreign investments |
8.9% |
|
||

Semiannual Report
(Unaudited)
Showing Percentage of Net Assets
|
Nonconvertible Bonds - 27.1% |
|||||
|
Moody's Ratings (unaudited) (a) |
Principal Amount (000s) |
Value (Note 1) (000s) |
|||
|
BASIC INDUSTRIES - 0.1% |
|||||
|
Paper & Forest Products - 0.1% |
|||||
|
Fort James Corp. 6.625% 9/15/04 |
Baa2 |
|
$ 1,060 |
$ 1,010 |
|
|
CONSTRUCTION & REAL ESTATE - 2.0% |
|||||
|
Real Estate - 0.3% |
|||||
|
Cabot Industrial Property LP 7.125% 5/1/04 |
Baa2 |
|
4,005 |
3,889 |
|
|
Duke Realty LP 7.3% 6/30/03 |
Baa1 |
|
4,000 |
3,976 |
|
|
|
7,865 |
||||
|
Real Estate Investment Trusts - 1.7% |
|||||
|
CenterPoint Properties Trust 6.75% 4/1/05 |
Baa2 |
|
2,490 |
2,366 |
|
|
Equity Office Properties Trust: |
|
|
|
|
|
|
6.5% 1/15/04 |
Baa1 |
|
7,290 |
7,068 |
|
|
6.625% 2/15/05 |
Baa1 |
|
7,250 |
6,996 |
|
|
6.75% 2/15/08 |
Baa1 |
|
5,560 |
5,178 |
|
|
ProLogis Trust 6.7% 4/15/04 |
Baa1 |
|
1,715 |
1,663 |
|
|
Spieker Properties LP: |
|
|
|
|
|
|
6.75% 1/15/08 |
Baa2 |
|
15,000 |
14,001 |
|
|
6.8% 5/1/04 |
Baa2 |
|
2,195 |
2,135 |
|
|
|
39,407 |
||||
|
TOTAL CONSTRUCTION & REAL ESTATE |
47,272 |
||||
|
DURABLES - 0.1% |
|||||
|
Autos, Tires, & Accessories - 0.1% |
|||||
|
Daimler-Chrysler North America Holding Corp. 8% 6/15/10 |
A1 |
|
2,300 |
2,336 |
|
|
ENERGY - 2.1% |
|||||
|
Oil & Gas - 2.1% |
|||||
|
Anadarko Petroleum Corp.: |
|
|
|
|
|
|
7% 11/15/27 |
Baa1 |
|
4,815 |
4,376 |
|
|
7.2% 3/15/29 |
Baa1 |
|
7,580 |
7,131 |
|
|
Apache Corp.: |
|
|
|
|
|
|
7.625% 7/1/19 |
Baa1 |
|
2,055 |
2,040 |
|
|
7.7% 3/15/26 |
Baa1 |
|
1,600 |
1,580 |
|
|
Apache Finance Property Ltd. 6.5% 12/15/07 |
Baa1 |
|
800 |
762 |
|
|
Duke Energy Field Services LLC 7.875% 8/16/10 |
Baa2 |
|
8,000 |
8,165 |
|
|
Oryx Energy Co. 8.125% 10/15/05 |
Baa1 |
|
4,285 |
4,461 |
|
|
Petro-Canada 7% 11/15/28 |
A3 |
|
3,850 |
3,475 |
|
|
Nonconvertible Bonds - continued |
|||||
|
Moody's Ratings (unaudited) (a) |
Principal Amount (000s) |
Value (Note 1) (000s) |
|||
|
ENERGY - continued |
|||||
|
Oil & Gas - continued |
|||||
|
Ras Laffan Liquid Natural Gas Co. Ltd. yankee 8.294% 3/15/14 (c) |
Baa3 |
|
$ 6,400 |
$ 6,130 |
|
|
Tosco Corp. 8.125% 2/15/30 |
Baa2 |
|
9,800 |
9,953 |
|
|
|
48,073 |
||||
|
FINANCE - 11.7% |
|||||
|
Banks - 4.9% |
|||||
|
ABN-Amro Bank NV, Chicago 6.625% 10/31/01 |
A1 |
|
3,000 |
2,988 |
|
|
Banc One Corp. 7.25% 8/1/02 |
A1 |
|
2,000 |
2,006 |
|
|
Bank of Montreal 6.1% 9/15/05 |
A1 |
|
4,000 |
3,810 |
|
|
Bank One Capital III 8.75% 9/1/30 |
Aa3 |
|
4,200 |
4,101 |
|
|
Bank One Corp. 7.875% 8/1/10 |
A1 |
|
11,700 |
11,773 |
|
|
BankBoston Corp. 6.625% 2/1/04 |
A3 |
|
4,000 |
3,922 |
|
|
Barclays Bank PLC yankee: |
|
|
|
|
|
|
5.95% 7/15/01 |
A1 |
|
10,100 |
10,041 |
|
|
8.55% 9/29/49 (b)(c) |
Aa2 |
|
7,985 |
8,039 |
|
|
Capital One Bank 6.375% 2/15/03 |
Baa2 |
|
4,550 |
4,415 |
|
|
Capital One Financial Corp. 7.125% 8/1/08 |
Baa3 |
|
5,490 |
5,211 |
|
|
First Tennessee National Corp. 6.75% 11/15/05 |
A3 |
|
1,650 |
1,608 |
|
|
FleetBoston Financial Corp. 7.25% 9/15/05 |
A2 |
|
5,790 |
5,803 |
|
|
HSBC Finance Nederland BV 7.4% 4/15/03 (c) |
A1 |
|
750 |
757 |
|
|
Kansallis-Osake-Pankki (NY Branch) yankee 10% 5/1/02 |
A1 |
|
1,780 |
1,848 |
|
|
Korea Development Bank: |
|
|
|
|
|
|
6.625% 11/21/03 |
Baa2 |
|
4,975 |
4,772 |
|
|
7.125% 4/22/04 |
Baa2 |
|
725 |
705 |
|
|
7.375% 9/17/04 |
Baa2 |
|
3,985 |
3,892 |
|
|
MBNA Corp.: |
|
|
|
|
|
|
6.34% 6/2/03 |
Baa2 |
|
1,800 |
1,738 |
|
|
6.875% 11/15/02 |
Baa2 |
|
8,300 |
8,269 |
|
|
National Westminster Bank PLC yankee 7.375% 10/1/09 |
Aa3 |
|
2,935 |
2,890 |
|
|
Providian National Bank 6.75% 3/15/02 |
Baa3 |
|
4,000 |
3,947 |
|
|
Royal Bank of Scotland Group PLC 9.118% 3/31/49 |
A1 |
|
3,750 |
3,906 |
|
|
Summit Bancorp 8.625% 12/10/02 |
A3 |
|
5,500 |
5,640 |
|
|
Union Planters Corp. 6.75% 11/1/05 |
Baa2 |
|
3,000 |
2,887 |
|
|
Nonconvertible Bonds - continued |
|||||
|
Moody's Ratings (unaudited) (a) |
Principal Amount (000s) |
Value (Note 1) (000s) |
|||
|
FINANCE - continued |
|||||
|
Banks - continued |
|||||
|
Union Planters National Bank 6.81% 8/20/01 |
A3 |
|
$ 4,000 |
$ 3,996 |
|
|
Zions Bancorp 8.625% 10/15/02 |
Baa1 |
|
5,000 |
5,105 |
|
|
|
114,069 |
||||
|
Credit & Other Finance - 6.1% |
|||||
|
Abbey National Capital Trust I 8.963% 12/29/49 (d) |
Aa3 |
|
2,850 |
2,839 |
|
|
Associates Corp. of North America: |
|
|
|
|
|
|
6% 4/15/03 |
A1 |
|
5,500 |
5,379 |
|
|
6% 7/15/05 |
A1 |
|
9,500 |
9,103 |
|
|
Bell Atlantic Financial Service, Inc. 7.6% 3/15/07 |
A1 |
|
3,200 |
3,262 |
|
|
CIT Group, Inc. 5.5% 2/15/04 |
A1 |
|
2,240 |
2,105 |
|
|
Citigroup, Inc. 7.25% 10/1/10 |
Aa3 |
|
9,900 |
9,822 |
|
|
Daimler-Chrysler NA Holding Corp. 6.59% 6/18/02 |
A1 |
|
1,250 |
1,242 |
|
|
ERP Operating LP: |
|
|
|
|
|
|
6.55% 11/15/01 |
A3 |
|
1,900 |
1,885 |
|
|
7.1% 6/23/04 |
A3 |
|
4,000 |
3,953 |
|
|
First Security Capital I 8.41% 12/15/26 |
A3 |
|
1,400 |
1,283 |
|
|
Ford Motor Credit Co. 7.875% 6/15/10 |
A2 |
|
6,550 |
6,568 |
|
|
General Motors Acceptance Corp.: |
|
|
|
|
|
|
7.5% 7/15/05 |
A2 |
|
3,000 |
3,027 |
|
|
7.625% 6/15/04 |
A2 |
|
6,800 |
6,909 |
|
|
7.75% 1/19/10 |
A2 |
|
4,600 |
4,617 |
|
|
GS Escrow Corp. 7.125% 8/1/05 |
Ba1 |
|
2,005 |
1,839 |
|
|
Household Finance Corp. 8% 5/9/05 |
A2 |
|
6,800 |
6,954 |
|
|
HSBC Capital Funding LP: |
|
|
|
|
|
|
9.547% 12/31/49 (b)(c) |
A1 |
|
8,400 |
8,837 |
|
|
10.176% 12/31/49 (b)(c) |
A1 |
|
3,120 |
3,414 |
|
|
Newcourt Credit Group, Inc. 6.875% 2/16/05 |
A1 |
|
4,330 |
4,183 |
|
|
Qwest Capital Funding, Inc.: |
|
|
|
|
|
|
7.75% 8/15/06 (c) |
Baa1 |
|
4,500 |
4,563 |
|
|
7.9% 8/15/10 (c) |
Baa1 |
|
3,700 |
3,754 |
|
|
Sprint Capital Corp.: |
|
|
|
|
|
|
5.7% 11/15/03 |
Baa1 |
|
4,800 |
4,593 |
|
|
5.875% 5/1/04 |
Baa1 |
|
4,405 |
4,193 |
|
|
6.875% 11/15/28 |
Baa1 |
|
10,005 |
8,173 |
|
|
Trizec Finance Ltd. yankee 10.875% 10/15/05 |
Baa3 |
|
2,445 |
2,469 |
|
|
TXU Eastern Funding 6.75% 5/15/09 |
Baa1 |
|
3,980 |
3,583 |
|
|
Nonconvertible Bonds - continued |
|||||
|
Moody's Ratings (unaudited) (a) |
Principal Amount (000s) |
Value (Note 1) (000s) |
|||
|
FINANCE - continued |
|||||
|
Credit & Other Finance - continued |
|||||
|
U.S. West Capital Funding, Inc.: |
|
|
|
|
|
|
6.5% 11/15/18 |
Baa1 |
|
$ 3,355 |
$ 2,927 |
|
|
6.875% 7/15/28 |
Baa1 |
|
2,450 |
2,152 |
|
|
UBS Preferred Funding Trust 1 8.622% 12/29/49 |
Aa2 |
|
5,400 |
5,454 |
|
|
Unicredito Italiano Capital Trust II yankee 9.2% 10/29/49 (b)(c) |
A1 |
|
2,400 |
2,385 |
|
|
Unilever Capital Corp. 6.875% 11/1/05 |
A1 |
|
10,000 |
9,947 |
|
|
|
141,414 |
||||
|
Insurance - 0.3% |
|||||
|
Executive Risk Capital Trust 8.675% 2/1/27 |
Baa3 |
|
7,500 |
7,134 |
|
|
Savings & Loans - 0.3% |
|||||
|
H.F. Ahmanson & Co. 7.875% 9/1/04 |
Baa1 |
|
2,600 |
2,625 |
|
|
Long Island Savings Bank FSB 6.2% 4/2/01 |
Baa3 |
|
3,550 |
3,526 |
|
|
|
6,151 |
||||
|
Securities Industry - 0.1% |
|||||
|
Amvescap PLC yankee 6.6% 5/15/05 |
A2 |
|
3,000 |
2,867 |
|
|
TOTAL FINANCE |
271,635 |
||||
|
INDUSTRIAL MACHINERY & EQUIPMENT - 0.2% |
|||||
|
Tyco International Group SA yankee 6.875% 1/15/29 |
Baa1 |
|
6,000 |
5,232 |
|
|
MEDIA & LEISURE - 3.0% |
|||||
|
Broadcasting - 1.8% |
|||||
|
British Sky Broadcasting Group PLC 8.2% 7/15/09 |
Baa3 |
|
10,750 |
9,953 |
|
|
Continental Cablevision, Inc. 8.3% 5/15/06 |
A2 |
|
3,190 |
3,267 |
|
|
Hearst-Argyle Television, Inc. 7% 1/15/18 |
Baa3 |
|
4,800 |
4,148 |
|
|
TCI Communications, Inc. 9.8% 2/1/12 |
A2 |
|
8,355 |
9,251 |
|
|
TCI Communications Financing III 9.65% 3/31/27 |
A3 |
|
4,500 |
4,786 |
|
|
Time Warner, Inc. 9.125% 1/15/13 |
Baa3 |
|
2,000 |
2,242 |
|
|
USA Networks, Inc./USANi LLC 6.75% 11/15/05 |
Baa3 |
|
7,500 |
7,307 |
|
|
|
40,954 |
||||
|
Publishing - 1.2% |
|||||
|
News America Holdings, Inc. 8% 10/17/16 |
Baa3 |
|
1,000 |
950 |
|
|
Nonconvertible Bonds - continued |
|||||
|
Moody's Ratings (unaudited) (a) |
Principal Amount (000s) |
Value (Note 1) (000s) |
|||
|
MEDIA & LEISURE - continued |
|||||
|
Publishing - continued |
|||||
|
News America, Inc.: |
|
|
|
|
|
|
7.125% 4/8/28 |
Baa3 |
|
$ 7,901 |
$ 6,562 |
|
|
7.3% 4/30/28 |
Baa3 |
|
5,235 |
4,442 |
|
|
Time Warner Entertainment Co. LP: |
|
|
|
|
|
|
8.375% 7/15/33 |
Baa2 |
|
7,300 |
7,600 |
|
|
9.625% 5/1/02 |
Baa2 |
|
8,000 |
8,295 |
|
|
|
27,849 |
||||
|
TOTAL MEDIA & LEISURE |
68,803 |
||||
|
NONDURABLES - 0.7% |
|||||
|
Beverages - 0.2% |
|||||
|
Seagram JE & Sons, Inc. 6.625% 12/15/05 |
Baa3 |
|
5,130 |
5,165 |
|
|
Foods - 0.3% |
|||||
|
ConAgra Foods, Inc. 7.125% 10/1/26 |
Baa1 |
|
5,790 |
5,548 |
|
|
Tobacco - 0.2% |
|||||
|
RJ Reynolds Tobacco Holdings, Inc. 7.375% 5/15/03 |
Baa2 |
|
5,500 |
5,205 |
|
|
TOTAL NONDURABLES |
15,918 |
||||
|
RETAIL & WHOLESALE - 0.3% |
|||||
|
General Merchandise Stores - 0.3% |
|||||
|
Federated Department Stores, Inc. 8.5% 6/15/03 |
Baa1 |
|
7,945 |
7,889 |
|
|
TECHNOLOGY - 0.9% |
|||||
|
Computers & Office Equipment - 0.9% |
|||||
|
Comdisco, Inc.: |
|
|
|
|
|
|
5.95% 4/30/02 |
Baa2 |
|
6,000 |
4,380 |
|
|
6.375% 11/30/01 |
Baa2 |
|
16,000 |
12,640 |
|
|
7.25% 9/1/02 |
Baa2 |
|
4,300 |
3,139 |
|
|
|
20,159 |
||||
|
Nonconvertible Bonds - continued |
|||||
|
Moody's Ratings (unaudited) (a) |
Principal Amount (000s) |
Value (Note 1) (000s) |
|||
|
TRANSPORTATION - 1.0% |
|||||
|
Air Transportation - 0.1% |
|||||
|
Continental Airlines, Inc. pass thru trust certificates: |
|
|
|
|
|
|
7.434% 3/15/06 |
Baa1 |
|
$ 1,735 |
$ 1,702 |
|
|
7.73% 9/15/12 |
Baa1 |
|
639 |
624 |
|
|
|
2,326 |
||||
|
Railroads - 0.9% |
|||||
|
Burlington Northern Santa Fe Corp. 6.53% 7/15/37 |
Baa2 |
|
10,000 |
9,825 |
|
|
Norfolk Southern Corp. 7.05% 5/1/37 |
Baa1 |
|
9,930 |
9,864 |
|
|
|
19,689 |
||||
|
TOTAL TRANSPORTATION |
22,015 |
||||
|
UTILITIES - 5.0% |
|||||
|
Electric Utility - 1.9% |
|||||
|
Avon Energy Partners Holdings: |
|
|
|
|
|
|
6.46% 3/4/08 (c) |
Baa2 |
|
7,200 |
6,495 |
|
|
7.05% 12/11/07 (c) |
Baa2 |
|
8,000 |
7,485 |
|
|
Dominion Resources, Inc.: |
|
|
|
|
|
|
7.6% 7/15/03 |
Baa1 |
|
2,900 |
2,938 |
|
|
8.125% 6/15/10 |
Baa1 |
|
1,535 |
1,583 |
|
|
DR Investments UK PLC yankee 7.1% 5/15/02 (c) |
A2 |
|
8,000 |
7,959 |
|
|
Illinois Power Co. 7.5% 6/15/09 |
Baa1 |
|
5,000 |
4,949 |
|
|
Israel Electric Corp. Ltd.: |
|
|
|
|
|
|
7.75% 12/15/27 (c) |
A3 |
|
10,790 |
9,173 |
|
|
yankee 7.25% 12/15/06 (c) |
A3 |
|
2,000 |
1,871 |
|
|
Texas Utilities Co. 6.375% 1/1/08 |
Baa3 |
|
1,010 |
919 |
|
|
|
43,372 |
||||
|
Gas - 0.4% |
|||||
|
CMS Panhandle Holding Co. 6.125% 3/15/04 |
Baa3 |
|
4,100 |
3,868 |
|
|
Reliant Energy Resources Corp. 8.125% 7/15/05 (c) |
Baa1 |
|
3,000 |
3,036 |
|
|
Sempra Energy 7.95% 3/1/10 |
A2 |
|
2,115 |
2,134 |
|
|
|
9,038 |
||||
|
Telephone Services - 2.7% |
|||||
|
Cable & Wireless Optus Ltd.: |
|
|
|
|
|
|
8% 6/22/10 (c) |
Baa1 |
|
2,400 |
2,478 |
|
|
8.125% 6/15/09 (c) |
Baa1 |
|
11,000 |
11,418 |
|
|
Nonconvertible Bonds - continued |
|||||
|
Moody's Ratings (unaudited) (a) |
Principal Amount (000s) |
Value (Note 1) (000s) |
|||
|
UTILITIES - continued |
|||||
|
Telephone Services - continued |
|||||
|
Deutsche Telekom International Finance BV 8.25% 6/15/30 |
A2 |
|
$ 2,690 |
$ 2,745 |
|
|
Telecomunicaciones de Puerto Rico, Inc. 6.65% 5/15/06 |
Baa2 |
|
5,395 |
5,127 |
|
|
Telefonica Europe BV 8.25% 9/15/30 |
A2 |
|
4,050 |
4,170 |
|
|
Teleglobe Canada, Inc.: |
|
|
|
|
|
|
7.2% 7/20/09 |
Baa1 |
|
9,844 |
9,435 |
|
|
7.7% 7/20/29 |
Baa1 |
|
7,223 |
6,815 |
|
|
WorldCom, Inc.: |
|
|
|
|
|
|
6.95% 8/15/28 |
A3 |
|
12,560 |
11,038 |
|
|
7.75% 4/1/07 |
A3 |
|
1,750 |
1,771 |
|
|
8.875% 1/15/06 |
A3 |
|
8,854 |
9,136 |
|
|
|
64,133 |
||||
|
TOTAL UTILITIES |
116,543 |
||||
|
TOTAL NONCONVERTIBLE BONDS (Cost $645,707) |
626,885 |
||||
|
U.S. Government and Government Agency Obligations - 20.1% |
|||||
|
|
|||||
|
U.S. Government Agency Obligations - 6.4% |
|||||
|
Fannie Mae: |
|
|
|
|
|
|
6.5% 4/29/09 |
Aaa |
|
20,550 |
19,568 |
|
|
7% 7/15/05 |
Aaa |
|
19,285 |
19,650 |
|
|
7.125% 6/15/10 |
Aaa |
|
7,810 |
8,046 |
|
|
7.25% 1/15/10 |
Aaa |
|
20,750 |
21,509 |
|
|
Federal Home Loan Bank 6.75% 2/1/02 |
Aaa |
|
12,140 |
12,178 |
|
|
Financing Corp. - coupon STRIPS 0% 3/7/05 |
Aaa |
|
11,375 |
8,586 |
|
|
Freddie Mac: |
|
|
|
|
|
|
6.45% 4/29/09 |
Aaa |
|
11,000 |
10,440 |
|
|
6.75% 3/15/31 |
Aaa |
|
25,000 |
24,945 |
|
|
6.875% 1/15/05 |
Aaa |
|
5,610 |
5,682 |
|
|
7% 7/15/05 |
Aaa |
|
18,175 |
18,516 |
|
|
TOTAL U.S. GOVERNMENT AGENCY OBLIGATIONS |
149,120 |
||||
|
U.S. Treasury Obligations - 13.7% |
|||||
|
U.S. Treasury Bonds: |
|
|
|
|
|
|
6.125% 8/15/29 |
Aaa |
|
97,760 |
101,242 |
|
|
U.S. Government and Government Agency Obligations - continued |
|||||
|
Moody's Ratings (unaudited) (a) |
Principal Amount (000s) |
Value (Note 1) (000s) |
|||
|
U.S. Treasury Obligations - continued |
|||||
|
U.S. Treasury Bonds: - continued |
|
|
|
|
|
|
8% 11/15/21 |
Aaa |
|
$ 37,390 |
$ 46,212 |
|
|
8.75% 5/15/17 |
Aaa |
|
4,140 |
5,319 |
|
|
8.875% 8/15/17 |
Aaa |
|
20,695 |
26,904 |
|
|
9.875% 11/15/15 |
Aaa |
|
5,230 |
7,217 |
|
|
12% 8/15/13 |
Aaa |
|
33,400 |
45,648 |
|
|
14% 11/15/11 |
Aaa |
|
4,615 |
6,457 |
|
|
U.S. Treasury Notes: |
|
|
|
|
|
|
5.625% 9/30/01 |
Aaa |
|
15,100 |
15,003 |
|
|
6.5% 5/31/02 |
Aaa |
|
37,080 |
37,300 |
|
|
7% 7/15/06 |
Aaa |
|
4,850 |
5,113 |
|
|
U.S. Treasury Notes - Principal Strips 0% 5/15/02 |
Aaa |
|
22,950 |
20,923 |
|
|
TOTAL U.S. TREASURY OBLIGATIONS |
317,338 |
||||
|
TOTAL U.S. GOVERNMENT AND (Cost $461,339) |
466,458 |
||||
|
U.S. Government Agency - Mortgage Securities - 35.3% |
|||||
|
|
|||||
|
Fannie Mae - 30.5% |
|||||
|
5.5% 2/1/11 to 5/1/14 |
Aaa |
|
15,485 |
14,690 |
|
|
6% 3/1/11 to 2/1/29 |
Aaa |
|
74,651 |
70,928 |
|
|
6.5% 8/1/25 to 11/1/28 |
Aaa |
|
184,429 |
177,463 |
|
|
7% 7/1/22 to 2/1/30 |
Aaa |
|
74,763 |
73,415 |
|
|
7.5% 6/1/25 to 11/1/30 |
Aaa |
|
230,900 |
230,622 |
|
|
8% 3/1/24 to 10/1/30 |
Aaa |
|
135,822 |
137,497 |
|
|
9.5% 1/1/17 to 2/1/25 |
Aaa |
|
2,189 |
2,310 |
|
|
12.5% 7/1/11 to 7/1/15 |
Aaa |
|
137 |
154 |
|
|
TOTAL FANNIE MAE |
707,079 |
||||
|
Freddie Mac - 2.2% |
|||||
|
7.5% 11/1/30 |
Aaa |
|
45,000 |
44,972 |
|
|
8.5% 9/1/22 to 9/1/27 |
Aaa |
|
5,078 |
5,202 |
|
|
TOTAL FREDDIE MAC |
50,174 |
||||
|
Government National Mortgage Association - 2.6% |
|||||
|
6% 10/15/08 to 5/15/09 |
Aaa |
|
4,014 |
3,921 |
|
|
U.S. Government Agency - Mortgage Securities - continued |
|||||
|
Moody's Ratings (unaudited) (a) |
Principal Amount (000s) |
Value (Note 1) (000s) |
|||
|
Government National Mortgage Association - continued |
|||||
|
6.5% 3/15/26 to 12/15/28 |
Aaa |
|
$ 35,643 |
$ 34,406 |
|
|
7% 1/15/26 to 10/15/28 |
Aaa |
|
391 |
386 |
|
|
7.5% 10/15/05 to 8/15/28 |
Aaa |
|
19,801 |
19,907 |
|
|
8% 9/15/24 to 10/15/25 |
Aaa |
|
675 |
686 |
|
|
9% 12/15/19 to 4/15/23 |
Aaa |
|
35 |
36 |
|
|
TOTAL GOVERNMENT NATIONAL MORTGAGE ASSOCIATION |
59,342 |
||||
|
TOTAL U.S. GOVERNMENT AGENCY - MORTGAGE SECURITIES (Cost $824,801) |
816,595 |
||||
|
Asset-Backed Securities - 2.9% |
|||||
|
|
|||||
|
American Express Credit Account Master Trust 6.1% 12/15/06 |
A1 |
|
4,600 |
4,488 |
|
|
Capita Equipment Receivables Trust 6.48% 10/15/06 |
Baa2 |
|
4,700 |
4,599 |
|
|
Discover Card Master Trust I 5.85% 11/16/04 |
A2 |
|
5,000 |
4,934 |
|
|
Ford Credit Auto Owner Trust: |
|
|
|
|
|
|
6.2% 12/15/02 |
Aa2 |
|
4,050 |
4,014 |
|
|
6.4% 12/15/02 |
Aa2 |
|
2,370 |
2,358 |
|
|
7.03% 11/15/03 |
Aaa |
|
1,119 |
1,128 |
|
|
JCPenney Master Credit Card Trust 5.5% 6/15/07 |
Aaa |
|
18,000 |
17,370 |
|
|
Key Auto Finance Trust: |
|
|
|
|
|
|
6.3% 10/15/03 |
A2 |
|
468 |
465 |
|
|
6.65% 10/15/03 |
Baa3 |
|
322 |
321 |
|
|
Premier Auto Trust 5.59% 2/9/04 |
Aaa |
|
16,000 |
15,710 |
|
|
Sears Credit Account Master Trust II: |
|
|
|
|
|
|
6.75% 9/16/09 |
Aaa |
|
7,720 |
7,702 |
|
|
7.5% 11/15/07 |
A2 |
|
3,950 |
4,014 |
|
|
TOTAL ASSET-BACKED SECURITIES (Cost $68,063) |
67,103 |
||||
|
Collateralized Mortgage Obligations - 0.4% |
|||||
|
|
|||||
|
U.S. Government Agency - 0.4% |
|||||
|
Freddie Mac REMIC planned amortization class
Series 1669 Class H, 6.5% 7/15/23 |
Aaa |
|
10,122 |
9,660 |
|
|
Commercial Mortgage Securities - 3.2% |
|||||
|
Moody's Ratings (unaudited) (a) |
Principal Amount (000s) |
Value (Note 1) (000s) |
|||
|
CS First Boston Mortgage Securities Corp.: |
|
|
|
|
|
|
Series 1997-C2 Class D, 7.27% 1/17/35 |
Baa2 |
|
$ 5,740 |
$ 5,461 |
|
|
Series 1998-FL1: |
|
|
|
|
|
|
Class D, 7.1188% 12/10/00 (c)(d) |
Aa1 |
|
6,600 |
6,599 |
|
|
Class E, 7.4688% 1/10/13 (c)(d) |
Baa1 |
|
12,080 |
12,294 |
|
|
Series 2000-C1 Class A2, 7.545% 4/15/62 |
AAA |
|
3,700 |
3,793 |
|
|
DLJ Commercial Mortgage Corp. Series 2000-CF1 Class A1B, 7.62% 5/10/10 |
Aaa |
|
10,000 |
10,303 |
|
|
Equitable Life Assurance Society of the United States Series 174: |
|
|
|
|
|
|
Class B1, 7.33% 5/15/06 (c) |
Aa2 |
|
3,400 |
3,434 |
|
|
Class C1, 7.52% 5/15/06 (c) |
A2 |
|
3,500 |
3,511 |
|
|
GS Mortgage Securities Corp. II Series 1998-GLII Class E, 6.9698% 4/13/31 (c)(d) |
Baa3 |
|
5,000 |
4,533 |
|
|
Nomura Asset Securities Corp. Series 1998-D6 Class A1C, 6.69% 3/17/28 |
Aaa |
|
5,000 |
4,787 |
|
|
Prudential Securities Secured Financing Corp. Series 2000-C1 Class A2, 7.727% 2/15/10 |
Aaa |
|
10,000 |
10,431 |
|
|
Thirteen Affiliates of General Growth Properties, Inc. sequential pay Series 1 Class A2, 6.602% 12/15/10 (c) |
Aaa |
|
9,000 |
8,859 |
|
|
TOTAL COMMERCIAL MORTGAGE SECURITIES (Cost $73,495) |
74,005 |
||||
|
Foreign Government and Government Agency Obligations (e) - 1.4% |
|||||
|
|
|||||
|
Korean Republic yankee 8.75% 4/15/03 |
Baa2 |
|
2,345 |
2,397 |
|
|
Quebec Province: |
|
|
|
|
|
|
yankee: |
|
|
|
|
|
|
7.125% 2/9/24 |
A2 |
|
810 |
789 |
|
|
7.5% 7/15/23 |
A2 |
|
2,810 |
2,855 |
|
|
7% 1/30/07 |
A2 |
|
5,000 |
4,988 |
|
|
7.5% 9/15/29 |
A2 |
|
9,420 |
9,550 |
|
|
United Mexican States: |
|
|
|
|
|
|
8.5% 2/1/06 |
Baa3 |
|
4,025 |
4,013 |
|
|
9.875% 2/1/10 |
Baa3 |
|
7,860 |
8,155 |
|
|
TOTAL FOREIGN GOVERNMENT AND (Cost $33,136) |
32,747 |
||||
|
Supranational Obligations - 0.5% |
|||||
|
Moody's Ratings (unaudited) (a) |
Principal Amount (000s) |
Value (Note 1) (000s) |
|||
|
Inter-American Development Bank yankee |
Aaa |
|
$ 12,000 |
$ 11,704 |
|
|
Commercial Paper - 1.1% |
||||
|
|
||||
|
British Telecom PLC 6.8525% 10/9/01 (c)(d) |
|
25,000 |
24,954 |
|
|
Cash Equivalents - 11.1% |
|||
|
Maturity Amount (000s) |
|
||
|
Investments in repurchase agreements (U.S. Government Obligations), in a joint trading account at 6.62%, dated 10/31/00 due
11/1/00 |
$ 256,531 |
256,484 |
|
|
|
2,386,595 |
||
|
TOTAL INVESTMENT PORTFOLIO - 103.1% (Cost $2,409,691) |
2,386,595 |
||
|
NET OTHER ASSETS - (3.1)% |
(71,435) |
||
|
NET ASSETS - 100% |
$ 2,315,160 |
||
|
Legend |
|
(a) S&P credit ratings are used in the absence of a rating by Moody's Investors Service, Inc. |
|
(b) Debt obligation initially issued at one coupon which converts to a higher coupon at a specified date. The rate shown is the rate at period end. |
|
(c) Security exempt from registration under Rule 144A of the Securities Act of 1933. These securities may be resold in transactions exempt from registration, normally to qualified institutional buyers. At the period end, the value of these securities amounted to $151,978,000 or 6.6% of net assets. |
|
(d) The coupon rate shown on floating or adjustable rate securities represents the rate at period end. |
|
(e) For foreign government obligations not individually rated by S&P or Moody's, the ratings listed have been assigned by FMR, the fund's investment adviser, based principally on S&P and Moody's ratings of the sovereign credit of the issuing government. |
|
Other Information |
|
The composition of long-term debt holdings as a percentage of total value of investments in securities, is as follows (ratings are unaudited): |
|
Moody's Ratings |
S&P Ratings |
|||
|
Aaa, Aa, A |
70.6% |
|
AAA, AA, A |
63.4% |
|
Baa |
17.4% |
|
BBB |
15.4% |
|
Ba |
0.1% |
|
BB |
1.3% |
|
B |
0.0% |
|
B |
0.0% |
|
Caa |
0.0% |
|
CCC |
0.0% |
|
Ca, C |
0.0% |
|
CC, C |
0.0% |
|
|
|
|
D |
0.0% |
|
Income Tax Information |
|
At October 31, 2000, the aggregate cost of investment securities for income tax purposes was $2,409,765,000. Net unrealized depreciation aggregated $23,170,000, of which $16,078,000 related to appreciated investment securities and $39,248,000 related to depreciated investment securities. |
|
At April 30, 2000, the fund had a capital loss carryforward of approximately $24,617,000 all of which will expire on April 30, 2008. |
See accompanying notes which are an integral part of the financial statements.
Semiannual Report
Statement of Assets and Liabilities
|
Amounts in thousands (except per-share amount) |
October 31, 2000 (Unaudited) |
|
|
Assets |
|
|
|
Investment in securities, at value (including repurchase agreements of $256,484) (cost $2,409,691) - |
|
$ 2,386,595 |
|
Receivable for investments sold |
|
37,160 |
|
Receivable for fund shares sold |
|
2,503 |
|
Interest receivable |
|
27,226 |
|
Total assets |
|
2,453,484 |
|
Liabilities |
|
|
|
Payable for investments purchased |
$ 102,278 |
|
|
Payable for fund shares redeemed |
2,077 |
|
|
Distributions payable |
680 |
|
|
Accrued management fee |
812 |
|
|
Other payables and accrued expenses |
590 |
|
|
Collateral on securities loaned, at value |
31,887 |
|
|
Total liabilities |
|
138,324 |
|
Net Assets |
|
$ 2,315,160 |
|
Net Assets consist of: |
|
|
|
Paid in capital |
|
$ 2,399,566 |
|
Distributions in excess of net investment income |
|
(49) |
|
Accumulated undistributed net realized gain (loss) on investments and foreign currency transactions |
|
(61,261) |
|
Net unrealized appreciation (depreciation) on investments |
|
(23,096) |
|
Net Assets, for 331,040 shares outstanding |
|
$ 2,315,160 |
|
Net Asset Value, offering price and redemption price |
|
$6.99 |
See accompanying notes which are an integral part of the financial statements.
Semiannual Report
Financial Statements - continued
Statement of Operations
|
Amounts in thousands |
Six months ended October 31, 2000 (Unaudited) |
|
|
Investment Income Interest |
|
$ 77,570 |
|
Security lending |
|
27 |
|
Total Income |
|
77,597 |
|
Expenses |
|
|
|
Management fee |
$ 4,625 |
|
|
Transfer agent fees |
2,333 |
|
|
Accounting and security lending fees |
226 |
|
|
Non-interested trustees' compensation |
4 |
|
|
Custodian fees and expenses |
63 |
|
|
Registration fees |
53 |
|
|
Audit |
18 |
|
|
Legal |
7 |
|
|
Miscellaneous |
1 |
|
|
Total expenses before reductions |
7,330 |
|
|
Expense reductions |
(116) |
7,214 |
|
Net investment income |
|
70,383 |
|
Realized and Unrealized Gain (Loss) Net realized gain (loss) on investment securities |
|
(14,088) |
|
Change in net unrealized appreciation (depreciation) |
|
55,576 |
|
Net gain (loss) |
|
41,488 |
|
Net increase (decrease) in net assets resulting |
|
$ 111,871 |
See accompanying notes which are an integral part of the financial statements.
Semiannual Report
Financial Statements - continued
Statement of Changes in Net Assets
|
Amounts in thousands |
Six months ended
October 31, 2000 |
Year ended |
|
Increase (Decrease) in Net Assets |
|
|
|
Operations |
$ 70,383 |
$ 130,546 |
|
Net realized gain (loss) |
(14,088) |
(43,530) |
|
Change in net unrealized appreciation (depreciation) |
55,576 |
(76,412) |
|
Net increase (decrease) in net assets resulting |
111,871 |
10,604 |
|
Distributions to shareholders from net investment income |
(71,058) |
(131,083) |
|
Share transactions |
476,079 |
923,981 |
|
Reinvestment of distributions |
67,056 |
122,760 |
|
Cost of shares redeemed |
(399,174) |
(1,098,803) |
|
Net increase (decrease) in net assets resulting |
143,961 |
(52,062) |
|
Total increase (decrease) in net assets |
184,774 |
(172,541) |
|
Net Assets |
|
|
|
Beginning of period |
2,130,386 |
2,302,927 |
|
End of period (including (over) under distribution of net investment income of $(49) and $626, respectively) |
$ 2,315,160 |
$ 2,130,386 |
|
Other Information Shares |
|
|
|
Sold |
68,617 |
132,691 |
|
Issued in reinvestment of distributions |
9,655 |
17,645 |
|
Redeemed |
(57,722) |
(157,384) |
|
Net increase (decrease) |
20,550 |
(7,048) |
See accompanying notes which are an integral part of the financial statements.
Semiannual Report
Financial Highlights
|
|
Six months ended October 31, 2000 |
Years ended April 30, |
||||
|
|
(Unaudited) |
2000 |
1999 |
1998 |
1997 |
1996 |
|
Selected Per-Share Data |
|
|
|
|
|
|
|
Net asset value, beginning of period |
$ 6.860 |
$ 7.250 |
$ 7.300 |
$ 7.020 |
$ 7.040 |
$ 7.010 |
|
Income from Invest- |
.224 D |
.433 D |
.423 D |
.441 D |
.460 D |
.484 |
|
Net realized and unrealized gain (loss) |
.132 |
(.388) |
(.022) |
.282 |
(.020) |
.047 |
|
Total from investment operations |
.356 |
.045 |
.401 |
.723 |
.440 |
.531 |
|
Less Distributions |
|
|
|
|
|
|
|
From net investment income |
(.226) |
(.435) |
(.410) |
(.443) |
(.460) |
(.471) |
|
From net realized gain |
- |
- |
(.041) |
- |
- |
- |
|
In excess of net realized gain |
- |
- |
- |
- |
- |
(.030) |
|
Total distributions |
(.226) |
(.435) |
(.451) |
(.443) |
(.460) |
(.501) |
|
Net asset value, end of period |
$ 6.990 |
$ 6.860 |
$ 7.250 |
$ 7.300 |
$ 7.020 |
$ 7.040 |
|
Total Return B, C |
5.26% |
0.71% |
5.58% |
10.54% |
6.42% |
7.62% |
|
Ratios and Supplemental Data |
|
|
|
|
|
|
|
Net assets, end of period (in millions) |
$ 2,315 |
$ 2,130 |
$ 2,303 |
$ 1,909 |
$ 1,442 |
$ 1,358 |
|
Ratio of expenses to average net assets |
.67% A |
.70% |
.71% |
.72% |
.76% |
.77% |
|
Ratio of expenses to average net assets after expense reductions |
.66% A, E |
.69% E |
.70% E |
.71% E |
.75% E |
.76% E |
|
Ratio of net invest- |
6.42% A |
6.21% |
5.77% |
6.12% |
6.53% |
6.58% |
|
Portfolio turnover rate |
156% A |
115% |
167% |
207% |
120% |
134% |
A Annualized
B Total returns for periods of less than one year are not annualized.
C The total returns would have been lower had certain expenses not been reduced during the periods shown.
D Net investment income per share has been calculated based on average shares outstanding during the period.
E FMR or the fund has entered into varying arrangements with third parties who either paid or reduced a portion of the fund's expenses.
See accompanying notes which are an integral part of the financial statements.
Semiannual Report
For the period ended October 31, 2000 (Unaudited)
1. Significant Accounting Policies.
Fidelity Investment Grade Bond Fund (the fund) is a fund of Fidelity Fixed-Income Trust (the trust) and is authorized to issue an unlimited number of shares. The trust is registered under the Investment Company Act of 1940, as amended, as an open-end management investment company organized as a Massachusetts business trust. The financial statements have been prepared in conformity with generally accepted accounting principles which require management to make certain estimates and assumptions at the date of the financial statements. The following summarizes the significant accounting policies of the fund:
Security Valuation. Securities are valued based upon a computerized matrix system and/or appraisals by a pricing service, both of which consider market transactions and dealer-supplied valuations. Securities (including restricted securities) for which market quotations are not readily available are valued at their fair value as determined in good faith under consistently applied procedures under the general supervision of the Board of Trustees. Short-term securities with remaining maturities of sixty days or less for which quotations are not readily available are valued at amortized cost or original cost plus accrued interest, both of which approximate current value. Investments in open-end investment companies are valued at their net asset value each business day.
Foreign Currency Translation. The accounting records of the fund are maintained in U.S. dollars. Investment securities and other assets and liabilities denominated in a foreign currency are translated into U.S. dollars at the prevailing rates of exchange at period end. Purchases and sales of securities, income receipts and expense payments are translated into U.S. dollars at the prevailing exchange rate on the respective dates of the transactions.
Net realized gains and losses on foreign currency transactions represent net gains and losses from sales and maturities of foreign currency contracts, disposition of foreign currencies, the difference between the amount of net investment income accrued and the U.S. dollar amount actually received, and gains and losses between trade and settlement date on purchases and sales of securities. The effects of changes in foreign currency exchange rates on investments in securities are included with the net realized and unrealized gain or loss on investment securities.
Income Taxes. As a qualified regulated investment company under Subchapter M of the Internal Revenue Code, the fund is not subject to income taxes to the extent that it distributes substantially all of its taxable income for its fiscal year. The schedule of investments includes information regarding income taxes under the caption "Income Tax Information."
Investment Income. Interest income, which includes accretion of original issue discount, is accrued as earned.
Semiannual Report
Notes to Financial Statements (Unaudited) - continued
1. Significant Accounting Policies - continued
Expenses. Most expenses of the trust can be directly attributed to a fund. Expenses which cannot be directly attributed are apportioned among the funds in the trust.
Distributions to Shareholders. Dividends are declared daily and paid monthly from net investment income. Distributions to shareholders from realized capital gains on investments, if any, are recorded on the ex-dividend date.
Income and capital gain distributions are determined in accordance with income tax regulations which may differ from generally accepted accounting principles. These differences, which may result in distribution reclassifications, are primarily due to differing treatments for paydown gains/losses on certain securities, market discount, capital loss carryforwards, and losses deferred due to wash sales and excise tax regulations.
Permanent book and tax basis differences relating to shareholder distributions will result in reclassifications to paid in capital. Distributions in excess of net investment income and accumulated undistributed net realized gain (loss) on investments and foreign currency transactions may include temporary book and tax basis differences which will reverse in a subsequent period. Any taxable income or gain remaining at fiscal year end is distributed in the following year.
Security Transactions. Security transactions are accounted for as of trade date. Gains and losses on securities sold are determined on the basis of identified cost.
2. Operating Policies.
Joint Trading Account. Pursuant to an Exemptive Order issued by the Securities and Exchange Commission, the fund, along with other affiliated entities of Fidelity Management & Research Company (FMR), may transfer uninvested cash balances into one or more joint trading accounts. These balances are invested in one or more repurchase agreements for U.S. Treasury or Federal Agency obligations.
Repurchase Agreements. The underlying U.S. Treasury, Federal Agency, or other obligations found to be satisfactory by FMR are transferred to an account of the fund, or to the Joint Trading Account, at a custodian bank. The securities are marked-to-market daily and maintained at a value at least equal to the principal amount of the repurchase agreement (including accrued interest). FMR, the fund's investment adviser, is responsible for determining that the value of the underlying securities remains in accordance with the market value requirements stated above.
Delayed Delivery Transactions. The fund may purchase or sell securities on a delayed delivery basis. Payment and delivery may take place after the customary settlement period for that security. The price of the underlying securities and the date when the securities will be delivered and paid for are fixed at the time the transaction is negotiated. The fund may receive compensation for interest forgone in the purchase of a delayed delivery security. With respect to purchase commitments, the fund identifies
Semiannual Report
Notes to Financial Statements (Unaudited) - continued
2. Operating Policies - continued
Delayed Delivery Transactions - continued
securities as segregated in its records with a value at least equal to the amount of the commitment. Losses may arise due to changes in the market value of the underlying securities or if the counterparty does not perform under the contract.
Restricted Securities. The fund is permitted to invest in securities that are subject to legal or contractual restrictions on resale. These securities generally may be resold in transactions exempt from registration or to the public if the securities are registered. Disposal of these securities may involve time-consuming negotiations and expense, and prompt sale at an acceptable price may be difficult. At the end of the period, the fund had no investments in restricted securities (excluding 144A issues).
3. Purchases and Sales of Investments.
Purchases and sales of securities, other than short-term securities, aggregated $1,626,875,000 and $1,609,344,000, respectively, of which U.S. government and government agency obligations aggregated $1,246,328,000 and $1,246,240,000, respectively.
4. Fees and Other Transactions with Affiliates.
Management Fee. As the fund's investment adviser, FMR receives a monthly fee that is calculated on the basis of a group fee rate plus a fixed individual fund fee rate applied to the average net assets of the fund. The group fee rate is the weighted average of a series of rates and is based on the monthly average net assets of all the mutual funds advised by FMR. The rates ranged from .0920% to .3700% for the period. The annual individual fund fee rate is .30%. In the event that these rates were lower than the contractual rates in effect during the period, FMR voluntarily implemented the above rates, as they resulted in the same or a lower management fee. For the period, the management fee was equivalent to an annualized rate of .43% of average net assets.
Sub-Adviser Fee. FMR, on behalf of the fund, has entered into a sub-advisory agreement with Fidelity Investments Money Management, Inc. (FIMM), a wholly owned subsidiary of FMR. For its services, FIMM receives a fee from FMR of 50% of the management fee payable to FMR. The fee is paid prior to any voluntary expense reimbursements which may be in effect.
Transfer Agent Fees. Fidelity Service Company, Inc. (FSC), an affiliate of FMR, is the fund's transfer, dividend disbursing and shareholder servicing agent. FSC receives account fees and asset-based fees that vary according to account size and type of account. FSC pays for typesetting, printing and mailing of all shareholder reports, except proxy statements. For the period, the transfer agent fees were equivalent to an annualized rate of .21% of average net assets.
Semiannual Report
Notes to Financial Statements (Unaudited) - continued
4. Fees and Other Transactions with Affiliates - continued
Accounting and Security Lending Fees. FSC maintains the fund's accounting records and administers the security lending program. The security lending fee is based on the number and duration of lending transactions. The accounting fee is based on the level of average net assets for the month plus out-of-pocket expenses.
5. Security Lending.
The fund lends portfolio securities from time to time in order to earn additional income. The fund receives collateral in the form of U.S. Treasury obligations, letters of credit, and/or cash against the loaned securities, and maintains collateral in an amount not less than 100% of the market value of the loaned securities during the period of the loan. The market value of the loaned securities is determined at the close of business of the fund and any additional required collateral is delivered to the fund on the next business day. If the borrower defaults on its obligation to return the securities loaned because of insolvency or other reasons, the fund could experience delays and costs in recovering the securities loaned or in gaining access to the collateral. At period end, the value of the securities loaned amounted to $31,262,000. The fund received cash collateral of $31,887,000 which was invested in cash equivalents.
6. Expense Reductions.
Through arrangements with the fund's custodian and transfer agent, credits realized as a result of uninvested cash balances were used to reduce a portion of the fund's expenses. During the period, the fund's custodian and transfer agent fees were reduced by $10,000 and $106,000, respectively, under these arrangements.
Semiannual Report
Fidelity offers several ways to conveniently manage your personal investments via your telephone or PC. You can access your account information, conduct trades and research your investments 24 hours a day.
By Phone
Fidelity Automated Service Telephone provides a single toll-free number to access account balances, positions, quotes and trading. It's easy to navigate the service, and on your first call, the system will help you create a personal identification number (PIN) for security.
(phone_graphic)Fidelity Automated
Service Telephone (FAST®)
1-800-544-5555
Press
1 For mutual fund and brokerage trading.
2 For quotes.*
3 For account balances and holdings.
4 To review orders and mutual
fund activity.
5 To change your PIN.
*0 To speak to a Fidelity representative.
By PC
Fidelity's web site on the Internet provides a wide range of information, including daily financial news, fund performance, interactive planning tools and news about Fidelity products and services.
(computer_graphic)Fidelity's Web Site
www.fidelity.com
If you are not currently on the Internet, call EarthLink Sprint at 1-800-288-2967, and be sure to ask for registration number SMD004 to receive a special Fidelity package that includes 30 days of free Internet access. EarthLink is North America's #1 independent Internet access provider.
(computer_graphic)
Fidelity On-line Xpress+®
Fidelity On-line Xpress+ software for Windows combines comprehensive portfolio management capabilities, securities trading and access to research and analysis tools . . . all on your desktop. Call Fidelity at 1-800-544-0240 or visit our web site for more information on how to manage your investments via your PC.
* When you call the quotes line, please remember that a fund's yield and return will vary and, except for money market funds, share price will also vary. This means that you may have a gain or loss when you sell your shares. There is no assurance that money market funds will be able to maintain a stable $1 share price; an investment in a money market fund is not insured or guaranteed by the U.S. government. Total returns are historical and include changes in share price, reinvestment of dividends and capital gains, and the effects of any sales charges.
Semiannual Report
Investment Adviser
Fidelity Management & Research Company
Boston, MA
Investment Sub-Advisers
Fidelity Management & Research
(U.K.) Inc.
Fidelity Management & Research
(Far East) Inc.
Fidelity Investments
Japan Limited
Fidelity Investments Money
Management, Inc.
Officers
Edward C. Johnson 3d, President
Robert C. Pozen, Senior Vice President
Dwight D. Churchill, Vice President
Kevin E. Grant, Vice President
David L. Murphy, Vice President
Stanley N. Griffith, Assistant Vice President
Eric D. Roiter, Secretary
Robert A. Dwight, Treasurer
Maria F. Dwyer, Deputy Treasurer
John H. Costello, Assistant Treasurer
Thomas J. Simpson, Assistant Treasurer
Board of Trustees
Ralph F. Cox *
Phyllis Burke Davis *
Robert M. Gates *
Edward C. Johnson 3d
Donald J. Kirk *
Ned C. Lautenbach *
Peter S. Lynch
Marvin L. Mann *
William O. McCoy *
Gerald C. McDonough *
Robert C. Pozen
Thomas R. Williams *
Advisory Board
J. Michael Cook
Abigail P. Johnson
Marie L. Knowles
* Independent trustees
General Distributor
Fidelity Distributors Corporation
Boston, MA
Transfer and Shareholder
Servicing Agent
Fidelity Service Company, Inc.
Boston, MA
Custodian
The Bank of New York
New York, NY
Fidelity's Taxable Bond Funds
Capital & Income
Ginnie Mae
Government Income
High Income
Intermediate Bond
Intermediate Government Income
International Bond
Investment Grade Bond
New Markets Income
Short-Term Bond
Spartan® Government Income
Spartan Investment Grade Bond
Strategic Income
Target TimelineSM 2001 & 2003
The Fidelity Telephone Connection
Mutual Fund 24-Hour Service
Exchanges/Redemptions
and Account Assistance 1-800-544-6666
Product Information 1-800-544-6666
Retirement Accounts 1-800-544-4774
(8 a.m. - 9 p.m.)
TDD Service 1-800-544-0118
for the deaf and hearing impaired
(9 a.m. - 9 p.m. Eastern time)
Fidelity Automated Service
Telephone (FAST®) (automated graphic) 1-800-544-5555
(automated graphic) Automated line for quickest service
(Fidelity Investment logo)(registered trademark)
Corporate Headquarters
82 Devonshire St., Boston, MA 02109
www.fidelity.com
IGB-SANN-1200 118722
1.538655.103
Fidelity®
Fund
Semiannual Report
October 31, 2000
(2_fidelity_logos)(Registered_Trademark)
|
President's Message |
3 |
Ned Johnson on investing strategies. |
|
Performance |
4 |
How the fund has done over time. |
|
Fund Talk |
7 |
The manager's review of fund performance, strategy and outlook. |
|
Investment Changes |
10 |
A summary of major shifts in the fund's investments over the past six months. |
|
Investments |
11 |
A complete list of the fund's investments with their market values. |
|
Financial Statements |
25 |
Statements of assets and liabilities,
operations, and changes in net assets, |
|
Notes |
29 |
Notes to the financial statements. |
|
|
|
|
To reduce expenses, only one copy of most financial reports and prospectuses may be mailed to households, even if more than one person in the household has an account in the fund. Call Fidelity at 1-800-544-8544 if you need additional copies of financial reports or prospectuses. If you do not want the mailing of these documents to be combined with those for other members of your household, contact Fidelity in writing at P.O. Box 5000, Cincinnati, OH 45273-8692.
Standard & Poor's, S&P and S&P 500 are registered service marks of The McGraw-Hill Companies, Inc. and have been licensed for use by Fidelity Distributors Corporation.
Other third party marks appearing herein are the property of their respective owners.
All other marks appearing herein are registered or unregistered trademarks or service marks of FMR Corp. or an affiliated company.
(Recycle graphic) This report is printed on recycled paper using soy-based inks.
This report and the financial statements contained herein are submitted for the general information of the shareholders of the fund. This report is not authorized for distribution to prospective investors in the fund unless preceded or accompanied by an effective prospectus.
Mutual fund shares are not deposits or obligations of, or guaranteed by, any depository institution. Shares are not insured by the FDIC, Federal Reserve Board or any other agency, and are subject to investment risks, including possible loss of principal amount invested.
Neither the fund nor Fidelity Distributors Corporation is a bank.
For more information on any Fidelity fund, including charges and expenses, call 1-800-544-6666 for a free prospectus. Read it carefully before you invest or send money.
Semiannual Report
(photo_of_Edward_C_Johnson_3d)
Dear Shareholder:
A sixth-straight year of double-digit positive returns for the Dow Jones Industrial Average, NASDAQ and S&P 500® could be in jeopardy unless the U.S. stock market shows marked improvement in the final two months of 2000. Through October, all three indexes had negative year-to-date returns. On the other hand, most fixed-income sectors were solidly in the black. Treasuries and other long-term government securities led the way, returning nearly 14%.
While it's impossible to predict the future direction of the markets with any degree of certainty, there are certain basic principles that can help investors plan for their future needs.
The longer your investment time frame, the less likely it is that you will be affected by short-term market volatility. A 10-year investment horizon appropriate for saving for a college education, for example, enables you to weather market cycles in a long-term fund, which may have a higher risk potential, but also has a higher potential rate of return.
An intermediate-length fund could make sense if your investment horizon is two to four years, while a short-term bond fund could be the right choice if you need your money in one or two years.
If your time horizon is less than a year, you might want to consider moving some of your bond investment into a money market fund. These funds seek income and a stable share price by investing in high-quality, short-term investments. Of course, it's important to remember that an investment in a money market fund is not insured or guaranteed by the Federal Deposit Insurance Corporation or any other government agency. Although money market funds seek to preserve the value of your investment at $1.00 per share, it is possible to lose money by investing in these types of funds.
Finally, no matter what your time horizon or portfolio diversity, it makes good sense to follow a regular investment plan, investing a certain amount of money in a fund at the same time each month or quarter and periodically reviewing your overall portfolio. By doing so, you won't get caught up in the excitement of a rapidly rising market, nor will you buy all your shares at market highs. While this strategy - known as dollar cost averaging - won't assure a profit or protect you from a loss in a declining market, it should help you lower the average cost of your purchases. Of course, you should consider your financial ability to continue your purchases through periods of low price levels before undertaking such a strategy.
If you have questions, please call us at 1-800-544-6666, or visit our web site at www.fidelity.com. We are available 24 hours a day, seven days a week to provide you the information you need to make the investments that are right for you.
Best regards,
/s/Edward C. Johnson 3d
Edward C. Johnson 3d
Semiannual Report
There are several ways to evaluate a fund's historical performance. You can look at the total percentage change in value, the average annual percentage change or the growth of a hypothetical $10,000 investment. Total return reflects the change in the value of an investment, assuming reinvestment of the fund's dividend income and capital gains (the profits earned upon the sale of securities that have grown in value). You can also look at the fund's income, as reflected in the fund's yield, to measure performance. If Fidelity had not reimbursed certain fund expenses, the one year, five year, and ten year total returns would have been lower.
Cumulative Total Returns
|
Periods ended October 31, 2000 |
Past 6 |
Past 1 |
Past 5 |
Past 10 |
|
Fidelity Short-Term Bond |
4.03% |
6.05% |
30.70% |
83.88% |
|
LB 1-3 Year Govt/Credit Bond |
4.29% |
6.15% |
33.04% |
87.31% |
|
Short Investment Grade Debt |
3.94% |
5.76% |
29.56% |
84.22% |
Cumulative total returns show the fund's performance in percentage terms over a set period - in this case, six months, one year, five years or 10 years. For example, if you had invested $1,000 in a fund that had a 5% return over the past year, the value of your investment would be $1,050. You can compare the fund's returns to the performance of the Lehman Brothers 1-3 Year Government/Credit Bond Index - a market value-weighted index of government and investment-grade corporate fixed-rate debt issues with maturities between one and three years. To measure how the fund's performance stacked up against its peers, you can compare it to the short investment grade debt funds average, which reflects the performance of mutual funds with similar objectives tracked by Lipper Inc. The past six months average represents a peer group of 110 mutual funds. These benchmarks reflect reinvestment of dividends and capital gains, if any, and exclude the effect of sales charges.
Average Annual Total Returns
|
Periods ended October 31, 2000 |
Past 1 |
Past 5 |
Past 10 |
|
Fidelity Short-Term Bond |
6.05% |
5.50% |
6.28% |
|
LB 1-3 Year Govt/Credit Bond |
6.15% |
5.88% |
6.48% |
|
Short Investment Grade Debt |
5.76% |
5.31% |
6.29% |
Average annual total returns take the fund's cumulative return and show you what would have happened if the fund had performed at a constant rate each year. (Note: Lipper calculates average annual total returns by annualizing each fund's total return, then taking an arithmetic average. This may produce a different figure than that obtained by averaging the cumulative total returns and annualizing the result.)
Semiannual Report
Performance - continued
$10,000 Over 10 Years
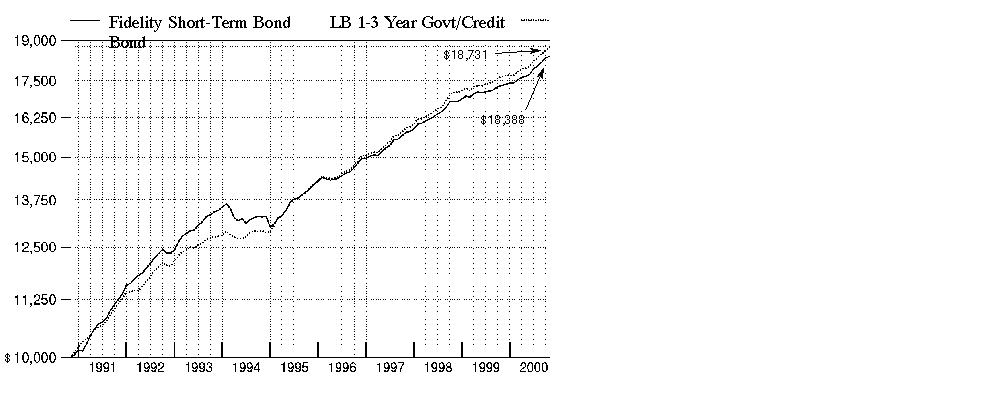
$10,000 Over 10 Years: Let's say hypothetically that $10,000 was invested in Fidelity Short-Term Bond Fund on October 31, 1990. As the chart shows, by October 31, 2000, the value of the investment would have grown to $18,388 - an 83.88% increase on the initial investment. For comparison, look at how the Lehman Brothers 1-3 Year Government/Credit Bond Index, did over the same period. With dividends and capital gains, if any, reinvested, the same $10,000 would have grown to $18,731 - an 87.31% increase.
Understanding
Performance
How a fund did yesterday is no guarantee of how it will do tomorrow. Bond prices, for example, generally move in the opposite direction of interest rates. In turn, the share price, return and yield of a fund that invests in bonds will vary. That means if you sell your shares during a market downturn, you might lose money. But if you can ride out the market's ups and downs, you may have a gain.
3Semiannual Report
Performance - continued
Total Return Components
|
|
Six months ended October 31, |
Years ended April 30, |
||||
|
|
2000 |
2000 |
1999 |
1998 |
1997 |
1996 |
|
Dividend returns |
3.20% |
5.86% |
5.85% |
6.40% |
6.55% |
6.52% |
|
Capital returns |
0.83% |
-2.65% |
-0.23% |
0.46% |
-0.69% |
0.00% |
|
Total returns |
4.03% |
3.21% |
5.62% |
6.86% |
5.86% |
6.52% |
Total return components include both dividend returns and capital returns. A dividend return reflects the actual dividends paid by the fund. A capital return reflects both the amount paid by the fund to shareholders as capital gain distributions and changes in the fund's share price. Both returns assume the dividends or capital gains, if any, paid by the fund are reinvested.
Dividends and Yield
|
Periods ended October 31, 2000 |
Past 1 |
Past 6 |
Past 1 |
|
Dividends per share |
4.52¢ |
26.63¢ |
51.96¢ |
|
Annualized dividend rate |
6.23% |
6.22% |
6.12% |
|
30-day annualized yield |
6.70% |
- |
- |
Dividends per share show the income paid by the fund for a set period. If you annualize this number, based on an average share price of $8.54 over the past one month, $8.49 over the past six months and $8.49 over the past one year, you can compare the fund's income over these three periods. The 30-day annualized yield is a standard formula for all bond funds based on the yields of the bonds in the fund, averaged over the past 30 days. This figure shows you the yield characteristics of the fund's investments at the end of the period. It also helps you compare funds from different companies on an equal basis.
Semiannual Report
Market Recap
Strong technical factors in the market helped most investment-grade bonds overcome unusually volatile market conditions, enabling them to handily outperform most major U.S. equity indexes during the six-month period that ended October 31, 2000. The Lehman Brothers Aggregate Bond Index - a popular measure of taxable-bond performance - returned 5.80% during this time frame. Treasuries continued their hot streak from the beginning of 2000 thanks to a swelling federal surplus and the U.S. government's decision to buy back increasingly larger amounts of outstanding long-term debt. Anticipation that the Fed was finished raising interest rates following a half-point hike in May, combined with persistent flights-to-safety from risk-averse investors concerned about volatility in equity markets, further bolstered the long bond, helping the Lehman Brothers Treasury Index return 5.50% during the period. Mortgage and agency securities rallied back from their period lows in May to post formidable six-month returns. Discount mortgages were boosted by higher-than-normal prepayment activity supported by a strong housing market. Agencies staged a comeback behind reduced political risk surrounding government-sponsored enterprises. During the past six months, the Lehman Brothers Mortgage-Backed Securities and U.S. Agency indexes returned 6.24% and 6.08%, respectively. The corporate sector was the worst-performing segment of the market, plagued by deteriorating credit conditions and growing supply pressures. The Lehman Brothers Credit Bond Index posted a 5.37% return during the six-month period.
(Portfolio Manager photograph)
An interview with Andrew Dudley, Portfolio Manager of Fidelity Short-Term Bond Fund
Q. How did the fund perform, Andy?
A. For the six months that ended October 31, 2000, the fund had a total return of 4.03%. By comparison, the Lehman Brothers 1-3 Year Government/Credit Bond Index returned 4.29%, while the short investment grade debt funds average was 3.94%, as tracked by Lipper Inc. For the 12-month period that ended October 31, 2000, the fund returned 6.05%, while the Lehman Brothers 1-3 Year Government/Credit Bond Index returned 6.15% and the short investment grade debt funds average was 5.76%.
Q. What was the investment environment like during the period?
A. We saw a turn in investors' attitudes about credit risk during the six-month period. Many believed we were approaching the end of a cycle of business expansion and the beginning of a slowdown in economic growth, which potentially could be negative for corporate bonds. At the same time, the heightened focus on stock market performance created pressures among many company managements to support their companies' stock prices. This has encouraged steps such as stock buyback programs and other activities that potentially could cause the credit trends of the companies to deteriorate. Meanwhile, rapidly rising energy prices created another uncertainty for bond investors. In combination, these factors added up to a negative environment for corporate bonds. In contrast, government agency bonds, mortgages and, in particular, asset-backed securities tended to perform well during the six-month period. Among corporate subsectors, defensive areas such as real estate investment trusts (REITs) and utility and energy company bonds tended to perform somewhat better than the overall corporate bond market.
Semiannual Report
Fund Talk: The Manager's Overview - continued
Q. What were your principal strategies, and how did they affect performance?
A. We emphasized the spread sectors - those parts of the fixed-income market that offer a yield advantage, or spread, over Treasury securities. During the past six months, we overweighted mortgages, asset-backed securities and corporate bonds, while underweighting government agency bonds and Treasury securities. While we emphasized corporate securities, which on October 31, 2000, totaled 41.0% of net assets, we were relatively defensive within the corporate bond sector. For example, we modestly shortened the duration of our corporate bond allocation and increased our diversification so the fund was less vulnerable to problems with any individual security. We focused on sound credit analysis and also evaluated individual securities based on the market's heightened sensitivity to deteriorating credit quality. We also looked for better credit quality and emphasized defensive sectors. Consistent with our policy, we did not bet on changes in the direction of interest rates and tended to
have an interest-rate sensitivity, or duration, close to that of the Lehman Brothers benchmark index.
Q. What specific areas particularly helped performance, and what areas hurt?
A. Our investments in REITs and asset-backed securities, such as pools of consumer loans, helped the fund's returns, as did our emphasis on commercial mortgage-backed securities, which typically were between 5% and 7% of net assets. Hurting performance were our underweighted position in government agency bonds and our overweighted position in corporate securities relative to the Lehman Brothers benchmark. While our overall security selection of corporate bonds tended to be good, we did have some individual laggards. One noteworthy disappointment was our investment in Finova, a commercial finance company. The credit quality of the company had deteriorated, in part because the company was unable to extend its line of credit with its banks. We have sold our position in Finova bonds.
Q. What's your outlook?
A. I believe we have entered a new period of heightened volatility among the spread sectors as fixed-income investors search for a new equilibrium in setting valuations for credit risk. This volatility, however, is less dramatic among the shorter-term securities in which we invest, and we believe it still makes sense to invest in corporate bonds because of their yield advantages. At the same time, mortgages and asset-backed securities continue to appear very attractive. I have positioned the fund so it is not overly exposed to shifts in the relationships of yields of shorter-term bonds to the yields of longer-term securities.
Semiannual Report
Fund Talk: The Manager's Overview - continued
The views expressed in this report reflect those of the portfolio manager only through the end of the period of the report as stated on the cover and do not necessarily represent the views of Fidelity or any other person in the Fidelity organization. Any such views are subject to change at any time based upon market or other conditions and Fidelity disclaims any responsibility to update such views. These views may not be relied on as investment advice and, because investment decisions for a Fidelity fund are based on numerous factors, may not be relied on as an indication of trading intent on behalf of any Fidelity fund.
Fund Facts
Goal: high current income, consistent with preservation of capital, by investing primarily in investment-grade, fixed-income securities while maintaining an average maturity of three years or less
Fund number: 450
Trading symbol: FSHBX
Start date: September 15, 1986
Size: as of October 31, 2000, more than $1.6 billion
Manager: Andrew Dudley, since 1997; manager, Spartan Short-Term Bond Fund and Fidelity Advisor Short-Fixed Income Fund, since 1997; Fidelity Advisor Intermediate Bond Fund, since December 1999; joined Fidelity in 1996
3Andrew Dudley on the bond market's perception of the national elections:
"From the perspective of fixed-income investors, the most important outcome of the elections is that there does not appear to be any broad, sweeping mandate for change. The results of both the presidential election and the fight for control of Congress are likely to be so close that it will be difficult for anyone to make dramatic shifts in policy. The financial markets would like that result. They don't like the prospect of broad sweeping changes that create uncertainty in the market.
"The new Congress is likely to be almost evenly split between Republicans and Democrats. The split means that the defection of just one member, for any reason, can jeopardize the outcome of a vote on any issue. That is not an environment for major change, particularly if you also have a president who has been narrowly elected. The bond market was most fearful of a Republican president with a mandate for cutting taxes and clear Republican control in both houses of Congress. That would have increased the potential for large tax cuts, which could reduce or eliminate the federal surplus, causing an increase in the issuance of Treasury securities, higher interest rates and greater volatility in the bond market. To the extent there was no broad, sweeping mandate, there would be less uncertainty for the bond market to worry about."
Semiannual Report
|
Quality Diversification as of October 31, 2000 |
||
|
(Moody's Ratings) |
% of fund's investments |
% of fund's investments |
|
Aaa |
50.2 |
39.6 |
|
Aa |
6.1 |
5.7 |
|
A |
16.9 |
16.0 |
|
Baa |
23.1 |
30.1 |
|
Ba and Below |
0.5 |
0.5 |
|
Not Rated |
0.1 |
0.2 |
|
Table excludes short-term investments. Where Moody's ratings are not available, we have used S&P ® ratings. |
|
Average Years to Maturity as of October 31, 2000 |
||
|
|
|
6 months ago |
|
Years |
2.4 |
2.3 |
|
Average years to maturity is based on the average time remaining until principal payments are expected from each of the fund's bonds, weighted by dollar amount. |
|
Duration as of October 31, 2000 |
||
|
|
|
6 months ago |
|
Years |
1.8 |
1.8 |
|
Duration shows how much a bond fund's price fluctuates with changes in comparable interest rates. If rates rise 1%, for example, a fund with a five-year duration is likely to lose about 5% of its value. Other factors also can influence a bond fund's performance and share price. Accordingly, a bond fund's actual performance may differ from this example. |
|
Asset Allocation (% of fund's net assets) |
|||||||
|
As of October 31, 2000 * |
As of April 30, 2000 ** |
||||||
|
Corporate Bonds 41.0% |
|
|
Corporate Bonds 47.0% |
|
||
|
U.S. Government and Government Agency Obligations 26.1% |
|
|
U.S. Government and Government Agency Obligations 23.7% |
|
||
|
Asset-Backed |
|
|
Asset-Backed |
|
||
|
CMOs and Other Mortgage Related Securities 9.5% |
|
|
CMOs and Other Mortgage Related Securities 5.7% |
|
||
|
Other Investments 2.3% |
|
|
Other Investments 2.9% |
|
||
|
Short-Term |
|
|
Short-Term |
|
||
|
* Foreign investments |
8.1% |
|
** Foreign investments |
7.1% |
|
||

Semiannual Report
(Unaudited)
Showing Percentage of Net Assets
|
Nonconvertible Bonds - 41.0% |
|||||
|
Moody's Ratings |
Principal Amount (000s) |
Value (Note 1) (000s) |
|||
|
BASIC INDUSTRIES - 0.6% |
|||||
|
Chemicals & Plastics - 0.3% |
|||||
|
Pharmacia Corp. 5.375% 12/1/01 |
A1 |
|
$ 5,250 |
$ 5,178 |
|
|
Paper & Forest Products - 0.3% |
|||||
|
Abitibi-Consolidated, Inc. yankee 8.3% 8/1/05 |
Baa3 |
|
1,565 |
1,582 |
|
|
Georgia-Pacific Corp. 9.95% 6/15/02 |
Baa2 |
|
2,500 |
2,580 |
|
|
|
4,162 |
||||
|
TOTAL BASIC INDUSTRIES |
9,340 |
||||
|
CONSTRUCTION & REAL ESTATE - 2.3% |
|||||
|
Real Estate - 0.6% |
|||||
|
Arden Realty LP 8.875% 3/1/05 |
Baa3 |
|
2,725 |
2,776 |
|
|
Cabot Industrial Property LP 7.125% 5/1/04 |
Baa2 |
|
2,195 |
2,132 |
|
|
Duke-Weeks Realty LP 6.875% 3/15/05 |
Baa2 |
|
4,100 |
4,002 |
|
|
|
8,910 |
||||
|
Real Estate Investment Trusts - 1.7% |
|||||
|
Avalonbay Communities, Inc.: |
|
|
|
|
|
|
6.58% 2/15/04 |
Baa1 |
|
2,435 |
2,372 |
|
|
8.25% 7/15/08 |
Baa1 |
|
2,500 |
2,541 |
|
|
CenterPoint Properties Trust: |
|
|
|
|
|
|
6.75% 4/1/05 |
Baa2 |
|
1,530 |
1,454 |
|
|
7.125% 3/15/04 |
Baa2 |
|
4,700 |
4,579 |
|
|
Equity Office Properties Trust 6.375% 1/15/02 |
Baa1 |
|
5,700 |
5,618 |
|
|
Merry Land & Investment Co., Inc. 7.25% 6/15/05 |
A3 |
|
2,400 |
2,338 |
|
|
ProLogis Trust 6.7% 4/15/04 |
Baa1 |
|
4,935 |
4,786 |
|
|
Spieker Properties LP 6.8% 5/1/04 |
Baa2 |
|
4,510 |
4,386 |
|
|
|
28,074 |
||||
|
TOTAL CONSTRUCTION & REAL ESTATE |
36,984 |
||||
|
DURABLES - 2.0% |
|||||
|
Autos, Tires, & Accessories - 1.3% |
|||||
|
Daimler-Chrysler North America Holding Corp.: |
|
|
|
|
|
|
6.96% 8/23/02 (c) |
A1 |
|
6,000 |
6,028 |
|
|
7.75% 5/27/03 |
A1 |
|
6,675 |
6,795 |
|
|
TRW, Inc.: |
|
|
|
|
|
|
6.45% 6/15/01 |
Baa1 |
|
5,550 |
5,504 |
|
|
6.625% 6/1/04 |
Baa1 |
|
2,400 |
2,306 |
|
|
|
20,633 |
||||
|
Nonconvertible Bonds - continued |
|||||
|
Moody's Ratings |
Principal Amount (000s) |
Value (Note 1) (000s) |
|||
|
DURABLES - continued |
|||||
|
Textiles & Apparel - 0.7% |
|||||
|
Jones Apparel Group, Inc./Jones Apparel Group Hldgs., Inc./Jones Apparel Group USA, Inc. 6.25% 10/1/01 |
Baa2 |
|
$ 8,155 |
$ 7,983 |
|
|
Jones Apparel Group, Inc. 7.5% 6/15/04 |
Baa2 |
|
3,200 |
3,006 |
|
|
|
10,989 |
||||
|
TOTAL DURABLES |
31,622 |
||||
|
ENERGY - 1.4% |
|||||
|
Energy Services - 0.2% |
|||||
|
Petroliam Nasional BHD (Petronas) yankee 7.125% 10/18/06 (b) |
Baa2 |
|
3,650 |
3,481 |
|
|
Oil & Gas - 1.2% |
|||||
|
Canada Occidental Petroleum Ltd. 7.125% 2/4/04 |
Baa2 |
|
5,600 |
5,529 |
|
|
Oryx Energy Co.: |
|
|
|
|
|
|
8% 10/15/03 |
Baa1 |
|
2,840 |
2,892 |
|
|
8.125% 10/15/05 |
Baa1 |
|
4,200 |
4,373 |
|
|
The Coastal Corp. 6.2% 5/15/04 |
Baa2 |
|
6,522 |
6,331 |
|
|
|
19,125 |
||||
|
TOTAL ENERGY |
22,606 |
||||
|
FINANCE - 18.1% |
|||||
|
Banks - 6.2% |
|||||
|
Banc One Corp. 7.25% 8/1/02 |
A1 |
|
3,900 |
3,912 |
|
|
Bank One Corp. 7.625% 8/1/05 |
Aa3 |
|
12,750 |
12,896 |
|
|
BankBoston Corp. 6.625% 2/1/04 |
A3 |
|
390 |
382 |
|
|
Capital One Bank: |
|
|
|
|
|
|
6.48% 6/28/02 |
Baa2 |
|
5,315 |
5,184 |
|
|
6.65% 3/15/04 |
Baa3 |
|
4,000 |
3,835 |
|
|
Chase Manhattan Corp. 5.75% 4/15/04 |
Aa3 |
|
3,300 |
3,168 |
|
|
Citicorp 8% 2/1/03 |
A1 |
|
5,040 |
5,159 |
|
|
Den Danske Bank Group AS yankee 6.55% 9/15/03 (b) |
A1 |
|
6,500 |
6,392 |
|
|
First Security Corp. 5.875% 11/1/03 |
Aa2 |
|
1,750 |
1,686 |
|
|
FleetBoston Financial Corp. 7.25% 9/15/05 |
A2 |
|
5,000 |
5,011 |
|
|
Korea Development Bank: |
|
|
|
|
|
|
7.125% 4/22/04 |
Baa2 |
|
2,425 |
2,358 |
|
|
7.375% 9/17/04 |
Baa2 |
|
3,140 |
3,066 |
|
|
Nonconvertible Bonds - continued |
|||||
|
Moody's Ratings |
Principal Amount (000s) |
Value (Note 1) (000s) |
|||
|
FINANCE - continued |
|||||
|
Banks - continued |
|||||
|
National Australia Bank Ltd. yankee 6.4% 12/10/07 (c) |
A1 |
|
$ 6,300 |
$ 6,115 |
|
|
NationsBank Corp. 7% 9/15/01 |
Aa2 |
|
11,500 |
11,513 |
|
|
Popular, Inc. 6.2% 4/30/01 |
A3 |
|
9,230 |
9,179 |
|
|
Providian National Bank: |
|
|
|
|
|
|
6.25% 5/7/01 |
Baa3 |
|
3,250 |
3,228 |
|
|
6.75% 3/15/02 |
Baa3 |
|
1,250 |
1,234 |
|
|
Summit Bancorp 8.625% 12/10/02 |
A3 |
|
7,000 |
7,178 |
|
|
Wells Fargo & Co.: |
|
|
|
|
|
|
6.5% 9/3/02 |
Aa2 |
|
6,000 |
5,974 |
|
|
7.2% 5/1/03 |
Aa2 |
|
2,250 |
2,265 |
|
|
|
99,735 |
||||
|
Credit & Other Finance - 8.7% |
|||||
|
Abbey National PLC 6.69% 10/17/05 |
Aa3 |
|
900 |
881 |
|
|
Aristar, Inc. 6% 8/1/01 |
A3 |
|
4,500 |
4,455 |
|
|
CIT Group Holdings, Inc. 6.5% 6/14/02 |
A1 |
|
3,430 |
3,377 |
|
|
Daimler-Chrysler NA Holding Corp. 6.84% 10/15/02 |
A1 |
|
7,200 |
7,195 |
|
|
Edison Mission Energy Funding Corp. 6.77% 9/15/03 (b) |
Baa1 |
|
4,726 |
4,591 |
|
|
ERP Operating LP: |
|
|
|
|
|
|
6.55% 11/15/01 |
A3 |
|
1,150 |
1,141 |
|
|
7.1% 6/23/04 |
A3 |
|
2,003 |
1,979 |
|
|
Ford Motor Credit Co.: |
|
|
|
|
|
|
7.0581% 7/16/02 (c) |
A2 |
|
11,800 |
11,802 |
|
|
7.6% 8/1/05 |
A2 |
|
4,700 |
4,725 |
|
|
General Electric Capital Corp.: |
|
|
|
|
|
|
6.33% 9/17/01 |
Aaa |
|
13,000 |
12,955 |
|
|
6.65% 9/3/02 |
Aaa |
|
16,700 |
16,680 |
|
|
7.25% 5/3/04 |
Aaa |
|
7,500 |
7,628 |
|
|
General Motors Acceptance Corp.: |
|
|
|
|
|
|
7.48% 2/28/03 |
A2 |
|
5,700 |
5,762 |
|
|
7.625% 6/15/04 |
A2 |
|
4,400 |
4,471 |
|
|
9% 10/15/02 |
A2 |
|
1,250 |
1,296 |
|
|
Heller Financial, Inc. 6.5% 7/22/02 |
A3 |
|
5,900 |
5,816 |
|
|
PNC Funding Corp. 6.95% 9/1/02 |
A2 |
|
11,500 |
11,505 |
|
|
Popular North America, Inc. 7.375% 9/15/01 |
A3 |
|
5,640 |
5,629 |
|
|
Qwest Capital Funding, Inc. 7.75% 8/15/06 (b) |
Baa1 |
|
8,300 |
8,415 |
|
|
Sears Roebuck Acceptance Corp. 6% 3/20/03 |
A3 |
|
2,175 |
2,120 |
|
|
Sprint Capital Corp. 5.7% 11/15/03 |
Baa1 |
|
6,490 |
6,210 |
|
|
Nonconvertible Bonds - continued |
|||||
|
Moody's Ratings |
Principal Amount (000s) |
Value (Note 1) (000s) |
|||
|
FINANCE - continued |
|||||
|
Credit & Other Finance - continued |
|||||
|
The Money Store, Inc. 7.3% 12/1/02 |
A2 |
|
$ 2,520 |
$ 2,538 |
|
|
Trizec Finance Ltd. yankee 10.875% 10/15/05 |
Baa3 |
|
2,190 |
2,212 |
|
|
TXU Eastern Funding 6.15% 5/15/02 |
Baa1 |
|
7,200 |
7,047 |
|
|
|
140,430 |
||||
|
Insurance - 0.3% |
|||||
|
New York Life Insurance Co. 6.4% 12/15/03 (b) |
Aa3 |
|
4,800 |
4,708 |
|
|
Savings & Loans - 0.9% |
|||||
|
Long Island Savings Bank FSB: |
|
|
|
|
|
|
6.2% 4/2/01 |
Baa3 |
|
6,000 |
5,959 |
|
|
7% 6/13/02 |
Baa3 |
|
5,000 |
4,966 |
|
|
Sovereign Bancorp, Inc. 6.625% 3/15/01 |
Ba3 |
|
3,600 |
3,572 |
|
|
|
14,497 |
||||
|
Securities Industry - 2.0% |
|||||
|
Amvescap PLC yankee: |
|
|
|
|
|
|
6.375% 5/15/03 |
A2 |
|
10,350 |
10,028 |
|
|
6.6% 5/15/05 |
A2 |
|
2,200 |
2,103 |
|
|
Donaldson Lufkin & Jenrette, Inc. 6.25% 8/1/01 |
A3 |
|
9,500 |
9,451 |
|
|
Goldman Sachs Group LP 6.6% 7/15/02 (b) |
A1 |
|
1,500 |
1,479 |
|
|
Lehman Brothers Holdings 7% 5/15/03 |
A3 |
|
5,000 |
4,978 |
|
|
Morgan Stanley Dean Witter & Co. 7.75% 6/15/05 |
Aa3 |
|
4,000 |
4,092 |
|
|
|
32,131 |
||||
|
TOTAL FINANCE |
291,501 |
||||
|
INDUSTRIAL MACHINERY & EQUIPMENT - 0.7% |
|||||
|
Tyco International Group SA 6.875% 9/5/02 |
Baa1 |
|
11,860 |
11,770 |
|
|
MEDIA & LEISURE - 2.3% |
|||||
|
Broadcasting - 1.2% |
|||||
|
British Sky Broadcasting Group PLC 7.3% 10/15/06 |
Ba1 |
|
5,500 |
4,990 |
|
|
Clear Channel Communications, Inc. 7.875% 6/15/05 |
Baa3 |
|
11,840 |
11,933 |
|
|
TCI Communications, Inc.: |
|
|
|
|
|
|
8% 8/1/05 |
A2 |
|
2,000 |
2,025 |
|
|
8.65% 9/15/04 |
A2 |
|
700 |
726 |
|
|
|
19,674 |
||||
|
Nonconvertible Bonds - continued |
|||||
|
Moody's Ratings |
Principal Amount (000s) |
Value (Note 1) (000s) |
|||
|
MEDIA & LEISURE - continued |
|||||
|
Publishing - 1.1% |
|||||
|
News America Holdings, Inc.: |
|
|
|
|
|
|
8.5% 2/15/05 |
Baa3 |
|
$ 4,000 |
$ 4,131 |
|
|
8.625% 2/1/03 |
Baa3 |
|
5,750 |
5,874 |
|
|
Time Warner Entertainment Co. LP 9.625% 5/1/02 |
Baa2 |
|
7,340 |
7,611 |
|
|
|
17,616 |
||||
|
TOTAL MEDIA & LEISURE |
37,290 |
||||
|
NONDURABLES - 2.0% |
|||||
|
Beverages - 0.9% |
|||||
|
Seagram JE & Sons, Inc.: |
|
|
|
|
|
|
5.79% 4/15/01 |
Baa3 |
|
3,700 |
3,669 |
|
|
6.4% 12/15/03 |
Baa3 |
|
11,300 |
11,299 |
|
|
|
14,968 |
||||
|
Foods - 0.1% |
|||||
|
ConAgra Foods, Inc. 7.5% 9/15/05 |
Baa1 |
|
2,100 |
2,120 |
|
|
Tobacco - 1.0% |
|||||
|
Philip Morris Companies, Inc.: |
|
|
|
|
|
|
7.25% 9/15/01 |
A2 |
|
3,375 |
3,351 |
|
|
7.625% 5/15/02 |
A2 |
|
6,000 |
5,974 |
|
|
8.75% 6/1/01 |
A2 |
|
2,900 |
2,909 |
|
|
RJ Reynolds Tobacco Holdings, Inc. 7.375% 5/15/03 |
Baa2 |
|
3,000 |
2,839 |
|
|
|
15,073 |
||||
|
TOTAL NONDURABLES |
32,161 |
||||
|
RETAIL & WHOLESALE - 0.9% |
|||||
|
General Merchandise Stores - 0.5% |
|||||
|
Federated Department Stores, Inc.: |
|
|
|
|
|
|
8.125% 10/15/02 |
Baa1 |
|
6,570 |
6,545 |
|
|
8.5% 6/15/03 |
Baa1 |
|
1,750 |
1,738 |
|
|
|
8,283 |
||||
|
Grocery Stores - 0.4% |
|||||
|
Safeway, Inc. 7% 9/15/02 |
Baa2 |
|
6,800 |
6,784 |
|
|
TOTAL RETAIL & WHOLESALE |
15,067 |
||||
|
Nonconvertible Bonds - continued |
|||||
|
Moody's Ratings |
Principal Amount (000s) |
Value (Note 1) (000s) |
|||
|
TECHNOLOGY - 1.3% |
|||||
|
Computers & Office Equipment - 1.3% |
|||||
|
Comdisco, Inc.: |
|
|
|
|
|
|
6.1% 6/5/01 |
Baa2 |
|
$ 16,790 |
$ 14,607 |
|
|
6.65% 11/13/01 |
Baa2 |
|
4,990 |
3,942 |
|
|
7.25% 9/1/02 |
Baa2 |
|
3,500 |
2,555 |
|
|
|
21,104 |
||||
|
TRANSPORTATION - 2.0% |
|||||
|
Air Transportation - 1.1% |
|||||
|
Continental Airlines, Inc. pass thru trust certificates: |
|
|
|
|
|
|
6.954% 2/2/11 |
Baa1 |
|
7,356 |
7,138 |
|
|
7.08% 11/1/04 |
Baa1 |
|
3,332 |
3,246 |
|
|
Delta Air Lines 6.65% 3/15/04 |
Baa3 |
|
2,370 |
2,255 |
|
|
Qantas Airways Ltd. 7.5% 6/30/03 (b) |
Baa1 |
|
4,000 |
3,990 |
|
|
|
16,629 |
||||
|
Railroads - 0.5% |
|||||
|
CSX Corp. 7.05% 5/1/02 |
Baa2 |
|
5,100 |
5,073 |
|
|
Norfolk Southern Corp. 6.95% 5/1/02 |
Baa1 |
|
3,100 |
3,090 |
|
|
|
8,163 |
||||
|
Trucking & Freight - 0.4% |
|||||
|
Federal Express Corp. 7.53% 9/23/06 |
A3 |
|
6,828 |
6,802 |
|
|
TOTAL TRANSPORTATION |
31,594 |
||||
|
UTILITIES - 7.4% |
|||||
|
Cellular - 0.6% |
|||||
|
AirTouch Communications, Inc. 6.35% 6/1/05 |
A2 |
|
4,200 |
4,052 |
|
|
Vodafone AirTouch PLC 7.625% 2/15/05 (b) |
A2 |
|
5,700 |
5,783 |
|
|
|
9,835 |
||||
|
Electric Utility - 2.7% |
|||||
|
Avon Energy Partners Holdings 6.73% 12/11/02 (b) |
Baa2 |
|
7,700 |
7,522 |
|
|
Illinois Power Co. 6% 9/15/03 |
Baa1 |
|
4,250 |
4,126 |
|
|
Niagara Mohawk Power Corp.: |
|
|
|
|
|
|
5.875% 9/1/02 |
Baa2 |
|
1,000 |
977 |
|
|
7.375% 8/1/03 |
Baa2 |
|
2,800 |
2,825 |
|
|
9.25% 10/1/01 |
Baa2 |
|
7,900 |
8,001 |
|
|
Nonconvertible Bonds - continued |
|||||
|
Moody's Ratings |
Principal Amount (000s) |
Value (Note 1) (000s) |
|||
|
UTILITIES - continued |
|||||
|
Electric Utility - continued |
|||||
|
Philadelphia Electric Co.: |
|
|
|
|
|
|
5.625% 11/1/01 |
Baa1 |
|
$ 4,940 |
$ 4,853 |
|
|
6.5% 5/1/03 |
Baa1 |
|
2,527 |
2,484 |
|
|
6.625% 3/1/03 |
Baa1 |
|
1,800 |
1,776 |
|
|
Texas Utilities Electric Co.: |
|
|
|
|
|
|
7.375% 8/1/01 |
A3 |
|
2,430 |
2,432 |
|
|
8% 6/1/02 |
A3 |
|
6,702 |
6,802 |
|
|
8.25% 4/1/04 |
A3 |
|
1,440 |
1,493 |
|
|
|
43,291 |
||||
|
Gas - 1.8% |
|||||
|
Consolidated Natural Gas Co. 7.375% 4/1/05 |
A2 |
|
4,900 |
4,920 |
|
|
Enron Corp.: |
|
|
|
|
|
|
6.45% 11/15/01 |
Baa1 |
|
4,200 |
4,174 |
|
|
6.5% 8/1/02 |
Baa1 |
|
5,650 |
5,586 |
|
|
9.875% 6/15/03 |
Baa1 |
|
4,400 |
4,696 |
|
|
Enserch Corp. 6.25% 1/1/03 |
Baa2 |
|
2,350 |
2,304 |
|
|
Reliant Energy Resources Corp. 8.125% 7/15/05 (b) |
Baa1 |
|
5,900 |
5,971 |
|
|
Sonat, Inc. 6.875% 6/1/05 |
Baa2 |
|
1,925 |
1,895 |
|
|
|
29,546 |
||||
|
Telephone Services - 2.3% |
|||||
|
Telecomunicaciones de Puerto Rico, Inc. 6.15% 5/15/02 |
Baa2 |
|
9,190 |
9,023 |
|
|
Telefonica Europe BV 7.35% 9/15/05 |
A2 |
|
7,200 |
7,231 |
|
|
Teleglobe Canada, Inc. 7.2% 7/20/09 |
Baa1 |
|
6,450 |
6,182 |
|
|
US West Communications 7.2% 11/1/04 |
A2 |
|
6,500 |
6,462 |
|
|
WorldCom, Inc.: |
|
|
|
|
|
|
8% 5/16/06 |
A3 |
|
5,000 |
5,145 |
|
|
8.875% 1/15/06 |
A3 |
|
2,508 |
2,588 |
|
|
|
36,631 |
||||
|
TOTAL UTILITIES |
119,303 |
||||
|
TOTAL NONCONVERTIBLE BONDS (Cost $669,219) |
660,342 |
||||
|
U.S. Government and Government Agency Obligations - 19.3% |
|||||
|
Moody's Ratings |
Principal Amount (000s) |
Value (Note 1) (000s) |
|||
|
U.S. Government Agency Obligations - 8.8% |
|||||
|
Fannie Mae 5.375% 3/15/02 |
Aaa |
|
$ 15,000 |
$ 14,789 |
|
|
Federal Home Loan Bank: |
|
|
|
|
|
|
6.75% 5/1/02 |
Aaa |
|
50,100 |
50,303 |
|
|
6.75% 8/15/02 |
Aaa |
|
20,000 |
20,097 |
|
|
Freddie Mac 7.375% 5/15/03 |
Aaa |
|
48,600 |
49,641 |
|
|
Government Trust Certificates (assets of Trust guaranteed by U.S. Government through Defense Security Assistance Agency) Class 3-T, 9.625% 5/15/02 |
Aaa |
|
364 |
367 |
|
|
Guaranteed Export Trust Certificates (assets of Trust guaranteed by U.S. Government through Export-Import Bank) Series 1995-A, 6.28% 6/15/04 |
Aaa |
|
3,765 |
3,733 |
|
|
Israel Export Trust Certificates (assets of Trust guaranteed by U.S. Government through Export-Import Bank) Series 1994-1, 6.88% 1/26/03 |
Aaa |
|
1,097 |
1,095 |
|
|
Private Export Funding Corp. secured 6.86% 4/30/04 |
Aaa |
|
1,180 |
1,182 |
|
|
TOTAL U.S. GOVERNMENT AGENCY OBLIGATIONS |
141,207 |
||||
|
U.S. Treasury Obligations - 10.5% |
|||||
|
U.S. Treasury Notes: |
|
|
|
|
|
|
5.25% 5/31/01 |
Aaa |
|
82,900 |
82,332 |
|
|
5.75% 6/30/01 |
Aaa |
|
15,000 |
14,935 |
|
|
6.625% 4/30/02 |
Aaa |
|
12,200 |
12,286 |
|
|
7.875% 8/15/01 |
Aaa |
|
58,500 |
59,158 |
|
|
TOTAL U.S. TREASURY OBLIGATIONS |
168,711 |
||||
|
TOTAL U.S. GOVERNMENT AND (Cost $310,118) |
309,918 |
||||
|
U.S. Government Agency - Mortgage Securities - 6.8% |
|||||
|
|
|||||
|
Fannie Mae - 0.9% |
|||||
|
8% 4/1/30 to 7/1/30 |
Aaa |
|
12,719 |
12,874 |
|
|
11.5% 11/1/15 |
Aaa |
|
931 |
1,024 |
|
|
TOTAL FANNIE MAE |
13,898 |
||||
|
U.S. Government Agency - Mortgage Securities - continued |
|||||
|
Moody's Ratings |
Principal Amount (000s) |
Value (Note 1) (000s) |
|||
|
Freddie Mac - 2.2% |
|||||
|
7.5% 10/1/30 |
Aaa |
|
$ 11,669 |
$ 11,661 |
|
|
8.5% 5/1/27 to 5/1/30 |
Aaa |
|
23,097 |
23,654 |
|
|
12% 11/1/19 |
Aaa |
|
232 |
255 |
|
|
TOTAL FREDDIE MAC |
35,570 |
||||
|
Government National Mortgage Association - 3.7% |
|||||
|
8% 3/15/27 to 8/15/30 |
Aaa |
|
18,239 |
18,541 |
|
|
8.5% 7/15/30 to 10/15/30 |
Aaa |
|
40,172 |
41,201 |
|
|
11% 7/15/10 |
Aaa |
|
2 |
2 |
|
|
TOTAL GOVERNMENT NATIONAL MORTGAGE ASSOCIATION |
59,744 |
||||
|
TOTAL U.S. GOVERNMENT AGENCY - MORTGAGE SECURITIES (Cost $108,774) |
109,212 |
||||
|
Asset-Backed Securities - 17.8% |
|||||
|
|
|||||
|
Americredit Automobile Receivables Trust: |
|
|
|
|
|
|
7.02% 12/15/05 |
Aaa |
|
16,000 |
16,088 |
|
|
7.15% 8/15/04 |
Aaa |
|
5,700 |
5,725 |
|
|
ANRC Auto Owner Trust 7.06% 5/17/04 |
Aaa |
|
8,400 |
8,450 |
|
|
Arcadia Automobile Receivables Trust: |
|
|
|
|
|
|
5.67% 1/15/04 |
Aaa |
|
4,311 |
4,258 |
|
|
7.2% 6/15/07 |
Aaa |
|
4,278 |
4,309 |
|
|
ARG Funding Corp. 5.88% 5/20/03 (b) |
Aaa |
|
9,350 |
9,248 |
|
|
Associates Auto Receivables Trust 6.9% 8/15/05 |
Aaa |
|
10,000 |
10,025 |
|
|
BankAmerica Manufacturing Housing Contract Trust V 6.2% 4/10/09 |
Aaa |
|
720 |
712 |
|
|
Capita Equipment Receivables Trust 6.45% 8/15/02 |
Aa3 |
|
6,800 |
6,758 |
|
|
Capital One Master Trust 7.1% 4/17/06 |
Aaa |
|
8,500 |
8,585 |
|
|
Caterpillar Financial Asset Trust 6.2% 4/25/04 |
Aaa |
|
5,745 |
5,716 |
|
|
Chase Manhattan Marine Owner Trust 6.25% 4/16/07 |
Aaa |
|
1,178 |
1,177 |
|
|
Chevy Chase Auto Receivables Trust: |
|
|
|
|
|
|
5.97% 10/20/04 |
Aaa |
|
2,181 |
2,159 |
|
|
6.2% 3/20/04 |
Aaa |
|
809 |
803 |
|
|
CIT RV Trust 5.78% 7/15/08 |
Aaa |
|
7,000 |
6,898 |
|
|
Contimortgage Home Equity Loan Trust 6.3% 7/15/12 |
Aaa |
|
1,968 |
1,954 |
|
|
Asset-Backed Securities - continued |
|||||
|
Moody's Ratings |
Principal Amount (000s) |
Value (Note 1) (000s) |
|||
|
CS First Boston Mortgage Securities Corp. 7% 3/15/27 |
Aaa |
|
$ 1,402 |
$ 1,400 |
|
|
Daimlerchrysler Auto Trust: |
|
|
|
|
|
|
6.7% 6/8/03 |
Aaa |
|
14,700 |
14,700 |
|
|
6.85% 11/6/05 |
Aaa |
|
15,000 |
15,094 |
|
|
Discover Card Master Trust I: |
|
|
|
|
|
|
5.65% 11/16/04 |
Aaa |
|
7,000 |
6,892 |
|
|
6.98% 7/18/05 (c) |
A2 |
|
17,119 |
17,138 |
|
|
Distribution Financial Services Marine Trust 6.2% 11/15/11 |
Aaa |
|
5,900 |
5,808 |
|
|
Fidelity Funding Auto Trust 6.99% 11/15/02 (b) |
Aaa |
|
229 |
229 |
|
|
First Security Auto Owner Trust 6.2% 10/2/06 |
A3 |
|
3,712 |
3,655 |
|
|
Ford Credit Auto Owner Trust: |
|
|
|
|
|
|
6.15% 9/15/02 |
Aaa |
|
6,700 |
6,658 |
|
|
7.03% 11/15/03 |
Aaa |
|
3,265 |
3,291 |
|
|
7.5% 10/15/04 |
A1 |
|
8,300 |
8,406 |
|
|
Green Tree Financial Corp. 6.68% 1/15/29 |
AAA |
|
1,920 |
1,906 |
|
|
Honda Auto Receivables Owner Trust 6.62% 7/15/04 |
Aaa |
|
6,600 |
6,595 |
|
|
Key Auto Finance Trust: |
|
|
|
|
|
|
5.83% 1/15/07 |
Aaa |
|
7,800 |
7,683 |
|
|
6.65% 10/15/03 |
Baa3 |
|
231 |
230 |
|
|
Olympic Automobile Receivables Trust 6.125% 11/15/04 |
Aaa |
|
716 |
709 |
|
|
Onyx Acceptance Grantor Trust 5.95% 7/15/04 |
Aaa |
|
2,489 |
2,469 |
|
|
Onyx Acceptance Owner Trust: |
|
|
|
|
|
|
5.78% 2/15/03 |
Aaa |
|
5,565 |
5,532 |
|
|
7.26% 5/15/07 |
Aaa |
|
9,200 |
9,308 |
|
|
Orix Credit Alliance Receivables Trust 7.12% 5/15/04 |
Aaa |
|
4,800 |
4,808 |
|
|
Petroleum Enhanced Trust Receivables Offering Petroleum Trust 7.12% 2/5/03 (b)(c) |
Baa2 |
|
2,493 |
2,485 |
|
|
Premier Auto Trust 5.7% 10/6/02 |
Aaa |
|
12,734 |
12,658 |
|
|
Prime Credit Card Master Trust 6.75% 11/15/05 |
Aaa |
|
2,895 |
2,896 |
|
|
Reliance Auto Receivables Corp., Inc. 6.1% 7/15/02 (b) |
Aaa |
|
60 |
60 |
|
|
Sears Credit Account Master Trust II: |
|
|
|
|
|
|
6.2% 7/16/07 |
Aaa |
|
10,800 |
10,699 |
|
|
7% 7/15/08 |
Aaa |
|
15,700 |
15,803 |
|
|
7.5% 11/15/07 |
A2 |
|
8,300 |
8,435 |
|
|
Toyota Auto Owners Trust 7.21% 4/15/07 |
Aaa |
|
6,600 |
6,683 |
|
|
Toyota Auto Receivables Owner Trust |
Aaa |
|
6,800 |
6,810 |
|
|
Asset-Backed Securities - continued |
|||||
|
Moody's Ratings |
Principal Amount (000s) |
Value (Note 1) (000s) |
|||
|
Tranex Auto Receivables Owner Trust 6.334% 8/15/03 (b) |
Aaa |
|
$ 944 |
$ 940 |
|
|
Triad Auto Receivables Owner Trust 5.98% 9/17/05 |
Aaa |
|
3,389 |
3,348 |
|
|
TOTAL ASSET-BACKED SECURITIES (Cost $286,002) |
286,193 |
||||
|
Collateralized Mortgage Obligations - 5.0% |
|||||
|
|
|||||
|
Private Sponsor - 0.2% |
|||||
|
GE Capital Mortgage Services, Inc. planned
amortization class Series 1994-2 Class A4, |
Aaa |
|
636 |
630 |
|
|
Residential Funding Mortgage Securities I, Inc. planned amortization class Series 1994-S12 Class A2, 6.5% 4/25/09 |
Aaa |
|
2,304 |
2,286 |
|
|
TOTAL PRIVATE SPONSOR |
2,916 |
||||
|
U.S. Government Agency - 4.8% |
|||||
|
Fannie Mae sequential pay Series 1998-2 |
Aaa |
|
10,143 |
10,003 |
|
|
Freddie Mac: |
|
|
|
|
|
|
REMIC planned amortization class: |
|
|
|
|
|
|
Series 2134 Class PC, 5.725% 4/15/11 |
Aaa |
|
14,783 |
14,460 |
|
|
Series 2143 Class CH, 6% 2/15/19 |
Aaa |
|
7,964 |
7,864 |
|
|
sequential pay: |
|
|
|
|
|
|
Series 2134 Class H, 6.5% 12/15/24 |
Aaa |
|
9,557 |
9,378 |
|
|
Series 1815 Class B, 7% 1/15/21 |
Aaa |
|
6,201 |
6,191 |
|
|
Series 2061 Class J, 6.5% 9/20/22 |
Aaa |
|
10,704 |
10,534 |
|
|
Series 2070 Class A, 6% 8/15/24 |
Aaa |
|
11,095 |
10,648 |
|
|
Government National Mortgage Association
sequential pay Series 1998-19 Class B, |
Aaa |
|
7,890 |
7,747 |
|
|
TOTAL U.S. GOVERNMENT AGENCY |
76,825 |
||||
|
TOTAL COLLATERALIZED MORTGAGE OBLIGATIONS (Cost $79,629) |
79,741 |
||||
|
Commercial Mortgage Securities - 4.5% |
|||||
|
Moody's Ratings |
Principal Amount (000s) |
Value (Note 1) (000s) |
|||
|
Allied Capital Commercial Mortgage Trust sequential pay Series 1998-1 Class A, 6.31% 1/25/28 (b) |
Aaa |
|
$ 1,366 |
$ 1,352 |
|
|
Bankers Trust II Series 1999-S1A Class D, 8.81% 2/28/14 (b)(c) |
Baa2 |
|
7,800 |
7,817 |
|
|
CBM Funding Corp. sequential pay Series 1996-1B Class A2, 6.88% 7/1/02 |
AA |
|
2,596 |
2,587 |
|
|
CS First Boston Mortgage Securities Corp.: |
|
|
|
|
|
|
sequential pay Series 1997-SPICE Class A, 6.653% 8/20/36 (b) |
- |
|
1,454 |
1,448 |
|
|
sequential pay Series 2000-C1 Class A1, 7.325% 4/15/62 |
AAA |
|
5,832 |
5,910 |
|
|
Series 1998-FL1: |
|
|
|
|
|
|
Class D, 7.1188% 12/10/00 (b)(c) |
Aa1 |
|
3,700 |
3,700 |
|
|
Class E, 7.4688% 1/10/13 (b)(c) |
Baa1 |
|
9,300 |
9,465 |
|
|
Equitable Life Assurance Society of the United States floater Series 174 Class D2, 6.7063% 5/15/03 (b)(c) |
Baa2 |
|
3,255 |
3,176 |
|
|
Federal Deposit Insurance Corp. REMIC Trust sequential pay Series 1996-C1 Class 1A, 6.75% 7/25/26 |
Aaa |
|
2,016 |
1,996 |
|
|
FMAC Loan Receivables Trust sequential pay Series 1998-C Class A1, 5.99% 9/15/20 (b) |
Aaa |
|
2,004 |
1,944 |
|
|
Franchise Loan Trust sequential pay |
Aaa |
|
3,767 |
3,691 |
|
|
Hilton Hotel Pool Trust Series 2000 HLT |
Aaa |
|
4,500 |
4,511 |
|
|
Host Marriot Pool Trust sequential pay |
Aaa |
|
3,672 |
3,664 |
|
|
Morgan Stanly Dean Witter Capital Trust sequential pay Series 2000-PRIN Class A1, 7.07% 4/23/06 |
Aaa |
|
7,424 |
7,452 |
|
|
Nomura Depositor Trust floater |
Baa2 |
|
7,610 |
7,471 |
|
|
Structured Asset Securities Corp. floater |
Aa3 |
|
6,168 |
6,168 |
|
|
TOTAL COMMERCIAL MORTGAGE SECURITIES (Cost $72,478) |
72,352 |
||||
|
Foreign Government and Government Agency Obligations (d) - 1.9% |
|||||
|
Moody's Ratings |
Principal Amount (000s) |
Value (Note 1) (000s) |
|||
|
Korean Republic yankee 8.75% 4/15/03 |
Baa2 |
|
$ 175 |
$ 179 |
|
|
Ontario Province yankee 7.75% 6/4/02 |
Aa3 |
|
23,900 |
24,247 |
|
|
United Mexican States 8.5% 2/1/06 |
Baa3 |
|
6,450 |
6,431 |
|
|
TOTAL FOREIGN GOVERNMENT AND (Cost $30,711) |
30,857 |
||||
|
Supranational Obligations - 0.4% |
|||||
|
|
|||||
|
African Development Bank 7.75% 12/15/01 |
Aa1 |
|
6,760 |
6,819 |
|
|
Commercial Paper - 0.5% |
||||
|
|
||||
|
British Telecom PLC 6.8525% 10/9/01 (b)(c) |
|
8,200 |
8,185 |
|
|
Cash Equivalents - 2.7% |
|||
|
Maturity Amount (000s) |
|
||
|
Investments in repurchase agreements: |
|
|
|
|
(U.S. Government Obligations), in a joint trading account at 6.62%, dated 10/31/00 due 11/1/00 |
$ 32,304 |
32,298 |
|
|
(U.S. Treasury Obligations), in a joint trading account at 6.55%, dated 10/31/00 due 11/1/00 |
10,338 |
10,336 |
|
|
TOTAL CASH EQUIVALENTS (Cost $42,634) |
42,634 |
||
|
TOTAL INVESTMENT PORTFOLIO - 99.9% (Cost $1,614,889) |
1,606,253 |
||
|
NET OTHER ASSETS - 0.1% |
2,373 |
||
|
NET ASSETS - 100% |
$ 1,608,626 |
||
|
Legend |
|
(a) S&P credit ratings are used in the absence of a rating by Moody's Investors Service, Inc. |
|
(b) Security exempt from registration under Rule 144A of the Securities Act of 1933. These securities may be resold in transactions exempt from registration, normally to qualified institutional buyers. At the period end, the value of these securities amounted to $119,711,000 or 7.4% of net assets. |
|
(c) The coupon rate shown on floating or adjustable rate securities represents the rate at period end. |
|
(d) For foreign government obligations not individually rated by S&P or Moody's, the ratings listed have been assigned by FMR, the fund's investment adviser, based principally on S&P and Moody's ratings of the sovereign credit of the issuing government. |
|
Other Information |
|
The composition of long-term debt holdings as a percentage of total value of investments in securities, is as follows (ratings are unaudited): |
|
Moody's Ratings |
S&P Ratings |
|||
|
Aaa, Aa, A |
72.5% |
|
AAA, AA, A |
61.8% |
|
Baa |
23.1% |
|
BBB |
22.7% |
|
Ba |
0.5% |
|
BB |
1.1% |
|
B |
0.0% |
|
B |
0.0% |
|
Caa |
0.0% |
|
CCC |
0.0% |
|
Ca, C |
0.0% |
|
CC, C |
0.0% |
|
|
|
|
D |
0.0% |
|
The percentage not rated by Moody's or S&P amounted to 0.1%. |
|
Income Tax Information |
|
At October 31, 2000, the aggregate cost of investment securities for income tax purposes was $1,614,931,000. Net unrealized depreciation aggregated $8,678,000, of which $6,088,000 related to appreciated investment securities and $14,766,000 related to depreciated investment securities. |
|
At April 30, 2000, the fund had a capital loss carryforward of approximately $241,749,000 of which $18,091,000, $94,824,000, $99,539,000, $10,379,000, $10,466,000 and $8,450,000 will expire on April 30, 2002, 2003, 2004, 2005, 2006 and 2008, respectively. Of the loss carryforwards expiring on April 30, 2003, 2004, 2005 and 2006, $29,296,000, $25,460,000, $4,138,000 and $2,203,000, respectively, was acquired in the merger and is available to offset future capital gains of the fund to the extent by regulations |
See accompanying notes which are an integral part of the financial statements.
Semiannual Report
Statement of Assets and Liabilities
|
Amounts in thousands (except per-share amount) |
October 31, 2000 (Unaudited) |
|
|
Assets |
|
|
|
Investment in securities, at value (including repurchase agreements of $42,634) (cost $1,614,889) - |
|
$ 1,606,253 |
|
Receivable for investments sold |
|
25,788 |
|
Receivable for fund shares sold |
|
7,524 |
|
Interest receivable |
|
22,383 |
|
Other receivables |
|
3 |
|
Total assets |
|
1,661,951 |
|
Liabilities |
|
|
|
Payable for investments purchased |
$ 42,258 |
|
|
Payable for fund shares redeemed |
9,238 |
|
|
Distributions payable |
1,021 |
|
|
Accrued management fee |
562 |
|
|
Other payables and accrued expenses |
246 |
|
|
Total liabilities |
|
53,325 |
|
Net Assets |
|
$ 1,608,626 |
|
Net Assets consist of: |
|
|
|
Paid in capital |
|
$ 1,872,851 |
|
Distributions in excess of net investment income |
|
(1,602) |
|
Accumulated undistributed net realized gain (loss) on investments and foreign currency transactions |
|
(253,987) |
|
Net unrealized appreciation (depreciation) on investments |
|
(8,636) |
|
Net Assets, for 188,742 shares outstanding |
|
$ 1,608,626 |
|
Net Asset Value, offering price and redemption price |
|
$8.52 |
See accompanying notes which are an integral part of the financial statements.
Semiannual Report
Financial Statements - continued
Statement of Operations
|
Amounts in thousands |
Six months ended October 31, 2000 (Unaudited) |
|
|
Investment Income Interest |
|
$ 51,217 |
|
Security lending |
|
6 |
|
Total Income |
|
51,223 |
|
Expenses |
|
|
|
Management fee |
$ 3,136 |
|
|
Transfer agent fees |
962 |
|
|
Accounting and security lending fees |
159 |
|
|
Non-interested trustees' compensation |
3 |
|
|
Custodian fees and expenses |
25 |
|
|
Registration fees |
67 |
|
|
Audit |
20 |
|
|
Legal |
4 |
|
|
Miscellaneous |
1 |
|
|
Total expenses before reductions |
4,377 |
|
|
Expense reductions |
(52) |
4,325 |
|
Net investment income |
|
46,898 |
|
Realized and Unrealized Gain (Loss) Net realized gain (loss) on investment securities |
|
(3,314) |
|
Change in net unrealized appreciation (depreciation) on investment securities |
|
15,028 |
|
Net gain (loss) |
|
11,714 |
|
Net increase (decrease) in net assets resulting |
|
$ 58,612 |
See accompanying notes which are an integral part of the financial statements.
Semiannual Report
Financial Statements - continued
Statement of Changes in Net Assets
|
Amounts in thousands |
Six months ended October 31, 2000 (Unaudited) |
Year ended |
|
Increase (Decrease) in Net Assets |
|
|
|
Operations |
$ 46,898 |
$ 74,815 |
|
Net realized gain (loss) |
(3,314) |
(14,730) |
|
Change in net unrealized appreciation (depreciation) |
15,028 |
(17,318) |
|
Net increase (decrease) in net assets resulting |
58,612 |
42,767 |
|
Distributions to shareholders from net investment income |
(46,290) |
(73,596) |
|
Share transactions |
651,918 |
1,015,415 |
|
Net asset value of shares issued in exchange |
- |
282,178 |
|
Reinvestment of distributions |
40,297 |
64,786 |
|
Cost of shares redeemed |
(439,438) |
(961,335) |
|
Net increase (decrease) in net assets resulting |
252,777 |
401,044 |
|
Total increase (decrease) in net assets |
265,099 |
370,215 |
|
Net Assets |
|
|
|
Beginning of period |
1,343,527 |
973,312 |
|
End of period (including distributions in excess |
$ 1,608,626 |
$ 1,343,527 |
|
Other Information Shares |
|
|
|
Sold |
76,806 |
118,998 |
|
Issued in exchange for shares of |
- |
32,926 |
|
Issued in reinvestment of distributions |
4,741 |
7,602 |
|
Redeemed |
(51,769) |
(112,714) |
|
Net increase (decrease) |
29,778 |
46,812 |
See accompanying notes which are an integral part of the financial statements.
Semiannual Report
Financial Highlights
|
|
Six months ended October 31, 2000 |
Years ended April 30, |
||||
|
|
(Unaudited) |
2000 |
1999 |
1998 |
1997 |
1996 |
|
Selected Per-Share Data |
|
|
|
|
|
|
|
Net asset value,
beginning |
$ 8.450 |
$ 8.680 |
$ 8.700 |
$ 8.660 |
$ 8.720 |
$ 8.720 |
|
Income from Investment
Operations |
.269 D |
.507 D |
.507 D |
.546 D |
.558 D |
.579 |
|
Net realized |
.067 |
(.238) |
(.030) |
.033 |
(.061) |
(.020) |
|
Total from investment operations |
.336 |
.269 |
.477 |
.579 |
.497 |
.559 |
|
Less Distributions |
|
|
|
|
|
|
|
From net investment income |
(.266) |
(.499) |
(.497) |
(.539) |
(.552) |
(.504) |
|
Return of capital |
- |
- |
- |
- |
(.005) |
(.055) |
|
Total distributions |
(.266) |
(.499) |
(.497) |
(.539) |
(.557) |
(.559) |
|
Net asset value, |
$ 8.520 |
$ 8.450 |
$ 8.680 |
$ 8.700 |
$ 8.660 |
$ 8.720 |
|
Total Return B, C |
4.03% |
3.21% |
5.62% |
6.86% |
5.86% |
6.52% |
|
Ratios and Supplemental Data |
|
|
|
|
|
|
|
Net assets, |
$ 1,609 |
$ 1,344 |
$ 973 |
$ 809 |
$ 922 |
$ 1,048 |
|
Ratio of expenses to average net assets |
.59% A |
.63% E |
.66% E |
.70% |
.70% |
.69% |
|
Ratio of expenses |
.58% A, F |
.62% F |
.65% F |
.70% |
.70% |
.68% F |
|
Ratio of net investment income to average net assets |
6.31% A |
5.96% |
5.83% |
6.26% |
6.41% |
6.37% |
|
Portfolio turnover rate |
60% A |
126% G |
133% |
117% |
104% |
151% |
A Annualized
B Total returns for periods of less than one year are not annualized.
C The total returns would have been lower had certain expenses not been reduced during the periods shown.
D Net investment income per share has been calculated based on average shares outstanding during the period.
E FMR agreed to reimburse a portion of the fund's expenses during the period. Without this reimbursement, the fund's expense ratio would have been higher.
F FMR or the fund has entered into varying arrangements with third parties who either paid or reduced a portion of the fund's expenses.
G The portfolio turnover rate does not include the assets acquired in the merger.
See accompanying notes which are an integral part of the financial statements.
Semiannual Report
For the period ended October 31, 2000 (Unaudited)
1. Significant Accounting Policies.
Fidelity Short-Term Bond Fund (the fund) is a fund of Fidelity Fixed-Income Trust (the trust) and is authorized to issue an unlimited number of shares. The trust is registered under the Investment Company Act of 1940, as amended, as an open-end management investment company organized as a Massachusetts business trust. The financial statements have been prepared in conformity with generally accepted accounting principles which require management to make certain estimates and assumptions at the date of the financial statements. The following summarizes the significant accounting policies of the fund:
Security Valuation. Securities are valued based upon a computerized matrix system and/or appraisals by a pricing service, both of which consider market transactions and dealer-supplied valuations. Securities (including restricted securities) for which market quotations are not readily available are valued at their fair value as determined in good faith under consistently applied procedures under the general supervision of the Board of Trustees. Short-term securities with remaining maturities of sixty days or less for which quotations are not readily available are valued at amortized cost or original cost plus accrued interest, both of which approximate current value. Investments in open-end investment companies are valued at their net asset value each business day.
Foreign Currency Translation. The accounting records of the fund are maintained in U.S. dollars. Investment securities and other assets and liabilities denominated in a foreign currency are translated into U.S. dollars at the prevailing rates of exchange at period end. Purchases and sales of securities, income receipts and expense payments are translated into U.S. dollars at the prevailing exchange rate on the respective dates of the transactions.
Net realized gains and losses on foreign currency transactions represent net gains and losses from sales and maturities of foreign currency contracts, disposition of foreign currencies, the difference between the amount of net investment income accrued and the U.S. dollar amount actually received, and gains and losses between trade and settlement date on purchases and sales of securities. The effects of changes in foreign currency exchange rates on investments in securities are included with the net realized and unrealized gain or loss on investment securities.
Income Taxes. As a qualified regulated investment company under Subchapter M of the Internal Revenue Code, the fund is not subject to income taxes to the extent that it distributes substantially all of its taxable income for its fiscal year. The schedule of investments includes information regarding income taxes under the caption "Income Tax Information."
Investment Income. Interest income, which includes accretion of original issue discount, is accrued as earned.
Semiannual Report
Notes to Financial Statements (Unaudited) - continued
1. Significant Accounting Policies - continued
Expenses. Most expenses of the trust can be directly attributed to a fund. Expenses which cannot be directly attributed are apportioned among the funds in the trust.
Deferred Trustee Compensation. Under a Deferred Compensation Plan (the Plan) non-interested Trustees must defer receipt of a portion of, and may elect to defer receipt of an additional portion of, their annual compensation. Deferred amounts are treated as though equivalent dollar amounts had been invested in shares of the fund or are invested in a cross-section of other Fidelity funds. Deferred amounts remain in the fund until distributed in accordance with the Plan.
Distributions to Shareholders. Dividends are declared daily and paid monthly from net investment income. Distributions to shareholders from realized capital gains on investments, if any, are recorded on the ex-dividend date.
Income and capital gain distributions are determined in accordance with income tax regulations which may differ from generally accepted accounting principles. These differences, which may result in distribution reclassifications, are primarily due to differing treatments for paydown gains/losses on certain securities, market discount, capital loss carryforwards, expiring capital loss carryforwards and losses deferred due to wash sales and excise tax regulations.
Permanent book and tax basis differences relating to shareholder distributions will result in reclassifications to paid in capital. Distributions in excess of net investment income and accumulated undistributed net realized gain (loss) on investments and foreign currency transactions may include temporary book and tax basis differences which will reverse in a subsequent period. Any taxable income or gain remaining at fiscal year end is distributed in the following year.
Security Transactions. Security transactions are accounted for as of trade date. Gains and losses on securities sold are determined on the basis of identified cost.
2. Operating Policies.
Joint Trading Account. Pursuant to an Exemptive Order issued by the Securities and Exchange Commission (the SEC), the fund, along with other affiliated entities of Fidelity Management & Research Company (FMR), may transfer uninvested cash balances into one or more joint trading accounts. These balances are invested in one or more repurchase agreements for U.S. Treasury or Federal Agency obligations.
Repurchase Agreements. The underlying U.S. Treasury, Federal Agency, or other obligations found to be satisfactory by FMR are transferred to an account of the fund, or to the Joint Trading Account, at a custodian bank. The securities are marked-to-market daily and maintained at a value at least equal to the principal amount of the
Semiannual Report
Notes to Financial Statements (Unaudited) - continued
2. Operating Policies - continued
Repurchase Agreements - continued
repurchase agreement (including accrued interest). FMR, the fund's investment adviser, is responsible for determining that the value of the underlying securities remains in accordance with the market value requirements stated above.
Interfund Lending Program. Pursuant to an Exemptive Order issued by the SEC, the fund, along with other registered investment companies having management contracts with FMR, may participate in an interfund lending program. This program provides an alternative credit facility allowing the fund to borrow from, or lend money to, other participating funds.
Delayed Delivery Transactions. The fund may purchase or sell securities on a delayed delivery basis. Payment and delivery may take place after the customary settlement period for that security. The price of the underlying securities and the date when the securities will be delivered and paid for are fixed at the time the transaction is negotiated. The fund may receive compensation for interest forgone in the purchase of a delayed delivery security. With respect to purchase commitments, the fund identifies securities as segregated in its records with a value at least equal to the amount of the commitment. Losses may arise due to changes in the market value of the underlying securities or if the counterparty does not perform under the contract.
Restricted Securities. The fund is permitted to invest in securities that are subject to legal or contractual restrictions on resale. These securities generally may be resold in transactions exempt from registration or to the public if the securities are registered. Disposal of these securities may involve time-consuming negotiations and expense, and prompt sale at an acceptable price may be difficult. At the end of the period, the fund had no investments in restricted securities (excluding 144A issues).
3. Purchases and Sales of Investments.
Purchases and sales of securities, other than short-term securities, aggregated $691,244,000 and $422,703,000, respectively, of which U.S. government and government agency obligations aggregated $266,502,000 and $168,308,000, respectively.
4. Fees and Other Transactions with Affiliates.
Management Fee. As the fund's investment adviser, FMR receives a monthly fee that is calculated on the basis of a group fee rate plus a fixed individual fund fee rate applied to the average net assets of the fund. The group fee rate is the weighted average of a series of rates and is based on the monthly average net assets of all the mutual funds advised by FMR. The rates ranged from .0920% to .3700% for the period. The annual individual fund fee rate is .30%. In the event that these rates were lower than the contractual rates in effect during the period, FMR voluntarily implemented the above rates, as they resulted in the
Semiannual Report
Notes to Financial Statements (Unaudited) - continued
4. Fees and Other Transactions with Affiliates - continued
Management Fee - continued
same or a lower management fee. For the period, the management fee was equivalent to an annualized rate of .43% of average net assets.
Sub-Adviser Fee. FMR, on behalf of the fund, has entered into a sub-advisory agreement with Fidelity Investments Money Management, Inc. (FIMM), a wholly owned subsidiary of FMR. For its services, FIMM receives a fee from FMR of 50% of the management fee payable to FMR. The fee is paid prior to any voluntary expense reimbursements which may be in effect.
Transfer Agent Fees. Fidelity Service Company, Inc. (FSC), an affiliate of FMR, is the fund's transfer, dividend disbursing and shareholder servicing agent. FSC receives account fees and asset-based fees that vary according to account size and type of account. FSC pays for typesetting, printing and mailing of all shareholder reports, except proxy statements. For the period, the transfer agent fees were equivalent to an annualized rate of .13% of average net assets.
Accounting and Security Lending Fees. FSC maintains the fund's accounting records and administers the security lending program. The security lending fee is based on the number and duration of lending transactions. The accounting fee
is based on the level of average net assets for the month plus out-of-pocket expenses.
5. Interfund Lending Program.
The fund participated in the interfund lending program as a lender. The average daily loan balance during the period for which the loan was outstanding amounted to $15,432,000. The weighted average interest rate was 6.62%. Interest earned from the interfund lending program amounted to $17,000 and is included in interest income on the Statement of Operations. At period end there were no interfund loans outstanding.
6. Security Lending.
The fund lends portfolio securities from time to time in order to earn additional income. The fund receives collateral in the form of U.S. Treasury obligations, letters of credit, and/or cash against the loaned securities, and maintains collateral in an amount not less than 100% of the market value of the loaned securities during the period of the loan. The market value of the loaned securities is determined at the close of business of the fund and any additional required collateral is delivered to the fund on the next business day. If the borrower defaults on its obligation to return the securities loaned because of insolvency or other reasons, the fund could experience delays and costs in recovering the securities loaned or in gaining access to the collateral. At period end there were no security loans outstanding.
Semiannual Report
Notes to Financial Statements (Unaudited) - continued
7. Expense Reductions.
Through arrangements with the fund's custodian and transfer agent, credits realized as a result of uninvested cash balances were used to reduce a portion of the fund's expenses. During the period, the fund's custodian and transfer agent fees were reduced by $24,000 and $28,000, respectively, under these arrangements.
8. Merger Information.
On June 24, 1999, the fund acquired all of the assets and assumed all of the liabilities of Spartan Short-Term Bond Fund. The acquisition, which was approved by the shareholders of Spartan Short-Term Bond Fund on June 16, 1999, was accomplished by an exchange of 32,926,000 shares of the fund for the 31,705,000 shares then outstanding (each valued at $8.90) of Spartan Short-Term Bond Fund. Based on the opinion of fund counsel, the reorganization qualified as a tax-free reorganization for federal income tax purposes with no gain or loss recognized to the funds or their shareholders. Spartan Short-Term Bond Fund's net assets, including $3,778,000 of unrealized depreciation, were combined with the fund for total net assets after the acquisition of $1,264,246,000.
Semiannual Report
Fidelity offers several ways to conveniently manage your personal investments via your telephone or PC. You can access your account information, conduct trades and research your investments 24 hours a day.
By Phone
Fidelity Automated Service Telephone provides a single toll-free number to access account balances, positions, quotes and trading. It's easy to navigate the service, and on your first call, the system will help you create a personal identification number (PIN) for security.
(phone_graphic)Fidelity Automated
Service Telephone (FAST®)
1-800-544-5555
Press
1 For mutual fund and brokerage trading.
2 For quotes.*
3 For account balances and holdings.
4 To review orders and mutual
fund activity.
5 To change your PIN.
*0 To speak to a Fidelity representative.
By PC
Fidelity's web site on the Internet provides a wide range of information, including daily financial news, fund performance, interactive planning tools and news about Fidelity products and services.
(computer_graphic)Fidelity's Web Site
www.fidelity.com
If you are not currently on the Internet, call EarthLink Sprint at 1-800-288-2967, and be sure to ask for registration number SMD004 to receive a special Fidelity package that includes 30 days of free Internet access. EarthLink is North America's #1 independent Internet access provider.
(computer_graphic)
Fidelity On-line Xpress+®
Fidelity On-line Xpress+ software for Windows combines comprehensive portfolio management capabilities, securities trading and access to research and analysis tools . . . all on your desktop. Call Fidelity at 1-800-544-0240 or visit our web site for more information on how to manage your investments via your PC.
* When you call the quotes line, please remember that a fund's yield and return will vary and, except for money market funds, share price will also vary. This means that you may have a gain or loss when you sell your shares. There is no assurance that money market funds will be able to maintain a stable $1 share price; an investment in a money market fund is not insured or guaranteed by the U.S. government. Total returns are historical and include changes in share price, reinvestment of dividends and capital gains, and the effects of any sales charges.
Semiannual Report
If more than one address is listed, please locate the address that is closest to you. We'll give your correspondence immediate attention and send you written confirmation upon completion of your request.
(letter_graphic)Making Changes
To Your Account
(such as changing name, address, bank, etc.)
Fidelity Investments
P.O. Box 770001
Cincinnati, OH 45277-0002
(letter_graphic)For Non-Retirement
Accounts
Buying shares
Fidelity Investments
P.O. Box 770001
Cincinnati, OH 45277-0003
Overnight Express
Fidelity Investments
2300 Litton Lane - KH1A
Hebron, KY 41048
Selling shares
Fidelity Investments
P.O. Box 660602
Dallas, TX 75266-0602
Overnight Express
Fidelity Investments
Attn: Redemptions - CP6I
400 East Las Colinas Blvd.
Irving, TX 75039-5587
General Correspondence
Fidelity Investments
P.O. Box 500
Merrimack, NH 03054-0500
(letter_graphic)For Retirement
Accounts
Buying shares
Fidelity Investments
P.O. Box 770001
Cincinnati, OH 45277-0003
Selling shares
Fidelity Investments
P.O. Box 660602
Dallas, TX 75266-0602
Overnight Express
Fidelity Investments
Attn: Redemptions - CP6R
400 East Las Colinas Blvd.
Irving, TX 75039-5587
General Correspondence
Fidelity Investments
P.O. Box 500
Merrimack, NH 03054-0500
Semiannual Report
For directions and hours,
please call 1-800-544-9797.
Arizona
7373 N. Scottsdale Road
Scottsdale, AZ
California
815 East Birch Street
Brea, CA
851 East Hamilton Avenue
Campbell, CA
527 North Brand Boulevard
Glendale, CA
19200 Von Karman Avenue
Irvine, CA
10100 Santa Monica Blvd.
Los Angeles, CA
251 University Avenue
Palo Alto, CA
1760 Challenge Way
Sacramento, CA
7676 Hazard Center Drive
San Diego, CA
8 Montgomery Street
San Francisco, CA
950 Northgate Drive
San Rafael, CA
1400 Civic Drive
Walnut Creek, CA
6300 Canoga Avenue
Woodland Hills, CA
Colorado
1625 Broadway
Denver, CO
Connecticut
48 West Putnam Avenue
Greenwich, CT
265 Church Street
New Haven, CT
300 Atlantic Street
Stamford, CT
29 South Main Street
West Hartford, CT
Delaware
222 Delaware Avenue
Wilmington, DE
Florida
4400 N. Federal Highway
Boca Raton, FL
90 Alhambra Plaza
Coral Gables, FL
4090 N. Ocean Boulevard
Ft. Lauderdale, FL
1907 West State Road 434
Longwood, FL
8880 Tamiami Trail, North
Naples, FL
2401 PGA Boulevard
Palm Beach Gardens, FL
8065 Beneva Road
Sarasota, FL
1502 N. Westshore Blvd.
Tampa, FL
Georgia
3445 Peachtree Road, N.E.
Atlanta, GA
1000 Abernathy Road
Atlanta, GA
Illinois
One North Franklin Street
Chicago, IL
1415 West 22nd Street
Oak Brook, IL
1700 East Golf Road
Schaumburg, IL
3232 Lake Avenue
Wilmette, IL
Indiana
4729 East 82nd Street
Indianapolis, IN
Maine
Three Canal Plaza
Portland, ME
Maryland
7401 Wisconsin Avenue
Bethesda, MD
One W. Pennsylvania Ave.
Towson, MD
Massachusetts
801 Boylston Street
Boston, MA
155 Congress Street
Boston, MA
25 State Street
Boston, MA
300 Granite Street
Braintree, MA
44 Mall Road
Burlington, MA
416 Belmont Street
Worcester, MA
Semiannual Report
Michigan
280 Old N. Woodward Ave.
Birmingham, MI
29155 Northwestern Hwy.
Southfield, MI
Minnesota
7600 France Avenue South
Edina, MN
Missouri
700 West 47th Street
Kansas City, MO
8885 Ladue Road
Ladue, MO
New Jersey
150 Essex Street
Millburn, NJ
56 South Street
Morristown, NJ
501 Route 17, South
Paramus, NJ
New York
1055 Franklin Avenue
Garden City, NY
999 Walt Whitman Road
Melville, L.I., NY
1271 Avenue of the Americas
New York, NY
71 Broadway
New York, NY
350 Park Avenue
New York, NY
North Carolina
4611 Sharon Road
Charlotte, NC
Ohio
600 Vine Street
Cincinnati, OH
28699 Chagrin Boulevard
Woodmere Village, OH
Oregon
16850 SW 72nd Avenue
Tigard, OR
Pennsylvania
1735 Market Street
Philadelphia, PA
439 Fifth Avenue
Pittsburgh, PA
Rhode Island
47 Providence Place
Providence, RI
Tennessee
6150 Poplar Avenue
Memphis, TN
Texas
10000 Research Boulevard
Austin, TX
4017 Northwest Parkway
Dallas, TX
1155 Dairy Ashford Street
Houston, TX
2701 Drexel Drive
Houston, TX
400 East Las Colinas Blvd.
Irving, TX
14100 San Pedro
San Antonio, TX
19740 IH 45 North
Spring, TX
Utah
215 South State Street
Salt Lake City, UT
Virginia
1861 International Drive
McLean, VA
Washington
411 108th Avenue, N.E.
Bellevue, WA
511 Pine Street
Seattle, WA
Washington, DC
1900 K Street, N.W.
Washington, DC
Wisconsin
595 North Barker Road
Brookfield, WI
Fidelity Brokerage Services, Inc., 100 Summer St., Boston, MA 02110 Member NYSE/SIPC
Semiannual Report
Semiannual Report
Semiannual Report
Investment Adviser
Fidelity Management & Research Company Boston, MA
Investment Sub-Advisers
Fidelity Management & Research (U.K.) Inc.
Fidelity Management & Research
(Far East) Inc.
Fidelity Investments Japan Limited
Fidelity Investments Money
Management, Inc.
Officers
Edward C. Johnson 3d, President
Robert C. Pozen, Senior Vice President
Dwight D. Churchill, Vice President
Andrew J. Dudley, Vice President
David L. Murphy, Vice President
Stanley N. Griffith, Assistant Vice President
Eric D. Roiter, Secretary
Robert A. Dwight, Treasurer
Maria F. Dwyer, Deputy Treasurer
John H. Costello, Assistant Treasurer
Thomas J. Simpson, Assistant Treasurer
Board of Trustees
Ralph F. Cox *
Phyllis Burke Davis *
Robert M. Gates *
Edward C. Johnson 3d
Donald J. Kirk *
Ned C. Lautenbach *
Peter S. Lynch
Marvin L. Mann *
William O. McCoy *
Gerald C. McDonough *
Robert C. Pozen
Thomas R. Williams *
Advisory Board
J. Michael Cook
Abigail P. Johnson
Marie L. Knowles
* Independent trustees
General Distributor
Fidelity Distributors Corporation
Boston, MA
Transfer and Shareholder
Servicing Agent
Fidelity Service Company, Inc.
Boston, MA
Custodian
The Bank of New York
New York, NY
Fidelity's Taxable Bond Funds
Capital & Income
Ginnie Mae
Government Income
High Income
Intermediate Bond
Intermediate Government Income
International Bond
Investment Grade Bond
New Markets Income
Short-Term Bond
Spartan® Government Income
Spartan Investment Grade Bond
Strategic Income
Target TimelineSM 2001 & 2003
The Fidelity Telephone Connection
Mutual Fund 24-Hour Service
Exchanges/Redemptions
and Account Assistance 1-800-544-6666
Product Information 1-800-544-6666
Retirement Accounts 1-800-544-4774
(8 a.m. - 9 p.m.)
TDD Service 1-800-544-0118
for the deaf and hearing impaired
(9 a.m. - 9 p.m. Eastern time)
Fidelity Automated Service
Telephone (FAST®) (automated graphic) 1-800-544-5555
(automated graphic) Automated line for quickest service
(Fidelity Investment logo)(registered trademark)
Corporate Headquarters
82 Devonshire St., Boston, MA 02109
www.fidelity.com
STP-SANN-1200 118910
1.538290.103
Spartan®
Fund
Semiannual Report
October 31, 2000
(2_fidelity_logos)
|
President's Message |
3 |
Ned Johnson on investing strategies. |
|
Performance |
4 |
How the fund has done over time. |
|
Fund Talk |
7 |
The manager's review of fund performance, strategy and outlook. |
|
Investment Changes |
10 |
A summary of major shifts in the fund's investments over the past six months. |
|
Investments |
11 |
A complete list of the fund's investments with their market values. |
|
Financial Statements |
16 |
Statements of assets and liabilities,
operations, and changes in net assets, |
|
Notes |
20 |
Notes to the financial statements. |
|
|
|
|
To reduce expenses, only one copy of most financial reports and prospectuses may be mailed to households, even if more than one person in the household has an account in the fund. Call Fidelity at 1-800-544-8544 if you need additional copies of financial reports or prospectuses. If you do not want the mailing of these documents to be combined with those for other members of your household, contact Fidelity in writing at P.O. Box 5000, Cincinnati, OH 45273-8692.
Standard & Poor's, S&P and S&P 500 are registered service marks of The McGraw-Hill Companies, Inc. and have been licensed for use by Fidelity Distributors Corporation.
Other third party marks appearing herein are the property of their respective owners.
All other marks appearing herein are registered or unregistered trademarks or service marks of FMR Corp. or an affiliated company.
(Recycle graphic) This report is printed on recycled paper using soy-based inks.
This report and the financial statements contained herein are submitted for the general information of the shareholders of the fund. This report is not authorized for distribution to prospective investors in the fund unless preceded or accompanied by an effective prospectus.
Mutual fund shares are not deposits or obligations of, or guaranteed by, any depository institution. Shares are not insured by the FDIC, Federal Reserve Board or any other agency, and are subject to investment risks, including possible loss of principal amount invested.
Neither the fund nor Fidelity Distributors Corporation is a bank.
For more information on any Fidelity fund, including charges and expenses, call 1-800-544-6666 for a free prospectus. Read it carefully before you invest or send money.
Semiannual Report
(photo_of_Edward_C_Johnson_3d)
Dear Shareholder:
A sixth-straight year of double-digit positive returns for the Dow Jones Industrial Average, NASDAQ and S&P 500® could be in jeopardy unless the U.S. stock market shows marked improvement in the final two months of 2000. Through October, all three indexes had negative year-to-date returns. On the other hand, most fixed-income sectors were solidly in the black. Treasuries and other long-term government securities led the way, returning nearly 14%.
While it's impossible to predict the future direction of the markets with any degree of certainty, there are certain basic principles that can help investors plan for their future needs.
The longer your investment time frame, the less likely it is that you will be affected by short-term market volatility. A 10-year investment horizon appropriate for saving for a college education, for example, enables you to weather market cycles in a long-term fund, which may have a higher risk potential, but also has a higher potential rate of return.
An intermediate-length fund could make sense if your investment horizon is two to four years, while a short-term bond fund could be the right choice if you need your money in one or two years.
If your time horizon is less than a year, you might want to consider moving some of your bond investment into a money market fund. These funds seek income and a stable share price by investing in high-quality, short-term investments. Of course, it's important to remember that an investment in a money market fund is not insured or guaranteed by the Federal Deposit Insurance Corporation or any other government agency. Although money market funds seek to preserve the value of your investment at $1.00 per share, it is possible to lose money by investing in these types of funds.
Finally, no matter what your time horizon or portfolio diversity, it makes good sense to follow a regular investment plan, investing a certain amount of money in a fund at the same time each month or quarter and periodically reviewing your overall portfolio. By doing so, you won't get caught up in the excitement of a rapidly rising market, nor will you buy all your shares at market highs. While this strategy - known as dollar cost averaging - won't assure a profit or protect you from a loss in a declining market, it should help you lower the average cost of your purchases. Of course, you should consider your financial ability to continue your purchases through periods of low price levels before undertaking such a strategy.
If you have questions, please call us at 1-800-544-6666, or visit our web site at www.fidelity.com. We are available 24 hours a day, seven days a week to provide you the information you need to make the investments that are right for you.
Best regards,
/s/Edward C. Johnson 3d
Edward C. Johnson 3d
Semiannual Report
There are several ways to evaluate a fund's historical performance. You can look at the total percentage change in value, the average annual percentage change or the growth of a hypothetical $10,000 investment. Total return reflects the change in the value of an investment, assuming reinvestment of the fund's dividend income and capital gains (the profits earned upon the sale of securities that have grown in value). You can also look at the fund's income, as reflected in the fund's yield, to measure performance. If Fidelity had not reimbursed certain fund expenses, the total returns and dividends would have been lower.
Cumulative Total Returns
|
Periods ended October 31, 2000 |
Past 6 |
Past 1 |
Past 5 |
Past 10 |
|
Spartan Government Income |
5.94% |
7.95% |
33.56% |
103.55% |
|
LB Government Bond |
5.65% |
8.04% |
35.66% |
113.90% |
|
General US Government Funds Average |
5.33% |
6.77% |
29.13% |
96.96% |
Cumulative total returns show the fund's performance in percentage terms over a set period - in this case, six months, one year, five years or 10 years. For example, if you had invested $1,000 in a fund that had a 5% return over the past year, the value of your investment would be $1,050. You can compare the fund's returns to the performance of the Lehman Brothers Government Bond Index - a market value-weighted index of U.S. Government and government agency securities (other than mortgage securities) with maturities of one year or more. To measure how the fund's performance stacked up against its peers, you can compare it to the general U.S. government funds average, which reflects the performance of mutual funds with similar objectives tracked by Lipper Inc. The past six months average represents a peer group of 189 mutual funds. These benchmarks include reinvested dividends and capital gains, if any, and exclude the effect of sales charges.
Average Annual Total Returns
|
Periods ended October 31, 2000 |
|
Past 1 |
Past 5 |
Past 10 |
|
Spartan Government Income |
|
7.95% |
5.96% |
7.37% |
|
LB Government Bond |
|
8.04% |
6.29% |
7.90% |
|
General US Government Funds Average |
|
6.77% |
5.24% |
6.99% |
Average annual total returns take the fund's cumulative return and show you what would have happened if the fund had performed at a constant rate each year.
Semiannual Report
Performance - continued
$10,000 Over 10 Years
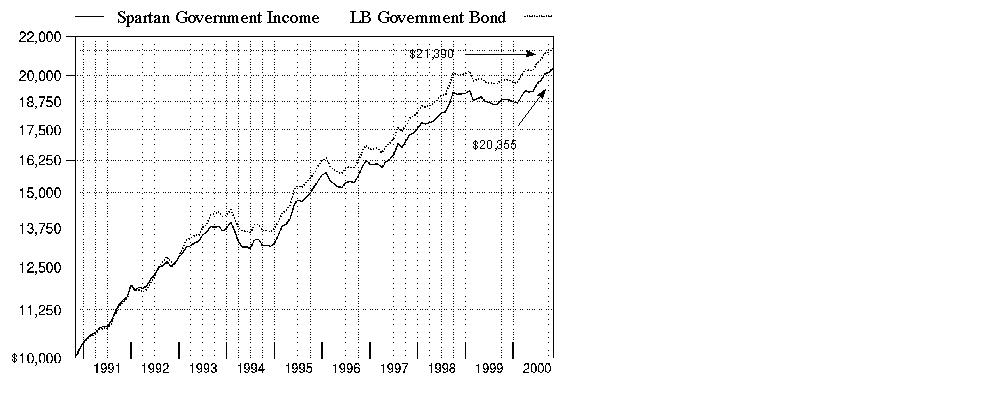
$10,000 Over 10 Years: Let's say hypothetically that $10,000 was invested in Spartan Government Income Fund on October 31, 1990. As the chart shows, by October 31, 2000, the value of the investment would have grown to $20,355 - a 103.55% increase on the initial investment. For comparison, look at how the Lehman Brothers Government Bond Index did over the same period. With dividends and capital gains, if any, reinvested, the same $10,000 would have grown to $21,390 - a 113.90% increase.
Understanding
Performance
How a fund did yesterday is no guarantee of how it will do tomorrow. Bond prices, for example, generally move in the opposite direction of interest rates. In turn, the share price, return and yield of a fund that invests in bonds will vary. That means if you sell your shares during a market downturn, you might lose money. But if you can ride out the market's ups and downs, you may have a gain.
3Semiannual Report
Performance - continued
Total Return Components
|
|
Six months ended October 31, |
Years ended April 30, |
||||
|
|
2000 |
2000 |
1999 |
1998 |
1997 |
1996 |
|
Dividend returns |
3.32% |
6.22% |
5.94% |
6.55% |
6.76% |
6.69% |
|
Capital returns |
2.62% |
-4.97% |
0.10% |
4.08% |
-0.50% |
1.41% |
|
Total returns |
5.94% |
1.25% |
6.04% |
10.63% |
6.26% |
8.10% |
Total return components include both dividend returns and capital returns. A dividend return reflects the actual dividends paid by the fund. A capital return reflects both the amount paid by the fund to shareholders as capital gain distributions and changes in the fund's share price. Both returns assume the dividends or capital gains, if any, paid by the fund are reinvested.
Dividends and Yield
|
Periods ended October 31, 2000 |
Past 1 |
Past 6 |
Past 1 |
|
Dividends per share |
5.41¢ |
32.26¢ |
64.89¢ |
|
Annualized dividend rate |
6.24% |
6.36% |
6.48% |
|
30-day annualized yield |
6.26% |
- |
- |
Dividends per share show the income paid by the fund for a set period. If you annualize this number, based on an average share price of $10.20 over the past one month, $10.06 over the past six months and $10.01 over the past one year, you can compare the fund's income over these three periods. The 30-day annualized yield is a standard formula for all bond funds based on the yields of the bonds in the fund, averaged over the past 30 days. This figure shows you the yield characteristics of the fund's investments at the end of the period. It also helps you compare funds from different companies on an equal basis. If Fidelity had not reimbursed certain fund expenses the yield would have been 6.16%.
Semiannual Report
Market Recap
Strong technical factors in the market helped most investment-grade bonds overcome unusually volatile market conditions, enabling them to handily outperform most major U.S. equity indexes during the six-month period that ended October 31, 2000. The Lehman Brothers Aggregate Bond Index - a popular measure of taxable-bond performance - returned 5.80% during this time frame. Treasuries continued their hot streak from the beginning of 2000 thanks to a swelling federal surplus and the U.S. government's decision to buy back increasingly larger amounts of outstanding long-term debt. Anticipation that the Fed was finished raising interest rates following a half-point hike in May, combined with persistent flights-to-safety from risk-averse investors concerned about volatility in equity markets, further bolstered the long bond, helping the Lehman Brothers Treasury Index return 5.50% during the period. Mortgage and agency securities rallied back from their period lows in May to post formidable six-month returns. Discount mortgages were boosted by higher-than-normal prepayment activity supported by a strong housing market. Agencies staged a comeback behind reduced political risk surrounding government-sponsored enterprises. During the past six months, the Lehman Brothers Mortgage-Backed Securities and U.S. Agency indexes returned 6.24% and 6.08%, respectively. The corporate sector was the worst-performing segment of the market, plagued by deteriorating credit conditions and growing supply pressures. The Lehman Brothers Credit Bond Index posted a 5.37% return during the six-month period.
(Portfolio Manager photograph)
An interview with Tom Silvia, Portfolio Manager of Spartan Government Income Fund
Q. How did the fund perform, Tom?
A. For the six-month period that ended October 31, 2000, the fund provided a total return of 5.94%. To get a sense of how the fund did relative to its competitors, the general U.S. government funds average returned 5.33% for the same six-month period, according to Lipper Inc. Additionally, the Lehman Brothers Government Bond Index - which tracks the types of securities in which the fund invests - returned 5.65% for the six-month period. For the 12-month period that ended October 31, 2000, the fund provided a total return of 7.95%, compared to the 6.77% return for the U.S. government funds average and 8.04% for the Lehman Brothers index.
Q. What helped the fund beat its peers and the Lehman Brothers index during the most recent six-month period?
A. Sector allocation was the main contributor to the fund's performance for a couple of reasons. First, the fund's larger-than-average weighting - compared with its peers - in mortgage securities, which are not contained in the Lehman Brothers index, was a plus because they outpaced both agency and Treasury securities during the period. The threat of prepayments was quite low during much of period, which helped mortgage securities. Also, the fund had a relatively large stake in 30-year mortgages, which outpaced their 15-year counterparts during the period.
Semiannual Report
Fund Talk: The Manager's Overview - continued
Q. How did the fund's stake in U.S. government agency obligations - at 41.4% of net assets as of October 31, 2000 - fare?
A. They were a bit of a disappointment early on, although they improved later in the period and boosted the fund's performance. Agencies spent the spring and summer battling an unfavorable supply and demand backdrop. Just as the Treasury was cutting back its issuance, many agencies were expanding theirs. Furthermore, agency obligations had to contend with the threat that Congress might cut off longstanding but never-used lines of credit that give some agencies - particularly mortgage securities issuers Fannie Mae and Freddie Mac - implicit government backing. More recently, however, these securities bounced back because they made some concessions to legislators, adopting measures to improve their capital structure and to allow more scrutiny of their books.
Q. Which agency securities did you emphasize?
A. In choosing agency obligations for the fund, I try to achieve a balance between those that are liquid, or easily traded, and those that offer a bit more yield. From the standpoint of liquidity, I focused on securities issued by Fannie Mae and Freddie Mac. For yield, I chose securities issued by other agencies guaranteed by the U.S. government, such as the Export/Import Bank, the U.S. Department of Housing and Urban Development and others, which offered as little as one basis point (0.01 percentage points) or as much as 20 basis points or more in yield than Fannie Mae and Freddie Mac securities.
Q. Were there any disappointments during the past six months?
A. After performing well in the spring and summer, long-term Treasury securities were somewhat disappointing in the fall. Early on, longer-term Treasury securities posted strong gains and outperformed short- and intermediate-term Treasury securities as the government bought back older, longer-term, high-interest Treasury debt. More recently, however, short- and intermediate-term securities outperformed longer-term bonds as short-term interest rates fell on evidence that economic growth was slowing. That fanned expectations that the Fed would stop raising, if not lower, interest rates in the months ahead.
Q. What's your outlook?
A. I believe that mortgage and agency securities continue to offer very attractive long-term values. The current yield advantage they enjoy helps position them to perform better than Treasury securities, in my view. That's why I plan to keep relatively large weightings in each. To the extent that their spread relationship relative to Treasuries returns to more normal levels, agency and mortgage securities can do well. Even if the current spread relationship remains constant, their yield advantage should help them gain ground on Treasuries.
Fund Facts
Goal: seeks a high level of current income
Fund number: 453
Trading symbol: SPGVX
Start date: December 20, 1988
Size: as of October 31, 2000, more than $659 million
Manager: Tom Silvia, since 1998; manager, various Fidelity and Spartan government and mortgage funds; joined Fidelity in 1993
3Tom Silvia on the government's buyback of Treasury securities:
"As the federal budget deficits of the early 1990s morphed into federal budget surpluses during the past three years, the U.S. Treasury was able to make significant progress in reducing the nation's debt load. During the past three years, the government has paid down $363 billion of publicly held debt, which helped cut the nation's debt to 34% of gross domestic product, down from nearly 50% seven years ago. One way debt was reduced was through the buyback of outstanding Treasury securities. By the end of October 2000, the Treasury had conducted 16 debt buyback operations, redeeming $25 billion in debt. Additionally, the Treasury eliminated three- and seven-year Treasury notes and reduced the frequencies and sizes of remaining debt auctions. The Treasury Department already has announced that it expects to pay down another $23 billion in marketable debt during the October through December quarter of 2000. Beyond that, it's my view that the Treasury will continue to use buybacks as an important debt management tool. To the extent that more Treasury securities are bought back, the Treasury market should benefit, much as it has during the past year."
Semiannual Report
Fund Talk: The Manager's Overview - continued
The views expressed in this report reflect those of the portfolio manager only through the end of the period of the report as stated on the cover and do not necessarily represent the views of Fidelity or any other person in the Fidelity organization. Any such views are subject to change at any time based upon market or other conditions and Fidelity disclaims any responsibility to update such views. These views may not be relied on as investment advice and, because investment decisions for a Fidelity fund are based on numerous factors, may not be relied on as an indication of trading intent on behalf of any Fidelity fund.
Semiannual Report
|
Coupon Distribution as of October 31, 2000 |
||
|
|
% of fund's investments |
% of fund's investments |
|
5 - 5.99% |
10.4 |
9.5 |
|
6 - 6.99% |
45.6 |
34.1 |
|
7 - 7.99% |
15.5 |
26.5 |
|
8 - 8.99% |
19.2 |
21.6 |
|
9 - 9.99% |
4.0 |
4.0 |
|
10% and over |
1.7 |
0.5 |
|
Coupon distribution shows the range of stated interest rates on the fund's investments, excluding short-term investments. |
|
Average Years to Maturity as of October 31, 2000 |
||
|
|
|
6 months ago |
|
Years |
9.7 |
9.4 |
|
Average years to maturity is based on the average time remaining until principal payments are expected from each of the fund's bonds, weighted by dollar amount. |
|
Duration as of October 31, 2000 |
||
|
|
|
6 months ago |
|
Years |
5.2 |
5.3 |
|
Duration shows how much a bond fund's price fluctuates with changes in comparable interest rates. If rates rise 1%, for example, a fund with a five-year duration is likely to lose about 5% of its value. Other factors also can influence a bond fund's performance and share price. Accordingly, a bond fund's actual performance may differ from this example. |
|
Asset Allocation (% of fund's net assets) |
|||||||
|
As of October 31, 2000 |
As of April 30, 2000 |
||||||
|
Mortgage |
|
|
Mortgage |
|
||
 |
CMOs and Other Mortgage Related Securities 6.3% |
|
|
CMOs and Other Mortgage Related Securities 5.3% |
|
||
 |
U.S. Treasury |
|
|
U.S. Treasury |
|
||
|
U.S. Government |
|
|
U.S. Government |
|
||
|
Short-Term |
|
|
Short-Term |
|
||

Semiannual Report
(Unaudited)
Showing Percentage of Net Assets
|
U.S. Government and Government Agency Obligations - 71.5% |
||||
|
|
Principal Amount |
Value |
||
|
U.S. Government Agency Obligations - 41.4% |
||||
|
Fannie Mae: |
|
|
|
|
|
6.375% 10/15/02 |
|
$ 3,000,000 |
$ 2,998,590 |
|
|
6.5% 4/29/09 |
|
16,760,000 |
15,958,704 |
|
|
6.625% 10/15/07 |
|
17,250,000 |
17,255,348 |
|
|
7.25% 5/15/30 |
|
9,295,000 |
9,868,790 |
|
|
Farm Credit Systems Financial Assistance Corp.: |
|
|
|
|
|
8.8% 6/10/05 |
|
1,860,000 |
2,020,425 |
|
|
9.375% 7/21/03 |
|
9,910,000 |
10,609,844 |
|
|
Federal Farm Credit Bank 6.05% 1/3/06 |
|
3,425,000 |
3,341,499 |
|
|
Federal Home Loan Bank: |
|
|
|
|
|
5.125% 9/15/03 |
|
490,000 |
472,928 |
|
|
5.29% 1/27/06 |
|
15,000,000 |
13,976,888 |
|
|
Freddie Mac: |
|
|
|
|
|
6.45% 4/29/09 |
|
27,500,000 |
26,099,975 |
|
|
6.75% 3/15/31 |
|
8,155,000 |
8,137,141 |
|
|
Government Loan Trusts (assets of Trust guaranteed by U.S. Government through Agency for International Development) 8.5% 4/1/06 |
|
5,359,077 |
5,629,871 |
|
|
Government Trust Certificates (assets of Trust guaranteed by U.S. Government through Defense Security Assistance Agency): |
|
|
|
|
|
Class 1-C, 9.25% 11/15/01 |
|
4,095,118 |
4,155,112 |
|
|
Class 2-E, 9.4% 5/15/02 |
|
433,379 |
436,824 |
|
|
Class 3-T, 9.625% 5/15/02 |
|
3,036,804 |
3,066,079 |
|
|
Guaranteed Export Trust Certificates (assets of Trust guaranteed by U.S. Government through Export- |
|
|
|
|
|
Series 1993-C, 5.2% 10/15/04 |
|
107,378 |
104,246 |
|
|
Series 1993-D, 5.23% 5/15/05 |
|
1,621,064 |
1,570,694 |
|
|
Series 1994-A, 7.12% 4/15/06 |
|
7,517,886 |
7,626,896 |
|
|
Series 1995-A, 6.28% 6/15/04 |
|
6,630,589 |
6,573,983 |
|
|
Series 1996-A, 6.55% 6/15/04 |
|
3,517,616 |
3,503,960 |
|
|
Guaranteed Trade Trust Certificates (assets of Trust guaranteed by U.S. Government through Export- |
|
|
|
|
|
Series 1994-A, 7.39% 6/26/06 |
|
30,499,999 |
31,045,949 |
|
|
Series 1994-B, 7.5% 1/26/06 |
|
185,731 |
189,378 |
|
|
Series 1997-A, 6.104% 7/15/03 |
|
2,800,000 |
2,776,200 |
|
|
Israel Export Trust Certificates (assets of Trust guaranteed by U.S. Government through Export- |
|
200,000 |
199,652 |
|
|
Knoxville Tennessee U.S. Government Guaranteed Notes Series 1990-A, 9.2% 8/1/02 |
|
1,000,000 |
1,046,300 |
|
|
U.S. Government and Government Agency Obligations - continued |
||||
|
|
Principal Amount |
Value |
||
|
U.S. Government Agency Obligations - continued |
||||
|
Overseas Private Investment Corp. U.S. Government guaranteed participation certificate: |
|
|
|
|
|
Series 1994-195, 6.08% 8/15/04 (callable) |
|
$ 8,140,500 |
$ 8,091,331 |
|
|
Series 1996-A1, 6.726% 9/15/10 (callable) |
|
1,739,130 |
1,762,243 |
|
|
Private Export Funding Corp. secured: |
|
|
|
|
|
5.31% 11/15/03 (a) |
|
810,000 |
780,613 |
|
|
5.65% 3/15/03 |
|
401,072 |
394,682 |
|
|
5.8% 2/1/04 |
|
4,777,500 |
4,693,989 |
|
|
5.82% 6/15/03 (a) |
|
11,790,000 |
11,462,091 |
|
|
6.62% 10/1/05 |
|
2,220,000 |
2,233,609 |
|
|
6.86% 4/30/04 |
|
8,793,867 |
8,808,966 |
|
|
State of Israel (guaranteed by U.S. Government |
|
|
|
|
|
5.7% 2/15/03 |
|
5,000,000 |
4,915,900 |
|
|
6.6% 2/15/08 |
|
22,250,000 |
22,124,733 |
|
|
6.625% 8/15/03 |
|
18,200,000 |
18,254,964 |
|
|
U.S. Department of Housing and Urban Development government guaranteed participation certificates Series 1999-A: |
|
|
|
|
|
5.75% 8/1/06 |
|
4,100,000 |
3,942,560 |
|
|
5.96% 8/1/09 |
|
6,650,000 |
6,312,513 |
|
|
U.S. Trade Trust Certificates (assets of Trust guaranteed by U.S. Government through Export-Import Bank) 8.17% 1/15/07 |
|
549,792 |
575,192 |
|
|
TOTAL U.S. GOVERNMENT AGENCY OBLIGATIONS |
273,018,662 |
|||
|
U.S. Treasury Obligations - 30.1% |
||||
|
U.S. Treasury Bonds: |
|
|
|
|
|
6.125% 11/15/27 |
|
20,875,000 |
21,325,065 |
|
|
6.125% 8/15/29 |
|
44,000,000 |
45,567,280 |
|
|
8% 11/15/21 |
|
6,440,000 |
7,959,454 |
|
|
8.875% 8/15/17 |
|
61,341,000 |
79,743,295 |
|
|
14% 11/15/11 |
|
6,000,000 |
8,394,360 |
|
|
U.S. Treasury Notes: |
|
|
|
|
|
5.25% 5/31/01 |
|
14,000,000 |
13,905,094 |
|
|
6.625% 6/30/01 |
|
21,900,000 |
21,931,930 |
|
|
TOTAL U.S. TREASURY OBLIGATIONS |
198,826,478 |
|||
|
TOTAL U.S. GOVERNMENT AND (Cost $475,310,074) |
471,845,140 |
|||
|
U.S. Government Agency - Mortgage Securities - 18.3% |
||||
|
|
Principal Amount |
Value |
||
|
Fannie Mae - 12.2% |
||||
|
5.5% 9/1/08 to 7/1/09 |
|
$ 5,889,030 |
$ 5,652,537 |
|
|
6% 11/1/09 to 1/1/29 |
|
11,356,647 |
10,887,083 |
|
|
6.5% 2/1/10 to 11/1/30 |
|
15,567,225 |
14,972,782 |
|
|
7% 11/1/06 to 9/1/29 |
|
18,965,061 |
18,620,995 |
|
|
7.5% 9/1/29 to 11/1/30 |
|
26,260,501 |
26,219,286 |
|
|
8.25% 12/1/01 |
|
1,878,826 |
1,881,946 |
|
|
9.5% 11/1/06 to 11/15/09 |
|
1,179,083 |
1,215,480 |
|
|
11% 8/1/10 |
|
249,608 |
270,730 |
|
|
11.25% 5/1/14 |
|
77,312 |
85,127 |
|
|
11.5% 6/1/19 |
|
381,805 |
423,803 |
|
|
12.5% 3/1/16 |
|
38,841 |
43,878 |
|
|
13% 9/1/13 |
|
26,815 |
30,636 |
|
|
13.5% 5/1/11 to 1/1/15 |
|
67,088 |
74,254 |
|
|
|
80,378,537 |
|||
|
Freddie Mac - 5.0% |
||||
|
6.5% 5/1/08 |
|
355,563 |
350,895 |
|
|
6.775% 11/15/03 |
|
4,983,406 |
4,958,295 |
|
|
7.5% 6/1/07 |
|
183,210 |
185,086 |
|
|
8% 1/1/07 |
|
592,282 |
599,988 |
|
|
8.5% 7/1/22 to 5/1/30 |
|
20,558,210 |
21,055,758 |
|
|
9% 8/1/08 to 4/1/20 |
|
601,542 |
619,927 |
|
|
9.5% 6/1/09 to 8/1/21 |
|
3,256,903 |
3,398,020 |
|
|
10% 7/1/09 to 8/1/21 |
|
894,783 |
956,008 |
|
|
12% 9/1/03 to 12/1/15 |
|
57,681 |
62,772 |
|
|
12.25% 3/1/11 to 9/1/13 |
|
91,781 |
99,025 |
|
|
12.5% 2/1/14 to 6/1/19 |
|
283,659 |
318,516 |
|
|
13% 8/1/10 to 6/1/15 |
|
115,202 |
131,324 |
|
|
13.5% 10/1/11 |
|
999 |
1,150 |
|
|
|
32,736,764 |
|||
|
Government National Mortgage Association - 1.1% |
||||
|
6.5% 5/15/02 to 7/15/03 |
|
920,840 |
911,550 |
|
|
7.5% 8/15/06 to 6/15/07 |
|
1,601,890 |
1,625,551 |
|
|
8% 12/15/23 |
|
4,317,482 |
4,398,435 |
|
|
10.5% 4/15/14 to 1/15/18 |
|
470,721 |
508,058 |
|
|
13.5% 7/15/11 |
|
36,181 |
41,301 |
|
|
|
7,484,895 |
|||
|
TOTAL U.S. GOVERNMENT AGENCY - MORTGAGE SECURITIES (Cost $121,347,413) |
120,600,196 |
|||
|
Collateralized Mortgage Obligations - 6.1% |
||||
|
|
Principal Amount |
Value |
||
|
U.S. Government Agency - 6.1% |
||||
|
Fannie Mae REMIC planned amortization class: |
|
|
|
|
|
Series 1991-170 Class E, 8% 12/25/06 |
|
$ 2,373,176 |
$ 2,397,649 |
|
|
Series 1993-134 Class GA, 6.5% 2/25/07 |
|
2,870,000 |
2,845,777 |
|
|
Series 1993-160 Class PK, 6.5% 11/25/22 |
|
16,800,000 |
16,449,065 |
|
|
Series 1994-72 Class G, 6% 10/25/19 |
|
6,300,000 |
6,219,234 |
|
|
Freddie Mac: |
|
|
|
|
|
REMIC planned amortization class: |
|
|
|
|
|
Series 1141 Class G, 9% 9/15/21 |
|
1,967,201 |
2,040,971 |
|
|
Series 1727 Class H, 6.5% 8/15/23 |
|
5,200,000 |
4,985,500 |
|
|
sequential pay Series 1974 Class Z, 7% 8/15/20 |
|
5,219,252 |
5,018,624 |
|
|
TOTAL COLLATERALIZED MORTGAGE OBLIGATIONS (Cost $39,551,150) |
39,956,820 |
|||
|
Commercial Mortgage Securities - 0.2% |
||||
|
|
||||
|
Fannie Mae ACES sequential pay Series 1996-M5 Class A1, 7.141% 7/25/10 |
|
1,525,719 |
1,532,394 |
|
|
Cash Equivalents - 3.5% |
|||
|
Maturity Amount |
|
||
|
Investments in repurchase agreements (U.S. Government Obligations), in a joint trading account at 6.62%, |
$ 23,217,268 |
23,213,000 |
|
|
|
|
||
|
TOTAL INVESTMENT PORTFOLIO - 99.6% (Cost $660,960,797) |
657,147,550 |
||
|
|
|
|
|
|
NET OTHER ASSETS - 0.4% |
2,798,819 |
||
|
NET ASSETS - 100% |
$ 659,946,369 |
||
|
Legend |
|
(a) Security exempt from registration under Rule 144A of the Securities Act of 1933. These securities may be resold in transactions exempt from registration, normally to qualified institutional buyers. At the period end, the value of these securities amounted to $12,242,704 or 1.9% of net assets. |
|
Income Tax Information |
|
At October 31, 2000, the aggregate cost of investment securities for income tax purposes was $660,965,328. Net unrealized depreciation aggregated $3,817,778, of which $4,416,863 related to appreciated investment securities and $8,234,641 related to depreciated investment securities. |
|
At April 30, 2000, the fund had a capital loss carryforward of approximately $21,568,000 of which $2,265,000, $1,392,000, $2,162,000 and $15,749,000 will expire on April 30, 2003, 2004, 2005 and 2008, respectively. |
|
The fund intends to elect to defer to its fiscal year ending April 30, 2001 approximately $8,662,000 of losses recognized during the period November 1, 1999 to April 30, 2000. |
See accompanying notes which are an integral part of the financial statements.
Semiannual Report
Statement of Assets and Liabilities
|
|
October 31, 2000 (Unaudited) |
|
|
Assets |
|
|
|
Investment in securities, at value (including repurchase agreements of $23,213,000) (cost $660,960,797) - See accompanying schedule |
|
$ 657,147,550 |
|
Cash |
|
828 |
|
Receivable for investments sold |
|
44,675 |
|
Receivable for fund shares sold |
|
733,732 |
|
Interest receivable |
|
8,463,385 |
|
Total assets |
|
666,390,170 |
|
Liabilities |
|
|
|
Payable for investments purchased |
$ 5,166,082 |
|
|
Payable for fund shares redeemed |
697,682 |
|
|
Distributions payable |
302,991 |
|
|
Accrued management fee |
272,137 |
|
|
Other payables and accrued expenses |
4,909 |
|
|
Total liabilities |
|
6,443,801 |
|
Net Assets |
|
$ 659,946,369 |
|
Net Assets consist of: |
|
|
|
Paid in capital |
|
$ 693,497,863 |
|
Undistributed net investment income |
|
714,120 |
|
Accumulated undistributed net realized gain (loss) |
|
(30,452,367) |
|
Net unrealized appreciation (depreciation) on investments |
|
(3,813,247) |
|
Net Assets, for 64,718,105 shares outstanding |
|
$ 659,946,369 |
|
Net Asset Value, offering price and redemption price |
|
$10.20 |
See accompanying notes which are an integral part of the financial statements.
Semiannual Report
Financial Statements - continued
Statement of Operations
|
|
Six months ended October 31, 2000 (Unaudited) |
|
|
Investment Income Interest |
|
$ 21,803,688 |
|
Security lending |
|
3,410 |
|
Total Income |
|
21,807,098 |
|
Expenses |
|
|
|
Management fee |
$ 1,906,289 |
|
|
Non-interested trustees' compensation |
1,226 |
|
|
Total expenses before reductions |
1,907,515 |
|
|
Expense reductions |
(352,720) |
1,554,795 |
|
Net investment income |
|
20,252,303 |
|
Realized and Unrealized Gain (Loss) Net realized gain (loss) on investment securities |
|
(193,144) |
|
Change in net unrealized appreciation (depreciation) |
|
15,868,691 |
|
Net gain (loss) |
|
15,675,547 |
|
Net increase (decrease) in net assets resulting |
|
$ 35,927,850 |
See accompanying notes which are an integral part of the financial statements.
Semiannual Report
Financial Statements - continued
Statement of Changes in Net Assets
|
|
Six months ended
October 31, 2000 |
Year ended |
|
Increase (Decrease) in Net Assets |
|
|
|
Operations |
$ 20,252,303 |
$ 33,481,133 |
|
Net realized gain (loss) |
(193,144) |
(19,821,577) |
|
Change in net unrealized appreciation (depreciation) |
15,868,691 |
(12,045,459) |
|
Net increase (decrease) in net assets resulting |
35,927,850 |
1,614,097 |
|
Distributions to shareholders from net investment income |
(20,224,843) |
(33,886,147) |
|
Share transactions |
96,018,688 |
361,028,152 |
|
Reinvestment of distributions |
18,265,809 |
29,554,678 |
|
Cost of shares redeemed |
(86,691,273) |
(485,432,497) |
|
Net increase (decrease) in net assets resulting |
27,593,224 |
(94,849,667) |
|
Total increase (decrease) in net assets |
43,296,231 |
(127,121,717) |
|
Net Assets |
|
|
|
Beginning of period |
616,650,138 |
743,771,855 |
|
End of period (including undistributed net investment income of $714,120 and $686,660, respectively) |
$ 659,946,369 |
$ 616,650,138 |
|
Other Information Shares |
|
|
|
Sold |
9,522,024 |
35,992,227 |
|
Issued in reinvestment of distributions |
1,810,235 |
2,940,052 |
|
Redeemed |
(8,623,806) |
(48,046,625) |
|
Net increase (decrease) |
2,708,453 |
(9,114,346) |
See accompanying notes which are an integral part of the financial statements.
Semiannual Report
Financial Highlights
|
|
Six months ended October 31, 2000 |
Years ended April 30, |
||||
|
|
(Unaudited) |
2000 |
1999 |
1998 |
1997 |
1996 |
|
Selected Per-Share Data |
|
|
|
|
|
|
|
Net asset value,
beginning |
$ 9.940 |
$ 10.460 |
$ 10.450 |
$ 10.040 |
$ 10.090 |
$ 9.950 |
|
Income from Investment
Operations |
.323 D |
.628 D |
.629 D |
.647 D |
.672 D |
.672 |
|
Net realized |
.260 |
(.509) |
(.003) |
.396 |
(.057) |
.132 |
|
Total from investment operations |
.583 |
.119 |
.626 |
1.043 |
.615 |
.804 |
|
Less Distributions |
|
|
|
|
|
|
|
From net investment income |
(.323) |
(.639) |
(.616) |
(.633) |
(.665) |
(.664) |
|
Net asset value, |
$ 10.200 |
$ 9.940 |
$ 10.460 |
$ 10.450 |
$ 10.040 |
$ 10.090 |
|
Total Return B, C |
5.94% |
1.25% |
6.04% |
10.63% |
6.26% |
8.10% |
|
Ratios and Supplemental Data |
|
|
|
|
|
|
|
Net assets, |
$ 659,946 |
$ 616,650 |
$ 743,772 |
$ 322,504 |
$ 257,784 |
$ 233,597 |
|
Ratio of expenses |
.50% A, E |
.50% E |
.51% E |
.60% E |
.60% E |
.65% |
|
Ratio of expenses to average net assets after expense reductions |
.49% A, F |
.50% |
.51% |
.60% |
.60% |
.62% F |
|
Ratio of net investment income to average net assets |
6.37% A |
6.23% |
5.94% |
6.27% |
6.65% |
6.55% |
|
Portfolio turnover rate |
186% A |
118% |
218% |
173% |
135% |
114% |
A Annualized
B The total returns would have been lower had certain expenses not been reduced during the periods shown.
C Total returns do not include the former account closeout fee and for periods of less than one year are not annualized.
D Net investment income per share has been calculated based on average shares outstanding during the period.
E FMR agreed to reimburse a portion of the fund's expenses during the period. Without this reimbursement, the fund's expense ratio would have been higher.
F FMR or the fund has entered into varying arrangements with third parties who either paid or reduced a portion of the fund's expenses.
See accompanying notes which are an integral part of the financial statements.
Semiannual Report
For the period ended October 31, 2000 (Unaudited)
1. Significant Accounting Policies.
Spartan Government Income Fund (the fund) is a fund of Fidelity Fixed-Income Trust (the trust) and is authorized to issue an unlimited number of shares. The trust is registered under the Investment Company Act of 1940, as amended, as an open-end management investment company organized as a Massachusetts business trust. The financial statements have been prepared in conformity with generally accepted accounting principles which require management to make certain estimates and assumptions at the date of the financial statements. The following summarizes the significant accounting policies of the fund:
Security Valuation. Securities are valued based upon a computerized matrix system and/or appraisals by a pricing service, both of which consider market transactions and dealer-supplied valuations. Securities (including restricted securities) for which market quotations are not readily available are valued at their fair value as determined in good faith under consistently applied procedures under the general supervision of the Board of Trustees. Short-term securities with remaining maturities of sixty days or less for which quotations are not readily available are valued at amortized cost or original cost plus accrued interest, both of which approximate current value. Investments in open-end investment companies are valued at their net asset value each business day.
Income Taxes. As a qualified regulated investment company under Subchapter M of the Internal Revenue Code, the fund is
not subject to income taxes to the extent that it distributes substantially all of its taxable income for its fiscal year. The schedule of investments includes information regarding income taxes under the caption "Income Tax Information."
Investment Income. Interest income, which includes accretion of original issue discount, is accrued as earned.
Expenses. Most expenses of the trust can be directly attributed to a fund. Expenses which cannot be directly attributed are apportioned among the funds in the trust.
Distributions to Shareholders. Distributions are declared daily and paid monthly from net investment income. Distributions from realized gains, if any, are recorded on the ex-dividend date.
Income and capital gain distributions are determined in accordance with income tax regulations which may differ from generally accepted accounting principles. These differences, which may result in distribution reclassifications, are primarily due to differing treatments for paydown gains/losses on certain securities, market discount, capital loss carryforwards and losses deferred due to wash sales and excise tax regulations.
Permanent book and tax basis differences relating to shareholder distributions will result in reclassifications to paid in capital. Undistributed net investment income and accumulated undistributed net realized gain (loss) on investments may include temporary book and tax basis differences which will reverse in a subsequent period. Any taxable income or gain remaining at fiscal year end is distributed in the following year.
Semiannual Report
Notes to Financial Statements (Unaudited) - continued
1. Significant Accounting Policies - continued
Security Transactions. Security transactions are accounted for as of trade date. Gains and losses on securities sold are determined on the basis of identified cost.
2. Operating Policies.
Joint Trading Account. Pursuant to an Exemptive Order issued by the Securities and Exchange Commission, the fund, along with other affiliated entities of Fidelity Management & Research Company (FMR), may transfer uninvested cash balances into one or more joint trading accounts. These balances are invested in one or more repurchase agreements for U.S. Treasury or Federal Agency obligations.
Repurchase Agreements. The underlying U.S. Treasury, Federal Agency, or other obligations found to be satisfactory by FMR are transferred to an account of the fund, or to the Joint Trading Account, at a custodian bank. The securities are marked-to-market daily and maintained at a value at least equal to the principal amount of the repurchase agreement (including accrued interest). FMR, the fund's investment adviser, is responsible for determining that the value of the underlying securities remains in accordance with the market value requirements stated above.
Delayed Delivery Transactions. The fund may purchase or sell securities on a delayed delivery basis. Payment and delivery may take place after the customary settlement period for that security. The price of the underlying securities and the date when the securities will be delivered and paid for are fixed at the time the transaction is negotiated. The fund may receive compensation for interest forgone in the purchase of a delayed delivery security. With respect to purchase commitments, the fund identifies securities as segregated in its records with a value at least equal to the amount of the commitment. Losses may arise due to changes in the market value of the underlying securities or if the counterparty does not perform under the contract.
Restricted Securities. The fund is permitted to invest in securities that are subject to legal or contractual restrictions on resale. These securities generally may be resold in transactions exempt from registration or to the public if the securities are registered. Disposal of these securities may involve time-consuming negotiations and expense, and prompt sale at an acceptable price may be difficult. At the end of the period, the fund had no investments in restricted securities (excluding 144A issues).
3. Purchases and Sales of Investments.
Purchases and sales of long-term U.S. government and government agency obligations aggregated $587,471,070 and $568,826,959, respectively.
4. Fees and Other Transactions with Affiliates.
Management Fee. As the fund's investment adviser, FMR receives a fee that is computed daily at an annual rate of .60% of the fund's average net assets. FMR pays
Semiannual Report
Notes to Financial Statements (Unaudited) - continued
4. Fees and Other Transactions with Affiliates - continued
Management Fee - continued
all other expenses, except the compensation of the non-interested Trustees and certain exceptions such as interest, taxes, brokerage commissions and extraordinary expenses. The management fee paid to FMR by the fund is reduced by an amount equal to the fees and expenses paid by the fund to the non-interested Trustees.
Sub-Adviser Fee. FMR, on behalf of the fund, has entered into a sub-advisory agreement with Fidelity Investments Money Management, Inc. (FIMM), a wholly owned subsidiary of FMR. For its services, FIMM receives a fee from FMR of 50% of the management fee payable to FMR. The fee is paid prior to any voluntary expense reimbursements which may be in effect.
5. Security Lending.
The fund lends portfolio securities from time to time in order to earn additional income. The fund receives collateral in the form of U.S. Treasury obligations, letters of credit, and/or cash against the loaned securities, and maintains collateral in an amount not less than 100% of the market value of the loaned securities during the period of the loan. The market value of the loaned securities is determined at the close of business of the fund and any additional required collateral is delivered to the fund on the next business day. If the borrower defaults on its obligation to return the securities loaned because of insolvency or other reasons, the fund could experience delays and costs in recovering the securities loaned or in gaining access to the collateral. At period end there were no security loans outstanding.
6. Expense Reductions.
FMR voluntarily agreed to reimburse the fund's operating expenses (excluding interest, taxes, brokerage commissions and extraordinary expenses, if any) above an annual rate of .50% of average net assets. For the period, the reimbursement reduced the expenses by $330,903.
In addition, through arrangements with the fund's custodian and transfer agent, credits realized as a result of uninvested cash balances were used to reduce a portion of the fund's expenses. During the period, the fund's expenses were reduced by $21,817 under these arrangements.
7. Beneficial Interest.
At the end of the period, Charitable Gift Fund, an affiliate of FMR was record owner of approximately 8% of the total outstanding shares of the fund.
Semiannual Report
Fidelity offers several ways to conveniently manage your personal investments via your telephone or PC. You can access your account information, conduct trades and research your investments 24 hours a day.
By Phone
Fidelity Automated Service Telephone provides a single toll-free number to access account balances, positions, quotes and trading. It's easy to navigate the service, and on your first call, the system will help you create a personal identification number (PIN) for security.
(phone_graphic)Fidelity Automated
Service Telephone (FAST®)
1-800-544-5555
Press
1 For mutual fund and brokerage trading.
2 For quotes.*
3 For account balances and holdings.
4 To review orders and mutual
fund activity.
5 To change your PIN.
*0 To speak to a Fidelity representative.
By PC
Fidelity's web site on the Internet provides a wide range of information, including daily financial news, fund performance, interactive planning tools and news about Fidelity products and services.
(computer_graphic)Fidelity's Web Site
www.fidelity.com
If you are not currently on the Internet, call EarthLink Sprint at 1-800-288-2967, and be sure to ask for registration number SMD004 to receive a special Fidelity package that includes 30 days of free Internet access. EarthLink is North America's #1 independent Internet access provider.
(computer_graphic)
Fidelity On-line Xpress+®
Fidelity On-line Xpress+ software for Windows combines comprehensive portfolio management capabilities, securities trading and access to research and analysis tools . . . all on your desktop. Call Fidelity at 1-800-544-0240 or visit our web site for more information on how to manage your investments via your PC.
* When you call the quotes line, please remember that a fund's yield and return will vary and, except for money market funds, share price will also vary. This means that you may have a gain or loss when you sell your shares. There is no assurance that money market funds will be able to maintain a stable $1 share price; an investment in a money market fund is not insured or guaranteed by the U.S. government. Total returns are historical and include changes in share price, reinvestment of dividends and capital gains, and the effects of any sales charges.
Semiannual Report
Investment Adviser
Fidelity Management & Research Company
Boston, MA
Investment Sub-Adviser
Fidelity Investments Money
Management, Inc.
Officers
Edward C. Johnson 3d, President
Robert C. Pozen, Senior Vice President
Dwight D. Churchill, Vice President
David L. Murphy, Vice President
Thomas J. Silvia, Vice President
Stanley N. Griffith, Assistant Vice President
Eric D. Roiter, Secretary
Robert A. Dwight, Treasurer
Maria F. Dwyer, Deputy Treasurer
John H. Costello, Assistant Treasurer
Thomas J. Simpson, Assistant Treasurer
Board of Trustees
Ralph F. Cox *
Phyllis Burke Davis *
Robert M. Gates *
Edward C. Johnson 3d
Donald J. Kirk *
Ned C. Lautenbach *
Peter S. Lynch
Marvin L. Mann *
William O. McCoy *
Gerald C. McDonough *
Robert C. Pozen
Thomas R. Williams *
Advisory Board
J. Michael Cook
Abigail P. Johnson
Marie L. Knowles
General Distributor
Fidelity Distributors Corporation
Boston, MA
* Independent trustees
Transfer and Shareholder
Servicing Agent
Fidelity Service Company, Inc.
Boston, MA
Custodian
The Bank of New York
New York, NY
Fidelity's Taxable Bond Funds
Capital & Income
Ginnie Mae
Government Income
High Income
Intermediate Bond
Intermediate Government Income
International Bond
Investment Grade Bond
New Markets Income
Short-Term Bond
Spartan® Government Income
Spartan Investment Grade Bond
Strategic Income
Target TimelineSM 2001 & 2003
The Fidelity Telephone Connection
Mutual Fund 24-Hour Service
Exchanges/Redemptions
and Account Assistance 1-800-544-6666
Product Information 1-800-544-6666
Retirement Accounts 1-800-544-4774
(8 a.m. - 9 p.m.)
TDD Service 1-800-544-0118
for the deaf and hearing impaired
(9 a.m. - 9 p.m. Eastern time)
Fidelity Automated Service
Telephone (FAST®)(automated graphic) 1-800-544-5555
(automated graphic) Automated line for quickest service
(Fidelity Investment logo)(registered trademark)
Corporate Headquarters
82 Devonshire St., Boston, MA 02109
www.fidelity.com
SPG-SANN-1200 118993
1.538297.103
Fidelity®
Fund
Semiannual Report
October 31, 2000
(2_fidelity_logos)
|
President's Message |
3 |
Ned Johnson on investing strategies. |
|
Performance |
4 |
How the fund has done over time. |
|
Fund Talk |
7 |
The manager's review of fund performance, strategy and outlook. |
|
Investment Changes |
10 |
A summary of major shifts in the fund's investments over the past six months. |
|
Investments |
11 |
A complete list of the fund's investments with their market values. |
|
Financial Statements |
28 |
Statements of assets and liabilities, operations, and changes in net assets, as well as financial highlights. |
|
Notes |
32 |
Notes to the financial statements. |
To reduce expenses, only one copy of most financial reports and prospectuses may be mailed to households, even if more than one person in the household has an account in the fund. Call Fidelity at 1-800-544-8544 if you need additional copies of financial reports or prospectuses. If you do not want the mailing of these documents to be combined with those for other members of your household, contact Fidelity in writing at P.O. Box 5000, Cincinnati, OH 45273-8692.
Standard & Poor's, S&P and S&P 500 are registered service marks of The McGraw-Hill Companies, Inc. and have been licensed for use by Fidelity Distributors Corporation.
Other third party marks appearing herein are the property of their respective owners.
All other marks appearing herein are registered or unregistered trademarks or service marks of FMR Corp. or an affiliated company.
(Recycle graphic) This report is printed on recycled paper using soy-based inks.
This report and the financial statements contained herein are submitted for the general information of the shareholders of the fund. This report is not authorized for distribution to prospective investors in the fund unless preceded or accompanied by an effective prospectus.
Mutual fund shares are not deposits or obligations of, or guaranteed by, any depository institution. Shares are not insured by the FDIC, Federal Reserve Board or any other agency, and are subject to investment risks, including possible loss of principal amount invested.
Neither the fund nor Fidelity Distributors Corporation is a bank.
For more information on any Fidelity fund, including charges and expenses, call 1-800-544-6666 for a free prospectus. Read it carefully before you invest or send money.
Semiannual Report
(photo_of_Edward_C_Johnson_3d)
Dear Shareholder:
A sixth-straight year of double-digit positive returns for the Dow Jones Industrial Average, NASDAQ and S&P 500® could be in jeopardy unless the U.S. stock market shows marked improvement in the final two months of 2000. Through October, all three indexes had negative year-to-date returns. On the other hand, most fixed-income sectors were solidly in the black. Treasuries and other long-term government securities led the way, returning nearly 14%.
While it's impossible to predict the future direction of the markets with any degree of certainty, there are certain basic principles that can help investors plan for their future needs.
The longer your investment time frame, the less likely it is that you will be affected by short-term market volatility. A 10-year investment horizon appropriate for saving for a college education, for example, enables you to weather market cycles in a long-term fund, which may have a higher risk potential, but also has a higher potential rate of return.
An intermediate-length fund could make sense if your investment horizon is two to four years, while a short-term bond fund could be the right choice if you need your money in one or two years.
If your time horizon is less than a year, you might want to consider moving some of your bond investment into a money market fund. These funds seek income and a stable share price by investing in high-quality, short-term investments. Of course, it's important to remember that an investment in a money market fund is not insured or guaranteed by the Federal Deposit Insurance Corporation or any other government agency. Although money market funds seek to preserve the value of your investment at $1.00 per share, it is possible to lose money by investing in these types of funds.
Finally, no matter what your time horizon or portfolio diversity, it makes good sense to follow a regular investment plan, investing a certain amount of money in a fund at the same time each month or quarter and periodically reviewing your overall portfolio. By doing so, you won't get caught up in the excitement of a rapidly rising market, nor will you buy all your shares at market highs. While this strategy - known as dollar cost averaging - won't assure a profit or protect you from a loss in a declining market, it should help you lower the average cost of your purchases. Of course, you should consider your financial ability to continue your purchases through periods of low price levels before undertaking such a strategy.
If you have questions, please call us at 1-800-544-6666, or visit our web site at www.fidelity.com. We are available 24 hours a day, seven days a week to provide you the information you need to make the investments that are right for you.
Best regards,
/s/Edward C. Johnson 3d
Edward C. Johnson 3d
Semiannual Report
There are several ways to evaluate a fund's historical performance. You can look at the total percentage change in value, the average annual percentage change or the growth of a hypothetical $10,000 investment. Total return reflects the change in the value of an investment, assuming reinvestment of the fund's dividend income and capital gains (the profits earned upon the sale of securities that have grown in value). You can also look at the fund's income, as reflected in the fund's yield, to measure performance.
Cumulative Total Returns
|
Periods ended October 31, 2000 |
Past 6 |
Past 1 |
Past 5 |
Past 10 |
|
Fidelity High Income |
-7.12% |
-8.32% |
35.70% |
239.61% |
|
ML High Yield Master II |
-1.93% |
-1.68% |
31.76% |
199.32% |
|
High Current Yield Funds Average |
-3.83% |
-2.77% |
25.45% |
173.70% |
Cumulative total returns show the fund's performance in percentage terms over a set period - in this case, six months, one year, five years or 10 years. For example, if you had invested $1,000 in a fund that had a 5% return over the past year, the value of your investment would be $1,050. You can compare the fund's returns to the performance of the Merrill Lynch High Yield Master II Index - a market value-weighted index of all domestic and yankee high-yield bonds, including deferred interest bonds and payment-in-kind securities. Issues included in the index have maturities of one year or more and have a credit rating lower than BBB-/Baa3, but are not in default. To measure how the fund's performance stacked up against its peers, you can compare it to the high current yield funds average, which reflects the performance of mutual funds with similar objectives tracked by Lipper Inc. The past six months average represents a peer group of 382 mutual funds. These benchmarks reflect reinvestment of dividends and capital gains, if any, and exclude the effect of sales charges.
Average Annual Total Returns
|
Periods ended October 31, 2000 |
Past 1 |
Past 5 |
Past 10 |
|
Fidelity High Income |
-8.32% |
6.30% |
13.01% |
|
ML High Yield Master II |
-1.68% |
5.67% |
11.59% |
|
High Current Yield Funds Average |
-2.77% |
4.55% |
10.51% |
Average annual total returns take the fund's cumulative return and show you what would have happened if the fund had performed at a constant rate each year. (Note: Lipper calculates average annual total returns by annualizing each fund's total return, then taking an arithmetic average. This may produce a different figure than that obtained by averaging the cumulative total returns and annualizing the result.)
Semiannual Report
Performance - continued
$10,000 Over 10 Years
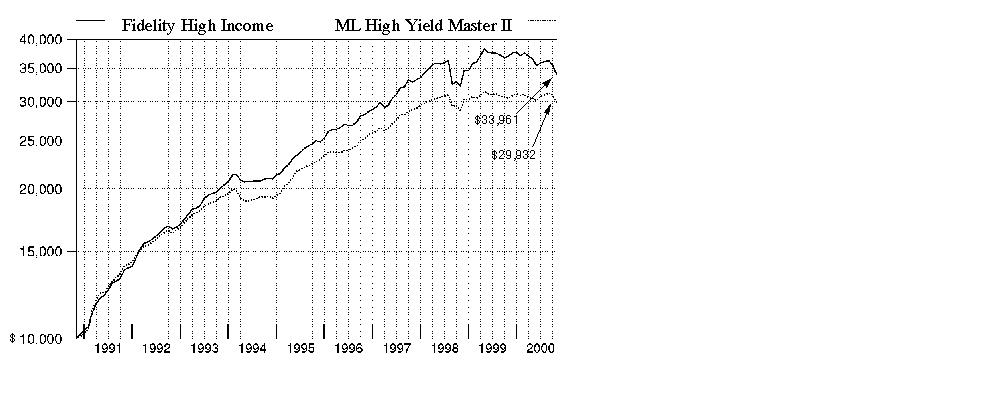
$10,000 Over 10 Years: Let's say hypothetically that $10,000 was invested in Fidelity High Income Fund on October 31, 1990. As the chart shows, by October 31, 2000, the value of the investment would have grown to $33,961 - a 239.61% increase on the initial investment. For comparison, look at how the Merrill Lynch High Yield Master II Index did over the same period. With dividends and capital gains, if any, reinvested, the same $10,000 would have grown to $29,932 - a 199.32% increase.
Understanding
Performance
How a fund did yesterday is no guarantee of how it will do tomorrow. Bond prices, for example, generally move in the opposite direction of interest rates. In turn, the share price, return and yield of a fund that invests in bonds will vary. That means if you sell your shares during a market downturn, you might lose money. But if you can ride out the market's ups and downs, you may have a gain.
3Semiannual Report
Performance - continued
Total Return Components
|
|
Six months
ended |
Years ended April 30, |
||||
|
|
2000 |
2000 |
1999 |
1998 |
1997 |
1996 |
|
Dividend returns |
3.83% |
8.98% |
8.83% |
9.64% |
8.76% |
10.66% |
|
Capital returns |
-10.95% |
-13.46% |
-1.92% |
11.98% |
1.81% |
5.40% |
|
Total returns |
-7.12% |
-4.48% |
6.91% |
21.62% |
10.57% |
16.06% |
Total return components include both dividend returns and capital returns. A dividend return reflects the actual dividends paid by the fund. A capital return reflects both the amount paid by the fund to shareholders as capital gain distributions and changes in the fund's share price. Both returns assume the dividends or capital gains, if any, paid by the fund are reinvested.
Dividends and Yield
|
Periods ended October 31, 2000 |
Past 1 |
Past 6 |
Past 1 |
|
Dividends per share |
7.65¢ |
45.45¢ |
92.93¢ A |
|
Annualized dividend rate |
8.74% |
8.30% |
8.21% |
|
30-day annualized yield |
11.98% |
- |
- |
Dividends per share show the income paid by the fund for a set period, and do not reflect any tax reclassifications. If you annualize this number, based on an average share price of $10.30 over the past one month, $10.86 over the past six months and $11.32 over the past one year, you can compare the fund's income over these three periods. The 30-day annualized yield is a standard formula based on the yields of the securities in the fund, averaged over the past 30 days. This figure shows you the yield characteristics of the fund's investments at the end of the period. It also helps you compare funds from different companies on an equal basis.
A Non-taxable dividends: Dividends paid are based on the fund's investment income at the time of distribution. Dividends of approximately 8.8¢ per share paid during 2000 were a non-taxable return of capital. The exact non-taxable amount to use in preparing your income tax return will depend upon your share activity and will be reported to you in January 2001.
Semiannual Report
Market Recap
While the six-month period ending October 31, 2000, was one that most high-yield investors would just as soon forget, positive signs about the market's prospects emerged toward the end of the period. During the past six months, the Merrill Lynch High Yield Master II Index - a broad measure of high-yield market performance - fell 1.93%. This return lagged the overall U.S. taxable bond market as measured by the Lehman Brothers Aggregate Bond Index, which gained 5.80% during the same time frame. A number of adverse conditions held back high-yield performance, including a struggling telecommunications sector - which makes up a large portion of the high-yield debt market - and an increasing default rate that led to decreasing demand. In a flight to safety, many high-yield investors turned to the relative security of the Treasury market, this year's best-performing fixed-income sector through the end of October. One potential catalyst for improved performance in the high-yield market could be a continued increase in merger and acquisition activity. From July to August, $90 billion in M&A activity took place where the target company was in the high-yield universe. Not only do these deals reduce the supply of high-yield credits, they also establish benchmark valuations for some sectors of the market.
(Portfolio Manager photograph)
Note to shareholders: Frederick Hoff became Portfolio Manager of Fidelity High Income Fund on June 1, 2000.
Q. How did the fund perform, Fred?
A. Rather poorly. For the six-month period that ended October 31, 2000, the fund had a total return of -7.12%. To get a sense of how the fund did relative to its competitors, the high current yield funds average returned -3.83% for the same six-month period, according to Lipper Inc. The overall high-yield market, as measured by the Merrill Lynch High Yield Master II Index, returned -1.93%. For the 12-month period that ended October 31, 2000, the fund had a total return of -8.32%. In comparison, the high current yield funds average returned -2.77% and the Merrill Lynch index returned -1.68% for the same 12-month period.
Q. Can you give us some perspective about the factors that affected fund performance during the past six months?
A. Credit quality - especially for lower-rated high-yield bonds - deteriorated during the past six months as short-term interest rates rose and liquidity fell. Essentially, rising rates slowed economic activity and created increasingly difficult conditions, causing more companies to miss earnings targets. The lack of liquidity - meaning how easily investors could buy and sell bonds - stifled demand. Furthermore, the market suffered outflows from high-yield mutual funds in favor of more defensive investments. Even though there was a significant drop in new issue supply, it wasn't enough to offset the gloom that settled over the market. Against this negative backdrop, the fund had several disappointments that caused it to lag both the index and the peer group.
Semiannual Report
Fund Talk: The Manager's Overview - continued
Q. Which investments caused the fund to underperform?
A. The biggest disappointment was an investment in Macsaver Financial, the financing arm of the country's largest furniture retailer, Heilig-Meyers. Macsaver filed for Chapter 11 bankruptcy protection during the period due to slowing sales and customer collection problems. The fund's comparatively large weighting in telecommunications holdings also detracted from performance. Following several earnings disappointments from companies such as Call-Net and ICG Communications, investors became increasingly concerned with the industry's ability to raise additional capital. Even telecommunications companies that continued to meet their business plans - such as Adelphia Business Solutions, NEXTLINK and WinStar - eventually succumbed to market pressures. Finally, the fund was overweighted relative to the Merrill Lynch index in securities rated B and CCC, and in deferred pay securities, such as zero coupon bonds and payment-in-kind preferred stocks. These types of securities - which tend to be quite volatile - significantly underperformed during the period.
Q. Which holdings held up well and helped the fund's performance?
A. Our bond holdings in EchoStar, the second-largest participant in satellite television transmission, performed well. Investors remained optimistic about the company's ability to expand its subscriber base and increase revenue. Our equity holdings in Intersil, which we received as part of our original debt investment in the company, posted strong gains following the company's initial public offering of stock. The fund also benefited from several takeovers, including Federal Data, which was bought by Northrop Grumman; Gothic Energy, which was purchased by Chesapeake Energy; and Verio, which was acquired by NTT.
Q. What's ahead for the high-yield market and the fund?
A. Market sentiment is extremely negative right now, and investors are pricing high-yield securities at a significant discount to par assuming a worst-case scenario. My view is that by applying Fidelity's expertise in research, we will be able to identify companies that have been unfairly punished and will do well when the market recovers. Furthermore, I expect the pace of merger and acquisition activity to remain solid and will likely continue to be a positive for the fund. Telecommunications companies in particular now face more limited access to capital, which may force them to sell out to better-funded companies. Across a number of other industries, good companies are available at very cheap prices and also are likely acquisition targets as a result.
The views expressed in this report reflect those of the portfolio manager only through the end of the period of the report as stated on the cover and do not necessarily represent the views of Fidelity or any other person in the Fidelity organization. Any such views are subject to change at any time based upon market or other conditions and Fidelity disclaims any responsibility to update such views. These views may not be relied on as investment advice and, because investment decisions for a Fidelity fund are based on numerous factors, may not be relied on as an indication of trading intent on behalf of any Fidelity fund.
Semiannual Report
Fund Talk: The Manager's Overview - continued
Fund Facts
Goal: high current income; growth of capital may also be considered
Fund number: 455
Trading symbol: SPHIX
Start date: August 29, 1990
Size: as of October 31, 2000, more than $2.4 billion
Manager: Fred Hoff, since June 2000; high-yield subportfolio manager, several Fidelity asset allocation funds, 1997-present; high-yield analyst, 1991-2000; joined Fidelity in 1991
3Frederick Hoff on recent changes in the fund:
"Drawing on my previous experience as a research analyst, I select investments for the fund by starting with company fundamentals. With the help of Fidelity's research team, I do incredibly in-depth research and spend a lot of time communicating with the management teams of the companies in which we invest. Since taking over the fund in June, I've made a couple of changes that reflect our research efforts. For example, I've reduced the fund's exposure to ´turnaround' situations. Based on a risk/reward tradeoff, I'd rather emphasize companies that already have exhibited good positive momentum. I also reduced the fund's stake in ´cyclical' companies whose performance is dependent on the strength of the economy. I cut back on investments in the paper, chemical and auto supply industries in response to more signs that the economy is slowing."
Semiannual Report
|
Top Five Holdings as of October 31, 2000 |
||
|
(by issuer, excluding cash equivalents) |
% of fund's |
% of fund's net assets |
|
Nextel Communications, Inc. |
8.1 |
9.5 |
|
CSC Holdings, Inc. |
5.3 |
4.3 |
|
XO Communications, Inc. |
2.5 |
2.2 |
|
EchoStar Communications Corp. |
2.4 |
2.9 |
|
WinStar Communications, Inc. |
2.2 |
0.2 |
|
|
20.5 |
19.1 |
|
Top Five Market Sectors as of October 31, 2000 |
||
|
|
% of fund's |
% of fund's net assets |
|
Media & Leisure |
33.6 |
28.3 |
|
Utilities |
26.2 |
26.8 |
|
Technology |
7.1 |
8.1 |
|
Basic Industries |
5.3 |
8.3 |
|
Construction & Real Estate |
3.8 |
3.9 |
|
Quality Diversification as of October 31, 2000 |
||
|
(Moody's Ratings) |
% of fund's investments |
% of fund's investments |
|
Aaa, Aa, A |
0.0 |
0.0 |
|
Baa |
1.2 |
1.6 |
|
Ba |
9.4 |
6.1 |
|
B |
48.5 |
41.8 |
|
Caa, Ca, C |
10.8 |
15.1 |
|
D |
0.1 |
0.0 |
|
Not Rated |
1.6 |
5.0 |
|
Table excludes short-term investments. Where Moody's ratings are not available, we have used S&P ® ratings. Unrated debt securities that are equivalent to Ba and below at October 31, 2000 and April 30, 2000 account for 1.6% and 5.0% respectively of the fund's investments. |
|
Asset Allocation (% of fund's net assets) |
|||||||
|
As of October 31, 2000 * |
As of April 30, 2000 ** |
||||||
|
Nonconvertible |
|
|
Nonconvertible |
|
||
|
Convertible Bonds, Preferred Stocks 21.3% |
|
|
Convertible Bonds, Preferred Stocks 25.2% |
|
||
|
Common Stocks 4.2% |
|
|
Common Stocks 4.9% |
|
||
|
Other Investments 1.1% |
|
|
Other Investments 0.8% |
|
||
|
Short-Term |
|
|
Short-Term |
|
||
|
* Foreign investments |
7.6% |
|
** Foreign investments |
10.4% |
|
||

Semiannual Report
(Unaudited)
Showing Percentage of Net Assets
|
Corporate Bonds - 69.2% |
|||||
|
Moody's Ratings (unaudited) (b) |
Principal Amount (000s) |
Value (Note 1) (000s) |
|||
|
Convertible Bonds - 2.4% |
|||||
|
CONSTRUCTION & REAL ESTATE - 0.1% |
|||||
|
Building Materials - 0.1% |
|||||
|
Hexcel Corp. 7% 8/1/03 |
B3 |
|
$ 1,210 |
$ 1,101 |
|
|
FINANCE - 0.1% |
|||||
|
Credit & Other Finance - 0.1% |
|||||
|
HIH Capital Ltd. euro 7.5% 9/25/06 |
- |
|
5,500 |
2,090 |
|
|
HEALTH - 0.6% |
|||||
|
Medical Facilities Management - 0.6% |
|||||
|
Tenet Healthcare Corp. 6% 12/1/05 |
B1 |
|
5,260 |
4,471 |
|
|
Total Renal Care Holdings, Inc.: |
|
|
|
|
|
|
7% 5/15/09 |
B3 |
|
5,900 |
4,366 |
|
|
7% 5/15/09 (e) |
B3 |
|
9,360 |
6,926 |
|
|
|
15,763 |
||||
|
MEDIA & LEISURE - 0.8% |
|||||
|
Broadcasting - 0.5% |
|||||
|
EchoStar Communications Corp. 4.875% 1/1/07 (e) |
Caa2 |
|
10,240 |
12,032 |
|
|
Lodging & Gaming - 0.3% |
|||||
|
Hilton Hotels Corp. 5% 5/15/06 |
Ba2 |
|
9,530 |
7,719 |
|
|
TOTAL MEDIA & LEISURE |
19,751 |
||||
|
RETAIL & WHOLESALE - 0.8% |
|||||
|
Retail & Wholesale, Miscellaneous - 0.8% |
|||||
|
Sunglass Hut International, Inc.: |
|
|
|
|
|
|
5.25% 6/15/03 (e) |
B2 |
|
19,730 |
15,118 |
|
|
5.25% 6/15/03 |
B3 |
|
5,780 |
4,429 |
|
|
|
19,547 |
||||
|
TOTAL CONVERTIBLE BONDS |
58,252 |
||||
|
Nonconvertible Bonds - 66.8% |
|||||
|
AEROSPACE & DEFENSE - 0.0% |
|||||
|
Ship Building & Repair - 0.0% |
|||||
|
Newport News Shipbuilding, Inc. 9.25% 12/1/06 |
Ba3 |
|
370 |
374 |
|
|
Corporate Bonds - continued |
|||||
|
Moody's Ratings (unaudited) (b) |
Principal Amount (000s) |
Value (Note 1) (000s) |
|||
|
Nonconvertible Bonds - continued |
|||||
|
BASIC INDUSTRIES - 5.3% |
|||||
|
Chemicals & Plastics - 3.2% |
|||||
|
Avecia Group PLC 11% 7/1/09 |
B2 |
|
$ 750 |
$ 713 |
|
|
Geo Specialty Chemicals, Inc. 10.125% 8/1/08 |
B3 |
|
5,390 |
4,312 |
|
|
Huntsman Corp. 9.5% 7/1/07 (e) |
B2 |
|
34,320 |
20,592 |
|
|
Lyondell Chemical Co.: |
|
|
|
|
|
|
9.875% 5/1/07 |
Ba3 |
|
19,825 |
19,329 |
|
|
10.875% 5/1/09 |
B2 |
|
4,775 |
4,584 |
|
|
Sterling Chemicals, Inc.: |
|
|
|
|
|
|
11.25% 4/1/07 |
Caa3 |
|
6,460 |
3,424 |
|
|
11.75% 8/15/06 |
Caa3 |
|
9,310 |
5,121 |
|
|
12.375% 7/15/06 |
B3 |
|
21,725 |
20,747 |
|
|
|
78,822 |
||||
|
Metals & Mining - 0.4% |
|||||
|
Better Minerals & Aggregates Co. 13% 9/15/09 |
B3 |
|
11,480 |
9,414 |
|
|
Packaging & Containers - 1.2% |
|||||
|
Gaylord Container Corp.: |
|
|
|
|
|
|
9.375% 6/15/07 |
Caa1 |
|
23,515 |
15,285 |
|
|
9.75% 6/15/07 |
Caa1 |
|
9,665 |
6,476 |
|
|
9.875% 2/15/08 |
Caa3 |
|
25,060 |
7,518 |
|
|
|
29,279 |
||||
|
Paper & Forest Products - 0.5% |
|||||
|
Container Corp. of America gtd. 9.75% 4/1/03 |
B2 |
|
7,380 |
7,380 |
|
|
Stone Container Corp. 12.58% 8/1/16 (f) |
B2 |
|
3,990 |
3,990 |
|
|
|
11,370 |
||||
|
TOTAL BASIC INDUSTRIES |
128,885 |
||||
|
CONSTRUCTION & REAL ESTATE - 2.3% |
|||||
|
Building Materials - 1.3% |
|||||
|
American Standard Companies, Inc. 8.25% 6/1/09 |
Ba2 |
|
6,860 |
6,654 |
|
|
American Standard Companies, Inc.: |
|
|
|
|
|
|
7.375% 2/1/08 |
Ba2 |
|
6,140 |
5,710 |
|
|
7.625% 2/15/10 |
Ba2 |
|
3,660 |
3,404 |
|
|
Corporate Bonds - continued |
|||||
|
Moody's Ratings (unaudited) (b) |
Principal Amount (000s) |
Value (Note 1) (000s) |
|||
|
Nonconvertible Bonds - continued |
|||||
|
CONSTRUCTION & REAL ESTATE - continued |
|||||
|
Building Materials - continued |
|||||
|
Atrium Companies, Inc. 10.5% 5/1/09 |
B3 |
|
$ 12,690 |
$ 10,755 |
|
|
Numatics, Inc. 9.625% 4/1/08 |
B3 |
|
5,971 |
4,598 |
|
|
|
31,121 |
||||
|
Construction - 0.4% |
|||||
|
Blount, Inc. 13% 8/1/09 |
B3 |
|
12,105 |
10,168 |
|
|
Engineering - 0.6% |
|||||
|
Anteon Corp. 12% 5/15/09 |
B3 |
|
8,000 |
7,040 |
|
|
Morrison Knudsen Corp. 11% 7/1/10 (e) |
Ba2 |
|
7,980 |
6,584 |
|
|
|
13,624 |
||||
|
Real Estate - 0.0% |
|||||
|
LNR Property Corp. 9.375% 3/15/08 |
B1 |
|
1,000 |
900 |
|
|
TOTAL CONSTRUCTION & REAL ESTATE |
55,813 |
||||
|
DURABLES - 0.4% |
|||||
|
Autos, Tires, & Accessories - 0.0% |
|||||
|
Cambridge Industries, Inc. 10.25% 7/15/07 (c) |
- |
|
2,230 |
624 |
|
|
Home Furnishings - 0.4% |
|||||
|
Omega Cabinets Ltd. 10.5% 6/15/07 |
B3 |
|
10,810 |
9,945 |
|
|
TOTAL DURABLES |
10,569 |
||||
|
ENERGY - 2.4% |
|||||
|
Energy Services - 0.6% |
|||||
|
R&B Falcon Corp.: |
|
|
|
|
|
|
6.5% 4/15/03 |
Ba3 |
|
10,080 |
9,576 |
|
|
6.75% 4/15/05 |
Ba3 |
|
5,942 |
5,526 |
|
|
|
15,102 |
||||
|
Oil & Gas - 1.8% |
|||||
|
Chesapeake Energy Corp. 9.625% 5/1/05 |
B2 |
|
1,995 |
1,995 |
|
|
Gothic Production Corp. 11.125% 5/1/05 |
B3 |
|
28,858 |
30,301 |
|
|
Nuevo Energy Co. 9.375% 10/1/10 (e) |
B1 |
|
2,625 |
2,612 |
|
|
Petsec Energy, Inc. 9.5% 6/15/07 (c) |
D |
|
5,270 |
2,767 |
|
|
Western Gas Resources, Inc. 10% 6/15/09 |
Ba3 |
|
5,480 |
5,699 |
|
|
|
43,374 |
||||
|
TOTAL ENERGY |
58,476 |
||||
|
Corporate Bonds - continued |
|||||
|
Moody's Ratings (unaudited) (b) |
Principal Amount (000s) |
Value (Note 1) (000s) |
|||
|
Nonconvertible Bonds - continued |
|||||
|
FINANCE - 1.1% |
|||||
|
Credit & Other Finance - 1.1% |
|||||
|
GS Escrow Corp. 7% 8/1/03 |
Ba1 |
|
$ 25,000 |
$ 23,688 |
|
|
Macsaver Financial Services, Inc.: |
|
|
|
|
|
|
7.4% 2/15/02 (c) |
Ca |
|
2,090 |
251 |
|
|
7.6% 8/1/07 (c) |
Ca |
|
14,010 |
1,681 |
|
|
7.875% 8/1/03 (c) |
Ca |
|
15,180 |
1,822 |
|
|
|
27,442 |
||||
|
HEALTH - 2.5% |
|||||
|
Drugs & Pharmaceuticals - 0.3% |
|||||
|
Warner Chilcott, Inc. 12.625% 2/15/08 (e) |
B2 |
|
6,600 |
6,666 |
|
|
Medical Facilities Management - 2.2% |
|||||
|
Dynacare, Inc. 10.75% 1/15/06 |
B2 |
|
7,210 |
6,922 |
|
|
Everest Healthcare Services, Inc. 9.75% 5/1/08 |
B3 |
|
5,130 |
4,822 |
|
|
Fountain View, Inc. 11.25% 4/15/08 |
Caa1 |
|
17,360 |
3,472 |
|
|
Oxford Health Plans, Inc. 11% 5/15/05 |
B2 |
|
26,260 |
28,623 |
|
|
Tenet Healthcare Corp. 8.125% 12/1/08 |
Ba3 |
|
2,670 |
2,570 |
|
|
Unilab Corp. 12.75% 10/1/09 |
B3 |
|
8,395 |
8,983 |
|
|
|
55,392 |
||||
|
TOTAL HEALTH |
62,058 |
||||
|
INDUSTRIAL MACHINERY & EQUIPMENT - 3.4% |
|||||
|
Industrial Machinery & Equipment - 1.8% |
|||||
|
Dunlop Standard Aero Holdings PLC 11.875% 5/15/09 |
B3 |
|
18,150 |
18,059 |
|
|
International Knife & Saw, Inc. 11.375% 11/15/06 |
Caa1 |
|
5,280 |
2,482 |
|
|
Roller Bearing Co. of America, Inc. 9.625% 6/15/07 |
B- |
|
7,550 |
6,644 |
|
|
Roller Bearing Holding, Inc. 0% 6/15/09 (d)(e) |
- |
|
22,220 |
12,443 |
|
|
Tenneco Automotive, Inc. 11.625% 10/15/09 |
B2 |
|
5,805 |
3,367 |
|
|
|
42,995 |
||||
|
Pollution Control - 1.6% |
|||||
|
Allied Waste North America, Inc.: |
|
|
|
|
|
|
7.375% 1/1/04 |
Ba3 |
|
2,570 |
2,339 |
|
|
Corporate Bonds - continued |
|||||
|
Moody's Ratings (unaudited) (b) |
Principal Amount (000s) |
Value (Note 1) (000s) |
|||
|
Nonconvertible Bonds - continued |
|||||
|
INDUSTRIAL MACHINERY & EQUIPMENT - continued |
|||||
|
Pollution Control - continued |
|||||
|
Allied Waste North America, Inc.: - continued |
|
|
|
|
|
|
7.625% 1/1/06 |
Ba2 |
|
$ 18,995 |
$ 16,811 |
|
|
10% 8/1/09 |
B2 |
|
25,070 |
21,247 |
|
|
|
40,397 |
||||
|
TOTAL INDUSTRIAL MACHINERY & EQUIPMENT |
83,392 |
||||
|
MEDIA & LEISURE - 23.2% |
|||||
|
Broadcasting - 17.4% |
|||||
|
360networks, Inc. 13% 5/1/08 |
B3 |
|
2,690 |
2,139 |
|
|
Adelphia Communications Corp.: |
|
|
|
|
|
|
7.75% 1/15/09 |
B2 |
|
10,060 |
7,847 |
|
|
10.875% 10/1/10 |
B2 |
|
9,000 |
8,370 |
|
|
Ascent Entertainment Group, Inc. 0% 12/15/04 (d) |
Ba1 |
|
22,890 |
18,884 |
|
|
Cable Satisfaction International, Inc. 12.75% 3/1/10 |
Caa1 |
|
13,120 |
9,184 |
|
|
Century Communications Corp. Series B, 0% 1/15/08 |
B2 |
|
32,355 |
12,295 |
|
|
Charter Communications Holdings LLC/Charter Communications Holdings Capital Corp. 8.625% 4/1/09 |
B2 |
|
32,540 |
29,286 |
|
|
Comcast UK Cable Partners Ltd. 0% 11/15/07 (d) |
B2 |
|
27,900 |
25,110 |
|
|
Diamond Cable Communications PLC yankee: |
|
|
|
|
|
|
0% 12/15/05 (d) |
B2 |
|
3,260 |
2,942 |
|
|
0% 2/15/07 (d) |
B2 |
|
18,920 |
14,190 |
|
|
Earthwatch, Inc. 0% 7/15/07 (d) |
- |
|
14,990 |
7,795 |
|
|
Fox Family Worldwide, Inc. 9.25% 11/1/07 |
B1 |
|
2,500 |
2,369 |
|
|
FrontierVision Holdings LP/FrontierVision Holdings Capital Corp. 0% 9/15/07 (d) |
B2 |
|
24,990 |
20,804 |
|
|
FrontierVision Holdings LP/FrontierVision Holdings Capital II Corp. 0% 9/15/07 (d) |
Caa1 |
|
5,000 |
4,163 |
|
|
Golden Sky DBS, Inc. 0% 3/1/07 (d) |
Caa1 |
|
9,610 |
6,535 |
|
|
Golden Sky Systems, Inc. 12.375% 8/1/06 |
B3 |
|
18,345 |
19,721 |
|
|
Impsat Fiber Networks, Inc. 12.375% 6/15/08 |
B3 |
|
10,630 |
7,122 |
|
|
International Cabletel, Inc. 0% 2/1/06 (d) |
B2 |
|
52,390 |
46,103 |
|
|
NorthPoint Communication Holdings, Inc. 12.875% 2/15/10 |
Caa1 |
|
10,550 |
9,917 |
|
|
Corporate Bonds - continued |
|||||
|
Moody's Ratings (unaudited) (b) |
Principal Amount (000s) |
Value (Note 1) (000s) |
|||
|
Nonconvertible Bonds - continued |
|||||
|
MEDIA & LEISURE - continued |
|||||
|
Broadcasting - continued |
|||||
|
NTL Communications Corp. 11.5% 10/1/08 |
B3 |
|
$ 32,740 |
$ 29,302 |
|
|
NTL, Inc.: |
|
|
|
|
|
|
0% 4/1/08 (d) |
B3 |
|
51,395 |
28,781 |
|
|
10% 2/15/07 |
B2 |
|
3,070 |
2,671 |
|
|
Pegasus Communications Corp.: |
|
|
|
|
|
|
9.625% 10/15/05 |
B3 |
|
2,620 |
2,555 |
|
|
12.5% 8/1/17 |
B3 |
|
19,250 |
20,020 |
|
|
Satelites Mexicanos SA de CV 10.125% 11/1/04 |
B3 |
|
7,960 |
5,015 |
|
|
Spectrasite Holdings, Inc.: |
|
|
|
|
|
|
0% 4/15/09 (d) |
B3 |
|
10,420 |
5,366 |
|
|
10.75% 3/15/10 |
B3 |
|
11,810 |
10,865 |
|
|
Telewest Communications PLC: |
|
|
|
|
|
|
0% 4/15/09 (d) |
B1 |
|
5,400 |
2,403 |
|
|
11.25% 11/1/08 |
B1 |
|
3,930 |
3,537 |
|
|
Telewest PLC: |
|
|
|
|
|
|
yankee 9.625% 10/1/06 |
B1 |
|
2,560 |
2,099 |
|
|
11% 10/1/07 |
B1 |
|
13,767 |
12,390 |
|
|
United Pan-Europe Communications NV: |
|
|
|
|
|
|
0% 11/1/09 (d) |
B2 |
|
31,670 |
11,876 |
|
|
10.875% 11/1/07 |
B2 |
|
13,390 |
10,444 |
|
|
10.875% 8/1/09 |
B2 |
|
31,665 |
22,957 |
|
|
|
425,057 |
||||
|
Entertainment - 1.8% |
|||||
|
AMC Entertainment, Inc. 9.5% 2/1/11 |
Caa3 |
|
5,450 |
2,562 |
|
|
Bally Total Fitness Holding Corp. 9.875% 10/15/07 |
B3 |
|
21,810 |
20,283 |
|
|
Cinemark USA, Inc. 8.5% 8/1/08 |
B2 |
|
7,465 |
3,061 |
|
|
Mandalay Resort Group: |
|
|
|
|
|
|
9.5% 8/1/08 |
Ba2 |
|
3,385 |
3,453 |
|
|
10.25% 8/1/07 |
Ba3 |
|
5,450 |
5,586 |
|
|
MGM Mirage, Inc. 9.75% 6/1/07 |
Ba2 |
|
4,300 |
4,456 |
|
|
Premier Parks, Inc. 9.75% 6/15/07 |
B3 |
|
5,500 |
5,115 |
|
|
|
44,516 |
||||
|
Lodging & Gaming - 2.2% |
|||||
|
HMH Properties, Inc. 7.875% 8/1/08 |
Ba2 |
|
22,315 |
20,530 |
|
|
Hollywood Casino Corp. 11.25% 5/1/07 |
B3 |
|
9,680 |
9,922 |
|
|
Corporate Bonds - continued |
|||||
|
Moody's Ratings (unaudited) (b) |
Principal Amount (000s) |
Value (Note 1) (000s) |
|||
|
Nonconvertible Bonds - continued |
|||||
|
MEDIA & LEISURE - continued |
|||||
|
Lodging & Gaming - continued |
|||||
|
Horseshoe Gaming LLC 8.625% 5/15/09 |
B2 |
|
$ 12,750 |
$ 12,431 |
|
|
Host Marriott LP 8.375% 2/15/06 |
Ba2 |
|
12,040 |
11,558 |
|
|
|
54,441 |
||||
|
Publishing - 0.8% |
|||||
|
Advanstar Communications, Inc. 9.25% 5/1/08 |
B2 |
|
14,960 |
15,110 |
|
|
Von Hoffman Press, Inc. 10.875% 5/15/07 (e) |
B3 |
|
4,660 |
4,194 |
|
|
|
19,304 |
||||
|
Restaurants - 1.0% |
|||||
|
Domino's, Inc. 10.375% 1/15/09 |
B3 |
|
16,190 |
14,409 |
|
|
NE Restaurant, Inc. 10.75% 7/15/08 |
B3 |
|
12,280 |
9,456 |
|
|
|
23,865 |
||||
|
TOTAL MEDIA & LEISURE |
567,183 |
||||
|
NONDURABLES - 0.2% |
|||||
|
Foods - 0.2% |
|||||
|
Del Monte Foods Co. 0% 12/15/07 (d) |
Caa1 |
|
7,611 |
5,651 |
|
|
RETAIL & WHOLESALE - 1.3% |
|||||
|
Drug Stores - 0.7% |
|||||
|
Rite Aid Corp.: |
|
|
|
|
|
|
6% 12/15/00 (e) |
B3 |
|
8,000 |
7,760 |
|
|
10.5% 9/15/02 (e) |
- |
|
15,150 |
9,393 |
|
|
|
17,153 |
||||
|
General Merchandise Stores - 0.6% |
|||||
|
Kmart Corp.: |
|
|
|
|
|
|
7.95% 2/1/23 |
Baa3 |
|
5,190 |
3,218 |
|
|
8.375% 7/1/22 |
Baa3 |
|
4,502 |
2,926 |
|
|
12.5% 3/1/05 |
Baa3 |
|
9,880 |
9,386 |
|
|
|
15,530 |
||||
|
TOTAL RETAIL & WHOLESALE |
32,683 |
||||
|
Corporate Bonds - continued |
|||||
|
Moody's Ratings (unaudited) (b)) |
Principal Amount (000s) |
Value (Note 1) (000s) |
|||
|
Nonconvertible Bonds - continued |
|||||
|
SERVICES - 1.2% |
|||||
|
Printing - 1.1% |
|||||
|
American Color Graphics, Inc. 12.75% 8/1/05 |
Caa1 |
|
$ 16,420 |
$ 15,517 |
|
|
World Color Press, Inc. 7.75% 2/15/09 |
Baa3 |
|
13,500 |
12,353 |
|
|
|
27,870 |
||||
|
Services - 0.1% |
|||||
|
Spin Cycle, Inc. 0% 5/1/05 (d) |
- |
|
15,960 |
1,915 |
|
|
TOTAL SERVICES |
29,785 |
||||
|
TECHNOLOGY - 6.6% |
|||||
|
Computer Services & Software - 2.6% |
|||||
|
Colo.com 13.875% 3/15/10 unit (e) |
- |
|
6,000 |
4,500 |
|
|
Concentric Network Corp. 12.75% 12/15/07 |
B |
|
2,460 |
2,448 |
|
|
Covad Communications Group, Inc.: |
|
|
|
|
|
|
0% 3/15/08 (d) |
B3 |
|
8,240 |
2,225 |
|
|
12% 2/15/10 |
B3 |
|
14,450 |
6,719 |
|
|
12.5% 2/15/09 |
B3 |
|
2,621 |
1,284 |
|
|
Exodus Communications, Inc.: |
|
|
|
|
|
|
10.75% 12/15/09 |
B3 |
|
10,000 |
9,200 |
|
|
11.625% 7/15/10 (e) |
B3 |
|
15,000 |
14,100 |
|
|
Federal Data Corp. 10.125% 8/1/05 |
B3 |
|
9,170 |
9,812 |
|
|
InterAct Operating Co., Inc. 14% 8/1/03 pay-in-kind |
- |
|
3,234 |
420 |
|
|
PSINet, Inc.: |
|
|
|
|
|
|
10% 2/15/05 |
B3 |
|
4,726 |
2,339 |
|
|
10.5% 12/1/06 |
B3 |
|
19,820 |
9,514 |
|
|
|
62,561 |
||||
|
Computers & Office Equipment - 0.2% |
|||||
|
Globix Corp. 12.5% 2/1/10 |
B- |
|
10,000 |
5,500 |
|
|
Electronic Instruments - 0.2% |
|||||
|
Telecommunications Techniques Co. LLC 9.75% 5/15/08 |
B3 |
|
6,960 |
6,194 |
|
|
Electronics - 3.6% |
|||||
|
ChipPAC International Ltd. 12.75% 8/1/09 |
B3 |
|
21,520 |
21,466 |
|
|
Fairchild Semiconductor Corp. 10.125% 3/15/07 |
B2 |
|
17,430 |
16,907 |
|
|
Intersil Corp. 13.25% 8/15/09 |
B1 |
|
6,552 |
7,535 |
|
|
Knowles Electronics Holdings, Inc. 13.125% 10/15/09 |
B3 |
|
5,120 |
4,710 |
|
|
Corporate Bonds - continued |
|||||
|
Moody's Ratings (unaudited) (b) |
Principal Amount (000s) |
Value (Note 1) (000s) |
|||
|
Nonconvertible Bonds - continued |
|||||
|
TECHNOLOGY - continued |
|||||
|
Electronics - continued |
|||||
|
Micron Technology, Inc. 6.5% 9/30/05 (g) |
B3 |
|
$ 21,000 |
$ 17,430 |
|
|
Viasystems, Inc. 9.75% 6/1/07 |
B3 |
|
21,523 |
19,263 |
|
|
|
87,311 |
||||
|
TOTAL TECHNOLOGY |
161,566 |
||||
|
TRANSPORTATION - 0.7% |
|||||
|
Railroads - 0.6% |
|||||
|
TFM SA de CV: |
|
|
|
|
|
|
0% 6/15/09 (d) |
B2 |
|
7,605 |
5,590 |
|
|
10.25% 6/15/07 |
B2 |
|
8,980 |
8,262 |
|
|
|
13,852 |
||||
|
Shipping - 0.1% |
|||||
|
MC Shipping, Inc. 11.25% 3/1/08 |
B3 |
|
3,840 |
2,688 |
|
|
TOTAL TRANSPORTATION |
16,540 |
||||
|
UTILITIES - 16.2% |
|||||
|
Cellular - 8.8% |
|||||
|
Crown Castle International Corp. 10.75% 8/1/11 |
B3 |
|
7,885 |
8,043 |
|
|
CTI Holdings SA 0% 4/15/08 (d) |
B1 |
|
13,000 |
6,630 |
|
|
Echostar Broadband Corp. 10.375% 10/1/07 (e) |
B3 |
|
30,000 |
30,000 |
|
|
McCaw International Ltd. 0% 4/15/07 (d) |
Caa1 |
|
65,360 |
45,752 |
|
|
Millicom International Cellular SA 0% 6/1/06 (d) |
Caa1 |
|
35,924 |
28,739 |
|
|
Nextel Communications, Inc.: |
|
|
|
|
|
|
9.375% 11/15/09 |
B1 |
|
30,000 |
28,950 |
|
|
12% 11/1/08 |
B1 |
|
18,610 |
19,727 |
|
|
Nextel International, Inc.: |
|
|
|
|
|
|
0% 4/15/08 (d) |
Caa1 |
|
33,720 |
20,232 |
|
|
12.75% 8/1/10 (e) |
Caa1 |
|
24,865 |
22,876 |
|
|
TeleCorp PCS, Inc. 10.625% 7/15/10 |
B3 |
|
4,870 |
4,833 |
|
|
|
215,782 |
||||
|
Electric Utility - 0.6% |
|||||
|
AES Corp.: |
|
|
|
|
|
|
8.5% 11/1/07 |
Ba3 |
|
4,425 |
4,160 |
|
|
Corporate Bonds - continued |
|||||
|
Moody's Ratings (unaudited) (b) |
Principal Amount (000s) |
Value (Note 1) (000s) |
|||
|
Nonconvertible Bonds - continued |
|||||
|
UTILITIES - continued |
|||||
|
Electric Utility - continued |
|||||
|
AES Corp.: - continued |
|
|
|
|
|
|
9.5% 6/1/09 |
Ba1 |
|
$ 2,000 |
$ 2,040 |
|
|
CMS Energy Corp.: |
|
|
|
|
|
|
8.125% 5/15/02 |
Ba3 |
|
3,370 |
3,315 |
|
|
9.875% 10/15/07 |
Ba3 |
|
4,330 |
4,362 |
|
|
|
13,877 |
||||
|
Telephone Services - 6.8% |
|||||
|
Alestra SA de RL de CV 12.625% 5/15/09 |
B2 |
|
8,950 |
7,563 |
|
|
Call-Net Enterprises, Inc.: |
|
|
|
|
|
|
0% 5/15/09 (d) |
B2 |
|
14,450 |
3,468 |
|
|
8% 8/15/08 |
B2 |
|
14,845 |
5,938 |
|
|
Focal Communications Corp. 11.875% 1/15/10 |
B3 |
|
2,375 |
1,805 |
|
|
Global Crossing Holdings Ltd. 9.125% 11/15/06 |
Ba2 |
|
7,000 |
6,720 |
|
|
Hermes Europe Railtel BV 10.375% 1/15/09 |
B3 |
|
4,000 |
2,000 |
|
|
Hyperion Telecommunications, Inc.: |
|
|
|
|
|
|
12% 11/1/07 |
Caa1 |
|
4,000 |
2,200 |
|
|
12.25% 9/1/04 |
B3 |
|
2,000 |
1,660 |
|
|
ICG Holdings, Inc.: |
|
|
|
|
|
|
0% 5/1/06 (d) |
Caa1 |
|
3,180 |
477 |
|
|
13.5% 9/15/05 |
Caa1 |
|
4,800 |
816 |
|
|
ICG Services, Inc. 0% 2/15/08 (d) |
Caa1 |
|
5,940 |
950 |
|
|
Intermedia Communications, Inc. 0% 7/15/07 (d) |
B2 |
|
2,000 |
1,650 |
|
|
KMC Telecom Holdings, Inc.: |
|
|
|
|
|
|
0% 2/15/08 (d) |
Caa2 |
|
3,950 |
553 |
|
|
13.5% 5/15/09 |
Caa2 |
|
17,860 |
5,537 |
|
|
Level 3 Communications, Inc. 11% 3/15/08 |
B3 |
|
21,490 |
19,395 |
|
|
McLeodUSA, Inc. 8.125% 2/15/09 |
B2 |
|
3,800 |
3,306 |
|
|
NEXTLINK Communications, Inc.: |
|
|
|
|
|
|
10.5% 12/1/09 |
B2 |
|
10,290 |
8,901 |
|
|
10.75% 6/1/09 |
B2 |
|
16,240 |
14,291 |
|
|
Ono Finance PLC 13% 5/1/09 |
Caa1 |
|
7,460 |
5,744 |
|
|
Rhythms NetConnections, Inc.: |
|
|
|
|
|
|
Series B, 14% 2/15/10 |
B3 |
|
10,000 |
4,600 |
|
|
12.75% 4/15/09 |
B3 |
|
4,820 |
2,217 |
|
|
Teligent, Inc.: |
|
|
|
|
|
|
0% 3/1/08 (d) |
Caa1 |
|
23,095 |
5,312 |
|
|
Corporate Bonds - continued |
|||||
|
Moody's Ratings (unaudited) (b) |
Principal Amount (000s) |
Value (Note 1) (000s) |
|||
|
Nonconvertible Bonds - continued |
|||||
|
UTILITIES - continued |
|||||
|
Telephone Services - continued |
|||||
|
Teligent, Inc.: - continued |
|
|
|
|
|
|
11.5% 12/1/07 |
Caa1 |
|
$ 18,510 |
$ 7,404 |
|
|
WinStar Communications, Inc.: |
|
|
|
|
|
|
0% 4/15/10 (d) |
B3 |
|
13,000 |
4,160 |
|
|
12.5% 4/15/08 |
B3 |
|
7,750 |
5,696 |
|
|
12.75% 4/15/10 |
B3 |
|
60,240 |
43,373 |
|
|
|
165,736 |
||||
|
TOTAL UTILITIES |
395,395 |
||||
|
TOTAL NONCONVERTIBLE BONDS |
1,635,812 |
||||
|
TOTAL CORPORATE BONDS (Cost $1,983,965) |
1,694,064 |
||||
|
Asset-Backed Securities - 0.6% |
|||||
|
|
|||||
|
Airplanes pass through trust 10.875% 3/15/19 |
Ba2 |
|
18,184 |
13,456 |
|
|
Commercial Mortgage Securities - 0.5% |
|||||
|
|
|||||
|
Structured Asset Securities Corp. Series
1996-CFL Class G, 7.75% 2/25/28 (e) |
BB |
|
13,040 |
12,135 |
|
|
Common Stocks - 4.2% |
|||
|
Shares |
|
||
|
BASIC INDUSTRIES - 0.0% |
|||
|
Chemicals & Plastics - 0.0% |
|||
|
Trivest 1992 Special Fund Ltd. (h) |
13.7 |
813 |
|
|
Metals & Mining - 0.0% |
|||
|
Metals USA, Inc. |
47,100 |
132 |
|
|
TOTAL BASIC INDUSTRIES |
945 |
||
|
Common Stocks - continued |
|||
|
Shares |
Value (Note 1) (000s) |
||
|
CONSTRUCTION & REAL ESTATE - 0.5% |
|||
|
Building Materials - 0.5% |
|||
|
American Standard Companies, Inc. (a) |
242,100 |
$ 11,106 |
|
|
Real Estate Investment Trusts - 0.0% |
|||
|
Swerdlow Real Estate Group, Inc.: |
|
|
|
|
Class A (g) |
79,800 |
0 |
|
|
Class B (g) |
19,817 |
0 |
|
|
|
0 |
||
|
TOTAL CONSTRUCTION & REAL ESTATE |
11,106 |
||
|
DURABLES - 0.1% |
|||
|
Textiles & Apparel - 0.1% |
|||
|
Arena Brands Holdings Corp. Class B |
143,778 |
3,594 |
|
|
FINANCE - 0.0% |
|||
|
Savings & Loans - 0.0% |
|||
|
Golden State Bancorp, Inc. litigation warrants 12/31/00 (a) |
87,800 |
115 |
|
|
Securities Industry - 0.0% |
|||
|
ECM Corp. LP (a)(e) |
5,400 |
454 |
|
|
TOTAL FINANCE |
569 |
||
|
INDUSTRIAL MACHINERY & EQUIPMENT - 0.2% |
|||
|
Terex Corp. (a) |
349,500 |
4,303 |
|
|
MEDIA & LEISURE - 1.9% |
|||
|
Broadcasting - 1.9% |
|||
|
Cable Satisfaction International, Inc. warrants 3/1/10 (a) |
13,120 |
0 |
|
|
EchoStar Communications Corp. Class A (a) |
1,000,360 |
45,266 |
|
|
|
45,266 |
||
|
RETAIL & WHOLESALE - 0.8% |
|||
|
Grocery Stores - 0.8% |
|||
|
Pathmark Stores, Inc. (a) |
1,115,028 |
17,492 |
|
|
Pathmark Stores, Inc. warrants 9/19/10 (a) |
548,674 |
2,469 |
|
|
|
19,961 |
||
|
SERVICES - 0.0% |
|||
|
Spin Cycle, Inc. warrants 5/1/05 (a)(e) |
15,960 |
0 |
|
|
Common Stocks - continued |
|||
|
Shares |
Value (Note 1) (000s) |
||
|
TECHNOLOGY - 0.5% |
|||
|
Computer Services & Software - 0.0% |
|||
|
Interact Systems, Inc.: |
|
|
|
|
warrants 8/1/03 (a)(e) |
5,650 |
$ 0 |
|
|
warrants 12/21/09 (a) |
5,650 |
0 |
|
|
|
0 |
||
|
Electronics - 0.5% |
|||
|
Fairchild Semiconductor International, Inc. Class A (a) |
333,000 |
7,014 |
|
|
Intersil Holding Corp. Class A |
128,678 |
6,169 |
|
|
|
13,183 |
||
|
TOTAL TECHNOLOGY |
13,183 |
||
|
UTILITIES - 0.2% |
|||
|
Cellular - 0.1% |
|||
|
Loral Orion Network Systems, Inc. warrants 1/15/07 |
15,350 |
35 |
|
|
McCaw International Ltd. warrants 4/16/07 (a)(e) |
64,950 |
974 |
|
|
|
1,009 |
||
|
Telephone Services - 0.1% |
|||
|
AT&T Latin America Corp. (a) |
298,900 |
2,130 |
|
|
Ono Finance PLC rights 5/31/09 (a)(e) |
7,460 |
52 |
|
|
WinStar Communications, Inc. (a) |
25,000 |
488 |
|
|
|
2,670 |
||
|
TOTAL UTILITIES |
3,679 |
||
|
TOTAL COMMON STOCKS (Cost $123,433) |
102,606 |
||
|
Preferred Stocks - 18.9% |
|||
|
|
|
|
|
|
Convertible Preferred Stocks - 0.1% |
|||
|
FINANCE - 0.1% |
|||
|
Credit & Other Finance - 0.1% |
|||
|
Host Marriott Financial Trust $3.375 QUIPS (e) |
23,200 |
841 |
|
|
MEDIA & LEISURE - 0.0% |
|||
|
Broadcasting - 0.0% |
|||
|
Earthwatch, Inc. $8.50 (e) |
735,935 |
184 |
|
|
Preferred Stocks - continued |
|||
|
Shares |
Value (Note 1) (000s) |
||
|
Convertible Preferred Stocks - continued |
|||
|
TECHNOLOGY - 0.0% |
|||
|
Computer Services & Software - 0.0% |
|||
|
Interact Systems, Inc. 14.00% |
5,650 |
$ 45 |
|
|
TOTAL CONVERTIBLE PREFERRED STOCKS |
1,070 |
||
|
Nonconvertible Preferred Stocks - 18.8% |
|||
|
CONSTRUCTION & REAL ESTATE - 0.9% |
|||
|
Real Estate Investment Trusts - 0.9% |
|||
|
California Federal Preferred Capital Corp. $2.2812 |
566,190 |
12,598 |
|
|
Swerdlow Real Estate Group, Inc.: |
|
|
|
|
junior (g) |
19,817 |
0 |
|
|
mezzanine (g) |
79,800 |
29 |
|
|
senior (g) |
79,800 |
8,816 |
|
|
|
21,443 |
||
|
FINANCE - 0.4% |
|||
|
Insurance - 0.4% |
|||
|
American Annuity Group Capital Trust II 8.875% |
10,430 |
9,938 |
|
|
MEDIA & LEISURE - 7.7% |
|||
|
Broadcasting - 6.3% |
|||
|
Adelphia Communications Corp. $13.00 |
46,066 |
4,146 |
|
|
Benedek Communications Corp. $11.50 pay-in-kind |
11,330 |
5,665 |
|
|
Citadel Broadcasting Co. Series B, 13.25% pay-in-kind |
52,182 |
5,009 |
|
|
CSC Holdings, Inc.: |
|
|
|
|
Series H, 11.75% pay-in-kind |
421,836 |
45,558 |
|
|
Series M, 11.125% pay-in-kind |
799,033 |
84,697 |
|
|
Granite Broadcasting Corp. 12.75% pay-in-kind |
18,662 |
9,704 |
|
|
|
154,779 |
||
|
Publishing - 1.4% |
|||
|
PRIMEDIA, Inc.: |
|
|
|
|
$9.20 |
108,856 |
8,926 |
|
|
8.625% |
97,102 |
7,865 |
|
|
Series D, $10.00 |
193,670 |
16,849 |
|
|
|
33,640 |
||
|
TOTAL MEDIA & LEISURE |
188,419 |
||
|
Preferred Stocks - continued |
|||
|
Shares |
Value (Note 1) (000s) |
||
|
Nonconvertible Preferred Stocks - continued |
|||
|
TECHNOLOGY - 0.0% |
|||
|
Computers & Office Equipment - 0.0% |
|||
|
Ampex Corp. 8% non-cumulative |
698 |
$ 1,089 |
|
|
UTILITIES - 9.8% |
|||
|
Cellular - 6.1% |
|||
|
Nextel Communications, Inc.: |
|
|
|
|
11.125% pay-in-kind |
103,122 |
95,385 |
|
|
Series D, 13% pay-in-kind |
54,347 |
54,075 |
|
|
|
149,460 |
||
|
Telephone Services - 3.7% |
|||
|
Adelphia Business Solution, Inc. Series B, $12.875 pay-in-kind |
23,097 |
9,239 |
|
|
Broadwing Communications, Inc. Series B, $12.50 pay-in-kind |
44,048 |
43,608 |
|
|
Intermedia Communications, Inc. 13.5% pay-in-kind |
3,649 |
3,102 |
|
|
XO Communications, Inc. $7.00 pay-in-kind |
858,669 |
34,347 |
|
|
|
90,296 |
||
|
TOTAL UTILITIES |
239,756 |
||
|
TOTAL NONCONVERTIBLE PREFERRED STOCKS |
460,645 |
||
|
TOTAL PREFERRED STOCKS (Cost $509,067) |
461,715 |
||
|
Cash Equivalents - 4.7% |
||
|
Maturity Amount (000s) |
Value (Note 1) (000s) |
|
|
Investments in repurchase agreements (U.S. Treasury Obligations), in a joint trading account at: |
|
|
|
6.55%, dated 10/31/00 due 11/1/00 |
$ 2,266 |
$ 2,266 |
|
6.56%, dated 10/31/00 due 11/1/00 |
113,530 |
113,509 |
|
TOTAL CASH EQUIVALENTS (Cost $115,775) |
115,775 |
|
|
TOTAL INVESTMENT PORTFOLIO - 98.1% (Cost $2,760,258) |
2,399,751 |
|
|
NET OTHER ASSETS - 1.9% |
46,902 |
|
|
NET ASSETS - 100% |
$ 2,446,653 |
|
|
Security Type Abbreviations |
||
|
QUIPS |
- |
Quarterly
Income |
|
Legend |
|
(a) Non-income producing |
|
(b) S&P credit ratings are used in the absence of a rating by Moody's Investors Service, Inc. |
|
(c) Non-income producing - issuer filed for protection under the Federal Bankruptcy Code or is in default of interest payment. |
|
(d) Debt obligation initially issued in zero coupon form which converts to coupon form at a specified rate and date. The rate shown is the rate at period end. |
|
(e) Security exempt from registration under Rule 144A of the Securities Act of 1933. These securities may be resold in transactions exempt from registration, normally to qualified institutional buyers. At the period end, the value of these securities amounted to $190,436,000 or 7.8% of net assets. |
|
(f) The coupon rate shown on floating or adjustable rate securities represents the rate at period end. |
|
(g) Restricted securities - Investment in securities not registered under the Securities Act of 1933. |
|
Additional information on each holding |
|
Security |
Acquisition Date |
Acquisition Cost (000s) |
|
Micron |
3/3/99 - 7/15/99 |
$ 16,635 |
|
Swerdlow Real |
1/15/99 |
$ 11 |
|
Swerdlow Real |
1/15/99 |
$ 3 |
|
Swerdlow Real |
1/15/99 |
$ 3 |
|
Swerdlow Real |
1/15/99 |
$ 79 |
|
Swerdlow Real |
1/15/99 |
$ 7,619 |
|
(h) Share amount represents number of units held. |
|
Other Information |
|
The composition of long-term debt holdings as a percentage of total value of investments in securities, is as follows (ratings are unaudited): |
|
Moody's Ratings |
S&P Ratings |
|||
|
Aaa, Aa, A |
0.0% |
|
AAA, AA, A |
0.0% |
|
Baa |
1.2% |
|
BBB |
0.8% |
|
Ba |
8.9% |
|
BB |
10.2% |
|
B |
47.9% |
|
B |
48.7% |
|
Caa |
10.7% |
|
CCC |
6.5% |
|
Ca, C |
0.2% |
|
CC, C |
0.0% |
|
|
|
|
D |
0.1% |
|
The percentage not rated by Moody's |
|
Income Tax Information |
|
At October 31, 2000, the aggregate |
|
The fund intends to elect to defer to its |
See accompanying notes which are an integral part of the financial statements.
Semiannual Report
Statement of Assets and Liabilities
|
Amounts in thousands (except per-share amount) |
October 31, 2000 (Unaudited) |
|
|
Assets |
|
|
|
Investment in securities, at value (including repurchase agreements of $115,775) (cost $2,760,258) - |
|
$ 2,399,751 |
|
Cash |
|
18 |
|
Receivable for investments sold |
|
30,257 |
|
Receivable for fund shares sold |
|
1,702 |
|
Dividends receivable |
|
3,273 |
|
Interest receivable |
|
46,936 |
|
Redemption fees receivable |
|
4 |
|
Other receivables |
|
139 |
|
Total assets |
|
2,482,080 |
|
Liabilities |
|
|
|
Payable for investments purchased |
$ 21,473 |
|
|
Payable for fund shares redeemed |
7,524 |
|
|
Distributions payable |
4,833 |
|
|
Accrued management fee |
1,222 |
|
|
Other payables and accrued expenses |
375 |
|
|
Total liabilities |
|
35,427 |
|
Net Assets |
|
$ 2,446,653 |
|
Net Assets consist of: |
|
|
|
Paid in capital |
|
$ 3,062,813 |
|
Undistributed net investment income |
|
134,989 |
|
Accumulated undistributed net realized gain (loss) on investments and foreign currency transactions |
|
(390,642) |
|
Net unrealized appreciation (depreciation) on investments and assets and liabilities in foreign currencies |
|
(360,507) |
|
Net Assets, for 242,652 shares outstanding |
|
$ 2,446,653 |
|
Net Asset Value, offering price and redemption price |
|
$10.08 |
See accompanying notes which are an integral part of the financial statements.
Semiannual Report
Financial Statements - continued
Statement of Operations
|
Amounts in thousands |
Six months ended October 31, 2000 (Unaudited) |
|
|
Investment Income Dividends |
|
$ 28,831 |
|
Interest |
|
128,524 |
|
Total income |
|
157,355 |
|
Expenses |
|
|
|
Management fee |
$ 7,987 |
|
|
Transfer agent fees |
1,730 |
|
|
Accounting fees and expenses |
356 |
|
|
Non-interested trustees' compensation |
5 |
|
|
Custodian fees and expenses |
39 |
|
|
Registration fees |
23 |
|
|
Audit |
21 |
|
|
Legal |
11 |
|
|
Miscellaneous |
1 |
|
|
Total expenses before reductions |
10,173 |
|
|
Expense reductions |
(32) |
10,141 |
|
Net investment income |
|
147,214 |
|
Realized and Unrealized Gain (Loss) Net realized gain (loss) on investment securities |
|
(313,880) |
|
Change in net unrealized appreciation (depreciation) on: |
|
|
|
Investment securities |
(29,956) |
|
|
Assets and liabilities in foreign currencies |
(1) |
(29,957) |
|
Net gain (loss) |
|
(343,837) |
|
Net increase (decrease) in net assets resulting |
|
$ (196,623) |
See accompanying notes which are an integral part of the financial statements.
Semiannual Report
Financial Statements - continued
Statement of Changes in Net Assets
|
Amounts in thousands |
Six months ended
October 31, 2000 |
Year ended |
|
Increase (Decrease) in Net Assets |
|
|
|
Operations |
$ 147,214 |
$ 317,511 |
|
Net realized gain (loss) |
(313,880) |
(44,324) |
|
Change in net unrealized appreciation (depreciation) |
(29,957) |
(424,763) |
|
Net increase (decrease) in net assets resulting |
(196,623) |
(151,576) |
|
Distributions to shareholders |
(115,982) |
(270,396) |
|
In excess of net realized gain |
- |
(24,187) |
|
Return of capital |
- |
(23,280) |
|
Total distributions |
(115,982) |
(317,863) |
|
Share transactions |
220,063 |
1,041,729 |
|
Reinvestment of distributions |
84,106 |
237,134 |
|
Cost of shares redeemed |
(535,861) |
(1,195,890) |
|
Net increase (decrease) in net assets resulting |
(231,692) |
82,973 |
|
Redemption fees |
737 |
2,436 |
|
Total increase (decrease) in net assets |
(543,560) |
(384,030) |
|
Net Assets |
|
|
|
Beginning of period |
2,990,213 |
3,374,243 |
|
End of period (including undistributed net investment income of $134,989 and $103,757, respectively) |
$ 2,446,653 |
$ 2,990,213 |
|
Other Information Shares |
|
|
|
Sold |
20,212 |
86,188 |
|
Issued in reinvestment of distributions |
7,831 |
19,618 |
|
Redeemed |
(49,609) |
(99,571) |
|
Net increase (decrease) |
(21,566) |
6,235 |
See accompanying notes which are an integral part of the financial statements.
Semiannual Report
Financial Highlights
|
|
Six months ended October 31, 2000 |
Years ended April 30, |
||||
|
|
(Unaudited) |
2000 |
1999 |
1998 |
1997 |
1996 |
|
Selected Per-Share Data |
|
|
|
|
|
|
|
Net asset value,
beginning |
$ 11.320 |
$ 13.080 |
$ 13.640 |
$ 12.480 |
$ 12.510 |
$ 11.990 |
|
Income from Invest- |
.577 D |
1.192D |
1.153D |
1.133D |
1.054D |
1.099 |
|
Net realized |
(1.365) |
(1.763) |
(.344) |
1.431 |
.192 |
.723 |
|
Total from investment operations |
(.788) |
(.571) |
.809 |
2.564 |
1.246 |
1.822 |
|
Less Distributions |
|
|
|
|
|
|
|
From net investment income |
(.455) |
(1.017) F |
(1.083) |
(1.100) |
(1.033) |
(1.190) |
|
From net |
- |
- |
(.300) |
(.310) |
(.250) |
(.087) |
|
In excess of net realized gain |
- |
(.093) F |
- |
- |
- |
(.033) |
|
Return of capital |
- |
(.088) |
- |
- |
- |
- |
|
Total distributions |
(.455) |
(1.198) |
(1.383) |
(1.410) |
(1.283) |
(1.310) |
|
Redemption fees
added to paid |
.003 |
.009 |
.014 |
.006 |
.007 |
.008 |
|
Net asset value, |
$ 10.080 |
$ 11.320 |
$ 13.080 |
$ 13.640 |
$ 12.480 |
$ 12.510 |
|
Total Return B, C |
(7.12)% |
(4.48)% |
6.91% |
21.62% |
10.57% |
16.06% |
|
Ratios and Supplemental Data |
|
|
|
|
|
|
|
Net assets, end of period (in millions) |
$ 2,447 |
$ 2,990 |
$ 3,374 |
$ 3,139 |
$ 1,890 |
$ 1,355 |
|
Ratio of expenses to average net assets |
.73% A |
.75% |
.80% |
.80% |
.80% |
.80% |
|
Ratio of expenses to average net assets after expense reductions |
.72% A, E |
.74% E |
.80% |
.80% |
.80% |
.79% E |
|
Ratio of net invest- |
10.52% A |
9.85% |
9.20% |
8.57% |
8.51% |
8.85% |
|
Portfolio turnover |
61% A |
50% |
68% |
85% |
102% |
170% |
A Annualized
B The total returns would have been lower had certain expenses not been reduced during the periods shown.
C Total returns for periods of less than one year are not annualized.
D Net investment income per share has been calculated based on average shares outstanding during the period.
E FMR or the fund has entered into varying arrangements with third parties who either paid or reduced a portion of the fund's expenses.
F The amounts shown reflect certain reclassifications related to book to tax differences.
See accompanying notes which are an integral part of the financial statements.
Semiannual Report
For the period ended October 31, 2000 (Unaudited)
1. Significant Accounting Policies.
Fidelity High Income Fund (the fund) is a fund of Fidelity Fixed-Income Trust (the trust) and is authorized to issue an unlimited number of shares. The trust is registered under the Investment Company Act of 1940, as amended, as an open-end management investment company organized as a Massachusetts business trust. The financial statements have been prepared in conformity with generally accepted accounting principles which require management to make certain estimates and assumptions at the date of the financial statements. The following summarizes the significant accounting policies of the fund:
Security Valuation. Securities for which quotations are readily available are valued by a pricing service at their market values as determined by their most recent bid prices in the principal market (sales prices if the principal market is an exchange) in which such securities are normally traded. Securities (including restricted securities) for which market quotations are not readily available are valued at their fair value as determined in good faith under consistently applied procedures under the general supervision of the Board of Trustees. Short-term securities with remaining maturities of sixty days or less for which quotations are not readily available are valued at amortized cost or original cost plus accrued interest, both of which approximate current value. Investments in open-end investment companies are valued at their net asset value each business day.
Foreign Currency Translation. The accounting records of the fund are maintained in U.S. dollars. Investment securities and other assets and liabilities denominated in a foreign currency are translated into U.S. dollars at the prevailing rates of exchange at period end. Purchases and sales of securities, income receipts and expense payments are translated into U.S. dollars at the prevailing exchange rate on the respective dates of the transactions.
Net realized gains and losses on foreign currency transactions represent net gains and losses from sales and maturities of foreign currency contracts, disposition of foreign currencies, the difference between the amount of net investment income accrued and the U.S. dollar amount actually received, and gains and losses between trade and settlement date on purchases and sales of securities. The effects of changes in foreign currency exchange rates on investments in securities are included with the net realized and unrealized gain or loss on investment securities.
Income Taxes. As a qualified regulated investment company under Subchapter M of the Internal Revenue Code, the fund is not subject to income taxes to the extent that it distributes substantially all of its taxable income for its fiscal year. The schedule of investments includes information regarding income taxes under the caption "Income Tax Information."
Semiannual Report
Notes to Financial Statements (Unaudited) - continued
1. Significant Accounting Policies - continued
Investment Income. Dividend income is recorded on the ex-dividend date, except certain dividends from foreign securities where the ex-dividend date may have passed, are recorded as soon as the fund is informed of the ex-dividend date. Non-cash dividends included in dividend income, if any, are recorded at the fair market value of the securities received. Interest income, which includes accretion of original issue discount, is accrued as earned. Investment income is recorded net of foreign taxes withheld where recovery of such taxes is uncertain. The fund may place a debt obligation on non-accrual status and reduce related interest income by ceasing current accruals and writing off interest receivables when the collection of all or a portion of interest has become doubtful based on consistently applied procedures, under the general supervision of the Board of Trustees of the fund. A debt obligation is removed from non-accrual status when the issuer resumes interest payments or when collectibility of interest is reasonably assured.
Expenses. Most expenses of the trust can be directly attributed to a fund. Expenses which cannot be directly attributed are apportioned among the funds in the trust.
Distributions to Shareholders. Dividends are declared daily and paid monthly from net investment income. Distributions to shareholders from realized capital gains on investments, if any, are recorded on the ex-dividend date.
Income and capital gain distributions are determined in accordance with income tax regulations which may differ from generally accepted accounting principles. These differences, which may result in distribution reclassifications, are primarily due to differing treatments for litigation proceeds, paydown gains/losses on certain securities, market discount, partnerships, non-taxable dividends, capital loss carryforwards, and losses deferred due to wash sales and excise tax regulations.
Permanent book and tax basis differences relating to shareholder distributions will result in reclassifications to paid in capital. Undistributed net investment income and accumulated undistributed net realized gain (loss) on investments and foreign currency transactions may include temporary book and tax basis differences which will reverse in a subsequent period. Any taxable income or gain remaining at fiscal year end is distributed in the following year.
For the period ended April 30, 2000, the fund's distributions exceeded the aggregate amount of taxable income and net realized gains resulting in a return of capital. This was due to reductions in taxable income available for distribution after certain distributions had been made.
Short-Term Trading (Redemption) Fees. Shares held in the fund less than 270 days are subject to a short-term trading fee equal to 1% of the proceeds of the redeemed shares. The fee, which is retained by the fund, is accounted for as an addition to paid in capital.
Semiannual Report
Notes to Financial Statements (Unaudited) - continued
1. Significant Accounting Policies - continued
Security Transactions. Security transactions are accounted for as of trade date. Gains and losses on securities sold are determined on the basis of identified cost.
2. Operating Policies.
Foreign Currency Contracts. The fund generally uses foreign currency contracts to facilitate transactions in foreign-denominated securities. Losses may arise from changes in the value of the foreign currency or if the counterparties do not perform under the contracts' terms. The U.S. dollar value of foreign currency contracts is determined using contractual currency exchange rates established at the time of each trade.
Joint Trading Account. Pursuant to an Exemptive Order issued by the Securities and Exchange Commission (the SEC), the fund, along with other affiliated entities of Fidelity Management & Research Company (FMR), may transfer uninvested cash balances into one or more joint trading accounts. These balances are invested in one or more repurchase agreements for U.S. Treasury or Federal Agency obligations.
Repurchase Agreements. The underlying U.S. Treasury, Federal Agency, or other obligations found to be satisfactory by FMR are transferred to an account of the fund, or to the Joint Trading Account, at a custodian bank. The securities are marked-to-market daily and maintained at a value at least equal to the principal amount of the repurchase agreement (including accrued interest). FMR, the fund's investment adviser, is responsible for determining that the value of the underlying securities remains in accordance with the market value requirements stated above.
Interfund Lending Program. Pursuant to an Exemptive Order issued by the SEC, the fund, along with other registered investment companies having management contracts with FMR, may participate in an interfund lending program. This program provides an alternative credit facility allowing the fund to borrow from, or lend money to, other participating funds.
Restricted Securities. The fund is permitted to invest in securities that are subject to legal or contractual restrictions on resale. These securities generally may be resold in transactions exempt from registration or to the public if the securities are registered. Disposal of these securities may involve time-consuming negotiations and expense, and prompt sale at an acceptable price may be difficult. At the end of the period, restricted securities (excluding 144A issues) amounted to $26,275,000 or 1.1% of net assets.
3. Purchases and Sales of Investments.
Purchases and sales of securities, other than short-term securities, aggregated $807,862,000 and $1,099,616,000, respectively.
Semiannual Report
Notes to Financial Statements (Unaudited) - continued
4. Fees and Other Transactions with Affiliates.
Management Fee. As the fund's investment adviser, FMR receives a monthly fee that is calculated on the basis of a group fee rate plus a fixed individual fund fee rate applied to the average net assets of the fund. The group fee rate is the weighted average of a series of rates and is based on the monthly average net assets of all the mutual funds advised by FMR. The rates ranged from .0920% to .3700% for the period. The annual individual fund fee rate is .45%. In the event that these rates were lower than the contractual rates in effect during the period, FMR voluntarily implemented the above rates, as they resulted in the same or a lower management fee. For the period, the management fee was equivalent to an annualized rate of .58% of average net assets.
Sub-Adviser Fee. Beginning January 1, 2001, FMR Co. (FMRC) will serve as sub-adviser for the fund. FMRC is a wholly owned subsidiary of FMR and will receive a fee from FMR of 50% of the management fee payable to FMR with respect to that portion of the fund's assets that will be managed by FMRC.
Transfer Agent Fees. Fidelity Service Company, Inc. (FSC), an affiliate of FMR, is the fund's transfer, dividend disbursing and shareholder servicing agent. FSC receives account fees and asset-based fees that vary according to account size and type of account. FSC pays for typesetting, printing and mailing of all shareholder reports, except proxy statements. For the period, the transfer agent fees were equivalent to an annualized rate of .12% of average net assets.
Accounting Fees. FSC maintains the fund's accounting records. The fee is based on the level of average net assets for the month plus out-of-pocket expenses.
Brokerage Commissions. The fund placed a portion of its portfolio transactions with brokerage firms which are affiliates of FMR. The commissions paid to these affiliated firms were $23,000 for the period.
5. Interfund Lending Program.
The fund participated in the interfund lending program as a lender. The average daily loan balance during the period for which loans were outstanding amounted to $4,546,000. The weighted average interest rate was 6.62%. Interest earned from the interfund lending program amounted to $7,000 and is included in interest income on the Statement of Operations. At period end there were no interfund loans outstanding.
6. Expense Reductions.
FMR has directed certain portfolio trades to brokers who paid a portion of the fund's expenses. For the period, the fund's expenses were reduced by $16,000 under this arrangement.
In addition, through an arrangement with the fund's transfer agent, credits realized as a result of uninvested cash balances were used to reduce a portion of the fund's expenses. During the period, the fund's transfer agent fees were reduced by $16,000 under this arrangement.
Semiannual Report
Fidelity offers several ways to conveniently manage your personal investments via your telephone or PC. You can access your account information, conduct trades and research your investments 24 hours a day.
By Phone
Fidelity Automated Service Telephone provides a single toll-free number to access account balances, positions, quotes and trading. It's easy to navigate the service, and on your first call, the system will help you create a personal identification number (PIN) for security.
(phone_graphic)Fidelity Automated
Service Telephone (FAST®)
1-800-544-5555
Press
1 For mutual fund and brokerage trading.
2 For quotes.*
3 For account balances and holdings.
4 To review orders and mutual
fund activity.
5 To change your PIN.
*0 To speak to a Fidelity representative.
By PC
Fidelity's web site on the Internet provides a wide range of information, including daily financial news, fund performance, interactive planning tools and news about Fidelity products and services.
(computer_graphic)Fidelity's Web Site
www.fidelity.com
If you are not currently on the Internet, call EarthLink Sprint at 1-800-288-2967, and be sure to ask for registration number SMD004 to receive a special Fidelity package that includes 30 days of free Internet access. EarthLink is North America's #1 independent Internet access provider.
(computer_graphic)
Fidelity On-line Xpress+®
Fidelity On-line Xpress+ software for Windows combines comprehensive portfolio management capabilities, securities trading and access to research and analysis tools . . . all on your desktop. Call Fidelity at 1-800-544-0240 or visit our web site for more information on how to manage your investments via your PC.
* When you call the quotes line, please remember that a fund's yield and return will vary and, except for money market funds, share price will also vary. This means that you may have a gain or loss when you sell your shares. There is no assurance that money market funds will be able to maintain a stable $1 share price; an investment in a money market fund is not insured or guaranteed by the U.S. government. Total returns are historical and include changes in share price, reinvestment of dividends and capital gains, and the effects of any sales charges.
Semiannual Report
If more than one address is listed, please locate the address that is closest to you. We'll give your correspondence immediate attention and send you written confirmation upon completion of your request.
(letter_graphic)Making Changes
To Your Account
(such as changing name, address, bank, etc.)
Fidelity Investments
P.O. Box 770001
Cincinnati, OH 45277-0002
(letter_graphic)For Non-Retirement
Accounts
Buying shares
Fidelity Investments
P.O. Box 770001
Cincinnati, OH 45277-0003
Overnight Express
Fidelity Investments
2300 Litton Lane - KH1A
Hebron, KY 41048
Selling shares
Fidelity Investments
P.O. Box 660602
Dallas, TX 75266-0602
Overnight Express
Fidelity Investments
Attn: Redemptions - CP6I
400 East Las Colinas Blvd.
Irving, TX 75039-5587
General Correspondence
Fidelity Investments
P.O. Box 500
Merrimack, NH 03054-0500
(letter_graphic)For Retirement
Accounts
Buying shares
Fidelity Investments
P.O. Box 770001
Cincinnati, OH 45277-0003
Selling shares
Fidelity Investments
P.O. Box 660602
Dallas, TX 75266-0602
Overnight Express
Fidelity Investments
Attn: Redemptions - CP6R
400 East Las Colinas Blvd.
Irving, TX 75039-5587
General Correspondence
Fidelity Investments
P.O. Box 500
Merrimack, NH 03054-0500
Semiannual Report
For directions and hours,
please call 1-800-544-9797.
Arizona
7373 N. Scottsdale Road
Scottsdale, AZ
California
815 East Birch Street
Brea, CA
851 East Hamilton Avenue
Campbell, CA
527 North Brand Boulevard
Glendale, CA
19200 Von Karman Avenue
Irvine, CA
10100 Santa Monica Blvd.
Los Angeles, CA
251 University Avenue
Palo Alto, CA
1760 Challenge Way
Sacramento, CA
7676 Hazard Center Drive
San Diego, CA
8 Montgomery Street
San Francisco, CA
950 Northgate Drive
San Rafael, CA
1400 Civic Drive
Walnut Creek, CA
6300 Canoga Avenue
Woodland Hills, CA
Colorado
1625 Broadway
Denver, CO
Connecticut
48 West Putnam Avenue
Greenwich, CT
265 Church Street
New Haven, CT
300 Atlantic Street
Stamford, CT
29 South Main Street
West Hartford, CT
Delaware
222 Delaware Avenue
Wilmington, DE
Florida
4400 N. Federal Highway
Boca Raton, FL
90 Alhambra Plaza
Coral Gables, FL
4090 N. Ocean Boulevard
Ft. Lauderdale, FL
1907 West State Road 434
Longwood, FL
8880 Tamiami Trail, North
Naples, FL
2401 PGA Boulevard
Palm Beach Gardens, FL
8065 Beneva Road
Sarasota, FL
1502 N. Westshore Blvd.
Tampa, FL
Georgia
3445 Peachtree Road, N.E.
Atlanta, GA
1000 Abernathy Road
Atlanta, GA
Illinois
One North Franklin Street
Chicago, IL
1415 West 22nd Street
Oak Brook, IL
1700 East Golf Road
Schaumburg, IL
3232 Lake Avenue
Wilmette, IL
Indiana
4729 East 82nd Street
Indianapolis, IN
Maine
Three Canal Plaza
Portland, ME
Maryland
7401 Wisconsin Avenue
Bethesda, MD
One W. Pennsylvania Ave.
Towson, MD
Massachusetts
801 Boylston Street
Boston, MA
155 Congress Street
Boston, MA
25 State Street
Boston, MA
300 Granite Street
Braintree, MA
44 Mall Road
Burlington, MA
416 Belmont Street
Worcester, MA
Semiannual Report
Michigan
280 Old N. Woodward Ave.
Birmingham, MI
29155 Northwestern Hwy.
Southfield, MI
Minnesota
7600 France Avenue South
Edina, MN
Missouri
700 West 47th Street
Kansas City, MO
8885 Ladue Road
Ladue, MO
New Jersey
150 Essex Street
Millburn, NJ
56 South Street
Morristown, NJ
501 Route 17, South
Paramus, NJ
New York
1055 Franklin Avenue
Garden City, NY
999 Walt Whitman Road
Melville, L.I., NY
1271 Avenue of the Americas
New York, NY
71 Broadway
New York, NY
350 Park Avenue
New York, NY
North Carolina
4611 Sharon Road
Charlotte, NC
Ohio
600 Vine Street
Cincinnati, OH
28699 Chagrin Boulevard
Woodmere Village, OH
Oregon
16850 SW 72nd Avenue
Tigard, OR
Pennsylvania
1735 Market Street
Philadelphia, PA
439 Fifth Avenue
Pittsburgh, PA
Rhode Island
47 Providence Place
Providence, RI
Tennessee
6150 Poplar Avenue
Memphis, TN
Texas
10000 Research Boulevard
Austin, TX
4017 Northwest Parkway
Dallas, TX
1155 Dairy Ashford Street
Houston, TX
2701 Drexel Drive
Houston, TX
400 East Las Colinas Blvd.
Irving, TX
14100 San Pedro
San Antonio, TX
19740 IH 45 North
Spring, TX
Utah
215 South State Street
Salt Lake City, UT
Virginia
1861 International Drive
McLean, VA
Washington
411 108th Avenue, N.E.
Bellevue, WA
511 Pine Street
Seattle, WA
Washington, DC
1900 K Street, N.W.
Washington, DC
Wisconsin
595 North Barker Road
Brookfield, WI
Fidelity Brokerage Services, Inc., 100 Summer St., Boston, MA 02110 Member NYSE/SIPC
Semiannual Report
Investment Adviser
Fidelity Management & Research Company Boston, MA
Investment Sub-Advisers
Fidelity Management & Research (U.K.) Inc.
Fidelity Management & Research
(Far East) Inc.
Fidelity Investments Japan Limited
Officers
Edward C. Johnson 3d, President
Robert C. Pozen, Senior Vice President
Frederick D. Hoff Jr., Vice President
Robert A. Lawrence, Vice President
Eric D. Roiter, Secretary
Robert A. Dwight, Treasurer
Maria F. Dwyer, Deputy Treasurer
John H. Costello, Assistant Treasurer
Thomas J. Simpson, Assistant Treasurer
Board of Trustees
Ralph F. Cox *
Phyllis Burke Davis *
Robert M. Gates *
Edward C. Johnson 3d
Donald J. Kirk *
Ned C. Lautenbach *
Peter S. Lynch
Marvin L. Mann *
William O. McCoy *
Gerald C. McDonough *
Robert C. Pozen
Thomas R. Williams *
Advisory Board
J. Michael Cook
Abigail P. Johnson
Marie L. Knowles
General Distributor
Fidelity Distributors Corporation
Boston, MA
* Independent trustees
Transfer and Shareholder
Servicing Agent
Fidelity Service Company, Inc.
Boston, MA
Custodian
The Bank of New York
New York, NY
Fidelity's Taxable Bond Funds
Capital & Income
Ginnie Mae
Government Income
High Income
Intermediate Bond
Intermediate Government Income
International Bond
Investment Grade Bond
New Markets Income
Short-Term Bond
Spartan® Government Income
Spartan Investment Grade Bond
Strategic Income
Target TimelineSM 2001 & 2003
The Fidelity Telephone Connection
Mutual Fund 24-Hour Service
Exchanges/Redemptions
and Account Assistance 1-800-544-6666
Product Information 1-800-544-6666
Retirement Accounts 1-800-544-4774
(8 a.m. - 9 p.m.)
TDD Service 1-800-544-0118
for the deaf and hearing impaired
(9 a.m. - 9 p.m. Eastern time)
Fidelity Automated Service
Telephone (FAST®) (automated graphic) 1-800-544-5555
(automated graphic) Automated line for quickest service
(Fidelity Investment logo)(registered trademark)
Corporate Headquarters
82 Devonshire St., Boston, MA 02109
www.fidelity.com
SPH-SANN-1200 118642
1.538299.103
|
|