
|
|
|
|
|
|
|
|
|
|
Previous: FARMLAND INDUSTRIES INC, 424B3, 2000-10-17 |
Next: FIRST NATIONAL BANK OF OMAHA, 13F-HR, 2000-10-17 |
Spartan®
Fund
Annual Report
August 31, 2000
(2_fidelity_logos)(Registered_Trademark)
|
President's Message |
Ned Johnson on investing strategies. |
|
|
Performance |
How the fund has done over time. |
|
|
Fund Talk |
The manager's review of fund performance, strategy and outlook. |
|
|
Investment Changes |
A summary of major shifts in the fund's investments over the past six months. |
|
|
Investments |
A complete list of the fund's investments with their market values. |
|
|
Financial Statements |
Statements of assets and liabilities,
operations, and changes in net assets, |
|
|
Notes |
Notes to the financial statements. |
|
|
Report of Independent Accountants |
The auditors' opinion. |
|
|
Distributions |
|
|
|
Proxy Voting Results |
|
Standard & Poor's, S&P and S&P 500 are registered service marks of The McGraw-Hill Companies, Inc. and have been licensed for use by Fidelity Distributors Corporation.
Other third party marks appearing herein are the property of their respective owners.
All other marks appearing herein are registered or unregistered trademarks or service marks of FMR Corp. or an affiliated company.
(Recycle graphic) This report is printed on recycled paper using soy-based inks.
This report and the financial statements contained herein are submitted for the general information of the shareholders of the fund. This report is not authorized for distribution to prospective investors in the fund unless preceded or accompanied by an effective prospectus.
Mutual fund shares are not deposits or obligations of, or guaranteed by, any depository institution. Shares are not insured by the FDIC, the Federal Reserve Board, or any other agency, and are subject to investment risks, including possible loss of principal amount invested.
Neither the fund nor Fidelity Distributors Corporation is a bank.
For more information on any Fidelity fund, including charges and expenses, call 1-800-544-6666 for a free prospectus. Read it carefully before you invest or send money.
Annual Report
(photo_of_Edward_C_Johnson_3d)
Dear Shareholder:
A slowing U.S. economy triggered an equity market rally during the later stages of summer, boosting most major stock indexes back into positive territory for calendar year 2000. One notable exception, however, was the Dow Jones Industrial Average, which posted a negative return during that timeframe. Fixed-income markets - particularly Treasuries - continued their yearlong trend of strong performance, as nearly every bond sector outperformed the stock market on a year-to-date basis.
While it's impossible to predict the future direction of the markets with any degree of certainty, there are certain basic principles that can help investors plan for their future needs.
The longer your investment time frame, the less likely it is that you will be affected by short-term market volatility. A 10-year investment horizon appropriate for saving for a college education, for example, enables you to weather market cycles in a long-term fund, which may have a higher risk potential, but also has a higher potential rate of return.
An intermediate-length fund could make sense if your investment horizon is two to four years, while a short-term bond fund could be the right choice if you need your money in one or two years.
If your time horizon is less than a year, you might want to consider moving some of your bond investment into a money market fund. These funds seek income and a stable share price by investing in high-quality, short-term investments. Of course, it's important to remember that an investment in a money market fund is not insured or guaranteed by the Federal Deposit Insurance Corporation or any other government agency. Although money market funds seek to preserve the value of your investment at $1.00 per share, it is possible to lose money by investing in these types of funds.
Finally, no matter what your time horizon or portfolio diversity, it makes good sense to follow a regular investment plan, investing a certain amount of money in a fund at the same time each month or quarter and periodically reviewing your overall portfolio. By doing so, you won't get caught up in the excitement of a rapidly rising market, nor will you buy all your shares at market highs. While this strategy - known as dollar cost averaging - won't assure a profit or protect you from a loss in a declining market, it should help you lower the average cost of your purchases. Of course, you should consider your financial ability to continue your purchases through periods of low price levels before undertaking such a strategy.
If you have questions, please call us at 1-800-544-6666, or visit our web site at www.fidelity.com. We are available 24 hours a day, seven days a week to provide you the information you need to make the investments that are right for you.
Best regards,
/s/Edward C. Johnson 3d
Edward C. Johnson 3d
Annual Report
There are several ways to evaluate a fund's historical performance. You can look at the total percentage change in value, the average annual percentage change or the growth of a hypothetical $10,000 investment. Total return reflects the change in the value of an investment, assuming reinvestment of the fund's dividend income and capital gains (the profits earned upon the sale of securities that have grown in value). You can also look at the fund's income, as reflected in the fund's yield, to measure performance. If Fidelity had not reimbursed certain fund expenses, the past five year and life of fund total returns would have been lower.
Cumulative Total Returns
|
Periods ended August 31, 2000 |
|
Past 1 |
Past 5 |
Life of |
|
Spartan MD Municipal Income |
|
6.53% |
31.16% |
47.34% |
|
LB Maryland 4 Plus Year Enhanced Municipal Bond |
|
6.17% |
31.82% |
n/a* |
|
Maryland Municipal Debt Funds Average |
|
4.90% |
26.75% |
n/a* |
Cumulative total returns show the fund's performance in percentage terms over a set period - in this case, one year, five years or since the fund started on April 22, 1993. For example, if you had invested $1,000 in a fund that had a 5% return over the past year, the value of your investment would be $1,050. You can compare the fund's returns to the performance of the Lehman Brothers Maryland 4 Plus Year Enhanced Municipal Bond Index - a market value-weighted index of Maryland investment-grade municipal bonds with maturities of four years or more. To measure how the fund's performance stacked up against its peers, you can compare it to the Maryland municipal debt funds average, which reflects the performance of mutual funds with similar objectives tracked by Lipper Inc. The past one year average represents a peer group of 38 mutual funds. These benchmarks include reinvested dividends and capital gains, if any, and exclude the effect of sales charges.
Average Annual Total Returns
|
Periods ended August 31, 2000 |
|
Past 1 |
Past 5 |
Life of Fund |
|
Spartan MD Municipal Income |
|
6.53% |
5.57% |
5.40% |
|
LB Maryland 4 Plus Year Enhanced Municipal Bond |
|
6.17% |
5.68% |
n/a* |
|
Maryland Municipal Debt Funds Average |
|
4.90% |
4.85% |
n/a* |
Average annual total returns take the fund's cumulative return and show you what would have happened if the fund had performed at a constant rate each year. (Note: Lipper calculates average annual total returns by annualizing each fund's total return, then taking an arithmetic average. This may produce a different figure than that obtained by averaging the cumulative total returns and annualizing the result.)
* Not available
Annual Report
Performance - continued
$10,000 Over Life of Fund
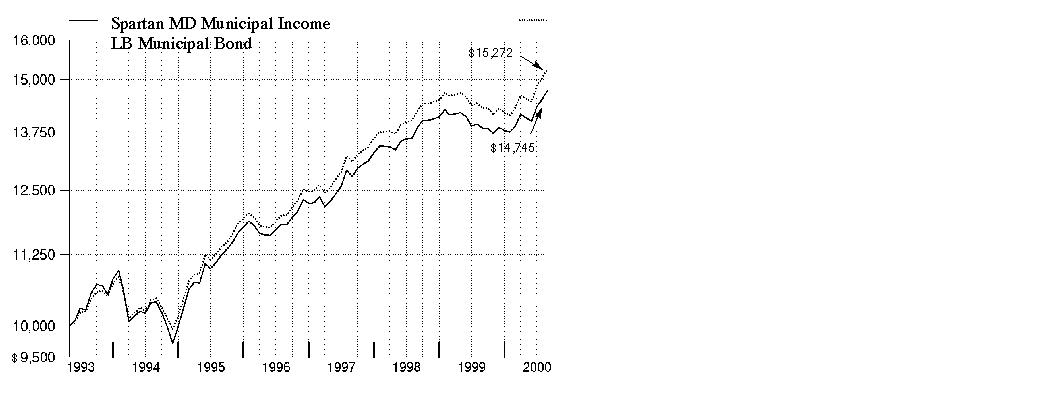
$10,000 Over Life of Fund: Let's say hypothetically that $10,000 was invested in Spartan Maryland Municipal Income Fund on April 30, 1993, shortly after the fund started. As the chart shows, by August 31, 2000, the value of the investment would have grown to $14,745 - a 47.45% increase on the initial investment. For comparison, look at how the Lehman Brothers Municipal Bond Index - a market-value oriented index of investment-grade municipal bonds with maturities of one year or more - did over the same period. With dividends and capital gains, if any, reinvested, the same $10,000 would have grown to $15,272 - a 52.72% increase.
Understanding
Performance
How a fund did yesterday is no guarantee of how it will do tomorrow. Bond prices, for example, generally move in the opposite direction of interest rates. In turn, the share price, return and yield of a fund that invests in bonds will vary. That means if you sell your shares during a market downturn, you might lose money. But if you can ride out the market's ups and downs, you may have a gain.
3Annual Report
Performance - continued
Total Return Components
|
|
|
Years ended August 31, |
||||
|
|
|
2000 |
1999 |
1998 |
1997 |
1996 |
|
Dividend returns |
|
4.94% |
4.21% |
4.69% |
4.89% |
5.02% |
|
Capital returns |
|
1.59% |
-4.36% |
3.74% |
3.28% |
0.10% |
|
Total returns |
|
6.53% |
-0.15% |
8.43% |
8.17% |
5.12% |
Total return components include both dividend returns and capital returns. A dividend return reflects the actual dividends paid by the fund. A capital return reflects both the amount paid by the fund to shareholders as capital gain distributions and changes in the fund's share price. Both returns assume the dividends or capital gains, if any, paid by the fund are reinvested.
Dividends and Yield
|
Periods ended August 31, 2000 |
Past 1 |
Past 6 |
Past 1 |
|
Dividends per share |
4.15¢ |
24.26¢ |
47.56¢ |
|
Annualized dividend rate |
4.78% |
4.80% |
4.77% |
|
30-day annualized yield |
4.68% |
- |
- |
|
30-day annualized tax-equivalent yield |
7.94% |
- |
- |
Dividends per share show the income paid by the fund for a set period. If you annualize this number, based on an average share price of $10.21 over the past one month, $10.02 over the past six months and $9.98 over the past one year, you can compare the fund's income over these three periods. The 30-day annualized yield is a standard formula for all bond funds based on the yields of the bonds in the fund, averaged over the past 30 days. This figure shows you the yield characteristics of the fund's investments at the end of the period. It also helps you compare funds from different companies on an equal basis. The tax-equivalent yield shows what you would have to earn on a taxable investment to equal the fund's tax-free yield, if you're in the 41.03% combined effective 2000 federal and state income tax bracket. The tax-equivalent yield also reflects that a portion of the fund's income was subject to state taxes, but does not reflect the payment of the federal alternative minimum tax, if applicable.
Annual Report
Market Recap
After struggling in the first half of the 12-month period ending August 31, 2000, municipal bonds roared back to life in the second half. At the period's outset, muni performance was tempered by a series of interest-rate hikes by the Federal Reserve Board. Munis also had to compete with record-setting equity performance and a strong rally in Treasuries. Beginning in February, however, bargain-hunting investors became attracted to the generally higher yields municipal bonds offered, and the muni market rallied. Demand continued to grow in March as equity markets tumbled. A number of investors, seeking to protect their gains in stocks, reinvested assets into the relative safety of muni bonds. But as demand grew, supply tapered off. Many municipal bond issuers, such as U.S. state and local governments, limited their issuance, partly because higher interest rates discouraged borrowing. The resulting supply/demand imbalance boosted municipal bond prices. The market received another lift in the summer of 2000 when it became apparent that the U.S. economy was slowing and the Fed bypassed opportunities to hike rates in June and August. For the overall 12-month period, the Lehman Brothers Municipal Bond Index - an index of over 35,000 investment-grade, fixed-rate, tax-exempt bonds - returned 6.77%. The overall taxable-bond market, as measured by the Lehman Brothers Aggregate Bond Index, gained 7.56% in the same time frame.
(Portfolio Manager photograph)
An interview with George Fischer, Portfolio Manager of Spartan Maryland Municipal Income Fund
Q. How did the fund perform, George?
A. For the 12-month period that ended August 31, 2000, the fund had a total return of 6.53%. To get a sense of how the fund did relative to its competitors, the Maryland municipal debt funds average returned 4.90% for the same 12-month period, according to Lipper Inc. Additionally, the Lehman Brothers Maryland 4 Plus Year Enhanced Municipal Bond Index returned 6.17%.
Q. After struggling last fall and winter, municipals rallied in the spring and summer of 2000. What was behind these changing conditions, and how did they affect the fund's performance?
A. When the period began, investors feared that the Federal Reserve Board would continue to raise interest rates in order to slow economic growth and curtail inflationary pressures. That forced bond yields higher and their prices, which move in the opposite direction, lower. In response, those worries and the fact that the Fed did raise rates on several occasions caused the fund's share price to fall. Since May, however, conditions have improved. Even though the Fed continued to raise interest rates in an effort to cool the economy and the stock market, municipal bond prices rose. That's primarily because investors began to anticipate that the Fed might be close to the end of its interest-rate hike cycle. Part of that optimism stemmed from several economic indicators that pointed to a slowdown in the economy. Those indicators, coupled with municipals' attractive prices and yields, helped them to rally in June, July and August. Against that backdrop, the fund's total return for the year reflects the combination of price gains or losses plus the income generated by its holdings during the period.
Annual Report
Fund Talk: The Manager's Overview - continued
Q. What helped the fund perform better than its peers during the past year?
A. A big factor was the fund's larger-than-average stake in premium coupon bonds - those that pay interest rates above prevailing rates. Because they generally were protected against the unfavorable tax treatment that can hurt some bonds when interest rates change, premium coupon bonds outperformed discount coupon and par coupon bonds, which carry interest rates below and at prevailing market rates, respectively. Also, the fund's relatively large weighting in longer-term bonds helped the fund outpace its peers. Longer-term bond yields fell the most during the past six months, pushing their prices up and helping them to outpace their short- and intermediate-term counterparts.
Q. Were there any disappointments?
A. Health care bonds continued to languish due to lower reimbursements from HMOs and the federal government and from increased pressure to cut costs. Despite their recent struggles, I held on to some bonds issued by selected hospitals that Fidelity's research indicated were in good financial shape and fundamentally sound.
Q. What's your outlook for the municipal market and the Maryland economy?
A. If the Fed continues to push rates higher, as it has for more than a year now, there may be more volatility ahead. If, on the other hand, the Fed really is at the end of its campaign to cool the economy and stave off inflationary pressures by raising interest rates, the bond markets should benefit. As for municipals, they are priced attractively relative to Treasury securities. Additionally, for investors in the highest national tax bracket, municipals offer yields above 9.00% on a tax-adjusted basis. Attractive prices and yields could bode well for municipals' near-term performance. As for the fund, I'll continue to approach the market fairly cautiously in terms of credit quality. We'll remain vigilant, looking for potential problems that could occur if the economy slows. As for the Maryland economy, I'm reasonably optimistic. The federal budget is running a surplus, which may translate into rising expenditures on defense and health research - two large components of Maryland's economy.
The views expressed in this report reflect those of the portfolio manager only through the end of the period of the report as stated on the cover and do not necessarily represent the views of Fidelity or any other person in the Fidelity organization. Any such views are subject to change at any time based upon market or other conditions and Fidelity disclaims any responsibility to update such views. These views may not be relied on as investment advice and, because investment decisions for a Fidelity fund are based on numerous factors, may not be relied on as an indication of trading intent on behalf of any Fidelity fund.
Annual Report
Fund Talk: The Manager's Overview - continued
Fund Facts
Goal: high level of current income exempt from federal and Maryland state and county income taxes
Fund number: 429
Trading symbol: SMDMX
Start date: April 22, 1993
Size: as of August 31, 2000, more than $54 million
Manager: George Fischer, since 1998; manager, various Fidelity and Spartan municipal income funds; joined Fidelity in 1989
3George Fischer on the fund's interest-rate sensitivity:
"The main source of volatility in this fund's shares is fluctuations in the general level of interest rates. Municipal interest rates are affected by inflation, Federal Reserve Board policy and new-issue supply, among other factors. One way that we estimate how sensitive a bond - or a fund - is to such shifts is to calculate its duration. The higher the duration a bond or a municipal bond fund has, the more sensitive it will be to changes in interest rates.
"As of August 31, 2000, Spartan Maryland Municipal Income Fund had a duration of 6.5 years. This means that the fund's net asset value would rise approximately 6.5% when bond yields fall 1%, and fall approximately 6.5% when bond yields rise 1%, all else being equal. The value of funds with a shorter duration would change less in response to interest-rate changes, and the value of funds with a longer duration would change more."
Annual Report
|
Top Five Sectors as of August 31, 2000 |
||
|
|
% of fund's |
% of fund's net assets |
|
General Obligations |
39.5 |
35.3 |
|
Special Tax |
14.8 |
9.1 |
|
Escrowed/Pre-Refunded |
12.0 |
13.9 |
|
Education |
7.1 |
6.3 |
|
Industrial Development |
5.4 |
6.4 |
|
Average Years to Maturity as of August 31, 2000 |
||
|
|
|
6 months ago |
|
Years |
14.0 |
13.8 |
|
Average years to maturity is based on the average time remaining until principal payments are expected from each of the fund's bonds, weighted by dollar amount. |
|
Duration as of August 31, 2000 |
||
|
|
|
6 months ago |
|
Years |
6.5 |
6.9 |
|
Duration shows how much a bond fund's price fluctuates with changes in comparable interest rates. |
|
Quality Diversification (Moody's Ratings) |
As of August 31, 2000 As of February 29, 2000


|
Where Moody's ratings are not available, we have used S&P ® ratings. Amounts shown are as a percentage of the fund's investments. |
Annual Report
Showing Percentage of Net Assets
|
Municipal Bonds - 96.7% |
|||||
|
Moody's Ratings (unaudited) (a) |
Principal Amount |
Value |
|||
|
Maryland - 88.9% |
|||||
|
Anne Arundel County (Consolidated Wtr. & |
Aa2 |
|
$ 550,000 |
$ 599,297 |
|
|
Baltimore County Metro. District (Spl. Assessment
Proj.) 63rd Issue, 6.125% 7/1/07 |
Aaa |
|
850,000 |
892,390 |
|
|
Baltimore Gen. Oblig.: |
|
|
|
|
|
|
(Consolidated Pub. Impt. Proj.) Series A: |
|
|
|
|
|
|
5.5% 10/15/11 (FGIC Insured) |
Aaa |
|
1,000,000 |
1,049,370 |
|
|
5.5% 10/15/14 (FGIC Insured) |
Aaa |
|
500,000 |
516,695 |
|
|
5.625% 10/15/13 (FGIC Insured) |
Aaa |
|
1,460,000 |
1,524,240 |
|
|
7% 10/15/09 (MBIA Insured) |
Aaa |
|
500,000 |
584,165 |
|
|
Rfdg. (Cap. Appreciation) (Consolidated |
Aaa |
|
2,000,000 |
1,475,500 |
|
|
Baltimore Gen. Oblig. Proj. Rev. Rfdg. (Wtr. Proj.) Series A, 5% 7/1/24 (FGIC Insured) |
Aaa |
|
1,100,000 |
1,030,161 |
|
|
Baltimore Port Facilities Rev. (Consolidated Coal Sales Co. Proj.) 6.5% 12/1/10 |
Aa3 |
|
2,000,000 |
2,108,637 |
|
|
Frederick County Gen. Oblig. Rfdg. |
Aa2 |
|
1,000,000 |
1,018,400 |
|
|
Maryland Cmnty. Dev. Administration Dept. |
|
|
|
|
|
|
(Single Family Mtg. Prog.) Series 7, 7.25% 4/1/19 (b) |
Aa2 |
|
500,000 |
523,300 |
|
|
Rfdg. (Residential Proj.) Series B, 5.05% 9/1/19 (b) |
Aa2 |
|
865,000 |
863,400 |
|
|
Maryland Gen. Oblig. (State & Local Facilities Ln. Prog.): |
|
|
|
|
|
|
First Series: |
|
|
|
|
|
|
4.5% 3/1/01 |
Aaa |
|
615,000 |
615,843 |
|
|
5.5% 2/1/06 |
Aaa |
|
1,000,000 |
1,031,700 |
|
|
Second Series: |
|
|
|
|
|
|
5% 7/15/11 |
Aaa |
|
1,500,000 |
1,519,470 |
|
|
5% 8/1/12 |
Aaa |
|
1,000,000 |
1,005,840 |
|
|
5.25% 7/15/12 |
Aaa |
|
2,000,000 |
2,048,640 |
|
|
5.25% 7/15/13 |
Aaa |
|
1,500,000 |
1,524,600 |
|
|
Maryland Health & Higher Edl. Facilities Auth. Rev.: |
|
|
|
|
|
|
(Charity Oblig. Group Proj.) Series D, |
Aa2 |
|
970,000 |
977,304 |
|
|
Municipal Bonds - continued |
|||||
|
Moody's Ratings (unaudited) (a) |
Principal Amount |
Value |
|||
|
Maryland - continued |
|||||
|
Maryland Health & Higher Edl. Facilities Auth. Rev.: - continued |
|
|
|
|
|
|
(Good Samaritan Hosp. Proj.): |
|
|
|
|
|
|
5.75% 7/1/13 (AMBAC Insured) |
Aaa |
|
$ 145,000 |
$ 153,597 |
|
|
5.75% 7/1/13 (Escrowed to Maturity) (c) |
A1 |
|
240,000 |
254,230 |
|
|
(John Hopkins Univ. Issue Proj.) 6% 7/1/39 |
Aa2 |
|
1,000,000 |
1,042,280 |
|
|
(Loyola College Issue Proj.) 5% 10/1/39 |
A2 |
|
2,000,000 |
1,784,820 |
|
|
(Univ. of Maryland Med. Sys. Proj.) 6.75% 7/1/30 |
Baa1 |
|
500,000 |
508,295 |
|
|
Rfdg.: |
|
|
|
|
|
|
(Good Samaritan Hosp. Proj.) 5.7% 7/1/09 (Escrowed to Maturity) (c) |
A1 |
|
1,000,000 |
1,072,190 |
|
|
(Helix Health Proj.) 5% 7/1/17 (AMBAC Insured) (Escrowed to Maturity) (c) |
Aaa |
|
1,000,000 |
964,470 |
|
|
(Howard County Gen. Hosp. Proj.) 5.5% 7/1/13 (Escrowed to Maturity) (c) |
Aaa |
|
1,000,000 |
1,018,990 |
|
|
(John Hopkins Univ. Proj.) 6% 7/1/10 |
Aa2 |
|
500,000 |
550,405 |
|
|
Maryland Ind. Dev. Fing. Auth. Econ. Dev. Rev.
(Holy Cross Health Sys. Corp. Proj.) |
Aa3 |
|
1,150,000 |
1,150,127 |
|
|
Maryland Ind. Dev. Fing. Auth. Rev. Rfdg. (Holy Cross Health Sys. Corp. Proj.) 5.7% 12/1/10 |
Aa3 |
|
1,000,000 |
1,049,690 |
|
|
Maryland Trans. Auth. Rev.: |
|
|
|
|
|
|
(Trans. Facilities Projs.) 6.8% 7/1/16 (Escrowed to Maturity) (c) |
Aaa |
|
1,015,000 |
1,168,346 |
|
|
Rfdg. (Trans. Facilities Projs.) 5.8% 7/1/06 |
Aa2 |
|
500,000 |
531,765 |
|
|
Rfdg. (Cap. Appreciation) (Trans. Facilities Projs.) 0% 7/1/04 (FGIC Insured) |
Aaa |
|
2,500,000 |
2,102,150 |
|
|
Montgomery County Gen. Oblig.: |
|
|
|
|
|
|
(Consolidated Pub. Impt. Proj.) Series A: |
|
|
|
|
|
|
5.375% 5/1/05 |
Aaa |
|
1,000,000 |
1,038,880 |
|
|
5.375% 5/1/12 |
Aaa |
|
1,000,000 |
1,033,990 |
|
|
5.625% 10/1/06 |
Aaa |
|
1,000,000 |
1,058,730 |
|
|
Series A, 6.3% 4/1/04 |
Aaa |
|
500,000 |
530,370 |
|
|
Montgomery County Hsg. Opportunity Commission Single Family Mtg. Rev. Series A, 6.6% 7/1/14 |
Aa2 |
|
980,000 |
1,032,861 |
|
|
Northeast Maryland Waste Disp. Auth. Resource Recovery Rev.: |
|
|
|
|
|
|
(Baltimore Resco Retrofit Proj.) 4.75% 1/1/12 (b) |
BBB+ |
|
1,000,000 |
820,760 |
|
|
Municipal Bonds - continued |
|||||
|
Moody's Ratings (unaudited) (a) |
Principal Amount |
Value |
|||
|
Maryland - continued |
|||||
|
Northeast Maryland Waste Disp. Auth. Resource Recovery Rev.: - continued |
|
|
|
|
|
|
Rfdg. (Southwest Resource Recovery Facilities Proj.) 7.2% 1/1/05 (MBIA Insured) |
Aaa |
|
$ 1,235,000 |
$ 1,355,944 |
|
|
Northeast Maryland Waste Disp. Auth. Solid Waste Rev. (Montgomery County Resource Recovery Proj.) Series A: |
|
|
|
|
|
|
5.9% 7/1/05 (b) |
A2 |
|
760,000 |
796,579 |
|
|
6% 7/1/07 (b) |
A2 |
|
500,000 |
525,270 |
|
|
Prince Georges County (Consolidated Pub. Impts. Proj.) 5.5% 3/15/16 (MBIA Insured) |
Aaa |
|
1,000,000 |
1,015,350 |
|
|
Prince Georges County Ctfs. of Prtn. (Cap.
Appreciation) Series A, 0% 6/30/11 |
Aaa |
|
2,400,000 |
1,394,880 |
|
|
Prince Georges County Hsg. Auth. Rev. |
AAA |
|
365,000 |
380,162 |
|
|
Univ. of Maryland Sys. Auxiliary Facility & Tuition Rev. Series A, 5.6% 4/1/16 |
Aa3 |
|
500,000 |
507,860 |
|
|
Washington D.C. Metro. Area Trans. Auth. Gross Rev. Rfdg. 6% 7/1/10 (FGIC Insured) |
Aaa |
|
1,570,000 |
1,737,409 |
|
|
Washington D.C. Suburban Sanitation District Rfdg. Second Series, 8% 1/1/02 |
Aa1 |
|
1,000,000 |
1,045,690 |
|
|
|
48,535,042 |
||||
|
Puerto Rico - 7.8% |
|||||
|
Puerto Rico Commonwealth Hwy. & Trans. |
Aaa |
|
1,000,000 |
1,018,830 |
|
|
Puerto Rico Commonwealth Hwy. & Trans. |
|
|
|
|
|
|
4.75% 7/1/38 (MBIA Insured) |
Aaa |
|
1,000,000 |
879,830 |
|
|
Municipal Bonds - continued |
|||||
|
Moody's Ratings (unaudited) (a) |
Principal Amount |
Value |
|||
|
Puerto Rico - continued |
|||||
|
Puerto Rico Commonwealth Hwy. & Trans. Auth. Rev. Series A: - continued |
|
|
|
|
|
|
5% 7/1/38 |
Baa1 |
|
$ 2,000,000 |
$ 1,818,300 |
|
|
Puerto Rico Commonwealth Infrastructure Fing. Auth. Spl. Tax Rev. Series A, 5% 7/1/28 (AMBAC Insured) |
Aaa |
|
600,000 |
562,392 |
|
|
|
4,279,352 |
||||
|
TOTAL INVESTMENT PORTFOLIO - 96.7% (Cost $51,930,918) |
52,814,394 |
||
|
NET OTHER ASSETS - 3.3% |
1,781,040 |
||
|
NET ASSETS - 100% |
$ 54,595,434 |
||
|
Legend |
|
(a) S&P credit ratings are used in the absence of a rating by Moody's Investors Service, Inc. |
|
(b) Private activity obligations whose interest is subject to the federal alternative minimum tax for individuals. |
|
(c) Security collateralized by an amount sufficient to pay interest and principal. |
|
Other Information |
|
The composition of long-term debt holdings as a percentage of total value of investments in securities, is as follows (ratings are unaudited): |
|
Moody's Ratings |
S&P Ratings |
|||
|
Aaa, Aa, A |
93.3% |
|
AAA, AA, A |
88.5% |
|
Baa |
4.4% |
|
BBB |
1.6% |
|
Ba |
0.0% |
|
BB |
0.0% |
|
B |
0.0% |
|
B |
0.0% |
|
Caa |
0.0% |
|
CCC |
0.0% |
|
Ca, C |
0.0% |
|
CC, C |
0.0% |
|
|
|
|
D |
0.0% |
|
The distribution of municipal securities by revenue source, as a percentage of total net assets, is as follows: |
|
General Obligations |
39.5% |
|
Special Tax |
14.8 |
|
Escrowed/Pre-Refunded |
12.0 |
|
Education |
7.1 |
|
Industrial Development |
5.4 |
|
Housing |
5.1 |
|
Resource Recovery |
5.0 |
|
Others* (individually less than 5%) |
11.1 |
|
|
100.0% |
|
* Includes net other assets. |
|
Income Tax Information |
|
At August 31, 2000, the aggregate cost |
|
At August 31, 2000, the fund had a capital loss carryforward of approximately $942,000 of which $924,000 and $18,000 will expire on August 31, 2004 and 2008, respectively. |
See accompanying notes which are an integral part of the financial statements.
Annual Report
Statement of Assets and Liabilities
|
|
August 31, 2000 |
|
|
Assets |
|
|
|
Investment in securities, at value (cost $51,930,918) - |
|
$ 52,814,394 |
|
Cash |
|
1,213,861 |
|
Receivable for fund shares sold |
|
40,000 |
|
Interest receivable |
|
611,714 |
|
Other receivables |
|
17,202 |
|
Total assets |
|
54,697,171 |
|
Liabilities |
|
|
|
Payable for fund shares redeemed |
$ 20,554 |
|
|
Distributions payable |
56,259 |
|
|
Accrued management fee |
24,924 |
|
|
Total liabilities |
|
101,737 |
|
Net Assets |
|
$ 54,595,434 |
|
Net Assets consist of: |
|
|
|
Paid in capital |
|
$ 54,887,082 |
|
Undistributed net interest income |
|
18,021 |
|
Accumulated undistributed net realized |
|
(1,193,145) |
|
Net unrealized appreciation (depreciation) on investments |
|
883,476 |
|
Net Assets, for 5,326,291 shares outstanding |
|
$ 54,595,434 |
|
Net Asset Value, offering price and redemption price per share ($54,595,434 ÷ 5,326,291 shares) |
|
$10.25 |
See accompanying notes which are an integral part of the financial statements.
Annual Report
Financial Statements - continued
Statement of Operations
|
|
Year ended August 31, 2000 |
|
|
Interest Income |
|
$ 2,516,542 |
|
Expenses |
|
|
|
Management fee |
$ 265,468 |
|
|
Non-interested trustees' compensation |
146 |
|
|
Total expenses before reductions |
265,614 |
|
|
Expense reductions |
(46,359) |
219,255 |
|
Net interest income |
|
2,297,287 |
|
Realized and Unrealized Gain (Loss) Net realized gain (loss) on: |
|
|
|
Investment securities |
(260,099) |
|
|
Futures contracts |
(8,118) |
(268,217) |
|
Change in net unrealized appreciation (depreciation) |
|
1,126,641 |
|
Net gain (loss) |
|
858,424 |
|
Net increase (decrease) in net assets resulting |
|
$ 3,155,711 |
See accompanying notes which are an integral part of the financial statements.
Annual Report
Financial Statements - continued
Statement of Changes in Net Assets
|
|
Year ended |
Year ended |
|
Increase (Decrease) in Net Assets |
|
|
|
Operations |
$ 2,297,287 |
$ 2,057,235 |
|
Net realized gain (loss) |
(268,217) |
116,867 |
|
Change in net unrealized appreciation (depreciation) |
1,126,641 |
(2,304,700) |
|
Net increase (decrease) in net assets resulting |
3,155,711 |
(130,598) |
|
Distributions to shareholders from net interest income |
(2,289,088) |
(2,057,235) |
|
Share transactions |
15,892,379 |
14,363,034 |
|
Reinvestment of distributions |
1,665,421 |
1,517,501 |
|
Cost of shares redeemed |
(12,459,301) |
(8,904,888) |
|
Net increase (decrease) in net assets resulting |
5,098,499 |
6,975,647 |
|
Redemption fees |
4,681 |
5,057 |
|
Total increase (decrease) in net assets |
5,969,803 |
4,792,871 |
|
Net Assets |
|
|
|
Beginning of period |
48,625,631 |
43,832,760 |
|
End of period (including undistributed net interest |
$ 54,595,434 |
$ 48,625,631 |
|
Other Information Shares |
|
|
|
Sold |
1,593,231 |
1,372,122 |
|
Issued in reinvestment of distributions |
166,668 |
145,212 |
|
Redeemed |
(1,253,279) |
(853,528) |
|
Net increase (decrease) |
506,620 |
663,806 |
See accompanying notes which are an integral part of the financial statements.
Annual Report
Financial Highlights
|
Years ended August 31, |
2000 |
1999 |
1998 |
1997 |
1996 |
|
Selected Per-Share Data |
|
|
|
|
|
|
Net asset value, |
$ 10.090 |
$ 10.550 |
$ 10.170 |
$ 9.850 |
$ 9.840 |
|
Income from Investment Operations |
.474 B |
.451 |
.461 |
.466 |
.488 |
|
Net realized and unrealized gain (loss) |
.161 |
(.461) |
.380 |
.323 |
.009 |
|
Total from investment operations |
.635 |
(.010) |
.841 |
.789 |
.497 |
|
Less Distributions |
|
|
|
|
|
|
From net interest income |
(.476) |
(.451) |
(.461) |
(.466) |
(.488) |
|
In excess of net realized gain |
- |
- |
- |
(.003) |
- |
|
Total distributions |
(.476) |
(.451) |
(.461) |
(.469) |
(.488) |
|
Redemption fees added to |
.001 |
.001 |
.000 |
.000 |
.001 |
|
Net asset value, end of period |
$ 10.250 |
$ 10.090 |
$ 10.550 |
$ 10.170 |
$ 9.850 |
|
Total Return A |
6.53% |
(0.15)% |
8.43% |
8.17% |
5.12% |
|
Ratios and Supplemental Data |
|
|
|
|
|
|
Net assets, end of period |
$ 54,595 |
$ 48,626 |
$ 43,833 |
$ 40,231 |
$ 45,359 |
|
Ratio of expenses to average |
.55% |
.55% |
.55% |
.55% |
.40% C |
|
Ratio of expenses to average net assets after expense reductions |
.45% D |
.49% D |
.53% D |
.54% D |
.39% D |
|
Ratio of net interest income to average net assets |
4.76% |
4.34% |
4.44% |
4.65% |
4.91% |
|
Portfolio turnover rate |
27% |
12% |
23% |
41% |
74% |
A The total returns would have been lower had certain expenses not been reduced during the periods shown.
B Net interest income per share has been calculated based on average shares outstanding during the period.
C FMR agreed to reimburse a portion of the fund's expenses during the period. Without this reimbursement, the fund's expense ratio would have been higher.
D FMR or the fund has entered into varying arrangements with third parties who either paid or reduced a portion of the fund's expenses.
See accompanying notes which are an integral part of the financial statements.
Annual Report
For the period ended August 31, 2000
1. Significant Accounting Policies.
Spartan Maryland Municipal Income Fund (the fund) is a fund of Fidelity Union Street Trust (the trust) and is authorized to issue an unlimited number of shares. The trust is registered under the Investment Company Act of 1940, as amended, as an open-end management investment company organized as a Massachusetts business trust.The fund may be affected by economic and political developments in the state of Maryland. The financial statements have been prepared in conformity with generally accepted accounting principles which require management to make certain estimates and assumptions at the date of the financial statements. The following summarizes the significant accounting policies of the fund:
Security Valuation. Securities are valued based upon a computerized matrix system and/or appraisals by a pricing service, both of which consider market transactions and dealer-supplied valuations. Securities for which quotations are not readily available are valued at their fair value as determined in good faith under consistently applied procedures under the general supervision of the Board of Trustees. Short-term securities with remaining maturities of sixty days or less for which quotations are not readily available are valued at amortized cost or original cost plus accrued interest, both of which approximate current value.
Income Taxes. As a qualified regulated investment company under Subchapter M of the Internal Revenue Code, the fund is
not subject to income taxes to the extent that it distributes substantially all of its taxable income for its fiscal year. The schedule of investments includes information regarding income taxes under the caption "Income Tax Information."
Interest Income. Interest income, which includes amortization of premium and accretion of original issue discount, is accrued as earned.
Expenses. Most expenses of the trust can be directly attributed to a fund. Expenses which cannot be directly attributed are apportioned among the funds in the trust.
Distributions to Shareholders. Distributions are declared daily and paid monthly from net interest income. Distributions from realized gains, if any, are recorded on the ex-dividend date.
Income and capital gain distributions are determined in accordance with income tax regulations which may differ from generally accepted accounting principles. These differences, which may result in distribution reclassifications, are primarily due to differing treatments for futures transactions, market discount, capital loss carryforwards and losses deferred due to excise tax regulations. The fund also utilized earnings and profits distributed to shareholders on redemption of shares as a part of the dividends paid deduction for income tax purposes.
Permanent book and tax basis differences relating to shareholder distributions will result in reclassifications to paid in capital. Undistributed net interest income and
Annual Report
Notes to Financial Statements - continued
1. Significant Accounting Policies - continued
Distributions to Shareholders -
continued
accumulated undistributed net realized gain (loss) on investments may include temporary book and tax basis differences which will reverse in a subsequent period. Any taxable gain remaining at fiscal year end is distributed in the following year.
Short-Term Trading (Redemption) Fees. Shares held in the fund less than 180 days are subject to a short-term trading fee equal to .50% of the proceeds of the redeemed shares. The fee, which is retained by the fund, is accounted for as an addition to paid in capital.
Security Transactions. Security transactions are accounted for as of trade date. Gains and losses on securities sold are determined on the basis of identified cost.
2. Operating Policies.
Fidelity Municipal Cash Central Fund. Pursuant to an Exemptive Order issued by the Securities and Exchange Commission, the fund may invest in the Fidelity Municipal Cash Central Fund (the Cash Fund) managed by Fidelity Investments Money Management, Inc. (FIMM), an affiliate of Fidelity Management & Research Company (FMR). The Cash Fund is an open-end money market fund available only to investment companies and other accounts managed by FMR and its affiliates. The Cash Fund seeks preservation of capital, liquidity, and current income by
investing in high-quality, short-term municipal securities of various states and municipalities. Income distributions from the Cash Fund are declared daily and paid monthly from net interest income. Income distributions earned by the fund are recorded as interest income in the accompanying financial statements.
Futures Contracts. The fund may use futures contracts to manage its exposure to the bond market and to fluctuations in interest rates. Buying futures tends to increase the fund's exposure to the underlying instrument, while selling futures tends to decrease the fund's exposure to the underlying instrument or hedge other fund investments. Losses may arise from changes in the value of the underlying instruments or if the counterparties do not perform under the contracts' terms. Gains (losses) are realized upon the expiration or closing of the futures contracts. Futures contracts are valued at the settlement price established each day by the board of trade or exchange on which they are traded.
3. Purchases and Sales of Investments.
Purchases and sales of securities, other than short-term securities, aggregated $16,183,903 and $12,527,678, respectively.
The market value of futures contracts opened and closed during the period amounted to $1,584,153 and $1,576,035, respectively.
Annual Report
Notes to Financial Statements - continued
4. Fees and Other Transactions with Affiliates.
Management Fee. As the fund's investment adviser, FMR receives a fee that is computed daily at an annual rate of .55% of the fund's average net assets. FMR pays all other expenses, except the compensation of the non-interested Trustees and certain exceptions such as interest, taxes, brokerage commissions and extraordinary expenses. The management fee paid to FMR by the fund is reduced by an amount equal to the fees and expenses paid by the fund to the non-interested Trustees.
Sub-Adviser Fee. FMR, on behalf of the fund, has entered into a sub-advisory agreement with FIMM, a wholly owned subsidiary of FMR. For its services, FIMM receives a fee from FMR of 50% of the management fee payable to FMR. The fee is paid prior to any voluntary expense reimbursements which may be in effect.
5. Expense Reductions.
Through arrangements with the fund's custodian and transfer agent, credits realized as a result of uninvested cash balances were used to reduce a portion of the fund's expenses. During the period, the fund's custodian, transfer agent and accounting fees were reduced by $46,359 under these arrangements.
Annual Report
To the Trustees of Fidelity Union Street Trust and the Shareholders of Spartan Maryland Municipal Income Fund:
In our opinion, the accompanying statement of assets and liabilities, including the schedule of investments, and the related statements of operations and of changes in net assets and the financial highlights present fairly, in all material respects, the financial position of Spartan Maryland Municipal Income Fund (a fund of Fidelity Union Street Trust) at August 31, 2000, and the results of its operations, the changes in its net assets and the financial highlights for the periods indicated, in conformity with accounting principles generally accepted in the United States. These financial statements and financial highlights (hereafter referred to as "financial statements") are the responsibility of the Spartan Maryland Municipal Income Fund's management; our responsibility is to express an opinion on these financial statements based on our audits. We conducted our audits of these financial statements in accordance with auditing standards generally accepted in the United States which require that we plan and perform the audit to obtain reasonable assurance about whether the financial statements are free of material misstatement. An audit includes examining, on a test basis, evidence supporting the amounts and disclosures in the financial statements, assessing the accounting principles used and significant estimates made by management, and evaluating the overall financial statement presentation. We believe that our audits, which included confirmation of securities at August 31, 2000 by correspondence with the custodian, provide a reasonable basis for the opinion expressed above.
/s/PricewaterhouseCoopers LLP
PricewaterhouseCoopers LLP
Boston, Massachusetts
October 6, 2000
Annual Report
During fiscal year ended 2000, 100% of the fund's income dividends was free from federal income tax, and 9.75% of the fund's income dividends was subject to the federal alternative minimum tax.
The fund will notify shareholders in January 2001 of amounts for use in preparing 2000 income tax returns.
Annual Report
A special meeting of fund's shareholders was held on September 13, 2000. The results of votes taken among shareholders on proposals before them are reported below. Each vote reported represents one dollar of net asset value held on the record date for the meeting.
PROPOSAL 1
To elect as Trustees the following twelve nominees.*
|
|
# of |
% of |
|
J. Michael Cook |
||
|
Affirmative |
719,905,794.09 |
94.672 |
|
Withheld |
40,517,203.69 |
5.328 |
|
TOTAL |
760,422,997.78 |
100.000 |
|
Ralph F. Cox |
||
|
Affirmative |
719,013,933.36 |
94,554 |
|
Withheld |
41,409,064.42 |
5.446 |
|
TOTAL |
760,422,997.78 |
100.000 |
|
Phyllis Burke Davis |
||
|
Affirmative |
718,961,403.49 |
94.548 |
|
Withheld |
41,461,594.29 |
5.452 |
|
TOTAL |
760,422,997.78 |
100.000 |
|
Robert M. Gates |
||
|
Affirmative |
719,482,012.45 |
94.616 |
|
Withheld |
40,940,985.33 |
5.384 |
|
TOTAL |
760,422,997.78 |
100.000 |
|
Edward C. Johnson 3d |
||
|
Affirmative |
719,048,405.90 |
94.559 |
|
Withheld |
41,374,591.88 |
5.441 |
|
TOTAL |
760,422,997.78 |
100.000 |
|
Donald J. Kirk |
||
|
Affirmative |
719,305,522.72 |
94.593 |
|
Withheld |
41,117,475.06 |
5.407 |
|
TOTAL |
760,422,997,78 |
100.000 |
|
|
# of |
% of |
|
Marie L. Knowles |
||
|
Affirmative |
720,009,886.09 |
94.685 |
|
Withheld |
40,413,111.69 |
5.315 |
|
TOTAL |
760,422,997.78 |
100.000 |
|
Ned C. Lautenbach |
||
|
Affirmative |
719,749,038.52 |
94.651 |
|
Withheld |
40,673,959.26 |
5.349 |
|
TOTAL |
760,422,997.78 |
100.000 |
|
Peter S. Lynch |
||
|
Affirmative |
715,851,375.12 |
94.139 |
|
Withheld |
44,571,622.66 |
5.861 |
|
TOTAL |
760,422,997.78 |
100.000 |
|
William O. McCoy |
||
|
Affirmative |
718,919,774.43 |
94.542 |
|
Withheld |
41,503,223.35 |
5.458 |
|
TOTAL |
760,422,997.78 |
100.000 |
|
Marvin L. Mann |
||
|
Affirmative |
719,517,282.26 |
94.621 |
|
Withheld |
40,905,715.52 |
5.379 |
|
TOTAL |
760,422,997.78 |
100.000 |
|
Robert C. Pozen |
||
|
Affirmative |
719,858,604.16 |
94.666 |
|
Withheld |
40,564,393.62 |
5.334 |
|
TOTAL |
760,422,997.78 |
100.000 |
|
PROPOSAL 2 |
||
|
To ratify the selection of PricewaterhouseCoopers LLP as independent accounts of the fund. |
||
|
|
# of |
% of |
|
Affirmative |
25,197,715.34 |
96.228 |
|
Against |
112,490.17 |
0.429 |
|
Abstain |
875,292.97 |
3.343 |
|
TOTAL |
26,185,498.48 |
100.000 |
|
PROPOSAL 3 |
||
|
To authorize the Trustees to adopt an Amended and Restated Declaration of Trust.* |
||
|
|
# of |
% of |
|
Affirmative |
676,198,304.03 |
89.494 |
|
Against |
27,996,750.36 |
3.706 |
|
Abstain |
51,382,916.46 |
6.800 |
|
TOTAL |
755,577,970.85 |
100.000 |
|
Broker |
4,845,026.93 |
|
|
PROPOSAL 4 |
||
|
To amend Spartan Maryland Municipal Income Fund's fundamental investment limitation concerning the concentration of its investments in a single industry. |
||
|
|
# of |
% of |
|
Affirmative |
22,539,542.01 |
86.121 |
|
Against |
2,429,533.85 |
9.283 |
|
Abstain |
1,202,983.26 |
4.596 |
|
TOTAL |
26,172,059.12 |
100.000 |
|
Broker |
13,439.36 |
|
|
PROPOSAL 5 |
||
|
To amend Spartan Maryland Municipal Income Fund's fundamental investment limitation concerning underwriting. |
||
|
|
# of |
% of |
|
Affirmative |
22,584,602.21 |
86.293 |
|
Against |
2,080,442.69 |
7.949 |
|
Abstain |
1,507,014.22 |
5.758 |
|
TOTAL |
26,172,059.12 |
100.000 |
|
Broker |
13,439.36 |
|
*Denotes trust-wide proposals and voting results.
Annual Report
Fidelity offers several ways to conveniently manage your personal investments via your telephone or PC. You can access your account information, conduct trades and research your investments 24 hours a day.
By Phone
Fidelity Automated Service Telephone provides a single toll-free number to access account balances, positions, quotes and trading. It's easy to navigate the service, and on your first call, the system will help you create a personal identification number (PIN) for security.
(phone_graphic)
Fidelity Automated
Service Telephone (FAST®)
1-800-544-5555
Press
1 For mutual fund and brokerage trading.
2 For quotes.*
3 For account balances and holdings.
4 To review orders and mutual
fund activity.
5 To change your PIN.
*0 To speak to a Fidelity representative.
By PC
Fidelity's web site on the Internet provides a wide range of information, including daily financial news, fund performance, interactive planning tools and news about Fidelity products and services.
(computer_graphic)
Fidelity's Web Site
www.fidelity.com
If you are not currently on the Internet, call EarthLink Sprint at 1-800-288-2967, and be sure to ask for registration number SMD004 to receive a special Fidelity package that includes 30 days of free Internet access. EarthLink is North America's #1 independent Internet access provider.
(computer_graphic)
Fidelity On-line Xpress+®
Fidelity On-line Xpress+ software for Windows combines comprehensive portfolio management capabilities, securities trading and access to research and analysis tools . . . all on your desktop. Call Fidelity at 1-800-544-0240 or visit our web site for more information on how to manage your investments via your PC.
* When you call the quotes line, please remember that a fund's yield and return will vary and, except for money market funds, share price will also vary. This means that you may have a gain or loss when you sell your shares. There is no assurance that money market funds will be able to maintain a stable $1 share price; an investment in a money market fund is not insured or guaranteed by the U.S. government. Total returns are historical and include changes in share price, reinvestment of dividends and capital gains, and the effects of any sales charges.
Annual Report
If more than one address is listed, please locate the address that is closest to you. We'll give your correspondence immediate attention and send you written confirmation upon completion of your request.
(letter_graphic)
Making Changes
To Your Account
(such as changing name, address, bank, etc.)
Fidelity Investments
P.O. Box 770001
Cincinnati, OH 45277-0002
(letter_graphic)
For Non-Retirement
Accounts
Buying shares
Fidelity Investments
P.O. Box 770001
Cincinnati, OH 45277-0003
Overnight Express
Fidelity Investments
2300 Litton Lane - KH1A
Hebron, KY 41048
Selling shares
Fidelity Investments
P.O. Box 660602
Dallas, TX 75266-0602
Overnight Express
Fidelity Investments
Attn: Redemptions - CP6I
400 East Las Colinas Blvd.
Irving, TX 75039-5587
General Correspondence
Fidelity Investments
P.O. Box 500
Merrimack, NH 03054-0500
(letter_graphic)
For Retirement
Accounts
Buying shares
Fidelity Investments
P.O. Box 770001
Cincinnati, OH 45277-0003
Selling shares
Fidelity Investments
P.O. Box 660602
Dallas, TX 75266-0602
Overnight Express
Fidelity Investments
Attn: Redemptions - CP6R
400 East Las Colinas Blvd.
Irving, TX 75039-5587
General Correspondence
Fidelity Investments
P.O. Box 500
Merrimack, NH 03054-0500
Annual Report
For directions and hours,
please call 1-800-544-9797.
Arizona
7373 N. Scottsdale Road
Scottsdale, AZ
California
815 East Birch Street
Brea, CA
851 East Hamilton Avenue
Campbell, CA
527 North Brand Boulevard
Glendale, CA
19200 Von Karman Avenue
Irvine, CA
10100 Santa Monica Blvd.
Los Angeles, CA
251 University Avenue
Palo Alto, CA
1760 Challenge Way
Sacramento, CA
7676 Hazard Center Drive
San Diego, CA
8 Montgomery Street
San Francisco, CA
950 Northgate Drive
San Rafael, CA
1400 Civic Drive
Walnut Creek, CA
6300 Canoga Avenue
Woodland Hills, CA
Colorado
1625 Broadway
Denver, CO
Connecticut
48 West Putnam Avenue
Greenwich, CT
265 Church Street
New Haven, CT
300 Atlantic Street
Stamford, CT
29 South Main Street
West Hartford, CT
Delaware
222 Delaware Avenue
Wilmington, DE
Florida
4400 N. Federal Highway
Boca Raton, FL
90 Alhambra Plaza
Coral Gables, FL
4090 N. Ocean Boulevard
Ft. Lauderdale, FL
1907 West State Road 434
Longwood, FL
8880 Tamiami Trail, North
Naples, FL
2401 PGA Boulevard
Palm Beach Gardens, FL
8065 Beneva Road
Sarasota, FL
1502 N. Westshore Blvd.
Tampa, FL
Georgia
3445 Peachtree Road, N.E.
Atlanta, GA
1000 Abernathy Road
Atlanta, GA
Illinois
One North Franklin Street
Chicago, IL
1415 West 22nd Street
Oak Brook, IL
1700 East Golf Road
Schaumburg, IL
3232 Lake Avenue
Wilmette, IL
Indiana
4729 East 82nd Street
Indianapolis, IN
Maine
Three Canal Plaza
Portland, ME
Maryland
7401 Wisconsin Avenue
Bethesda, MD
One W. Pennsylvania Ave.
Towson, MD
Massachusetts
801 Boylston Street
Boston, MA
155 Congress Street
Boston, MA
25 State Street
Boston, MA
300 Granite Street
Braintree, MA
44 Mall Road
Burlington, MA
416 Belmont Street
Worcester, MA
Annual Report
Michigan
280 Old N. Woodward Ave.
Birmingham, MI
29155 Northwestern Hwy.
Southfield, MI
Minnesota
7600 France Avenue South
Edina, MN
Missouri
700 West 47th Street
Kansas City, MO
8885 Ladue Road
Ladue, MO
New Jersey
150 Essex Street
Millburn, NJ
56 South Street
Morristown, NJ
501 Route 17, South
Paramus, NJ
New York
1055 Franklin Avenue
Garden City, NY
999 Walt Whitman Road
Melville, L.I., NY
1271 Avenue of the Americas
New York, NY
71 Broadway
New York, NY
350 Park Avenue
New York, NY
North Carolina
4611 Sharon Road
Charlotte, NC
Ohio
600 Vine Street
Cincinnati, OH
28699 Chagrin Boulevard
Woodmere Village, OH
Oregon
16850 SW 72nd Avenue
Tigard, OR
Pennsylvania
1735 Market Street
Philadelphia, PA
439 Fifth Avenue
Pittsburgh, PA
Rhode Island
47 Providence Place
Providence, RI
Tennessee
6150 Poplar Avenue
Memphis, TN
Texas
10000 Research Boulevard
Austin, TX
4017 Northwest Parkway
Dallas, TX
1155 Dairy Ashford Street
Houston, TX
2701 Drexel Drive
Houston, TX
400 East Las Colinas Blvd.
Irving, TX
14100 San Pedro
San Antonio, TX
19740 IH 45 North
Spring, TX
Utah
215 South State Street
Salt Lake City, UT
Virginia
1861 International Drive
McLean, VA
Washington
411 108th Avenue, N.E.
Bellevue, WA
511 Pine Street
Seattle, WA
Washington, DC
1900 K Street, N.W.
Washington, DC
Wisconsin
595 North Barker Road
Brookfield, WI
Fidelity Brokerage Services, Inc., 100 Summer St., Boston, MA 02110 Member NYSE/SIPC
Annual Report
Annual Report
Annual Report
Investment Adviser
Fidelity Management & Research Company
Boston, MA
Investment Sub-Adviser
Fidelity Investments
Money Management, Inc.
Officers
Edward C. Johnson 3d, President
Robert C. Pozen, Senior Vice President
Dwight D. Churchill, Vice President
Boyce I. Greer, Vice President
George A. Fischer, Vice President
Stanley N. Griffith, Assistant Vice President
Eric D. Roiter, Secretary
Robert A. Dwight, Treasurer
Maria F. Dwyer, Deputy Treasurer
John H. Costello, Assistant Treasurer
Thomas J. Simpson, Assistant Treasurer
Board of Trustees
Ralph F. Cox *
Phyllis Burke Davis *
Robert M. Gates *
Edward C. Johnson 3d
Donald J. Kirk *
Ned C. Lautenbach *
Peter S. Lynch
Marvin L. Mann *
William O. McCoy *
Gerald C. McDonough *
Robert C. Pozen
Thomas R. Williams *
Advisory Board
J. Michael Cook
Marie L. Knowles
General Distributor
Fidelity Distributors Corporation
Boston, MA
* Independent trustees
Transfer and Shareholder
Servicing Agents
Citibank, N.A.
New York, NY
and
Fidelity Service Company, Inc.
Boston, MA
Custodian
Citibank, N.A.
New York, NY
Fidelity's Municipal Bond Funds
Spartan(automated graphic) Arizona Municipal Income
Spartan California Municipal Income
Spartan Connecticut Municipal Income
Spartan Florida Municipal Income
Spartan Intermediate Municipal Income
Spartan Maryland Municipal Income
Spartan Massachusetts Municipal Income
Spartan Michigan Municipal Income
Spartan Minnesota Municipal Income
Spartan Municipal Income
Spartan New Jersey Municipal Income
Spartan New York Municipal Income
Spartan Ohio Municipal Income
Spartan Pennsylvania Municipal Income
Spartan Short-Intermediate
Municipal Income
The Fidelity Telephone Connection
Mutual Fund 24-Hour Service
Exchanges/Redemptions
and Account Assistance 1-800-544-6666
Product Information 1-800-544-6666
Retirement Accounts 1-800-544-4774 (8 a.m. - 9 p.m.)
TDD Service 1-800-544-0118
for the deaf and hearing impaired
(9 a.m. - 9 p.m. Eastern time)
Fidelity Automated Service
Telephone (FAST®) (automated graphic) 1-800-544-5555
(automated graphic) Automated line for quickest service
SMD-ANN-1000 113175
1.536791.103
(Fidelity Investment logo)(registered trademark)
Corporate Headquarters
82 Devonshire St., Boston, MA 02109
www.fidelity.com
Spartan®
Fund
Annual Report
August 31, 2000
(2_fidelity_logos)(Registered_Trademark)
|
President's Message |
Ned Johnson on investing strategies. |
|
|
Performance |
How the fund has done over time. |
|
|
Fund Talk |
The manager's review of fund performance, strategy and outlook. |
|
|
Investment Changes |
A summary of major shifts in the fund's investments over the past six months. |
|
|
Investments |
A complete list of the fund's investments with their market values. |
|
|
Financial Statements |
Statements of assets and liabilities,
operations, and changes in net assets, |
|
|
Notes |
Notes to the financial statements. |
|
|
Report of Independent Accountants |
The auditors' opinion. |
|
|
Distributions |
|
|
|
Proxy Voting Results |
|
Standard & Poor's, S&P and S&P 500 are registered service marks of The McGraw-Hill Companies, Inc. and have been licensed for use by Fidelity Distributors Corporation.
Other third party marks appearing herein are the property of their respective owners.
All other marks appearing herein are registered or unregistered trademarks or service marks of FMR Corp. or an affiliated company.
(Recycle graphic) This report is printed on recycled paper using soy-based inks.
This report and the financial statements contained herein are submitted for the general information of the shareholders of the funds. This report is not authorized for distribution to prospective investors in the funds unless preceded or accompanied by an effective prospectus.
Mutual fund shares are not deposits or obligations of, or guaranteed by, any depository institution. Shares are not insured by the FDIC, Federal Reserve Board or any other agency, and are subject to investment risks, including possible loss of principal amount invested.
Neither the funds nor Fidelity Distributors Corporation is a bank.
For more information on any Fidelity fund, including charges and expenses, call 1-800-544-6666 for a free prospectus. Read it carefully before you invest or send money.
Annual Report
(photo_of_Edward_C_Johnson_3d)
Dear Shareholder:
A slowing U.S. economy triggered an equity market rally during the later stages of summer, boosting most major stock indexes back into positive territory for calendar year 2000. One notable exception, however, was the Dow Jones Industrial Average, which posted a negative return during that timeframe. Fixed-income markets - particularly Treasuries - continued their yearlong trend of strong performance, as nearly every bond sector outperformed the stock market on a year-to-date basis.
While it's impossible to predict the future direction of the markets with any degree of certainty, there are certain basic principles that can help investors plan for their future needs.
The longer your investment time frame, the less likely it is that you will be affected by short-term market volatility. A 10-year investment horizon appropriate for saving for a college education, for example, enables you to weather market cycles in a long-term fund, which may have a higher risk potential, but also has a higher potential rate of return.
An intermediate-length fund could make sense if your investment horizon is two to four years, while a short-term bond fund could be the right choice if you need your money in one or two years.
If your time horizon is less than a year, you might want to consider moving some of your bond investment into a money market fund. These funds seek income and a stable share price by investing in high-quality, short-term investments. Of course, it's important to remember that an investment in a money market fund is not insured or guaranteed by the Federal Deposit Insurance Corporation or any other government agency. Although money market funds seek to preserve the value of your investment at $1.00 per share, it is possible to lose money by investing in these types of funds.
Finally, no matter what your time horizon or portfolio diversity, it makes good sense to follow a regular investment plan, investing a certain amount of money in a fund at the same time each month or quarter and periodically reviewing your overall portfolio. By doing so, you won't get caught up in the excitement of a rapidly rising market, nor will you buy all your shares at market highs. While this strategy - known as dollar cost averaging - won't assure a profit or protect you from a loss in a declining market, it should help you lower the average cost of your purchases. Of course, you should consider your financial ability to continue your purchases through periods of low price levels before undertaking such a strategy.
If you have questions, please call us at 1-800-544-6666, or visit our web site at www.fidelity.com. We are available 24 hours a day, seven days a week to provide you the information you need to make the investments that are right for you.
Best regards,
/s/Edward C. Johnson 3d
Edward C. Johnson 3d
Annual Report
There are several ways to evaluate a fund's historical performance. You can look at the total percentage change in value, the average annual percentage change or the growth of a hypothetical $10,000 investment. Total return reflects the change in the value of an investment, assuming reinvestment of the fund's dividend income and capital gains (the profits earned upon the sale of securities that have grown in value). You can also look at the fund's income, as reflected in the fund's yield, to measure performance. If Fidelity had not reimbursed certain fund expenses, the total returns and dividends would have been lower.
Cumulative Total Returns
|
Periods ended August 31, 2000 |
|
Past 1 |
Past 5 |
Past 10 |
|
Spartan Short-Intermediate Municipal Income |
|
4.45% |
23.39% |
66.85% |
|
LB 1-6 Year Municipal Bond |
|
4.89% |
25.81% |
n/a* |
|
Short-Intermediate Municipal Debt |
|
3.98% |
21.23% |
67.77% |
Cumulative total returns show the fund's performance in percentage terms over a set period - in this case, one year, five years or 10 years. For example, if you had invested $1,000 in a fund that had a 5% return over the past year, the value of your investment would be $1,050. You can compare the fund's returns to the performance of the Lehman Brothers 1-6 Year Municipal Bond Index - a market value-weighted index of investment-grade municipal bonds with maturities between one and six years. To measure how the fund's performance stacked up against its peers, you can compare it to the short-intermediate municipal debt funds average, which reflects the performance of mutual funds with similar objectives tracked by Lipper Inc. The past one year average represents a peer group of 40 mutual funds. These benchmarks include reinvested dividends and capital gains, if any, and exclude the effect of sales charges.
Average Annual Total Returns
|
Periods ended August 31, 2000 |
Past 1 |
Past 5 |
Past 10 |
|
Spartan Short-Intermediate Municipal Income |
4.45% |
4.29% |
5.25% |
|
LB 1-6 Year Municipal Bond |
4.89% |
4.70% |
n/a* |
|
Short-Intermediate Municipal Debt |
3.98% |
3.92% |
5.31% |
Average annual total returns take the fund's cumulative return and show you what would have happened if the fund had performed at a constant rate each year. (Note: Lipper calculates average annual total returns by annualizing each fund's total return, then taking an arithmetic average. This may produce a different figure than that obtained by averaging the cumulative total returns and annualizing the result.)
* Not available
Annual Report
Performance - continued
$10,000 Over 10 Years
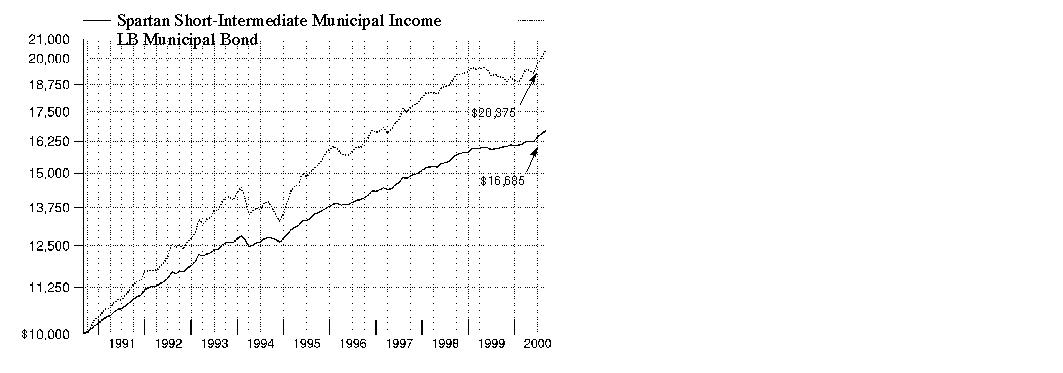
$10,000 Over 10 Years: Let's say hypothetically that $10,000 was invested in Spartan Short-Intermediate Municipal Income Fund on August 31, 1990. As the chart shows, by August 31, 2000, the value of the investment would have grown to $16,685 - a 66.85% increase on the initial investment. For comparison, look at how the Lehman Brothers Municipal Bond Index - a market value-weighted index of investment-grade municipal bonds with maturities of one year or more - did over the same period. With dividends and capital gains, if any, reinvested, the same $10,000 would have grown to $20,375 - a 103.75% increase.
Understanding
Performance
How a fund did yesterday is no guarantee of how it will do tomorrow. Bond prices, for example, generally move in the opposite direction of interest rates. In turn, the share price, return and yield of a fund that invests in bonds will vary. That means if you sell your shares during a market downturn, you might lose money. But if you can ride out the market's ups and downs, you may have a gain.
3Annual Report
Performance - continued
Total Return Components
|
|
|
Years ended August 31, |
||||
|
|
|
2000 |
1999 |
1998 |
1997 |
1996 |
|
Dividend returns |
|
4.12% |
3.92% |
4.27% |
4.38% |
4.25% |
|
Capital returns |
|
0.33% |
-1.48% |
1.10% |
1.11% |
-0.50% |
|
Total returns |
|
4.45% |
2.44% |
5.37% |
5.49% |
3.75% |
Total return components include both dividend returns and capital returns. A dividend return reflects the actual dividends paid by the fund. A capital return reflects both the amount paid by the fund to shareholders as capital gain distributions and changes in the fund's share price. Both returns assume the dividends or capital gains, if any, paid by the fund are reinvested.
Dividends and Yield
|
Periods ended August 31, 2000 |
Past 1 |
Past 6 |
Past 1 |
|
Dividends per share |
3.53¢ |
20.46¢ |
40.04¢ |
|
Annualized dividend rate |
4.15% |
4.08% |
4.03% |
|
30-day annualized yield |
4.09% |
- |
- |
|
30-day annualized tax-equivalent yield |
6.39% |
- |
- |
Dividends per share show the income paid by the fund for a set period. If you annualize this number, based on an average share price of $10.02 over the past one month, $9.94 over the past six months and $9.94 over the past one year, you can compare the fund's income over these three periods. The 30-day annualized yield is a standard formula for all bond funds based on the yields of the bonds in the fund, averaged over the past 30 days. This figure shows you the yield characteristics of the fund's investments at the end of the period. It also helps you compare funds from different companies on an equal basis. The tax-equivalent yield shows what you would have to earn on a taxable investment to equal the fund's tax-free yield, if you're in the 36% federal tax bracket, but does not reflect payment of the federal alternative minimum tax, if applicable. If Fidelity had not reimbursed certain fund expenses the yield and tax-equivalent yield would have been 4.05% and 6.33%, respectively.
Annual Report
Market Recap
After struggling in the first half of the 12-month period ending August 31, 2000, municipal bonds roared back to life in the second half. At the period's outset, muni performance was tempered by a series of interest-rate hikes by the Federal Reserve Board. Munis also had to compete with record-setting equity performance and a strong rally in Treasuries. Beginning in February, however, bargain-hunting investors became attracted to the generally higher yields municipal bonds offered, and the muni market rallied. Demand continued to grow in March as equity markets tumbled. A number of investors, seeking to protect their gains in stocks, reinvested assets into the relative safety of muni bonds. But as demand grew, supply tapered off. Many municipal bond issuers, such as U.S. state and local governments, limited their issuance, partly because higher interest rates discouraged borrowing. The resulting supply/demand imbalance boosted municipal bond prices. The market received another lift in the summer of 2000 when it became apparent that the U.S. economy was slowing and the Fed bypassed opportunities to hike rates in June and August. For the overall 12-month period, the Lehman Brothers Municipal Bond Index - an index of over 35,000 investment-grade, fixed-rate, tax-exempt bonds - returned 6.77%. The overall taxable-bond market, as measured by the Lehman Brothers Aggregate Bond Index, gained 7.56% in the same time frame.
(Portfolio Manager photograph)
Note to shareholders: Christine Thompson became Portfolio Manager of Spartan Short-Intermediate Municipal Income Fund on July 1, 2000.
Q. How did the fund perform, Christine?
A. For the 12-month period that ended August 31, 2000, the fund had a total return of 4.45%. To get a sense of how the fund did relative to its competitors, the short-intermediate municipal debt funds average returned 3.98% for the same 12-month period, according to Lipper Inc. Additionally, the Lehman Brothers 1-6 Year Municipal Bond Index, which tracks the types of securities in which the fund invests, returned 4.89%.
Q. What were some of the main forces behind the fund's performance during the past year?
A. In the period's first half, the municipal market and the fund came under pressure due to inflationary fears and rising interest rates. But in the second half, the municipal market rallied and boosted the fund's performance. Beginning in the spring of 2000, investors began to anticipate that the Federal Reserve Board's yearlong campaign to stave off inflation by raising interest rates was nearing a close. That optimism was based on several indicators that suggested that economic growth might be slowing. More favorable supply and demand conditions also helped propel the municipal market. The supply of municipals was down 10% during the first eight months of 2000, compared to the same period a year earlier. Meanwhile, the demand for municipals strengthened as bargain-hunting investors sought out their value and attractive yields. The fund's total return was the result of the appreciation of its holdings plus the income generated by them.
Annual Report
Fund Talk: The Manager's Overview - continued
Q. Why did the fund beat its peers during the period?
A. In keeping with Fidelity's investment approach, neither I nor the previous manager lengthened or shortened duration - that is, we didn't make the fund more or less interest-rate sensitive - based on where we thought interest rates would be at some point down the road. We managed the fund's interest-rate sensitivity to be in line with the short-intermediate municipal market as a whole. Given that interest rates were pretty volatile during the period, some peers may have suffered if they were positioned with too little or too much interest-rate sensitivity at the wrong time. Rather than make a bet on interest rates, we positioned the fund to emphasize the best value opportunities based on their performance potential under a variety of possible interest-rate scenarios. That leads to another factor that helped performance. More recently, I found that certain bonds - such as those trading at prices just below their face value - were very attractively priced. Since then, many of those bonds have performed better than the overall market because they enjoyed very strong demand from individual investors.
Q. What other factors helped the fund's performance?
A. The fund's focus on premium coupon bonds, which pay interest rates above face - or par - value, helped. One appealing aspect of premiums was that they were somewhat insulated from unfavorable tax treatment that hurt the prices of lower coupon bonds as rates rose. It's estimated that roughly one-quarter to one-third of all municipal bonds suffered because they were subject to that unfavorable tax treatment.
Q. Where there any disappointments?
A. The main disappointment was that the fund had a smaller stake - compared to the Lehman Brothers 1-6 Year Municipal Bond Index - in bonds from issuers in California. Mostly because of extremely strong demand for municipals in that state, the securities offered by California issuers - which began the period at much lower yields than similar securities from other states - later traded to richer valuations.
Q. What's your outlook for the municipal market?
A. As it generally does, the municipal market's performance will depend on the direction of interest rates and the supply/demand environment. While I don't forecast the direction of interest rates, my outlook for the technical aspects of supply and demand is favorable. The supply of municipals has continued to decline in response to rising interest rates because many issuers now find it too expensive to issue new or refinance old debt. As municipal bond yields rose above 6%, we saw incredibly strong demand from individual investors. To the extent that those conditions continue to prevail, municipals could do well. Another factor that could bode well for municipals is potentially increased demand from institutional investors. Should their interest in municipals re-ignite, municipals should benefit.
The views expressed in this report reflect those of the portfolio manager only through the end of the period of the report as stated on the cover and do not necessarily represent the views of Fidelity or any other person in the Fidelity organization. Any such views are subject to change at any time based upon market or other conditions and Fidelity disclaims any responsibility to update such views. These views may not be relied on as investment advice and, because investment decisions for a Fidelity fund are based on numerous factors, may not be relied on as an indication of trading intent on behalf of any Fidelity fund.
Fund Facts
Goal: seeks as high a level of current income, exempt from federal income tax, as is consistent with preservation of capital
Fund number: 404
Trading symbol: FSTFX
Start date: December 24, 1986
Size: as of August 31, 2000, more than $903 million
Manager: Christine Thompson, since July 2000; manager, various Fidelity and Spartan municipal income funds; joined Fidelity in 1985
Fund Talk: The Manager's Overview - continued
3Christine Thompson on her investment approach:
"I use the Lehman Brothers 1-6 Year Municipal Bond Index as a representation of the overall market in which the fund invests. The index includes most of the universe of short-intermediate municipal bonds. I manage the fund to have similar overall interest-rate sensitivity to the index.
"Beyond that, however, the fund can and does vary significantly from the index, with respect to sector, issuer and structural composition. The fund's holdings reflect my research conclusions on the relative value of bonds.
"Two examples of how the fund varied from the index over the past year was our relatively large stakes in electric and transportation bonds. I favored bonds issued by municipal-owned electric providers because I believe that the national movement toward a deregulated electricity provides an incentive for electric bond issuers to reduce their outstanding debt and enhance their competitive rate structures. In contrast, I favored transportation bonds because their recent valuations reflected an increase in issuance."
Annual Report
|
Top Five States as of August 31, 2000 |
||
|
|
% of fund's |
% of fund's net assets |
|
Texas |
16.6 |
14.1 |
|
Georgia |
9.3 |
4.2 |
|
New York |
7.3 |
16.9 |
|
Washington |
5.9 |
4.8 |
|
New Jersey |
4.6 |
2.4 |
|
Top Five Sectors as of August 31, 2000 |
||
|
|
% of fund's |
% of fund's net assets |
|
General Obligations |
36.5 |
32.2 |
|
Electric Utilities |
16.6 |
22.3 |
|
Escrowed/Pre-Refunded |
15.7 |
15.8 |
|
Transportation |
10.7 |
8.9 |
|
Special Tax |
9.7 |
7.1 |
|
Average Years to Maturity as of August 31, 2000 |
||
|
|
|
6 months ago |
|
Years |
3.2 |
3.3 |
|
Average years to maturity is based on the average time remaining until principal payments are expected from each of the fund's bonds, weighted by dollar amount. |
|
Duration as of August 31, 2000 |
||
|
|
|
6 months ago |
|
Years |
2.7 |
2.8 |
|
Duration shows how much a bond fund's price fluctuates with changes in comparable interest rates. |
|
Quality Diversification (Moody's Ratings) |
As of August 31, 2000 As of February 29, 2000


|
Where Moody's ratings are not available, we have used S&P ® ratings. Amounts shown are as a percentage of the fund's investments. |
Annual Report
Showing Percentage of Net Assets
|
Municipal Bonds - 94.6% |
|||||
|
Moody's Ratings |
Principal Amount (000s) |
Value (Note 1) (000s) |
|||
|
Alabama - 1.9% |
|||||
|
Alabama Agric. & Mechanical Univ. Revs. 6.5% 11/1/25 (MBIA Insured) (Pre-Refunded to 11/1/05 @ 102) (f) |
Aaa |
|
$ 2,000 |
$ 2,217 |
|
|
Alabama Gen. Oblig. Rfdg. Series A, 5.5% 10/1/01 |
Aa3 |
|
14,680 |
14,865 |
|
|
|
17,082 |
||||
|
Alaska - 1.4% |
|||||
|
Alaska Student Ln. Corp. Student Ln. Rev. Series A: |
|
|
|
|
|
|
5.1% 7/1/04 (AMBAC Insured) (e) |
Aaa |
|
2,700 |
2,712 |
|
|
5.55% 7/1/03 (AMBAC Insured) (e) |
Aaa |
|
1,000 |
1,018 |
|
|
North Slope Borough (Cap. Appreciation): |
|
|
|
|
|
|
Series A, 0% 6/30/03 (MBIA Insured) |
Aaa |
|
9,000 |
7,905 |
|
|
Series B, 0% 6/30/05 (FSA Insured) |
Aaa |
|
1,500 |
1,195 |
|
|
|
12,830 |
||||
|
Arizona - 2.1% |
|||||
|
Arizona Trans. Board Excise Tax Rev. (Maricopa County Reg'l. Area Road Proj.) 5.25% 7/1/05 (AMBAC Insured) |
Aaa |
|
10,000 |
10,335 |
|
|
Arizona Trans. Board Hwy. Rev. Sub Series A, 6.6% 7/1/08 (Pre-Refunded to 7/1/01 @ 101.5) (f) |
Aaa |
|
2,800 |
2,893 |
|
|
Coconino County Unified School District #001 Flagstaff Rfdg. 5.5% 7/1/02 (FSA Insured) |
Aaa |
|
2,275 |
2,321 |
|
|
Maricopa County School District #28 Kyrene Elementary Series E, 6% 7/1/12 (FGIC Insured) (Pre-Refunded to 7/1/02 @ 100) (f) |
Aaa |
|
1,065 |
1,096 |
|
|
Phoenix Civic Impt. Corp. Excise Tax Rev. |
Aa2 |
|
1,000 |
1,012 |
|
|
Salt River Proj. Agric. Impt. & Pwr. District Elec. Sys. Rev. Series D, 5.7% 1/1/04 |
Aa2 |
|
1,000 |
1,039 |
|
|
|
18,696 |
||||
|
Arkansas - 1.0% |
|||||
|
Arkansas Student Ln. Auth. Rev. Sr. Series A1: |
|
|
|
|
|
|
6.05% 6/1/02 (e) |
Aa |
|
4,700 |
4,796 |
|
|
6.05% 12/1/02 (e) |
Aa |
|
4,455 |
4,570 |
|
|
|
9,366 |
||||
|
Municipal Bonds - continued |
|||||
|
Moody's Ratings |
Principal Amount (000s) |
Value (Note 1) (000s) |
|||
|
California - 0.4% |
|||||
|
Los Angeles Dept. Wtr. & Pwr. Elec. Plant Rev. Second Issue: |
|
|
|
|
|
|
9% 10/15/00 |
Aa3 |
|
$ 1,300 |
$ 1,307 |
|
|
9% 10/15/01 |
Aa3 |
|
2,000 |
2,108 |
|
|
|
3,415 |
||||
|
Colorado - 2.6% |
|||||
|
Arapaho County Cap. Impt. Trust Fund Hwy. Rev.: |
|
|
|
|
|
|
(Cap. Appreciation) Series E 470: |
|
|
|
|
|
|
0% 8/31/07 (Pre-Refunded to 8/31/05 |
Aaa |
|
2,000 |
1,411 |
|
|
0% 8/31/08 (Pre-Refunded to 8/31/05 |
Aaa |
|
4,500 |
2,950 |
|
|
Series E 470, 7% 8/31/26 (Pre-Refunded to 8/31/05 @ 103) (f) |
Aaa |
|
2,150 |
2,442 |
|
|
Arapaho County School District #5 Cherry Creek Series B, 6% 12/15/04 |
Aa1 |
|
2,395 |
2,539 |
|
|
Colorado Pub. Hwy. Auth. E-470 Series B, 0% 9/1/07 (MBIA Insured) |
Aaa |
|
3,200 |
2,290 |
|
|
Denver City & County Arpt. Rev.: |
|
|
|
|
|
|
(Cap. Appreciation) Series A, 0% 11/15/03 (MBIA Insured) (e) |
Aaa |
|
3,370 |
2,897 |
|
|
Rfdg. Series C, 5.1% 11/15/01 (e) |
A2 |
|
2,320 |
2,329 |
|
|
Series C, 6.55% 11/15/02 (e) |
A2 |
|
1,420 |
1,471 |
|
|
Jefferson County School District # R001 Rfdg. 5.5% 12/15/06 (MBIA Insured) |
Aaa |
|
4,650 |
4,885 |
|
|
|
23,214 |
||||
|
Delaware - 0.7% |
|||||
|
Delaware Trans. Auth. Trans. Sys. Rev. Rfdg. 6% 7/1/05 (AMBAC Insured) |
Aaa |
|
6,160 |
6,534 |
|
|
District of Columbia - 0.2% |
|||||
|
District of Columbia Gen. Oblig. Rfdg. |
Aaa |
|
1,570 |
1,576 |
|
|
Florida - 4.2% |
|||||
|
Dade County Aviation Rev. Rfdg. (Miami Int'l. Arpt. Proj.) Series A, 5.25% 10/1/01 (FSA Insured) (e) |
Aaa |
|
3,500 |
3,530 |
|
|
Dade County School District 5.5% 8/1/12 |
Aaa |
|
2,000 |
2,096 |
|
|
Florida Dept. of Trans. (Right of Way Aquisition & Bridge Proj.) 6.5% 7/1/02 |
Aa2 |
|
2,725 |
2,825 |
|
|
Municipal Bonds - continued |
|||||
|
Moody's Ratings |
Principal Amount (000s) |
Value (Note 1) (000s) |
|||
|
Florida - continued |
|||||
|
Florida Ports Fing. Commission Rev. (State Trans. Trust Fund Proj.) 6% 6/1/05 (MBIA Insured) (e) |
Aaa |
|
$ 4,575 |
$ 4,835 |
|
|
Florida Tpk. Auth. Tpk. Rev. Series A, 6.5% 7/1/07 (FSA Insured) |
Aaa |
|
5,515 |
6,129 |
|
|
Jacksonville Elec. Auth. Rev. (Third Installment Proj.) 5.2% 7/1/01 (Escrowed to Maturity) (f) |
Aaa |
|
435 |
436 |
|
|
Lakeland Elec. & Wtr. Rev. Rfdg. (Energy Sys.
Proj.) First Lien Series B, 6.3% 10/1/01 |
Aaa |
|
9,255 |
9,449 |
|
|
Lee County Indl. Dev. Auth. Health Care Facilities Rev. (Shell Point Village Proj.) Series A: |
|
|
|
|
|
|
5.25% 11/15/04 |
BBB- |
|
500 |
485 |
|
|
5.25% 11/15/05 |
BBB- |
|
685 |
658 |
|
|
5.25% 11/15/06 |
BBB- |
|
1,145 |
1,088 |
|
|
Tampa Florida Guaranteed Entitlement Rev.: |
|
|
|
|
|
|
6% 10/1/02 (AMBAC Insured) (b) |
Aaa |
|
1,725 |
1,752 |
|
|
6% 10/1/03 (AMBAC Insured) (b) |
Aaa |
|
1,600 |
1,644 |
|
|
6% 10/1/04 (AMBAC Insured) (b) |
Aaa |
|
2,000 |
2,076 |
|
|
Tampa Gen. Oblig. (Catholic Health East Proj.) Series A3, 5.5% 11/15/02 (MBIA Insured) |
Aaa |
|
1,000 |
1,021 |
|
|
|
38,024 |
||||
|
Georgia - 9.3% |
|||||
|
Atlanta Arpt. Facilities Rev. Rfdg. 5% 1/1/01 (AMBAC Insured) |
Aaa |
|
1,800 |
1,804 |
|
|
Atlanta Wtr. & Swr. Rev. 4.75% 1/1/23 |
Aaa |
|
4,475 |
4,601 |
|
|
De Kalb County Gen. Oblig. 5.3% 1/1/02 |
Aa1 |
|
2,565 |
2,594 |
|
|
Dougherty County Gen. Oblig.: |
|
|
|
|
|
|
5.25% 10/1/03 (FSA Insured) |
Aaa |
|
1,860 |
1,903 |
|
|
5.25% 10/1/04 (FSA Insured) |
Aaa |
|
2,000 |
2,056 |
|
|
Georgia Gen. Oblig.: |
|
|
|
|
|
|
Rfdg. Series E, 5.5% 7/1/03 |
Aaa |
|
1,750 |
1,802 |
|
|
Series A: |
|
|
|
|
|
|
5.8% 3/1/05 |
Aaa |
|
3,780 |
3,985 |
|
|
6.25% 2/1/05 (Pre-Refunded to 2/1/01 |
Aaa |
|
9,140 |
9,392 |
|
|
Series B: |
|
|
|
|
|
|
6.1% 3/1/05 |
Aaa |
|
4,540 |
4,840 |
|
|
6.25% 4/1/03 |
Aaa |
|
7,500 |
7,839 |
|
|
6.3% 3/1/09 |
Aaa |
|
2,250 |
2,512 |
|
|
Municipal Bonds - continued |
|||||
|
Moody's Ratings |
Principal Amount (000s) |
Value (Note 1) (000s) |
|||
|
Georgia - continued |
|||||
|
Georgia Gen. Oblig.: - continued |
|
|
|
|
|
|
Series C: |
|
|
|
|
|
|
6% 7/1/04 |
Aaa |
|
$ 5,000 |
$ 5,278 |
|
|
6% 7/1/06 |
Aaa |
|
9,400 |
10,117 |
|
|
6.5% 7/1/06 |
Aaa |
|
4,010 |
4,413 |
|
|
6.5% 7/1/07 |
Aaa |
|
3,470 |
3,860 |
|
|
7.25% 7/1/06 |
Aaa |
|
2,000 |
2,274 |
|
|
Series D: |
|
|
|
|
|
|
5.8% 11/1/05 |
Aaa |
|
2,000 |
2,123 |
|
|
5.8% 11/1/07 |
Aaa |
|
3,640 |
3,913 |
|
|
6.7% 8/1/08 |
Aaa |
|
3,500 |
3,983 |
|
|
Series F, 6.5% 12/1/03 |
Aaa |
|
4,460 |
4,743 |
|
|
|
84,032 |
||||
|
Hawaii - 1.3% |
|||||
|
Hawaii Gen. Oblig.: |
|
|
|
|
|
|
Rfdg. Series CO, 4.625% 9/1/01 |
Aaa |
|
5,000 |
5,017 |
|
|
Series CN, 6.25% 3/1/02 (FGIC Insured) |
Aaa |
|
2,000 |
2,054 |
|
|
Honolulu City & County Gen. Oblig. Series B: |
|
|
|
|
|
|
5.5% 11/1/04 (FGIC Insured) |
Aaa |
|
465 |
483 |
|
|
5.5% 11/1/04 (FGIC Insured) |
Aaa |
|
4,160 |
4,325 |
|
|
|
11,879 |
||||
|
Illinois - 1.2% |
|||||
|
Chicago Midway Arpt. Rev. Series A: |
|
|
|
|
|
|
6.25% 1/1/14 (MBIA Insured) (Pre-Refunded to 1/1/04 @ 102) (e)(f) |
Aaa |
|
2,230 |
2,381 |
|
|
6.25% 1/1/24 (MBIA Insured) (Pre-Refunded to 1/1/04 @ 102) (e)(f) |
Aaa |
|
6,810 |
7,271 |
|
|
Will County School District #122 |
Aaa |
|
1,500 |
1,006 |
|
|
|
10,658 |
||||
|
Indiana - 0.5% |
|||||
|
Indiana Univ. Rev. Rfdg. (Student Fee Proj.) |
Aaa |
|
5,500 |
4,356 |
|
|
Municipal Bonds - continued |
|||||
|
Moody's Ratings |
Principal Amount (000s) |
Value (Note 1) (000s) |
|||
|
Iowa - 0.3% |
|||||
|
Iowa Student Ln. Liquidity Corp. Student Ln. Rev.: |
|
|
|
|
|
|
Series A, 6.35% 3/1/01 |
Aa1 |
|
$ 1,500 |
$ 1,514 |
|
|
Series D, 7% 12/1/03 (AMBAC Insured) (e) |
Aaa |
|
1,535 |
1,571 |
|
|
|
3,085 |
||||
|
Kentucky - 1.3% |
|||||
|
Kentucky Property & Bldgs. Commission Rev.: |
|
|
|
|
|
|
5.5% 9/1/07 |
Aa3 |
|
2,065 |
2,174 |
|
|
5.5% 9/1/08 |
Aa3 |
|
3,930 |
4,148 |
|
|
Owensboro Elec. Lt. & Pwr. Rev. Rfdg. Series B, 0% 1/1/01 (AMBAC Insured) |
Aaa |
|
5,450 |
5,373 |
|
|
|
11,695 |
||||
|
Louisiana - 0.2% |
|||||
|
Louisiana Pub. Facilities Auth. Rev. Rfdg. (Student Ln. Prog.) Sr. Series A1, 6.2% 3/1/01 |
Aaa |
|
1,900 |
1,916 |
|
|
Maryland - 1.6% |
|||||
|
Maryland Gen. Oblig. (State & Local Facilities Ln. Prog.) Series 2, 5% 7/15/01 |
Aaa |
|
4,000 |
4,025 |
|
|
Montgomery County Gen. Oblig. (Consolidated Pub. Impt. Proj.) Series A, 5.2% 10/1/01 |
Aaa |
|
4,000 |
4,040 |
|
|
Univ. of Maryland Sys. Auxiliary Facility & Tuition Rev. Rfdg. Series B, 5% 10/1/01 |
Aa3 |
|
6,325 |
6,365 |
|
|
|
14,430 |
||||
|
Massachusetts - 2.9% |
|||||
|
Massachusetts Dev. Fin. Agcy. Rev.: |
|
|
|
|
|
|
(Massachusetts Biomedical Research Corp. Proj.) Series C: |
|
|
|
|
|
|
5.75% 8/1/06 |
A2 |
|
1,200 |
1,228 |
|
|
5.875% 8/1/08 |
A2 |
|
1,630 |
1,681 |
|
|
Massachusetts Gen. Oblig.: |
|
|
|
|
|
|
(Consolidated Ln. Prog.): |
Aa2 |
|
7,000 |
7,338 |
|
|
Series C, 6.75% 8/1/06 |
Aaa |
|
1,000 |
1,041 |
|
|
Rfdg. Series A, 5% 8/1/01 |
Aa2 |
|
1,000 |
1,006 |
|
|
Rfdg. (Cap. Appreciation) Series B, 0% 8/1/02 (AMBAC Insured) |
Aaa |
|
3,830 |
3,511 |
|
|
Massachusetts Health & Edl. Facilities Auth. Rev. Rfdg. (Fairview Extended Care Proj.) Series B, 4.55% 1/1/21 (MBIA Insured) |
Aaa |
|
3,800 |
3,782 |
|
|
Municipal Bonds - continued |
|||||
|
Moody's Ratings |
Principal Amount (000s) |
Value (Note 1) (000s) |
|||
|
Massachusetts - continued |
|||||
|
Massachusetts Ind. Fin. Agcy. Resource Recovery Rev. Rfdg. (Ogden Haverhill Proj.) Series A, 4.5% 12/1/01 |
BBB |
|
$ 3,000 |
$ 2,976 |
|
|
Massachusetts Wtr. Resources Auth. Rev. Rfdg. Series C, 5.25% 12/1/01 |
A1 |
|
2,000 |
2,019 |
|
|
New England Ed. Ln. Marketing Corp. Massachusetts Student Ln. Rev. Rfdg. Sr. Issue D, 6.2% 9/1/00 |
Aaa |
|
2,000 |
2,000 |
|
|
|
26,582 |
||||
|
Michigan - 1.5% |
|||||
|
Detroit Convention Facilities Rev. Rfdg. |
|
|
|
|
|
|
4.75% 9/30/00 |
A |
|
5,220 |
5,221 |
|
|
4.8% 9/30/01 |
A |
|
1,000 |
1,005 |
|
|
Michigan Hosp. Fin. Auth. Rev. Rfdg.: |
|
|
|
|
|
|
(Genesys Reg'l. Med. Hosp. Proj.) Series A: |
|
|
|
|
|
|
5.25% 10/1/02 (Escrowed to Maturity) (f) |
Baa2 |
|
2,040 |
2,073 |
|
|
5.25% 10/1/03 (Escrowed to Maturity) (f) |
Baa2 |
|
1,000 |
1,022 |
|
|
(Mercy Health Svcs. Proj.): |
|
|
|
|
|
|
Series S, 5.75% 8/15/05 |
Aa3 |
|
1,275 |
1,309 |
|
|
Series T, 5.75% 8/15/05 |
Aa3 |
|
3,070 |
3,151 |
|
|
|
13,781 |
||||
|
Minnesota - 2.9% |
|||||
|
Minneapolis Gen. Oblig. (Cap. Appreciation) Series B, 0% 12/1/03 |
Aaa |
|
500 |
432 |
|
|
Minnesota Gen. Oblig.: |
|
|
|
|
|
|
4.75% 8/1/01 |
Aaa |
|
12,250 |
12,300 |
|
|
5.2% 8/1/07 |
Aaa |
|
9,000 |
9,133 |
|
|
5.9% 8/1/05 (Pre-Refunded to 8/1/02 |
Aaa |
|
3,815 |
3,921 |
|
|
|
25,786 |
||||
|
Mississippi - 0.1% |
|||||
|
Mississippi Higher Ed. Student Ln. Series 2000 B3, 5.3% 9/1/08 (e) |
A2 |
|
1,190 |
1,194 |
|
|
Missouri - 0.5% |
|||||
|
Kansas City Arpt. Rev. Rfdg. (Gen. Impt. Proj.) Series A, 5.25% 9/1/03 (FSA Insured) (e) |
Aaa |
|
4,085 |
4,156 |
|
|
Municipal Bonds - continued |
|||||
|
Moody's Ratings |
Principal Amount (000s) |
Value (Note 1) (000s) |
|||
|
Nebraska - 2.2% |
|||||
|
Nebraska Pub. Pwr. District Rev.: |
|
|
|
|
|
|
(Pwr. Supply Sys. Proj.) Series A, 5.25% 1/1/28 (MBIA Insured) (Pre-Refunded to 1/1/05 @ 101) (f) |
Aaa |
|
$ 4,400 |
$ 4,570 |
|
|
Rfdg.: |
|
|
|
|
|
|
Series A, 5% 1/1/01 |
A1 |
|
8,500 |
8,517 |
|
|
(Pwr. Supply Sys. Proj.) 5.8% 1/1/06 (Pre-Refunded to 1/1/03 @ 102) (f) |
Aaa |
|
3,500 |
3,671 |
|
|
(Nuclear Facilities Proj.) 5.4% 7/1/01 |
A1 |
|
3,085 |
3,111 |
|
|
|
19,869 |
||||
|
Nevada - 0.6% |
|||||
|
Clark County Gen. Oblig. (Flood Cont. Proj.) |
Aa2 |
|
1,000 |
1,018 |
|
|
Clark County Hwy. Impt. Rev. (Motor Vehicle |
Aaa |
|
2,000 |
2,011 |
|
|
Clark County Passenger Facility Charge Rev. |
Aaa |
|
2,350 |
2,444 |
|
|
|
5,473 |
||||
|
New Jersey - 4.6% |
|||||
|
New Jersey Econ. Dev. Auth. Rev. |
Aaa |
|
15,835 |
16,641 |
|
|
New Jersey Gen. Oblig. Rfdg. Series E, 6% 7/15/03 |
Aa1 |
|
6,730 |
7,021 |
|
|
New Jersey Health Care Facilities Fing. Auth.
Rev. Rfdg. (Atlantic City Med. Ctr. Proj.) |
A3 |
|
3,500 |
3,572 |
|
|
New Jersey Trans. Corp. Series A: |
|
|
|
|
|
|
5.25% 9/1/01 (FSA Insured) |
Aaa |
|
5,000 |
5,023 |
|
|
5.4% 9/1/02 (FSA Insured) |
Aaa |
|
6,950 |
7,039 |
|
|
South Jersey Trans. Auth. Trans. Sys. Rev. |
Aaa |
|
1,965 |
2,064 |
|
|
|
41,360 |
||||
|
New Mexico - 0.3% |
|||||
|
Albuquerque Arpt. Rev. Rfdg. 6.25% 7/1/01 (AMBAC Insured) (e) |
Aaa |
|
980 |
994 |
|
|
New Mexico Edl. Assistance Foundation Student Ln. Rev. Sr. Series IV A1, 6.5% 3/1/04 (e) |
Aaa |
|
2,065 |
2,134 |
|
|
|
3,128 |
||||
|
Municipal Bonds - continued |
|||||
|
Moody's Ratings |
Principal Amount (000s) |
Value (Note 1) (000s) |
|||
|
New York - 7.3% |
|||||
|
Metro. Trans. Auth. Commuter Facilities Rev. Series A: |
|
|
|
|
|
|
5% 7/1/06 |
Baa1 |
|
$ 1,520 |
$ 1,543 |
|
|
5.125% 7/1/07 |
Baa1 |
|
3,015 |
3,071 |
|
|
5.25% 7/1/08 |
Baa1 |
|
3,640 |
3,734 |
|
|
5.375% 7/1/09 |
Baa1 |
|
3,635 |
3,758 |
|
|
5.5% 7/1/10 |
Baa1 |
|
4,220 |
4,379 |
|
|
Metro. Trans. Auth. Svc. Contract Rev. Series O, 5.375% 7/1/02 |
Baa1 |
|
2,000 |
2,029 |
|
|
Muni. Assistance Corp. for New York City: |
|
|
|
|
|
|
Rfdg.: |
|
|
|
|
|
|
Series E, 5.5% 7/1/01 |
Aa2 |
|
20,400 |
20,609 |
|
|
Series L, 6% 7/1/06 |
Aa2 |
|
1,000 |
1,076 |
|
|
Series G, 5.5% 7/1/01 |
Aa2 |
|
5,000 |
5,052 |
|
|
New York City Gen. Oblig.: |
|
|
|
|
|
|
Rfdg.: |
|
|
|
|
|
|
Series A, 5.7% 8/1/02 |
A2 |
|
1,500 |
1,533 |
|
|
Series E, 5.4% 2/15/03 |
A2 |
|
6,285 |
6,411 |
|
|
Series D: |
|
|
|
|
|
|
6.6% 2/1/03 |
A2 |
|
975 |
1,021 |
|
|
6.6% 2/1/03 (Escrowed to Maturity) (f) |
A3 |
|
25 |
26 |
|
|
Series H: |
|
|
|
|
|
|
6.9% 2/1/01 |
A3 |
|
265 |
268 |
|
|
6.9% 2/1/01 (Escrowed to Maturity) (f) |
Aaa |
|
135 |
136 |
|
|
Series J, 6% 2/15/04 |
A2 |
|
1,750 |
1,829 |
|
|
New York State Med. Care Facilities Fin. Agcy. Rev. (Mental Health Services Facilities Proj.) Series C, 7.3% 2/15/21 (Pre-Refunded to 8/15/01 @ 102) (f) |
Aaa |
|
1,785 |
1,870 |
|
|
New York State Thruway Auth. Svc. Contract Rev. (Local Hwy. & Bridge Proj.): |
|
|
|
|
|
|
6% 4/1/01 |
Baa1 |
|
1,100 |
1,110 |
|
|
6% 4/1/03 |
Baa1 |
|
2,300 |
2,378 |
|
|
Triborough Bridge & Tunnel Auth. Revs. Rfdg. Series B, 6% 1/1/03 |
Aa3 |
|
3,885 |
4,022 |
|
|
|
65,855 |
||||
|
North Carolina - 3.3% |
|||||
|
North Carolina Eastern Muni. Pwr. Agcy. Pwr. Sys. Rev. Rfdg.: |
|
|
|
|
|
|
Series A: |
|
|
|
|
|
|
5.2% 1/1/01 |
Baa1 |
|
3,000 |
3,001 |
|
|
7.875% 1/1/02 |
Baa3 |
|
9,255 |
9,571 |
|
|
Municipal Bonds - continued |
|||||
|
Moody's Ratings |
Principal Amount (000s) |
Value (Note 1) (000s) |
|||
|
North Carolina - continued |
|||||
|
North Carolina Eastern Muni. Pwr. Agcy. Pwr. Sys. Rev. Rfdg.: - continued |
|
|
|
|
|
|
Series B, 5.5% 1/1/02 |
Baa3 |
|
$ 1,000 |
$ 1,004 |
|
|
North Carolina Muni. Pwr. Agcy. #1 Catawba Elec. Rev.: |
|
|
|
|
|
|
Rfdg.: |
|
|
|
|
|
|
5.75% 1/1/02 |
Baa1 |
|
1,000 |
1,008 |
|
|
6% 1/1/04 (AMBAC Insured) |
Aaa |
|
4,500 |
4,700 |
|
|
6% 1/1/05 (AMBAC Insured) |
Aaa |
|
9,750 |
10,224 |
|
|
|
29,508 |
||||
|
Ohio - 4.1% |
|||||
|
Akron Wtrwks. Rev. 6.55% 3/1/12 |
Aaa |
|
3,750 |
3,865 |
|
|
Cleveland Arpt. Sys. Rev. Series A, 5.5% 1/1/05 (FSA Insured) (e) |
Aaa |
|
1,000 |
1,032 |
|
|
Franklin County Gen. Oblig. (Courthouse Proj.) 6.375% 12/1/17 (Pre-Refunded to 12/1/01 @ 102) (f) |
- |
|
3,800 |
3,963 |
|
|
Ohio Bldg. Auth.: |
|
|
|
|
|
|
(Administration Bldg. Fund Prog.) Series A, 5.5% 10/1/01 |
Aa2 |
|
2,175 |
2,202 |
|
|
(Adult Correctional Proj.) Series A: |
|
|
|
|
|
|
5.5% 4/1/02 |
Aa2 |
|
1,390 |
1,414 |
|
|
5.5% 4/1/03 |
Aa2 |
|
2,280 |
2,341 |
|
|
5.75% 4/1/08 |
Aa2 |
|
3,555 |
3,802 |
|
|
Rfdg. (State Correctional Facilities Proj.) |
Aa2 |
|
5,600 |
5,985 |
|
|
Ohio Wtr. Dev. Auth. Poll. Cont. Rev.: |
|
|
|
|
|
|
(Wtr. Cont. Ln. Fund Prog.) 5.25% 6/1/06 (MBIA Insured) |
Aaa |
|
1,810 |
1,872 |
|
|
Rfdg. (Ohio Edison Co. Proj.) Series A, 4.25%, tender 6/1/01 |
Baa3 |
|
10,000 |
9,925 |
|
|
Ohio Wtr. Dev. Auth. Rev. (Fresh Wtr. Svc. Proj.) 5.4% 6/1/05 (AMBAC Insured) |
Aaa |
|
1,000 |
1,037 |
|
|
|
37,438 |
||||
|
Oregon - 0.2% |
|||||
|
Tri-County Metro. Trans. District (Lt. Rail
Extension Proj.) Series A, 5.6% 7/1/03 |
Aaa |
|
2,000 |
2,061 |
|
|
Municipal Bonds - continued |
|||||
|
Moody's Ratings |
Principal Amount (000s) |
Value (Note 1) (000s) |
|||
|
Pennsylvania - 1.9% |
|||||
|
Pennsylvania Higher Edl. Facilities Auth. Health Svcs. Rev. Rfdg. (Univ. of Pennslyvania Proj.) Series A, 5.125% 1/1/01 |
A3 |
|
$ 4,000 |
$ 4,004 |
|
|
Philadelphia Gas Works Rev. First Series A, 5.25% 7/1/05 (FSA Insured) |
Aaa |
|
5,000 |
5,148 |
|
|
Philadelphia Wtr. & Swr. Rev. 6.75% 8/1/05 (MBIA Insured) |
Aaa |
|
3,360 |
3,680 |
|
|
Somerset County Gen. Auth. Commonwealth Lease Rev. 6.25% 10/15/11 (FGIC Insured) (Pre-Refunded to 10/15/01 @ 100) (f) |
Aaa |
|
4,000 |
4,083 |
|
|
|
16,915 |
||||
|
South Carolina - 3.1% |
|||||
|
Berkeley County School District 7% 4/1/07 |
Aa1 |
|
2,615 |
2,958 |
|
|
Charleston County School District 4% 2/1/01 |
Aa1 |
|
5,000 |
4,993 |
|
|
Richland County School District #2 Series B, 5.6% 3/1/02 (MBIA Insured) |
Aaa |
|
1,100 |
1,120 |
|
|
South Carolina Ed. Assistance Auth. Rev. |
- |
|
1,400 |
1,419 |
|
|
South Carolina Gen. Oblig.: |
|
|
|
|
|
|
(Cap. Impt. Proj.) Series B, 5.75% 8/1/01 |
Aaa |
|
5,000 |
5,064 |
|
|
Series A, 5.5% 10/1/03 |
Aaa |
|
3,470 |
3,581 |
|
|
South Carolina Jobs Econ. Dev. Auth. Hosp. Facilities Rev. (Palmetto Health Alliance Proj.) Series A: |
|
|
|
|
|
|
6.125% 12/15/02 |
Baa1 |
|
1,670 |
1,673 |
|
|
6.3% 12/15/03 |
Baa1 |
|
2,940 |
2,949 |
|
|
South Carolina Pub. Svc. Auth. Rev. Rfdg. (Santee Cooper Proj.) Series B, 6.5% 7/1/26 (Pre-Refunded to 7/1/01 @ 102) (f) |
Aaa |
|
4,145 |
4,300 |
|
|
|
28,057 |
||||
|
Tennessee - 3.8% |
|||||
|
Memphis-Shelby County Arpt. Auth. Arpt. Rev. Rfdg. Series A: |
|
|
|
|
|
|
5.25% 2/15/01 (MBIA Insured) (e) |
Aaa |
|
800 |
803 |
|
|
5.25% 2/15/02 (MBIA Insured) (e) |
Aaa |
|
1,000 |
1,010 |
|
|
Shelby County Gen. Oblig.: |
|
|
|
|
|
|
Series 1996 B, 5.75% 11/1/21 (FSA Insured) (Pre-Refunded to 11/1/06 @ 100) (f) |
Aaa |
|
14,000 |
14,907 |
|
|
Municipal Bonds - continued |
|||||
|
Moody's Ratings |
Principal Amount (000s) |
Value (Note 1) (000s) |
|||
|
Tennessee - continued |
|||||
|
Shelby County Gen. Oblig.: - continued |
|
|
|
|
|
|
Series A: |
|
|
|
|
|
|
0% 5/1/10 (Pre-Refunded to 5/1/05 @ 74.444) (f) |
AA+ |
|
$ 15,750 |
$ 9,394 |
|
|
0% 5/1/12 (Pre-Refunded to 5/1/05 @ 65.1568) (f) |
AA+ |
|
15,130 |
7,899 |
|
|
|
34,013 |
||||
|
Texas - 12.7% |
|||||
|
Alief Independent School District Rfdg. (Cap. Appreciation) 0% 2/15/02 |
Aaa |
|
1,000 |
936 |
|
|
Austin Arpt. Sys. Rev. Prior Lien Series A, 6.5% 11/15/05 (MBIA Insured) (e) |
Aaa |
|
7,810 |
8,396 |
|
|
Austin Combined Util. Sys. Rev. Rfdg. Series A, 5.5% 11/15/06 |
A2 |
|
5,000 |
5,158 |
|
|
Brazos River Auth. Rev. Rfdg. (Reliant Energy, Inc. Proj.) Series B, 5.2%, tender 12/1/02 |
Baa1 |
|
5,000 |
5,003 |
|
|
Corpus Christi Independent School District Rfdg. (Cap. Appreciation) 0% 8/15/01 |
Aaa |
|
1,600 |
1,535 |
|
|
Cypress-Fairbanks Independent School District Rfdg. (Cap. Appreciation) Series B, 0% 8/1/07 (AMBAC Insured) |
Aaa |
|
10,000 |
7,152 |
|
|
Dallas County Gen. Oblig. 7% 8/15/01 |
Aaa |
|
1,750 |
1,794 |
|
|
Dallas Fort Worth Int'l. Arpt. Facility Impt. Corp. Rev. (American Airlines, Inc. Proj.) 7.5% 11/1/25 (Pre-Refunded to 11/1/00 @ 102) (e)(f) |
Baa1 |
|
3,340 |
3,421 |
|
|
Harris County Gen. Oblig.: |
|
|
|
|
|
|
(Cap. Appreciation) (Toll Road Proj.) Sub Lien Series A, 0% 8/15/02 (MBIA Insured) |
Aaa |
|
3,000 |
2,744 |
|
|
Rfdg. (Cap. Appreciation): |
|
|
|
|
|
|
(Toll Road Proj.) Sub Lien, 0% 8/1/01 |
Aa1 |
|
3,490 |
3,354 |
|
|
Series A, 0% 8/15/07 (FGIC Insured) |
Aaa |
|
4,400 |
3,141 |
|
|
Houston Wtr. & Swr. Sys. Rev. Series A, 6.375% 12/1/22 (MBIA Insured) (Pre-Refunded to 12/1/02 @ 102) (f) |
Aaa |
|
3,300 |
3,500 |
|
|
Irving Independent School District Rfdg. |
Aaa |
|
3,100 |
2,770 |
|
|
Klein Independent School District Rfdg. 5.25% 8/1/06 |
Aaa |
|
2,000 |
2,066 |
|
|
North East Independent School District: |
|
|
|
|
|
|
7% 2/1/02 |
Aaa |
|
1,250 |
1,293 |
|
|
7% 2/1/03 |
Aaa |
|
1,500 |
1,586 |
|
|
7% 2/1/04 |
Aaa |
|
2,250 |
2,423 |
|
|
7% 2/1/05 |
Aaa |
|
2,500 |
2,738 |
|
|
Municipal Bonds - continued |
|||||
|
Moody's Ratings |
Principal Amount (000s) |
Value (Note 1) (000s) |
|||
|
Texas - continued |
|||||
|
North Texas Health Facilities Dev. Corp. Hosp. Rev. Rfdg. (United Reg'l. Health Care Sys., Inc. Proj.) 4.5% 9/1/02 (MBIA Insured) |
Aaa |
|
$ 2,050 |
$ 2,052 |
|
|
Port Houston Auth. Harris County 6% 10/1/06 (FGIC Insured) (e) |
Aaa |
|
2,000 |
2,130 |
|
|
San Antonio Elec. & Gas Rev. Rfdg. |
Aaa |
|
3,830 |
2,669 |
|
|
San Antonio Wtr. Rev. 6.2% 5/15/03 |
Aaa |
|
4,665 |
4,872 |
|
|
Texas A&M Univ. Rev. Rfdg. (Fing. Sys. Proj.) 5.25% 5/15/01 |
Aa2 |
|
2,300 |
2,315 |
|
|
Texas Gen. Oblig.: |
|
|
|
|
|
|
(Texas Pub. Fin. Auth. Proj.) Series A, 6.25% 10/1/06 |
Aa1 |
|
16,210 |
17,209 |
|
|
Rfdg. (Cap. Appreciation): |
|
|
|
|
|
|
(Superconducting Proj.) Series C, 0% 4/1/02 (FGIC Insured) |
Aaa |
|
2,750 |
2,559 |
|
|
(Texas Pub. Fin. Auth. Proj.) Series A, 0% 10/1/01 (AMBAC Insured) |
Aaa |
|
9,000 |
8,585 |
|
|
Texas Muni. Pwr. Agcy. Rev. Rfdg. 5.25% 9/1/06 (MBIA Insured) |
Aaa |
|
10,000 |
10,298 |
|
|
Texas Pub. Fin. Auth. Bldg. Rev. Rfdg. (Cap. Appreciation) 0% 2/1/05 (MBIA Insured) |
Aaa |
|
3,725 |
3,023 |
|
|
|
114,722 |
||||
|
Utah - 3.6% |
|||||
|
Intermountain Pwr. Agcy. Pwr. Supply Rev.: |
|
|
|
|
|
|
Rfdg. Series C, 6% 7/1/01 (MBIA Insured) |
Aaa |
|
2,000 |
2,026 |
|
|
Rfdg. (Cap. Appreciation) Series B, 0% 7/1/01 (AMBAC Insured) |
Aaa |
|
12,495 |
12,034 |
|
|
Series B, 5.5% 7/1/01 (MBIA Insured) |
Aaa |
|
13,825 |
13,948 |
|
|
Jordan County School District 5.75% 6/15/07 |
AAA |
|
4,670 |
4,971 |
|
|
|
32,979 |
||||
|
Virginia - 1.9% |
|||||
|
Fairfax County Wtr. Auth. Wtr. Rev. 5.75% 4/1/29 (Pre-Refunded to 4/1/02 @ 100) (f) |
Aaa |
|
7,000 |
7,151 |
|
|
Richmond Metro. Auth. Expressway Rev. Rfdg. Series A, 6.375% 7/15/16 (FGIC Insured) (Pre-Refunded to 7/15/02 @ 102) (f) |
Aaa |
|
5,400 |
5,697 |
|
|
Municipal Bonds - continued |
|||||
|
Moody's Ratings |
Principal Amount (000s) |
Value (Note 1) (000s) |
|||
|
Virginia - continued |
|||||
|
Virginia Gen. Oblig. 6% 6/1/02 |
Aaa |
|
$ 1,810 |
$ 1,860 |
|
|
Virginia Pub. School Auth. Series A, 6% 8/1/02 |
Aa1 |
|
2,000 |
2,059 |
|
|
|
16,767 |
||||
|
Washington - 5.9% |
|||||
|
Clark County Pub. Util. District #1 Generating Sys. Rev. 6% 1/1/02 (FGIC Insured) |
Aaa |
|
2,000 |
2,041 |
|
|
Pierce County School District #10 Tacoma |
Aaa |
|
11,295 |
11,437 |
|
|
Port Seattle Gen. Oblig. Series B: |
|
|
|
|
|
|
5.5% 2/1/06 (MBIA Insured) (e) |
Aaa |
|
4,250 |
4,383 |
|
|
5.5% 2/1/07 (MBIA Insured) (e) |
Aaa |
|
5,775 |
5,966 |
|
|
Washington Gen. Oblig.: |
|
|
|
|
|
|
Rfdg. Series R 96 B, 5.5% 7/1/03 |
Aa1 |
|
1,000 |
1,027 |
|
|
Series 1996 A, 6.75% 7/1/05 |
Aa1 |
|
3,375 |
3,692 |
|
|
Washington Pub. Pwr. Supply Sys. Nuclear Proj. #1 Rev. Rfdg. Series A, 6.5% 7/1/02 |
Aa1 |
|
3,000 |
3,097 |
|
|
Washington Pub. Pwr. Supply Sys. Nuclear Proj. #2 Rev. Rfdg.: |
|
|
|
|
|
|
(Bonneville Pwr. Administration Proj.) Series A, 6% 7/1/08 (AMBAC Insured) |
Aaa |
|
3,000 |
3,220 |
|
|
Series A: |
|
|
|
|
|
|
5.75% 7/1/08 |
Aa1 |
|
3,000 |
3,166 |
|
|
6.5% 7/1/02 |
Aa1 |
|
2,220 |
2,292 |
|
|
Series B, 5.5% 7/1/03 |
Aa1 |
|
2,000 |
2,045 |
|
|
Washington Pub. Pwr. Supply Sys. Nuclear Proj. #3 Rev. Rfdg.: |
|
|
|
|
|
|
Series B, 0% 7/1/03 |
Aa1 |
|
7,065 |
6,184 |
|
|
Series C, 5% 7/1/06 (FSA Insured) |
Aaa |
|
5,000 |
5,064 |
|
|
|
53,614 |
||||
|
Wisconsin - 1.0% |
|||||
|
Wisconsin Gen. Oblig.: |
|
|
|
|
|
|
Series 5, 4.65% 11/1/04 |
Aa2 |
|
4,255 |
4,257 |
|
|
Series C, 5.25% 5/1/01 |
Aa2 |
|
1,370 |
1,379 |
|
|
Wisconsin Health & Edl. Facilities Auth. Rev.
(Saint Lukes Med. Ctr. Proj.) 7.1% 8/15/11
(MBIA Insured) (Pre-Refunded to 8/15/01 |
Aaa |
|
3,000 |
3,136 |
|
|
|
8,772 |
||||
|
TOTAL MUNICIPAL BONDS (Cost $848,666) |
854,818 |
||||
|
Municipal Notes - 3.9% |
|||
|
Principal Amount (000s) |
Value (Note 1) (000s) |
||
|
Texas - 3.9% |
|||
|
Texas Gen. Oblig. TRAN 5.25% 8/31/01 |
$ 35,000 |
$ 35,321 |
|
|
Cash Equivalents - 1.9% |
|||
|
Shares |
|
||
|
Fidelity Municipal Cash Central Fund, 4.28% (c)(d) |
16,547,697 |
16,548 |
|
|
TOTAL INVESTMENT PORTFOLIO - 100.4% (Cost $900,537) |
906,687 |
||
|
NET OTHER ASSETS - (0.4)% |
(3,169) |
|
|
NET ASSETS - 100% |
$ 903,518 |
|
|
Security Type Abbreviation |
|
TRAN - TAX AND REVENUE |
|
Legend |
|
(a) S&P credit ratings are used in the absence of a rating by Moody's Investors Service, Inc. |
|
(b) Security purchased on a delayed delivery or when-issued basis. |
|
(c) Information in this report regarding holdings by state and security types does not reflect the holdings of the Fidelity Municipal Cash Central Fund. |
|
(d) The rate quoted is the annualized seven-day yield of the fund at period end. |
|
(e) Private activity obligations whose interest is subject to the federal alternative minimum tax for individuals. |
|
(f) Security collateralized by an amount sufficient to pay interest and principal. |
|
Other Information |
|
The composition of long-term debt holdings as a percentage of total value of investments in securities, is as follows (ratings are unaudited): |
|
Moody's Ratings |
S&P Ratings |
|||
|
Aaa, Aa, A |
83.1% |
|
AAA, AA, A |
83.6% |
|
Baa |
7.0% |
|
BBB |
4.0% |
|
Ba |
0.0% |
|
BB |
1.1% |
|
B |
0.0% |
|
B |
0.0% |
|
Caa |
0.0% |
|
CCC |
0.0% |
|
Ca, C |
0.0% |
|
CC, C |
0.0% |
|
|
|
|
D |
0.0% |
|
The percentage not rated by Moody's or S&P amounted to 0.6%. |
|
|
|
The distribution of municipal securities by revenue source, as a percentage of total net assets, is as follows: |
|
General Obligations |
36.5% |
|
Electric Utilities |
16.6 |
|
Escrowed/Pre-Refunded |
15.7 |
|
Transportation |
10.7 |
|
Special Tax |
9.7 |
|
Others* (individually less than 5%) |
10.8 |
|
|
100.0% |
|
* Includes short-term investments |
|
Income Tax Information |
|
At August 31, 2000, the aggregate cost |
|
The fund hereby designates approximately $214,000 as a capital gain dividend for the purpose of the dividend paid deduction. |
|
At August 31, 2000, the fund had a capital loss carryforward of approximately $218,000 all of which will expire on August 31, 2008. |
See accompanying notes which are an integral part of the financial statements.
Annual Report
Statement of Assets and Liabilities
|
Amounts in thousands (except per-share amount) |
August 31, 2000 |
|
|
Assets |
|
|
|
Investment in securities, at value (cost $900,537) - |
|
$ 906,687 |
|
Cash |
|
1 |
|
Receivable for fund shares sold |
|
1,365 |
|
Interest receivable |
|
10,035 |
|
Total assets |
|
918,088 |
|
Liabilities |
|
|
|
Payable for investments purchased |
$ 6,336 |
|
|
Delayed delivery |
5,476 |
|
|
Payable for fund shares redeemed |
1,827 |
|
|
Distributions payable |
529 |
|
|
Accrued management fee |
394 |
|
|
Other payables and accrued expenses |
8 |
|
|
Total liabilities |
|
14,570 |
|
Net Assets |
|
$ 903,518 |
|
Net Assets consist of: |
|
|
|
Paid in capital |
|
$ 899,617 |
|
Undistributed net interest income |
|
9 |
|
Accumulated undistributed net realized gain (loss) |
|
(2,258) |
|
Net unrealized appreciation (depreciation) on investments |
|
6,150 |
|
Net Assets, for 90,061 shares outstanding |
|
$ 903,518 |
|
Net Asset Value, offering price and redemption price |
|
$10.03 |
See accompanying notes which are an integral part of the financial statements.
Annual Report
Financial Statements - continued
Statement of Operations
|
Amounts in thousands |
Year ended August 31, 2000 |
|
|
Interest Income |
|
$ 34,800 |
|
Expenses |
|
|
|
Management fee |
$ 4,198 |
|
|
Non-interested trustees' compensation |
3 |
|
|
Total expenses before reductions |
4,201 |
|
|
Expense reductions |
(73) |
4,128 |
|
Net interest income |
|
30,672 |
|
Realized and Unrealized Gain (Loss) Net realized gain (loss) on investment securities |
|
(1,866) |
|
Change in net unrealized appreciation (depreciation) |
|
6,149 |
|
Net gain (loss) |
|
4,283 |
|
Net increase (decrease) in net assets resulting |
|
$ 34,955 |
See accompanying notes which are an integral part of the financial statements.
Annual Report
Financial Statements - continued
Statement of Changes in Net Assets
|
Amounts in thousands |
Year ended |
Year ended |
|
Increase (Decrease) in Net Assets |
|
|
|
Operations |
$ 30,672 |
$ 26,004 |
|
Net realized gain (loss) |
(1,866) |
2,677 |
|
Change in net unrealized appreciation (depreciation) |
6,149 |
(13,114) |
|
Net increase (decrease) in net assets resulting |
34,955 |
15,567 |
|
Distributions to shareholders |
(30,876) |
(26,004) |
|
In excess of net realized gain |
(235) |
- |
|
Total distributions |
(31,111) |
(26,004) |
|
Share transactions |
706,425 |
337,840 |
|
Reinvestment of distributions |
25,165 |
20,370 |
|
Cost of shares redeemed |
(529,688) |
(299,020) |
|
Net increase (decrease) in net assets resulting |
201,902 |
59,190 |
|
Total increase (decrease) in net assets |
205,746 |
48,753 |
|
Net Assets |
|
|
|
Beginning of period |
697,772 |
649,019 |
|
End of period (including undistributed net interest |
$ 903,518 |
$ 697,772 |
|
Other Information Shares |
|
|
|
Sold |
71,021 |
33,370 |
|
Issued in reinvestment of distributions |
2,530 |
2,011 |
|
Redeemed |
(53,282) |
(29,541) |
|
Net increase (decrease) |
20,269 |
5,840 |
See accompanying notes which are an integral part of the financial statements.
Annual Report
Financial Highlights
|
Years ended August 31, |
2000 |
1999 |
1998 |
1997 |
1996 |
|
Selected Per-Share Data |
|
|
|
|
|
|
Net asset value, |
$ 10.000 |
$ 10.150 |
$ 10.040 |
$ 9.930 |
$ 9.980 |
|
Income from Investment Operations |
.399 B |
.395 |
.419 |
.425 |
.418 |
|
Net realized and |
.034 |
(.150) |
.110 |
.110 |
(.050) |
|
Total from investment |
.433 |
.245 |
.529 |
.535 |
.368 |
|
Less Distributions |
|
|
|
|
|
|
From net interest income |
(.400) |
(.395) |
(.419) |
(.425) |
(.418) |
|
In excess of net realized gain |
(.003) |
- |
- |
- |
- |
|
Total distributions |
(.403) |
(.395) |
(.419) |
(.425) |
(.418) |
|
Net asset value, end of period |
$ 10.030 |
$ 10.000 |
$ 10.150 |
$ 10.040 |
$ 9.930 |
|
Total Return A |
4.45% |
2.44% |
5.37% |
5.49% |
3.75% |
|
Ratios and Supplemental Data |
|
|
|
|
|
|
Net assets, end of period |
$ 904 |
$ 698 |
$ 649 |
$ 726 |
$ 791 |
|
Ratio of expenses to average |
.54% C |
.55% |
.55% |
.55% |
.54% C |
|
Ratio of net interest income to average net assets |
4.02% |
3.89% |
4.15% |
4.25% |
4.17% |
|
Portfolio turnover rate |
53% |
66% |
33% |
32% |
78% |
A The total returns would have been lower had certain expenses not been reduced during the periods shown.
B Net interest income per share has been calculated based on average shares outstanding during the period.
C FMR agreed to reimburse a portion of the fund's expenses during the period. Without this reimbursement, the fund's expense ratio would have been higher.
See accompanying notes which are an integral part of the financial statements.
Annual Report
For the period ended August 31, 2000
1. Significant Accounting Policies.
Spartan Short-Intermediate Municipal Income Fund (the fund) is a fund of Fidelity Union Street Trust (the trust) and is authorized to issue an unlimited number of shares. The trust is registered under the Investment Company Act of 1940, as amended, as an open-end management investment company organized as a Massachusetts business trust. The financial statements have been prepared in conformity with generally accepted accounting principles which require management to make certain estimates and assumptions at the date of the financial statements. At a special meeting of the shareholders of the fund held on September 13, 2000, shareholders approved an Agreement and Plan of Reorganization, providing for the reorganization of the fund into Fidelity Municipal Trust, effective on or about February 28, 2001. The following summarizes the significant accounting policies of the fund:
Security Valuation. Securities are valued based upon a computerized matrix system and/or appraisals by a pricing service, both of which consider market transactions and dealer-supplied valuations. Securities for which quotations are not readily available are valued at their fair value as determined in good faith under consistently applied procedures under the general supervision of the Board of Trustees. Short-term securities with remaining maturities of sixty days or less for which quotations are not readily available are valued at amortized cost or original cost plus accrued interest, both of which approximate current value.
Income Taxes. As a qualified regulated investment company under Subchapter M of the Internal Revenue Code, the fund is not subject to income taxes to the extent that it distributes substantially all of its taxable income for its fiscal year. The schedule of investments includes information regarding income taxes under the caption "Income Tax Information."
Interest Income. Interest income, which includes amortization of premium and accretion of original issue discount, is accrued as earned.
Expenses. Most expenses of the trust can be directly attributed to a fund. Expenses which cannot be directly attributed are apportioned among the funds in the trust.
Distributions to Shareholders. Distributions are declared daily and paid monthly from net interest income. Distributions from realized gains, if any, are recorded on the ex-dividend date.
Income and capital gain distributions are determined in accordance with income tax regulations which may differ from generally accepted accounting principles. These differences, which may result in distribution reclassifications, are primarily due to differing treatments for futures transactions, market discount, capital loss carryforwards and losses deferred due to futures transactions and excise tax regulations.
Permanent book and tax basis differences relating to shareholder distributions will result in reclassifications to paid in capital. Undistributed net interest income and accumulated undistributed
Annual Report
Notes to Financial Statements - continued
1. Significant Accounting
Policies - continued
Distributions to Shareholders -
continued
net realized gain (loss) on investments may include temporary book and tax basis differences which will reverse in a subsequent period. Any taxable income or gain remaining at fiscal year end is distributed in the following year.
Security Transactions. Security transactions are accounted for as of trade date. Gains and losses on securities sold are determined on the basis of identified cost.
2. Operating Policies.
Fidelity Municipal Cash Central Fund. Pursuant to an Exemptive Order issued by the Securities and Exchange Commission, the fund may invest in the Fidelity Municipal Cash Central Fund (the Cash Fund) managed by Fidelity Investments Money Management, Inc. (FIMM), an affiliate of Fidelity Management & Research Company (FMR). The Cash Fund is an open-end money market fund available only to investment companies and other accounts managed by FMR and its affiliates. The Cash Fund seeks preservation of capital, liquidity, and current income by investing in high-quality, short-term municipal securities of various states and municipalities. Income distributions from the Cash Fund are declared daily and paid monthly from net interest income. Income distributions earned by the fund are recorded as interest income in the accompanying financial statements.
Delayed Delivery Transactions and When Issued Securities. The fund may purchase or sell securities on a delayed delivery or when issued basis. Payment and delivery may take place after the customary settlement period for that security. The price of the underlying securities and the date when the securities will be delivered and paid for are fixed at the time the transaction is negotiated. The values of the securities purchased on a delayed delivery or when issued basis are identified as such in the fund's schedule of investments. The fund may receive compensation for interest forgone in the purchase of a delayed delivery or when issued security. With respect to purchase commitments, the fund identifies securities as segregated in its records with a value at least equal to the amount of the commitment. Losses may arise due to changes in the market value of the underlying securities or if the counterparty does not perform under the contract, or if the issuer does not issue the securities due to political, economic, or other factors.
3. Purchases and Sales of Investments.
Purchases and sales of securities, other than short-term securities, aggregated $565,887,000 and $394,245,000, respectively.
4. Fees and Other Transactions with Affiliates.
Management Fee. As the fund's investment adviser, FMR receives a fee that is computed daily at an annual rate of .55% of the fund's average net assets. FMR pays all other expenses, except the compensation of the non-interested Trustees and
Annual Report
Notes to Financial Statements - continued
4. Fees and Other Transactions with Affiliates - continued
Management Fee - continued
certain exceptions such as interest, taxes, brokerage commissions and extraordinary expenses. The management fee paid to FMR by the fund is reduced by an amount equal to the fees and expenses paid by the fund to the non-interested Trustees. Under the Amended Contract effective October 1, 2000, FMR will receive a monthly fee that is calculated on the basis of a group fee rate plus a fixed individual fund fee rate applied to the average net assets of the fund. The group fee rate is the weighted average of a series of rates and is based on the monthly average net assets of all the mutual funds advised by FMR. The rates ranged from .0920% to .3700% for the period. The annual individual fund fee rate is .25%. Under the Amended Contract, the fund will be responsible for paying all other expenses unless they are borne by FMR under a volunatry expense limit.
Sub-Adviser Fee. As the fund's investment sub-adviser, FIMM, a wholly owned subsidiary of FMR, receives a fee from FMR of 50% of the management fee payable to FMR. The fee is paid prior to any voluntary expense reimbursements which may be in effect.
5. Expense Reductions.
Effective July 1, 2000, FMR voluntarily agreed to reimburse the fund's management fee above an annual rate of .51% of the fund's average net assets until October 1, 2000. For the period, the reimbursement reduced the expenses by $60,000.
Effective October 1, 2000, FMR voluntarily agreed to reimburse operating expenses (excluding interest, taxes, brokerage commissions and extraordinary expenses, if any) above an annual rate of .53% of the fund's average net assets until December 31, 2001.
In addition, through arrangements with the fund's custodian and transfer agent, credits realized as a result of uninvested cash balances were used to reduce a portion of the fund's expenses. During the period, the fund's expenses were reduced by $13,000 under these arrangements.
Annual Report
To the Trustees of Fidelity Union Street Trust and the Shareholders of Spartan Short-Intermediate Municipal Income Fund:
In our opinion, the accompanying statement of assets and liabilities, including the schedule of investments, and the related statements of operations and of changes in net assets and the financial highlights present fairly, in all material respects, the financial position of Spartan Short-Intermediate Municipal Income Fund (a fund of Fidelity Union Street Trust) at August 31, 2000, and the results of its operations, the changes in its net assets and the financial highlights for the periods indicated, in conformity with accounting principles generally accepted in the United States. These financial statements and financial highlights (hereafter referred to as "financial statements") are the responsibility of the Spartan Short-Intermediate Municipal Income Fund's management; our responsibility is to express an opinion on these financial statements based on our audits. We conducted our audits of these financial statements in accordance with auditing standards generally accepted in the United States which require that we plan and perform the audit to obtain reasonable assurance about whether the financial statements are free of material misstatement. An audit includes examining, on a test basis, evidence supporting the amounts and disclosures in the financial statements, assessing the accounting principles used and significant estimates made by management, and evaluating the overall financial statement presentation. We believe that our audits, which included confirmation of securities at August 31, 2000 by correspondence with the custodian, provide a reasonable basis for the opinion expressed above.
/s/PricewaterhouseCoopers LLP
PricewaterhouseCoopers LLP
Boston, Massachusetts
October 6, 2000
Annual Report
The fund hereby designates 100% of the long-term capital gain dividends distributed during the fiscal year as 20%-rate capital gain dividends.
During fiscal year ended 2000, 100% of the fund's income dividends was free from federal income tax, and 8.69% of the fund's income dividends was subject to the federal alternative minimum tax.
The fund will notify shareholders in January 2001 of amounts for use in preparing 2000 income tax returns.
Annual Report
A special meeting of the fund's shareholders was held on September 13, 2000. The results of votes taken among shareholders on proposals before them are reported below. Each vote reported represents one dollar of net asset value held on the record date for the meeting.
PROPOSAL 1
To elect a Board of Trustees.*
|
|
# of |
% of |
|
J. Michael Cook |
||
|
Affirmative |
420,491,296.06 |
93.414 |
|
Withheld |
29,647,967.50 |
6.586 |
|
TOTAL |
450,139,263.56 |
100.000 |
|
Ralph F. Cox |
||
|
Affirmative |
420,083,464.19 |
93.323 |
|
Withheld |
30,055,799.37 |
6.677 |
|
TOTAL |
450,139,263.56 |
100.000 |
|
Phyllis Burke Davis |
||
|
Affirmative |
420,129,555.73 |
93.333 |
|
Withheld |
30,009,707.83 |
6.667 |
|
TOTAL |
450,139,263.56 |
100.000 |
|
Robert M. Gates |
||
|
Affirmative |
420,443,818.04 |
93.403 |
|
Withheld |
29,695,445.52 |
6.597 |
|
TOTAL |
450,139,263.56 |
100.000 |
|
Edward C. Johnson 3d |
||
|
Affirmative |
420,186,956.23 |
93.346 |
|
Withheld |
29,952,307.33 |
6.654 |
|
TOTAL |
450,139,263.56 |
100.000 |
|
Donald J. Kirk |
||
|
Affirmative |
420,282,275.27 |
93.367 |
|
Withheld |
29,856,988.29 |
6.633 |
|
TOTAL |
450,139,263.56 |
100.000 |
|
|
# of |
% of |
|
Maria L. Knowles |
||
|
Affirmative |
420,494,589.50 |
93.414 |
|
Withheld |
29,644,674.06 |
6.586 |
|
TOTAL |
450,139,263.56 |
100.000 |
|
Ned C. Lautenbach |
||
|
Affirmative |
420,232,931.11 |
93.356 |
|
Withheld |
29,906,332.45 |
6.644 |
|
TOTAL |
450,139,263.56 |
100.000 |
|
Peter S. Lynch |
||
|
Affirmative |
416,341,526.50 |
92.492 |
|
Withheld |
33,797,737.06 |
7.508 |
|
TOTAL |
450,139,263.56 |
100.000 |
|
William O. McCoy |
||
|
Affirmative |
420,164,421.95 |
93.341 |
|
Withheld |
29,974,841.61 |
6.659 |
|
TOTAL |
450,139,263.56 |
100.000 |
|
Marvin L. Mann |
||
|
Affirmative |
420,256,176.11 |
93.361 |
|
Withheld |
29,883,087.45 |
6.639 |
|
TOTAL |
450,139,263.56 |
100.000 |
|
Robert C. Pozen |
||
|
Affirmative |
420,392,422.30 |
93.392 |
|
Withheld |
29,746,841.26 |
6.608 |
|
TOTAL |
450,139,263.56 |
100.000 |
|
PROPOSAL 2 |
||
|
To ratify the selection of PricewaterhouseCoopers LLP as independent accountants of the fund. |
||
|
|
# of |
% of |
|
Affirmative |
416,460,525.19 |
92.518 |
|
Against |
3,191,802.18 |
0.709 |
|
Abstain |
30,486,936.19 |
6.773 |
|
TOTAL |
450,139,263.56 |
100.000 |
|
PROPOSAL 3 |
||
|
To authorize the Trustees to adopt an Amended and Restated Declaration |
||
|
|
# of |
% of |
|
Affirmative |
396,361,270.64 |
88.983 |
|
Against |
12,449,182.84 |
2.794 |
|
Abstain |
36,626,313.92 |
8.223 |
|
TOTAL |
445,436,767.40 |
100.000 |
|
Broker Non-Votes |
4,702,496.16 |
|
|
PROPOSAL 4 |
||
|
To approve an amended management contract, including a management fee structure change, for the fund. |
||
|
|
# of |
% of |
|
Affirmative |
392,295,132.05 |
87.150 |
|
Against |
19,789,951.59 |
4.396 |
|
Abstain |
38,054,179.92 |
8.454 |
|
TOTAL |
450,139,263.56 |
100.000 |
|
PROPOSAL 5 |
||
|
To approve an Agreement and Plan providing for the reorganization of the fund from a separate series of one Massachusetts business trust to another. |
||
|
|
# of |
% of |
|
Affirmative |
391,978,336.84 |
87.999 |
|
Against |
15,729,061.80 |
3.531 |
|
Abstain |
37,729,368.76 |
8.470 |
|
TOTAL |
445,436,767.40 |
100.000 |
|
Broker Non-Votes |
4,702,496.16 |
|
|
PROPOSAL 6 |
||
|
To eliminate a fundamental investment policy of the fund. |
||
|
|
# of |
% of |
|
Affirmative |
380,974,239.93 |
85.528 |
|
Against |
26,626,527.87 |
5.978 |
|
Abstain |
37,835,999.60 |
8.494 |
|
TOTAL |
445,436,767.40 |
100.000 |
|
Broker Non-Votes |
4,702,496.16 |
|
|
PROPOSAL 7 |
||
|
To eliminate the fund's fundamental 80% investment policy and adopt a comparable non-fundamental policy. |
||
|
|
# of |
% of |
|
Affirmative |
382,324,012.93 |
85.831 |
|
Against |
26,275,681.16 |
5.899 |
|
Abstain |
36,837,073.31 |
8.270 |
|
TOTAL |
445,436,767.40 |
100.000 |
|
Broker Non-Votes |
4,702,496.16 |
|
|
PROPOSAL 8 |
||
|
To amend the fund's fundamental investment limitation concerning the concentration of its investments in a single industry. |
||
|
|
# of |
% of |
|
Affirmative |
384,866,157.08 |
86.402 |
|
Against |
20,683,541.43 |
4.643 |
|
Abstain |
39,887,068.89 |
8.955 |
|
TOTAL |
445,436,767.40 |
100.000 |
|
Broker Non-Votes |
4,702,496.16 |
|
|
PROPOSAL 9 |
||
|
To amend the fund's fundamental investment limitation concerning underwriting. |
||
|
|
# of |
% of |
|
Affirmative |
384,141,635.06 |
86.239 |
|
Against |
21,750,856.94 |
4.883 |
|
Abstain |
39,544,275.40 |
8.878 |
|
TOTAL |
445,436,767.40 |
100.000 |
|
Broker Non-Votes |
4,702,496.16 |
|
*Denotes trust-wide proposals and voting results.
Annual Report
Fidelity offers several ways to conveniently manage your personal investments via your telephone or PC. You can access your account information, conduct trades and research your investments 24 hours a day.
By Phone
Fidelity Automated Service Telephone provides a single toll-free number to access account balances, positions, quotes and trading. It's easy to navigate the service, and on your first call, the system will help you create a personal identification number (PIN) for security.
(phone_graphic)
Fidelity Automated
Service Telephone (FAST®)
1-800-544-5555
Press
1 For mutual fund and brokerage trading.
2 For quotes.*
3 For account balances and holdings.
4 To review orders and mutual
fund activity.
5 To change your PIN.
*0 To speak to a Fidelity representative.
By PC
Fidelity's web site on the Internet provides a wide range of information, including daily financial news, fund performance, interactive planning tools and news about Fidelity products and services.
(computer_graphic)
Fidelity's Web Site
www.fidelity.com
If you are not currently on the Internet, call EarthLink Sprint at 1-800-288-2967, and be sure to ask for registration number SMD004 to receive a special Fidelity package that includes 30 days of free Internet access. EarthLink is North America's #1 independent Internet access provider.
(computer_graphic)
Fidelity On-line Xpress+®
Fidelity On-line Xpress+ software for Windows combines comprehensive portfolio management capabilities, securities trading and access to research and analysis tools . . . all on your desktop. Call Fidelity at 1-800-544-0240 or visit our web site for more information on how to manage your investments via your PC.
* When you call the quotes line, please remember that a fund's yield and return will vary and, except for money market funds, share price will also vary. This means that you may have a gain or loss when you sell your shares. There is no assurance that money market funds will be able to maintain a stable $1 share price; an investment in a money market fund is not insured or guaranteed by the U.S. government. Total returns are historical and include changes in share price, reinvestment of dividends and capital gains, and the effects of any sales charges.
Annual Report
If more than one address is listed, please locate the address that is closest to you. We'll give your correspondence immediate attention and send you written confirmation upon completion of your request.
(letter_graphic)
Making Changes
To Your Account
(such as changing name, address, bank, etc.)
Fidelity Investments
P.O. Box 770001
Cincinnati, OH 45277-0002
(letter_graphic)
For Non-Retirement
Accounts
Buying shares
Fidelity Investments
P.O. Box 770001
Cincinnati, OH 45277-0003
Overnight Express
Fidelity Investments
2300 Litton Lane - KH1A
Hebron, KY 41048
Selling shares
Fidelity Investments
P.O. Box 660602
Dallas, TX 75266-0602
Overnight Express
Fidelity Investments
Attn: Redemptions - CP6I
400 East Las Colinas Blvd.
Irving, TX 75039-5587
General Correspondence
Fidelity Investments
P.O. Box 500
Merrimack, NH 03054-0500
(letter_graphic)
For Retirement
Accounts
Buying shares
Fidelity Investments
P.O. Box 770001
Cincinnati, OH 45277-0003
Selling shares
Fidelity Investments
P.O. Box 660602
Dallas, TX 75266-0602
Overnight Express
Fidelity Investments
Attn: Redemptions - CP6R
400 East Las Colinas Blvd.
Irving, TX 75039-5587
General Correspondence
Fidelity Investments
P.O. Box 500
Merrimack, NH 03054-0500
Annual Report
Investment Adviser
Fidelity Management & Research Company
Boston, MA
Investment Sub-Adviser
Fidelity Investments Money
Management, Inc.
Officers
Edward C. Johnson 3d, President
Robert C. Pozen, Senior Vice President
Dwight D. Churchill, Vice President
Boyce I. Greer, Vice President
Christine J. Thompson, Vice President
Eric D. Roiter, Secretary
Robert A. Dwight, Treasurer
Stanley N. Griffith, Assistant Vice President
Maria F. Dwyer, Deputy Treasurer
John H. Costello, Assistant Treasurer
Thomas J. Simpson, Assistant Treasurer
Board of Trustees
Ralph F. Cox *
Phyllis Burke Davis *
Robert M. Gates *
Edward C. Johnson 3d
Donald J. Kirk *
Ned C. Lautenbach *
Peter S. Lynch
Marvin L. Mann *
William O. McCoy *
Gerald C. McDonough *
Robert C. Pozen
Thomas R. Williams *
Advisory Board
J. Michael Cook
Marie L. Knowles
General Distributor
Fidelity Distributors Corporation
Boston, MA
* Independent trustees
Transfer and Shareholder
Servicing Agents
Citibank, N.A.
New York, NY and
Fidelity Service Company, Inc.
Boston, MA
Custodian
Citibank, N.A.
New York, NY
Fidelity's Municipal Bond Funds
Spartan® Arizona Municipal Income
Spartan California Municipal Income
Spartan Connecticut Municipal Income
Spartan Florida Municipal Income
Spartan Intermediate Municipal Income
Spartan Maryland Municipal Income
Spartan Massachusetts Municipal Income
Spartan Michigan Municipal Income
Spartan Minnesota Municipal Income
Spartan Municipal Income
Spartan New Jersey Municipal Income
Spartan New York Municipal Income
Spartan Ohio Municipal Income
Spartan Pennsylvania Municipal Income
Spartan Short-Intermediate
Municipal Income
The Fidelity Telephone Connection
Mutual Fund 24-Hour Service
Exchanges/Redemptions
and Account Assistance 1-800-544-6666
Product Information 1-800-544-6666
Retirement Accounts 1-800-544-4774
(8 a.m. - 9 p.m.)
TDD Service 1-800-544-0118
for the deaf and hearing impaired
(9 a.m. - 9 p.m. Eastern time)
Fidelity Automated Service
Telephone (FAST®) (automated graphic) 1-800-544-5555
(automated graphic) Automated line for quickest service
STM-ANN-1000 113795
1.536709.103
(Fidelity Investment logo)(registered trademark)
Corporate Headquarters
82 Devonshire St., Boston, MA 02109
www.fidelity.com
Fidelity®
Fund
Annual Report
August 31, 2000
(2_fidelity_logos) (Registered_Trademark)
|
President's Message |
Ned Johnson on investing strategies. |
|
|
Performance |
How the fund has done over time. |
|
|
Fund Talk |
The manager's review of fund performance, strategy and outlook. |
|
|
Investment Changes |
A summary of the major shifts in the fund's investments over the past year. |
|
|
Investments |
A complete list of the fund's investments with their market values. |
|
|
Financial Statements |
Statements of assets and liabilities,
operations, and changes in net assets, |
|
|
Notes |
Notes to the financial statements. |
|
|
Report of Independent Accountants |
The auditors' opinion. |
|
|
Distributions |
|
|
|
Proxy Voting Results |
|
Standard & Poor's, S&P and S&P 500 are registered service marks of The McGraw-Hill Companies, Inc. and have been licensed for use by Fidelity Distributors Corporation.
Other third party marks appearing herein are the property of their respective owners.
All other marks appearing herein are registered or unregistered trademarks or service marks of FMR Corp. or an affiliated company.
(Recycle graphic) This report is printed on recycled paper using soy-based inks.
This report and the financial statements contained herein are submitted for the general information of the shareholders of the fund. This report is not authorized for distribution to prospective investors in the fund unless preceded or accompanied by an effective prospectus.
Mutual fund shares are not deposits or obligations of, or guaranteed by, any depository institution. Shares are not insured by the FDIC, Federal Reserve Board or any other agency, and are subject to investment risks, including possible loss of principal amount invested.
Neither the fund nor Fidelity Distributors Corporation is a bank.
For more information on any Fidelity fund, including charges and expenses, call 1-800-544-6666 for a free prospectus. Read it carefully before you invest or send money.
Annual Report
(Photograph of Edward C. Johnson 3d.)
Dear Shareholder:
A slowing U.S. economy triggered an equity market rally during the later stages of summer, boosting most major stock indexes back into positive territory for calendar year 2000. One notable exception, however, was the Dow Jones Industrial Average, which posted a negative return during that timeframe. Fixed-income markets - particularly Treasuries - continued their yearlong trend of strong performance, as nearly every bond sector outperformed the stock market on a year-to-date basis.
While it's impossible to predict the future direction of the markets with any degree of certainty, there are certain basic principles that can help investors plan for their future needs.
First, investors are encouraged to take a long-term view of their portfolios. If you can afford to leave your money invested through the inevitable up and down cycles of the financial markets, you will greatly reduce your vulnerability to any single decline. We know from experience, for example, that stock prices have gone up over longer periods of time, have significantly outperformed other types of investments and have stayed ahead of inflation.
Second, you can further manage your investing risk through diversification. A stock mutual fund, for instance, is already diversified, because it invests in many different companies. You can increase your diversification further by investing in a number of different stock funds, or in such other investment categories as bonds. If you have a short investment time horizon, you might want to consider moving some of your investment into a money market fund, which seeks income and a stable share price by investing in high-quality, short-term investments. Of course, it's important to remember that an investment in a money market fund is not insured or guaranteed by the Federal Deposit Insurance Corporation or any other government agency. Although money market funds seek to preserve the value of your investment at $1.00 per share, it is possible to lose money by investing in these types of funds.
Finally, no matter what your time horizon or portfolio diversity, it makes good sense to follow a regular investment plan, investing a certain amount of money in a fund at the same time each month or quarter and periodically reviewing your overall portfolio. By doing so, you won't get caught up in the excitement of a rapidly rising market, nor will you buy all your shares at market highs. While this strategy - known as dollar cost averaging - won't assure a profit or protect you from a loss in a declining market, it should help you lower the average cost of your purchases. Of course, you should consider your financial ability to continue your purchases through periods of low price levels before undertaking such a strategy.
If you have questions, please call us at 1-800-544-6666, or visit our web site at www.fidelity.com. We are available 24 hours a day, seven days a week to provide you the information you need to make the investments that are right for you.
Best regards,
/s/Edward C. Johnson 3d
Edward C. Johnson 3d
Annual Report
There are several ways to evaluate a fund's historical performance. You can look at the total percentage change in value, the average annual percentage change or the growth of a hypothetical $10,000 investment. Total return reflects the change in the value of an investment, assuming reinvestment of the fund's dividend income and capital gains (the profits earned upon the sale of securities that have grown in value). Total returns do not include the effect of the 3.00% sales load which was eliminated as of January 31, 2000.
Cumulative Total Returns
|
Periods ended August 31, 2000 |
|
Past 1 |
Past 5 |
Life of |
|
Fidelity Export and Multinational |
|
36.58% |
202.51% |
330.61% |
|
S&P 500 ® |
|
16.32% |
193.58% |
271.93% |
|
Growth Funds Average |
|
31.52% |
176.91% |
n/a* |
Cumulative total returns show the fund's performance in percentage terms over a set period - in this case, one year, five years, or since the fund started on October 4, 1994. For example, if you had invested $1,000 in a fund that had a 5% return over the past year, the value of your investment would be $1,050. You can com-pare the fund's returns to the performance of the Standard & Poor's 500SM Index - a market capitalization-weighted index of common stocks. To measure how the fund's performance stacked up against its peers, you can compare it to the growth funds average, which reflects the performance of mutual funds with similar objectives tracked by Lipper Inc. The past one year average represents a peer group of 1,304 mutual funds. These benchmarks include reinvested dividends and capital gains, if any, and exclude the effect of sales charges. Lipper has created new comparison categories that group funds according to portfolio characteristics and capitalization, as well as by capitalization only. These averages are listed on page 5 of this report.(dagger)
Average Annual Total Returns
|
Periods ended August 31, 2000 |
Past 1 |
Past 5 |
Life of |
|
Fidelity Export and Multinational |
36.58% |
24.78% |
28.01% |
|
S&P 500 |
16.32% |
24.04% |
24.88% |
|
Growth Funds Average |
31.52% |
21.97% |
n/a* |
Average annual total returns take the fund's cumulative return and show you what would have happened if the fund had performed at a constant rate each year. (Note: Lipper calculates average annual total returns by annualizing each fund's total return, then taking an arithmetic average. This may produce a different figure than that obtained by averaging the cumulative total returns and annualizing the result.)
* Not available
Annual Report
$10,000 Over Life of Fund
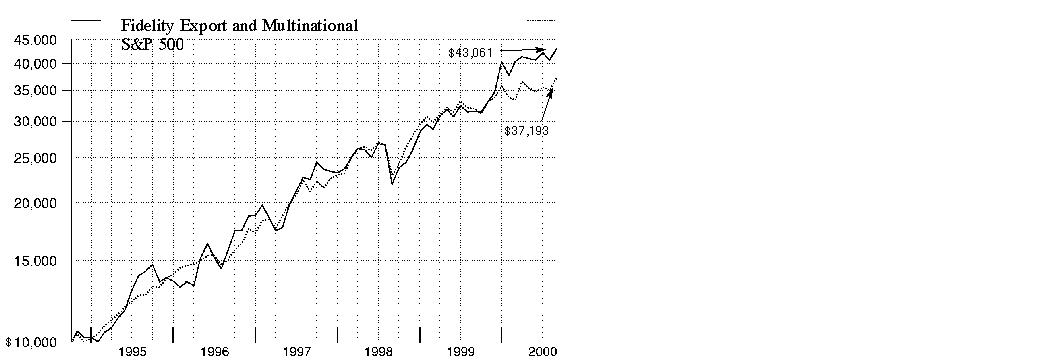
$10,000 Over Life of Fund: Let's say hypothetically that $10,000 was invested in Fidelity Export and Multinational Fund on October 4, 1994, when the fund started. As the chart shows, by August 31, 2000, the value of the investment would have grown to $43,061 - a 330.61% increase on the initial investment. For comparison, look at how the Standard & Poor's 500 Index did over the same period. With dividends and capital gains, if any, reinvested, the same $10,000 would have grown to $37,193 - a 271.93% increase.
Understanding
Performance
How a fund did yesterday is no guarantee of how it will do tomorrow. The stock market, for example, has a history of long-term growth and short-term volatility. In turn, the share price and return of a fund that invests in stocks will vary. That means if you sell your shares during a market downturn, you might lose money. But if you can ride out the market's ups and downs, you may have a gain.
3(dagger) The Lipper multi-cap growth funds average reflects the performance (excluding sales charges) of mutual funds with similar portfolio characteristics and capitalization. The Lipper multi-cap supergroup average reflects the performance (excluding sales charges) of mutual funds with similar capitalization. As of August 31, 2000, the one year and five year cumulative total returns for the multi-cap growth funds average were 61.35% and 229.05%, respectively. The one year and five year average annual total returns were 61.35% and 26.31%, respectively. The one year and five year cumulative total returns for the multi-cap supergroup average were 30.43% and 158.72%, respectively. The one year and five year average annual total returns were 30.43% and 20.10%, respectively.
Annual Report
Market Recap
In the beginning, there was technology. And it was good. So goes the opening chapter of U.S. stock market performance for the 12-month period ending August 31, 2000. But as the story unfolds, technology encounters several nemeses, including the Federal Reserve Board and the specter of inflation, which vanquish the sector's hold on market leadership and restore the old economy into power. Would technology regain its allure by the end of the period, or would yet another sector rise from the ashes to dominate performance? Through the first six months of the period, technology stood alone at the top of the market scoreboard. Then, the effects of a series of interest-rates hikes by the Fed and heightened inflation sent the sector into a three-month tailspin beginning in March. In the interim, previously dormant sectors such as real estate and health care marched to the forefront. But as the economy finally slowed, and the Fed bypassed its latest two opportunities to hike rates in June and August, technology rallied again and ended the 12-month period as the top-performing sector. For the overall period, the tech-laden NASDAQ Composite Index gained 53.87%. The Standard & Poor's 500SM Index, an index of 500 larger companies, returned 16.32%, while the Dow Jones Industrial Average - a benchmark of blue chip stocks - struggled to a 5.16% return.
(Portfolio Manager photograph)
An interview with Douglas Chase, Portfolio Manager of Fidelity
Export and Multinational Fund
Q. How did the fund perform, Doug?
A. Quite well. For the 12 months that ended August 31, 2000, the fund returned 36.58%. This outpaced the Standard & Poor's 500 Index - which returned 16.32% during the period - as well as the growth funds average, which returned 31.52% according to Lipper Inc.
Q. What factors helped the fund
perform well?
A. A combination of good timing and good stock picking helped the most. The fund's aggressive stake in technology stocks from September through March helped performance tremendously, as tech stocks dominated the market during that time. The high point came at the end of February, when just over 42% of the fund's investments were tech-related. In April, a pricing correction forced many technology investors to the sidelines. At that time, I switched gears and adopted more of a defensive approach, emphasizing groups such as energy, health and finance. This strategy helped the fund in the immediate aftermath of the tech correction.
Annual Report
Fund Talk: The Manager's Overview - continued
Q. How did you play technology
after the decline?
A. More cautiously. Technology is always going to be an important sector for this fund - that's where you're going to find some of the fastest-growing companies out there. I just got to a point where I felt many tech companies would have difficulty growing into their rich valuations. So I concentrated on companies that I felt were market leaders in their respective technology fields. At the end of the period, the fund's four-largest technology holdings were Cisco Systems, Intel, Compaq and Micron Technology.
Q. Combined, the fund's investments in energy, health and finance totaled around 36% of net assets at the end of this period. Six months ago, the combined stake was 15.7%. Where did you find opportunities in these groups?
A. Energy service stocks - companies that supply the equipment for drilling - were a prime focus. Our research group determined that energy supplies were at their lowest levels in 20 years. I felt that drilling would pick up sooner or later, and when it did stocks such as Nabors Industries, Vastar Resources and Ensco would stand to benefit. In terms of health, the fund's biggest position at the end of the period was Cardinal Health. I liked Cardinal for several reasons - the company has an attractive valuation relative to its earnings growth; it is a distributor of drugs and should benefit from the large number of patent expirations on the horizon; and the management team has a strong track record. I've also been attracted to medical device stocks such as Biomet - which makes artificial joint replacements - and hospital stocks such as Tenet Healthcare. Pure pharmaceutical stocks haven't played as big a role in the portfolio, mostly because the two candidates running for president in the U.S. have different prescription drug plans. Finally, on the finance side, I've been encouraged by positive pricing trends in the property and casualty insurance industries. Some of the fund's holdings in these areas included Chubb and Ace Ltd.
Q. What type of environment has it been for exporters and multinationals?
A. It's been a good news/bad news situation. With global economies so strong, many companies - whether they're selling technology or Avon products - are seeing strong growth numbers from their overseas operations. However, the dollar continues to rise and, when you translate those earnings and sales back into U.S. dollars, the growth doesn't look so great.
Q. Which stocks performed well during the period? Which were disappointing?
A. U.S. Foodservice was the fund's best performer during the period. The company - which distributes food to restaurants - was beaten down when I bought it, but bounced back after being acquired by Dutch company Royal Ahold. Independent power producer Calpine also turned in superb results. On the negative side, Healtheon - an Internet firm that wanted to create a centralized recordkeeping system for the health care industry - performed poorly, as did Pinnacle Systems, a company that makes equipment for displaying live graphics on television. Of these holdings, Pinnacle was the only stock still owned by the fund at the end of the period.
Q. What's your outlook for the coming months, Doug?
A. While the market didn't reward my defensive approach during the latter stages of the period, I feel good about how the fund is positioned. I believe the global economy will eventually slow, and earnings growth will decelerate as well. If I'm right, the fund should benefit from its positions in groups such as energy and health.
Annual Report
Fund Talk: The Manager's Overview - continued
The views expressed in this report reflect those of the portfolio manager only through the end of the period of the report as stated on the cover and do not necessarily represent the views of Fidelity or any other person in the Fidelity organization. Any such views are subject to change at any time based upon market or other conditions and Fidelity disclaims any responsibility to update such views. These views may not be relied on as investment advice and, because investment decisions for a Fidelity fund are based on numerous factors, may not be relied on as an indication of trading intent on behalf of any Fidelity fund.
Fund Facts
Goal: to increase the value of the fund's shares by investing mainly in equity securities of U.S. companies that are expected to benefit from exporting or selling their goods or services outside the U.S.
Fund number: 332
Trading symbol: FEXPX
Start date: October 4, 1994
Size: as of August 31, 2000, more than $537 million
Manager: Douglas Chase, since February 2000; manager, U.S. equities, Fidelity Worldwide Fund, since 1999; several Fidelity Select Portfolios, 1994-1999; joined Fidelity in 1993
3Doug Chase
covers more ground:
"One of the things I worry about the most - and why I think the economy will slow down - is the U.S. consumer. Higher interest rates and energy prices have made for less disposable income. At the same time, consumer debt is at an all-time high. This adds up to slower, more discretionary spending patterns, and I've tried to emphasize stocks that may be less susceptible to a spending slowdown. Consumers are still going to spend money on health and energy.
"Another good stock for the fund has been Avon. One of the key things I look for in a stock is that the company has good cash flow characteristics. Avon falls into this category and, because it sells its products directly, may be OK in the event of a spending slowdown. Avon is also a good example of an extreme multinational - 75% of the company's growth comes from outside U.S. borders.
"I haven't jumped on the wireless bandwagon yet, mostly because it seems only the equipment providers are making a profit. Also, people are assuming that adoption rates in the U.S. will be on a par with those in Europe and Japan. Historically, though, the adoption rates here are much slower."
Annual Report
|
Top Ten Stocks as of August 31, 2000 |
||
|
|
% of fund's |
% of fund's net assets |
|
Cisco Systems, Inc. |
7.0 |
0.0 |
|
Avon Products, Inc. |
6.3 |
3.7 |
|
Cardinal Health, Inc. |
3.6 |
0.0 |
|
Intel Corp. |
3.5 |
0.0 |
|
Nabors Industries, Inc. |
3.4 |
0.0 |
|
Bristol-Myers Squibb Co. |
3.0 |
1.1 |
|
Compaq Computer Corp. |
2.9 |
0.0 |
|
Micron Technology, Inc. |
2.7 |
0.0 |
|
Procter & Gamble Co. |
2.6 |
0.0 |
|
General Electric Co. |
2.2 |
0.0 |
|
|
37.2 |
4.8 |
|
Top Five Market Sectors as of August 31, 2000 |
||
|
|
% of fund's |
% of fund's net assets |
|
Technology |
27.6 |
42.3 |
|
Health |
14.2 |
8.6 |
|
Finance |
11.1 |
2.1 |
|
Energy |
10.9 |
5.0 |
|
Nondurables |
10.6 |
8.3 |
|
Asset Allocation (% of fund's net assets) |
|||||||
|
As of August 31, 2000 * |
As of February 29, 2000 ** |
||||||
 |
Stocks 95.7% |
|
|
Stocks 96.0% |
|
||
 |
Short-Term |
|
|
Short-Term |
|
||
|
* Foreign investments |
2.1% |
|
** Foreign investments |
2.0% |
|
||

Annual Report
Showing Percentage of Net Assets
|
Common Stocks - 95.7% |
|||
|
Shares |
Value (Note 1) |
||
|
AEROSPACE & DEFENSE - 1.0% |
|||
|
Aerospace & Defense - 0.3% |
|||
|
Northrop Grumman Corp. |
19,500 |
$ 1,517,344 |
|
|
Ship Building & Repair - 0.7% |
|||
|
General Dynamics Corp. |
60,200 |
3,788,838 |
|
|
TOTAL AEROSPACE & DEFENSE |
5,306,182 |
||
|
BASIC INDUSTRIES - 1.2% |
|||
|
Chemicals & Plastics - 0.3% |
|||
|
Praxair, Inc. |
40,700 |
1,800,975 |
|
|
Packaging & Containers - 0.9% |
|||
|
Ball Corp. |
132,200 |
4,577,425 |
|
|
TOTAL BASIC INDUSTRIES |
6,378,400 |
||
|
CONSTRUCTION & REAL ESTATE - 0.7% |
|||
|
Building Materials - 0.1% |
|||
|
Quixote Corp. |
35,900 |
574,400 |
|
|
Real Estate Investment Trusts - 0.6% |
|||
|
AMB Property Corp. |
32,900 |
795,769 |
|
|
Equity Office Properties Trust |
27,300 |
788,288 |
|
|
Equity Residential Properties Trust (SBI) |
16,200 |
777,600 |
|
|
Reckson Associates Realty Corp. |
33,000 |
802,313 |
|
|
|
3,163,970 |
||
|
TOTAL CONSTRUCTION & REAL ESTATE |
3,738,370 |
||
|
DURABLES - 3.9% |
|||
|
Autos, Tires, & Accessories - 3.4% |
|||
|
AutoNation, Inc. |
1,356,200 |
8,815,300 |
|
|
Sonic Automotive, Inc. Class A (a) |
899,200 |
9,497,800 |
|
|
|
18,313,100 |
||
|
Consumer Electronics - 0.5% |
|||
|
General Motors Corp. Class H |
81,600 |
2,703,000 |
|
|
TOTAL DURABLES |
21,016,100 |
||
|
ENERGY - 10.9% |
|||
|
Energy Services - 7.5% |
|||
|
ENSCO International, Inc. |
151,400 |
6,037,075 |
|
|
Global Industries Ltd. (a) |
259,800 |
3,231,263 |
|
|
Common Stocks - continued |
|||
|
Shares |
Value (Note 1) |
||
|
ENERGY - continued |
|||
|
Energy Services - continued |
|||
|
Halliburton Co. |
111,800 |
$ 5,925,400 |
|
|
Nabors Industries, Inc. (a) |
383,100 |
18,221,194 |
|
|
Superior Energy Services, Inc. (a) |
437,500 |
4,812,500 |
|
|
Varco International, Inc. (a) |
86,700 |
1,750,256 |
|
|
|
39,977,688 |
||
|
Oil & Gas - 3.4% |
|||
|
Devon Energy Corp. |
21,200 |
1,241,525 |
|
|
Grant Prideco, Inc. (a) |
217,000 |
5,099,500 |
|
|
National-Oilwell, Inc. (a) |
70,400 |
2,442,000 |
|
|
Vastar Resources, Inc. |
116,000 |
9,599,000 |
|
|
|
18,382,025 |
||
|
TOTAL ENERGY |
58,359,713 |
||
|
FINANCE - 11.1% |
|||
|
Federal Sponsored Credit - 2.1% |
|||
|
Fannie Mae |
52,800 |
2,838,000 |
|
|
Freddie Mac |
164,900 |
6,946,413 |
|
|
USA Education, Inc. |
40,100 |
1,571,419 |
|
|
|
11,355,832 |
||
|
Insurance - 9.0% |
|||
|
ACE Ltd. |
258,500 |
9,079,813 |
|
|
AMBAC Financial Group, Inc. |
130,500 |
8,433,563 |
|
|
CIGNA Corp. |
49,200 |
4,784,700 |
|
|
Hartford Financial Services Group, Inc. |
90,800 |
6,049,550 |
|
|
MBIA, Inc. |
84,500 |
5,555,875 |
|
|
MetLife, Inc. |
272,700 |
6,630,019 |
|
|
Reinsurance Group of America, Inc. |
38,400 |
1,094,400 |
|
|
The Chubb Corp. |
72,500 |
5,550,781 |
|
|
The St. Paul Companies, Inc. |
5,600 |
266,700 |
|
|
UnumProvident Corp. |
51,100 |
1,108,231 |
|
|
|
48,553,632 |
||
|
TOTAL FINANCE |
59,909,464 |
||
|
HEALTH - 14.2% |
|||
|
Drugs & Pharmaceuticals - 6.5% |
|||
|
Bristol-Myers Squibb Co. |
305,132 |
16,171,996 |
|
|
Eli Lilly & Co. |
37,100 |
2,708,300 |
|
|
Common Stocks - continued |
|||
|
Shares |
Value (Note 1) |
||
|
HEALTH - continued |
|||
|
Drugs & Pharmaceuticals - continued |
|||
|
Pfizer, Inc. |
202,667 |
$ 8,765,348 |
|
|
Schering-Plough Corp. |
185,500 |
7,443,188 |
|
|
|
35,088,832 |
||
|
Medical Equipment & Supplies - 6.1% |
|||
|
Baxter International, Inc. |
41,300 |
3,438,225 |
|
|
Biomet, Inc. |
170,300 |
5,758,269 |
|
|
Cardinal Health, Inc. |
237,300 |
19,414,106 |
|
|
DENTSPLY International, Inc. |
52,900 |
1,765,538 |
|
|
Novoste Corp. (a) |
27,600 |
1,490,400 |
|
|
Steris Corp. (a) |
100,000 |
1,025,000 |
|
|
|
32,891,538 |
||
|
Medical Facilities Management - 1.6% |
|||
|
HCA - The Healthcare Co. |
75,400 |
2,601,300 |
|
|
Tenet Healthcare Corp. |
181,900 |
5,638,900 |
|
|
|
8,240,200 |
||
|
TOTAL HEALTH |
76,220,570 |
||
|
INDUSTRIAL MACHINERY & EQUIPMENT - 5.5% |
|||
|
Electrical Equipment - 3.2% |
|||
|
C&D Technologies, Inc. |
21,700 |
1,198,925 |
|
|
General Electric Co. |
200,000 |
11,737,500 |
|
|
Pinnacle Systems (a) |
219,798 |
2,774,950 |
|
|
ViaSat, Inc. (a) |
25,000 |
1,496,875 |
|
|
|
17,208,250 |
||
|
Industrial Machinery & Equipment - 2.1% |
|||
|
Caterpillar, Inc. |
120,000 |
4,410,000 |
|
|
CNH Global NV |
207,000 |
2,031,188 |
|
|
Tyco International Ltd. |
81,400 |
4,639,800 |
|
|
|
11,080,988 |
||
|
Pollution Control - 0.2% |
|||
|
Republic Services, Inc. (a) |
78,300 |
1,145,138 |
|
|
TOTAL INDUSTRIAL MACHINERY & EQUIPMENT |
29,434,376 |
||
|
MEDIA & LEISURE - 1.0% |
|||
|
Entertainment - 0.5% |
|||
|
Park Place Entertainment Corp. (a) |
193,100 |
2,836,156 |
|
|
Common Stocks - continued |
|||
|
Shares |
Value (Note 1) |
||
|
MEDIA & LEISURE - continued |
|||
|
Publishing - 0.5% |
|||
|
Houghton Mifflin Co. |
54,900 |
$ 2,700,394 |
|
|
TOTAL MEDIA & LEISURE |
5,536,550 |
||
|
NONDURABLES - 10.6% |
|||
|
Foods - 1.7% |
|||
|
Earthgrains Co. |
67,000 |
1,180,875 |
|
|
Quaker Oats Co. |
34,400 |
2,337,050 |
|
|
Sysco Corp. |
128,900 |
5,454,081 |
|
|
|
8,972,006 |
||
|
Household Products - 8.9% |
|||
|
Avon Products, Inc. |
873,000 |
34,210,688 |
|
|
Procter & Gamble Co. |
223,200 |
13,796,550 |
|
|
|
48,007,238 |
||
|
TOTAL NONDURABLES |
56,979,244 |
||
|
SERVICES - 2.2% |
|||
|
H&R Block, Inc. |
52,800 |
1,894,200 |
|
|
Insurance Auto Auctions, Inc. (a) |
16,100 |
265,650 |
|
|
Manpower, Inc. |
70,000 |
2,533,125 |
|
|
NCO Group, Inc. (a) |
30,665 |
532,804 |
|
|
Viad Corp. |
230,550 |
6,757,997 |
|
|
TOTAL SERVICES |
11,983,776 |
||
|
TECHNOLOGY - 27.6% |
|||
|
Communications Equipment - 9.1% |
|||
|
Ciena Corp. (a) |
8,900 |
1,973,019 |
|
|
Cisco Systems, Inc. (a) |
547,500 |
37,572,178 |
|
|
Ditech Communications Corp. (a) |
160,000 |
9,440,000 |
|
|
|
48,985,197 |
||
|
Computer Services & Software - 3.4% |
|||
|
Affiliated Computer Services, Inc. Class A (a) |
31,400 |
1,462,063 |
|
|
Cadence Design Systems, Inc. (a) |
79,600 |
1,691,500 |
|
|
J.D. Edwards & Co. (a) |
163,500 |
4,056,844 |
|
|
MapInfo Corp. (a) |
30,000 |
1,245,000 |
|
|
Oracle Corp. (a) |
94,500 |
8,593,594 |
|
|
Synopsys, Inc. (a) |
5,000 |
185,313 |
|
|
Common Stocks - continued |
|||
|
Shares |
Value (Note 1) |
||
|
TECHNOLOGY - continued |
|||
|
Computer Services & Software - continued |
|||
|
Technology Solutions, Inc. |
215,200 |
$ 665,775 |
|
|
Travelocity.com, Inc. (a) |
45,000 |
618,750 |
|
|
|
18,518,839 |
||
|
Computers & Office Equipment - 7.3% |
|||
|
Advanced Digital Information Corp. (a) |
72,000 |
1,224,000 |
|
|
Apple Computer, Inc. (a) |
42,800 |
2,608,125 |
|
|
Compaq Computer Corp. |
456,900 |
15,563,156 |
|
|
Dell Computer Corp. (a) |
197,600 |
8,620,300 |
|
|
MRV Communications, Inc. (a) |
50,870 |
3,920,169 |
|
|
Oak Technology, Inc. (a) |
110,400 |
3,215,400 |
|
|
Pitney Bowes, Inc. |
99,100 |
3,623,344 |
|
|
Tidel Technologies, Inc. (a) |
33,200 |
263,525 |
|
|
|
39,038,019 |
||
|
Electronic Instruments - 0.7% |
|||
|
Agilent Technologies, Inc. |
38,600 |
2,328,063 |
|
|
Thermo Electron Corp. (a) |
56,400 |
1,311,300 |
|
|
|
3,639,363 |
||
|
Electronics - 7.1% |
|||
|
Intel Corp. |
256,078 |
19,173,840 |
|
|
Micron Technology, Inc. (a) |
176,600 |
14,437,050 |
|
|
SDL, Inc. (a) |
12,100 |
4,807,481 |
|
|
|
38,418,371 |
||
|
TOTAL TECHNOLOGY |
148,599,789 |
||
|
TRANSPORTATION - 1.7% |
|||
|
Railroads - 0.8% |
|||
|
Burlington Northern Santa Fe Corp. |
105,400 |
2,358,325 |
|
|
Union Pacific Corp. |
51,300 |
2,039,175 |
|
|
|
4,397,500 |
||
|
Shipping - 0.9% |
|||
|
Overseas Shipholding Group, Inc. |
158,100 |
4,654,069 |
|
|
TOTAL TRANSPORTATION |
9,051,569 |
||
|
Common Stocks - continued |
|||
|
Shares |
Value (Note 1) |
||
|
UTILITIES - 4.1% |
|||
|
Cellular - 1.7% |
|||
|
SBA Communications Corp. Class A (a) |
103,000 |
$ 4,596,375 |
|
|
VoiceStream Wireless Corp. (a) |
39,600 |
4,457,475 |
|
|
|
9,053,850 |
||
|
Electric Utility - 0.7% |
|||
|
AES Corp. (a) |
56,300 |
3,589,125 |
|
|
NRG Energy, Inc. |
13,000 |
341,250 |
|
|
|
3,930,375 |
||
|
Gas - 1.2% |
|||
|
Dynegy, Inc. Class A |
71,000 |
3,195,000 |
|
|
Kinder Morgan, Inc. |
85,000 |
3,129,063 |
|
|
|
6,324,063 |
||
|
Telephone Services - 0.5% |
|||
|
Qwest Communications International, Inc. (a) |
54,500 |
2,813,563 |
|
|
TOTAL UTILITIES |
22,121,851 |
||
|
TOTAL COMMON STOCKS (Cost $459,641,059) |
514,635,954 |
||
|
Cash Equivalents - 1.4% |
|||
|
|
|
|
|
|
Fidelity Cash Central Fund, 6.59% (b) |
6,175,149 |
6,175,149 |
|
|
Fidelity Securities Lending Cash Central Fund, 6.64% (b) |
1,459,800 |
1,459,800 |
|
|
TOTAL CASH EQUIVALENTS (Cost $7,634,949) |
7,634,949 |
||
|
TOTAL INVESTMENT PORTFOLIO - 97.1% (Cost $467,276,008) |
522,270,903 |
||
|
NET OTHER ASSETS - 2.9% |
15,626,812 |
||
|
NET ASSETS - 100% |
$ 537,897,715 |
||
|
Legend |
|
(a) Non-income producing |
|
(b) The rate quoted is the annualized seven-day yield of the fund at |
|
Income Tax Information |
|
At August 31, 2000, the aggregate cost of investment securities for income tax purposes was $471,064,759. Net unrealized appreciation aggregated $51,206,144, of which $68,461,696 related to appreciated investment securities and $17,255,552 related to depreciated investment securities. |
|
The fund hereby designates approximately $45,623,000 as a capital gain dividend for the purpose of the dividend paid deduction. |
See accompanying notes which are an integral part of the financial statements.
Annual Report
Statement of Assets and Liabilities
|
|
August 31, 2000 |
|
|
Assets |
|
|
|
Investment in securities, at value (cost $467,276,008) - See accompanying schedule |
|
$ 522,270,903 |
|
Receivable for investments sold |
|
19,648,327 |
|
Receivable for fund shares sold |
|
771,344 |
|
Dividends receivable |
|
372,653 |
|
Interest receivable |
|
128,214 |
|
Other receivables |
|
428,433 |
|
Total assets |
|
543,619,874 |
|
Liabilities |
|
|
|
Payable for investments purchased |
$ 2,949,499 |
|
|
Payable for fund shares redeemed |
979,679 |
|
|
Accrued management fee |
250,381 |
|
|
Other payables and accrued expenses |
82,800 |
|
|
Collateral on securities loaned, at value |
1,459,800 |
|
|
Total liabilities |
|
5,722,159 |
|
Net Assets |
|
$ 537,897,715 |
|
Net Assets consist of: |
|
|
|
Paid in capital |
|
$ 357,655,437 |
|
Undistributed net investment income |
|
1,839,337 |
|
Accumulated undistributed net realized gain (loss) on investments and foreign currency transactions |
|
123,408,046 |
|
Net unrealized appreciation (depreciation) on investments |
|
54,994,895 |
|
Net Assets, for 22,940,342 shares outstanding |
|
$ 537,897,715 |
|
Net Asset Value and redemption price per share ($537,897,715 ÷ 22,940,342 shares) |
|
$23.45 |
See accompanying notes which are an integral part of the financial statements.
Annual Report
Financial Statements - continued
Statement of Operations
|
|
Year ended August 31, 2000 |
|
|
Investment Income Dividends |
|
$ 4,400,716 |
|
Interest |
|
1,143,396 |
|
Security lending |
|
68,068 |
|
Total income |
|
5,612,180 |
|
Expenses |
|
|
|
Management fee |
$ 2,807,117 |
|
|
Transfer agent fees |
1,025,613 |
|
|
Accounting and security lending fees |
190,427 |
|
|
Non-interested trustees' compensation |
1,460 |
|
|
Custodian fees and expenses |
27,954 |
|
|
Registration fees |
39,169 |
|
|
Audit |
28,075 |
|
|
Legal |
6,603 |
|
|
Interest |
353 |
|
|
Reports to shareholders |
49,552 |
|
|
Miscellaneous |
799 |
|
|
Total expenses before reductions |
4,177,122 |
|
|
Expense reductions |
(432,712) |
3,744,410 |
|
Net investment income |
|
1,867,770 |
|
Realized and Unrealized Gain (Loss) Net realized gain (loss) on: |
|
|
|
Investment securities |
125,188,344 |
|
|
Foreign currency transactions |
8,080 |
125,196,424 |
|
Change in net unrealized appreciation (depreciation) on: |
|
|
|
Investment securities |
19,309,859 |
|
|
Assets and liabilities in foreign currencies |
239 |
19,310,098 |
|
Net gain (loss) |
|
144,506,522 |
|
Net increase (decrease) in net assets resulting |
|
$ 146,374,292 |
See accompanying notes which are an integral part of the financial statements.
Annual Report
Financial Statements - continued
Statement of Changes in Net Assets
|
|
Year ended |
Year ended |
|
Increase (Decrease) in Net Assets |
|
|
|
Operations |
$ 1,867,770 |
$ 916,183 |
|
Net realized gain (loss) |
125,196,424 |
96,338,917 |
|
Change in net unrealized appreciation (depreciation) |
19,310,098 |
44,496,311 |
|
Net increase (decrease) in net assets resulting |
146,374,292 |
141,751,411 |
|
Distributions to shareholders |
(930,998) |
- |
|
From net realized gain |
(89,382,565) |
(16,806,980) |
|
Total distributions |
(90,313,563) |
(16,806,980) |
|
Share transactions |
103,683,023 |
45,652,581 |
|
Reinvestment of distributions |
87,478,852 |
16,386,066 |
|
Cost of shares redeemed |
(123,198,283) |
(130,872,505) |
|
Net increase (decrease) in net assets resulting |
67,963,592 |
(68,833,858) |
|
Redemption fees |
41,694 |
38,219 |
|
Total increase (decrease) in net assets |
124,066,015 |
56,148,792 |
|
Net Assets |
|
|
|
Beginning of period |
413,831,700 |
357,682,908 |
|
End of period (including undistributed net investment income of $1,839,337 and $919,841, respectively) |
$ 537,897,715 |
$ 413,831,700 |
|
Other Information Shares |
|
|
|
Sold |
4,804,370 |
2,221,870 |
|
Issued in reinvestment of distributions |
5,106,764 |
1,021,577 |
|
Redeemed |
(5,755,336) |
(6,731,341) |
|
Net increase (decrease) |
4,155,798 |
(3,487,894) |
See accompanying notes which are an integral part of the financial statements.
Annual Report
Financial Highlights
|
Years ended August 31, |
2000 |
1999 |
1998 |
1997 |
1996 |
|
Selected Per-Share Data |
|
|
|
|
|
|
Net asset value, |
$ 22.03 |
$ 16.06 |
$ 20.02 |
$ 14.85 |
$ 14.22 |
|
Income from |
|
|
|
|
|
|
Net investment income (loss) C |
.08 |
.05 |
(.05) |
(.02) |
(.05) |
|
Net realized and |
6.19 |
6.69 |
(.13) |
6.05 |
1.52 |
|
Total from investment operations |
6.27 |
6.74 |
(.18) |
6.03 |
1.47 |
|
Less Distributions |
|
|
|
|
|
|
From net investment income |
(.05) |
- |
- |
- |
- |
|
From net realized gain |
(4.80) |
(.77) |
(3.79) |
(.86) |
(.84) |
|
Total distributions |
(4.85) |
(.77) |
(3.79) |
(.86) |
(.84) |
|
Redemption fees added to paid |
.00 |
.00 |
.01 |
.00 |
- |
|
Net asset value, end of period |
$ 23.45 |
$ 22.03 |
$ 16.06 |
$ 20.02 |
$ 14.85 |
|
Total Return A, B |
36.58% |
43.76% |
(2.35)% |
41.94% |
11.15% |
|
Ratios and Supplemental Data |
|
|
|
|
|
|
Net assets, end of period |
$ 537,898 |
$ 413,832 |
$ 357,683 |
$ 452,636 |
$ 267,059 |
|
Ratio of expenses to average |
.86% |
.91% |
.93% |
.98% |
1.03% |
|
Ratio of expenses to average net assets after expense reductions |
.77% D |
.86% D |
.88% D |
.91% D |
1.00% D |
|
Ratio of net investment income (loss) to average net assets |
.38% |
.23% |
(.25)% |
(.13)% |
(.39)% |
|
Portfolio turnover rate |
380% |
265% |
281% |
429% |
313% |
A The total returns would have been lower had certain expenses not been reduced during the periods shown.
B Total returns do not include the former one time sales charge.
C Net investment income (loss) per share has been calculated based on average shares outstanding during the period.
D FMR or the fund has entered into varying arrangements with third parties who either paid or reduced a portion of the fund's expenses.
See accompanying notes which are an integral part of the financial statements.
Annual Report
For the period ended August 31, 2000
1. Significant Accounting Policies.
Fidelity Export and Multinational Fund (the fund) is a fund of Fidelity Union Street Trust (the trust) and is authorized to issue an unlimited number of shares. The trust is registered under the Investment Company Act of 1940, as amended, as an open-end management investment company organized as a Massachusetts business trust. The financial statements have been prepared in conformity with generally accepted accounting principles which require management to make certain estimates and assumptions at the date of the financial statements. The following summarizes the significant accounting policies of the fund:
Security Valuation. Securities for which exchange quotations are readily available are valued at the last sale price, or if no sale price, at the closing bid price. Foreign securities are valued based on quotations from the principal market in which such securities are normally traded. If trading or events occurring in other markets after the close of the principal market in which foreign securities are traded, and before the close of the business of the fund, are expected to materially affect the value of those securities, then they are valued at their fair value taking this trading or these events into account. Fair value is determined in good faith under consistently applied procedures under the general supervision of the Board of Trustees. Securities for which exchange quotations are not readily available (and in certain cases debt securities which trade on an exchange) are valued primarily using dealer-supplied valuations or at their fair value. Short-term securities with remaining maturities of sixty days or less for which quotations are not readily available are valued at amortized cost or original cost plus accrued interest, both of which approximate current value.
Foreign Currency Translation. The accounting records of the fund are maintained in U.S. dollars. Investment securities and other assets and liabilities denominated in a foreign currency are translated into U.S. dollars at the prevailing rates of exchange at period end. Purchases and sales of securities, income receipts and expense payments are translated into U.S. dollars at the prevailing exchange rate on the respective dates of the transactions.
Net realized gains and losses on foreign currency transactions represent net gains and losses from sales and maturities of foreign currency contracts, disposition of foreign currencies, the difference between the amount of net investment income accrued and the U.S. dollar amount actually received, and gains and losses between trade and settlement date on purchases and sales of securities. The effects of changes in foreign currency exchange rates on investments in securities are included with the net realized and unrealized gain or loss on investment securities.
Income Taxes. As a qualified regulated investment company under Subchapter M of the Internal Revenue Code, the fund is not subject to income taxes to the extent that it distributes substantially all of its taxable income for its fiscal year. The schedule of investments includes information regarding income taxes under the caption "Income Tax Information."
Annual Report
Notes to Financial Statements - continued
1. Significant Accounting Policies - continued
Investment Income. Dividend income is recorded on the ex-dividend date except certain dividends from foreign securities where the ex-dividend date may have passed, are recorded as soon as the fund is informed of the ex-dividend date. Non-cash dividends included in dividend income, if any, are recorded at the fair market value of the securities received. Interest income is accrued as earned. Investment income is recorded net of foreign taxes withheld where recovery of such taxes is uncertain.
Expenses. Most expenses of the trust can be directly attributed to a fund. Expenses which cannot be directly attributed are apportioned among the funds in the trust.
Distributions to Shareholders. Distributions are recorded on the ex-dividend date.
Income and capital gain distributions are determined in accordance with income tax regulations which may differ from generally accepted accounting principles. These differences, which may result in distribution reclassifications, are primarily due to differing treatments for litigation proceeds, foreign currency transactions and losses deferred due to wash sales. The fund also utilized earnings and profits distributed to shareholders on redemption of shares as a part of the dividends paid deduction for income tax purposes.
Permanent book and tax basis differences relating to shareholder distributions will result in reclassifications to paid in capital. Undistributed net investment income and accumulated undistributed net realized gain (loss) on investments and foreign currency transactions may include temporary book and tax basis differences which will reverse in a subsequent period. Any taxable income or gain remaining at fiscal year end is distributed in the following year.
Short-Term Trading (Redemption) Fees. Shares held in the fund less than 30 days are subject to a short-term trading fee equal to .75% of the proceeds of the redeemed shares. Redemptions on or prior to January 31, 2000 of shares held less than 90 days were subject to a short-term trading fee equal to .75% of the proceeds of the redeemed shares. The fee, which is retained by the fund, is accounted for as an addition to paid in capital.
Security Transactions. Security transactions are accounted for as of trade date. Gains and losses on securities sold are determined on the basis of identified cost.
2. Operating Policies.
Foreign Currency Contracts. The fund generally uses foreign currency contracts to facilitate transactions in foreign-denominated securities. Losses may arise from changes in the value of the foreign currency or if the counterparties do not perform under the contracts' terms. The U.S. dollar value of foreign currency contracts is determined using contractual currency exchange rates established at the time of each trade.
Joint Trading Account. Pursuant to an Exemptive Order issued by the Securities and Exchange Commission (the SEC), the fund, along with other affiliated entities of Fidelity Management & Research Company (FMR), may transfer
Annual Report
Notes to Financial Statements - continued
2. Operating Policies - continued
Joint Trading Account - continued
uninvested cash balances into one or more joint trading accounts. These balances are invested in one or more repurchase agreements for U.S. Treasury or Federal Agency obligations.
Repurchase Agreements. The underlying U.S. Treasury, Federal Agency, or other obligations found to be satisfactory by FMR are transferred to an account of the fund, or to the Joint Trading Account, at a custodian bank. The securities are marked-to-market daily and maintained at a value at least equal to the principal amount of the repurchase agreement (including accrued interest). FMR, the fund's investment adviser, is responsible for determining that the value of the underlying securities remains in accordance with the market value requirements stated above.
Cash Central Funds. Pursuant to an Exemptive Order issued by the SEC, the fund may invest in the Fidelity Cash Central Fund and the Fidelity Securities Lending Cash Central Fund (the Cash Funds) managed by Fidelity Investments Money Management, Inc., an affiliate of FMR. The Cash Funds are open-end money market funds available only to investment companies and other accounts managed by FMR and its affiliates. The Cash Funds seek preservation of capital, liquidity, and current income. Income distributions from the Cash Funds are declared daily and paid monthly from net interest income. Income distributions earned by the fund are recorded as either interest income or security lending income in the accompanying financial statements.
3. Purchases and Sales of Investments.
Purchases and sales of securities, other than short-term securities, aggregated $1,761,654,397 and $1,772,991,387, respectively.
4. Fees and Other Transactions with Affiliates.
Management Fee. As the fund's investment adviser, FMR receives a monthly fee that is calculated on the basis of a group fee rate plus a fixed individual fund fee rate applied to the average net assets of the fund. The group fee rate is the weighted average of a series of rates and is based on the monthly average net assets of all the mutual funds advised by FMR. The rates ranged from .2167% to .5200% for the period. The annual individual fund fee rate is .30%. In the event that these rates were lower than the contractual rates in effect during the period, FMR voluntarily implemented the above rates, as they resulted in the same or a lower management fee. For the period, the management fee was equivalent to an annual rate of .58% of average net assets.
Sales Load. For the period, Fidelity Distributors Corporation (FDC), an affiliate of FMR and the general distributor of the fund, received sales charges of $59,205 on sales of shares of the fund of which $59,192 was retained. Effective January 31,2000, the fund's 3% sales charge was eliminated.
Annual Report
Notes to Financial Statements - continued
4. Fees and Other Transactions with Affiliates - continued
Transfer Agent Fees. Fidelity Service Company, Inc. (FSC), an affiliate of FMR, is the fund's transfer, dividend disbursing and shareholder servicing agent. FSC receives account fees and asset-based fees that vary according to account size and type of account. FSC pays for typesetting, printing and mailing of all shareholder reports, except proxy statements. For the period, the transfer agent fees were equivalent to an annual rate of .21% of average net assets.
Accounting and Security Lending Fees. FSC maintains the fund's accounting records and administers the security lending program. The security lending fee is based on the number and duration of lending transactions. The accounting fee is based on the level of average net assets for the month plus out-of-pocket expenses.
Brokerage Commissions. The fund placed a portion of its portfolio transactions with brokerage firms which are affiliates of FMR. The commissions paid to these affiliated firms were $103,359 for the period.
5. Security Lending.
The fund lends portfolio securities from time to time in order to earn additional income. The fund receives collateral in the form of U.S. Treasury obligations, letters of credit, and/or cash against the loaned securities, and maintains collateral in an amount not less than 100% of the market value of the loaned securities during the period of the loan. The market value of the loaned securities is determined at the close of business of the fund and any additional required collateral is delivered to the fund on the next business day. If the borrower defaults on its obligation to return the securities loaned because of insolvency or other reasons, the fund could experience delays and costs in recovering the securities loaned or in gaining access to the collateral. At period end, the value of the securities loaned amounted to $1,450,021. The fund received cash collateral of $1,459,800 which was invested in cash equivalents.
6. Bank Borrowings.
The fund is permitted to have bank borrowings for temporary or emergency purposes to fund shareholder redemptions. The fund has established borrowing arrangements with certain banks. The interest rate on the borrowings is the bank's base rate, as revised from time to time. The average daily loan balance during the period for which the loan was outstanding amounted to $2,193,000. The weighted average interest rate was 5.79%.
7. Expense Reductions.
FMR has directed certain portfolio trades to brokers who paid a portion of the fund's expenses. For the period, the fund's expenses were reduced by $405,562 under this arrangement.
In addition, through arrangements with the fund's custodian and transfer agent, credits realized as a result of uninvested cash balances were used to reduce a portion of the fund's expenses. During the period, the fund's custodian and transfer agent fees were reduced by $7,197 and $19,953, respectively, under these arrangements.
Annual Report
To the Trustees of Fidelity Union Street Trust and the Shareholders of Fidelity Export and Multinational Fund:
In our opinion, the accompanying statement of assets and liabilities, including the schedules of investments, and the related statements of operations and of changes in net assets and the financial highlights present fairly, in all material respects, the financial position of Fidelity Export and Multinational Fund (a fund of Fidelity Union Street Trust ) at August 31, 2000, and the results of its operations, the changes in its net assets and the financial highlights for the periods indicated, in conformity with accounting principles generally accepted in the United States. These financial statements and financial highlights (hereafter referred to as "financial statements") are the responsibility of the Fidelity Export and Multinational Fund's management; our responsibility is to express an opinion on these financial statements based on our audits. We conducted our audits of these financial statements in accordance with auditing standards generally accepted in the United States which require that we plan and perform the audit to obtain reasonable assurance about whether the financial statements are free of material misstatement. An audit includes examining, on a test basis, evidence supporting the amounts and disclosures in the financial statements, assessing the accounting principles used and significant estimates made by management, and evaluating the overall financial statement presentation. We believe that our audits, which included confirmation of securities at August 31, 2000 by correspondence with the custodian and brokers, provide a reasonable basis for the opinion expressed above.
/s/PricewaterhouseCoopers LLP
PricewaterhouseCoopers LLP
Boston, Massachusetts
October 6, 2000
Annual Report
The Board of Trustees of Fidelity Export and Multinational Fund voted to pay on October 9, 2000, to shareholders of record at the opening of business on October 6, 2000, a distribution of $4.99 per share derived from capital gains realized from sales of portfolio securities and a dividend of $.08 per share from net investment income.
A total of 8% of the dividends distributed during the fiscal year qualifies for the dividends-received deduction for corporate shareholders.
The fund hereby designates 100% of the long-term capital gain dividends distributed during the fiscal year as 20%-rate capital gain dividends.
The fund will notify shareholders in January 2001 of amounts for use in preparing 2000 income tax returns.
Annual Report
A special meeting of the fund's shareholders was held on September 13, 2000. The results of votes taken among shareholders on proposals before them are reported below. Each vote reported represents one dollar of net asset value held on the record date for the meeting.
PROPOSAL 1
To elect as Trustees the following twelve nominees.*
|
|
# of |
% of |
|
J. Michael Cook |
||
|
Affirmative |
719,905,794.09 |
94.672 |
|
Withheld |
40,517,203.69 |
5.328 |
|
TOTAL |
760,422,997.78 |
100.000 |
|
Ralph F. Cox |
||
|
Affirmative |
719,013,933.36 |
94.554 |
|
Withheld |
41,409,064.42 |
5.446 |
|
TOTAL |
760,422,997.78 |
100.000 |
|
Phyllis Burke Davis |
||
|
Affirmative |
718,961,403.49 |
94.548 |
|
Withheld |
41,461,594.29 |
5.452 |
|
TOTAL |
760,422,997.78 |
100.000 |
|
Robert M. Gates |
||
|
Affirmative |
719,482,012.45 |
94.616 |
|
Withheld |
40,940,985.33 |
5.384 |
|
TOTAL |
760,422,997.78 |
100.000 |
|
Edward C. Johnson 3d |
||
|
Affirmative |
719,048,405.90 |
94.559 |
|
Withheld |
41,374,591.88 |
5.441 |
|
TOTAL |
760,422,997.78 |
100.000 |
|
Donald J. Kirk |
||
|
Affirmative |
719,305,522.72 |
94.593 |
|
Withheld |
41,117,475.06 |
5.407 |
|
TOTAL |
760,422,997.78 |
100.000 |
|
|
# of |
% of |
|
Marie L. Knowles |
||
|
Affirmative |
720,009,886.09 |
94.685 |
|
Withheld |
40,413,111.69 |
5.315 |
|
TOTAL |
760,422,997.78 |
100.000 |
|
Ned C. Lautenbach |
||
|
Affirmative |
719,749,038.52 |
94.651 |
|
Withheld |
40,673,959.26 |
5.349 |
|
TOTAL |
760,422,997.78 |
100.000 |
|
Peter S. Lynch |
||
|
Affirmative |
715,851,375.12 |
94.139 |
|
Withheld |
44,571,622.66 |
5.861 |
|
TOTAL |
760,422,997.78 |
100.000 |
|
William O. McCoy |
||
|
Affirmative |
718,919,774.43 |
94.542 |
|
Withheld |
41,503,223.35 |
5.458 |
|
TOTAL |
760,422,997.78 |
100.000 |
|
Marvin L. Mann |
||
|
Affirmative |
719,517,282.26 |
94.621 |
|
Withheld |
40,905,715.52 |
5.379 |
|
TOTAL |
760,422,997.78 |
100.000 |
|
Robert C. Pozen |
||
|
Affirmative |
719,858,604.16 |
94.666 |
|
Withheld |
40,564,393.62 |
5.334 |
|
TOTAL |
760,422,997.78 |
100.000 |
|
PROPOSAL 2 |
||
|
To ratify the selection of PricewaterhouseCoopers LLP as independent accountants of the fund. |
||
|
|
# of |
% of |
|
Affirmative |
249,831,942.59 |
94.977 |
|
Against |
4,625,879.00 |
1.758 |
|
Abstain |
8,587,457.97 |
3.265 |
|
TOTAL |
263,045,279.56 |
100.000 |
|
PROPOSAL 3 |
||
|
To adopt an Amended and Restated Declaration of Trust.* |
||
|
|
# of |
% of |
|
Affirmative |
676,198,304.03 |
89.494 |
|
Against |
27,996,750.36 |
3.706 |
|
Abstain |
51,382,916.46 |
6.800 |
|
TOTAL |
755,577,970.85 |
100.000 |
|
PROPOSAL 4 |
||
|
To approve an amended management contract for the fund. |
||
|
|
# of |
% of |
|
Affirmative |
244,267,043.55 |
92.861 |
|
Against |
7,560,586.38 |
2.874 |
|
Abstain |
11,217,649.63 |
4.265 |
|
TOTAL |
263,045,279.56 |
100.000 |
|
PROPOSAL 5 |
||
|
To approve an amended sub-advisory agreement with Fidelity Management & Research (U.K.) Inc. (FMR U.K.). |
||
|
|
# of |
% of |
|
Affirmative |
240,235,917.34 |
91.329 |
|
Against |
9,976,717.13 |
3.793 |
|
Abstain |
12,832,645.09 |
4.878 |
|
TOTAL |
263,045,279.56 |
100.000 |
|
PROPOSAL 6 |
||
|
To approve an amended sub-advisory agreement with Fidelity Management & Research (Far East) Inc. (FMR Far East). |
||
|
|
# of |
% of |
|
Affirmative |
239,503,802.56 |
91.050 |
|
Against |
10,666,737.26 |
4.056 |
|
Abstain |
12,874,739.74 |
4.894 |
|
TOTAL |
263,045,279.56 |
100.000 |
|
PROPOSAL 7 |
||
|
To approve a Distribution and Service Plan pursuant to Rule 12b-1 for the fund. |
||
|
|
# of |
% of |
|
Affirmative |
230,999,179.83 |
87.817 |
|
Against |
18,704,124.72 |
7.111 |
|
Abstain |
13,341,975.01 |
5.072 |
|
TOTAL |
263,045,279.56 |
100.000 |
|
PROPOSAL 8 |
||
|
To amend the fund's fundamental investment limitation concerning the concentration of its investments in a single industry. |
||
|
|
# of |
% of |
|
Affirmative |
237,068,844.73 |
90.125 |
|
Against |
12,851,243.19 |
4.885 |
|
Abstain |
13,125,191.64 |
4.990 |
|
TOTAL |
263,045,279.56 |
100.000 |
|
PROPOSAL 9 |
||
|
To amend the fund's fundamental investment limitation concerning underwriting. |
||
|
|
# of |
% of |
|
Affirmative |
236,470,012.36 |
89.897 |
|
Against |
12,580,064.50 |
4.783 |
|
Abstain |
13,995,202.70 |
5.320 |
|
TOTAL |
263,045,279.56 |
100.000 |
* Denotes trust-wide proposals and voting results.
Annual Report
Fidelity offers several ways to conveniently manage your personal investments via your telephone or PC. You can access your account information, conduct trades and research your investments 24 hours a day.
By Phone
Fidelity Automated Service Telephone provides a single toll-free number to access account balances, positions, quotes and trading. It's easy to navigate the service, and on your first call, the system will help you create a personal identification number (PIN) for security.
(phone_graphic)
Fidelity Automated
Service Telephone (FAST®)
1-800-544-5555
Press
1 For mutual fund and brokerage trading.
2 For quotes.*
3 For account balances and holdings.
4 To review orders and mutual
fund activity.
5 To change your PIN.
*0 To speak to a Fidelity representative.
By PC
Fidelity's web site on the Internet provides a wide range of information, including daily financial news, fund performance, interactive planning tools and news about Fidelity products and services.
(computer_graphic)
Fidelity's Web Site
www.fidelity.com
If you are not currently on the Internet, call EarthLink Sprint at 1-800-288-2967, and be sure to ask for registration number SMD004 to receive a special Fidelity package that includes 30 days of free Internet access. EarthLink is North America's #1 independent Internet access provider.
(computer_graphic)
Fidelity On-line Xpress+®
Fidelity On-line Xpress+ software for Windows combines comprehensive portfolio management capabilities, securities trading and access to research and analysis tools . . . all on your desktop. Call Fidelity at 1-800-544-0240 or visit our web site for more information on how to manage your investments via your PC.
* When you call the quotes line, please remember that a fund's yield and return will vary and, except for money market funds, share price will also vary. This means that you may have a gain or loss when you sell your shares. There is no assurance that money market funds will be able to maintain a stable $1 share price; an investment in a money market fund is not insured or guaranteed by the U.S. government. Total returns are historical and include changes in share price, reinvestment of dividends and capital gains, and the effects of any sales charges.
Annual Report
For directions and hours,
please call 1-800-544-9797.
Arizona
7373 N. Scottsdale Road
Scottsdale, AZ
California
815 East Birch Street
Brea, CA
851 East Hamilton Avenue
Campbell, CA
527 North Brand Boulevard
Glendale, CA
19200 Von Karman Avenue
Irvine, CA
10100 Santa Monica Blvd.
Los Angeles, CA
251 University Avenue
Palo Alto, CA
1760 Challenge Way
Sacramento, CA
7676 Hazard Center Drive
San Diego, CA
8 Montgomery Street
San Francisco, CA
950 Northgate Drive
San Rafael, CA
1400 Civic Drive
Walnut Creek, CA
6300 Canoga Avenue
Woodland Hills, CA
Colorado
1625 Broadway
Denver, CO
Connecticut
48 West Putnam Avenue
Greenwich, CT
265 Church Street
New Haven, CT
300 Atlantic Street
Stamford, CT
29 South Main Street
West Hartford, CT
Delaware
222 Delaware Avenue
Wilmington, DE
Florida
4400 N. Federal Highway
Boca Raton, FL
90 Alhambra Plaza
Coral Gables, FL
4090 N. Ocean Boulevard
Ft. Lauderdale, FL
1907 West State Road 434
Longwood, FL
8880 Tamiami Trail, North
Naples, FL
2401 PGA Boulevard
Palm Beach Gardens, FL
8065 Beneva Road
Sarasota, FL
1502 N. Westshore Blvd.
Tampa, FL
Georgia
3445 Peachtree Road, N.E.
Atlanta, GA
1000 Abernathy Road
Atlanta, GA
Illinois
One North Franklin Street
Chicago, IL
1415 West 22nd Street
Oak Brook, IL
1700 East Golf Road
Schaumburg, IL
3232 Lake Avenue
Wilmette, IL
Indiana
4729 East 82nd Street
Indianapolis, IN
Maine
Three Canal Plaza
Portland, ME
Maryland
7401 Wisconsin Avenue
Bethesda, MD
One W. Pennsylvania Ave.
Towson, MD
Massachusetts
801 Boylston Street
Boston, MA
155 Congress Street
Boston, MA
25 State Street
Boston, MA
300 Granite Street
Braintree, MA
44 Mall Road
Burlington, MA
416 Belmont Street
Worcester, MA
Annual Report
Michigan
280 Old N. Woodward Ave.
Birmingham, MI
29155 Northwestern Hwy.
Southfield, MI
Minnesota
7600 France Avenue South
Edina, MN
Missouri
700 West 47th Street
Kansas City, MO
8885 Ladue Road
Ladue, MO
New Jersey
150 Essex Street
Millburn, NJ
56 South Street
Morristown, NJ
501 Route 17, South
Paramus, NJ
New York
1055 Franklin Avenue
Garden City, NY
999 Walt Whitman Road
Melville, L.I., NY
1271 Avenue of the Americas
New York, NY
71 Broadway
New York, NY
350 Park Avenue
New York, NY
North Carolina
4611 Sharon Road
Charlotte, NC
Ohio
600 Vine Street
Cincinnati, OH
28699 Chagrin Boulevard
Woodmere Village, OH
Oregon
16850 SW 72nd Avenue
Tigard, OR
Pennsylvania
1735 Market Street
Philadelphia, PA
439 Fifth Avenue
Pittsburgh, PA
Rhode Island
47 Providence Place
Providence, RI
Tennessee
6150 Poplar Avenue
Memphis, TN
Texas
10000 Research Boulevard
Austin, TX
4017 Northwest Parkway
Dallas, TX
1155 Dairy Ashford Street
Houston, TX
2701 Drexel Drive
Houston, TX
400 East Las Colinas Blvd.
Irving, TX
14100 San Pedro
San Antonio, TX
19740 IH 45 North
Spring, TX
Utah
215 South State Street
Salt Lake City, UT
Virginia
1861 International Drive
McLean, VA
Washington
411 108th Avenue, N.E.
Bellevue, WA
511 Pine Street
Seattle, WA
Washington, DC
1900 K Street, N.W.
Washington, DC
Wisconsin
595 North Barker Road
Brookfield, WI
Fidelity Brokerage Services, Inc., 100 Summer St., Boston, MA 02110 Member NYSE/SIPC
Annual Report
Investment Adviser
Fidelity Management & Research Company
Boston, MA
Investment Sub-Advisers
Fidelity Management & Research
(U.K.) Inc.
Fidelity Management & Research
(Far East) Inc.
Fidelity Investments Japan Limited
Officers
Edward C. Johnson 3d, President
Robert C. Pozen, Senior Vice President
Eric D. Roiter, Secretary
Robert A. Dwight, Treasurer
Abigail P. Johnson, Vice President
Maria F. Dwyer, Deputy Treasurer
John H. Costello, Assistant Treasurer
Thomas J. Simpson, Assistant Treasurer
Board of Trustees
Ralph F. Cox *
Phyllis Burke Davis *
Robert M. Gates *
Edward C. Johnson 3d
Donald J. Kirk *
Ned C. Lautenbach *
Peter S. Lynch
Marvin L. Mann *
William O. McCoy *
Gerald C. McDonough *
Robert C. Pozen
Thomas R. Williams *
General Distributor
Fidelity Distributors Corporation
Boston, MA
Transfer and Shareholder
Servicing Agent
Fidelity Service Company, Inc.
Boston, MA
* Independent trustees
Custodian
The Chase Manhattan Bank
New York, NY
Fidelity's Growth Funds
Aggressive Growth Fund
Blue Chip Growth Fund
Capital Appreciation Fund
Contrafund ®
Contrafund® II
Disciplined Equity Fund
Dividend Growth Fund
Export and Multinational Fund
Fidelity Fifty ®
Growth Company Fund
Large Cap Stock Fund
Low-Priced Stock Fund
Magellan® Fund
Mid-Cap Stock Fund
New Millennium Fund®
OTC Portfolio
Retirement Growth Fund
Small Cap Selector
Small Cap Stock Fund
Stock Selector
Tax Managed Stock Fund
TechnoQuantSM Growth Fund
Trend Fund
Value Fund
The Fidelity Telephone Connection
Mutual Fund 24-Hour Service
Exchanges/Redemptions
and Account Assistance 1-800-544-6666
Product Information 1-800-544-6666
Retirement Accounts 1-800-544-4774
(8 a.m. - 9 p.m.)
TDD Service 1-800-544-0118
for the deaf and hearing impaired
(9 a.m. - 9 p.m. Eastern time)
Fidelity Automated Service
Telephone (FAST®) (automated graphic) 1-800-544-5555
(automated graphic) Automated line for quickest service
EXF-ANN-1000 113011
1.462213.103
(Fidelity Investment logo)(registered trademark)
Corporate Headquarters
82 Devonshire St., Boston, MA 02109
www.fidelity.com
Spartan®
Funds
Annual Report
August 31, 2000
(2_fidelity_logos) (Registered_Trademark)
|
President's Message |
Ned Johnson on investing strategies. |
|
|
Spartan Arizona Municipal Income Fund |
||
|
Performance |
How the fund has done over time. |
|
|
Fund Talk |
The manager's review of fund performance, strategy and outlook. |
|
|
Investment Changes |
A summary of major shifts in the fund's investments over the past six months. |
|
|
Investments |
A complete list of the fund's investments with their market values. |
|
|
Financial Statements |
Statements of assets and liabilities,
operations, and changes in net assets, |
|
|
Spartan Arizona Municipal Money Market Fund |
||
|
Performance |
How the fund has done over time. |
|
|
Fund Talk |
The manager's review of fund performance, strategy and outlook. |
|
|
Investment Changes |
A summary of major shifts in the fund's
investments over the past six months |
|
|
Investments |
A complete list of the fund's investments. |
|
|
Financial Statements |
Statements of assets and liabilities,
operations, and changes in net assets, |
|
|
Notes |
Notes to the financial statements |
|
|
Report of Independent Accountants |
The auditors' opinion. |
|
|
Proxy Voting Results |
|
|
Standard & Poor's, S&P and S&P 500 are registered service marks of The McGraw-Hill Companies, Inc. and have been licensed for use by Fidelity Distributors Corporation.
Other third party marks appearing herein are the property of their respective owners.
All other marks appearing herein are registered or unregistered trademarks or service marks of FMR Corp. or an affiliated company.
(Recycle graphic) This report is printed on recycled paper using soy-based inks.
This report and the financial statements contained herein are submitted for the general information of the shareholders of the funds. This report is not authorized for distribution to prospective investors in the funds unless preceded or accompanied by an effective prospectus.
Mutual fund shares are not deposits or obligations of, or guaranteed by, any depository institution. Shares are not insured by the FDIC, Federal Reserve Board or any other agency, and are subject to investment risks, including possible loss of principal amount invested.
Neither the funds nor Fidelity Distributors Corporation is a bank.
For more information on any Fidelity fund, including charges and expenses, call 1-800-544-6666 for a free prospectus. Read it carefully before you invest or send money.
Annual Report
(photo_of_Edward_C_Johnson_3d)
Dear Shareholder:
A slowing U.S. economy triggered an equity market rally during the later stages of summer, boosting most major stock indexes back into positive territory for calendar year 2000. One notable exception, however, was the Dow Jones Industrial Average, which posted a negative return during that timeframe. Fixed-income markets - particularly Treasuries - continued their yearlong trend of strong performance, as nearly every bond sector outperformed the stock market on a year-to-date basis.
While it's impossible to predict the future direction of the markets with any degree of certainty, there are certain basic principles that can help investors plan for their future needs.
The longer your investment time frame, the less likely it is that you will be affected by short-term market volatility. A 10-year investment horizon appropriate for saving for a college education, for example, enables you to weather market cycles in a long-term fund, which may have a higher risk potential, but also has a higher potential rate of return.
An intermediate-length fund could make sense if your investment horizon is two to four years, while a short-term bond fund could be the right choice if you need your money in one or two years.
If your time horizon is less than a year, you might want to consider moving some of your bond investment into a money market fund. These funds seek income and a stable share price by investing in high-quality, short-term investments. Of course, it's important to remember that an investment in a money market fund is not insured or guaranteed by the Federal Deposit Insurance Corporation or any other government agency. Although money market funds seek to preserve the value of your investment at $1.00 per share, it is possible to lose money by investing in these types of funds.
Finally, no matter what your time horizon or portfolio diversity, it makes good sense to follow a regular investment plan, investing a certain amount of money in a fund at the same time each month or quarter and periodically reviewing your overall portfolio. By doing so, you won't get caught up in the excitement of a rapidly rising market, nor will you buy all your shares at market highs. While this strategy - known as dollar cost averaging - won't assure a profit or protect you from a loss in a declining market, it should help you lower the average cost of your purchases. Of course, you should consider your financial ability to continue your purchases through periods of low price levels before undertaking such a strategy.
If you have questions, please call us at 1-800-544-6666, or visit our web site at www.fidelity.com. We are available 24 hours a day, seven days a week to provide you the information you need to make the investments that are right for you.
Best regards,
/s/Edward C. Johnson 3d
Edward C. Johnson 3d
Annual Report
Spartan Arizona Municipal Income Fund
There are several ways to evaluate a fund's historical performance. You can look at the total percentage change in value, the average annual percentage change or the growth of a hypothetical $10,000 investment. Total return reflects the change in the value of an investment, assuming reinvestment of the fund's dividend income and capital gains (the profits earned upon the sale of securities that have grown in value). You can also look at the fund's income, as reflected in the fund's yield, to measure performance. If Fidelity had not reimbursed certain fund expenses, the past five year and life of fund total returns would have been lower.
Cumulative Total Returns
|
Periods ended August 31, 2000 |
|
Past 1 |
Past 5 |
Life of |
|
Spartan Arizona Municipal Income |
|
6.69% |
29.99% |
45.26% |
|
LB Arizona 4 Plus Year Enhanced |
|
6.67% |
n/a* |
n/a* |
|
Arizona Municipal Debt Funds Average |
|
5.10% |
28.39% |
n/a* |
Cumulative total returns show the fund's performance in percentage terms over a set period - in this case, one year, five years or since the fund started on October 11, 1994. For example, if you had invested $1,000 in a fund that had a 5% return over the past year, the value of your investment would be $1,050. You can compare the fund's returns to the performance of the Lehman Brothers Arizona 4 Plus Year Enhanced Municipal Bond Index - a market value-weighted index of Arizona investment-grade municipal bonds with maturities of four years or more. To measure how the fund's performance stacked up against its peers, you can compare it to the Arizona municipal debt funds average, which reflects the performance of mutual funds with similar objectives tracked by Lipper Inc. The past one year average represents a peer group of 39 mutual funds. These benchmarks will include reinvested dividends and capital gains, if any, and exclude the effect of sales charges.
Average Annual Total Returns
|
Periods ended August 31, 2000 |
Past 1 |
Past 5 |
Life of |
|
Spartan Arizona Municipal Income |
6.69% |
5.39% |
6.54% |
|
LB Arizona 4 Plus Year Enhanced |
6.67% |
n/a* |
n/a* |
|
Arizona Municipal Debt Funds Average |
5.10% |
5.12% |
n/a* |
Average annual total returns take the fund's cumulative return and show you what would have happened if the fund had performed at a constant rate each year. (Note: Lipper calculates average annual total returns by annualizing each fund's total return, then taking an arithmetic average. This may produce a different figure than that obtained by averaging the cumulative total returns and annualizing the result.)
* Not available
Annual Report
Spartan Arizona Municipal Income Fund
Performance - continued
$10,000 Over Life of Fund
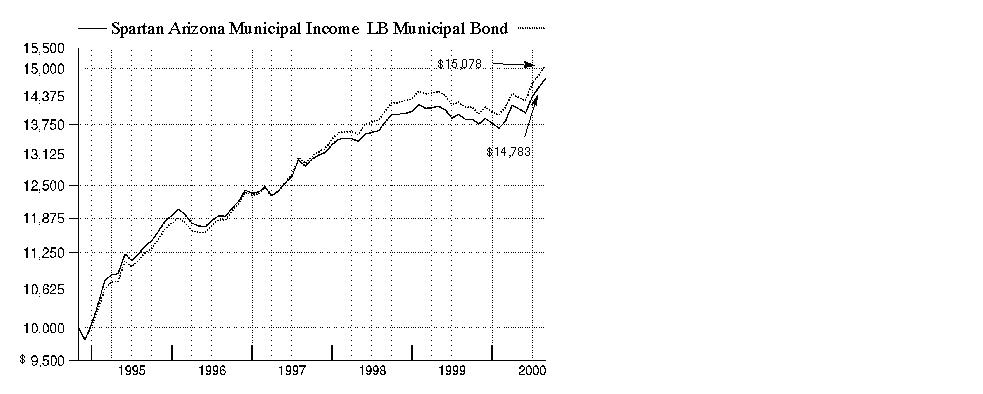
$10,000 Over Life of Fund: Let's say hypothetically that $10,000 was invested in Spartan Arizona Municipal Income Fund on October 31, 1994, shortly after the fund started. As the chart shows, by August 31, 2000, the value of the investment would have grown to $14,783 - a 47.83% increase on the initial investment. For comparison, look at how the Lehman Brothers Municipal Bond Index - a market-value oriented index of investment-grade municipal bonds with maturities of one year or more - did over the same period. With dividends and capital gains, if any, reinvested, the same $10,000 would have grown to $15,078 - a 50.78% increase.
Understanding
Performance
How a fund did yesterday is no guarantee of how it will do tomorrow. Bond prices, for example, generally move in the opposite direction of interest rates. In turn, the share price, return and yield of a fund that invests in bonds will vary. That means if you sell your shares during a market downturn, you might lose money. But if you can ride out the market's ups and downs, you may have a gain.
3Annual Report
Spartan Arizona Municipal Income Fund
Performance - continued
Total Return Components
|
|
|
Years ended August 31, |
||||
|
|
|
2000 |
1999 |
1998 |
1997 |
1996 |
|
Dividend returns |
|
4.85% |
4.13% |
4.55% |
4.80% |
4.92% |
|
Capital returns |
|
1.84% |
-3.75% |
2.61% |
3.36% |
-0.20% |
|
Total returns |
|
6.69% |
0.38% |
7.16% |
8.16% |
4.72% |
Total return components include both dividend returns and capital returns. A dividend return reflects the actual dividends paid by the fund. A capital return reflects both the amount paid by the fund to shareholders as capital gain distributions and changes in the fund's share price. Both returns assume the dividends or capital gains, if any, paid by the fund are reinvested.
Dividends and Yield
|
Periods ended August 31, 2000 |
Past 1 |
Past 6 |
Past 1 |
|
Dividends per share |
4.12¢ |
24.71¢ |
48.52¢ |
|
Annualized dividend rate |
4.54% |
4.69% |
4.66% |
|
30-day annualized yield |
4.53% |
- |
- |
|
30-day annualized tax-equivalent yield |
7.45% |
- |
- |
Dividends per share show the income paid by the fund for a set period. If you annualize this number, based on an average share price of $10.68 over the past one month, $10.46 over the past six months and $10.41 over the past one year, you can compare the fund's income over these three periods. The 30-day annualized yield is a standard formula for all bond funds based on the yields of the bonds in the fund, averaged over the past 30 days. This figure shows you the yield characteristics of the fund's investments at the end of the period. It also helps you compare funds from different companies on an equal basis. The tax-equivalent yield shows what you would have to earn on a taxable investment to equal the fund's tax-free yield, if you're in the 39.23% combined effective 2000 federal and state income tax bracket. The tax-equivalent yield also reflects that a portion of the fund's income was subject to state taxes, but does not reflect the payment of the federal alternative minimum tax, if applicable.
Annual Report
Spartan Arizona Municipal Income Fund
Market Recap
After struggling in the first half of the 12-month period ending August 31, 2000, municipal bonds roared back to life in the second half. At the period's outset, muni performance was tempered by a series of interest-rate hikes by the Federal Reserve Board. Munis also had to compete with record-setting equity performance and a strong rally in Treasuries. Beginning in February, however, bargain-hunting investors became attracted to the generally higher yields municipal bonds offered, and the muni market rallied. Demand continued to grow in March as equity markets tumbled. A number of investors, seeking to protect their gains in stocks, reinvested assets into the relative safety of muni bonds. But as demand grew, supply tapered off. Many municipal bond issuers, such as U.S. state and local governments, limited their issuance, partly because higher interest rates discouraged borrowing. The resulting supply/demand imbalance boosted municipal bond prices. The market received another lift in the summer of 2000 when it became apparent that the U.S. economy was slowing and the Fed bypassed opportunities to hike rates in June and August. For the overall 12-month period, the Lehman Brothers Municipal Bond Index - an index of over 35,000 investment-grade, fixed-rate, tax-exempt bonds - returned 6.77%. The overall taxable-bond market, as measured by the Lehman Brothers Aggregate Bond Index, gained 7.56% in the same time frame.
(Portfolio Manager photograph)
An interview with Christine Thompson, Portfolio Manager of Spartan Arizona Municipal Income Fund
Q. How did the fund perform, Christine?
A. For the 12-month period that ended August 31, 2000, the fund had a total return of 6.69%. To get a sense of how the fund did relative to its competitors, the Arizona municipal debt funds average returned 5.10% for the same 12-month period, according to Lipper Inc. Additionally, the Lehman Brothers Arizona 4 Plus Year Enhanced Municipal Bond Index, which tracks the types of securities in which the fund invests, returned 6.67%.
Q. What were some of the main forces behind the fund's performance during the past year?
A. In the first half, the municipal market and the fund came under pressure due to inflationary fears and rising interest rates. But in the second half, the municipal market rallied and boosted the fund's performance. Beginning in the spring of 2000, investors began to anticipate that the Federal Reserve Board's yearlong campaign to stave off inflation by raising interest rates was nearing a close. That was based on economic indicators that suggested economic growth might be slowing. More favorable supply and demand conditions also helped propel the municipal market. The supply of Arizona municipals was down 10% during the first eight months of 2000, compared to the same period a year earlier. Meanwhile, the demand for municipals strengthened as bargain-hunting investors sought out their value and attractive yields. The fund's total return was the result of the appreciation of its holdings plus the income generated by them.
Annual Report
Spartan Arizona Municipal Income Fund
Fund Talk: The Manager's Overview - continued
Q. Why did the fund beat its peers during the period?
A. In keeping with Fidelity's investment approach, I didn't lengthen or shorten duration - that is, I didn't make the fund more or less interest-rate sensitive - based on where I thought interest rates would be at some point down the road. Instead, I managed the fund's duration to be in line with the Arizona municipal market as a whole. Given that interest rates were pretty volatile during the period, some peers may have suffered if they were positioned with too little or too much interest-rate sensitivity at the wrong time. Rather than make a bet on interest rates, I positioned the fund to emphasize the best value opportunities based on their performance potential under a variety of possible interest-rate scenarios. That leads to another factor that helped performance. Early in the period, I found that certain bonds - such as those trading at prices just below their face value - were very attractively priced. Since then, many of those bonds have performed better than the overall market because they enjoyed very strong demand from individual investors.
Q. What other factors helped the fund's performance?
A. The fund's focus on premium coupon bonds, which pay interest rates above face - or par - value, helped. One appealing aspect of premiums was that they were somewhat insulated from unfavorable tax treatment that hurt the prices of lower coupon bonds as rates rose. It's estimated that roughly one-quarter to one-third of all municipal bonds suffered because they were subject to that unfavorable tax treatment.
Q. Were there any disappointments?
A. Unfortunately, the health care sector continued to struggle in response to concerns about competition, reductions in reimbursements from Medicaid and HMOs, and other factors. Fortunately, the fund had only a small stake in health care holdings, and those that we did hold remained in good shape from a financial perspective.
Q. What choices did you make in terms of credit quality and why?
A. As of August 31, 2000, nearly half of the fund's investments were in bonds with the highest credit rating of Aaa; nearly all of those were insured. The fund's emphasis on higher-quality bonds helped performance for the 12-month period because, generally speaking, below-investment-grade bonds performed relatively poorly. The fund's focus on higher-quality securities reflected that, for the most part, I didn't feel lower-quality bonds offered enough incentive by way of additional yield for owning them. In addition, higher-quality bonds tend to make up the vast majority of the Arizona municipal market.
Q. What's your outlook for the municipal market?
A. As it generally does, the municipal market's performance will depend on the direction of interest rates and the supply/demand environment. While I don't forecast the direction of interest rates, my outlook for the technical aspects of supply and demand is favorable. The supply of municipals has continued to decline in response to rising interest rates because many issuers now find it too expensive to issue new or refinance old debt. As municipal bond yields rose above 6%, we saw incredibly strong demand from individual investors. To the extent that those conditions continue to prevail, municipals could do well. Another factor that could bode well for municipals is the potential for increased demand from institutional investors. Should their interest in municipals re-ignite, municipals should benefit.
The views expressed in this report reflect those of the portfolio manager only through the end of the period of the report as stated on the cover and do not necessarily represent the views of Fidelity or any other person in the Fidelity organization. Any such views are subject to change at any time based upon market or other conditions and Fidelity disclaims any responsibility to update such views. These views may not be relied on as investment advice and, because investment decisions for a Fidelity fund are based on numerous factors, may not be relied on as an indication of trading intent on behalf of any Fidelity fund.
Fund Facts
Goal: seeks a high level of current income, exempt from federal income tax and Arizona personal income tax
Fund number: 434
Trading symbol: FSAZX
Start date: October 11, 1994
Size: as of August 31, 2000, more than $34 million
Manager: Christine Thompson, since 1998; manager, various Fidelity and Spartan municipal income funds; joined Fidelity in 1985
3Christine Thompson on her investment approach:
"I use the Lehman Brothers Arizona 4 Plus Year Enhanced Municipal Bond Index as a representation of the overall market in which the fund invests. The index includes most of the universe of Arizona bonds. I manage the fund to have similar overall interest-rate sensitivity to the index. Beyond that, however, the fund can and does vary significantly from the index, with respect to sector, issuer and structural composition. The fund's holdings reflect my research conclusions on the relative value of bonds.
"One example of how the fund can vary from the index is its large stake relative to the index in education bonds, particularly those backed by Arizona colleges and universities. Based on my analysis, an increasing number of students are expected to seek advanced degrees in the state over the next several years. That's mainly because a sizable portion of the very large ´baby boomlet' population - the children of ´baby boomers' - is expected to enter college during the next several years. Furthermore, education bonds provide a good way to diversify the fund away from economically sensitive bonds such as general obligation bonds, which are supported by tax revenues."
Annual Report
Spartan Arizona Municipal Income Fund
|
Top Five Sectors as of August 31, 2000 |
||
|
|
% of fund's |
% of fund's net assets |
|
General Obligations |
33.7 |
29.9 |
|
Special Tax |
22.6 |
17.3 |
|
Health Care |
9.9 |
11.6 |
|
Education |
8.8 |
10.4 |
|
Electric Utilities |
8.2 |
9.7 |
|
Average Years to Maturity as of August 31, 2000 |
||
|
|
|
6 months ago |
|
Years |
13.0 |
13.2 |
|
Average years to maturity is based on the average time remaining until principal payments are expected from each of the fund's bonds, weighted by dollar amount. |
|
Duration as of August 31, 2000 |
||
|
|
|
6 months ago |
|
Years |
6.8 |
6.9 |
|
Duration shows how much a bond fund's price fluctuates with changes in comparable interest rates. |
|
Quality Diversification (Moody's Ratings) |
As of August 31, 2000 As of February 29, 2000

|
Where Moody's ratings are not available, we have used S&P ratings. Amounts shown are as a percentage of the fund's investments. |
Annual Report
Spartan Arizona Municipal Income Fund
Showing Percentage of Net Assets
|
Municipal Bonds - 98.1% |
|||||
|
Moody's Ratings (unaudited) (a) |
Principal Amount |
Value |
|||
|
Arizona - 90.7% |
|||||
|
Arizona Health Facilities Auth. Hosp. Sys. Rev.: |
|
|
|
|
|
|
(Phoenix Children's Hosp. Proj.) Series A, 6.25% 11/15/29 |
A2 |
|
$ 1,000,000 |
$ 1,002,240 |
|
|
Rfdg. (Saint Lukes Health Sys. Proj.) |
Aaa |
|
345,000 |
376,188 |
|
|
Arizona Student Ln. Aquisition Auth. Student Ln. Rev. Rfdg. Sub Series B1, 6.15% 5/1/29 (b) |
A2 |
|
500,000 |
507,585 |
|
|
Arizona Trans. Board Excise Tax Rev.: |
|
|
|
|
|
|
(Maricopa County Reg'l. Area Road Proj.) Series A: |
|
|
|
|
|
|
5% 7/1/01 |
Aa2 |
|
1,000,000 |
1,006,100 |
|
|
5.75% 7/1/05 (AMBAC Insured) |
Aaa |
|
400,000 |
421,984 |
|
|
Rfdg. (Maricopa County Reg'l. Area |
|
|
|
|
|
|
Series A, 6.5% 7/1/04 (AMBAC Insured) |
Aaa |
|
100,000 |
107,229 |
|
|
Series B, 6% 7/1/05 (AMBAC Insured) |
Aaa |
|
150,000 |
159,854 |
|
|
Arizona Trans. Board Hwy. Rev.: |
|
|
|
|
|
|
Rfdg. 5.75% 7/1/19 |
Aa1 |
|
670,000 |
686,335 |
|
|
Series A, 6.5% 7/1/11 (Pre-Refunded to 7/1/01 @ 101.5) (c) |
Aaa |
|
300,000 |
309,777 |
|
|
Arizona Univ. Rev. Rfdg. 6% 7/1/06 |
A1 |
|
1,000,000 |
1,074,200 |
|
|
Central Arizona Wtr. Conservation District Contract Rev.: |
|
|
|
|
|
|
(Central Arizona Proj.) Series B, 6.3% 11/1/02 (MBIA Insured) |
Aaa |
|
200,000 |
206,398 |
|
|
Rfdg. (Central Arizona Proj.) Series A: |
|
|
|
|
|
|
5.5% 11/1/09 |
A1 |
|
1,000,000 |
1,058,400 |
|
|
5.5% 11/1/10 |
A1 |
|
375,000 |
396,953 |
|
|
Chandler Gen. Oblig.: |
|
|
|
|
|
|
6.25% 7/1/10 |
Aa2 |
|
500,000 |
556,550 |
|
|
6.5% 7/1/10 (MBIA Insured) |
Aaa |
|
200,000 |
226,778 |
|
|
6.5% 7/1/11 (MBIA Insured) |
Aaa |
|
225,000 |
256,280 |
|
|
Chandler Wtr. & Swr. Rev. 5.5% 7/1/15 (MBIA Insured) |
Aaa |
|
1,000,000 |
1,019,680 |
|
|
Cochise County Unified School District #68
(Sierra Vista Proj.) Series B, 9% 7/1/02 |
Aaa |
|
200,000 |
216,006 |
|
|
Flagstaff Gen. Oblig. 4.5% 7/1/13 |
Aaa |
|
200,000 |
189,992 |
|
|
Municipal Bonds - continued |
|||||
|
Moody's Ratings (unaudited) (a) |
Principal Amount |
Value |
|||
|
Arizona - continued |
|||||
|
Glendale Ind. Dev. Auth. Edl. Facilities Rev. Rfdg. (American Graduate School Int'l. Proj.) 6.55% 7/1/06 (AMBAC Insured) (Pre-Refunded to 7/1/05 @ 101) (c) |
AAA |
|
$ 150,000 |
$ 164,936 |
|
|
Maricopa County Hosp. Rev. Rfdg. (Sun Health Corp. Proj.) 6.125% 4/1/18 |
Baa1 |
|
300,000 |
288,765 |
|
|
Maricopa County Ind. Dev. Auth. Health Facilities Rev. Rfdg. (Catholic Health Care West Proj.) Series A, 5% 7/1/03 |
Baa1 |
|
500,000 |
494,190 |
|
|
Maricopa County Ind. Dev. Auth. Hosp. |
AA+ |
|
1,000,000 |
925,330 |
|
|
Maricopa County School District #1 Rfdg. (Cap. Appreciation) (Phoenix Elementary Proj.) Second Series, 0% 7/1/05 (MBIA Insured) |
Aaa |
|
500,000 |
400,395 |
|
|
Maricopa County School District #14 Rfdg. (Creighton Proj.) 6.5% 7/1/04 (FGIC Insured) |
Aaa |
|
200,000 |
214,458 |
|
|
Maricopa County School District #28 Kyrene
Elementary Rfdg. (Cap. Appreciation) |
Aaa |
|
955,000 |
691,726 |
|
|
Maricopa County School District #3 Rfdg. (Cap. Appreciation) (Temple Elementary Proj.) 0% 7/1/08 (AMBAC Insured) |
Aaa |
|
500,000 |
344,695 |
|
|
Maricopa County School District #4 Rfdg. (Mesa Univ. Proj.) 5.25% 7/1/04 (FSA Insured) |
Aaa |
|
300,000 |
308,643 |
|
|
Maricopa County Unified School District #41 Gilbert Rfdg. (Cap. Appreciation) 0% 1/1/06 (FGIC Insured) |
Aaa |
|
1,000,000 |
780,610 |
|
|
Maricopa County Unified School District #80 (Chandler Proj.) 6.6% 7/1/06 (FGIC Insured) |
Aaa |
|
400,000 |
442,272 |
|
|
Mesa Gen. Oblig. Rfdg. 5.7% 7/1/03 |
Aaa |
|
250,000 |
258,713 |
|
|
Mesa Ind. Dev. Auth. Rev. (Discovery Health |
Aaa |
|
500,000 |
506,255 |
|
|
Mohave County Ind. Dev. Auth. Ind. Dev. Rev. (North Star Steel Co. Proj.) Series B, 5.5% 12/1/20 (b) |
A+ |
|
250,000 |
238,195 |
|
|
Navajo County Poll. Cont. Corp. Rev. Rfdg. (Pub. Svc. Co. Proj.) Series A, 5.875% 8/15/28 |
Baa1 |
|
200,000 |
196,656 |
|
|
Peoria Gen. Oblig. 7.5% 4/1/02 (FGIC Insured) |
Aaa |
|
450,000 |
471,470 |
|
|
Phoenix Arpt. Rev. Series D, 6.4% 7/1/12 (MBIA Insured) (b) |
Aaa |
|
810,000 |
860,876 |
|
|
Municipal Bonds - continued |
|||||
|
Moody's Ratings (unaudited) (a) |
Principal Amount |
Value |
|||
|
Arizona - continued |
|||||
|
Phoenix Civic Impt. Corp. Arpt. Excise Tax Rev. Rfdg. Sr. Lien: |
|
|
|
|
|
|
5% 7/1/03 (b) |
Aa2 |
|
$ 500,000 |
$ 506,125 |
|
|
5.25% 7/1/09 (b) |
Aa2 |
|
400,000 |
411,712 |
|
|
Phoenix Civic Impt. Corp. Excise Tax Rev.: |
|
|
|
|
|
|
(Muni. Courthouse Proj.) Sr. Lien Series A: |
|
|
|
|
|
|
5.5% 7/1/11 |
Aa2 |
|
200,000 |
210,114 |
|
|
5.75% 7/1/15 |
Aa2 |
|
675,000 |
707,663 |
|
|
5.375% 7/1/29 |
Aa2 |
|
560,000 |
541,335 |
|
|
Phoenix Civic Impt. Corp. Muni. Facilities |
|
|
|
|
|
|
5.75% 7/1/10 (FGIC Insured) |
Aaa |
|
340,000 |
365,707 |
|
|
5.75% 7/1/14 (FGIC Insured) |
Aaa |
|
1,000,000 |
1,056,470 |
|
|
Phoenix Civic Impt. Corp. Wtr. Sys. Rev. Jr. Lien, 5.45% 7/1/19 |
Aa3 |
|
500,000 |
499,825 |
|
|
Phoenix Gen. Oblig.: |
|
|
|
|
|
|
Rfdg.: |
|
|
|
|
|
|
Series 1995 A, 6% 7/1/11 |
Aa1 |
|
1,485,000 |
1,637,326 |
|
|
Series A, 7.5% 7/1/08 |
Aa1 |
|
510,000 |
604,059 |
|
|
4.5% 7/1/18 |
Aa1 |
|
400,000 |
352,568 |
|
|
4.5% 7/1/22 |
Aa1 |
|
495,000 |
420,008 |
|
|
Phoenix Street & Hwy. User Rev. Rfdg. Jr. Lien, 6.25% 7/1/11 (MBIA Insured) |
Aaa |
|
250,000 |
261,255 |
|
|
Pima County Ind. Dev. Auth. Rev. Rfdg. (HealthPartners Proj.) Series A, 5.625% 4/1/14 (MBIA Insured) |
Aaa |
|
200,000 |
205,560 |
|
|
Pima County Unified School District #1 Tucson Rfdg. 7.5% 7/1/10 (FGIC Insured) |
Aaa |
|
250,000 |
303,998 |
|
|
Scottsdale Gen. Oblig. Rfdg. 5.5% 7/1/09 |
Aa1 |
|
100,000 |
106,035 |
|
|
Scottsdale Street & Hwy. User Rev. Rfdg. 5.5% 7/1/07 |
A1 |
|
500,000 |
526,320 |
|
|
Scottsdale Wtr. & Swr. Rev. (1989 Proj.) |
Aa1 |
|
150,000 |
171,140 |
|
|
Tempe Union High School District #213: |
|
|
|
|
|
|
(1994 Proj.): |
|
|
|
|
|
|
Series B, 7% 7/1/03 (FGIC Insured) |
Aaa |
|
400,000 |
427,040 |
|
|
Series C, 4% 7/1/12 (MBIA Insured) |
Aaa |
|
200,000 |
183,396 |
|
|
Rfdg. & Impt. 7% 7/1/08 (FGIC Insured) |
Aaa |
|
310,000 |
358,208 |
|
|
Tucson Gen. Oblig.: |
|
|
|
|
|
|
Rfdg. 6.75% 7/1/03 (FGIC Insured) |
Aaa |
|
200,000 |
212,482 |
|
|
Series A, 6% 7/1/13 |
Aa2 |
|
800,000 |
874,776 |
|
|
Tucson Street & Hwy. User Rev.: |
|
|
|
|
|
|
Rfdg. Sr. Lien, 6% 7/1/10 (MBIA Insured) |
Aaa |
|
400,000 |
439,664 |
|
|
Municipal Bonds - continued |
|||||
|
Moody's Ratings (unaudited) (a) |
Principal Amount |
Value |
|||
|
Arizona - continued |
|||||
|
Tucson Street & Hwy. User Rev.: - continued |
|
|
|
|
|
|
Sr. Lien Series A, 7% 7/1/11 (MBIA Insured) |
Aaa |
|
$ 300,000 |
$ 354,234 |
|
|
Tucson Wtr. Rev. Series 1994 C, 6.75% 7/1/07 (FGIC Insured) |
Aaa |
|
200,000 |
225,408 |
|
|
Univ. of Arizona Ctfs. of Prtn. (Univ. of Arizona Parking & Student Hsg. Proj.) 5.75% 6/1/24 (AMBAC Insured) |
Aaa |
|
500,000 |
509,295 |
|
|
Univ. of Arizona Univ. Rev. Rfdg.: |
|
|
|
|
|
|
5.25% 6/1/13 (FSA Insured) |
Aaa |
|
500,000 |
506,630 |
|
|
6.375% 6/1/05 |
A1 |
|
400,000 |
420,176 |
|
|
Yuma County Hosp. District #001 6.35% 11/15/07 (Escrowed to Maturity) (c) |
A |
|
265,000 |
283,259 |
|
|
|
31,048,502 |
||||
|
Puerto Rico - 7.4% |
|||||
|
Puerto Rico Commonwealth Hwy. & Trans. Auth. Hwy. Rev.: |
|
|
|
|
|
|
Rfdg. Series W, 5.5% 7/1/17 |
Baa1 |
|
100,000 |
100,539 |
|
|
Series Y, 5.5% 7/1/36 |
Baa1 |
|
500,000 |
502,490 |
|
|
Puerto Rico Commonwealth Hwy. & Trans. Auth. Rev. Series B, 6% 7/1/31 |
Baa1 |
|
250,000 |
264,993 |
|
|
Puerto Rico Elec. Pwr. Auth. Pwr. Rev. Series DD, 5% 7/1/28 (MBIA Insured) |
Aaa |
|
1,000,000 |
937,320 |
|
|
Puerto Rico Pub. Bldgs Auth. Rev. (Govt. Facilities Proj.) Series B, 5% 7/1/27 (AMBAC Insured) |
Aaa |
|
750,000 |
702,720 |
|
|
|
2,508,062 |
||||
|
TOTAL INVESTMENT PORTFOLIO - 98.1% (Cost $32,898,001) |
33,556,564 |
||
|
NET OTHER ASSETS - 1.9% |
664,887 |
||
|
NET ASSETS - 100% |
$ 34,221,451 |
||
|
Legend |
|
(a) S&P credit ratings are used in the absence of a rating by Moody's Investors Service, Inc. |
|
(b) Private activity obligations whose interest is subject to the federal alternative minimum tax for individuals. |
|
(c) Security collateralized by an amount sufficient to pay interest and principal. |
|
Other Information |
|
The composition of long-term debt holdings as a percentage of total value of investments in securities, is as follows (ratings are unaudited): |
|
Moody's Ratings |
S&P Ratings |
|||
|
Aaa, Aa, A |
90.5% |
|
AAA, AA, A |
89.8% |
|
Baa |
5.5% |
|
BBB |
2.3% |
|
Ba |
0.0% |
|
BB |
0.0% |
|
B |
0.0% |
|
B |
0.0% |
|
Caa |
0.0% |
|
CCC |
0.0% |
|
Ca, C |
0.0% |
|
CC, C |
0.0% |
|
|
|
|
D |
0.0% |
|
|
|
The distribution of municipal securities by revenue source, as a percentage of total net assets, is as follows: |
|
General Obligations |
33.7% |
|
Special Tax |
22.6 |
|
Health Care |
9.9 |
|
Education |
8.8 |
|
Electric Utilities |
8.2 |
|
Water & Sewer |
5.7 |
|
Transportation |
5.2 |
|
Others* (individually less than 5%) |
5.9 |
|
|
100.0% |
|
* Includes short-term investments |
|
Income Tax Information |
|
At August 31, 2000, the aggregate cost of investment securities for income tax purposes was $32,898,001. Net unrealized appreciation aggregated $658,563, of which $869,195 related to appreciated investment securities and $210,632 related to depreciated investment securities. |
|
The fund hereby designates approximately $3,000 as a capital gain dividend for the purpose of the dividend paid deduction. |
|
The fund hereby designates 100% of the long-term capital gain dividends distributed during the fiscal year as 20%-rate capital gain dividends. |
|
At August 31, 2000, the fund had a capital loss carryforward of approximately $94,000 all of which will expire on |
|
During the fiscal year ended August 31, 2000, 100% of the fund's income dividends was free from federal income tax, and 9.21% of the fund's income dividends was subject to the federal alternative minimum tax. |
|
The fund will notify shareholders in January 2001 of amounts for use in preparing 2000 income tax returns. |
See accompanying notes which are an integral part of the financial statements.
Annual Report
Spartan Arizona Municipal Income Fund
Statement of Assets and Liabilities
|
|
August 31, 2000 |
|
|
Assets |
|
|
|
Investment in securities, at value (cost $32,898,001) - |
|
$ 33,556,564 |
|
Cash |
|
416,108 |
|
Receivable for fund shares sold |
|
9,736 |
|
Interest receivable |
|
350,997 |
|
Other receivables |
|
14,085 |
|
Total assets |
|
34,347,490 |
|
Liabilities |
|
|
|
Payable for fund shares redeemed |
$ 74,038 |
|
|
Distributions payable |
36,426 |
|
|
Accrued management fee |
15,575 |
|
|
Total liabilities |
|
126,039 |
|
Net Assets |
|
$ 34,221,451 |
|
Net Assets consist of: |
|
|
|
Paid in capital |
|
$ 33,681,745 |
|
Undistributed net interest income |
|
7,039 |
|
Accumulated undistributed net realized |
|
(125,896) |
|
Net unrealized appreciation (depreciation) on investments |
|
658,563 |
|
Net Assets, for 3,192,187 shares outstanding |
|
$ 34,221,451 |
|
Net Asset Value, offering price and redemption price |
|
$10.72 |
See accompanying notes which are an integral part of the financial statements.
Annual Report
Spartan Arizona Municipal Income Fund
Financial Statements - continued
Statement of Operations
|
|
Year ended August 31, 2000 |
|
|
Interest Income |
|
$ 1,518,236 |
|
Expenses |
|
|
|
Management fee |
$ 161,912 |
|
|
Non-interested trustees' compensation |
90 |
|
|
Total expenses before reductions |
162,002 |
|
|
Expense reductions |
(20,244) |
141,758 |
|
Net interest income |
|
1,376,478 |
|
Realized and Unrealized Gain (Loss) Net realized gain (loss) on: |
|
|
|
Investment securities |
(1,696) |
|
|
Futures contracts |
3,245 |
1,549 |
|
Change in net unrealized appreciation (depreciation) |
|
625,970 |
|
Net gain (loss) |
|
627,519 |
|
Net increase (decrease) in net assets resulting |
|
$ 2,003,997 |
See accompanying notes which are an integral part of the financial statements.
Annual Report
Spartan Arizona Municipal Income Fund
Financial Statements - continued
Statement of Changes in Net Assets
|
|
Year ended |
Year ended |
|
Increase (Decrease) in Net Assets |
|
|
|
Operations |
$ 1,376,478 |
$ 1,155,047 |
|
Net realized gain (loss) |
1,549 |
(55,209) |
|
Change in net unrealized appreciation (depreciation) |
625,970 |
(1,075,095) |
|
Net increase (decrease) in net assets resulting |
2,003,997 |
24,743 |
|
Distributions to shareholders |
(1,375,127) |
(1,155,047) |
|
From net realized gain |
(1,549) |
(36,964) |
|
In excess of net realized gain |
(9,168) |
(54,789) |
|
Total distributions |
(1,385,844) |
(1,246,800) |
|
Share transactions |
14,362,543 |
10,812,895 |
|
Reinvestment of distributions |
1,010,735 |
942,439 |
|
Cost of shares redeemed |
(11,422,361) |
(5,501,589) |
|
Net increase (decrease) in net assets resulting |
3,950,917 |
6,253,745 |
|
Redemption fees |
10,061 |
4,734 |
|
Total increase (decrease) in net assets |
4,579,131 |
5,036,422 |
|
Net Assets |
|
|
|
Beginning of period |
29,642,320 |
24,605,898 |
|
End of period (including undistributed net interest |
$ 34,221,451 |
$ 29,642,320 |
|
Other Information Shares |
|
|
|
Sold |
1,380,229 |
994,437 |
|
Issued in reinvestment of distributions |
96,992 |
86,645 |
|
Redeemed |
(1,099,530) |
(507,000) |
|
Net increase (decrease) |
377,691 |
574,082 |
See accompanying notes which are an integral part of the financial statements.
Annual Report
Financial Highlights
|
Years ended August 31, |
2000 |
1999 |
1998 |
1997 |
1996 |
|
Selected Per-Share Data |
|
|
|
|
|
|
Net asset value, beginning |
$ 10.530 |
$ 10.980 |
$ 10.740 |
$ 10.460 |
$ 10.640 |
|
Income from Investment Operations |
.486 B |
.458 |
.473 |
.483 |
.514 |
|
Net realized and unrealized gain (loss) |
.189 |
(.412) |
.279 |
.351 |
(.022) |
|
Total from investment operations |
.675 |
.046 |
.752 |
.834 |
.492 |
|
Less Distributions |
|
|
|
|
|
|
From net interest income |
(.485) |
(.458) |
(.473) |
(.484) |
(.514) |
|
From net realized gain |
(.001) |
(.016) |
(.040) |
(.070) |
(.160) |
|
In excess of net realized gain |
(.003) |
(.024) |
- |
- |
- |
|
Total distributions |
(.489) |
(.498) |
(.513) |
(.554) |
(.674) |
|
Redemption fees added to |
.004 |
.002 |
.001 |
.000 |
.002 |
|
Net asset value, end of period |
$ 10.720 |
$ 10.530 |
$ 10.980 |
$ 10.740 |
$ 10.460 |
|
Total Return A |
6.69% |
0.38% |
7.16% |
8.16% |
4.72% |
|
Ratios and Supplemental Data |
|
|
|
|
|
|
Net assets, end of period |
$ 34,221 |
$ 29,642 |
$ 24,606 |
$ 19,766 |
$ 20,388 |
|
Ratio of expenses to |
.55% |
.55% |
.55% |
.55% |
.30% C |
|
Ratio of expenses to average net assets after expense reductions |
.48% D |
.54% D |
.54% D |
.53% D |
.30% |
|
Ratio of net interest income to average net assets |
4.67% |
4.21% |
4.35% |
4.55% |
4.82% |
|
Portfolio turnover rate |
37% |
12% |
25% |
27% |
32% |
A The total returns would have been lower had certain expenses not been reduced during the periods shown.
B Net interest income per share has been calculated based on average shares outstanding during the period.
C FMR agreed to reimburse a portion of the fund's expenses during the period. Without this reimbursement, the fund's expense ratio would have been higher.
D FMR or the fund has entered into varying arrangements with third parties who either paid or reduced a portion of the fund's expenses.
See accompanying notes which are an integral part of the financial statements.
Annual Report
Spartan Arizona Municipal Money Market Fund
To evaluate a money market fund's historical performance, you can look at either total return or yield. Total return reflects the change in the value of an investment, assuming reinvestment of the fund's dividend income, but does not include the effect of the fund's $5 account closeout fee on an average-sized account. Yield measures the income paid by a fund. Since a money market fund tries to maintain a $1 share price, yield is an important measure of performance. If Fidelity had not reimbursed certain fund expenses, the past five year and life of fund total returns would have been lower.
Cumulative Total Returns
|
Periods ended August 31, 2000 |
|
Past 1 |
Past 5 |
Life of |
|
Spartan AZ Municipal Money Market |
|
3.50% |
17.81% |
21.86% |
|
All Tax-Free Money Market Funds Average |
|
3.29% |
16.21% |
n/a* |
Cumulative total returns show the fund's performance in percentage terms over a set period - in this case, one year, five years or since the fund started on October 11, 1994. For example, if you had invested $1,000 in a fund that had a 5% return over the past year, the value of your investment would be $1,050. To measure how the fund's performance stacked up against its peers, you can compare it to the all tax-free money market funds average, which reflects the performance of all tax-free money market funds with similar objectives tracked by iMoneyNet, Inc. The past one year average represents a peer group of 461 money market funds.
Average Annual Total Returns
|
Periods ended August 31, 2000 |
|
Past 1 |
Past 5 |
Life of |
|
Spartan AZ Municipal Money Market |
|
3.50% |
3.33% |
3.41% |
|
All Tax-Free Money Market Funds Average |
|
3.29% |
3.05% |
n/a* |
Average annual total returns take the fund's cumulative return and show you what would have happened if the fund had performed at a constant rate each year.
* Not available
Annual Report
Spartan Arizona Municipal Money Market
Performance - continued
Yields
|
|
8/28/00 |
5/29/00 |
2/28/00 |
11/29/99 |
8/30/99 |
|||
|
|
||||||||
|
Spartan Arizona Municipal |
3.81% |
3.76% |
3.32% |
3.27% |
2.86% |
|||
|
|
||||||||
|
All Tax-Free Money |
3.56% |
3.60% |
3.12% |
3.16% |
2.66% |
|||
|
|
||||||||
|
Spartan Arizona Municipal |
6.26% |
6.20% |
5.48% |
5.38% |
4.71% |
|||
|
|
||||||||
|
Portion of fund's income subject |
7.03% |
9.71% |
1.17% |
5.67% |
0.04% |
|||

Yield refers to the income paid by the fund over a given period. Yields for money market funds are usually for seven-day periods, expressed as annual percentage rates. A yield that assumes income earned is reinvested or compounded is called an effective yield. The table above shows the fund's current seven-day yield at quarterly intervals over the past year. You can compare these yields to the all tax-free money market funds average tracked by iMoneyNet, Inc. Or you can look at the fund's tax-equivalent yield, which is based on a combined effective 2000 federal and state income tax rate of 39.23%. The fund's yields mentioned above reflect that a portion of the fund's income was subject to state taxes. A portion of the fund's income may be subject to the federal alternative minimum tax.
A money market fund's total returns and yields will vary, and reflect past results rather than predict future performance.
Comparing
Performance
Yields on tax-free investments are usually lower than yields on taxable investments. However, a straight comparison between the two may be misleading because it ignores the way taxes reduce taxable returns. Tax-equivalent yield - the yield you'd have to earn on a similar taxable investment to match the tax-free yield - makes the comparison more meaningful. Keep in mind that the U.S. government neither insures nor guarantees a money market fund. In fact, there is no assurance that a money fund will maintain a $1 share price.
3Annual Report
Spartan Arizona Municipal Money Market Fund
(Portfolio Manager photograph)
Note to shareholders: Norm Lind became Portfolio Manager of Spartan Arizona Municipal Money Market Fund on July 1, 2000.
Q. Norm, what was the investment environment like during the 12 months that ended August 31, 2000?
A. During most of the period, the backdrop seemed ripe for the build-up of inflationary pressures. Economic growth was robust, unemployment reached historic lows and consumer spending was strong. To dampen growth and keep inflation at bay, the Federal Reserve Board implemented a program of short-term interest-rate hikes. As the period progressed, market participants tried to gauge the pace of the Fed's tightening monetary policy approach. Through the second quarter of 2000, inflation remained subdued despite strong growth. As a result, the Fed followed a deliberate approach, raising the rate banks charge each other for overnight loans - known as the fed funds target rate - by increments of 0.25 percentage points in November 1999, and in February and March 2000. The Fed did this after having raised rates by the same amount twice previously, in June and August 1999. In April and May, there was a general recognition of inflationary pressures and the employment cost index - a broad measure of the costs incurred by businesses for wages and benefits - posted a higher-than-expected gain. The Fed responded by becoming more aggressive, raising the fed funds target rate in May by 0.50 percentage points, to 6.50%. Since that time, however, broad indicators have demonstrated a slowing of the economy amid relatively tame inflation, with the exception of higher oil prices.
Q. How was the fund managed during this period?
A. Throughout the period, Arizona's money market yield curve - a representation of the difference between short- and long-term money market yields - remained relatively flat. That means that long-term - one-year - fixed-rate money market securities did not offer much of a yield advantage over short-term, variable-rate money market securities. Yields on longer-term notes remained low because there was a lack of supply of these bonds during a period when demand was fairly solid. The healthy Arizona economy helped contribute to the short supply, as municipalities reaped revenues due to vibrant economic growth. As a result of this backdrop, the fund concentrated on finding opportunities among short-term securities such as variable rate demand notes (VRDNs). Yields on these instruments are reset at regular intervals, usually daily or weekly. This approach helped the fund capture higher market yields as the Fed continued to raise short-term rates. Holding a large percentage in VRDNs also helped boost the fund's performance in April and early May, due to a unique circumstance. With the run-up in the equity market in 1999, many investors earned more capital gains than usual and needed to pay higher tax bills. As a result, investors redeemed shares of money market funds to pay their taxes. Fund managers in turn, sold VRDNs to meet redemptions. Dealers of VRDNs were therefore forced to raise yields - in some cases as high as levels seen in taxable markets - to attract buyers. The fund took advantage of these buying opportunities to add yield.
Annual Report
Spartan Arizona Municipal Money Market Fund
Fund Talk: The Manager's Overview - continued
Q. How did the fund perform?
A. The fund's seven-day yield on August 31, 2000, was 3.82%, compared to 2.86% 12 months ago. The more recent seven-day yield was the equivalent of a 6.28% taxable rate of return for Arizona investors in the 39.23% combined state and federal income tax bracket. The fund's yields reflect that a portion of the fund's income was subject to state taxes. Through August 31, 2000, the fund's 12-month total return was 3.50%, compared to 3.29% for the all tax-free money market funds average, according to iMoneyNet, Inc.
Q. What is your outlook?
A. Market rates currently reflect the sentiment that the Fed may have completed its latest round of interest-rate hikes. Data showing subdued growth, a less tight labor market and tame inflation have left the market fairly positive about the coming months. The one blemish on this benign landscape would be higher oil prices, which some fear might incite price hikes elsewhere in the economy. Thus far, however, that scenario has not come to pass. Therefore, it appears likely that the Fed will stay on the sidelines at least through November's election.
The views expressed in this report reflect those of the portfolio manager only through the end of the period of the report as stated on the cover and do not necessarily represent the views of Fidelity or any other person in the Fidelity organization. Any such views are subject to change at any time based upon market or other conditions and Fidelity disclaims any responsibility to update such views. These views may not be relied on as investment advice and, because investment decisions for a Fidelity fund are based on numerous factors, may not be relied on as an indication of trading intent on behalf of any Fidelity fund.
Fund Facts
Goal: seeks a high level of current income, exempt from federal income tax and Arizona personal income tax
Fund number: 433
Trading symbol: FSAXX
Start date: October 11, 1994
Size: as of August 31, 2000, more than $105 million
Manager: Norm Lind, since July 2000; manager, various Fidelity and Spartan municipal money market funds; joined Fidelity in 1986
3Annual Report
Spartan Arizona Municipal Money Market Fund
|
Maturity Diversification |
|||
|
Days |
% of fund's
investments |
% of fund's investments 2/29/00 |
% of fund's |
|
0 - 30 |
93.1 |
70.7 |
56.5 |
|
31 - 90 |
2.8 |
11.0 |
14.3 |
|
91 - 180 |
0.0 |
16.3 |
20.7 |
|
181 - 397 |
4.1 |
2.0 |
8.5 |
|
Weighted Average Maturity |
|||
|
|
8/31/00 |
2/29/00 |
8/31/99 |
|
Spartan Arizona Municipal Money |
21 Days |
35 Days |
62 Days |
|
All Tax-Free Money Market |
42 Days |
39 Days |
51 Days |
|
Asset Allocation (% of fund's net assets) |
|||||||
|
As of August 31, 2000 |
As of February 29, 2000 |
||||||
|
Variable Rate |
|
|
Variable Rate |
|
||
 |
Commercial Paper
(including |
|
|
Commercial Paper
(including |
|
||
 |
Tender Bonds 1.0% |
|
|
Tender Bonds 1.0% |
|
||
 |
Municipal Notes 1.9% |
|
|
Municipal Notes 3.1% |
|
||
|
Other Investments |
|
|
Other Investments |
|
||

*Source: IBC's MONEY FUND REPORT®
Annual Report
Spartan Arizona Municipal Money Market Fund
Showing Percentage of Net Assets
|
Municipal Securities - 99.5% |
|||
|
Principal Amount |
Value |
||
|
Arizona - 96.8% |
|||
|
Apache County Ind. Dev. Auth. (Imperial Components, Inc. Proj.) Series 1996, 4.35%, LOC Harris Trust & Savings Bank, Chicago, VRDN (a)(d) |
$ 1,800,000 |
$ 1,800,000 |
|
|
Arizona Edl. Ln. Marketing Corp. Series 1991 A, 4.3%, |
14,000,000 |
14,000,000 |
|
|
Arizona Health Facilities Auth. Rev. (Blood Sys., Inc. Proj.) Series 1995, 4.35%, LOC Bank One, Arizona NA, VRDN (a) |
900,000 |
900,000 |
|
|
Arizona School District Fing. Prog. Ctfs. of Prtn. TAN Series 2000, 4.875% 7/31/01 (AMBAC Insured) |
2,000,000 |
2,009,569 |
|
|
Arizona Trans. Board Hwy. Rev. Participating VRDN Series MSDW 00 367, 4.35% (Liquidity Facility Morgan Stanley Dean Witter & Co.) (a)(e) |
2,855,000 |
2,855,000 |
|
|
Casa Grande Indl. Dev. Auth. Indl. Dev. Rev. (Aztec Pulp & Paper Prod. Proj.) Series 2000 A, 4.45%, LOC Bank of America NA, VRDN (a)(d) |
1,000,000 |
1,000,000 |
|
|
Chandler Indl. Dev. Auth. Indl. Dev. Rev. (Red Rock Stamping Co. Proj.) Series 2000, 4.45%, LOC Key Bank Nat'l. |
3,250,000 |
3,250,000 |
|
|
Cochise County Poll. Cont. Rev. Solid Waste Disp. Rev. Bonds (Arizona Elec. Pwr. Coop. Proj.) 4.1%, tender 9/1/00 (Nat'l. Rural Util. Coop. Fin. Corp. Guaranteed) (d) |
1,000,000 |
1,000,000 |
|
|
Coconino County Poll. Cont. Corp. Rev. (Arizona Pub. Svc. Co. Navajo Proj.) Series 1994 A, 4.2%, LOC Kredietbank, VRDN (a)(d) |
1,750,000 |
1,750,000 |
|
|
Flagstaff Indl. Dev. Auth. Indl. Dev. Rev. Bonds (Citizens Utils. Co. Proj.) 4.65% tender 9/7/00, CP mode (d) |
2,100,000 |
2,100,000 |
|
|
Flagstaff Indl. Dev. Auth. Solid Waste Disp. Rev. (Norton Envir., Inc. Proj.) Series 1997, 4.45%, LOC Key Bank Nat'l. Assoc., VRDN (a)(d) |
2,500,000 |
2,500,000 |
|
|
Glendale Indl. Dev. Auth. Indl. Dev. Rev. (Superior Bedding |
1,500,000 |
1,500,000 |
|
|
Glendale Wtr. & Swr. Rev. Bonds 4.75% 7/1/01 |
1,175,000 |
1,175,923 |
|
|
Maricopa County Indl. Dev. Auth. Rev. (Orangewood CCRC Proj.) Series A, 4.25%, LOC Banque Nationale de Paris (BNP), VRDN (a) |
500,000 |
500,000 |
|
|
Maricopa County Ind. Dev. Auth. Ind. Dev. Rev.: |
|
|
|
|
Bonds (Citizens Communications Co. Proj.) Series 1988, 4.65% tender 9/1/00, CP mode (d) |
1,000,000 |
1,000,000 |
|
|
(Clayton Homes Proj.) Series 1998, 4.4%, LOC Wachovia Bank NA, VRDN (a)(d) |
1,000,000 |
1,000,000 |
|
|
Municipal Securities - continued |
|||
|
Principal Amount |
Value |
||
|
Arizona - continued |
|||
|
Maricopa County Poll. Cont. Rev.: |
|
|
|
|
Bonds (Southern California Edison Co. Proj.): |
|
|
|
|
Series 1985 B, 4.6% tender 9/11/00, CP mode |
$ 1,000,000 |
$ 1,000,000 |
|
|
Series 1985 D, 4.35% tender 9/8/00, CP mode |
1,000,000 |
1,000,000 |
|
|
Series 1985 E, 4.35% tender 9/8/00, CP mode |
2,200,000 |
2,200,000 |
|
|
Series 1985 F, 4.2% tender 9/8/00, CP mode |
5,250,000 |
5,250,000 |
|
|
(Arizona Pub. Svc. Co. Proj.) Series 1994 E, 4.3%, |
500,000 |
500,000 |
|
|
(Southern California Edison Co. Proj.) Series 2000 B, 4.35%, VRDN (a) |
600,000 |
600,000 |
|
|
Mesa Ind. Dev. Auth. Rev. (Discovery Health Sys. Proj.) |
4,650,000 |
4,650,000 |
|
|
Mesa Muni. Dev. Corp. Bonds Series 1985, 4.2% tender 9/13/00, LOC Westdeutsche Landesbank Girozentrale, |
1,500,000 |
1,500,000 |
|
|
Mohave County Ind. Dev. Auth. Ind. Dev. Rev.: |
|
|
|
|
Bonds: |
|
|
|
|
(Citizens Communications Co. Proj.) Series 1993 E, |
900,000 |
900,000 |
|
|
(Citizens Utils. Co. Proj.) Series 1988 B, 4.8% tender 10/19/00, CP mode (d) |
1,000,000 |
1,000,000 |
|
|
(Citizens Utils. Co. Proj.) Series 1997 4.6%, VRDN (a)(d) |
2,090,000 |
2,090,000 |
|
|
Phoenix Civic Impt. Board Arpt. Rev. Participating VRDN Series PA 405, 4.38% (Liquidity Facility Merrill Lynch & Co., Inc.) (a)(e) |
1,920,000 |
1,920,000 |
|
|
Phoenix Ind. Dev. Auth. Participating VRDN Series PT 1082, 4.38% (Liquidity Facility Merrill Lynch & Co., Inc.) (a)(e) |
945,000 |
945,000 |
|
|
Phoenix Ind. Dev. Auth. Multi-family Hsg. Rev. (Bell Square Apt. Proj.) Series 1995, 4.4%, LOC Gen. Elec. Cap. Corp., VRDN (a) |
1,000,000 |
1,000,000 |
|
|
Phoenix Ind. Dev. Auth. Rev.: |
|
|
|
|
(Marlyn Nutraceuticals Proj.) 4.5%, LOC Bank One, |
1,000,000 |
1,000,000 |
|
|
(Plastican Proj.) Series 1997, 4.5%, LOC Fleet Bank NA, VRDN (a)(d) |
3,885,000 |
3,885,000 |
|
|
Rfdg. (V.A.W. of America Proj.) Series 1997, 4.45%, |
1,000,000 |
1,000,000 |
|
|
Phoenix Indl. Dev. Auth. Rev. (Independent Newspaper, Inc. Proj.) Series 2000, 4.45%, LOC First Union Nat'l. Bank, North Carolina, VRDN (a)(d) |
1,070,000 |
1,070,000 |
|
|
Municipal Securities - continued |
|||
|
Principal Amount |
Value |
||
|
Arizona - continued |
|||
|
Pima County Ind. Dev. Auth. Multi-family Hsg. Rev. |
$ 2,925,000 |
$ 2,925,000 |
|
|
Pima County Ind. Dev. Auth. Single Family Hsg. |
2,000,000 |
2,000,000 |
|
|
Pima County Indl. Dev. Auth. Indl. Rev. (Tucson Elec. Pwr. Co. Proj.) Series 1982 A, 4.25%, LOC Toronto Dominion Bank, VRDN (a) |
3,700,000 |
3,700,000 |
|
|
Pima County Indl. Dev. Auth. Single Family Mtg. Rev. Bonds 4.1% 9/1/00 (Pacific Life Ins. Co. Guaranteed) (d) |
1,000,000 |
1,000,000 |
|
|
Pinal County Ind. Dev. Auth. Hosp. Rev. (Casa Grande Med. Ctr. Proj.) Series 1995, 4.3%, LOC Chase Manhattan Bank, VRDN (a) |
4,805,000 |
4,805,000 |
|
|
Pinal County Ind. Dev. Poll. Cont. Rev. (Magma Copper Co. Proj.) Series 1992, 4.2%, LOC BNP Paribas Sa, VRDN (a) |
4,665,000 |
4,665,000 |
|
|
Salt River Proj. Agric. Impt. & Pwr. District Elec. Sys. Rev.: |
|
|
|
|
Participating VRDN Series MSDW 00 208, 4.33% |
2,495,000 |
2,495,000 |
|
|
Series B, 4.55% 10/16/00, CP |
2,000,000 |
2,000,000 |
|
|
Tucson & Pima County Indl. Dev. Auth. Single Family Mtg. |
1,100,000 |
1,100,000 |
|
|
Tucson Arpt. Auth. Spl. Facility Rev. (LearJet, Inc. Proj.) |
1,300,000 |
1,300,000 |
|
|
Yavapai County Ind. Dev. Auth. Ind. Dev. Rev.: |
|
|
|
|
Bonds: |
|
|
|
|
(Citizens Communications Co. Proj.) Series 1993, 4.65% tender 9/7/00, CP mode (d) |
1,000,000 |
1,000,000 |
|
|
(Citizens Utils. Co. Proj.) Series 1997, 4.65% tender 9/7/00, CP mode (d) |
1,500,000 |
1,500,000 |
|
|
(Oxycal Lab. Proj.) Series 1999 A, 4.5%, LOC Bank One, Arizona NA, VRDN (a)(d) |
1,000,000 |
1,000,000 |
|
|
Yuma County Ind. Dev. Auth. Rev. (Meadowcraft, Inc. Proj.) Series 1997, 4.45%, LOC Bank of America NA, VRDN (a)(d) |
3,000,000 |
3,000,000 |
|
|
|
102,340,492 |
||
|
Municipal Securities - continued |
|||
|
Shares |
Value |
||
|
Other - 2.7% |
|||
|
Fidelity Municipal Cash Central Fund, 4.28% (b)(c) |
2,847,344 |
$ 2,847,344 |
|
|
TOTAL INVESTMENT PORTFOLIO - 99.5% |
105,187,836 |
|
|
NET OTHER ASSETS - 0.5% |
515,998 |
|
|
NET ASSETS - 100% |
$ 105,703,834 |
|
|
Total Cost for Income Tax Purposes $ 105,187,836 |
|
Security Type Abbreviations |
|
CP - COMMERCIAL PAPER |
|
TAN - TAX ANTICIPATION NOTE |
|
VRDN - VARIABLE RATE DEMAND NOTE |
|
Legend |
|
(a) The coupon rate shown on floating or adjustable rate securities represents the rate at period end. |
|
(b) Information in this report regarding holdings by state and security types does not reflect the holdings of the Fidelity Municipal Cash Central Fund. A listing of the Fidelity Municipal Cash Central Fund's holdings as of its most recent fiscal period end is available upon request. |
|
(c) The rate quoted is the annualized seven-day yield of the fund at period end. |
|
(d) Private activity obligations whose interest is subject to the federal alternative minimum tax for individuals. |
|
(e) Provides evidence of ownership in one or more underlying municipal bonds. |
|
Income Tax Information |
|
At August 31, 2000, the fund had a capital loss carryforward of approximately $34,000 all of which will expire on |
|
During the fiscal year ended August 31, 2000, 100.00% of the fund's income dividends was free from federal income tax, and 45.66% of the fund's income dividends was subject to the federal alternative minimum tax (unaudited). |
|
The fund will notify shareholders in January 2001 of amounts for use in preparing 2000 income tax returns. |
See accompanying notes which are an integral part of the financial statements.
Annual Report
Spartan Arizona Municipal Money Market Fund
Statement of Assets and Liabilities
|
|
August 31, 2000 |
|
|
Assets |
|
|
|
Investment in securities, at value - |
|
$ 105,187,836 |
|
Receivable for fund shares sold |
|
37,991 |
|
Interest receivable |
|
702,338 |
|
Total assets |
|
105,928,165 |
|
Liabilities |
|
|
|
Payable to custodian bank |
$ 57,954 |
|
|
Payable for fund shares redeemed |
106,159 |
|
|
Distributions payable |
14,897 |
|
|
Accrued management fee |
45,244 |
|
|
Other payables and accrued expenses |
77 |
|
|
Total liabilities |
|
224,331 |
|
Net Assets |
|
$ 105,703,834 |
|
Net Assets consist of: |
|
|
|
Paid in capital |
|
$ 105,742,732 |
|
Accumulated net realized gain (loss) on investments |
|
(38,898) |
|
Net Assets, for 105,715,950 shares outstanding |
|
$ 105,703,834 |
|
Net Asset Value, offering price and redemption price |
|
$1.00 |
See accompanying notes which are an integral part of the financial statements.
Annual Report
Spartan Arizona Municipal Money Market Fund
Financial Statements - continued
Statement of Operations
|
|
Year ended August 31, 2000 |
|
|
Interest Income |
|
$ 3,957,290 |
|
Expenses |
|
|
|
Management fee |
$ 499,571 |
|
|
Non-interested trustees' compensation |
299 |
|
|
Total expenses before reductions |
499,870 |
|
|
Expense reductions |
(638) |
499,232 |
|
Net interest income |
|
3,458,058 |
|
Net Realized Gain (Loss) on Investments |
|
(15,144) |
|
Net increase in net assets resulting from operations |
|
$ 3,442,914 |
See accompanying notes which are an integral part of the financial statements.
Annual Report
Spartan Arizona Municipal Money Market Fund
Financial Statements - continued
Statement of Changes in Net Assets
|
|
Year ended |
Year ended |
|
Increase (Decrease) in Net Assets |
|
|
|
Operations |
$ 3,458,058 |
$ 2,580,497 |
|
Net realized gain (loss) |
(15,144) |
(23,612) |
|
Net increase (decrease) in net assets resulting |
3,442,914 |
2,556,885 |
|
Distributions to shareholders from net interest income |
(3,458,058) |
(2,580,497) |
|
Share transactions at net asset value of $1.00 per share |
113,958,442 |
93,042,199 |
|
Reinvestment of distributions from net interest income |
3,239,350 |
2,439,841 |
|
Cost of shares redeemed |
(102,135,902) |
(99,324,559) |
|
Net increase (decrease) in net assets and shares resulting from share transactions |
15,061,890 |
(3,842,519) |
|
Total increase (decrease) in net assets |
15,046,746 |
(3,866,131) |
|
Net Assets |
|
|
|
Beginning of period |
90,657,088 |
94,523,219 |
|
End of period |
$ 105,703,834 |
$ 90,657,088 |
See accompanying notes which are an integral part of the financial statements.
Annual Report
Financial Highlights
|
Years ended August 31, |
2000 |
1999 |
1998 |
1997 |
1996 |
|
Selected Per-Share Data |
|
|
|
|
|
|
Net asset value, |
$ 1.000 |
$ 1.000 |
$ 1.000 |
$ 1.000 |
$ 1.000 |
|
Income from Investment Operations |
.034 |
.028 |
.034 |
.033 |
.035 |
|
Less Distributions |
|
|
|
|
|
|
From net interest income |
(.034) |
(.028) |
(.034) |
(.033) |
(.035) |
|
Net asset value, end of period |
$ 1.000 |
$ 1.000 |
$ 1.000 |
$ 1.000 |
$ 1.000 |
|
Total Return A, B |
3.50% |
2.84% |
3.41% |
3.39% |
3.52% |
|
Ratios and Supplemental Data |
|
|
|
|
|
|
Net assets, end of period |
$ 105,704 |
$ 90,657 |
$ 94,523 |
$ 88,134 |
$ 82,741 |
|
Ratio of expenses to average |
.50% |
.50% |
.36% C |
.35% C |
.22% C |
|
Ratio of net interest income to average net assets |
3.46% |
2.79% |
3.36% |
3.34% |
3.44% |
A The total returns would have been lower had certain expenses not been reduced during the periods shown.
B Total returns do not include the account closeout fee.
C FMR agreed to reimburse a portion of the fund's expenses during the period. Without this reimbursement, the fund's expense ratio would have been higher.
See accompanying notes which are an integral part of the financial statements.
Annual Report
For the period ended August 31, 2000
1. Significant Accounting Policies.
Spartan Arizona Municipal Income Fund (the income fund) is a fund of Fidelity Union Street Trust. Spartan Arizona Municipal Money Market Fund (the money market fund) is a fund of Fidelity Union Street Trust II. Each trust is registered under the Investment Company Act of 1940, as amended (the 1940 Act), as an open-end management investment company. Fidelity Union Street Trust and Fidelity Union Street Trust II (the trusts) are organized as a Massachusetts business trust and a Delaware business trust, respectively. Each fund is authorized to issue an unlimited number of shares. The financial statements have been prepared in conformity with generally accepted accounting principles which require management to make certain estimates and assumptions at the date of the financial statements. Each fund may be affected by economic and political developments in the state of Arizona. The following summarizes the significant accounting policies of the income fund and the money market fund:
Security Valuation.
Income Fund. Securities are valued based upon a computerized matrix system and/or appraisals by a pricing service, both of which consider market transactions and dealer-supplied valuations. Securities for which quotations are not readily available are valued at their fair value as determined in good faith under consistently applied procedures under the general supervision of the Board of Trustees. Short-term securities with remaining maturities of sixty days or less for which quotations are not readily available are valued at amortized cost or original cost plus accrued interest, both of which approximate current value.
Money Market Fund. As permitted under Rule 2a-7 of the 1940 Act, and certain conditions therein, securities are valued initially at cost and thereafter assume a constant amortization to maturity of any discount or premium.
Income Taxes. As a qualified regulated investment company under Subchapter M of the Internal Revenue Code, each fund is not subject to income taxes to the extent that it distributes substantially all of its taxable income for the fiscal year. The schedules of investments include information regarding income taxes under the caption "Income Tax Information."
Interest Income. Interest income, which includes amortization of premium and accretion of original issue discount, is accrued as earned. For the money market fund, accretion of discount represents unrealized gain until realized at the time of a security disposition or maturity.
Expenses. Most expenses of each trust can be directly attributed to a fund. Expenses which cannot be directly attributed are apportioned among the funds in the trust.
Distributions to Shareholders. Dividends are declared daily and paid monthly from net interest income. Distributions to shareholders from realized capital gains on investments, if any, are recorded on the ex-dividend date.
Annual Report
Notes to Financial Statements - continued
1. Significant Accounting
Policies - continued
Distributions to Shareholders -
continued
Income and capital gain distributions are determined in accordance with income tax regulations which may differ from generally accepted accounting principles. These differences, which may result in distribution reclassifications, are primarily due to differing treatments for futures transactions, market discount, capital loss carryforwards and losses deferred due to futures transactions and excise tax regulations.
Permanent book and tax basis differences relating to shareholder distributions will result in reclassifications to paid in capital. Undistributed net interest income and accumulated undistributed net realized gain (loss) on investments may include temporary book and tax basis differences which will reverse in a subsequent period. Any taxable income or gain remaining at fiscal year end is distributed in the following year.
Short-Term Trading (Redemption) Fees. Shares held in the income fund less than 180 days are subject to a short-term trading fee equal to .50% of the proceeds of the redeemed shares. The fee, which is retained by the fund, is accounted for as an addition to paid in capital.
Security Transactions. Security transactions are accounted for as of trade date. Gains and losses on securities sold are determined on the basis of identified cost.
2. Operating Policies.
Fidelity Municipal Cash Central Fund. Pursuant to an Exemptive Order issued by the Securities and Exchange Commission (the SEC), the funds may invest in the Fidelity Municipal Cash Central Fund (the Cash Fund) managed by Fidelity Investments Money Management, Inc. (FIMM), an affiliate of Fidelity Management & Research Company (FMR). The Cash Fund is an open-end money market fund available only to investment companies and other accounts managed by FMR and its affiliates. The Cash Fund seeks preservation of capital, liquidity, and current income by investing in high-quality, short-term municipal securities of various states and municipalities. Income distributions from the Cash Fund are declared daily and paid monthly from net interest income. Income distributions earned by the funds are recorded as interest income in the accompanying financial statements.
Delayed Delivery Transactions. Each fund may purchase or sell securities on a delayed delivery basis. Payment and delivery may take place after the customary settlement period for that security. The price of the underlying securities and the date when the securities will be delivered and paid for are fixed at the time the transaction is negotiated. Each fund may receive compensation for interest forgone in the purchase of a delayed delivery security. With respect to purchase commitments, each fund identifies securities as segregated in its records with a value at least equal to the
Annual Report
Notes to Financial Statements - continued
2. Operating Policies -
continued
Delayed Delivery Transactions -
continued
amount of the commitment. Losses may arise due to changes in the value of the underlying securities or if the counterparty does not perform under the contract.
Futures Contracts. The income fund may use futures contracts to manage its exposure to the bond market and to fluctuations in interest rates. Buying futures tends to increase the fund's exposure to the underlying instrument, while selling futures tends to decrease the fund's exposure to the underlying instrument or hedge other fund investments. Losses may arise from changes in the value of the underlying instruments or if the counterparties do not perform under the contracts' terms. Gains (losses) are realized upon the expiration or closing of the futures contracts. Futures contracts are valued at the settlement price established each day by the board of trade or exchange on which they are traded.
3. Purchases and Sales of Investments.
Income Fund. Purchases and sales of securities, other than short-term securities, aggregated $14,383,941 and $10,582,080, respectively.
The market value of futures contracts opened and closed during the period amounted to $333,357 and $330,112, respectively.
4. Fees and Other Transactions with Affiliates.
Management Fee. As each fund's investment adviser, FMR receives a fee that is computed daily at an annual rate of .55% and .50% of average net assets for the income fund and the money market fund, respectively. FMR pays all other expenses, except the compensation of the non-interested Trustees and certain exceptions such as interest, taxes, brokerage commissions and extraordinary expenses. The management fee paid to FMR by each fund is reduced by an amount equal to the fees and expenses paid by each fund to the non-interested Trustees.
FMR also bears the cost of providing shareholder services to the money market fund. To offset the cost of providing these services, FMR or its affiliates collected certain transaction fees from shareholders which amounted to $768 for the period.
Sub-Adviser Fee. As each funds' investment sub-adviser, FIMM, a wholly owned subsidiary of FMR, receives a fee from FMR of 50% of the management fee payable to FMR. The fee is paid prior to any voluntary expense reimbursements which may be in effect.
Money Market Insurance. Pursuant to an Exemptive Order issued by the SEC, the money market fund, along with other money market funds advised by FMR or its affiliates, has entered into insurance agreements with FIDFUNDS Mutual Limited (FIDFUNDS), an affiliated mutual insurance company. FIDFUNDS provides limited coverage for certain loss events
Annual Report
Notes to Financial Statements - continued
4. Fees and Other Transactions with Affiliates -
continued
Money Market Insurance -
continued
including issuer default as to payment of principal or interest and bankruptcy or insolvency of a credit enhancement provider. The insurance does not cover losses resulting from changes in interest rates, ratings downgrades or other market conditions. The fund may be subject to a special assessment of up to approximately 2.5 times the fund's annual gross premium if covered losses exceed certain levels. During the period, FMR has borne the cost of the fund's premium payable to FIDFUNDS.
5. Expense Reductions.
Through arrangements with the funds' custodian and transfer agent, credits realized as a result of uninvested cash balances were used to reduce a portion of each applicable fund's expenses. During the period, the credits reduced expenses by $20,244 and $638 for the income fund and the money market fund, respectively, under these arrangements.
6. Beneficial Interest.
At the end of the period, one shareholder was record owner of approximately 12% of the total outstanding shares of the money market fund.
Annual Report
To the Trustees of Fidelity Union Street Trust and Fidelity Union Street Trust II and the Shareholders of Spartan Arizona Municipal Income Fund and Spartan Arizona Municipal Money Market Fund:
In our opinion, the accompanying statements of assets and liabilities, including the schedules of investments, and the related statements of operations and of changes in net assets and the financial highlights present fairly, in all material respects, the financial position of Spartan Arizona Municipal Income Fund (a fund of Fidelity Union Street Trust) and Spartan Arizona Municipal Money Market Fund (a fund of Fidelity Union Street Trust II) at August 31, 2000, and the results of operations, the changes in their net assets and the financial highlights for the periods indicated, in conformity with accounting principles generally accepted in the United States. These financial statements and financial highlights (hereafter referred to as "financial statements") are the responsibility of the funds' management; our responsibility is to express an opinion on these financial statements based on our audits. We conducted our audits of these financial statements in accordance with auditing standards generally accepted in the United States which require that we plan and perform the audit to obtain reasonable assurance about whether the financial statements are free of material misstatement. An audit includes examining, on a test basis, evidence supporting the amounts and disclosures in the financial statements, assessing the accounting principles used and significant estimates made by management, and evaluating the overall financial statement presentation. We believe that our audits, which included confirmation of securities at August 31, 2000 by correspondence with the custodian, provide a reasonable basis for the opinion expressed above.
/s/PricewaterhouseCoopers LLP
PricewaterhouseCoopers LLP
Boston, Massachusetts
October 6, 2000
Annual Report
A special meeting of Spartan Arizona Municipal Income Fund's shareholders was held on September 13, 2000. The results of votes taken among shareholders on proposals before them are reported below. Each vote reported represents one dollar of net asset value held on the record date for the meeting.
PROPOSAL 1
To elect as Trustees the following twelve nominees.*
|
|
# of |
% of |
|
J. Michael Cook |
||
|
Affirmative |
719,905,794.09 |
94.672 |
|
Withheld |
40,517,203.69 |
5.328 |
|
TOTAL |
760,422,997.78 |
100.000 |
|
Ralph F. Cox |
||
|
Affirmative |
719,013,933.36 |
94.554 |
|
Withheld |
41,409,064.42 |
5.446 |
|
TOTAL |
760,422,997.78 |
100.000 |
|
Phyllis Burke Davis |
||
|
Affirmative |
718,961,403.49 |
94.548 |
|
Withheld |
41,461,594.29 |
5.452 |
|
TOTAL |
760,422,997.78 |
100.000 |
|
Robert M. Gates |
||
|
Affirmative |
719,482,012.45 |
94.616 |
|
Withheld |
40,940,985.33 |
5.384 |
|
TOTAL |
760,422,997.78 |
100.000 |
|
Edward C. Johnson 3d |
||
|
Affirmative |
719,048,405.90 |
94.559 |
|
Withheld |
41,374,591.88 |
5.441 |
|
TOTAL |
760,422,997.78 |
100.000 |
|
Donald J. Kirk |
||
|
Affirmative |
719,305,522.72 |
94.593 |
|
Withheld |
41,117,475.06 |
5.407 |
|
TOTAL |
760,422,997.78 |
100.000 |
|
|
# of |
% of |
|
Marie L. Knowles |
||
|
Affirmative |
720,009,886.09 |
94.685 |
|
Withheld |
40,413,111.69 |
5.315 |
|
TOTAL |
760,422,997.78 |
100.000 |
|
Ned C. Lautenbach |
||
|
Affirmative |
719,749,038.52 |
94.651 |
|
Withheld |
40,673,959.26 |
5.349 |
|
TOTAL |
760,422,997.78 |
100.000 |
|
Peter S. Lynch |
||
|
Affirmative |
715,851,375.12 |
94.139 |
|
Withheld |
44,571,622.66 |
5.861 |
|
TOTAL |
760,422,997.78 |
100.000 |
|
William O. McCoy |
||
|
Affirmative |
718,919,774.43 |
94.542 |
|
Withheld |
41,503,223.35 |
5.458 |
|
TOTAL |
760,422,997.78 |
100.000 |
|
Marvin L. Mann |
||
|
Affirmative |
719,517,282.26 |
94.621 |
|
Withheld |
40,905,715.52 |
5.379 |
|
TOTAL |
760,422,997.78 |
100.000 |
|
Robert C. Pozen |
||
|
Affirmative |
719,858,604.16 |
94.666 |
|
Withheld |
40,564,393.62 |
5.334 |
|
TOTAL |
760,422,997.78 |
100.000 |
|
PROPOSAL 2 |
||
|
To ratify the selection of Pricewaterhouse Coopers LLP as independent accountants of the fund. |
||
|
|
# of |
% of |
|
Affirmative |
20,349,637.06 |
96,659 |
|
Against |
364,232.25 |
1.730 |
|
Abstain |
339,086.88 |
1.611 |
|
TOTAL |
21,052,956.19 |
100.000 |
|
PROPOSAL 3 |
||
|
To adopt an Amended and Restated |
||
|
|
# of |
% of |
|
Affirmative |
676,198,304.03 |
89.494 |
|
Against |
27,996,750.36 |
3.706 |
|
Abstain |
51,382,916.46 |
6.800 |
|
TOTAL |
755,577,970.85 |
100.000 |
|
Broker |
4,845,026.93 |
|
|
PROPOSAL 4 |
||
|
To amend the fund's fundamental investment limitation concerning the concentration of its assets in a single industry. |
||
|
|
# of |
% of |
|
Affirmative |
19,185,600.82 |
91.692 |
|
Against |
1,339,721.30 |
6.403 |
|
Abstain |
398,542.66 |
1.905 |
|
TOTAL |
20,923,864.78 |
100.000 |
|
Broker |
129,091.41 |
|
|
PROPOSAL 5 |
||
|
To amend the fund's fundamental investment limitation concerning underwriting. |
||
|
|
# of |
% of |
|
Affirmative |
19,046,639.21 |
91.028 |
|
Against |
1,369,740.58 |
6.547 |
|
Abstain |
507,484.99 |
2.425 |
|
TOTAL |
20,923,864.78 |
100.000 |
|
Broker |
129,091.41 |
|
*Denotes trust-wide proposals and voting results.
Annual Report
Investment Adviser
Fidelity Management & Research Company
Boston, MA
Sub-Adviser
Fidelity Investments
Money Management, Inc.
Officers
Edward C. Johnson 3d, President
Robert C. Pozen, Senior Vice President
Boyce I. Greer, Vice President -
Money Market Fund
Norman U. Lind, Vice President -
Money Market Fund
Dwight D. Churchill, Vice President -
Income Fund
Christine J. Thompson, Vice President -
Income Fund
Stanley N. Griffith, Assistant Vice President
Eric D. Roiter, Secretary
Robert A. Dwight, Treasurer
Maria F. Dwyer, Deputy Treasurer
John H. Costello, Assistant Treasurer
Thomas J. Simpson, Assistant Treasurer
Board of Trustees
Ralph F. Cox *
Phyllis Burke Davis *
Robert M. Gates *
Edward C. Johnson 3d
Donald J. Kirk *
Ned C. Lautenbach *
Peter S. Lynch
Marvin L. Mann *
William O. McCoy *
Gerald C. McDonough *
Robert C. Pozen
Thomas R. Williams *
* Independent trustees
Advisory Board
J. Michael Cook
Abigail P. Johnson
Marie L. Knowles
General Distributor
Fidelity Distributors Corporation
Boston, MA
Transfer and Shareholder
Servicing Agents
Citibank, N.A.
New York, NY
and
Fidelity Service Company, Inc.
Boston, MA
Custodian
Citibank, N.A.
New York, NY
The Fidelity Telephone Connection
Mutual Fund 24-Hour Service
Exchanges/Redemptions
and Account Assistance 1-800-544-6666
Product Information 1-800-544-6666
Retirement Accounts 1-800-544-4774 (8 a.m. - 9 p.m.)
TDD Service 1-800-544-0118
for the deaf and hearing impaired
(9 a.m. - 9 p.m. Eastern time)
Fidelity Automated Service
Telephone (FAST®) (automated graphic) 1-800-544-5555
(automated graphic) Automated line for quickest service
AZI/SPZ-ANN-1000 112772
1.536826.103
(Fidelity Investment logo)(registered trademark)
Corporate Headquarters
82 Devonshire St., Boston, MA 02109
www.fidelity.com
|
|