
|
|
|
|
|
|
|
|
|
|
Previous: FARMLAND INDUSTRIES INC, 10-K, EX-27, 2000-11-22 |
Next: FIFTH THIRD BANCORP, 425, 2000-11-22 |
Fidelity®
DestinySM
Portfolios:
Destiny I - Class N
Destiny II - Class N
Annual Report
Annual Report
|
Performance |
How the funds have done over time. |
|
|
Fund Talk |
The managers' review of the funds' performance, strategy and outlook. |
|
|
Investment Changes |
A summary of major shifts in the funds' investments over |
|
|
Destiny I |
|
|
|
Investments |
A complete list of the fund's investments with their market values. |
|
|
Financial Statements |
Statements of assets and liabilities, operations, and changes in net assets, as well as financial highlights. |
|
|
Destiny II |
|
|
|
Investments |
A complete list of the fund's investments with their market values. |
|
|
Financial Statements |
Statements of assets and liabilities, operations, and changes in net assets, as well as financial highlights. |
|
|
Notes |
Notes to the financial statements. |
|
|
Independent Auditors' Report |
The auditors' opinion. |
|
|
Distributions |
|
Standard & Poor's, S&P and S&P 500 are registered service marks of The McGraw-Hill Companies, Inc. and have been licensed for use by Fidelity
Distributors Corporation.
Other third party marks appearing herein are the property of their respective owners.
All other marks appearing herein are registered or unregistered trademarks or service marks of FMR Corp. or an affiliated company.
(Recycle graphic) This report is printed on recycled paper using soy-based inks.
The views expressed in this report reflect those of each fund's portfolio manager only through the end of the period of the report as stated on the cover and do not necessarily represent the views of Fidelity or any other person in the Fidelity organization. Any such views are subject to change at any time based upon market or other conditions and Fidelity disclaims any responsibility to update such views. These views may not be relied on as investment advice and, because investment decisions for a Fidelity fund are based on numerous factors, may not be relied on as an indication of trading intent on behalf of any Fidelity fund.
This report and the financial statements contained herein are submitted for the general information of the shareholders of the funds. This report is not authorized for distribution to prospective investors in the funds unless preceded or accompanied by an effective prospectus.
Mutual fund shares are not deposits or obligations of, or guaranteed by, any bank or depository institution. Shares are not insured by the FDIC, Federal Reserve Board or any other agency, and are subject to investment risks, including possible loss of principal amount invested.
Neither the funds nor Fidelity Distributors Corporation is a bank.
Annual Report
Fidelity Destiny Portfolios: Destiny I: Class N
Performance: The Bottom Line
$10,000 Over 10 Years
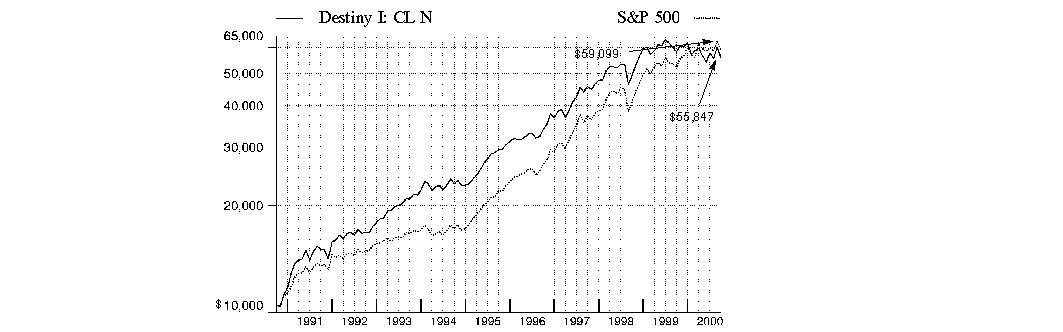
$10,000 Over 10 Years: Let's say hypothetically that $10,000 was invested in Destiny I: Class N on September 30, 1990. As the chart shows, by September 30, 2000, the value of the investment would have grown to $55,847 - a 458.47% increase on the initial investment. For comparison, look at how the S&P 500 ® did over the same period. With dividends and capital gains, if any, reinvested, the same $10,000 investment would have grown to $59,099 - a 490.99% increase.
Cumulative Total Returns
|
Periods ended |
|
Past 1 |
Past 5 |
Past 10 |
|
Destiny I: CL N |
|
-3.98% |
89.78% |
458.47% |
|
S&P 500 |
|
13.28% |
166.82% |
490.99% |
|
Lipper Growth |
|
26.19% |
153.59% |
475.51% |
Average Annual Total Returns
|
Periods ended |
Past 1 |
Past 5 |
Past 10 |
|
Destiny I: CL N |
-3.98% |
13.67% |
18.77% |
|
$50/month 15-Year Plan |
-52.01% |
11.29% |
18.16% |
|
S&P 500 |
13.28% |
21.69% |
19.44% |
|
Lipper Growth |
26.19% |
19.89% |
18.55% |
Destiny I began offering Class N shares on April 30, 1999. The total returns for Class N reported for periods prior to April 30, 1999 are those of Class O, restated to reflect the higher 12b-1 and transfer agent fees applicable to Class N.
The charts above show Destiny I: Class N total returns, which include changes in share price and reinvestment of dividends and capital gains. The fund's cumulative total returns and average annual total returns do not include the effects of the separate sales charges assessed through Destiny Plans I: N (the Plans); the figures provided for a "$50/month 15-year plan" illustrate the fund's performance adjusted to reflect fees and sales charges assessed by the Plans. The illustrations assume an initial investment at the beginning of each period shown. Because the illustrations assume yearly lump sum investments, they do not reflect what investors would have earned had they made regular monthly investments over the period. As shares of the funds may be acquired only through the Plans, investors should consult the Plans' prospectus for more complete information on the impact of the separate charges and fees applicable to each Plan. The rate (%) of deductions decreases as Plan sizes increase. Figures for the S&P 500, a market capitalization-weighted index of common stocks, include reinvestment of dividends. To measure how the funds' performance stacked up against its peers, you can compare it to the growth funds average, which reflects the performance of mutual funds with similar objectives tracked by Lipper Inc. The past one year average represents a peer group of 1,326 mutual funds. These benchmarks include reinvested dividends and capital gains, if any, and exclude the effect of sales charges. Lipper has created new comparison categories that group funds according to portfolio characteristics and capitalization, as well as by capitalization only. These averages are listed below. (dagger)
All performance numbers are historical; the fund's share price and return will vary and you may have a gain or loss when you sell your shares. (Note: Lipper calculates average annual total returns by annualizing each fund's total return, then taking an arithmetic average. This may produce a different figure than that obtained by averaging the cumulative total returns and annualizing the result.)
(dagger) The Lipper large cap value funds average reflects the performance (excluding sales charges) of mutual funds with similar portfolio characteristics and capitalization. The Lipper large cap supergroup average reflects the performance (excluding sales charges) of mutual funds with similar capitalization. As of September 30, 2000, the one year, five year, and 10 year cumulative total returns for the large cap value funds average were, 17.80%, 148.49%, and 428.07%, respectively; and the one year, five year, and 10 year average annual total returns were 17.80%, 19.84%, and 17.89%, respectively. The one year, five year and 10 year cumulative total returns for the large cap supergroup average were, 20.47%, 153.64%, and 454.26%, respectively; and the one year, five year and 10 year average annual total returns were 20.47%, 20.11%, and 18.37%, respectively.
Annual Report
Fidelity Destiny Portfolios: Destiny II: Class N
Performance: The Bottom Line
$10,000 Over 10 Years
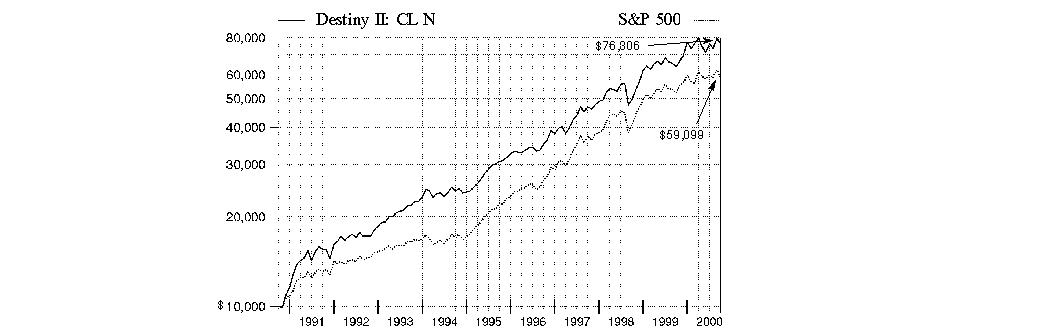
$10,000 Over 10 Years: Let's say hypothetically that $10,000 was invested in Destiny II: Class N on September 30, 1990. As the chart shows, by September 30, 2000, the value of the investment would have grown to $76,306 - a 663.06% increase on the initial investment. For comparison, look at how the S&P 500 did over the same period. With dividends and capital gains, if any, reinvested, the same $10,000 investment would have grown to $59,099 - a 490.99% increase.
Cumulative Total Returns
|
Periods ended |
|
Past 1 |
Past 5 |
Past 10 |
|
Destiny II: CL N |
|
19.13% |
148.44% |
663.06% |
|
S&P 500 |
|
13.28% |
166.82% |
490.99% |
|
Lipper Growth |
|
26.19% |
153.59% |
475.51% |
Average Annual Total Returns
|
Periods ended |
Past 1 |
Past 5 |
Past 10 |
|
Destiny II: CL N |
19.13% |
19.96% |
22.53% |
|
$50/month 15-Year Plan |
-40.43% |
17.46% |
21.91% |
|
S&P 500 |
13.28% |
21.69% |
19.44% |
|
Lipper Growth |
26.19% |
19.89% |
18.55% |
Destiny II began offering Class N shares on April 30, 1999. The total returns for Class N reported for periods prior to April 30, 1999 are those of Class O, restated to reflect the higher 12b-1 and transfer agent fee applicable to Class N.
The charts above show Destiny II: Class N total returns, which include changes in share price and reinvestment of dividends and capital gains. The fund's cumulative total returns and average annual total returns do not include the effects of the separate sales charges assessed through Destiny Plans II: N (the Plans); the figures provided for a "$50/month 15-year plan" illustrate the fund's performance adjusted to reflect fees and sales charges assessed by the Plans. The illustrations assume an initial investment at the beginning of each period shown. Because the illustrations assume yearly lump sum investments, they do not reflect what investors would have earned had they made regular monthly investments over the period. As shares of the funds may be acquired only through the Plans, investors should consult the Plans' prospectus for more complete information on the impact of the separate charges and fees applicable to each Plan. The rate (%) of deductions decreases as Plan sizes increase. Figures for the S&P 500, a market capitalization-weighted index of common stocks, include reinvestment of dividends. To measure how the funds' performance stacked up against its peers, you can compare it to the growth funds average, which reflects the performance of mutual funds with similar objectives tracked by Lipper Inc. The past one year average represents a peer group of 1,326 mutual funds. These benchmarks include reinvested dividends and capital gains, if any, and exclude the effect of sales charges. Lipper has created new comparison categories that group funds according to portfolio characteristics and capitalization, as well as by capitalization only. These averages are listed below. (dagger)
All performance numbers are historical; the fund's share price and return will vary and you may have a gain or loss when you sell your shares. (Note: Lipper calculates average annual total returns by annualizing each fund's total return, then taking an arithmetic average. This may produce a different figure than that obtained by averaging the cumulative total returns and annualizing the result.)
(dagger) The Lipper large cap core funds average reflects the performance (excluding sales charges) of mutual funds with similar portfolio characteristics and capitalization. The Lipper large cap supergroup average reflects the performance (excluding sales charges) of mutual funds with similar capitalization. As of September 30, 2000, the one year, five year, and 10 year cumulative total returns for the large cap core funds average were, 17.80%, 148.49%, and 428.07%, respectively; and the one year, five year, and 10 year average annual total returns were 17.80%, 19.84%, and 17.89%, respectively. The one year, five year and 10 year cumulative total returns for the large cap supergroup average were, 20.47%, 153.64%, and 454.26%, respectively; and the one year, five year and 10 year average annual total returns were 20.47%, 20.11%, and 18.37%, respectively.
Annual Report
Fidelity Destiny Portfolios: Destiny I
Fund Talk: The Manager's Overview
Market Recap
For the most part, the rise and fall of the U.S. equity markets during the 12 months ending September 30, 2000, was predicated on the fortunes of the technology sector. At the period's outset, technology began its meteoric rise as investors rallied behind the sector's growth potential in light of the Internet's accelerating power to reshape how businesses and consumers work and communicate. That euphoria reached its apex in mid-March, when the NASDAQ Composite Index - the bellwether benchmark for the technology sector - broke through the 5,000 point barrier, only four months after first crossing the 3,000 point threshold. But just days later, the tech sector began a 30% descent over a 10-week period. With the Federal Reserve Board continuing to hike interest rates, investors finally realized that technology stock valuations could not be sustained in the event of an economic slowdown. Given its one-third weighting in technology, the Standard & Poor's 500SM Index also suffered, albeit to a lesser extent, as did the blue chips' proxy Dow Jones Industrial Average. Retreating from technology in droves, investors shifted their assets into segments of the market that traditionally perform better in a more moderate-growth economy, such as health care and energy. During the summer months, technology returned to favor to some extent, but investors generally targeted large, steady earnings growers, leaving smaller and more speculative tech stocks to flounder. But come September, more bad news was in store for technology, as the highest oil prices in a decade and a weak European currency combined to dampen the global economy. For the overall 12-month period ending September 30, 2000, the Dow returned 4.62%, the S&P 500 gained 13.28%, and the NASDAQ gained 34.01%. Those numbers can be somewhat misleading, however; all three indexes had negative returns through the first nine months of 2000.
(Portfolio Manager photograph)
An interview with
Karen Firestone, Portfolio Manager of Destiny I
Q. How did the fund perform, Karen?
A. For the 12-month period that ended September 30, 2000, the fund's Class N shares returned -3.98%, trailing the Standard & Poor's 500 Index, which returned 13.28%. Fund performance also lagged the growth funds average tracked by Lipper Inc., which returned 26.19% during this same time frame.
Q. Why did the fund lag its benchmark and peer group during the past 12 months?
A. It had a lot to do with timing. Not owning enough technology stocks during their impressive run-up late in 1999 and early 2000 played a big part in the fund's underperformance. On top of that, shifting the fund's emphasis to growth stocks, particularly technology - at the expense of financial and cyclical, or economically sensitive, stocks - after taking over the fund in February left us overexposed to the sharp correction in the NASDAQ Composite Index during the spring. Investors collectively turned their backs on growth - despite a pair of short-lived rallies in June and August - and assumed a more defensive posture. Even though we owned a lot of the higher-quality larger-cap tech names, such as Cisco and Intel, during the second-half of the period, momentum for these stocks - along with much of their price appreciation - vanished as the market grew increasingly concerned about how a slowing economy would affect the earnings of tech firms. Since we didn't own as many of the smaller-cap tech stocks - a group that produced many of the period's finest performers - as our Lipper peers did on average, we lost ground on a competitive basis.
Q. What other factors influenced fund returns?
A. The fund's positioning in financial stocks dragged on performance. Growing euphoria surrounding tech stocks, coupled with steadily rising interest rates and increased competition, spelled trouble for large bank holdings such as FleetBoston early on in the period. Moreover, we paid the price for not increasing the fund's weighting in banks when the market fled for safety in mid-March. Having significant stakes in home loan financers Fannie Mae and Freddie Mac also hurt, as these issues wilted in the face of proposed legislation threatening to cut their lines of credit with the federal government. Not holding enough of the higher-growth financials, such as Citigroup and Morgan Stanley Dean Witter, which shined during the period, further widened the performance gap. Poor timing in terms of raising the fund's exposure to media stocks also worked against us. Cable stocks, such as Time Warner, struggled with rising rates and the emergence of satellite broadcasters that threatened cable's dominance over local service markets. Most media companies also suffered from concerns about a slowdown in advertising spending by dot-com companies. On a brighter note, the fund's underexposure to traditional incumbent telecommunications companies - namely AT&T - helped. Many of these issues fell in response to pricing pressures applied by new entrants in the consumer long-distance business.
Annual Report
Fidelity Destiny Portfolios: Destiny I
Fund Talk: The Manager's Overview - continued
Q. Could you mention some stocks that fared well and some others that didn't?
A. Sure. Hospital stocks, along with most areas of the health sector, offered a safe haven for jittery tech investors during the period. With Medicare and third-party reimbursements improving and balance sheets stabilizing, investors shrugged off fears of increased government regulation and bid up the prices of stocks such as HCA Healthcare. We also owned some biotechnology firms that performed well, most notably Human Genome, reflecting renewed enthusiasm for the industry following historic advances in gene research. Favorable energy prices resulting from supply shortages lifted stocks such as Calpine and Schlumberger. On the tech front, our emphasis on Internet infrastructure produced some big winners, including Juniper, EMC and Corning. However, we were punished for holding a number of disappointments, namely Microsoft, Philip Morris, Citrix, Texas Instruments and Motorola. The fund no longer held Citrix at the close of the period.
Q. What's your outlook?
A. The market remains volatile and extremely unforgiving, as seen in the recent declines of stocks that failed to beat the Street's earnings expectations. It's become as important as ever to own the stocks that are expected to make their numbers over not just the following quarter, but two to three quarters down the road. With that said, I'll continue to put a premium on earnings and maintain a focus on uncovering exciting new growth opportunities in the marketplace. By sticking with a balanced approach, which allows us to be aggressive and defensive at the same time, we should be able to smooth out some of the turbulence expected over the coming months.
The views expressed in this report reflect those of the portfolio manager only through the end of the period of the report as stated on the cover. The manager's views are subject to change at any time based on market or other conditions. For more information, see page <Click Here>.
Fund Facts
Goal: seeks capital growth
Start date: July 10, 1970
Size: as of September 30, 2000, more than $6.1 billion
Manager: Karen Firestone, since February 2000; manager, Fidelity Advisor Large Cap Stock Fund, since 1998; Fidelity Large Cap Stock Fund, since 1998; several Fidelity Select Portfolios, 1986-1997; joined Fidelity in 1983
3Karen Firestone reviews
her investment philosophy:
"I'm very revenue-growth oriented. I'm certainly more product and sales growth driven than I am guided by cost-control, turnaround and restructuring stories. The fund's former manager, George Vanderheiden, to his credit, had a keen eye for restructuring situations that would emerge over the long term, calling it right countless times during his career. In contrast, I'd say my success has been tied more to short-term results over the next product cycle, or the next year for that matter. I'm a big believer in certain sectors of the market, such as health and media, where I've seen growth work throughout the years. So, my bias has been and will continue to be toward growth, but I overlay some valuation parameters on it. I'm just not willing to pay any price for growth; there are constraints. Comparatively, I'd say that George's tolerance level was even lower than mine in that regard, which is perfectly reasonable. But, even though we share a similar aversion to inordinate risk, I'm willing to pay a little bit more for a stock if I feel that the growth is coming with it.
"During the period's volatility, I stayed the course with many of the fund's technology and media holdings that suffered significant losses. I simply couldn't justify selling stocks that I believed in and whose long-term prospects were solid, and then replace them with unknown commodities. Many of the stocks that declined were purchased at a time when there was a lot of euphoria in the market and prices were unusually high. So I have little choice but to be patient and wait for them to come back. Of course, in hindsight, I wish I had delayed making any significant changes to the portfolio until around May, which would have helped us avoid this problem to begin with. Unfortunately, as many investors know too well, it's not that easy to predict when the market will turn."
Annual Report
Fidelity Destiny Portfolios: Destiny II
Fund Talk: The Manager's Overview
Market Recap
For the most part, the rise and fall of the U.S. equity markets during the 12 months ending September 30, 2000, was predicated on the fortunes of the technology sector. At the period's outset, technology began its meteoric rise as investors rallied behind the sector's growth potential in light of the Internet's accelerating power to reshape how businesses and consumers work and communicate. That euphoria reached its apex in mid-March, when the NASDAQ Composite Index - the bellwether benchmark for the technology sector - broke through the 5,000 point barrier, only four months after first crossing the 3,000 point threshold. But just days later, the tech sector began a 30% descent over a 10-week period. With the Federal Reserve Board continuing to hike interest rates, investors finally realized that technology stock valuations could not be sustained in the event of an economic slowdown. Given its one-third weighting in technology, the Standard & Poor's 500SM Index also suffered, albeit to a lesser extent, as did the blue chips' proxy Dow Jones Industrial Average. Retreating from technology in droves, investors shifted their assets into segments of the market that traditionally perform better in a more moderate-growth economy, such as health care and energy. During the summer months, technology returned to favor to some extent, but investors generally targeted large, steady earnings growers, leaving smaller and more speculative tech stocks to flounder. But come September, more bad news was in store for technology, as the highest oil prices in a decade and a weak European currency combined to dampen the global economy. For the overall 12-month period ending September 30, 2000, the Dow returned 4.62%, the S&P 500 gained 13.28%, and the NASDAQ gained 34.01%. Those numbers can be somewhat misleading, however; all three indexes had negative returns through the first nine months of 2000.
(Portfolio Manager photograph)
Note to shareholders: Adam Hetnarski became Portfolio Manager of
Destiny II on June 1, 2000.
Q. How did the fund perform, Adam?
A. For the 12-month period that ended September 30, 2000, the fund's Class N shares returned 19.13%. The fund outperformed the 13.28% return of the Standard & Poor's 500 Index, but lagged the Lipper growth funds average, which returned 26.19%.
Q. What helped the fund outperform the index during the past year?
A. The fund's overweighted position in technology - a sector that experienced tremendous gains during the first half of the period - was the biggest factor in its strong performance relative to the S&P index. Out-of-benchmark holdings in stocks such as Juniper Networks, i2 Technologies, Nokia and Ariba, the last three of which were added to the fund during the second quarter of 2000, helped significantly. Stock selection in the health care sector, particularly out-of-benchmark biotechnology holdings Human Genome and Genentech, also boosted returns. Additionally, the fund's underweighted position in some large-cap stocks that did poorly - namely Microsoft, Lucent, AT&T and Samsung - enhanced performance. The fund suffered from not owning enough of certain stocks that performed well, such as Oracle and Nortel, while owning too much of others that declined, such as Lexmark and Dell.
Q. What adjustments did you make to the fund since taking over in June?
A. I reduced technology, utilities and international holdings. During this repositioning, I also reduced the number of stocks to roughly 150 names from more than 200. In technology, I reduced the fund's stake in the sector because I didn't want to make that big of a bet in an area where fundamentals were decelerating. I also reduced or eliminated some technology stocks and replaced them with others I felt more strongly about - such as Ariba, a leading business-to-business e-commerce network services provider. In the utilities sector, I reduced exposure to wireless cellular carriers, given the higher-than-expected costs to obtain new spectrum licensing and increased levels of subscriber churn - or customers switching carriers. I also positioned the fund to take advantage of the increased use of wireless technology via stock selection in companies such as - Aether Systems - that are developing software platforms to harness the next generation of wireless transmission. I reduced our international exposure due to slowing economies and the declining value of the euro. Names such as Samsung Electronics, Vodafone AirTouch and Hutchison Whampoa were either significantly reduced or eliminated from the fund. Elsewhere, I boosted the fund's holdings of financial stocks. I felt the slowing of the economy and a diminished threat of interest-rate hikes presented a more positive environment for these stocks. Finally, my repositioning also caused the fund to own more small- and mid-cap stocks with higher growth prospects, such as Juniper.
Annual Report
Fidelity Destiny Portfolios: Destiny II
Fund Talk: The Manager's Overview - continued
Q. What specific stocks worked well for the fund?
A. General Electric was a top performer. Investors seeking less risk during volatile market conditions embraced General Electric's steady growth. Most of the fund's top performers came from the technology sector. Data storage provider EMC, Sun Microsystems and Ariba all performed well due to their strategic positioning in the development of the Internet's architecture.
Q. What stocks disappointed?
A. Holdings in the personal computer (PC) area hurt the fund, as a result of slower-than-expected demand. Printer manufacturer Lexmark experienced problems executing its business model and suffered a slowdown in corporate orders for laser printers. Worldwide PC leader Dell pre-announced a third-quarter profit warning in September, which hurt its stock.
Q. What's your outlook, Adam?
A. Despite the recent pullback in technology stocks, I'm optimistic that this sector is going to perform well, both in the short and long term - hence the fund's large weighting in that area. At the end of the period, there was some overcapacity in the telecommunications space and in the semiconductor industry, but I think the demand for new and better technology is increasing, not decreasing. When I walk around the city, for instance, I see more and more people with the latest wireless handsets and the latest personal digital assistants (PDAs). Turning to the economy, I believe that interest rates have peaked and that the economic slowdown will bottom out, potentially delivering a strong period for the market during the next six months.
The views expressed in this report reflect those of the portfolio manager only through the end of the period of the report as stated on the cover. The manager's views are subject to change at any time based on market or other conditions. For more information, see page <Click Here>.
Fund Facts
Goal: seeks capital growth
Start date: December 30, 1985
Size: as of September 30, 2000, more than $6.2 billion
Manager: Adam Hetnarski, since June 2000; manager, Contrafund II, since February 2000; Fidelity Export and Multinational Fund, 1998-2000; Fidelity Select Technology Portfolio, 1996-1998; analyst, networking and electronics industries, 1994-1996; joined Fidelity in 1991
3Adam Hetnarski on the personal computer market:
"Despite recent warnings of slower growth, I believe that PC unit growth is going to accelerate over the next two years. Entering 2000, the market expected annual growth in the range of 15%-18%. At the end of the third quarter, unit growth appears to be between 13%-15%. I believe that much of the perceived slowdown is actually an oversupply problem and not as dire of a demand issue as it first appeared.
"Going forward, I think PC unit growth will accelerate due to increasing demand. In the first half of 2001, I expect to see a significant replacement cycle when Microsoft's new operating system - Windows 2000 - gains momentum. The new Windows 2000 product requires a faster processor than previous Microsoft operating systems, which could force a percentage of users to upgrade their hardware - or PCs - if they want access to the new operating system and new applications.
"For most of the past year, systems departments within corporations have been evaluating Windows 2000, making sure the operating system functions smoothly within each organization. As more systems managers become satisfied with its functionality and begin deploying the operating system throughout their companies, I expect them to purchase additional hardware to run it. That said, I don't think the majority of corporations reached an adequate level of comfort with Windows 2000 through the third quarter of this year, but those perceptions should begin to change in the next six months."
Annual Report
Top Ten Equity Holdings - Destiny I
|
as of September 30, 2000 |
as of March 31, 2000 |
|
General Electric Co. |
Cisco Systems, Inc. |
|
Cisco Systems, Inc. |
Microsoft Corp. |
|
Intel Corp. |
Intel Corp. |
|
Pfizer, Inc. |
General Electric Co. |
|
Microsoft Corp. |
Fannie Mae |
|
Fannie Mae |
Lucent Technologies, Inc. |
|
EMC Corp. |
Texas Instruments, Inc. |
|
Merck & Co., Inc. |
Home Depot, Inc. |
|
Wal-Mart Stores, Inc. |
Wal-Mart Stores, Inc. |
|
Sun Microsystems, Inc. |
Bristol-Myers Squibb Co. |
Top Ten Equity Holdings - Destiny II
|
as of September 30, 2000 |
as of March 31, 2000 |
|
General Electric Co. |
General Electric Co. |
|
Cisco Systems, Inc. |
Cisco Systems, Inc. |
|
Fannie Mae |
Microsoft Corp. |
|
Microsoft Corp. |
Texas Instruments, Inc. |
|
EMC Corp. |
Chase Manhattan Corp. |
|
Exxon Mobil Corp. |
Nokia AB sponsored ADR |
|
Bristol-Myers Squibb Co. |
Home Depot, Inc. |
|
Freddie Mac |
Sun Microsystems, Inc. |
|
Viacom, Inc. Class B (non-vtg.) |
American Express Co. |
|
Dell Computer Corp. |
Warner-Lambert Co. |
Top Five Market Sectors - Destiny I
|
as of September 30, 2000 |
% of fund's net assets |
as of March 31, 2000 |
% of fund's net assets |
|
Technology |
34.0% |
Technology |
40.8% |
|
Health |
16.2% |
Health |
11.3% |
|
Finance |
10.8% |
Media & Leisure |
10.1% |
|
Media & Leisure |
9.2% |
Finance |
10.0% |
|
Industrial Machinery & Equipment |
7.2% |
Industrial Machinery & Equipment |
6.7% |
Top Five Market Sectors - Destiny II
|
as of September 30, 2000 |
% of fund's net assets |
as of March 31, 2000 |
% of fund's net assets |
|
Technology |
34.9% |
Technology |
37.1% |
|
Finance |
13.8% |
Utilities |
12.2% |
|
Health |
12.1% |
Finance |
11.0% |
|
Industrial Machinery & Equipment |
7.6% |
Media & Leisure |
8.6% |
|
Energy |
6.5% |
Health |
8.0% |
Annual Report
Fidelity Destiny Portfolios: Destiny I
Showing Percentage of Net Assets
|
Common Stocks - 97.7% |
|||
|
Shares |
Value (Note 1) |
||
|
AEROSPACE & DEFENSE - 0.6% |
|||
|
Rockwell International Corp. |
504,800 |
$ 15,270,200 |
|
|
United Technologies Corp. |
320,400 |
22,187,700 |
|
|
TOTAL AEROSPACE & DEFENSE |
37,457,900 |
||
|
BASIC INDUSTRIES - 0.3% |
|||
|
Chemicals & Plastics - 0.2% |
|||
|
Union Carbide Corp. |
288,800 |
10,902,200 |
|
|
Packaging & Containers - 0.1% |
|||
|
Tupperware Corp. |
481,450 |
8,666,100 |
|
|
TOTAL BASIC INDUSTRIES |
19,568,300 |
||
|
DURABLES - 1.0% |
|||
|
Consumer Durables - 0.3% |
|||
|
Minnesota Mining & Manufacturing Co. |
178,200 |
16,238,475 |
|
|
Consumer Electronics - 0.7% |
|||
|
Sony Corp. sponsored ADR |
250,900 |
25,325,219 |
|
|
The Swatch Group AG (Reg.) |
69,700 |
20,590,246 |
|
|
|
45,915,465 |
||
|
TOTAL DURABLES |
62,153,940 |
||
|
ENERGY - 4.7% |
|||
|
Energy Services - 2.8% |
|||
|
Global Marine, Inc. (a) |
516,000 |
15,931,500 |
|
|
Halliburton Co. |
833,100 |
40,769,831 |
|
|
Noble Drilling Corp. (a) |
791,700 |
39,782,925 |
|
|
Schlumberger Ltd. (NY Shares) |
878,700 |
72,327,994 |
|
|
|
168,812,250 |
||
|
Oil & Gas - 1.9% |
|||
|
Chevron Corp. |
327,700 |
27,936,425 |
|
|
Devon Energy Corp. |
507,100 |
30,502,065 |
|
|
Exxon Mobil Corp. |
664,900 |
59,259,213 |
|
|
|
117,697,703 |
||
|
TOTAL ENERGY |
286,509,953 |
||
|
FINANCE - 10.8% |
|||
|
Banks - 1.5% |
|||
|
FleetBoston Financial Corp. |
1,169,869 |
45,624,891 |
|
|
Mellon Financial Corp. |
540,000 |
25,042,500 |
|
|
State Street Corp. |
181,500 |
23,595,000 |
|
|
|
94,262,391 |
||
|
Credit & Other Finance - 2.4% |
|||
|
American Express Co. |
885,400 |
53,788,050 |
|
|
Citigroup, Inc. |
1,697,366 |
91,763,849 |
|
|
|
145,551,899 |
||
|
|
|||
|
Shares |
Value (Note 1) |
||
|
Federal Sponsored Credit - 3.1% |
|||
|
Fannie Mae |
1,994,400 |
$ 142,599,600 |
|
|
Freddie Mac |
890,100 |
48,121,031 |
|
|
|
190,720,631 |
||
|
Insurance - 2.8% |
|||
|
American International Group, Inc. |
1,106,364 |
105,865,205 |
|
|
MetLife, Inc. |
1,623,500 |
42,515,406 |
|
|
The Chubb Corp. |
250,500 |
19,820,813 |
|
|
|
168,201,424 |
||
|
Securities Industry - 1.0% |
|||
|
Charles Schwab Corp. |
695,100 |
24,676,050 |
|
|
Morgan Stanley Dean Witter & Co. |
289,100 |
26,434,581 |
|
|
Nomura Securities Co. Ltd. |
520,000 |
11,297,032 |
|
|
|
62,407,663 |
||
|
TOTAL FINANCE |
661,144,008 |
||
|
HEALTH - 16.2% |
|||
|
Drugs & Pharmaceuticals - 13.2% |
|||
|
Alkermes, Inc. (a) |
278,800 |
10,768,650 |
|
|
Amgen, Inc. (a) |
690,600 |
48,223,303 |
|
|
Andrx Corp. - Andrx Group (a) |
230,700 |
21,541,613 |
|
|
ARIAD Pharmaceuticals, Inc. (a) |
518,900 |
6,518,681 |
|
|
ArQule, Inc. (a) |
10,900 |
185,981 |
|
|
Bristol-Myers Squibb Co. |
1,757,700 |
100,408,613 |
|
|
Cambridge Antibody Technology Group PLC (a) |
209,800 |
12,450,497 |
|
|
Eli Lilly & Co. |
658,600 |
53,428,925 |
|
|
Geneva Proteomics (c) |
262,000 |
1,441,000 |
|
|
Human Genome Sciences, Inc. (a) |
66,800 |
11,564,750 |
|
|
ImClone Systems, Inc. (a) |
144,200 |
16,880,413 |
|
|
Merck & Co., Inc. |
1,659,000 |
123,491,813 |
|
|
Millennium Pharmaceuticals, Inc. (a) |
174,800 |
25,531,725 |
|
|
Mylan Laboratories, Inc. |
785,000 |
21,145,938 |
|
|
PE Corp. - Celera Genomics Group (a) |
217,200 |
21,638,550 |
|
|
Pfizer, Inc. |
3,986,725 |
179,153,455 |
|
|
Protein Design Labs, Inc. (a) |
165,000 |
19,882,500 |
|
|
Schering-Plough Corp. |
1,776,400 |
82,602,600 |
|
|
Shire Pharmaceuticals Group PLC ADR (a) |
281,700 |
14,542,763 |
|
|
Vertex Pharmaceuticals, Inc. (a) |
168,700 |
14,255,150 |
|
|
Watson Pharmaceuticals, Inc. (a) |
330,500 |
21,441,188 |
|
|
|
807,098,108 |
||
|
Medical Equipment & Supplies - 1.8% |
|||
|
Johnson & Johnson |
458,700 |
43,089,131 |
|
|
Medtronic, Inc. |
1,121,000 |
58,081,813 |
|
|
Novoste Corp. (a) |
278,700 |
11,844,750 |
|
|
|
113,015,694 |
||
|
Common Stocks - continued |
|||
|
Shares |
Value (Note 1) |
||
|
HEALTH - continued |
|||
|
Medical Facilities Management - 1.2% |
|||
|
HCA - The Healthcare Co. |
1,081,000 |
$ 40,132,125 |
|
|
Tenet Healthcare Corp. |
838,330 |
30,494,254 |
|
|
|
70,626,379 |
||
|
TOTAL HEALTH |
990,740,181 |
||
|
INDUSTRIAL MACHINERY & EQUIPMENT - 7.2% |
|||
|
Electrical Equipment - 6.8% |
|||
|
Emerson Electric Co. |
430,900 |
28,870,300 |
|
|
General Electric Co. |
6,398,900 |
369,136,531 |
|
|
Omron Corp. |
553,000 |
14,544,559 |
|
|
|
412,551,390 |
||
|
Industrial Machinery & Equipment - 0.4% |
|||
|
Illinois Tool Works, Inc. |
171,900 |
9,604,913 |
|
|
Ingersoll-Rand Co. |
469,900 |
15,917,863 |
|
|
|
25,522,776 |
||
|
TOTAL INDUSTRIAL MACHINERY & EQUIPMENT |
438,074,166 |
||
|
MEDIA & LEISURE - 9.2% |
|||
|
Broadcasting - 4.9% |
|||
|
AT&T Corp. - Liberty Media Group |
1,653,584 |
29,764,512 |
|
|
Carlton Communications PLC |
981,333 |
7,639,513 |
|
|
Comcast Corp. Class A (special) (a) |
1,016,300 |
41,604,781 |
|
|
Cox Communications, Inc. Class A (a) |
760,700 |
29,096,775 |
|
|
EchoStar Communications Corp. Class A (a) |
455,590 |
24,032,373 |
|
|
Grupo Televisa SA de CV sponsored GDR |
588,400 |
33,943,325 |
|
|
Infinity Broadcasting Corp. Class A (a) |
360,300 |
11,889,900 |
|
|
Pegasus Communications Corp. (a) |
340,750 |
16,462,484 |
|
|
RTL Group |
157,345 |
17,044,872 |
|
|
Time Warner, Inc. |
787,600 |
61,629,700 |
|
|
Univision Communications, Inc. Class A (a) |
711,000 |
26,573,625 |
|
|
|
299,681,860 |
||
|
Entertainment - 3.5% |
|||
|
Fox Entertainment Group, Inc. Class A (a) |
925,200 |
24,517,800 |
|
|
MGM Mirage, Inc. |
685,300 |
26,169,894 |
|
|
Ticketmaster Online CitySearch, Inc. |
532,400 |
9,017,525 |
|
|
Viacom, Inc. Class B (non-vtg.) (a) |
880,165 |
51,489,653 |
|
|
Walt Disney Co. |
2,649,300 |
101,335,725 |
|
|
|
212,530,597 |
||
|
Publishing - 0.6% |
|||
|
The New York Times Co. Class A |
955,200 |
37,551,300 |
|
|
|
|||
|
Shares |
Value (Note 1) |
||
|
Restaurants - 0.2% |
|||
|
McDonald's Corp. |
459,600 |
$ 13,874,175 |
|
|
TOTAL MEDIA & LEISURE |
563,637,932 |
||
|
NONDURABLES - 5.3% |
|||
|
Beverages - 2.6% |
|||
|
Anheuser-Busch Companies, Inc. |
966,200 |
40,882,338 |
|
|
Heineken NV |
391,700 |
21,768,904 |
|
|
The Coca-Cola Co. |
1,761,500 |
97,102,688 |
|
|
|
159,753,930 |
||
|
Foods - 0.6% |
|||
|
Quaker Oats Co. |
502,700 |
39,776,138 |
|
|
Household Products - 1.2% |
|||
|
Clorox Co. |
37,800 |
1,495,463 |
|
|
Gillette Co. |
842,100 |
25,999,838 |
|
|
Luxottica Group Spa sponsored ADR |
574,200 |
9,258,975 |
|
|
Procter & Gamble Co. |
581,300 |
38,947,100 |
|
|
|
75,701,376 |
||
|
Tobacco - 0.9% |
|||
|
Philip Morris Companies, Inc. |
1,787,200 |
52,610,700 |
|
|
TOTAL NONDURABLES |
327,842,144 |
||
|
RETAIL & WHOLESALE - 4.6% |
|||
|
Drug Stores - 0.1% |
|||
|
CVS Corp. |
94,000 |
4,353,375 |
|
|
General Merchandise Stores - 2.5% |
|||
|
Costco Wholesale Corp. (a) |
158,100 |
5,523,619 |
|
|
Kohls Corp. (a) |
504,400 |
29,097,575 |
|
|
Target Corp. |
235,800 |
6,042,375 |
|
|
Wal-Mart Stores, Inc. |
2,356,400 |
113,401,750 |
|
|
|
154,065,319 |
||
|
Retail & Wholesale, Miscellaneous - 2.0% |
|||
|
Best Buy Co., Inc. (a) |
302,750 |
19,262,469 |
|
|
Home Depot, Inc. |
1,913,400 |
101,529,788 |
|
|
|
120,792,257 |
||
|
TOTAL RETAIL & WHOLESALE |
279,210,951 |
||
|
SERVICES - 1.0% |
|||
|
Advertising - 1.0% |
|||
|
DoubleClick, Inc. (a) |
304,900 |
9,756,800 |
|
|
TMP Worldwide, Inc. (a) |
309,300 |
24,898,650 |
|
|
WPP Group PLC sponsored ADR |
465,800 |
27,627,763 |
|
|
|
62,283,213 |
||
|
TECHNOLOGY - 34.0% |
|||
|
Communications Equipment - 5.7% |
|||
|
Cisco Systems, Inc. (a) |
4,705,800 |
259,995,450 |
|
|
Corning, Inc. |
143,400 |
42,589,800 |
|
|
Lucent Technologies, Inc. |
438,100 |
13,389,431 |
|
|
Common Stocks - continued |
|||
|
Shares |
Value (Note 1) |
||
|
TECHNOLOGY - continued |
|||
|
Communications Equipment - continued |
|||
|
Nortel Networks Corp. |
394,300 |
$ 23,485,494 |
|
|
UTStarcom, Inc. |
535,200 |
11,205,750 |
|
|
|
350,665,925 |
||
|
Computer Services & Software - 9.1% |
|||
|
Affymetrix, Inc. (a) |
377,000 |
18,802,875 |
|
|
Amazon.com, Inc. (a) |
336,500 |
12,934,219 |
|
|
America Online, Inc. (a) |
1,302,600 |
70,014,750 |
|
|
Automatic Data Processing, Inc. |
1,180,400 |
78,939,250 |
|
|
BEA Systems, Inc. (a) |
218,200 |
16,992,325 |
|
|
Cadence Design Systems, Inc. (a) |
809,900 |
20,804,306 |
|
|
CNET Networks, Inc. (a) |
496,000 |
12,082,250 |
|
|
First Data Corp. |
277,000 |
10,820,313 |
|
|
Microsoft Corp. (a) |
2,557,600 |
154,255,250 |
|
|
Oracle Corp. (a) |
657,600 |
51,786,000 |
|
|
Synopsys, Inc. (a) |
134,800 |
5,105,550 |
|
|
VeriSign, Inc. (a) |
220,100 |
44,584,006 |
|
|
VERITAS Software Corp. (a) |
214,500 |
30,459,000 |
|
|
Yahoo!, Inc. (a) |
348,200 |
31,686,200 |
|
|
|
559,266,294 |
||
|
Computers & Office Equipment - 9.9% |
|||
|
Brocade Communications Systems, Inc. (a) |
53,900 |
12,720,400 |
|
|
CDW Computer Centers, Inc. (a) |
337,200 |
23,266,800 |
|
|
Comdisco, Inc. |
216,400 |
4,125,125 |
|
|
Compaq Computer Corp. |
1,049,700 |
28,950,726 |
|
|
Dell Computer Corp. (a) |
1,486,500 |
45,802,781 |
|
|
EMC Corp. (a) |
1,378,000 |
136,594,250 |
|
|
Extreme Networks, Inc. (a) |
86,700 |
9,927,150 |
|
|
Gateway, Inc. (a) |
267,000 |
12,482,250 |
|
|
Hewlett-Packard Co. |
413,500 |
40,109,500 |
|
|
International Business Machines Corp. |
941,600 |
105,930,000 |
|
|
Juniper Networks, Inc. (a) |
153,100 |
33,519,331 |
|
|
Lexmark International Group, Inc. Class A (a) |
271,300 |
10,173,750 |
|
|
Palm, Inc. |
540,000 |
28,586,250 |
|
|
Sun Microsystems, Inc. (a) |
931,400 |
108,740,950 |
|
|
Symbol Technologies, Inc. |
129,800 |
4,664,688 |
|
|
|
605,593,951 |
||
|
Electronic Instruments - 1.2% |
|||
|
Agilent Technologies, Inc. |
290,005 |
14,192,120 |
|
|
Applied Materials, Inc. (a) |
308,800 |
18,315,700 |
|
|
Kudelski SA (a) |
8,850 |
13,558,996 |
|
|
|
|||
|
Shares |
Value (Note 1) |
||
|
LAM Research Corp. (a) |
859,600 |
$ 17,997,875 |
|
|
Novellus Systems, Inc. (a) |
236,400 |
11,007,375 |
|
|
|
75,072,066 |
||
|
Electronics - 8.1% |
|||
|
Altera Corp. (a) |
464,400 |
22,175,100 |
|
|
Analog Devices, Inc. (a) |
356,500 |
29,433,531 |
|
|
Chartered Semiconductor Manufacturing |
292,900 |
17,775,369 |
|
|
GlobeSpan, Inc. (a) |
223,300 |
27,242,600 |
|
|
Intel Corp. |
4,525,100 |
188,074,469 |
|
|
International Rectifier Corp. (a) |
249,900 |
12,635,569 |
|
|
JDS Uniphase Corp. (a) |
318,000 |
30,110,625 |
|
|
Linear Technology Corp. |
251,700 |
16,297,575 |
|
|
LSI Logic Corp. (a) |
425,200 |
12,437,100 |
|
|
Micron Technology, Inc. (a) |
281,340 |
12,941,640 |
|
|
Motorola, Inc. |
732,100 |
20,681,825 |
|
|
PMC-Sierra, Inc. (a) |
51,800 |
11,149,950 |
|
|
SDL, Inc. (a) |
45,900 |
14,197,444 |
|
|
Texas Instruments, Inc. |
1,646,900 |
77,713,094 |
|
|
|
492,865,891 |
||
|
TOTAL TECHNOLOGY |
2,083,464,127 |
||
|
TRANSPORTATION - 0.2% |
|||
|
Trucking & Freight - 0.2% |
|||
|
United Parcel Service, Inc. Class B |
230,300 |
12,983,163 |
|
|
UTILITIES - 2.6% |
|||
|
Cellular - 0.9% |
|||
|
QUALCOMM, Inc. (a) |
269,200 |
19,180,500 |
|
|
Sprint Corp. - PCS Group Series 1 (a) |
450,800 |
15,806,175 |
|
|
Vodafone Group PLC |
5,973,984 |
22,103,781 |
|
|
|
57,090,456 |
||
|
Electric Utility - 0.8% |
|||
|
AES Corp. (a) |
287,900 |
19,721,150 |
|
|
Calpine Corp. (a) |
294,100 |
30,696,688 |
|
|
|
50,417,838 |
||
|
Telephone Services - 0.9% |
|||
|
AT&T Corp. |
335,178 |
9,845,854 |
|
|
DDI Corp. |
1,059 |
6,951,003 |
|
|
McLeodUSA, Inc. Class A (a) |
682,300 |
9,765,419 |
|
|
Metromedia Fiber Network, Inc. Class A (a) |
547,000 |
13,298,938 |
|
|
Qwest Communications International, Inc. (a) |
270,900 |
13,020,131 |
|
|
|
52,881,345 |
||
|
TOTAL UTILITIES |
160,389,639 |
||
|
TOTAL COMMON STOCKS (Cost $5,179,064,482) |
5,985,459,617 |
||
|
Cash Equivalents - 3.9% |
|||
|
Shares |
Value (Note 1) |
||
|
Fidelity Cash Central Fund, 6.60% (b) |
239,922,694 |
$ 239,922,694 |
|
|
|
|
||
|
TOTAL INVESTMENT PORTFOLIO - 101.6% (Cost $5,418,987,176) |
6,225,382,311 |
||
|
NET OTHER ASSETS - (1.6)% |
(101,028,082) |
||
|
NET ASSETS - 100% |
$ 6,124,354,229 |
||
|
Legend |
|
(a) Non-income producing |
|
(b) The rate quoted is the annualized seven-day yield of the fund at period end. A complete listing of the fund's holdings as of its most recent fiscal year end is available upon request. |
|
(c) Restricted securities - Investment in securities not registered under the Securities Act of 1933. |
|
Additional information on each holding is as follows: |
|
Security |
Acquisition Date |
Acquisition Cost |
|
Geneva Proteomics |
7/7/00 |
$ 1,441,000 |
|
Other Information |
|
Purchases and sales of securities, other than short-term securities, aggregated $9,375,176,143 and $9,687,929,601, respectively, of which long-term U.S. government and government agency obligations aggregated $0 and $513,842,688, respectively. |
|
The fund invested in securities that are not registered under the Securities Act of 1933. These securities are subject to legal or contractual restrictions on resale. At the end of the period, restricted securities (excluding Rule 144A issues) amounted to $1,441,000 or 0.0% of net assets. |
|
The fund participated in the security lending program. At period end, the value of securities loaned amounted to $131,799,001. The fund received cash collateral of $140,470,800 which was invested in cash equivalents. |
|
Income Tax Information |
|
At September 30, 2000, the aggregate cost of investment securities for income tax purposes was $5,318,034,092. Net unrealized appreciation aggregated $907,348,219, of which $1,455,155,384 related to appreciated investment securities and $547,807,165 related to depreciated investment securities. |
|
The fund hereby designates approximately $942,283,000 as a capital gain dividend for the purpose of the dividend paid deduction. |
See accompanying notes which are an integral part of the financial statements.
Annual Report
Fidelity Destiny Portfolios: Destiny I
Statement of Assets and Liabilities
|
September 30, 2000 |
||
|
Assets |
|
|
|
Investment in securities, at value |
|
$ 6,225,382,311 |
|
Receivable for investments sold |
|
129,548,835 |
|
Receivable for fund shares sold |
|
432,914 |
|
Dividends receivable |
|
4,575,392 |
|
Interest receivable |
|
1,248,116 |
|
Other receivables |
|
39,007 |
|
Total assets |
|
6,361,226,575 |
|
Liabilities |
|
|
|
Payable for investments purchased |
$ 92,895,859 |
|
|
Payable for fund shares redeemed |
1,615,142 |
|
|
Accrued management fee |
1,213,075 |
|
|
Distribution fees payable |
648 |
|
|
Other payables and accrued expenses |
676,822 |
|
|
Collateral on securities loaned, at value |
140,470,800 |
|
|
Total liabilities |
|
236,872,346 |
|
Net Assets |
|
$ 6,124,354,229 |
|
Net Assets consist of: |
|
|
|
Paid in capital |
|
$ 4,205,152,065 |
|
Undistributed net investment income |
|
26,831,597 |
|
Accumulated undistributed net realized gain (loss) on investments and foreign currency transactions |
|
1,086,012,042 |
|
Net unrealized appreciation (depreciation) on investments and assets and liabilities in foreign currencies |
|
806,358,525 |
|
Net Assets |
|
$ 6,124,354,229 |
|
Class O: |
|
$22.09 |
|
Class N: |
|
$21.90 |
Statement of Operations
|
|
Year ended September 30, 2000 |
|
|
Investment Income Dividends |
|
$ 51,610,297 |
|
Interest |
|
20,719,388 |
|
Security lending |
|
858,474 |
|
Total income |
|
73,188,159 |
|
Expenses |
|
|
|
Management fee |
$ 29,697,889 |
|
|
Performance adjustment |
(13,259,333) |
|
|
Transfer agent fees |
427,389 |
|
|
Distribution fees |
3,366 |
|
|
Accounting and security lending fees |
807,517 |
|
|
Non-interested trustees' compensation |
25,229 |
|
|
Custodian fees and expenses |
231,786 |
|
|
Registration fees |
26,826 |
|
|
Audit |
50,169 |
|
|
Legal |
18,860 |
|
|
Interest |
3,396 |
|
|
Miscellaneous |
39,127 |
|
|
Total expenses before reductions |
18,072,221 |
|
|
Expense reductions |
(1,618,145) |
16,454,076 |
|
Net investment income |
|
56,734,083 |
|
Realized and Unrealized Gain (Loss) Net realized gain (loss) on: |
|
|
|
Investment securities |
1,114,577,420 |
|
|
Foreign currency transactions |
(230,884) |
1,114,346,536 |
|
Change in net unrealized appreciation (depreciation) on: |
|
|
|
Investment securities |
(1,365,920,944) |
|
|
Assets and liabilities in |
(39,517) |
(1,365,960,461) |
|
Net gain (loss) |
|
(251,613,925) |
|
Net increase (decrease) in net assets resulting from operations |
|
$ (194,879,842) |
See accompanying notes which are an integral part of the financial statements.
Annual Report
Fidelity Destiny Portfolios: Destiny I
Financial Statements - continued
Statement of Changes in Net Assets
|
|
Year ended
September 30, |
Year ended
September 30, |
|
Increase (Decrease) in Net Assets |
|
|
|
Operations |
$ 56,734,083 |
$ 111,568,555 |
|
Net realized gain (loss) |
1,114,346,536 |
979,781,946 |
|
Change in net unrealized appreciation (depreciation) |
(1,365,960,461) |
90,347,540 |
|
Net increase (decrease) in net assets resulting from operations |
(194,879,842) |
1,181,698,041 |
|
Distributions to shareholders |
(114,858,565) |
(105,484,207) |
|
From net realized gain |
(897,912,414) |
(544,915,685) |
|
Total distributions |
(1,012,770,979) |
(650,399,892) |
|
Share transactions - net increase (decrease) |
354,594,496 |
240,053,910 |
|
Total increase (decrease) in net assets |
(853,056,325) |
771,352,059 |
|
Net Assets |
|
|
|
Beginning of period |
6,977,410,554 |
6,206,058,495 |
|
End of period (including undistributed net investment income of $26,831,597 and $88,705,313, respectively) |
$ 6,124,354,229 |
$ 6,977,410,554 |
Financial Highlights - Class O
|
Years ended September 30, |
2000 |
1999 |
1998 |
1997 |
1996 |
|
Selected Per-Share Data |
|
|
|
|
|
|
Net asset value, beginning of period |
$ 26.54 |
$ 24.58 |
$ 25.08 |
$ 20.41 |
$ 18.78 |
|
Income from Investment Operations |
|
|
|
|
|
|
Net investment income |
.20 C |
.42 C |
.44 C |
.49 C |
.45 |
|
Net realized and unrealized gain (loss) |
(.77) |
4.13 |
1.56 |
6.36 |
2.42 |
|
Total from investment operations |
(.57) |
4.55 |
2.00 |
6.85 |
2.87 |
|
Less Distributions |
|
|
|
|
|
|
From net investment income |
(.44) |
(.42) |
(.47) |
(.45) |
(.43) |
|
From net realized gain |
(3.44) |
(2.17) |
(2.03) |
(1.73) |
(.81) |
|
Total distributions |
(3.88) |
(2.59) |
(2.50) |
(2.18) |
(1.24) |
|
Net asset value, end of period |
$ 22.09 |
$ 26.54 |
$ 24.58 |
$ 25.08 |
$ 20.41 |
|
Total Return A, B |
(3.23)% |
18.99% |
8.72% |
36.29% |
16.04% |
|
Ratios and Supplemental Data |
|
|
|
|
|
|
Net assets, end of period (000 omitted) |
$ 6,121,273 |
$ 6,977,155 |
$ 6,206,058 |
$ 5,960,742 |
$ 4,565,482 |
|
Ratio of expenses to average net assets |
.27% |
.32% |
.33% |
.39% |
.65% |
|
Ratio of expenses to average net assets after expense reductions |
.25% D |
.31% D |
.33% |
.38% D |
.65% |
|
Ratio of net investment income to average net assets |
.85% |
1.55% |
1.71% |
2.20% |
2.40% |
|
Portfolio turnover |
145% |
36% |
27% |
32% |
42% |
|
A The total returns would have been lower had certain expenses not been reduced during the periods shown. B Total returns do not include the effects of the separate sales charge and other fees assessed through Fidelity Systematic Investment Plans. C Net investment income per share has been calculated based on average shares outstanding during the period. D FMR or the fund has entered into varying arrangements with third parties who either paid or reduced a portion of the class' expenses. |
|||||
See accompanying notes which are an integral part of the financial statements.
Annual Report
Fidelity Destiny Portfolios: Destiny I
Financial Statements - continued
Financial Highlights - Class N
|
Years ended September 30, |
2000 |
1999 F |
|
Selected Per-Share Data |
|
|
|
Net asset value, beginning of period |
$ 26.45 |
$ 27.76 |
|
Income from Investment Operations |
|
|
|
Net investment income (loss) D |
(.01) |
.08 |
|
Net realized and unrealized gain (loss) |
(.74) |
(1.39) G |
|
Total from investment operations |
(.75) |
(1.31) |
|
Less Distributions |
|
|
|
From net investment income |
(.36) |
- |
|
From net realized gain |
(3.44) |
- |
|
Total distributions |
(3.80) |
- |
|
Net asset value, end of period |
$ 21.90 |
$ 26.45 |
|
Total Return B, C |
(3.98)% |
(4.72)% |
|
Ratios and Supplemental Data |
|
|
|
Net assets, end of period (000 omitted) |
$ 3,081 |
$ 256 |
|
Ratio of expenses to average net assets |
1.14% |
1.18% A |
|
Ratio of expenses to average net assets after expense reductions |
1.12% E |
1.17% A, E |
|
Ratio of net investment income (loss) to average net assets |
(.02)% |
.68% A |
|
Portfolio turnover |
145% |
36% |
|
A Annualized B The total returns would have been lower had certain expenses not been reduced during the periods shown. C Total returns do not include the effects of the separate sales charge and other fees assessed through Fidelity Systematic Investment Plans and for periods of less than one year are not annualized. D Net investment income (loss) per share has been calculated based on average shares outstanding during the period. E FMR or the fund has entered into varying arrangements with third parties who either paid or reduced a portion of the class' expenses. F For the period April 30, 1999 (commencement of sale of Class N shares) to September 30, 1999. G The amount shown for a share outstanding does not correspond with the aggregate net gain on investments for the period due to the timing of sales and repurchases of class shares in relation to fluctuating market values of the investments of the fund. |
||
See accompanying notes which are an integral part of the financial statements.
Annual Report
Fidelity Destiny Portfolios: Destiny II
Showing Percentage of Net Assets
|
Common Stocks - 95.1% |
|||
|
Shares |
Value (Note 1) |
||
|
AEROSPACE & DEFENSE - 0.4% |
|||
|
Ship Building & Repair - 0.4% |
|||
|
General Dynamics Corp. |
367,600 |
$ 23,089,875 |
|
|
BASIC INDUSTRIES - 0.5% |
|||
|
Iron & Steel - 0.1% |
|||
|
Bethlehem Steel Corp. (a) |
2,000,000 |
6,000,000 |
|
|
Metals & Mining - 0.4% |
|||
|
Martin Marietta Materials, Inc. |
625,000 |
23,925,000 |
|
|
TOTAL BASIC INDUSTRIES |
29,925,000 |
||
|
CONSTRUCTION & REAL ESTATE - 1.1% |
|||
|
Building Materials - 0.2% |
|||
|
Florida Rock Industries, Inc. |
375,700 |
14,816,669 |
|
|
Construction - 0.5% |
|||
|
D.R. Horton, Inc. |
600,000 |
10,312,500 |
|
|
Lennar Corp. |
700,000 |
20,781,250 |
|
|
|
31,093,750 |
||
|
Real Estate Investment Trusts - 0.4% |
|||
|
Pinnacle Holdings, Inc. (a) |
900,500 |
23,975,813 |
|
|
TOTAL CONSTRUCTION & REAL ESTATE |
69,886,232 |
||
|
DURABLES - 0.2% |
|||
|
Consumer Electronics - 0.2% |
|||
|
Sony Corp. |
100,000 |
10,093,750 |
|
|
ENERGY - 6.5% |
|||
|
Energy Services - 2.2% |
|||
|
BJ Services Co. (a) |
300,000 |
18,337,500 |
|
|
Halliburton Co. |
700,000 |
34,256,250 |
|
|
Nabors Industries, Inc. (a) |
600,000 |
31,440,000 |
|
|
Noble Drilling Corp. (a) |
900,000 |
45,225,000 |
|
|
Weatherford International, Inc. |
300,000 |
12,900,000 |
|
|
|
142,158,750 |
||
|
Oil & Gas - 4.3% |
|||
|
BP Amoco PLC sponsored ADR |
307,812 |
16,314,036 |
|
|
Cabot Oil & Gas Corp. Class A |
775,600 |
15,802,850 |
|
|
Cooper Cameron Corp. (a) |
165,000 |
12,158,438 |
|
|
Exxon Mobil Corp. |
1,949,766 |
173,772,895 |
|
|
Grant Prideco, Inc. (a) |
349,500 |
7,667,156 |
|
|
Royal Dutch Petroleum Co. (NY Shares) |
700,000 |
41,956,250 |
|
|
|
267,671,625 |
||
|
TOTAL ENERGY |
409,830,375 |
||
|
FINANCE - 13.6% |
|||
|
Banks - 1.4% |
|||
|
Bank of New York Co., Inc. |
625,040 |
35,041,305 |
|
|
Bank One Corp. |
1,400,000 |
54,075,000 |
|
|
|
89,116,305 |
||
|
|
|||
|
Shares |
Value (Note 1) |
||
|
Credit & Other Finance - 2.4% |
|||
|
American Express Co. |
1,600,000 |
$ 97,200,000 |
|
|
Citigroup, Inc. |
999,933 |
54,058,878 |
|
|
|
151,258,878 |
||
|
Federal Sponsored Credit - 6.1% |
|||
|
Fannie Mae |
3,250,000 |
232,375,000 |
|
|
Freddie Mac |
2,765,000 |
149,482,813 |
|
|
|
381,857,813 |
||
|
Insurance - 2.6% |
|||
|
AFLAC, Inc. |
320,200 |
20,512,813 |
|
|
AMBAC Financial Group, Inc. |
300,000 |
21,975,000 |
|
|
American International Group, Inc. |
1,282,981 |
122,765,244 |
|
|
|
165,253,057 |
||
|
Securities Industry - 1.1% |
|||
|
Bear Stearns Companies, Inc. |
175,000 |
11,025,000 |
|
|
Daiwa Securities Group, Inc. |
2,377,000 |
27,841,905 |
|
|
Nikko Securities Co. Ltd. |
3,114,000 |
27,636,497 |
|
|
|
66,503,402 |
||
|
TOTAL FINANCE |
853,989,455 |
||
|
HEALTH - 12.1% |
|||
|
Drugs & Pharmaceuticals - 10.8% |
|||
|
Amgen, Inc. (a) |
335,200 |
23,406,388 |
|
|
Bristol-Myers Squibb Co. |
3,000,872 |
171,424,813 |
|
|
Decode Genetics, Inc. |
250,100 |
6,424,444 |
|
|
Eli Lilly & Co. |
1,500,000 |
121,687,500 |
|
|
Genentech, Inc. (a) |
275,000 |
51,064,063 |
|
|
Geneva Proteomics (f) |
255,000 |
1,402,500 |
|
|
Human Genome Sciences, Inc. (a) |
225,000 |
38,953,125 |
|
|
Immunex Corp. (a) |
825,000 |
35,887,500 |
|
|
Pfizer, Inc. |
1,624,975 |
73,022,314 |
|
|
Schering-Plough Corp. |
2,163,000 |
100,579,500 |
|
|
Vertex Pharmaceuticals, Inc. (a) |
200,000 |
16,900,000 |
|
|
Watson Pharmaceuticals, Inc. (a) |
500,000 |
32,437,500 |
|
|
|
673,189,647 |
||
|
Medical Equipment & Supplies - 1.3% |
|||
|
Biomet, Inc. |
915,325 |
32,036,375 |
|
|
Cardinal Health, Inc. |
569,954 |
50,262,818 |
|
|
|
82,299,193 |
||
|
TOTAL HEALTH |
755,488,840 |
||
|
INDUSTRIAL MACHINERY & EQUIPMENT - 7.6% |
|||
|
Electrical Equipment - 6.4% |
|||
|
Alcatel SA sponsored ADR |
685,000 |
43,069,375 |
|
|
Furukawa Electric Co. Ltd. |
300,000 |
8,278,635 |
|
|
General Electric Co. |
6,032,000 |
347,970,990 |
|
|
|
399,319,000 |
||
|
Common Stocks - continued |
|||
|
Shares |
Value (Note 1) |
||
|
INDUSTRIAL MACHINERY & EQUIPMENT - continued |
|||
|
Industrial Machinery & Equipment - 1.2% |
|||
|
Caterpillar, Inc. |
1,125,000 |
$ 37,968,750 |
|
|
Tyco International Ltd. |
700,000 |
36,312,500 |
|
|
|
74,281,250 |
||
|
TOTAL INDUSTRIAL MACHINERY & EQUIPMENT |
473,600,250 |
||
|
MEDIA & LEISURE - 5.6% |
|||
|
Broadcasting - 2.0% |
|||
|
AT&T Corp. - Liberty Media Group |
699,984 |
12,599,712 |
|
|
Clear Channel Communications, Inc. (a) |
500,000 |
28,250,000 |
|
|
Grupo Televisa SA de CV sponsored GDR |
650,000 |
37,496,875 |
|
|
Infinity Broadcasting Corp. Class A (a) |
1,150,000 |
37,950,000 |
|
|
Radio One, Inc. Class D (non-vtg.) (a) |
129,700 |
916,006 |
|
|
Time Warner, Inc. |
129,962 |
10,169,527 |
|
|
|
127,382,120 |
||
|
Entertainment - 2.5% |
|||
|
MGM Mirage, Inc. |
700,000 |
26,731,250 |
|
|
Viacom, Inc. Class B (non-vtg.) (a) |
2,201,030 |
128,760,255 |
|
|
|
155,491,505 |
||
|
Publishing - 1.1% |
|||
|
McGraw-Hill Companies, Inc. |
1,050,000 |
66,740,625 |
|
|
TOTAL MEDIA & LEISURE |
349,614,250 |
||
|
NONDURABLES - 5.4% |
|||
|
Beverages - 2.1% |
|||
|
Anheuser-Busch Companies, Inc. |
1,550,000 |
65,584,375 |
|
|
The Coca-Cola Co. |
1,250,000 |
68,906,250 |
|
|
|
134,490,625 |
||
|
Foods - 1.1% |
|||
|
Keebler Foods Co. |
300,000 |
12,600,000 |
|
|
Quaker Oats Co. |
700,000 |
55,387,500 |
|
|
|
67,987,500 |
||
|
Tobacco - 2.2% |
|||
|
Philip Morris Companies, Inc. |
3,000,000 |
88,312,500 |
|
|
RJ Reynolds Tobacco Holdings, Inc. |
550,000 |
17,737,500 |
|
|
UST, Inc. |
1,250,000 |
28,593,750 |
|
|
|
134,643,750 |
||
|
TOTAL NONDURABLES |
337,121,875 |
||
|
PRECIOUS METALS - 0.2% |
|||
|
Homestake Mining Co. |
2,866,600 |
14,870,488 |
|
|
RETAIL & WHOLESALE - 2.6% |
|||
|
Apparel Stores - 0.4% |
|||
|
Abercrombie & Fitch Co. Class A (a) |
1,500,000 |
28,593,750 |
|
|
|
|||
|
Shares |
Value (Note 1) |
||
|
General Merchandise Stores - 0.9% |
|||
|
Kohls Corp. (a) |
200,000 |
$ 11,537,500 |
|
|
Wal-Mart Stores, Inc. |
950,800 |
45,757,250 |
|
|
|
57,294,750 |
||
|
Retail & Wholesale, Miscellaneous - 1.3% |
|||
|
eToys, Inc. (a) |
100,000 |
534,375 |
|
|
Home Depot, Inc. |
1,474,950 |
78,264,534 |
|
|
|
78,798,909 |
||
|
TOTAL RETAIL & WHOLESALE |
164,687,409 |
||
|
SERVICES - 0.3% |
|||
|
Advertising - 0.3% |
|||
|
Omnicom Group, Inc. |
300,000 |
21,881,250 |
|
|
TECHNOLOGY - 34.8% |
|||
|
Communications Equipment - 5.5% |
|||
|
Ciena Corp. (a) |
120,000 |
14,737,500 |
|
|
Cisco Systems, Inc. (a) |
4,915,000 |
271,553,750 |
|
|
Nokia AB sponsored ADR |
1,250,000 |
49,765,625 |
|
|
Telefonaktiebolaget LM Ericsson |
575,000 |
8,517,188 |
|
|
|
344,574,063 |
||
|
Computer Services & Software - 16.1% |
|||
|
Aether Systems, Inc. |
330,000 |
34,815,000 |
|
|
Affymetrix, Inc. (a) |
250,000 |
12,468,750 |
|
|
Amazon.com, Inc. (a) |
600,000 |
23,062,500 |
|
|
Ariba, Inc. (a) |
840,000 |
120,343,125 |
|
|
BEA Systems, Inc. (a) |
678,100 |
52,807,038 |
|
|
BMC Software, Inc. (a) |
350,000 |
6,693,750 |
|
|
Cadence Design Systems, Inc. (a) |
1,690,600 |
43,427,288 |
|
|
Computer Associates International, Inc. |
950,000 |
23,928,125 |
|
|
i2 Technologies, Inc. (a) |
555,000 |
103,819,688 |
|
|
Internap Network Services Corp. |
894,100 |
28,890,606 |
|
|
Interwoven, Inc. |
185,000 |
20,916,563 |
|
|
Intuit, Inc. (a) |
771,800 |
43,992,600 |
|
|
J.D. Edwards & Co. (a) |
250,000 |
6,468,750 |
|
|
Microsoft Corp. (a) |
3,600,000 |
217,125,000 |
|
|
NaviSite, Inc. |
60,400 |
1,627,025 |
|
|
Oracle Corp. (a) |
425,000 |
33,468,750 |
|
|
Phone.com, Inc. (a) |
220,000 |
24,997,500 |
|
|
Software.com, Inc. (a) |
277,400 |
50,330,763 |
|
|
VERITAS Software Corp. (a) |
895,700 |
127,189,400 |
|
|
Vignette Corp. (a) |
773,300 |
23,102,338 |
|
|
Yahoo!, Inc. (a) |
75,000 |
6,825,000 |
|
|
|
1,006,299,559 |
||
|
Computers & Office Equipment - 11.3% |
|||
|
Apple Computer, Inc. (a) |
376,400 |
9,692,300 |
|
|
Comdisco, Inc. |
347,700 |
6,628,031 |
|
|
Dell Computer Corp. (a) |
4,175,000 |
128,642,188 |
|
|
EMC Corp. (a) |
1,800,000 |
178,425,000 |
|
|
Hutchinson Technology, Inc. (a) |
600,000 |
12,637,500 |
|
|
Common Stocks - continued |
|||
|
Shares |
Value (Note 1) |
||
|
TECHNOLOGY - continued |
|||
|
Computers & Office Equipment - continued |
|||
|
Ingram Micro, Inc. Class A (a) |
2,500,000 |
$ 34,375,000 |
|
|
International Business Machines Corp. |
252,000 |
28,350,000 |
|
|
Juniper Networks, Inc. (a) |
365,000 |
79,912,188 |
|
|
Lexmark International Group, Inc. |
1,625,000 |
60,937,500 |
|
|
Maxtor Corp. (a) |
2,280,000 |
23,940,000 |
|
|
Network Appliance, Inc. (a) |
50,000 |
6,368,750 |
|
|
Sun Microsystems, Inc. (a) |
1,030,600 |
120,322,550 |
|
|
Western Digital Corp. (a) |
2,750,000 |
16,156,250 |
|
|
|
706,387,257 |
||
|
Electronics - 1.9% |
|||
|
Analog Devices, Inc. (a) |
250,000 |
20,640,625 |
|
|
Flextronics International Ltd. (a) |
124,941 |
10,260,780 |
|
|
Intel Corp. |
127,000 |
5,278,438 |
|
|
Micron Technology, Inc. (a) |
150,000 |
6,900,000 |
|
|
Mitsubishi Electric Corp. |
2,000,000 |
16,548,026 |
|
|
Sanmina Corp. (a) |
185,000 |
17,320,625 |
|
|
Solectron Corp. (a) |
239,984 |
11,069,262 |
|
|
Texas Instruments, Inc. |
675,000 |
31,851,563 |
|
|
|
119,869,319 |
||
|
TOTAL TECHNOLOGY |
2,177,130,198 |
||
|
UTILITIES - 4.2% |
|||
|
Cellular - 2.2% |
|||
|
AT&T Corp. - Wireless Group |
300,000 |
6,262,500 |
|
|
China Mobile (Hong Kong) Ltd. (a) |
2,000,000 |
12,974,999 |
|
|
SBA Communications Corp. Class A (a) |
844,800 |
35,428,800 |
|
|
Sprint Corp. - PCS Group Series 1 (a) |
850,000 |
29,803,125 |
|
|
Tritel, Inc. Class A |
480,600 |
6,878,588 |
|
|
Vodafone Group PLC sponsored ADR |
821,300 |
30,388,100 |
|
|
VoiceStream Wireless Corp. (a) |
149,100 |
17,304,919 |
|
|
|
139,041,031 |
||
|
Electric Utility - 0.9% |
|||
|
AES Corp. (a) |
800,000 |
54,800,000 |
|
|
Gas - 0.7% |
|||
|
Dynegy, Inc. Class A |
847,404 |
48,302,028 |
|
|
Telephone Services - 0.4% |
|||
|
Metromedia Fiber Network, Inc. Class A (a) |
350,000 |
8,509,375 |
|
|
Telefonos de Mexico SA de CV Series L sponsored ADR |
300,000 |
15,956,250 |
|
|
TeraBeam Networks (f) |
19,200 |
72,000 |
|
|
|
24,537,625 |
||
|
TOTAL UTILITIES |
266,680,684 |
||
|
TOTAL COMMON STOCKS (Cost $4,390,611,639) |
5,957,889,931 |
||
|
Convertible Preferred Stocks - 0.0% |
|||
|
Shares |
Value (Note 1) |
||
|
TECHNOLOGY - 0.0% |
|||
|
Communications Equipment - 0.0% |
|||
|
Chorum Technologies (f) |
27,000 |
$ 465,480 |
|
|
Corporate Bonds - 0.7% |
|||||
|
Moody's Ratings |
Principal Amount |
|
|||
|
Convertible Bonds - 0.6% |
|||||
|
FINANCE - 0.2% |
|||||
|
Credit & Other Finance - 0.2% |
|||||
|
Elan Finance Corp. Ltd. liquid yield option notes 0% 12/14/18 (e) |
Baa3 |
|
$ 19,620,000 |
15,892,200 |
|
|
MEDIA & LEISURE - 0.4% |
|||||
|
Broadcasting - 0.4% |
|||||
|
Liberty Media Corp.: |
|
|
|
|
|
|
3.75% 2/15/30 (e) |
Baa3 |
|
16,020,000 |
12,375,450 |
|
|
4% 11/15/29 (e) |
Baa3 |
|
4,330,000 |
4,102,675 |
|
|
4% 11/15/29 |
Baa3 |
|
6,100,000 |
5,779,750 |
|
|
|
22,257,875 |
||||
|
TECHNOLOGY - 0.0% |
|||||
|
Computer Services & Software - 0.0% |
|||||
|
Cyras Systems, Inc. 4.5% 8/15/05 (e) |
- |
|
1,525,000 |
1,830,000 |
|
|
TOTAL CONVERTIBLE BONDS |
39,980,075 |
||||
|
Nonconvertible Bonds - 0.1% |
|||||
|
TECHNOLOGY - 0.1% |
|||||
|
Computer Services & Software - 0.1% |
|||||
|
Amazon.com, Inc. 0% 5/1/08 (d) |
Caa1 |
|
$ 5,000,000 |
2,700,000 |
|
|
TOTAL CORPORATE BONDS (Cost $42,332,242) |
42,680,075 |
||||
|
Cash Equivalents - 5.0% |
|||
|
Shares |
Value (Note 1) |
||
|
Fidelity Cash Central Fund, 6.60% (c) |
313,772,402 |
$ 313,772,402 |
|
|
|
|
||
|
TOTAL INVESTMENT PORTFOLIO - 100.8% (Cost $4,747,181,763) |
6,314,807,888 |
||
|
NET OTHER ASSETS - (0.8)% |
(52,639,758) |
||
|
NET ASSETS - 100% |
$ 6,262,168,130 |
||
|
Legend |
|
(a) Non-income producing |
|
(b) S&P credit ratings are used in the absence of a rating by Moody's Investors Service, Inc. |
|
(c) The rate quoted is the annualized seven-day yield of the fund at period end. A complete listing of the fund's holdings as of its most recent fiscal year end is available upon request. |
|
(d) Debt obligation initially issued in zero coupon form which converts to coupon form at a specified rate and date. The rate shown is the rate at period end. |
|
(e) Security exempt from registration under Rule 144A of the Securities Act of 1933. These securities may be resold in transactions exempt from registration, normally to qualified institutional buyers. At the period end, the value of these securities amounted to $34,200,325 or 0.5% of net assets. |
|
(f) Restricted securities - Investment in securities not registered under the Securities Act of 1933. |
|
Additional information on each holding is as follows: |
|
Security |
Acquisition Date |
Acquisition Cost |
|
Chorum Technologies |
9/19/00 |
$ 465,480 |
|
Geneva Proteomics |
7/7/00 |
$ 1,402,500 |
|
TeraBeam Networks |
4/7/00 |
$ 72,000 |
|
Other Information |
|
Purchases and sales of securities, other than short-term securities, aggregated $6,669,363,277 and $6,575,975,224, respectively. |
|
The fund invested in securities that are not registered under the Securities Act of 1933. These securities are subject to legal or contractual restrictions on resale. At the end of the period, restricted securities (excluding Rule 144A issues) amounted to $1,939,980 or 0.0% of net assets. |
|
The fund participated in the security lending program. At period end, the value of securities loaned amounted to $60,589,779. The fund received cash collateral of $64,627,700 which was invested in cash equivalents. |
|
Income Tax Information |
|
At September 30, 2000, the aggregate cost of investment securities for income tax purposes was $4,712,779,460. Net unrealized appreciation aggregated $1,602,028,428, of which $1,904,224,307 related to appreciated investment securities and $302,195,879 related to depreciated investment securities. |
|
The fund hereby designates approximately $523,066,000 as a capital gain dividend for the purpose of the dividend paid deduction. |
See accompanying notes which are an integral part of the financial statements.
Annual Report
Fidelity Destiny Portfolios: Destiny II
Statement of Assets and Liabilities
|
September 30, 2000 |
||
|
Assets |
|
|
|
Investment in securities, at value |
|
$ 6,314,807,888 |
|
Receivable for investments sold |
|
84,498,306 |
|
Receivable for fund shares sold |
|
256,197 |
|
Dividends receivable |
|
3,957,253 |
|
Interest receivable |
|
1,744,768 |
|
Other receivables |
|
18,696 |
|
Total assets |
|
6,405,283,108 |
|
Liabilities |
|
|
|
Payable to custodian bank |
$ 370,404 |
|
|
Payable for investments purchased |
73,191,983 |
|
|
Payable for fund shares redeemed |
1,377,093 |
|
|
Accrued management fee |
3,056,306 |
|
|
Distribution fees payable |
3,900 |
|
|
Other payables and accrued expenses |
487,592 |
|
|
Collateral on securities loaned, at value |
64,627,700 |
|
|
Total liabilities |
|
$ 143,114,978 |
|
Net Assets |
|
$ 6,262,168,130 |
|
Net Assets consist of: |
|
|
|
Paid in capital |
|
$ 4,165,044,830 |
|
Undistributed net investment income |
|
25,557,974 |
|
Accumulated undistributed net realized gain (loss) on investments and foreign currency transactions |
|
503,953,512 |
|
Net unrealized appreciation (depreciation) on investments and assets and liabilities in foreign currencies |
|
1,567,611,814 |
|
Net Assets |
|
$ 6,262,168,130 |
|
Class O: |
|
$16.13 |
|
Class N: |
|
$15.94 |
Statement of Operations
|
|
Year ended September 30, 2000 |
|
|
Investment Income Dividends |
|
$ 39,271,585 |
|
Interest |
|
16,046,182 |
|
Security lending |
|
1,132,017 |
|
Total income |
|
56,449,784 |
|
Expenses |
|
|
|
Management fee |
$ 34,983,993 |
|
|
Performance adjustment |
(1,567,750) |
|
|
Transfer agent fees |
312,921 |
|
|
Distribution fees |
22,690 |
|
|
Accounting and security lending fees |
815,421 |
|
|
Non-interested trustees' compensation |
29,135 |
|
|
Custodian fees and expenses |
330,760 |
|
|
Registration fees |
163,536 |
|
|
Audit |
47,019 |
|
|
Legal |
15,944 |
|
|
Miscellaneous |
71,892 |
|
|
Total expenses before reductions |
35,225,561 |
|
|
Expense reductions |
(1,266,665) |
33,958,896 |
|
Net investment income |
|
22,490,888 |
|
Realized and Unrealized Gain (Loss) Net realized gain (loss) on: |
|
|
|
Investment securities |
532,244,815 |
|
|
Foreign currency transactions |
129,392 |
532,374,207 |
|
Change in net unrealized appreciation (depreciation) on: |
|
|
|
Investment securities |
508,094,592 |
|
|
Assets and liabilities in |
(16,396) |
508,078,196 |
|
Net gain (loss) |
|
1,040,452,403 |
|
Net increase (decrease) in net assets resulting from operations |
|
$ 1,062,943,291 |
See accompanying notes which are an integral part of the financial statements.
Annual Report
Fidelity Destiny Portfolios: Destiny II
Financial Statements - continued
Statement of Changes in Net Assets
|
|
Year ended
September 30, |
Year ended
September 30, |
|
Increase (Decrease) in Net Assets |
|
|
|
Operations |
$ 22,490,888 |
$ 40,217,501 |
|
Net realized gain (loss) |
532,374,207 |
514,603,714 |
|
Change in net unrealized appreciation (depreciation) |
508,078,196 |
644,423,653 |
|
Net increase (decrease) in net assets resulting from operations |
1,062,943,291 |
1,199,244,868 |
|
Distributions to shareholders |
(39,217,077) |
(34,149,944) |
|
From net realized gain |
(509,476,717) |
(864,396,346) |
|
Total distributions |
(548,693,794) |
(898,546,290) |
|
Share transactions - net increase (decrease) |
520,091,432 |
957,719,512 |
|
Total increase (decrease) in net assets |
1,034,340,929 |
1,258,418,090 |
|
Net Assets |
|
|
|
Beginning of period |
5,227,827,201 |
3,969,409,111 |
|
End of period (including undistributed net investment income of $25,557,974 and $39,810,345, respectively) |
$ 6,262,168,130 |
$ 5,227,827,201 |
Financial Highlights - Class O
|
Years ended September 30, |
2000 |
1999 |
1998 |
1997 |
1996 E |
|
Selected Per-Share Data |
|
|
|
|
|
|
Net asset value, beginning of period |
$ 14.76 |
$ 14.07 |
$ 14.40 |
$ 11.61 |
$ 10.57 |
|
Income from Investment Operations |
|
|
|
|
|
|
Net investment income |
.06 C |
.12 C |
.18 C |
.27 C |
.24 |
|
Net realized and unrealized gain (loss) |
2.85 |
3.73 |
.71 |
3.52 |
1.34 |
|
Total from investment operations |
2.91 |
3.85 |
.89 |
3.79 |
1.58 |
|
Less Distributions |
|
|
|
|
|
|
From net investment income |
(.11) |
(.12) |
(.25) |
(.25) |
(.22) |
|
From net realized gain |
(1.43) |
(3.04) |
(.97) |
(.75) |
(.32) |
|
Total distributions |
(1.54) |
(3.16) |
(1.22) |
(1.00) |
(.54) |
|
Net asset value, end of period |
$ 16.13 |
$ 14.76 |
$ 14.07 |
$ 14.40 |
$ 11.61 |
|
Total Return A, B |
20.25% |
30.06% |
6.64% |
34.72% |
15.43% |
|
Ratios and Supplemental Data |
|
|
|
|
|
|
Net assets, end of period (000 omitted) |
$ 6,242,943 |
$ 5,226,303 |
$ 3,969,409 |
$ 3,609,144 |
$ 2,538,407 |
|
Ratio of expenses to average net assets |
.58% |
.48% |
.48% |
.54% |
.78% |
|
Ratio of expenses to average net assets after expense reductions |
.56% D |
.47% D |
.48% |
.53% D |
.78% |
|
Ratio of net investment income to average net assets |
.37% |
.79% |
1.23% |
2.11% |
2.38% |
|
Portfolio turnover |
113% |
77% |
106% |
35% |
37% |
|
A The total returns would have been lower had certain expenses not been reduced during the periods shown. B Total returns do not include the effects of the separate sales charge and other fees assessed through Fidelity Systematic Investment Plans. C Net investment income per share has been calculated based on average shares outstanding during the period. D FMR or the fund has entered into varying arrangements with third parties who either paid or reduced a portion of the class' expenses. E Per-share data have been adjusted for a 3 for 1 share split paid June 21, 1996. |
|||||
See accompanying notes which are an integral part of the financial statements.
Annual Report
Fidelity Destiny Portfolios: Destiny II
Financial Statements - continued
Financial Highlights - Class N
|
Year ended September 30, |
2000 |
1999 F |
|
Selected Per-Share Data |
|
|
|
Net asset value, beginning of period |
$ 14.72 |
$ 15.35 |
|
Income from Investment Operations |
|
|
|
Net investment income (loss) D |
(.08) |
.00 |
|
Net realized and unrealized gain (loss) |
2.83 |
(.63) G |
|
Total from investment operations |
2.75 |
(.63) |
|
Less Distributions |
|
|
|
From net investment income |
(.10) |
- |
|
From net realized gain |
(1.43) |
- |
|
Total distributions |
(1.53) |
- |
|
Net asset value, end of period |
$ 15.94 |
$ 14.72 |
|
Total Return B, C |
19.13% |
(4.10)% |
|
Ratios and Supplemental Data |
|
|
|
Net assets, end of period (000 omitted) |
$ 19,225 |
$ 1,524 |
|
Ratio of expenses to average net assets |
1.45% |
1.35% A |
|
Ratio of expenses to average net assets after expense reductions |
1.43% E |
1.33% A, E |
|
Ratio of net investment income (loss) to average net assets |
(.51)% |
(.07)% A |
|
Portfolio turnover |
113% |
77% |
|
A Annualized B The total returns would have been lower had certain expenses not been reduced during the periods shown. C Total returns do not include the effects of the separate sales charge and other fees assessed through Fidelity Systematic Investment Plans and for periods of less than one year are not annualized. D Net investment income (loss) per share has been calculated based on average shares outstanding during the period. E FMR or the fund has entered into varying arrangements with third parties who either paid or reduced a portion of the class' expenses. F For the period April 30, 1999 (commencement of sale of Class N shares) to September 30, 1999. G The amount shown for a share outstanding does not correspond with the aggregate net gain on investments for the period due to the timing of sales and repurchases of class shares in relation to fluctuating market values of the investments of the fund. |
||
See accompanying notes which are an integral part of the financial statements.
Annual Report
For the period ended September 30, 2000
1. Significant Accounting Policies.
Destiny I and Destiny II (the funds) are funds of Fidelity Destiny Portfolios (the trust). The trust is registered under the Investment Company Act of 1940, as amended (the 1940 Act), as an open-end management investment company organized as a Massachusetts business trust. Each fund is authorized to issue an unlimited number of shares.
Each fund offers two classes of shares, Class O and Class N, each of which has equal rights as to assets and voting privileges. Each class has exclusive voting rights with respect to matters that affect that class. Investment income, realized and unrealized capital gains and losses, the common expenses of the funds, and certain fund-level expense reductions, if any, are allocated on a pro rata basis to each class based on the relative net assets of each class to the total net assets of each fund. Each class of shares differs in its respective distribution and transfer agent expenses, and expense reductions. Shares of each fund are offered to the general public through Fidelity Systematic Investment Plans: Destiny Plans I and Destiny Plans II (the Plans), a unit investment trust with four series.
The financial statements have been prepared in conformity with generally accepted accounting principles which require management to make certain estimates and assumptions at the date of the financial statements. The following summarizes the significant accounting policies of the funds:
Security Valuation. Securities for which exchange quotations are readily available are valued at the last sale price, or if no sale price, at the closing bid price. Foreign securities are valued based on quotations from the principal market in which such securities are normally traded. If trading or events occurring in other markets after the close of the principal market in which foreign securities are traded, and before the close of the business of the fund, are expected to materially affect the value of those securities, then they are valued at their fair value taking this trading or these events into account. Fair value is determined in good faith under consistently applied procedures under the general supervision of the Board of Trustees. Securities (including restricted securities) for which exchange quotations are not readily available (and in certain cases debt securities which trade on an exchange) are valued primarily using dealer-supplied valuations or at their fair value. Short-term securities with remaining maturities of sixty days or less for which quotations are not readily available are valued at amortized cost or original cost plus accrued interest, both of which approximate current value. Investments in open-end investment companies are valued at their net asset value each business day.
Foreign Currency Translation. The accounting records of the funds are maintained in U.S. dollars. Investment securities and other assets and liabilities denominated in a foreign currency are translated into U.S. dollars at the prevailing rates of exchange at period end. Purchases and sales of securities, income receipts and expense payments are translated into U.S. dollars at the prevailing exchange rate on the respective dates of the transactions.
Net realized gains and losses on foreign currency transactions represent net gains and losses from sales and maturities of foreign currency contracts, disposition of foreign currencies, the difference between the amount of net investment income accrued and the U.S. dollar amount actually received, and gains and losses between trade and settlement date on purchases and sales of securities. The effects of changes in foreign currency exchange rates on investments in securities are included with the net realized and unrealized gain or loss on investment securities.
Income Taxes. As a qualified regulated investment company under Subchapter M of the Internal Revenue Code, each fund is not subject to income taxes to the extent that it distributes substantially all of its taxable income for the fiscal year. The schedules of investments include information regarding income taxes under the caption "Income Tax Information."
Investment Income. Dividend income is recorded on the ex-dividend date. Non-cash dividends included in dividend income, if any, are recorded at the fair market value of the securities received. Interest income, which includes accretion of original issue discount, is accrued as earned. Investment income is recorded net of foreign taxes withheld where recovery of such taxes is uncertain.
Expenses. Most expenses of the trust can be directly attributed to a fund. Expenses which cannot be directly attributed are apportioned among the funds in the trust.
Deferred Trustee Compensation. Under a Deferred Compensation Plan (the Plan) non-interested Trustees must defer receipt of a portion of, and may elect to defer receipt of an additional portion of, their annual compensation. Deferred amounts are treated as though equivalent dollar amounts had been invested in shares of the fund or are invested in a cross-section of other Fidelity funds. Deferred amounts remain in the fund until distributed in accordance with the Plan.
Distributions to Shareholders. Distributions are recorded on the ex-dividend date. Income dividends and capital gain distributions are declared separately for each class.
Income and capital gain distributions are determined in accordance with income tax regulations which may differ from generally accepted accounting principles. These differences, which may result in distribution reclassifications, are primarily due to differing treatments for litigation proceeds, foreign currency transactions, partnerships, non-taxable dividends and losses deferred due to wash sales. The funds also utilized earnings and profits distributed to shareholders on redemption of shares as a part of the dividends paid deduction for income tax purposes.
Permanent book and tax basis differences relating to shareholder distributions will result in reclassifications to paid in capital. Undistributed net investment income and accumulated undistributed net realized gain (loss) on investments and foreign currency transactions may include temporary book and tax basis differences which will reverse in a subsequent period. Any taxable income or gain remaining at fiscal year end is distributed in the following year.
Security Transactions. Security transactions are accounted for as of trade date. Gains and losses on securities sold are determined on the basis of identified cost.
Annual Report
Notes to Financial Statements - continued
2. Operating Policies.
Foreign Currency Contracts. The funds may use foreign currency contracts to facilitate transactions in foreign-denominated securities. Losses may arise from changes in the value of the foreign currency or if the counterparties do not perform under the contracts' terms. The U.S. dollar value of foreign currency contracts is determined using contractual currency exchange rates established at the time of each trade.
Joint Trading Account. Pursuant to an Exemptive Order issued by the Securities and Exchange Commission (the SEC), the funds, along with other affiliated entities of Fidelity Management & Research Company (FMR), may transfer uninvested cash balances into one or more joint trading accounts. These balances are invested in one or more repurchase agreements for U.S. Treasury or Federal Agency obligations.
Repurchase Agreements. The underlying U.S. Treasury, Federal Agency, or other obligations found to be satisfactory by FMR are transferred to an account of the funds, or to the Joint Trading Account, at a custodian bank. The securities are marked-to-market daily and maintained at a value at least equal to the principal amount of the repurchase agreement (including accrued interest). FMR, the funds' investment adviser, is responsible for determining that the value of the underlying securities remains in accordance with the market value requirements stated above.
Restricted Securities. The funds are permitted to invest in securities that are subject to legal or contractual restrictions on resale. These securities generally may be resold in transactions exempt from registration or to the public if the securities are registered. Disposal of these securities may involve time-consuming negotiations and expense, and prompt sale at an acceptable price may be difficult. Information regarding restricted securities is included under the caption "Other Information" at the end of each applicable fund's schedule of investments.
3. Purchases and Sales of Investments.
Information regarding purchases and sales of securities (other than short-term securities), is included under the caption "Other Information" at the end of each applicable fund's schedule of investments.
4. Fees and Other Transactions with Affiliates.
Management Fee. As each fund's investment adviser, FMR receives a monthly basic fee that is calculated on the basis of a group fee rate plus a fixed individual fund fee rate applied to the average net assets of each fund. The group fee rate is the weighted average of a series of rates and is based on the monthly average net assets of all the mutual funds advised by FMR. The rates ranged from .2167% to .5200% for the period for the funds. The annual individual fund fee rate is .17% and .30% for the Destiny I and Destiny II funds, respectively. In the event that these rates were lower than the contractual rates in effect during the period, FMR voluntarily implemented the above rates, as they resulted in the same or a lower management fee. The basic fee is subject to a performance adjustment (up to a maximum of -.24% of each fund's average net assets up to and including $100,000,000 and -.20% of each fund's average net assets in excess of $100,000,000 over the performance period) based on each fund's investment performance as compared to the appropriate index over a specified period of time. For the period, the management fees were equivalent to annual rates of .25% and .55%, respectively of average net assets after the performance adjustment for the Destiny I and Destiny II funds, respectively. Effective July 1, 1999 each fund's performance adjustment will be phased out over an 18 month period. During the phase out period the performance adjustment can decrease, but not increase, the management fee owed by the funds.
Sub-Adviser Fee. Beginning January 1, 2001, FMR Co. (FMRC) will serve as sub-adviser for the funds. FMRC is a wholly owned subsidiary of FMR and will receive a fee from FMR of 50% of the management fee payable to FMR.
Distribution and Service Plan. In accordance with Rule 12b-1 of the 1940 Act, the Board of Trustees has adopted a Distribution and Service Plan (the Plan) for Class N for each fund. During the period, Class N paid Fidelity Distributors Corporation (FDC), an affiliate of FMR, a service fee based on an annual rate of .25% of Class N's average net assets pursuant to the Plan. For the period, Class N paid FDC the following amounts:
|
|
Paid to FDC |
|
|
Destiny I |
$ 3,366 |
|
|
Destiny II |
$ 22,690 |
|
Transfer Agent Fees. Fidelity Service Company, Inc., (FSC), an affiliate of FMR, is the transfer, dividend disbursing and shareholder servicing agent for each class of the funds. For Class O non-Destiny Plan accounts, FSC receives account fees and asset-based fees that vary according to account size and type of account. FSC does not receive a fee for Class O Destiny Plan accounts. For Class N, FSC receives a fee based on monthly Plan payment amounts or per transaction that may not exceed an annual rate of .63% of the Class N shares' average net assets. In addition, FSC pays for typesetting, printing, and mailing of all shareholder reports, except proxy statements. For the period, the following amounts were paid to FSC:
|
Destiny I |
Amount |
% of |
|
Class O |
$ 418,885 |
.01 |
|
Class N |
8,504 |
.63 |
|
|
$ 427,389 |
|
|
Destiny II |
Amount |
% of |
|
Class O |
$ 255,580 |
.00 |
|
Class N |
57,341 |
.63 |
|
|
$ 312,921 |
|
Accounting and Security Lending Fees. FSC maintains each fund's accounting records and administers the security lending program. The security lending fee is based on the number and duration of lending transactions. The accounting fee is based on the level of average net assets for the month plus out-of-pocket expenses.
Annual Report
Notes to Financial Statements - continued
4. Fees and Other Transactions with Affiliates - continued
Fidelity Cash Central Fund. Pursuant to an Exemptive Order issued by the SEC, the funds may invest in the Fidelity Cash Central Fund (the Cash Fund) managed by Fidelity Institutional Money Management, Inc., an affiliate of FMR. The Cash Fund is an open-end money market fund available only to investment companies and other accounts managed by FMR and its affiliates. The Cash Fund seeks preservation of capital, liquidity, and current income. Income distributions from the Cash Fund are declared daily and paid monthly from net interest income. Income distributions earned by the fund are recorded as either interest income or security lending income in the accompanying financial statements.
Brokerage Commissions. The funds placed a portion of their portfolio transactions with brokerage firms which are affiliates of FMR. The commissions paid to these affiliated firms for Destiny I and Destiny II were $333,734 and $253,138, respectively for the period.
5. Security Lending.
Certain funds lend portfolio securities from time to time in order to earn additional income. Each applicable fund receives collateral (in the form of U.S. Treasury obligations, letters of credit and/or cash) against the loaned securities and maintains collateral in an amount not less than 100% of the market value of the loaned securities during the period of the loan. The market value of the loaned securities is determined at the close of business of the funds and any additional required collateral is delivered to the funds on the next business day. If the borrower defaults on its obligation to return the securities loaned because of insolvency or other reasons, a fund could experience delays and costs in recovering the securities loaned or in gaining access to the collateral. Information regarding the value of securities loaned and the value of collateral at period end is included under the caption "Other Information" at the end of each applicable fund's schedule of investments.
6. Bank Borrowings.
The funds are permitted to have bank borrowings for temporary or emergency purposes to fund shareholder redemptions. The funds have established borrowing arrangements with certain banks. The interest rate on the borrowings is the bank's base rate, as revised from time to time. For Destiny I, the average daily loan balance during the period for which the loan was outstanding amounted to $6,895,000. The weighted average interest rate was 5.90%. For Destiny II, there were no loans during the period.
7. Expense Reductions.
FMR has directed certain portfolio trades to brokers who paid a portion of the fund's expenses. For the period, each fund's expenses were reduced by $1,585,969 and $1,247,764 under this arrangement for Destiny I and Destiny II, respectively.
In addition, each fund has entered into arrangements with its custodian and each class' transfer agent, whereby credits realized as a result of uninvested cash balances were used to reduce a portion of expenses. During the period, each fund's custodian fees were reduced by $8,272 and $4,681 for Destiny I and Destiny II, respectively under the custodian arrangement. Each applicable class' expenses were reduced as follows under the transfer agent arrangements:
Destiny I
|
|
Transfer |
|
Class O |
$ 23,904 |
Destiny II
|
|
Transfer |
|
Class O |
$ 14,220 |
Annual Report
Notes to Financial Statements - continued
8. Distributions to Shareholders.
Distributions to shareholders of each class were as follows:
Destiny I
|
|
Years ended September 30, |
|
|
|
2000 |
1999 A |
|
From net investment income |
|
|
|
Class O |
$ 114,852,495 |
$ 105,484,207 |
|
Class N |
6,070 |
- |
|
Total |
$ 114,858,565 |
$ 105,484,207 |
|
From net realized gain |
|
|
|
Class O |
$ 897,856,524 |
$ 544,915,685 |
|
Class N |
55,890 |
- |
|
Total |
$ 897,912,414 |
$ 544,915,685 |
|
|
$ 1,012,770,979 |
$ 650,399,892 |
Destiny II
|
|
Years ended September 30, |
|
|
|
2000 |
1999 A |
|
From net investment income |
|
|
|
Class O |
$ 39,189,835 |
$ 34,149,944 |
|
Class N |
27,242 |
- |
|
Total |
$ 39,217,077 |
$ 34,149,944 |
|
From net realized gain |
|
|
|
Class O |
$ 509,166,630 |
$ 864,396,346 |
|
Class N |
310,087 |
- |
|
Total |
$ 509,476,717 |
$ 864,396,346 |
|
Total Distributions |
$ 548,693,794 |
$ 898,546,290 |
A Distributions for Destiny I: Class N and Destiny II: Class N are for the period April 30, 1999 (commencement of sale of shares) to September 30, 1999.
Annual Report
Notes to Financial Statements - continued
9. Share Transactions.
Transactions for each class of shares were as follows:
Destiny I
|
|
Shares |
Dollars |
||
|
|
Year ended September 30, |
Year ended September 30, |
Year ended September 30, |
Year ended September 30, |
|
|
2000 |
1999 A |
2000 |
1999 A |
|
|
|
|
|
|
|
Class O |
10,121,533 |
9,223,182 |
$ 247,091,425 |
$ 248,764,091 |
|
Reinvestment of distributions |
36,918,705 |
22,671,053 |
880,880,397 |
575,618,075 |
|
Shares redeemed |
(32,842,158) |
(21,478,357) |
(776,372,755) |
(584,597,461) |
|
Net increase (decrease) |
14,198,080 |
10,415,878 |
$ 351,599,067 |
$ 239,784,705 |
|
Class N |
135,884 |
9,786 |
$ 3,103,245 |
$ 272,403 |
|
Reinvestment of distributions |
2,602 |
- |
59,465 |
- |
|
Shares redeemed |
(7,425) |
(114) |
(167,281) |
(3,198) |
|
Net increase (decrease) |
131,061 |
9,672 |
$ 2,995,429 |
$ 269,205 |
Destiny II
|
|
Shares |
Dollars |
||
|
|
Year ended September 30, |
Year ended September 30, |
Year ended September 30, |
Year ended September 30, |
|
|
2000 |
1999 A |
2000 |
1999 A |
|
|
|
|
|
|
|
Class O |
45,411,519 |
42,363,720 |
$ 716,733,769 |
$ 629,670,010 |
|
Reinvestment of distributions |
34,359,293 |
66,407,354 |
527,413,256 |
875,248,918 |
|
Shares redeemed |
(46,803,164) |
(36,859,021) |
(741,499,830) |
(548,780,811) |
|
Net increase (decrease) |
32,967,648 |
71,912,053 |
$ 502,647,195 |
$ 956,138,117 |
|
Class N |
1,137,584 |
105,039 |
$ 18,003,674 |
$ 1,603,569 |
|
Reinvestment of distributions |
22,042 |
- |
336,797 |
- |
|
Shares redeemed |
(56,991) |
(1,461) |
(896,234) |
(22,174) |
|
Net increase (decrease) |
1,102,635 |
103,578 |
$ 17,444,237 |
$ 1,581,395 |
A Share transactions for Destiny I: Class N and Destiny II: Class N are for the period April 30, 1999 (commencement of sale of shares) to September 30, 1999.
Annual Report
To the Trustees and Shareholders of Fidelity Destiny Portfolios: Destiny I and Destiny II:
We have audited the accompanying statements of assets and liabilities of Destiny I and Destiny II, (funds of Fidelity Destiny Portfolios), including the portfolios of investments, as of September 30, 2000, and the related statements of operations for the year then ended, the statements of changes in net assets for each of the two years in the period then ended, and the financial highlights for each of the five years in the period then ended. These financial statements and financial highlights are the responsibility of the Funds' management. Our responsibility is to express an opinion on these financial statements and financial highlights based on our audits.
We conducted our audits in accordance with auditing standards generally accepted in the United States of America. Those standards require that we plan and perform the audit to obtain reasonable assurance about whether the financial statements and financial highlights are free of material misstatement. An audit includes examining, on a test basis, evidence supporting the amounts and disclosures in the financial statements. Our procedures included confirmation of securities owned as of September 30, 2000, by correspondence with the custodian and brokers; where replies were not received from brokers, we performed other auditing procedures. An audit also includes assessing the accounting principles used and significant estimates made by management, as well as evaluating the overall financial statement presentation. We believe that our audits provide a reasonable basis for our opinion.
In our opinion, the financial statements and financial highlights referred to above present fairly, in all material respects, the financial position of Destiny I and Destiny II as of September 30, 2000, the results of their operations for the year then ended, the changes in their net assets for each of the two years in the period then ended, and their financial highlights for each of the five years in the period then ended, in conformity with accounting principles generally accepted in the United States of America.
/s/DELOITTE & TOUCHE LLP
DELOITTE & TOUCHE LLP
Boston, Massachusetts
November 17, 2000
Annual Report
The funds hereby designates 100% of the long-term capital gain dividends distributed during the fiscal year as 20%-rate capital gain dividends.
A total of 22.60% and 9.16% of the dividends distributed during the fiscal year was derived from interest on U.S. Government securities which is generally exempt from state income tax for Destiny I and Destiny II, respectively.
A total of 48%, 100%, 56% and 100% of the dividends distributed by Destiny I: Class O, Destiny II: Class O, Destiny I: Class N and Destiny II: Class N, respectively during the fiscal year qualifies for the dividends-received deduction for corporate shareholders.
The fund will notify shareholders in January 2001 of amounts for use in preparing 2000 income tax returns.
Annual Report
Annual Report
Annual Report
Annual Report
Fidelity
Destiny Portfolios:
Destiny I - Class N
Destiny II - Class N
82 Devonshire Street,
Boston, Massachusetts 02109
INVESTMENT ADVISER
Fidelity Management & Research Company
Boston, MA
INVESTMENT SUB-ADVISERS
Fidelity Management & Research (U.K.) Inc.
Fidelity Management & Research (Far East) Inc.
Fidelity Investments Japan Limited
OFFICERS
Edward C. Johnson 3d, President
Robert C. Pozen, Senior Vice President
Abigail P. Johnson, Vice President
Karen Firestone, Vice President (Destiny I)
Adam Hetnarski, Vice President (Destiny II)
Eric D. Roiter, Secretary
Robert A. Dwight, Treasurer
Maria F. Dwyer, Deputy Treasurer
John H. Costello, Assistant Treasurer
Thomas J. Simpson, Assistant Treasurer
BOARD OF TRUSTEES
Ralph F. Cox *
Phyllis Burke Davis *
Robert M. Gates *
Edward C. Johnson 3d
Donald J. Kirk *
Ned C. Lautenbach *
Peter S. Lynch
Marvin L. Mann *
William O. McCoy *
Gerald C. McDonough *
Robert C. Pozen
Thomas R. Williams *
ADVISORY BOARD
J. Michael Cook
Marie L. Knowles
GENERAL DISTRIBUTOR
Fidelity Distributors Corporation
Boston, MA
TRANSFER AND SHAREHOLDER
SERVICING AGENT
Fidelity Service Company, Inc.
Boston, MA
CUSTODIAN
State Street Bank and Trust Company
Boston, MA
* Independent trustees
(Recycle graphic)Printed on recycled
paper
6i-117181
Fidelity®
DestinySM
Portfolios:
Destiny I - Class O
Destiny II - Class O
Annual Report
Annual Report
|
Performance |
How the funds have done over time. |
|
|
Fund Talk |
The managers' review of the funds' performance, strategy and outlook. |
|
|
Investment Changes |
A summary of major shifts in the funds' investments over the |
|
|
Destiny I |
|
|
|
Investments |
A complete list of the fund's investments with their market values. |
|
|
Financial Statements |
Statements of assets and liabilities, operations, and changes in net assets, as well as financial highlights. |
|
|
Destiny II |
|
|
|
Investments |
A complete list of the fund's investments with their market values. |
|
|
Financial Statements |
Statements of assets and liabilities, operations, and changes in net assets, as well as financial highlights. |
|
|
Notes |
Notes to the financial statements. |
|
|
Independent Auditors' Report |
The auditors' opinion. |
|
|
Distributions |
|
Standard & Poor's, S&P and S&P 500 are registered service marks of The McGraw-Hill Companies, Inc. and have been licensed for use by Fidelity
Distributors Corporation.
Other third party marks appearing herein are the property of their respective owners.
All other marks appearing herein are registered or unregistered trademarks or service marks of FMR Corp. or an affiliated company.
(Recycle graphic) This report is printed on recycled paper using soy-based inks.
The views expressed in this report reflect those of each fund's portfolio manager only through the end of the period of the report as stated on the cover and do not necessarily represent the views of Fidelity or any other person in the Fidelity organization. Any such views are subject to change at any time based upon market or other conditions and Fidelity disclaims any responsibility to update such views. These views may not be relied on as investment advice and, because investment decisions for a Fidelity fund are based on numerous factors, may not be relied on as an indication of trading intent on behalf of any Fidelity fund.
This report and the financial statements contained herein are submitted for the general information of the shareholders of the funds. This report is not authorized for distribution to prospective investors in the funds unless preceded or accompanied by an effective prospectus.
Mutual fund shares are not deposits or obligations of, or guaranteed by, any bank or depository institution. Shares are not insured by the FDIC, Federal Reserve Board or any other agency, and are subject to investment risks, including possible loss of principal amount invested.
Neither the funds nor Fidelity Distributors Corporation is a bank.
Annual Report
Fidelity Destiny Portfolios: Destiny I: Class O
Performance: The Bottom Line
$10,000 Over 10 Years
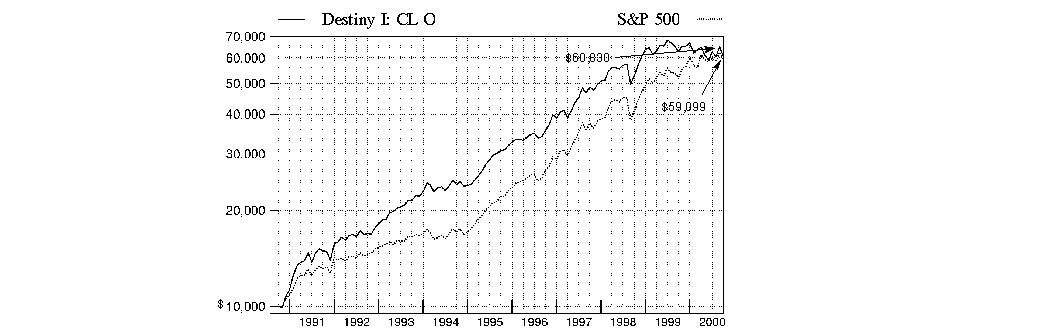
$10,000 Over 10 Years: Let's say hypothetically that $10,000 was invested in Destiny I: Class O on September 30, 1990. As the chart shows, by September 30, 2000, the value of the investment would have grown to $60,830 - a 508.30% increase on the initial investment. For comparison, look at how the S&P 500® did over the same period. With dividends and capital gains, if any, reinvested, the same $10,000 investment would have grown to $59,099 - a 490.99% increase.
Cumulative Total Returns
|
Periods ended |
|
Past 1 |
Past 5 |
Past 10 |
|
Destiny I: CL O |
|
-3.23% |
97.97% |
508.30% |
|
S&P 500 |
|
13.28% |
166.82% |
490.99% |
|
Lipper Growth |
|
26.19% |
153.59% |
475.51% |
Average Annual Total Returns
|
Periods ended |
Past 1 |
Past 5 |
Past 10 |
|
Destiny I: CL O |
-3.23% |
14.64% |
19.79% |
|
$50/month 15-Year Plan |
-53.74% |
10.50% |
18.22% |
|
S&P 500 |
13.28% |
21.69% |
19.44% |
|
Lipper Growth |
26.19% |
19.89% |
18.55% |
The charts above show Destiny I: Class O total returns, which include changes in share price and reinvestment of dividends and capital gains. The fund's cumulative total returns and average annual total returns do not include the effects of the separate sales charges and custodian fees assessed through Destiny Plans I: O (the Plans); the figures provided for a "$50/month 15-year plan" illustrate the fund's performance adjusted to reflect fees and sales charges assessed by the Plans. The illustrations assume an initial investment at the beginning of each period shown. Because the illustrations assume yearly lump sum investments, they do not reflect what investors would have earned had they made regular monthly investments over the period. As shares of the funds may be acquired only through the Plans, investors should consult the Plans' prospectus for more complete information on the impact of the separate charges and fees applicable to each Plan. The rate (%) of deductions decreases as Plan sizes increase. Figures for the S&P 500, a market capitalization-weighted index of common stocks, include reinvestment of dividends. To measure how the funds' performance stacked up against its peers, you can compare it to the growth funds average, which reflects the performance of mutual funds with similar objectives tracked by Lipper Inc. The past one year average represents a peer group of 1,326 mutual funds. These benchmarks include reinvested dividends and capital gains, if any, and exclude the effect of sales charges. Lipper has created new comparison categories that group funds according to portfolio characteristics and capitalization, as well as by capitalization only. These averages are listed below. (dagger)
All performance numbers are historical; the fund's share price and return will vary and you may have a gain or loss when you sell your shares. (Note: Lipper calculates average annual total returns by annualizing each fund's total return, then taking an arithmetic average. This may produce a different figure than that obtained by averaging the cumulative total returns and annualizing the result.)
(dagger) The Lipper large cap core funds average reflects the performance (excluding sales charges) of mutual funds with similar portfolio characteristics and capitalization. The Lipper large cap supergroup average reflects the performance (excluding sales charges) of mutual funds with similar capitalization. As of September 30, 2000, the one year, five year, and 10 year cumulative total returns for the large cap core funds average were, 17.80%, 148.49%, and 428.07%, respectively; and the one year, five year, and 10 year average annual total returns were 17.80%, 19.84%, and 17.89%, respectively. The one year, five year and 10 year cumulative total returns for the large cap supergroup average were, 20.47%, 153.64%, and 454.26%, respectively; and the one year, five year and 10 year average annual total returns were 20.47%, 20.11%, and 18.37%, respectively.
Annual Report
Fidelity Destiny Portfolios: Destiny II: Class O
Performance: The Bottom Line
$10,000 Over 10 Years

$10,000 Over 10 Years: Let's say hypothetically that $10,000 was invested in Destiny II: Class O on September 30, 1990. As the chart shows, by September 30, 2000, the value of the investment would have grown to $83,177 - a 731.77% increase on the initial investment. For comparison, look at how the S&P 500 did over the same period. With dividends and capital gains, if any, reinvested, the same $10,000 investment would have grown to $59,099 - a 490.99% increase.
Cumulative Total Returns
|
Periods ended |
|
Past 1 |
Past 5 |
Past 10 |
|
Destiny II: CL O |
|
20.25% |
159.36% |
731.77% |
|
S&P 500 |
|
13.28% |
166.82% |
490.99% |
|
Lipper Growth |
|
26.19% |
153.59% |
475.51% |
Average Annual Total Returns
|
Periods ended |
Past 1 |
Past 5 |
Past 10 |
|
Destiny II: CL O |
20.25% |
21.00% |
23.59% |
|
$50/month 15-Year Plan |
-42.52% |
16.63% |
21.98% |
|
S&P 500 |
13.28% |
21.69% |
19.44% |
|
Lipper Growth |
26.19% |
19.89% |
18.55% |
The charts above show Destiny II: Class O total returns, which include changes in share price and reinvestment of dividends and capital gains. The fund's cumulative total returns and average annual total returns do not include the effects of the separate sales charges and custodian fees assessed through Destiny Plans II: O (the Plans); the figures provided for a "$50/month 15-year plan" illustrate the fund's performance adjusted to reflect fees and sales charges assessed by the Plans. The illustrations assume an initial investment at the beginning of each period shown. Because the illustrations assume yearly lump sum investments, they do not reflect what investors would have earned had they made regular monthly investments over the period. As shares of the funds may be acquired by the general public only through the Plans, investors should consult the Plans' prospectus for more complete information on the impact of the separate charges and fees applicable to each Plan. The rate (%) of deductions decreases as Plan sizes increase. Figures for the S&P 500, a market capitalization-weighted index of common stocks, include reinvestment of dividends. To measure how the funds' performance stacked up against its peers, you can compare it to the growth funds average, which reflects the performance of mutual funds with similar objectives tracked by Lipper Inc. The past one year average represents a peer group of 1,326 mutual funds. These benchmarks include reinvested dividends and capital gains, if any, and exclude the effect of sales charges. Lipper has created new comparison categories that group funds according to portfolio characteristics and capitalization, as well as by capitalization only. These averages are listed below. (dagger)
All performance numbers are historical; the fund's share price and return will vary and you may have a gain or loss when you sell your shares. (Note: Lipper calculates average annual total returns by annualizing each fund's total return, then taking an arithmetic average. This may produce a different figure than that obtained by averaging the cumulative total returns and annualizing the result.)
(dagger) The Lipper large cap core funds average reflects the performance (excluding sales charges) of mutual funds with similar portfolio characteristics and capitalization. The Lipper large cap supergroup average reflects the performance (excluding sales charges) of mutual funds with similar capitalization. As of September 30, 2000, the one year, five year, and 10 year cumulative total returns for the large cap core funds average were, 17.80%, 148.49%, and 428.07%, respectively; and the one year, five year, and 10 year average annual total returns were 17.80%, 19.84%, and 17.89%, respectively. The one year, five year and 10 year cumulative total returns for the large cap supergroup average were, 20.47%, 153.64%, and 454.26%, respectively; and the one year, five year and 10 year average annual total returns were 20.47%, 20.11%, and 18.37%, respectively.
Annual Report
Fidelity Destiny Portfolios: Destiny I
Fund Talk: The Manager's Overview
Market Recap
For the most part, the rise and fall of the U.S. equity markets during the 12 months ending September 30, 2000, was predicated on the fortunes of the technology sector. At the period's outset, technology began its meteoric rise as investors rallied behind the sector's growth potential in light of the Internet's accelerating power to reshape how businesses and consumers work and communicate. That euphoria reached its apex in mid-March, when the NASDAQ Composite Index - the bellwether benchmark for the technology sector - broke through the 5,000 point barrier, only four months after first crossing the 3,000 point threshold. But just days later, the tech sector began a 30% descent over a 10-week period. With the Federal Reserve Board continuing to hike interest rates, investors finally realized that technology stock valuations could not be sustained in the event of an economic slowdown. Given its one-third weighting in technology, the Standard & Poor's 500SM Index also suffered, albeit to a lesser extent, as did the blue chips' proxy Dow Jones Industrial Average. Retreating from technology in droves, investors shifted their assets into segments of the market that traditionally perform better in a more moderate-growth economy, such as health care and energy. During the summer months, technology returned to favor to some extent, but investors generally targeted large, steady earnings growers, leaving smaller and more speculative tech stocks to flounder. But come September, more bad news was in store for technology, as the highest oil prices in a decade and a weak European currency combined to dampen the global economy. For the overall 12-month period ending September 30, 2000, the Dow returned 4.62%, the S&P 500 gained 13.28%, and the NASDAQ gained 34.01%. Those numbers can be somewhat misleading, however; all three indexes had negative returns through the first nine months of 2000.
(Portfolio Manager photograph)
An interview with
Karen Firestone, Portfolio Manager of Destiny I
Q. How did the fund perform, Karen?
A. For the 12-month period that ended September 30, 2000, the fund's Class O shares returned -3.23%, trailing the Standard & Poor's 500 Index, which returned 13.28%. Fund performance also lagged the growth funds average tracked by Lipper Inc., which returned 26.19% during this same time frame.
Q. Why did the fund lag its benchmark and peer group during the past 12 months?
A. It had a lot to do with timing. Not owning enough technology stocks during their impressive run-up late in 1999 and early 2000 played a big part in the fund's underperformance. On top of that, shifting the fund's emphasis to growth stocks, particularly technology - at the expense of financial and cyclical, or economically sensitive, stocks - after taking over the fund in February left us overexposed to the sharp correction in the NASDAQ Composite Index during the spring. Investors collectively turned their backs on growth - despite a pair of short-lived rallies in June and August - and assumed a more defensive posture. Even though we owned a lot of the higher-quality larger-cap tech names, such as Cisco and Intel, during the second-half of the period, momentum for these stocks - along with much of their price appreciation - vanished as the market grew increasingly concerned about how a slowing economy would affect the earnings of tech firms. Since we didn't own as many of the smaller-cap tech stocks - a group that produced many of the period's finest performers - as our Lipper peers did on average, we lost ground on a competitive basis.
Q. What other factors influenced fund returns?
A. The fund's positioning in financial stocks dragged on performance. Growing euphoria surrounding tech stocks, coupled with steadily rising interest rates and increased competition, spelled trouble for large bank holdings such as FleetBoston early on in the period. Moreover, we paid the price for not increasing the fund's weighting in banks when the market fled for safety in mid-March. Having significant stakes in home loan financers Fannie Mae and Freddie Mac also hurt, as these issues wilted in the face of proposed legislation threatening to cut their lines of credit with the federal government. Not holding enough of the higher-growth financials, such as Citigroup and Morgan Stanley Dean Witter, which shined during the period, further widened the performance gap. Poor timing in terms of raising the fund's exposure to media stocks also worked against us. Cable stocks, such as Time Warner, struggled with rising rates and the emergence of satellite broadcasters that threatened cable's dominance over local service markets. Most media companies also suffered from concerns about a slowdown in advertising spending by dot-com companies. On a brighter note, the fund's underexposure to traditional incumbent telecommunications companies - namely AT&T - helped. Many of these issues fell in response to pricing pressures applied by new entrants in the consumer long-distance business.
Annual Report
Fidelity Destiny Portfolios: Destiny I
Fund Talk: The Manager's Overview - continued
Q. Could you mention some stocks that fared well and some others that didn't?
A. Sure. Hospital stocks, along with most areas of the health sector, offered a safe haven for jittery tech investors during the period. With Medicare and third-party reimbursements improving and balance sheets stabilizing, investors shrugged off fears of increased government regulation and bid up the prices of stocks such as HCA Healthcare. We also owned some biotechnology firms that performed well, most notably Human Genome, reflecting renewed enthusiasm for the industry following historic advances in gene research. Favorable energy prices resulting from supply shortages lifted stocks such as Calpine and Schlumberger. On the tech front, our emphasis on Internet infrastructure produced some big winners, including Juniper, EMC and Corning. However, we were punished for holding a number of disappointments, namely Microsoft, Philip Morris, Citrix, Texas Instruments and Motorola. The fund no longer held Citrix at the close of the period.
Q. What's your outlook?
A. The market remains volatile and extremely unforgiving, as seen in the recent declines of stocks that failed to beat the Street's earnings expectations. It's become as important as ever to own the stocks that are expected to make their numbers over not just the following quarter, but two to three quarters down the road. With that said, I'll continue to put a premium on earnings and maintain a focus on uncovering exciting new growth opportunities in the marketplace. By sticking with a balanced approach, which allows us to be aggressive and defensive at the same time, we should be able to smooth out some of the turbulence expected over the coming months.
The views expressed in this report reflect those of the portfolio manager only through the end of the period of the report as stated on the cover. The manager's views are subject to change at any time based on market or other conditions. For more information, see page <Click Here>.
Fund Facts
Goal: seeks capital growth
Start date: July 10, 1970
Size: as of September 30, 2000, more than $6.1 billion
Manager: Karen Firestone, since February 2000; manager, Fidelity Advisor Large Cap Stock Fund, since 1998; Fidelity Large Cap Stock Fund, since 1998; several Fidelity Select Portfolios, 1986-1997; joined Fidelity in 1983
3Karen Firestone reviews
her investment philosophy:
"I'm very revenue-growth oriented. I'm certainly more product and sales growth driven than I am guided by cost-control, turnaround and restructuring stories. The fund's former manager, George Vanderheiden, to his credit, had a keen eye for restructuring situations that would emerge over the long term, calling it right countless times during his career. In contrast, I'd say my success has been tied more to short-term results over the next product cycle, or the next year for that matter. I'm a big believer in certain sectors of the market, such as health and media, where I've seen growth work throughout the years. So, my bias has been and will continue to be toward growth, but I overlay some valuation parameters on it. I'm just not willing to pay any price for growth; there are constraints. Comparatively, I'd say that George's tolerance level was even lower than mine in that regard, which is perfectly reasonable. But, even though we share a similar aversion to inordinate risk, I'm willing to pay a little bit more for a stock if I feel that the growth is coming with it.
"During the period's volatility, I stayed the course with many of the fund's technology and media holdings that suffered significant losses. I simply couldn't justify selling stocks that I believed in and whose long-term prospects were solid, and then replace them with unknown commodities. Many of the stocks that declined were purchased at a time when there was a lot of euphoria in the market and prices were unusually high. So I have little choice but to be patient and wait for them to come back. Of course, in hindsight, I wish I had delayed making any significant changes to the portfolio until around May, which would have helped us avoid this problem to begin with. Unfortunately, as many investors know too well, it's not that easy to predict when the market will turn."
Annual Report
Fidelity Destiny Portfolios: Destiny II
Fund Talk: The Manager's Overview
Market Recap
For the most part, the rise and fall of the U.S. equity markets during the 12 months ending September 30, 2000, was predicated on the fortunes of the technology sector. At the period's outset, technology began its meteoric rise as investors rallied behind the sector's growth potential in light of the Internet's accelerating power to reshape how businesses and consumers work and communicate. That euphoria reached its apex in mid-March, when the NASDAQ Composite Index - the bellwether benchmark for the technology sector - broke through the 5,000 point barrier, only four months after first crossing the 3,000 point threshold. But just days later, the tech sector began a 30% descent over a 10-week period. With the Federal Reserve Board continuing to hike interest rates, investors finally realized that technology stock valuations could not be sustained in the event of an economic slowdown. Given its one-third weighting in technology, the Standard & Poor's 500SM Index also suffered, albeit to a lesser extent, as did the blue chips' proxy Dow Jones Industrial Average. Retreating from technology in droves, investors shifted their assets into segments of the market that traditionally perform better in a more moderate-growth economy, such as health care and energy. During the summer months, technology returned to favor to some extent, but investors generally targeted large, steady earnings growers, leaving smaller and more speculative tech stocks to flounder. But come September, more bad news was in store for technology, as the highest oil prices in a decade and a weak European currency combined to dampen the global economy. For the overall 12-month period ending September 30, 2000, the Dow returned 4.62%, the S&P 500 gained 13.28%, and the NASDAQ gained 34.01%. Those numbers can be somewhat misleading, however; all three indexes had negative returns through the first nine months of 2000.
(Portfolio Manager photograph)
Note to shareholders: Adam Hetnarski became Portfolio Manager of
Destiny II on June 1, 2000.
Q. How did the fund perform, Adam?
A. For the 12-month period that ended September 30, 2000, the fund's Class O shares returned 20.25%. The fund outperformed the 13.28% return of the Standard & Poor's 500 Index, but lagged the Lipper growth funds average, which returned 26.19%.
Q. What helped the fund outperform the index during the past year?
A. The fund's overweighted position in technology - a sector that experienced tremendous gains during the first half of the period - was the biggest factor in its strong performance relative to the S&P index. Out-of-benchmark holdings in stocks such as Juniper Networks, i2 Technologies, Nokia and Ariba, the last three of which were added to the fund during the second quarter of 2000, helped significantly. Stock selection in the health care sector, particularly out-of-benchmark biotechnology holdings Human Genome and Genentech, also boosted returns. Additionally, the fund's underweighted position in some large-cap stocks that did poorly - namely Microsoft, Lucent, AT&T and Samsung - enhanced performance. The fund suffered from not owning enough of certain stocks that performed well, such as Oracle and Nortel, while owning too much of others that declined, such as Lexmark and Dell.
Q. What adjustments did you make to the fund since taking over in June?
A. I reduced technology, utilities and international holdings. During this repositioning, I also reduced the number of stocks to roughly 150 names from more than 200. In technology, I reduced the fund's stake in the sector because I didn't want to make that big of a bet in an area where fundamentals were decelerating. I also reduced or eliminated some technology stocks and replaced them with others I felt more strongly about - such as Ariba, a leading business-to-business e-commerce network services provider. In the utilities sector, I reduced exposure to wireless cellular carriers, given the higher-than-expected costs to obtain new spectrum licensing and increased levels of subscriber churn - or customers switching carriers. I also positioned the fund to take advantage of the increased use of wireless technology via stock selection in companies such as - Aether Systems - that are developing software platforms to harness the next generation of wireless transmission. I reduced our international exposure due to slowing economies and the declining value of the euro. Names such as Samsung Electronics, Vodafone AirTouch and Hutchison Whampoa were either significantly reduced or eliminated from the fund. Elsewhere, I boosted the fund's holdings of financial stocks. I felt the slowing of the economy and a diminished threat of interest-rate hikes presented a more positive environment for these stocks. Finally, my repositioning also caused the fund to own more small- and mid-cap stocks with higher growth prospects, such as Juniper.
Annual Report
Fidelity Destiny Portfolios: Destiny II
Fund Talk: The Manager's Overview - continued
Q. What specific stocks worked well for the fund?
A. General Electric was a top performer. Investors seeking less risk during volatile market conditions embraced General Electric's steady growth. Most of the fund's top performers came from the technology sector. Data storage provider EMC, Sun Microsystems and Ariba all performed well due to their strategic positioning in the development of the Internet's architecture.
Q. What stocks disappointed?
A. Holdings in the personal computer (PC) area hurt the fund, as a result of slower-than-expected demand. Printer manufacturer Lexmark experienced problems executing its business model and suffered a slowdown in corporate orders for laser printers. Worldwide PC leader Dell pre-announced a third-quarter profit warning in September, which hurt its stock.
Q. What's your outlook, Adam?
A. Despite the recent pullback in technology stocks, I'm optimistic that this sector is going to perform well, both in the short and long term - hence the fund's large weighting in that area. At the end of the period, there was some overcapacity in the telecommunications space and in the semiconductor industry, but I think the demand for new and better technology is increasing, not decreasing. When I walk around the city, for instance, I see more and more people with the latest wireless handsets and the latest personal digital assistants (PDAs). Turning to the economy, I believe that interest rates have peaked and that the economic slowdown will bottom out, potentially delivering a strong period for the market during the next six months.
The views expressed in this report reflect those of the portfolio manager only through the end of the period of the report as stated on the cover. The manager's views are subject to change at any time based on market or other conditions. For more information, see page <Click Here>.
Fund Facts
Goal: seeks capital growth
Start date: December 30, 1985
Size: as of September 30, 2000, more than $6.2 billion
Manager: Adam Hetnarski, since June 2000; manager, Contrafund II, since February 2000; Fidelity Export and Multinational Fund, 1998-2000; Fidelity Select Technology Portfolio, 1996-1998; analyst, networking and electronics industries, 1994-1996; joined Fidelity in 1991
3Adam Hetnarski on the personal computer market:
"Despite recent warnings of slower growth, I believe that PC unit growth is going to accelerate over the next two years. Entering 2000, the market expected annual growth in the range of 15%-18%. At the end of the third quarter, unit growth appears to be between 13%-15%. I believe that much of the perceived slowdown is actually an oversupply problem and not as dire of a demand issue as it first appeared.
"Going forward, I think PC unit growth will accelerate due to increasing demand. In the first half of 2001, I expect to see a significant replacement cycle when Microsoft's new operating system - Windows 2000 - gains momentum. The new Windows 2000 product requires a faster processor than previous Microsoft operating systems, which could force a percentage of users to upgrade their hardware - or PCs - if they want access to the new operating system and new applications.
"For most of the past year, systems departments within corporations have been evaluating Windows 2000, making sure the operating system functions smoothly within each organization. As more systems managers become satisfied with its functionality and begin deploying the operating system throughout their companies, I expect them to purchase additional hardware to run it. That said, I don't think the majority of corporations reached an adequate level of comfort with Windows 2000 through the third quarter of this year, but those perceptions should begin to change in the next six months."
Annual Report
Top Ten Equity Holdings - Destiny I
|
as of September 30, 2000 |
as of March 31, 2000 |
|
General Electric Co. |
Cisco Systems, Inc. |
|
Cisco Systems, Inc. |
Microsoft Corp. |
|
Intel Corp. |
Intel Corp. |
|
Pfizer, Inc. |
General Electric Co. |
|
Microsoft Corp. |
Fannie Mae |
|
Fannie Mae |
Lucent Technologies, Inc. |
|
EMC Corp. |
Texas Instruments, Inc. |
|
Merck & Co., Inc. |
Home Depot, Inc. |
|
Wal-Mart Stores, Inc. |
Wal-Mart Stores, Inc. |
|
Sun Microsystems, Inc. |
Bristol-Myers Squibb Co. |
Top Ten Equity Holdings - Destiny II
|
as of September 30, 2000 |
as of March 31, 2000 |
|
General Electric Co. |
General Electric Co. |
|
Cisco Systems, Inc. |
Cisco Systems, Inc. |
|
Fannie Mae |
Microsoft Corp. |
|
Microsoft Corp. |
Texas Instruments, Inc. |
|
EMC Corp. |
Chase Manhattan Corp. |
|
Exxon Mobil Corp. |
Nokia AB sponsored ADR |
|
Bristol-Myers Squibb Co. |
Home Depot, Inc. |
|
Freddie Mac |
Sun Microsystems, Inc. |
|
Viacom, Inc. Class B (non-vtg.) |
American Express Co. |
|
Dell Computer Corp. |
Warner-Lambert Co. |
Top Five Market Sectors - Destiny I
|
as of September 30, 2000 |
% of fund's net assets |
as of March 31, 2000 |
% of fund's net assets |
|
Technology |
34.0% |
Technology |
40.8% |
|
Health |
16.2% |
Health |
11.3% |
|
Finance |
10.8% |
Media & Leisure |
10.1% |
|
Media & Leisure |
9.2% |
Finance |
10.0% |
|
Industrial Machinery & Equipment |
7.2% |
Industrial Machinery & Equipment |
6.7% |
Top Five Market Sectors - Destiny II
|
as of September 30, 2000 |
% of fund's net assets |
as of March 31, 2000 |
% of fund's net assets |
|
Technology |
34.9% |
Technology |
37.1% |
|
Finance |
13.8% |
Utilities |
12.2% |
|
Health |
12.1% |
Finance |
11.0% |
|
Industrial Machinery & Equipment |
7.6% |
Media & Leisure |
8.6% |
|
Energy |
6.5% |
Health |
8.0% |
Annual Report
Fidelity Destiny Portfolios: Destiny I
Showing Percentage of Net Assets
|
Common Stocks - 97.7% |
|||
|
Shares |
Value (Note 1) |
||
|
AEROSPACE & DEFENSE - 0.6% |
|||
|
Rockwell International Corp. |
504,800 |
$ 15,270,200 |
|
|
United Technologies Corp. |
320,400 |
22,187,700 |
|
|
TOTAL AEROSPACE & DEFENSE |
37,457,900 |
||
|
BASIC INDUSTRIES - 0.3% |
|||
|
Chemicals & Plastics - 0.2% |
|||
|
Union Carbide Corp. |
288,800 |
10,902,200 |
|
|
Packaging & Containers - 0.1% |
|||
|
Tupperware Corp. |
481,450 |
8,666,100 |
|
|
TOTAL BASIC INDUSTRIES |
19,568,300 |
||
|
DURABLES - 1.0% |
|||
|
Consumer Durables - 0.3% |
|||
|
Minnesota Mining & Manufacturing Co. |
178,200 |
16,238,475 |
|
|
Consumer Electronics - 0.7% |
|||
|
Sony Corp. sponsored ADR |
250,900 |
25,325,219 |
|
|
The Swatch Group AG (Reg.) |
69,700 |
20,590,246 |
|
|
|
45,915,465 |
||
|
TOTAL DURABLES |
62,153,940 |
||
|
ENERGY - 4.7% |
|||
|
Energy Services - 2.8% |
|||
|
Global Marine, Inc. (a) |
516,000 |
15,931,500 |
|
|
Halliburton Co. |
833,100 |
40,769,831 |
|
|
Noble Drilling Corp. (a) |
791,700 |
39,782,925 |
|
|
Schlumberger Ltd. (NY Shares) |
878,700 |
72,327,994 |
|
|
|
168,812,250 |
||
|
Oil & Gas - 1.9% |
|||
|
Chevron Corp. |
327,700 |
27,936,425 |
|
|
Devon Energy Corp. |
507,100 |
30,502,065 |
|
|
Exxon Mobil Corp. |
664,900 |
59,259,213 |
|
|
|
117,697,703 |
||
|
TOTAL ENERGY |
286,509,953 |
||
|
FINANCE - 10.8% |
|||
|
Banks - 1.5% |
|||
|
FleetBoston Financial Corp. |
1,169,869 |
45,624,891 |
|
|
Mellon Financial Corp. |
540,000 |
25,042,500 |
|
|
State Street Corp. |
181,500 |
23,595,000 |
|
|
|
94,262,391 |
||
|
Credit & Other Finance - 2.4% |
|||
|
American Express Co. |
885,400 |
53,788,050 |
|
|
Citigroup, Inc. |
1,697,366 |
91,763,849 |
|
|
|
145,551,899 |
||
|
|
|||
|
Shares |
Value (Note 1) |
||
|
Federal Sponsored Credit - 3.1% |
|||
|
Fannie Mae |
1,994,400 |
$ 142,599,600 |
|
|
Freddie Mac |
890,100 |
48,121,031 |
|
|
|
190,720,631 |
||
|
Insurance - 2.8% |
|||
|
American International Group, Inc. |
1,106,364 |
105,865,205 |
|
|
MetLife, Inc. |
1,623,500 |
42,515,406 |
|
|
The Chubb Corp. |
250,500 |
19,820,813 |
|
|
|
168,201,424 |
||
|
Securities Industry - 1.0% |
|||
|
Charles Schwab Corp. |
695,100 |
24,676,050 |
|
|
Morgan Stanley Dean Witter & Co. |
289,100 |
26,434,581 |
|
|
Nomura Securities Co. Ltd. |
520,000 |
11,297,032 |
|
|
|
62,407,663 |
||
|
TOTAL FINANCE |
661,144,008 |
||
|
HEALTH - 16.2% |
|||
|
Drugs & Pharmaceuticals - 13.2% |
|||
|
Alkermes, Inc. (a) |
278,800 |
10,768,650 |
|
|
Amgen, Inc. (a) |
690,600 |
48,223,303 |
|
|
Andrx Corp. - Andrx Group (a) |
230,700 |
21,541,613 |
|
|
ARIAD Pharmaceuticals, Inc. (a) |
518,900 |
6,518,681 |
|
|
ArQule, Inc. (a) |
10,900 |
185,981 |
|
|
Bristol-Myers Squibb Co. |
1,757,700 |
100,408,613 |
|
|
Cambridge Antibody Technology Group PLC (a) |
209,800 |
12,450,497 |
|
|
Eli Lilly & Co. |
658,600 |
53,428,925 |
|
|
Geneva Proteomics (c) |
262,000 |
1,441,000 |
|
|
Human Genome Sciences, Inc. (a) |
66,800 |
11,564,750 |
|
|
ImClone Systems, Inc. (a) |
144,200 |
16,880,413 |
|
|
Merck & Co., Inc. |
1,659,000 |
123,491,813 |
|
|
Millennium Pharmaceuticals, Inc. (a) |
174,800 |
25,531,725 |
|
|
Mylan Laboratories, Inc. |
785,000 |
21,145,938 |
|
|
PE Corp. - Celera Genomics Group (a) |
217,200 |
21,638,550 |
|
|
Pfizer, Inc. |
3,986,725 |
179,153,455 |
|
|
Protein Design Labs, Inc. (a) |
165,000 |
19,882,500 |
|
|
Schering-Plough Corp. |
1,776,400 |
82,602,600 |
|
|
Shire Pharmaceuticals Group PLC ADR (a) |
281,700 |
14,542,763 |
|
|
Vertex Pharmaceuticals, Inc. (a) |
168,700 |
14,255,150 |
|
|
Watson Pharmaceuticals, Inc. (a) |
330,500 |
21,441,188 |
|
|
|
807,098,108 |
||
|
Medical Equipment & Supplies - 1.8% |
|||
|
Johnson & Johnson |
458,700 |
43,089,131 |
|
|
Medtronic, Inc. |
1,121,000 |
58,081,813 |
|
|
Novoste Corp. (a) |
278,700 |
11,844,750 |
|
|
|
113,015,694 |
||
|
Common Stocks - continued |
|||
|
Shares |
Value (Note 1) |
||
|
HEALTH - continued |
|||
|
Medical Facilities Management - 1.2% |
|||
|
HCA - The Healthcare Co. |
1,081,000 |
$ 40,132,125 |
|
|
Tenet Healthcare Corp. |
838,330 |
30,494,254 |
|
|
|
70,626,379 |
||
|
TOTAL HEALTH |
990,740,181 |
||
|
INDUSTRIAL MACHINERY & EQUIPMENT - 7.2% |
|||
|
Electrical Equipment - 6.8% |
|||
|
Emerson Electric Co. |
430,900 |
28,870,300 |
|
|
General Electric Co. |
6,398,900 |
369,136,531 |
|
|
Omron Corp. |
553,000 |
14,544,559 |
|
|
|
412,551,390 |
||
|
Industrial Machinery & Equipment - 0.4% |
|||
|
Illinois Tool Works, Inc. |
171,900 |
9,604,913 |
|
|
Ingersoll-Rand Co. |
469,900 |
15,917,863 |
|
|
|
25,522,776 |
||
|
TOTAL INDUSTRIAL MACHINERY & EQUIPMENT |
438,074,166 |
||
|
MEDIA & LEISURE - 9.2% |
|||
|
Broadcasting - 4.9% |
|||
|
AT&T Corp. - Liberty Media Group |
1,653,584 |
29,764,512 |
|
|
Carlton Communications PLC |
981,333 |
7,639,513 |
|
|
Comcast Corp. Class A (special) (a) |
1,016,300 |
41,604,781 |
|
|
Cox Communications, Inc. Class A (a) |
760,700 |
29,096,775 |
|
|
EchoStar Communications Corp. Class A (a) |
455,590 |
24,032,373 |
|
|
Grupo Televisa SA de CV sponsored GDR |
588,400 |
33,943,325 |
|
|
Infinity Broadcasting Corp. Class A (a) |
360,300 |
11,889,900 |
|
|
Pegasus Communications Corp. (a) |
340,750 |
16,462,484 |
|
|
RTL Group |
157,345 |
17,044,872 |
|
|
Time Warner, Inc. |
787,600 |
61,629,700 |
|
|
Univision Communications, Inc. Class A (a) |
711,000 |
26,573,625 |
|
|
|
299,681,860 |
||
|
Entertainment - 3.5% |
|||
|
Fox Entertainment Group, Inc. Class A (a) |
925,200 |
24,517,800 |
|
|
MGM Mirage, Inc. |
685,300 |
26,169,894 |
|
|
Ticketmaster Online CitySearch, Inc. |
532,400 |
9,017,525 |
|
|
Viacom, Inc. Class B (non-vtg.) (a) |
880,165 |
51,489,653 |
|
|
Walt Disney Co. |
2,649,300 |
101,335,725 |
|
|
|
212,530,597 |
||
|
Publishing - 0.6% |
|||
|
The New York Times Co. Class A |
955,200 |
37,551,300 |
|
|
|
|||
|
Shares |
Value (Note 1) |
||
|
Restaurants - 0.2% |
|||
|
McDonald's Corp. |
459,600 |
$ 13,874,175 |
|
|
TOTAL MEDIA & LEISURE |
563,637,932 |
||
|
NONDURABLES - 5.3% |
|||
|
Beverages - 2.6% |
|||
|
Anheuser-Busch Companies, Inc. |
966,200 |
40,882,338 |
|
|
Heineken NV |
391,700 |
21,768,904 |
|
|
The Coca-Cola Co. |
1,761,500 |
97,102,688 |
|
|
|
159,753,930 |
||
|
Foods - 0.6% |
|||
|
Quaker Oats Co. |
502,700 |
39,776,138 |
|
|
Household Products - 1.2% |
|||
|
Clorox Co. |
37,800 |
1,495,463 |
|
|
Gillette Co. |
842,100 |
25,999,838 |
|
|
Luxottica Group Spa sponsored ADR |
574,200 |
9,258,975 |
|
|
Procter & Gamble Co. |
581,300 |
38,947,100 |
|
|
|
75,701,376 |
||
|
Tobacco - 0.9% |
|||
|
Philip Morris Companies, Inc. |
1,787,200 |
52,610,700 |
|
|
TOTAL NONDURABLES |
327,842,144 |
||
|
RETAIL & WHOLESALE - 4.6% |
|||
|
Drug Stores - 0.1% |
|||
|
CVS Corp. |
94,000 |
4,353,375 |
|
|
General Merchandise Stores - 2.5% |
|||
|
Costco Wholesale Corp. (a) |
158,100 |
5,523,619 |
|
|
Kohls Corp. (a) |
504,400 |
29,097,575 |
|
|
Target Corp. |
235,800 |
6,042,375 |
|
|
Wal-Mart Stores, Inc. |
2,356,400 |
113,401,750 |
|
|
|
154,065,319 |
||
|
Retail & Wholesale, Miscellaneous - 2.0% |
|||
|
Best Buy Co., Inc. (a) |
302,750 |
19,262,469 |
|
|
Home Depot, Inc. |
1,913,400 |
101,529,788 |
|
|
|
120,792,257 |
||
|
TOTAL RETAIL & WHOLESALE |
279,210,951 |
||
|
SERVICES - 1.0% |
|||
|
Advertising - 1.0% |
|||
|
DoubleClick, Inc. (a) |
304,900 |
9,756,800 |
|
|
TMP Worldwide, Inc. (a) |
309,300 |
24,898,650 |
|
|
WPP Group PLC sponsored ADR |
465,800 |
27,627,763 |
|
|
|
62,283,213 |
||
|
TECHNOLOGY - 34.0% |
|||
|
Communications Equipment - 5.7% |
|||
|
Cisco Systems, Inc. (a) |
4,705,800 |
259,995,450 |
|
|
Corning, Inc. |
143,400 |
42,589,800 |
|
|
Lucent Technologies, Inc. |
438,100 |
13,389,431 |
|
|
Common Stocks - continued |
|||
|
Shares |
Value (Note 1) |
||
|
TECHNOLOGY - continued |
|||
|
Communications Equipment - continued |
|||
|
Nortel Networks Corp. |
394,300 |
$ 23,485,494 |
|
|
UTStarcom, Inc. |
535,200 |
11,205,750 |
|
|
|
350,665,925 |
||
|
Computer Services & Software - 9.1% |
|||
|
Affymetrix, Inc. (a) |
377,000 |
18,802,875 |
|
|
Amazon.com, Inc. (a) |
336,500 |
12,934,219 |
|
|
America Online, Inc. (a) |
1,302,600 |
70,014,750 |
|
|
Automatic Data Processing, Inc. |
1,180,400 |
78,939,250 |
|
|
BEA Systems, Inc. (a) |
218,200 |
16,992,325 |
|
|
Cadence Design Systems, Inc. (a) |
809,900 |
20,804,306 |
|
|
CNET Networks, Inc. (a) |
496,000 |
12,082,250 |
|
|
First Data Corp. |
277,000 |
10,820,313 |
|
|
Microsoft Corp. (a) |
2,557,600 |
154,255,250 |
|
|
Oracle Corp. (a) |
657,600 |
51,786,000 |
|
|
Synopsys, Inc. (a) |
134,800 |
5,105,550 |
|
|
VeriSign, Inc. (a) |
220,100 |
44,584,006 |
|
|
VERITAS Software Corp. (a) |
214,500 |
30,459,000 |
|
|
Yahoo!, Inc. (a) |
348,200 |
31,686,200 |
|
|
|
559,266,294 |
||
|
Computers & Office Equipment - 9.9% |
|||
|
Brocade Communications Systems, Inc. (a) |
53,900 |
12,720,400 |
|
|
CDW Computer Centers, Inc. (a) |
337,200 |
23,266,800 |
|
|
Comdisco, Inc. |
216,400 |
4,125,125 |
|
|
Compaq Computer Corp. |
1,049,700 |
28,950,726 |
|
|
Dell Computer Corp. (a) |
1,486,500 |
45,802,781 |
|
|
EMC Corp. (a) |
1,378,000 |
136,594,250 |
|
|
Extreme Networks, Inc. (a) |
86,700 |
9,927,150 |
|
|
Gateway, Inc. (a) |
267,000 |
12,482,250 |
|
|
Hewlett-Packard Co. |
413,500 |
40,109,500 |
|
|
International Business Machines Corp. |
941,600 |
105,930,000 |
|
|
Juniper Networks, Inc. (a) |
153,100 |
33,519,331 |
|
|
Lexmark International Group, Inc. Class A (a) |
271,300 |
10,173,750 |
|
|
Palm, Inc. |
540,000 |
28,586,250 |
|
|
Sun Microsystems, Inc. (a) |
931,400 |
108,740,950 |
|
|
Symbol Technologies, Inc. |
129,800 |
4,664,688 |
|
|
|
605,593,951 |
||
|
Electronic Instruments - 1.2% |
|||
|
Agilent Technologies, Inc. |
290,005 |
14,192,120 |
|
|
Applied Materials, Inc. (a) |
308,800 |
18,315,700 |
|
|
Kudelski SA (a) |
8,850 |
13,558,996 |
|
|
|
|||
|
Shares |
Value (Note 1) |
||
|
LAM Research Corp. (a) |
859,600 |
$ 17,997,875 |
|
|
Novellus Systems, Inc. (a) |
236,400 |
11,007,375 |
|
|
|
75,072,066 |
||
|
Electronics - 8.1% |
|||
|
Altera Corp. (a) |
464,400 |
22,175,100 |
|
|
Analog Devices, Inc. (a) |
356,500 |
29,433,531 |
|
|
Chartered Semiconductor Manufacturing |
292,900 |
17,775,369 |
|
|
GlobeSpan, Inc. (a) |
223,300 |
27,242,600 |
|
|
Intel Corp. |
4,525,100 |
188,074,469 |
|
|
International Rectifier Corp. (a) |
249,900 |
12,635,569 |
|
|
JDS Uniphase Corp. (a) |
318,000 |
30,110,625 |
|
|
Linear Technology Corp. |
251,700 |
16,297,575 |
|
|
LSI Logic Corp. (a) |
425,200 |
12,437,100 |
|
|
Micron Technology, Inc. (a) |
281,340 |
12,941,640 |
|
|
Motorola, Inc. |
732,100 |
20,681,825 |
|
|
PMC-Sierra, Inc. (a) |
51,800 |
11,149,950 |
|
|
SDL, Inc. (a) |
45,900 |
14,197,444 |
|
|
Texas Instruments, Inc. |
1,646,900 |
77,713,094 |
|
|
|
492,865,891 |
||
|
TOTAL TECHNOLOGY |
2,083,464,127 |
||
|
TRANSPORTATION - 0.2% |
|||
|
Trucking & Freight - 0.2% |
|||
|
United Parcel Service, Inc. Class B |
230,300 |
12,983,163 |
|
|
UTILITIES - 2.6% |
|||
|
Cellular - 0.9% |
|||
|
QUALCOMM, Inc. (a) |
269,200 |
19,180,500 |
|
|
Sprint Corp. - PCS Group Series 1 (a) |
450,800 |
15,806,175 |
|
|
Vodafone Group PLC |
5,973,984 |
22,103,781 |
|
|
|
57,090,456 |
||
|
Electric Utility - 0.8% |
|||
|
AES Corp. (a) |
287,900 |
19,721,150 |
|
|
Calpine Corp. (a) |
294,100 |
30,696,688 |
|
|
|
50,417,838 |
||
|
Telephone Services - 0.9% |
|||
|
AT&T Corp. |
335,178 |
9,845,854 |
|
|
DDI Corp. |
1,059 |
6,951,003 |
|
|
McLeodUSA, Inc. Class A (a) |
682,300 |
9,765,419 |
|
|
Metromedia Fiber Network, Inc. Class A (a) |
547,000 |
13,298,938 |
|
|
Qwest Communications International, Inc. (a) |
270,900 |
13,020,131 |
|
|
|
52,881,345 |
||
|
TOTAL UTILITIES |
160,389,639 |
||
|
TOTAL COMMON STOCKS (Cost $5,179,064,482) |
5,985,459,617 |
||
|
Cash Equivalents - 3.9% |
|||
|
Shares |
Value (Note 1) |
||
|
Fidelity Cash Central Fund, 6.60% (b) |
239,922,694 |
$ 239,922,694 |
|
|
|
|
||
|
TOTAL INVESTMENT PORTFOLIO - 101.6% (Cost $5,418,987,176) |
6,225,382,311 |
||
|
NET OTHER ASSETS - (1.6)% |
(101,028,082) |
||
|
NET ASSETS - 100% |
$ 6,124,354,229 |
||
|
Legend |
|
(a) Non-income producing |
|
(b) The rate quoted is the annualized seven-day yield of the fund at period end. A complete listing of the fund's holdings as of its most recent fiscal year end is available upon request. |
|
(c) Restricted securities - Investment in securities not registered under the Securities Act of 1933. |
|
Additional information on each holding is as follows: |
|
Security |
Acquisition Date |
Acquisition Cost |
|
Geneva Proteomics |
7/7/00 |
$ 1,441,000 |
|
Other Information |
|
Purchases and sales of securities, other than short-term securities, aggregated $9,375,176,143 and $9,687,929,601, respectively, of which long-term U.S. government and government agency obligations aggregated $0 and $513,842,688, respectively. |
|
The fund invested in securities that are not registered under the Securities Act of 1933. These securities are subject to legal or contractual restrictions on resale. At the end of the period, restricted securities (excluding Rule 144A issues) amounted to $1,441,000 or 0.0% of net assets. |
|
The fund participated in the security lending program. At period end, the value of securities loaned amounted to $131,799,001. The fund received cash collateral of $140,470,800 which was invested in cash equivalents. |
|
Income Tax Information |
|
At September 30, 2000, the aggregate cost of investment securities for income tax purposes was $5,318,034,092. Net unrealized appreciation aggregated $907,348,219, of which $1,455,155,384 related to appreciated investment securities and $547,807,165 related to depreciated investment securities. |
|
The fund hereby designates approximately $942,283,000 as a capital gain dividend for the purpose of the dividend paid deduction. |
See accompanying notes which are an integral part of the financial statements.
Annual Report
Fidelity Destiny Portfolios: Destiny I
Statement of Assets and Liabilities
|
September 30, 2000 |
||
|
Assets |
|
|
|
Investment in securities, at value |
|
$ 6,225,382,311 |
|
Receivable for investments sold |
|
129,548,835 |
|
Receivable for fund shares sold |
|
432,914 |
|
Dividends receivable |
|
4,575,392 |
|
Interest receivable |
|
1,248,116 |
|
Other receivables |
|
39,007 |
|
Total assets |
|
6,361,226,575 |
|
Liabilities |
|
|
|
Payable for investments purchased |
$ 92,895,859 |
|
|
Payable for fund shares redeemed |
1,615,142 |
|
|
Accrued management fee |
1,213,075 |
|
|
Distribution fees payable |
648 |
|
|
Other payables and accrued expenses |
676,822 |
|
|
Collateral on securities loaned, at value |
140,470,800 |
|
|
Total liabilities |
|
236,872,346 |
|
Net Assets |
|
$ 6,124,354,229 |
|
Net Assets consist of: |
|
|
|
Paid in capital |
|
$ 4,205,152,065 |
|
Undistributed net investment income |
|
26,831,597 |
|
Accumulated undistributed net realized gain (loss) on investments and foreign currency transactions |
|
1,086,012,042 |
|
Net unrealized appreciation (depreciation) on investments and assets and liabilities in foreign currencies |
|
806,358,525 |
|
Net Assets |
|
$ 6,124,354,229 |
|
Class O: |
|
$22.09 |
|
Class N: |
|
$21.90 |
Statement of Operations
|
|
Year ended September 30, 2000 |
|
|
Investment Income Dividends |
|
$ 51,610,297 |
|
Interest |
|
20,719,388 |
|
Security lending |
|
858,474 |
|
Total income |
|
73,188,159 |
|
Expenses |
|
|
|
Management fee |
$ 29,697,889 |
|
|
Performance adjustment |
(13,259,333) |
|
|
Transfer agent fees |
427,389 |
|
|
Distribution fees |
3,366 |
|
|
Accounting and security lending fees |
807,517 |
|
|
Non-interested trustees' compensation |
25,229 |
|
|
Custodian fees and expenses |
231,786 |
|
|
Registration fees |
26,826 |
|
|
Audit |
50,169 |
|
|
Legal |
18,860 |
|
|
Interest |
3,396 |
|
|
Miscellaneous |
39,127 |
|
|
Total expenses before reductions |
18,072,221 |
|
|
Expense reductions |
(1,618,145) |
16,454,076 |
|
Net investment income |
|
56,734,083 |
|
Realized and Unrealized Gain (Loss) Net realized gain (loss) on: |
|
|
|
Investment securities |
1,114,577,420 |
|
|
Foreign currency transactions |
(230,884) |
1,114,346,536 |
|
Change in net unrealized appreciation (depreciation) on: |
|
|
|
Investment securities |
(1,365,920,944) |
|
|
Assets and liabilities in |
(39,517) |
(1,365,960,461) |
|
Net gain (loss) |
|
(251,613,925) |
|
Net increase (decrease) in net assets resulting from operations |
|
$ (194,879,842) |
See accompanying notes which are an integral part of the financial statements.
Annual Report
Fidelity Destiny Portfolios: Destiny I
Financial Statements - continued
Statement of Changes in Net Assets
|
|
Year ended
September 30, |
Year ended
September 30, |
|
Increase (Decrease) in Net Assets |
|
|
|
Operations |
$ 56,734,083 |
$ 111,568,555 |
|
Net realized gain (loss) |
1,114,346,536 |
979,781,946 |
|
Change in net unrealized appreciation (depreciation) |
(1,365,960,461) |
90,347,540 |
|
Net increase (decrease) in net assets resulting from operations |
(194,879,842) |
1,181,698,041 |
|
Distributions to shareholders |
(114,858,565) |
(105,484,207) |
|
From net realized gain |
(897,912,414) |
(544,915,685) |
|
Total distributions |
(1,012,770,979) |
(650,399,892) |
|
Share transactions - net increase (decrease) |
354,594,496 |
240,053,910 |
|
Total increase (decrease) in net assets |
(853,056,325) |
771,352,059 |
|
Net Assets |
|
|
|
Beginning of period |
6,977,410,554 |
6,206,058,495 |
|
End of period (including undistributed net investment income of $26,831,597 and $88,705,313, respectively) |
$ 6,124,354,229 |
$ 6,977,410,554 |
Financial Highlights - Class O
|
Years ended September 30, |
2000 |
1999 |
1998 |
1997 |
1996 |
|
Selected Per-Share Data |
|
|
|
|
|
|
Net asset value, beginning of period |
$ 26.54 |
$ 24.58 |
$ 25.08 |
$ 20.41 |
$ 18.78 |
|
Income from Investment Operations |
|
|
|
|
|
|
Net investment income |
.20 C |
.42 C |
.44 C |
.49 C |
.45 |
|
Net realized and unrealized gain (loss) |
(.77) |
4.13 |
1.56 |
6.36 |
2.42 |
|
Total from investment operations |
(.57) |
4.55 |
2.00 |
6.85 |
2.87 |
|
Less Distributions |
|
|
|
|
|
|
From net investment income |
(.44) |
(.42) |
(.47) |
(.45) |
(.43) |
|
From net realized gain |
(3.44) |
(2.17) |
(2.03) |
(1.73) |
(.81) |
|
Total distributions |
(3.88) |
(2.59) |
(2.50) |
(2.18) |
(1.24) |
|
Net asset value, end of period |
$ 22.09 |
$ 26.54 |
$ 24.58 |
$ 25.08 |
$ 20.41 |
|
Total Return A, B |
(3.23)% |
18.99% |
8.72% |
36.29% |
16.04% |
|
Ratios and Supplemental Data |
|
|
|
|
|
|
Net assets, end of period (000 omitted) |
$ 6,121,273 |
$ 6,977,155 |
$ 6,206,058 |
$ 5,960,742 |
$ 4,565,482 |
|
Ratio of expenses to average net assets |
.27% |
.32% |
.33% |
.39% |
.65% |
|
Ratio of expenses to average net assets after expense reductions |
.25% D |
.31% D |
.33% |
.38% D |
.65% |
|
Ratio of net investment income to average net assets |
.85% |
1.55% |
1.71% |
2.20% |
2.40% |
|
Portfolio turnover |
145% |
36% |
27% |
32% |
42% |
|
A The total returns would have been lower had certain expenses not been reduced during the periods shown. B Total returns do not include the effects of the separate sales charge and other fees assessed through Fidelity Systematic Investment Plans. C Net investment income per share has been calculated based on average shares outstanding during the period. D FMR or the fund has entered into varying arrangements with third parties who either paid or reduced a portion of the class' expenses. |
|||||
See accompanying notes which are an integral part of the financial statements.
Annual Report
Fidelity Destiny Portfolios: Destiny I
Financial Statements - continued
Financial Highlights - Class N
|
Years ended September 30, |
2000 |
1999 F |
|
Selected Per-Share Data |
|
|
|
Net asset value, beginning of period |
$ 26.45 |
$ 27.76 |
|
Income from Investment Operations |
|
|
|
Net investment income (loss) D |
(.01) |
.08 |
|
Net realized and unrealized gain (loss) |
(.74) |
(1.39) G |
|
Total from investment operations |
(.75) |
(1.31) |
|
Less Distributions |
|
|
|
From net investment income |
(.36) |
- |
|
From net realized gain |
(3.44) |
- |
|
Total distributions |
(3.80) |
- |
|
Net asset value, end of period |
$ 21.90 |
$ 26.45 |
|
Total Return B, C |
(3.98)% |
(4.72)% |
|
Ratios and Supplemental Data |
|
|
|
Net assets, end of period (000 omitted) |
$ 3,081 |
$ 256 |
|
Ratio of expenses to average net assets |
1.14% |
1.18% A |
|
Ratio of expenses to average net assets after expense reductions |
1.12% E |
1.17% A, E |
|
Ratio of net investment income (loss) to average net assets |
(.02)% |
.68% A |
|
Portfolio turnover |
145% |
36% |
|
A Annualized B The total returns would have been lower had certain expenses not been reduced during the periods shown. C Total returns do not include the effects of the separate sales charge and other fees assessed through Fidelity Systematic Investment Plans and for periods of less than one year are not annualized. D Net investment income (loss) per share has been calculated based on average shares outstanding during the period. E FMR or the fund has entered into varying arrangements with third parties who either paid or reduced a portion of the class' expenses. F For the period April 30, 1999 (commencement of sale of Class N shares) to September 30, 1999. G The amount shown for a share outstanding does not correspond with the aggregate net gain on investments for the period due to the timing of sales and repurchases of class shares in relation to fluctuating market values of the investments of the fund. |
||
See accompanying notes which are an integral part of the financial statements.
Annual Report
Fidelity Destiny Portfolios: Destiny II
Showing Percentage of Net Assets
|
Common Stocks - 95.1% |
|||
|
Shares |
Value (Note 1) |
||
|
AEROSPACE & DEFENSE - 0.4% |
|||
|
Ship Building & Repair - 0.4% |
|||
|
General Dynamics Corp. |
367,600 |
$ 23,089,875 |
|
|
BASIC INDUSTRIES - 0.5% |
|||
|
Iron & Steel - 0.1% |
|||
|
Bethlehem Steel Corp. (a) |
2,000,000 |
6,000,000 |
|
|
Metals & Mining - 0.4% |
|||
|
Martin Marietta Materials, Inc. |
625,000 |
23,925,000 |
|
|
TOTAL BASIC INDUSTRIES |
29,925,000 |
||
|
CONSTRUCTION & REAL ESTATE - 1.1% |
|||
|
Building Materials - 0.2% |
|||
|
Florida Rock Industries, Inc. |
375,700 |
14,816,669 |
|
|
Construction - 0.5% |
|||
|
D.R. Horton, Inc. |
600,000 |
10,312,500 |
|
|
Lennar Corp. |
700,000 |
20,781,250 |
|
|
|
31,093,750 |
||
|
Real Estate Investment Trusts - 0.4% |
|||
|
Pinnacle Holdings, Inc. (a) |
900,500 |
23,975,813 |
|
|
TOTAL CONSTRUCTION & REAL ESTATE |
69,886,232 |
||
|
DURABLES - 0.2% |
|||
|
Consumer Electronics - 0.2% |
|||
|
Sony Corp. |
100,000 |
10,093,750 |
|
|
ENERGY - 6.5% |
|||
|
Energy Services - 2.2% |
|||
|
BJ Services Co. (a) |
300,000 |
18,337,500 |
|
|
Halliburton Co. |
700,000 |
34,256,250 |
|
|
Nabors Industries, Inc. (a) |
600,000 |
31,440,000 |
|
|
Noble Drilling Corp. (a) |
900,000 |
45,225,000 |
|
|
Weatherford International, Inc. |
300,000 |
12,900,000 |
|
|
|
142,158,750 |
||
|
Oil & Gas - 4.3% |
|||
|
BP Amoco PLC sponsored ADR |
307,812 |
16,314,036 |
|
|
Cabot Oil & Gas Corp. Class A |
775,600 |
15,802,850 |
|
|
Cooper Cameron Corp. (a) |
165,000 |
12,158,438 |
|
|
Exxon Mobil Corp. |
1,949,766 |
173,772,895 |
|
|
Grant Prideco, Inc. (a) |
349,500 |
7,667,156 |
|
|
Royal Dutch Petroleum Co. (NY Shares) |
700,000 |
41,956,250 |
|
|
|
267,671,625 |
||
|
TOTAL ENERGY |
409,830,375 |
||
|
FINANCE - 13.6% |
|||
|
Banks - 1.4% |
|||
|
Bank of New York Co., Inc. |
625,040 |
35,041,305 |
|
|
Bank One Corp. |
1,400,000 |
54,075,000 |
|
|
|
89,116,305 |
||
|
|
|||
|
Shares |
Value (Note 1) |
||
|
Credit & Other Finance - 2.4% |
|||
|
American Express Co. |
1,600,000 |
$ 97,200,000 |
|
|
Citigroup, Inc. |
999,933 |
54,058,878 |
|
|
|
151,258,878 |
||
|
Federal Sponsored Credit - 6.1% |
|||
|
Fannie Mae |
3,250,000 |
232,375,000 |
|
|
Freddie Mac |
2,765,000 |
149,482,813 |
|
|
|
381,857,813 |
||
|
Insurance - 2.6% |
|||
|
AFLAC, Inc. |
320,200 |
20,512,813 |
|
|
AMBAC Financial Group, Inc. |
300,000 |
21,975,000 |
|
|
American International Group, Inc. |
1,282,981 |
122,765,244 |
|
|
|
165,253,057 |
||
|
Securities Industry - 1.1% |
|||
|
Bear Stearns Companies, Inc. |
175,000 |
11,025,000 |
|
|
Daiwa Securities Group, Inc. |
2,377,000 |
27,841,905 |
|
|
Nikko Securities Co. Ltd. |
3,114,000 |
27,636,497 |
|
|
|
66,503,402 |
||
|
TOTAL FINANCE |
853,989,455 |
||
|
HEALTH - 12.1% |
|||
|
Drugs & Pharmaceuticals - 10.8% |
|||
|
Amgen, Inc. (a) |
335,200 |
23,406,388 |
|
|
Bristol-Myers Squibb Co. |
3,000,872 |
171,424,813 |
|
|
Decode Genetics, Inc. |
250,100 |
6,424,444 |
|
|
Eli Lilly & Co. |
1,500,000 |
121,687,500 |
|
|
Genentech, Inc. (a) |
275,000 |
51,064,063 |
|
|
Geneva Proteomics (f) |
255,000 |
1,402,500 |
|
|
Human Genome Sciences, Inc. (a) |
225,000 |
38,953,125 |
|
|
Immunex Corp. (a) |
825,000 |
35,887,500 |
|
|
Pfizer, Inc. |
1,624,975 |
73,022,314 |
|
|
Schering-Plough Corp. |
2,163,000 |
100,579,500 |
|
|
Vertex Pharmaceuticals, Inc. (a) |
200,000 |
16,900,000 |
|
|
Watson Pharmaceuticals, Inc. (a) |
500,000 |
32,437,500 |
|
|
|
673,189,647 |
||
|
Medical Equipment & Supplies - 1.3% |
|||
|
Biomet, Inc. |
915,325 |
32,036,375 |
|
|
Cardinal Health, Inc. |
569,954 |
50,262,818 |
|
|
|
82,299,193 |
||
|
TOTAL HEALTH |
755,488,840 |
||
|
INDUSTRIAL MACHINERY & EQUIPMENT - 7.6% |
|||
|
Electrical Equipment - 6.4% |
|||
|
Alcatel SA sponsored ADR |
685,000 |
43,069,375 |
|
|
Furukawa Electric Co. Ltd. |
300,000 |
8,278,635 |
|
|
General Electric Co. |
6,032,000 |
347,970,990 |
|
|
|
399,319,000 |
||
|
Common Stocks - continued |
|||
|
Shares |
Value (Note 1) |
||
|
INDUSTRIAL MACHINERY & EQUIPMENT - continued |
|||
|
Industrial Machinery & Equipment - 1.2% |
|||
|
Caterpillar, Inc. |
1,125,000 |
$ 37,968,750 |
|
|
Tyco International Ltd. |
700,000 |
36,312,500 |
|
|
|
74,281,250 |
||
|
TOTAL INDUSTRIAL MACHINERY & EQUIPMENT |
473,600,250 |
||
|
MEDIA & LEISURE - 5.6% |
|||
|
Broadcasting - 2.0% |
|||
|
AT&T Corp. - Liberty Media Group |
699,984 |
12,599,712 |
|
|
Clear Channel Communications, Inc. (a) |
500,000 |
28,250,000 |
|
|
Grupo Televisa SA de CV sponsored GDR |
650,000 |
37,496,875 |
|
|
Infinity Broadcasting Corp. Class A (a) |
1,150,000 |
37,950,000 |
|
|
Radio One, Inc. Class D (non-vtg.) (a) |
129,700 |
916,006 |
|
|
Time Warner, Inc. |
129,962 |
10,169,527 |
|
|
|
127,382,120 |
||
|
Entertainment - 2.5% |
|||
|
MGM Mirage, Inc. |
700,000 |
26,731,250 |
|
|
Viacom, Inc. Class B (non-vtg.) (a) |
2,201,030 |
128,760,255 |
|
|
|
155,491,505 |
||
|
Publishing - 1.1% |
|||
|
McGraw-Hill Companies, Inc. |
1,050,000 |
66,740,625 |
|
|
TOTAL MEDIA & LEISURE |
349,614,250 |
||
|
NONDURABLES - 5.4% |
|||
|
Beverages - 2.1% |
|||
|
Anheuser-Busch Companies, Inc. |
1,550,000 |
65,584,375 |
|
|
The Coca-Cola Co. |
1,250,000 |
68,906,250 |
|
|
|
134,490,625 |
||
|
Foods - 1.1% |
|||
|
Keebler Foods Co. |
300,000 |
12,600,000 |
|
|
Quaker Oats Co. |
700,000 |
55,387,500 |
|
|
|
67,987,500 |
||
|
Tobacco - 2.2% |
|||
|
Philip Morris Companies, Inc. |
3,000,000 |
88,312,500 |
|
|
RJ Reynolds Tobacco Holdings, Inc. |
550,000 |
17,737,500 |
|
|
UST, Inc. |
1,250,000 |
28,593,750 |
|
|
|
134,643,750 |
||
|
TOTAL NONDURABLES |
337,121,875 |
||
|
PRECIOUS METALS - 0.2% |
|||
|
Homestake Mining Co. |
2,866,600 |
14,870,488 |
|
|
RETAIL & WHOLESALE - 2.6% |
|||
|
Apparel Stores - 0.4% |
|||
|
Abercrombie & Fitch Co. Class A (a) |
1,500,000 |
28,593,750 |
|
|
|
|||
|
Shares |
Value (Note 1) |
||
|
General Merchandise Stores - 0.9% |
|||
|
Kohls Corp. (a) |
200,000 |
$ 11,537,500 |
|
|
Wal-Mart Stores, Inc. |
950,800 |
45,757,250 |
|
|
|
57,294,750 |
||
|
Retail & Wholesale, Miscellaneous - 1.3% |
|||
|
eToys, Inc. (a) |
100,000 |
534,375 |
|
|
Home Depot, Inc. |
1,474,950 |
78,264,534 |
|
|
|
78,798,909 |
||
|
TOTAL RETAIL & WHOLESALE |
164,687,409 |
||
|
SERVICES - 0.3% |
|||
|
Advertising - 0.3% |
|||
|
Omnicom Group, Inc. |
300,000 |
21,881,250 |
|
|
TECHNOLOGY - 34.8% |
|||
|
Communications Equipment - 5.5% |
|||
|
Ciena Corp. (a) |
120,000 |
14,737,500 |
|
|
Cisco Systems, Inc. (a) |
4,915,000 |
271,553,750 |
|
|
Nokia AB sponsored ADR |
1,250,000 |
49,765,625 |
|
|
Telefonaktiebolaget LM Ericsson |
575,000 |
8,517,188 |
|
|
|
344,574,063 |
||
|
Computer Services & Software - 16.1% |
|||
|
Aether Systems, Inc. |
330,000 |
34,815,000 |
|
|
Affymetrix, Inc. (a) |
250,000 |
12,468,750 |
|
|
Amazon.com, Inc. (a) |
600,000 |
23,062,500 |
|
|
Ariba, Inc. (a) |
840,000 |
120,343,125 |
|
|
BEA Systems, Inc. (a) |
678,100 |
52,807,038 |
|
|
BMC Software, Inc. (a) |
350,000 |
6,693,750 |
|
|
Cadence Design Systems, Inc. (a) |
1,690,600 |
43,427,288 |
|
|
Computer Associates International, Inc. |
950,000 |
23,928,125 |
|
|
i2 Technologies, Inc. (a) |
555,000 |
103,819,688 |
|
|
Internap Network Services Corp. |
894,100 |
28,890,606 |
|
|
Interwoven, Inc. |
185,000 |
20,916,563 |
|
|
Intuit, Inc. (a) |
771,800 |
43,992,600 |
|
|
J.D. Edwards & Co. (a) |
250,000 |
6,468,750 |
|
|
Microsoft Corp. (a) |
3,600,000 |
217,125,000 |
|
|
NaviSite, Inc. |
60,400 |
1,627,025 |
|
|
Oracle Corp. (a) |
425,000 |
33,468,750 |
|
|
Phone.com, Inc. (a) |
220,000 |
24,997,500 |
|
|
Software.com, Inc. (a) |
277,400 |
50,330,763 |
|
|
VERITAS Software Corp. (a) |
895,700 |
127,189,400 |
|
|
Vignette Corp. (a) |
773,300 |
23,102,338 |
|
|
Yahoo!, Inc. (a) |
75,000 |
6,825,000 |
|
|
|
1,006,299,559 |
||
|
Computers & Office Equipment - 11.3% |
|||
|
Apple Computer, Inc. (a) |
376,400 |
9,692,300 |
|
|
Comdisco, Inc. |
347,700 |
6,628,031 |
|
|
Dell Computer Corp. (a) |
4,175,000 |
128,642,188 |
|
|
EMC Corp. (a) |
1,800,000 |
178,425,000 |
|
|
Hutchinson Technology, Inc. (a) |
600,000 |
12,637,500 |
|
|
Common Stocks - continued |
|||
|
Shares |
Value (Note 1) |
||
|
TECHNOLOGY - continued |
|||
|
Computers & Office Equipment - continued |
|||
|
Ingram Micro, Inc. Class A (a) |
2,500,000 |
$ 34,375,000 |
|
|
International Business Machines Corp. |
252,000 |
28,350,000 |
|
|
Juniper Networks, Inc. (a) |
365,000 |
79,912,188 |
|
|
Lexmark International Group, Inc. |
1,625,000 |
60,937,500 |
|
|
Maxtor Corp. (a) |
2,280,000 |
23,940,000 |
|
|
Network Appliance, Inc. (a) |
50,000 |
6,368,750 |
|
|
Sun Microsystems, Inc. (a) |
1,030,600 |
120,322,550 |
|
|
Western Digital Corp. (a) |
2,750,000 |
16,156,250 |
|
|
|
706,387,257 |
||
|
Electronics - 1.9% |
|||
|
Analog Devices, Inc. (a) |
250,000 |
20,640,625 |
|
|
Flextronics International Ltd. (a) |
124,941 |
10,260,780 |
|
|
Intel Corp. |
127,000 |
5,278,438 |
|
|
Micron Technology, Inc. (a) |
150,000 |
6,900,000 |
|
|
Mitsubishi Electric Corp. |
2,000,000 |
16,548,026 |
|
|
Sanmina Corp. (a) |
185,000 |
17,320,625 |
|
|
Solectron Corp. (a) |
239,984 |
11,069,262 |
|
|
Texas Instruments, Inc. |
675,000 |
31,851,563 |
|
|
|
119,869,319 |
||
|
TOTAL TECHNOLOGY |
2,177,130,198 |
||
|
UTILITIES - 4.2% |
|||
|
Cellular - 2.2% |
|||
|
AT&T Corp. - Wireless Group |
300,000 |
6,262,500 |
|
|
China Mobile (Hong Kong) Ltd. (a) |
2,000,000 |
12,974,999 |
|
|
SBA Communications Corp. Class A (a) |
844,800 |
35,428,800 |
|
|
Sprint Corp. - PCS Group Series 1 (a) |
850,000 |
29,803,125 |
|
|
Tritel, Inc. Class A |
480,600 |
6,878,588 |
|
|
Vodafone Group PLC sponsored ADR |
821,300 |
30,388,100 |
|
|
VoiceStream Wireless Corp. (a) |
149,100 |
17,304,919 |
|
|
|
139,041,031 |
||
|
Electric Utility - 0.9% |
|||
|
AES Corp. (a) |
800,000 |
54,800,000 |
|
|
Gas - 0.7% |
|||
|
Dynegy, Inc. Class A |
847,404 |
48,302,028 |
|
|
Telephone Services - 0.4% |
|||
|
Metromedia Fiber Network, Inc. Class A (a) |
350,000 |
8,509,375 |
|
|
Telefonos de Mexico SA de CV Series L sponsored ADR |
300,000 |
15,956,250 |
|
|
TeraBeam Networks (f) |
19,200 |
72,000 |
|
|
|
24,537,625 |
||
|
TOTAL UTILITIES |
266,680,684 |
||
|
TOTAL COMMON STOCKS (Cost $4,390,611,639) |
5,957,889,931 |
||
|
Convertible Preferred Stocks - 0.0% |
|||
|
Shares |
Value (Note 1) |
||
|
TECHNOLOGY - 0.0% |
|||
|
Communications Equipment - 0.0% |
|||
|
Chorum Technologies (f) |
27,000 |
$ 465,480 |
|
|
Corporate Bonds - 0.7% |
|||||
|
Moody's Ratings |
Principal Amount |
|
|||
|
Convertible Bonds - 0.6% |
|||||
|
FINANCE - 0.2% |
|||||
|
Credit & Other Finance - 0.2% |
|||||
|
Elan Finance Corp. Ltd. liquid yield option notes 0% 12/14/18 (e) |
Baa3 |
|
$ 19,620,000 |
15,892,200 |
|
|
MEDIA & LEISURE - 0.4% |
|||||
|
Broadcasting - 0.4% |
|||||
|
Liberty Media Corp.: |
|
|
|
|
|
|
3.75% 2/15/30 (e) |
Baa3 |
|
16,020,000 |
12,375,450 |
|
|
4% 11/15/29 (e) |
Baa3 |
|
4,330,000 |
4,102,675 |
|
|
4% 11/15/29 |
Baa3 |
|
6,100,000 |
5,779,750 |
|
|
|
22,257,875 |
||||
|
TECHNOLOGY - 0.0% |
|||||
|
Computer Services & Software - 0.0% |
|||||
|
Cyras Systems, Inc. 4.5% 8/15/05 (e) |
- |
|
1,525,000 |
1,830,000 |
|
|
TOTAL CONVERTIBLE BONDS |
39,980,075 |
||||
|
Nonconvertible Bonds - 0.1% |
|||||
|
TECHNOLOGY - 0.1% |
|||||
|
Computer Services & Software - 0.1% |
|||||
|
Amazon.com, Inc. 0% 5/1/08 (d) |
Caa1 |
|
$ 5,000,000 |
2,700,000 |
|
|
TOTAL CORPORATE BONDS (Cost $42,332,242) |
42,680,075 |
||||
|
Cash Equivalents - 5.0% |
|||
|
Shares |
Value (Note 1) |
||
|
Fidelity Cash Central Fund, 6.60% (c) |
313,772,402 |
$ 313,772,402 |
|
|
|
|
||
|
TOTAL INVESTMENT PORTFOLIO - 100.8% (Cost $4,747,181,763) |
6,314,807,888 |
||
|
NET OTHER ASSETS - (0.8)% |
(52,639,758) |
||
|
NET ASSETS - 100% |
$ 6,262,168,130 |
||
|
Legend |
|
(a) Non-income producing |
|
(b) S&P credit ratings are used in the absence of a rating by Moody's Investors Service, Inc. |
|
(c) The rate quoted is the annualized seven-day yield of the fund at period end. A complete listing of the fund's holdings as of its most recent fiscal year end is available upon request. |
|
(d) Debt obligation initially issued in zero coupon form which converts to coupon form at a specified rate and date. The rate shown is the rate at period end. |
|
(e) Security exempt from registration under Rule 144A of the Securities Act of 1933. These securities may be resold in transactions exempt from registration, normally to qualified institutional buyers. At the period end, the value of these securities amounted to $34,200,325 or 0.5% of net assets. |
|
(f) Restricted securities - Investment in securities not registered under the Securities Act of 1933. |
|
Additional information on each holding is as follows: |
|
Security |
Acquisition Date |
Acquisition Cost |
|
Chorum Technologies |
9/19/00 |
$ 465,480 |
|
Geneva Proteomics |
7/7/00 |
$ 1,402,500 |
|
TeraBeam Networks |
4/7/00 |
$ 72,000 |
|
Other Information |
|
Purchases and sales of securities, other than short-term securities, aggregated $6,669,363,277 and $6,575,975,224, respectively. |
|
The fund invested in securities that are not registered under the Securities Act of 1933. These securities are subject to legal or contractual restrictions on resale. At the end of the period, restricted securities (excluding Rule 144A issues) amounted to $1,939,980 or 0.0% of net assets. |
|
The fund participated in the security lending program. At period end, the value of securities loaned amounted to $60,589,779. The fund received cash collateral of $64,627,700 which was invested in cash equivalents. |
|
Income Tax Information |
|
At September 30, 2000, the aggregate cost of investment securities for income tax purposes was $4,712,779,460. Net unrealized appreciation aggregated $1,602,028,428, of which $1,904,224,307 related to appreciated investment securities and $302,195,879 related to depreciated investment securities. |
|
The fund hereby designates approximately $523,066,000 as a capital gain dividend for the purpose of the dividend paid deduction. |
See accompanying notes which are an integral part of the financial statements.
Annual Report
Fidelity Destiny Portfolios: Destiny II
Statement of Assets and Liabilities
|
September 30, 2000 |
||
|
Assets |
|
|
|
Investment in securities, at value |
|
$ 6,314,807,888 |
|
Receivable for investments sold |
|
84,498,306 |
|
Receivable for fund shares sold |
|
256,197 |
|
Dividends receivable |
|
3,957,253 |
|
Interest receivable |
|
1,744,768 |
|
Other receivables |
|
18,696 |
|
Total assets |
|
6,405,283,108 |
|
Liabilities |
|
|
|
Payable to custodian bank |
$ 370,404 |
|
|
Payable for investments purchased |
73,191,983 |
|
|
Payable for fund shares redeemed |
1,377,093 |
|
|
Accrued management fee |
3,056,306 |
|
|
Distribution fees payable |
3,900 |
|
|
Other payables and accrued expenses |
487,592 |
|
|
Collateral on securities loaned, at value |
64,627,700 |
|
|
Total liabilities |
|
$ 143,114,978 |
|
Net Assets |
|
$ 6,262,168,130 |
|
Net Assets consist of: |
|
|
|
Paid in capital |
|
$ 4,165,044,830 |
|
Undistributed net investment income |
|
25,557,974 |
|
Accumulated undistributed net realized gain (loss) on investments and foreign currency transactions |
|
503,953,512 |
|
Net unrealized appreciation (depreciation) on investments and assets and liabilities in foreign currencies |
|
1,567,611,814 |
|
Net Assets |
|
$ 6,262,168,130 |
|
Class O: |
|
$16.13 |
|
Class N: |
|
$15.94 |
Statement of Operations
|
|
Year ended September 30, 2000 |
|
|
Investment Income Dividends |
|
$ 39,271,585 |
|
Interest |
|
16,046,182 |
|
Security lending |
|
1,132,017 |
|
Total income |
|
56,449,784 |
|
Expenses |
|
|
|
Management fee |
$ 34,983,993 |
|
|
Performance adjustment |
(1,567,750) |
|
|
Transfer agent fees |
312,921 |
|
|
Distribution fees |
22,690 |
|
|
Accounting and security lending fees |
815,421 |
|
|
Non-interested trustees' compensation |
29,135 |
|
|
Custodian fees and expenses |
330,760 |
|
|
Registration fees |
163,536 |
|
|
Audit |
47,019 |
|
|
Legal |
15,944 |
|
|
Miscellaneous |
71,892 |
|
|
Total expenses before reductions |
35,225,561 |
|
|
Expense reductions |
(1,266,665) |
33,958,896 |
|
Net investment income |
|
22,490,888 |
|
Realized and Unrealized Gain (Loss) Net realized gain (loss) on: |
|
|
|
Investment securities |
532,244,815 |
|
|
Foreign currency transactions |
129,392 |
532,374,207 |
|
Change in net unrealized appreciation (depreciation) on: |
|
|
|
Investment securities |
508,094,592 |
|
|
Assets and liabilities in |
(16,396) |
508,078,196 |
|
Net gain (loss) |
|
1,040,452,403 |
|
Net increase (decrease) in net assets resulting from operations |
|
$ 1,062,943,291 |
See accompanying notes which are an integral part of the financial statements.
Annual Report
Fidelity Destiny Portfolios: Destiny II
Financial Statements - continued
Statement of Changes in Net Assets
|
|
Year ended
September 30, |
Year ended
September 30, |
|
Increase (Decrease) in Net Assets |
|
|
|
Operations |
$ 22,490,888 |
$ 40,217,501 |
|
Net realized gain (loss) |
532,374,207 |
514,603,714 |
|
Change in net unrealized appreciation (depreciation) |
508,078,196 |
644,423,653 |
|
Net increase (decrease) in net assets resulting from operations |
1,062,943,291 |
1,199,244,868 |
|
Distributions to shareholders |
(39,217,077) |
(34,149,944) |
|
From net realized gain |
(509,476,717) |
(864,396,346) |
|
Total distributions |
(548,693,794) |
(898,546,290) |
|
Share transactions - net increase (decrease) |
520,091,432 |
957,719,512 |
|
Total increase (decrease) in net assets |
1,034,340,929 |
1,258,418,090 |
|
Net Assets |
|
|
|
Beginning of period |
5,227,827,201 |
3,969,409,111 |
|
End of period (including undistributed net investment income of $25,557,974 and $39,810,345, respectively) |
$ 6,262,168,130 |
$ 5,227,827,201 |
Financial Highlights - Class O
|
Years ended September 30, |
2000 |
1999 |
1998 |
1997 |
1996 E |
|
Selected Per-Share Data |
|
|
|
|
|
|
Net asset value, beginning of period |
$ 14.76 |
$ 14.07 |
$ 14.40 |
$ 11.61 |
$ 10.57 |
|
Income from Investment Operations |
|
|
|
|
|
|
Net investment income |
.06 C |
.12 C |
.18 C |
.27 C |
.24 |
|
Net realized and unrealized gain (loss) |
2.85 |
3.73 |
.71 |
3.52 |
1.34 |
|
Total from investment operations |
2.91 |
3.85 |
.89 |
3.79 |
1.58 |
|
Less Distributions |
|
|
|
|
|
|
From net investment income |
(.11) |
(.12) |
(.25) |
(.25) |
(.22) |
|
From net realized gain |
(1.43) |
(3.04) |
(.97) |
(.75) |
(.32) |
|
Total distributions |
(1.54) |
(3.16) |
(1.22) |
(1.00) |
(.54) |
|
Net asset value, end of period |
$ 16.13 |
$ 14.76 |
$ 14.07 |
$ 14.40 |
$ 11.61 |
|
Total Return A, B |
20.25% |
30.06% |
6.64% |
34.72% |
15.43% |
|
Ratios and Supplemental Data |
|
|
|
|
|
|
Net assets, end of period (000 omitted) |
$ 6,242,943 |
$ 5,226,303 |
$ 3,969,409 |
$ 3,609,144 |
$ 2,538,407 |
|
Ratio of expenses to average net assets |
.58% |
.48% |
.48% |
.54% |
.78% |
|
Ratio of expenses to average net assets after expense reductions |
.56% D |
.47% D |
.48% |
.53% D |
.78% |
|
Ratio of net investment income to average net assets |
.37% |
.79% |
1.23% |
2.11% |
2.38% |
|
Portfolio turnover |
113% |
77% |
106% |
35% |
37% |
|
A The total returns would have been lower had certain expenses not been reduced during the periods shown. B Total returns do not include the effects of the separate sales charge and other fees assessed through Fidelity Systematic Investment Plans. C Net investment income per share has been calculated based on average shares outstanding during the period. D FMR or the fund has entered into varying arrangements with third parties who either paid or reduced a portion of the class' expenses. E Per-share data have been adjusted for a 3 for 1 share split paid June 21, 1996. |
|||||
See accompanying notes which are an integral part of the financial statements.
Annual Report
Fidelity Destiny Portfolios: Destiny II
Financial Statements - continued
Financial Highlights - Class N
|
Year ended September 30, |
2000 |
1999 F |
|
Selected Per-Share Data |
|
|
|
Net asset value, beginning of period |
$ 14.72 |
$ 15.35 |
|
Income from Investment Operations |
|
|
|
Net investment income (loss) D |
(.08) |
.00 |
|
Net realized and unrealized gain (loss) |
2.83 |
(.63) G |
|
Total from investment operations |
2.75 |
(.63) |
|
Less Distributions |
|
|
|
From net investment income |
(.10) |
- |
|
From net realized gain |
(1.43) |
- |
|
Total distributions |
(1.53) |
- |
|
Net asset value, end of period |
$ 15.94 |
$ 14.72 |
|
Total Return B, C |
19.13% |
(4.10)% |
|
Ratios and Supplemental Data |
|
|
|
Net assets, end of period (000 omitted) |
$ 19,225 |
$ 1,524 |
|
Ratio of expenses to average net assets |
1.45% |
1.35% A |
|
Ratio of expenses to average net assets after expense reductions |
1.43% E |
1.33% A, E |
|
Ratio of net investment income (loss) to average net assets |
(.51)% |
(.07)% A |
|
Portfolio turnover |
113% |
77% |
|
A Annualized B The total returns would have been lower had certain expenses not been reduced during the periods shown. C Total returns do not include the effects of the separate sales charge and other fees assessed through Fidelity Systematic Investment Plans and for periods of less than one year are not annualized. D Net investment income (loss) per share has been calculated based on average shares outstanding during the period. E FMR or the fund has entered into varying arrangements with third parties who either paid or reduced a portion of the class' expenses. F For the period April 30, 1999 (commencement of sale of Class N shares) to September 30, 1999. G The amount shown for a share outstanding does not correspond with the aggregate net gain on investments for the period due to the timing of sales and repurchases of class shares in relation to fluctuating market values of the investments of the fund. |
||
See accompanying notes which are an integral part of the financial statements.
Annual Report
For the period ended September 30, 2000
1. Significant Accounting Policies.
Destiny I and Destiny II (the funds) are funds of Fidelity Destiny Portfolios (the trust). The trust is registered under the Investment Company Act of 1940, as amended (the 1940 Act), as an open-end management investment company organized as a Massachusetts business trust. Each fund is authorized to issue an unlimited number of shares.
Each fund offers two classes of shares, Class O and Class N, each of which has equal rights as to assets and voting privileges. Each class has exclusive voting rights with respect to matters that affect that class. Investment income, realized and unrealized capital gains and losses, the common expenses of the funds, and certain fund-level expense reductions, if any, are allocated on a pro rata basis to each class based on the relative net assets of each class to the total net assets of each fund. Each class of shares differs in its respective distribution and transfer agent expenses, and expense reductions. Shares of each fund are offered to the general public through Fidelity Systematic Investment Plans: Destiny Plans I and Destiny Plans II (the Plans), a unit investment trust with four series.
The financial statements have been prepared in conformity with generally accepted accounting principles which require management to make certain estimates and assumptions at the date of the financial statements. The following summarizes the significant accounting policies of the funds:
Security Valuation. Securities for which exchange quotations are readily available are valued at the last sale price, or if no sale price, at the closing bid price. Foreign securities are valued based on quotations from the principal market in which such securities are normally traded. If trading or events occurring in other markets after the close of the principal market in which foreign securities are traded, and before the close of the business of the fund, are expected to materially affect the value of those securities, then they are valued at their fair value taking this trading or these events into account. Fair value is determined in good faith under consistently applied procedures under the general supervision of the Board of Trustees. Securities (including restricted securities) for which exchange quotations are not readily available (and in certain cases debt securities which trade on an exchange) are valued primarily using dealer-supplied valuations or at their fair value. Short-term securities with remaining maturities of sixty days or less for which quotations are not readily available are valued at amortized cost or original cost plus accrued interest, both of which approximate current value. Investments in open-end investment companies are valued at their net asset value each business day.
Foreign Currency Translation. The accounting records of the funds are maintained in U.S. dollars. Investment securities and other assets and liabilities denominated in a foreign currency are translated into U.S. dollars at the prevailing rates of exchange at period end. Purchases and sales of securities, income receipts and expense payments are translated into U.S. dollars at the prevailing exchange rate on the respective dates of the transactions.
Net realized gains and losses on foreign currency transactions represent net gains and losses from sales and maturities of foreign currency contracts, disposition of foreign currencies, the difference between the amount of net investment income accrued and the U.S. dollar amount actually received, and gains and losses between trade and settlement date on purchases and sales of securities. The effects of changes in foreign currency exchange rates on investments in securities are included with the net realized and unrealized gain or loss on investment securities.
Income Taxes. As a qualified regulated investment company under Subchapter M of the Internal Revenue Code, each fund is not subject to income taxes to the extent that it distributes substantially all of its taxable income for the fiscal year. The schedules of investments include information regarding income taxes under the caption "Income Tax Information."
Investment Income. Dividend income is recorded on the ex-dividend date. Non-cash dividends included in dividend income, if any, are recorded at the fair market value of the securities received. Interest income, which includes accretion of original issue discount, is accrued as earned. Investment income is recorded net of foreign taxes withheld where recovery of such taxes is uncertain.
Expenses. Most expenses of the trust can be directly attributed to a fund. Expenses which cannot be directly attributed are apportioned among the funds in the trust.
Deferred Trustee Compensation. Under a Deferred Compensation Plan (the Plan) non-interested Trustees must defer receipt of a portion of, and may elect to defer receipt of an additional portion of, their annual compensation. Deferred amounts are treated as though equivalent dollar amounts had been invested in shares of the fund or are invested in a cross-section of other Fidelity funds. Deferred amounts remain in the fund until distributed in accordance with the Plan.
Distributions to Shareholders. Distributions are recorded on the ex-dividend date. Income dividends and capital gain distributions are declared separately for each class.
Income and capital gain distributions are determined in accordance with income tax regulations which may differ from generally accepted accounting principles. These differences, which may result in distribution reclassifications, are primarily due to differing treatments for litigation proceeds, foreign currency transactions, partnerships, non-taxable dividends and losses deferred due to wash sales. The funds also utilized earnings and profits distributed to shareholders on redemption of shares as a part of the dividends paid deduction for income tax purposes.
Permanent book and tax basis differences relating to shareholder distributions will result in reclassifications to paid in capital. Undistributed net investment income and accumulated undistributed net realized gain (loss) on investments and foreign currency transactions may include temporary book and tax basis differences which will reverse in a subsequent period. Any taxable income or gain remaining at fiscal year end is distributed in the following year.
Security Transactions. Security transactions are accounted for as of trade date. Gains and losses on securities sold are determined on the basis of identified cost.
Annual Report
Notes to Financial Statements - continued
2. Operating Policies.
Foreign Currency Contracts. The funds may use foreign currency contracts to facilitate transactions in foreign-denominated securities. Losses may arise from changes in the value of the foreign currency or if the counterparties do not perform under the contracts' terms. The U.S. dollar value of foreign currency contracts is determined using contractual currency exchange rates established at the time of each trade.
Joint Trading Account. Pursuant to an Exemptive Order issued by the Securities and Exchange Commission (the SEC), the funds, along with other affiliated entities of Fidelity Management & Research Company (FMR), may transfer uninvested cash balances into one or more joint trading accounts. These balances are invested in one or more repurchase agreements for U.S. Treasury or Federal Agency obligations.
Repurchase Agreements. The underlying U.S. Treasury, Federal Agency, or other obligations found to be satisfactory by FMR are transferred to an account of the funds, or to the Joint Trading Account, at a custodian bank. The securities are marked-to-market daily and maintained at a value at least equal to the principal amount of the repurchase agreement (including accrued interest). FMR, the funds' investment adviser, is responsible for determining that the value of the underlying securities remains in accordance with the market value requirements stated above.
Restricted Securities. The funds are permitted to invest in securities that are subject to legal or contractual restrictions on resale. These securities generally may be resold in transactions exempt from registration or to the public if the securities are registered. Disposal of these securities may involve time-consuming negotiations and expense, and prompt sale at an acceptable price may be difficult. Information regarding restricted securities is included under the caption "Other Information" at the end of each applicable fund's schedule of investments.
3. Purchases and Sales of Investments.
Information regarding purchases and sales of securities (other than short-term securities), is included under the caption "Other Information" at the end of each applicable fund's schedule of investments.
4. Fees and Other Transactions with Affiliates.
Management Fee. As each fund's investment adviser, FMR receives a monthly basic fee that is calculated on the basis of a group fee rate plus a fixed individual fund fee rate applied to the average net assets of each fund. The group fee rate is the weighted average of a series of rates and is based on the monthly average net assets of all the mutual funds advised by FMR. The rates ranged from .2167% to .5200% for the period for the funds. The annual individual fund fee rate is .17% and .30% for the Destiny I and Destiny II funds, respectively. In the event that these rates were lower than the contractual rates in effect during the period, FMR voluntarily implemented the above rates, as they resulted in the same or a lower management fee. The basic fee is subject to a performance adjustment (up to a maximum of -.24% of each fund's average net assets up to and including $100,000,000 and -.20% of each fund's average net assets in excess of $100,000,000 over the performance period) based on each fund's investment performance as compared to the appropriate index over a specified period of time. For the period, the management fees were equivalent to annual rates of .25% and .55%, respectively of average net assets after the performance adjustment for the Destiny I and Destiny II funds, respectively. Effective July 1, 1999 each fund's performance adjustment will be phased out over an 18 month period. During the phase out period the performance adjustment can decrease, but not increase, the management fee owed by the funds.
Sub-Adviser Fee. Beginning January 1, 2001, FMR Co. (FMRC) will serve as sub-adviser for the funds. FMRC is a wholly owned subsidiary of FMR and will receive a fee from FMR of 50% of the management fee payable to FMR.
Distribution and Service Plan. In accordance with Rule 12b-1 of the 1940 Act, the Board of Trustees has adopted a Distribution and Service Plan (the Plan) for Class N for each fund. During the period, Class N paid Fidelity Distributors Corporation (FDC), an affiliate of FMR, a service fee based on an annual rate of .25% of Class N's average net assets pursuant to the Plan. For the period, Class N paid FDC the following amounts:
|
|
Paid to FDC |
|
|
Destiny I |
$ 3,366 |
|
|
Destiny II |
$ 22,690 |
|
Transfer Agent Fees. Fidelity Service Company, Inc., (FSC), an affiliate of FMR, is the transfer, dividend disbursing and shareholder servicing agent for each class of the funds. For Class O non-Destiny Plan accounts, FSC receives account fees and asset-based fees that vary according to account size and type of account. FSC does not receive a fee for Class O Destiny Plan accounts. For Class N, FSC receives a fee based on monthly Plan payment amounts or per transaction that may not exceed an annual rate of .63% of the Class N shares' average net assets. In addition, FSC pays for typesetting, printing, and mailing of all shareholder reports, except proxy statements. For the period, the following amounts were paid to FSC:
|
Destiny I |
Amount |
% of |
|
Class O |
$ 418,885 |
.01 |
|
Class N |
8,504 |
.63 |
|
|
$ 427,389 |
|
|
Destiny II |
Amount |
% of |
|
Class O |
$ 255,580 |
.00 |
|
Class N |
57,341 |
.63 |
|
|
$ 312,921 |
|
Accounting and Security Lending Fees. FSC maintains each fund's accounting records and administers the security lending program. The security lending fee is based on the number and duration of lending transactions. The accounting fee is based on the level of average net assets for the month plus out-of-pocket expenses.
Annual Report
Notes to Financial Statements - continued
4. Fees and Other Transactions with Affiliates - continued
Fidelity Cash Central Fund. Pursuant to an Exemptive Order issued by the SEC, the funds may invest in the Fidelity Cash Central Fund (the Cash Fund) managed by Fidelity Institutional Money Management, Inc., an affiliate of FMR. The Cash Fund is an open-end money market fund available only to investment companies and other accounts managed by FMR and its affiliates. The Cash Fund seeks preservation of capital, liquidity, and current income. Income distributions from the Cash Fund are declared daily and paid monthly from net interest income. Income distributions earned by the fund are recorded as either interest income or security lending income in the accompanying financial statements.
Brokerage Commissions. The funds placed a portion of their portfolio transactions with brokerage firms which are affiliates of FMR. The commissions paid to these affiliated firms for Destiny I and Destiny II were $333,734 and $253,138, respectively for the period.
5. Security Lending.
Certain funds lend portfolio securities from time to time in order to earn additional income. Each applicable fund receives collateral (in the form of U.S. Treasury obligations, letters of credit and/or cash) against the loaned securities and maintains collateral in an amount not less than 100% of the market value of the loaned securities during the period of the loan. The market value of the loaned securities is determined at the close of business of the funds and any additional required collateral is delivered to the funds on the next business day. If the borrower defaults on its obligation to return the securities loaned because of insolvency or other reasons, a fund could experience delays and costs in recovering the securities loaned or in gaining access to the collateral. Information regarding the value of securities loaned and the value of collateral at period end is included under the caption "Other Information" at the end of each applicable fund's schedule of investments.
6. Bank Borrowings.
The funds are permitted to have bank borrowings for temporary or emergency purposes to fund shareholder redemptions. The funds have established borrowing arrangements with certain banks. The interest rate on the borrowings is the bank's base rate, as revised from time to time. For Destiny I, the average daily loan balance during the period for which the loan was outstanding amounted to $6,895,000. The weighted average interest rate was 5.90%. For Destiny II, there were no loans during the period.
7. Expense Reductions.
FMR has directed certain portfolio trades to brokers who paid a portion of the fund's expenses. For the period, each fund's expenses were reduced by $1,585,969 and $1,247,764 under this arrangement for Destiny I and Destiny II, respectively.
In addition, each fund has entered into arrangements with its custodian and each class' transfer agent, whereby credits realized as a result of uninvested cash balances were used to reduce a portion of expenses. During the period, each fund's custodian fees were reduced by $8,272 and $4,681 for Destiny I and Destiny II, respectively under the custodian arrangement. Each applicable class' expenses were reduced as follows under the transfer agent arrangements:
Destiny I
|
|
Transfer |
|
Class O |
$ 23,904 |
Destiny II
|
|
Transfer |
|
Class O |
$ 14,220 |
Annual Report
Notes to Financial Statements - continued
8. Distributions to Shareholders.
Distributions to shareholders of each class were as follows:
Destiny I
|
|
Years ended September 30, |
|
|
|
2000 |
1999 A |
|
From net investment income |
|
|
|
Class O |
$ 114,852,495 |
$ 105,484,207 |
|
Class N |
6,070 |
- |
|
Total |
$ 114,858,565 |
$ 105,484,207 |
|
From net realized gain |
|
|
|
Class O |
$ 897,856,524 |
$ 544,915,685 |
|
Class N |
55,890 |
- |
|
Total |
$ 897,912,414 |
$ 544,915,685 |
|
|
$ 1,012,770,979 |
$ 650,399,892 |
Destiny II
|
|
Years ended September 30, |
|
|
|
2000 |
1999 A |
|
From net investment income |
|
|
|
Class O |
$ 39,189,835 |
$ 34,149,944 |
|
Class N |
27,242 |
- |
|
Total |
$ 39,217,077 |
$ 34,149,944 |
|
From net realized gain |
|
|
|
Class O |
$ 509,166,630 |
$ 864,396,346 |
|
Class N |
310,087 |
- |
|
Total |
$ 509,476,717 |
$ 864,396,346 |
|
Total Distributions |
$ 548,693,794 |
$ 898,546,290 |
A Distributions for Destiny I: Class N and Destiny II: Class N are for the period April 30, 1999 (commencement of sale of shares) to September 30, 1999.
Annual Report
Notes to Financial Statements - continued
9. Share Transactions.
Transactions for each class of shares were as follows:
Destiny I
|
|
Shares |
Dollars |
||
|
|
Year ended September 30, |
Year ended September 30, |
Year ended September 30, |
Year ended September 30, |
|
|
2000 |
1999 A |
2000 |
1999 A |
|
|
|
|
|
|
|
Class O |
10,121,533 |
9,223,182 |
$ 247,091,425 |
$ 248,764,091 |
|
Reinvestment of distributions |
36,918,705 |
22,671,053 |
880,880,397 |
575,618,075 |
|
Shares redeemed |
(32,842,158) |
(21,478,357) |
(776,372,755) |
(584,597,461) |
|
Net increase (decrease) |
14,198,080 |
10,415,878 |
$ 351,599,067 |
$ 239,784,705 |
|
Class N |
135,884 |
9,786 |
$ 3,103,245 |
$ 272,403 |
|
Reinvestment of distributions |
2,602 |
- |
59,465 |
- |
|
Shares redeemed |
(7,425) |
(114) |
(167,281) |
(3,198) |
|
Net increase (decrease) |
131,061 |
9,672 |
$ 2,995,429 |
$ 269,205 |
Destiny II
|
|
Shares |
Dollars |
||
|
|
Year ended September 30, |
Year ended September 30, |
Year ended September 30, |
Year ended September 30, |
|
|
2000 |
1999 A |
2000 |
1999 A |
|
|
|
|
|
|
|
Class O |
45,411,519 |
42,363,720 |
$ 716,733,769 |
$ 629,670,010 |
|
Reinvestment of distributions |
34,359,293 |
66,407,354 |
527,413,256 |
875,248,918 |
|
Shares redeemed |
(46,803,164) |
(36,859,021) |
(741,499,830) |
(548,780,811) |
|
Net increase (decrease) |
32,967,648 |
71,912,053 |
$ 502,647,195 |
$ 956,138,117 |
|
Class N |
1,137,584 |
105,039 |
$ 18,003,674 |
$ 1,603,569 |
|
Reinvestment of distributions |
22,042 |
- |
336,797 |
- |
|
Shares redeemed |
(56,991) |
(1,461) |
(896,234) |
(22,174) |
|
Net increase (decrease) |
1,102,635 |
103,578 |
$ 17,444,237 |
$ 1,581,395 |
A Share transactions for Destiny I: Class N and Destiny II: Class N are for the period April 30, 1999 (commencement of sale of shares) to September 30, 1999.
Annual Report
To the Trustees and Shareholders of Fidelity Destiny Portfolios: Destiny I and Destiny II:
We have audited the accompanying statements of assets and liabilities of Destiny I and Destiny II, (funds of Fidelity Destiny Portfolios), including the portfolios of investments, as of September 30, 2000, and the related statements of operations for the year then ended, the statements of changes in net assets for each of the two years in the period then ended, and the financial highlights for each of the five years in the period then ended. These financial statements and financial highlights are the responsibility of the Funds' management. Our responsibility is to express an opinion on these financial statements and financial highlights based on our audits.
We conducted our audits in accordance with auditing standards generally accepted in the United States of America. Those standards require that we plan and perform the audit to obtain reasonable assurance about whether the financial statements and financial highlights are free of material misstatement. An audit includes examining, on a test basis, evidence supporting the amounts and disclosures in the financial statements. Our procedures included confirmation of securities owned as of September 30, 2000, by correspondence with the custodian and brokers; where replies were not received from brokers, we performed other auditing procedures. An audit also includes assessing the accounting principles used and significant estimates made by management, as well as evaluating the overall financial statement presentation. We believe that our audits provide a reasonable basis for our opinion.
In our opinion, the financial statements and financial highlights referred to above present fairly, in all material respects, the financial position of Destiny I and Destiny II as of September 30, 2000, the results of their operations for the year then ended, the changes in their net assets for each of the two years in the period then ended, and their financial highlights for each of the five years in the period then ended, in conformity with accounting principles generally accepted in the United States of America.
/s/DELOITTE & TOUCHE LLP
DELOITTE & TOUCHE LLP
Boston, Massachusetts
November 17, 2000
Annual Report
The funds hereby designates 100% of the long-term capital gain dividends distributed during the fiscal year as 20%-rate capital gain dividends.
A total of 22.60% and 9.16% of the dividends distributed during the fiscal year was derived from interest on U.S. Government securities which is generally exempt from state income tax for Destiny I and Destiny II, respectively.
A total of 48%, 100%, 56% and 100% of the dividends distributed by Destiny I: Class O, Destiny II: Class O, Destiny I: Class N and Destiny II: Class N, respectively during the fiscal year qualifies for the dividends-received deduction for corporate shareholders.
The fund will notify shareholders in January 2001 of amounts for use in preparing 2000 income tax returns.
Annual Report
Annual Report
Annual Report
Annual Report
Fidelity
Destiny Portfolios:
Destiny I - Class O
Destiny II - Class O
82 Devonshire Street,
Boston, Massachusetts 02109
INVESTMENT ADVISER
Fidelity Management & Research Company
Boston, MA
INVESTMENT SUB-ADVISERS
Fidelity Management & Research (U.K.) Inc.
Fidelity Management & Research (Far East) Inc.
Fidelity Investments Japan Limited
OFFICERS
Edward C. Johnson 3d, President
Robert C. Pozen, Senior Vice President
Abigail P. Johnson, Vice President
Karen Firestone, Vice President (Destiny I)
Adam Hetnarski, Vice President (Destiny II)
Eric D. Roiter, Secretary
Robert A. Dwight, Treasurer
Maria F. Dwyer, Deputy Treasurer
John H. Costello, Assistant Treasurer
Thomas J. Simpson, Assistant Treasurer
BOARD OF TRUSTEES
Ralph F. Cox *
Phyllis Burke Davis *
Robert M. Gates *
Edward C. Johnson 3d
Donald J. Kirk *
Ned C. Lautenbach *
Peter S. Lynch
Marvin L. Mann *
William O. McCoy *
Gerald C. McDonough *
Robert C. Pozen
Thomas R. Williams *
ADVISORY BOARD
J. Michael Cook
Marie L. Knowles
GENERAL DISTRIBUTOR
Fidelity Distributors Corporation
Boston, MA
TRANSFER AND SHAREHOLDER
SERVICING AGENT
Fidelity Service Company, Inc.
Boston, MA
CUSTODIAN
State Street Bank and Trust Company
Boston, MA
* Independent trustees
(Recycle graphic)
Printed on recycled paper
6i-117183
DES-ANN-1100
1.537812.103
|
|