
|
|
|
|
|
|
|
|
|
|
Previous: EATON VANCE SPECIAL INVESTMENT TRUST, 497, 2000-09-18 |
Next: FORD MOTOR CO, 8-K, 2000-09-18 |
Fidelity®
Fund
Semiannual Report
July 31, 2000
(2_fidelity_logos) (Registered_Trademark)
|
President's Message |
3 |
Ned Johnson on investing strategies. |
|
Performance |
4 |
How the fund has done over time. |
|
Fund Talk |
6 |
The manager's review of fund performance, strategy and outlook. |
|
Investment Changes |
9 |
A summary of major shifts in the fund's investments over the past six months. |
|
Investments |
10 |
A complete list of the fund's investments with their market values. |
|
Financial Statements |
27 |
Statements of assets and liabilities,
operations, and changes in net assets, |
|
Notes |
31 |
Notes to the financial statements. |
Standard & Poor's, S&P and S&P 500 are registered service marks of The McGraw-Hill Companies, Inc. and have been licensed for use by Fidelity Distributors Corporation.
Other third party marks appearing herein are the property of their respective owners.
All other marks appearing herein are registered or unregistered trademarks or service marks of FMR Corp. or an affiliated company.
(Recycle graphic) This report is printed on recycled paper using soy-based inks. This report and the financial statements contained herein are submitted for the
general information
of the shareholders of the fund. This report is not authorized for distribution to prospective investors
in the fund unless preceded or accompanied by an effective prospectus.
Mutual fund shares are not deposits or obligations of, or guaranteed by, any depository institution. Shares are not insured by the FDIC, Federal Reserve Board or any other agency, and are subject to investment risks, including possible loss of principal amount invested.
Neither the fund nor Fidelity Distributors Corporation is a bank.
For more information on any Fidelity fund, including charges and expenses, call 1-800-544-6666 for a free prospectus. Read it carefully before you invest or send money.
Semiannual Report
(photo_of_Edward_C_Johnson_3d)
Dear Shareholder:
The Federal Reserve Board's effort to keep inflation in check without over-cooling the U.S. economy has taken a toll on the stock market. Through July 2000, bellwether equity indexes such as the Dow Jones Industrial Average, NASDAQ and S&P 500® have negative returns for the year. On the other hand, fixed-income markets are enjoying strong performance. Except for high-yield, most bond sectors - corporates, mortgages, Treasuries and agencies - have returned 4%-6% year to date.
While it's impossible to predict the future direction of the markets with any degree of certainty, there are certain basic principles that can help investors plan for their future needs.
First, investors are encouraged to take a long-term view of their portfolios. If you can afford to leave your money invested through the inevitable up and down cycles of the financial markets, you will greatly reduce your vulnerability to any single decline. We know from experience, for example, that stock prices have gone up over longer periods of time, have significantly outperformed other types of investments and have stayed ahead of inflation.
Second, you can further manage your investing risk through diversification. A stock mutual fund, for instance, is already diversified, because it invests in many different companies. You can increase your diversification further by investing in a number of different stock funds, or in such other investment categories as bonds. If you have a short investment time horizon, you might want to consider moving some of your investment into a money market fund, which seeks income and a stable share price by investing in high-quality, short-term investments. Of course, it's important to remember that an investment in a money market fund is not insured or guaranteed by the Federal Deposit Insurance Corporation or any other government agency. Although money market funds seek to preserve the value of your investment at $1.00 per share, it is possible to lose money by investing in these types of funds.
Finally, no matter what your time horizon or portfolio diversity, it makes good sense to follow a regular investment plan, investing a certain amount of money in a fund at the same time each month or quarter and periodically reviewing your overall portfolio. By doing so, you won't get caught up in the excitement of a rapidly rising market, nor will you buy all your shares at market highs. While this strategy - known as dollar cost averaging - won't assure a profit or protect you from a loss in a declining market, it should help you lower the average cost of your purchases. Of course, you should consider your financial ability to continue your purchases through periods of low price levels before undertaking such a strategy.
If you have questions, please call us at 1-800-544-6666, or visit our web site at www.fidelity.com. We are available 24 hours a day, seven days a week to provide you the information you need to make the investments that are right for you.
Best regards,
/s/Edward C. Johnson 3d
Edward C. Johnson 3d
Semiannual Report
There are several ways to evaluate a fund's historical performance. You can look at the total percentage change in value, the average annual percentage change or the growth of a hypothetical $10,000 investment. Total return reflects the change in the value of an investment, assuming reinvestment of the fund's dividend income and capital gains (the profits earned upon the sale of securities that have grown in value).
Cumulative Total Returns
|
Periods ended July 31, 2000 |
Past 6 |
Past 1 |
Past 5 |
Past 10 |
|
Fidelity Equity-Income |
3.59% |
-3.83% |
105.78% |
304.71% |
|
Russell 3000 Value |
1.04% |
-4.34% |
116.57% |
315.59% |
|
Equity Income Funds Average |
2.72% |
-2.57% |
92.15% |
236.02% |
Cumulative total returns show the fund's performance in percentage terms over a set period - in this case, six months, one year, five years or 10 years. For example, if you had invested $1,000 in a fund that had a 5% return over the past year, the value of your investment would be $1,050. You can compare the fund's returns to the performance of the Russell 3000® Value Index - a market capitalization-weighted index of U.S. domiciled value-oriented stocks. To measure how the fund's performance stacked up against its peers, you can compare it to the equity income funds average, which reflects the performance of mutual funds with similar objectives tracked by Lipper Inc. The past six months average represents a peer group of 237 mutual funds. These benchmarks include reinvested dividends and capital gains, if any, and exclude the effect of sales charges. Lipper has created new comparison categories that group funds according to portfolio characteristics and capitalization, as well as by capitalization only. The averages are listed on page 5 of this report.*
Average Annual Total Returns
|
Periods ended July 31, 2000 |
|
Past 1 |
Past 5 |
Past 10 |
|
Fidelity Equity-Income |
|
-3.83% |
15.53% |
15.00% |
|
Russell 3000 Value |
|
-4.34% |
16.71% |
15.31% |
|
Equity Income Funds Average |
|
-2.57% |
13.81% |
12.74% |
Average annual total returns take the fund's cumulative return and show you what would have happened if the fund had performed at a constant rate each year. (Note: Lipper calculates average annual total returns by annualizing each fund's total return, then taking an arithmetic average. This may produce a different figure than that obtained by averaging the cumulative total returns and annualizing the result.)
Semiannual Report
$10,000 Over 10 Years
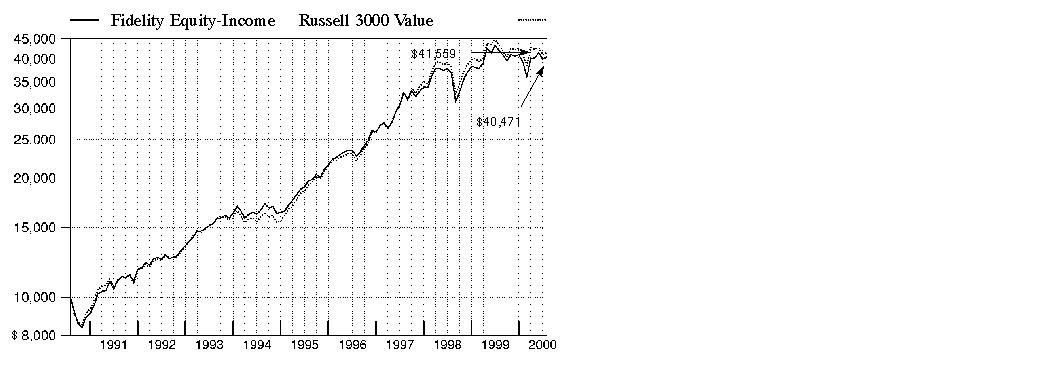
$10,000 Over 10 Years: Let's say hypothetically that $10,000 was invested in Fidelity Equity-Income Fund on July 31, 1990. As the chart shows, by July 31, 2000, the value of the investment would have grown to $40,471 - a 304.71% increase on the initial investment. For comparison, look at how the Russell 3000 Value Index did over the same period. With dividends and capital gains, if any, reinvested, the same $10,000 would have grown to $41,559 - a 315.59% increase.
Understanding
Performance
How a fund did yesterday is no guarantee of how it will do tomorrow. The stock market, for example, has a history of long-term growth and short-term volatility. In turn, the share price and return of a fund that invests in stocks will vary. That means if you sell your shares during a market downturn, you might lose money. But if you can ride out the market's ups and downs, you may have a gain.
3* The Lipper equity income funds average reflects the performance (excluding sales charges) of mutual funds with similar portfolio characteristics and capitalization. As of July
31, 2000, the six month, one year, five year, and 10 year cumulative total returns for the equity income funds were 2.47%, -3.68%, 87.03%, and 232.72%, respectively; and the one
year, five year, and
ten year average annual total returns were -3.68%, 13.25%, and 12.66%, respectively.
Semiannual Report
Market Recap
Volatility and rising interest rates were the main factors influencing equity investors during the six-month period that ended July 31, 2000. The U.S. equity markets struggled to break free from the grip of the Federal Reserve Board, whose effort to cool the overheated economy was delivered via a series of interest-rate hikes. With every clench of its fist, the Fed's effort - which raised the federal funds rate three times by a combined total of 1.0% - gradually tempered the optimism toward stocks as the period progressed. The effect of the Fed's tightening, coupled with the market's concerns about corporate earnings, took its toll beginning in March with a correction in technology stocks. The seemingly invincible NASDAQ Composite Index, which had soared to a 19.2% gain in February, dropped more than 10% in March and shed 25% during a single week in April, before finishing the volatile period with a -4.31% return. The Dow Jones Industrial Average, the blue chips' benchmark, returned -3.08%, while the Standard & Poor's 500 SM Index, an index of 500 commonly held large-cap companies, fared better, gaining 3.20%. Growing concerns about a potential economic slowdown also affected small-cap stocks, as evidenced by the Russell 2000®'s mere 1.35% six-month advance. The S&P and Russell indexes weren't immune from the market's indecisiveness, dropping 1.56% and 3.22%, respectively, during July.
(Portfolio Manager photograph)
An interview with Steve Petersen, Portfolio Manager of Fidelity Equity-Income Fund
Q. How did the fund perform, Steve?
A. For the six-month period ending July 31, 2000, the fund returned 3.59%, outperforming the 2.72% return of the equity income funds average, as tracked by Lipper Inc. By comparison, the Russell 3000 Value Index returned 1.04% during the same time period. For the 12-month period ending July 31, 2000, the fund was down 3.83%, compared to the -2.57% and -4.34% returns of the Lipper average and the Russell index, respectively.
Q. What strategy did you use in the past six-month period to outperform the fund's benchmark and peer group?
A. I continued to follow my long-term strategy of emphasizing companies that pay dividend yields, show signs of improvement in their business fundamentals and have good valuations. The most important aspect of the fund's performance relative to the index and its peers was the huge swing in technology stock prices. Until mid-March, technology stocks led the market. That came to an end as the NASDAQ plummeted and was still struggling to recover at the end of the period. Given the fund's underweighting in technology relative to the Russell 3000 Value Index, the fund was not as exposed to these wild swings. The fund also held a lower proportion of technology stocks than many of its competitors, giving it an edge in performance.
Semiannual Report
Fund Talk: The Manager's Overview - continued
Q. Financial stocks accounted for a significant portion of the fund's holdings. How did they do?
A. Their performance was mixed. Fannie Mae continued to be plagued both by Congress' ongoing debate about whether the U.S. government should continue to implicitly guarantee its debt, and by higher interest rates. On the positive side, many financial companies that earned a higher percentage of their revenues from transactions or asset management businesses did well during the period. Fund holding Citigroup benefited from subsidiary Salomon Smith Barney's strong revenues, while Bank of New York's growing revenues from its successful custody business helped its performance. Growing optimism about improved pricing for commercial insurers and positive quarterly results helped the performance of Hartford Financial, a commercial insurer, and ACE Ltd., a specialty insurance company.
Q. Pharmaceutical stocks appeared to come back from their slump last year . . .
A. That's right. A growing perception of a slowing economy helped pharmaceutical stocks, which are considered defensive and tend to do well in a moderating economy. As a result, the fund's pharmaceutical holdings generally performed very well. Eli Lily was one example. The company developed a drug to treat sepsis, an often-fatal condition resulting from severe infection, and its stock soared following reports of promising clinical test results. Bristol-Myers Squibb, however, had disappointing performance. Its new hypertension drug, Vanlev, was pulled from its planned launch because of Food and Drug Administration concerns.
Q. Which stocks were disappointments?
A. AT&T was hurt by announcements that its earnings growth would be lower than expected. Its core business - consumer long-distance telephone services - has been rather flat over the past few years. Prices have declined while competition has increased. BellSouth and Bell Atlantic - now known as Verizon - also were hurt by these concerns. Honeywell's expectations for earnings growth also slipped. This multi-industry company saw a softening in a couple of its business lines, and its performance slumped.
Q. What's your near-term outlook, Steve?
A. The big question is how much the economy will slow. If it strengthens once again, showing the past couple of months to be an anomaly, it could cause the Federal Reserve Board to increase interest rates significantly, potentially causing a recession. On the other hand, if the Fed's tightening moves have been sufficient to slow the economy and reduce expectations for growth, perhaps even causing a bit of a correction in technology stocks, the market would probably perceive that as a very positive scenario. No matter what scenario evolves, I will continue to focus on finding very solid companies, looking for good value and strong dividend yields.
Semiannual Report
Fund Talk: The Manager's Overview - continued
The views expressed in this report reflect those of the portfolio manager only through the end of the period of the report as stated on the cover and do not necessarily represent the views of Fidelity or any other person in the Fidelity organization. Any such views are subject to change at any time based upon market or other conditions and Fidelity disclaims any responsibility to update such views. These views may not be relied on as investment advice and, because investment decisions for a Fidelity fund are based on numerous factors, may not be relied on as an indication of trading intent on behalf of any Fidelity fund.
Fund Facts
Goal: seeks reasonable income
Fund number: 023
Trading symbol: FEQIX
Start date: May 16, 1966
Size: as of July 31, 2000, more than $20.4 billion
Manager: Stephen Petersen,
since 1993; manager, Fidelity
Puritan Fund, since 2000;
Fidelity Balanced Fund,
1996-1997; joined Fidelity
in 1980
Stephen Petersen on recent shifts and their potential impact on the fund:
"Two important changes could potentially signal better news for the fund's common sense approach to investing. First, market sentiment has shifted, most particularly relative to technology stocks. The markets have become more suspicious about the ability of technology companies to deliver the growth that was expected. Second, the economy is slowing. These two factors lead me to believe that, slowly but surely, investors will gravitate back to a common sense approach once again.
"If the economy continues to slow, traditional cyclical companies could provide better-than-average earnings growth for some time, and investors may change their expectations for technology stocks, which could be detrimental to their performance. At the same time, the prospects for cyclical companies could improve, especially if pressure is taken off of interest rates. There are many good companies trading at very attractive valuation levels in the marketplace that I believe provide an important component of diversification to investors' portfolios. It's possible that these companies could enter a more positive environment over the coming months."
Semiannual Report
|
Top Ten Stocks as of July 31, 2000 |
||
|
|
% of fund's |
% of fund's net assets |
|
Citigroup, Inc. |
4.1 |
3.9 |
|
General Electric Co. |
3.5 |
4.1 |
|
Exxon Mobil Corp. |
3.4 |
3.4 |
|
BP Amoco PLC |
2.3 |
2.4 |
|
SBC Communications, Inc. |
2.3 |
2.0 |
|
TotalFinaElf SA |
2.2 |
1.8 |
|
Viacom, Inc. Class B (non-vtg.) |
2.2 |
1.8 |
|
Eli Lilly & Co. |
2.1 |
1.2 |
|
Fannie Mae |
2.1 |
2.3 |
|
Bank of New York Co., Inc. |
2.1 |
1.8 |
|
|
26.3 |
24.7 |
|
Top Five Market Sectors as of July 31, 2000 |
||
|
|
% of fund's |
% of fund's net assets |
|
Finance |
25.7 |
24.5 |
|
Energy |
14.7 |
14.4 |
|
Utilities |
10.2 |
12.0 |
|
Industrial Machinery & Equipment |
7.7 |
6.7 |
|
Health |
7.3 |
6.4 |
|
Asset Allocation (% of fund's net assets) |
|||||||
|
As of July 31, 2000 * |
As of January 31, 2000 ** |
||||||
 |
Stocks 92.6% |
|
|
Stocks 94.2% |
|
||
 |
Bonds 0.4% |
|
|
Bonds 0.4% |
|
||
 |
Convertible |
|
|
Convertible |
|
||
 |
Short-Term |
|
|
Short-Term |
|
||
|
* Foreign investments |
8.6% |
|
** Foreign investments |
9.0% |
|
||

Semiannual Report
(Unaudited)
Showing Percentage of Net Assets
|
Common Stocks - 92.6% |
|||
|
Shares |
Value (Note 1) (000s) |
||
|
AEROSPACE & DEFENSE - 3.6% |
|||
|
Aerospace & Defense - 3.3% |
|||
|
Boeing Co. |
3,212,900 |
$ 157,432 |
|
|
Honeywell International, Inc. |
3,573,650 |
120,164 |
|
|
Rockwell International Corp. |
1,194,400 |
41,879 |
|
|
Textron, Inc. |
3,115,100 |
177,755 |
|
|
United Technologies Corp. |
2,938,280 |
171,522 |
|
|
|
668,752 |
||
|
Ship Building & Repair - 0.3% |
|||
|
General Dynamics Corp. |
1,021,300 |
57,640 |
|
|
TOTAL AEROSPACE & DEFENSE |
726,392 |
||
|
BASIC INDUSTRIES - 4.8% |
|||
|
Chemicals & Plastics - 2.5% |
|||
|
Arch Chemicals, Inc. |
650,350 |
13,007 |
|
|
Celanese AG |
301,960 |
5,124 |
|
|
Crompton Corp. |
2,237,324 |
21,954 |
|
|
Dow Chemical Co. |
1,646,400 |
47,334 |
|
|
E.I. du Pont de Nemours and Co. |
1,246,885 |
56,499 |
|
|
Engelhard Corp. |
1,112,000 |
20,086 |
|
|
Great Lakes Chemical Corp. |
2,118,500 |
62,231 |
|
|
Hercules Trust II unit |
31,600 |
18,012 |
|
|
Hercules, Inc. |
1,762,100 |
26,321 |
|
|
IMC Global, Inc. |
3,281,500 |
45,326 |
|
|
M.A. Hanna Co. |
1,973,300 |
15,786 |
|
|
Millennium Chemicals, Inc. |
1,541,857 |
23,899 |
|
|
Olin Corp. |
1,430,500 |
22,441 |
|
|
Praxair, Inc. |
1,403,430 |
55,523 |
|
|
Rohm & Haas Co. |
389,100 |
10,117 |
|
|
Solutia, Inc. |
2,499,300 |
35,771 |
|
|
Union Carbide Corp. |
754,600 |
33,816 |
|
|
|
513,247 |
||
|
Iron & Steel - 0.5% |
|||
|
Allegheny Technologies, Inc. |
1,558,350 |
32,238 |
|
|
Dofasco, Inc. |
1,613,100 |
26,520 |
|
|
Nucor Corp. |
1,262,700 |
47,667 |
|
|
|
106,425 |
||
|
Metals & Mining - 1.0% |
|||
|
Alcoa, Inc. |
4,633,576 |
140,166 |
|
|
Common Stocks - continued |
|||
|
Shares |
Value (Note 1) (000s) |
||
|
BASIC INDUSTRIES - continued |
|||
|
Metals & Mining - continued |
|||
|
Phelps Dodge Corp. |
1,112,500 |
$ 45,265 |
|
|
Ryerson Tull, Inc. (e) |
1,534,295 |
13,521 |
|
|
|
198,952 |
||
|
Packaging & Containers - 0.2% |
|||
|
Ball Corp. |
786,228 |
27,272 |
|
|
Owens-Illinois, Inc. (a) |
1,425,500 |
18,977 |
|
|
|
46,249 |
||
|
Paper & Forest Products - 0.6% |
|||
|
Bowater, Inc. |
1,597,100 |
78,657 |
|
|
Georgia-Pacific Corp. |
411,800 |
10,218 |
|
|
Pentair, Inc. |
474,800 |
14,541 |
|
|
Smurfit-Stone Container Corp. (a) |
1,512,800 |
18,815 |
|
|
|
122,231 |
||
|
TOTAL BASIC INDUSTRIES |
987,104 |
||
|
CONSTRUCTION & REAL ESTATE - 1.5% |
|||
|
Building Materials - 0.4% |
|||
|
Fortune Brands, Inc. |
1,612,300 |
36,277 |
|
|
Masco Corp. |
2,549,100 |
50,345 |
|
|
|
86,622 |
||
|
Real Estate Investment Trusts - 1.1% |
|||
|
Alexandria Real Estate Equities, Inc. |
232,800 |
8,337 |
|
|
Crescent Real Estate Equities Co. |
1,608,100 |
35,479 |
|
|
Duke-Weeks Realty Corp. |
868,496 |
21,278 |
|
|
Equity Office Properties Trust |
1,053,200 |
32,123 |
|
|
Equity Residential Properties Trust (SBI) |
1,295,600 |
64,618 |
|
|
Public Storage, Inc. |
1,219,600 |
31,252 |
|
|
Spieker Properties, Inc. |
558,500 |
28,867 |
|
|
|
221,954 |
||
|
TOTAL CONSTRUCTION & REAL ESTATE |
308,576 |
||
|
DURABLES - 2.5% |
|||
|
Autos, Tires, & Accessories - 1.2% |
|||
|
ArvinMeritor, Inc. |
617,925 |
9,655 |
|
|
AutoNation, Inc. |
1,318,700 |
9,148 |
|
|
Eaton Corp. |
871,200 |
59,078 |
|
|
Goodyear Tire & Rubber Co. |
827,800 |
16,504 |
|
|
Common Stocks - continued |
|||
|
Shares |
Value (Note 1) (000s) |
||
|
DURABLES - continued |
|||
|
Autos, Tires, & Accessories - continued |
|||
|
Johnson Controls, Inc. |
677,000 |
$ 35,162 |
|
|
Navistar International Corp. (a) |
774,700 |
27,647 |
|
|
Pep Boys-Manny, Moe & Jack |
1,330,600 |
7,734 |
|
|
TRW, Inc. |
1,590,000 |
71,451 |
|
|
|
236,379 |
||
|
Consumer Durables - 0.9% |
|||
|
Minnesota Mining & Manufacturing Co. |
1,383,900 |
124,637 |
|
|
Snap-On, Inc. |
2,236,600 |
67,517 |
|
|
|
192,154 |
||
|
Consumer Electronics - 0.1% |
|||
|
Black & Decker Corp. |
504,800 |
18,772 |
|
|
Home Furnishings - 0.2% |
|||
|
Newell Rubbermaid, Inc. |
1,244,100 |
33,513 |
|
|
Textiles & Apparel - 0.1% |
|||
|
Kellwood Co. |
818,000 |
18,303 |
|
|
TOTAL DURABLES |
499,121 |
||
|
ENERGY - 14.5% |
|||
|
Energy Services - 2.1% |
|||
|
Baker Hughes, Inc. |
3,632,900 |
125,789 |
|
|
Halliburton Co. |
5,542,800 |
255,662 |
|
|
Schlumberger Ltd. (NY Shares) |
644,300 |
47,638 |
|
|
|
429,089 |
||
|
Oil & Gas - 12.4% |
|||
|
Anadarko Petroleum Corp. |
1,795,007 |
85,824 |
|
|
BP Amoco PLC sponsored ADR |
9,006,204 |
471,137 |
|
|
Burlington Resources, Inc. |
2,382,600 |
77,732 |
|
|
Chevron Corp. |
2,559,741 |
202,220 |
|
|
Conoco, Inc.: |
|
|
|
|
Class A |
1,478,200 |
33,075 |
|
|
Class B |
4,242,249 |
97,837 |
|
|
Exxon Mobil Corp. |
8,797,437 |
703,795 |
|
|
Occidental Petroleum Corp. |
1,597,300 |
32,345 |
|
|
Royal Dutch Petroleum Co. (NY Shares) |
4,046,400 |
235,703 |
|
|
Santa Fe Snyder Corp. (a) |
2,674,275 |
26,743 |
|
|
TotalFinaElf SA: |
|
|
|
|
Class B |
899,543 |
132,345 |
|
|
sponsored ADR |
4,441,903 |
326,757 |
|
|
Common Stocks - continued |
|||
|
Shares |
Value (Note 1) (000s) |
||
|
ENERGY - continued |
|||
|
Oil & Gas - continued |
|||
|
Ultramar Diamond Shamrock Corp. |
1,431,600 |
$ 32,748 |
|
|
USX - Marathon Group |
3,318,900 |
80,691 |
|
|
|
2,538,952 |
||
|
TOTAL ENERGY |
2,968,041 |
||
|
FINANCE - 24.9% |
|||
|
Banks - 10.5% |
|||
|
Bank of America Corp. |
5,857,717 |
277,509 |
|
|
Bank of New York Co., Inc. |
9,061,634 |
424,198 |
|
|
Bank One Corp. |
3,250,829 |
103,417 |
|
|
Chase Manhattan Corp. |
5,945,950 |
295,439 |
|
|
Comerica, Inc. |
3,201,939 |
163,299 |
|
|
Firstar Corp. |
420,600 |
8,307 |
|
|
FleetBoston Financial Corp. |
3,896,096 |
139,529 |
|
|
Mellon Financial Corp. |
4,565,000 |
172,043 |
|
|
National Bank of Canada |
4,357,140 |
62,990 |
|
|
PNC Financial Services Group, Inc. |
846,900 |
43,086 |
|
|
U.S. Bancorp |
4,178,500 |
80,175 |
|
|
Wachovia Corp. |
728,800 |
40,084 |
|
|
Wells Fargo & Co. |
7,965,268 |
329,065 |
|
|
|
2,139,141 |
||
|
Credit & Other Finance - 8.1% |
|||
|
American Express Co. |
7,267,800 |
411,993 |
|
|
Associates First Capital Corp. Class A |
7,239,824 |
189,593 |
|
|
Citigroup, Inc. |
11,791,200 |
832,016 |
|
|
Household International, Inc. |
5,092,378 |
226,929 |
|
|
|
1,660,531 |
||
|
Federal Sponsored Credit - 2.6% |
|||
|
Fannie Mae |
8,542,600 |
426,062 |
|
|
Freddie Mac |
1,548,400 |
61,065 |
|
|
SLM Holding Corp. |
853,900 |
36,771 |
|
|
|
523,898 |
||
|
Insurance - 2.9% |
|||
|
ACE Ltd. |
2,940,400 |
105,854 |
|
|
American International Group, Inc. |
940,200 |
82,444 |
|
|
Everest Re Group Ltd. |
155,200 |
6,160 |
|
|
Hartford Financial Services Group, Inc. |
3,407,200 |
218,913 |
|
|
Highlands Insurance Group, Inc. (a)(e) |
787,590 |
7,285 |
|
|
Common Stocks - continued |
|||
|
Shares |
Value (Note 1) (000s) |
||
|
FINANCE - continued |
|||
|
Insurance - continued |
|||
|
Protective Life Corp. |
273,500 |
$ 7,419 |
|
|
The Chubb Corp. |
759,000 |
56,166 |
|
|
The St. Paul Companies, Inc. |
747,900 |
33,235 |
|
|
UnumProvident Corp. |
2,222,500 |
51,118 |
|
|
XL Capital Ltd. Class A |
455,800 |
30,083 |
|
|
|
598,677 |
||
|
Savings & Loans - 0.2% |
|||
|
TCF Financial Corp. |
1,165,000 |
34,295 |
|
|
Securities Industry - 0.6% |
|||
|
Franklin Resources, Inc. |
296,800 |
10,648 |
|
|
Morgan Stanley Dean Witter & Co. |
824,400 |
75,227 |
|
|
Nomura Securities Co. Ltd. |
2,138,000 |
41,931 |
|
|
Waddell & Reed Financial, Inc. Class A |
1 |
0 |
|
|
|
127,806 |
||
|
TOTAL FINANCE |
5,084,348 |
||
|
HEALTH - 7.3% |
|||
|
Drugs & Pharmaceuticals - 5.4% |
|||
|
Bristol-Myers Squibb Co. |
4,997,400 |
247,996 |
|
|
Eli Lilly & Co. |
4,106,700 |
426,583 |
|
|
Merck & Co., Inc. |
3,436,300 |
246,340 |
|
|
Schering-Plough Corp. |
4,276,900 |
184,709 |
|
|
|
1,105,628 |
||
|
Medical Equipment & Supplies - 1.2% |
|||
|
Abbott Laboratories |
3,199,300 |
133,171 |
|
|
Becton, Dickinson & Co. |
1,349,300 |
34,070 |
|
|
Cardinal Health, Inc. |
954,200 |
70,134 |
|
|
|
237,375 |
||
|
Medical Facilities Management - 0.7% |
|||
|
HCA - The Healthcare Co. |
4,567,900 |
155,309 |
|
|
TOTAL HEALTH |
1,498,312 |
||
|
INDUSTRIAL MACHINERY & EQUIPMENT - 7.5% |
|||
|
Electrical Equipment - 3.9% |
|||
|
General Electric Co. |
14,049,600 |
722,676 |
|
|
Common Stocks - continued |
|||
|
Shares |
Value (Note 1) (000s) |
||
|
INDUSTRIAL MACHINERY & EQUIPMENT - continued |
|||
|
Electrical Equipment - continued |
|||
|
Siemens AG |
450,900 |
$ 69,822 |
|
|
W.W. Grainger, Inc. |
412,000 |
13,081 |
|
|
|
805,579 |
||
|
Industrial Machinery & Equipment - 3.5% |
|||
|
Caterpillar, Inc. |
2,047,000 |
69,726 |
|
|
CNH Global NV |
1,027,300 |
8,026 |
|
|
Deere & Co. |
2,552,350 |
98,425 |
|
|
Illinois Tool Works, Inc. |
544,200 |
31,155 |
|
|
Ingersoll-Rand Co. |
1,598,900 |
62,757 |
|
|
ITT Industries, Inc. |
437,500 |
14,383 |
|
|
Kennametal, Inc. |
1,004,909 |
25,060 |
|
|
Parker-Hannifin Corp. |
1,612,800 |
57,355 |
|
|
The Stanley Works |
596,400 |
15,618 |
|
|
Tyco International Ltd. |
6,369,840 |
340,786 |
|
|
|
723,291 |
||
|
Pollution Control - 0.1% |
|||
|
Republic Services, Inc. (a) |
676,100 |
11,325 |
|
|
TOTAL INDUSTRIAL MACHINERY & EQUIPMENT |
1,540,195 |
||
|
MEDIA & LEISURE - 5.2% |
|||
|
Broadcasting - 0.8% |
|||
|
Clear Channel Communications, Inc. (a) |
251,100 |
19,131 |
|
|
Time Warner, Inc. |
1,993,541 |
152,880 |
|
|
|
172,011 |
||
|
Entertainment - 2.9% |
|||
|
Fox Entertainment Group, Inc. Class A (a) |
1,463,800 |
44,829 |
|
|
Mandalay Resort Group (a) |
1,216,900 |
29,738 |
|
|
Six Flags, Inc. (a) |
141,400 |
2,148 |
|
|
Viacom, Inc. Class B (non-vtg.) (a) |
6,811,354 |
451,678 |
|
|
Walt Disney Co. |
1,417,000 |
54,820 |
|
|
|
583,213 |
||
|
Lodging & Gaming - 0.6% |
|||
|
Harrah's Entertainment, Inc. (a) |
918,700 |
23,025 |
|
|
Starwood Hotels & Resorts Worldwide, Inc. unit |
2,990,900 |
102,064 |
|
|
|
125,089 |
||
|
Publishing - 0.4% |
|||
|
Reader's Digest Association, Inc. Class A (non-vtg.) |
1,902,300 |
71,931 |
|
|
Common Stocks - continued |
|||
|
Shares |
Value (Note 1) (000s) |
||
|
MEDIA & LEISURE - continued |
|||
|
Restaurants - 0.5% |
|||
|
McDonald's Corp. |
3,126,200 |
$ 98,475 |
|
|
TOTAL MEDIA & LEISURE |
1,050,719 |
||
|
NONDURABLES - 3.3% |
|||
|
Beverages - 0.1% |
|||
|
Brown-Forman Corp. Class B (non-vtg.) |
294,500 |
14,725 |
|
|
Foods - 0.6% |
|||
|
Nabisco Group Holdings Corp. |
1,945,500 |
51,556 |
|
|
Nabisco Holdings Corp. Class A |
1,569,800 |
83,003 |
|
|
|
134,559 |
||
|
Household Products - 1.7% |
|||
|
Avon Products, Inc. |
1,830,300 |
72,640 |
|
|
Clorox Co. |
1,170,800 |
48,369 |
|
|
Dial Corp. |
1,269,100 |
16,102 |
|
|
Gillette Co. |
1,848,100 |
53,941 |
|
|
International Flavors & Fragrances, Inc. |
499,400 |
13,359 |
|
|
Procter & Gamble Co. |
981,700 |
55,834 |
|
|
Unilever NV (NY Shares) |
355,714 |
15,740 |
|
|
Unilever PLC |
10,757,678 |
65,050 |
|
|
|
341,035 |
||
|
Tobacco - 0.9% |
|||
|
Philip Morris Companies, Inc. |
7,610,500 |
192,165 |
|
|
TOTAL NONDURABLES |
682,484 |
||
|
RETAIL & WHOLESALE - 2.3% |
|||
|
Apparel Stores - 1.0% |
|||
|
Charming Shoppes, Inc. (a) |
1,334,600 |
7,507 |
|
|
Footstar, Inc. (a) |
92,254 |
2,906 |
|
|
The Limited, Inc. |
5,339,078 |
109,117 |
|
|
TJX Companies, Inc. |
4,004,146 |
67,069 |
|
|
Venator Group, Inc. (a) |
441,500 |
6,236 |
|
|
|
192,835 |
||
|
General Merchandise Stores - 1.3% |
|||
|
Ames Department Stores, Inc. (a) |
320,600 |
2,284 |
|
|
Consolidated Stores Corp. (a) |
2,598,100 |
31,015 |
|
|
Federated Department Stores, Inc. (a) |
2,203,740 |
53,027 |
|
|
Hudson's Bay Co. (f) |
642,800 |
6,699 |
|
|
Common Stocks - continued |
|||
|
Shares |
Value (Note 1) (000s) |
||
|
RETAIL & WHOLESALE - continued |
|||
|
General Merchandise Stores - continued |
|||
|
JCPenney Co., Inc. |
603,200 |
$ 9,727 |
|
|
Target Corp. |
3,552,200 |
103,014 |
|
|
Wal-Mart Stores, Inc. |
1,234,800 |
67,837 |
|
|
|
273,603 |
||
|
TOTAL RETAIL & WHOLESALE |
466,438 |
||
|
SERVICES - 1.4% |
|||
|
Printing - 0.2% |
|||
|
New England Business Service, Inc. |
587,800 |
12,197 |
|
|
R.R. Donnelley & Sons Co. |
1,069,400 |
23,794 |
|
|
|
35,991 |
||
|
Services - 1.2% |
|||
|
ACNielsen Corp. (a) |
1,379,633 |
33,801 |
|
|
Brascan Corp. Class A (ltd. vtg.) |
7,136,569 |
87,576 |
|
|
Dun & Bradstreet Corp. |
268,000 |
7,923 |
|
|
H&R Block, Inc. |
2,187,400 |
69,997 |
|
|
Viad Corp. |
1,966,500 |
51,252 |
|
|
|
250,549 |
||
|
TOTAL SERVICES |
286,540 |
||
|
TECHNOLOGY - 3.5% |
|||
|
Communications Equipment - 0.1% |
|||
|
Nortel Networks Corp. |
244,509 |
18,185 |
|
|
Computer Services & Software - 1.0% |
|||
|
Ceridian Corp. (a) |
343,300 |
7,810 |
|
|
Electronic Data Systems Corp. |
340,300 |
14,633 |
|
|
IMS Health, Inc. |
2,415,000 |
43,621 |
|
|
Microsoft Corp. (a) |
581,300 |
40,582 |
|
|
NCR Corp. (a) |
1,668,900 |
59,142 |
|
|
Sabre Holdings Corp. Class A |
92,803 |
2,268 |
|
|
Unisys Corp. (a) |
4,146,271 |
40,685 |
|
|
|
208,741 |
||
|
Computers & Office Equipment - 1.8% |
|||
|
Compaq Computer Corp. |
4,281,300 |
120,144 |
|
|
Hewlett-Packard Co. |
314,100 |
34,296 |
|
|
International Business Machines Corp. |
1,124,800 |
126,470 |
|
|
Common Stocks - continued |
|||
|
Shares |
Value (Note 1) (000s) |
||
|
TECHNOLOGY - continued |
|||
|
Computers & Office Equipment - continued |
|||
|
Pitney Bowes, Inc. |
2,003,800 |
$ 69,382 |
|
|
Xerox Corp. |
939,800 |
13,980 |
|
|
|
364,272 |
||
|
Electronic Instruments - 0.3% |
|||
|
Thermo Electron Corp. (a) |
2,632,200 |
54,618 |
|
|
Electronics - 0.2% |
|||
|
Motorola, Inc. |
1,137,900 |
37,622 |
|
|
Photographic Equipment - 0.1% |
|||
|
Eastman Kodak Co. |
518,100 |
28,431 |
|
|
TOTAL TECHNOLOGY |
711,869 |
||
|
TRANSPORTATION - 1.3% |
|||
|
Air Transportation - 0.2% |
|||
|
AMR Corp. |
740,200 |
24,473 |
|
|
Southwest Airlines Co. |
862,200 |
20,369 |
|
|
|
44,842 |
||
|
Railroads - 1.1% |
|||
|
Burlington Northern Santa Fe Corp. |
5,980,900 |
146,158 |
|
|
CSX Corp. |
1,123,300 |
27,872 |
|
|
Union Pacific Corp. |
885,500 |
38,243 |
|
|
|
212,273 |
||
|
TOTAL TRANSPORTATION |
257,115 |
||
|
UTILITIES - 9.0% |
|||
|
Cellular - 0.1% |
|||
|
AT&T Corp. - Wireless Group |
904,500 |
24,874 |
|
|
Electric Utility - 2.5% |
|||
|
Allegheny Energy, Inc. |
2,456,600 |
77,076 |
|
|
American Electric Power Co., Inc. |
2,031,100 |
66,645 |
|
|
Cinergy Corp. |
1,083,198 |
28,163 |
|
|
DPL, Inc. |
333,679 |
8,050 |
|
|
Entergy Corp. |
6,373,700 |
172,887 |
|
|
IPALCO Enterprises, Inc. |
910,300 |
20,596 |
|
|
Niagara Mohawk Holdings, Inc. (a) |
3,449,000 |
45,915 |
|
|
Common Stocks - continued |
|||
|
Shares |
Value (Note 1) (000s) |
||
|
UTILITIES - continued |
|||
|
Electric Utility - continued |
|||
|
NRG Energy, Inc. |
443,100 |
$ 10,385 |
|
|
PG&E Corp. |
3,118,898 |
80,701 |
|
|
|
510,418 |
||
|
Telephone Services - 6.4% |
|||
|
AT&T Corp. |
9,589,756 |
296,683 |
|
|
BellSouth Corp. |
4,265,201 |
169,808 |
|
|
Pathnet, Inc. warrants 4/15/08 (a)(f) |
1,010 |
10 |
|
|
Qwest Communications International, Inc. (a) |
667,690 |
31,340 |
|
|
SBC Communications, Inc. |
10,841,144 |
461,426 |
|
|
Verizon Communications |
5,209,644 |
244,853 |
|
|
WorldCom, Inc. (a) |
2,566,490 |
100,253 |
|
|
|
1,304,373 |
||
|
TOTAL UTILITIES |
1,839,665 |
||
|
TOTAL COMMON STOCKS (Cost $13,551,648) |
18,906,919 |
||
|
Preferred Stocks - 3.2% |
|||
|
|
|
|
|
|
Convertible Preferred Stocks - 3.2% |
|||
|
BASIC INDUSTRIES - 0.2% |
|||
|
Chemicals & Plastics - 0.1% |
|||
|
Monsanto Co. $1.625 ACES |
572,300 |
27,435 |
|
|
Paper & Forest Products - 0.1% |
|||
|
Georgia-Pacific Corp. $3.75 PEPS |
631,600 |
19,225 |
|
|
TOTAL BASIC INDUSTRIES |
46,660 |
||
|
ENERGY - 0.2% |
|||
|
Oil & Gas - 0.2% |
|||
|
Apache Corp. $2.015 ACES |
368,200 |
16,040 |
|
|
The Coastal Corp. $1.20 PRIDES |
741,500 |
22,824 |
|
|
|
38,864 |
||
|
FINANCE - 0.8% |
|||
|
Credit & Other Finance - 0.5% |
|||
|
Federal-Mogul Financing Trust $3.50 |
990,000 |
20,790 |
|
|
Preferred Stocks - continued |
|||
|
Shares |
Value (Note 1) (000s) |
||
|
Convertible Preferred Stocks - continued |
|||
|
FINANCE - continued |
|||
|
Credit & Other Finance - continued |
|||
|
Union Pacific Capital Trust: |
|
|
|
|
$3.125 |
823,100 |
$ 34,673 |
|
|
$3.125 TIDES (f) |
817,600 |
34,441 |
|
|
|
89,904 |
||
|
Insurance - 0.3% |
|||
|
ACE Ltd. $4.125 PRIDES |
450,600 |
33,827 |
|
|
MetLife, Inc. $4.00 |
450,300 |
30,620 |
|
|
|
64,447 |
||
|
TOTAL FINANCE |
154,351 |
||
|
INDUSTRIAL MACHINERY & EQUIPMENT - 0.2% |
|||
|
Electrical Equipment - 0.1% |
|||
|
Loral Space & Communications Ltd. Series C: |
|
|
|
|
$3.00 (f) |
303,300 |
5,611 |
|
|
$3.00 |
418,500 |
7,742 |
|
|
|
13,353 |
||
|
Industrial Machinery & Equipment - 0.1% |
|||
|
Ingersoll Rand Co./Ingersoll Rand Finance $1.68 Growth PRIDES |
1,126,900 |
21,223 |
|
|
TOTAL INDUSTRIAL MACHINERY & EQUIPMENT |
34,576 |
||
|
MEDIA & LEISURE - 0.8% |
|||
|
Broadcasting - 0.6% |
|||
|
Cox Communications, Inc.: |
|
|
|
|
$2.27 PRIDES |
321,700 |
14,412 |
|
|
$6.858 PRIZES |
247,700 |
25,296 |
|
|
MediaOne Group, Inc.: |
|
|
|
|
$3.04 |
638,600 |
26,183 |
|
|
(Vodafone AirTouch PLC) $3.63 PIES |
528,700 |
49,367 |
|
|
|
115,258 |
||
|
Entertainment - 0.1% |
|||
|
Six Flags, Inc. $4.05 PIES |
581,100 |
19,539 |
|
|
Preferred Stocks - continued |
|||
|
Shares |
Value (Note 1) (000s) |
||
|
Convertible Preferred Stocks - continued |
|||
|
MEDIA & LEISURE - continued |
|||
|
Publishing - 0.1% |
|||
|
Readers Digest Automatic Common Exchange Securities Trust $1.93 TRACES |
985,200 |
$ 33,066 |
|
|
Taylor (J.N.) Holdings Ltd. 9.5% |
956,400 |
0 |
|
|
|
33,066 |
||
|
TOTAL MEDIA & LEISURE |
167,863 |
||
|
NONDURABLES - 0.3% |
|||
|
Beverages - 0.2% |
|||
|
Seagram Co. Ltd. $3.76 ACES |
950,900 |
48,971 |
|
|
Foods - 0.1% |
|||
|
Chiquita Brands International, Inc.: |
|
|
|
|
Series A, $2.875 |
474,500 |
6,910 |
|
|
Series B, $3.75 |
178,500 |
3,414 |
|
|
|
10,324 |
||
|
TOTAL NONDURABLES |
59,295 |
||
|
RETAIL & WHOLESALE - 0.1% |
|||
|
General Merchandise Stores - 0.1% |
|||
|
Kmart Financing I $3.875 |
607,400 |
21,259 |
|
|
UTILITIES - 0.6% |
|||
|
Electric Utility - 0.3% |
|||
|
Alliant Energy Resources, Inc. $4.91 (f) |
105,400 |
6,403 |
|
|
NiSource, Inc. $3.875 PIES |
606,800 |
24,955 |
|
|
TXU Corp. $1.6575 |
795,000 |
26,434 |
|
|
|
57,792 |
||
|
Gas - 0.3% |
|||
|
Enron Corp.: |
|
|
|
|
(EOG Resources, Inc.) $1.5575 ACES |
976,300 |
26,604 |
|
|
Series J, $10.50 |
21,800 |
43,823 |
|
|
|
70,427 |
||
|
TOTAL UTILITIES |
128,219 |
||
|
TOTAL CONVERTIBLE PREFERRED STOCKS |
651,087 |
||
|
Preferred Stocks - continued |
|||
|
Shares |
Value (Note 1) (000s) |
||
|
Nonconvertible Preferred Stocks - 0.0% |
|||
|
MEDIA & LEISURE - 0.0% |
|||
|
Broadcasting - 0.0% |
|||
|
CSC Holdings, Inc. 11.125% pay-in-kind |
47,240 |
$ 5,007 |
|
|
Publishing - 0.0% |
|||
|
PRIMEDIA, Inc. 8.625% |
12,245 |
1,041 |
|
|
TOTAL MEDIA & LEISURE |
6,048 |
||
|
TOTAL PREFERRED STOCKS (Cost $696,083) |
657,135 |
||
|
Corporate Bonds - 2.2% |
|||||
|
Moody's Ratings (unaudited) (b) |
Principal Amount (000s) |
|
|||
|
Convertible Bonds - 1.8% |
|||||
|
CONSTRUCTION & REAL ESTATE - 0.0% |
|||||
|
Real Estate Investment Trusts - 0.0% |
|||||
|
Liberty Property LP 8.3% 7/1/01 |
Ba2 |
|
$ 1,358 |
1,952 |
|
|
DURABLES - 0.1% |
|||||
|
Consumer Electronics - 0.1% |
|||||
|
Sunbeam Corp. 0% 3/25/18 (f) |
Caa2 |
|
128,730 |
21,562 |
|
|
FINANCE - 0.0% |
|||||
|
Insurance - 0.0% |
|||||
|
Loews Corp. 3.125% 9/15/07 |
A2 |
|
9,210 |
7,748 |
|
|
MEDIA & LEISURE - 0.6% |
|||||
|
Broadcasting - 0.2% |
|||||
|
Cox Communications, Inc. 1% 4/19/20 |
Baa3 |
|
53,170 |
26,319 |
|
|
Jacor Communications, Inc. liquid yield option notes 0% 6/12/11 |
Ba3 |
|
18,492 |
21,868 |
|
|
|
48,187 |
||||
|
Publishing - 0.4% |
|||||
|
News America Holdings, Inc. liquid yield option notes 0% 3/11/13 |
Baa3 |
|
84,780 |
84,628 |
|
|
TOTAL MEDIA & LEISURE |
132,815 |
||||
|
Corporate Bonds - continued |
|||||
|
Moody's Ratings (unaudited) (b) |
Principal Amount (000s) |
Value (Note 1) (000s) |
|||
|
Convertible Bonds - continued |
|||||
|
NONDURABLES - 0.0% |
|||||
|
Foods - 0.0% |
|||||
|
Chiquita Brands International, Inc. 7% 3/28/01 |
B3 |
|
$ 1,680 |
$ 1,462 |
|
|
RETAIL & WHOLESALE - 0.1% |
|||||
|
Apparel Stores - 0.1% |
|||||
|
Charming Shoppes, Inc. 7.5% 7/15/06 |
B2 |
|
5,338 |
4,964 |
|
|
J. Baker, Inc. 7% 6/1/02 |
B3 |
|
13,300 |
10,507 |
|
|
|
15,471 |
||||
|
SERVICES - 0.3% |
|||||
|
ADT Operations, Inc. liquid yield option notes 0%, 7/6/10 |
Baa1 |
|
19,295 |
56,434 |
|
|
TECHNOLOGY - 0.3% |
|||||
|
Computer Services & Software - 0.1% |
|||||
|
Softkey International, Inc. 5.5% 11/1/00 (f) |
- |
|
29,030 |
28,667 |
|
|
Computers & Office Equipment - 0.1% |
|||||
|
Quantum Corp. 7% 8/1/04 |
B2 |
|
16,080 |
12,693 |
|
|
Electronics - 0.1% |
|||||
|
Solectron Corp. 0% 5/8/20 |
BBB |
|
22,890 |
14,235 |
|
|
Vitesse Semiconductor Corp. 4% 3/15/05 (f) |
B2 |
|
15,600 |
12,987 |
|
|
|
27,222 |
||||
|
TOTAL TECHNOLOGY |
68,582 |
||||
|
UTILITIES - 0.4% |
|||||
|
Cellular - 0.2% |
|||||
|
Nextel Communications, Inc. 5.25% 1/15/10 (f) |
B1 |
|
26,830 |
26,964 |
|
|
Telephone Services - 0.2% |
|||||
|
Level 3 Communications, Inc. 6% 3/15/10 |
Caa1 |
|
26,620 |
21,296 |
|
|
Telefonos de Mexico SA de CV 4.25% 6/15/04 |
Baa3 |
|
19,710 |
24,982 |
|
|
|
46,278 |
||||
|
TOTAL UTILITIES |
73,242 |
||||
|
TOTAL CONVERTIBLE BONDS |
379,268 |
||||
|
Corporate Bonds - continued |
|||||
|
Moody's Ratings (unaudited) (b) |
Principal Amount (000s) |
Value (Note 1) (000s) |
|||
|
Nonconvertible Bonds - 0.4% |
|||||
|
BASIC INDUSTRIES - 0.0% |
|||||
|
Chemicals & Plastics - 0.0% |
|||||
|
Lyondell Chemical Co. 9.875% 5/1/07 |
Ba3 |
|
$ 2,660 |
$ 2,660 |
|
|
ENERGY - 0.0% |
|||||
|
Energy Services - 0.0% |
|||||
|
RBF Finance Co. 11.375% 3/15/09 |
Ba3 |
|
3,030 |
3,295 |
|
|
FINANCE - 0.0% |
|||||
|
Credit & Other Finance - 0.0% |
|||||
|
Macsaver Financial Services, Inc. 7.875% 8/1/03 |
Ba2 |
|
2,000 |
1,100 |
|
|
HEALTH - 0.0% |
|||||
|
Medical Facilities Management - 0.0% |
|||||
|
Tenet Healthcare Corp. 8.125% 12/1/08 |
Ba3 |
|
3,110 |
2,939 |
|
|
INDUSTRIAL MACHINERY & EQUIPMENT - 0.0% |
|||||
|
Pollution Control - 0.0% |
|||||
|
Allied Waste North America, Inc.: |
|
|
|
|
|
|
7.625% 1/1/06 |
Ba2 |
|
1,895 |
1,706 |
|
|
7.875% 1/1/09 |
Ba2 |
|
2,125 |
1,859 |
|
|
|
3,565 |
||||
|
MEDIA & LEISURE - 0.2% |
|||||
|
Broadcasting - 0.2% |
|||||
|
Adelphia Communications Corp. 9.875% 3/1/07 |
B1 |
|
4,670 |
4,390 |
|
|
Charter Communications Holdings LLC/Charter Communications Holdings Capital Corp. 8.625% 4/1/09 |
B2 |
|
2,680 |
2,345 |
|
|
NTL Communications Corp. 11.5% 10/1/08 |
B3 |
|
8,280 |
8,342 |
|
|
Telewest PLC 0% 10/1/07 (d) |
B1 |
|
4,655 |
4,469 |
|
|
UIH Australia/Pacific, Inc. Series D 0% 5/15/06 (d) |
B2 |
|
2,235 |
2,056 |
|
|
United Pan-Europe Communications NV 10.875% 11/1/07 |
B2 |
|
4,770 |
4,198 |
|
|
|
25,800 |
||||
|
Entertainment - 0.0% |
|||||
|
Mandalay Resort Group 10.25% 8/1/07 (f) |
Ba3 |
|
3,125 |
3,152 |
|
|
Corporate Bonds - continued |
|||||
|
Moody's Ratings (unaudited) (b) |
Principal Amount (000s) |
Value (Note 1) (000s) |
|||
|
Nonconvertible Bonds - continued |
|||||
|
MEDIA & LEISURE - continued |
|||||
|
Restaurants - 0.0% |
|||||
|
Domino's, Inc. 10.375% 1/15/09 |
B3 |
|
$ 2,020 |
$ 1,919 |
|
|
TOTAL MEDIA & LEISURE |
30,871 |
||||
|
TECHNOLOGY - 0.0% |
|||||
|
Computer Services & Software - 0.0% |
|||||
|
PSINet, Inc. 10.5% 12/1/06 |
B3 |
|
2,665 |
2,159 |
|
|
UTILITIES - 0.2% |
|||||
|
Cellular - 0.1% |
|||||
|
Nextel Communications, Inc.: |
|
|
|
|
|
|
0% 10/31/07 (d) |
B1 |
|
7,500 |
5,569 |
|
|
12% 11/1/08 |
B1 |
|
4,160 |
4,462 |
|
|
|
10,031 |
||||
|
Telephone Services - 0.1% |
|||||
|
Global Crossing Holdings Ltd. 9.625% 5/15/08 |
Ba2 |
|
2,665 |
2,618 |
|
|
McLeodUSA, Inc. 9.5% 11/1/08 |
B1 |
|
1,815 |
1,742 |
|
|
NEXTLINK Communications, Inc. 9.625% 10/1/07 |
B2 |
|
5,550 |
5,162 |
|
|
Pathnet, Inc. 12.25% 4/15/08 |
- |
|
1,010 |
566 |
|
|
Rhythms NetConnections, Inc. 12.75% 4/15/09 |
B3 |
|
3,330 |
1,998 |
|
|
WinStar Communications, Inc.: |
|
|
|
|
|
|
0% 4/15/10 (d)(f) |
B3 |
|
2,864 |
1,260 |
|
|
12.75% 4/15/10 (f) |
B3 |
|
7,842 |
7,097 |
|
|
|
20,443 |
||||
|
TOTAL UTILITIES |
30,474 |
||||
|
TOTAL NONCONVERTIBLE BONDS |
77,063 |
||||
|
TOTAL CORPORATE BONDS (Cost $394,209) |
456,331 |
||||
|
Cash Equivalents - 2.2% |
|||
|
Shares |
Value (Note 1) |
||
|
Fidelity Cash Central Fund, 6.57% (c) |
388,588,791 |
$ 388,589 |
|
|
Fidelity Securities Lending Cash Central Fund, 6.65% (c) |
48,075,000 |
48,075 |
|
|
TOTAL CASH EQUIVALENTS (Cost $436,664) |
436,664 |
||
|
TOTAL INVESTMENT PORTFOLIO - 100.2% (Cost $15,078,604) |
20,457,049 |
||
|
NET OTHER ASSETS - (0.2)% |
(39,845) |
||
|
NET ASSETS - 100% |
$ 20,417,204 |
||
|
Security Type Abbreviations |
||
|
ACES |
- |
Automatic Common Exchange Securities |
|
PEPS |
- |
Participating Equity Preferred Shares/Premium Exchangeable Participating Shares |
|
PIES |
- |
Premium Income |
|
PRIDES |
- |
Preferred Redeemable Increased Dividend Equity Securities |
|
PRIZES |
- |
Participating Redeemable Indexed Zero-Premium Exchangeable Securities |
|
TIDES |
- |
Term Income Deferred Equity Securities |
|
TRACES |
- |
Trust Automatic Common Exchange Securities |
|
Legend |
|
(a) Non-income producing |
|
(b) S&P credit ratings are used in the absence of a rating by Moody's Investors Service, Inc. |
|
(c) The rate quoted is the annualized seven-day yield of the fund at |
|
(d) Debt obligation initially issued in zero coupon form which converts to coupon form at a specified rate and date. The rate shown is the rate at period end. |
|
(e) Affiliated company |
|
(f) Security exempt from registration under Rule 144A of the Securities Act of 1933. These securities may be resold in transactions exempt from registration, normally to qualified institutional buyers. At the period end, the value of these securities amounted to $154,853,000 or 0.8% of net assets. |
|
Income Tax Information |
|
At July 31, 2000, the aggregate cost of investment securities for income tax purposes was $15,083,793,000. Net unrealized appreciation aggregated $5,373,256,000, of which $6,908,769,000 related to appreciated investment securities and $1,535,513,000 related to depreciated investment securities. |
See accompanying notes which are an integral part of the financial statements.
Semiannual Report
Statement of Assets and Liabilities
|
Amounts in thousands (except per-share amount) |
July 31, 2000 (Unaudited) |
|
|
Assets |
|
|
|
Investment in securities, at value (cost $15,078,604) - |
|
$ 20,457,049 |
|
Cash |
|
229 |
|
Receivable for investments sold |
|
94,111 |
|
Receivable for fund shares sold |
|
17,465 |
|
Dividends receivable |
|
26,577 |
|
Interest receivable |
|
7,002 |
|
Other receivables |
|
279 |
|
Total assets |
|
20,602,712 |
|
Liabilities |
|
|
|
Payable for investments purchased |
$ 57,617 |
|
|
Payable for fund shares redeemed |
68,219 |
|
|
Accrued management fee |
8,189 |
|
|
Other payables and accrued expenses |
3,408 |
|
|
Collateral on securities loaned, at value |
48,075 |
|
|
Total liabilities |
|
185,508 |
|
Net Assets |
|
$ 20,417,204 |
|
Net Assets consist of: |
|
|
|
Paid in capital |
|
$ 14,286,405 |
|
Undistributed net investment income |
|
38,600 |
|
Accumulated undistributed net realized gain (loss) on investments and foreign currency transactions |
|
713,865 |
|
Net unrealized appreciation (depreciation) on investments and assets and liabilities in foreign currencies |
|
5,378,334 |
|
Net Assets, for 400,684 shares outstanding |
|
$ 20,417,204 |
|
Net Asset Value, offering price and redemption price |
|
$50.96 |
See accompanying notes which are an integral part of the financial statements.
Semiannual Report
Financial Statements - continued
Statement of Operations
|
Amounts in thousands |
Six months ended July 31, 2000 (Unaudited) |
|
|
Investment Income Dividends (including $153 received from affiliated issuers) |
|
$ 231,177 |
|
Interest |
|
20,323 |
|
Security lending |
|
295 |
|
Total income |
|
251,795 |
|
Expenses |
|
|
|
Management fee |
$ 48,469 |
|
|
Transfer agent fees |
20,099 |
|
|
Accounting and security lending fees |
661 |
|
|
Non-interested trustees' compensation |
47 |
|
|
Custodian fees and expenses |
215 |
|
|
Registration fees |
327 |
|
|
Audit |
71 |
|
|
Legal |
41 |
|
|
Interest |
336 |
|
|
Miscellaneous |
11 |
|
|
Total expenses before reductions |
70,277 |
|
|
Expense reductions |
(2,324) |
67,953 |
|
Net investment income |
|
183,842 |
|
Realized and Unrealized Gain (Loss) Net realized gain (loss) on: |
|
|
|
Investment securities (including realized gain (loss) of |
720,351 |
|
|
Foreign currency transactions |
(402) |
719,949 |
|
Change in net unrealized appreciation (depreciation) on: |
|
|
|
Investment securities |
(255,870) |
|
|
Assets and liabilities in foreign currencies |
(23) |
(255,893) |
|
Net gain (loss) |
|
464,056 |
|
Net increase (decrease) in net assets resulting |
|
$ 647,898 |
See accompanying notes which are an integral part of the financial statements.
Semiannual Report
Financial Statements - continued
Statement of Changes in Net Assets
|
Amounts in thousands |
Six months ended July 31, 2000 (Unaudited) |
Year ended
January 31, |
|
Increase (Decrease) in Net Assets |
|
|
|
Operations |
$ 183,842 |
$ 336,157 |
|
Net realized gain (loss) |
719,949 |
2,508,360 |
|
Change in net unrealized appreciation (depreciation) |
(255,893) |
(2,260,412) |
|
Net increase (decrease) in net assets resulting |
647,898 |
584,105 |
|
Distributions to shareholders |
(168,461) |
(333,394) |
|
From net realized gain |
(506,734) |
(2,055,215) |
|
Total distributions |
(675,195) |
(2,388,609) |
|
Share transactions |
2,995,110 |
4,570,193 |
|
Reinvestment of distributions |
655,589 |
2,319,337 |
|
Cost of shares redeemed |
(4,317,526) |
(7,240,283) |
|
Net increase (decrease) in net assets resulting |
(666,827) |
(350,753) |
|
Total increase (decrease) in net assets |
(694,124) |
(2,155,257) |
|
Net Assets |
|
|
|
Beginning of period |
21,111,328 |
23,266,585 |
|
End of period (including undistributed net investment income of $38,600 and $23,219, respectively) |
$ 20,417,204 |
$ 21,111,328 |
|
Other Information Shares |
|
|
|
Sold |
59,348 |
79,856 |
|
Issued in reinvestment of distributions |
13,887 |
43,176 |
|
Redeemed |
(86,830) |
(128,249) |
|
Net increase (decrease) |
(13,595) |
(5,217) |
See accompanying notes which are an integral part of the financial statements.
Semiannual Report
Financial Highlights
|
|
Six months ended July 31, 2000 |
Years ended January 31, |
||||
|
|
(Unaudited) |
2000 |
1999 |
1998 |
1997 |
1996 |
|
Selected Per-Share Data |
|
|
|
|
|
|
|
Net asset value,
beginning |
$ 50.96 |
$ 55.46 |
$ 52.20 |
$ 44.47 |
$ 39.15 |
$ 30.89 |
|
Income from Invest- |
|
|
|
|
|
|
|
Net investment income |
.45 D |
.82 D |
.85 D |
.94 D |
1.01 D |
.93 |
|
Net realized |
1.24 |
.63 |
5.65 |
9.79 |
7.17 |
9.65 |
|
Total from investment operations |
1.69 |
1.45 |
6.50 |
10.73 |
8.18 |
10.58 |
|
Less Distributions |
|
|
|
|
|
|
|
From net investment income |
(.42) |
(.82) |
(.85) |
(.96) |
(1.02) |
(.96) |
|
From net |
(1.27) |
(5.13) |
(2.39) |
(2.04) |
(1.84) |
(1.36) |
|
Total distributions |
(1.69) |
(5.95) |
(3.24) |
(3.00) |
(2.86) |
(2.32) |
|
Net asset value, |
$ 50.96 |
$ 50.96 |
$ 55.46 |
$ 52.20 |
$ 44.47 |
$ 39.15 |
|
Total Return B, C |
3.59% |
2.27% |
12.79% |
24.69% |
21.74% |
35.21% |
|
Ratios and Supplemental Data |
|
|
|
|
|
|
|
Net assets, |
$ 20,417 |
$ 21,111 |
$ 23,267 |
$ 21,272 |
$ 15,024 |
$ 11,010 |
|
Ratio of expenses |
.69% A |
.69% |
.67% |
.67% |
.68% |
.68% |
|
Ratio of expenses to average net assets after expense reductions |
.67% A, E |
.67% E |
.66% E |
.65% E |
.66% E |
.67% E |
|
Ratio of net invest- |
1.81% A |
1.42% |
1.54% |
1.90% |
2.46% |
2.86% |
|
Portfolio turnover rate |
21% A |
26% |
30% |
23% |
30% |
39% |
A Annualized
B Total returns for periods of less than one year are not annualized.
C The total returns would have been lower had certain expenses not been reduced during the periods shown.
D Net investment income per share has been calculated based on average shares outstanding during the period.
E FMR or the fund has entered into varying arrangements with third parties who either paid or reduced a portion of the fund's expenses.
See accompanying notes which are an integral part of the financial statements.
Semiannual Report
For the period ended July 31, 2000 (Unaudited)
1. Significant Accounting Policies.
Fidelity Equity-Income Fund (the fund) is a fund of Fidelity Devonshire Trust (the trust) and is authorized to issue an unlimited number of shares. The trust is registered under the Investment Company Act of 1940, as amended, as an open-end management investment company organized as a Massachusetts business trust. The financial statements have been prepared in conformity with generally accepted accounting principles which require management to make certain estimates and assumptions at the date of the financial statements. The following summarizes the significant accounting policies of the fund:
Security Valuation. Securities for which exchange quotations are readily available are valued at the last sale price, or if no sale price, at the closing bid price. Foreign securities are valued based on quotations from the principal market in which such securities are normally traded. If trading or events occurring in other markets after the close of the principal market in which foreign securities are traded, and before the close of the business of the fund, are expected to materially affect the value of those securities, then they are valued at their fair value taking this trading or these events into account. Fair value is determined in good faith under consistently applied procedures under the general supervision of the Board of Trustees. Securities (including restricted securities) for which exchange quotations are not readily available (and in certain cases debt securities which trade on an exchange) are valued primarily using dealer-supplied valuations or at their fair value. Short-term securities with remaining maturities of sixty days or less for which quotations are not readily available are valued at amortized cost or original cost plus accrued interest, both of which approximate current value.
Foreign Currency Translation. The accounting records of the fund are maintained in U.S. dollars. Investment securities and other assets and liabilities denominated in a foreign currency are translated into U.S. dollars at the prevailing rates of exchange at period end. Purchases and sales of securities, income receipts and expense payments are translated into U.S. dollars at the prevailing exchange rate on the respective dates of the transactions.
Net realized gains and losses on foreign currency transactions represent net gains and losses from sales and maturities of foreign currency contracts, disposition of foreign currencies, the difference between the amount of net investment income accrued and the U.S. dollar amount actually received, and gains and losses between trade and settlement date on purchases and sales of securities. The effects of changes in foreign currency exchange rates on investments in securities are included with the net realized and unrealized gain or loss on investment securities.
Income Taxes. As a qualified regulated investment company under Subchapter M of the Internal Revenue Code, the fund is not subject to U.S. federal income taxes to the extent that it distributes substantially all of its taxable income for its fiscal year.
Semiannual Report
Notes to Financial Statements (Unaudited) - continued
1. Significant Accounting Policies - continued
Income Taxes - continued
The fund may be subject to foreign taxes on income and gains on investments which are accrued based upon the fund's understanding of the tax rules and regulations that exist in the markets in which it invests. Foreign governments may also impose taxes on other payments or transactions with respect to foreign securities. The fund accrues such taxes as applicable. The schedule of investments includes information regarding income taxes under the caption "Income Tax Information."
Investment Income. Dividend income is recorded on the ex-dividend date, except certain dividends from foreign securities where the ex-dividend date may have passed, are recorded as soon as the fund is informed of the ex-dividend date. Non-cash dividends included in dividend income, if any, are recorded at the fair market value of the securities received. Interest income, which includes accretion of original issue discount, is accrued as earned. Investment income is recorded net of foreign taxes withheld where recovery of such taxes is uncertain.
Expenses. Most expenses of the trust can be directly attributed to a fund. Expenses which cannot be directly attributed are apportioned among the funds in the trust.
Deferred Trustee Compensation. Under a Deferred Compensation Plan (the Plan) non-interested Trustees must defer receipt of a portion of, and may elect to defer receipt of an additional portion of, their annual compensation. Deferred amounts are treated as though equivalent dollar amounts had been invested in shares of the fund or are invested in a cross-section of other Fidelity funds. Deferred amounts remain in the fund until distributed in accordance with the Plan.
Distributions to Shareholders. Distributions are recorded on the ex-dividend date.
Income and capital gain distributions are determined in accordance with income tax regulations which may differ from generally accepted accounting principles. These differences, which may result in distribution reclassifications, are primarily due to differing treatments for litigation proceeds, foreign currency transactions, market discount, non-taxable dividends and losses deferred due to wash sales. The fund also utilized earnings and profits distributed to shareholders on redemption of shares as a part of the dividends paid deduction for income tax purposes.Permanent book and tax basis differences relating to shareholder distributions will result in reclassifications to paid in capital. Undistributed net investment income and accumulated undistributed net realized gain (loss) on investments and foreign currency transactions may include temporary book and tax basis differences which will reverse in a subsequent period. Any taxable income or gain remaining at fiscal year end is distributed in the following year.
Security Transactions. Security transactions are accounted for as of trade date. Gains and losses on securities sold are determined on the basis of identified cost.
Semiannual Report
Notes to Financial Statements (Unaudited) - continued
2. Operating Policies.
Foreign Currency Contracts. The fund generally uses foreign currency contracts to facilitate transactions in foreign-denominated securities. Losses may arise from changes in the value of the foreign currency or if the counterparties do not perform under the contracts' terms. The U.S. dollar value of foreign currency contracts is determined using contractual currency exchange rates established at the time of each trade.
Joint Trading Account. Pursuant to an Exemptive Order issued by the Securities and Exchange Commission (the SEC), the fund, along with other affiliated entities of Fidelity Management & Research Company (FMR), may transfer uninvested cash balances into one or more joint trading accounts. These balances are invested in one or more repurchase agreements for U.S. Treasury or Federal Agency obligations.
Repurchase Agreements. The underlying U.S. Treasury, Federal Agency, or other obligations found to be satisfactory by FMR are transferred to an account of the fund, or to the Joint Trading Account, at a custodian bank. The securities are marked-to-market daily and maintained at a value at least equal to the principal amount of the repurchase agreement (including accrued interest). FMR, the fund's investment adviser, is responsible for determining that the value of the underlying securities remains in accordance with the market value requirements stated above.
Cash Central Funds. Pursuant to an Exemptive Order issued by the SEC, the fund may invest in the Fidelity Cash Central Fund and the Fidelity Securities Lending Cash Central Fund (the Cash Funds) managed by Fidelity Investments Money Management, Inc. (FIMM), an affiliate of FMR. The Cash Funds are open-end money market funds available only to investment companies and other accounts managed by FMR and its affiliates. The Cash Funds seek preservation of capital, liquidity, and current income. Income distributions from the Cash Funds are declared daily and paid monthly from net interest income. Income distributions earned by the fund are recorded as either interest income or security lending income in the accompanying financial statements.
Interfund Lending Program. Pursuant to an Exemptive Order issued by the SEC, the fund, along with other registered investment companies having management contracts with FMR, may participate in an interfund lending program. This program provides an alternative credit facility allowing the fund to borrow from, or lend money to, other participating funds.
Indexed Securities. The fund may invest in indexed securities whose values are linked either directly or inversely to changes in foreign currencies, interest rates, commodities, indices, or other underlying instruments. The fund uses these securities to increase or decrease its exposure to different underlying instruments and to gain exposure to markets that might be difficult to invest in through conventional securities. Indexed securities may be more volatile than their underlying
Semiannual Report
Notes to Financial Statements (Unaudited) - continued
2. Operating Policies - continued
Indexed Securities - continued
instruments, but any loss is limited to the amount of the original investment. Gains (losses) realized upon the sale of indexed securities are included in realized gains (losses) on investment securities.
Restricted Securities. The fund is permitted to invest in securities that are subject to legal or contractual restrictions on resale. These securities generally may be resold in transactions exempt from registration or to the public if the securities are registered. Disposal of these securities may involve time-consuming negotiations and expense, and prompt sale at an acceptable price may be difficult. At the end of the period, the fund had no investments in restricted securities (excluding 144A issues).
3. Purchases and Sales of Investments.
Purchases and sales of securities, other than short-term securities, aggregated $2,137,962,000 and $3,689,030,000, respectively.
4. Fees and Other Transactions with Affiliates.
Management Fee. As the fund's investment adviser, FMR receives a monthly fee that is calculated on the basis of a group fee rate plus a fixed individual fund fee rate applied to the average net assets of the fund. The group fee rate is the weighted average of a series of rates and is based on the monthly average net assets of all the mutual funds advised by FMR. The rates ranged from .2167% to .5200% for the period. The annual individual fund fee rate is .20%. In the event that these rates were lower than the contractual rates in effect during the period, FMR voluntarily implemented the above rates, as they resulted in the same or a lower management fee. For the period, the management fee was equivalent to an annualized rate of .48% of average net assets.
Transfer Agent Fees. Fidelity Service Company, Inc. (FSC), an affiliate of FMR, is the fund's transfer, dividend disbursing and shareholder servicing agent. FSC receives account fees and asset-based fees that vary according to account size and type of account. FSC pays for typesetting, printing and mailing of all shareholder reports, except proxy statements. For the period, the transfer agent fees were equivalent to an annualized rate of .20% of average net assets.
Accounting and Security Lending Fees. FSC, an affiliate of FMR, maintains the fund's accounting records and administers the security lending program. The security lending fee is based on the number and duration of lending transactions. The accounting fee is based on the level of average net assets for the month plus out-of-pocket expenses.
Brokerage Commissions. The fund placed a portion of its portfolio transactions with brokerage firms which are affiliates of FMR. The commissions paid to these affiliated firms were $204,000 for the period.
Semiannual Report
Notes to Financial Statements (Unaudited) - continued
5. Interfund Lending Program.
The fund participated in the interfund lending program as a borrower. The average daily loan balance during the period for which loans were outstanding amounted to $ 31,307,000. The weighted average interest rate was 5.96%. Interest expense includes $251,000 paid under the interfund lending program. At period end there were no interfund loans outstanding.
6. Security Lending.
The fund lends portfolio securities from time to time in order to earn additional income. The fund receives collateral in the form of U.S. Treasury obligations, letters of credit, and/or cash against the loaned securities, and maintains collateral in an amount not less than 100% of the market value of the loaned securities during the period of the loan. The market value of the loaned securities is determined at the close of business of the fund and any additional required collateral is delivered to the fund on the next business day. If the borrower defaults on its obligation to return the securities loaned because of insolvency or other reasons, the fund could experience delays and costs in recovering the securities loaned or in gaining access to the collateral. At period end, the value of the securities loaned amounted to $83,950,000. The fund received cash collateral of $48,075,000 which was invested in cash equivalents, and U.S. Treasury obligations valued at $41,200,000.
7. Bank Borrowings.
The fund is permitted to have bank borrowings for temporary or emergency purposes to fund shareholder redemptions. The fund has established borrowing arrangements with certain banks. The interest rate on the borrowings is the bank's base rate, as revised from time to time. The average daily loan balance during the period for which loans were outstanding amounted to $29,682,000. The weighted average interest rate was 6.09%. Interest expense includes $85,000 paid under the bank borrowing program. At period end there were no bank borrowings outstanding.
8. Expense Reductions.
FMR has directed certain portfolio trades to brokers who paid a portion of the fund's expenses. For the period, the fund's expenses were reduced by $1,271,000 under this arrangement.
In addition, through arrangements with the fund's custodian and transfer agent, credits realized as a result of uninvested cash balances were used to reduce a portion of the fund's expenses. During the period, the fund's custodian and transfer agent fees were reduced by $4,000 and $1,049,000, respectively, under these arrangements.
Semiannual Report
Notes to Financial Statements (Unaudited) - continued
9. Transactions with Affiliated Companies.
An affiliated company is a company in which the fund has ownership of at least 5% of the voting securities. Transactions during the period with companies which are or were affiliates are as follows:
|
Summary of Transactions with Affiliated Companies |
||||
|
Amounts in thousands Affiliate |
Purchase |
Sales |
Dividend |
Value |
|
Footstar, Inc. |
$ - |
$ 4,486 |
$ - |
$ - |
|
Highlands Insurance Group, Inc. |
- |
- |
- |
7,285 |
|
Ryerson Tull, Inc. |
- |
- |
153 |
13,521 |
|
TOTALS |
$ - |
$ 4,486 |
$ 153 |
$ 20,806 |
Semiannual Report
Fidelity offers several ways to conveniently manage your personal investments via your telephone or PC. You can access your account information, conduct trades and research your investments 24 hours a day.
By Phone
Fidelity Automated Service Telephone provides a single toll-free number to access account balances, positions, quotes and trading. It's easy to navigate the service, and on your first call, the system will help you create a personal identification number (PIN) for security.
(phone_graphic)Fidelity Automated
Service Telephone (FAST®)
1-800-544-5555
Press
1 For mutual fund and brokerage trading.
2 For quotes.*
3 For account balances and holdings.
4 To review orders and mutual
fund activity.
5 To change your PIN.
*0 To speak to a Fidelity representative.
By PC
Fidelity's web site on the Internet provides a wide range of information, including daily financial news, fund performance, interactive planning tools and news about Fidelity products and services.
(computer_graphic)Fidelity's Web Site
www.fidelity.com
If you are not currently on the Internet, call EarthLink Sprint at 1-800-288-2967, and be sure to ask for registration number SMD004 to receive a special Fidelity package that includes 30 days of free Internet access. EarthLink is North America's #1 independent Internet access provider.
(computer_graphic)
Fidelity On-line Xpress+®
Fidelity On-line Xpress+ software for Windows combines comprehensive portfolio management capabilities, securities trading and access to research and analysis tools . . . all on your desktop. Call Fidelity at 1-800-544-0240 or visit our web site for more information on how to manage your investments via your PC.
* When you call the quotes line, please remember that a fund's yield and return will vary and, except for money market funds, share price will also vary. This means that you may have a gain or loss when you sell your shares. There is no assurance that money market funds will be able to maintain a stable $1 share price; an investment in a money market fund is not insured or guaranteed by the U.S. government. Total returns are historical and include changes in share price, reinvestment of dividends and capital gains, and the effects of any sales charges.
Semiannual Report
If more than one address is listed, please locate the address that is closest to you. We'll give your correspondence immediate attention and send you written confirmation upon completion of your request.
(letter_graphic)Making Changes
To Your Account
(such as changing name, address, bank, etc.)
Fidelity Investments
P.O. Box 770001
Cincinnati, OH 45277-0002
(letter_graphic)For Non-Retirement
Accounts
Buying shares
Fidelity Investments
P.O. Box 770001
Cincinnati, OH 45277-0003
Overnight Express
Fidelity Investments
2300 Litton Lane - KH1A
Hebron, KY 41048
Selling shares
Fidelity Investments
P.O. Box 660602
Dallas, TX 75266-0602
Overnight Express
Fidelity Investments
Attn: Redemptions - CP6I
400 East Las Colinas Blvd.
Irving, TX 75039-5587
General Correspondence
Fidelity Investments
P.O. Box 500
Merrimack, NH 03054-0500
(letter_graphic)For Retirement
Accounts
Buying shares
Fidelity Investments
P.O. Box 770001
Cincinnati, OH 45277-0003
Selling shares
Fidelity Investments
P.O. Box 660602
Dallas, TX 75266-0602
Overnight Express
Fidelity Investments
Attn: Redemptions - CP6R
400 East Las Colinas Blvd.
Irving, TX 75039-5587
General Correspondence
Fidelity Investments
P.O. Box 500
Merrimack, NH 03054-0500
Semiannual Report
Semiannual Report
Investment Adviser
Fidelity Management & Research Company
Boston, MA
Investment Sub-Advisers
Fidelity Management & Research
(U.K.) Inc.
Fidelity Management & Research
(Far East) Inc.
Fidelity Investments Japan Limited
Officers
Edward C. Johnson 3d, President
Robert C. Pozen, Senior Vice President
Stephen R. Petersen, Vice President
Richard A. Spillane, Jr., Vice President
Eric D. Roiter, Secretary
Robert A. Dwight, Treasurer
Maria F. Dwyer, Deputy Treasurer
John H. Costello, Assistant Treasurer
Board of Trustees
Ralph F. Cox *
Phyllis Burke Davis *
Robert M. Gates *
Edward C. Johnson 3d
Donald J. Kirk *
Ned C. Lautenbach *
Peter S. Lynch
Marvin L. Mann *
William O. McCoy *
Gerald C. McDonough *
Robert C. Pozen
Thomas R. Williams *
Advisory Board
J. Michael Cook
Abigail P. Johnson
Marie L. Knowles
* Independent trustees
General Distributor
Fidelity Distributors Corporation
Boston, MA
Transfer and Shareholder
Servicing Agent
Fidelity Service Company, Inc.
Boston, MA
Custodian
The Chase Manhattan Bank
New York, NY
Fidelity's Growth and Income Funds
Balanced Fund
Convertible Securities Fund
Equity-Income Fund
Equity-Income II Fund
Fidelity® Fund
Global Balanced Fund
Growth & Income Portfolio
Growth & Income II Portfolio
Puritan® Fund
Real Estate Investment Portfolio
Utilities Fund
The Fidelity Telephone Connection
Mutual Fund 24-Hour Service
Exchanges/Redemptions
and Account Assistance 1-800-544-6666
Product Information 1-800-544-6666
Retirement Accounts 1-800-544-4774
(8 a.m. - 9 p.m.)
TDD Service 1-800-544-0118
for the deaf and hearing impaired
(9 a.m. - 9 p.m. Eastern time)(Fidelity Investment logo)(registered trademark)
Corporate Headquarters
82 Devonshire St., Boston, MA 02109
www.fidelity.com
Fidelity Automated Service
Telephone (FAST®) (automated graphic) 1-800-544-5555
(automated graphic) Automated line for quickest service
EQU-SANN-0900 110702
1.536123.103
Fidelity®
Portfolio
Semiannual Report
July 31, 2000
(2_fidelity_logos) (Registered_Trademark)
|
President's Message |
3 |
Ned Johnson on investing strategies. |
|
Performance |
4 |
How the fund has done over time. |
|
Fund Talk |
6 |
The manager's review of fund performance, strategy and outlook. |
|
Investment Changes |
9 |
A summary of major shifts in the fund's investments over the past six months. |
|
Investments |
10 |
A complete list of the fund's investments with their market values. |
|
Financial Statements |
15 |
Statements of assets and liabilities,
operations, and changes in net assets, |
|
Notes |
19 |
Notes to the financial statements. |
Standard & Poor's, S&P and S&P 500 are registered service marks of The McGraw-Hill Companies, Inc. and have been licensed for use by Fidelity Distributors Corporation.
Other third party marks appearing herein are the property of their respective owners.
All other marks appearing herein are registered or unregistered trademarks or service marks of FMR Corp. or an affiliated company.
(Recycle graphic) This report is printed on recycled paper using soy-based inks.
This report and the financial statements contained herein are submitted for the general information of the shareholders of the fund. This report is not authorized for distribution to prospective investors in the fund unless preceded or accompanied by an effective prospectus.
Mutual fund shares are not deposits or obligations of, or guaranteed by, any depository institution. Shares are not insured by the FDIC, Federal Reserve Board or any other agency, and are subject to investment risks, including possible loss of principal amount invested.
Neither the fund nor Fidelity Distributors Corporation is a bank.
For more information on any Fidelity fund, including charges and expenses, call 1-800-544-6666 for a free prospectus. Read it carefully before you invest or send money.
Semiannual Report
(photo_of_Edward_C_Johnson_3d)
Dear Shareholder:
The Federal Reserve Board's effort to keep inflation in check without over-cooling the U.S. economy has taken a toll on the stock market. Through July 2000, bellwether equity indexes such as the Dow Jones Industrial Average, NASDAQ and S&P 500® have negative returns for the year. On the other hand, fixed-income markets are enjoying strong performance. Except for high-yield, most bond sectors - corporates, mortgages, Treasuries and agencies - have returned 4%-6% year to date.
While it's impossible to predict the future direction of the markets with any degree of certainty, there are certain basic principles that can help investors plan for their future needs.
First, investors are encouraged to take a long-term view of their portfolios. If you can afford to leave your money invested through the inevitable up and down cycles of the financial markets, you will greatly reduce your vulnerability to any single decline. We know from experience, for example, that stock prices have gone up over longer periods of time, have significantly outperformed other types of investments and have stayed ahead of inflation.
Second, you can further manage your investing risk through diversification. A stock mutual fund, for instance, is already diversified, because it invests in many different companies. You can increase your diversification further by investing in a number of different stock funds, or in such other investment categories as bonds. If you have a short investment time horizon, you might want to consider moving some of your investment into a money market fund, which seeks income and a stable share price by investing in high-quality, short-term investments. Of course, it's important to remember that an investment in a money market fund is not insured or guaranteed by the Federal Deposit Insurance Corporation or any other government agency. Although money market funds seek to preserve the value of your investment at $1.00 per share, it is possible to lose money by investing in these types of funds.
Finally, no matter what your time horizon or portfolio diversity, it makes good sense to follow a regular investment plan, investing a certain amount of money in a fund at the same time each month or quarter and periodically reviewing your overall portfolio. By doing so, you won't get caught up in the excitement of a rapidly rising market, nor will you buy all your shares at market highs. While this strategy - known as dollar cost averaging - won't assure a profit or protect you from a loss in a declining market, it should help you lower the average cost of your purchases. Of course, you should consider your financial ability to continue your purchases through periods of low price levels before undertaking such a strategy.
If you have questions, please call us at 1-800-544-6666, or visit our web site at www.fidelity.com. We are available 24 hours a day, seven days a week to provide you the information you need to make the investments that are right for you.
Best regards,
/s/Edward C. Johnson 3d
Edward C. Johnson 3d
Semiannual Report
There are several ways to evaluate a fund's historical performance. You can look at the total percentage change in value, the average annual percentage change or the growth of a hypothetical $10,000 investment. Total return reflects the change in the value of an investment, assuming reinvestment of the fund's dividend income and capital gains (the profits earned upon the sale of securities that have grown in value).
Cumulative Total Returns
|
Periods ended July 31, 2000 |
Past 6 |
Past 1 |
Past 5 |
Past 10 |
|
Fidelity Real Estate |
26.27% |
21.48% |
79.27% |
229.22% |
|
S&P 500 |
3.20% |
8.98% |
177.11% |
408.31% |
|
Wilshire Real Estate Securities |
25.05% |
18.37% |
75.75% |
110.23% |
|
Real Estate Funds Average |
21.59% |
13.32% |
66.84% |
148.09% |
Cumulative total returns show the fund's performance in percentage terms over a set period - in this case, six months, one year, five years or 10 years. For example, if you had invested $1,000 in a fund that had a 5% return over the past year, the value of your investment would be $1,050. You can compare the fund's returns to the performance of the Wilshire Real Estate Securities Index - a market capitalization-weighted index of publicly traded real estate securities such as real estate investment trusts (REITs) and real estate operating companies (REOCs) - and the performance of the Standard & Poor's 500 SM Index - a market capitalization-weighted index of common stocks. To measure how the fund's performance stacked up against its peers, you can compare it to the real estate funds average, which reflects the performance of mutual funds with similar objectives tracked by Lipper Inc. The past six months average represents a peer group of 152 mutual funds. These benchmarks include reinvested dividends and capital gains, if any, and exclude the effect of sales charges.
Average Annual Total Returns
|
Periods ended July 31, 2000 |
|
Past 1 |
Past 5 |
Past 10 |
|
Fidelity Real Estate |
|
21.48% |
12.38% |
12.65% |
|
S&P 500 |
|
8.98% |
22.61% |
17.65% |
|
Wilshire Real Estate Securities |
|
18.37% |
11.94% |
7.71% |
|
Real Estate Funds Average |
|
13.32% |
10.55% |
9.06% |
Average annual total returns take the fund's cumulative return and show you what would have happened if the fund had performed at a constant rate each year. (Note: Lipper calculates average annual total returns by annualizing each fund's total return, then taking an arithmetic average. This may produce a different figure than that obtained by averaging the cumulative total returns and annualizing the result.)
Semiannual Report
$10,000 Over 10 Years
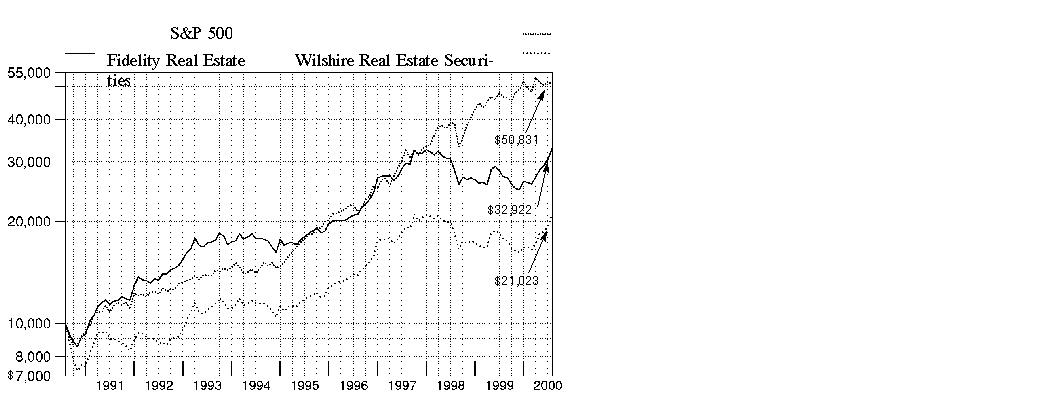
$10,000 Over 10 Years: Let's say hypothetically that $10,000 was invested in Fidelity Real Estate Investment Portfolio on July 31, 1990. As the chart shows, by July 31, 2000, the value of the investment would have grown to $32,922 - a 229.22% increase on the initial investment. For comparison, look at how both the Wilshire Real Estate Securities Index and Standard & Poor's 500 Index did over the same period. With dividends and capital gains, if any, reinvested, the same $10,000 investment in the Wilshire Real Estate Securities Index would have grown to $21,023 - a 110.23% increase. If $10,000 was invested in the S&P 500 Index, it would have grown to $50,831 - a 408.31% increase.
Understanding
Performance
How a fund did yesterday is no guarantee of how it will do tomorrow. The stock market, for example, has a history of long-term growth and short-term volatility. In turn, the share price and return of a fund that invests in stocks will vary. That means if you sell your shares during a market downturn, you might lose money. But if you can ride out the market's ups and downs, you may have a gain.
3Semiannual Report
Market Recap
Volatility and rising interest rates were the main factors influencing equity investors during the six-month period that ended July 31, 2000. The U.S. equity markets struggled to break free from the grip of the Federal Reserve Board, whose effort to cool the overheated economy was delivered via a series of interest-rate hikes. With every clench of its fist, the Fed's effort - which raised the federal funds rate three times by a combined total of 1.0% - gradually tempered the optimism toward stocks as the period progressed. The effect of the Fed's tightening, coupled with the market's concerns about corporate earnings, took its toll beginning in March with a correction in technology stocks. The seemingly invincible NASDAQ Composite Index, which had soared to a 19.2% gain in February, dropped more than 10% in March and shed 25% during a single week in April, before finishing the volatile period with a -4.31% return. The Dow Jones Industrial Average, the blue chips' benchmark, returned -3.08%, while the Standard & Poor's 500 SM Index, an index of 500 commonly held large-cap companies, fared better, gaining 3.20%. Growing concerns about a potential economic slowdown also affected small-cap stocks, as evidenced by the Russell 2000®'s mere 1.35% six-month advance. The S&P and Russell indexes weren't immune from the market's indecisiveness, dropping 1.56% and 3.22%, respectively, during July.
(Portfolio Manager photograph)
An interview with Steve Buller, Portfolio Manager of Fidelity Real Estate Investment Portfolio
Q. How did the fund perform, Steve?
A. Quite well. For the six months that ended July 31, 2000, the fund returned 26.27%. In comparison, the Wilshire Real Estate Securities Index returned 25.05%. During the same period, the real estate funds average tracked by Lipper Inc. returned 21.59%, while the Standard & Poor's 500 Index returned 3.20%. For the 12-month period that ended July 31, 2000, the fund returned 21.48%, outdistancing the Wilshire index, Lipper average and S&P 500 ®, which returned 18.37%, 13.32% and 8.98%, respectively.
Q. What helped the fund outperform the Wilshire index and Lipper peer group during the six-month period?
A. The fund outperformed the index mainly as a result of good sector selection within the industry. Specifically, our large overweighted position in office real estate investment trusts (REITs), slight overweighting in industrial REITs and market weighting relative to the index in the strong-performing apartment REIT sector allowed the fund to surpass the benchmark's performance. Remaining underexposed to the poorly performing retail sector also benefited the fund, as malls, strip centers and factory outlets continued to suffer from concerns about the advent of electronic commerce and its impact on the retail industry. The fund further benefited by not owning any major disappointments. Having a relatively small exposure to strip center owner JDN Realty and no exposure to shopping mall/apartment REIT New Plan Excel Realty - both of which suffered from poor management decisions - extended the fund's rally during the period.
Semiannual Report
Fund Talk: The Manager's Overview - continued
Q. What factors drove the strong performance of REITs during the six-month period?
A. Good fundamentals in real estate securities coupled with favorable market conditions - constrained supply and high demand - along with high occupancy levels and steady rental growth produced strong bottom-line earnings growth for these companies. Real estate securities also looked attractive on a valuation basis. At the beginning of the period, these securities were incredibly inexpensive, trading at about eight-times earnings on average, after a few years of being neglected by investors. At that level, real estate securities had been trading at a historical low - about a 15%-20% discount to the underlying value of the real estate. Finally, REITs benefited from a sharp decline and extreme volatility in the technology sector, which had attracted the majority of market interest during the past year. After the tech-heavy NASDAQ corrected in the spring, investors began to look at other sectors for more defensive stocks and better valuations.
Q. What adjustments did you make to the portfolio, if any?
A. I didn't make any significant sector changes. I marginally added to the fund's underweighting in hotel REITs when it appeared demand for lodging was stronger than expected, despite considerable supply and rising interest rates. I maintained the fund's overweighting in office REITs, which proved beneficial as demand for space ticked up, particularly in coastal cities.
Q. What holdings stood out as the fund's top performers? Which disappointed?
A. Starwood Hotels & Resorts - the fund's second-largest position - was the fund's top contributor and benefited from a strong revenue-per-available-room ratio. In the office sector, our large overweighting in Reckson Associates Realty surged on robust demand for office space in the New York City area. On the down side, there were no major disappointments. However, Canadian apartment company Boardwalk Equities underperformed due to slower-than-expected implementation of tech-nology within its management operations and building units. Unexpected troubles in its brokerage subsidiary plagued the performance of manufactured housing firm Sun Communities.
Q. What's your outlook?
A. Despite a big run-up during the past six months, my view on real estate securities is still positive. Fundamentals continue to improve, and while valuations in the sector are not as inexpensive as they had been six months ago, they still trade at a discount to their underlying real estate value. Further, the average price-multiple for these securities is still below the historical average. That said, investors should keep in mind that despite the recent period's strong gain, real estate securities historically have appreciated 10%-15% annually on average.
Semiannual Report
Fund Talk: The Manager's Overview - continued
The views expressed in this report reflect those of the portfolio manager only through the end of the period of the report as stated on the cover and do not necessarily represent the views of Fidelity or any other person in the Fidelity organization. Any such views are subject to change at any time based upon market or other conditions and Fidelity disclaims any responsibility to update such views. These views may not be relied on as investment advice and, because investment decisions for a Fidelity fund are based on numerous factors, may not be relied on as an indication of trading intent on behalf of any Fidelity fund.
Fund Facts
Goal: above-average income and long-term capital growth by investing mainly in the equity securities of companies in the real estate industry
Fund number: 303
Trading symbol: FRESX
Start date: November 17, 1986
Size: as of July 31, 2000, more than $934 million
Manager: Steve Buller, since
1998; associate portfolio
manager, Fidelity Real Estate
Investment Portfolio, 1997-
1998; manager, Fidelity
Select Environmental Services
Portfolio, 1997-1998; joined
Fidelity in 1992
Steve Buller on the impact of an economic soft landing on real estate securities:
"A soft landing, or the gradual slowdown of the U.S. economy to a growth rate consistent with the historical 3% average, should be very good for real estate and real estate securities. In this environment, these securities could do well relative to other industries because most real estate is a contractual business, requiring long-term deals, either through rental agreements or leases. These contracts generate consistent cash flows for real estate companies - cash flows that don't disappear unless the economy goes into a serious recession, which can then lead to higher default rates. But unless the tenants are in considerable economic distress, revenues remain consistent.
"In a soft-landing situation, demand for real estate typically goes down to some extent, but in today's real estate market, a reduction in demand shouldn't create a significant imbalance because there is no indication of oversupply in the marketplace. What hurts real estate most over time is oversupply. As long as the supply side of the market remains constrained, even a reduction of demand from a soft-landing scenario should position real estate securities well relative to other types of securities."
Semiannual Report
|
Top Ten Stocks as of July 31, 2000 |
||
|
|
% of fund's |
% of fund's net assets |
|
Equity Office Properties Trust |
7.8 |
9.6 |
|
Starwood Hotels & Resorts Worldwide, Inc. unit |
7.4 |
2.1 |
|
Equity Residential Properties Trust (SBI) |
5.0 |
5.6 |
|
CenterPoint Properties Trust |
4.7 |
4.7 |
|
Crescent Real Estate Equities Co. |
4.5 |
4.1 |
|
Reckson Associates Realty Corp. |
4.1 |
4.0 |
|
Duke-Weeks Realty Corp. |
4.1 |
4.5 |
|
ProLogis Trust |
3.7 |
2.8 |
|
Apartment Investment & Management Co. Class A |
3.6 |
7.3 |
|
Boston Properties, Inc. |
3.5 |
3.3 |
|
|
48.4 |
48.0 |
|
Top Five REIT Sectors as of July 31, 2000 |
||
|
|
% of fund's |
% of fund's net assets |
|
REITs - Office Buildings |
23.3 |
26.4 |
|
REITs - Industrial Buildings |
22.7 |
27.9 |
|
REITs - Apartments |
14.1 |
20.1 |
|
REITs - Malls |
7.5 |
5.8 |
|
REITs - Shopping Centers |
6.0 |
6.4 |
|
Asset Allocation (% of fund's net assets) |
|||||||
|
As of July 31, 2000 * |
As of January 31, 2000 ** |
||||||
|
Stocks 92.3% |
|
|
Stocks 96.4% |
|
||
|
Short-Term |
|
|
Short-Term |
|
||
|
* Foreign |
3.1% |
|
** Foreign investments |
4.4% |
|
||

Semiannual Report
(Unaudited)
Showing Percentage of Net Assets
|
Common Stocks - 92.3% |
|||
|
Shares |
Value (Note 1) (000s) |
||
|
ENTERTAINMENT - 0.9% |
|||
|
Miscellaneous Amusement, Recreation Services - 0.9% |
|||
|
Mandalay Resort Group (a) |
128,000 |
$ 3,128 |
|
|
Park Place Entertainment Corp. (a) |
415,600 |
5,221 |
|
|
|
8,349 |
||
|
FEDERAL SPONSORED CREDIT - 0.7% |
|||
|
Federal & Federally Sponsored Credit Agencies - 0.7% |
|||
|
Fannie Mae |
140,000 |
6,983 |
|
|
LODGING & GAMING - 7.4% |
|||
|
Hotels & Motels - 7.4% |
|||
|
Prime Hospitality Corp. (a) |
10,900 |
104 |
|
|
Starwood Hotels & Resorts Worldwide, Inc. unit |
2,025,383 |
69,116 |
|
|
|
69,220 |
||
|
PAPER & FOREST PRODUCTS - 0.2% |
|||
|
Paperboard Mills - 0.2% |
|||
|
The St. Joe Co. |
54,500 |
1,621 |
|
|
REAL ESTATE - 6.1% |
|||
|
Operators, Non-Residental - 1.0% |
|||
|
Brookfield Properties Corp. |
619,700 |
9,542 |
|
|
CR Leasing & Development, Inc.: |
|
|
|
|
Class A (d) |
46 |
0 |
|
|
Class B (non-vtg.) (d) |
216 |
2 |
|
|
|
9,544 |
||
|
Real Estate Agents - 0.0% |
|||
|
Insignia Financial Group, Inc. (a) |
8,100 |
90 |
|
|
Trammell Crow Co. (a) |
19,500 |
202 |
|
|
|
292 |
||
|
Real Estate, General - 2.1% |
|||
|
Boardwalk Equities, Inc. (a) |
2,043,600 |
17,383 |
|
|
Boardwalk Equities, Inc. (a)(c) |
254,100 |
2,161 |
|
|
|
19,544 |
||
|
Common Stocks - continued |
|||
|
Shares |
Value (Note 1) (000s) |
||
|
REAL ESTATE - CONTINUED |
|||
|
Subdivided Real Estate Development - 3.0% |
|||
|
Catellus Development Corp. (a) |
1,321,400 |
$ 22,794 |
|
|
Newhall Land & Farming Co. |
193,800 |
5,305 |
|
|
|
28,099 |
||
|
TOTAL REAL ESTATE |
57,479 |
||
|
REAL ESTATE INVESTMENT TRUSTS - 76.6% |
|||
|
Real Estate Investment Trusts - 0.5% |
|||
|
Grove Property Trust |
3,900 |
63 |
|
|
Highwoods Properties, Inc. |
30,100 |
813 |
|
|
JDN Realty Corp. |
95,000 |
998 |
|
|
Pan Pacific Retail Properties, Inc. |
119,700 |
2,506 |
|
|
|
4,380 |
||
|
REITs - Apartments - 14.1% |
|||
|
Apartment Investment & Management Co. Class A |
691,800 |
33,466 |
|
|
Archstone Communities Trust |
1,048,200 |
27,188 |
|
|
Avalonbay Communities, Inc. |
269,904 |
12,719 |
|
|
BRE Properties, Inc. Class A |
187,800 |
6,092 |
|
|
Colonial Properties Trust (SBI) |
97,000 |
2,686 |
|
|
Equity Residential Properties Trust (SBI) |
931,462 |
46,457 |
|
|
Gables Residential Trust (SBI) |
111,000 |
3,018 |
|
|
|
131,626 |
||
|
REITs - Hotels - 0.3% |
|||
|
Host Marriott Corp. |
212,600 |
2,365 |
|
|
Wyndham International, Inc. Class A (a) |
50,000 |
106 |
|
|
|
2,471 |
||
|
REITs - Industrial Buildings - 22.7% |
|||
|
AMB Property Corp. |
1,232,900 |
29,435 |
|
|
Bedford Property Investors, Inc. |
52,700 |
1,014 |
|
|
CenterPoint Properties Trust |
1,031,900 |
43,856 |
|
|
Duke-Weeks Realty Corp. |
1,560,934 |
38,243 |
|
|
Liberty Property Trust (SBI) |
977,000 |
28,089 |
|
|
ProLogis Trust |
1,481,100 |
34,528 |
|
|
Public Storage, Inc. |
1,137,100 |
29,138 |
|
|
Spieker Properties, Inc. |
151,400 |
7,825 |
|
|
|
212,128 |
||
|
Common Stocks - continued |
|||
|
Shares |
Value (Note 1) (000s) |
||
|
REAL ESTATE INVESTMENT TRUSTS - CONTINUED |
|||
|
REITs - Leisure - 0.1% |
|||
|
Golf Trust of America, Inc. |
47,000 |
$ 734 |
|
|
REITs - Malls - 7.5% |
|||
|
CBL & Associates Properties, Inc. |
693,740 |
17,344 |
|
|
Crown American Realty Trust |
1,122,300 |
6,874 |
|
|
General Growth Properties, Inc. |
462,000 |
15,650 |
|
|
Simon Property Group, Inc. |
1,174,800 |
30,692 |
|
|
|
70,560 |
||
|
REITs - Mobile Home Parks - 1.9% |
|||
|
Manufactured Home Communities, Inc. |
267,100 |
6,410 |
|
|
Sun Communities, Inc. |
377,600 |
11,942 |
|
|
|
18,352 |
||
|
REITs - Office Buildings - 23.3% |
|||
|
Arden Realty Group, Inc. |
375,700 |
9,956 |
|
|
Boston Properties, Inc. |
792,400 |
32,885 |
|
|
Crescent Real Estate Equities Co. |
1,907,900 |
42,093 |
|
|
Crocker Realty, Inc.: |
|
|
|
|
Class A (d) |
1,497 |
15 |
|
|
Class B (non-vtg.) (d) |
1,521,600 |
15,321 |
|
|
Equity Office Properties Trust |
2,395,610 |
73,065 |
|
|
PS Business Parks, Inc. (d) |
61,600 |
1,571 |
|
|
Reckson Associates Realty Corp. |
1,462,400 |
38,388 |
|
|
SL Green Realty Corp. |
154,200 |
4,578 |
|
|
|
217,872 |
||
|
REITs - Prison - 0.2% |
|||
|
Correctional Properties Trust |
155,000 |
1,686 |
|
|
REITs - Shopping Centers - 6.0% |
|||
|
Bradley Real Estate, Inc. (SBI) |
150,219 |
3,230 |
|
|
Federal Realty Investment Trust (SBI) |
25,000 |
534 |
|
|
Kimco Realty Corp. |
595,700 |
24,573 |
|
|
Mid-Atlantic Realty Trust |
23,300 |
253 |
|
|
Philips International Realty Corp. |
32,500 |
557 |
|
|
Vornado Realty Trust |
688,000 |
26,918 |
|
|
|
56,065 |
||
|
TOTAL REAL ESTATE INVESTMENT TRUSTS |
715,874 |
||
|
Common Stocks - continued |
|||
|
Shares |
Value (Note 1) (000s) |
||
|
SECURITIES INDUSTRY - 0.3% |
|||
|
Investment Managers - 0.3% |
|||
|
Security Capital Group, Inc. Class B (a) |
140,600 |
$ 2,522 |
|
|
SHIPPING - 0.1% |
|||
|
Water Transportation - 0.1% |
|||
|
Alexander & Baldwin, Inc. |
22,700 |
572 |
|
|
TOTAL COMMON STOCKS (Cost $655,127) |
862,620 |
||
|
Cash Equivalents - 7.0% |
|||
|
Shares |
|
||
|
Fidelity Cash Central Fund, 6.57% (b) |
65,007,529 |
65,008 |
|
|
TOTAL INVESTMENT PORTFOLIO - 99.3% (Cost $720,135) |
927,628 |
||
|
NET OTHER ASSETS - 0.7% |
6,789 |
||
|
NET ASSETS - 100% |
$ 934,417 |
||
|
Legend |
|
(a) Non-income producing |
|
(b) The rate quoted is the annualized seven-day yield of the fund at |
|
(c) Security exempt from registration under Rule 144A of the Securities Act of 1933. These securities may be resold in transactions exempt from registration, normally to qualified institutional buyers. At the period end, the value of these securities amounted to $2,161,000 or 0.2% of net assets. |
|
(d) Restricted securities - Investment in securities not registered under the Securities Act of 1933. |
|
Additional information on each holding |
|
Security |
Acquisition Date |
Acquisition Cost (000s) |
|
CR Leasing & |
11/19/97 |
$ 0 |
|
CR Leasing & |
11/19/97 |
$ 2 |
|
Crocker Realty, |
11/19/97 |
$ 15 |
|
Crocker Realty, |
11/19/97 - 12/28/98 |
$ 15,215 |
|
PS Business |
5/6/98 |
$ 1,409 |
|
Income Tax Information |
|
At July 31, 2000, the aggregate cost |
|
At January 31, 2000, the fund had a capital loss carryforward of approximately $52,659,000 all of which will expire on January 31, 2008. |
|
The fund intends to elect to defer to its fiscal year ending January 31, 2001 approximately $3,979,000 of losses recognized during the period November 1, 1999 to January 31, 2000. |
See accompanying notes which are an integral part of the financial statements.
Semiannual Report
Statement of Assets and Liabilities
|
Amounts in thousands (except per-share amount) |
July 31, 2000 (Unaudited) |
|
|
Assets |
|
|
|
Investment in securities, at value (cost $720,135) - |
|
$ 927,628 |
|
Receivable for investments sold |
|
10,950 |
|
Receivable for fund shares sold |
|
10,767 |
|
Dividends receivable |
|
1,657 |
|
Interest receivable |
|
301 |
|
Redemption fees receivable |
|
3 |
|
Other receivables |
|
162 |
|
Total assets |
|
951,468 |
|
Liabilities |
|
|
|
Payable for investments purchased |
$ 14,706 |
|
|
Payable for fund shares redeemed |
1,806 |
|
|
Accrued management fee |
417 |
|
|
Other payables and accrued expenses |
122 |
|
|
Total liabilities |
|
17,051 |
|
Net Assets |
|
$ 934,417 |
|
Net Assets consist of: |
|
|
|
Paid in capital |
|
$ 744,575 |
|
Undistributed net investment income |
|
4,542 |
|
Accumulated undistributed net realized gain (loss) on investments and foreign currency transactions |
|
(22,195) |
|
Net unrealized appreciation (depreciation) on investments and assets and liabilities in foreign currencies |
|
207,495 |
|
Net Assets, for 51,644 shares outstanding |
|
$ 934,417 |
|
Net Asset Value, offering price and redemption price |
|
$18.09 |
See accompanying notes which are an integral part of the financial statements.
Semiannual Report
Financial Statements - continued
Statement of Operations
|
Amounts in thousands |
Six months ended July 31, 2000 (Unaudited) |
|
|
Investment Income Dividends |
|
$ 18,612 |
|
Interest |
|
1,200 |
|
Total income |
|
19,812 |
|
Expenses |
|
|
|
Management fee |
$ 2,144 |
|
|
Transfer agent fees |
894 |
|
|
Accounting fees and expenses |
112 |
|
|
Non-interested trustees' compensation |
1 |
|
|
Custodian fees and expenses |
23 |
|
|
Registration fees |
39 |
|
|
Audit |
15 |
|
|
Legal |
2 |
|
|
Miscellaneous |
4 |
|
|
Total expenses before reductions |
3,234 |
|
|
Expense reductions |
(199) |
3,035 |
|
Net investment income |
|
16,777 |
|
Realized and Unrealized Gain (Loss) Net realized gain (loss) on: |
|
|
|
Investment securities |
35,605 |
|
|
Foreign currency transactions |
(13) |
35,592 |
|
Change in net unrealized appreciation (depreciation) on: |
|
|
|
Investment securities |
126,113 |
|
|
Assets and liabilities in foreign currencies |
3 |
126,116 |
|
Net gain (loss) |
|
161,708 |
|
Net increase (decrease) in net assets resulting |
|
$ 178,485 |
See accompanying notes which are an integral part of the financial statements.
Semiannual Report
Financial Statements - continued
Statement of Changes in Net Assets
|
Amounts in thousands |
Six months ended
July 31, 2000 |
Year ended
January 31, |
|
Increase (Decrease) in Net Assets |
|
|
|
Operations |
$ 16,777 |
$ 36,394 |
|
Net realized gain (loss) |
35,592 |
(25,996) |
|
Change in net unrealized appreciation (depreciation) |
126,116 |
(8,499) |
|
Net increase (decrease) in net assets resulting |
178,485 |
1,899 |
|
Distributions to shareholders from net investment income |
(13,093) |
(39,916) |
|
Share transactions |
196,098 |
166,845 |
|
Reinvestment of distributions |
11,851 |
35,890 |
|
Cost of shares redeemed |
(138,430) |
(550,052) |
|
Net increase (decrease) in net assets resulting |
69,519 |
(347,317) |
|
Redemption fees |
217 |
249 |
|
Total increase (decrease) in net assets |
235,128 |
(385,085) |
|
Net Assets |
|
|
|
Beginning of period |
699,289 |
1,084,374 |
|
End of period (including undistributed net investment income of $4,542 and $858, respectively) |
$ 934,417 |
$ 699,289 |
|
Other Information Shares |
|
|
|
Sold |
11,942 |
10,721 |
|
Issued in reinvestment of distributions |
776 |
2,386 |
|
Redeemed |
(9,007) |
(36,464) |
|
Net increase (decrease) |
3,711 |
(23,357) |
See accompanying notes which are an integral part of the financial statements.
Semiannual Report
Financial Highlights
|
|
Six months ended July 31, 2000 |
Years ended January 31, |
||||
|
|
(Unaudited) |
2000 |
1999 |
1998 |
1997 |
1996 |
|
Selected Per-Share Data |
|
|
|
|
|
|
|
Net asset value,
beginning |
$ 14.59 |
$ 15.21 |
$ 20.11 |
$ 18.25 |
$ 14.13 |
$ 12.62 |
|
Income from Invest- |
|
|
|
|
|
|
|
Net investment income |
.36 C |
.62 C |
.75 C |
.79 C |
.86 C |
.72 |
|
Net realized |
3.42 |
(.55) |
(4.48) |
2.41 |
3.97 |
1.50 |
|
Total from investment operations |
3.78 |
.07 |
(3.73) |
3.20 |
4.83 |
2.22 |
|
Less Distributions |
|
|
|
|
|
|
|
From net investment income |
(.28) |
(.69) |
(.78) |
(.79) |
(.72) |
(.71) |
|
From net |
- |
- |
(.27) |
(.56) |
- |
- |
|
In excess of net realized gain |
- |
- |
(.13) |
- |
- |
- |
|
Total distributions |
(.28) |
(.69) |
(1.18) |
(1.35) |
(.72) |
(.71) |
|
Redemption fees
added to paid |
- |
- |
.01 |
.01 |
.01 |
- |
|
Net asset value, |
$ 18.09 |
$ 14.59 |
$ 15.21 |
$ 20.11 |
$ 18.25 |
$ 14.13 |
|
Total Return B |
26.27% |
0.43% |
(18.98)% |
17.93% |
35.45% |
18.10% |
|
Ratios and Supplemental Data |
|
|
|
|
|
|
|
Net assets, end of period (in millions) |
$ 934 |
$ 699 |
$ 1,084 |
$ 2,480 |
$ 2,196 |
$ 731 |
|
Ratio of expenses to average net assets |
.87% A |
.90% |
.89% |
.86% |
.94% |
.99% |
|
Ratio of expenses to average net assets after expense reductions |
.82% A, D |
.88% D |
.86% D |
.84% D |
.90% D |
.95% D |
|
Ratio of net invest- |
4.52% A |
4.06% |
4.23% |
4.06% |
5.63% |
6.28% |
|
Portfolio turnover rate |
83% A |
32% |
28% |
76% |
55% |
85% |
A Annualized
B The total returns would have been lower had certain expenses not been reduced during the periods shown and for periods of less than one year are not annualized.
C Net investment income per share has been calculated based on average shares outstanding during the period.
D FMR or the fund has entered into varying arrangements with third parties who either paid or reduced a portion of the fund's expenses.
See accompanying notes which are an integral part of the financial statements.
Semiannual Report
For the period ended July 31, 2000 (Unaudited)
1. Significant Accounting Policies.
Fidelity Real Estate Portfolio (the fund) is a fund of Fidelity Devonshire Trust (the trust) and is authorized to issue an unlimited number of shares. The trust is registered under the Investment Company Act of 1940, as amended, as an open-end management investment company organized as a Massachusetts business trust. The financial statements have been prepared in conformity with generally accepted accounting principles which require management to make certain estimates and assumptions at the date of the financial statements. The following summarizes the significant accounting policies of the fund:
Security Valuation. Securities for which exchange quotations are readily available are valued at the last sale price, or if no sale price, at the closing bid price. Foreign securities are valued based on quotations from the principal market in which such securities are normally traded. If trading or events occurring in other markets after the close of the principal market in which foreign securities are traded, and before the close of the business of the fund, are expected to materially affect the value of those securities, then they are valued at their fair value taking this trading or these events into account. Fair value is determined in good faith under consistently applied procedures under the general supervision of the Board of Trustees. Securities (including restricted securities) for which exchange quotations are not readily available (and in certain cases debt securities which trade on an exchange) are valued primarily using dealer-supplied valuations or at their fair value. Short-term securities with remaining maturities of sixty days or less for which quotations are not readily available are valued at amortized cost or original cost plus accrued interest, both of which approximate current value.
Foreign Currency Translation. The accounting records of the fund are maintained in U.S. dollars. Investment securities and other assets and liabilities denominated in a foreign currency are translated into U.S. dollars at the prevailing rates of exchange at period end. Purchases and sales of securities, income receipts and expense payments are translated into U.S. dollars at the prevailing exchange rate on the respective dates of the transactions.
Net realized gains and losses on foreign currency transactions represent net gains and losses from sales and maturities of foreign currency contracts, disposition of foreign currencies, the difference between the amount of net investment income accrued and the U.S. dollar amount actually received, and gains and losses between trade and settlement date on purchases and sales of securities. The effects of changes in foreign currency exchange rates on investments in securities are included with the net realized and unrealized gain or loss on investment securities.
Income Taxes. As a qualified regulated investment company under Subchapter M of the Internal Revenue Code, the fund is not subject to income taxes to the extent that it distributes substantially all of its taxable income for its fiscal year. The schedule of investments includes information regarding income taxes under the caption "Income Tax Information."
Semiannual Report
Notes to Financial Statements (Unaudited) - continued
1. Significant Accounting Policies - continued
Investment Income. Dividend income is recorded on the ex-dividend date, except certain dividends from foreign securities where the ex-dividend date may have passed, are recorded as soon as the fund is informed of the ex-dividend date. Non-cash dividends included in dividend income, if any, are recorded at the fair market value of the securities received. Interest income is accrued as earned. Investment income is recorded net of foreign taxes withheld where recovery of such taxes is uncertain.
Expenses. Most expenses of the trust can be directly attributed to a fund. Expenses which cannot be directly attributed are apportioned among the funds in the trust.
Distributions to Shareholders. Distributions are recorded on the ex-dividend date.
Income and capital gain distributions are determined in accordance with income tax regulations which may differ from generally accepted accounting principles. These differences, which may result in distribution reclassifications, are primarily due to differing treatments for foreign currency transactions, partnerships, non-taxable dividends and losses deferred due to wash sales and excise tax regulations.
Permanent book and tax basis differences relating to shareholder distributions will result in reclassifications to paid in capital. Undistributed net investment income and accumulated undistributed net realized gain (loss) on investments and foreign currency transactions may include temporary book and tax basis differences which will reverse in a subsequent period. Any taxable income or gain remaining at fiscal year end is distributed in the following year.
Short-Term Trading (Redemption) Fees. Shares held in the fund less than 90 days are subject to a short-term trading fee equal to .75% of the proceeds of the redeemed shares. The fee, which is retained by the fund, is accounted for as an addition to paid in capital.
Security Transactions. Security transactions are accounted for as of trade date. Gains and losses on securities sold are determined on the basis of identified cost.
2. Operating Policies.
Foreign Currency Contracts. The fund generally uses foreign currency contracts to facilitate transactions in foreign-denominated securities. Losses may arise from changes in the value of the foreign currency or if the counterparties do not perform under the contracts' terms. The U.S. dollar value of foreign currency contracts is determined using contractual currency exchange rates established at the time of each trade.
Joint Trading Account. Pursuant to an Exemptive Order issued by the Securities and Exchange Commission (the SEC), the fund, along with other affiliated entities of Fidelity Management & Research Company (FMR), may transfer uninvested cash balances into one or more joint trading accounts. These balances are invested in one or more repurchase agreements for U.S. Treasury or Federal Agency obligations.
Semiannual Report
Notes to Financial Statements (Unaudited) - continued
2. Operating Policies - continued
Repurchase Agreements. The underlying U.S. Treasury, Federal Agency, or other obligations found to be satisfactory by FMR are transferred to an account of the fund, or to the Joint Trading Account, at a custodian bank. The securities are marked-to-market daily and maintained at a value at least equal to the principal amount of the repurchase agreement (including accrued interest). FMR, the fund's investment adviser, is responsible for determining that the value of the underlying securities remains in accordance with the market value requirements stated above.
Fidelity Cash Central Fund. Pursuant to an Exemptive Order issued by the SEC, the fund may invest in the Fidelity Cash Central Fund (the Cash Fund) managed by Fidelity Investments Money Management, Inc., an affiliate of FMR. The Cash Fund is an open-end money market fund available only to investment companies and other accounts managed by FMR and its affiliates. The Cash Fund seeks preservation of capital, liquidity, and current income. Income distributions from the Cash Fund are declared daily and paid monthly from net interest income. Income distributions earned by the fund are recorded as interest income in the accompanying financial statements.
Restricted Securities. The fund is permitted to invest in securities that are subject to legal or contractual restrictions on resale. These securities generally may be resold in transactions exempt from registration or to the public if the securities are registered. Disposal of these securities may involve time-consuming negotiations and expense, and prompt sale at an acceptable price may be difficult. At the end of the period, restricted securities (excluding 144A issues) amounted to $16,909,000 or 1.8% of net assets.
3. Purchases and Sales of Investments.
Purchases and sales of securities, other than short-term securities, aggregated $323,075,000 and $293,548,000, respectively.
4. Fees and Other Transactions with Affiliates.
Management Fee. As the fund's investment adviser, FMR receives a monthly fee that is calculated on the basis of a group fee rate plus a fixed individual fund fee rate applied to the average net assets of the fund. The group fee rate is the weighted average of a series of rates and is based on the monthly average net assets of all the mutual funds advised by FMR. The rates ranged from .2167% to .5200% for the period. The annual individual fund fee rate is .30%. In the event that these rates were lower than the contractual rates in effect during the period, FMR voluntarily implemented the above rates, as they resulted in the same or a lower management fee. For the period, the management fee was equivalent to an annualized rate of .58% of average net assets.
Semiannual Report
Notes to Financial Statements (Unaudited) - continued
4. Fees and Other Transactions with Affiliates - continued
Transfer Agent Fees. Fidelity Service Company, Inc. (FSC), an affiliate of FMR, is the fund's transfer, dividend disbursing and shareholder servicing agent. FSC receives account fees and asset-based fees that vary according to account size and type of account. FSC pays for typesetting, printing and mailing of all shareholder reports, except proxy statements. For the period, the transfer agent fees were equivalent to an annualized rate of .24% of average net assets.
Accounting Fees. FSC, an affiliate of FMR, maintains the fund's accounting records. The fee is based on the level of average net assets for the month plus out-of-pocket expenses.
Brokerage Commissions. The fund placed a portion of its portfolio transactions with brokerage firms which are affiliates of FMR. The commissions paid to these affiliated firms were $68,000 for the period.
5. Expense Reductions.
FMR has directed certain portfolio trades to brokers who paid a portion of the fund's expenses. For the period, the fund's expenses were reduced by $189,000 under this arrangement.
In addition, through arrangements with the fund's custodian and transfer agent, credits realized as a result of uninvested cash balances were used to reduce a portion of the fund's expenses. During the period, the fund's custodian and transfer agent fees were reduced by $1,000 and $9,000, respectively, under these arrangements.
Semiannual Report
Fidelity offers several ways to conveniently manage your personal investments via your telephone or PC. You can access your account information, conduct trades and research your investments 24 hours a day.
By Phone
Fidelity Automated Service Telephone provides a single toll-free number to access account balances, positions, quotes and trading. It's easy to navigate the service, and on your first call, the system will help you create a personal identification number (PIN) for security.
(phone_graphic)Fidelity Automated
Service Telephone (FAST®)
1-800-544-5555
Press
1 For mutual fund and brokerage trading.
2 For quotes.*
3 For account balances and holdings.
4 To review orders and mutual
fund activity.
5 To change your PIN.
*0 To speak to a Fidelity representative.
By PC
Fidelity's web site on the Internet provides a wide range of information, including daily financial news, fund performance, interactive planning tools and news about Fidelity products and services.
(computer_graphic)Fidelity's Web Site
www.fidelity.com
If you are not currently on the Internet, call EarthLink Sprint at 1-800-288-2967, and be sure to ask for registration number SMD004 to receive a special Fidelity package that includes 30 days of free Internet access. EarthLink is North America's #1 independent Internet access provider.
(computer_graphic)
Fidelity On-line Xpress+®
Fidelity On-line Xpress+ software for Windows combines comprehensive portfolio management capabilities, securities trading and access to research and analysis tools . . . all on your desktop. Call Fidelity at 1-800-544-0240 or visit our web site for more information on how to manage your investments via your PC.
* When you call the quotes line, please remember that a fund's yield and return will vary and, except for money market funds, share price will also vary. This means that you may have a gain or loss when you sell your shares. There is no assurance that money market funds will be able to maintain a stable $1 share price; an investment in a money market fund is not insured or guaranteed by the U.S. government. Total returns are historical and include changes in share price, reinvestment of dividends and capital gains, and the effects of any sales charges.
Semiannual Report
Investment Adviser
Fidelity Management & Research Company
Boston, MA
Investment Sub-Advisers
Fidelity Management & Research
(U.K.) Inc.
Fidelity Management & Research
(Far East) Inc.
Fidelity Investments Japan Limited
Officers
Edward C. Johnson 3d, President
Robert C. Pozen, Senior Vice President
Robert A. Lawrence, Vice President
Eric D. Roiter, Secretary
Robert A. Dwight, Treasurer
Maria F. Dwyer, Deputy Treasurer
John H. Costello, Assistant Treasurer
Board of Trustees
Ralph F. Cox *
Phyllis Burke Davis *
Robert M. Gates *
Edward C. Johnson 3d
Donald J. Kirk *
Ned C. Lautenbach *
Peter S. Lynch
Marvin L. Mann *
William O. McCoy *
Gerald C. McDonough *
Robert C. Pozen
Thomas R. Williams *
Advisory Board
J. Michael Cook
Marie L. Knowles
General Distributor
Fidelity Distributors Corporation
Boston, MA
* Independent trustees
Transfer and Shareholder
Servicing Agent
Fidelity Service Company, Inc.
Boston, MA
Custodian
Brown Brothers Harriman & Co.
Boston, MA
Fidelity's Growth and Income Funds
Balanced Fund
Convertible Securities Fund
Equity-Income Fund
Equity-Income II Fund
Fidelity® Fund
Global Balanced Fund
Growth & Income Portfolio
Growth & Income II Portfolio
Puritan® Fund
Real Estate Investment Portfolio
Utilities Fund
The Fidelity Telephone Connection
Mutual Fund 24-Hour Service
Exchanges/Redemptions
and Account Assistance 1-800-544-6666
Product Information 1-800-544-6666
Retirement Accounts 1-800-544-4774
(8 a.m. - 9 p.m.)
TDD Service 1-800-544-0118
for the deaf and hearing impaired
(9 a.m. - 9 p.m. Eastern time)(Fidelity Investment logo)(registered trademark)
Corporate Headquarters
82 Devonshire St., Boston, MA 02109
www.fidelity.com
Fidelity Automated Service
Telephone (FAST®) (automated graphic) 1-800-544-5555
(automated graphic) Automated line for quickest service
REA-SANN-0900 111266
1.706448.102
|
|