
|
|
|
|
|
|
|
|
|
Fidelity®
Fund
Semiannual Report
July 31, 2000
(2_fidelity_logos) (Registered_Trademark)
|
President's Message |
3 |
Ned Johnson on investing strategies. |
|
Performance |
4 |
How the fund has done over time. |
|
Fund Talk |
6 |
The manager's review of fund performance, strategy and outlook. |
|
Investment Changes |
9 |
A summary of major shifts in the fund's investments over the past six months. |
|
Investments |
10 |
A complete list of the fund's investments with their market values. |
|
Financial Statements |
13 |
Statements of assets and liabilities,
operations, and changes in net assets, |
|
Notes |
17 |
Notes to the financial statements. |
Standard & Poor's, S&P and S&P 500 are registered service marks of The McGraw-Hill Companies, Inc. and have been licensed for use by Fidelity Distributors Corporation.
Other third party marks appearing herein are the property of their respective owners.
All other marks appearing herein are registered or unregistered trademarks or service marks of FMR Corp. or an affiliated company.
(Recycle graphic) This report is printed on recycled paper using soy-based inks.
This report and the financial statements contained herein are submitted for the general information of the shareholders of the fund. This report is not authorized for distribution to prospective investors in the fund unless preceded or accompanied by an effective prospectus.
Mutual fund shares are not deposits or obligations of, or guaranteed
by, any depository institution. Shares are not insured by the FDIC,
Federal Reserve Board or any other agency, and are subject to
investment risks, including possible loss of principal amount invested.
Neither the fund nor Fidelity Distributors Corporation is a bank.
For more information on any Fidelity fund, including charges and expenses, call 1-800-544-6666 for a free prospectus. Read it carefully before you invest or send money.
Semiannual Report
(photo_of_Edward_C_Johnson_3d)
Dear Shareholder:
The Federal Reserve Board's effort to keep inflation in check without over-cooling the U.S. economy has taken a toll on the stock market. Through July 2000, bellwether equity indexes such as the Dow Jones Industrial Average, NASDAQ and S&P 500® have negative returns for the year. On the other hand, fixed-income markets are enjoying strong performance. Except for high-yield, most bond sectors - corporates, mortgages, Treasuries and agencies - have returned 4%-6% year to date.
While it's impossible to predict the future direction of the markets with any degree of certainty, there are certain basic principles that can help investors plan for their future needs.
First, investors are encouraged to take a long-term view of their portfolios. If you can afford to leave your money invested through the inevitable up and down cycles of the financial markets, you will greatly reduce your vulnerability to any single decline. We know from experience, for example, that stock prices have gone up over longer periods of time, have significantly outperformed other types of investments and have stayed ahead of inflation.
Second, you can further manage your investing risk through diversification. A stock mutual fund, for instance, is already diversified, because it invests in many different companies. You can increase your diversification further by investing in a number of different stock funds, or in such other investment categories as bonds. If you have a short investment time horizon, you might want to consider moving some of your investment into a money market fund, which seeks income and a stable share price by investing in high-quality, short-term investments. Of course, it's important to remember that an investment in a money market fund is not insured or guaranteed by the Federal Deposit Insurance Corporation or any other government agency. Although money market funds seek to preserve the value of your investment at $1.00 per share, it is possible to lose money by investing in these types of funds.
Finally, no matter what your time horizon or portfolio diversity, it makes good sense to follow a regular investment plan, investing a certain amount of money in a fund at the same time each month or quarter and periodically reviewing your overall portfolio. By doing so, you won't get caught up in the excitement of a rapidly rising market, nor will you buy all your shares at market highs. While this strategy - known as dollar cost averaging - won't assure a profit or protect you from a loss in a declining market, it should help you lower the average cost of your purchases. Of course, you should consider your financial ability to continue your purchases through periods of low price levels before undertaking such a strategy.
If you have questions, please call us at 1-800-544-6666, or visit our web site at www.fidelity.com. We are available 24 hours a day, seven days a week to provide you the information you need to make the investments that are right for you.
Best regards,
/s/Edward C. Johnson 3d
Edward C. Johnson 3d
Semiannual Report
There are several ways to evaluate a fund's historical performance. You can look at the total percentage change in value, the average annual percentage change or the growth of a hypothetical $10,000 investment. Total return reflects the change in the value of an investment, assuming reinvestment of the fund's dividend income and capital gains (the profits earned upon the sale of securities that have grown in value).
Cumulative Total Returns
|
Periods ended July 31, 2000 |
Past 6 |
Past 1 |
Past 5 |
Past 10 |
|
Fidelity® Utilities |
-2.59% |
9.38% |
169.07% |
381.47% |
|
S&P 500 ® |
3.20% |
8.98% |
177.11% |
408.31% |
|
Russell 3000® Utilities |
-14.46% |
-13.71% |
122.63% |
274.83% |
|
Utility Funds Average |
-1.17% |
10.80% |
111.78% |
252.10% |
Cumulative total returns show the fund's performance in percentage terms over a set period - in this case, six months, one year, five years or 10 years. For example, if you had invested $1,000 in a fund that had a 5% return over the past year, the value of your investment would be $1,050. You can compare the fund's returns to the performance of the Standard & Poor's 500 SM Index - a market capitalization-weighted index of common stocks - and the Russell 3000® Utilities Index - a market capitalization-weighted index comprised of over 200 utility stocks that are included in the Russell 3000 Index. To measure how the fund's performance stacked up against its peers, you can compare it to the utility funds average, which reflects the performance of mutual funds with similar objectives tracked by Lipper Inc. The past six months average represents a peer group of 98 mutual funds. These benchmarks include reinvested dividends and capital gains, if any, and exclude the effect of sales charges.
Average Annual Total Returns
|
Periods ended July 31, 2000 |
|
Past 1 |
Past 5 |
Past 10 |
|
Fidelity Utilities |
|
9.38% |
21.89% |
17.02% |
|
S&P 500 |
|
8.98% |
22.61% |
17.65% |
|
Russell 3000 Utilities |
|
-13.71% |
17.36% |
14.13% |
|
Utility Funds Average |
|
10.80% |
15.95% |
13.21% |
Average annual total returns take the fund's cumulative return and show you what would have happened if the fund had performed at a constant rate each year. (Note: Lipper calculates average annual total returns by annualizing each fund's total return, then taking an arithmetic average. This may produce a different figure than that obtained by averaging the cumulative total returns and annualizing the result.)
Semiannual Report
$10,000 Over 10 Years
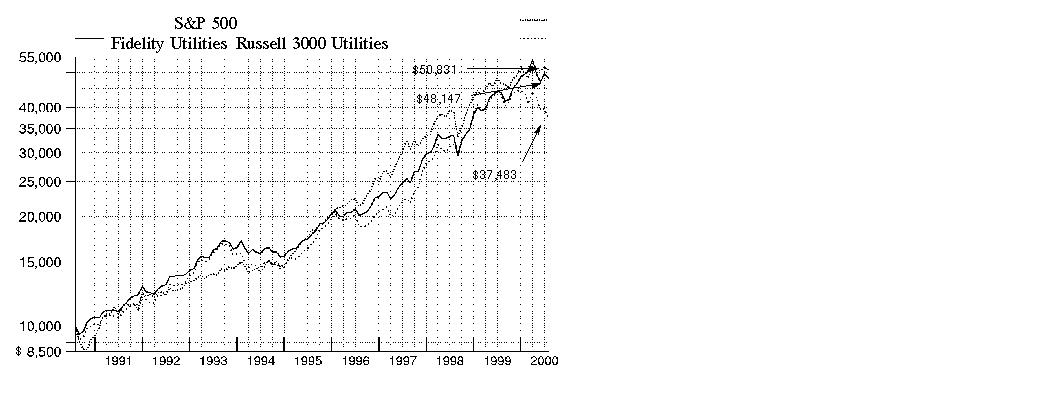
$10,000 Over 10 Years: Let's say hypothetically that $10,000 was invested in Fidelity Utilities Fund on July 31, 1990. As the chart shows, by July 31, 2000, the value of the investment would have grown to $48,147 - a 381.47% increase on the initial investment. For comparison, look at how both the Standard & Poor's 500 Index and the Russell 3000 Utilities Index did over the same period. With dividends and capital gains, if any, reinvested, the same $10,000 in the S&P 500 Index would have grown to $50,831 - a 408.31% increase. If $10,000 was put in the Russell 3000 Utilities Index, it would have grown to $37,483 - a 274.83% increase.
Understanding
Performance
How a fund did yesterday is no guarantee of how it will do tomorrow. The stock market, for example, has a history of long-term growth and short-term volatility. In turn, the share price and return of a fund that invests in stocks will vary. That means if you sell your shares during a market downturn, you might lose money. But if you can ride out the market's ups and downs, you may have a gain.
3Semiannual Report
Market Recap
Volatility and rising interest rates were the main factors influencing equity investors during the six-month period that ended July 31, 2000. The U.S. equity markets struggled to break free from the grip of the Federal Reserve Board, whose effort to cool the overheated economy was delivered via a series of interest-rate hikes. With every clench of its fist, the Fed's effort - which raised the federal funds rate three times by a combined total of 1.0% - gradually tempered the optimism toward stocks as the period progressed. The effect of the Fed's tightening, coupled with the market's concerns about corporate earnings, took its toll beginning in March with a correction in technology stocks. The seemingly invincible NASDAQ Composite Index, which had soared to a 19.2% gain in February, dropped more than 10% in March and shed 25% during a single week in April, before finishing the volatile period with a -4.31% return. The Dow Jones Industrial Average, the blue chips' benchmark, returned -3.08%, while the Standard & Poor's 500 SM Index, an index of 500 commonly held large-cap companies, fared better, gaining 3.20%. Growing concerns about a potential economic slowdown also affected small-cap stocks, as evidenced by the Russell 2000®'s mere 1.35% six-month advance. The S&P and Russell indexes weren't immune from the market's indecisiveness, dropping 1.56% and 3.22%, respectively, during July.
(Portfolio Manager photograph)
The following is an interview with Peter Saperstone, Portfolio Manager of Fidelity Utilities Fund
Q. How did the fund perform, Peter?
A. For the six months ending July 31, 2000, the fund returned -2.59%. During the same period, the Russell 3000 Utilities Index returned -14.46%, and the utility funds average, as tracked by Lipper Inc., returned -1.17%. For the 12 months ending July 31, 2000, the fund posted a gain of 9.38%. Meanwhile, the Lipper average returned 10.80%, and the Russell index returned -13.71%.
Q. Why did the fund outperform the Russell index by such a wide margin for the six-month period, yet fall short of the Lipper average?
A. The fund significantly underweighted large-cap telephone companies - regional Bell operating companies and long-distance companies - compared to the Russell 3000 Index. The stocks of those companies did not perform well during the period in the face of continued competition and deregulation - leading to the fund's outperformance of its benchmark. The Lipper peers held a larger weighting in electric utility stocks than the fund. These stocks performed well in the second quarter of the year in response to the NASDAQ correction, as investors looked for safety in established utility companies.
Semiannual Report
Fund Talk: The Manager's Overview - continued
Q. What stocks contributed the most to the fund's performance?
A. The strongest contributor to the fund was AES, an independent power company that continued to gain market share during the past six months. Calpine Corporation, another independent power company, also added to performance. These companies benefited from industry deregulation and increased competition. Dynegy, a natural gas utility, also was a top performer as a result of increased consumer demand and rising prices due to the industry's inability to meet that demand. In addition, telephone company U.S. West added to the fund's performance. After being acquired by Qwest Communications, the combined company profited from having a good revenue outlook, accelerating growth rates and increased market share.
Q. Which stocks detracted from performance?
A. Larger telecommunications stocks posted the lowest returns. AT&T was particularly hard hit as a result of increased competition, new technology and deregulation. The fund underweighted AT&T compared to the index, so the negative impact on the fund was somewhat diminished. Covad Communications and PSINet also took away from performance but I continue to hold them in the fund because I believe their outlook is still positive. Covad is a leader in digital subscriber line (DSL) technology with good growth prospects, while PSINet is a very valuable strategic asset given its tier-one Internet backbone position.
Q. Has stock market volatility caused you to change your investment strategy?
A. No, it hasn't. I continue to run the fund with a higher concentration of assets in telecommunications relative to electric utilities. Within telecommunications, I have been focusing on wireless communications companies because I see continued demand for wireless services in the U.S. At the present time, approximately 35% of U.S. households use wireless communications. This is low when compared to the 55% penetration in Europe and Asia. Within wireless, I tended to favor companies such as Sprint PCS, Nextel and VoiceStream, all of which are 100% digital networks, that were gaining market share in a rapidly growing arena and should benefit further from this expansion.
Q. What is your outlook, Peter?
A. My outlook continues to be positive. I plan to continue to favor telecommunications stocks versus traditional utility stocks because of better long-term growth potential. As deregulation continues and new technologies emerge, the incumbent telephone companies will continue to face competition and could suffer further loss of market share.
Semiannual Report
Fund Talk: The Manager's Overview - continued
The views expressed in this report reflect those of the portfolio manager only through the end of the period of the report as stated on the cover and do not necessarily represent the views of Fidelity or any other person in the Fidelity organization. Any such views are subject to change at any time based upon market or other conditions and Fidelity disclaims any responsibility to update such views. These views may not be relied on as investment advice and, because investment decisions for a Fidelity fund are based on numerous factors, may not be relied on as an indication of trading intent on behalf of any Fidelity fund.
Fund Facts
Goal: high total return through a combination of current income and capital appreciation
Fund number: 311
Symbol: FIUIX
Start date: November 27, 1987
Size: as of July 31, 2000, more than $2.9 billion
Manager: Peter Saperstone, since 1998; manager, several Fidelity Select Portfolios, 1996-1998; joined Fidelity in 1995
3Peter Saperstone on wireless penetration in the U.S. and Europe:
"By year end 2000, the penetration rate of wireless voice technology will be approximately 38% in the U.S., compared to nearly 60% in Europe.
"This difference implies that European companies will need to expand the services they offer in order to continue to grow their business. Primarily, they'll need to purchase new spectrum - licensed capacity - in order to offer third generation (3G) data over wireless lines, which is costly. 3G refers to new wireless technology that enables faster and more advanced Internet services and promises to make the Internet widely available through mobile phone and other handheld devices. At about the same time as expenses are expected to increase for the providers, incremental voice subscriber penetration rates are expected to slow. This combination could lead to poor-performing wireless telecommunications stocks in Europe over the next one to two years.
"In comparison, growth expectations for U.S. wireless companies are quite strong. Penetration rates are relatively low and consumer demand continues to be strong. It is estimated that the U.S. will not reach the high usage rates being experienced in Europe for another two to three years. In addition, U.S. companies will not see significant capital expenditures - for the purchase of new spectrum and build-out for 3G capabilities - for a few years. This should lead to better performing wireless stocks in the U.S. relative to Europe."
Semiannual Report
|
Top Ten Stocks as of July 31, 2000 |
||
|
|
% of fund's |
% of fund's net assets |
|
VoiceStream Wireless Corp. |
7.2 |
0.0 |
|
Nextel Communications, Inc. Class A |
6.4 |
4.5 |
|
Qwest Communications International, Inc. |
6.3 |
0.9 |
|
Sprint Corp. - PCS Group Series 1 |
6.1 |
5.2 |
|
AES Corp. |
5.5 |
5.4 |
|
SBC Communications, Inc. |
5.1 |
6.8 |
|
BellSouth Corp. |
5.0 |
4.8 |
|
Citizens Communications Co. |
5.0 |
0.2 |
|
AT&T Corp. |
4.8 |
6.5 |
|
Nokia AB sponsored ADR |
3.7 |
4.6 |
|
|
55.1 |
38.9 |
|
Top Utility Industries as of July 31, 2000 |
||
|
|
% of fund's |
% of fund's net assets |
|
Telephone Services |
31.1 |
40.3 |
|
Cellular |
24.4 |
18.1 |
|
Electric Utility |
13.4 |
14.9 |
|
Asset Allocation (% of fund's net assets) |
|||||||
|
As of July 31, 2000 * |
As of January 31, 2000 ** |
||||||
 |
Stocks 88.0% |
|
|
Stocks 97.7% |
|
||
 |
Convertible |
|
|
Convertible |
|
||
 |
Short-Term |
|
|
Short-Term |
|
||
|
* Foreign |
5.9% |
|
** Foreign investments |
11.7% |
|
||

Semiannual Report
(Unaudited)
Showing Percentage of Net Assets
|
Common Stocks - 88.0% |
|||
|
Shares |
Value (Note 1) (000s) |
||
|
CONSTRUCTION & REAL ESTATE - 1.3% |
|||
|
Real Estate Investment Trusts - 1.3% |
|||
|
Pinnacle Holdings, Inc. (a) |
684,600 |
$ 38,466 |
|
|
ENERGY - 1.0% |
|||
|
Oil & Gas - 1.0% |
|||
|
The Coastal Corp. |
507,000 |
29,279 |
|
|
MEDIA & LEISURE - 3.0% |
|||
|
Broadcasting - 3.0% |
|||
|
AT&T Corp. - Liberty Media Group Class A (a) |
1,211,812 |
26,963 |
|
|
Comcast Corp. Class A (special) (a) |
1,800,000 |
61,228 |
|
|
|
88,191 |
||
|
SERVICES - 0.5% |
|||
|
Universal Access, Inc. |
501,600 |
13,857 |
|
|
TECHNOLOGY - 5.6% |
|||
|
Communications Equipment - 3.9% |
|||
|
Corvis Corp. |
12,000 |
988 |
|
|
Lexent, Inc. |
231,000 |
6,150 |
|
|
Nokia AB sponsored ADR |
2,446,800 |
108,424 |
|
|
|
115,562 |
||
|
Computer Services & Software - 1.6% |
|||
|
Covad Communications Group, Inc. (a) |
1,255,012 |
20,708 |
|
|
Exodus Communications, Inc. (a) |
46,800 |
2,080 |
|
|
PSINet, Inc. (a) |
1,473,400 |
25,692 |
|
|
|
48,480 |
||
|
Electronics - 0.1% |
|||
|
TyCom Ltd. |
54,000 |
1,839 |
|
|
TOTAL TECHNOLOGY |
165,881 |
||
|
UTILITIES - 76.6% |
|||
|
Cellular - 24.4% |
|||
|
ALLTEL Corp. |
561,000 |
34,572 |
|
|
Dobson Communications Corp. Class A |
1,180,600 |
25,826 |
|
|
Nextel Communications, Inc. Class A (a) |
3,352,400 |
187,525 |
|
|
SBA Communications Corp. Class A |
1,007,400 |
45,459 |
|
|
Sprint Corp. - PCS Group Series 1 (a) |
3,236,800 |
178,833 |
|
|
Common Stocks - continued |
|||
|
Shares |
Value (Note 1) (000s) |
||
|
UTILITIES - continued |
|||
|
Cellular - continued |
|||
|
Vodafone Group PLC sponsored ADR |
789,200 |
$ 34,034 |
|
|
VoiceStream Wireless Corp. (a) |
1,666,686 |
213,751 |
|
|
|
720,000 |
||
|
Electric Utility - 13.4% |
|||
|
AES Corp. (a) |
3,049,800 |
162,974 |
|
|
Calpine Corp. (a) |
600,000 |
42,750 |
|
|
Citizens Communications Co. (a) |
8,728,031 |
146,195 |
|
|
IPALCO Enterprises, Inc. |
1,000,000 |
22,625 |
|
|
Niagara Mohawk Holdings, Inc. (a) |
941,525 |
12,534 |
|
|
NRG Energy, Inc. |
307,000 |
7,195 |
|
|
|
394,273 |
||
|
Gas - 7.7% |
|||
|
Dynegy, Inc. Class A |
1,136,016 |
79,947 |
|
|
Enron Corp. |
599,946 |
44,171 |
|
|
KeySpan Corp. |
500,000 |
15,875 |
|
|
Kinder Morgan, Inc. |
2,153,300 |
73,212 |
|
|
Williams Companies, Inc. |
301,440 |
12,585 |
|
|
|
225,790 |
||
|
Telephone Services - 31.1% |
|||
|
Alaska Communication Systems Group, Inc. |
717,700 |
6,818 |
|
|
Allegiance Telecom, Inc. (a) |
266,100 |
14,785 |
|
|
AT&T Corp. |
4,554,487 |
140,904 |
|
|
BellSouth Corp. |
3,694,900 |
147,103 |
|
|
BroadWing, Inc. |
400,000 |
10,500 |
|
|
CenturyTel, Inc. |
1,007,300 |
29,526 |
|
|
Focal Communications Corp. |
383,700 |
14,245 |
|
|
Global Crossing Ltd. (a) |
1,000,000 |
24,313 |
|
|
Level 3 Communications, Inc. (a) |
838,300 |
57,371 |
|
|
McLeodUSA, Inc. Class A (a) |
4,782,800 |
81,009 |
|
|
Metromedia Fiber Network, Inc. Class A (a) |
1,000,000 |
35,125 |
|
|
NEXTLINK Communications, Inc. Class A (a) |
297,000 |
9,820 |
|
|
Qwest Communications International, Inc. (a) |
3,933,627 |
184,635 |
|
|
SBC Communications, Inc. |
3,556,134 |
151,358 |
|
|
Common Stocks - continued |
|||
|
Shares |
Value (Note 1) (000s) |
||
|
UTILITIES - continued |
|||
|
Telephone Services - continued |
|||
|
TeraBeam Networks (c) |
9,600 |
$ 36 |
|
|
TRICOM SA sponsored ADR (a) |
453,000 |
7,022 |
|
|
|
914,570 |
||
|
TOTAL UTILITIES |
2,254,633 |
||
|
TOTAL COMMON STOCKS (Cost $2,214,135) |
2,590,307 |
||
|
Cash Equivalents - 20.1% |
|||
|
|
|
|
|
|
Fidelity Cash Central Fund, 6.57% (b) |
392,779,215 |
392,779 |
|
|
Fidelity Securities Lending Cash Central Fund, 6.65% (b) |
199,028,600 |
199,029 |
|
|
TOTAL CASH EQUIVALENTS (Cost $591,808) |
591,808 |
||
|
TOTAL INVESTMENT PORTFOLIO - 108.1% (Cost $2,805,943) |
3,182,115 |
||
|
NET OTHER ASSETS - (8.1)% |
(237,665) |
||
|
NET ASSETS - 100% |
$ 2,944,450 |
||
|
Legend |
|
(a) Non-income producing |
|
(b) The rate quoted is the annualized seven-day yield of the fund at |
|
(c) Restricted securities - Investment in securities not registered under the Securities Act of 1933. |
|
Additional information on each holding is as follows: |
|
Security |
Acquisition Date |
Acquisition Cost (000s) |
|
TeraBeam |
4/7/00 |
$ 36 |
|
Income Tax Information |
|
At July 31, 2000, the aggregate cost |
See accompanying notes which are an integral part of the financial statements.
Semiannual Report
Statement of Assets and Liabilities
|
Amounts in thousands (except per-share amount) |
July 31, 2000 (Unaudited) |
|
|
Assets |
|
|
|
Investment in securities, at value (cost $2,805,943) - |
|
$ 3,182,115 |
|
Receivable for investments sold |
|
7,547 |
|
Receivable for fund shares sold |
|
2,098 |
|
Dividends receivable |
|
2,791 |
|
Interest receivable |
|
2,091 |
|
Other receivables |
|
240 |
|
Total assets |
|
3,196,882 |
|
Liabilities |
|
|
|
Payable for investments purchased |
$ 46,498 |
|
|
Payable for fund shares redeemed |
5,012 |
|
|
Accrued management fee |
1,520 |
|
|
Other payables and accrued expenses |
373 |
|
|
Collateral on securities loaned, at value |
199,029 |
|
|
Total liabilities |
|
252,432 |
|
Net Assets |
|
$ 2,944,450 |
|
Net Assets consist of: |
|
|
|
Paid in capital |
|
$ 2,114,094 |
|
Undistributed net investment income |
|
913 |
|
Accumulated undistributed net realized gain (loss) on investments and foreign currency transactions |
|
453,267 |
|
Net unrealized appreciation (depreciation) on investments |
|
376,176 |
|
Net Assets, for 119,339 shares outstanding |
|
$ 2,944,450 |
|
Net Asset Value, offering price and redemption price |
|
$24.67 |
See accompanying notes which are an integral part of the financial statements.
Semiannual Report
Financial Statements - continued
Statement of Operations
|
Amounts in thousands |
Six months ended July 31, 2000 (Unaudited) |
|
|
Investment Income Dividends |
|
$ 9,838 |
|
Interest |
|
4,647 |
|
Security lending |
|
1,434 |
|
Total income |
|
15,919 |
|
Expenses |
|
|
|
Management fee |
$ 7,312 |
|
|
Performance adjustment |
1,562 |
|
|
Transfer agent fees |
2,516 |
|
|
Accounting and security lending fees |
307 |
|
|
Non-interested trustees' compensation |
8 |
|
|
Custodian fees and expenses |
35 |
|
|
Registration fees |
97 |
|
|
Audit |
22 |
|
|
Legal |
6 |
|
|
Interest |
1 |
|
|
Miscellaneous |
5 |
|
|
Total expenses before reductions |
11,871 |
|
|
Expense reductions |
(352) |
11,519 |
|
Net investment income |
|
4,400 |
|
Realized and Unrealized Gain (Loss) Net realized gain (loss) on: |
|
|
|
Investment securities |
456,334 |
|
|
Foreign currency transactions |
131 |
456,465 |
|
Change in net unrealized appreciation (depreciation) on: |
|
|
|
Investment securities |
(542,969) |
|
|
Assets and liabilities in foreign currencies |
(1) |
(542,970) |
|
Net gain (loss) |
|
(86,505) |
|
Net increase (decrease) in net assets resulting |
|
$ (82,105) |
See accompanying notes which are an integral part of the financial statements.
Semiannual Report
Financial Statements - continued
Statement of Changes in Net Assets
|
Amounts in thousands |
Six months ended |
Year ended
January 31, |
|
Increase (Decrease) in Net Assets |
|
|
|
Operations |
$ 4,400 |
$ 15,605 |
|
Net realized gain (loss) |
456,465 |
313,557 |
|
Change in net unrealized appreciation (depreciation) |
(542,970) |
222,402 |
|
Net increase (decrease) in net assets resulting |
(82,105) |
551,564 |
|
Distributions to shareholders |
(3,487) |
(17,558) |
|
From net realized gain |
(103,136) |
(306,125) |
|
Total distributions |
(106,623) |
(323,683) |
|
Share transactions |
425,550 |
933,858 |
|
Reinvestment of distributions |
97,162 |
293,170 |
|
Cost of shares redeemed |
(362,459) |
(727,037) |
|
Net increase (decrease) in net assets resulting |
160,253 |
499,991 |
|
Total increase (decrease) in net assets |
(28,475) |
727,872 |
|
Net Assets |
|
|
|
Beginning of period |
2,972,925 |
2,245,053 |
|
End of period (including undistributed net investment income of $913 and $0, respectively) |
$ 2,944,450 |
$ 2,972,925 |
|
Other Information Shares |
|
|
|
Sold |
16,196 |
37,713 |
|
Issued in reinvestment of distributions |
3,524 |
12,247 |
|
Redeemed |
(13,949) |
(29,509) |
|
Net increase (decrease) |
5,771 |
20,451 |
See accompanying notes which are an integral part of the financial statements.
Semiannual Report
Financial Highlights
|
|
Six months ended |
Years ended January 31, |
||||
|
|
(Unaudited) |
2000 |
1999 |
1998 |
1997 |
1996 |
|
Selected Per-Share Data |
|
|
|
|
|
|
|
Net asset value,
beginning |
$ 26.18 |
$ 24.11 |
$ 19.62 |
$ 17.37 |
$ 16.41 |
$ 13.47 |
|
Income from Invest- |
|
|
|
|
|
|
|
Net investment |
.04 C |
.15 C |
.35 C |
.43 C |
.48 C |
.54 |
|
Net realized |
(.62) |
5.15 |
5.78 |
4.46 |
1.50 |
3.22 |
|
Total from investment operations |
(.58) |
5.30 |
6.13 |
4.89 |
1.98 |
3.76 |
|
Less Distributions |
|
|
|
|
|
|
|
From net investment income |
(.03) |
(.18) |
(.35) |
(.44) |
(.48) |
(.54) |
|
From net |
(.90) |
(3.05) |
(1.29) |
(2.20) |
(.54) |
(.28) |
|
Total distributions |
(.93) |
(3.23) |
(1.64) |
(2.64) |
(1.02) |
(.82) |
|
Net asset value, |
$ 24.67 |
$ 26.18 |
$ 24.11 |
$ 19.62 |
$ 17.37 |
$ 16.41 |
|
Total Return B, E |
(2.59)% |
23.80% |
32.60% |
29.16% |
12.73% |
28.61% |
|
Ratios and Supplemental Data |
|
|
|
|
|
|
|
Net assets, end of period (in millions) |
$ 2,944 |
$ 2,973 |
$ 2,245 |
$ 1,738 |
$ 1,280 |
$ 1,546 |
|
Ratio of expenses to average net assets |
.77% A |
.80% |
.85% |
.87% |
.84% |
.80% |
|
Ratio of expenses to average net assets after expense reductions |
.75% A, D |
.79% D |
.83% D |
.85% D |
.81% D |
.77% D |
|
Ratio of net invest- |
.29% A |
.61% |
1.63% |
2.34% |
2.96% |
3.69% |
|
Portfolio turnover rate |
103% A |
50% |
55% |
57% |
56% |
98% |
A Annualized
B The total returns would have been lower had certain expenses not been reduced during the periods shown.
C Net investment income per share has been calculated based on average shares outstanding during the period.
D FMR or the fund has entered into varying arrangements with third parties who either paid or reduced a portion of the fund's expenses.
E Total returns for periods of less than one year are not annualized.
See accompanying notes which are an integral part of the financial statements.
Semiannual Report
For the period ended July 31, 2000 (Unaudited)
1. Significant Accounting Policies.
Fidelity Utilities Fund (the fund) is a fund of Fidelity Devonshire Trust (the trust) and is authorized to issue an unlimited number of shares. The trust is registered under the Investment Company Act of 1940, as amended, as an open-end management investment company organized as a Massachusetts business trust. The financial statements have been prepared in conformity with generally accepted accounting principles which require management to make certain estimates and assumptions at the date of the financial statements. The following summarizes the significant accounting policies of the fund:
Security Valuation. Securities for which exchange quotations are readily available are valued at the last sale price, or if no sale price, at the closing bid price. Foreign securities are valued based on quotations from the principal market in which such securities are normally traded. If trading or events occurring in other markets after the close of the principal market in which foreign securities are traded, and before the close of the business of the fund, are expected to materially affect the value of those securities, then they are valued at their fair value taking this trading or these events into account. Fair value is determined in good faith under consistently applied procedures under the general supervision of the Board of Trustees. Securities (including restricted securities) for which exchange quotations are not readily available (and in certain cases debt securities which trade on an exchange) are valued primarily using dealer-supplied valuations or at their fair value. Short-term securities with remaining maturities of sixty days or less for which quotations are not readily available are valued at amortized cost or original cost plus accrued interest, both of which approximate current value.
Foreign Currency Translation. The accounting records of the fund are maintained in U.S. dollars. Investment securities and other assets and liabilities denominated in a foreign currency are translated into U.S. dollars at the prevailing rates of exchange at period end. Purchases and sales of securities, income receipts and expense payments are translated into U.S. dollars at the prevailing exchange rate on the respective dates of the transactions.
Net realized gains and losses on foreign currency transactions represent net gains and losses from sales and maturities of foreign currency contracts, disposition of foreign currencies, the difference between the amount of net investment income accrued and the U.S. dollar amount actually received, and gains and losses between trade and settlement date on purchases and sales of securities. The effects of changes in foreign currency exchange rates on investments in securities are included with the net realized and unrealized gain or loss on investment securities.
Income Taxes. As a qualified regulated investment company under Subchapter M of the Internal Revenue Code, the fund is not subject to income taxes to the extent
Semiannual Report
Notes to Financial Statements (Unaudited) - continued
1. Significant Accounting Policies - continued
Income Taxes - continued
that it distributes substantially all of its taxable income for its fiscal year. The schedule of investments includes information regarding income taxes under the caption "Income Tax Information."
Investment Income. Dividend income is recorded on the ex-dividend date, except certain dividends from foreign securities where the ex-dividend date may have passed, are recorded as soon as the fund is informed of the ex-dividend date. Non-cash dividends included in dividend income, if any, are recorded at the fair market value of the securities received. Interest income is accrued as earned. Investment income is recorded net of foreign taxes withheld where recovery of such taxes is uncertain.
Expenses. Most expenses of the trust can be directly attributed to a fund. Expenses which cannot be directly attributed are apportioned among the funds in the trust.
Deferred Trustee Compensation. Under a Deferred Compensation Plan (the Plan) non-interested Trustees must defer receipt of a portion of, and may elect to defer receipt of an additional portion of, their annual compensation. Deferred amounts are treated as though equivalent dollar amounts had been invested in shares of the fund or are invested in a cross-section of other Fidelity funds. Deferred amounts remain in the fund until distributed in accordance with the Plan.
Distributions to Shareholders. Distributions are recorded on the ex-dividend date.
Income and capital gain distributions are determined in accordance with income tax regulations which may differ from generally accepted accounting principles. These differences, which may result in distribution reclassifications, are primarily due to differing treatments for litigation proceeds, foreign currency transactions, non-taxable dividends and losses deferred due to wash sales. The fund also utilized earnings and profits distributed to shareholders on redemption of shares as a part of the dividends paid deduction for income tax purposes.
Permanent book and tax basis differences relating to shareholder distributions will result in reclassifications to paid in capital. Undistributed net investment income and accumulated undistributed net realized gain (loss) on investments and foreign currency transactions may include temporary book and tax basis differences which will reverse in a subsequent period. Any taxable income or gain remaining at fiscal year end is distributed in the following year.
Security Transactions. Security transactions are accounted for as of trade date. Gains and losses on securities sold are determined on the basis of identified cost.
2. Operating Policies.
Foreign Currency Contracts. The fund generally uses foreign currency contracts to facilitate transactions in foreign-denominated securities. Losses may arise from changes in the value of
Semiannual Report
Notes to Financial Statements (Unaudited) - continued
2. Operating Policies - continued
Foreign Currency Contracts - continued
the foreign currency or if the counterparties do not perform under the contracts' terms. The U.S. dollar value of foreign currency contracts is determined using contractual currency exchange rates established at the time of each trade.
Joint Trading Account. Pursuant to an Exemptive Order issued by the Securities and Exchange Commission (the SEC), the fund, along with other affiliated entities of Fidelity Management & Research Company (FMR), may transfer uninvested cash balances into one or more joint trading accounts. These balances are invested in one or more repurchase agreements for U.S. Treasury or Federal Agency obligations.
Repurchase Agreements. The underlying U.S. Treasury, Federal Agency, or other obligations found to be satisfactory by FMR are transferred to an account of the fund, or to the Joint Trading Account, at a custodian bank. The securities are marked-to-market daily and maintained at a value at least equal to the principal amount of the repurchase agreement (including accrued interest). FMR, the fund's investment adviser, is responsible for determining that the value of the underlying securities remains in accordance with the market value requirements stated above.
Cash Central Funds. Pursuant to an Exemptive Order issued by the SEC, the
fund may invest in the Fidelity Cash Central Fund and the Fidelity Securities Lending Cash Central Fund (the Cash Funds) managed by Fidelity Investments Money Management, Inc., an affiliate of FMR. The Cash Funds are open-end money market funds available only to investment companies and other accounts managed by FMR and its affiliates. The Cash Funds seek preservation of capital, liquidity, and current income. Income distributions from the Cash Funds are declared daily and paid monthly from net interest income. Income distributions earned by the fund are recorded as either interest income or security lending income in the accompanying financial statements.
Restricted Securities. The fund is permitted to invest in securities that are subject to legal or contractual restrictions on resale. These securities generally may be resold in transactions exempt from registration or to the public if the securities are registered. Disposal of these securities may involve time-consuming negotiations and expense, and prompt sale at an acceptable price may be difficult. At the end of the period, restricted securities (excluding 144A issues) amounted to $36,000 or 0.0% of net assets.
3. Purchases and Sales of Investments.
Purchases and sales of securities, other than short-term securities, aggregated $1,480,472,000 and $1,716,750,000, respectively.
Semiannual Report
Notes to Financial Statements (Unaudited) - continued
4. Fees and Other Transactions with Affiliates.
Management Fee. As the fund's investment adviser, FMR receives a monthly basic fee that is calculated on the basis of a group fee rate plus a fixed individual fund fee rate applied to the average net assets of the fund. The group fee rate is the weighted average of a series of rates and is based on the monthly average net assets of all the mutual funds advised by FMR. The rates ranged from .2167% to .5200% for the period. The annual individual fund fee rate is .20%. In the event that these rates were lower than the contractual rates in effect during the period, FMR voluntarily implemented the above rates, as they resulted in the same or a lower management fee. The basic fee is subject to a performance adjustment (up to a maximum of ±.15% of the fund's average net assets over the performance period) based on the fund's investment performance as compared to the appropriate index over a specified period of time. For the period, the management fee was equivalent to an annualized rate of .58% of average net assets after the performance adjustment.
Transfer Agent Fees. Fidelity Service Company, Inc. (FSC), an affiliate of FMR, is the fund's transfer, dividend disbursing and shareholder servicing agent. FSC receives account fees and asset-based fees that vary according to account size and type of account. FSC pays for typesetting, printing and mailing of all shareholder reports, except proxy statements. For the period, the transfer agent fees were equivalent to an annualized rate of .16% of average net assets.
Accounting and Security Lending Fees. FSC, an affiliate of FMR, maintains the fund's accounting records and administers the security lending program. The security lending fee is based on the number and duration of lending transactions. The accounting fee is based on the level of average net assets for the month plus out-of-pocket expenses.
Brokerage Commissions. The fund placed a portion of its portfolio transactions with brokerage firms which are affiliates of FMR. The commissions paid to these affiliated firms were $8,000 for the period.
5. Security Lending.
The fund lends portfolio securities from time to time in order to earn additional income. The fund receives collateral in the form of U.S. Treasury obligations, letters of credit, and/or cash against the loaned securities, and maintains collateral in an amount not less than 100% of the market value of the loaned securities during the period of the loan. The market value of the loaned securities is determined at the close of business of the fund and any additional required collateral is delivered to the fund on the next business day. If the borrower defaults on its obligation to return the securities loaned because of insolvency or other reasons, the fund could experience delays and costs in recovering the securities loaned or in gaining access to the collateral. At period end, the value of the securities loaned amounted to $193,980,000. The
Semiannual Report
Notes to Financial Statements (Unaudited) - continued
5. Security Lending - continued
fund received cash collateral of $199,029,000 which was invested in cash equivalents.
6. Bank Borrowings.
The fund is permitted to have bank borrowings for temporary or emergency purposes to fund shareholder redemptions. The fund has established borrowing arrangements with certain banks. The interest rate on the borrowings is the bank's base rate, as revised from time to time. The average daily loan balance during the period for which loans were outstanding amounted to $2,190,000. The weighted average interest rate was 6.15%. At period end there was no bank borrowing outstanding.
7. Expense Reductions.
FMR has directed certain portfolio trades to brokers who paid a portion of the fund's expenses. For the period, the fund's expenses were reduced by $326,000 under this arrangement.
In addition, through arrangements with the fund's custodian and transfer agent, credits realized as a result of uninvested cash balances were used to reduce a portion of the fund's expenses. During the period, the fund's custodian and transfer agent fees were reduced by $2,000 and $24,000, respectively, under these arrangements.
Semiannual Report
Fidelity offers several ways to conveniently manage your personal investments via your telephone or PC. You can access your account information, conduct trades and research your investments 24 hours a day.
By Phone
Fidelity Automated Service Telephone provides a single toll-free number to access account balances, positions, quotes and trading. It's easy to navigate the service, and on your first call, the system will help you create a personal identification number (PIN) for security.
(phone_graphic)
Fidelity Automated
Service Telephone (FAST®)
1-800-544-5555
Press
1 For mutual fund and brokerage trading.
2 For quotes.*
3 For account balances and holdings.
4 To review orders and mutual
fund activity.
5 To change your PIN.
*0 To speak to a Fidelity representative.
By PC
Fidelity's web site on the Internet provides a wide range of information, including daily financial news, fund performance, interactive planning tools and news about Fidelity products and services.
(computer_graphic)
Fidelity's Web Site
www.fidelity.com
If you are not currently on the Internet, call EarthLink Sprint at 1-800-288-2967, and be sure to ask for registration number SMD004 to receive a special Fidelity package that includes 30 days of free Internet access. EarthLink is North America's #1 independent Internet access provider.
(computer_graphic)
Fidelity On-line Xpress+®
Fidelity On-line Xpress+ software for Windows combines comprehensive portfolio management capabilities, securities trading and access to research and analysis tools . . . all on your desktop. Call Fidelity at 1-800-544-0240 or visit our web site for more information on how to manage your investments via your PC.
* When you call the quotes line, please remember that a fund's yield and return will vary and, except for money market funds, share price will also vary. This means that you may have a gain or loss when you sell your shares. There is no assurance that money market funds will be able to maintain a stable $1 share price; an investment in a money market fund is not insured or guaranteed by the U.S. government. Total returns are historical and include changes in share price, reinvestment of dividends and capital gains, and the effects of any sales charges.
Semiannual Report
If more than one address is listed, please locate the address that is closest to you. We'll give your correspondence immediate attention and send you written confirmation upon completion of your request.
(letter_graphic)Making Changes
To Your Account
(such as changing name, address, bank, etc.)
Fidelity Investments
P.O. Box 770001
Cincinnati, OH 45277-0002
(letter_graphic)For Non-Retirement
Accounts
Buying shares
Fidelity Investments
P.O. Box 770001
Cincinnati, OH 45277-0003
Overnight Express
Fidelity Investments
2300 Litton Lane - KH1A
Hebron, KY 41048
Selling shares
Fidelity Investments
P.O. Box 660602
Dallas, TX 75266-0602
Overnight Express
Fidelity Investments
Attn: Redemptions - CP6I
400 East Las Colinas Blvd.
Irving, TX 75039-5587
General Correspondence
Fidelity Investments
P.O. Box 500
Merrimack, NH 03054-0500
(letter_graphic)For Retirement
Accounts
Buying shares
Fidelity Investments
P.O. Box 770001
Cincinnati, OH 45277-0003
Selling shares
Fidelity Investments
P.O. Box 660602
Dallas, TX 75266-0602
Overnight Express
Fidelity Investments
Attn: Redemptions - CP6R
400 East Las Colinas Blvd.
Irving, TX 75039-5587
General Correspondence
Fidelity Investments
P.O. Box 500
Merrimack, NH 03054-0500
Semiannual Report
Investment Adviser
Fidelity Management & Research Company
Boston, MA
Investment Sub-Advisers
Fidelity Management & Research (U.K.) Inc.
Fidelity Management & Research
(Far East) Inc.
Fidelity Investments Japan Limited
Officers
Edward C. Johnson 3d, President
Robert C. Pozen, Senior Vice President
Robert A. Lawrence, Vice President
Eric D. Roiter, Secretary
Robert A. Dwight, Treasurer
Maria F. Dwyer, Deputy Treasurer
John H. Costello, Assistant Treasurer
Board of Trustees
Ralph F. Cox *
Phyllis Burke Davis *
Robert M. Gates *
Edward C. Johnson 3d
Donald J. Kirk *
Ned C. Lautenbach *
Peter S. Lynch
Marvin L. Mann *
William O. McCoy *
Gerald C. McDonough *
Robert C. Pozen
Thomas R. Williams *
Advisory Board
J. Michael Cook
Abigail P. Johnson
Marie L. Knowles
General Distributor
Fidelity Distributors Corporation
Boston, MA
* Independent trustees
Transfer and Shareholder
Servicing Agent
Fidelity Service Company, Inc.
Boston, MA
Custodian
Brown Brothers Harriman & Co.
Boston, MA
Fidelity's Growth and Income Funds
Balanced Fund
Convertible Securities Fund
Equity-Income Fund
Equity-Income II Fund
Fidelity ® Fund
Global Balanced Fund
Growth & Income Portfolio
Growth & Income II Portfolio
Puritan® Fund
Real Estate Investment Portfolio
Utilities Fund
The Fidelity Telephone Connection
Mutual Fund 24-Hour Service
Exchanges/Redemptions
and Account Assistance 1-800-544-6666
Product Information 1-800-544-6666
Retirement Accounts 1-800-544-4774
(8 a.m. - 9 p.m.)
TDD Service 1-800-544-0118
for the deaf and hearing impaired
(9 a.m. - 9 p.m. Eastern time)
Fidelity Automated Service
Telephone (FAST®) (automated graphic) 1-800-544-5555
(automated graphic) Automated line for quickest service
(Fidelity Investment logo)(registered trademark)
Corporate Headquarters
82 Devonshire St., Boston, MA 02109
www.fidelity.com
UIF-SANN-0900 110241
1.706447.102
|
|