
|
|
|
|
|
|
|
|
|
|
Previous: SOUTH TEXAS DRILLING & EXPLORATION INC, 10-Q, EX-27, 2000-11-20 |
Next: CROWN JEWEL RESOURCES CORP, 10QSB, 2000-11-20 |
Spartan®
Fund
Annual Report
September 30, 2000
(2_fidelity_logos)(Registered_Trademark)
|
President's Message |
Ned Johnson on investing strategies. |
|
|
Performance |
How the fund has done over time. |
|
|
Fund Talk |
The manager's review of fund performance, strategy and outlook. |
|
|
Investment Changes |
A summary of major shifts in the fund's investments over the past six months. |
|
|
Investments |
A complete list of the fund's investments with their market values. |
|
|
Financial Statements |
Statements of assets and liabilities, operations, and changes in net assets, as well as financial highlights. |
|
|
Notes |
Notes to the financial statements. |
|
|
Independent Auditors' Report |
The auditors' opinion. |
|
|
Distributions |
|
Standard & Poor's, S&P and S&P 500 are registered service marks of The McGraw-Hill Companies, Inc. and have been licensed for use by Fidelity Distributors Corporation.
Other third party marks appearing herein are the property of their respective owners.
All other marks appearing herein are registered or unregistered trademarks or service marks of FMR Corp. or an affiliated company.
(Recycle graphic) This report is printed on recycled paper using soy-based inks.
This report and the financial statements contained herein are submitted for the general information of the shareholders of the fund. This report is not authorized for distribution to prospective investors in the fund unless preceded or accompanied by an effective prospectus.
Mutual fund shares are not deposits or obligations of, or guaranteed by, any depository institution. Shares are not insured by the FDIC, Federal Reserve Board or any other agency, and are subject to investment risks, including possible loss of principal amount invested.
Neither the fund nor Fidelity Distributors Corporation is a bank.
For more information on any Fidelity fund, including charges and expenses, call 1-800-544-6666 for a free prospectus. Read it carefully before you invest or send money.
Annual Report
(photo_of_Edward_C_Johnson_3d)
Dear Shareholder:
Disappointing third quarter corporate earnings announcements resulted in negative performance for many major U.S. equity indexes through the first nine months of 2000. A weak euro and the highest oil prices in 10 years frightened many investors into selling shares of large U.S. corporations with multinational presence. In fixed-income markets, 30-year Treasury prices also dropped, and these securities outyielded 10-year Treasury notes for the first time since January.
While it's impossible to predict the future direction of the markets with any degree of certainty, there are certain basic principles that can help investors plan for their future needs.
The longer your investment time frame, the less likely it is that you will be affected by short-term market volatility. A 10-year investment horizon appropriate for saving for a college education, for example, enables you to weather market cycles in a long-term fund, which may have a higher risk potential, but also has a higher potential rate of return.
An intermediate-length fund could make sense if your investment horizon is two to four years, while a short-term bond fund could be the right choice if you need your money in one or two years.
If your time horizon is less than a year, you might want to consider moving some of your bond investment into a money market fund. These funds seek income and a stable share price by investing in high-quality, short-term investments. Of course, it's important to remember that an investment in a money market fund is not insured or guaranteed by the Federal Deposit Insurance Corporation or any other government agency. Although money market funds seek to preserve the value of your investment at $1.00 per share, it is possible to lose money by investing in these types of funds.
Finally, no matter what your time horizon or portfolio diversity, it makes good sense to follow a regular investment plan, investing a certain amount of money in a fund at the same time each month or quarter and periodically reviewing your overall portfolio. By doing so, you won't get caught up in the excitement of a rapidly rising market, nor will you buy all your shares at market highs. While this strategy - known as dollar cost averaging - won't assure a profit or protect you from a loss in a declining market, it should help you lower the average cost of your purchases. Of course, you should consider your financial ability to continue your purchases through periods of low price levels before undertaking such a strategy.
If you have questions, please call us at 1-800-544-6666, or visit our web site at www.fidelity.com. We are available 24 hours a day, seven days a week to provide you the information you need to make the investments that are right for you.
Best regards,
/s/Edward C. Johnson 3d
Edward C. Johnson 3d
Annual Report
There are several ways to evaluate a fund's historical performance. You can look at the total percentage change in value, the average annual percentage change or the growth of a hypothetical $10,000 investment. Total return reflects the change in the value of an investment, assuming reinvestment of the fund's dividend income and capital gains (the profits earned upon the sale of securities that have grown in value). You can also look at the fund's income, as reflected in the fund's yield, to measure performance. If Fidelity had not reimbursed certain fund expenses, the total returns and dividends would have been lower.
Cumulative Total Returns
|
Periods ended September 30, 2000 |
|
Past 1 |
Past 5 |
Life of |
|
Spartan ® Inv. Grade Bond |
|
6.63% |
35.36% |
71.45% |
|
LB Aggregate Bond |
|
6.99% |
36.81% |
65.22% |
|
Intermediate Investment Grade |
|
5.75% |
31.03% |
n/a* |
Cumulative total returns show the fund's performance in percentage terms over a set period - in this case, one year, five years or since the fund started on October 1, 1992. For example, if you had invested $1,000 in a fund that had a 5% return over the past year, the value of your investment would be $1,050. You can compare the fund's returns to the performance of the Lehman Brothers Aggregate Bond Index - a market value-weighted index of investment-grade fixed-rate debt issues, including government, corporate, asset-backed, and mortgage-backed securities, with maturities of one year or more. To measure how the fund's performance stacked up against its peers, you can compare it to the intermediate investment grade debt funds average, which reflects the performance of mutual funds with similar objectives tracked by Lipper Inc. The past one year average represents a peer group of 287 mutual funds. These benchmarks include reinvested dividends and capital gains, if any, and exclude the effect of sales charges.
Average Annual Total Returns
|
Periods ended September 30, 2000 |
Past 1 |
Past 5 |
Life of |
|
Spartan Inv. Grade Bond |
6.63% |
6.24% |
6.97% |
|
LB Aggregate Bond |
6.99% |
6.47% |
6.48% |
|
Intermediate Investment Grade |
5.75% |
5.54% |
n/a* |
Average annual total returns take the fund's cumulative return and show you what would have happened if the fund had performed at a constant rate each year. (Note: Lipper calculates average annual total returns by annualizing each fund's total return, then taking an arithmetic average. This may produce a different figure than that obtained by averaging the cumulative total returns and annualizing the result.)
* Not available
Annual Report
Performance - continued
$10,000 Over Life of Fund
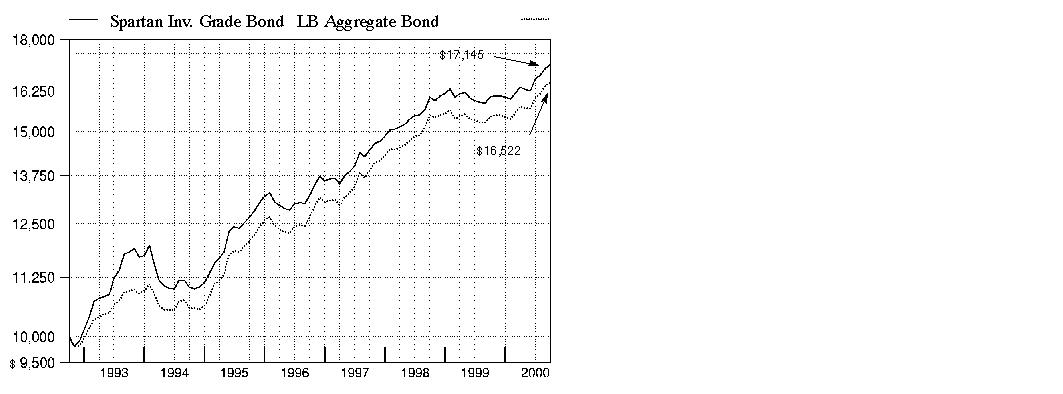
$10,000 Over Life of Fund: Let's say hypothetically that $10,000 was invested in Spartan Investment Grade Bond Fund on October 1, 1992, when the fund started. As the chart shows, by September 30, 2000, the value of the investment would have grown to $17,145 - a 71.45% increase on the initial investment. For comparison, look at how the Lehman Brothers Aggregate Bond Index did over the same period. With dividends and capital gains, if any, reinvested, the same $10,000 would have grown to $16,522 - a 65.22% increase.
Understanding
Performance
How a fund did yesterday is no guarantee of how it will do tomorrow. Bond prices, for example, generally move in the opposite direction of interest rates. In turn, the share price, return and yield of a fund that invests in bonds will vary. That means if you sell your shares during a market downturn, you might lose money. But if you can ride out the market's ups and downs, you may have a gain.
3Annual Report
Performance - continued
Total Return Components
|
|
|
Years ended September 30, |
||||
|
|
|
2000 |
1999 |
1998 |
1997 |
1996 |
|
Dividend returns |
|
6.73% |
5.83% |
6.56% |
6.72% |
6.33% |
|
Capital returns |
|
-0.10% |
-5.73% |
4.39% |
2.71% |
-1.87% |
|
Total returns |
|
6.63% |
0.10% |
10.95% |
9.43% |
4.46% |
Total return components include both dividend returns and capital returns. A dividend return reflects the actual dividends paid by the fund. A capital return reflects both the amount paid by the fund to shareholders as capital gain distributions and changes in the fund's share price. Both returns assume the dividends or capital gains, if any, paid by the fund are reinvested.
Dividends and Yield
|
Periods ended September 30, 2000 |
Past 1 |
Past 6 |
Past 1 |
|
Dividends per share |
5.41¢ |
32.32¢ |
64.46¢ |
|
Annualized dividend rate |
6.60% |
6.54% |
6.54% |
|
30-day annualized yield |
6.73% |
- |
- |
Dividends per share show the income paid by the fund for a set period. If you annualize this number, based on an average share price of $9.97 over the past one month, $9.86 over the past six months and $9.86 over the past one year, you can compare the fund's income over these three periods. The 30-day annualized yield is a standard formula for all bond funds based on the yields of the bonds in the fund, averaged over the past 30 days. This figure shows you the yield characteristics of the fund's investments at the end of the period. It also helps you compare funds from different companies on an equal basis. If Fidelity had not reimbursed certain fund expenses during the periods shown, the yield would have been 6.59%.
Annual Report
Market Recap
Most investment-grade bonds overcame sharply rising interest rates and unusually volatile market conditions en route to posting positive returns during the 12-month period that ended September 30, 2000. The Lehman Brothers Aggregate Bond Index - a widely followed measure of taxable-bond performance - returned 6.99% during this time frame. Treasuries struggled the most early on, as investors pursued more attractive alternatives in high-flying stocks and higher-yielding spread sector securities - namely mortgage bonds, government agency issues and corporate bonds. However, the struggle was short-lived, as conditions changed abruptly beginning in January with the announcement by the U.S. Treasury of its intention to reduce new borrowing and use government surplus proceeds to repurchase outstanding debt. Treasury prices jumped in response and, with the help of rising short-term interest rates, induced an inverted yield curve - which occurs when short-term bonds outyield longer-dated securities. Spread sectors recoiled on the news, with their yield spreads widening out relative to Treasuries. Anticipation that the Fed was finished raising rates, combined with persistent flights-to-safety from risk-averse investors concerned about volatility in equity markets, helped further bolster the long bond during the period. The Lehman Brothers Treasury Index returned 7.29%. Mortgages recovered nicely behind reduced interest-rate volatility and stronger-than-anticipated prepayment activity. Similarly, agencies and corporates staged late rallies and outperformed most major U.S. equity indexes through the first nine months of 2000. For the overall 12-month period, the Lehman Brothers Mortgage-Backed Securities, U.S. Agency and Credit Bond indexes returned 7.42%, 6.73% and 5.87%, respectively.
(Portfolio Manager photograph)
An interview with Kevin Grant, Portfolio Manager of Spartan Investment Grade Bond Fund
Q. How did the fund perform, Kevin?
A. For the 12-month period that ended September 30, 2000, the fund returned 6.63%, outpacing the intermediate investment grade debt funds average tracked by Lipper Inc., which returned 5.75%. The Lehman Brothers Aggregate Bond Index returned 6.99% during this same time frame.
Q. What factors had the most influence on fund performance?
A. A big factor was our positioning in corporate bonds. Early in the period, there was a lot of concern in the marketplace about oversupply heading into the Y2K changeover, which caused many corporates to cheapen considerably. Since we really didn't believe the supply scare to begin with, we viewed it as an opportunity to add bonds that we liked, bringing the corporate weighting in the fund to around 40%. The supply fears ultimately proved unfounded, which caused prices to rebound nicely during the fourth quarter of 1999. As it became clear to me early in 2000 that the Federal Reserve Board was going to continue to raise interest rates, I decided to reduce the fund's stake in corporates to around 30% and, in doing so, lock in some profits. My focus was on reducing a long-standing overweighting in banks - a posture that worked out well for us in the past - because I felt that it would be extremely difficult for these securities to outperform in a more difficult credit environment. This strategy paid off as the market proceeded to punish the group during the spring.
Annual Report
Fund Talk: The Manager's Overview - continued
Q. What other strategies worked?
A. Overall, I became much more defensive in terms of our corporate holdings, reducing our risk exposure through increased diversification. Despite the fact that most corporates lagged the rest of the market, tactical allocations into various subsectors, such as energy, aided relative performance. The fund benefited from buying bonds from high-quality issuers when oil was trading at around $11 per barrel, which offered a tremendous value opportunity, and selling some of them as oil eclipsed the $30 plateau. Owning Yankee bonds - dollar-denominated securities issued by foreign entities - at the expense of banks also helped. Moreover, by investing in other defensive issues, including commercial mortgage-backed securities, we were able to further diversify the portfolio while providing the fund with some additional yield. In hindsight, I wish I had sold all of our credit risk earlier in the year. I trimmed positions as prudently as possible, but I wanted to maintain some sort of yield in the fund. Still, we maintained an edge over our Lipper peers by holding fewer long-term, lower-quality corporate bonds, which underperformed all sectors of the market during the period.
Q. How did the fund's mortgage holdings fare?
A. We were rewarded for our emphasis on seasoned discount bonds - mortgages created in 1996 and 1997 - which benefited from strong housing turnover fueled by a robust economy. A red-hot housing market meant higher-than-normal prepayment activity, which resulted in a steady windfall for us as we got prepaid at par, or face value, while market prices were at discounts.
Q. How did your decision to remain underweighted in Treasuries and agency securities play out for the fund?
A. It worked to our advantage. Treasuries led the market during the first half of 2000, spurred by the U.S. government's decision to repurchase outstanding debt as a result of the growing federal surplus. Even though we were underweighted relative to the index at this time, we managed to gain ground by way of security selection. We benefited by positioning the fund ahead of the buybacks in long-term Treasuries and callable Treasuries, the latter of which also were repurchased. This strategy worked out nicely for us. The fund's underexposure to agencies also helped, as these securities retreated in response to rumblings in Washington threatening to strip Fannie Mae and Freddie Mac of their implicit government backing.
Q. What's your outlook?
A. I feel that investment-grade bonds should continue to produce reasonably attractive absolute returns in the coming months. I think there's a lot of value in non-Treasury markets, especially in the corporate segment where prices haven't been this low in over a decade. By historical standards, investors are currently paid handsomely for taking on additional risk. Since it seems like it will be tougher to make money on Treasuries going forward, I plan to maintain an overweighting in corporate bonds - focusing on the more defensive sectors and adding to the fund's position while valuations appear attractive.
Annual Report
Fund Talk: The Manager's Overview - continued
The views expressed in this report reflect those of the portfolio manager only through the end of the period of the report as stated on the cover and do not necessarily represent the views of Fidelity or any other person in the Fidelity organization. Any such views are subject to change at any time based upon market or other conditions and Fidelity disclaims any responsibility to update such views. These views may not be relied on as investment advice and, because investment decisions for a Fidelity fund are based on numerous factors, may not be relied on as an indication of trading intent on behalf of any Fidelity fund.
Fund Facts
Goal: high current income
Fund number: 448
Trading symbol: FSIBX
Start date: October 1, 1992
Size: as of September 30, 2000, more than $1.8 billion
Manager: Kevin Grant, since 1997; manager, several Fidelity investment-grade taxable bond funds; joined Fidelity in 1993
3Kevin Grant on the importance of diversification in today's market:
"Diversification has been an important theme for me for quite some time now. The idea is that it's a very tough environment for corporations these days, and it's become increasingly difficult to predict random credit events that besiege companies. The only way, I feel, to truly protect yourself from negative event risk is through diversification.
"It's important to note that diversification works differently for bonds than it does for stocks. Concentrated stock portfolios can work because stocks are capable of doubling, tripling or even rising tenfold. When this happens, it can cover up a lot of duds, or issues that go to zero. However, it's not that easy for bonds, which don't have the luxury of growing in price exponentially. So, if a company gets into trouble, bondholders are left holding the bag. On the other hand, if things work out well investors are limited to the yield on the bond and, if they're fortunate, a bit of price appreciation to go along with it.
"As a money manager, I want the advantages of owning corporate bonds without being heavily exposed to a small number of issuers. The only way to do that is to own a lot of names. By leveraging the research strength and trading capabilities of Fidelity, we're able to do just that, which gives us the opportunity to succeed."
Annual Report
|
Quality Diversification as of September 30, 2000 |
||
|
(Moody's Ratings) |
% of fund's investments |
% of fund's investments |
|
Aaa |
65.9 |
61.4 |
|
Aa |
1.2 |
1.5 |
|
A |
9.7 |
9.0 |
|
Baa |
17.6 |
20.3 |
|
Ba and Below |
0.2 |
0.8 |
|
Table excludes short-term investments. Where Moody's ratings are not available, we have used S&P ® ratings. |
|
Average Years to Maturity as of September 30, 2000 |
||
|
|
|
6 months ago |
|
Years |
9.7 |
9.0 |
|
Average years to maturity is based on the average time remaining until principal payments are expected from each of the fund's bonds, weighted by dollar amount. |
|
Duration as of September 30, 2000 |
||
|
|
|
6 months ago |
|
Years |
4.9 |
5.2 |
|
Duration shows how much a bond fund's price fluctuates with changes in comparable interest rates. If rates rise 1%, for example, a fund with a five-year duration is likely to lose about 5% of its value. Other factors also can influence a bond fund's performance and share price. Accordingly, a bond fund's actual performance may differ from this example. |
|
Asset Allocation (% of fund's net assets) |
|||||||
|
As of September 30, 2000 * |
As of March 31, 2000 ** |
||||||
 |
Corporate Bonds 24.2% |
|
|
Corporate Bonds 28.0% |
|
||
 |
U.S. Government |
|
|
U.S. Government |
|
||
 |
Asset-Backed |
|
|
Asset-Backed |
|
||
 |
CMOs and Other Mortgage Related Securities 2.9% |
|
|
CMOs and Other Mortgage Related Securities 1.2% |
|
||
 |
Other Investments 3.1% |
|
|
Other Investments 3.4% |
|
||
 |
Short-Term Investments
and Net |
|
|
Short-Term Investments
and Net |
|
||
|
* Foreign investments |
7.1% |
|
** Foreign investments |
8.8% |
|
||

Annual Report
Showing Percentage of Net Assets
|
Nonconvertible Bonds - 24.2% |
|||||
|
Moody's Ratings |
Principal Amount (000s) |
Value (Note 1) (000s) |
|||
|
AEROSPACE & DEFENSE - 0.1% |
|||||
|
Defense Electronics - 0.1% |
|||||
|
Raytheon Co. 7.9% 3/1/03 (c) |
Baa2 |
|
$ 1,420 |
$ 1,431 |
|
|
BASIC INDUSTRIES - 0.0% |
|||||
|
Paper & Forest Products - 0.0% |
|||||
|
Fort James Corp. 6.625% 9/15/04 |
Baa2 |
|
595 |
574 |
|
|
CONSTRUCTION & REAL ESTATE - 2.7% |
|||||
|
Real Estate - 0.3% |
|||||
|
Cabot Industrial Property LP 7.125% 5/1/04 |
Baa2 |
|
2,280 |
2,207 |
|
|
Duke Realty LP 7.3% 6/30/03 |
Baa1 |
|
4,000 |
3,985 |
|
|
|
6,192 |
||||
|
Real Estate Investment Trusts - 2.4% |
|||||
|
CenterPoint Properties Trust 6.75% 4/1/05 |
Baa2 |
|
1,100 |
1,043 |
|
|
Equity Office Properties Trust: |
|
|
|
|
|
|
6.5% 1/15/04 |
Baa1 |
|
4,040 |
3,929 |
|
|
6.625% 2/15/05 |
Baa1 |
|
8,010 |
7,748 |
|
|
6.75% 2/15/08 |
Baa1 |
|
6,270 |
5,859 |
|
|
7.25% 2/15/18 |
Baa1 |
|
5,200 |
4,607 |
|
|
Merry Land & Investment Co., Inc. 7.25% 6/15/05 |
A3 |
|
3,150 |
3,062 |
|
|
ProLogis Trust 6.7% 4/15/04 |
Baa1 |
|
970 |
939 |
|
|
Spieker Properties LP: |
|
|
|
|
|
|
6.75% 1/15/08 |
Baa2 |
|
5,750 |
5,367 |
|
|
6.8% 5/1/04 |
Baa2 |
|
5,250 |
5,111 |
|
|
6.9% 1/15/04 |
Baa2 |
|
1,650 |
1,620 |
|
|
Spieker Properties, Inc. 7.125% 7/1/09 |
Baa2 |
|
5,000 |
4,733 |
|
|
|
44,018 |
||||
|
TOTAL CONSTRUCTION & REAL ESTATE |
50,210 |
||||
|
DURABLES - 0.1% |
|||||
|
Autos, Tires, & Accessories - 0.1% |
|||||
|
Daimler-Chrysler North America Holding Corp. 8% 6/15/10 |
A1 |
|
1,990 |
2,046 |
|
|
ENERGY - 2.6% |
|||||
|
Oil & Gas - 2.6% |
|||||
|
Anadarko Petroleum Corp.: |
|
|
|
|
|
|
7% 11/15/27 |
Baa1 |
|
3,785 |
3,308 |
|
|
7.2% 3/15/29 |
Baa1 |
|
8,200 |
7,617 |
|
|
Nonconvertible Bonds - continued |
|||||
|
Moody's Ratings |
Principal Amount (000s) |
Value (Note 1) (000s) |
|||
|
ENERGY - continued |
|||||
|
Oil & Gas - continued |
|||||
|
Apache Corp.: |
|
|
|
|
|
|
7.625% 7/1/19 |
Baa1 |
|
$ 1,535 |
$ 1,513 |
|
|
7.7% 3/15/26 |
Baa1 |
|
900 |
886 |
|
|
Apache Finance Property Ltd. 6.5% 12/15/07 |
Baa1 |
|
1,600 |
1,518 |
|
|
Duke Energy Field Services LLC 7.875% 8/16/10 |
Baa2 |
|
6,000 |
6,104 |
|
|
Oryx Energy Co.: |
|
|
|
|
|
|
8.125% 10/15/05 |
Baa1 |
|
4,640 |
4,821 |
|
|
8.375% 7/15/04 |
Baa1 |
|
5,000 |
5,181 |
|
|
Petro-Canada 7% 11/15/28 |
A3 |
|
4,105 |
3,662 |
|
|
Ras Laffan Liquid Natural Gas Co. Ltd. yankee 8.294% 3/15/14 (c) |
Baa3 |
|
5,200 |
4,971 |
|
|
Tosco Corp. 8.125% 2/15/30 |
Baa2 |
|
7,200 |
7,226 |
|
|
|
46,807 |
||||
|
FINANCE - 8.9% |
|||||
|
Banks - 3.8% |
|||||
|
ABN-Amro Bank NV, Chicago 6.625% 10/31/01 |
A1 |
|
5,750 |
5,730 |
|
|
Banc One Corp. 7.25% 8/1/02 |
A1 |
|
2,000 |
2,011 |
|
|
Bank of Montreal 6.1% 9/15/05 |
A1 |
|
3,000 |
2,848 |
|
|
Bank of Tokyo-Mitsubishi Ltd. 8.4% 4/15/10 |
A3 |
|
1,500 |
1,527 |
|
|
Bank One Capital III 8.75% 9/1/30 |
Aa3 |
|
3,400 |
3,390 |
|
|
Bank One Corp. 7.875% 8/1/10 |
A1 |
|
9,700 |
9,841 |
|
|
Barclays Bank PLC yankee: |
|
|
|
|
|
|
5.95% 7/15/01 |
A1 |
|
4,450 |
4,419 |
|
|
8.55% 9/29/49 (b)(c) |
Aa2 |
|
1,800 |
1,815 |
|
|
Capital One Bank 6.375% 2/15/03 |
Baa2 |
|
2,400 |
2,339 |
|
|
Capital One Financial Corp. 7.125% |
Baa3 |
|
2,900 |
2,728 |
|
|
Fleet/Norstar Financial Group, Inc. 9% |
A3 |
|
370 |
379 |
|
|
FleetBoston Financial Corp. 7.25% 9/15/05 |
A2 |
|
4,730 |
4,746 |
|
|
HSBC Finance Nederland BV 7.4% |
A1 |
|
250 |
252 |
|
|
Kansallis-Osake-Pankki (NY Branch) yankee |
A1 |
|
430 |
448 |
|
|
Korea Development Bank: |
|
|
|
|
|
|
6.625% 11/21/03 |
Baa2 |
|
2,775 |
2,703 |
|
|
7.125% 4/22/04 |
Baa2 |
|
400 |
394 |
|
|
7.375% 9/17/04 |
Baa2 |
|
3,060 |
3,032 |
|
|
Nonconvertible Bonds - continued |
|||||
|
Moody's Ratings |
Principal Amount (000s) |
Value (Note 1) (000s) |
|||
|
FINANCE - continued |
|||||
|
Banks - continued |
|||||
|
MBNA Corp.: |
|
|
|
|
|
|
6.34% 6/2/03 |
Baa2 |
|
$ 800 |
$ 772 |
|
|
6.875% 11/15/02 |
Baa2 |
|
3,600 |
3,583 |
|
|
Providian National Bank: |
|
|
|
|
|
|
6.25% 5/7/01 |
Baa3 |
|
5,590 |
5,539 |
|
|
6.75% 3/15/02 |
Baa3 |
|
2,160 |
2,134 |
|
|
Sanwa Finance Aruba AEC 8.35% 7/15/09 |
Baa1 |
|
6,000 |
5,965 |
|
|
Sumitomo Bank International Finance NV 8.5% 6/15/09 |
Baa1 |
|
1,100 |
1,121 |
|
|
Summit Bancorp 8.625% 12/10/02 |
A3 |
|
1,000 |
1,024 |
|
|
Union Planters Corp. 6.75% 11/1/05 |
Baa2 |
|
1,200 |
1,152 |
|
|
Union Planters National Bank 6.81% 8/20/01 |
A3 |
|
1,000 |
998 |
|
|
|
70,890 |
||||
|
Credit & Other Finance - 4.7% |
|||||
|
Associates Corp. of North America: |
|
|
|
|
|
|
6% 4/15/03 |
A1 |
|
2,400 |
2,355 |
|
|
6% 7/15/05 |
A1 |
|
5,000 |
4,816 |
|
|
Bell Atlantic Financial Service, Inc. 7.6% 3/15/07 |
A1 |
|
2,500 |
2,546 |
|
|
CIT Group, Inc. 5.5% 2/15/04 |
A1 |
|
980 |
928 |
|
|
Daimler-Chrysler NA Holding Corp. 6.59% 6/18/02 |
A1 |
|
575 |
571 |
|
|
ERP Operating LP: |
|
|
|
|
|
|
6.55% 11/15/01 |
A3 |
|
1,000 |
992 |
|
|
7.1% 6/23/04 |
A3 |
|
4,000 |
3,949 |
|
|
First Security Capital I 8.41% 12/15/26 |
A3 |
|
4,420 |
4,069 |
|
|
Ford Motor Credit Co.: |
|
|
|
|
|
|
7.5% 3/15/05 |
A2 |
|
8,000 |
8,066 |
|
|
7.875% 6/15/10 |
A2 |
|
2,210 |
2,233 |
|
|
General Motors Acceptance Corp.: |
|
|
|
|
|
|
7.5% 7/15/05 |
A2 |
|
4,000 |
4,050 |
|
|
7.625% 6/15/04 |
A2 |
|
5,400 |
5,497 |
|
|
7.75% 1/19/10 |
A2 |
|
3,700 |
3,737 |
|
|
GS Escrow Corp. 7.125% 8/1/05 |
Ba1 |
|
1,860 |
1,731 |
|
|
Household Finance Corp. 8% 5/9/05 |
A2 |
|
5,300 |
5,476 |
|
|
HSBC Capital Funding LP: |
|
|
|
|
|
|
9.547% 12/31/49 (b)(c) |
A1 |
|
1,900 |
2,012 |
|
|
10.176% 12/31/49 (b)(c) |
A1 |
|
775 |
854 |
|
|
Newcourt Credit Group, Inc. 6.875% |
A1 |
|
1,850 |
1,823 |
|
|
Nonconvertible Bonds - continued |
|||||
|
Moody's Ratings |
Principal Amount (000s) |
Value (Note 1) (000s) |
|||
|
FINANCE - continued |
|||||
|
Credit & Other Finance - continued |
|||||
|
Qwest Capital Funding, Inc.: |
|
|
|
|
|
|
7.75% 8/15/06 (c) |
Baa1 |
|
$ 3,700 |
$ 3,751 |
|
|
7.9% 8/15/10 (c) |
Baa1 |
|
3,100 |
3,164 |
|
|
Sprint Capital Corp.: |
|
|
|
|
|
|
5.7% 11/15/03 |
Baa1 |
|
2,800 |
2,678 |
|
|
5.875% 5/1/04 |
Baa1 |
|
290 |
277 |
|
|
6.875% 11/15/28 |
Baa1 |
|
5,670 |
4,894 |
|
|
Trizec Finance Ltd. yankee 10.875% 10/15/05 |
Baa3 |
|
1,385 |
1,406 |
|
|
TXU Eastern Funding 6.75% 5/15/09 |
Baa1 |
|
4,200 |
3,804 |
|
|
U.S. West Capital Funding, Inc.: |
|
|
|
|
|
|
6.5% 11/15/18 |
Baa1 |
|
1,450 |
1,276 |
|
|
6.875% 7/15/28 |
Baa1 |
|
8,800 |
7,868 |
|
|
Unicredito Italiano Capital Trust II yankee 9.2% 10/29/49 (b)(c) |
A1 |
|
1,950 |
1,962 |
|
|
|
86,785 |
||||
|
Insurance - 0.1% |
|||||
|
Executive Risk Capital Trust 8.675% 2/1/27 |
Baa3 |
|
1,750 |
1,725 |
|
|
Savings & Loans - 0.1% |
|||||
|
Long Island Savings Bank FSB 6.2% 4/2/01 |
Baa3 |
|
1,550 |
1,538 |
|
|
Securities Industry - 0.2% |
|||||
|
Amvescap PLC yankee: |
|
|
|
|
|
|
6.375% 5/15/03 |
A3 |
|
1,500 |
1,453 |
|
|
6.6% 5/15/05 |
A3 |
|
1,750 |
1,666 |
|
|
|
3,119 |
||||
|
TOTAL FINANCE |
164,057 |
||||
|
INDUSTRIAL MACHINERY & EQUIPMENT - 0.3% |
|||||
|
Tyco International Group SA: |
|
|
|
|
|
|
yankee 6.875% 1/15/29 |
Baa1 |
|
5,000 |
4,313 |
|
|
yankee 6.375% 6/15/05 |
Baa1 |
|
1,830 |
1,778 |
|
|
TOTAL INDUSTRIAL MACHINERY & EQUIPMENT |
6,091 |
||||
|
MEDIA & LEISURE - 2.4% |
|||||
|
Broadcasting - 1.9% |
|||||
|
British Sky Broadcasting Group PLC 8.2% 7/15/09 |
Baa3 |
|
7,750 |
7,359 |
|
|
Clear Channel Communications, Inc. 6.875% 6/15/18 |
Baa3 |
|
5,000 |
4,379 |
|
|
Nonconvertible Bonds - continued |
|||||
|
Moody's Ratings |
Principal Amount (000s) |
Value (Note 1) (000s) |
|||
|
MEDIA & LEISURE - continued |
|||||
|
Broadcasting - continued |
|||||
|
Continental Cablevision, Inc. 8.3% 5/15/06 |
A2 |
|
$ 1,775 |
$ 1,839 |
|
|
TCI Communications, Inc. 9.8% 2/1/12 |
A2 |
|
4,700 |
5,359 |
|
|
TCI Communications Financing III 9.65% 3/31/27 |
A3 |
|
2,500 |
2,699 |
|
|
Time Warner, Inc. 9.125% 1/15/13 |
Baa3 |
|
3,000 |
3,366 |
|
|
USA Networks, Inc./USANi LLC 6.75% 11/15/05 |
Baa3 |
|
10,000 |
9,764 |
|
|
|
34,765 |
||||
|
Publishing - 0.5% |
|||||
|
News America Holdings, Inc. 8% 10/17/16 |
Baa3 |
|
6,000 |
5,782 |
|
|
News America, Inc. 7.125% 4/8/28 |
Baa3 |
|
1,500 |
1,280 |
|
|
Time Warner Entertainment Co. LP: |
|
|
|
|
|
|
8.875% 10/1/12 |
Baa2 |
|
750 |
812 |
|
|
10.15% 5/1/12 |
Baa2 |
|
500 |
588 |
|
|
|
8,462 |
||||
|
TOTAL MEDIA & LEISURE |
43,227 |
||||
|
NONDURABLES - 0.6% |
|||||
|
Beverages - 0.3% |
|||||
|
Seagram JE & Sons, Inc. 6.625% 12/15/05 |
Baa3 |
|
5,320 |
5,188 |
|
|
Foods - 0.1% |
|||||
|
ConAgra, Inc. 7.125% 10/1/26 |
Baa1 |
|
2,040 |
2,004 |
|
|
Tobacco - 0.2% |
|||||
|
RJ Reynolds Tobacco Holdings, Inc. 7.375% 5/15/03 |
Baa2 |
|
3,100 |
2,938 |
|
|
TOTAL NONDURABLES |
10,130 |
||||
|
RETAIL & WHOLESALE - 0.4% |
|||||
|
Drug Stores - 0.2% |
|||||
|
Rite Aid Corp.: |
|
|
|
|
|
|
6.5% 12/15/05 (c) |
Caa1 |
|
6,780 |
2,305 |
|
|
7.125% 1/15/07 |
Caa1 |
|
970 |
320 |
|
|
|
2,625 |
||||
|
Nonconvertible Bonds - continued |
|||||
|
Moody's Ratings |
Principal Amount (000s) |
Value (Note 1) (000s) |
|||
|
RETAIL & WHOLESALE - continued |
|||||
|
General Merchandise Stores - 0.2% |
|||||
|
Federated Department Stores, Inc.: |
|
|
|
|
|
|
6.79% 7/15/27 |
Baa1 |
|
$ 2,000 |
$ 1,928 |
|
|
8.5% 6/15/03 |
Baa1 |
|
2,275 |
2,322 |
|
|
|
4,250 |
||||
|
TOTAL RETAIL & WHOLESALE |
6,875 |
||||
|
TECHNOLOGY - 1.0% |
|||||
|
Computers & Office Equipment - 1.0% |
|||||
|
Comdisco, Inc.: |
|
|
|
|
|
|
5.95% 4/30/02 |
Baa1 |
|
4,200 |
3,965 |
|
|
6.375% 11/30/01 |
Baa1 |
|
6,000 |
5,798 |
|
|
7.23% 8/16/01 |
Baa1 |
|
7,000 |
7,003 |
|
|
7.25% 9/1/02 |
Baa1 |
|
1,000 |
962 |
|
|
|
17,728 |
||||
|
TRANSPORTATION - 1.1% |
|||||
|
Air Transportation - 0.3% |
|||||
|
Continental Airlines, Inc. pass thru trust certificates: |
|
|
|
|
|
|
7.434% 3/15/06 |
Baa1 |
|
995 |
980 |
|
|
7.73% 9/15/12 |
Baa1 |
|
365 |
358 |
|
|
Delta Air Lines, Inc. equipment trust certificate 8.54% 1/2/07 |
Baa1 |
|
2,202 |
2,131 |
|
|
United Air Lines, Inc.: |
|
|
|
|
|
|
9% 12/15/03 |
Baa3 |
|
2,000 |
1,997 |
|
|
10.25% 7/15/21 |
Baa3 |
|
1,000 |
1,034 |
|
|
|
6,500 |
||||
|
Railroads - 0.8% |
|||||
|
Burlington Northern Santa Fe Corp.: |
|
|
|
|
|
|
6.53% 7/15/37 |
Baa2 |
|
10,000 |
9,818 |
|
|
6.875% 12/1/27 |
Baa2 |
|
2,000 |
1,719 |
|
|
Norfolk Southern Corp. 7.05% 5/1/37 |
Baa1 |
|
2,510 |
2,498 |
|
|
|
14,035 |
||||
|
TOTAL TRANSPORTATION |
20,535 |
||||
|
Nonconvertible Bonds - continued |
|||||
|
Moody's Ratings |
Principal Amount (000s) |
Value (Note 1) (000s) |
|||
|
UTILITIES - 4.0% |
|||||
|
Electric Utility - 1.1% |
|||||
|
Avon Energy Partners Holdings: |
|
|
|
|
|
|
6.46% 3/4/08 (c) |
Baa2 |
|
$ 3,200 |
$ 2,886 |
|
|
7.05% 12/11/07 (c) |
Baa2 |
|
6,000 |
5,612 |
|
|
Dominion Resources, Inc.: |
|
|
|
|
|
|
7.6% 7/15/03 |
Baa1 |
|
2,400 |
2,417 |
|
|
8.125% 6/15/10 |
Baa1 |
|
1,200 |
1,236 |
|
|
DR Investments UK PLC yankee 7.1% 5/15/02 (c) |
A2 |
|
2,000 |
1,991 |
|
|
Hydro-Quebec yankee 8% 2/1/13 |
A2 |
|
250 |
265 |
|
|
Israel Electric Corp. Ltd.: |
|
|
|
|
|
|
7.75% 12/15/27 (c) |
A3 |
|
4,445 |
3,939 |
|
|
yankee 7.25% 12/15/06 (c) |
A3 |
|
1,000 |
978 |
|
|
Texas Utilities Co. 6.375% 1/1/08 |
Baa3 |
|
1,065 |
974 |
|
|
|
20,298 |
||||
|
Gas - 0.5% |
|||||
|
CMS Panhandle Holding Co.: |
|
|
|
|
|
|
6.125% 3/15/04 |
Baa3 |
|
2,350 |
2,249 |
|
|
7% 7/15/29 |
Baa3 |
|
1,800 |
1,518 |
|
|
Reliant Energy Resources Corp. 8.125% 7/15/05 (c) |
Baa1 |
|
3,000 |
3,045 |
|
|
Sempra Energy 7.95% 3/1/10 |
A2 |
|
1,650 |
1,647 |
|
|
|
8,459 |
||||
|
Telephone Services - 2.4% |
|||||
|
Cable & Wireless Optus Ltd.: |
|
|
|
|
|
|
8% 6/22/10 (c) |
Baa1 |
|
5,900 |
6,145 |
|
|
8.125% 6/15/09 (c) |
Baa1 |
|
4,000 |
4,077 |
|
|
Deutsche Telekom International Finance BV 8.25% 6/15/30 |
Aa2 |
|
5,895 |
6,049 |
|
|
GTE Corp. 7.83% 5/1/23 |
A2 |
|
1,000 |
962 |
|
|
Koninklijke KPN NV yankee 8% 10/1/10 (c) |
A3 |
|
680 |
680 |
|
|
Telecomunicaciones de Puerto Rico, Inc. 6.65% 5/15/06 |
Baa2 |
|
3,075 |
2,937 |
|
|
Telefonica Europe BV 8.25% 9/15/30 |
A2 |
|
4,800 |
4,917 |
|
|
Teleglobe Canada, Inc.: |
|
|
|
|
|
|
7.2% 7/20/09 |
Baa1 |
|
7,900 |
7,653 |
|
|
7.7% 7/20/29 |
Baa1 |
|
7,556 |
7,209 |
|
|
Nonconvertible Bonds - continued |
|||||
|
Moody's Ratings |
Principal Amount (000s) |
Value (Note 1) (000s) |
|||
|
UTILITIES - continued |
|||||
|
Telephone Services - continued |
|||||
|
WorldCom, Inc.: |
|
|
|
|
|
|
6.95% 8/15/28 |
A3 |
|
$ 3,735 |
$ 3,373 |
|
|
7.75% 4/1/07 |
A3 |
|
1,000 |
1,025 |
|
|
|
45,027 |
||||
|
TOTAL UTILITIES |
73,784 |
||||
|
TOTAL NONCONVERTIBLE BONDS (Cost $456,465) |
443,495 |
||||
|
U.S. Government and Government Agency Obligations - 26.2% |
|||||
|
|
|||||
|
U.S. Government Agency Obligations - 5.0% |
|||||
|
Fannie Mae: |
|
|
|
|
|
|
6.5% 4/29/09 |
Aaa |
|
22,010 |
20,854 |
|
|
7% 7/15/05 |
Aaa |
|
17,005 |
17,292 |
|
|
7.125% 6/15/10 |
Aaa |
|
6,070 |
6,221 |
|
|
7.25% 1/15/10 |
Aaa |
|
14,600 |
15,056 |
|
|
Federal Home Loan Bank 6.75% 2/1/02 |
Aaa |
|
9,370 |
9,392 |
|
|
Financing Corp. - coupon STRIPS |
Aaa |
|
5,606 |
4,451 |
|
|
Freddie Mac: |
|
|
|
|
|
|
6.45% 4/29/09 |
Aaa |
|
9,000 |
8,509 |
|
|
6.875% 1/15/05 |
Aaa |
|
4,020 |
4,063 |
|
|
7% 7/15/05 |
Aaa |
|
5,500 |
5,590 |
|
|
TOTAL U.S. GOVERNMENT AGENCY OBLIGATIONS |
91,428 |
||||
|
U.S. Treasury Obligations - 21.2% |
|||||
|
U.S. Treasury Bonds: |
|
|
|
|
|
|
6.125% 8/15/29 |
Aaa |
|
78,935 |
80,625 |
|
|
8% 11/15/21 |
Aaa |
|
29,775 |
36,363 |
|
|
8.75% 5/15/17 |
Aaa |
|
11,220 |
14,263 |
|
|
8.875% 8/15/17 |
Aaa |
|
41,710 |
53,656 |
|
|
12% 8/15/13 |
Aaa |
|
14,580 |
19,861 |
|
|
14% 11/15/11 |
Aaa |
|
1,170 |
1,635 |
|
|
U.S. Treasury Notes: |
|
|
|
|
|
|
4.75% 11/15/08 |
Aaa |
|
1,760 |
1,629 |
|
|
5.5% 2/15/08 |
Aaa |
|
9,000 |
8,765 |
|
|
5.625% 9/30/01 |
Aaa |
|
38,600 |
38,347 |
|
|
U.S. Government and Government Agency Obligations - continued |
|||||
|
Moody's Ratings |
Principal Amount (000s) |
Value (Note 1) (000s) |
|||
|
U.S. Treasury Obligations - continued |
|||||
|
U.S. Treasury Notes: - continued |
|
|
|
|
|
|
6.5% 5/31/02 |
Aaa |
|
$ 104,640 |
$ 105,294 |
|
|
7% 7/15/06 |
Aaa |
|
780 |
820 |
|
|
U.S. Treasury Notes - stripped principal 0% 5/15/02 |
Aaa |
|
31,510 |
28,599 |
|
|
TOTAL U.S. TREASURY OBLIGATIONS |
389,857 |
||||
|
TOTAL U.S. GOVERNMENT AND (Cost $479,555) |
481,285 |
||||
|
U.S. Government Agency - Mortgage Securities - 34.7% |
|||||
|
|
|||||
|
Fannie Mae - 31.9% |
|||||
|
5.5% 1/1/09 to 4/1/11 |
Aaa |
|
10,361 |
9,808 |
|
|
6% 4/1/13 to 2/1/29 |
Aaa |
|
39,107 |
36,713 |
|
|
6.5% 12/1/25 to 2/1/30 |
Aaa |
|
250,169 |
240,393 |
|
|
7% 3/1/23 to 1/1/29 |
Aaa |
|
36,209 |
35,570 |
|
|
7.5% 7/1/25 to 9/1/30 |
Aaa |
|
154,489 |
154,226 |
|
|
8% 7/1/13 to 9/1/30 |
Aaa |
|
107,455 |
108,889 |
|
|
9.5% 4/1/17 to 12/1/18 |
Aaa |
|
545 |
566 |
|
|
TOTAL FANNIE MAE |
586,165 |
||||
|
Freddie Mac - 0.2% |
|||||
|
8.5% 5/1/25 to 8/1/27 |
Aaa |
|
3,051 |
3,135 |
|
|
Government National Mortgage Association - 2.6% |
|||||
|
6% 10/15/08 to 5/15/09 |
Aaa |
|
2,220 |
2,172 |
|
|
6.5% 10/15/27 to 4/15/29 (g) |
Aaa |
|
32,993 |
31,776 |
|
|
6.5% 10/15/27 (d) |
Aaa |
|
3,215 |
3,105 |
|
|
7% 10/15/27 |
Aaa |
|
235 |
231 |
|
|
7.5% 12/15/05 to 10/15/27 |
Aaa |
|
9,789 |
9,851 |
|
|
TOTAL GOVERNMENT NATIONAL MORTGAGE ASSOCIATION |
47,135 |
||||
|
TOTAL U.S. GOVERNMENT AGENCY - MORTGAGE SECURITIES (Cost $642,764) |
636,435 |
||||
|
Asset-Backed Securities - 2.2% |
|||||
|
Moody's Ratings |
Principal Amount (000s) |
Value (Note 1) (000s) |
|||
|
American Express Credit Account Master Trust 6.1% 12/15/06 |
A1 |
|
$ 2,600 |
$ 2,533 |
|
|
Capita Equipment Receivables Trust 6.48% 10/15/06 |
Baa2 |
|
1,760 |
1,710 |
|
|
Discover Card Master Trust I 5.85% 11/16/04 |
A2 |
|
4,000 |
3,924 |
|
|
Ford Credit Auto Owner Trust: |
|
|
|
|
|
|
6.2% 12/15/02 |
Aa2 |
|
1,790 |
1,772 |
|
|
6.4% 12/15/02 |
Aa2 |
|
1,020 |
1,012 |
|
|
7.03% 11/15/03 |
Aaa |
|
424 |
425 |
|
|
JCPenney Master Credit Card Trust 5.5% 6/15/07 |
Aaa |
|
13,400 |
12,908 |
|
|
Key Auto Finance Trust: |
|
|
|
|
|
|
6.3% 10/15/03 |
A2 |
|
204 |
203 |
|
|
6.65% 10/15/03 |
Baa3 |
|
133 |
132 |
|
|
Premier Auto Trust 5.59% 2/9/04 |
Aaa |
|
10,000 |
9,816 |
|
|
Sears Credit Account Master Trust II 6.75% 9/16/09 |
Aaa |
|
6,300 |
6,267 |
|
|
TOTAL ASSET-BACKED SECURITIES (Cost $41,475) |
40,702 |
||||
|
Collateralized Mortgage Obligations - 0.5% |
|||||
|
|
|||||
|
U.S. Government Agency - 0.5% |
|||||
|
Freddie Mac REMIC planned amortization class
Series 1669 Class H, 6.5% 7/15/23 |
Aaa |
|
10,000 |
9,566 |
|
|
Commercial Mortgage Securities - 2.4% |
|||||
|
|
|||||
|
CS First Boston Mortgage Securities Corp.: |
|
|
|
|
|
|
Series 1997-C2 Class D, 7.27% 1/17/35 |
Baa2 |
|
2,200 |
2,074 |
|
|
Series 1998-FL1: |
|
|
|
|
|
|
Class D, 7.12% 12/10/00 (c)(e) |
Aa1 |
|
3,800 |
3,797 |
|
|
Class E, 7.47% 1/10/13 (c)(e) |
Baa1 |
|
5,260 |
5,249 |
|
|
Series 2000-C1 Class A2, 7.545% 4/15/62 |
AAA |
|
3,100 |
3,166 |
|
|
DLJ Commercial Mortgage Corp. Series 2000-CF1 Class A1B, 7.62% 5/10/10 |
Aaa |
|
8,000 |
8,216 |
|
|
Equitable Life Assurance Society of the United States Series 174: |
|
|
|
|
|
|
Class B1, 7.33% 5/15/06 (c) |
Aa2 |
|
1,000 |
1,010 |
|
|
Class C1, 7.52% 5/15/06 (c) |
A2 |
|
1,000 |
1,003 |
|
|
GS Mortgage Securities Corp. II Series 1998-GLII Class E, 7.1905% 4/13/31 (c)(e) |
Baa3 |
|
2,000 |
1,768 |
|
|
Commercial Mortgage Securities - continued |
|||||
|
Moody's Ratings |
Principal Amount (000s) |
Value (Note 1) (000s) |
|||
|
Nomura Asset Securities Corp. Series 1998-D6 Class A1C, 6.69% 3/17/28 |
Aaa |
|
$ 6,000 |
$ 5,733 |
|
|
Prudential Securities Secured Financing Corp. Series 2000-C1 Class A2, 7.727% 2/15/10 |
Aaa |
|
7,830 |
8,045 |
|
|
Thirteen Affiliates of General Growth Properties, Inc. sequential pay Series 1 Class A2, 6.602% 12/15/10 (c) |
Aaa |
|
3,000 |
2,951 |
|
|
TOTAL COMMERCIAL MORTGAGE SECURITIES (Cost $42,701) |
43,012 |
||||
|
Foreign Government and Government Agency Obligations (f) - 2.7% |
|||||
|
|
|||||
|
Korean Republic yankee 8.75% 4/15/03 |
Baa2 |
|
1,310 |
1,347 |
|
|
New Brunswick Province yankee 7.625% 2/15/13 |
A1 |
|
500 |
518 |
|
|
Ontario Province 7%, 8/4/05 |
Aa3 |
|
2,000 |
2,024 |
|
|
Quebec Province: |
|
|
|
|
|
|
yankee: |
|
|
|
|
|
|
7.125% 2/9/24 |
A2 |
|
480 |
461 |
|
|
7.5% 7/15/23 |
A2 |
|
15,480 |
15,501 |
|
|
7% 1/30/07 |
A2 |
|
4,000 |
4,004 |
|
|
7.5% 9/15/29 |
A2 |
|
14,570 |
14,554 |
|
|
Saskatchewan Province yankee 8.5% 7/15/22 |
A1 |
|
300 |
333 |
|
|
United Mexican States: |
|
|
|
|
|
|
8.5% 2/1/06 |
Baa3 |
|
3,325 |
3,315 |
|
|
9.875% 2/1/10 |
Baa3 |
|
5,930 |
6,315 |
|
|
TOTAL FOREIGN GOVERNMENT AND (Cost $49,681) |
48,372 |
||||
|
Supranational Obligations - 0.4% |
|||||
|
|
|||||
|
Inter-American Development Bank |
Aaa |
|
8,000 |
7,799 |
|
|
Cash Equivalents - 5.4% |
|||
|
Maturity Amount (000s) |
Value (Note 1) (000s) |
||
|
Investments in repurchase agreements (U.S. Government Obligations), in a joint trading account at 6.66%, dated 9/29/00 due 10/2/00 |
$ 99,538 |
$ 99,483 |
|
|
TOTAL INVESTMENT PORTFOLIO - 98.7% (Cost $1,829,741) |
1,810,149 |
||
|
NET OTHER ASSETS - 1.3% |
24,601 |
||
|
NET ASSETS - 100% |
$ 1,834,750 |
||
|
Legend |
|
(a) S&P credit ratings are used in the absence of a rating by Moody's Investors Service, Inc. |
|
(b) Debt obligation initially issued at one coupon which converts to a higher coupon at a specified date. The rate shown is the rate at period end. |
|
(c) Security exempt from registration under Rule 144A of the Securities Act of 1933. These securities may be resold in transactions exempt from registration, normally to qualified institutional buyers. At the period end, the value of these securities amounted to $67,648,000 or 3.7% of net assets. |
|
(d) Security purchased on a delayed delivery or when-issued basis. |
|
(e) The coupon rate shown on floating or adjustable rate securities represents the rate at period end. |
|
(f) For foreign government obligations not individually rated by S&P or Moody's, the ratings listed have been assigned by FMR, the fund's investment adviser, based principally on S&P and Moody's ratings of the sovereign credit of the issuing government. |
|
(g) A portion of this security is subject to a forward commitment to sell. |
|
Other Information |
|
The composition of long-term debt holdings as a percentage of total value of investments in securities, is as follows (ratings are unaudited): |
|
Moody's Ratings |
S&P Ratings |
|||
|
Aaa, Aa, A |
76.5% |
|
AAA, AA, A |
71.0% |
|
Baa |
17.6% |
|
BBB |
16.2% |
|
Ba |
0.1% |
|
BB |
1.4% |
|
B |
0.0% |
|
B |
0.1% |
|
Caa |
0.1% |
|
CCC |
0.0% |
|
Ca, C |
0.0% |
|
CC, C |
0.0% |
|
|
|
|
D |
0.0% |
|
Income Tax Information |
|
At September 30, 2000, the aggregate cost of investment securities for income tax purposes was $1,830,236,000. Net unrealized depreciation aggregated $20,087,000, of which $12,580,000 related to appreciated investment securities and $32,667,000 related to depreciated investment securities. |
|
At September 30, 2000, the fund had a capital loss carryforward of approximately $12,553,000 all of which will expire on September 30, 2008. |
|
The fund intends to elect to defer to its fiscal year ending September 30, 2001 approximately $20,215,000 of losses recognized during the period November 1, 1999 to September 30, 2000. |
See accompanying notes which are an integral part of the financial statements.
Annual Report
Statement of Assets and Liabilities
|
Amounts in thousands (except per-share amount) |
September 30, 2000 |
|
|
Assets |
|
|
|
Investment in securities, at value (including repurchase agreements of $99,483) (cost $1,829,741) - |
|
$ 1,810,149 |
|
Commitment to sell securities on a delayed delivery basis |
$ (3,083) |
|
|
Receivable for securities sold on a delayed delivery basis |
3,066 |
(17) |
|
Receivable for investments sold, regular delivery |
|
18,837 |
|
Receivable for fund shares sold |
|
1,852 |
|
Interest receivable |
|
20,451 |
|
Total assets |
|
1,851,272 |
|
Liabilities |
|
|
|
Payable for investments purchased |
10,834 |
|
|
Delayed delivery |
3,099 |
|
|
Payable for fund shares redeemed |
899 |
|
|
Distributions payable |
937 |
|
|
Accrued management fee |
753 |
|
|
Total liabilities |
|
16,522 |
|
Net Assets |
|
$ 1,834,750 |
|
Net Assets consist of: |
|
|
|
Paid in capital |
|
$ 1,887,209 |
|
Undistributed net investment income |
|
730 |
|
Accumulated undistributed net realized gain (loss) on investments and foreign currency transactions |
|
(33,580) |
|
Net unrealized appreciation (depreciation) on investments |
|
(19,609) |
|
Net Assets, for 183,506 shares outstanding |
|
$ 1,834,750 |
|
Net Asset Value, offering price and redemption price |
|
$10.00 |
See accompanying notes which are an integral part of the financial statements.
Annual Report
Financial Statements - continued
Statement of Operations
|
Amounts in thousands |
Year ended September 30, 2000 |
|
|
Investment Income Interest |
|
$ 115,461 |
|
Security lending |
|
136 |
|
Total income |
|
115,597 |
|
Expenses |
|
|
|
Management fee |
$ 9,907 |
|
|
Non-interested trustees' compensation |
5 |
|
|
Total expenses before reductions |
9,912 |
|
|
Expense reductions |
(1,669) |
8,243 |
|
Net investment income |
|
107,354 |
|
Realized and Unrealized Gain (Loss) Net realized gain (loss) on investment securities |
|
(21,054) |
|
Change in net unrealized appreciation (depreciation) on: |
|
|
|
Investment securities |
23,985 |
|
|
Delayed delivery commitments |
(17) |
23,968 |
|
Net gain (loss) |
|
2,914 |
|
Net increase (decrease) in net assets resulting |
|
$ 110,268 |
See accompanying notes which are an integral part of the financial statements.
Annual Report
Financial Statements - continued
Statement of Changes in Net Assets
|
Amounts in thousands |
Year ended
September 30, |
Year ended
September 30, |
|
Increase (Decrease) in Net Assets |
|
|
|
Operations |
$ 107,354 |
$ 84,523 |
|
Net realized gain (loss) |
(21,054) |
(1,742) |
|
Change in net unrealized appreciation (depreciation) |
23,968 |
(79,841) |
|
Net increase (decrease) in net assets resulting |
110,268 |
2,940 |
|
Distributions to shareholders |
(108,036) |
(84,467) |
|
From net realized gain |
- |
(2,620) |
|
In excess of net realized gain |
- |
(6,924) |
|
Total distributions |
(108,036) |
(94,011) |
|
Share transactions |
660,195 |
1,197,543 |
|
Reinvestment of distributions |
96,721 |
81,973 |
|
Cost of shares redeemed |
(561,952) |
(771,182) |
|
Net increase (decrease) in net assets resulting |
194,964 |
508,334 |
|
Total increase (decrease) in net assets |
197,196 |
417,263 |
|
Net Assets |
|
|
|
Beginning of period |
1,637,554 |
1,220,291 |
|
End of period (including undistributed net investment income of $730 and $474, respectively) |
$ 1,834,750 |
$ 1,637,554 |
|
Other Information Shares |
|
|
|
Sold |
66,969 |
116,572 |
|
Issued in reinvestment of distributions |
9,802 |
7,968 |
|
Redeemed |
(56,927) |
(74,907) |
|
Net increase (decrease) |
19,844 |
49,633 |
See accompanying notes which are an integral part of the financial statements.
Annual Report
Financial Highlights
|
Years ended September 30, |
2000 |
1999 |
1998 |
1997 |
1996 |
|
Selected Per-Share Data |
|
|
|
|
|
|
Net asset value, |
$ 10.010 |
$ 10.700 |
$ 10.250 |
$ 9.980 |
$ 10.170 |
|
Income from Investment Operations |
.640 B |
.620 B |
.634 B |
.640 B |
.655 |
|
Net realized and unrealized gain (loss) |
(.005) |
(.610) |
.453 |
.273 |
(.211) |
|
Total from investment operations |
.635 |
.010 |
1.087 |
.913 |
.444 |
|
Less Distributions |
|
|
|
|
|
|
From net investment income |
(.645) |
(.620) |
(.637) |
(.643) |
(.634) |
|
From net realized gain |
- |
(.022) |
- |
- |
- |
|
In excess of net realized gain |
- |
(.058) |
- |
- |
- |
|
Total distributions |
(.645) |
(.700) |
(.637) |
(.643) |
(.634) |
|
Net asset value, end of period |
$ 10.000 |
$ 10.010 |
$ 10.700 |
$ 10.250 |
$ 9.980 |
|
Total Return A |
6.63% |
0.10% |
10.95% |
9.43% |
4.46% |
|
Ratios and Supplemental Data |
|
|
|
|
|
|
Net assets, end of period |
$ 1,835 |
$ 1,638 |
$ 1,220 |
$ 551 |
$ 344 |
|
Ratio of expenses to average |
.50% C |
.47% C |
.38% C |
.48% C |
.65% |
|
Ratio of net investment income to average net assets |
6.50% |
6.04% |
6.11% |
6.36% |
6.35% |
|
Portfolio turnover rate |
122% |
148% |
222% |
194% |
169% |
A The total returns would have been lower had certain expenses not been reduced during the periods shown.
B Net investment income per share has been calculated based on average shares outstanding during the period.
C FMR agreed to reimburse a portion of the fund's expenses during the period. Without this reimbursement, the fund's expense ratio would have been higher.
See accompanying notes which are an integral part of the financial statements.
Annual Report
For the period ended September 30, 2000
1. Significant Accounting Policies.
Spartan Investment Grade Bond Fund (the fund) is a fund of Fidelity Charles Street Trust (the trust) and is authorized to issue an unlimited number of shares. The trust is registered under the Investment Company Act of 1940, as amended, as an open-end management investment company organized as a Massachusetts business trust. The financial statements have been prepared in conformity with generally accepted accounting principles which require management to make certain estimates and assumptions at the date of the financial statements. The following summarizes the significant accounting policies of the fund:
Security Valuation. Securities are valued based upon a computerized matrix system and/or appraisals by a pricing service, both of which consider market transactions and dealer-supplied valuations. Securities (including restricted securities) for which quotations are not readily available are valued at their fair value as determined in good faith under consistently applied procedures under the general supervision of the Board of Trustees. Short-term securities with remaining maturities of sixty days or less for which quotations are not readily available are valued at amortized cost or original cost plus accrued interest, both of which approximate current value. Investments in open-end investment companies are valued at their net asset value each business day.
Income Taxes. As a qualified regulated investment company under Subchapter M of the Internal Revenue Code, the fund is not subject to income taxes to the extent that it distributes substantially all of its taxable income for its fiscal year. The schedule of investments includes information regarding income taxes under the caption "Income Tax Information."
Investment Income. Interest income, which includes accretion of original issue discount, is accrued as earned.
Expenses. Most expenses of the trust can be directly attributed to a fund. Expenses which cannot be directly attributed are apportioned among the funds in the trust.
Distributions to Shareholders. Distributions are declared daily and paid monthly from net investment income. Distributions from realized gains, if any, are recorded on the ex-dividend date.
Income and capital gain distributions are determined in accordance with income tax regulations which may differ from generally accepted accounting principles. These differences, which may result in distribution reclassifications, are primarily due to differing treatments for paydown gains/losses on certain securities, market discount and losses deferred due to wash sales, futures transactions and excise tax regulations.
Permanent book and tax basis differences relating to shareholder distributions will result in reclassifications to paid in capital. Undistributed net investment income and accumulated undistributed net realized
Annual Report
Notes to Financial Statements - continued
1. Significant Accounting
Policies - continued
Distributions to Shareholders -
continued
gain (loss) on investments and foreign currency transactions may include temporary book and tax basis differences which will reverse in a subsequent period. Any taxable income or gain remaining at fiscal year end is distributed in the following year.
Security Transactions. Security transactions are accounted for as of trade date. Gains and losses on securities sold are determined on the basis of identified cost.
2. Operating Policies.
Joint Trading Account. Pursuant to an Exemptive Order issued by the Securities and Exchange Commission (the SEC), the fund, along with other affiliated entities of Fidelity Management & Research Company (FMR), may transfer uninvested cash balances into one or more joint trading accounts. These balances are invested in one or more repurchase agreements for U.S. Treasury or Federal Agency obligations.
Repurchase Agreements. The underlying U.S. Treasury, Federal Agency, or other obligations found to be satisfactory by FMR are transferred to an account of the fund, or to the Joint Trading Account, at a custodian bank. The securities are marked-to-market daily and maintained at a value at least equal to the principal amount of the repurchase agreement (including accrued interest). FMR, the fund's investment adviser, is responsible for determining that the value of the underlying securities remains in accordance with the market value requirements stated above.
Interfund Lending Program. Pursuant to an Exemptive Order issued by the SEC, the fund, along with other registered investment companies having management contracts with FMR, may participate in an interfund lending program. This program provides an alternative credit facility allowing the fund to borrow from, or lend money to, other participating funds.
Delayed Delivery Transactions. The fund may purchase or sell securities on a delayed delivery basis. Payment and delivery may take place after the customary settlement period for that security. The price of the underlying securities and the date when the securities will be delivered and paid for are fixed at the time the transaction is negotiated. The market values of the securities purchased on a delayed delivery basis are identified as such in the fund's schedule of investments. The fund may receive compensation for interest forgone in the purchase of a delayed delivery security. With respect to purchase commitments, the fund identifies securities as segregated in its records with a value at least equal to the amount of the commitment. Losses may arise due to changes in the market value of the underlying securities or if the counterparty does not perform under the contract.
Restricted Securities. The fund is permitted to invest in securities that are subject to legal or contractual restrictions on resale. These securities generally may be resold in transactions exempt from registration or to the public if the securities
Annual Report
Notes to Financial Statements - continued
2. Operating Policies - continued
Restricted Securities - continued
are registered. Disposal of these securities may involve time-consuming negotiations and expense, and prompt sale at an acceptable price may be difficult. At the end of the period, the fund had no investments in restricted securities (excluding 144A issues).
3. Purchases and Sales of Investments.
Purchases and sales of securities, other than short-term securities, aggregated $2,042,356,000 and $1,937,146,000, respectively, of which U.S. government and government agency obligations aggregated $1,608,913,000 and $1,385,321,000, respectively.
4. Fees and Other Transactions with Affiliates.
Management Fee. As the fund's investment adviser, FMR receives a fee that is computed daily at an annual rate of .60% of the fund's average net assets. FMR pays all other expenses, except the compensation of the non-interested Trustees and certain exceptions such as interest, taxes, brokerage commissions and extraordinary expenses. The management fee paid to FMR by the fund is reduced by an amount equal to the fees and expenses paid by the fund to the non-interested Trustees.
Sub-Adviser Fee. FMR, on behalf of the fund, has entered into a sub-advisory agreement with Fidelity Investments Money
Management, Inc. (FIMM), a wholly owned subsidiary of FMR. For its services, FIMM receives a fee from FMR of 50% of the management fee payable to FMR. The fee is paid prior to any voluntary expense reimbursements which may be in effect.
5. Interfund Lending Program.
The fund participated in the interfund lending program as a lender. The average daily loan balance during the period for which loans were outstanding amounted to $17,334,000. The weighted average interest rate was 5.73%. Interest earned from the interfund lending program amounted to $75,000 and is included in interest income on the Statement of Operations. At period end there were no interfund loans outstanding.
6. Security Lending.
The fund lends portfolio securities from time to time in order to earn additional income. The fund receives collateral in the form of U.S. Treasury obligations, letters of credit, and/or cash against the loaned securities, and maintains collateral in an amount not less than 100% of the market value of the loaned securities during the period of the loan. The market value of the loaned securities is determined at the close of business of the fund and any additional required collateral is delivered to the fund on the next business day. If the borrower defaults on its obligation to return the securities loaned because of insolvency or other reasons, the fund could experience delays and costs in recovering the securities loaned or in gaining access to the collateral. At period end there were no security loans outstanding.
Annual Report
Notes to Financial Statements - continued
7. Expense Reductions.
FMR voluntarily agreed to reimburse the fund's operating expenses (excluding interest, taxes, brokerage commissions and extraordinary expenses, if any) above an annual rate of .50% of average net assets. For the period, the reimbursement reduced the expenses by $1,652,000.
In addition, through arrangements with the fund's custodian and transfer agent, credits realized as a result of uninvested cash balances were used to reduce a portion of the fund's expenses. During the period, the fund's expenses were reduced by $17,000 under these arrangements.
Annual Report
To the Trustees of Fidelity Charles Street Trust and Shareholders of Spartan Investment Grade Bond Fund:
We have audited the accompanying statement of assets and liabilities of Spartan Investment Grade Bond Fund, (the Fund), a series of Fidelity Charles Street Trust, including the portfolio of investments, as of September 30, 2000, and the related statements of operations, changes in net assets, and financial highlights for the year then ended. These financial statements and financial highlights are the responsibility of the Fund's management. Our responsibility is to express an opinion on these financial statements and financial highlights based on our audit. The statement of changes in net assets for the year ended September 30, 1999, and the financial highlights for each of the four years in the period then ended were audited by other auditors whose report, dated November 8, 1999, expressed an unqualified opinion on those statements and financial highlights.
We conducted our audit in accordance with auditing standards generally accepted in the United States of America. Those standards require that we plan and perform the audit to obtain reasonable assurance about whether the financial statements and financial highlights are free of material misstatement. An audit includes examining, on a test basis, evidence supporting the amounts and disclosures in the financial statements. Our procedures included confirmation of securities owned as of September 30, 2000, by correspondence with the custodian and brokers; where replies were not received from brokers, we performed other auditing procedures. An audit also includes assessing the accounting principles used and significant estimates made by management, as well as evaluating the overall financial statement presentation. We believe that our audit provides a reasonable basis for our opinion.
In our opinion, the financial statements and financial highlights referred to above present fairly, in all material respects, the financial position of Spartan Investment Grade Bond Fund as of September 30, 2000, the results of its operations, the changes in its net assets, and the financial highlights for the year then ended, in conformity with accounting principles generally accepted in the United States of America.
/s/DELOITTE & TOUCHE LLP
DELOITTE & TOUCHE LLP
Boston, Massachusetts
November 3, 2000
Annual Report
A total of 17.65% of the dividends distributed during the fiscal year was derived from interest on U.S. Government securities which is generally exempt from state income tax.
The fund will notify shareholders in January 2001 of amounts for use in preparing 2000 income tax returns.
Annual Report
Fidelity offers several ways to conveniently manage your personal investments via your telephone or PC. You can access your account information, conduct trades and research your investments 24 hours a day.
By Phone
Fidelity Automated Service Telephone provides a single toll-free number to access account balances, positions, quotes and trading. It's easy to navigate the service, and on your first call, the system will help you create a personal identification number (PIN) for security.
(phone_graphic)
Fidelity Automated
Service Telephone (FAST®)
1-800-544-5555
Press
1 For mutual fund and brokerage trading.
2 For quotes.*
3 For account balances and holdings.
4 To review orders and mutual
fund activity.
5 To change your PIN.
*0 To speak to a Fidelity representative.
By PC
Fidelity's web site on the Internet provides a wide range of information, including daily financial news, fund performance, interactive planning tools and news about Fidelity products and services.
(computer_graphic)
Fidelity's Web Site
www.fidelity.com
If you are not currently on the Internet, call EarthLink Sprint at 1-800-288-2967, and be sure to ask for registration number SMD004 to receive a special Fidelity package that includes 30 days of free Internet access. EarthLink is North America's #1 independent Internet access provider.
(computer_graphic)
Fidelity On-line Xpress+®
Fidelity On-line Xpress+ software for Windows combines comprehensive portfolio management capabilities, securities trading and access to research and analysis tools . . . all on your desktop. Call Fidelity at 1-800-544-0240 or visit our web site for more information on how to manage your investments via your PC.
* When you call the quotes line, please remember that a fund's yield and return will vary and, except for money market funds, share price will also vary. This means that you may have a gain or loss when you sell your shares. There is no assurance that money market funds will be able to maintain a stable $1 share price; an investment in a money market fund is not insured or guaranteed by the U.S. government. Total returns are historical and include changes in share price, reinvestment of dividends and capital gains, and the effects of any sales charges.
Annual Report
For directions and hours,
please call 1-800-544-9797.
Arizona
7373 N. Scottsdale Road
Scottsdale, AZ
California
815 East Birch Street
Brea, CA
851 East Hamilton Avenue
Campbell, CA
527 North Brand Boulevard
Glendale, CA
19200 Von Karman Avenue
Irvine, CA
10100 Santa Monica Blvd.
Los Angeles, CA
251 University Avenue
Palo Alto, CA
1760 Challenge Way
Sacramento, CA
7676 Hazard Center Drive
San Diego, CA
8 Montgomery Street
San Francisco, CA
950 Northgate Drive
San Rafael, CA
1400 Civic Drive
Walnut Creek, CA
6300 Canoga Avenue
Woodland Hills, CA
Colorado
1625 Broadway
Denver, CO
Connecticut
48 West Putnam Avenue
Greenwich, CT
265 Church Street
New Haven, CT
300 Atlantic Street
Stamford, CT
29 South Main Street
West Hartford, CT
Delaware
222 Delaware Avenue
Wilmington, DE
Florida
4400 N. Federal Highway
Boca Raton, FL
90 Alhambra Plaza
Coral Gables, FL
4090 N. Ocean Boulevard
Ft. Lauderdale, FL
1907 West State Road 434
Longwood, FL
8880 Tamiami Trail, North
Naples, FL
2401 PGA Boulevard
Palm Beach Gardens, FL
8065 Beneva Road
Sarasota, FL
1502 N. Westshore Blvd.
Tampa, FL
Georgia
3445 Peachtree Road, N.E.
Atlanta, GA
1000 Abernathy Road
Atlanta, GA
Illinois
One North Franklin Street
Chicago, IL
1415 West 22nd Street
Oak Brook, IL
1700 East Golf Road
Schaumburg, IL
3232 Lake Avenue
Wilmette, IL
Indiana
4729 East 82nd Street
Indianapolis, IN
Maine
Three Canal Plaza
Portland, ME
Maryland
7401 Wisconsin Avenue
Bethesda, MD
One W. Pennsylvania Ave.
Towson, MD
Massachusetts
801 Boylston Street
Boston, MA
155 Congress Street
Boston, MA
25 State Street
Boston, MA
300 Granite Street
Braintree, MA
44 Mall Road
Burlington, MA
416 Belmont Street
Worcester, MA
Annual Report
Michigan
280 Old N. Woodward Ave.
Birmingham, MI
29155 Northwestern Hwy.
Southfield, MI
Minnesota
7600 France Avenue South
Edina, MN
Missouri
700 West 47th Street
Kansas City, MO
8885 Ladue Road
Ladue, MO
New Jersey
150 Essex Street
Millburn, NJ
56 South Street
Morristown, NJ
501 Route 17, South
Paramus, NJ
New York
1055 Franklin Avenue
Garden City, NY
999 Walt Whitman Road
Melville, L.I., NY
1271 Avenue of the Americas
New York, NY
71 Broadway
New York, NY
350 Park Avenue
New York, NY
North Carolina
4611 Sharon Road
Charlotte, NC
Ohio
600 Vine Street
Cincinnati, OH
28699 Chagrin Boulevard
Woodmere Village, OH
Oregon
16850 SW 72nd Avenue
Tigard, OR
Pennsylvania
1735 Market Street
Philadelphia, PA
12001 Perry Highway
Wexford, PA
Rhode Island
47 Providence Place
Providence, RI
Tennessee
6150 Poplar Avenue
Memphis, TN
Texas
10000 Research Boulevard
Austin, TX
4017 Northwest Parkway
Dallas, TX
1155 Dairy Ashford Street
Houston, TX
2701 Drexel Drive
Houston, TX
400 East Las Colinas Blvd.
Irving, TX
14100 San Pedro
San Antonio, TX
19740 IH 45 North
Spring, TX
Utah
215 South State Street
Salt Lake City, UT
Virginia
1861 International Drive
McLean, VA
Washington
411 108th Avenue, N.E.
Bellevue, WA
511 Pine Street
Seattle, WA
Washington, DC
1900 K Street, N.W.
Washington, DC
Wisconsin
595 North Barker Road
Brookfield, WI
Fidelity Brokerage Services, Inc., 100 Summer St., Boston, MA 02110 Member NYSE/SIPC
Annual Report
If more than one address is listed, please locate the address that is closest to you. We'll give your correspondence immediate attention and send you written confirmation upon completion of your request.
(letter_graphic)
Making Changes
To Your Account
(such as changing name, address, bank, etc.)
Fidelity Investments
P.O. Box 770001
Cincinnati, OH 45277-0002
(letter_graphic)
For Non-Retirement
Accounts
Buying shares
Fidelity Investments
P.O. Box 770001
Cincinnati, OH 45277-0003
Overnight Express
Fidelity Investments
2300 Litton Lane - KH1A
Hebron, KY 41048
Selling shares
Fidelity Investments
P.O. Box 660602
Dallas, TX 75266-0602
Overnight Express
Fidelity Investments
Attn: Redemptions - CP6I
400 East Las Colinas Blvd.
Irving, TX 75039-5587
General Correspondence
Fidelity Investments
P.O. Box 500
Merrimack, NH 03054-0500
(letter_graphic)
For Retirement
Accounts
Buying shares
Fidelity Investments
P.O. Box 770001
Cincinnati, OH 45277-0003
Selling shares
Fidelity Investments
P.O. Box 660602
Dallas, TX 75266-0602
Overnight Express
Fidelity Investments
Attn: Redemptions - CP6R
400 East Las Colinas Blvd.
Irving, TX 75039-5587
General Correspondence
Fidelity Investments
P.O. Box 500
Merrimack, NH 03054-0500
Annual Report
Annual Report
Annual Report
Annual Report
Investment Adviser
Fidelity Management & Research
Company
Boston, MA
Investment Sub-Advisers
Fidelity Management & Research
(U.K.) Inc.
Fidelity Management & Research
(Far East) Inc.
Fidelity Investments
Money Management, Inc.
Fidelity Investments Japan Limited
Officers
Edward C. Johnson 3d, President
Robert C. Pozen, Senior Vice President
Dwight D. Churchill, Vice President
Kevin E. Grant, Vice President
David L. Murphy, Vice President
Stanley N. Griffith, Assistant Vice President
Eric D. Roiter, Secretary
Robert A. Dwight, Treasurer
Maria F. Dwyer, Deputy Treasurer
John H. Costello, Assistant Treasurer
Thomas J. Simpson, Assistant Treasurer
Board of Trustees
Ralph F. Cox *
Phyllis Burke Davis *
Robert M. Gates *
Edward C. Johnson 3d
Donald J. Kirk *
Ned C. Lautenbach *
Peter S. Lynch
Marvin L. Mann *
William O. McCoy *
Gerald C. McDonough *
Robert C. Pozen
Thomas R. Williams *
Advisory Board
J. Michael Cook
Abigail P. Johnson
Marie L. Knowles
* Independent trustees
General Distributor
Fidelity Distributors Corporation
Boston, MA
Transfer and Shareholder
Servicing Agent
Fidelity Service Company, Inc.
Boston, MA
Custodian
The Bank of New York
New York, NY
Fidelity's Taxable Bond Funds
Capital & Income
Ginnie Mae
Government Income
High Income
Intermediate Bond
Intermediate Government Income
International Bond
Investment Grade Bond
New Markets Income
Short-Term Bond
Spartan® Government Income
Spartan Investment Grade Bond
Strategic Income
Target Timeline® 2001 & 2003
The Fidelity Telephone Connection
Mutual Fund 24-Hour Service
Exchanges/Redemptions
and Account Assistance 1-800-544-6666
Product Information 1-800-544-6666
Retirement Accounts 1-800-544-4774
(8 a.m. - 9 p.m.)
TDD Service 1-800-544-0118
for the deaf and hearing impaired
(9 a.m. - 9 p.m. Eastern time)
Fidelity Automated Service
Telephone (FAST®) (automated graphic) 1-800-544-5555
(automated graphic) Automated line for quickest service
SIG-ANN-1100 116212
1.703372.103
(Fidelity Investment logo)(registered trademark)
Corporate Headquarters
82 Devonshire St., Boston, MA 02109
www.fidelity.com
Fidelity®
Annual Report
September 30, 2000
(2_fidelity_logos)(Registered_trademark)
|
President's Message |
Ned Johnson on investing strategies. |
|
|
Performance |
How the fund has done over time. |
|
|
Market Recap |
An overview of the market's performance and the factors driving it. |
|
|
Fund Talk |
The manager's review of fund performance, strategy and outlook. |
|
|
Investment Changes |
A summary of the fund's investments. |
|
|
Investments |
A complete list of the fund's investments with their market values. |
|
|
Financial Statements |
Statements of assets and liabilities, operations, and changes in net assets, as well as financial highlights. |
|
|
Notes |
Notes to the financial statements. |
|
|
Independent Auditors' Report |
The auditors' opinion. |
|
|
Distributions |
|
Standard & Poor's, S&P and S&P 500 are registered service marks of The McGraw-Hill Companies, Inc. and have been licensed for use by Fidelity Distributors Corporation.
Third party marks appearing herein are the property of their respective owners.
All other marks appearing herein are registered or unregistered trademarks or service marks of FMR Corp. or an affiliated company.
(Recycle graphic) This report is printed on recycled paper using soy-based inks.
This report and the financial statements contained herein are submitted for the general information of the shareholders of the fund. This report is not authorized for distribution to prospective investors in the fund unless preceded or accompanied by an effective prospectus.
Mutual fund shares are not deposits or obligations of, or guaranteed by, any depository institution. Shares are not insured by the FDIC, Federal Reserve Board or any other agency, and are subject to investment risks, including possible loss of principal amount invested.
Neither the fund nor Fidelity Distributors Corporation is a bank.
For more information on any Fidelity fund, including charges and expenses, call 1-800-544-6666 for a free prospectus. Read it carefully before you invest or send money.
Annual Report
(photo_of_Edward_C_Johnson_3d)
Dear Shareholder:
Disappointing third quarter corporate earnings announcements resulted in negative performance for many major U.S. equity indexes through the first nine months of 2000. A weak euro and the highest oil prices in 10 years frightened many investors into selling shares of large U.S. corporations with multinational presence. In fixed-income markets, 30-year Treasury prices also dropped, and these securities outyielded 10-year Treasury notes for the first time since January.
While it's impossible to predict the future direction of the markets with any degree of certainty, there are certain basic principles that can help investors plan for their future needs.
First, investors are encouraged to take a long-term view of their portfolios. If you can afford to leave your money invested through the inevitable up and down cycles of the financial markets, you will greatly reduce your vulnerability to any single decline. We know from experience, for example, that stock prices have gone up over longer periods of time, have significantly outperformed other types of investments and have stayed ahead of inflation.
Second, you can further manage your investing risk through diversification. Asset Manager funds are already diversified because they invest in stocks, bonds and short-term and money market instruments, both in the U.S. and overseas. If you have a shorter investment time horizon, you might want to consider moving some of your investment into Asset Manager: Income, which generally has a higher weighting in short-term investments compared with the other Asset Manager funds.
Finally, no matter what your time horizon or portfolio diversity, it makes good sense to follow a regular investment plan, investing a certain amount of money in a fund at the same time each month or quarter and periodically reviewing your overall portfolio. By doing so, you won't get caught up in the excitement of a rapidly rising market, nor will you buy all your shares at market highs. While this strategy - known as dollar cost averaging - won't assure a profit or protect you from a loss in a declining market, it should help you lower the average cost of your purchases. Of course, you should consider your financial ability to continue your purchases through periods of low price levels before undertaking such a strategy.
If you have questions, please call us at 1-800-544-6666, or visit our web site at www.fidelity.com. We are available 24 hours a day, seven days a week to provide you the information you need to make the investments that are right for you.
Best regards,
/s/Edward C. Johnson 3d
Edward C. Johnson 3d
Annual Report
There are several ways to evaluate a fund's historical performance. You can look at the total percentage change in value, the average annual percentage change or the growth of a hypothetical $10,000 investment. Total return reflects the change in the value of an investment, assuming reinvestment of the fund's dividend income and capital gains (the profits earned upon the sale of securities that have grown in value). If Fidelity had not reimbursed certain fund expenses, the life of fund total returns would have been lower.
Cumulative Total Returns
|
Period ended September 30, 2000 |
|
|
Past 1 |
Life of |
|
Asset Manager: Aggressive SM |
|
|
50.84% |
54.16% |
|
Asset Manager: Aggressive Composite |
|
|
12.49% |
12.82% |
|
S&P 500 ® |
|
|
13.28% |
13.78% |
|
LB Aggregate Bond |
|
|
6.99% |
6.44% |
|
Flexible Portfolio Funds Average |
|
|
12.82% |
n/a* |
Cumulative total returns show the fund's performance in percentage terms over a set period - in this case, one year or since the fund started on September 24, 1999. For example, if you had invested $1,000 in a fund that had a 5% return over the past year, the value of your investment would be $1,050. You can compare the fund's returns to the performance of the Asset Manager: Aggressive Composite Index, a hypothetical combination of unmanaged indices. The composite index combines the total returns of the Standard & Poor's 500 SM Index and the Lehman Brothers Aggregate Bond Index, weighted according to the fund's neutral mix. To measure how the fund's performance stacked up against its peers, you can compare it to the flexible portfolio funds average, which reflects the performance of mutual funds with similar objectives tracked by Lipper Inc. The past one year average represents a peer group of 233 mutual funds. These benchmarks include reinvested dividends and capital gains, if any.
Average Annual Total Returns
|
Periods ended September 30, 2000 |
Past 1 |
Life of |
|
Asset Manager: Aggressive |
50.84% |
52.92% |
|
Asset Manager: Aggressive Composite |
12.49% |
12.57% |
Average annual total returns take the fund's cumulative return and show you what would have happened if the fund had performed at a constant rate each year.
* Not available
Annual Report
Performance - continued
$10,000 Over Life of Fund
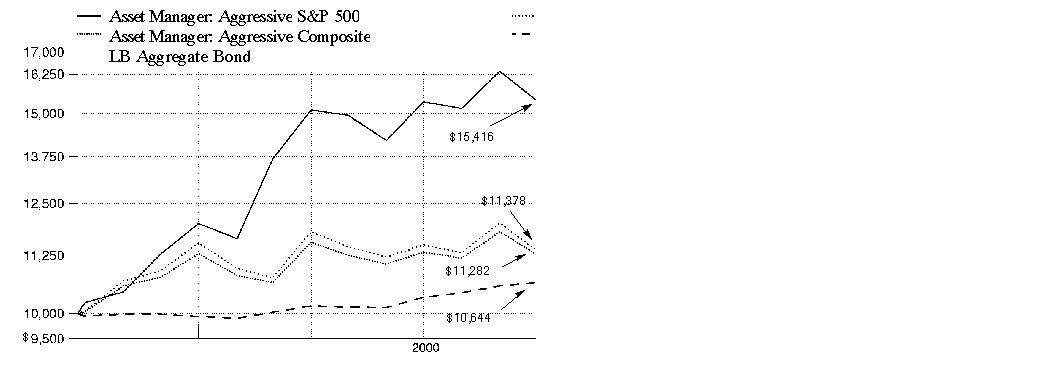
$10,000 Over Life of Fund: Let's say hypothetically that $10,000 was invested in Asset Manager: Aggressive on September 24, 1999, when the fund started. As the chart shows, by September 30, 2000, the value of the investment would have grown to $15,416 - a 54.16% increase on the initial investment. For comparison, look at how both the S&P 500 Index, a market capitalization-weighted index of common stocks, and the Lehman Brothers Aggregate Bond Index, a market value-weighted index of investment-grade fixed-rate debt issues, including government, corporate, asset-backed, and mortgage-backed securities, with maturities of one year or more, did over the same period. With dividends and capital gains, if any, reinvested, the same $10,000 investment in the S&P 500 Index would have grown to $11,378 - a 13.78% increase. If $10,000 was invested in the Lehman Brothers Aggregate Bond Index, it would have grown to $10,644 - a 6.44% increase. You can also look at how the Asset Manager: Aggressive Composite Index, did over the same period. The composite index combines the total returns of the S&P 500 Index, and the Lehman Brothers Aggregate Bond Index according to the fund's neutral mix, and assumes monthly rebalancing of the mix.** With dividends and capital gains, if any, reinvested, the same $10,000 investment would have grown to $11,282 - a 12.82% increase.
Understanding
Performance
How a fund did yesterday is no guarantee of how it will do tomorrow. If you sell your shares during a market downturn, you might lose money. But if you can ride out the market's ups and downs, you may have a gain.
3** Currently 85% stocks and 15% bonds effective September 24, 1999.
Annual Report
What a long, strange trip it's been. At least that's what some investors may think when reflecting on the 12-month period ending September 30, 2000. Historically high levels of volatility shook speculative excess out of tech stocks in 2000, leaving bonds seemingly alone to pick up the pieces. Excluding the dramatic run-up in the fourth quarter of 1999, major stock markets were down for the period, while bonds finished comfortably on the upside.
Stocks: U.S. equity market performance during the 12 months that ended September 30, 2000, generally was predicated on the fortunes of the technology sector. At the period's outset, technology began its meteoric rise as investors rallied behind the sector's growth potential relative to other areas of the market. But just 10 weeks after setting its record high in mid-March, the NASDAQ Composite Index - a technology sector benchmark - had dropped 30%, due mainly to Federal Reserve Board interest-rate hikes, excessive valuations and the potential of an economic slowdown. Given its one-third weighting in technology, the Standard & Poor's 500SM Index also suffered, as did the blue chips' proxy, the Dow Jones Industrial Average. In response, investors shifted their assets into sectors that traditionally perform better in a more moderate-growth economy, such as health care and energy. Technology rallied sporadically in the summer, but come September, more bad news was in store, as high oil prices and a weak European currency combined to dampen the global economy. For the overall 12-month period ending September 30, 2000, the Dow returned 4.62%, the S&P 500 gained 13.28% and the NASDAQ gained 34.01%. However, all three indexes had negative returns through the first nine months of 2000.
Bonds: Most investment-grade bonds overcame sharply rising interest rates and unusually volatile market conditions en route to posting positive returns during the 12-month period that ended September 30, 2000. The Lehman Brothers Aggregate Bond Index - a widely followed measure of taxable-bond performance - returned 6.99% during this time frame. Treasuries struggled the most early on, as investors pursued more attractive alternatives in high-flying stocks and higher-yielding spread sector securities - namely mortgage bonds, government agency issues and corporate bonds. However, the struggle was short-lived, as conditions changed abruptly beginning in January with the announcement by the U.S. Treasury of its intention to reduce new borrowing and use government surplus proceeds to repurchase outstanding debt. Treasury prices jumped in response and, with the help of rising short-term interest rates, induced an inverted yield curve - which occurs when short-term bonds outyield longer-dated securities. Spread sectors recoiled on the news, with their yield spreads widening out relative to Treasuries. Anticipation that the Fed was finished raising rates, combined with persistent flights-to-safety from risk-averse investors concerned about volatility in equity markets, helped further bolster the long bond during the period. The Lehman Brothers Treasury Index returned 7.29%. Mortgages recovered nicely behind reduced interest-rate volatility and stronger-than-anticipated prepayment activity. Similarly, agencies and corporates staged late rallies and outperformed most major U.S. equity indexes through the first nine months of 2000. For the overall 12-month period, the Lehman Brothers Mortgage-Backed Securities, U.S. Agency and Credit Bond indexes returned 7.42%, 6.73% and 5.87%, respectively.
Annual Report
(Portfolio Manager photograph)
An interview with Richard Habermann, Portfolio Manager of Asset Manager: Aggressive
Q. How did the fund perform, Dick?
A. It was an exceptional period for the fund. For the 12-month period that ended September 30, 2000, the fund returned 50.84%, far surpassing the Asset Manager: Aggressive Composite Index, which returned 12.49% during the same period. Fund performance also topped that of the flexible portfolio funds average tracked by Lipper Inc., which returned 12.82%.
Q. What asset allocation strategies did you pursue during the 12-month period?
A. We were slightly underweighted in equities overall, allocating just over 84% of fund assets on average to the asset class during the period. The fund's neutral allocation mix calls for 85% to be invested in stocks and 15% in bonds and short-term/money market instruments. Having ample exposure to the bullishness surrounding stocks early on in the period helped ensure our success relative to the index. The fund's aggressive posture in terms of asset allocation and security selection made it possible to outperform 100% of its peers, which held around 60% in stocks on average. Faced with growing uncertainty in the marketplace during the second half of the period, I began to reel in our equity exposure - from a high of around 92% early in 2000 - toward a more neutral weighting, which helped shelter us a bit during the volatile spring and summer months. While opportunistic trading toward the end of the period nudged the fund's equity weighting up slightly, my overall approach of emphasizing more of a neutral weighting remained intact. By moving some assets in and out of high-yield debt during the summer, we were able to take advantage of some yield spread tightening that occurred among higher-grade issues at the time. Shareholders should realize that, at times, the fund will experience fairly large asset and sector allocation swings, as it is very sensitive to short-term phenomena in the marketplace. The fund assumes a long-term time horizon and, thus, will take on more risk as a result.
Q. What was behind the strong performance of the fund's equity subportfolio?
A. Superior stock picking and timely trading helped the equity subportfolio handily outpace the Standard & Poor's 500 Index during the 12-month period. Brad Lewis - who directed the fund's equity investments until early spring - did a nice job uncovering the right names within the high-growth segments of the market, particularly the market-leading technology sector. The fund's focus on fast-growing smaller-cap tech and energy stocks allowed us to participate fully in the dramatic mid- and small-cap rally early in the period. Faced with growing uncertainty in the marketplace due to rising interest rates, Bahaa Fam - who took over for Brad - gets high marks for astutely repositioning the fund in front of May's sharp sell-off, the first of several moves that significantly extended the fund's equity gains during a very turbulent market. Feeling that many of the fund's small-cap stocks were particularly vulnerable in a higher rate environment, he decided to take profits and later deployed assets into larger-cap Internet infrastructure and emerging communications stocks, such as VeriSign and Ciena, that had become oversold during the May lows. Similarly, Bahaa added several high-quality health care and brokerage stocks, many of which rebounded nicely during the summer. He shed some of these holdings amid the summer rally and used the proceeds to buy a number of undervalued growth stocks, as well as several defensive names, which held up well during the September decline.
Annual Report
Fund Talk: The Manager's Overview - continued
Q. Which stocks performed well? Which didn't?
A. The fund's top contributors included JDS Uniphase, Adobe, Ciena and Kemet. Having considerably less exposure than the index to notable laggards within tech, such as Microsoft and Lucent, further boosted relative returns. Several energy stocks also gave us a lift, most notably BJ Services and Pogo Producing. Positions that helped during market declines included Fannie Mae, Freddie Mac and Calpine. On the down side, having out-of-benchmark exposure to lagging retailers, such as REX Stores and Haverty Furniture, worked against us. Additionally, a handful of tech stocks fell short of the mark, most notably hi/fn, Audiovox and Electronics for Imaging. Several stocks mentioned in this report were no longer held at the close of the period.
Q. How did the bond portion of the fund fare?
A. The fund's bond subportfolio continued to focus almost exclusively on high-yield bonds - an asset class not included in the index - which helped despite a difficult 12 months for the high-yield market in general. Poor liquidity and declining credit quality sent prices plunging during the period. Taking the reins from Fred Hoff - who ran the high-yield portion of the fund until June - Matt Conti leveraged a larger asset base to construct a fresh new portfolio that was more diversified and consisted of higher-quality, more liquid securities that held up well during the volatility. Having very little exposure to lower-rated debt earlier in the period helped us avoid some big losses. The investment-grade portion of the fund - run by Charlie Morrison - was not utilized for the majority of the period. Holding a small position in Treasuries during the fall, when interest rates were rising, detracted slightly from performance.
Q. What about the fund's short-term/money market investments?
A. John Todd felt that concerns surrounding Y2K were overblown and used the opportunity to extend the average maturity of the fund's money market subportfolio late last year to take advantage of a steeply sloped yield curve. Early in 2000, however, the yield curve flattened out dramatically. In response, we let the average maturity roll down, believing that strong economic growth and the risk of rising inflation were likely to set off a protracted period of Fed tightening. Since that time, the curve has remained flat, which has allowed us to maintain a shorter-maturity profile. It's important for shareholders to note that, in July, the fund began to invest nearly all of its money market investments in a Fidelity-managed money market mutual fund in lieu of investing directly in individual money market securities.
Q. What's your outlook?
A. I remain quite cautious. There's an old adage - don't catch a falling knife. Well, that's where I feel we stand today. It's still unclear to me as to whether or not the market will be able to shake its concerns about an economic slowdown and the potential impact on companies' bottom lines. Right now, with stocks facing a stiff headwind, I intend to sit on the sidelines and maintain a neutral equity weighting until I see a catalyst that can reverse the tide. Without that catalyst, it'll be hard for me to justify a significant move.
Annual Report
Fund Talk: The Manager's Overview - continued
The views expressed in this report reflect those of the portfolio manager only through the end of the period of the report as stated on the cover and do not necessarily represent the views of Fidelity or any other person in the Fidelity organization. Any such views are subject to change at any time based upon market or other conditions and Fidelity disclaims any responsibility to update such views. These views may not be relied on as investment advice and, because investment decisions for a Fidelity fund are based on numerous factors, may not be relied on as an indication of trading intent on behalf of any Fidelity fund.
Fund Facts
Goal: seeks to maximize total return over the long term by allocating its assets among stocks, bonds, short-term instruments and other investments
Fund number: 347
Trading symbol: FAMRX
Start date: September 24, 1999
Size: as of September 30, 2000, more than $565 million
Manager: Richard Habermann, since inception; manager, Asset Manager, Asset Manager: Income and Asset Manager: Growth, since 1996; Fidelity Trend Fund, 1977-1981; Fidelity Magellan Fund, 1972-1977; joined Fidelity in 1968
3Dick Habermann reflects on recent market volatility:
"There's a lot of uncertainty in the world today, and it's finding its way into the equity markets. Thankfully, the fund's equity exposure was generally lean toward the tail end of the period, when conditions really started to deteriorate. Our hope is to hold our own - with the help of bonds and cash - when markets are doing poorly and try to do considerably better when stock markets pick up again. That's the whole purpose of asset allocation funds. In a difficult market, sometimes the best thing to do is be patient, see what pans out and pick up some good companies at attractive levels in the process.
"What's particularly troubling for markets these days are shock events. Take the recent crisis in the Middle East, for example. With higher oil prices and inflation fears already weighing on the minds of investors, escalating tensions in that area of the world roiled the markets. There have been many events like this one during the past decade, including the emerging-markets crisis in 1998 and the Gulf War in 1990. As a money manager, it's important for me to anticipate what might be considered less-than-perfect times and, when they are in fact occurring, assess them and decide what to do. So far, we've completed the first part by anticipating difficult times. Early recognition of an uncertain market climate brought us down to a neutral equity weighting before it hurt us, which was key."
Annual Report
|
Top Ten Stocks as of September 30, 2000 |
||
|
|
% of fund's |
% of fund's net assets |
|
Ciena Corp. |
2.5 |
0.0 |
|
Adobe Systems, Inc. |
2.4 |
2.6 |
|
Freddie Mac |
2.2 |
0.0 |
|
Citigroup, Inc. |
2.1 |
0.7 |
|
Fannie Mae |
2.1 |
0.0 |
|
Covad Communications Group, Inc. |
1.9 |
0.0 |
|
SDL, Inc. |
1.9 |
0.7 |
|
Micron Technology, Inc. |
1.7 |
0.0 |
|
Novellus Systems, Inc. |
1.7 |
0.0 |
|
Oracle Corp. |
1.7 |
2.6 |
|
|
20.2 |
6.6 |
|
Top Ten Market Sectors (stocks only) as of September 30, 2000 |
||
|
|
% of fund's |
% of fund's net assets |
|
Technology |
31.9 |
29.2 |
|
Finance |
12.9 |
13.8 |
|
Health |
10.2 |
0.4 |
|
Utilities |
8.4 |
3.8 |
|
Retail & Wholesale |
6.1 |
2.1 |
|
Energy |
4.0 |
19.6 |
|
Industrial Machinery & Equipment |
3.8 |
5.2 |
|
Media & Leisure |
3.5 |
0.4 |
|
Durables |
2.1 |
2.3 |
|
Transportation |
1.3 |
0.0 |
|
Asset Allocation (% of fund's net assets) |
|||||||
|
As of September 30, 2000 * |
As of March 31, 2000 ** |
||||||
|
Stock Class 90.6% |
|
|
Stock Class 92.4% |
|
||
 |
Bond Class 6.6% |
|
|
Bond Class 2.9% |
|
||
|
Short-term Class 2.8% |
|
|
Short-term Class 4.7% |
|
||
 |
Foreign |
|
 |
Foreign |
|
||

Asset allocations in the pie charts reflect the categorization of assets as defined in the fund's prospectus in effect as of the time periods indicated above. Financial Statement categorizations conform to accounting standards and will differ from the pie chart.
Annual Report
Showing Percentage of Net Assets
|
Common Stocks - 88.3% |
|||
|
Shares |
Value |
||
|
AEROSPACE & DEFENSE - 1.2% |
|||
|
Ship Building & Repair - 1.2% |
|||
|
General Dynamics Corp. |
106,500 |
$ 6,689,531 |
|
|
BASIC INDUSTRIES - 0.9% |
|||
|
Chemicals & Plastics - 0.1% |
|||
|
Lyondell Chemical Co. |
54,400 |
642,600 |
|
|
Paper & Forest Products - 0.8% |
|||
|
Kimberly-Clark Corp. |
83,400 |
4,654,763 |
|
|
TOTAL BASIC INDUSTRIES |
5,297,363 |
||
|
CONSTRUCTION & REAL ESTATE - 1.0% |
|||
|
Building Materials - 0.3% |
|||
|
American Standard Companies, Inc. (a) |
40,000 |
1,777,500 |
|
|
Real Estate Investment Trusts - 0.7% |
|||
|
Equity Residential Properties Trust (SBI) |
64,000 |
3,072,000 |
|
|
Pinnacle Holdings, Inc. (a) |
23,600 |
628,350 |
|
|
|
3,700,350 |
||
|
TOTAL CONSTRUCTION & REAL ESTATE |
5,477,850 |
||
|
DURABLES - 2.1% |
|||
|
Autos, Tires, & Accessories - 0.6% |
|||
|
TRW, Inc. |
87,000 |
3,534,375 |
|
|
Consumer Durables - 0.9% |
|||
|
Minnesota Mining & Manufacturing Co. |
56,400 |
5,139,450 |
|
|
Consumer Electronics - 0.6% |
|||
|
Black & Decker Corp. |
36,300 |
1,241,006 |
|
|
Gemstar-TV Guide International, Inc. (a) |
23,100 |
2,014,031 |
|
|
|
3,255,037 |
||
|
TOTAL DURABLES |
11,928,862 |
||
|
ENERGY - 4.0% |
|||
|
Oil & Gas - 4.0% |
|||
|
Apache Corp. |
79,300 |
4,688,613 |
|
|
Chevron Corp. |
49,400 |
4,211,350 |
|
|
Devon Energy Corp. |
28,330 |
1,704,050 |
|
|
Exxon Mobil Corp. |
60,100 |
5,356,413 |
|
|
Common Stocks - continued |
|||
|
Shares |
Value |
||
|
ENERGY - continued |
|||
|
Oil & Gas - continued |
|||
|
Royal Dutch Petroleum Co. (NY Shares) |
62,800 |
$ 3,764,075 |
|
|
USX - Marathon Group |
90,900 |
2,579,288 |
|
|
|
22,303,789 |
||
|
FINANCE - 12.9% |
|||
|
Banks - 1.2% |
|||
|
Bank One Corp. |
72,600 |
2,804,175 |
|
|
Firstar Corp. |
189,500 |
4,240,063 |
|
|
|
7,044,238 |
||
|
Credit & Other Finance - 2.2% |
|||
|
Citigroup, Inc. |
224,700 |
12,147,844 |
|
|
Concord EFS, Inc. (a) |
9,700 |
344,502 |
|
|
|
12,492,346 |
||
|
Federal Sponsored Credit - 5.6% |
|||
|
Fannie Mae |
168,600 |
12,054,900 |
|
|
Freddie Mac |
226,300 |
12,234,344 |
|
|
USA Education, Inc. |
150,200 |
7,237,763 |
|
|
|
31,527,007 |
||
|
Insurance - 2.2% |
|||
|
AMBAC Financial Group, Inc. |
18,800 |
1,377,100 |
|
|
American International Group, Inc. |
14,050 |
1,344,409 |
|
|
Commerce Group, Inc. |
41,300 |
1,195,119 |
|
|
PMI Group, Inc. |
50,800 |
3,441,700 |
|
|
XL Capital Ltd. Class A |
71,800 |
5,277,300 |
|
|
|
12,635,628 |
||
|
Securities Industry - 1.7% |
|||
|
Charles Schwab Corp. |
62,950 |
2,234,725 |
|
|
Lehman Brothers Holdings, Inc. |
27,300 |
4,033,575 |
|
|
Morgan Stanley Dean Witter & Co. |
34,100 |
3,118,019 |
|
|
|
9,386,319 |
||
|
TOTAL FINANCE |
73,085,538 |
||
|
HEALTH - 10.2% |
|||
|
Drugs & Pharmaceuticals - 9.3% |
|||
|
Bristol-Myers Squibb Co. |
91,500 |
5,226,938 |
|
|
Celgene Corp. (a) |
61,300 |
3,647,350 |
|
|
Cephalon, Inc. (a) |
73,400 |
3,559,900 |
|
|
COR Therapeutics, Inc. (a) |
99,600 |
6,206,325 |
|
|
Common Stocks - continued |
|||
|
Shares |
Value |
||
|
HEALTH - continued |
|||
|
Drugs & Pharmaceuticals - continued |
|||
|
Eli Lilly & Co. |
71,900 |
$ 5,832,888 |
|
|
Immunex Corp. (a) |
156,800 |
6,820,800 |
|
|
Medimmune, Inc. (a) |
27,700 |
2,139,825 |
|
|
Merck & Co., Inc. |
29,400 |
2,188,463 |
|
|
Pfizer, Inc. |
56,700 |
2,547,956 |
|
|
Protein Design Labs, Inc. (a) |
42,800 |
5,157,400 |
|
|
Vertex Pharmaceuticals, Inc. (a) |
96,000 |
8,112,000 |
|
|
Watson Pharmaceuticals, Inc. (a) |
17,700 |
1,148,288 |
|
|
|
52,588,133 |
||
|
Medical Equipment & Supplies - 0.9% |
|||
|
Cardinal Health, Inc. |
58,400 |
5,150,150 |
|
|
TOTAL HEALTH |
57,738,283 |
||
|
INDUSTRIAL MACHINERY & EQUIPMENT - 3.8% |
|||
|
Electrical Equipment - 2.6% |
|||
|
General Electric Co. |
132,700 |
7,655,131 |
|
|
Scientific-Atlanta, Inc. |
111,800 |
7,113,275 |
|
|
|
14,768,406 |
||
|
Industrial Machinery & Equipment - 1.2% |
|||
|
Caterpillar, Inc. |
76,000 |
2,565,000 |
|
|
Tyco International Ltd. |
82,900 |
4,300,438 |
|
|
|
6,865,438 |
||
|
TOTAL INDUSTRIAL MACHINERY & EQUIPMENT |
21,633,844 |
||
|
MEDIA & LEISURE - 3.3% |
|||
|
Broadcasting - 1.6% |
|||
|
Clear Channel Communications, Inc. (a) |
118,512 |
6,695,928 |
|
|
EchoStar Communications Corp. Class A (a) |
22,300 |
1,176,325 |
|
|
Radio One, Inc. Class A (a) |
118,500 |
985,031 |
|
|
|
8,857,284 |
||
|
Entertainment - 1.0% |
|||
|
Viacom, Inc. Class B (non-vtg.) (a) |
30,000 |
1,755,000 |
|
|
Walt Disney Co. |
95,700 |
3,660,525 |
|
|
|
5,415,525 |
||
|
Common Stocks - continued |
|||
|
Shares |
Value |
||
|
MEDIA & LEISURE - continued |
|||
|
Publishing - 0.7% |
|||
|
The New York Times Co. Class A |
107,700 |
$ 4,233,956 |
|
|
TOTAL MEDIA & LEISURE |
18,506,765 |
||
|
NONDURABLES - 0.9% |
|||
|
Foods - 0.2% |
|||
|
Quaker Oats Co. |
17,000 |
1,345,125 |
|
|
Household Products - 0.7% |
|||
|
Procter & Gamble Co. |
57,000 |
3,819,000 |
|
|
TOTAL NONDURABLES |
5,164,125 |
||
|
RETAIL & WHOLESALE - 6.1% |
|||
|
Apparel Stores - 0.3% |
|||
|
The Limited, Inc. |
76,400 |
1,685,575 |
|
|
Drug Stores - 0.8% |
|||
|
Walgreen Co. |
114,700 |
4,351,431 |
|
|
General Merchandise Stores - 1.4% |
|||
|
BJ's Wholesale Club, Inc. (a) |
60,000 |
2,047,500 |
|
|
Wal-Mart Stores, Inc. |
124,000 |
5,967,500 |
|
|
|
8,015,000 |
||
|
Grocery Stores - 0.2% |
|||
|
Pathmark Stores, Inc. (a) |
2,133 |
26,263 |
|
|
Safeway, Inc. (a) |
22,100 |
1,031,794 |
|
|
|
1,058,057 |
||
|
Retail & Wholesale, Miscellaneous - 3.4% |
|||
|
Best Buy Co., Inc. (a) |
84,600 |
5,382,675 |
|
|
Home Depot, Inc. |
145,700 |
7,731,206 |
|
|
Lowe's Companies, Inc. |
48,900 |
2,194,388 |
|
|
Staples, Inc. (a) |
275,300 |
3,905,819 |
|
|
|
19,214,088 |
||
|
TOTAL RETAIL & WHOLESALE |
34,324,151 |
||
|
SERVICES - 0.4% |
|||
|
Advertising - 0.4% |
|||
|
Omnicom Group, Inc. |
34,500 |
2,516,344 |
|
|
Common Stocks - continued |
|||
|
Shares |
Value |
||
|
TECHNOLOGY - 31.9% |
|||
|
Communications Equipment - 7.0% |
|||
|
Ciena Corp. (a) |
112,600 |
$ 13,828,669 |
|
|
Cisco Systems, Inc. (a) |
147,500 |
8,149,375 |
|
|
Corning, Inc. |
31,300 |
9,296,100 |
|
|
Nortel Networks Corp. |
138,400 |
8,243,450 |
|
|
|
39,517,594 |
||
|
Computer Services & Software - 9.5% |
|||
|
Adobe Systems, Inc. |
86,000 |
13,351,500 |
|
|
Affymetrix, Inc. (a) |
52,200 |
2,603,475 |
|
|
Art Technology Group, Inc. (a) |
42,100 |
3,988,975 |
|
|
Computer Sciences Corp. (a) |
12,000 |
891,000 |
|
|
Covad Communications Group, Inc. (a) |
802,800 |
10,737,450 |
|
|
Oracle Corp. (a) |
122,700 |
9,662,625 |
|
|
VeriSign, Inc. (a) |
46,550 |
9,429,284 |
|
|
Vignette Corp. (a) |
106,200 |
3,172,725 |
|
|
|
53,837,034 |
||
|
Computers & Office Equipment - 3.2% |
|||
|
Brocade Communications Systems, Inc. (a) |
14,200 |
3,351,200 |
|
|
Dell Computer Corp. (a) |
121,800 |
3,752,963 |
|
|
EMC Corp. (a) |
83,600 |
8,286,850 |
|
|
Sun Microsystems, Inc. (a) |
22,300 |
2,603,525 |
|
|
|
17,994,538 |
||
|
Electronic Instruments - 4.2% |
|||
|
KLA-Tencor Corp. (a) |
214,500 |
8,834,719 |
|
|
LAM Research Corp. (a) |
80,600 |
1,687,563 |
|
|
Newport Corp. |
21,400 |
3,408,284 |
|
|
Novellus Systems, Inc. (a) |
210,900 |
9,820,031 |
|
|
|
23,750,597 |
||
|
Electronics - 8.0% |
|||
|
Analog Devices, Inc. (a) |
26,700 |
2,204,419 |
|
|
Cypress Semiconductor Corp. (a) |
117,500 |
4,883,594 |
|
|
JDS Uniphase Corp. (a) |
61,800 |
5,851,688 |
|
|
LSI Logic Corp. (a) |
115,000 |
3,363,750 |
|
|
Micron Technology, Inc. (a) |
214,200 |
9,853,200 |
|
|
NVIDIA Corp. (a) |
16,400 |
1,342,750 |
|
|
PMC-Sierra, Inc. (a) |
28,400 |
6,113,100 |
|
|
Common Stocks - continued |
|||
|
Shares |
Value |
||
|
TECHNOLOGY - continued |
|||
|
Electronics - continued |
|||
|
Power-One, Inc. (a) |
16,000 |
$ 968,250 |
|
|
SDL, Inc. (a) |
34,300 |
10,609,419 |
|
|
|
45,190,170 |
||
|
TOTAL TECHNOLOGY |
180,289,933 |
||
|
TRANSPORTATION - 1.3% |
|||
|
Air Transportation - 0.4% |
|||
|
Northwest Airlines Corp. Class A (a) |
96,400 |
2,367,825 |
|
|
Railroads - 0.7% |
|||
|
Canadian Pacific Ltd. |
157,500 |
4,095,126 |
|
|
Trucking & Freight - 0.2% |
|||
|
Expeditors International of Washington, Inc. |
21,700 |
977,856 |
|
|
TOTAL TRANSPORTATION |
7,440,807 |
||
|
UTILITIES - 8.3% |
|||
|
Cellular - 1.7% |
|||
|
Leap Wireless International, Inc. warrants 4/15/10 (a)(e) |
285 |
5,700 |
|
|
Nextel Communications, Inc. Class A (a) |
115,100 |
5,380,925 |
|
|
Sprint Corp. - PCS Group Series 1 (a) |
118,000 |
4,137,375 |
|
|
|
9,524,000 |
||
|
Electric Utility - 2.6% |
|||
|
AES Corp. (a) |
93,400 |
6,397,900 |
|
|
Calpine Corp. (a) |
79,600 |
8,308,250 |
|
|
|
14,706,150 |
||
|
Gas - 2.7% |
|||
|
Dynegy, Inc. Class A |
144,400 |
8,230,800 |
|
|
Kinder Morgan, Inc. |
79,900 |
3,270,906 |
|
|
Williams Companies, Inc. |
87,900 |
3,713,775 |
|
|
|
15,215,481 |
||
|
Telephone Services - 1.3% |
|||
|
Level 3 Communications, Inc. (a) |
42,000 |
3,239,250 |
|
|
McLeodUSA, Inc. Class A (a) |
114,800 |
1,643,075 |
|
|
Pathnet, Inc. warrants 4/15/08 (a)(e) |
30 |
300 |
|
|
Common Stocks - continued |
|||
|
Shares |
Value |
||
|
UTILITIES - continued |
|||
|
Telephone Services - continued |
|||
|
Qwest Communications International, Inc. (a) |
25,894 |
$ 1,244,530 |
|
|
Time Warner Telecom, Inc. Class A (a) |
27,900 |
1,347,919 |
|
|
|
7,475,074 |
||
|
TOTAL UTILITIES |
46,920,705 |
||
|
TOTAL COMMON STOCKS (Cost $491,265,254) |
499,317,890 |
||
|
Preferred Stocks - 0.3% |
|||
|
|
|
|
|
|
Convertible Preferred Stocks - 0.1% |
|||
|
UTILITIES - 0.1% |
|||
|
Telephone Services - 0.1% |
|||
|
Global Crossing Ltd. $17.50 |
1,500 |
297,657 |
|
|
Nonconvertible Preferred Stocks - 0.2% |
|||
|
HEALTH - 0.0% |
|||
|
Medical Facilities Management - 0.0% |
|||
|
Fresenius Medical Care Capital Trust II 7.875% |
70 |
67,344 |
|
|
MEDIA & LEISURE - 0.2% |
|||
|
Broadcasting - 0.2% |
|||
|
CSC Holdings, Inc. 11.125% pay-in-kind |
9,807 |
1,041,994 |
|
|
Publishing - 0.0% |
|||
|
PRIMEDIA, Inc. 8.625% |
500 |
41,000 |
|
|
TOTAL MEDIA & LEISURE |
1,082,994 |
||
|
UTILITIES - 0.0% |
|||
|
Cellular - 0.0% |
|||
|
Crown Castle International Corp. 12.75% pay-in-kind |
39 |
39,293 |
|
|
Preferred Stocks - continued |
|||
|
Shares |
Value |
||
|
Nonconvertible Preferred Stocks - continued |
|||
|
UTILITIES - continued |
|||
|
Cellular - continued |
|||
|
Nextel Communications, Inc.: |
|
|
|
|
11.125% pay-in-kind |
42 |
$ 40,635 |
|
|
Series D, 13% pay-in-kind |
85 |
89,888 |
|
|
|
169,816 |
||
|
TOTAL NONCONVERTIBLE PREFERRED STOCKS |
1,320,154 |
||
|
TOTAL PREFERRED STOCKS (Cost $1,639,090) |
1,617,811 |
||
|
Corporate Bonds - 6.7% |
|||||
|
Moody's Ratings (unaudited) (b) |
Principal Amount |
|
|||
|
Convertible Bonds - 0.4% |
|||||
|
ENERGY - 0.0% |
|||||
|
Energy Services - 0.0% |
|||||
|
Key Energy Group, Inc. 5% 9/15/04 |
B3 |
|
$ 85,000 |
70,975 |
|
|
HEALTH - 0.2% |
|||||
|
Medical Facilities Management - 0.2% |
|||||
|
Tenet Healthcare Corp. 6% 12/1/05 |
B1 |
|
30,000 |
25,500 |
|
|
Total Renal Care Holdings, Inc.: |
|
|
|
|
|
|
7% 5/15/09 |
B3 |
|
990,000 |
696,713 |
|
|
7% 5/15/09 (e) |
B3 |
|
10,000 |
7,038 |
|
|
|
729,251 |
||||
|
INDUSTRIAL MACHINERY & EQUIPMENT - 0.0% |
|||||
|
Pollution Control - 0.0% |
|||||
|
Waste Management, Inc. 4% 2/1/02 |
Ba1 |
|
160,000 |
150,000 |
|
|
MEDIA & LEISURE - 0.2% |
|||||
|
Broadcasting - 0.0% |
|||||
|
EchoStar Communications Corp. 4.875% 1/1/07 (e) |
Caa2 |
|
100,000 |
131,625 |
|
|
NTL Delaware, Inc./NTL, Inc. 5.75% 12/15/09 |
Caa1 |
|
70,000 |
47,775 |
|
|
NTL, Inc. 5.75% 12/15/09 (e) |
Caa1 |
|
150,000 |
102,375 |
|
|
|
281,775 |
||||
|
Corporate Bonds - continued |
|||||
|
Moody's Ratings (unaudited) (b) |
Principal Amount |
Value |
|||
|
Convertible Bonds - continued |
|||||
|
MEDIA & LEISURE - continued |
|||||
|
Lodging & Gaming - 0.2% |
|||||
|
Hilton Hotels Corp. 5% 5/15/06 |
Ba2 |
|
$ 1,020,000 |
$ 851,700 |
|
|
TOTAL MEDIA & LEISURE |
1,133,475 |
||||
|
TOTAL CONVERTIBLE BONDS |
2,083,701 |
||||
|
Nonconvertible Bonds - 6.3% |
|||||
|
BASIC INDUSTRIES - 0.5% |
|||||
|
Chemicals & Plastics - 0.2% |
|||||
|
Acetex Corp. yankee 9.75% 10/1/03 |
B3 |
|
80,000 |
76,000 |
|
|
Avecia Group PLC 11% 7/1/09 |
B2 |
|
85,000 |
82,238 |
|
|
Huntsman Corp. 9.5% 7/1/07 (e) |
B2 |
|
25,000 |
20,188 |
|
|
Huntsman ICI Chemicals LLC 10.125% 7/1/09 |
B2 |
|
335,000 |
328,300 |
|
|
Lyondell Chemical Co. 9.875% 5/1/07 |
Ba3 |
|
675,000 |
658,125 |
|
|
Scotts Co. 8.625% 1/15/09 (e) |
B2 |
|
30,000 |
28,950 |
|
|
Sterling Chemicals, Inc. 12.375% 7/15/06 |
B3 |
|
10,000 |
10,150 |
|
|
|
1,203,951 |
||||
|
Packaging & Containers - 0.2% |
|||||
|
Gaylord Container Corp.: |
|
|
|
|
|
|
9.375% 6/15/07 |
Caa1 |
|
50,000 |
37,000 |
|
|
9.75% 6/15/07 |
Caa1 |
|
135,000 |
102,600 |
|
|
Packaging Corp. of America 9.625% 4/1/09 |
B1 |
|
750,000 |
759,375 |
|
|
U.S. Can Corp. 12.375% 10/1/10 (e) |
B3 |
|
40,000 |
40,400 |
|
|
|
939,375 |
||||
|
Paper & Forest Products - 0.1% |
|||||
|
Doman Industries Ltd. yankee 8.75% 3/15/04 |
Caa1 |
|
345,000 |
227,700 |
|
|
Repap New Brunswick, Inc. yankee 10.625% 4/15/05 |
Caa1 |
|
315,000 |
324,450 |
|
|
|
552,150 |
||||
|
TOTAL BASIC INDUSTRIES |
2,695,476 |
||||
|
CONSTRUCTION & REAL ESTATE - 0.3% |
|||||
|
Building Materials - 0.0% |
|||||
|
Numatics, Inc. 9.625% 4/1/08 |
B3 |
|
65,000 |
50,700 |
|
|
Corporate Bonds - continued |
|||||
|
Moody's Ratings (unaudited) (b) |
Principal Amount |
Value |
|||
|
Nonconvertible Bonds - continued |
|||||
|
CONSTRUCTION & REAL ESTATE - continued |
|||||
|
Construction - 0.2% |
|||||
|
Blount, Inc. 13% 8/1/09 |
B3 |
|
$ 430,000 |
$ 435,375 |
|
|
D.R. Horton, Inc. 8% 2/1/09 |
Ba1 |
|
25,000 |
22,938 |
|
|
Del Webb Corp. 9.375% 5/1/09 |
B2 |
|
45,000 |
41,400 |
|
|
Ryland Group, Inc. 9.75% 9/1/10 |
Ba2 |
|
500,000 |
497,500 |
|
|
Standard Pacific Corp. 9.5% 9/15/10 |
Ba2 |
|
145,000 |
143,550 |
|
|
|
1,140,763 |
||||
|
Engineering - 0.1% |
|||||
|
Morrison Knudsen Corp. 11% 7/1/10 (e) |
Ba2 |
|
220,000 |
223,300 |
|
|
Real Estate Investment Trusts - 0.0% |
|||||
|
Pinnacle Holdings, Inc. 0% 3/15/08 (d) |
B3 |
|
50,000 |
36,500 |
|
|
TOTAL CONSTRUCTION & REAL ESTATE |
1,451,263 |
||||
|
DURABLES - 0.0% |
|||||
|
Textiles & Apparel - 0.0% |
|||||
|
Levi Strauss & Co. 6.8% 11/1/03 |
Ba3 |
|
30,000 |
25,500 |
|
|
ENERGY - 0.6% |
|||||
|
Coal - 0.2% |
|||||
|
P&L Coal Holdings Corp. 9.625% 5/15/08 |
B2 |
|
1,325,000 |
1,288,563 |
|
|
Energy Services - 0.1% |
|||||
|
DI Industries, Inc. 8.875% 7/1/07 |
B1 |
|
285,000 |
275,025 |
|
|
Parker Drilling Co. 9.75% 11/15/06 |
B1 |
|
110,000 |
111,100 |
|
|
Pride Petroleum Services, Inc. 9.375% 5/1/07 |
Ba3 |
|
75,000 |
76,125 |
|
|
|
462,250 |
||||
|
Oil & Gas - 0.3% |
|||||
|
Canadian Forest Oil Ltd. 8.75% 9/15/07 |
B2 |
|
65,000 |
63,050 |
|
|
Chesapeake Energy Corp. 9.625% 5/1/05 |
B2 |
|
670,000 |
666,650 |
|
|
Cross Timbers Oil Co.: |
|
|
|
|
|
|
8.75% 11/1/09 |
B2 |
|
635,000 |
619,125 |
|
|
9.25% 4/1/07 |
B2 |
|
65,000 |
65,000 |
|
|
Plains Resources, Inc. 10.25% 3/15/06 (e) |
B2 |
|
10,000 |
10,175 |
|
|
|
1,424,000 |
||||
|
TOTAL ENERGY |
3,174,813 |
||||
|
Corporate Bonds - continued |
|||||
|
Moody's Ratings (unaudited) (b) |
Principal Amount |
Value |
|||
|
Nonconvertible Bonds - continued |
|||||
|
FINANCE - 0.0% |
|||||
|
Credit & Other Finance - 0.0% |
|||||
|
Macsaver Financial Services, Inc. 7.875% 8/1/03 (h) |
Ca |
|
$ 20,000 |
$ 3,400 |
|
|
HEALTH - 0.1% |
|||||
|
Drugs & Pharmaceuticals - 0.0% |
|||||
|
Chattem, Inc. 8.875% 4/1/08 |
B2 |
|
80,000 |
67,200 |
|
|
Medical Facilities Management - 0.1% |
|||||
|
Express Scripts, Inc. 9.625% 6/15/09 |
Ba2 |
|
15,000 |
15,225 |
|
|
Tenet Healthcare Corp. 8.625% 1/15/07 |
Ba3 |
|
450,000 |
445,500 |
|
|
Triad Hospitals Holdings, Inc. 11% 5/15/09 |
B3 |
|
30,000 |
30,938 |
|
|
|
491,663 |
||||
|
TOTAL HEALTH |
558,863 |
||||
|
INDUSTRIAL MACHINERY & EQUIPMENT - 0.2% |
|||||
|
Electrical Equipment - 0.0% |
|||||
|
Loral Space & Communications Ltd. 9.5% 1/15/06 |
B1 |
|
30,000 |
21,300 |
|
|
Industrial Machinery & Equipment - 0.0% |
|||||
|
Dunlop Standard Aero Holdings PLC 11.875% 5/15/09 |
B3 |
|
290,000 |
299,425 |
|
|
Pollution Control - 0.2% |
|||||
|
Allied Waste North America, Inc.: |
|
|
|
|
|
|
7.375% 1/1/04 |
Ba3 |
|
20,000 |
18,500 |
|
|
10% 8/1/09 |
B2 |
|
1,230,000 |
1,063,950 |
|
|
Browning-Ferris Industries, Inc. 6.375% 1/15/08 |
Ba3 |
|
15,000 |
12,150 |
|
|
|
1,094,600 |
||||
|
TOTAL INDUSTRIAL MACHINERY & EQUIPMENT |
1,415,325 |
||||
|
MEDIA & LEISURE - 1.9% |
|||||
|
Broadcasting - 1.5% |
|||||
|
ACME Television LLC/ACME Financial Corp. 10.875% 9/30/04 |
B3 |
|
55,000 |
51,975 |
|
|
Adelphia Communications Corp. 9.875% 3/1/07 |
B2 |
|
60,000 |
56,700 |
|
|
Ascent Entertainment Group, Inc. 0% 12/15/04 (d) |
Ba1 |
|
470,000 |
383,050 |
|
|
Corporate Bonds - continued |
|||||
|
Moody's Ratings (unaudited) (b) |
Principal Amount |
Value |
|||
|
Nonconvertible Bonds - continued |
|||||
|
MEDIA & LEISURE - continued |
|||||
|
Broadcasting - continued |
|||||
|
British Sky Broadcasting Group PLC 7.3% 10/15/06 |
Ba1 |
|
$ 140,000 |
$ 128,548 |
|
|
Callahan Nordrhein Westfalen: |
|
|
|
|
|
|
0% 7/15/10 (d)(e) |
B3 |
|
225,000 |
103,500 |
|
|
14% 7/15/10 (e) |
B3 |
|
110,000 |
109,450 |
|
|
Charter Communications Holdings LLC/Charter Communications Holdings Capital Corp.: |
|
|
|
|
|
|
8.625% 4/1/09 |
B2 |
|
200,000 |
179,500 |
|
|
10% 4/1/09 |
B2 |
|
730,000 |
715,400 |
|
|
Citadel Broadcasting Co. 10.25% 7/1/07 |
B3 |
|
400,000 |
415,000 |
|
|
CSC Holdings, Inc.: |
|
|
|
|
|
|
9.875% 4/1/23 |
B1 |
|
100,000 |
102,500 |
|
|
10.5% 5/15/16 |
Ba3 |
|
275,000 |
292,188 |
|
|
Diamond Cable Communications PLC 0% 2/15/07 (d) |
B2 |
|
25,000 |
19,188 |
|
|
EchoStar DBS Corp. 9.375% 2/1/09 |
B1 |
|
750,000 |
736,875 |
|
|
FrontierVision Operating Partners LP/ FrontierVision Capital Corp. 11% 10/15/06 |
B2 |
|
80,000 |
80,800 |
|
|
Golden Sky Systems, Inc. 12.375% 8/1/06 |
B3 |
|
20,000 |
21,900 |
|
|
International Cabletel, Inc. 0% 2/1/06 (d) |
B2 |
|
100,000 |
93,500 |
|
|
LodgeNet Entertainment Corp. 10.25% 12/15/06 |
B1 |
|
50,000 |
49,000 |
|
|
NTL Communications Corp. 11.5% 10/1/08 |
B3 |
|
60,000 |
58,350 |
|
|
NTL, Inc. 0% 4/1/08 (d) |
B3 |
|
730,000 |
445,300 |
|
|
Pegasus Communications Corp. 9.625% 10/15/05 |
B3 |
|
900,000 |
877,500 |
|
|
Satelites Mexicanos SA de CV 11.28% 6/30/04 (e)(g) |
B1 |
|
45,000 |
40,500 |
|
|
Spectrasite Holdings, Inc.: |
|
|
|
|
|
|
0% 3/15/10 (d) |
B3 |
|
180,000 |
90,900 |
|
|
10.75% 3/15/10 |
B3 |
|
800,000 |
752,000 |
|
|
Telemundo Holdings, Inc. 0% 8/15/08 (d) |
Caa1 |
|
145,000 |
103,313 |
|
|
Telewest PLC 0% 10/1/07 (d) |
B1 |
|
1,060,000 |
1,017,600 |
|
|
United International Holdings, Inc. 0% 2/15/08 (d) |
B3 |
|
95,000 |
63,650 |
|
|
United Pan-Europe Communications NV: |
|
|
|
|
|
|
0% 2/1/10 (d) |
B2 |
|
1,665,000 |
765,900 |
|
|
10.875% 8/1/09 |
B2 |
|
675,000 |
587,250 |
|
|
|
8,341,337 |
||||
|
Corporate Bonds - continued |
|||||
|
Moody's Ratings (unaudited) (b) |
Principal Amount |
Value |
|||
|
Nonconvertible Bonds - continued |
|||||
|
MEDIA & LEISURE - continued |
|||||
|
Entertainment - 0.2% |
|||||
|
Alliance Gaming Corp. 10% 8/1/07 |
Caa1 |
|
$ 70,000 |
$ 38,500 |
|
|
Bally Total Fitness Holding Corp. 9.875% 10/15/07 |
B3 |
|
300,000 |
284,250 |
|
|
Mandalay Resort Group: |
|
|
|
|
|
|
9.5% 8/1/08 (e) |
Ba2 |
|
75,000 |
76,313 |
|
|
10.25% 8/1/07 (e) |
Ba3 |
|
160,000 |
164,800 |
|
|
MGM Mirage, Inc. 9.75% 6/1/07 |
Ba2 |
|
300,000 |
309,750 |
|
|
Premier Parks, Inc. 9.75% 6/15/07 |
B3 |
|
110,000 |
103,675 |
|
|
|
977,288 |
||||
|
Lodging & Gaming - 0.2% |
|||||
|
Courtyard by Marriott II LP/Courtyard II Finance Co. 10.75% 2/1/08 |
B- |
|
50,000 |
50,000 |
|
|
HMH Properties, Inc. 7.875% 8/1/05 |
Ba2 |
|
905,000 |
855,225 |
|
|
Hollywood Casino Shreveport/Shreveport Capital Corp. 13% 8/1/06 |
B3 |
|
70,000 |
75,075 |
|
|
Host Marriott LP 8.375% 2/15/06 |
Ba2 |
|
25,000 |
24,000 |
|
|
ITT Corp. 7.375% 11/15/15 |
Ba1 |
|
25,000 |
21,500 |
|
|
Mohegan Tribal Gaming Authority 8.75% 1/1/09 |
Ba3 |
|
35,000 |
34,738 |
|
|
Station Casinos, Inc. 10.125% 3/15/06 |
B1 |
|
50,000 |
50,003 |
|
|
|
1,110,541 |
||||
|
Publishing - 0.0% |
|||||
|
Ziff Davis Media, Inc. 12% 7/15/10 (e) |
B2 |
|
20,000 |
19,800 |
|
|
Restaurants - 0.0% |
|||||
|
AFC Enterprises, Inc. 10.25% 5/15/07 |
B3 |
|
15,000 |
14,963 |
|
|
Domino's, Inc. 10.375% 1/15/09 |
B3 |
|
390,000 |
371,475 |
|
|
|
386,438 |
||||
|
TOTAL MEDIA & LEISURE |
10,835,404 |
||||
|
NONDURABLES - 0.0% |
|||||
|
Beverages - 0.0% |
|||||
|
Canandaigua Brands, Inc. 8.5% 3/1/09 |
B1 |
|
45,000 |
44,044 |
|
|
Corporate Bonds - continued |
|||||
|
Moody's Ratings (unaudited) (b) |
Principal Amount |
Value |
|||
|
Nonconvertible Bonds - continued |
|||||
|
RETAIL & WHOLESALE - 0.0% |
|||||
|
General Merchandise Stores - 0.0% |
|||||
|
JCPenney Co., Inc. 7.6% 4/1/07 |
Baa2 |
|
$ 30,000 |
$ 24,750 |
|
|
Kmart Corp. 7.95% 2/1/23 |
Baa3 |
|
300,000 |
195,000 |
|
|
|
219,750 |
||||
|
SERVICES - 0.0% |
|||||
|
Printing - 0.0% |
|||||
|
World Color Press, Inc. 7.75% 2/15/09 |
Baa3 |
|
75,000 |
69,938 |
|
|
TECHNOLOGY - 0.5% |
|||||
|
Computer Services & Software - 0.2% |
|||||
|
Amazon.com, Inc. 0% 5/1/08 (d) |
Caa1 |
|
345,000 |
186,300 |
|
|
Concentric Network Corp. 12.75% 12/15/07 |
B |
|
10,000 |
10,100 |
|
|
Covad Communications Group, Inc. 12% 2/15/10 |
B3 |
|
210,000 |
153,300 |
|
|
Exodus Communications, Inc. 10.75% 12/15/09 |
B3 |
|
140,000 |
135,100 |
|
|
PSINet, Inc.: |
|
|
|
|
|
|
10% 2/15/05 |
B3 |
|
10,000 |
6,400 |
|
|
10.5% 12/1/06 |
B3 |
|
155,000 |
99,200 |
|
|
11% 8/1/09 |
B3 |
|
470,000 |
300,800 |
|
|
Unisys Corp. 11.75% 10/15/04 |
Ba1 |
|
75,000 |
78,938 |
|
|
|
970,138 |
||||
|
Computers & Office Equipment - 0.1% |
|||||
|
Globix Corp. 12.5% 2/1/10 |
B- |
|
685,000 |
486,350 |
|
|
Electronic Instruments - 0.0% |
|||||
|
Fisher Scientific International, Inc. 9% 2/1/08 |
B3 |
|
140,000 |
129,150 |
|
|
Telecommunications Techniques Co. LLC 9.75% 5/15/08 |
B3 |
|
145,000 |
135,575 |
|
|
|
264,725 |
||||
|
Electronics - 0.2% |
|||||
|
ChipPAC International Ltd. 12.75% 8/1/09 |
B3 |
|
555,000 |
582,750 |
|
|
Details, Inc. 10% 11/15/05 |
B3 |
|
20,000 |
19,600 |
|
|
Viasystems, Inc. 9.75% 6/1/07 |
B3 |
|
420,000 |
394,800 |
|
|
|
997,150 |
||||
|
TOTAL TECHNOLOGY |
2,718,363 |
||||
|
Corporate Bonds - continued |
|||||
|
Moody's Ratings (unaudited) (b) |
Principal Amount |
Value |
|||
|
Nonconvertible Bonds - continued |
|||||
|
TRANSPORTATION - 0.1% |
|||||
|
Air Transportation - 0.0% |
|||||
|
Atlas Air, Inc. 9.25% 4/15/08 |
B1 |
|
$ 10,000 |
$ 9,875 |
|
|
Railroads - 0.1% |
|||||
|
TFM SA de CV: |
|
|
|
|
|
|
0% 6/15/09 (d) |
B2 |
|
135,000 |
103,275 |
|
|
10.25% 6/15/07 |
B2 |
|
125,000 |
118,125 |
|
|
Transtar Holdings LP/Transtar Capital Corp. 13.375% 12/15/03 |
B- |
|
190,000 |
190,475 |
|
|
|
411,875 |
||||
|
TOTAL TRANSPORTATION |
421,750 |
||||
|
UTILITIES - 2.1% |
|||||
|
Cellular - 1.0% |
|||||
|
AirGate PCS, Inc. 0% 10/1/09 (d) |
Caa1 |
|
290,000 |
174,725 |
|
|
Dobson Communications Corp. 10.875% 7/1/10 |
B3 |
|
145,000 |
141,375 |
|
|
Echostar Broadband Corp. 10.375% 10/1/07 (e) |
B3 |
|
140,000 |
140,000 |
|
|
Leap Wireless International, Inc. 12.5% 4/15/10 |
Caa2 |
|
285,000 |
233,700 |
|
|
McCaw International Ltd. 0% 4/15/07 (d) |
Caa1 |
|
1,020,000 |
759,900 |
|
|
Millicom International Cellular SA 0% 6/1/06 (d) |
Caa1 |
|
1,240,000 |
1,066,400 |
|
|
Nextel Communications, Inc.: |
|
|
|
|
|
|
0% 10/31/07 (d) |
B1 |
|
1,280,000 |
992,000 |
|
|
9.375% 11/15/09 |
B1 |
|
500,000 |
493,750 |
|
|
Nextel International, Inc.: |
|
|
|
|
|
|
0% 4/15/08 (d) |
Caa1 |
|
690,000 |
434,700 |
|
|
12.75% 8/1/10 (e) |
Caa1 |
|
250,000 |
245,000 |
|
|
Nextel Partners, Inc.: |
|
|
|
|
|
|
0% 2/1/09 (d) |
B3 |
|
175,000 |
122,500 |
|
|
11% 3/15/10 (e) |
B3 |
|
175,000 |
175,875 |
|
|
11% 3/15/10 |
B3 |
|
115,000 |
115,575 |
|
|
TeleCorp PCS, Inc. 10.625% 7/15/10 |
B3 |
|
100,000 |
101,000 |
|
|
Telesystem International Wireless, Inc. yankee 0% 6/30/07 (d) |
Caa1 |
|
675,000 |
445,500 |
|
|
Corporate Bonds - continued |
|||||
|
Moody's Ratings (unaudited) (b) |
Principal Amount |
Value |
|||
|
Nonconvertible Bonds - continued |
|||||
|
UTILITIES - continued |
|||||
|
Cellular - continued |
|||||
|
VoiceStream Wireless Corp.: |
|
|
|
|
|
|
0% 11/15/09 (d) |
B2 |
|
$ 115,000 |
$ 83,088 |
|
|
10.375% 11/15/09 |
B2 |
|
50,000 |
54,125 |
|
|
|
5,779,213 |
||||
|
Electric Utility - 0.1% |
|||||
|
AES Corp.: |
|
|
|
|
|
|
8.5% 11/1/07 |
Ba3 |
|
675,000 |
642,938 |
|
|
9.375% 9/15/10 |
Ba1 |
|
80,000 |
81,200 |
|
|
CMS Energy Corp. 7.5% 1/15/09 |
Ba3 |
|
30,000 |
26,813 |
|
|
|
750,951 |
||||
|
Telephone Services - 1.0% |
|||||
|
FirstWorld Communications, Inc. 0% 4/15/08 (d) |
- |
|
5,000 |
1,000 |
|
|
Focal Communications Corp.: |
|
|
|
|
|
|
0% 2/15/08 (d) |
B3 |
|
155,000 |
77,500 |
|
|
11.875% 1/15/10 |
B3 |
|
270,000 |
207,900 |
|
|
Global Crossing Holdings Ltd. 9.125% 11/15/06 |
Ba2 |
|
110,000 |
108,900 |
|
|
Hyperion Telecommunications, Inc.: |
|
|
|
|
|
|
0% 4/15/03 (d) |
B3 |
|
1,070,000 |
872,050 |
|
|
12% 11/1/07 |
Caa1 |
|
675,000 |
438,750 |
|
|
12.25% 9/1/04 |
B3 |
|
120,000 |
109,200 |
|
|
ICG Holdings, Inc. 13.5% 9/15/05 |
Caa1 |
|
50,000 |
11,000 |
|
|
Intermedia Communications, Inc.: |
|
|
|
|
|
|
0% 7/15/07 (d) |
B2 |
|
75,000 |
61,875 |
|
|
0% 3/1/09 (d) |
B3 |
|
10,000 |
6,500 |
|
|
8.6% 6/1/08 |
B2 |
|
535,000 |
510,925 |
|
|
KMC Telecom Holdings, Inc. 13.5% 5/15/09 |
Caa2 |
|
160,000 |
92,800 |
|
|
Level 3 Communications, Inc.: |
|
|
|
|
|
|
0% 12/1/08 (d) |
B3 |
|
70,000 |
40,600 |
|
|
9.125% 5/1/08 |
B3 |
|
435,000 |
373,013 |
|
|
Metromedia Fiber Network, Inc. 10% |
B2 |
|
180,000 |
166,500 |
|
|
NEXTLINK Communications, Inc.: |
|
|
|
|
|
|
0% 12/1/09 (d) |
B2 |
|
1,000,000 |
530,000 |
|
|
10.75% 6/1/09 |
B2 |
|
400,000 |
368,000 |
|
|
Corporate Bonds - continued |
|||||
|
Moody's Ratings (unaudited) (b) |
Principal Amount |
Value |
|||
|
Nonconvertible Bonds - continued |
|||||
|
UTILITIES - continued |
|||||
|
Telephone Services - continued |
|||||
|
NorthEast Optic Network, Inc. 12.75% |
- |
|
$ 375,000 |
$ 324,375 |
|
|
Pathnet, Inc. 12.25% 4/15/08 |
- |
|
30,000 |
12,000 |
|
|
Rhythms NetConnections, Inc. 12.75% |
B3 |
|
270,000 |
167,400 |
|
|
Teligent, Inc.: |
|
|
|
|
|
|
0% 3/1/08 (d) |
Caa1 |
|
210,000 |
56,700 |
|
|
11.5% 12/1/07 |
Caa1 |
|
45,000 |
19,350 |
|
|
WinStar Communications, Inc.: |
|
|
|
|
|
|
0% 4/15/10 (d)(e) |
B3 |
|
100,000 |
31,000 |
|
|
12.5% 4/15/08 (e) |
B3 |
|
560,000 |
403,200 |
|
|
12.75% 4/15/10 (e) |
B3 |
|
619,000 |
445,680 |
|
|
|
5,436,218 |
||||
|
TOTAL UTILITIES |
11,966,382 |
||||
|
TOTAL NONCONVERTIBLE BONDS |
35,600,271 |
||||
|
TOTAL CORPORATE BONDS (Cost $38,930,086) |
37,683,972 |
||||
|
U.S. Treasury Obligations - 0.0% |
|||||
|
|
|||||
|
U.S. Treasury Bills, yield at date of purchase
6.05% 10/12/00 (f) |
- |
|
300,000 |
299,521 |
|
|
Money Market Funds - 6.3% |
|||
|
Shares |
Value |
||
|
Fidelity Cash Central Fund, 6.60% (c) |
22,091,624 |
$ 22,091,624 |
|
|
Fidelity Securities Lending Cash Central Fund, 6.63% (c) |
13,306,545 |
13,306,545 |
|
|
TOTAL MONEY MARKET FUNDS (Cost $35,398,169) |
35,398,169 |
||
|
TOTAL INVESTMENT PORTFOLIO - 101.6% (Cost $567,532,002) |
574,317,363 |
||
|
NET OTHER ASSETS - (1.6)% |
(9,058,933) |
||
|
NET ASSETS - 100% |
$ 565,258,430 |
||
|
Futures Contracts |
|||||
|
|
Expiration Date |
Underlying Face Amount at Value |
Unrealized Gain/(Loss) |
||
|
Purchased |
|||||
|
16 S&P 500 Stock Index Contracts |
Dec. 2000 |
$ 5,814,800 |
$ (95,296) |
||
|
The face value of futures purchased as a percentage of net assets - 1.0% |
|
Legend |
|
(a) Non-income producing |
|
(b) S&P credit ratings are used in the absence of a rating by Moody's Investors Service, Inc. |
|
(c) The rate quoted is the annualized seven-day yield of the fund at period end. A complete listing of the fund's holdings as of its most recent fiscal year end is available upon request. |
|
(d) Debt obligation initially issued in zero coupon form which converts to coupon form at a specified rate and date. The rate shown is the rate at period end. |
|
(e) Security exempt from registration under Rule 144A of the Securities Act of 1933. These securities may be resold in transactions exempt from registration, normally to qualified institutional buyers. At the period end, the value of these securities amounted to $2,525,169 or 0.4% of net assets. |
|
(f) Security or a portion of the security was pledged to cover margin requirements for futures contracts. At the period end, the value of securities pledged amounted to $299,521. |
|
(g) The coupon rate shown on floating or adjustable rate securities represents the rate at period end. |
|
(h) Non-income producing - issuer filed for protection under the Federal Bankruptcy Code or is in default of interest payment. |
|
Other Information |
|
The composition of long-term debt holdings as a percentage of total value of investments in securities, is as follows (ratings are unaudited): |
|
Moody's Ratings |
S&P Ratings |
|||
|
Aaa, Aa, A |
0.0% |
|
AAA, AA, A |
0.0% |
|
Baa |
0.1% |
|
BBB |
0.1% |
|
Ba |
1.1% |
|
BB |
0.9% |
|
B |
4.3% |
|
B |
4.9% |
|
Caa |
0.9% |
|
CCC |
0.5% |
|
Ca, C |
0.0% |
|
CC, C |
0.0% |
|
|
|
|
D |
0.0% |
|
The percentage not rated by Moody's or S&P amounted to 0.1%. FMR has determined that unrated debt securities that are lower quality account for 0.1% of the total value of investment in securities. |
|
Income Tax Information |
|
At September 30, 2000, the aggregate cost of investment securities for income tax purposes was $570,531,245. Net unrealized appreciation aggregated $3,786,118, of which $49,825,252 related to appreciated investment securities and $46,039,134 related to depreciated investment securities. |
|
The fund hereby designates approximately $73,000 as a capital gain dividend for the purpose of the dividend paid deduction. |
See accompanying notes which are an integral part of the financial statements.
Annual Report
Statement of Assets and Liabilities
|
|
September 30, 2000 |
|
|
Assets |
|
|
|
Investment in securities, at value (cost $567,532,002) - See accompanying schedule |
|
$ 574,317,363 |
|
Cash |
|
180 |
|
Receivable for investments sold |
|
15,789,036 |
|
Receivable for fund shares sold |
|
4,101,469 |
|
Dividends receivable |
|
201,215 |
|
Interest receivable |
|
1,059,719 |
|
Other receivables |
|
5,025 |
|
Total assets |
|
595,474,007 |
|
Liabilities |
|
|
|
Payable for investments purchased |
$ 13,903,051 |
|
|
Payable for fund shares redeemed |
2,444,089 |
|
|
Accrued management fee |
268,654 |
|
|
Payable for daily variation on futures contracts |
89,200 |
|
|
Other payables and accrued expenses |
204,038 |
|
|
Collateral on securities loaned, at value |
13,306,545 |
|
|
Total liabilities |
|
30,215,577 |
|
Net Assets |
|
$ 565,258,430 |
|
Net Assets consist of: |
|
|
|
Paid in capital |
|
$ 535,416,546 |
|
Undistributed net investment income |
|
2,846,951 |
|
Accumulated undistributed net realized gain (loss) on investments and foreign currency transactions |
|
20,305,014 |
|
Net unrealized appreciation (depreciation) on investments |
|
6,689,919 |
|
Net Assets, for 36,905,120 shares outstanding |
|
$ 565,258,430 |
|
Net Asset Value, offering price and redemption price |
|
$15.32 |
See accompanying notes which are an integral part of the financial statements.
Annual Report
Financial Statements - continued
Statement of Operations
|
|
Year ended September 30, 2000 |
|
|
Investment Income Dividends |
|
$ 1,195,436 |
|
Interest |
|
3,619,439 |
|
Security lending |
|
9,794 |
|
Total income |
|
4,824,669 |
|
Expenses |
|
|
|
Management fee |
$ 1,243,481 |
|
|
Transfer agent fees |
425,916 |
|
|
Accounting and security lending fees |
100,128 |
|
|
Non-interested trustees' compensation |
536 |
|
|
Custodian fees and expenses |
20,573 |
|
|
Registration fees |
276,780 |
|
|
Audit |
21,089 |
|
|
Legal |
321 |
|
|
Miscellaneous |
306 |
|
|
Total expenses before reductions |
2,089,130 |
|
|
Expense reductions |
(130,729) |
1,958,401 |
|
Net investment income |
|
2,866,268 |
|
Realized and Unrealized Gain (Loss) Net realized gain (loss) on: |
|
|
|
Investment securities |
19,708,778 |
|
|
Foreign currency transactions |
10,660 |
|
|
Futures contracts |
782,860 |
20,502,298 |
|
Change in net unrealized appreciation (depreciation) on: |
|
|
|
Investment securities |
6,722,541 |
|
|
Assets and liabilities in foreign currencies |
(146) |
|
|
Futures contracts |
(95,296) |
6,627,099 |
|
Net gain (loss) |
|
27,129,397 |
|
Net increase (decrease) in net assets resulting |
|
$ 29,995,665 |
See accompanying notes which are an integral part of the financial statements.
Annual Report
Financial Statements - continued
Statement of Changes in Net Assets
|
|
Year ended |
September 24, 1999
(commencement of
operations) to
September 30, |
|
Increase (Decrease) in Net Assets |
|
|
|
Operations |
$ 2,866,268 |
$ 1,950 |
|
Net realized gain (loss) |
20,502,298 |
- |
|
Change in net unrealized appreciation (depreciation) |
6,627,099 |
62,820 |
|
Net increase (decrease) in net assets resulting |
29,995,665 |
64,770 |
|
Distributions to shareholders |
(62,493) |
- |
|
From net realized gain |
(156,058) |
- |
|
Total distributions |
(218,551) |
- |
|
Share transactions |
736,456,081 |
3,000,010 |
|
Reinvestment of distributions |
211,997 |
- |
|
Cost of shares redeemed |
(204,251,542) |
- |
|
Net increase (decrease) in net assets resulting |
532,416,536 |
3,000,010 |
|
Total increase (decrease) in net assets |
562,193,650 |
3,064,780 |
|
Net Assets |
|
|
|
Beginning of period |
3,064,780 |
- |
|
End of period (including undistributed net investment income of $2,846,951 and $1,950, respectively) |
$ 565,258,430 |
$ 3,064,780 |
|
Other Information Shares |
|
|
|
Sold |
50,446,597 |
300,001 |
|
Issued in reinvestment of distributions |
19,013 |
- |
|
Redeemed |
(13,860,491) |
- |
|
Net increase (decrease) |
36,605,119 |
300,001 |
See accompanying notes which are an integral part of the financial statements.
Annual Report
Financial Highlights
|
Years ended September 30, |
2000 |
1999 E |
|
Selected Per-Share Data |
|
|
|
Net asset value, beginning of period |
$ 10.22 |
$ 10.00 |
|
Income from Investment Operations |
|
|
|
Net investment income D |
.19 |
.01 |
|
Net realized and unrealized gain (loss) |
4.98 |
.21 |
|
Total from investment operations |
5.17 |
.22 |
|
Less Distributions |
|
|
|
From net investment income |
(.02) |
- |
|
From net realized gain |
(.05) |
- |
|
Total distributions |
(.07) |
- |
|
Net asset value, end of period |
$ 15.32 |
$ 10.22 |
|
Total Return B, C |
50.84% |
2.20% |
|
Ratios and Supplemental Data |
|
|
|
Net assets, end of period (000 omitted) |
$ 565,258 |
$ 3,065 |
|
Ratio of expenses to average net assets |
.96% |
1.20% A, F |
|
Ratio of expenses to average net assets after expense reductions |
.90% G |
1.20% A |
|
Ratio of net investment income to average net assets |
1.32% |
4.06% A |
|
Portfolio turnover rate |
338% |
0% A |
A Annualized
B Total returns for periods of less than one year are not annualized.
C The total returns would have been lower had certain expenses not been reduced during the periods shown.
D Net investment income per share has been calculated based on average shares outstanding during the period.
E For the period September 24, 1999 (commencement of operations) to September 30, 1999.
F FMR agreed to reimburse a portion of the fund's expenses during the period. Without this reimbursement, the fund's expense ratio would have been higher.
G FMR or the fund has entered into varying arrangements with third parties who either paid or reduced a portion of the fund's expenses.
See accompanying notes which are an integral part of the financial statements.
Annual Report
For the period ended September 30, 2000
1. Significant Accounting Policies.
Asset Manager: Aggressive (the fund) is a fund of Fidelity Charles Street Trust (the trust) and is authorized to issue an unlimited number of shares. The trust is registered under the Investment Company Act of 1940, as amended, as an open-end management investment company organized as a Massachusetts business trust. The financial statements have been prepared in conformity with generally accepted accounting principles which require management to make certain estimates and assumptions at the date of the financial statements. The following summarizes the significant accounting policies of the fund:
Security Valuation. Securities for which exchange quotations are readily available are valued at the last sale price, or if no sale price, at the closing bid price. Foreign securities are valued based on quotations from the principal market in which such securities are normally traded. If trading or events occurring in other markets after the close of the principal market in which foreign securities are traded, and before the close of the business of the fund, are expected to materially affect the value of those securities, then they are valued at their fair value taking this trading or these events into account. Fair value is determined in good faith under consistently applied procedures under the general supervision of the Board of Trustees. Securities (including restricted securities) for which exchange quotations are not readily available (and in certain cases debt securities which trade on an exchange) are valued primarily using dealer-supplied valuations or at their fair value. Short-term securities with remaining maturities of sixty days or less for which quotations are not readily available are valued at amortized cost or original cost plus accrued interest, both of which approximate current value. Investments in open-end investment companies are valued at their net asset value each business day.
Foreign Currency Translation. The accounting records of the fund are maintained in U.S. dollars. Investment securities and other assets and liabilities denominated in a foreign currency are translated into U.S. dollars at the prevailing rates of exchange at period end. Purchases and sales of securities, income receipts and expense payments are translated into U.S. dollars at the prevailing exchange rate on the respective dates of the transactions.
Net realized gains and losses on foreign currency transactions represent net gains and losses from sales and maturities of foreign currency contracts, disposition of foreign currencies, the difference between the amount of net investment income accrued and the U.S. dollar amount actually received, and gains and losses between trade and settlement date on purchases and sales of securities. The effects of changes in foreign currency exchange rates on investments in securities are included with the net realized and unrealized gain or loss on investment securities.
Income Taxes. As a qualified regulated investment company under Subchapter M of the Internal Revenue Code, the fund is not subject to income taxes to the extent that it distributes substantially all of its
Annual Report
Notes to Financial Statements - continued
1. Significant Accounting Policies - continued
Income Taxes - continued
taxable income for its fiscal year. The schedule of investments includes information regarding income taxes under the caption "Income Tax Information."
Investment Income. Dividend income is recorded on the ex-dividend date, except certain dividends from foreign securities where the ex-dividend date may have passed, are recorded as soon as the fund is informed of the ex-dividend date. Non-cash dividends included in dividend income, if any, are recorded at the fair market value of the securities received. Interest income is accrued as earned. Investment income is recorded net of foreign taxes withheld where recovery of such taxes is uncertain. The fund may place a debt obligation on non-accrual status and reduce related interest income by ceasing current accruals and writing off interest receivables when the collection of all or a portion of interest has become doubtful based on consistently applied procedures, under the general supervision of the Board of Trustees of the fund. A debt obligation is removed from non-accrual status when the issuer resumes interest payments or when collectibility of interest is reasonably assured.
Expenses. Most expenses of the trust can be directly attributed to a fund. Expenses which cannot be directly attributed are apportioned among the funds in the trust.
Distributions to Shareholders. Distributions are recorded on the ex-dividend date.
Income and capital gain distributions are determined in accordance with income tax regulations which may differ from generally accepted accounting principles. These differences, which may result in distribution reclassifications, are primarily due to differing treatments for futures transactions, foreign currency transactions, market discount, non-taxable dividends and losses deferred due to wash sales. The fund also utilized earnings and profits distributed to shareholders on redemptions of shares as part of the dividends paid deduction for income tax purposes.
Permanent book and tax basis differences relating to shareholder distributions will result in reclassifications to paid in capital. Undistributed net investment income and accumulated undistributed net realized gain (loss) on investments and foreign currency transactions may include temporary book and tax basis differences which will reverse in a subsequent period. Any taxable income or gain remaining at fiscal year end is distributed in the following year.
Security Transactions. Security transactions are accounted for as of trade date. Gains and losses on securities sold are determined on the basis of identified cost.
2. Operating Policies.
Foreign Currency Contracts. The fund generally uses foreign currency contracts to facilitate transactions in foreign-denominated securities. Losses may arise from changes in the value of the foreign currency or if
Annual Report
Notes to Financial Statements - continued
2. Operating Policies - continued
Foreign Currency Contracts - continued
the counterparties do not perform under the contracts' terms. The U.S. dollar value of foreign currency contracts is determined using contractual currency exchange rates established at the time of each trade.
Joint Trading Account. Pursuant to an Exemptive Order issued by the Securities and Exchange Commission (the SEC), the fund, along with other affiliated entities of Fidelity Management & Research Company (FMR), may transfer uninvested cash balances into one or more joint trading accounts. These balances are invested in one or more repurchase agreements for U.S. Treasury or Federal Agency obligations.
Repurchase Agreements. The underlying U.S. Treasury, Federal Agency, or other obligations found to be satisfactory by FMR are transferred to an account of the fund, or to the Joint Trading Account, at a custodian bank. The securities are marked-to-market daily and maintained at a value at least equal to the principal amount of the repurchase agreement (including accrued interest). FMR, the fund's investment adviser, is responsible for determining that the value of the underlying securities remains in accordance with the market value requirements stated above.
Futures Contracts. The fund may use futures contracts to manage its exposure to the stock market. Buying futures tends to increase the fund's exposure to the underlying instrument, while selling futures tends to decrease the fund's exposure to the underlying instrument or hedge other fund investments. Futures contracts involve, to varying degrees, risk of loss in excess of the futures variation margin reflected in the Statement of Assets and Liabilities. The underlying face amount at value of any open futures contracts at period end is shown in the schedule of investments under the caption "Futures Contracts." This amount reflects each contract's exposure to the underlying instrument at period end. Losses may arise from changes in the value of the underlying instruments or if the counterparties do not perform under the contracts' terms. Gains (losses) are realized upon the expiration or closing of the futures contracts. Futures contracts are valued at the settlement price established each day by the board of trade or exchange on which they are traded.
Restricted Securities. The fund is permitted to invest in securities that are subject to legal or contractual restrictions on resale. These securities generally may be resold in transactions exempt from registration or to the public if the securities are registered. Disposal of these securities may involve time-consuming negotiations and expense, and prompt sale at an acceptable price may be difficult. At the end of the period, the fund had no investments in restricted securities (excluding 144A issues).
3. Purchases and Sales of Investments.
Purchases and sales of securities, other than short-term securities, aggregated $1,188,218,962 and $679,490,703, respectively, of which U.S. government and government agency obligations aggregated $55,108 and $346,798, respectively.
Annual Report
Notes to Financial Statements - continued
3. Purchases and Sales of Investments - continued
The market value of futures contracts opened and closed during the period amounted to $106,854,412 and $101,727,176, respectively.
4. Fees and Other Transactions with Affiliates.
Management Fee. As the fund's investment adviser, FMR receives a monthly fee that is calculated on the basis of a group fee rate plus a fixed individual fund fee rate applied to the average net assets of the fund. The group fee rate is the weighted average of a series of rates and is based on the monthly average net assets of all the mutual funds advised by FMR. The rates ranged from .2167% to .5200% for the period. The annual individual fund fee rate is 0.30%. In the event that these rates were lower than the contractual rates in effect during the period, FMR voluntarily implemented the above rates, as they resulted in the same or a lower management fee. For the period, the management fee was equivalent to an annual rate of 0.57% of average net assets.
Sub-Adviser Fee. Beginning January 1, 2001, FMR Co.(FMRC) will serve as sub-adviser for the fund. FMRC is a wholly owned subsidiary of FMR and will receive a fee from FMR of 50% of the management fee payable to FMR.
Transfer Agent Fees. Fidelity Service Company, Inc. (FSC), an affiliate of FMR, is the fund's transfer, dividend disbursing and shareholder servicing agent. FSC receives account fees and asset-based fees that vary according to account size and type of account. FSC pays for typesetting, printing and mailing of all shareholder reports, except proxy statements. For the period, the transfer agent fees were equivalent to an annual rate of 0.20% of average net assets.
Accounting and Security Lending Fees. FSC maintains the fund's accounting records and administers the security lending program. The security lending fee is based on the number and duration of lending transactions. The accounting fee is based on the level of average net assets for the month plus out-of-pocket expenses.
Central Funds. Pursuant to an Exemptive Order issued by the SEC, the fund may invest in one or more open-end money market funds managed by Fidelity Investments Money Management, Inc., an affiliate of FMR. These funds (collectively referred to as the "Central Funds") are only available to investment companies and other accounts managed by FMR and its affiliates. The Central Funds seek preservation of capital, liquidity, and current income and do not pay a management fee.
The Fidelity Securities Lending Cash Central Fund and the Fidelity Cash Central Fund are principally used for allocations of available cash. Income distributions from the Central Funds are recorded as interest income in the accompanying financial statements except for distributions from the Fidelity Securities Lending Cash Central Fund, which are recorded as security lending income. Distributions from the Central Funds to the fund totaled $1,499,494 for the period.
Annual Report
Notes to Financial Statements - continued
4. Fees and Other Transactions with Affiliates - continued
Brokerage Commissions. The fund placed a portion of its portfolio transactions with brokerage firms which are affiliates of FMR. The commissions paid to these affiliated firms were $54,020 for the period.
5. Security Lending.
The fund lends portfolio securities from time to time in order to earn additional income. The fund receives collateral in the form of U.S. Treasury obligations, letters of credit, and/or cash against the loaned securities, and maintains collateral in an amount not less than 100% of the market value of the loaned securities during the period of the loan. The market value of the loaned securities is determined at the close of business of the fund and any additional required collateral is delivered to the fund on the next business day. If the borrower defaults on its obligation to return the securities loaned because of insolvency or other reasons, the fund could experience delays and costs in recovering the securities loaned or in gaining access to the collateral. At period end, the value of the securities loaned amounted to $12,682,204. The fund received cash collateral of $13,306,545 which was invested in cash equivalents.
6. Expense Reductions.
FMR has directed certain portfolio trades to brokers who paid a portion of the fund's expenses. For the period, the fund's expenses were reduced by $127,648 under this arrangement.
In addition, through arrangements with the fund's custodian and transfer agent, credits realized as a result of uninvested cash balances were used to reduce a portion of the fund's expenses. During the period, the fund's custodian and transfer agent fees were reduced by $1,841, and $1,240, respectively, under these arrangements.
Annual Report
To the Trustees of Fidelity Charles Street Trust and Shareholders of Asset Manager: Aggressive:
We have audited the accompanying statement of assets and liabilities of Asset Manager: Aggressive (the fund), a series of Fidelity Charles Street Trust (the Trust), including the portfolio of investments, as of September 30, 2000, and the related statement of operations for the year then ended, the statement of changes in net assets and financial highlights for each of the two years in the period then ended. These financial statements and financial highlights are the responsibility of the Fund's management. Our responsibility is to express an opinion on these financial statements and financial highlights based on our audits.
We conducted our audits in accordance with auditing standards generally accepted in the United States of America. Those standards require that we plan and perform the audit to obtain reasonable assurance about whether the financial statements and financial highlights are free of material misstatement. An audit includes examining, on a test basis, evidence supporting the amounts and disclosures in the financial statements. Our procedures included confirmation of securities owned as of September 30, 2000, by correspondence with the custodian and brokers; where replies were not received from brokers, we performed other auditing procedures. An audit also includes assessing the accounting principles used and significant estimates made by management, as well as evaluating
the overall financial statement presentation. We believe that our audits provide a reasonable basis for our opinion.
In our opinion, the financial statements and financial highlights referred to above present fairly, in all material respects, the financial position of Asset Manager: Aggressive as of September 30, 2000, and the results of its operations for the year then ended, and the changes in its net assets and its financial highlights for each of the two years in the period then ended, in conformity with accounting principles generally accepted in the United States of America.
/s/DELOITTE & TOUCHE LLP
DELOITTE & TOUCHE LLP
Boston, Massachusetts
November 7, 2000
Annual Report
A total of 10% of the dividends distributed during the fiscal year qualifies for the dividends-received deduction for corporate shareholders.
The fund will notify shareholders in January 2001 of amounts for use in preparing 2000 income tax returns.
Annual Report
Fidelity offers several ways to conveniently manage your personal investments via your telephone or PC. You can access your account information, conduct trades and research your investments 24 hours a day.
By Phone
Fidelity Automated Service Telephone provides a single toll-free number to access account balances, positions, quotes and trading. It's easy to navigate the service, and on your first call, the system will help you create a personal identification number (PIN) for security.
(phone_graphic)
Fidelity Automated
Service Telephone (FAST®)
1-800-544-5555
Press
1 For mutual fund and brokerage trading.
2 For quotes.*
3 For account balances and holdings.
4 To review orders and mutual
fund activity.
5 To change your PIN.
*0 To speak to a Fidelity representative.
By PC
Fidelity's web site on the Internet provides a wide range of information, including daily financial news, fund performance, interactive planning tools and news about Fidelity products and services.
(computer_graphic)
Fidelity's Web Site
www.fidelity.com
If you are not currently on the Internet, call EarthLink Sprint at 1-800-288-2967, and be sure to ask for registration number SMD004 to receive a special Fidelity package that includes 30 days of free Internet access. EarthLink is North America's #1 independent Internet access provider.
(computer_graphic)
Fidelity On-line Xpress+®
Fidelity On-line Xpress+ software for Windows combines comprehensive portfolio management capabilities, securities trading and access to research and analysis tools . . . all on your desktop. Call Fidelity at 1-800-544-0240 or visit our web site for more information on how to manage your investments via your PC.
* When you call the quotes line, please remember that a fund's yield and return will vary and, except for money market funds, share price will also vary. This means that you may have a gain or loss when you sell your shares. There is no assurance that money market funds will be able to maintain a stable $1 share price; an investment in a money market fund is not insured or guaranteed by the U.S. government. Total returns are historical and include changes in share price, reinvestment of dividends and capital gains, and the effects of any sales charges.
Annual Report
For directions and hours,
please call 1-800-544-9797.
Arizona
7373 N. Scottsdale Road
Scottsdale, AZ
California
815 East Birch Street
Brea, CA
851 East Hamilton Avenue
Campbell, CA
527 North Brand Boulevard
Glendale, CA
19200 Von Karman Avenue
Irvine, CA
10100 Santa Monica Blvd.
Los Angeles, CA
251 University Avenue
Palo Alto, CA
1760 Challenge Way
Sacramento, CA
7676 Hazard Center Drive
San Diego, CA
8 Montgomery Street
San Francisco, CA
950 Northgate Drive
San Rafael, CA
1400 Civic Drive
Walnut Creek, CA
6300 Canoga Avenue
Woodland Hills, CA
Colorado
1625 Broadway
Denver, CO
Connecticut
48 West Putnam Avenue
Greenwich, CT
265 Church Street
New Haven, CT
300 Atlantic Street
Stamford, CT
29 South Main Street
West Hartford, CT
Delaware
222 Delaware Avenue
Wilmington, DE
Florida
4400 N. Federal Highway
Boca Raton, FL
90 Alhambra Plaza
Coral Gables, FL
4090 N. Ocean Boulevard
Ft. Lauderdale, FL
1907 West State Road 434
Longwood, FL
8880 Tamiami Trail, North
Naples, FL
2401 PGA Boulevard
Palm Beach Gardens, FL
8065 Beneva Road
Sarasota, FL
1502 N. Westshore Blvd.
Tampa, FL
Georgia
3445 Peachtree Road, N.E.
Atlanta, GA
1000 Abernathy Road
Atlanta, GA
Illinois
One North Franklin Street
Chicago, IL
1415 West 22nd Street
Oak Brook, IL
1700 East Golf Road
Schaumburg, IL
3232 Lake Avenue
Wilmette, IL
Indiana
4729 East 82nd Street
Indianapolis, IN
Maine
Three Canal Plaza
Portland, ME
Maryland
7401 Wisconsin Avenue
Bethesda, MD
One W. Pennsylvania Ave.
Towson, MD
Massachusetts
801 Boylston Street
Boston, MA
155 Congress Street
Boston, MA
25 State Street
Boston, MA
300 Granite Street
Braintree, MA
44 Mall Road
Burlington, MA
416 Belmont Street
Worcester, MA
Annual Report
Michigan
280 Old N. Woodward Ave.
Birmingham, MI
29155 Northwestern Hwy.
Southfield, MI
Minnesota
7600 France Avenue South
Edina, MN
Missouri
700 West 47th Street
Kansas City, MO
8885 Ladue Road
Ladue, MO
New Jersey
150 Essex Street
Millburn, NJ
56 South Street
Morristown, NJ
501 Route 17, South
Paramus, NJ
New York
1055 Franklin Avenue
Garden City, NY
999 Walt Whitman Road
Melville, L.I., NY
1271 Avenue of the Americas
New York, NY
71 Broadway
New York, NY
350 Park Avenue
New York, NY
North Carolina
4611 Sharon Road
Charlotte, NC
Ohio
600 Vine Street
Cincinnati, OH
28699 Chagrin Boulevard
Woodmere Village, OH
Oregon
16850 SW 72nd Avenue
Tigard, OR
Pennsylvania
1735 Market Street
Philadelphia, PA
12001 Perry Highway
Wexford, PA
Rhode Island
47 Providence Place
Providence, RI
Tennessee
6150 Poplar Avenue
Memphis, TN
Texas
10000 Research Boulevard
Austin, TX
4017 Northwest Parkway
Dallas, TX
1155 Dairy Ashford Street
Houston, TX
2701 Drexel Drive
Houston, TX
400 East Las Colinas Blvd.
Irving, TX
14100 San Pedro
San Antonio, TX
19740 IH 45 North
Spring, TX
Utah
215 South State Street
Salt Lake City, UT
Virginia
1861 International Drive
McLean, VA
Washington
411 108th Avenue, N.E.
Bellevue, WA
511 Pine Street
Seattle, WA
Washington, DC
1900 K Street, N.W.
Washington, DC
Wisconsin
595 North Barker Road
Brookfield, WI
Fidelity Brokerage Services, Inc., 100 Summer St., Boston, MA 02110 Member NYSE/SIPC
Annual Report
If more than one address is listed, please locate the address that is closest to you. We'll give your correspondence immediate attention and send you written confirmation upon completion of your request.
(letter_graphic)
Making Changes
To Your Account
(such as changing name, address, bank, etc.)
Fidelity Investments
P.O. Box 770001
Cincinnati, OH 45277-0002
(letter_graphic)
For Non-Retirement
Accounts
Buying shares
Fidelity Investments
P.O. Box 770001
Cincinnati, OH 45277-0003
Overnight Express
Fidelity Investments
2300 Litton Lane - KH1A
Hebron, KY 41048
Selling shares
Fidelity Investments
P.O. Box 660602
Dallas, TX 75266-0602
Overnight Express
Fidelity Investments
Attn: Redemptions - CP6I
400 East Las Colinas Blvd.
Irving, TX 75039-5587
General Correspondence
Fidelity Investments
P.O. Box 500
Merrimack, NH 03054-0500
(letter_graphic)
For Retirement
Accounts
Buying shares
Fidelity Investments
P.O. Box 770001
Cincinnati, OH 45277-0003
Selling shares
Fidelity Investments
P.O. Box 660602
Dallas, TX 75266-0602
Overnight Express
Fidelity Investments
Attn: Redemptions - CP6R
400 East Las Colinas Blvd.
Irving, TX 75039-5587
General Correspondence
Fidelity Investments
P.O. Box 500
Merrimack, NH 03054-0500
Annual Report
Annual Report
Annual Report
Annual Report
Investment Adviser
Fidelity Management & Research Company
Boston, MA
Investment Sub-Advisers
Fidelity Investments Money
Management, Inc.
Fidelity Management & Research
(U.K.) Inc.
Fidelity Management & Research
(Far East) Inc.
Fidelity Investments Japan Limited
Officers
Edward C. Johnson 3d, President
Robert C. Pozen, Senior Vice President
Robert A. Lawrence, Vice President
Richard C. Habermann, Vice President
Charles S. Morrison, Vice President
Eric D. Roiter, Secretary
Robert A. Dwight, Treasurer
Maria F. Dwyer, Deputy Treasurer
Thomas J. Simpson, Assistant Treasurer
John H. Costello, Assistant Treasurer
Board of Trustees
Ralph F. Cox *
Phyllis Burke Davis *
Robert M. Gates *
Edward C. Johnson 3d
Donald J. Kirk *
Ned C. Lautenbach *
Peter S. Lynch
Marvin L. Mann *
William O. McCoy *
Gerald C. McDonough *
Robert C. Pozen
Thomas R. Williams *
* Independent trustees
Advisory Board
J. Michael Cook
Abigail P. Johnson
Marie L. Knowles
General Distributor
Fidelity Distributors Corporation
Boston, MA
Transfer and Shareholder
Servicing Agent
Fidelity Service Company, Inc.
Boston, MA
Custodian
The Chase Manhattan Bank
New York, NY
Fidelity's Asset Allocation Funds
Asset ManagerSM
Asset Manager: AggressiveSM
Asset Manager: Growth®
Asset Manager: Income®
Fidelity Freedom Funds® -
Income, 2000, 2010, 2020, 2030, 2040
The Fidelity Telephone Connection
Mutual Fund 24-Hour Service
Exchanges/Redemptions
and Account Assistance 1-800-544-6666
Product Information 1-800-544-6666
Retirement Accounts 1-800-544-4774
(8 a.m. - 9 p.m.)
TDD Service 1-800-544-0118
(for the deaf and hearing impaired)
(9 a.m. - 9 p.m. Eastern time)
Fidelity Automated Service
Telephone (FAST®) (automated graphic) 1-800-544-5555
(automated graphic) Automated line for quickest service
AGG-ANN-1100 116402
1.728722.101
(Fidelity Investment logo)(registered trademark)
Corporate Headquarters
82 Devonshire St., Boston, MA 02109
www.fidelity.com
Fidelity®
Annual Report
September 30, 2000
(2_fidelity_logos)(Registered_Trademark)
|
President's Message |
Ned Johnson on investing strategies. |
|
|
Performance |
How the fund has done over time. |
|
|
Market Recap |
An overview of the market's performance and the factors driving it. |
|
|
Fund Talk |
The manager's review of fund performance, strategy and outlook. |
|
|
Investment Changes |
A summary of major shifts in the fund's investments over the past six months. |
|
|
Investments |
A complete list of the fund's investments with their market values. |
|
|
Financial Statements |
Statements of assets and liabilities, operations, and changes in net assets, as well as financial highlights. |
|
|
Notes |
Notes to the financial statements. |
|
|
Independent Auditors' Report |
The auditors' opinion. |
|
|
Distributions |
|
Standard & Poor's, S&P and S&P 500 are registered service marks of The McGraw-Hill Companies, Inc. and have been licensed for use by Fidelity Distributors Corporation.
Other third party marks appearing herein are the property of their respective owners.
All other marks appearing herein are registered or unregistered trademarks or service marks of FMR Corp. or an affiliated company.
(Recycle graphic) This report is printed on recycled paper using soy-based inks.
This report and the financial statements contained herein are submitted for the general information of the shareholders of the fund. This report is not authorized for distribution to prospective investors in the fund unless preceded or accompanied by an effective prospectus.
Mutual fund shares are not deposits or obligations of, or guaranteed by, any depository institution. Shares are not insured by the FDIC, Federal Reserve Board or any other agency, and are subject to investment risks, including possible loss of principal amount invested.
Neither the fund nor Fidelity Distributors Corporation is a bank.
For more information on any Fidelity fund, including charges and expenses, call 1-800-544-6666 for a free prospectus. Read it carefully before you invest or send money.
Annual Report
(photo_of_Edward_C_Johnson_3d)
Dear Shareholder:
Disappointing third quarter corporate earnings announcements resulted in negative performance for many major U.S. equity indexes through the first nine months of 2000. A weak euro and the highest oil prices in 10 years frightened many investors into selling shares of large U.S. corporations with multinational presence. In fixed-income markets, 30-year Treasury prices also dropped, and these securities outyielded 10-year Treasury notes for the first time since January.
While it's impossible to predict the future direction of the markets with any degree of certainty, there are certain basic principles that can help investors plan for their future needs.
First, investors are encouraged to take a long-term view of their portfolios. If you can afford to leave your money invested through the inevitable up and down cycles of the financial markets, you will greatly reduce your vulnerability to any single decline. We know from experience, for example, that stock prices have gone up over longer periods of time, have significantly outperformed other types of investments and have stayed ahead of inflation.
Second, you can further manage your investing risk through diversification. Asset Manager funds are already diversified because they invest in stocks, bonds and short-term and money market instruments, both in the U.S. and overseas. If you have a shorter investment time horizon, you might want to consider moving some of your investment into Asset Manager: Income, which generally has a higher weighting in short-term investments compared with the other Asset Manager funds.
Finally, no matter what your time horizon or portfolio diversity, it makes good sense to follow a regular investment plan, investing a certain amount of money in a fund at the same time each month or quarter and periodically reviewing your overall portfolio. By doing so, you won't get caught up in the excitement of a rapidly rising market, nor will you buy all your shares at market highs. While this strategy - known as dollar cost averaging - won't assure a profit or protect you from a loss in a declining market, it should help you lower the average cost of your purchases. Of course, you should consider your financial ability to continue your purchases through periods of low price levels before undertaking such a strategy.
If you have questions, please call us at 1-800-544-6666, or visit our web site at www.fidelity.com. We are available 24 hours a day, seven days a week to provide you the information you need to make the investments that are right for you.
Best regards,
/s/Edward C. Johnson 3d
Edward C. Johnson 3d
Annual Report
There are several ways to evaluate a fund's historical performance. You can look at the total percentage change in value, the average annual percentage change or the growth of a hypothetical $10,000 investment. Total return reflects the change in the value of an investment, assuming reinvestment of the fund's dividend income and capital gains (the profits earned upon the sale of securities that have grown in value). If Fidelity had not reimbursed certain fund expenses, the life of fund total returns would have been lower.
Cumulative Total Returns
|
Periods ended September 30, 2000 |
|
Past 1 |
Past 5 |
Life of |
|
Asset Manager: Growth ® |
|
15.50% |
114.08% |
248.36% |
|
Asset Manager: Growth Composite |
|
11.59% |
118.21% |
n/a * |
|
S&P 500 ® |
|
13.28% |
166.82% |
317.67% |
|
LB Aggregate Bond |
|
6.99% |
36.81% |
78.18% |
|
LB 3 Month T-Bill |
|
5.82% |
30.28% |
n/a * |
|
Flexible Portfolio Funds Average |
|
12.82% |
88.42% |
n/a * |
Cumulative total returns show the fund's performance in percentage terms over a set period - in this case, one year, five years or since the fund started on December 30, 1991. For example, if you had invested $1,000 in a fund that had a 5% return over the past year, the value of your investment would be $1,050. You can compare the fund's returns to the performance of the Asset Manager: Growth Composite Index, a hypothetical combination of unmanaged indices. The composite index combines the total returns of the Standard & Poor's 500 SM Index, the Lehman Brothers Aggregate Bond Index and the Lehman Brothers 3 Month Treasury Bill Index weighted according to the fund's neutral mix. To measure how the fund's performance stacked up against its peers, you can compare it to the flexible portfolio funds average, which reflects the performance of mutual funds with similar objectives tracked by Lipper Inc. The past one year average represents a peer group of 233 mutual funds. These benchmarks include reinvested dividends and capital gains, if any, and exclude the effect of sales charges.
Average Annual Total Returns
|
Periods ended September 30, 2000 |
Past 1 |
Past 5 |
Life of |
|
Asset Manager: Growth |
15.50% |
16.44% |
15.31% |
|
Asset Manager: Growth Composite |
11.59% |
16.89% |
n/a * |
Average annual total returns take the fund's cumulative return and show you what would have happened if the fund had performed at a constant rate each year.
* Not available
Annual Report
Performance - continued
$10,000 Over Life of Fund
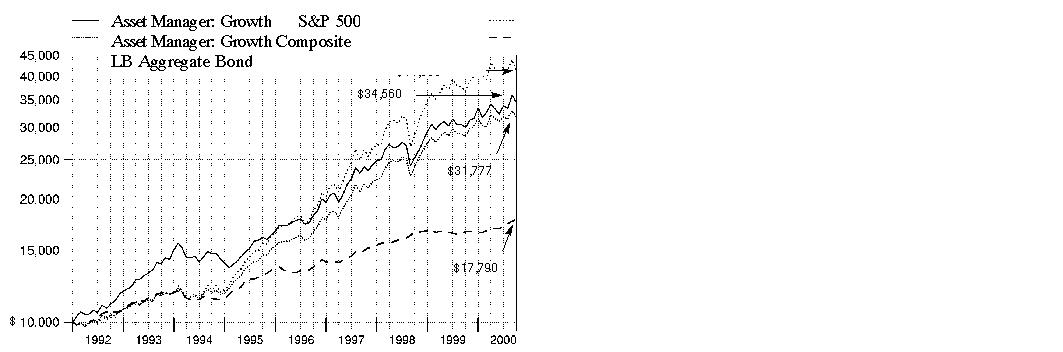
$10,000 Over Life of Fund: Let's say hypothetically that $10,000 was invested in Asset Manager: Growth Fund on December 31, 1991, shortly after the fund started. As the chart shows, by September 30, 2000, the value of the investment would have grown to $34,560 - a 245.60% increase on the initial investment. For comparison, look at how both the S&P 500 Index, a market capitalization-weighted index of common stocks, and the Lehman Brothers Aggregate Bond Index, a market value-weighted index of investment-grade fixed-rate debt issues, including government, corporate, asset-backed, and mortgage-backed securities, with maturities of one year or more, did over the same period. With dividends and capital gains, if any, reinvested, the same $10,000 investment in the S&P 500 Index would have grown to $41,568 - a 315.68% increase. If $10,000 was invested in the Lehman Brothers Aggregate Bond Index, it would have grown to $17,790 - a 77.90% increase. You can also look at how the Asset Manager: Growth Composite Index, did over the same period. The composite index combines the total returns of the S&P 500 Index, the Lehman Brothers Aggregate Bond Index and the Lehman Brothers 3-month T-Bill Index according to the fund's neutral mix and assumes monthly rebalancing of the mix.** With dividends and capital gains, if any, reinvested, the same $10,000 investment would have grown to $31,777 - a 217.77% increase.
Understanding
Performance
How a fund did yesterday is no guarantee of how it will do tomorrow. If you sell your shares during a market downturn, you might lose money. But if you can ride out the market's ups and downs, you may have a gain.
3** Currently 70% stocks, 25% bonds and 5% short-term/money market instruments effective
January 1, 1997; 65%, 30% and 5%, respectively, prior to January 1, 1997.
Annual Report
What a long, strange trip it's been. At least that's what some investors may think when reflecting on the 12-month period ending September 30, 2000. Historically high levels of volatility shook speculative excess out of tech stocks in 2000, leaving bonds seemingly alone to pick up the pieces. Excluding the dramatic run-up in the fourth quarter of 1999, major stock markets were down for the period, while bonds finished comfortably on the upside.
Stocks: U.S. equity market performance during the 12 months that ended September 30, 2000, generally was predicated on the fortunes of the technology sector. At the period's outset, technology began its meteoric rise as investors rallied behind the sector's growth potential relative to other areas of the market. But just 10 weeks after setting its record high in mid-March, the NASDAQ Composite Index - a technology sector benchmark - had dropped 30%, due mainly to Federal Reserve Board interest-rate hikes, excessive valuations and the potential of an economic slowdown. Given its one-third weighting in technology, the Standard & Poor's 500(automated graphic) Index also suffered, as did the blue chips' proxy, the Dow Jones Industrial Average. In response, investors shifted their assets into sectors that traditionally perform better in a more moderate-growth economy, such as health care and energy. Technology rallied sporadically in the summer, but come September, more bad news was in store, as high oil prices and a weak European currency combined to dampen the global economy. For the overall 12-month period ending September 30, 2000, the Dow returned 4.62%, the S&P 500 gained 13.28% and the NASDAQ gained 34.01%. However, all three indexes had negative returns through the first nine months of 2000.
Bonds: Most investment-grade bonds overcame sharply rising interest rates and unusually volatile market conditions en route to posting positive returns during the 12-month period that ended September 30, 2000. The Lehman Brothers Aggregate Bond Index - a widely followed measure of taxable-bond performance - returned 6.99% during this time frame. Treasuries struggled the most early on, as investors pursued more attractive alternatives in high-flying stocks and higher-yielding spread sector securities - namely mortgage bonds, government agency issues and corporate bonds. However, the struggle was short-lived, as conditions changed abruptly beginning in January with the announcement by the U.S. Treasury of its intention to reduce new borrowing and use government surplus proceeds to repurchase outstanding debt. Treasury prices jumped in response and, with the help of rising short-term interest rates, induced an inverted yield curve - which occurs when short-term bonds outyield longer-dated securities. Spread sectors recoiled on the news, with their yield spreads widening out relative to Treasuries. Anticipation that the Fed was finished raising rates, combined with persistent flights-to-safety from risk-averse investors concerned about volatility in equity markets, helped further bolster the long bond during the period. The Lehman Brothers Treasury Index returned 7.29%. Mortgages recovered nicely behind reduced interest-rate volatility and stronger-than-anticipated prepayment activity. Similarly, agencies and corporates staged late rallies and outperformed most major U.S. equity indexes through the first nine months of 2000. For the overall 12-month period, the Lehman Brothers Mortgage-Backed Securities, U.S. Agency and Credit Bond indexes returned 7.42%, 6.73% and 5.87%, respectively.
Annual Report
(Portfolio Manager photograph)
An interview with Richard
Habermann, Portfolio Manager
of Asset Manager: Growth
Q. How did the fund perform, Dick?
A. Quite well. For the 12-month period that ended September 30, 2000, the fund returned 15.50%, topping the Asset Manager: Growth Composite Index, which returned 11.59% during the same period. Fund performance also surpassed that of the flexible portfolio funds average tracked by Lipper Inc., which returned 12.82%.
Q. What asset allocation strategies did you pursue during the period, and what influence did they have on performance?
A. We continued to emphasize equities, allocating just over 73% of fund assets on average to the asset class during the period. The fund's neutral allocation mix calls for 70% to be invested in stocks, 25% in bonds and 5% in short-term and money market instruments. Having ample exposure to the bullishness surrounding stocks early on in the period helped ensure our success relative to the index. We had a similar advantage over our Lipper peers, which held around 60% in stocks on average. Faced with growing uncertainty in the marketplace during the second half of the period, I began to pare back our equity exposure toward a more neutral weighting, which, coupled with strong security selection, helped insulate us somewhat from the volatile spring and summer months. While opportunistic trading toward the end of the period nudged the fund's equity weighting up slightly, my overall approach of emphasizing more of a neutral weighting remained intact. On the bond front, we paid the price for focusing on high-yield securities at the expense of investment-grade debt.
Q. What factors drove the performance of the fund's equity positions?
A. Superior stock picking and timely trading helped the equity subportfolio handily outpace the Standard & Poor's 500 Index during the 12-month period. Brad Lewis - who directed the fund's equity investments until May - and Tom Sprague, who succeeded Brad, get high marks for uncovering the right names within the high-growth segments of the market, particularly the market-leading technology sector. The fund's focus on large, high-quality tech stocks allowed us to participate in the dramatic run-up early in the period, and also sheltered us a bit when things began to fall apart in April and May. Additionally, we took advantage of several good growth stories among some smaller-cap companies that posted big numbers during the period. Also important was Brad's decision to reduce the fund's tech weighting heading into the spring, rotating some assets into more defensive areas of the market, such as health stocks. Faced with a slowing economy induced by rising interest rates and sharply higher energy prices, Tom used a strict sell discipline to neutralize market turbulence and lock in profits for the fund. Knowing when to get out of even the quality tech names was one of the keys to outperforming the index during the period.
Annual Report
Fund Talk: The Manager's Overview - continued
Q. Which stocks helped the most? Which hurt?
A. Our best picks along the way included companies engaged in the build-out of Internet infrastructure and next-generation communications networks. Texas Instruments, Motorola, LSI Logic, JDS Uniphase, Qualcomm and Ciena were notable contributors. Many of our growth-oriented financial stocks, such as Morgan Stanley Dean Witter, also performed well. GE was another strong performer for us. Conversely, our overexposure to poorly performing cyclicals - or economically sensitive stocks - such as Ingersoll-Rand and Alcoa, hurt. Internet-related stocks, namely CMGI and America Online, also detracted from returns, as did Microsoft. Several of the aforementioned stocks were no longer held at the close of the period.
Q. How did the fund's bond subportfolio fare?
A. Maintaining a tilt toward high-yield bonds - an asset class not included in the index - proved troublesome, as yield spreads widened to levels not seen since the 1990 recession. Poor liquidity and declining credit quality sent prices plunging during the period. The fund's overweighting in telecommunications issues - which suffered the most - detracted from performance. Taking the reins from Fred Hoff - who ran the high-yield portion of the fund until June - Matt Conti helped limit our downside by reducing the fund's risk profile through further diversification. The story was much brighter in terms of our investment-grade holdings. Charlie Morrison and his team responded well to changing conditions in the marketplace and positioned the fund to benefit from them. Scaling back on corporate bonds in January proved wise, as the performance of corporates deteriorated during the period. The federal government's decision to buy back outstanding debt and reduce future issuance, coupled with persistent flights to safety from nervous tech investors, sparked a tremendous rally in our long-term Treasuries. Our overweighting in discount mortgage securities also helped, thanks to strong housing turnover.
Q. What about the fund's short-term/money market investments?
A. John Todd felt that concerns surrounding Y2K were overblown and used the opportunity to extend the average maturity of the fund's money market subportfolio late last year to take advantage of a steeply sloped yield curve. Early in 2000, however, the yield curve flattened out dramatically. In response, we let the average maturity roll down, believing that strong economic growth and the risk of rising inflation were likely to set off a protracted period of Fed tightening. Since that time, the curve has remained flat, which has allowed us to maintain a shorter-maturity profile. It's important for shareholders to note that, in July, the fund began to invest nearly all of its money market investments in a Fidelity-managed money market mutual fund in lieu of investing directly in individual money market securities.
Q. What's your outlook?
A. I remain quite cautious. There's an old adage - don't catch a falling knife. Well, that's where I feel we stand today. It's still unclear to me as to whether or not the market will be able to shake its concerns about an economic slowdown and the potential impact on companies' bottom lines. Right now, with stocks facing a stiff headwind, I intend to sit on the sidelines and maintain a neutral equity weighting until I see a catalyst that can reverse the tide. Without that catalyst, it'll be hard for me to justify a significant move.
Annual Report
Fund Talk: The Manager's Overview - continued
The views expressed in this report reflect those of the portfolio manager only through the end of the period of the report as stated on the cover and do not necessarily represent the views of Fidelity or any other person in the Fidelity organization. Any such views are subject to change at any time based upon market or other conditions and Fidelity disclaims any responsibility to update such views. These views may not be relied on as investment advice and, because investment decisions for a Fidelity fund are based on numerous factors, may not be relied on as an indication of trading intent on behalf of any Fidelity fund.
Fund Facts
Goal: maximum total return over the long term through investing in stocks, bonds and short-term and money market instruments
Fund number: 321
Trading symbol: FASGX
Start date: December 30, 1991
Size: as of September 30, 2000, more than $5.2 billion
Manager: Richard Habermann, since 1996; manager, Asset Manager: Aggressive, since 1999; Asset Manager and Asset Manager: Income, since 1996; Fidelity Trend Fund, 1977-1981; Fidelity Magellan Fund, 1972-1977; joined Fidelity in 1968
3Dick Habermann reflects
on recent market volatility:
"There's a lot of uncertainty in the world today, and it's finding its way into the equity markets. Thankfully, the fund's equity exposure was generally lean toward the tail end of the period, when conditions really started to deteriorate. Our hope is to hold our own - with the help of bonds and cash - when stock markets are doing poorly and try to do considerably better when markets pick up again. That's the whole purpose of asset allocation funds. In a difficult market, sometimes the best thing to do is be patient, see what pans out and pick up some good companies at attractive levels in the process.
"What's particularly troubling for markets these days are shock events. Take the recent crisis in the Middle East, for example. With higher oil prices and inflation fears already weighing on the minds of investors, escalating tensions in that area of the world roiled the markets. There have been many events like this one during the past decade, including the emerging-markets crisis in 1998 and the Gulf War in 1990. As a money manager, it's important for me to anticipate what might be considered less-than-perfect times and, when they are in fact occurring, assess them and decide what to do. So far, we've completed the first part by anticipating difficult times. Early recognition of an uncertain market climate brought us down to a neutral equity weighting before it hurt us, which was key."
Annual Report
|
Top Ten Stocks as of September 30, 2000 |
||
|
|
% of fund's |
% of fund's net assets |
|
General Electric Co. |
2.8 |
2.8 |
|
Cisco Systems, Inc. |
2.3 |
2.0 |
|
Exxon Mobil Corp. |
2.1 |
2.6 |
|
EMC Corp. |
1.4 |
0.6 |
|
Fannie Mae |
1.4 |
0.0 |
|
America Online, Inc. |
1.4 |
0.3 |
|
Citigroup, Inc. |
1.4 |
1.3 |
|
Comverse Technology, Inc. |
1.4 |
0.4 |
|
Philip Morris Companies, Inc. |
1.3 |
0.0 |
|
AMBAC Financial Group, Inc. |
1.2 |
0.0 |
|
|
16.7 |
10.0 |
|
Top Ten Market Sectors as of September 30, 2000 |
||
|
(stocks only) |
% of fund's |
% of fund's net assets |
|
Technology |
22.8 |
27.8 |
|
Finance |
11.3 |
10.1 |
|
Health |
7.8 |
1.8 |
|
Energy |
6.6 |
11.7 |
|
Industrial Machinery & Equipment |
3.8 |
3.5 |
|
Utilities |
3.7 |
1.7 |
|
Media & Leisure |
3.6 |
1.8 |
|
Retail & Wholesale |
3.2 |
4.8 |
|
Aerospace & Defense |
2.7 |
0.1 |
|
Nondurables |
2.5 |
1.8 |
|
Asset Allocation (% of fund's net assets) |
|||||||
|
As of September 30, 2000 * |
As of March 31, 2000 ** |
||||||
|
Stock class 76.8% |
|
|
Stock class 75.5% |
|
||
 |
Bond class 19.7% |
|
|
Bond class 19.3% |
|
||
|
Short-term class 3.5% |
|
|
Short-term class 5.2% |
|
||
|
* Foreign investments |
5.5% |
|
** Foreign investments |
4.6% |
|
||
Asset allocations in the pie charts reflect the categorization of assets as defined in the fund's prospectus in effect as of the time periods indicated above. Financial Statement categorizations conform to accounting standards and will differ from the pie chart.

Annual Report
Showing Percentage of Net Assets
|
Common Stocks - 71.7% |
|||
|
Shares |
Value (Note 1) (000s) |
||
|
AEROSPACE & DEFENSE - 2.7% |
|||
|
Aerospace & Defense - 1.6% |
|||
|
Boeing Co. |
431,400 |
$ 27,178 |
|
|
Lockheed Martin Corp. |
139,500 |
4,598 |
|
|
Northrop Grumman Corp. |
240,170 |
21,825 |
|
|
United Technologies Corp. |
429,200 |
29,722 |
|
|
|
83,323 |
||
|
Ship Building & Repair - 1.1% |
|||
|
General Dynamics Corp. |
910,000 |
57,159 |
|
|
TOTAL AEROSPACE & DEFENSE |
140,482 |
||
|
BASIC INDUSTRIES - 0.8% |
|||
|
Chemicals & Plastics - 0.1% |
|||
|
Praxair, Inc. |
67,870 |
2,537 |
|
|
Iron & Steel - 0.3% |
|||
|
Allegheny Technologies, Inc. |
851,600 |
15,435 |
|
|
Metals & Mining - 0.3% |
|||
|
Alcoa, Inc. |
608,800 |
15,410 |
|
|
Martin Marietta Materials, Inc. |
2,100 |
80 |
|
|
|
15,490 |
||
|
Paper & Forest Products - 0.1% |
|||
|
International Paper Co. |
244,100 |
7,003 |
|
|
TOTAL BASIC INDUSTRIES |
40,465 |
||
|
CONSTRUCTION & REAL ESTATE - 0.3% |
|||
|
Engineering - 0.3% |
|||
|
Fluor Corp. |
445,900 |
13,377 |
|
|
DURABLES - 2.4% |
|||
|
Autos, Tires, & Accessories - 0.4% |
|||
|
Danaher Corp. |
386,300 |
19,218 |
|
|
Consumer Durables - 0.1% |
|||
|
Minnesota Mining & Manufacturing Co. |
84,200 |
7,673 |
|
|
Consumer Electronics - 1.3% |
|||
|
Black & Decker Corp. |
13,870 |
474 |
|
|
Gemstar-TV Guide International, Inc. (a) |
208,500 |
18,179 |
|
|
Pioneer Corp. |
735,000 |
29,897 |
|
|
Sony Corp. |
212,200 |
21,419 |
|
|
|
69,969 |
||
|
Common Stocks - continued |
|||
|
Shares |
Value (Note 1) (000s) |
||
|
DURABLES - continued |
|||
|
Home Furnishings - 0.5% |
|||
|
Herman Miller, Inc. |
473,000 |
$ 15,166 |
|
|
Leggett & Platt, Inc. |
548,700 |
8,676 |
|
|
|
23,842 |
||
|
Textiles & Apparel - 0.1% |
|||
|
Arena Brands Holdings Corp. Class B |
5,556 |
139 |
|
|
Liz Claiborne, Inc. |
203,200 |
7,823 |
|
|
|
7,962 |
||
|
TOTAL DURABLES |
128,664 |
||
|
ENERGY - 6.6% |
|||
|
Energy Services - 2.6% |
|||
|
Baker Hughes, Inc. |
481,500 |
17,876 |
|
|
BJ Services Co. (a) |
293,200 |
17,922 |
|
|
ENSCO International, Inc. |
601,000 |
22,988 |
|
|
Halliburton Co. |
710,900 |
34,790 |
|
|
Nabors Industries, Inc. (a) |
173,900 |
9,112 |
|
|
Schlumberger Ltd. (NY Shares) |
188,100 |
15,483 |
|
|
Transocean Sedco Forex, Inc. |
352,300 |
20,654 |
|
|
|
138,825 |
||
|
Oil & Gas - 4.0% |
|||
|
Anadarko Petroleum Corp. |
416,200 |
27,661 |
|
|
Apache Corp. |
696,300 |
41,169 |
|
|
Exxon Mobil Corp. |
1,240,750 |
110,582 |
|
|
TotalFinaElf SA sponsored ADR |
398,000 |
29,228 |
|
|
|
208,640 |
||
|
TOTAL ENERGY |
347,465 |
||
|
FINANCE - 11.3% |
|||
|
Banks - 1.3% |
|||
|
Bank of New York Co., Inc. |
392,100 |
21,982 |
|
|
Bank One Corp. |
558,000 |
21,553 |
|
|
Northern Trust Corp. |
200,800 |
17,846 |
|
|
PNC Financial Services Group, Inc. |
122,200 |
7,943 |
|
|
|
69,324 |
||
|
Credit & Other Finance - 2.6% |
|||
|
American Express Co. |
861,100 |
52,312 |
|
|
Common Stocks - continued |
|||
|
Shares |
Value (Note 1) (000s) |
||
|
FINANCE - continued |
|||
|
Credit & Other Finance - continued |
|||
|
Citigroup, Inc. |
1,337,933 |
$ 72,332 |
|
|
MBNA Corp. |
279,000 |
10,742 |
|
|
|
135,386 |
||
|
Federal Sponsored Credit - 2.2% |
|||
|
Fannie Mae |
1,062,400 |
75,962 |
|
|
Freddie Mac |
714,600 |
38,633 |
|
|
|
114,595 |
||
|
Insurance - 4.2% |
|||
|
AFLAC, Inc. |
411,460 |
26,359 |
|
|
Allmerica Financial Corp. |
106,000 |
6,777 |
|
|
AMBAC Financial Group, Inc. |
823,800 |
60,343 |
|
|
American International Group, Inc. |
461,700 |
44,179 |
|
|
CIGNA Corp. |
335,900 |
35,068 |
|
|
Hartford Financial Services Group, Inc. |
209,000 |
15,244 |
|
|
Marsh & McLennan Companies, Inc. |
34,800 |
4,620 |
|
|
MBIA, Inc. |
104,600 |
7,440 |
|
|
UnumProvident Corp. |
411,600 |
11,216 |
|
|
XL Capital Ltd. Class A |
168,600 |
12,392 |
|
|
|
223,638 |
||
|
Securities Industry - 1.0% |
|||
|
Charles Schwab Corp. |
400,750 |
14,227 |
|
|
Daiwa Securities Group, Inc. |
1,312,000 |
15,368 |
|
|
Morgan Stanley Dean Witter & Co. |
254,350 |
23,257 |
|
|
|
52,852 |
||
|
TOTAL FINANCE |
595,795 |
||
|
HEALTH - 7.7% |
|||
|
Drugs & Pharmaceuticals - 5.0% |
|||
|
Abgenix, Inc. (a) |
200,000 |
16,163 |
|
|
Bristol-Myers Squibb Co. |
476,700 |
27,231 |
|
|
Celgene Corp. (a) |
440,900 |
26,234 |
|
|
Eli Lilly & Co. |
558,600 |
45,316 |
|
|
Genentech, Inc. (a) |
69,800 |
12,961 |
|
|
ImClone Systems, Inc. (a) |
41,100 |
4,811 |
|
|
Merck & Co., Inc. |
285,800 |
21,274 |
|
|
PE Corp. - Celera Genomics Group (a) |
123,100 |
12,264 |
|
|
Pfizer, Inc. |
1,227,925 |
55,180 |
|
|
Common Stocks - continued |
|||
|
Shares |
Value (Note 1) (000s) |
||
|
HEALTH - continued |
|||
|
Drugs & Pharmaceuticals - continued |
|||
|
Protein Design Labs, Inc. (a) |
188,100 |
$ 22,666 |
|
|
Schering-Plough Corp. |
394,700 |
18,354 |
|
|
|
262,454 |
||
|
Medical Equipment & Supplies - 2.3% |
|||
|
Biomet, Inc. |
273,600 |
9,576 |
|
|
Cardinal Health, Inc. |
400,800 |
35,346 |
|
|
Guidant Corp. (a) |
160,400 |
11,338 |
|
|
Johnson & Johnson |
232,700 |
21,859 |
|
|
Medtronic, Inc. |
821,600 |
42,569 |
|
|
|
120,688 |
||
|
Medical Facilities Management - 0.4% |
|||
|
Express Scripts, Inc. Class A (a) |
183,700 |
13,272 |
|
|
HCA - The Healthcare Co. |
209,500 |
7,778 |
|
|
|
21,050 |
||
|
TOTAL HEALTH |
404,192 |
||
|
INDUSTRIAL MACHINERY & EQUIPMENT - 3.8% |
|||
|
Electrical Equipment - 3.0% |
|||
|
General Electric Co. |
2,529,800 |
145,924 |
|
|
Harris Corp. |
364,800 |
10,374 |
|
|
|
156,298 |
||
|
Industrial Machinery & Equipment - 0.8% |
|||
|
Caterpillar, Inc. |
572,000 |
19,305 |
|
|
Tyco International Ltd. |
486,400 |
25,232 |
|
|
|
44,537 |
||
|
TOTAL INDUSTRIAL MACHINERY & EQUIPMENT |
200,835 |
||
|
MEDIA & LEISURE - 3.0% |
|||
|
Broadcasting - 0.4% |
|||
|
Clear Channel Communications, Inc. (a) |
286,170 |
16,169 |
|
|
Grupo Televisa SA de CV sponsored GDR |
104,000 |
6,000 |
|
|
NTL, Inc. warrants 10/14/08 (a) |
5,605 |
95 |
|
|
|
22,264 |
||
|
Entertainment - 1.5% |
|||
|
Mandalay Resort Group (a) |
712,600 |
18,260 |
|
|
MGM Mirage, Inc. |
346,600 |
13,236 |
|
|
Common Stocks - continued |
|||
|
Shares |
Value (Note 1) (000s) |
||
|
MEDIA & LEISURE - continued |
|||
|
Entertainment - continued |
|||
|
Viacom, Inc. Class B (non-vtg.) (a) |
552,443 |
$ 32,318 |
|
|
Walt Disney Co. |
367,500 |
14,057 |
|
|
|
77,871 |
||
|
Lodging & Gaming - 0.3% |
|||
|
Harrah's Entertainment, Inc. (a) |
470,500 |
12,939 |
|
|
Restaurants - 0.8% |
|||
|
Brinker International, Inc. (a) |
369,600 |
11,134 |
|
|
Darden Restaurants, Inc. |
1,528,000 |
31,802 |
|
|
|
42,936 |
||
|
TOTAL MEDIA & LEISURE |
156,010 |
||
|
NONDURABLES - 2.5% |
|||
|
Beverages - 0.1% |
|||
|
The Coca-Cola Co. |
139,350 |
7,682 |
|
|
Foods - 0.3% |
|||
|
Quaker Oats Co. |
178,200 |
14,100 |
|
|
Household Products - 0.8% |
|||
|
Avon Products, Inc. |
630,800 |
25,784 |
|
|
Colgate-Palmolive Co. |
69,900 |
3,299 |
|
|
Gillette Co. |
276,200 |
8,528 |
|
|
Procter & Gamble Co. |
52,200 |
3,497 |
|
|
|
41,108 |
||
|
Tobacco - 1.3% |
|||
|
Philip Morris Companies, Inc. |
2,399,200 |
70,626 |
|
|
TOTAL NONDURABLES |
133,516 |
||
|
RETAIL & WHOLESALE - 3.2% |
|||
|
Drug Stores - 0.7% |
|||
|
Walgreen Co. |
1,033,700 |
39,216 |
|
|
General Merchandise Stores - 1.2% |
|||
|
Costco Wholesale Corp. (a) |
174,200 |
6,086 |
|
|
Dollar Tree Stores, Inc. (a) |
379,700 |
15,402 |
|
|
Wal-Mart Stores, Inc. |
849,100 |
40,863 |
|
|
|
62,351 |
||
|
Common Stocks - continued |
|||
|
Shares |
Value (Note 1) (000s) |
||
|
RETAIL & WHOLESALE - continued |
|||
|
Grocery Stores - 0.4% |
|||
|
Pathmark Stores, Inc. (a) |
662,564 |
$ 8,158 |
|
|
Safeway, Inc. (a) |
330,100 |
15,412 |
|
|
|
23,570 |
||
|
Retail & Wholesale, Miscellaneous - 0.9% |
|||
|
Best Buy Co., Inc. (a) |
449,200 |
28,580 |
|
|
Home Depot, Inc. |
314,200 |
16,672 |
|
|
|
45,252 |
||
|
TOTAL RETAIL & WHOLESALE |
170,389 |
||
|
SERVICES - 0.8% |
|||
|
Advertising - 0.6% |
|||
|
Omnicom Group, Inc. |
386,900 |
28,220 |
|
|
Services - 0.2% |
|||
|
Ecolab, Inc. |
122,000 |
4,400 |
|
|
FreeMarkets, Inc. |
139,600 |
7,975 |
|
|
|
12,375 |
||
|
TOTAL SERVICES |
40,595 |
||
|
TECHNOLOGY - 22.8% |
|||
|
Communications Equipment - 5.4% |
|||
|
Ciena Corp. (a) |
265,200 |
32,570 |
|
|
Cisco Systems, Inc. (a) |
2,208,010 |
121,993 |
|
|
Comverse Technology, Inc. (a) |
667,300 |
72,068 |
|
|
Corning, Inc. |
181,780 |
53,989 |
|
|
Corvis Corp. |
47,900 |
2,924 |
|
|
|
283,544 |
||
|
Computer Services & Software - 6.6% |
|||
|
America Online, Inc. (a) |
1,407,200 |
75,637 |
|
|
Ariba, Inc. (a) |
162,000 |
23,209 |
|
|
Automatic Data Processing, Inc. |
476,100 |
31,839 |
|
|
BEA Systems, Inc. (a) |
227,900 |
17,748 |
|
|
BMC Software, Inc. (a) |
523,900 |
10,020 |
|
|
Cadence Design Systems, Inc. (a) |
286,700 |
7,365 |
|
|
Electronic Data Systems Corp. |
243,700 |
10,114 |
|
|
Exodus Communications, Inc. (a) |
395,180 |
19,512 |
|
|
Inktomi Corp. (a) |
63,000 |
7,182 |
|
|
Internap Network Services Corp. |
231,100 |
7,467 |
|
|
Common Stocks - continued |
|||
|
Shares |
Value (Note 1) (000s) |
||
|
TECHNOLOGY - continued |
|||
|
Computer Services & Software - continued |
|||
|
Intuit, Inc. (a) |
188,100 |
$ 10,722 |
|
|
Microsoft Corp. (a) |
284,700 |
17,171 |
|
|
Oracle Corp. (a) |
588,700 |
46,360 |
|
|
PeopleSoft, Inc. (a) |
368,400 |
10,292 |
|
|
StorageNetworks, Inc. |
57,300 |
5,855 |
|
|
Synopsys, Inc. (a) |
186,680 |
7,071 |
|
|
VA Linux Systems, Inc. |
243,700 |
11,271 |
|
|
VeriSign, Inc. (a) |
58,400 |
11,830 |
|
|
VERITAS Software Corp. (a) |
116,200 |
16,500 |
|
|
|
347,165 |
||
|
Computers & Office Equipment - 5.8% |
|||
|
Brocade Communications Systems, Inc. (a) |
100,360 |
23,685 |
|
|
CacheFlow, Inc. |
46,200 |
6,607 |
|
|
CDW Computer Centers, Inc. (a) |
387,000 |
26,703 |
|
|
Compaq Computer Corp. |
591,000 |
16,300 |
|
|
Dell Computer Corp. (a) |
418,630 |
12,899 |
|
|
EMC Corp. (a) |
767,700 |
76,098 |
|
|
Gateway, Inc. (a) |
328,100 |
15,339 |
|
|
International Business Machines Corp. |
366,200 |
41,198 |
|
|
Juniper Networks, Inc. (a) |
52,300 |
11,450 |
|
|
Maxtor Corp. (a) |
522,100 |
5,482 |
|
|
Network Appliance, Inc. (a) |
62,900 |
8,012 |
|
|
Quantum Corp. - Hard Disk Drive Group (a) |
460,300 |
4,574 |
|
|
Sun Microsystems, Inc. (a) |
202,900 |
23,689 |
|
|
Symbol Technologies, Inc. |
599,500 |
21,545 |
|
|
Tech Data Corp. (a) |
247,000 |
10,559 |
|
|
|
304,140 |
||
|
Electronic Instruments - 1.1% |
|||
|
Beckman Coulter, Inc. |
123,300 |
9,510 |
|
|
KLA-Tencor Corp. (a) |
210,500 |
8,670 |
|
|
PE Corp. - Biosystems Group |
87,200 |
10,159 |
|
|
PerkinElmer, Inc. |
79,900 |
8,340 |
|
|
Thermo Electron Corp. (a) |
721,700 |
18,764 |
|
|
|
55,443 |
||
|
Electronics - 3.9% |
|||
|
Altera Corp. (a) |
107,900 |
5,152 |
|
|
Analog Devices, Inc. (a) |
161,800 |
13,359 |
|
|
Flextronics International Ltd. (a) |
342,700 |
28,144 |
|
|
Intel Corp. |
1,405,800 |
58,429 |
|
|
Common Stocks - continued |
|||
|
Shares |
Value (Note 1) (000s) |
||
|
TECHNOLOGY - continued |
|||
|
Electronics - continued |
|||
|
JDS Uniphase Corp. (a) |
199,100 |
$ 18,852 |
|
|
Linear Technology Corp. |
460,900 |
29,843 |
|
|
Sanmina Corp. (a) |
269,600 |
25,241 |
|
|
Solectron Corp. (a) |
455,600 |
21,015 |
|
|
Xilinx, Inc. (a) |
67,200 |
5,754 |
|
|
|
205,789 |
||
|
TOTAL TECHNOLOGY |
1,196,081 |
||
|
TRANSPORTATION - 1.2% |
|||
|
Air Transportation - 0.4% |
|||
|
SkyWest, Inc. |
91,600 |
4,695 |
|
|
Southwest Airlines Co. |
723,900 |
17,555 |
|
|
|
22,250 |
||
|
Railroads - 0.4% |
|||
|
Union Pacific Corp. |
488,500 |
18,990 |
|
|
Trucking & Freight - 0.4% |
|||
|
C.H. Robinson Worldwide, Inc. |
34,900 |
1,967 |
|
|
Expeditors International of Washington, Inc. |
440,400 |
19,846 |
|
|
|
21,813 |
||
|
TOTAL TRANSPORTATION |
63,053 |
||
|
UTILITIES - 2.6% |
|||
|
Cellular - 1.1% |
|||
|
China Mobile (Hong Kong) Ltd. (a) |
1,515,600 |
9,832 |
|
|
Crown Castle International Corp. (a) |
389,500 |
12,099 |
|
|
Leap Wireless International, Inc. warrants 4/15/10 (a)(g) |
1,100 |
22 |
|
|
McCaw International Ltd. warrants 4/16/07 (a)(g) |
12,170 |
183 |
|
|
Nextel Communications, Inc. Class A (a) |
544,900 |
25,474 |
|
|
Vodafone Group PLC sponsored ADR |
277,400 |
10,264 |
|
|
|
57,874 |
||
|
Electric Utility - 1.1% |
|||
|
AES Corp. (a) |
600,100 |
41,107 |
|
|
Calpine Corp. (a) |
153,800 |
16,053 |
|
|
|
57,160 |
||
|
Telephone Services - 0.4% |
|||
|
Metromedia Fiber Network, Inc. Class A (a) |
503,400 |
12,239 |
|
|
Common Stocks - continued |
|||
|
Shares |
Value (Note 1) (000s) |
||
|
UTILITIES - continued |
|||
|
Telephone Services - continued |
|||
|
Ono Finance PLC rights 5/31/09 (a)(g) |
2,840 |
$ 26 |
|
|
Pathnet, Inc. warrants 4/15/08 (a)(g) |
8,980 |
90 |
|
|
SBC Communications, Inc. |
156,800 |
7,840 |
|
|
|
20,195 |
||
|
TOTAL UTILITIES |
135,229 |
||
|
TOTAL COMMON STOCKS (Cost $3,254,622) |
3,766,148 |
||
|
Preferred Stocks - 1.9% |
|||
|
|
|
|
|
|
Convertible Preferred Stocks - 0.0% |
|||
|
MEDIA & LEISURE - 0.0% |
|||
|
Broadcasting - 0.0% |
|||
|
Earthwatch, Inc. $8.50 (g) |
201,289 |
50 |
|
|
UTILITIES - 0.0% |
|||
|
Telephone Services - 0.0% |
|||
|
Global Crossing Ltd. $17.50 |
12,800 |
2,540 |
|
|
TOTAL CONVERTIBLE PREFERRED STOCKS |
2,590 |
||
|
Nonconvertible Preferred Stocks - 1.9% |
|||
|
CONSTRUCTION & REAL ESTATE - 0.1% |
|||
|
Real Estate Investment Trusts - 0.1% |
|||
|
California Federal Preferred Capital Corp. $2.2812 |
298,366 |
6,564 |
|
|
FINANCE - 0.0% |
|||
|
Insurance - 0.0% |
|||
|
American Annuity Group Capital Trust II 8.875% |
1,800 |
1,749 |
|
|
HEALTH - 0.1% |
|||
|
Medical Facilities Management - 0.1% |
|||
|
Fresenius Medical Care Capital Trust II 7.875% |
3,040 |
2,925 |
|
|
Preferred Stocks - continued |
|||
|
Shares |
Value (Note 1) (000s) |
||
|
Nonconvertible Preferred Stocks - continued |
|||
|
MEDIA & LEISURE - 0.6% |
|||
|
Broadcasting - 0.4% |
|||
|
Adelphia Communications Corp. $13.00 |
22,164 |
$ 2,128 |
|
|
CSC Holdings, Inc. 11.125% pay-in-kind |
179,794 |
19,103 |
|
|
|
21,231 |
||
|
Publishing - 0.2% |
|||
|
PRIMEDIA, Inc.: |
|
|
|
|
$9.20 |
40,737 |
3,605 |
|
|
8.625% |
1,203 |
99 |
|
|
Series D, $10.00 |
41,288 |
3,819 |
|
|
|
7,523 |
||
|
TOTAL MEDIA & LEISURE |
28,754 |
||
|
RETAIL & WHOLESALE - 0.0% |
|||
|
Grocery Stores - 0.0% |
|||
|
Supermarkets General Holdings Corp. $3.52 pay-in-kind |
15,622 |
2 |
|
|
UTILITIES - 1.1% |
|||
|
Cellular - 0.6% |
|||
|
Crown Castle International Corp. 12.75% pay-in-kind |
3,451 |
3,477 |
|
|
Nextel Communications, Inc.: |
|
|
|
|
11.125% pay-in-kind |
26,322 |
25,467 |
|
|
Series D, 13% pay-in-kind |
490 |
518 |
|
|
|
29,462 |
||
|
Telephone Services - 0.5% |
|||
|
Adelphia Business Solution, Inc. 12.875% pay-in-kind |
8,167 |
4,410 |
|
|
Broadwing Communications, Inc. $12.50 pay-in-kind |
2,568 |
2,632 |
|
|
Intermedia Communications, Inc. 13.5% pay-in-kind |
7,894 |
7,578 |
|
|
NEXTLINK Communications, Inc. 14% pay-in-kind |
322,786 |
14,525 |
|
|
|
29,145 |
||
|
TOTAL UTILITIES |
58,607 |
||
|
TOTAL NONCONVERTIBLE PREFERRED STOCKS |
98,601 |
||
|
TOTAL PREFERRED STOCKS (Cost $109,109) |
101,191 |
||
|
Corporate Bonds - 14.6% |
|||||
|
Moody's Ratings (unaudited) (b) |
Principal Amount (000s) |
Value (Note 1) (000s) |
|||
|
Convertible Bonds - 0.5% |
|||||
|
ENERGY - 0.0% |
|||||
|
Energy Services - 0.0% |
|||||
|
Key Energy Group, Inc. 5% 9/15/04 |
B3 |
|
$ 1,485 |
$ 1,240 |
|
|
HEALTH - 0.3% |
|||||
|
Medical Facilities Management - 0.3% |
|||||
|
Tenet Healthcare Corp. 6% 12/1/05 |
B1 |
|
10,345 |
8,793 |
|
|
Total Renal Care Holdings, Inc.: |
|
|
|
|
|
|
7% 5/15/09 |
B3 |
|
860 |
605 |
|
|
7% 5/15/09 (g) |
B3 |
|
4,590 |
3,230 |
|
|
|
12,628 |
||||
|
INDUSTRIAL MACHINERY & EQUIPMENT - 0.0% |
|||||
|
Pollution Control - 0.0% |
|||||
|
Waste Management, Inc. 4% 2/1/02 |
Ba1 |
|
1,380 |
1,294 |
|
|
MEDIA & LEISURE - 0.2% |
|||||
|
Broadcasting - 0.1% |
|||||
|
EchoStar Communications Corp. 4.875% 1/1/07 (g) |
Caa2 |
|
850 |
1,119 |
|
|
NTL Delaware, Inc./NTL, Inc. 5.75% 12/15/09 |
Caa1 |
|
1,460 |
996 |
|
|
NTL, Inc. 5.75% 12/15/09 (g) |
Caa1 |
|
2,910 |
1,986 |
|
|
|
4,101 |
||||
|
Lodging & Gaming - 0.1% |
|||||
|
Hilton Hotels Corp. 5% 5/15/06 |
Ba2 |
|
5,990 |
5,002 |
|
|
TOTAL MEDIA & LEISURE |
9,103 |
||||
|
TOTAL CONVERTIBLE BONDS |
24,265 |
||||
|
Nonconvertible Bonds - 14.1% |
|||||
|
BASIC INDUSTRIES - 0.8% |
|||||
|
Chemicals & Plastics - 0.5% |
|||||
|
Avecia Group PLC 11% 7/1/09 |
B2 |
|
4,065 |
3,933 |
|
|
Huntsman Corp. 9.5% 7/1/07 (g) |
B2 |
|
1,900 |
1,534 |
|
|
Huntsman ICI Chemicals LLC 10.125% 7/1/09 |
B2 |
|
1,890 |
1,852 |
|
|
Lyondell Chemical Co.: |
|
|
|
|
|
|
9.875% 5/1/07 |
Ba3 |
|
8,230 |
8,024 |
|
|
10.875% 5/1/09 |
B2 |
|
7,975 |
7,736 |
|
|
Methanex Corp. yankee 7.4% 8/15/02 |
Ba1 |
|
565 |
528 |
|
|
Corporate Bonds - continued |
|||||
|
Moody's Ratings (unaudited) (b) |
Principal Amount (000s) |
Value (Note 1) (000s) |
|||
|
Nonconvertible Bonds - continued |
|||||
|
BASIC INDUSTRIES - continued |
|||||
|
Chemicals & Plastics - continued |
|||||
|
Scotts Co. 8.625% 1/15/09 (g) |
B2 |
|
$ 2,360 |
$ 2,277 |
|
|
Sterling Chemicals, Inc.: |
|
|
|
|
|
|
11.25% 4/1/07 |
Caa3 |
|
730 |
496 |
|
|
12.375% 7/15/06 |
B3 |
|
190 |
193 |
|
|
|
26,573 |
||||
|
Packaging & Containers - 0.2% |
|||||
|
Gaylord Container Corp.: |
|
|
|
|
|
|
9.375% 6/15/07 |
Caa1 |
|
4,515 |
3,341 |
|
|
9.75% 6/15/07 |
Caa1 |
|
6,735 |
5,119 |
|
|
Packaging Corp. of America 9.625% 4/1/09 |
B1 |
|
1,535 |
1,554 |
|
|
U.S. Can Corp. 12.375% 10/1/10 (g) |
B3 |
|
730 |
737 |
|
|
|
10,751 |
||||
|
Paper & Forest Products - 0.1% |
|||||
|
Doman Industries Ltd.: |
|
|
|
|
|
|
9.25% 11/15/07 |
Caa1 |
|
320 |
192 |
|
|
yankee 8.75% 3/15/04 |
Caa1 |
|
5,100 |
3,366 |
|
|
Potlatch Corp. 6.25% 3/15/02 |
Baa1 |
|
810 |
792 |
|
|
Repap New Brunswick, Inc. yankee 10.625% 4/15/05 |
Caa1 |
|
330 |
340 |
|
|
Stone Container Corp. 10.75% 10/1/02 |
B1 |
|
145 |
147 |
|
|
|
4,837 |
||||
|
TOTAL BASIC INDUSTRIES |
42,161 |
||||
|
CONSTRUCTION & REAL ESTATE - 0.5% |
|||||
|
Building Materials - 0.0% |
|||||
|
Numatics, Inc. 9.625% 4/1/08 |
B3 |
|
885 |
690 |
|
|
Construction - 0.2% |
|||||
|
Blount, Inc. 13% 8/1/09 |
B3 |
|
375 |
380 |
|
|
D.R. Horton, Inc. 8% 2/1/09 |
Ba1 |
|
2,470 |
2,266 |
|
|
Del Webb Corp. 9.375% 5/1/09 |
B2 |
|
1,430 |
1,316 |
|
|
Ryland Group, Inc. 9.75% 9/1/10 |
Ba2 |
|
2,890 |
2,876 |
|
|
Standard Pacific Corp. 9.5% 9/15/10 |
Ba2 |
|
2,890 |
2,861 |
|
|
|
9,699 |
||||
|
Engineering - 0.1% |
|||||
|
360networks, Inc. 13% 5/1/08 |
B3 |
|
1,025 |
943 |
|
|
Corporate Bonds - continued |
|||||
|
Moody's Ratings (unaudited) (b) |
Principal Amount (000s) |
Value (Note 1) (000s) |
|||
|
Nonconvertible Bonds - continued |
|||||
|
CONSTRUCTION & REAL ESTATE - continued |
|||||
|
Engineering - continued |
|||||
|
Anteon Corp. 12% 5/15/09 |
B3 |
|
$ 3,130 |
$ 2,817 |
|
|
Morrison Knudsen Corp. 11% 7/1/10 (g) |
Ba2 |
|
2,975 |
3,020 |
|
|
|
6,780 |
||||
|
Real Estate - 0.1% |
|||||
|
Duke-Weeks Realty LP 6.875% 3/15/05 |
Baa2 |
|
1,000 |
972 |
|
|
LNR Property Corp.: |
|
|
|
|
|
|
9.375% 3/15/08 |
B1 |
|
4,715 |
4,409 |
|
|
10.5% 1/15/09 |
B1 |
|
1,840 |
1,794 |
|
|
|
7,175 |
||||
|
Real Estate Investment Trusts - 0.1% |
|||||
|
CenterPoint Properties Trust: |
|
|
|
|
|
|
6.75% 4/1/05 |
Baa2 |
|
530 |
503 |
|
|
7.125% 3/15/04 |
Baa2 |
|
1,030 |
1,002 |
|
|
Equity Office Properties Trust: |
|
|
|
|
|
|
6.375% 2/15/03 |
Baa1 |
|
1,200 |
1,174 |
|
|
6.75% 2/15/08 |
Baa1 |
|
570 |
533 |
|
|
Pinnacle Holdings, Inc. 0% 3/15/08 (e) |
B3 |
|
750 |
548 |
|
|
|
3,760 |
||||
|
TOTAL CONSTRUCTION & REAL ESTATE |
28,104 |
||||
|
DURABLES - 0.2% |
|||||
|
Autos, Tires, & Accessories - 0.1% |
|||||
|
American Axle & Manufacturing, Inc. 9.75% 3/1/09 |
B1 |
|
1,460 |
1,431 |
|
|
Collins & Aikman Products Co. 11.5% 4/15/06 |
B2 |
|
295 |
282 |
|
|
Daimler-Chrysler North America Holding Corp. 8% 6/15/10 |
A1 |
|
2,180 |
2,241 |
|
|
Lear Corp. 8.11% 5/15/09 |
Ba1 |
|
1,165 |
1,086 |
|
|
TRW, Inc. 8.75% 5/15/06 |
Baa1 |
|
960 |
1,000 |
|
|
|
6,040 |
||||
|
Textiles & Apparel - 0.1% |
|||||
|
Jones Apparel Group, Inc. 7.875% 6/15/06 |
Baa2 |
|
1,270 |
1,189 |
|
|
Levi Strauss & Co.: |
|
|
|
|
|
|
6.8% 11/1/03 |
Ba3 |
|
1,640 |
1,394 |
|
|
Corporate Bonds - continued |
|||||
|
Moody's Ratings (unaudited) (b) |
Principal Amount (000s) |
Value (Note 1) (000s) |
|||
|
Nonconvertible Bonds - continued |
|||||
|
DURABLES - continued |
|||||
|
Textiles & Apparel - continued |
|||||
|
Levi Strauss & Co.: - continued |
|
|
|
|
|
|
7% 11/1/06 |
Ba3 |
|
$ 865 |
$ 675 |
|
|
Tommy Hilfiger USA, Inc. 6.5% 6/1/03 |
Ba1 |
|
1,515 |
1,227 |
|
|
|
4,485 |
||||
|
TOTAL DURABLES |
10,525 |
||||
|
ENERGY - 0.8% |
|||||
|
Coal - 0.1% |
|||||
|
P&L Coal Holdings Corp. 9.625% 5/15/08 |
B2 |
|
4,735 |
4,605 |
|
|
Energy Services - 0.2% |
|||||
|
DI Industries, Inc. 8.875% 7/1/07 |
B1 |
|
2,085 |
2,012 |
|
|
Ocean Rig Norway AS 10.25% 6/1/08 |
B3 |
|
1,445 |
1,272 |
|
|
Parker Drilling Co. 9.75% 11/15/06 |
B1 |
|
2,240 |
2,262 |
|
|
Pride Petroleum Services, Inc. 9.375% 5/1/07 |
Ba3 |
|
930 |
944 |
|
|
R&B Falcon Corp. 6.5% 4/15/03 |
Ba3 |
|
2,890 |
2,746 |
|
|
RBF Finance Co. 11% 3/15/06 |
Ba3 |
|
2,160 |
2,484 |
|
|
|
11,720 |
||||
|
Oil & Gas - 0.5% |
|||||
|
Apache Corp. 7.625% 7/1/19 |
Baa1 |
|
750 |
739 |
|
|
Canadian Forest Oil Ltd. 8.75% 9/15/07 |
B2 |
|
1,425 |
1,382 |
|
|
Chesapeake Energy Corp. 9.625% 5/1/05 |
B2 |
|
7,420 |
7,383 |
|
|
Cross Timbers Oil Co.: |
|
|
|
|
|
|
8.75% 11/1/09 |
B2 |
|
4,180 |
4,076 |
|
|
9.25% 4/1/07 |
B2 |
|
2,315 |
2,315 |
|
|
Occidental Petroleum Corp. 6.39% 11/9/00 |
Baa3 |
|
500 |
499 |
|
|
Oryx Energy Co.: |
|
|
|
|
|
|
8% 10/15/03 |
Baa1 |
|
895 |
911 |
|
|
8.125% 10/15/05 |
Baa1 |
|
1,305 |
1,356 |
|
|
8.375% 7/15/04 |
Baa1 |
|
1,700 |
1,762 |
|
|
Petro-Canada 7% 11/15/28 |
A3 |
|
520 |
464 |
|
|
Phillips Petroleum Co. 8.75% 5/25/10 |
Baa2 |
|
545 |
592 |
|
|
Pioneer Natural Resources Co. 9.625% 4/1/10 |
Ba2 |
|
680 |
717 |
|
|
Corporate Bonds - continued |
|||||
|
Moody's Ratings (unaudited) (b) |
Principal Amount (000s) |
Value (Note 1) (000s) |
|||
|
Nonconvertible Bonds - continued |
|||||
|
ENERGY - continued |
|||||
|
Oil & Gas - continued |
|||||
|
Plains Resources, Inc.: |
|
|
|
|
|
|
Series B 10.25% 3/15/06 |
B2 |
|
$ 685 |
$ 700 |
|
|
10.25% 3/15/06 (g) |
B2 |
|
470 |
478 |
|
|
|
23,374 |
||||
|
TOTAL ENERGY |
39,699 |
||||
|
FINANCE - 0.8% |
|||||
|
Banks - 0.2% |
|||||
|
Bank of America Corp. 7.8% 2/15/10 |
Aa3 |
|
500 |
513 |
|
|
Bank of Tokyo-Mitsubishi Ltd. 8.4% 4/15/10 |
A3 |
|
920 |
937 |
|
|
Bank One Capital III 8.75% 9/1/30 |
Aa3 |
|
700 |
698 |
|
|
Bank One Corp. 7.875% 8/1/10 |
A1 |
|
2,050 |
2,080 |
|
|
BankBoston Corp. 6.625% 2/1/04 |
A3 |
|
600 |
590 |
|
|
Capital One Bank: |
|
|
|
|
|
|
6.375% 2/15/03 |
Baa2 |
|
1,240 |
1,209 |
|
|
6.65% 3/15/04 |
Baa3 |
|
2,550 |
2,465 |
|
|
Capital One Financial Corp. 7.125% 8/1/08 |
Baa3 |
|
1,150 |
1,082 |
|
|
Commonwealth Bank of Australia 8.5% 6/1/10 |
A1 |
|
500 |
529 |
|
|
Den Danske Bank AS 6.375% 6/15/08 (g)(j) |
A1 |
|
1,590 |
1,491 |
|
|
Korea Development Bank: |
|
|
|
|
|
|
6.625% 11/21/03 |
Baa2 |
|
875 |
852 |
|
|
7.125% 4/22/04 |
Baa2 |
|
150 |
148 |
|
|
7.375% 9/17/04 |
Baa2 |
|
130 |
129 |
|
|
Royal Bank of Scotland Group PLC 9.118% 3/31/49 |
A1 |
|
495 |
520 |
|
|
Summit Bancorp 8.625% 12/10/02 |
A3 |
|
650 |
666 |
|
|
|
13,909 |
||||
|
Credit & Other Finance - 0.5% |
|||||
|
Ahmanson Capital Trust I 8.36% 12/1/26 (g) |
A3 |
|
800 |
704 |
|
|
Associates Corp. of North America 5.8% 4/20/04 |
A1 |
|
3,250 |
3,130 |
|
|
CIT Group, Inc. 5.5% 2/15/04 |
A1 |
|
160 |
152 |
|
|
Countrywide Funding Corp. 6.45% 2/27/03 |
A3 |
|
1,300 |
1,280 |
|
|
Denbury Management, Inc. 9% 3/1/08 |
B3 |
|
2,285 |
2,091 |
|
|
Details Capital Corp. 0% 11/15/07 (e) |
Caa1 |
|
810 |
640 |
|
|
ERP Operating LP: |
|
|
|
|
|
|
6.55% 11/15/01 |
A3 |
|
600 |
595 |
|
|
Corporate Bonds - continued |
|||||
|
Moody's Ratings (unaudited) (b) |
Principal Amount (000s) |
Value (Note 1) (000s) |
|||
|
Nonconvertible Bonds - continued |
|||||
|
FINANCE - continued |
|||||
|
Credit & Other Finance - continued |
|||||
|
ERP Operating LP: - continued |
|
|
|
|
|
|
7.1% 6/23/04 |
A3 |
|
$ 1,000 |
$ 987 |
|
|
Finova Capital Corp. 7.25% 11/8/04 |
Ba1 |
|
270 |
200 |
|
|
First Security Capital I 8.41% 12/15/26 |
A3 |
|
850 |
782 |
|
|
Ford Motor Credit Co.: |
|
|
|
|
|
|
7.5% 3/15/05 |
A2 |
|
1,250 |
1,260 |
|
|
7.875% 6/15/10 |
A2 |
|
1,810 |
1,829 |
|
|
GS Escrow Corp.: |
|
|
|
|
|
|
7% 8/1/03 |
Ba1 |
|
2,935 |
2,810 |
|
|
7.125% 8/1/05 |
Ba1 |
|
190 |
177 |
|
|
HSBC Capital Funding LP 10.176% 12/31/49 (f)(g) |
A1 |
|
570 |
628 |
|
|
Macsaver Financial Services, Inc.: |
|
|
|
|
|
|
7.4% 2/15/02 (d) |
Ca |
|
2,330 |
396 |
|
|
7.6% 8/1/07 (d) |
Ca |
|
6,630 |
1,127 |
|
|
7.875% 8/1/03 (d) |
Ca |
|
1,110 |
189 |
|
|
Newcourt Credit Group, Inc. 6.875% 2/16/05 |
A1 |
|
330 |
325 |
|
|
Qwest Capital Funding, Inc. 7.75% 8/15/06 (g) |
Baa1 |
|
1,600 |
1,622 |
|
|
Sprint Capital Corp. 5.7% 11/15/03 |
Baa1 |
|
430 |
411 |
|
|
The Money Store, Inc. 7.3% 12/1/02 |
A2 |
|
850 |
856 |
|
|
Triton Energy Ltd./Triton Energy Corp. 9.25% 4/15/05 |
Ba3 |
|
500 |
500 |
|
|
TXU Eastern Funding: |
|
|
|
|
|
|
6.15% 5/15/02 |
Baa1 |
|
590 |
577 |
|
|
6.75% 5/15/09 |
Baa1 |
|
1,115 |
1,010 |
|
|
U.S. West Capital Funding, Inc. 6.875% 7/15/28 |
Baa1 |
|
870 |
778 |
|
|
|
25,056 |
||||
|
Savings & Loans - 0.1% |
|||||
|
Chevy Chase Savings Bank FSB 9.25% 12/1/08 |
B1 |
|
1,020 |
941 |
|
|
Home Savings of America FSB 6.5% 8/15/04 |
A3 |
|
970 |
937 |
|
|
Long Island Savings Bank FSB 7% 6/13/02 |
Baa3 |
|
650 |
643 |
|
|
Sovereign Bancorp, Inc. 6.625% 3/15/01 |
Ba3 |
|
1,000 |
991 |
|
|
|
3,512 |
||||
|
Securities Industry - 0.0% |
|||||
|
Amvescap PLC yankee 6.375% 5/15/03 |
A3 |
|
1,650 |
1,599 |
|
|
TOTAL FINANCE |
44,076 |
||||
|
Corporate Bonds - continued |
|||||
|
Moody's Ratings (unaudited) (b) |
Principal Amount (000s) |
Value (Note 1) (000s) |
|||
|
Nonconvertible Bonds - continued |
|||||
|
HEALTH - 0.1% |
|||||
|
Drugs & Pharmaceuticals - 0.0% |
|||||
|
Chattem, Inc. 8.875% 4/1/08 |
B2 |
|
$ 1,545 |
$ 1,298 |
|
|
Medical Equipment & Supplies - 0.0% |
|||||
|
Millipore Corp. 7.5% 4/1/07 |
Ba2 |
|
290 |
268 |
|
|
Medical Facilities Management - 0.1% |
|||||
|
Express Scripts, Inc. 9.625% 6/15/09 |
Ba2 |
|
290 |
294 |
|
|
Tenet Healthcare Corp. 8.625% 1/15/07 |
Ba3 |
|
805 |
797 |
|
|
Triad Hospitals Holdings, Inc. 11% 5/15/09 |
B3 |
|
575 |
593 |
|
|
Unilab Corp. 12.75% 10/1/09 |
B3 |
|
2,245 |
2,430 |
|
|
|
4,114 |
||||
|
TOTAL HEALTH |
5,680 |
||||
|
INDUSTRIAL MACHINERY & EQUIPMENT - 0.6% |
|||||
|
Electrical Equipment - 0.0% |
|||||
|
Loral Space & Communications Ltd. 9.5% 1/15/06 |
B1 |
|
1,450 |
1,030 |
|
|
Industrial Machinery & Equipment - 0.2% |
|||||
|
Dunlop Standard Aero Holdings PLC 11.875% 5/15/09 |
B3 |
|
4,860 |
5,018 |
|
|
Roller Bearing Holding, Inc. 0% 6/15/09 (e)(g) |
- |
|
4,780 |
2,492 |
|
|
Tyco International Group SA: |
|
|
|
|
|
|
7% 6/15/28 |
Baa1 |
|
2,590 |
2,276 |
|
|
yankee 6.375% 6/15/05 |
Baa1 |
|
315 |
306 |
|
|
|
10,092 |
||||
|
Pollution Control - 0.4% |
|||||
|
Allied Waste North America, Inc.: |
|
|
|
|
|
|
7.375% 1/1/04 |
Ba3 |
|
2,060 |
1,906 |
|
|
7.625% 1/1/06 |
Ba2 |
|
1,795 |
1,598 |
|
|
10% 8/1/09 |
B2 |
|
17,835 |
15,427 |
|
|
Browning-Ferris Industries, Inc. 6.375% 1/15/08 |
Ba3 |
|
1,970 |
1,596 |
|
|
Envirosource, Inc. Series B, 9.75% 6/15/03 |
Caa3 |
|
70 |
25 |
|
|
WMX Technologies, Inc. 6.25% 10/15/00 |
Ba1 |
|
700 |
699 |
|
|
|
21,251 |
||||
|
TOTAL INDUSTRIAL MACHINERY & EQUIPMENT |
32,373 |
||||
|
Corporate Bonds - continued |
|||||
|
Moody's Ratings (unaudited) (b) |
Principal Amount (000s) |
Value (Note 1) (000s) |
|||
|
Nonconvertible Bonds - continued |
|||||
|
MEDIA & LEISURE - 4.4% |
|||||
|
Broadcasting - 3.3% |
|||||
|
ACME Television LLC/ACME Financial Corp. 10.875% 9/30/04 |
B3 |
|
$ 2,980 |
$ 2,816 |
|
|
Adelphia Communications Corp. 9.875% 3/1/07 |
B2 |
|
6,320 |
5,972 |
|
|
AMFM Operating, Inc. 12.625% 10/31/06 pay-in-kind |
- |
|
2,931 |
3,363 |
|
|
Ascent Entertainment Group, Inc. 0% 12/15/04 (e) |
Ba1 |
|
4,800 |
3,912 |
|
|
British Sky Broadcasting Group PLC: |
|
|
|
|
|
|
7.3% 10/15/06 |
Ba1 |
|
2,885 |
2,649 |
|
|
8.2% 7/15/09 |
Baa3 |
|
1,970 |
1,871 |
|
|
Callahan Nordrhein Westfalen: |
|
|
|
|
|
|
0% 7/15/10 (e)(g) |
B3 |
|
3,200 |
1,472 |
|
|
14% 7/15/10 (g) |
B3 |
|
1,455 |
1,448 |
|
|
CD Radio, Inc. 14.5% 5/15/09 |
CCC+ |
|
1,460 |
1,303 |
|
|
Century Communications Corp. Series B, 0% 1/15/08 |
B2 |
|
4,820 |
1,952 |
|
|
Charter Communications Holdings LLC/Charter Communications Holdings Capital Corp.: |
|
|
|
|
|
|
8.25% 4/1/07 |
B2 |
|
2,450 |
2,230 |
|
|
8.625% 4/1/09 |
B2 |
|
1,405 |
1,261 |
|
|
10% 4/1/09 |
B2 |
|
9,800 |
9,604 |
|
|
Citadel Broadcasting Co. 10.25% 7/1/07 |
B3 |
|
4,160 |
4,316 |
|
|
Clear Channel Communications, Inc. 6.875% 6/15/18 |
Baa3 |
|
2,870 |
2,514 |
|
|
Comcast UK Cable Partners Ltd. 0% 11/15/07 (e) |
B2 |
|
6,330 |
5,950 |
|
|
CSC Holdings, Inc.: |
|
|
|
|
|
|
9.25% 11/1/05 |
Ba3 |
|
1,710 |
1,710 |
|
|
9.875% 5/15/06 |
Ba3 |
|
3,220 |
3,268 |
|
|
9.875% 4/1/23 |
B1 |
|
1,435 |
1,471 |
|
|
10.5% 5/15/16 |
Ba3 |
|
2,980 |
3,166 |
|
|
Diamond Cable Communications PLC: |
|
|
|
|
|
|
0% 2/15/07 (e) |
B2 |
|
10,110 |
7,759 |
|
|
yankee 0% 12/15/05 (e) |
B2 |
|
3,950 |
3,693 |
|
|
Earthwatch, Inc. 0% 7/15/07 (e) |
- |
|
4,100 |
2,296 |
|
|
EchoStar DBS Corp.: |
|
|
|
|
|
|
9.25% 2/1/06 |
B1 |
|
8,530 |
8,381 |
|
|
9.375% 2/1/09 |
B1 |
|
260 |
255 |
|
|
Corporate Bonds - continued |
|||||
|
Moody's Ratings (unaudited) (b) |
Principal Amount (000s) |
Value (Note 1) (000s) |
|||
|
Nonconvertible Bonds - continued |
|||||
|
MEDIA & LEISURE - continued |
|||||
|
Broadcasting - continued |
|||||
|
Fox Family Worldwide, Inc. 0% 11/1/07 (e) |
B1 |
|
$ 2,025 |
$ 1,448 |
|
|
FrontierVision Holdings LP/FrontierVision Holdings Capital Corp. 0% 9/15/07 (e) |
B2 |
|
6,301 |
5,450 |
|
|
FrontierVision Operating Partners LP/ FrontierVision Capital Corp. 11% 10/15/06 |
B2 |
|
8,282 |
8,365 |
|
|
Golden Sky DBS, Inc. 0% 3/1/07 (e) |
Caa1 |
|
5,500 |
3,905 |
|
|
Golden Sky Systems, Inc. 12.375% 8/1/06 |
B3 |
|
3,055 |
3,345 |
|
|
Hearst-Argyle Television, Inc. 7.5% 11/15/27 |
Baa3 |
|
1,810 |
1,574 |
|
|
International Cabletel, Inc. 0% 2/1/06 (e) |
B2 |
|
3,000 |
2,805 |
|
|
Knology Holding, Inc. 0% 10/15/07 (e) |
- |
|
7,290 |
2,770 |
|
|
LodgeNet Entertainment Corp. 10.25% 12/15/06 |
B1 |
|
620 |
608 |
|
|
NTL Communications Corp. 11.5% 10/1/08 |
B3 |
|
1,090 |
1,060 |
|
|
Olympus Communications LP/Olympus Capital Corp. 10.625% 11/15/06 |
B2 |
|
6,550 |
6,468 |
|
|
Pegasus Communications Corp. 9.625% 10/15/05 |
B3 |
|
1,720 |
1,677 |
|
|
Satelites Mexicanos SA de CV 11.28% 6/30/04 (g)(j) |
B1 |
|
655 |
590 |
|
|
Spectrasite Holdings, Inc.: |
|
|
|
|
|
|
0% 3/15/10 (e) |
B3 |
|
5,250 |
2,651 |
|
|
10.75% 3/15/10 |
B3 |
|
745 |
700 |
|
|
TCI Communications, Inc. 9.8% 2/1/12 |
A2 |
|
1,790 |
2,041 |
|
|
Telemundo Holdings, Inc. 0% 8/15/08 (e) |
Caa1 |
|
2,255 |
1,607 |
|
|
Telewest PLC 0% 10/1/07 (e) |
B1 |
|
15,850 |
15,216 |
|
|
Time Warner, Inc. 9.125% 1/15/13 |
Baa3 |
|
1,595 |
1,789 |
|
|
United International Holdings, Inc. 0% 2/15/08 (e) |
B3 |
|
14,220 |
9,527 |
|
|
United Pan-Europe Communications NV: |
|
|
|
|
|
|
0% 2/1/10 (e) |
B2 |
|
17,875 |
8,223 |
|
|
10.875% 8/1/09 |
B2 |
|
8,824 |
7,677 |
|
|
USA Networks, Inc./USANi LLC 6.75% 11/15/05 |
Baa3 |
|
335 |
327 |
|
|
|
174,455 |
||||
|
Entertainment - 0.3% |
|||||
|
Alliance Gaming Corp. 10% 8/1/07 |
Caa1 |
|
1,440 |
792 |
|
|
Bally Total Fitness Holding Corp. 9.875% 10/15/07 |
B3 |
|
5,210 |
4,936 |
|
|
Corporate Bonds - continued |
|||||
|
Moody's Ratings (unaudited) (b) |
Principal Amount (000s) |
Value (Note 1) (000s) |
|||
|
Nonconvertible Bonds - continued |
|||||
|
MEDIA & LEISURE - continued |
|||||
|
Entertainment - continued |
|||||
|
Mandalay Resort Group: |
|
|
|
|
|
|
9.5% 8/1/08 (g) |
Ba2 |
|
$ 940 |
$ 956 |
|
|
10.25% 8/1/07 (g) |
Ba3 |
|
3,530 |
3,636 |
|
|
MGM Mirage, Inc. 9.75% 6/1/07 |
Ba2 |
|
3,355 |
3,464 |
|
|
Paramount Communications, Inc. 7.5% 1/15/02 |
Baa1 |
|
600 |
600 |
|
|
Premier Parks, Inc. 9.75% 6/15/07 |
B3 |
|
2,105 |
1,984 |
|
|
|
16,368 |
||||
|
Lodging & Gaming - 0.4% |
|||||
|
Coast Hotels & Casinos, Inc. 9.5% 4/1/09 |
B3 |
|
585 |
579 |
|
|
Courtyard by Marriott II LP/Courtyard II Finance Co. 10.75% 2/1/08 |
B- |
|
5,010 |
5,010 |
|
|
HMH Properties, Inc. 7.875% 8/1/05 |
Ba2 |
|
3,340 |
3,156 |
|
|
Hollywood Casino Shreveport/Shreveport Capital Corp. 13% 8/1/06 |
B3 |
|
1,445 |
1,550 |
|
|
Horseshoe Gaming LLC 8.625% 5/15/09 |
B2 |
|
1,465 |
1,443 |
|
|
Host Marriott LP 8.375% 2/15/06 |
Ba2 |
|
5,990 |
5,750 |
|
|
ITT Corp. 7.375% 11/15/15 |
Ba1 |
|
400 |
344 |
|
|
Mohegan Tribal Gaming Authority 8.75% 1/1/09 |
Ba3 |
|
1,600 |
1,588 |
|
|
Station Casinos, Inc. 10.125% 3/15/06 |
B1 |
|
1,015 |
1,015 |
|
|
|
20,435 |
||||
|
Publishing - 0.3% |
|||||
|
Garden State Newspapers, Inc. Series B, 8.75% 10/1/09 |
B1 |
|
5,830 |
5,458 |
|
|
News America Holdings, Inc.: |
|
|
|
|
|
|
7.7% 10/30/25 |
Baa3 |
|
1,150 |
1,058 |
|
|
7.75% 1/20/24 |
Baa3 |
|
680 |
627 |
|
|
8% 10/17/16 |
Baa3 |
|
720 |
694 |
|
|
Time Warner Entertainment Co. LP 8.375% 3/15/23 |
Baa2 |
|
2,880 |
2,956 |
|
|
Ziff Davis Media, Inc. 12% 7/15/10 (g) |
B2 |
|
1,910 |
1,891 |
|
|
|
12,684 |
||||
|
Restaurants - 0.1% |
|||||
|
AFC Enterprises, Inc. 10.25% 5/15/07 |
B3 |
|
290 |
289 |
|
|
Corporate Bonds - continued |
|||||
|
Moody's Ratings (unaudited) (b) |
Principal Amount (000s) |
Value (Note 1) (000s) |
|||
|
Nonconvertible Bonds - continued |
|||||
|
MEDIA & LEISURE - continued |
|||||
|
Restaurants - continued |
|||||
|
Domino's, Inc. 10.375% 1/15/09 |
B3 |
|
$ 3,410 |
$ 3,248 |
|
|
NE Restaurant, Inc. 10.75% 7/15/08 |
B3 |
|
4,040 |
3,111 |
|
|
|
6,648 |
||||
|
TOTAL MEDIA & LEISURE |
230,590 |
||||
|
NONDURABLES - 0.2% |
|||||
|
Beverages - 0.1% |
|||||
|
Canandaigua Brands, Inc. 8.5% 3/1/09 |
B1 |
|
1,450 |
1,419 |
|
|
Canandaigua Brands, Inc. 8.75% 12/15/03 |
B1 |
|
880 |
878 |
|
|
Seagram JE & Sons, Inc.: |
|
|
|
|
|
|
6.4% 12/15/03 |
Baa3 |
|
1,180 |
1,156 |
|
|
6.8% 12/15/08 |
Baa3 |
|
940 |
911 |
|
|
|
4,364 |
||||
|
Foods - 0.0% |
|||||
|
ConAgra, Inc. 7.125% 10/1/26 |
Baa1 |
|
1,280 |
1,257 |
|
|
Del Monte Corp. 12.25% 4/15/07 |
B3 |
|
145 |
154 |
|
|
|
1,411 |
||||
|
Tobacco - 0.1% |
|||||
|
Philip Morris Companies, Inc.: |
|
|
|
|
|
|
7% 7/15/05 |
A2 |
|
600 |
581 |
|
|
7.25% 9/15/01 |
A2 |
|
540 |
536 |
|
|
RJ Reynolds Tobacco Holdings, Inc. 7.375% 5/15/03 |
Baa2 |
|
900 |
853 |
|
|
|
1,970 |
||||
|
TOTAL NONDURABLES |
7,745 |
||||
|
RETAIL & WHOLESALE - 0.2% |
|||||
|
Drug Stores - 0.0% |
|||||
|
Rite Aid Corp.: |
|
|
|
|
|
|
6.5% 12/15/05 (g) |
Caa1 |
|
990 |
337 |
|
|
7.125% 1/15/07 |
Caa1 |
|
210 |
69 |
|
|
10.5% 9/15/02 (g) |
- |
|
110 |
72 |
|
|
|
478 |
||||
|
General Merchandise Stores - 0.2% |
|||||
|
Dayton Hudson Corp. 7.5% 7/15/06 |
A2 |
|
1,000 |
1,014 |
|
|
Corporate Bonds - continued |
|||||
|
Moody's Ratings (unaudited) (b) |
Principal Amount (000s) |
Value (Note 1) (000s) |
|||
|
Nonconvertible Bonds - continued |
|||||
|
RETAIL & WHOLESALE - continued |
|||||
|
General Merchandise Stores - continued |
|||||
|
Federated Department Stores, Inc.: |
|
|
|
|
|
|
6.79% 7/15/27 |
Baa1 |
|
$ 1,100 |
$ 1,061 |
|
|
8.5% 6/15/03 |
Baa1 |
|
520 |
531 |
|
|
JCPenney Co., Inc. 7.6% 4/1/07 |
Baa2 |
|
575 |
474 |
|
|
Kmart Corp. 12.5% 3/1/05 |
Baa3 |
|
4,240 |
4,198 |
|
|
|
7,278 |
||||
|
TOTAL RETAIL & WHOLESALE |
7,756 |
||||
|
SERVICES - 0.2% |
|||||
|
Leasing & Rental - 0.0% |
|||||
|
United Rentals, Inc.: |
|
|
|
|
|
|
8.8% 8/15/08 |
B1 |
|
1,205 |
1,051 |
|
|
9.25% 1/15/09 |
B1 |
|
885 |
823 |
|
|
|
1,874 |
||||
|
Printing - 0.1% |
|||||
|
American Color Graphics, Inc. 12.75% 8/1/05 |
Caa1 |
|
1,830 |
1,812 |
|
|
World Color Press, Inc. 7.75% 2/15/09 |
Baa3 |
|
3,210 |
2,993 |
|
|
|
4,805 |
||||
|
Services - 0.1% |
|||||
|
Iron Mountain, Inc. 8.75% 9/30/09 |
B2 |
|
660 |
627 |
|
|
La Petite Academy, Inc./La Petite Academy Holding Co. 10% 5/15/08 |
B3 |
|
4,570 |
2,879 |
|
|
|
3,506 |
||||
|
TOTAL SERVICES |
10,185 |
||||
|
TECHNOLOGY - 1.1% |
|||||
|
Computer Services & Software - 0.5% |
|||||
|
Amazon.com, Inc. 0% 5/1/08 (e) |
Caa1 |
|
5,385 |
2,908 |
|
|
Concentric Network Corp. 12.75% 12/15/07 |
B |
|
935 |
944 |
|
|
Covad Communications Group, Inc.: |
|
|
|
|
|
|
0% 3/15/08 (e) |
B3 |
|
4,830 |
2,174 |
|
|
12% 2/15/10 |
B3 |
|
2,030 |
1,482 |
|
|
Exodus Communications, Inc. 10.75% 12/15/09 |
B3 |
|
1,860 |
1,795 |
|
|
Federal Data Corp. 10.125% 8/1/05 |
B3 |
|
5,080 |
5,283 |
|
|
PSINet, Inc.: |
|
|
|
|
|
|
10% 2/15/05 |
B3 |
|
155 |
99 |
|
|
Corporate Bonds - continued |
|||||
|
Moody's Ratings (unaudited) (b) |
Principal Amount (000s) |
Value (Note 1) (000s) |
|||
|
Nonconvertible Bonds - continued |
|||||
|
TECHNOLOGY - continued |
|||||
|
Computer Services & Software - continued |
|||||
|
PSINet, Inc.: - continued |
|
|
|
|
|
|
10.5% 12/1/06 |
B3 |
|
$ 13,720 |
$ 8,781 |
|
|
11% 8/1/09 |
B3 |
|
645 |
413 |
|
|
Unisys Corp. 11.75% 10/15/04 |
Ba1 |
|
2,890 |
3,042 |
|
|
|
26,921 |
||||
|
Computers & Office Equipment - 0.1% |
|||||
|
Comdisco, Inc.: |
|
|
|
|
|
|
6.375% 11/30/01 |
Baa1 |
|
800 |
773 |
|
|
7.25% 9/1/02 |
Baa1 |
|
1,750 |
1,683 |
|
|
Compaq Computer Corp. 7.45% 8/1/02 |
Baa2 |
|
1,100 |
1,103 |
|
|
Globix Corp. 12.5% 2/1/10 |
B- |
|
6,300 |
4,473 |
|
|
|
8,032 |
||||
|
Electronic Instruments - 0.1% |
|||||
|
Fisher Scientific International, Inc. 9% 2/1/08 |
B3 |
|
2,880 |
2,657 |
|
|
Telecommunications Techniques Co. LLC 9.75% 5/15/08 |
B3 |
|
1,460 |
1,365 |
|
|
|
4,022 |
||||
|
Electronics - 0.4% |
|||||
|
ChipPAC International Ltd. 12.75% 8/1/09 |
B3 |
|
6,330 |
6,647 |
|
|
Details, Inc. 10% 11/15/05 |
B3 |
|
825 |
809 |
|
|
Fairchild Semiconductor Corp.: |
|
|
|
|
|
|
10.125% 3/15/07 |
B2 |
|
580 |
580 |
|
|
10.375% 10/1/07 |
B2 |
|
2,000 |
2,020 |
|
|
Flextronics International Ltd. 9.875% 7/1/10 (g) |
Ba3 |
|
2,225 |
2,281 |
|
|
Micron Technology, Inc. 6.5% 9/30/05 (l) |
B3 |
|
3,000 |
2,550 |
|
|
Viasystems, Inc. 9.75% 6/1/07 |
B3 |
|
4,805 |
4,517 |
|
|
|
19,404 |
||||
|
TOTAL TECHNOLOGY |
58,379 |
||||
|
TRANSPORTATION - 0.5% |
|||||
|
Air Transportation - 0.2% |
|||||
|
Atlas Air, Inc. 9.25% 4/15/08 |
B1 |
|
7,020 |
6,932 |
|
|
Continental Airlines, Inc. pass thru trust certificates: |
|
|
|
|
|
|
7.434% 3/15/06 |
Baa1 |
|
280 |
276 |
|
|
7.73% 9/15/12 |
Baa1 |
|
102 |
100 |
|
|
Corporate Bonds - continued |
|||||
|
Moody's Ratings (unaudited) (b) |
Principal Amount (000s) |
Value (Note 1) (000s) |
|||
|
Nonconvertible Bonds - continued |
|||||
|
TRANSPORTATION - continued |
|||||
|
Air Transportation - continued |
|||||
|
Delta Air Lines, Inc. 8.3% 12/15/29 |
Baa3 |
|
$ 1,450 |
$ 1,311 |
|
|
Qantas Airways Ltd. 7.75% 6/15/09 (g) |
Baa1 |
|
1,090 |
1,093 |
|
|
US Airways Group, Inc. 10.375% 3/1/13 |
Ba3 |
|
3,340 |
3,031 |
|
|
|
12,743 |
||||
|
Railroads - 0.2% |
|||||
|
Canadian National Railway Co. 6.9% 7/15/28 |
Baa2 |
|
1,000 |
866 |
|
|
CSX Corp.: |
|
|
|
|
|
|
6.25% 10/15/08 |
Baa2 |
|
585 |
530 |
|
|
6.46% 6/22/05 |
Baa2 |
|
990 |
947 |
|
|
Norfolk Southern Corp. 7.05% 5/1/37 |
Baa1 |
|
2,340 |
2,329 |
|
|
TFM SA de CV: |
|
|
|
|
|
|
0% 6/15/09 (e) |
B2 |
|
1,600 |
1,224 |
|
|
10.25% 6/15/07 |
B2 |
|
1,600 |
1,512 |
|
|
Transtar Holdings LP/Transtar Capital Corp. 13.375% 12/15/03 |
B- |
|
3,950 |
3,960 |
|
|
Wisconsin Central Transportation Corp. 6.625% 4/15/08 |
Baa2 |
|
1,000 |
900 |
|
|
|
12,268 |
||||
|
Shipping - 0.1% |
|||||
|
Transport Maritima Mexicana yankee: |
|
|
|
|
|
|
10% 11/15/06 |
Ba3 |
|
1,660 |
1,311 |
|
|
9.25% 5/15/03 |
Ba3 |
|
2,700 |
2,241 |
|
|
|
3,552 |
||||
|
TOTAL TRANSPORTATION |
28,563 |
||||
|
UTILITIES - 3.7% |
|||||
|
Cellular - 1.7% |
|||||
|
AirGate PCS, Inc. 0% 10/1/09 (e) |
Caa1 |
|
3,745 |
2,256 |
|
|
Clearnet Communications, Inc. yankee 0% 5/1/09 (e) |
B3 |
|
2,905 |
2,295 |
|
|
Crown Castle International Corp. 0% 5/15/11 (e) |
B3 |
|
860 |
553 |
|
|
Dobson Communications Corp. 10.875% 7/1/10 |
B3 |
|
2,235 |
2,179 |
|
|
Echostar Broadband Corp. 10.375% 10/1/07 (g) |
B3 |
|
2,870 |
2,870 |
|
|
Leap Wireless International, Inc. 12.5% 4/15/10 |
Caa2 |
|
1,100 |
902 |
|
|
Corporate Bonds - continued |
|||||
|
Moody's Ratings (unaudited) (b) |
Principal Amount (000s) |
Value (Note 1) (000s) |
|||
|
Nonconvertible Bonds - continued |
|||||
|
UTILITIES - continued |
|||||
|
Cellular - continued |
|||||
|
McCaw International Ltd. 0% 4/15/07 (e) |
Caa1 |
|
$ 12,507 |
$ 9,318 |
|
|
Millicom International Cellular SA 0% 6/1/06 (e) |
Caa1 |
|
15,710 |
13,511 |
|
|
Nextel Communications, Inc.: |
|
|
|
|
|
|
0% 10/31/07 (e) |
B1 |
|
27,600 |
21,390 |
|
|
9.375% 11/15/09 |
B1 |
|
3,845 |
3,797 |
|
|
12% 11/1/08 |
B1 |
|
1,810 |
1,955 |
|
|
Nextel International, Inc.: |
|
|
|
|
|
|
0% 4/15/08 (e) |
Caa1 |
|
7,730 |
4,870 |
|
|
12.75% 8/1/10 (g) |
Caa1 |
|
2,830 |
2,773 |
|
|
Nextel Partners, Inc.: |
|
|
|
|
|
|
0% 2/1/09 (e) |
B3 |
|
7,760 |
5,432 |
|
|
11% 3/15/10 (g) |
B3 |
|
1,980 |
1,990 |
|
|
11% 3/15/10 |
B3 |
|
1,610 |
1,618 |
|
|
TeleCorp PCS, Inc. 10.625% 7/15/10 |
B3 |
|
1,315 |
1,328 |
|
|
Telesystem International Wireless, Inc. yankee 0% 6/30/07 (e) |
Caa1 |
|
4,485 |
2,960 |
|
|
Vodafone AirTouch PLC 7.625% 2/15/05 (g) |
A2 |
|
940 |
953 |
|
|
VoiceStream Wireless Corp.: |
|
|
|
|
|
|
0% 11/15/09 (e) |
B2 |
|
1,715 |
1,239 |
|
|
10.375% 11/15/09 |
B2 |
|
6,090 |
6,592 |
|
|
|
90,781 |
||||
|
Electric Utility - 0.3% |
|||||
|
AES Corp.: |
|
|
|
|
|
|
8.375% 8/15/07 |
Ba3 |
|
800 |
760 |
|
|
8.5% 11/1/07 |
Ba3 |
|
6,670 |
6,353 |
|
|
9.375% 9/15/10 |
Ba1 |
|
1,755 |
1,781 |
|
|
Avon Energy Partners Holdings 6.46% 3/4/08 (g) |
Baa2 |
|
1,320 |
1,190 |
|
|
CMS Energy Corp. 7.5% 1/15/09 |
Ba3 |
|
3,815 |
3,410 |
|
|
Dominion Resources, Inc. 8.125% 6/15/10 |
Baa1 |
|
255 |
263 |
|
|
Hydro-Quebec yankee 8.4% 3/28/25 |
A2 |
|
1,050 |
1,118 |
|
|
Illinois Power Co. 7.5% 6/15/09 |
Baa1 |
|
550 |
548 |
|
|
Israel Electric Corp. Ltd.: |
|
|
|
|
|
|
7.75% 12/15/27 (g) |
A3 |
|
1,355 |
1,201 |
|
|
yankee 7.875% 12/15/26 (g) |
A3 |
|
660 |
597 |
|
|
Texas Utilities Co. 6.375% 1/1/08 |
Baa3 |
|
130 |
119 |
|
|
|
17,340 |
||||
|
Corporate Bonds - continued |
|||||
|
Moody's Ratings (unaudited) (b) |
Principal Amount (000s) |
Value (Note 1) (000s) |
|||
|
Nonconvertible Bonds - continued |
|||||
|
UTILITIES - continued |
|||||
|
Gas - 0.0% |
|||||
|
Reliant Energy Resources Corp. 8.125% 7/15/05 (g) |
Baa1 |
|
$ 600 |
$ 609 |
|
|
Sempra Energy 7.95% 3/1/10 |
A2 |
|
355 |
354 |
|
|
|
963 |
||||
|
Telephone Services - 1.7% |
|||||
|
Cable & Wireless Optus Ltd. 8% 6/22/10 (g) |
Baa1 |
|
730 |
760 |
|
|
Deutsche Telekom International Finance BV 8.25% 6/15/30 |
Aa2 |
|
750 |
770 |
|
|
FirstWorld Communications, Inc. 0% 4/15/08 (e) |
- |
|
3,670 |
734 |
|
|
Focal Communications Corp.: |
|
|
|
|
|
|
0% 2/15/08 (e) |
B3 |
|
6,235 |
3,118 |
|
|
11.875% 1/15/10 |
B3 |
|
900 |
693 |
|
|
Global Crossing Holdings Ltd. 9.125% 11/15/06 |
Ba2 |
|
1,355 |
1,341 |
|
|
Hyperion Telecommunications, Inc.: |
|
|
|
|
|
|
0% 4/15/03 (e) |
B3 |
|
970 |
791 |
|
|
12% 11/1/07 |
Caa1 |
|
3,150 |
2,048 |
|
|
12.25% 9/1/04 |
B3 |
|
1,685 |
1,533 |
|
|
ICG Holdings, Inc. 13.5% 9/15/05 |
Caa1 |
|
1,850 |
407 |
|
|
ICG Services, Inc. 0% 5/1/08 (e) |
Caa1 |
|
4,940 |
692 |
|
|
Intermedia Communications, Inc.: |
|
|
|
|
|
|
0% 7/15/07 (e) |
B2 |
|
3,980 |
3,284 |
|
|
0% 3/1/09 (e) |
B3 |
|
1,650 |
1,073 |
|
|
8.6% 6/1/08 |
B2 |
|
470 |
449 |
|
|
KMC Telecom Holdings, Inc. 13.5% 5/15/09 |
Caa2 |
|
4,800 |
2,784 |
|
|
Koninklijke KPN NV yankee 8% 10/1/10 (g) |
A3 |
|
140 |
140 |
|
|
Level 3 Communications, Inc.: |
|
|
|
|
|
|
0% 12/1/08 (e) |
B3 |
|
3,210 |
1,862 |
|
|
9.125% 5/1/08 |
B3 |
|
7,715 |
6,616 |
|
|
11% 3/15/08 |
B3 |
|
755 |
717 |
|
|
McLeodUSA, Inc. 9.5% 11/1/08 |
B1 |
|
1,655 |
1,539 |
|
|
Metromedia Fiber Network, Inc. 10% 12/15/09 |
B2 |
|
2,215 |
2,049 |
|
|
NEXTLINK Communications, Inc.: |
|
|
|
|
|
|
0% 4/15/08 (e) |
B2 |
|
125 |
75 |
|
|
9.625% 10/1/07 |
B2 |
|
5,840 |
5,198 |
|
|
NorthEast Optic Network, Inc. 12.75% 8/15/08 |
- |
|
4,055 |
3,508 |
|
|
Ono Finance PLC 13% 5/1/09 |
Caa1 |
|
1,265 |
1,113 |
|
|
Pathnet, Inc. 12.25% 4/15/08 |
- |
|
8,980 |
3,592 |
|
|
Corporate Bonds - continued |
|||||
|
Moody's Ratings (unaudited) (b) |
Principal Amount (000s) |
Value (Note 1) (000s) |
|||
|
Nonconvertible Bonds - continued |
|||||
|
UTILITIES - continued |
|||||
|
Telephone Services - continued |
|||||
|
Rhythms NetConnections, Inc.: |
|
|
|
|
|
|
0% 5/15/08 (e) |
B3 |
|
$ 12,972 |
$ 4,929 |
|
|
12.75% 4/15/09 |
B3 |
|
2,890 |
1,792 |
|
|
Telecomunicaciones de Puerto Rico, Inc. 6.65% 5/15/06 |
Baa2 |
|
1,385 |
1,323 |
|
|
Telefonica Europe BV 8.25% 9/15/30 |
A2 |
|
1,480 |
1,516 |
|
|
Teleglobe Canada, Inc.: |
|
|
|
|
|
|
7.2% 7/20/09 |
Baa1 |
|
1,716 |
1,662 |
|
|
7.7% 7/20/29 |
Baa1 |
|
1,575 |
1,503 |
|
|
Teligent, Inc.: |
|
|
|
|
|
|
0% 3/1/08 (e) |
Caa1 |
|
8,080 |
2,182 |
|
|
11.5% 12/1/07 |
Caa1 |
|
4,805 |
2,066 |
|
|
Time Warner Telecom LLC/Time Warner Telecom, Inc. 9.75% 7/15/08 |
B2 |
|
300 |
273 |
|
|
WinStar Communications, Inc.: |
|
|
|
|
|
|
0% 4/15/10 (e)(g) |
B3 |
|
29,197 |
9,051 |
|
|
12.75% 4/15/10 (g) |
B3 |
|
13,601 |
9,793 |
|
|
WorldCom, Inc.: |
|
|
|
|
|
|
8% 5/16/06 |
A3 |
|
1,310 |
1,362 |
|
|
8.875% 1/15/06 |
A3 |
|
1,180 |
1,221 |
|
|
Worldwide Fiber, Inc. 12% 8/1/09 |
B3 |
|
1,350 |
1,175 |
|
|
|
86,734 |
||||
|
TOTAL UTILITIES |
195,818 |
||||
|
TOTAL NONCONVERTIBLE BONDS |
741,654 |
||||
|
TOTAL CORPORATE BONDS (Cost $836,231) |
765,919 |
||||
|
U.S. Government and Government Agency Obligations - 2.0% |
|||||
|
|
|||||
|
U.S. Government Agency Obligations - 0.9% |
|||||
|
Fannie Mae: |
|
|
|
|
|
|
6% 5/15/08 |
Aaa |
|
7,100 |
6,783 |
|
|
6.5% 4/29/09 |
Aaa |
|
1,970 |
1,867 |
|
|
7% 7/15/05 |
Aaa |
|
3,215 |
3,269 |
|
|
7.25% 1/15/10 |
Aaa |
|
4,770 |
4,919 |
|
|
U.S. Government and Government Agency Obligations - continued |
|||||
|
Moody's Ratings (unaudited) (b) |
Principal Amount (000s) |
Value (Note 1) (000s) |
|||
|
U.S. Government Agency Obligations - continued |
|||||
|
Fannie Mae: - continued |
|
|
|
|
|
|
7.25% 5/15/30 |
Aaa |
|
$ 1,485 |
$ 1,557 |
|
|
Federal Home Loan Bank 6.75% 2/1/02 |
Aaa |
|
7,270 |
7,287 |
|
|
Freddie Mac: |
|
|
|
|
|
|
5.5% 5/15/02 |
Aaa |
|
10,500 |
10,334 |
|
|
5.75% 3/15/09 |
Aaa |
|
4,700 |
4,389 |
|
|
6.45% 4/29/09 |
Aaa |
|
1,000 |
945 |
|
|
6.875% 1/15/05 |
Aaa |
|
940 |
950 |
|
|
6.875% 9/15/10 |
Aaa |
|
3,400 |
3,423 |
|
|
7% 7/15/05 |
Aaa |
|
1,200 |
1,220 |
|
|
Tennessee Valley Authority 7.125% 5/1/30 |
Aaa |
|
635 |
649 |
|
|
TOTAL U.S. GOVERNMENT AGENCY OBLIGATIONS |
47,592 |
||||
|
U.S. Treasury Obligations - 1.1% |
|||||
|
U.S. Treasury Bills, yield at date of purchase 6.04% to 6.08% 12/7/00 (i) |
- |
|
9,150 |
9,049 |
|
|
U.S. Treasury Bonds: |
|
|
|
|
|
|
6.125% 11/15/27 |
Aaa |
|
4,370 |
4,410 |
|
|
6.125% 8/15/29 |
Aaa |
|
1,005 |
1,027 |
|
|
8.125% 8/15/19 |
Aaa |
|
11,980 |
14,632 |
|
|
8.875% 8/15/17 |
Aaa |
|
3,190 |
4,104 |
|
|
12% 8/15/13 |
Aaa |
|
815 |
1,110 |
|
|
U.S. Treasury Notes: |
|
|
|
|
|
|
4.75% 11/15/08 |
Aaa |
|
7,670 |
7,098 |
|
|
5.875% 10/31/01 |
Aaa |
|
6,900 |
6,870 |
|
|
6.5% 5/31/02 |
Aaa |
|
1,800 |
1,811 |
|
|
6.625% 6/30/01 |
Aaa |
|
8,380 |
8,396 |
|
|
TOTAL U.S. TREASURY OBLIGATIONS |
58,507 |
||||
|
TOTAL U.S. GOVERNMENT AND GOVERNMENT AGENCY OBLIGATIONS (Cost $104,533) |
106,099 |
||||
|
U.S. Government Agency - Mortgage Securities - 2.5% |
|||||
|
|
|||||
|
Fannie Mae - 2.0% |
|||||
|
6% 1/1/09 to 1/1/29 |
Aaa |
|
15,124 |
14,466 |
|
|
6.5% 4/1/14 to 10/1/29 |
Aaa |
|
19,046 |
18,307 |
|
|
7% 12/1/24 to 11/1/29 |
Aaa |
|
29,461 |
28,909 |
|
|
U.S. Government Agency - Mortgage Securities - continued |
|||||
|
Moody's Ratings (unaudited) (b) |
Principal Amount (000s) |
Value (Note 1) (000s) |
|||
|
Fannie Mae - continued |
|||||
|
7.5% 5/1/27 to 9/1/30 |
Aaa |
|
$ 24,082 |
$ 24,034 |
|
|
8% 6/1/10 to 8/1/30 |
Aaa |
|
18,831 |
19,082 |
|
|
TOTAL FANNIE MAE |
104,798 |
||||
|
Freddie Mac - 0.1% |
|||||
|
7.5% 4/1/22 to 10/1/30 |
Aaa |
|
4,524 |
4,524 |
|
|
7.5% 10/1/30 (h) |
Aaa |
|
950 |
949 |
|
|
8% 7/1/25 to 4/1/27 |
Aaa |
|
553 |
562 |
|
|
TOTAL FREDDIE MAC |
6,035 |
||||
|
Government National Mortgage Association - 0.4% |
|||||
|
6% 6/15/08 to 9/15/10 |
Aaa |
|
929 |
910 |
|
|
6.5% 9/15/08 to 5/15/09 |
Aaa |
|
4,579 |
4,548 |
|
|
6.5% 8/15/27 (h) |
Aaa |
|
7,332 |
7,082 |
|
|
7% 1/15/28 to 7/15/28 |
Aaa |
|
6,103 |
6,011 |
|
|
7.5% 10/15/22 to 8/15/28 |
Aaa |
|
2,580 |
2,595 |
|
|
8% 5/15/25 |
Aaa |
|
213 |
217 |
|
|
TOTAL GOVERNMENT NATIONAL MORTGAGE ASSOCIATION |
21,363 |
||||
|
TOTAL U.S. GOVERNMENT AGENCY - MORTGAGE SECURITIES (Cost $132,646) |
132,196 |
||||
|
Asset-Backed Securities - 0.3% |
|||||
|
|
|||||
|
Airplanes pass through trust 10.875% 3/15/19 |
Ba2 |
|
4,484 |
3,318 |
|
|
BankAmerica Manufacturing Housing Contract Trust V 6.2% 4/10/09 |
Aaa |
|
1,510 |
1,491 |
|
|
Capita Equipment Receivables Trust 6.48% 10/15/06 |
Baa2 |
|
1,000 |
972 |
|
|
CIT Marine Trust 5.8% 4/15/10 |
Aaa |
|
1,190 |
1,167 |
|
|
CPS Auto Grantor Trust 6.55% 8/15/02 |
Aaa |
|
175 |
174 |
|
|
CPS Auto Receivables Trust 6% 8/15/03 |
Aaa |
|
612 |
605 |
|
|
CSXT Trade Receivables Master Trust 6% 7/25/04 |
Aaa |
|
1,780 |
1,746 |
|
|
Ford Credit Auto Owner Trust: |
|
|
|
|
|
|
6.2% 12/15/02 |
Aa2 |
|
890 |
881 |
|
|
6.4% 12/15/02 |
Aa2 |
|
490 |
486 |
|
|
7.03% 11/15/03 |
Aaa |
|
241 |
242 |
|
|
Asset-Backed Securities - continued |
|||||
|
Moody's Ratings (unaudited) (b) |
Principal Amount (000s) |
Value (Note 1) (000s) |
|||
|
Green Tree Financial Corp. 6.8% 6/15/27 |
Aaa |
|
$ 85 |
$ 85 |
|
|
Petroleum Enhanced Trust Receivables Offering Petroleum Trust 6.125% 2/5/03 (g)(j) |
Baa2 |
|
436 |
434 |
|
|
Sears Credit Account Master Trust II 7.5% 11/15/07 |
A2 |
|
650 |
652 |
|
|
UAF Auto Grantor Trust 6.1% 1/15/03 (g) |
Aaa |
|
703 |
701 |
|
|
TOTAL ASSET-BACKED SECURITIES (Cost $14,432) |
12,954 |
||||
|
Collateralized Mortgage Obligations - 0.0% |
|||||
|
|
|||||
|
Private Sponsor - 0.0% |
|||||
|
Bank America Mortgage Securities, Inc. Series 1999-3, Class A1 6.25% 5/25/14 |
AAA |
|
10 |
9 |
|
|
Credit-Based Asset Servicing and Securitization LLC Series 1997-2 Class 2B, 7.1738% 12/29/25 (d)(g)(j) |
Ba3 |
|
1,173 |
569 |
|
|
TOTAL PRIVATE SPONSOR |
578 |
||||
|
U.S. Government Agency - 0.0% |
|||||
|
Fannie Mae REMIC planned amortization class: |
|
|
|
|
|
|
Series 1999-54 Class PH, 6.5% 11/18/29 |
Aaa |
|
800 |
727 |
|
|
Series 1999-57 Class PH, 6.5% 12/25/29 |
Aaa |
|
700 |
631 |
|
|
TOTAL U.S. GOVERNMENT AGENCY |
1,358 |
||||
|
TOTAL COLLATERALIZED MORTGAGE OBLIGATIONS (Cost $1,980) |
1,936 |
||||
|
Commercial Mortgage Securities - 0.6% |
|||||
|
|
|||||
|
Bankers Trust REMIC Trust 1998-1 Series 1998-S1A Class G, 9.4703% 11/28/02 (g)(j) |
Baa3 |
|
1,008 |
969 |
|
|
Berkeley Federal Bank & Trust FSB Series 1994-1 Class B, 7.5003% 8/1/24 (g)(j) |
- |
|
1,900 |
1,324 |
|
|
BKB Commercial Mortgage Trust Series 1997-C1 Class D, 7.83% 2/25/43 (g)(j) |
BBB |
|
163 |
162 |
|
|
CBM Funding Corp. sequential pay Series 1996-1: |
|
|
|
|
|
|
Class A-3PI, 7.08% 11/1/07 |
AA |
|
990 |
987 |
|
|
Class B, 7.48% 2/1/08 |
A |
|
770 |
765 |
|
|
Commercial Mortgage Securities - continued |
|||||
|
Moody's Ratings (unaudited) (b) |
Principal Amount (000s) |
Value (Note 1) (000s) |
|||
|
CS First Boston Mortgage Securities Corp.: |
|
|
|
|
|
|
Series 1997-C2 Class D, 7.27% 1/17/35 |
Baa2 |
|
$ 1,910 |
$ 1,801 |
|
|
Series 1998-FL1 Class E, 7.47% 1/10/13 (g)(j) |
Baa1 |
|
2,210 |
2,205 |
|
|
Deutsche Mortgage & Asset Receiving Corp. Series 1998-C1 Class D, 7.231% 7/15/12 |
Baa2 |
|
1,420 |
1,306 |
|
|
Equitable Life Assurance Society of the United States Series 174: |
|
|
|
|
|
|
Class B1, 7.33% 5/15/06 (g) |
Aa2 |
|
1,200 |
1,212 |
|
|
Class C1, 7.52% 5/15/06 (g) |
A2 |
|
1,000 |
1,003 |
|
|
First Chicago/Lennar Trust I Series 1997-CHL1 Class E, 8.0835% 4/1/39 (j) |
- |
|
1,800 |
1,354 |
|
|
FMAC Loan Receivables Trust: |
|
|
|
|
|
|
Series 1997-A Class E, 8.111% 4/15/19 (g)(j) |
- |
|
500 |
318 |
|
|
Series 1997-B Class E, 7.8912% 9/15/19 (g)(j) |
- |
|
1,050 |
158 |
|
|
GAFCO Franchisee Loan Trust Series 1998-1 Class D, 14% 6/1/16 (g)(j) |
- |
|
1,650 |
1,323 |
|
|
General Motors Acceptance Corp. Commercial Mortgage Securities, Inc. Series 1996-C1 Class F, 7.86% 10/15/28 (g) |
Ba3 |
|
750 |
672 |
|
|
GS Mortgage Securities Corp. II Series 1998-GLII Class E, 7.1905% 4/13/31 (g)(j) |
Baa3 |
|
1,750 |
1,547 |
|
|
LTC Commercial Mortgage pass through certificates: |
|
|
|
|
|
|
Series 1996-1 Class E, 9.16% 4/15/28 |
BB- |
|
500 |
455 |
|
|
Series 1998-1 Class A, 6.029% 5/30/30 (g) |
AAA |
|
996 |
951 |
|
|
Nomura Asset Securities Corp. Series 1998-D6 Class A4, 7.6088% 3/17/28 (j) |
Baa2 |
|
1,420 |
1,337 |
|
|
Nomura Depositor Trust floater Series 1998-ST1A: |
|
|
|
|
|
|
Class B2, 10.8713% 1/15/03 (g)(j) |
- |
|
1,100 |
1,019 |
|
|
Class B2-A, 10.8713% 2/15/34 (g)(j) |
- |
|
300 |
278 |
|
|
Penn Mutual Life Insurance Co. (The)/Penn Insurance & Annuity Co. Series 1996-PML: |
|
|
|
|
|
|
Class K, 7.9% 11/15/26 (g) |
- |
|
1,750 |
1,154 |
|
|
Class L, 7.9% 11/15/26 (g) |
- |
|
1,300 |
696 |
|
|
Prudential Securities Secured Financing Corp. Series 2000-C1 Class A2, 7.727% 2/15/10 |
Aaa |
|
480 |
493 |
|
|
Structured Asset Securities Corp.: |
|
|
|
|
|
|
Series 1995-C1 Class E, 7.375% 9/25/24 (g) |
BB |
|
1,100 |
1,041 |
|
|
Series 1996-CFL: |
|
|
|
|
|
|
Class E, 7.75% 2/25/28 |
AA |
|
820 |
819 |
|
|
Class G, 7.75% 2/25/28 (g) |
BB |
|
2,000 |
1,838 |
|
|
Commercial Mortgage Securities - continued |
|||||
|
Moody's Ratings (unaudited) (b) |
Principal Amount (000s) |
Value (Note 1) (000s) |
|||
|
Thirteen Affiliates of General Growth |
|
|
|
|
|
|
Series D-2, 6.992% 12/15/10 (g) |
Baa2 |
|
$ 1,410 |
$ 1,315 |
|
|
Series E-2, 7.224% 12/15/10 (g) |
Baa3 |
|
840 |
775 |
|
|
TOTAL COMMERCIAL MORTGAGE SECURITIES (Cost $30,340) |
29,277 |
||||
|
Foreign Government and Government Agency Obligations (k) - 0.1% |
|||||
|
|
|||||
|
Korean Republic yankee: |
|
|
|
|
|
|
8.75% 4/15/03 |
Baa2 |
|
280 |
288 |
|
|
8.875% 4/15/08 |
Baa2 |
|
394 |
412 |
|
|
Quebec Province 7.5% 9/15/29 |
A2 |
|
3,250 |
3,246 |
|
|
United Mexican States 9.875% 2/1/10 |
Baa3 |
|
850 |
905 |
|
|
TOTAL FOREIGN GOVERNMENT AND GOVERNMENT AGENCY OBLIGATIONS (Cost $4,772) |
4,851 |
||||
|
Supranational Obligations - 0.0% |
|||||
|
|
|||||
|
Inter-American Development Bank yankee |
Aaa |
|
1,600 |
1,560 |
|
|
Purchased Bank Debt - 0.1% |
|||||
|
|
|||||
|
PRIMEDIA, Inc. Tranche B term loan 8.995% 7/31/04 (j) |
Ba3 |
|
1,650 |
1,654 |
|
|
Six Flags Theme Park, Inc. Tranche B term loan 9.9133% 9/30/05 (j) |
Ba2 |
|
2,300 |
2,320 |
|
|
Telemundo Group, Inc. Tranche B term loan 8.785% 3/31/07 (j) |
B1 |
|
1,100 |
1,100 |
|
|
TOTAL PURCHASED BANK DEBT (Cost $5,082) |
5,074 |
||||
|
Money Market Funds - 6.4% |
|||
|
Shares |
Value (Note 1) (000s) |
||
|
Fidelity Cash Central Fund, 6.60% (c) |
233,576,889 |
$ 233,577 |
|
|
Fidelity Money Market Central Fund, 6.73% (c) |
89,556,119 |
89,556 |
|
|
Fidelity Securities Lending Cash Central Fund, 6.63% (c) |
15,584,600 |
15,585 |
|
|
TOTAL MONEY MARKET FUNDS (Cost $338,718) |
338,718 |
||
|
TOTAL INVESTMENT PORTFOLIO - 100.2% (Cost $4,834,055) |
5,265,923 |
||
|
NET OTHER ASSETS - (0.2)% |
(9,678) |
||
|
NET ASSETS - 100% |
$ 5,256,245 |
||
|
Futures Contracts |
|||||
|
|
Expiration Date |
Underlying Face Amount at Value (000s) |
Unrealized
Gain/(Loss) |
||
|
Purchased |
|||||
|
460 S&P 500 Stock Index Contracts |
Dec. 2000 |
$ 167,176 |
$ (1,351) |
||
|
|
|
The face value of futures purchased as a percentage of net assets - 3.2% |
|
Legend |
|
(a) Non-income producing |
|
(b) S&P credit ratings are used in the absence of a rating by Moody's Investors Service, Inc. |
|
(c) The rate quoted is the annualized seven-day yield of the fund at period end. A complete listing of the fund's holdings as of its most recent fiscal |
|
(d) Non-income producing - issuer filed for protection under the Federal Bankruptcy Code or is in default of interest payment. |
|
(e) Debt obligation initially issued in zero coupon form which converts to coupon form at a specified rate and date. The rate shown is the rate at period end. |
|
(f) Debt obligation initially issued at one coupon which converts to a higher coupon at a specified date. The rate shown is the rate at period end. |
|
(g) Security exempt from registration under Rule 144A of the Securities Act of 1933. These securities may be resold in transactions exempt from registration, normally to qualified
institutional buyers. At the period end, the value of these securities amounted to $89,056,000 |
|
(h) Security purchased on a delayed delivery or when-issued basis. |
|
(i) Security or a portion of the security was pledged to cover margin requirements for futures contracts. At the period end, the value of securities pledged amounted to $9,049,000. |
|
(j) The coupon rate shown on floating or adjustable rate securities represents the rate at period end. |
|
(k) For foreign government obligations not individually rated by S&P or Moody's, the ratings listed have been assigned by FMR, the fund's investment adviser, based principally on S&P and Moody's ratings of the sovereign credit of the issuing government. |
|
(l) Restricted securities - Investment in securities not registered under the Securities Act of 1933. |
|
Additional information on each holding |
|
Security |
Acquisition Date |
Acquisition Cost (000s) |
|
Micron |
7/15/99 - 4/10/00 |
$ 2,418 |
|
Other Information |
|
The composition of long-term debt holdings as a percentage of total value of investments in securities, is as follows (ratings are unaudited): |
|
Moody's Ratings |
S&P Ratings |
|||
|
Aaa, Aa, A |
5.4% |
|
AAA, AA, A |
4.6% |
|
Baa |
1.7% |
|
BBB |
1.6% |
|
Ba |
2.2% |
|
BB |
2.2% |
|
B |
8.2% |
|
B |
9.0% |
|
Caa |
1.5% |
|
CCC |
0.9% |
|
Ca, C |
0.0% |
|
CC, C |
0.0% |
|
|
|
|
D |
0.0% |
|
The percentage not rated by Moody's |
|
Income Tax Information |
|
At September 30, 2000, the aggregate |
|
The fund hereby designates approximately $303,897,000 as a capital gain dividend for the purpose of the dividend paid deduction. |
See accompanying notes which are an integral part of the financial statements.
Annual Report
Statement of Assets and Liabilities
|
Amounts in thousands (except per-share amount) |
September 30, 2000 |
|
|
Assets |
|
|
|
Investment in securities, at value (cost $4,834,055) - |
|
$ 5,265,923 |
|
Cash |
|
385 |
|
Receivable for investments sold |
|
101,151 |
|
Receivable for fund shares sold |
|
5,063 |
|
Dividends receivable |
|
2,848 |
|
Interest receivable |
|
22,181 |
|
Other receivables |
|
72 |
|
Total assets |
|
5,397,623 |
|
Liabilities |
|
|
|
Payable for investments purchased |
$ 107,882 |
|
|
Delayed delivery |
8,014 |
|
|
Payable for fund shares redeemed |
3,809 |
|
|
Accrued management fee |
2,558 |
|
|
Payable for daily variation on futures contracts |
2,565 |
|
|
Other payables and accrued expenses |
965 |
|
|
Collateral on securities loaned, at value |
15,585 |
|
|
Total liabilities |
|
141,378 |
|
Net Assets |
|
$ 5,256,245 |
|
Net Assets consist of: |
|
|
|
Paid in capital |
|
$ 3,961,122 |
|
Undistributed net investment income |
|
122,706 |
|
Accumulated undistributed net realized gain (loss) on investments and foreign currency transactions |
|
741,893 |
|
Net unrealized appreciation (depreciation) on investments and assets and liabilities in foreign currencies |
|
430,524 |
|
Net Assets, for 258,569 shares outstanding |
|
$ 5,256,245 |
|
Net Asset Value, offering price and redemption price |
|
$20.33 |
See accompanying notes which are an integral part of the financial statements.
Annual Report
Financial Statements - continued
Statement of Operations
|
Amounts in thousands |
Year ended September 30, 2000 |
|
|
Investment Income Dividends |
|
$ 44,283 |
|
Interest |
|
123,968 |
|
Security lending |
|
36 |
|
Total income |
|
168,287 |
|
Expenses |
|
|
|
Management fee |
$ 29,970 |
|
|
Transfer agent fees |
10,641 |
|
|
Accounting and security lending fees |
742 |
|
|
Non-interested trustees' compensation |
21 |
|
|
Custodian fees and expenses |
140 |
|
|
Registration fees |
35 |
|
|
Audit |
79 |
|
|
Legal |
25 |
|
|
Reports to shareholders |
236 |
|
|
Miscellaneous |
13 |
|
|
Total expenses before reductions |
41,902 |
|
|
Expense reductions |
(1,565) |
40,337 |
|
Net investment income |
|
127,950 |
|
Realized and Unrealized Gain (Loss) Net realized gain (loss) on: |
|
|
|
Investment securities |
753,666 |
|
|
Foreign currency transactions |
(395) |
|
|
Futures contracts |
(5,463) |
747,808 |
|
Change in net unrealized appreciation (depreciation) on: |
|
|
|
Investment securities |
(126,388) |
|
|
Assets and liabilities in foreign currencies |
(1) |
|
|
Futures contracts |
(1,351) |
(127,740) |
|
Net gain (loss) |
|
620,068 |
|
Net increase (decrease) in net assets resulting |
|
$ 748,018 |
See accompanying notes which are an integral part of the financial statements.
Annual Report
Financial Statements - continued
Statement of Changes in Net Assets
|
Amounts in thousands |
Year ended September 30, 2000 |
Year ended September 30, 1999 |
|
Increase (Decrease) in Net Assets |
|
|
|
Operations |
$ 127,950 |
$ 122,999 |
|
Net realized gain (loss) |
747,808 |
312,734 |
|
Change in net unrealized appreciation (depreciation) |
(127,740) |
387,947 |
|
Net increase (decrease) in net assets resulting |
748,018 |
823,680 |
|
Distributions to shareholders |
(117,014) |
(82,569) |
|
From net realized gain |
(286,035) |
(632,226) |
|
Total distributions |
(403,049) |
(714,795) |
|
Share transactions |
861,158 |
1,012,409 |
|
Reinvestment of distributions |
395,685 |
702,529 |
|
Cost of shares redeemed |
(1,396,860) |
(1,309,362) |
|
Net increase (decrease) in net assets resulting |
(140,017) |
405,576 |
|
Total increase (decrease) in net assets |
204,952 |
514,461 |
|
Net Assets |
|
|
|
Beginning of period |
5,051,293 |
4,536,832 |
|
End of period (including undistributed net investment income of $122,706 and $124,030, respectively) |
$ 5,256,245 |
$ 5,051,293 |
|
Other Information Shares |
|
|
|
Sold |
43,800 |
52,137 |
|
Issued in reinvestment of distributions |
21,013 |
38,986 |
|
Redeemed |
(71,349) |
(67,394) |
|
Net increase (decrease) |
(6,536) |
23,729 |
See accompanying notes which are an integral part of the financial statements.
Annual Report
Financial Highlights
|
Years ended September 30, |
2000 |
1999 |
1998 |
1997 |
1996 |
|
Selected Per-Share Data |
|
|
|
|
|
|
Net asset value, |
$ 19.05 |
$ 18.80 |
$ 19.97 |
$ 16.56 |
$ 14.88 |
|
Income from |
|
|
|
|
|
|
Net investment income |
.48 B |
.46 B |
.49 B |
.42 B |
.47 |
|
Net realized and |
2.35 |
2.82 |
.49 |
4.49 |
1.44 |
|
Total from investment operations |
2.83 |
3.28 |
.98 |
4.91 |
1.91 |
|
Less Distributions |
|
|
|
|
|
|
From net investment income |
(.45) |
(.35) |
(.40) |
(.43) |
(.23) |
|
From net realized gain |
(1.10) |
(2.68) |
(1.75) |
(1.07) |
- |
|
Total distributions |
(1.55) |
(3.03) |
(2.15) |
(1.50) |
(.23) |
|
Net asset value, end of period |
$ 20.33 |
$ 19.05 |
$ 18.80 |
$ 19.97 |
$ 16.56 |
|
Total Return A |
15.50% |
18.37% |
5.33% |
31.57% |
12.99% |
|
Ratios and Supplemental Data |
|
|
|
|
|
|
Net assets, end of period |
$ 5,256 |
$ 5,051 |
$ 4,537 |
$ 4,457 |
$ 3,099 |
|
Ratio of expenses to average |
.80% |
.83% |
.84% |
.87% |
1.02% |
|
Ratio of expenses to average net assets after expense reductions |
.77% C |
.80% C |
.80% C |
.86% C |
1.01% C |
|
Ratio of net investment income to average net assets |
2.46% |
2.38% |
2.49% |
2.36% |
2.51% |
|
Portfolio turnover rate |
197% |
101% |
150% |
70% |
138% |
A The total returns would have been lower had certain expenses not been reduced during the periods shown.
B Net investment income per share has been calculated based on average shares outstanding during the period.
C FMR or the fund has entered into varying arrangements with third parties who either paid or reduced a portion of the fund's expenses.
See accompanying notes which are an integral part of the financial statements.
Annual Report
For the period ended September 30, 2000
1. Significant Accounting Policies.
Asset Manager: Growth (the fund) is a fund of Fidelity Charles Street Trust (the trust) and is authorized to issue an unlimited number of shares. The trust is registered under the Investment Company Act of 1940, as amended, as an open-end management investment company organized as a Massachusetts business trust. The financial statements have been prepared in conformity with generally accepted accounting principles which require management to make certain estimates and assumptions at the date of the financial statements. The following summarizes the significant accounting policies of the fund:
Security Valuation. Equity securities for which quotations are readily available are valued at the last sale price, or if no sale price, at the closing bid price. Foreign equity securities are valued based on quotations from the principal market in which such securities are normally traded. If trading or events occurring in other markets after the close of the principal market in which foreign securities are traded, and before the close of the business of the fund, are expected to materially affect the value of those securities, then they are valued at their fair value taking this trading or these events into account. Fair value is determined in good faith under consistently applied procedures under the general supervision of the Board of Trustees. Debt securities for which quotations are readily available are valued by a pricing service at their market values as determined by their most recent bid prices in the principal market (sales prices if the principal market is an exchange) in which such securities are normally traded. Securities (including restricted securities) for which market quotations are not readily available are valued at their fair value. Short-term securities with remaining maturities of sixty days or less for which quotations are not readily available are valued at amortized cost or original cost plus accrued interest, both of which approximate current value. Investments in open-end investment companies are valued at their net asset value each business day.
Foreign Currency Translation. The accounting records of the fund are maintained in U.S. dollars. Investment securities and other assets and liabilities denominated in a foreign currency are translated into U.S. dollars at the prevailing rates of exchange at period end. Purchases and sales of securities, income receipts and expense payments are translated into U.S. dollars at the prevailing exchange rate on the respective dates of the transactions.
Net realized gains and losses on foreign currency transactions represent net gains and losses from sales and maturities of foreign currency contracts, disposition of foreign currencies, the difference between the amount of net investment income accrued and the U.S. dollar amount actually received, and gains and losses between trade and settlement date on purchases and sales of securities. The effects of changes in foreign currency exchange rates on investments in securities are included with the net realized and unrealized gain or loss on investment securities.
Annual Report
Notes to Financial Statements - continued
1. Significant Accounting Policies - continued
Income Taxes. As a qualified regulated investment company under Subchapter M of the Internal Revenue Code, the fund is not subject to income taxes to the extent that it distributes substantially all of its taxable income for its fiscal year. The schedule of investments includes information regarding income taxes under the caption "Income Tax Information."
Investment Income. Dividend income is recorded on the ex-dividend date, except certain dividends from foreign securities where the ex-dividend date may have passed, are recorded as soon as the fund is informed of the ex-dividend date. Non-cash dividends included in dividend income, if any, are recorded at the fair market value of the securities received. Interest income, which includes accretion of original issue discount, is accrued as earned. Investment income is recorded net of foreign taxes withheld where recovery of such taxes is uncertain. The fund may place a debt obligation on non-accrual status and reduce related interest income by ceasing current accruals and writing off interest receivables when the collection of all or a portion of interest has become doubtful based on consistently applied procedures, under the general supervision of the Board of Trustees of the fund. A debt obligation is removed from non-accrual status when the issuer resumes interest payments or when collectibility of interest is reasonably assured.
Expenses. Most expenses of the trust can be directly attributed to a fund. Expenses which cannot be directly attributed are apportioned among the funds in the trust.
Deferred Trustee Compensation. Under a Deferred Compensation Plan (the Plan) non-interested Trustees must defer receipt of a portion of, and may elect to defer receipt of an additional portion of, their annual compensation. Deferred amounts are treated as though equivalent dollar amounts had been invested in shares of the fund or are invested in a cross-section of other Fidelity funds. Deferred amounts remain in the fund until distributed in accordance with the Plan.
Distributions to Shareholders. Distributions are recorded on the ex-dividend date.
Income and capital gain distributions are determined in accordance with income tax regulations which may differ from generally accepted accounting principles. These differences, which may result in distribution reclassifications, are primarily due to differing treatments for litigation proceeds, paydown gains/losses on certain securities, futures transactions, foreign currency transactions, market discount, non-taxable dividends and losses deferred due to wash sales. The fund also utilized earnings and profits distributed to shareholders on redemption of shares as a part of the dividends paid deduction for income tax purposes.
Annual Report
Notes to Financial Statements - continued
1. Significant Accounting Policies - continued
Distributions to Shareholders - continued
Permanent book and tax basis differences relating to shareholder distributions will result in reclassifications to paid in capital. Undistributed net investment income and accumulated undistributed net realized gain (loss) on investments and foreign currency transactions may include temporary book and tax basis differences which will reverse in a subsequent period. Any taxable income or gain remaining at fiscal year end is distributed in the following year.
Security Transactions. Security transactions are accounted for as of trade date. Gains and losses on securities sold are determined on the basis of identified cost.
2. Operating Policies.
Foreign Currency Contracts. The fund generally uses foreign currency contracts to facilitate transactions in foreign-denominated securities. Losses may arise from changes in the value of the foreign currency or if the counterparties do not perform under the contracts' terms. The U.S. dollar value of foreign currency contracts is determined using contractual currency exchange rates established at the time of each trade.
Joint Trading Account. Pursuant to an Exemptive Order issued by the Securities and Exchange Commission (the SEC), the fund, along with other affiliated entities of Fidelity Management & Research Company (FMR), may transfer uninvested cash balances into one or more joint trading accounts. These balances are invested in one or more repurchase agreements for U.S. Treasury or Federal Agency obligations.
Repurchase Agreements. The underlying U.S. Treasury, Federal Agency, or other obligations found to be satisfactory by FMR are transferred to an account of the fund, or to the Joint Trading Account, at a custodian bank. The securities are marked-to-market daily and maintained at a value at least equal to the principal amount of the repurchase agreement (including accrued interest). FMR, the fund's investment adviser, is responsible for determining that the value of the underlying securities remains in accordance with the market value requirements stated above.
Delayed Delivery Transactions. The fund may purchase or sell securities on a delayed delivery basis. Payment and delivery may take place after the customary settlement period for that security. The price of the underlying securities and the date when the securities will be delivered and paid for are fixed at the time the transaction is negotiated. The market values of the securities purchased on a delayed delivery basis are identified as such in the fund's schedule of investments. The fund may receive compensation for interest forgone in the purchase of a delayed delivery security. With respect to purchase commitments, the fund identifies securities as segregated in its records with a value at least equal to the amount of the commitment. Losses may arise due to changes in the market value of the underlying securities or if the counterparty does not perform under the contract.
Annual Report
Notes to Financial Statements - continued
2. Operating Policies - continued
Futures Contracts. The fund may use futures contracts to manage its exposure to the stock market. Buying futures tends to increase the fund's exposure to the underlying instrument, while selling futures tends to decrease the fund's exposure to the underlying instrument or hedge other fund investments. Futures contracts involve, to varying degrees, risk of loss in excess of the futures variation margin reflected in the Statement of Assets and Liabilities. The underlying face amount at value of any open futures contracts at period end is shown in the schedule of investments under the caption "Futures Contracts." This amount reflects each contract's exposure to the underlying instrument at period end. Losses may arise from changes in the value of the underlying instruments or if the counterparties do not perform under the contracts' terms. Gains (losses) are realized upon the expiration or closing of the futures contracts. Futures contracts are valued at the settlement price established each day by the board of trade or exchange on which they are traded.
Restricted Securities. The fund is permitted to invest in securities that are subject to legal or contractual restrictions on resale. These securities generally may be resold in transactions exempt from registration or to the public if the securities are registered. Disposal of these securities may
involve time-consuming negotiations and expense, and prompt sale at an acceptable price may be difficult. At the end of the period, restricted securities (excluding 144A issues) amounted to $2,550,000 or 0.0% of net assets.
Loans and Other Direct Debt Instruments. The fund is permitted to invest in loans and loan participations, trade claims or other receivables. These investments may include standby financing commitments that obligate the fund to supply additional cash to the borrower on demand. Loan participations involve a risk of insolvency of the lending bank or other financial intermediary. At the end of the period, these investments amounted to $5,074,000 or 0.1% of net assets.
3. Purchases and Sales of Investments.
Purchases and sales of securities, other than short-term securities, aggregated $9,609,284,000 and $10,188,447,000, respectively, of which U.S. government and government agency obligations aggregated $589,294,000 and $548,331,000, respectively.
The market value of futures contracts opened and closed during the period amounted to $895,342,000 and $721,352,000, respectively.
On July 25, 2000, the fund transferred substantially all of its money market investments to Fidelity Money Market Central Fund in exchange for shares of this fund.
Annual Report
Notes to Financial Statements - continued
4. Fees and Other Transactions with Affiliates.
Management Fee. As the fund's investment adviser, FMR receives a monthly fee that is calculated on the basis of a group fee rate plus a fixed individual fund fee rate applied to the average net assets of the fund. The group fee rate is the weighted average of a series of rates and is based on the monthly average net assets of all the mutual funds advised by FMR. The rates ranged from .2167% to .5200% for the period. The annual individual fund fee rate is .30%. In the event that these rates were lower than the contractual rates in effect during the period, FMR voluntarily implemented the above rates, as they resulted in the same or a lower management fee. For the period, the management fee was equivalent to an annual rate of .58% of average net assets.
Sub-Adviser Fee. Beginning January 1, 2001, FMR Co.(FMRC) will serve as sub-adviser for the fund. FMRC is a wholly owned subsidiary of FMR and will receive a fee from FMR of 50% of the management fee payable to FMR with respect to that portion of the fund's assets that will be managed by FMRC.
Transfer Agent Fees. Fidelity Service Company, Inc. (FSC), an affiliate of FMR, is the fund's transfer, dividend disbursing and shareholder servicing agent. FSC receives account fees and asset-based fees that vary according to account size and type of account. FSC pays for typesetting, printing and mailing of all shareholder reports, except proxy statements. For the period, the transfer agent fees were equivalent to an annual rate of .20% of average net assets.
Accounting and Security Lending Fees. FSC maintains the fund's accounting records and administers the security lending program. The security lending fee is based on the number and duration of lending transactions. The accounting fee is based on the level of average net assets for the month plus out-of-pocket expenses.
Cash Central Funds. Pursuant to an Exemptive Order issued by the SEC, the fund may invest in one or more open-end money market funds managed by Fidelity Investments Money Management, Inc., an affiliate of FMR. These funds (collectively referred to as the "Central Funds") are only available to investment companies and other accounts managed by FMR and its affiliates. The Central Funds seek preservation of capital, liquidity, and current income and do not pay a management fee.
The Fidelity Money Market Central Fund is principally used for the fund's strategic allocation to money market investments. The Fidelity Securities Lending Cash Central Fund and the Fidelity Cash Central Fund are principally used for allocations of available cash. Income distributions from the Central Funds are recorded as interest in the accompanying financial statements except for distributions from the Fidelity Securities Lending Cash Central Fund, which are recorded as security lending income. Distributions from the Central Funds to the fund totaled $16,238,000.
Brokerage Commissions. The fund placed a portion of its portfolio transactions with brokerage firms which are affiliates of FMR. The commissions paid to these affiliated firms were $233,000 for the period.
Annual Report
Notes to Financial Statements - continued
5. Security Lending.
The fund lends portfolio securities from time to time in order to earn additional income. The fund receives collateral in the form of U.S. Treasury obligations, letters of credit, and/or cash against the loaned securities, and maintains collateral in an amount not less than 100% of the market value of the loaned securities during the period of the loan. The market value of the loaned securities is determined at the close of business of the fund and any additional required collateral is delivered to the fund on the next business day. If the borrower defaults on its obligation to return the securities loaned because of insolvency or other reasons, the fund could experience delays and costs in recovering the securities loaned or in gaining access to the collateral. At period end, the value of the securities loaned amounted to $13,880,000. The fund received cash collateral of $15,585,000 which was invested in cash equivalents.
6. Expense Reductions.
FMR has directed certain portfolio trades to brokers who paid a portion of the fund's expenses. For the period, the fund's expenses were reduced by $1,169,000 under this arrangement.
In addition, through arrangements with the fund's custodian and transfer agent, credits realized as a result of uninvested cash balances were used to reduce a portion of the fund's expenses. During the period, the fund's custodian and transfer agent fees were reduced by $24,000 and $372,000, respectively, under these arrangements.
7. Litigation.
The fund is engaged in litigation against the obligor on the inflation adjusted debt of Siderurgica Brasileiras SA, contesting the calculation of the principal adjustment. The probability of success of this litigation cannot be predicted and the amount of recovery cannot be estimated. Any recovery from this litigation would inure to the benefit of the fund. As of period end, the fund no longer holds Siderurgica Brasileiras SA debt securities.
Annual Report
To the Trustees of Fidelity Charles Street Trust and Shareholders of Fidelity Asset Manager: Growth:
We have audited the accompanying statement of assets and liabilities of Fidelity Asset Manager: Growth (the Fund), a fund of Fidelity Charles Street Trust (the Trust), including the portfolio of investments, as of September 30, 2000, and the related statements of operations, changes in net assets, and financial highlights for the year then ended. These financial statements and financial highlights are the responsibility of the Fund's management. Our responsibility is to express an opinion on these financial statements and financial highlights based on our audit. The statement of changes in net assets for the year ended September 30, 1999, and the financial highlights for each of the four years in the period then ended were audited by other auditors whose report, dated November 8, 1999, expressed an unqualified opinion on those statements and financial highlights.
We conducted our audit in accordance with auditing standards generally accepted in the United States of America. Those standards require that we plan and perform the audit to obtain reasonable assurance about whether the financial statements and financial highlights are free of material misstatement. An audit includes examining, on a test basis, evidence supporting the amounts and disclosures in the financial statements. Our procedures included confirmation of securities owned as of September 30, 2000, by correspondence with the custodian and brokers; where replies were not received from brokers, we performed other auditing procedures. An audit also includes assessing the accounting principles used and significant estimates made by management, as well as evaluating the overall financial statement presentation. We believe that our audit provides a reasonable basis for our opinion.
In our opinion, the financial statements and financial highlights referred to above present fairly, in all material respects, the financial position of Fidelity Asset Manager: Growth as of September 30, 2000, and the results of its operations, the changes in its net assets, and its financial highlights for the year then ended, in conformity with accounting principles generally accepted in the United States of America.
/s/DELOITTE & TOUCHE LLP
DELOITTE & TOUCHE LLP
Boston, Massachusetts
November 7, 2000
Annual Report
A total of 24% of the dividends distributed during the fiscal year qualifies for the dividends-received deduction for corporate shareholders.
The fund hereby designates 100% of the long-term capital gain dividends distributed during the fiscal year as 20%-rate capital gain dividends.
The fund will notify shareholders in January 2001 of amounts for use in preparing 2000 income tax returns.
Annual Report
Fidelity offers several ways to conveniently manage your personal investments via your telephone or PC. You can access your account information, conduct trades and research your investments 24 hours a day.
By Phone
Fidelity Automated Service Telephone provides a single toll-free number to access account balances, positions, quotes and trading. It's easy to navigate the service, and on your first call, the system will help you create a personal identification number (PIN) for security.
(phone_graphic)
Fidelity Automated
Service Telephone (FAST®)
1-800-544-5555
Press
1 For mutual fund and brokerage trading.
2 For quotes.*
3 For account balances and holdings.
4 To review orders and mutual
fund activity.
5 To change your PIN.
*0 To speak to a Fidelity representative.
By PC
Fidelity's web site on the Internet provides a wide range of information, including daily financial news, fund performance, interactive planning tools and news about Fidelity products and services.
(computer_graphic)
Fidelity's Web Site
www.fidelity.com
If you are not currently on the Internet, call EarthLink Sprint at 1-800-288-2967, and be sure to ask for registration number SMD004 to receive a special Fidelity package that includes 30 days of free Internet access. EarthLink is North America's #1 independent Internet access provider.
(computer_graphic)
Fidelity On-line Xpress+®
Fidelity On-line Xpress+ software for Windows combines comprehensive portfolio management capabilities, securities trading and access to research and analysis tools . . . all on your desktop. Call Fidelity at 1-800-544-0240 or visit our web site for more information on how to manage your investments via your PC.
* When you call the quotes line, please remember that a fund's yield and return will vary and, except for money market funds, share price will also vary. This means that you may have a gain or loss when you sell your shares. There is no assurance that money market funds will be able to maintain a stable $1 share price; an investment in a money market fund is not insured or guaranteed by the U.S. government. Total returns are historical and include changes in share price, reinvestment of dividends and capital gains, and the effects of any sales charges.
Annual Report
For directions and hours,
please call 1-800-544-9797.
Arizona
7373 N. Scottsdale Road
Scottsdale, AZ
California
815 East Birch Street
Brea, CA
851 East Hamilton Avenue
Campbell, CA
527 North Brand Boulevard
Glendale, CA
19200 Von Karman Avenue
Irvine, CA
10100 Santa Monica Blvd.
Los Angeles, CA
251 University Avenue
Palo Alto, CA
1760 Challenge Way
Sacramento, CA
7676 Hazard Center Drive
San Diego, CA
8 Montgomery Street
San Francisco, CA
950 Northgate Drive
San Rafael, CA
1400 Civic Drive
Walnut Creek, CA
6300 Canoga Avenue
Woodland Hills, CA
Colorado
1625 Broadway
Denver, CO
Connecticut
48 West Putnam Avenue
Greenwich, CT
265 Church Street
New Haven, CT
300 Atlantic Street
Stamford, CT
29 South Main Street
West Hartford, CT
Delaware
222 Delaware Avenue
Wilmington, DE
Florida
4400 N. Federal Highway
Boca Raton, FL
90 Alhambra Plaza
Coral Gables, FL
4090 N. Ocean Boulevard
Ft. Lauderdale, FL
1907 West State Road 434
Longwood, FL
8880 Tamiami Trail, North
Naples, FL
2401 PGA Boulevard
Palm Beach Gardens, FL
8065 Beneva Road
Sarasota, FL
1502 N. Westshore Blvd.
Tampa, FL
Georgia
3445 Peachtree Road, N.E.
Atlanta, GA
1000 Abernathy Road
Atlanta, GA
Illinois
One North Franklin Street
Chicago, IL
1415 West 22nd Street
Oak Brook, IL
1700 East Golf Road
Schaumburg, IL
3232 Lake Avenue
Wilmette, IL
Indiana
4729 East 82nd Street
Indianapolis, IN
Maine
Three Canal Plaza
Portland, ME
Maryland
7401 Wisconsin Avenue
Bethesda, MD
One W. Pennsylvania Ave.
Towson, MD
Massachusetts
801 Boylston Street
Boston, MA
155 Congress Street
Boston, MA
25 State Street
Boston, MA
300 Granite Street
Braintree, MA
44 Mall Road
Burlington, MA
416 Belmont Street
Worcester, MA
Annual Report
Michigan
280 Old N. Woodward Ave.
Birmingham, MI
29155 Northwestern Hwy.
Southfield, MI
Minnesota
7600 France Avenue South
Edina, MN
Missouri
700 West 47th Street
Kansas City, MO
8885 Ladue Road
Ladue, MO
New Jersey
150 Essex Street
Millburn, NJ
56 South Street
Morristown, NJ
501 Route 17, South
Paramus, NJ
New York
1055 Franklin Avenue
Garden City, NY
999 Walt Whitman Road
Melville, L.I., NY
1271 Avenue of the Americas
New York, NY
71 Broadway
New York, NY
350 Park Avenue
New York, NY
North Carolina
4611 Sharon Road
Charlotte, NC
Ohio
600 Vine Street
Cincinnati, OH
28699 Chagrin Boulevard
Woodmere Village, OH
Oregon
16850 SW 72nd Avenue
Tigard, OR
Pennsylvania
1735 Market Street
Philadelphia, PA
12001 Perry Highway
Wexford, PA
Rhode Island
47 Providence Place
Providence, RI
Tennessee
6150 Poplar Avenue
Memphis, TN
Texas
10000 Research Boulevard
Austin, TX
4017 Northwest Parkway
Dallas, TX
1155 Dairy Ashford Street
Houston, TX
2701 Drexel Drive
Houston, TX
400 East Las Colinas Blvd.
Irving, TX
14100 San Pedro
San Antonio, TX
19740 IH 45 North
Spring, TX
Utah
215 South State Street
Salt Lake City, UT
Virginia
1861 International Drive
McLean, VA
Washington
411 108th Avenue, N.E.
Bellevue, WA
511 Pine Street
Seattle, WA
Washington, DC
1900 K Street, N.W.
Washington, DC
Wisconsin
595 North Barker Road
Brookfield, WI
Fidelity Brokerage Services, Inc., 100 Summer St., Boston, MA 02110 Member NYSE/SIPC
Annual Report
If more than one address is listed, please locate the address that is closest to you. We'll give your correspondence immediate attention and send you written confirmation upon completion of your request.
(letter_graphic)
Making Changes
To Your Account
(such as changing name, address, bank, etc.)
Fidelity Investments
P.O. Box 770001
Cincinnati, OH 45277-0002
(letter_graphic)
For Non-Retirement
Accounts
Buying shares
Fidelity Investments
P.O. Box 770001
Cincinnati, OH 45277-0003
Overnight Express
Fidelity Investments
2300 Litton Lane - KH1A
Hebron, KY 41048
Selling shares
Fidelity Investments
P.O. Box 660602
Dallas, TX 75266-0602
Overnight Express
Fidelity Investments
Attn: Redemptions - CP6I
400 East Las Colinas Blvd.
Irving, TX 75039-5587
General Correspondence
Fidelity Investments
P.O. Box 500
Merrimack, NH 03054-0500
(letter_graphic)
For Retirement
Accounts
Buying shares
Fidelity Investments
P.O. Box 770001
Cincinnati, OH 45277-0003
Selling shares
Fidelity Investments
P.O. Box 660602
Dallas, TX 75266-0602
Overnight Express
Fidelity Investments
Attn: Redemptions - CP6R
400 East Las Colinas Blvd.
Irving, TX 75039-5587
General Correspondence
Fidelity Investments
P.O. Box 500
Merrimack, NH 03054-0500
Annual Report
Annual Report
Annual Report
Annual Report
Investment Adviser
Fidelity Management & Research Company
Boston, MA
Investment Sub-Advisers
Fidelity Investments
Money Management, Inc.
Fidelity Management & Research
(U.K.) Inc.
Fidelity Management & Research
(Far East) Inc.
Fidelity Investments Japan Limited
Officers
Edward C. Johnson 3d, President
Robert C. Pozen, Senior Vice President
Robert A. Lawrence, Vice President
Richard C. Habermann, Vice President
Charles S. Morrison, Vice President
John J. Todd, Vice President
Eric D. Roiter, Secretary
Robert A. Dwight, Treasurer
Maria F. Dwyer, Deputy Treasurer
John H. Costello, Assistant Treasurer
Thomas J. Simpson, Assistant Treasurer
Board of Trustees
Ralph F. Co x *
Phyllis Burke Davis *
Robert M. Gates *
Edward C. Johnson 3d
Donald J. Kirk *
Ned C. Lautenbach *
Peter S. Lynch
Marvin L. Mann *
William O. McCoy *
Gerald C. McDonough *
Robert C. Pozen
Thomas R. Williams *
* Independent trustees
Advisory Board
J. Michael Cook
Abigail P. Johnson
Marie L. Knowles
General Distributor
Fidelity Distributors Corporation
Boston, MA
Transfer and Shareholder
Servicing Agent
Fidelity Service Company, Inc.
Boston, MA
Custodian
The Chase Manhattan Bank
New York, NY
Fidelity's Asset Allocation Funds
Asset ManagerSM
Asset Manager: AggressiveSM
Asset Manager: Growth®
Asset Manager: Income®
Fidelity Freedom Funds® -
Income, 2000, 2010, 2020, 2030, 2040
The Fidelity Telephone Connection
Mutual Fund 24-Hour Service
Exchanges/Redemptions
and Account Assistance 1-800-544-6666
Product Information 1-800-544-6666
Retirement Accounts 1-800-544-4774
(8 a.m. - 9 p.m.)
TDD Service 1-800-544-0118
(for the deaf and hearing impaired)
(9 a.m. - 9 p.m. Eastern time)
Fidelity Automated Service
Telephone (FAST®) (automated graphic) 1-800-544-5555
(automated graphic) Automated line for quickest service
AMG-ANN-1100 116401
1.537733.103
(Fidelity Investment logo)(registered trademark)
Corporate Headquarters
82 Devonshire St., Boston, MA 02109
www.fidelity.com
Fidelity®
Annual Report
September 30, 2000
(2_fidelity_logos)(Registered_Trademark)
|
President's Message |
Ned Johnson on investing strategies. |
|
|
Performance |
How the fund has done over time. |
|
|
Market Recap |
An overview of the market's performance and the factors driving it. |
|
|
Fund Talk |
The manager's review of fund performance, strategy and outlook. |
|
|
Investment Changes |
A summary of major shifts in the fund's investments over the past six months. |
|
|
Investments |
A complete list of the fund's investments with their market values. |
|
|
Financial Statements |
Statements of assets and liabilities, operations, and changes in net assets, as well as financial highlights. |
|
|
Notes |
Notes to the financial statements. |
|
|
Independent Auditors' Report |
The auditors' opinion. |
|
|
Distributions |
|
Standard & Poor's, S&P and S&P 500 are registered service marks of The McGraw-Hill Companies, Inc. and have been licensed for use by Fidelity Distributors Corporation.
Other third party marks appearing herein are the property of their respective owners.
All other marks appearing herein are registered or unregistered trademarks or service marks of FMR Corp. or an affiliated company.
(Recycle graphic) This report is printed on recycled paper using soy-based inks.
This report and the financial statements contained herein are submitted for the general information of the shareholders of the fund. This report is not authorized for distribution to prospective investors in the fund unless preceded or accompanied by an effective prospectus.
Mutual fund shares are not deposits or obligations of, or guaranteed by, any depository institution. Shares are not insured by the FDIC, Federal Reserve Board or any other agency, and are subject to investment risks, including possible loss of principal amount invested.
Neither the fund nor Fidelity Distributors Corporation is a bank.
For more information on any Fidelity fund, including charges and expenses, call 1-800-544-6666 for a free prospectus. Read it carefully before you invest or send money.
Annual Report
(photo_of_Edward_C_Johnson_3d)
Dear Shareholder:
Disappointing third quarter corporate earnings announcements resulted in negative performance for many major U.S. equity indexes through the first nine months of 2000. A weak euro and the highest oil prices in 10 years frightened many investors into selling shares of large U.S. corporations with multinational presence. In fixed-income markets, 30-year Treasury prices also dropped, and these securities outyielded 10-year Treasury notes for the first time since January.
While it's impossible to predict the future direction of the markets with any degree of certainty, there are certain basic principles that can help investors plan for their future needs.
First, investors are encouraged to take a long-term view of their portfolios. If you can afford to leave your money invested through the inevitable up and down cycles of the financial markets, you will greatly reduce your vulnerability to any single decline. We know from experience, for example, that stock prices have gone up over longer periods of time, have significantly outperformed other types of investments and have stayed ahead of inflation.
Second, you can further manage your investing risk through diversification. Asset Manager funds are already diversified because they invest in stocks, bonds and short-term and money market instruments, both in the U.S. and overseas. If you have a shorter investment time horizon, you might want to consider moving some of your investment into a bond or money market mutual fund.
Finally, no matter what your time horizon or portfolio diversity, it makes good sense to follow a regular investment plan, investing a certain amount of money in a fund at the same time each month or quarter and periodically reviewing your overall portfolio. By doing so, you won't get caught up in the excitement of a rapidly rising market, nor will you buy all your shares at market highs. While this strategy - known as dollar cost averaging - won't assure a profit or protect you from a loss in a declining market, it should help you lower the average cost of your purchases. Of course, you should consider your financial ability to continue your purchases through periods of low price levels before undertaking such a strategy.
If you have questions, please call us at 1-800-544-6666, or visit our web site at www.fidelity.com. We are available 24 hours a day, seven days a week to provide you the information you need to make the investments that are right for you.
Best regards,
/s/Edward C. Johnson 3d
Edward C. Johnson 3d
Annual Report
There are several ways to evaluate a fund's historical performance. You can look at the total percentage change in value, the average annual percentage change or the growth of a hypothetical $10,000 investment. Total return reflects the change in the value of an investment, assuming reinvestment of the fund's dividend income and capital gains (the profits earned upon the sale of securities that have grown in value). If Fidelity had not reimbursed certain fund expenses, the life of fund total returns would have been lower.
Cumulative Total Returns
|
Periods ended September 30, 2000 |
|
Past 1 |
Past 5 |
Life of |
|
Asset Manager: Income ® |
|
8.10% |
52.57% |
99.89% |
|
Asset Manager: Income Composite |
|
8.09% |
55.09% |
n/a* |
|
S&P 500 ® |
|
13.28% |
166.82% |
307.11% |
|
LB Aggregate Bond |
|
6.99% |
36.81% |
65.22% |
|
LB 3 Month T-Bill |
|
5.82% |
30.28% |
n/a* |
|
Income Funds Average |
|
8.84% |
66.20% |
n/a* |
Cumulative total returns show the fund's performance in percentage terms over a set period - in this case, one year, five years or since the fund started on October 1, 1992. For example, if you had invested $1,000 in a fund that had a 5% return over the past year, the value of your investment would be $1,050. You can compare the fund's returns to the performance of the Asset Manager: Income Composite Index, a hypothetical combination of unmanaged indices. The composite index combines the total returns of the Standard & Poor's 500 SM Index, the Lehman Brothers Aggregate Bond Index and the Lehman Brothers 3 Month Treasury Bill Index, weighted according to the fund's neutral mix. To measure how the fund's performance stacked up against its peers, you can compare it to the income funds average, which reflects the performance of mutual funds with similar objectives tracked by Lipper Inc. The past one year average represents a peer group of 91 mutual funds. These benchmarks include reinvested dividends and capital gains, if any, and exclude the effect of sales charges.
Average Annual Total Returns
|
Periods ended September 30, 2000 |
Past 1 |
Past 5 |
Life of |
|
Asset Manager: Income® |
8.10% |
8.82% |
9.04% |
|
Asset Manager: Income Composite |
8.09% |
9.17% |
n/a* |
Average annual total returns take the fund's cumulative return and show you what would have happened if the fund had performed at a constant rate each year.
* Not available
Annual Report
Performance - continued
$10,000 Over Life of Fund
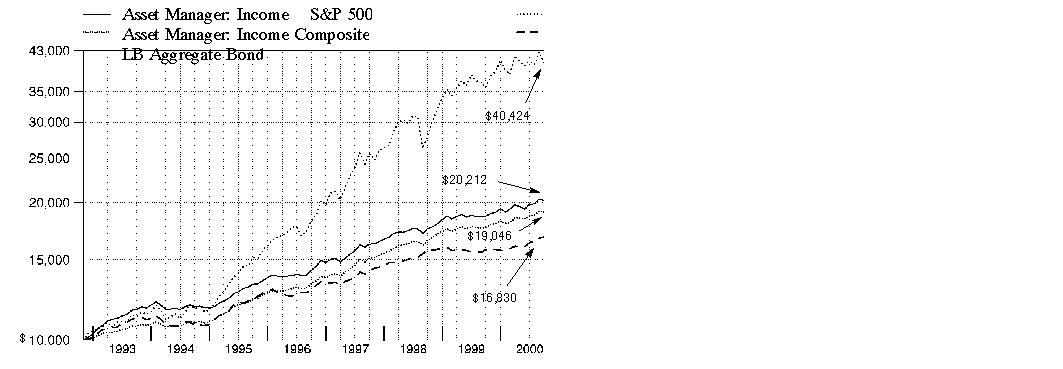
$10,000 Over Life of Fund: Let's say hypothetically that $10,000 was invested in Asset Manager: Income Fund on October 31, 1992, shortly after the fund started. As the chart shows, by September 30, 2000, the value of the investment would have grown to $20,212 - a 102.12% increase on the initial investment. For comparison, look at how both the Lehman Brothers Aggregate Bond Index, a market value-weighted index of investment-grade fixed-rate debt issues, including government, corporate, asset-backed, and mortgage-backed securities with maturities of one year or more, and the S&P 500 Index, a market capitalization-weighted index of common stocks, did over the same period. With dividends and capital gains, if any, reinvested, the same $10,000 investment in the Lehman Brothers Aggregate Bond Index would have grown to $16,830 - a 68.30% increase. If $10,000 was invested in the S&P 500 Index, it would have grown to $40,424 - a 304.24% increase. You can also look at how the Asset Manager: Income Composite Index did over the same period. The composite index combines the total returns of the S&P 500 Index, the Lehman Brothers Aggregate Bond Index and the Lehman Brothers 3 Month T-Bill Index according to the fund's neutral mix and assumes monthly rebalancing of the mix**. With dividends and capital gains, if any, reinvested, the same $10,000 investment would have grown to $19,046 - a 90.46% increase.
Understanding
Performance
How a fund did yesterday is no guarantee of how it will do tomorrow. If you sell your shares during a market downturn, you might lose money. But if you can ride out the market's ups and downs, you may have a gain.
3** Currently 20% stocks, 50% bonds and 30% short-term/money market instruments effective January 1, 1997;
20%, 30% and 50%, respectively, prior to January 1, 1997.
Annual Report
What a long, strange trip it's been. At least that's what some investors may think when reflecting on the 12-month period ending September 30, 2000. Historically high levels of volatility shook speculative excess out of tech stocks in 2000, leaving bonds seemingly alone to pick up the pieces. Excluding the dramatic run-up in the fourth quarter of 1999, major stock markets were down for the period, while bonds finished comfortably on the upside.
Stocks: U.S. equity market performance during the 12 months that ended September 30, 2000, generally was predicated on the fortunes of the technology sector. At the period's outset, technology began its meteoric rise as investors rallied behind the sector's growth potential relative to other areas of the market. But just 10 weeks after setting its record high in mid-March, the NASDAQ Composite Index - a technology sector benchmark - had dropped 30%, due mainly to Federal Reserve Board interest-rate hikes, excessive valuations and the potential of an economic slowdown. Given its one-third weighting in technology, the Standard & Poor's 500SM Index also suffered, as did the blue chips' proxy, the Dow Jones Industrial Average. In response, investors shifted their assets into sectors that traditionally perform better in a more moderate-growth economy, such as health care and energy. Technology rallied sporadically in the summer, but come September, more bad news was in store, as high oil prices and a weak European currency combined to dampen the global economy. For the overall 12-month period ending September 30, 2000, the Dow returned 4.62%, the S&P 500 gained 13.28% and the NASDAQ gained 34.01%. However, all three indexes had negative returns through the first nine months of 2000.
Bonds: Most investment-grade bonds overcame sharply rising interest rates and unusually volatile market conditions en route to posting positive returns during the 12-month period that ended September 30, 2000. The Lehman Brothers Aggregate Bond Index - a widely followed measure of taxable-bond performance - returned 6.99% during this time frame. Treasuries struggled the most early on, as investors pursued more attractive alternatives in high-flying stocks and higher-yielding spread sector securities - namely mortgage bonds, government agency issues and corporate bonds. However, the struggle was short-lived, as conditions changed abruptly beginning in January with the announcement by the U.S. Treasury of its intention to reduce new borrowing and use government surplus proceeds to repurchase outstanding debt. Treasury prices jumped in response and, with the help of rising short-term interest rates, induced an inverted yield curve - which occurs when short-term bonds outyield longer-dated securities. Spread sectors recoiled on the news, with their yield spreads widening out relative to Treasuries. Anticipation that the Fed was finished raising rates, combined with persistent flights-to-safety from risk-averse investors concerned about volatility in equity markets, helped further bolster the long bond during the period. The Lehman Brothers Treasury Index returned 7.29%. Mortgages recovered nicely behind reduced interest-rate volatility and stronger-than-anticipated prepayment activity. Similarly, agencies and corporates staged late rallies and outperformed most major U.S. equity indexes through the first nine months of 2000. For the overall 12-month period, the Lehman Brothers Mortgage-Backed Securities, U.S. Agency and Credit Bond indexes returned 7.42%, 6.73% and 5.87%, respectively.
Annual Report
(Portfolio Manager photograph)
An interview with Richard Habermann, Portfolio Manager of Asset Manager: Income
Q. How did the fund perform, Dick?
A. For the 12-month period that ended September 30, 2000, the fund returned 8.10%, edging the Asset Manager: Income Composite Index, which returned 8.09%. The income funds average tracked by Lipper Inc. returned 8.84% during the same period.
Q. How did your asset allocation decisions play out for the fund?
A. We maintained a slight tilt toward equities, allocating just over 21% of fund assets on average to the asset class during the period. The fund's neutral allocation mix calls for 20% to be invested in stocks, 50% in bonds and 30% in short-term and money market instruments. Even though stocks represented a relatively small piece of the pie, they accounted for almost half of the fund's return. Having ample exposure to the bullishness surrounding stocks early on in the period helped us gain an advantage over the index. Strong security selection kept us within striking distance of our Lipper peers, which tended to hold nearly double our weighting in stocks. Faced with growing uncertainty in the marketplace during the second half of the period, I began to pare back our equity exposure toward a more neutral weighting, which, coupled with strong security selection, helped insulate us somewhat from the volatile spring and summer months. While opportunistic trading toward the end of the period nudged the fund's equity weighting up slightly, my overall approach of emphasizing more of a neutral weighting remained intact. In terms of bonds, we paid the price for allocating part of the portfolio to high-yield securities instead of owning solely investment-grade debt. The short-term/cash portion of the fund added appreciable return during the 12-month period.
Q. What was the fund's strategy with bonds?
A. It was a strong period for our investment-grade holdings. Charlie Morrison and his team responded well to changing conditions in the marketplace and positioned the fund to benefit from them. Following a strong period for corporate bonds in the fourth quarter of 1999, we decided to scale back on the position in January, fearing the effect that rising interest rates would have on longer-term issues. This decision proved wise, as the performance of corporates deteriorated during the period. A driving influence at this time was the U.S. Treasury's campaign of repurchasing outstanding debt and reducing future issuance. This move, coupled with persistent flights to safety from nervous tech investors, sparked a tremendous rally in our long-term Treasuries. Our overweighting in discount mortgage securities also helped, thanks to strong housing turnover. So, even though interest rates were higher during the period, strong technical factors in the market resulted in a positive return for the investment-grade subportfolio. On the other hand, having a modest stake in high-yield bonds - an asset class not included in the index - proved problematic, as yield spreads widened to levels not seen since the 1990 recession. Poor liquidity and declining credit quality sent prices plunging during the period. The fund's overweighting in telecommunications issues - which suffered the most - detracted from performance. Taking the reins from Fred Hoff - who ran the high-yield portion of the fund until June - Matt Conti helped limit our downside by reducing the fund's risk profile through further diversification. We also got a yield boost from carrying a number of issues with historically attractive coupons.
Annual Report
Fund Talk: The Manager's Overview - continued
Q. What factors influenced performance of the equity subportfolio?
A. Superior stock picking and timely trading helped the equity subportfolio handily outpace the Standard & Poor's 500 Index during the 12-month period. Brad Lewis - who directed the fund's equity investments until May - and John Chow, who succeeded Brad, deserve credit for uncovering the right names within the high-growth segments of the market, particularly the market-leading technology sector. The fund's focus on large, high-quality tech stocks allowed us to participate in the dramatic run-up early in the period, and also sheltered us a bit when things began to fall apart in April and May. We further benefited from holding a handful of smaller-cap stocks that enjoyed tremendous gains during the period. Also important was Brad's decision to reduce the fund's tech weighting heading into the spring, rotating some assets into more defensive areas of the market, such as health stocks. Faced with a slowing economy induced by rising interest rates and sharply higher energy prices, John used a strict sell discipline to neutralize market turbulence and lock in profits for the fund. Knowing when to get out of even the quality tech names was one of the keys to outperforming the S&P 500 index during the period. Many of the fund's top performers included firms engaged in the build-out of Internet infrastructure and next-generation communications networks, with Texas Instruments, PMC-Sierra, LSI Logic, Corning and Qualcomm leading the way. Having considerably less exposure than the index to the notable laggards within tech, such as Lucent, further boosted relative returns. Several of our growth-oriented financial stocks, particularly Morgan Stanley Dean Witter and Merrill Lynch, also performed well. BP Amoco and Calpine helped out from the energy sector. GE was another strong performer for us. Conversely, our overexposure to poorly performing cyclical - or economically sensitive - stocks such as Dow Chemical and Alcoa, hurt. Selected tech stocks, namely Microsoft and CMGI, also dragged on performance, as did consumer giant Nike. Several of the aforementioned stocks were no longer held at the close of the period.
Q. And the fund's short-term/money market investments?
A. John Todd felt that concerns surrounding Y2K were overblown and used the opportunity to extend the average maturity of the fund's money market subportfolio late last year to take advantage of a steeply sloped yield curve. Early in 2000, however, the yield curve flattened out dramatically. In response, we let the average maturity roll down, believing that strong economic growth and the risk of rising inflation were likely to set off a protracted period of Fed tightening. Since that time, the curve has remained flat, which has allowed us to maintain a shorter-maturity profile. It's important for shareholders to note that, in July, the fund began to invest nearly all of its money market investments in a Fidelity-managed money market mutual fund in lieu of investing directly in individual money market securities.
Q. What's your outlook?
A. I remain quite cautious. There's an old adage - don't catch a falling knife. Well, that's where I feel we stand today. It's still unclear to me as to whether or not the market will be able to shake its concerns about an economic slowdown and the potential impact on companies' bottom lines. Right now, with stocks facing a stiff headwind, I intend to sit on the sidelines and maintain a neutral equity weighting until I see a catalyst that can reverse the tide. Without that catalyst, it'll be hard for me to justify a significant move.
Annual Report
Fund Talk: The Manager's Overview - continued
The views expressed in this report reflect those of the portfolio manager only through the end of the period of the report as stated on the cover and do not necessarily represent the views of Fidelity or any other person in the Fidelity organization. Any such views are subject to change at any time based upon market or other conditions and Fidelity disclaims any responsibility to update such views. These views may not be relied on as investment advice and, because investment decisions for a Fidelity fund are based on numerous factors, may not be relied on as an indication of trading intent on behalf of any Fidelity fund.
Fund Facts
Goal: high current income, and capital appreciation when appropriate
Fund number: 328
Trading symbol: FASIX
Start date: October 1, 1992
Size: as of September 30, 2000, more than $818 million
Manager: Richard Habermann, since 1996; manager, Asset Manager: Aggressive, since 1999; Asset Manager and Asset Manager: Growth, since 1996; Fidelity Trend Fund, 1977-1981; Fidelity Magellan Fund, 1972-1977; joined Fidelity in 1968
3Dick Habermann reflects on recent market volatility:
"There's a lot of uncertainty in the world today, and it's finding its way into the equity markets. Thankfully, the fund's equity exposure was generally lean toward the tail end of the period, when conditions really started to deteriorate. Our hope is to hold our own - with the help of bonds and cash - when stock markets are doing poorly and try to do considerably better when markets pick up again. That's the whole purpose of asset allocation funds. In a difficult market, sometimes the best thing to do is be patient, see what pans out and pick up some good companies at attractive levels in the process.
"What's particularly troubling for markets these days are shock events. Take the recent crisis in the Middle East, for example. With higher oil prices and inflation fears already weighing on the minds of investors, escalating tensions in that area of the world roiled the markets. There have been many events like this one during the past decade, including the emerging-markets crisis in 1998 and the Gulf War in 1990. As a money manager, it's important for me to anticipate what might be considered less-than-perfect times and, when they are in fact occurring, assess them and decide what to do. So far, we've completed the first part, by anticipating difficult times. Early recognition of an uncertain market climate brought us down to a neutral equity weighting before it hurt us, which was key."
Annual Report
|
Top Five Bond Issuers as of September 30, 2000 |
||
|
(with maturities greater than one year) |
% of fund's net assets |
% of fund's net assets |
|
Fannie Mae |
16.8 |
15.1 |
|
U.S. Treasury Obligations |
5.8 |
8.0 |
|
Government National Mortgage Association |
2.4 |
2.5 |
|
Federal Home Loan Bank |
1.9 |
0.1 |
|
Freddie Mac |
1.5 |
1.2 |
|
|
28.4 |
26.9 |
|
Quality Diversification as of September 30, 2000 |
||
|
(Moody's Ratings) |
% of fund's investments |
% of fund's investments |
|
Aaa, Aa, A |
38.9 |
36.3 |
|
Baa |
9.8 |
10.9 |
|
Ba and Below |
8.7 |
8.7 |
|
Not Rated |
0.1 |
0.6 |
|
Table excludes short-term investments. Where Moody's ratings are not available, we have used |
|
Top Five Stocks as of September 30, 2000 |
||
|
|
% of fund's net assets |
% of fund's net assets |
|
General Electric Co. |
1.0 |
0.8 |
|
Corning, Inc. |
0.9 |
0.2 |
|
Cisco Systems, Inc. |
0.7 |
0.6 |
|
Sun Microsystems, Inc. |
0.7 |
0.2 |
|
Microsoft Corp. |
0.5 |
1.0 |
|
|
3.8 |
2.8 |
|
Asset Allocation (% of fund's net assets) |
|||||||
|
As of September 30, 2000 * |
As of March 31, 2000 ** |
||||||
|
Stock Class 24.0% |
|
|
Stock Class 21.8% |
|
||
|
Bond Class 55.3% |
|
|
Bond Class 55.3% |
|
||
|
Short-term Class 20.7% |
|
|
Short-term Class 22.9% |
|
||
|
Foreign |
|
|
Foreign |
|
||

Asset allocations in the pie charts reflect the categorization of assets as defined in the fund's prospectus in effect as of the time periods indicated above. Financial Statement categorizations conform to accounting standards and will differ from the pie chart.
Annual Report
Showing Percentage of Net Assets
|
Common Stocks - 23.1% |
|||
|
Shares |
Value |
||
|
AEROSPACE & DEFENSE - 0.4% |
|||
|
Aerospace & Defense - 0.4% |
|||
|
Boeing Co. |
24,500 |
$ 1,543,500 |
|
|
Lockheed Martin Corp. |
11,800 |
388,928 |
|
|
Precision Castparts Corp. |
25,000 |
959,375 |
|
|
United Technologies Corp. |
5,700 |
394,725 |
|
|
|
3,286,528 |
||
|
Ship Building & Repair - 0.0% |
|||
|
Newport News Shipbuilding, Inc. |
8,800 |
381,700 |
|
|
TOTAL AEROSPACE & DEFENSE |
3,668,228 |
||
|
BASIC INDUSTRIES - 0.2% |
|||
|
Chemicals & Plastics - 0.2% |
|||
|
Air Products & Chemicals, Inc. |
6,900 |
248,400 |
|
|
Albemarle Corp. |
11,100 |
224,081 |
|
|
Cabot Corp. |
6,700 |
212,306 |
|
|
FMC Corp. (a) |
10,800 |
724,275 |
|
|
|
1,409,062 |
||
|
CONSTRUCTION & REAL ESTATE - 0.0% |
|||
|
Real Estate - 0.0% |
|||
|
Concord Pacific Group, Inc. (a) |
4,400 |
2,633 |
|
|
DURABLES - 0.3% |
|||
|
Consumer Durables - 0.1% |
|||
|
Minnesota Mining & Manufacturing Co. |
5,500 |
501,188 |
|
|
Home Furnishings - 0.1% |
|||
|
Steelcase, Inc. Class A |
29,500 |
494,125 |
|
|
Textiles & Apparel - 0.1% |
|||
|
Columbia Sportswear Co. (a) |
22,900 |
1,050,538 |
|
|
TOTAL DURABLES |
2,045,851 |
||
|
ENERGY - 1.4% |
|||
|
Energy Services - 0.5% |
|||
|
Baker Hughes, Inc. |
12,900 |
478,913 |
|
|
BJ Services Co. (a) |
4,900 |
299,513 |
|
|
ENSCO International, Inc. |
25,200 |
963,900 |
|
|
Global Marine, Inc. (a) |
28,500 |
879,938 |
|
|
Nabors Industries, Inc. (a) |
11,100 |
581,640 |
|
|
Common Stocks - continued |
|||
|
Shares |
Value |
||
|
ENERGY - continued |
|||
|
Energy Services - continued |
|||
|
Noble Drilling Corp. (a) |
18,100 |
$ 909,525 |
|
|
Weatherford International, Inc. |
4,400 |
189,200 |
|
|
|
4,302,629 |
||
|
Oil & Gas - 0.9% |
|||
|
Anadarko Petroleum Corp. |
9,540 |
634,028 |
|
|
Apache Corp. |
10,200 |
603,075 |
|
|
Chevron Corp. |
4,000 |
341,000 |
|
|
EOG Resources, Inc. |
18,200 |
707,525 |
|
|
Exxon Mobil Corp. |
36,300 |
3,235,238 |
|
|
Phillips Petroleum Co. |
11,500 |
721,625 |
|
|
The Coastal Corp. |
8,400 |
622,650 |
|
|
|
6,865,141 |
||
|
TOTAL ENERGY |
11,167,770 |
||
|
FINANCE - 3.3% |
|||
|
Banks - 0.4% |
|||
|
Bank of New York Co., Inc. |
9,700 |
543,806 |
|
|
Capital One Financial Corp. |
7,600 |
532,475 |
|
|
Mellon Financial Corp. |
11,300 |
524,038 |
|
|
Northern Trust Corp. |
11,300 |
1,004,288 |
|
|
Silicon Valley Bancshares (a) |
7,200 |
419,288 |
|
|
State Street Corp. |
4,300 |
559,000 |
|
|
|
3,582,895 |
||
|
Credit & Other Finance - 0.7% |
|||
|
American Express Co. |
20,100 |
1,221,075 |
|
|
Citigroup, Inc. |
63,067 |
3,409,542 |
|
|
Heller Financial, Inc. Class A |
13,600 |
388,450 |
|
|
Providian Financial Corp. |
4,000 |
508,000 |
|
|
|
5,527,067 |
||
|
Federal Sponsored Credit - 0.2% |
|||
|
Fannie Mae |
14,600 |
1,043,900 |
|
|
Freddie Mac |
9,100 |
491,969 |
|
|
|
1,535,869 |
||
|
Insurance - 1.0% |
|||
|
AFLAC, Inc. |
10,400 |
666,250 |
|
|
Allstate Corp. |
11,400 |
396,150 |
|
|
American International Group, Inc. |
32,550 |
3,114,628 |
|
|
CIGNA Corp. |
3,000 |
313,200 |
|
|
Common Stocks - continued |
|||
|
Shares |
Value |
||
|
FINANCE - continued |
|||
|
Insurance - continued |
|||
|
Hartford Financial Services Group, Inc. |
5,600 |
$ 408,450 |
|
|
Lincoln National Corp. |
10,500 |
505,313 |
|
|
Loews Corp. |
12,000 |
1,000,500 |
|
|
Marsh & McLennan Companies, Inc. |
3,500 |
464,625 |
|
|
Old Republic International Corp. |
22,500 |
541,406 |
|
|
PMI Group, Inc. |
8,100 |
548,775 |
|
|
StanCorp Financial Group, Inc. |
12,200 |
521,550 |
|
|
|
8,480,847 |
||
|
Savings & Loans - 0.1% |
|||
|
Golden West Financial Corp. |
11,400 |
611,325 |
|
|
TCF Financial Corp. |
14,100 |
530,513 |
|
|
|
1,141,838 |
||
|
Securities Industry - 0.9% |
|||
|
A.G. Edwards, Inc. |
5,400 |
282,488 |
|
|
Charles Schwab Corp. |
7,300 |
259,150 |
|
|
Goldman Sachs Group, Inc. |
3,000 |
341,813 |
|
|
Lehman Brothers Holdings, Inc. |
6,700 |
989,925 |
|
|
Merrill Lynch & Co., Inc. |
29,700 |
1,960,200 |
|
|
Morgan Stanley Dean Witter & Co. |
14,300 |
1,307,556 |
|
|
PaineWebber Group, Inc. |
9,600 |
654,000 |
|
|
T. Rowe Price Associates, Inc. |
23,800 |
1,117,113 |
|
|
Waddell & Reed Financial, Inc. Class A |
7,300 |
226,300 |
|
|
|
7,138,545 |
||
|
TOTAL FINANCE |
27,407,061 |
||
|
HEALTH - 2.7% |
|||
|
Drugs & Pharmaceuticals - 1.4% |
|||
|
Allergan, Inc. |
15,900 |
1,342,556 |
|
|
ALZA Corp. (a) |
7,100 |
614,150 |
|
|
American Home Products Corp. |
10,400 |
588,250 |
|
|
Amgen, Inc. (a) |
5,600 |
391,038 |
|
|
Andrx Corp. - Andrx Group (a) |
9,400 |
877,725 |
|
|
Ciphergen Biosystems, Inc. |
300 |
9,600 |
|
|
Eli Lilly & Co. |
10,600 |
859,925 |
|
|
Forest Laboratories, Inc. (a) |
3,300 |
378,469 |
|
|
IVAX Corp. (a) |
14,100 |
648,600 |
|
|
Merck & Co., Inc. |
20,300 |
1,511,081 |
|
|
Pfizer, Inc. |
87,200 |
3,918,550 |
|
|
|
11,139,944 |
||
|
Common Stocks - continued |
|||
|
Shares |
Value |
||
|
HEALTH - continued |
|||
|
Medical Equipment & Supplies - 0.4% |
|||
|
Abbott Laboratories |
7,700 |
$ 366,231 |
|
|
Baxter International, Inc. |
8,400 |
670,425 |
|
|
Biomet, Inc. |
8,850 |
309,750 |
|
|
Cardinal Health, Inc. |
5,200 |
458,575 |
|
|
Johnson & Johnson |
19,900 |
1,869,356 |
|
|
|
3,674,337 |
||
|
Medical Facilities Management - 0.9% |
|||
|
Foundation Health Systems, Inc. Class A (a) |
22,100 |
367,413 |
|
|
HCA - The Healthcare Co. |
19,300 |
716,513 |
|
|
Health Management Associates, Inc. Class A (a) |
23,600 |
491,175 |
|
|
Oxford Health Plans, Inc. (a) |
18,400 |
565,512 |
|
|
Tenet Healthcare Corp. |
33,600 |
1,222,200 |
|
|
UnitedHealth Group, Inc. |
10,300 |
1,017,125 |
|
|
Universal Health Services, Inc. Class B (a) |
22,000 |
1,883,750 |
|
|
Wellpoint Health Networks, Inc. (a) |
7,500 |
720,000 |
|
|
|
6,983,688 |
||
|
TOTAL HEALTH |
21,797,969 |
||
|
INDUSTRIAL MACHINERY & EQUIPMENT - 1.3% |
|||
|
Electrical Equipment - 1.2% |
|||
|
C&D Technologies, Inc. |
17,900 |
1,015,825 |
|
|
General Electric Co. |
143,200 |
8,260,850 |
|
|
Inrange Technologies Corp. Class B (a) |
300 |
15,900 |
|
|
Proton Energy Systems, Inc. |
300 |
8,588 |
|
|
Scientific-Atlanta, Inc. |
4,000 |
254,500 |
|
|
|
9,555,663 |
||
|
Industrial Machinery & Equipment - 0.1% |
|||
|
Tyco International Ltd. |
24,200 |
1,255,375 |
|
|
TOTAL INDUSTRIAL MACHINERY & EQUIPMENT |
10,811,038 |
||
|
MEDIA & LEISURE - 0.9% |
|||
|
Broadcasting - 0.1% |
|||
|
Time Warner, Inc. |
5,800 |
453,850 |
|
|
Entertainment - 0.2% |
|||
|
Walt Disney Co. |
33,300 |
1,273,725 |
|
|
Leisure Durables & Toys - 0.1% |
|||
|
Harley-Davidson, Inc. |
23,400 |
1,120,275 |
|
|
Common Stocks - continued |
|||
|
Shares |
Value |
||
|
MEDIA & LEISURE - continued |
|||
|
Lodging & Gaming - 0.4% |
|||
|
Anchor Gaming (a) |
5,300 |
$ 421,681 |
|
|
Extended Stay America, Inc. (a) |
36,100 |
478,325 |
|
|
Harrah's Entertainment, Inc. (a) |
16,400 |
451,000 |
|
|
International Game Technology (a) |
32,100 |
1,079,363 |
|
|
WMS Industries, Inc. (a) |
51,800 |
1,165,500 |
|
|
|
3,595,869 |
||
|
Publishing - 0.1% |
|||
|
McGraw-Hill Companies, Inc. |
11,200 |
711,900 |
|
|
The New York Times Co. Class A |
4,100 |
161,181 |
|
|
|
873,081 |
||
|
TOTAL MEDIA & LEISURE |
7,316,800 |
||
|
NONDURABLES - 0.9% |
|||
|
Beverages - 0.4% |
|||
|
Anheuser-Busch Companies, Inc. |
15,000 |
634,688 |
|
|
Pepsi Bottling Group, Inc. |
29,300 |
880,831 |
|
|
The Coca-Cola Co. |
28,000 |
1,543,500 |
|
|
|
3,059,019 |
||
|
Foods - 0.5% |
|||
|
Keebler Foods Co. |
18,500 |
777,000 |
|
|
PepsiCo, Inc. |
22,700 |
1,044,200 |
|
|
Quaker Oats Co. |
3,400 |
269,025 |
|
|
Ralston Purina Co. |
33,100 |
784,056 |
|
|
Suiza Foods Corp. (a) |
13,100 |
664,006 |
|
|
Sysco Corp. |
6,200 |
287,138 |
|
|
|
3,825,425 |
||
|
Household Products - 0.0% |
|||
|
Avon Products, Inc. |
10,400 |
425,100 |
|
|
Tobacco - 0.0% |
|||
|
Philip Morris Companies, Inc. |
12,500 |
367,969 |
|
|
TOTAL NONDURABLES |
7,677,513 |
||
|
RETAIL & WHOLESALE - 1.0% |
|||
|
Apparel Stores - 0.2% |
|||
|
AnnTaylor Stores Corp. (a) |
13,300 |
511,219 |
|
|
Common Stocks - continued |
|||
|
Shares |
Value |
||
|
RETAIL & WHOLESALE - continued |
|||
|
Apparel Stores - continued |
|||
|
Talbots, Inc. |
10,300 |
$ 682,375 |
|
|
Venator Group, Inc. (a) |
26,700 |
330,413 |
|
|
|
1,524,007 |
||
|
General Merchandise Stores - 0.5% |
|||
|
99 Cents Only Stores (a) |
8,100 |
406,519 |
|
|
Kohls Corp. (a) |
7,900 |
455,731 |
|
|
Neiman Marcus Group, Inc. Class A (a) |
11,200 |
363,300 |
|
|
Wal-Mart Stores, Inc. |
64,200 |
3,089,625 |
|
|
|
4,315,175 |
||
|
Grocery Stores - 0.1% |
|||
|
Pathmark Stores, Inc. (a) |
63,215 |
778,335 |
|
|
Safeway, Inc. (a) |
5,400 |
252,113 |
|
|
|
1,030,448 |
||
|
Retail & Wholesale, Miscellaneous - 0.2% |
|||
|
Home Depot, Inc. |
16,300 |
864,919 |
|
|
Tiffany & Co., Inc. |
8,900 |
343,206 |
|
|
Williams-Sonoma, Inc. (a) |
11,200 |
389,200 |
|
|
|
1,597,325 |
||
|
TOTAL RETAIL & WHOLESALE |
8,466,955 |
||
|
TECHNOLOGY - 7.7% |
|||
|
Communications Equipment - 2.0% |
|||
|
ADC Telecommunications, Inc. (a) |
14,100 |
379,158 |
|
|
Ciena Corp. (a) |
14,000 |
1,719,375 |
|
|
Cisco Systems, Inc. (a) |
100,000 |
5,525,000 |
|
|
Corning, Inc. |
24,500 |
7,276,500 |
|
|
Elastic Networks, Inc. |
200 |
2,788 |
|
|
Jabil Circuit, Inc. (a) |
4,500 |
255,375 |
|
|
Lucent Technologies, Inc. |
45,900 |
1,402,819 |
|
|
|
16,561,015 |
||
|
Computer Services & Software - 1.5% |
|||
|
Adobe Systems, Inc. |
9,700 |
1,505,925 |
|
|
Docent, Inc. |
1,800 |
32,963 |
|
|
Fiserv, Inc. (a) |
9,300 |
556,838 |
|
|
Genomica Corp. |
500 |
9,719 |
|
|
Microsoft Corp. (a) |
69,800 |
4,209,813 |
|
|
Oracle Corp. (a) |
36,100 |
2,842,875 |
|
|
Rational Software Corp. (a) |
10,200 |
707,625 |
|
|
Common Stocks - continued |
|||
|
Shares |
Value |
||
|
TECHNOLOGY - continued |
|||
|
Computer Services & Software - continued |
|||
|
Siebel Systems, Inc. (a) |
6,000 |
$ 667,875 |
|
|
VERITAS Software Corp. (a) |
8,900 |
1,263,800 |
|
|
|
11,797,433 |
||
|
Computers & Office Equipment - 2.1% |
|||
|
Apple Computer, Inc. (a) |
4,200 |
108,150 |
|
|
Brocade Communications Systems, Inc. (a) |
3,000 |
708,000 |
|
|
Dell Computer Corp. (a) |
12,500 |
385,156 |
|
|
EMC Corp. (a) |
40,000 |
3,965,000 |
|
|
Gateway, Inc. (a) |
4,600 |
215,050 |
|
|
Hewlett-Packard Co. |
10,100 |
979,700 |
|
|
International Business Machines Corp. |
26,100 |
2,936,250 |
|
|
Juniper Networks, Inc. (a) |
7,600 |
1,663,925 |
|
|
Network Appliance, Inc. (a) |
7,000 |
891,625 |
|
|
Simple Technology, Inc. |
500 |
4,844 |
|
|
Sun Microsystems, Inc. (a) |
47,300 |
5,522,275 |
|
|
|
17,379,975 |
||
|
Electronic Instruments - 0.2% |
|||
|
Applied Materials, Inc. (a) |
7,100 |
421,119 |
|
|
KLA-Tencor Corp. (a) |
6,300 |
259,481 |
|
|
Newport Corp. |
5,600 |
891,888 |
|
|
|
1,572,488 |
||
|
Electronics - 1.9% |
|||
|
Altera Corp. (a) |
5,500 |
262,625 |
|
|
Analog Devices, Inc. (a) |
10,500 |
866,906 |
|
|
Applied Micro Circuits Corp. (a) |
6,000 |
1,242,375 |
|
|
Broadcom Corp. Class A (a) |
3,800 |
926,250 |
|
|
Cirrus Logic, Inc. (a) |
23,200 |
935,250 |
|
|
Integrated Device Technology, Inc. (a) |
10,700 |
968,350 |
|
|
Intel Corp. |
80,200 |
3,333,313 |
|
|
International Rectifier Corp. (a) |
7,900 |
399,444 |
|
|
Linear Technology Corp. |
4,500 |
291,375 |
|
|
Marvell Technology Group Ltd. |
300 |
23,138 |
|
|
Micron Technology, Inc. (a) |
9,900 |
455,400 |
|
|
Motorola, Inc. |
9,100 |
257,075 |
|
|
PMC-Sierra, Inc. (a) |
4,600 |
990,150 |
|
|
Power-One, Inc. (a) |
8,200 |
496,228 |
|
|
Sanmina Corp. (a) |
2,800 |
262,150 |
|
|
SDL, Inc. (a) |
7,400 |
2,288,913 |
|
|
Common Stocks - continued |
|||
|
Shares |
Value |
||
|
TECHNOLOGY - continued |
|||
|
Electronics - continued |
|||
|
Texas Instruments, Inc. |
19,100 |
$ 901,281 |
|
|
Xilinx, Inc. (a) |
8,800 |
753,500 |
|
|
|
15,653,723 |
||
|
TOTAL TECHNOLOGY |
62,964,634 |
||
|
TRANSPORTATION - 0.1% |
|||
|
Air Transportation - 0.1% |
|||
|
Southwest Airlines Co. |
39,600 |
960,300 |
|
|
UTILITIES - 2.9% |
|||
|
Cellular - 0.4% |
|||
|
Leap Wireless International, Inc. warrants 4/15/10 (a)(f) |
120 |
2,400 |
|
|
QUALCOMM, Inc. (a) |
39,300 |
2,800,125 |
|
|
Sprint Corp. - PCS Group Series 1 (a) |
15,300 |
536,456 |
|
|
|
3,338,981 |
||
|
Electric Utility - 1.0% |
|||
|
AES Corp. (a) |
24,500 |
1,678,250 |
|
|
Calpine Corp. (a) |
16,000 |
1,670,000 |
|
|
Dominion Resources, Inc. |
5,300 |
307,731 |
|
|
Duke Energy Corp. |
7,200 |
617,400 |
|
|
Entergy Corp. |
15,700 |
584,825 |
|
|
Florida Progress Corp. |
9,200 |
487,025 |
|
|
FPL Group, Inc. |
6,400 |
420,800 |
|
|
PECO Energy Co. |
5,700 |
345,206 |
|
|
Pinnacle West Capital Corp. |
8,000 |
407,000 |
|
|
Reliant Energy, Inc. |
26,800 |
1,246,200 |
|
|
|
7,764,437 |
||
|
Gas - 0.8% |
|||
|
Dynegy, Inc. Class A |
32,100 |
1,829,700 |
|
|
El Paso Energy Corp. |
15,600 |
961,350 |
|
|
Enron Corp. |
18,000 |
1,577,250 |
|
|
Equitable Resources, Inc. |
18,200 |
1,153,425 |
|
|
KeySpan Corp. |
20,900 |
838,613 |
|
|
Kinder Morgan, Inc. |
7,500 |
307,031 |
|
|
|
6,667,369 |
||
|
Telephone Services - 0.7% |
|||
|
AT&T Corp. |
10,900 |
320,188 |
|
|
Ono Finance PLC rights 5/31/09 (a)(f) |
190 |
1,710 |
|
|
Pathnet, Inc. warrants 4/15/08 (a)(f) |
570 |
5,700 |
|
|
Common Stocks - continued |
|||
|
Shares |
Value |
||
|
UTILITIES - continued |
|||
|
Telephone Services - continued |
|||
|
Qwest Communications International, Inc. (a) |
9,184 |
$ 441,406 |
|
|
SBC Communications, Inc. |
53,200 |
2,660,000 |
|
|
Sprint Corp. - FON Group |
19,700 |
577,456 |
|
|
Verizon Communications |
20,700 |
1,002,656 |
|
|
WorldCom, Inc. (a) |
20,400 |
619,650 |
|
|
|
5,628,766 |
||
|
TOTAL UTILITIES |
23,399,553 |
||
|
TOTAL COMMON STOCKS (Cost $164,529,752) |
189,095,367 |
||
|
Preferred Stocks - 1.0% |
|||
|
|
|
|
|
|
Convertible Preferred Stocks - 0.1% |
|||
|
MEDIA & LEISURE - 0.0% |
|||
|
Broadcasting - 0.0% |
|||
|
Earthwatch, Inc. $8.50 (f) |
24,056 |
6,014 |
|
|
UTILITIES - 0.1% |
|||
|
Telephone Services - 0.1% |
|||
|
Global Crossing Ltd. $17.50 |
2,900 |
575,470 |
|
|
TOTAL CONVERTIBLE PREFERRED STOCKS |
581,484 |
||
|
Nonconvertible Preferred Stocks - 0.9% |
|||
|
HEALTH - 0.0% |
|||
|
Medical Facilities Management - 0.0% |
|||
|
Fresenius Medical Care Capital Trust II 7.875% |
250 |
240,516 |
|
|
MEDIA & LEISURE - 0.3% |
|||
|
Broadcasting - 0.2% |
|||
|
CSC Holdings, Inc.: |
|
|
|
|
11.125% pay-in-kind |
6,105 |
648,656 |
|
|
Series H, 11.75% pay-in-kind |
6,690 |
725,865 |
|
|
|
1,374,521 |
||
|
Preferred Stocks - continued |
|||
|
Shares |
Value |
||
|
Nonconvertible Preferred Stocks - continued |
|||
|
MEDIA & LEISURE - continued |
|||
|
Publishing - 0.1% |
|||
|
PRIMEDIA, Inc.: |
|
|
|
|
$9.20 |
450 |
$ 39,825 |
|
|
8.625% |
10,680 |
875,760 |
|
|
|
915,585 |
||
|
TOTAL MEDIA & LEISURE |
2,290,106 |
||
|
UTILITIES - 0.6% |
|||
|
Cellular - 0.3% |
|||
|
Crown Castle International Corp. 12.75% pay-in-kind |
398 |
400,985 |
|
|
Nextel Communications, Inc.: |
|
|
|
|
11.125% pay-in-kind |
2,212 |
2,140,110 |
|
|
Series D, 13% pay-in-kind |
68 |
71,910 |
|
|
|
2,613,005 |
||
|
Telephone Services - 0.3% |
|||
|
Adelphia Business Solution, Inc. 12.875% pay-in-kind |
1,053 |
568,620 |
|
|
Intermedia Communications, Inc. 13.5% pay-in-kind |
503 |
482,880 |
|
|
NEXTLINK Communications, Inc. 14% pay-in-kind |
31,972 |
1,438,740 |
|
|
|
2,490,240 |
||
|
TOTAL UTILITIES |
5,103,245 |
||
|
TOTAL NONCONVERTIBLE PREFERRED STOCKS |
7,633,867 |
||
|
TOTAL PREFERRED STOCKS (Cost $8,889,563) |
8,215,351 |
||
|
Corporate Bonds - 23.0% |
|||||
|
Moody's Ratings |
Principal Amount |
|
|||
|
Convertible Bonds - 0.4% |
|||||
|
ENERGY - 0.0% |
|||||
|
Energy Services - 0.0% |
|||||
|
Key Energy Group, Inc. 5% 9/15/04 |
B3 |
|
$ 185,000 |
154,475 |
|
|
HEALTH - 0.2% |
|||||
|
Medical Facilities Management - 0.2% |
|||||
|
Tenet Healthcare Corp. 6% 12/1/05 |
B1 |
|
1,690,000 |
1,436,500 |
|
|
Corporate Bonds - continued |
|||||
|
Moody's Ratings |
Principal Amount |
Value |
|||
|
Convertible Bonds - continued |
|||||
|
HEALTH - continued |
|||||
|
Medical Facilities Management - continued |
|||||
|
Total Renal Care Holdings, Inc.: |
|
|
|
|
|
|
7% 5/15/09 |
B3 |
|
$ 200,000 |
$ 140,750 |
|
|
7% 5/15/09 (f) |
B3 |
|
490,000 |
344,838 |
|
|
|
1,922,088 |
||||
|
INDUSTRIAL MACHINERY & EQUIPMENT - 0.1% |
|||||
|
Pollution Control - 0.1% |
|||||
|
Waste Management, Inc. 4% 2/1/02 |
Ba1 |
|
320,000 |
300,000 |
|
|
MEDIA & LEISURE - 0.1% |
|||||
|
Broadcasting - 0.1% |
|||||
|
EchoStar Communications Corp. 4.875% 1/1/07 (f) |
Caa2 |
|
200,000 |
263,250 |
|
|
NTL Delaware, Inc./NTL, Inc. 5.75% 12/15/09 |
Caa1 |
|
150,000 |
102,375 |
|
|
NTL, Inc. 5.75% 12/15/09 (f) |
Caa1 |
|
295,000 |
201,338 |
|
|
|
566,963 |
||||
|
Lodging & Gaming - 0.0% |
|||||
|
Hilton Hotels Corp. 5% 5/15/06 |
Ba2 |
|
190,000 |
158,650 |
|
|
TOTAL MEDIA & LEISURE |
725,613 |
||||
|
TOTAL CONVERTIBLE BONDS |
3,102,176 |
||||
|
Nonconvertible Bonds - 22.6% |
|||||
|
BASIC INDUSTRIES - 0.7% |
|||||
|
Chemicals & Plastics - 0.4% |
|||||
|
Avecia Group PLC 11% 7/1/09 |
B2 |
|
160,000 |
154,800 |
|
|
Huntsman Corp. 9.5% 7/1/07 (f) |
B2 |
|
135,000 |
109,013 |
|
|
Huntsman ICI Chemicals LLC 10.125% 7/1/09 |
B2 |
|
200,000 |
196,000 |
|
|
Lyondell Chemical Co.: |
|
|
|
|
|
|
9.875% 5/1/07 |
Ba3 |
|
990,000 |
965,250 |
|
|
10.875% 5/1/09 |
B2 |
|
1,605,000 |
1,556,850 |
|
|
Methanex Corp. yankee 7.4% 8/15/02 |
Ba1 |
|
55,000 |
51,425 |
|
|
Scotts Co. 8.625% 1/15/09 (f) |
B2 |
|
240,000 |
231,600 |
|
|
Sterling Chemicals, Inc.: |
|
|
|
|
|
|
11.25% 4/1/07 |
Caa3 |
|
75,000 |
51,000 |
|
|
12.375% 7/15/06 |
B3 |
|
20,000 |
20,300 |
|
|
|
3,336,238 |
||||
|
Corporate Bonds - continued |
|||||
|
Moody's Ratings |
Principal Amount |
Value |
|||
|
Nonconvertible Bonds - continued |
|||||
|
BASIC INDUSTRIES - continued |
|||||
|
Packaging & Containers - 0.1% |
|||||
|
Gaylord Container Corp.: |
|
|
|
|
|
|
9.375% 6/15/07 |
Caa1 |
|
$ 615,000 |
$ 455,100 |
|
|
9.75% 6/15/07 |
Caa1 |
|
600,000 |
456,000 |
|
|
U.S. Can Corp. 12.375% 10/1/10 (f) |
B3 |
|
70,000 |
70,700 |
|
|
|
981,800 |
||||
|
Paper & Forest Products - 0.2% |
|||||
|
Doman Industries Ltd. yankee 8.75% 3/15/04 |
Caa1 |
|
495,000 |
326,700 |
|
|
Potlatch Corp. 6.25% 3/15/02 |
Baa1 |
|
990,000 |
967,765 |
|
|
Repap New Brunswick, Inc. yankee 10.625% 4/15/05 |
Caa1 |
|
35,000 |
36,050 |
|
|
Stone Container Corp. 10.75% 10/1/02 |
B1 |
|
15,000 |
15,188 |
|
|
|
1,345,703 |
||||
|
TOTAL BASIC INDUSTRIES |
5,663,741 |
||||
|
CONSTRUCTION & REAL ESTATE - 0.9% |
|||||
|
Building Materials - 0.0% |
|||||
|
Numatics, Inc. 9.625% 4/1/08 |
B3 |
|
95,000 |
74,100 |
|
|
Construction - 0.2% |
|||||
|
Blount, Inc. 13% 8/1/09 |
B3 |
|
715,000 |
723,938 |
|
|
D.R. Horton, Inc. 8% 2/1/09 |
Ba1 |
|
150,000 |
137,625 |
|
|
Del Webb Corp. 9.375% 5/1/09 |
B2 |
|
155,000 |
142,600 |
|
|
Ryland Group, Inc. 9.75% 9/1/10 |
Ba2 |
|
605,000 |
601,975 |
|
|
Standard Pacific Corp. 9.5% 9/15/10 |
Ba2 |
|
295,000 |
292,050 |
|
|
|
1,898,188 |
||||
|
Engineering - 0.1% |
|||||
|
360networks, Inc. 13% 5/1/08 |
B3 |
|
105,000 |
96,600 |
|
|
Anteon Corp. 12% 5/15/09 |
B3 |
|
290,000 |
261,000 |
|
|
Morrison Knudsen Corp. 11% 7/1/10 (f) |
Ba2 |
|
305,000 |
309,575 |
|
|
|
667,175 |
||||
|
Real Estate - 0.2% |
|||||
|
Duke-Weeks Realty LP 6.875% 3/15/05 |
Baa2 |
|
900,000 |
875,034 |
|
|
LNR Property Corp.: |
|
|
|
|
|
|
9.375% 3/15/08 |
B1 |
|
30,000 |
28,050 |
|
|
10.5% 1/15/09 |
B1 |
|
220,000 |
214,500 |
|
|
|
1,117,584 |
||||
|
Corporate Bonds - continued |
|||||
|
Moody's Ratings |
Principal Amount |
Value |
|||
|
Nonconvertible Bonds - continued |
|||||
|
CONSTRUCTION & REAL ESTATE - continued |
|||||
|
Real Estate Investment Trusts - 0.4% |
|||||
|
CenterPoint Properties Trust: |
|
|
|
|
|
|
6.75% 4/1/05 |
Baa2 |
|
$ 490,000 |
$ 464,633 |
|
|
7.125% 3/15/04 |
Baa2 |
|
1,250,000 |
1,215,850 |
|
|
Equity Office Properties Trust: |
|
|
|
|
|
|
6.375% 2/15/03 |
Baa1 |
|
1,050,000 |
1,027,299 |
|
|
6.75% 2/15/08 |
Baa1 |
|
480,000 |
448,517 |
|
|
Pinnacle Holdings, Inc. 0% 3/15/08 (d) |
B3 |
|
80,000 |
58,400 |
|
|
|
3,214,699 |
||||
|
TOTAL CONSTRUCTION & REAL ESTATE |
6,971,746 |
||||
|
DURABLES - 0.3% |
|||||
|
Autos, Tires, & Accessories - 0.1% |
|||||
|
American Axle & Manufacturing, Inc. 9.75% 3/1/09 |
B1 |
|
150,000 |
147,000 |
|
|
Collins & Aikman Products Co. 11.5% 4/15/06 |
B2 |
|
30,000 |
28,650 |
|
|
Lear Corp. 8.11% 5/15/09 |
Ba1 |
|
120,000 |
111,900 |
|
|
TRW, Inc. 8.75% 5/15/06 |
Baa1 |
|
1,070,000 |
1,114,833 |
|
|
|
1,402,383 |
||||
|
Textiles & Apparel - 0.2% |
|||||
|
Jones Apparel Group, Inc. 7.875% 6/15/06 |
Baa2 |
|
1,425,000 |
1,334,655 |
|
|
Levi Strauss & Co.: |
|
|
|
|
|
|
6.8% 11/1/03 |
Ba3 |
|
75,000 |
63,750 |
|
|
7% 11/1/06 |
Ba3 |
|
90,000 |
70,200 |
|
|
|
1,468,605 |
||||
|
TOTAL DURABLES |
2,870,988 |
||||
|
ENERGY - 1.1% |
|||||
|
Coal - 0.1% |
|||||
|
P&L Coal Holdings Corp. 9.625% 5/15/08 |
B2 |
|
660,000 |
641,850 |
|
|
Energy Services - 0.1% |
|||||
|
DI Industries, Inc. 8.875% 7/1/07 |
B1 |
|
190,000 |
183,350 |
|
|
Ocean Rig Norway AS 10.25% 6/1/08 |
B3 |
|
155,000 |
136,400 |
|
|
Parker Drilling Co. 9.75% 11/15/06 |
B1 |
|
235,000 |
237,350 |
|
|
R&B Falcon Corp. 6.5% 4/15/03 |
Ba3 |
|
370,000 |
351,500 |
|
|
RBF Finance Co. 11% 3/15/06 |
Ba3 |
|
130,000 |
149,500 |
|
|
|
1,058,100 |
||||
|
Corporate Bonds - continued |
|||||
|
Moody's Ratings |
Principal Amount |
Value |
|||
|
Nonconvertible Bonds - continued |
|||||
|
ENERGY - continued |
|||||
|
Oil & Gas - 0.9% |
|||||
|
Apache Corp. 7.625% 7/1/19 |
Baa1 |
|
$ 840,000 |
$ 828,173 |
|
|
Canadian Forest Oil Ltd. 8.75% 9/15/07 |
B2 |
|
150,000 |
145,500 |
|
|
Chesapeake Energy Corp. 9.625% 5/1/05 |
B2 |
|
770,000 |
766,150 |
|
|
Cross Timbers Oil Co.: |
|
|
|
|
|
|
8.75% 11/1/09 |
B2 |
|
405,000 |
394,875 |
|
|
9.25% 4/1/07 |
B2 |
|
85,000 |
85,000 |
|
|
Oryx Energy Co.: |
|
|
|
|
|
|
8% 10/15/03 |
Baa1 |
|
920,000 |
936,109 |
|
|
8.125% 10/15/05 |
Baa1 |
|
1,440,000 |
1,496,074 |
|
|
8.375% 7/15/04 |
Baa1 |
|
1,420,000 |
1,471,461 |
|
|
Petro-Canada 7% 11/15/28 |
A3 |
|
430,000 |
383,560 |
|
|
Phillips Petroleum Co. 8.75% 5/25/10 |
Baa2 |
|
580,000 |
629,926 |
|
|
Plains Resources, Inc. 10.25% 3/15/06 (f) |
B2 |
|
15,000 |
15,263 |
|
|
|
7,152,091 |
||||
|
TOTAL ENERGY |
8,852,041 |
||||
|
FINANCE - 5.7% |
|||||
|
Banks - 2.5% |
|||||
|
Bank of America Corp. 7.8% 2/15/10 |
Aa3 |
|
400,000 |
410,084 |
|
|
Bank of Tokyo-Mitsubishi Ltd. 8.4% 4/15/10 |
A3 |
|
730,000 |
743,279 |
|
|
Bank One Capital III 8.75% 9/1/30 |
Aa3 |
|
800,000 |
797,608 |
|
|
Bank One Corp. 7.875% 8/1/10 |
A1 |
|
2,200,000 |
2,231,944 |
|
|
BankBoston Corp. 6.625% 2/1/04 |
A3 |
|
500,000 |
491,580 |
|
|
BankBoston NA 6.5% 12/19/07 |
A2 |
|
2,000,000 |
1,879,200 |
|
|
BanPonce Financial Corp. 6.75% 8/9/01 |
A3 |
|
1,660,000 |
1,654,140 |
|
|
Capital One Bank: |
|
|
|
|
|
|
6.26% 5/7/01 |
Baa2 |
|
1,160,000 |
1,149,746 |
|
|
6.375% 2/15/03 |
Baa2 |
|
1,080,000 |
1,052,633 |
|
|
6.48% 6/28/02 |
Baa2 |
|
640,000 |
626,970 |
|
|
6.65% 3/15/04 |
Baa3 |
|
690,000 |
667,133 |
|
|
Capital One Financial Corp. 7.125% 8/1/08 |
Baa3 |
|
1,920,000 |
1,806,298 |
|
|
Commonwealth Bank of Australia 8.5% 6/1/10 |
A1 |
|
500,000 |
528,880 |
|
|
Den Danske Bank AS 6.375% 6/15/08 (f)(g) |
A1 |
|
2,190,000 |
2,053,809 |
|
|
HSBC Finance Nederland BV 7.4% |
A1 |
|
250,000 |
251,738 |
|
|
Korea Development Bank: |
|
|
|
|
|
|
6.625% 11/21/03 |
Baa2 |
|
1,320,000 |
1,285,838 |
|
|
7.125% 4/22/04 |
Baa2 |
|
200,000 |
196,750 |
|
|
Corporate Bonds - continued |
|||||
|
Moody's Ratings |
Principal Amount |
Value |
|||
|
Nonconvertible Bonds - continued |
|||||
|
FINANCE - continued |
|||||
|
Banks - continued |
|||||
|
Korea Development Bank: - continued |
|
|
|
|
|
|
7.375% 9/17/04 |
Baa2 |
|
$ 195,000 |
$ 193,210 |
|
|
Popular, Inc. 6.2% 4/30/01 |
A3 |
|
635,000 |
630,428 |
|
|
Royal Bank of Scotland Group PLC 9.118% 3/31/49 |
A1 |
|
555,000 |
582,728 |
|
|
Union Planters National Bank 6.81% 8/20/01 |
A3 |
|
1,000,000 |
998,190 |
|
|
|
20,232,186 |
||||
|
Credit & Other Finance - 2.3% |
|||||
|
Ahmanson Capital Trust I 8.36% 12/1/26 (f) |
A3 |
|
1,000,000 |
880,580 |
|
|
Associates Corp. of North America: |
|
|
|
|
|
|
5.8% 4/20/04 |
A1 |
|
2,170,000 |
2,090,122 |
|
|
6.95% 11/1/18 |
A1 |
|
1,190,000 |
1,109,770 |
|
|
CIT Group, Inc. 5.5% 2/15/04 |
A1 |
|
250,000 |
236,843 |
|
|
Countrywide Funding Corp. 6.45% 2/27/03 |
A3 |
|
1,200,000 |
1,181,244 |
|
|
Daimler-Chrysler NA Holding Corp. 6.59% 6/18/02 |
A1 |
|
250,000 |
248,265 |
|
|
Denbury Management, Inc. 9% 3/1/08 |
B3 |
|
75,000 |
68,625 |
|
|
Details Capital Corp. 0% 11/15/07 (d) |
Caa1 |
|
85,000 |
67,150 |
|
|
ERP Operating LP: |
|
|
|
|
|
|
6.55% 11/15/01 |
A3 |
|
400,000 |
396,764 |
|
|
7.1% 6/23/04 |
A3 |
|
1,130,000 |
1,115,672 |
|
|
Finova Capital Corp. 7.25% 11/8/04 |
Ba1 |
|
230,000 |
170,200 |
|
|
First Security Capital I 8.41% 12/15/26 |
A3 |
|
420,000 |
386,602 |
|
|
Ford Motor Credit Co.: |
|
|
|
|
|
|
7.5% 3/15/05 |
A2 |
|
1,060,000 |
1,068,681 |
|
|
7.875% 6/15/10 |
A2 |
|
500,000 |
505,175 |
|
|
GS Escrow Corp.: |
|
|
|
|
|
|
7% 8/1/03 |
Ba1 |
|
155,000 |
148,413 |
|
|
7.125% 8/1/05 |
Ba1 |
|
320,000 |
297,856 |
|
|
HSBC Capital Funding LP 10.176% 12/31/49 (e)(f) |
A1 |
|
1,225,000 |
1,350,391 |
|
|
Macsaver Financial Services, Inc.: |
|
|
|
|
|
|
7.4% 2/15/02 (j) |
Ca |
|
230,000 |
39,100 |
|
|
7.6% 8/1/07 (j) |
Ca |
|
220,000 |
37,400 |
|
|
7.875% 8/1/03 (j) |
Ca |
|
495,000 |
84,150 |
|
|
Newcourt Credit Group, Inc. 6.875% 2/16/05 |
A1 |
|
475,000 |
467,961 |
|
|
PNC Funding Corp. 6.875% 3/1/03 |
A3 |
|
530,000 |
526,089 |
|
|
Popular North America, Inc. 7.375% 9/15/01 |
A3 |
|
1,000,000 |
998,700 |
|
|
Corporate Bonds - continued |
|||||
|
Moody's Ratings |
Principal Amount |
Value |
|||
|
Nonconvertible Bonds - continued |
|||||
|
FINANCE - continued |
|||||
|
Credit & Other Finance - continued |
|||||
|
Qwest Capital Funding, Inc. 7.75% 8/15/06 (f) |
Baa1 |
|
$ 1,600,000 |
$ 1,622,096 |
|
|
The Money Store, Inc. 7.3% 12/1/02 |
A2 |
|
750,000 |
754,928 |
|
|
TXU Eastern Funding: |
|
|
|
|
|
|
6.15% 5/15/02 |
Baa1 |
|
720,000 |
704,009 |
|
|
6.75% 5/15/09 |
Baa1 |
|
1,180,000 |
1,068,797 |
|
|
U.S. West Capital Funding, Inc. 6.875% 7/15/28 |
Baa1 |
|
1,220,000 |
1,090,851 |
|
|
|
18,716,434 |
||||
|
Savings & Loans - 0.5% |
|||||
|
Chevy Chase Savings Bank FSB 9.25% 12/1/08 |
B1 |
|
310,000 |
285,975 |
|
|
Home Savings of America FSB 6.5% 8/15/04 |
A3 |
|
750,000 |
724,245 |
|
|
Long Island Savings Bank FSB: |
|
|
|
|
|
|
6.2% 4/2/01 |
Baa3 |
|
700,000 |
694,694 |
|
|
7% 6/13/02 |
Baa3 |
|
1,670,000 |
1,653,283 |
|
|
Sovereign Bancorp, Inc. 6.625% 3/15/01 |
Ba3 |
|
1,200,000 |
1,189,296 |
|
|
|
4,547,493 |
||||
|
Securities Industry - 0.4% |
|||||
|
Amvescap PLC yankee: |
|
|
|
|
|
|
6.375% 5/15/03 |
A3 |
|
700,000 |
678,181 |
|
|
6.6% 5/15/05 |
A3 |
|
2,920,000 |
2,779,022 |
|
|
|
3,457,203 |
||||
|
TOTAL FINANCE |
46,953,316 |
||||
|
HEALTH - 0.1% |
|||||
|
Drugs & Pharmaceuticals - 0.0% |
|||||
|
Chattem, Inc. 8.875% 4/1/08 |
B2 |
|
160,000 |
134,400 |
|
|
Medical Equipment & Supplies - 0.0% |
|||||
|
Millipore Corp. 7.5% 4/1/07 |
Ba2 |
|
30,000 |
27,675 |
|
|
Medical Facilities Management - 0.1% |
|||||
|
Express Scripts, Inc. 9.625% 6/15/09 |
Ba2 |
|
30,000 |
30,450 |
|
|
Triad Hospitals Holdings, Inc. 11% 5/15/09 |
B3 |
|
60,000 |
61,875 |
|
|
Unilab Corp. 12.75% 10/1/09 |
B3 |
|
160,000 |
173,200 |
|
|
|
265,525 |
||||
|
TOTAL HEALTH |
427,600 |
||||
|
Corporate Bonds - continued |
|||||
|
Moody's Ratings |
Principal Amount |
Value |
|||
|
Nonconvertible Bonds - continued |
|||||
|
INDUSTRIAL MACHINERY & EQUIPMENT - 0.6% |
|||||
|
Electrical Equipment - 0.0% |
|||||
|
Loral Space & Communications Ltd. 9.5% 1/15/06 |
B1 |
|
$ 150,000 |
$ 106,500 |
|
|
Industrial Machinery & Equipment - 0.3% |
|||||
|
Dunlop Standard Aero Holdings PLC 11.875% 5/15/09 |
B3 |
|
570,000 |
588,525 |
|
|
Tyco International Group SA: |
|
|
|
|
|
|
7% 6/15/28 |
Baa1 |
|
1,500,000 |
1,317,870 |
|
|
yankee 6.375% 6/15/05 |
Baa1 |
|
220,000 |
213,710 |
|
|
|
2,120,105 |
||||
|
Pollution Control - 0.3% |
|||||
|
Allied Waste North America, Inc.: |
|
|
|
|
|
|
7.375% 1/1/04 |
Ba3 |
|
260,000 |
240,500 |
|
|
7.625% 1/1/06 |
Ba2 |
|
180,000 |
160,200 |
|
|
10% 8/1/09 |
B2 |
|
1,795,000 |
1,552,675 |
|
|
Browning-Ferris Industries, Inc. 6.375% 1/15/08 |
Ba3 |
|
240,000 |
194,400 |
|
|
WMX Technologies, Inc. 6.25% 10/15/00 |
Ba1 |
|
600,000 |
599,394 |
|
|
|
2,747,169 |
||||
|
TOTAL INDUSTRIAL MACHINERY & EQUIPMENT |
4,973,774 |
||||
|
MEDIA & LEISURE - 4.4% |
|||||
|
Broadcasting - 3.0% |
|||||
|
ACME Television LLC/ACME Financial Corp. 10.875% 9/30/04 |
B3 |
|
170,000 |
160,650 |
|
|
Adelphia Communications Corp. 9.875% 3/1/07 |
B2 |
|
175,000 |
165,375 |
|
|
Ascent Entertainment Group, Inc. 0% 12/15/04 (d) |
Ba1 |
|
25,000 |
20,375 |
|
|
British Sky Broadcasting Group PLC: |
|
|
|
|
|
|
7.3% 10/15/06 |
Ba1 |
|
290,000 |
266,278 |
|
|
8.2% 7/15/09 |
Baa3 |
|
1,680,000 |
1,595,244 |
|
|
Callahan Nordrhein Westfalen: |
|
|
|
|
|
|
0% 7/15/10 (d)(f) |
B3 |
|
325,000 |
149,500 |
|
|
14% 7/15/10 (f) |
B3 |
|
150,000 |
149,250 |
|
|
CD Radio, Inc. 14.5% 5/15/09 |
CCC+ |
|
150,000 |
133,875 |
|
|
Charter Communications Holdings LLC/Charter Communications Holdings Capital Corp.: |
|
|
|
|
|
|
8.625% 4/1/09 |
B2 |
|
205,000 |
183,988 |
|
|
Corporate Bonds - continued |
|||||
|
Moody's Ratings |
Principal Amount |
Value |
|||
|
Nonconvertible Bonds - continued |
|||||
|
MEDIA & LEISURE - continued |
|||||
|
Broadcasting - continued |
|||||
|
Charter Communications Holdings LLC/Charter Communications Holdings Capital Corp.: - continued |
|
|
|
|
|
|
10% 4/1/09 |
B2 |
|
$ 1,280,000 |
$ 1,254,400 |
|
|
Citadel Broadcasting Co. 10.25% 7/1/07 |
B3 |
|
810,000 |
840,375 |
|
|
Clear Channel Communications, Inc. 6.875% 6/15/18 |
Baa3 |
|
900,000 |
788,211 |
|
|
Continental Cablevision, Inc.: |
|
|
|
|
|
|
8.3% 5/15/06 |
A2 |
|
795,000 |
823,493 |
|
|
8.625% 8/15/03 |
A2 |
|
480,000 |
498,082 |
|
|
CSC Holdings, Inc.: |
|
|
|
|
|
|
9.875% 4/1/23 |
B1 |
|
300,000 |
307,500 |
|
|
10.5% 5/15/16 |
Ba3 |
|
35,000 |
37,188 |
|
|
Diamond Cable Communications PLC: |
|
|
|
|
|
|
0% 2/15/07 (d) |
B2 |
|
1,230,000 |
944,025 |
|
|
yankee 0% 12/15/05 (d) |
B2 |
|
190,000 |
177,650 |
|
|
Earthwatch, Inc. 0% 7/15/07 (d) |
- |
|
490,000 |
274,400 |
|
|
EchoStar DBS Corp. 9.25% 2/1/06 |
B1 |
|
500,000 |
491,250 |
|
|
Fox Family Worldwide, Inc. 0% 11/1/07 (d) |
B1 |
|
215,000 |
153,725 |
|
|
FrontierVision Holdings LP/FrontierVision Holdings Capital Corp. 0% 9/15/07 (d) |
B2 |
|
615,000 |
531,975 |
|
|
FrontierVision Holdings LP/FrontierVision Holdings Capital II Corp. 0% 9/15/07 (d) |
Caa1 |
|
1,370,000 |
1,185,050 |
|
|
FrontierVision Operating Partners LP/ FrontierVision Capital Corp. 11% 10/15/06 |
B2 |
|
590,000 |
595,900 |
|
|
Golden Sky DBS, Inc. 0% 3/1/07 (d) |
Caa1 |
|
660,000 |
468,600 |
|
|
Golden Sky Systems, Inc. 12.375% 8/1/06 |
B3 |
|
190,000 |
208,050 |
|
|
Hearst-Argyle Television, Inc. 7.5% 11/15/27 |
Baa3 |
|
1,240,000 |
1,078,118 |
|
|
Knology Holding, Inc. 0% 10/15/07 (d) |
- |
|
880,000 |
334,400 |
|
|
NTL Communications Corp. 11.5% 10/1/08 |
B3 |
|
200,000 |
194,500 |
|
|
Olympus Communications LP/Olympus Capital Corp. 10.625% 11/15/06 |
B2 |
|
270,000 |
266,625 |
|
|
Pegasus Communications Corp. 9.625% 10/15/05 |
B3 |
|
830,000 |
809,250 |
|
|
Satelites Mexicanos SA de CV 11.28% 6/30/04 (f)(g) |
B1 |
|
30,000 |
27,000 |
|
|
Spectrasite Holdings, Inc. 0% 3/15/10 (d) |
B3 |
|
260,000 |
131,300 |
|
|
TCI Communications, Inc. 9.8% 2/1/12 |
A2 |
|
1,190,000 |
1,356,838 |
|
|
Telemundo Holdings, Inc. 0% 8/15/08 (d) |
Caa1 |
|
55,000 |
39,188 |
|
|
Telewest PLC 0% 10/1/07 (d) |
B1 |
|
2,280,000 |
2,188,800 |
|
|
Corporate Bonds - continued |
|||||
|
Moody's Ratings |
Principal Amount |
Value |
|||
|
Nonconvertible Bonds - continued |
|||||
|
MEDIA & LEISURE - continued |
|||||
|
Broadcasting - continued |
|||||
|
Time Warner, Inc.: |
|
|
|
|
|
|
8.18% 8/15/07 |
Baa3 |
|
$ 2,115,000 |
$ 2,210,535 |
|
|
9.125% 1/15/13 |
Baa3 |
|
1,300,000 |
1,458,431 |
|
|
United International Holdings, Inc. 0% 2/15/08 (d) |
B3 |
|
685,000 |
458,950 |
|
|
United Pan-Europe Communications NV: |
|
|
|
|
|
|
0% 2/1/10 (d) |
B2 |
|
1,930,000 |
887,800 |
|
|
10.875% 8/1/09 |
B2 |
|
803,000 |
698,610 |
|
|
USA Networks, Inc./USANi LLC 6.75% 11/15/05 |
Baa3 |
|
375,000 |
366,131 |
|
|
|
24,910,885 |
||||
|
Entertainment - 0.3% |
|||||
|
Alliance Gaming Corp. 10% 8/1/07 |
Caa1 |
|
145,000 |
79,750 |
|
|
Bally Total Fitness Holding Corp. 9.875% 10/15/07 |
B3 |
|
580,000 |
549,550 |
|
|
Mandalay Resort Group: |
|
|
|
|
|
|
9.5% 8/1/08 (f) |
Ba2 |
|
100,000 |
101,750 |
|
|
10.25% 8/1/07 (f) |
Ba3 |
|
190,000 |
195,700 |
|
|
MGM Mirage, Inc. 9.75% 6/1/07 |
Ba2 |
|
500,000 |
516,250 |
|
|
Paramount Communications, Inc. 7.5% |
Baa1 |
|
585,000 |
585,181 |
|
|
Premier Parks, Inc. 9.75% 6/15/07 |
B3 |
|
300,000 |
282,750 |
|
|
|
2,310,931 |
||||
|
Lodging & Gaming - 0.3% |
|||||
|
Coast Hotels & Casinos, Inc. 9.5% 4/1/09 |
B3 |
|
60,000 |
59,400 |
|
|
Courtyard by Marriott II LP/Courtyard II |
B- |
|
790,000 |
790,000 |
|
|
HMH Properties, Inc. 7.875% 8/1/05 |
Ba2 |
|
450,000 |
425,250 |
|
|
Hollywood Casino Shreveport/Shreveport Capital Corp. 13% 8/1/06 |
B3 |
|
145,000 |
155,513 |
|
|
Horseshoe Gaming LLC 8.625% 5/15/09 |
B2 |
|
150,000 |
147,750 |
|
|
Host Marriott LP 8.375% 2/15/06 |
Ba2 |
|
730,000 |
700,800 |
|
|
ITT Corp. 7.375% 11/15/15 |
Ba1 |
|
40,000 |
34,400 |
|
|
Mohegan Tribal Gaming Authority 8.75% 1/1/09 |
Ba3 |
|
165,000 |
163,763 |
|
|
Station Casinos, Inc. 10.125% 3/15/06 |
B1 |
|
105,000 |
105,005 |
|
|
|
2,581,881 |
||||
|
Corporate Bonds - continued |
|||||
|
Moody's Ratings |
Principal Amount |
Value |
|||
|
Nonconvertible Bonds - continued |
|||||
|
MEDIA & LEISURE - continued |
|||||
|
Publishing - 0.7% |
|||||
|
Garden State Newspapers, Inc. Series B, 8.75% 10/1/09 |
B1 |
|
$ 915,000 |
$ 856,669 |
|
|
News America Holdings, Inc.: |
|
|
|
|
|
|
7.7% 10/30/25 |
Baa3 |
|
1,390,000 |
1,279,398 |
|
|
7.75% 1/20/24 |
Baa3 |
|
720,000 |
664,308 |
|
|
8% 10/17/16 |
Baa3 |
|
770,000 |
741,980 |
|
|
Time Warner Entertainment Co. LP 8.375% 3/15/23 |
Baa2 |
|
1,520,000 |
1,560,098 |
|
|
Ziff Davis Media, Inc. 12% 7/15/10 (f) |
B2 |
|
195,000 |
193,050 |
|
|
|
5,295,503 |
||||
|
Restaurants - 0.1% |
|||||
|
AFC Enterprises, Inc. 10.25% 5/15/07 |
B3 |
|
30,000 |
29,925 |
|
|
Domino's, Inc. 10.375% 1/15/09 |
B3 |
|
570,000 |
542,925 |
|
|
NE Restaurant, Inc. 10.75% 7/15/08 |
B3 |
|
360,000 |
277,200 |
|
|
|
850,050 |
||||
|
TOTAL MEDIA & LEISURE |
35,949,250 |
||||
|
NONDURABLES - 0.8% |
|||||
|
Beverages - 0.4% |
|||||
|
Canandaigua Brands, Inc. 8.5% 3/1/09 |
B1 |
|
145,000 |
141,919 |
|
|
Canandaigua Brands, Inc. 8.75% 12/15/03 |
B1 |
|
90,000 |
89,775 |
|
|
Seagram JE & Sons, Inc.: |
|
|
|
|
|
|
6.4% 12/15/03 |
Baa3 |
|
1,870,000 |
1,832,376 |
|
|
6.8% 12/15/08 |
Baa3 |
|
945,000 |
916,045 |
|
|
|
2,980,115 |
||||
|
Foods - 0.1% |
|||||
|
ConAgra, Inc. 7.125% 10/1/26 |
Baa1 |
|
755,000 |
741,704 |
|
|
Del Monte Corp. 12.25% 4/15/07 |
B3 |
|
15,000 |
15,938 |
|
|
|
757,642 |
||||
|
Tobacco - 0.3% |
|||||
|
Philip Morris Companies, Inc.: |
|
|
|
|
|
|
7% 7/15/05 |
A2 |
|
1,265,000 |
1,225,266 |
|
|
Corporate Bonds - continued |
|||||
|
Moody's Ratings |
Principal Amount |
Value |
|||
|
Nonconvertible Bonds - continued |
|||||
|
NONDURABLES - continued |
|||||
|
Tobacco - continued |
|||||
|
Philip Morris Companies, Inc.: - continued |
|
|
|
|
|
|
7.25% 9/15/01 |
A2 |
|
$ 380,000 |
$ 377,439 |
|
|
RJ Reynolds Tobacco Holdings, Inc. 7.375% 5/15/03 |
Baa2 |
|
1,000,000 |
947,630 |
|
|
|
2,550,335 |
||||
|
TOTAL NONDURABLES |
6,288,092 |
||||
|
RETAIL & WHOLESALE - 0.4% |
|||||
|
Drug Stores - 0.1% |
|||||
|
Rite Aid Corp.: |
|
|
|
|
|
|
6.5% 12/15/05 (f) |
Caa1 |
|
1,490,000 |
506,600 |
|
|
7.125% 1/15/07 |
Caa1 |
|
235,000 |
77,550 |
|
|
10.5% 9/15/02 (f) |
- |
|
10,000 |
6,500 |
|
|
|
590,650 |
||||
|
General Merchandise Stores - 0.3% |
|||||
|
Dayton Hudson Corp. 7.5% 7/15/06 |
A2 |
|
1,125,000 |
1,141,189 |
|
|
Federated Department Stores, Inc.: |
|
|
|
|
|
|
6.79% 7/15/27 |
Baa1 |
|
800,000 |
771,352 |
|
|
8.5% 6/15/03 |
Baa1 |
|
830,000 |
846,965 |
|
|
JCPenney Co., Inc. 7.6% 4/1/07 |
Baa2 |
|
60,000 |
49,500 |
|
|
|
2,809,006 |
||||
|
TOTAL RETAIL & WHOLESALE |
3,399,656 |
||||
|
SERVICES - 0.2% |
|||||
|
Leasing & Rental - 0.0% |
|||||
|
United Rentals, Inc.: |
|
|
|
|
|
|
8.8% 8/15/08 |
B1 |
|
125,000 |
109,063 |
|
|
9.25% 1/15/09 |
B1 |
|
90,000 |
83,700 |
|
|
|
192,763 |
||||
|
Printing - 0.1% |
|||||
|
World Color Press, Inc. 7.75% 2/15/09 |
Baa3 |
|
320,000 |
298,400 |
|
|
Corporate Bonds - continued |
|||||
|
Moody's Ratings |
Principal Amount |
Value |
|||
|
Nonconvertible Bonds - continued |
|||||
|
SERVICES - continued |
|||||
|
Services - 0.1% |
|||||
|
Iron Mountain, Inc. 8.75% 9/30/09 |
B2 |
|
$ 65,000 |
$ 61,750 |
|
|
La Petite Academy, Inc./La Petite Academy Holding Co. 10% 5/15/08 |
B3 |
|
1,460,000 |
919,800 |
|
|
|
981,550 |
||||
|
TOTAL SERVICES |
1,472,713 |
||||
|
TECHNOLOGY - 1.2% |
|||||
|
Communications Equipment - 0.1% |
|||||
|
Corning, Inc. 6.85% 3/1/29 |
A2 |
|
730,000 |
657,460 |
|
|
Computer Services & Software - 0.3% |
|||||
|
Amazon.com, Inc. 0% 5/1/08 (d) |
Caa1 |
|
450,000 |
243,000 |
|
|
Concentric Network Corp. 12.75% 12/15/07 |
B |
|
120,000 |
121,200 |
|
|
Covad Communications Group, Inc.: |
|
|
|
|
|
|
0% 3/15/08 (d) |
B3 |
|
570,000 |
256,500 |
|
|
12% 2/15/10 |
B3 |
|
165,000 |
120,450 |
|
|
Exodus Communications, Inc. 10.75% 12/15/09 |
B3 |
|
230,000 |
221,950 |
|
|
PSINet, Inc.: |
|
|
|
|
|
|
10.5% 12/1/06 |
B3 |
|
1,525,000 |
976,000 |
|
|
11% 8/1/09 |
B3 |
|
60,000 |
38,400 |
|
|
Unisys Corp. 11.75% 10/15/04 |
Ba1 |
|
300,000 |
315,750 |
|
|
|
2,293,250 |
||||
|
Computers & Office Equipment - 0.5% |
|||||
|
Comdisco, Inc.: |
|
|
|
|
|
|
6.375% 11/30/01 |
Baa1 |
|
1,150,000 |
1,111,222 |
|
|
7.25% 9/1/02 |
Baa1 |
|
1,300,000 |
1,250,496 |
|
|
Compaq Computer Corp. 7.45% 8/1/02 |
Baa2 |
|
1,200,000 |
1,202,976 |
|
|
Globix Corp. 12.5% 2/1/10 |
B- |
|
680,000 |
482,800 |
|
|
|
4,047,494 |
||||
|
Electronic Instruments - 0.0% |
|||||
|
Fisher Scientific International, Inc. 9% 2/1/08 |
B3 |
|
290,000 |
267,525 |
|
|
Telecommunications Techniques Co. LLC 9.75% 5/15/08 |
B3 |
|
225,000 |
210,375 |
|
|
|
477,900 |
||||
|
Electronics - 0.3% |
|||||
|
ChipPAC International Ltd. 12.75% 8/1/09 |
B3 |
|
750,000 |
787,500 |
|
|
Details, Inc. 10% 11/15/05 |
B3 |
|
95,000 |
93,100 |
|
|
Corporate Bonds - continued |
|||||
|
Moody's Ratings |
Principal Amount |
Value |
|||
|
Nonconvertible Bonds - continued |
|||||
|
TECHNOLOGY - continued |
|||||
|
Electronics - continued |
|||||
|
Fairchild Semiconductor Corp.: |
|
|
|
|
|
|
10.125% 3/15/07 |
B2 |
|
$ 60,000 |
$ 60,000 |
|
|
10.375% 10/1/07 |
B2 |
|
68,000 |
68,680 |
|
|
Flextronics International Ltd. 9.875% 7/1/10 (f) |
Ba3 |
|
225,000 |
230,625 |
|
|
Micron Technology, Inc. 6.5% 9/30/05 (k) |
B3 |
|
1,000,000 |
850,000 |
|
|
Viasystems, Inc. 9.75% 6/1/07 |
B3 |
|
630,000 |
592,200 |
|
|
|
2,682,105 |
||||
|
TOTAL TECHNOLOGY |
10,158,209 |
||||
|
TRANSPORTATION - 1.2% |
|||||
|
Air Transportation - 0.4% |
|||||
|
Atlas Air, Inc. 9.25% 4/15/08 |
B1 |
|
810,000 |
799,875 |
|
|
Continental Airlines, Inc. pass thru trust certificates: |
|
|
|
|
|
|
7.434% 3/15/06 |
Baa1 |
|
315,000 |
310,212 |
|
|
7.73% 9/15/12 |
Baa1 |
|
115,929 |
113,772 |
|
|
Delta Air Lines, Inc. 8.3% 12/15/29 |
Baa3 |
|
1,110,000 |
1,003,251 |
|
|
Qantas Airways Ltd. 7.75% 6/15/09 (f) |
Baa1 |
|
1,240,000 |
1,243,720 |
|
|
|
3,470,830 |
||||
|
Railroads - 0.7% |
|||||
|
Canadian National Railway Co. 6.9% 7/15/28 |
Baa2 |
|
950,000 |
823,023 |
|
|
CSX Corp.: |
|
|
|
|
|
|
6.25% 10/15/08 |
Baa2 |
|
715,000 |
647,954 |
|
|
6.46% 6/22/05 |
Baa2 |
|
1,340,000 |
1,281,670 |
|
|
Norfolk Southern Corp. 7.05% 5/1/37 |
Baa1 |
|
1,830,000 |
1,821,399 |
|
|
TFM SA de CV: |
|
|
|
|
|
|
0% 6/15/09 (d) |
B2 |
|
175,000 |
133,875 |
|
|
10.25% 6/15/07 |
B2 |
|
175,000 |
165,375 |
|
|
Transtar Holdings LP/Transtar Capital Corp. 13.375% 12/15/03 |
B- |
|
250,000 |
250,625 |
|
|
Wisconsin Central Transportation Corp. 6.625% 4/15/08 |
Baa2 |
|
900,000 |
809,766 |
|
|
|
5,933,687 |
||||
|
Corporate Bonds - continued |
|||||
|
Moody's Ratings |
Principal Amount |
Value |
|||
|
Nonconvertible Bonds - continued |
|||||
|
TRANSPORTATION - continued |
|||||
|
Shipping - 0.1% |
|||||
|
Transport Maritima Mexicana yankee: |
|
|
|
|
|
|
10% 11/15/06 |
Ba3 |
|
$ 165,000 |
$ 130,350 |
|
|
9.25% 5/15/03 |
Ba3 |
|
275,000 |
228,250 |
|
|
|
358,600 |
||||
|
TOTAL TRANSPORTATION |
9,763,117 |
||||
|
UTILITIES - 5.0% |
|||||
|
Cellular - 1.5% |
|||||
|
AirGate PCS, Inc. 0% 10/1/09 (d) |
Caa1 |
|
335,000 |
201,838 |
|
|
Clearnet Communications, Inc. yankee 0% 5/1/09 (d) |
B3 |
|
295,000 |
233,050 |
|
|
Dobson Communications Corp. 10.875% 7/1/10 |
B3 |
|
235,000 |
229,125 |
|
|
Echostar Broadband Corp. 10.375% 10/1/07 (f) |
B3 |
|
625,000 |
625,000 |
|
|
Leap Wireless International, Inc. 12.5% |
Caa2 |
|
120,000 |
98,400 |
|
|
McCaw International Ltd. 0% 4/15/07 (d) |
Caa1 |
|
254,000 |
189,230 |
|
|
Millicom International Cellular SA 0% 6/1/06 (d) |
Caa1 |
|
1,540,000 |
1,324,400 |
|
|
Nextel Communications, Inc.: |
|
|
|
|
|
|
0% 10/31/07 (d) |
B1 |
|
5,020,000 |
3,890,500 |
|
|
9.375% 11/15/09 |
B1 |
|
200,000 |
197,500 |
|
|
Nextel International, Inc.: |
|
|
|
|
|
|
0% 4/15/08 (d) |
Caa1 |
|
1,380,000 |
869,400 |
|
|
12.75% 8/1/10 (f) |
Caa1 |
|
305,000 |
298,900 |
|
|
Nextel Partners, Inc.: |
|
|
|
|
|
|
0% 2/1/09 (d) |
B3 |
|
635,000 |
444,500 |
|
|
11% 3/15/10 (f) |
B3 |
|
210,000 |
211,050 |
|
|
11% 3/15/10 |
B3 |
|
165,000 |
165,825 |
|
|
TeleCorp PCS, Inc. 10.625% 7/15/10 |
B3 |
|
140,000 |
141,400 |
|
|
Telesystem International Wireless, Inc. yankee 0% 6/30/07 (d) |
Caa1 |
|
475,000 |
313,500 |
|
|
Vodafone AirTouch PLC 7.625% 2/15/05 (f) |
A2 |
|
1,805,000 |
1,830,559 |
|
|
VoiceStream Wireless Corp.: |
|
|
|
|
|
|
0% 11/15/09 (d) |
B2 |
|
175,000 |
126,438 |
|
|
10.375% 11/15/09 |
B2 |
|
710,000 |
768,575 |
|
|
|
12,159,190 |
||||
|
Corporate Bonds - continued |
|||||
|
Moody's Ratings |
Principal Amount |
Value |
|||
|
Nonconvertible Bonds - continued |
|||||
|
UTILITIES - continued |
|||||
|
Electric Utility - 0.7% |
|||||
|
AES Corp.: |
|
|
|
|
|
|
8% 12/31/08 |
Ba1 |
|
$ 385,000 |
$ 358,050 |
|
|
8.375% 8/15/07 |
Ba3 |
|
85,000 |
80,750 |
|
|
8.5% 11/1/07 |
Ba3 |
|
210,000 |
200,025 |
|
|
9.375% 9/15/10 |
Ba1 |
|
465,000 |
471,975 |
|
|
Avon Energy Partners Holdings: |
|
|
|
|
|
|
6.46% 3/4/08 (f) |
Baa2 |
|
1,160,000 |
1,045,995 |
|
|
6.73% 12/11/02 (f) |
Baa2 |
|
1,340,000 |
1,319,967 |
|
|
CMS Energy Corp. 7.5% 1/15/09 |
Ba3 |
|
390,000 |
348,563 |
|
|
Dominion Resources, Inc. 8.125% 6/15/10 |
Baa1 |
|
270,000 |
278,054 |
|
|
Illinois Power Co. 7.5% 6/15/09 |
Baa1 |
|
580,000 |
578,040 |
|
|
Israel Electric Corp. Ltd.: |
|
|
|
|
|
|
7.75% 12/15/27 (f) |
A3 |
|
1,025,000 |
908,304 |
|
|
yankee 7.875% 12/15/26 (f) |
A3 |
|
660,000 |
596,996 |
|
|
Texas Utilities Co. 6.375% 1/1/08 |
Baa3 |
|
115,000 |
105,148 |
|
|
|
6,291,867 |
||||
|
Gas - 0.2% |
|||||
|
Reliant Energy Resources Corp. 8.125% 7/15/05 (f) |
Baa1 |
|
750,000 |
761,153 |
|
|
Sempra Energy 7.95% 3/1/10 |
A2 |
|
375,000 |
374,393 |
|
|
Southwest Gas Corp. 9.75% 6/15/02 |
Baa2 |
|
300,000 |
309,795 |
|
|
|
1,445,341 |
||||
|
Telephone Services - 2.6% |
|||||
|
Cable & Wireless Optus Ltd. 8% 6/22/10 (f) |
Baa1 |
|
750,000 |
781,140 |
|
|
Deutsche Telekom International Finance BV 8.25% 6/15/30 |
Aa2 |
|
1,930,000 |
1,980,431 |
|
|
FirstWorld Communications, Inc. 0% 4/15/08 (d) |
- |
|
395,000 |
79,000 |
|
|
Focal Communications Corp.: |
|
|
|
|
|
|
0% 2/15/08 (d) |
B3 |
|
360,000 |
180,000 |
|
|
11.875% 1/15/10 |
B3 |
|
90,000 |
69,300 |
|
|
Global Crossing Holdings Ltd. 9.125% 11/15/06 |
Ba2 |
|
140,000 |
138,600 |
|
|
Hyperion Telecommunications, Inc.: |
|
|
|
|
|
|
0% 4/15/03 (d) |
B3 |
|
70,000 |
57,050 |
|
|
12% 11/1/07 |
Caa1 |
|
255,000 |
165,750 |
|
|
12.25% 9/1/04 |
B3 |
|
60,000 |
54,600 |
|
|
ICG Holdings, Inc. 13.5% 9/15/05 |
Caa1 |
|
195,000 |
42,900 |
|
|
Corporate Bonds - continued |
|||||
|
Moody's Ratings |
Principal Amount |
Value |
|||
|
Nonconvertible Bonds - continued |
|||||
|
UTILITIES - continued |
|||||
|
Telephone Services - continued |
|||||
|
ICG Services, Inc. 0% 5/1/08 (d) |
Caa1 |
|
$ 510,000 |
$ 71,400 |
|
|
Intermedia Communications, Inc.: |
|
|
|
|
|
|
0% 7/15/07 (d) |
B2 |
|
315,000 |
259,875 |
|
|
0% 3/1/09 (d) |
B3 |
|
200,000 |
130,000 |
|
|
8.6% 6/1/08 |
B2 |
|
50,000 |
47,750 |
|
|
KMC Telecom Holdings, Inc. 13.5% 5/15/09 |
Caa2 |
|
560,000 |
324,800 |
|
|
Koninklijke KPN NV yankee 8% 10/1/10 (f) |
A3 |
|
150,000 |
150,104 |
|
|
Level 3 Communications, Inc.: |
|
|
|
|
|
|
0% 12/1/08 (d) |
B3 |
|
340,000 |
197,200 |
|
|
9.125% 5/1/08 |
B3 |
|
965,000 |
827,488 |
|
|
11% 3/15/08 |
B3 |
|
655,000 |
622,250 |
|
|
McLeodUSA, Inc. 9.5% 11/1/08 |
B1 |
|
190,000 |
176,700 |
|
|
Metromedia Fiber Network, Inc. 10% 12/15/09 |
B2 |
|
285,000 |
263,625 |
|
|
NEXTLINK Communications, Inc. 9.625% 10/1/07 |
B2 |
|
1,110,000 |
987,900 |
|
|
NorthEast Optic Network, Inc. 12.75% 8/15/08 |
- |
|
270,000 |
233,550 |
|
|
Ono Finance PLC 13% 5/1/09 |
Caa1 |
|
85,000 |
74,800 |
|
|
Pathnet, Inc. 12.25% 4/15/08 |
- |
|
570,000 |
228,000 |
|
|
Rhythms NetConnections, Inc.: |
|
|
|
|
|
|
0% 5/15/08 (d) |
B3 |
|
1,475,000 |
560,500 |
|
|
12.75% 4/15/09 |
B3 |
|
355,000 |
220,100 |
|
|
Telecomunicaciones de Puerto Rico, Inc. 6.65% 5/15/06 |
Baa2 |
|
1,560,000 |
1,490,174 |
|
|
Telefonica Europe BV 8.25% 9/15/30 |
A2 |
|
1,620,000 |
1,659,398 |
|
|
Teleglobe Canada, Inc.: |
|
|
|
|
|
|
7.2% 7/20/09 |
Baa1 |
|
1,947,000 |
1,886,156 |
|
|
7.7% 7/20/29 |
Baa1 |
|
1,780,000 |
1,698,280 |
|
|
Teligent, Inc.: |
|
|
|
|
|
|
0% 3/1/08 (d) |
Caa1 |
|
575,000 |
155,250 |
|
|
11.5% 12/1/07 |
Caa1 |
|
640,000 |
275,200 |
|
|
Time Warner Telecom LLC/Time Warner Telecom, Inc. 9.75% 7/15/08 |
B2 |
|
25,000 |
22,750 |
|
|
WinStar Communications, Inc.: |
|
|
|
|
|
|
0% 4/15/10 (d)(f) |
B3 |
|
4,068,000 |
1,261,080 |
|
|
12.75% 4/15/10 (f) |
B3 |
|
941,000 |
677,520 |
|
|
WorldCom, Inc.: |
|
|
|
|
|
|
7.75% 4/1/07 |
A3 |
|
450,000 |
461,462 |
|
|
8% 5/16/06 |
A3 |
|
1,800,000 |
1,872,126 |
|
|
Corporate Bonds - continued |
|||||
|
Moody's Ratings |
Principal Amount |
Value |
|||
|
Nonconvertible Bonds - continued |
|||||
|
UTILITIES - continued |
|||||
|
Telephone Services - continued |
|||||
|
WorldCom, Inc.: - continued |
|
|
|
|
|
|
8.875% 1/15/06 |
A3 |
|
$ 793,000 |
$ 820,707 |
|
|
Worldwide Fiber, Inc. 12% 8/1/09 |
B3 |
|
140,000 |
121,800 |
|
|
|
21,326,716 |
||||
|
TOTAL UTILITIES |
41,223,114 |
||||
|
TOTAL NONCONVERTIBLE BONDS |
184,967,357 |
||||
|
TOTAL CORPORATE BONDS (Cost $198,227,396) |
188,069,533 |
||||
|
U.S. Government and Government Agency Obligations - 12.6% |
|||||
|
|
|||||
|
U.S. Government Agency Obligations - 5.8% |
|||||
|
Fannie Mae: |
|
|
|
|
|
|
5.125% 2/13/04 |
Aaa |
|
1,300,000 |
1,243,931 |
|
|
5.25% 1/15/09 |
Aaa |
|
1,850,000 |
1,672,234 |
|
|
6% 5/15/08 |
Aaa |
|
2,700,000 |
2,579,337 |
|
|
6.5% 4/29/09 |
Aaa |
|
1,350,000 |
1,279,125 |
|
|
7% 7/15/05 |
Aaa |
|
5,735,000 |
5,831,749 |
|
|
7.25% 1/15/10 |
Aaa |
|
1,950,000 |
2,010,938 |
|
|
7.25% 5/15/30 |
Aaa |
|
2,250,000 |
2,358,430 |
|
|
Federal Home Loan Bank 6.75% 2/1/02 |
Aaa |
|
15,820,000 |
15,857,019 |
|
|
Freddie Mac: |
|
|
|
|
|
|
5.75% 3/15/09 |
Aaa |
|
4,000,000 |
3,735,640 |
|
|
6.45% 4/29/09 |
Aaa |
|
1,000,000 |
945,470 |
|
|
6.875% 1/15/05 |
Aaa |
|
920,000 |
929,918 |
|
|
6.875% 9/15/10 |
Aaa |
|
1,300,000 |
1,308,931 |
|
|
7% 7/15/05 |
Aaa |
|
1,200,000 |
1,219,692 |
|
|
Government Loan Trusts (assets of Trust guaranteed by U.S. Government through Agency for International Development) 8.5% 4/1/06 |
Aaa |
|
3,658,042 |
3,843,724 |
|
|
Government Trust Certificates (assets of Trust guaranteed by U.S. Government through Defense Security Assistance Agency): |
|
|
|
|
|
|
Class 1-C, 9.25% 11/15/01 |
Aaa |
|
162,307 |
164,944 |
|
|
Class 3-T, 9.625% 5/15/02 |
Aaa |
|
20,625 |
20,869 |
|
|
U.S. Government and Government Agency Obligations - continued |
|||||
|
Moody's Ratings |
Principal Amount |
Value |
|||
|
U.S. Government Agency Obligations - continued |
|||||
|
Israel Export Trust Certificates (assets of Trust
guaranteed by U.S. Government through |
Aaa |
|
$ 191,176 |
$ 191,069 |
|
|
Private Export Funding Corp. secured 6.86% 4/30/04 |
Aaa |
|
546,000 |
546,449 |
|
|
Tennessee Valley Authority 7.125% 5/1/30 |
Aaa |
|
960,000 |
980,832 |
|
|
U.S. Department of Housing and Urban
Development government guaranteed
participation certificates Series 1996-A, |
Aaa |
|
1,000,000 |
995,790 |
|
|
TOTAL U.S. GOVERNMENT AGENCY OBLIGATIONS |
47,716,091 |
||||
|
U.S. Treasury Obligations - 6.8% |
|||||
|
U.S. Treasury Bonds: |
|
|
|
|
|
|
6.125% 11/15/27 |
Aaa |
|
5,300,000 |
5,348,866 |
|
|
6.125% 8/15/29 |
Aaa |
|
1,665,000 |
1,700,648 |
|
|
7.625% 2/15/25 |
Aaa |
|
660,000 |
788,390 |
|
|
8.125% 8/15/19 |
Aaa |
|
13,670,000 |
16,696,675 |
|
|
8.875% 8/15/17 |
Aaa |
|
3,115,000 |
4,007,167 |
|
|
13.875% 5/15/11 (callable) |
Aaa |
|
3,060,000 |
4,175,951 |
|
|
14% 11/15/11 |
Aaa |
|
2,655,000 |
3,710,363 |
|
|
U.S. Treasury Notes: |
|
|
|
|
|
|
4.75% 11/15/08 |
Aaa |
|
8,280,000 |
7,662,892 |
|
|
5.875% 10/31/01 |
Aaa |
|
500,000 |
497,810 |
|
|
6.5% 5/31/02 |
Aaa |
|
2,570,000 |
2,586,063 |
|
|
6.625% 6/30/01 |
Aaa |
|
7,900,000 |
7,914,813 |
|
|
7.25% 8/15/04 |
Aaa |
|
110,000 |
114,984 |
|
|
TOTAL U.S. TREASURY OBLIGATIONS |
55,204,622 |
||||
|
TOTAL U.S. GOVERNMENT AND (Cost $102,153,250) |
102,920,713 |
||||
|
U.S. Government Agency - Mortgage Securities - 17.4% |
|||||
|
|
|||||
|
Fannie Mae - 14.5% |
|||||
|
6% 4/1/09 to 1/1/29 |
Aaa |
|
12,291,541 |
11,673,845 |
|
|
6.5% 8/1/14 to 12/1/29 |
Aaa |
|
37,096,766 |
35,669,040 |
|
|
7% 12/1/25 to 7/1/30 |
Aaa |
|
35,977,550 |
35,301,688 |
|
|
7.5% 10/1/09 to 9/1/30 |
Aaa |
|
16,270,791 |
16,241,768 |
|
|
U.S. Government Agency - Mortgage Securities - continued |
|||||
|
Moody's Ratings |
Principal Amount |
Value |
|||
|
Fannie Mae - continued |
|||||
|
8% 11/1/24 to 7/1/30 |
Aaa |
|
$ 19,128,011 |
$ 19,391,224 |
|
|
11.5% 11/1/15 |
Aaa |
|
166,025 |
182,269 |
|
|
TOTAL FANNIE MAE |
118,459,834 |
||||
|
Freddie Mac - 0.5% |
|||||
|
7.5% 8/1/28 |
Aaa |
|
3,229,043 |
3,226,108 |
|
|
7.5% 10/1/30 (h) |
Aaa |
|
950,000 |
948,813 |
|
|
8.5% 3/1/22 to 5/1/22 |
Aaa |
|
29,123 |
29,960 |
|
|
12% 11/1/19 |
Aaa |
|
85,106 |
93,325 |
|
|
TOTAL FREDDIE MAC |
4,298,206 |
||||
|
Government National Mortgage Association - 2.4% |
|||||
|
6.5% 11/15/08 to 8/15/27 |
Aaa |
|
3,225,962 |
3,203,699 |
|
|
6.5% 8/15/27 (h) |
Aaa |
|
7,913,061 |
7,643,463 |
|
|
7% 3/15/28 to 7/15/28 |
Aaa |
|
4,690,070 |
4,619,719 |
|
|
7.5% 5/15/22 to 8/15/28 |
Aaa |
|
4,355,611 |
4,375,418 |
|
|
TOTAL GOVERNMENT NATIONAL MORTGAGE ASSOCIATION |
19,842,299 |
||||
|
TOTAL U.S. GOVERNMENT AGENCY - MORTGAGE SECURITIES (Cost $143,310,349) |
142,600,339 |
||||
|
Asset-Backed Securities - 1.1% |
|||||
|
|
|||||
|
Airplanes pass through trust 10.875% 3/15/19 |
Ba2 |
|
943,254 |
698,008 |
|
|
BankAmerica Manufacturing Housing Contract Trust V 6.2% 4/10/09 |
Aaa |
|
950,000 |
937,977 |
|
|
Capita Equipment Receivables Trust 6.48% 10/15/06 |
Baa2 |
|
780,000 |
757,819 |
|
|
CIT Marine Trust 5.8% 4/15/10 |
Aaa |
|
1,900,000 |
1,862,594 |
|
|
CPS Auto Grantor Trust 6.55% 8/15/02 |
Aaa |
|
134,382 |
134,130 |
|
|
CPS Auto Receivables Trust 6% 8/15/03 |
Aaa |
|
531,811 |
525,662 |
|
|
CSXT Trade Receivables Master Trust 6% 7/25/04 |
Aaa |
|
1,200,000 |
1,176,938 |
|
|
Ford Credit Auto Owner Trust: |
|
|
|
|
|
|
6.2% 12/15/02 |
Aa2 |
|
780,000 |
772,078 |
|
|
6.4% 12/15/02 |
Aa2 |
|
450,000 |
446,344 |
|
|
7.03% 11/15/03 |
Aaa |
|
194,000 |
194,541 |
|
|
Green Tree Financial Corp. 6.8% 6/15/27 |
Aaa |
|
73,656 |
73,609 |
|
|
Petroleum Enhanced Trust Receivables Offering Petroleum Trust 6.125% 2/5/03 (f)(g) |
Baa2 |
|
387,883 |
386,611 |
|
|
Railcar Trust 7.75% 6/1/04 |
Aaa |
|
23,243 |
23,933 |
|
|
Asset-Backed Securities - continued |
|||||
|
Moody's Ratings |
Principal Amount |
Value |
|||
|
Sears Credit Account Master Trust II 7.5% 11/15/07 |
A2 |
|
$ 750,000 |
$ 751,875 |
|
|
UAF Auto Grantor Trust 6.1% 1/15/03 (f) |
Aaa |
|
476,559 |
475,517 |
|
|
TOTAL ASSET-BACKED SECURITIES (Cost $9,309,712) |
9,217,636 |
||||
|
Collateralized Mortgage Obligations - 0.2% |
|||||
|
|
|||||
|
Private Sponsor - 0.0% |
|||||
|
Bank America Mortgage Securities, Inc. |
AAA |
|
20,298 |
19,461 |
|
|
U.S. Government Agency - 0.2% |
|||||
|
Fannie Mae REMIC planned amortization class: |
|
|
|
|
|
|
Series 1999-54 Class PH, 6.5% 11/18/29 |
Aaa |
|
900,000 |
817,587 |
|
|
Series 1999-57 Class PH, 6.5% 12/25/29 |
Aaa |
|
800,000 |
721,625 |
|
|
TOTAL U.S. GOVERNMENT AGENCY |
1,539,212 |
||||
|
TOTAL COLLATERALIZED MORTGAGE OBLIGATIONS (Cost $1,545,769) |
1,558,673 |
||||
|
Commercial Mortgage Securities - 2.3% |
|||||
|
|
|||||
|
BKB Commercial Mortgage Trust Series 1997-C1 Class D, 7.83% 2/25/43 (f)(g) |
BBB |
|
107,818 |
107,245 |
|
|
CBM Funding Corp. sequential pay Series 1996-1: |
|
|
|
|
|
|
Class A-2, 6.88% 7/1/02 |
AA |
|
970,024 |
966,083 |
|
|
Class A-3PI, 7.08% 11/1/07 |
AA |
|
870,000 |
867,519 |
|
|
Class B, 7.48% 2/1/08 |
A |
|
680,000 |
675,989 |
|
|
CS First Boston Mortgage Securities Corp.: |
|
|
|
|
|
|
Series 1997-C2 Class D, 7.27% 1/17/35 |
Baa2 |
|
1,570,000 |
1,480,216 |
|
|
Series 1998-FL1 Class E, 7.47% 1/10/13 (f)(g) |
Baa1 |
|
1,400,000 |
1,397,102 |
|
|
Deutsche Mortgage & Asset Receiving Corp. Series 1998-C1 Class D, 7.231% 7/15/12 |
Baa2 |
|
1,320,000 |
1,213,781 |
|
|
Equitable Life Assurance Society of the United States Series 174: |
|
|
|
|
|
|
Class B1, 7.33% 5/15/06 (f) |
Aa2 |
|
1,000,000 |
1,010,000 |
|
|
Class C1, 7.52% 5/15/06 (f) |
A2 |
|
700,000 |
702,188 |
|
|
First Union-Lehman Brothers Commercial Mortgage Trust sequential pay Series 1997-C2 Class B, 6.79% 11/18/29 |
Aa2 |
|
2,050,000 |
1,968,721 |
|
|
GS Mortgage Securities Corp. II Series 1998-GLII Class E, 7.1905% 4/13/31 (f)(g) |
Baa3 |
|
1,420,000 |
1,255,591 |
|
|
Commercial Mortgage Securities - continued |
|||||
|
Moody's Ratings |
Principal Amount |
Value |
|||
|
LTC Commercial Mortgage pass through certificates Series 1998-1 Class A, 6.029% 5/30/30 (f) |
AAA |
|
$ 912,291 |
$ 870,953 |
|
|
Nomura Asset Securities Corp. Series 1998-D6 Class A4, 7.6088% 3/17/28 (g) |
Baa2 |
|
1,320,000 |
1,243,069 |
|
|
Prudential Securities Secured Financing Corp. Series 2000-C1 Class A2, 7.727% 2/15/10 |
Aaa |
|
520,000 |
534,300 |
|
|
Resolution Trust Corp. Series 1995-C1 Class C, 6.9% 2/25/27 |
A2 |
|
1,077,974 |
1,055,013 |
|
|
Structured Asset Securities Corp. Series 1996-CFL Class E, 7.75% 2/25/28 |
AA |
|
640,000 |
639,000 |
|
|
Thirteen Affiliates of General Growth |
|
|
|
|
|
|
sequential pay Series 1 Class A2, 6.602% 12/15/10 (f) |
Aaa |
|
1,150,000 |
1,131,133 |
|
|
Series D-2, 6.992% 12/15/10 (f) |
Baa2 |
|
1,100,000 |
1,025,879 |
|
|
Series E-2, 7.224% 12/15/10 (f) |
Baa3 |
|
660,000 |
609,082 |
|
|
TOTAL COMMERCIAL MORTGAGE SECURITIES (Cost $19,481,297) |
18,752,864 |
||||
|
Foreign Government and Government Agency Obligations (i) - 0.6% |
|||||
|
|
|||||
|
Israeli State euro 6.375% 12/19/01 |
A2 |
|
800,000 |
788,000 |
|
|
Korean Republic yankee: |
|
|
|
|
|
|
8.75% 4/15/03 |
Baa2 |
|
420,000 |
431,722 |
|
|
8.875% 4/15/08 |
Baa2 |
|
602,000 |
629,993 |
|
|
Quebec Province 7.5% 9/15/29 |
A2 |
|
2,020,000 |
2,017,758 |
|
|
United Mexican States 9.875% 2/1/10 |
Baa3 |
|
760,000 |
809,400 |
|
|
TOTAL FOREIGN GOVERNMENT AND (Cost $4,624,222) |
4,676,873 |
||||
|
Supranational Obligations - 0.1% |
|||||
|
|
|||||
|
Inter-American Development Bank |
Aaa |
|
1,270,000 |
1,238,110 |
|
|
Money Market Funds - 18.2% |
|||
|
Shares |
Value |
||
|
Fidelity Cash Central Fund, 6.60% (c) |
3,261,289 |
$ 3,261,289 |
|
|
Fidelity Money Market Central Fund, 6.73% (c) |
145,550,134 |
145,550,134 |
|
|
TOTAL MONEY MARKET FUNDS (Cost $148,811,389) |
148,811,423 |
||
|
TOTAL INVESTMENT PORTFOLIO - 99.6% (Cost $802,144,711) |
815,156,882 |
||
|
NET OTHER ASSETS - 0.4% |
3,270,102 |
||
|
NET ASSETS - 100% |
$ 818,426,984 |
||
|
Legend |
|
(a) Non-income producing |
|
(b) S&P credit ratings are used in the absence of a rating by Moody's Investors Service, Inc. |
|
(c) The rate quoted is the annualized seven-day yield of the fund at period end. A complete listing of the fund's holdings as of its most recent fiscal year end is available upon request. |
|
(d) Debt obligation initially issued in zero coupon form which converts to coupon form at a specified rate and date. The rate shown is the rate at period end. |
|
(e) Debt obligation initially issued at one coupon which converts to a higher coupon at a specified date. The rate shown is the rate at period end. |
|
(f) Security exempt from registration under Rule 144A of the Securities Act of 1933. These securities may be resold in transactions exempt from registration, normally to qualified institutional buyers. At the period end, the value of these securities amounted to $29,962,779 or 3.7% of net assets. |
|
(g) The coupon rate shown on floating or adjustable rate securities represents the rate at period end. |
|
(h) Security purchased on a delayed delivery or when-issued basis. |
|
(i) For foreign government obligations not individually rated by S&P or Moody's, the ratings listed have been assigned by FMR, the fund's investment advisor, based principally on S&P and Moody's ratings of the sovereign credit of the issuing government. |
|
(j) Non-income producing - issuer filed for protection under the Federal Bankruptcy Code or is in default of interest payment. |
|
(k) Restricted securities - Investment in securities not registered under the Securities Act of 1933. |
|
Additional information on each holding is as follows: |
|
Security |
Acquisition Date |
Acquisition Cost |
|
Micron Technology, Inc. 6.5% 9/30/05 |
11/1/99 |
$ 787,500 |
|
Other Information |
|
The composition of long-term debt holdings as a percentage of total value of investments in securities, is as follows (ratings are unaudited): |
|
Moody's Ratings |
S&P Ratings |
|||
|
Aaa, Aa, A |
38.4% |
|
AAA, AA, A |
32.1% |
|
Baa |
9.8% |
|
BBB |
10.0% |
|
Ba |
1.5% |
|
BB |
1.9% |
|
B |
5.9% |
|
B |
6.1% |
|
Caa |
1.1% |
|
CCC |
0.6% |
|
Ca, C |
0.0% |
|
CC, C |
0.0% |
|
|
|
|
D |
0.0% |
|
The percentage not rated by Moody's or S&P amounted to 0.1%. |
|
Income Tax Information |
|
At September 30, 2000, the aggregate cost of investment securities for income tax purposes was $805,033,842. Net unrealized appreciation aggregated $10,123,040, of which $35,350,323 related to appreciated investment securities and $25,227,283 related to depreciated investment securities. |
|
The fund hereby designates approximately $17,948,000 as a capital gain dividend for the purpose of the dividend paid deduction. |
See accompanying notes which are an integral part of the financial statements.
Annual Report
Statement of Assets and Liabilities
|
|
September 30, 2000 |
|
|
Assets |
|
|
|
Investment in securities, at value (cost $802,144,711) - See accompanying schedule |
|
$ 815,156,882 |
|
Cash |
|
25,302 |
|
Receivable for investments sold |
|
19,035,267 |
|
Receivable for fund shares sold |
|
1,243,864 |
|
Dividends receivable |
|
189,939 |
|
Interest receivable |
|
7,661,492 |
|
Other receivables |
|
3,900 |
|
Total assets |
|
843,316,646 |
|
Liabilities |
|
|
|
Payable for investments purchased |
$ 14,419,297 |
|
|
Delayed delivery |
8,573,518 |
|
|
Payable for fund shares redeemed |
1,430,367 |
|
|
Accrued management fee |
292,575 |
|
|
Other payables and accrued expenses |
173,905 |
|
|
Total liabilities |
|
24,889,662 |
|
Net Assets |
|
$ 818,426,984 |
|
Net Assets consist of: |
|
|
|
Paid in capital |
|
$ 778,224,689 |
|
Undistributed net investment income |
|
4,958,606 |
|
Accumulated undistributed net realized gain (loss) |
|
22,231,518 |
|
Net unrealized appreciation (depreciation) on investments |
|
13,012,171 |
|
Net Assets, for 66,840,369 shares outstanding |
|
$ 818,426,984 |
|
Net Asset Value, offering price and redemption price |
|
$12.24 |
See accompanying notes which are an integral part of the financial statements.
Annual Report
Financial Statements - continued
Statement of Operations
|
|
Year ended September 30, 2000 |
|
|
Investment Income Dividends |
|
$ 2,483,733 |
|
Interest |
|
47,708,961 |
|
Total income |
|
50,192,694 |
|
Expenses |
|
|
|
Management fee |
$ 3,573,158 |
|
|
Transfer agent fees |
1,430,916 |
|
|
Accounting fees and expenses |
208,361 |
|
|
Non-interested trustees' compensation |
2,718 |
|
|
Custodian fees and expenses |
53,611 |
|
|
Registration fees |
40,047 |
|
|
Audit |
56,023 |
|
|
Legal |
3,894 |
|
|
Reports to shareholders |
50,112 |
|
|
Miscellaneous |
2,084 |
|
|
Total expenses before reductions |
5,420,924 |
|
|
Expense reductions |
(181,337) |
5,239,587 |
|
Net investment income |
|
44,953,107 |
|
Realized and Unrealized Gain (Loss) Net realized gain (loss) on: |
|
|
|
Investment securities |
23,999,123 |
|
|
Foreign currency transactions |
(457) |
|
|
Futures contracts |
(517,160) |
23,481,506 |
|
Change in net unrealized appreciation (depreciation) |
|
(1,888,874) |
|
Net gain (loss) |
|
21,592,632 |
|
Net increase (decrease) in net assets resulting |
|
$ 66,545,739 |
See accompanying notes which are an integral part of the financial statements.
Annual Report
Financial Statements - continued
Statement of Changes in Net Assets
|
|
Year ended
September 30, |
Year ended September 30, 1999 |
|
Increase (Decrease) in Net Assets |
|
|
|
Operations |
$ 44,953,107 |
$ 43,195,392 |
|
Net realized gain (loss) |
23,481,506 |
20,929,774 |
|
Change in net unrealized appreciation (depreciation) |
(1,888,874) |
(7,309,264) |
|
Net increase (decrease) in net assets resulting |
66,545,739 |
56,815,902 |
|
Distributions to shareholders |
(44,898,768) |
(41,923,096) |
|
From net realized gain |
(15,249,488) |
(36,664,108) |
|
Total distributions |
(60,148,256) |
(78,587,204) |
|
Share transactions |
253,105,851 |
541,145,296 |
|
Reinvestment of distributions |
56,478,351 |
74,281,475 |
|
Cost of shares redeemed |
(400,309,555) |
(467,016,784) |
|
Net increase (decrease) in net assets resulting |
(90,725,353) |
148,409,987 |
|
Total increase (decrease) in net assets |
(84,327,870) |
126,638,685 |
|
Net Assets |
|
|
|
Beginning of period |
902,754,854 |
776,116,169 |
|
End of period (including undistributed net investment income of $4,958,606 and $4,547,216, respectively) |
$ 818,426,984 |
$ 902,754,854 |
|
Other Information Shares |
|
|
|
Sold |
20,837,070 |
43,710,825 |
|
Issued in reinvestment of distributions |
4,661,759 |
6,082,564 |
|
Redeemed |
(32,988,862) |
(37,785,305) |
|
Net increase (decrease) |
(7,490,033) |
12,008,084 |
See accompanying notes which are an integral part of the financial statements.
Annual Report
Financial Highlights
|
Year ended September 30, |
2000 |
1999 |
1998 |
1997 |
1996 |
|
Selected Per-Share Data |
|
|
|
|
|
|
Net asset value, beginning |
$ 12.15 |
$ 12.45 |
$ 12.36 |
$ 11.63 |
$ 11.46 |
|
Income from Investment Operations |
|
|
|
|
|
|
Net investment income |
.65 B |
.58 B |
.57 B |
.56 B |
.61 |
|
Net realized and unrealized gain (loss) |
.30 |
.22 |
.39 |
1.02 |
.20 |
|
Total from investment operations |
.95 |
.80 |
.96 |
1.58 |
.81 |
|
Less Distributions |
|
|
|
|
|
|
From net investment income |
(.65) |
(.57) |
(.58) |
(.59) |
(.64) |
|
From net realized gain |
(.21) |
(.53) |
(.29) |
(.26) |
- |
|
Total distributions |
(.86) |
(1.10) |
(.87) |
(.85) |
(.64) |
|
Net asset value, end of period |
$ 12.24 |
$ 12.15 |
$ 12.45 |
$ 12.36 |
$ 11.63 |
|
Total Return A |
8.10% |
6.65% |
8.06% |
14.16% |
7.28% |
|
Ratios and Supplemental Data |
|
|
|
|
|
|
Net assets, end of period |
$ 818,427 |
$ 902,755 |
$ 776,116 |
$ 647,402 |
$ 566,104 |
|
Ratio of expenses to average |
.65% |
.69% |
.71% |
.77% |
.82% |
|
Ratio of expenses to average net assets after expense reductions |
.62% C |
.67% C |
.69% C |
.76% C |
.80% C |
|
Ratio of net investment income |
5.36% |
4.72% |
4.62% |
4.74% |
5.03% |
|
Portfolio turnover rate |
140% |
121% |
156% |
112% |
148% |
A The total returns would have been lower had certain expenses not been reduced during the periods shown.
B Net investment income per share has been calculated based on average shares outstanding during the period.
C FMR or the fund has entered into varying arrangements with third parties who either paid or reduced a portion of the fund's expenses.
See accompanying notes which are an integral part of the financial statements.
Annual Report
For the period ended September 30, 2000
1. Significant Accounting Policies.
Asset Manager: Income (the fund) is a fund of Fidelity Charles Street Trust (the trust) and is authorized to issue an unlimited number of shares. The trust is registered under the Investment Company Act of 1940, as amended, as an open-end management investment company organized as a Massachusetts business trust. The financial statements have been prepared in conformity with generally accepted accounting principles which require management to make certain estimates and assumptions at the date of the financial statements. The following summarizes the significant accounting policies of the fund:
Security Valuation. Debt securities for which quotations are readily available are valued by a pricing service at their market values as determined by their most recent bid prices in the principal market (sales prices if the principal market is an exchange) in which such securities are normally traded. Equity securities for which quotations are readily available are valued at the last sale price, or if no sale price, at the closing bid price. Foreign equity securities are valued based on quotations from the principal market in which such securities are normally traded. If trading or events occurring in other markets after the close of the principal market in which foreign securities are traded, and before the close of the business of the fund, are expected to materially affect the value of those securities, then they are valued at their fair value taking this trading or these events into account. Fair value is determined in good faith under consistently applied procedures under the general supervision of the Board of Trustees. Securities (including restricted securities) for which market quotations are not readily available are valued at their fair value. Short-term securities with remaining maturities of sixty days or less for which quotations are not readily available are valued at amortized cost or original cost plus accrued interest, both of which approximate current value. Investments in open-end investment companies are valued at their net asset value each business day.
Foreign Currency Translation. The accounting records of the fund are maintained in U.S. dollars. Investment securities and other assets and liabilities denominated in a foreign currency are translated into U.S. dollars at the prevailing rates of exchange at period end. Purchases and sales of securities, income receipts and expense payments are translated into U.S. dollars at the prevailing exchange rate on the respective dates of the transactions.
Net realized gains and losses on foreign currency transactions represent net gains and losses from sales and maturities of foreign currency contracts, disposition of foreign currencies, the difference between the amount of net investment income accrued and the U.S. dollar amount actually received, and gains and losses between trade and settlement date on purchases and sales of securities. The effects of changes in foreign currency exchange rates on investments in securities are included with the net realized and unrealized gain or loss on investment securities.
Annual Report
Notes to Financial Statements - continued
1. Significant Accounting Policies - continued
Income Taxes. As a qualified regulated investment company under Subchapter M of the Internal Revenue Code, the fund is not subject to income taxes to the extent that it distributes substantially all of its taxable income for its fiscal year. The schedule of investments includes information regarding income taxes under the caption "Income Tax Information."
Investment Income. Dividend income is recorded on the ex-dividend date, except certain dividends from foreign securities where the ex-dividend date may have passed, are recorded as soon as the fund is informed of the ex-dividend date. Non-cash dividends included in dividend income, if any, are recorded at the fair market value of the securities received. Interest income, which includes accretion of original issue discount, is accrued as earned. Investment income is recorded net of foreign taxes withheld where recovery of such taxes is uncertain. The fund may place a debt obligation on non-accrual status and reduce related interest income by ceasing current accruals and writing off interest receivables when the collection of all or a portion of interest has become doubtful based on consistently applied procedures, under the general supervision of the Board of Trustees of the fund. A debt obligation is removed from non-accrual status when the issuer resumes interest payments or when collectibility of interest is reasonably assured.
Expenses. Most expenses of the trust can be directly attributed to a fund. Expenses which cannot be directly attributed are apportioned among the funds in the trust.
Distributions to Shareholders. Distributions are recorded on the ex-dividend date.
Income and capital gain distributions are determined in accordance with income tax regulations which may differ from generally accepted accounting principles. These differences, which may result in distribution reclassifications, are primarily due to differing treatments for litigation proceeds, paydown gains/losses on certain securities, futures transactions, foreign currency transactions, market discount, non-taxable dividends and losses deferred due to wash sales. The fund also utilized earnings and profits distributed to shareholders on redemption of shares as a part of the dividends paid deduction for income tax purposes.
Permanent book and tax basis differences relating to shareholder distributions will result in reclassifications to paid in capital. Undistributed net investment income and accumulated undistributed net realized gain (loss) on investments and foreign currency transactions may include temporary book and tax basis differences which will reverse in a subsequent period. Any taxable income or gain remaining at fiscal year end is distributed in the following year.
Security Transactions. Security transactions are accounted for as of trade date. Gains and losses on securities sold are determined on the basis of identified cost.
Annual Report
Notes to Financial Statements - continued
2. Operating Policies.
Foreign Currency Contracts. The fund generally uses foreign currency contracts to facilitate transactions in foreign-denominated securities. Losses may arise from changes in the value of the foreign currency or if the counterparties do not perform under the contracts' terms. The U.S. dollar value of foreign currency contracts is determined using contractual currency exchange rates established at the time of each trade.
Joint Trading Account. Pursuant to an Exemptive Order issued by the Securities and Exchange Commission (the SEC), the fund, along with other affiliated entities of Fidelity Management & Research Company (FMR), may transfer uninvested cash balances into one or more joint trading accounts. These balances are invested in one or more repurchase agreements for U.S. Treasury or Federal Agency obligations.
Repurchase Agreements. The underlying U.S. Treasury, Federal Agency, or other obligations found to be satisfactory by FMR are transferred to an account of the fund, or to the Joint Trading Account, at a custodian bank. The securities are marked-to-market daily and maintained at a value at least equal to the principal amount of the repurchase agreement (including accrued interest). FMR, the fund's investment adviser, is responsible for determining that the value of the underlying securities remains in accordance with the market value requirements stated above.
Delayed Delivery Transactions. The fund may purchase or sell securities on a delayed delivery basis. Payment and delivery may take place after the customary settlement period for that security. The price of the underlying securities and the date when the securities will be delivered and paid for are fixed at the time the transaction is negotiated. The market values of the securities purchased on a delayed delivery basis are identified as such in the fund's schedule of investments. The fund may receive compensation for interest forgone in the purchase of a delayed delivery security. With respect to purchase commitments, the fund identifies securities as segregated in its records with a value at least equal to the amount of the commitment. Losses may arise due to changes in the market value of the underlying securities or if the counterparty does not perform under the contract.
Futures Contracts. The fund may use futures contracts to manage its exposure to the stock market. Buying futures tends to increase the fund's exposure to the underlying instrument, while selling futures tends to decrease the fund's exposure to the underlying instrument or hedge other fund investments. Losses may arise from changes in the value of the underlying instruments or if the counterparties do not perform under the contracts' terms. Gains (losses) are realized upon the expiration or closing of the futures contracts. Futures contracts are valued at the settlement price established each day by the board of trade or exchange on which they are traded.
Restricted Securities. The fund is permitted to invest in securities that are subject to legal or contractual restrictions on resale. These securities generally may be resold in transactions exempt from registration or to the public if the securities
Annual Report
Notes to Financial Statements - continued
2. Operating Policies - continued
Restricted Securities - continued
are registered. Disposal of these securities may involve time-consuming negotiations and expense, and prompt sale at an acceptable price may be difficult. At the end of the period, restricted securities (excluding 144A issues) amounted to $850,000 or 0.1% of net assets.
3. Purchases and Sales of Investments.
Purchases and sales of securities, other than short-term securities, aggregated $983,786,785 and $1,046,727,404, respectively, of which U.S. government and government agency obligations aggregated $380,719,472 and $423,803,090, respectively.
The market value of futures contracts opened and closed during the period amounted to $14,507,355 and $13,990,195, respectively.
On July 25, 2000, the fund transferred substantially all of its money market investments to Fidelity Money Market Central Fund in exchange for shares of this fund.
4. Fees and Other Transactions with Affiliates.
Management Fee. As the fund's investment adviser, FMR receives a monthly fee that is calculated on the basis of a group fee rate plus a fixed individual fund fee rate applied to the average net assets of
the fund. The group fee rate is the weighted average of a series of rates and is based on the monthly average net assets of all the mutual funds advised by FMR. The rates ranged from .0920% to .3700% for the period. The annual individual fund fee rate is .30%. In the event that these rates were lower than the contractual rates in effect during the period, FMR voluntarily implemented the above rates, as they resulted in the same or a lower management fee. For the period, the management fee was equivalent to an annual rate of .43% of average net assets.
Sub-Adviser Fee. Beginning January 1, 2001, FMR Co.(FMRC) will serve as sub-adviser for the fund. FMRC is a wholly owned subsidiary of FMR and will receive a fee from FMR of 50% of the management fee payable to FMR with respect to that portion of the fund's assets that will be managed by FMRC.
Transfer Agent Fees. Fidelity Service Company, Inc. (FSC), an affiliate of FMR, is the funds' transfer, dividend disbursing and shareholder servicing agent. FSC receives account fees and asset-based fees that vary according to account size and type of account. FSC pays for typesetting, printing and mailing of all shareholder reports, except proxy statements. For the period, the transfer agent fees were equivalent to an annual rate of .17% of average net assets.
Accounting Fees. FSC maintains the fund's accounting records. The fee is based on the level of average net assets for the month plus out-of-pocket expenses.
Annual Report
Notes to Financial Statements - continued
4. Fees and Other Transactions with Affiliates - continued
Central Funds. Pursuant to an Exemptive Order issued by the SEC, the fund may invest in one or more open-end money market funds managed by Fidelity Investments Money Management, Inc., an affiliate of FMR. These funds (collectively referred to as the "Central Funds") are only available to investment companies and other accounts managed by FMR and its affiliates. The Central Funds seek preservation of capital, liquidity, and current income and do not pay a management fee.
The Fidelity Money Market Central Fund is principally used for the fund's strategic allocation to money market investments. Fidelity Cash Central Fund is principally used for allocations of available cash. Income distributions from the Central Funds are recorded as interest income in the accompanying financial statements. Distributions from the Central Funds to the fund totaled $2,465,034 for the period.
Brokerage Commissions. The fund placed a portion of its portfolio transactions with brokerage firms which are affiliates of FMR. The commissions paid to these affiliated firms were $32,665 for the period.
5. Expense Reductions.
FMR has directed certain portfolio trades to brokers who paid a portion of the fund's expenses. For the period, the fund's expenses were reduced by $69,599 under this arrangement.
In addition, through arrangements with the fund's custodian and transfer agent, credits realized as a result of uninvested cash balances were used to reduce a portion of the fund's expenses. During the period, the fund's custodian and transfer agent fees were reduced by $10,130 and $101,608, respectively, under these arrangements.
Annual Report
To the Trustees of Fidelity Charles Street Trust and Shareholders of Asset Manager: Income:
We have audited the accompanying statement of assets and liabilities of Asset Manager: Income (the Fund) a fund of Fidelity Charles Street Trust (the Trust), including the portfolio of investments, as of September 30, 2000, and the related statements of operations, changes in net assets, and financial highlights for the year then ended. These financial statements and financial highlights are the responsibility of the Fund's management. Our responsibility is to express an opinion on these financial statements and financial highlights based on our audit. The statement of changes in net assets for the year ended September 30, 1999, and the financial highlights for each of the four years in the period then ended were audited by other auditors whose report, dated November 8, 1999, expressed an unqualified opinion on those statements and financial highlights.
We conducted our audit in accordance with auditing standards generally accepted in the United States of America. Those standards require that we plan and perform the audit to obtain reasonable assurance about whether the financial statements and financial highlights are free of material misstatement. An audit includes examining, on a test basis, evidence supporting the amounts and disclosures in the financial statements. Our procedures included confirmation of securities owned as of September 30, 2000, by correspondence with the custodian and brokers; where replies were not received from brokers, we performed other auditing procedures. An audit also includes assessing the accounting principles used and significant estimates made by management, as well as evaluating the overall financial statement presentation. We believe that our audit provides a reasonable basis for our opinion.
In our opinion, the financial statements and financial highlights referred to above present fairly, in all material respects, the financial position of Asset Manager: Income as of September 30, 2000, and the results of its operations, the changes in its net assets, and its financial highlights for the year then ended, in conformity with accounting principles generally accepted in the United States of America.
/s/DELOITTE & TOUCHE LLP
DELOITTE & TOUCHE LLP
Boston, Massachusetts
November 7, 2000
Annual Report
The fund hereby designates 100% of the long-term capital gain dividends distributed during the fiscal year as 20%-rate capital gain dividends.
A total of 9.80% of the dividends distributed during the fiscal year was derived from interest on U.S. Government securities which is generally exempt from state income tax.
A total of 5% of the dividends distributed during the fiscal year qualifies for the dividends-received deduction for corporate shareholders.
The fund will notify shareholders in January 2001 of amounts for use in preparing 2000 income tax returns.
Annual Report
Fidelity offers several ways to conveniently manage your personal investments via your telephone or PC. You can access your account information, conduct trades and research your investments 24 hours a day.
By Phone
Fidelity Automated Service Telephone provides a single toll-free number to access account balances, positions, quotes and trading. It's easy to navigate the service, and on your first call, the system will help you create a personal identification number (PIN) for security.
(phone_graphic)
Fidelity Automated
Service Telephone (FAST®)
1-800-544-5555
Press
1 For mutual fund and brokerage trading.
2 For quotes.*
3 For account balances and holdings.
4 To review orders and mutual
fund activity.
5 To change your PIN.
*0 To speak to a Fidelity representative.
By PC
Fidelity's web site on the Internet provides a wide range of information, including daily financial news, fund performance, interactive planning tools and news about Fidelity products and services.
(computer_graphic)
Fidelity's Web Site
www.fidelity.com
If you are not currently on the Internet, call EarthLink Sprint at 1-800-288-2967, and be sure to ask for registration number SMD004 to receive a special Fidelity package that includes 30 days of free Internet access. EarthLink is North America's #1 independent Internet access provider.
(computer_graphic)
Fidelity On-line Xpress+®
Fidelity On-line Xpress+ software for Windows combines comprehensive portfolio management capabilities, securities trading and access to research and analysis tools . . . all on your desktop. Call Fidelity at 1-800-544-0240 or visit our web site for more information on how to manage your investments via your PC.
* When you call the quotes line, please remember that a fund's yield and return will vary and, except for money market funds, share price will also vary. This means that you may have a gain or loss when you sell your shares. There is no assurance that money market funds will be able to maintain a stable $1 share price; an investment in a money market fund is not insured or guaranteed by the U.S. government. Total returns are historical and include changes in share price, reinvestment of dividends and capital gains, and the effects of any sales charges.
Annual Report
Investment Adviser
Fidelity Management & Research Company
Boston, MA
Investment Sub-Advisers
Fidelity Investments Money
Management, Inc.
Fidelity Management & Research
(U.K.) Inc.
Fidelity Management & Research
(Far East) Inc.
Fidelity Investments Japan Limited
Officers
Edward C. Johnson 3d, President
Robert C. Pozen, Senior Vice President
Robert A. Lawrence, Vice President
Richard C. Habermann, Vice President
Charles S. Morrison, Vice President
John J. Todd, Vice President
Eric D. Roiter, Secretary
Robert A. Dwight, Treasurer
Maria F. Dwyer, Deputy Treasurer
John H. Costello, Assistant Treasurer
Thomas J. Simpson, Assistant Treasurer
Board of Trustees
Ralph F. Cox *
Phyllis Burke Davis *
Robert M. Gates *
Edward C. Johnson 3d
Donald J. Kirk *
Ned C. Lautenbach *
Peter S. Lynch
Marvin L. Mann *
William O. McCoy *
Gerald C. McDonough *
Robert C. Pozen
Thomas R. Williams *
* Independent trustees
Advisory Board
J. Michael Cook
Abigail P. Johnson
Marie L. Knowles
General Distributor
Fidelity Distributors Corporation
Boston, MA
Transfer and Shareholder
Servicing Agent
Fidelity Service Company, Inc.
Boston, MA
Custodian
The Chase Manhattan Bank
New York, NY
Fidelity's Asset Allocation Funds
Asset ManagerSM
Asset Manager: AggressiveSM
Asset Manager: Growth®
Asset Manager: Income®
Fidelity Freedom Funds® -
Income, 2000, 2010, 2020, 2030, 2040
The Fidelity Telephone Connection
Mutual Fund 24-Hour Service
Exchanges/Redemptions
and Account Assistance 1-800-544-6666
Product Information 1-800-544-6666
Retirement Accounts 1-800-544-4774
(8 a.m. - 9 p.m.)
TDD Service 1-800-544-0118
(for the deaf and hearing impaired)
(9 a.m. - 9 p.m. Eastern time)
Fidelity Automated Service
Telephone (FAST®) (automated graphic) 1-800-544-5555
(automated graphic) Automated line for quickest service
AMI-ANN-1100 116706
1.537737.103
(Fidelity Investment logo)(registered trademark)
Corporate Headquarters
82 Devonshire St., Boston, MA 02109
www.fidelity.com
Fidelity®
Annual Report
September 30, 2000
(2_fidelity_logos)(Registered_Trademark)
|
President's Message |
Ned Johnson on investing strategies. |
|
|
Performance |
How the fund has done over time. |
|
|
Market Recap |
An overview of the market's performance and the factors driving it. |
|
|
Fund Talk |
The manager's review of fund performance, strategy and outlook. |
|
|
Investment Changes |
A summary of major shifts in the fund's investments over the past six months. |
|
|
Investments |
A complete list of the fund's investments with their market values. |
|
|
Financial Statements |
Statements of assets and liabilities, operations, and changes in net assets, as well as financial highlights. |
|
|
Notes |
Notes to the financial statements. |
|
|
Independent Auditors' Report |
The auditors' opinion. |
|
|
Distributions |
|
Standard & Poor's, S&P and S&P 500 are registered service marks of The McGraw-Hill Companies, Inc. and have been licensed for use by Fidelity Distributors Corporation.
Third party marks appearing herein are the property of their respective owners.
All other marks appearing herein are registered or unregistered trademarks or service marks of FMR Corp. or an affiliated company.
(Recycle graphic) This report is printed on recycled paper using soy-based inks.
This report and the financial statements contained herein are submitted for the general information of the shareholders of the fund. This report is not authorized for distribution to prospective investors in the fund unless preceded or accompanied by an effective prospectus.
Mutual fund shares are not deposits or obligations of, or guaranteed by, any depository institution. Shares are not insured by the FDIC, Federal Reserve Board or any other agency, and are subject to investment risks, including possible loss of principal amount invested.
Neither the fund nor Fidelity Distributors Corporation is a bank.
For more information on any Fidelity fund, including charges and expenses, call 1-800-544-6666 for a free prospectus. Read it carefully before you invest or send money.
Annual Report
(photo_of_Edward_C_Johnson_3d)
Dear Shareholder:
Disappointing third quarter corporate earnings announcements resulted in negative performance for many major U.S. equity indexes through the first nine months of 2000. A weak euro and the highest oil prices in 10 years frightened many investors into selling shares of large U.S. corporations with multinational presence. In fixed-income markets, 30-year Treasury prices also dropped, and these securities outyielded 10-year Treasury notes for the first time since January.
While it's impossible to predict the future direction of the markets with any degree of certainty, there are certain basic principles that can help investors plan for their future needs.
First, investors are encouraged to take a long-term view of their portfolios. If you can afford to leave your money invested through the inevitable up and down cycles of the financial markets, you will greatly reduce your vulnerability to any single decline. We know from experience, for example, that stock prices have gone up over longer periods of time, have significantly outperformed other types of investments and have stayed ahead of inflation.
Second, you can further manage your investing risk through diversification. Asset Manager funds are already diversified because they invest in stocks, bonds and short-term and money market instruments, both in the U.S. and overseas. If you have a shorter investment time horizon, you might want to consider moving some of your investment into Asset Manager: Income, which generally has a higher weighting in short-term investments compared with the other Asset Manager funds.
Finally, no matter what your time horizon or portfolio diversity, it makes good sense to follow a regular investment plan, investing a certain amount of money in a fund at the same time each month or quarter and periodically reviewing your overall portfolio. By doing so, you won't get caught up in the excitement of a rapidly rising market, nor will you buy all your shares at market highs. While this strategy - known as dollar cost averaging - won't assure a profit or protect you from a loss in a declining market, it should help you lower the average cost of your purchases. Of course, you should consider your financial ability to continue your purchases through periods of low price levels before undertaking such a strategy.
If you have questions, please call us at 1-800-544-6666, or visit our web site at www.fidelity.com. We are available 24 hours a day, seven days a week to provide you the information you need to make the investments that are right for you.
Best regards,
/s/Edward C. Johnson 3d
Edward C. Johnson 3d
Annual Report
There are several ways to evaluate a fund's historical performance. You can look at the total percentage change in value, the average annual percentage change or the growth of a hypothetical $10,000 investment. Total return reflects the change in the value of an investment, assuming reinvestment of the fund's dividend income and capital gains (the profits earned upon the sale of securities that have grown in value).
Cumulative Total Returns
|
Periods ended September 30, 2000 |
|
Past 1 |
Past 5 |
Past 10 |
|
Asset Manager SM |
|
18.73% |
100.59% |
297.53% |
|
Asset Manager Composite |
|
10.32% |
88.83% |
219.24% |
|
S&P 500 ® |
|
13.28% |
166.82% |
490.99% |
|
LB Aggregate Bond |
|
6.99% |
36.81% |
116.81% |
|
LB 3 Month T-Bill |
|
5.82% |
30.28% |
63.30% |
|
Flexible Portfolio Funds Average |
|
12.82% |
88.42% |
259.80% |
Cumulative total returns show the fund's performance in percentage terms over a set period - in this case, one year, five years or 10 years. For example, if you had invested $1,000 in a fund that had a 5% return over the past year, the value of your investment would be $1,050. You can compare the fund's returns to the performance of the Asset Manager Composite Index, a hypothetical combination of unmanaged indices. The composite index combines the total returns of the Standard & Poor's 500 SM Index, the Lehman Brothers Aggregate Bond Index and the Lehman Brothers 3 Month Treasury Bill Index, weighted according to the fund's neutral mix. To measure how the fund's performance stacked up against its peers, you can compare it to the flexible portfolio funds average, which reflects the performance of mutual funds with similar objectives tracked by Lipper Inc. The past one year average represents a peer group of 233 mutual funds. These benchmarks include reinvested dividends and capital gains, if any, and exclude the effect of sales charges.
Average Annual Total Returns
|
Periods ended September 30, 2000 |
Past 1 |
Past 5 |
Past 10 |
|
Asset ManagerSM |
18.73% |
14.94% |
14.80% |
|
Asset Manager Composite |
10.32% |
13.56% |
12.31% |
Average annual total returns take the fund's cumulative return and show you what would have happened if the fund had performed at a constant rate each year.
Annual Report
Performance - continued
$10,000 Over 10 Years
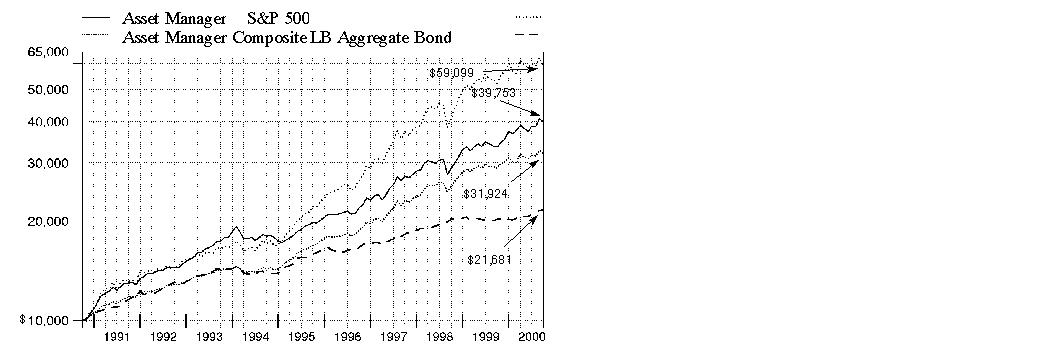
$10,000 Over 10 Years: Let's say hypothetically that $10,000 was invested in Asset Manager Fund on September 30, 1990. As the chart shows, by September 30, 2000, the value of the investment would have grown to $39,753 - a 297.53% increase on the initial investment. For comparison, look at how both the S&P 500 Index, a market capitalization-weighted index of common stocks, and the Lehman Brothers Aggregate Bond Index, a market value-weighted index of investment-grade fixed-rate debt issues, including government, corporate, asset-backed, and mortgage-backed securities with maturities of one year or more, did over the same period. With dividends and capital gains, if any, reinvested, the same $10,000 investment in the S&P 500 Index would have grown to $59,099 - a 490.99% increase. If $10,000 was invested in the Lehman Brothers Aggregate Bond Index, it would have grown to $21,681 - a 116.81% increase. You can also look at how the Asset Manager Composite Index, a hypothetical combination of unmanaged indices, did over the same period. The composite index combines the total returns of the S&P 500 Index, the Lehman Brothers Aggregate Bond Index and the Lehman Brothers 3 Month T-Bill Index according to the fund's neutral mix**, and assumes monthly rebalancing of the mix. With dividends and capital gains, if any, reinvested, the same $10,000 investment would have grown to $31,924 - a 219.24% increase.
Understanding
Performance
How a fund did yesterday is no guarantee of how it will do tomorrow. If you sell your shares during a market downturn, you might lose money. But if you can ride out the market's ups and downs, you may have a gain.
3** Currently 50% stocks, 40% bonds and 10% short-term/money market instruments effective January 1, 1997;
40%, 40% and 20%, respectively, between June 1, 1992 and December 31, 1996; 30%, 40%, and 30%,
respectively, prior to June 1, 1992.
Annual Report
What a long, strange trip it's been. At least that's what some investors may think when reflecting on the 12-month period ending September 30, 2000. Historically high levels of volatility shook speculative excess out of tech stocks in 2000, leaving bonds seemingly alone to pick up the pieces. Excluding the dramatic run-up in the fourth quarter of 1999, major stock markets were down for the period, while bonds finished comfortably on the upside.
Stocks: U.S. equity market performance during the 12 months that ended September 30, 2000, generally was predicated on the fortunes of the technology sector. At the period's outset, technology began its meteoric rise as investors rallied behind the sector's growth potential relative to other areas of the market. But just 10 weeks after setting its record high in mid-March, the NASDAQ Composite Index - a technology sector benchmark - had dropped 30%, due mainly to Federal Reserve Board interest-rate hikes, excessive valuations and the potential of an economic slowdown. Given its one-third weighting in technology, the Standard & Poor's 500SM Index also suffered, as did the blue chips' proxy, the Dow Jones Industrial Average. In response, investors shifted their assets into sectors that traditionally perform better in a more moderate-growth economy, such as health care and energy. Technology rallied sporadically in the summer, but come September, more bad news was in store, as high oil prices and a weak European currency combined to dampen the global economy. For the overall 12-month period ending September 30, 2000, the Dow returned 4.62%, the S&P 500 gained 13.28% and the NASDAQ gained 34.01%. However, all three indexes had negative returns through the first nine months of 2000.
Bonds: Most investment-grade bonds overcame sharply rising interest rates and unusually volatile market conditions en route to posting positive returns during the 12-month period that ended September 30, 2000. The Lehman Brothers Aggregate Bond Index - a widely followed measure of taxable-bond performance - returned 6.99% during this time frame. Treasuries struggled the most early on, as investors pursued more attractive alternatives in high-flying stocks and higher-yielding spread sector securities - namely mortgage bonds, government agency issues and corporate bonds. However, the struggle was short-lived, as conditions changed abruptly beginning in January with the announcement by the U.S. Treasury of its intention to reduce new borrowing and use government surplus proceeds to repurchase outstanding debt. Treasury prices jumped in response and, with the help of rising short-term interest rates, induced an inverted yield curve - which occurs when short-term bonds outyield longer-dated securities. Spread sectors recoiled on the news, with their yield spreads widening out relative to Treasuries. Anticipation that the Fed was finished raising rates, combined with persistent flights-to-safety from risk-averse investors concerned about volatility in equity markets, helped further bolster the long bond during the period. The Lehman Brothers Treasury Index returned 7.29%. Mortgages recovered nicely behind reduced interest-rate volatility and stronger-than-anticipated prepayment activity. Similarly, agencies and corporates staged late rallies and outperformed most major U.S. equity indexes through the first nine months of 2000. For the overall 12-month period, the Lehman Brothers Mortgage-Backed Securities, U.S. Agency and Credit Bond indexes returned 7.42%, 6.73% and 5.87%, respectively.
Annual Report
(Portfolio Manager photograph)
An interview with Richard Habermann, Portfolio Manager of Asset Manager
Q. How did the fund perform, Dick?
A. We had a successful period. For the 12 months that ended September 30, 2000, the fund returned 18.73%, topping the Asset Manager Composite Index, which returned 10.32% during the same period. Fund performance also topped that of the flexible portfolio funds average tracked by Lipper Inc., which returned 12.82%.
Q. How did your asset allocation decisions influence fund performance during the 12-month period?
A. We continued to emphasize equities, allocating just over 55% of fund assets on average to the asset class during the period. The fund's neutral allocation mix calls for 50% to be invested in stocks, 40% in bonds and 10% in short-term and money market instruments. Having ample exposure to the bullishness surrounding stocks early on in the period helped ensure our success relative to the index. Strong security selection powered us past our Lipper peers, which tended to be more heavily invested in stocks. Faced with growing uncertainty in the marketplace during the second half of the period, I began to pare back our equity exposure toward a more neutral weighting, which, coupled with strong security selection, helped insulate us somewhat from the volatile spring and summer months. While opportunistic trading toward the end of the period nudged the fund's equity weighting up slightly, my overall approach of emphasizing more of a neutral weighting remained intact. In terms of bonds, we paid the price for allocating part of the portfolio to high-yield securities instead of owning solely investment-grade debt.
Q. What factors fueled the strong performance of the fund's equity investments?
A. Superior stock picking and timely trading helped the equity subportfolio handily outpace the Standard & Poor's 500 Index during the 12-month period. Tom Sprague, who directed the fund's equity investments, did a fine job of uncovering the right names within the high-growth segments of the market, particularly the market-leading technology sector. The fund's focus on large, high-quality tech stocks allowed us to participate in the dramatic run-up early in the period, and also sheltered us a bit when things began to fall apart in April and May. We further benefited from holding modest positions in a handful of smaller-cap stocks that posted triple-digit gains during the period. Also important was the decision to reduce the fund's tech weighting heading into the spring, rotating some assets into more defensive areas of the market, such as health stocks. Faced with a slowing economy induced by rising interest rates and sharply higher energy prices, Tom used a strict sell discipline to neutralize market turbulence and lock in profits for the fund. Knowing when to get out of even the quality tech names was one of the keys to outperforming the index during the period. Many of the fund's top performers included firms engaged in the build-out of Internet infrastructure and next-generation communications networks, with JDS Uniphase, Network Appliance, Comverse, EMC and Exodus leading the way. Having considerably less exposure than the index to the notable laggards within tech, such as Microsoft and Lucent, further boosted relative returns. Several health stocks, most notably Eli Lilly and Human Genome, also performed well. AES helped out from the energy front. GE was another strong performer for us. On the flip side, we gave up some gains by holding some cyclical - or economically sensitive - stocks such as Navistar and CNF Transportation. Our overexposure to media stocks - particularly cable companies such as Comcast - also hurt, as did a handful of tech stocks including America Online, Dell and EDS. Several of the aforementioned stocks were no longer held at the close of the period.
Annual Report
Fund Talk: The Manager's Overview - continued
Q. How did the bond portion of the fund fare?
A. It was a strong period for our investment-grade holdings. Charlie Morrison and his team responded well to changing conditions in the marketplace and positioned the fund to benefit from them. Following a strong period for corporate bonds in the fourth quarter of 1999, we decided to scale back on the position in January, fearing the effect that rising interest rates would have on longer-term issues. This decision proved wise, as the performance of corporates deteriorated during the period. A driving influence at this time was the U.S. Treasury's campaign of repurchasing outstanding debt and reducing future issuance. This move, coupled with persistent flights to safety from nervous tech investors, sparked a tremendous rally in our long-term Treasuries. Our overweighting in discount mortgage securities also helped, thanks to strong housing turnover. So, even though interest rates were higher during the period, strong technical factors in the market resulted in a positive return for the investment-grade subportfolio. Having a modest stake in high-yield bonds - an asset class not included in the index - proved problematic, as yield spreads widened to levels not seen since the 1990 recession. Poor liquidity and declining credit quality sent prices plunging during the period. The fund's overweighting in telecommunications issues - which suffered the most - detracted from performance. Taking the reins from Fred Hoff - who ran the high-yield portion of the fund until June - Matt Conti helped limit our downside by reducing the fund's risk profile through further diversification. We also got a yield boost from carrying a number of issues with historically attractive coupons.
Q. And the fund's short-term/money market investments?
A. John Todd felt that concerns surrounding Y2K were overblown and used the opportunity to extend the average maturity of the fund's money market subportfolio late last year to take advantage of a steeply sloped yield curve. Early in 2000, however, the yield curve flattened out dramatically. In response, we let the average maturity roll down, believing that strong economic growth and the risk of rising inflation were likely to set off a protracted period of Fed tightening. Since that time, the curve has remained flat, which has allowed us to maintain a shorter-maturity profile. It's important for shareholders to note that, in July, the fund began to invest nearly all of its money market investments in a Fidelity-managed money market mutual fund in lieu of investing directly in individual money market securities.
Q. What's your outlook?
A. I remain quite cautious. There's an old adage - don't catch a falling knife. Well, that's where I feel we stand today. It's still unclear to me as to whether or not the market will be able to shake its concerns about an economic slowdown and the potential impact on companies' bottom lines. Right now, with stocks facing a stiff headwind, I intend to sit on the sidelines and maintain a neutral equity weighting until I see a catalyst that can reverse the tide. Without that catalyst, it'll be hard for me to justify a significant move.
Annual Report
Fund Talk: The Manager's Overview - continued
The views expressed in this report reflect those of the portfolio manager only through the end of the period of the report as stated on the cover and do not necessarily represent the views of Fidelity or any other person in the Fidelity organization. Any such views are subject to change at any time based upon market or other conditions and Fidelity disclaims any responsibility to update such views. These views may not be relied on as investment advice and, because investment decisions for a Fidelity fund are based on numerous factors, may not be relied on as an indication of trading intent on behalf of any Fidelity fund.
Fund Facts
Goal: seeks high total return with reduced risk over the long term by allocating its assets among stocks, bonds and short-term instruments
Fund number: 314
Trading symbol: FASMX
Start date: December 28, 1988
Size: as of September 30, 2000, more than $13.5 billion
Manager: Richard Habermann, since 1996; manager, Asset Manager: Aggressive, since 1999; Asset Manager: Income and Asset Manager: Growth, since 1996; Fidelity Trend Fund, 1977-1981; Fidelity Magellan Fund, 1972-1977; joined Fidelity in 1968
3Dick Habermann reflects on recent market volatility:
"There's a lot of uncertainty in the world today, and it's finding its way into the equity markets. Thankfully, the fund's equity exposure was generally lean toward the tail end of the period, when conditions really started to deteriorate. Our hope is to hold our own - with the help of bonds and cash - when stock markets are doing poorly and try to do considerably better when markets pick up again. That's the whole purpose of asset allocation funds. In a difficult market, sometimes the best thing to do is be patient, see what pans out and pick up some good companies at attractive levels in the process.
"What's particularly troubling for markets these days are shock events. Take the recent crisis in the Middle East, for example. With higher oil prices and inflation fears already weighing on the minds of investors, escalating tensions in that area of the world roiled the markets. There have been many events like this one during the past decade, including the emerging-markets crisis in 1998 and the Gulf War in 1990. As a money manager, it's important for me to anticipate what might be considered less-than-perfect times and, when they are in fact occurring, assess them and decide what to do. So far, we've completed the first part by anticipating difficult times. Early recognition of an uncertain market climate brought us down to a neutral equity weighting before it hurt us, which was key."
Annual Report
|
Top Five Stocks as of September 30, 2000 |
||
|
|
% of fund's net assets |
% of fund's net assets |
|
General Electric Co. |
2.0 |
1.5 |
|
Cisco Systems, Inc. |
1.7 |
2.1 |
|
Exxon Mobil Corp. |
1.5 |
1.1 |
|
EMC Corp. |
1.0 |
0.8 |
|
Fannie Mae |
1.0 |
1.0 |
|
|
7.2 |
6.5 |
|
Top Five Bond Issuers as of September 30, 2000 |
||
|
(with maturities greater than one year) |
% of fund's net assets |
% of fund's net assets |
|
Fannie Mae |
9.4 |
8.6 |
|
U.S. Treasury Obligations |
3.4 |
4.9 |
|
Government National Mortgage Association |
1.6 |
1.7 |
|
Freddie Mac |
1.2 |
1.3 |
|
Federal Home Loan Bank |
1.0 |
0.0 |
|
|
16.6 |
16.5 |
|
Top Five Market Sectors as of September 30, 2000 |
||
|
|
% of fund's net assets |
% of fund's net assets |
|
Technology |
17.0 |
19.7 |
|
Finance |
11.0 |
9.8 |
|
Utilities |
6.2 |
8.6 |
|
Media & Leisure |
6.2 |
7.9 |
|
Health |
5.7 |
4.4 |
|
Asset Allocation (% of fund's net assets) |
As of September 30, 2000 * As of March 31,2000 **

Asset allocations in the pie charts reflect the categorization of assets as defined in the fund's prospectus in effect as of the time periods indicated above. Financial Statement categorizations conform to accounting standards and will differ from the pie chart.
Annual Report
Showing Percentage of Net Assets
|
Common Stocks - 51.5% |
|||
|
Shares |
Value (Note 1) (000s) |
||
|
AEROSPACE & DEFENSE - 1.9% |
|||
|
Aerospace & Defense - 1.1% |
|||
|
Boeing Co. |
798,200 |
$ 50,287 |
|
|
Lockheed Martin Corp. |
258,600 |
8,523 |
|
|
Northrop Grumman Corp. |
445,220 |
40,459 |
|
|
United Technologies Corp. |
793,146 |
54,925 |
|
|
|
154,194 |
||
|
Ship Building & Repair - 0.8% |
|||
|
General Dynamics Corp. |
1,689,200 |
106,103 |
|
|
TOTAL AEROSPACE & DEFENSE |
260,297 |
||
|
BASIC INDUSTRIES - 0.6% |
|||
|
Chemicals & Plastics - 0.1% |
|||
|
Praxair, Inc. |
125,830 |
4,703 |
|
|
Iron & Steel - 0.2% |
|||
|
Allegheny Technologies, Inc. |
1,582,000 |
28,674 |
|
|
Metals & Mining - 0.2% |
|||
|
Alcoa, Inc. |
1,127,700 |
28,545 |
|
|
Martin Marietta Materials, Inc. |
3,800 |
145 |
|
|
|
28,690 |
||
|
Paper & Forest Products - 0.1% |
|||
|
International Paper Co. |
452,800 |
12,990 |
|
|
TOTAL BASIC INDUSTRIES |
75,057 |
||
|
CONSTRUCTION & REAL ESTATE - 0.2% |
|||
|
Engineering - 0.2% |
|||
|
Fluor Corp. |
827,500 |
24,825 |
|
|
DURABLES - 1.9% |
|||
|
Autos, Tires, & Accessories - 0.3% |
|||
|
Danaher Corp. |
717,000 |
35,671 |
|
|
Consumer Durables - 0.1% |
|||
|
Minnesota Mining & Manufacturing Co. |
155,700 |
14,188 |
|
|
Consumer Electronics - 1.1% |
|||
|
Black & Decker Corp. |
25,700 |
879 |
|
|
Gemstar-TV Guide International, Inc. (a) |
389,300 |
33,942 |
|
|
Pioneer Corp. |
1,335,000 |
54,303 |
|
|
Sony Corp. |
544,800 |
54,991 |
|
|
|
144,115 |
||
|
Common Stocks - continued |
|||
|
Shares |
Value (Note 1) (000s) |
||
|
DURABLES - continued |
|||
|
Home Furnishings - 0.3% |
|||
|
Herman Miller, Inc. |
874,100 |
$ 28,026 |
|
|
Leggett & Platt, Inc. |
1,028,005 |
16,255 |
|
|
|
44,281 |
||
|
Textiles & Apparel - 0.1% |
|||
|
Arena Brands Holdings Corp. Class B |
130,444 |
3,261 |
|
|
Liz Claiborne, Inc. |
378,900 |
14,588 |
|
|
|
17,849 |
||
|
TOTAL DURABLES |
256,104 |
||
|
ENERGY - 4.8% |
|||
|
Energy Services - 1.9% |
|||
|
Baker Hughes, Inc. |
893,500 |
33,171 |
|
|
BJ Services Co. (a) |
543,600 |
33,228 |
|
|
ENSCO International, Inc. |
1,127,700 |
43,135 |
|
|
Halliburton Co. |
1,313,600 |
64,284 |
|
|
Nabors Industries, Inc. (a) |
324,400 |
16,999 |
|
|
Schlumberger Ltd. (NY Shares) |
349,200 |
28,744 |
|
|
Transocean Sedco Forex, Inc. |
657,700 |
38,558 |
|
|
|
258,119 |
||
|
Oil & Gas - 2.9% |
|||
|
Anadarko Petroleum Corp. |
772,200 |
51,320 |
|
|
Apache Corp. |
1,292,000 |
76,390 |
|
|
Exxon Mobil Corp. |
2,302,550 |
205,215 |
|
|
TotalFinaElf SA sponsored ADR |
745,672 |
54,760 |
|
|
|
387,685 |
||
|
TOTAL ENERGY |
645,804 |
||
|
FINANCE - 8.2% |
|||
|
Banks - 0.9% |
|||
|
Bank of New York Co., Inc. |
727,700 |
40,797 |
|
|
Bank One Corp. |
1,035,700 |
40,004 |
|
|
Northern Trust Corp. |
324,400 |
28,831 |
|
|
PNC Financial Services Group, Inc. |
226,200 |
14,703 |
|
|
|
124,335 |
||
|
Credit & Other Finance - 1.8% |
|||
|
American Express Co. |
1,605,300 |
97,522 |
|
|
Common Stocks - continued |
|||
|
Shares |
Value (Note 1) (000s) |
||
|
FINANCE - continued |
|||
|
Credit & Other Finance - continued |
|||
|
Citigroup, Inc. |
2,478,767 |
$ 134,008 |
|
|
MBNA Corp. |
517,300 |
19,916 |
|
|
|
251,446 |
||
|
Federal Sponsored Credit - 1.6% |
|||
|
Fannie Mae |
1,973,600 |
141,112 |
|
|
Freddie Mac |
1,327,400 |
71,763 |
|
|
|
212,875 |
||
|
Insurance - 3.1% |
|||
|
AFLAC, Inc. |
764,500 |
48,976 |
|
|
Allmerica Financial Corp. |
198,800 |
12,711 |
|
|
AMBAC Financial Group, Inc. |
1,536,165 |
112,524 |
|
|
American International Group, Inc. |
856,569 |
81,963 |
|
|
CIGNA Corp. |
623,988 |
65,144 |
|
|
Hartford Financial Services Group, Inc. |
388,400 |
28,329 |
|
|
Marsh & McLennan Companies, Inc. |
64,600 |
8,576 |
|
|
MBIA, Inc. |
194,000 |
13,798 |
|
|
UnumProvident Corp. |
765,500 |
20,860 |
|
|
XL Capital Ltd. Class A |
315,000 |
23,153 |
|
|
|
416,034 |
||
|
Securities Industry - 0.8% |
|||
|
Charles Schwab Corp. |
740,500 |
26,288 |
|
|
Daiwa Securities Group, Inc. |
3,377,000 |
39,555 |
|
|
Morgan Stanley Dean Witter & Co. |
469,900 |
42,966 |
|
|
|
108,809 |
||
|
TOTAL FINANCE |
1,113,499 |
||
|
HEALTH - 5.3% |
|||
|
Drugs & Pharmaceuticals - 3.4% |
|||
|
Bristol-Myers Squibb Co. |
890,800 |
50,887 |
|
|
Celgene Corp. (a) |
828,900 |
49,320 |
|
|
Eli Lilly & Co. |
1,041,518 |
84,493 |
|
|
Genentech, Inc. (a) |
130,500 |
24,232 |
|
|
ImClone Systems, Inc. (a) |
76,200 |
8,920 |
|
|
Merck & Co., Inc. |
534,400 |
39,779 |
|
|
PE Corp. - Celera Genomics Group (a) |
230,100 |
22,924 |
|
|
Pfizer, Inc. |
2,278,675 |
102,398 |
|
|
Common Stocks - continued |
|||
|
Shares |
Value (Note 1) (000s) |
||
|
HEALTH - continued |
|||
|
Drugs & Pharmaceuticals - continued |
|||
|
Protein Design Labs, Inc. (a) |
349,100 |
$ 42,067 |
|
|
Schering-Plough Corp. |
736,900 |
34,266 |
|
|
|
459,286 |
||
|
Medical Equipment & Supplies - 1.6% |
|||
|
Biomet, Inc. |
507,600 |
17,766 |
|
|
Cardinal Health, Inc. |
752,100 |
66,326 |
|
|
Guidant Corp. (a) |
297,600 |
21,037 |
|
|
Johnson & Johnson |
438,700 |
41,210 |
|
|
Medtronic, Inc. |
1,524,754 |
79,001 |
|
|
|
225,340 |
||
|
Medical Facilities Management - 0.3% |
|||
|
Express Scripts, Inc. Class A (a) |
340,900 |
24,630 |
|
|
HCA - The Healthcare Co. |
388,100 |
14,408 |
|
|
|
39,038 |
||
|
TOTAL HEALTH |
723,664 |
||
|
INDUSTRIAL MACHINERY & EQUIPMENT - 2.7% |
|||
|
Electrical Equipment - 2.1% |
|||
|
General Electric Co. |
4,690,000 |
270,554 |
|
|
Harris Corp. |
682,700 |
19,414 |
|
|
|
289,968 |
||
|
Industrial Machinery & Equipment - 0.6% |
|||
|
Caterpillar, Inc. |
1,073,500 |
36,231 |
|
|
Tyco International Ltd. |
906,800 |
47,040 |
|
|
|
83,271 |
||
|
TOTAL INDUSTRIAL MACHINERY & EQUIPMENT |
373,239 |
||
|
MEDIA & LEISURE - 2.4% |
|||
|
Broadcasting - 0.6% |
|||
|
Clear Channel Communications, Inc. (a) |
531,591 |
30,035 |
|
|
Grupo Televisa SA de CV sponsored GDR |
195,000 |
11,249 |
|
|
NTL, Inc. warrants 10/14/08 (a) |
11,305 |
192 |
|
|
Time Warner, Inc. |
504,241 |
39,457 |
|
|
|
80,933 |
||
|
Entertainment - 1.0% |
|||
|
Mandalay Resort Group (a) |
1,322,500 |
33,889 |
|
|
Common Stocks - continued |
|||
|
Shares |
Value (Note 1) (000s) |
||
|
MEDIA & LEISURE - continued |
|||
|
Entertainment - continued |
|||
|
MGM Mirage, Inc. |
649,900 |
$ 24,818 |
|
|
Viacom, Inc. Class B (non-vtg.) (a) |
1,024,281 |
59,920 |
|
|
Walt Disney Co. |
679,200 |
25,979 |
|
|
|
144,606 |
||
|
Lodging & Gaming - 0.2% |
|||
|
Harrah's Entertainment, Inc. (a) |
873,400 |
24,019 |
|
|
Restaurants - 0.6% |
|||
|
Brinker International, Inc. (a) |
690,000 |
20,786 |
|
|
Darden Restaurants, Inc. |
2,836,100 |
59,026 |
|
|
|
79,812 |
||
|
TOTAL MEDIA & LEISURE |
329,370 |
||
|
NONDURABLES - 1.8% |
|||
|
Beverages - 0.1% |
|||
|
The Coca-Cola Co. |
258,850 |
14,269 |
|
|
Foods - 0.2% |
|||
|
Quaker Oats Co. |
332,200 |
26,285 |
|
|
Household Products - 0.5% |
|||
|
Avon Products, Inc. |
1,168,500 |
47,762 |
|
|
Colgate-Palmolive Co. |
129,700 |
6,122 |
|
|
Gillette Co. |
512,600 |
15,827 |
|
|
Procter & Gamble Co. |
96,800 |
6,486 |
|
|
|
76,197 |
||
|
Tobacco - 1.0% |
|||
|
Philip Morris Companies, Inc. |
4,481,500 |
131,924 |
|
|
TOTAL NONDURABLES |
248,675 |
||
|
RETAIL & WHOLESALE - 2.3% |
|||
|
Drug Stores - 0.5% |
|||
|
Walgreen Co. |
1,944,800 |
73,781 |
|
|
General Merchandise Stores - 0.9% |
|||
|
Costco Wholesale Corp. (a) |
323,500 |
11,302 |
|
|
Dollar Tree Stores, Inc. (a) |
704,650 |
28,582 |
|
|
Wal-Mart Stores, Inc. |
1,574,100 |
75,754 |
|
|
|
115,638 |
||
|
Common Stocks - continued |
|||
|
Shares |
Value (Note 1) (000s) |
||
|
RETAIL & WHOLESALE - continued |
|||
|
Grocery Stores - 0.3% |
|||
|
Pathmark Stores, Inc. (a) |
1,119,745 |
$ 13,787 |
|
|
Safeway, Inc. (a) |
612,700 |
28,605 |
|
|
|
42,392 |
||
|
Retail & Wholesale, Miscellaneous - 0.6% |
|||
|
Best Buy Co., Inc. (a) |
841,800 |
53,560 |
|
|
Home Depot, Inc. |
585,100 |
31,047 |
|
|
|
84,607 |
||
|
TOTAL RETAIL & WHOLESALE |
316,418 |
||
|
SERVICES - 0.6% |
|||
|
Advertising - 0.4% |
|||
|
Omnicom Group, Inc. |
718,000 |
52,369 |
|
|
Services - 0.2% |
|||
|
Ecolab, Inc. |
226,500 |
8,168 |
|
|
FreeMarkets, Inc. |
259,000 |
14,795 |
|
|
|
22,963 |
||
|
TOTAL SERVICES |
75,332 |
||
|
TECHNOLOGY - 16.0% |
|||
|
Communications Equipment - 3.9% |
|||
|
Ciena Corp. (a) |
492,000 |
60,424 |
|
|
Cisco Systems, Inc. (a) |
4,091,014 |
226,029 |
|
|
Comverse Technology, Inc. (a) |
1,239,800 |
133,898 |
|
|
Corning, Inc. |
337,400 |
100,208 |
|
|
Corvis Corp. |
88,500 |
5,403 |
|
|
|
525,962 |
||
|
Computer Services & Software - 4.4% |
|||
|
America Online, Inc. (a) |
1,684,100 |
90,520 |
|
|
Ariba, Inc. (a) |
302,200 |
43,295 |
|
|
Automatic Data Processing, Inc. |
884,400 |
59,144 |
|
|
BEA Systems, Inc. (a) |
425,900 |
33,167 |
|
|
BMC Software, Inc. (a) |
970,600 |
18,563 |
|
|
Cadence Design Systems, Inc. (a) |
530,300 |
13,622 |
|
|
Electronic Data Systems Corp. |
455,400 |
18,899 |
|
|
Exodus Communications, Inc. (a) |
733,320 |
36,208 |
|
|
Inktomi Corp. (a) |
116,400 |
13,270 |
|
|
Internap Network Services Corp. |
428,940 |
13,860 |
|
|
Common Stocks - continued |
|||
|
Shares |
Value (Note 1) (000s) |
||
|
TECHNOLOGY - continued |
|||
|
Computer Services & Software - continued |
|||
|
Intuit, Inc. (a) |
351,300 |
$ 20,024 |
|
|
Microsoft Corp. (a) |
526,000 |
31,724 |
|
|
Oracle Corp. (a) |
1,092,400 |
86,027 |
|
|
PeopleSoft, Inc. (a) |
686,700 |
19,185 |
|
|
StorageNetworks, Inc. |
106,300 |
10,863 |
|
|
Synopsys, Inc. (a) |
346,570 |
13,126 |
|
|
VA Linux Systems, Inc. |
452,700 |
20,937 |
|
|
VeriSign, Inc. (a) |
109,000 |
22,079 |
|
|
VERITAS Software Corp. (a) |
215,500 |
30,601 |
|
|
|
595,114 |
||
|
Computers & Office Equipment - 4.2% |
|||
|
Brocade Communications Systems, Inc. (a) |
187,200 |
44,179 |
|
|
CacheFlow, Inc. |
85,700 |
12,255 |
|
|
CDW Computer Centers, Inc. (a) |
718,140 |
49,552 |
|
|
Compaq Computer Corp. |
1,093,400 |
30,156 |
|
|
Dell Computer Corp. (a) |
773,700 |
23,840 |
|
|
EMC Corp. (a) |
1,431,300 |
141,878 |
|
|
Gateway, Inc. (a) |
608,800 |
28,461 |
|
|
International Business Machines Corp. |
679,700 |
76,466 |
|
|
Juniper Networks, Inc. (a) |
97,200 |
21,281 |
|
|
Maxtor Corp. (a) |
969,000 |
10,175 |
|
|
Network Appliance, Inc. (a) |
116,300 |
14,814 |
|
|
Quantum Corp. - Hard Disk Drive Group (a) |
854,100 |
8,488 |
|
|
Sun Microsystems, Inc. (a) |
376,600 |
43,968 |
|
|
Symbol Technologies, Inc. |
1,112,500 |
39,980 |
|
|
Tech Data Corp. (a) |
457,400 |
19,554 |
|
|
|
565,047 |
||
|
Electronic Instruments - 0.7% |
|||
|
Beckman Coulter, Inc. |
230,400 |
17,770 |
|
|
KLA-Tencor Corp. (a) |
390,600 |
16,088 |
|
|
PE Corp. - Biosystems Group |
161,800 |
18,850 |
|
|
PerkinElmer, Inc. |
149,100 |
15,562 |
|
|
Thermo Electron Corp. (a) |
1,357,900 |
35,305 |
|
|
|
103,575 |
||
|
Electronics - 2.8% |
|||
|
Altera Corp. (a) |
199,400 |
9,521 |
|
|
Analog Devices, Inc. (a) |
299,900 |
24,760 |
|
|
Flextronics International Ltd. (a) |
638,600 |
52,445 |
|
|
Intel Corp. |
2,608,900 |
108,432 |
|
|
Common Stocks - continued |
|||
|
Shares |
Value (Note 1) (000s) |
||
|
TECHNOLOGY - continued |
|||
|
Electronics - continued |
|||
|
JDS Uniphase Corp. (a) |
369,500 |
$ 34,987 |
|
|
Linear Technology Corp. |
855,450 |
55,390 |
|
|
Sanmina Corp. (a) |
502,600 |
47,056 |
|
|
Solectron Corp. (a) |
849,100 |
39,165 |
|
|
Xilinx, Inc. (a) |
124,600 |
10,669 |
|
|
|
382,425 |
||
|
TOTAL TECHNOLOGY |
2,172,123 |
||
|
TRANSPORTATION - 0.9% |
|||
|
Air Transportation - 0.3% |
|||
|
SkyWest, Inc. |
170,900 |
8,759 |
|
|
Southwest Airlines Co. |
1,350,000 |
32,738 |
|
|
|
41,497 |
||
|
Railroads - 0.3% |
|||
|
Union Pacific Corp. |
906,500 |
35,240 |
|
|
Trucking & Freight - 0.3% |
|||
|
C.H. Robinson Worldwide, Inc. |
64,600 |
3,641 |
|
|
Expeditors International of Washington, Inc. |
817,300 |
36,830 |
|
|
|
40,471 |
||
|
TOTAL TRANSPORTATION |
117,208 |
||
|
UTILITIES - 1.9% |
|||
|
Cellular - 0.9% |
|||
|
China Mobile (Hong Kong) Ltd. (a) |
3,420,237 |
22,189 |
|
|
Crown Castle International Corp. (a) |
1,006,300 |
31,258 |
|
|
Leap Wireless International, Inc. warrants 4/15/10 (a)(g) |
1,800 |
36 |
|
|
McCaw International Ltd. warrants 4/16/07 (a)(g) |
22,840 |
343 |
|
|
Nextel Communications, Inc. Class A (a) |
1,008,200 |
47,133 |
|
|
SK Telecom Co. Ltd. |
290 |
71 |
|
|
Vodafone Group PLC sponsored ADR |
517,500 |
19,148 |
|
|
|
120,178 |
||
|
Electric Utility - 0.8% |
|||
|
AES Corp. (a) |
1,114,800 |
76,364 |
|
|
Calpine Corp. (a) |
284,800 |
29,726 |
|
|
|
106,090 |
||
|
Common Stocks - continued |
|||
|
Shares |
Value (Note 1) (000s) |
||
|
UTILITIES - continued |
|||
|
Telephone Services - 0.2% |
|||
|
Metromedia Fiber Network, Inc. Class A (a) |
934,400 |
$ 22,718 |
|
|
Ono Finance PLC rights 5/31/09 (a)(g) |
4,510 |
41 |
|
|
Pathnet, Inc. warrants 4/15/08 (a)(g) |
14,915 |
149 |
|
|
SBC Communications, Inc. |
290,800 |
14,540 |
|
|
|
37,448 |
||
|
TOTAL UTILITIES |
263,716 |
||
|
TOTAL COMMON STOCKS (Cost $4,922,678) |
6,995,331 |
||
|
Preferred Stocks - 1.3% |
|||
|
|
|
|
|
|
Convertible Preferred Stocks - 0.0% |
|||
|
MEDIA & LEISURE - 0.0% |
|||
|
Broadcasting - 0.0% |
|||
|
Earthwatch, Inc. $8.50 (g) |
324,518 |
81 |
|
|
UTILITIES - 0.0% |
|||
|
Telephone Services - 0.0% |
|||
|
Global Crossing Ltd. $17.50 |
24,300 |
4,822 |
|
|
TOTAL CONVERTIBLE PREFERRED STOCKS |
4,903 |
||
|
Nonconvertible Preferred Stocks - 1.3% |
|||
|
CONSTRUCTION & REAL ESTATE - 0.1% |
|||
|
Real Estate Investment Trusts - 0.1% |
|||
|
California Federal Preferred Capital Corp. $2.2812 |
581,326 |
12,789 |
|
|
FINANCE - 0.0% |
|||
|
Insurance - 0.0% |
|||
|
American Annuity Group Capital Trust II 8.875% |
4,320 |
4,197 |
|
|
HEALTH - 0.1% |
|||
|
Medical Facilities Management - 0.1% |
|||
|
Fresenius Medical Care Capital Trust II 7.875% |
4,534 |
4,362 |
|
|
Preferred Stocks - continued |
|||
|
Shares |
Value (Note 1) (000s) |
||
|
Nonconvertible Preferred Stocks - continued |
|||
|
MEDIA & LEISURE - 0.4% |
|||
|
Broadcasting - 0.3% |
|||
|
Adelphia Communications Corp. $13.00 |
43,728 |
$ 4,198 |
|
|
CSC Holdings, Inc. 11.125% pay-in-kind |
293,244 |
31,157 |
|
|
|
35,355 |
||
|
Publishing - 0.1% |
|||
|
PRIMEDIA, Inc.: |
|
|
|
|
$9.20 |
63,732 |
5,640 |
|
|
8.625% |
1,932 |
158 |
|
|
Series D, $10.00 |
81,921 |
7,578 |
|
|
|
13,376 |
||
|
TOTAL MEDIA & LEISURE |
48,731 |
||
|
RETAIL & WHOLESALE - 0.0% |
|||
|
Grocery Stores - 0.0% |
|||
|
Supermarkets General Holdings Corp. $3.52 pay-in-kind |
60,330 |
8 |
|
|
UTILITIES - 0.7% |
|||
|
Cellular - 0.3% |
|||
|
Crown Castle International Corp. 12.75% pay-in-kind |
5,519 |
5,560 |
|
|
Nextel Communications, Inc.: |
|
|
|
|
11.125% pay-in-kind |
41,003 |
39,670 |
|
|
Series D, 13% pay-in-kind |
772 |
816 |
|
|
|
46,046 |
||
|
Telephone Services - 0.4% |
|||
|
Adelphia Business Solution, Inc. 12.875% pay-in-kind |
14,676 |
7,925 |
|
|
Broadwing Communications, Inc. 12.50% pay-in-kind |
5,466 |
5,603 |
|
|
Intermedia Communications, Inc. 13.5% pay-in-kind |
14,142 |
13,576 |
|
|
NEXTLINK Communications, Inc. 14% pay-in-kind |
547,498 |
24,637 |
|
|
|
51,741 |
||
|
TOTAL UTILITIES |
97,787 |
||
|
TOTAL NONCONVERTIBLE PREFERRED STOCKS |
167,874 |
||
|
TOTAL PREFERRED STOCKS (Cost $186,630) |
172,777 |
||
|
Corporate Bonds - 15.7% |
|||||
|
Moody's Ratings |
Principal Amount (000s) |
Value (Note 1) (000s) |
|||
|
Convertible Bonds - 0.3% |
|||||
|
ENERGY - 0.0% |
|||||
|
Energy Services - 0.0% |
|||||
|
Key Energy Group, Inc. 5% 9/15/04 |
B3 |
|
$ 2,550 |
$ 2,129 |
|
|
HEALTH - 0.2% |
|||||
|
Medical Facilities Management - 0.2% |
|||||
|
Tenet Healthcare Corp. 6% 12/1/05 |
B1 |
|
17,540 |
14,909 |
|
|
Total Renal Care Holdings, Inc.: |
|
|
|
|
|
|
7% 5/15/09 |
B3 |
|
1,610 |
1,133 |
|
|
7% 5/15/09 (g) |
B3 |
|
9,630 |
6,777 |
|
|
|
22,819 |
||||
|
INDUSTRIAL MACHINERY & EQUIPMENT - 0.0% |
|||||
|
Pollution Control - 0.0% |
|||||
|
Waste Management, Inc. 4% 2/1/02 |
Ba1 |
|
2,580 |
2,419 |
|
|
MEDIA & LEISURE - 0.1% |
|||||
|
Broadcasting - 0.0% |
|||||
|
EchoStar Communications Corp. 4.875% 1/1/07 (g) |
Caa2 |
|
1,590 |
2,093 |
|
|
NTL Delaware, Inc./NTL, Inc. 5.75% 12/15/09 |
Caa1 |
|
2,460 |
1,679 |
|
|
NTL, Inc. 5.75% 12/15/09 (g) |
Caa1 |
|
4,885 |
3,334 |
|
|
|
7,106 |
||||
|
Lodging & Gaming - 0.1% |
|||||
|
Hilton Hotels Corp. 5% 5/15/06 |
Ba2 |
|
10,410 |
8,692 |
|
|
TOTAL MEDIA & LEISURE |
15,798 |
||||
|
TOTAL CONVERTIBLE BONDS |
43,165 |
||||
|
Nonconvertible Bonds - 15.4% |
|||||
|
BASIC INDUSTRIES - 0.6% |
|||||
|
Chemicals & Plastics - 0.4% |
|||||
|
Acetex Corp. yankee 9.75% 10/1/03 |
B3 |
|
1,920 |
1,824 |
|
|
Avecia Group PLC 11% 7/1/09 |
B2 |
|
6,930 |
6,705 |
|
|
Huntsman Corp. 9.5% 7/1/07 (g) |
B2 |
|
3,910 |
3,157 |
|
|
Huntsman ICI Chemicals LLC 10.125% 7/1/09 |
B2 |
|
3,230 |
3,165 |
|
|
Lyondell Chemical Co.: |
|
|
|
|
|
|
9.875% 5/1/07 |
Ba3 |
|
14,110 |
13,757 |
|
|
10.875% 5/1/09 |
B2 |
|
13,110 |
12,717 |
|
|
Corporate Bonds - continued |
|||||
|
Moody's Ratings |
Principal Amount (000s) |
Value (Note 1) (000s) |
|||
|
Nonconvertible Bonds - continued |
|||||
|
BASIC INDUSTRIES - continued |
|||||
|
Chemicals & Plastics - continued |
|||||
|
Methanex Corp. yankee 7.4% 8/15/02 |
Ba1 |
|
$ 960 |
$ 898 |
|
|
Scotts Co. 8.625% 1/15/09 (g) |
B2 |
|
3,975 |
3,836 |
|
|
Sterling Chemicals, Inc.: |
|
|
|
|
|
|
11.25% 4/1/07 |
Caa3 |
|
1,235 |
840 |
|
|
12.375% 7/15/06 |
B3 |
|
315 |
320 |
|
|
|
47,219 |
||||
|
Packaging & Containers - 0.1% |
|||||
|
Gaylord Container Corp.: |
|
|
|
|
|
|
9.375% 6/15/07 |
Caa1 |
|
7,220 |
5,343 |
|
|
9.75% 6/15/07 |
Caa1 |
|
10,920 |
8,299 |
|
|
Packaging Corp. of America 9.625% 4/1/09 |
B1 |
|
2,625 |
2,658 |
|
|
U.S. Can Corp. 12.375% 10/1/10 (g) |
B3 |
|
1,240 |
1,252 |
|
|
|
17,552 |
||||
|
Paper & Forest Products - 0.1% |
|||||
|
Doman Industries Ltd.: |
|
|
|
|
|
|
9.25% 11/15/07 |
Caa1 |
|
550 |
330 |
|
|
yankee 8.75% 3/15/04 |
Caa1 |
|
8,675 |
5,726 |
|
|
Potlatch Corp. 6.25% 3/15/02 |
Baa1 |
|
8,610 |
8,417 |
|
|
Repap New Brunswick, Inc. yankee 10.625% 4/15/05 |
Caa1 |
|
565 |
582 |
|
|
Stone Container Corp. 10.75% 10/1/02 |
B1 |
|
240 |
243 |
|
|
|
15,298 |
||||
|
TOTAL BASIC INDUSTRIES |
80,069 |
||||
|
CONSTRUCTION & REAL ESTATE - 0.6% |
|||||
|
Building Materials - 0.0% |
|||||
|
Numatics, Inc. 9.625% 4/1/08 |
B3 |
|
1,490 |
1,162 |
|
|
Construction - 0.1% |
|||||
|
Blount, Inc. 13% 8/1/09 |
B3 |
|
1,625 |
1,645 |
|
|
D.R. Horton, Inc. 8% 2/1/09 |
Ba1 |
|
4,215 |
3,867 |
|
|
Del Webb Corp. 9.375% 5/1/09 |
B2 |
|
2,445 |
2,249 |
|
|
Ryland Group, Inc. 9.75% 9/1/10 |
Ba2 |
|
4,940 |
4,915 |
|
|
Standard Pacific Corp. 9.5% 9/15/10 |
Ba2 |
|
4,850 |
4,802 |
|
|
|
17,478 |
||||
|
Corporate Bonds - continued |
|||||
|
Moody's Ratings |
Principal Amount (000s) |
Value (Note 1) (000s) |
|||
|
Nonconvertible Bonds - continued |
|||||
|
CONSTRUCTION & REAL ESTATE - continued |
|||||
|
Engineering - 0.1% |
|||||
|
360networks, Inc. 13% 5/1/08 |
B3 |
|
$ 1,725 |
$ 1,587 |
|
|
Anteon Corp. 12% 5/15/09 |
B3 |
|
5,055 |
4,550 |
|
|
Morrison Knudsen Corp. 11% 7/1/10 (g) |
Ba2 |
|
5,075 |
5,151 |
|
|
|
11,288 |
||||
|
Real Estate - 0.2% |
|||||
|
Duke-Weeks Realty LP 6.875% 3/15/05 |
Baa2 |
|
8,200 |
7,973 |
|
|
LNR Property Corp.: |
|
|
|
|
|
|
9.375% 3/15/08 |
B1 |
|
7,845 |
7,335 |
|
|
10.5% 1/15/09 |
B1 |
|
3,080 |
3,003 |
|
|
|
18,311 |
||||
|
Real Estate Investment Trusts - 0.2% |
|||||
|
CenterPoint Properties Trust: |
|
|
|
|
|
|
6.75% 4/1/05 |
Baa2 |
|
4,360 |
4,134 |
|
|
7.125% 3/15/04 |
Baa2 |
|
10,930 |
10,631 |
|
|
Equity Office Properties Trust: |
|
|
|
|
|
|
6.375% 2/15/03 |
Baa1 |
|
10,000 |
9,784 |
|
|
6.75% 2/15/08 |
Baa1 |
|
4,520 |
4,224 |
|
|
Pinnacle Holdings, Inc. 0% 3/15/08 (e) |
B3 |
|
1,260 |
920 |
|
|
|
29,693 |
||||
|
TOTAL CONSTRUCTION & REAL ESTATE |
77,932 |
||||
|
DURABLES - 0.3% |
|||||
|
Autos, Tires, & Accessories - 0.2% |
|||||
|
American Axle & Manufacturing, Inc. 9.75% 3/1/09 |
B1 |
|
2,465 |
2,416 |
|
|
Collins & Aikman Products Co. 11.5% 4/15/06 |
B2 |
|
485 |
463 |
|
|
Daimler-Chrysler North America Holding Corp. 8% 6/15/10 |
A1 |
|
8,510 |
8,750 |
|
|
Lear Corp. 8.11% 5/15/09 |
Ba1 |
|
1,975 |
1,842 |
|
|
TRW, Inc. 8.75% 5/15/06 |
Baa1 |
|
9,820 |
10,231 |
|
|
|
23,702 |
||||
|
Corporate Bonds - continued |
|||||
|
Moody's Ratings |
Principal Amount (000s) |
Value (Note 1) (000s) |
|||
|
Nonconvertible Bonds - continued |
|||||
|
DURABLES - continued |
|||||
|
Textiles & Apparel - 0.1% |
|||||
|
Jones Apparel Group, Inc. 7.875% 6/15/06 |
Baa2 |
|
$ 13,095 |
$ 12,265 |
|
|
Levi Strauss & Co.: |
|
|
|
|
|
|
6.8% 11/1/03 |
Ba3 |
|
2,760 |
2,346 |
|
|
7% 11/1/06 |
Ba3 |
|
1,485 |
1,158 |
|
|
Tommy Hilfiger USA, Inc. 6.5% 6/1/03 |
Ba1 |
|
2,575 |
2,086 |
|
|
|
17,855 |
||||
|
TOTAL DURABLES |
41,557 |
||||
|
ENERGY - 0.8% |
|||||
|
Coal - 0.1% |
|||||
|
P&L Coal Holdings Corp. 9.625% 5/15/08 |
B2 |
|
10,725 |
10,430 |
|
|
Energy Services - 0.1% |
|||||
|
DI Industries, Inc. 8.875% 7/1/07 |
B1 |
|
6,080 |
5,867 |
|
|
Ocean Rig Norway AS 10.25% 6/1/08 |
B3 |
|
2,470 |
2,174 |
|
|
Parker Drilling Co. 9.75% 11/15/06 |
B1 |
|
3,830 |
3,868 |
|
|
Pride Petroleum Services, Inc. 9.375% 5/1/07 |
Ba3 |
|
1,595 |
1,619 |
|
|
R&B Falcon Corp. 6.5% 4/15/03 |
Ba3 |
|
4,620 |
4,389 |
|
|
RBF Finance Co. 11% 3/15/06 |
Ba3 |
|
3,850 |
4,428 |
|
|
|
22,345 |
||||
|
Oil & Gas - 0.6% |
|||||
|
Apache Corp. 7.625% 7/1/19 |
Baa1 |
|
7,680 |
7,572 |
|
|
Canadian Forest Oil Ltd. 8.75% 9/15/07 |
B2 |
|
2,440 |
2,367 |
|
|
Chesapeake Energy Corp. 9.625% 5/1/05 |
B2 |
|
13,780 |
13,711 |
|
|
Cross Timbers Oil Co.: |
|
|
|
|
|
|
8.75% 11/1/09 |
B2 |
|
7,115 |
6,937 |
|
|
9.25% 4/1/07 |
B2 |
|
3,950 |
3,950 |
|
|
Occidental Petroleum Corp. 6.39% 11/9/00 |
Baa3 |
|
3,000 |
2,997 |
|
|
Oryx Energy Co.: |
|
|
|
|
|
|
8% 10/15/03 |
Baa1 |
|
8,205 |
8,349 |
|
|
8.125% 10/15/05 |
Baa1 |
|
12,820 |
13,319 |
|
|
8.375% 7/15/04 |
Baa1 |
|
6,170 |
6,394 |
|
|
Petro-Canada 7% 11/15/28 |
A3 |
|
3,350 |
2,988 |
|
|
Phillips Petroleum Co. 8.75% 5/25/10 |
Baa2 |
|
5,285 |
5,740 |
|
|
Pioneer Natural Resources Co. 9.625% 4/1/10 |
Ba2 |
|
1,165 |
1,229 |
|
|
Corporate Bonds - continued |
|||||
|
Moody's Ratings |
Principal Amount (000s) |
Value (Note 1) (000s) |
|||
|
Nonconvertible Bonds - continued |
|||||
|
ENERGY - continued |
|||||
|
Oil & Gas - continued |
|||||
|
Plains Resources, Inc.: |
|
|
|
|
|
|
Series B 10.25% 3/15/06 |
B2 |
|
$ 1,160 |
$ 1,186 |
|
|
10.25% 3/15/06 (g) |
B2 |
|
800 |
814 |
|
|
|
77,553 |
||||
|
TOTAL ENERGY |
110,328 |
||||
|
FINANCE - 2.8% |
|||||
|
Banks - 1.1% |
|||||
|
Bank of America Corp. 7.8% 2/15/10 |
Aa3 |
|
3,400 |
3,486 |
|
|
Bank of Tokyo-Mitsubishi Ltd. 8.4% 4/15/10 |
A3 |
|
7,220 |
7,351 |
|
|
Bank One Capital III 8.75% 9/1/30 |
Aa3 |
|
7,300 |
7,278 |
|
|
Bank One Corp. 7.875% 8/1/10 |
A1 |
|
20,950 |
21,254 |
|
|
BankBoston Corp. 6.625% 2/1/04 |
A3 |
|
4,570 |
4,493 |
|
|
Capital One Bank: |
|
|
|
|
|
|
6.26% 5/7/01 |
Baa2 |
|
9,025 |
8,945 |
|
|
6.375% 2/15/03 |
Baa2 |
|
9,860 |
9,610 |
|
|
6.48% 6/28/02 |
Baa2 |
|
5,075 |
4,972 |
|
|
6.65% 3/15/04 |
Baa3 |
|
7,440 |
7,193 |
|
|
Capital One Financial Corp. 7.125% 8/1/08 |
Baa3 |
|
13,290 |
12,503 |
|
|
Commonwealth Bank of Australia 8.5% 6/1/10 |
A1 |
|
4,200 |
4,443 |
|
|
Den Danske Bank AS 6.375% 6/15/08 (g)(j) |
A1 |
|
22,050 |
20,679 |
|
|
HSBC Finance Nederland BV 7.4% 4/15/03 (g) |
A1 |
|
1,750 |
1,762 |
|
|
Korea Development Bank: |
|
|
|
|
|
|
6.625% 11/21/03 |
Baa2 |
|
10,798 |
10,519 |
|
|
7.125% 4/22/04 |
Baa2 |
|
1,550 |
1,525 |
|
|
7.375% 9/17/04 |
Baa2 |
|
1,620 |
1,605 |
|
|
Popular, Inc. 6.2% 4/30/01 |
A3 |
|
6,435 |
6,389 |
|
|
Royal Bank of Scotland Group PLC 9.118% 3/31/49 |
A1 |
|
5,060 |
5,313 |
|
|
Summit Bancorp 8.625% 12/10/02 |
A3 |
|
5,500 |
5,634 |
|
|
Union Planters National Bank 6.81% 8/20/01 |
A3 |
|
10,000 |
9,982 |
|
|
|
154,936 |
||||
|
Credit & Other Finance - 1.3% |
|||||
|
Ahmanson Capital Trust I 8.36% 12/1/26 (g) |
A3 |
|
13,000 |
11,448 |
|
|
Associates Corp. of North America 5.8% 4/20/04 |
A1 |
|
24,980 |
24,060 |
|
|
CIT Group, Inc. 5.5% 2/15/04 |
A1 |
|
1,790 |
1,696 |
|
|
Corporate Bonds - continued |
|||||
|
Moody's Ratings |
Principal Amount (000s) |
Value (Note 1) (000s) |
|||
|
Nonconvertible Bonds - continued |
|||||
|
FINANCE - continued |
|||||
|
Credit & Other Finance - continued |
|||||
|
Countrywide Funding Corp. 6.45% 2/27/03 |
A3 |
|
$ 10,900 |
$ 10,730 |
|
|
Daimler-Chrysler NA Holding Corp. 6.59% 6/18/02 |
A1 |
|
2,500 |
2,483 |
|
|
Denbury Management, Inc. 9% 3/1/08 |
B3 |
|
3,915 |
3,582 |
|
|
Details Capital Corp. 0% 11/15/07 (e) |
Caa1 |
|
1,355 |
1,070 |
|
|
ERP Operating LP: |
|
|
|
|
|
|
6.55% 11/15/01 |
A3 |
|
3,900 |
3,868 |
|
|
7.1% 6/23/04 |
A3 |
|
10,290 |
10,160 |
|
|
Finova Capital Corp. 7.25% 11/8/04 |
Ba1 |
|
2,540 |
1,880 |
|
|
First Security Capital I 8.41% 12/15/26 |
A3 |
|
5,290 |
4,869 |
|
|
Ford Motor Credit Co.: |
|
|
|
|
|
|
7.5% 3/15/05 |
A2 |
|
11,680 |
11,776 |
|
|
7.875% 6/15/10 |
A2 |
|
7,090 |
7,163 |
|
|
GS Escrow Corp.: |
|
|
|
|
|
|
7% 8/1/03 |
Ba1 |
|
5,020 |
4,807 |
|
|
7.125% 8/1/05 |
Ba1 |
|
3,025 |
2,816 |
|
|
HSBC Capital Funding LP 10.176% 12/31/49 (f)(g) |
A1 |
|
8,400 |
9,260 |
|
|
Macsaver Financial Services, Inc.: |
|
|
|
|
|
|
7.4% 2/15/02 (d) |
Ca |
|
3,891 |
661 |
|
|
7.6% 8/1/07 (d) |
Ca |
|
11,020 |
1,873 |
|
|
7.875% 8/1/03 (d) |
Ca |
|
1,780 |
303 |
|
|
Newcourt Credit Group, Inc. 6.875% 2/16/05 |
A1 |
|
3,430 |
3,379 |
|
|
Qwest Capital Funding, Inc. 7.75% |
Baa1 |
|
15,200 |
15,410 |
|
|
The Money Store, Inc. 7.3% 12/1/02 |
A2 |
|
8,750 |
8,807 |
|
|
TXU Eastern Funding: |
|
|
|
|
|
|
6.15% 5/15/02 |
Baa1 |
|
6,520 |
6,375 |
|
|
6.75% 5/15/09 |
Baa1 |
|
10,575 |
9,578 |
|
|
U.S. West Capital Funding, Inc. 6.875% 7/15/28 |
Baa1 |
|
12,865 |
11,503 |
|
|
|
169,557 |
||||
|
Savings & Loans - 0.3% |
|||||
|
Chevy Chase Savings Bank FSB 9.25% |
B1 |
|
2,310 |
2,131 |
|
|
Home Savings of America FSB 6.5% |
A3 |
|
8,080 |
7,803 |
|
|
Corporate Bonds - continued |
|||||
|
Moody's Ratings |
Principal Amount (000s) |
Value (Note 1) (000s) |
|||
|
Nonconvertible Bonds - continued |
|||||
|
FINANCE - continued |
|||||
|
Savings & Loans - continued |
|||||
|
Long Island Savings Bank FSB: |
|
|
|
|
|
|
6.2% 4/2/01 |
Baa3 |
|
$ 10,550 |
$ 10,470 |
|
|
7% 6/13/02 |
Baa3 |
|
9,680 |
9,583 |
|
|
Sovereign Bancorp, Inc. 6.625% 3/15/01 |
Ba3 |
|
10,900 |
10,803 |
|
|
|
40,790 |
||||
|
Securities Industry - 0.1% |
|||||
|
Amvescap PLC yankee: |
|
|
|
|
|
|
6.375% 5/15/03 |
A3 |
|
6,150 |
5,958 |
|
|
6.6% 5/15/05 |
A3 |
|
11,360 |
10,812 |
|
|
|
16,770 |
||||
|
TOTAL FINANCE |
382,053 |
||||
|
HEALTH - 0.1% |
|||||
|
Drugs & Pharmaceuticals - 0.0% |
|||||
|
Chattem, Inc. 8.875% 4/1/08 |
B2 |
|
2,595 |
2,180 |
|
|
Medical Equipment & Supplies - 0.0% |
|||||
|
Millipore Corp. 7.5% 4/1/07 |
Ba2 |
|
490 |
452 |
|
|
Medical Facilities Management - 0.1% |
|||||
|
Express Scripts, Inc. 9.625% 6/15/09 |
Ba2 |
|
480 |
487 |
|
|
Tenet Healthcare Corp. 8.625% 1/15/07 |
Ba3 |
|
3,750 |
3,713 |
|
|
Triad Hospitals Holdings, Inc. 11% 5/15/09 |
B3 |
|
970 |
1,000 |
|
|
Unilab Corp. 12.75% 10/1/09 |
B3 |
|
3,705 |
4,011 |
|
|
|
9,211 |
||||
|
TOTAL HEALTH |
11,843 |
||||
|
INDUSTRIAL MACHINERY & EQUIPMENT - 0.5% |
|||||
|
Electrical Equipment - 0.0% |
|||||
|
Loral Space & Communications Ltd. 9.5% 1/15/06 |
B1 |
|
2,460 |
1,747 |
|
|
Industrial Machinery & Equipment - 0.2% |
|||||
|
Dunlop Standard Aero Holdings PLC 11.875% 5/15/09 |
B3 |
|
7,800 |
8,054 |
|
|
Roller Bearing Holding, Inc. 0% 6/15/09 (e)(g) |
- |
|
9,790 |
5,103 |
|
|
Corporate Bonds - continued |
|||||
|
Moody's Ratings |
Principal Amount (000s) |
Value (Note 1) (000s) |
|||
|
Nonconvertible Bonds - continued |
|||||
|
INDUSTRIAL MACHINERY & EQUIPMENT - continued |
|||||
|
Industrial Machinery & Equipment - continued |
|||||
|
Tyco International Group SA: |
|
|
|
|
|
|
7% 6/15/28 |
Baa1 |
|
$ 16,260 |
$ 14,286 |
|
|
yankee 6.375% 6/15/05 |
Baa1 |
|
2,380 |
2,312 |
|
|
|
29,755 |
||||
|
Pollution Control - 0.3% |
|||||
|
Allied Waste North America, Inc.: |
|
|
|
|
|
|
7.375% 1/1/04 |
Ba3 |
|
3,280 |
3,034 |
|
|
7.625% 1/1/06 |
Ba2 |
|
2,965 |
2,639 |
|
|
10% 8/1/09 |
B2 |
|
31,325 |
27,096 |
|
|
Browning-Ferris Industries, Inc. 6.375% |
Ba3 |
|
3,150 |
2,552 |
|
|
Envirosource, Inc. Series B, 9.75% 6/15/03 |
Caa3 |
|
140 |
49 |
|
|
WMX Technologies, Inc. 6.25% 10/15/00 |
Ba1 |
|
5,750 |
5,744 |
|
|
|
41,114 |
||||
|
TOTAL INDUSTRIAL MACHINERY & EQUIPMENT |
72,616 |
||||
|
MEDIA & LEISURE - 3.4% |
|||||
|
Broadcasting - 2.4% |
|||||
|
ACME Television LLC/ACME Financial Corp. 10.875% 9/30/04 |
B3 |
|
4,020 |
3,799 |
|
|
Adelphia Communications Corp. 9.875% 3/1/07 |
B2 |
|
1,820 |
1,720 |
|
|
AMFM Operating, Inc. 12.625% 10/31/06 pay-in-kind |
- |
|
4,409 |
5,059 |
|
|
Ascent Entertainment Group, Inc. 0% 12/15/04 (e) |
Ba1 |
|
8,840 |
7,205 |
|
|
British Sky Broadcasting Group PLC: |
|
|
|
|
|
|
7.3% 10/15/06 |
Ba1 |
|
4,855 |
4,458 |
|
|
8.2% 7/15/09 |
Baa3 |
|
15,650 |
14,860 |
|
|
Callahan Nordrhein Westfalen: |
|
|
|
|
|
|
0% 7/15/10 (e)(g) |
B3 |
|
5,600 |
2,576 |
|
|
14% 7/15/10 (g) |
B3 |
|
2,485 |
2,473 |
|
|
CD Radio, Inc. 14.5% 5/15/09 |
CCC+ |
|
2,465 |
2,200 |
|
|
Century Communications Corp. Series B, 0% 1/15/08 |
B2 |
|
6,929 |
2,806 |
|
|
Corporate Bonds - continued |
|||||
|
Moody's Ratings |
Principal Amount (000s) |
Value (Note 1) (000s) |
|||
|
Nonconvertible Bonds - continued |
|||||
|
MEDIA & LEISURE - continued |
|||||
|
Broadcasting - continued |
|||||
|
Charter Communications Holdings LLC/Charter Communications Holdings Capital Corp.: |
|
|
|
|
|
|
8.625% 4/1/09 |
B2 |
|
$ 6,850 |
$ 6,148 |
|
|
10% 4/1/09 |
B2 |
|
18,115 |
17,753 |
|
|
Citadel Broadcasting Co. 10.25% 7/1/07 |
B3 |
|
6,880 |
7,138 |
|
|
Clear Channel Communications, Inc. 6.875% 6/15/18 |
Baa3 |
|
10,925 |
9,568 |
|
|
Comcast UK Cable Partners Ltd. 0% 11/15/07 (e) |
B2 |
|
9,190 |
8,639 |
|
|
Continental Cablevision, Inc.: |
|
|
|
|
|
|
8.3% 5/15/06 |
A2 |
|
7,530 |
7,800 |
|
|
8.625% 8/15/03 |
A2 |
|
8,070 |
8,374 |
|
|
CSC Holdings, Inc.: |
|
|
|
|
|
|
9.25% 11/1/05 |
Ba3 |
|
2,110 |
2,110 |
|
|
9.875% 5/15/06 |
Ba3 |
|
4,825 |
4,897 |
|
|
9.875% 4/1/23 |
B1 |
|
2,550 |
2,614 |
|
|
10.5% 5/15/16 |
Ba3 |
|
5,705 |
6,062 |
|
|
Diamond Cable Communications PLC: |
|
|
|
|
|
|
0% 2/15/07 (e) |
B2 |
|
4,955 |
3,803 |
|
|
yankee 0% 12/15/05 (e) |
B2 |
|
6,505 |
6,082 |
|
|
Earthwatch, Inc. 0% 7/15/07 (e) |
- |
|
6,610 |
3,702 |
|
|
EchoStar DBS Corp.: |
|
|
|
|
|
|
9.25% 2/1/06 |
B1 |
|
14,270 |
14,020 |
|
|
9.375% 2/1/09 |
B1 |
|
435 |
427 |
|
|
Fox Family Worldwide, Inc. 0% 11/1/07 (e) |
B1 |
|
3,605 |
2,578 |
|
|
FrontierVision Holdings LP/FrontierVision Holdings Capital Corp. 0% 9/15/07 (e) |
B2 |
|
11,215 |
9,701 |
|
|
FrontierVision Operating Partners LP/ FrontierVision Capital Corp. 11% 10/15/06 |
B2 |
|
7,210 |
7,282 |
|
|
Golden Sky DBS, Inc. 0% 3/1/07 (e) |
Caa1 |
|
9,050 |
6,426 |
|
|
Golden Sky Systems, Inc. 12.375% 8/1/06 |
B3 |
|
4,985 |
5,459 |
|
|
Hearst-Argyle Television, Inc. 7.5% 11/15/27 |
Baa3 |
|
9,630 |
8,373 |
|
|
International Cabletel, Inc. 0% 2/1/06 (e) |
B2 |
|
5,560 |
5,199 |
|
|
Knology Holding, Inc. 0% 10/15/07 (e) |
- |
|
11,590 |
4,404 |
|
|
LodgeNet Entertainment Corp. 10.25% 12/15/06 |
B1 |
|
1,065 |
1,044 |
|
|
NTL Communications Corp. 11.5% 10/1/08 |
B3 |
|
1,635 |
1,590 |
|
|
Olympus Communications LP/Olympus Capital Corp. 10.625% 11/15/06 |
B2 |
|
11,925 |
11,776 |
|
|
Corporate Bonds - continued |
|||||
|
Moody's Ratings |
Principal Amount (000s) |
Value (Note 1) (000s) |
|||
|
Nonconvertible Bonds - continued |
|||||
|
MEDIA & LEISURE - continued |
|||||
|
Broadcasting - continued |
|||||
|
Pegasus Communications Corp. 9.625% 10/15/05 |
B3 |
|
$ 3,000 |
$ 2,925 |
|
|
Satelites Mexicanos SA de CV 11.28% 6/30/04 (g)(j) |
B1 |
|
1,089 |
980 |
|
|
Spectrasite Holdings, Inc.: |
|
|
|
|
|
|
0% 3/15/10 (e) |
B3 |
|
8,970 |
4,530 |
|
|
10.75% 3/15/10 |
B3 |
|
1,255 |
1,180 |
|
|
TCI Communications, Inc.: |
|
|
|
|
|
|
8.25% 1/15/03 |
A2 |
|
430 |
445 |
|
|
9.8% 2/1/12 |
A2 |
|
12,130 |
13,831 |
|
|
Telemundo Holdings, Inc. 0% 8/15/08 (e) |
Caa1 |
|
880 |
627 |
|
|
Telewest PLC 0% 10/1/07 (e) |
B1 |
|
25,170 |
24,163 |
|
|
Time Warner, Inc. 9.125% 1/15/13 |
Baa3 |
|
13,875 |
15,566 |
|
|
United International Holdings, Inc. 0% 2/15/08 (e) |
B3 |
|
22,350 |
14,975 |
|
|
United Pan-Europe Communications NV: |
|
|
|
|
|
|
0% 2/1/10 (e) |
B2 |
|
29,095 |
13,384 |
|
|
10.875% 8/1/09 |
B2 |
|
14,336 |
12,472 |
|
|
USA Networks, Inc./USANi LLC 6.75% 11/15/05 |
Baa3 |
|
4,995 |
4,877 |
|
|
|
330,080 |
||||
|
Entertainment - 0.2% |
|||||
|
Alliance Gaming Corp. 10% 8/1/07 |
Caa1 |
|
2,425 |
1,334 |
|
|
Bally Total Fitness Holding Corp. 9.875% 10/15/07 |
B3 |
|
8,379 |
7,939 |
|
|
Mandalay Resort Group: |
|
|
|
|
|
|
9.5% 8/1/08 (g) |
Ba2 |
|
1,610 |
1,638 |
|
|
10.25% 8/1/07 (g) |
Ba3 |
|
6,035 |
6,216 |
|
|
MGM Mirage, Inc. 9.75% 6/1/07 |
Ba2 |
|
2,510 |
2,592 |
|
|
Paramount Communications, Inc. 7.5% |
Baa1 |
|
3,885 |
3,886 |
|
|
Premier Parks, Inc. 9.75% 6/15/07 |
B3 |
|
3,610 |
3,402 |
|
|
|
27,007 |
||||
|
Leisure Durables & Toys - 0.0% |
|||||
|
Outboard Marine Corp. 10.75% 6/1/08 |
B3 |
|
2,000 |
780 |
|
|
Lodging & Gaming - 0.3% |
|||||
|
Coast Hotels & Casinos, Inc. 9.5% 4/1/09 |
B3 |
|
985 |
975 |
|
|
Courtyard by Marriott II LP/Courtyard II Finance Co. 10.75% 2/1/08 |
B- |
|
10,260 |
10,260 |
|
|
Corporate Bonds - continued |
|||||
|
Moody's Ratings |
Principal Amount (000s) |
Value (Note 1) (000s) |
|||
|
Nonconvertible Bonds - continued |
|||||
|
MEDIA & LEISURE - continued |
|||||
|
Lodging & Gaming - continued |
|||||
|
HMH Properties, Inc. 7.875% 8/1/05 |
Ba2 |
|
$ 5,170 |
$ 4,886 |
|
|
Hollywood Casino Shreveport/Shreveport Capital Corp. 13% 8/1/06 |
B3 |
|
2,435 |
2,612 |
|
|
Horseshoe Gaming LLC 8.625% 5/15/09 |
B2 |
|
2,460 |
2,423 |
|
|
Host Marriott LP 8.375% 2/15/06 |
Ba2 |
|
8,020 |
7,699 |
|
|
ITT Corp. 7.375% 11/15/15 |
Ba1 |
|
675 |
581 |
|
|
Mohegan Tribal Gaming Authority 8.75% 1/1/09 |
Ba3 |
|
2,680 |
2,660 |
|
|
Station Casinos, Inc. 10.125% 3/15/06 |
B1 |
|
1,700 |
1,700 |
|
|
|
33,796 |
||||
|
Publishing - 0.4% |
|||||
|
Garden State Newspapers, Inc. Series B, 8.75% 10/1/09 |
B1 |
|
11,837 |
11,082 |
|
|
News America Holdings, Inc.: |
|
|
|
|
|
|
7.7% 10/30/25 |
Baa3 |
|
11,440 |
10,530 |
|
|
7.75% 1/20/24 |
Baa3 |
|
6,830 |
6,302 |
|
|
8% 10/17/16 |
Baa3 |
|
7,250 |
6,986 |
|
|
Time Warner Entertainment Co. LP 8.375% 3/15/23 |
Baa2 |
|
15,000 |
15,396 |
|
|
Ziff Davis Media, Inc. 12% 7/15/10 (g) |
B2 |
|
3,215 |
3,183 |
|
|
|
53,479 |
||||
|
Restaurants - 0.1% |
|||||
|
AFC Enterprises, Inc. 10.25% 5/15/07 |
B3 |
|
485 |
484 |
|
|
Domino's, Inc. 10.375% 1/15/09 |
B3 |
|
8,215 |
7,825 |
|
|
NE Restaurant, Inc. 10.75% 7/15/08 |
B3 |
|
6,520 |
5,020 |
|
|
|
13,329 |
||||
|
TOTAL MEDIA & LEISURE |
458,471 |
||||
|
NONDURABLES - 0.5% |
|||||
|
Beverages - 0.2% |
|||||
|
Canandaigua Brands, Inc.: |
B1 |
|
2,445 |
2,393 |
|
|
8.75% 12/15/03 |
B1 |
|
1,475 |
1,471 |
|
|
Seagram JE & Sons, Inc.: |
|
|
|
|
|
|
6.4% 12/15/03 |
Baa3 |
|
15,210 |
14,904 |
|
|
6.8% 12/15/08 |
Baa3 |
|
8,465 |
8,206 |
|
|
|
26,974 |
||||
|
Corporate Bonds - continued |
|||||
|
Moody's Ratings |
Principal Amount (000s) |
Value (Note 1) (000s) |
|||
|
Nonconvertible Bonds - continued |
|||||
|
NONDURABLES - continued |
|||||
|
Foods - 0.1% |
|||||
|
ConAgra, Inc. 7.125% 10/1/26 |
Baa1 |
|
$ 10,165 |
$ 9,986 |
|
|
Del Monte Corp. 12.25% 4/15/07 |
B3 |
|
240 |
255 |
|
|
|
10,241 |
||||
|
Tobacco - 0.2% |
|||||
|
Philip Morris Companies, Inc.: |
|
|
|
|
|
|
7% 7/15/05 |
A2 |
|
11,375 |
11,018 |
|
|
7.25% 9/15/01 |
A2 |
|
4,350 |
4,321 |
|
|
RJ Reynolds Tobacco Holdings, Inc. 7.375% 5/15/03 |
Baa2 |
|
8,900 |
8,434 |
|
|
|
23,773 |
||||
|
TOTAL NONDURABLES |
60,988 |
||||
|
RETAIL & WHOLESALE - 0.3% |
|||||
|
Drug Stores - 0.1% |
|||||
|
Rite Aid Corp.: |
|
|
|
|
|
|
6.5% 12/15/05 (g) |
Caa1 |
|
13,360 |
4,542 |
|
|
7.125% 1/15/07 |
Caa1 |
|
2,125 |
701 |
|
|
10.5% 9/15/02 (g) |
- |
|
190 |
124 |
|
|
|
5,367 |
||||
|
General Merchandise Stores - 0.2% |
|||||
|
Dayton Hudson Corp. 7.5% 7/15/06 |
A2 |
|
9,000 |
9,130 |
|
|
Federated Department Stores, Inc.: |
|
|
|
|
|
|
6.79% 7/15/27 |
Baa1 |
|
8,750 |
8,437 |
|
|
8.5% 6/15/03 |
Baa1 |
|
6,400 |
6,531 |
|
|
JCPenney Co., Inc. 7.6% 4/1/07 |
Baa2 |
|
975 |
804 |
|
|
Kmart Corp. 12.5% 3/1/05 |
Baa3 |
|
6,590 |
6,524 |
|
|
|
31,426 |
||||
|
TOTAL RETAIL & WHOLESALE |
36,793 |
||||
|
SERVICES - 0.1% |
|||||
|
Leasing & Rental - 0.0% |
|||||
|
United Rentals, Inc.: |
|
|
|
|
|
|
8.8% 8/15/08 |
B1 |
|
2,025 |
1,767 |
|
|
9.25% 1/15/09 |
B1 |
|
1,485 |
1,381 |
|
|
|
3,148 |
||||
|
Corporate Bonds - continued |
|||||
|
Moody's Ratings |
Principal Amount (000s) |
Value (Note 1) (000s) |
|||
|
Nonconvertible Bonds - continued |
|||||
|
SERVICES - continued |
|||||
|
Printing - 0.1% |
|||||
|
American Color Graphics, Inc. 12.75% |
Caa1 |
|
$ 4,180 |
$ 4,138 |
|
|
World Color Press, Inc. 7.75% 2/15/09 |
Baa3 |
|
5,420 |
5,054 |
|
|
|
9,192 |
||||
|
Services - 0.0% |
|||||
|
Iron Mountain, Inc. 8.75% 9/30/09 |
B2 |
|
1,110 |
1,055 |
|
|
La Petite Academy, Inc./La Petite Academy Holding Co. 10% 5/15/08 |
B3 |
|
7,630 |
4,807 |
|
|
|
5,862 |
||||
|
TOTAL SERVICES |
18,202 |
||||
|
TECHNOLOGY - 1.0% |
|||||
|
Communications Equipment - 0.0% |
|||||
|
Corning, Inc. 6.85% 3/1/29 |
A2 |
|
6,120 |
5,512 |
|
|
Computer Services & Software - 0.3% |
|||||
|
Amazon.com, Inc. 0% 5/1/08 (e) |
Caa1 |
|
8,960 |
4,838 |
|
|
Concentric Network Corp. 12.75% 12/15/07 |
B |
|
1,480 |
1,495 |
|
|
Covad Communications Group, Inc.: |
|
|
|
|
|
|
0% 3/15/08 (e) |
B3 |
|
9,480 |
4,266 |
|
|
12% 2/15/10 |
B3 |
|
3,365 |
2,456 |
|
|
Exodus Communications, Inc. 10.75% |
B3 |
|
2,950 |
2,847 |
|
|
Federal Data Corp. 10.125% 8/1/05 |
B3 |
|
7,660 |
7,966 |
|
|
PSINet, Inc.: |
|
|
|
|
|
|
10% 2/15/05 |
B3 |
|
270 |
173 |
|
|
10.5% 12/1/06 |
B3 |
|
22,350 |
14,304 |
|
|
11% 8/1/09 |
B3 |
|
1,125 |
720 |
|
|
Unisys Corp. 11.75% 10/15/04 |
Ba1 |
|
4,895 |
5,152 |
|
|
|
44,217 |
||||
|
Computers & Office Equipment - 0.3% |
|||||
|
Comdisco, Inc.: |
|
|
|
|
|
|
6.375% 11/30/01 |
Baa1 |
|
13,775 |
13,311 |
|
|
7.25% 9/1/02 |
Baa1 |
|
12,000 |
11,543 |
|
|
Compaq Computer Corp. 7.45% 8/1/02 |
Baa2 |
|
11,000 |
11,027 |
|
|
Globix Corp. 12.5% 2/1/10 |
B- |
|
10,330 |
7,334 |
|
|
|
43,215 |
||||
|
Corporate Bonds - continued |
|||||
|
Moody's Ratings |
Principal Amount (000s) |
Value (Note 1) (000s) |
|||
|
Nonconvertible Bonds - continued |
|||||
|
TECHNOLOGY - continued |
|||||
|
Electronic Instruments - 0.1% |
|||||
|
Fisher Scientific International, Inc. 9% 2/1/08 |
B3 |
|
$ 4,855 |
$ 4,479 |
|
|
Telecommunications Techniques Co. LLC 9.75% 5/15/08 |
B3 |
|
2,485 |
2,323 |
|
|
|
6,802 |
||||
|
Electronics - 0.3% |
|||||
|
ChipPAC International Ltd. 12.75% 8/1/09 |
B3 |
|
10,220 |
10,731 |
|
|
Details, Inc. 10% 11/15/05 |
B3 |
|
1,340 |
1,313 |
|
|
Fairchild Semiconductor Corp.: |
|
|
|
|
|
|
10.125% 3/15/07 |
B2 |
|
980 |
980 |
|
|
10.375% 10/1/07 |
B2 |
|
5,066 |
5,117 |
|
|
Flextronics International Ltd. 9.875% 7/1/10 (g) |
Ba3 |
|
3,795 |
3,890 |
|
|
Micron Technology, Inc. 6.5% 9/30/05 (l) |
B3 |
|
6,000 |
5,100 |
|
|
Viasystems, Inc. 9.75% 6/1/07 |
B3 |
|
7,885 |
7,412 |
|
|
|
34,543 |
||||
|
TOTAL TECHNOLOGY |
134,289 |
||||
|
TRANSPORTATION - 0.8% |
|||||
|
Air Transportation - 0.3% |
|||||
|
Atlas Air, Inc. 9.25% 4/15/08 |
B1 |
|
10,705 |
10,571 |
|
|
Continental Airlines, Inc. pass thru trust certificates: |
|
|
|
|
|
|
7.434% 3/15/06 |
Baa1 |
|
2,870 |
2,826 |
|
|
7.73% 9/15/12 |
Baa1 |
|
1,055 |
1,035 |
|
|
Delta Air Lines, Inc. 8.3% 12/15/29 |
Baa3 |
|
10,460 |
9,454 |
|
|
Qantas Airways Ltd. 7.75% 6/15/09 (g) |
Baa1 |
|
11,290 |
11,324 |
|
|
US Airways Group, Inc. 10.375% 3/1/13 |
Ba3 |
|
7,185 |
6,520 |
|
|
|
41,730 |
||||
|
Railroads - 0.5% |
|||||
|
Canadian National Railway Co. 6.9% |
Baa2 |
|
9,010 |
7,806 |
|
|
CSX Corp.: |
|
|
|
|
|
|
6.25% 10/15/08 |
Baa2 |
|
6,210 |
5,628 |
|
|
6.46% 6/22/05 |
Baa2 |
|
13,650 |
13,056 |
|
|
Norfolk Southern Corp. 7.05% 5/1/37 |
Baa1 |
|
21,900 |
21,797 |
|
|
TFM SA de CV: |
|
|
|
|
|
|
0% 6/15/09 (e) |
B2 |
|
2,720 |
2,081 |
|
|
10.25% 6/15/07 |
B2 |
|
2,715 |
2,566 |
|
|
Corporate Bonds - continued |
|||||
|
Moody's Ratings |
Principal Amount (000s) |
Value (Note 1) (000s) |
|||
|
Nonconvertible Bonds - continued |
|||||
|
TRANSPORTATION - continued |
|||||
|
Railroads - continued |
|||||
|
Transtar Holdings LP/Transtar Capital Corp. 13.375% 12/15/03 |
B- |
|
$ 6,715 |
$ 6,732 |
|
|
Wisconsin Central Transportation Corp. 6.625% 4/15/08 |
Baa2 |
|
4,870 |
4,382 |
|
|
|
64,048 |
||||
|
Shipping - 0.0% |
|||||
|
Transport Maritima Mexicana yankee: |
|
|
|
|
|
|
9.25% 5/15/03 |
Ba3 |
|
4,535 |
3,764 |
|
|
10% 11/15/06 |
Ba3 |
|
2,800 |
2,212 |
|
|
|
5,976 |
||||
|
TOTAL TRANSPORTATION |
111,754 |
||||
|
UTILITIES - 3.6% |
|||||
|
Cellular - 1.2% |
|||||
|
AirGate PCS, Inc. 0% 10/1/09 (e) |
Caa1 |
|
6,370 |
3,838 |
|
|
Clearnet Communications, Inc. yankee 0% 5/1/09 (e) |
B3 |
|
4,890 |
3,863 |
|
|
Crown Castle International Corp. 0% 5/15/11 (e) |
B3 |
|
1,470 |
944 |
|
|
Dobson Communications Corp. 10.875% 7/1/10 |
B3 |
|
3,755 |
3,661 |
|
|
Echostar Broadband Corp. 10.375% 10/1/07 (g) |
B3 |
|
4,890 |
4,890 |
|
|
Leap Wireless International, Inc. 12.5% 4/15/10 |
Caa2 |
|
1,800 |
1,476 |
|
|
McCaw International Ltd. 0% 4/15/07 (e) |
Caa1 |
|
22,453 |
16,727 |
|
|
Millicom International Cellular SA 0% 6/1/06 (e) |
Caa1 |
|
25,565 |
21,986 |
|
|
Nextel Communications, Inc.: |
|
|
|
|
|
|
0% 10/31/07 (e) |
B1 |
|
45,390 |
35,177 |
|
|
9.375% 11/15/09 |
B1 |
|
1,825 |
1,802 |
|
|
12% 11/1/08 |
B1 |
|
3,340 |
3,607 |
|
|
Nextel International, Inc.: |
|
|
|
|
|
|
0% 4/15/08 (e) |
Caa1 |
|
12,685 |
7,992 |
|
|
12.75% 8/1/10 (g) |
Caa1 |
|
4,825 |
4,729 |
|
|
Nextel Partners, Inc.: |
|
|
|
|
|
|
0% 2/1/09 (e) |
B3 |
|
13,050 |
9,135 |
|
|
11% 3/15/10 (g) |
B3 |
|
3,425 |
3,442 |
|
|
11% 3/15/10 |
B3 |
|
2,695 |
2,708 |
|
|
TeleCorp PCS, Inc. 10.625% 7/15/10 |
B3 |
|
2,250 |
2,273 |
|
|
Corporate Bonds - continued |
|||||
|
Moody's Ratings |
Principal Amount (000s) |
Value (Note 1) (000s) |
|||
|
Nonconvertible Bonds - continued |
|||||
|
UTILITIES - continued |
|||||
|
Cellular - continued |
|||||
|
Telesystem International Wireless, Inc. yankee 0% 6/30/07 (e) |
Caa1 |
|
$ 7,580 |
$ 5,003 |
|
|
Vodafone AirTouch PLC 7.625% 2/15/05 (g) |
A2 |
|
17,355 |
17,601 |
|
|
VoiceStream Wireless Corp.: |
|
|
|
|
|
|
0% 11/15/09 (e) |
B2 |
|
7,875 |
5,690 |
|
|
10.375% 11/15/09 |
B2 |
|
11,580 |
12,535 |
|
|
|
169,079 |
||||
|
Electric Utility - 0.5% |
|||||
|
AES Corp.: |
|
|
|
|
|
|
8% 12/31/08 |
Ba1 |
|
3,135 |
2,916 |
|
|
8.375% 8/15/07 |
Ba3 |
|
1,370 |
1,302 |
|
|
8.5% 11/1/07 |
Ba3 |
|
9,270 |
8,830 |
|
|
9.375% 9/15/10 |
Ba1 |
|
2,950 |
2,994 |
|
|
Avon Energy Partners Holdings: |
|
|
|
|
|
|
6.46% 3/4/08 (g) |
Baa2 |
|
10,920 |
9,847 |
|
|
6.73% 12/11/02 (g) |
Baa2 |
|
13,550 |
13,347 |
|
|
CMS Energy Corp. 7.5% 1/15/09 |
Ba3 |
|
6,445 |
5,760 |
|
|
Dominion Resources, Inc. 8.125% 6/15/10 |
Baa1 |
|
2,615 |
2,693 |
|
|
Illinois Power Co. 7.5% 6/15/09 |
Baa1 |
|
5,330 |
5,312 |
|
|
Israel Electric Corp. Ltd.: |
|
|
|
|
|
|
7.75% 12/15/27 (g) |
A3 |
|
10,710 |
9,491 |
|
|
yankee 7.875% 12/15/26 (g) |
A3 |
|
6,380 |
5,771 |
|
|
Texas Utilities Co. 6.375% 1/1/08 |
Baa3 |
|
1,105 |
1,010 |
|
|
|
69,273 |
||||
|
Gas - 0.1% |
|||||
|
Reliant Energy Resources Corp. 8.125% 7/15/05 (g) |
Baa1 |
|
6,600 |
6,698 |
|
|
Sempra Energy 7.95% 3/1/10 |
A2 |
|
3,600 |
3,594 |
|
|
|
10,292 |
||||
|
Telephone Services - 1.8% |
|||||
|
Cable & Wireless Optus Ltd. 8% 6/22/10 (g) |
Baa1 |
|
14,000 |
14,581 |
|
|
Deutsche Telekom International Finance BV 8.25% 6/15/30 |
Aa2 |
|
13,450 |
13,801 |
|
|
FirstWorld Communications, Inc. 0% 4/15/08 (e) |
- |
|
6,115 |
1,223 |
|
|
Focal Communications Corp.: |
|
|
|
|
|
|
0% 2/15/08 (e) |
B3 |
|
11,510 |
5,755 |
|
|
11.875% 1/15/10 |
B3 |
|
1,525 |
1,174 |
|
|
Corporate Bonds - continued |
|||||
|
Moody's Ratings |
Principal Amount (000s) |
Value (Note 1) (000s) |
|||
|
Nonconvertible Bonds - continued |
|||||
|
UTILITIES - continued |
|||||
|
Telephone Services - continued |
|||||
|
Global Crossing Holdings Ltd. 9.125% 11/15/06 |
Ba2 |
|
$ 2,260 |
$ 2,237 |
|
|
Hyperion Telecommunications, Inc.: |
|
|
|
|
|
|
0% 4/15/03 (e) |
B3 |
|
1,645 |
1,341 |
|
|
12% 11/1/07 |
Caa1 |
|
5,140 |
3,341 |
|
|
12.25% 9/1/04 |
B3 |
|
2,850 |
2,594 |
|
|
ICG Holdings, Inc. 13.5% 9/15/05 |
Caa1 |
|
3,085 |
679 |
|
|
ICG Services, Inc. 0% 5/1/08 (e) |
Caa1 |
|
8,255 |
1,156 |
|
|
Intermedia Communications, Inc.: |
|
|
|
|
|
|
0% 7/15/07 (e) |
B2 |
|
6,695 |
5,523 |
|
|
0% 3/1/09 (e) |
B3 |
|
2,650 |
1,723 |
|
|
8.6% 6/1/08 |
B2 |
|
800 |
764 |
|
|
KMC Telecom Holdings, Inc. 13.5% 5/15/09 |
Caa2 |
|
6,380 |
3,700 |
|
|
Koninklijke KPN NV yankee 8% 10/1/10 (g) |
A3 |
|
1,410 |
1,411 |
|
|
Level 3 Communications, Inc.: |
|
|
|
|
|
|
0% 12/1/08 (e) |
B3 |
|
5,405 |
3,135 |
|
|
9.125% 5/1/08 |
B3 |
|
19,109 |
16,386 |
|
|
11% 3/15/08 |
B3 |
|
1,270 |
1,207 |
|
|
McLeodUSA, Inc. 9.5% 11/1/08 |
B1 |
|
3,215 |
2,990 |
|
|
Metromedia Fiber Network, Inc. 10% 12/15/09 |
B2 |
|
3,765 |
3,483 |
|
|
NEXTLINK Communications, Inc.: |
|
|
|
|
|
|
9.625% 10/1/07 |
B2 |
|
9,440 |
8,402 |
|
|
10.75% 6/1/09 |
B2 |
|
2,000 |
1,840 |
|
|
NorthEast Optic Network, Inc. 12.75% 8/15/08 |
- |
|
8,106 |
7,012 |
|
|
Ono Finance PLC 13% 5/1/09 |
Caa1 |
|
2,030 |
1,786 |
|
|
Pathnet, Inc. 12.25% 4/15/08 |
- |
|
14,915 |
5,966 |
|
|
Rhythms NetConnections, Inc.: |
|
|
|
|
|
|
0% 5/15/08 (e) |
B3 |
|
20,949 |
7,961 |
|
|
12.75% 4/15/09 |
B3 |
|
4,580 |
2,840 |
|
|
Telecomunicaciones de Puerto Rico, Inc. 6.65% 5/15/06 |
Baa2 |
|
14,005 |
13,378 |
|
|
Telefonica Europe BV 8.25% 9/15/30 |
A2 |
|
14,890 |
15,252 |
|
|
Teleglobe Canada, Inc.: |
|
|
|
|
|
|
7.2% 7/20/09 |
Baa1 |
|
17,847 |
17,289 |
|
|
7.7% 7/20/29 |
Baa1 |
|
16,260 |
15,514 |
|
|
Teligent, Inc.: |
|
|
|
|
|
|
0% 3/1/08 (e) |
Caa1 |
|
13,715 |
3,703 |
|
|
11.5% 12/1/07 |
Caa1 |
|
7,875 |
3,386 |
|
|
Corporate Bonds - continued |
|||||
|
Moody's Ratings |
Principal Amount (000s) |
Value (Note 1) (000s) |
|||
|
Nonconvertible Bonds - continued |
|||||
|
UTILITIES - continued |
|||||
|
Telephone Services - continued |
|||||
|
Time Warner Telecom LLC/Time Warner Telecom, Inc. 9.75% 7/15/08 |
B2 |
|
$ 200 |
$ 182 |
|
|
WinStar Communications, Inc.: |
|
|
|
|
|
|
0% 4/15/10 (e)(g) |
B3 |
|
47,446 |
14,708 |
|
|
12.75% 4/15/10 (g) |
B3 |
|
22,299 |
16,055 |
|
|
WorldCom, Inc.: |
|
|
|
|
|
|
7.75% 4/1/07 |
A3 |
|
4,200 |
4,307 |
|
|
8% 5/16/06 |
A3 |
|
4,545 |
4,727 |
|
|
8.875% 1/15/06 |
A3 |
|
9,729 |
10,069 |
|
|
Worldwide Fiber, Inc. 12% 8/1/09 |
B3 |
|
2,255 |
1,962 |
|
|
|
244,543 |
||||
|
TOTAL UTILITIES |
493,187 |
||||
|
TOTAL NONCONVERTIBLE BONDS |
2,090,082 |
||||
|
TOTAL CORPORATE BONDS (Cost $2,273,271) |
2,133,247 |
||||
|
U.S. Government and Government Agency Obligations - 7.7% |
|||||
|
|
|||||
|
U.S. Government Agency Obligations - 3.4% |
|||||
|
Fannie Mae: |
|
|
|
|
|
|
5.25% 1/15/09 |
Aaa |
|
2,500 |
2,260 |
|
|
5.625% 5/14/04 |
Aaa |
|
36,160 |
35,064 |
|
|
5.75% 4/15/03 |
Aaa |
|
20,800 |
20,420 |
|
|
6% 5/15/08 |
Aaa |
|
42,200 |
40,314 |
|
|
6.5% 8/15/04 |
Aaa |
|
11,000 |
10,971 |
|
|
6.5% 4/29/09 |
Aaa |
|
22,260 |
21,091 |
|
|
7% 7/15/05 |
Aaa |
|
30,505 |
31,020 |
|
|
7.25% 1/15/10 |
Aaa |
|
12,510 |
12,901 |
|
|
7.25% 5/15/30 |
Aaa |
|
20,885 |
21,891 |
|
|
Federal Home Loan Bank 6.75% 2/1/02 |
Aaa |
|
139,540 |
139,867 |
|
|
Financing Corp. - coupon STRIPS: |
|
|
|
|
|
|
0% 4/5/02 |
Aaa |
|
2,276 |
2,061 |
|
|
0% 5/11/02 |
Aaa |
|
2,275 |
2,043 |
|
|
0% 8/8/05 |
Aaa |
|
5,482 |
3,981 |
|
|
0% 11/30/05 |
Aaa |
|
1,666 |
1,180 |
|
|
U.S. Government and Government Agency Obligations - continued |
|||||
|
Moody's Ratings |
Principal Amount (000s) |
Value (Note 1) (000s) |
|||
|
U.S. Government Agency Obligations - continued |
|||||
|
Freddie Mac: |
|
|
|
|
|
|
5.75% 3/15/09 |
Aaa |
|
$ 37,250 |
$ 34,788 |
|
|
6.45% 4/29/09 |
Aaa |
|
13,000 |
12,291 |
|
|
6.875% 1/15/05 |
Aaa |
|
8,295 |
8,384 |
|
|
6.875% 9/15/10 |
Aaa |
|
20,800 |
20,943 |
|
|
7% 7/15/05 |
Aaa |
|
11,475 |
11,663 |
|
|
7.35% 3/22/05 |
Aaa |
|
5,000 |
5,141 |
|
|
Tennessee Valley Authority 7.125% 5/1/30 |
Aaa |
|
8,920 |
9,114 |
|
|
U.S. Department of Housing and Urban
Development government guaranteed
participation certificates Series 1996-A, |
Aaa |
|
10,090 |
10,021 |
|
|
TOTAL U.S. GOVERNMENT AGENCY OBLIGATIONS |
457,409 |
||||
|
U.S. Treasury Obligations - 4.3% |
|||||
|
U.S. Treasury Bills, yield at date of purchase 6.04% to 6.08% 12/7/00 (i) |
- |
|
23,600 |
23,340 |
|
|
U.S. Treasury Bonds: |
|
|
|
|
|
|
6.125% 11/15/27 |
Aaa |
|
59,750 |
60,301 |
|
|
6.125% 8/15/29 |
Aaa |
|
13,210 |
13,493 |
|
|
7.625% 2/15/25 |
Aaa |
|
13,005 |
15,535 |
|
|
8.125% 8/15/19 |
Aaa |
|
147,190 |
179,779 |
|
|
8.875% 8/15/17 |
Aaa |
|
13,304 |
17,114 |
|
|
8.875% 2/15/19 |
Aaa |
|
1,360 |
1,768 |
|
|
10.75% 5/15/03 |
Aaa |
|
1,750 |
1,945 |
|
|
10.75% 8/15/05 |
Aaa |
|
5,080 |
6,095 |
|
|
11.75% 2/15/10 (callable) |
Aaa |
|
9,750 |
11,820 |
|
|
12% 8/15/13 |
Aaa |
|
4,070 |
5,544 |
|
|
14% 11/15/11 |
Aaa |
|
5,385 |
7,526 |
|
|
U.S. Treasury Notes: |
|
|
|
|
|
|
4.75% 11/15/08 |
Aaa |
|
89,670 |
82,987 |
|
|
5.5% 5/31/03 |
Aaa |
|
3,100 |
3,065 |
|
|
6.5% 5/31/02 |
Aaa |
|
65,900 |
66,312 |
|
|
6.625% 6/30/01 |
Aaa |
|
87,590 |
87,754 |
|
|
7.875% 11/15/04 |
Aaa |
|
3,500 |
3,746 |
|
|
TOTAL U.S. TREASURY OBLIGATIONS |
588,124 |
||||
|
TOTAL U.S. GOVERNMENT AND (Cost $1,031,691) |
1,045,533 |
||||
|
U.S. Government Agency - Mortgage Securities - 9.9% |
|||||
|
Moody's Ratings |
Principal Amount (000s) |
Value (Note 1) (000s) |
|||
|
Fannie Mae - 7.8% |
|||||
|
5.5% 2/1/11 to 1/1/14 |
Aaa |
|
$ 6,159 |
$ 5,824 |
|
|
6% 4/1/09 to 1/1/29 |
Aaa |
|
139,665 |
132,713 |
|
|
6.5% 4/1/13 to 12/1/29 |
Aaa |
|
255,140 |
248,226 |
|
|
7% 9/1/21 to 11/1/29 |
Aaa |
|
329,501 |
323,333 |
|
|
7.5% 9/1/22 to 9/1/30 |
Aaa |
|
150,244 |
149,961 |
|
|
8% 11/1/22 to 9/1/30 |
Aaa |
|
193,636 |
196,190 |
|
|
TOTAL FANNIE MAE |
1,056,247 |
||||
|
Freddie Mac - 0.5% |
|||||
|
6% 10/1/23 to 9/1/25 |
Aaa |
|
9,698 |
9,149 |
|
|
7.5% 11/1/16 to 8/1/28 |
Aaa |
|
61,018 |
61,044 |
|
|
7.5% 10/1/30 (h) |
Aaa |
|
375 |
375 |
|
|
8% 10/1/27 |
Aaa |
|
146 |
148 |
|
|
8.5% 2/1/19 to 8/1/22 |
Aaa |
|
187 |
192 |
|
|
TOTAL FREDDIE MAC |
70,908 |
||||
|
Government National Mortgage Association - 1.6% |
|||||
|
6% 10/15/08 to 12/15/10 |
Aaa |
|
19,123 |
18,703 |
|
|
6.5% 12/15/07 to 8/15/27 |
Aaa |
|
36,264 |
36,003 |
|
|
6.5% 8/15/27 (h) |
Aaa |
|
74,419 |
71,884 |
|
|
7% 2/15/28 to 7/15/28 |
Aaa |
|
45,880 |
45,192 |
|
|
7.5% 3/15/22 to 8/15/28 |
Aaa |
|
43,456 |
43,643 |
|
|
8% 4/15/24 to 12/15/25 |
Aaa |
|
2,797 |
2,850 |
|
|
TOTAL GOVERNMENT NATIONAL MORTGAGE ASSOCIATION |
218,275 |
||||
|
TOTAL U.S. GOVERNMENT AGENCY - MORTGAGE SECURITIES (Cost $1,352,545) |
1,345,430 |
||||
|
Asset-Backed Securities - 0.7% |
|||||
|
|
|||||
|
Airplanes pass through trust 10.875% 3/15/19 |
Ba2 |
|
9,126 |
6,753 |
|
|
BankAmerica Manufacturing Housing Contract Trust V 6.2% 4/10/09 |
Aaa |
|
9,930 |
9,804 |
|
|
Capita Equipment Receivables Trust 6.48% 10/15/06 |
Baa2 |
|
8,150 |
7,918 |
|
|
CIT Marine Trust 5.8% 4/15/10 |
Aaa |
|
15,400 |
15,097 |
|
|
CPS Auto Grantor Trust 6.55% 8/15/02 |
Aaa |
|
1,377 |
1,375 |
|
|
CPS Auto Receivables Trust 6% 8/15/03 |
Aaa |
|
5,051 |
4,992 |
|
|
CSXT Trade Receivables Master Trust 6% 7/25/04 |
Aaa |
|
12,240 |
12,005 |
|
|
Asset-Backed Securities - continued |
|||||
|
Moody's Ratings |
Principal Amount (000s) |
Value (Note 1) (000s) |
|||
|
Ford Credit Auto Owner Trust: |
|
|
|
|
|
|
6.2% 12/15/02 |
Aa2 |
|
$ 7,380 |
$ 7,305 |
|
|
6.4% 12/15/02 |
Aa2 |
|
4,070 |
4,037 |
|
|
7.03% 11/15/03 |
Aaa |
|
1,945 |
1,950 |
|
|
Green Tree Financial Corp. 6.8% 6/15/27 |
Aaa |
|
737 |
736 |
|
|
JCPenney Master Credit Card Trust 5.5% 6/15/07 |
Aaa |
|
3,300 |
3,179 |
|
|
Petroleum Enhanced Trust Receivables Offering Petroleum Trust 6.125% 2/5/03 (g)(j) |
Baa2 |
|
3,620 |
3,608 |
|
|
Sears Credit Account Master Trust II: |
|
|
|
|
|
|
6.75% 9/16/09 |
Aaa |
|
2,500 |
2,487 |
|
|
7.5% 11/15/07 |
A2 |
|
4,350 |
4,361 |
|
|
UAF Auto Grantor Trust 6.1% 1/15/03 (g) |
Aaa |
|
4,827 |
4,817 |
|
|
TOTAL ASSET-BACKED SECURITIES (Cost $93,962) |
90,424 |
||||
|
Collateralized Mortgage Obligations - 0.1% |
|||||
|
|
|||||
|
Private Sponsor - 0.0% |
|||||
|
Bank America Mortgage Securities, Inc. |
AAA |
|
229 |
220 |
|
|
Credit-Based Asset Servicing and Securitization LLC Series 1997-2 Class 2B, 7.1738% 12/29/25 (d)(g)(j) |
Ba3 |
|
2,216 |
1,074 |
|
|
TOTAL PRIVATE SPONSOR |
1,294 |
||||
|
U.S. Government Agency - 0.1% |
|||||
|
Fannie Mae REMIC planned amortization class: |
|
|
|
|
|
|
Series 1999-54 Class PH, 6.5% 11/18/29 |
Aaa |
|
8,575 |
7,790 |
|
|
Series 1999-57 Class PH, 6.5% 12/25/29 |
Aaa |
|
6,978 |
6,294 |
|
|
TOTAL U.S. GOVERNMENT AGENCY |
14,084 |
||||
|
TOTAL COLLATERALIZED MORTGAGE OBLIGATIONS (Cost $15,361) |
15,378 |
||||
|
Commercial Mortgage Securities - 1.5% |
|||||
|
|
|||||
|
Atherton Franchisee Loan Funding LLP |
BB |
|
2,047 |
1,378 |
|
|
Bankers Trust REMIC Trust 1998-1 |
Baa3 |
|
2,665 |
2,564 |
|
|
Commercial Mortgage Securities - continued |
|||||
|
Moody's Ratings |
Principal Amount (000s) |
Value (Note 1) (000s) |
|||
|
Berkeley Federal Bank & Trust FSB Series 1994-1 Class B, 7.5003% 8/1/24 (g)(j) |
- |
|
$ 3,280 |
$ 2,286 |
|
|
BKB Commercial Mortgage Trust Series 1997-C1 Class D, 7.83% 2/25/43 (g)(j) |
BBB |
|
1,289 |
1,282 |
|
|
CBM Funding Corp. sequential pay Series 1996-1: |
|
|
|
|
|
|
Class A-3PI, 7.08% 11/1/07 |
AA |
|
8,220 |
8,197 |
|
|
Class B, 7.48% 2/1/08 |
A |
|
9,885 |
9,827 |
|
|
CS First Boston Mortgage Securities Corp.: |
|
|
|
|
|
|
Series 1997-C2 Class D, 7.27% 1/17/35 |
Baa2 |
|
15,800 |
14,896 |
|
|
Series 1998-FL1 Class E, 7.47% 1/10/13 (g)(j) |
Baa1 |
|
14,600 |
14,570 |
|
|
Deutsche Mortgage & Asset Receiving Corp. Series 1998-C1 Class D, 7.231% 7/15/12 |
Baa2 |
|
11,800 |
10,850 |
|
|
Equitable Life Assurance Society of the United States Series 174: |
|
|
|
|
|
|
Class B1, 7.33% 5/15/06 (g) |
Aa2 |
|
10,400 |
10,504 |
|
|
Class C1, 7.52% 5/15/06 (g) |
A2 |
|
8,000 |
8,025 |
|
|
Class D1, 7.77% 5/15/06 (g) |
Baa2 |
|
6,800 |
6,777 |
|
|
First Chicago/Lennar Trust I Series 1997-CHL1 Class E, 8.0835% 4/1/39 (j) |
- |
|
3,800 |
2,859 |
|
|
First Union-Lehman Brothers Commercial Mortgage Trust sequential pay Series 1997-C2 Class B, 6.79% 11/18/29 |
Aa2 |
|
24,310 |
23,346 |
|
|
FMAC Loan Receivables Trust: |
|
|
|
|
|
|
Series 1997-A Class E, 8.111% 4/15/19 (g)(j) |
- |
|
1,471 |
937 |
|
|
Series 1997-B Class E, 7.8912% 9/15/19 (g)(j) |
- |
|
2,307 |
346 |
|
|
GAFCO Franchisee Loan Trust Series 1998-1 Class D, 14% 6/1/16 (g)(j) |
- |
|
4,600 |
3,689 |
|
|
General Motors Acceptance Corp. Commercial Mortgage Securities, Inc. Series 1996-C1 Class F, 7.86% 10/15/28 (g) |
Ba3 |
|
1,250 |
1,120 |
|
|
GS Mortgage Securities Corp. II Series 1998-GLII Class E, 7.1905% 4/13/31 (g)(j) |
Baa3 |
|
13,588 |
12,015 |
|
|
LTC Commercial Mortgage pass through certificates Series 1998-1 Class A, 6.029% 5/30/30 (g) |
AAA |
|
8,229 |
7,856 |
|
|
Nomura Asset Securities Corp. Series 1998-D6 Class A4, 7.6088% 3/17/28 (j) |
Baa2 |
|
11,800 |
11,112 |
|
|
Nomura Depositor Trust floater Series 1998-ST1A: |
|
|
|
|
|
|
Class B2, 10.8713% 1/15/03 (g)(j) |
- |
|
2,975 |
2,755 |
|
|
Class B2-A, 10.8713% 2/15/34 (g)(j) |
- |
|
500 |
463 |
|
|
Commercial Mortgage Securities - continued |
|||||
|
Moody's Ratings |
Principal Amount (000s) |
Value (Note 1) (000s) |
|||
|
Penn Mutual Life Insurance Co. (The)/Penn Insurance & Annuity Co. Series 1996-PML: |
|
|
|
|
|
|
Class K, 7.9% 11/15/26 (g) |
- |
|
$ 750 |
$ 495 |
|
|
Class L, 7.9% 11/15/26 (g) |
- |
|
600 |
321 |
|
|
Prudential Securities Secured Financing Corp. Series 2000-C1 Class A2, 7.727% 2/15/10 |
Aaa |
|
4,830 |
4,963 |
|
|
Structured Asset Securities Corp.: |
|
|
|
|
|
|
Series 1995-C1 Class E, 7.375% 9/25/24 (g) |
BB |
|
2,390 |
2,262 |
|
|
Series 1996-CFL: |
|
|
|
|
|
|
Class E, 7.75% 2/25/28 |
AA |
|
6,820 |
6,809 |
|
|
Class G, 7.75% 2/25/28 (g) |
BB |
|
3,700 |
3,399 |
|
|
Class H, 7.75% 2/25/28 (g) |
B |
|
1,000 |
667 |
|
|
Thirteen Affiliates of General Growth Properties, Inc.: |
|
|
|
|
|
|
sequential pay Series 1 Class A2, 6.602% 12/15/10 (g) |
Aaa |
|
11,530 |
11,341 |
|
|
Series D-2, 6.992% 12/15/10 (g) |
Baa2 |
|
11,380 |
10,613 |
|
|
Series E-2, 7.224% 12/15/10 (g) |
Baa3 |
|
6,760 |
6,238 |
|
|
TOTAL COMMERCIAL MORTGAGE SECURITIES (Cost $214,125) |
204,762 |
||||
|
Foreign Government and Government Agency Obligations (k) - 0.4% |
|||||
|
|
|||||
|
Israeli State euro 6.375% 12/19/01 |
A2 |
|
13,265 |
13,066 |
|
|
Korean Republic yankee: |
|
|
|
|
|
|
8.75% 4/15/03 |
Baa2 |
|
3,465 |
3,562 |
|
|
8.875% 4/15/08 |
Baa2 |
|
4,832 |
5,057 |
|
|
Newfoundland Province yankee 11.625% 10/15/07 |
Baa1 |
|
5,750 |
7,081 |
|
|
Quebec Province 7.5% 9/15/29 |
A2 |
|
18,790 |
18,769 |
|
|
United Mexican States 9.875% 2/1/10 |
Baa3 |
|
7,220 |
7,689 |
|
|
TOTAL FOREIGN GOVERNMENT AND (Cost $55,266) |
55,224 |
||||
|
Supranational Obligations - 0.1% |
|||||
|
|
|||||
|
Inter-American Development Bank |
Aaa |
|
13,000 |
12,674 |
|
|
Purchased Bank Debt - 0.1% |
|||||
|
Moody's Ratings |
Principal Amount (000s) |
Value (Note 1) (000s) |
|||
|
PRIMEDIA, Inc. Tranche B term loan 8.995% 7/31/04 (j) |
Ba3 |
|
$ 2,750 |
$ 2,757 |
|
|
Six Flags Theme Park, Inc. Tranche B term loan 9.9133% 9/30/05 (j) |
Ba2 |
|
3,800 |
3,833 |
|
|
Telemundo Group, Inc. Tranche B term loan 8.785% 3/31/07 (j) |
B1 |
|
1,800 |
1,800 |
|
|
TOTAL PURCHASED BANK DEBT (Cost $8,404) |
8,390 |
||||
|
Money Market Funds - 10.9% |
|||
|
Shares |
|
||
|
Fidelity Cash Central Fund, 6.60% (c) |
1,045,968,955 |
1,045,969 |
|
|
Fidelity Money Market Central Fund, 6.73% (c) |
425,013,442 |
425,013 |
|
|
Fidelity Securities Lending Cash Central Fund, 6.63% (c) |
12,750,700 |
12,751 |
|
|
TOTAL MONEY MARKET FUNDS (Cost $1,483,733) |
1,483,733 |
||
|
TOTAL INVESTMENT PORTFOLIO - 99.9% (Cost $11,650,584) |
13,562,903 |
||
|
NET OTHER ASSETS - 0.1% |
7,547 |
||
|
NET ASSETS - 100% |
$ 13,570,450 |
||
|
Futures Contracts |
|||||
|
|
Expiration Date |
Underlying Face Amount at Value (000s) |
Unrealized Gain/(Loss) (000s) |
||
|
Purchased |
|||||
|
1,186 S&P 500 Stock Index Contracts |
Dec. 2000 |
$ 431,022 |
$ (3,490) |
||
|
The face value of futures purchased as a percentage of net assets - 3.2% |
|
Legend |
|
(a) Non-income producing |
|
(b) S&P credit ratings are used in the absence of a rating by Moody's Investors Service, Inc. |
|
(c) The rate quoted is the annualized seven-day yield of the fund at period end. A complete listing of the fund's holdings as of its most recent fiscal year end is available upon request. |
|
(d) Non-income producing - issuer filed for protection under the Federal Bankruptcy Code or is in default of interest payment. |
|
(e) Debt obligation initially issued in zero coupon form which converts to coupon form at a specified rate and date. The rate shown is the rate at period end. |
|
(f) Debt obligation initially issued at one coupon which converts to a higher coupon at a specified date. The rate shown is the rate at period end. |
|
(g) Security exempt from registration under Rule 144A of the Securities Act of 1933. These securities may be resold in transactions exempt from registration, normally to qualified institutional buyers. At the period end, the value of these securities amounted to $371,645,000 or 2.7% of net assets. |
|
(h) Security purchased on a delayed delivery or when-issued basis. |
|
(i) Security or a portion of the security was pledged to cover margin requirements for futures contracts. At the period end, the value of securities pledged amounted to $23,340,000. |
|
(j) The coupon rate shown on floating or adjustable rate securities represents the rate at period end. |
|
(k) For foreign government obligations not individually rated by S&P or Moody's, the ratings listed have been assigned by FMR, the fund's investment adviser, based principally on S&P and Moody's ratings of the sovereign credit of the issuing government. |
|
(l) Restricted securities - Investment in securities not registered under the Securities Act of 1933. |
|
Additional information on each holding is as follows: |
|
Security |
Acquisition Date |
Acquisition Cost (000s) |
|
Micron Technology, Inc. 6.5% 9/30/05 |
7/15/99 - 4/10/00 |
$ 4,835 |
|
Other Information |
|
The composition of long-term debt holdings as a percentage of total value of investments in securities, is as follows (ratings are unaudited): |
|
Moody's Ratings |
S&P Ratings |
|||
|
Aaa, Aa, A |
21.7% |
|
AAA, AA, A |
18.5% |
|
Baa |
5.5% |
|
BBB |
5.2% |
|
Ba |
1.6% |
|
BB |
1.7% |
|
B |
5.3% |
|
B |
5.9% |
|
Caa |
1.0% |
|
CCC |
0.5% |
|
Ca, C |
0.0% |
|
CC, C |
0.0% |
|
|
|
|
D |
0.0% |
|
The percentage not rated by Moody's or S&P amounted to 0.3%. FMR has determined that unrated debt securities that are lower quality account for 0.3% of the total value of investment in securities. |
|
Income Tax Information |
|
At September 30, 2000, the aggregate cost of investment securities for income tax purposes was $11,676,771,000. Net unrealized appreciation aggregated $1,886,132,000, of which $2,298,346,000 related to appreciated investment securities and $412,214,000 related to depreciated investment securities. |
|
The fund hereby designates approximately $581,439,000 as a capital gain dividend for the purpose of the dividend paid deduction. |
See accompanying notes which are an integral part of the financial statements.
Annual Report
Statement of Assets and Liabilities
|
Amounts in thousands (except per-share amount) |
September 30, 2000 |
|
|
Assets |
|
|
|
Investment in securities, at value (cost $11,650,584) - |
|
$ 13,562,903 |
|
Cash |
|
1,465 |
|
Receivable for investments sold |
|
266,192 |
|
Receivable for fund shares sold |
|
9,881 |
|
Dividends receivable |
|
5,380 |
|
Interest receivable |
|
80,720 |
|
Other receivables |
|
235 |
|
Total assets |
|
13,926,776 |
|
Liabilities |
|
|
|
Payable for investments purchased |
$ 230,458 |
|
|
Delayed delivery |
72,111 |
|
|
Payable for fund shares redeemed |
26,107 |
|
|
Accrued management fee |
5,985 |
|
|
Payable for daily variation on futures contracts |
6,612 |
|
|
Other payables and accrued expenses |
2,302 |
|
|
Collateral on securities loaned, at value |
12,751 |
|
|
Total liabilities |
|
356,326 |
|
Net Assets |
|
$ 13,570,450 |
|
Net Assets consist of: |
|
|
|
Paid in capital |
|
$ 10,500,743 |
|
Undistributed net investment income |
|
43,259 |
|
Accumulated undistributed net realized gain (loss) on investments and foreign currency transactions |
|
1,117,475 |
|
Net unrealized appreciation (depreciation) on investments and assets and liabilities in foreign currencies |
|
1,908,973 |
|
Net Assets, for 710,008 shares outstanding |
|
$ 13,570,450 |
|
Net Asset Value, offering price and redemption price |
|
$19.11 |
See accompanying notes which are an integral part of the financial statements.
Annual Report
Financial Statements - continued
Statement of Operations
|
Amounts in thousands |
Year ended September 30, 2000 |
|
|
Investment Income Dividends |
|
$ 73,064 |
|
Interest |
|
452,051 |
|
Security lending |
|
128 |
|
Total income |
|
525,243 |
|
Expenses |
|
|
|
Management fee |
$ 68,480 |
|
|
Transfer agent fees |
24,669 |
|
|
Accounting and security lending fees |
1,043 |
|
|
Non-interested trustees' compensation |
64 |
|
|
Custodian fees and expenses |
377 |
|
|
Registration fees |
119 |
|
|
Audit |
117 |
|
|
Legal |
58 |
|
|
Reports to shareholders |
503 |
|
|
Miscellaneous |
25 |
|
|
Total expenses before reductions |
95,455 |
|
|
Expense reductions |
(2,747) |
92,708 |
|
Net investment income |
|
432,535 |
|
Realized and Unrealized Gain (Loss) Net realized gain (loss) on: |
|
|
|
Investment securities |
1,183,486 |
|
|
Foreign currency transactions |
(113) |
|
|
Futures contracts |
7,808 |
1,191,181 |
|
Change in net unrealized appreciation (depreciation) on: |
|
|
|
Investment securities |
595,870 |
|
|
Assets and liabilities in foreign currencies |
(5) |
|
|
Futures contracts |
(3,490) |
592,375 |
|
Net gain (loss) |
|
1,783,556 |
|
Net increase (decrease) in net assets resulting |
|
$ 2,216,091 |
See accompanying notes which are an integral part of the financial statements.
Annual Report
Financial Statements - continued
Statement of Changes in Net Assets
|
Amounts in thousands |
Year ended
September 30, |
Year ended
September 30, |
|
Increase (Decrease) in Net Assets |
|
|
|
Operations |
$ 432,535 |
$ 379,313 |
|
Net realized gain (loss) |
1,191,181 |
572,745 |
|
Change in net unrealized appreciation (depreciation) |
592,375 |
888,144 |
|
Net increase (decrease) in net assets resulting |
2,216,091 |
1,840,202 |
|
Distributions to shareholders |
(403,179) |
(389,627) |
|
From net realized gain |
(501,336) |
(1,959,810) |
|
Total distributions |
(904,515) |
(2,349,437) |
|
Share transactions |
2,249,442 |
1,984,725 |
|
Reinvestment of distributions |
879,726 |
2,288,038 |
|
Cost of shares redeemed |
(3,093,277) |
(3,116,440) |
|
Net increase (decrease) in net assets resulting |
35,891 |
1,156,323 |
|
Total increase (decrease) in net assets |
1,347,467 |
647,088 |
|
Net Assets |
|
|
|
Beginning of period |
12,222,983 |
11,575,895 |
|
End of period (including undistributed net investment income of $43,259 and $12,915, respectively) |
$ 13,570,450 |
$ 12,222,983 |
|
Other Information Shares |
|
|
|
Sold |
121,200 |
111,298 |
|
Issued in reinvestment of distributions |
48,508 |
135,284 |
|
Redeemed |
(167,213) |
(173,738) |
|
Net increase (decrease) |
2,495 |
72,844 |
See accompanying notes which are an integral part of the financial statements.
Annual Report
Financial Highlights
|
Years ended September 30, |
2000 |
1999 |
1998 |
1997 |
1996 |
|
Selected Per-Share Data |
|
|
|
|
|
|
Net asset value, |
$ 17.28 |
$ 18.24 |
$ 19.01 |
$ 16.49 |
$ 15.47 |
|
Income from Investment Operations |
|
|
|
|
|
|
Net investment income |
.61 B |
.54 B |
.61 B |
.59 B |
.62 |
|
Net realized and unrealized gain (loss) |
2.53 |
2.23 |
.37 |
3.35 |
.96 |
|
Total from investment operations |
3.14 |
2.77 |
.98 |
3.94 |
1.58 |
|
Less Distributions |
|
|
|
|
|
|
From net investment income |
(.58) |
(.56) |
(.64) |
(.67) |
(.56) |
|
From net realized gain |
(.73) |
(3.17) |
(1.11) |
(.75) |
- |
|
Total distributions |
(1.31) |
(3.73) |
(1.75) |
(1.42) |
(.56) |
|
Net asset value, end of period |
$ 19.11 |
$ 17.28 |
$ 18.24 |
$ 19.01 |
$ 16.49 |
|
Total Return A |
18.73% |
16.12% |
5.34% |
25.15% |
10.37% |
|
Ratios and Supplemental Data |
|
|
|
|
|
|
Net assets, end of period |
$ 13,570 |
$ 12,223 |
$ 11,576 |
$ 11,866 |
$ 10,674 |
|
Ratio of expenses to average |
.73% |
.75% |
.76% |
.79% |
.95% |
|
Ratio of expenses to average net assets after expense reductions |
.71% C |
.73% C |
.74% C |
.78% C |
.93% C |
|
Ratio of net investment income |
3.32% |
3.01% |
3.19% |
3.39% |
3.64% |
|
Portfolio turnover rate |
109% |
104% |
136% |
79% |
131% |
A The total returns would have been lower had certain expenses not been reduced during the periods shown.
B Net investment income per share has been calculated based on average shares outstanding during the period.
C FMR or the fund has entered into varying arrangements with third parties who either paid or reduced a portion of the fund's expenses.
See accompanying notes which are an integral part of the financial statements.
Annual Report
For the period ended September 30, 2000
1. Significant Accounting Policies.
Asset Manager (the fund) is a fund of Fidelity Charles Street Trust (the trust) and is authorized to issue an unlimited number of shares. The trust is registered under the Investment Company Act of 1940, as amended, as an open-end management investment company organized as a Massachusetts business trust. The financial statements have been prepared in conformity with generally accepted accounting principles which require management to make certain estimates and assumptions at the date of the financial statements. The following summarizes the significant accounting policies of the fund:
Security Valuation. Equity securities for which quotations are readily available are valued at the last sale price, or if no sale price, at the closing bid price. Foreign equity securities are valued based on quotations from the principal market in which such securities are normally traded. If trading or events occurring in other markets after the close of the principal market in which foreign securities are traded, and before the close of the business of the fund, are expected to materially affect the value of those securities, then they are valued at their fair value taking this trading or these events into account. Fair value is determined in good faith under consistently applied procedures under the general supervision of the Board of Trustees. Debt securities for which quotations are readily available are valued by a pricing service at their market values as determined by their most recent bid prices in the principal market (sales prices if the principal market is an exchange) in which such securities are normally traded. Securities (including restricted securities) for which market quotations are not readily available are valued at their fair value. Short-term securities with remaining maturities of sixty days or less for which quotations are not readily available are valued at amortized cost or original cost plus accrued interest, both of which approximate current value. Investments in open-end investment companies are valued at their net asset value each business day.
Foreign Currency Translation. The accounting records of the fund are maintained in U.S. dollars. Investment securities and other assets and liabilities denominated in a foreign currency are translated into U.S. dollars at the prevailing rates of exchange at period end. Purchases and sales of securities, income receipts and expense payments are translated into U.S. dollars at the prevailing exchange rate on the respective dates of the transactions.
Net realized gains and losses on foreign currency transactions represent net gains and losses from sales and maturities of foreign currency contracts, disposition of foreign currencies, the difference between the amount of net investment income accrued and the U.S. dollar amount actually received, and gains and losses between trade and settlement date on purchases and sales of securities. The effects of changes in foreign currency exchange rates on investments in securities are included with the net realized and unrealized gain or loss on investment securities.
Annual Report
Notes to Financial Statements - continued
1. Significant Accounting Policies - continued
Income Taxes. As a qualified regulated investment company under Subchapter M of the Internal Revenue Code, the fund is not subject to income taxes to the extent that it distributes substantially all of its taxable income for its fiscal year. The schedule of investments includes information regarding income taxes under the caption "Income Tax Information."
Investment Income. Dividend income is recorded on the ex-dividend date, except certain dividends from foreign securities where the ex-dividend date may have passed, are recorded as soon as the fund is informed of the ex-dividend date. Non-cash dividends included in dividend income, if any, are recorded at the fair market value of the securities received. Interest income, which includes accretion of original issue discount, is accrued as earned. Investment income is recorded net of foreign taxes withheld where recovery of such taxes is uncertain. The fund may place a debt obligation on non-accrual status and reduce related interest income by ceasing current accruals and writing off interest receivables when the collection of all or a portion of interest has become doubtful based on consistently applied procedures, under the general supervision of the Board of Trustees of the fund. A debt obligation is removed from non-accrual status when the issuer resumes interest payments or when collectibility of interest is reasonably assured.
Expenses. Most expenses of the trust can be directly attributed to a fund. Expenses which cannot be directly attributed are apportioned among the funds in the trust.
Deferred Trustee Compensation. Under a Deferred Compensation Plan (the Plan) non-interested Trustees must defer receipt of a portion of, and may elect to defer receipt of an additional portion of, their annual compensation. Deferred amounts are treated as though equivalent dollar amounts had been invested in shares of the fund or are invested in a cross-section of other Fidelity funds. Deferred amounts remain in the fund until distributed in accordance with the Plan.
Distributions to Shareholders. Distributions are recorded on the ex-dividend date.
Income and capital gain distributions are determined in accordance with income tax regulations which may differ from generally accepted accounting principles. These differences, which may result in distribution reclassifications, are primarily due to differing treatments for litigation proceeds, paydown gains/losses on certain securities, futures transactions, foreign currency transactions, market discount, non-taxable dividends and losses deferred due to wash sales. The fund also utilized earnings and profits distributed to shareholders on redemption of shares as a part of the dividends paid deduction for income tax purposes.
Permanent book and tax basis differences relating to shareholder distributions will result in reclassifications to paid in capital. Undistributed net investment income and accumulated undistributed net realized gain (loss) on investments and foreign currency transactions may include temporary book and tax basis differences which will reverse in a subsequent period.
Annual Report
Notes to Financial Statements - continued
1. Significant Accounting Policies - continued
Distributions to Shareholders - continued
Any taxable income or gain remaining at fiscal year end is distributed in the following year.
Security Transactions. Security transactions are accounted for as of trade date. Gains and losses on securities sold are determined on the basis of identified cost.
2. Operating Policies.
Foreign Currency Contracts. The fund generally uses foreign currency contracts to facilitate transactions in foreign-denominated securities. Losses may arise from changes in the value of the foreign currency or if the counterparties do not perform under the contracts' terms. The U.S. dollar value of foreign currency contracts is determined using contractual currency exchange rates established at the time of each trade.
Joint Trading Account. Pursuant to an Exemptive Order issued by the Securities and Exchange Commission (the SEC), the fund, along with other affiliated entities of Fidelity Management & Research Company (FMR), may transfer uninvested cash balances into one or more joint trading accounts. These balances are invested in one or more repurchase agreements for U.S. Treasury or Federal Agency obligations.
Repurchase Agreements. The underlying U.S. Treasury, Federal Agency, or other obligations found to be satisfactory by FMR are transferred to an account of the fund, or to the Joint Trading Account, at a custodian bank. The securities are marked-to-market daily and maintained at a value at least equal to the principal amount of the repurchase agreement (including accrued interest). FMR, the fund's investment adviser, is responsible for determining that the value of the underlying securities remains in accordance with the market value requirements stated above.
Delayed Delivery Transactions. The fund may purchase or sell securities on a delayed delivery basis. Payment and delivery may take place after the customary settlement period for that security. The price of the underlying securities and the date when the securities will be delivered and paid for are fixed at the time the transaction is negotiated. The market values of the securities purchased on a delayed delivery basis are identified as such in the fund's schedule of investments. The fund may receive compensation for interest forgone in the purchase of a delayed delivery security. With respect to purchase commitments, the fund identifies securities as segregated in its records with a value at least equal to the amount of the commitment. Losses may arise due to changes in the market value of the underlying securities or if the counterparty does not perform under the contract.
Futures Contracts. The fund may use futures contracts to manage its exposure to the stock and bond markets. Buying futures tends to increase the fund's exposure to the underlying instrument, while selling futures tends to decrease the fund's exposure to the underlying instrument or hedge other fund investments. Futures contracts involve, to varying degrees, risk of loss in excess of the
Annual Report
Notes to Financial Statements - continued
2. Operating Policies -
continued
Futures Contracts - continued
futures variation margin reflected in the Statement of Assets and Liabilities. The underlying face amount at value of any open futures contracts at period end is shown in the schedule of investments under the caption "Futures Contracts." This amount reflects each contract's exposure to the underlying instrument at period end. Losses may arise from changes in the value of the underlying instruments or if the counterparties do not perform under the contracts' terms. Gains (losses) are realized upon the expiration or closing of the futures contracts. Futures contracts are valued at the settlement price established each day by the board of trade or exchange on which they are traded.
Restricted Securities. The fund is permitted to invest in securities that are subject to legal or contractual restrictions on resale. These securities generally may be resold in transactions exempt from registration or to the public if the securities are registered. Disposal of these securities may involve time-consuming negotiations and expense, and prompt sale at an acceptable price may be difficult. At the end of the period, restricted securities (excluding 144A issues) amounted to $5,100,000 or 0.0% of net assets.
Loans and Other Direct Debt Instruments. The fund is permitted to invest in loans and loan participations, trade claims or other receivables. These investments may include standby financing commitments that obligate the fund to supply additional cash to the borrower on demand. Loan participations involve a risk of insolvency of the lending bank or other financial intermediary. At the end of the period, these investments amounted to $8,390,000 or 0.1% of net assets.
3. Purchases and Sales of Investments.
Purchases and sales of securities, other than short-term securities, aggregated $13,069,995,000 and $14,567,689,000, respectively, of which U.S. government and government agency obligations aggregated $3,150,110,000 and $2,502,470,000, respectively.
On July 25, 2000, the fund transferred substantially all of its money market investments to Fidelity Money Market Central Fund in exchange for shares of this fund.
The market value of futures contracts opened and closed during the period amounted to $1,411,599,000 and $984,895,000, respectively.
4. Fees and Other Transactions with Affiliates.
Management Fee. As the fund's investment adviser, FMR receives a monthly fee that is calculated on the basis of a group fee rate plus a fixed individual fund fee rate applied to the average net assets of the fund. The group fee rate is the weighted average of a series of rates and is based on the monthly average net assets of all the mutual funds advised by FMR. The rates ranged from .2167% to .5200% for the period. The annual individual fund fee rate is .25%. In the event that these rates were lower
Annual Report
Notes to Financial Statements - continued
4. Fees and Other Transactions with Affiliates - continued
Management Fee - continued
than the contractual rates in effect during the period, FMR voluntarily implemented the above rates, as they resulted in the same or a lower management fee. For the period, the management fee was equivalent to an annual rate of .53% of average net assets.
Sub-Adviser Fee. Beginning January 1, 2001, FMR Co.(FMRC) will serve as sub-adviser for the fund. FMRC is a wholly owned subsidiary of FMR and will receive a fee from FMR of 50% of the management fee payable to FMR.
Transfer Agent Fees. Fidelity Service Company, Inc. (FSC), an affiliate of FMR, is the fund's transfer, dividend disbursing and shareholder servicing agent. FSC receives account fees and asset-based fees that vary according to account size and type of account. FSC pays for typesetting, printing and mailing of all shareholder reports, except proxy statements. For the period, the transfer agent fees were equivalent to an annual rate of .19% of average net assets.
Accounting and Security Lending Fees. FSC maintains the fund's accounting records and administers the security lending program. The security lending fee is based on the number and duration of lending transactions. The accounting fee is based on the level of average net assets for the month plus out-of-pocket expenses.
Central Funds. Pursuant to an Exemptive Order issued by the SEC, the fund may invest in one or more open-end money market funds managed by Fidelity Investments Money Management, Inc., an affiliate of FMR. These funds (collectively referred to as the "Central Funds") are only available to investment companies and other accounts managed by FMR and its affiliates. The Central Funds seek preservation of capital, liquidity, and current income and do not pay a management fee.
The Fidelity Money Market Central Fund is principally used for the fund's strategic allocation to money market investments. The Fidelity Securities Lending Cash Central Fund and the Fidelity Cash Central Fund are principally used for allocations of available cash. Income distributions from the Central Funds are recorded as interest income in the accompanying financial statements except for distributions from the Fidelity Securities Lending Cash Central Fund, which are recorded as security lending income. Distributions from the Central Funds to the fund totaled $50,172,000 for the period.
Brokerage Commissions. The fund placed a portion of its portfolio transactions with brokerage firms which are affiliates of FMR. The commissions paid to these affiliated firms were $447,000 for the period.
5. Security Lending.
The fund lends portfolio securities from time to time in order to earn additional income. The fund receives collateral in the form of U.S. Treasury obligations, letters of credit, and/or cash against the loaned securities, and maintains collateral in an amount not less than 100% of the market value of the loaned securities during the period of the loan. The market value of the loaned securities is determined at
Annual Report
Notes to Financial Statements - continued
5. Security Lending - continued
the close of business of the fund and any additional required collateral is delivered to the fund on the next business day. If the borrower defaults on its obligation to return the securities loaned because of insolvency or other reasons, the fund could experience delays and costs in recovering the securities loaned or in gaining access to the collateral. At period end, the value of the securities loaned amounted to $11,061,000. The fund received cash collateral of $12,751,000 which was invested in cash equivalents.
6. Expense Reductions.
FMR has directed certain portfolio trades to brokers who paid a portion of the fund's expenses. For the period, the fund's expenses were reduced by $1,855,000 under this arrangement.
In addition, through arrangements with the fund's custodian and transfer agent, credits realized as a result of uninvested cash balances were used to reduce a portion of the fund's expenses. During the period, the fund's custodian and transfer agent fees were reduced by $26,000 and $866,000, respectively, under these arrangements.
Annual Report
To the Trustees of Fidelity Charles Street Trust and Shareholders of Fidelity Asset Manager:
We have audited the accompanying statement of assets and liabilities of Fidelity Asset Manager, (the Fund), a fund of Fidelity Charles Street Trust (the Trust), including the portfolio of investments, as of September 30, 2000, and the related statements of operations, changes in net assets, and financial highlights for the year then ended. These financial statements and financial highlights are the responsibility of the Fund's management. Our responsibility is to express an opinion on these financial statements and financial highlights based on our audit. The statement of changes in net assets for the year ended September 30, 1999, and the financial highlights for each of the four years in the period then ended were audited by other auditors whose report, dated November 8, 1999, expressed an unqualified opinion on those statements and financial highlights.
We conducted our audit in accordance with auditing standards generally accepted in the United States of America. Those standards require that we plan and perform the audit to obtain reasonable assurance about whether the financial statements and financial highlights are free of material misstatement. An audit includes examining, on a test basis, evidence supporting the amounts and disclosures in the financial statements. Our procedures included confirmation of securities owned as of September 30, 2000, by correspondence with the custodian and brokers; where replies were not received from brokers, we performed other auditing procedures. An audit also includes assessing the accounting principles used and significant estimates made by management, as well as evaluating the overall financial statement presentation. We believe that our audit provides a reasonable basis for our opinion.
In our opinion, the financial statements and financial highlights referred to above present fairly, in all material respects, the financial position of Fidelity Asset Manager as of September 30, 2000, and the results of its operations, the changes in its net assets, and the financial highlights for the year then ended, in conformity with accounting principles generally accepted in the United States of America.
/s/DELOITTE & TOUCHE LLP
DELOITTE & TOUCHE LLP
Boston, Massachusetts
November 7, 2000
Annual Report
The fund hereby designates 100% of the long-term capital gain dividends distributed during the fiscal year as 20%-rate capital gain dividends.
A total of 9.72% of the dividends distributed during the fiscal year was derived from interest on U.S. Government securities which is generally exempt from state income tax.
A total of 14% of the dividends distributed during the fiscal year qualifies for the dividends-received deduction for corporate shareholders.
The fund will notify shareholders in January 2001 of amounts for use in preparing 2000 income tax returns.
Annual Report
Fidelity offers several ways to conveniently manage your personal investments via your telephone or PC. You can access your account information, conduct trades and research your investments 24 hours a day.
By Phone
Fidelity Automated Service Telephone provides a single toll-free number to access account balances, positions, quotes and trading. It's easy to navigate the service, and on your first call, the system will help you create a personal identification number (PIN) for security.
(phone_graphic)
Fidelity Automated
Service Telephone (FAST®)
1-800-544-5555
Press
1 For mutual fund and brokerage trading.
2 For quotes.*
3 For account balances and holdings.
4 To review orders and mutual
fund activity.
5 To change your PIN.
*0 To speak to a Fidelity representative.
By PC
Fidelity's web site on the Internet provides a wide range of information, including daily financial news, fund performance, interactive planning tools and news about Fidelity products and services.
(computer_graphic)
Fidelity's Web Site
www.fidelity.com
If you are not currently on the Internet, call EarthLink Sprint at 1-800-288-2967, and be sure to ask for registration number SMD004 to receive a special Fidelity package that includes 30 days of free Internet access. EarthLink is North America's #1 independent Internet access provider.
(computer_graphic)
Fidelity On-line Xpress+®
Fidelity On-line Xpress+ software for Windows combines comprehensive portfolio management capabilities, securities trading and access to research and analysis tools . . . all on your desktop. Call Fidelity at 1-800-544-0240 or visit our web site for more information on how to manage your investments via your PC.
* When you call the quotes line, please remember that a fund's yield and return will vary and, except for money market funds, share price will also vary. This means that you may have a gain or loss when you sell your shares. There is no assurance that money market funds will be able to maintain a stable $1 share price; an investment in a money market fund is not insured or guaranteed by the U.S. government. Total returns are historical and include changes in share price, reinvestment of dividends and capital gains, and the effects of any sales charges.
Annual Report
If more than one address is listed, please locate the address that is closest to you. We'll give your correspondence immediate attention and send you written confirmation upon completion of your request.
(letter_graphic)
Making Changes
To Your Account
(such as changing name, address, bank, etc.)
Fidelity Investments
P.O. Box 770001
Cincinnati, OH 45277-0002
(letter_graphic)
For Non-Retirement
Accounts
Buying shares
Fidelity Investments
P.O. Box 770001
Cincinnati, OH 45277-0003
Overnight Express
Fidelity Investments
2300 Litton Lane - KH1A
Hebron, KY 41048
Selling shares
Fidelity Investments
P.O. Box 660602
Dallas, TX 75266-0602
Overnight Express
Fidelity Investments
Attn: Redemptions - CP6I
400 East Las Colinas Blvd.
Irving, TX 75039-5587
General Correspondence
Fidelity Investments
P.O. Box 500
Merrimack, NH 03054-0500
(letter_graphic)
For Retirement
Accounts
Buying shares
Fidelity Investments
P.O. Box 770001
Cincinnati, OH 45277-0003
Selling shares
Fidelity Investments
P.O. Box 660602
Dallas, TX 75266-0602
Overnight Express
Fidelity Investments
Attn: Redemptions - CP6R
400 East Las Colinas Blvd.
Irving, TX 75039-5587
General Correspondence
Fidelity Investments
P.O. Box 500
Merrimack, NH 03054-0500
Annual Report
For directions and hours,
please call 1-800-544-9797.
Arizona
7373 N. Scottsdale Road
Scottsdale, AZ
California
815 East Birch Street
Brea, CA
851 East Hamilton Avenue
Campbell, CA
527 North Brand Boulevard
Glendale, CA
19200 Von Karman Avenue
Irvine, CA
10100 Santa Monica Blvd.
Los Angeles, CA
251 University Avenue
Palo Alto, CA
1760 Challenge Way
Sacramento, CA
7676 Hazard Center Drive
San Diego, CA
8 Montgomery Street
San Francisco, CA
950 Northgate Drive
San Rafael, CA
1400 Civic Drive
Walnut Creek, CA
6300 Canoga Avenue
Woodland Hills, CA
Colorado
1625 Broadway
Denver, CO
Connecticut
48 West Putnam Avenue
Greenwich, CT
265 Church Street
New Haven, CT
300 Atlantic Street
Stamford, CT
29 South Main Street
West Hartford, CT
Delaware
222 Delaware Avenue
Wilmington, DE
Florida
4400 N. Federal Highway
Boca Raton, FL
90 Alhambra Plaza
Coral Gables, FL
4090 N. Ocean Boulevard
Ft. Lauderdale, FL
1907 West State Road 434
Longwood, FL
8880 Tamiami Trail, North
Naples, FL
2401 PGA Boulevard
Palm Beach Gardens, FL
8065 Beneva Road
Sarasota, FL
1502 N. Westshore Blvd.
Tampa, FL
Georgia
3445 Peachtree Road, N.E.
Atlanta, GA
1000 Abernathy Road
Atlanta, GA
Illinois
One North Franklin Street
Chicago, IL
1415 West 22nd Street
Oak Brook, IL
1700 East Golf Road
Schaumburg, IL
3232 Lake Avenue
Wilmette, IL
Indiana
4729 East 82nd Street
Indianapolis, IN
Maine
Three Canal Plaza
Portland, ME
Maryland
7401 Wisconsin Avenue
Bethesda, MD
One W. Pennsylvania Ave.
Towson, MD
Massachusetts
801 Boylston Street
Boston, MA
155 Congress Street
Boston, MA
25 State Street
Boston, MA
300 Granite Street
Braintree, MA
44 Mall Road
Burlington, MA
416 Belmont Street
Worcester, MA
Annual Report
Michigan
280 Old N. Woodward Ave.
Birmingham, MI
29155 Northwestern Hwy.
Southfield, MI
Minnesota
7600 France Avenue South
Edina, MN
Missouri
700 West 47th Street
Kansas City, MO
8885 Ladue Road
Ladue, MO
New Jersey
150 Essex Street
Millburn, NJ
56 South Street
Morristown, NJ
501 Route 17, South
Paramus, NJ
New York
1055 Franklin Avenue
Garden City, NY
999 Walt Whitman Road
Melville, L.I., NY
1271 Avenue of the Americas
New York, NY
71 Broadway
New York, NY
350 Park Avenue
New York, NY
North Carolina
4611 Sharon Road
Charlotte, NC
Ohio
600 Vine Street
Cincinnati, OH
28699 Chagrin Boulevard
Woodmere Village, OH
Oregon
16850 SW 72nd Avenue
Tigard, OR
Pennsylvania
1735 Market Street
Philadelphia, PA
12001 Perry Highway
Wexford, PA
Rhode Island
47 Providence Place
Providence, RI
Tennessee
6150 Poplar Avenue
Memphis, TN
Texas
10000 Research Boulevard
Austin, TX
4017 Northwest Parkway
Dallas, TX
1155 Dairy Ashford Street
Houston, TX
2701 Drexel Drive
Houston, TX
400 East Las Colinas Blvd.
Irving, TX
14100 San Pedro
San Antonio, TX
19740 IH 45 North
Spring, TX
Utah
215 South State Street
Salt Lake City, UT
Virginia
1861 International Drive
McLean, VA
Washington
411 108th Avenue, N.E.
Bellevue, WA
511 Pine Street
Seattle, WA
Washington, DC
1900 K Street, N.W.
Washington, DC
Wisconsin
595 North Barker Road
Brookfield, WI
Fidelity Brokerage Services, Inc., 100 Summer St., Boston, MA 02110 Member NYSE/SIPC
Annual Report
Annual Report
Annual Report
Investment Adviser
Fidelity Management & Research Company
Boston, MA
Investment Sub-Advisers
Fidelity Investments Money
Management, Inc.
Fidelity Management & Research
(U.K.) Inc.
Fidelity Management & Research
(Far East) Inc.
Fidelity Investments Japan Limited
Officers
Edward C. Johnson 3d, President
Robert C. Pozen, Senior Vice President
Robert A. Lawrence, Vice President
Richard C. Habermann, Vice President
Thomas M. Sprague, Vice President
Charles S. Morrison, Vice President
John J. Todd, Vice President
Eric D. Roiter, Secretary
Robert A. Dwight, Treasurer
Maria F. Dwyer, Deputy Treasurer
John H. Costello, Assistant Treasurer
Thomas J. Simpson, Assistant Treasurer
Board of Trustees
Ralph F. Cox *
Phyllis Burke Davis *
Robert M. Gates *
Edward C. Johnson 3d
Donald J. Kirk *
Ned C. Lautenbach *
Peter S. Lynch
Marvin L. Mann *
William O. McCoy *
Gerald C. McDonough *
Robert C. Pozen
Thomas R. Williams *
* Independent trustees
Advisory Board
J. Michael Cook
Abigail P. Johnson
Marie L. Knowles
General Distributor
Fidelity Distributors Corporation
Boston, MA
Transfer and Shareholder
Servicing Agent
Fidelity Service Company, Inc.
Boston, MA
Custodian
The Chase Manhattan Bank
New York, NY
Fidelity's Asset Allocation Funds
Asset ManagerSM
Asset Manager: AggressiveSM
Asset Manager: Growth®
Asset Manager: Income®
Fidelity Freedom Funds® -
Income, 2000, 2010, 2020, 2030, 2040
The Fidelity Telephone Connection
Mutual Fund 24-Hour Service
Exchanges/Redemptions
and Account Assistance 1-800-544-6666
Product Information 1-800-544-6666
Retirement Accounts 1-800-544-4774
(8 a.m. - 9 p.m.)
TDD Service 1-800-544-0118
(for the deaf and hearing impaired)
(9 a.m. - 9 p.m. Eastern time)
Fidelity Automated Service
Telephone (FAST®) (automated graphic) 1-800-544-5555
(automated graphic) Automated line for quickest service
FAA-ANN-1100 116147
1.537740.103
(Fidelity Investment logo)(registered trademark)
Corporate Headquarters
82 Devonshire St., Boston, MA 02109
www.fidelity.com
|
|