
|
|
|
|
|
|
|
|
|
|
Previous: TRIMEDYNE INC, S-2, EX-23, 2000-09-18 |
Next: MERRILL LYNCH PHOENIX FUND INC, N-30D, 2000-09-18 |
Spartan®
Semiannual Report
July 31, 2000
(2_fidelity_logos)((Registered_Trademark)
|
President's Message |
3 |
Ned Johnson on investing strategies |
|
Spartan Massachusetts Municipal Income Fund |
||
|
|
4 |
Performance |
|
|
7 |
Fund Talk: The Manager's Overview |
|
|
10 |
Investment Changes |
|
|
11 |
Investments |
|
|
23 |
Financial Statements |
|
Spartan Massachusetts Municipal Money Market Fund |
||
|
|
27 |
Performance |
|
|
29 |
Fund Talk: The Manager's Overview |
|
|
31 |
Investment Changes |
|
|
32 |
Investments |
|
|
40 |
Financial Statements |
|
Fidelity Massachusetts Municipal Money Market Fund |
||
|
|
44 |
Performance |
|
|
46 |
Fund Talk: The Manager's Overview |
|
|
48 |
Investment Changes |
|
|
49 |
Investments |
|
|
59 |
Financial Statements |
|
Notes |
63 |
Notes to the financial statements |
|
|
|
|
|
|
|
|
Standard & Poor's, S&P and S&P 500 are registered service marks of The McGraw-Hill Companies, Inc. and have been licensed for use by Fidelity Distributors Corporation.
Other third party marks appearing herein are the property of their respective owners.
All other marks appearing herein are registered or unregistered trademarks or service marks of FMR Corp. or an affiliated company.
(Recycle graphic) This report is printed on recycled paper using soy-based inks.
This report and the financial statements contained herein are submitted for the general information of the shareholders of the funds. This report is not authorized for distribution to prospective investors in the funds unless preceded or accompanied by an effective prospectus.
Mutual fund shares are not deposits or obligations of, or guaranteed by, any depository institution. Shares are not insured by the FDIC, Federal Reserve Board or any other agency, and are subject to investment risks, including possible loss of principal amount invested.
Neither the funds nor Fidelity Distributors Corporation is a bank.
For more information on any Fidelity fund, including charges and expenses, call 1-800-544-6666 for a free prospectus. Read it carefully before you invest or send money.
Semiannual Report
(photo_of_Edward_C_Johnson_3d)
Dear Shareholder:
The Federal Reserve Board's effort to keep inflation in check without over-cooling the U.S. economy has taken a toll on the stock market. Through July 2000, bellwether equity indexes such as the Dow Jones Industrial Average, NASDAQ and S&P 500® have negative returns for the year. On the other hand, fixed-income markets are enjoying strong performance. Except for high-yield, most bond sectors - corporates, mortgages, Treasuries and agencies - have returned 4%-6% year to date.
While it's impossible to predict the future direction of the markets with any degree of certainty, there are certain basic principles that can help investors plan for their future needs.
The longer your investment time frame, the less likely it is that you will be affected by short-term market volatility. A 10-year investment horizon appropriate for saving for a college education, for example, enables you to weather market cycles in a long-term fund, which may have a higher risk potential, but also has a higher potential rate of return.
An intermediate-length fund could make sense if your investment horizon is two to four years, while a short-term bond fund could be the right choice if you need your money in one or two years.
If your time horizon is less than a year, you might want to consider moving some of your bond investment into a money market fund. These funds seek income and a stable share price by investing in high-quality, short-term investments. Of course, it's important to remember that an investment in a money market fund is not insured or guaranteed by the Federal Deposit Insurance Corporation or any other government agency. Although money market funds seek to preserve the value of your investment at $1.00 per share, it is possible to lose money by investing in these types of funds.
Finally, no matter what your time horizon or portfolio diversity, it makes good sense to follow a regular investment plan, investing a certain amount of money in a fund at the same time each month or quarter and periodically reviewing your overall portfolio. By doing so, you won't get caught up in the excitement of a rapidly rising market, nor will you buy all your shares at market highs. While this strategy - known as dollar cost averaging - won't assure a profit or protect you from a loss in a declining market, it should help you lower the average cost of your purchases. Of course, you should consider your financial ability to continue your purchases through periods of low price levels before undertaking such a strategy.
If you have questions, please call us at 1-800-544-6666, or visit our web site at www.fidelity.com. We are available 24 hours a day, seven days a week to provide you the information you need to make the investments that are right for you.
Best regards,
/s/Edward C. Johnson 3d
Edward C. Johnson 3d
Semiannual Report
Spartan Massachusetts Municipal Income Fund
Performance: The Bottom Line
There are several ways to evaluate a fund's historical performance. You can look at the total percentage change in value, the average annual percentage change or the growth of a hypothetical $10,000 investment. Total return reflects the change in the value of an investment, assuming reinvestment of the fund's dividend income and capital gains (the profits earned upon the sale of securities that have grown in value). You can also look at the fund's income, as reflected in its yield, to measure performance.
Cumulative Total Returns
|
Periods ended July 31, 2000 |
Past 6 |
Past 1 |
Past 5 |
Past 10 |
|
Spartan MA Municipal Income |
6.08% |
4.00% |
32.18% |
93.89% |
|
LB Massachusetts 3 Plus Year Enhanced |
6.93% |
4.20% |
n/a* |
n/a* |
|
Massachusetts Municipal Debt Funds Average |
6.42% |
2.15% |
27.07% |
86.64% |
Cumulative total returns show the fund's performance in percentage terms over a set period - in this case, six months, one year, five years or 10 years. For example, if you had invested $1,000 in a fund that had a 5% return over the past year, the value of your investment would be $1,050. You can compare the fund's returns to the performance of the Lehman Brothers Massachusetts 3 Plus Year Enhanced Municipal Bond Index - a market value-weighted index of Massachusetts investment-grade municipal bonds with maturities of three years or more. To measure how the fund's performance stacked up against its peers, you can compare it to the Massachusetts municipal debt funds average, which reflects the performance of mutual funds with similar objectives tracked by Lipper Inc. The past six months average represents a peer group of 57 mutual funds. These benchmarks include reinvested dividends and capital gains, if any, and exclude the effect of sales charges.
Average Annual Total Returns
|
Periods ended July 31, 2000 |
|
Past 1 |
Past 5 |
Past 10 |
|
Spartan MA Municipal Income |
|
4.00% |
5.74% |
6.85% |
|
LB Massachusetts 3 Plus Year Enhanced |
|
4.20% |
n/a* |
n/a* |
|
Massachusetts Municipal Debt Funds Average |
|
2.15% |
4.90% |
6.43% |
Average annual total returns take the fund's cumulative return and show you what would have happened if the fund had performed at a constant rate each year. (Note: Lipper calculates average annual total returns by annualizing each fund's total return, then taking the arithmetic average. This may produce a different figure than that obtained by averaging the cumulative total returns and annualizing the result.)
* Not available
Semiannual Report
Spartan Massachusetts Municipal Income Fund
Performance - continued
$10,000 Over 10 Years
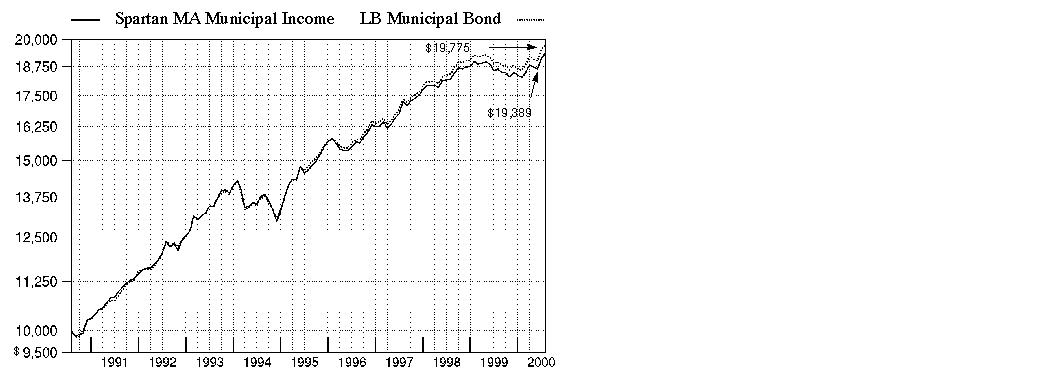
$10,000 Over 10 Years: Let's say hypothetically that $10,000 was invested in Spartan Massachusetts Municipal Income Fund on July 31, 1990. As the chart shows, by July 31, 2000, the value of the investment would have grown to $19,389 - a 93.89% increase on the initial investment. For comparison, look at how the Lehman Brothers Municipal Bond Index - a market value-weighted index of investment-grade municipal bonds with maturities of one year or more - did over the same period. With dividends and capital gains, if any, reinvested, the same $10,000 would have grown to $19,775 - a 97.75% increase.
Understanding
Performance
How a fund did yesterday is no guarantee of how it will do tomorrow. Bond prices, for example, generally move in the opposite direction of interest rates. In turn, the share price, return, and yield of a fund that invests in bonds will vary. That means if you sell your shares during a market downturn, you might lose money. But if you can ride out the market's ups and downs, you may have a gain.
3Semiannual Report
Spartan Massachusetts Municipal Income Fund
Performance - continued
Total Return Components
|
|
Six months ended July 31, |
Years ended January 31, |
||||
|
|
2000 |
2000 |
1999 |
1998 |
1997 |
1996 |
|
Dividend returns |
2.63% |
4.57% |
4.92% |
5.47% |
5.33% |
6.41% |
|
Capital returns |
3.45% |
-8.27% |
0.84% |
4.74% |
-2.27% |
8.35% |
|
Total returns |
6.08% |
-3.70% |
5.76% |
10.21% |
3.06% |
14.76% |
Total return components include both dividend returns and capital returns. A dividend return reflects the actual dividends paid by the fund. A capital return reflects both the amount paid by the fund to shareholders as capital gain distributions and changes in the fund's share price. Both returns assume the dividends or capital gains, if any, paid by the fund are reinvested.
Dividends and Yield
|
Periods ended July 31, 2000 |
Past 1 |
Past 6 |
Past 1 |
|
Dividends per share |
4.84 ¢ |
28.25 ¢ |
56.44 ¢ |
|
Annualized dividend rate |
5.02% |
5.07% |
5.03% |
|
30-day annualized yield |
5.02% |
- |
- |
|
30-day annualized tax-equivalent yield |
8.34% |
- |
- |
Dividends per share show the income paid by the fund for a set period. If you annualize this number, based on an average share price of $11.36 over the past one month, $11.18 over the past six months and $11.21 over the past one year, you can compare the fund's income over these three periods. The 30-day annualized yield is a standard formula for all bond funds based on the yields of the bonds in the fund, averaged over the past 30 days. This figure shows you the yield characteristics of the fund's investments at the end of the period. It also helps you compare funds from different companies on an equal basis. The tax-equivalent yield shows what you would have to earn on a taxable investment to equal the fund's tax-free yield, if you're in the 39.74% combined 2000 federal and state tax bracket, but does not reflect the payment of the federal alternative minimum tax, if applicable.
Semiannual Report
Spartan Massachusetts Municipal Income Fund
Fund Talk: The Manager's Overview
Market Recap
Favorable technical conditions in the municipal bond market overcame three more interest-rate hikes by the Federal Reserve Board during the six-month period ending July 31, 2000, helping municipal bonds outperform most other investments in both the fixed-income and equity markets. Municipal bond yields in the neighborhood of 6%, a diminished supply of new issues coming to market, attractive prices and strong demand from individual investors spurred the Lehman Brothers Municipal Bond Index - an index of over 35,000 investment-grade, fixed-rate, tax-exempt bonds - to a six-month return of 6.39%. That outperformed the overall taxable-bond market, as measured by the Lehman Brothers Aggregate Bond Index, which gained 5.28% in the same time frame. In fact, the six-month municipal bond return was higher than the return of corporate, mortgage, government, Treasury and agency bonds, according to their respective Lehman Brothers benchmarks. On a tax-equivalent yield basis, municipal bond outperformance was even more significant. The muni market, along with most other fixed-income sectors, also benefited from increased volatility in the equity markets, and from economic data demonstrating evidence that the Fed's effort to cool down the U.S. economy was working, perhaps signaling an end to the Fed's rate hikes for the remainder of 2000.
(Portfolio Manager photograph)
An interview with Christine Thompson, Portfolio Manager of Spartan Massachusetts Municipal Income Fund
Q. How did the fund perform, Christine?
A. For the six-month period that ended July 31, 2000, the fund had a total return of 6.08%. To get a sense of how the fund did relative to its competitors, the Massachusetts municipal debt funds average returned 6.42% for the same six-month period, according to Lipper Inc. The fund's new benchmark, the Lehman Brothers Massachusetts 3 Plus Year Enhanced Municipal Bond Index, returned 6.93%. The fund is managed to have similar overall interest-rate risk to this benchmark, which includes Massachusetts investment-grade municipal bonds with maturities of three years or more. The new benchmark was effective on July 27, 2000. It has a slightly longer duration than the previous benchmark and is more representative of the fund's investment universe. For the 12-month period that ended July 31, 2000, the fund had a total return of 4.00%. In comparison, the Massachusetts municipal debt funds average returned 2.15% and the Lehman Brothers Massachusetts 3 Plus Year Enhanced Municipal Bond Index returned 4.20% for the same 12-month period.
Semiannual Report
Spartan Massachusetts Municipal Income Fund
Fund Talk: The Manager's Overview - continued
Q. What were some of the main forces behind the fund's performance during the past six months?
A. A recent municipal bond market rally boosted municipal bond returns into positive territory for the period, despite the fact that short-term interest rates were on the rise. Beginning in the spring of 2000, investors began to anticipate that the Federal Reserve Board's yearlong campaign to stave off inflation by raising interest rates was nearing a close. Whether or not that actually proves to be the case will depend on the direction of the economy. Furthermore, demand for municipals strengthened as bargain-hunting investors sought their attractive prices and relatively high yields. In addition, the supply of municipals diminished. In Massachusetts, the supply of municipals was down 11% between January and July 2000, compared to the same seven-month period a year earlier. As a result of this supply/demand imbalance and the anticipation that rate hikes were behind us, municipal bond prices moved higher. The fund's total return was the result of better municipal bond prices plus the income generated by its holdings.
Q. What factors caused the fund to lag its peers during the six-month period?
A. The fund generally had less interest-rate sensitivity, as measured by its somewhat shorter duration, than many of its peers for the six-month period. I didn't lengthen or shorten duration based on where I thought interest rates would be at some point down the road. Instead, I positioned the fund to emphasize the best value opportunities based on their performance potential under a variety of possible interest-rate scenarios. My approach is to manage the fund's duration to be in line with the Massachusetts municipal market as a whole, an approach that may cause short-term performance comparisons to lag, but which has generated competitive long-term results.
Q. What factors aided performance?
A. The fund's focus on premium coupon bonds, which pay interest rates above face - or par - value, helped. One appealing aspect of premiums was that they were somewhat insulated from unfavorable tax treatment that negatively affected the prices of lower coupon bonds, or "discounts," as rates rose.
Q. In terms of credit quality, what choices did you make?
A. As of July 31, 2000, more than 45% of the fund's investments were in bonds with the highest credit rating of Aaa; roughly one-third of those were insured. The fund's focus on these higher-quality bonds reflected the fact that I generally didn't feel that lower-quality bonds offered enough incentive by way of additional yield for owning them.
Q. What's your outlook for municipal bonds over the next six months or so?
A. The primary factor, as always, will be the direction of interest rates. Supply and demand also will play a role. The supply of municipals has continued to decline in response to rising interest rates. Many issuers now find it too expensive to issue new or refinance old debt. As municipal bond yields rose above 6%, we saw renewed buying from individual investors. In general, municipals were cheap relative to Treasury securities, although they were more or less fairly valued compared to other types of taxable bonds. To the extent that supply remains low and demand stays firm, municipal bonds could benefit.
Semiannual Report
Spartan Massachusetts Municipal Income Fund
Fund Talk: The Manager's Overview - continued
The views expressed in this report reflect those of the portfolio manager only through the end of the period of the report as stated on the cover and do not necessarily represent the views of Fidelity or any other person in the Fidelity organization. Any such views are subject to change at any time based upon market or other conditions and Fidelity disclaims any responsibility to update such views. These views may not be relied on as investment advice and, because investment decisions for a Fidelity fund are based on numerous factors, may not be relied on as an indication of trading intent on behalf of any Fidelity fund.
Fund Facts
Goal: to provide high current income exempt from federal income tax and Massachusetts personal income tax
Fund number: 070
Trading symbol: FDMMX
Start date: November 10, 1983
Size: as of July 31, 2000, more than $1.3 billion
Manager: Christine Thompson, since 1998; manager, various Fidelity and Spartan municipal income funds; joined Fidelity in 1985
3Christine Thompson on the strength of Massachusetts' economy:
"The Massachusetts economy was quite strong during the past six months. The unemployment rate remained very low and continued to fall, while employment growth - particularly in high-growth industries such as high tech - was quite good. Massachusetts continued to add more high-paying jobs than many other states. It also benefited from a number of other favorable trends. Personal income growth - fueled mainly by strong job markets and some pockets of labor shortages - was strong, and the commercial and residential real estate markets were tight. Exports with the state's two leading trading partners - Canada and Western Europe - also accelerated.
"One of the developments that may affect the credit quality of the state down the road is the infrastructure enhancements that are underway across the state. Much attention has been paid to the funding of cost overruns associated with the Central Artery Project in Boston, commonly known as the ´Big Dig.' For that project, most of the overruns will be paid for by the state, rather than the federal, government. Other projects, including the expansion of Route 3, are beginning to employ more creative means of financing to contain costs. We'll closely monitor these and other developments to determine their potential effect on the state's credit quality."
Semiannual Report
Spartan Massachusetts Municipal Income Fund
|
Top Five Sectors as of July 31, 2000 |
||
|
|
% of fund's |
% of fund's net assets |
|
General Obligations |
22.0 |
21.7 |
|
Education |
19.7 |
16.4 |
|
Health Care |
17.1 |
18.1 |
|
Transportation |
12.4 |
8.8 |
|
Water & Sewer |
8.6 |
9.7 |
|
Average Years to Maturity as of July 31, 2000 |
||
|
|
|
6 months ago |
|
Years |
16.7 |
13.6 |
|
Average years to maturity is based on the average time remaining until principal payments are expected from each of the fund's bonds, weighted by dollar amount. |
|
Duration as of July 31, 2000 |
||
|
|
|
6 months ago |
|
Years |
6.9 |
6.4 |
|
Duration shows how much a bond fund's price fluctuates with changes in comparable interest rates. |
|
Quality Diversification (Moody's Ratings) |
As of July 31, 2000 As of January 31, 2000


|
Where Moody's ratings are not available, we have used S&P ® ratings. Amounts shown are as a percentage of the fund's investments. |
Semiannual Report
Spartan Massachusetts Municipal Income Fund
(Unaudited)
Showing Percentage of Net Assets
|
Municipal Bonds - 97.4% |
|||||
|
Moody's Ratings |
Principal Amount |
Value |
|||
|
Guam - 0.2% |
|||||
|
Guam Pwr. Auth. Rev. Rfdg. Series A, 4.25% 10/1/00 |
Baa3 |
|
$ 2,950,000 |
$ 2,946,785 |
|
|
Massachusetts - 96.6% |
|||||
|
Barnstable Gen. Oblig. 5% 3/15/14 |
Aa3 |
|
2,370,000 |
2,287,406 |
|
|
Barnstable Ind. Dev. Fing. Auth. Ind. Dev. Rev. (Whitehall Pavilion Proj.) 10.125% 2/15/26 (Fed. Hsg. Administration Insured) |
AA- |
|
2,855,000 |
2,927,917 |
|
|
Boston Economic Dev. & Ind. Corp. |
- |
|
3,660,000 |
3,692,391 |
|
|
Boston Gen. Oblig. Series A: |
|
|
|
|
|
|
5.75% 2/1/14 |
Aa3 |
|
4,190,000 |
4,323,996 |
|
|
5.75% 2/1/15 |
Aa3 |
|
4,190,000 |
4,308,242 |
|
|
5.75% 2/1/17 |
Aa3 |
|
2,460,000 |
2,505,584 |
|
|
Boston Hsg. Dev. Corp. Mtg. Rev. Rfdg. Series A, 5.15% 7/1/08 (MBIA Insured) |
Aaa |
|
2,700,000 |
2,693,115 |
|
|
Boston Wtr. & Swr. Commission Rev.: |
|
|
|
|
|
|
Rfdg. Sr. Series A, 5.75% 11/1/13 |
A1 |
|
1,575,000 |
1,656,617 |
|
|
Sr. Series A, 5.25% 11/1/19 |
A1 |
|
10,100,000 |
9,684,789 |
|
|
Sr. Series C, 5.2% 11/1/21 (FGIC Insured) |
Aaa |
|
4,000,000 |
3,743,040 |
|
|
Sr. Series D, 5% 11/1/28 (FGIC Insured) |
Aaa |
|
9,250,000 |
8,177,463 |
|
|
Brockton Gen. Oblig.: |
|
|
|
|
|
|
5% 4/1/13 (MBIA Insured) |
Aaa |
|
1,165,000 |
1,144,170 |
|
|
5.1% 4/1/12 (MBIA Insured) |
Aaa |
|
1,550,000 |
1,549,132 |
|
|
Brockton Hsg. Dev. Corp. Multi-family Rev. |
AAA |
|
7,895,000 |
8,130,903 |
|
|
Chelsea Gen. Oblig. Rfdg.: |
|
|
|
|
|
|
5% 6/15/13 (AMBAC Insured) |
Aaa |
|
2,390,000 |
2,346,813 |
|
|
5.125% 6/15/16 (AMBAC Insured) |
Aaa |
|
1,750,000 |
1,689,608 |
|
|
Fitchburg Gen. Oblig. 5.125% 2/15/14 |
Aaa |
|
2,355,000 |
2,314,800 |
|
|
Foxborough Stadium Infrastructure Impt.: |
|
|
|
|
|
|
5.75% 6/1/25 |
Aa2 |
|
10,000,000 |
10,042,600 |
|
|
6% 6/1/15 |
Aa2 |
|
2,545,000 |
2,691,261 |
|
|
6% 6/1/16 |
Aa2 |
|
3,015,000 |
3,170,453 |
|
|
6% 6/1/17 |
Aa2 |
|
3,195,000 |
3,349,031 |
|
|
6% 6/1/18 |
Aa2 |
|
3,390,000 |
3,539,262 |
|
|
6% 6/1/19 |
Aa2 |
|
3,590,000 |
3,736,149 |
|
|
6% 6/1/20 |
Aa2 |
|
3,785,000 |
3,923,417 |
|
|
Haverhill Gen. Oblig. Rfdg. Series A: |
|
|
|
|
|
|
6.4% 9/1/03 (AMBAC Insured) |
Aaa |
|
1,600,000 |
1,658,448 |
|
|
6.5% 9/1/04 (AMBAC Insured) |
Aaa |
|
1,595,000 |
1,656,120 |
|
|
Municipal Bonds - continued |
|||||
|
Moody's Ratings |
Principal Amount |
Value |
|||
|
Massachusetts - continued |
|||||
|
Holyoke Gen. Oblig.: |
|
|
|
|
|
|
(Muni. Purp. Ln. Prog.) Series A: |
|
|
|
|
|
|
5.5% 6/15/16 (FSA Insured) |
Aaa |
|
$ 2,100,000 |
$ 2,109,198 |
|
|
6% 6/15/05 (FSA Insured) |
Aaa |
|
1,350,000 |
1,426,181 |
|
|
(School Ln. Act Proj.): |
|
|
|
|
|
|
7.35% 8/1/02 (Pre-Refunded to 8/1/01 |
Baa1 |
|
1,265,000 |
1,312,311 |
|
|
7.65% 8/1/09 (Pre-Refunded to 8/1/01 |
Baa1 |
|
2,205,000 |
2,316,220 |
|
|
Rfdg. Series B, 6% 6/15/06 (FSA Insured) |
Aaa |
|
1,400,000 |
1,490,538 |
|
|
Ipswich Gen. Oblig.: |
|
|
|
|
|
|
5.5% 11/15/18 (FGIC Insured) |
Aaa |
|
2,460,000 |
2,458,745 |
|
|
5.75% 11/15/14 (FGIC Insured) |
Aaa |
|
1,100,000 |
1,149,456 |
|
|
Lowell Gen. Oblig.: |
|
|
|
|
|
|
Rfdg. Series A, 5.5% 1/15/10 (FSA Insured) |
Aaa |
|
2,000,000 |
2,054,240 |
|
|
5.8% 4/1/08 (FSA Insured) |
Aaa |
|
1,195,000 |
1,260,163 |
|
|
8.4% 1/15/09 (Pre-Refunded to 1/15/01 |
Aa3 |
|
1,250,000 |
1,295,213 |
|
|
Lowell Hsg. Dev. Corp. Multi-family Rev. Rfdg. Series A: |
|
|
|
|
|
|
7.875% 11/1/00 |
AAA |
|
130,000 |
130,389 |
|
|
7.875% 11/1/24 |
AAA |
|
5,440,000 |
5,562,998 |
|
|
Massachusetts Bay Trans. Auth.: |
|
|
|
|
|
|
Rfdg.: |
|
|
|
|
|
|
Series A: |
|
|
|
|
|
|
5.5% 3/1/12 |
Aa2 |
|
4,350,000 |
4,491,245 |
|
|
5.75% 3/1/26 (FGIC Insured) |
Aa2 |
|
5,500,000 |
5,501,485 |
|
|
6.25% 3/1/12 |
Aa2 |
|
1,500,000 |
1,650,240 |
|
|
7% 3/1/07 |
Aa2 |
|
5,000,000 |
5,610,700 |
|
|
7% 3/1/08 |
Aa2 |
|
1,000,000 |
1,134,360 |
|
|
Series B, 6.2% 3/1/16 |
Aa2 |
|
27,500,000 |
30,005,250 |
|
|
Series 1997 D, 5% 3/1/27 |
Aa2 |
|
17,135,000 |
15,224,105 |
|
|
Series 1998 B, 5% 3/1/28 |
Aa2 |
|
10,000,000 |
8,846,900 |
|
|
Series A: |
|
|
|
|
|
|
5% 3/1/23 (FGIC Insured) |
Aaa |
|
6,430,000 |
5,854,001 |
|
|
5.375% 3/1/19 |
Aa2 |
|
5,000,000 |
4,887,200 |
|
|
5.7% 3/1/09 |
Aa2 |
|
5,000,000 |
5,288,900 |
|
|
5.8% 3/1/11 |
Aa2 |
|
7,435,000 |
7,903,108 |
|
|
5.8% 3/1/12 |
Aa2 |
|
3,000,000 |
3,178,020 |
|
|
7% 3/1/21 |
Aa2 |
|
1,500,000 |
1,744,740 |
|
|
Municipal Bonds - continued |
|||||
|
Moody's Ratings |
Principal Amount |
Value |
|||
|
Massachusetts - continued |
|||||
|
Massachusetts Bay Trans. Auth.: - continued |
|
|
|
|
|
|
Series B: |
|
|
|
|
|
|
5.375% 3/1/25 (AMBAC Insured) |
Aaa |
|
$ 13,060,000 |
$ 12,452,318 |
|
|
5.5% 3/1/21 |
Aa3 |
|
4,835,000 |
4,752,708 |
|
|
6% 3/1/12 |
Aa3 |
|
7,180,000 |
7,437,475 |
|
|
Series C: |
|
|
|
|
|
|
5% 3/1/24 |
Aa2 |
|
9,900,000 |
8,958,807 |
|
|
5.5% 3/1/08 |
Aa2 |
|
2,000,000 |
2,086,760 |
|
|
5.5% 3/1/13 (FGIC Insured) |
Aaa |
|
3,000,000 |
3,095,250 |
|
|
Series D, 5% 3/1/22 |
Aa2 |
|
5,750,000 |
5,246,415 |
|
|
Massachusetts College Bldg. Auth. Proj. Rev. Rfdg. Series A, 7.5% 5/1/05 |
Aa2 |
|
3,000,000 |
3,353,520 |
|
|
Massachusetts Dev. Fin. Agcy. Rev.: |
|
|
|
|
|
|
(Eastern Nazarene College Proj.): |
|
|
|
|
|
|
5.625% 4/1/19 |
BBB- |
|
1,800,000 |
1,676,124 |
|
|
5.625% 4/1/29 |
BBB- |
|
2,000,000 |
1,802,780 |
|
|
(Higher Ed.-Smith College Issue Proj.) 5.75% 7/1/29 |
Aa1 |
|
7,000,000 |
7,013,370 |
|
|
(Regis College Proj.): |
|
|
|
|
|
|
5.25% 10/1/18 |
BBB- |
|
2,240,000 |
2,006,883 |
|
|
5.5% 10/1/28 |
BBB- |
|
5,660,000 |
5,017,873 |
|
|
Rfdg. (Clark Univ. Issue Proj.) 5% 7/1/28 |
A3 |
|
2,000,000 |
1,701,900 |
|
|
Massachusetts Ed. Ln. Auth. Ed. Ln. Rev. Series B Issue E, 5.75% 7/1/07 (AMBAC Insured) (b) |
Aaa |
|
4,235,000 |
4,340,663 |
|
|
Massachusetts Edl. Fing. Auth. Ed. Ln. Rev.: |
|
|
|
|
|
|
Issue G, 4.4% 12/1/04 (MBIA Insured) (b) |
Aaa |
|
2,950,000 |
2,837,458 |
|
|
Rfdg.: |
|
|
|
|
|
|
Issue E: |
|
|
|
|
|
|
4.85% 7/1/02 (AMBAC Insured) (b) |
Aaa |
|
925,000 |
925,296 |
|
|
5.25% 7/1/06 (AMBAC Insured) (b) |
Aaa |
|
1,815,000 |
1,813,112 |
|
|
Series A Issue E: |
|
|
|
|
|
|
4.3% 7/1/06 (AMBAC Insured) (b) |
AAA |
|
4,000,000 |
3,752,880 |
|
|
4.4% 7/1/07 (AMBAC Insured) (b) |
AAA |
|
6,275,000 |
5,869,447 |
|
|
4.55% 7/1/09 (AMBAC Insured) (b) |
AAA |
|
2,000,000 |
1,858,140 |
|
|
4.65% 7/1/10 (AMBAC Insured) (b) |
AAA |
|
4,745,000 |
4,411,332 |
|
|
4.75% 7/1/11 (AMBAC Insured) (b) |
AAA |
|
4,000,000 |
3,705,200 |
|
|
4.8% 7/1/12 (AMBAC Insured) (b) |
AAA |
|
2,110,000 |
1,947,636 |
|
|
4.95% 7/1/14 (AMBAC Insured) (b) |
AAA |
|
4,000,000 |
3,676,000 |
|
|
5% 7/1/15 (AMBAC Insured) (b) |
AAA |
|
1,880,000 |
1,723,434 |
|
|
Series A Issue G, 5.45% 12/1/06 |
AAA |
|
6,945,000 |
7,001,046 |
|
|
Municipal Bonds - continued |
|||||
|
Moody's Ratings |
Principal Amount |
Value |
|||
|
Massachusetts - continued |
|||||
|
Massachusetts Edl. Fing. Auth. Ed. Ln. Rev.: - continued |
|
|
|
|
|
|
Series A Issue G, 5% 12/1/11 |
Aaa |
|
$ 3,815,000 |
$ 3,629,820 |
|
|
Series C Issue G, 4.9% 12/1/11 |
AAA |
|
4,815,000 |
4,529,856 |
|
|
Massachusetts Gen. Oblig.: |
|
|
|
|
|
|
(Cap. Appreciation) (Consolidated Ln. Prog.) Series B: |
|
|
|
|
|
|
0% 6/1/02 (FGIC Insured) |
Aaa |
|
1,105,000 |
1,014,865 |
|
|
0% 7/1/02 |
Aa2 |
|
12,250,000 |
11,207,158 |
|
|
(Consolidated Ln. Prog.): |
|
|
|
|
|
|
Series A, 7.5% 6/1/04 |
Aa2 |
|
4,830,000 |
5,204,180 |
|
|
Series B: |
|
|
|
|
|
|
5.75% 6/1/20 |
Aa2 |
|
10,045,000 |
10,151,778 |
|
|
6% 6/1/14 |
Aa2 |
|
5,000,000 |
5,286,250 |
|
|
6% 6/1/15 |
Aa2 |
|
7,500,000 |
7,882,275 |
|
|
Series D: |
|
|
|
|
|
|
5% 11/1/14 |
Aa2 |
|
3,000,000 |
2,906,790 |
|
|
5.25% 11/1/12 |
Aa2 |
|
4,500,000 |
4,529,925 |
|
|
Series A: |
|
|
|
|
|
|
5.25% 6/15/09 |
Aa3 |
|
3,190,000 |
3,274,567 |
|
|
5.25% 6/15/12 |
Aa3 |
|
5,000,000 |
5,057,250 |
|
|
5.5% 6/15/14 |
Aa3 |
|
3,000,000 |
3,048,210 |
|
|
Series B: |
|
|
|
|
|
|
5.125% 12/15/11 |
Aa3 |
|
10,030,000 |
10,102,216 |
|
|
5.125% 12/15/12 |
Aa3 |
|
5,480,000 |
5,486,960 |
|
|
Massachusetts Health & Edl. Facilities Auth. Rev.: |
|
|
|
|
|
|
(1st Mtg. Fairview Extended Care Proj.) |
Aaa |
|
5,355,000 |
5,595,225 |
|
|
(Anna Jaques Hosp. Proj.) Series B: |
|
|
|
|
|
|
6% 10/1/00 |
Baa1 |
|
985,000 |
986,576 |
|
|
6.875% 10/1/12 |
Baa1 |
|
3,250,000 |
3,294,753 |
|
|
(Baystate Med. Ctr. Proj.): |
|
|
|
|
|
|
Series D, 5.5% 7/1/16 (FGIC Insured) |
Aaa |
|
6,400,000 |
6,384,896 |
|
|
Series E: |
|
|
|
|
|
|
6% 7/1/04 (FSA Insured) |
Aaa |
|
1,290,000 |
1,347,818 |
|
|
6% 7/1/05 (FSA Insured) |
Aaa |
|
1,385,000 |
1,458,239 |
|
|
6% 7/1/06 (FSA Insured) |
Aaa |
|
1,425,000 |
1,510,244 |
|
|
(Blood Research Institute Proj.) Series A, 6.5% 2/1/22 |
- |
|
14,475,000 |
14,715,575 |
|
|
Municipal Bonds - continued |
|||||
|
Moody's Ratings |
Principal Amount |
Value |
|||
|
Massachusetts - continued |
|||||
|
Massachusetts Health & Edl. Facilities Auth. Rev.: - continued |
|
|
|
|
|
|
(Brandeis Univ. Proj.) Series I: |
|
|
|
|
|
|
5.25% 10/1/14 (MBIA Insured) |
Aaa |
|
$ 2,780,000 |
$ 2,765,322 |
|
|
5.25% 10/1/16 (MBIA Insured) |
Aaa |
|
1,000,000 |
981,580 |
|
|
(Cape Cod Health Sys. Proj.) Series A, 5.25% 11/15/13 (AMBAC Insured) |
AAA |
|
3,500,000 |
3,455,795 |
|
|
(Caritas Christi Oblig. Group Proj.) Series A: |
|
|
|
|
|
|
5.25% 7/1/01 |
Baa2 |
|
2,000,000 |
1,997,020 |
|
|
5.25% 7/1/02 |
Baa2 |
|
2,000,000 |
1,970,400 |
|
|
5.25% 7/1/03 |
Baa2 |
|
2,000,000 |
1,951,220 |
|
|
(Dana Farber Cancer Proj.) Series G1: |
|
|
|
|
|
|
5.5% 12/1/27 |
A1 |
|
18,600,000 |
16,601,244 |
|
|
6.25% 12/1/14 |
A1 |
|
3,000,000 |
3,061,080 |
|
|
(Falmouth Hosp. Proj.) Series C, 5.5% 7/1/08 (MBIA Insured) |
Aaa |
|
1,000,000 |
1,024,170 |
|
|
(Faulkner Hosp. Proj.) Series C: |
|
|
|
|
|
|
6% 7/1/13 (Pre-Refunded to 7/1/03 @ 102) (c) |
Baa1 |
|
9,745,000 |
10,291,207 |
|
|
6% 7/1/23 (Pre-Refunded to 7/1/03 @ 102) (c) |
Baa1 |
|
6,010,000 |
6,346,861 |
|
|
(Harvard Univ. Issue Proj.) Series W, 6% 7/1/35 |
Aaa |
|
11,825,000 |
12,359,017 |
|
|
(Lahey Clinic Med. Ctr. Proj.) Series B, 5.25% 7/1/10 (MBIA Insured) |
Aaa |
|
14,120,000 |
14,217,004 |
|
|
(Lowell Gen. Hosp. Proj.) Series A, 8.4% 6/1/11 (Pre-Refunded to 6/1/01 @ 102) (c) |
A3 |
|
2,565,000 |
2,696,738 |
|
|
(Med. Academic & Scientific Proj.) Series A: |
|
|
|
|
|
|
6.25% 1/1/05 |
BBB- |
|
1,160,000 |
1,180,787 |
|
|
6.625% 1/1/15 |
BBB- |
|
5,150,000 |
5,249,344 |
|
|
(MIT Proj.) Series I1, 5.2% 1/1/28 |
Aaa |
|
7,000,000 |
6,591,550 |
|
|
(Mount Auburn Hosp. Proj.) Series B1: |
|
|
|
|
|
|
6.25% 8/15/14 (MBIA Insured) |
Aaa |
|
1,250,000 |
1,307,075 |
|
|
6.3% 8/15/24 (MBIA Insured) |
Aaa |
|
5,000,000 |
5,155,250 |
|
|
(New England Med. Ctr. Hosp. Proj.): |
|
|
|
|
|
|
Series F, 6.625% 7/1/25 (FGIC Insured) |
Aaa |
|
4,850,000 |
5,022,127 |
|
|
Series G, 5.375% 7/1/24 (MBIA Insured) |
Aaa |
|
1,000,000 |
936,730 |
|
|
(Notre Dame Health Care Ctr. Proj.) Series A: |
|
|
|
|
|
|
7.25% 10/1/01 |
- |
|
260,000 |
262,925 |
|
|
7.875% 10/1/22 |
- |
|
5,000,000 |
5,171,250 |
|
|
Municipal Bonds - continued |
|||||
|
Moody's Ratings |
Principal Amount |
Value |
|||
|
Massachusetts - continued |
|||||
|
Massachusetts Health & Edl. Facilities Auth. Rev.: - continued |
|
|
|
|
|
|
(Partners Health Care Sys. Proj.) Series A: |
|
|
|
|
|
|
5.25% 7/1/04 (FSA Insured) |
Aaa |
|
$ 2,000,000 |
$ 2,033,080 |
|
|
5.375% 7/1/24 (MBIA Insured) |
Aaa |
|
7,600,000 |
7,212,780 |
|
|
5.5% 7/1/05 (FSA Insured) |
Aaa |
|
2,000,000 |
2,058,020 |
|
|
(Simmons College Proj.) Series C, 5% 10/1/19 (MBIA Insured) |
Aaa |
|
4,190,000 |
3,882,035 |
|
|
(South Shore Hosp. Proj.): |
|
|
|
|
|
|
Series 1999 F, 5.5% 7/1/12 |
A2 |
|
2,165,000 |
2,065,843 |
|
|
Series F: |
|
|
|
|
|
|
4.75% 7/1/05 |
A2 |
|
1,275,000 |
1,214,718 |
|
|
5.125% 7/1/08 |
A2 |
|
2,000,000 |
1,898,380 |
|
|
5.25% 7/1/09 |
A2 |
|
2,120,000 |
2,017,604 |
|
|
5.625% 7/1/19 |
A2 |
|
1,000,000 |
926,890 |
|
|
5.75% 7/1/29 |
A2 |
|
3,600,000 |
3,261,060 |
|
|
(UMass Memorial Issue Proj.) Series A: |
|
|
|
|
|
|
5% 7/1/18 (AMBAC Insured) |
Aaa |
|
3,000,000 |
2,752,050 |
|
|
5.25% 7/1/14 (AMBAC Insured) |
Aaa |
|
1,000,000 |
984,160 |
|
|
(Univ. of Massachusetts Proj.) Series A, 5.875% 10/1/29 (FGIC Insured) |
Aaa |
|
5,000,000 |
5,060,700 |
|
|
(Wellesley College Proj.) Series F, 5.125% 7/1/39 |
Aa1 |
|
16,550,000 |
14,880,602 |
|
|
(Williams College Issue Proj.): |
|
|
|
|
|
|
Series F, 5.75% 7/1/19 |
Aaa |
|
3,000,000 |
3,032,160 |
|
|
Series G, 5.5% 7/1/14 |
Aaa |
|
3,665,000 |
3,726,462 |
|
|
Rfdg.: |
|
|
|
|
|
|
(Amherst College Proj.) Series G: |
|
|
|
|
|
|
5% 11/1/23 |
Aa1 |
|
5,720,000 |
5,206,973 |
|
|
5% 11/1/28 |
Aa1 |
|
8,960,000 |
7,969,293 |
|
|
5.25% 11/1/17 |
Aa1 |
|
4,670,000 |
4,549,981 |
|
|
(Boston College Issue Proj.) Series L: |
|
|
|
|
|
|
4.75% 6/1/31 |
Aa3 |
|
16,300,000 |
13,763,557 |
|
|
5% 6/1/26 |
Aa3 |
|
6,250,000 |
5,578,438 |
|
|
(Boston College Proj.) Series K, 5.375% 6/1/14 |
Aa3 |
|
8,945,000 |
9,068,441 |
|
|
(Emerson Hosp. Proj.) Series D, 5.7% 8/15/12 (FSA Insured) |
Aaa |
|
9,475,000 |
9,705,148 |
|
|
(Eye & Ear Infirmary Proj.) Series B: |
|
|
|
|
|
|
5.25% 7/1/08 (American Cap. Access Corp. Insured) |
A |
|
2,000,000 |
1,996,120 |
|
|
5.25% 7/1/09 (American Cap. Access Corp. Insured) |
A |
|
2,540,000 |
2,534,920 |
|
|
Municipal Bonds - continued |
|||||
|
Moody's Ratings |
Principal Amount |
Value |
|||
|
Massachusetts - continued |
|||||
|
Massachusetts Health & Edl. Facilities Auth. Rev.: - continued |
|
|
|
|
|
|
Rfdg.: - continued |
|
|
|
|
|
|
(Eye & Ear Infirmary Proj.) Series B: - continued |
|
|
|
|
|
|
5.25% 7/1/10 (American Cap. Access Corp. Insured) |
A |
|
$ 2,000,000 |
$ 1,988,240 |
|
|
5.25% 7/1/11 (American Cap. Access Corp. Insured) |
A |
|
3,025,000 |
2,993,843 |
|
|
(Fairview Extended Care Proj.) Series B, 4.55% 1/1/21 (MBIA Insured) |
Aaa |
|
6,400,000 |
6,346,112 |
|
|
(Harvard Univ. Proj.) Series P: |
|
|
|
|
|
|
5.6% 11/1/14 |
Aaa |
|
1,000,000 |
1,017,720 |
|
|
5.625% 11/1/28 |
Aaa |
|
1,500,000 |
1,499,310 |
|
|
(Massachusetts Gen. Hosp. Proj.) Series F, 6.25% 7/1/12 (AMBAC Insured) |
Aaa |
|
4,750,000 |
5,244,855 |
|
|
(Morton Hosp. & Med. Ctr. Proj.) Series B, 5.25% 7/1/08 (AMBAC Insured) |
AAA |
|
2,800,000 |
2,837,464 |
|
|
(Newton-Wellesley Hosp. Proj.) Series G: |
|
|
|
|
|
|
6% 7/1/12 (MBIA Insured) |
Aaa |
|
4,070,000 |
4,312,409 |
|
|
6.125% 7/1/15 (MBIA Insured) |
Aaa |
|
4,500,000 |
4,709,520 |
|
|
(Partners Health Care Sys. Proj.) Series B: |
|
|
|
|
|
|
3.85% 7/1/02 |
A1 |
|
1,000,000 |
972,260 |
|
|
3.95% 7/1/03 |
A1 |
|
1,000,000 |
957,110 |
|
|
(Wheaton College Proj.) Series C: |
|
|
|
|
|
|
5.125% 7/1/09 |
A2 |
|
1,130,000 |
1,125,740 |
|
|
5.25% 7/1/14 |
A2 |
|
2,655,000 |
2,605,298 |
|
|
5.25% 7/1/19 |
A2 |
|
2,000,000 |
1,891,840 |
|
|
5.95% 8/15/18 (FGIC Insured) |
Aaa |
|
7,900,000 |
7,997,012 |
|
|
6.55% 6/23/22 (AMBAC Insured) |
Aaa |
|
20,000,000 |
21,127,400 |
|
|
Massachusetts Hsg. Fin. Agcy. Hsg. Rev.: |
|
|
|
|
|
|
Rfdg.: |
|
|
|
|
|
|
Series 53, 5.2% 12/1/21 (MBIA Insured) (b) |
Aaa |
|
1,135,000 |
1,137,486 |
|
|
Series A, 6% 12/1/13 (MBIA Insured) |
Aaa |
|
5,525,000 |
5,659,865 |
|
|
Series 29, 6.75% 6/1/26 (b) |
Aa |
|
2,465,000 |
2,547,134 |
|
|
Series 40: |
|
|
|
|
|
|
6.6% 12/1/24 (b) |
Aa |
|
19,375,000 |
19,967,875 |
|
|
6.65% 12/1/27 (b) |
Aa |
|
6,930,000 |
7,157,304 |
|
|
Massachusetts Ind. Fin. Agcy. Poll. Cont. Rev. Rfdg. (Boston Edison Co. Proj.) Series A, 5.75% 2/1/14 |
A1 |
|
9,900,000 |
9,702,297 |
|
|
Municipal Bonds - continued |
|||||
|
Moody's Ratings |
Principal Amount |
Value |
|||
|
Massachusetts - continued |
|||||
|
Massachusetts Ind. Fin. Agcy. Resource Recovery Rev. Rfdg. (Ogden Haverhill Proj.) Series 1992 A: |
|
|
|
|
|
|
4.7% 12/1/03 |
BBB |
|
$ 3,000,000 |
$ 2,913,450 |
|
|
4.8% 12/1/04 |
BBB |
|
3,570,000 |
3,437,624 |
|
|
Massachusetts Ind. Fin. Agcy. Rev.: |
|
|
|
|
|
|
(Babson College Proj.) Series A, 5.6% 10/1/06 (MBIA Insured) |
Aaa |
|
515,000 |
538,865 |
|
|
(Cap. Appreciation) (Massachusetts Biomedical Research Corp. Proj.): |
|
|
|
|
|
|
Series A1, 0% 8/1/02 |
A1 |
|
3,650,000 |
3,319,894 |
|
|
Series A2: |
|
|
|
|
|
|
0% 8/1/03 |
A1 |
|
1,000,000 |
864,800 |
|
|
0% 8/1/05 |
A1 |
|
24,600,000 |
19,182,586 |
|
|
0% 8/1/07 |
A+ |
|
25,000,000 |
17,522,500 |
|
|
0% 8/1/08 |
A+ |
|
15,000,000 |
9,963,150 |
|
|
(Concord Academy Proj.) 6.9% 9/1/21 |
Aaa |
|
1,370,000 |
1,433,226 |
|
|
(Groton School Proj.) Series A, 5% 3/1/28 |
Aa2 |
|
5,000,000 |
4,452,650 |
|
|
(Tufts Univ. Proj.) Series H, 4.75% 2/15/28 (MBIA Insured) |
Aaa |
|
10,000,000 |
8,552,000 |
|
|
(Whitehead Institute Biomedical Research Proj.) 5.125% 7/1/26 |
Aa1 |
|
14,600,000 |
13,284,102 |
|
|
Rfdg.: |
|
|
|
|
|
|
(Lesley College Proj.) Series A, 6.3% 7/1/15 (AMBAC Insured) |
AAA |
|
2,525,000 |
2,660,264 |
|
|
(Milton Academy Proj.) Series B, 5.25% 9/1/19 (MBIA Insured) |
Aaa |
|
2,500,000 |
2,406,325 |
|
|
(Worcester Polytechnic Institute Proj.): |
|
|
|
|
|
|
5.75% 9/1/05 (MBIA Insured) |
Aaa |
|
1,340,000 |
1,404,253 |
|
|
5.75% 9/1/06 (MBIA Insured) |
Aaa |
|
1,115,000 |
1,174,831 |
|
|
5.75% 9/1/07 (MBIA Insured) |
Aaa |
|
1,000,000 |
1,057,610 |
|
|
Massachusetts Muni. Wholesale Elec. Co. Pwr. Supply Sys. Rev.: |
|
|
|
|
|
|
Rfdg.: |
|
|
|
|
|
|
Series A: |
|
|
|
|
|
|
5.1% 7/1/08 (AMBAC Insured) |
Aaa |
|
1,000,000 |
1,017,600 |
|
|
6% 7/1/18 (MBIA Insured) |
Aaa |
|
10,000,000 |
10,079,900 |
|
|
6.75% 7/1/08 |
Baa2 |
|
3,000,000 |
3,143,370 |
|
|
Series B: |
|
|
|
|
|
|
4.75% 7/1/11 (MBIA Insured) |
Aaa |
|
2,000,000 |
1,884,960 |
|
|
6.5% 7/1/02 (MBIA Insured) |
Aaa |
|
2,000,000 |
2,073,100 |
|
|
6.625% 7/1/04 |
Baa2 |
|
7,925,000 |
8,321,488 |
|
|
Municipal Bonds - continued |
|||||
|
Moody's Ratings |
Principal Amount |
Value |
|||
|
Massachusetts - continued |
|||||
|
Massachusetts Muni. Wholesale Elec. Co. Pwr. Supply Sys. Rev.: - continued |
|
|
|
|
|
|
Series B: - continued |
|
|
|
|
|
|
6.75% 7/1/08 |
Baa2 |
|
$ 6,000,000 |
$ 6,286,740 |
|
|
Series C, 6.6% 7/1/05 |
Baa2 |
|
2,075,000 |
2,175,160 |
|
|
Series B, 6.75% 7/1/17 |
Baa2 |
|
9,050,000 |
9,320,957 |
|
|
Series C, 6.625% 7/1/18 (MBIA Insured) |
Aaa |
|
10,000,000 |
10,399,600 |
|
|
Series D: |
|
|
|
|
|
|
6% 7/1/06 |
Baa2 |
|
1,000,000 |
1,036,150 |
|
|
6% 7/1/11 (MBIA Insured) |
Aaa |
|
2,000,000 |
2,067,280 |
|
|
Series E: |
|
|
|
|
|
|
6% 7/1/06 |
Baa2 |
|
1,640,000 |
1,699,286 |
|
|
6% 7/1/11 (MBIA Insured) |
Aaa |
|
3,000,000 |
3,100,920 |
|
|
Massachusetts Port Auth. Rev.: |
|
|
|
|
|
|
(Spl. Facilities-US Air Proj.) Series A, 5.5% 9/1/10 (MBIA Insured) (b) |
Aaa |
|
2,030,000 |
2,085,987 |
|
|
Rfdg. Series A: |
|
|
|
|
|
|
5% 7/1/13 |
Aa3 |
|
5,000,000 |
4,891,150 |
|
|
5% 7/1/23 |
Aa3 |
|
8,750,000 |
7,854,613 |
|
|
5.5% 7/1/09 |
Aa3 |
|
3,160,000 |
3,240,548 |
|
|
5.5% 7/1/17 |
Aa3 |
|
2,105,000 |
2,103,842 |
|
|
Series B: |
|
|
|
|
|
|
5.5% 7/1/10 (FSA Insured) (b) |
Aaa |
|
11,470,000 |
11,844,610 |
|
|
5.5% 7/1/11 (FSA Insured) (b) |
Aaa |
|
5,500,000 |
5,647,400 |
|
|
5.5% 7/1/12 (FSA Insured) (b) |
Aaa |
|
4,000,000 |
4,080,400 |
|
|
5.5% 7/1/14 (FSA Insured) (b) |
Aaa |
|
5,335,000 |
5,358,474 |
|
|
Series C, 5.75% 7/1/29 |
Aa3 |
|
5,000,000 |
4,997,350 |
|
|
5.625% 7/1/12 (Escrowed to Maturity) (c) |
Aaa |
|
1,755,000 |
1,818,320 |
|
|
Massachusetts Tpk. Auth. Metro. Hwy. Sys. Rev. Series A: |
|
|
|
|
|
|
5% 1/1/37 (MBIA Insured) |
Aaa |
|
60,750,000 |
53,419,288 |
|
|
5.125% 1/1/23 (MBIA Insured) |
Aaa |
|
10,000,000 |
9,240,700 |
|
|
Massachusetts Tpk. Auth. Western Tpk. |
Aaa |
|
52,360,000 |
52,256,327 |
|
|
Massachusetts Wtr. Poll. Abatement Trust Rev. |
|
|
|
|
|
|
Series 3: |
|
|
|
|
|
|
5.4% 2/1/10 |
Aaa |
|
1,700,000 |
1,755,165 |
|
|
5.5% 2/1/13 |
Aaa |
|
6,715,000 |
6,848,091 |
|
|
Series 4: |
|
|
|
|
|
|
5.125% 8/1/11 |
Aaa |
|
3,245,000 |
3,267,683 |
|
|
5.125% 8/1/14 |
Aaa |
|
2,205,000 |
2,166,589 |
|
|
Municipal Bonds - continued |
|||||
|
Moody's Ratings |
Principal Amount |
Value |
|||
|
Massachusetts - continued |
|||||
|
Massachusetts Wtr. Poll. Abatement Trust Wtr. Poll. Abatement Rev. (MWRA Ln. Prog.) Series A: |
|
|
|
|
|
|
5% 8/1/15 |
Aa1 |
|
$ 50,000 |
$ 47,949 |
|
|
5% 8/1/15 (Escrowed to Maturity) (c) |
Aa1 |
|
950,000 |
919,809 |
|
|
5.25% 8/1/12 |
Aa1 |
|
565,000 |
571,305 |
|
|
5.25% 8/1/13 |
Aa1 |
|
330,000 |
330,350 |
|
|
5.375% 8/1/16 |
Aa1 |
|
125,000 |
123,720 |
|
|
5.45% 2/1/13 |
Aa1 |
|
140,000 |
141,267 |
|
|
5.45% 2/1/13 (Escrowed to Maturity) (c) |
Aa1 |
|
1,960,000 |
2,013,684 |
|
|
Massachusetts Wtr. Resources Auth. Rev.: |
|
|
|
|
|
|
Rfdg.: |
|
|
|
|
|
|
Series A, 5.75% 8/1/39 (FGIC Insured) |
Aaa |
|
15,250,000 |
15,243,900 |
|
|
Series B: |
|
|
|
|
|
|
5% 3/1/22 |
A1 |
|
13,000,000 |
11,727,040 |
|
|
5.5% 8/1/15 (FSA Insured) |
Aaa |
|
1,500,000 |
1,539,855 |
|
|
5.5% 8/1/16 (FSA Insured) |
Aaa |
|
1,425,000 |
1,452,146 |
|
|
5.875% 11/1/04 |
A1 |
|
1,975,000 |
2,059,313 |
|
|
6% 11/1/08 |
A1 |
|
4,500,000 |
4,688,235 |
|
|
6.25% 11/1/10 |
A1 |
|
4,930,000 |
5,156,731 |
|
|
Series C, 4.75% 12/1/23 |
A1 |
|
13,000,000 |
11,234,470 |
|
|
Series A, 6.5% 7/15/19 |
A1 |
|
16,960,000 |
18,897,510 |
|
|
Mendon Upton Reg'l. School District 5.25% 6/1/11 (FGIC Insured) |
Aaa |
|
1,435,000 |
1,457,429 |
|
|
Methuen Gen. Oblig. 5% 11/1/16 |
Aaa |
|
1,500,000 |
1,427,415 |
|
|
Nantucket Gen. Oblig. Rfdg. 5% 7/15/17 (MBIA Insured) |
Aaa |
|
5,000,000 |
4,725,550 |
|
|
New England Ed. Ln. Marketing Corp.
Massachusetts Rfdg. (Student Ln. Prog.) |
Aa2 |
|
15,555,000 |
15,950,253 |
|
|
New England Ed. Ln. Marketing Corp. Massachusetts Student Ln. Rev.: |
|
|
|
|
|
|
Issue A, 5.8% 3/1/02 |
Aaa |
|
37,155,000 |
37,722,728 |
|
|
Sub Issue C, 6.75% 9/1/02 (b) |
A |
|
1,250,000 |
1,282,188 |
|
|
North Attleborough Gen. Oblig. Rfdg. 5.25% 11/1/13 (AMBAC Insured) |
Aaa |
|
1,000,000 |
1,001,850 |
|
|
Pentucket Reg'l. School District: |
|
|
|
|
|
|
5.1% 2/15/13 (MBIA Insured) |
Aaa |
|
575,000 |
570,067 |
|
|
5.1% 2/15/14 (MBIA Insured) |
Aaa |
|
525,000 |
516,773 |
|
|
Randolph Gen. Oblig. 5.5% 4/1/20 |
Aaa |
|
1,600,000 |
1,590,256 |
|
|
Municipal Bonds - continued |
|||||
|
Moody's Ratings |
Principal Amount |
Value |
|||
|
Massachusetts - continued |
|||||
|
South Essex Swr. District Rfdg. Series A: |
|
|
|
|
|
|
5.25% 6/15/24 (MBIA Insured) |
Aaa |
|
$ 2,810,000 |
$ 2,649,437 |
|
|
6% 6/15/05 (MBIA Insured) |
Aaa |
|
1,175,000 |
1,241,305 |
|
|
6% 6/15/06 (MBIA Insured) |
Aaa |
|
2,305,000 |
2,454,064 |
|
|
Southern Berkshire Reg'l. School District 7% 4/15/11 (MBIA Insured) |
Aaa |
|
4,000,000 |
4,241,160 |
|
|
Taunton Ind. Dev. Fin. Auth. Ind. Dev. Rev. |
A1 |
|
2,400,000 |
2,464,176 |
|
|
Westfield Gen. Oblig. (Muni. Purp. Ln. Prog.) 5% 9/1/13 (FSA Insured) |
Aaa |
|
750,000 |
736,320 |
|
|
Winchendon School Proj. Ln. 6.05% 3/15/12 (AMBAC Insured) |
Aaa |
|
1,275,000 |
1,325,771 |
|
|
Woods Hole Martha's Vineyard & Nantucket Steamship Rfdg. Series A, 5.125% 3/1/11 |
Aa2 |
|
1,100,000 |
1,099,901 |
|
|
Worcester Gen. Oblig. (Muni. Purp. Ln. Prog.) Series A: |
|
|
|
|
|
|
5.5% 4/1/11 (FSA Insured) |
Aaa |
|
1,350,000 |
1,408,010 |
|
|
5.75% 4/1/12 (FSA Insured) |
Aaa |
|
2,935,000 |
3,107,079 |
|
|
|
1,294,441,285 |
||||
|
Puerto Rico - 0.6% |
|||||
|
Puerto Rico Commonwealth Gen. Oblig. |
Aaa |
|
5,500,000 |
5,079,745 |
|
|
Puerto Rico Commonwealth Hwy. & Trans. Auth. Trans. Rev. Series B, 6% 7/1/39 |
Baa1 |
|
3,000,000 |
3,088,110 |
|
|
|
8,167,855 |
||||
|
TOTAL INVESTMENT PORTFOLIO - 97.4% (Cost $1,289,602,081) |
1,305,555,925 |
|
|
NET OTHER ASSETS - 2.6% |
34,689,055 |
|
|
NET ASSETS - 100% |
$ 1,340,244,980 |
|
|
Legend |
|
(a) S&P credit ratings are used in the absence of a rating by Moody's Investors Service, Inc. |
|
(b) Private activity obligations whose interest is subject to the federal alternative minimum tax for individuals. |
|
(c) Security collateralized by an amount sufficient to pay interest and principal. |
|
Other Information |
|
The composition of long-term debt holdings as a percentage of total value of investments in securities, is as follows (ratings are unaudited): |
|
Moody's Ratings |
S&P Ratings |
|||
|
Aaa, Aa, A |
83.4% |
|
AAA, AA, A |
82.7% |
|
Baa |
5.2% |
|
BBB |
4.9% |
|
Ba |
0.0% |
|
BB |
0.0% |
|
B |
0.0% |
|
B |
0.0% |
|
Caa |
0.0% |
|
CCC |
0.0% |
|
Ca, C |
0.0% |
|
CC, C |
0.0% |
|
|
|
|
D |
0.0% |
|
The percentage not rated by Moody's or S&P amounted to 1.8%. |
|
The distribution of municipal securities by revenue source, as a percentage of total net assets, is as follows: |
|
General Obligations |
22.0% |
|
Education |
19.7 |
|
Health Care |
17.1 |
|
Transportation |
12.4 |
|
Water & Sewer |
8.6 |
|
Electric Utilities |
5.7 |
|
Others* (individually less than 5%) |
14.5 |
|
|
100.0% |
|
* Includes short-term investments |
|
Income Tax Information |
|
At July 31, 2000, the aggregate cost |
See accompanying notes which are an integral part of the financial statements.
Semiannual Report
Spartan Massachusetts Municipal Income Fund
Statement of Assets and Liabilities
|
|
July 31, 2000 (Unaudited) |
|
|
Assets |
|
|
|
Investment in securities, at value (cost $1,289,602,081) - See accompanying schedule |
|
$ 1,305,555,925 |
|
Cash |
|
33,196,092 |
|
Receivable for investments sold |
|
9,627,929 |
|
Receivable for fund shares sold |
|
1,054,119 |
|
Interest receivable |
|
15,666,697 |
|
Other receivables |
|
49,335 |
|
Total assets |
|
1,365,150,097 |
|
Liabilities |
|
|
|
Payable for investments purchased |
$ 22,010,694 |
|
|
Payable for fund shares redeemed |
932,580 |
|
|
Distributions payable |
1,554,080 |
|
|
Accrued management fee |
407,763 |
|
|
Total liabilities |
|
24,905,117 |
|
Net Assets |
|
$ 1,340,244,980 |
|
Net Assets consist of: |
|
|
|
Paid in capital |
|
$ 1,331,798,577 |
|
Distributions in excess of net interest income |
|
(385,046) |
|
Accumulated undistributed net realized gain (loss) |
|
(7,122,395) |
|
Net unrealized appreciation (depreciation) on investments |
|
15,953,844 |
|
Net Assets, for 117,570,865 shares outstanding |
|
$ 1,340,244,980 |
|
Net Asset Value, offering price and redemption price per share ($1,340,244,980 ÷ 117,570,865 shares) |
|
$11.40 |
See accompanying notes which are an integral part of the financial statements.
Semiannual Report
Spartan Massachusetts Municipal Income Fund
Financial Statements - continued
Statement of Operations
|
|
Six months ended July 31, 2000 (Unaudited) |
|
|
Interest Income |
|
$ 35,351,580 |
|
Expenses |
|
|
|
Management fee |
$ 2,391,493 |
|
|
Transfer agent fees |
474,883 |
|
|
Accounting fees and expenses |
155,012 |
|
|
Non-interested trustees' compensation |
2,207 |
|
|
Custodian fees and expenses |
13,316 |
|
|
Registration fees |
23,067 |
|
|
Audit |
17,753 |
|
|
Legal |
16,052 |
|
|
Miscellaneous |
11,305 |
|
|
Total expenses before reductions |
3,105,088 |
|
|
Expense reductions |
(259,773) |
2,845,315 |
|
Net interest income |
|
32,506,265 |
|
Realized and Unrealized Gain (Loss) Net realized gain (loss) on investment securities |
|
(585,654) |
|
Change in net unrealized appreciation (depreciation) |
|
44,217,533 |
|
Net gain (loss) |
|
43,631,879 |
|
Net increase (decrease) in net assets resulting |
|
$ 76,138,144 |
|
Other information |
|
|
|
Expense reductions: |
|
$ 12,185 |
|
Transfer agent credits |
|
226,639 |
|
Accounting credits |
|
20,949 |
|
|
|
$ 259,773 |
See accompanying notes which are an integral part of the financial statements.
Semiannual Report
Spartan Massachusetts Municipal Income Fund
Financial Statements - continued
Statement of Changes in Net Assets
|
|
Six months ended
July 31, 2000 |
Year ended
January 31, |
|
Increase (Decrease) in Net Assets |
|
|
|
Operations |
$ 32,506,265 |
$ 66,743,817 |
|
Net realized gain (loss) |
(585,654) |
2,731,736 |
|
Change in net unrealized appreciation (depreciation) |
44,217,533 |
(121,641,113) |
|
Net increase (decrease) in net assets resulting |
76,138,144 |
(52,165,560) |
|
Distributions to shareholders |
(32,223,647) |
(65,874,659) |
|
From net realized gain |
- |
(2,917,419) |
|
Total distributions |
(32,223,647) |
(68,792,078) |
|
Share transactions |
240,038,235 |
428,856,656 |
|
Reinvestment of distributions |
23,037,351 |
50,405,206 |
|
Cost of shares redeemed |
(217,194,460) |
(502,589,047) |
|
Net increase (decrease) in net assets resulting |
45,881,126 |
(23,327,185) |
|
Total increase (decrease) in net assets |
89,795,623 |
(144,284,823) |
|
Net Assets |
|
|
|
Beginning of period |
1,250,449,357 |
1,394,734,180 |
|
End of period (including distributions in excess |
$ 1,340,244,980 |
$ 1,250,449,357 |
|
Other Information Shares |
|
|
|
Sold |
21,465,203 |
37,090,556 |
|
Issued in reinvestment of distributions |
2,055,530 |
4,390,234 |
|
Redeemed |
(19,469,595) |
(43,811,523) |
|
Net increase (decrease) |
4,051,138 |
(2,330,733) |
See accompanying notes which are an integral part of the financial statements.
Semiannual Report
|
Financial Highlights |
Six months ended July 31, 2000 |
Years ended January 31, |
||||
|
|
(Unaudited) |
2000 |
1999 |
1998 |
1997 |
1996 |
|
Selected Per-Share Data |
|
|
|
|
|
|
|
Net asset value, beginning of period |
$ 11.020 |
$ 12.040 |
$ 11.970 |
$ 11.430 |
$ 11.700 |
$ 10.800 |
|
Income from Investment Operations |
.285 D |
.565 D |
.571 |
.593 |
.605 |
.652 |
|
Net realized and unrealized |
.378 |
(1.000) |
.100 |
.542 |
(.266) |
.902 |
|
Total from investment operations |
.663 |
(.435) |
.671 |
1.135 |
.339 |
1.554 |
|
Less Distributions |
|
|
|
|
|
|
|
From net interest income |
(.283) |
(.560) |
(.571) |
(.593) |
(.605) |
(.654) |
|
From net realized gain |
- |
(.025) |
(.030) |
(.002) |
(.004) |
- |
|
Total distributions |
(.283) |
(.585) |
(.601) |
(.595) |
(.609) |
(.654) |
|
Net asset value, end of period |
$ 11.400 |
$ 11.020 |
$ 12.040 |
$ 11.970 |
$ 11.430 |
$ 11.700 |
|
Total Return B, C |
6.08% |
(3.70)% |
5.76% |
10.21% |
3.06% |
14.76% |
|
Ratios and Supplemental Data |
|
|
|
|
|
|
|
Net assets, end of period (000 omitted) |
$ 1,340,245 |
$ 1,250,449 |
$ 1,394,734 |
$ 1,232,151 |
$ 1,127,851 |
$ 1,170,207 |
|
Ratio of expenses to average net assets |
.49% A |
.49% |
.51% |
.53% |
.56% |
.55% |
|
Ratio of expenses to average net assets after expense reductions |
.45% A, E |
.48% E |
.51% |
.53% |
.56% |
.54% E |
|
Ratio of net interest income to average net assets |
5.13% A |
4.91% |
4.80% |
5.10% |
5.29% |
5.80% |
|
Portfolio turnover rate |
34% A |
22% |
12% |
21% |
44% |
33% |
A Annualized
B Total returns for periods of less than one year are not annualized.
C The total returns would have been lower had certain expenses not been reduced during the periods shown.
D Net interest income per share has been calculated based on average shares outstanding during the period.
E FMR or the fund has entered into varying arrangements with third parties who either paid or reduced a portion of the fund's expenses.
See accompanying notes which are an integral part of the financial statements.
Spartan Massachusetts Municipal Money Market Fund
Performance: The Bottom Line
To evaluate a money market fund's historical performance, you can look at either total return or yield. Total return reflects the change in the value of an investment, assuming reinvestment of the fund's dividend income, and does not include the effect of the fund's $5 account closeout fee on an average size account. Yield measures the income paid by a fund. Since a money market fund tries to maintain a $1 share price, yield is an important measure of performance. If Fidelity had not reimbursed certain fund expenses, the life of fund total returns would have been lower.
Cumulative Total Returns
|
Periods ended July 31, 2000 |
Past 6 |
Past 1 |
Past 5 |
Life of |
|
Spartan MA Municipal Money Market |
1.75% |
3.29% |
16.41% |
31.64% |
|
Massachusetts Tax-Free Retail |
1.66% |
3.08% |
15.56% |
n/a* |
Cumulative total returns show the fund's performance in percentage terms over a set period - in this case, six months, one year, five years or since the fund started on March 4, 1991. For example, if you had invested $1,000 in a fund that had a 5% return over the past year, the value of your investment would be $1,050. To measure how the fund's performance stacked up against its peers, you can compare it to the Massachusetts tax-free retail money market funds average, which reflects the performance of tax-free retail money market funds with similar objectives tracked by iMoneyNet, Inc. The past six months average represents a peer group of 11 money market funds.
Average Annual Total Returns
|
Periods ended July 31, 2000 |
|
Past 1 |
Past 5 |
Life of |
|
Spartan MA Municipal Money Market |
|
3.29% |
3.09% |
2.96% |
|
Massachusetts Tax-Free Retail |
|
3.08% |
2.93% |
n/a* |
Average annual total returns take the fund's cumulative return and show you what would have happened if the fund had performed at a constant rate each year.
* Not available
Semiannual Report
Spartan Massachusetts Municipal Money Market Fund
Performance - continued
Yields
|
|
7/31/00 |
5/1/00 |
1/31/00 |
11/1/99 |
8/2/99 |
|
|
|
|
|
|
|
|
Spartan Massachusetts |
3.63% |
4.00% |
2.85% |
2.95% |
2.63% |
|
|
|
|
|
|
|
|
Massachusetts |
3.47% |
3.49% |
2.61% |
2.68% |
2.46% |
|
|
|
|
|
|
|
|
Spartan Massachusetts |
6.05% |
6.66% |
4.73% |
4.90% |
4.37% |
|
|
|
|
|
|
|
|
Portion of fund's income |
7.70% |
3.66% |
4.15% |
7.28% |
4.08% |
Yield refers to the income paid by the fund over a given period. Yields for money market funds are usually for seven-day periods, expressed as annual percentage rates. A yield that assumes income earned is reinvested or compounded is called an effective yield. The table above shows the fund's current seven-day yield at quarterly intervals over the past year. You can compare these yields to the Massachusetts tax-free retail money market funds average as tracked by iMoneyNet, Inc. Or you can look at the fund's tax-equivalent yield, which is based on a combined effective 2000 federal and state income tax rate of 39.74%. The fund's yields mentioned above reflect that a portion of the fund's income was subject to state taxes. A portion of the fund's income may be subject to the federal alternative minimum tax.
A money market fund's total returns and yields will vary, and reflect past results rather than predict future performance.
Comparing
Performance
Yields on tax-free investments are usually lower than yields on taxable investments. However, a straight comparison between the two may be misleading because it ignores the way taxes reduce taxable returns. Tax-equivalent yield - the yield you'd have to earn on a similar taxable investment to match the tax-free yield - makes the comparison more meaningful. Keep in mind that the U.S. government neither insures nor guarantees a money market fund. In fact, there is no assurance that a money market fund will maintain a $1 share price.
3Semiannual Report
Spartan Massachusetts Municipal Money Market Fund
Fund Talk: The Manager's Overview
Note to shareholders: Norm Lind became Portfolio Manager of Spartan Massachusetts Municipal Money Market Fund on July 1, 2000.
(Portfolio Manager photograph)
Q. Norm, what was the investment environment like during the six months that ended July 31, 2000?
A. In the first half of 2000, the backdrop seemed ripe for the build-up of inflationary pressures. Economic growth was robust, unemployment reached historic lows and consumer spending was strong. To dampen growth and keep inflation at bay, the Federal Reserve Board continued its program of short-term interest-rate hikes. As the period progressed, market participants tried to gauge the pace of the Fed's tightening monetary policy approach. Through the second quarter of 2000, inflation remained subdued despite strong growth. As a result, the Fed followed a deliberate approach, raising the rate banks charge each other for overnight loans - known as the fed funds target rate - by increments of 0.25 percentage points in February and March. In April and May, though, there was a general recognition of inflationary pressures and the employment cost index - a broad measure of the costs incurred by businesses for wages and benefits - posted a higher-than-expected gain. In response, the Fed became more aggressive at its May meeting, raising the fed funds target rate by 0.50 percentage points, to 6.50%. At its June meeting, the Fed chose to keep rates unchanged after seeing some signs of an economic slowdown. Nevertheless, the Fed also indicated it was more likely to raise, not lower, rates in the future.
Q. How was the fund managed during this period?
A. For most of the first half of 2000, the fund held a significant weighting in variable-rate demand notes (VRDNs). Yields on these instruments are reset at regular intervals, usually daily or weekly. This approach helped the fund capture higher market yields as the Fed continued to raise short-term rates. Holding a large percentage in VRDNs also helped boost the fund's performance in April and early May, due to a unique circumstance. With the run-up in the equity market in 1999, many investors earned more capital gains than usual and needed to pay higher tax bills. As a result, investors redeemed shares of money market funds to pay their taxes. Fund managers, in turn, sold VRDNs to meet redemptions. Dealers of VRDNs were therefore forced to raise yields - in some cases as high as levels seen in taxable markets - to attract buyers, and the fund took advantage of these buying opportunities to add yield. In June, this strategy shifted as Massachusetts issuers came to market with one-year fixed-rate notes. My predecessor and I worked to focus more of the fund on one-year paper. Even though this paper did not offer significantly higher yields than shorter-term alternatives, we believed that their yields would, in the long run, prove to be attractive given our interest-rate outlook.
Semiannual Report
Spartan Massachusetts Municipal Money Market Fund
Fund Talk: The Manager's Overview - continued
Q. How did the fund perform?
A. The fund's seven-day yield on July 31, 2000, was 3.63%, compared to 2.85% six months ago. The more recent seven-day yield was the equivalent of a 6.05% taxable rate of return for Massachusetts investors in the 39.74% combined state and federal income tax bracket. Through July 31, 2000, the fund's six-month total return was 1.75%, compared to 1.66% for the Massachusetts tax-free retail money market funds average, according to iMoneyNet, Inc.
Q. What is your outlook, Norm?
A. Market rates currently reflect the sentiment that perhaps the Fed has completed its latest round of interest-rate hikes. While I don't believe we'll see as many rate hikes as I expected at the beginning of 2000, I do believe there is a strong chance we will see further rate hikes this year. That's because I don't believe the Fed has slowed economic growth significantly. As a result, I remain somewhat cautious, and will look for opportunities in investments that compensate the fund for the possibility of further Fed rate hikes. We will continue to watch emerging data carefully, especially those regarding employment and inflation. If any signs emerge that economic growth continues to be robust, I believe the Fed will err on the side of being more aggressive, raising rates again in order to slow growth and stifle inflationary pressures.
The views expressed in this report reflect those of the portfolio manager only through the end of the period of the report as stated on the cover and do not necessarily represent the views of Fidelity or any other person in the Fidelity organization. Any such views are subject to change at any time based upon market or other conditions and Fidelity disclaims any responsibility to update such views. These views may not be relied on as investment advice and, because investment decisions for a Fidelity fund are based on numerous factors, may not be relied on as an indication of trading intent on behalf of any Fidelity fund.
Fund Facts
Goal: high level of current income, exempt from federal income tax and Massachusetts personal income tax, as is consistent with preservation of capital
Fund number: 426
Trading symbol: FMSXX
Start date: March 4, 1991
Size: as of July 31, 2000, more than $844 million
Manager: Norm Lind, since July 2000; manager, various Fidelity and Spartan municipal money market funds; joined Fidelity in 1986
3Semiannual Report
Spartan Massachusetts Municipal Money Market Fund
|
Maturity Diversification |
|||
|
Days |
% of fund's
investments |
% of fund's investments 1/31/00 |
% of fund's |
|
0 - 30 |
71.2 |
65.0 |
62.9 |
|
31 - 90 |
14.4 |
17.5 |
18.8 |
|
91 - 180 |
4.6 |
5.8 |
6.2 |
|
181 - 397 |
9.8 |
11.7 |
12.1 |
|
Weighted Average Maturity |
|||
|
|
7/31/00 |
1/31/00 |
7/31/99 |
|
Spartan Massachusetts Municipal Money Market Fund |
42 Days |
54 Days |
53 Days |
|
Massachusetts Tax-Free Money Market Funds Average * |
41 Days |
50 Days |
50 Days |
|
Asset Allocation (% of fund's net assets) |
|||||||
|
As of July 31, 2000 |
As of January 31, 2000 |
||||||
 |
Variable Rate |
|
|
Variable Rate |
|
||
 |
Commercial Paper
(including |
|
|
Commercial Paper
(including |
|
||
 |
Tender Bonds 0.0% |
|
|
Tender Bonds 0.8% |
|
||
 |
Municipal Notes 20.6% |
|
|
Municipal Notes 22.9% |
|
||
 |
Municipal Money |
|
|
Municipal Money |
|
||
 |
Other Investments |
|
|
Other Investments |
|
||

*Source: iMoneyNet, Inc.®
Semiannual Report
Spartan Massachusetts Municipal Money Market Fund
(Unaudited)
Showing Percentage of Net Assets
|
Municipal Securities - 99.2% |
|||
|
Principal Amount |
Value |
||
|
Massachusetts - 92.0% |
|||
|
Acton & Boxborough Reg'l. School District BAN 4.25% 12/14/00 |
$ 3,000,000 |
$ 3,003,939 |
|
|
Beverly Gen. Oblig. BAN 4.5% 9/14/00 |
5,800,000 |
5,804,768 |
|
|
Billerica Gen. Oblig. BAN 5% 7/13/01 |
3,100,000 |
3,117,739 |
|
|
Boston Gen. Oblig. Bonds Series A, 5% 2/1/01 |
2,800,000 |
2,811,562 |
|
|
Boston Ind. Dev. Rev. (New Boston Seafood Ctr. Proj.) |
600,000 |
600,000 |
|
|
Boston Wtr. & Swr. Commission Rev. Participating VRDN Series SG 75, 4.18% (Liquidity Facility Societe Generale) (a)(f) |
5,100,000 |
5,100,000 |
|
|
Bourne Gen. Oblig. BAN 4.5% 9/29/00 |
3,612,000 |
3,614,434 |
|
|
Bridgewater Gen. Oblig. BAN 4.25% 1/19/01 |
2,900,000 |
2,900,639 |
|
|
Brockton Area Transit Auth. BAN 5% 8/3/01 |
2,000,000 |
2,006,860 |
|
|
Chelmsford Gen. Oblig. BAN 5% 3/1/01 |
2,150,000 |
2,154,835 |
|
|
East Longmeadow Gen. Oblig. BAN 4.5% 2/1/01 |
3,100,000 |
3,104,486 |
|
|
Foxborough Gen. Oblig. BAN 4.25% 11/15/00 |
2,200,000 |
2,202,268 |
|
|
Gloucester Gen. Oblig. BAN 4% 8/3/00 |
3,000,000 |
3,000,079 |
|
|
Harvard Univ. Participating VRDN Series 962101, 4.23% (Liquidity Facility Citibank NA, New York) (a)(f) |
5,975,000 |
5,975,000 |
|
|
Hingham Gen. Oblig. BAN: |
|
|
|
|
4.25% 9/28/00 |
7,520,000 |
7,526,087 |
|
|
4.25% 11/15/00 |
2,700,000 |
2,702,854 |
|
|
Holliston Gen. Oblig. BAN: |
|
|
|
|
4.25% 9/21/00 |
2,465,000 |
2,466,754 |
|
|
4.25% 12/13/00 |
4,900,000 |
4,906,386 |
|
|
Hopkinton Gen. Oblig. BAN 4% 8/25/00 |
9,000,000 |
9,001,771 |
|
|
Lexington Gen. Oblig. BAN 4.5% 2/15/01 |
6,350,000 |
6,363,844 |
|
|
Littleton Gen. Oblig. BAN 5% 5/4/01 |
3,555,000 |
3,569,906 |
|
|
Ludlow Gen. Oblig. BAN: |
|
|
|
|
4.5% 2/14/01 |
2,800,000 |
2,805,063 |
|
|
5% 7/13/01 |
5,200,000 |
5,230,695 |
|
|
Marion Gen. Oblig. BAN 4.25% 9/28/00 |
3,000,000 |
3,002,341 |
|
|
Marshfield Gen. Oblig. BAN 4.25% 9/8/00 |
3,100,000 |
3,101,246 |
|
|
Massachusetts Bay Trans. Auth.: |
|
|
|
|
Bonds: |
|
|
|
|
Series A, 7% 3/1/11 (Pre-Refunded to 3/1/01 @ 102) (e) |
5,255,000 |
5,439,907 |
|
|
Series D, 5% 3/1/01 |
3,335,000 |
3,349,992 |
|
|
Participating VRDN: |
|
|
|
|
Series Merlots 00 H, 4.34% (Liquidity Facility First Union Nat'l. Bank, North Carolina) (a)(f) |
8,400,000 |
8,400,000 |
|
|
Municipal Securities - continued |
|||
|
Principal Amount |
Value |
||
|
Massachusetts - continued |
|||
|
Massachusetts Bay Trans. Auth.: - continued |
|
|
|
|
Participating VRDN: |
|
|
|
|
Series Putters 112, 4.23% (Liquidity Facility Morgan Guaranty Trust Co., NY) (a)(f) |
$ 1,910,000 |
$ 1,910,000 |
|
|
RAN Series 1999 B, 4.25% 9/1/00 |
8,400,000 |
8,399,641 |
|
|
4.25% (Liquidity Facility Westdeutsche Landesbank Girozentrale), VRDN (a) |
44,900,000 |
44,900,001 |
|
|
Massachusetts Bay Transit Auth. Rev. Participating VRDN Series 992101, 4.23% (Liquidity Facility Citibank NA, New York) (a)(f) |
4,645,000 |
4,645,000 |
|
|
Massachusetts Dev. Fin. Agcy. Ind. Dev. Rev.: |
|
|
|
|
(Charm Sciences, Inc. Proj.) Series 1999 A, 4.35%, |
1,600,000 |
1,600,000 |
|
|
(Monkiewicz Realty Trust Proj.) 4.4%, (Kayem Foods, Inc.) LOC Fleet Bank NA, VRDN (a)(d) |
1,850,000 |
1,850,000 |
|
|
Massachusetts Dev. Fin. Agcy. Rev.: |
|
|
|
|
(Boston Renaissance Charter School Proj.) Series 1999, 4.28%, LOC BankBoston NA, VRDN (a) |
5,000,000 |
5,000,000 |
|
|
(Carleton-Willard Village Proj.) 4.25%, LOC Fleet Nat'l. Bank, VRDN (a) |
4,400,000 |
4,400,000 |
|
|
(Draper Lab. Issue Proj.) Series 2000, 4.2% (MBIA Insured), VRDN (a) |
9,800,000 |
9,800,000 |
|
|
(Edgewood Retirement Proj.) Series A, 4.2%, LOC Fleet Nat'l. Bank, VRDN (a) |
4,380,000 |
4,380,000 |
|
|
(Wentworth Institute of Technology Proj.) Series 2000, 4.2% (AMBAC Insured), VRDN (a) |
6,000,000 |
6,000,000 |
|
|
Massachusetts Edl. Fing. Auth. Ed. Ln. Rev. Participating VRDN Series PA 701, 4.23% (Liquidity Facility Merrill Lynch & Co., Inc.) (a)(d)(f) |
3,065,000 |
3,065,000 |
|
|
Massachusetts Gen. Oblig.: |
|
|
|
|
Bonds (Consolidated Ln. Prog.): |
|
|
|
|
Series 2000 A, 4.75% 2/1/01 |
3,510,000 |
3,519,584 |
|
|
Series A, 6% 6/1/11 (Pre-Refunded to 6/1/01 @ 100) (e) |
2,000,000 |
2,025,635 |
|
|
Participating VRDN: |
|
|
|
|
Series 002101, 4.23% (Liquidity Facility Citibank NA, New York) (a)(f) |
5,145,000 |
5,145,000 |
|
|
Series 96C2101, 4.23% (Liquidity Facility Citibank NA, New York) (a)(f) |
5,300,000 |
5,300,000 |
|
|
Series PA 680R, 4.18% (Liquidity Facility Merrill Lynch & Co., Inc.) (a)(f) |
6,685,000 |
6,685,000 |
|
|
Series PA 689R, 4.18% (Liquidity Facility Merrill Lynch & Co., Inc.) (a)(f) |
6,360,000 |
6,360,000 |
|
|
Series PA 721, 4.18% (Liquidity Facility Merrill Lynch & Co., Inc.) (a)(f) |
4,550,000 |
4,550,000 |
|
|
Municipal Securities - continued |
|||
|
Principal Amount |
Value |
||
|
Massachusetts - continued |
|||
|
Massachusetts Gen. Oblig.: - continued |
|
|
|
|
Participating VRDN: |
|
|
|
|
Series PA 724 R, 4.18% (Liquidity Facility Merrill Lynch & Co., Inc.) (a)(f) |
$ 6,150,000 |
$ 6,150,000 |
|
|
Series PT 392, 4.18% (Liquidity Facility Merrill Lynch & Co., Inc.) (a)(f) |
11,820,000 |
11,820,000 |
|
|
Series PT 393, 4.18% (Liquidity Facility Merrill Lynch & Co., Inc.) (a)(f) |
6,000,000 |
6,000,000 |
|
|
Series ROC 00 4, 4.23% (Liquidity Facility Salomon Smith Barney Hldgs., Inc.) (a)(f) |
9,000,000 |
9,000,000 |
|
|
Series ROC 2 99 11, 4.23% (Liquidity Facility Salomon Smith Barney Hldgs., Inc.) (a)(f) |
1,500,000 |
1,500,000 |
|
|
Rfdg. Participating VRDN Series MSDW 98 35, 4.26% (Liquidity Facility Morgan Stanley Dean Witter & Co.) (a)(f) |
8,600,000 |
8,600,000 |
|
|
Series 1998 A, 4.25%, VRDN (a) |
11,160,000 |
11,160,000 |
|
|
Massachusetts Health & Edl. Facilities Auth. Rev.: |
|
|
|
|
Participating VRDN: |
|
|
|
|
Series Merlots 00 T, 4.34% (Liquidity Facility First Union Nat'l. Bank, North Carolina) (a)(f) |
1,600,000 |
1,600,000 |
|
|
Series Merlots 00 WW, 4.29% (Liquidity Facility First Union Nat'l. Bank, North Carolina) (a)(f) |
4,800,000 |
4,800,000 |
|
|
Series Merlots 97 Y, 4.34% (Liquidity Facility First Union Nat'l. Bank, North Carolina) (a)(f) |
4,435,000 |
4,435,000 |
|
|
Series MSDW 98 101, 4.28% (Liquidity Facility Morgan Stanley Dean Witter & Co.) (a)(f) |
4,895,000 |
4,895,000 |
|
|
Series PA 595R, 4.18% (Liquidity Facility Merrill Lynch & Co., Inc.) (a)(f) |
4,000,000 |
4,000,000 |
|
|
Series SG 27, 4.18% (Liquidity Facility Societe Generale) (a)(f) |
3,935,000 |
3,935,000 |
|
|
(Cap. Asset Prog.): |
|
|
|
|
Series C, 4.2% (MBIA Insured), VRDN (a) |
1,000,000 |
1,000,000 |
|
|
Series E, 4.2%, LOC Bank One NA, Chicago, VRDN (a) |
2,300,000 |
2,300,000 |
|
|
(CIL Realty of Massachusetts Proj.) Series 1999, 4.15%, |
1,650,000 |
1,650,000 |
|
|
(Home for Little Wanderers Proj.) Series B, 4.2%, |
2,400,000 |
2,400,000 |
|
|
(Partners Health Care Sys. Proj.): |
|
|
|
|
Series P1, 4.15% (FSA Insured), VRDN (a) |
5,200,000 |
5,200,000 |
|
|
Series P2, 4.15% (FSA Insured), VRDN (a) |
5,400,000 |
5,400,000 |
|
|
Massachusetts Hsg. Fin. Agcy. Rfdg. (Hbr. Point Apt. Proj.) Series 1995 A, 4.25% (Govt. Nat'l. Mortgage Assoc. Guaranteed) (BPA HSBC Bank USA), VRDN (a) |
9,600,000 |
9,600,000 |
|
|
Municipal Securities - continued |
|||
|
Principal Amount |
Value |
||
|
Massachusetts - continued |
|||
|
Massachusetts Hsg. Fin. Agcy. Hsg. Rev.: |
|
|
|
|
Bonds Series C, 4.9% 6/1/01 |
$ 2,740,000 |
$ 2,740,000 |
|
|
Participating VRDN: |
|
|
|
|
Series CDC 98 B, 4.23% (Liquidity Facility Caisse des Depots et Consignations) (a)(d)(f) |
14,925,000 |
14,925,000 |
|
|
Series Merlots H, 4.34% (Liquidity Facility First Union Nat'l. Bank, North Carolina) (a)(f) |
8,375,000 |
8,375,000 |
|
|
Series PA 370, 4.23% (Liquidity Facility Merrill Lynch & Co., Inc.) (a)(d)(f) |
3,815,000 |
3,815,000 |
|
|
Series PT 160, 4.23% (Liquidity Facility Commerzbank AG) (a)(d)(f) |
2,900,000 |
2,900,000 |
|
|
Series PT 212, 4.23% (Liquidity Facility Bayerische Hypo-und Vereinsbank AG) (a)(d)(f) |
3,645,000 |
3,645,000 |
|
|
Series PT 33, 4.23% (Liquidity Facility BNP Paribas Sa) (a)(d)(f) |
1,160,000 |
1,160,000 |
|
|
Series PT 42, 4.18% (Liquidity Facility Commerzbank AG) (a)(f) |
1,440,000 |
1,440,000 |
|
|
Massachusetts Hsg. Fin. Proj. Participating VRDN Series PT 250, 4.18% (Liquidity Facility Bayerische Hypo-und Vereinsbank AG) (a)(f) |
3,500,000 |
3,500,000 |
|
|
Massachusetts Ind. Fin. Agcy. Health Care Facilities Auth. (Jewish Geriatric Svs. Proj.) 4.35%, LOC BankBoston NA, VRDN (a) |
1,900,000 |
1,900,000 |
|
|
Massachusetts Ind. Fin. Agcy. Ind. Dev. Rev.: |
|
|
|
|
(346 Univ. LLC Proj.) Series 1996, 4.35%, |
1,200,000 |
1,200,000 |
|
|
(Abbott Box Co. Proj.) Series 1997, 4.4%, (Ten Campanelli Cir Realty Trust) LOC Fleet Nat'l. Bank, VRDN (a)(d) |
2,045,000 |
2,045,000 |
|
|
(Barbour Corp. Proj.) Series 1998, 4.4%, (Barbour Realty LLC) LOC Fleet Nat'l. Bank, VRDN (a)(d) |
2,515,000 |
2,515,000 |
|
|
(Barker Steel Co. Proj.) Series 1995, 4.25%, |
800,000 |
800,000 |
|
|
(BBB Esq. LLC Proj.) Series 1996, 4.35%, |
800,000 |
800,000 |
|
|
(Brady Enterprises Proj.) Series 1996, 4.4%, |
1,550,000 |
1,550,000 |
|
|
(Canton/Cedar Realty LLC Proj.) Series 1997, 4.4%, |
1,400,000 |
1,400,000 |
|
|
(Carand Realty Trust Proj.) Series 1997, 4.25%, (Alden Merrell Corp.) LOC State Street Bank & Trust Co., VRDN (a)(d) |
800,000 |
800,000 |
|
|
(Decas Cranberry Proj.) Series 1997, 4.4%, |
2,700,000 |
2,700,000 |
|
|
(Hazen Paper Co. Proj.) Series 1996, 4.35%, |
700,000 |
700,000 |
|
|
Municipal Securities - continued |
|||
|
Principal Amount |
Value |
||
|
Massachusetts - continued |
|||
|
Massachusetts Ind. Fin. Agcy. Ind. Dev. Rev.: - continued |
|
|
|
|
(Heat Fab, Inc. Proj.) Series 1996, 4.35%, |
$ 1,575,000 |
$ 1,575,000 |
|
|
(Lightlife Foods, Inc. Proj.) Series 1997, 4.4%, |
2,500,000 |
2,500,000 |
|
|
(Parker-Hannifin Corp. Proj.) Series 1997, 4.4%, |
1,800,000 |
1,800,000 |
|
|
(Riverdale Mills Corp. Proj.) Series 1995, 4.35%, |
1,700,000 |
1,700,000 |
|
|
(Sencorp Systems, Inc. Proj.) Series 1998 A, 4.35%, |
2,200,000 |
2,200,000 |
|
|
(United Plastics Proj.) Series 1997, 4.4%, (33 Patriot Circle Trust) LOC Fleet Nat'l. Bank, VRDN (a)(d) |
1,900,000 |
1,900,000 |
|
|
Massachusetts Ind. Fin. Agcy. Poll. Cont. Rev. Rfdg. Bonds (New England Pwr. Co. Proj.): |
|
|
|
|
Series 1992, 3.95% tender 8/2/00, CP mode |
27,000,000 |
27,000,000 |
|
|
Series 1993 A, 4.3% tender 9/11/00, CP mode |
15,400,000 |
15,400,000 |
|
|
Series 1993 B, 4.125% tender 8/16/00, CP mode |
3,700,000 |
3,700,000 |
|
|
Massachusetts Ind. Fin. Agcy. Rev.: |
|
|
|
|
Participating VRDN: |
|
|
|
|
Series SG 108, 4.18% (Liquidity Facility Societe Generale) (a)(f) |
3,755,000 |
3,755,000 |
|
|
Series SG 56, 4.18% (Liquidity Facility Societe Generale) (a)(f) |
7,025,000 |
7,025,000 |
|
|
(Assumption College Proj.) Series 1998, 4.3%, |
2,750,000 |
2,750,000 |
|
|
(Fessenden School Proj.) Series 1997, 4.3%, |
3,000,000 |
3,000,000 |
|
|
(Gordon College Proj.) Series 1997, 4.15%, |
8,000,000 |
8,000,000 |
|
|
(Governor Dummer Academy Proj.) Series 1996, 4.15%, LOC State Street Bank & Trust Co., VRDN (a) |
3,000,000 |
3,000,000 |
|
|
(Groton School Proj.) Series 1998 B, 4.2% (Liquidity Facility Fleet Nat'l. Bank), VRDN (a) |
8,000,000 |
8,000,000 |
|
|
(JHC Assisted Living Corp. Proj.) Series 1998 A, 4.25%, LOC Fleet Bank NA, VRDN (a) |
2,170,000 |
2,170,000 |
|
|
(Mary Ann Morse Nursing Home Proj.): |
|
|
|
|
Series 1994 A, 4.2%, LOC ABN-AMRO Bank NV, VRDN (a) |
3,100,000 |
3,100,000 |
|
|
Series 1994 B, 4.2%, LOC ABN-AMRO Bank NV, VRDN (a) |
4,500,000 |
4,500,000 |
|
|
(Mount Ida College Proj.) Series 1997, 4.15%, |
1,700,000 |
1,700,000 |
|
|
Municipal Securities - continued |
|||
|
Principal Amount |
Value |
||
|
Massachusetts - continued |
|||
|
Massachusetts Ind. Fin. Agcy. Rev.: - continued |
|
|
|
|
(Society for the Prevention of Cruelty to Animals Proj.) |
$ 3,000,000 |
$ 3,000,000 |
|
|
(Southern New England School of Law Proj.) 4.3%, |
1,400,000 |
1,400,000 |
|
|
(Youville Place Proj.) Series 1996, 4.3% (AMBAC Insured) (BPA Fleet Nat'l. Bank), VRDN (a) |
4,400,000 |
4,400,000 |
|
|
Massachusetts Muni. Wholesale Elec. Co. Pwr. Supply Sys. Rev.: |
|
|
|
|
Series 1994 C, 4.15% (MBIA Insured) (BPA Cr. Suisse First Boston Bank), VRDN (a) |
16,600,000 |
16,600,000 |
|
|
Series B, 4.3% 9/11/00, LOC Fleet Nat'l. Bank, CP |
7,890,000 |
7,890,000 |
|
|
Massachusetts Port Auth. Rev. Participating VRDN: |
|
|
|
|
Series Merlots 00 Q, 4.39% (Liquidity Facility First Union Nat'l. Bank, North Carolina) (a)(d)(f) |
2,500,000 |
2,500,000 |
|
|
Series PA 598, 4.23% (Liquidity Facility Merrill Lynch & Co., Inc.) (a)(d)(f) |
5,820,000 |
5,820,000 |
|
|
Series PA 599R, 4.18% (Liquidity Facility Merrill Lynch & Co., Inc.) (a)(f) |
4,850,000 |
4,850,000 |
|
|
Series SGA 64, 4.32% (Liquidity Facility Societe Generale) (a)(d)(f) |
3,405,000 |
3,405,000 |
|
|
Massachusetts Tpk. Auth. Metro. Hwy. Sys. Rev. Participating VRDN: |
|
|
|
|
Series PT 135, 4.18% (Liquidity Facility Banco Santander SA) (a)(f) |
10,390,000 |
10,390,000 |
|
|
Series SG 124, 4.18% (Liquidity Facility Societe Generale) (a)(f) |
12,200,000 |
12,200,000 |
|
|
Massachusetts Tpk. Auth. Tpk. Rev. Participating VRDN: |
|
|
|
|
Series PA 581R, 4.18% (Liquidity Facility Merrill Lynch & Co., Inc.) (a)(f) |
19,885,000 |
19,885,000 |
|
|
Series Putters 140, 4.16% (Liquidity Facility Morgan Guaranty Trust Co., NY) (a)(f) |
2,905,000 |
2,905,000 |
|
|
Massachusetts Tpk. Auth. Western Tpk. Rev. Participating VRDN Series BA 97 N, 4.41% (Liquidity Facility Bank of America NA) (a)(f) |
6,150,000 |
6,150,000 |
|
|
Massachusetts Wtr. Poll. Abatement Trust Wtr. Poll. Abatement Rev.: |
|
|
|
|
Bonds (MWRA Ln. Prog.) Series A, 4.25% 8/1/00 |
4,600,000 |
4,600,000 |
|
|
Participating VRDN: |
|
|
|
|
Series Merlots 99 N, 4.34% (Liquidity Facility First Union Nat'l. Bank, North Carolina) (a)(f) |
5,070,000 |
5,070,000 |
|
|
Series SGA 87, 4.35% (Liquidity Facility Societe Generale) (a)(f) |
975,000 |
975,000 |
|
|
Municipal Securities - continued |
|||
|
Principal Amount |
Value |
||
|
Massachusetts - continued |
|||
|
Massachusetts Wtr. Resources Auth. Rev.: |
|
|
|
|
Participating VRDN: |
|
|
|
|
Series PA 639, 4.31% (Liquidity Facility Merrill Lynch & Co., Inc.) (a)(f) |
$ 4,850,000 |
$ 4,850,000 |
|
|
Series PA 700, 4.18% (Liquidity Facility Merrill Lynch & Co., Inc.) (a)(f) |
3,295,000 |
3,295,000 |
|
|
Series SG 63, 4.18% (Liquidity Facility Societe Generale) (a)(f) |
1,000,000 |
1,000,000 |
|
|
Rfdg. Series 2000 C, 4.15% (FGIC Insured), VRDN (a) |
14,300,000 |
14,300,000 |
|
|
Series 1999, 4.3% 9/12/00, LOC State Street Bank & Trust Co., CP |
11,700,000 |
11,700,000 |
|
|
4% 9/7/00, LOC Morgan Guaranty Trust Co., NY, CP |
17,600,000 |
17,600,000 |
|
|
4.05% 8/10/00, LOC Morgan Guaranty Trust Co., NY, CP |
3,600,000 |
3,600,000 |
|
|
4.25% 11/14/00, LOC Morgan Guaranty Trust Co., NY, CP |
4,900,000 |
4,900,000 |
|
|
4.25% 11/16/00, LOC Morgan Guaranty Trust Co., NY, CP |
6,100,000 |
6,100,000 |
|
|
4.55% 10/11/00, LOC Morgan Guaranty Trust Co., NY, CP |
5,000,000 |
5,000,000 |
|
|
Medford Gen. Oblig. BAN 4.5% 3/16/01 |
4,800,000 |
4,809,165 |
|
|
Methuen Gen. Oblig. BAN 4.4% 10/20/00 |
3,000,000 |
3,000,257 |
|
|
Montachusett Reg'l. Transit Auth. RAN 5% 6/22/01 |
2,600,000 |
2,608,171 |
|
|
Northampton Gen. Oblig. BAN 4.25% 10/27/00 |
4,700,000 |
4,704,302 |
|
|
Norwell Gen. Oblig. BAN 4.5% 2/23/01 |
5,100,000 |
5,108,520 |
|
|
Peabody Gen. Oblig. BAN 4.75% 4/27/01 |
2,200,000 |
2,208,080 |
|
|
Plymouth Gen. Oblig. BAN: |
|
|
|
|
4.25% 10/18/00 |
5,489,604 |
5,494,900 |
|
|
5% 10/18/00 |
2,600,000 |
2,601,617 |
|
|
Salem Gen. Oblig. BAN 4.5% 9/15/00 |
3,800,000 |
3,801,952 |
|
|
Sandwich Gen. Oblig. BAN 4.25% 8/15/00 |
5,920,000 |
5,920,266 |
|
|
Saugus Gen. Oblig. BAN 5.25% 5/25/01 |
2,335,000 |
2,343,512 |
|
|
Scituate Gen. Oblig. BAN 4.5% 3/8/01 |
5,000,000 |
5,009,480 |
|
|
South Hadley Gen. Oblig. BAN 4.7% 4/4/01 |
2,200,000 |
2,206,391 |
|
|
Springfield Gen. Oblig. BAN: |
|
|
|
|
4.25% 9/15/00, LOC Fleet Bank NA |
3,200,000 |
3,201,895 |
|
|
4.75% 1/12/01, LOC Fleet Nat'l. Bank |
2,800,000 |
2,806,031 |
|
|
Stoneham Gen. Oblig. BAN 4.25% 11/16/00 |
5,500,000 |
5,506,207 |
|
|
Taunton Gen. Oblig. BAN 5% 3/7/01 |
3,167,000 |
3,175,247 |
|
|
Topsfield Gen. Oblig. BAN 4.25% 9/22/00 |
2,200,000 |
2,201,686 |
|
|
Walpole Gen. Oblig. BAN 4.25% 11/30/00 |
3,800,000 |
3,804,585 |
|
|
Westfield Gen. Oblig. BAN 4.5% 2/1/01 |
3,250,000 |
3,254,689 |
|
|
Weston Gen. Oblig. BAN 4.1% 9/14/00 |
3,560,000 |
3,561,652 |
|
|
Worcester Reg'l. Trans. Auth. RAN 5.25% 6/15/01 |
3,280,000 |
3,292,809 |
|
|
|
776,934,730 |
||
|
Municipal Securities - continued |
|||
|
Shares |
Value |
||
|
Other - 7.2% |
|||
|
Fidelity Municipal Cash Central Fund, 4.30% (b)(c) |
60,415,553 |
$ 60,415,553 |
|
|
TOTAL INVESTMENT PORTFOLIO - 99.2% |
837,350,283 |
|
|
NET OTHER ASSETS - 0.8% |
7,062,166 |
||
|
NET ASSETS - 100% |
$ 844,412,449 |
||
|
Total Cost for Income Tax Purposes $ 837,350,153 |
|
Security Type Abbreviations |
|
BAN - BOND ANTICIPATION NOTE |
|
CP - COMMERCIAL PAPER |
|
RAN - REVENUE ANTICIPATION NOTE |
|
VRDN - VARIABLE RATE DEMAND NOTE |
|
Legend |
|
(a) The coupon rate shown on floating or adjustable rate securities represents the rate at period end. |
|
(b) Information in this report regarding holdings by state and security types does not reflect the holdings of the Fidelity Municipal Cash Central Fund. A listing of the Fidelity Municipal Cash Central Fund's holdings as of its most recent fiscal period end is available upon request. |
|
(c) The rate quoted is the annualized seven-day yield of the fund at period end. |
|
(d) Private activity obligations whose interest is subject to the federal alternative minimum tax for individuals. |
|
(e) Security collateralized by an amount sufficient to pay interest and principal. |
|
(f) Provides evidence of ownership in one or more underlying municipal bonds. |
See accompanying notes which are an integral part of the financial statements.
Semiannual Report
Spartan Massachusetts Municipal Money Market Fund
Statement of Assets and Liabilities
|
|
July 31, 2000 (Unaudited) |
|
|
Assets |
|
|
|
Investment in securities, at value - |
|
$ 837,350,283 |
|
Cash |
|
35,840 |
|
Receivable for fund shares sold |
|
1,483,614 |
|
Interest receivable |
|
9,250,892 |
|
Total assets |
|
848,120,629 |
|
Liabilities |
|
|
|
Payable for investments purchased |
$ 2,006,860 |
|
|
Payable for fund shares redeemed |
1,110,922 |
|
|
Distributions payable |
232,753 |
|
|
Accrued management fee |
355,481 |
|
|
Other payables and accrued expenses |
2,164 |
|
|
Total liabilities |
|
3,708,180 |
|
Net Assets |
|
$ 844,412,449 |
|
Net Assets consist of: |
|
|
|
Paid in capital |
|
$ 844,421,795 |
|
Accumulated undistributed net realized gain (loss) |
|
(9,659) |
|
Unrealized gain from accretion of discount |
|
313 |
|
Net Assets, for 844,417,051 shares outstanding |
|
$ 844,412,449 |
|
Net Asset Value, offering price and redemption price |
|
$1.00 |
See accompanying notes which are an integral part of the financial statements.
Semiannual Report
Spartan Massachusetts Municipal Money Market Fund
Financial Statements - continued
Statement of Operations
|
|
Six months ended July 31, 2000 (Unaudited) |
|
|
Interest Income |
|
$ 16,544,200 |
|
Expenses |
|
|
|
Management fee |
$ 2,069,948 |
|
|
Non-interested trustees' compensation |
1,301 |
|
|
Total expenses before reductions |
2,071,249 |
|
|
Expense reductions |
(15,165) |
2,056,084 |
|
Net interest income |
|
14,488,116 |
|
Realized and Unrealized Gain (Loss) Net realized gain (loss) on investment securities |
|
(2,143) |
|
Increase (decrease) in net unrealized gain from accretion |
|
(1,441) |
|
Net gain (loss) |
|
(3,584) |
|
Net increase (decrease) in net assets resulting |
|
$ 14,484,532 |
See accompanying notes which are an integral part of the financial statements.
Semiannual Report
Spartan Massachusetts Municipal Money Market Fund
Financial Statements - continued
Statement of Changes in Net Assets
|
|
Six months ended
July 31, 2000 |
Year ended
January 31, |
|
Increase (Decrease) in Net Assets |
|
|
|
Operations |
$ 14,488,116 |
$ 23,368,735 |
|
Net realized gain (loss) |
(2,143) |
32,639 |
|
Increase (decrease) in net unrealized gain from |
(1,441) |
1,754 |
|
Net increase (decrease) in net assets resulting |
14,484,532 |
23,403,128 |
|
Distributions to shareholders from net interest income |
(14,488,116) |
(23,368,735) |
|
Share transactions at net asset value of $1.00 per share |
461,821,780 |
808,657,581 |
|
Reinvestment of distributions from net interest income |
13,228,396 |
20,918,842 |
|
Cost of shares redeemed |
(461,716,743) |
(903,758,060) |
|
Net increase (decrease) in net assets and shares resulting from share transactions |
13,333,433 |
(74,181,637) |
|
Total increase (decrease) in net assets |
13,329,849 |
(74,147,244) |
|
Net Assets |
|
|
|
Beginning of period |
831,082,600 |
905,229,844 |
|
End of period |
$ 844,412,449 |
$ 831,082,600 |
See accompanying notes which are an integral part of the financial statements.
Semiannual Report
Financial Highlights
|
|
Six months ended July 31, 2000 |
Years ended January 31, |
||||
|
|
(Unaudited) |
2000 |
1999 |
1998 |
1997 |
1996 |
|
Selected Per-Share Data |
|
|
|
|
|
|
|
Net asset value, beginning of period |
$ 1.000 |
$ 1.000 |
$ 1.000 |
$ 1.000 |
$ 1.000 |
$ 1.000 |
|
Income from Investment
Operations |
.017 |
.028 |
.030 |
.031 |
.030 |
.033 |
|
Less Distributions |
|
|
|
|
|
|
|
From net |
(.017) |
(.028) |
(.030) |
(.031) |
(.030) |
(.033) |
|
Net asset value, |
$ 1.000 |
$ 1.000 |
$ 1.000 |
$ 1.000 |
$ 1.000 |
$ 1.000 |
|
Total Return B, C |
1.75% |
2.83% |
3.00% |
3.19% |
3.00% |
3.32% |
|
Ratios and Supplemental Data |
|
|
|
|
|
|
|
Net assets, end of period (000 omitted) |
$ 844,412 |
$ 831,083 |
$ 905,230 |
$ 744,860 |
$ 671,462 |
$ 514,492 |
|
Ratio of expenses to average net assets |
.50% A |
.50% |
.50% |
.50% |
.50% |
.50% |
|
Ratio of expenses to average net assets after expense reductions |
.50% A |
.50% |
.49% D |
.50% |
.50% |
.50% |
|
Ratio of net interest income to average net assets |
3.50% A |
2.79% |
2.95% |
3.15% |
2.96% |
3.27% |
A Annualized
B The total returns would have been lower had certain expenses not been reduced during the periods shown.
C Total returns do not include the account closeout fee and for periods of less than one year are not annualized.
D FMR or the fund has entered into varying arrangements with third parties who either paid or reduced a portion of the fund's expenses.
See accompanying notes which are an integral part of the financial statements.
Semiannual Report
Fidelity Massachusetts Municipal Money Market Fund
Performance: The Bottom Line
To evaluate a money market fund's historical performance, you can look at either total return or yield. Total return reflects the change in the value of an investment, assuming reinvestment of the fund's dividend income. Yield measures the income paid by a fund. Since a money market fund tries to maintain a $1 share price, yield is an important measure of performance.
Cumulative Total Returns
|
Periods ended July 31, 2000 |
Past 6 |
Past 1 |
Past 5 |
Past 10 |
|
Fidelity MA Municipal Money Market |
1.74% |
3.25% |
15.94% |
33.39% |
|
Massachusetts Tax-Free Retail |
1.66% |
3.08% |
15.56% |
32.32% |
Cumulative total returns show the fund's performance in percentage terms over a set period - in this case, six months, one year, five years or 10 years. For example, if you had invested $1,000 in a fund that had a 5% return over the past year, the value of your investment would be $1,050. To measure how the fund's performance stacked up against its peers, you can compare it to the Massachusetts tax-free retail money market funds average, which reflects the performance of tax-free retail money market funds with similar objectives tracked by iMoneyNet, Inc. The past six months average represents a peer group of 11 money market funds.
Average Annual Total Returns
|
Periods ended July 31, 2000 |
|
Past 1 |
Past 5 |
Past 10 |
|
Fidelity MA Municipal Money Market |
|
3.25% |
3.00% |
2.92% |
|
Massachusetts Tax-Free Retail |
|
3.08% |
2.93% |
2.84% |
Average annual total returns take the fund's cumulative return and show you what would have happened if the fund had performed at a constant rate each year.
Semiannual Report
Fidelity Massachusetts Municipal Money Market Fund
Performance - continued
Yields
|
|
7/31/00 |
5/1/00 |
1/31/00 |
11/1/99 |
8/2/99 |
|
|
|
|
|
|
|
|
Fidelity Massachusetts |
3.61% |
3.92% |
2.77% |
2.89% |
2.54% |
|
|
|
|
|
|
|
|
Massachusetts Tax-Free |
3.47% |
3.49% |
2.61% |
2.68% |
2.46% |
|
|
|
|
|
|
|
|
Fidelity Massachusetts |
5.99% |
6.51% |
4.61% |
4.80% |
4.22% |
|
|
|
|
|
|
|
|
Portion of fund's income |
12.03% |
12.36% |
8.45% |
12.21% |
7.01% |
|
|
|
|
|
|
|
Yield refers to the income paid by the fund over a given period. Yields for money market funds are usually for seven-day periods, expressed as annual percentage rates. A yield that assumes income earned is reinvested or compounded is called an effective yield. The table above shows the fund's current seven-day yield at quarterly intervals over the past year. You can compare these yields to the Massachusetts tax-free retail money market funds average as tracked by iMoneyNet, Inc. Or you can look at the fund's tax-equivalent yield, which is based on a combined effective 2000 federal and state income tax rate of 39.74%. The fund's yields mentioned above reflect that a portion of the fund's income was subject to state taxes. A portion of the fund's income may be subject to the federal alternative minimum tax.
A money market fund's total returns and yields will vary, and reflect past results rather than predict future performance.
Comparing
Performance
Yields on tax-free investments are usually lower than yields on taxable investments. However, a straight comparison between the two may be misleading because it ignores the way taxes reduce taxable returns. Tax-equivalent yield - the yield you'd have to earn on a similar taxable investment to match the tax-free yield - makes the comparison more meaningful. Keep in mind that the U.S. Government neither insures nor guarantees a money market fund, and there is no assurance that a money market fund will maintain a $1 share price.
3Semiannual Report
Fidelity Massachusetts Municipal Money Market Fund
Note to shareholders: Norm Lind became Portfolio Manager of Fidelity Massachusetts Municipal Money Market Fund on July 1, 2000.
(Portfolio Manager photograph)
Q. Norm, what was the investment environment like during the six months that ended July 31, 2000?
A. In the first half of 2000, the backdrop seemed ripe for the build-up of inflationary pressures. Economic growth was robust, unemployment reached historic lows and consumer spending was strong. To dampen growth and keep inflation at bay, the Federal Reserve Board continued its program of short-term interest-rate hikes. As the period progressed, market participants tried to gauge the pace of the Fed's tightening monetary policy approach. Through the second quarter of 2000, inflation remained subdued despite strong growth. As a result, the Fed followed a deliberate approach, raising the rate banks charge each other for overnight loans - known as the fed funds target rate - by increments of 0.25 percentage points in February and March. In April and May, though, there was a general recognition of inflationary pressures and the employment cost index - a broad measure of the costs incurred by businesses for wages and benefits - posted a higher-than-expected gain. In response, the Fed became more aggressive at its May meeting, raising the fed funds target rate by 0.50 percentage points, to 6.50%. At its June meeting, the Fed chose to keep rates unchanged after seeing some signs of an economic slowdown. Nevertheless, the Fed also indicated it was more likely to raise, not lower, rates in the future.
Q. How was the fund managed during this period?
A. For most of the first half of 2000, the fund held a significant weighting in variable-rate demand notes (VRDNs). Yields on these instruments are reset at regular intervals, usually daily or weekly. This approach helped the fund capture higher market yields as the Fed continued to raise short-term rates. Holding a large percentage in VRDNs also helped boost the fund's performance in April and early May, due to a unique circumstance. With the run-up in the equity market in 1999, many investors earned more capital gains than usual and needed to pay higher tax bills. As a result, investors redeemed shares of money market funds to pay their taxes. Fund managers, in turn, sold VRDNs to meet redemptions. Dealers of VRDNs were therefore forced to raise yields - in some cases as high as levels seen in taxable markets - to attract buyers, and the fund took advantage of these buying opportunities to add yield. In June, this strategy shifted as Massachusetts issuers came to market with one-year fixed-rate notes. My predecessor and I worked to focus more of the fund on one-year paper. Even though this paper did not offer significantly higher yields than shorter-term alternatives, we believed that their yields would, in the long run, prove to be attractive given our interest-rate outlook.
Semiannual Report
Fidelity Massachusetts Municipal Money Market Fund
Fund Talk: The Manager's Overview - continued
Q. How did the fund perform?
A. The fund's seven-day yield on July 31, 2000, was 3.61%, compared to 2.77% six months ago. The more recent seven-day yield was the equivalent of a 5.99% taxable rate of return for Massachusetts investors in the 39.74% combined state and federal income tax bracket. Through July 31, 2000, the fund's six-month total return was 1.74%, compared to 1.66% for the Massachusetts tax-free retail money market funds average, according to iMoneyNet, Inc.
Q. What is your outlook, Norm?
A. Market rates currently reflect the sentiment that perhaps the Fed has completed its latest round of interest-rate hikes. While I don't believe we'll see as many rate hikes as I expected at the beginning of 2000, I do believe there is a strong chance we will see further rate hikes this year. That's because I don't believe the Fed has slowed economic growth significantly. As a result, I remain somewhat cautious, and will look for opportunities in investments that compensate the fund for the possibility of further Fed rate hikes. We will continue to watch emerging data carefully, especially those regarding employment and inflation. If any signs emerge that economic growth continues to be robust, I believe the Fed will err on the side of being more aggressive, raising rates again in order to slow growth and stifle inflationary pressures.
The views expressed in this report reflect those of the portfolio manager only through the end of the period of the report as stated on the cover and do not necessarily represent the views of Fidelity or any other person in the Fidelity organization. Any such views are subject to change at any time based upon market or other conditions and Fidelity disclaims any responsibility to update such views. These views may not be relied on as investment advice and, because investment decisions for a Fidelity fund are based on numerous factors, may not be relied on as an indication of trading intent on behalf of any Fidelity fund.
Fund Facts
Goal: high level of current income, exempt from federal income tax and Massachusetts personal income tax, as is consistent with preservation of capital
Fund number: 074
Trading symbol: FDMXX
Start date: November 11, 1983
Size: as of July 31, 2000, more than $2.4 billion
Manager: Norm Lind, since July 2000; manager, various Fidelity and Spartan municipal money market funds; joined Fidelity in 1986
3Semiannual Report
Fidelity Massachusetts Municipal Money Market Fund
|
Maturity Diversification |
|||
|
Days |
% of fund's
investments |
% of fund's investments 1/31/00 |
% of fund's |
|
0 - 30 |
74.3 |
70.6 |
68.8 |
|
31 - 90 |
11.5 |
11.5 |
13.7 |
|
91 - 180 |
4.8 |
6.0 |
5.1 |
|
181 - 397 |
9.4 |
11.9 |
12.4 |
|
Weighted Average Maturity |
|||
|
|
7/31/00 |
1/31/00 |
7/31/99 |
|
Fidelity Massachusetts Municipal Money Market Fund |
41 Days |
50 Days |
51 Days |
|
Massachusetts Tax-Free Money Market Funds Average * |
41 Days |
50 Days |
50 Days |
|
Asset Allocation (% of fund's net assets) |
|||||||
|
As of July 31, 2000 |
As of January 31, 2000 |
||||||
|
Variable Rate |
|
|
Variable Rate |
|
||
|
Commercial Paper
(including |
|
|
Commercial Paper
(including |
|
||
|
Tender Bonds 0.0% |
|
|
Tender Bonds 0.6% |
|
||
|
Municipal Notes 18.7% |
|
|
Municipal Notes 21.0% |
|
||
|
Municipal Money |
|
|
Municipal Money |
|
||
|
Other Investments |
|
|
Other Investments |
|
||

*Source: iMoneyNet, Inc.®
Semiannual Report
Fidelity Massachusetts Municipal Money Market Fund
(Unaudited)
Showing Percentage of Net Assets
|
Municipal Securities - 99.1% |
|||
|
Principal Amount |
Value |
||
|
Massachusetts - 88.2% |
|||
|
Acton & Boxborough Reg'l. School District BAN 4.25% 12/14/00 |
$ 6,743,000 |
$ 6,751,853 |
|
|
Beverly Gen. Oblig. BAN 4.5% 9/14/00 |
12,335,000 |
12,345,141 |
|
|
Billerica Gen. Oblig. BAN 5% 7/13/01 |
8,900,000 |
8,950,929 |
|
|
Boston Gen. Oblig. Bonds: |
|
|
|
|
Series A, 5% 2/1/01 |
7,040,000 |
7,069,070 |
|
|
Series C, 4% 11/1/00 |
6,285,000 |
6,288,487 |
|
|
Boston Ind. Dev. Rev. (New Boston Seafood Ctr. Proj.) |
3,515,000 |
3,515,000 |
|
|
Boston Wtr. & Swr. Commission Rev. Participating VRDN |
8,380,000 |
8,380,000 |
|
|
Bourne Gen. Oblig. BAN: |
|
|
|
|
4.25% 9/29/00 |
3,760,000 |
3,762,838 |
|
|
4.5% 9/29/00 |
8,900,000 |
8,905,998 |
|
|
Bridgewater Gen. Oblig. BAN 4.25% 1/19/01 |
7,000,000 |
7,001,541 |
|
|
Brockton Area Transit Auth. BAN 5% 8/3/01 |
5,300,000 |
5,318,179 |
|
|
Canton Hsg. Auth. Multi-family Hsg. Mtg. Rev. Rfdg. |
3,695,000 |
3,695,000 |
|
|
Chelmsford Gen. Oblig. BAN 5% 3/1/01 |
6,100,000 |
6,113,717 |
|
|
Dudley Charlton Reg'l. School District Participating VRDN Series PA 521, 4.18% (Liquidity Facility Merrill Lynch & Co., Inc.) (a)(f) |
2,840,000 |
2,840,000 |
|
|
East Longmeadow Gen. Oblig. BAN 4.5% 2/1/01 |
13,100,000 |
13,119,186 |
|
|
Foxborough Gen. Oblig. BAN: |
|
|
|
|
4.25% 11/15/00 |
4,800,000 |
4,804,948 |
|
|
4.8% 11/15/00 |
7,000,000 |
7,005,504 |
|
|
Gloucester Gen. Oblig. BAN 4% 8/3/00 |
6,448,000 |
6,448,170 |
|
|
Groton-Dunstable Reg'l. School District BAN 5% 7/27/01 |
5,050,000 |
5,073,310 |
|
|
Harvard Univ. Participating VRDN Series 962101, 4.23% (Liquidity Facility Citibank NA, New York) (a)(f) |
17,000,000 |
17,000,000 |
|
|
Hingham Gen. Oblig. BAN: |
|
|
|
|
4.25% 9/28/00 |
16,600,000 |
16,613,437 |
|
|
4.25% 11/15/00 |
6,300,000 |
6,306,660 |
|
|
Holliston Gen. Oblig. BAN: |
|
|
|
|
4.25% 9/21/00 |
5,500,000 |
5,503,915 |
|
|
4.25% 12/13/00 |
11,100,000 |
11,114,465 |
|
|
Hopkinton Gen. Oblig. BAN 4% 8/25/00 |
19,000,000 |
19,003,739 |
|
|
Lexington Gen. Oblig. BAN 4.5% 2/15/01 |
15,900,000 |
15,934,665 |
|
|
Littleton Gen. Oblig. BAN 5% 5/4/01 |
10,300,000 |
10,343,189 |
|
|
Ludlow Gen. Oblig. BAN: |
|
|
|
|
4.5% 2/14/01 |
7,200,000 |
7,213,018 |
|
|
Municipal Securities - continued |
|||
|
Principal Amount |
Value |
||
|
Massachusetts - continued |
|||
|
Ludlow Gen. Oblig. BAN: - continued |
|
|
|
|
5% 7/13/01 |
$ 14,750,000 |
$ 14,837,068 |
|
|
Marion Gen. Oblig. BAN: |
|
|
|
|
4.25% 9/28/00 |
6,400,000 |
6,404,993 |
|
|
4.8% 7/20/01 |
5,200,000 |
5,217,801 |
|
|
Marshfield Gen. Oblig. BAN 4.25% 9/8/00 |
14,100,000 |
14,105,473 |
|
|
Massachusetts Bay Trans. Auth.: |
|
|
|
|
Bonds Series B: |
|
|
|
|
7.8% 3/1/10 (Pre-Refunded to 3/1/01 @ 102) (e) |
5,300,000 |
5,510,869 |
|
|
7.875% 3/1/21 (Pre-Refunded to 3/1/01 @ 102) (e) |
15,500,000 |
16,121,871 |
|
|
Participating VRDN: |
|
|
|
|
Series Merlots 00 H, 4.34% (Liquidity Facility First Union Nat'l. Bank, North Carolina) (a)(f) |
21,030,000 |
21,030,000 |
|
|
Series MSDW 98 107, 4.28% (Liquidity Facility Morgan Stanley Dean Witter & Co.) (a)(f) |
5,565,000 |
5,565,000 |
|
|
Series PA 675, 4.18% (Liquidity Facility Merrill Lynch & Co., Inc.) (a)(f) |
4,835,000 |
4,835,000 |
|
|
Series Putters 112, 4.23% (Liquidity Facility Morgan Guaranty Trust Co., NY) (a)(f) |
5,400,000 |
5,400,000 |
|
|
RAN Series 1999 B, 4.25% 9/1/00 |
24,000,000 |
23,998,974 |
|
|
4.25% (Liquidity Facility Westdeutsche Landesbank Girozentrale), VRDN (a) |
93,200,000 |
93,200,003 |
|
|
Massachusetts Bay Transit Auth. Rev. Participating VRDN Series 992101, 4.23% (Liquidity Facility Citibank NA, |
10,600,000 |
10,600,000 |
|
|
Massachusetts Dev. Fin. Agcy. Ind. Dev. Rev.: |
|
|
|
|
(Bartley RF Sys. Proj.) Series 1999, 4.4%, |
5,170,000 |
5,170,000 |
|
|
(Charm Sciences, Inc. Proj.) Series 1999 A, 4.35%, |
3,400,000 |
3,400,000 |
|
|
(Monkiewicz Realty Trust Proj.) 4.4%, (Kayem Foods, Inc.) LOC Fleet Bank NA, VRDN (a)(d) |
5,400,000 |
5,400,000 |
|
|
Massachusetts Dev. Fin. Agcy. Rev.: |
|
|
|
|
(Boston Renaissance Charter School Proj.) Series 1999, 4.28%, LOC BankBoston NA, VRDN (a) |
10,275,000 |
10,275,000 |
|
|
(Brooks School Issue Proj.) Series 1999 A, 4.2% |
3,800,000 |
3,800,000 |
|
|
(Carleton-Willard Village Proj.) 4.25%, |
12,600,000 |
12,600,000 |
|
|
(Draper Lab. Issue Proj.) Series 2000, 4.2% |
33,000,000 |
33,000,000 |
|
|
(Edgewood Retirement Proj.) Series A, 4.2%, |
12,500,000 |
12,500,000 |
|
|
Municipal Securities - continued |
|||
|
Principal Amount |
Value |
||
|
Massachusetts - continued |
|||
|
Massachusetts Dev. Fin. Agcy. Rev.: - continued |
|
|
|
|
(Shady Hills School Proj.) Series 1998 A, 4.2%, |
$ 3,000,000 |
$ 3,000,000 |
|
|
(Wentworth Institute of Technology Proj.) Series 2000, 4.2% (AMBAC Insured), VRDN (a) |
15,500,000 |
15,500,000 |
|
|
Massachusetts Edl. Fing. Auth. Ed. Ln. Rev. Participating VRDN Series PA 701, 4.23% (Liquidity Facility Merrill Lynch & Co., Inc.) (a)(d)(f) |
8,700,000 |
8,700,000 |
|
|
Massachusetts Gen. Oblig.: |
|
|
|
|
Bonds (Consolidated Ln. Prog.): |
|
|
|
|
Series 2000 A, 4.75% 2/1/01 |
10,000,000 |
10,027,305 |
|
|
Series A, 6% 6/1/11 (Pre-Refunded to 6/1/01 @ 100) (e) |
5,875,000 |
5,950,303 |
|
|
Participating VRDN: |
|
|
|
|
Series 002101, 4.23% (Liquidity Facility Citibank NA, New York) (a)(f) |
14,600,000 |
14,600,000 |
|
|
Series 96C2101, 4.23% (Liquidity Facility Citibank NA, New York) (a)(f) |
8,955,000 |
8,955,000 |
|
|
Series MSDW 00 241, 4.28% (Liquidity Facility Morgan Stanley Dean Witter & Co.) (a)(f) |
5,462,500 |
5,462,500 |
|
|
Series PA 647, 4.18% (Liquidity Facility Merrill Lynch & Co., Inc.) (a)(f) |
4,840,000 |
4,840,000 |
|
|
Series PA 680R, 4.18% (Liquidity Facility Merrill Lynch & Co., Inc.) (a)(f) |
18,300,000 |
18,300,000 |
|
|
Series PA 689R, 4.18% (Liquidity Facility Merrill Lynch & Co., Inc.) (a)(f) |
17,500,000 |
17,500,000 |
|
|
Series PA 721, 4.18% (Liquidity Facility Merrill Lynch & Co., Inc.) (a)(f) |
10,600,000 |
10,600,000 |
|
|
Series PA 724 R, 4.18% (Liquidity Facility Merrill Lynch & Co., Inc.) (a)(f) |
18,100,000 |
18,100,000 |
|
|
Series PT 391, 4.18% (Liquidity Facility Merrill Lynch & Co., Inc.) (a)(f) |
12,130,000 |
12,130,000 |
|
|
Series PT 393, 4.18% (Liquidity Facility Merrill Lynch & Co., Inc.) (a)(f) |
16,865,000 |
16,865,000 |
|
|
Series ROC 00 4, 4.23% (Liquidity Facility Salomon Smith Barney Hldgs., Inc.) (a)(f) |
15,750,000 |
15,750,000 |
|
|
Series ROC 2 99 11, 4.23% (Liquidity Facility Salomon Smith Barney Hldgs., Inc.) (a)(f) |
3,500,000 |
3,500,000 |
|
|
Series ROC 2 R 13, 4.23% (Liquidity Facility Salomon Smith Barney Hldgs., Inc.) (a)(f) |
6,000,000 |
6,000,000 |
|
|
Series SG 126, 4.18% (Liquidity Facility Societe Generale) (a)(f) |
3,255,000 |
3,255,000 |
|
|
Municipal Securities - continued |
|||
|
Principal Amount |
Value |
||
|
Massachusetts - continued |
|||
|
Massachusetts Gen. Oblig.: - continued |
|
|
|
|
Rfdg.: |
|
|
|
|
Series 1998 B, 4.25%, VRDN (a) |
$ 72,060,000 |
$ 72,060,000 |
|
|
Bonds Series A, 5% 8/1/00 |
4,285,000 |
4,285,000 |
|
|
Participating VRDN: |
|
|
|
|
Series MSDW 98 35, 4.26% (Liquidity Facility Morgan Stanley Dean Witter & Co.) (a)(f) |
21,630,000 |
21,630,000 |
|
|
Series PA 363, 4.18% (Liquidity Facility Merrill Lynch & Co., Inc.) (a)(f) |
4,920,000 |
4,920,000 |
|
|
Series 1998 A, 4.25%, VRDN (a) |
69,900,000 |
69,900,000 |
|
|
Massachusetts Health & Edl. Facilities Auth. Rev.: |
|
|
|
|
Participating VRDN: |
|
|
|
|
Series FRRI A12, 4.2% (Liquidity Facility Bayerische Hypo-und Vereinsbank AG) (a)(f) |
9,980,000 |
9,980,000 |
|
|
Series Merlots 00 T, 4.34% (Liquidity Facility First Union Nat'l. Bank, North Carolina) (a)(f) |
4,000,000 |
4,000,000 |
|
|
Series Merlots 00 WW, 4.29% (Liquidity Facility First Union Nat'l. Bank, North Carolina) (a)(f) |
13,680,000 |
13,680,000 |
|
|
Series Merlots 97 Y, 4.34% (Liquidity Facility First Union Nat'l. Bank, North Carolina) (a)(f) |
6,500,000 |
6,500,000 |
|
|
Series PA 595R, 4.18% (Liquidity Facility Merrill Lynch & Co., Inc.) (a)(f) |
4,245,000 |
4,245,000 |
|
|
Series SG 27, 4.18% (Liquidity Facility Societe Generale) (a)(f) |
7,500,000 |
7,500,000 |
|
|
(Boston Univ. Proj.) Series H, 4.2%, LOC Landesbank Hessen-Thuringen, VRDN (a) |
9,700,000 |
9,700,000 |
|
|
(Cap. Asset Prog.): |
|
|
|
|
Series C, 4.2% (MBIA Insured), VRDN (a) |
1,800,000 |
1,800,000 |
|
|
Series D, 4.25% (MBIA Insured) (BPA Cr. Suisse First Boston Bank), VRDN (a) |
10,300,000 |
10,300,000 |
|
|
(Harvard Univ. Proj.) Series R, 4.15%, VRDN (a) |
14,395,000 |
14,395,000 |
|
|
(Home for Little Wanderers Proj.) Series B, 4.2%, |
5,100,000 |
5,100,000 |
|
|
(Partners Health Care Sys. Proj.): |
|
|
|
|
Series P1, 4.15% (FSA Insured), VRDN (a) |
13,625,000 |
13,625,000 |
|
|
Series P2, 4.15% (FSA Insured), VRDN (a) |
26,550,000 |
26,550,000 |
|
|
Massachusetts Hsg. Fin. Agcy.: |
|
|
|
|
Participating VRDN: |
|
|
|
|
Series PA 132, 4.23% (Liquidity Facility Merrill Lynch & Co., Inc.) (a)(d)(f) |
4,330,000 |
4,330,000 |
|
|
Series PT 271, 4.18% (Liquidity Facility Bayerische Hypo-und Vereinsbank AG) (a)(f) |
5,670,000 |
5,670,000 |
|
|
Municipal Securities - continued |
|||
|
Principal Amount |
Value |
||
|
Massachusetts - continued |
|||
|
Massachusetts Hsg. Fin. Agcy.: - continued |
|
|
|
|
(Princeton Crossing Proj.) Series 1996, 4.2%, |
$ 200,000 |
$ 200,000 |
|
|
Rfdg. (Hbr. Point Apt. Proj.) Series 1995 A, 4.25% |
61,650,000 |
61,650,000 |
|
|
Massachusetts Hsg. Fin. Agcy. Hsg. Rev.: |
|
|
|
|
Bonds Series C, 4.9% 6/1/01 |
7,700,000 |
7,700,000 |
|
|
Participating VRDN: |
|
|
|
|
Series CDC 98 B, 4.23% (Liquidity Facility Caisse des Depots et Consignations) (a)(d)(f) |
33,940,000 |
33,940,000 |
|
|
Series FRRI A13, 4.2% (Liquidity Facility Bayerische Hypo-und Vereinsbank AG) (a)(f) |
8,500,000 |
8,500,000 |
|
|
Series Merlots H, 4.34% (Liquidity Facility First Union Nat'l. Bank, North Carolina) (a)(f) |
19,000,000 |
19,000,000 |
|
|
Series PA 370, 4.23% (Liquidity Facility Merrill Lynch & Co., Inc.) (a)(d)(f) |
3,600,000 |
3,600,000 |
|
|
Series PA 83, 4.23% (Liquidity Facility Merrill Lynch & Co., Inc.) (a)(d)(f) |
5,106,000 |
5,106,000 |
|
|
Series PT 160, 4.23% (Liquidity Facility Commerzbank AG) (a)(d)(f) |
10,255,000 |
10,255,000 |
|
|
Series PT 212, 4.23% (Liquidity Facility Bayerische Hypo-und Vereinsbank AG) (a)(d)(f) |
7,420,000 |
7,420,000 |
|
|
Series PT 33, 4.23% (Liquidity Facility BNP Paribas Sa) (a)(d)(f) |
4,095,000 |
4,095,000 |
|
|
Series PT 42, 4.18% (Liquidity Facility Commerzbank AG) (a)(f) |
1,800,000 |
1,800,000 |
|
|
Massachusetts Hsg. Fin. Proj. Participating VRDN |
6,400,000 |
6,400,000 |
|
|
Massachusetts Ind. Fin. Agcy. Health Care Facilities Auth. (Jewish Geriatric Svs. Proj.) 4.35%, LOC BankBoston NA, VRDN (a) |
5,000,000 |
5,000,000 |
|
|
Massachusetts Ind. Fin. Agcy. Ind. Dev. Rev.: |
|
|
|
|
(346 Univ. LLC Proj.) Series 1996, 4.35%, |
2,000,000 |
2,000,000 |
|
|
(Abbott Box Co. Proj.) Series 1997, 4.4%, (Ten Campanelli Cir Realty Trust) LOC Fleet Nat'l. Bank, VRDN (a)(d) |
3,200,000 |
3,200,000 |
|
|
(Barbour Corp. Proj.) Series 1998, 4.4%, (Barbour Realty LLC) LOC Fleet Nat'l. Bank, VRDN (a)(d) |
3,900,000 |
3,900,000 |
|
|
(Barker Steel Co. Proj.) Series 1995, 4.25%, |
800,000 |
800,000 |
|
|
(BBB Esq. LLC Proj.) Series 1996, 4.35%, |
1,100,000 |
1,100,000 |
|
|
Municipal Securities - continued |
|||
|
Principal Amount |
Value |
||
|
Massachusetts - continued |
|||
|
Massachusetts Ind. Fin. Agcy. Ind. Dev. Rev.: - continued |
|
|
|
|
(Boutwell Owens & Co., Inc. Proj.) Series 1998, 4.4%, (J&M Acquisition Corp.) LOC Fleet Nat'l. Bank, VRDN (a)(d) |
$ 4,570,000 |
$ 4,570,000 |
|
|
(Brady Enterprises Proj.) Series 1996, 4.4%, |
1,900,000 |
1,900,000 |
|
|
(Canton/Cedar Realty LLC Proj.) Series 1997, 4.4%, |
1,800,000 |
1,800,000 |
|
|
(Carand Realty Trust Proj.) Series 1997, 4.25%, (Alden Merrell Corp.) LOC State Street Bank & Trust Co., VRDN (a)(d) |
800,000 |
800,000 |
|
|
(Decas Cranberry Proj.) Series 1997, 4.4%, |
3,675,000 |
3,675,000 |
|
|
(Hazen Paper Co. Proj.) Series 1996, 4.35%, |
1,100,000 |
1,100,000 |
|
|
(Heat Fab, Inc. Proj.) Series 1996, 4.35%, |
2,300,000 |
2,300,000 |
|
|
(Interpolymer Corp. Proj.) Series 1992, 4.35%, |
2,800,000 |
2,800,000 |
|
|
(Lightlife Foods, Inc. Proj.) Series 1997, 4.4%, |
3,960,000 |
3,960,000 |
|
|
(Longview Fibre Co. Proj.) Series 1987, 4.45%, |
2,070,000 |
2,070,000 |
|
|
(Parker-Hannifin Corp. Proj.) Series 1997, 4.4%, |
2,700,000 |
2,700,000 |
|
|
(Riverdale Mills Corp. Proj.) Series 1995, 4.35%, |
2,900,000 |
2,900,000 |
|
|
(Sencorp Systems, Inc. Proj.) Series 1998 A, 4.35%, |
4,200,000 |
4,200,000 |
|
|
(United Med. Corp. Proj.) Series 1992, 4.3%, |
2,100,000 |
2,100,000 |
|
|
(United Plastics Proj.) Series 1997, 4.4%, (33 Patriot Circle Trust) LOC Fleet Nat'l. Bank, VRDN (a)(d) |
2,065,000 |
2,065,000 |
|
|
Massachusetts Ind. Fin. Agcy. Poll. Cont. Rev. Rfdg. Bonds (New England Pwr. Co. Proj.): |
|
|
|
|
Series 1992, 4.3% tender 8/22/00, CP mode |
10,000,000 |
10,000,000 |
|
|
Series 1993 A: |
|
|
|
|
4.05% tender 8/21/00, CP mode |
2,000,000 |
2,000,000 |
|
|
4.3% tender 9/11/00, CP mode |
14,600,000 |
14,600,000 |
|
|
Series 1993 B: |
|
|
|
|
4.125% tender 8/16/00, CP mode |
10,300,000 |
10,300,000 |
|
|
4.15% tender 8/17/00, CP mode |
6,400,000 |
6,400,000 |
|
|
4.3% tender 9/11/00, CP mode |
3,800,000 |
3,800,000 |
|
|
4.4% tender 8/28/00, CP mode |
6,550,000 |
6,550,000 |
|
|
Municipal Securities - continued |
|||
|
Principal Amount |
Value |
||
|
Massachusetts - continued |
|||
|
Massachusetts Ind. Fin. Agcy. Rev.: |
|
|
|
|
Participating VRDN: |
|
|
|
|
Series SG 108, 4.18% (Liquidity Facility Societe Generale) (a)(f) |
$ 6,000,000 |
$ 6,000,000 |
|
|
Series SG 56, 4.18% (Liquidity Facility Societe Generale) (a)(f) |
11,100,000 |
11,100,000 |
|
|
(Assumption College Proj.) Series 1998, 4.3%, |
4,000,000 |
4,000,000 |
|
|
(Buckingham Browne Nichols School Proj.) Series 1997, 4.15%, LOC State Street Bank & Trust Co., VRDN (a) |
11,300,000 |
11,300,000 |
|
|
(Fessenden School Proj.) Series 1997, 4.3%, |
4,265,000 |
4,265,000 |
|
|
(Goddard House Proj.) 4.2%, LOC Fleet Bank NA, VRDN (a) |
8,025,000 |
8,025,000 |
|
|
(Groton School Proj.) Series 1998 B, 4.2% |
12,000,000 |
12,000,000 |
|
|
(Heritage at Darmouth Proj.) Series 1996, 4.3%, |
1,820,000 |
1,820,000 |
|
|
(Heritage at Hingham Proj.) Series 1997, 4.3%, |
6,265,000 |
6,265,000 |
|
|
(JHC Assisted Living Corp. Proj.) Series 1998 A, 4.25%, LOC Fleet Bank NA, VRDN (a) |
3,800,000 |
3,800,000 |
|
|
(Mary Ann Morse Nursing Home Proj.): |
|
|
|
|
Series 1994 A, 4.2%, LOC ABN-AMRO Bank NV, VRDN (a) |
5,500,000 |
5,500,000 |
|
|
Series 1994 B, 4.2%, LOC ABN-AMRO Bank NV, VRDN (a) |
6,500,000 |
6,500,000 |
|
|
(Society for the Prevention of Cruelty to Animals Proj.) |
3,900,000 |
3,900,000 |
|
|
(Southern New England School of Law Proj.) 4.3%, |
1,770,000 |
1,770,000 |
|
|
(Wheelock College Issue Proj.) Series A, 4.25%, |
3,600,000 |
3,600,000 |
|
|
(Youville Place Proj.) Series 1996, 4.3% (AMBAC Insured) (BPA Fleet Nat'l. Bank), VRDN (a) |
5,200,000 |
5,200,000 |
|
|
Rfdg. (Showa Womens Institute Boston, Inc. 1994 Proj.) 4.3%, LOC Bank of New York NA, VRDN (a) |
1,200,000 |
1,200,000 |
|
|
Massachusetts Muni. Wholesale Elec. Co. Pwr. Supply Sys. Rev.: |
|
|
|
|
Series 1994 C, 4.15% (MBIA Insured) (BPA Cr. Suisse First Boston Bank), VRDN (a) |
19,935,000 |
19,935,000 |
|
|
Series B, 4.3% 9/11/00, LOC Fleet Nat'l. Bank, CP |
20,875,000 |
20,875,000 |
|
|
Massachusetts Port Auth. Series 1996, 4.45% 10/12/00, |
2,000,000 |
2,000,000 |
|
|
Municipal Securities - continued |
|||
|
Principal Amount |
Value |
||
|
Massachusetts - continued |
|||
|
Massachusetts Port Auth. Rev. Participating VRDN: |
|
|
|
|
Series Merlots 00 Q, 4.39% (Liquidity Facility First Union Nat'l. Bank, North Carolina) (a)(d)(f) |
$ 6,545,000 |
$ 6,545,000 |
|
|
Series PA 592, 4.23% (Liquidity Facility Merrill Lynch & |
4,850,000 |
4,850,000 |
|
|
Series PA 600R, 4.23% (Liquidity Facility Merrill Lynch & Co., Inc.) (a)(d)(f) |
4,850,000 |
4,850,000 |
|
|
Series PT 1206, 4.18% (Liquidity Facility Merrill Lynch & |
16,220,000 |
16,220,000 |
|
|
Series SGA 64, 4.32% (Liquidity Facility Societe Generale) (a)(d)(f) |
5,300,000 |
5,300,000 |
|
|
Massachusetts Tpk. Auth. Metro. Hwy. Sys. Rev. Participating VRDN: |
|
|
|
|
Series PT 135, 4.18% (Liquidity Facility Banco Santander SA) (a)(f) |
23,680,000 |
23,680,000 |
|
|
Series SG 124, 4.18% (Liquidity Facility Societe Generale) (a)(f) |
23,400,000 |
23,400,000 |
|
|
Massachusetts Tpk. Auth. Tpk. Rev. Participating VRDN |
6,500,000 |
6,500,000 |
|
|
Massachusetts Tpk. Auth. Western Tpk. Rev. Participating VRDN: |
|
|
|
|
Series BA 97 N, 4.41% (Liquidity Facility Bank of America NA) (a)(f) |
9,200,000 |
9,200,000 |
|
|
Series CDC 00 C, 4.18% (Liquidity Facility Caisse des Depots et Consignations) (a)(f) |
27,135,000 |
27,135,000 |
|
|
Massachusetts Wtr. Poll. Abatement Trust Wtr. Poll. Abatement Rev.: |
|
|
|
|
Bonds (MWRA Ln. Prog.) Series A, 4.25% 8/1/00 |
10,385,000 |
10,385,000 |
|
|
Participating VRDN: |
|
|
|
|
Series Merlots 99 N, 4.34% (Liquidity Facility First Union Nat'l. Bank, North Carolina) (a)(f) |
11,800,000 |
11,800,000 |
|
|
Series MSDW 98 182, 4.28% (Liquidity Facility Morgan Stanley Dean Witter & Co.) (a)(f) |
2,745,000 |
2,745,000 |
|
|
Series SGA 87, 4.35% (Liquidity Facility Societe Generale) (a)(f) |
36,800,000 |
36,800,000 |
|
|
Massachusetts Wtr. Resources Auth. Rev.: |
|
|
|
|
Participating VRDN: |
|
|
|
|
Series PA 637, 4.31% (Liquidity Facility Merrill Lynch & Co., Inc.) (a)(f) |
4,850,000 |
4,850,000 |
|
|
Series PA 700, 4.18% (Liquidity Facility Merrill Lynch & Co., Inc.) (a)(f) |
9,300,000 |
9,300,000 |
|
|
Series SG 63, 4.18% (Liquidity Facility Societe Generale) (a)(f) |
1,000,000 |
1,000,000 |
|
|
Municipal Securities - continued |
|||
|
Principal Amount |
Value |
||
|
Massachusetts - continued |
|||
|
Massachusetts Wtr. Resources Auth. Rev.: - continued |
|
|
|
|
Rfdg.: |
|
|
|
|
Series 2000 C, 4.15% (FGIC Insured), VRDN (a) |
$ 80,700,000 |
$ 80,700,000 |
|
|
Participating VRDN Series SG 17, 4.18% |
8,440,000 |
8,440,000 |
|
|
Series 1997 B, 4.15% (AMBAC Insured), VRDN (a) |
49,000,000 |
49,000,000 |
|
|
Series 1998 D, 4.15% (FGIC Insured), VRDN (a) |
29,300,000 |
29,300,000 |
|
|
Series 1999, 4.3% 9/12/00, LOC State Street Bank & Trust Co., CP |
27,800,000 |
27,800,000 |
|
|
4% 9/7/00, LOC Morgan Guaranty Trust Co., NY, CP |
23,700,000 |
23,700,000 |
|
|
4.05% 8/10/00, LOC Morgan Guaranty Trust Co., NY, CP |
6,400,000 |
6,400,000 |
|
|
4.1% 8/10/00, LOC Morgan Guaranty Trust Co., NY, CP |
3,765,000 |
3,765,000 |
|
|
4.2% 11/17/00, LOC Morgan Guaranty Trust Co., NY, CP |
2,000,000 |
2,000,000 |
|
|
4.25% 11/14/00, LOC Morgan Guaranty Trust Co., NY, CP |
14,500,000 |
14,500,000 |
|
|
4.25% 11/16/00, LOC Morgan Guaranty Trust Co., NY, CP |
17,900,000 |
17,900,000 |
|
|
4.3% 9/8/00, LOC Morgan Guaranty Trust Co., NY, CP |
4,300,000 |
4,300,000 |
|
|
4.55% 10/11/00, LOC Morgan Guaranty Trust Co., NY, CP |
26,300,000 |
26,300,000 |
|
|
Maynard Gen. Oblig. BAN 4.75% 3/2/01 |
9,100,000 |
9,126,465 |
|
|
Medford Gen. Oblig. BAN 4.5% 3/16/01 |
12,500,000 |
12,523,866 |
|
|
Methuen Gen. Oblig. BAN 4.4% 10/20/00 |
8,300,000 |
8,300,711 |
|
|
Montachusett Reg'l. Transit Auth. RAN 5% 6/22/01 |
7,300,000 |
7,322,943 |
|
|
Natick Gen. Oblig. BAN 3.75% 8/4/00 |
5,530,000 |
5,530,132 |
|
|
New Bedford Gen. Oblig. BAN 5.5% 12/1/00 |
3,000,000 |
3,007,320 |
|
|
Northampton Gen. Oblig. BAN 4.25% 10/27/00 |
10,589,000 |
10,598,693 |
|
|
Norwell Gen. Oblig. BAN 4.5% 2/23/01 |
12,400,000 |
12,420,715 |
|
|
Peabody Gen. Oblig. BAN 4.75% 4/27/01 |
7,300,000 |
7,326,812 |
|
|
Plymouth Gen. Oblig. BAN: |
|
|
|
|
4.25% 10/18/00 |
12,100,000 |
12,111,674 |
|
|
5% 10/18/00 |
7,267,000 |
7,271,519 |
|
|
Salem Gen. Oblig. BAN: |
|
|
|
|
4.5% 9/15/00 |
9,500,000 |
9,504,881 |
|
|
4.5% 1/18/01 |
2,000,000 |
2,002,850 |
|
|
Sandwich Gen. Oblig. BAN 4.25% 8/15/00 |
16,600,000 |
16,600,746 |
|
|
Saugus Gen. Oblig. BAN 5.25% 5/25/01 |
6,800,000 |
6,824,789 |
|
|
South Hadley Gen. Oblig. BAN 4.7% 4/4/01 |
5,800,000 |
5,816,848 |
|
|
Springfield Gen. Oblig. BAN: |
|
|
|
|
4.25% 9/15/00, LOC Fleet Bank NA |
6,800,000 |
6,804,027 |
|
|
4.75% 1/12/01, LOC Fleet Nat'l. Bank |
7,200,000 |
7,215,507 |
|
|
5% 6/22/01 (BPA Fleet Bank NA) |
3,350,000 |
3,364,267 |
|
|
Stoneham Gen. Oblig. BAN 4.25% 11/16/00 |
12,500,000 |
12,514,106 |
|
|
Taunton Gen. Oblig. BAN 5% 3/7/01 |
9,000,000 |
9,023,435 |
|
|
Municipal Securities - continued |
|||
|
Principal Amount |
Value |
||
|
Massachusetts - continued |
|||
|
Topsfield Gen. Oblig. BAN 4.25% 9/22/00 |
$ 4,800,000 |
$ 4,803,679 |
|
|
Walpole Gen. Oblig. BAN 4.25% 11/30/00 |
8,700,000 |
8,710,498 |
|
|
Westfield Gen. Oblig. BAN 4.75% 2/1/01 |
2,250,000 |
2,254,890 |
|
|
Weston Gen. Oblig. BAN 4.1% 9/14/00 |
7,600,000 |
7,603,527 |
|
|
Worcester Reg'l. Trans. Auth. RAN 5.25% 6/15/01 |
9,200,000 |
9,235,927 |
|
|
|
2,182,395,946 |
||
|
Shares |
|
||
|
Other - 10.9% |
|||
|
Fidelity Municipal Cash Central Fund, 4.30% (b)(c) |
268,644,513 |
268,644,513 |
|
|
TOTAL INVESTMENT PORTFOLIO - 99.1% |
2,451,040,459 |
|
|
NET OTHER ASSETS - 0.9% |
22,454,510 |
|
|
NET ASSETS - 100% |
$ 2,473,494,969 |
|
|
Total Cost for Income Tax Purposes $ 2,451,040,145 |
|
Security Type Abbreviations |
|
BAN - BOND ANTICIPATION NOTE |
|
CP - COMMERCIAL PAPER |
|
RAN - REVENUE ANTICIPATION NOTE |
|
VRDN - VARIABLE RATE DEMAND NOTE |
|
Legend |
|
(a) The coupon rate shown on floating or adjustable rate securities represents the rate at period end. |
|
(b) Information in this report regarding holdings by state and security types does not reflect the holdings of the Fidelity Municipal Cash Central Fund. A listing of the Fidelity Municipal Cash Central Fund's holdings as of its most recent fiscal period end is available upon request. |
|
(c) The rate quoted is the annualized seven-day yield of the fund at period end. |
|
(d) Private activity obligations whose interest is subject to the federal alternative minimum tax for individuals. |
|
(e) Security collateralized by an amount sufficient to pay interest and principal. |
|
(f) Provides evidence of ownership in one or more underlying municipal bonds. |
See accompanying notes which are an integral part of the financial statements.
Semiannual Report
Fidelity Massachusetts Municipal Money Market Fund
Statement of Assets and Liabilities
|
|
July 31, 2000 (Unaudited) |
|
|
Assets |
|
|
|
Investment in securities, at value - |
|
$ 2,451,040,459 |
|
Receivable for fund shares sold |
|
27,151,119 |
|
Interest receivable |
|
24,601,506 |
|
Prepaid expenses |
|
28,329 |
|
Total assets |
|
2,502,821,413 |
|
Liabilities |
|
|
|
Payable to custodian bank |
$ 343 |
|
|
Payable for investments purchased |
5,318,179 |
|
|
Payable for fund shares redeemed |
22,904,197 |
|
|
Accrued management fee |
756,599 |
|
|
Other payables and accrued expenses |
347,126 |
|
|
Total liabilities |
|
29,326,444 |
|
Net Assets |
|
$ 2,473,494,969 |
|
Net Assets consist of: |
|
|
|
Paid in capital |
|
$ 2,473,516,863 |
|
Accumulated net realized gain (loss) on investments |
|
(22,788) |
|
Unrealized gain from accretion of discount |
|
894 |
|
Net Assets, for 2,473,416,035 shares outstanding |
|
$ 2,473,494,969 |
|
Net Asset Value, offering price and redemption price per share ($2,473,494,969 ÷ 2,473,416,035 shares) |
|
$1.00 |
See accompanying notes which are an integral part of the financial statements.
Semiannual Report
Fidelity Massachusetts Municipal Money Market Fund
Financial Statements - continued
Statement of Operations
|
|
Six months ended July 31, 2000 (Unaudited) |
|
|
Interest Income |
|
$ 45,936,591 |
|
Expenses |
|
|
|
Management fee |
$ 4,313,274 |
|
|
Transfer agent fees |
1,465,287 |
|
|
Accounting fees and expenses |
118,934 |
|
|
Non-interested trustees' compensation |
3,667 |
|
|
Custodian fees and expenses |
22,356 |
|
|
Registration fees |
134,871 |
|
|
Audit |
12,153 |
|
|
Legal |
19,350 |
|
|
Miscellaneous |
60,376 |
|
|
Total expenses before reductions |
6,150,268 |
|
|
Expense reductions |
(3,569) |
6,146,699 |
|
Net interest income |
|
39,789,892 |
|
Realized and Unrealized Gain (Loss) Net realized gain (loss) on investment securities |
|
(1,011) |
|
Increase (decrease) in net unrealized gain from |
|
(2,735) |
|
Net gain (loss) |
|
(3,746) |
|
Net increase in net assets resulting from operations |
|
$ 39,786,146 |
|
Other information |
|
|
|
Expense reductions: |
|
$ 3,569 |
See accompanying notes which are an integral part of the financial statements.
Semiannual Report
Fidelity Massachusetts Municipal Money Market Fund
Financial Statements - continued
Statement of Changes in Net Assets
|
|
Six months ended
July 31, 2000 |
Year ended
January 31, |
|
Increase (Decrease) in Net Assets |
|
|
|
Operations |
$ 39,789,892 |
$ 48,442,922 |
|
Net realized gain (loss) |
(1,011) |
29,378 |
|
Increase (decrease) in net unrealized gain from |
(2,735) |
3,629 |
|
Net increase (decrease) in net assets resulting |
39,786,146 |
48,475,929 |
|
Distributions to shareholders from net interest income |
(39,789,892) |
(48,442,922) |
|
Share transactions at net asset value of $1.00 per share |
4,399,444,853 |
6,321,644,955 |
|
Reinvestment of distributions from net interest income |
39,115,278 |
46,994,809 |
|
Cost of shares redeemed |
(4,049,337,799) |
(5,869,535,929) |
|
Net increase (decrease) in net assets and shares resulting from share transactions |
389,222,332 |
499,103,835 |
|
Total increase (decrease) in net assets |
389,218,586 |
499,136,842 |
|
Net Assets |
|
|
|
Beginning of period |
2,084,276,383 |
1,585,139,541 |
|
End of period |
$ 2,473,494,969 |
$ 2,084,276,383 |
See accompanying notes which are an integral part of the financial statements.
Semiannual Report
Financial Highlights
|
|
Six months ended July 31, 2000 |
Years ended January 31, |
||||
|
|
(Unaudited) |
2000 |
1999 |
1998 |
1997 |
1996 |
|
Selected Per-Share Data |
|
|
|
|
|
|
|
Net asset value, beginning of period |
$ 1.000 |
$ 1.000 |
$ 1.000 |
$ 1.000 |
$ 1.000 |
$ 1.000 |
|
Income from
Investment
Operations |
.017 |
.027 |
.029 |
.031 |
.029 |
.032 |
|
Less Distributions |
|
|
|
|
|
|
|
From net interest income |
(.017) |
(.027) |
(.029) |
(.031) |
(.029) |
(.032) |
|
Net asset value, end of period |
$ 1.000 |
$ 1.000 |
$ 1.000 |
$ 1.000 |
$ 1.000 |
$ 1.000 |
|
Total Return B |
1.74% |
2.77% |
2.90% |
3.10% |
2.90% |
3.20% |
|
Ratios and Supplemental Data |
|
|
|
|
|
|
|
Net assets, |
$ 2,473,495 |
$ 2,084,276 |
$ 1,585,140 |
$ 1,199,547 |
$ 967,689 |
$ 847,490 |
|
Ratio of expenses
to average |
.54% A |
.55% |
.56% |
.57% |
.59% |
.60% |
|
Ratio of net |
3.48% A |
2.75% |
2.86% |
3.07% |
2.86% |
3.15% |
A Annualized
B Total returns for periods of less than one year are not annualized.
See accompanying notes which are an integral part of the financial statements.
Semiannual Report
For the period ended July 31, 2000 (Unaudited)
1. Significant Accounting Policies.
Spartan Massachusetts Municipal Income Fund (the income fund), Spartan Massachusetts Municipal Money Market Fund and Fidelity Massachusetts Municipal Money Market Fund (the money market funds) (collectively, the funds) are funds of Fidelity Massachusetts Municipal Trust (the trust). The trust is registered under the Investment Company Act of 1940, as amended (the 1940 Act), as an open-end management investment company organized as a Massachusetts business trust. Each fund is authorized to issue an unlimited number of shares. The financial statements have been prepared in conformity with generally accepted accounting principles which require management to make certain estimates and assumptions at the date of the financial statements. Each fund may be affected by economic and political developments in the state of Massachusetts. The following summarizes the significant accounting policies of the funds:
Security Valuation.
Income Fund. Securities are valued based upon a computerized matrix system and/or appraisals by a pricing service, both of which consider market transactions and dealer-supplied valuations. Securities for which quotations are not readily available are valued at their fair value as determined in good faith under consistently applied procedures under the general supervision of the Board of Trustees. Short-term securities with remaining maturities of sixty days or less for which quotations are not readily available are valued at amortized cost or original cost plus accrued interest, both of which approximate current value.
Money Market Funds. As permitted under Rule 2a-7 of the 1940 Act, and certain conditions therein, securities are valued initially at cost and thereafter assume a constant amortization to maturity of any discount or premium.
Income Taxes. As a qualified regulated investment company under Subchapter M of the Internal Revenue Code, each fund is not subject to income taxes to the extent that it distributes substantially all of its taxable income for the fiscal year. The schedules of investments include information regarding income taxes under the caption "Income Tax Information."
Interest Income. Interest income, which includes amortization of premium and accretion of original issue discount, is accrued as earned. For the money market funds, accretion of discount represents unrealized gain until realized at the time of a security disposition or maturity.
Expenses. Most expenses of the trust can be directly attributed to a fund. Expenses which cannot be directly attributed are apportioned among the funds in the trust.
Distributions to Shareholders. Dividends are declared daily and paid monthly from net interest income. Distributions to shareholders from realized capital gains on investments, if any, are recorded on the ex-dividend date.
Semiannual Report
Notes to Financial Statements (Unaudited) - continued
1. Significant Accounting
Policies - continued
Distributions to Shareholders -
continued
Income and capital gain distributions are determined in accordance with income tax regulations which may differ from generally accepted accounting principles. These differences, which may result in distribution reclassifications, are primarily due to differing treatments for futures transactions, market discount and losses deferred due to wash sales and futures. The funds also utilized earnings and profits distributed to shareholders on redemption of shares as a part of the dividends paid deduction for income tax purposes.
Permanent book and tax basis differences relating to shareholder distributions will result in reclassifications to paid in capital and may affect the per-share allocation between net interest income and realized and unrealized gain (loss). Distributions in excess of net interest income and accumulated undistributed net realized gain (loss) on investments may include temporary book and tax basis differences which will reverse in a subsequent period. Any taxable income or gain remaining at fiscal year end is distributed in the following year.
Security Transactions. Security transactions are accounted for as of trade date. Gains and losses on securities sold are determined on the basis of identified cost.
2. Operating Policies.
Fidelity Municipal Cash Central Fund. Pursuant to an Exemptive Order issued by the Securities and Exchange Commission (the SEC), the funds may invest in the Fidelity Municipal Cash Central Fund (the Cash Fund) managed by Fidelity Investments Money Management, Inc. (FIMM), an affiliate of Fidelity Management & Research Company (FMR). The Cash Fund is an open-end money market fund available only to investment companies and other accounts managed by FMR and its affiliates. The Cash Fund seeks preservation of capital, liquidity, and current income by investing in high-quality, short-term municipal securities of various states and municipalities. Income distributions from the Cash Fund are declared daily and paid monthly from net interest income. Income distributions earned by the funds are recorded as interest income in the accompanying financial statements.
When-Issued Securities. Each fund may purchase or sell securities on a when-issued basis. Payment and delivery may take place after the customary settlement period for that security. The price of the underlying securities is fixed at the time the transaction is negotiated. Each fund may receive compensation for interest forgone in the purchase of a when-issued security. With respect to purchase commitments, each fund identifies securities as segregated in its records with a value at least equal to the amount of the commitment. Losses may arise due to changes in the market value of the underlying securities, if the counterparty does not perform under the contract, or if the issuer does not issue the securities due to political, economic, or other factors.
Semiannual Report
Notes to Financial Statements (Unaudited) - continued
3. Purchases and Sales of Investments.
Income Fund. Purchases and sales of securities, other than short-term securities, aggregated $251,971,933 and $211,537,727, respectively.
4. Fees and Other Transactions with Affiliates.
Management Fee. As the investment adviser for the income fund and Fidelity Massachusetts Municipal Money Market Fund, FMR receives a monthly fee that is calculated on the basis of a group fee rate plus a fixed individual fund fee rate applied to the average net assets of each fund. The group fee rate is the weighted average of a series of rates and is based on the monthly average net assets of all the mutual funds advised by FMR. The rates ranged from .0920% to .3700% for the period. The annual individual fund fee rate is .25%. In the event that these rates were lower than the contractual rates in effect during the period, FMR voluntarily implemented the above rates, as they resulted in the same or a lower management fee. For the period, the management fees were equivalent to annualized rates of .38% of average net assets for the income fund and Fidelity Massachusetts Municipal Money Market Fund.
For Spartan Massachusetts Municipal Money Market Fund, FMR receives a fee that is computed daily at an annual rate of .50% of the fund's average net assets. FMR pays all other expenses, except the compensation of the non-interested Trustees and certain exceptions such as interest,
taxes, brokerage commissions and extraordinary expenses. The management fee paid to FMR by the fund is reduced by an amount equal to the fees and expenses paid by the fund to the non-interested Trustees.
FMR also bears the cost of providing shareholder services to Spartan Massachusetts Municipal Money Market fund. To offset the cost of providing these services, FMR or its affiliates collected certain transaction fees from shareholders which amounted to $2,838 for the period.
Sub-Adviser Fee. As each funds' investment sub-adviser, FIMM, a wholly owned subsidiary of FMR, receives a fee from FMR of 50% of the management fee payable to FMR. The fee is paid prior to any voluntary expense reimbursements which may be in effect.
Transfer Agent and Accounting Fees. Citibank, N.A.(Citibank) is the custodian, transfer agent and shareholder servicing agent for the income fund and Fidelity Massachusetts Municipal Money Market Fund. Citibank has entered into a sub-contract with Fidelity Service Company, Inc. (FSC), an affiliate of FMR, under which FSC performs the activities associated with the funds' transfer and shareholder servicing agent and accounting functions. The funds pay account fees and asset-based fees that vary according to account size and type of account. FSC pays for typesetting, printing and mailing of all shareholder reports, except proxy statements. The accounting fee is based on the level of average net assets for the month plus out-of-pocket expenses.
Semiannual Report
Notes to Financial Statements (Unaudited) - continued
4. Fees and Other Transactions with Affiliates -
continued
Transfer Agent and Accounting Fees - continued
For the period, the transfer agent fees were equivalent to an annualized rate of .08% and .13% of average net assets for the income fund and Fidelity Massachusetts Municipal Money Market Fund, respectively.
Money Market Insurance. Pursuant to an Exemptive Order issued by the SEC, the money market funds, along with other money market funds advised by FMR or its affiliates, have entered into insurance agreements with FIDFUNDS Mutual Limited (FIDFUNDS), an affiliated mutual insurance company. FIDFUNDS provides limited coverage for certain loss events including issuer default as to payment of principal or interest and bankruptcy or insolvency of a credit enhancement provider. The insurance does not cover losses resulting from changes in interest rates, ratings downgrades or other market conditions. The money market funds may be subject to a special assessment of up to approximately 2.5 times the fund's annual gross premium if covered losses exceed certain levels. During the period, Fidelity Massachusetts Municipal Money Market Fund paid premiums of $67,989 for the calendar year 2000 to FIDFUNDS, which are being amortized over one year. During the period, FMR has borne the cost of Spartan Massachusetts Municipal Money Market Fund's premium payable to FIDFUNDS.
5. Expense Reductions.
Through arrangements with the income fund's and Fidelity Massachusetts Municipal Money Market Fund's custodian and transfer agent, credits realized as a result of uninvested cash balances were used to reduce a portion of each applicable fund's expenses. For the period, the reductions under these arrangements are shown under the caption "Other Information" on each applicable fund's Statement of Operations.
In addition, through arrangements with Spartan Massachusetts Municipal Money Market Fund's custodian and transfer agent, credits realized as a result of uninvested cash balances were used to reduce a portion of the fund's expenses. During the period, the fund's expenses were reduced by $15,165 under these arrangements.
Semiannual Report
Fidelity offers several ways to conveniently manage your personal investments via your telephone or PC. You can access your account information, conduct trades and research your investments 24 hours a day.
By Phone
Fidelity Automated Service Telephone provides a single toll-free number to access account balances, positions, quotes and trading. It's easy to navigate the service, and on your first call, the system will help you create a personal identification number (PIN) for security.
(phone_graphic)Fidelity Automated
Service Telephone (FAST®)
1-800-544-5555
Press
1 For mutual fund and brokerage trading.
2 For quotes.*
3 For account balances and holdings.
4 To review orders and mutual
fund activity.
5 To change your PIN.
*0 To speak to a Fidelity representative.
By PC
Fidelity's web site on the Internet provides a wide range of information, including daily financial news, fund performance, interactive planning tools and news about Fidelity products and services.
(computer_graphic)Fidelity's Web Site
www.fidelity.com
If you are not currently on the Internet, call EarthLink Sprint at 1-800-288-2967, and be sure to ask for registration number SMD004 to receive a special Fidelity package that includes 30 days of free Internet access. EarthLink is North America's #1 independent Internet access provider.
(computer_graphic)
Fidelity On-line Xpress+®
Fidelity On-line Xpress+ software for Windows combines comprehensive portfolio management capabilities, securities trading and access to research and analysis tools . . . all on your desktop. Call Fidelity at 1-800-544-0240 or visit our web site for more information on how to manage your investments via your PC.
* When you call the quotes line, please remember that a fund's yield and return will vary and, except for money market funds, share price will also vary. This means that you may have a gain or loss when you sell your shares. There is no assurance that money market funds will be able to maintain a stable $1 share price; an investment in a money market fund is not insured or guaranteed by the U.S. government. Total returns are historical and include changes in share price, reinvestment of dividends and capital gains, and the effects of any sales charges.
Semiannual Report
For directions and hours,
please call 1-800-544-9797.
Arizona
7373 N. Scottsdale Road
Scottsdale, AZ
California
815 East Birch Street
Brea, CA
851 East Hamilton Avenue
Campbell, CA
527 North Brand Boulevard
Glendale, CA
19200 Von Karman Avenue
Irvine, CA
10100 Santa Monica Blvd.
Los Angeles, CA
251 University Avenue
Palo Alto, CA
1760 Challenge Way
Sacramento, CA
7676 Hazard Center Drive
San Diego, CA
8 Montgomery Street
San Francisco, CA
950 Northgate Drive
San Rafael, CA
1400 Civic Drive
Walnut Creek, CA
6300 Canoga Avenue
Woodland Hills, CA
Colorado
1625 Broadway
Denver, CO
Connecticut
48 West Putnam Avenue
Greenwich, CT
265 Church Street
New Haven, CT
300 Atlantic Street
Stamford, CT
29 South Main Street
West Hartford, CT
Delaware
222 Delaware Avenue
Wilmington, DE
Florida
4400 N. Federal Highway
Boca Raton, FL
90 Alhambra Plaza
Coral Gables, FL
4090 N. Ocean Boulevard
Ft. Lauderdale, FL
1907 West State Road 434
Longwood, FL
8880 Tamiami Trail, North
Naples, FL
2401 PGA Boulevard
Palm Beach Gardens, FL
8065 Beneva Road
Sarasota, FL
1502 N. Westshore Blvd.
Tampa, FL
Georgia
3445 Peachtree Road, N.E.
Atlanta, GA
1000 Abernathy Road
Atlanta, GA
Illinois
One North Franklin Street
Chicago, IL
1415 West 22nd Street
Oak Brook, IL
1700 East Golf Road
Schaumburg, IL
3232 Lake Avenue
Wilmette, IL
Indiana
4729 East 82nd Street
Indianapolis, IN
Maine
Three Canal Plaza
Portland, ME
Maryland
7401 Wisconsin Avenue
Bethesda, MD
One W. Pennsylvania Ave.
Towson, MD
Massachusetts
801 Boylston Street
Boston, MA
155 Congress Street
Boston, MA
25 State Street
Boston, MA
300 Granite Street
Braintree, MA
44 Mall Road
Burlington, MA
416 Belmont Street
Worcester, MA
Semiannual Report
Michigan
280 Old N. Woodward Ave.
Birmingham, MI
29155 Northwestern Hwy.
Southfield, MI
Minnesota
7600 France Avenue South
Edina, MN
Missouri
700 West 47th Street
Kansas City, MO
8885 Ladue Road
Ladue, MO
New Jersey
150 Essex Street
Millburn, NJ
56 South Street
Morristown, NJ
501 Route 17, South
Paramus, NJ
New York
1055 Franklin Avenue
Garden City, NY
999 Walt Whitman Road
Melville, L.I., NY
1271 Avenue of the Americas
New York, NY
71 Broadway
New York, NY
350 Park Avenue
New York, NY
North Carolina
4611 Sharon Road
Charlotte, NC
Ohio
600 Vine Street
Cincinnati, OH
28699 Chagrin Boulevard
Woodmere Village, OH
Oregon
16850 SW 72nd Avenue
Tigard, OR
Pennsylvania
1735 Market Street
Philadelphia, PA
439 Fifth Avenue
Pittsburgh, PA
Rhode Island
47 Providence Place
Providence, RI
Tennessee
6150 Poplar Avenue
Memphis, TN
Texas
10000 Research Boulevard
Austin, TX
4017 Northwest Parkway
Dallas, TX
1155 Dairy Ashford Street
Houston, TX
2701 Drexel Drive
Houston, TX
400 East Las Colinas Blvd.
Irving, TX
14100 San Pedro
San Antonio, TX
19740 IH 45 North
Spring, TX
Utah
215 South State Street
Salt Lake City, UT
Virginia
1861 International Drive
McLean, VA
Washington
411 108th Avenue, N.E.
Bellevue, WA
511 Pine Street
Seattle, WA
Washington, DC
1900 K Street, N.W.
Washington, DC
Wisconsin
595 North Barker Road
Brookfield, WI
Fidelity Brokerage Services, Inc., 100 Summer St., Boston, MA 02110 Member NYSE/SIPC
Semiannual Report
If more than one address is listed, please locate the address that is closest to you. We'll give your correspondence immediate attention and send you written confirmation upon completion of your request.
(letter_graphic)Making Changes
To Your Account
(such as changing name, address, bank, etc.)
Fidelity Investments
P.O. Box 770001
Cincinnati, OH 45277-0002
(letter_graphic)For Non-Retirement
Accounts
Buying shares
Fidelity Investments
P.O. Box 770001
Cincinnati, OH 45277-0003
Overnight Express
Fidelity Investments
2300 Litton Lane - KH1A
Hebron, KY 41048
Selling shares
Fidelity Investments
P.O. Box 660602
Dallas, TX 75266-0602
Overnight Express
Fidelity Investments
Attn: Redemptions - CP6I
400 East Las Colinas Blvd.
Irving, TX 75039-5587
General Correspondence
Fidelity Investments
P.O. Box 500
Merrimack, NH 03054-0500
(letter_graphic)For Retirement
Accounts
Buying shares
Fidelity Investments
P.O. Box 770001
Cincinnati, OH 45277-0003
Selling shares
Fidelity Investments
P.O. Box 660602
Dallas, TX 75266-0602
Overnight Express
Fidelity Investments
Attn: Redemptions - CP6R
400 East Las Colinas Blvd.
Irving, TX 75039-5587
General Correspondence
Fidelity Investments
P.O. Box 500
Merrimack, NH 03054-0500
Semiannual Report
Semiannual Report
Investment Adviser
Fidelity Management & Research
Company
Boston, MA
Sub-Adviser
Fidelity Investments Money
Management, Inc.
Officers
Edward C. Johnson 3d, President
Robert C. Pozen, Senior Vice President
Boyce I. Greer, Vice President -
Money Market Funds
Dwight D. Churchill, Vice President -
Income Fund
Norm Lind, Vice President -
Money Market Funds
Christine J. Thompson, Vice President -
Income Fund
Eric D. Roiter, Secretary
Robert A. Dwight, Treasurer
Maria F. Dwyer, Deputy Treasurer
Stanley N. Griffith, Assistant
Vice President
John H. Costello, Assistant Treasurer
Thomas J. Simpson, Assistant Treasurer
Board of Trustees
Ralph F. Cox *
Phyllis Burke Davis *
Robert M. Gates *
Edward C. Johnson 3d
Donald J. Kirk *
Ned C. Lautenbach *
Peter S. Lynch
Marvin L. Mann *
William O. McCoy *
Gerald C. McDonough *
Robert C. Pozen
Thomas R. Williams *
* Independent trustees
Advisory Board
J. Michael Cook
Abigail P. Johnson
Marie L. Knowles
General Distributor
Fidelity Distributors Corporation
Boston, MA
Transfer and Shareholder
Servicing Agents
Citibank, N.A.
New York, NY
and
Fidelity Service Company, Inc.
Boston, MA
Custodian
Citibank, N.A.
New York, NY
The Fidelity Telephone Connection
Mutual Fund 24-Hour Service
Exchanges/Redemptions
and Account Assistance 1-800-544-6666
Product Information 1-800-544-6666
Retirement Accounts 1-800-544-4774 (8 a.m. - 9 p.m.)
TDD Service 1-800-544-0118
for the deaf and hearing impaired
(9 a.m. - 9 p.m. Eastern time)
Fidelity Automated Service
Telephone (FAST®) (automated graphic) 1-800-544-5555
(automated graphic) Automated line for quickest service
(Fidelity Investment logo)(registered trademark)
Corporate Headquarters
82 Devonshire St., Boston, MA 02109
www.fidelity.com
MAS-SANN-0900 110770
1.536216.103
|
|