
|
|
|
|
|
|
|
|
|
Fidelity®
Fund
Semiannual Report
September 30, 2000
(2_fidelity_logos)(Registered_Trademark)
|
President's Message |
Ned Johnson on investing strategies. |
|
|
Performance |
How the fund has done over time. |
|
|
Fund Talk |
The manager's review of fund performance, strategy and outlook. |
|
|
Investment Changes |
A summary of major shifts in the fund's investments over the past six months. |
|
|
Investments |
A complete list of the fund's investments with their market values. |
|
|
Financial Statements |
Statements of assets and liabilities, operations, and changes in net assets, as well as financial highlights. |
|
|
Notes |
Notes to the financial statements. |
|
|
Report of Independent Accountants |
The auditors' opinion. |
Standard & Poor's, S&P and S&P 500 are registered service marks of The McGraw-Hill Companies, Inc. and have been licensed for use by Fidelity Distributors Corporation.
Other third party marks appearing herein are the property of their respective owners.
All other marks appearing herein are registered or unregistered trademarks or service marks of FMR Corp. or an affiliated company.
(Recycle graphic) This report is printed on recycled paper using soy-based inks.
This report and the financial statements contained herein are submitted for the general information of the shareholders of the fund. This report is not authorized for distribution to prospective investors in the fund unless preceded or accompanied by an effective prospectus.
Mutual fund shares are not deposits or obligations of, or guaranteed by, any depository institution. Shares are not insured by the FDIC, the Federal Reserve Board or any other agency, and are subject to investment risks, including the possible loss of principal amount invested.
Neither the fund nor Fidelity Distributors Corporation is a bank.
For more information on any Fidelity fund, including charges and expenses, call 1-800-544-6666 for a free prospectus. Read it carefully before you invest or send money.
Semiannual Report
(photo_of_Edward_C_Johnson_3d)
Dear Shareholder:
Disappointing third quarter corporate earnings announcements resulted in negative performance for many major U.S. equity indexes through the first nine months of 2000. A weak euro and the highest oil prices in 10 years frightened many investors into selling shares of large U.S. corporations with multinational presence. In fixed-income markets, 30-year Treasury prices also dropped, and these securities outyielded 10-year Treasury notes for the first time since January.
While it's impossible to predict the future direction of the markets with any degree of certainty, there are certain basic principles that can help investors plan for their future needs.
First, investors are encouraged to take a long-term view of their portfolios. If you can afford to leave your money invested through the inevitable up and down cycles of the financial markets, you will greatly reduce your vulnerability to any single decline. We know from experience, for example, that stock prices have gone up over longer periods of time, have significantly outperformed other types of investments and have stayed ahead of inflation.
Second, you can further manage your investing risk through diversification. A stock mutual fund, for instance, is already diversified, because it invests in many different companies. You can increase your diversification further by investing in a number of different stock funds, or in such other investment categories as bonds. If you have a short investment time horizon, you might want to consider moving some of your investment into a money market fund, which seeks income and a stable share price by investing in high-quality, short-term investments. Of course, it's important to remember that an investment in a money market fund is not insured or guaranteed by the Federal Deposit Insurance Corporation or any other government agency. Although money market funds seek to preserve the value of your investment at $1.00 per share, it is possible to lose money by investing in these types of funds.
Finally, no matter what your time horizon or portfolio diversity, it makes good sense to follow a regular investment plan, investing a certain amount of money in a fund at the same time each month or quarter and periodically reviewing your overall portfolio. By doing so, you won't get caught up in the excitement of a rapidly rising market, nor will you buy all your shares at market highs. While this strategy - known as dollar cost averaging - won't assure a profit or protect you from a loss in a declining market, it should help you lower the average cost of your purchases. Of course, you should consider your financial ability to continue your purchases through periods of low price levels before undertaking such a strategy.
If you have questions, please call us at 1-800-544-6666, or visit our web site at www.fidelity.com. We are available 24 hours a day, seven days a week to provide you the information you need to make the investments that are right for you.
Best regards,
/s/Edward C. Johnson 3d
Edward C. Johnson 3d
Semiannual Report
There are several ways to evaluate a fund's historical performance. You can look at the total percentage change in value, the average annual percentage change or the growth of a hypothetical $10,000 investment. Total return reflects the change in the value of an investment, assuming reinvestment of the fund's dividend income and capital gains (the profits earned upon the sale of securities that have grown in value).
Cumulative Total Returns
|
Periods ended September 30, 2000 |
Past 6 |
Past 1 |
Past 5 |
Past 10 |
|
Fidelity Magellan |
-4.52% |
16.11% |
131.20% |
549.58% |
|
Fidelity Magellan (incl. 3.00% sales charge) |
-7.38% |
12.62% |
124.27% |
530.09% |
|
S&P 500 ® |
-3.60% |
13.28% |
166.82% |
490.99% |
|
Growth Funds Average |
-2.73% |
26.19% |
153.59% |
475.51% |
Cumulative total returns show the fund's performance in percentage terms over a set period - in this case, six months, one year, five years or 10 years. For example, if you had invested $1,000 in a fund that had a 5% return over the past year, the value of your investment would be $1,050. You can compare the fund's returns to the performance of the Standard & Poor's 500SM Index (S&P 500) - a market capitalization-weighted index of common stocks. To measure how the fund's performance stacked up against its peers, you can compare it to the growth funds average, which reflects the performance of mutual funds with similar objectives tracked by Lipper Inc. The past six months average represents a peer group of 1,326 mutual funds. These benchmarks include reinvested dividends and capital gains, if any, and exclude the effect of sales charges. Lipper has created new comparison categories that group funds according to portfolio characteristics and capitalization, as well as by capitalization only. These averages are listed on page 5 of this report.(dagger)
Average Annual Total Returns
|
Periods ended September 30, 2000 |
Past 1 |
Past 5 |
Past 10 |
|
Fidelity Magellan |
16.11% |
18.25% |
20.58% |
|
Fidelity Magellan (incl. 3.00% sales charge) |
12.62% |
17.53% |
20.21% |
|
S&P 500 |
13.28% |
21.69% |
19.44% |
|
Growth Funds Average |
26.19% |
19.89% |
18.55% |
Average annual total returns take the fund's cumulative return and show you what would have happened if the fund had performed at a constant rate each year. (Note: Lipper calculates average annual total returns by annualizing each fund's total return, then taking an arithmetic average. This may produce a different figure than that obtained by averaging the cumulative total returns and annualizing the result.)
Semiannual Report
$10,000 Over 10 Years
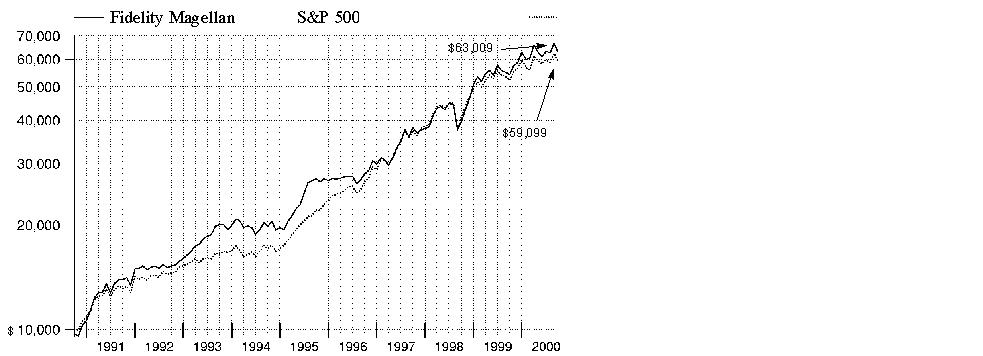
$10,000 Over 10 Years: Let's say hypothetically that $10,000 was invested in Fidelity Magellan Fund on September 30, 1990, and the current 3.00% sales charge was paid. As the chart shows, by September 30, 2000, the value of the investment would have grown to $63,009 - a 530.09% increase on the initial investment. For comparison, look at how the Standard & Poor's 500 Index did over the same period. With dividends and capital gains, if any, reinvested, the same $10,000 would have grown to $59,099 - a 490.99% increase.
Understanding
Performance
How a fund did yesterday is no guarantee of how it will do tomorrow. The stock market, for example, has a history of long-term growth and short-term volatility. In turn, the share price and return of a fund that invests in stocks will vary. That means if you sell your shares during a market downturn, you might lose money. But if you can ride out the market's ups and downs, you may have a gain.
3* The Lipper large cap core funds average reflects the performance (excluding sales charges) of mutual funds with similar portfolio characteristics and capitalization. The Lipper large cap supergroup average reflects the performance (excluding sales charges) of mutual funds with similar capitalization. As of September 30, 2000, the six months, one year, five year, and 10 year cumulative total returns for the large cap core funds average were, -3.33%, 17.80%, 148.49%, 428.07%. The one year, five year, and 10 year average annual total returns were 17.80%, 19.84%, and 17.89%, respectively. The six months, one year, five year and 10 year cumulative returns for the large cap supergroup average were, -3.14%, 20.47%, 153.64%, and 454.26%, respectively. The one year, five year, and 10 year average annual total returns were 20.47%, 20.11%, and 18.37%, respectively.
Semiannual Report
Market Recap
In May, the Federal Reserve Board made its latest, largest and potentially its last in a series of interest-rate hikes to slow the U.S. economy. Apparently, the Fed's actions were successful. As data emerged that indicated clear signs of an economic slowdown, the Fed bypassed opportunities to raise rates for the remainder of the six-month period ending September 30, 2000. In response, the U.S. stock market had mixed results. Historically, economic growth is tied to technology spending. Therefore, the prospect of a decelerating U.S. economy was particularly hard on tech stocks, as illustrated by the six-month return of -19.60% for the NASDAQ Composite Index. Fears of a slowdown in consumer spending also hurt retail stocks, as investors gravitated toward sectors that traditionally hold up better in a slower-growth climate, such as health care and energy. But as the period progressed, two events threatened to decelerate growth on a global scale: surging oil prices, which reached a 10-year high, and a weak European currency. This resulted in a flurry of disappointing third-quarter earnings announcements, leaving many U.S. equity indexes with negative returns on a six-month and year-to-date basis. The Standard & Poor's 500SM Index, for example, fell 3.60% during the six-month period ending September 30, 2000, while the Dow Jones Industrial Average declined 1.71% during the same time frame.
(Portfolio Manager photograph)
An interview with Robert Stansky, Portfolio Manager of Fidelity Magellan Fund
Q. Bob, how did the fund perform?
A. It was an uphill battle during the past six months for the stock market and the fund. During the six-month period that ended September 30, 2000, the fund had a total return of -4.52%, which trailed the -3.60% return of the Standard & Poor's 500 Index and the -2.73% return of the Lipper growth funds average. For the 12 months that ended September 30, 2000, the fund topped the index - returning 16.11% to the index's 13.28% - but trailed the Lipper growth funds average, which rose 26.19%.
Q. Why did the fund trail the S&P 500 during the recent period?
A. As I mentioned, the investing environment was difficult, as the Federal Reserve Board continued its strategy of raising short-term interest rates in an effort to cool the economy and stave off inflation. During the period, many of the market's traditional defensive stocks in sectors such as health care, consumer nondurables, utilities and finance did well. Underweighting the latter three groups relative to the index hurt the fund's performance. In addition, overweighting the retail sector negatively impacted performance as consumer spending slowed from the rapid pace of the past few years, which contributed to lower valuations on many retail stocks. Although the fund also was underweighted in the strong-performing health care sector relative to the index during the period, this group was a positive contributor to performance due to strong stock selection. However, the largest positive contribution to the fund's performance came from the selection of stocks within the technology sector.
Semiannual Report
Fund Talk: The Manager's Overview - continued
Q. Can you elaborate on some of these points?
A. Sure. Sectors less impacted by changes in the overall economy - such as health care - often attract investors during periods of uncertainty. However, in many instances, I believed the timing of the long-term earnings growth within some of these sectors remained unclear, which is why they remained underweighted in the portfolio relative to the S&P 500. That said, several of the health care stocks the fund did have significant stakes in - such as Cardinal Health and Eli Lilly & Co. - performed very well.
Q. How about utilities and finance?
A. In the utilities sector, the negative market environment helped spark a rally in electric utilities and regional Bell operating companies. The fund was underweighted in some of these areas, but did have significant investments in other companies within the sector. With regard to financial stocks, the fund benefited from the steady performance of Citigroup and American International Group. Also, insurance companies rebounded from their lows earlier in the year as they began to gain the ability to raise prices on their products. However, the fact that the fund held a smaller percentage of its assets than the index in certain other financial stocks - such as brokerage companies - detracted slightly from performance.
Q. And retail?
A. In the retail sector, the fund's investment in Home Depot during the period was more than twice as large as the stock's weighting in the index. The stock made up 2.4% of the portfolio on September 30 compared to 1.0% for the S&P 500. This was based on my belief in the solid long-term growth potential of the company. However, the Fed continued to raise interest rates and retail spending slowed from very high levels. Investors became worried that these factors would lead to reduced demand for building products and put a damper on the company's near-term earnings potential. As a result, the stock fell sharply. Lowe's - which also caters to the home remodeling crowd - suffered a similar fate.
Q. Let's move on to the sector that many shareholders are most interested in - technology. What was the story there?
A. The past six months was an interesting period for tech stocks. No longer were investors willing to throw their support behind many of the more speculative companies that had not yet shown any earnings. The upshot was, as an investor, you really had to be selective. Fortunately, the fund did very well by its stock picks in this area. Three of the stocks that shined brightest were EMC, which manufactures computer disk memory hardware and software; Sun Microsystems, which manufactures workstation computers, storage devices and servers; and Juniper Networks, which designs and sells Internet routers. Investors rewarded all three stocks with even higher valuations on the heels of continued solid earnings growth - much of it tied to the continued build-out of the Internet and other communications systems worldwide.
Semiannual Report
Fund Talk: The Manager's Overview - continued
Q. How about the technology names we've become used to hearing you talk about, such as Cisco, Intel and Microsoft?
A. The picture wasn't nearly as good for several of these "old line" tech names. First, many were at stratospheric levels when the sector peaked in March. Second, we saw evidence of a slowing in corporate spending on selected areas of computer technology as the year wore on and Y2K became a distant memory. The reduced demand for desktop computers hurt companies whose fortunes are closely tied to the PC market, such as Intel, Microsoft, Cisco and Texas Instruments. The good news is that the fund owned less of many of these companies than the S&P 500 as I focused more heavily on other areas of technology.
Q. How about the rest of the market? What are the prospects for the fund going forward?
A. Interestingly, we may be on the verge of experiencing the first calendar year of sub-20 percent returns in the stock market in six years. And we very well could end the year in the red. Although we've said it many times, it bears repeating: The strong results of the past several years were historical anomalies. The average annual return of the S&P 500 over time is closer to 12 or 13 percent. And to create that sort of average, you have to have years on the low side. All of this is not surprising. The Fed steadily raised short-term interest rates during the past year. Historically, that's not an environment in which stocks do well. Over the past few years, prior to this year, we've had nirvana - falling interest rates, strong corporate earnings and healthy investor inflows into the stock market. Due to the rising interest rates, I think the probability of a slowdown of some magnitude in the economy going forward is likely. At the same time, we may see a broad slowing of corporate earnings growth. That's an environment where knowing companies inside and out in order to accurately assess their earnings potential is critical. And it's where I spend 99 percent of my time on the job.
The views expressed in this report reflect those of the portfolio manager only through the end of the period of the report as stated on the cover and do not necessarily represent the views of Fidelity or any other person in the Fidelity organization. Any such views are subject to change at any
Semiannual Report
Fund Talk: The Manager's Overview - continued
time based upon market or other conditions and Fidelity disclaims any responsibility to update such views. These views may not be relied on as investment advice and, because investment decisions for a Fidelity fund are based on numerous factors, may not be relied on as an indication of trading intent on behalf of any Fidelity fund.
Fund Facts
Goal: to increase the value of the fund's shares by investing primarily in common stocks
Fund number: 021
Trading symbol: FMAGX
Start date: May 2, 1963
Size: as of September 30, 2000, more than $103.6 billion
Manager: Robert Stansky,
since 1996; manager, Fidelity
Growth Company Fund and
Fidelity Advisor Equity Growth
Fund, 1987-1996; Fidelity
Emerging Growth Fund,
1990-1991; Fidelity Select
Defense & Aerospace Portfolio,
1984-1985; joined
Fidelity in 1983
Bob Stansky on the near-term prospects for technology stocks:
"Because I focus so closely on the business prospects of individual companies, I don't make predictions on the stock market overall. However, taking a step back and looking at the environment for tech stocks, we've already seen a number of companies send out warnings that they will have trouble meeting earnings expectations. Also, I'm concerned about the slowdown we've seen in corporate spending on technology. Usually companies spend strongly near the end of the third quarter and, if they're cutting back at that time, they may not rush back in and spend heavily at the end of the year. All of that said, some tech companies likely will do well if they find themselves in the sweet spot of their product cycles. Also, the build-out of the Internet continues full steam ahead and benefits many tech companies. I think one of the keys to strong performance from tech stocks in the near term is consistent strength in earnings growth among the leading companies in the sector."
Semiannual Report
|
Top Ten Stocks as of September 30, 2000 |
||
|
|
% of fund's |
% of fund's net assets |
|
General Electric Co. |
5.1 |
4.7 |
|
Citigroup, Inc. |
3.0 |
2.4 |
|
Cisco Systems, Inc. |
2.9 |
3.7 |
|
Exxon Mobil Corp. |
2.5 |
2.1 |
|
Home Depot, Inc. |
2.4 |
2.9 |
|
Tyco International Ltd. |
2.1 |
1.9 |
|
EMC Corp. |
2.0 |
1.3 |
|
Viacom, Inc. Class B (non-vtg.) |
2.0 |
0.9 |
|
American International Group, Inc. |
1.9 |
1.4 |
|
Sun Microsystems, Inc. |
1.8 |
1.0 |
|
|
25.7 |
22.3 |
|
Top Five Market Sectors as of September 30, 2000 |
||
|
|
% of fund's |
% of fund's net assets |
|
Technology |
29.1 |
35.2 |
|
Finance |
14.3 |
11.8 |
|
Health |
10.2 |
7.9 |
|
Industrial Machinery & Equipment |
7.7 |
5.1 |
|
Retail & Wholesale |
7.6 |
9.6 |
|
Asset Allocation (% of fund's net assets) |
|||||||
|
As of September 30, 2000 * |
As of March 31, 2000 ** |
||||||
 |
Stocks 96.3% |
|
|
Stocks 98.4% |
|
||
 |
Short-Term |
|
|
Short-Term |
|
||
|
* Foreign |
5.2% |
|
** Foreign investments |
5.4% |
|
||

Semiannual Report
Showing Percentage of Net Assets
|
Common Stocks - 96.3% |
|||
|
Shares |
Value (Note 1) (000s) |
||
|
AEROSPACE & DEFENSE - 1.0% |
|||
|
Aerospace & Defense - 0.9% |
|||
|
Boeing Co. |
2,527,200 |
$ 159,214 |
|
|
Honeywell International, Inc. |
9,176,937 |
326,928 |
|
|
Textron, Inc. |
1,911,400 |
88,163 |
|
|
United Technologies Corp. |
4,631,600 |
320,738 |
|
|
|
895,043 |
||
|
Ship Building & Repair - 0.1% |
|||
|
General Dynamics Corp. |
2,041,800 |
128,251 |
|
|
TOTAL AEROSPACE & DEFENSE |
1,023,294 |
||
|
BASIC INDUSTRIES - 0.7% |
|||
|
Chemicals & Plastics - 0.4% |
|||
|
E.I. du Pont de Nemours and Co. |
3,810,575 |
157,901 |
|
|
Eden Bioscience Corp. |
28,200 |
931 |
|
|
Pharmacia Corp. |
4,682,800 |
281,846 |
|
|
Praxair, Inc. |
300,000 |
11,213 |
|
|
Trivest 1992 Special Fund Ltd. (d) |
26.6 |
1,583 |
|
|
|
453,474 |
||
|
Iron & Steel - 0.1% |
|||
|
Nucor Corp. |
2,492,400 |
75,084 |
|
|
Metals & Mining - 0.2% |
|||
|
Alcoa, Inc. |
6,280,000 |
158,963 |
|
|
Martin Marietta Materials, Inc. |
400 |
15 |
|
|
Tycom Ltd. |
622,700 |
23,896 |
|
|
|
182,874 |
||
|
Paper & Forest Products - 0.0% |
|||
|
Georgia-Pacific Corp. |
500,000 |
11,750 |
|
|
Kimberly-Clark Corp. |
200,000 |
11,163 |
|
|
|
22,913 |
||
|
TOTAL BASIC INDUSTRIES |
734,345 |
||
|
CONSTRUCTION & REAL ESTATE - 0.6% |
|||
|
Building Materials - 0.3% |
|||
|
Lafarge Corp. (c) |
4,574,320 |
99,491 |
|
|
Masco Corp. |
8,565,200 |
159,527 |
|
|
|
259,018 |
||
|
Common Stocks - continued |
|||
|
Shares |
Value (Note 1) (000s) |
||
|
CONSTRUCTION & REAL ESTATE - continued |
|||
|
Construction - 0.0% |
|||
|
Centex Corp. |
600,000 |
$ 19,275 |
|
|
Pulte Corp. |
106,200 |
3,505 |
|
|
|
22,780 |
||
|
Engineering - 0.0% |
|||
|
360networks, Inc. (sub. vtg.) |
2,407,100 |
47,380 |
|
|
Real Estate Investment Trusts - 0.3% |
|||
|
Equity Office Properties Trust |
1,986,400 |
61,703 |
|
|
Equity Residential Properties Trust (SBI) |
1,271,500 |
61,032 |
|
|
Host Marriott Corp. |
9,930,200 |
111,715 |
|
|
Public Storage, Inc. |
936,300 |
22,413 |
|
|
|
256,863 |
||
|
TOTAL CONSTRUCTION & REAL ESTATE |
586,041 |
||
|
DURABLES - 1.4% |
|||
|
Autos, Tires, & Accessories - 0.7% |
|||
|
AutoNation, Inc. |
11,567,927 |
69,408 |
|
|
Danaher Corp. |
2,356,349 |
117,228 |
|
|
Ford Motor Co. |
15,935,454 |
403,366 |
|
|
General Motors Corp. |
2,551,808 |
165,868 |
|
|
|
755,870 |
||
|
Consumer Electronics - 0.2% |
|||
|
Black & Decker Corp. |
3,958,500 |
135,331 |
|
|
General Motors Corp. Class H |
1,584,054 |
58,895 |
|
|
|
194,226 |
||
|
Home Furnishings - 0.2% |
|||
|
Leggett & Platt, Inc. (c) |
12,516,700 |
197,920 |
|
|
Textiles & Apparel - 0.3% |
|||
|
Liz Claiborne, Inc. |
2,547,800 |
98,090 |
|
|
NIKE, Inc. Class B |
3,398,500 |
136,152 |
|
|
Polo Ralph Lauren Corp. Class A (a)(c) |
2,333,700 |
37,631 |
|
|
|
271,873 |
||
|
TOTAL DURABLES |
1,419,889 |
||
|
ENERGY - 7.4% |
|||
|
Energy Services - 1.3% |
|||
|
Baker Hughes, Inc. |
3,200,000 |
118,800 |
|
|
Common Stocks - continued |
|||
|
Shares |
Value (Note 1) (000s) |
||
|
ENERGY - continued |
|||
|
Energy Services - continued |
|||
|
ENSCO International, Inc. |
500,000 |
$ 19,125 |
|
|
Global Marine, Inc. (a) |
300,000 |
9,263 |
|
|
Halliburton Co. |
8,099,600 |
396,374 |
|
|
Nabors Industries, Inc. (a) |
200,000 |
10,480 |
|
|
Schlumberger Ltd. (NY Shares) |
7,596,300 |
625,270 |
|
|
Transocean Sedco Forex, Inc. |
1,912,563 |
112,124 |
|
|
Weatherford International, Inc. |
500,000 |
21,500 |
|
|
|
1,312,936 |
||
|
Oil & Gas - 6.1% |
|||
|
Anadarko Petroleum Corp. |
6,110,000 |
406,071 |
|
|
Apache Corp. |
2,759,715 |
163,168 |
|
|
BP Amoco PLC |
24,753,870 |
218,659 |
|
|
BP Amoco PLC sponsored ADR |
6,368,842 |
337,549 |
|
|
Burlington Resources, Inc. |
2,952,525 |
108,690 |
|
|
Chevron Corp. |
5,962,100 |
508,269 |
|
|
Conoco, Inc. Class B |
8,292,088 |
223,368 |
|
|
Cooper Cameron Corp. (a) |
1,671,500 |
123,169 |
|
|
Devon Energy Corp. |
200,000 |
12,030 |
|
|
Exxon Mobil Corp. |
29,251,268 |
2,607,019 |
|
|
Occidental Petroleum Corp. |
4,321,400 |
94,261 |
|
|
Royal Dutch Petroleum Co. (NY Shares) |
7,932,700 |
475,466 |
|
|
Shell Transport & Trading Co. PLC (Reg.) |
13,327,100 |
108,699 |
|
|
Texaco, Inc. |
6,352,000 |
333,480 |
|
|
The Coastal Corp. |
4,384,000 |
324,964 |
|
|
TotalFinaElf SA Class B |
1,896,611 |
278,565 |
|
|
USX - Marathon Group |
550,000 |
15,606 |
|
|
|
6,339,033 |
||
|
TOTAL ENERGY |
7,651,969 |
||
|
FINANCE - 14.3% |
|||
|
Banks - 3.3% |
|||
|
Bank of America Corp. |
13,402,754 |
701,969 |
|
|
Bank of New York Co., Inc. |
1,654,400 |
92,750 |
|
|
Bank One Corp. |
1,473,800 |
56,926 |
|
|
Capital One Financial Corp. |
400,000 |
28,025 |
|
|
Chase Manhattan Corp. |
14,229,300 |
657,216 |
|
|
Comerica, Inc. |
2,321,000 |
135,633 |
|
|
FleetBoston Financial Corp. |
10,110,083 |
394,293 |
|
|
Mellon Financial Corp. |
1,300,000 |
60,288 |
|
|
Common Stocks - continued |
|||
|
Shares |
Value (Note 1) (000s) |
||
|
FINANCE - continued |
|||
|
Banks - continued |
|||
|
PNC Financial Services Group, Inc. |
200,000 |
$ 13,000 |
|
|
Synovus Finanical Corp. |
1,709,775 |
36,226 |
|
|
U.S. Bancorp |
6,411,600 |
145,864 |
|
|
Wells Fargo & Co. |
24,155,000 |
1,109,620 |
|
|
|
3,431,810 |
||
|
Credit & Other Finance - 4.7% |
|||
|
American Express Co. |
9,054,500 |
550,061 |
|
|
Associates First Capital Corp. Class A |
14,830,774 |
563,569 |
|
|
Citigroup, Inc. |
58,246,444 |
3,148,948 |
|
|
Concord EFS, Inc. (a) |
1,500,000 |
53,273 |
|
|
Household International, Inc. |
3,920,395 |
221,992 |
|
|
MBNA Corp. |
1,800,000 |
69,300 |
|
|
Providian Financial Corp. |
2,600,000 |
330,200 |
|
|
|
4,937,343 |
||
|
Federal Sponsored Credit - 1.9% |
|||
|
Fannie Mae |
17,281,100 |
1,235,599 |
|
|
Freddie Mac |
13,411,600 |
725,065 |
|
|
|
1,960,664 |
||
|
Insurance - 3.0% |
|||
|
AFLAC, Inc. |
3,754,800 |
240,542 |
|
|
American General Corp. |
200,000 |
15,600 |
|
|
American International Group, Inc. |
20,273,970 |
1,939,966 |
|
|
Berkshire Hathaway, Inc. Class A (a) |
557 |
35,871 |
|
|
ChoicePoint, Inc. (a) |
525,000 |
24,084 |
|
|
CIGNA Corp. |
200,000 |
20,880 |
|
|
Hartford Financial Services Group, Inc. |
1,400,000 |
102,113 |
|
|
Marsh & McLennan Companies, Inc. |
2,337,700 |
310,330 |
|
|
MetLife, Inc. |
5,000,000 |
130,938 |
|
|
The Chubb Corp. |
1,800,000 |
142,425 |
|
|
The St. Paul Companies, Inc. |
400,000 |
19,725 |
|
|
UnumProvident Corp. |
3,333,400 |
90,835 |
|
|
|
3,073,309 |
||
|
Savings & Loans - 0.1% |
|||
|
Charter One Financial, Inc. |
2,855,960 |
69,614 |
|
|
Securities Industry - 1.3% |
|||
|
Charles Schwab Corp. |
3,525,000 |
125,138 |
|
|
Daiwa Securities Group, Inc. |
3,571,000 |
41,827 |
|
|
Common Stocks - continued |
|||
|
Shares |
Value (Note 1) (000s) |
||
|
FINANCE - continued |
|||
|
Securities Industry - continued |
|||
|
Morgan Stanley Dean Witter & Co. |
11,066,270 |
$ 1,011,872 |
|
|
Nomura Securities Co. Ltd. |
6,301,000 |
136,890 |
|
|
|
1,315,727 |
||
|
TOTAL FINANCE |
14,788,467 |
||
|
HEALTH - 10.2% |
|||
|
Drugs & Pharmaceuticals - 7.4% |
|||
|
American Home Products Corp. |
10,979,200 |
621,011 |
|
|
Bristol-Myers Squibb Co. |
16,076,900 |
918,393 |
|
|
Ciphergen Biosystems, Inc. |
43,500 |
1,392 |
|
|
Durect Corp. |
45,700 |
686 |
|
|
Elan Corp. PLC sponsored ADR (a) |
3,802,000 |
208,160 |
|
|
Eli Lilly & Co. |
16,788,500 |
1,361,967 |
|
|
Genentech, Inc. (a) |
2,306,875 |
428,358 |
|
|
Immunex Corp. (a) |
200,000 |
8,700 |
|
|
Inverness Medical Technology, Inc. (a) |
721,600 |
13,891 |
|
|
Medarex, Inc. (a) |
109,300 |
12,822 |
|
|
Merck & Co., Inc. |
14,368,700 |
1,069,570 |
|
|
Pain Therapeutics, Inc. |
189,800 |
3,760 |
|
|
PE Corp. - Celera Genomics Group (a) |
301,800 |
30,067 |
|
|
Pfizer, Inc. |
40,477,975 |
1,818,979 |
|
|
Schering-Plough Corp. |
20,787,700 |
966,628 |
|
|
Serono SA sponsored ADR (a) |
7,538,300 |
228,034 |
|
|
|
7,692,418 |
||
|
Medical Equipment & Supplies - 2.2% |
|||
|
Abbott Laboratories |
12,896,500 |
613,390 |
|
|
Baxter International, Inc. |
300,000 |
23,944 |
|
|
Boston Scientific Corp. (a) |
7,462,000 |
122,657 |
|
|
Cardinal Health, Inc. |
7,905,514 |
697,168 |
|
|
Guidant Corp. (a) |
600,000 |
42,413 |
|
|
Johnson & Johnson |
5,600,100 |
526,059 |
|
|
Medtronic, Inc. |
4,418,000 |
228,908 |
|
|
|
2,254,539 |
||
|
Medical Facilities Management - 0.6% |
|||
|
Express Scripts, Inc. Class A (a) |
1,000,000 |
72,250 |
|
|
HEALTHSOUTH Corp. (a) |
12,352,200 |
100,362 |
|
|
Common Stocks - continued |
|||
|
Shares |
Value (Note 1) (000s) |
||
|
HEALTH - continued |
|||
|
Medical Facilities Management - continued |
|||
|
UnitedHealth Group, Inc. |
3,594,100 |
$ 354,917 |
|
|
Wellpoint Health Networks, Inc. (a) |
1,200,000 |
115,200 |
|
|
|
642,729 |
||
|
TOTAL HEALTH |
10,589,686 |
||
|
INDUSTRIAL MACHINERY & EQUIPMENT - 7.7% |
|||
|
Electrical Equipment - 5.3% |
|||
|
Emerson Electric Co. |
2,932,400 |
196,471 |
|
|
General Electric Co. |
91,363,400 |
5,270,509 |
|
|
Inrange Technologies Corp. Class B (a) |
31,300 |
1,659 |
|
|
Proton Energy Systems, Inc. |
32,100 |
919 |
|
|
|
5,469,558 |
||
|
Industrial Machinery & Equipment - 2.4% |
|||
|
Caterpillar, Inc. |
750,000 |
25,313 |
|
|
Deere & Co. |
660,000 |
21,945 |
|
|
Illinois Tool Works, Inc. |
3,760,000 |
210,090 |
|
|
Ingersoll-Rand Co. |
1,352,850 |
45,828 |
|
|
Pentair, Inc. |
200,000 |
5,350 |
|
|
Tyco International Ltd. |
41,166,112 |
2,135,492 |
|
|
|
2,444,018 |
||
|
Pollution Control - 0.0% |
|||
|
Republic Services, Inc. (a) |
3,500,000 |
45,938 |
|
|
TOTAL INDUSTRIAL MACHINERY & EQUIPMENT |
7,959,514 |
||
|
MEDIA & LEISURE - 6.9% |
|||
|
Broadcasting - 3.0% |
|||
|
Charter Communications, Inc. |
2,300,000 |
37,411 |
|
|
Clear Channel Communications, Inc. (a) |
10,776,900 |
608,895 |
|
|
Comcast Corp. Class A (special) (a) |
3,250,000 |
133,047 |
|
|
Cox Communications, Inc. Class A (a) |
2,689,400 |
102,870 |
|
|
EchoStar Communications Corp. Class A (a) |
2,400,000 |
126,600 |
|
|
Grupo Televisa SA de CV sponsored GDR |
800,000 |
46,150 |
|
|
Infinity Broadcasting Corp. Class A (a) |
11,930,796 |
393,716 |
|
|
Time Warner, Inc. |
20,217,903 |
1,582,051 |
|
|
UnitedGlobalCom, Inc. Class A (a) |
1,100,000 |
33,000 |
|
|
Common Stocks - continued |
|||
|
Shares |
Value (Note 1) (000s) |
||
|
MEDIA & LEISURE - continued |
|||
|
Broadcasting - continued |
|||
|
Univision Communications, Inc. Class A (a) |
790,000 |
$ 29,526 |
|
|
USA Networks, Inc. (a) |
1,389,600 |
30,484 |
|
|
|
3,123,750 |
||
|
Entertainment - 2.8% |
|||
|
Fox Entertainment Group, Inc. Class A (a) |
1,988,000 |
52,682 |
|
|
News Corp. Ltd. sponsored ADR |
3,700,000 |
207,431 |
|
|
Park Place Entertainment Corp. (a) |
3,529,200 |
53,379 |
|
|
Viacom, Inc. Class B (non-vtg.) (a) |
35,376,906 |
2,069,549 |
|
|
Walt Disney Co. |
14,157,000 |
541,505 |
|
|
|
2,924,546 |
||
|
Lodging & Gaming - 0.2% |
|||
|
Extended Stay America, Inc. (a)(c) |
5,859,603 |
77,640 |
|
|
Starwood Hotels & Resorts Worldwide, Inc. unit |
2,474,327 |
77,323 |
|
|
|
154,963 |
||
|
Publishing - 0.5% |
|||
|
Gannett Co., Inc. |
3,210,400 |
170,151 |
|
|
Harcourt General, Inc. |
1,248,900 |
73,685 |
|
|
McGraw-Hill Companies, Inc. |
2,326,000 |
147,846 |
|
|
Tribune Co. |
2,183,922 |
95,274 |
|
|
|
486,956 |
||
|
Restaurants - 0.4% |
|||
|
McDonald's Corp. |
15,094,800 |
455,674 |
|
|
TOTAL MEDIA & LEISURE |
7,145,889 |
||
|
NONDURABLES - 2.8% |
|||
|
Beverages - 0.7% |
|||
|
Anheuser-Busch Companies, Inc. |
2,783,200 |
117,764 |
|
|
Seagram Co. Ltd. |
3,800,000 |
218,262 |
|
|
The Coca-Cola Co. |
7,966,800 |
439,170 |
|
|
|
775,196 |
||
|
Foods - 0.6% |
|||
|
PepsiCo, Inc. |
13,424,300 |
617,518 |
|
|
Household Products - 0.7% |
|||
|
Avon Products, Inc. |
2,546,000 |
104,068 |
|
|
Clorox Co. |
2,105,696 |
83,307 |
|
|
Common Stocks - continued |
|||
|
Shares |
Value (Note 1) (000s) |
||
|
NONDURABLES - continued |
|||
|
Household Products - continued |
|||
|
Gillette Co. |
8,585,800 |
$ 265,087 |
|
|
Procter & Gamble Co. |
4,247,300 |
284,569 |
|
|
|
737,031 |
||
|
Tobacco - 0.8% |
|||
|
Philip Morris Companies, Inc. |
26,463,400 |
779,016 |
|
|
TOTAL NONDURABLES |
2,908,761 |
||
|
RETAIL & WHOLESALE - 7.6% |
|||
|
Apparel Stores - 0.8% |
|||
|
Gap, Inc. |
11,429,300 |
230,015 |
|
|
Intimate Brands, Inc. Class A |
2,889,630 |
54,000 |
|
|
The Limited, Inc. |
20,300,800 |
447,886 |
|
|
TJX Companies, Inc. |
6,096,800 |
137,178 |
|
|
|
869,079 |
||
|
Drug Stores - 0.5% |
|||
|
CVS Corp. |
9,731,786 |
450,703 |
|
|
Walgreen Co. |
200,000 |
7,588 |
|
|
|
458,291 |
||
|
General Merchandise Stores - 1.9% |
|||
|
Consolidated Stores Corp. (a) |
753,300 |
10,170 |
|
|
Costco Wholesale Corp. (a) |
2,311,000 |
80,741 |
|
|
Kohls Corp. (a) |
450,000 |
25,959 |
|
|
Neiman Marcus Group, Inc. Class A (a) |
668,700 |
21,691 |
|
|
Target Corp. |
18,588,600 |
476,333 |
|
|
Wal-Mart Stores, Inc. |
28,645,000 |
1,378,541 |
|
|
|
1,993,435 |
||
|
Grocery Stores - 0.6% |
|||
|
Kroger Co. (a) |
3,810,000 |
85,963 |
|
|
Safeway, Inc. (a) |
11,254,400 |
525,440 |
|
|
|
611,403 |
||
|
Retail & Wholesale, Miscellaneous - 3.8% |
|||
|
Bed Bath & Beyond, Inc. (a) |
1,200,000 |
29,269 |
|
|
Best Buy Co., Inc. (a) |
4,523,000 |
287,776 |
|
|
Home Depot, Inc. |
46,807,275 |
2,483,711 |
|
|
Lowe's Companies, Inc. |
14,547,000 |
652,797 |
|
|
Office Depot, Inc. (a) |
11,766,600 |
91,927 |
|
|
RadioShack Corp. |
695,200 |
44,927 |
|
|
Common Stocks - continued |
|||
|
Shares |
Value (Note 1) (000s) |
||
|
RETAIL & WHOLESALE - continued |
|||
|
Retail & Wholesale, Miscellaneous - continued |
|||
|
Staples, Inc. (a) |
22,300,000 |
$ 316,381 |
|
|
Williams-Sonoma, Inc. (a) |
1,000,000 |
34,750 |
|
|
|
3,941,538 |
||
|
TOTAL RETAIL & WHOLESALE |
7,873,746 |
||
|
SERVICES - 0.8% |
|||
|
Advertising - 0.5% |
|||
|
Omnicom Group, Inc. |
7,451,576 |
543,499 |
|
|
Leasing & Rental - 0.0% |
|||
|
ANC Rental Corp. (a) |
598,890 |
3,444 |
|
|
Services - 0.3% |
|||
|
Cendant Corp. (a) |
14,987,000 |
162,984 |
|
|
Manpower, Inc. |
2,905,900 |
92,807 |
|
|
|
255,791 |
||
|
TOTAL SERVICES |
802,734 |
||
|
TECHNOLOGY - 29.1% |
|||
|
Communications Equipment - 6.3% |
|||
|
ADC Telecommunications, Inc. (a) |
2,000,000 |
53,781 |
|
|
Ciena Corp. (a) |
2,170,000 |
266,503 |
|
|
Cisco Systems, Inc. (a) |
54,979,779 |
3,037,633 |
|
|
Comverse Technology, Inc. (a) |
2,925,000 |
315,900 |
|
|
Corning, Inc. |
2,500,000 |
742,500 |
|
|
Corvis Corp. |
102,000 |
6,227 |
|
|
Elastic Networks, Inc. |
22,900 |
319 |
|
|
Lucent Technologies, Inc. |
10,120,198 |
309,299 |
|
|
Nokia AB sponsored ADR |
10,191,200 |
405,737 |
|
|
Nortel Networks Corp. |
16,200,000 |
964,913 |
|
|
ONI Systems Corp. |
56,900 |
4,911 |
|
|
Sycamore Networks, Inc. |
1,899,400 |
205,135 |
|
|
Telefonaktiebolaget LM Ericsson sponsored ADR |
8,200,000 |
121,463 |
|
|
Tellabs, Inc. (a) |
1,400,000 |
66,850 |
|
|
|
6,501,171 |
||
|
Computer Services & Software - 7.6% |
|||
|
Aether Systems, Inc. |
485,600 |
51,231 |
|
|
Akamai Technologies, Inc. |
513,710 |
26,978 |
|
|
America Online, Inc. (a) |
15,060,000 |
809,475 |
|
|
Common Stocks - continued |
|||
|
Shares |
Value (Note 1) (000s) |
||
|
TECHNOLOGY - continued |
|||
|
Computer Services & Software - continued |
|||
|
Ariba, Inc. (a) |
1,200,000 |
$ 171,919 |
|
|
Art Technology Group, Inc. (a) |
100,000 |
9,475 |
|
|
At Home Corp. Series A (a) |
1,390,422 |
19,640 |
|
|
Automatic Data Processing, Inc. |
2,400,000 |
160,500 |
|
|
AvantGo, Inc. |
47,200 |
944 |
|
|
BEA Systems, Inc. (a) |
3,000,000 |
233,625 |
|
|
BMC Software, Inc. (a) |
1,417,700 |
27,114 |
|
|
BroadVision, Inc. (a) |
403,800 |
10,373 |
|
|
Ceridian Corp. (a) |
2,601,400 |
73,002 |
|
|
Computer Associates International, Inc. |
2,952,800 |
74,374 |
|
|
Computer Sciences Corp. (a) |
653,200 |
48,500 |
|
|
Compuware Corp. (a) |
1,850,000 |
15,494 |
|
|
Covad Communications Group, Inc. (a) |
2,279,700 |
30,491 |
|
|
Digex, Inc. Class A |
438,500 |
20,555 |
|
|
Electronic Data Systems Corp. |
3,500,000 |
145,250 |
|
|
Equant NV (NY Shares) (a) |
1,000,000 |
36,688 |
|
|
Exodus Communications, Inc. (a) |
2,600,000 |
128,375 |
|
|
First Data Corp. |
4,674,000 |
182,578 |
|
|
Genomica Corp. |
66,800 |
1,298 |
|
|
Inktomi Corp. (a) |
3,471,400 |
395,740 |
|
|
Internap Network Services Corp. |
1,433,000 |
46,304 |
|
|
Intuit, Inc. (a) |
1,000,000 |
57,000 |
|
|
Lycos, Inc. (a) |
5,066,840 |
348,424 |
|
|
Microsoft Corp. (a) |
27,122,300 |
1,635,814 |
|
|
Nuance Communications, Inc. |
48,300 |
5,878 |
|
|
Oracle Corp. (a) |
19,700,000 |
1,551,375 |
|
|
Phone.com, Inc. (a) |
1,400,000 |
159,075 |
|
|
Priceline.com, Inc. (a) |
928,000 |
11,020 |
|
|
Redback Networks, Inc. (a) |
2,910,900 |
477,388 |
|
|
Sabre Holdings Corp. Class A |
995,886 |
28,818 |
|
|
Siebel Systems, Inc. (a) |
3,600,000 |
400,725 |
|
|
Software.com, Inc. (a) |
310,000 |
56,246 |
|
|
StorageNetworks, Inc. |
54,900 |
5,610 |
|
|
VERITAS Software Corp. (a) |
1,375,000 |
195,250 |
|
|
WebMD Corp. (a) |
1,400,000 |
21,350 |
|
|
Yahoo!, Inc. (a) |
2,800,000 |
254,800 |
|
|
|
7,928,696 |
||
|
Computers & Office Equipment - 8.0% |
|||
|
Alteon Websystems, Inc. |
300,000 |
32,517 |
|
|
Aura Systems, Inc. warrants 5/31/05 (a) |
37 |
0 |
|
|
Common Stocks - continued |
|||
|
Shares |
Value (Note 1) (000s) |
||
|
TECHNOLOGY - continued |
|||
|
Computers & Office Equipment - continued |
|||
|
Brocade Communications Systems, Inc. (a) |
850,000 |
$ 200,600 |
|
|
Compaq Computer Corp. |
12,000,000 |
330,960 |
|
|
Cosine Communications, Inc. |
58,200 |
3,234 |
|
|
Dell Computer Corp. (a) |
13,676,800 |
421,416 |
|
|
EMC Corp. (a) |
21,041,928 |
2,085,781 |
|
|
Hewlett-Packard Co. |
5,262,000 |
510,414 |
|
|
International Business Machines Corp. |
12,706,800 |
1,429,515 |
|
|
Juniper Networks, Inc. (a) |
4,365,800 |
955,837 |
|
|
Lexmark International Group, Inc. Class A (a) |
600,000 |
22,500 |
|
|
Network Appliance, Inc. (a) |
1,204,800 |
153,461 |
|
|
Oak Technology, Inc. (a) |
350,000 |
9,581 |
|
|
Palm, Inc. |
1,044,962 |
55,318 |
|
|
Pitney Bowes, Inc. |
5,208,400 |
205,406 |
|
|
Simple Technology, Inc. |
67,400 |
653 |
|
|
Sun Microsystems, Inc. (a) |
15,800,000 |
1,844,650 |
|
|
Tech Data Corp. (a) |
788,800 |
33,721 |
|
|
|
8,295,564 |
||
|
Electronic Instruments - 0.5% |
|||
|
Agilent Technologies, Inc. |
3,225,526 |
157,849 |
|
|
Applied Materials, Inc. (a) |
1,900,000 |
112,694 |
|
|
Kulicke & Soffa Industries, Inc. (a) |
400,000 |
5,325 |
|
|
Novellus Systems, Inc. (a) |
500,000 |
23,281 |
|
|
Thermo Electron Corp. (a) |
2,871,500 |
74,659 |
|
|
Waters Corp. (a) |
2,016,200 |
179,442 |
|
|
|
553,250 |
||
|
Electronics - 6.7% |
|||
|
Analog Devices, Inc. (a) |
2,307,732 |
190,532 |
|
|
Broadcom Corp. Class A (a) |
1,000,000 |
243,750 |
|
|
Conexant Systems, Inc. (a) |
300,000 |
12,563 |
|
|
Flextronics International Ltd. (a) |
2,000,000 |
164,250 |
|
|
Intel Corp. |
43,095,200 |
1,791,144 |
|
|
Intersil Holding Corp. Class A |
637,500 |
31,795 |
|
|
JDS Uniphase Corp. (a) |
5,270,000 |
499,003 |
|
|
Linear Technology Corp. |
6,853,200 |
443,745 |
|
|
LSI Logic Corp. (a) |
600,000 |
17,550 |
|
|
Maxim Integrated Products, Inc. (a) |
3,178,400 |
255,663 |
|
|
Micron Technology, Inc. (a) |
5,434,000 |
249,964 |
|
|
Motorola, Inc. |
21,148,600 |
597,448 |
|
|
PMC-Sierra, Inc. (a) |
2,300,000 |
495,075 |
|
|
Common Stocks - continued |
|||
|
Shares |
Value (Note 1) (000s) |
||
|
TECHNOLOGY - continued |
|||
|
Electronics - continued |
|||
|
QLogic Corp. (a) |
405,500 |
$ 35,684 |
|
|
SDL, Inc. (a) |
1,117,000 |
345,502 |
|
|
Solectron Corp. (a) |
2,260,400 |
104,261 |
|
|
Texas Instruments, Inc. |
29,235,200 |
1,379,536 |
|
|
TTM Technologies, Inc. |
68,600 |
1,612 |
|
|
Vitesse Semiconductor Corp. (a) |
400,000 |
35,575 |
|
|
|
6,894,652 |
||
|
Photographic Equipment - 0.0% |
|||
|
Eastman Kodak Co. |
1,100,000 |
44,963 |
|
|
TOTAL TECHNOLOGY |
30,218,296 |
||
|
TRANSPORTATION - 0.1% |
|||
|
Air Transportation - 0.0% |
|||
|
AMR Corp. |
1,378,100 |
45,047 |
|
|
Southwest Airlines Co. |
200,000 |
4,850 |
|
|
|
49,897 |
||
|
Trucking & Freight - 0.1% |
|||
|
CNF Transportation, Inc. |
592,000 |
13,172 |
|
|
Swift Transportation Co., Inc. (a)(c) |
3,319,875 |
43,366 |
|
|
|
56,538 |
||
|
TOTAL TRANSPORTATION |
106,435 |
||
|
UTILITIES - 5.7% |
|||
|
Cellular - 1.4% |
|||
|
AT&T Corp. - Wireless Group |
11,000,000 |
229,625 |
|
|
China Mobile (Hong Kong) Ltd. sponsored ADR (a) |
1,400,000 |
45,413 |
|
|
Nextel Communications, Inc. Class A (a) |
6,700,000 |
313,225 |
|
|
Nextel Partners, Inc. Class A |
146,500 |
4,267 |
|
|
OmniSky Corp. |
100,000 |
2,031 |
|
|
QUALCOMM, Inc. (a) |
2,965,700 |
211,306 |
|
|
Sprint Corp. - PCS Group Series 1 (a) |
4,100,000 |
143,756 |
|
|
Vodafone Group PLC |
34,461,206 |
127,507 |
|
|
Vodafone Group PLC sponsored ADR |
7,464,500 |
276,187 |
|
|
VoiceStream Wireless Corp. (a) |
1,046,987 |
121,516 |
|
|
|
1,474,833 |
||
|
Common Stocks - continued |
|||
|
Shares |
Value (Note 1) (000s) |
||
|
UTILITIES - continued |
|||
|
Electric Utility - 0.0% |
|||
|
Montana Power Co. |
200,000 |
$ 6,675 |
|
|
Southern Energy, Inc. |
329,000 |
10,322 |
|
|
|
16,997 |
||
|
Gas - 0.5% |
|||
|
Enron Corp. |
5,808,700 |
508,987 |
|
|
Telephone Services - 3.8% |
|||
|
Allied Riser Communications Corp. |
155,900 |
1,033 |
|
|
AT&T Corp. |
28,189,984 |
828,081 |
|
|
BellSouth Corp. |
12,157,400 |
489,335 |
|
|
Global Crossing Ltd. (a) |
1,800,000 |
55,800 |
|
|
ITXC Corp. |
300,000 |
4,388 |
|
|
Level 3 Communications, Inc. (a) |
1,300,000 |
100,263 |
|
|
Metromedia Fiber Network, Inc. Class A (a) |
3,000,000 |
72,938 |
|
|
NEXTLINK Communications, Inc. Class A (a) |
300,000 |
10,556 |
|
|
Qwest Communications International, Inc. (a) |
4,077,400 |
195,970 |
|
|
SBC Communications, Inc. |
16,347,214 |
817,361 |
|
|
Sprint Corp. - FON Group |
2,964,400 |
86,894 |
|
|
Telefonos de Mexico SA de CV Series L sponsored ADR |
300,000 |
15,956 |
|
|
Verizon Communications |
16,933,004 |
820,192 |
|
|
WorldCom, Inc. (a) |
14,445,024 |
438,768 |
|
|
|
3,937,535 |
||
|
TOTAL UTILITIES |
5,938,352 |
||
|
TOTAL COMMON STOCKS (Cost $56,029,049) |
99,747,418 |
||
|
Nonconvertible Preferred Stocks - 0.0% |
|||
|
|
|
|
|
|
TECHNOLOGY - 0.0% |
|||
|
Computers and Office Equipment - 0.0% |
|||
|
Ampex Corp. 8% non-cumulative |
1,167 |
1,821 |
|
|
Cash Equivalents - 4.1% |
|||
|
Maturity Amount (000s) |
Value (Note 1) |
||
|
Investments in repurchase agreements (U.S. Treasury Obligations), in a joint trading account at 6.52%, dated 9/29/00 due 10/2/00 |
$ 1,406,205 |
$ 1,405,441 |
|
|
Shares |
|
||
|
Fidelity Cash Central Fund, 6.60% (b) |
2,898,463,324 |
2,898,463 |
|
|
TOTAL CASH EQUIVALENTS (Cost $4,303,904) |
4,303,904 |
||
|
TOTAL INVESTMENT PORTFOLIO - 100.4% (Cost $60,334,774) |
104,053,143 |
||
|
NET OTHER ASSETS - (0.4)% |
(442,564) |
||
|
NET ASSETS - 100% |
$ 103,610,579 |
||
|
Legend |
|
(a) Non-income producing |
|
(b) The rate quoted is the annualized seven-day yield of the fund at period end. A complete listing of the fund's holdings as of its most recent fiscal |
|
(c) Affiliated company |
|
(d) Share amount represents number of units held. |
|
Income Tax Information |
|
At September 30, 2000, the aggregate |
See accompanying notes which are an integral part of the financial statements.
Semiannual Report
Statement of Assets and Liabilities
|
Amounts in thousands (except per-share amounts) |
September 30, 2000 |
|
|
Assets |
|
|
|
Investment in securities, at value (including repurchase agreements of $1,405,441) (cost $60,334,774) - |
|
$ 104,053,143 |
|
Receivable for investments sold |
|
152,330 |
|
Receivable for fund shares sold |
|
83,456 |
|
Dividends receivable |
|
66,210 |
|
Interest receivable |
|
14,321 |
|
Other receivables |
|
4,176 |
|
Total assets |
|
104,373,636 |
|
Liabilities |
|
|
|
Payable to custodian bank |
$ 89 |
|
|
Payable for investments purchased |
304,226 |
|
|
Payable for fund shares redeemed |
135,133 |
|
|
Accrued management fee |
60,817 |
|
|
Other payables and accrued expenses |
17,146 |
|
|
Collateral on securities loaned, at value |
245,646 |
|
|
Total liabilities |
|
763,057 |
|
Net Assets |
|
$ 103,610,579 |
|
Net Assets consist of: |
|
|
|
Paid in capital |
|
$ 58,460,924 |
|
Undistributed net investment income |
|
44,925 |
|
Accumulated undistributed net realized gain (loss) on investments and foreign currency transactions |
|
1,386,680 |
|
Net unrealized appreciation (depreciation) on investments and assets and liabilities in foreign currencies |
|
43,718,050 |
|
Net Assets, for 774,103 shares outstanding |
|
$ 103,610,579 |
|
Net Asset Value and redemption price per share ($103,610,579 ÷ 774,103 shares) |
|
$133.85 |
|
Maximum offering price per share |
|
$137.99 |
See accompanying notes which are an integral part of the financial statements.
Semiannual Report
Financial Statements - continued
Statement of Operations
|
Amounts in thousands |
Six months ended September 30, 2000 |
|
|
Investment Income Dividends (including $3,988 received from affiliated issuers) |
|
$ 432,449 |
|
Interest |
|
67,587 |
|
Security lending |
|
2,810 |
|
Total income |
|
502,846 |
|
Expenses |
|
|
|
Management fee |
$ 302,157 |
|
|
Performance adjustment |
75,184 |
|
|
Transfer agent fees |
87,859 |
|
|
Accounting and security lending fees |
1,160 |
|
|
Non-interested trustees' compensation |
287 |
|
|
Custodian fees and expenses |
1,068 |
|
|
Registration fees |
1,031 |
|
|
Audit |
124 |
|
|
Legal |
122 |
|
|
Reports to shareholders |
1,033 |
|
|
Miscellaneous |
16 |
|
|
Total expenses before reductions |
470,041 |
|
|
Expense reductions |
(6,121) |
463,920 |
|
Net investment income |
|
38,926 |
|
Realized and Unrealized Gain (Loss) Net realized gain (loss) on: |
|
|
|
Investment securities (including realized gain (loss) of |
1,629,010 |
|
|
Foreign currency transactions |
(235) |
1,628,775 |
|
Change in net unrealized appreciation (depreciation) on: |
|
|
|
Investment securities |
(6,575,522) |
|
|
Assets and liabilities in foreign currencies |
(117) |
(6,575,639) |
|
Net gain (loss) |
|
(4,946,864) |
|
Net increase (decrease) in net assets resulting |
|
$ (4,907,938) |
See accompanying notes which are an integral part of the financial statements.
Semiannual Report
Financial Statements - continued
Statement of Changes in Net Assets
|
Amounts in thousands |
Six months ended |
Year ended |
|
Increase (Decrease) in Net Assets |
|
|
|
Operations |
$ 38,926 |
$ 448,529 |
|
Net realized gain (loss) |
1,628,775 |
5,625,049 |
|
Change in net unrealized appreciation (depreciation) |
(6,575,639) |
13,131,636 |
|
Net increase (decrease) in net assets resulting |
(4,907,938) |
19,205,214 |
|
Distributions to shareholders |
(53,387) |
(538,548) |
|
From net realized gain |
(2,158,863) |
(8,240,210) |
|
Total distributions |
(2,212,250) |
(8,778,758) |
|
Share transactions |
7,811,136 |
19,790,882 |
|
Reinvestment of distributions |
2,168,547 |
8,608,613 |
|
Cost of shares redeemed |
(8,343,864) |
(20,445,861) |
|
Net increase (decrease) in net assets resulting |
1,635,819 |
7,953,634 |
|
Total increase (decrease) in net assets |
(5,484,369) |
18,380,090 |
|
Net Assets |
|
|
|
Beginning of period |
109,094,948 |
90,714,858 |
|
End of period (including undistributed net investment income of $44,925 and $70,989, respectively) |
$ 103,610,579 |
$ 109,094,948 |
|
Other Information Shares |
|
|
|
Sold |
57,658 |
151,936 |
|
Issued in reinvestment of distributions |
16,427 |
67,297 |
|
Redeemed |
(61,515) |
(156,828) |
|
Net increase (decrease) |
12,570 |
62,405 |
See accompanying notes which are an integral part of the financial statements.
Semiannual Report
Financial Highlights
|
|
Six months ended September 30, |
Years ended March 31, |
||||
|
|
2000 |
2000 |
1999 |
1998 |
1997 |
1996 |
|
Selected Per-Share Data |
|
|
|
|
|
|
|
Net asset value, beginning of period |
$ 143.26 |
$ 129.75 |
$ 108.82 |
$ 80.20 |
$ 87.52 |
$ 72.44 |
|
Income from Invest- |
|
|
|
|
|
|
|
Net investment income |
.05 D |
.59 D |
.73 D |
.73 D |
1.38 D |
.79 |
|
Net realized |
(6.56) |
25.04 |
26.02 |
34.35 |
5.25 |
19.57 |
|
Total from investment operations |
(6.51) |
25.63 |
26.75 |
35.08 |
6.63 |
20.36 |
|
Less Distributions |
|
|
|
|
|
|
|
From net investment income |
(.07) |
(.73) |
(.67) |
(1.25) |
(1.10) |
(.59) |
|
From net |
(2.83) |
(11.39) |
(5.15) |
(5.21) |
(12.85) |
(4.69) |
|
Total distributions |
(2.90) |
(12.12) |
(5.82) |
(6.46) |
(13.95) |
(5.28) |
|
Net asset value, |
$ 133.85 |
$ 143.26 |
$ 129.75 |
$ 108.82 |
$ 80.20 |
$ 87.52 |
|
Total Return B, C |
(4.52)% |
21.11% |
25.63% |
45.41% |
9.11% |
28.43% |
|
Ratios and Supplemental Data |
|
|
|
|
|
|
|
Net assets, end of period (in millions) |
$ 103,611 |
$ 109,095 |
$ 90,715 |
$ 71,968 |
$ 51,243 |
$ 56,179 |
|
Ratio of expenses to average net assets |
.89% A |
.75% |
.62% |
.62% |
.66% |
.95% |
|
Ratio of expenses to average net assets after expense reductions |
.88% A, E |
.74% E |
.60% E |
.61% E |
.64% E |
.92% E |
|
Ratio of net invest- |
.07% A |
.46% |
.66% |
.77% |
1.75% |
.95% |
|
Portfolio turnover rate |
16% A |
28% |
37% |
34% |
67% |
155% |
A Annualized
B The total returns would have been lower had certain expenses not been reduced during the periods shown.
C Total returns do not include the one time sales charge and for periods of less than one year are not annualized.
D Net investment income per share has been calculated based on average shares outstanding during the period.
E FMR or the fund has entered into varying arrangements with third parties who either paid or reduced a portion of the fund's expenses.
See accompanying notes which are an integral part of the financial statements.
Semiannual Report
For the period ended September 30, 2000
1. Significant Accounting Policies.
Fidelity Magellan Fund (the fund) is registered under the Investment Company Act of 1940, as amended, as an open-end management investment company organized as a Massachusetts business trust and is authorized to issue an unlimited number of shares. Effective the close of business on September 30, 1997, the fund was closed to new accounts. The financial statements have been prepared in conformity with generally accepted accounting principles which require management to make certain estimates and assumptions at the date of the financial statements. The following summarizes the significant accounting policies of the fund:
Security Valuation. Securities for which exchange quotations are readily available are valued at the last sale price, or if no sale price, at the closing bid price. Foreign securities are valued based on quotations from the principal market in which such securities are normally traded. If trading or events occurring in other markets after the close of the principal market in which foreign securities are traded, and before the close of the business of the fund, are expected to materially affect the value of those securities, then they are valued at their fair value taking this trading or these events into account. Fair value is determined in good faith under consistently applied procedures under the general supervision of the Board of Trustees. Securities (including restricted securities) for which exchange quotations are not readily available (and in certain cases debt securities which trade on an exchange) are valued primarily using dealer-supplied valuations or at their fair value. Short-term securities with remaining maturities of sixty days or less for which quotations are not readily available are valued at amortized cost or original cost plus accrued interest, both of which approximate current value. Investments in open-end investment companies are valued at their net asset value each business day.
Foreign Currency Translation. The accounting records of the fund are maintained in U.S. dollars. Investment securities and other assets and liabilities denominated in a foreign currency are translated into U.S. dollars at the prevailing rates of exchange at period end. Purchases and sales of securities, income receipts and expense payments are translated into U.S. dollars at the prevailing exchange rate on the respective dates of the transactions.
Net realized gains and losses on foreign currency transactions represent net gains and losses from sales and maturities of foreign currency contracts, disposition of foreign currencies, the difference between the amount of net investment income accrued and the U.S. dollar amount actually received, and gains and losses between trade and settlement date on purchases and sales of securities. The effects of changes in foreign currency exchange rates on investments in securities are included with the net realized and unrealized gain or loss on investment securities.
Semiannual Report
Notes to Financial Statements - continued
1. Significant Accounting Policies - continued
Income Taxes. As a qualified regulated investment company under Subchapter M of the Internal Revenue Code, the fund is not subject to income taxes to the extent that it distributes substantially all of its taxable income for its fiscal year. The schedule of investments includes information regarding income taxes under the caption "Income Tax Information."
Investment Income. Dividend income is recorded on the ex-dividend date, except certain dividends from foreign securities where the ex-dividend date may have passed, are recorded as soon as the fund is informed of the ex-dividend date. Non-cash dividends included in dividend income, if any, are recorded at the fair market value of the securities received. Interest income is accrued as earned. Investment income is recorded net of foreign taxes withheld where recovery of such taxes is uncertain.
Deferred Trustee Compensation. Under a Deferred Compensation Plan (the Plan) non-interested Trustees must defer receipt of a portion of, and may elect to defer receipt of an additional portion of, their annual compensation. Deferred amounts are treated as though equivalent dollar amounts had been invested in shares of the fund or are invested in a cross-section of other Fidelity funds. Deferred amounts remain in the fund until distributed in accordance with the Plan.
Distributions to Shareholders. Distributions are recorded on the ex-dividend date.
Income and capital gain distributions are determined in accordance with income tax regulations which may differ from generally accepted accounting principles. These differences, which may result in distribution reclassifications, are primarily due to differing treatments for litigation proceeds, futures transactions, foreign currency transactions, partnerships, non-taxable dividends and losses deferred due to wash sales. The fund also utilized earnings and profits distributed to shareholders on redemption of shares as a part of the dividends paid deduction for income tax purposes.
Permanent book and tax basis differences relating to shareholder distributions will result in reclassifications to paid in capital. Undistributed net investment income and accumulated undistributed net realized gain (loss) on investments and foreign currency transactions may include temporary book and tax basis differences which will reverse in a subsequent period. Any taxable income or gain remaining at fiscal year end is distributed in the following year.
Security Transactions. Security transactions are accounted for as of trade date. Gains and losses on securities sold are determined on the basis of identified cost.
Semiannual Report
Notes to Financial Statements - continued
2. Operating Policies.
Foreign Currency Contracts. The fund generally uses foreign currency contracts to facilitate transactions in foreign-denominated securities. Losses may arise from changes in the value of the foreign currency or if the counterparties do not perform under the contracts' terms. The U.S. dollar value of foreign currency contracts is determined using contractual currency exchange rates established at the time of each trade.
Joint Trading Account. Pursuant to an Exemptive Order issued by the Securities and Exchange Commission (the SEC), the fund, along with other affiliated entities of Fidelity Management & Research Company (FMR), may transfer uninvested cash balances into one or more joint trading accounts. These balances are invested in one or more repurchase agreements for U.S. Treasury or Federal Agency obligations.
Repurchase Agreements. The underlying U.S. Treasury, Federal Agency, or other obligations found to be satisfactory by FMR are transferred to an account of the fund, or to the Joint Trading Account, at a custodian bank. The securities are marked-to-market daily and maintained at a value at least equal to the principal amount of the repurchase agreement (including accrued interest). FMR, the fund's investment adviser, is responsible for determining that the value of the underlying securities remains in accordance with the market value requirements stated above.
Restricted Securities. The fund is permitted to invest in securities that are subject to legal or contractual restrictions on resale. These securities generally may be resold in transactions exempt from registration or to the public if the securities are registered. Disposal of these securities may involve time-consuming negotiations and expense, and prompt sale at an acceptable price may be difficult. At the end of the period, the fund had no investments in restricted securities.
3. Purchases and Sales of Investments.
Purchases and sales of securities, other than short-term securities, aggregated $8,226,844,000 and $10,841,022,000, respectively.
4. Fees and Other Transactions with Affiliates.
Management Fee. As the fund's investment adviser, FMR receives a monthly basic fee that is calculated on the basis of a group fee rate plus a fixed individual fund fee rate applied to the average net assets of the fund. The group fee rate is the weighted average of a series of rates and is based on the monthly average net assets of all the mutual funds advised by FMR. The rates ranged from .2167% to .5200% for the period. The annual individual fund fee rate is .30%. In the event that these rates were lower than the contractual rates in effect during the period, FMR voluntarily implemented
Semiannual Report
Notes to Financial Statements - continued
4. Fees and Other Transactions with Affiliates - continued
Management Fee - continued
the above rates, as they resulted in the same or a lower management fee. The basic fee is subject to a performance adjustment (up to a maximum of ±.20% of the fund's average net assets over the performance period) based on the fund's investment performance as compared to the appropriate index over a specified period of time. For the period, the management fee was equivalent to an annualized rate of .71% of average net assets after the performance adjustment.
Sub-Adviser Fee. Beginning January 1, 2001, FMR Co.(FMRC) will serve as sub-adviser for the fund. FMRC is a wholly owned subsidiary of FMR and will receive a fee from FMR of 50% of the management fee payable to FMR.
Sales Load. For the period, Fidelity Distributors Corporation (FDC), an affiliate of FMR and the general distributor of the fund, received sales charges of $3,774,000 on sales of shares of the fund all of which was retained.
Transfer Agent Fees. Fidelity Service Company, Inc. (FSC), an affiliate of FMR, is the fund's transfer, dividend disbursing and shareholder servicing agent. FSC receives account fees and asset-based fees that vary according to account size and type of account. FSC pays for typesetting, printing and mailing of all shareholder reports, except proxy
statements. For the period, the transfer agent fees were equivalent to an annualized rate of .17% of average net assets.
Accounting and Security Lending Fees. FSC maintains the fund's accounting records and administers the security lending program. The security lending fee is based on the number and duration of lending transactions. The accounting fee is based on the level of average net assets for the month plus out-of-pocket expenses.
Fidelity Cash Central Fund. Pursuant to an Exemptive Order issued by the SEC, the fund may invest in the Fidelity Cash Central Fund (the Cash Fund) managed by Fidelity Investments Money Management, Inc., an affiliate of FMR. The Cash Fund is an open-end money market fund available only to investment companies and other accounts managed by FMR and its affiliates. The Cash Fund seeks preservation of capital, liquidity, and current income. Income distributions from the Cash Fund are declared daily and paid monthly from net interest income. Income distributions earned by the fund are recorded as either interest income or security lending income in the accompanying financial statements.
Brokerage Commissions. The fund placed a portion of its portfolio transactions with brokerage firms which are affiliates of FMR. The commissions paid to these affiliated firms were $751,000 for the period.
Semiannual Report
Notes to Financial Statements - continued
5. Security Lending.
The fund lends portfolio securities from time to time in order to earn additional income. The fund receives collateral in the form of U.S. Treasury obligations, letters of credit, and/or cash against the loaned securities, and maintains collateral in an amount not less than 100% of the market value of the loaned securities during the period of the loan. The market value of the loaned securities is determined at the close of business of the fund and any additional required collateral is delivered to the fund on the next business day. If the borrower defaults on its obligation to return the securities loaned because of insolvency or other reasons, the fund could experience delays and costs in recovering the securities loaned or in gaining access to the collateral. At period end, the value of the securities loaned amounted to $231,800,000. The fund received cash collateral of $245,646,000 which was invested in cash equivalents.
6. Expense Reductions.
FMR has directed certain portfolio trades to brokers who paid a portion of the fund's expenses. For the period, the fund's expenses were reduced by $1,455,000 under this arrangement.
In addition, through arrangements with the fund's custodian and transfer agent, credits realized as a result of uninvested cash balances were used to reduce a portion of the fund's expenses. During the period, the fund's custodian and transfer agent fees were reduced by $9,000 and $4,657,000, respectively, under these arrangements.
7. Transactions with Affiliated Companies.
An affiliated company is a company in which the fund has ownership of at least 5% of the voting securities. Transactions during the period with companies which are or were affiliates are as follows:
|
Summary of Transactions with Affiliated Companies |
||||
|
Amounts in thousands Affiliate |
Purchase |
Sales |
Dividend |
Value |
|
Anadarko Petroleum Corp. |
$ - |
$ - |
$ - |
$ - |
|
Extended Stay America, Inc. |
- |
- |
- |
77,640 |
|
Host Marriott Corp. |
- |
4,956 |
- |
- |
|
Lafarge Corp. |
1,429 |
- |
1,359 |
99,491 |
|
Leggett & Platt, Inc. |
- |
- |
2,629 |
197,920 |
|
Lycos, Inc. |
8,631 |
27,604 |
- |
- |
|
Polo Ralph Lauren Corp. Class A |
- |
- |
- |
37,631 |
|
Swift Transportation Co., Inc. |
- |
- |
- |
43,366 |
|
TOTALS |
$ 10,060 |
$ 32,560 |
$ 3,988 |
$ 456,048 |
Semiannual Report
To the Trustees and the Shareholders of Fidelity Magellan Fund:
In our opinion, the accompanying statements of assets and liabilities, including the schedule of investments, and the related statements of operations and of changes in net assets and the financial highlights present fairly, in all material respects, the financial position of Fidelity Magellan Fund at September 30, 2000, and the results of its operations, the changes in its net assets and the financial highlights for the periods indicated, in conformity with accounting principles generally accepted in the United States of America. These financial statements and financial highlights (hereafter referred to as "financial statements") are the responsibility of the Fidelity Magellan Fund's management; our responsibility is to express an opinion on these financial statements based on our audits. We conducted our audits of these financial statements in accordance with auditing standards generally accepted in the United States of America which require that we plan and perform the audit to obtain reasonable assurance about whether the financial statements are free of material misstatement. An audit includes examining, on a test basis, evidence supporting the amounts and disclosures in the financial statements, assessing the accounting principles used and significant estimates made by management, and evaluating the overall financial statement presentation. We believe that our audits, which included confirmation of securities at September 30, 2000 by correspondence with the custodian and brokers, provide a reasonable basis for our opinion.
/s/PricewaterhouseCoopers LLP
PricewaterhouseCoopers LLP
Boston, Massachusetts
November 2, 2000
Semiannual Report
Fidelity offers several ways to conveniently manage your personal investments via your telephone or PC. You can access your account information, conduct trades and research your investments 24 hours a day.
By Phone
Fidelity Automated Service Telephone provides a single toll-free number to access account balances, positions, quotes and trading. It's easy to navigate the service, and on your first call, the system will help you create a personal identification number (PIN) for security.
(phone_graphic)Fidelity Automated
Service Telephone (FAST®)
1-800-544-5555
Press
1 For mutual fund and brokerage trading.
2 For quotes.*
3 For account balances and holdings.
4 To review orders and mutual fund activity.
5 To change your PIN.
*0 To speak to a Fidelity representative.
By PC
Fidelity's web site on the Internet provides a wide range of information, including daily financial news, fund performance, interactive planning tools and news about Fidelity products and services.
(computer_graphic)Fidelity's Web Site
www.fidelity.com
If you are not currently on the Internet, call EarthLink Sprint at 1-800-288-2967, and be sure to ask for registration number SMD004 to receive a special Fidelity package that includes 30 days of free Internet access. EarthLink is North America's #1 independent Internet access provider.
(computer_graphic)
Fidelity On-line Xpress+®
Fidelity On-line Xpress+ software for Windows combines comprehensive portfolio management capabilities, securities trading and access to research and analysis tools . . . all on your desktop. Call Fidelity at 1-800-544-0240 or visit our web site for more information on how to manage your investments via your PC.
* When you call the quotes line, please remember that a fund's yield and return will vary and, except for money market funds, share price will also vary. This means that you may have a gain or loss when you sell your shares. There is no assurance that money market funds will be able to maintain a stable $1 share price; an investment in a money market fund is not insured or guaranteed by the U.S. government. Total returns are historical and include changes in share price, reinvestment of dividends and capital gains, and the effects of any sales charges.
Semiannual Report
For directions and hours,
please call 1-800-544-9797.
Arizona
7373 N. Scottsdale Road
Scottsdale, AZ
California
815 East Birch Street
Brea, CA
851 East Hamilton Avenue
Campbell, CA
527 North Brand Boulevard
Glendale, CA
19200 Von Karman Avenue
Irvine, CA
10100 Santa Monica Blvd.
Los Angeles, CA
251 University Avenue
Palo Alto, CA
1760 Challenge Way
Sacramento, CA
7676 Hazard Center Drive
San Diego, CA
8 Montgomery Street
San Francisco, CA
950 Northgate Drive
San Rafael, CA
1400 Civic Drive
Walnut Creek, CA
6300 Canoga Avenue
Woodland Hills, CA
Colorado
1625 Broadway
Denver, CO
Connecticut
48 West Putnam Avenue
Greenwich, CT
265 Church Street
New Haven, CT
300 Atlantic Street
Stamford, CT
29 South Main Street
West Hartford, CT
Delaware
222 Delaware Avenue
Wilmington, DE
Florida
4400 N. Federal Highway
Boca Raton, FL
90 Alhambra Plaza
Coral Gables, FL
4090 N. Ocean Boulevard
Ft. Lauderdale, FL
1907 West State Road 434
Longwood, FL
8880 Tamiami Trail, North
Naples, FL
2401 PGA Boulevard
Palm Beach Gardens, FL
8065 Beneva Road
Sarasota, FL
1502 N. Westshore Blvd.
Tampa, FL
Georgia
3445 Peachtree Road, N.E.
Atlanta, GA
1000 Abernathy Road
Atlanta, GA
Illinois
One North Franklin Street
Chicago, IL
1415 West 22nd Street
Oak Brook, IL
1700 East Golf Road
Schaumburg, IL
3232 Lake Avenue
Wilmette, IL
Indiana
4729 East 82nd Street
Indianapolis, IN
Maine
Three Canal Plaza
Portland, ME
Maryland
7401 Wisconsin Avenue
Bethesda, MD
One W. Pennsylvania Ave.
Towson, MD
Massachusetts
801 Boylston Street
Boston, MA
155 Congress Street
Boston, MA
25 State Street
Boston, MA
300 Granite Street
Braintree, MA
44 Mall Road
Burlington, MA
416 Belmont Street
Worcester, MA
Semiannual Report
Michigan
280 Old N. Woodward Ave.
Birmingham, MI
29155 Northwestern Hwy.
Southfield, MI
Minnesota
7600 France Avenue South
Edina, MN
Missouri
700 West 47th Street
Kansas City, MO
8885 Ladue Road
Ladue, MO
New Jersey
150 Essex Street
Millburn, NJ
56 South Street
Morristown, NJ
501 Route 17, South
Paramus, NJ
New York
1055 Franklin Avenue
Garden City, NY
999 Walt Whitman Road
Melville, L.I., NY
1271 Avenue of the Americas
New York, NY
71 Broadway
New York, NY
350 Park Avenue
New York, NY
North Carolina
4611 Sharon Road
Charlotte, NC
Ohio
600 Vine Street
Cincinnati, OH
28699 Chagrin Boulevard
Woodmere Village, OH
Oregon
16850 SW 72nd Avenue
Tigard, OR
Pennsylvania
1735 Market Street
Philadelphia, PA
439 Fifth Avenue
Pittsburgh, PA
Rhode Island
47 Providence Place
Providence, RI
Tennessee
6150 Poplar Avenue
Memphis, TN
Texas
10000 Research Boulevard
Austin, TX
4017 Northwest Parkway
Dallas, TX
1155 Dairy Ashford Street
Houston, TX
2701 Drexel Drive
Houston, TX
400 East Las Colinas Blvd.
Irving, TX
14100 San Pedro
San Antonio, TX
19740 IH 45 North
Spring, TX
Utah
215 South State Street
Salt Lake City, UT
Virginia
1861 International Drive
McLean, VA
Washington
411 108th Avenue, N.E.
Bellevue, WA
511 Pine Street
Seattle, WA
Washington, DC
1900 K Street, N.W.
Washington, DC
Wisconsin
595 North Barker Road
Brookfield, WI
Fidelity Brokerage Services, Inc., 100 Summer St., Boston, MA 02110 Member NYSE/SIPC
Semiannual Report
If more than one address is listed, please locate the address that is closest to you. We'll give your correspondence immediate attention and send you written confirmation upon completion of your request.
(letter_graphic)Making Changes
To Your Account
(such as changing name, address, bank, etc.)
Fidelity Investments
P.O. Box 770001
Cincinnati, OH 45277-0002
(letter_graphic)For Non-Retirement
Accounts
Buying shares
Fidelity Investments
P.O. Box 770001
Cincinnati, OH 45277-0003
Overnight Express
Fidelity Investments
2300 Litton Lane - KH1A
Hebron, KY 41048
Selling shares
Fidelity Investments
P.O. Box 660602
Dallas, TX 75266-0602
Overnight Express
Fidelity Investments
Attn: Redemptions - CP6I
400 East Las Colinas Blvd.
Irving, TX 75039-5587
General Correspondence
Fidelity Investments
P.O. Box 500
Merrimack, NH 03054-0500
(letter_graphic)For Retirement
Accounts
Buying shares
Fidelity Investments
P.O. Box 770001
Cincinnati, OH 45277-0003
Selling shares
Fidelity Investments
P.O. Box 660602
Dallas, TX 75266-0602
Overnight Express
Fidelity Investments
Attn: Redemptions - CP6R
400 East Las Colinas Blvd.
Irving, TX 75039-5587
General Correspondence
Fidelity Investments
P.O. Box 500
Merrimack, NH 03054-0500
Semiannual Report
Semiannual Report
Investment Adviser
Fidelity Management & Research Company
Boston, MA
Investment Sub-Advisers
Fidelity Management & Research
(U.K.) Inc.
Fidelity Management & Research
(Far East) Inc.
Fidelity Investments Japan Limited
Officers
Edward C. Johnson 3d, President
Robert C. Pozen, Senior Vice President
Abigail P. Johnson, Vice President
Robert E. Stansky, Vice President
Eric D. Roiter, Secretary
Robert A. Dwight, Treasurer
Maria F. Dwyer, Deputy Treasurer
John H. Costello, Assistant Treasurer
Thomas J. Simpson, Assistant Treasurer
Board of Trustees
Ralph F. Cox *
Phyllis Burke Davis *
Robert M. Gates *
Edward C. Johnson 3d
Donald J. Kirk *
Ned C. Lautenbach *
Peter S. Lynch
Marvin L. Mann *
William O. McCoy *
Gerald C. McDonough *
Robert C. Pozen
Thomas R. Williams *
Advisory Board
J. Michael Cook
Marie L. Knowles
General Distributor
Fidelity Distributors Corporation
Boston, MA
Transfer and Shareholder
Servicing Agent
Fidelity Service Company, Inc.
Boston, MA
* Independent trustees
Custodian
State Street Bank and Trust Company Quincy, MA
Fidelity's Growth Funds
Aggressive Growth Fund
Blue Chip Growth Fund
Capital Appreciation Fund
Contrafund SM
Contrafund SM II
Disciplined Equity Fund
Dividend Growth Fund
Export and Multinational Fund
Fidelity Fifty ®
Growth Company Fund
Large Cap Stock Fund
Low-Priced Stock Fund
Magellan® Fund
Mid-Cap Stock Fund
New Millennium Fund®
OTC Portfolio
Retirement Growth Fund
Small Cap Selector
Small Cap Stock Fund
Stock Selector
Tax Managed Stock Fund
TechnoQuantSM Growth Fund
Trend Fund
Value Fund
The Fidelity Telephone Connection
Mutual Fund 24-Hour Service
Exchanges/Redemptions
and Account Assistance 1-800-544-6666
Product Information 1-800-544-6666
Retirement Accounts 1-800-544-4774
(8 a.m. - 9 p.m.)
TDD Service 1-800-544-0118
for the deaf and hearing impaired
(9 a.m. - 9 p.m. Eastern time)(Fidelity Investment logo)(registered trademark)
Corporate Headquarters
82 Devonshire St., Boston, MA 02109
www.fidelity.com
Fidelity Automated Service
Telephone (FAST®) (automated graphic) 1-800-544-5555
(automated graphic) Automated line for quickest service
|
MAG-SANN-1100 |
116143 |
|
1.537468.103 |
|
|
|