
|
|
|
|
|
|
|
|
|
|
Previous: MINNESOTA MINING & MANUFACTURING CO, S-8, EX-24, 2000-08-29 |
Next: PRUDENTIAL MONEYMART ASSETS INC, NSAR-A, 2000-08-29 |
| Page |
||
|---|---|---|
| To Our Shareholders | 2-11 | |
| Statement of Assets and Liabilities as of June 30, 2000 | 12 | |
| MML Equity Fund | ||
| MML Money Market Fund | ||
| MML Managed Bond Fund | ||
| MML Blend Fund | ||
| Statement of Operations For the Six Months Ended June 30, 2000 | 13 | |
| MML Equity Fund | ||
| MML Money Market Fund | ||
| MML Managed Bond Fund | ||
| MML Blend Fund | ||
|
Statement of Changes in Net Assets For the Six Months Ended June 30, 2000 and For the Year Ended
December 31, 1999 |
14 | |
| MML Equity Fund | ||
| MML Money Market Fund | ||
| MML Managed Bond Fund | ||
| MML Blend Fund | ||
| Financial Highlights | ||
| MML Equity Fund | 15 | |
| MML Money Market Fund | 16 | |
| MML Managed Bond Fund | 17 | |
| MML Blend Fund | 18 | |
| Schedule of Investments as of June 30, 2000 | ||
| MML Equity Fund | 19-20 | |
| MML Money Market Fund | 21 | |
| MML Managed Bond Fund | 22-24 | |
| MML Blend Fund | 25-29 | |
| Notes to Financial Statements | 30-35 | |
| MML Series Investment Fund – Letter to Shareholders
|

| |
| MassMutual Expands Fund Offerings
|
| I’d like to announce some exciting additions to the MML Series Investment Fund. Through our comprehensive due diligence
process, we’ve uncovered significant investor demand for a number of fund types and managers that were not previously addressed by our selections. As a result, we’ve added three new funds, listed as follows, with their managers (sub-advisers) in
parentheses: Large Cap Value (Davis Selected Advisers), OTC 100 (Deutsche Asset Management/Bankers Trust Company), and Emerging Growth (RS Investment Management). These new choices span a broad range of investment styles and market sectors—value vs.
growth, active vs. indexed, and large-cap vs. emerging growth. All of our new managers have produced excellent long-term track records, and have passed through our extensive selection process. We will continue to monitor all of our funds carefully so that
you can be assured of access to top-flight investment management talent.
|
| MML Equity Fund
|
Ÿ
|
achieve high total returns over the long term while minimizing risk
|
Ÿ
|
invest in a diversified portfolio of equity securities of larger, well-established companies (generally companies with market
capitalization over $2.0 billion)
|
Ÿ
|
utilize a value-oriented strategy in making investment decisions
|
Ÿ
|
utilize Fundamental analysis to identify companies which
|
| -are of high investment quality
|
| -offer above-average dividend growth potential
|
| -are attractively valued in the marketplace
|
| MML Equity Fund (Continued)
|
What are some examples of stocks you bought and sold?
Alcatel, a European telecommunications equipment manufacturer, was an example of a recent purchase that contributed positively to performance. The company stands to reap substantial benefits from the ongoing expansion of the Internet’s infrastructure in Europe. Liberty Media Group, the video programming arm of AT&T, was also an addition, joining the Fund’s 10 largest holdings. Headed by media titan John Malone, this company has both profitable established lines of business and a track record of creating promising startup media companies. News Corp., Radio Shack, and Micron Technology are some other recent purchases.On the sell side, we liquidated or reduced positions in Albertson’s, Engelhard, Illinois Tool Works, Crown, Cork & Seal, and Delphi, among others. It made little sense to us to own a stock like Albertson’s given that the company’s business lies directly in the path of expansion of a retail juggernaut like Wal-Mart. Delphi exemplified a company whose earnings appeared better than they really were. As a former subsidiary of General Motors, Delphi is obliged to plow a significant portion of its earnings back into supporting the subcontracting business of GM.
What is your outlook?
The consensus view at the end of the period was that the Fed was finished raising interest rates for the time being. We are not entirely comfortable with this view. While the recent numbers on consumer spending and other data indicate that an economic slowdown might be starting, we believe that those numbers were influenced in part by a seasonal shortage of cash in the second quarter due to income tax payments. The pattern during the past few years has been for spending to pick up again in the third quarter. Consequently, we have positioned the Fund defensively as a precaution against more rate hikes later in 2000. We are comfortable with most of the Fund’s holdings and sector weightings roughly as they are, and we anticipate much lower turnover in the second half of the year.
| Year to
Date |
One Year | Five Year | Ten Year | ||||||
|---|---|---|---|---|---|---|---|---|---|
| 1/1/00 -
6/30/00 |
7/1/99 -
6/30/00 |
Average
Annual 7/1/95 - 6/30/00 |
Average
Annual 6/30/90 - 6/30/00 |
||||||
| MML Equity Fund | -4.17% | -14.22% | 13.33% | 12.78% | |||||
| S&P’s 500
Composite Index |
-0.42% | 7.25% | 23.81% | 17.80% | |||||
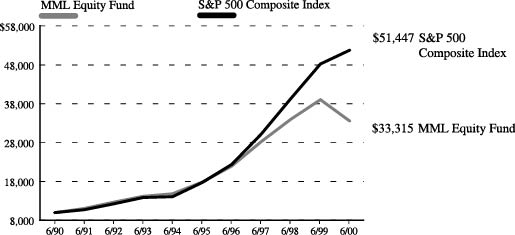
| The investment return and principal value of shares of the Fund will fluctuate with market conditions so that shares of the
Fund, when redeemed, may be worth more or less than their original cost. Investors should note that the Fund is a professionally managed mutual fund, while the S&P’s 500 Composite Index is unmanaged and does not incur expenses, and cannot be
purchased directly by investors. The Fund’s return reflects changes in the net asset value per share without the deduction of any product charges. The inclusion of these charges would have reduced the performance shown here. Past performance is no
indication of future results.
|
| MML Money Market Fund
|
Ÿ maximize current income to the extent consistent with
liquidity and the preservation of capital
Ÿ invest in a diversified portfolio of money market instruments
Ÿ invest in high quality debt instruments with remaining maturity not to exceed 397 days
| MML Money Market Fund (Continued)
|
| MML Money Market Fund (Continued)
|
| MML Series Investment Fund | |||||||||
|---|---|---|---|---|---|---|---|---|---|
|
Total Return
|
Year to
Date |
One Year | Five Year | Ten Year | |||||
| 1/1/00 -
6/30/00 |
7/1/99 -
6/30/00 |
Average
Annual 7/1/95 - 6/30/00 |
Average
Annual 6/30/90 - 6/30/00 |
||||||
| MML Money
Market Fund |
2.82% | 5.38% | 5.14% | 4.86% | |||||
| |
|||||||||
| Lipper Taxable Money
Market Fund Index |
2.80% | 5.33% | 5.11% | 4.80% | |||||
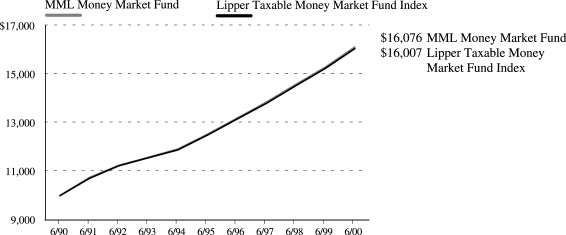
| The investment return and principal value of shares of the Fund will fluctuate with market conditions so that shares of the
Fund, when redeemed, may be worth more or less than their original cost. Investors should note that the Fund is a professionally managed mutual fund, while the Lipper Taxable Money Market Fund Index is unmanaged and does not incur expenses, and cannot be
purchased directly by investors. The Fund’s return reflects changes in the net asset value per share without the deduction of any product charges. The inclusion of these charges would have reduced the performance shown here. Past performance is no
indication of future results.
|
| MML Managed Bond Fund
|
Ÿ
|
achieve a high total return consistent with prudent investment risk and the preservation of capital
|
Ÿ
|
invest primarily in a diversified portfolio of investment grade, fixed income securities
|
Ÿ
|
maintain duration in a targeted range from four to seven years
|
Ÿ
|
diversify investments by industry, sector, maturity, issuer class, and quality sectors to reduce risk of capital erosion
|
| MML Managed Bond Fund (Continued)
|
| MML Series Investment Fund
Total Return
|
|||||||||
|---|---|---|---|---|---|---|---|---|---|
| Year to
Date |
One Year | Five Year | Ten Year | ||||||
| 1/1/00 -
6/30/00 |
7/1/99 -
6/30/00 |
Average
Annual 7/1/95 - 6/30/00 |
Average
Annual 6/30/90 - 6/30/00 |
||||||
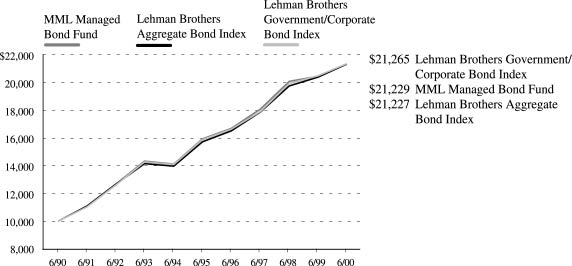
| MML Managed
Bond Fund |
4.12% | 4.24% | 5.97% | 7.81% | |||||
| |
|||||||||
| Lehman Brothers
Aggregate Bond Index |
3.99% | 4.56% | 6.25% | 7.82% | |||||
| MML Blend Fund
|
Ÿ
|
achieve a high total rate of return over an extended period of time consistent with the preservation of capital values
|
Ÿ
|
invest in a diversified portfolio of equity securities, fixed-income securities and money market instruments
|
Ÿ
|
manage the allocation of investments, under normal circumstances, in three sectors with the following ranges:
|
| Money Market segment at least 25% of net assets
|
| Bond segment no more than 50% of net assets
|
| Equity segment no more than 90% of net assets
|
While the Fund’s absolute return was disappointing, relative performance improved markedly from the previous period. For the six months ended June 30, 2000, the Fund’s shares returned -0.51%, about in line with the -0.12% return of the Lipper Balanced Fund Index, an unmanaged index of stock and bond portfolios. A modest gain in the Fund’s bond portfolio was offset by a negative return on the equity side. The Fund’s return reflects changes in the net asset value per share without the deduction of any product charges. The inclusion of these charges would have reduced the performance shown here. Past performance is no indication of future results.
What was the Fund's asset allocation strategy during the period?
We increased the Fund’s equity allocation twice—once in March and once in April. We felt that the correction in stocks created some attractive values and tried to position the Fund to take advantage of them. On the other hand, we decreased the Fund’s bond allocation in April and June. Continued upward pressure on interest rates and a still-vibrant U.S. economy contributed to our decision to de-emphasize the bond portion of the portfolio. At the end of the period, our target allocations of stocks, bonds, and money market securities were 57.0%, 27.5%, and 15.5%, respectively.| MML Blend Fund (Continued)
|
| MML Blend Fund (Continued)
|
| Growth of a $10,000 Investment
|
| Year to
Date |
One Year | Five Year | Ten Year | ||||||
|---|---|---|---|---|---|---|---|---|---|
| 1/1/00 -
6/30/00 |
7/1/99 -
6/30/00 |
Average
Annual 7/1/95 - 6/30/00 |
Average
Annual 6/30/90 - 6/30/00 |
||||||
| MML
Blend Fund |
-0.51% | -6.06% | 10.99% | 11.14% | |||||
| Lipper Balanced
Fund Index |
-0.12% | 2.51% | 13.35% | 11.88% | |||||
| S&P’s 500
Composite Index |
-0.42% | 7.25% | 23.81% | 17.80% | |||||
| Lehman Brothers
Aggregate Bond Index |
3.99% | 4.56% | 6.25% | 7.82% | |||||
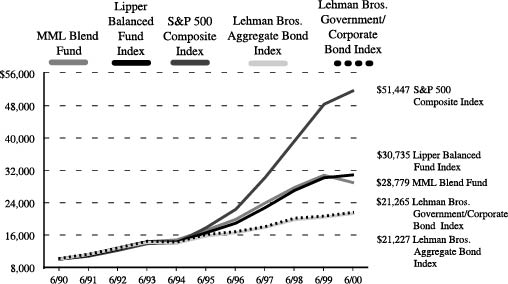
| The investment return and principal value of shares of the Fund will fluctuate with market conditions so that shares of the
Fund, when redeemed, may be worth more or less than their original cost. Investors should note that the Fund is a professionally managed mutual fund, while the Lipper Balanced Fund Index, the Lehman Brothers Aggregate Bond Index, and the S&P’s
500 Composite Index are unmanaged and do not incur expenses, and cannot be purchased directly by investors. The Fund’s return reflects changes in the net asset value per share without the deduction of any product charges. The inclusion of these
charges would have reduced the performance shown here. Past performance is no indication of future results.
|
| MML
Equity Fund |
MML
Money Market Fund |
MML
Managed Bond Fund |
MML
Blend Fund |
|||||||
|---|---|---|---|---|---|---|---|---|---|---|
| ASSETS: | ||||||||||
| Investments, at value (cost $1,620,159,861, $0, $210,760,246, $1,467,227,018) (Note 2) | $ 2,252,311,156 | $ - | $ 205,241,674 | $ 1,912,872,565 | ||||||
| Short-term investments, at amortized cost (Note 2) | 50,016,610 | 181,570,068 | 15,837,760 | 257,380,103 | ||||||
| Total investments | 2,302,327,766 | 181,570,068 | 221,079,434 | 2,170,252,668 | ||||||
| Cash | - | 639 | 4,672 | 50,314 | ||||||
| Receivables from: | ||||||||||
| Investments sold | 27,725,155 | - | 1,025,503 | 28,456,537 | ||||||
| Interest and dividends | 2,868,342 | 792 | 2,736,502 | 8,884,434 | ||||||
| Foreign taxes withheld | 64,390 | - | - | 40,434 | ||||||
| Total assets | 2,332,985,653 | 181,571,499 | 224,846,111 | 2,207,684,387 | ||||||
| LIABILITIES: | ||||||||||
| Payables for: | ||||||||||
| Investments purchased | 18,182,949 | - | - | 11,495,439 | ||||||
| Securities on loan (Note 2) | 50,016,610 | - | 11,606,171 | 107,727,822 | ||||||
| Dividends payable (Note 2) | - | 948,361 | - | - | ||||||
| Directors’ fees and expenses (Note 3) | 1,410 | 811 | 819 | 1,227 | ||||||
| Affiliates (Note 3): | ||||||||||
| Investment management fees | 711,843 | 73,148 | 82,945 | 657,352 | ||||||
| Due to Custodian | 9,225,213 | - | - | - | ||||||
| Accrued expenses and other liabilities | 15,335 | 23,652 | 9,403 | 29,431 | ||||||
| Total liabilities | 78,153,360 | 1,045,972 | 11,699,338 | 119,911,271 | ||||||
| NET ASSETS | $ 2,254,832,293 | $ 180,525,527 | $ 213,146,773 | $ 2,087,773,116 | ||||||
| Net assets consist of: | ||||||||||
| Paid-in capital | $ 1,382,598,351 | $ 180,523,437 | $ 219,448,946 | $ 1,461,678,548 | ||||||
| Undistributed net investment income | 21,616,248 | 16,538 | 3,570,196 | 18,169,858 | ||||||
| Accumulated net realized gain (loss) on investments | 218,466,399 | (14,448 | ) | (4,353,797 | ) | 162,279,163 | ||||
| Net unrealized appreciation (depreciation) on investments | 632,151,295 | - | (5,518,572 | ) | 445,645,547 | |||||
| $ 2,254,832,293 | $ 180,525,527 | $ 213,146,773 | $ 2,087,773,116 | |||||||
| Shares outstanding: | 64,366,795 | 180,525,527 | 17,942,587 | 90,108,842 | ||||||
| Net asset value, offering price and redemption price per share: | $ 35.03 | $ 1.00 | $ 11.88 | $ 23.17 | ||||||
| MML
Equity Fund |
MML
Money Market Fund |
MML
Managed Bond Fund |
MML
Blend Fund |
||||||||
|---|---|---|---|---|---|---|---|---|---|---|---|
| Investment income: (Note 2) | |||||||||||
| Dividends (net of withholding tax of $126,579, $0, $0, $78,304) | $ 25,388,511 | $ - | $ - | $ 15,074,899 | |||||||
| Interest (including securities lending income of $18,895, $0, $6,195, $25,409) | 804,531 | 5,850,581 | 7,936,994 | 29,699,488 | |||||||
| Total investment income | 26,193,042 | 5,850,581 | 7,936,994 | 44,774,387 | |||||||
| Expenses: (Note 3) | |||||||||||
| Investment management fees (Note 3) | 4,520,975 | 456,229 | 529,767 | 4,324,395 | |||||||
| Custody fees | 56,150 | 6,989 | - | 58,926 | |||||||
| Audit and legal fees | 47,250 | 11,491 | 12,389 | 44,205 | |||||||
| Directors’ fees (Note 3) | 8,419 | 7,915 | 7,921 | 8,450 | |||||||
| Other expenses | 2,730 | 2,730 | - | 2,820 | |||||||
| Total expenses | 4,635,524 | 485,354 | 550,077 | 4,438,796 | |||||||
| Net investment income | 21,557,518 | 5,365,227 | 7,386,917 | 40,335,591 | |||||||
| Realized and unrealized gain (loss): | |||||||||||
| Net realized gain (loss) on investments | 218,466,399 | - | (2,366,261 | ) | 162,473,031 | ||||||
| Net change in unrealized appreciation (depreciation) on investments | (362,291,737 | ) | - | 3,973,770 | (225,642,995 | ) | |||||
| Net realized and unrealized gain (loss) | (143,825,338 | ) | - | 1,607,509 | (63,169,964 | ) | |||||
| Net increase (decrease) in net assets resulting from operations | $(122,267,820 | ) | $ 5,365,227 | $ 8,994,426 | $ (22,834,373 | ) | |||||
| Six months ended June 30, 2000 (Unaudited) |
Year ended December 31, 1999 |
|||||||||||||||||||||||
|---|---|---|---|---|---|---|---|---|---|---|---|---|---|---|---|---|---|---|---|---|---|---|---|---|
| MML
Equity Fund |
MML
Money Market Fund |
MML
Managed Bond Fund |
MML
Blend Fund |
MML
Equity Fund |
MML
Money Market Fund |
MML
Managed Bond Fund |
MML
Blend Fund |
|||||||||||||||||
| Increase (Decrease) in Net Assets: | ||||||||||||||||||||||||
| Operations: | ||||||||||||||||||||||||
| Net investment income | $ 21,557,518 | $ 5,365,227 | $ 7,386,917 | $ 40,335,591 | $ 53,666,623 | $ 8,721,660 | $ 15,791,736 | $ 96,536,711 | ||||||||||||||||
| Net realized gain (loss) on
investment transactions |
218,466,399 | - | (2,366,261 | ) | 162,473,031 | 32,212,209 | (2,451 | ) | (1,987,536 | ) | 49,460,859 | |||||||||||||
| Net change in unrealized
appreciation (depreciation) on investments |
(362,291,737 | ) | - | 3,973,770 | (225,642,995 | ) | (199,732,667 | ) | - | (18,606,086 | ) | (178,772,580 | ) | |||||||||||
| Net increase (decrease) in net
assets resulting from operations |
(122,267,820 | ) | 5,365,227 | 8,994,426 | (22,834,373 | ) | (113,853,835 | ) | 8,719,209 | (4,801,886 | ) | (32,775,010 | ) | |||||||||||
| Distributions to shareholders:
(Note 2) |
||||||||||||||||||||||||
| From net investment income: | - | (5,365,227 | ) | (3,866,691 | ) | (22,216,285 | ) | (53,615,000 | ) | (8,719,209 | ) | (15,861,796 | ) | (96,568,344 | ) | |||||||||
| From net realized gains: | - | - | - | (193,868 | ) | (32,524,676 | ) | - | - | (49,654,848 | ) | |||||||||||||
| - | (5,365,227 | ) | (3,866,691 | ) | (22,410,153 | ) | (86,139,676 | ) | (8,719,209 | ) | (15,861,796 | ) | (146,223,192 | ) | ||||||||||
| Net fund share transactions (Note 5) | (371,055,220 | ) | (20,044,384 | ) | (31,890,524 | ) | (503,303,194 | ) | 10,041,380 | 22,136,154 | 6,464,564 | 630,128 | ||||||||||||
| Total increase (decrease) in net
assets |
(493,323,040 | ) | (20,044,384 | ) | (26,762,789 | ) | (548,547,720 | ) | (189,952,131 | ) | 22,136,154 | (14,199,118 | ) | (178,368,074 | ) | |||||||||
| NET ASSETS: | ||||||||||||||||||||||||
| Beginning of period | 2,748,155,333 | 200,569,911 | 239,909,562 | 2,636,320,836 | 2,938,107,464 | 178,433,757 | 254,108,680 | 2,814,688,910 | ||||||||||||||||
| End of period | $ 2,254,832,293 | $ 180,525,527 | $ 213,146,773 | $ 2,087,773,116 | $ 2,748,155,333 | $ 200,569,911 | $ 239,909,562 | $ 2,636,320,836 | ||||||||||||||||
| Undistributed net investment
income included in net assets at end of period |
$ 21,616,248 | $ 16,538 | $ 3,570,196 | $ 18,169,858 | $ 58,730 | $ 16,538 | $ 49,970 | $ 50,552 | ||||||||||||||||
| *
|
Annualized
|
**
|
Percentage represents results for the period and are not annualized.
|
@
|
Total return information shown in the Financial Highlights tables does not reflect expenses that apply at the separate account level or to
related insurance products. Inclusion of these charges would reduce the total return figures for all periods shown.
|
*
|
Annualized
|
**
|
Percentage represents results for the period and are not annualized.
|
***
|
Distribution from net realized gains was less that $0.01 per share.
|
| @
|
Total return information shown in the Financial Highlights tables does not reflect expenses that apply at the separate account level or to
related insurance products. Inclusion of these charges would reduce the total return figures for all periods shown.
|
| Number
of Shares |
Market Value |
|||
|---|---|---|---|---|
| EQUITIES - 99.9% | ||||
| Aerospace & Defense - 6.5% | ||||
| Boeing Co. | 1,755,000 | $ 73,380,937 | ||
| Honeywell International, Inc. | 1,301,625 | 43,848,492 | ||
| TRW, Inc. | 700,000 | 30,362,500 | ||
| 147,591,929 | ||||
| Automotive & Parts - 2.3% | ||||
| Ford Motor Company | 500,000 | 21,500,000 | ||
| General Motors Corp. | 504,900 | 29,315,756 | ||
| Visteon Corp.* | 65,467 | 793,783 | ||
| 51,609,539 | ||||
| Banking, Savings & Loans - 7.1% | ||||
| The Bank of New York
Company, Incorporated |
1,320,000 | 61,380,000 | ||
| Chase Manhattan Corp. | 378,000 | 17,411,625 | ||
| Fleet Boston Financial Corp. | 609,953 | 20,738,402 | ||
| Wachovia Corp. | 544,300 | 29,528,275 | ||
| Wells Fargo & Company | 782,000 | 30,302,500 | ||
| 159,360,802 | ||||
| Beverages - 1.1% | ||||
| Brown-Forman Corporation
Cl. B |
463,000 | 24,886,250 | ||
| Broadcasting, Publishing & Printing - 3.7% | ||||
| The McGraw-Hill
Companies, Inc. |
1,000,000 | 54,000,000 | ||
| News Corporation Limited
Sponsored† |
527,200 | 28,732,400 | ||
| 82,732,400 | ||||
| Chemicals - 2.1% | ||||
| Rohm & Haas Company | 1,385,900 | 47,813,550 | ||
| Communications - 6.3% | ||||
| Alcatel SA Sponsored† | 374,300 | 24,890,950 | ||
| GTE Corporation | 946,800 | 58,938,300 | ||
| SBC Communications, Inc. | 1,352,824 | 58,509,638 | ||
| 142,338,888 | ||||
| Computer Integrated Systems Design - 2.1% | ||||
| Computer Sciences Corp.* | 634,400 | 47,381,750 | ||
| Number
of Shares |
Market Value |
|||
|---|---|---|---|---|
| Computers & Information - 2.3% | ||||
| Compaq Computer Corp. | 954,600 | $ 24,401,962 | ||
| Jabil Circuit, Inc.* | 540,000 | 26,797,500 | ||
| 51,199,462 | ||||
| Computers & Office Equipment - 1.2% | ||||
| International Business
Machines Corporation |
237,400 | 26,010,137 | ||
| Containers - 1.9% | ||||
| Sealed Air Corp.* | 567,400 | 29,717,575 | ||
| Temple-Inland, Inc. | 330,000 | 13,860,000 | ||
| 43,577,575 | ||||
| Cosmetics & Personal Care - 2.2% | ||||
| Kimberly-Clark Corporation | 863,400 | 49,537,575 | ||
| Electric Utilities - 2.4% | ||||
| Dominion Resources, Inc. | 840,000 | 36,015,000 | ||
| Teco Energy, Inc. | 904,700 | 18,150,544 | ||
| 54,165,544 | ||||
| Electrical Equipment & Electronics - 6.4% | ||||
| General Electric Company | 1,878,700 | 99,571,100 | ||
| Micron Technology, Inc.* | 352,500 | 31,042,032 | ||
| SCI Systems, Inc.* | 354,600 | 13,895,887 | ||
| 144,509,019 | ||||
| Energy - 12.9% | ||||
| Apache Corporation | 714,200 | 42,003,887 | ||
| BP Amoco PLC Sponsored† | 1,202,732 | 68,029,529 | ||
| Burlington Resources, Inc. | 850,000 | 32,512,500 | ||
| Chevron Corporation | 350,000 | 29,684,375 | ||
| Coastal Corp. | 398,500 | 24,258,687 | ||
| Conoco, Inc. Cl. A | 843,400 | 18,554,800 | ||
| Exxon Mobil Corp. | 726,082 | 56,997,437 | ||
| Total Fina Elf SA
Sponsored† |
235,050 | 18,054,778 | ||
| 290,095,993 | ||||
| Entertainment & Leisure - 2.5% | ||||
| AT&T - Liberty Media Group* | 2,317,900 | 56,209,075 | ||
| Number
of Shares |
Market Value |
|||
|---|---|---|---|---|
| Financial Services - 3.8% | ||||
| American Express Company | 900,000 | $ 46,912,500 | ||
| American General
Corporation |
634,900 | 38,728,900 | ||
| 85,641,400 | ||||
| Foods - 2.9% | ||||
| Bestfoods | 493,000 | 34,140,250 | ||
| General Mills, Inc. | 800,000 | 30,600,000 | ||
| 64,740,250 | ||||
| Forest Products & Paper - 0.9% | ||||
| Weyerhaeuser Company | 480,500 | 20,661,500 | ||
| Healthcare - 4.2% | ||||
| Becton, Dickinson and
Company |
1,388,600 | 39,835,463 | ||
| Schering-Plough Corp. | 1,100,000 | 55,550,000 | ||
| 95,385,463 | ||||
| Industrial - Diversified - 2.2% | ||||
| Illinois Tool Works, Inc. | 450,000 | 25,650,000 | ||
| Tyco International Ltd. | 492,808 | 23,346,779 | ||
| 48,996,779 | ||||
| Insurance - 5.1% | ||||
| The Hartford Financial
Services Group, Inc. |
745,100 | 41,679,031 | ||
| Marsh & McLennan
Companies, Inc. |
700,000 | 73,106,250 | ||
| MBIA, Inc. | 3,000 | 144,563 | ||
| 114,929,844 | ||||
| Miscellaneous - 1.4% | ||||
| Avery-Dennison Corp. | 471,600 | 31,656,180 | ||
| Pharmaceuticals - 6.5% | ||||
| American Home Products
Corporation |
750,000 | 44,062,500 | ||
| Merck & Co., Inc. | 676,800 | 51,859,800 | ||
| Pharmacia Corp. | 1,000,222 | 51,698,975 | ||
| 147,621,275 | ||||
| Restaurants - 1.6% | ||||
| McDonald’s Corp. | 1,086,900 | 35,799,769 | ||
| Number
of Shares |
Market Value |
|||||
|---|---|---|---|---|---|---|
| Retail - 2.3% | ||||||
| RadioShack Corporation | 565,200 | $ 26,776,350 | ||||
| Target Corporation | 430,000 | 24,940,000 | ||||
| 51,716,350 | ||||||
| Retail-Grocery - 1.4% | ||||||
| Albertson’s, Inc. | 938,366 | 31,200,670 | ||||
| Telephone Utilities - 1.4% | ||||||
| BellSouth Corporation | 755,100 | 32,186,138 | ||||
| Tobacco - 1.2% | ||||||
| Fortune Brands, Inc. | 1,200,000 | 27,675,000 | ||||
| Transportation - 2.0% | ||||||
| Burlington Northern
Santa Fe Corp. |
1,038,600 | 23,822,888 | ||||
| Galileo International, Inc. | 220,200 | 4,596,675 | ||||
| Norfolk Southern
Corporation |
1,120,100 | 16,661,487 | ||||
| 45,081,050 | ||||||
| TOTAL EQUITIES
(Cost $1,620,159,861) |
2,252,311,156 | |||||
| Principal
Amount |
||||||
| SHORT-TERM INVESTMENTS - 2.2% | ||||||
| Cash Equivalents | ||||||
| Bank of America Bank Note** | ||||||
| 6.670% 03/22/2001 | $ 1,071,571 | $ 1,071,571 | ||||
| Bank of Montreal Bank Note** | ||||||
| 6.630% 08/16/2000 | 1,551,234 | 1,551,234 | ||||
| Bank of Nova Scotia
Eurodollar Time Deposit** |
||||||
| 7.000% 07/03/2000 | 2,143,153 | 2,143,153 | ||||
| Credit Agricole Bank
Eurodollar Time Deposit** |
||||||
| 6.750% 07/06/2000 | 7,143,843 | 7,143,843 | ||||
|
Principal Amount |
Market Value |
|||
|---|---|---|---|---|
| Cash Equivalents (Continued) | ||||
| Credit Agricole Bank
Eurodollar Time Deposit** |
||||
| 6.750% 07/07/2000 | $ 1,071,572 | $ 1,071,572 | ||
| Den Danske Bank
Eurodollar Time Deposit** |
||||
| 6.810% 07/05/2000 | 3,929,112 | 3,929,112 | ||
| First Union Bank Note** | ||||
| 6.900% 05/09/2001 | 1,071,567 | 1,071,567 | ||
| Fleet National Bank
Eurodollar Time Deposit** |
||||
| 7.260% 10/31/2000 | 6,533,609 | 6,533,609 | ||
| HypoVereinsbank
Eurodollar Time Deposit** |
||||
| 6.750% 07/05/2000 | 8,929,802 | 8,929,802 | ||
| Merrimac Money Market
Fund** |
||||
| 6.440% 07/03/2000 | 10,715,827 | 10,715,827 | ||
| Morgan Stanley Dean
Witter & Co.** |
||||
| 6.890% 07/17/2000 | 1,569,014 | 1,569,014 | ||
| Paribas Bank Eurodollar
Time Deposit** |
||||
| 6.750% 07/05/2000 | 4,286,306 | 4,286,306 | ||
| 50,016,610 | ||||
| TOTAL SHORT-TERM INVESTMENTS | ||||
| (At Amortized Cost) | 50,016,610 | |||
| TOTAL INVESTMENTS - 102.1% | 2,302,327,766 | |||
| (Cost $1,670,176,471)*** | ||||
| Other Assets/(Liabilities) - (2.1%) | (47,495,473) | |||
| NET ASSETS - 100.0% | $2,254,832,293 | |||
*
|
Non-income producing security.
|
**
|
Represents investment of security lending collateral. (Note 2).
|
***
|
Aggregate cost for Federal tax purposes. (Note 7).
|
†
|
American Depository Receipt.
|
| Principal
Amount |
Market Value |
|||
|---|---|---|---|---|
| SHORT-TERM INVESTMENTS - 100.6% | ||||
| Commercial Paper | ||||
| Alcoa, Inc. | ||||
| 6.560% 09/21/2000 | $ 2,455,000 | $ 2,418,317 | ||
| Alcoa, Inc. | ||||
| 6.580% 09/29/2000 | 2,380,000 | 2,340,849 | ||
| American Greetings Corp. | ||||
| 6.520% 08/01/2000 | 1,460,000 | 1,451,803 | ||
| American Greetings Corp. | ||||
| 6.580% 09/18/2000 | 6,000,000 | 5,913,363 | ||
| Anheuser-Busch Companies, Inc. | ||||
| 6.120% 07/10/2000 | 4,500,000 | 4,493,115 | ||
| Anheuser-Busch Companies, Inc. | ||||
| 6.500% 09/22/2000 | 1,900,000 | 1,871,527 | ||
| Bellsouth Corporation | ||||
| 6.530% 08/11/2000 | 3,970,000 | 3,940,475 | ||
| Bemis Company, Inc. | ||||
| 6.550% 08/10/2000 | 3,725,000 | 3,697,890 | ||
| Bestfoods | ||||
| 5.980% 07/14/2000 | 4,365,000 | 4,355,574 | ||
| Campbell Soup Company | ||||
| 6.130% 07/12/2000 | 5,275,000 | 5,265,120 | ||
| Caterpillar Financial Services | ||||
| 6.120% 11/14/2000 | 7,045,000 | 6,882,120 | ||
| The Clorox Company | ||||
| 6.080% 07/10/2000 | 2,480,000 | 2,476,230 | ||
| Coca-Cola Company, The | ||||
| 6.570% 10/13/2000 | 1,950,000 | 1,912,989 | ||
| Coca-Cola Company, The | ||||
| 6.600% 09/15/2000 | 3,825,000 | 3,771,705 | ||
| Duke Energy Corporation | ||||
| 6.540% 09/08/2000 | 1,630,000 | 1,609,568 | ||
| Duke Energy Corporation | ||||
| 6.540% 09/12/2000 | 5,625,000 | 5,550,403 | ||
| E. I. du Pont de Nemours
and Company |
||||
| 5.530% 08/28/2000 | 2,520,000 | 2,497,548 | ||
| Principal
Amount |
Market Value |
|||
|---|---|---|---|---|
| E. I. du Pont de Nemours
and Company |
||||
| 6.290% 10/03/2000 | $ 2,960,000 | $ 2,911,386 | ||
| Eastman Kodak Co. | ||||
| 6.580% 08/14/2000 | 5,700,000 | 5,654,159 | ||
| Florida Power Corporation | ||||
| 6.550% 08/25/2000 | 5,915,000 | 5,855,809 | ||
| Ford Motor Credit
Corporation |
||||
| 6.570% 10/16/2000 | 4,340,000 | 4,255,251 | ||
| Fortune Brands, Inc. | ||||
| 6.100% 07/20/2000 | 7,000,000 | 6,977,464 | ||
| Gap, Inc. | ||||
| 6.540% 08/21/2000 | 4,085,000 | 4,047,153 | ||
| Gap, Inc. | ||||
| 6.580% 08/28/2000 | 3,200,000 | 3,166,077 | ||
| General Electric Capital
Corporation |
||||
| 5.820% 09/29/2000 | 1,600,000 | 1,576,720 | ||
| General Electric Capital
Corporation |
||||
| 6.150% 08/31/2000 | 2,435,000 | 2,409,625 | ||
| General Mills, Inc. | ||||
| 6.480% 07/07/2000 | 6,645,000 | 6,637,823 | ||
| General Motors Acceptance
Corporation |
||||
| 5.900% 07/21/2000 | 2,035,000 | 2,028,329 | ||
| General Motors Acceptance
Corporation |
||||
| 6.360% 08/31/2000 | 2,030,000 | 2,008,123 | ||
| General Motors Acceptance
Corporation |
||||
| 6.660% 10/05/2000 | 3,080,000 | 3,025,299 | ||
| GTE Funding Corporation | ||||
| 6.620% 07/06/2000 | 7,700,000 | 7,692,920 | ||
| Heinz (H. J.) Company | ||||
| 6.540% 08/07/2000 | 4,000,000 | 3,973,113 | ||
| Honeywell International, Inc. | ||||
| 6.530% 07/11/2000 | 5,710,000 | 5,699,643 | ||
| Principal
Amount |
Market Value |
||||||
|---|---|---|---|---|---|---|---|
| Honeywell International, Inc. | |||||||
| 6.630% 12/22/2000 | $ 1,700,000 | $ 1,645,524 | |||||
| Kimberly-Clark Corporation | |||||||
| 6.520% 08/16/2000 | 6,360,000 | 6,307,014 | |||||
| Lucent Technologies, Inc. | |||||||
| 6.600% 08/15/2000 | 6,475,000 | 6,421,581 | |||||
| Minnesota Mining &
Manufacturing Company |
|||||||
| 6.280% 07/18/2000 | 1,585,000 | 1,580,299 | |||||
| Minnesota Mining &
Manufacturing Company |
|||||||
| 6.500% 08/22/2000 | 6,000,000 | 5,943,667 | |||||
| Motorola, Inc. | |||||||
| 6.080% 07/05/2000 | 4,400,000 | 4,397,028 | |||||
| Motorola, Inc. | |||||||
| 6.590% 09/27/2000 | 3,100,000 | 3,050,062 | |||||
| Nestle Capital Corp. | |||||||
| 5.480% 09/22/2000 | 3,650,000 | 3,603,884 | |||||
| Toyota Motor Credit
Corporation |
|||||||
| 6.520% 07/28/2000 | 5,130,000 | 5,104,914 | |||||
| Unilever Capital Corp. | |||||||
| 5.990% 07/13/2000 | 3,560,000 | 3,552,891 | |||||
| Walt Disney Company, The | |||||||
| 6.580% 10/11/2000 | 6,300,000 | 6,182,547 | |||||
| Wisconsin Electric Power | |||||||
| 6.570% 08/17/2000 | 5,460,000 | 5,413,167 | |||||
| 181,570,068 | |||||||
| TOTAL SHORT-TERM INVESTMENTS | |||||||
| (At Amortized Cost)* | 181,570,068 | ||||||
| TOTAL INVESTMENTS - 100.6% | |||||||
| Other Assets/(Liabilities) - (0.6%) | (1,044,541 | ) | |||||
| NET ASSETS - 100.0% | $ 180,525,527 | ||||||
| Notes to Portfolio of Investments | ||||||||
| * Aggregate cost for Federal tax purposes.
(Note 7). |
||||||||
| Principal
Amount |
Market Value |
|||
|---|---|---|---|---|
| BONDS & NOTES - 96.3% | ||||
| Asset Backed Securities - 7.5% | ||||
| California Infrastructure
SCE-1, 1997-1, Class A5 |
||||
| 6.280% 09/25/2005 | $ 300,000 | $ 294,006 | ||
| California Infrastructure
SDG&E-1, 1997-1, Class A5 |
||||
| 6.190% 09/25/2005 | 250,000 | 244,477 | ||
| Case Equipment Loan Trust
1998-A, Class A4 |
||||
| 5.830% 02/15/2005 | 1,279,877 | 1,260,372 | ||
| Chase Manhattan Auto
Owner Trust 1998-A, Class A4 |
||||
| 5.800% 12/16/2002 | 1,500,000 | 1,481,655 | ||
| Chase Manhattan RV Owner
Trust 1997-A, Class A7 |
||||
| 6.140% 10/16/2006 | 2,000,000 | 1,981,240 | ||
| Metlife Capital Equipment
Loan Trust Series 1997-A, Class A |
||||
| 6.850% 05/20/2008 | 1,000,000 | 991,460 | ||
| Peco Energy Transition
Trust Series 1999-A, Class A6 |
||||
| 6.050% 03/01/2009 | 1,000,000 | 933,790 | ||
| Peco Energy Transition Trust
Series 1999-A, Class A7 |
||||
| 6.130% 03/01/2009 | 500,000 | 460,930 | ||
| Premier Auto Trust Series
1998-4, Class A3 |
||||
| 5.690% 06/08/2002 | 1,456,362 | 1,447,857 | ||
| Premier Auto Trust Series
1998-5, Class A3 |
||||
| 5.070% 07/08/2002 | 1,000,000 | 987,420 | ||
| Railcar Trust No. 1992-1 | ||||
| 7.750% 06/01/2004 | 984,760 | 986,001 | ||
| Rental Car Finance Corp.
Series 1999-1A, Class A† |
||||
| 5.900% 02/25/2007 | 750,000 | 715,920 | ||
| Textron Financial Corporation
Series 1998-A, Class A2† |
||||
| 5.890% 01/15/2005 | 1,500,000 | 1,474,500 | ||
| Principal
Amount |
Market Value |
||||||||
|---|---|---|---|---|---|---|---|---|---|
| Toyota Auto Lease Trust
Series 1998-B, Class A1 |
|||||||||
| 5.350% 07/25/2002 | $ 1,500,000 | $ 1,492,200 | |||||||
| Travelers Funding Ltd. Class
A-1† |
|||||||||
| 6.300% 02/18/2014 | 1,400,000 | 1,232,000 | |||||||
| Total Asset Backed Securities | |||||||||
| (Cost $16,460,522) | 15,983,828 | ||||||||
| Corporate Debt - 48.4% | |||||||||
| AirTouch Communications,
Inc. |
|||||||||
| 7.500% 07/15/2006 | 1,500,000 | 1,483,920 | |||||||
| Alcan Aluminum Limited | |||||||||
| 6.250% 11/01/2008 | 800,000 | 740,783 | |||||||
| America West Airlines, Inc.
1996-1, Class A |
|||||||||
| 6.850% 07/02/2009 | 1,655,233 | 1,540,575 | |||||||
| American Airlines 1994-A
Pass Through Trusts, Class A4 |
|||||||||
| 9.780% 11/26/2011 | 1,611,131 | 1,684,936 | |||||||
| American General Finance
Corporation |
|||||||||
| 5.750% 11/01/2003 | 1,000,000 | 944,950 | |||||||
| AMR Corporation | |||||||||
| 9.000% 08/01/2012 | 1,000,000 | 983,700 | |||||||
| Associates Corporation of
North America |
|||||||||
| 7.875% 09/30/2001 | 2,000,000 | 2,011,160 | |||||||
| AT&T - Liberty Media Group | |||||||||
| 8.250% 02/01/2030 | 1,000,000 | 918,263 | |||||||
| Atlantic Richfield Series
MTNB |
|||||||||
| 7.770% 02/13/2002 | 3,000,000 | 3,023,184 | |||||||
| Barrick Gold Corporation | |||||||||
| 7.500% 05/01/2007 | 2,000,000 | 1,935,180 | |||||||
| BellSouth Capital Funding
Corporation |
|||||||||
| 7.750% 02/15/2010 | 1,000,000 | 1,000,040 | |||||||
| BHP Finance (USA) Limited | |||||||||
| 6.420% 03/01/2026 | 2,000,000 | 1,934,160 | |||||||
| Boston Scientific Corporation | |||||||||
| 6.625% 03/15/2005 | 2,500,000 | 2,273,500 | |||||||
| Capitol Records, Inc.† | |||||||||
| 8.375% 08/15/2009 | 2,000,000 | 2,048,080 | |||||||
| Principal
Amount |
Market Value |
|||
|---|---|---|---|---|
| Celulosa Arauco y
Constitucion, S.A. |
||||
| 6.950% 09/15/2005 | $ 1,000,000 | $ 945,100 | ||
| Champion International
Corporation |
||||
| 6.400% 02/15/2026 | 1,500,000 | 1,392,570 | ||
| The Charles Schwab
Corporation |
||||
| 6.250% 01/23/2003 | 2,000,000 | 1,933,179 | ||
| The CIT Group, Inc. | ||||
| 5.625% 10/15/2003 | 1,000,000 | 936,880 | ||
| The Columbia Gas System,
Inc. |
||||
| 6.610% 11/28/2002 | 2,000,000 | 1,943,920 | ||
| Comcast Cable
Communications, Inc. |
||||
| 8.375% 05/01/2007 | 1,250,000 | 1,287,862 | ||
| Commercial Credit Company | ||||
| 7.750% 03/01/2005 | 3,000,000 | 3,024,750 | ||
| ConAgra, Inc. | ||||
| 7.000% 10/01/2028 | 1,250,000 | 999,825 | ||
| Continental Airlines, Inc.,
Series 1996-2B |
||||
| 8.560% 07/02/2014 | 905,275 | 925,396 | ||
| Continental Airlines, Inc.,
Series 1996-B |
||||
| 7.820% 04/15/2015 | 1,330,837 | 1,309,130 | ||
| Crown Cork & Seal
Company, Inc. |
||||
| 7.125% 09/01/2002 | 1,300,000 | 1,241,252 | ||
| CSX Corporation | ||||
| 7.050% 05/01/2002 | 1,000,000 | 983,670 | ||
| CSX Corporation | ||||
| 7.250% 05/01/2027 | 2,000,000 | 1,888,700 | ||
| Donnelley (R.R.) & Sons | ||||
| 6.625% 04/15/2029 | 1,000,000 | 831,320 | ||
| Dover Corporation | ||||
| 6.250% 06/01/2008 | 750,000 | 661,110 | ||
| Duke Capital Corp. | ||||
| 7.500% 10/01/2009 | 800,000 | 788,128 | ||
| Emerald Investment Grade
CBO† |
||||
| 7.553% 05/24/2011 | 1,000,000 | 1,000,000 | ||
| ERAC USA Finance
Company† |
||||
| 6.750% 05/15/2007 | 2,000,000 | 1,857,720 | ||
| Principal
Amount |
Market Value |
|||
|---|---|---|---|---|
| FBG Finance Limited | ||||
| 7.875% 06/01/2016 | $ 1,250,000 | $ 1,289,025 | ||
| Fletcher Challenge Capital
Canada, Inc. |
||||
| 6.750% 03/24/2005 | 500,000 | 460,830 | ||
| Fletcher Challenge Capital
Canada, Inc. |
||||
| 7.750% 06/20/2006 | 1,500,000 | 1,447,425 | ||
| Ford Motor Credit
Corporation |
||||
| 7.375% 10/28/2009 | 1,000,000 | 967,270 | ||
| General American
Transportation Corporation |
||||
| 6.750% 03/01/2006 | 2,000,000 | 1,877,580 | ||
| General Electric Capital
Corporation |
||||
| 8.750% 05/21/2007 | 1,000,000 | 1,084,860 | ||
| General Electric Capital
Corporation Series MTNA |
||||
| 5.500% 04/15/2002 | 1,000,000 | 972,330 | ||
| General Mills, Inc. | ||||
| 8.900% 06/15/2006 | 1,000,000 | 1,087,020 | ||
| Goodyear Tire & Rubber
Company |
||||
| 8.500% 03/15/2007 | 1,300,000 | 1,333,696 | ||
| Heller Financial, Inc. | ||||
| 6.250% 03/01/2001 | 1,000,000 | 990,670 | ||
| Heller Financial, Inc. | ||||
| 7.375% 11/01/2009 | 1,000,000 | 943,460 | ||
| Hershey Foods Corporation | ||||
| 7.200% 08/15/2027 | 1,500,000 | 1,431,000 | ||
| Household Finance
Corporation |
||||
| 6.500% 11/15/2008 | 1,000,000 | 909,800 | ||
| ICI Wilmington, Inc. | ||||
| 7.050% 09/15/2007 | 750,000 | 700,830 | ||
| IMC Global, Inc. | ||||
| 6.625% 10/15/2001 | 1,000,000 | 980,070 | ||
| IMCERA Group, Inc. | ||||
| 6.000% 10/15/2003 | 2,000,000 | 1,872,460 | ||
| Interpool, Inc. | ||||
| 7.350% 08/01/2007 | 500,000 | 407,526 | ||
| Jet Equipment Trust Series
1995-A,† |
||||
| 8.235% 11/01/2012 | 1,766,724 | 1,772,730 | ||
| The Kroger Co. | ||||
| 7.000% 05/01/2018 | 500,000 | 433,670 | ||
| Principal
Amount |
Market Value |
|||
|---|---|---|---|---|
| LASMO (USA), Inc. | ||||
| 6.750% 12/15/2007 | $ 2,000,000 | $ 1,858,828 | ||
| Leucadia National
Corporation |
||||
| 7.750% 08/15/2013 | 2,000,000 | 1,956,340 | ||
| Marsh & McLennan
Companies, Inc. |
||||
| 7.125% 06/15/2009 | 750,000 | 718,415 | ||
| Meritor Automotive, Inc. | ||||
| 6.800% 02/15/2009 | 1,000,000 | 860,600 | ||
| Millipore Corporation | ||||
| 7.500% 04/01/2007 | 1,000,000 | 948,300 | ||
| Mobil Corporation | ||||
| 8.625% 08/15/2021 | 2,000,000 | 2,201,920 | ||
| Morgan Stanley Dean Witter
& Co. |
||||
| 5.625% 01/20/2004 | 1,300,000 | 1,225,926 | ||
| Newmont Mining Corporation | ||||
| 8.625% 04/01/2002 | 2,000,000 | 1,999,220 | ||
| News America Holdings, Inc. | ||||
| 9.250% 02/01/2013 | 2,000,000 | 2,161,220 | ||
| Norfolk Southern Corporation | ||||
| 7.050% 05/01/2037 | 2,500,000 | 2,443,400 | ||
| Pepsi Bottling Holdings,
Inc.† |
||||
| 5.625% 02/17/2009 | 700,000 | 615,494 | ||
| Raytheon Company | ||||
| 6.550% 03/15/2010 | 750,000 | 671,685 | ||
| Raytheon Company | ||||
| 6.750% 08/15/2007 | 500,000 | 469,765 | ||
| Republic Services, Inc. | ||||
| 7.125% 05/15/2009 | 1,000,000 | 896,739 | ||
| Ryder System, Inc. | ||||
| 6.600% 11/15/2005 | 750,000 | 700,995 | ||
| Scholastic Corporation | ||||
| 7.000% 12/15/2003 | 1,500,000 | 1,461,795 | ||
| Sears Roebuck Acceptance
Corp. |
||||
| 6.750% 09/15/2005 | 1,500,000 | 1,430,115 | ||
| Sprint Capital Corporation | ||||
| 6.125% 11/15/2008 | 750,000 | 668,527 | ||
| Sprint Capital Corporation | ||||
| 6.900% 05/01/2019 | 750,000 | 666,870 | ||
| SuperValu, Inc. | ||||
| 7.875% 08/01/2009 | 1,000,000 | 982,168 | ||
| Thomas & Betts Corporation | ||||
| 8.250% 01/15/2004 | 1,500,000 | 1,505,175 | ||
| Principal
Amount |
Market Value |
|||
|---|---|---|---|---|
| Time Warner, Inc. Pass-Thru
Asset Trust 1997-1† |
||||
| 6.100% 12/30/2001 | $ 500,000 | $ 490,455 | ||
| Times Mirror Co. | ||||
| 7.450% 10/15/2009 | 1,300,000 | 1,267,876 | ||
| TRW, Inc. | ||||
| 8.750% 05/15/2006 | 2,000,000 | 2,037,436 | ||
| Union Tank Car Co. | ||||
| 6.790% 05/01/2010 | 2,000,000 | 1,831,257 | ||
| United Air Lines, Inc. | ||||
| 10.110% 02/19/2006 | 329,559 | 335,979 | ||
| US Air, Inc., Class B | ||||
| 7.500% 10/15/2009 | 902,414 | 826,611 | ||
| Valero Energy Corporation | ||||
| 7.375% 03/15/2006 | 1,000,000 | 965,448 | ||
| Vulcan Materials Company | ||||
| 6.000% 04/01/2009 | 800,000 | 714,221 | ||
| WPP Finance (USA) Corporation | ||||
| 6.625% 07/15/2005 | 900,000 | 853,674 | ||
| Total Corporate Debt | ||||
| (Cost $107,610,237) | 103,201,649 | |||
| Non-U.S. Government Agency Obligations - 3.1% | ||||
| Collateralized Mortgage Obligations | ||||
| Asset Securitization
Corporation Series 1995-MD4, Class A1 |
||||
| 7.100% 08/13/2029 | 2,302,808 | 2,277,730 | ||
| CS First Boston Mortgage
Securities Corp. Series 1998-C2, Class A1 |
||||
| 5.960% 12/15/2007 | 908,126 | 860,534 | ||
| Merrill Lynch Mortgage
Investors, Inc., Series 1997-Cl-CTL, A-1 |
||||
| 6.310% 11/15/2026 | 1,424,731 | 1,353,160 | ||
| Salomon Brothers Mortgage
Securities 1997-TZH, Class B† |
||||
| 7.491% 03/25/2022 | 1,250,000 | 1,228,912 | ||
| Starwood Commercial
Mortgage Trust Series 1999-C1A, Class B† |
||||
| 6.920% 02/05/2009 | 1,000,000 | 907,500 | ||
| Total Non-U.S. Government
Agency Obligations |
||||
| (Cost $7,073,646) | 6,627,836 | |||
| Principal
Amount |
Market Value |
|||
|---|---|---|---|---|
| U.S. Government Agency Obligations - 19.0% | ||||
| Federal Home Loan Mortgage Corporation
(FHLMC) - 2.3% |
||||
| Collateralized Mortgage Obligations - 1.3% | ||||
| FHLMC Series 1322 Class G | ||||
| 7.500% 02/15/2007 | $ 823,253 | $ 826,596 | ||
| FHLMC Series 1460 Class H | ||||
| 7.000% 05/15/2007 | 2,000,000 | 1,988,740 | ||
| 2,815,336 | ||||
| Pass-Through Securities - 1.0% | ||||
| FHLMC | ||||
| 6.420% 12/01/2005 | 2,084,928 | 2,007,786 | ||
| FHLMC | ||||
| 9.000% 03/01/2017 | 70,033 | 72,237 | ||
| 2,080,023 | ||||
| 4,895,359 | ||||
| Federal National Mortgage Association (FNMA) - 10.0% | ||||
| Collateralized Mortgage Obligations - 6.3% | ||||
| FNMA Series 1993-134
Class GA |
||||
| 6.500% 02/25/2007 | 2,000,000 | 1,978,740 | ||
| FNMA Series 1993-186
Class G |
||||
| 6.250% 03/25/2008 | 3,438,102 | 3,399,424 | ||
| FNMA Series 1993-221
Class D |
||||
| 6.000% 12/25/2008 | 1,000,000 | 965,000 | ||
| FNMA Series 1993-231,
Class M |
||||
| 6.000% 12/25/2008 | 3,322,000 | 3,182,875 | ||
| FNMA Series 1996-54
Class C |
||||
| 6.000% 09/25/2008 | 4,000,000 | 3,832,480 | ||
| 13,358,519 | ||||
| Pass-Through Securities - 3.7% | ||||
| FNMA | ||||
| 6.000% 11/01/2028 | 1,836,785 | 1,681,227 | ||
| FNMA 7.500% | ||||
| 09/01/2029 - 04/01/2030 | 5,282,251 | 5,206,292 | ||
| FNMA 8.000% | ||||
| 12/01/2029 - 05/01/2030 | 998,645 | 1,002,699 | ||
| FNMA | ||||
| 9.000% 05/01/2009 | 119,534 | 122,715 | ||
| 8,012,933 | ||||
| 21,371,452 | ||||
| Principal
Amount |
Market Value |
|||
|---|---|---|---|---|
| Government National Mortgage Association
(GNMA) - 6.7% |
||||
| Pass-Through Securities | ||||
| GNMA 6.000% | ||||
| 11/20/2025 - 11/20/2027 | $ 567,269 | $ 566,936 | ||
| GNMA 7.000% | ||||
| 09/15/2023 - 09/15/2029 | 7,145,914 | 6,949,998 | ||
| GNMA 7.500% | ||||
| 03/15/2017 - 06/15/2024 | 2,856,974 | 2,855,891 | ||
| GNMA 8.000% | ||||
| 12/15/2003 - 01/15/2009 | 3,791,219 | 3,858,265 | ||
| 14,231,090 | ||||
| Total U.S. Government
Agency Obligations |
||||
| (Cost $41,214,757) | 40,497,901 | |||
| U.S. Treasury Obligations - 18.3% | ||||
| U.S. Treasury Bonds - 2.2% | ||||
| U.S. Treasury Bond | ||||
| 7.125% 02/15/2023 | 1,000,000 | 1,111,410 | ||
| U.S. Treasury Bond | ||||
| 7.500% 11/15/2016 | 3,225,000 | 3,642,218 | ||
| 4,753,628 | ||||
| U.S. Treasury Notes - 11.1% | ||||
| U.S. Treasury Note | ||||
| 5.500% 05/15/2009 | 3,150,000 | 3,014,141 | ||
| U.S. Treasury Note | ||||
| 6.500% 10/15/2006 | 20,380,000 | 20,625,171 | ||
| 23,639,312 | ||||
| U.S. Treasury Strip - 5.0% | ||||
| U.S. Treasury Strip -
Principal Only |
||||
| 0.000% 05/15/2016 | 28,000,000 | 10,537,520 | ||
| Total U.S. Treasury Obligations | ||||
| (Cost $38,401,084) | 38,930,460 | |||
| TOTAL BONDS & NOTES | ||||
| (Cost $210,760,246) | 205,241,674 | |||
| SHORT-TERM INVESTMENTS - 7.4% | ||||
| Cash Equivalents - 5.4% | ||||
| Bank of America Bank Note* | ||||
| 6.670% 03/22/2001 | 248,658 | 248,658 | ||
| Bank of Montreal Bank Note* | ||||
| 6.630% 08/16/2000 | 399,553 | 399,553 | ||
| Bank of Nova Scotia
Eurodollar Time Deposit* |
||||
| 7.000% 07/03/2000 | 497,311 | 497,311 | ||
| Principal
Amount |
Market Value |
||||||||||
|---|---|---|---|---|---|---|---|---|---|---|---|
| Credit Agricole Bank
Eurodollar Time Deposit* |
|||||||||||
| 6.750% 07/06/2000 | $ 1,657,698 | $ 1,657,698 | |||||||||
| Credit Agricole Bank
Eurodollar Time Deposit* |
|||||||||||
| 6.750% 07/07/2000 | 248,655 | 248,655 | |||||||||
| Den Danske Bank Eurodollar
Time Deposit* |
|||||||||||
| 6.810% 07/05/2000 | 911,736 | 911,736 | |||||||||
| First Union Bank Note* | |||||||||||
| 6.900% 05/09/2001 | 248,655 | 248,655 | |||||||||
| Fleet National Bank
Eurodollar Time Deposit* |
|||||||||||
| 7.260% 10/31/2000 | 761,484 | 761,484 | |||||||||
| HypoVereinsbank Eurodollar
Time Deposit* |
|||||||||||
| 6.750% 07/05/2000 | 2,072,128 | 2,072,128 | |||||||||
| Merrimac Money Market
Fund* |
|||||||||||
| 6.440% 07/03/2000 | 2,902,592 | 2,902,592 | |||||||||
| Morgan Stanley Dean Witter
& Co.* |
|||||||||||
| 6.890% 07/17/2000 | 497,311 | 497,311 | |||||||||
| Morgan Stanley Dean Witter
& Co.* |
|||||||||||
| 6.910% 11/22/2000 | 165,769 | 165,769 | |||||||||
| Paribas Bank Eurodollar
Time Deposit* |
|||||||||||
| 6.750% 07/05/2000 | 994,621 | 994,621 | |||||||||
| 11,606,171 | |||||||||||
| Commercial Paper - 2.0% | |||||||||||
| Maytag Corp. | |||||||||||
| 7.250% 07/05/2000 | 4,235,000 | 4,231,589 | |||||||||
| TOTAL SHORT-TERM INVESTMENTS | |||||||||||
| (At Amortized Cost) | 15,837,760 | ||||||||||
| TOTAL INVESTMENTS - 103.7% | |||||||||||
| (Cost $226,598,006)** | 221,079,434 | ||||||||||
| Other Assets/(Liabilities) - (3.7%) | (7,932,661 | ) | |||||||||
| NET ASSETS - 100.0% | $ 213,146,773 | ||||||||||
| Notes to Portfolio of Investments | ||||||
*
|
Represents investment of security lending collateral. (Note 2).
|
**
|
Aggregate cost for Federal tax purposes. (Note 7).
|
†
|
Securities exempt from registration under Rule 144A of the Securities Act of 1933. These securities may be resold in transactions exempt
from registration, normally to qualified institutional buyers.
|
| Number
of Shares |
Market Value |
|||
|---|---|---|---|---|
| EQUITIES - 67.6% | ||||
| Aerospace & Defense - 4.6% | ||||
| Boeing Co. | 1,107,500 | $ 46,307,344 | ||
| Honeywell International,
Inc. |
821,387 | 27,670,475 | ||
| TRW, Inc. | 496,600 | 21,540,025 | ||
| 95,517,844 | ||||
| Automotive & Parts - 1.5% | ||||
| Ford Motor Company | 282,300 | 12,138,900 | ||
| General Motors Corp. | 316,500 | 18,376,781 | ||
| Visteon Corp.* | 36,962 | 448,170 | ||
| 30,963,851 | ||||
| Banking, Savings & Loans - 5.0% | ||||
| The Bank of New York
Company, Incorporated |
920,200 | 42,789,300 | ||
| Chase Manhattan Corp. | 235,050 | 10,826,991 | ||
| Fleet Boston Financial
Corp. |
378,860 | 12,881,240 | ||
| Wachovia Corp. | 338,400 | 18,358,200 | ||
| Wells Fargo & Company | 508,300 | 19,696,625 | ||
| 104,552,356 | ||||
| Beverages - 1.0% | ||||
| Brown-Forman
Corporation Cl. B |
382,500 | 20,559,375 | ||
| Broadcasting, Publishing & Printing - 2.7% | ||||
| The McGraw-Hill
Companies, Inc. |
700,000 | 37,800,000 | ||
| News Corporation Limited
Sponsored†† |
333,100 | 18,153,950 | ||
| 55,953,950 | ||||
| Chemicals - 1.4% | ||||
| Rohm & Haas Company | 865,000 | 29,842,500 | ||
| Communications - 3.8% | ||||
| Alcatel SA Sponsored†† | 235,000 | 15,627,500 | ||
| GTE Corporation | 494,400 | 30,776,400 | ||
| SBC Communications,
Inc. |
750,036 | 32,439,057 | ||
| 78,842,957 | ||||
| Number
of Shares |
Market Value |
|||
|---|---|---|---|---|
| Computer Integrated Systems Design - 1.4% | ||||
| Computer Sciences Corp.* | 401,700 | $ 30,001,969 | ||
| Computers & Information - 1.5% | ||||
| Compaq Computer Corp. | 597,300 | 15,268,481 | ||
| Jabil Circuit, Inc.* | 336,600 | 16,703,775 | ||
| 31,972,256 | ||||
| Computers & Office Equipment - 0.8% | ||||
| International Business
Machines Corporation |
146,500 | 16,050,906 | ||
| Containers - 1.2% | ||||
| Sealed Air Corp.* | 352,600 | 18,467,425 | ||
| Temple-Inland, Inc. | 140,600 | 5,905,200 | ||
| 24,372,625 | ||||
| Cosmetics & Personal Care - 1.7% | ||||
| Kimberly-Clark
Corporation |
615,900 | 35,337,262 | ||
| Electric Utilities - 1.3% | ||||
| Dominion Resources, Inc. | 388,000 | 16,635,500 | ||
| Teco Energy, Inc. | 541,300 | 10,859,831 | ||
| 27,495,331 | ||||
| Electrical Equipment & Electronics - 4.8% | ||||
| General Electric Company | 1,350,000 | 71,550,000 | ||
| Micron Technology, Inc.* | 222,600 | 19,602,713 | ||
| SCI Systems, Inc.* | 222,100 | 8,703,544 | ||
| 99,856,257 | ||||
| Energy - 8.7% | ||||
| Apache Corporation | 350,000 | 20,584,375 | ||
| BP Amoco PLC
Sponsored†† |
800,358 | 45,270,249 | ||
| Burlington Resources, Inc. | 500,500 | 19,144,125 | ||
| Chevron Corporation | 200,000 | 16,962,500 | ||
| Coastal Corp. | 251,700 | 15,322,237 | ||
| Conoco, Inc. Cl. A | 600,000 | 13,200,000 | ||
| Exxon Mobil Corp. | 500,099 | 39,257,772 | ||
| Total Fina Elf SA
Sponsored†† |
147,600 | 11,337,525 | ||
| 181,078,783 | ||||
| Number
of Shares |
Market Value |
|||
|---|---|---|---|---|
| Entertainment & Leisure - 1.7% | ||||
| AT&T - Liberty Media Group* | 1,463,400 | $ 35,487,450 | ||
| Financial Services - 2.5% | ||||
| American Express
Company |
547,200 | 28,522,800 | ||
| American General
Corporation |
400,000 | 24,400,000 | ||
| 52,922,800 | ||||
| Foods - 1.9% | ||||
| Bestfoods | 318,200 | 22,035,350 | ||
| General Mills, Inc. | 469,400 | 17,954,550 | ||
| 39,989,900 | ||||
| Forest Products & Paper - 0.6% | ||||
| Weyerhaeuser Company | 299,700 | 12,887,100 | ||
| Healthcare - 2.8% | ||||
| Becton, Dickinson and
Company |
907,900 | 26,045,381 | ||
| Schering-Plough Corp. | 629,400 | 31,784,700 | ||
| 57,830,081 | ||||
| Industrial - Diversified - 1.5% | ||||
| Illinois Tool Works, Inc. | 300,000 | 17,100,000 | ||
| Tyco International Ltd. | 311,162 | 14,741,300 | ||
| 31,841,300 | ||||
| Insurance - 3.6% | ||||
| The Hartford Financial
Services Group, Inc. |
481,100 | 26,911,531 | ||
| Marsh & McLennan
Companies, Inc. |
458,300 | 47,863,706 | ||
| MBIA, Inc. | 2,100 | 101,194 | ||
| 74,876,431 | ||||
| Miscellaneous - 1.0% | ||||
| Avery-Dennison Corp. | 308,900 | 20,734,912 | ||
| Pharmaceuticals - 4.0% | ||||
| American Home Products
Corporation |
453,100 | 26,619,625 | ||
| Merck & Co., Inc. | 422,700 | 32,389,387 | ||
| Pharmacia Corp. | 494,088 | 25,538,174 | ||
| 84,547,186 | ||||
| Number
of Shares |
Market Value |
||||||||
|---|---|---|---|---|---|---|---|---|---|
| Restaurants - 1.1% | |||||||||
| McDonald’s Corp. | 685,800 | $ 22,588,537 | |||||||
| Retail - 1.5% | |||||||||
| RadioShack Corporation | 354,900 | 16,813,387 | |||||||
| Target Corporation | 269,000 | 15,602,000 | |||||||
| 32,415,387 | |||||||||
| Retail - Grocery - 0.9% | |||||||||
| Albertson’s, Inc. | 590,702 | 19,640,842 | |||||||
| Telephone Utilities - 1.0% | |||||||||
| BellSouth Corporation | 476,500 | 20,310,813 | |||||||
| Tobacco - 0.7% | |||||||||
| Fortune Brands, Inc. | 600,000 | 13,837,500 | |||||||
| Transportation - 1.4% | |||||||||
| Burlington Northern
Santa Fe Corp. |
667,000 | 15,299,313 | |||||||
| Galileo International, Inc. | 132,300 | 2,761,763 | |||||||
| Norfolk Southern
Corporation |
730,200 | 10,861,725 | |||||||
| 28,922,801 | |||||||||
| TOTAL EQUITIES | |||||||||
| (Cost $949,543,828) | 1,411,231,262 | ||||||||
|
Principal Amount |
|||||||||
| BONDS & NOTES - 24.0% | |||||||||
| Asset Backed Securities - 1.8% | |||||||||
| California Infrastructure SCE-1,
1997-1, Class A5 |
|||||||||
| 6.280% 09/25/2005 | $ 650,000 | 637,013 | |||||||
| California Infrastructure SDG&E-1,
1997-1, Class A5 |
|||||||||
| 6.190% 09/25/2005 | 500,000 | 488,955 | |||||||
| Case Equipment Loan Trust
1998-A, Class A4 |
|||||||||
| 5.830% 02/15/2005 | 2,986,379 | 2,940,867 | |||||||
| Caterpillar Financial Asset Trust,
1997-B, Class A3 |
|||||||||
| 6.160% 09/25/2003 | 1,220,659 | 1,216,753 | |||||||
|
Principal Amount |
Market Value |
|||
|---|---|---|---|---|
| Chase Manhattan Auto Owner Trust
1998-A, Class A4 |
||||
| 5.800% 12/16/2002 | $ 3,750,000 | $ 3,704,137 | ||
| Chase Manhattan RV Owner Trust
1997-A, Class A7 |
||||
| 6.140% 10/16/2006 | 4,500,000 | 4,457,790 | ||
| Metlife Capital Equipment Loan Trust Series
1997-A, Class A |
||||
| 6.850% 05/20/2008 | 2,500,000 | 2,478,650 | ||
| Peco Energy Transition Trust Series
1999-A, Class A6 |
||||
| 6.050% 03/01/2009 | 2,450,000 | 2,287,785 | ||
| Peco Energy Transition Trust Series
1999-A, Class A7 |
||||
| 6.130% 03/01/2009 | 1,300,000 | 1,198,418 | ||
| Premier Auto Trust Series
1998-4, Class A3 |
||||
| 5.690% 06/08/2002 | 3,883,633 | 3,860,952 | ||
| Premier Auto Trust Series
1998-5, Class A3 |
||||
| 5.070% 07/08/2002 | 2,000,000 | 1,974,840 | ||
| Railcar Trust No. 1992-1 | ||||
| 7.750% 06/01/2004 | 891,208 | 892,331 | ||
| Rental Car Finance Corp. Series
1999-1A, Class A† |
||||
| 5.900% 02/25/2007 | 2,400,000 | 2,290,944 | ||
| Textron Financial Corporation Series
1998-A, Class A2† |
||||
| 5.890% 01/15/2005 | 3,500,000 | 3,440,500 | ||
| Toyota Auto Lease Trust Series
1998-B, Class A1 |
||||
| 5.350% 07/25/2002 | 3,500,000 | 3,481,800 | ||
| Travelers Funding Ltd.
Class A-1† |
||||
| 6.300% 02/18/2014 | 3,400,000 | 2,992,000 | ||
| Total Asset Backed Securities | ||||
| (Cost $39,449,221) | 38,343,735 | |||
| Corporate Debt - 12.2% | ||||
| AirTouch Communications, Inc. | ||||
| 7.500% 07/15/2006 | 4,000,000 | 3,957,120 | ||
| Alcan Aluminum Limited | ||||
| 6.250% 11/01/2008 | 2,500,000 | 2,314,947 | ||
| America West Airlines, Inc.
1996-1, Class A |
||||
| 6.850% 07/02/2009 | 4,019,852 | 3,741,397 | ||
|
Principal Amount |
Market Value |
|||
|---|---|---|---|---|
| American Airlines 1994-A Pass Through
Trusts, Class A4 |
||||
| 9.780% 11/26/2011 | $ 4,027,826 | $ 4,212,341 | ||
| American General Finance Corporation | ||||
| 5.750% 11/01/2003 | 2,000,000 | 1,889,900 | ||
| AMR Corporation | ||||
| 9.000% 08/01/2012 | 2,000,000 | 1,967,400 | ||
| Associates Corporation of North America | ||||
| 6.750% 08/01/2001 | 4,000,000 | 3,973,400 | ||
| AT&T - Liberty Media Group | ||||
| 8.250% 02/01/2030 | 5,695,000 | 5,229,508 | ||
| Barrick Gold Corporation | ||||
| 7.500% 05/01/2007 | 4,250,000 | 4,112,257 | ||
| BellSouth Capital Funding Corporation | ||||
| 7.750% 02/15/2010 | 2,000,000 | 2,000,080 | ||
| BHP Finance (USA) Limited | ||||
| 6.420% 03/01/2026 | 4,500,000 | 4,351,860 | ||
| Bombardier Capital, Inc.† | ||||
| 6.000% 01/15/2002 | 4,000,000 | 3,905,164 | ||
| Boston Scientific Corporation | ||||
| 6.625% 03/15/2005 | 6,050,000 | 5,501,870 | ||
| Celulosa Arauco y Constitucion, S.A. | ||||
| 6.950% 09/15/2005 | 2,500,000 | 2,362,750 | ||
| Champion International Corporation | ||||
| 6.400% 02/15/2026 | 3,500,000 | 3,249,330 | ||
| The Charles Schwab Corporation | ||||
| 6.250% 01/23/2003 | 2,500,000 | 2,416,473 | ||
| The CIT Group, Inc. | ||||
| 5.625% 10/15/2003 | 2,500,000 | 2,342,200 | ||
| The CIT Group, Inc. | ||||
| 6.375% 10/01/2002 | 4,000,000 | 3,892,360 | ||
| The Columbia Gas System, Inc. | ||||
| 6.610% 11/28/2002 | 3,000,000 | 2,915,880 | ||
| Comcast Cable Communications, Inc. | ||||
| 8.375% 05/01/2007 | 2,500,000 | 2,575,725 | ||
| Commercial Credit Company | ||||
| 7.750% 03/01/2005 | 2,500,000 | 2,520,625 | ||
| ConAgra, Inc. | ||||
| 7.000% 10/01/2028 | 3,000,000 | 2,399,580 | ||
| Continental Airlines, Inc.,
Series 1996-2B |
||||
| 8.560% 07/02/2014 | 1,584,231 | 1,619,443 | ||
| Continental Airlines, Inc.,
Series 1996-B |
||||
| 7.820% 04/15/2015 | 1,774,450 | 1,745,506 | ||
| Principal
Amount |
Market Value |
|||
|---|---|---|---|---|
| Corporate Debt (Continued) | ||||
| Crown Cork & Seal Company, Inc. | ||||
| 7.125% 09/01/2002 | $ 3,200,000 | $ 3,055,389 | ||
| CSX Corporation | ||||
| 7.050% 05/01/2002 | 2,000,000 | 1,967,340 | ||
| CSX Corporation | ||||
| 7.250% 05/01/2027 | 4,500,000 | 4,249,575 | ||
| Donnelley (R.R.) & Sons | ||||
| 6.625% 04/15/2029 | 3,000,000 | 2,493,960 | ||
| Dover Corporation | ||||
| 6.250% 06/01/2008 | 2,000,000 | 1,762,960 | ||
| Duke Capital Corp. | ||||
| 7.500% 10/01/2009 | 3,800,000 | 3,743,608 | ||
| The E.W. Scripps Company | ||||
| 6.625% 10/15/2007 | 5,000,000 | 4,751,250 | ||
| Emerald Investment Grade CBO† | ||||
| 7.553% 05/24/2011 | 3,000,000 | 3,000,000 | ||
| ERAC USA Finance Company† | ||||
| 6.750% 05/15/2007 | 6,000,000 | 5,573,160 | ||
| FBG Finance Limited† | ||||
| 7.875% 06/01/2016 | 4,000,000 | 4,124,880 | ||
| Fletcher Challenge Capital Canada, Inc. | ||||
| 6.750% 03/24/2005 | 2,000,000 | 1,843,320 | ||
| Fletcher Challenge Capital Canada, Inc. | ||||
| 7.750% 06/20/2006 | 2,000,000 | 1,929,900 | ||
| Ford Motor Credit Corp. Variable Rate | ||||
| 6.400% 07/15/2006 | 1,500,000 | 1,497,570 | ||
| Ford Motor Credit Corporation | ||||
| 7.375% 10/28/2009 | 3,000,000 | 2,901,810 | ||
| General American Transportation Corporation | ||||
| 6.750% 03/01/2006 | 3,000,000 | 2,816,370 | ||
| General Electric Capital Corporation | ||||
| 8.750% 05/21/2007 | 1,500,000 | 1,627,290 | ||
| General Electric Capital Corporation Series MTNA | ||||
| 5.500% 04/15/2002 | 5,000,000 | 4,861,650 | ||
| General Mills, Inc. | ||||
| 8.900% 06/15/2006 | 2,250,000 | 2,445,795 | ||
| The Goldman Sachs Group, L.P.† | ||||
| 6.200% 02/15/2001 | 4,000,000 | 3,971,160 | ||
| Goodyear Tire & Rubber Company | ||||
| 8.500% 03/15/2007 | 3,350,000 | 3,436,832 | ||
| Halliburton Company | ||||
| 5.625% 12/01/2008 | 1,500,000 | 1,344,088 | ||
| Heller Financial, Inc. | ||||
| 6.250% 03/01/2001 | 2,500,000 | 2,476,675 | ||
| Principal
Amount |
Market Value |
|||
|---|---|---|---|---|
| Heller Financial, Inc. | ||||
| 7.375% 11/01/2009 | $ 2,500,000 | $ 2,358,650 | ||
| Hershey Foods Corporation | ||||
| 7.200% 08/15/2027 | 5,300,000 | 5,056,200 | ||
| Household Finance Corporation | ||||
| 6.500% 11/15/2008 | 2,500,000 | 2,274,500 | ||
| ICI Wilmington, Inc. | ||||
| 7.050% 09/15/2007 | 2,500,000 | 2,336,100 | ||
| IMC Global, Inc. | ||||
| 6.625% 10/15/2001 | 2,500,000 | 2,450,175 | ||
| Interpool, Inc. | ||||
| 7.350% 08/01/2007 | 2,000,000 | 1,630,104 | ||
| The Kroger Co. | ||||
| 7.000% 05/01/2018 | 2,000,000 | 1,734,680 | ||
| LASMO (USA), Inc. | ||||
| 6.750% 12/15/2007 | 2,000,000 | 1,858,828 | ||
| Leucadia National Corporation | ||||
| 7.750% 08/15/2013 | 3,000,000 | 2,934,510 | ||
| Marsh & McLennan Companies, Inc. | ||||
| 7.125% 06/15/2009 | 2,000,000 | 1,915,774 | ||
| Meritor Automotive, Inc. | ||||
| 6.800% 02/15/2009 | 4,000,000 | 3,442,400 | ||
| Midway Airlines Corp. Pass Through
Certificates Class B† |
||||
| 8.140% 01/02/2013 | 2,427,966 | 2,170,238 | ||
| Millipore Corporation | ||||
| 7.500% 04/01/2007 | 4,250,000 | 4,030,275 | ||
| Mobil Corporation | ||||
| 8.625% 08/15/2021 | 4,500,000 | 4,954,320 | ||
| Morgan Stanley Dean Witter & Co. | ||||
| 5.625% 01/20/2004 | 5,000,000 | 4,715,100 | ||
| Newmont Mining Corporation | ||||
| 8.625% 04/01/2002 | 5,000,000 | 4,998,050 | ||
| News America Holdings, Inc. | ||||
| 9.250% 02/01/2013 | 4,000,000 | 4,322,440 | ||
| Norfolk Southern Corporation | ||||
| 7.050% 05/01/2037 | 6,000,000 | 5,864,160 | ||
| North Finance (Bermuda) Limited† | ||||
| 7.000% 09/15/2005 | 4,000,000 | 3,890,200 | ||
| Pepsi Bottling Holdings, Inc.† | ||||
| 5.625% 02/17/2009 | 2,250,000 | 1,978,373 | ||
| Raytheon Company | ||||
| 6.550% 03/15/2010 | 1,750,000 | 1,567,265 | ||
| Raytheon Company | ||||
| 6.750% 08/15/2007 | 2,700,000 | 2,536,731 | ||
| Principal
Amount |
Market Value |
|||
|---|---|---|---|---|
| Republic Services, Inc. | ||||
| 7.125% 05/15/2009 | $ 3,000,000 | $ 2,690,216 | ||
| Ryder System, Inc. | ||||
| 6.600% 11/15/2005 | 3,500,000 | 3,271,310 | ||
| Scholastic Corporation | ||||
| 7.000% 12/15/2003 | 3,000,000 | 2,923,590 | ||
| Sprint Capital Corporation | ||||
| 6.125% 11/15/2008 | 2,000,000 | 1,782,740 | ||
| Sprint Capital Corporation | ||||
| 6.900% 05/01/2019 | 2,000,000 | 1,778,320 | ||
| SuperValu, Inc. | ||||
| 7.875% 08/01/2009 | 3,000,000 | 2,946,504 | ||
| Texaco, Inc. | ||||
| 5.500% 01/15/2009 | 4,000,000 | 3,534,304 | ||
| Thomas & Betts Corporation | ||||
| 8.250% 01/15/2004 | 1,000,000 | 1,003,450 | ||
| Time Warner, Inc. Pass-Thru Asset Trust
1997-1† |
||||
| 6.100% 12/30/2001 | 4,750,000 | 4,659,322 | ||
| Times Mirror Co. | ||||
| 7.450% 10/15/2009 | 3,600,000 | 3,511,043 | ||
| TRW, Inc. | ||||
| 8.750% 05/15/2006 | 5,500,000 | 5,602,949 | ||
| Union Tank Car Co. | ||||
| 6.790% 05/01/2010 | 4,000,000 | 3,662,513 | ||
| US Air, Inc., Class B | ||||
| 7.500% 10/15/2009 | 902,414 | 826,611 | ||
| Valero Energy Corporation | ||||
| 7.375% 03/15/2006 | 2,000,000 | 1,930,896 | ||
| Vulcan Materials Company | ||||
| 6.000% 04/01/2009 | 3,500,000 | 3,124,715 | ||
| WPP Finance (USA) Corporation | ||||
| 6.625% 07/15/2005 | 2,250,000 | 2,134,186 | ||
| Total Corporate Debt | ||||
| (Cost $267,212,469) | 255,473,440 | |||
| Non-U.S. Government Agency Obligations - 0.8% | ||||
| Collateralized Mortgage Obligations | ||||
| Asset Securitization Corporation Series
1995-MD4, Class A1 |
||||
| 7.100% 08/13/2029 | 5,976,472 | 5,911,388 | ||
| CS First Boston Mortgage Securities Corp.
Series 1998-C2, Class A1 |
||||
| 5.960% 12/15/2007 | 2,724,377 | 2,581,603 | ||
| Principal
Amount |
Market Value |
|||
|---|---|---|---|---|
| Collateralized Mortgage Obligations (Continued) | ||||
| Merrill Lynch Mortgage Investors, Inc.,
Series 1997- Cl-CTL, A-1 |
||||
| 6.310% 11/15/2026 | $ 3,663,047 | $ 3,479,034 | ||
| Salomon Brothers Mortgage Securities
1997-TZH, Class B† |
||||
| 7.491% 03/25/2022 | 3,000,000 | 2,949,390 | ||
| Starwood Commercial Mortgage Trust
Series 1999-C1A, Class B† |
||||
| 6.920% 02/05/2009 | 3,000,000 | 2,722,500 | ||
| Total Non-U.S. Government Agency Obligations | ||||
| (Cost $18,842,666) | 17,643,915 | |||
| U.S. Government Agency Obligations - 5.1% | ||||
| Federal Home Loan Mortgage Corporation
(FHLMC) - 0.7% |
||||
| Collateralized Mortgage Obligations - 0.4% | ||||
| FHLMC Series 1322 Class G | ||||
| 7.500% 02/15/2007 | 2,058,134 | 2,066,490 | ||
| FHLMC Series 1460 Class H | ||||
| 7.000% 05/15/2007 | 1,789,000 | 1,778,928 | ||
| FHLMC Series 1490 Class PG | ||||
| 6.300% 05/15/2007 | 5,000,000 | 4,975,000 | ||
| 8,820,418 | ||||
| Pass-Through Securities - 0.3% | ||||
| FHLMC | ||||
| 6.420% 12/01/2005 | 5,382,905 | 5,183,738 | ||
| FHLMC | ||||
| 9.000% 03/01/2017 | 210,100 | 216,710 | ||
| 5,400,448 | ||||
| 14,220,866 | ||||
| Federal National Mortgage Association (FNMA) - 2.9% | ||||
| Collateralized Mortgage Obligations - 1.6% | ||||
| FNMA Series 1993-107 Class E | ||||
| 6.500% 06/25/2008 | 5,000,000 | 4,878,100 | ||
| FNMA Series 1993-134 Class GA | ||||
| 6.500% 02/25/2007 | 5,000,000 | 4,946,850 | ||
| FNMA Series 1993-175 Class PU | ||||
| 6.350% 09/25/2008 | 7,015,000 | 6,795,781 | ||
| FNMA Series 1993-186 Class G | ||||
| 6.250% 03/25/2008 | 4,646,086 | 4,593,817 | ||
| Principal
Amount |
Market Value |
|||
|---|---|---|---|---|
| FNMA Series 1993-71 Class PG | ||||
| 6.250% 07/25/2007 | $ 8,000,000 | $ 7,940,000 | ||
| FNMA Series 1996-54 Class C | ||||
| 6.000% 09/25/2008 | 4,000,000 | 3,832,480 | ||
| 32,987,028 | ||||
| Pass-Through Securities - 1.3% | ||||
| FNMA 6.000% | ||||
| 11/01/2028 – 12/01/2028 | 5,504,143 | 5,037,997 | ||
| FNMA 7.500% | ||||
| 09/01/2029 – 05/01/2030 | 18,094,528 | 17,834,546 | ||
| FNMA 8.000% | ||||
| 05/01/2013 – 05/01/2030 | 4,540,943 | 4,555,455 | ||
| 27,427,998 | ||||
| 60,415,026 | ||||
| Government National Mortgage Association
(GNMA) - 1.2% |
||||
| Pass-Through Securities | ||||
| GNMA 6.500% | ||||
| 10/15/2028 – 03/15/2029 | 14,516,487 | 13,778,552 | ||
| GNMA 7.000% | ||||
| 04/15/2023 – 11/15/2023 | 3,240,485 | 3,161,483 | ||
| GNMA 7.500% | ||||
| 09/15/2016 – 10/15/2017 | 2,021,587 | 2,021,184 | ||
| GNMA 8.000% | ||||
| 01/15/2004 – 01/15/2009 | 5,078,768 | 5,169,508 | ||
| GNMA 9.000% | ||||
| 08/15/2008 – 09/15/2009 | 830,096 | 862,995 | ||
| 24,993,722 | ||||
| U.S. Government Guaranteed Notes - 0.3% | ||||
| 1991-A Caguas, PR | ||||
| 8.740% 08/01/2001 | 280,000 | 285,057 | ||
| 1991-A Cncl. Bluffs, IA | ||||
| 8.740% 08/01/2001 | 155,000 | 157,799 | ||
| 1991-A Fairfax County, VA | ||||
| 8.740% 08/01/2001 | 85,000 | 86,535 | ||
| 1991-A Fajardo, PR | ||||
| 8.740% 08/01/2001 | 210,000 | 213,793 | ||
| 1991-A Gadsden, AL | ||||
| 8.740% 08/01/2001 | 100,000 | 101,806 | ||
| 1991-A Lorain, OH | ||||
| 8.740% 08/01/2001 | 30,000 | 30,542 | ||
| Principal
Amount |
Market Value |
||||||||
|---|---|---|---|---|---|---|---|---|---|
| 1991-A Mayaguez, PR | |||||||||
| 8.740% 08/01/2001 | $ 150,000 | $ 152,709 | |||||||
| 1991-A Rochester, NY | |||||||||
| 8.650% 08/01/2000 | 4,295,000 | 4,299,123 | |||||||
| 5,327,364 | |||||||||
| Total U.S. Government Agency Obligations | |||||||||
| (Cost $106,797,151) | 104,956,978 | ||||||||
| U.S. Treasury Obligations - 4.1% | |||||||||
| U.S. Treasury Bonds - 2.9% | |||||||||
| U.S. Treasury Bond | |||||||||
| 7.500% 11/15/2016 | 8,598,000 | 9,710,323 | |||||||
| U.S. Treasury Bond | |||||||||
| 8.750% 05/15/2017 | 40,100,000 | 50,507,153 | |||||||
| 60,217,476 | |||||||||
| U.S. Treasury Notes - 1.2% | |||||||||
| U.S. Treasury Note | |||||||||
| 6.500% 08/15/2005 | 17,500,000 | 17,680,425 | |||||||
| U.S. Treasury Note | |||||||||
| 6.500% 10/15/2006 | 6,460,000 | 6,537,714 | |||||||
| 24,218,139 | |||||||||
| U.S. Treasury Strip - 0.0% | |||||||||
| U.S. Treasury Strip - Principal Only | |||||||||
| 0.000% 08/15/2015 | 2,000,000 | 787,620 | |||||||
| Total U.S. Treasury Obligations | |||||||||
| (Cost $85,381,683) | 85,223,235 | ||||||||
| TOTAL BONDS & NOTES | |||||||||
| (Cost $517,683,190) | 501,641,303 | ||||||||
| SHORT-TERM INVESTMENTS - 12.4% | |||||||||
| Cash Equivalents - 5.2% | |||||||||
| Bank of America Bank Note** | |||||||||
| 6.670% 03/22/2001 | 2,308,010 | 2,308,010 | |||||||
| Bank of Montreal Bank Note** | |||||||||
| 6.630% 08/16/2000 | 4,115,222 | 4,115,222 | |||||||
| Bank of Nova Scotia Eurodollar
Time Deposit** |
|||||||||
| 7.000% 07/03/2000 | 4,616,010 | 4,616,010 | |||||||
| Credit Agricole Bank Eurodollar
Time Deposit** |
|||||||||
| 6.750% 07/06/2000 | 17,654,388 | 17,654,388 | |||||||
| Principal
Amount |
Market Value |
|||
|---|---|---|---|---|
| Cash Equivalents (Continued) | ||||
| Credit Agricole Bank Eurodollar
Time Deposit** |
||||
| 6.750% 07/07/2000 | $ 2,308,006 | $ 2,308,006 | ||
| Den Danske Bank Eurodollar
Time Deposit** |
||||
| 6.810% 07/05/2000 | 9,662,684 | 9,662,684 | ||
| First Union Bank Note** | ||||
| 6.900% 05/09/2001 | 2,308,013 | 2,308,013 | ||
| Fleet National Bank Eurodollar
Time Deposit** |
||||
| 7.260% 10/31/2000 | 6,272,569 | 6,272,569 | ||
| HypoVereinsbank Eurodollar
Time Deposit** |
||||
| 6.750% 07/05/2000 | 19,233,373 | 19,233,373 | ||
| Merrimac Money Market Fund** | ||||
| 6.440% 07/03/2000 | 27,657,120 | 27,657,120 | ||
| Morgan Stanley Dean Witter & Co.** | ||||
| 6.890% 07/17/2000 | 464,475 | 464,475 | ||
| Morgan Stanley Dean Witter & Co.** | ||||
| 6.910% 11/22/2000 | 1,895,935 | 1,895,935 | ||
| Paribas Bank Eurodollar Time Deposit** | ||||
| 6.750% 07/05/2000 | 9,232,017 | 9,232,017 | ||
| 107,727,822 | ||||
| Commercial Paper - 7.2% | ||||
| Appalachian Power Company | ||||
| 6.970% 07/19/2000 | 7,730,000 | 7,703,061 | ||
| Burlington Resources, Inc. | ||||
| 6.900% 07/13/2000 | 5,950,000 | 5,936,315 | ||
| ConAgra, Inc. | ||||
| 6.800% 07/12/2000 | 9,085,000 | 9,066,123 | ||
| Countrywide Home Loans, Inc. | ||||
| 7.000% 07/03/2000 | 5,000,000 | 4,998,055 | ||
| Dana Credit Corporation | ||||
| 6.780% 07/14/2000 | 10,200,000 | 10,175,027 | ||
| Dana Credit Corporation | ||||
| 6.820% 07/05/2000 | 3,190,000 | 3,187,583 | ||
| Federated Department Stores, Inc. | ||||
| 6.750% 07/05/2000 | 7,465,000 | 7,459,401 | ||
| Principal
Amount |
Market Value |
||||
|---|---|---|---|---|---|
| Houston Industrial Finance Co. L.P. | |||||
| 6.900% 07/07/2000 | $ 10,000,000 | $ 9,988,500 | |||
| Houston Industries Finance Co. L.P. | |||||
| 7.050% 07/18/2000 | 14,580,000 | 14,531,461 | |||
| Pentair, Inc. | |||||
| 6.870% 07/26/2000 | 10,000,000 | 9,952,292 | |||
| Public Service Electric and Gas Company | |||||
| 6.790% 07/06/2000 | 13,500,000 | 13,487,269 | |||
| Solutia, Inc. | |||||
| 6.850% 07/20/2000 | 10,110,000 | 10,073,450 | |||
| UOP | |||||
| 6.870% 07/10/2000 | 12,000,000 | 11,979,390 | |||
| UOP | |||||
| 6.950% 07/24/2000 | 8,000,000 | 7,964,478 | |||
| US West Capital Funding Corporation | |||||
| 6.850% 07/17/2000 | 10,000,000 | 9,969,556 | |||
| US West Capital Funding Corporation | |||||
| 6.950% 07/31/2000 | 10,000,000 | 9,942,083 | |||
| VF Corporation | |||||
| 6.180% 07/31/2000 | 3,255,000 | 3,238,237 | |||
| 149,652,281 | |||||
| TOTAL SHORT-TERM INVESTMENTS | |||||
| (At Amortized Cost) | 257,380,103 | ||||
| TOTAL INVESTMENTS - 104.0% | |||||
| (Cost $1,724,607,121) *** | $ 2,170,252,668 | ||||
| Other Assets/(Liabilities) - (4.0%) | (82,479,552 | ) | |||
| NET ASSETS - 100.0% | $ 2,087,773,116 | ||||
| Notes to Portfolio of Investments | ||||||
| * Non-income producing security. | ||||||
| ** Represents investment of security lending
collateral. (Note 2). |
||||||
| *** Aggregate cost for Federal tax purposes. (Note 7). | ||||||
| † Securities exempt from registration under Rule
144A of the Securities Act of 1933. These securities may be resold in transactions exempt from registration, normally to qualified institutional buyers. |
||||||
| †† American Depository Receipt. |
| 1. The Fund | MML Series Investment Fund (“MML Trust”) is registered under the Investment Company Act of 1940, as amended (the “
1940 Act”), as a no-load, registered open-end, management investment company. The Trust is organized under the laws of the Commonwealth of Massachusetts as a Massachusetts business trust pursuant to an Agreement and Declaration of Trust dated
December 19, 1984, as amended. The following are four series of the Trust (each individually referred to as a “Fund” or collectively as the “Funds”): MML Equity Fund (“Equity Fund”), MML Money Market Fund (“Money Market
Fund”), MML Managed Bond Fund (“Managed Bond Fund”) and MML Blend Fund (“Blend Fund”).
|
| The MML Trust was established by Massachusetts Mutual Life Insurance Company (“MassMutual”) for the purpose of providing
vehicles for the investment of assets of various separate investment accounts established by MassMutual and by life insurance companies which are subsidiaries of MassMutual. Shares of MML Trust are not offered to the general public.
|
| 2. Significant
Accounting Policies |
The following is a summary of significant accounting policies followed consistently by each Fund in the preparation of the
financial statements in conformity with generally accepted accounting principles. The preparation of the financial statements in accordance with generally accepted accounting principles requires management to make estimates and assumptions that affect the
reported amounts and disclosures in the financial statements. Actual results could differ from those estimates.
|
| Investment
Valuation |
Equity securities are valued on the basis of valuations furnished by a pricing service, authorized by the Board of Trustees (“
Trustees”), which provides the last reported sale price for securities listed on a national securities exchange or on the NASDAQ National Market System, or in the case of over-the-counter securities not so listed, the last reported bid price. Debt
securities (other than short-term obligations with a remaining maturity of sixty days or less) are valued on the basis of valuations furnished by a pricing service, authorized by the Trustees, which determines valuations taking into account appropriate
factors such as institutional-size trading in similar groups of securities, yield, quality, coupon rate, maturity, type of issue, trading characteristics and other market data. For the Equity Fund, Managed Bond Fund and Blend Fund, short-term securities
with a remaining maturity of sixty days or less are valued at either amortized cost or at original cost plus accrued interest, whichever approximates current market value. The Money Market Fund’s portfolio securities are valued at amortized cost in
accordance with a rule of the Securities and Exchange Commission pursuant to which the Money Market Fund must adhere to certain conditions. It is the intention of the Money Market Fund to maintain a per-share net asset value of $1.00. All other securities
and other assets, including debt securities for which the prices supplied by a pricing agent are deemed by MassMutual not to be representative of market values, including restricted securities and securities for which no market quotation is available, are
valued at fair value in accordance with procedures approved by and determined in good faith by the Trustees, although the actual calculation may be done by others.
|
| Portfolio securities traded on more than one national securities exchange are valued at the last price on the business day as of
which such value is being determined at the close of the exchange representing the principal market for such securities. All assets and liabilities expressed in foreign currencies will be converted into U.S. dollars at the mean between the buying and
selling rates of such currencies against U.S. dollars last quoted by any major bank. If such quotations are not available, the rate of exchange will be determined in accordance with policies established by the Trustees.
|
| Accounting for
Investments |
Investment transactions are accounted for on the trade date. Realized gains and losses on sales of investments and unrealized
appreciation and depreciation of investments are computed on the specific identification cost method. Interest income, adjusted for amortization of discounts and premiums on short-term securities, is earned from the settlement date and is recorded on the
accrual basis. Dividend income is recorded on the ex-dividend date.
|
| The cost basis of long-term bonds is not adjusted for amortization of premium or accrual of discount since the Managed Bond Fund
and the Blend Fund do not generally intend to hold such investments until maturity; however, MML Trust has elected to accrue for financial reporting purposes, certain discounts which are required to be accrued for federal income tax purposes.
|
| Federal Income Tax
|
It is each Fund’s intent to continue to comply with the provisions of subchapter M of the Internal Revenue Code of 1986, as
amended (the “Code”), applicable to a regulated investment company. Under such provisions, the Funds will not be subject to federal income taxes on their ordinary income and net realized capital gains to the extent they are distributed or deemed
to have been distributed to their shareholders. Therefore, no Federal income tax provision is required.
|
| Dividends and
Distributions to Shareholders |
Dividends from net investment income are declared and paid quarterly for the Managed Bond and Blend Funds and annually for the
Equity Fund. Dividends from net investment income are declared daily and paid monthly for the Money Market Fund. Distributions of any net realized capital gains of each Fund are declared and paid annually and at other times as may be required to satisfy
tax or regulatory requirements. Distributions to shareholders are recorded on the ex-dividend date. Income and capital gain distributions are determined in accordance with income tax regulations which may differ from generally accepted accounting
principles. These differences are primarily due to investments in forward contracts, passive foreign investment companies, the deferral of wash sale losses, and paydowns on certain mortgage-backed securities. As a result, net investment income and net
realized gain on investment transactions for a reporting period may differ significantly from distributions during such period. Accordingly, the Funds may periodically make reclassifications among certain of their capital accounts without impacting the
net asset value of the Funds.
|
| Foreign Currency
Translation |
The books and records of the Funds are maintained in U.S. dollars. The market values of foreign currencies, foreign securities and
other assets and liabilities denominated in foreign currencies are translated into U.S. dollars at the mean of the buying and selling rates of such currencies against the U.S. dollar at the end of each business day. Purchases and sales of foreign
securities and income and expense items are translated at the rates of exchange prevailing on the respective dates of such transactions. The Funds do not isolate that portion of the results of operations arising from changes in the exchange rates from
that portion arising from changes in the market price of securities.
|
| Net realized foreign currency gains and losses resulting from changes in exchange rates include foreign currency gains and losses
between trade date and settlement date on investment securities transactions, foreign currency transactions and the difference between the amounts of dividends recorded on the books of the Funds and the amount actually received.
|
| Securities Lending
|
The Managed Bond Fund, Equity Fund and Blend Fund may lend their securities to qualified brokers; however, securities lending
cannot exceed 10% of the total assets of the Managed Bond Fund taken at current value, and 33% of the total assets of the Equity Fund and the Blend Fund taken at current value. The loans are collateralized at all times with cash or securities with a
market value at least equal to 100% of the market value of the securities on loan. As with other extensions of credit, the Funds may bear the risk of delay in recovery or even loss of rights in the collateral should the borrower of the securities fail
financially. The Funds receive compensation for lending their securities. At June 30, 2000, the Funds had the following:
|
| Securities
on Loan |
Collateral |
|||
|---|---|---|---|---|
| Equity Fund | $ 48,632,912 | $ 50,016,610 | ||
| Managed Bond Fund | 11,462,692 | 11,606,171 | ||
| Blend Fund | 105,332,803 | 107,727,822 |
| Forward Foreign
Currency Contracts |
The Fund may enter into forward foreign currency contracts in order to convert foreign denominated securities or obligations to
U.S. dollar denominated investments. A forward foreign currency contract is an agreement between two parties to buy and sell a currency at a set price on a future date. The market value of a forward currency contract fluctuates with changes in forward
foreign currency
exchange rates. Forward foreign currency contracts are marked to market daily and the change in their value is recorded by the Fund as an unrealized gain or loss. When a forward foreign currency contract is extinguished, through delivery or offset by
entering into another forward foreign currency contract, the Fund records a realized gain or loss equal to the difference between the value of the contract at the time it was opened and the value of the contract at the time it was extinguished or offset.
|
| Forward foreign currency contracts involve a risk of loss from the potential inability of counterparties to meet the terms of
their contracts and from unanticipated movements in foreign currency values and interest rates.
|
| The notional or contractual amounts of these instruments represent the investments the Fund has in particular classes of financial
instruments and do not necessarily represent the amounts potentially subject to risk. The measurement of the risk associated with these instruments is meaningful only when all related and offsetting transactions are considered.
|
| There were no outstanding forward foreign currency contracts at June 30, 2000.
|
| Forward
Commitments |
Each Fund may purchase or sell securities on a “when issued,” delayed delivery or forward commitment basis. The Funds
use forward commitments to manage interest rate exposure or as a temporary substitute for purchasing or selling particular debt securities. Delivery and payment for securities purchased on a forward commitment basis can take place a month or more after
the date of the transaction. The Funds instruct the custodian to segregate assets in a separate account with a current market value at least equal to the amount of its forward purchase commitments. The price of the underlying security and the date when
the securities will be delivered and paid for are fixed at the time the transaction is negotiated. The value of the forward commitment is determined by management using a commonly accepted pricing model and fluctuates based upon changes in the value of
the underlying security and market repurchase rates. Such rates equate the counterparty’s cost to purchase and finance the underlying security to the earnings received on the security and forward delivery proceeds. The Funds record on a daily basis
the unrealized appreciation/depreciation based upon changes in the value of the forward commitment. When a forward commitment contract is closed, the Funds record a realized gain or loss equal to the difference between the value of the contract at the
time it was opened and the value of the contract at the time it was extinguished. Forward commitments involve a risk of loss if the value of the security to be purchased declines prior to the settlement date. The Funds could also be exposed to loss if
they cannot close out their forward commitments because of an illiquid secondary market, or the inability of counterparties to perform. The Funds monitor exposure to ensure counterparties are creditworthy and concentration of exposure is minimized. At
June 30, 2000 the Funds had no open forward commitments.
|
| Financial Futures
Contracts |
Each Fund may purchase or sell financial futures contracts and options on such futures contracts for the purpose of hedging the
market risk on existing securities or the intended purchase of securities. Futures contracts are contracts for delayed delivery of securities at a specific future date and at a specific price or yield. Upon entering into a contract, the Funds deposit and
maintain as collateral such initial margin as required by the exchange on which the transaction is effected. Pursuant to the contract, the Funds agree to receive from or pay to the broker an amount of cash equal to the daily fluctuation in value of the
contract. Such receipts or payments are known as variation margin and are recorded by the Funds as unrealized gains or losses. When the contract is closed, each Fund records a realized gain or loss equal to the difference between the value of the contract
at the time it was opened and the value at the time it was closed. At June 30, 2000, the Funds had no open financial futures contracts.
|
| 3. Management
Fees and Other Transactions with Affiliates |
| Investment
Management Fee |
MassMutual serves as investment adviser to the Funds and provides administrative services needed by the Funds. For acting as such,
MassMutual receives a monthly fee from each Fund at the annual rate of 0.50% of the first $100,000,000, 0.45% of the next $200,000,000, 0.40% of the next $200,000,000 and 0.35% of any excess over $500,000,000 of the average daily net asset value of each
Fund.
|
| MassMutual has entered into an investment sub-advisory agreement with David L. Babson and Company, Inc. (“DLB”),
pursuant to which DLB serves as the Funds’ sub-adviser providing day-to-day management of the Funds’ investments. DLB is a wholly-owned subsidiary of DLB Acquisition Corporation, which is a controlled subsidiary of MassMutual. (Note 9) MassMutual pays DLB a monthly fee equal to an annual rate of 0.13% of the average daily net asset value of the Equity Fund and the Equity Segment of the Blend Fund, 0.05% of the average daily net asset value of the Money Market Fund, 0.10%
of the average daily net asset value of the Managed Bond Fund and 0.09% of the average daily net asset value of the Money Market Fund and Bond Segment of the Blend Fund.
|
| MassMutual has agreed, at least through April 30, 2001, to bear the expenses of each Fund to the extent that the aggregate
expenses (excluding each Fund’s management fee, interest, taxes, brokerage commissions and extraordinary expenses) incurred during the Fund’s fiscal year exceed 0.11% of the average daily net asset value of each Fund for such year.
|
| Other
|
Certain officers and trustees of the Funds are also officers of MassMutual. The compensation of unaffiliated directors of the
Funds is borne by the Funds.
|
| 4. Purchases and
Sales of Investments |
Cost of purchases and proceeds from sales of investment securities (excluding short-term investments) for the six months ended
June 30, 2000, were as follows:
|
| Long-Term
U.S. Government Securities |
Other Long-Term
Securities |
|||
|---|---|---|---|---|
| Purchases | ||||
| Equity Fund | $ - | $ 772,613,549 | ||
| Managed Bond Fund | 3,379,609 | 14,357,941 | ||
| Blend Fund | 8,234,469 | 535,753,711 | ||
| Sales | ||||
| Equity Fund | $ - | $1,138,409,009 | ||
| Managed Bond Fund | 29,226,481 | 33,919,979 | ||
| Blend Fund | 128,217,983 | 754,603,827 | ||
| |
| 5. Capital Share
Transactions |
The Funds are authorized to issue an unlimited number of shares, with no par value. The change in shares outstanding for each Fund
are as follows:
|
| For the Six Months Ended June 30, 2000 |
|||||||||||||
|---|---|---|---|---|---|---|---|---|---|---|---|---|---|
| MML
Equity Fund |
MML
Money Market Fund |
MML
Managed Bond Fund |
MML
Blend Fund |
||||||||||
| Shares
|
|||||||||||||
| Reinvestment of dividends | 2,355,731 | 5,291,394 | 643,573 | 4,044,812 | |||||||||
| Sales of shares | 2,185,402 | 90,620,632 | 1,337,893 | 2,446,320 | |||||||||
| Redemptions of shares | (15,350,910 | ) | (115,956,410 | ) | (4,702,283 | ) | (28,534,080 | ) | |||||
| |
|
|
|
||||||||||
| Net decrease | (10,809,777 | ) | (20,044,384 | ) | (2,720,817 | ) | (22,042,948 | ) | |||||
| |
|
|
|
||||||||||
| Amount | |||||||||||||
| Reinvestment of dividends | $ 86,114,676 | $ 5,291,394 | $ 7,516,691 | $ 95,065,001 | |||||||||
| Sales of shares | 76,867,972 | 90,620,632 | 15,657,633 | 56,722,452 | |||||||||
| Redemptions of shares | (534,037,868 | ) | (115,956,410 | ) | (55,064,848 | ) | (655,090,647 | ) | |||||
| |
|
|
|
||||||||||
| Net decrease | $(371,055,220 | ) | $ (20,044,384 | ) | $(31,890,524 | ) | $(503,303,194 | ) | |||||
| |
|
|
|
||||||||||
| For the Year Ended December 31, 1999 |
|||||||||||||
| MML
Equity Fund |
MML
Money Market Fund |
MML
Managed Bond Fund |
MML
Blend Fund |
||||||||||
| Shares | |||||||||||||
| Reinvestment of dividends | 3,796,729 | 8,562,616 | 1,382,881 | 9,983,544 | |||||||||
| Sales of shares | 4,812,759 | 167,122,965 | 3,342,080 | 4,777,625 | |||||||||
| Redemptions of shares | (8,388,952 | ) | (153,549,427 | ) | (4,234,710 | ) | (14,823,643 | ) | |||||
| |
|
|
|
||||||||||
| Net Increase | 220,536 | 22,136,154 | 490,251 | (62,474 | ) | ||||||||
| |
|
|
|
||||||||||
| Amount | |||||||||||||
| Reinvestment of dividends | $148,822,870 | $ 8,562,616 | $16,813,962 | $249,891,784 | |||||||||
| Sales of shares | 189,299,023 | 167,122,965 | 40,899,424 | 118,555,152 | |||||||||
| Redemptions of shares | (328,080,513 | ) | (153,549,427 | ) | (51,248,822 | ) | (367,816,808 | ) | |||||
| |
|
|
|
||||||||||
| Net Increase | $ 10,041,380 | $ 22,136,154 | $ 6,464,564 | $ 630,128 | |||||||||
| |
|
|
|
||||||||||
| 6. Foreign
Securities |
The Funds may also invest in foreign securities, subject to certain percentage restrictions. Investing in securities of foreign
companies and foreign governments involves special risks and considerations not typically associated with investing in securities issued by U.S. companies and the U.S. Government. These risks include revaluation of currencies and future adverse political
and economic developments. Moreover, securities of many foreign companies and foreign governments and their markets may be less liquid and their prices more volatile than those of securities of comparable U.S. companies and the U.S. Government.
|
| 7. Federal Income
Tax Information |
At June 30, 2000, the cost of securities and the unrealized appreciation (depreciation) in the value of investments owned by the
Funds, as computed on a Federal income tax basis, were as follows:
|
| Federal
Income Tax Cost |
Tax Basis
Unrealized Appreciation |
Tax Basis
Unrealized Depreciation |
Net Unrealized
Appreciation (Depreciation) |
|||||||
|---|---|---|---|---|---|---|---|---|---|---|
| Equity Fund | $1,670,176,471 | $688,512,135 | $56,360,840 | $632,151,295 | ||||||
| Managed Bond Fund | 226,598,006 | 1,380,848 | 6,899,420 | (5,518,572 | ) | |||||
| Blend Fund | 1,724,607,121 | 488,125,787 | 42,480,240 | 445,645,547 | ||||||
| Note: The aggregate cost for investments for the Money Market Fund as of June 30, 2000, is the same for financial reporting and
Federal income tax purposes.
|
| At December 31, 1999, the following Funds had available, for Federal income tax purposes, unused capital losses:
|
| Amount |
Expiration Date |
|||
|---|---|---|---|---|
| Money Market Fund | $ 1,204 | December 31, 2000 | ||
| Money Market Fund | 201 | December 31, 2001 | ||
| Money Market Fund | 5,364 | December 31, 2002 | ||
| Money Market Fund | 841 | December 31, 2003 | ||
| Money Market Fund | 4,291 | December 31, 2005 | ||
| Money Market Fund | 96 | December 31, 2006 | ||
| Money Market Fund | 2,451 | December 31, 2007 | ||
| Managed Bond Fund | 1,987,536 | December 31, 2007 |
| 9. Corporate
Reorganization |
Effective January 1, 2000, MassMutual completed an internal corporate reorganization among certain investment advisory functions
and subsidiaries (the “Reorganization”). The Reorganization combined the business operations of MassMutual’s Investment Management division (the “IM Division”) and Charter Oak Capital Management, Inc. (“Charter Oak”), a
majority-owned indirect subsidiary of MassMutual, with and into DLB. DLB is a majority-owned (85%) indirect subsidiary of MassMutual. DLB is registered with the Commission as an investment adviser under the Investment Advisers Act of 1940, as amended (the
“Advisers Act”) and, prior to the Reorganization, served as investment sub-adviser to the Equity Fund and the Equity segment of the Blend Fund.
|
| As a result of the Reorganization, MassMutual appointed DLB to serve as investment sub-adviser for the Money Market Fund, Managed
Bond Fund and the Money Market and Bond Segments of the Blend Fund. The Trustees of the Trust, including a majority of the Trustees who are disinterested, approved MassMutual’s appointment of DLB as sub-adviser. No increase in fees or change in
portfolio management personnel for any of the Funds occurred as a result of the Reorganization or the appointment of DLB as sub-adviser to such Funds.
|
|
|