
|
|
|
|
|
|
|
|
|
|
Previous: MOSAIC TAX-FREE TRUST, NSAR-B, EX-99.13OTHCONTRCT, 2000-11-29 |
Next: BRINKER INTERNATIONAL INC, POS AM, 2000-11-29 |
Contents
| Management’s Discussion of Fund Performance | 1 |
| Independent Auditors’ Report | 6 |
| Portfolio of Investments | |
| Arizona Fund | 7 |
| Maryland Fund | 9 |
| Missouri Fund | 11 |
| Virginia Fund | 13 |
| National Fund | 16 |
| Money Market | 19 |
| Statements of Assets and Liabilities | 22 |
| Statements of Operations | 23 |
| Statements of Changes in Net Assets | 24 |
| Financial Highlights | 26 |
| Notes to Financial Statements | 29 |
| Special Information | 33 |
Management’s Discussion of Fund Performance
 The annual period ended September 30, 2000 was characterized by two
quite different trends for municipal bond investors. The last quarter of 1999, which was
the first quarter of the fund’s fiscal year, saw bond values continue to wilt in the
wake of steadily increasing interest rates. But with the new year, quality municipal bonds
of the sort Mosaic concentrates on reversed fortune. All three quarters of the year 2000
were solidly positive for investors in Tax-Free Trust. By September 30, 2000 one-year
total returns for the bond funds were: 5.53% for Tax-Free National; 4.93% for Tax-Free
Arizona; 4.63% for Tax-Free Maryland; 5.03% for Tax-Free Missouri; and 4.78% for Tax-Free
Virginia. As of September 30, 2000, Mosaic Tax-Free Money Market was yielding 3.84% on a
seven-day basis with an effective annual yield of 3.91%.
The annual period ended September 30, 2000 was characterized by two
quite different trends for municipal bond investors. The last quarter of 1999, which was
the first quarter of the fund’s fiscal year, saw bond values continue to wilt in the
wake of steadily increasing interest rates. But with the new year, quality municipal bonds
of the sort Mosaic concentrates on reversed fortune. All three quarters of the year 2000
were solidly positive for investors in Tax-Free Trust. By September 30, 2000 one-year
total returns for the bond funds were: 5.53% for Tax-Free National; 4.93% for Tax-Free
Arizona; 4.63% for Tax-Free Maryland; 5.03% for Tax-Free Missouri; and 4.78% for Tax-Free
Virginia. As of September 30, 2000, Mosaic Tax-Free Money Market was yielding 3.84% on a
seven-day basis with an effective annual yield of 3.91%.
When the fortunes for municipal bonds changed, Mosaic was well positioned to take advantage. With maturities at the long range of the intermediate spectrum, our funds responded well to the downward drift of yields over the past nine months. A particularly important aspect of our discipline was our emphasis on quality. Not all municipal bonds showed strength in the year 2000, and investors who concentrated on lower-quality bonds had much less success, and even negative returns over the period.
Economic Overview
The bond market has reacted positively to signs that the economy is slowing to a more sustainable growth rate. Over the past quarters we’ve seen slowing housing demand—the first hint the economy was slowing; now manufacturing and retail sales activity have weakened as well. Sharp increases in energy prices are impacting consumer spending and with the heating season approaching consumers will be burdened further. Given the increased signs that higher rates are slowing the economy and inflation pressures are remaining subdued, the Fed is likely on hold until after the election. At this point it appears as though we may see a ‘soft-landing’ where the economy slows, easing inflation pressures, without recession. Such a scenario would be very positive for bonds.
Still, an economic slowdown could reduce capital investment, as companies become less optimistic about the future, reducing productivity and allowing inflation pressures to intensify. This investment in productivity-enhancing technology has kept labor costs, a key component of the inflation formula, in check during the current economic expansion. And while potential election outcomes are unclear at this point, recent spending and tax reform plans from both parties suggest that the next administration may not place the same value upon debt reduction as the current one.
Outlook
Over the past few years investors’ attention has drifted from the conservative world of bonds and towards the stocks and stock funds that have participated in the great bull market of the 1990s. Some seven years ago, municipal bond assets accounted for about 16% of the mutual fund universe. Recently that share dropped below 5%. We believe that many investors will be well served to reassess the role of municipal bonds in their portfolios, and there’s increasing evidence that this trend is underway. Recently, with the go-go stock market becoming increasingly volatile, a more diverse body of investors has turned to the municipal bond market. In fact, as the baby boom generation matures and ‘tech boomers’ cash in a portion of their stock portfolios, the demand for munis has increased at a time when state and local governments, flush with cash from strong tax revenues, are issuing much less debt.
Looking out over the next six to 12 months, we anticipate
that the economy will continue to slow. The Federal Reserve has increased short-term
interest rates in an attempt to engineer a "soft landing." The bond market has
reacted favorably to the Fed’s policy and is poised to rally further as the economy
slows to a more sustainable rate of growth. We believe that the combination of lower
interest rates and reduced municipal issuance is a recipe for strong returns in the months
to come.
ARIZONA FUND
Arizona continues to enjoy a strong, well-diversified
service and tourism based economy. The State does not have a credit rating because it does
not issue general obligation bonds. The Fund had a total return of 4.93% for the annual
period and the 30-day SEC yield was 4.24%. The duration of the portfolio was extended to
7.95 years while the average credit quality remained at AA. Purchases made during the
period included Mesa General Obligations, Pima County Industrial Development Authority for
HealthPartners, and the University of Arizona. Arizona ranked 22nd in the country in terms
of issuance on a year-to-date basis.
Comparison of Changes in the Value of a $10,000
Investment
with the Lehman Municipal Bond Index and Lipper
General
Municipal Bond Index for Mosaic Arizona Fund
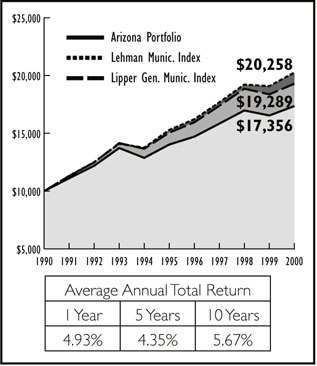
Past performance is not predictive of future
performance.
MARYLAND FUND
Maryland’s economy is diversified among services, light manufacturing and the federal government. The State’s general obligation bonds are rated AAA. The Fund had a total return of 4.63% for the annual period and the 30-day SEC yield was 4.07%. The duration of the portfolio remained at 7.33 years while the average credit quality continues to be AA. Purchases during the period included Howard County Construction Improvement Prerefunded bonds, Montgomery Housing Authority, and Prince Georges Parking Facility Authority. Maryland ranked 27th in the country in terms of issuance on a year-to-date basis.
Comparison of Changes in the Value of a $10,000
Investment with the
Lehman Municipal Bond Index and Lipper General
Municipal Bond
Index for Mosaic Maryland Fund
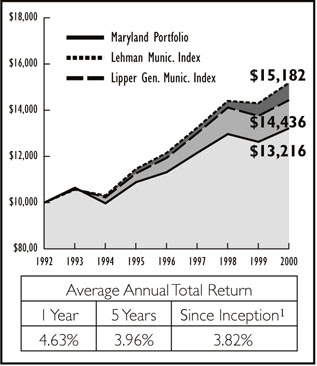
1 February 10, 1993
Past performance is not predictive of future
performance.
MISSOURI FUND
Missouri has a broad-based and diversified economy that is service-sector oriented. The State’s general obligation bonds are rated AAA. The Fund had a total return of 5.03% for the annual period and the 30-day SEC yield was 4.3%. The duration of the portfolio was extended to 7.64 years while the average credit quality was maintained at AA. Purchases during the period included Greene County Certificates of Participation, Kansas City School Building Authority, and Normandy School District General Obligations. Missouri ranked 21st in the country in terms of issuance on a year-to-date basis.
Comparison of Changes in the Value of a $10,000
Investment with the
Lehman Municipal Bond Index and Lipper General
Municipal Bond
Index for Mosaic Missouri Fund

Past performance is not predictive of future
performance.
VIRGINIA FUND
The Commonwealth of Virginia maintains a AAA general obligation bond rating based on a well-diversified economy that emphasizes services and government. The Fund had a total return of 4.78% for the annual period and the 30-day SEC yield was 4.5%. The duration of the portfolio was extended to 7.68 years while the average credit quality was maintained at AA. Purchases during the period included Culpeper County General Obligations, Greater Richmond Convention Center, and Virginia Commonwealth Transportation Authority. Virginia ranked 23rd in the country in terms of issuance on a year-to-date basis.
Comparison of Changes in the Value of a $10,000
Investment with the
Lehman Municipal Bond Index and Lipper General
Municipal Bond
Index for Mosaic Virginia Fund
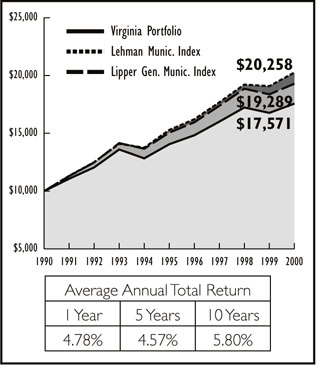
Past performance is not predictive of future
performance.
NATIONAL FUND
The National Fund had a total return of 5.53% for the annual period and the 30-day SEC yield was 4.15%. The duration of the portfolio was extended to 8.05 years while the average credit quality was maintained at AA. Purchases made during the period included Melrose Park, Illinois Water Authority, University of the Virgin Islands, and Lower Colorado River Authority. The United States and its territories has issued $141 billion in muni bonds year-to-date through the end of September which represents a 19% decrease in volume over the same period last year.
Comparison of Changes in the Value of a $10,000
Investment with the
Lehman Municipal Bond Index and Lipper General
Municipal Bond
Index for Mosaic National Fund
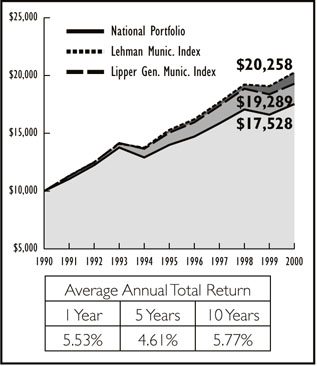
Past performance is not predictive of future
performance.
MONEY MARKET FUND
The fund continues to provide a high degree of liquidity and safety of principal. As of September 30, 2000, the fund’s seven-day yield was 3.84%, which is equivalent to a taxable yield of 6.0% for an investor in the 36% federal tax bracket. The average maturity of the fund stood at 37 days at the end of the annual period.
We appreciate your confidence in Mosaic Funds and reaffirm our commitment to provide you with competitive returns to meet your investment objectives.
Sincerely,
(signature)
Michael J. Peters, CFA
Vice President
Independent Auditors’ Report
TO THE BOARD OF TRUSTEES AND SHAREHOLDERS OF MOSAIC TAX-FREE TRUST
We have audited the accompanying statements of assets and liabilities, including the portfolios of investments, of Mosaic Tax-Free Trust (the "Trust")(including Arizona Fund, Maryland Fund, Missouri Fund, Virginia Fund, National Fund, and Money Market Fund (collectively, the "Funds")), as of September 30, 2000, the related statements of operations for the year then ended and changes in net assets for each of the two years in the period then ended, and the financial highlights for each of the four years in the period then ended. These financial statements and financial highlights are the responsibility of the Trust’s management. Our responsibility is to express an opinion on these financial statements and financial highlights based on our audits. The Funds’ financial highlights for the year ended September 30, 1996, were audited by other auditors whose report, dated November 7, 1996, expressed an unqualified opinion on such financial highlights.
We conducted our audits in accordance with auditing standards generally accepted in the United States of America. Those standards require that we plan and perform the audit to obtain reasonable assurance about whether the financial statements and financial highlights are free of material misstatement. An audit includes examining, on a test basis, evidence supporting the amounts and disclosures in the financial statements and financial highlights. Our procedures included confirmation of securities owned as of September 30, 2000, by correspondence with the Fund’s custodian. An audit also includes assessing the accounting principles used and significant estimates made by management, as well as evaluating the overall financial statement presentation. We believe that our audits provide a reasonable basis for our opinion.
In our opinion, the financial statements and financial highlights referred to above present fairly, in all material respects, the financial position of each of the Funds constituting the Mosaic Tax-Free Trust as of September 30, 2000, the results of their operations for the year then ended, the changes in their net assets for each of the two years in the period then ended, and the financial highlights for each of the four years in the period then ended, in conformity with accounting principles generally accepted in the United States of America.

Chicago, Illinois
November 3, 2000
Arizona Fund - Portfolio of Investments
Credit Rating* |
Principal Amount |
Market Value |
||
| Moody’s | S&P | |||
| LONG TERM MUNICIPAL BONDS: 96.3% of net assets | ||||
| EDUCATION: 4.3% | ||||
| Aaa | AAA | University of Arizona, Arizona Board of Regents, (FGIC Insured) 5.8%, 6/1/24 | 275,000 |
$277,062 |
| ELECTRIC: 5.6% | ||||
| Baa1 | BBB+ | Puerto Rico Electric Power Authority, Power Revenue, 5%, 7/1/28 | 400,000 |
360,000 |
| GENERAL OBLIGATION: 28.4% | ||||
| Aa3 | AA | Maricopa County Unified High School District #210 (Phoenix), 5.375%, 7/1/13 | 400,000 |
418,000 |
| Aaa | AAA | Mesa Recreational, Water and Sewer Improvements (FGIC Insured), 6.5%, 7/1/10 | 250,000 |
280,625 |
| Aaa | AAA | Mohave County Elementary School District #16 (Mohave Valley) (MBIA Insured), 5.375%, 7/1/13 | 300,000 |
303,750 |
| Aaa | AAA | Scottsdale Preserve Authority Excise Tax Revenue (FGIC Insured), 5.625% 7/1/22 | 225,000 |
225,562 |
| Aa2 | AA | Tucson Recreational Facility Inprovements, 5.25%, 7/1/19 | 250,000 |
242,188 |
| Baa1 | A | Puerto Rico Commonwealth, 6.5%, 7/1/14 | 320,000 |
362,400 |
| HOSPITAL:11.6% | ||||
| Aaa# | AAA | Arizona Health Facilities Authority, Hospital Revenue (Phoenix Baptist Hospital) (MBIA Insured), 6.25%, 9/1/11 | 200,000 |
208,750 |
| Aaa | AAA | Pima County Industrial Development Authority Revenue (Refunding Bonds), 5.625%, 4/1/14 | 250,000 |
255,000 |
| NA | A | Show Low Industrial Development Authority, Hospital Revenue (Nacapache Regional Medical Center), 5.5%, 12/1/17 | 300,000 |
286,125 |
| HOUSING: 13.4% | ||||
| NA | AA | Maricopa County Industrial Development Authority, Multifamily Housing Revenue, (Pines at Camelback Apartments), 5.45%, 5/1/28 | 200,000 |
$186,750 |
| Aaa | NA | Maricopa County Industrial Development Authority, Single Family Mortgage Revenue, 4.3%, 12/1/06 | 225,000 |
219,094 |
| nr | AAA | Phoenix Industrial Development Authority, Multifamily Housing Revenue, (GNMA), 7.5%, 7/20/35 | 200,000 |
224,500 |
| NA | AAA | PIMA County Industrial Development Authority, Multifamily Revenue (Jolla Tuscan Apartments), 5.2%, 4/1/19 | 250,000 |
235,625 |
| INDUSTRIAL DEVELOPMENT: 10.6% | ||||
| nr | AAA | Mohave County Industrial Development Authority Industrial Development Revenue (Citizens Utilities), 7.05%, 8/1/20 | 300,000 |
305,610 |
| Aa2 | AAA+ | Phoenix Civic Improvement Corp. Excise Tax, 5.25%, 7/1/24 | 300,000 |
281,625 |
| Aaa | AAA | Phoenix Civic Improvement Corp. Excise Tax, 4.25%, 7/1/08 | 100,000 |
98,500 |
| POLLUTION CONTROL: 3.9% | ||||
| Aaa | AAA | Navajo County Arizona Pollution Control Corporate, (MBIA-IBC Insured) 5.875%, 8/15/28 | 250,000 |
252,500 |
| TRANSPORTATION: 8.5% | ||||
| Aaa | AAA | Flagstaff, Street and Highway User Revenue, Junior Lien (FGIC Insured), 5.9%, 7/1/10 | 500,000 |
540,625 |
| WATER AND SEWER: 10.0% | ||||
| Aaa | AAA | Chandler, Water and Sewer Revenue (FGIC Insured), 6.75%, 7/1/06 | 250,000 |
256,675 |
| Aaa | AAA | Peoria, Water and Sewer Revenue (FGIC Insured), 4%, 7/1/18 | 475,000 |
391,281 |
| TOTAL INVESTMENTS (cost $6,194,975) | 6,212,247 |
|||
| CASH AND RECEIVABLES LESS LIABILITIES: 3.7% of net assets | 239,001 |
|||
| NET ASSETS:100% | $ 06,451,248 |
|||
Maryland Fund - Portfolio of Investments
Credit Rating* |
Principal Amount |
Market Value |
||
| Moody’s | S&P | |||
| LONG TERM MUNICIPAL BONDS: 94.1% of net assets | ||||
| EDUCATION: 21.9% | ||||
| Aaa | AAA | Maryland State Health & Higher Educational Facilities Authority Revenue (Loyola College) (MBIA Insured), 5.375%, 10/1/26 | 100,000 |
$96,000 |
| nr | BBB- | Maryland State Health & Higher Educational Facilities Authority Revenue (Green Acres), 5.3%, 7/1/28 | 100,000 |
87,375 |
| Aaa | AAA | St. Mary’s College, University Revenue (MBIA Insured), 5.55%, 9/1/23 | 100,000 |
98,875 |
| Aaa | AAA | Prince Georges County, 5.375%, 3/15/16 | 100,000 |
100,000 |
| Aa3 | AA+ | University of Maryland System Auxiliary Facility & Tuition Revenue, 5%, 4/1/17 | 55,000 |
51,288 |
| Aa3 | AA+ | University of Maryland System Auxiliary Facility & Tuition Revenue, 4.5%, 10/1/18 | 45,000 |
38,475 |
| ELECTRIC: 4.8% | ||||
| Baa1 | N/A | Puerto Rico Electric Power Authority, Power Revenue, 6%, 7/1/14 | 100,000 |
104,375 |
| GENERAL OBLIGATION: 11.9% | ||||
| Aa | AA+ | Anne Arundel County, Solid Waste Projects (AMT), 5.5%, 9/1/16 | 100,000 |
99,250 |
| Aaa | AAA | Baltimore, Public Improvements (AMBAC Insured), 6%, 10/15/04 | 100,000 |
105,500 |
| AAA# | AAA | Howard County, Public Improvements (Prerefunded 5/15/03 @ 100), 5.75%, 5/15/08 | 50,000 |
51,500 |
| HOSPITAL: 11.1% | ||||
| Baa1 | nr | Maryland State Health & Higher Educational Facilities Authority Revenue (Kennedy Krieger Issue), 5.125%, 7/1/22 | 75,000 |
58,219 |
| Aaa | nr | Maryland State Health & Higher Educational Facilities Authority Revenue (Upper Chesapeake Hospitals-Series A) (FSA Insured), 5.125%, 1/1/38 | 100,000 |
91,125 |
| Aaa | AAA | Maryland State Health & Higher Educational Facilities Authority Revenue, Johns Hopkins Medicine-Howard County General Hospital Acquisition, 5%, 7/1/33 | 100,000 |
90,125 |
| HOUSING: 9.0% | ||||
| Aa2 | nr | Maryland State Community Development Administration (Single-Family Housing) (AMT), 6.2%, 4/1/17 | 100,000 |
102,125 |
| Aaa | nr | Montgomery County, Maryland Housing Opportunity, Community Housing Revenue, 5.05%, 7/1/28 | 100,000 |
90,750 |
| LEASING: 4.7% | ||||
| nr | AA | Montgomery County Revenue Authority, Lease Revenue (Human Services Headquarters) 5.6%, 8/1/14 | 100,000 |
102,000 |
| POLLUTION CONTROL: 4.7% | ||||
| A2 | A | Anne Arundel County, Pollution Control Revenue (Baltimore Gas And Electric Company), 6%, 4/1/24 | 100,000 |
101,000 |
| PUBLIC FACILITIES: 3.2% | ||||
| Aaa | AAA | Baltimore Convention Center Revenue (MBIA Insured), 5%, 9/1/19 | 75,000 |
68,906 |
| TRANSPORTATION: 10.2% | ||||
| Aa3 | AA- | Baltimore, Port Facilities Revenue (Consolidated Coal Sales), 6.5%, 10/1/11 | 100,000 |
105,000 |
| Aaa# | AAA | Maryland State Transportation Authority Transportation Facilities Project Revenue, 6.8%, 7/1/16 | 100,000 |
114,125 |
| STATE GENERAL OBLIGATION: 6.8% | ||||
| Aaa | AAA | Maryland State, 5%, 7/15/11 | 50,000 |
50,250 |
| Baa1 | A | Puerto Rico Commonwealth, 6.5%, 7/1/14 | 85,000 |
96,262 |
| MUNICIPAL OTHER: 5.8% | ||||
| Aa | AA- | Howard County, Special Facilities Revenue, 5.95%, 2/15/10 | 50,000 |
52,000 |
| A2 | nr | Northeast Waste Disposal Authority, Solid Waste Revenue Bond, 5.8%, 7/1/04 | 70,000 |
72,275 |
| TOTAL INVESTMENTS (cost $2,049,330) | 2,026,800 |
|||
| CASH AND RECEIVABLES LESS LIABILITIES: 5.9% of net assets | 126,350 |
|||
| NET ASSETS: 100% | $ 02,153,150 |
|||
Missouri Fund - Portfolio of Investments
Credit Rating* |
PRINCIPAL
AMOUNT |
MARKET
VALUE |
||
| Moody’s | S&P | |||
| LONG TERM MUNICIPAL BONDS: 95.4% of net assets | ||||
| EDUCATION: 21.2% | ||||
| Aaa | AAA | St. Louis Board of Education, 5.5%, 4/1/10 | 275,000 | $289,438 |
| Aaa | AAA | St. Louis County Pattonville R-3 School District (FGIC Insured) 5.75%, 3/1/16 | 200,000 | 207,750 |
| Aaa | AAA | Kansas City School District Building, (FGIC Insured), 5%, 2/1/14 | 150,000 | 146,438 |
| Aaa | AAA | Missouri State Health and Educational Facilities Authority, Educational Facilities Revenue Bond, (AMBAC Insured) 5.125%, 10/1/16 | 300,000 | 287,625 |
| nr | AA+ | Normandy School District, General Obligation, 5.4%, 3/1/18 | 325,000 | 317,688 |
| Aa1 | AA+ | Platte County, School District Park Hill, 5.5%, 3/1/14 | 300,000 | 306,375 |
| ELECTRIC: 5.9% | ||||
| Aaa | AAA | Sikeston, Electric Revenue (MBIA Insured), 6%, 6/1/14 | 400,000 | 434,000 |
| GENERAL OBLIGATION: 16.0% | ||||
| Aa2 | nr | Jefferson City School District, 6.7%, 3/1/11 | 200,000 | 224,500 |
| Aaa | AAA | Missouri State (Fourth State Building), 5.75%, 8/1/19 | 400,000 | 406,500 |
| Baa1 | A | Puerto Rico Commonwealth, Public Improvement, 6.5%, 7/1/14 | 480,000 | 543,600 |
| HOSPITAL: 10.9% | ||||
| Aaa | AAA | Missouri State Health and Educational Facilities Authority, Health Facilities Revenue (Heartland Health System) (AMBAC Insured), 6.35%, 11/15/17 | 500,000 | 516,875 |
| nr | AAA | Missouri State Health and Educational Facilities Authority, Health Facilities Revenue (SSM Health Care) (MBIA Insured), 5%, 6/1/18 | 250,000 | 233,437 |
| Aaa# | nr | Missouri State Health and Educational Facilities Authority, Health Facilities Revenue (SSM Health Care) (MBIA Insured) (Prerefunded 6/1/02 @ 102), 6.25%, 6/1/16 | 45,000 | 47,081 |
| HOUSING: 8.4% | ||||
| nr | AAA | Missouri State Housing Development Commission, Single-Family Mortgage Revenue (GNMA Collaterized) (FHA) (AMT), 7.375%, 8/1/23 | 105,000 | $107,519 |
| nr | AAA# | St. Louis County, Mortgage Revenue (AMT), 5.65%, 2/1/20 | 500,000 | 504,375 |
| LEASING AND OTHER FACILITIES: 30.0% | ||||
| A1 | nr | Greene County Certificate Participatioon, 5.25%, 7/1/11 | 300,000 | 303,000 |
| A1 | A+ | Missouri State Regional Convention and Sports Complex Authority, 5.6%, 8/15/17 | 250,000 | 251,250 |
| A1 | A+ | Missouri State Regional Convention and Sports Complex Authority, 5.5%, 8/15/13 | 250,000 | 252,812 |
| A | BBB+ | St Louis County Regional Convention and Sports Complex Authority, 5.5%, 8/15/13 | 300,000 | 303,375 |
| Aaa | nr | St Louis Municipal Finance Corporation, Leasehold Revenue Bond, (AMBAC Insured), 5.75%, 2/15/17 | 300,000 | 309,375 |
| Aaa | AAA | St Louis Parking Facilities Revenue (MBIA Insured), 5.375%, 12/15/21 | 500,000 | 490,000 |
| Aaa | AAA | Springfield Public Building Corp. Leasehold Revenue Bond, 5.8%, 6/1/13 | 275,000 | 284,281 |
| POLLUTION CONTROL REVENUE: 3.0% | ||||
| A1 | AA- | St Louis Industrial Development Authority Pollution Control Revenue, 6.65%, 5/1/16 | 200,000 | 219,750 |
| LONG TERM MUNICIPAL BOND TOTAL | 6,987,044 | |||
| SHORT TERM MUNICIPAL BONDS: 2.8% of net assets | ||||
| nr | AA | Missouri State Health and Educational Facilities Authority, Health Facilities Revenue 5.65%, 6/1/26** | 200,000 | 200,000 |
| TOTAL INVESTMENTS (cost $7,047,220) | 7,187,044 | |||
| CASH AND RECEIVABLES LESS LIABILITIES: 1.8% of net assets | 134,275 | |||
| NET ASSETS: 100% | $07,321,319 | |||
Virginia Fund - Portfolio of Investments
| Credit Rating* | Principal Amount |
Market Value |
||
Moody’s |
S&P |
|||
| LONG TERM MUNICIPAL BONDS: 98.2% of net assets | ||||
| AIRPORT: 5.4% | ||||
| Aaa | AAA | Capital Regional Airport Commission, Airport Revenue (AMBAC Insured), 5.625%, 7/1/15 | 500,000 |
$509,375 |
| Aaa | AAA | Metropolitan Washington DC Airports, Airport Revenue (FGIC Insured) (AMT), 7%, 10/1/18 | 500,000 |
515,245 |
| Aaa | AAA | Metropolitan Washington DC Airports, Airport Revenue (MBIA Insured) (AMT), 6.625%, 10/1/12 | 500,000 |
524,375 |
| EDUCATION: 9.4% | ||||
| A1 | nr | Loudoun County Industrial Development Authority, University Facilities Revenue (George Washington University), 6.25%, 5/15/22 | 500,000 |
510,000 |
| nr | A- | Lynchburg Industrial Development Authority, Educational Facilities Revenue (Randolph-Macon Women’s College), 5.875%, 9/1/13 | 500,000 |
511,875 |
| nr | A | University Virgin Islands, 5.65%, 12/01/12 | 590,000 |
604,013 |
| Aa2 | AA | Virginia College Building Authority, Educational Facilities Revenue (Washington and Lee University), 5.75%, 1/1/14 | 20,000 |
20,500 |
| Aa | AA | Virginia State Public Schools Authority, Special Obligation (York County), 5.9%, 7/15/13 | 500,000 |
521,250 |
| A1 | AA- | Virginia State Universities, University Revenue (Virginia Commonwealth University), 5.75%, 5/1/15 | 500,000 |
511,875 |
| ELECTRIC: 3.9% | ||||
| Baa1 | BBB+ | Puerto Rico Electric Power Authority, Power Revenue, 5%, 7/1/28 | 1,250,000 |
1,125,000 |
| GENERAL OBLIGATION: 19.1% | ||||
| Aaa | AAA | Culpepper County, 6%, 1/15/21 | 500,000 |
520,625 |
| Aaa | AAA | Fairfax County Public Improvement, 4.5%, 6/1/13 | 1,000,000 |
925,000 |
| A2 | A | Henry County, 6%, 7/15/14 | 500,000 |
522,500 |
| Aaa | AAA | Leesburg, (AMBAC Insured), 5.6%, 6/1/15 | 500,000 |
529,375 |
| Aa3 | AA | Lynchburg, 5.7%, 6/1/25 | 1,170,000 |
1,175,850 |
| Aaa | AAA | Norfolk, (MBIA Insured), 5.75%, 6/1/13 | 500,000 |
518,125 |
| Baa | A | Puerto Rico Commonwealth, 6.5%, 7/1/14 | 1,115,000 |
1,262,737 |
| HOSPITAL: 13.3% | ||||
| Aaa# | AAA | Danville Industrial Development Authority, Hospital Revenue (Danville Regional Medical Center) (FGIC Insured) (Prerefunded 10/1/04 @ 101), 6.375%, 10/1/14 | 350,000 |
$376,250 |
| Aaa | AAA | Danville Industrial Development Authority, Hospital Revenue (Danville Regional Medical Center) (AMBAC Insured) 5%,10/1/10 | 250,000 |
251,250 |
| Aaa | AAA | Hanover County Industrial Development Authority, Revenue Bon Secours Health System (MBIA Insured), 6%, 8/15/10 | 640,000 |
688,000 |
| A1 | A+ | Lynchburg Industrial Development Authority, Healthcare Facilities Revenue (Centra Health), 5.2%, 1/1/28 | 1,000,000 |
892,500 |
| Aa2 | AA+ | Norfolk Industrial Development Authority, Hospital Revenue (Sentara Hospital), 6.5%, 11/1/13 | 1,000,000 |
1,057,500 |
| Aaa | AAA | Roanoke Industrial Development Authority, Hospital Revenue (Roanoke Memorial Hospitals) (MBIA Insured), 6.125%, 7/1/17 | 500,000 |
536,250 |
| HOUSING: 6.8% | ||||
| nr | AAA | Fairfax County Redevelopment & Housing Authority, Multi-Family Housing Revenue (Castel Lani Project) (FHA Insured), 5.5%, 4/1/28 | 625,000 |
591,406 |
| Aa1 | AA+ | Virginia State Housing Development Authority Commonwealth Mortgage, 5.8% 7/1/05 | 1,310,000 |
1,352,575 |
| INDUSTRIAL DEVELOPMENT: 13.7% | ||||
| Baa2 | nr | Amherst Industrial Development Authority Revenue (Georgia Pacific Corp.) (AMT), 5.25%, 2/1/11 | 500,000 |
466,875 |
| Aaa | NA | Fairfax County Economic Development Authority (National Wildlife Assoc.), 5.25%, 9/1/19 | 1,000,000 |
968,750 |
| Baa2 | nr | Greensville County, Industrial Development Authority Revenue, (Georgia Pacific Corp.) 5.3%, 8/1/14 | 500,000 |
460,625 |
| Baa3 | BBB | Peninsula Ports Authority, Coal Terminal Revenue (Dominion Terminal), 7.375%, 6/1/20 | 1,000,000 |
1,038,750 |
| Aaa | AAA | Portsmouth Industrial Development Authority Revenue, Hotel Conference Center and Parking, 5.125%, 4/1/17 | 1,000,000 |
962,500 |
| LEASING AND OTHER FACILITIES: 1.8% | ||||
| Aa | AA | Fairfax County Economic Development Authority, Lease Revenue, 5.5%, 5/15/18 | 500,000 |
500,625 |
| TRANSPORTATION: 13.2% | ||||
| Aaa | AAA | Northern Virginia Transportation District Commuter Rail Revenue, (Virginia Railway Express Project), 5.375%, 7/1/14 | 1,000,000 |
1,012,500 |
| Aa1 | AA | Virginia Commonwealth Transportation Board, Transportation Revenue Bond, 5.7%, 5/15/19 | 1,000,000 |
1,018,750 |
| Aaa | AAA | Chesapeake Bay Bridge and Tunnel (MBIA Insured), 5%, 7/1/22 | 1,000,000 |
926,250 |
| Baa3 | BBB- | Pocahontas Parkway AS, Rt 895, Connector Toll Road Revenue, 5.5%, 8/15/28 | 1,000,000 |
818,750 |
| WATER & WASTE: 9.7% | ||||
| Aaa | AAA | Augusta County Service Authority, Water and Sewer Revenue (MBIA Insured), 5%, 11/1/24 | 1,500,000 |
1,380,000 |
| Aaa | AAA | Loudoun County Sanitation Authority, Water and Sewer Revenue (FGIC Insured), 6.25%, 1/1/16 | 500,000 |
518,750 |
| Aaa | AAA | Upper Occoquan Sewer Authority, Sewer Revenue (MBIA Insured), 4.75%, 7/1/29 | 1,000,000 |
862,500 |
| MUNICIPAL OTHER: 1.9% | ||||
| nr | BBB | Fairfax County Park Authority, Park Facilities Revenue, 6.625%, 7/15/14 | 500,000 |
518,125 |
| TOTAL INVESTMENTS (cost $28,195,542) | 28,007,201 |
|||
| CASH AND RECEIVABLES LESS LIABILITIES: 1.8% of net assets | 518,709 |
|||
| NET ASSETS: 100% | $28,525,910 |
|||
National Fund • Portfolio of Investments
Credit Rating* |
Principal Amount |
Market Value |
||
Moody’s |
S&P |
|||
| LONG TERM MUNICIPAL BONDS: 97.3% of net assets | ||||
| ILLINOIS: 18.2% | ||||
| Aaa | nr | Grundy County School District #054, General Obligation, (AMBAC Insured), 8.35%, 12/1/07 | 720,000 |
$869,400 |
| Aaa | AAA | Illinois Development Financial Authority Revenue, Health Facilities, 5.5%, 11/15/13 | 1,000,000 |
997,500 |
| Aaa | AAA | Melrose Park Illinois Water Revenue, (MBIA Insured), 5.2%, 7/1/18 | 750,000 |
706,875 |
| Aaa | AAA | Regional Illinois Transportation Authority, Transit Revenue (AMBAC Insured), 7.2%, 11/1/20 | 300,000 |
357,000 |
| Aaa | AAA | University of Illinois Certificates, Utility Infrastructure Projects (MBIA Insured), 5.75%, 8/15/09 | 1,000,000 |
1,058,750 |
| INDIANA: 2.6% | ||||
| Aaa | AAA | Indiana Bond Bank Comm, 5.75%, 8/1/13 | 550,000 |
576,813 |
| KANSAS: 9.8% | ||||
| Aa3# | AA- | Manhattan Kansas Commercial Dev Rev, 11%, 7/1/16 | 1,000,000 |
1,596,250 |
| Aa | AA | Kansas State Department of Transportation, Hwy Revenue, 6.125%, 9/1/09 | 500,000 |
548,125 |
| MASSACHUSETTS: 10.4% | ||||
| Aa3 | AA- | Massachusetts Bay Transportation Authority, Transit Revenue, 7%, 3/1/14 | 1,000,000 |
1,168,750 |
| Aa3 | A+ | University Of Massachusetts Building Authority Revenue, 6.625%, 5/1/08 | 1,000,000 |
1,116,250 |
| MICHIGAN: 11.4% | ||||
| nr | A | Grand Rapids Charter Township, Retirement Facilities, 5.35%, 7/1/19 | 500,000 |
476,250 |
| nr | A+ | Michigan Higher Education Facilities Authority Revenue, 5.0%, 5/1/11 | 1,000,000 |
990,000 |
| A2 | A | Michigan State Strategic Fund, Pollution Control Revenue Bond, 6.2%, 9/1/20 | 1,000,000 |
1,027,500 |
| MINNESOTA: 8.6% | ||||
| Aa2 | AA+ | Minnesota State Housing Finance Agency, Housing Revenue (Single-Family Mortgage) (AMT), 6.25%, 7/1/26 | 395,000 |
400,925 |
| Aaa | AAA | Metropolitan Council St. Paul Metropolitan Area, 5.625%, 2/1/17 | 875,000 |
881,563 |
| Aa1 | nr | St. Clair Minnesota Independent School District No. 075, 5.5%, 4/1/17 | 600,000 |
600,750 |
| MISSISSIPPI: 6.8% | ||||
| Aaa | AAA | Harrison County Wastewater Management District, Sewer Revenue, (Wastewater Treatment Facilities) (FGIC Insured), 7.75%, 2/1/14 | 500,000 |
620,625 |
| Aaa | AAA | Harrison County Mississippi Wastewater Management District, Sewer Revenue, (Wastewater Treatment Facilities) (FGIC Insured), 8.5%, 2/1/13 | 500,000 |
658,125 |
| nr | AAA | South Panola Mississippi School District (AMBAC Insured), 6.5%, 5/1/04 | 205,000 |
217,812 |
| NORTH DAKOTA: 2.3% | ||||
| Baa1 | nr | Grand Forks Health Care Systems Revenue Bond, 7.125%, 8/15/24 | 500,000 |
505,000 |
| PENNSYLVANIA: 5.3% | ||||
| Aaa | AAA | Lehigh County, PA General Obligation (Lehigh Valley Hospital) (MBIA Insured), 7%, 7/1/16 | 1,000,000 |
1,158,750 |
| SOUTH CAROLINA: 0.7% | ||||
| Aaa# | AAA | Piedmont Municipal Power Agency Electrical Revenue (FGIC Insured), 6.5%, 1/1/16 | 145,000 |
162,400 |
| TEXAS: 11.6% | ||||
| Aaa | AAA | Brownsville, TX General Obligation (Recreation Facility Improvements)(FGIC Insured), 6.5%, 2/15/18 | 340,000 |
364,650 |
| Aa2 | AA | Dallas Waterworks and Sewer System, 5.35%, 4/1/14 | 700,000 |
700,875 |
| Aaa# | AAA | Lower Colorado River Authority, Utility Revenue, (AMBAC Insured), 6.0%, 1/1/17 | 305,000 |
324,825 |
| Aaa# | AAA | Texas Public Building Authority, Building Revenue (MBIA Insured), 7.125%, 8/1/11 | 1,000,000 |
1,156,250 |
| VIRGIN ISLANDS: 2.9% | ||||
| nr | A | University Virgin Islands, Education Revenue, 5.3%, 12/1/8 | 300,000 |
304,875 |
| nr | A | University Virgin Islands, Education Renenue, 5.55%, 12/1/11 | 315,000 |
322,481 |
| VIRGINIA: 3.8% | ||||
| Aaa | nr | Dinwiddie Cty, VA Industrial Development Authority, Lease Revenue County Courthouse Completion Project-Series C (MBIA Insured), 5%, 2/1/17 | 300,000 |
286,125 |
| Aaa | AAA | Hanover County Industrial Development Authority Hospital (Bon Secours Health Systems) (MBIA Insured), 6%, 8/15/10 | 500,000 |
537,500 |
| WASHINGTON: 0.7% | ||||
| nr | AA-# | Port Seattle Washington, Revenue, (Prerefunded 12/01/00 @ 102), 7.6%, 12/1/09 | 155,000 |
158,805 |
| WISCONSIN: 2.2% | ||||
| Aaa | nr | Madison Metropolitan School District, 5.5%, 4/1/14 | 495,000 |
507,375 |
| LONG TERM MUNICIPAL BOND TOTAL | 21,359,174 |
|||
| SHORT TERM MUNICIPAL BONDS: 0.9% of net assets | ||||
| Aa3 | AAA | New York, NY General Obligation, 5.6%, 8/1/20** | 100,000 |
100,000 |
| Aa3 | AAA | New York, NY General Obligation, 5.6%, 8/1/21** | 100,000 |
100,000 |
| TOTAL INVESTMENTS (cost $20,958,471) | 21,559,174 |
|||
| CASH AND RECEIVABLES LESS LIABILITIES: 1.8% of net assets | 391,596 |
|||
| NET ASSETS: 100% | $21,950,770 |
|||
Money Market • Portfolio of Investments
| Credit Rating* | Principal Amount |
Market Value |
||
| Moody’s | S&P | |||
| SHORT TERM MUNICIPAL SECURITIES: 97.4% of net assets | ||||
| FLORIDA: 6.0% | ||||
| Aa3 | nr | Eustis Florida Health Facilities Authority Revenue, Waterman Medical Center, 3.9%, 12/1/15** | 290,000 |
$290,000 |
| GEORGIA: 2.1% | ||||
| nr | AAA/A-1+ | Fulton County Georgia Residential Care Facilities (LOC-Rabobank Nederland), 4.0%, 1/1/18** | 100,000 |
100,000 |
| ILLINOIS: 4.1% | ||||
| nr | A1+ | Illinois Development Financial Authority Industrial Development Revenue (Field Container Corp.)(LOC-American National Bank & Trust), 4.0%, 6/1/03** | 200,000 |
200,000 |
| KENTUCKY: 6.2% | ||||
| AA3 | nr | Ashland Pollution Control Revenue (Ashland Oil Inc) (LOC-Suntrust Bank Nashville), 3.8%, 4/1/09** | 300,000 |
300,000 |
| LOUISIANA: 10.3% | ||||
| VMIG1 | A1 | Louisiana Public Authority Hospital Revenue (Willis Knighton Medical Project) (AMBAC Insured), 4.0%, 9/1/23** | 200,000 |
200,000 |
| VMIG1 | A1 | New Orleans Aviation, 4.0%, 8/1/16** | 300,000 |
300,000 |
| MASSACHUSETTS: 11.5% | ||||
| MIG1 | nr | Athol & Royalston Massachusetts Regional School District, 4.5%, 1/19/01 | 200,000 |
200,082 |
| AAA | AAA | Boston Massachusetts, General Obligation, Series A (MBIA Insured) 6.75%, 7/01/11 | 200,000 |
207,398 |
| AAA# | AAA | Massachusetts Bay Transition Authority, 7%, 3/1/11 | 150,000 |
154,557 |
| MISSOURI: 9.3% | ||||
| AA2 | nr | Columbia, Special Obligation (LOC-Toronto Dominion Bank), 3.9%, 6/1/08** | 300,000 |
300,000 |
| AAA | AAA | Kansas City, Missouri Industrial, 4.1%, 10/15/15 | 150,000 |
151,281 |
| NEBRASKA: 6.2% | ||||
| AAA | AAA | Nebhelp, Inc. Revenue, Multiple Mode Student Loans (MBIA Insured), 3.9%, 12/1/15** | 300,000 |
300,000 |
| NORTH CAROLINA: 12.3% | ||||
| VMIG1 | A1+ | Greensboro, General Obligation (SPA-Wachovia Bank of NC), 3.85%, 4/1/07** | 300,000 |
300,000 |
| VMIG1 | AAA | North Carolina Medical Care Commission, Hospital Revenue (Pooled Equipment Project) (MBIA Insured), 3.85%, 12/1/25** | 300,000 |
300,000 |
| OHIO: 3.7% | ||||
| AAA | AAA | Pickerington Ohio Local School District (AMBAC Insured), 4.2%, 12/01/13 | 175,000 |
179,123 |
| TENNESSEE: 5.6% | ||||
| AAA | AAA | Metropolitan Nashville Airport Authority Revenue (FGIC Insured) (LOC-Societe Generale), 3.9%, 7/1/19 ** | 275,000 |
275,000 |
| TEXAS: 8.2% | ||||
| AAA | nr | Arlington Texas Independent School District (PSF-GTD Insured), 5.7%, 2/15/01 | 100,000 |
100,500 |
| VMIG1 | A1+ | Port Development Corporation, Marine Terminal Revenue (Stolt Terminal) (LOC-Canadian Imperial Bank), 3.85%, 1/15/14** | 300,000 |
300,000 |
| WASHINGTON: 11.9% | ||||
| VMIG1 | nr | Washington State Housing Finance Commission, Housing Revenue (Panorama City Project) (LOC-Key Bank of Washington), 4.1%, 1/1/27** | 100,000 |
100,000 |
| nr | AAA | Washington State Housing Finance Commission, Multi-Family Mortgage Revenue (LOC-Key Bank of Washington), 3.75%, 7/1/20** | 300,000 |
300,000 |
| VMIG1 | nr | Washington State Housing Finance Commission, Non-Profit Housing Revenue, 4.1%, 8/1/19** | 180,000 |
180,000 |
| TOTAL INVESTMENTS (cost $4,732,085) | 4,737,941 |
|||
| CASH AND RECEIVABLES LESS LIABILITIES: 2.6% of net assets | 127,901 |
|||
| NET ASSETS: 100% | $ 04,865,842 |
|||
Notes to Portfolio of Investments:
| ** | Security has a variable coupon rate and is subject to a demand feature before final maturity. Coupon rate as of September 30, 2000. |
| # | Refunded or escrowed to maturity |
| AMBAC | American Municipal Bond Assurance Corporation |
| AMT | Subject to Alternative Minimum Tax |
| FGIC | Financial Guaranty Insurance Company |
| FHA | Federal Housing Administration |
| FSA | Federal Security Assistance |
| GNMA | Government National Mortgage Association |
| LOC | Letter of Credit |
| MBIA | Municipal Bond Investors Assurance Corporation |
| Moody’s | Moody’s Investors Service, Inc. |
| nr | Not rated |
| PSF | Permanent School Fund |
| S&P | Standard & Poor’s Corporation |
| * | Credit Ratings are unaudited |
Statements of Assets and Liabilities
Arizona |
Maryland |
Missouri |
Virginia |
National |
Money |
|
| ASSETS | ||||||
| Investments, at value (Note 1) | ||||||
| Investment securities | $6,212,247 |
$2,026,800 |
$6,987,044 |
$28,007,201 |
$21,359,174 |
$ 000000,-- |
| Short term securities | -- |
-- |
200,000 |
-- |
200,000 |
4,737,941 |
| Total investments | 6,212,247 |
2,026,800 |
7,187,044 |
28,007,201 |
21,559,174 |
4,737,941 |
| Cash | 48,492 |
93,623 |
43,545 |
67,864 |
36,172 |
83,302 |
| Receivables | ||||||
| Interest | 98,212 |
33,574 |
96,518 |
477,359 |
364,508 |
34,704 |
| Capital shares sold | 100,000 |
-- |
-- |
-- |
100 |
12,473 |
| Total assets | 6,458,951 |
2,153,997 |
7,327,107 |
28,552,424 |
21,959,954 |
4,868,420 |
| LIABILITIES | ||||||
| Payables | ||||||
| Dividends | 6,294 |
847 |
5,390 |
15,443 |
9,064 |
80 |
| Capital shares redeemed | 1,409 |
-- |
398 |
11,071 |
120 |
2,498 |
| Total liabilities | 7,703 |
847 |
5,788 |
26,514 |
9,184 |
2,578 |
| NET ASSETS (Note 5) | $6,451,248 |
$2,153,150 |
$7,321,319 |
$28,525,910 |
$21,950,770 |
$4,865,842 |
| CAPITAL SHARES OUTSTANDING | 641,564 |
224,264 |
719,875 |
2,559,768 |
2,105,499 |
4,860,803 |
| NET ASSET VALUE PER SHARE | $ 0(0010.06 |
$ 0000,9.60 |
$ 000,10.17 |
$ 0000,11.14 |
$ 000,10.43 |
$ 0000,1.00 |
Statements of Operations
For the year ended September 30, 2000
Arizona
|
Maryland
|
Missouri
|
Virginia
|
National
|
Money
|
|
| INVESTMENT INCOME (Note 1) | ||||||
| Interest income | $(370,114) |
$(110,170( |
$(399,027( |
$1,596,450( |
$1,164,101( |
$(229,508( |
| EXPENSES (Notes 2 and 3) |
||||||
| Investment advisory fees | 41,100( |
12,630( |
45,306( |
178,265( |
139,943( |
30,497( |
| Transfer agent, administrative, registration and professional fees | 31,982( |
10,229( |
33,796( |
111,237( |
98,520( |
21,934( |
| Expenses waived | --( |
--( |
--( |
--( |
--( |
(6,075) |
| Total expenses | 73,082( |
22,859( |
79,102( |
289,502( |
238,463( |
46,356( |
| NET INVESTMENT INCOME | 297,032( |
87,311( |
319,925( |
1,306,948( |
925,638( |
183,152( |
| REALIZED AND UNREALIZED GAIN | ||||||
| (LOSS) ON INVESTMENTS | ||||||
| Net realized gain (loss) on investments | (22,638) |
2,147( |
(101,260) |
(13,913) |
(160,551) |
(751) |
| Change in net unrealized appreciation (depreciation) of investments | 21,865( |
(2) |
135,041( |
11,975( |
430,643( |
8,088( |
| NET REALIZED AND UNREALIZED GAIN (LOSS) ON INVESTMENTS | (773) |
2,145( |
33,781( |
(1,938) |
270,092( |
7,337( |
| TOTAL INCREASE IN NET ASSETS RESULTING FROM OPERATIONS | $(296,259( |
$(089,456( |
$(353,706( |
$1,305,010( |
$1,195,730( |
$(190,489( |
Statements of Changes in Net Assets
For the year ended September 30
Arizona Fund |
Maryland Fund |
Missouri Fund |
||||
2000 |
1999 |
2000 |
1999 |
2000 |
1999 |
|
| INCREASE (DECREASE) IN NET ASSETS RESULTING FROM OPERATIONS | ||||||
| Net investment income | $0,297,032( | $0,340,343( | $0,087,311( | $0,088,075( | $0,319,925( | $0,483,558( |
| Net realized gain (loss) on investments | (22,638) | 12,653( | 2,147( | 1,862( | (101,260) | (88,347) |
| Net unrealized appreciation (depreciation) of investments | 21,865( | (550,257) | (2) | (146,915) | 135,041( | (746,293) |
| Total increase (decrease) in net assets resulting from operations | 296,259( | (197,261) | 89,456( | (56,978) | 353,706( | (351,082) |
| DISTRIBUTIONS TO SHAREHOLDERS | ||||||
| Net investment income | (297,032) | (340,343) | (87,311) | (88,075) | (319,925) | (483,558) |
| CAPITAL SHARE TRANSACTIONS (Note 7) | (723,451) | (912,088) | 105,830) | 77,232( | (398,402) | (3,481,651) |
| TOTAL INCREASE (DECREASE) IN NET ASSETS | (724,224) | (1,449,692) | 107,975 | (67,821) | (364,621) | (4,316,291) |
| NET ASSETS | ||||||
| Beginning of period | 7,175,472( | 8,625,164( | 2,045,175( | 2,112,996( | 7,685,940( | 12,002,231( |
| End of period | $6,451,248( | $7,175,472( | $2,153,150( | $2,045,175( | $7,321,319( | $7,685,940( |
Virginia Fund |
National Fund |
Money Market |
||||
2000 |
1999 |
2000 |
1999 |
2000 |
1999 |
|
| INCREASE (DECREASE) IN NET ASSETS RESULTING FROM OPERATIONS | ||||||
| Net investment income | $ 01,306,948( |
$ 01,357,120( |
$ 00925,638( |
$ 00955,450( |
$ 0,183,152( |
$ 0,165,848( |
| Net realized gain loss) on investments | (13,913) |
210,914 ( |
(160,551) |
213,644 ( |
(751) |
(9) |
| Net unrealized appreciation (depreciation) of investments | 11,975 ( |
(2,429,697) |
430,643 ( |
(1,817,595) |
8,088 ( |
(5,599) |
| Total increase (decrease) in net assets resulting from operations | 1,305,010 ( |
(861,663) |
1,195,730 ( |
(648,501) |
190,489 ( |
160,240 ( |
| DISTRIBUTIONS TO SHAREHOLDERS | ||||||
| Net investment income | (1,306,948) |
(1,357,120) |
(925,638) |
(955,450) |
(183,152) |
(165,848) |
| CAPITAL SHARE TRANSACTIONS (Note 7) | (1,701,398) |
(164,094) |
(1,157,629) |
(1,164,490) |
(1,959,725) |
(446,131) |
| TOTAL DECREASE IN NET ASSETS | (1,703,336) |
(2,382,877) |
(887,537) |
(2,768,441) |
(1,952,388) |
(451,739) |
| NET ASSETS | ||||||
| Beginning of period | 30,229,246 ( |
32,612,123 ( |
22,838,307 ( |
25,606,748 ( |
6,818,230 ( |
7,269,969 ( |
| End of period | $28,525,910 ( |
$30,229,246 ( |
$21,950,770 ( |
$22,838,307 ( |
$4,865,842 ( |
$6,818,230 ( |
Financial Highlights
Selected data for a share outstanding for the periods
indicated.
| ARIZONA FUND | Year Ended September 30, |
||||
2000 |
1999 |
1998 |
1997 |
1996 |
|
| Net asset value beginning of year | $10.03 |
$10.74 |
$10.45 |
$10.15 |
$10.11 |
| Investment operations: | |||||
| Net investment income | 0.45 |
0.44 |
0.45 |
0.47 |
0.44 |
| Net realized and unrealized gain (loss) on investments | 0.03 |
(0.71) |
0.29 |
0.30 |
0.04 |
| Total from investment operations | 0.48 |
(0.27) |
0.74 |
0.77 |
0.48 |
| Less distributions from net investment income | (0.45) |
(0.44) |
(0.45) |
(0.47) |
(0.44) |
| Net asset value, end of year | $10.06 |
$10.03 |
$10.74 |
$10.45 |
$10.15 |
| Total return (%) | 4.93 |
(2.57) |
7.21 |
7.67 |
4.85 |
| Ratios and supplemental data | |||||
| Net assets, end of year (in thousands) | $6,451 |
$7,175 |
$8,625 |
$8,746 |
$9,066 |
| Ratio of expenses to average net assets(%) | 1.12 |
1.12 |
1.11 |
1.11 |
1.35 |
| Ratio of net investment income to average net assets (%) | 4.53 |
4.23 |
4.22 |
4.54 |
4.35 |
| Portfolio turnover (%) | . 29 |
. 37 |
. 26 |
. 32 |
.0 9 |
| MARYLAND FUND | Year Ended September 30, |
||||
2000 |
1999 |
1998 |
1997 |
1996 |
|
| Net asset value beginning of year | $9.58 |
$10.24 |
$10.00 |
$9.71 |
$9.74 |
| Investment operations: | |||||
| Net investment income | 0.41 |
0.40 |
0.41 |
0.42 |
0.41 |
| Net realized and unrealized gain (loss) on investments | 0.02 |
(0.66) |
0.24 |
0.29 |
(0.03) |
| Total from investment operations | 0.43 |
(0.26) |
0.65 |
0.71 |
0.38 |
| Less distributions from net investment income | (0.41) |
(0.40) |
(0.41) |
(0.42) |
(0.41) |
| Net asset value, end of year | $9.60 |
$9.58 |
$10.24 |
$10.00 |
$9.71 |
| Total return (%) | 4.63 |
(2.60) |
6.68 |
7.42 |
3.96 |
| Ratios and supplemental data | |||||
| Net assets, end of year (in thousands) | $2,153 |
$2,045 |
$2,113 |
$2,098 |
$2,042 |
| Ratio of expenses to average net assets (%) | 1.13 |
1.13 |
1.13 |
1.12 |
1.28 |
| Ratio of net investment income to average net assets (%) | 4.34 |
4.02 |
4.09 |
4.29 |
4.12 |
| Portfolio turnover (%) | . 12 |
. 14 |
. 30 |
. 15 |
. 21 |
| MISSOURI FUND | Year Ended September 30, |
||||
2000 |
1999 |
1998 |
1997 |
1996 |
|
| Net asset value beginning of year | $10.12 |
$10.87 |
$10.53 |
$10.22 |
$10.13 |
| Investment operations: | |||||
| Net investment income | 0.44 |
0.44 |
0.44 |
0.46 |
0.44 |
| Net realized and unrealized gain (loss) on investments | 0.05 |
(0.75) |
0.34 |
0.31 |
0.09 |
| Total from investment operations | 0.49 |
(0.31) |
0.78 |
0.77 |
0.53 |
| Less distributions from net investment income | (0.44) |
(0.44) |
(0.44) |
(0.46) |
(0.44) |
| Net asset value, end of year | $10.17 |
$10.12 |
$10.87 |
$10.53 |
$10.22 |
| Total return (%) | 5.03 |
(2.95) |
7.61 |
7.72 |
5.24 |
| Ratios and supplemental data | |||||
| Net assets, end of year (in thousands) | $7,321 |
$7,686 |
$12,002 |
$11,553 |
$11,381 |
| Ratio of expenses to average net assets1 (%) | 1.09 |
1.10 |
1.09 |
1.02 |
1.34 |
| Ratio of net investment income to average net assets (%) | 4.43 |
4.15 |
4.18 |
4.45 |
4.27 |
| Portfolio turnover (%) | . 26 |
. 17 |
. 24 |
. 41 |
. 21 |
| VIRGINIA FUND | Year Ended September 30, |
||||
2000 |
1999 |
1998 |
1997 |
1996 |
|
| Net asset value beginning of year | $11.13 |
$11.93 |
$11.56 |
$11.21 |
$11.12 |
| Investment operations: | |||||
| Net investment income | 0.50 |
0.49 |
0.50 |
0.52 |
0.51 |
| Net realized and unrealized gain (loss) on investments | 0.01 |
(0.80) |
0.37 |
0.35 |
0.09 |
| Total from investment operations | 0.51 |
(0.31) |
0.87 |
0.87 |
0.60 |
| Less distribution from net investment income | (0.50) |
(0.49) |
(0.50) |
(0.52) |
(0.51) |
| Net asset value, end of year | $11.14 |
$11.13 |
$11.93 |
$11.56 |
$11.21 |
| Total return (%) | 4.78 |
(2.69) |
7.66 |
7.95 |
5.50 |
| Ratios and supplemental data | |||||
| Net assets, end of year (in thousands) | $28,526 |
$30,229 |
$32,612 |
$32,614 |
$33,340 |
| Ratio of expenses to average net assets1 (%) | 1.02 |
1.02 |
1.02 |
1.05 |
1.20 |
| Ratio of net investment income to average net assets (%) | 4.60 |
4.22 |
4.28 |
4.55 |
4.53 |
| Portfolio turnover (%) | . 24 |
. 27 |
. 32 |
. 28 |
. 28 |
| NATIONAL FUND | Year Ended September 30, |
||||
2000 |
1999 |
1998 |
1997 |
1996 |
|
| Net asset value beginning of year | $10.30 |
$11.00 |
$10.62 |
$10.29 |
$10.21 |
| Investment operations: | |||||
| Net investment income | 0.42 |
0.42 |
0.42 |
0.44 |
0.45 |
| Net realized and unrealized gain (loss) on investments | 0.13 |
(0.70) |
0.38 |
0.33 |
0.08 |
| Total from investment operations | 0.55 |
(0.28) |
0.80 |
0.77 |
0.53 |
| Less distribution from net investment income | (0.42) |
(0.42) |
(0.42) |
(0.44) |
(0.45) |
| Net asset value, end of year | $10.43 |
$10.30 |
$11.00 |
$10.62 |
$10.29 |
| Total return (%) | 5.53 |
(2.67) |
7.66 |
7.70 |
5.17 |
| Ratios and supplemental data | |||||
| Net assets, end of year (in thousands) | $21,951 |
$28,838 |
$25,607 |
$26,698 |
$29,286 |
| Ratio of expenses to average net assets(%) | 1.07 |
1.07 |
1.07 |
1.05 |
1.20 |
| Ratio of net investment income to average net assets (%) | 4.15 |
3.87 |
3.91 |
4.20 |
4.32 |
| Portfolio turnover (%) | . 78 |
. 35 |
. 20 |
. 44 |
. 39 |
| MONEY MARKET | Year Ended September 30, |
||||
2000 |
1999 |
1998 |
1997 |
1996 |
|
| Net asset value beginning of year | $1.00 |
$1.00 |
$1.00 |
$1.00 |
$1.00 |
| Net investment income | 0.03 |
0.02 |
0.03 |
0.03 |
0.03 |
| Less distribution from net investment income | (0.03) |
(0.02) |
(0.03) |
(0.03) |
(0.03) |
| Net asset value, end of year | $1.00 |
$1.00 |
$1.00 |
$1.00 |
$1.00 |
| Total return (%) | 3.06 |
2.49 |
2.75 |
2.71 |
2.63 |
| Ratios and supplemental data | |||||
| Net assets, end of year (in thousands) | $4,866 |
$6,818 |
$7,270 |
$6,852 |
$7,499 |
| Ratio of expenses to average net assets1 (%) | 0.764 |
0.774 |
0.85 |
0.832 |
0.882 |
| Ratio of net investment income to average net assets (%) | 3.014 |
2.464 |
2.70 |
2.683 |
2.593 |
1 For the years ended September 30, 1997 and 1996, the ratio reflects fee paid indirectly.
2 For the years ended September 30, 1997 and 1996, the ratio of expenses before expenses incurred and paid by the investment advisor to average net assets would have been 0.95% and 1.15%, respectively, for such years.
3 For the years ended September 30, 1997 and 1996, the ratio of net investment income before expenses incurred and paid by the investment advisor to average net assets would have been 2.56% and 2.32%, respectively, for such years.
4 See Note 3 to the Financial Statements.
Notes to Financial Statements
For the year ended September 30, 2000
1. Summary of Significant Accounting Policies. Mosaic Tax-Free Trust (the "Trust") is registered with the Securities and Exchange Commission under the Investment Company Act of 1940 as an open-end, diversified investment management company. The Trust maintains six separate funds (described in the following sentences and defined as the "Funds") which invest principally in securities exempt from federal income taxes, commonly known as "municipal" securities. The Arizona, Maryland, Missouri and Virginia Funds (the "State Funds") invest solely in securities exempt from both federal and state income taxes in their respective states. The National Fund invests in securities exempt from federal taxes. The National Fund and the State Funds invest in intermediate and long-term securities. The Money Market invests in short-term securities and is priced according to the "penny rounding" method whereby the share price is rounded to the nearest cent to maintain a stable share price of $1.00. The State and National Funds’ price per share fluctuates with the market value of the respective underlying portfolio of securities. Because the Trust is 100% no-load, the shares of each fund are offered and redeemed at the net asset value per share.
Securities Valuation: Securities having maturities of 60 days or less are valued at amortized cost, which approximates market value. Securities having longer maturities, for which market quotations are readily available are valued at the mean between their bid and ask prices. Securities for which market quotations are not readily available are valued at their fair value as determined in good faith by the trustees. Investment transactions are recorded on the trade date. The cost of investments sold is determined on the identified cost basis for financial statement and federal income tax purposes.
Investment Income: Interest income, net of amortization of premium and original issue discount, and other income (if any) is recorded as earned.
Dividends: Net investment income, determined as gross investment income less expenses, is declared as a regular dividend each business day. Dividends are distributed to shareholders or reinvested in additional shares as of the close of business at the end of each month. Capital gain dividends, if any, are declared and paid annually. Additional distributions may be made if necessary.
Income Tax: In accordance with the provisions of
Subchapter M of the Internal Revenue Code applicable to regulated investment companies,
substantially all taxable income, if any, of each fund is distributed to its shareholders.
Therefore, no federal income tax provision is required. As of September 30, 2000, capital
loss carryovers available to offset future capital gains for federal income tax purposes
and the years they expire are as follows:
| Expiration Date | Arizona Fund |
| September 30, 2003 | $239,047 |
| September 30, 2008 | 22,638 |
| Expiration Date | Maryland Fund |
| September 30, 2003 | $159,572 |
| September 30, 2004 | 13,070 |
| Expiration Date | Missouri Fund |
| September 30, 2003 | $29,189 |
| September 30, 2007 | 88,347 |
| September 30, 2008 | 101,260 |
| Expiration Date | Virginia Fund |
| September 30, 2003 | $57,063 |
| September 30, 2008 | 13,913 |
| Expiration Date | National Fund |
| September 30, 2003 | $1,288,785 |
| September 30, 2008 | 160,551 |
| Expiration Date | Money Market |
| September 30, 2007 | $9 |
| September 30, 2008 | 751 |
Use of Estimates: The preparation of the financial statements in conformity with accounting principles generally accepted in the United States of America requires management to make estimates and assumptions that affect the reported amounts of assets and liabilities and reported amounts of increases and decreases in net assets from operations during the reporting period. Actual results could differ from those estimates.
2. Investment Advisory Fees and Other Transactions with
Affiliates. The investment advisor to the Trust, Madison Mosaic, LLC, a wholly owned
subsidiary of Madison Investment Advisors, Inc. ("the Advisor"), earns an
advisory fee equal to 0.625% per annum of the average net assets of the State and National
Funds and 0.5% per annum of the average net assets of the Money Market. The fees are
accrued daily and are paid monthly.
3. Other Expenses. Effective October 1, 1997, all expenses and support services are provided by the Advisor under a Services Agreement for fees based on a percentage of average net assets that is accrued daily and paid monthly. This percentage is 0.48% for the Arizona Fund, 0.50% for the Maryland Fund, 0.46% for the Missouri Fund, 0.39% for the Virginia Fund, 0.44% for the National Fund and 0.36% for the Money Market. During the years ended September 30, 1999 and 2000, $6,062 and $6,075, respectively, of this fee was irrevocably waived for the Money Market. Had this portion of the fee not been waived, the ratio of expenses for 1999 and 2000 would have been 0.86% and 0.86%, respectively. The ratio of net investment income to average net assets for 1999 and 2000 would have been 2.37% and 2.91%, respectively. Pursuant to the Services Agreement, the Advisor retained Firstar Mutual Fund Services, LLC to serve as the Trust’s transfer agent effective September 27, 1999.
The Advisor is responsible for the fees and expenses of trustees who are affiliated with the Advisor and certain promotional expenses.
4. Aggregate Cost and Unrealized Appreciation. The
aggregate cost for federal income tax purposes and the net unrealized appreciation are
stated as follows as of September 30, 2000:
Arizona Fund |
Maryland Fund |
|
| Aggregate Cost | $ (6,194,975) |
$ (2,049,330) |
| Gross unrealized appreciation | 121,392 ) |
29,398 ) |
| Gross unrealized depreciation | (104,120) |
(51,928) |
| Net unrealized appreciation (depreciation) | $ 00,(17,272) |
$ 00,(22,530) |
Missouri Fund |
Virginia Fund |
|
| Aggregate Cost | $ (7,047,220) |
$28,195,542 ) |
| Gross unrealized appreciation | 181,241 ) |
564,829 ) |
| Gross unrealized depreciation | (41,417) |
(753,170) |
| Net unrealized appreciation(depreciation) | $ 0),139,824) |
$ 0,(188,341) |
National Fund |
Money Market |
|
| Aggregate Cost | $20,958,471 ) |
$ (4,732,085) |
| Gross unrealized appreciation | 694,099 ) |
6,011 ) |
| Gross unrealized depreciation | (93,396) |
(155) |
| Net unrealized appreciation | $ (0,600,703) |
$ 00(, 5,856) |
5. Net Assets. At September 30, 2000, net assets included the following:
Arizona Fund |
Maryland Fund |
|
| Paid in capital | $ (6,695,661) |
$ (2,348,322) |
| Accumulated net realized losses | (261,685) |
(172,642) |
| Net unrealized appreciation(depreciation) on investments | 17,272 ) |
(22,530) |
| Total Net Assets | $ (6,451,248) |
$ (2,153,150) |
Missouri Fund |
Virginia Fund |
|
| Paid in capital | $ 07,400,291) |
$28,785,227 ) |
| Accumulated net realized losses | (218,796) |
(70,976) |
| Net unrealized appreciation(depreciation) on investments | 139,824 ) |
(188,341) |
| Total Net Assets | $ (7,321,319) |
$28,525,910 ) |
National Fund |
Money Market |
|
| Paid in capital | $22,799,403 ) |
$ 04,860,746) |
| Accumulated net realized losses | (1,449,336) |
(760) |
| Net unrealized appreciationon investments | 600,703 ) |
5,856 ) |
| Total Net Assets | $21,950,770 ) |
$ 04,865,842) |
6. Investment Transactions. Purchases and sales of
securities other than short-term securities, for the year ended September 30, 2000, were
as follows:
Purchases |
Sales |
|
| Arizona Fund | $1,887,079 |
$2,702,739 |
| Maryland Fund | 266,198 |
230,890 |
| Missouri Fund | 1,834,384 |
2,138,789 |
| Virginia Fund | 6,816,862 |
7,765,204 |
| National Fund | 16,779,423 |
17,685,591 |
7. Capital Share Transactions. An unlimited number
of capital shares, without par value, are authorized. Transactions in capital shares were
as follows:
Year Ended September 30, |
||
| ARIZONA FUND | 2000 |
1999 |
| In Dollars | ||
| Shares sold | $ 00,407,796) |
$ ( 475,384) |
| Shares issued in reinvestment of dividends | 215,422 ) |
254,345 ) |
| Total shares issued | 623,218 ) |
729,729 ) |
| Shares redeemed | (1,346,669) |
(1,641,817) |
| Net decrease | $ 0,(723,451) |
$ 0,(912,088) |
| In Shares | ||
| Shares sold | 40,689 ) |
44,931 ) |
| Shares issued in reinvestment of dividends | 21,751 ) |
24,293 ) |
| Total shares issued | 62,440 ) |
69,224 ) |
| Shares redeemed | (136,603) |
(156,678) |
| Net decrease | (74,163) |
(87,454) |
Year Ended September 30, |
||
| MARYLAND FUND | 2000 |
1999 |
| In Dollars | ||
| Shares sold | $ ( 312,471) |
$ ( 587,608) |
| Shares issued in reinvestment of dividends | 76,865 ) |
77,790 ) |
| Total shares issued | 389,336 ) |
665,398 ) |
| Shares redeemed | (283,506) |
(588,166) |
| Net increase | $ ( 105,830) |
$ 00077,232) |
| In Shares | ||
| Shares sold | 32,768 ) |
58,224 ) |
| Shares issued in reinvestment of dividends | 8,143 ) |
7,782 ) |
| Total shares issued | 40,911 ) |
66,006 ) |
| Shares redeemed | (30,174) |
(58,863) |
| Net increase | 10,737 ) |
7,143 ) |
Year Ended September 30, |
||
| MISSOURI FUND | 2000 |
1999 |
| In Dollars | ||
| Shares sold | $ 0,205,521) |
$ ( 989,719) |
| Shares issued in reinvestment of dividends | 255,977 ) |
414,347 ) |
| Total shares issued | 461,498 ) |
1,404,066 ) |
| Shares redeemed | (859,900) |
(4,885,717) |
| Net decrease | $ 00(398,402)) |
$(3,481,651) |
| In Shares | ||
| Shares sold | 20,605 ) |
93,111 ) |
| Shares issued in reinvestment of dividends | 25,596 ) |
39,186 ) |
| Total shares issued | 46,201 ) |
132,297 ) |
| Shares redeemed | (86,058) |
(477,072) |
| Net decrease | (39,857) |
(344,775) |
Year Ended September 30, |
||
| VIRGINIA FUND | 2000 |
1999 |
| In Dollars | ||
| Shares sold | $ (3,667,553) |
$ (3,892,739) |
| Shares issued in reinvestment of dividends | 1,097,536 ) |
1,134,905 ) |
| Total shares issued | 4,765,089 ) |
5,027,644 ) |
| Shares redeemed | (6,466,487) ) |
(5,191,738) |
| Net decrease | $(1,701,398) ) |
$ 0,(164,094) |
| In Shares | ||
| Shares sold | 336,100 ) |
333,387 ) |
| Shares issued in reinvestment of dividends | 100,257 ) |
97,737 ) |
| Total shares issued | 436,357 ) |
431,124 ) |
| Shares redeemed | (593,608) |
(448,179) |
| Net decrease | (157,251) |
(17,055) |
Year Ended September 30, |
||
| NATIONAL FUND | 2000 |
1999 |
| In Dollars | ||
| Shares sold | $ (1,973,104) |
$ (3,151,849) |
| Shares issued in reinvestment of dividends | 818,581 ) |
796,850 ) |
| Total shares issued | 2,791,685 ) |
3,948,699 ) |
| Shares redeemed | (3,949,314) |
(5,113,189) |
| Net increase | $(1,157,629) ) |
$(1,164,490) |
| In Shares | ||
| Shares sold | 193,167 ) |
289,814 ) |
| Shares issued in reinvestment of dividends | 79,823 ) |
78,677 ) |
| Total shares issued | 272,990 ) |
368,491 ) |
| Shares redeemed | (385,197) |
(478,188) |
| Net decrease | (112,207) |
(109,697) |
Year Ended September 30, |
||
| MONEY MARKET | 2000 |
1999 |
| In Dollars &Shares | ||
| Shares sold | $ 05,567,554) |
$ (4,977,145) |
| Shares issued in reinvestment of dividends | 180,679 ) |
160,223 ) |
| Total shares issued | 5,748,233 ) |
5,137,368 ) |
| Shares redeemed | 7,707,958 ) |
(5,583,499) |
| Net decrease | $(1,959,725) ) |
$ 0,(446,131) |
Special Information
For the year ended September 30, 2000 (unaudited)
Pursuant to Section 852 of the Internal Revenue Code of 1986, as amended, the following are designated as tax-exempt dividends: $297,032 for the Arizona Fund; $87,311 for the Maryland Fund; $319,925 for the Missouri Fund; $1,306,948 for the Virginia Fund; $925,638 for the National Fund; and $183,152 for the Money Market.
In January 2001, shareholders of the Tax-Free Trust will
receive Federal income tax information on all distributions paid to their accounts in
calendar year 2000, including any distributions paid between September 30, 2000 and
December 31, 2000.

|
|