
|
|
|
|
|
|
|
|
|
|
Previous: SYSTEMS & COMPUTER TECHNOLOGY CORP, SC 13G, 2001-01-19 |
Next: FLOW INTERNATIONAL CORP, SC 13G/A, 2001-01-19 |
Fidelity®
Fund
Annual Report
November 30, 2000
(2_fidelity_logos)
|
President's Message |
Ned Johnson on investing strategies. |
|
|
Performance |
How the fund has done over time. |
|
|
Fund Talk |
The manager's review of fund performance, strategy and outlook. |
|
|
Investment Changes |
A summary of major shifts in the fund's investments over the past six months. |
|
|
Investments |
A complete list of the fund's investments with their market values. |
|
|
Financial Statements |
Statements of assets and liabilities, operations, and changes in net assets, as well as financial highlights. |
|
|
Notes |
Footnotes to the financial statements. |
|
|
Report of Independent Accountants |
The auditors' opinion. |
|
|
Distributions |
|
Standard & Poor's, S&P and S&P 500 are registered service marks of The McGraw-Hill Companies, Inc. and have been licensed for use by Fidelity Distributors Corporation.
Other third party marks appearing herein are the property of their respective owners.
All other marks appearing herein are registered or unregistered trademarks or service marks of FMR Corp. or an affiliated company.
(Recycle graphic) This report is printed on recycled paper using soy-based inks.
This report and the financial statements contained herein are submitted for the general information of the shareholders of the fund. This report is not authorized for distribution to prospective investors in the fund unless preceded or accompanied by an effective prospectus.
Mutual fund shares are not deposits or obligations of, or guaranteed by, any depository institution. Shares are not insured by the FDIC, Federal Reserve Board or any other agency, and are subject to investment risks, including possible loss of principal amount invested.
Neither the fund nor Fidelity Distributors Corporation is a bank.
For more information on any Fidelity fund, including charges and expenses, call 1-800-544-6666 for a free prospectus. Read it carefully before you invest or send money.
Annual Report
(Photograph of Edward C. Johnson 3d.)
Dear Shareholder:
For the first time since 1990, the taxable bond market, as measured by the Lehman Brothers Aggregate Bond Index, appeared nearly certain to outperform the U.S. stock market, as measured by the S&P 500®. The former was up nearly 10% year to date through November, while the S&P 500 was down by approximately the same amount. Disappointing corporate earnings and uncertainty concerning a president-elect toppled the stock market late in the period.
While it's impossible to predict the future direction of the markets with any degree of certainty, there are certain basic principles that can help investors plan for their future needs.
First, investors are encouraged to take a long-term view of their portfolios. If you can afford to leave your money invested through the inevitable up and down cycles of the financial markets, you will greatly reduce your vulnerability to any single decline. We know from experience, for example, that stock prices have gone up over longer periods of time, have significantly outperformed other types of investments and have stayed ahead of inflation.
Second, you can further manage your investing risk through diversification. A stock mutual fund, for instance, is already diversified, because it invests in many different companies. You can increase your diversification further by investing in a number of different stock funds, or in such other investment categories as bonds. If you have a short investment time horizon, you might want to consider moving some of your investment into a money market fund, which seeks income and a stable share price by investing in high-quality, short-term investments. Of course, it's important to remember that an investment in a money market fund is not insured or guaranteed by the Federal Deposit Insurance Corporation or any other government agency. Although money market funds seek to preserve the value of your investment at $1.00 per share, it is possible to lose money by investing in these types of funds.
Finally, no matter what your time horizon or portfolio diversity, it makes good sense to follow a regular investment plan, investing a certain amount of money in a fund at the same time each month or quarter and periodically reviewing your overall portfolio. By doing so, you won't get caught up in the excitement of a rapidly rising market, nor will you buy all your shares at market highs. While this strategy - known as dollar cost averaging - won't assure a profit or protect you from a loss in a declining market, it should help you lower the average cost of your purchases. Of course, you should consider your financial ability to continue your purchases through periods of low price levels before undertaking such a strategy.
If you have questions, please call us at 1-800-544-6666, or visit our web site at www.fidelity.com. We are available 24 hours a day, seven days a week to provide you the information you need to make the investments that are right for you.
Best regards,
/s/Edward C. Johnson 3d
Edward C. Johnson 3d
Annual Report
There are several ways to evaluate a fund's historical performance. You can look at the total percentage change in value, the average annual percentage change or the growth of a hypothetical $10,000 investment. Total return reflects the change in the value of an investment, assuming reinvestment of the fund's dividend income and capital gains (the profits earned upon the sale of securities that have grown in value).
Cumulative Total Returns
|
Periods ended November 30, 2000 |
|
Past 1 |
Past 5 |
Life of |
|
Fidelity Aggressive Growth |
|
-17.94% |
162.73% |
722.73% |
|
Russell Midcap® Growth |
|
-1.65% |
115.33% |
401.37%** |
|
Mid-Cap Funds Average |
|
9.25% |
108.03% |
n/a* |
Cumulative total returns show the fund's performance in percentage terms over a set period - in this case, one year, five years or since the fund started on December 28, 1990. For example, if you had invested $1,000 in a fund that had a 5% return over the past year, the value of your investment would be $1,050. You can compare the fund's returns to the performance of the Russell Midcap® Growth Index - a market capitalization-weighted index of U.S. domiciled, medium-capitalization, growth-oriented stocks of U.S. corporations. To measure how the fund's performance stacked up against its peers, you can compare it to the mid-cap funds average, which reflects the performance of mutual funds with similar objectives tracked by Lipper Inc. The past one year average represents a peer group of 462 mutual funds. These benchmarks include reinvested dividends and capital gains, if any, and exclude the effect of sales charges. Lipper has created new comparison categories that group funds according to portfolio characteristics and capitalization, as well as by capitalization only. These averages are listed on page 5 of this report.(dagger)
Average Annual Total Returns
|
Periods ended November 30, 2000 |
Past 1 |
Past 5 |
Life of |
|
Fidelity Aggressive Growth |
-17.94% |
21.31% |
23.64% |
|
Russell Midcap Growth |
-1.65% |
16.58% |
17.65%** |
|
Mid-Cap Funds Average |
9.25% |
15.20% |
n/a* |
Average annual total returns take the fund's cumulative return and show you what would have happened if the fund had performed at a constant rate each year. (Note: Lipper calculates average annual total returns by annualizing each fund's total return, then taking an arithmetic average. This may produce a different figure than that obtained by averaging the cumulative total returns and annualizing the result.)
* Not available
** From December 31, 1990
Annual Report
$10,000 Over Life of Fund
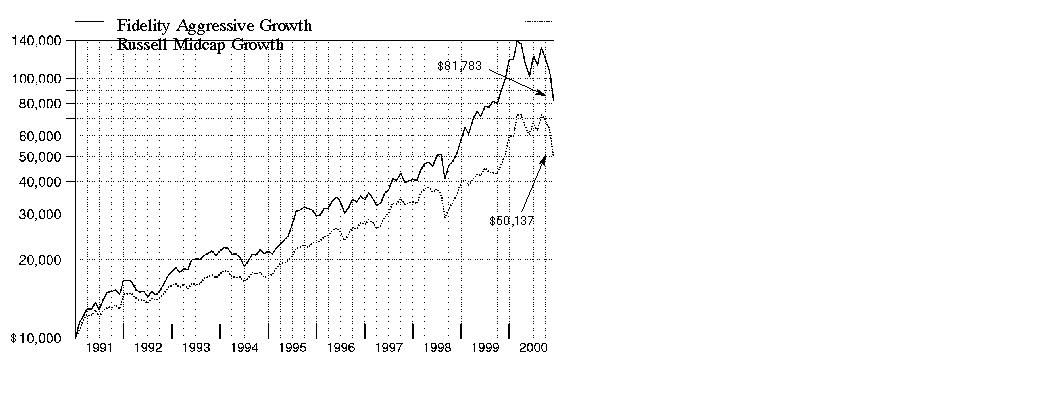
$10,000 Over Life of Fund: Let's say hypothetically that $10,000 was invested in Fidelity Aggressive Growth Fund on December 31, 1990, shortly after the fund started. As the chart shows, by November 30, 2000, the value of the investment would have grown to $81,783 - a 717.83% increase on the initial investment. For comparison, look at how the Russell Midcap Growth Index did over the same period. With dividends and capital gains, if any, reinvested, the same $10,000 would have grown to $50,137 - a 401.37% increase.
Understanding
Performance
How a fund did yesterday is no guarantee of how it will do tomorrow. The stock market, for example, has a history of long-term growth and short-term volatility. In turn, the share price and return of a fund that invests in stocks will vary. That means if you sell your shares during a market downturn, you might lose money. But if you can ride out the market's ups and downs, you may have a gain.
3(dagger) The Lipper multi-cap growth funds average reflects the performance (excluding sales charges) of mutual funds with similar portfolio characteristics and capitalization. As of November 30, 2000, the one year and five year cumulative and average annual total returns for the multi-cap growth funds average were 0.35%, 132.27%, and 0.35%, 17.93%, respectively.
Annual Report
Market Recap
After a promising beginning, U.S. equity markets were hammered by a convergence of adverse conditions during the remainder of the 12-month period ending November 30, 2000. The technology-heavy NASDAQ Composite Index was particularly hard hit. After a period of strong appreciation, the tech sector lost its grip on market leadership in mid-March as the Federal Reserve Board continued its campaign to slow economic growth through higher interest rates. Then, in May, the markets were rocked by a 0.50% Fed interest-rate hike, and signs soon emerged that clearly indicated a slowdown ahead. Escalating oil prices put additional strain on corporate profits, and disappointing earnings announcements began to pile up. Any hopes for a late season rally were broadsided by the uncertainty stemming from the presidential election in November. The resulting anxiety weighed the markets down to their lowest point of the year. For the overall period, the Standard & Poor's 500SM Index fell 4.22%, the Dow Jones Industrial Average sank 2.77% and the NASDAQ plunged 21.99%. Investors should keep in mind, however, that the last two times the NASDAQ had negative calendar year returns, in 1990 and 1994, the index responded with gains of 59.01% and 41.40% in 1991 and 1995, respectively. Of course, past performance is no guarantee of future results.
(Portfolio Manager photograph)
An interview with Bob Bertelson, Portfolio Manager of Fidelity Aggressive Growth Fund
Q. How did the fund perform, Bob?
A. For the 12 months that ended November 30, 2000, the fund returned -17.94%, lagging the Russell Midcap Growth Index, which returned -1.65%. The mid-cap funds average tracked by Lipper Inc. returned 9.25% during the same period.
Q. Why did the fund underperform its index and peer group?
A. In periods of economic uncertainty, stocks with high valuations and high earnings-growth rates typically fare worse than those with lower absolute valuations and lower earnings-growth rates. The past year was no exception. While the Russell index itself had a high growth component to it and a relatively high valuation, the fund tended to own even faster-growing companies - particularly in technology - which came at a cost of higher valuations. This more aggressive posture helped as growth stocks rose early in the period, but hurt when market conditions began to deteriorate in the spring. Also, given the fund's charter to invest in companies across market capitalizations, the fund's larger-cap stocks struggled against a backdrop of strong mid-cap performance. The fund's heavy growth bias put it at a distinct disadvantage relative to its Lipper peers, which were generally less growth-oriented.
Annual Report
Fund Talk: The Manager's Overview - continued
Q. What guided your decision-making in terms of the fund's positioning in technology?
A. After the steep sell-off in the spring, performance was driven more by being in the right tech stocks rather than just by maximizing exposure to the sector. While we held a large weighting in technology, our bets were focused on a few high-growth areas, namely fiber optics, Internet software and data networking. Particularly in the first half of the year, the fund's relative performance was hurt by owning some large-cap tech stocks that disappointed, while, at the same time, being underweighted in several mid-caps that fared quite well. I dumped many of the stocks that failed us during the period and moved on. While I sold the stocks of companies whose fundamental outlooks had deteriorated, I'm also generally not willing to sell stocks that get unfairly painted with the broad brush of being in a certain industry that's out of favor.
Q. What were some of your other sector-related strategies?
A. Outside of technology, it's been difficult finding the high levels of earnings growth I seek. However, I did find new opportunities in energy and health care. In energy, I focused primarily on the service providers, which I felt were poised to benefit from the growing need to develop additional energy sources. I should note that late in the period even energy companies fell victim to concerns about a weaker economy and falling oil prices, which mostly eliminated the gains the fund accumulated earlier in the period. In health care, I maintained a focus on biotechnology firms with strong potential to exploit historic developments in gene research. Additionally, I added some medical device companies for their defensive growth characteristics. I continued to underweight financial stocks, which hurt relative performance somewhat during the period given the market's rotation from growth to value. I still didn't see much opportunity for high levels of growth in financials, and I remained concerned about the potential for deteriorating credit conditions as the economy weakened.
Q. What stocks helped? Which hurt?
A. Investors rallied around the potential for optical networking companies and their role in changing the way that telecommunications networks are constructed. Ciena - the fund's top holding - and Juniper were standouts here. Data storage was another hot area, with companies such as Brocade and EMC leading the way. I sold off the fund's stake in EMC prior to the close of the period. Other key contributors included Internet software provider BEA Systems and biotech drug maker Genentech. On the downside, semiconductor stocks hurt the most. After generating strong returns earlier in the period, chipmakers suffered a tremendous correction due to slowing demand and a weakening price environment. Micron Technology and LSI Logic were notable laggards. Motorola hurt the fund early in the period after disappointing performance in its cellular handset business. Finally, holding a large out-of-benchmark stake in Microsoft also backfired.
Q. What's your outlook?
A. At this point, while the rate of economic growth is clearly slowing, I don't see any evidence that the economy is headed for a recession. It also seems that the Federal Reserve Board feels it has accomplished its objective of slowing the economy and nipping inflationary pressures in the bud. If that is true and the economy continues to grow without the fear of inflation, the outlook for the kinds of high-growth stocks in which this fund invests is rather bright. Despite the fact that fund performance has been weak of late, very few of our holdings have had significant earnings disappointments. This is an important fact considering that it's usually the companies whose earnings prospects have remained intact that rebound the fastest and strongest out of a correction.
Annual Report
Fund Talk: The Manager's Overview - continued
The views expressed in this report reflect those of the portfolio manager only through the end of the period of the report as stated on the cover and do not necessarily represent the views of Fidelity or any other person in the Fidelity organization. Any such views are subject to change at any time based upon market or other conditions and Fidelity disclaims any responsibility to update such views. These views may not be relied on as investment advice and, because investment decisions for a Fidelity fund are based on numerous factors, may not be relied on as an indication of trading intent on behalf of any Fidelity fund.
Fund Facts
Goal: seeks capital appreciation
Fund number: 324
Trading symbol: FDEGX
Start date: December 28, 1990
Size: as of November 30, 2000, more than $14.6 billion
Manager: Bob Bertelson, since 2000; manager, Fidelity OTC Portfolio, 1997-2000; Fidelity Convertible Securities Fund, 1996-1997; several Fidelity Select Portfolios, 1992-1996; joined Fidelity in 1991
3Bob Bertelson reflects on the evolution of the Internet:
"A year ago, the Internet was all the rage with nearly everyone. Many people believed that virtually all commerce would be done over the Internet without the need for physical assets. It also was believed to be quite possible to grow a business from zero to a very large enterprise in a very short period of time. Today, we seem to be coming back to a state of greater sobriety, which is healthy. I think the most important lesson we learned from all of this is that the Net's an extraordinarily powerful and transforming tool, but it's by and large not the sole basis for a business. The astounding collapse we've seen in shares of dot-com companies is not an indication to me that the Internet is lacking the promise that many people believe it had, it's merely a sign that businesses require more than just a set of computers and a Web site to function. Rather than dying, Internet technology continues to grow by leaps and bounds and has been embraced by virtually all major companies as a way to lower costs and improve the services and value they provide to customers. I think we're entering into the next stage of Internet growth that will provide successful companies with a unique means to differentiate themselves, and the firms that provide the infrastructure to help with that should have great opportunities going forward."
Annual Report
|
Top Ten Stocks as of November 30, 2000 |
||
|
|
% of fund's |
% of fund's net assets |
|
Ciena Corp. |
6.4 |
2.9 |
|
BEA Systems, Inc. |
5.4 |
1.9 |
|
Nokia AB sponsored ADR |
4.4 |
3.5 |
|
Corning, Inc. |
3.3 |
2.0 |
|
Brocade Communications Systems, Inc. |
3.0 |
2.0 |
|
Medtronic, Inc. |
2.4 |
0.9 |
|
BJ Services Co. |
2.3 |
1.5 |
|
Medimmune, Inc. |
2.3 |
1.7 |
|
Cisco Systems, Inc. |
2.3 |
2.7 |
|
Gemstar-TV Guide International, Inc. |
2.3 |
1.7 |
|
|
34.1 |
|
|
Top Five Market Sectors as of November 30, 2000 |
||
|
|
% of fund's |
% of fund's net assets |
|
Technology |
53.9 |
61.0 |
|
Health |
16.8 |
9.1 |
|
Energy |
14.5 |
5.6 |
|
Utilities |
4.5 |
10.0 |
|
Media & Leisure |
2.7 |
5.3 |
|
Asset Allocation (% of fund's net assets) |
|||||||
|
As of November 30, 2000 * |
As of May 31, 2000 ** |
||||||
 |
Stocks 97.5% |
|
|
Stocks 96.8% |
|
||
 |
Convertible |
|
|
Convertible |
|
||
 |
Short-Term |
|
|
Short-Term |
|
||
|
* Foreign |
12.3% |
|
** Foreign |
14.2% |
|
||

Annual Report
Showing Percentage of Net Assets
|
Common Stocks - 97.5% |
|||
|
Shares |
Value (Note 1) (000s) |
||
|
BASIC INDUSTRIES - 0.1% |
|||
|
Chemicals & Plastics - 0.1% |
|||
|
Praxair, Inc. |
584,850 |
$ 21,018 |
|
|
DURABLES - 2.5% |
|||
|
Consumer Electronics - 2.5% |
|||
|
Gemstar-TV Guide International, Inc. (a) |
8,001,450 |
325,559 |
|
|
General Motors Corp. Class H |
1,500,000 |
32,610 |
|
|
|
358,169 |
||
|
ENERGY - 14.5% |
|||
|
Energy Services - 12.8% |
|||
|
BJ Services Co. (a)(d) |
6,343,050 |
337,767 |
|
|
ENSCO International, Inc. |
3,620,320 |
88,019 |
|
|
Global Marine, Inc. (a) |
1,900,000 |
41,681 |
|
|
Halliburton Co. |
8,704,900 |
290,526 |
|
|
Nabors Industries, Inc. (a) |
2,966,000 |
130,326 |
|
|
Noble Drilling Corp. (a) |
6,683,273 |
192,562 |
|
|
R&B Falcon Corp. (a) |
3,157,500 |
59,993 |
|
|
Schlumberger Ltd. (NY Shares) |
5,211,700 |
323,125 |
|
|
Smith International, Inc. (a) |
2,468,100 |
143,304 |
|
|
Tidewater, Inc. (d) |
3,000,000 |
121,500 |
|
|
Transocean Sedco Forex, Inc. |
257,200 |
10,256 |
|
|
Weatherford International, Inc. |
3,966,487 |
132,134 |
|
|
|
1,871,193 |
||
|
Oil & Gas - 1.7% |
|||
|
Apache Corp. |
719,990 |
37,619 |
|
|
Cooper Cameron Corp. (a) |
2,031,190 |
110,192 |
|
|
Devon Energy Corp. |
900,000 |
44,325 |
|
|
Tosco Corp. |
875,800 |
25,125 |
|
|
Valero Energy Corp. |
1,000,000 |
31,438 |
|
|
|
248,699 |
||
|
TOTAL ENERGY |
2,119,892 |
||
|
FINANCE - 0.2% |
|||
|
Federal Sponsored Credit - 0.2% |
|||
|
USA Education, Inc. |
499,600 |
28,914 |
|
|
HEALTH - 16.8% |
|||
|
Drugs & Pharmaceuticals - 11.7% |
|||
|
Abgenix, Inc. (a) |
600,000 |
29,288 |
|
|
Common Stocks - continued |
|||
|
Shares |
Value (Note 1) (000s) |
||
|
HEALTH - continued |
|||
|
Drugs & Pharmaceuticals - continued |
|||
|
Allergan, Inc. |
2,200,000 |
$ 204,188 |
|
|
Andrx Corp. - Andrx Group (a) |
499,990 |
35,679 |
|
|
Celgene Corp. (a) |
600,000 |
34,238 |
|
|
Cephalon, Inc. (a)(d) |
2,426,200 |
112,212 |
|
|
Elan Corp. PLC sponsored ADR (a) |
2,200,000 |
118,663 |
|
|
Forest Laboratories, Inc. (a) |
200,000 |
27,100 |
|
|
Genentech, Inc. (a) |
3,226,100 |
219,576 |
|
|
Human Genome Sciences, Inc. (a) |
1,600,000 |
99,500 |
|
|
IDEC Pharmaceuticals Corp. (a) |
200,000 |
34,813 |
|
|
ImClone Systems, Inc. (a) |
698,000 |
30,974 |
|
|
Immunex Corp. (a) |
6,398,700 |
237,952 |
|
|
IVAX Corp. (a) |
1,000,000 |
41,070 |
|
|
Medarex, Inc. (a) |
1,150,400 |
41,702 |
|
|
Medimmune, Inc. (a) |
6,332,128 |
336,790 |
|
|
Millennium Pharmaceuticals, Inc. (a) |
800,000 |
38,850 |
|
|
Protein Design Labs, Inc. (a) |
877,000 |
67,748 |
|
|
|
1,710,343 |
||
|
Medical Equipment & Supplies - 5.1% |
|||
|
Biomet, Inc. |
2,000,000 |
74,000 |
|
|
Guidant Corp. (a) |
3,999,930 |
215,746 |
|
|
McKesson HBOC, Inc. |
2,640,000 |
86,790 |
|
|
Medtronic, Inc. |
6,632,346 |
353,172 |
|
|
Millipore Corp. |
246,230 |
10,834 |
|
|
|
740,542 |
||
|
TOTAL HEALTH |
2,450,885 |
||
|
INDUSTRIAL MACHINERY & EQUIPMENT - 2.1% |
|||
|
Electrical Equipment - 2.1% |
|||
|
Aura Systems, Inc. warrants 5/31/05 (a) |
312 |
0 |
|
|
Avaya, Inc. (a)(e) |
1,646 |
14 |
|
|
Scientific-Atlanta, Inc. |
7,439,900 |
300,386 |
|
|
TOTAL INDUSTRIAL MACHINERY & EQUIPMENT |
300,400 |
||
|
Common Stocks - continued |
|||
|
Shares |
Value (Note 1) (000s) |
||
|
MEDIA & LEISURE - 2.5% |
|||
|
Broadcasting - 2.5% |
|||
|
AT&T Corp. - Liberty Media Group Class A (a) |
2,800,000 |
$ 37,975 |
|
|
EchoStar Communications Corp. Class A (a) |
4,010,000 |
117,042 |
|
|
Grupo Televisa SA de CV sponsored GDR |
600,000 |
27,938 |
|
|
Netro Corp. (a) |
820,000 |
7,893 |
|
|
United Pan-Europe Communications NV Class A (a) |
5,206,750 |
59,047 |
|
|
UnitedGlobalCom, Inc. Class A (a)(d) |
6,277,100 |
94,941 |
|
|
Univision Communications, Inc. Class A (a) |
624,200 |
21,847 |
|
|
|
366,683 |
||
|
RETAIL & WHOLESALE - 0.2% |
|||
|
General Merchandise Stores - 0.2% |
|||
|
Kohls Corp. (a) |
548,300 |
29,368 |
|
|
TECHNOLOGY - 53.8% |
|||
|
Communications Equipment - 20.4% |
|||
|
Aspect Communications Corp. (a) |
2,499,200 |
32,958 |
|
|
Ciena Corp. (a) |
12,254,600 |
930,576 |
|
|
Cisco Systems, Inc. (a) |
6,840,420 |
327,485 |
|
|
Comverse Technology, Inc. (a) |
2,790,900 |
240,541 |
|
|
Corning, Inc. |
8,352,100 |
488,598 |
|
|
Lucent Technologies, Inc. |
177,794 |
2,767 |
|
|
Lucent Technologies, Inc. (e) |
19,754 |
231 |
|
|
Nokia AB sponsored ADR |
15,000,000 |
641,250 |
|
|
Nortel Networks Corp. |
8,600,000 |
324,650 |
|
|
|
2,989,056 |
||
|
Computer Services & Software - 15.4% |
|||
|
Aether Systems, Inc. (a) |
437,100 |
24,751 |
|
|
Affymetrix, Inc. (a) |
1,127,500 |
66,523 |
|
|
Ariba, Inc. (a) |
2,550,600 |
158,775 |
|
|
Art Technology Group, Inc. (a)(d) |
5,454,900 |
156,487 |
|
|
BEA Systems, Inc. (a) |
13,394,250 |
784,401 |
|
|
BMC Software, Inc. (a) |
2,997,700 |
51,898 |
|
|
Broadbase Software, Inc. (a) |
1,747,800 |
9,558 |
|
|
Clarent Corp. (a) |
150,000 |
1,800 |
|
|
Computer Associates International, Inc. |
549,600 |
14,358 |
|
|
Critical Path, Inc. (a) |
1,383,100 |
29,218 |
|
|
i2 Technologies, Inc. (a) |
90,000 |
8,685 |
|
|
Informatica Corp. (a) |
800,000 |
55,900 |
|
|
Internap Network Services Corp. |
3,405,500 |
37,461 |
|
|
Common Stocks - continued |
|||
|
Shares |
Value (Note 1) (000s) |
||
|
TECHNOLOGY - continued |
|||
|
Computer Services & Software - continued |
|||
|
NetIQ Corp. (a)(d) |
1,966,367 |
$ 157,801 |
|
|
OpenTV Corp. |
615,146 |
11,496 |
|
|
Peregrine Systems, Inc. (a) |
6,025,700 |
97,918 |
|
|
Quest Software, Inc. (a) |
530,500 |
14,324 |
|
|
Redback Networks, Inc. (a) |
964,600 |
67,341 |
|
|
TIBCO Software, Inc. (a) |
700,000 |
24,238 |
|
|
VeriSign, Inc. (a) |
1,660,000 |
143,901 |
|
|
VERITAS Software Corp. (a) |
1,000,000 |
97,563 |
|
|
Vignette Corp. (a) |
8,865,280 |
139,628 |
|
|
Vitria Technology, Inc. (a) |
1,800,000 |
28,125 |
|
|
webMethods, Inc. |
1,027,272 |
64,654 |
|
|
|
2,246,804 |
||
|
Computers & Office Equipment - 5.4% |
|||
|
Brocade Communications Systems, Inc. (a) |
2,592,600 |
435,395 |
|
|
Dell Computer Corp. (a) |
4,000,000 |
77,000 |
|
|
Juniper Networks, Inc. (a) |
500,000 |
62,313 |
|
|
Maxtor Corp. (a) |
48,700 |
289 |
|
|
MRV Communications, Inc. (a) |
1,774,600 |
25,954 |
|
|
Palm, Inc. |
5,170,000 |
187,089 |
|
|
|
788,040 |
||
|
Electronic Instruments - 1.9% |
|||
|
Applera Corp. - Applied Biosystems Group |
2,600,000 |
214,825 |
|
|
ASM Lithography Holding NV (a) |
700,000 |
14,306 |
|
|
Waters Corp. (a) |
700,000 |
45,019 |
|
|
|
274,150 |
||
|
Electronics - 10.7% |
|||
|
Advanced Micro Devices, Inc. (a) |
5,099,100 |
77,761 |
|
|
Analog Devices, Inc. (a) |
2,300,000 |
114,138 |
|
|
Atmel Corp. (a) |
3,332,900 |
32,183 |
|
|
Bookham Technology PLC sponsored ADR |
1,000,000 |
12,438 |
|
|
Chartered Semiconductor Manufacturing Ltd. ADR (a) |
2,934,000 |
92,604 |
|
|
Cypress Semiconductor Corp. (a) |
1,900,000 |
40,138 |
|
|
Epcos AG sponsored ADR (a) |
250,300 |
19,805 |
|
|
Flextronics International Ltd. (a) |
3,599,000 |
90,200 |
|
|
Infineon Technologies AG |
1,950,000 |
74,184 |
|
|
Integrated Device Technology, Inc. (a) |
2,572,200 |
76,523 |
|
|
LSI Logic Corp. (a) |
4,604,900 |
82,888 |
|
|
Micron Technology, Inc. (a) |
5,550,190 |
174,831 |
|
|
NVIDIA Corp. (a) |
801,000 |
32,441 |
|
|
PMC-Sierra, Inc. (a) |
635,700 |
58,604 |
|
|
Common Stocks - continued |
|||
|
Shares |
Value (Note 1) (000s) |
||
|
TECHNOLOGY - continued |
|||
|
Electronics - continued |
|||
|
Sanmina Corp. (a) |
1,500,000 |
$ 114,375 |
|
|
SDL, Inc. (a) |
1,750,100 |
318,081 |
|
|
Texas Instruments, Inc. |
4,167,900 |
155,515 |
|
|
|
1,566,709 |
||
|
TOTAL TECHNOLOGY |
7,864,759 |
||
|
TRANSPORTATION - 0.3% |
|||
|
Air Transportation - 0.3% |
|||
|
Southwest Airlines Co. |
1,500,000 |
47,344 |
|
|
UTILITIES - 4.5% |
|||
|
Cellular - 0.7% |
|||
|
AT&T Corp. - Wireless Group |
2,500,000 |
45,000 |
|
|
Nextel Communications, Inc. Class A (a) |
1,713,900 |
53,131 |
|
|
|
98,131 |
||
|
Electric Utility - 1.7% |
|||
|
AES Corp. (a) |
2,562,100 |
132,909 |
|
|
Calpine Corp. (a) |
3,399,940 |
120,698 |
|
|
|
253,607 |
||
|
Telephone Services - 2.1% |
|||
|
BroadWing, Inc. (a) |
1,000,000 |
21,500 |
|
|
McLeodUSA, Inc. Class A (a) |
2,963,100 |
40,187 |
|
|
Metromedia Fiber Network, Inc. Class A (a) |
2,400,600 |
28,057 |
|
|
Qwest Communications International, Inc. (a) |
5,000,000 |
188,750 |
|
|
TeraBeam Networks (a)(e) |
66,400 |
249 |
|
|
Time Warner Telecom, Inc. Class A (a) |
496,300 |
23,760 |
|
|
|
302,503 |
||
|
TOTAL UTILITIES |
654,241 |
||
|
TOTAL COMMON STOCKS (Cost $17,974,481) |
14,241,673 |
||
|
Preferred Stocks - 0.2% |
|||
|
Shares |
Value (Note 1) (000s) |
||
|
Convertible Preferred Stocks - 0.2% |
|||
|
MEDIA & LEISURE - 0.2% |
|||
|
Broadcasting - 0.2% |
|||
|
Tellium, Inc. Series E (a)(e) |
645,666 |
$ 19,370 |
|
|
TECHNOLOGY - 0.0% |
|||
|
Communications Equipment - 0.0% |
|||
|
Chorum Technologies Series E (a)(e) |
96,800 |
1,669 |
|
|
TOTAL CONVERTIBLE PREFERRED STOCKS |
21,039 |
||
|
Nonconvertible Preferred Stocks - 0.0% |
|||
|
TECHNOLOGY - 0.0% |
|||
|
Computer Services & Software - 0.0% |
|||
|
Procket Networks, Inc. (a)(e) |
582,749 |
5,755 |
|
|
TOTAL PREFERRED STOCKS (Cost $26,794) |
26,794 |
||
|
Convertible Bonds - 0.1% |
|||||
|
Moody's Ratings (unaudited) |
Principal Amount (000s) |
|
|||
|
TECHNOLOGY - 0.1% |
|||||
|
Computer Services & Software - 0.1% |
|||||
|
Cyras Systems, Inc. 4.5% 8/15/05 (c) |
- |
|
$ 7,000 |
6,440 |
|
|
Cash Equivalents - 3.9% |
|||
|
Shares |
|
||
|
Fidelity Cash Central Fund, 6.57% (b) |
212,523,785 |
212,524 |
|
|
Fidelity Securities Lending Cash Central Fund, 6.63% (b) |
361,046,000 |
361,046 |
|
|
TOTAL CASH EQUIVALENTS (Cost $573,570) |
573,570 |
||
|
TOTAL INVESTMENT PORTFOLIO - 101.7% (Cost $18,582,875) |
14,848,477 |
||
|
NET OTHER ASSETS - (1.7)% |
(240,993) |
||
|
NET ASSETS - 100% |
$ 14,607,484 |
||
|
Legend |
|
(a) Non-income producing |
|
(b) The rate quoted is the annualized seven-day yield of the fund at period end. A complete listing of the fund's holdings as of its most recent fiscal year end is available upon request. |
|
(c) Security exempt from registration under Rule 144A of the Securities Act of 1933. These securities may be resold in transactions exempt from registration, normally to qualified institutional buyers. At the period end, the value of these securities amounted to $6,440,000 or 0.1% of net assets. |
|
(d) Affiliated company |
|
(e) Restricted securities - Investment in securities not registered under the Securities Act of 1933. |
|
Additional information on each holding is as follows: |
|
Security |
Acquisition Date |
Acquisition Cost (000s) |
|
Avaya, Inc. |
5/19/00 |
$ 10 |
|
Chorum Technologies Series E |
9/19/00 |
$ 1,669 |
|
Procket |
11/15/00 |
$ 5,755 |
|
Tellium, Inc. |
9/20/00 |
$ 19,370 |
|
TeraBeam Networks |
4/7/00 |
$ 249 |
|
Lucent |
5/19/00 |
$ 147 |
|
Distribution of investments by country of issue, as a percentage of total net assets, is as follows: |
|
United States of America |
87.7% |
|
Finland |
4.4 |
|
Canada |
2.2 |
|
Netherlands Antilles |
2.2 |
|
Singapore |
1.2 |
|
Others (individually less than 1%) |
2.3 |
|
|
100.0% |
|
Income Tax Information |
|
At November 30, 2000, the aggregate cost of investment securities for income tax purposes was $18,088,407,000. Net unrealized depreciation aggregated $3,239,930,000, of which $1,402,742,000 related to appreciated investment securities and $4,642,672,000 related to depreciated investment securities. |
|
The fund hereby designates approximately $360,140,000 as a capital gain dividend for the purpose of the dividend paid deduction. |
|
The fund intends to elect to defer to its fiscal year ending November 30, 2001 approximately $888,905,000 of losses recognized during the period November 1, 2000 to November 30, 2000. |
See accompanying notes which are an integral part of the financial statements.
Annual Report
Statement of Assets and Liabilities
|
Amounts in thousands (except per-share amount) |
November 30, 2000 |
|
|
Assets |
|
|
|
Investment in securities, at value (cost $18,582,875) - |
|
$ 14,848,477 |
|
Receivable for investments sold |
|
387,433 |
|
Receivable for fund shares sold |
|
24,060 |
|
Dividends receivable |
|
2,365 |
|
Interest receivable |
|
2,795 |
|
Redemption fees receivable |
|
75 |
|
Other receivables |
|
228 |
|
Total assets |
|
15,265,433 |
|
Liabilities |
|
|
|
Payable for investments purchased |
$ 217,714 |
|
|
Payable for fund shares redeemed |
62,977 |
|
|
Accrued management fee |
10,738 |
|
|
Other payables and accrued expenses |
5,474 |
|
|
Collateral on securities loaned, at value |
361,046 |
|
|
Total liabilities |
|
657,949 |
|
Net Assets |
|
$ 14,607,484 |
|
Net Assets consist of: |
|
|
|
Paid in capital |
|
$ 16,514,138 |
|
Accumulated undistributed net realized gain (loss) on investments and foreign currency transactions |
|
1,827,732 |
|
Net unrealized appreciation (depreciation) on investments and assets and liabilities in foreign currencies |
|
(3,734,386) |
|
Net Assets, for 364,024 shares outstanding |
|
$ 14,607,484 |
|
Net Asset Value, offering price and redemption price |
|
$40.13 |
See accompanying notes which are an integral part of the financial statements.
Annual Report
Financial Statements - continued
Statement of Operations
|
Amounts in thousands |
Year ended November 30, 2000 |
|
|
Investment Income Dividends |
|
$ 24,288 |
|
Interest |
|
36,963 |
|
Security lending |
|
5,191 |
|
Total income |
|
66,442 |
|
Expenses |
|
|
|
Management fee |
$ 121,932 |
|
|
Performance adjustment |
12,645 |
|
|
Transfer agent fees |
37,292 |
|
|
Accounting and security lending fees |
1,335 |
|
|
Non-interested trustees' compensation |
79 |
|
|
Custodian fees and expenses |
606 |
|
|
Registration fees |
4,216 |
|
|
Audit |
75 |
|
|
Legal |
82 |
|
|
Interest |
3 |
|
|
Miscellaneous |
49 |
|
|
Total expenses before reductions |
178,314 |
|
|
Expense reductions |
(4,690) |
173,624 |
|
Net investment income (loss) |
|
(107,182) |
|
Realized and Unrealized Gain (Loss) Net realized gain (loss) on: |
|
|
|
Investment securities (including realized gain of $759 |
1,950,226 |
|
|
Foreign currency transactions |
(51) |
1,950,175 |
|
Change in net unrealized appreciation (depreciation) on: |
|
|
|
Investment securities |
(6,683,290) |
|
|
Assets and liabilities in foreign currencies |
8 |
(6,683,282) |
|
Net gain (loss) |
|
(4,733,107) |
|
Net increase (decrease) in net assets resulting |
|
$ (4,840,289) |
See accompanying notes which are an integral part of the financial statements.
Annual Report
Financial Statements - continued
Statement of Changes in Net Assets
|
Amounts in thousands |
Year ended
November 30, |
Year ended
November 30, |
|
Increase (Decrease) in Net Assets |
|
|
|
Operations |
$ (107,182) |
$ (32,592) |
|
Net realized gain (loss) |
1,950,175 |
1,271,740 |
|
Change in net unrealized appreciation (depreciation) |
(6,683,282) |
2,431,219 |
|
Net increase (decrease) in net assets resulting |
(4,840,289) |
3,670,367 |
|
Distributions to shareholders from net realized gains |
(1,111,585) |
(235,997) |
|
Share transactions |
13,919,119 |
6,661,315 |
|
Reinvestment of distributions |
1,091,567 |
230,927 |
|
Cost of shares redeemed |
(6,048,306) |
(1,258,379) |
|
Net increase (decrease) in net assets resulting |
8,962,380 |
5,633,863 |
|
Redemption fees |
14,385 |
3,265 |
|
Total increase (decrease) in net assets |
3,024,891 |
9,071,498 |
|
Net Assets |
|
|
|
Beginning of period |
11,582,593 |
2,511,095 |
|
End of period |
$ 14,607,484 |
$ 11,582,593 |
|
Other Information Shares |
|
|
|
Sold |
231,648 |
157,336 |
|
Issued in reinvestment of distributions |
19,728 |
7,624 |
|
Redeemed |
(105,692) |
(30,724) |
|
Net increase (decrease) |
145,684 |
134,236 |
See accompanying notes which are an integral part of the financial statements.
Annual Report
Financial Highlights
|
Years ended November 30, |
2000 |
1999 |
1998 |
1997 |
1996 |
|
Selected Per-Share Data |
|
|
|
|
|
|
Net asset value, |
$ 53.05 |
$ 29.86 |
$ 29.68 |
$ 26.37 |
$ 24.41 |
|
Income from |
|
|
|
|
|
|
Net investment |
(.32) |
(.23) |
(.18) |
(.17) |
(.07) |
|
Net realized and |
(8.03) |
26.12 |
6.44 |
3.79 |
3.10 |
|
Total from |
(8.35) |
25.89 |
6.26 |
3.62 |
3.03 |
|
Less Distributions |
|
|
|
|
|
|
from net realized gain |
(4.61) |
(2.72) |
(6.08) |
(.32) |
(1.08) |
|
Redemption fees added to paid in capital |
.04 |
.02 |
- |
.01 |
.01 |
|
Net asset value, |
$ 40.13 |
$ 53.05 |
$ 29.86 |
$ 29.68 |
$ 26.37 |
|
Total Return A |
(17.94)% |
93.91% |
27.89% |
13.98% |
13.27% |
|
Ratios and Supplemental Data |
|
|
|
|
|
|
Net assets, end of period |
$ 14,607 |
$ 11,583 |
$ 2,511 |
$ 1,978 |
$ 1,939 |
|
Ratio of expenses to average net assets |
.91% |
.99% |
1.08% |
1.09% |
1.10% |
|
Ratio of expenses to |
.89% C |
.97% C |
1.05% C |
1.05% C |
1.09% C |
|
Ratio of net investment
income (loss) to average |
(.55)% |
(.58)% |
(.67)% |
(.60)% |
(.31)% |
|
Portfolio turnover rate |
176% |
186% |
199% |
212% |
105% |
A The total returns would have been lower had certain expenses not been reduced during the periods shown.
B Net investment income (loss) per share has been calculated based on average shares outstanding during the period.
C FMR or the fund has entered into varying arrangements with third parties who either paid or reduced a portion of the fund's expenses.
See accompanying notes which are an integral part of the financial statements.
Annual Report
For the period ended November 30, 2000
1. Significant Accounting Policies.
Fidelity Aggressive Growth Fund (the fund) is a fund of Fidelity Mt. Vernon Street Trust (the trust) and is authorized to issue an unlimited number of shares. The trust is registered under the Investment Company Act of 1940, as amended , as an open-end management investment company organized as a Massachusetts business trust. The financial statements have been prepared in conformity with generally accepted accounting principles which require management to make certain estimates and assumptions at the date of the financial statements. The following summarizes the significant accounting policies of the fund:
Security Valuation. Securities for which exchange quotations are readily available are valued at the last sale price, or if no sale price, at the closing bid price. Foreign securities are valued based on quotations from the principal market in which such securities are normally traded. If trading or events occurring in other markets after the close of the principal market in which foreign securities are traded, and before the close of business of the fund, are expected to materially affect the value of those securities, then they are valued at their fair value taking this trading or these events into account. Fair value is determined in good faith under consistently applied procedures under the general supervision of the Board of Trustees. Securities (including restricted securities) for which exchange quotations are not readily available (and in certain cases debt securities which trade on an exchange) are valued primarily using dealer-supplied valuations or at their fair value. Short-term securities with remaining maturities of sixty days or less for which quotations are not readily available are valued at amortized cost or original cost plus accrued interest, both of which approximate current value. Investments in open-end investment companies are valued at their net asset value each business day.
Foreign Currency Translation. The accounting records of the fund are maintained in U.S. dollars. Investment securities and other assets and liabilities denominated in a foreign currency are translated into U.S. dollars at the prevailing rates of exchange at period end. Purchases and sales of securities, income receipts and expense payments are translated into U.S. dollars at the prevailing exchange rate on the respective dates of the transactions.
Net realized gains and losses on foreign currency transactions represent net gains and losses from sales and maturities of foreign currency contracts, disposition of foreign currencies, the difference between the amount of net investment income accrued and the U.S. dollar amount actually received, and gains and losses between trade and settlement date on purchases and sales of securities. The effects of changes in foreign currency exchange rates on investments in securities are included with the net realized and unrealized gain or loss on investment securities.
Income Taxes. As a qualified regulated investment company under Subchapter M of the Internal Revenue Code, the fund is not subject to income taxes to the extent that it distributes substantially all of its taxable income for its fiscal year. The schedule of investments includes information regarding income taxes under the caption "Income Tax Information."
Annual Report
Notes to Financial Statements - continued
1. Significant Accounting Policies - continued
Investment Income. Dividend income is recorded on the ex-dividend date, except certain dividends from foreign securities where the ex-dividend date may have passed, are recorded as soon as the fund is informed of the ex-dividend date. Non-cash dividends included in dividend income, if any, are recorded at the fair market value of the securities received. Interest income is accrued as earned. Investment income is recorded net of foreign taxes withheld where recovery of such taxes is uncertain.
Expenses. Most expenses of the trust can be directly attributed to a fund. Expenses which cannot be directly attributed are apportioned among the funds in the trust.
Deferred Trustee Compensation. Under a Deferred Compensation Plan (the Plan) non-interested Trustees must defer receipt of a portion of, and may elect to defer receipt of an additional portion of, their annual compensation. Deferred amounts are treated as though equivalent dollar amounts had been invested in shares of the fund or are invested in a cross-section of other Fidelity funds. Deferred amounts remain in the fund until distributed in accordance with the Plan.
Distributions to Shareholders. Distributions are recorded on the ex-dividend date.
Income and capital gain distributions are determined in accordance with income tax regulations which may differ from
generally accepted accounting principles. These differences, which may result in distribution reclassifications, are primarily due to differing treatments for litigation proceeds, foreign currency transactions, net operating losses and losses deferred due to wash sales and excise tax regulations. The fund also utilized earnings and profits distributed to shareholders on redemption of shares as a part of the dividends paid deduction for income tax purposes.
Permanent book and tax basis differences relating to shareholder distributions will result in reclassifications to paid in capital. Accumulated undistributed net realized gain (loss) on investments and foreign currency transactions may include temporary book and tax basis differences which will reverse in a subsequent period. Any taxable income or gain remaining at fiscal year end is distributed in the following year.
Short-Term Trading (Redemption) Fees. Shares held in the fund less than 90 days are subject to a short-term trading fee equal to 1.5% of the proceeds of the redeemed shares. Redemptions on or prior to March 19, 2000 of shares held less than 90 days were subject to a short-term trading fee equal to 0.75% of the proceeds of the redeemed shares. The fee, which is retained by the fund, is accounted for as an addition to paid in capital.
Security Transactions. Security transactions are accounted for as of trade date. Gains and losses on securities sold are determined on the basis of identified cost.
Annual Report
Notes to Financial Statements - continued
2. Operating Policies.
Foreign Currency Contracts. The fund generally uses foreign currency contracts to facilitate transactions in foreign-denominated securities. Losses may arise from changes in the value of the foreign currency or if the counterparties do not perform under the contracts' terms. The U.S. dollar value of foreign currency contracts is determined using contractual currency exchange rates established at the time of each trade.
Joint Trading Account. Pursuant to an Exemptive Order issued by the Securities and Exchange Commission (the SEC), the fund, along with other affiliated entities of Fidelity Management & Research Company (FMR), may transfer uninvested cash balances into one or more joint trading accounts. These balances are invested in one or more repurchase agreements for U.S. Treasury or Federal Agency obligations.
Repurchase Agreements. The underlying U.S. Treasury, Federal Agency, or other obligations found to be satisfactory by FMR are transferred to an account of the fund, or to the Joint Trading Account, at a custodian bank. The securities are marked-to-market daily and maintained at a value at least equal to the principal amount of the repurchase agreement (including accrued interest). FMR, the fund's investment adviser, is responsible for determining that the value of the underlying securities remains in accordance with the market value requirements stated above.
Restricted Securities. The fund is permitted to invest in securities that are subject to legal or contractual restrictions on resale. These securities generally may be resold in transactions exempt from registration or to the public if the securities are registered. Disposal of these securities may involve time-consuming negotiations and expense, and prompt sale at an acceptable price may be difficult. At the end of the period, restricted securities (excluding 144A issues) amounted to $27,288,000 or .19% of net assets. Information regarding restricted securities is included under the caption "Other Information" at the end of the fund's schedule of investments.
3. Purchases and Sales of Investments.
Purchases and sales of securities, other than short-term securities, aggregated $40,083,871,000 and $32,461,386,000, respectively.
4. Fees and Other Transactions with Affiliates.
Management Fee. As the fund's investment adviser, FMR receives a monthly basic fee that is calculated on the basis of a group fee rate plus a fixed individual fund fee rate applied to the average net assets of the fund. The group fee rate is the weighted average of a series of rates and is based on the monthly average net assets of all the mutual funds advised by FMR. The rates ranged from .2167% to .5200% for the period. The annual individual fund fee rate is .35%. In the event that these rates were lower than the contractual rates in effect during the period, FMR voluntarily implemented the above rates, as they resulted in the
Annual Report
Notes to Financial Statements - continued
4. Fees and Other Transactions with Affiliates - continued
Management Fee - continued
same or a lower management fee. The basic fee is subject to a performance adjustment (up to a maximum of ±.20% of the fund's average net assets over the performance period) based on the fund's investment performance as compared to the appropriate index over a specified period of time. For the period, the management fee was equivalent to an annual rate of .69% of average net assets after the performance adjustment.
Sub-Adviser Fee. Beginning January 1, 2001, FMR Co.(FMRC) will serve as sub-adviser for the fund. FMRC is a wholly owned subsidiary of FMR and will receive a fee from FMR of 50% of the management fee payable to FMR with respect to that portion of the fund's assets that will be managed by FMRC.
Transfer Agent Fees. Fidelity Service Company, Inc. (FSC), an affiliate of FMR, is the fund's transfer, dividend disbursing and shareholder servicing agent. FSC receives account fees and asset-based fees that vary according to account size and type of account. FSC pays for typesetting, printing and mailing of all shareholder reports, except proxy statements. For the period, the transfer agent fees were equivalent to an annual rate of .19% of average net assets.
Accounting and Security Lending Fees. FSC maintains the fund's accounting records and administers the security lending program. The security lending fee is based on the number and duration of lending transactions. The accounting fee is based on the level of average net assets for the month plus out-of-pocket expenses.
Fidelity Cash Central Funds. Pursuant to an Exemptive Order issued by the SEC, the fund may invest in the Fidelity Cash Central Fund and the Fidelity Securities Lending Cash Central Fund (the Cash Funds) managed by Fidelity Investments Money Management, Inc. (FIMM), an affiliate of FMR. The Cash Funds are open-end money market funds available only to investment companies and other accounts managed by FMR and its affiliates. The Cash Funds seek preservation of capital, liquidity, and current income and do not pay a management fee. Income distributions from the Cash Funds are declared daily and paid monthly from net investment income. Income distributions earned by the fund are recorded as either interest income or security lending income in the accompanying financial statements.
Brokerage Commissions. The fund placed a portion of its portfolio transactions with brokerage firms which are affiliates of FMR. The commissions paid to these affiliated firms were $1,403,000 for the period.
Annual Report
Notes to Financial Statements - continued
5. Security Lending.
The fund lends portfolio securities from time to time in order to earn additional income. The fund receives collateral in the form of U.S. Treasury obligations, letters of credit, and/or cash against the loaned securities, and maintains collateral in an amount not less than 100% of the market value of the loaned securities during the period of the loan. The market value of the loaned securities is determined at the close of business of the fund and any additional required collateral is delivered to the fund on the next business day. If the borrower defaults on its obligation to return the securities loaned because of insolvency or other reasons, the fund could experience delays and costs in recovering the securities loaned or in gaining access to the collateral. At period end, the value of the securities loaned amounted to $338,859,000. The fund received cash collateral of $361,046,000 which was invested in cash equivalents.
6. Bank Borrowings.
The fund is permitted to have bank borrowings for temporary or emergency purposes to fund shareholder redemptions. The fund has established borrowing arrangements with certain banks. The interest rate on the borrowings is the bank's base rate, as revised from time to time. The average daily loan balance during the period for which the loan was outstanding amounted to $16,122,000. The weighted average interest rate was 6.9%. Interest expense includes $3,000 paid under the bank borrowing program.
7. Expense Reductions.
FMR has directed certain portfolio trades to brokers who paid a portion of the fund's expenses. For the period, the fund's expenses were reduced by $3,626,000 under this arrangement.
In addition, through arrangements with the fund's custodian and transfer agent, credits realized as a result of uninvested cash balances were used to reduce a portion of the fund's expenses. During the period, the fund's custodian and transfer agent fees were reduced by $6,000 and $1,058,000, respectively, under these arrangements.
Annual Report
Notes to Financial Statements - continued
8. Transactions with Affiliated Companies.
An affiliated company is a company in which the fund has ownership of at least 5% of the voting securities. Transactions during the period with companies which are or were affiliates were as follows:
|
Summary of Transactions with Affiliated Companies |
||||||||
|
Amounts in thousands Affiliate |
|
Purchase |
|
Sales |
|
Dividend |
|
Value |
|
ANTEC Corp |
|
$ - |
|
$ 7,733 |
|
$ - |
|
$ - |
|
Art Technology Group, Inc. |
|
138,908 |
|
46,739 |
|
- |
|
156,487 |
|
Axent Technologies, Inc |
|
- |
|
15,083 |
|
- |
|
- |
|
BJ Services Co. |
|
121,177 |
|
- |
|
- |
|
337,767 |
|
Brocade Communications |
|
5,939 |
|
221,374 |
|
- |
|
- |
|
Cephalon, Inc. |
|
27,350 |
|
- |
|
- |
|
112,212 |
|
Digex, Inc. Class A |
|
- |
|
3,333 |
|
- |
|
- |
|
Exodus Communications, Inc. |
|
- |
|
93,486 |
|
- |
|
- |
|
F5 Networks, Inc. |
|
- |
|
44,124 |
|
- |
|
- |
|
Legato Systems, Inc |
|
7,903 |
|
67,606 |
|
- |
|
- |
|
Mercator Software, Inc |
|
79,972 |
|
113,970 |
|
- |
|
- |
|
NetlQ Corp. |
|
7,110 |
|
- |
|
- |
|
157,801 |
|
New Era of Networks, Inc |
|
17,388 |
|
52,445 |
|
- |
|
- |
|
Open TV Corp. |
|
44,478 |
|
70,837 |
|
- |
|
- |
|
Spyglass, Inc |
|
11,068 |
|
15,180 |
|
- |
|
- |
|
TideWater, Inc |
|
6,881 |
|
- |
|
- |
|
121,500 |
|
UnitedGlobalCom, Inc. Class A |
|
87,215 |
|
- |
|
- |
|
94,941 |
|
TOTALS |
|
$ 555,389 |
|
$ 751,910 |
|
$ - |
|
$ 980,708 |
Annual Report
To the Trustees of Mt. Vernon Street Trust and the Shareholders of Fidelity Aggressive Growth Fund:
In our opinion, the accompanying statement of assets and liabilities, including the schedule of investments, and the related statements of operations and of changes in net assets and the financial highlights present fairly, in all material respects, the financial position of Fidelity Aggressive Growth Fund(a fund of Fidelity Mt. Vernon Street Trust) at November 30, 2000, and the results of its operations, the changes in net assets and the financial highlights for the periods indicated, in conformity with accounting principles generally accepted in the United States of America. These financial statements and financial highlights (hereafter referred to as "financial statements") are the responsibility of the Fidelity Aggressive Growth Fund's management; our responsibility is to express an opinion on these financial statements based on our audits. We conducted our audits of these financial statements in accordance with auditing standards generally accepted in the United States of America which require that we plan and perform the audit to obtain reasonable assurance about whether the financial statements are free of material misstatement. An audit includes examining, on a test basis, evidence supporting the amounts and disclosures in the financial statements, assessing the accounting principles used and significant estimates made by management, and evaluating the overall financial statement presentation. We believe that our audits, which included confirmation of securities at November 30, 2000 by correspondence with the custodian and brokers, provide a reasonable basis for our opinion.
/s/PricewaterhouseCoopers LLP
PricewaterhouseCoopers LLP
Boston, Massachusetts
January 10, 2001
Annual Report
The Board of Trustees of Fidelity Aggressive Growth Fund voted to pay to shareholders of record at the opening of business on record date, the following distributions per share derived from capital gains realized from sales of portfolio securities, and dividends derived from net investment income:
|
Pay Date |
Record Date |
Dividends |
Capital Gains |
|
12/26/00 |
12/22/00 |
- |
$6.17 |
|
01/08/01 |
01/05/01 |
- |
$0.09 |
The fund hereby designates 100% of the long-term capital gain dividends distributed during the fiscal year as 20%-rate capital gain dividends.
A total of 3% of the dividends distributed during the fiscal year qualifies for the dividends-received deduction for corporate shareholders.
The fund will notify shareholders in January 2001 of amounts for use in preparing 2000 income tax returns.
Annual Report
Fidelity offers several ways to conveniently manage your personal investments via your telephone or PC. You can access your account information, conduct trades and research your investments 24 hours a day.
By Phone
Fidelity Automated Service Telephone provides a single toll-free number to access account balances, positions, quotes and trading. It's easy to navigate the service, and on your first call, the system will help you create a personal identification number (PIN) for security.
(phone_graphic)
Fidelity Automated
Service Telephone (FAST®)
1-800-544-5555
Press
1 For mutual fund and brokerage trading.
2 For quotes.*
3 For account balances and holdings.
4 To review orders and mutual
fund activity.
5 To change your PIN.
*0 To speak to a Fidelity representative.
By PC
Fidelity's web site on the Internet provides a wide range of information, including daily financial news, fund performance, interactive planning tools and news about Fidelity products and services.
(computer_graphic)
Fidelity's Web Site
www.fidelity.com
If you are not currently on the Internet, call EarthLink Sprint at 1-800-288-2967, and be sure to ask for registration number SMD004 to receive a special Fidelity package that includes 30 days of free Internet access. EarthLink is North America's #1 independent Internet access provider.
(computer_graphic)
Fidelity On-line Xpress+®
Fidelity On-line Xpress+ software for Windows combines comprehensive portfolio management capabilities, securities trading and access to research and analysis tools . . . all on your desktop. Call Fidelity at 1-800-544-0240 or visit our web site for more information on how to manage your investments via your PC.
* When you call the quotes line, please remember that a fund's yield and return will vary and, except for money market funds, share price will also vary. This means that you may have a gain or loss when you sell your shares. There is no assurance that money market funds will be able to maintain a stable $1 share price; an investment in a money market fund is not insured or guaranteed by the U.S. government. Total returns are historical and include changes in share price, reinvestment of dividends and capital gains, and the effects of any sales charges.
Annual Report
For directions and hours,
please call 1-800-544-9797.
Arizona
7373 N. Scottsdale Road
Scottsdale, AZ
California
815 East Birch Street
Brea, CA
851 East Hamilton Avenue
Campbell, CA
527 North Brand Boulevard
Glendale, CA
19200 Von Karman Avenue
Irvine, CA
10100 Santa Monica Blvd.
Los Angeles, CA
251 University Avenue
Palo Alto, CA
1760 Challenge Way
Sacramento, CA
7676 Hazard Center Drive
San Diego, CA
8 Montgomery Street
San Francisco, CA
950 Northgate Drive
San Rafael, CA
1400 Civic Drive
Walnut Creek, CA
6300 Canoga Avenue
Woodland Hills, CA
Colorado
1625 Broadway
Denver, CO
Connecticut
48 West Putnam Avenue
Greenwich, CT
265 Church Street
New Haven, CT
300 Atlantic Street
Stamford, CT
29 South Main Street
West Hartford, CT
Delaware
222 Delaware Avenue
Wilmington, DE
Florida
4400 N. Federal Highway
Boca Raton, FL
90 Alhambra Plaza
Coral Gables, FL
4090 N. Ocean Boulevard
Ft. Lauderdale, FL
1907 West State Road 434
Longwood, FL
8880 Tamiami Trail, North
Naples, FL
2401 PGA Boulevard
Palm Beach Gardens, FL
8065 Beneva Road
Sarasota, FL
1502 N. Westshore Blvd.
Tampa, FL
Georgia
3445 Peachtree Road, N.E.
Atlanta, GA
1000 Abernathy Road
Atlanta, GA
Illinois
One North Franklin Street
Chicago, IL
1415 West 22nd Street
Oak Brook, IL
1700 East Golf Road
Schaumburg, IL
3232 Lake Avenue
Wilmette, IL
Indiana
4729 East 82nd Street
Indianapolis, IN
Maine
Three Canal Plaza
Portland, ME
Maryland
7401 Wisconsin Avenue
Bethesda, MD
One W. Pennsylvania Ave.
Towson, MD
Massachusetts
801 Boylston Street
Boston, MA
155 Congress Street
Boston, MA
25 State Street
Boston, MA
300 Granite Street
Braintree, MA
44 Mall Road
Burlington, MA
416 Belmont Street
Worcester, MA
Annual Report
Michigan
280 Old N. Woodward Ave.
Birmingham, MI
29155 Northwestern Hwy.
Southfield, MI
Minnesota
7600 France Avenue South
Edina, MN
Missouri
700 West 47th Street
Kansas City, MO
8885 Ladue Road
Ladue, MO
New Jersey
150 Essex Street
Millburn, NJ
56 South Street
Morristown, NJ
501 Route 17, South
Paramus, NJ
New York
1055 Franklin Avenue
Garden City, NY
999 Walt Whitman Road
Melville, L.I., NY
1271 Avenue of the Americas
New York, NY
71 Broadway
New York, NY
350 Park Avenue
New York, NY
North Carolina
4611 Sharon Road
Charlotte, NC
Ohio
600 Vine Street
Cincinnati, OH
28699 Chagrin Boulevard
Woodmere Village, OH
Oregon
16850 SW 72nd Avenue
Tigard, OR
Pennsylvania
1735 Market Street
Philadelphia, PA
439 Fifth Avenue
Pittsburgh, PA
Rhode Island
47 Providence Place
Providence, RI
Tennessee
6150 Poplar Avenue
Memphis, TN
Texas
10000 Research Boulevard
Austin, TX
4017 Northwest Parkway
Dallas, TX
1155 Dairy Ashford Street
Houston, TX
2701 Drexel Drive
Houston, TX
400 East Las Colinas Blvd.
Irving, TX
14100 San Pedro
San Antonio, TX
19740 IH 45 North
Spring, TX
Utah
215 South State Street
Salt Lake City, UT
Virginia
1861 International Drive
McLean, VA
Washington
411 108th Avenue, N.E.
Bellevue, WA
511 Pine Street
Seattle, WA
Washington, DC
1900 K Street, N.W.
Washington, DC
Wisconsin
595 North Barker Road
Brookfield, WI
Fidelity Brokerage Services, Inc., 100 Summer St., Boston, MA 02110 Member NYSE/SIPC
Annual Report
Investment Adviser
Fidelity Management & Research Company
Boston, MA
Investment Sub-Advisers
Fidelity Management & Research
(U.K.) Inc.
Fidelity Management & Research
(Far East) Inc.
Fidelity Investment Japan Limited
Officers
Edward C. Johnson 3d, President
Robert C. Pozen, Senior Vice President
Abigail P. Johnson, Vice President
Robert Bertelson, Vice President
Eric D. Roiter, Secretary
Robert A. Dwight, Treasurer
Maria F. Dwyer, Deputy Treasurer
John H. Costello, Assistant Treasurer
Thomas J. Simpson, Assistant Treasurer
Board of Trustees
Ralph F. Cox *
Phyllis Burke Davis *
Robert M. Gates *
Edward C. Johnson 3d
Donald J. Kirk *
Ned C. Lautenbach *
Peter S. Lynch
Marvin L. Mann *
William O. McCoy *
Gerald C. McDonough *
Robert C. Pozen
Thomas R. Williams *
Advisory Board
J. Michael Cook
Marie L. Knowles
William S. Stavropoulos
General Distributor
Fidelity Distributors Corporation
Boston, MA
Transfer and Shareholder
Servicing Agent
Fidelity Service Company, Inc.
Boston, MA
* Independent trustees
Custodian
Brown Brothers Harriman & Co.
Boston, MA
Fidelity's Growth Funds
Aggressive Growth Fund
Blue Chip Growth Fund
Capital Appreciation Fund
Contrafund ®
Contrafund® II
Disciplined Equity Fund
Dividend Growth Fund
Export and Multinational Fund
Fidelity Fifty ®
Growth Company Fund
Independence Fund
Large Cap Stock Fund
Low-Priced Stock Fund
Magellan® Fund
Mid-Cap Stock Fund
New Millennium Fund®
OTC Portfolio
Small Cap Selector
Small Cap Stock Fund
Stock Selector
Tax Managed Stock Fund
TechnoQuant ® Growth Fund
Trend Fund
Value Fund
The Fidelity Telephone Connection
Mutual Fund 24-Hour Service
Exchanges/Redemptions and
Account Assistance 1-800-544-6666
Product Information 1-800-544-6666
Retirement Accounts 1-800-544-4774
(8 a.m. - 9 p.m.)
TDD Service 1-800-544-0118
for the deaf and hearing impaired
(9 a.m. - 9 p.m. Eastern time)
Fidelity Automated Service
Telephone (FAST®) (automated graphic) 1-800-544-5555
(automated graphic) Automated line for quickest service
FEG-ANN-0101 122056
1.539208.103
(Fidelity Investment logo)(registered trademark)
Corporate Headquarters
82 Devonshire St., Boston, MA 02109
www.fidelity.com
Fidelity®
Fund
Annual Report
November 30, 2000
(2_fidelity_logos)(Registered_trademark)
|
President's Message |
Ned Johnson on investing strategies. |
|
|
Performance |
How the fund has done over time. |
|
|
Fund Talk |
The manager's review of fund performance, strategy and outlook. |
|
|
Investment Changes |
A summary of major shifts in the fund's investments over the past six months. |
|
|
Investments |
A complete list of the fund's investments with their market values. |
|
|
Financial Statements |
Statements of assets and liabilities,
operations, and changes in net assets, |
|
|
Notes |
Notes to the financial statements. |
|
|
Independent Auditors' Report |
The auditors' opinion. |
|
|
Distributions |
|
Standard & Poor's, S&P and S&P 500 are registered service marks of The McGraw-Hill Companies, Inc. and have been licensed for use by Fidelity Distributors Corporation.
Other third party marks appearing herein are the property of their respective owners.
All other marks appearing herein are registered or unregistered trademarks or service marks of FMR Corp. or an affiliated company.
(Recycle graphic) This report is printed on recycled paper using soy-based inks.
This report and the financial statements contained herein are submitted for the general information of the shareholders of the fund. This report is not authorized for distribution to prospective investors in the fund unless preceded or accompanied by an effective prospectus.
Mutual fund shares are not deposits or obligations of, or guaranteed by, any depository institution. Shares are not insured by the FDIC, Federal Reserve Board or any other agency, and are subject to investment risks, including possible loss of principal amount invested.
Neither the fund nor Fidelity Distributors Corporation is a bank.
For more information on any Fidelity fund, including charges and expenses, call 1-800-544-6666 for a free prospectus. Read it carefully before you invest or send money.
Annual Report
(Photograph of Edward C. Johnson 3d.)
Dear Shareholder:
For the first time since 1990, the taxable bond market, as measured by the Lehman Brothers Aggregate Bond Index, appeared nearly certain to outperform the U.S. stock market, as measured by the S&P 500®. The former was up nearly 10% year to date through November, while the S&P 500 was down by approximately the same amount. Disappointing corporate earnings and uncertainty concerning a president-elect toppled the stock market late in the period.
While it's impossible to predict the future direction of the markets with any degree of certainty, there are certain basic principles that can help investors plan for their future needs.
First, investors are encouraged to take a long-term view of their portfolios. If you can afford to leave your money invested through the inevitable up and down cycles of the financial markets, you will greatly reduce your vulnerability to any single decline. We know from experience, for example, that stock prices have gone up over longer periods of time, have significantly outperformed other types of investments and have stayed ahead of inflation.
Second, you can further manage your investing risk through diversification. A stock mutual fund, for instance, is already diversified, because it invests in many different companies. You can increase your diversification further by investing in a number of different stock funds, or in such other investment categories as bonds. If you have a short investment time horizon, you might want to consider moving some of your investment into a money market fund, which seeks income and a stable share price by investing in high-quality, short-term investments. Of course, it's important to remember that an investment in a money market fund is not insured or guaranteed by the Federal Deposit Insurance Corporation or any other government agency. Although money market funds seek to preserve the value of your investment at $1.00 per share, it is possible to lose money by investing in these types of funds.
Finally, no matter what your time horizon or portfolio diversity, it makes good sense to follow a regular investment plan, investing a certain amount of money in a fund at the same time each month or quarter and periodically reviewing your overall portfolio. By doing so, you won't get caught up in the excitement of a rapidly rising market, nor will you buy all your shares at market highs. While this strategy - known as dollar cost averaging - won't assure a profit or protect you from a loss in a declining market, it should help you lower the average cost of your purchases. Of course, you should consider your financial ability to continue your purchases through periods of low price levels before undertaking such a strategy.
If you have questions, please call us at 1-800-544-6666, or visit our web site at www.fidelity.com. We are available 24 hours a day, seven days a week to provide you the information you need to make the investments that are right for you.
Best regards,
/s/Edward C. Johnson 3d
Edward C. Johnson 3d
Annual Report
There are several ways to evaluate a fund's historical performance. You can look at the total percentage change in value, the average annual percentage change or the growth of a hypothetical $10,000 investment. Total return reflects the change in the value of an investment, assuming reinvestment of the fund's dividend income and capital gains (the profits earned upon the sale of securities that have grown in value).
Cumulative Total Returns
|
Periods ended November 30, 2000 |
|
Past 1 |
Past 5 |
Past 10 |
|
Fidelity Growth Company |
|
9.22% |
181.84% |
659.73% |
|
Russell 3000® Growth |
|
-11.70% |
127.42% |
404.54% |
|
Growth Funds Average |
|
-1.25% |
114.99% |
377.26% |
Cumulative total returns show the fund's performance in percentage terms over a set period - in this case, one year, five years or 10 years. For example, if you had invested $1,000 in a fund that had a 5% return over the past year, the value of your investment would be $1,050. You can compare the fund's returns to the performance of the Russell 3000 Growth Index - a market capitalization-weighted index of growth-oriented stocks of U.S. domiciled corporations. To measure how the fund's performance stacked up against its peers, you can compare it to the growth funds average, which reflects the performance of mutual funds with similar objectives tracked by Lipper Inc. The past one year average represents a peer group of 1,389 mutual funds. These benchmarks include reinvested dividends and capital gains, if any, and exclude the effect of sales charges. Lipper has created new comparison categories that group funds according to portfolio characteristics and capitalization, as well as by capitalization only. These averages are listed on page 5 of this report.(dagger)
Average Annual Total Returns
|
Periods ended November 30, 2000 |
Past 1 |
Past 5 |
Past 10 |
|
Fidelity Growth Company |
9.22% |
23.03% |
22.48% |
|
Russell 3000 Growth |
-11.70% |
17.86% |
17.57% |
|
Growth Funds Average |
-1.25% |
16.11% |
16.47% |
Average annual total returns take the fund's cumulative return and show you what would have happened if the fund had performed at a constant rate each year. (Note: Lipper calculates average annual total returns by annualizing each fund's total return, then taking an arithmetic average. This may produce a different figure than that obtained by averaging the cumulative total returns and annualizing the result.)
Annual Report
$10,000 Over 10 Years
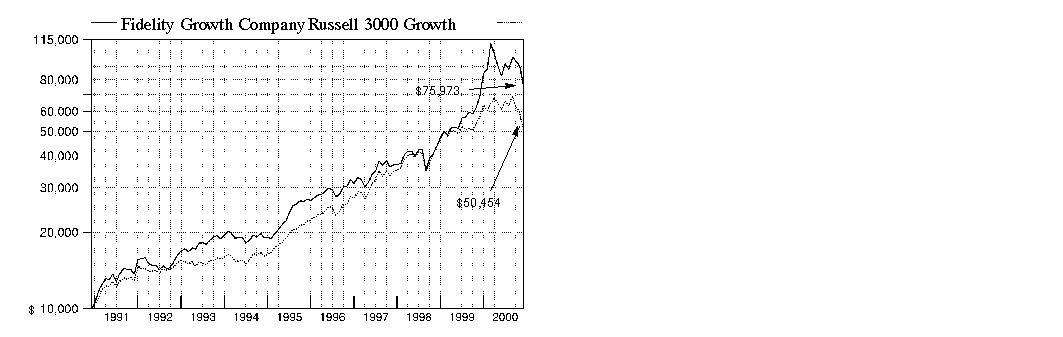
$10,000 Over 10 Years: Let's say hypothetically that $10,000 was invested in Fidelity Growth Company Fund on November 30, 1990. As the chart shows, by November 30, 2000, the value of the investment would have grown to $75,973 - a 659.73% increase on the initial investment. For comparison, look at how the Russell 3000 Growth Index did over the same period. With dividends and capital gains, if any, reinvested, the same $10,000 would have grown to $50,454 - a 404.54% increase.
Understanding
Performance
How a fund did yesterday is no guarantee of how it will do tomorrow. The stock market, for example, has a history of long-term growth and short-term volatility. In turn, the share price and return of a fund that invests in stocks will vary. That means if you sell your shares during a market downturn, you might lose money. But if you can ride out the market's ups and downs, you may have a gain.
3(dagger) The Lipper multi-cap growth funds average reflects the performance (excluding sales charges) of mutual funds with similar portfolio characteristics and capitalization. As of November 30, 2000, the one year, five year, and 10 year cumulative total returns for the multi-cap growth funds average were 0.35%, 132.27%, and 462.65%, respectively; and the one year, five year, and 10 year average annual total returns were 0.35%, 17.93%, and 18.43%, respectively.
Annual Report
Market Recap
After a promising beginning, U.S. equity markets were hammered by a convergence of adverse conditions during the remainder of the 12-month period ending November 30, 2000. The tech-heavy NASDAQ Composite Index was particularly hard hit. After successfully weathering the Federal Reserve Board's campaign to calm surging economic growth, the technology sector's grip on market leadership finally weakened in mid-March, when analysts warned that valuations were overinflated. Then, in May, the markets were rocked by a 0.50% Fed interest-rate hike, and signs soon emerged that clearly indicated a slowdown ahead. Escalating oil prices put additional strain on corporate profits, and disappointing earnings announcements began to pile up. Any hopes for a late season rally were broadsided by the uncertainty stemming from the presidential election in November. The resulting anxiety weighed the markets down to their lowest point of the year. For the overall period, the Standard & Poor's 500SM Index fell 4.22%, the Dow Jones Industrial Average sank 2.77% and the NASDAQ plunged 21.99%. Investors should keep in mind, however, that the last two times the NASDAQ had negative calendar year returns, in 1990 and 1994, the index responded with gains of 59.01% and 41.40% in 1991 and 1995, respectively. Of course, past performance is no guarantee of future results.
(Portfolio Manager photograph)
An interview with Steven Wymer, Portfolio Manager of Fidelity Growth Company Fund
Q. How did the fund perform, Steve?
A. It did well. For the 12-month period that ended November 30, 2000, the fund returned 9.22%. In comparison, the Russell 3000 Growth Index - the fund's benchmark - fell 11.70%. The fund's return also compared favorably to the -1.25% return of the growth funds average tracked by Lipper Inc.
Q. What factors helped the fund outperform its index and peer group during the past year?
A. Favorable stock selection among our holdings in the technology and health sectors - the fund's two largest sector positions - was the main reason the fund outperformed. My focus on more aggressive stocks in the faster-growing subsectors of technology proved beneficial during the first half of the period. In the second half, I reduced the fund's technology holdings - a move driven by rising oil prices, a decline in the European currency and a tightening credit environment - in anticipation of a slowing economy and the economically sensitive nature of technology stocks. This technology underweighting was helpful during the past six months as the sector underperformed. At the same time, I increased the fund's positions in selected health care and nondurables stocks that presented better growth prospects. In hindsight, my reallocation of the fund's assets out of technology and into these two better-performing sectors was a wise decision, but a more aggressive shift would have been even more helpful. Despite the sector's troubles, our holdings in specific technology companies with compelling market positions, strong sales growth and adequate funding - such as Research in Motion and BEA Systems - were strong performers. The fund's performance also got a boost from selected genomics and drug discovery companies, such as Applera-Celera Genomics Group, IDEC Pharmaceuticals and Sepracor, and our nondurables holdings in Procter & Gamble and Coca-Cola.
Annual Report
Fund Talk: The Manager's Overview - continued
Q. The fund's health care stake rose to 21.3% of net assets at the end of the period, from 14.3% six months ago. What areas did you find attractive?
A. I'm still a strong believer in the long-term growth of the biotechnology sector. In the first and second quarters of 2000, I took some profits in these stocks because they had risen to unsustainable levels. From there, it took some time to redeploy those assets back into the sector, as I became more selective. Meanwhile, the companies that I held onto throughout the period, such as those previously mentioned, performed quite well. During the past six months, I began selectively redeploying assets back into the fund's existing holdings in the biotechnology and drug discovery areas, and also increased our exposure in health maintenance organizations, hospitals and medical products companies.
Q. How did the fund's financial stocks perform?
A. Early in the period, our financial stocks generally were pressured by rising interest rates domestically. However, the fund's overweighting in this sector proved valuable in the third quarter of 2000 as interest rates stabilized and the market began to anticipate that the Federal Reserve Board would ease up on its bias toward tightening monetary supply. That perception, coupled with a reduction of political pressure surrounding the advantageous market leverage of Fannie Mae and Freddie Mac, enhanced our holdings in these two stocks during the final six months. The fund's holdings in American International Group and MetLife also performed well.
Q. What about the performance of the fund's technology holdings, given the sector's troubles in 2000 . . .
A. Our overweighted holdings in communications semiconductor companies, such as National Semiconductor, Texas Instruments and Xilinx, suffered from a slowdown in their respective growth rates and an inventory correction. The first signs of these problems showed up in the wireless industry. Given these obstacles in the latter half of the period, I focused on companies that had strong enough fundamentals to grow through a slowing economy, especially those companies exposed to the wireless industry, such as Nokia, whose stock appeared to have already discounted a slowdown.
Q. What's your outlook?
A. It's clear that the economy has slowed and many growth stocks have suffered. However, the growth stocks this fund emphasizes showed better resiliency toward bad corporate news near the end of the period than they had in previous months. Going forward, this relative strength, along with a potentially better macroeconomic environment due to clarity in the U.S. presidential election and some monetary policy easing by the Fed, should benefit the fund's holdings.
Annual Report
Fund Talk: The Manager's Overview - continued
The views expressed in this report reflect those of the portfolio manager only through the end of the period of the report as stated on the cover and do not necessarily represent the views of Fidelity or any other person in the Fidelity organization. Any such views are subject to change at any time based upon market or other conditions and Fidelity disclaims any responsibility to update such views. These views may not be relied on as investment advice and, because investment decisions for a Fidelity fund are based on numerous factors, may not be relied on as an indication of trading intent on behalf of any Fidelity fund.
Fund Facts
Goal: to increase the value of the fund's shares over the long term by investing in stocks of companies with above-average growth potential
Fund number: 025
Trading symbol: FDGRX
Start date: January 17, 1983
Size: as of November 30, 2000, more than $29.0 billion
Manager: Steven Wymer, since 1997; manager, Fidelity Dividend Growth Fund, 1995-1997; several Fidelity Select Portfolios, 1990-1994; joined Fidelity in 1989
3Steve Wymer on his stock selection process:
"In general, I'm looking for individual companies that offer very compelling stories. To meet that threshold, I evaluate a number of criteria. Specifically, a company should be a leader in a niche industry with high product demand. An example of such an industry right now would be the drug discovery area, due to the unmet medical need for new drugs and the industry's robust product pipelines and patent protection. I also look for companies that are executing double-digit sales growth. If you grow the top-line of a business - meaning its revenues - good things tend to happen. Then I like to see a company that is making progress - one whose quarterly corporate earnings are either ahead of or in-line with expectations - to show me that both the short-term execution and long-term promise of the business are on track.
"Additionally, I favor companies possessing strong product cycles, which will accelerate growth, particularly in the face of a slowing economy. I'm also attracted to companies with what I call a ´self-help' cycle, or those with new management, acquisition goals, a disposition plan for non-core or unprofitable businesses, or cost-cutting programs to enhance returns. A company also should have strong cash flow to sustain its growth rate. Further, shareholder-oriented management is a plus. By looking at the portfolio, you will see that evaluating companies with these criteria leads me to stocks of all market capitalizations - from large-cap companies to emerging growth companies."
Annual Report
|
Top Ten Stocks as of November 30, 2000 |
||
|
|
% of fund's |
% of fund's net assets |
|
Cisco Systems, Inc. |
3.4 |
3.9 |
|
Network Appliance, Inc. |
2.4 |
3.2 |
|
Nokia AB sponsored ADR |
2.2 |
0.5 |
|
BEA Systems, Inc. |
2.1 |
1.0 |
|
Fannie Mae |
1.9 |
1.5 |
|
General Electric Co. |
1.9 |
1.5 |
|
Sepracor, Inc. |
1.8 |
2.2 |
|
The Coca-Cola Co. |
1.8 |
1.2 |
|
Applera Corp. - Applied Biosystems Group |
1.6 |
1.3 |
|
PeopleSoft, Inc. |
1.5 |
0.0 |
|
|
20.6 |
|
|
Top Five Market Sectors as of November 30, 2000 |
||
|
|
% of fund's |
% of fund's net assets |
|
Technology |
32.8 |
44.1 |
|
Health |
21.3 |
14.3 |
|
Finance |
11.3 |
8.7 |
|
Nondurables |
7.2 |
4.3 |
|
Retail & Wholesale |
4.3 |
3.1 |
|
Asset Allocation (% of fund's net assets) |
|||||||
|
As of November 30, 2000 * |
As of May 31, 2000 ** |
||||||
|
Stocks 97.9% |
|
|
Stocks 98.1% |
|
||
|
Short-Term |
|
|
Short-Term |
|
||
|
* Foreign |
6.9% |
|
** Foreign investments |
6.9% |
|
||

Annual Report
Showing Percentage of Net Assets
|
Common Stocks - 97.9% |
|||
|
Shares |
Value (Note 1) (000s) |
||
|
AEROSPACE & DEFENSE - 0.4% |
|||
|
Aerospace & Defense - 0.3% |
|||
|
Boeing Co. |
1,325,000 |
$ 91,508 |
|
|
Defense Electronics - 0.1% |
|||
|
REMEC, Inc. (a) |
1,309,500 |
17,760 |
|
|
TOTAL AEROSPACE & DEFENSE |
109,268 |
||
|
BASIC INDUSTRIES - 2.5% |
|||
|
Chemicals & Plastics - 1.5% |
|||
|
Dow Chemical Co. |
2,825,000 |
86,339 |
|
|
E.I. du Pont de Nemours and Co. |
845,973 |
35,795 |
|
|
IMC Global, Inc. |
1,025,000 |
12,172 |
|
|
Minerals Technologies, Inc. (c) |
1,475,000 |
49,781 |
|
|
Pharmacia Corp. |
3,805,500 |
232,136 |
|
|
Union Carbide Corp. |
772,700 |
33,371 |
|
|
|
449,594 |
||
|
Metals & Mining - 0.3% |
|||
|
Alcoa, Inc. |
1,400,000 |
39,463 |
|
|
Inco Ltd. (a) |
2,775,000 |
39,658 |
|
|
|
79,121 |
||
|
Packaging & Containers - 0.2% |
|||
|
Tupperware Corp. (c) |
3,267,700 |
59,636 |
|
|
Paper & Forest Products - 0.5% |
|||
|
Kimberly-Clark Corp. |
2,006,600 |
140,337 |
|
|
TOTAL BASIC INDUSTRIES |
728,688 |
||
|
CONSTRUCTION & REAL ESTATE - 0.4% |
|||
|
Building Materials - 0.0% |
|||
|
Masco Corp. |
900,000 |
17,381 |
|
|
Engineering - 0.4% |
|||
|
Fluor Corp. |
2,913,968 |
106,360 |
|
|
TOTAL CONSTRUCTION & REAL ESTATE |
123,741 |
||
|
DURABLES - 2.3% |
|||
|
Autos, Tires, & Accessories - 0.1% |
|||
|
AutoZone, Inc. (a) |
1,575,000 |
40,655 |
|
|
Consumer Durables - 0.5% |
|||
|
Minnesota Mining & Manufacturing Co. |
1,460,000 |
145,818 |
|
|
Common Stocks - continued |
|||
|
Shares |
Value (Note 1) (000s) |
||
|
DURABLES - continued |
|||
|
Consumer Electronics - 0.5% |
|||
|
Gemstar-TV Guide International, Inc. (a) |
3,043,558 |
$ 123,835 |
|
|
General Motors Corp. Class H |
775,000 |
16,849 |
|
|
|
140,684 |
||
|
Home Furnishings - 0.0% |
|||
|
Linens'n Things, Inc. (a) |
610,000 |
16,737 |
|
|
Textiles & Apparel - 1.2% |
|||
|
NIKE, Inc. Class B |
6,867,000 |
292,706 |
|
|
Timberland Co. Class A (a) |
924,400 |
45,296 |
|
|
|
338,002 |
||
|
TOTAL DURABLES |
681,896 |
||
|
ENERGY - 3.4% |
|||
|
Energy Services - 2.4% |
|||
|
Baker Hughes, Inc. |
5,677,500 |
187,712 |
|
|
Diamond Offshore Drilling, Inc. |
1,000,000 |
30,188 |
|
|
Halliburton Co. |
3,800,000 |
126,825 |
|
|
Schlumberger Ltd. (NY Shares) |
4,302,700 |
266,767 |
|
|
Transocean Sedco Forex, Inc. |
1,903,170 |
75,889 |
|
|
|
687,381 |
||
|
Oil & Gas - 1.0% |
|||
|
Anadarko Petroleum Corp. |
1,389,600 |
82,681 |
|
|
Apache Corp. |
275,000 |
14,369 |
|
|
Conoco, Inc. Class B |
675,629 |
16,933 |
|
|
Devon Energy Corp. |
1,247,300 |
61,430 |
|
|
EOG Resources, Inc. |
1,350,000 |
57,291 |
|
|
Tosco Corp. |
2,050,000 |
58,809 |
|
|
|
291,513 |
||
|
TOTAL ENERGY |
978,894 |
||
|
FINANCE - 11.3% |
|||
|
Banks - 1.8% |
|||
|
Bank One Corp. |
6,300,000 |
225,619 |
|
|
State Street Corp. |
490,900 |
63,326 |
|
|
Synovus Finanical Corp. |
4,043,500 |
89,462 |
|
|
U.S. Bancorp |
2,275,400 |
55,036 |
|
|
Wells Fargo & Co. |
2,147,800 |
101,886 |
|
|
|
535,329 |
||
|
Common Stocks - continued |
|||
|
Shares |
Value (Note 1) (000s) |
||
|
FINANCE - continued |
|||
|
Credit & Other Finance - 0.7% |
|||
|
American Express Co. |
2,847,548 |
$ 156,437 |
|
|
Citigroup, Inc. |
950,197 |
47,332 |
|
|
NextCard, Inc. (a) |
460,000 |
3,824 |
|
|
|
207,593 |
||
|
Federal Sponsored Credit - 2.8% |
|||
|
Fannie Mae |
7,124,300 |
562,820 |
|
|
Freddie Mac |
4,350,400 |
262,927 |
|
|
|
825,747 |
||
|
Insurance - 5.3% |
|||
|
Allmerica Financial Corp. |
1,423,161 |
88,325 |
|
|
Allstate Corp. |
1,475,000 |
56,419 |
|
|
American International Group, Inc. |
4,353,750 |
422,042 |
|
|
CIGNA Corp. |
3,200,000 |
421,600 |
|
|
Hartford Financial Services Group, Inc. |
500,000 |
35,375 |
|
|
John Hancock Financial Services, Inc. |
485,000 |
15,278 |
|
|
MetLife, Inc. |
9,955,000 |
294,917 |
|
|
MONY Group, Inc. |
635,600 |
26,973 |
|
|
The Chubb Corp. |
2,100,000 |
171,150 |
|
|
|
1,532,079 |
||
|
Savings & Loans - 0.1% |
|||
|
Net.B@nk, Inc. (a)(c) |
1,785,000 |
12,049 |
|
|
Securities Industry - 0.6% |
|||
|
Charles Schwab Corp. |
1,458,375 |
40,379 |
|
|
E*Trade Group, Inc. (a) |
384,000 |
3,072 |
|
|
Nomura Securities Co. Ltd. |
6,182,000 |
130,507 |
|
|
|
173,958 |
||
|
TOTAL FINANCE |
3,286,755 |
||
|
HEALTH - 21.3% |
|||
|
Drugs & Pharmaceuticals - 14.9% |
|||
|
Abgenix, Inc. (a) |
3,231,200 |
157,723 |
|
|
Alexion Pharmaceuticals, Inc. (a) |
715,000 |
59,926 |
|
|
Allergan, Inc. |
500,000 |
46,406 |
|
|
Alpharma, Inc. Class A |
1,320,000 |
45,045 |
|
|
ALZA Corp. (a) |
330,000 |
14,644 |
|
|
American Home Products Corp. |
1,000,000 |
60,125 |
|
|
Amgen, Inc. (a) |
2,625,000 |
167,016 |
|
|
Applera Corp. - Celera Genomics Group (a) |
3,854,448 |
160,441 |
|
|
Common Stocks - continued |
|||
|
Shares |
Value (Note 1) (000s) |
||
|
HEALTH - continued |
|||
|
Drugs & Pharmaceuticals - continued |
|||
|
Biogen, Inc. (a) |
619,540 |
$ 33,920 |
|
|
Bristol-Myers Squibb Co. |
5,214,200 |
361,409 |
|
|
Celgene Corp. (a) |
2,308,000 |
131,700 |
|
|
Chiron Corp. (a) |
705,000 |
28,817 |
|
|
CV Therapeutics, Inc. (a) |
925,000 |
64,808 |
|
|
EntreMed, Inc. (a)(c) |
1,005,752 |
17,664 |
|
|
Genentech, Inc. (a) |
2,480,400 |
168,822 |
|
|
Geneva Proteomics (a)(d) |
1,373,363 |
7,553 |
|
|
Genzyme Corp. - General Division (a) |
475,000 |
41,711 |
|
|
Gilead Sciences, Inc. (a) |
725,000 |
59,042 |
|
|
Glaxo Wellcome PLC sponsored ADR |
450,000 |
25,791 |
|
|
Human Genome Sciences, Inc. (a) |
1,560,010 |
97,013 |
|
|
IDEC Pharmaceuticals Corp. (a) |
1,201,388 |
209,117 |
|
|
ImClone Systems, Inc. (a) |
2,509,013 |
111,337 |
|
|
Immunex Corp. (a) |
4,909,200 |
182,561 |
|
|
Medimmune, Inc. (a) |
652,800 |
34,721 |
|
|
Merck & Co., Inc. |
1,924,800 |
178,405 |
|
|
Millennium Pharmaceuticals, Inc. (a) |
2,578,480 |
125,217 |
|
|
Mylan Laboratories, Inc. (c) |
6,541,200 |
156,580 |
|
|
OSI Pharmaceuticals, Inc. (a) |
1,574,000 |
88,341 |
|
|
PAREXEL International Corp. (a) |
175,000 |
1,477 |
|
|
Pfizer, Inc. |
6,185,000 |
274,073 |
|
|
Pharmacyclics, Inc. (a) |
235,000 |
10,134 |
|
|
QLT, Inc. (a)(c) |
4,484,500 |
198,108 |
|
|
Quintiles Transnational Corp. (a) |
1,475,000 |
22,125 |
|
|
Schering-Plough Corp. |
2,828,000 |
158,545 |
|
|
Sepracor, Inc. (a)(c) |
7,319,760 |
534,800 |
|
|
Tanox, Inc. |
375,000 |
14,438 |
|
|
Teva Pharmaceutical Industries Ltd. ADR |
1,050,000 |
69,038 |
|
|
Tularik, Inc. |
1,010,000 |
27,901 |
|
|
Vertex Pharmaceuticals, Inc. (a) |
1,325,000 |
74,034 |
|
|
Watson Pharmaceuticals, Inc. (a) |
2,550,100 |
117,305 |
|
|
XOMA Ltd. (a) |
1,300,666 |
11,747 |
|
|
|
4,349,580 |
||
|
Medical Equipment & Supplies - 4.7% |
|||
|
Abbott Laboratories |
5,350,000 |
294,584 |
|
|
Baxter International, Inc. |
2,855,000 |
247,136 |
|
|
Becton, Dickinson & Co. |
150,000 |
5,100 |
|
|
Cardinal Health, Inc. |
498,305 |
49,799 |
|
|
Guidant Corp. (a) |
2,000,000 |
107,875 |
|
|
Common Stocks - continued |
|||
|
Shares |
Value (Note 1) (000s) |
||
|
HEALTH - continued |
|||
|
Medical Equipment & Supplies - continued |
|||
|
Johnson & Johnson |
1,115,350 |
$ 111,535 |
|
|
McKesson HBOC, Inc. |
9,905,200 |
325,633 |
|
|
Medtronic, Inc. |
4,074,964 |
216,992 |
|
|
Novoste Corp. (a) |
198,500 |
5,099 |
|
|
|
1,363,753 |
||
|
Medical Facilities Management - 1.7% |
|||
|
Express Scripts, Inc. Class A (a) |
870,300 |
65,164 |
|
|
HCA - The Healthcare Co. |
1,650,000 |
68,372 |
|
|
Health Management Associates, Inc. Class A (a) |
3,950,000 |
84,184 |
|
|
HEALTHSOUTH Corp. (a) |
7,250,000 |
101,047 |
|
|
Laboratory Corp. of America Holdings (a) |
205,000 |
29,123 |
|
|
Tenet Healthcare Corp. |
1,085,000 |
46,180 |
|
|
UnitedHealth Group, Inc. |
588,200 |
69,003 |
|
|
Wellpoint Health Networks, Inc. (a) |
250,000 |
26,953 |
|
|
|
490,026 |
||
|
TOTAL HEALTH |
6,203,359 |
||
|
INDUSTRIAL MACHINERY & EQUIPMENT - 4.1% |
|||
|
Electrical Equipment - 3.0% |
|||
|
Adaptive Broadband Corp. (a)(c) |
3,386,900 |
23,920 |
|
|
Airspan Networks, Inc. |
543,300 |
1,732 |
|
|
General Electric Co. |
10,975,000 |
543,948 |
|
|
Research in Motion Ltd. (a)(c) |
4,512,300 |
290,851 |
|
|
Telaxis Communications Corp. (c) |
851,500 |
1,756 |
|
|
Triton Network Systems, Inc. |
703,000 |
2,175 |
|
|
Vyyo, Inc. |
1,008,400 |
8,887 |
|
|
|
873,269 |
||
|
Industrial Machinery & Equipment - 1.1% |
|||
|
Deere & Co. |
6,180,000 |
251,449 |
|
|
Tyco International Ltd. |
1,374,916 |
72,527 |
|
|
|
323,976 |
||
|
TOTAL INDUSTRIAL MACHINERY & EQUIPMENT |
1,197,245 |
||
|
MEDIA & LEISURE - 1.6% |
|||
|
Broadcasting - 0.9% |
|||
|
Adelphia Communications Corp. Class A (a) |
16,300 |
453 |
|
|
AT&T Corp. - Liberty Media Group Class A (a) |
7,600,000 |
103,075 |
|
|
Common Stocks - continued |
|||
|
Shares |
Value (Note 1) (000s) |
||
|
MEDIA & LEISURE - continued |
|||
|
Broadcasting - continued |
|||
|
Charter Communications, Inc. |
1,200,000 |
$ 23,700 |
|
|
Infinity Broadcasting Corp. Class A (a) |
299,000 |
9,045 |
|
|
Netro Corp. (a)(c) |
3,896,600 |
37,505 |
|
|
NTL, Inc. (a) |
476,563 |
12,986 |
|
|
Time Warner, Inc. |
408,767 |
25,344 |
|
|
UnitedGlobalCom, Inc. Class A (a) |
427,500 |
6,466 |
|
|
USA Networks, Inc. (a) |
2,701,000 |
45,411 |
|
|
|
263,985 |
||
|
Entertainment - 0.3% |
|||
|
News Corp. Ltd. ADR |
150,000 |
5,231 |
|
|
Viacom, Inc. Class B (non-vtg.) (a) |
539,969 |
27,606 |
|
|
Walt Disney Co. |
1,636,500 |
47,356 |
|
|
|
80,193 |
||
|
Restaurants - 0.4% |
|||
|
McDonald's Corp. |
3,390,200 |
108,063 |
|
|
Starbucks Corp. (a) |
379,600 |
17,296 |
|
|
|
125,359 |
||
|
TOTAL MEDIA & LEISURE |
469,537 |
||
|
NONDURABLES - 7.2% |
|||
|
Beverages - 1.8% |
|||
|
The Coca-Cola Co. |
8,507,000 |
532,751 |
|
|
Foods - 1.6% |
|||
|
Archer-Daniels-Midland Co. |
11,541,220 |
147,151 |
|
|
ConAgra Foods, Inc. |
3,100,000 |
78,856 |
|
|
PepsiCo, Inc. |
4,263,500 |
193,456 |
|
|
Quaker Oats Co. |
281,800 |
24,499 |
|
|
Sara Lee Corp. |
950,000 |
22,800 |
|
|
|
466,762 |
||
|
Household Products - 3.1% |
|||
|
Avon Products, Inc. |
3,565,000 |
148,393 |
|
|
Clorox Co. |
1,311,600 |
58,612 |
|
|
Colgate-Palmolive Co. |
3,375,000 |
198,281 |
|
|
Gillette Co. |
5,754,596 |
194,937 |
|
|
Procter & Gamble Co. |
3,977,800 |
297,838 |
|
|
|
898,061 |
||
|
Common Stocks - continued |
|||
|
Shares |
Value (Note 1) (000s) |
||
|
NONDURABLES - continued |
|||
|
Tobacco - 0.7% |
|||
|
Philip Morris Companies, Inc. |
4,858,400 |
$ 185,530 |
|
|
TOTAL NONDURABLES |
2,083,104 |
||
|
PRECIOUS METALS - 0.1% |
|||
|
Barrick Gold Corp. |
2,221,800 |
33,416 |
|
|
RETAIL & WHOLESALE - 4.3% |
|||
|
Apparel Stores - 0.6% |
|||
|
Gap, Inc. |
2,442,825 |
60,918 |
|
|
Venator Group, Inc. (a)(c) |
8,129,800 |
109,244 |
|
|
|
170,162 |
||
|
Drug Stores - 0.3% |
|||
|
CVS Corp. |
1,164,890 |
66,253 |
|
|
Walgreen Co. |
650,000 |
28,966 |
|
|
|
95,219 |
||
|
General Merchandise Stores - 2.1% |
|||
|
Costco Wholesale Corp. (a) |
1,500,800 |
48,964 |
|
|
JCPenney Co., Inc. |
1,360,000 |
13,090 |
|
|
Target Corp. |
4,660,000 |
140,091 |
|
|
Wal-Mart Stores, Inc. |
7,696,200 |
401,645 |
|
|
|
603,790 |
||
|
Grocery Stores - 0.6% |
|||
|
Albertson's, Inc. |
475,000 |
12,142 |
|
|
Safeway, Inc. (a) |
2,687,900 |
158,418 |
|
|
|
170,560 |
||
|
Retail & Wholesale, Miscellaneous - 0.7% |
|||
|
Bed Bath & Beyond, Inc. (a) |
319,200 |
6,643 |
|
|
Home Depot, Inc. |
3,791,150 |
148,566 |
|
|
Lowe's Companies, Inc. |
1,000,200 |
40,071 |
|
|
Staples, Inc. (a) |
2,192,068 |
26,305 |
|
|
|
221,585 |
||
|
TOTAL RETAIL & WHOLESALE |
1,261,316 |
||
|
SERVICES - 0.8% |
|||
|
Advertising - 0.3% |
|||
|
TMP Worldwide, Inc. (a) |
1,215,300 |
71,323 |
|
|
Common Stocks - continued |
|||
|
Shares |
Value (Note 1) (000s) |
||
|
SERVICES - continued |
|||
|
Services - 0.5% |
|||
|
CheckFree Corp. (a) |
2,314,700 |
$ 120,943 |
|
|
Convergys Corp. (a) |
746,000 |
31,379 |
|
|
Per-Se Technologies, Inc. warrants 7/8/03 (a) |
38,410 |
0 |
|
|
|
152,322 |
||
|
TOTAL SERVICES |
223,645 |
||
|
TECHNOLOGY - 32.8% |
|||
|
Communications Equipment - 8.2% |
|||
|
3Com Corp. |
3,405,000 |
41,711 |
|
|
Aspect Communications Corp. (a)(c) |
2,971,820 |
39,191 |
|
|
AudioCodes Ltd. (a) |
1,080,000 |
17,820 |
|
|
Cabletron Systems, Inc. (a) |
6,925,000 |
109,069 |
|
|
Ciena Corp. (a) |
2,090,000 |
158,709 |
|
|
Cisco Systems, Inc. (a) |
20,687,200 |
990,391 |
|
|
Comverse Technology, Inc. (a) |
141,500 |
12,196 |
|
|
Corning, Inc. |
1,550,000 |
90,675 |
|
|
Corvis Corp. |
1,799,900 |
51,860 |
|
|
Lucent Technologies, Inc. |
2,015,890 |
31,372 |
|
|
Natural MicroSystems Corp. (a)(c) |
3,444,398 |
56,402 |
|
|
Next Level Communications, Inc. (c) |
5,041,500 |
54,196 |
|
|
Nokia AB sponsored ADR |
15,040,000 |
642,960 |
|
|
Nortel Networks Corp. |
1,401,400 |
52,903 |
|
|
ONI Systems Corp. |
471,100 |
20,493 |
|
|
P-Com, Inc. (a) |
2,425,000 |
8,033 |
|
|
Telefonaktiebolaget LM Ericsson sponsored ADR |
1,725,000 |
19,622 |
|
|
|
2,397,603 |
||
|
Computer Services & Software - 10.4% |
|||
|
Adobe Systems, Inc. |
1,937,400 |
122,783 |
|
|
Aether Systems, Inc. (a) |
797,600 |
45,164 |
|
|
Affiliated Computer Services, Inc. Class A (a) |
353,000 |
19,856 |
|
|
Amazon.com, Inc. (a) |
870,000 |
21,478 |
|
|
America Online, Inc. (a) |
4,775,000 |
193,913 |
|
|
Ariba, Inc. (a) |
160,000 |
9,960 |
|
|
Automatic Data Processing, Inc. |
375,800 |
24,803 |
|
|
BEA Systems, Inc. (a) |
10,358,472 |
606,618 |
|
|
Bottomline Technologies, Inc. (a) |
50,000 |
863 |
|
|
Cadence Design Systems, Inc. (a) |
620,000 |
14,531 |
|
|
Cerner Corp. (a) |
645,000 |
31,524 |
|
|
Clarent Corp. (a)(c) |
2,165,800 |
25,990 |
|
|
Common Stocks - continued |
|||
|
Shares |
Value (Note 1) (000s) |
||
|
TECHNOLOGY - continued |
|||
|
Computer Services & Software - continued |
|||
|
CNET Networks, Inc. (a) |
134,600 |
$ 2,877 |
|
|
Cobalt Networks, Inc. |
635,000 |
24,209 |
|
|
DST Systems, Inc. (a) |
373,600 |
26,689 |
|
|
Eclipsys Corp. (a) |
1,250,000 |
29,375 |
|
|
Electronic Arts, Inc. (a) |
510,000 |
18,201 |
|
|
i2 Technologies, Inc. (a) |
350,000 |
33,775 |
|
|
IDX Systems Corp. (a) |
415,000 |
10,842 |
|
|
Interact Commerce Corp. (a)(c) |
1,962,220 |
15,452 |
|
|
Interwoven, Inc. |
340,000 |
18,721 |
|
|
Intuit, Inc. (a) |
177,200 |
8,074 |
|
|
Liberate Technologies (a) |
870,000 |
9,244 |
|
|
Macromedia, Inc. (a)(c) |
2,653,000 |
169,792 |
|
|
Microsoft Corp. (a) |
7,200,000 |
413,100 |
|
|
National Instrument Corp. (a) |
15,000 |
598 |
|
|
Network Engines, Inc. |
370,400 |
2,176 |
|
|
Novell, Inc. (a) |
3,720,000 |
19,763 |
|
|
Openwave Systems, Inc. (a) |
298,798 |
13,633 |
|
|
Oracle Corp. (a) |
4,010,000 |
106,265 |
|
|
PeopleSoft, Inc. (a) |
13,222,928 |
439,662 |
|
|
Polycom, Inc. (a) |
920,000 |
31,108 |
|
|
RealNetworks, Inc. (a) |
1,545,000 |
19,216 |
|
|
Redback Networks, Inc. (a) |
110,000 |
7,679 |
|
|
Sonus Networks, Inc. |
5,178,270 |
125,897 |
|
|
SunGard Data Systems, Inc. (a) |
1,460,000 |
71,631 |
|
|
TIBCO Software, Inc. (a) |
160,100 |
5,543 |
|
|
VA Linux Systems, Inc. |
1,400,000 |
11,463 |
|
|
VERITAS Software Corp. (a) |
2,475,352 |
241,502 |
|
|
WebMD Corp. (a) |
1,025,000 |
7,688 |
|
|
Yahoo!, Inc. (a) |
420,270 |
16,653 |
|
|
|
3,018,311 |
||
|
Computers & Office Equipment - 6.5% |
|||
|
Brocade Communications Systems, Inc. (a) |
729,400 |
122,494 |
|
|
Compaq Computer Corp. |
275,000 |
5,913 |
|
|
Concurrent Computer Corp. (a) |
1,180,000 |
11,689 |
|
|
Dell Computer Corp. (a) |
6,320,200 |
121,664 |
|
|
EMC Corp. (a) |
700,000 |
52,063 |
|
|
Extreme Networks, Inc. (a) |
525,000 |
26,972 |
|
|
FileNET Corp. (a)(c) |
2,425,100 |
63,507 |
|
|
Finisar Corp. |
75,000 |
1,748 |
|
|
International Business Machines Corp. |
499,800 |
46,731 |
|
|
Common Stocks - continued |
|||
|
Shares |
Value (Note 1) (000s) |
||
|
TECHNOLOGY - continued |
|||
|
Computers & Office Equipment - continued |
|||
|
Juniper Networks, Inc. (a) |
1,419,400 |
$ 176,893 |
|
|
Lexmark International Group, Inc. Class A (a) |
283,000 |
13,018 |
|
|
Network Appliance, Inc. (a) |
14,284,908 |
705,317 |
|
|
Palm, Inc. |
1,211,426 |
43,838 |
|
|
Proxim, Inc. (a) |
1,122,100 |
51,967 |
|
|
Silicon Graphics, Inc. (c) |
11,426,600 |
45,706 |
|
|
Softbank Corp. |
341,100 |
17,894 |
|
|
SONICblue, Inc. (a)(c) |
5,464,300 |
30,737 |
|
|
Sun Microsystems, Inc. (a) |
4,475,000 |
340,380 |
|
|
|
1,878,531 |
||
|
Electronic Instruments - 2.1% |
|||
|
Agilent Technologies, Inc. |
786,100 |
41,025 |
|
|
Applera Corp. - Applied Biosystems Group |
5,602,800 |
462,931 |
|
|
Applied Materials, Inc. (a) |
405,200 |
16,385 |
|
|
Novellus Systems, Inc. (a) |
300,000 |
7,781 |
|
|
Thermo Electron Corp. (a) |
2,684,245 |
77,843 |
|
|
Trimble Navigation Ltd. (a) |
562,500 |
12,094 |
|
|
|
618,059 |
||
|
Electronics - 5.6% |
|||
|
Altera Corp. (a) |
2,670,000 |
63,913 |
|
|
Analog Devices, Inc. (a) |
2,255,000 |
111,904 |
|
|
Applied Micro Circuits Corp. (a) |
400,000 |
19,375 |
|
|
Conexant Systems, Inc. (a) |
965,000 |
19,602 |
|
|
DMC Stratex Networks, Inc. (a) |
535,000 |
7,055 |
|
|
Harmonic, Inc. (a) |
1,795,000 |
13,463 |
|
|
Intel Corp. |
8,866,800 |
337,493 |
|
|
Intersil Holding Corp. Class A |
103,100 |
2,373 |
|
|
JDS Uniphase Corp. (a) |
1,431,736 |
71,676 |
|
|
Linear Technology Corp. |
510,800 |
24,167 |
|
|
LSI Logic Corp. (a) |
306,100 |
5,510 |
|
|
Maxim Integrated Products, Inc. (a) |
330,400 |
16,850 |
|
|
Micron Technology, Inc. (a) |
721,800 |
22,737 |
|
|
MIPS Technologies, Inc.: |
|
|
|
|
Class A (a)(c) |
1,960,800 |
52,942 |
|
|
Class B (a)(c) |
1,809,527 |
40,262 |
|
|
Motorola, Inc. |
3,067,955 |
61,551 |
|
|
National Semiconductor Corp. (a) |
7,203,100 |
133,708 |
|
|
PMC-Sierra, Inc. (a) |
535,000 |
49,320 |
|
|
Texas Instruments, Inc. |
8,051,000 |
300,403 |
|
|
Common Stocks - continued |
|||
|
Shares |
Value (Note 1) (000s) |
||
|
TECHNOLOGY - continued |
|||
|
Electronics - continued |
|||
|
Transmeta Corp. |
42,100 |
$ 953 |
|
|
Vitesse Semiconductor Corp. (a) |
434,700 |
18,746 |
|
|
Xilinx, Inc. (a) |
6,235,000 |
243,165 |
|
|
|
1,617,168 |
||
|
TOTAL TECHNOLOGY |
9,529,672 |
||
|
TRANSPORTATION - 2.5% |
|||
|
Air Transportation - 1.2% |
|||
|
Ryanair Holdings PLC sponsored ADR (a) |
847,400 |
41,099 |
|
|
SkyWest, Inc. (c) |
1,679,700 |
99,942 |
|
|
Southwest Airlines Co. |
6,686,775 |
211,051 |
|
|
|
352,092 |
||
|
Railroads - 1.0% |
|||
|
Burlington Northern Santa Fe Corp. |
2,125,000 |
53,789 |
|
|
Canadian National Railway Co. |
2,224,500 |
69,810 |
|
|
CSX Corp. |
2,300,100 |
59,659 |
|
|
Norfolk Southern Corp. |
1,595,000 |
22,928 |
|
|
Union Pacific Corp. |
1,800,000 |
83,700 |
|
|
|
289,886 |
||
|
Trucking & Freight - 0.3% |
|||
|
FedEx Corp. (a) |
700,000 |
33,544 |
|
|
United Parcel Service, Inc. Class B |
950,000 |
57,653 |
|
|
|
91,197 |
||
|
TOTAL TRANSPORTATION |
733,175 |
||
|
UTILITIES - 2.9% |
|||
|
Cellular - 0.5% |
|||
|
China Mobile (Hong Kong) Ltd. sponsored ADR (a) |
540,400 |
14,321 |
|
|
Nextel Communications, Inc. Class A (a) |
869,600 |
26,958 |
|
|
QUALCOMM, Inc. (a) |
480,000 |
38,520 |
|
|
Sprint Corp. - PCS Group Series 1 (a) |
875,000 |
19,852 |
|
|
Vodafone Group PLC |
9,544,930 |
32,691 |
|
|
Vodafone Group PLC sponsored ADR |
427,660 |
14,647 |
|
|
|
146,989 |
||
|
Common Stocks - continued |
|||
|
Shares |
Value (Note 1) (000s) |
||
|
UTILITIES - continued |
|||
|
Electric Utility - 1.0% |
|||
|
AES Corp. (a) |
5,585,000 |
$ 289,722 |
|
|
TNPC, Inc. |
1,793,000 |
9,077 |
|
|
|
298,799 |
||
|
Gas - 0.7% |
|||
|
Enron Corp. |
3,102,474 |
200,885 |
|
|
Telephone Services - 0.7% |
|||
|
Allegiance Telecom, Inc. (a) |
123,200 |
1,727 |
|
|
AT&T Corp. |
1,985,487 |
38,965 |
|
|
Level 3 Communications, Inc. (a) |
1,765,000 |
47,434 |
|
|
Metromedia Fiber Network, Inc. Class A (a) |
1,400,400 |
16,367 |
|
|
Net2Phone, Inc. (a) |
872,900 |
10,529 |
|
|
Qwest Communications International, Inc. (a) |
1,307,880 |
49,372 |
|
|
RCN Corp. |
1,063,800 |
12,433 |
|
|
TeraBeam Networks (a)(d) |
104,132 |
390 |
|
|
WorldCom, Inc. (a) |
426,535 |
6,371 |
|
|
XO Communications, Inc. Class A (a) |
835,000 |
12,421 |
|
|
|
196,009 |
||
|
TOTAL UTILITIES |
842,682 |
||
|
TOTAL COMMON STOCKS (Cost $24,348,576) |
28,486,393 |
||
|
Cash Equivalents - 2.7% |
|||
|
|
|
||
|
Fidelity Cash Central Fund, 6.57% (b) |
598,417,264 |
598,417 |
|
|
Fidelity Securities Lending Cash Central Fund, 6.63% (b) |
179,339,300 |
179,339 |
|
|
TOTAL CASH EQUIVALENTS (Cost $777,756) |
777,756 |
||
|
TOTAL INVESTMENT PORTFOLIO - 100.6% (Cost $25,126,332) |
29,264,149 |
||
|
NET OTHER ASSETS - (0.6)% |
(185,000) |
||
|
NET ASSETS - 100% |
$ 29,079,149 |
||
|
Legend |
|
(a) Non-income producing |
|
(b) The rate quoted is the annualized seven-day yield of the fund at period end. A complete listing of the fund's holdings as of its most recent fiscal year end is available upon request. |
|
(c) Affiliated company |
|
(d) Restricted securities - Investment in securities not registered under the Securities Act of 1933. |
|
Additional information on each holding is as follows: |
|
Security |
Acquisition Date |
Acquisition Cost (000s) |
|
Geneva Proteomics |
7/7/00 |
$ 7,553 |
|
TeraBeam Networks |
4/7/00 |
$ 390 |
|
Income Tax Information |
|
At November 30, 2000, the aggregate cost of investment securities for income tax purposes was $25,383,581,000. Net unrealized appreciation aggregated $3,880,568,000, of which $8,285,407,000 related to appreciated investment securities and $4,404,839,000 related to depreciated investment securities. |
|
The fund hereby designates approximately $2,107,579,000 as a capital gain dividend for the purpose of the dividend paid deduction. |
See accompanying notes which are an integral part of the financial statements.
Annual Report
Statement of Assets and Liabilities
|
Amounts in thousands (except per-share amount) |
November 30, 2000 |
|
|
Assets |
|
|
|
Investment in securities, at value (cost $25,126,332) - |
|
$ 29,264,149 |
|
Receivable for investments sold |
|
393,532 |
|
Receivable for fund shares sold |
|
43,090 |
|
Dividends receivable |
|
16,076 |
|
Interest receivable |
|
2,592 |
|
Other receivables |
|
6,150 |
|
Total assets |
|
29,725,589 |
|
Liabilities |
|
|
|
Payable to custodian bank |
$ 7,723 |
|
|
Payable for investments purchased |
316,181 |
|
|
Payable for fund shares redeemed |
116,073 |
|
|
Accrued management fee |
18,685 |
|
|
Other payables and accrued expenses |
8,439 |
|
|
Collateral on securities loaned, at value |
179,339 |
|
|
Total liabilities |
|
646,440 |
|
Net Assets |
|
$ 29,079,149 |
|
Net Assets consist of: |
|
|
|
Paid in capital |
|
$ 21,723,335 |
|
Accumulated undistributed net realized gain (loss) on investments and foreign currency transactions |
|
3,217,985 |
|
Net unrealized appreciation (depreciation) on investments and assets and liabilities in foreign currencies |
|
4,137,829 |
|
Net Assets, for 388,959 shares outstanding |
|
$ 29,079,149 |
|
Net Asset Value, offering price and redemption price |
|
$74.76 |
See accompanying notes which are an integral part of the financial statements.
Annual Report
Financial Statements - continued
Statement of Operations
|
Amounts in thousands |
Year ended November 30, 2000 |
|
|
Investment Income Dividends (including $3,453 received from affiliated issuers) |
|
$ 125,059 |
|
Interest |
|
42,918 |
|
Security lending |
|
4,947 |
|
Total income |
|
172,924 |
|
Expenses |
|
|
|
Management fee |
$ 183,577 |
|
|
Performance adjustment |
30,275 |
|
|
Transfer agent fees |
56,660 |
|
|
Accounting and security lending fees |
1,582 |
|
|
Non-interested trustees' compensation |
185 |
|
|
Custodian fees and expenses |
842 |
|
|
Registration fees |
4,943 |
|
|
Audit |
99 |
|
|
Legal |
179 |
|
|
Miscellaneous |
76 |
|
|
Total expenses before reductions |
278,418 |
|
|
Expense reductions |
(5,431) |
272,987 |
|
Net investment income (loss) |
|
(100,063) |
|
Realized and Unrealized Gain (Loss) Net realized gain (loss) on: |
|
|
|
Investment securities (including realized gain of |
3,278,126 |
|
|
Foreign currency transactions |
(448) |
3,277,678 |
|
Change in net unrealized appreciation (depreciation) on: |
|
|
|
Investment securities |
(3,512,398) |
|
|
Assets and liabilities in foreign currencies |
1 |
(3,512,397) |
|
Net gain (loss) |
|
(234,719) |
|
Net increase (decrease) in net assets resulting |
|
$ (334,782) |
See accompanying notes which are an integral part of the financial statements.
Annual Report
Financial Statements - continued
Statement of Changes in Net Assets
|
Amounts in thousands |
Year ended
November 30, |
Year ended
November 30, |
|
Increase (Decrease) in Net Assets |
|
|
|
Operations |
$ (100,063) |
$ (14,794) |
|
Net realized gain (loss) |
3,277,678 |
2,059,264 |
|
Change in net unrealized appreciation (depreciation) |
(3,512,397) |
4,541,688 |
|
Net increase (decrease) in net assets resulting |
(334,782) |
6,586,158 |
|
Distributions to shareholders |
- |
(18,887) |
|
From net realized gain |
(1,815,834) |
(791,061) |
|
Total distributions |
(1,815,834) |
(809,948) |
|
Share transactions |
23,349,869 |
6,247,189 |
|
Reinvestment of distributions |
1,789,370 |
797,355 |
|
Cost of shares redeemed |
(13,131,652) |
(4,177,783) |
|
Net increase (decrease) in net assets resulting |
12,007,587 |
2,866,761 |
|
Total increase (decrease) in net assets |
9,856,971 |
8,642,971 |
|
Net Assets |
|
|
|
Beginning of period |
19,222,178 |
10,579,207 |
|
End of period |
29,079,149 |
19,222,178 |
|
Other Information Shares |
|
|
|
Sold |
252,532 |
101,695 |
|
Issued in reinvestment of distributions |
23,318 |
16,228 |
|
Redeemed |
(144,628) |
(70,843) |
|
Net increase (decrease) |
131,222 |
47,080 |
See accompanying notes which are an integral part of the financial statements.
Annual Report
Financial Highlights
|
Years ended November 30, |
2000 |
1999 |
1998 |
1997 |
1996 |
|
Selected Per-Share Data |
|
|
|
|
|
|
Net asset value, |
$ 74.58 |
$ 50.22 |
$ 47.84 |
$ 43.54 |
$ 38.42 |
|
Income from |
|
|
|
|
|
|
Net investment income (loss) |
(.28) B |
(.06) B |
.11 B |
.24 B |
.34 |
|
Net realized and |
7.26 D |
28.25 |
7.20 |
5.80 |
6.72 |
|
Total from investment operations |
6.98 |
28.19 |
7.31 |
6.04 |
7.06 |
|
Less Distributions |
|
|
|
|
|
|
From net investment income |
- |
(.09) |
(.22) |
(.28) |
(.14) |
|
From net realized gain |
(6.80) |
(3.74) |
(4.71) |
(1.46) |
(1.80) |
|
Total distributions |
(6.80) |
(3.83) |
(4.93) |
(1.74) |
(1.94) |
|
Net asset value, end of period |
$ 74.76 |
$ 74.58 |
$ 50.22 |
$ 47.84 |
$ 43.54 |
|
Total Return A |
9.22% |
60.17% |
17.55% |
14.63% |
19.55% |
|
Ratios and Supplemental Data |
|
|
|
|
|
|
Net assets, end of period |
$ 29,079 |
$ 19,222 |
$ 10,579 |
$ 10,524 |
$ 9,607 |
|
Ratio of expenses to average |
.87% |
.74% |
.65% |
.71% |
.88% |
|
Ratio of expenses to average net assets after expense reductions |
.85% C |
.72% C |
.63% C |
.68% C |
.85% C |
|
Ratio of net investment income (loss) to average net assets |
(.31)% |
(.11)% |
.24% |
.54% |
.96% |
|
Portfolio turnover rate |
69% |
86% |
76% |
93% |
78% |
A The total returns would have been lower had certain expenses not been reduced during the periods shown.
B Net investment income (loss) per share has been calculated based on average shares outstanding during the period.
C FMR or the fund has entered into varying arrangements with third parties who either paid or reduced a portion of the fund's expenses.
D The amount shown for a share outstanding does not correspond with the aggregate net loss on investments for the period due to the timing of sales and repurchases of fund shares in relation to fluctuating market values of the investments of the fund.
See accompanying notes which are an integral part of the financial statements.
Annual Report
For the period ended November 30, 2000
1. Significant Accounting Policies.
Fidelity Growth Company Fund (the fund) is a fund of Fidelity Mt. Vernon Street Trust (the trust) and is authorized to issue an unlimited number of shares. The trust is registered under the Investment Company Act of 1940, as amended (the 1940 Act), as an open-end management investment company organized as a Massachusetts business trust. The financial statements have been prepared in conformity with generally accepted accounting principles which require management to make certain estimates and assumptions at the date of the financial statements. The following summarizes the significant accounting policies of the fund:
Security Valuation. Securities for which exchange quotations are readily available are valued at the last sale price, or if no sale price, at the closing bid price. Foreign securities are valued based on quotations from the principal market in which such securities are normally traded. If trading or events occurring in other markets after the close of the principal market in which foreign securities are traded, and before the close of business of the fund, are expected to materially affect the value of those securities, then they are valued at their fair value taking this trading or these events into account. Fair value is determined in good faith under consistently applied procedures under the general supervision of the Board of Trustees. Securities (including restricted securities) for which exchange quotations are not readily available (and in certain cases debt securities which trade on an exchange) are valued primarily using dealer-supplied valuations or at their fair value. Short-term securities with remaining maturities of sixty days or less for which quotations are not readily available are valued at amortized cost or original cost plus accrued interest, both of which approximate current value. Investments in open-end investment companies are valued at their net asset value each business day.
Foreign Currency Translation. The accounting records of the fund are maintained in U.S. dollars. Investment securities and other assets and liabilities denominated in a foreign currency are translated into U.S. dollars at the prevailing rates of exchange at period end. Purchases and sales of securities, income receipts and expense payments are translated into U.S. dollars at the prevailing exchange rate on the respective dates of the transactions.
Net realized gains and losses on foreign currency transactions represent net gains and losses from sales and maturities of foreign currency contracts, disposition of foreign currencies, the difference between the amount of net investment income accrued and the U.S. dollar amount actually received, and gains and losses between trade and settlement date on purchases and sales of securities. The effects of changes in foreign currency exchange rates on investments in securities are included with the net realized and unrealized gain or loss on investment securities.
Annual Report
Notes to Financial Statements - continued
1. Significant Accounting Policies - continued
Income Taxes. As a qualified regulated investment company under Subchapter M of the Internal Revenue Code, the fund is not subject to income taxes to the extent that it distributes substantially all of its taxable income for its fiscal year. The schedule of investments includes information regarding income taxes under the caption "Income Tax Information."
Investment Income. Dividend income is recorded on the ex-dividend date, except certain dividends from foreign securities where the ex-dividend date may have passed, are recorded as soon as the fund is informed of the ex-dividend date. Non-cash dividends included in dividend income, if any, are recorded at the fair market value of the securities received. Interest income is accrued as earned. Investment income is recorded net of foreign taxes withheld where recovery of such taxes is uncertain.
Expenses. Most expenses of the trust can be directly attributed to a fund. Expenses which cannot be directly attributed are apportioned among the funds in the trust.
Deferred Trustee Compensation. Under a Deferred Compensation Plan (the Plan) non-interested Trustees must defer receipt of a portion of, and may elect to defer receipt of an additional portion of, their annual compensation. Deferred amounts are treated as though equivalent dollar amounts had been invested in shares of the fund or are invested in a cross-section of other Fidelity funds. Deferred amounts remain in the fund until distributed in accordance with the Plan.
Distributions to Shareholders. Distributions are recorded on the ex-dividend date.
Income and capital gain distributions are determined in accordance with income tax regulations which may differ from generally accepted accounting principles. These differences, which may result in distribution reclassifications, are primarily due to differing treatments for litigation proceeds, foreign currency transactions, net operating losses and losses deferred due to wash sales. The fund also utilized earnings and profits distributed to shareholders on redemption of shares as a part of the dividends paid deduction for income tax purposes.
Permanent book and tax basis differences relating to shareholder distributions will result in reclassifications to paid in capital. Accumulated undistributed net realized gain (loss) on investments and foreign currency transactions may include temporary book and tax basis differences which will reverse in a subsequent period. Any taxable income or gain remaining at fiscal year end is distributed in the following year.
Security Transactions. Security transactions are accounted for as of trade date. Gains and losses on securities sold are determined on the basis of identified cost.
Annual Report
Notes to Financial Statements - continued
2. Operating Policies.
Foreign Currency Contracts. The fund generally uses foreign currency contracts to facilitate transactions in foreign-denominated securities. Losses may arise from changes in the value of the foreign currency or if the counterparties do not perform under the contracts' terms. The U.S. dollar value of foreign currency contracts is determined using contractual currency exchange rates established at the time of each trade.
Joint Trading Account. Pursuant to an Exemptive Order issued by the Securities and Exchange Commission (the SEC), the fund, along with other affiliated entities of Fidelity Management & Research Company (FMR), may transfer uninvested cash balances into one or more joint trading accounts. These balances are invested in one or more repurchase agreements for U.S. Treasury or Federal Agency obligations.
Repurchase Agreements. The underlying U.S. Treasury, Federal Agency, or other obligations found to be satisfactory by FMR are transferred to an account of the fund, or to the Joint Trading Account, at a custodian bank. The securities are marked-to-market daily and maintained at a value at least equal to the principal amount of the repurchase agreement (including accrued interest). FMR, the fund's investment adviser, is responsible for determining that the value of the underlying securities remains in accordance with the market value requirements stated above.
Restricted Securities. The fund is permitted to invest in securities that are subject to legal or contractual restrictions on resale. These securities generally may be resold in transactions exempt from registration or to the public if the securities are registered. Disposal of these securities may involve time-consuming negotiations and expense, and prompt sale at an acceptable price may be difficult. At the end of the period, restricted securities (excluding 144A issues) amounted to $7,943,000 or 0.0% of net assets.
3. Purchases and Sales of Investments.
Purchases and sales of securities, other than short-term securities, aggregated $31,040,931,000 and $21,114,810,000, respectively.
4. Fees and Other Transactions with Affiliates.
Management Fee. As the fund's investment adviser, FMR receives a monthly basic fee that is calculated on the basis of a group fee rate plus a fixed individual fund fee rate applied to the average net assets of the fund. The group fee rate is the weighted average of a series of rates and is based on the monthly average net assets of all the mutual funds advised by FMR. The rates ranged from .2167% to .5200% for the period. The annual individual fund fee rate is .30%. In the event that these rates were lower than the contractual rates in effect during the period, FMR voluntarily implemented the above rates, as they resulted in the
Annual Report
Notes to Financial Statements - continued
4. Fees and Other Transactions with Affiliates - continued
Management Fee - continued
same or a lower management fee. The basic fee is subject to a performance adjustment (up to a maximum of ±.20% of the fund's average net assets over the performance period) based on the fund's investment performance as compared to the appropriate index over a specified period of time. For the period, the management fee was equivalent to an annual rate of .67% of average net assets after the performance adjustment.
Sub-Adviser Fee. Beginning January 1, 2001, FMR Co.(FMRC) will serve as sub-adviser for the fund. FMRC is a wholly owned subsidiary of FMR and will receive a fee from FMR of 50% of the management fee payable to FMR with respect to that portion of the fund's assets that will be managed by FMRC.
Transfer Agent Fees. Fidelity Service Company, Inc. (FSC), an affiliate of FMR, is the fund's transfer, dividend disbursing and shareholder servicing agent. FSC receives account fees and asset-based fees that vary according to account size and type of account. FSC pays for typesetting, printing and mailing of all shareholder reports, except proxy statements. For the period, the transfer agent fees were equivalent to an annual rate of .18% of average net assets.
Accounting and Security Lending Fees. FSC maintains the fund's accounting records and administers the security lending program. The security lending fee is based on the number and duration of lending transactions. The accounting fee is based on the level of average net assets for the month plus out-of-pocket expenses.
Fidelity Cash Central Funds. Pursuant to an Exemptive Order issued by the SEC, the fund may invest in the Fidelity Cash Central Fund and the Fidelity Securities Lending Cash Central Fund (the Cash Funds) managed by Fidelity Investments Money Management, Inc. (FIMM), an affiliate of FMR. The Cash Funds are open-end money market funds available only to investment companies and other accounts managed by FMR and its affiliates. The Cash Funds seek preservation of capital, liquidity, and current income and do not pay a management fee. Income distributions from the Cash Funds are declared daily and paid monthly from net investment income. Income distributions earned by the fund are recorded as either interest income or security lending income in the accompanying financial statements.
Brokerage Commissions. The fund placed a portion of its portfolio transactions with brokerage firms which are affiliates of FMR. The commissions paid to these affiliated firms were $1,177,000 for the period.
Annual Report
Notes to Financial Statements - continued
5. Security Lending.
The fund lends portfolio securities from time to time in order to earn additional income. The fund receives collateral in the form of U.S. Treasury obligations, letters of credit, and/or cash against the loaned securities, and maintains collateral in an amount not less than 100% of the market value of the loaned securities during the period of the loan. The market value of the loaned securities is determined at the close of business of the fund and any additional required collateral is delivered to the fund on the next business day. If the borrower defaults on its obligation to return the securities loaned because of insolvency or other reasons, the fund could experience delays and costs in recovering the securities loaned or in gaining access to the collateral. At period end, the value of the securities loaned amounted to $166,862,000. The fund received cash collateral of $179,339,000 which was invested in cash equivalents.
6. Expense Reductions.
FMR has directed certain portfolio trades to brokers who paid a portion of the fund's expenses. For the period, the fund's expenses were reduced by $3,090,000 under this arrangement.
In addition, through arrangements with the fund's custodian and transfer agent, credits realized as a result of uninvested cash balances were used to reduce a portion of the fund's expenses. During the period, the fund's custodian and transfer agent fees were reduced by $67,000, and $2,274,000, respectively, under these arrangements.
7. Transactions with Affiliated Companies.
An affiliated company is a company in which the fund has ownership of at least 5% of the voting securities. Transactions during the period with companies which are or were affiliates are as follows:
|
Summary of Transactions with Affiliated Companies |
||||||||
|
Amounts in thousands Affiliate |
|
Purchase |
|
Sales |
|
Dividend |
|
Value |
|
Abgenix, Inc. |
|
$ 121,156 |
|
$ 125,461 |
|
$ - |
|
$ - |
|
Adaptive Broadband Corp. |
|
73,582 |
|
19,980 |
|
- |
|
23,920 |
|
American Mobile Satellite Corp. |
|
- |
|
125 |
|
- |
|
- |
|
ANTEC Corp. |
|
17,155 |
|
22,035 |
|
- |
|
- |
|
Applera Corp. - |
|
79,454 |
|
58,210 |
|
- |
|
- |
|
Aspect Communications Corp. |
|
26,756 |
|
47,259 |
|
- |
|
39,191 |
|
CheckFree Holdings Corp. |
|
67,136 |
|
102,306 |
|
- |
|
- |
|
Clarent Corp. |
|
201,372 |
|
175,386 |
|
- |
|
25,990 |
|
EntreMed, Inc.. |
|
7,459 |
|
2,094 |
|
- |
|
17,664 |
|
FileNET Corp. |
|
52,464 |
|
38,420 |
|
- |
|
63,507 |
|
Genesis Microchip, Inc. |
|
- |
|
13,954 |
|
- |
|
- |
|
Gilead Sciences, Inc. |
|
- |
|
72,819 |
|
- |
|
- |
|
Harmonic, Inc. |
|
- |
|
7,764 |
|
- |
|
- |
Annual Report
Notes to Financial Statements - continued
7. Transactions with Affiliated Companies - continued
|
Summary of Transactions with Affiliated Companies - continued |
||||||||
|
Amounts in thousands Affiliate |
|
Purchase |
|
Sales |
|
Dividend |
|
Value |
|
iBasis, Inc. |
|
$ 10,338 |
|
$ 28,825 |
|
$ - |
|
$ - |
|
IDEC Pharmaceuticals Corp. |
|
35,714 |
|
39,035 |
|
- |
|
- |
|
Interact Commerce Corp. |
|
3,682 |
|
- |
|
- |
|
15,452 |
|
Interleaf, Inc. |
|
6,999 |
|
4,520 |
|
- |
|
- |
|
ITXC Corp. |
|
8,327 |
|
29,117 |
|
- |
|
- |
|
Macromedia, Inc. |
|
- |
|
- |
|
- |
|
169,792 |
|
Metricom, Inc.. |
|
46,293 |
|
66,459 |
|
- |
|
- |
|
Minerals Technologies, Inc.. |
|
2,903 |
|
29,404 |
|
180 |
|
49,781 |
|
MIPS Technologies, Inc. Class A |
|
49,579 |
|
- |
|
- |
|
52,942 |
|
MIPS Technologies, Inc. Class B |
|
10,036 |
|
- |
|
- |
|
40,262 |
|
Mylan Laboratories, Inc. |
|
6,809 |
|
- |
|
259 |
|
156,580 |
|
National Semiconductor Corp. |
|
56,589 |
|
149,549 |
|
- |
|
- |
|
Natural MicroSystems Corp. |
|
45,374 |
|
- |
|
- |
|
56,402 |
|
Net.B@nk, Inc. |
|
12,935 |
|
9,976 |
|
- |
|
12,049 |
|
Net2Phone, Inc. |
|
42,594 |
|
48,695 |
|
- |
|
- |
|
Netro Corp. |
|
92,660 |
|
11,426 |
|
- |
|
37,505 |
|
Network Appliance, Inc. |
|
59,796 |
|
51,380 |
|
- |
|
- |
|
New Era of Networks, Inc. |
|
13,820 |
|
36,607 |
|
- |
|
- |
|
Next Level Communications, Inc. |
|
40,264 |
|
9,542 |
|
- |
|
54,196 |
|
Proxim, Inc. |
|
56,417 |
|
57,315 |
|
- |
|
- |
|
QLT, Inc. |
|
20,723 |
|
71,147 |
|
- |
|
198,108 |
|
Research in Motion Ltd. |
|
126,140 |
|
155,968 |
|
- |
|
290,851 |
|
S3, Inc. |
|
14,429 |
|
27,884 |
|
- |
|
- |
|
Sepracor, Inc. |
|
142,803 |
|
- |
|
- |
|
534,800 |
|
Silicon Graphics, Inc. |
|
33,316 |
|
9,487 |
|
- |
|
45,706 |
|
SkyWest, Inc. |
|
15,361 |
|
- |
|
134 |
|
99,942 |
|
SONICblue, Inc. |
|
9,487 |
|
505 |
|
- |
|
30,737 |
|
Telaxis Communications Corp. |
|
6,103 |
|
7,291 |
|
- |
|
1,756 |
|
Tupperware Corp. |
|
21,496 |
|
21,811 |
|
2,880 |
|
59,636 |
|
Venator Group, Inc. |
|
17,149 |
|
- |
|
- |
|
109,244 |
|
TOTALS |
|
$ 1,654,670 |
|
$ 1,551,756 |
|
$ 3,453 |
|
$ 2,186,013 |
Annual Report
To the Trustees of Fidelity Mt. Vernon Street Trust and the Shareholders of Fidelity Growth Company Fund:
We have audited the accompanying statement of assets and liabilities of Fidelity Growth Company Fund, (the Fund), a fund of Fidelity Mt. Vernon Street Trust, including the portfolio of investments, as of November 30, 2000, and the related statement of operations, changes in net assets, and financial highlights for the year then ended. These financial statements and financial highlights are the responsibility of the Fund's management. Our responsibility is to express an opinion on these financial statements and financial highlights based on our audit. The statement of changes in net assets for the year ended November 30, 1999, and the financial highlights for each of the four years in the period then ended were audited by other auditors whose report, dated January 7, 2000, expressed an unqualified opinion on those statements and financial highlights.
We conducted our audit in accordance with auditing standards generally accepted in the United States of America. Those standards require that we plan and perform the audit to obtain reasonable assurance about whether the financial statements and financial highlights are free of material misstatement. An audit includes examining, on a test basis, evidence supporting the amounts and disclosures in the financial statements. Our procedures included confirmation of securities owned as of November 30, 2000, by correspondence with the custodian and brokers; where replies were not received from brokers, we performed other auditing procedures. An audit also includes assessing the accounting principles used and significant estimates made by management, as well as evaluating the overall financial statement presentation. We believe that our audit provides a reasonable basis for our opinion.
In our opinion, the financial statements and financial highlights referred to above present fairly, in all material respects, the financial position of Fidelity Growth Company Fund as of November 30, 2000, the results of its operations, the changes in its net assets, and its financial highlights for the year then ended, in conformity with accounting principles generally accepted in the United States of America.
/s/DELOITTE & TOUCHE LLP
DELOITTE & TOUCHE LLP
Boston, Massachusetts
January 8, 2001
Annual Report
The Board of Trustees of Fidelity Growth Company Fund voted to pay to shareholders of record at the opening of business on record date, the following distributions per share derived from capital gains realized from sales of portfolio securities, and dividends derived from net investment income:
|
Pay Date |
Record Date |
Dividends |
Capital Gains |
|
12/26/00 |
12/22/00 |
- |
$6.55 |
|
1/8/01 |
1/5/01 |
- |
$.16 |
The fund hereby designates 100% of the long-term capital gain dividends distributed during the fiscal year as 20%-rate capital gain dividends.
A total of 13% of the dividends distributed during the fiscal year qualifies for the dividends-received deduction for corporate shareholders.
The fund will notify shareholders in January 2001 of amounts for use in preparing 2000 income tax returns.
Annual Report
Fidelity offers several ways to conveniently manage your personal investments via your telephone or PC. You can access your account information, conduct trades and research your investments 24 hours a day.
By Phone
Fidelity Automated Service Telephone provides a single toll-free number to access account balances, positions, quotes and trading. It's easy to navigate the service, and on your first call, the system will help you create a personal identification number (PIN) for security.
(phone_graphic)
Fidelity Automated
Service Telephone (FAST®)
1-800-544-5555
Press
1 For mutual fund and brokerage trading.
2 For quotes.*
3 For account balances and holdings.
4 To review orders and mutual
fund activity.
5 To change your PIN.
*0 To speak to a Fidelity representative.
By PC
Fidelity's web site on the Internet provides a wide range of information, including daily financial news, fund performance, interactive planning tools and news about Fidelity products and services.
(computer_graphic)
Fidelity's Web Site
www.fidelity.com
If you are not currently on the Internet, call EarthLink Sprint at 1-800-288-2967, and be sure to ask for registration number SMD004 to receive a special Fidelity package that includes 30 days of free Internet access. EarthLink is North America's #1 independent Internet access provider.
(computer_graphic)
Fidelity On-line Xpress+®
Fidelity On-line Xpress+ software for Windows combines comprehensive portfolio management capabilities, securities trading and access to research and analysis tools . . . all on your desktop. Call Fidelity at 1-800-544-0240 or visit our web site for more information on how to manage your investments via your PC.
* When you call the quotes line, please remember that a fund's yield and return will vary and, except for money market funds, share price will also vary. This means that you may have a gain or loss when you sell your shares. There is no assurance that money market funds will be able to maintain a stable $1 share price; an investment in a money market fund is not insured or guaranteed by the U.S. government. Total returns are historical and include changes in share price, reinvestment of dividends and capital gains, and the effects of any sales charges.
Annual Report
For directions and hours,
please call 1-800-544-9797.
Arizona
7373 N. Scottsdale Road
Scottsdale, AZ
California
815 East Birch Street
Brea, CA
851 East Hamilton Avenue
Campbell, CA
527 North Brand Boulevard
Glendale, CA
19200 Von Karman Avenue
Irvine, CA
10100 Santa Monica Blvd.
Los Angeles, CA
251 University Avenue
Palo Alto, CA
1760 Challenge Way
Sacramento, CA
7676 Hazard Center Drive
San Diego, CA
8 Montgomery Street
San Francisco, CA
950 Northgate Drive
San Rafael, CA
1400 Civic Drive
Walnut Creek, CA
6300 Canoga Avenue
Woodland Hills, CA
Colorado
1625 Broadway
Denver, CO
Connecticut
48 West Putnam Avenue
Greenwich, CT
265 Church Street
New Haven, CT
300 Atlantic Street
Stamford, CT
29 South Main Street
West Hartford, CT
Delaware
222 Delaware Avenue
Wilmington, DE
Florida
4400 N. Federal Highway
Boca Raton, FL
90 Alhambra Plaza
Coral Gables, FL
4090 N. Ocean Boulevard
Ft. Lauderdale, FL
1907 West State Road 434
Longwood, FL
8880 Tamiami Trail, North
Naples, FL
2401 PGA Boulevard
Palm Beach Gardens, FL
8065 Beneva Road
Sarasota, FL
1502 N. Westshore Blvd.
Tampa, FL
Georgia
3445 Peachtree Road, N.E.
Atlanta, GA
1000 Abernathy Road
Atlanta, GA
Illinois
One North Franklin Street
Chicago, IL
1415 West 22nd Street
Oak Brook, IL
1700 East Golf Road
Schaumburg, IL
3232 Lake Avenue
Wilmette, IL
Indiana
4729 East 82nd Street
Indianapolis, IN
Maine
Three Canal Plaza
Portland, ME
Maryland
7401 Wisconsin Avenue
Bethesda, MD
One W. Pennsylvania Ave.
Towson, MD
Massachusetts
801 Boylston Street
Boston, MA
155 Congress Street
Boston, MA
25 State Street
Boston, MA
300 Granite Street
Braintree, MA
44 Mall Road
Burlington, MA
416 Belmont Street
Worcester, MA
Annual Report
Michigan
280 Old N. Woodward Ave.
Birmingham, MI
29155 Northwestern Hwy.
Southfield, MI
Minnesota
7600 France Avenue South
Edina, MN
Missouri
700 West 47th Street
Kansas City, MO
8885 Ladue Road
Ladue, MO
New Jersey
150 Essex Street
Millburn, NJ
56 South Street
Morristown, NJ
501 Route 17, South
Paramus, NJ
New York
1055 Franklin Avenue
Garden City, NY
999 Walt Whitman Road
Melville, L.I., NY
1271 Avenue of the Americas
New York, NY
71 Broadway
New York, NY
350 Park Avenue
New York, NY
North Carolina
4611 Sharon Road
Charlotte, NC
Ohio
600 Vine Street
Cincinnati, OH
28699 Chagrin Boulevard
Woodmere Village, OH
Oregon
16850 SW 72nd Avenue
Tigard, OR
Pennsylvania
1735 Market Street
Philadelphia, PA
439 Fifth Avenue
Pittsburgh, PA
Rhode Island
47 Providence Place
Providence, RI
Tennessee
6150 Poplar Avenue
Memphis, TN
Texas
10000 Research Boulevard
Austin, TX
4017 Northwest Parkway
Dallas, TX
1155 Dairy Ashford Street
Houston, TX
2701 Drexel Drive
Houston, TX
400 East Las Colinas Blvd.
Irving, TX
14100 San Pedro
San Antonio, TX
19740 IH 45 North
Spring, TX
Utah
215 South State Street
Salt Lake City, UT
Virginia
1861 International Drive
McLean, VA
Washington
411 108th Avenue, N.E.
Bellevue, WA
511 Pine Street
Seattle, WA
Washington, DC
1900 K Street, N.W.
Washington, DC
Wisconsin
595 North Barker Road
Brookfield, WI
Fidelity Brokerage Services, Inc., 100 Summer St., Boston, MA 02110 Member NYSE/SIPC
Annual Report
If more than one address is listed, please locate the address that is closest to you. We'll give your correspondence immediate attention and send you written confirmation upon completion of your request.
(letter_graphic)
Making Changes
To Your Account
(such as changing name, address, bank, etc.)
Fidelity Investments
P.O. Box 770001
Cincinnati, OH 45277-0002
(letter_graphic)
For Non-Retirement
Accounts
Buying shares
Fidelity Investments
P.O. Box 770001
Cincinnati, OH 45277-0003
Overnight Express
Fidelity Investments
2300 Litton Lane - KH1A
Hebron, KY 41048
Selling shares
Fidelity Investments
P.O. Box 660602
Dallas, TX 75266-0602
Overnight Express
Fidelity Investments
Attn: Redemptions - CP6I
400 East Las Colinas Blvd.
Irving, TX 75039-5587
General Correspondence
Fidelity Investments
P.O. Box 500
Merrimack, NH 03054-0500
(letter_graphic)
For Retirement
Accounts
Buying shares
Fidelity Investments
P.O. Box 770001
Cincinnati, OH 45277-0003
Selling shares
Fidelity Investments
P.O. Box 660602
Dallas, TX 75266-0602
Overnight Express
Fidelity Investments
Attn: Redemptions - CP6R
400 East Las Colinas Blvd.
Irving, TX 75039-5587
General Correspondence
Fidelity Investments
P.O. Box 500
Merrimack, NH 03054-0500
Annual Report
Annual Report
Investment Adviser
Fidelity Management & Research Company
Boston, MA
Investment Sub-Advisers
Fidelity Management & Research
(U.K.) Inc.
Fidelity Management & Research
(Far East) Inc.
Fidelity Investments Japan Limited
Officers
Edward C. Johnson 3d, President
Robert C. Pozen, Senior Vice President
Abigail P. Johnson, Vice President
Steven S. Wymer, Vice President
Eric D. Roiter, Secretary
Robert A. Dwight, Treasurer
Maria F. Dwyer, Deputy Treasurer
John H. Costello, Assistant Treasurer
Thomas J. Simpson, Assistant Treasurer
Board of Trustees
Ralph F. Cox *
Phyllis Burke Davis *
Robert M. Gates *
Edward C. Johnson 3d
Donald J. Kirk *
Ned C. Lautenbach *
Peter S. Lynch
Marvin L. Mann *
William O. McCoy *
Gerald C. McDonough *
Robert C. Pozen
Thomas R. Williams *
Advisory Board
J. Michael Cook
Marie L. Knowles
William S. Stavropoulos
General Distributor
Fidelity Distributors Corporation
Boston, MA
Transfer and Shareholder
Servicing Agent
Fidelity Service Company, Inc.
Boston, MA
* Independent trustees
Custodian
Brown Brothers Harriman & Co.
Boston, MA
Fidelity's Growth Funds
Aggressive Growth Fund
Blue Chip Growth Fund
Capital Appreciation Fund
Contrafund ®
Contrafund®II
Disciplined Equity Fund
Dividend Growth Fund
Export and Multinational Fund
Fidelity Fifty ®
Growth Company Fund
Independence Fund
Large Cap Stock Fund
Low-Priced Stock Fund
Magellan® Fund
Mid-Cap Stock Fund
New Millennium Fund®
OTC Portfolio
Small Cap Selector
Small Cap Stock Fund
Stock Selector
Tax Managed Stock Fund
TechnoQuant® Growth Fund
Trend Fund
Value Fund
The Fidelity Telephone Connection
Mutual Fund 24-Hour Service
Exchanges/Redemptions
and Account Assistance 1-800-544-6666
Product Information 1-800-544-6666
Retirement Accounts 1-800-544-4774
(8 a.m. - 9 p.m.)
TDD Service 1-800-544-0118
for the deaf and hearing impaired
(9 a.m. - 9 p.m. Eastern time)
Fidelity Automated Service
Telephone (FAST®) (automated graphic) 1-800-544-5555
(automated graphic) Automated line for quickest service
GCF-ANN-0101 122334
1.539089.103
(Fidelity Investment logo)(registered trademark)
Corporate Headquarters
82 Devonshire St., Boston, MA 02109
www.fidelity.com
Fidelity®
Fund®
Annual Report
November 30, 2000
(2_fidelity_logos)(Registered_trademark)
|
President's Message |
Ned Johnson on investing strategies. |
|
|
Performance |
How the fund has done over time. |
|
|
Fund Talk |
The manager's review of fund performance, strategy and outlook. |
|
|
Investment Changes |
A summary of major shifts in the fund's investments over the past six months. |
|
|
Investments |
A complete list of the fund's investments with their market values. |
|
|
Financial Statements |
Statements of assets and liabilities,
operations, and changes in net assets, |
|
|
Notes |
Footnotes to the financial statements. |
|
|
Report of Independent Accountants |
The auditors' opinion. |
|
|
Distributions |
|
Standard & Poor's, S&P and S&P 500 are registered service marks of The McGraw-Hill Companies, Inc. and have been licensed for use by Fidelity Distributors Corporation.
Other third party marks appearing herein are the property of their respective owners.
All other marks appearing herein are registered or unregistered trademarks or service marks of FMR Corp. or an affiliated company.
(Recycle graphic) This report is printed on recycled paper using soy-based inks.
This report and the financial statements contained herein are submitted for the general information of the shareholders of the fund. This report is not authorized for distribution to prospective investors in the fund unless preceded or accompanied by an effective prospectus.
Mutual fund shares are not deposits or obligations of, or guaranteed by, any depository institution. Shares are not insured by the FDIC, Federal Reserve Board or any other agency, and are subject to investment risks, including possible loss of principal amount invested.
Neither the fund nor Fidelity Distributors Corporation is a bank.
For more information on any Fidelity fund, including charges and expenses, call 1-800-544-6666 for a free prospectus. Read it carefully before you invest or send money.
Annual Report
(Photograph of Edward C. Johnson 3d.)
Dear Shareholder:
For the first time since 1990, the taxable bond market, as measured by the Lehman Brothers Aggregate Bond Index, appeared nearly certain to outperform the U.S. stock market, as measured by the S&P 500®. The former was up nearly 10% year to date through November, while the S&P 500 was down by approximately the same amount. Disappointing corporate earnings and uncertainty concerning a president-elect toppled the stock market late in the period.
While it's impossible to predict the future direction of the markets with any degree of certainty, there are certain basic principles that can help investors plan for their future needs.
First, investors are encouraged to take a long-term view of their portfolios. If you can afford to leave your money invested through the inevitable up and down cycles of the financial markets, you will greatly reduce your vulnerability to any single decline. We know from experience, for example, that stock prices have gone up over longer periods of time, have significantly outperformed other types of investments and have stayed ahead of inflation.
Second, you can further manage your investing risk through diversification. A stock mutual fund, for instance, is already diversified, because it invests in many different companies. You can increase your diversification further by investing in a number of different stock funds, or in such other investment categories as bonds. If you have a short investment time horizon, you might want to consider moving some of your investment into a money market fund, which seeks income and a stable share price by investing in high-quality, short-term investments. Of course, it's important to remember that an investment in a money market fund is not insured or guaranteed by the Federal Deposit Insurance Corporation or any other government agency. Although money market funds seek to preserve the value of your investment at $1.00 per share, it is possible to lose money by investing in these types of funds.
Finally, no matter what your time horizon or portfolio diversity, it makes good sense to follow a regular investment plan, investing a certain amount of money in a fund at the same time each month or quarter and periodically reviewing your overall portfolio. By doing so, you won't get caught up in the excitement of a rapidly rising market, nor will you buy all your shares at market highs. While this strategy - known as dollar cost averaging - won't assure a profit or protect you from a loss in a declining market, it should help you lower the average cost of your purchases. Of course, you should consider your financial ability to continue your purchases through periods of low price levels before undertaking such a strategy.
If you have questions, please call us at 1-800-544-6666, or visit our web site at www.fidelity.com. We are available 24 hours a day, seven days a week to provide you the information you need to make the investments that are right for you.
Best regards,
/s/Edward C. Johnson 3d
Edward C. Johnson 3d
Annual Report
There are several ways to evaluate a fund's historical performance. You can look at the total percentage change in value, the average annual percentage change or the growth of a hypothetical $10,000 investment. Total return reflects the change in the value of an investment, assuming reinvestment of the fund's dividend income and capital gains (the profits earned upon the sale of securities that have grown in value).
Cumulative Total Returns
|
Periods ended November 30, 2000 |
|
Past 1 |
Past 5 |
Life of |
|
Fidelity New Millennium |
|
12.44% |
262.14% |
589.09% |
|
Fidelity New Millennium |
|
9.07% |
251.28% |
568.41% |
|
S&P 500 ® |
|
-4.22% |
135.29% |
251.51% |
|
Capital Appreciation Funds Average |
|
-0.59% |
107.59% |
n/a* |
Cumulative total returns show the fund's performance in percentage terms over a set period - in this case, one year, five years or since the fund started on December 28, 1992. For example, if you had invested $1,000 in a fund that had a 5% return over the past year, the value of your investment would be $1,050. You can compare the fund's returns to the performance of the Standard & Poor's 500SM Index - a market capitalization-weighted index of common stocks. To measure how the fund's performance stacked up against its peers, you can compare it to the capital appreciation funds average, which reflects the performance of mutual funds with similar objectives tracked by Lipper Inc. The past one year average represents a peer group of 302 mutual funds. These benchmarks include reinvested dividends and capital gains, if any, and exclude the effect of sales charges. Lipper has created new comparison categories that group funds according to portfolio characteristics and capitalization, as well as by capitalization only. These averages are listed on page 5 of this report.(dagger)
Average Annual Total Returns
|
Periods ended November 30, 2000 |
Past 1 |
Past 5 |
Life of |
|
Fidelity New Millennium |
12.44% |
29.35% |
27.56% |
|
Fidelity New Millennium |
9.07% |
28.57% |
27.07% |
|
S&P 500 |
-4.22% |
18.66% |
17.18% |
|
Capital Appreciation Funds Average |
-0.59% |
14.18% |
n/a* |
Average annual total returns take the fund's cumulative return and show you what would have happened if the fund had performed at a constant rate each year. (Note: Lipper calculates average annual total returns by annualizing each fund's total return, then taking an arithmetic average. This may produce a different figure than that obtained by averaging the cumulative total returns and annualizing the result.)
* Not available
Annual Report
$10,000 Over Life of Fund

$10,000 Over Life of Fund: Let's say hypothetically that $10,000 was invested in Fidelity New Millennium Fund on December 28, 1992, when the fund started, and the current 3.00% sales charge was paid. As the chart shows, by November 30, 2000, the value of the investment would have grown to $66,841 - a 568.41% increase on the initial investment. For comparison, look at how the Standard & Poor's 500 Index did over the same period. With dividends and capital gains, if any, reinvested, the same $10,000 would have grown to $35,151 - a 251.51% increase.
Understanding
Performance
How a fund did yesterday is no guarantee of how it will do tomorrow. The stock market, for example, has a history of long-term growth and short-term volatility. In turn, the share price and return of a fund that invests in stocks will vary. That means if you sell your shares during a market downturn, you might lose money. But if you can ride out the market's ups and downs, you may have a gain.
3(dagger) The Lipper multi-cap growth funds average reflects the performance (excluding sales charges) of mutual funds with similar portfolio characteristics and capitalization. The Lipper multi-cap supergroup average reflects the performance (excluding sales charges) of mutual funds with similar capitalization. As of November 30, 2000, the one year and five year cumulative total returns for the multi-cap growth funds average were 0.35% and 132.27%, respectively; and the one year and five year average annual total returns were 0.35% and 17.93%, respectively. The one year and five year cumulative total returns for the multi-cap supergroup average were 2.68% and 107.13%, respectively; and the one year and five year average annual total returns were 2.68% and 15.27%, respectively.
Annual Report
Market Recap
After a promising beginning, U.S. equity markets were hammered by a convergence of adverse conditions during the remainder of the 12-month period ending November 30, 2000. The tech-heavy NASDAQ Composite Index was particularly hard hit. After successfully weathering the Federal Reserve Board's campaign to calm surging economic growth, the technology sector's grip on market leadership finally weakened in mid-March, when analysts warned that valuations were overinflated. Then, in May, the markets were rocked by a 0.50% Fed interest-rate hike, and signs soon emerged that clearly indicated a slowdown ahead. Escalating oil prices put additional strain on corporate profits, and disappointing earnings announcements began to pile up. Any hopes for a late season rally were broadsided by the uncertainty stemming from the presidential election in November. The resulting anxiety weighed the markets down to their lowest point of the year. For the overall period, the Standard & Poor's 500SM Index fell 4.22%, the Dow Jones Industrial Average sank 2.77% and the NASDAQ plunged 21.99%. Investors should keep in mind, however, that the last two times the NASDAQ had negative calendar year returns, in 1990 and 1994, the index responded with gains of 59.01% and 41.40% in 1991 and 1995, respectively. Of course, past performance is no guarantee of future results.
(Portfolio Manager photograph)
An interview with Neal Miller, Portfolio Manager of Fidelity New Millennium Fund
Q. How did the fund perform, Neal?
A. For the 12 months that ended November 30, 2000, the fund returned 12.44%. This topped the Standard & Poor's 500 Index, which fell 4.22% during the period, as well as the capital appreciation funds average, which returned -0.59% according to Lipper Inc.
Q. What factors shaped the fund's performance during the period?
A. It was a very challenging market for stock pickers. The fund rode the technology wave of the period, but cracks in some of the underlying growth stories forced me to rethink some of my strategies. For instance, I adopted a completely different mindset on the Internet and was able to find some good opportunities in that space even as the consumer-oriented dot-com market struggled. I also uncovered some fruitful trends in the health sector. My philosophy has always been to find the companies that I feel can exceed investors' expectations. This strategy continues to work, but it was easier said than done during the period, particularly with so much economic and political uncertainty. In the end, my willingness to re-engineer the fund's technology approach helped the fund's performance.
Annual Report
Fund Talk: The Manager's Overview - continued
Q. Where were you able to find opportunities in the Internet group?
A. My main focus revolved around the need to organize information in such a way that people can access it simultaneously from a variety of platforms. In today's information age, data needs to be portable, disposable and accurate. Several companies - including QLogic in the NT environment and Emulex in the UNIX environment - are leaders in determining how to merge information from two separate sources to one common source. Once the information is merged, you then need to have a company that can configure the storage space - such as Sun Microsystems or EMC - and someone to actually manage the storage, like Veritas Software. As time goes on, companies' information technology budgets may tilt more toward enhancing storage capabilities and less toward increasing processing power. Emulex, Veritas and QLogic were the fund's top three performers during the period.
Q. You increased the fund's exposure to health stocks from around 5% of net assets to 17% during the period. What caught your attention?
A. A couple of interesting trends. The first revolved around the developing notion of customized medicine. We're getting closer and closer to the day when genetic engineering will be able to suggest certain therapies that will work for a particular patient. These therapies may be administered by devices that will either inject the medicine on a timed schedule or, at the very least, give off some sort of reminder to the patient. Two companies in this area that caught my attention during the period were Medtronic and C.R. Bard. Another area that interested me was the re-emergence of "new and improved" health care service providers. Companies such as Tenet Healthcare and HCA Healthcare have fixed their financial problems and have enjoyed favorable pricing trends. Lastly, I also found some good growth in the biotechnology area. The fund's best biotech performer during the period was Immunex. The company discovered that a drug it had initially developed for the treatment of arthritis also had the potential to reverse the course of congestive heart failure.
Q. Which other stocks performed well during the period? Which were disappointments?
A. Energy services stocks such as Global Marine and Smith International performed well, as did several of the fund's electric utility related holdings, including Calpine and Dynegy. The fund's investments in high-end retail stocks such as Bulgari, an Italian designer of jewelry and perfumes, also performed well. Disappointments included Openwave Systems, a company that provides Web-based communication infrastructure software and applications, and MTI Technology, a storage company that counted a number of struggling dot-com firms among its clientele.
Q. What's your outlook, Neal?
A. Compared to this time a year ago, investors' expectations for the market have been greatly reduced. Uncertainty has infiltrated all corners of the market, and only time will tell whether the economy
Annual Report
Fund Talk: The Manager's Overview - continued
can land softly, where oil prices will go and how the U.S. presidential situation will play out. In terms of managing the fund, I'll continue to stick by my philosophy that favorable earnings will be rewarded over time.
The views expressed in this report reflect those of the portfolio manager only through the end of the period of the report as stated on the cover and do not necessarily represent the views of Fidelity or any other person in the Fidelity organization. Any such views are subject to change at any time based upon market or other conditions and Fidelity disclaims any responsibility to update such views. These views may not be relied on as investment advice and, because investment decisions for a Fidelity fund are based on numerous factors, may not be relied on as an indication of trading intent on behalf of any Fidelity fund.
Fund Facts
Goal: long-term capital appreciation by investing mainly in equity securities of companies that are likely to benefit from social and economic trends
Fund number: 300
Trading symbol: FMILX
Start date: December 28, 1992
Size: as of November 30, 2000, more than $3.3 billion
Manager: Neal Miller, since inception; joined Fidelity in 1988
3Neal Miller talks about being an "idea" investor:
"When I come across an idea, my first steps are to analyze its merits and determine what types of companies can make that idea a reality. One good example from the past involved ulcers. I remember wondering if there was a good cure for ulcers. Ulcers affected many people, you knew for sure when you had one and there was no alternative therapy. My pursuit led me to SmithKline - now known as SmithKline Beecham - which was in the process of developing a new ulcer-fighting drug. The product? Tagamet. Of course, one of the keys was investing in the idea before SmithKline commercialized Tagamet. That was back in the early 1970s.
"Back in the 1950s - when I was dabbling with investments as a high schooler - I heard about a new process called xerography, or photocopying. At the time, all copies were made with carbon or chemically treated paper, and this new process - with its ability to replicate pictures - was promising. I promptly added a company called Haloid, which was the original name of Xerox, to my portfolio.
"The point is that behind every good stock story is an even better idea. But the idea needs to grow, and it needs to be supported by investors who feel the idea has real, long-term value. The dot-coms found out the hard way that Internet-related ideas had their limits. Hopefully, investor confidence will be restored in 2001 and new ideas will get a closer look."
Annual Report
|
Top Ten Stocks as of November 30, 2000 |
||
|
|
% of fund's |
% of fund's net assets |
|
QLogic Corp. |
7.7 |
3.2 |
|
Emulex Corp. |
5.7 |
1.6 |
|
Immunex Corp. |
3.5 |
2.4 |
|
Micron Technology, Inc. |
3.2 |
6.8 |
|
Global Marine, Inc. |
2.8 |
3.2 |
|
VERITAS Software Corp. |
2.5 |
3.8 |
|
Juniper Networks, Inc. |
1.9 |
1.4 |
|
The Stanley Works |
1.8 |
1.6 |
|
Dynegy, Inc. Class A |
1.8 |
1.6 |
|
Andrew Corp. |
1.8 |
3.0 |
|
|
32.7 |
|
|
Top Five Market Sectors as of November 30, 2000 |
||
|
|
% of fund's |
% of fund's net assets |
|
Technology |
43.0 |
53.2 |
|
Health |
17.0 |
5.4 |
|
Energy |
8.7 |
11.5 |
|
Media & Leisure |
7.3 |
3.4 |
|
Finance |
5.0 |
4.0 |
|
Asset Allocation (% of fund's net assets) |
|||||||
|
As of November 30, 2000 * |
As of May 31, 2000 ** |
||||||
|
Stocks 94.5% |
|
|
Stocks 95.9% |
|
||
|
Short-Term |
|
|
Short-Term |
|
||
|
* Foreign |
6.9% |
|
** Foreign investments |
8.9% |
|
||

Annual Report
Showing Percentage of Net Assets
|
Common Stocks - 94.5% |
|||
|
Shares |
Value (Note 1) (000s) |
||
|
AEROSPACE & DEFENSE - 0.1% |
|||
|
Defense Electronics - 0.1% |
|||
|
Raytheon Co. Class B |
94,700 |
$ 3,320 |
|
|
BASIC INDUSTRIES - 1.1% |
|||
|
Chemicals & Plastics - 0.0% |
|||
|
Cabot Microelectronics Corp. |
21,700 |
797 |
|
|
Metals & Mining - 0.9% |
|||
|
Martin Marietta Materials, Inc. |
717,400 |
28,251 |
|
|
Packaging & Containers - 0.2% |
|||
|
Bemis Co., Inc. |
199,700 |
5,929 |
|
|
Packaging Corp. of America |
80,000 |
1,175 |
|
|
|
7,104 |
||
|
TOTAL BASIC INDUSTRIES |
36,152 |
||
|
CONSTRUCTION & REAL ESTATE - 0.5% |
|||
|
Building Materials - 0.5% |
|||
|
Fastenal Co. |
5,500 |
339 |
|
|
Florida Rock Industries, Inc. |
475,900 |
15,734 |
|
|
|
16,073 |
||
|
Construction - 0.0% |
|||
|
Centex Corp. |
17,800 |
630 |
|
|
TOTAL CONSTRUCTION & REAL ESTATE |
16,703 |
||
|
DURABLES - 1.1% |
|||
|
Autos, Tires, & Accessories - 0.0% |
|||
|
AutoZone, Inc. (a) |
17,800 |
459 |
|
|
O'Reilly Automotive, Inc. (a) |
12,400 |
206 |
|
|
|
665 |
||
|
Consumer Electronics - 0.1% |
|||
|
Gemstar-TV Guide International, Inc. (a) |
55,000 |
2,238 |
|
|
Harman International Industries, Inc. |
17,800 |
650 |
|
|
|
2,888 |
||
|
Home Furnishings - 0.6% |
|||
|
Ethan Allen Interiors, Inc. |
52,100 |
1,416 |
|
|
Hillenbrand Industries, Inc. |
336,700 |
17,172 |
|
|
|
18,588 |
||
|
Textiles & Apparel - 0.4% |
|||
|
Brown Shoe Co., Inc. |
23,500 |
251 |
|
|
Common Stocks - continued |
|||
|
Shares |
Value (Note 1) (000s) |
||
|
DURABLES - continued |
|||
|
Textiles & Apparel - continued |
|||
|
Coach, Inc. |
118,800 |
$ 2,628 |
|
|
Columbia Sportswear Co. (a) |
61,500 |
2,546 |
|
|
Reebok International Ltd. (a) |
117,200 |
2,498 |
|
|
Stride Rite Corp. |
1,029,800 |
6,114 |
|
|
|
14,037 |
||
|
TOTAL DURABLES |
36,178 |
||
|
ENERGY - 8.7% |
|||
|
Energy Services - 8.7% |
|||
|
Atwood Oceanics, Inc. (a) |
154,000 |
4,861 |
|
|
Cal Dive International, Inc. (a) |
327,400 |
6,425 |
|
|
ENSCO International, Inc. |
1,992,800 |
48,450 |
|
|
Global Marine, Inc. (a) |
4,333,800 |
95,073 |
|
|
Marine Drilling Companies, Inc. (a) |
1,355,300 |
27,106 |
|
|
Noble Drilling Corp. (a) |
586,500 |
16,899 |
|
|
R&B Falcon Corp. (a) |
1,865,300 |
35,441 |
|
|
Santa Fe International Corp. |
191,600 |
4,730 |
|
|
Smith International, Inc. (a) |
768,400 |
44,615 |
|
|
Tidewater, Inc. |
238,800 |
9,671 |
|
|
|
293,271 |
||
|
FINANCE - 5.0% |
|||
|
Banks - 0.0% |
|||
|
SouthTrust Corp. |
35,300 |
1,191 |
|
|
Credit & Other Finance - 0.1% |
|||
|
Federal Agricultural Mortgage Corp. Class C (non-vtg.) (a) |
84,400 |
1,688 |
|
|
JAFCO Co. Ltd. |
18,000 |
1,892 |
|
|
|
3,580 |
||
|
Insurance - 0.4% |
|||
|
ACE Ltd. |
166,000 |
6,557 |
|
|
Brown & Brown, Inc. |
61,400 |
1,942 |
|
|
Progressive Corp. |
26,600 |
2,489 |
|
|
W.R. Berkley Corp. |
16,900 |
606 |
|
|
|
11,594 |
||
|
Savings & Loans - 0.1% |
|||
|
Washington Mutual, Inc. |
97,300 |
4,421 |
|
|
Securities Industry - 4.4% |
|||
|
A.F.P. Provida SA sponsored ADR |
14,500 |
299 |
|
|
Common Stocks - continued |
|||
|
Shares |
Value (Note 1) (000s) |
||
|
FINANCE - continued |
|||
|
Securities Industry - continued |
|||
|
Bear Stearns Companies, Inc. |
54,000 |
$ 2,481 |
|
|
Daiwa Securities Group, Inc. |
5,045,000 |
53,252 |
|
|
Nikko Securities Co. Ltd. |
4,253,000 |
32,715 |
|
|
Nomura Securities Co. Ltd. |
2,745,000 |
57,949 |
|
|
UBS AG (NY Shares) (a) |
15,630 |
2,145 |
|
|
|
148,841 |
||
|
TOTAL FINANCE |
169,627 |
||
|
HEALTH - 17.0% |
|||
|
Drugs & Pharmaceuticals - 7.8% |
|||
|
Abgenix, Inc. (a) |
67,000 |
3,270 |
|
|
Allergan, Inc. |
417,600 |
38,759 |
|
|
Andrx Corp. - Andrx Group (a) |
39,400 |
2,812 |
|
|
Applera Corp. - Celera Genomics Group (a) |
177,200 |
7,376 |
|
|
Barr Laboratories, Inc. (a) |
57,000 |
3,438 |
|
|
Carter-Wallace, Inc. |
14,300 |
430 |
|
|
Celgene Corp. (a) |
67,500 |
3,852 |
|
|
Cephalon, Inc. (a) |
84,900 |
3,927 |
|
|
Chiron Corp. (a) |
35,200 |
1,439 |
|
|
COR Therapeutics, Inc. (a) |
65,800 |
2,332 |
|
|
Decode Genetics, Inc. |
94,600 |
999 |
|
|
Genentech, Inc. (a) |
136,000 |
9,257 |
|
|
Human Genome Sciences, Inc. (a) |
177,100 |
11,013 |
|
|
ImClone Systems, Inc. (a) |
33,800 |
1,500 |
|
|
Immunex Corp. (a) |
3,117,200 |
115,921 |
|
|
ImmunoGen, Inc. (a) |
55,100 |
1,388 |
|
|
Inhale Therapeutic Systems, Inc. (a) |
24,900 |
959 |
|
|
Invitrogen Corp. (a) |
3,600 |
259 |
|
|
King Pharmaceuticals, Inc. (a) |
7,100 |
346 |
|
|
Medarex, Inc. (a) |
23,200 |
841 |
|
|
Mylan Laboratories, Inc. |
618,500 |
14,805 |
|
|
SICOR, Inc. (a) |
17,800 |
266 |
|
|
Teva Pharmaceutical Industries Ltd. ADR |
426,600 |
28,049 |
|
|
Watson Pharmaceuticals, Inc. (a) |
209,200 |
9,623 |
|
|
|
262,861 |
||
|
Medical Equipment & Supplies - 3.4% |
|||
|
Abbott Laboratories |
53,400 |
2,940 |
|
|
ADAC Laboratories (a) |
19,500 |
358 |
|
|
ATS Medical, Inc. (a) |
60,300 |
769 |
|
|
Common Stocks - continued |
|||
|
Shares |
Value (Note 1) (000s) |
||
|
HEALTH - continued |
|||
|
Medical Equipment & Supplies - continued |
|||
|
C.R. Bard, Inc. |
568,300 |
$ 27,989 |
|
|
Cardinal Health, Inc. |
105,200 |
10,513 |
|
|
McKesson HBOC, Inc. |
966,300 |
31,767 |
|
|
Medtronic, Inc. |
630,518 |
33,575 |
|
|
Millipore Corp. |
32,900 |
1,448 |
|
|
Novoste Corp. (a) |
32,200 |
827 |
|
|
Patterson Dental Co. (a) |
14,300 |
425 |
|
|
Priority Healthcare Corp. Class B (a) |
19,000 |
518 |
|
|
Respironics, Inc. (a) |
26,600 |
653 |
|
|
Steris Corp. (a) |
54,300 |
815 |
|
|
|
112,597 |
||
|
Medical Facilities Management - 5.8% |
|||
|
Advance Paradigm, Inc. (a) |
6,000 |
199 |
|
|
HCA - The Healthcare Co. |
1,230,300 |
50,981 |
|
|
Health Management Associates, Inc. Class A (a) |
35,500 |
757 |
|
|
Health Net, Inc. (a) |
32,200 |
757 |
|
|
HEALTHSOUTH Corp. (a) |
71,000 |
990 |
|
|
Humana, Inc. (a) |
393,600 |
4,723 |
|
|
Lifepoint Hospitals, Inc. (a) |
37,400 |
1,480 |
|
|
Lincare Holdings, Inc. (a) |
31,100 |
1,372 |
|
|
Manor Care, Inc. (a) |
58,400 |
993 |
|
|
Oxford Health Plans, Inc. (a) |
384,900 |
15,613 |
|
|
Province Healthcare Co. (a) |
28,500 |
1,051 |
|
|
RehabCare Group, Inc. (a) |
13,300 |
575 |
|
|
Tenet Healthcare Corp. |
1,000,800 |
42,597 |
|
|
Triad Hospitals, Inc. (a) |
153,700 |
4,592 |
|
|
Trigon Healthcare, Inc. (a) |
181,600 |
13,018 |
|
|
UnitedHealth Group, Inc. |
250,500 |
29,387 |
|
|
Universal Health Services, Inc. Class B (a) |
121,200 |
12,415 |
|
|
Wellpoint Health Networks, Inc. (a) |
134,400 |
14,490 |
|
|
|
195,990 |
||
|
TOTAL HEALTH |
571,448 |
||
|
HOLDING COMPANIES - 0.0% |
|||
|
Leucadia National Corp. |
18,500 |
511 |
|
|
INDUSTRIAL MACHINERY & EQUIPMENT - 3.2% |
|||
|
Electrical Equipment - 0.8% |
|||
|
C&D Technologies, Inc. |
35,500 |
1,447 |
|
|
Common Stocks - continued |
|||
|
Shares |
Value (Note 1) (000s) |
||
|
INDUSTRIAL MACHINERY & EQUIPMENT - continued |
|||
|
Electrical Equipment - continued |
|||
|
Cymer, Inc. (a) |
75,300 |
$ 1,506 |
|
|
Hydrogenics Corp. |
76,500 |
202 |
|
|
Littelfuse, Inc. (a) |
32,000 |
820 |
|
|
Scientific-Atlanta, Inc. |
591,300 |
23,874 |
|
|
|
27,849 |
||
|
Industrial Machinery & Equipment - 1.9% |
|||
|
Ag-Chem Equipment, Inc. (a) |
16,000 |
369 |
|
|
Ibis Technology Corp. (a) |
37,200 |
512 |
|
|
Ionics, Inc. (a) |
161,000 |
3,602 |
|
|
The Stanley Works |
2,273,900 |
61,253 |
|
|
Ultratech Stepper, Inc. (a) |
4,400 |
77 |
|
|
|
65,813 |
||
|
Pollution Control - 0.5% |
|||
|
Allied Waste Industries, Inc. (a) |
98,100 |
1,208 |
|
|
Waste Management, Inc. |
594,500 |
14,231 |
|
|
|
15,439 |
||
|
TOTAL INDUSTRIAL MACHINERY & EQUIPMENT |
109,101 |
||
|
MEDIA & LEISURE - 7.3% |
|||
|
Broadcasting - 1.9% |
|||
|
AT&T Corp. - Liberty Media Group Class A (a) |
254,804 |
3,456 |
|
|
BHC Communications, Inc. Class A |
161,100 |
21,104 |
|
|
Cablevision Systems Corp. Class A (a) |
148,100 |
11,293 |
|
|
Cox Communications, Inc. Class A (a) |
351,300 |
13,986 |
|
|
E.W. Scripps Co. Class A |
83,300 |
4,920 |
|
|
EchoStar Communications Corp. Class A (a) |
81,700 |
2,385 |
|
|
Infinity Broadcasting Corp. Class A (a) |
51,700 |
1,564 |
|
|
TV Azteca SA de CV sponsored ADR |
330,000 |
3,300 |
|
|
|
62,008 |
||
|
Entertainment - 1.4% |
|||
|
International Speedway Corp.: |
|
|
|
|
Class A |
375,538 |
14,083 |
|
|
Class B |
174,700 |
6,508 |
|
|
Mandalay Resort Group (a) |
496,600 |
9,901 |
|
|
MGM Mirage, Inc. |
251,200 |
7,191 |
|
|
Common Stocks - continued |
|||
|
Shares |
Value (Note 1) (000s) |
||
|
MEDIA & LEISURE - continued |
|||
|
Entertainment - continued |
|||
|
Park Place Entertainment Corp. (a) |
571,600 |
$ 7,681 |
|
|
Speedway Motorsports, Inc. (a) |
94,100 |
1,817 |
|
|
|
47,181 |
||
|
Leisure Durables & Toys - 0.0% |
|||
|
Callaway Golf Co. |
76,700 |
1,357 |
|
|
Lodging & Gaming - 1.6% |
|||
|
Anchor Gaming (a) |
195,600 |
7,384 |
|
|
Four Seasons Hotels, Inc. |
56,600 |
3,460 |
|
|
Harrah's Entertainment, Inc. (a) |
174,100 |
4,875 |
|
|
International Game Technology (a) |
811,800 |
36,227 |
|
|
|
51,946 |
||
|
Publishing - 0.4% |
|||
|
Harcourt General, Inc. |
130,100 |
7,187 |
|
|
Houghton Mifflin Co. |
183,000 |
6,702 |
|
|
John Wiley & Sons, Inc. Class A |
44,800 |
896 |
|
|
|
14,785 |
||
|
Restaurants - 2.0% |
|||
|
Bob Evans Farms, Inc. |
5,300 |
108 |
|
|
Brinker International, Inc. (a) |
511,700 |
20,916 |
|
|
Cheesecake Factory, Inc. (a) |
593,250 |
25,695 |
|
|
Jack in the Box, Inc. (a) |
97,200 |
2,624 |
|
|
Outback Steakhouse, Inc. (a) |
281,300 |
7,648 |
|
|
P.F. Chang's China Bistro, Inc. (a) |
42,700 |
1,569 |
|
|
Quality Dining, Inc. (a) |
75,000 |
197 |
|
|
Sonic Corp. (a) |
33,800 |
1,318 |
|
|
Wendy's International, Inc. |
258,000 |
6,934 |
|
|
|
67,009 |
||
|
TOTAL MEDIA & LEISURE |
244,286 |
||
|
NONDURABLES - 0.4% |
|||
|
Agriculture - 0.0% |
|||
|
Charles River Labs International, Inc. |
21,500 |
460 |
|
|
Beverages - 0.1% |
|||
|
Brown-Forman Corp. Class B (non-vtg.) |
27,900 |
1,807 |
|
|
Common Stocks - continued |
|||
|
Shares |
Value (Note 1) (000s) |
||
|
NONDURABLES - continued |
|||
|
Foods - 0.1% |
|||
|
Archer-Daniels-Midland Co. |
97,900 |
$ 1,248 |
|
|
Tootsie Roll Industries, Inc. |
65,300 |
2,596 |
|
|
|
3,844 |
||
|
Household Products - 0.2% |
|||
|
Aptargroup, Inc. |
13,900 |
348 |
|
|
Estee Lauder Companies, Inc. Class A |
128,400 |
5,561 |
|
|
|
5,909 |
||
|
Tobacco - 0.0% |
|||
|
DIMON, Inc. |
94,400 |
325 |
|
|
Souza Cruz Industria Comerico |
50,000 |
200 |
|
|
Standard Commercial Corp. |
7,000 |
35 |
|
|
|
560 |
||
|
TOTAL NONDURABLES |
12,580 |
||
|
RETAIL & WHOLESALE - 2.0% |
|||
|
Apparel Stores - 0.6% |
|||
|
Chico's FAS, Inc. (a) |
204,200 |
4,977 |
|
|
Genesco, Inc. (a) |
17,700 |
377 |
|
|
Talbots, Inc. |
49,300 |
2,604 |
|
|
Venator Group, Inc. (a) |
910,500 |
12,235 |
|
|
|
20,193 |
||
|
Drug Stores - 0.4% |
|||
|
Walgreen Co. |
283,200 |
12,620 |
|
|
General Merchandise Stores - 0.1% |
|||
|
Kohls Corp. (a) |
49,800 |
2,667 |
|
|
Grocery Stores - 0.4% |
|||
|
Albertson's, Inc. |
296,500 |
7,579 |
|
|
Kroger Co. (a) |
161,000 |
4,267 |
|
|
Safeway, Inc. (a) |
14,400 |
849 |
|
|
Winn-Dixie Stores, Inc. |
17,800 |
385 |
|
|
|
13,080 |
||
|
Retail & Wholesale, Miscellaneous - 0.5% |
|||
|
Best Buy Co., Inc. (a) |
322,500 |
8,304 |
|
|
Bulgari Spa |
435,789 |
5,309 |
|
|
Common Stocks - continued |
|||
|
Shares |
Value (Note 1) (000s) |
||
|
RETAIL & WHOLESALE - continued |
|||
|
Retail & Wholesale, Miscellaneous - continued |
|||
|
Staples, Inc. (a) |
356,200 |
$ 4,274 |
|
|
Ultimate Electronics, Inc. (a) |
7,100 |
193 |
|
|
|
18,080 |
||
|
TOTAL RETAIL & WHOLESALE |
66,640 |
||
|
SERVICES - 1.2% |
|||
|
Advertising - 0.3% |
|||
|
Omnicom Group, Inc. |
111,600 |
8,775 |
|
|
PubliGroupe SA (Reg.) |
3,463 |
1,982 |
|
|
|
10,757 |
||
|
Educational Services - 0.6% |
|||
|
Corinthian Colleges, Inc. (a) |
58,200 |
3,841 |
|
|
Devry, Inc. (a) |
533,200 |
16,163 |
|
|
Edison Schools, Inc. |
19,600 |
473 |
|
|
|
20,477 |
||
|
Printing - 0.1% |
|||
|
Deluxe Corp. |
53,600 |
1,250 |
|
|
Wallace Computer Services, Inc. |
134,800 |
2,098 |
|
|
|
3,348 |
||
|
Services - 0.2% |
|||
|
ASE Test Ltd. (a) |
60,000 |
645 |
|
|
Caremark Rx, Inc. (a) |
328,100 |
3,568 |
|
|
Kelly Services, Inc. Class A |
1,000 |
24 |
|
|
Regis Corp. |
8,900 |
140 |
|
|
Rollins, Inc. |
6,500 |
136 |
|
|
StarTek, Inc. (a) |
119,200 |
1,937 |
|
|
Watson Wyatt & Co. Holdings |
16,800 |
369 |
|
|
|
6,819 |
||
|
TOTAL SERVICES |
41,401 |
||
|
TECHNOLOGY - 43.0% |
|||
|
Communications Equipment - 4.0% |
|||
|
Andrew Corp. (a) |
3,303,500 |
60,082 |
|
|
Avici Systems, Inc. |
58,000 |
1,225 |
|
|
Ciena Corp. (a) |
440,900 |
33,481 |
|
|
Comverse Technology, Inc. (a) |
113,000 |
9,739 |
|
|
Corning, Inc. |
69,759 |
4,081 |
|
|
Common Stocks - continued |
|||
|
Shares |
Value (Note 1) (000s) |
||
|
TECHNOLOGY - continued |
|||
|
Communications Equipment - continued |
|||
|
GN Store Nordic AS |
132,200 |
$ 1,854 |
|
|
McDATA Corp. Class B |
37,300 |
2,014 |
|
|
Nokia AB sponsored ADR |
35,700 |
1,526 |
|
|
Nortel Networks Corp. |
329,704 |
12,446 |
|
|
Plantronics, Inc. (a) |
210,400 |
8,232 |
|
|
|
134,680 |
||
|
Computer Services & Software - 13.3% |
|||
|
Adobe Systems, Inc. |
273,200 |
17,314 |
|
|
Aether Systems, Inc. (a) |
65,200 |
3,692 |
|
|
Agile Software Corp. (a) |
59,600 |
2,750 |
|
|
Akamai Technologies, Inc. (a) |
5,600 |
161 |
|
|
Ariba, Inc. (a) |
345,600 |
21,514 |
|
|
Art Technology Group, Inc. (a) |
94,600 |
2,714 |
|
|
BEA Systems, Inc. (a) |
400,700 |
23,466 |
|
|
Cadence Design Systems, Inc. (a) |
1,732,900 |
40,615 |
|
|
Cerner Corp. (a) |
10,700 |
523 |
|
|
CMGI, Inc. (a) |
124,487 |
1,253 |
|
|
Computer Associates International, Inc. |
444,600 |
11,615 |
|
|
Cybear Group (a) |
431 |
0 |
|
|
FactSet Research Systems, Inc. |
37,200 |
1,194 |
|
|
Foundry Networks, Inc. |
130,500 |
4,812 |
|
|
i2 Technologies, Inc. (a) |
3,520 |
340 |
|
|
IMS Health, Inc. |
124,900 |
3,497 |
|
|
Internap Network Services Corp. |
404,400 |
4,448 |
|
|
Internet Security Systems, Inc. (a) |
5,200 |
384 |
|
|
J.D. Edwards & Co. (a) |
149,700 |
3,799 |
|
|
Legato Systems, Inc. (a) |
196,200 |
1,790 |
|
|
Manugistics Group, Inc. (a) |
133,500 |
10,113 |
|
|
Mentor Graphics Corp. (a) |
305,300 |
7,213 |
|
|
Mercury Interactive Corp. (a) |
42,000 |
2,827 |
|
|
Micromuse, Inc. (a) |
331,300 |
29,113 |
|
|
Microsoft Corp. (a) |
39,100 |
2,243 |
|
|
Netegrity, Inc. (a) |
121,300 |
5,603 |
|
|
Nuance Communications, Inc. |
120,800 |
3,692 |
|
|
Openwave Systems, Inc. (a) |
1,067,616 |
48,710 |
|
|
PeopleSoft, Inc. (a) |
136,200 |
4,529 |
|
|
Polycom, Inc. (a) |
796,800 |
26,942 |
|
|
Redback Networks, Inc. (a) |
482,200 |
33,664 |
|
|
Siebel Systems, Inc. (a) |
39,500 |
2,760 |
|
|
SilverStream Software, Inc. (a) |
226,000 |
4,096 |
|
|
Common Stocks - continued |
|||
|
Shares |
Value (Note 1) (000s) |
||
|
TECHNOLOGY - continued |
|||
|
Computer Services & Software - continued |
|||
|
Sonus Networks, Inc. |
239,800 |
$ 5,830 |
|
|
SpeechWorks International, Inc. |
49,400 |
1,531 |
|
|
Sybase, Inc. (a) |
876,100 |
17,522 |
|
|
Terra Networks SA sponsored ADR |
117,220 |
1,641 |
|
|
Ulticom, Inc. |
9,000 |
285 |
|
|
VERITAS Software Corp. (a) |
857,900 |
83,699 |
|
|
Vignette Corp. (a) |
654,800 |
10,313 |
|
|
|
448,207 |
||
|
Computers & Office Equipment - 13.8% |
|||
|
Brocade Communications Systems, Inc. (a) |
47,700 |
8,011 |
|
|
Compaq Computer Corp. |
487,200 |
10,475 |
|
|
Diebold, Inc. |
36,600 |
1,059 |
|
|
EMC Corp. (a) |
732,900 |
54,509 |
|
|
Emulex Corp. (a) |
1,659,000 |
192,859 |
|
|
Extended Systems, Inc. (a) |
42,600 |
831 |
|
|
Extreme Networks, Inc. (a) |
90,500 |
4,649 |
|
|
Inrange Technologies Corp. Class B (a) |
288,500 |
3,751 |
|
|
International Business Machines Corp. |
508,300 |
47,526 |
|
|
Iomega Corp. (a) |
71,300 |
342 |
|
|
Juniper Networks, Inc. (a) |
501,600 |
62,512 |
|
|
MTI Technology Corp. (a) |
1,198,200 |
6,965 |
|
|
Sun Microsystems, Inc. (a) |
618,400 |
47,037 |
|
|
Symbol Technologies, Inc. |
544,600 |
21,818 |
|
|
Zebra Technologies Corp. Class A (a) |
26,600 |
1,114 |
|
|
|
463,458 |
||
|
Electronic Instruments - 0.8% |
|||
|
Applera Corp. - Applied Biosystems Group |
117,400 |
9,700 |
|
|
ASM Lithography Holding NV (a) |
883,100 |
18,048 |
|
|
KLA-Tencor Corp. (a) |
36,600 |
1,007 |
|
|
|
28,755 |
||
|
Electronics - 11.1% |
|||
|
Broadcom Corp. Class A (a) |
9,800 |
956 |
|
|
Fairchild Semiconductor International, Inc. Class A (a) |
115,600 |
1,676 |
|
|
Micron Technology, Inc. (a) |
3,423,300 |
107,834 |
|
|
PMC-Sierra, Inc. (a) |
19,600 |
1,807 |
|
|
QLogic Corp. (a) |
3,191,898 |
258,336 |
|
|
Sanmina Corp. (a) |
17,800 |
1,357 |
|
|
Common Stocks - continued |
|||
|
Shares |
Value (Note 1) (000s) |
||
|
TECHNOLOGY - continued |
|||
|
Electronics - continued |
|||
|
Supertex, Inc. (a) |
5,300 |
$ 104 |
|
|
Taiwan Semiconductor Manufacturing Co. Ltd. sponsored ADR (a) |
20,544 |
345 |
|
|
|
372,415 |
||
|
TOTAL TECHNOLOGY |
1,447,515 |
||
|
TRANSPORTATION - 0.6% |
|||
|
Air Transportation - 0.0% |
|||
|
Frontier Airlines, Inc. (a) |
17,700 |
502 |
|
|
SkyWest, Inc. |
20,400 |
1,214 |
|
|
|
1,716 |
||
|
Railroads - 0.1% |
|||
|
Union Pacific Corp. |
69,700 |
3,241 |
|
|
Shipping - 0.4% |
|||
|
Alexander & Baldwin, Inc. |
460,100 |
12,250 |
|
|
Transport Maritima Mexicana SA de CV sponsored ADR (a) |
15,000 |
149 |
|
|
|
12,399 |
||
|
Trucking & Freight - 0.1% |
|||
|
FedEx Corp. (a) |
35,700 |
1,711 |
|
|
Heartland Express, Inc. (a) |
1,000 |
21 |
|
|
United Parcel Service, Inc. Class B |
35,500 |
2,154 |
|
|
|
3,886 |
||
|
TOTAL TRANSPORTATION |
21,242 |
||
|
UTILITIES - 3.3% |
|||
|
Cellular - 0.1% |
|||
|
TeleCorp PCS, Inc. Class A |
42,000 |
793 |
|
|
Triton PCS Holdings, Inc. Class A (a) |
42,400 |
1,442 |
|
|
|
2,235 |
||
|
Electric Utility - 0.6% |
|||
|
Black Hills Corp. |
265,250 |
9,052 |
|
|
Calpine Corp. (a) |
337,500 |
11,981 |
|
|
|
21,033 |
||
|
Common Stocks - continued |
|||
|
Shares |
Value (Note 1) (000s) |
||
|
UTILITIES - continued |
|||
|
Gas - 2.3% |
|||
|
Dynegy, Inc. Class A |
1,377,088 |
$ 60,936 |
|
|
Enron Corp. |
247,200 |
16,006 |
|
|
|
76,942 |
||
|
Telephone Services - 0.3% |
|||
|
Metromedia Fiber Network, Inc. Class A (a) |
1,046,800 |
12,234 |
|
|
TOTAL UTILITIES |
112,444 |
||
|
TOTAL COMMON STOCKS (Cost $2,708,921) |
3,182,419 |
||
|
Convertible Preferred Stocks - 0.0% |
|||
|
|
|
|
|
|
TECHNOLOGY - 0.0% |
|||
|
Communications Equipment - 0.0% |
|||
|
Chorum Technologies Series E (a)(c) |
18,500 |
319 |
|
|
Cash Equivalents - 7.3% |
|||
|
|
|
|
|
|
Fidelity Cash Central Fund, 6.57% (b) |
229,758,827 |
229,759 |
|
|
Fidelity Securities Lending Cash Central Fund, 6.63% (b) |
16,997,376 |
16,997 |
|
|
TOTAL CASH EQUIVALENTS (Cost $246,756) |
246,756 |
||
|
TOTAL INVESTMENT PORTFOLIO - 101.8% (Cost $2,955,996) |
3,429,494 |
||
|
NET OTHER ASSETS - (1.8)% |
(61,109) |
||
|
NET ASSETS - 100% |
$ 3,368,385 |
||
|
Legend |
|
(a) Non-income producing |
|
(b) The rate quoted is the annualized seven-day yield of the fund at period end. A complete listing of the fund's holdings as of its most recent fiscal year end is available upon request. |
|
(c) Restricted securities - Investment in securities not registered under the Securities Act of 1933. |
|
Additional information on each holding is as follows: |
|
Security |
Acquisition Date |
Acquisition Cost (000s) |
|
Chorum Technologies Series E |
9/19/00 |
$ 319 |
|
Income Tax Information |
|
At November 30, 2000, the aggregate |
|
The fund hereby designates approximately $393,202,000 as a capital gain dividend for the purpose of the dividend paid deduction. |
See accompanying notes which are an integral part of the financial statements.
Annual Report
Statement of Assets and Liabilities
|
Amounts in thousands (except per-share amounts) |
November 30, 2000 |
|
|
Assets |
|
|
|
Investment in securities, at value (cost $2,955,996) - |
|
$ 3,429,494 |
|
Receivable for investments sold |
|
7,898 |
|
Receivable for fund shares sold |
|
2,035 |
|
Dividends receivable |
|
1,315 |
|
Interest receivable |
|
1,269 |
|
Other receivables |
|
88 |
|
Total assets |
|
3,442,099 |
|
Liabilities |
|
|
|
Payable for investments purchased |
$ 46,816 |
|
|
Payable for fund shares redeemed |
6,794 |
|
|
Accrued management fee |
2,469 |
|
|
Other payables and accrued expenses |
638 |
|
|
Collateral on securities loaned, at value |
16,997 |
|
|
Total liabilities |
|
73,714 |
|
Net Assets |
|
$ 3,368,385 |
|
Net Assets consist of: |
|
|
|
Paid in capital |
|
$ 2,008,372 |
|
Accumulated net investment (loss) |
|
(1,017) |
|
Accumulated undistributed net realized gain (loss) on investments and foreign currency transactions |
|
887,533 |
|
Net unrealized appreciation (depreciation) on investments and assets and liabilities in foreign currencies |
|
473,497 |
|
Net Assets, for 83,157 shares outstanding |
|
$ 3,368,385 |
|
Net Asset Value and redemption price per share ($3,368,385 ÷ 83,157 shares) |
|
$40.51 |
|
Maximum offering price per share (100/97.00 of $40.51) |
|
$41.76 |
See accompanying notes which are an integral part of the financial statements.
Annual Report
Financial Statements - continued
Statement of Operations
|
Amounts in thousands |
Year ended November 30, 2000 |
|
|
Investment Income Dividends |
|
$ 9,577 |
|
Interest |
|
10,432 |
|
Security lending |
|
803 |
|
Total income |
|
20,812 |
|
Expenses |
|
|
|
Management fee |
$ 24,700 |
|
|
Performance adjustment |
4,385 |
|
|
Transfer agent fees |
5,277 |
|
|
Accounting and security lending fees |
654 |
|
|
Non-interested trustees' compensation |
14 |
|
|
Custodian fees and expenses |
153 |
|
|
Registration fees |
412 |
|
|
Audit |
50 |
|
|
Legal |
12 |
|
|
Miscellaneous |
9 |
|
|
Total expenses before reductions |
35,666 |
|
|
Expense reductions |
(611) |
35,055 |
|
Net investment income (loss) |
|
(14,243) |
|
Realized and Unrealized Gain (Loss) Net realized gain (loss) on: |
|
|
|
Investment securities |
919,232 |
|
|
Foreign currency transactions |
(44) |
919,188 |
|
Change in net unrealized appreciation (depreciation) on: |
|
|
|
Investment securities |
(570,956) |
|
|
Assets and liabilities in foreign currencies |
19 |
(570,937) |
|
Net gain (loss) |
|
348,251 |
|
Net increase (decrease) in net assets resulting |
|
$ 334,008 |
See accompanying notes which are an integral part of the financial statements.
Annual Report
Financial Statements - continued
Statement of Changes in Net Assets
|
Amounts in thousands |
Year ended
November 30, |
Year ended
November 30, |
|
Increase (Decrease) in Net Assets |
|
|
|
Operations |
$ (14,243) |
$ (8,090) |
|
Net realized gain (loss) |
919,188 |
577,960 |
|
Change in net unrealized appreciation (depreciation) |
(570,937) |
675,633 |
|
Net increase (decrease) in net assets resulting |
334,008 |
1,245,503 |
|
Distributions to shareholders from net realized gains |
(514,097) |
(116,063) |
|
Share transactions |
1,127,640 |
791,580 |
|
Reinvestment of distributions |
491,186 |
111,045 |
|
Cost of shares redeemed |
(966,652) |
(666,947) |
|
Net increase (decrease) in net assets resulting |
652,174 |
235,678 |
|
Total increase (decrease) in net assets |
472,085 |
1,365,118 |
|
Net Assets |
|
|
|
Beginning of period |
2,896,300 |
1,531,182 |
|
End of period (including accumulated net investment |
$ 3,368,385 |
$ 2,896,300 |
|
Other Information Shares |
|
|
|
Sold |
23,217 |
23,550 |
|
Issued in reinvestment of distributions |
11,801 |
4,440 |
|
Redeemed |
(19,994) |
(20,459) |
|
Net increase (decrease) |
15,024 |
7,531 |
See accompanying notes which are an integral part of the financial statements.
Annual Report
Financial Highlights
|
Years ended November 30, |
2000 |
1999 |
1998 |
1997 |
1996 |
|
Selected Per-Share Data |
|
|
|
|
|
|
Net asset value, |
$ 42.51 |
$ 25.27 |
$ 24.48 |
$ 20.79 |
$ 18.11 |
|
Income from |
|
|
|
|
|
|
Net investment income (loss) C |
(.17) |
(.12) |
(.03) |
(.03) |
(.03) |
|
Net realized and |
5.50 |
19.30 |
3.74 |
4.27 |
4.15 |
|
Total from investment operations |
5.33 |
19.18 |
3.71 |
4.24 |
4.12 |
|
Less Distributions |
|
|
|
|
|
|
From net realized gain |
(7.33) |
(1.94) |
(2.92) |
(.55) |
(1.44) |
|
Net asset value, end of period |
$ 40.51 |
$ 42.51 |
$ 25.27 |
$ 24.48 |
$ 20.79 |
|
Total Return A, B |
12.44% |
81.31% |
17.55% |
21.01% |
24.88% |
|
Ratios and Supplemental Data |
|
|
|
|
|
|
Net assets, end of period |
$ 3,368 |
$ 2,896 |
$ 1,531 |
$ 1,530 |
$ 1,267 |
|
Ratio of expenses to average |
.90% |
.95% |
.86% |
.99% |
1.07% |
|
Ratio of expenses to average net assets after expense reductions |
.89% D |
.93% D |
.83% D |
.94% D |
1.03% D |
|
Ratio of net investment income (loss) to average net assets |
(.36)% |
(.36)% |
(.13)% |
(.13)% |
(.17)% |
|
Portfolio turnover rate |
97% |
116% |
121% |
142% |
158% |
A The total returns would have been lower had certain expenses not been reduced during the periods shown.
B Total returns do not include the one time sales charge.
C Net investment income (loss) per share has been calculated based on average shares outstanding during the period.
D FMR or the fund has entered into varying arrangements with third parties who either paid or reduced a portion of the fund's expenses.
See accompanying notes which are an integral part of the financial statements.
Annual Report
For the period ended November 30, 2000
1. Significant Accounting Policies.
Fidelity New Millennium Fund (the fund) is a fund of Fidelity Mt. Vernon Street Trust (the trust) and is authorized to issue an unlimited number of shares. Effective the close of business on May 15, 1996, the fund was closed to new accounts. The trust is registered under the Investment Company Act of 1940, as amended, as an open-end management investment company organized as a Massachusetts business trust. The financial statements have been prepared in conformity with generally accepted accounting principles which require management to make certain estimates and assumptions at the date of the financial statements. The following summarizes the significant accounting policies of the fund:
Security Valuation. Securities for which exchange quotations are readily available are valued at the last sale price, or if no sale price, at the closing bid price. Foreign securities are valued based on quotations from the principal market in which such securities are normally traded. If trading or events occurring in other markets after the close of the principal market in which foreign securities are traded, and before the close of business of the fund, are expected to materially affect the value of those securities, then they are valued at their fair value taking this trading or these events into account. Fair value is determined in good faith under consistently applied procedures under the general supervision of the Board of Trustees. Securities (including restricted securities) for which exchange quotations are not readily available (and in certain cases debt securities which trade on an exchange) are valued primarily using dealer-supplied valuations or at their fair value. Short-term securities with remaining maturities of sixty days or less for which quotations are not readily available are valued at amortized cost or original cost plus accrued interest, both of which approximate current value. Investments in open-end investment companies are valued at their net asset value each business day.
Foreign Currency Translation. The accounting records of the fund are maintained in U.S. dollars. Investment securities and other assets and liabilities denominated in a foreign currency are translated into U.S. dollars at the prevailing rates of exchange at period end. Purchases and sales of securities, income receipts and expense payments are translated into U.S. dollars at the prevailing exchange rate on the respective dates of the transactions.
Net realized gains and losses on foreign currency transactions represent net gains and losses from sales and maturities of foreign currency contracts, disposition of foreign currencies, the difference between the amount of net investment income accrued and the U.S. dollar amount actually received, and gains and losses between trade and settlement date on purchases and sales of securities. The effects of changes in foreign currency exchange rates on investments
Annual Report
Notes to Financial Statements - continued
1. Significant Accounting Policies - continued
Foreign Currency Translation - continued
in securities are included with the net realized and unrealized gain or loss on investment securities.
Income Taxes. As a qualified regulated investment company under Subchapter M of the Internal Revenue Code, the fund is not subject to income taxes to the extent that it distributes substantially all of its taxable income for its fiscal year. The schedule of investments includes information regarding income taxes under the caption "Income Tax Information."
Investment Income. Dividend income is recorded on the ex-dividend date, except certain dividends from foreign securities where the ex-dividend date may have passed, are recorded as soon as the fund is informed of the ex-dividend date. Non-cash dividends included in dividend income, if any, are recorded at the fair market value of the securities received. Interest income is accrued as earned. Investment income is recorded net of foreign taxes withheld where recovery of such taxes is uncertain.
Expenses. Most expenses of the trust can be directly attributed to a fund. Expenses which cannot be directly attributed are apportioned among the funds in the trust.
Distributions to Shareholders. Distributions are recorded on the ex-dividend date.
Income and capital gain distributions are determined in accordance with income tax regulations which may differ from generally accepted accounting principles. These differences, which may result in distribution reclassifications, are primarily due to differing treatments for litigation proceeds, foreign currency transactions, passive foreign investment companies (PFIC), net operating losses and losses deferred due to wash sales. The fund also utilized earnings and profits distributed to shareholders on redemption of shares as a part of the dividends paid deduction for income tax purposes.
Permanent book and tax basis differences relating to shareholder distributions will result in reclassifications to paid in capital. Accumulated net investment loss and accumulated undistributed net realized gain (loss) on investments and foreign currency transactions may include temporary book and tax basis differences which will reverse in a subsequent period. Any taxable income or gain remaining at fiscal year end is distributed in the following year.
Security Transactions. Security transactions are accounted for as of trade date. Gains and losses on securities sold are determined on the basis of identified cost.
2. Operating Policies.
Foreign Currency Contracts. The fund generally uses foreign currency contracts to facilitate transactions in foreign-denominated securities. Losses may arise from changes in the
Annual Report
Notes to Financial Statements - continued
2. Operating Policies - continued
Foreign Currency Contracts - continued
value of the foreign currency or if the counterparties do not perform under the contracts' terms. The U.S. dollar value of foreign currency contracts is determined using contractual currency exchange rates established at the time of each trade.
Joint Trading Account. Pursuant to an Exemptive Order issued by the Securities and Exchange Commission (the SEC), the fund, along with other affiliated entities of Fidelity Management & Research Company (FMR), may transfer uninvested cash balances into one or more joint trading accounts. These balances are invested in one or more repurchase agreements for U.S. Treasury or Federal Agency obligations.
Repurchase Agreements. The underlying U.S. Treasury, Federal Agency, or other obligations found to be satisfactory by FMR are transferred to an account of the fund, or to the Joint Trading Account, at a custodian bank. The securities are marked-to-market daily and maintained at a value at least equal to the principal amount of the repurchase agreement (including accrued interest). FMR, the fund's investment adviser, is responsible for determining that the value of the underlying securities remains in accordance with the market value requirements stated above.
Restricted Securities. The fund is permitted to invest in securities that are subject to legal or contractual restrictions on resale. These securities generally may be resold in transactions exempt from registration or to the public if the securities are registered. Disposal of these securities may involve time-consuming negotiations and expense, and prompt sale at an acceptable price may be difficult. At the end of the period, restricted securities (excluding 144A issues) amounted to $319,000 or 0.0% of net assets.
3. Purchases and Sales of Investments.
Purchases and sales of securities, other than short-term securities, aggregated $3,607,711,000 and $3,599,890,000, respectively.
4. Fees and Other Transactions with Affiliates.
Management Fee. As the fund's investment adviser, FMR receives a monthly basic fee that is calculated on the basis of a group fee rate plus a fixed individual fund fee rate applied to the average net assets of the fund. The group fee rate is the weighted average of a series of rates and is based on the monthly average net assets of all the mutual funds advised by FMR. The rates ranged from .2167% to .5200% for the period. The annual individual fund fee rate is .35%. In the event that these rates were lower than the contractual rates in effect during the period, FMR voluntarily implemented the above rates, as they resulted in the same or a lower management fee. The basic fee is subject to a performance adjustment (up to a maximum of ±.20% of the fund's average net assets over
Annual Report
Notes to Financial Statements - continued
4. Fees and Other Transactions with Affiliates - continued
Management Fee - continued
the performance period) based on the fund's investment performance as compared to the appropriate index over a specified period of time. For the period, the management fee was equivalent to an annual rate of .74% of average net assets after the performance adjustment.
Sub-Adviser Fee. Beginning January 1, 2001, FMR Co.(FMRC) will serve as sub-adviser for the fund. FMRC is a wholly owned subsidiary of FMR and will receive a fee from FMR of 50% of the management fee payable to FMR with respect to that portion of the fund's assets that will be managed by FMRC.
Sales Load. For the period, Fidelity Distributors Corporation, an affiliate of FMR and the general distributor of the fund, received sales charges of $2,287,000 on sales of shares of the fund of which $2,286,000 was retained.
Transfer Agent Fees. Fidelity Service Company, Inc. (FSC), an affiliate of FMR, is the fund's transfer, dividend disbursing and shareholder servicing agent. FSC receives account fees and asset-based fees that vary according to account size and type of account. FSC pays for typesetting, printing and mailing of all shareholder reports, except proxy statements. For the period, the transfer agent fees were equivalent to an annual rate of .13% of average net assets.
Accounting and Security Lending Fees. FSC maintains the fund's accounting records and administers the security lending program. The security lending fee is based on the number and duration of lending transactions. The accounting fee is based on the level of average net assets for the month plus out-of-pocket expenses.
Fidelity Cash Central Funds. Pursuant to an Exemptive Order issued by the SEC, the fund may invest in the Fidelity Cash Central Fund and the Fidelity Securities Lending Cash Central Fund (the Cash Funds) managed by Fidelity Investments Money Management, Inc., an affiliate of FMR. The Cash Funds are open-end money market funds available only to investment companies and other accounts managed by FMR and its affiliates. The Cash Funds seek preservation of capital, liquidity, and current income and do not pay a management fee. Income distributions from the Cash Funds are declared daily and paid monthly from net investment income. Income distributions earned by the fund are recorded as either interest income or security lending income in the accompanying financial statements.
Brokerage Commissions. The fund placed a portion of its portfolio transactions with brokerage firms which are affiliates of FMR. The commissions paid to these affiliated firms were $143,000 for the period.
Annual Report
Notes to Financial Statements - continued
5. Security Lending.
The fund lends portfolio securities from time to time in order to earn additional income. The fund receives collateral in the form of U.S. Treasury obligations, letters of credit, and/or cash against the loaned securities, and maintains collateral in an amount not less than 100% of the market value of the loaned securities during the period of the loan. The market value of the loaned securities is determined at the close of business of the fund and any additional required collateral is delivered to the fund on the next business day. If the borrower defaults on its obligation to return the securities loaned because of insolvency or other reasons, the fund could experience delays and costs in recovering the securities loaned or in gaining access to the collateral. At period end, the value of the securities loaned amounted to $15,930,000. The fund received cash collateral of $16,997,000 which was invested in cash equivalents.
6. Expense Reductions.
FMR has directed certain portfolio trades to brokers who paid a portion of the fund's expenses. For the period, the fund's expenses were reduced by $531,000 under this arrangement.
In addition, through arrangements with the fund's custodian and transfer agent, credits realized as a result of uninvested cash balances were used to reduce a portion of the fund's expenses. During the period, the fund's custodian and transfer agent fees were reduced by $12,000 and $68,000, respectively, under these arrangements.
Annual Report
To the Trustees of Fidelity Mt. Vernon Street Trust and the Shareholders of Fidelity New Millennium Fund:
In our opinion, the accompanying statement of assets and liabilities, including the schedule of investments, and the related statements of operations and of changes in net assets and the financial highlights present fairly, in all material respects, the financial position of Fidelity New Millennium Fund (a fund of Fidelity Mt. Vernon Street Trust) at November 30, 2000, and the results of its operations, the changes in its net assets and the financial highlights for the periods indicated, in conformity with accounting principles generally accepted in the United States of America. These financial statements and financial highlights (hereafter referred to as "financial statements") are the responsibility of the Fidelity New Millennium Fund's management; our responsibility is to express an opinion on these financial statements based on our audits. We conducted our audits of these financial statements in accordance with auditing standards generally accepted in the United States of America which require that we plan and perform the audit to obtain reasonable assurance about whether the financial statements are free of material misstatement. An audit includes examining, on a test basis, evidence supporting the amounts and disclosures in the financial statements, assessing the accounting principles used and significant estimates made by management, and evaluating the overall financial statement presentation. We believe that our audits, which included confirmation of securities at November 30, 2000 by correspondence with the custodian and brokers, provide a reasonable basis for our opinion.
/s/PricewaterhouseCoopers LLP
PricewaterhouseCoopers LLP
Boston, Massachusetts
January 10, 2001
Annual Report
The Board of Trustees of Fidelity New Millennium Fund voted to pay to shareholders of record at the opening of business on record date, the following distributions derived from capital gains realized from sales of portfolio securities, and dividends derived from net investment income:
|
Pay Date |
\\\\\\\\\\\\\\ |
Record Date |
\\\\\\\\\\\\\\ |
Dividends |
\\\\\\\\\\\\\\ |
Capital Gains |
|
12/26/00 |
|
12/22/00 |
|
- |
|
$9.08 |
|
1/8/01 |
|
1/5/01 |
|
- |
|
$.53 |
The fund hereby designates 100% of the long-term capital gain dividends distributed during the fiscal year as 20%-rate capital gain dividends.
A total of 6% of the dividends distributed during the fiscal year qualifies for the dividends-received deduction for corporate shareholders.
The fund will notify shareholders in January 2001 of amounts for use in preparing 2000 income tax returns.
Annual Report
Fidelity offers several ways to conveniently manage your personal investments via your telephone or PC. You can access your account information, conduct trades and research your investments 24 hours a day.
By Phone
Fidelity Automated Service Telephone provides a single toll-free number to access account balances, positions, quotes and trading. It's easy to navigate the service, and on your first call, the system will help you create a personal identification number (PIN) for security.
(phone_graphic)
Fidelity Automated
Service Telephone (FAST®)
1-800-544-5555
Press
1 For mutual fund and brokerage trading.
2 For quotes.*
3 For account balances and holdings.
4 To review orders and mutual
fund activity.
5 To change your PIN.
*0 To speak to a Fidelity representative.
By PC
Fidelity's web site on the Internet provides a wide range of information, including daily financial news, fund performance, interactive planning tools and news about Fidelity products and services.
(computer_graphic)
Fidelity's Web Site
www.fidelity.com
If you are not currently on the Internet, call EarthLink Sprint at 1-800-288-2967, and be sure to ask for registration number SMD004 to receive a special Fidelity package that includes 30 days of free Internet access. EarthLink is North America's #1 independent Internet access provider.
(computer_graphic)
Fidelity On-line Xpress+®
Fidelity On-line Xpress+ software for Windows combines comprehensive portfolio management capabilities, securities trading and access to research and analysis tools . . . all on your desktop. Call Fidelity at 1-800-544-0240 or visit our web site for more information on how to manage your investments via your PC.
* When you call the quotes line, please remember that a fund's yield and return will vary and, except for money market funds, share price will also vary. This means that you may have a gain or loss when you sell your shares. There is no assurance that money market funds will be able to maintain a stable $1 share price; an investment in a money market fund is not insured or guaranteed by the U.S. government. Total returns are historical and include changes in share price, reinvestment of dividends and capital gains, and the effects of any sales charges.
Annual Report
If more than one address is listed, please locate the address that is closest to you. We'll give your correspondence immediate attention and send you written confirmation upon completion of your request.
(letter_graphic)
Making Changes
To Your Account
(such as changing name, address, bank, etc.)
Fidelity Investments
P.O. Box 770001
Cincinnati, OH 45277-0002
(letter_graphic)
For Non-Retirement
Accounts
Buying shares
Fidelity Investments
P.O. Box 770001
Cincinnati, OH 45277-0003
Overnight Express
Fidelity Investments
2300 Litton Lane - KH1A
Hebron, KY 41048
Selling shares
Fidelity Investments
P.O. Box 660602
Dallas, TX 75266-0602
Overnight Express
Fidelity Investments
Attn: Redemptions - CP6I
400 East Las Colinas Blvd.
Irving, TX 75039-5587
General Correspondence
Fidelity Investments
P.O. Box 500
Merrimack, NH 03054-0500
(letter_graphic)
For Retirement
Accounts
Buying shares
Fidelity Investments
P.O. Box 770001
Cincinnati, OH 45277-0003
Selling shares
Fidelity Investments
P.O. Box 660602
Dallas, TX 75266-0602
Overnight Express
Fidelity Investments
Attn: Redemptions - CP6R
400 East Las Colinas Blvd.
Irving, TX 75039-5587
General Correspondence
Fidelity Investments
P.O. Box 500
Merrimack, NH 03054-0500
Annual Report
For directions and hours,
please call 1-800-544-9797.
Arizona
7373 N. Scottsdale Road
Scottsdale, AZ
California
815 East Birch Street
Brea, CA
851 East Hamilton Avenue
Campbell, CA
527 North Brand Boulevard
Glendale, CA
19200 Von Karman Avenue
Irvine, CA
10100 Santa Monica Blvd.
Los Angeles, CA
251 University Avenue
Palo Alto, CA
1760 Challenge Way
Sacramento, CA
7676 Hazard Center Drive
San Diego, CA
8 Montgomery Street
San Francisco, CA
950 Northgate Drive
San Rafael, CA
1400 Civic Drive
Walnut Creek, CA
6300 Canoga Avenue
Woodland Hills, CA
Colorado
1625 Broadway
Denver, CO
Connecticut
48 West Putnam Avenue
Greenwich, CT
265 Church Street
New Haven, CT
300 Atlantic Street
Stamford, CT
29 South Main Street
West Hartford, CT
Delaware
222 Delaware Avenue
Wilmington, DE
Florida
4400 N. Federal Highway
Boca Raton, FL
90 Alhambra Plaza
Coral Gables, FL
4090 N. Ocean Boulevard
Ft. Lauderdale, FL
1907 West State Road 434
Longwood, FL
8880 Tamiami Trail, North
Naples, FL
2401 PGA Boulevard
Palm Beach Gardens, FL
8065 Beneva Road
Sarasota, FL
1502 N. Westshore Blvd.
Tampa, FL
Georgia
3445 Peachtree Road, N.E.
Atlanta, GA
1000 Abernathy Road
Atlanta, GA
Illinois
One North Franklin Street
Chicago, IL
1415 West 22nd Street
Oak Brook, IL
1700 East Golf Road
Schaumburg, IL
3232 Lake Avenue
Wilmette, IL
Indiana
4729 East 82nd Street
Indianapolis, IN
Maine
Three Canal Plaza
Portland, ME
Maryland
7401 Wisconsin Avenue
Bethesda, MD
One W. Pennsylvania Ave.
Towson, MD
Massachusetts
801 Boylston Street
Boston, MA
155 Congress Street
Boston, MA
25 State Street
Boston, MA
300 Granite Street
Braintree, MA
44 Mall Road
Burlington, MA
416 Belmont Street
Worcester, MA
Annual Report
Michigan
280 Old N. Woodward Ave.
Birmingham, MI
29155 Northwestern Hwy.
Southfield, MI
Minnesota
7600 France Avenue South
Edina, MN
Missouri
700 West 47th Street
Kansas City, MO
8885 Ladue Road
Ladue, MO
New Jersey
150 Essex Street
Millburn, NJ
56 South Street
Morristown, NJ
501 Route 17, South
Paramus, NJ
New York
1055 Franklin Avenue
Garden City, NY
999 Walt Whitman Road
Melville, L.I., NY
1271 Avenue of the Americas
New York, NY
71 Broadway
New York, NY
350 Park Avenue
New York, NY
North Carolina
4611 Sharon Road
Charlotte, NC
Ohio
600 Vine Street
Cincinnati, OH
28699 Chagrin Boulevard
Woodmere Village, OH
Oregon
16850 SW 72nd Avenue
Tigard, OR
Pennsylvania
1735 Market Street
Philadelphia, PA
439 Fifth Avenue
Pittsburgh, PA
Rhode Island
47 Providence Place
Providence, RI
Tennessee
6150 Poplar Avenue
Memphis, TN
Texas
10000 Research Boulevard
Austin, TX
4017 Northwest Parkway
Dallas, TX
1155 Dairy Ashford Street
Houston, TX
2701 Drexel Drive
Houston, TX
400 East Las Colinas Blvd.
Irving, TX
14100 San Pedro
San Antonio, TX
19740 IH 45 North
Spring, TX
Utah
215 South State Street
Salt Lake City, UT
Virginia
1861 International Drive
McLean, VA
Washington
411 108th Avenue, N.E.
Bellevue, WA
511 Pine Street
Seattle, WA
Washington, DC
1900 K Street, N.W.
Washington, DC
Wisconsin
595 North Barker Road
Brookfield, WI
Fidelity Brokerage Services, Inc., 100 Summer St., Boston, MA 02110 Member NYSE/SIPC
Annual Report
Annual Report
Annual Report
Investment Adviser
Fidelity Management & Research Company
Boston, MA
Investment Sub-Advisers
Fidelity Management & Research
(U.K.) Inc.
Fidelity Management & Research
(Far East) Inc.
Fidelity Investments Japan Limited
Officers
Edward C. Johnson 3d, President
Robert C. Pozen, Senior Vice President
Abigail P. Johnson, Vice President
Neal P. Miller, Vice President
Eric D. Roiter, Secretary
Robert A. Dwight, Treasurer
Maria F. Dwyer, Deputy Treasurer
John H. Costello, Assistant Treasurer
Thomas J. Simpson, Assistant Treasurer
Board of Trustees
Ralph F. Cox *
Phyllis Burke Davis *
Robert M. Gates *
Edward C. Johnson 3d
Ned C. Lautenbach *
Donald J. Kirk *
Peter S. Lynch
Marvin L. Mann *
William O. McCoy *
Gerald C. McDonough *
Robert C. Pozen
Thomas R. Williams *
Advisory Board
J. Michael Cook
Marie L. Knowles
William S. Stavropoulos
General Distributor
Fidelity Distributors Corporation
Boston, MA
Transfer and Shareholder
Servicing Agent
Fidelity Service Company, Inc.
Boston, MA
* Independent trustees
Custodian
The Chase Manhattan Bank
New York, NY
Fidelity's Growth Funds
Aggressive Growth Fund
Blue Chip Growth Fund
Capital Appreciation Fund
Contrafund®
Contrafund® II
Disciplined Equity Fund
Dividend Growth Fund
Export and Multinational Fund
Fidelity Fifty®
Growth Company Fund
Independence Fund
Large Cap Stock Fund
Low-Priced Stock Fund
Magellan® Fund
Mid-Cap Stock Fund
New Millennium Fund®
OTC Portfolio
Small Cap Selector
Small Cap Stock Fund
Stock Selector
Tax Managed Stock Fund
TechnoQuant ® Growth Fund
Trend Fund
Value Fund
The Fidelity Telephone Connection
Mutual Fund 24-Hour Service
Exchanges/Redemptions
and Account Assistance 1-800-544-6666
Product Information 1-800-544-6666
Retirement Accounts 1-800-544-4774
(8 a.m. - 9 p.m.)
TDD Service 1-800-544-0118
for the deaf and hearing impaired
(9 a.m. - 9 p.m. Eastern time)
Fidelity Automated Service
Telephone (FAST®) (automated graphic) 1-800-544-5555
(automated graphic) Automated line for quickest service
NMF-ANN-0101 122427
1.539033.103
(Fidelity Investment logo)(registered trademark)
Corporate Headquarters
82 Devonshire St., Boston, MA 02109
www.fidelity.com
|
|