
|
|
|
|
|
|
|
|
|
|
Previous: METROPOLITAN SERIES FUND INC, DEFS14A, 2000-09-01 |
Next: MOSAIC INCOME TRUST, N-30D, 2000-09-01 |
Mosaic Equity Trust
Semi-Annual Report (unaudited)
June 30, 2000
Mosaic Funds
www.mosaicfunds.com
Contents
| Letter to Shareholders | 1 |
| Management's Discussion of Fund Performance | |
| ---Review of Period | 2 |
| ---Outlook for the remainder of the year 2000 | 2 |
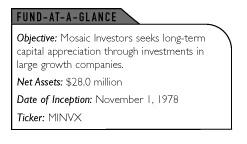
| ---Mosaic Investors | 3 |
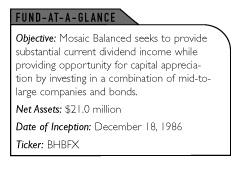
| ---Mosaic Balanced | 5 |
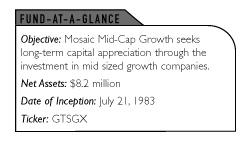
| ---Mosaic Mid-Cap Growth | 6 |
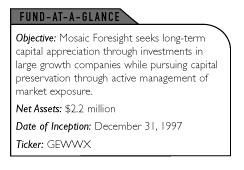
| ---Mosaic Foresight | 7 |
| Portfolio of Investments | |
| ---Investors Fund | 9 |
| ---Balanced Fund | 11 |
| ---Mid-Cap Growth Fund | 13 |
| ---Foresight Fund | 14 |
| Statements of Assets and Liabilities | 15 |
| Statements of Operations | 16 |
| Statements of Changes in Net Assets | 17 |
| Financial Highlights | 19 |
| Notes to Financial Statements | 23 |
MOSAIC EQUITY TRUST June 30, 2000
Letter to Shareholders
(photograph of ) Katherine Frank
The stock market of 2000 has made generalizations dangerous: The market's disposition has changed as often as the weather. At the beginning of this semi-annual period the year was shaping up to look a lot like the previous year's narrow market. While the broad market was down or flat, technology companies whose earnings were mere promises and whose stock valuations were off the charts continued to prosper. Then, in March and April, the market demonstrated second thoughts, as the Nasdaq market, where many of these stocks trade, dropped some 35% from its peak.
As we had been anticipating, some of the money coming out of the more speculative stocks went into the more reasonably priced, steadily growing companies that Mosaic owns. So even as the headlines concentrated on the billions being lost as high-flying technology stocks dropped, the value of Mosaic's portfolios held steady. Towards the end of the six-month period there was a resurgence in technology stocks, but this time with a bias for the larger, profitable companies. We were able to benefit from this turn by purchasing some high-quality stocks when their prices were depressed by the overall sell-off in technology.
One of the tenets of our investment style is risk management. In other words, we screen stocks for both upward potential and downside risk. The benefits of this approach were clear during this past six months, when our funds did a nice job of dampening the volatility of the more speculative edges of the market. At the same time, we are not happy unless we're helping shareholders build wealth. We feel the stocks in our Equity Trust funds hold great potential for growth, and will realize this best in a market that values earnings and steady growth. We believe we are moving into just such a market.
Our current newsletter, Mosaic Update, which was enclosed with your June 30, 2000 statements, discusses our management approach at greater length. If you missed the newsletter, or would like extra copies, give us a call at 1-800-368-3195.
Sincerely,
(signature)
Katherine Frank
President
Management's Discussion of Fund Performance
Review of PeriodThe first half of 2000 proved once again that high stock valuations and instability go hand-in-hand, as the market, especially the Nasdaq, experienced significant setbacks. The index saw as much as a 35% decline from its early March peak, yet recovered to end the period down -2.54%. The Dow Jones Industrial Average was down -8.44%; the S&P 500 was down -0.42%. Extreme valuations and rising interest rates were the main culprits of the decline. The technology sector was the hardest hit, as the stocks that had gone up the most seemed to be the ones most vulnerable. In a reversal of 1999, when Nasdaq stocks without earnings were the market's darlings, non-revenue producing Internet companies were battered, and it appeared that bottom-line results once again mattered.
As was true for much of 1999, we saw a period of rapid economic growth accompanied with strong corporate earnings growth. On the negative side were increasing signs of inflation. In May, the Federal Reserve Board reacted by increasing interest rates by 50 basis points (.50%). They met again at the end of June, held rates steady, but signaled that further rate increases would occur if warranted. On a week-by-week basis stock investors monitored the major economic indicators, buoyed when news suggested a slowing economy (which would discourage interest rates hikes), and driving markets down when the news suggested inflation or continued expansion (since these are the drivers of higher Federal Reserve rates).
During the period the market was decidedly mixed. The healthcare sector had the best results, propelled by acquisitions and optimism regarding the economic promise of biotechnology. Fears of a slowing economy drove down companies in the basic materials and consumer cyclical areas. In the end, many of the major indices recouped much of their early losses, and some of the larger, well-known tech names were once again near all-time highs. By the end of June the market was characterized by increased interest in the kind of steadily growing companies held in Mosaic's equity funds and very high valuations for most of the leading technology companies.
Outlook for the remainder of the year 2000
Given that earnings are likely to slow along with the economy, we will continue to seek
to own great companies that we believe can deliver solid earning gains in this
environment. As always, we buy only when valuations appear reasonable. Despite the loss in
value in some sectors of the market, we don't believe the market has been stripped of
excessive risk. We do hope that the quick, substantial decline seen in the March through
May period will remind investors of the risk the stock market has to offer, and that
stocks that seem to have no price ceiling may be subject to major reversals. The prospect
of a slowing economy also reinforces our determination to buy only those companies with
consistent earnings growth that are available at reasonable valuations. We believe a
slowing economy, which is exactly what the Federal Reserve is insisting upon, will bring
more investors our way, rewarding our shareholders for sticking with our long-standing
investment discipline.
Interview with lead equity manager Jay Sekelsky
(photograph of ) Jay Sekelsky
How did the four funds in Equity Trust perform in the first half of 2000?
Results were in line or better than the market in general, as measured by the most
commonly followed indices. Mosaic Investors was down -0.47% for the year, Mosaic Balanced
was up 0.37%, Mosaic Mid-Cap was up 3.13% and Mosaic Foresight was up 3.66%. These results
are not enough to warrant belief in a sea change in the market, but certainly the first
six months were much more favorable to our approach than was 1999. We've seen a growing
interest in the sort of dependable, steadily growing companies we favor, and a retreat
from the more speculative technology companies which do not meet our investment criteria.
Mosaic Investors
Did you make any significant additions to the portfolio since December 31, 1999?
We saw some major market moves during this period, particularly in the technology
sector. As a result, some high-quality stocks that we admire dipped inside our valuation
parameters. We added Microsoft, whose shares have been depressed due to fears over the
anti-trust court case. It is our feeling that even a breakup would not mean a loss of
value at our acquisition prices. We think the odds are against a forceable breakup of the
company, in which case we anticipate solid gains going forward. We also added a name
familiar to many consumers, clothing maker Liz Claiborne and a cable provider, RNC Inc. In
the consumer sector, we added home supply store Lowes, which has most of its stores on the
West Coast. In the financial sector, we added Chase Manhattan, which is a leading global
financial services company.
What holdings were the strongest contributors to fund performance?
We had a number of positive contributors to performance. One of the stronger sectors
for Mosaic Investors was the consumer staples area. We had excellent performance from
supermarket chain Safeway and from Pepsico, whose profits were powered by its Frito-Lay
division. Johnson & Johnson, which is diversified across the consumer, healthcare and
pharmaceutical businesses, had an excellent six months. Although technology was a
dangerous sector in general, computer-chip maker Intel was among our best performers.
What holdings were the largest constraints on performance?
When interest rates are rising, as they were over the course of the period, financial
stocks tend to lose value. This period was no exception, with banks getting the worst of
it. However, financial holdings are not all subject to the same interest rate pressures.
For instance, long-term holding Wells Fargo derives some 50% of its revenues from fees,
which are not interest-rate sensitive, and the stock held up well over the period. Our
other financials were not so cushioned, and we saw stock prices fall for holdings such as
Finova, MGIC Investment and Freddie Mac. We did not go unscathed on the technology side
either, with bad news for Compuware convincing us it was best to let go of our stock at a
loss. We had a similar, but less dramatic story with Computer Associates, which we also
sold from the portfolio, prior to a significant decline for the stock.
TOP TEN STOCK HOLDINGS AS OF
JUNE 30, 2000 FOR MOSAIC INVESTORS
% of net assets |
|
| Worldcom Inc. | 5.7% |
| Johnson & Johnson | 5.5% |
| Abbott Laboratories | 5.1% |
| MGIC Investment Corp. | 4.8% |
| Wells Fargo Co. | 4.4% |
| Federal Home Loan Mortgage | 4.4% |
| Target Corp. | 4.4% |
| CVS Corporation | 4.3% |
| Bristol-Myers Squibb | 4.2% |
| Tellabs, Inc. | 3.9% |
Mosaic Balanced
Did you make any significant additions to the portfolio since December 31, 1999?
The stock holdings of Balanced mirror the holdings of Mosaic Investors, as discussed above. One of the factors in our holdings as we manage Balanced is the mix of stocks and bonds, with 70% being the highest percentage of stocks held. We began the period holding 64.4% stocks and finished the period a bit closer to our ceiling with 68.1% in stocks. While we don't attempt to time the market in Balanced by making major asset class bets, holdings close to 70% show that we have had no problem finding companies and valuations we like. Actually, we're quite optimistic about both our stock and bond holdings at this time, and hope to see the fund returning to something closer to its historical double-digit returns from the positive, but muted results we've had of late.
How did the bond holdings in Balanced contribute to overall performance?
While rising interest rate environments are difficult for bonds, we achieved positive
results for the bond portfolio of Balanced over the first six months of the year. We
rotated holdings towards corporate and agency issues, which developed a marked yield
advantage over Treasuries over the course of the period. Towards the end of the six months
we began to lengthen durations a bit, anticipating that the Federal Reserve's efforts to
cool the economy were working, producing an environment favorable for bonds.
TOP FIVE STOCK AND FIXED INCOME HOLDINGS
AS OF JUNE 30, 2000 FOR MOSAIC BALANCED
% of net assets |
|
| Top Five Stock Holdings (68.1% of net assets in stocks) | |
| Worldcom, Inc | 3.9% |
| Abbott Labs | 3.7% |
| Johnson & Johnson | 3.6% |
| MGIC Investment Corporation | 3.4% |
| CVS Corporation | 3.4% |
| Top Five Fixed Income Holdings (31.1% of net assets in fixed income) | |
| Federal National Mortgage Assoc., 5.375%, 3/30/02 | 3.5% |
| U.S. Treasury Notes, 5.25%, 1/31/01 | 2.4% |
| Federal Home Loan Mortgage, 7.375%, 5/2003 | 2.0% |
| Cardinal Health, Inc., 6.25%, 7/30/08 | 1.7% |
| Gap Inc. 6.9%, 9/30/07 | 1.6% |
Mosaic Mid-Cap Growth
Did you make any significant additions to the portfolio since December 31, 1999?
We were able to add some excellent companies to the Mid-Cap Growth portfolio over the first six months of the year. In the healthcare area we added drug delivery system maker, Alza. In addition, we were able to buy Cardinal Health, a diversified healthcare company. Both these stocks were subsequently sold in June after generating sizeable gains. In the technology sector, we bought Affiliated Computer Services, which we anticipate will be a beneficiary of the trend towards outsourcing in the computer industry.
What holdings were the strongest contributors to fund performance?
The best results for the period were seen in the consumer and healthcare sectors. All of our consumer holdings showed positive results, led by Rogers Communications, a cellular and cable provider, and Kroger, the supermarket chain. We were also able to realize our gains in Progressive Corporation in May, as the stock reached our price target in rapid order, showing a rapid ramp-up of almost 50%.
What holdings were the largest constraints on performance?
As in our large-cap portfolios, our significant exposure to the financial sector did not yet produce results. The companies held in this sector that had negative performance during the period include MBIA, Inc., MGIC Investment and Southtrust. As previously discussed, these results are typical of environments with rising interest rates.
We are confident that our financial holdings contain significant value that will be
realized when the Federal Reserve succeeds in slowing the economy and is no longer raising
interest rates.
TOP TEN STOCK HOLDINGS AS OF JUNE 30, 2000
FOR MOSAIC MID-CAP GROWTH
% of net assets |
|
| Kroger Company | 5.1% |
| CVS Corporation | 4.6% |
| Martin Marietta Material | 4.6% |
| Callaway Golf | 4.2% |
| Dentsply International | 4.1% |
| Kansas City Southern | 4.1% |
| Becton Dickinson & Co. | 4.1% |
| American Power Conversion | 3.9% |
| MGIC Investment Corp. | 3.9% |
| Telephone & Data Systems | 3.9% |
Mosaic Foresight
(photograph of)--Frank
Burgess
An interview with Foresight manager and Madison Investment Advisors' founder and President, Frank Burgess.
How would you characterize the performance of Foresight for the period?
We were pleased to be able to preserve capital during the first half of the period, when many investors were suffering significant stock market losses. The market pullback turned into an excellent buying opportunity for us, as we increased our stock exposure and saw returns increase over the second quarter. With the most common market indices negative for the period, we were pleased with our 3.66% positive return. As we enter the second half of the year 2000, we have the highest percentage of stocks in the portfolio since the fund's initial investments at the beginning of 1998, and the greatest optimism regarding the fund's immediate prospects, which are now poised more towards capital growth than capital preservation.
Did you make any significant additions to the portfolio since December 31, 1999?
The most important shift in the portfolio during this six-month period was an increase in stock exposure from about 35% at the beginning of the period to some 68% at the end of the period. This shift signified management's improving outlook on the market in general, but more importantly, on the low valuations assessed to the financial sector, which composes 33% of the overall portfolio as of June 30, 2000 in a number of financial-related industries such as insurance and banking. We not only added in terms of percentage holdings, but in terms of numbers of companies. We entered the period holding shares in nine companies and ended the period with holdings in 17. Four of the top-five stock holdings as of June 30 were not among the top five at the beginning of the period: Tellabs, Worldcom, Metlife and Kroger.
What holdings were the strongest contributors to fund performance?
Stock holdings in technology, telecommunications, industrials and healthcare were all additive to the portfolio. Federated Investors was the biggest single contributor, followed by Tellabs, Martin Marietta, and Metlife. We sold our Federated Investors and Martin Marietta stock at significant gains. Although technology was a volatile sector during this period, our overall holdings were positive, including gains in our new position in Microsoft.
What holdings were the largest constraints on performance?
Our largest sector exposure was to financials, and these holdings underperformed
through this six months. We had particularly disappointing results from Finova Group,
long-time holding Freddie Mac, Marshall & Ilsley and MGIC Investment, the mortgage
insurance company. Nevertheless, while the financial holdings hurt us over the short-term,
we believe they have the potential to drive the portfolio's growth going forward. We're
confident that the companies are strong and that the market's lack of interest in them
should turn when the Federal Reserve completes its latest round of interest rate
increases.
TOP FIVE STOCK HOLDINGS AS OF JUNE 30, 2000
FOR MOSAIC FORESIGHT
| (68.1% of net assets in stocks) | % of net assets |
| Tellabs, Inc. | 5.7% |
| Worldcom, Inc. | 5.6% |
| Metlife | 5.4% |
| Kroger Company | 5.2% |
| Federal Home Loan Mortgage | 4.7% |
Investors Fund - Portfolio of Investments
(unaudited)NUMBER OF SHARES |
VALUE |
|
| COMMON STOCKS: 96.8% of net assets | ||
| BANKS: 7.4% | ||
| ---Chase Manhattan Corp. | 18,427 |
$848,816 |
| ---Wells Fargo & Co. | 31,990 |
1,239,613 |
| CONSUMER CYCLICALS: 10.6% | ||
| ---Liz Claiborne | 19,290 |
679,973 |
| ---Low's Companies | 25,985 |
1,067,009 |
| ---Target Corporation | 21,055 |
1,221,190 |
| CONSUMER SERVICES - TELECOMMUNICATIONS: 9.9% | ||
| ---RCN Corporation* | 15,975 |
405,366 |
| ---US Cellular Corp.* | 12,140 |
764,820 |
| ---Worldcom, Inc.* | 34,875 |
1,599,891 |
| CONSUMER STAPLES - FOOD & BEVERAGE: 3.4% | ||
| ---PepsiCo, Incorporated | 21,700 |
964,293 |
| CONSUMER STAPLES - RETAIL: 13.8% | ||
| ---CVS Corporation | 30,000 |
1,200,000 |
| ---Kroger Company | 48,000 |
1,059,000 |
| ---Safeway, Incorporated* | 17,720 |
799,615 |
| ---Scripps, Corporation | 16,125 |
794,156 |
| ENTERTAINMENT: 3.4% | ||
| ---Time Warner, Inc. | 12,375 |
940,500 |
| FINANCIAL - SERVICES: 8.8% | ||
| ---Associates First Capital | 42,120 |
$939,803 |
| ---Federal Home Loan Mortgage Corp. | 30,260 |
1,225,530 |
| ---Finova Group, Inc. | 22,895 |
297,635 |
| HEALTHCARE: 14.8% | ||
| ---Abbott Laboratories | 32,100 |
1,430,457 |
| ---Bristol-Myers Squibb Co. | 20,070 |
1,169,077 |
| ---Johnson & Johnson | 15,035 |
1,531,691 |
| INDUSTRIAL: 2.6% | ||
| ---Martin Marietta Material | 18,055 |
730,099 |
| INSURANCE: 4.8% | ||
| ---MGIC Investment Corp. | 29,670 |
1,349,985 |
| TECHNOLOGY: 17.3% | ||
| ---Fiserv Incorporated* | 18,500 |
800,125 |
| ---Intel Corporation | 6,000 |
802,125 |
| ---Lexmark
International Group, ---Incorporated* |
7,745 |
520,851 |
| ---Microsoft Corporation* | 13,450 |
1,076,000 |
| ---Solectron Corporation* | 12,770 |
534,744 |
| ---Tellabs Incorporated* | 16,140 |
1,104,581 |
| ------TOTAL
COMMON STOCKS ------(cost $25,271,446) |
$27,096,945 |
|
| REPURCHASE AGREEMENT: 3.1% of net assets
With Donaldson, Lufkin & Jenrette Securities Corporation issued 6/30/00 at 5.25%, due 7/03/00, collateralized by $917,103 in United States Treasury Notes due 11/15/08. Proceeds at maturity are $899,393 (cost $899,000) |
$899,000 |
|
| TOTAL INVESTMENTS: 99.9% of net assets (cost $26,170,446) | 27,995,945 |
|
| CASH AND RECEIVABLES LESS LIABILITIES: 0.1% of net assets | 1,453 |
|
| NET ASSETS: 100% | $27,997,398 |
*Non-income producing
The Notes to Financial Statements are an integral part of these statements.
Balanced Fund - Portfolio of Investments (unaudited)
NUMBER OF SHARES |
VALUE |
|
| COMMON STOCKS: 68.1% of net assets | ||
| BANKS: 5.4% | ||
| ---Chase Manhattan Corp. | 9,802 |
$451,527 |
| ---Wells Fargo & Co. | 17,500 |
678,125 |
| CONSUMER CYCLICALS: 7.2% | ||
| ---Liz Claiborne | 9,890 |
348,623 |
| ---Lowe's Companies | 13,325 |
547,158 |
| ---Target Corporation | 10,710 |
621,180 |
| CONSUMER SERVICES - TELECOMMUNICATIONS: 7.0% | ||
| ---RCN Corporation* | 8,115 |
205,918 |
| ---US Cellular Corp.* | 7,015 |
441,945 |
| ---Worldcom, Inc.* | 17,807 |
816,896 |
| CONSUMER STAPLES - FOOD & BEVERAGE: 2.4% | ||
| ---PepsiCo, Incorporated | 11,130 |
494,589 |
| CONSUMER STAPLES - RETAIL: 10.1% | ||
| ---CVS Corporation | 17,610 |
704,400 |
| ---Kroger Company | 23,450 |
517,366 |
| ---Safeway, Incorporated* | 9,705 |
437,938 |
| ---Scripps, Corporation | 9,170 |
451,622 |
| ENTERTAINMENT: 2.2% | ||
| ---Time Warner, Inc. | 6,075 |
461,700 |
| FINANCIAL - SERVICES: 6.3% | ||
| ---Associates First Capital | 24,000 |
535,500 |
| ---Federal Home Loan Mortgage Corp. | 15,705 |
636,053 |
| ---Finova Group, Inc. | 11,000 |
143,000 |
| HEALTHCARE: 10.4% | ||
| ---Abbott Laboratories | 17,500 |
779,843 |
| ---Bristol-Myers Squibb Co. | 11,130 |
648,322 |
| ---Johnson & Johnson | 7,490 |
763,044 |
| INDUSTRIAL: 1.7% | ||
| ---Martin Marietta Material | 9,000 |
363,938 |
| INSURANCE: 3.4% | ||
| ---MGIC Investment Corp. | 15,640 |
711,620 |
| TECHNOLOGY: 12.0% | ||
| ---Fiserv, Incorporated* | 10,090 |
436,393 |
| ---Intel Corporation | 2500 |
334,219 |
| ---Lexmark
International Group, ---Incorporated* |
3,980 |
267,655 |
| ---Microsoft Corporation* | 6,980 |
558,400 |
| ---Solectron Corporation* | 6,545 |
274,072 |
| ---Tellabs Incorporated* | 9,385 |
642,286 |
| ------TOTAL
COMMON STOCKS : ------(cost $13,432,481) |
$14,273,332 |
|
PRINCIPAL AMOUNT |
VALUE |
|
| DEBT INSTRUMENTS: 31.1% of net assets | ||
| Corporate Obligations: 22.4% | ||
| ---Associates
Corporation of North ---America, 6%, 4/1/03 |
325,000 |
$312,000 |
| ---AT&T Corporation, 5.625%, 3/15/04 | 350,000 |
329,438 |
| ---Cardinal Health, Inc., 6.25%, 7/1/08 | 390,000 |
355,875 |
| ---Emerson
Electric Co., 7.875%, ---6/1/2005 |
255,000 |
262,331 |
| ---Ford
Motor Credit Co., 7.75%, ---3/15/05 |
325,000 |
327,437 |
| ---Gap, Incorporated, 6.9%, 9/15/07 | 345,000 |
333,787 |
| ---General
Motors Acceptance Corp., ---5.875%, 1/22/03 |
330,000 |
318,038 |
| ---Household
Finance Corporation, ---7.875%, 3/1/2007 |
300,000 |
298,875 |
| ---International
Lease Finance ---Corporation, 8.375%, 12/15/04 |
315,000 |
325,237 |
| ---Kohls Corporation, 6.7%, 2/1/06 | 280,000 |
269,500 |
| ---Lexmark International, 6.75%, 5/1/08 | 350,000 |
320,688 |
| ---Motorola, Inc., 5.8%, 10/15/08 | 230,000 |
209,013 |
| ---Seagate
Technology, Inc., Senior ---Notes, 7.37%, 3/1/07 |
275,000 |
254,375 |
| ---The
Goldman Sachs Company, ---7.35%, 10/1/09 |
340,000 |
220,800 |
| ---Tommy
Hilfiger USA, Incorporated, ---6.5%, 6/1/03 |
340,000 |
259,250 |
| ---Worldcom Inc., 7.75%, 4/01/07 | 305,000 |
305,381 |
| U.S. Treasury & Agency Obligations: 8.7% | ||
| ---Federal
Home Loan Mortgage Corp, ---7.375%, 05/15/03 |
405,000 |
$409,050 |
| ---Federal
National Mortgage ---Association, 5.375%, 3/15/02 |
750,000 |
732,188 |
| ---U.S. Treasury Notes, 5.25%, 1/31/01 | 500,000 |
496,875 |
| ---U.S. Treasury Notes, 6.25%, 8/31/02 | 170,000 |
169,415 |
| ------TOTAL
DEBT INSTRUMENTS ------(cost $6,788,716) |
6,509,553 |
|
| REPURCHASE AGREEMENT: 0.3% of net assets With Donaldson, Lufkin & Jenrette Securities Corporation issued 6/30/00 at 5.25%, due 7/03/00, collateralized by $74,470 in United States Treasury Notes due 11/15/08. Proceeds at maturity are $73,032. (cost $73,000) |
73,000 |
|
| TOTAL INVESTMENTS: 99.5% of net assets (cost $20,294,197) |
20,855,885 |
|
| CASH AND RECEIVABLES LESS LIABILITIES: 0.5% of net assets |
99,847 |
|
| NET ASSETS: 100% | $20,955,732 |
*Non-income producing
Mid-Cap Growth Fund - Portfolio of Investments (unaudited)
NUMBER OF SHARES |
VALUE |
|
| COMMON STOCKS: 80.2% of net assets | ||
| BANKS: 3.1% | ||
| ---Southtrust Corporation | 11,260 |
$254,757 |
| CAPITAL GOODS - ELECTRICAL EQUIPMENT: 3.9% | ||
| ---American Power Conversion Corp.* | 7,935 |
323,847 |
| CONSUMER CYCLICALS: 10.0% | ||
| ---Callaway Golf Company | 21,000 |
342,562 |
| ---Liz Claiborne | 8,090 |
285,173 |
| ---Officemax, Inc.* | 39,180 |
195,900 |
| CONSUMER SERVICES - TELECOMMUNICATIONS: 8.8% | ||
| ---RCN Corporation* | 6,240 |
158,145 |
| ---Telephone & Data Systems, Inc. | 3,155 |
316,289 |
| ---US Cellular Corp.* | 3,900 |
245,700 |
| CONSUMER STAPLES: 15.9% | ||
| ---CVS Corporation | 9,525 |
381,000 |
| ---Kroger Company | 19,000 |
419,187 |
| ---Rogers Communication* | 6,950 |
198,075 |
| ---Scripps, Corporation | 6,290 |
309,783 |
| HEALTHCARE: 8.2% | ||
| ---Becton Dickinson & Co. | 11,615 |
333,205 |
| ---Dentsply International, Incorporated. | 10,940 |
336,747 |
| INDUSTRIAL: 4.6% | ||
| ---Martin Marietta Material | 9,375 |
379,102 |
| INSURANCE: 10.4% | ||
| ---MBIA, Incorporated | 6,025 |
290,330 |
| ---MGIC Investment Corp. | 7,000 |
318,500 |
| ---Unumprovident Corp. | 11,980 |
240,349 |
| TECHNOLOGY: 8.9% | ||
| ---Affiliated Computer Services* | 8,035 |
265,657 |
| ---Fiserv, Incorporated* | 5,285 |
228,576 |
| ---Lexmark International Group, Inc.* | 3,480 |
234,030 |
| TRANSPORTATION: 6.4% | ||
| ---Expiditors
International of ---Washington, Inc. |
4,000 |
190,000 |
| ---Kansas City Southern | 3,785 |
335,682 |
| ------TOTAL COMMON STOCKS: ------(cost $5,970,842) |
6,582,596 |
|
| REPURCHASE AGREEMENT: 19.7% of net assets With Donaldson, Lufkin & Jenrette Securities Corporation issued 6/30/00 at 5.25%, due 7/03/00, collateralized by $1,655,683 in United States Treasury Notes due 11/15/08. Proceeds at maturity are $1,623,710. (cost $1,623,000) |
1,623,000 |
|
| TOTAL INVESTMENTS: 99.9% of net assets (cost $7,593,842) |
8,205,596 |
|
| CASH AND RECEIVABLES LESS LIABILITIES: 0.1% of net assets |
105 |
|
| NET ASSETS: 100% | $8,205,701 |
*Non-income producing
Foresight Fund - Portfolio of Investments (unaudited)
NUMBER OF SHARES |
VALUE |
|
| COMMON STOCKS: 68.1% of net assets | ||
| BANKS: 10.8% | ||
| ---Marshall & Ilsley Corp. | 2,000 |
$83,000 |
| ---Southtrust Corporation | 2,595 |
58,712 |
| ---Wells Fargo & Company | 2,565 |
99,394 |
| CONSUMER CYCLICALS: 2.8% | ||
| ---Liz Claiborne | 1,805 |
63,626 |
| CONSUMER SERVICES - TELECOMMUNICATIONS: 5.6% | ||
| ---Worldcom, Inc.* | 2,720 |
124,780 |
| CONSUMER STAPLES - RETAIL: 5.2% | ||
| ---Kroger Company | 5,270 |
116,269 |
| FINANCIAL - SERVICES: 9.5% | ||
| ---Associates First Capital | 3,400 |
75,863 |
| ---Federal Home Loan Mortgage Corp. | 2,590 |
104,895 |
| ---Finova Group Inc. | 2,390 |
31,070 |
| HEALTHCARE: 8.3% | ||
| ---Bristol-Myers Squibb Co. | 1,750 |
101,938 |
| ---Johnson & Johnson | 825 |
84,047 |
| INSURANCE: 12.8% | ||
| ---MBIA, Incorporated | 1,500 |
72,281 |
| ---MGIC Investment Corp. | 2,035 |
92,592 |
| ---MetLife Incorporated* | 5,700 |
120,056 |
| TECHNOLOGY: 13.1% | ||
| ---Affiliated Computer Services* | 1,910 |
63,149 |
| ---Microsoft Corporation* | 1,265 |
101,200 |
| ---Tellabs Incorporated* | 1,855 |
126,952 |
| ------TOTAL
COMMON STOCKS ------(cost $1,540,015) |
1,519,824 |
|
| DEBT INSTRUMENTS: 27.3% of net assets |
||
| U.S. Government Agency Obligations: | ||
| ---Federal
Home Loan Mortgage Corp., ---6.40%, 7/05/00 |
500,000 |
499,815 |
| ---Federal
National Mortgage Assn, ---6.45%, 7/05/00 |
110,000 |
109,959 |
| ------TOTAL
U.S. GOVERNMENT ------AGENCY OBLIGATIONS ------(cost $609,783) |
609,774 |
|
| REPURCHASE AGREEMENT: 4.5% of net assets With Donaldson, Lufkin & Jenrette Securities Corporation issued 6/30/00 at 5.25%, due 7/3/00, collateralized by $102,013 in United States Treasury Notes due 11/15/08. Proceeds at maturity are $100,044. (cost $100,000) |
100,000 |
|
| TOTAL INVESTMENTS: 99.9% of net assets (cost $2,249,798) |
2,229,598 |
|
| CASH AND RECEIVABLES LESS LIABILITIES: 0.1% of net assets |
2,111 |
|
| NET ASSETS: 100% | $2,231,709 |
*Non-income producing
Statements of Assets and Liabilities (unaudited)
June 30, 2000
Investors Fund |
Balanced Fund |
Mid-Cap Growth Fund |
Foresight Fund |
|
| ASSETS | ||||
| Investments, at value (Notes 1 and 2) |
||||
| ---Investment securities | $27,096,945 |
$20,782,885 |
$6,582,596 |
$2,129,598 |
| ---Repurchase
---agreements |
899,000 |
73,000 |
1,623,000 |
100,000 |
| ------Total investments | 27,995,945 |
20,855,885 |
8,205,596 |
2,229,598 |
| Cash | 846 |
364 |
333 |
681 |
| Receivables | ||||
| ---Dividends and interest | 4,514 |
121,205 |
7,028 |
1,430 |
| ---Capital shares sold | -- |
4,013 |
-- |
-- |
| ------Total assets | 28,001,305 |
20,981,467 |
8,212,957 |
2,231,709 |
| LIABILITIES | ||||
| Payables | ||||
| ---Investment
securities ---purchased |
-- |
5,852 |
-- |
-- |
| ---Capital
shares ---redeemed |
3,907 |
19,883 |
7,256 |
-- |
| ------Total liabilities | 3,907 |
25,735 |
7,256 |
-- |
| NET ASSETS (Note 6) | $27,997,398 |
$20,955,732 |
$8,205,701 |
$2,231,709 |
| CAPITAL SHARES OUTSTANDING | 1,333,201 |
1,110,671 |
831,684 |
187,928 |
| NET ASSET VALUE PER SHARE | $21.00 |
$18.87 |
$9.87 |
$11.88 |
Statements of Operations(unaudited)
For the six months ended June 30, 2000
Investors Fund |
Balanced Fund |
Mid-Cap Growth Fund |
Foresight Fund |
|
| INVESTMENT INCOME (Note 1) |
||||
| ---Interest income | $42,028 |
$245,205 |
$32,687 |
$39,464 |
| ---Dividend income | 107,201 |
59,304 |
30,781 |
5,185 |
| ---Other income | 152 |
-- |
-- |
-- |
| -----Total investment income | 149,381 |
304,509 |
63,468 |
44,649 |
| EXPENSES (Notes 3 and 5) | ||||
| ---Investment advisory fees | 104,065 ) |
83,552 ) |
30,807 ) |
8,734 |
| ---Transfer
agent, ---administrative, ---registration & professional ---fees |
55,501 |
50,131 |
20,538 |
5,823 |
| ------Total expenses | 159,566 |
133,683 |
51,345 |
14,557 |
| NET INVESTMENT INCOME (LOSS) | (10,185) |
170,826 |
12,123 |
30,092 |
| REALIZED AND UNREALIZED GAIN (LOSS) ON INVESTMENTS | ||||
| ---Net
realized gain on ---investments |
1,344,043 |
864,051 |
969,127 |
105,092 |
| ---Change
in net unrealized ---depreciation ---of investments |
(1,628,375) |
(1,080,093) |
(780,204) |
(66,620) |
| ---Net
realized and ---unrealized gain ---(loss) on investments |
(284,332) |
(216,042) |
188,92 |
38,472 |
| TOTAL INCREASE (DECREASE)
IN NET ASSETS RESULTING FROM OPERATIONS |
$(294,517) |
$(45,216) |
$201,046 |
$68,564 |
Statements of Changes in Net Assets
For the period indicated
Investors Fund |
Balanced Fund |
|||
(unaudited) Six Months Ended June 30, 2000 |
Year Ended
|
(unaudited) Six Months Ended June 30, 2000 |
Year Ended Dec. 31, 1999 |
|
| INCREASE (DECREASE) IN NET ASSETS RESULTING FROM OPERATIONS | ||||
| ---Net investment income (loss) | $(10,185) |
$(8,678) |
$170,82 |
$400,564 |
| ---Net realized gain on investments | 1,344,043 |
5,544,052 |
864,051 |
2,442,279 |
| ---Net
unrealized depreciation of ---investments |
(1,628,375) |
(3,969,589) |
(1,080,093) |
(2,118,999) |
| ------Total
increase (decrease) in ------net assets resulting from ---operations |
(294,517) |
1,565,785) |
(45,216) |
723,844 |
| DISTRIBUTIONS TO SHAREHOLDERS | ||||
| ---From net investment income | -- ) |
-- ) |
(170,638) |
(400,753) |
| ---From net capital gains | -- ) |
(5,079,576) |
-- |
(2,244,659) |
| ------Total distributions | -- |
(5,079,576) |
(170,638) |
(2,645,412) |
| CAPITAL SHARE TRANSACTIONS (Note 8) | (1,034,523) |
3,312,465 |
(4,154,636) |
2,512,380 |
| TOTAL INCREASE (DECREASE) IN NET ASSETS | (1,329,040) |
(201,326) |
(4,370,490) |
590,812 |
| NET ASSETS | ||||
| Beginning of period | $29,326,438 |
$29,527,764 |
$25,326,222 |
$24,735,410 |
| End of period | $27,997,398 |
$29,326,438 |
$20,955,732 |
$25,326,222 |
Mid-Cap Growth Fund |
Foresight Fund |
|||
(unaudited) Six Months Ended June 30, 2000 |
Year Ended
|
(unaudited) Six Months Ended June 30, 2000 |
Year Ended Dec. 31, 1999 |
|
| INCREASE (DECREASE) IN NET ASSETS RESULTING FROM OPERATIONS | ||||
| ---Net investment income (loss) | $12,123 |
$(2,487) |
$30,092 |
$82,698 |
| ---Net realized gain on investments | 969,127 |
579,262 |
105,092 |
91,484 |
| ---Net
unrealized appreciation ---(depreciation) of investments |
(780,204) |
118,047 |
(66,620) |
(205,807) |
| ------Total
increase (decrease) in ------net assets resulting from ------operations |
201,046 |
694,822 |
68,564 |
(31,625) |
| DISTRIBUTIONS TO SHAREHOLDERS | ||||
| ---From net investment income | -- |
-- |
-- |
(82,658) |
| ---From net capital gains | -- |
-- |
-- |
-- |
| ------Total distributions | -- |
-- |
-- |
(82,658) |
| CAPITAL SHARE TRANSACTIONS (Note 8) | (784,720) |
(2,112,339) |
(421,381) |
(594,807) |
| TOTAL DECREASE IN NET ASSETS | (583,674) |
(1,417,517) |
(352,817) |
(709,090) |
| NET ASSETS | ||||
| Beginning of period | $8,789,375 |
$10,206,892 |
$2,584,526 |
$3,293,616 |
| End of period | $8,205,701 |
$8,789,375 |
$2,231,709 |
$2,584,526 |
Selected data for a share outstanding for the periods indicated.
Six Months Ended June 30, |
Year Ended December 31, |
||||
| INVESTORS FUND-2 | 2000 |
1999 |
1998 |
1997-1 |
1996 |
| Net asset value beginning of year |
$21.10 |
$24.26 |
$22.37 |
$19.16 |
$18.03 |
| Investment operations: | |||||
| ---Net investment income (loss) | (0.01) |
(0.01) |
0.04 |
0.14 |
0.24 |
| ---Net
realized and unrealized gain ---(loss) on investments |
(0.09) |
1.21 |
4.13 |
6.39 |
3.91 |
| Total from investment operations | (0.10) |
1.20 |
4.17 |
6.53 |
4.15 |
| ---Less distributions: | |||||
| ------From net investment income | -- |
-- |
(0.04) |
(0.14)-3 |
(0.25) |
| ------From
net realized gain ------on investments |
-- |
(4.36) |
(2.24) |
(3.18)-3 |
(4.01) |
| Total distributions | -- |
(4.36) |
(2.28) |
(3.32)3 |
(4.26) |
| Net asset value, end of period | $21.00 |
$21.10 |
$24.26 |
$22.37 |
$17.92 |
| Total return (%) | (0.47)-6 |
5.06 |
18.66 |
34.84 |
22.75 |
| Ratios and supplemental data |
|||||
| Net assets, end of period
(in thousands) |
$27,997 |
$29,326 |
$29,528 |
$25,202 |
$13,112 |
| ---Ratio
of expenses to ---average net assets (%) |
1.165 |
1.15 |
1.16 |
1.15 |
1.17 |
| ---Ratio
of net investment ---income (loss) ---to average net assets (%) |
(0.07)-5 |
(0.03) |
0.17 |
0.49 |
1.20 |
| ---Portfolio turnover (%) | 42 |
74 |
85 |
78-4 |
81 |
1 All data reflect share price adjustment due to fund merger on June 13, 1997. (See note 1).
2 Data prior to June 13, 1997 represents Bascom Hill Investors, Inc.
3 Includes distribution attributable to net investment income and net realized gain from Mosaic Investors Fund. (See note 1).
4 For purposes of determining portfolio turnover, the transfer of securities pursuant to the merger on June 13, 1997 are not considered.
5 Annualized.
6 Not annualized.
Six Months Ended June 30, |
Year Ended December 31, |
||||
| BALANCED FUND-2 | 2000 |
1999 |
1998 |
19971 |
1996 |
| Net asset value beginning of year |
$18.95 |
$20.47 |
$19.48 |
$18.09 |
$22.44 |
| Investment operations: | |||||
| ---Net investment income | 0.14 |
0.33 |
0.37 |
0.40 |
0.50 |
| ---Net
realized and unrealized ---gain on investments |
(0.08) |
0.31 |
2.56 |
4.04 |
3.20 |
| Total from investment operations | 0.06 |
0.64 |
2.93 |
4.44 |
3.70 |
| ---Less distributions: | |||||
| ------From net investment income | (0.14) |
(0.33) |
(0.37) |
(0.41)3 |
(0.50) |
| ------From
net realized gain ------on investments |
-- |
(1.83) |
(1.57) |
(2.64)-3 |
(3.61) |
| Total distributions | (0.14) |
(2.16) |
(1.94) |
(3.05)-3 |
(4.11) |
| Net asset value, end of period |
$18.87 |
$18.95 |
$20.47 |
$19.48 |
$22.03 |
| Total return (%) | 0.37-6 |
3.14 |
15.15 |
25.49 |
17.00 |
| Ratios and supplemental data |
|||||
| Net assets, end of period
(in thousands) |
$20,956 |
$25,326 |
$24,735 |
$17,403 |
$11,018 |
| ---Ratio
of expenses to ---average net assets (%) |
1.21-5 |
1.20 |
1.20 |
1.35 |
1.42 |
| ---Ratio
of net investment ---income to average ---net assets (%) |
1.55-5 |
1.57 |
1.83 |
1.80 |
2.06 |
| ---Portfolio turnover (%) | 33 |
55 |
94 |
78-4 |
86 |
1 All data reflect share price adjustment due to fund merger on June 13, 1997. (See note 1).
2 Data prior to June 13, 1997 represents Bascom Hill BALANCED Fund, Inc.
3 Includes distribution attributable to net investment income and net realized gain from Mosaic Equity Income Fund. (See note 1).
4 For purposes of determining portfolio turnover, the transfer of securities pursuant to the merger on June 13, 1997 are not considered.
5 Annualized.
6 Not annualized.
Six Months Ended June 30, |
Year Ended December 31, |
Nine Months Ended Dec. 31 |
Year Ended
|
|||
| MID-CAP GROWTH FUND-1 | 2000 |
1999 |
1998 |
1997 |
1997 |
1996 |
| Net asset value beginning of period |
$9.57 |
$8.74 |
$9.25 |
$9.88 |
$20.49 |
$18.09 |
| Investment operations: | ||||||
| ---Net
investment ---income (loss) |
0.01 |
-- |
(0.01) |
(0.03) |
(0.02) |
0.13 |
| ---Net
realized and ---unrealized gain (loss) ---on investments |
0.29 |
0.83 |
0.64 |
1.91 |
(0.47) |
3.63 |
| Total from investment operations |
0.30 |
0.83 |
0.63 |
1.88 |
(0.49) |
3.76 |
| ---Less distributions: | ||||||
| ------From
net investment ------income |
-- |
-- |
-- |
-- |
(0.02) |
(0.12) |
| ------From
net realized gain ------on investments |
-- |
-- |
(1.14) |
(2.51) |
(10.10) |
(1.24) |
| Total distributions | -- |
-- |
(1.14) |
(2.51) |
(10.12) |
(1.36) |
| Net asset value, end of period |
$9.87 |
$9.57 |
$8.74 |
$9.25 |
$9.88 |
$20.49 |
| Total return (%) | 3.13-3 |
9.50 |
6.81 |
26.06 |
(5.59) |
21.22 |
| Ratios and supplemental data |
||||||
| Net assets, end of period (in thousands) |
$8,206 |
$8,789 |
$10,207 |
$11,468 |
$10,964 |
$17,091 |
| ---Ratio
of expenses ---to average net ---assets (%) |
1.26-2 |
1.25 |
1.26 |
1.27-2 |
1.62 |
1.41 |
| ---Ratio
of net investment ---income to average ---net assets (%) |
0.30-2 |
(0.03) |
(0.09) |
(0.35)-2 |
(0.12) |
0.56 |
| ---Portfolio turnover (%) | 36 |
65 |
88 |
80 |
127 |
21 |
1 Effective July 31, 1996, the investment advisory services transferred to Madison Mosaic, LLC from Bankers Finance Investment Management Corp.
2 Annualized.
3 Not annualized.
Six Months Ended June 30, |
Year Ended December 31, |
Nine Months Ended Dec. 31, |
Year
Ended |
|||
| FORESIGHT FUND-1 | 2000 |
1999 |
1998 |
1997 |
1997 |
1996 |
| Net asset value beginning of period |
$11.46 |
$11.95 |
$10.46 |
$10.97 |
$9.86 |
$8.50 |
| Investment operations: | ||||||
| ---Net
investment ---income (loss) |
0.15 |
0.37 |
0.22 |
(0.01) |
0.01 |
0.04 |
| ---Net
realized and ---unrealized gain (loss) ---on investments |
0.27 |
(0.49) |
1.49 |
(0.50) |
1.10 |
1.39 |
| Total from investment operations |
0.42 |
(0.12) |
1.71 |
(0.51) |
1.11 |
1.43 |
| ---Less distributions: | ||||||
| ------From
net investment ------income |
-- |
(0.37) |
(0.22) |
-- |
-- |
(0.07) |
| ------From
net realized ------gain on investments |
-- |
-- |
-- |
-- |
-- |
-- |
| Total distributions | -- |
(0.37) |
(0.22) |
-- |
-- |
(0.07) |
| Net asset value, end of period |
$11.88 |
$11.46 |
$11.95 |
$10.46 |
$10.97 |
$9.86 |
| Total return (%) | 3.66-3 |
(0.94) |
16.36 |
(4.65) |
11.21 |
16.88 |
| Ratios and supplemental data |
||||||
| Net assets, end of period (in thousands) |
$2,232 |
$2,585 |
$3,294 |
$1,914 |
$2,582 |
$3,116 |
| ---Ratio
of expenses ---to average net ---assets-4 (%) |
1.26-2 |
1.25 |
1.30 |
2.41-2 |
2.50 |
2.38 |
| ---Ratio
of net investment ---income to average ---net assets-4 (%) |
2.60-2 |
2.73 |
2.59 |
0.05-2 |
0.10 |
0.43 |
| ---Portfolio turnover (%) | 38 |
76 |
185 |
2 |
47 |
78 |
1 Effective July 31, 1996, the investment advisory services transferred to Madison Mosaic, LLC from Bankers Finance Investment Management Corp. Prior to January 1, 1998, the Foresight Fund had different investment policies and objectives and was called Worldwide Growth Fund.
2 Annualized.
3 Not annualized.
4 Had the Advisor not waived advisory fees, the Worldwide Growth Fund's ratios of expenses and net investment loss to average net assets would have been 2.92% and (0.56)%, respectively, for the nine month period ended December 13, 1997; 3.00% and (0.40)%, respectively, for the year ended March 31, 1997; and 2.97% and (0.17)%, respectively, for the year ended March 31, 1996.
Notes to Financial Statements
For the six months ended June 30, 2000 (unaudited)
1. Summary of Significant Accounting Policies. Mosaic Equity Trust (the "Trust") is registered with the Securities and Exchange Commission under the Investment Company Act of 1940 as an open-end, investment management company. The Trust offers shares in four separate diversified funds which invest in differing securities. The Investors Fund, the surviving economic entity of the merger between Mosaic Equity Trust Investors Fund and Bascom Hill Investors, Inc., which occurred on June 13, 1997, is invested in established companies that may be undervalued and may offer significant growth potential. The Balanced Fund, the surviving economic entity of the merger between Mosaic Equity Trust Equity Income Fund and Bascom Hill BALANCED Fund, Inc., which occurred on June 13, 1997, is invested in a combination of investment grade fixed-income securities and equity securities of established companies. All financial information presented prior to the effective date of the mergers represents activity of the Bascom Hill Investors, Inc. and the Bascom Hill BALANCED Fund, Inc., respectively. The Mid-Cap Growth Fund is invested primarily in "mid-cap" companies that may offer rapid growth potential. The Foresight Fund moves in and out of the stock and bond markets when these markets appear unusually over-or-under valued. Prior to January 1, 1998, the Foresight Fund had different investment policies and objectives and was called Worldwide Growth Fund. Its portfolio was liquidated on December 31, 1997 and information for the period prior to such liquidation is presented for informational purposes.
Securities Valuation: Securities traded on a national securities exchange are valued at their closing sale price, if available, and if not available such securities are valued at the mean between their bid and asked prices. Other securities, for which current market quotations are not readily available, are valued at their fair value as determined in good faith by the Board of Trustees. Investment transactions are recorded on the trade date. The cost of investments sold is determined on the identified cost basis for financial statement and federal income tax purposes. Short-term securities (maturing within 60 days) are valued at amortized cost which approximates market value. Securities with maturities in excess of 60 days are valued at market value.
Investment Income: Interest and other income is accrued on a daily basis. Dividend income is recorded on the ex-dividend date.
Dividends: Substantially all of the Trust's accumulated net investment income, if any, determined as gross investment income less expenses, is declared as a regular dividend and distributed to shareholders at year end for the Investors, Mid-Cap Growth and Foresight Funds. The Trust intends to declare and pay regular dividends quarterly on the Balanced Fund. Capital gain distributions, if any, are declared and paid annually at year end. Additional distributions may be made if necessary.
Income Tax: In accordance with the provisions of Subchapter M of the Internal Revenue Code applicable to regulated investment companies, all of the taxable income of each portfolio is distributed to its shareholders, and therefore, no federal income tax provision is required. As of June 30, 2000, the Foresight Fund had available for federal income tax purposes an unused capital loss carryover of $192,463, expiring December 31, 2003.
Use of Estimates: The preparation of financial statements in conformity with generally accepted accounting principles requires management to make estimates and assumptions that affect the reported amounts of assets and liabilities and reported amounts of increases and decreases in net assets from operations during the reporting period. Actual results could differ from those estimates.
2. Investments in Repurchase Agreements. When the Trust purchases securities under agreements to resell, the securities are held for safekeeping by the custodian bank as collateral. Should the market value of the securities purchased under such an agreement decrease below the principal amount to be received at the termination of the agreement plus accrued interest, the counterparty is required to place an equivalent amount of additional securities in safekeeping with the Trust's custodian bank. Repurchase agreements may be terminated within seven days. Pursuant to an Exemptive Order issued by the Securities and Exchange Commission, the Trust, along with other registered investment companies having Advisory and Services Agreements with the same advisor, transfers uninvested cash balances into a joint trading account. The aggregate balance in this joint trading account is invested in one or more consolidated repurchase agreements whose underlying securities are U.S. Treasury or federal agency obligations.
3. Investment Advisory Fees and Other Transactions with Affiliates. The Investment Advisor to the Trust, Madison Mosaic, LLC, a wholly owned subsidiary of Madison Investment Advisors, Inc. ("the Advisor"), earns an advisory fee equal to 0.75% per annum of the average net assets of each of the Investors, Balanced, Mid-Cap Growth and Foresight Funds; the fees are accrued daily and are paid monthly.
4. Aggregate Cost and Unrealized Appreciation (Depreciation). The aggregate cost
for federal income tax purposes and the net unrealized appreciation are stated as follows
as of June 30, 2000:
Investors Fund |
Balanced Fund |
Mid-Cap Growth Fund |
Foresight Fund |
|
| Aggregate Cost | $26,170,446 |
$20,294,197 |
$7,593,842 |
$2,249,798 |
| Gross unrealized appreciation | 3,469,435 |
1,659,307 |
1,162,590 |
145,276 |
| Gross unrealized depreciation | (1,643,936) |
(1,097,619) |
(550,836) |
(165,476) |
| Net unrealized appreciation (depreciation) | $1,825,499 |
$561,688 |
$611,754 |
$(20,200) |
5. Other Expenses. All support services are provided by the Advisor under a Services Agreement for fees based on a percentage of average net assets. This percentage is 0.40% for the Investors Fund, 0.45% for the Balanced Fund and 0.50% for the Mid-Cap Growth Fund and Foresight Fund.
The Advisor is also responsible for the fees and expenses of Trustees who are affiliated with the Advisor and certain promotional expenses.
6. Net Assets. At June 30, 2000, net assets included the following:
Investors Fund |
Balanced Fund |
Mid-Cap Growth Fund |
Foresight Fund |
|
| Net paid in capital on shares of beneficial interest | $23,533,538 |
$18,910,474 |
$6,169,754 |
$2,309,148 |
| Undistributed net investment income (loss) | (10,185) |
-- |
12,123 |
30,132 |
| Accumulated net realized gains (losses) | 2,648,546 |
1,483,570 |
1,412,070 |
(87,371) |
| Net unrealized appreciation on investments | 1,825,499 |
561,688 |
11,754 |
(20,200) |
| ---Total Net Assets | $27,997,398 |
$20,955,732 |
$8,205,701 |
$2,231,709 |
7. Investment Transactions. Purchases and sales of securities other than
short-term securities for the year ended June 30, 2000 were as follows:
Investors Fund |
Balanced Fund |
Mid-Cap Growth Fund |
Foresight Fund |
|
| Purchases | $11,250,761 |
$7,196,281 |
$2,563,965 |
$953,136 |
| Sales | 11,781,592 |
10,121,258 |
3,976,800 |
378,262 |
8. Capital Share Transactions. An unlimited number of capital shares, without
par value, are authorized. Transactions in capital shares for the following periods were:
| Investors Fund | (unaudited)
|
Year Ended Dec. 31, 1999 |
| In Dollars | ||
| Shares sold | $13,547,592 |
$18,657,217 |
| Shares issued in reinvestment of dividends |
-- |
4,868,593 |
| Total shares issued | 13,547,592 |
23,525,810 |
| Shares redeemed | (14,582,115) |
(20,213,345) |
| Net increase (decrease) | $(1,034,523) |
$3,312,465 |
| In Shares | ||
| Shares sold | 663,005 |
622,680 |
| Shares issued in reinvestment of dividends |
-- |
101,199 |
| Total shares issued | 663,005 |
723,879 |
| Shares redeemed | (719,722) |
(633,406) |
| Net increase (decrease) | (56,717) |
90,473 |
| Balanced Fund | (unaudited)
|
Year Ended Dec. 31, 1999 |
| In Dollars | ||
| Shares sold | $892,500 |
$3,499,336 |
| Shares issued in reinvestment of dividends |
159,172 |
2,510,195 |
| Total shares issued | 1,051,672 |
6,009,531 |
| Shares redeemed | (5,206,308) |
(3,497,151) |
| Net increase (decrease) | $(4,154,636) |
$2,512,380 |
| In Shares | ||
| Shares sold | 48,957 |
164,542 |
| Shares issued in reinvestment of dividends |
8,465 |
131,712 |
| Total shares issued | 57,422 |
296,254 |
| Shares redeemed | (283,556) |
(167,852) |
| Net increase (decrease) | (226,134) |
128,402 |
| Mid-Cap Growth Fund | (unaudited)
|
Year Ended Dec. 31, 1999 |
| In Dollars | ||
| Shares sold | $(2,402,264) |
$(8,439,187) |
| Shares issued in reinvestment of dividends |
-- |
-- |
| Total shares issued | 2,402,264 |
8,439,187 |
| Shares redeemed | (3,186,984) |
(10,551,528) |
| Net decrease | $(784,720) |
$(2,112,341) |
| In Shares | ||
| Shares sold | 270,362 |
996,771 |
| Shares issued in reinvestment of dividends |
-- |
-- |
| Total shares issued | 270,362 |
996,771 |
| Shares redeemed | (356,885) |
(1,246,057) |
| Net decrease | (86,523) |
(249,286) |
| Foresight Fund | (unaudited)
|
Year Ended Dec. 31, 1999 |
| In Dollars | ||
| Shares sold | $29,679 |
$547,899 |
| Shares issued in reinvestment of dividends |
-- |
80,623 |
| Total shares issued | 29,679 |
628,522 |
| Shares redeemed | (451,060) |
(1,223,329) |
| Net decrease | $(421,381) |
$(594,807) |
| In Shares | ||
| Shares sold | 2,676 |
45,873 |
| Shares issued in reinvestment of dividends |
-- |
7,078 |
| Total shares issued | 2,676 |
52,951 |
| Shares redeemed | (40,190) |
(103,154) |
| Net decrease | (37,514) |
(50,203) |
Mosaic Equity Trust
Mosaic Focus Fund
Mosaic Income Trust
Mosaic Tax-Free Trust
Mosaic Government Money Market
For more complete information on any Mosaic Fund, including charges and expenses, request a prospectus by calling 1-800-368-3195. Read it carefully before you invest or send money. This document does not constitute an offering by the distributor in any jurisdiction in which such offering may not be lawfully made. Mosaic Funds Distributor, LLC.
Transfer Agent
Mosaic Funds
c/o Firstar Mutual Fund Services, LLC
P.O. Box 701
Milwaukee, WI 53201-0701
888-670-3600
Telephone Numbers
Shareholder Service
Toll-free nationwide: 888 670 3600
Mosaic Tiles (24 hour automated information)
Toll-free nationwide: 800 336 3063
Mosaic Funds
www.mosaicfunds.com
|
|