
|
|
|
|
|
|
|
|
|
|
Previous: INTEGRAL SYSTEMS INC /MD/, 8-K, EX-99.1, 2000-09-15 |
Next: CONSOLIDATED CAPITAL INSTITUTIONAL PROPERTIES 2, DEFC14A, 2000-09-15 |
Semiannual Report
July 31, 2000
(2_fidelity_logos)(Registered_Trademark)
|
President's Message |
3 |
Ned Johnson on investing strategies |
|
Spartan New York Municipal Income Fund |
||
|
|
4 |
Performance |
|
|
7 |
Fund Talk: The Manager's Overview |
|
|
10 |
Investment Changes |
|
|
11 |
Investments |
|
|
24 |
Financial Statements |
|
Spartan New York Municipal Money Market Fund |
||
|
|
28 |
Performance |
|
|
30 |
Fund Talk: The Manager's Overview |
|
|
32 |
Investment Changes |
|
|
33 |
Investments |
|
|
42 |
Financial Statements |
|
Fidelity New York Municipal Money Market Fund |
||
|
|
46 |
Performance |
|
|
48 |
Fund Talk: The Manager's Overview |
|
|
50 |
Investment Changes |
|
|
51 |
Investments |
|
|
62 |
Financial Statements |
|
Notes |
66 |
Notes to the financial statements |
|
|
|
|
|
|
|
|
Standard & Poor's, S&P and S&P 500 are registered service marks of The McGraw-Hill Companies, Inc. and have been licensed for use by Fidelity Distributors Corporation.
Other third party marks appearing herein are the property of their respective owners.
All other marks appearing herein are registered or unregistered trademarks or service marks of FMR Corp. or an affiliated company.
(Recycle graphic) This report is printed on recycled paper using soy-based inks.
This report and the financial statements contained herein are submitted for the general information of the shareholders of the funds. This report is not authorized for distribution to prospective investors in the funds unless preceded or accompanied by an effective prospectus.
Mutual fund shares are not deposits or obligations of, or guaranteed by, any depository institution. Shares are not insured by the FDIC, Federal Reserve Board or any other agency, and are subject to investment risks, including possible loss of principal amount invested.
Neither the funds nor Fidelity Distributors Corporation is a bank.
For more information on any Fidelity fund, including charges and expenses, call 1-800-544-6666 for a free prospectus. Read it carefully before you invest or send money.
Semiannual Report
(photo_of_Edward_C_Johnson_3d)Dear Shareholder:
The Federal Reserve Board's effort to keep inflation in check without over-cooling the U.S. economy has taken a toll on the stock market. Through July 2000, bellwether equity indexes such as the Dow Jones Industrial Average, NASDAQ and S&P 500® have negative returns for the year. On the other hand, fixed-income markets are enjoying strong performance. Except for high-yield, most bond sectors - corporates, mortgages, Treasuries and agencies - have returned 4%-6% year to date.
While it's impossible to predict the future direction of the markets with any degree of certainty, there are certain basic principles that can help investors plan for their future needs.
The longer your investment time frame, the less likely it is that you will be affected by short-term market volatility. A 10-year investment horizon appropriate for saving for a college education, for example, enables you to weather market cycles in a long-term fund, which may have a higher risk potential, but also has a higher potential rate of return.
An intermediate-length fund could make sense if your investment horizon is two to four years, while a short-term bond fund could be the right choice if you need your money in one or two years.
If your time horizon is less than a year, you might want to consider moving some of your bond investment into a money market fund. These funds seek income and a stable share price by investing in high-quality, short-term investments. Of course, it's important to remember that an investment in a money market fund is not insured or guaranteed by the Federal Deposit Insurance Corporation or any other government agency. Although money market funds seek to preserve the value of your investment at $1.00 per share, it is possible to lose money by investing in these types of funds.
Finally, no matter what your time horizon or portfolio diversity, it makes good sense to follow a regular investment plan, investing a certain amount of money in a fund at the same time each month or quarter and periodically reviewing your overall portfolio. By doing so, you won't get caught up in the excitement of a rapidly rising market, nor will you buy all your shares at market highs. While this strategy - known as dollar cost averaging - won't assure a profit or protect you from a loss in a declining market, it should help you lower the average cost of your purchases. Of course, you should consider your financial ability to continue your purchases through periods of low price levels before undertaking such a strategy.
If you have questions, please call us at 1-800-544-6666, or visit our web site at www.fidelity.com. We are available 24 hours a day, seven days a week to provide you the information you need to make the investments that are right for you.
Best regards,
/s/Edward C. Johnson 3d
Edward C. Johnson 3d
Semiannual Report
Spartan New York Municipal Income Fund
Performance: The Bottom Line
There are several ways to evaluate historical performance. You can look at the total percentage change in value, the average annual percentage change, or the growth of a hypothetical $10,000 investment. Total return reflects the change in value of an investment, assuming reinvestment of the fund's dividend income and capital gains (the profits earned upon the sale of securities that have grown in value). You can also look at the fund's income, as reflected in its yield, to measure performance. If Fidelity had not reimbursed certain fund expenses, the past five year and past 10 year total returns would have been lower.
Cumulative Total Returns
|
Periods ended July 31, 2000 |
Past 6 |
Past 1 |
Past 5 |
Past 10 |
|
Spartan NY Municipal Income |
6.91% |
4.35% |
33.20% |
92.84% |
|
LB New York 4 Plus Year Municipal Bond |
7.32% |
4.41% |
36.77% |
n/a* |
|
New York Municipal Debt Funds Average |
6.61% |
2.35% |
27.39% |
84.99% |
Cumulative total returns show the fund's performance in percentage terms over a set period - in this case, six months, one year, five years or 10 years. For example, if you had invested $1,000 in a fund that had a 5% return over the past year, the value of your investment would be $1,050. You can compare the fund's returns to the performance of the Lehman Brothers New York 4 Plus Year Municipal Bond Index - a market value-weighted index of New York investment-grade municipal bonds with maturities of four years or more. To measure how the fund's performance stacked up against its peers, you can compare it to the New York municipal debt funds average, which reflects the performance of mutual funds with similar objectives tracked by Lipper Inc. The past six months average represents a peer group of 105 mutual funds. These benchmarks include reinvested dividends and capital gains, if any, and exclude the effect of sales charges.
Average Annual Total Returns
|
Periods ended July 31, 2000 |
|
Past 1 |
Past 5 |
Past 10 |
|
Spartan NY Municipal Income |
|
4.35% |
5.90% |
6.79% |
|
LB New York 4 Plus Year Municipal Bond |
|
4.41% |
6.46% |
n/a* |
|
New York Municipal Debt Funds Average |
|
2.35% |
4.93% |
6.29% |
Average annual total returns take the fund's cumulative return and show you what would have happened if the fund had performed at a constant rate each year. (Note: Lipper calculates average annual total returns by annualizing each fund's total return, then taking an arithmetic average. This may produce a different figure than that obtained by averaging the cumulative total returns and annualizing the result.)
* Not available
Semiannual Report
Spartan New York Municipal Income Fund
Performance - continued
$10,000 Over 10 Years
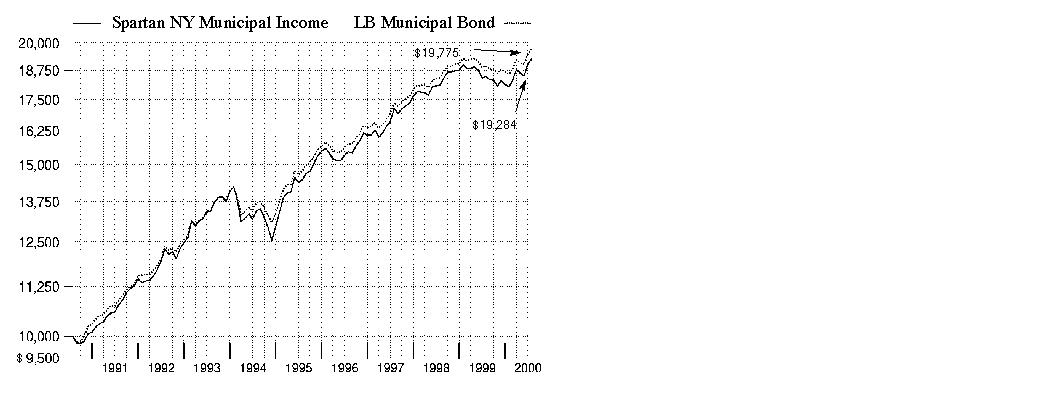
$10,000 Over 10 Years: Let's say hypothetically that $10,000 was invested in Spartan New York Municipal Income Fund on July 31, 1990. As the chart shows, by July 31, 2000, the value of the investment would have grown to $19,284 - a 92.84% increase on the initial investment. For comparison, look at how the Lehman Brothers Municipal Bond Index - a market value-weighted index of investment-grade municipal bonds with maturities of one year or more - did over the same period. With dividends reinvested, the same $10,000 would have grown to $19,775 - a 97.75% increase.
Understanding
Performance
How a fund did yesterday is no guarantee of how it will do tomorrow. Bond prices, for example, generally move in the opposite direction of interest rates. In turn, the share price, return and yield of a fund that invests in bonds will vary. That means if you sell your shares during a market downturn, you might lose money. But if you can ride out the market's ups and downs, you may have a gain.
3Semiannual Report
Spartan New York Municipal Income Fund
Performance - continued
Total Return Components
|
|
Six months ended July 31, |
Years ended January 31, |
||||
|
|
2000 |
2000 |
1999 |
1998 |
1997 |
1996 |
|
Dividend returns |
2.65% |
4.44% |
4.81% |
5.36% |
5.20% |
5.93% |
|
Capital returns |
4.26% |
-9.47% |
1.64% |
5.46% |
-1.98% |
10.36% |
|
Total returns |
6.91% |
-5.03% |
6.45% |
10.82% |
3.22% |
16.29% |
Total return components include both dividend returns and capital returns. A dividend return reflects the actual dividends paid by the fund. A capital return reflects both the amount paid by the fund to shareholders as capital gain distributions and changes in the fund's share price. Both returns assume the dividends or capital gains, if any, paid by the fund are reinvested.
Dividends and Yield
|
Periods ended July 31, 2000 |
Past 1 |
Past 6 |
Past 1 |
|
Dividends per share |
5.19 ¢ |
30.28 ¢ |
59.98 ¢ |
|
Annualized dividend rate |
5.00% |
5.06% |
5.00% |
|
30-day annualized yield |
4.94% |
- |
- |
|
30-day annualized tax-equivalent yield |
8.64% |
- |
- |
Dividends per share show the income paid by the fund for a set period. If you annualize this number, based on an average share price of $12.22 over the past one month, $11.99 over the past six months and $12.00 over the past one year, you can compare the fund's income over these three periods. The 30-day annualized yield is a standard formula for all bond funds based on the yields of the bonds in the fund, averaged over the past 30 days. This figure shows you the yield characteristics of the fund's investments at the end of the period. It also helps you compare funds from different companies on an equal basis. The tax-equivalent yield shows what you would have to earn on a taxable investment to equal the fund's tax-free yield, if you're in the 42.80% combined effective 2000 federal, state and New York City tax bracket, but does not reflect the payment of the federal alternative minimum tax, if applicable.
Semiannual Report
Spartan New York Municipal Income Fund
Market Recap
Favorable technical conditions in the municipal bond market overcame three more interest-rate hikes by the Federal Reserve Board during the six-month period ending July 31, 2000, helping municipal bonds outperform most other investments in both the fixed-income and equity markets. Municipal bond yields in the neighborhood of 6%, a diminished supply of new issues coming to market, attractive prices and strong demand from individual investors spurred the Lehman Brothers Municipal Bond Index - an index of over 35,000 investment-grade, fixed-rate, tax-exempt bonds - to a six-month return of 6.39%. That outperformed the overall taxable-bond market, as measured by the Lehman Brothers Aggregate Bond Index, which gained 5.28% in the same time frame. In fact, the six-month municipal bond return was higher than the return of corporate, mortgage, government, Treasury and agency bonds, according to their respective Lehman Brothers benchmarks. On a tax-equivalent yield basis, municipal bond outperformance was even more significant. The muni market, along with most other fixed-income sectors, also benefited from increased volatility in the equity markets, and from economic data demonstrating evidence that the Fed's effort to cool down the U.S. economy was working, perhaps signaling an end to the Fed's rate hikes for the remainder of 2000.
(Portfolio Manager photograph)
Note to shareholders: George Fischer became Portfolio Manager of Spartan New York Municipal Income Fund on July 1, 2000.
Q. How did the fund perform, George?
A. For the six-month period that ended July 31, 2000, the fund had a total return of 6.91%. To get a sense of how the fund did relative to its competitors, the New York municipal debt funds average returned 6.61% for the same six-month period, according to Lipper Inc. Additionally, the Lehman Brothers New York 4 Plus Year Municipal Bond Index, which tracks the types of securities in which the fund invests, returned 7.32%. For the 12-month period that ended July 31, 2000, the fund had a total return of 4.35%. In comparison, the New York municipal debt funds average returned 2.35% and the Lehman Brothers index returned 4.41% for the same 12-month period.
Q. The municipal market enjoyed a fairly significant turnaround during the past six-month period. Can you tell us what prompted it and how it affected the fund's performance?
A. Sure. Even though the Federal Reserve Board continued to raise interest rates in an effort to cool the economy and the stock market, municipal bond prices ended the period higher than they began it. That's primarily because investors began to anticipate that the Fed's interest-rate increases might be nearing an end. Part of their optimism stemmed from some indicators that pointed to a slowdown in the economy. Somewhat weaker economic signals, coupled with municipals' attractive prices and yields, helped them to rally in June and July. Longer-term bond yields fell the most during the period, causing them to outpace their short- and intermediate-term counterparts. Against that backdrop, the fund's total return for the six months reflects the combination of those recent price gains plus the income generated by its holdings during the period.
Semiannual Report
Spartan New York Municipal Income Fund
Fund Talk: The Manager's Overview - continued
Q. What helped the fund perform better than its peers during the six-month period?
A. The fund's relatively large weighting in longer-term bonds was one factor, for the reason I just mentioned. Also, the fund's larger-than-average stake in premium coupon bonds - those that pay interest rates above prevailing rates - helped the fund outpace its peers. Premium coupon bonds generally outperformed discount coupon and par coupon bonds, which offer interest rates below and at prevailing market rates, respectively.
Q. In terms of credit quality, what was your approach?
A. I focused on higher-quality investment-grade bonds, those rated A, Aa or Aaa. They made up 81.3% of the fund's investments at the end of the period. Those ratings are a current assessment of the creditworthiness of an issuer with respect to a specific bond offering. Aaa-rated bonds, which are the highest rated, are judged to have an extremely strong ability to pay interest and repay principal. At the other end of the investment-grade spectrum, Baa-rated bonds, which are the lowest-rated of the bonds deemed investment grade, are judged to have an adequate capacity to pay interest and principal. Bonds rated below Baa are regarded as speculative because they face large uncertainties or major risk exposure under adverse conditions.
Q. Were there any disappointments?
A. Health care bonds continued to languish due to lower reimbursements from HMOs and the federal government and from increased pressure to cut costs. Despite their short-term struggles, I held onto some bonds issued by selected hospitals that were in good financial shape and were fundamentally sound.
Q. What's ahead for the municipal market and the fund?
A. If the Fed continues to push rates higher, as it has for more than a year now, there may be more volatility ahead. If, on the other hand, the Fed really is at the end of its campaign to cool the economy and stave off inflationary pressures by raising interest rates, the bond markets should benefit. As for municipals, they are priced attractively relative to Treasury securities. Additionally, for investors in the highest federal income tax bracket, municipals offer yields above 9.00% on a tax-equivalent yield basis. Attractive prices and yields could bode well for municipals' near-term performance. As for the fund, I'll continue to approach the market fairly cautiously in terms of credit quality. The economy has been good for so long that it's easy to get lulled into complacency. We'll remain vigilant, looking for potential problems that could occur if the economy slows.
Semiannual Report
Spartan New York Municipal Income Fund
Fund Talk: The Manager's Overview - continued
The views expressed in this report reflect those of the portfolio manager only through the end of the period of the report as stated on the cover and do not necessarily represent the views of Fidelity or any other person in the Fidelity organization. Any such views are subject to change at any time based upon market or other conditions and Fidelity disclaims any responsibility to update such views. These views may not be relied on as investment advice and, because investment decisions for a Fidelity fund are based on numerous factors, may not be relied on as an indication of trading intent on behalf of any Fidelity fund.
Fund Facts
Goal: high current income free from federal, state and New York City income taxes by normally investing in investment-grade debt securities
Fund number: 071
Trading symbol: FTFMX
Start date: July 10, 1984
Size: as of July 31, 2000, more than $1.0 billion
Manager: George Fischer, since July 2000; manager, various Fidelity and Spartan municipal income funds; joined Fidelity in 1989
3George Fischer on
managing the fund's
interest-rate sensitivity:
"The main source of volatility in this fund's shares is fluctuations in the general level of interest rates. Municipal interest rates are affected by inflation, Federal Reserve policy and new issue supply, among other things. One way that we estimate how sensitive a bond - or a fund - is to such shifts is to calculate its duration. The higher the duration a bond or a fund has, the more sensitive it will be to changes in interest rates. Spartan New York Municipal Bond Fund has a duration of about seven years. This means that the fund's net asset value would rise approximately 7% when bond yields fall 1%, and fall approximately 7% when bond yields rise 1%, all else being equal. The value of funds with a shorter duration would change less in response to interest-rate changes, and the value of funds with a longer duration would change more."
Semiannual Report
Spartan New York Municipal Income Fund
|
Top Five Sectors as of July 31, 2000 |
||
|
|
% of fund's |
% of fund's net assets |
|
General Obligations |
36.5 |
37.7 |
|
Transportation |
18.7 |
16.9 |
|
Special Tax |
12.8 |
15.0 |
|
Water & Sewer |
12.0 |
8.9 |
|
Education |
6.1 |
5.5 |
|
Average Years to Maturity as of July 31, 2000 |
||
|
|
|
6 months ago |
|
Years |
15.8 |
15.0 |
|
Average years to maturity is based on the average time remaining until principal payments are expected from each of the fund's bonds, weighted by dollar amount. |
|
Duration as of July 31, 2000 |
||
|
|
|
6 months ago |
|
Years |
7.5 |
7.8 |
|
Duration shows how much a bond fund's price fluctuates with changes in comparable interest rates. |
|
Quality Diversification (Moody's Ratings) |
As of July 31, 2000 As of January 31, 2000


|
Where Moody's ratings are not available, we have used S&P ratings. Amounts shown are as a percentage of the fund's investments. |
Semiannual Report
Spartan New York Municipal Income Fund
(Unaudited)
Showing Percentage of Net Assets
|
Municipal Bonds - 96.9% |
|||||
|
Moody's Ratings |
Principal Amount |
Value |
|||
|
New York - 92.5% |
|||||
|
Albany County Gen. Oblig. 5.85% 6/1/13 (FGIC Insured) |
Aaa |
|
$ 1,275,000 |
$ 1,316,450 |
|
|
Buffalo Swr. Auth. Rev. Rfdg. (Swr. Sys. Proj.) Series G, 5% 7/1/12 (FGIC Insured) |
Aaa |
|
2,700,000 |
2,648,997 |
|
|
Cherry Valley Springfield Central School District: |
|
|
|
|
|
|
7.8% 5/1/14 (MBIA Insured) |
Aaa |
|
435,000 |
542,045 |
|
|
7.8% 5/1/15 (MBIA Insured) |
Aaa |
|
435,000 |
545,220 |
|
|
7.8% 5/1/16 (MBIA Insured) |
Aaa |
|
435,000 |
546,317 |
|
|
7.8% 5/1/17 (MBIA Insured) |
Aaa |
|
435,000 |
547,400 |
|
|
7.8% 5/1/18 (MBIA Insured) |
Aaa |
|
434,000 |
546,736 |
|
|
Dutchess County Indl. Dev. Agcy. Civic Facility Rev. (Bard College Civic Facility Proj.) 5.75% 9/1/30 |
A3 |
|
7,000,000 |
6,824,580 |
|
|
Erie County Gen. Oblig. Series A: |
|
|
|
|
|
|
6% 2/1/04 (FGIC Insured) |
Aaa |
|
1,100,000 |
1,149,907 |
|
|
6% 2/1/05 (FGIC Insured) |
Aaa |
|
1,000,000 |
1,054,180 |
|
|
6% 2/1/06 (FGIC Insured) |
Aaa |
|
1,030,000 |
1,094,427 |
|
|
Erie County Wtr. Auth. Impt. & Extension Rev. Series 3, 6.1% 12/1/04 (Escrowed to Maturity) (d) |
AA |
|
2,000,000 |
2,077,280 |
|
|
Long Island Pwr. Auth. Elec. Sys. Rev.: |
|
|
|
|
|
|
Series A, 5.75% 12/1/24 |
Baa1 |
|
25,000,000 |
24,612,250 |
|
|
Sub Series 8D, 4.5%, tender 4/1/04 |
Aaa |
|
10,000,000 |
9,946,100 |
|
|
Metro. Trans. Auth. Commuter Facilities Rev.: |
|
|
|
|
|
|
Rfdg.: |
|
|
|
|
|
|
(Svc. Contract Proj.): |
|
|
|
|
|
|
Series 8, 5.25% 7/1/17 |
Baa1 |
|
8,000,000 |
7,635,600 |
|
|
Series R, 5.4% 7/1/10 |
Baa1 |
|
2,960,000 |
3,029,205 |
|
|
Series D, 5.125% 7/1/22 (MBIA Insured) |
Aaa |
|
3,000,000 |
2,764,170 |
|
|
Series A: |
|
|
|
|
|
|
5.625% 7/1/27 (MBIA Insured) |
Aaa |
|
6,000,000 |
5,922,480 |
|
|
5.75% 7/1/21 (MBIA Insured) |
Aaa |
|
5,300,000 |
5,333,443 |
|
|
6% 7/1/24 |
Baa1 |
|
5,000,000 |
5,076,150 |
|
|
Series B: |
|
|
|
|
|
|
4.75% 7/1/26 (FGIC Insured) |
Aaa |
|
6,000,000 |
5,140,080 |
|
|
5.125% 7/1/24 (AMBAC Insured) |
Aaa |
|
5,080,000 |
4,682,134 |
|
|
Series E, 5.5% 7/1/09 (AMBAC Insured) |
Aaa |
|
2,705,000 |
2,821,504 |
|
|
Metro. Trans. Auth. Dedicated Tax Fund Series A: |
|
|
|
|
|
|
4.75% 4/1/28 (FGIC Insured) |
Aaa |
|
5,445,000 |
4,639,848 |
|
|
5% 4/1/23 (FGIC Insured) |
Aaa |
|
6,000,000 |
5,409,060 |
|
|
5% 4/1/29 (FSA Insured) |
Aaa |
|
10,000,000 |
8,875,300 |
|
|
5.25% 4/1/26 (MBIA Insured) |
Aaa |
|
5,580,000 |
5,193,585 |
|
|
Municipal Bonds - continued |
|||||
|
Moody's Ratings |
Principal Amount |
Value |
|||
|
New York - continued |
|||||
|
Metro. Trans. Auth. Svc. Contract Rev.: |
|
|
|
|
|
|
(Commuter Facilities Proj.): |
|
|
|
|
|
|
Series 3, 7.375% 7/1/08 |
Baa1 |
|
$ 5,400,000 |
$ 6,000,210 |
|
|
Series O, 5.75% 7/1/13 |
Baa1 |
|
3,000,000 |
3,109,770 |
|
|
(Trans. Facilities Proj.): |
|
|
|
|
|
|
Series 3, 7.375% 7/1/08 |
Baa1 |
|
1,830,000 |
2,033,405 |
|
|
Series P, 5.75% 7/1/15 |
Baa1 |
|
6,000,000 |
6,055,980 |
|
|
Rfdg. (Trans. Facilities Proj.): |
|
|
|
|
|
|
Series 5, 6.9% 7/1/05 |
Baa1 |
|
4,100,000 |
4,262,770 |
|
|
Series 7: |
|
|
|
|
|
|
5.45% 7/1/07 |
Baa1 |
|
4,930,000 |
5,075,139 |
|
|
5.625% 7/1/16 |
Baa1 |
|
3,000,000 |
3,004,350 |
|
|
Rfdg. (Cap. Appreciation) (Trans. Facilities Proj.) Series 7, 0% 7/1/10 |
Baa1 |
|
9,500,000 |
5,655,730 |
|
|
Metro. Trans. Auth. Trans. Facilities Rev.: |
|
|
|
|
|
|
Rfdg.: |
|
|
|
|
|
|
(Cap. Appreciation) Series N, 0% 7/1/11 (FGIC Insured) |
Aaa |
|
5,980,000 |
3,386,175 |
|
|
(Svc. Contract Proj.): |
|
|
|
|
|
|
Series 8: |
|
|
|
|
|
|
5.375% 7/1/21 (FSA Insured) |
Aaa |
|
3,000,000 |
2,877,840 |
|
|
5.375% 7/1/21 (MBIA Insured) |
Aaa |
|
3,000,000 |
2,895,600 |
|
|
Series R: |
|
|
|
|
|
|
5.3% 7/1/09 |
Baa1 |
|
4,000,000 |
4,071,600 |
|
|
5.4% 7/1/10 |
Baa1 |
|
3,000,000 |
3,070,140 |
|
|
Series 8, 5.25% 7/1/17 |
Baa1 |
|
3,000,000 |
2,863,350 |
|
|
Series A: |
|
|
|
|
|
|
4.75% 7/1/21 (MBIA Insured) |
Aaa |
|
2,000,000 |
1,747,400 |
|
|
4.75% 7/1/24 (MBIA Insured) |
Aaa |
|
5,000,000 |
4,311,100 |
|
|
Series C, 4.75% 7/1/16 (FSA Insured) |
Aaa |
|
3,000,000 |
2,721,390 |
|
|
Series K, 6.3% 7/1/06 (MBIA Insured) |
Aaa |
|
10,150,000 |
10,977,327 |
|
|
Series A: |
|
|
|
|
|
|
5.75% 7/1/21 (MBIA Insured) |
Aaa |
|
14,500,000 |
14,591,495 |
|
|
6% 7/1/16 (FSA Insured) |
Aaa |
|
9,090,000 |
9,478,961 |
|
|
6% 7/1/24 |
Baa1 |
|
2,000,000 |
2,030,460 |
|
|
6.125% 7/1/29 |
Baa1 |
|
25,000,000 |
25,543,740 |
|
|
Series B, 4.75% 7/1/26 (FGIC Insured) |
Aaa |
|
8,500,000 |
7,281,780 |
|
|
Monroe County Gen. Oblig.: |
|
|
|
|
|
|
(Pub. Impt. Proj.): |
|
|
|
|
|
|
6.1% 3/1/04 (MBIA Insured) |
Aaa |
|
870,000 |
894,621 |
|
|
6.5% 6/1/04 |
Aa2 |
|
65,000 |
69,496 |
|
|
6.5% 6/1/05 |
Aa2 |
|
115,000 |
124,561 |
|
|
Municipal Bonds - continued |
|||||
|
Moody's Ratings |
Principal Amount |
Value |
|||
|
New York - continued |
|||||
|
Monroe County Gen. Oblig.: - continued |
|
|
|
|
|
|
(Pub. Impt. Proj.): |
|
|
|
|
|
|
6.5% 6/1/06 |
Aa2 |
|
$ 120,000 |
$ 131,466 |
|
|
6.5% 6/1/07 (AMBAC Insured) |
Aaa |
|
50,000 |
55,324 |
|
|
7% 6/1/03 (FGIC Insured) |
Aaa |
|
1,000,000 |
1,063,150 |
|
|
7% 6/1/04 (FGIC Insured) |
Aaa |
|
2,150,000 |
2,326,687 |
|
|
6% 6/1/04 |
Aa2 |
|
1,510,000 |
1,584,383 |
|
|
6% 6/1/05 |
Aa2 |
|
2,155,000 |
2,279,516 |
|
|
Monroe Woodbury Central School District: |
|
|
|
|
|
|
5.625% 5/15/22 (MBIA Insured) |
Aaa |
|
1,245,000 |
1,237,904 |
|
|
5.625% 5/15/24 (MBIA Insured) |
Aaa |
|
2,645,000 |
2,619,185 |
|
|
Muni. Assistance Corp. for New York City Rfdg.: |
|
|
|
|
|
|
Series D, 6% 7/1/05 (AMBAC Insured) |
Aaa |
|
10,000,000 |
10,587,200 |
|
|
Series L, 6% 7/1/07 |
Aa2 |
|
5,000,000 |
5,364,150 |
|
|
Nassau County Gen. Oblig.: |
|
|
|
|
|
|
Rfdg.: |
|
|
|
|
|
|
(Combined Swr. District Proj.) Series F, 5.3% 7/1/07 (MBIA Insured) |
Aaa |
|
350,000 |
359,114 |
|
|
Series A: |
|
|
|
|
|
|
6% 7/1/09 (FGIC Insured) |
Aaa |
|
3,320,000 |
3,549,611 |
|
|
6.5% 5/1/07 (FGIC Insured) |
Aaa |
|
4,000,000 |
4,375,240 |
|
|
Series D, 5.25% 9/1/03 (FSA Insured) |
Aaa |
|
2,500,000 |
2,543,175 |
|
|
Series P, 6.3% 11/1/03 (FGIC Insured) |
Aaa |
|
1,000,000 |
1,054,620 |
|
|
Series R, 5.125% 11/1/05 (FGIC Insured) |
Aaa |
|
2,065,000 |
2,100,725 |
|
|
Series T, 5.2% 9/1/11 (FGIC Insured) |
Aaa |
|
2,695,000 |
2,691,523 |
|
|
Series U: |
|
|
|
|
|
|
5.125% 11/1/04 (AMBAC Insured) |
Aaa |
|
1,505,000 |
1,530,254 |
|
|
5.25% 11/1/11 (AMBAC Insured) |
Aaa |
|
1,500,000 |
1,502,970 |
|
|
5.25% 11/1/15 (AMBAC Insured) |
Aaa |
|
2,150,000 |
2,074,922 |
|
|
New York City Edl. Construction Fund Sr. |
Aaa |
|
1,895,000 |
1,987,571 |
|
|
New York City Gen. Oblig.: |
|
|
|
|
|
|
Rfdg.: |
|
|
|
|
|
|
Series A: |
|
|
|
|
|
|
5.3% 8/1/12 |
A3 |
|
6,000,000 |
6,010,920 |
|
|
6.25% 8/1/08 |
A3 |
|
1,000,000 |
1,076,120 |
|
|
7% 8/1/03 |
A3 |
|
2,000,000 |
2,127,100 |
|
|
Series B: |
|
|
|
|
|
|
5.7% 8/15/02 |
A3 |
|
2,260,000 |
2,309,901 |
|
|
5.7% 8/15/02 (Escrowed to Maturity) (d) |
A3 |
|
75,000 |
76,846 |
|
|
6.2% 8/15/06 |
A3 |
|
2,195,000 |
2,341,407 |
|
|
Municipal Bonds - continued |
|||||
|
Moody's Ratings |
Principal Amount |
Value |
|||
|
New York - continued |
|||||
|
New York City Gen. Oblig.: - continued |
|
|
|
|
|
|
Rfdg.: |
|
|
|
|
|
|
Series C: |
|
|
|
|
|
|
5.7% 8/15/02 |
A3 |
|
$ 1,310,000 |
$ 1,338,925 |
|
|
6% 2/1/22 |
A3 |
|
3,500,000 |
3,553,305 |
|
|
Series E: |
|
|
|
|
|
|
6% 8/1/26 |
A3 |
|
3,455,000 |
3,500,986 |
|
|
6.5% 2/15/06 |
A3 |
|
1,000,000 |
1,078,470 |
|
|
Series F, 6% 8/1/16 |
A3 |
|
7,750,000 |
7,983,198 |
|
|
Series G: |
|
|
|
|
|
|
5.25% 8/1/11 |
A3 |
|
5,000,000 |
5,023,450 |
|
|
5.35% 8/1/13 |
A3 |
|
5,000,000 |
4,993,750 |
|
|
Series H, 6% 8/1/17 |
A3 |
|
1,000,000 |
1,028,850 |
|
|
Series I, 5.875% 3/15/12 |
A3 |
|
10,000,000 |
10,368,700 |
|
|
Series J, 6.125% 8/1/12 |
A3 |
|
1,000,000 |
1,058,790 |
|
|
Series B: |
|
|
|
|
|
|
5.875% 8/15/13 |
A3 |
|
3,870,000 |
3,996,356 |
|
|
6.5% 8/15/11 |
A3 |
|
1,000,000 |
1,112,170 |
|
|
7.5% 2/1/02 |
A3 |
|
1,000,000 |
1,041,420 |
|
|
7.5% 2/1/03 |
A3 |
|
5,000,000 |
5,273,450 |
|
|
7.5% 2/1/07 |
A3 |
|
5,500,000 |
5,795,075 |
|
|
Series C, 6.4% 8/1/03 |
A3 |
|
6,000,000 |
6,279,900 |
|
|
Series D: |
|
|
|
|
|
|
5.25% 8/1/13 |
A3 |
|
2,500,000 |
2,473,675 |
|
|
5.25% 8/1/21 (MBIA Insured) |
Aaa |
|
5,000,000 |
4,714,450 |
|
|
5.375% 8/1/17 |
A3 |
|
2,500,000 |
2,422,400 |
|
|
5.75% 2/15/08 |
A3 |
|
1,000,000 |
1,038,460 |
|
|
Series E, 6% 8/1/26 (Pre-Refunded to |
A3 |
|
295,000 |
318,824 |
|
|
Series F, 5.75% 2/1/15 |
A3 |
|
2,500,000 |
2,534,825 |
|
|
Series G: |
|
|
|
|
|
|
6% 10/15/26 |
A3 |
|
4,950,000 |
5,023,706 |
|
|
6% 10/15/26 (Pre-Refunded to |
A3 |
|
50,000 |
54,254 |
|
|
Series H: |
|
|
|
|
|
|
5.5% 8/1/12 |
A3 |
|
9,000,000 |
9,154,980 |
|
|
7% 2/1/05 |
A3 |
|
665,000 |
695,936 |
|
|
7% 2/1/06 |
A3 |
|
280,000 |
293,026 |
|
|
7% 2/1/06 (Pre-Refunded to |
A3 |
|
140,000 |
147,134 |
|
|
Municipal Bonds - continued |
|||||
|
Moody's Ratings |
Principal Amount |
Value |
|||
|
New York - continued |
|||||
|
New York City Gen. Oblig.: - continued |
|
|
|
|
|
|
Series I: |
|
|
|
|
|
|
6.125% 4/15/11 |
A3 |
|
$ 17,510,000 |
$ 18,598,772 |
|
|
6.125% 4/15/11 (Pre-Refunded to 4/15/07 @ 101) (d) |
A3 |
|
7,490,000 |
8,147,098 |
|
|
Series J, 5.875% 2/15/19 |
A3 |
|
4,000,000 |
4,037,280 |
|
|
Series L, 5.75% 8/1/12 |
A3 |
|
3,700,000 |
3,823,950 |
|
|
New York City Ind. Dev. Agcy. Ind. Dev. Rev. (Japan Airlines Co. Ltd. Proj.) Series 1991, 6% 11/1/15 (FSA Insured) (c) |
Aaa |
|
2,805,000 |
2,964,997 |
|
|
New York City Ind. Dev. Agcy. Spl. Facilities Rev. (Term. One Group Assoc. Proj.): |
|
|
|
|
|
|
5.7% 1/1/04 (c) |
A3 |
|
1,500,000 |
1,535,790 |
|
|
6% 1/1/08 (c) |
A3 |
|
500,000 |
519,435 |
|
|
New York City Muni. Wtr. Fin. Auth. Wtr. & Swr. Sys. Rev.: |
|
|
|
|
|
|
Series B: |
|
|
|
|
|
|
5.375% 6/15/07 (AMBAC Insured) |
Aaa |
|
355,000 |
363,147 |
|
|
5.375% 6/15/07 (AMBAC Insured) (Pre-Refunded to 6/15/04 @ 101) (d) |
Aaa |
|
145,000 |
150,617 |
|
|
5.5% 6/15/27 (MBIA Insured) |
Aaa |
|
7,525,000 |
7,289,242 |
|
|
5.75% 6/15/26 (MBIA Insured) |
Aaa |
|
5,000,000 |
5,009,050 |
|
|
5.75% 6/15/29 (MBIA Insured) |
Aaa |
|
4,000,000 |
3,997,200 |
|
|
5.875% 6/15/26 |
Aa3 |
|
21,250,000 |
21,418,513 |
|
|
6% 6/15/33 |
Aa3 |
|
20,735,000 |
21,307,701 |
|
|
Series C, 7% 6/15/16 (FGIC Insured) (Pre-Refunded to 6/15/01 @ 101.5) (d) |
Aaa |
|
500,000 |
518,775 |
|
|
New York City Transitional Fin. Auth. Rev.: |
|
|
|
|
|
|
Second Series B, 5.125% 11/1/14 |
Aa3 |
|
4,000,000 |
3,897,960 |
|
|
Series A: |
|
|
|
|
|
|
5% 8/15/15 |
Aa3 |
|
3,375,000 |
3,222,889 |
|
|
5.125% 8/15/21 |
Aa3 |
|
23,000,000 |
21,335,490 |
|
|
Series B: |
|
|
|
|
|
|
4.75% 11/15/16 |
Aa3 |
|
11,470,000 |
10,394,917 |
|
|
4.75% 11/1/23 |
Aa3 |
|
9,000,000 |
7,760,790 |
|
|
6% 11/15/29 |
Aa3 |
|
3,000,000 |
3,080,190 |
|
|
New York City Trust Cultural Resources Rev.: |
|
|
|
|
|
|
(American Museum of Natural History Proj.) Series A, 5.65% 4/1/22 (MBIA Insured) |
Aaa |
|
4,850,000 |
4,837,487 |
|
|
(New York Botanical Garden Proj.) 5.75% 7/1/16 (MBIA Insured) |
Aaa |
|
1,250,000 |
1,271,888 |
|
|
Municipal Bonds - continued |
|||||
|
Moody's Ratings |
Principal Amount |
Value |
|||
|
New York - continued |
|||||
|
New York State Dorm. Auth. Lease Rev. |
Aaa |
|
$ 3,150,000 |
$ 2,974,640 |
|
|
New York State Dorm. Auth. Rev.: |
|
|
|
|
|
|
(Barnard College Proj.) 5.25% 7/1/26 (AMBAC Insured) |
Aaa |
|
4,625,000 |
4,315,264 |
|
|
(Champlain Valley Physicians Proj.): |
|
|
|
|
|
|
6% 7/1/08 (AMBAC Insured) |
AAA |
|
600,000 |
641,670 |
|
|
6% 7/1/09 (AMBAC Insured) |
AAA |
|
370,000 |
398,346 |
|
|
6% 7/1/10 (AMBAC Insured) |
AAA |
|
250,000 |
269,433 |
|
|
(City Univ. Sys. Consolidation Proj.): |
|
|
|
|
|
|
Series A, 5.5% 7/1/05 |
Baa1 |
|
1,000,000 |
1,029,450 |
|
|
Series D, 7% 7/1/09 |
Baa1 |
|
6,000,000 |
6,597,540 |
|
|
(City Univ. Sys. Proj.) Series C, 7.5% 7/1/10 |
Baa1 |
|
4,000,000 |
4,575,520 |
|
|
(Ithaca College Proj.) 5.25% 7/1/26 |
Aaa |
|
9,805,000 |
9,148,359 |
|
|
(Judicial Facilities Lease Prog.) Series B, 7% 4/15/16 |
Baa1 |
|
2,000,000 |
2,067,160 |
|
|
(Mental Health Svcs. Facilities Impt. Proj.): |
|
|
|
|
|
|
Series A, 5.75% 8/15/11 |
A3 |
|
3,000,000 |
3,119,220 |
|
|
Series D, 4.75% 2/15/25 (MBIA Insured) |
Aaa |
|
10,000,000 |
8,575,500 |
|
|
Series F, 4.5% 8/15/28 (AMBAC Insured) |
Aaa |
|
5,000,000 |
4,057,200 |
|
|
(New York Hosp. Med. Ctr. Proj.) 5.25% 2/1/07 (AMBAC Insured) |
Aaa |
|
4,500,000 |
4,591,125 |
|
|
(New York Univ. Proj.) Series A: |
|
|
|
|
|
|
5.75% 7/1/15 (MBIA Insured) |
Aaa |
|
1,250,000 |
1,311,125 |
|
|
5.75% 7/1/27 (MBIA Insured) |
Aaa |
|
5,000,000 |
5,104,100 |
|
|
(Saint Joseph's Hosp. Health Ctr. Proj.) 6% 7/1/08 (MBIA Insured) |
Aaa |
|
1,260,000 |
1,343,248 |
|
|
(Saint Vincent's Hosp. & Med. Ctr. Proj.): |
|
|
|
|
|
|
6% 2/1/03 (AMBAC Insured) |
Aaa |
|
1,820,000 |
1,878,531 |
|
|
6% 8/1/03 (AMBAC Insured) |
Aaa |
|
1,875,000 |
1,946,588 |
|
|
(State Univ. Edl. Facilities Proj.) Series A, 4.75% 5/15/25 (MBIA Insured) |
Aaa |
|
3,000,000 |
2,584,770 |
|
|
Rfdg.: |
|
|
|
|
|
|
(City Univ. Sys. Consolidation Proj.) Series A, 5.75% 7/1/07 |
Baa1 |
|
500,000 |
523,415 |
|
|
(City Univ. Sys. Proj. Third Gen. |
Aaa |
|
2,500,000 |
2,507,875 |
|
|
(City Univ. Sys. Proj.) Series U, 6.25% 7/1/03 |
Baa1 |
|
525,000 |
546,294 |
|
|
Municipal Bonds - continued |
|||||
|
Moody's Ratings |
Principal Amount |
Value |
|||
|
New York - continued |
|||||
|
New York State Dorm. Auth. Rev.: - continued |
|
|
|
|
|
|
Rfdg.: |
|
|
|
|
|
|
(Colgate Univ. Proj.): |
|
|
|
|
|
|
6% 7/1/16 (MBIA Insured) |
Aaa |
|
$ 1,900,000 |
$ 2,039,289 |
|
|
6% 7/1/21 (MBIA Insured) |
Aaa |
|
2,500,000 |
2,644,500 |
|
|
(FIT Student Hsg. Proj.): |
|
|
|
|
|
|
5.75% 7/1/03 (AMBAC Insured) |
Aaa |
|
1,590,000 |
1,640,530 |
|
|
5.75% 7/1/04 (AMBAC Insured) |
Aaa |
|
1,680,000 |
1,747,754 |
|
|
5.75% 7/1/05 (AMBAC Insured) |
Aaa |
|
1,650,000 |
1,728,210 |
|
|
5.75% 7/1/06 (AMBAC Insured) |
Aaa |
|
1,500,000 |
1,580,100 |
|
|
(Jamaica Hosp. Med. Ctr. Proj.) Series F, 5.1% 2/15/12 (MBIA Insured) |
Aaa |
|
3,605,000 |
3,554,061 |
|
|
(Jamaica Med. Hosp. Proj.) Series F, 5.2% 2/15/13 (MBIA Insured) |
Aaa |
|
6,585,000 |
6,481,352 |
|
|
(Mental Health Svcs. Facilities Proj.) Series B, 5.75% 2/15/11 |
A3 |
|
2,550,000 |
2,651,337 |
|
|
(New York & Presbyterian Hosp. Proj.) 4.4% 8/1/13 (AMBAC Insured) (Fed. Hsg. Administration Insured) |
Aaa |
|
5,000,000 |
4,897,700 |
|
|
(Rochester Institute of Technology Proj.) 5.25% 7/1/22 (MBIA Insured) |
Aaa |
|
4,875,000 |
4,567,144 |
|
|
(State Univ. Edl. Facilities Proj.): |
|
|
|
|
|
|
Series A: |
|
|
|
|
|
|
6.5% 5/15/05 |
A3 |
|
5,080,000 |
5,442,864 |
|
|
6.5% 5/15/06 |
A3 |
|
3,400,000 |
3,673,632 |
|
|
Series B, 7.5% 5/15/11 |
A2 |
|
3,500,000 |
4,033,680 |
|
|
5.5% 5/15/09 |
A2 |
|
3,000,000 |
3,101,580 |
|
|
(Univ. of Rochester Proj.) Series A, 5% 7/1/27 (MBIA Insured) |
Aaa |
|
16,475,000 |
14,658,302 |
|
|
Series E, 5% 2/15/10 (MBIA Insured) |
Aaa |
|
3,500,000 |
3,482,430 |
|
|
Rfdg. (Cap. Appreciation) (Manhattanville College Proj.) 0% 7/1/10 (MBIA Insured) |
Aaa |
|
2,175,000 |
1,313,809 |
|
|
New York State Energy Research & Dev. Auth. Facilities Rev. Rfdg. (Consolidated Edison Co. Proj.) Series A, 6.1% 8/15/20 |
A1 |
|
10,600,000 |
10,679,712 |
|
|
New York State Energy Research & Dev. Auth. Gas Facilities Rev. Rfdg. (Brooklyn Union Gas Co. Proj.) Series A, 5.5% 1/1/21 (MBIA Insured) |
Aaa |
|
1,000,000 |
980,660 |
|
|
New York State Energy Research & Dev. Auth. Poll. Cont. Rev. Rfdg. (New York State Elec. & Gas Corp. Proj.) Series E, 5.9% 12/1/06 (MBIA Insured) |
Aaa |
|
1,000,000 |
1,064,830 |
|
|
Municipal Bonds - continued |
|||||
|
Moody's Ratings |
Principal Amount |
Value |
|||
|
New York - continued |
|||||
|
New York State Envir. Facilities Corp. Clean Wtr. & Drinking Wtr. Rev.: |
|
|
|
|
|
|
(State Wtr. Revolving Funds Prog.): |
|
|
|
|
|
|
Series C, 5% 6/15/19 |
Aa1 |
|
$ 4,000,000 |
$ 3,681,920 |
|
|
Series F: |
|
|
|
|
|
|
4.875% 6/15/18 |
Aa1 |
|
3,000,000 |
2,728,530 |
|
|
4.875% 6/15/20 |
Aa1 |
|
3,555,000 |
3,191,608 |
|
|
5% 6/15/15 |
Aa1 |
|
3,000,000 |
2,877,420 |
|
|
Series F, 5.25% 6/15/13 |
Aa1 |
|
3,980,000 |
3,974,746 |
|
|
New York State Envir. Facilities Corp. Poll. Cont. Rev.: |
|
|
|
|
|
|
(State Wtr. Revolving Fund Pooled Ln. Prog.): |
|
|
|
|
|
|
Series B, 5.2% 5/15/14 |
Aaa |
|
2,220,000 |
2,227,903 |
|
|
Series C, 5.85% 7/15/15 |
Aaa |
|
3,060,000 |
3,156,665 |
|
|
(State Wtr. Revolving Fund Prog.) Series D: |
|
|
|
|
|
|
5% 6/15/11 |
Aa1 |
|
3,645,000 |
3,631,149 |
|
|
5% 6/15/12 |
Aa1 |
|
2,000,000 |
1,976,220 |
|
|
5.125% 6/15/19 |
Aa1 |
|
5,000,000 |
4,735,650 |
|
|
(State Wtr. Revolving Fund-New York City Muni. Wtr. Proj.): |
|
|
|
|
|
|
Series A: |
|
|
|
|
|
|
6.8% 6/15/01 |
Aa2 |
|
2,000,000 |
2,042,300 |
|
|
6.9% 6/15/02 |
Aaa |
|
265,000 |
275,473 |
|
|
6.9% 6/15/02 (Pre-Refunded to |
Aaa |
|
835,000 |
869,678 |
|
|
7% 6/15/12 |
Aaa |
|
190,000 |
197,784 |
|
|
Series B, 5.25% 6/15/14 |
Aa1 |
|
3,180,000 |
3,148,009 |
|
|
Series D: |
|
|
|
|
|
|
6.3% 5/15/05 |
Aaa |
|
2,000,000 |
2,139,180 |
|
|
6.3% 11/15/05 |
Aaa |
|
2,725,000 |
2,932,482 |
|
|
Series E: |
|
|
|
|
|
|
6.25% 6/15/05 |
Aa1 |
|
1,200,000 |
1,283,100 |
|
|
6.5% 6/15/14 |
Aaa |
|
130,000 |
133,879 |
|
|
Rfdg. (State Wtr. Revolving Fund-New York City Muni. Wtr. Proj.) Series A, 5.75% 6/15/11 |
Aa1 |
|
5,000,000 |
5,322,150 |
|
|
New York State Hsg. Fin. Agcy. Rev.: |
|
|
|
|
|
|
Rfdg. (Nursing Home & Health Care Proj.) Series A, 4.6% 11/1/06 (MBIA Insured) |
Aaa |
|
3,890,000 |
3,847,443 |
|
|
8.25% 5/1/09 (e) |
Aa3 |
|
4,215,000 |
4,215,000 |
|
|
New York State Local Govt. Assistance Corp.: |
|
|
|
|
|
|
Rfdg. Series E, 5.25% 4/1/16 |
A3 |
|
23,600,000 |
23,295,796 |
|
|
Series C, 5.5% 4/1/22 |
A3 |
|
6,375,000 |
6,240,105 |
|
|
Series D, 5.375% 4/1/14 |
A3 |
|
4,000,000 |
4,001,440 |
|
|
Municipal Bonds - continued |
|||||
|
Moody's Ratings |
Principal Amount |
Value |
|||
|
New York - continued |
|||||
|
New York State Med. Care Facilities Fin. Agcy. Rev.: |
|
|
|
|
|
|
(Long-Term. Health Care Proj.) Series A, 6.8% 11/1/14 (FSA Insured) |
Aaa |
|
$ 1,170,000 |
$ 1,221,503 |
|
|
(Mental Health Svcs. Facilities Proj.): |
|
|
|
|
|
|
Series A: |
|
|
|
|
|
|
7.5% 2/15/21 |
A3 |
|
50,000 |
51,593 |
|
|
7.5% 2/15/21 (Pre-Refunded to 2/15/01 @ 102) (d) |
Aaa |
|
85,000 |
88,102 |
|
|
Series D, 7.4% 2/15/18 |
A3 |
|
450,000 |
473,877 |
|
|
Rfdg.: |
|
|
|
|
|
|
(Mental Health Svcs. Facilities Proj.) |
A3 |
|
1,660,000 |
1,665,345 |
|
|
(Presbyterian Hosp. Proj.) Series A, 5.25% 8/15/14 |
Aa2 |
|
3,000,000 |
2,919,750 |
|
|
Series A, 7.25% 11/1/11 (MBIA Insured) |
Aaa |
|
890,000 |
913,523 |
|
|
New York State Mtg. Agcy. (Homeowner Mtg. Prog.): |
|
|
|
|
|
|
Series 53, 5.9% 10/1/17 |
Aa2 |
|
2,000,000 |
2,021,200 |
|
|
Series 69, 4.7% 4/1/24 (c) |
Aa2 |
|
5,900,000 |
5,834,097 |
|
|
5.5% 4/1/19 (AMBAC Insured) (c) |
Aaa |
|
4,500,000 |
4,480,830 |
|
|
New York State Pwr. Auth. Rev. & Gen. Purp. Rfdg. Series W, 6.5% 1/1/08 (Escrowed to Maturity) (d) |
Aaa |
|
250,000 |
273,633 |
|
|
New York State Thruway Auth. Gen. Rev.: |
|
|
|
|
|
|
Rfdg. Series E, 5.25% 1/1/12 |
Aa3 |
|
5,410,000 |
5,442,947 |
|
|
Series D, 5.375% 1/1/27 |
Aa3 |
|
3,000,000 |
2,848,110 |
|
|
New York State Thruway Auth. Hwy. & Bridge Trust Fund: |
|
|
|
|
|
|
Series A, 5.25% 4/1/16 (AMBAC Insured) |
Aaa |
|
5,175,000 |
5,054,733 |
|
|
Series B1: |
|
|
|
|
|
|
5.75% 4/1/14 (FGIC Insured) |
AAA |
|
3,000,000 |
3,104,880 |
|
|
5.75% 4/1/15 (FGIC Insured) |
AAA |
|
4,000,000 |
4,120,120 |
|
|
New York State Thruway Auth. Svc. Contract Rev.: |
|
|
|
|
|
|
(Local Hwy. & Bridge Proj.): |
|
|
|
|
|
|
Series A2, 5.375% 4/1/10 (MBIA Insured) |
Aaa |
|
12,940,000 |
13,371,290 |
|
|
5.75% 4/1/16 |
Baa1 |
|
13,700,000 |
13,842,343 |
|
|
Rfdg. (Local Hwy. & Bridge Proj.) 6% 4/1/11 |
Baa1 |
|
4,000,000 |
4,235,560 |
|
|
New York State Urban Dev. Corp. Rev.: |
|
|
|
|
|
|
(Correctional Cap. Facilities Proj.) Series 5, 5.9% 1/1/08 |
Baa1 |
|
1,455,000 |
1,525,000 |
|
|
Municipal Bonds - continued |
|||||
|
Moody's Ratings |
Principal Amount |
Value |
|||
|
New York - continued |
|||||
|
New York State Urban Dev. Corp. Rev.: - continued |
|
|
|
|
|
|
(Sports Facilities Assistance Prog.) Series A, 6.25% 4/1/06 (MBIA Insured) |
Aaa |
|
$ 15,000 |
$ 16,139 |
|
|
Rfdg.: |
|
|
|
|
|
|
(Correctional Cap. Facilities Proj.) Series A, 6.3% 1/1/03 |
Baa1 |
|
700,000 |
724,570 |
|
|
(Correctional Facilities Proj.) 5.625% 1/1/07 (AMBAC Insured) |
Aaa |
|
2,000,000 |
2,065,520 |
|
|
(Syracuse Univ. Ctr. Proj.) 5.2% 1/1/03 |
Baa1 |
|
1,000,000 |
1,010,770 |
|
|
Niagara Falls Gen. Oblig.: |
|
|
|
|
|
|
(Pub. Impt. Proj.): |
|
|
|
|
|
|
7.5% 3/1/08 (MBIA Insured) |
Aaa |
|
995,000 |
1,156,508 |
|
|
7.5% 3/1/10 (MBIA Insured) |
Aaa |
|
1,155,000 |
1,375,986 |
|
|
7.5% 3/1/11 (MBIA Insured) |
Aaa |
|
1,245,000 |
1,498,943 |
|
|
7.5% 3/1/16 (MBIA Insured) |
Aaa |
|
1,060,000 |
1,302,539 |
|
|
7.5% 3/1/17 (MBIA Insured) |
Aaa |
|
1,200,000 |
1,476,672 |
|
|
(Wtr. Treatment Plant Proj.) 7% 11/1/13 (MBIA Insured) (c) |
Aaa |
|
1,000,000 |
1,088,490 |
|
|
North Hempstead Gen. Oblig. Rfdg. Series B, 6.1% 4/1/06 (FGIC Insured) |
Aaa |
|
500,000 |
534,545 |
|
|
Rensselaer County Indl. Dev. Auth. Civic Facilities Rev. (Polytechnic Institute Proj.) Series B, 5% 8/1/09 (AMBAC Insured) |
Aaa |
|
1,500,000 |
1,513,275 |
|
|
Rockland County Gen. Oblig. 6% 8/15/05 (AMBAC Insured) |
Aaa |
|
1,475,000 |
1,563,618 |
|
|
Suffolk County Gen. Oblig. Series A, 6% 8/1/05 (AMBAC Insured) |
Aaa |
|
3,380,000 |
3,581,685 |
|
|
Suffolk County Ind. Dev. Agcy. Civic Facility |
BBB |
|
925,000 |
954,804 |
|
|
Suffolk County Wtr. Auth. Wtrwks. Rev. Rfdg. Series C, 5.75% 6/1/10 (AMBAC Insured) (Pre-Refunded to 6/1/02 @ 102) (d) |
Aaa |
|
30,000 |
31,272 |
|
|
Triborough Bridge & Tunnel Auth. Rev. (Convention Ctr. Proj.) Series E: |
|
|
|
|
|
|
6% 1/1/11 |
Baa1 |
|
4,000,000 |
4,266,120 |
|
|
7.25% 1/1/10 |
Baa1 |
|
9,870,000 |
11,058,447 |
|
|
Triborough Bridge & Tunnel Auth. Revs.: |
|
|
|
|
|
|
Rfdg.: |
|
|
|
|
|
|
Series A, 5.25% 1/1/28 |
Aa3 |
|
9,500,000 |
8,823,790 |
|
|
Series B, 5% 1/1/14 |
Aa3 |
|
2,000,000 |
1,936,600 |
|
|
Series Q, 6.75% 1/1/09 |
Aa3 |
|
1,000,000 |
1,109,580 |
|
|
Series Y, 6% 1/1/12 |
Aa3 |
|
16,610,000 |
17,959,396 |
|
|
Municipal Bonds - continued |
|||||
|
Moody's Ratings |
Principal Amount |
Value |
|||
|
New York - continued |
|||||
|
Triborough Bridge & Tunnel Auth. Revs.: - continued |
|
|
|
|
|
|
Series A, 6% 1/1/11 |
Aa3 |
|
$ 500,000 |
$ 540,390 |
|
|
Series B: |
|
|
|
|
|
|
5.2% 1/1/22 |
Aa3 |
|
7,870,000 |
7,385,916 |
|
|
5.5% 1/1/30 |
Aa3 |
|
2,015,000 |
1,946,833 |
|
|
Triborough Bridge & Tunnel Auth. Spl. Oblig.: |
|
|
|
|
|
|
Rfdg. Series A: |
|
|
|
|
|
|
5% 1/1/15 (FGIC Insured) |
Aaa |
|
2,200,000 |
2,105,554 |
|
|
5.125% 1/1/11 (MBIA Insured) |
Aaa |
|
3,000,000 |
3,014,160 |
|
|
5.125% 1/1/12 (MBIA Insured) |
Aaa |
|
1,000,000 |
996,570 |
|
|
5.25% 1/1/11 (FGIC Insured) |
Aaa |
|
3,000,000 |
3,040,620 |
|
|
Upper Mohawk Valley Reg'l. Wtr. Fin. Auth. Wtr. Sys. Rev. Rfdg. Series A, 5.125% 10/1/26 (FSA Insured) |
Aaa |
|
5,000,000 |
4,579,550 |
|
|
Yonkers Gen. Oblig. Series A: |
|
|
|
|
|
|
6% 8/1/04 (FGIC Insured) |
Aaa |
|
1,020,000 |
1,068,532 |
|
|
6% 8/1/05 (FGIC Insured) |
Aaa |
|
1,080,000 |
1,139,519 |
|
|
|
975,402,293 |
||||
|
New York & New Jersey - 2.8% |
|||||
|
Port Auth. New York & New Jersey: |
|
|
|
|
|
|
Rfdg. Series 107, 6% 10/15/06 (c) |
A1 |
|
1,530,000 |
1,623,728 |
|
|
Series 109, 5.375% 1/15/32 |
A1 |
|
12,500,000 |
11,875,375 |
|
|
Series 73, 6.75% 10/15/06 (c) |
A1 |
|
2,000,000 |
2,046,100 |
|
|
Series 77, 6.25% 1/15/27 (c) |
A1 |
|
2,000,000 |
2,032,680 |
|
|
Series 85: |
|
|
|
|
|
|
5.2% 9/1/15 |
A1 |
|
2,400,000 |
2,338,152 |
|
|
5.2% 9/1/16 |
A1 |
|
2,000,000 |
1,948,500 |
|
|
Series 99, 7% 11/1/04 (FGIC Insured) (c) |
Aaa |
|
5,040,000 |
5,478,631 |
|
|
Port Auth. New York & New Jersey Spl. Oblig. Rev. (JFK Int'l. Air Term. Spl. Proj.) Series 6, 5.75% 12/1/25 (MBIA Insured) (c) |
Aaa |
|
2,000,000 |
1,998,500 |
|
|
|
29,341,666 |
||||
|
Puerto Rico - 1.6% |
|||||
|
Puerto Rico Commonwealth Hwy. & Trans. Auth. Trans. Rev. Series A, 4.75% 7/1/38 |
Baa1 |
|
1,400,000 |
1,194,466 |
|
|
Municipal Bonds - continued |
|||||
|
Moody's Ratings |
Principal Amount |
Value |
|||
|
Puerto Rico - continued |
|||||
|
Puerto Rico Commonwealth Urban Renewal & Hsg. Corp. Rfdg. 7.875% 10/1/04 |
Baa |
|
$ 6,270,000 |
$ 6,365,931 |
|
|
Puerto Rico Tel. Auth. Rev. 5.45% 1/16/15 (MBIA Insured) (Pre-Refunded to 1/1/03 @ 101.5) (d) |
Aaa |
|
9,600,000 |
9,944,064 |
|
|
|
17,504,461 |
||||
|
TOTAL MUNICIPAL BONDS (Cost $1,010,315,381) |
1,022,248,420 |
||||
|
Municipal Notes - 2.1% |
|||
|
|
|
|
|
|
New York - 2.1% |
|||
|
New York City Gen. Oblig.: |
|
|
|
|
Series 1994 A4, 4.1%, LOC Chase Manhattan Bank, VRDN (b) |
6,900,000 |
6,900,000 |
|
|
Series B2 B5, 4.2% (MBIA Insured), VRDN (b) |
4,700,000 |
4,700,000 |
|
|
New York City Muni. Wtr. Fin. Auth. Wtr. & Swr. Sys. Rev. Series 2000 C, 4.25% (Liquidity Facility Dexia Cr. Local |
10,000,000 |
10,000,000 |
|
|
TOTAL MUNICIPAL NOTES (Cost $21,600,000) |
21,600,000 |
||
|
TOTAL INVESTMENT PORTFOLIO - 99.0% (Cost $1,031,915,381) |
1,043,848,420 |
||
|
NET OTHER ASSETS - 1.0% |
10,919,389 |
||
|
NET ASSETS - 100% |
$ 1,054,767,809 |
||
|
Security Type Abbreviation |
|
VRDN - VARIABLE RATE DEMAND NOTE |
|
Legend |
|
(a) S&P credit ratings are used in the absence of a rating by Moody's Investors Service, Inc. |
|
(b) The coupon rate shown on floating or adjustable rate securities represents the rate at period end. |
|
(c) Private activity obligations whose interest is subject to the federal alternative minimum tax for individuals. |
|
(d) Security collateralized by an amount sufficient to pay interest and principal. |
|
(e) Restricted securities - Investment in securities not registered under the Securities Act of 1933. |
|
Additional information on each holding is as follows: |
|
Security |
Acquisition Date |
Acquisition Cost |
|
New York State Hsg. Fin. Agcy. Rev. 8.25% 5/1/09 |
5/1/86 |
$ 4,341,450 |
|
Other Information |
|
The composition of long-term debt holdings as a percentage of total value of investments in securities, is as follows (ratings are unaudited): |
|
Moody's Ratings |
S&P Ratings |
|||
|
Aaa, Aa, A |
80.3% |
|
AAA, AA, A |
93.2% |
|
Baa |
16.5% |
|
BBB |
1.7% |
|
Ba |
0.0% |
|
BB |
0.0% |
|
B |
0.0% |
|
B |
0.0% |
|
Caa |
0.0% |
|
CCC |
0.0% |
|
Ca, C |
0.0% |
|
CC, C |
0.0% |
|
|
|
|
D |
0.0% |
|
The fund invested in securities that are not registered under the Securities Act of 1933. These securities are subject to legal or contractual restrictions on resale. At the end of the period, restricted securities (excluding Rule 144A issues) amounted to $4,215,000 or 0.4% of net assets. |
|
The distribution of municipal securities by revenue source, as a percentage of total net assets, is as follows: |
|
General Obligations |
36.5% |
|
Transportation |
18.7 |
|
Special Tax |
12.8 |
|
Water & Sewer |
12.0 |
|
Education |
6.1 |
|
Others* (individually less than 5%) |
13.9 |
|
|
100.0% |
|
* Includes net other assets. |
|
Income Tax Information |
|
At July 31, 2000, the aggregate cost |
|
At January 31, 2000, the fund had a capital loss carryforward of approximately $2,776,000 all of which will expire on January 31, 2008. |
See accompanying notes which are an integral part of the financial statements.
Semiannual Report
Spartan New York Municipal Income Fund
Statement of Assets and Liabilities
|
|
July 31, 2000 (Unaudited) |
|
|
Assets |
|
|
|
Investment in securities, at value (cost $1,031,915,381) - See accompanying schedule |
|
$ 1,043,848,420 |
|
Cash |
|
6,198,296 |
|
Receivable for fund shares sold |
|
636,203 |
|
Interest receivable |
|
13,207,023 |
|
Other receivables |
|
26,596 |
|
Total assets |
|
1,063,916,538 |
|
Liabilities |
|
|
|
Payable for investments purchased |
$ 6,857,599 |
|
|
Payable for fund shares redeemed |
861,716 |
|
|
Distributions payable |
1,102,924 |
|
|
Accrued management fee |
326,490 |
|
|
Total liabilities |
|
9,148,729 |
|
Net Assets |
|
$ 1,054,767,809 |
|
Net Assets consist of: |
|
|
|
Paid in capital |
|
$ 1,051,584,299 |
|
Distributions in excess of net interest income |
|
(298,825) |
|
Accumulated undistributed net realized gain (loss) |
|
(8,450,704) |
|
Net unrealized appreciation (depreciation) on investments |
|
11,933,039 |
|
Net Assets, for 86,141,919 shares outstanding |
|
$ 1,054,767,809 |
|
Net Asset Value, offering price and redemption price |
|
$12.24 |
See accompanying notes which are an integral part of the financial statements.
Semiannual Report
Spartan New York Municipal Income Fund
Financial Statements - continued
Statement of Operations
|
|
Six months ended July 31, 2000 (Unaudited) |
|
|
Interest Income |
|
$ 28,087,037 |
|
Expenses |
|
|
|
Management fee |
$ 1,918,277 |
|
|
Transfer agent fees |
407,681 |
|
|
Accounting fees and expenses |
129,889 |
|
|
Non-interested trustees' compensation |
1,955 |
|
|
Custodian fees and expenses |
10,427 |
|
|
Registration fees |
23,392 |
|
|
Audit |
16,079 |
|
|
Legal |
10,354 |
|
|
Reports to shareholders |
12,393 |
|
|
Miscellaneous |
607 |
|
|
Total expenses before reductions |
2,531,054 |
|
|
Expense reductions |
(252,466) |
2,278,588 |
|
Net interest income |
|
25,808,449 |
|
Realized and Unrealized Gain (Loss) Net realized gain (loss) on investment securities |
|
(3,650,394) |
|
Change in net unrealized appreciation (depreciation) on investment securities |
|
46,708,534 |
|
Net gain (loss) |
|
43,058,140 |
|
Net increase (decrease) in net assets resulting |
|
$ 68,866,589 |
|
Other information |
|
|
|
Expense reductions: |
|
$ 8,326 |
|
Transfer agent credits |
|
227,765 |
|
Accounting credits |
|
16,375 |
|
|
|
$ 252,466 |
See accompanying notes which are an integral part of the financial statements.
Semiannual Report
Spartan New York Municipal Income Fund
Financial Statements - continued
Statement of Changes in Net Assets
|
|
Six months ended
July 31, 2000 |
Year ended
January 31, |
|
Increase (Decrease) in Net Assets |
|
|
|
Operations |
$ 25,808,449 |
$ 54,485,450 |
|
Net realized gain (loss) |
(3,650,394) |
(3,481,379) |
|
Change in net unrealized appreciation (depreciation) |
46,708,534 |
(110,200,928) |
|
Net increase (decrease) in net assets resulting |
68,866,589 |
(59,196,857) |
|
Distributions to shareholders |
(25,800,326) |
(54,350,673) |
|
From net realized gain |
- |
(603,460) |
|
In excess of net realized gain |
- |
(1,354,809) |
|
Total distributions |
(25,800,326) |
(56,308,942) |
|
Share transactions |
96,803,456 |
227,054,112 |
|
Reinvestment of distributions |
19,342,941 |
43,201,504 |
|
Cost of shares redeemed |
(111,891,417) |
(347,394,370) |
|
Net increase (decrease) in net assets resulting |
4,254,980 |
(77,138,754) |
|
Total increase (decrease) in net assets |
47,321,243 |
(192,644,553) |
|
Net Assets |
|
|
|
Beginning of period |
1,007,446,566 |
1,200,091,119 |
|
End of period (including distributions in excess of |
$ 1,054,767,809 |
$ 1,007,446,566 |
|
Other Information Shares |
|
|
|
Sold |
8,085,465 |
18,303,331 |
|
Issued in reinvestment of distributions |
1,607,738 |
3,511,447 |
|
Redeemed |
(9,336,960) |
(28,383,532) |
|
Net increase (decrease) |
356,243 |
(6,568,754) |
See accompanying notes which are an integral part of the financial statements.
Semiannual Report
Financial Highlights
|
|
Six months ended July 31, 2000 |
Years ended January 31, |
||||
|
|
(Unaudited) |
2000 |
1999 |
1998 |
1997 |
1996 |
|
Selected Per-Share Data |
|
|
|
|
|
|
|
Net asset value, beginning of period |
$ 11.740 |
$ 12.990 |
$ 12.940 |
$ 12.290 |
$ 12.540 |
$ 11.370 |
|
Income from
Investment
Operations |
.303 D |
.590 D |
.602 |
.624 |
.629 |
.635 |
|
Net realized and
unrealized |
.500 |
(1.230) |
.205 |
.670 |
(.246) |
1.177 |
|
Total from investment operations |
.803 |
(.640) |
.807 |
1.294 |
.383 |
1.812 |
|
Less Distributions |
|
|
|
|
|
|
|
From net interest income |
(.303) |
(.589) |
(.602) |
(.624) |
(.631) |
(.642) |
|
From net |
- |
(.006) |
(.155) |
(.020) |
(.002) |
- |
|
In excess of net realized gain |
- |
(.015) |
- |
- |
- |
- |
|
Total distributions |
(.303) |
(.610) |
(.757) |
(.644) |
(.633) |
(.642) |
|
Net asset value, |
$ 12.240 |
$ 11.740 |
$ 12.990 |
$ 12.940 |
$ 12.290 |
$ 12.540 |
|
Total Return B, C |
6.91% |
(5.03)% |
6.45% |
10.82% |
3.22% |
16.29% |
|
Ratios and Supplemental Data |
|
|
|
|
|
|
|
Net assets, |
$ 1,054,768 |
$ 1,007,447 |
$ 1,200,091 |
$ 1,133,668 |
$ 401,071 |
$ 433,678 |
|
Ratio of expenses to average net assets |
.50% A |
.49% |
.53% E |
.55% E |
.59% |
.59% |
|
Ratio of expenses to average net assets after expense reductions |
.45% A, F |
.49% |
.53% |
.55% |
.59% |
.58% F |
|
Ratio of net interest income to average net assets |
5.08% A |
4.78% |
4.67% |
4.97% |
5.15% |
5.26% |
|
Portfolio turnover rate |
26% A |
19% |
25% |
43% |
44% |
83% |
A Annualized
B Total returns for periods of less than one year are not annualized.
C The total returns would have been lower had certain expenses not been reduced during the periods shown.
D Net interest income per share has been calculated based on average shares outstanding during the period.
E FMR agreed to reimburse a portion of the fund's expenses during the period. Without this reimbursement, the fund's expense ratio would have been higher.
F FMR or the fund has entered into varying arrangements with third parties who either paid or reduced a portion of the fund's expenses.
See accompanying notes which are an integral part of the financial statements.
Semiannual Report
Spartan New York Municipal Money Market Fund
Performance: The Bottom Line
To evaluate a money market fund's historical performance, you can look at either total return or yield. Total return reflects the change in value of an investment, assuming reinvestment of the fund's dividend income and does not include the effect of the fund's $5 account closeout fee on an average-sized account. Yield measures the income paid by a fund. Since a money market fund tries to maintain a $1 share price, yield is an important measure of performance. If Fidelity had not reimbursed certain fund expenses, the past 10 year total returns would have been lower.
Cumulative Total Returns
|
Periods ended July 31, 2000 |
Past 6 |
Past 1 |
Past 5 |
Past 10 |
|
Spartan NY Municipal Money Market |
1.78% |
3.35% |
16.71% |
36.39% |
|
New York Tax-Free Retail |
1.68% |
3.12% |
15.45% |
32.55% |
Cumulative total returns show the fund's performance over a set period - in this case, six months, one year, five years or 10 years. For example, if you had invested $1,000 in a fund that had a 5% return over the past year, the value of your investment would be $1,050. To measure how the fund's performance stacked up against its peers, you can compare it to the New York tax-free retail money market funds average, which reflects the performance of tax-free retail money market funds with similar objectives tracked by iMoneyNet, Inc. The past six months average represents a peer group of 37 money market funds.
Average Annual Total Returns
|
Periods ended July 31, 2000 |
Past 1 |
Past 5 |
Past 10 |
|
Spartan NY Municipal Money Market |
3.35% |
3.14% |
3.15% |
|
New York Tax-Free Retail |
3.12% |
2.91% |
2.85% |
Average annual total returns take the fund's cumulative return and show you what would have happened if the fund had performed at a constant rate each year.
Semiannual Report
Performance - continued
Spartan New York Municipal Money Market Fund
Yields
|
|
7/31/00 |
5/1/00 |
1/31/00 |
11/1/99 |
8/2/99 |
|
Spartan New York Municipal |
3.75% |
4.12% |
2.88% |
2.98% |
2.66% |
|
|
|||||
|
New York Tax-Free Retail |
3.51% |
3.47% |
2.71% |
2.71% |
2.46% |
|
|
|||||
|
Spartan New York Municipal |
6.55% |
7.20% |
5.04% |
5.22% |
4.65% |
|
|
|||||
|
Portion of fund's income |
1.12% |
2.57% |
2.30% |
4.75% |
6.90% |
|
|
|||||

|
|
Yield refers to the income paid by the fund over a given period. Yields for money market funds are usually for seven-day periods, expressed as annual percentage rates. A yield that assumes income earned is reinvested or compounded is called an effective yield. The table above shows the fund's current seven-day yield at quarterly intervals over the past year. You can compare these yields to the New York tax-free retail money market funds average as tracked by iMoneyNet, Inc. Or you can look at the fund's tax-equivalent yield, which is based on a combined effective 2000 federal, state and New York City income tax rate of 42.80%. The fund's yields mentioned above reflect that a portion of the fund's income was subject to state taxes. A portion of the fund's income may be subject to the federal alternative minimum tax.
A money market fund's total returns and yields will vary, and reflect past results rather than predict future performance.
Comparing
Performance
Yields on tax-free investments are usually lower than yields on taxable investments. However, a straight comparison between the two may be misleading because it ignores the way taxes reduce taxable returns. Tax-equivalent yield - the yield you'd have to earn on a similar taxable investment to match the tax-free yield - makes the comparison more meaningful. Keep in mind that the U.S. government neither insures nor guarantees a money market fund. In fact, there is no assurance that a money market fund will maintain a $1 share price.
3Semiannual Report
Spartan New York Municipal Money Market Fund
(Portfolio Manager photograph)
An interview with Diane McLaughlin, Portfolio Manager of Spartan New York Municipal Money Market Fund
Q. Diane, what was the investment environment like during the six months that ended July 31, 2000?
A. For most of the period, indications of robust economic growth raised fears that inflation was on the horizon. Gross domestic product (GDP) grew at an annual rate of 4.8% in the first quarter of 2000 and the preliminary projection for second quarter GDP growth came in at 5.3%, continuing the vibrant pace seen in 1999. Economic activity was sustained by the wealth effect caused by gains in the equity market, which resulted in high consumer confidence and sustained consumer spending. In addition, the housing market continued to be strong in spite of rising mortgage rates. Business spending also was strong. Other data underscored the momentum of the U.S. economy. In April, the unemployment rate fell to 3.9%, the lowest level in 30 years. Foreign economies demonstrated strength and increased demand for U.S. exports. This backdrop encouraged the Federal Reserve Board to continue to raise short-term interest rates in order to slow growth and head off inflation. The Fed raised the rate banks charge each other for overnight loans - known as the fed funds target rate - three times during the period. The first two hikes each increased the target rate by 0.25 percentage points in February and March. In May, the Fed became more aggressive, raising the fed funds target rate by 0.50 percentage points, bringing it to 6.50%. This move came shortly after the employment cost index - a broad measure of the costs incurred by businesses for wages and benefits - rose at a higher-than-expected annual rate of 5.6% in the first quarter, up from 3.4% in 1999. At its June meeting, however, the Fed kept rates unchanged after seeing some indications that the economy was slowing. Price inflation surfaced at the consumer level; fueled by increases in energy costs, consumer prices increased at an annual rate of 4.2% during the first six months of the year, up from 2.8% from the prior 12 months. However, most price gains were offset by productivity improvements. Even though the Fed held off in June, it indicated it was more likely to raise rates, not lower them, in the future.
Q. What was your strategy with the fund?
A. For most of the period, I concentrated most of the fund's fixed-rate purchases on commercial paper with maturities averaging 90 days. These investments were attractive because, with rates rising, I was able to re-invest maturing assets at higher rates. Toward the end of the period, however, I focused the fund's fixed-rate investments on longer-term, one-year notes. Many issuers of these securities came to market in the summer, and the added supply drove one-year fixed rates higher. The fund's purchases in this area - which pushed its average maturity longer than its peers - should outperform shorter-term alternatives even if the Fed is more aggressive than anticipated. From time to time, I also purchased short-term variable rate demand notes (VRDNs) - whose yields are reset every seven days - when I anticipated rates would move higher. In April, for example, money market managers sold VRDNs to meet redemptions as shareholders withdrew funds to pay taxes. Yields on VRDNs rose, in some cases as high as those offered by taxable money market securities. Because of its overweighting in VRDNs, the fund was positioned to take advantage of these increases in yield.
Semiannual Report
Spartan New York Municipal Money Market Fund
Fund Talk: The Manager's Overview - continued
Q. How did the fund perform?
A. The fund's seven-day yield on July 31, 2000, was 3.75%, compared to 2.88% six months ago. The latest yield was the equivalent of a 6.55% taxable yield for New York investors in the 42.80% combined federal, state and New York City tax bracket. The fund's yields reflect that a portion of the fund's income was subject to state taxes. Through July 31, 2000, the fund's six-month total return was 1.78%, compared to 1.68% for the New York tax-free retail money market funds average, according to iMoneyNet, Inc.
Q. What is your outlook?
A. I believe the Fed may have reached the end of this latest rate-hike program, after having raised short-term rates by a total of 1.75 percentage points since June 1999. Market observers and the Fed will be watching economic indicators for any sign of increased inflationary pressures or actual higher prices. Although the Fed refrained from raising rates in June, it may increase rates again if we do see more indications of inflation. As far as my management of the fund is concerned, I'll continue to look for opportunities driven by supply and demand.
The views expressed in this report reflect those of the portfolio manager only through the end of the period of the report as stated on the cover and do not necessarily represent the views of Fidelity or any other person in the Fidelity organization. Any such views are subject to change at any time based upon market or other conditions and Fidelity disclaims any responsibility to update such views. These views may not be relied on as investment advice and, because investment decisions for a Fidelity fund are based on numerous factors, may not be relied on as an indication of trading intent on behalf of any Fidelity fund.
Fund Facts
Goal: high current income free from federal income tax and New York State and City income taxes, consistent with the preservation of capital, by investing in municipal money market securities
Fund number: 422
Trading symbol: FSNXX
Start date: February 3, 1990
Size: as of July 31, 2000, more than $880 million
Manager: Diane McLaughlin, since 1997; manager, various Fidelity and Spartan municipal money market funds; joined Fidelity in 1992
3Semiannual Report
Spartan New York Municipal Money Market Fund
|
Maturity Diversification |
|||
|
Days |
% of fund's
investments |
% of fund's investments 1/31/00 |
% of fund's |
|
0 - 30 |
67.9 |
56.6 |
61.6 |
|
31 - 90 |
17.3 |
31.3 |
23.2 |
|
91 - 180 |
1.7 |
8.4 |
1.2 |
|
181 - 397 |
13.1 |
3.7 |
14.0 |
|
Weighted Average Maturity |
|||
|
|
7/31/00 |
1/31/00 |
7/31/99 |
|
Spartan New York Municipal Money Market Fund |
54 Days |
42 Days |
58 Days |
|
New York Tax-Free Retail Money Market Funds Average* |
47 Days |
41 Days |
53 Days |
|
Asset Allocation (% of fund's net assets) |
|||||||
|
As of July 31, 2000 |
As of January 31, 2000 |
||||||
 |
Variable Rate |
|
|
Variable Rate |
|
||
 |
Commercial Paper (including CP Mode) 22.7% |
|
|
Commercial Paper (including CP Mode) 25.0% |
|
||
 |
Tender Bonds 5.9% |
|
|
Tender Bonds 4.4% |
|
||
 |
Municipal Notes 14.8% |
|
|
Municipal Notes 15.3% |
|
||
 |
Other Investments |
|
|
Other Investments |
|
||

*Source: iMoneyNet, Inc.®
Semiannual Report
Spartan New York Municipal Money Market Fund
(Unaudited)
Showing Percentage of Net Assets
|
Municipal Securities - 99.0% |
|||
|
Principal Amount |
Value |
||
|
New York - 96.0% |
|||
|
Albany County Arpt. Auth. Arpt. Rev. Participating VRDN Series RobIns 8, 4.38% (Liquidity Facility Bank of New York NA) (a)(d)(e) |
$ 2,490,000 |
$ 2,490,000 |
|
|
Amherst Indl. Dev. Auth. Ind. Dev. Rev. (Maple Dev. Proj.) Series 1986, 4.15%, LOC HSBC Bank USA, VRDN (a)(d) |
4,720,000 |
4,720,000 |
|
|
Babylon Indl. Dev. Agcy. Indl. Dev. Rev. (Southern Container Corp. Proj.) 4.15%, LOC Fleet Bank NA, VRDN (a)(d) |
2,400,000 |
2,400,000 |
|
|
Brentwood Union Free School District #12 TAN 5% 6/29/01 |
3,400,000 |
3,417,761 |
|
|
Briarcliff Manor Union Free School District BAN 5% 6/21/01 |
3,200,000 |
3,212,498 |
|
|
Chautauqua County Gen. Oblig. BAN 4.75% 5/3/01 |
5,200,000 |
5,215,358 |
|
|
Chemung County Ind. Dev. Agcy. Ind. Dev. Rev. (Mmars 2nd Prog. Trayer, Inc. Proj.) Series A, 4.15%, LOC HSBC Bank USA, VRDN (a)(d) |
2,400,000 |
2,400,000 |
|
|
Clarence Central School District BAN 5% 7/12/01 |
2,268,500 |
2,280,186 |
|
|
Deer Park Union Free School District TAN 5% 6/26/01 |
3,000,000 |
3,013,197 |
|
|
Dutchess County Gen. Oblig. BAN Series 1999 A, 4% 8/18/00 |
4,500,000 |
4,500,807 |
|
|
East Islip Unified School District TAN 5% 6/28/01 |
2,800,000 |
2,812,643 |
|
|
Erie County Ind. Dev. Auth. Ind. Dev. Rev. (Uniland Dev./Buffalo Campus Proj.) Series 1986 D, 4.15%, |
1,215,000 |
1,215,000 |
|
|
Fairport Central School District BAN 4.5% 3/15/01 |
2,610,000 |
2,614,024 |
|
|
Harborfields Central Schoold District Greenlawn TAN 5% 6/28/01 |
2,000,000 |
2,008,670 |
|
|
Hauppauge Union Free School District TAN 5% 6/28/01 |
2,000,000 |
2,009,554 |
|
|
Haverstraw Stony Point Central School District BAN 5% 6/29/01 |
3,000,000 |
3,014,353 |
|
|
Hempstead Town Gen. Oblig. BAN 4.5% 1/5/01 |
3,300,000 |
3,303,416 |
|
|
Herkimer County Ind. Dev. Agcy. (H.M. Quackenbush, Inc. Proj.) Series 1988 A, 4.15%, LOC HSBC Bank USA, VRDN (a)(d) |
630,000 |
630,000 |
|
|
Huntington Union Free School District TAN 5% 6/28/01 |
6,100,000 |
6,134,495 |
|
|
Islip Ind. Dev. Agcy. Rev. (Interstate Litho Corp. Proj.) |
370,000 |
370,000 |
|
|
Long Island Pwr. Auth. Elec. Sys. Rev.: |
|
|
|
|
Bonds: |
|
|
|
|
Series 4: |
|
|
|
|
4.05% tender 8/11/00, LOC Bayerische Landesbank Girozentrale, LOC Westdeutsche Landesbank Girozentrale, CP mode |
2,600,000 |
2,600,000 |
|
|
4.1% tender 9/14/00, LOC Bayerische Landesbank Girozentrale, LOC Westdeutsche Landesbank Girozentrale, CP mode |
3,000,000 |
3,000,000 |
|
|
Municipal Securities - continued |
|||
|
Principal Amount |
Value |
||
|
New York - continued |
|||
|
Long Island Pwr. Auth. Elec. Sys. Rev.: - continued |
|
|
|
|
Bonds: - continued |
|
|
|
|
Series 4: |
|
|
|
|
4.15% tender 9/8/00, LOC Bayerische Landesbank Girozentrale, LOC Westdeutsche Landesbank Girozentrale, CP mode |
$ 15,300,000 |
$ 15,300,000 |
|
|
4.2% tender 8/8/00, LOC Bayerische Landesbank Girozentrale, LOC Westdeutsche Landesbank Girozentrale, CP mode |
2,900,000 |
2,900,000 |
|
|
4.5% tender 9/8/00, LOC Bayerische Landesbank Girozentrale, LOC Westdeutsche Landesbank Girozentrale, CP mode |
16,500,000 |
16,500,000 |
|
|
Series PT 1043, 4.6%, tender 2/13/01 (Liquidity Facility Bank of America NA) (e) |
4,300,000 |
4,300,000 |
|
|
Participating VRDN: |
|
|
|
|
Series PA 522, 4.31% (Liquidity Facility Merrill Lynch & Co., Inc.) (a)(e) |
8,095,000 |
8,095,000 |
|
|
Series PA 565, 4.31% (Liquidity Facility Merrill Lynch & Co., Inc.) (a)(e) |
5,700,000 |
5,700,000 |
|
|
Series SG 125, 4.31% (Liquidity Facility Societe Generale) (a)(e) |
2,000,000 |
2,000,000 |
|
|
Series 6, 4.3%, LOC ABN-AMRO Bank NV, LOC Morgan Guaranty Trust Co., NY, VRDN (a) |
9,880,000 |
9,880,000 |
|
|
Sub Series 7A, 4.05% (MBIA Insured), VRDN (a) |
4,840,000 |
4,840,000 |
|
|
Metro. Trans. Auth. Dedicated Tax Fund Participating VRDN Series PA 619, 4.26% (Liquidity Facility Merrill Lynch & Co., Inc.) (a)(e) |
6,995,000 |
6,995,000 |
|
|
Metro. Trans. Auth. Trans. Facilities Rev. Series B, 4.15% 10/20/00, LOC ABN-AMRO Bank NV, CP |
10,900,000 |
10,900,000 |
|
|
Monroe County Arpt. Auth. Rev. Participating VRDN |
3,365,000 |
3,365,000 |
|
|
Monroe County Ind. Dev. Agcy. Rev.: |
|
|
|
|
(Advent Tool & Mold Proj.) Series 1990 D, 4.15%, |
830,000 |
830,000 |
|
|
(AJL Manufacturing Proj.) Series 1996 A, 4.45%, |
2,460,000 |
2,460,000 |
|
|
(Flower City Proj.) 4.45%, LOC Key Bank Nat'l. Assoc., VRDN (a)(d) |
2,775,000 |
2,775,000 |
|
|
Nassau County Gen. Oblig.: |
|
|
|
|
RAN: |
|
|
|
|
Series 2000 A, 6% 3/20/01, LOC Bank of Nova Scotia, LOC First Union Nat'l. Bank, North Carolina |
8,500,000 |
8,579,358 |
|
|
Series 2000 C, 6% 4/12/01, LOC Bank of Nova Scotia, LOC First Union Nat'l. Bank, North Carolina |
4,900,000 |
4,950,044 |
|
|
Municipal Securities - continued |
|||
|
Principal Amount |
Value |
||
|
New York - continued |
|||
|
Nassau County Gen. Oblig.: - continued |
|
|
|
|
RAN: - continued |
|
|
|
|
Series 2000 D, 6% 4/12/01, LOC Bayerische Landesbank Girozentrale, LOC State Street Bank & Trust Co. |
$ 3,400,000 |
$ 3,434,725 |
|
|
TAN 4.75% 8/31/00, LOC First Union Nat'l. Bank, |
8,200,000 |
8,204,901 |
|
|
New York City Gen. Oblig.: |
|
|
|
|
Bonds: |
|
|
|
|
Series 1994 H2: |
|
|
|
|
4.15% tender 9/8/00 (MBIA Insured) (Liquidity Facility Commerzbank AG), CP mode |
2,000,000 |
2,000,000 |
|
|
4.5% tender 9/8/00 (MBIA Insured) (Liquidity Facility Commerzbank AG), CP mode |
8,300,000 |
8,300,000 |
|
|
Series H3, 4.1% tender 8/11/00 (FSA Insured) (Liquidity Facility State Street Bank & Trust Co.), CP mode |
4,700,000 |
4,700,000 |
|
|
Participating VRDN: |
|
|
|
|
Series 94C3, 4.33% (Liquidity Facility Citibank NA, |
10,100,000 |
10,100,000 |
|
|
Series PT 1027, 4.31% (Liquidity Facility Bank of America NA) (a)(e) |
3,305,000 |
3,305,000 |
|
|
Series 1993 E5, 4.2%, LOC Morgan Guaranty Trust Co., NY, VRDN (a) |
2,000,000 |
2,000,000 |
|
|
Series 1994 A4, 4.1%, LOC Chase Manhattan Bank, VRDN (a) |
300,000 |
300,000 |
|
|
Series 1994 E3, 4.2%, LOC Morgan Guaranty Trust Co., NY, VRDN (a) |
2,000,000 |
2,000,000 |
|
|
New York City Hsg. Dev. Corp. Multi-family Rental Hsg. Rev.: |
|
|
|
|
(Brittany Dev. Proj.) Series A, 4.05% (Fannie Mae Guaranteed), VRDN (a)(d) |
6,900,000 |
6,900,000 |
|
|
(One Columbus Place Dev. Proj.) Series A, 4.05% |
13,000,000 |
13,000,000 |
|
|
New York City Ind. Dev. Agcy. Ind. Dev. Rev. Participating VRDN Series CDC 97 E, 4.31% (Liquidity Facility Caisse |
4,160,000 |
4,160,000 |
|
|
New York City Muni. Wtr. Fin. Auth. Wtr. & Swr. Sys. Rev.: |
|
|
|
|
Bonds Series PT 1032, 4.6%, tender 2/13/01 (Liquidity Facility Bank of America NA) (e) |
2,200,000 |
2,200,000 |
|
|
Participating VRDN: |
|
|
|
|
Series Merlots 00 DDD, 4.76% (Liquidity Facility First Union Nat'l. Bank, North Carolina) (a)(e) |
4,000,000 |
4,000,000 |
|
|
Series PA 454, 4.26% (Liquidity Facility Merrill Lynch & Co., Inc.) (a)(e) |
3,995,000 |
3,995,000 |
|
|
Series PA 523, 4.26% (Liquidity Facility Merrill Lynch & Co., Inc.) (a)(e) |
8,140,000 |
8,140,000 |
|
|
Municipal Securities - continued |
|||
|
Principal Amount |
Value |
||
|
New York - continued |
|||
|
New York City Muni. Wtr. Fin. Auth. Wtr. & Swr. Sys. Rev.: - continued |
|
|
|
|
Participating VRDN: - continued |
|
|
|
|
Series SGB 25, 4.33% (Liquidity Facility Societe Generale) (a)(e) |
$ 5,700,000 |
$ 5,700,000 |
|
|
Series SGB 26, 4.33% (Liquidity Facility Societe Generale) (a)(e) |
3,000,000 |
3,000,000 |
|
|
Series 1: |
|
|
|
|
4.35% 8/10/00, LOC Commerzbank AG, LOC Toronto Dominion Bank, CP |
8,800,000 |
8,800,000 |
|
|
4.7% 8/31/00, LOC Commerzbank AG, LOC Toronto Dominion Bank, CP |
6,200,000 |
6,200,000 |
|
|
4.75% 8/31/00, LOC Commerzbank AG, LOC Toronto Dominion Bank, CP |
24,100,000 |
24,100,000 |
|
|
Series 5A, 4.7% 8/31/00, LOC Westdeutsche Landesbank Girozentrale, LOC Bayerische Landesbank Girozentrale, CP |
5,300,000 |
5,300,000 |
|
|
New York City Transitional Fin. Auth. Rev. Participating VRDN: |
|
|
|
|
Series FRRI 00 A16, 4.55% (Liquidity Facility Bayerische Hypo-und Vereinsbank AG) (a)(e) |
45,950,000 |
45,950,000 |
|
|
Series Merlots 99 G, 4.34% (Liquidity Facility First Union Nat'l. Bank, North Carolina) (a)(e) |
8,000,000 |
8,000,000 |
|
|
New York City Trust Cultural Resources Rev. Participating VRDN Series SGA 91, 4.35% (Liquidity Facility Societe Generale) (a)(e) |
3,300,000 |
3,300,000 |
|
|
New York Gen. Oblig. Bonds: |
|
|
|
|
Series B, 4.05%, tender 8/9/00, LOC Dexia Cr. Local de France |
17,000,000 |
17,000,000 |
|
|
4.55% tender 9/19/00, LOC Morgan Guaranty Trust Co., NY, LOC Bayerische Landesbank Girozentrale, CP mode |
8,100,000 |
8,100,000 |
|
|
New York Metro. Trans. Auth. Rev. Participating VRDN |
4,900,000 |
4,900,000 |
|
|
New York State Dorm. Auth. Rev. Participating VRDN: |
|
|
|
|
Series Merlots 00 G, 4.34% (Liquidity Facility First Union Nat'l. Bank, North Carolina) (a)(e) |
8,000,000 |
8,000,000 |
|
|
Series Merlots 00 X, 4.34% (Liquidity Facility First Union Nat'l. Bank, North Carolina) (a)(e) |
2,600,000 |
2,600,000 |
|
|
Series MSDW 00 305, 4.28% (Liquidity Facility Morgan Stanley Dean Witter & Co.) (a)(e) |
10,000,000 |
10,000,000 |
|
|
Series PA 434, 4.26% (Liquidity Facility Merrill Lynch & Co., Inc.) (a)(e) |
6,995,000 |
6,995,000 |
|
|
Municipal Securities - continued |
|||
|
Principal Amount |
Value |
||
|
New York - continued |
|||
|
New York State Dorm. Auth. Rev. Participating VRDN: - continued |
|
|
|
|
Series PT 1067, 4.26% (Liquidity Facility Bank of |
$ 12,285,000 |
$ 12,285,000 |
|
|
Series PT 407, 4.26% (Liquidity Facility Merrill Lynch & Co., Inc.) (a)(e) |
8,140,000 |
8,140,000 |
|
|
New York State Energy Research & Dev. Auth. Facilities Rev. (Consolidated Edison Co. Proj.): |
|
|
|
|
Series A1, 4.1% (Liquidity Facility Morgan Guaranty Trust Co., NY), VRDN (a)(d) |
18,300,000 |
18,300,000 |
|
|
Series A2, 4.2% (Liquidity Facility Morgan Guaranty Trust Co., NY), VRDN (a)(d) |
8,500,000 |
8,500,000 |
|
|
Sub Series A3, 4.2% (Liquidity Facility Morgan Guaranty Trust Co., NY), VRDN (a)(d) |
12,000,000 |
12,000,000 |
|
|
New York State Energy Research & Dev. Auth. Poll. Cont. Rev.: |
|
|
|
|
Bonds (New York State Elec. & Gas Corp. Proj.) Series 1985 A, 4.2%, tender 3/15/01, LOC Morgan Guaranty Trust Co., NY |
9,145,000 |
9,145,000 |
|
|
Participating VRDN Series MSDW 181, 4.33% (Liquidity Facility Morgan Stanley Dean Witter & Co.) (a)(d)(e) |
4,000,000 |
4,000,000 |
|
|
(Niagara Mohawk Pwr. Corp. Proj.) Series 1988 A, 4.35%, LOC Morgan Guaranty Trust Co., NY, VRDN (a)(d) |
13,000,000 |
13,000,000 |
|
|
4.25%, LOC Mellon Bank NA, Pittsburgh, VRDN (a) |
5,100,000 |
5,100,000 |
|
|
New York State Envir. Facilities Corp. Poll. Cont. Rev. Participating VRDN Series RobIns 9, 4.33% (Liquidity Facility Bank of New York NA) (a)(e) |
6,020,000 |
6,020,000 |
|
|
New York State Hsg. Fin. Agcy. Rev.: |
|
|
|
|
(101 West End Avenue Hsg. Proj.) Series 2000 A, 4.15%, LOC Fleet Bank NA, VRDN (a)(d) |
2,700,000 |
2,700,000 |
|
|
(240 East 39th Street Proj.) Series 1997 A, 4.1%, LOC Chase Manhattan Bank, VRDN (a)(d) |
8,900,000 |
8,900,000 |
|
|
(750 Sixth Avenue Hsg. Proj.) Series 1999 A, 4.05%, |
1,400,000 |
1,400,000 |
|
|
(East 84th Street Proj.) Series 1995 A, 4.1%, LOC Bayerische Hypo-und Vereinsbank AG, VRDN (a)(d) |
3,000,000 |
3,000,000 |
|
|
(Normandie Court II Proj.) Series 1999 A, 4.05%, LOC Freddie Mac, VRDN (a)(d) |
3,600,000 |
3,600,000 |
|
|
(South Cove Plaza Proj.) Series A, 4.05%, LOC HSBC Bank USA, VRDN (a)(d) |
10,000,000 |
10,000,000 |
|
|
New York State Local Govt. Assistance Corp.: |
|
|
|
|
Participating VRDN: |
|
|
|
|
Series PA 445, 4.26% (Liquidity Facility Merrill Lynch & Co., Inc.) (a)(e) |
6,895,000 |
6,895,000 |
|
|
Municipal Securities - continued |
|||
|
Principal Amount |
Value |
||
|
New York - continued |
|||
|
New York State Local Govt. Assistance Corp.: - continued |
|
|
|
|
Participating VRDN: - continued |
|
|
|
|
Series SG 99, 4.26% (Liquidity Facility Societe Generale) (a)(e) |
$ 17,450,000 |
$ 17,450,000 |
|
|
Rfdg. Bonds Series PT 1040, 4.6%, tender 1/10/01 (Liquidity Facility Bank of America NA) (e) |
11,200,000 |
11,200,000 |
|
|
New York State Med. Care Facilities Fin. Agcy. Rev. Participating VRDN Series PA 89, 4.26% (Liquidity Facility Merrill Lynch & Co., Inc.) (a)(e) |
9,319,000 |
9,319,000 |
|
|
New York State Mtg. Agcy. Participating VRDN: |
|
|
|
|
Series Merlots 00 B, 4.39% (Liquidity Facility First Union Nat'l. Bank, North Carolina) (a)(d)(e) |
7,200,000 |
7,200,000 |
|
|
Series Merlots 00 PP, 4.39% (Liquidity Facility First Union Nat'l. Bank, North Carolina) (a)(d)(e) |
5,195,000 |
5,195,000 |
|
|
Series PA 153, 4.31% (Liquidity Facility Merrill Lynch & Co., Inc.) (a)(d)(e) |
4,640,000 |
4,640,000 |
|
|
Series PA 29, 4.31% (Liquidity Facility Merrill Lynch & Co., Inc.) (a)(d)(e) |
6,000,000 |
6,000,000 |
|
|
Series PA 691R, 4.31% (Liquidity Facility Merrill Lynch & Co., Inc.) (a)(d)(e) |
3,200,000 |
3,200,000 |
|
|
Series PT 15A, 4.31% (Liquidity Facility Commerzbank AG) (a)(d)(e) |
4,500,000 |
4,500,000 |
|
|
Series PT 15B, 4.31% (Liquidity Facility Commerzbank AG) (a)(d)(e) |
1,540,000 |
1,540,000 |
|
|
Series PT 108, 4.31% (Liquidity Facility Banco Santander SA) (a)(d)(e) |
2,845,000 |
2,845,000 |
|
|
Series PT 1204, 4.31% (Liquidity Facility Merrill Lynch & Co., Inc.) (a)(d)(e) |
3,110,000 |
3,110,000 |
|
|
New York State Pwr. Auth. Rev. & Gen. Purp.: |
|
|
|
|
Bonds 4%, tender 9/1/00 |
7,600,000 |
7,600,000 |
|
|
Series 1: |
|
|
|
|
4.15% 10/12/00, CP |
11,900,000 |
11,900,000 |
|
|
4.15% 10/13/00, CP |
14,800,000 |
14,800,000 |
|
|
Series 2: |
|
|
|
|
4.1% 8/10/00, CP |
22,000,000 |
22,000,000 |
|
|
4.25% 8/8/00, CP |
3,200,000 |
3,200,000 |
|
|
4.6% 8/8/00, CP |
2,000,000 |
2,000,000 |
|
|
4.65% 8/7/00, CP |
9,500,000 |
9,500,000 |
|
|
Series 4: |
|
|
|
|
4.05% 8/11/00, CP |
2,200,000 |
2,200,000 |
|
|
4.25% 8/8/00, CP |
16,500,000 |
16,500,000 |
|
|
Municipal Securities - continued |
|||
|
Principal Amount |
Value |
||
|
New York - continued |
|||
|
New York State Urban Dev. Corp. Rev. Participating VRDN: |
|
|
|
|
Series Merlots 00 N, 4.39% (Liquidity Facility First Union Nat'l. Bank, North Carolina) (a)(e) |
$ 2,700,000 |
$ 2,700,000 |
|
|
Series SG 33, 4.26% (Liquidity Facility Societe Generale) (a)(e) |
5,000,000 |
5,000,000 |
|
|
Niagara Frontier Trans. Auth. Arpt. Rev. Participating VRDN Series Putters 121, 4.3% (Liquidity Facility Morgan Guaranty Trust Co., NY) (a)(d)(e) |
2,800,000 |
2,800,000 |
|
|
North Shore Central School District TAN 5% 6/28/01 |
3,000,000 |
3,016,939 |
|
|
Northport-East Northport Union Free School District TAN 5% 6/29/01 |
3,000,000 |
3,014,910 |
|
|
Oneida County Ind. Dev. Agcy. Rev. (Utica Corp. Proj.) |
1,680,000 |
1,680,000 |
|
|
Oswego County Ind. Dev. Agcy. Ind. Rev. (Engraph, Inc. Proj.) Series 1989, 4.35%, LOC Suntrust Bank, VRDN (a)(d) |
4,520,000 |
4,520,000 |
|
|
Oswego County Ind. Dev. Agcy. Poll. Cont. Rev. Rfdg. |
5,200,000 |
5,200,000 |
|
|
Oyster Bay Gen. Oblig. BAN: |
|
|
|
|
Series 1999 E, 4.25% 9/29/00 |
8,900,000 |
8,905,256 |
|
|
Series C, 4% 8/25/00 |
3,800,000 |
3,800,117 |
|
|
Series D, 4% 8/25/00 |
3,600,000 |
3,600,705 |
|
|
Plainview Old Bethpage Central School District TAN 5% 6/28/01 |
6,000,000 |
6,026,553 |
|
|
Port Washington Union Free School District TAN (Nassau County Proj.) 5% 6/28/01 |
6,000,000 |
6,033,909 |
|
|
Riverhead Indl. Dev. Auth. Ind. Dev. Rev. (Adchem Corp. Facility Proj.) Series 1998, 4.31%, LOC European American Bank Uniondale, VRDN (a)(d) |
2,800,000 |
2,800,000 |
|
|
Rochester Gen. Oblig. BAN 4.75% 3/7/01 |
6,200,000 |
6,219,531 |
|
|
Rockland County Ind. Dev. Agcy. Ind. Dev. Rev. (INSL-X Prod. Corp. Proj.) Series 1990, 4.1%, LOC Bank of New York NA, VRDN (a)(d) |
2,225,000 |
2,225,000 |
|
|
Saint Lawrence County Ind. Dev. Agcy. Poll. Cont. Rev. (Aluminum Co. of America Proj.) Series B, 4.28%, VRDN (a) |
5,000,000 |
5,000,000 |
|
|
Saint Lawrence County Ind. Dev. Auth. Envir. Facilities (Aluminum Co. of America Proj.) Series 1998 A, 4.33%, VRDN (a)(d) |
3,250,000 |
3,250,000 |
|
|
Smithtown Central School District TAN 5% 6/26/01 |
7,000,000 |
7,033,181 |
|
|
South Huntington Union Free School District TAN 5% 6/29/01 |
3,000,000 |
3,016,207 |
|
|
Suffolk County Gen. Oblig. Participating VRDN Series FRRI A38, 4.3% (Liquidity Facility Bank of New York NA) (a)(e) |
11,650,000 |
11,650,000 |
|
|
Suffolk County Ind. Dev. Agcy. Civic Facility Rev. (Maryhaven Ctr. of Hope Proj.) Series 1997 A, 4.35%, LOC Key Bank Nat'l. Assoc., VRDN (a) |
2,405,000 |
2,405,000 |
|
|
Municipal Securities - continued |
|||
|
Principal Amount |
Value |
||
|
New York - continued |
|||
|
Suffolk County Solid Waste Disp. Rev. Participating VRDN Series RobIns 1, 4.34% (Liquidity Facility Bank of New York NA) (a)(d)(e) |
$ 6,275,000 |
$ 6,275,000 |
|
|
Syosset Central School District TAN 5% 6/28/01 |
6,000,000 |
6,031,281 |
|
|
Three Village Central School District TAN 5% 6/29/01 |
5,800,000 |
5,832,858 |
|
|
|
845,336,437 |
||
|
New York & New Jersey - 2.4% |
|||
|
Port Auth. New York & New Jersey: |
|
|
|
|
Series 1991, 4.577%, VRDN (a)(d)(f) |
9,800,000 |
9,800,000 |
|
|
Series 1996 5, 4.25%, VRDN (a) |
4,800,000 |
4,800,000 |
|
|
Series 1997 4B, 4.35%, VRDN (a)(d) |
2,000,000 |
2,000,000 |
|
|
Series 4, 4.25%, VRDN (a) |
4,400,000 |
4,400,000 |
|
|
|
21,000,000 |
||
|
Shares |
|
||
|
Other - 0.6% |
|||
|
Fidelity Municipal Cash Central Fund, 4.30% (b)(c) |
5,207,956 |
5,207,956 |
|
|
TOTAL INVESTMENT PORTFOLIO - 99.0% |
871,544,393 |
||
|
NET OTHER ASSETS - 1.0% |
8,829,208 |
||
|
NET ASSETS - 100% |
$ 880,373,601 |
||
|
Total Cost for Income Tax Purposes $ 871,544,393 |
|
Security Type Abbreviations |
|
BAN - BOND ANTICIPATION NOTE |
|
CP - COMMERCIAL PAPER |
|
RAN - REVENUE ANTICIPATION NOTE |
|
TAN - TAX ANTICIPATION NOTE |
|
VRDN - VARIABLE RATE DEMAND NOTE |
|
Legend |
|
(a) The coupon rate shown on floating or adjustable rate securities represents the rate at period end. |
|
(b) Information in this report regarding holdings by state and security types does not reflect the holdings of the Fidelity Municipal Cash Central Fund. |
|
(c) The rate quoted is the annualized seven-day yield of the fund at period end. |
|
(d) Private activity obligations whose interest is subject to the federal alternative minimum tax for individuals. |
|
(e) Provides evidence of ownership in one or more underlying municipal bonds. |
|
(f) Restricted securities - Investment in securities not registered under the Securities Act of 1933. |
|
Additional information on each holding is as follows: |
|
Security |
Acquisition Date |
Cost |
|
Port Auth. |
6/18/91 |
$ 9,800,000 |
|
Other Information |
|
The fund invested in securities that are not registered under the Securities Act of 1933. These securities are subject to legal or contractual restrictions on resale. At the end of the period, restricted securities (excluding Rule 144A issues) amounted to $9,800,000 or 1.1% of net assets. |
|
Income Tax Information |
|
At January 31, 2000, the fund had a capital loss carryforward of approximately $102,000 of which $33,000, $28,000 and $41,000 will expire on January 31, 2002, 2005 and 2006, respectively. |
See accompanying notes which are an integral part of the financial statements.
Semiannual Report
Spartan New York Municipal Money Market Fund
Statement of Assets and Liabilities
|
|
July 31, 2000 (Unaudited) |
|
|
Assets |
|
|
|
Investment in securities, at value - |
|
$ 871,544,393 |
|
Receivable for fund shares sold |
|
2,662,310 |
|
Interest receivable |
|
8,582,903 |
|
Total assets |
|
882,789,606 |
|
Liabilities |
|
|
|
Payable to custodian bank |
$ 429 |
|
|
Payable for fund shares redeemed |
1,738,192 |
|
|
Distributions payable |
302,412 |
|
|
Accrued management fee |
370,895 |
|
|
Other payables and accrued expenses |
4,077 |
|
|
Total liabilities |
|
2,416,005 |
|
Net Assets |
|
$ 880,373,601 |
|
Net Assets consist of: |
|
|
|
Paid in capital |
|
$ 880,466,493 |
|
Accumulated undistributed net realized gain (loss) |
|
(92,892) |
|
Net Assets, for 880,449,502 shares outstanding |
|
$ 880,373,601 |
|
Net Asset Value, offering price and redemption price |
|
$1.00 |
See accompanying notes which are an integral part of the financial statements.
Semiannual Report
Spartan New York Municipal Money Market Fund
Financial Statements - continued
Statement of Operations
|
|
Six months ended July 31, 2000 (Unaudited) |
|
|
Interest Income |
|
$ 16,832,526 |
|
Expenses |
|
|
|
Management fee |
$ 2,073,035 |
|
|
Non-interested trustees' compensation |
1,343 |
|
|
Total expenses before reductions |
2,074,378 |
|
|
Expense reductions |
(34,048) |
2,040,330 |
|
Net interest income |
|
14,792,196 |
|
Net Realized Gain (Loss) on Investments |
|
8,660 |
|
Net increase in net assets resulting from operations |
|
$ 14,800,856 |
See accompanying notes which are an integral part of the financial statements.
Semiannual Report
Spartan New York Municipal Money Market Fund
Financial Statements - continued
Statement of Changes in Net Assets
|
|
Six months ended
July 31, 2000 |
Year ended
January 31, |
|
Increase (Decrease) in Net Assets |
|
|
|
Operations |
$ 14,792,196 |
$ 23,012,959 |
|
Net realized gain (loss) |
8,660 |
22,941 |
|
Net increase (decrease) in net assets resulting |
14,800,856 |
23,035,900 |
|
Distributions to shareholders from net interest income |
(14,792,196) |
(23,012,959) |
|
Share transactions at net asset value of $1.00 per share |
416,039,975 |
631,581,062 |
|
Reinvestment of distributions from net interest income |
13,686,242 |
21,823,688 |
|
Cost of shares redeemed |
(358,449,357) |
(652,822,355) |
|
Net increase (decrease) in net assets and shares resulting from share transactions |
71,276,860 |
582,395 |
|
Total increase (decrease) in net assets |
71,285,520 |
605,336 |
|
Net Assets |
|
|
|
Beginning of period |
809,088,081 |
808,482,745 |
|
End of period |
$ 880,373,601 |
$ 809,088,081 |
See accompanying notes which are an integral part of the financial statements.
Semiannual Report
Financial Highlights
|
|
Six months ended July 31, 2000 |
Years ended January 31, |
||||
|
|
(Unaudited) |
2000 |
1999 |
1998 |
1997 |
1996 |
|
Selected Per-Share Data |
|
|
|
|
|
|
|
Net asset value, beginning of period |
$ 1.000 |
$ 1.000 |
$ 1.000 |
$ 1.000 |
$ 1.000 |
$ 1.000 |
|
Income from
Investment
Operations |
.018 |
.028 |
.030 |
.032 |
.030 |
.034 |
|
Less Distributions |
|
|
|
|
|
|
|
From net |
(.018) |
(.028) |
(.030) |
(.032) |
(.030) |
(.034) |
|
Net asset value, |
$ 1.000 |
$ 1.000 |
$ 1.000 |
$ 1.000 |
$ 1.000 |
$ 1.000 |
|
Total Return B, C |
1.78% |
2.86% |
3.01% |
3.26% |
3.07% |
3.46% |
|
Ratios and Supplemental Data |
|
|
|
|
|
|
|
Net assets, |
$ 880,374 |
$ 809,088 |
$ 808,483 |
$ 786,679 |
$ 743,928 |
$ 676,475 |
|
Ratio of expenses |
.50%A |
.50% |
.50% |
.50% |
.50% |
.50% |
|
Ratio of expenses to average net assets after expense reductions |
.49% A, D |
.50% |
.49% D |
.50% |
.49% D |
.50% |
|
Ratio of net |
3.57% A |
2.82% |
2.97% |
3.21% |
3.03% |
3.41% |
A Annualized
B Total returns do not include the account closeout fee and for periods of less than one year are not annualized.
C The total returns would have been lower had certain expenses not been reduced during the periods shown.
D FMR or the fund has entered into varying arrangements with third parties who either paid or reduced a portion of the fund's expenses.
See accompanying notes which are an integral part of the financial statements.
Semiannual Report
Fidelity New York Municipal Money Market Fund
Performance: The Bottom Line
To evaluate a money market fund's historical performance, you can look at either total return or yield. Total return reflects the change in value of an investment, assuming reinvestment of the fund's dividend income. Yield measures the income paid by a fund. Since a money market fund tries to maintain a $1 share price, yield is an important measure of performance.
Cumulative Total Returns
|
Periods ended July 31, 2000 |
Past 6 |
Past 1 |
Past 5 |
Past 10 |
|
Fidelity NY Municipal Money Market |
1.75% |
3.28% |
16.09% |
34.06% |
|
New York Tax-Free Retail |
1.68% |
3.12% |
15.45% |
32.55% |
Cumulative total returns show the fund's performance in percentage terms over a set period - in this case, six months, one year, five years or 10 years. For example, if you had invested $1,000 in a fund that had a 5% return over the past year, the value of your investment would be $1,050. To measure how the fund's performance stacked up against its peers, you can compare it to the New York tax-free retail money market funds average, which reflects the performance of tax-free retail money market funds with similar objectives tracked by iMoneyNet, Inc. The past six months average represents a peer group of 37 money market funds.
Average Annual Total Returns
|
Periods ended July 31, 2000 |
|
Past 1 |
Past 5 |
Past 10 |
|
Fidelity NY Municipal Money Market |
|
3.28% |
3.03% |
2.97% |
|
New York Tax-Free Retail |
|
3.12% |
2.91% |
2.85% |
Average annual total returns take the fund's cumulative return and show you what would have happened if the fund had performed at a constant rate each year.
Semiannual Report
Fidelity New York Municipal Money Market Fund
Performance - continued
Yields
|
|
7/31/00 |
5/1/00 |
1/31/00 |
11/1/99 |
8/2/99 |
|
M |
|||||
|
Fidelity New York Municipal |
3.71% |
4.06% |
2.81% |
2.92% |
2.60% |
|
|
|||||
|
New York Tax-Free Retail |
3.51% |
3.47% |
2.71% |
2.71% |
2.46% |
|
|
|||||
|
Fidelity New York Municipal |
6.49% |
7.10% |
4.91% |
5.10% |
4.55% |
|
|
|||||
|
Portion of fund's income |
0.18% |
0.00% |
2.98% |
4.48% |
3.61% |

Yield refers to the income paid by the fund over a given period. Yields for money market funds are usually for seven-day periods, expressed as annual percentage rates. A yield that assumes income earned is reinvested or compounded is called an effective yield. The table above shows the fund's current seven-day yield at quarterly intervals over the past year. You can compare these yields to the New York tax-free retail money market funds average as tracked by iMoneyNet, Inc. Or you can look at the fund's tax-equivalent yield, which is based on a combined effective 2000 federal, state and New York City income tax rate of 42.80%. The fund's yields mentioned above reflect that a portion of the fund's income was subject to state taxes. A portion of the fund's income may be subject to the federal alternative minimum tax.
A money market fund's total returns and yields will vary, and reflect past results rather than predict future performance.
Comparing
Performance
Yields on tax-free investments are usually lower than yields on taxable investments. However, a straight comparison between the two may be misleading because it ignores the way taxes reduce taxable returns. Tax-equivalent yield - the yield you'd have to earn on a similar taxable investment to match the tax-free yield - makes the comparison more meaningful. Keep in mind that the U.S. government neither insures nor guarantees a money market fund. In fact, there is no assurance that a money market fund will maintain a $1 share price.
3Semiannual Report
Fidelity New York Municipal Money Market Fund
(Portfolio Manager photograph)
An interview with Diane McLaughlin, Portfolio Manager of Fidelity New York Municipal Money Market Fund
Q. Diane, what was the investment environment like during the six months that ended July 31, 2000?
A. For most of the period, indications of robust economic growth raised fears that inflation was on the horizon. Gross domestic product (GDP) grew at an annual rate of 4.8% in the first quarter of 2000 and the preliminary projection for second quarter GDP growth came in at 5.3%, continuing the vibrant pace seen in 1999. Economic activity was sustained by the wealth effect caused by gains in the equity market, which resulted in high consumer confidence and sustained consumer spending. In addition, the housing market continued to be strong in spite of rising mortgage rates. Business spending also was strong. Other data underscored the momentum of the U.S. economy. In April, the unemployment rate fell to 3.9%, the lowest level in 30 years. Foreign economies demonstrated strength and increased demand for U.S. exports. This backdrop encouraged the Federal Reserve Board to continue to raise short-term interest rates in order to slow growth and head off inflation. The Fed raised the rate banks charge each other for overnight loans - known as the fed funds target rate - three times during the period. The first two hikes each increased the target rate by 0.25 percentage points in February and March. In May, the Fed became more aggressive, raising the fed funds target rate by 0.50 percentage points, bringing it to 6.50%. This move came shortly after the employment cost index - a broad measure of the costs incurred by businesses for wages and benefits - rose at a higher-than-expected annual rate of 5.6% in the first quarter, up from 3.4% in 1999. At its June meeting, however, the Fed kept rates unchanged after seeing some indications that the economy was slowing. Price inflation surfaced at the consumer level; fueled by increases in energy costs, consumer prices increased at an annual rate of 4.2% during the first six months of the year, up from 2.8% from the prior 12 months. However, most price gains were offset by productivity improvements. Even though the Fed held off in June, it indicated it was more likely to raise rates, not lower them, in the future.
Q. What was your strategy with the fund?
A. For most of the period, I concentrated most of the fund's fixed-rate purchases on commercial paper with maturities averaging 90 days. These investments were attractive because, with rates rising, I was able to re-invest maturing assets at higher rates. Toward the end of the period, however, I focused the fund's fixed-rate investments on longer-term, one-year notes. Many issuers of these securities came to market in the summer, and the added supply drove one-year fixed rates higher. The fund's purchases in this area - which pushed its average maturity longer than its peers - should outperform shorter-term alternatives even if the Fed is more aggressive than anticipated. From time to time, I also purchased short-term variable rate demand notes (VRDNs) - whose yields are reset every seven days - when I anticipated rates would move higher. In April, for example, money market managers sold VRDNs to meet redemptions as shareholders withdrew funds to pay taxes. Yields on VRDNs rose, in some cases as high as those offered by taxable money market securities. Because of its overweighting in VRDNs, the fund was positioned to take advantage of these increases in yield.
Semiannual Report
Fidelity New York Municipal Money Market Fund
Fund Talk: The Manager's Overview - continued
Q. How did the fund perform?
A. The fund's seven-day yield on July 31, 2000, was 3.71%, compared to 2.81% six months ago. The latest yield was the equivalent of a 6.49% taxable yield for New York investors in the 42.80% combined federal, state and New York City tax bracket. The fund's yields reflect that a portion of the fund's income was subject to state taxes. Through July 31, 2000, the fund's six-month total return was 1.75%, compared to 1.68% for the New York tax-free retail money market funds average, according to iMoneyNet, Inc.
Q. What is your outlook?
A. I believe the Fed may have reached the end of this latest rate-hike program, after having raised short-term rates by a total of 1.75 percentage points since June 1999. Market observers and the Fed will be watching economic indicators for any sign of increased inflationary pressures or actual higher prices. Although the Fed refrained from raising rates in June, it may increase rates again if we do see more indications of inflation. As far as my management of the fund is concerned, I'll continue to look for opportunities driven by supply and demand.
The views expressed in this report reflect those of the portfolio manager only through the end of the period of the report as stated on the cover and do not necessarily represent the views of Fidelity or any other person in the Fidelity organization. Any such views are subject to change at any time based upon market or other conditions and Fidelity disclaims any responsibility to update such views. These views may not be relied on as investment advice and, because investment decisions for a Fidelity fund are based on numerous factors, may not be relied on as an indication of trading intent on behalf of any Fidelity fund.
Fund Facts
Goal: high current income free from federal income tax and New York State and City income taxes, consistent with the preservation of capital, by investing in municipal money market securities
Fund number: 092
Trading symbol: FNYXX
Start date: July 6, 1984
Size: as of July 31, 2000, more than $1.6 billion
Manager: Diane McLaughlin, since 1997; manager, various Fidelity and Spartan municipal money market funds; joined Fidelity in 1992
3Semiannual Report
Fidelity New York Municipal Money Market Fund
|
Maturity Diversification |
|||
|
Days |
% of fund's
investments |
% of fund's investments 1/31/00 |
% of fund's |
|
0 - 30 |
72.2 |
61.6 |
63.9 |
|
31 - 90 |
11.8 |
26.3 |
22.1 |
|
91 - 180 |
1.5 |
8.8 |
1.2 |
|
181 - 397 |
14.5 |
3.3 |
12.8 |
|
Weighted Average Maturity |
|||
|
|
7/31/00 |
1/31/00 |
7/31/99 |
|
New York Municipal Money Market Fund |
54 Days |
39 Days |
55 Days |
|
New York Tax-Free Retail Money Market Funds Average* |
47 Days |
41 Days |
53 Days |
|
Asset Allocation (% of fund's net assets) |
|||||||
|
As of July 31, 2000 |
As of January 31, 2000 |
||||||
|
Variable Rate |
|
|
Variable Rate |
|
||
|
Commercial Paper (including CP Mode) 16.6% |
|
|
Commercial Paper (including CP Mode) 21.5% |
|
||
|
Tender Bonds 6.5% |
|
|
Tender Bonds 3.8% |
|
||
|
Municipal Notes 14.5% |
|
|
Municipal Notes 13.6% |
|
||
|
Other Investments |
|
|
Other Investments |
|
||
*Source: iMoneyNet, Inc.®
Semiannual Report
Fidelity New York Municipal Money Market Fund
(Unaudited)
Showing Percentage of Net Assets
|
Municipal Securities - 98.4% |
|||
|
Principal Amount |
Value |
||
|
New York - 94.9% |
|||
|
Albany County Arpt. Auth. Arpt. Rev. Participating VRDN Series RobIns 8, 4.38% (Liquidity Facility Bank of New York NA) (a)(d)(f) |
$ 4,800,000 |
$ 4,800,000 |
|
|
Amherst Indl. Dev. Auth. Ind. Dev. Rev. (Maple Dev. Proj.) Series 1986, 4.15%, LOC HSBC Bank USA, VRDN (a)(d) |
765,000 |
765,000 |
|
|
Amsterdam Ind. Dev. Agcy. Ind. Dev. Rev. (Longview Fiber Co. Proj.) Series 1987, 4.45%, LOC ABN-AMRO Bank NV, VRDN (a) |
1,880,000 |
1,880,000 |
|
|
Babylon Indl. Dev. Agcy. Indl. Dev. Rev. (Southern Container Corp. Proj.) 4.15%, LOC Fleet Bank NA, VRDN (a)(d) |
2,800,000 |
2,800,000 |
|
|
Brentwood Union Free School District #12 TAN 5% 6/29/01 |
6,600,000 |
6,634,477 |
|
|
Briarcliff Manor Union Free School District: |
|
|
|
|
BAN 5% 6/21/01 |
5,300,000 |
5,320,700 |
|
|
TAN Series 2000, 5% 6/21/01 |
1,500,000 |
1,505,859 |
|
|
Chautauqua County Gen. Oblig. BAN 4.75% 5/3/01 |
10,500,000 |
10,531,011 |
|
|
Chemung County Ind. Dev. Agcy. Ind. Dev. Rev.: |
|
|
|
|
(McWane, Inc. Proj.) Series 1992 A, 4.43%, |
2,100,000 |
2,100,000 |
|
|
(Mmars 2nd Prog. Trayer, Inc. Proj.) Series A, 4.15%, |
850,000 |
850,000 |
|
|
Clarence Central School District TAN 5% 6/29/01 |
6,000,000 |
6,031,872 |
|
|
Deer Park Union Free School District TAN 5% 6/26/01 |
3,000,000 |
3,013,197 |
|
|
Dutchess County Gen. Oblig. BAN: |
|
|
|
|
Series 1999 A, 4% 8/18/00 |
7,200,000 |
7,201,291 |
|
|
4.5% 2/15/01 |
3,000,000 |
3,004,646 |
|
|
East Islip Unified School District TAN 5% 6/28/01 |
5,700,000 |
5,725,737 |
|
|
Erie County Ind. Dev. Auth. Ind. Dev. Rev. (Uniland Dev./Buffalo Campus Proj.) Series 1986 D, 4.15%, |
1,115,000 |
1,115,000 |
|
|
Fairport Central School District BAN 4.5% 3/15/01 |
5,100,000 |
5,107,863 |
|
|
Half Hollow Hills Central School District of Huntington & Babylon TAN 5% 6/29/01 |
8,000,000 |
8,045,308 |
|
|
Harborfields Central Schoold District Greenlawn TAN 5% 6/28/01 |
4,000,000 |
4,017,340 |
|
|
Hauppauge Union Free School District TAN 5% 6/28/01 |
7,000,000 |
7,033,439 |
|
|
Haverstraw Stony Point Central School District BAN 5% 6/29/01 |
6,000,000 |
6,028,707 |
|
|
Hempstead Town Gen. Oblig. BAN 4.5% 1/5/01 |
6,700,000 |
6,706,936 |
|
|
Hicksville Union Free School District TAN 4.75% 6/28/01 |
4,000,000 |
4,012,159 |
|
|
Huntington Union Free School District TAN 5% 6/28/01 |
11,400,000 |
11,463,946 |
|
|
Islip Ind. Dev. Agcy. Rev. (Interstate Litho Corp. Proj.) |
1,350,000 |
1,350,000 |
|
|
Municipal Securities - continued |
|||
|
Principal Amount |
Value |
||
|
New York - continued |
|||
|
Jefferson County Ind. Dev. Agcy. Ind. Dev. Rev. (Fisher Gauge Facilities Proj.) Series 1996, 4.15%, LOC Fleet Bank NA, VRDN (a)(d) |
$ 2,400,000 |
$ 2,400,000 |
|
|
Long Island Pwr. Auth. Elec. Sys. Rev.: |
|
|
|
|
Bonds: |
|
|
|
|
Series 4: |
|
|
|
|
4.05% tender 8/11/00, LOC Bayerische Landesbank Girozentrale, LOC Westdeutsche Landesbank Girozentrale, CP mode |
14,800,000 |
14,800,000 |
|
|
4.2% tender 8/8/00, LOC Bayerische Landesbank Girozentrale, LOC Westdeutsche Landesbank Girozentrale, CP mode |
6,000,000 |
6,000,000 |
|
|
4.5% tender 9/8/00, LOC Bayerische Landesbank Girozentrale, LOC Westdeutsche Landesbank Girozentrale, CP mode |
10,000,000 |
10,000,000 |
|
|
Series PT 1043, 4.6%, tender 2/13/01 (Liquidity Facility Bank of America NA) (f) |
12,800,000 |
12,800,000 |
|
|
Participating VRDN: |
|
|
|
|
Series Merlots 98 65, 4.28% (Liquidity Facility Morgan Stanley Dean Witter & Co.) (a)(f) |
5,000,000 |
5,000,000 |
|
|
Series Merlots 98 66, 4.28% (Liquidity Facility Morgan Stanley Dean Witter & Co.) (a)(f) |
3,635,000 |
3,635,000 |
|
|
Series PA 420, 4.31% (Liquidity Facility Merrill Lynch & Co., Inc.) (a)(f) |
14,600,000 |
14,600,000 |
|
|
Series PA 421, 4.31% (Liquidity Facility Merrill Lynch & Co., Inc.) (a)(f) |
7,200,000 |
7,200,000 |
|
|
Series PA 522, 4.31% (Liquidity Facility Merrill Lynch & Co., Inc.) (a)(f) |
12,900,000 |
12,900,000 |
|
|
Series PA 565, 4.31% (Liquidity Facility Merrill Lynch & Co., Inc.) (a)(f) |
9,300,000 |
9,300,000 |
|
|
Series SG 125, 4.31% (Liquidity Facility Societe Generale) (a)(f) |
3,200,000 |
3,200,000 |
|
|
Series 6, 4.3%, LOC ABN-AMRO Bank NV, LOC Morgan Guaranty Trust Co., NY, VRDN (a) |
1,500,000 |
1,500,000 |
|
|
Sub Series 7A, 4.05% (MBIA Insured), VRDN (a) |
27,000,000 |
27,000,000 |
|
|
Metro. Trans. Auth. Trans. Facilities Rev. Participating VRDN Series Merlots 00 F, 4.34% (Liquidity Facility First Union Nat'l. Bank, North Carolina) (a)(f) |
6,165,000 |
6,165,000 |
|
|
Monroe County Arpt. Auth. Rev. Participating VRDN |
5,600,000 |
5,600,000 |
|
|
Monroe County Ind. Dev. Agcy. Rev.: |
|
|
|
|
(Advent Tool & Mold Proj.) Series 1990 D, 4.15%, |
450,000 |
450,000 |
|
|
Municipal Securities - continued |
|||
|
Principal Amount |
Value |
||
|
New York - continued |
|||
|
Monroe County Ind. Dev. Agcy. Rev.: - continued |
|
|
|
|
(AJL Manufacturing Proj.) Series 1996 A, 4.45%, |
$ 4,115,000 |
$ 4,115,000 |
|
|
(Flower City Proj.) 4.45%, LOC Key Bank Nat'l. Assoc., VRDN (a)(d) |
4,040,000 |
4,040,000 |
|
|
(Hover-Davis, Inc. Proj.) Series 2000, 4.55%, |
2,840,000 |
2,840,000 |
|
|
Nassau County Gen. Oblig.: |
|
|
|
|
RAN: |
|
|
|
|
Series 2000 A, 6% 3/20/01, LOC Bank of Nova Scotia, LOC First Union Nat'l. Bank, North Carolina |
16,600,000 |
16,754,982 |
|
|
Series 2000 C, 6% 4/12/01, LOC Bank of Nova Scotia, LOC First Union Nat'l. Bank, North Carolina |
9,600,000 |
9,698,046 |
|
|
Series 2000 D, 6% 4/12/01, LOC Bayerische Landesbank Girozentrale, LOC State Street Bank & Trust Co. |
6,600,000 |
6,667,406 |
|
|
TAN 4.75% 8/31/00, LOC First Union Nat'l. Bank, North Carolina |
13,800,000 |
13,808,247 |
|
|
Nassau County Ind. Dev. Agcy. Ind. Dev. Rev. (CR/PL, Inc. Proj.) Series 1985, 4.45%, LOC American Nat'l. Bank & Trust, Chicago, VRDN (a) |
4,930,000 |
4,930,000 |
|
|
New York City Gen. Oblig.: |
|
|
|
|
Bonds: |
|
|
|
|
Series 1994 H2, 4.1% tender 8/17/00 (MBIA Insured) (Liquidity Facility Commerzbank AG), CP mode |
3,000,000 |
3,000,000 |
|
|
Series 1994 H5: |
|
|
|
|
4.15% tender 9/8/00 (MBIA Insured) (Liquidity Facility Cr. Agricole Indosuez), CP mode |
6,400,000 |
6,400,000 |
|
|
4.2% tender 9/7/00 (MBIA Insured) (Liquidity Facility Cr. Agricole Indosuez), CP mode |
2,500,000 |
2,500,000 |
|
|
Series 1994 H6: |
|
|
|
|
4.15% tender 9/8/00 (MBIA Insured) (Liquidity Facility Dexia Cr. Local de France), CP mode |
2,500,000 |
2,500,000 |
|
|
4.5% tender 9/8/00 (MBIA Insured) (Liquidity Facility Dexia Cr. Local de France), CP mode |
5,000,000 |
5,000,000 |
|
|
Series H Sub Series H4, 4.15% tender 9/8/00 |
2,000,000 |
2,000,000 |
|
|
Series H: |
|
|
|
|
4.2% tender 9/7/00 (MBIA Insured) (Liquidity Facility Dexia Cr. Local de France), CP mode |
2,500,000 |
2,500,000 |
|
|
4.5% tender 9/8/00 (MBIA Insured) (Liquidity Facility Dexia Cr. Local de France), CP mode |
7,100,000 |
7,100,000 |
|
|
Municipal Securities - continued |
|||
|
Principal Amount |
Value |
||
|
New York - continued |
|||
|
New York City Gen. Oblig.: - continued |
|
|
|
|
Bonds: - continued |
|
|
|
|
Series H3: |
|
|
|
|
4.1% tender 8/11/00 (FSA Insured) (BPA State Street Bank & Trust Co.), CP mode |
$ 5,500,000 |
$ 5,500,000 |
|
|
4.1% tender 8/17/00 (FSA Insured) (Liquidity Facility State Street Bank & Trust Co.), CP mode |
1,000,000 |
1,000,000 |
|
|
Participating VRDN: |
|
|
|
|
Series 94C3, 4.33% (Liquidity Facility Citibank NA, |
19,740,000 |
19,740,000 |
|
|
Series PA 624R, 4.26% (Liquidity Facility Merrill |
5,995,000 |
5,995,000 |
|
|
Series PT 1027, 4.31% (Liquidity Facility Bank of America NA) (a)(f) |
4,390,000 |
4,390,000 |
|
|
Series 1994 A7, 4.2%, LOC Morgan Guaranty Trust Co., NY, VRDN (a) |
6,400,000 |
6,400,000 |
|
|
Series 1994 B2, 4.4%, LOC Morgan Guaranty Trust Co., NY, VRDN (a) |
2,050,000 |
2,050,000 |
|
|
Series 1995 B5, 4.2% (MBIA Insured), VRDN (a) |
2,100,000 |
2,100,000 |
|
|
Series 1995 B6, 4.2% (MBIA Insured) (BPA Bank of |
4,400,000 |
4,400,000 |
|
|
Series A 10, 4.4%, LOC Morgan Guaranty Trust Co., NY, VRDN (a) |
8,935,000 |
8,935,000 |
|
|
Series E5, 4.2%, LOC Morgan Guaranty Trust Co., NY, VRDN (a) |
3,100,000 |
3,100,000 |
|
|
New York City Hsg. Dev. Corp. Multi-family Hsg. Mtg. Rev. (East 17th Street Property Proj.) Series 1993 A, 4.25%, |
2,500,000 |
2,500,000 |
|
|
New York City Hsg. Dev. Corp. Multi-family Rental Hsg. Rev.: |
|
|
|
|
(Brittany Dev. Proj.) Series A, 4.05% (92nd Realty LLC) (Fannie Mae Guaranteed), VRDN (a)(d) |
34,100,000 |
34,100,000 |
|
|
(One Columbus Place Dev. Proj.) Series A, 4.05% |
43,100,000 |
43,100,001 |
|
|
(West 43rd Street Proj.) Series 1999 A, 4.05% |
2,200,000 |
2,200,000 |
|
|
New York City Ind. Dev. Agcy. Civic Facilities Rev.: |
|
|
|
|
(Casa Proj.) Series 2000, 4.4%, (National Ctr. for Addiction/Substance Abuse) LOC Chase |
3,600,000 |
3,600,000 |
|
|
(Peninsula Hosp. Ctr. Proj.) Series 1998, 4.4%, |
2,425,000 |
2,425,000 |
|
|
Municipal Securities - continued |
|||
|
Principal Amount |
Value |
||
|
New York - continued |
|||
|
New York City Ind. Dev. Agcy. Ind. Dev. Rev. Participating VRDN: |
|
|
|
|
Series CDC 96 H, 4.31% (Liquidity Facility Caisse des Depots et Consignations) (a)(d)(f) |
$ 3,280,000 |
$ 3,280,000 |
|
|
Series CDC 97 E, 4.31% (Liquidity Facility Caisse des Depots et Consignations) (a)(d)(f) |
4,800,000 |
4,800,000 |
|
|
Series CDC 97 H, 4.31% (Liquidity Facility Caisse des Depots et Consignations) (a)(d)(f) |
6,740,000 |
6,740,000 |
|
|
New York City Ind. Dev. Agcy. Spl. Facilities Rev. (Air Express Int'l. Corp. Proj.) Series 1997, 4.25%, LOC First Union Nat'l. Bank, North Carolina, VRDN (a)(d) |
9,000,000 |
9,000,000 |
|
|
New York City Muni. Wtr. Fin. Auth. Wtr. & Swr. Sys. Rev.: |
|
|
|
|
Bonds Series PT 1032, 4.6%, tender 2/13/01 (Liquidity Facility Bank of America NA) (f) |
12,020,000 |
12,020,000 |
|
|
Participating VRDN: |
|
|
|
|
Series BA 97 A2, 4.28% (Liquidity Facility Bank of America NA) (a)(f) |
6,345,000 |
6,345,000 |
|
|
Series FRRI 6, 4.3% (Liquidity Facility Bank of New York NA) (a)(f) |
1,800,000 |
1,800,000 |
|
|
Series Merlots 00 DDD, 4.76% (Liquidity Facility First Union Nat'l. Bank, North Carolina) (a)(f) |
8,000,000 |
8,000,000 |
|
|
Series PA 444, 4.26% (Liquidity Facility Merrill Lynch & Co., Inc.) (a)(f) |
14,995,000 |
14,995,000 |
|
|
Series PA 454, 4.26% (Liquidity Facility Merrill Lynch & Co., Inc.) (a)(f) |
9,500,000 |
9,500,000 |
|
|
Series SGB 25, 4.33% (Liquidity Facility Societe Generale) (a)(f) |
37,400,000 |
37,400,000 |
|
|
Series SGB 26, 4.33% (Liquidity Facility Societe Generale) (a)(f) |
19,900,000 |
19,900,000 |
|
|
Series 1: |
|
|
|
|
4.35% 8/10/00, LOC Commerzbank AG, LOC Toronto Dominion Bank, CP |
16,500,000 |
16,500,000 |
|
|
4.7% 8/31/00, LOC Commerzbank AG, LOC Toronto Dominion Bank, CP |
22,600,000 |
22,600,000 |
|
|
4.75% 8/31/00, LOC Commerzbank AG, LOC Toronto Dominion Bank, CP |
35,500,000 |
35,500,000 |
|
|
Series 1995 A, 4.3% (FGIC Insured) (BPA FGIC-SPI), VRDN (a) |
10,275,000 |
10,275,000 |
|
|
Series 2000 C, 4.25% (Liquidity Facility Dexia Cr. Local de France), VRDN (a) |
7,900,000 |
7,900,000 |
|
|
Series 5B, 4.1% 8/17/00, LOC Westdeutsche Landesbank Girozentrale, LOC Bayerische Landesbank Girozentrale, CP |
5,000,000 |
5,000,000 |
|
|
Municipal Securities - continued |
|||
|
Principal Amount |
Value |
||
|
New York - continued |
|||
|
New York City Transitional Fin. Auth. Rev. Participating VRDN: |
|
|
|
|
Series FRRI 00 A16, 4.55% (Liquidity Facility Bayerische Hypo-und Vereinsbank AG) (a)(f) |
$ 17,500,000 |
$ 17,500,000 |
|
|
Series Merlots 99 G, 4.34% (Liquidity Facility First Union Nat'l. Bank, North Carolina) (a)(f) |
13,000,000 |
13,000,000 |
|
|
Series MSDW 98 95, 4.28% (Liquidity Facility Morgan Stanley Dean Witter & Co.) (a)(f) |
14,630,000 |
14,630,000 |
|
|
Series PA 536, 4.26% (Liquidity Facility Merrill |
6,445,000 |
6,445,000 |
|
|
Series Putters 129, 4.25% (Liquidity Facility |
8,000,000 |
8,000,000 |
|
|
New York City Trust Cultural Resources Rev. Participating VRDN Series SGA 91, 4.35% (Liquidity Facility Societe Generale) (a)(f) |
2,400,000 |
2,400,000 |
|
|
New York Dorm. Auth. Rev. Participating VRDN Series 97C3201, 4.33% (Liquidity Facility Citibank NA, |
5,000,000 |
5,000,000 |
|
|
New York Gen. Oblig. Bonds: |
|
|
|
|
Series 1997 A, 4.209% tender 9/14/00, LOC Bayerische Landesbank Girozentrale, LOC Landesbank Hessen-Thuringen, CP mode |
11,200,000 |
11,200,000 |
|
|
Series B, 4.05%, tender 8/9/00, LOC Dexia Cr. |
33,000,000 |
33,000,000 |
|
|
4.55% tender 9/19/00, LOC Morgan Guaranty Trust Co., NY, LOC Bayerische Landesbank Girozentrale, CP mode |
16,400,000 |
16,400,000 |
|
|
New York Metro. Trans. Auth. Rev. Participating VRDN |
6,700,000 |
6,700,000 |
|
|
New York State Dorm. Auth. Rev.: |
|
|
|
|
Participating VRDN: |
|
|
|
|
Series 97C3202, 4.33% (Liquidity Facility Citibank NA, New York) (a)(f) |
8,400,000 |
8,400,000 |
|
|
Series Merlots 00 G, 4.34% (Liquidity Facility First Union Nat'l. Bank, North Carolina) (a)(f) |
15,620,000 |
15,620,000 |
|
|
Series Merlots 00 X, 4.34% (Liquidity Facility First Union Nat'l. Bank, North Carolina) (a)(f) |
4,900,000 |
4,900,000 |
|
|
Series PT 1067, 4.26% (Liquidity Facility Bank of |
11,400,000 |
11,400,000 |
|
|
(Cornell Univ. Proj.) Series 1990 B, 4.15% (BPA Morgan Guaranty Trust Co., NY), VRDN (a) |
5,500,000 |
5,500,000 |
|
|
(Sloan-Kettering Cancer Ctr. Proj.) Series 1989 A, 4.25%, LOC Chase Manhattan Bank, VRDN (a) |
2,050,000 |
2,050,000 |
|
|
Municipal Securities - continued |
|||
|
Principal Amount |
Value |
||
|
New York - continued |
|||
|
New York State Energy Research & Dev. Auth. Facilities Rev. (Consolidated Edison Co. Proj.): |
|
|
|
|
Series A1, 4.1% (Liquidity Facility Morgan Guaranty Trust Co., NY), VRDN (a)(d) |
$ 18,400,000 |
$ 18,400,000 |
|
|
Series A2, 4.2% (Liquidity Facility Morgan Guaranty Trust Co., NY), VRDN (a)(d) |
16,275,000 |
16,275,000 |
|
|
Sub Series A3, 4.2% (Liquidity Facility Morgan Guaranty Trust Co., NY), VRDN (a)(d) |
32,600,000 |
32,600,000 |
|
|
New York State Energy Research & Dev. Auth. Poll. Cont. Rev.: |
|
|
|
|
Bonds (New York State Elec. & Gas Corp. Proj.) |
18,000,000 |
18,000,000 |
|
|
Participating VRDN: |
|
|
|
|
Series MSDW 181, 4.33% (Liquidity Facility Morgan Stanley Dean Witter & Co.) (a)(d)(f) |
6,870,000 |
6,870,000 |
|
|
Series PA 450, 4.26% (Liquidity Facility Merrill Lynch & Co., Inc.) (a)(f) |
10,450,000 |
10,450,000 |
|
|
(Niagara Mohawk Pwr. Corp. Proj.): |
|
|
|
|
Series 1985 A, 4.3%, LOC Toronto Dominion Bank, VRDN (a) |
2,500,000 |
2,500,000 |
|
|
Series 1986 A, 4.3%, LOC Bank One NA, VRDN (a)(d) |
2,500,000 |
2,500,000 |
|
|
Series B, 4.35%, LOC Morgan Guaranty Trust Co., NY, VRDN (a)(d) |
6,500,000 |
6,500,000 |
|
|
New York State Envir. Facilities Corp. Clean Wtr. & Drinking Wtr. Rev. Participating VRDN Series PT 409, 4.26% (Liquidity Facility Merrill Lynch & Co., Inc.) (a)(f) |
9,170,000 |
9,170,000 |
|
|
New York State Envir. Facilities Corp. Poll. Cont. Rev. Participating VRDN Series RobIns 9, 4.33% (Liquidity Facility Bank of New York NA) (a)(f) |
12,100,000 |
12,100,000 |
|
|
New York State Hsg. Fin. Agcy. Rev.: |
|
|
|
|
(101 West End Avenue Hsg. Proj.) Series 2000 A, 4.15%, LOC Fleet Bank NA, VRDN (a)(d) |
5,300,000 |
5,300,000 |
|
|
(101 West End Avenue Proj.) Series A, 4.15%, |
11,000,000 |
11,000,000 |
|
|
(240 East 39th Street Proj.) Series 1997 A, 4.1%, |
2,500,000 |
2,500,000 |
|
|
(750 Sixth Avenue Hsg. Proj.) Series 1998 A, 4.05%, |
8,300,000 |
8,300,000 |
|
|
(East 39th Street Hsg. Proj.) Series 1999 A, 4.05%, |
20,000,000 |
20,000,000 |
|
|
(Normandie Court II Proj.) Series 1999 A, 4.05%, (Yorkville Plaza Associates) LOC Freddie Mac, VRDN (a)(d) |
7,400,000 |
7,400,000 |
|
|
Municipal Securities - continued |
|||
|
Principal Amount |
Value |
||
|
New York - continued |
|||
|
New York State Hsg. Fin. Agcy. Rev.: - continued |
|
|
|
|
(South Cove Plaza Proj.) Series A, 4.05%, (DeMatteis Battery Park) LOC HSBC Bank USA, VRDN (a)(d) |
$ 22,000,000 |
$ 22,000,000 |
|
|
(Theatre Row Tower Hsg. Proj.) Series 2000 A, 4%, |
1,000,000 |
1,000,000 |
|
|
Series 2000 A, 4.1%, LOC Fed. Home Ln. Bank of, |
18,000,000 |
18,000,000 |
|
|
New York State Local Govt. Assistance Corp.: |
|
|
|
|
Bonds Series A, 6.5% 4/1/20 (Pre-Refunded to |
6,100,000 |
6,306,290 |
|
|
Rfdg. Bonds Series PT 1040, 4.6%, tender 1/10/01 (Liquidity Facility Bank of America NA) (f) |
18,295,000 |
18,295,000 |
|
|
New York State Med. Care Facilities Fin. Agcy. Rev. Participating VRDN Series PT 411, 4.31% (Liquidity Facility Merrill Lynch & Co., Inc.) (a)(f) |
5,015,000 |
5,015,000 |
|
|
New York State Mtg. Agcy. Participating VRDN: |
|
|
|
|
Series Merlots 00 B, 4.39% (Liquidity Facility First Union Nat'l. Bank, North Carolina) (a)(d)(f) |
12,800,000 |
12,800,000 |
|
|
Series Merlots 00 PP, 4.39% (Liquidity Facility First Union Nat'l. Bank, North Carolina) (a)(d)(f) |
10,800,000 |
10,800,000 |
|
|
Series Merlots 97 J, 4.39% (Liquidity Facility First Union Nat'l. Bank, North Carolina) (a)(d)(f) |
2,200,000 |
2,200,000 |
|
|
Series PA 410, 4.31% (Liquidity Facility Merrill Lynch & Co., Inc.) (a)(d)(f) |
4,705,000 |
4,705,000 |
|
|
Series PA 628R, 4.31% (Liquidity Facility Merrill Lynch & Co., Inc.) (a)(d)(f) |
2,835,000 |
2,835,000 |
|
|
Series PA 691R, 4.31% (Liquidity Facility Merrill Lynch & Co., Inc.) (a)(d)(f) |
6,790,000 |
6,790,000 |
|
|
Series PA 87, 4.33% (Liquidity Facility Merrill Lynch & Co., Inc.) (a)(d)(f) |
1,880,000 |
1,880,000 |
|
|
Series PT 108, 4.31% (Liquidity Facility Banco Santander SA) (a)(d)(f) |
3,500,000 |
3,500,000 |
|
|
Series PT 1204, 4.31% (Liquidity Facility Merrill Lynch & Co., Inc.) (a)(d)(f) |
5,000,000 |
5,000,000 |
|
|
Series PT 15A, 4.31% (Liquidity Facility Commerzbank AG) (a)(d)(f) |
6,880,000 |
6,880,000 |
|
|
Series PT 15B, 4.31% (Liquidity Facility Commerzbank AG) (a)(d)(f) |
2,215,000 |
2,215,000 |
|
|
Series PT 289, 4.26% (Liquidity Facility Landesbank Hessen-Thuringen) (a)(f) |
9,600,000 |
9,600,000 |
|
|
Series PT 343, 4.26% (Liquidity Facility Bayerische Hypo-und Vereinsbank AG) (a)(f) |
8,270,000 |
8,270,000 |
|
|
Municipal Securities - continued |
|||
|
Principal Amount |
Value |
||
|
New York - continued |
|||
|
New York State Pwr. Auth. Rev. & Gen. Purp.: |
|
|
|
|
Bonds 4%, tender 9/1/00 |
$ 13,100,000 |
$ 13,100,000 |
|
|
Series 1, 4.15% 10/13/00, CP |
27,800,000 |
27,800,000 |
|
|
Series 2: |
|
|
|
|
4.1% 8/10/00, CP |
38,800,000 |
38,800,000 |
|
|
4.25% 8/8/00, CP |
6,800,000 |
6,800,000 |
|
|
4.45% 8/8/00, CP |
1,000,000 |
1,000,000 |
|
|
4.6% 8/8/00, CP |
4,000,000 |
4,000,000 |
|
|
4.65% 8/7/00, CP |
19,200,000 |
19,200,000 |
|
|
New York State Thruway Auth. Gen. Rev. Participating VRDN: |
|
|
|
|
Series SG 121, 4.26% (Liquidity Facility Societe Generale) (a)(f) |
19,665,000 |
19,665,000 |
|
|
Series SGA 66, 4.2% (Liquidity Facility Societe Generale) (a)(f) |
3,900,000 |
3,900,000 |
|
|
New York State Thruway Auth. Hwy. & Bridge Trust Fund: |
|
|
|
|
Bonds Series 1998 C, 4.5% 4/1/01 |
4,000,000 |
4,000,517 |
|
|
Participating VRDN Series PA 682, 4.26% (Liquidity Facility Merrill Lynch & Co., Inc.) (a)(f) |
7,315,000 |
7,315,000 |
|
|
New York State Urban Dev. Corp. Rev. Participating VRDN: |
|
|
|
|
Series Merlots 00 N, 4.39% (Liquidity Facility First Union Nat'l. Bank, North Carolina) (a)(f) |
5,300,000 |
5,300,000 |
|
|
Series SG 33, 4.26% (Liquidity Facility Societe Generale) (a)(f) |
8,650,000 |
8,650,000 |
|
|
Niagara Frontier Trans. Auth. Arpt. Rev. Participating VRDN Series Putters 121, 4.3% (Liquidity Facility Morgan Guaranty Trust Co., NY) (a)(d)(f) |
4,445,000 |
4,445,000 |
|
|
North Shore Central School District BAN 5% 7/12/01 |
7,000,000 |
7,041,154 |
|
|
Oneida County Ind. Dev. Agcy. Rev. (Utica Corp. Proj.) |
1,850,000 |
1,850,000 |
|
|
Oswego County Ind. Dev. Agcy. Poll. Cont. Rev. Rfdg. |
9,500,000 |
9,500,000 |
|
|
Oyster Bay Gen. Oblig. BAN: |
|
|
|
|
Series 1999 E, 4.25% 9/29/00 |
14,430,000 |
14,438,505 |
|
|
Series C, 4% 8/25/00 |
14,270,000 |
14,271,759 |
|
|
Plainview Old Bethpage Central School District: |
|
|
|
|
BAN 5% 6/28/01 |
4,825,000 |
4,846,353 |
|
|
TAN 5% 6/28/01 |
8,000,000 |
8,035,403 |
|
|
Riverhead Indl. Dev. Auth. Ind. Dev. Rev. |
4,200,000 |
4,200,000 |
|
|
Municipal Securities - continued |
|||
|
Principal Amount |
Value |
||
|
New York - continued |
|||
|
Rochester Gen. Oblig. BAN 4.75% 3/7/01 |
$ 11,862,000 |
$ 11,899,368 |
|
|
Rocky Point Union Free School District TAN 5% 6/29/01 |
3,000,000 |
3,015,688 |
|
|
Saint Lawrence County Ind. Dev. Agcy. Envir. Impt. Rev. (Reynolds Metals Proj.) 4.15%, LOC Royal Bank of Canada, VRDN (a)(d) |
1,200,000 |
1,200,000 |
|
|
Saint Lawrence County Ind. Dev. Auth. Envir. Facilities (Aluminum Co. of America Proj.) Series 1998 A, 4.33%, VRDN (a)(d) |
6,600,000 |
6,600,000 |
|
|
Smithtown Central School District TAN 5% 6/26/01 |
16,000,000 |
16,075,842 |
|
|
Suffolk County Gen. Oblig. Participating VRDN Series FRRI A38, 4.3% (Liquidity Facility Bank of New York NA) (a)(f) |
27,200,000 |
27,200,000 |
|
|
Suffolk County Ind. Dev. Agcy. Civic Facility Rev. (Maryhaven Ctr. of Hope Proj.) Series 1997 A, 4.35%, LOC Key Bank Nat'l. Assoc., VRDN (a) |
2,610,000 |
2,610,000 |
|
|
Suffolk County Solid Waste Disp. Rev. Participating VRDN Series RobIns 1, 4.34% (Liquidity Facility Bank of New York NA) (a)(d)(f) |
12,400,000 |
12,400,000 |
|
|
Three Village Central School District TAN 5% 6/29/01 |
10,700,000 |
10,760,618 |
|
|
Triborough Bridge & Tunnel Auth. Spl. Oblig. Participating VRDN Series Merlots 00 SS, 4.34% (Liquidity Facility First Union Nat'l. Bank, North Carolina) (a)(f) |
5,200,000 |
5,200,000 |
|
|
Wyoming County Ind. Dev. Agcy. Ind. Dev. Rev. (American Precision Proj.) Series 1988 A, 4.15%, LOC HSBC Bank USA, VRDN (a)(d) |
300,000 |
300,000 |
|
|
Yorktown Central School District BAN 5% 6/29/01 |
3,000,000 |
3,013,835 |
|
|
|
1,585,073,502 |
||
|
New York & New Jersey - 3.3% |
|||
|
Port Auth. New York & New Jersey: |
|
|
|
|
Participating VRDN: |
|
|
|
|
Series Merlots 00 Z, 4.34% (Liquidity Facility First Union Nat'l. Bank, North Carolina) (a)(d)(f) |
5,095,000 |
5,095,000 |
|
|
Series SG 52, 4.16% (Liquidity Facility Societe Generale) (a)(d)(f) |
3,400,000 |
3,400,000 |
|
|
Series 1996 1, 4.25%, VRDN (a) |
5,000,000 |
5,000,000 |
|
|
Series 1996 4, 4.25%, VRDN (a) |
4,200,000 |
4,200,000 |
|
|
Series 1997 1C, 4.25%, VRDN (a) |
3,800,000 |
3,800,000 |
|
|
Series 1997 1D, 4.25%, VRDN (a) |
4,500,000 |
4,500,000 |
|
|
Series 1997 2, 4.35%, VRDN (a)(d) |
1,600,000 |
1,600,000 |
|
|
Series 1997 3A, 4.25%, VRDN (a) |
10,200,000 |
10,200,000 |
|
|
Series 1997 3B, 4.25%, VRDN (a) |
8,300,000 |
8,300,000 |
|
|
Municipal Securities - continued |
|||
|
Principal Amount |
Value |
||
|
New York & New Jersey - continued |
|||
|
Port Auth. New York & New Jersey: - continued |
|
|
|
|
Series 1997 4A, 4.35%, VRDN (a)(d) |
$ 2,300,000 |
$ 2,300,000 |
|
|
Series 3, 4.25%, VRDN (a) |
6,600,000 |
6,600,000 |
|
|
|
54,995,000 |
||
|
Shares |
|
||
|
Other - 0.2% |
|||
|
Fidelity Municipal Cash Central Fund, 4.30% (b)(c) |
2,933,000 |
2,933,000 |
|
|
TOTAL INVESTMENT PORTFOLIO - 98.4% |
1,643,001,502 |
||
|
NET OTHER ASSETS - 1.6% |
27,389,687 |
||
|
NET ASSETS - 100% |
$ 1,670,391,189 |
||
|
Total Cost for Income Tax Purposes $ 1,643,001,502 |
|
Security Type Abbreviations |
|
BAN - BOND ANTICIPATION NOTE |
|
CP - COMMERCIAL PAPER |
|
RAN - REVENUE ANTICIPATION NOTE |
|
TAN - TAX ANTICIPATION NOTE |
|
VRDN - VARIABLE RATE DEMAND NOTE |
|
Legend |
|
(a) The coupon rate shown on floating or adjustable rate securities represents the rate at period end. |
|
(b) Information in this report regarding holdings by state and security types does not reflect the holdings of the Fidelity Municipal Cash Central Fund. |
|
(c) The rate quoted is the annualized seven-day yield of the fund at period end. |
|
(d) Private activity obligations whose interest is subject to the federal alternative minimum tax for individuals. |
|
(e) Security collateralized by an amount sufficient to pay interest and principal. |
|
(f) Provides evidence of ownership in one or more underlying municipal bonds. |
|
Income Tax Information |
|
At January 31, 2000, the fund had a capital loss carryforward of approximately $111,000 of which $20,000, $3,000, $33,000, $50,000 and $5,000 will expire on January 31, 2001, 2003, 2004, 2005 and 2007, respectively. |
See accompanying notes which are an integral part of the financial statements.
Semiannual Report
Fidelity New York Municipal Money Market Fund
Statement of Assets and Liabilities
|
|
July 31, 2000 (Unaudited) |
|
|
Assets |
|
|
|
Investment in securities, at value - |
|
$ 1,643,001,502 |
|
Receivable for fund shares sold |
|
30,006,512 |
|
Interest receivable |
|
14,927,209 |
|
Prepaid expenses |
|
23,033 |
|
Total assets |
|
1,687,958,256 |
|
Liabilities |
|
|
|
Payable to custodian bank |
$ 8,896 |
|
|
Payable for fund shares redeemed |
16,689,210 |
|
|
Distributions payable |
108,159 |
|
|
Accrued management fee |
516,280 |
|
|
Other payables and accrued expenses |
244,522 |
|
|
Total liabilities |
|
17,567,067 |
|
Net Assets |
|
$ 1,670,391,189 |
|
Net Assets consist of: |
|
|
|
Paid in capital |
|
$ 1,670,502,036 |
|
Accumulated undistributed net realized gain (loss) |
|
(110,847) |
|
Net Assets, for 1,670,336,745 shares outstanding |
|
$ 1,670,391,189 |
|
Net Asset Value, offering price and redemption price |
|
$1.00 |
See accompanying notes which are an integral part of the financial statements.
Semiannual Report
Fidelity New York Municipal Money Market Fund
Financial Statements - continued
Statement of Operations
|
|
Six months ended July 31, 2000 (Unaudited) |
|
|
Interest Income |
|
$ 33,213,684 |
|
Expenses |
|
|
|
Management fee |
$ 3,095,236 |
|
|
Transfer agent fees |
1,120,018 |
|
|
Accounting fees and expenses |
92,957 |
|
|
Non-interested trustees' compensation |
2,620 |
|
|
Custodian fees and expenses |
10,873 |
|
|
Registration fees |
59,848 |
|
|
Audit |
12,518 |
|
|
Legal |
10,606 |
|
|
Miscellaneous |
27,640 |
|
|
Total expenses before reductions |
4,432,316 |
|
|
Expense reductions |
(6,980) |
4,425,336 |
|
Net interest income |
|
28,788,348 |
|
Net Realized Gain (Loss) on Investment Securities |
|
(42) |
|
Net increase (decrease) in net assets resulting |
|
$ 28,788,306 |
|
Other information |
|
|
|
Expense reductions: |
|
$ 6,980 |
See accompanying notes which are an integral part of the financial statements.
Semiannual Report
Fidelity New York Municipal Money Market Fund
Financial Statements - continued
Statement of Changes in Net Assets
|
|
Six months ended
July 31, 2000 |
Year ended
January 31, |
|
Increase (Decrease) in Net Assets |
|
|
|
Operations |
$ 28,788,348 |
$ 36,584,139 |
|
Net realized gain (loss) |
(42) |
18,220 |
|
Net increase (decrease) in net assets resulting |
28,788,306 |
36,602,359 |
|
Distributions to shareholders from net interest income |
(28,788,348) |
(36,584,139) |
|
Share transactions at net asset value of $1.00 per share |
3,013,419,802 |
4,873,783,359 |
|
Reinvestment of distributions from net interest income |
28,184,265 |
35,906,642 |
|
Cost of shares redeemed |
(2,936,448,450) |
(4,600,877,054) |
|
Net increase (decrease) in net assets and shares resulting from share transactions |
105,155,617 |
308,812,947 |
|
Total increase (decrease) in net assets |
105,155,575 |
308,831,167 |
|
Net Assets |
|
|
|
Beginning of period |
1,565,235,614 |
1,256,404,447 |
|
End of period |
$ 1,670,391,189 |
$ 1,565,235,614 |
See accompanying notes which are an integral part of the financial statements.
Semiannual Report
Financial Highlights
|
|
Six months ended July 31, 2000 |
Years ended January 31, |
||||
|
|
(Unaudited) |
2000 |
1999 |
1998 |
1997 |
1996 |
|
Selected Per-Share Data |
|
|
|
|
|
|
|
Net asset value, beginning of period |
$ 1.000 |
$ 1.000 |
$ 1.000 |
$ 1.000 |
$ 1.000 |
$ 1.000 |
|
Income from
Investment
Operations |
.017 |
.027 |
.029 |
.031 |
.029 |
.033 |
|
Less Distributions |
|
|
|
|
|
|
|
From net interest income |
(.017) |
(.027) |
(.029) |
(.031) |
(.029) |
(.033) |
|
Net asset value, |
$ 1.000 |
$ 1.000 |
$ 1.000 |
$ 1.000 |
$ 1.000 |
$ 1.000 |
|
Total Return B |
1.75% |
2.78% |
2.91% |
3.13% |
2.94% |
3.32% |
|
Ratios and Supplemental Data |
|
|
|
|
|
|
|
Net assets, |
$ 1,670,391 |
$ 1,565,236 |
$ 1,256,404 |
$ 1,082,642 |
$ 880,075 |
$ 822,866 |
|
Ratio of expenses |
.54% A |
.56% |
.58% |
.61% |
.61% |
.62% |
|
Ratio of net interest income to average net assets |
3.51% A |
2.75% |
2.86% |
3.10% |
2.89% |
3.26% |
A Annualized
B Total returns for periods of less than one year are not annualized.
See accompanying notes which are an integral part of the financial statements.
Semiannual Report
For the period ended July 31, 2000 (Unaudited)
1. Significant Accounting Policies.
Spartan New York Municipal Income Fund (the income fund) is a fund of Fidelity New York Municipal Trust. Spartan New York Municipal Money Market Fund and Fidelity New York Municipal Money Market Fund (the money market funds) are funds of Fidelity New York Municipal Trust II. Each trust is registered under the Investment Company Act of 1940, as amended (the 1940 Act), as an open-end management investment company. Fidelity New York Municipal Trust and Fidelity New York Municipal Trust II (the trusts) are organized as a Massachusetts business trust and a Delaware business trust, respectively. Each fund is authorized to issue an unlimited number of shares. The financial statements have been prepared in conformity with generally accepted accounting principles which require management to make certain estimates and assumptions at the date of the financial statements. Each fund may be affected by economic and political developments in the state of New York. The following summarizes the significant accounting policies of the income fund and the money market funds:
Security Valuation.
Income Fund. Securities are valued based upon a computerized matrix system and/or appraisals by a pricing service, both of which consider market transactions and dealer-supplied valuations. Securities (including restricted securities) for which quotations are not readily available are valued at their fair value as determined in good faith under consistently applied procedures under the general supervision of the Board of Trustees. Short-term securities with remaining maturities of sixty days or less for which quotations are not readily available are valued at amortized cost or original cost plus accrued interest, both of which approximate current value.
Money Market Funds. As permitted under Rule 2a-7 of the 1940 Act, and certain conditions therein, securities are valued initially at cost and thereafter assume a constant amortization to maturity of any discount or premium.
Income Taxes. As a qualified regulated investment company under Subchapter M of the Internal Revenue Code, each fund is not subject to income taxes to the extent that it distributes substantially all of its taxable income for the fiscal year. The schedules of investments include information regarding income taxes under the caption "Income Tax Information."
Interest Income. Interest income, which includes amortization of premium and accretion of original issue discount, is accrued as earned. For the money market funds, accretion of discount represents unrealized gain until realized at the time of a security disposition or maturity.
Expenses. Most expenses of each trust can be directly attributed to a fund. Expenses which cannot be directly attributed are apportioned among the funds in the trust.
Distributions to Shareholders. Dividends are declared daily and paid monthly from net interest income. Distributions to shareholders from realized capital
Semiannual Report
Notes to Financial Statements (Unaudited) - continued
1. Significant Accounting
Policies - continued
Distributions to Shareholders -
continued
gains on investments, if any, are recorded on the ex-dividend date.
Income and capital gain distributions are determined in accordance with income tax regulations which may differ from generally accepted accounting principles. These differences, which may result in distribution reclassifications, are primarily due to differing treatments for futures transactions, market discount, capital loss carryforwards and losses deferred due to futures and excise tax regulations.
Permanent book and tax basis differences relating to shareholder distributions will result in reclassifications to paid in capital. Distributions in excess of net interest income and accumulated undistributed net realized gain (loss) on investments may include temporary book and tax basis differences which will reverse in a subsequent period. Any taxable income or gain remaining at fiscal year end is distributed in the following year.
Security Transactions. Security transactions are accounted for as of trade date. Gains and losses on securities sold are determined on the basis of identified cost.
2. Operating Policies.
Fidelity Municipal Cash Central Fund. Pursuant to an Exemptive Order issued by the Securities and Exchange Commission (the SEC), the funds may invest in the Fidelity Municipal Cash Central Fund (the Cash Fund) managed by Fidelity Investments Money Management, Inc. (FIMM), an affiliate of Fidelity Management & Research Company (FMR). The Cash Fund is an open-end money market fund available only to investment companies and other accounts managed by FMR and its affiliates. The Cash Fund seeks preservation of capital, liquidity, and current income by investing in high-quality, short-term municipal securities of various states and municipalities. Income distributions from the Cash Fund are declared daily and paid monthly from net interest income. Income distributions earned by the funds are recorded as interest income in the accompanying financial statements.
Restricted Securities. Certain funds are permitted to invest in securities that are subject to legal or contractual restrictions on resale. These securities generally may be resold in transactions exempt from registration or to the public if the securities are registered. Disposal of these securities may involve time-consuming negotiations and expense, and prompt sale at an acceptable price may be difficult. Information regarding restricted securities is included under the caption "Other Information" at the end of each applicable fund's schedule of investments.
3. Purchases and Sales of Investments.
Income Fund. Purchases and sales of securities, other than short-term securities, aggregated $131,314,631 and $147,083,623, respectively.
Semiannual Report
Notes to Financial Statements (Unaudited) - continued
4. Fees and Other Transactions with Affiliates.
Management Fee. As the fund's investment adviser for the income fund and Fidelity New York Municipal Money Market Fund, FMR receives a monthly fee that is calculated on the basis of a group fee rate plus a fixed individual fund fee rate applied to the average net assets of each fund. The group fee rate is the weighted average of a series of rates and is based on the monthly average net assets of all the mutual funds advised by FMR. The rates ranged from .0920% to .3700% for the period. The annual individual fund fee rate is .25%. In the event that these rates were lower than the contractual rates in effect during the period, FMR voluntarily implemented the above rates, as they resulted in the same or a lower management fee. For the period, the management fees were equivalent to annualized rates of .38% of average net assets for the income fund and Fidelity New York Municipal Money Market Fund.
As Spartan New York Municipal Money Market Fund's investment adviser, FMR receives a fee that is computed daily at an annual rate of .50% of the fund's average net assets. FMR pays all other expenses, except the compensation of the non-interested Trustees and certain exceptions such as interest, taxes, brokerage commissions and extraordinary expenses. The management fee paid to FMR by the fund is reduced by an amount equal to the fees and expenses paid by the fund to the non-interested Trustees.
FMR also bears the cost of providing shareholder services to Spartan New York Municipal Money Market Fund. To offset the cost of providing these services, FMR or its affiliates collected certain transaction fees from shareholders which amounted to $2,984 for the period.
Sub-Adviser Fee. As each fund's investment sub-adviser, FIMM, a wholly owned subsidiary of FMR, receives a fee from FMR of 50% of the management fee payable to FMR. The fee is paid prior to any voluntary expense reimbursements which may be in effect.
Transfer Agent and Accounting Fees. Citibank, N.A.(Citibank) is the custodian, transfer agent and shareholder servicing agent for the income fund and Fidelity New York Municipal Money Market Fund. Citibank has entered into a sub-contract with Fidelity Service Company, Inc. (FSC), an affiliate of FMR, under which FSC performs the activities associated with the funds' transfer and shareholder servicing agent and accounting functions. The funds pay account fees and asset-based fees that vary according to account size and type of account. FSC pays for typesetting, printing and mailing of all shareholder reports, except proxy statements. The accounting fee is based on the level of average net assets for the month plus out-of-pocket expenses.
For the period, the transfer agent fees were equivalent to an annualized rate of .08% and .14% of average net assets for the income fund and Fidelity New York Municipal Money Market Fund, respectively.
Semiannual Report
Notes to Financial Statements (Unaudited) - continued
4. Fees and Other Transactions with Affiliates -
continued
Money Market Insurance. Pursuant to an Exemptive Order issued by the SEC, the money market funds, along with other money market funds advised by FMR or its affiliates, have entered into insurance agreements with FIDFUNDS Mutual Limited (FIDFUNDS), an affiliated mutual insurance company. FIDFUNDS provides limited coverage for certain loss events including issuer default as to payment of principal or interest and bankruptcy or insolvency of a credit enhancement provider. The insurance does not cover losses resulting from changes in interest rates, ratings downgrades or other market conditions. Each fund may be subject to a special assessment of up to approximately 2.5 times the fund's annual gross premium if covered losses exceed certain levels. During the period, Fidelity New York Municipal Money Market Fund paid premiums of $55,280, for the calendar year 2000 to FIDFUNDS, which are being amortized over one year. FMR has borne the cost of Spartan New York Municipal Money Market Fund's premium payable to FIDFUNDS.
5. Expense Reductions.
Through arrangements with the income fund's and Fidelity New York Municipal Money Market Fund's custodian and transfer agent, credits realized as a result of uninvested cash balances were used to reduce a portion of each applicable fund's expenses. For the period, the reductions under these arrangements are shown under the caption "Other Information" on each applicable fund's Statement of Operations.
In addition, through arrangements with Spartan New York Municipal Money Market Fund's custodian and transfer agent, credits realized as a result of uninvested cash balances were used to reduce a portion of the fund's expenses. During the period, the fund's expenses were reduced by $34,048 under these arrangements.
Semiannual Report
Fidelity offers several ways to conveniently manage your personal investments via your telephone or PC. You can access your account information, conduct trades and research your investments 24 hours a day.
By Phone
Fidelity Automated Service Telephone provides a single toll-free number to access account balances, positions, quotes and trading. It's easy to navigate the service, and on your first call, the system will help you create a personal identification number (PIN) for security.
(phone_graphic)
Fidelity Automated
Service Telephone (FAST®)
1-800-544-5555
Press
1 For mutual fund and brokerage trading.
2 For quotes.*
3 For account balances and holdings.
4 To review orders and mutual
fund activity.
5 To change your PIN.
*0 To speak to a Fidelity representative.
By PC
Fidelity's web site on the Internet provides a wide range of information, including daily financial news, fund performance, interactive planning tools and news about Fidelity products and services.
(computer_graphic)
Fidelity's Web Site
www.fidelity.com
If you are not currently on the Internet, call EarthLink Sprint at 1-800-288-2967, and be sure to ask for registration number SMD004 to receive a special Fidelity package that includes 30 days of free Internet access. EarthLink is North America's #1 independent Internet access provider.
(computer_graphic)
Fidelity On-line Xpress+®
Fidelity On-line Xpress+ software for Windows combines comprehensive portfolio management capabilities, securities trading and access to research and analysis tools . . . all on your desktop. Call Fidelity at 1-800-544-0240 or visit our web site for more information on how to manage your investments via your PC.
* When you call the quotes line, please remember that a fund's yield and return will vary and, except for money market funds, share price will also vary. This means that you may have a gain or loss when you sell your shares. There is no assurance that money market funds will be able to maintain a stable $1 share price; an investment in a money market fund is not insured or guaranteed by the U.S. government. Total returns are historical and include changes in share price, reinvestment of dividends and capital gains, and the effects of any sales charges.
Semiannual Report
If more than one address is listed, please locate the address that is closest to you. We'll give your correspondence immediate attention and send you written confirmation upon completion of your request.
(letter_graphic)
Making Changes
To Your Account
(such as changing name, address, bank, etc.)
Fidelity Investments
P.O. Box 770001
Cincinnati, OH 45277-0002
(letter_graphic)
For Non-Retirement
Accounts
Buying shares
Fidelity Investments
P.O. Box 770001
Cincinnati, OH 45277-0003
Overnight Express
Fidelity Investments
2300 Litton Lane - KH1A
Hebron, KY 41048
Selling shares
Fidelity Investments
P.O. Box 660602
Dallas, TX 75266-0602
Overnight Express
Fidelity Investments
Attn: Redemptions - CP6I
400 East Las Colinas Blvd.
Irving, TX 75039-5587
General Correspondence
Fidelity Investments
P.O. Box 500
Merrimack, NH 03054-0500
(letter_graphic)
For Retirement
Accounts
Buying shares
Fidelity Investments
P.O. Box 770001
Cincinnati, OH 45277-0003
Selling shares
Fidelity Investments
P.O. Box 660602
Dallas, TX 75266-0602
Overnight Express
Fidelity Investments
Attn: Redemptions - CP6R
400 East Las Colinas Blvd.
Irving, TX 75039-5587
General Correspondence
Fidelity Investments
P.O. Box 500
Merrimack, NH 03054-0500
Semiannual Report
Investment Adviser
Fidelity Management & Research
Company
Boston, MA
Investment Sub-Adviser
Fidelity Investments
Money Management, Inc.
Officers
Edward C. Johnson 3d, President
Robert C. Pozen, Senior Vice President
Dwight D. Churchill, Vice President
Boyce I. Greer, Vice President
George A. Fischer, Vice President -
Income Fund
Diane M. McLaughlin, Vice President -
Money Market Funds
Eric D. Roiter, Secretary
Robert A. Dwight, Treasurer
Maria F. Dwyer, Deputy Treasurer
Stanley N. Griffith, Assistant
Vice President
John H. Costello, Assistant Treasurer
Thomas J. Simpson, Assistant Treasurer
Board of Trustees
Ralph F. Cox *
Phyllis Burke Davis *
Robert M. Gates *
Edward C. Johnson 3d
Donald J. Kirk *
Ned C. Lautenbach *
Peter S. Lynch
Marvin L. Mann *
William O. McCoy *
Gerald C. McDonough *
Robert C. Pozen
Thomas R. Williams *
* Independent trustees
Advisory Board
J. Michael Cook
Abigail P. Johnson
Marie L. Knowles
General Distributor
Fidelity Distributors Corporation
Boston, MA
Transfer and Shareholder
Servicing Agents
Citibank, N.A.
New York, NY
and
Fidelity Service Company, Inc.
Boston, MA
Custodian
Citibank, N.A.
New York, NY
The Fidelity Telephone Connection
Mutual Fund 24-Hour Service
Exchanges/Redemptions
and Account Assistance 1-800-544-6666
Product Information 1-800-544-6666
Retirement Accounts 1-800-544-4774 (8 a.m. - 9 p.m.)
TDD Service 1-800-544-0118
for the deaf and hearing impaired
(9 a.m. - 9 p.m. Eastern time)
Fidelity Automated Service
Telephone (FAST®) (automated graphic) 1-800-544-5555
(automated graphic) Automated line for quickest service
NYS-SANN-0900 110515
1.536272.103
(Fidelity Investment logo)(registered trademark)
Corporate Headquarters
82 Devonshire St., Boston, MA 02109
www.fidelity.com
|
|