
|
|
|
|
|
|
|
|
|
(Fidelity Investment logo)(registered trademark)
(2_fidelity_logos)Fidelity® Advisor
Semiannual Report
June 30, 2000
|
President's Message |
3 |
Ned Johnson on investing strategies. |
|
Performance |
4 |
How the fund has done over time. |
|
Fund Talk |
19 |
The manager's review of fund performance, strategy and outlook. |
|
Investment Changes |
22 |
A summary of major shifts in the fund's investments over the past six months. |
|
Investments |
23 |
A complete list of the fund's investments with their market values. |
|
Financial Statements |
31 |
Statements of assets and liabilities,
operations, and changes in net assets, |
|
Notes |
40 |
Notes to financial statements. |
|
|
|
|
Standard & Poor's, S&P and S&P 500 are registered service marks of The McGraw-Hill Companies, Inc. and have been licensed for use by Fidelity Distributors Corporation.
Other third party marks appearing herein are the property of their respective owners.
All other marks appearing herein are registered or unregistered trademarks or service marks of FMR Corp. or an affiliated company.
(Recycle graphic) This report is printed on recycled paper using soy-based inks.
This report and the financial statements contained herein are submitted for the general information of the shareholders of the fund. This report is not authorized for distribution to prospective investors in the fund unless preceded or accompanied by an effective prospectus.
Mutual fund shares are not deposits or obligations of, or guaranteed by, any depository institution. Shares are not insured by the FDIC, Federal Reserve Board or any other agency, and are subject to investment risks, including possible loss of principal amount invested.
Neither the fund nor Fidelity Distributors Corporation is a bank.
For more information on any Fidelity Advisor fund, including charges and expenses, contact your investment professional for a free prospectus. Read it carefully before you invest or send money.
Semiannual Report
(photo_of_Edward_C_Johnson_3d)Dear Shareholder:
In stark contrast to the final six months of 1999, most major equity market indexes posted negative returns for the first half of 2000, due mainly to a correction in the technology sector during the second quarter. The majority of bond markets - with the notable exception of high yield - fared better, as Treasuries and non-Treasuries alike benefited as a haven from the volatility of stocks and riskier investment alternatives.
While it's impossible to predict the future direction of the markets with any degree of certainty, there are certain basic principles that can help investors plan for their future needs.
The longer your investment time frame, the less likely it is that you will be affected by short-term market volatility. A 10-year investment horizon appropriate for saving for a college education, for example, enables you to weather market cycles in a long-term fund, which may have a higher risk potential, but also has a higher potential rate of return.
An intermediate-length fund could make sense if your investment horizon is two to four years, while a short-term bond fund could be the right choice if you need your money in one or two years.
If your time horizon is less than a year, you might want to consider moving some of your bond investment into a money market fund. These funds seek income and a stable share price by investing in high-quality, short-term investments. Of course, it's important to remember that an investment in a money market fund is not insured or guaranteed by the Federal Deposit Insurance Corporation or any other government agency. Although money market funds seek to preserve the value of your investment at $1.00 per share, it is possible to lose money by investing in these types of funds.
Finally, no matter what your time horizon or portfolio diversity, it makes good sense to follow a regular investment plan, investing a certain amount of money in a fund at the same time each month or quarter and periodically reviewing your overall portfolio. By doing so, you won't get caught up in the excitement of a rapidly rising market, nor will you buy all your shares at market highs. While this strategy - known as dollar cost averaging - won't assure a profit or protect you from a loss in a declining market, it should help you lower the average cost of your purchases. Of course, you should consider your financial ability to continue your purchases through periods of low price levels before undertaking such a strategy.
Remember to contact your investment professional if you need help with your investments.
Best regards,
/s/Edward C. Johnson 3d
Edward C. Johnson 3d
Semiannual Report
Fidelity Advisor Emerging Markets Income Fund - Class A
There are several ways to evaluate historical performance. You can look at the total percentage change in value, the average annual percentage change or the growth of a hypothetical $10,000 investment. Total return reflects the change in the value of an investment, assuming reinvestment of the class' dividend income and capital gains (the profits earned upon the sale of securities that have grown in value). You can also look at the class' income to measure performance. The initial offering of Class A shares took place on September 3, 1996. Class A shares bear a 0.15% 12b-1 fee. Returns prior to September 3, 1996 are those of Class T shares, the original class of the fund, and reflect Class T shares' 0.25% 12b-1 fee. If Fidelity had not reimbursed certain class expenses, the total returns and dividends would have been lower.
Cumulative Total Returns
|
Periods ended June 30, 2000 |
Past 6 |
Past 1 |
Past 5 |
Life of |
|
Fidelity Adv Emerging Markets Income - CL A |
8.30% |
24.53% |
118.67% |
106.88% |
|
Fidelity Adv Emerging Markets Income - CL A |
3.15% |
18.61% |
108.29% |
97.05% |
|
JP EMBI Global |
6.95% |
20.74% |
107.11% |
103.00% |
|
Emerging Markets Debt Funds Average |
6.45% |
20.74% |
93.67% |
n/a* |
Cumulative total returns show Class A's performance in percentage terms over a set period - in this case, six months, one year, five years or since the fund started on March 10, 1994. For example, if you had invested $1,000 in a fund that had a 5% return over the past year, the value of your investment would be $1,050. You can compare Class A's returns to those of the J.P. Morgan Emerging Markets Bond Index Global - a market value-weighted index of U.S. dollar denominated Brady bonds, Eurobonds, traded loans, and local market debt instruments issued by emerging markets sovereign and quasi-sovereign entities. The index currently covers 27 emerging market countries. To measure how Class A's performance stacked up against its peers, you can compare it to the emerging markets debt funds average, which reflects the performance of mutual funds with similar objectives tracked by Lipper Inc. The past six months average represents a peer group of 47 mutual funds. These benchmarks reflect reinvestment of dividends and capital gains, if any, and exclude the effect of sales charges.
Average Annual Total Returns
|
Periods ended June 30, 2000 |
Past 1 |
Past 5 |
Life of |
|
Fidelity Adv Emerging Markets Income - CL A |
24.53% |
16.94% |
12.21% |
|
Fidelity Adv Emerging Markets Income - CL A |
18.61% |
15.81% |
11.34% |
|
JP EMBI Global |
20.74% |
15.67% |
11.87% |
|
Emerging Markets Debt Funds Average |
20.74% |
13.89% |
n/a* |
Average annual total returns take Class A's cumulative return and show you what would have happened if Class A shares had performed at a constant rate each year.
* Not available
Semiannual Report
Fidelity Advisor Emerging Markets Income Fund - Class A
Performance - continued
$10,000 Over Life of Fund
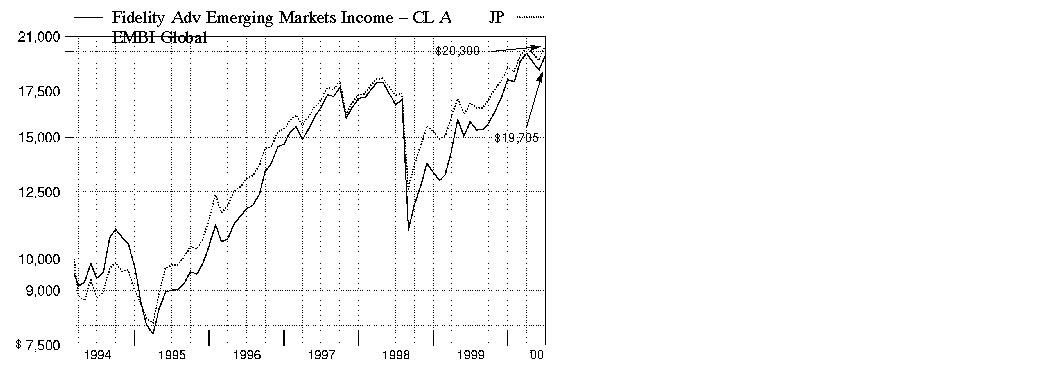
$10,000 Over Life of Fund: Let's say hypothetically that $10,000 was invested in Fidelity Advisor Emerging Markets Income Fund - Class A on March 10, 1994, when the fund started, and the current 4.75% sales charge was paid. As the chart shows, by June 30, 2000, the value of the investment would have grown to $19,705 - a 97.05% increase on the initial investment. For comparison, look at how the J.P. Morgan Emerging Markets Bond Index Global did over the same period. With dividends and capital gains, if any, reinvested, the JP EMBI Global would have grown to $20,300 - a 103.00% increase.
Understanding
Performance
Many markets around the globe offer the potential for significant growth over time; however, investing in foreign markets means assuming greater risks than investing in the United States. Factors like changes in a country's financial markets, its local political and economic climate, and the fluctuating value of its currency create these risks. For these reasons an international fund's performance may be more volatile than a fund that invests exclusively in the United States. Past performance is no guarantee of future results and you may have a gain or loss when you sell your shares.
3Semiannual Report
Fidelity Advisor Emerging Markets Income Fund - Class A
Performance - continued
Total Return Components
|
|
Six months ended June 30, |
Years ended December 31, |
September 3, 1996 |
||
|
|
2000 |
1999 |
1998 |
1997 |
1996 |
|
Dividend returns |
3.75% |
11.93% |
8.10% |
8.37% |
2.32% |
|
Capital returns |
4.55% |
24.42% |
-30.04% |
8.15% |
15.39% |
|
Total returns |
8.30% |
36.35% |
-21.94% |
16.52% |
17.71% |
Total return components include both dividend returns and capital returns. A dividend return reflects the actual dividends paid by the class. A capital return reflects both the amount paid by the class to shareholders as capital gain distributions and changes in the class' share price. Both returns assume the dividends or capital gains, if any, paid by the class are reinvested, and exclude the effect of sales charges.
Dividends and Yield
|
Periods ended June 30, 2000 |
Past 1 |
Past 6 |
Past 1 |
|
Dividends per share |
5.95 ¢ |
35.26 ¢ |
83.28 ¢ |
|
Annualized dividend rate |
7.21% |
7.09% |
8.83% |
|
30-day annualized yield |
n/a* |
- |
- |
Dividends per share show the income paid by the class for a set period. If you annualize this number, based on an average share price of $10.04 over the past one month, $9.98 over the past six months, and $9.43 over the past one year, you can compare the class' income distributions over these three periods. The 30-day annualized yield is a standard formula for all bond funds based on the yields of the bonds in the fund, averaged over the past 30 days. This figure shows you the yield characteristics of the fund's investments at the end of the period. It also helps you to compare funds from different companies on an equal basis. Yield information will be reported once Class A has a longer, more stable operating history.
* Not available
Semiannual Report
Fidelity Advisor Emerging Markets Income Fund - Class T
There are several ways to evaluate historical performance. You can look at the total percentage change in value, the average annual percentage change or the growth of a hypothetical $10,000 investment. Total return reflects the change in the value of an investment, assuming reinvestment of the class' dividend income and capital gains (the profits earned upon the sale of securities that have grown in value). You can also look at the class' income, as reflected in its yield, to measure performance. If Fidelity had not reimbursed certain class expenses, the past five year and life of fund total returns would have been lower.
Semiannual Report
Fidelity Advisor Emerging Markets Income Fund - Class T
Performance - continued
Cumulative Total Returns
|
Periods ended June 30, 2000 |
Past 6 |
Past 1 |
Past 5 |
Life of |
|
Fidelity Adv Emerging Markets Income - CL T |
8.26% |
24.32% |
118.00% |
106.24% |
|
Fidelity Adv Emerging Markets Income - CL T |
4.47% |
19.97% |
110.37% |
99.02% |
|
JP EMBI Global |
6.95% |
20.74% |
107.11% |
103.00% |
|
Emerging Markets Debt Funds Average |
6.45% |
20.74% |
93.67% |
n/a* |
Cumulative total returns show Class T's performance in percentage terms over a set period - in this case, six months, one year, five years or since the fund started on March 10, 1994. For example, if you had invested $1,000 in a fund that had a 5% return over the past year, the value of your investment would be $1,050. You can compare Class T's returns to those of the J.P. Morgan Emerging Markets Bond Index Global - a market value-weighted index of U.S. dollar denominated Brady bonds, Eurobonds, traded loans, and local market debt instruments issued by emerging markets sovereign and quasi-sovereign entities. The index currently covers 27 emerging market countries. To measure how Class T's performance stacked up against its peers, you can compare it to the emerging markets debt funds average, which reflects the performance of mutual funds with similar objectives tracked by Lipper Inc. The past six months average represents a peer group of 47 mutual funds. These benchmarks reflect reinvestment of dividends and capital gains, if any, and exclude the effect of sales charges.
Average Annual Total Returns
|
Periods ended June 30, 2000 |
Past 1 |
Past 5 |
Life of |
|
Fidelity Adv Emerging Markets Income - CL T |
24.32% |
16.87% |
12.15% |
|
Fidelity Adv Emerging Markets Income - CL T |
19.97% |
16.04% |
11.52% |
|
JP EMBI Global |
20.74% |
15.67% |
11.87% |
|
Emerging Markets Debt Funds Average |
20.74% |
13.89% |
n/a* |
Average annual total returns take Class T's cumulative return and show you what would have happened if Class T had performed at a constant rate each year.
* Not available
Semiannual Report
Fidelity Advisor Emerging Markets Income Fund - Class T
Performance - continued
$10,000 Over Life of Fund
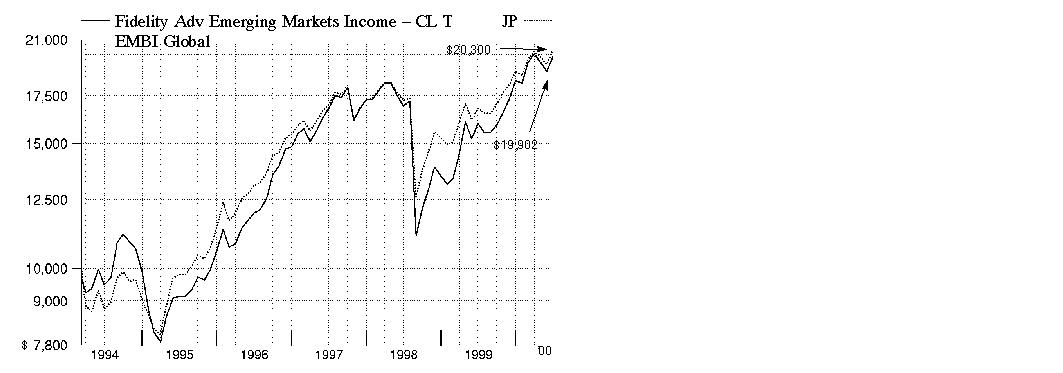
$10,000 Over Life of Fund: Let's say hypothetically that $10,000 was invested in Fidelity Advisor Emerging Markets Income Fund - Class T on March 10, 1994, when the fund started, and the current 3.50% sales charge was paid. As the chart shows, by June 30, 2000, the value of your investment would have grown to $19,902 - a 99.02% increase on the initial investment. For comparison, look at how the J.P. Morgan Emerging Markets Bond Index Global did over the same period. With dividends and capital gains, if any, reinvested, the JP EMBI Global would have grown to $20,300 - a 103.00% increase.
Understanding
Performance
Many markets around the globe offer the potential for significant growth over time; however, investing in foreign markets means assuming greater risks than investing in the United States. Factors like changes in a country's financial markets, its local political and economic climate, and the fluctuating value of its currency create these risks. For these reasons an international fund's performance may be more volatile than a fund that invests exclusively in the United States. Past performance is no guarantee of future results and you may have a gain or loss when you sell your shares.
3Semiannual Report
Fidelity Advisor Emerging Markets Income Fund - Class T
Performance - continued
Total Return Components
|
|
Six months ended June 30, |
Years ended December 31, |
||||
|
|
2000 |
1999 |
1998 |
1997 |
1996 |
1995 |
|
Dividend returns |
3.70% |
11.88% |
7.99% |
8.32% |
9.46% |
9.51% |
|
Capital returns |
4.56% |
24.46% |
-30.06% |
8.15% |
30.95% |
-2.52% |
|
Total returns |
8.26% |
36.34% |
-22.07% |
16.47% |
40.41% |
6.99% |
Total return components include both dividend returns and capital returns. A dividend return reflects the actual dividends paid by the class. A capital return reflects both the amount paid by the class to shareholders as capital gain distributions and changes in the class' share price. Both returns assume the dividends or capital gains paid by the class are reinvested, if any, and exclude the effect of sales charges.
Dividends and Yield
|
Periods ended June 30, 2000 |
Past 1 |
Past 6 |
Past 1 |
|
Dividends per share |
5.95 ¢ |
34.83 ¢ |
82.53 ¢ |
|
Annualized dividend rate |
7.22% |
7.01% |
8.75% |
|
30-day annualized yield |
7.50% |
- |
- |
Dividends per share show the income paid by the class for a set period. If you annualize this number, based on an average share price of $10.03 over the past one month, $9.97 over the past six months and $9.43 over the past one year, you can compare the class' income distributions over these three periods. The 30-day annualized yield is a standard formula for all bond funds based on the yields of the bonds in the fund, averaged over the past 30 days. This figure shows you the yield characteristics of the fund's investments at the end of the period. It also helps you to compare funds from different companies on an equal basis. The offering share price used in the calculation of the yield includes the effect of Class T's maximum 3.50% sales charge.
Semiannual Report
Fidelity Advisor Emerging Markets Income Fund - Class B
There are several ways to evaluate historical performance. You can look at the total percentage change in value, the average annual percentage change or the growth of a hypothetical $10,000 investment. Total return reflects the change in the value of an investment, assuming reinvestment of the class' dividend income and capital gains (the profits earned upon the sale of securities that have grown in value). You can also look at income, as reflected in its yield, to measure performance.
The initial offering of Class B shares took place on June 30, 1994. Class B shares bear a 0.90% 12b-1 fee (1.00% prior to January 1, 1996). Returns prior to June 30, 1994 are those of Class T, the original class of the fund, and reflect Class T shares' 0.25% 12b-1 fee. Had Class B shares' 12b-1 fee been reflected, returns prior to June 30, 1994 would have been lower. Class B shares' contingent deferred sales charge included in the past six months, past one year, past five year and life of fund total return figures are 5%, 5%, 2% and 0%, respectively. If Fidelity had not reimbursed certain class expenses, the total returns and dividends would have been lower.
Semiannual Report
Fidelity Advisor Emerging Markets Income Fund - Class B
Performance - continued
Cumulative Total Returns
|
Periods ended June 30, 2000 |
Past 6 |
Past 1 |
Past 5 |
Life of |
|
Fidelity Adv Emerging Markets Income - CL B |
7.87% |
23.55% |
110.88% |
98.20% |
|
Fidelity Adv Emerging Markets Income - CL B (incl. contingent deferred sales charge) |
2.87% |
18.55% |
108.88% |
98.20% |
|
JP EMBI Global |
6.95% |
20.74% |
107.11% |
103.00% |
|
Emerging Markets Debt Funds Average |
6.45% |
20.74% |
93.67% |
n/a* |
Cumulative total returns show Class B's performance in percentage terms over a set period - in this case, six months, one year, five years or since the fund started on March 10, 1994. For example, if you had invested $1,000 in a fund that had a 5% return over the past year, the value of your investment would be $1,050. You can compare Class B's returns to those of the J.P. Morgan Emerging Markets Bond Index Global - a market value-weighted index of U.S. dollar denominated Brady bonds, Eurobonds, traded loans, and local market debt instruments issued by emerging markets sovereign and quasi-sovereign entities. The index currently covers 27 emerging market countries. To measure how Class B's performance stacked up against its peers, you can compare it to the emerging markets debt funds average, which reflects the performance of mutual funds tracked by Lipper Inc. The past six months average represents a peer group of 47 mutual funds. These benchmarks reflect reinvestment of dividends and capital gains, if any, and exclude the effect of sales charges.
Average Annual Total Returns
|
Periods ended June 30, 2000 |
Past 1 |
Past 5 |
Life of |
|
Fidelity Adv Emerging Markets Income - CL B |
23.55% |
16.09% |
11.45% |
|
Fidelity Adv Emerging Markets Income - CL B |
18.55% |
15.87% |
11.45% |
|
JP EMBI Global |
20.74% |
15.67% |
11.87% |
|
Emerging Markets Debt Funds Average |
20.74% |
13.89% |
n/a* |
Average annual total returns take Class B's cumulative return and show you what would have happened if Class B had performed at a constant rate each year.
* Not available
Semiannual Report
Fidelity Advisor Emerging Markets Income Fund - Class B
Performance - continued
$10,000 Over Life of Fund

$10,000 Over Life of Fund: Let's say hypothetically that $10,000 was invested in Fidelity Advisor Emerging Markets Income Fund - Class B on March 10, 1994, when the fund started. As the chart shows, by June 30, 2000, the value of the investment would have been $19,820 - a 98.20% increase on the initial investment. For comparison, look at how the J.P. Morgan Emerging Markets Bond Index Global did over the same period. With dividends and capital gains, if any, reinvested, the JP EMBI Global would have grown to $20,300 - a 103.00% increase.
Understanding
Performance
Many markets around the globe offer the potential for significant growth over time; however, investing in foreign markets means assuming greater risks than investing in the United States. Factors like changes in a country's financial markets, its local political and economic climate, and the fluctuating value of its currency create these risks. For these reasons an international fund's performance may be more volatile than a fund that invests exclusively in the United States. Past performance is no guarantee of future results and you may have a gain or loss when you sell your shares.
3Semiannual Report
Fidelity Advisor Emerging Markets Income Fund - Class B
Performance - continued
Total Return Components
|
|
Six months ended June 30, |
Years ended December 31, |
||||
|
|
2000 |
1999 |
1998 |
1997 |
1996 |
1995 |
|
Dividend returns |
3.35% |
10.97% |
7.45% |
7.57% |
8.54% |
8.69% |
|
Capital returns |
4.52% |
24.61% |
-30.11% |
8.13% |
31.07% |
-2.31% |
|
Total returns |
7.87% |
35.58% |
-22.66% |
15.70% |
39.61% |
6.38% |
Total return components include both dividend returns and capital returns. A dividend return reflects the actual dividends paid by the class. A capital return reflects both the amount paid by the class to shareholders as capital gain distributions and changes in the class' share price. Both returns assume the dividends or capital gains, if any, paid by the class are reinvested, and exclude the effect of sales charges.
Dividends and Yield
|
Periods ended June 30, 2000 |
Past 1 |
Past 6 |
Past 1 |
|
Dividends per share |
5.36 ¢ |
31.64 ¢ |
76.57 ¢ |
|
Annualized dividend rate |
6.47% |
6.33% |
8.09% |
|
30-day annualized yield |
7.04% |
- |
- |
Dividends per share show the income paid by the class for a set period. If you annualize this number, based on an average share price of $10.08 over the past one month, $10.02 over the past six months, and $9.47 over the past one year, you can compare the class' income distributions over these three periods. The 30-day annualized yield is a standard formula for all bond funds based on the yields of the bonds in the fund, averaged over the past 30 days. This figure shows you the yield characteristics of the fund's investments at the end of the period. It also helps you compare funds from different companies on an equal basis. The offering share price used in the calculation of the yield excludes the effect of Class B's contingent deferred sales charge.
Semiannual Report
Fidelity Advisor Emerging Markets Income Fund - Class C
There are several ways to evaluate historical performance. You can look at the total percentage change in value, the average annual percentage change or the growth of a hypothetical $10,000 investment. Total return reflects the change in the value of an investment, assuming reinvestment of the class' dividend income and capital gains (the profits earned upon the sale of securities that have grown in value). You can also look at income to measure performance.
The initial offering of Class C shares took place on November 3, 1997. Class C shares bear a 1.00% 12b-1 fee that is reflected in returns after November 3, 1997. Returns between June 30, 1994 and November 3, 1997 are those of Class B shares and reflect Class B shares' 0.90% 12b-1 fee (1.00% prior to January 1, 1996). Returns prior to June 30, 1994 are those of Class T shares and reflect Class T shares' 0.25% 12b-1 fee. Had Class C shares' 12b-1 fee been reflected, returns from January 1, 1996 through November 3, 1997 and prior to June 30, 1994 would have been lower. Class C shares' contingent deferred sales charge included in the past six months, past one year, past five year and life of fund total return figures are 1%, 1%, 0% and 0%, respectively. If Fidelity had not reimbursed certain class expenses, the total returns and dividends would have been lower.
Semiannual Report
Fidelity Advisor Emerging Markets Income Fund - Class C
Performance - continued
Cumulative Total Returns
|
Periods ended June 30, 2000 |
Past 6 |
Past 1 |
Past 5 |
Life of |
|
Fidelity Adv Emerging Markets Income - CL C |
7.94% |
23.55% |
110.94% |
98.25% |
|
Fidelity Adv Emerging Markets Income - CL C |
6.94% |
22.55% |
110.94% |
98.25% |
|
JP EMBI Global |
6.95% |
20.74% |
107.11% |
103.00% |
|
Emerging Markets Debt Funds Average |
6.45% |
20.74% |
93.67% |
n/a* |
Cumulative total returns show Class C's performance in percentage terms over a set period - in this case, six months, one year, five years or since the fund started on March 10, 1994. For example, if you had invested $1,000 in a fund that had a 5% return over the past year, the value of your investment would be $1,050. You can compare Class C's returns to those of the J.P. Morgan Emerging Markets Bond Index Global - a market value-weighted index of U.S. dollar denominated Brady bonds, Eurobonds, traded loans, and local market debt instruments issued by emerging markets sovereign and quasi-sovereign entities. The index currently covers 27 emerging market countries. To measure how Class C's performance stacked up against its peers, you can compare it to the emerging markets debt funds average, which reflects the performance of mutual funds tracked by Lipper Inc. The past six months average represents a peer group of 47 mutual funds. These benchmarks reflect reinvestment of dividends and capital gains, if any, and exclude the effect of sales charges.
Average Annual Total Returns
|
Periods ended June 30, 2000 |
Past 1 |
Past 5 |
Life of |
|
Fidelity Adv Emerging Markets Income - CL C |
23.55% |
16.10% |
11.45% |
|
Fidelity Adv Emerging Markets Income - CL C |
22.55% |
16.10% |
11.45% |
|
JP EMBI Global |
20.74% |
15.67% |
11.87% |
|
Emerging Markets Debt Funds Average |
20.74% |
13.89% |
n/a* |
Average annual total returns take Class C's cumulative return and show you what would have happened if Class C had performed at a constant rate each year.
* Not available
Semiannual Report
Fidelity Advisor Emerging Markets Income Fund - Class C
Performance - continued
$10,000 Over Life of Fund
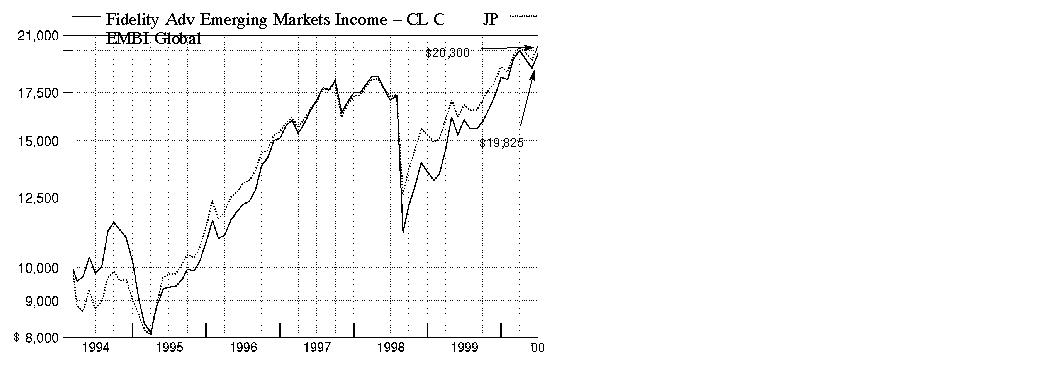
$10,000 Over Life of Fund: Let's say hypothetically that $10,000 was invested in Fidelity Advisor Emerging Markets Income Fund - Class C on March 10, 1994, when the fund started. As the chart shows, by June 30, 2000, the value of the investment would have been $19,825 - a 98.25% increase on the initial investment. For comparison, look at how the J.P. Morgan Emerging Markets Bond Index Global did over the same period. With dividends and capital gains, if any, reinvested, the JP EMBI Global would have grown to $20,300 - a 103.00% increase.
Understanding
Performance
Many markets around the globe offer the potential for significant growth over time; however, investing in foreign markets means assuming greater risks than investing in the United States. Factors like changes in a country's financial markets, its local political and economic climate, and the fluctuating value of its currency create these risks. For these reasons an international fund's performance may be more volatile than a fund that invests exclusively in the United States. Past performance is no guarantee of future results and you may have a gain or loss when you sell your shares.
3Semiannual Report
Fidelity Advisor Emerging Markets Income Fund - Class C
Performance - continued
Total Return Components
|
|
Six months ended June 30, |
Years ended December 31, |
November 3, 1997 |
|
|
|
2000 |
1999 |
1998 |
1997 |
|
Dividend returns |
3.29% |
10.79% |
7.41% |
2.48% |
|
Capital returns |
4.65% |
24.52% |
-29.88% |
1.68% |
|
Total returns |
7.94% |
35.31% |
-22.47% |
4.16% |
Total return components include both dividend returns and capital returns. A dividend return reflects the actual dividends paid by the class. A capital return reflects both the amount paid by the class to shareholders as capital gain distributions and changes in the class' share price. Both returns assume the dividends or capital gains, if any, paid by the class are reinvested, and exclude the effect of sales charges.
Dividends and Yield
|
Periods ended June 30, 2000 |
Past 1 |
Past 6 |
Past 1 |
|
Dividends per share |
5.25 ¢ |
31.15 ¢ |
75.32 ¢ |
|
Annualized dividend rate |
6.34% |
6.24% |
7.96% |
|
30-day annualized yield |
n/a* |
- |
- |
Dividends per share show the income paid by the class for a set period. If you annualize this number, based on an average share price of $10.07 over the past one month, $10.01 over the past six months, and $9.46 over the past one year, you can compare the class' income distributions over these three periods. The 30-day annualized yield is a standard formula for all bond funds based on the yields of the bonds in the fund, averaged over the past 30 days. This figure shows you the yield characteristics of the fund's investments at the end of the period. It also helps you compare funds from different companies on an equal basis. Yield information will be reported once Class C has a longer, more stable, operating history.
* Not available
Semiannual Report
Market Recap
As one of the best-performing asset classes of 1999, emerging markets continued that strength into 2000. But as U.S. equity markets sold off during the spring, emerging-market nations followed suit. Fortunately, a variety of factors helped contain their slide. Since many emerging-market countries are commodity exporters, the increased price of oil, precious metals and agricultural goods helped support their performance. A number of credit upgrades - particularly Mexico's, which represents 15% of the J.P. Morgan Emerging Markets Bond Index Global - also proved beneficial. Additionally, emerging-market fundamentals remained strong for the most part, as many of their governments had taken steps to position their economies for growth and keep inflation under control. Overall, emerging markets gained a solid 6.95% - according to the J.P. Morgan Emerging Markets Bond Index Global - for the six-month period ending June 30, 2000. Turning to individual performers, Russia, as in 1999, was again a standout performer. The transition from President Yeltsin to President Putin was smooth, and investors reacted favorably to the government's Soviet-era debt restructuring plan.
(Portfolio Manager photograph)
An interview with John Carlson, Portfolio Manager of Fidelity Advisor Emerging Markets Income Fund
Q. How did the fund perform, John?
A. Very well, relative to its benchmark and peers. For the six months ending June 30, 2000, the fund's Class A, Class T, Class B and Class C shares returned 8.30%, 8.26%, 7.87% and 7.94%, respectively. The emerging market debt funds average, as tracked by Lipper Inc., returned 6.45% during the period, while the J.P. Morgan Emerging Markets Bond Index Global returned 6.95%. For the 12 months ending June 30, 2000, the fund's Class A, Class T, Class B and Class C shares returned 24.53%, 24.32%, 23.55% and 23.55%, respectively. The Lipper average returned 20.74% for the same period, while the J.P. Morgan index also returned 20.74%.
Q. What were some of the events that affected emerging markets during the six-month period?
A. There were three key events. The first was the resignation of Russian President Boris Yeltsin on New Year's Eve, which led to continued improvements and positive performance from Russia. The second was the long-awaited and much anticipated upgrade of Mexico to investment-grade status by Moody's Investor Services in March. The third factor was the continued strength in the commodities sector, particularly oil, which positively impacted many emerging-markets countries.
Semiannual Report
Fund Talk: The Manager's Overview - continued
Q. You mentioned continued good news from Russia. What factors in particular aided its performance?
A. Vladimir Putin, who acted as president after the resignation of President Yeltsin until he was formally elected in March, enacted a number of reforms to enhance governability and enforce the rule of law. On the fiscal side, the country has been particularly disciplined and, as this report is written, currently is working on an overhaul of the tax system. Putin has enjoyed unprecedented popularity resulting in a stable political environment. Local and foreign investors responded favorably to the changes, as evidenced by a substantial increase in the country's international reserves. The completion of Soviet-era debt restructuring talks also was an extremely positive event that helped to drive asset prices upward. Furthermore, Russia's performance was helped by the continued firmness in oil prices, providing an enormous boost to the country's external accounts. The fund's overweighted position in Russia, relative to its benchmark, was the largest contributor to outperformance during the past six months.
Q. In terms of Mexico's upgrade, what is the implication for emerging-markets debt?
A. Mexico's story in the first half of this year was a noteworthy one, not only for that country but also for emerging markets in general. Recognizing Mexico's strong fiscal discipline, reduced risk from the banking sector and increasing integration into the world economy, Moody's Investor Services raised the country's rating to the investment-grade level on March 7, 2000. In addition, with elections slated for the first week in July, President Ernesto Zedillo has been working diligently to avoid the election-related problems of the past. The upgrade of Mexico's debt is proof that emerging-markets countries can reap the benefit of enacting reforms, solving fiscal imbalances and increasing the efficiency and openness of their economies. Broadly speaking, this is a very positive credit enhancer for the entire emerging-debt market.
Q. What was the impact of the global economic backdrop on emerging markets?
A. Most of the countries that the fund invests in are exporters of goods. This includes manufactured products such as electronics, and commodities such as metals, agricultural goods and, in particular, oil. The prices of most of these goods rose during the first half of this year, resulting in increased earnings for the exporting countries. In addition, the developed countries - the main destination for these goods - saw continued growth during the same period, ensuring a stable market for those exports.
Q. John, what's your outlook for the next six months?
A. My outlook is constructive. I remain optimistic on commodity prices and anticipate that we will have more balanced growth globally. I also expect that we will see continued upgrades as more countries conduct debt buybacks and exchanges to strengthen their positions in the global economy. I further think that we will see more-diversified security issuance with a greater percentage going into euros and less supply of U.S. dollar-denominated debt going forward. Since I expect that fundamentals will continue to differentiate the winners from the losers, we will continue to focus Fidelity's research strength toward selecting securities that can enable the fund to continue outperforming.
The views expressed in this report reflect those of the portfolio manager only through the end of the period of the report as stated on the cover and do not necessarily represent the views of Fidelity or any other person in the Fidelity organization. Any such views are subject to change at any time based upon market or other conditions and Fidelity disclaims any responsibility to update such views. These views may not be relied on as investment advice and, because investment decisions for a Fidelity fund are based on numerous factors, may not be relied on as an indication of trading intent on behalf of any Fidelity fund.
Semiannual Report
Fund Talk: The Manager's Overview - continued
Fund Facts
Goal: seeks a high level of current income; as a secondary objective, the fund may seek capital appreciation
Start date: March 10, 1994
Size: as of June 30, 2000, more than $82 million
Manager: John Carlson, since 1995; also lead manager, Fidelity Advisor Strategic Income Fund, since 1996; joined Fidelity in 1995
3John Carlson discusses emerging markets - five years later:
"This year marks my fifth anniversary managing Fidelity's emerging-markets debt funds and funds holding positions in emerging markets. Over the past five years, the emerging-markets debt marketplace has evolved positively, becoming more efficient, deeper and broader.
"When I began managing these funds, the benchmark index used was the J.P. Morgan Emerging Markets Bond Index, which included nine countries, was 88% invested in Latin America and contained no investment-grade securities. The current index used as the benchmark is the J.P. Morgan Emerging Markets Bond Index Global. As the marketplace has evolved, the index also changed to reflect greater diversification with 27 countries, only 65% exposure to Latin America and now 30% in investment-grade securities. In addition, the new index allows a greater number of securities to be held and has a much larger market capitalization - $190 billion as of June 30, 2000, compared to $66 billion as of June 30, 1995.
"The changes in the marketplace and the index complement our portfolio management style. We have always looked for undervalued, out-of-index countries and securities in an effort to enhance performance and achieve better diversification for the portfolios we manage. I remain optimistic about emerging-markets debt and look forward to continued growth and development in this marketplace."
Semiannual Report
|
Top Five Countries as of June 30, 2000 |
||
|
(excluding cash equivalents) |
% of fund's |
% of fund's net assets |
|
Brazil |
23.3 |
21.0 |
|
Russia |
13.4 |
11.3 |
|
Mexico |
12.1 |
14.1 |
|
Argentina |
11.6 |
15.7 |
|
Venezuela |
4.7 |
4.6 |
|
Percentages are adjusted for the effect of open futures contracts, if applicable. Top countries are based upon location of issuer of each security, including where the fund is exposed to potential political and credit risk. |
|
Top Five Holdings as of June 30, 2000 |
||
|
(by issuer, excluding cash equivalents) |
% of fund's |
% of fund's net assets |
|
Brazilian Federative Rep. |
18.5 |
15.3 |
|
Argentinian Republic |
11.6 |
11.6 |
|
United Mexican States |
10.5 |
11.3 |
|
Russian Federation |
7.0 |
6.3 |
|
Banco Nacional De Desenvolvimento |
4.8 |
4.4 |
|
|
52.4 |
48.9 |
|
Asset Allocation (% of fund's net assets) |
|||||||
|
As of June 30, 2000 |
As of December 31, 1999 |
||||||
 |
Corporate Bonds 11.9% |
|
|
Corporate Bonds 13.4% |
|
||
 |
Government |
|
|
Government |
|
||
 |
Supranational Obligations 0.0% |
|
|
Supranational Obligations 0.1% |
|
||
 |
Stocks 0.0% |
|
|
Stocks 3.5% |
|
||
 |
Other Investments 8.2% |
|
|
Other Investments 5.7% |
|
||
 |
Short-Term |
|
|
Short-Term |
|
||

Semiannual Report
(Unaudited)
Showing Percentage of Net Assets
|
Nonconvertible Bonds - 11.9% |
|||||
|
Moody's Ratings |
Principal |
Value |
|||
|
Brazil - 4.8% |
|||||
|
Banco Nacional de Desenvolvimento Economico e Social: |
|
|
|
|
|
|
12.554% 6/16/08 (h) |
B2 |
|
$ 3,229,000 |
$ 3,023,151 |
|
|
12.554% 6/16/08 (g)(h) |
B2 |
|
980,000 |
917,525 |
|
|
|
3,940,676 |
||||
|
Colombia - 0.8% |
|||||
|
Comunicacion Celular SA 0% 3/1/05 (e)(g) |
B3 |
|
550,000 |
407,000 |
|
|
Occidente Y Caribe Celular SA 0% |
B3 |
|
380,000 |
266,000 |
|
|
|
673,000 |
||||
|
Indonesia - 0.3% |
|||||
|
APP International Finance Co. 11.75% |
Caa1 |
|
305,000 |
213,500 |
|
|
Malaysia - 1.9% |
|||||
|
Petroliam Nasional BHD (Petronas): |
|
|
|
|
|
|
7.125% 10/18/06 (Reg. S) |
Baa3 |
|
625,000 |
591,406 |
|
|
7.625% 10/15/26 (Reg. S) |
Baa3 |
|
1,000,000 |
856,250 |
|
|
yankee 7.625% 10/15/26 (g) |
Baa3 |
|
110,000 |
94,188 |
|
|
|
1,541,844 |
||||
|
Mauritius - 0.8% |
|||||
|
APP International Finance (Mauritius) Ltd. 0% 7/5/01 (g) |
B3 |
|
885,000 |
699,150 |
|
|
Mexico - 1.6% |
|||||
|
Banco Nacional de Comercio Exterior SNC 11.25% 5/30/06 |
Baa3 |
|
880,000 |
939,400 |
|
|
Petroleos Mexicanos 9.4367% 7/15/05 |
Baa3 |
|
400,000 |
401,000 |
|
|
|
1,340,400 |
||||
|
Netherlands - 1.5% |
|||||
|
Netia Holdings II BV euro 13.5% 6/15/09 |
B3 |
EUR |
860,000 |
828,601 |
|
|
Tjiwi Kimia International Finance Co. 13.25% 8/1/01 |
Caa1 |
|
450,000 |
396,000 |
|
|
|
1,224,601 |
||||
|
Nonconvertible Bonds - continued |
|||||
|
Moody's Ratings |
Principal |
Value |
|||
|
Netherlands Antilles - 0.2% |
|||||
|
Astra Overseas Finance BV: |
|
|
|
|
|
|
(Reg. S) 6.7775% 6/30/05 (Reg. S) (h) |
- |
|
$ 180,358 |
$ 109,117 |
|
|
6.7775% 6/30/05 (g)(h) |
- |
|
159,745 |
96,646 |
|
|
|
205,763 |
||||
|
TOTAL NONCONVERTIBLE BONDS (Cost $9,119,025) |
9,838,934 |
||||
|
Government Obligations (i) - 64.4% |
|||||
|
|
|||||
|
Argentina - 11.6% |
|||||
|
Argentinian Republic: |
|
|
|
|
|
|
BOCON 2.8068% 4/1/07 (h) |
B1 |
ARS |
4,974,614 |
3,447,474 |
|
|
Brady discount 7.875% 3/31/23 (h) |
B1 |
|
1,230,000 |
993,225 |
|
|
9.75% 9/19/27 |
B1 |
|
1,338,000 |
1,041,968 |
|
|
11.375% 3/15/10 |
B1 |
|
530,000 |
480,975 |
|
|
11.75% 2/12/07 |
B1 |
ARS |
910,000 |
753,447 |
|
|
11.75% 4/7/09 |
B1 |
|
1,893,000 |
1,765,223 |
|
|
11.75% 6/15/15 |
B1 |
|
445,000 |
403,838 |
|
|
12% 2/1/20 |
B1 |
|
362,000 |
335,303 |
|
|
12.125% 2/25/19 |
B1 |
|
404,000 |
379,760 |
|
|
|
9,601,213 |
||||
|
Brazil - 18.5% |
|||||
|
Brazilian Federative Rep.: |
|
|
|
|
|
|
euro 11.625% 4/15/04 |
B2 |
|
1,315,000 |
1,324,863 |
|
|
Brady: |
|
|
|
|
|
|
capitalization bond 8% 4/15/14 |
B2 |
|
3,869,090 |
2,851,035 |
|
|
debt conversion bond 7.4375% |
B2 |
|
4,598,000 |
3,391,025 |
|
|
discount euro 7.375% 4/15/24 (h) |
B2 |
|
510,000 |
403,538 |
|
|
new money bond L, 7.4375% 4/15/09 (Bearer) (h) |
B2 |
|
951,000 |
797,651 |
|
|
7.375% 4/15/06 (h) |
B2 |
|
1,599,600 |
1,457,636 |
|
|
10.125% 5/15/27 |
B2 |
|
1,682,000 |
1,326,678 |
|
|
12.25% 3/6/30 |
B2 |
|
768,000 |
706,560 |
|
|
12.75% 1/15/20 |
B2 |
|
605,000 |
578,531 |
|
|
14.5% 10/15/09 |
B2 |
|
2,307,000 |
2,468,490 |
|
|
|
15,306,007 |
||||
|
Government Obligations (i) - continued |
|||||
|
Moody's Ratings |
Principal |
Value |
|||
|
Bulgaria - 1.9% |
|||||
|
Bulgarian Republic Brady: |
|
|
|
|
|
|
discount A 7.0625% 7/28/24 (h) |
B2 |
|
$ 521,000 |
$ 412,241 |
|
|
FLIRB A 2.75% 7/28/12 (h) |
B2 |
|
954,000 |
702,383 |
|
|
interest arrears bond 7.0625% 7/28/11 (h) |
B2 |
|
568,000 |
450,850 |
|
|
|
1,565,474 |
||||
|
Colombia - 2.3% |
|||||
|
Colombian Republic: |
|
|
|
|
|
|
7.625% 2/15/07 |
Ba2 |
|
330,000 |
239,250 |
|
|
8.375% 2/15/27 |
Ba2 |
|
440,000 |
280,500 |
|
|
8.625% 4/1/08 |
Ba2 |
|
295,000 |
218,300 |
|
|
9.75% 4/23/09 |
Ba2 |
|
220,000 |
171,050 |
|
|
10.875% 3/9/04 |
Ba2 |
|
215,000 |
201,025 |
|
|
11.75% 2/25/20 |
Ba2 |
|
954,000 |
782,280 |
|
|
|
1,892,405 |
||||
|
Croatia - 0.6% |
|||||
|
Croatia Republic 7.0325% 7/31/06 (h) |
Baa3 |
|
558,210 |
528,904 |
|
|
Ecuador - 1.0% |
|||||
|
Ecuador Republic Brady: |
|
|
|
|
|
|
discount 7.1875% 2/28/25 (c)(h) |
Caa2 |
|
590,000 |
231,575 |
|
|
par 4% 2/28/25 (c)(f) |
Caa2 |
|
740,000 |
251,600 |
|
|
past due interest 7.1875% 2/28/15 (Bearer) (c)(h) |
Caa3 |
|
1,394,666 |
334,720 |
|
|
|
817,895 |
||||
|
Ivory Coast - 0.1% |
|||||
|
Ivory Coast Brady FLIRB A 1.9% |
- |
FRF |
3,610,000 |
76,125 |
|
|
Mexico - 10.4% |
|||||
|
United Mexican States: |
|
|
|
|
|
|
Brady discount A 7.3125% 12/31/19 (h) |
Baa3 |
|
1,770,000 |
1,739,025 |
|
|
value recovery rights 6/30/03: |
|
|
|
|
|
|
discount A (j) |
- |
|
2,724,000 |
27 |
|
|
discount C (j) |
- |
|
2,000 |
0 |
|
|
9.875% 2/1/10 |
Baa3 |
|
2,790,000 |
2,908,575 |
|
|
10.375% 2/17/09 |
Baa3 |
|
790,000 |
844,313 |
|
|
11.375% 9/15/16 |
Baa3 |
|
1,169,000 |
1,339,966 |
|
|
11.5% 5/15/26 |
Baa3 |
|
1,522,000 |
1,835,913 |
|
|
|
8,667,819 |
||||
|
Government Obligations (i) - continued |
|||||
|
Moody's Ratings |
Principal |
Value |
|||
|
Nigeria - 1.1% |
|||||
|
Central Bank of Nigeria: |
|
|
|
|
|
|
Brady 6.25% 11/15/20 |
- |
|
$ 750,000 |
$ 378,750 |
|
|
Promissory notes 5.092% 1/5/10 |
- |
|
1,208,189 |
528,940 |
|
|
warrants 11/15/20 (a)(j) |
- |
|
750 |
0 |
|
|
|
907,690 |
||||
|
Panama - 0.5% |
|||||
|
Panamanian Republic 8.25% 4/22/08 |
Ba1 |
|
440,000 |
389,400 |
|
|
Peru - 0.7% |
|||||
|
Peruvian Republic Brady: |
|
|
|
|
|
|
FLIRB 3.75% 3/7/17 (h) |
Ba3 |
|
395,000 |
239,963 |
|
|
past due interest 4.5% 3/7/17 (h) |
Ba3 |
|
479,000 |
320,930 |
|
|
|
560,893 |
||||
|
Philippines - 1.3% |
|||||
|
Philippine Government: |
|
|
|
|
|
|
8.875% 4/15/08 |
Ba1 |
|
445,000 |
400,500 |
|
|
9.875% 3/16/10 |
Ba1 |
|
360,000 |
331,200 |
|
|
9.875% 1/15/19 |
Ba1 |
|
455,000 |
371,394 |
|
|
|
1,103,094 |
||||
|
Russia - 8.7% |
|||||
|
City of St. Petersburg Russia 9.5% 6/18/02 (Reg. S) |
Caa1 |
|
1,200,000 |
1,020,000 |
|
|
Russian Federation: |
|
|
|
|
|
|
8.75% 7/24/05 (Reg. S) |
B3 |
|
1,424,000 |
1,105,380 |
|
|
9.25% 11/27/01 |
B3 |
|
419,000 |
400,145 |
|
|
10% 6/26/07 |
B3 |
|
1,334,000 |
1,028,848 |
|
|
11% 7/24/18 (Reg. S) |
B3 |
|
1,452,000 |
1,087,185 |
|
|
11.75% 6/10/03 (Reg. S) |
B3 |
|
961,000 |
892,529 |
|
|
12.75% 6/24/28 (Reg. S) |
B3 |
|
1,509,000 |
1,301,513 |
|
|
Russian Federation Ministry of Finance 3% 5/14/03 |
Caa3 |
|
890,000 |
396,050 |
|
|
|
7,231,650 |
||||
|
Turkey - 0.3% |
|||||
|
Turkish Republic 11.875% 11/5/04 |
B1 |
|
235,000 |
244,400 |
|
|
Ukraine - 0.7% |
|||||
|
Ukraine Government 11% 3/15/07 (Reg. S) |
- |
|
860,000 |
589,100 |
|
|
Government Obligations (i) - continued |
|||||
|
Moody's Ratings |
Principal |
Value |
|||
|
Venezuela - 4.7% |
|||||
|
Venezuelan Republic: |
|
|
|
|
|
|
Brady debt conversion bond 7.875% 12/18/07 (h) |
B2 |
|
$ 3,571,400 |
$ 2,910,691 |
|
|
Oil recovery rights 4/15/20 (j) |
- |
|
30 |
0 |
|
|
9.25% 9/15/27 |
B2 |
|
1,485,000 |
980,100 |
|
|
|
3,890,791 |
||||
|
TOTAL GOVERNMENT OBLIGATIONS (Cost $48,880,715) |
53,372,860 |
||||
|
Common Stocks - 0.0% |
|||
|
Shares |
|
||
|
Mexico - 0.0% |
|||
|
Cemex SA de CV ADR (a) |
1,368 |
3,591 |
|
|
Sovereign Loan Participations - 8.1% |
|||||
|
|
Principal |
|
|||
|
Algeria - 1.9% |
|||||
|
Algerian Republic loan participation: |
|
|
|
|
|
|
Series 1 - Deutsche Bank 6.625% |
- |
|
$ 685,000 |
565,125 |
|
|
Series 1 - Merrill Lynch, Pierce, Fenner & Smith, Inc. 6.625% 9/4/06 (h) |
- |
|
305,000 |
251,625 |
|
|
Series 1- Societe Generale 6.625% |
- |
|
240,000 |
198,000 |
|
|
Series 3 - Merrill Lynch, Pierce, Fenner & Smith, Inc. 7.1875% 3/4/10 (h) |
- |
|
485,000 |
374,663 |
|
|
Series 3 - The Chase Manhattan Bank 7.1875% 3/4/10 (h) |
- |
|
273,000 |
210,893 |
|
|
|
1,600,306 |
||||
|
Angola - 0.3% |
|||||
|
Banco Nacional de Angola loan participation - Societe Generale (a) |
- |
|
1,596,128 |
207,497 |
|
|
Cameroon - 0.1% |
|||||
|
Cameroon Republic: |
|
|
|
|
|
|
loan participation - Societe Generale (a) |
- |
FRF |
1,960,000 |
29,929 |
|
|
loan participation - Societe Generale (a) |
- |
DEM |
1,430,000 |
73,235 |
|
|
|
103,164 |
||||
|
Sovereign Loan Participations - continued |
|||||
|
Moody's Ratings |
Principal |
Value |
|||
|
Congo - 0.1% |
|||||
|
Congo Republic loan participation - |
- |
|
$ 1,056,047 |
$ 95,044 |
|
|
Morocco - 1.0% |
|||||
|
Moroccan Kingdom loan participation: |
|
|
|
|
|
|
Series A - Deutsche Bank 7.75% |
- |
|
325,000 |
292,500 |
|
|
Series A - Morgan Guaranty Trust Co. 7.75% 1/1/09 (h) |
- |
|
272,780 |
245,502 |
|
|
Series A - Paribas Capital Markets 7.75% 1/1/09 (h) |
- |
|
337,483 |
303,734 |
|
|
|
841,736 |
||||
|
Russia - 4.7% |
|||||
|
Bank for Foreign Economic Affairs of Russia (Vnesheconombank) loan participation restructured under 1997 Agreement: |
|
|
|
|
|
|
- Deutsche Bank 7.9375% 12/15/20 (c)(h) |
- |
|
7,281,000 |
2,229,806 |
|
|
- Merrill Lynch, Pierce, Fenner & Smith, Inc. 7.9375% 12/15/20 (c)(h) |
- |
|
440,000 |
134,750 |
|
|
- Morgan (J.P.) Securities, Inc. 7.9375% 12/15/20 (c)(h) |
- |
|
1,445,000 |
442,531 |
|
|
- Paribas Capital Markets 7.9375% 12/15/20 (c)(h) |
- |
|
450,000 |
137,813 |
|
|
- The Chase Manhattan Bank 7.9375% 12/15/20 (c)(h) |
- |
|
2,920,000 |
894,250 |
|
|
|
3,839,150 |
||||
|
TOTAL SOVEREIGN LOAN PARTICIPATIONS (Cost $5,365,158) |
6,686,897 |
||||
|
Cash Equivalents - 12.9% |
|||
|
Maturity Amount |
|
||
|
Investments in repurchase agreements (U.S. Treasury Obligations), in a joint trading account at 6.58%, |
$ 10,729,882 |
10,724,000 |
|
|
Purchased Options - 0.1% |
|||||
|
Expiration |
Underlying
Face Amount |
Value |
|||
|
Argentina - 0.0% |
|||||
|
Salomon Brothers International Call Option on $2,216,000 notional amount of Argentinian Republic Brady floating rate bond 7.375%, 3/31/05 |
July 00/91.70 |
|
$ 2,023,208 |
$ 2,659 |
|
|
Salomon Brothers International Call Option on $3,775,000 notional amount of Argentinian Republic Brady par L-GP 6%, 3/31/23 |
July 00/61.125 |
|
2,510,375 |
7,550 |
|
|
|
10,209 |
||||
|
Mexico - 0.1% |
|||||
|
Salomon Brothers International Call Option on $4,280,000 notional amount of United Mexican States Brady par A 6.25%, 12/31/19 |
July 00/82.5625 |
|
3,584,500 |
39,804 |
|
|
Russia - 0.0% |
|||||
|
The Deutsche Bank Call Option on $5,000,000 notional amount of Bank for Foreign Economic Affairs of Russia (Vnesheconombank) loan participation restructured under 1997 Agreement - Deutsche Bank 7.9375% 12/15/20 |
July 00/31.25 |
|
1,531,250 |
12,500 |
|
|
TOTAL PURCHASED OPTIONS (Cost $106,771) |
62,513 |
||||
|
TOTAL INVESTMENT PORTFOLIO - 97.4% (Cost $74,198,063) |
80,688,795 |
||
|
NET OTHER ASSETS - 2.6% |
2,191,704 |
||
|
NET ASSETS - 100% |
$ 82,880,499 |
||
|
Security Type Abbreviation |
||
|
FLIRB |
- |
Front Loaded Interest Reduction Bond |
|
Currency Abbreviations |
||
|
ARS |
- |
Argentine peso |
|
DEM |
- |
German deutsche mark |
|
EUR |
- |
European Monetary Unit |
|
FRF |
- |
French franc |
|
Legend |
|
(a) Non-income producing |
|
(b) S&P credit ratings are used in the absence of a rating by Moody's Investors Service, Inc. |
|
(c) Non-income producing - issuer filed for protection under the Federal Bankruptcy Code or is in default of interest payment. |
|
(d) Principal amount is stated in United States dollars unless otherwise noted. |
|
(e) Debt obligation initially issued in zero coupon form which converts to coupon form at a specified rate and date. The rate shown is the rate at period end. |
|
(f) Debt obligation initially issued at one coupon which converts to a higher coupon at a specified date. The rate shown is the rate at period end. |
|
(g) Security exempt from registration under Rule 144A of the Securities Act of 1933. These securities may be resold in transactions exempt from registration, normally to qualified institutional buyers. At the period end, the value of these securities amounted to $2,214,509 or 2.7% of net assets. |
|
(h) The coupon rate shown on floating or adjustable rate securities represents the rate at period end. |
|
(i) For foreign government obligations not individually rated by S&P or Moody's, the ratings listed have been assigned by FMR, the fund's investment adviser, based principally on S&P and Moody's ratings of the sovereign credit of the issuing government. |
|
(j) Quantity represents share amount. |
|
Other Information |
|
The composition of long-term debt holdings as a percentage of total value of investments in securities, is as follows (ratings are unaudited): |
|
Moody's Ratings |
S&P Ratings |
|||
|
Aaa, Aa, A |
0.0% |
|
AAA, AA, A |
0.0% |
|
Baa |
15.0% |
|
BBB |
7.8% |
|
Ba |
4.9% |
|
BB |
23.5% |
|
B |
52.8% |
|
B |
33.3% |
|
Caa |
3.5% |
|
CCC |
9.2% |
|
Ca, C |
0.0% |
|
CC, C |
0.0% |
|
|
|
|
D |
0.0% |
|
The percentage not rated by Moody's or S&P amounted to 10.5%. FMR has determined that unrated debt securities that are lower quality account for 10.5% of the total value of investment in securities. |
|
Income Tax Information |
|
At June 30, 2000, the aggregate cost of investment securities for income tax purposes was $74,316,042. Net unrealized appreciation aggregated $6,372,753, of which $7,999,354 related to appreciated investment securities and $1,626,601 related to depreciated investment securities. |
|
At December 31, 1999, the fund had a capital loss carryforward of approximately $24,164,000 of which $20,267,000 and $3,897,000 will expire on December 31, 2006 and 2007, respectively. |
See accompanying notes which are an integral part of the financial statements.
Semiannual Report
Statement of Assets and Liabilities
|
|
June 30, 2000 (Unaudited) |
|
|
Assets |
|
|
|
Investment in securities, at value (including repurchase agreements of $10,724,000) (cost $74,198,063) - |
|
$ 80,688,795 |
|
Foreign currency held at value (cost $182,222) |
|
183,582 |
|
Receivable for investments sold |
|
2,139,952 |
|
Receivable for fund shares sold |
|
194,933 |
|
Dividends receivable |
|
1,915 |
|
Interest receivable |
|
1,452,653 |
|
Total assets |
|
84,661,830 |
|
Liabilities |
|
|
|
Payable to custodian bank |
$ 31,616 |
|
|
Payable for investments purchased |
968,380 |
|
|
Payable for fund shares redeemed |
593,813 |
|
|
Distributions payable |
69,515 |
|
|
Accrued management fee |
45,774 |
|
|
Distribution fees payable |
28,048 |
|
|
Other payables and accrued expenses |
44,185 |
|
|
Total liabilities |
|
1,781,331 |
|
Net Assets |
|
$ 82,880,499 |
|
Net Assets consist of: |
|
|
|
Paid in capital |
|
$ 94,473,990 |
|
Undistributed net investment income |
|
870,134 |
|
Accumulated undistributed net realized gain (loss) on investments and foreign currency transactions |
|
(18,956,877) |
|
Net unrealized appreciation (depreciation) on investments and assets and liabilities in foreign currencies |
|
6,493,252 |
|
Net Assets |
|
$ 82,880,499 |
See accompanying notes which are an integral part of the financial statements.
Semiannual Report
Financial Statements - continued
Statement of Assets and Liabilities - continued
|
|
June 30, 2000 (Unaudited) |
|
|
Calculation of Maximum Offering Price |
|
$10.12 |
|
Maximum offering price per share (100/95.25 of 10.12) |
|
$10.62 |
|
Class T: |
|
$10.11 |
|
Maximum offering price per share (100/96.50 of 10.11) |
|
$10.48 |
|
Class B: |
|
$10.16 |
|
Class C: |
|
$10.15 |
|
Institutional Class: |
|
$10.06 |
A Redemption price per share is equal to net asset value less any applicable contingent deferred sales charge.
See accompanying notes which are an integral part of the financial statements.
Semiannual Report
Financial Statements - continued
Statement of Operations
|
|
Six months ended June 30, 2000 (Unaudited) |
|
|
Investment Income Dividends |
|
$ 11,282 |
|
Interest |
|
4,071,824 |
|
|
|
4,083,106 |
|
Less foreign taxes withheld |
|
(931) |
|
Total income |
|
4,082,175 |
|
Expenses |
|
|
|
Management fee |
$ 284,329 |
|
|
Transfer agent fees |
100,061 |
|
|
Distribution fees |
171,663 |
|
|
Accounting fees and expenses |
30,093 |
|
|
Non-interested trustees' compensation |
132 |
|
|
Custodian fees and expenses |
26,404 |
|
|
Registration fees |
52,347 |
|
|
Audit |
15,441 |
|
|
Legal |
2,263 |
|
|
Miscellaneous |
2,222 |
|
|
Total expenses before reductions |
684,955 |
|
|
Expense reductions |
(11,246) |
673,709 |
|
Net investment income |
|
3,408,466 |
|
Realized and Unrealized Gain (Loss) Net realized gain (loss) on: |
|
|
|
Investment securities |
6,316,866 |
|
|
Foreign currency transactions |
(2,422) |
6,314,444 |
|
Change in net unrealized appreciation (depreciation) on: |
|
|
|
Investment securities |
(2,665,531) |
|
|
Assets and liabilities in foreign currencies |
7,168 |
(2,658,363) |
|
Net gain (loss) |
|
3,656,081 |
|
Net increase (decrease) in net assets resulting |
|
$ 7,064,547 |
See accompanying notes which are an integral part of the financial statements.
Semiannual Report
Financial Statements - continued
Statement of Changes in Net Assets
|
|
Six months ended
June 30, 2000 |
Year ended
December 31, |
|
Increase (Decrease) in Net Assets |
|
|
|
Operations |
$ 3,408,466 |
$ 7,066,489 |
|
Net realized gain (loss) |
6,314,444 |
2,942,521 |
|
Change in net unrealized appreciation (depreciation) |
(2,658,363) |
13,270,548 |
|
Net increase (decrease) in net assets resulting |
7,064,547 |
23,279,558 |
|
Distributions to shareholders |
(2,871,256) |
(6,921,285) |
|
Share transactions - net increase (decrease) |
(6,400,954) |
(6,842,513) |
|
Total increase (decrease) in net assets |
(2,207,663) |
9,515,760 |
|
Net Assets |
|
|
|
Beginning of period |
85,088,162 |
75,572,402 |
|
End of period (including undistributed net investment income of $870,134 and $332,924, respectively) |
$ 82,880,499 |
$ 85,088,162 |
See accompanying notes which are an integral part of the financial statements.
Semiannual Report
Financial Highlights - Class A
|
|
Six months ended June 30, 2000 |
Years ended December 31, |
|||
|
|
(Unaudited) |
1999 |
1998 |
1997 |
1996 E |
|
Selected Per-Share Data |
|
|
|
|
|
|
Net asset value, beginning |
$ 9.680 |
$ 7.780 |
$ 11.120 |
$ 11.720 |
$ 10.520 |
|
Income from Investment Operations |
|
|
|
|
|
|
Net investment income D |
.412 |
.821 |
.943 |
.953 |
.274 |
|
Net realized and |
.381 |
1.884 |
(3.275) |
.891 |
1.574 |
|
Total from investment |
.793 |
2.705 |
(2.332) |
1.844 |
1.848 |
|
Less Distributions |
|
|
|
|
|
|
From net investment income |
(.353) |
(.805) |
(.834) |
(.984) |
(.238) |
|
From net realized gain |
- |
- |
- |
(1.460) |
(.410) |
|
Return of capital |
- |
- |
(.174) |
- |
- |
|
Total distributions |
(.353) |
(.805) |
(1.008) |
(2.444) |
(.648) |
|
Net asset value, |
$ 10.120 |
$ 9.680 |
$ 7.780 |
$ 11.120 |
$ 11.720 |
|
Total Return B, C |
8.30% |
36.35% |
(21.94)% |
16.52% |
17.71% |
|
Ratios and Supplemental Data |
|
|
|
|
|
|
Net assets, end of period (000 omitted) |
$ 3,501 |
$ 2,140 |
$ 2,829 |
$ 2,313 |
$ 478 |
|
Ratio of expenses to |
1.40% A, F |
1.40% F |
1.40% F |
1.40% F |
1.40% A, F |
|
Ratio of expenses to |
1.38% A, G |
1.40% |
1.39% G |
1.38% G |
1.40% A |
|
Ratio of net investment income to average net assets |
8.38% A |
9.57% |
10.05% |
7.74% |
7.31% A |
|
Portfolio turnover rate |
317% A |
275% |
514% |
660% |
410% |
A Annualized
B The total returns would have been lower had certain expenses not been reduced during the periods shown.
C Total returns do not include the one time sales charge and for periods of less than one year are not annualized.
D Net investment income per share has been calculated based on average shares outstanding during the period.
E For the period September 3, 1996 (commencement of sale of Class A shares) to December 31, 1996.
F FMR agreed to reimburse a portion of the class' expenses during the period. Without this reimbursement, the class' expense ratio would have been higher.
G FMR or the fund has entered into varying arrangements with third parties who either paid or reduced a portion of the class' expenses.
See accompanying notes which are an integral part of the financial statements.
Semiannual Report
Financial Highlights - Class T
|
|
Six months ended June 30, 2000 |
Years ended December 31, |
||||
|
|
(Unaudited) |
1999 |
1998 |
1997 |
1996 |
1995 |
|
Selected Per-Share Data |
|
|
|
|
|
|
|
Net asset value,
beginning |
$ 9.670 |
$ 7.770 |
$ 11.110 |
$ 11.710 |
$ 9.280 |
$ 9.520 |
|
Income from Investment Operations |
|
|
|
|
|
|
|
Net investment |
.413 D |
.815 D |
.975 D |
.877 D |
.758 D |
.860 |
|
Net realized |
.375 |
1.886 |
(3.319) |
.961 |
2.832 |
(.323) |
|
Total from invest-ment operations |
.788 |
2.701 |
(2.344) |
1.838 |
3.590 |
.537 |
|
Less Distributions |
|
|
|
|
|
|
|
From net invest- |
(.348) |
(.801) |
(.824) |
(.978) |
(.750) |
(.777) |
|
From net |
- |
- |
- |
(1.460) |
(.410) |
- |
|
Return of capital |
- |
- |
(.172) |
- |
- |
- |
|
Total distributions |
(.348) |
(.801) |
(.996) |
(2.438) |
(1.160) |
(.777) |
|
Net asset value, |
$ 10.110 |
$ 9.670 |
$ 7.770 |
$ 11.110 |
$ 11.710 |
$ 9.280 |
|
Total Return B, C |
8.26% |
36.34% |
(22.07)% |
16.47% |
40.41% |
6.99% |
|
Ratios and Supplemental Data |
|
|
|
|
|
|
|
Net assets, end |
$ 49,602 |
$ 55,715 |
$ 53,643 |
$ 93,228 |
$ 78,861 |
$ 36,205 |
|
Ratio of expenses |
1.47% A |
1.42% |
1.50% |
1.47% |
1.49% |
1.50% E |
|
Ratio of expenses to average net assets after expense reductions |
1.45% A, F |
1.42% |
1.48% F |
1.45% F |
1.48% F |
1.50% |
|
Ratio of net invest- |
8.31% A |
9.54% |
9.96% |
7.08% |
7.23% |
9.32% |
|
Portfolio |
317% A |
275% |
514% |
660% |
410% |
305% |
A Annualized
B The total returns would have been lower had certain expenses not been reduced during the periods shown.
C Total returns do not include the one time sales charge and for periods of less than one year are not annualized.
D Net investment income per share has been calculated based on average shares outstanding during the period.
E FMR agreed to reimburse a portion of the class' expenses during the period. Without this reimbursement, the class' expense ratio would have been higher.
F FMR or the fund has entered into varying arrangements with third parties who either paid or reduced a portion of the class' expenses.
See accompanying notes which are an integral part of the financial statements.
Semiannual Report
Financial Highlights - Class B
|
|
Six months ended June 30, 2000 |
Years ended December 31, |
||||
|
|
(Unaudited) |
1999 |
1998 |
1997 |
1996 |
1995 |
|
Selected Per-Share Data |
|
|
|
|
|
|
|
Net asset value,
beginning |
$ 9.720 |
$ 7.800 |
$ 11.160 |
$ 11.750 |
$ 9.300 |
$ 9.520 |
|
Income from Investment Operations |
|
|
|
|
|
|
|
Net invesment |
.380 D |
.761 D |
.907 D |
.806 D |
.686 D |
.835 |
|
Net realized and unrealized gain (loss) |
.376 |
1.904 |
(3.334) |
.956 |
2.853 |
(.342) |
|
Total from investment operations |
.756 |
2.665 |
(2.427) |
1.762 |
3.539 |
.493 |
|
Less Distributions |
|
|
|
|
|
|
|
From net invest-ment income |
(.316) |
(.745) |
(.772) |
(.892) |
(.679) |
(.713) |
|
From net |
- |
- |
- |
(1.460) |
(.410) |
- |
|
Return of capital |
- |
- |
(.161) |
- |
- |
- |
|
Total distributions |
(.316) |
(.745) |
(.933) |
(2.352) |
(1.089) |
(.713) |
|
Net asset value, |
$ 10.160 |
$ 9.720 |
$ 7.800 |
$ 11.160 |
$ 11.750 |
$ 9.300 |
|
Total Return B, C |
7.87% |
35.58% |
(22.66)% |
15.70% |
39.61% |
6.38% |
|
Ratios and Supplemental Data |
|
|
|
|
|
|
|
Net assets, |
$ 20,458 |
$ 19,054 |
$ 16,703 |
$ 23,576 |
$ 17,746 |
$ 9,486 |
|
Ratio of expenses |
2.15% A, E |
2.10% |
2.15% E |
2.15% |
2.15% E |
2.25% E |
|
Ratio of expenses to average net assets after expense reductions |
2.13% A, F |
2.10% |
2.13% F |
2.13% F |
2.15% |
2.25% |
|
Ratio of net invest- |
7.63% A |
8.86% |
9.36% |
6.48% |
6.56% |
8.48% |
|
Portfolio |
317% A |
275% |
514% |
660% |
410% |
305% |
A Annualized
B The total returns would have been lower had certain expenses not been reduced during the periods shown.
C Total returns do not include the contingent deferred sales charge and for periods of less than one year are not annualized.
D Net investment income per share has been calculated based on average shares outstanding during the period.
E FMR agreed to reimburse a portion of the class' expenses during the period. Without this reimbursement, the class' expense ratio would have been higher.
F FMR or the fund has entered into varying arrangements with third parties who either paid or reduced a portion of the class' expenses.
See accompanying notes which are an integral part of the financial statements.
Semiannual Report
Financial Highlights - Class C
|
|
Six months ended June 30, 2000 |
Years ended December 31, |
||
|
|
(Unaudited) |
1999 |
1998 |
1997 E |
|
Selected Per-Share Data |
|
|
|
|
|
Net asset value, beginning of period |
$ 9.700 |
$ 7.790 |
$ 11.110 |
$ 12.190 |
|
Income from Investment Operations |
|
|
|
|
|
Net investment income D |
.373 |
.750 |
.792 |
.154 |
|
Net realized and unrealized |
.389 |
1.893 |
(3.191) |
.322 |
|
Total from investment operations |
.762 |
2.643 |
(2.399) |
.476 |
|
Less Distributions |
|
|
|
|
|
From net investment income |
(.312) |
(.733) |
(.762) |
(.286) |
|
From net realized gain |
- |
- |
- |
(1.270) |
|
Return of capital |
- |
- |
(.159) |
- |
|
Total distributions |
(.312) |
(.733) |
(.921) |
(1.556) |
|
Net asset value, end of period |
$ 10.150 |
$ 9.700 |
$ 7.790 |
$ 11.110 |
|
Total Return B, C |
7.94% |
35.31% |
(22.47)% |
4.16% |
|
Ratios and Supplemental Data |
|
|
|
|
|
Net assets, end of period (000 omitted) |
$ 2,844 |
$ 2,402 |
$ 964 |
$ 66 |
|
Ratio of expenses to average net assets |
2.25% A, F |
2.23% |
2.25% F |
2.25% A, F |
|
Ratio of expenses to average net assets after expense reductions |
2.23% A, G |
2.23% |
2.23% G |
2.25% A |
|
Ratio of net investment income to |
7.53% A |
8.73% |
9.30% |
9.04% A |
|
Portfolio turnover rate |
317% A |
275% |
514% |
660% |
A Annualized
B The total returns would have been lower had certain expenses not been reduced during the periods shown.
C Total returns do not include the contingent deferred sales charge and for periods of less than one year are not annualized.
D Net investment income per share has been calculated based on average shares outstanding during the period.
E For the period November 3, 1997 (commencement of sale of Class C shares) to December 31, 1997.
F FMR agreed to reimburse a portion of the class' expenses during the period. Without this reimbursement, the class' expense ratio would have been higher.
G FMR or the fund has entered into varying arrangements with third parties who either paid or reduced a portion of the class' expenses.
See accompanying notes which are an integral part of the financial statements.
Semiannual Report
Financial Highlights - Institutional Class
|
|
Six months ended June 30, 2000 |
Years ended December 31, |
||||
|
|
(Unaudited) |
1999 |
1998 |
1997 |
1996 |
1995 E |
|
Selected Per-Share Data |
|
|
|
|
|
|
|
Net asset value, beginning of period |
$ 9.620 |
$ 7.740 |
$ 11.060 |
$ 11.650 |
$ 9.280 |
$ 8.400 |
|
Income from Investment Operations |
|
|
|
|
|
|
|
Net investment income |
.425 D |
.837 D |
.931 D |
.860 D |
.786 D |
.393 |
|
Net realized and unrealized gain (loss) |
.381 |
1.868 |
(3.229) |
1.008 |
2.779 |
.876 |
|
Total from investment operations |
.806 |
2.705 |
(2.298) |
1.868 |
3.565 |
1.269 |
|
Less Distributions |
|
|
|
|
|
|
|
From net invest-ment income |
(.366) |
(.825) |
(.846) |
(.998) |
(.785) |
(.389) |
|
From net |
- |
- |
- |
(1.460) |
(.410) |
- |
|
Return of capital |
- |
- |
(.176) |
- |
- |
- |
|
Total distributions |
(.366) |
(.825) |
(1.022) |
(2.458) |
(1.195) |
(.389) |
|
Net asset value, end of period |
$ 10.060 |
$ 9.620 |
$ 7.740 |
$ 11.060 |
$ 11.650 |
$ 9.280 |
|
Total Return B, C |
8.49% |
36.59% |
(21.75)% |
16.84% |
40.21% |
15.52% |
|
Ratios and Supplemental Data |
|
|
|
|
|
|
|
Net assets, |
$ 6,475 |
$ 5,778 |
$ 1,434 |
$ 1,320 |
$ 2,639 |
$ 201 |
|
Ratio of expenses to average net assets |
1.15% A |
1.14% |
1.25% F |
1.25% F |
1.25% F |
1.25% A, F |
|
Ratio of expenses to average net assets after expense reductions |
1.12% A, G |
1.13% G |
1.24% G |
1.23% G |
1.25% |
1.25% A |
|
Ratio of net invest- |
8.64% A |
9.83% |
10.02% |
6.85% |
7.46% |
9.09% A |
|
Portfolio |
317% A |
275% |
514% |
660% |
410% |
305% |
A Annualized
B Total returns for periods of less than one year are not annualized.
C The total returns would have been lower had certain expenses not been reduced during the periods shown.
D Net investment income per share has been calculated based on average shares outstanding during the period.
E For the period July 3, 1995 (commencement of sale of Institutional Class shares) to December 31, 1995.
F FMR agreed to reimburse a portion of the class' expenses during the period. Without this reimbursement, the class' expense ratio would have been higher.
G FMR or the fund has entered into varying arrangements with third parties who either paid or reduced a portion of the class' expenses.
See accompanying notes which are an integral part of the financial statements.
Semiannual Report
For the period ended June 30, 2000 (Unaudited)
1. Significant Accounting Policies.
Fidelity Advisor Emerging Markets Income Fund (the fund) is a fund of Fidelity Advisor Series VIII (the trust) and is authorized to issue an unlimited number of shares. The trust is registered under the Investment Company Act of 1940, as amended (the 1940 Act), as an open-end management investment company organized as a Massachusetts business trust.
The fund offers Class A, Class T, Class B, Class C, and Institutional Class shares, each of which has equal rights as to assets and voting privileges. Each class has exclusive voting rights with respect to matters that affect that class. Class B shares will automatically convert to Class A shares after a holding period of seven years from the initial date of purchase. Investment income, realized and unrealized capital gains and losses, the common expenses of the fund, and certain fund-level expense reductions, if any, are allocated on a pro rata basis to each class based on the relative net assets of each class to the total net assets of the fund. Each class of shares differs in its respective distribution, transfer agent, and certain other class-specific fees, expenses, and expense reductions.
The financial statements have been prepared in conformity with generally accepted accounting principles which require management to make certain estimates and assumptions at the date of the financial statements. The following summarizes the significant accounting policies of the fund:
Security Valuation. Securities for which quotations are readily available are valued at the last sale price, or if no sale price, at the closing bid price in the principal market in which such securities are normally traded. Securities (including restricted securities) for which quotations are not readily available are valued primarily using dealer-supplied valuations or at their fair value as determined in good faith under consistently applied procedures under the general supervision of the Board of Trustees. Short-term securities with remaining maturities of sixty days or less for which quotations are not readily available are valued at amortized cost or original cost plus accrued interest, both of which approximate current value.
Foreign Currency Translation. The accounting records of the fund are maintained in U.S. dollars. Investment securities and other assets and liabilities denominated in a foreign currency are translated into U.S. dollars at the prevailing rates of exchange at period end. Purchases and sales of securities, income receipts and expense payments are translated into U.S. dollars at the prevailing exchange rate on the respective dates of the transactions.
Net realized gains and losses on foreign currency transactions represent net gains and losses from sales and maturities of foreign currency contracts and foreign currency options, disposition of foreign currencies, the difference between the amount of net investment income accrued and the U.S. dollar amount actually received, and gains
Semiannual Report
Notes to Financial Statements (Unaudited) - continued
1. Significant Accounting Policies - continued
Foreign Currency Translation - continued
and losses between trade and settlement date on purchases and sales of securities. The effects of changes in foreign currency exchange rates on investments in securities are included with the net realized and unrealized gain or loss on investment securities.
Income Taxes. As a qualified regulated investment company under Subchapter M of the Internal Revenue Code, the fund is not subject to U.S. federal income taxes to the extent that it distributes substantially all of its taxable income for its fiscal year. The fund may be subject to foreign taxes on income and gains on investments which are accrued based upon the fund's understanding of the tax rules and regulations that exist in the markets in which it invests. Foreign governments may also impose taxes on other payments or transactions with respect to foreign securities. The fund accrues such taxes as applicable. The schedule of investments includes information regarding income taxes under the caption "Income Tax Information."
Investment Income. Dividend income is recorded on the ex-dividend date, except certain dividends from foreign securities where the ex-dividend date may have passed, are recorded as soon as the fund is informed of the ex-dividend date. Non-cash dividends included in dividend income, if any, are recorded at the fair market value of the securities received. Interest income, which includes accretion of original issue discount, is accrued as earned. Investment income is recorded net of foreign taxes withheld where recovery of such taxes is uncertain. The fund may place a debt obligation on non-accrual status and reduce related interest income by ceasing current accruals and writing off interest receivables when the collection of all or a portion of interest has become doubtful based on consistently applied procedures, under the general supervision of the Board of Trustees of the fund. A debt obligation is removed from non-accrual status when the issuer resumes interest payments or when collectibility of interest is reasonably assured.
Expenses. Most expenses of the trust can be directly attributed to a fund. Expenses which cannot be directly attributed are apportioned among the funds in the trust.
Distributions to Shareholders. Distributions are declared daily and paid monthly from net investment income. Distributions from realized gains, if any, are recorded on the ex-dividend date. Income dividends and capital gain distributions are declared separately for each class.
Income and capital gain distributions are determined in accordance with income tax regulations which may differ from generally accepted accounting principles. These differences, which may result in distribution reclassifications, are primarily due to differing treatments for foreign currency transactions, market discount, capital loss carryforwards and losses deferred due to wash sales and excise tax regulations.
Semiannual Report
Notes to Financial Statements (Unaudited) - continued
1. Significant Accounting Policies - continued
Distributions to Shareholders - continued
Permanent book and tax basis differences relating to shareholder distributions will result in reclassifications to paid in capital. Undistributed net investment income and accumulated undistributed net realized gain (loss) on investments and foreign currency transactions may include temporary book and tax basis differences which will reverse in a subsequent period. Any taxable income or gain remaining at fiscal year end is distributed in the following year.
Security Transactions. Security transactions are accounted for as of trade date. Gains and losses on securities sold are determined on the basis of identified cost.
2. Operating Policies.
Foreign Currency Contracts. The fund generally uses foreign currency contracts to facilitate transactions in foreign-denominated securities. Losses may arise from changes in the value of the foreign currency or if the counterparties do not perform under the contracts' terms. The U.S. dollar value of foreign currency contracts is determined using contractual currency exchange rates established at the time of each trade.
Joint Trading Account. Pursuant to an Exemptive Order issued by the Securities and Exchange Commission (the SEC), the fund, along with other affiliated entities of Fidelity Management & Research Company (FMR), may transfer uninvested cash balances into one or more joint trading accounts. These balances are invested in one or more repurchase agreements for U.S. Treasury or Federal Agency obligations.
Repurchase Agreements. The underlying U.S. Treasury, Federal Agency, or other obligations found to be satisfactory by FMR are transferred to an account of the fund, or to the Joint Trading Account, at a bank custodian. The securities are marked-to-market daily and maintained at a value at least equal to the principal amount of the repurchase agreement (including accrued interest). FMR, the fund's investment adviser, is responsible for determining that the value of the underlying securities remains in accordance with the market value requirements stated above.
Options. The fund may use options to manage its exposure to the bond market and to fluctuations in interest rates and currency values. Writing puts and buying calls tend to increase the fund's exposure to the underlying instrument. Buying puts and writing calls tend to decrease the fund's exposure to the underlying instrument, or hedge other fund investments. The underlying face amount at value of any open options at period end is shown in the schedule of investments under the caption "Purchased Options." This amount reflects each contract's exposure to the underlying instrument at period end. Losses may arise from changes in the value of the underlying instruments, if there is an illiquid secondary market for the contracts, or if the counterparties do not perform under the
Semiannual Report
Notes to Financial Statements (Unaudited) - continued
2. Operating Policies - continued
Options - continued
contracts' terms. Gains and losses are realized upon the expiration or closing of the options. Realized gains (losses) on purchased options are included in realized gains (losses) on investment securities, except purchased options on foreign currency which are included in realized gains (losses) on foreign currency transactions.
Exchange-traded options are valued using the last sale price or, in the absence of a sale, the last offering price. Options traded over-the-counter are valued using dealer-supplied valuations.
Restricted Securities. The fund is permitted to invest in securities that are subject to legal or contractual restrictions on resale. These securities generally may be resold in transactions exempt from registration or to the public if the securities are registered. Disposal of these securities may involve time-consuming negotiations and expense, and prompt sale at an acceptable price may be difficult. At the end of the period, the fund had no investments in restricted securities (excluding 144A issues).
Loans and Other Direct Debt Instruments. The fund is permitted to invest in loans and loan participations, trade claims or other receivables. These investments may include standby financing commitments that obligate the fund to supply additional cash to the borrower on demand. Loan participations involve a risk of insolvency of the lending bank or other financial intermediary. At the end of the period, these investments amounted to $6,686,897 or 8.1% of net assets.
3. Purchases and Sales of Investments.
Purchases and sales of securities, other than short-term securities, aggregated $116,102,554 and $123,160,336, respectively.
4. Fees and Other Transactions with Affiliates.
Management Fee. As the fund's investment adviser, FMR receives a monthly fee that is calculated on the basis of a group fee rate plus a fixed individual fund fee rate applied to the average net assets of the fund. The group fee rate is the weighted average of a series of rates and is based on the monthly average net assets of all the mutual funds advised by FMR. The rates ranged from .0920% to .3700% for the period. The annual individual fund fee rate is .55%. In the event that these rates were lower than the contractual rates in effect during the period, FMR voluntarily implemented the above rates, as they resulted in the same or a lower management fee. For the period, the management fee was equivalent to an annualized rate of .68% of average net assets.
Semiannual Report
Notes to Financial Statements (Unaudited) - continued
4. Fees and Other Transactions with Affiliates - continued
Sub-Adviser Fee. FMR, on behalf of the fund, entered into sub-advisory agreements with Fidelity Management & Research (U.K.) Inc., Fidelity Management & Research (Far East) Inc., Fidelity International Investment Advisors (FIIA) and Fidelity Investments Japan Limited (FIJ). Under the sub-advisory arrangements, FMR may receive investment advice and research services and may grant the sub-advisers investment management authority to buy and sell securities. FMR pays its sub-advisers either a portion of its management fee or a fee based on costs incurred for these services.
Distribution and Service Plan. In accordance with Rule 12b-1 of the 1940 Act, the Board of Trustees has adopted separate Distribution and Service Plans with respect to each class of shares (collectively referred to as "the Plans"). Under certain of the Plans, the class pays Fidelity Distributors Corporation (FDC), an affiliate of FMR, a 12b-1 fee. A portion of this fee may be reallowed to securities dealers, banks and other financial institutions for the distribution of each class of shares and providing shareholder support services. For the period, this fee was based on the following annual rates of the average net assets of each applicable class:
|
Class A |
.15% |
|
Class T |
.25% |
|
Class B |
.90%* |
|
Class C |
1.00%* * |
* .65% represents a distribution fee and .25% represents a shareholder service fee.
* * .75% represents a distribution fee and .25% represents a shareholder service fee.
For the period, each class paid FDC the following amounts, a portion of which was retained by FDC:
|
|
Paid to |
Retained |
|
Class A |
$ 2,046 |
$ 9 |
|
Class T |
65,352 |
7,125 |
|
Class B |
90,487 |
65,486 |
|
Class C |
13,778 |
6,048 |
|
|
$ 171,663 |
$ 78,668 |
Sales Load. FDC receives a front-end sales charge of up to 4.75% for selling Class A shares, and 3.50% for selling Class T shares of the fund. FDC receives the proceeds of contingent deferred sales charges levied on Class B share redemptions occurring within six years of purchase and Class C share redemptions occurring within one year of purchase. Contingent deferred sales charges are based on declining rates ranging from 5% to 1% for Class B and 1% for Class C, of the lesser of the cost of shares at the initial date of purchase or the net asset value of the redeemed shares, excluding any reinvested dividends and capital gains.
Semiannual Report
Notes to Financial Statements (Unaudited) - continued
4. Fees and Other Transactions with Affiliates - continued
Sales Load - continued
In addition, purchases of Class A and Class T shares that were subject to a finder's fee bear a contingent deferred sales charge on assets that do not remain in the fund for at least one year. The Class A and Class T contingent deferred sales charge is based on 0.25% of the lesser of the cost of shares at the initial date of purchase or the net asset value of the redeemed shares, excluding any reinvested dividends and capital gains. A portion of the sales charges paid to FDC is paid to securities dealers, banks and other financial institutions.
For the period, sales charge amounts paid to and retained by FDC were as follows:
|
|
Paid to |
Retained |
|
Class A |
$ 12,631 |
$ 2,516 |
|
Class T |
19,943 |
5,652 |
|
Class B |
22,383 |
22,383* |
|
Class C |
1,315 |
1,315* |
|
|
$ 56,272 |
$ 31,866 |
* When Class B and Class C shares are initially sold, FDC pays commissions from its own resources to securities dealers,
banks, and other financial institutions through which the sales are made.
Transfer Agent Fees. Fidelity Investments Institutional Operations Company, Inc., (FIIOC), an affiliate of FMR, is the transfer, dividend disbursing and shareholder servicing agent (collectively referred to as the transfer agent) for each class of the fund. FIIOC receives account fees and asset-based fees that vary according to the account size and type of account of the shareholders of the respective classes of the fund. FIIOC pays for typesetting, printing and mailing of all shareholder reports, except proxy statements. For the period, the following amounts were paid to FIIOC:
|
|
Amount |
% of |
|
Class A |
$ 4,289 |
.32 |
|
Class T |
60,554 |
.23 |
|
Class B |
26,422 |
.26 |
|
Class C |
3,813 |
.28 |
|
Institutional Class |
4,983 |
.16 |
|
|
$ 100,061 |
|
* Annualized.
Accounting Fees. Fidelity Service Company, Inc. (FSC), an affiliate of FMR, maintains the fund's accounting records. The fee is based on the level of average net assets for the month plus out-of-pocket expenses.
Semiannual Report
Notes to Financial Statements (Unaudited) - continued
5. Expense Reductions.
FMR voluntarily agreed to reimburse operating expenses (excluding interest, taxes, certain securities lending fees, brokerage commissions and extraordinary expenses, if any) above the following annual rates or range of annual rates of average net assets for each of the following classes:
|
|
FMR |
Reimbursement |
|
Class A |
1.40% |
$ 696 |
|
Class B |
2.15% |
370 |
|
Class C |
2.25% |
243 |
|
|
|
$ 1,309 |
In addition, through an arrangement with the fund's custodian, credits realized as a result of uninvested cash balances were used to reduce a portion of the fund's expenses. During the period, the fund's custodian fees were reduced by $9,937 under this arrangement.
6. Credit Risk.
The fund's relatively large investment in countries with limited or developing capital markets may involve greater risks than investments in more developed markets and the prices of such investments may be volatile. The yields of emerging market debt obligations reflect, among other things, perceived credit risk. The consequences of political, social or economic changes in these markets may have disruptive effects on the market prices of the fund's investments and the income they generate, as well as the fund's ability to repatriate such amounts.
7. Distributions to Shareholders.
Distributions to shareholders of each class were as follows:
|
|
Six months ended June 30, |
Year ended December 31, |
|
|
2000 |
1999 |
|
From net investment income |
|
|
|
Class A |
$ 96,552 |
$ 198,550 |
|
Class T |
1,822,339 |
4,792,465 |
|
Class B |
635,118 |
1,508,455 |
|
Class C |
85,879 |
159,916 |
|
Institutional Class |
231,368 |
261,899 |
|
Total |
$ 2,871,256 |
$ 6,921,285 |
Semiannual Report
Notes to Financial Statements (Unaudited) - continued
8. Share Transactions.
Transactions for each class of shares were as follows:
|
|
Shares |
Dollars |
||
|
|
Six months ended June 30, |
Year ended December 31, |
Six months ended June 30, |
Year ended December 31, |
|
|
2000 |
1999 |
2000 |
1999 |
|
|
|
|
|
|
|
Class A |
140,303 |
85,049 |
$ 1,398,174 |
$ 725,615 |
|
Reinvestment of distributions |
9,012 |
19,735 |
89,943 |
172,036 |
|
Shares redeemed |
(24,163) |
(247,480) |
(242,710) |
(1,984,096) |
|
Net increase (decrease) |
125,152 |
(142,696) |
$ 1,245,407 |
$ (1,086,445) |
|
Class T |
1,093,245 |
2,796,838 |
$ 10,916,260 |
$ 23,706,190 |
|
Reinvestment of distributions |
154,606 |
476,741 |
1,539,059 |
4,150,699 |
|
Shares redeemed |
(2,100,954) |
(4,418,691) |
(21,389,339) |
(37,034,387) |
|
Net increase (decrease) |
(853,103) |
(1,145,112) |
$ (8,934,020) |
$ (9,177,498) |
|
Class B |
340,671 |
565,451 |
$ 3,417,142 |
$ 4,858,849 |
|
Reinvestment of distributions |
50,008 |
134,352 |
500,722 |
1,179,380 |
|
Shares redeemed |
(337,553) |
(879,623) |
(3,396,744) |
(7,521,597) |
|
Net increase (decrease) |
53,126 |
(179,820) |
$ 521,120 |
$ (1,483,368) |
|
Class C |
109,265 |
255,248 |
$ 1,089,435 |
$ 2,187,018 |
|
Reinvestment of distributions |
6,434 |
12,291 |
64,450 |
108,919 |
|
Shares redeemed |
(83,026) |
(143,693) |
(819,964) |
(1,240,277) |
|
Net increase (decrease) |
32,673 |
123,846 |
$ 333,921 |
$ 1,055,660 |
|
Institutional Class |
154,366 |
749,979 |
$ 1,545,072 |
$ 6,571,465 |
|
Reinvestment of distributions |
21,965 |
24,724 |
218,052 |
223,316 |
|
Shares redeemed |
(133,551) |
(359,249) |
(1,330,506) |
(2,945,643) |
|
Net increase (decrease) |
42,780 |
415,454 |
$ 432,618 |
$ 3,849,138 |
Semiannual Report
Investment Adviser
Fidelity Management & Research Company
Boston, MA
Investment Sub-Adviser
Fidelity Management & Research
(U.K.) Inc.
Fidelity Management & Research
(Far East) Inc.
Fidelity Investments Japan Limited
Fidelity International Investment Advisors
Fidelity International Investment
Advisors (U.K.) Limited
Officers
Edward C. Johnson 3d, President
Robert C. Pozen, Senior Vice President
Robert A. Lawrence, Vice President
John H. Carlson, Vice President
Eric D. Roiter, Secretary
Robert A. Dwight, Treasurer
Maria F. Dwyer, Deputy Treasurer
John H. Costello, Assistant Treasurer
Board of Trustees
Ralph F. Cox *
Phyllis Burke Davis *
Robert M. Gates *
Edward C. Johnson 3d
Donald J. Kirk *
Ned C. Lautenbach *
Peter S. Lynch
Marvin L. Mann *
William O. McCoy *
Gerald C. McDonough *
Robert C. Pozen
Thomas R. Williams *
* Independent trustees
Advisory Board
J. Michael Cook
Abigail P. Johnson
Marie L. Knowles
General Distributor
Fidelity Distributors Corporation
Boston, MA
Transfer and Shareholder
Servicing Agent
Fidelity Investments Institutional Operations Company, Inc.
Boston, MA
Custodian
The Chase Manhattan Bank
New York, NY
EMI-SANN-0800 109090
1.705745.102
(Fidelity Investment logo)(registered trademark)
Corporate Headquarters
82 Devonshire St., Boston, MA 02109
www.fidelity.com
(Fidelity Investment logo)(registered trademark)
(2_fidelity_logos)Fidelity ® Advisor
Semiannual Report
June 30, 2000
|
President's Message |
3 |
Ned Johnson on investing strategies. |
|
Performance |
4 |
How the fund has done over time. |
|
Fund Talk |
9 |
The manager's review of fund performance, strategy and outlook. |
|
Investment Changes |
12 |
A summary of major shifts in the fund's investments over the past six months. |
|
Investments |
13 |
A complete list of the fund's investments with their market values. |
|
Financial Statements |
21 |
Statements of assets and liabilities,
operations, and changes in net assets, |
|
Notes |
30 |
Notes to financial statements. |
|
|
|
|
|
|
|
|
Standard & Poor's, S&P and S&P 500 are registered service marks of The McGraw-Hill Companies, Inc. and have been licensed for use by Fidelity Distributors Corporation.
Other third party marks appearing herein are the property of their respective owners.
All other marks appearing herein are registered or unregistered trademarks or service marks of FMR Corp. or an affiliated company.
(Recycle graphic) This report is printed on recycled paper using soy-based inks.
This report and the financial statements contained herein are submitted for the general information of the shareholders of the fund. This report is not authorized for distribution to prospective investors in the fund unless preceded or accompanied by an effective prospectus.
Mutual fund shares are not deposits or obligations of, or guaranteed by, any depository institution. Shares are not insured by the FDIC, Federal Reserve Board or any other agency, and are subject to investment risks, including possible loss of principal amount invested.
Neither the fund nor Fidelity Distributors Corporation is a bank.
For more information on any Fidelity Advisor fund, including charges and expenses, contact your investment professional for a free prospectus. Read it carefully before you invest or send money.
Semiannual Report
(photo_of_Edward_C_Johnson_3d)
Dear Shareholder:
In stark contrast to the final six months of 1999, most major equity market indexes posted negative returns for the first half of 2000, due mainly to a correction in the technology sector during the second quarter. The majority of bond markets - with the notable exception of high yield - fared better, as Treasuries and non-Treasuries alike benefited as a haven from the volatility of stocks and riskier investment alternatives.
While it's impossible to predict the future direction of the markets with any degree of certainty, there are certain basic principles that can help investors plan for their future needs.
The longer your investment time frame, the less likely it is that you will be affected by short-term market volatility. A 10-year investment horizon appropriate for saving for a college education, for example, enables you to weather market cycles in a long-term fund, which may have a higher risk potential, but also has a higher potential rate of return.
An intermediate-length fund could make sense if your investment horizon is two to four years, while a short-term bond fund could be the right choice if you need your money in one or two years.
If your time horizon is less than a year, you might want to consider moving some of your bond investment into a money market fund. These funds seek income and a stable share price by investing in high-quality, short-term investments. Of course, it's important to remember that an investment in a money market fund is not insured or guaranteed by the Federal Deposit Insurance Corporation or any other government agency. Although money market funds seek to preserve the value of your investment at $1.00 per share, it is possible to lose money by investing in these types of funds.
Finally, no matter what your time horizon or portfolio diversity, it makes good sense to follow a regular investment plan, investing a certain amount of money in a fund at the same time each month or quarter and periodically reviewing your overall portfolio. By doing so, you won't get caught up in the excitement of a rapidly rising market, nor will you buy all your shares at market highs. While this strategy - known as dollar cost averaging - won't assure a profit or protect you from a loss in a declining market, it should help you lower the average cost of your purchases. Of course, you should consider your financial ability to continue your purchases through periods of low price levels before undertaking such a strategy.
Remember to contact your investment professional if you need help with your investments.
Best regards,
/s/Edward C. Johnson 3d
Edward C. Johnson 3d
Semiannual Report
Fidelity Advisor Emerging Markets Income Fund - Institutional Class
There are several ways to evaluate historical performance. You can look at the total percentage change in value, the average annual percentage change or the growth of a hypothetical $10,000 investment. Total return reflects the change in the value of an investment, assuming reinvestment of the class' dividend income and capital gains (the profits earned upon the sale of securities that have grown in value). You can also look at the class' income, as reflected in its yield, to measure performance. The initial offering of Institutional Class shares took place on July 3, 1995. Institutional Class shares are sold to eligible investors without a sales load or 12b-1 fee. Returns prior to July 3, 1995 are those of Class T, the original class of the fund, and reflect Class T shares' 0.25% 12b-1 fee. If Fidelity had not reimbursed certain class expenses, the past five year and life of fund total returns would have been lower.
Semiannual Report
Fidelity Advisor Emerging Markets Income Fund - Institutional Class
Performance - continued
Cumulative Total Returns
|
Periods ended June 30, 2000 |
Past 6 |
Past 1 |
Past 5 |
Life of |
|
Fidelity Adv Emerging Markets Income - Inst CL |
8.49% |
24.73% |
120.39% |
108.50% |
|
JP EMBI Global |
6.95% |
20.74% |
107.11% |
103.00% |
|
Emerging Markets Debt Funds Average |
6.45% |
20.74% |
93.67% |
n/a* |
Cumulative total returns show Institutional Class' performance in percentage terms over a set period - in this case, six months, one year, five years or since the fund started on March 10, 1994. For example, if you had invested $1,000 in a fund that had a 5% return over the past year, the value of your investment would be $1,050. You can compare Institutional Class' returns to those of the J.P. Morgan Emerging Markets Bond Index Global - a market value-weighted index of U.S. dollar denominated Brady bonds, Eurobonds, traded loans, and local market debt instruments issued by emerging markets sovereign and quasi-sovereign entities. The index currently covers 27 emerging market countries. To measure how Institutional Class' performance stacked up against its peers, you can compare it to the emerging markets debt funds average, which reflects the performance of mutual funds with similar objectives tracked by Lipper, Inc. The past six months average represents a peer group of 47 mutual funds. These benchmarks reflect reinvestment of dividends and capital gains, if any, and exclude the effect of sales charges.
* Not available
Semiannual Report
Fidelity Advisor Emerging Markets Income Fund - Institutional Class
Performance - continued
Average Annual Total Returns
|
Periods ended June 30, 2000 |
Past 1 |
Past 5 |
Life of |
|
Fidelity Adv Emerging Markets Income - Inst CL |
24.73% |
17.12% |
12.35% |
|
JP EMBI Global |
20.74% |
15.67% |
11.87% |
|
Emerging Markets Debt Funds Average |
20.74% |
13.89% |
n/a* |
Average annual total returns take Institutional Class' cumulative return and show you what would have happened if Institutional Class had performed at a constant rate each year. (Note: Lipper calculates average annual total returns by annualizing each fund's total return, then taking an arithmetic average. This may produce a different figure than that obtained by averaging the cumulative total returns and annualizing the result.)
* Not available
Semiannual Report
Fidelity Advisor Emerging Markets Income Fund - Institutional Class
Performance - continued
$10,000 Over Life of Fund
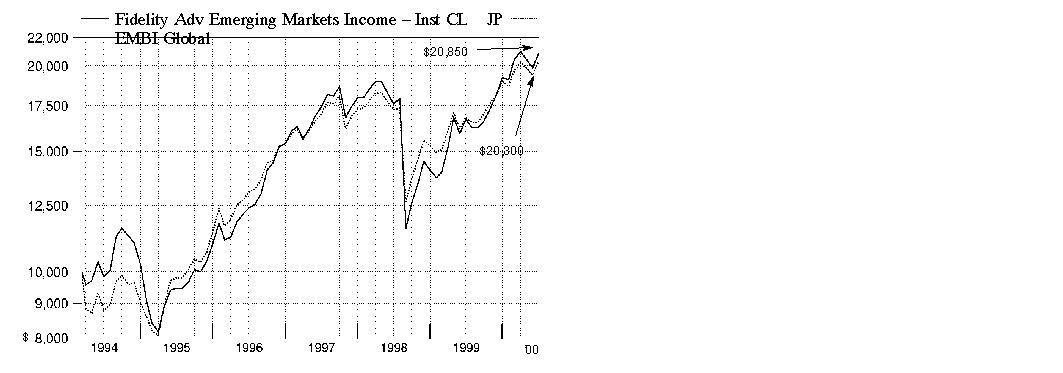
$10,000 Over Life of Fund: Let's say hypothetically that $10,000 was invested in Fidelity Advisor Emerging Markets Income Fund - Institutional Class on March 10, 1994, when the fund started. As the chart shows, by June 30, 2000, the value of the investment would have grown to $20,850 - a 108.50% increase on the initial investment. For comparison, look at how the J.P. Morgan Emerging Markets Bond Index Global did over the same period. With dividends and capital gains, if any, reinvested, the same JP EMBI Global would have grown to $20,300 a 103.00% increase.
Understanding
Performance
Many markets around the globe offer the potential for significant growth over time; however, investing in foreign markets means assuming greater risks than investing in the United States. Factors like changes in a country's financial markets, its local political and economic climate, and the fluctuating value of its currency create these risks. For these reasons an international fund's performance may be more volatile than a fund that invests exclusively in the United States. Past performance is no guarantee of future results and you may have a gain or loss when you sell your shares.
3Semiannual Report
Fidelity Advisor Emerging Markets Income Fund - Institutional Class
Performance - continued
Total Return Components
|
|
Six months ended June 30, |
Years ended December 31, |
July 3, 1995 |
|||
|
|
2000 |
1999 |
1998 |
1997 |
1996 |
1995 |
|
Dividend returns |
3.91% |
12.30% |
8.27% |
8.54% |
9.89% |
5.04% |
|
Capital returns |
4.58% |
24.29% |
-30.02% |
8.30% |
30.32% |
10.48% |
|
Total returns |
8.49% |
36.59% |
-21.75% |
16.84% |
40.21% |
15.52% |
Total return components include both dividend returns and capital returns. A dividend return reflects the actual dividends paid by the class. A capital return reflects both the amount paid by the class to shareholders as capital gain distributions and changes in the class' share price. Both returns assume the dividends or capital gains, if any, paid by the class are reinvested, and exclude the effects of sales charges.
Dividends and Yield
|
Periods ended June 30, 2000 |
Past 1 |
Past 6 |
Past 1 |
|
Dividends per share |
6.22 ¢ |
36.56 ¢ |
85.71 ¢ |
|
Annualized dividend rate |
7.58% |
7.38% |
9.14% |
|
30-day annualized yield |
8.17% |
- |
- |
Dividends per share show the income paid by the class for a set period. If you annualize this number, based on an average share price of $9.98 over the past one month, $9.93 over the past six months, and $9.38 over the past one year, you can compare the class' income distributions over these three periods. The 30-day annualized yield is a standard formula for all bond funds based on the yields of the bonds in the fund, averaged over the past 30 days. This figure shows you the yield characteristics of the fund's investments at the end of the period. It also helps you to compare funds from different companies on an equal basis.
Semiannual Report
Market Recap
As one of the best-performing asset classes of 1999, emerging markets continued that strength into 2000. But as U.S. equity markets sold off during the spring, emerging-market nations followed suit. Fortunately, a variety of factors helped contain their slide. Since many emerging-market countries are commodity exporters, the increased price of oil, precious metals and agricultural goods helped support their performance. A number of credit upgrades - particularly Mexico's, which represents 15% of the J.P. Morgan Emerging Markets Bond Index Global - also proved beneficial. Additionally, emerging-market fundamentals remained strong for the most part, as many of their governments had taken steps to position their economies for growth and keep inflation under control. Overall, emerging markets gained a solid 6.95% - according to the J.P. Morgan Emerging Markets Bond Index Global - for the six-month period ending June 30, 2000. Turning to individual performers, Russia, as in 1999, was again a standout performer. The transition from President Yeltsin to President Putin was smooth, and investors reacted favorably to the government's Soviet-era debt restructuring plan.
(Portfolio Manager photograph)
An interview with John Carlson, Portfolio Manager of Fidelity Advisor Emerging Markets Income Fund
Q. How did the fund perform, John?
A. Very well, relative to its benchmark and peers. For the six months ending June 30, 2000, the fund's Institutional Class shares returned 8.49%. The emerging market debt funds average, as tracked by Lipper Inc., returned 6.45% during the period, while the J.P. Morgan Emerging Markets Bond Index Global returned 6.95%. For the 12 months ending June 30, 2000, the fund's Institutional Class shares returned 24.73%. The Lipper average returned 20.74% for the same period, while the J.P. Morgan index also returned 20.74%.
Semiannual Report
Fund Talk: The Manager's Overview - continued
Q. What were some of the events that affected emerging markets during the six-month period?
A. There were three key events. The first was the resignation of Russian President Boris Yeltsin on New Year's Eve, which led to continued improvements and positive performance from Russia. The second was the long-awaited and much anticipated upgrade of Mexico to investment-grade status by Moody's Investor Services in March. The third factor was the continued strength in the commodities sector, particularly oil, which positively impacted many emerging-markets countries.
Q. You mentioned continued good news from Russia. What factors in particular aided its performance?
A. Vladimir Putin, who acted as president after the resignation of President Yeltsin until he was formally elected in March, enacted a number of reforms to enhance governability and enforce the rule of law. On the fiscal side, the country has been particularly disciplined and, as this report is written, currently is working on an overhaul of the tax system. Putin has enjoyed unprecedented popularity resulting in a stable political environment. Local and foreign investors responded favorably to the changes, as evidenced by a substantial increase in the country's international reserves. The completion of Soviet-era debt restructuring talks also was an extremely positive event that helped to drive asset prices upward. Furthermore, Russia's performance was helped by the continued firmness in oil prices, providing an enormous boost to the country's external accounts. The fund's overweighted position in Russia, relative to its benchmark, was the largest contributor to outperformance during the past six months.
Q. In terms of Mexico's upgrade, what is the implication for emerging-markets debt?
A. Mexico's story in the first half of this year was a noteworthy one, not only for that country but also for emerging markets in general. Recognizing Mexico's strong fiscal discipline, reduced risk from the banking sector and increasing integration into the world economy, Moody's Investor Services raised the country's rating to the investment-grade level on March 7, 2000. In addition, with elections slated for the first week in July, President Ernesto Zedillo has been working diligently to avoid the election-related problems of the past. The upgrade of Mexico's debt is proof that emerging-markets countries can reap the benefit of enacting reforms, solving fiscal imbalances and increasing the efficiency and openness of their economies. Broadly speaking, this is a very positive credit enhancer for the entire emerging-debt market.
Q. What was the impact of the global economic backdrop on emerging markets?
A. Most of the countries that the fund invests in are exporters of goods. This includes manufactured products such as electronics, and commodities such as metals, agricultural goods and, in particular, oil. The prices of most of these goods rose during the first half of this year, resulting in increased earnings for the exporting countries. In addition, the developed countries - the main destination for these goods - saw continued growth during the same period, ensuring a stable market for those exports.
Semiannual Report
Fund Talk: The Manager's Overview - continued
Q. John, what's your outlook for the next six months?
A. My outlook is constructive. I remain optimistic on commodity prices and anticipate that we will have more balanced growth globally. I also expect that we will see continued upgrades as more countries conduct debt buybacks and exchanges to strengthen their positions in the global economy. I further think that we will see more-diversified security issuance with a greater percentage going into euros and less supply of U.S. dollar-denominated debt going forward. Since I expect that fundamentals will continue to differentiate the winners from the losers, we will continue to focus Fidelity's research strength toward selecting securities that can enable the fund to continue outperforming.
The views expressed in this report reflect those of the portfolio manager only through the end of the period of the report as stated on the cover and do not necessarily represent the views of Fidelity or any other person in the Fidelity organization. Any such views are subject to change at any time based upon market or other conditions and Fidelity disclaims any responsibility to update such views. These views may not be relied on as investment advice and, because investment decisions for a Fidelity fund are based on numerous factors, may not be relied on as an indication of trading intent on behalf of any Fidelity fund.
Fund Facts
Goal: seeks a high level of current income; as a secondary objective, the fund may seek capital appreciation
Start date: March 10, 1994
Size: as of June 30, 2000, more than $82 million
Manager: John Carlson, since 1995; also lead manager, Fidelity Advisor Strategic Income Fund, since 1996; joined Fidelity in 1995
3John Carlson discusses emerging markets - five years later:
"This year marks my fifth anniversary managing Fidelity's emerging-markets debt funds and funds holding positions in emerging markets. Over the past five years, the emerging-markets debt marketplace has evolved positively, becoming more efficient, deeper and broader.
"When I began managing these funds, the benchmark index used was the J.P. Morgan Emerging Markets Bond Index, which included nine countries, was 88% invested in Latin America and contained no investment-grade securities. The current index used as the benchmark is the J.P. Morgan Emerging Markets Bond Index Global. As the marketplace has evolved, the index also changed to reflect greater diversification with 27 countries, only 65% exposure to Latin America and now 30% in investment-grade securities. In addition, the new index allows a greater number of securities to be held and has a much larger market capitalization - $190 billion as of June 30, 2000, compared to $66 billion as of June 30, 1995.
"The changes in the marketplace and the index complement our portfolio management style. We have always looked for undervalued, out-of-index countries and securities in an effort to enhance performance and achieve better diversification for the portfolios we manage. I remain optimistic about emerging-markets debt and look forward to continued growth and development in this marketplace."
Semiannual Report
|
Top Five Countries as of June 30, 2000 |
||
|
(excluding cash equivalents) |
% of fund's |
% of fund's net assets |
|
Brazil |
23.3 |
21.0 |
|
Russia |
13.4 |
11.3 |
|
Mexico |
12.1 |
14.1 |
|
Argentina |
11.6 |
15.7 |
|
Venezuela |
4.7 |
4.6 |
|
Percentages are adjusted for the effect of open futures contracts, if applicable. Top countries are based upon location of issuer of each security, including where the fund is exposed to potential political and credit risk. |
|
Top Five Holdings as of June 30, 2000 |
||
|
(by issuer, excluding cash equivalents) |
% of fund's |
% of fund's net assets |
|
Brazilian Federative Rep. |
18.5 |
15.3 |
|
Argentinian Republic |
11.6 |
11.6 |
|
United Mexican States |
10.5 |
11.3 |
|
Russian Federation |
7.0 |
6.3 |
|
Banco Nacional De Desenvolvimento |
4.8 |
4.4 |
|
|
52.4 |
48.9 |
|
Asset Allocation (% of fund's net assets) |
|||||||
|
As of June 30, 2000 |
As of December 31, 1999 |
||||||
|
Corporate Bonds 11.9% |
|
|
Corporate Bonds 13.4% |
|
||
|
Government |
|
|
Government |
|
||
|
Supranational Obligations 0.0% |
|
|
Supranational Obligations 0.1% |
|
||
|
Stocks 0.0% |
|
|
Stocks 3.5% |
|
||
|
Other Investments 8.2% |
|
|
Other Investments 5.7% |
|
||
|
Short-Term |
|
|
Short-Term |
|
||
Semiannual Report
(Unaudited)
Showing Percentage of Net Assets
|
Nonconvertible Bonds - 11.9% |
|||||
|
Moody's Ratings |
Principal |
Value |
|||
|
Brazil - 4.8% |
|||||
|
Banco Nacional de Desenvolvimento Economico e Social: |
|
|
|
|
|
|
12.554% 6/16/08 (h) |
B2 |
|
$ 3,229,000 |
$ 3,023,151 |
|
|
12.554% 6/16/08 (g)(h) |
B2 |
|
980,000 |
917,525 |
|
|
|
3,940,676 |
||||
|
Colombia - 0.8% |
|||||
|
Comunicacion Celular SA 0% 3/1/05 (e)(g) |
B3 |
|
550,000 |
407,000 |
|
|
Occidente Y Caribe Celular SA 0% |
B3 |
|
380,000 |
266,000 |
|
|
|
673,000 |
||||
|
Indonesia - 0.3% |
|||||
|
APP International Finance Co. 11.75% |
Caa1 |
|
305,000 |
213,500 |
|
|
Malaysia - 1.9% |
|||||
|
Petroliam Nasional BHD (Petronas): |
|
|
|
|
|
|
7.125% 10/18/06 (Reg. S) |
Baa3 |
|
625,000 |
591,406 |
|
|
7.625% 10/15/26 (Reg. S) |
Baa3 |
|
1,000,000 |
856,250 |
|
|
yankee 7.625% 10/15/26 (g) |
Baa3 |
|
110,000 |
94,188 |
|
|
|
1,541,844 |
||||
|
Mauritius - 0.8% |
|||||
|
APP International Finance (Mauritius) Ltd. 0% 7/5/01 (g) |
B3 |
|
885,000 |
699,150 |
|
|
Mexico - 1.6% |
|||||
|
Banco Nacional de Comercio Exterior SNC 11.25% 5/30/06 |
Baa3 |
|
880,000 |
939,400 |
|
|
Petroleos Mexicanos 9.4367% 7/15/05 |
Baa3 |
|
400,000 |
401,000 |
|
|
|
1,340,400 |
||||
|
Netherlands - 1.5% |
|||||
|
Netia Holdings II BV euro 13.5% 6/15/09 |
B3 |
EUR |
860,000 |
828,601 |
|
|
Tjiwi Kimia International Finance Co. 13.25% 8/1/01 |
Caa1 |
|
450,000 |
396,000 |
|
|
|
1,224,601 |
||||
|
Nonconvertible Bonds - continued |
|||||
|
Moody's Ratings |
Principal |
Value |
|||
|
Netherlands Antilles - 0.2% |
|||||
|
Astra Overseas Finance BV: |
|
|
|
|
|
|
(Reg. S) 6.7775% 6/30/05 (Reg. S) (h) |
- |
|
$ 180,358 |
$ 109,117 |
|
|
6.7775% 6/30/05 (g)(h) |
- |
|
159,745 |
96,646 |
|
|
|
205,763 |
||||
|
TOTAL NONCONVERTIBLE BONDS (Cost $9,119,025) |
9,838,934 |
||||
|
Government Obligations (i) - 64.4% |
|||||
|
|
|||||
|
Argentina - 11.6% |
|||||
|
Argentinian Republic: |
|
|
|
|
|
|
BOCON 2.8068% 4/1/07 (h) |
B1 |
ARS |
4,974,614 |
3,447,474 |
|
|
Brady discount 7.875% 3/31/23 (h) |
B1 |
|
1,230,000 |
993,225 |
|
|
9.75% 9/19/27 |
B1 |
|
1,338,000 |
1,041,968 |
|
|
11.375% 3/15/10 |
B1 |
|
530,000 |
480,975 |
|
|
11.75% 2/12/07 |
B1 |
ARS |
910,000 |
753,447 |
|
|
11.75% 4/7/09 |
B1 |
|
1,893,000 |
1,765,223 |
|
|
11.75% 6/15/15 |
B1 |
|
445,000 |
403,838 |
|
|
12% 2/1/20 |
B1 |
|
362,000 |
335,303 |
|
|
12.125% 2/25/19 |
B1 |
|
404,000 |
379,760 |
|
|
|
9,601,213 |
||||
|
Brazil - 18.5% |
|||||
|
Brazilian Federative Rep.: |
|
|
|
|
|
|
euro 11.625% 4/15/04 |
B2 |
|
1,315,000 |
1,324,863 |
|
|
Brady: |
|
|
|
|
|
|
capitalization bond 8% 4/15/14 |
B2 |
|
3,869,090 |
2,851,035 |
|
|
debt conversion bond 7.4375% |
B2 |
|
4,598,000 |
3,391,025 |
|
|
discount euro 7.375% 4/15/24 (h) |
B2 |
|
510,000 |
403,538 |
|
|
new money bond L, 7.4375% 4/15/09 (Bearer) (h) |
B2 |
|
951,000 |
797,651 |
|
|
7.375% 4/15/06 (h) |
B2 |
|
1,599,600 |
1,457,636 |
|
|
10.125% 5/15/27 |
B2 |
|
1,682,000 |
1,326,678 |
|
|
12.25% 3/6/30 |
B2 |
|
768,000 |
706,560 |
|
|
12.75% 1/15/20 |
B2 |
|
605,000 |
578,531 |
|
|
14.5% 10/15/09 |
B2 |
|
2,307,000 |
2,468,490 |
|
|
|
15,306,007 |
||||
|
Government Obligations (i) - continued |
|||||
|
Moody's Ratings |
Principal |
Value |
|||
|
Bulgaria - 1.9% |
|||||
|
Bulgarian Republic Brady: |
|
|
|
|
|
|
discount A 7.0625% 7/28/24 (h) |
B2 |
|
$ 521,000 |
$ 412,241 |
|
|
FLIRB A 2.75% 7/28/12 (h) |
B2 |
|
954,000 |
702,383 |
|
|
interest arrears bond 7.0625% 7/28/11 (h) |
B2 |
|
568,000 |
450,850 |
|
|
|
1,565,474 |
||||
|
Colombia - 2.3% |
|||||
|
Colombian Republic: |
|
|
|
|
|
|
7.625% 2/15/07 |
Ba2 |
|
330,000 |
239,250 |
|
|
8.375% 2/15/27 |
Ba2 |
|
440,000 |
280,500 |
|
|
8.625% 4/1/08 |
Ba2 |
|
295,000 |
218,300 |
|
|
9.75% 4/23/09 |
Ba2 |
|
220,000 |
171,050 |
|
|
10.875% 3/9/04 |
Ba2 |
|
215,000 |
201,025 |
|
|
11.75% 2/25/20 |
Ba2 |
|
954,000 |
782,280 |
|
|
|
1,892,405 |
||||
|
Croatia - 0.6% |
|||||
|
Croatia Republic 7.0325% 7/31/06 (h) |
Baa3 |
|
558,210 |
528,904 |
|
|
Ecuador - 1.0% |
|||||
|
Ecuador Republic Brady: |
|
|
|
|
|
|
discount 7.1875% 2/28/25 (c)(h) |
Caa2 |
|
590,000 |
231,575 |
|
|
par 4% 2/28/25 (c)(f) |
Caa2 |
|
740,000 |
251,600 |
|
|
past due interest 7.1875% 2/28/15 (Bearer) (c)(h) |
Caa3 |
|
1,394,666 |
334,720 |
|
|
|
817,895 |
||||
|
Ivory Coast - 0.1% |
|||||
|
Ivory Coast Brady FLIRB A 1.9% |
- |
FRF |
3,610,000 |
76,125 |
|
|
Mexico - 10.4% |
|||||
|
United Mexican States: |
|
|
|
|
|
|
Brady discount A 7.3125% 12/31/19 (h) |
Baa3 |
|
1,770,000 |
1,739,025 |
|
|
value recovery rights 6/30/03: |
|
|
|
|
|
|
discount A (j) |
- |
|
2,724,000 |
27 |
|
|
discount C (j) |
- |
|
2,000 |
0 |
|
|
9.875% 2/1/10 |
Baa3 |
|
2,790,000 |
2,908,575 |
|
|
10.375% 2/17/09 |
Baa3 |
|
790,000 |
844,313 |
|
|
11.375% 9/15/16 |
Baa3 |
|
1,169,000 |
1,339,966 |
|
|
11.5% 5/15/26 |
Baa3 |
|
1,522,000 |
1,835,913 |
|
|
|
8,667,819 |
||||
|
Government Obligations (i) - continued |
|||||
|
Moody's Ratings |
Principal |
Value |
|||
|
Nigeria - 1.1% |
|||||
|
Central Bank of Nigeria: |
|
|
|
|
|
|
Brady 6.25% 11/15/20 |
- |
|
$ 750,000 |
$ 378,750 |
|
|
Promissory notes 5.092% 1/5/10 |
- |
|
1,208,189 |
528,940 |
|
|
warrants 11/15/20 (a)(j) |
- |
|
750 |
0 |
|
|
|
907,690 |
||||
|
Panama - 0.5% |
|||||
|
Panamanian Republic 8.25% 4/22/08 |
Ba1 |
|
440,000 |
389,400 |
|
|
Peru - 0.7% |
|||||
|
Peruvian Republic Brady: |
|
|
|
|
|
|
FLIRB 3.75% 3/7/17 (h) |
Ba3 |
|
395,000 |
239,963 |
|
|
past due interest 4.5% 3/7/17 (h) |
Ba3 |
|
479,000 |
320,930 |
|
|
|
560,893 |
||||
|
Philippines - 1.3% |
|||||
|
Philippine Government: |
|
|
|
|
|
|
8.875% 4/15/08 |
Ba1 |
|
445,000 |
400,500 |
|
|
9.875% 3/16/10 |
Ba1 |
|
360,000 |
331,200 |
|
|
9.875% 1/15/19 |
Ba1 |
|
455,000 |
371,394 |
|
|
|
1,103,094 |
||||
|
Russia - 8.7% |
|||||
|
City of St. Petersburg Russia 9.5% 6/18/02 (Reg. S) |
Caa1 |
|
1,200,000 |
1,020,000 |
|
|
Russian Federation: |
|
|
|
|
|
|
8.75% 7/24/05 (Reg. S) |
B3 |
|
1,424,000 |
1,105,380 |
|
|
9.25% 11/27/01 |
B3 |
|
419,000 |
400,145 |
|
|
10% 6/26/07 |
B3 |
|
1,334,000 |
1,028,848 |
|
|
11% 7/24/18 (Reg. S) |
B3 |
|
1,452,000 |
1,087,185 |
|
|
11.75% 6/10/03 (Reg. S) |
B3 |
|
961,000 |
892,529 |
|
|
12.75% 6/24/28 (Reg. S) |
B3 |
|
1,509,000 |
1,301,513 |
|
|
Russian Federation Ministry of Finance 3% 5/14/03 |
Caa3 |
|
890,000 |
396,050 |
|
|
|
7,231,650 |
||||
|
Turkey - 0.3% |
|||||
|
Turkish Republic 11.875% 11/5/04 |
B1 |
|
235,000 |
244,400 |
|
|
Ukraine - 0.7% |
|||||
|
Ukraine Government 11% 3/15/07 (Reg. S) |
- |
|
860,000 |
589,100 |
|
|
Government Obligations (i) - continued |
|||||
|
Moody's Ratings |
Principal |
Value |
|||
|
Venezuela - 4.7% |
|||||
|
Venezuelan Republic: |
|
|
|
|
|
|
Brady debt conversion bond 7.875% 12/18/07 (h) |
B2 |
|
$ 3,571,400 |
$ 2,910,691 |
|
|
Oil recovery rights 4/15/20 (j) |
- |
|
30 |
0 |
|
|
9.25% 9/15/27 |
B2 |
|
1,485,000 |
980,100 |
|
|
|
3,890,791 |
||||
|
TOTAL GOVERNMENT OBLIGATIONS (Cost $48,880,715) |
53,372,860 |
||||
|
Common Stocks - 0.0% |
|||
|
Shares |
|
||
|
Mexico - 0.0% |
|||
|
Cemex SA de CV ADR (a) |
1,368 |
3,591 |
|
|
Sovereign Loan Participations - 8.1% |
|||||
|
|
Principal |
|
|||
|
Algeria - 1.9% |
|||||
|
Algerian Republic loan participation: |
|
|
|
|
|
|
Series 1 - Deutsche Bank 6.625% |
- |
|
$ 685,000 |
565,125 |
|
|
Series 1 - Merrill Lynch, Pierce, Fenner & Smith, Inc. 6.625% 9/4/06 (h) |
- |
|
305,000 |
251,625 |
|
|
Series 1- Societe Generale 6.625% |
- |
|
240,000 |
198,000 |
|
|
Series 3 - Merrill Lynch, Pierce, Fenner & Smith, Inc. 7.1875% 3/4/10 (h) |
- |
|
485,000 |
374,663 |
|
|
Series 3 - The Chase Manhattan Bank 7.1875% 3/4/10 (h) |
- |
|
273,000 |
210,893 |
|
|
|
1,600,306 |
||||
|
Angola - 0.3% |
|||||
|
Banco Nacional de Angola loan participation - Societe Generale (a) |
- |
|
1,596,128 |
207,497 |
|
|
Cameroon - 0.1% |
|||||
|
Cameroon Republic: |
|
|
|
|
|
|
loan participation - Societe Generale (a) |
- |
FRF |
1,960,000 |
29,929 |
|
|
loan participation - Societe Generale (a) |
- |
DEM |
1,430,000 |
73,235 |
|
|
|
103,164 |
||||
|
Sovereign Loan Participations - continued |
|||||
|
Moody's Ratings |
Principal |
Value |
|||
|
Congo - 0.1% |
|||||
|
Congo Republic loan participation - |
- |
|
$ 1,056,047 |
$ 95,044 |
|
|
Morocco - 1.0% |
|||||
|
Moroccan Kingdom loan participation: |
|
|
|
|
|
|
Series A - Deutsche Bank 7.75% |
- |
|
325,000 |
292,500 |
|
|
Series A - Morgan Guaranty Trust Co. 7.75% 1/1/09 (h) |
- |
|
272,780 |
245,502 |
|
|
Series A - Paribas Capital Markets 7.75% 1/1/09 (h) |
- |
|
337,483 |
303,734 |
|
|
|
841,736 |
||||
|
Russia - 4.7% |
|||||
|
Bank for Foreign Economic Affairs of Russia (Vnesheconombank) loan participation restructured under 1997 Agreement: |
|
|
|
|
|
|
- Deutsche Bank 7.9375% 12/15/20 (c)(h) |
- |
|
7,281,000 |
2,229,806 |
|
|
- Merrill Lynch, Pierce, Fenner & Smith, Inc. 7.9375% 12/15/20 (c)(h) |
- |
|
440,000 |
134,750 |
|
|
- Morgan (J.P.) Securities, Inc. 7.9375% 12/15/20 (c)(h) |
- |
|
1,445,000 |
442,531 |
|
|
- Paribas Capital Markets 7.9375% 12/15/20 (c)(h) |
- |
|
450,000 |
137,813 |
|
|
- The Chase Manhattan Bank 7.9375% 12/15/20 (c)(h) |
- |
|
2,920,000 |
894,250 |
|
|
|
3,839,150 |
||||
|
TOTAL SOVEREIGN LOAN PARTICIPATIONS (Cost $5,365,158) |
6,686,897 |
||||
|
Cash Equivalents - 12.9% |
|||
|
Maturity Amount |
|
||
|
Investments in repurchase agreements (U.S. Treasury Obligations), in a joint trading account at 6.58%, |
$ 10,729,882 |
10,724,000 |
|
|
Purchased Options - 0.1% |
|||||
|
Expiration |
Underlying
Face Amount |
Value |
|||
|
Argentina - 0.0% |
|||||
|
Salomon Brothers International Call Option on $2,216,000 notional amount of Argentinian Republic Brady floating rate bond 7.375%, 3/31/05 |
July 00/91.70 |
|
$ 2,023,208 |
$ 2,659 |
|
|
Salomon Brothers International Call Option on $3,775,000 notional amount of Argentinian Republic Brady par L-GP 6%, 3/31/23 |
July 00/61.125 |
|
2,510,375 |
7,550 |
|
|
|
10,209 |
||||
|
Mexico - 0.1% |
|||||
|
Salomon Brothers International Call Option on $4,280,000 notional amount of United Mexican States Brady par A 6.25%, 12/31/19 |
July 00/82.5625 |
|
3,584,500 |
39,804 |
|
|
Russia - 0.0% |
|||||
|
The Deutsche Bank Call Option on $5,000,000 notional amount of Bank for Foreign Economic Affairs of Russia (Vnesheconombank) loan participation restructured under 1997 Agreement - Deutsche Bank 7.9375% 12/15/20 |
July 00/31.25 |
|
1,531,250 |
12,500 |
|
|
TOTAL PURCHASED OPTIONS (Cost $106,771) |
62,513 |
||||
|
TOTAL INVESTMENT PORTFOLIO - 97.4% (Cost $74,198,063) |
80,688,795 |
||
|
NET OTHER ASSETS - 2.6% |
2,191,704 |
||
|
NET ASSETS - 100% |
$ 82,880,499 |
||
|
Security Type Abbreviation |
||
|
FLIRB |
- |
Front Loaded Interest Reduction Bond |
|
Currency Abbreviations |
||
|
ARS |
- |
Argentine peso |
|
DEM |
- |
German deutsche mark |
|
EUR |
- |
European Monetary Unit |
|
FRF |
- |
French franc |
|
Legend |
|
(a) Non-income producing |
|
(b) S&P credit ratings are used in the absence of a rating by Moody's Investors Service, Inc. |
|
(c) Non-income producing - issuer filed for protection under the Federal Bankruptcy Code or is in default of interest payment. |
|
(d) Principal amount is stated in United States dollars unless otherwise noted. |
|
(e) Debt obligation initially issued in zero coupon form which converts to coupon form at a specified rate and date. The rate shown is the rate at period end. |
|
(f) Debt obligation initially issued at one coupon which converts to a higher coupon at a specified date. The rate shown is the rate at period end. |
|
(g) Security exempt from registration under Rule 144A of the Securities Act of 1933. These securities may be resold in transactions exempt from registration, normally to qualified institutional buyers. At the period end, the value of these securities amounted to $2,214,509 or 2.7% of net assets. |
|
(h) The coupon rate shown on floating or adjustable rate securities represents the rate at period end. |
|
(i) For foreign government obligations not individually rated by S&P or Moody's, the ratings listed have been assigned by FMR, the fund's investment adviser, based principally on S&P and Moody's ratings of the sovereign credit of the issuing government. |
|
(j) Quantity represents share amount. |
|
Other Information |
|
The composition of long-term debt holdings as a percentage of total value of investments in securities, is as follows (ratings are unaudited): |
|
Moody's Ratings |
S&P Ratings |
|||
|
Aaa, Aa, A |
0.0% |
|
AAA, AA, A |
0.0% |
|
Baa |
15.0% |
|
BBB |
7.8% |
|
Ba |
4.9% |
|
BB |
23.5% |
|
B |
52.8% |
|
B |
33.3% |
|
Caa |
3.5% |
|
CCC |
9.2% |
|
Ca, C |
0.0% |
|
CC, C |
0.0% |
|
|
|
|
D |
0.0% |
|
The percentage not rated by Moody's or S&P amounted to 10.5%. FMR has determined that unrated debt securities that are lower quality account for 10.5% of the total value of investment in securities. |
|
Income Tax Information |
|
At June 30, 2000, the aggregate cost of investment securities for income tax purposes was $74,316,042. Net unrealized appreciation aggregated $6,372,753, of which $7,999,354 related to appreciated investment securities and $1,626,601 related to depreciated investment securities. |
|
At December 31, 1999, the fund had a capital loss carryforward of approximately $24,164,000 of which $20,267,000 and $3,897,000 will expire on December 31, 2006 and 2007, respectively. |
See accompanying notes which are an integral part of the financial statements.
Semiannual Report
Statement of Assets and Liabilities
|
|
June 30, 2000 (Unaudited) |
|
|
Assets |
|
|
|
Investment in securities, at value (including repurchase agreements of $10,724,000) (cost $74,198,063) - |
|
$ 80,688,795 |
|
Foreign currency held at value (cost $182,222) |
|
183,582 |
|
Receivable for investments sold |
|
2,139,952 |
|
Receivable for fund shares sold |
|
194,933 |
|
Dividends receivable |
|
1,915 |
|
Interest receivable |
|
1,452,653 |
|
Total assets |
|
84,661,830 |
|
Liabilities |
|
|
|
Payable to custodian bank |
$ 31,616 |
|
|
Payable for investments purchased |
968,380 |
|
|
Payable for fund shares redeemed |
593,813 |
|
|
Distributions payable |
69,515 |
|
|
Accrued management fee |
45,774 |
|
|
Distribution fees payable |
28,048 |
|
|
Other payables and accrued expenses |
44,185 |
|
|
Total liabilities |
|
1,781,331 |
|
Net Assets |
|
$ 82,880,499 |
|
Net Assets consist of: |
|
|
|
Paid in capital |
|
$ 94,473,990 |
|
Undistributed net investment income |
|
870,134 |
|
Accumulated undistributed net realized gain (loss) on investments and foreign currency transactions |
|
(18,956,877) |
|
Net unrealized appreciation (depreciation) on investments and assets and liabilities in foreign currencies |
|
6,493,252 |
|
Net Assets |
|
$ 82,880,499 |
See accompanying notes which are an integral part of the financial statements.
Semiannual Report
Financial Statements - continued
Statement of Assets and Liabilities - continued
|
|
June 30, 2000 (Unaudited) |
|
|
Calculation of Maximum Offering Price |
|
$10.12 |
|
Maximum offering price per share (100/95.25 of 10.12) |
|
$10.62 |
|
Class T: |
|
$10.11 |
|
Maximum offering price per share (100/96.50 of 10.11) |
|
$10.48 |
|
Class B: |
|
$10.16 |
|
Class C: |
|
$10.15 |
|
Institutional Class: |
|
$10.06 |
A Redemption price per share is equal to net asset value less any applicable contingent deferred sales charge.
See accompanying notes which are an integral part of the financial statements.
Semiannual Report
Financial Statements - continued
Statement of Operations
|
|
Six months ended June 30, 2000 (Unaudited) |
|
|
Investment Income Dividends |
|
$ 11,282 |
|
Interest |
|
4,071,824 |
|
|
|
4,083,106 |
|
Less foreign taxes withheld |
|
(931) |
|
Total income |
|
4,082,175 |
|
Expenses |
|
|
|
Management fee |
$ 284,329 |
|
|
Transfer agent fees |
100,061 |
|
|
Distribution fees |
171,663 |
|
|
Accounting fees and expenses |
30,093 |
|
|
Non-interested trustees' compensation |
132 |
|
|
Custodian fees and expenses |
26,404 |
|
|
Registration fees |
52,347 |
|
|
Audit |
15,441 |
|
|
Legal |
2,263 |
|
|
Miscellaneous |
2,222 |
|
|
Total expenses before reductions |
684,955 |
|
|
Expense reductions |
(11,246) |
673,709 |
|
Net investment income |
|
3,408,466 |
|
Realized and Unrealized Gain (Loss) Net realized gain (loss) on: |
|
|
|
Investment securities |
6,316,866 |
|
|
Foreign currency transactions |
(2,422) |
6,314,444 |
|
Change in net unrealized appreciation (depreciation) on: |
|
|
|
Investment securities |
(2,665,531) |
|
|
Assets and liabilities in foreign currencies |
7,168 |
(2,658,363) |
|
Net gain (loss) |
|
3,656,081 |
|
Net increase (decrease) in net assets resulting |
|
$ 7,064,547 |
See accompanying notes which are an integral part of the financial statements.
Semiannual Report
Financial Statements - continued
Statement of Changes in Net Assets
|
|
Six months ended
June 30, 2000 |
Year ended
December 31, |
|
Increase (Decrease) in Net Assets |
|
|
|
Operations |
$ 3,408,466 |
$ 7,066,489 |
|
Net realized gain (loss) |
6,314,444 |
2,942,521 |
|
Change in net unrealized appreciation (depreciation) |
(2,658,363) |
13,270,548 |
|
Net increase (decrease) in net assets resulting |
7,064,547 |
23,279,558 |
|
Distributions to shareholders |
(2,871,256) |
(6,921,285) |
|
Share transactions - net increase (decrease) |
(6,400,954) |
(6,842,513) |
|
Total increase (decrease) in net assets |
(2,207,663) |
9,515,760 |
|
Net Assets |
|
|
|
Beginning of period |
85,088,162 |
75,572,402 |
|
End of period (including undistributed net investment income of $870,134 and $332,924, respectively) |
$ 82,880,499 |
$ 85,088,162 |
See accompanying notes which are an integral part of the financial statements.
Semiannual Report
Financial Highlights - Class A
|
|
Six months ended June 30, 2000 |
Years ended December 31, |
|||
|
|
(Unaudited) |
1999 |
1998 |
1997 |
1996 E |
|
Selected Per-Share Data |
|
|
|
|
|
|
Net asset value, beginning |
$ 9.680 |
$ 7.780 |
$ 11.120 |
$ 11.720 |
$ 10.520 |
|
Income from Investment Operations |
|
|
|
|
|
|
Net investment income D |
.412 |
.821 |
.943 |
.953 |
.274 |
|
Net realized and |
.381 |
1.884 |
(3.275) |
.891 |
1.574 |
|
Total from investment |
.793 |
2.705 |
(2.332) |
1.844 |
1.848 |
|
Less Distributions |
|
|
|
|
|
|
From net investment income |
(.353) |
(.805) |
(.834) |
(.984) |
(.238) |
|
From net realized gain |
- |
- |
- |
(1.460) |
(.410) |
|
Return of capital |
- |
- |
(.174) |
- |
- |
|
Total distributions |
(.353) |
(.805) |
(1.008) |
(2.444) |
(.648) |
|
Net asset value, |
$ 10.120 |
$ 9.680 |
$ 7.780 |
$ 11.120 |
$ 11.720 |
|
Total Return B, C |
8.30% |
36.35% |
(21.94)% |
16.52% |
17.71% |
|
Ratios and Supplemental Data |
|
|
|
|
|
|
Net assets, end of period (000 omitted) |
$ 3,501 |
$ 2,140 |
$ 2,829 |
$ 2,313 |
$ 478 |
|
Ratio of expenses to |
1.40% A, F |
1.40% F |
1.40% F |
1.40% F |
1.40% A, F |
|
Ratio of expenses to |
1.38% A, G |
1.40% |
1.39% G |
1.38% G |
1.40% A |
|
Ratio of net investment income to average net assets |
8.38% A |
9.57% |
10.05% |
7.74% |
7.31% A |
|
Portfolio turnover rate |
317% A |
275% |
514% |
660% |
410% |
A Annualized
B The total returns would have been lower had certain expenses not been reduced during the periods shown.
C Total returns do not include the one time sales charge and for periods of less than one year are not annualized.
D Net investment income per share has been calculated based on average shares outstanding during the period.
E For the period September 3, 1996 (commencement of sale of Class A shares) to December 31, 1996.
F FMR agreed to reimburse a portion of the class' expenses during the period. Without this reimbursement, the class' expense ratio would have been higher.
G FMR or the fund has entered into varying arrangements with third parties who either paid or reduced a portion of the class' expenses.
See accompanying notes which are an integral part of the financial statements.
Semiannual Report
Financial Highlights - Class T
|
|
Six months ended June 30, 2000 |
Years ended December 31, |
||||
|
|
(Unaudited) |
1999 |
1998 |
1997 |
1996 |
1995 |
|
Selected Per-Share Data |
|
|
|
|
|
|
|
Net asset value,
beginning |
$ 9.670 |
$ 7.770 |
$ 11.110 |
$ 11.710 |
$ 9.280 |
$ 9.520 |
|
Income from Investment Operations |
|
|
|
|
|
|
|
Net investment |
.413 D |
.815 D |
.975 D |
.877 D |
.758 D |
.860 |
|
Net realized |
.375 |
1.886 |
(3.319) |
.961 |
2.832 |
(.323) |
|
Total from invest-ment operations |
.788 |
2.701 |
(2.344) |
1.838 |
3.590 |
.537 |
|
Less Distributions |
|
|
|
|
|
|
|
From net invest- |
(.348) |
(.801) |
(.824) |
(.978) |
(.750) |
(.777) |
|
From net |
- |
- |
- |
(1.460) |
(.410) |
- |
|
Return of capital |
- |
- |
(.172) |
- |
- |
- |
|
Total distributions |
(.348) |
(.801) |
(.996) |
(2.438) |
(1.160) |
(.777) |
|
Net asset value, |
$ 10.110 |
$ 9.670 |
$ 7.770 |
$ 11.110 |
$ 11.710 |
$ 9.280 |
|
Total Return B, C |
8.26% |
36.34% |
(22.07)% |
16.47% |
40.41% |
6.99% |
|
Ratios and Supplemental Data |
|
|
|
|
|
|
|
Net assets, end |
$ 49,602 |
$ 55,715 |
$ 53,643 |
$ 93,228 |
$ 78,861 |
$ 36,205 |
|
Ratio of expenses |
1.47% A |
1.42% |
1.50% |
1.47% |
1.49% |
1.50% E |
|
Ratio of expenses to average net assets after expense reductions |
1.45% A, F |
1.42% |
1.48% F |
1.45% F |
1.48% F |
1.50% |
|
Ratio of net invest- |
8.31% A |
9.54% |
9.96% |
7.08% |
7.23% |
9.32% |
|
Portfolio |
317% A |
275% |
514% |
660% |
410% |
305% |
A Annualized
B The total returns would have been lower had certain expenses not been reduced during the periods shown.
C Total returns do not include the one time sales charge and for periods of less than one year are not annualized.
D Net investment income per share has been calculated based on average shares outstanding during the period.
E FMR agreed to reimburse a portion of the class' expenses during the period. Without this reimbursement, the class' expense ratio would have been higher.
F FMR or the fund has entered into varying arrangements with third parties who either paid or reduced a portion of the class' expenses.
See accompanying notes which are an integral part of the financial statements.
Semiannual Report
Financial Highlights - Class B
|
|
Six months ended June 30, 2000 |
Years ended December 31, |
||||
|
|
(Unaudited) |
1999 |
1998 |
1997 |
1996 |
1995 |
|
Selected Per-Share Data |
|
|
|
|
|
|
|
Net asset value,
beginning |
$ 9.720 |
$ 7.800 |
$ 11.160 |
$ 11.750 |
$ 9.300 |
$ 9.520 |
|
Income from Investment Operations |
|
|
|
|
|
|
|
Net invesment |
.380 D |
.761 D |
.907 D |
.806 D |
.686 D |
.835 |
|
Net realized and unrealized gain (loss) |
.376 |
1.904 |
(3.334) |
.956 |
2.853 |
(.342) |
|
Total from investment operations |
.756 |
2.665 |
(2.427) |
1.762 |
3.539 |
.493 |
|
Less Distributions |
|
|
|
|
|
|
|
From net invest-ment income |
(.316) |
(.745) |
(.772) |
(.892) |
(.679) |
(.713) |
|
From net |
- |
- |
- |
(1.460) |
(.410) |
- |
|
Return of capital |
- |
- |
(.161) |
- |
- |
- |
|
Total distributions |
(.316) |
(.745) |
(.933) |
(2.352) |
(1.089) |
(.713) |
|
Net asset value, |
$ 10.160 |
$ 9.720 |
$ 7.800 |
$ 11.160 |
$ 11.750 |
$ 9.300 |
|
Total Return B, C |
7.87% |
35.58% |
(22.66)% |
15.70% |
39.61% |
6.38% |
|
Ratios and Supplemental Data |
|
|
|
|
|
|
|
Net assets, |
$ 20,458 |
$ 19,054 |
$ 16,703 |
$ 23,576 |
$ 17,746 |
$ 9,486 |
|
Ratio of expenses |
2.15% A, E |
2.10% |
2.15% E |
2.15% |
2.15% E |
2.25% E |
|
Ratio of expenses to average net assets after expense reductions |
2.13% A, F |
2.10% |
2.13% F |
2.13% F |
2.15% |
2.25% |
|
Ratio of net invest- |
7.63% A |
8.86% |
9.36% |
6.48% |
6.56% |
8.48% |
|
Portfolio |
317% A |
275% |
514% |
660% |
410% |
305% |
A Annualized
B The total returns would have been lower had certain expenses not been reduced during the periods shown.
C Total returns do not include the contingent deferred sales charge and for periods of less than one year are not annualized.
D Net investment income per share has been calculated based on average shares outstanding during the period.
E FMR agreed to reimburse a portion of the class' expenses during the period. Without this reimbursement, the class' expense ratio would have been higher.
F FMR or the fund has entered into varying arrangements with third parties who either paid or reduced a portion of the class' expenses.
See accompanying notes which are an integral part of the financial statements.
Semiannual Report
Financial Highlights - Class C
|
|
Six months ended June 30, 2000 |
Years ended December 31, |
||
|
|
(Unaudited) |
1999 |
1998 |
1997 E |
|
Selected Per-Share Data |
|
|
|
|
|
Net asset value, beginning of period |
$ 9.700 |
$ 7.790 |
$ 11.110 |
$ 12.190 |
|
Income from Investment Operations |
|
|
|
|
|
Net investment income D |
.373 |
.750 |
.792 |
.154 |
|
Net realized and unrealized |
.389 |
1.893 |
(3.191) |
.322 |
|
Total from investment operations |
.762 |
2.643 |
(2.399) |
.476 |
|
Less Distributions |
|
|
|
|
|
From net investment income |
(.312) |
(.733) |
(.762) |
(.286) |
|
From net realized gain |
- |
- |
- |
(1.270) |
|
Return of capital |
- |
- |
(.159) |
- |
|
Total distributions |
(.312) |
(.733) |
(.921) |
(1.556) |
|
Net asset value, end of period |
$ 10.150 |
$ 9.700 |
$ 7.790 |
$ 11.110 |
|
Total Return B, C |
7.94% |
35.31% |
(22.47)% |
4.16% |
|
Ratios and Supplemental Data |
|
|
|
|
|
Net assets, end of period (000 omitted) |
$ 2,844 |
$ 2,402 |
$ 964 |
$ 66 |
|
Ratio of expenses to average net assets |
2.25% A, F |
2.23% |
2.25% F |
2.25% A, F |
|
Ratio of expenses to average net assets after expense reductions |
2.23% A, G |
2.23% |
2.23% G |
2.25% A |
|
Ratio of net investment income to |
7.53% A |
8.73% |
9.30% |
9.04% A |
|
Portfolio turnover rate |
317% A |
275% |
514% |
660% |
A Annualized
B The total returns would have been lower had certain expenses not been reduced during the periods shown.
C Total returns do not include the contingent deferred sales charge and for periods of less than one year are not annualized.
D Net investment income per share has been calculated based on average shares outstanding during the period.
E For the period November 3, 1997 (commencement of sale of Class C shares) to December 31, 1997.
F FMR agreed to reimburse a portion of the class' expenses during the period. Without this reimbursement, the class' expense ratio would have been higher.
G FMR or the fund has entered into varying arrangements with third parties who either paid or reduced a portion of the class' expenses.
See accompanying notes which are an integral part of the financial statements.
Semiannual Report
Financial Highlights - Institutional Class
|
|
Six months ended June 30, 2000 |
Years ended December 31, |
||||
|
|
(Unaudited) |
1999 |
1998 |
1997 |
1996 |
1995 E |
|
Selected Per-Share Data |
|
|
|
|
|
|
|
Net asset value, beginning of period |
$ 9.620 |
$ 7.740 |
$ 11.060 |
$ 11.650 |
$ 9.280 |
$ 8.400 |
|
Income from Investment Operations |
|
|
|
|
|
|
|
Net investment income |
.425 D |
.837 D |
.931 D |
.860 D |
.786 D |
.393 |
|
Net realized and unrealized gain (loss) |
.381 |
1.868 |
(3.229) |
1.008 |
2.779 |
.876 |
|
Total from investment operations |
.806 |
2.705 |
(2.298) |
1.868 |
3.565 |
1.269 |
|
Less Distributions |
|
|
|
|
|
|
|
From net invest-ment income |
(.366) |
(.825) |
(.846) |
(.998) |
(.785) |
(.389) |
|
From net |
- |
- |
- |
(1.460) |
(.410) |
- |
|
Return of capital |
- |
- |
(.176) |
- |
- |
- |
|
Total distributions |
(.366) |
(.825) |
(1.022) |
(2.458) |
(1.195) |
(.389) |
|
Net asset value, end of period |
$ 10.060 |
$ 9.620 |
$ 7.740 |
$ 11.060 |
$ 11.650 |
$ 9.280 |
|
Total Return B, C |
8.49% |
36.59% |
(21.75)% |
16.84% |
40.21% |
15.52% |
|
Ratios and Supplemental Data |
|
|
|
|
|
|
|
Net assets, |
$ 6,475 |
$ 5,778 |
$ 1,434 |
$ 1,320 |
$ 2,639 |
$ 201 |
|
Ratio of expenses to average net assets |
1.15% A |
1.14% |
1.25% F |
1.25% F |
1.25% F |
1.25% A, F |
|
Ratio of expenses to average net assets after expense reductions |
1.12% A, G |
1.13% G |
1.24% G |
1.23% G |
1.25% |
1.25% A |
|
Ratio of net invest- |
8.64% A |
9.83% |
10.02% |
6.85% |
7.46% |
9.09% A |
|
Portfolio |
317% A |
275% |
514% |
660% |
410% |
305% |
A Annualized
B Total returns for periods of less than one year are not annualized.
C The total returns would have been lower had certain expenses not been reduced during the periods shown.
D Net investment income per share has been calculated based on average shares outstanding during the period.
E For the period July 3, 1995 (commencement of sale of Institutional Class shares) to December 31, 1995.
F FMR agreed to reimburse a portion of the class' expenses during the period. Without this reimbursement, the class' expense ratio would have been higher.
G FMR or the fund has entered into varying arrangements with third parties who either paid or reduced a portion of the class' expenses.
See accompanying notes which are an integral part of the financial statements.
Semiannual Report
For the period ended June 30, 2000 (Unaudited)
1. Significant Accounting Policies.
Fidelity Advisor Emerging Markets Income Fund (the fund) is a fund of Fidelity Advisor Series VIII (the trust) and is authorized to issue an unlimited number of shares. The trust is registered under the Investment Company Act of 1940, as amended (the 1940 Act), as an open-end management investment company organized as a Massachusetts business trust.
The fund offers Class A, Class T, Class B, Class C, and Institutional Class shares, each of which has equal rights as to assets and voting privileges. Each class has exclusive voting rights with respect to matters that affect that class. Class B shares will automatically convert to Class A shares after a holding period of seven years from the initial date of purchase. Investment income, realized and unrealized capital gains and losses, the common expenses of the fund, and certain fund-level expense reductions, if any, are allocated on a pro rata basis to each class based on the relative net assets of each class to the total net assets of the fund. Each class of shares differs in its respective distribution, transfer agent, and certain other class-specific fees, expenses, and expense reductions.
The financial statements have been prepared in conformity with generally accepted accounting principles which require management to make certain estimates and assumptions at the date of the financial statements. The following summarizes the significant accounting policies of the fund:
Security Valuation. Securities for which quotations are readily available are valued at the last sale price, or if no sale price, at the closing bid price in the principal market in which such securities are normally traded. Securities (including restricted securities) for which quotations are not readily available are valued primarily using dealer-supplied valuations or at their fair value as determined in good faith under consistently applied procedures under the general supervision of the Board of Trustees. Short-term securities with remaining maturities of sixty days or less for which quotations are not readily available are valued at amortized cost or original cost plus accrued interest, both of which approximate current value.
Foreign Currency Translation. The accounting records of the fund are maintained in U.S. dollars. Investment securities and other assets and liabilities denominated in a foreign currency are translated into U.S. dollars at the prevailing rates of exchange at period end. Purchases and sales of securities, income receipts and expense payments are translated into U.S. dollars at the prevailing exchange rate on the respective dates of the transactions.
Net realized gains and losses on foreign currency transactions represent net gains and losses from sales and maturities of foreign currency contracts and foreign currency options, disposition of foreign currencies, the difference between the amount of net investment income accrued and the U.S. dollar amount actually received, and gains
Semiannual Report
Notes to Financial Statements (Unaudited) - continued
1. Significant Accounting Policies - continued
Foreign Currency Translation - continued
and losses between trade and settlement date on purchases and sales of securities. The effects of changes in foreign currency exchange rates on investments in securities are included with the net realized and unrealized gain or loss on investment securities.
Income Taxes. As a qualified regulated investment company under Subchapter M of the Internal Revenue Code, the fund is not subject to U.S. federal income taxes to the extent that it distributes substantially all of its taxable income for its fiscal year. The fund may be subject to foreign taxes on income and gains on investments which are accrued based upon the fund's understanding of the tax rules and regulations that exist in the markets in which it invests. Foreign governments may also impose taxes on other payments or transactions with respect to foreign securities. The fund accrues such taxes as applicable. The schedule of investments includes information regarding income taxes under the caption "Income Tax Information."
Investment Income. Dividend income is recorded on the ex-dividend date, except certain dividends from foreign securities where the ex-dividend date may have passed, are recorded as soon as the fund is informed of the ex-dividend date. Non-cash dividends included in dividend income, if any, are recorded at the fair market value of the securities received. Interest income, which includes accretion of original issue discount, is accrued as earned. Investment income is recorded net of foreign taxes withheld where recovery of such taxes is uncertain. The fund may place a debt obligation on non-accrual status and reduce related interest income by ceasing current accruals and writing off interest receivables when the collection of all or a portion of interest has become doubtful based on consistently applied procedures, under the general supervision of the Board of Trustees of the fund. A debt obligation is removed from non-accrual status when the issuer resumes interest payments or when collectibility of interest is reasonably assured.
Expenses. Most expenses of the trust can be directly attributed to a fund. Expenses which cannot be directly attributed are apportioned among the funds in the trust.
Distributions to Shareholders. Distributions are declared daily and paid monthly from net investment income. Distributions from realized gains, if any, are recorded on the ex-dividend date. Income dividends and capital gain distributions are declared separately for each class.
Income and capital gain distributions are determined in accordance with income tax regulations which may differ from generally accepted accounting principles. These differences, which may result in distribution reclassifications, are primarily due to differing treatments for foreign currency transactions, market discount, capital loss carryforwards and losses deferred due to wash sales and excise tax regulations.
Semiannual Report
Notes to Financial Statements (Unaudited) - continued
1. Significant Accounting Policies - continued
Distributions to Shareholders - continued
Permanent book and tax basis differences relating to shareholder distributions will result in reclassifications to paid in capital. Undistributed net investment income and accumulated undistributed net realized gain (loss) on investments and foreign currency transactions may include temporary book and tax basis differences which will reverse in a subsequent period. Any taxable income or gain remaining at fiscal year end is distributed in the following year.
Security Transactions. Security transactions are accounted for as of trade date. Gains and losses on securities sold are determined on the basis of identified cost.
2. Operating Policies.
Foreign Currency Contracts. The fund generally uses foreign currency contracts to facilitate transactions in foreign-denominated securities. Losses may arise from changes in the value of the foreign currency or if the counterparties do not perform under the contracts' terms. The U.S. dollar value of foreign currency contracts is determined using contractual currency exchange rates established at the time of each trade.
Joint Trading Account. Pursuant to an Exemptive Order issued by the Securities and Exchange Commission (the SEC), the fund, along with other affiliated entities of Fidelity Management & Research Company (FMR), may transfer uninvested cash balances into one or more joint trading accounts. These balances are invested in one or more repurchase agreements for U.S. Treasury or Federal Agency obligations.
Repurchase Agreements. The underlying U.S. Treasury, Federal Agency, or other obligations found to be satisfactory by FMR are transferred to an account of the fund, or to the Joint Trading Account, at a bank custodian. The securities are marked-to-market daily and maintained at a value at least equal to the principal amount of the repurchase agreement (including accrued interest). FMR, the fund's investment adviser, is responsible for determining that the value of the underlying securities remains in accordance with the market value requirements stated above.
Options. The fund may use options to manage its exposure to the bond market and to fluctuations in interest rates and currency values. Writing puts and buying calls tend to increase the fund's exposure to the underlying instrument. Buying puts and writing calls tend to decrease the fund's exposure to the underlying instrument, or hedge other fund investments. The underlying face amount at value of any open options at period end is shown in the schedule of investments under the caption "Purchased Options." This amount reflects each contract's exposure to the underlying instrument at period end. Losses may arise from changes in the value of the underlying instruments, if there is an illiquid secondary market for the contracts, or if the counterparties do not perform under the
Semiannual Report
Notes to Financial Statements (Unaudited) - continued
2. Operating Policies - continued
Options - continued
contracts' terms. Gains and losses are realized upon the expiration or closing of the options. Realized gains (losses) on purchased options are included in realized gains (losses) on investment securities, except purchased options on foreign currency which are included in realized gains (losses) on foreign currency transactions.
Exchange-traded options are valued using the last sale price or, in the absence of a sale, the last offering price. Options traded over-the-counter are valued using dealer-supplied valuations.
Restricted Securities. The fund is permitted to invest in securities that are subject to legal or contractual restrictions on resale. These securities generally may be resold in transactions exempt from registration or to the public if the securities are registered. Disposal of these securities may involve time-consuming negotiations and expense, and prompt sale at an acceptable price may be difficult. At the end of the period, the fund had no investments in restricted securities (excluding 144A issues).
Loans and Other Direct Debt Instruments. The fund is permitted to invest in loans and loan participations, trade claims or other receivables. These investments may include standby financing commitments that obligate the fund to supply additional cash to the borrower on demand. Loan participations involve a risk of insolvency of the lending bank or other financial intermediary. At the end of the period, these investments amounted to $6,686,897 or 8.1% of net assets.
3. Purchases and Sales of Investments.
Purchases and sales of securities, other than short-term securities, aggregated $116,102,554 and $123,160,336, respectively.
4. Fees and Other Transactions with Affiliates.
Management Fee. As the fund's investment adviser, FMR receives a monthly fee that is calculated on the basis of a group fee rate plus a fixed individual fund fee rate applied to the average net assets of the fund. The group fee rate is the weighted average of a series of rates and is based on the monthly average net assets of all the mutual funds advised by FMR. The rates ranged from .0920% to .3700% for the period. The annual individual fund fee rate is .55%. In the event that these rates were lower than the contractual rates in effect during the period, FMR voluntarily implemented the above rates, as they resulted in the same or a lower management fee. For the period, the management fee was equivalent to an annualized rate of .68% of average net assets.
Semiannual Report
Notes to Financial Statements (Unaudited) - continued
4. Fees and Other Transactions with Affiliates - continued
Sub-Adviser Fee. FMR, on behalf of the fund, entered into sub-advisory agreements with Fidelity Management & Research (U.K.) Inc., Fidelity Management & Research (Far East) Inc., Fidelity International Investment Advisors (FIIA) and Fidelity Investments Japan Limited (FIJ). Under the sub-advisory arrangements, FMR may receive investment advice and research services and may grant the sub-advisers investment management authority to buy and sell securities. FMR pays its sub-advisers either a portion of its management fee or a fee based on costs incurred for these services.
Distribution and Service Plan. In accordance with Rule 12b-1 of the 1940 Act, the Board of Trustees has adopted separate Distribution and Service Plans with respect to each class of shares (collectively referred to as "the Plans"). Under certain of the Plans, the class pays Fidelity Distributors Corporation (FDC), an affiliate of FMR, a 12b-1 fee. A portion of this fee may be reallowed to securities dealers, banks and other financial institutions for the distribution of each class of shares and providing shareholder support services. For the period, this fee was based on the following annual rates of the average net assets of each applicable class:
|
Class A |
.15% |
|
Class T |
.25% |
|
Class B |
.90%* |
|
Class C |
1.00%* * |
* .65% represents a distribution fee and .25% represents a shareholder service fee.
* * .75% represents a distribution fee and .25% represents a shareholder service fee.
For the period, each class paid FDC the following amounts, a portion of which was retained by FDC:
|
|
Paid to |
Retained |
|
Class A |
$ 2,046 |
$ 9 |
|
Class T |
65,352 |
7,125 |
|
Class B |
90,487 |
65,486 |
|
Class C |
13,778 |
6,048 |
|
|
$ 171,663 |
$ 78,668 |
Sales Load. FDC receives a front-end sales charge of up to 4.75% for selling Class A shares, and 3.50% for selling Class T shares of the fund. FDC receives the proceeds of contingent deferred sales charges levied on Class B share redemptions occurring within six years of purchase and Class C share redemptions occurring within one year of purchase. Contingent deferred sales charges are based on declining rates ranging from 5% to 1% for Class B and 1% for Class C, of the lesser of the cost of shares at the initial date of purchase or the net asset value of the redeemed shares, excluding any reinvested dividends and capital gains.
Semiannual Report
Notes to Financial Statements (Unaudited) - continued
4. Fees and Other Transactions with Affiliates - continued
Sales Load - continued
In addition, purchases of Class A and Class T shares that were subject to a finder's fee bear a contingent deferred sales charge on assets that do not remain in the fund for at least one year. The Class A and Class T contingent deferred sales charge is based on 0.25% of the lesser of the cost of shares at the initial date of purchase or the net asset value of the redeemed shares, excluding any reinvested dividends and capital gains. A portion of the sales charges paid to FDC is paid to securities dealers, banks and other financial institutions.
For the period, sales charge amounts paid to and retained by FDC were as follows:
|
|
Paid to |
Retained |
|
Class A |
$ 12,631 |
$ 2,516 |
|
Class T |
19,943 |
5,652 |
|
Class B |
22,383 |
22,383* |
|
Class C |
1,315 |
1,315* |
|
|
$ 56,272 |
$ 31,866 |
* When Class B and Class C shares are initially sold, FDC pays commissions from its own resources to securities dealers,
banks, and other financial institutions through which the sales are made.
Transfer Agent Fees. Fidelity Investments Institutional Operations Company, Inc., (FIIOC), an affiliate of FMR, is the transfer, dividend disbursing and shareholder servicing agent (collectively referred to as the transfer agent) for each class of the fund. FIIOC receives account fees and asset-based fees that vary according to the account size and type of account of the shareholders of the respective classes of the fund. FIIOC pays for typesetting, printing and mailing of all shareholder reports, except proxy statements. For the period, the following amounts were paid to FIIOC:
|
|
Amount |
% of |
|
Class A |
$ 4,289 |
.32 |
|
Class T |
60,554 |
.23 |
|
Class B |
26,422 |
.26 |
|
Class C |
3,813 |
.28 |
|
Institutional Class |
4,983 |
.16 |
|
|
$ 100,061 |
|
* Annualized.
Accounting Fees. Fidelity Service Company, Inc. (FSC), an affiliate of FMR, maintains the fund's accounting records. The fee is based on the level of average net assets for the month plus out-of-pocket expenses.
Semiannual Report
Notes to Financial Statements (Unaudited) - continued
5. Expense Reductions.
FMR voluntarily agreed to reimburse operating expenses (excluding interest, taxes, certain securities lending fees, brokerage commissions and extraordinary expenses, if any) above the following annual rates or range of annual rates of average net assets for each of the following classes:
|
|
FMR |
Reimbursement |
|
Class A |
1.40% |
$ 696 |
|
Class B |
2.15% |
370 |
|
Class C |
2.25% |
243 |
|
|
|
$ 1,309 |
In addition, through an arrangement with the fund's custodian, credits realized as a result of uninvested cash balances were used to reduce a portion of the fund's expenses. During the period, the fund's custodian fees were reduced by $9,937 under this arrangement.
6. Credit Risk.
The fund's relatively large investment in countries with limited or developing capital markets may involve greater risks than investments in more developed markets and the prices of such investments may be volatile. The yields of emerging market debt obligations reflect, among other things, perceived credit risk. The consequences of political, social or economic changes in these markets may have disruptive effects on the market prices of the fund's investments and the income they generate, as well as the fund's ability to repatriate such amounts.
7. Distributions to Shareholders.
Distributions to shareholders of each class were as follows:
|
|
Six months ended June 30, |
Year ended December 31, |
|
|
2000 |
1999 |
|
From net investment income |
|
|
|
Class A |
$ 96,552 |
$ 198,550 |
|
Class T |
1,822,339 |
4,792,465 |
|
Class B |
635,118 |
1,508,455 |
|
Class C |
85,879 |
159,916 |
|
Institutional Class |
231,368 |
261,899 |
|
Total |
$ 2,871,256 |
$ 6,921,285 |
Semiannual Report
Notes to Financial Statements (Unaudited) - continued
8. Share Transactions.
Transactions for each class of shares were as follows:
|
|
Shares |
Dollars |
||
|
|
Six months ended June 30, |
Year ended December 31, |
Six months ended June 30, |
Year ended December 31, |
|
|
2000 |
1999 |
2000 |
1999 |
|
|
|
|
|
|
|
Class A |
140,303 |
85,049 |
$ 1,398,174 |
$ 725,615 |
|
Reinvestment of distributions |
9,012 |
19,735 |
89,943 |
172,036 |
|
Shares redeemed |
(24,163) |
(247,480) |
(242,710) |
(1,984,096) |
|
Net increase (decrease) |
125,152 |
(142,696) |
$ 1,245,407 |
$ (1,086,445) |
|
Class T |
1,093,245 |
2,796,838 |
$ 10,916,260 |
$ 23,706,190 |
|
Reinvestment of distributions |
154,606 |
476,741 |
1,539,059 |
4,150,699 |
|
Shares redeemed |
(2,100,954) |
(4,418,691) |
(21,389,339) |
(37,034,387) |
|
Net increase (decrease) |
(853,103) |
(1,145,112) |
$ (8,934,020) |
$ (9,177,498) |
|
Class B |
340,671 |
565,451 |
$ 3,417,142 |
$ 4,858,849 |
|
Reinvestment of distributions |
50,008 |
134,352 |
500,722 |
1,179,380 |
|
Shares redeemed |
(337,553) |
(879,623) |
(3,396,744) |
(7,521,597) |
|
Net increase (decrease) |
53,126 |
(179,820) |
$ 521,120 |
$ (1,483,368) |
|
Class C |
109,265 |
255,248 |
$ 1,089,435 |
$ 2,187,018 |
|
Reinvestment of distributions |
6,434 |
12,291 |
64,450 |
108,919 |
|
Shares redeemed |
(83,026) |
(143,693) |
(819,964) |
(1,240,277) |
|
Net increase (decrease) |
32,673 |
123,846 |
$ 333,921 |
$ 1,055,660 |
|
Institutional Class |
154,366 |
749,979 |
$ 1,545,072 |
$ 6,571,465 |
|
Reinvestment of distributions |
21,965 |
24,724 |
218,052 |
223,316 |
|
Shares redeemed |
(133,551) |
(359,249) |
(1,330,506) |
(2,945,643) |
|
Net increase (decrease) |
42,780 |
415,454 |
$ 432,618 |
$ 3,849,138 |
Semiannual Report
Semiannual Report
Investment Adviser
Fidelity Management & Research Company
Boston, MA
Investment Sub-Adviser
Fidelity Management & Research
(U.K.) Inc.
Fidelity Management & Research
(Far East) Inc.
Fidelity Investments Japan Limited
Fidelity International Investment Advisors
Fidelity International Investment
Advisors (U.K.) Limited
Officers
Edward C. Johnson 3d, President
Robert C. Pozen, Senior Vice President
Robert A. Lawrence, Vice President
John H. Carlson, Vice President
Eric D. Roiter, Secretary
Robert A. Dwight, Treasurer
Maria F. Dwyer, Deputy Treasurer
John H. Costello, Assistant Treasurer
Board of Trustees
Ralph F. Cox *
Phyllis Burke Davis *
Robert M. Gates *
Edward C. Johnson 3d
Donald J. Kirk *
Ned C. Lautenbach *
Peter S. Lynch
Marvin L. Mann *
William O. McCoy *
Gerald C. McDonough *
Robert C. Pozen
Thomas R. Williams *
* Independent trustees
Advisory Board
J. Michael Cook
Abigail P. Johnson
Marie L. Knowles
General Distributor
Fidelity Distributors Corporation
Boston, MA
Transfer and Shareholder
Servicing Agent
Fidelity Investments Institutional Operations Company, Inc.
Boston, MA
Custodian
The Chase Manhattan Bank
New York, NY
Semiannual Report
Focus Funds
Fidelity Advisor Consumer
Industries Fund
Fidelity Advisor Cyclical
Industries Fund
Fidelity Advisor Financial
Services Fund
Fidelity Advisor Health Care Fund
Fidelity Advisor Natural
Resources Fund
Fidelity Advisor Technology Fund
Fidelity Advisor Utilities Growth Fund
Growth Funds
Fidelity Advisor Korea Fund
Fidelity Advisor Emerging Asia Fund
Fidelity Advisor Latin America Fund
Fidelity Advisor Japan Fund
Fidelity Advisor Europe Capital Appreciation Fund
Fidelity Advisor International Capital Appreciation Fund
Fidelity Advisor Overseas Fund
Fidelity Advisor Diversified International Fund
Fidelity Advisor Global Equity Fund
Fidelity Advisor TechnoQuant ®
Growth Fund
Fidelity Advisor Small Cap Fund
Fidelity Advisor Value Strategies Fund
Fidelity Advisor Mid Cap Fund
Fidelity Advisor Dynamic Capital
Appreciation Fund
Fidelity Advisor Equity Growth Fund
Fidelity Advisor Large Cap Fund
Fidelity Advisor Dividend Growth Fund
Fidelity Advisor Growth
Opportunities Fund
Growth and Income Funds
Fidelity Advisor Growth & Income Fund
Fidelity Advisor Equity Income Fund
Fidelity Advisor Asset Allocation Fund
Fidelity Advisor Balanced Fund
Taxable Income Funds
Fidelity Advisor Emerging Markets Income Fund
Fidelity Advisor High Yield Fund
Fidelity Advisor High Income Fund
Fidelity Advisor Strategic Income Fund
Fidelity Advisor Mortgage
Securities Fund
Fidelity Advisor Government Investment Fund
Fidelity Advisor Intermediate Bond Fund
Fidelity Advisor Short Fixed-Income Fund
Municipal Funds
Fidelity Advisor Municipal Income Fund
Money Market Funds
Prime Fund
Treasury Fund
Tax-Exempt Fund
EMII-SANN-0800 109092
1.705746.102(Fidelity Investment logo)(registered trademark)
Corporate Headquarters
82 Devonshire St., Boston, MA 02109
www.fidelity.com
|
|