
|
|
|
|
|
|
|
|
|
|
Previous: ENZON INC, 8-K, 2000-12-21 |
Next: Z SEVEN FUND INC, N-30B-2, 2000-12-21 |
Fidelity® Advisor
Fund - Class A, Class T, Class B and Class C
Annual Report
October 31, 2000
(2_fidelity_logos)(registered trademark)
|
President's Message |
Ned Johnson on investing strategies. |
|
|
Performance |
How the fund has done over time. |
|
|
Fund Talk |
The manager's review of fund performance, strategy and outlook. |
|
|
Investment Changes |
A summary of major shifts in the fund's investments over the past six months. |
|
|
Investments |
A complete list of the fund's investments with their market values. |
|
|
Financial Statements |
Statements of assets and liabilities,
operations, and changes in net assets, |
|
|
Notes |
Notes to the financial statements. |
|
|
Report of Independent Accountants |
The auditors' opinion. |
|
|
Distributions |
|
Standard & Poor's, S&P and S&P 500 are registered service marks of The McGraw-Hill Companies, Inc. and have been licensed for use by Fidelity Distributors Corporation.
Other third party marks appearing herein are the property of their respective owners.
All other marks appearing herein are registered or unregistered trademarks or service marks of FMR Corp. or an affiliated company.
(Recycle graphic) This report is printed on recycled paper using soy-based inks.
This report and the financial statements contained herein are submitted for the general information of the shareholders of the fund. This report is not authorized for distribution to prospective investors in the fund unless preceded or accompanied by an effective prospectus.
Mutual fund shares are not deposits or obligations of, or guaranteed by, any depository institution. Shares are not insured by the FDIC, Federal Reserve Board or any other agency, and are subject to investment risks, including possible loss of principal amount invested.
Neither the fund nor Fidelity Distributors Corporation is a bank.
For more information on any Fidelity Advisor fund, including charges and expenses, contact your investment professional for a free prospectus. Read it carefully before you invest or send money.
Annual Report
(photo_of_Edward_C_Johnson_3d)
Dear Shareholder:
A sixth-straight year of double-digit positive returns for the Dow Jones Industrial Average, NASDAQ and S&P 500® could be in jeopardy unless the U.S. stock market shows marked improvement in the final two months of 2000. Through October, all three indexes had negative year-to-date returns. On the other hand, most fixed-income sectors were solidly in the black. Treasuries and other long-term government securities led the way, returning nearly 14%.
While it's impossible to predict the future direction of the markets with any degree of certainty, there are certain basic principles that can help investors plan for their future needs.
First, investors are encouraged to take a long-term view of their portfolios. If you can afford to leave your money invested through the inevitable up and down cycles of the financial markets, you will greatly reduce your vulnerability to any single decline. We know from experience, for example, that stock prices have gone up over longer periods of time, have significantly outperformed other types of investments and have stayed ahead of inflation.
Second, you can further manage your investing risk through diversification. A stock mutual fund, for instance, is already diversified, because it invests in many different companies. You can increase your diversification further by investing in a number of different stock funds, or in such other investment categories as bonds. If you have a short investment time horizon, you might want to consider moving some of your investment into a money market fund, which seeks income and a stable share price by investing in high-quality, short-term investments. Of course, it's important to remember that an investment in a money market fund is not insured or guaranteed by the Federal Deposit Insurance Corporation or any other government agency. Although money market funds seek to preserve the value of your investment at $1.00 per share, it is possible to lose money by investing in these types of funds.
Finally, no matter what your time horizon or portfolio diversity, it makes good sense to follow a regular investment plan, investing a certain amount of money in a fund at the same time each month or quarter and periodically reviewing your overall portfolio. By doing so, you won't get caught up in the excitement of a rapidly rising market, nor will you buy all your shares at market highs. While this strategy - known as dollar cost averaging - won't assure a profit or protect you from a loss in a declining market, it should help you lower the average cost of your purchases. Of course, you should consider your financial ability to continue your purchases through periods of low price levels before undertaking such a strategy.
Remember to contact your investment professional if you need help with your investments.
Best regards,
/s/Edward C. Johnson 3d
Edward C. Johnson 3d
Annual Report
Fidelity Advisor Overseas Fund - Class A
There are several ways to evaluate historical performance. You can look at the total percentage change in value, the average annual percentage change or the growth of a hypothetical $10,000 investment. Total return reflects the change in the value of an investment, assuming reinvestment of the class' dividend income and capital gains (the profits earned upon the sale of securities that have grown in value). The initial offering of Class A shares took place on September 3, 1996. Class A shares bear a 0.25% 12b-1 fee. Returns prior to September 3, 1996 are those of Class T, the original class of the fund, and reflect Class T shares' 0.50% 12b-1 fee (0.65% prior to January 1, 1996). If Fidelity had not reimbursed certain class expenses, the past five year and past 10 year total returns would have been lower. Prior to December 1, 1992, Fidelity Advisor Overseas Fund operated under a different investment objective. Accordingly, the fund's historical performance may not represent its current investment policies.
Cumulative Total Returns
|
Periods ended October 31, 2000 |
|
Past 1 |
Past 5 |
Past 10 |
|
Fidelity Adv Overseas - CL A |
|
1.78% |
74.90% |
166.13% |
|
Fidelity Adv Overseas - CL A |
|
-4.07% |
64.85% |
150.82% |
|
MSCI EAFE® |
|
-2.72% |
52.63% |
113.59% |
|
International Funds Average |
|
2.70% |
62.88% |
149.02% |
Cumulative total returns show Class A's performance in percentage terms over a set period - in this case, one year, five years or 10 years. For example, if you had invested $1,000 in a fund that had a 5% return over the past year, the value of your investment would be $1,050. You can compare Class A's returns to the performance of the Morgan Stanley Capital Inter-national Europe, Australasia, Far East Index (MSCI EAFE®) - a market capitalization-weighted index that is designed to represent the performance of developed stock markets outside the United States and Canada. As of October 31, 2000 the index included over 840 equity securities of companies domiciled in 20 countries. To measure how Class A's performance stacked up against its peers, you can compare it to the international funds average, which reflects the performance of mutual funds with similar objectives tracked by Lipper Inc. The past one year average represents a peer group of 666 mutual funds. These benchmarks include reinvested dividends and capital gains, if any, and exclude the effect of sales charges.
Average Annual Total Returns
|
Periods ended October 31, 2000 |
Past 1 |
Past 5 |
Past 10 |
|
Fidelity Adv Overseas - CL A |
1.78% |
11.83% |
10.28% |
|
Fidelity Adv Overseas - CL A |
-4.07% |
10.51% |
9.63% |
|
MSCI EAFE |
-2.72% |
8.82% |
7.88% |
|
International Funds Average |
2.70% |
9.93% |
9.30% |
Average annual total returns take Class A shares' cumulative return and show you what would have happened if Class A shares had performed at a constant rate each year.
Annual Report
$10,000 Over 10 Years
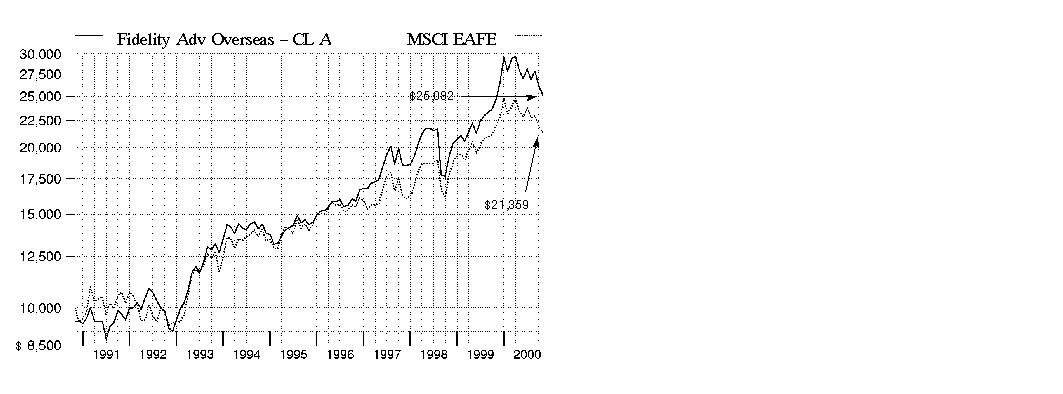
$10,000 Over 10 Years: Let's say hypothetically that $10,000 was invested in Fidelity Advisor Overseas Fund - Class A on October 31, 1990, and the current 5.75% sales charge was paid. As the chart shows, by October 31, 2000, the value of the investment would have grown to $25,082 - a 150.82% increase on the initial investment. For comparison, look at how the MSCI EAFE Index did over the same period. With dividends reinvested, the same $10,000 would have grown to $21,359 - a 113.59% increase.
Understanding
Performance
Many markets around the globe offer the potential for significant growth over time; however, investing in foreign markets means assuming greater risks than investing in the United States. Factors like changes in a country's financial markets, its local political and economic climate, and the fluctuating value of its currency create these risks. For these reasons an international fund's performance may be more volatile than a fund that invests exclusively in the United States. Past performance is no guarantee of future results and you may have a gain or loss when you sell your shares.
3Annual Report
Fidelity Advisor Overseas Fund - Class T
There are several ways to evaluate historical performance. You can look at the total percentage change in value, the average annual percentage change or the growth of a hypothetical $10,000 investment. Total return reflects the change in the value of an investment, assuming reinvestment of the class' dividend income and capital gains (the profits earned upon the sale of securities that have grown in value). Prior to December 1, 1992, Fidelity Advisor Overseas Fund operated under a different investment objective. Accordingly, the fund's historical performance may not represent its current investment policies.
Cumulative Total Returns
|
Periods ended October 31, 2000 |
|
Past 1 |
Past 5 |
Past 10 |
|
Fidelity Adv Overseas - CL T |
|
1.62% |
74.22% |
165.09% |
|
Fidelity Adv Overseas - CL T |
|
-1.93% |
68.12% |
155.81% |
|
MSCI EAFE |
|
-2.72% |
52.63% |
113.59% |
|
International Funds Average |
|
2.70% |
62.88% |
149.02% |
Cumulative total returns show Class T's performance in percentage terms over a set period - in this case, one year, five years or 10 years. For example, if you had invested $1,000 in a fund that had a 5% return over the past year, the value of your investment would be $1,050. You can compare Class T's returns to the performance of the Morgan Stanley Capital International Europe, Australasia, Far East Index (MSCI EAFE) - a market capitalization-weighted index that is designed to represent the performance of developed stock markets outside the United States and Canada. As of October 31, 2000, the index included over 840 equity securities of companies domiciled in 20 countries. To measure how Class T's performance stacked up against its peers, you can compare it to the international funds average, which reflects the performance of mutual funds with similar objectives tracked by Lipper Inc. The past one year average represents a peer group of 666 mutual funds. These benchmarks include reinvested dividends and capital gains, if any, and exclude the effect of sales charges.
Average Annual Total Returns
|
Periods ended October 31, 2000 |
Past 1 |
Past 5 |
Past 10 |
|
Fidelity Adv Overseas - CL T |
1.62% |
11.74% |
10.24% |
|
Fidelity Adv Overseas - CL T |
-1.93% |
10.95% |
9.85% |
|
MSCI EAFE |
-2.72% |
8.82% |
7.88% |
|
International Funds Average |
2.70% |
9.93% |
9.30% |
Average annual total returns take Class T shares' cumulative return and show you what would have happened if Class T shares had performed at a constant rate each year.
Annual Report
$10,000 Over 10 Years
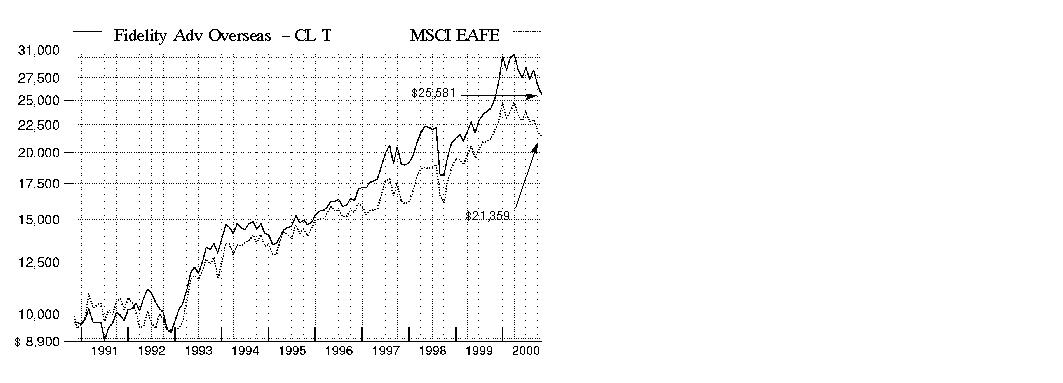
$10,000 Over 10 Years: Let's say hypothetically that $10,000 was invested in Fidelity Advisor Overseas Fund - Class T on October 31, 1990, and the current 3.50% sales charge was paid. As the chart shows, by October 31, 2000, the value of the investment would have grown to $25,581 - a 155.81% increase on the initial investment. For comparison, look at how the MSCI EAFE Index did over the same period. With dividends reinvested, the same $10,000 investment would have grown to $21,359 - a 113.59% increase.
Understanding
Performance
Many markets around the globe offer the potential for significant growth over time; however, investing in foreign markets means assuming greater risks than investing in the United States. Factors like changes in a country's financial markets, its local political and economic climate, and the fluctuating value of its currency create these risks. For these reasons an international fund's performance may be more volatile than a fund that invests exclusively in the United States. Past performance is no guarantee of future results and you may have a gain or loss when you sell your shares.
3Annual Report
Fidelity Advisor Overseas Fund - Class B
There are several ways to evaluate historical performance. You can look at the total percentage change in value, the average annual percentage change or the growth of a hypothetical $10,000 investment. Total return reflects the change in the value of an investment, assuming reinvestment of the class' dividend income and capital gains (the profits earned upon the sale of securities that have grown in value). The initial offering of Class B shares took place on July 3, 1995. Class B shares bear a 1.00% 12b-1 fee. Returns prior to July 3, 1995 are those of Class T, the original class of the fund, and reflect Class T shares' prior 0.65% 12b-1 fee. Had Class B shares' 12b-1 fee been reflected, returns prior to July 3, 1995 would have been lower. Class B shares' contingent deferred sales charges included in the past one year, past five year, and past 10 year total return figures are 5%, 2% and 0%, respectively. If Fidelity had not reimbursed certain class expenses, the past five year and past 10 year total returns would have been lower. Prior to December 1, 1992, Fidelity Advisor Overseas Fund operated under a different investment objective. Accordingly, the fund's historical performance may not represent its current investment policies.
Cumulative Total Returns
|
Periods ended October 31, 2000 |
|
Past 1 |
Past 5 |
Past 10 |
|
Fidelity Adv Overseas - CL B |
|
1.02% |
68.82% |
156.87% |
|
Fidelity Adv Overseas - CL B |
|
-3.79% |
66.82% |
156.87% |
|
MSCI EAFE |
|
-2.72% |
52.63% |
113.59% |
|
International Funds Average |
|
2.70% |
62.88% |
149.02% |
Cumulative total returns show Class B's performance in percentage terms over a set period - in this case, one year, five years or10 years. For example, if you had invested $1,000 in a fund that had a 5% return over the past year, the value of your investment would be $1,050. You can compare Class B's returns to the performance of the Morgan Stanley Capital International Europe, Australasia, Far East Index (MSCI EAFE) - a market capitalization-weighted index that is designed to represent the performance of developed stock markets outside the United States and Canada. As of October 31, 2000 the index included over 840 equity securities of companies domiciled in 20 countries. To measure how Class B's performance stacked up against its peers, you can compare it to the international funds average, which reflects the performance of mutual funds with similar objectives tracked by Lipper Inc. The past one year average represents a peer group of 666 mutual funds. These benchmarks include reinvested dividends and capital gains, if any, and exclude the effect of sales charges.
Average Annual Total Returns
|
Periods ended October 31, 2000 |
Past 1 |
Past 5 |
Past 10 |
|
Fidelity Adv Overseas - CL B |
1.02% |
11.04% |
9.89% |
|
Fidelity Adv Overseas - CL B |
-3.79% |
10.78% |
9.89% |
|
MSCI EAFE |
-2.72% |
8.82% |
7.88% |
|
International Funds Average |
2.70% |
9.93% |
9.30% |
Average annual total returns take Class B shares' cumulative return and show you what would have happened if Class B shares had performed at a constant rate each year.
Annual Report
$10,000 Over 10 Years
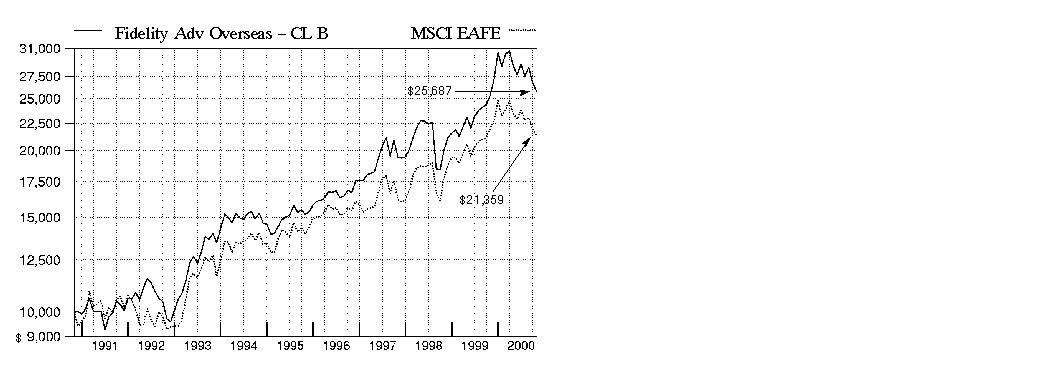
$10,000 Over 10 Years: Let's say hypothetically that $10,000 was invested in Fidelity Advisor Overseas Fund - Class B on October 31, 1990. As the chart shows, by October 31, 2000, the value of the investment would have been $25,687 - a 156.87% increase on the initial investment. For comparison, look at how the MSCI EAFE Index did over the same period. With dividends reinvested, the same $10,000 investment would have grown to $21,359 - a 113.59% increase.
Understanding
Performance
Many markets around the globe offer the potential for significant growth over time; however, investing in foreign markets means assuming greater risks than investing in the United States. Factors like changes in a country's financial markets, its local political and economic climate, and the fluctuating value of its currency create these risks. For these reasons an international fund's performance may be more volatile than a fund that invests exclusively in the United States. Past performance is no guarantee of future results and you may have a gain or loss when you sell your shares.
3Annual Report
Fidelity Advisor Overseas Fund - Class C
There are several ways to evaluate historical performance. You can look at the total percentage change in value, the average annual percentage change or the growth of a hypothetical $10,000 investment. Total return reflects the change in the value of an investment, assuming reinvestment of the class' dividend income and capital gains (the profits earned upon the sale of securities that have grown in value). The initial offering of Class C shares took place on November 3, 1997. Class C shares bear a 1.00% 12b-1 fee. Returns between July 3, 1995 and November 3, 1997 are those of Class B shares and reflect Class B shares' 1.00% 12b-1 fee. Returns prior to July 3, 1995 are those of Class T, the original class of the fund, and reflect Class T shares' prior 0.65% 12b-1 fee. Had Class C shares' 12b-1 fee been reflected, returns prior to July 3, 1995 would have been lower. Class C shares' contingent deferred sales charge included in the past one year, past five year, and past 10 year total return figures are 1%, 0% and 0%, respectively. If Fidelity had not reimbursed certain class expenses, the past five year and past 10 year total returns would have been lower. Prior to December 1, 1992, Fidelity Advisor Overseas Fund operated under a different investment objective. Accordingly, the fund's historical performance may not represent its current investment policies.
Cumulative Total Returns
|
Periods ended October 31, 2000 |
|
Past 1 |
Past 5 |
Past 10 |
|
Fidelity Adv Overseas - CL C |
|
1.05% |
68.88% |
156.96% |
|
Fidelity Adv Overseas - CL C |
|
0.09% |
68.88% |
156.96% |
|
MSCI EAFE |
|
-2.72% |
52.63% |
113.59% |
|
International Funds Average |
|
2.70% |
62.88% |
149.02% |
Cumulative total returns show Class C's performance in percentage terms over a set period - in this case, one year, five years or10 years. For example, if you had invested $1,000 in a fund that had a 5% return over the past year, the value of your investment would be $1,050. You can compare Class C's returns to the performance of the Morgan Stanley Capital International Europe, Australasia, Far East Index (MSCI EAFE) - a market capitalization-weighted index that is designed to represent the performance of stock markets outside the United States and Canada. As of October 31, 2000, the index included over 840 equity securities of companies domiciled in 20 countries. To measure how Class C's performance stacked up against its peers, you can compare it to the international funds average, which reflects the performance of mutual funds with similar objectives tracked by Lipper Inc. The past one year average represents a peer group of 666 mutual funds. These benchmarks include reinvested dividends and capital gains, if any, and exclude the effect of sales charges.
Average Annual Total Returns
|
Periods ended October 31, 2000 |
Past 1 |
Past 5 |
Past 10 |
|
Fidelity Adv Overseas - CL C |
1.05% |
11.05% |
9.90% |
|
Fidelity Adv Overseas - CL C |
0.09% |
11.05% |
9.90% |
|
MSCI EAFE |
-2.72% |
8.82% |
7.88% |
|
International Funds Average |
2.70% |
9.93% |
9.30% |
Average annual total returns take Class C shares' cumulative return and show you what would have happened if Class C shares had performed at a constant rate each year.
Annual Report
$10,000 Over 10 Years
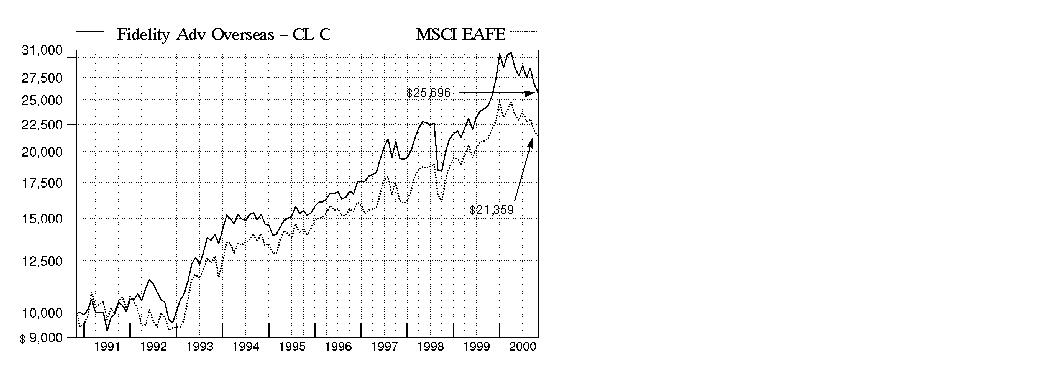
$10,000 Over 10 Years: Let's say hypothetically that $10,000 was invested in Fidelity Advisor Overseas Fund - Class C on October 31, 1990. As the chart shows, by October 31, 2000 the value of the investment would have been $25,696 - a 156.96% increase on the initial investment. For comparison, look at how the MSCI EAFE Index did over the same period. With dividends reinvested, the same $10,000 investment would have grown to $21,359 - a 113.59% increase.
Understanding
Performance
Many markets around the globe offer the potential for significant growth over time; however, investing in foreign markets means assuming greater risks than investing in the United States. Factors like changes in a country's financial markets, its local political and economic climate, and the fluctuating value of its currency create these risks. For these reasons an international fund's performance may be more volatile than a fund that invests exclusively in the United States. Past performance is no guarantee of future results and you may have a gain or loss when you sell your shares.
3Annual Report
Market Recap
Currency disparities, the see-saw performance of technology and telecommunications stocks and increased uncertainty over the direction of energy prices contributed to volatile world markets for the 12-month period that ended October 31, 2000. Through the first half of the period, foreign investors enjoyed handsome returns from technology and telecommunications holdings. These gains disappeared down the stretch, however, as the dollar continued to outperform the struggling euro - the uniform currency of 11 European nations - and the Japanese yen by wide margins. Soaring oil and gas prices also added to the volatility. The Morgan Stanley EAFE® index - which tracks the performance of stock markets in Europe, Australasia and the Far East - fell 2.72% during the period. Europe's economic recovery remained on course, but the euro's continued weakness proved to be a millstone. The Morgan Stanley Europe index had a 12-month return of 1.16%. Japan's economic recovery, on the other hand, appeared to be short-lived, or at least very, very slow in the making. The Morgan Stanley Japan index declined 11.61% during the period. Emerging markets, meanwhile, were unable to sustain the momentum they carried into early 2000 - the Morgan Stanley Emerging Markets Free index tumbled 10.33%.
(Portfolio Manager photograph)
An interview with Rick Mace,
Portfolio Manager of Fidelity
Advisor Overseas Fund
Q. How did the fund perform, Rick?
A. For the 12-month period that ended October 31, 2000, the fund's Class A, Class T, Class B and Class C shares returned 1.78%, 1.62%, 1.02% and 1.05%, respectively. For the same period, the Morgan Stanley Capital International (MSCI) EAFE Index, a broad measure of stock performance in Europe, Australasia and the Far East, declined 2.72%. The fund also compares its performance against the Lipper Inc. international funds average, which was up 2.70% during the past year.
Q. What factors helped the fund outperform its index during the 12-month period?
A. Overweightings and favorable stock selection in the industrial machinery, telecommunications, and transportation and shipping industries were the major factors. More specifically, our positions in Furukawa Electric, a company that manufactures optic fiber used in high-capacity telecommunications networks, and Kyocera, a producer of internal components for cellular handsets, provided a significant boost to performance. Many telephone holdings also aided performance, such as our positions in Mannesmann - later bought by Vodafone Group - and China Mobile, which were particular standouts. The fund also benefited from an early entrance into transportation and shipping stocks, such as Teekay Shipping and Overseas Shipholding, which rose sharply on an increase in worldwide demand for oil. Among energy stocks, French producer TotalFinaElf and several smaller Canadian holdings, such as Talisman, made strong contributions. From a country perspective, being slightly underweighted in the poor-performing Japanese market, particularly during the past six months, proved helpful. Meanwhile, holding significant out-of-benchmark stakes in the relatively strong-performing markets in Canada, Mexico and the U.S. fueled the fund's overall performance.
Annual Report
Fund Talk: The Manager's Overview - continued
Q. What other investment strategies did you employ?
A. During the past year, I reduced the fund's total number of stocks to focus more on the positions I felt offered the best value and potential for growth. This strategy increased the fund's top-10 holdings to roughly 26% of the fund's net assets, from about 20% at the beginning of 2000. I recently pared back the fund's telecommunications positions, particularly in equipment manufacturers where competitive pricing pressures and weakening handset demand threatened to hurt profits. Similarly, I cut back on a number of telephone holdings due to rising concerns over the prices that some of these companies were paying for recent acquisitions. I also was concerned by the high prices that many of these companies were bidding for G3 spectrum licenses to accommodate the next generation of wireless communications. Additionally, I generally took some profits across the board among our energy holdings due to less-favorable projections of supply and demand. At the same time, I increased the fund's exposure to pharmaceuticals and European consumer stocks, such as Unilever and Nestle, because of the relatively stable earnings growth those sectors historically provide.
Q. The fund's financial services weighting rose to 17.7% from 13.3% six months ago. What was your strategy there?
A. I increased our positions in Nomura Securities and Nikko Securities because I believed the trend of Japanese investors using the securities markets for wealth building was in the initial stage of a long-term growth trend. With the recent deregulation of financial services in Japan, these stocks could benefit going forward. As the period progressed, I opportunistically added to the fund's holdings in selected bank stocks, such as Royal Bank of Scotland and Lloyd's TSB Group in the United Kingdom, which reached such low levels that I couldn't ignore them.
Q. What were some of the fund's top performers? What stocks disappointed?
A. Despite a profit warning at the end of the period, Nokia, the Finnish cellular handset manufacturer, was rewarded for its industry leadership position. In addition, TotalFinaElf performed well as a result of the rising global demand for oil. Asian semiconductor holdings were among the fund's biggest disappointments as the price of main memory chips slid to a three-month low in September. South Korea's Samsung Electronics and Hyundai Electronics were among the fund's biggest detractors.
Q. What's your outlook for the next six months, Rick?
A. I expect the volatility we've experienced in the markets during the past six months to continue. The euro has shown little evidence of strengthening, and slowing global economies could hinder corporate profits. Global demand for PCs, handsets and other hardware appears to be slower than previously expected while, at the same time, there is an oversupply of internal components in the marketplace. Given these factors, I believe the performance of overseas stocks going forward will be closely tied to corporate earnings and fundamentals.
Annual Report
Fund Talk: The Manager's Overview - continued
The views expressed in this report reflect those of the portfolio manager only through the end of the period of the report as stated on the cover and do not necessarily represent the views of Fidelity or any other person in the Fidelity organization. Any such views are subject to change at any time based upon market or other conditions and Fidelity disclaims any responsibility to update such views. These views may not be relied on as investment advice and, because investment decisions for a Fidelity fund are based on numerous factors, may not be relied on as an indication of trading intent on behalf of any Fidelity fund.
Fund Facts
Goal: seeks growth of capital primarily through investments in foreign securities
Start date: April 23, 1990
Size: as of October 31, 2000, more than $2.0 billion
Manager: Rick Mace, since 1996; joined Fidelity in 1987
3Rick Mace on the recent
volatility in global markets:
"As we've seen during the past six months, volatility in the equity markets - both domestically and internationally - has increased this year. I believe it is here to stay for a while.
"It's important to realize that today volatility is truly global, influenced a great deal by economic conditions in the United States. When the U.S. economy cools, the rest of the world freezes. When U.S. markets warm, the rest of the world catches fire. Part of the reason volatility is global is that merger and acquisition activity is sweeping the world. Companies are buying one another not just within their own geographic markets, but on a global basis. This acquisition activity suggests that industries also are consolidating around the world.
"Turning to individual markets, I think we will see the European and Japanese economies sputter along in the short term. However, looking with a longer perspective, the corporate cultures in both Europe and Japan are changing - for the better. For example, an increasing number of companies are offering stock options to senior employees, a move that should improve bottom lines and add value for shareholders. Additionally, the increase in M&A activity is driving efficiency into companies and improving returns for shareholders. In the emerging markets, the outlook is mixed. Although Southeast Asian economies have stabilized, the rise in oil costs could hinder short-term growth. There is a slightly better outlook in Latin America, because a number of countries are self-sufficient in energy production.
"Understandably, most people fear volatility. But in my opinion, volatility can be a good thing, because it creates opportunities to buy and sell."
Annual Report
|
Top Five Stocks as of October 31, 2000 |
||
|
|
% of fund's |
% of fund's net assets |
|
Nokia AB (Finland, Communications Equipment) |
4.9 |
3.6 |
|
Vodafone Group PLC (United Kingdom, Cellular) |
3.6 |
3.9 |
|
TotalFinaElf SA Class B (France, Oil & Gas) |
3.5 |
3.8 |
|
Sony Corp. (Japan, Consumer Electronics) |
2.2 |
0.7 |
|
Nippon Telegraph & Telephone Corp. |
2.1 |
1.1 |
|
|
16.3 |
13.1 |
|
Top Five Market Sectors as of October 31, 2000 |
||
|
|
% of fund's |
% of fund's net assets |
|
Finance |
17.7 |
13.3 |
|
Technology |
15.0 |
20.5 |
|
Utilities |
14.6 |
19.7 |
|
Energy |
6.6 |
8.5 |
|
Health |
6.5 |
3.9 |
|
Top Five Countries as of October 31, 2000 |
||
|
(excluding cash equivalents) |
% of fund's |
% of fund's net assets |
|
Japan |
22.7 |
23.8 |
|
United Kingdom |
14.0 |
15.4 |
|
France |
10.0 |
10.3 |
|
Finland |
6.9 |
4.7 |
|
Switzerland |
6.0 |
3.6 |
|
Percentages are adjusted for the effect of open futures contracts, if applicable. |
|
Asset Allocation (% of fund's net assets) |
|||||||
|
As of October 31, 2000 |
As of April 30, 2000 |
||||||
 |
Stocks, Investment
Companies and |
|
|
Stocks and |
|
||
 |
Bonds 0.2% |
|
|
Bonds 0.2% |
|
||
 |
Short-Term |
|
|
Short-Term |
|
||

Annual Report
Showing Percentage of Net Assets
|
Common Stocks - 89.5% |
|||
|
Shares |
Value (Note 1) (000s) |
||
|
Australia - 1.0% |
|||
|
BHP Ltd. |
482,140 |
$ 4,690 |
|
|
Cable & Wireless Optus Ltd. (a) |
2,036,300 |
4,328 |
|
|
News Corp. Ltd. |
565,237 |
6,076 |
|
|
News Corp. Ltd. sponsored ADR (preferred ltd. vtg.) |
118,900 |
4,303 |
|
|
TOTAL AUSTRALIA |
19,397 |
||
|
Brazil - 0.2% |
|||
|
Telesp Celular Participacoes SA ADR |
100,000 |
3,163 |
|
|
Canada - 2.4% |
|||
|
Alberta Energy Co. Ltd. |
146,100 |
5,398 |
|
|
Alcan Aluminium Ltd. |
132,800 |
4,191 |
|
|
BCE, Inc. |
145,500 |
3,918 |
|
|
Canadian Natural Resources Ltd. (a) |
335,000 |
9,901 |
|
|
Ensign Resource Service Group, Inc. |
22,600 |
609 |
|
|
Nortel Networks Corp. |
67,369 |
3,065 |
|
|
Rio Alto Exploration Ltd. (a) |
443,500 |
7,545 |
|
|
Suncor Energy, Inc. |
15,500 |
303 |
|
|
Talisman Energy, Inc. (a) |
409,400 |
12,894 |
|
|
TOTAL CANADA |
47,824 |
||
|
Finland - 6.9% |
|||
|
Nokia AB |
2,328,100 |
99,528 |
|
|
Sampo Insurance Co. Ltd. (A Shares) |
93,000 |
3,789 |
|
|
Sonera Corp. |
155,100 |
3,418 |
|
|
UPM-Kymmene Corp. |
1,113,100 |
31,509 |
|
|
TOTAL FINLAND |
138,244 |
||
|
France - 10.0% |
|||
|
Alcatel SA (RFD) (a) |
218,500 |
13,629 |
|
|
Aventis SA (France) |
147,814 |
10,652 |
|
|
AXA SA de CV |
118,690 |
15,716 |
|
|
BNP Paribas SA |
114,345 |
9,861 |
|
|
Canal Plus SA |
20,700 |
2,996 |
|
|
Castorama Dubois Investissements SA |
86,430 |
17,577 |
|
|
France Telecom SA |
120,600 |
12,611 |
|
|
Sanofi-Synthelabo SA |
189,500 |
9,973 |
|
|
Suez Lyonnaise des Eaux (France) |
34,800 |
5,311 |
|
|
Television Francaise 1 SA (a) |
82,630 |
4,510 |
|
|
TotalFinaElf SA Class B |
492,596 |
70,564 |
|
|
Common Stocks - continued |
|||
|
Shares |
Value (Note 1) (000s) |
||
|
France - continued |
|||
|
Vivendi Environment (a) |
351,200 |
$ 13,116 |
|
|
Vivendi SA |
203,700 |
14,645 |
|
|
TOTAL FRANCE |
201,161 |
||
|
Germany - 2.4% |
|||
|
Allianz AG (Reg.) |
38,700 |
13,125 |
|
|
BASF AG |
372,800 |
14,619 |
|
|
Bayerische Hypo-und Vereinsbank AG |
80,500 |
4,424 |
|
|
Deutsche Lufthansa AG (Reg.) |
145,800 |
2,846 |
|
|
Kali Und Salz Beteiligungs AG |
363,500 |
5,245 |
|
|
Muenchener Ruckversicherungs-Gesellschaft AG (Reg.) |
20,100 |
6,321 |
|
|
United Internet AG (a) |
155,000 |
997 |
|
|
TOTAL GERMANY |
47,577 |
||
|
Hong Kong - 2.1% |
|||
|
China Mobile (Hong Kong) Ltd. (a) |
4,417,000 |
27,054 |
|
|
Hutchison Whampoa Ltd. |
905,200 |
11,231 |
|
|
Johnson Electric Holdings Ltd. |
2,498,000 |
4,965 |
|
|
TOTAL HONG KONG |
43,250 |
||
|
Ireland - 0.4% |
|||
|
Bank of Ireland, Inc. |
982,520 |
7,572 |
|
|
Italy - 1.4% |
|||
|
Banca Intesa Spa |
1,482,481 |
6,197 |
|
|
Olivetti Spa |
1,353,000 |
4,118 |
|
|
San Paolo IMI Spa |
351,300 |
5,658 |
|
|
Telecom Italia Spa |
1,003,828 |
11,795 |
|
|
TOTAL ITALY |
27,768 |
||
|
Japan - 22.4% |
|||
|
Advantest Corp. |
27,500 |
3,587 |
|
|
Asahi Chemical Industry Co. Ltd. (a) |
383,000 |
2,373 |
|
|
Canon, Inc. |
243,000 |
9,857 |
|
|
Daiwa Securities Group, Inc. |
1,469,000 |
16,277 |
|
|
DDI Corp. |
425 |
1,994 |
|
|
Fujitsu Ltd. |
463,000 |
8,249 |
|
|
Furukawa Electric Co. Ltd. |
1,154,000 |
30,355 |
|
|
Hitachi Chemical Co. Ltd. |
95,000 |
2,386 |
|
|
Hitachi Zosen Corp. (a) |
3,043,000 |
2,315 |
|
|
Ito-Yokado Co. Ltd. |
272,000 |
12,290 |
|
|
Kyocera Corp. |
77,700 |
10,392 |
|
|
Matsushita Electric Industrial Co. Ltd. |
374,000 |
10,930 |
|
|
Common Stocks - continued |
|||
|
Shares |
Value (Note 1) (000s) |
||
|
Japan - continued |
|||
|
Mitsubishi Electric Corp. |
502,000 |
$ 3,607 |
|
|
Mitsubishi Estate Co. Ltd. (a) |
444,000 |
4,720 |
|
|
Mitsui Fudosan Co. Ltd. |
198,000 |
2,399 |
|
|
NEC Corp. |
860,000 |
16,394 |
|
|
Net One Systems Co. Ltd. |
111 |
3,296 |
|
|
NGK Insulators Ltd. |
263,000 |
3,483 |
|
|
Nikko Securities Co. Ltd. |
4,221,000 |
36,442 |
|
|
Nikon Corp. |
246,000 |
3,576 |
|
|
Nintendo Co. Ltd. |
27,800 |
4,599 |
|
|
Nippon Telegraph & Telephone Corp. |
4,566 |
41,555 |
|
|
Nomura Securities Co. Ltd. |
1,810,000 |
38,403 |
|
|
NTT DoCoMo, Inc. |
745 |
18,367 |
|
|
Oki Electric Industry Co. Ltd. (a) |
513,000 |
3,051 |
|
|
Omron Corp. |
563,000 |
13,880 |
|
|
ORIX Corp. |
59,800 |
6,275 |
|
|
Rohm Co. Ltd. |
17,100 |
4,311 |
|
|
Softbank Corp. |
229,900 |
13,801 |
|
|
Sony Corp. |
521,400 |
43,276 |
|
|
Takeda Chemical Industries Ltd. |
346,000 |
22,800 |
|
|
Toko, Inc. |
423,000 |
2,210 |
|
|
Tokyo Broadcasting System, Inc. |
98,000 |
3,835 |
|
|
Tokyo Electron Ltd. |
46,400 |
3,632 |
|
|
Toshiba Corp. |
1,429,000 |
10,216 |
|
|
Toyota Motor Corp. |
786,400 |
31,424 |
|
|
Trans Cosmos, Inc. |
11,100 |
803 |
|
|
Yamanouchi Pharmaceutical Co. Ltd. |
84,000 |
3,803 |
|
|
TOTAL JAPAN |
451,163 |
||
|
Korea (South) - 2.7% |
|||
|
Hyundai Electronics Industries Co. Ltd. (a) |
1,592,480 |
9,786 |
|
|
Kookmin Bank |
319,000 |
3,646 |
|
|
Samsung Electronics Co. Ltd. |
281,600 |
35,277 |
|
|
Samsung Heavy Industries Ltd. (a) |
489,100 |
1,522 |
|
|
SK Telecom Co. Ltd. sponsored ADR |
181,100 |
4,539 |
|
|
TOTAL KOREA (SOUTH) |
54,770 |
||
|
Marshall Islands - 0.6% |
|||
|
Teekay Shipping Corp. |
342,000 |
12,782 |
|
|
Mexico - 1.7% |
|||
|
Grupo Televisa SA de CV sponsored GDR |
85,900 |
4,649 |
|
|
Common Stocks - continued |
|||
|
Shares |
Value (Note 1) (000s) |
||
|
Mexico - continued |
|||
|
Telefonos de Mexico SA de CV Series L sponsored ADR |
259,800 |
$ 14,013 |
|
|
TV Azteca SA de CV sponsored ADR |
1,234,800 |
15,435 |
|
|
TOTAL MEXICO |
34,097 |
||
|
Netherlands - 5.4% |
|||
|
ABN AMRO Holding NV |
288,700 |
6,690 |
|
|
Akzo Nobel NV |
185,600 |
8,452 |
|
|
Heineken NV |
67,900 |
3,689 |
|
|
ING Groep NV (Certificaten Van Aandelen) |
321,273 |
22,067 |
|
|
Koninklijke Ahold NV |
631,330 |
18,343 |
|
|
Koninklijke Philips Electronics NV |
166,258 |
6,535 |
|
|
Nutreco Holding NV |
90,104 |
3,885 |
|
|
Royal Dutch Petroleum Co. (Hague Registry) |
162,700 |
9,660 |
|
|
Unilever NV (Certificaten Van Aandelen) (a) |
243,300 |
12,205 |
|
|
United Pan-Europe Communications NV Class A (a) |
264,600 |
4,638 |
|
|
Vendex KBB NV |
436,900 |
5,481 |
|
|
VNU NV |
78,400 |
3,717 |
|
|
Wolters Kluwer NV (Certificaten Van Aandelen) |
171,900 |
3,869 |
|
|
TOTAL NETHERLANDS |
109,231 |
||
|
Norway - 1.7% |
|||
|
Bergesen dy ASA: |
|
|
|
|
(A Shares) |
492,900 |
9,813 |
|
|
(B Shares) |
401,300 |
7,342 |
|
|
DNB Holding ASA |
1,536,618 |
6,664 |
|
|
Frontline Ltd. (a) |
659,800 |
10,864 |
|
|
TOTAL NORWAY |
34,683 |
||
|
Singapore - 0.3% |
|||
|
Overseas Union Bank Ltd. |
631,272 |
3,058 |
|
|
United Overseas Bank Ltd. |
381,488 |
2,827 |
|
|
TOTAL SINGAPORE |
5,885 |
||
|
Spain - 2.4% |
|||
|
Altadis SA |
177,481 |
2,659 |
|
|
Banco Santander Central Hispano SA |
1,789,260 |
17,344 |
|
|
Telefonica SA (a) |
1,497,900 |
28,569 |
|
|
TOTAL SPAIN |
48,572 |
||
|
Sweden - 1.4% |
|||
|
Telefonaktiebolaget LM Ericsson (B Shares) |
2,059,800 |
28,580 |
|
|
Common Stocks - continued |
|||
|
Shares |
Value (Note 1) (000s) |
||
|
Switzerland - 6.0% |
|||
|
Credit Suisse Group (Reg.) |
130,678 |
$ 24,500 |
|
|
Julius Baer Holding AG |
927 |
4,590 |
|
|
Nestle SA (Reg.) |
19,953 |
41,349 |
|
|
Novartis AG (Reg.) |
6,923 |
10,503 |
|
|
The Swatch Group AG (Reg.) |
39,900 |
10,855 |
|
|
UBS AG |
78,778 |
10,913 |
|
|
Zurich Financial Services Group AG |
36,510 |
17,671 |
|
|
TOTAL SWITZERLAND |
120,381 |
||
|
Taiwan - 0.7% |
|||
|
Taiwan Semiconductor Manufacturing Co. Ltd. (a) |
2,821,451 |
8,560 |
|
|
United Microelectronics Corp. (a) |
3,303,600 |
5,830 |
|
|
TOTAL TAIWAN |
14,390 |
||
|
United Kingdom - 14.0% |
|||
|
Amvescap PLC |
400,300 |
8,937 |
|
|
AstraZeneca Group PLC (United Kingdom) |
100,800 |
4,807 |
|
|
BAE Systems PLC |
1,136,718 |
6,452 |
|
|
Barclays PLC |
193,300 |
5,526 |
|
|
BBA Group PLC |
428,300 |
2,350 |
|
|
Billiton PLC |
1,249,300 |
4,763 |
|
|
BP Amoco PLC |
1,966,660 |
16,696 |
|
|
British Telecommunications PLC |
937,900 |
11,161 |
|
|
Cable & Wireless PLC |
366,700 |
5,183 |
|
|
Carlton Communications PLC |
762,300 |
6,133 |
|
|
Diageo PLC |
456,800 |
4,308 |
|
|
Glaxo Wellcome PLC |
432,900 |
12,595 |
|
|
Granada Compass PLC (a) |
386,330 |
3,327 |
|
|
HSBC Holdings PLC (United Kingdom) (Reg.) |
687,667 |
9,916 |
|
|
Lloyds TSB Group PLC |
1,773,800 |
18,052 |
|
|
Marconi PLC |
256,500 |
3,235 |
|
|
Misys PLC |
550,900 |
5,734 |
|
|
Reed International PLC |
385,000 |
3,555 |
|
|
Reuters Group PLC |
692,700 |
13,609 |
|
|
Rio Tinto PLC (Reg. D) |
680,700 |
11,003 |
|
|
Royal Bank of Scotland Group PLC |
1,027,900 |
23,053 |
|
|
SMG PLC |
564,400 |
2,209 |
|
|
SmithKline Beecham PLC |
1,341,102 |
17,485 |
|
|
SSL International PLC |
339,300 |
3,947 |
|
|
Unilever PLC |
193,300 |
1,347 |
|
|
Common Stocks - continued |
|||
|
Shares |
Value (Note 1) (000s) |
||
|
United Kingdom - continued |
|||
|
Vodafone Group PLC |
17,106,916 |
$ 72,811 |
|
|
WPP Group PLC |
325,200 |
4,361 |
|
|
TOTAL UNITED KINGDOM |
282,555 |
||
|
United States of America - 3.4% |
|||
|
Bristol-Myers Squibb Co. |
249,900 |
15,228 |
|
|
Eli Lilly & Co. |
86,300 |
7,713 |
|
|
OMI Corp. (a) |
430,300 |
2,985 |
|
|
Overseas Shipholding Group, Inc. |
374,600 |
8,990 |
|
|
Pfizer, Inc. |
222,900 |
9,626 |
|
|
Schering-Plough Corp. |
249,900 |
12,917 |
|
|
VoiceStream Wireless Corp. (a) |
75,700 |
9,955 |
|
|
TOTAL UNITED STATES OF AMERICA |
67,414 |
||
|
TOTAL COMMON STOCKS (Cost $1,628,367) |
1,800,459 |
||
|
Investment Companies - 0.1% |
|||
|
|
|
|
|
|
Multi-National - 0.1% |
|||
|
European Warrant Fund, Inc. |
220,200 |
2,945 |
|
|
Convertible Bonds - 0.2% |
|||||
|
Moody's Ratings (unaudited) |
Principal Amount (000s) |
|
|||
|
Hong Kong - 0.2% |
|||||
|
China Mobile (Hong Kong) Ltd. 2.25% 11/3/05 |
Baa2 |
|
$ 3,439 |
3,439 |
|
|
Government Obligations - 0.0% |
|||||
|
|
|||||
|
United States of America - 0.0% |
|||||
|
U.S. Treasury Bills, yield at date of purchase
6.14% to 6.16% 11/9/00 to 1/11/01 (c) |
- |
|
475 |
471 |
|
|
Cash Equivalents - 9.6% |
|||
|
Shares |
Value (Note 1) (000s) |
||
|
Fidelity Cash Central Fund, 6.61% (b) |
171,742,079 |
$ 171,742 |
|
|
Fidelity Securities Lending Cash Central Fund, 6.66% (b) |
21,299,550 |
21,300 |
|
|
TOTAL CASH EQUIVALENTS (Cost $193,042) |
193,042 |
||
|
TOTAL INVESTMENT PORTFOLIO - 99.4% (Cost $1,828,962) |
2,000,356 |
||
|
NET OTHER ASSETS - 0.6% |
12,102 |
||
|
NET ASSETS - 100% |
$ 2,012,458 |
||
|
Futures Contracts |
|||||
|
|
Expiration Date |
Underlying Face Amount at Value (000s) |
Unrealized
Gain/(Loss) |
||
|
Purchased |
|||||
|
90 Nikkei 225 Index Contracts (Japan) |
Dec. 2000 |
$ 6,640 |
$ (754) |
||
|
|
|
The face value of futures purchased as a percentage of net assets - 0.3% |
|
Legend |
|
(a) Non-income producing |
|
(b) The rate quoted is the annualized seven-day yield of the fund at period end. A complete listing of the fund's holdings as of its most recent fiscal year end is available upon request. |
|
(c) Security or a portion of the security was pledged to cover margin requirements for futures contracts. At the period end, the value of securities pledged amounted to $471,000. |
|
Income Tax Information |
|
At October 31, 2000, the aggregate |
|
The fund hereby designates approximately $92,559,000 as a capital gain dividend for the purpose of the dividend paid deduction. |
See accompanying notes which are an integral part of the financial statements.
Annual Report
Statement of Assets and Liabilities
|
Amounts in thousands |
October 31, 2000 |
|
|
Asset |
|
|
|
Investment in securities, at value (cost $1,828,962) - |
|
$ 2,000,356 |
|
Cash |
|
325 |
|
Foreign currency held at value (cost $612) |
|
607 |
|
Receivable for investments sold |
|
54,685 |
|
Receivable for fund shares sold |
|
10,018 |
|
Dividends receivable |
|
2,764 |
|
Interest receivable |
|
966 |
|
Receivable for daily variation on futures contracts |
|
101 |
|
Other receivables |
|
21 |
|
Total assets |
|
2,069,843 |
|
Liabilities |
|
|
|
Payable for investments purchased |
$ 28,013 |
|
|
Payable for fund shares redeemed |
5,213 |
|
|
Accrued management fee |
1,280 |
|
|
Distribution fees payable |
872 |
|
|
Other payables and accrued expenses |
707 |
|
|
Collateral on securities loaned, at value |
21,300 |
|
|
Total liabilities |
|
57,385 |
|
Net Assets |
|
$ 2,012,458 |
|
Net Assets consist of: |
|
|
|
Paid in capital |
|
$ 1,635,481 |
|
Undistributed net investment income |
|
57,980 |
|
Accumulated undistributed net realized gain (loss) on investments and foreign currency transactions |
|
148,519 |
|
Net unrealized appreciation (depreciation) on investments and assets and liabilities in foreign currencies |
|
170,478 |
|
Net Assets |
|
$ 2,012,458 |
See accompanying notes which are an integral part of the financial statements.
Annual Report
Financial Statements - continued
Statement of Assets and Liabilities - continued
|
Amounts in thousands (except per-share amounts) |
October 31, 2000 |
|
|
Calculation of Maximum Offering Price |
|
$19.88 |
|
Maximum offering price per share (100/94.25 of $19.88) |
|
$21.09 |
|
Class T: |
|
$20.13 |
|
Maximum offering price per share (100/96.50 of $20.13) |
|
$20.86 |
|
Class B: |
|
$19.49 |
|
Class C: |
|
$19.80 |
|
Institutional Class: |
|
$19.95 |
A Redemption price per share is equal to net asset value less any applicable contingent deferred sales charge.
See accompanying notes which are an integral part of the financial statements.
Annual Report
Financial Statements - continued
Statement of Operations
|
Amounts in thousands |
Year ended October 31, 2000 |
|
|
Investment Income Dividends |
|
$ 25,315 |
|
Special dividend from BCE, Inc. |
|
3,831 |
|
Interest |
|
9,802 |
|
Security lending |
|
513 |
|
|
|
39,461 |
|
Less foreign taxes withheld |
|
(3,134) |
|
Total income |
|
36,327 |
|
Expenses |
|
|
|
Management fee |
$ 15,078 |
|
|
Performance adjustment |
2,434 |
|
|
Transfer agent fees |
4,601 |
|
|
Distribution fees |
10,704 |
|
|
Accounting and security lending fees |
1,003 |
|
|
Non-interested trustees' compensation |
6 |
|
|
Custodian fees and expenses |
993 |
|
|
Registration fees |
251 |
|
|
Audit |
54 |
|
|
Legal |
52 |
|
|
Miscellaneous |
22 |
|
|
Total expenses before reductions |
35,198 |
|
|
Expense reductions |
(444) |
34,754 |
|
Net investment income |
|
1,573 |
|
Realized and Unrealized Gain (Loss) Net realized gain (loss) on: |
|
|
|
Investment securities |
217,443 |
|
|
Foreign currency transactions |
(1,080) |
|
|
Futures contracts |
1,389 |
217,752 |
|
Change in net unrealized appreciation (depreciation) on: |
|
|
|
Investment securities |
(218,049) |
|
|
Assets and liabilities in foreign currencies |
(225) |
|
|
Futures contracts |
(1,136) |
(219,410) |
|
Net gain (loss) |
|
(1,658) |
|
Net increase (decrease) in net assets resulting |
|
$ (85) |
See accompanying notes which are an integral part of the financial statements.
Annual Report
Financial Statements - continued
Statement of Changes in Net Assets
|
Amounts in thousands |
Year ended |
Year ended |
|
Increase (Decrease) in Net Assets |
|
|
|
Operations |
$ 1,573 |
$ 5,488 |
|
Net realized gain (loss) |
217,752 |
133,044 |
|
Change in net unrealized appreciation (depreciation) |
(219,410) |
216,537 |
|
Net increase (decrease) in net assets resulting |
(85) |
355,069 |
|
Distributions to shareholders |
(5,290) |
(3,445) |
|
In excess of net investment income |
(5,539) |
- |
|
From net realized gain |
(81,508) |
(10,438) |
|
Total distributions |
(92,337) |
(13,883) |
|
Share transactions - net increase (decrease) |
388,023 |
127,794 |
|
Total increase (decrease) in net assets |
295,601 |
468,980 |
|
Net Assets |
|
|
|
Beginning of period |
1,716,857 |
1,247,877 |
|
End of period (including undistributed net investment income of $57,980 and $10,177, respectively) |
$ 2,012,458 |
$ 1,716,857 |
See accompanying notes which are an integral part of the financial statements.
Annual Report
Financial Highlights - Class A
|
Years ended October 31, |
2000 |
1999 |
1998 |
1997 |
1996 E |
|
Selected Per-Share Data |
|
|
|
|
|
|
Net asset value, beginning |
$ 20.59 |
$ 16.32 |
$ 16.89 |
$ 15.29 |
$ 14.98 |
|
Income from |
|
|
|
|
|
|
Net investment income D |
.06 H |
.10 |
.09 |
.09 |
.04 |
|
Net realized and unrealized gain (loss) |
.38 I |
4.42 |
.51 |
2.39 |
.27 |
|
Total from |
.44 |
4.52 |
.60 |
2.48 |
.31 |
|
Less Distributions |
|
|
|
|
|
|
From net investment income |
(.08) |
(.11) |
(.21) |
(.25) |
- |
|
In excess of |
(.09) |
- |
- |
- |
- |
|
From net realized gain |
(.98) |
(.14) |
(.96) |
(.63) |
- |
|
Total distributions |
(1.15) |
(.25) |
(1.17) |
(.88) |
- |
|
Net asset value, end of period |
$ 19.88 |
$ 20.59 |
$ 16.32 |
$ 16.89 |
$ 15.29 |
|
Total Return B, C |
1.78% |
28.05% |
3.73% |
16.95% |
2.07% |
|
Ratios and Supplemental Data |
|
|
|
|
|
|
Net assets, end of period |
$ 44 |
$ 23 |
$ 12 |
$ 5 |
$ 1 |
|
Ratio of expenses to |
1.49% |
1.55% |
1.55% F |
1.90% F |
1.16% A, F |
|
Ratio of expenses to average net assets after expense reductions |
1.46% G |
1.52% G |
1.54% G |
1.89% G |
1.16% A |
|
Ratio of net investment income to average net assets |
.28% |
.57% |
.51% |
.53% |
1.74% A |
|
Portfolio turnover |
132% |
85% |
74% |
70% |
82% |
A Annualized
B The total returns would have been lower had certain expenses not been reduced during the periods shown.
C Total returns do not include the one time sales charge and for periods of less than one year are not annualized.
D Net investment income per share has been calculated based on average shares outstanding during the period.
E For the period September 3, 1996 (commencement of sale of Class A shares) to October 31, 1996.
F FMR agreed to reimburse a portion of the class' expenses during the period. Without this reimbursement, the class' expense ratio would have been higher.
G FMR or the fund has entered into varying arrangements with third parties who either paid or reduced a portion of the class' expenses.
H Investment income per share reflects a special dividend (from BCE, Inc.) which amounted to $.04 per share.
I The amount shown for a share outstanding does not correspond with the aggregate net loss on investments for the period due to the timing of sales and repurchases of class shares in relation to fluctuating market values of the investments of the fund.
See accompanying notes which are an integral part of the financial statements.
Annual Report
Financial Highlights - Class T
|
Years ended October 31, |
2000 |
1999 |
1998 |
1997 |
1996 |
|
Selected Per-Share Data |
|
|
|
|
|
|
Net asset value, beginning |
$ 20.83 |
$ 16.48 |
$ 17.02 |
$ 15.30 |
$ 13.92 |
|
Income from |
|
|
|
|
|
|
Net investment income C |
.02 F |
.07 |
.06 |
.13 |
.19 D |
|
Net realized and |
.39 G |
4.46 |
.52 |
2.38 |
1.29 |
|
Total from |
.41 |
4.53 |
.58 |
2.51 |
1.48 |
|
Less Distributions |
|
|
|
|
|
|
From net |
(.06) |
(.04) |
(.16) |
(.16) |
(.09) |
|
In excess of |
(.07) |
- |
- |
- |
- |
|
From net realized gain |
(.98) |
(.14) |
(.96) |
(.63) |
(.01) |
|
Total distributions |
(1.11) |
(.18) |
(1.12) |
(.79) |
(.10) |
|
Net asset value, end |
$ 20.13 |
$ 20.83 |
$ 16.48 |
$ 17.02 |
$ 15.30 |
|
Total Return A, B |
1.62% |
27.74% |
3.57% |
17.07% |
10.69% |
|
Ratios and Supplemental Data |
|
|
|
|
|
|
Net assets, end of period |
$ 1,678 |
$ 1,480 |
$ 1,086 |
$ 1,111 |
$ 995 |
|
Ratio of expenses to average net assets |
1.67% |
1.72% |
1.74% |
1.66% |
1.61% |
|
Ratio of expenses to average net assets after expense reductions |
1.65% E |
1.69% E |
1.72% E |
1.65% E |
1.60% E |
|
Ratio of net investment income to average |
.10% |
.39% |
.35% |
.80% |
1.30% |
|
Portfolio turnover |
132% |
85% |
74% |
70% |
82% |
A The total returns would have been lower had certain expenses not been reduced during the periods shown.
B Total returns do not include the one time sales charge.
C Net investment income per share has been calculated based on average shares outstanding during the period.
D Investment income per share reflects a special dividend which amounted to $.04 per share.
E FMR or the fund has entered into varying arrangements with third parties who either paid or reduced a portion of the class' expenses.
F Investment income per share reflects a special dividend (from BCE, Inc.) which amounted to $.04 per share.
G The amount shown for a share outstanding does not correspond with the aggregate net loss on investments for the period due to the timing of sales and repurchases of class shares in relation to fluctuating market values of the investments of the fund.
See accompanying notes which are an integral part of the financial statements.
Annual Report
Financial Highlights - Class B
|
Years ended October 31, |
2000 |
1999 |
1998 |
1997 |
1996 |
|
Selected Per-Share Data |
|
|
|
|
|
|
Net asset value, beginning |
$ 20.25 |
$ 16.08 |
$ 16.69 |
$ 15.06 |
$ 13.92 |
|
Income from |
|
|
|
|
|
|
Net investment income (loss) C |
(.11) G |
(.03) |
(.03) |
.02 |
.08 D |
|
Net realized and unrealized gain (loss) |
.39 H |
4.34 |
.51 |
2.36 |
1.26 |
|
Total from investment operations |
.28 |
4.31 |
.48 |
2.38 |
1.34 |
|
Less Distributions |
|
|
|
|
|
|
From net investment income |
(.03) |
- |
(.13) |
(.12) |
(.19) |
|
In excess of |
(.03) |
- |
- |
- |
- |
|
From net realized gain |
(.98) |
(.14) |
(.96) |
(.63) |
(.01) |
|
Total distributions |
(1.04) |
(.14) |
(1.09) |
(.75) |
(.20) |
|
Net asset value, end of period |
$ 19.49 |
$ 20.25 |
$ 16.08 |
$ 16.69 |
$ 15.06 |
|
Total Return A, B |
1.02% |
27.00% |
3.00% |
16.41% |
9.73% |
|
Ratios and Supplemental Data |
|
|
|
|
|
|
Net assets, end of period |
$ 125 |
$ 89 |
$ 58 |
$ 40 |
$ 19 |
|
Ratio of expenses to average |
2.27% |
2.29% E |
2.30% E |
2.30% |
2.37% |
|
Ratio of expenses to average net assets after expense reductions |
2.25% F |
2.26% F |
2.29% F |
2.29% F |
2.37% |
|
Ratio of net investment income (loss) to average net assets |
(.50)% |
(.18)% |
(.19)% |
.15% |
.53% |
|
Portfolio turnover |
132% |
85% |
74% |
70% |
82% |
A The total returns would have been lower had certain expenses not been reduced during the periods shown.
B Total returns do not include the contingent deferred sales charge.
C Net investment income (loss) per share has been calculated based on average shares outstanding during the period.
D Investment income per share reflects a special dividend which amounted to $.04 per share.
E FMR agreed to reimburse a portion of the class' expenses during the period. Without this reimbursement, the class' expense ratio would have been higher.
F FMR or the fund has entered into varying arrangements with third parties who either paid or reduced a portion of the class' expenses.
G Investment income per share reflects a special dividend (from BCE, Inc.) which amounted to $.04 per share.
H The amount shown for a share outstanding does not correspond with the aggregate net loss on investments for the period due to the timing of sales and repurchases of class shares in relation to fluctuating market values of the investments of the fund.
See accompanying notes which are an integral part of the financial statements.
Annual Report
Financial Highlights - Class C
|
Years ended October 31, |
2000 |
1999 |
1998 E |
|
Selected Per-Share Data |
|
|
|
|
Net asset value, beginning of period |
$ 20.58 |
$ 16.37 |
$ 17.23 |
|
Income from Investment Operations |
|
|
|
|
Net investment income (loss) D |
(.10) H |
(.02) |
(.03) |
|
Net realized and unrealized gain (loss) |
.39 I |
4.43 |
.29 |
|
Total from investment operations |
.29 |
4.41 |
.26 |
|
Less Distributions |
|
|
|
|
From net investment income |
(.04) |
(.06) |
(.16) |
|
In excess of net investment income |
(.05) |
- |
- |
|
From net realized gain |
(.98) |
(.14) |
(.96) |
|
Total distributions |
(1.07) |
(.20) |
(1.12) |
|
Net asset value, end of period |
$ 19.80 |
$ 20.58 |
$ 16.37 |
|
Total Return B, C |
1.05% |
27.21% |
2.84% |
|
Ratios and Supplemental Data |
|
|
|
|
Net assets, end of period (in millions) |
$ 76 |
$ 35 |
$ 15 |
|
Ratio of expenses to average net assets |
2.22% |
2.25% F |
2.30% A, F |
|
Ratio of expenses to average net assets after |
2.20% G |
2.22% G |
2.30% A |
|
Ratio of net investment income (loss) to average net assets |
(.45)% |
(.13)% |
(.20)% A |
|
Portfolio turnover |
132% |
85% |
74% |
A Annualized
B The total returns would have been lower had certain expenses not been reduced during the periods shown.
C Total returns do not include the contingent deferred sales charge and for periods of less than one year are not annualized.
D Net investment income (loss) per share has been calculated based on average shares outstanding during the period.
E For the period November 3, 1997 (commencement of sale of Class C shares) to October 31, 1998.
F FMR agreed to reimburse a portion of the class' expenses during the period. Without this reimbursement, the class' expense ratio would have been higher.
G FMR or the fund has entered into varying arrangements with third parties who either paid or reduced a portion of the class' expenses.
H Investment income per share reflects a special dividend (from BCE, Inc.) which amounted to $.04 per share.
I The amount shown for a share outstanding does not correspond with the aggregate net loss on investments for the period due to the timing of sales and repurchases of class shares in relation to fluctuating market values of the investments of the fund.
See accompanying notes which are an integral part of the financial statements.
Annual Report
Financial Highlights - Institutional Class
|
Years ended October 31, |
2000 |
1999 |
1998 |
1997 |
1996 |
|
Selected Per-Share Data |
|
|
|
|
|
|
Net asset value, beginning |
$ 20.62 |
$ 16.36 |
$ 16.92 |
$ 15.20 |
$ 13.97 |
|
Income from |
|
|
|
|
|
|
Net investment income B |
.14 D |
.17 |
.13 |
.22 |
.21 C |
|
Net realized and unrealized gain (loss) |
.38 F |
4.39 |
.53 |
2.36 |
1.24 |
|
Total from investment operations |
.52 |
4.56 |
.66 |
2.58 |
1.45 |
|
Less Distributions |
|
|
|
|
|
|
From net investment income |
(.10) |
(.16) |
(.26) |
(.23) |
(.21) |
|
In excess of |
(.11) |
- |
- |
- |
- |
|
From net realized gain |
(.98) |
(.14) |
(.96) |
(.63) |
(.01) |
|
Total distributions |
(1.19) |
(.30) |
(1.22) |
(.86) |
(.22) |
|
Net asset value, end of period |
$ 19.95 |
$ 20.62 |
$ 16.36 |
$ 16.92 |
$ 15.20 |
|
Total Return A |
2.18% |
28.30% |
4.11% |
17.73% |
10.51% |
|
Ratios and Supplemental Data |
|
|
|
|
|
|
Net assets, end of period |
$ 90 |
$ 90 |
$ 77 |
$ 38 |
$ 16 |
|
Ratio of expenses to average |
1.13% |
1.18% |
1.26% |
1.17% |
1.44% |
|
Ratio of expenses to average net assets after expense reductions |
1.11% E |
1.15% E |
1.24% E |
1.16% E |
1.43% E |
|
Ratio of net investment income to average net assets |
.63% |
.94% |
.76% |
1.31% |
1.46% |
|
Portfolio turnover |
132% |
85% |
74% |
70% |
82% |
A The total returns would have been lower had certain expenses not been reduced during the periods shown.
B Net investment income per share has been calculated based on average shares outstanding during the period.
C Investment income per share reflects a special dividend which amounted to $.04 per share.
D Investment income per share reflects a special dividend (from BCE, Inc.) which amounted to $.04 per share.
E FMR or the fund has entered into varying arrangements with third parties who either paid or reduced a portion of the class' expenses.
F The amount shown for a share outstanding does not correspond with the aggregate net loss on investments for the period due to the timing of sales and repurchases of class shares in relation to fluctuating market values of the investments of the fund.
See accompanying notes which are an integral part of the financial statements.
Annual Report
For the period ended October 31, 2000
1. Significant Accounting Policies.
Fidelity Advisor Overseas Fund(the fund) is a fund of Fidelity Advisor Series VIII(the trust) and is authorized to issue an unlimited number of shares. The trust is registered under the Investment Company Act of 1940, as amended (the 1940 Act), as an open-end management investment company organized as a Massachusetts business trust.
The fund offers Class A, Class T, Class B, Class C, and Institutional Class shares, each of which has equal rights as to assets and voting privileges. Each class has exclusive voting rights with respect to matters that affect that class. Class B shares will automatically convert to Class A shares after a holding period of seven years from the initial date of purchase. Investment income, realized and unrealized capital gains and losses, the common expenses of the fund, and certain fund-level expense reductions, if any, are allocated on a pro rata basis to each class based on the relative net assets of each class to the total net assets of the fund. Each class of shares differs in its respective distribution, transfer agent, and certain other class-specific fees, expenses, and expense reductions.
The financial statements have been prepared in conformity with generally accepted accounting principles which require management to make certain estimates and assumptions at the date of the financial statements. The following summarizes the significant accounting policies of the fund:
Security Valuation. Securities for which quotations are readily available are valued using the official closing price or at the last sale price in the principal market in which they are traded. If the last sale price (on the local exchange) is unavailable, the last evaluated quote or closing bid price normally is used. If trading or events occurring in other markets after the close of the principal market in which securities are traded are expected to materially affect the value of those securities, then they are valued at their fair value taking this trading or these events into account. Fair value is determined in good faith under consistently applied procedures under the general supervision of the Board of Trustees. Securities (including restricted securities) for which quotations are not readily available are valued primarily using dealer-supplied valuations or at their fair value. Short-term securities with remaining maturities of sixty days or less for which quotations are not readily available are valued at amortized cost or original cost plus accrued interest, both of which approximate current value. Investments in open-end investment companies are valued at their net asset value each business day.
Foreign Currency Translation. The accounting records of the fund are maintained in U.S. dollars. Investment securities and other assets and liabilities denominated in a foreign currency are translated into U.S. dollars at the prevailing rates of exchange at period end. Purchases and sales of securities, income receipts and expense payments are translated into U.S. dollars at the prevailing exchange rate on the respective dates of the transactions.
Annual Report
Notes to Financial Statements - continued
1. Significant Accounting Policies - continued
Foreign Currency Translation - continued
Net realized gains and losses on foreign currency transactions represent net gains and losses from sales and maturities of foreign currency contracts, disposition of foreign currencies, the difference between the amount of net investment income accrued and the U.S. dollar amount actually received, and gains and losses between trade and settlement date on purchases and sales of securities. The effects of changes in foreign currency exchange rates on investments in securities are included with the net realized and unrealized gain or loss on investment securities.
Income Taxes. As a qualified regulated investment company under Subchapter M of the Internal Revenue Code, the fund is not subject to U.S. federal income taxes to the extent that it distributes substantially all of its taxable income for its fiscal year. The fund may be subject to foreign taxes on income and gains on investments which are accrued based upon the fund's understanding of the tax rules and regulations that exist in the markets in which it invests. Foreign governments may also impose taxes on other payments or transactions with respect to foreign securities. The fund accrues such taxes as applicable. The schedule of investments includes information regarding income taxes under the caption "Income Tax Information."
Investment Income. Dividend income is recorded on the ex-dividend date, except certain dividends from foreign securities where the ex-dividend date may have passed, are recorded as soon as the fund is informed of the ex-dividend date. Non-cash dividends included in dividend income, if any, are recorded at the fair market value of the securities received. Interest income is accrued as earned. Investment income is recorded net of foreign taxes withheld where recovery of such taxes is uncertain.
Expenses. Most expenses of the trust can be directly attributed to a fund. Expenses which cannot be directly attributed are apportioned among the funds in the trust.
Distributions to Shareholders. Distributions are recorded on the ex-dividend date. Income dividends and capital gain distributions are declared separately for each class.
Income and capital gain distributions are determined in accordance with income tax regulations which may differ from generally accepted accounting principles. These differences, which may result in distribution reclassifications, are primarily due to differing treatments for, futures transactions, foreign currency transactions, passive foreign investment companies (PFIC), non-taxable dividends and losses deferred due to wash sales. The fund also utilized earnings and profits distributed to shareholders on redemption of shares as a part of the dividends paid deduction for income tax purposes.
Annual Report
Notes to Financial Statements - continued
1. Significant Accounting Policies - continued
Distributions to Shareholders - continued
Permanent book and tax basis differences relating to shareholder distributions will result in reclassifications to paid in capital. Undistributed net investment income and accumulated undistributed net realized gain (loss) on investments and foreign currency transactions may include temporary book and tax basis differences which will reverse in a subsequent period. Any taxable income or gain remaining at fiscal year end is distributed in the following year.
Security Transactions. Security transactions are accounted for as of trade date. Gains and losses on securities sold are determined on the basis of identified cost.
2. Operating Policies.
Foreign Currency Contracts. The fund generally uses foreign currency contracts to facilitate transactions in foreign-denominated securities. Losses may arise from changes in the value of the foreign currency or if the counterparties do not perform under the contracts' terms. The U.S. dollar value of foreign currency contracts is determined using contractual currency exchange rates established at the time of each trade.
Joint Trading Account. Pursuant to an Exemptive Order issued by the Securities and Exchange Commission (the SEC), the fund, along with other affiliated entities of Fidelity Management & Research Company (FMR), may transfer uninvested cash balances into one or more joint trading accounts. These balances are invested in one or more repurchase agreements for U.S. Treasury or Federal Agency obligations.
Repurchase Agreements. The underlying U.S. Treasury, Federal Agency, or other obligations found to be satisfactory by FMR are transferred to an account of the fund, or to the Joint Trading Account, at a custodian bank. The securities are marked-to-market daily and maintained at a value at least equal to the principal amount of the repurchase agreement (including accrued interest). FMR, the fund's investment adviser, is responsible for determining that the value of the underlying securities remains in accordance with the market value requirements stated above.
Futures Contracts. The fund may use futures contracts to manage its exposure to the stock market and to fluctuations in currency values. Buying futures tends to increase the fund's exposure to the underlying instrument, while selling futures tends to decrease the fund's exposure to the underlying instrument or hedge other fund investments. Futures contracts involve, to varying degrees, risk of loss in excess of the futures variation margin reflected in the Statement of Assets and Liabilities. The underlying face amount at value of any open futures contracts at period end is shown in the schedule of investments
Annual Report
Notes to Financial Statements - continued
2. Operating Policies - continued
Futures Contracts - continued
under the caption "Futures Contracts." This amount reflects each contract's exposure to the underlying instrument at period end. Losses may arise from changes in the value of the underlying instruments or if the counterparties do not perform under the contracts' terms. Gains (losses) are realized upon the expiration or closing of the futures contracts. Futures contracts are valued at the settlement price established each day by the board of trade or exchange on which they are traded.
Restricted Securities. The fund is permitted to invest in securities that are subject to legal or contractual restrictions on resale. These securities generally may be resold in transactions exempt from registration or to the public if the securities are registered. Disposal of these securities may involve time-consuming negotiations and expense, and prompt sale at an acceptable price may be difficult. At the end of the period, the fund had no investments in restricted securities (excluding 144A issues).
3. Purchases and Sales of Investments.
Purchases and sales of securities, other than short-term securities, aggregated $2,739,133,000 and $2,502,270,000, respectively, of which U.S. government and government agency obligations aggregated $0 and $3,405,000, respectively.
The market value of futures contracts opened and closed during the period amounted to $26,938,000 and $31,192,000, respectively.
4. Fees and Other Transactions with Affiliates.
Management Fee. As the fund's investment adviser, FMR receives a monthly basic fee that is calculated on the basis of a group fee rate plus a fixed individual fund fee rate applied to the average net assets of the fund. The group fee rate is the weighted average of a series of rates and is based on the monthly average net assets of all the mutual funds advised by FMR. The rates ranged from .2167% to .5200% for the period. The annual individual fund fee rate is .45%. In the event that these rates were lower than the contractual rates in effect during the period, FMR voluntarily implemented the above rates, as they resulted in the same or a lower management fee. The basic fee is subject to a performance adjustment (up to a maximum of ±.20% of the fund's average net assets over the performance period) based on the fund's investment performance as compared to the appropriate index over a specified period of time. For the period, the management fee was equivalent to an annual rate of .84% of average net assets after the performance adjustment.
Annual Report
Notes to Financial Statements - continued
4. Fees and Other Transactions with Affiliates - continued
Sub-Adviser Fee.Beginning January 1, 2001, FMR Co. (FMRC) will serve as a sub-
adviser for the fund. FMRC may provide investment research and advice and may also provide investment advisory services for the fund. FMR, on behalf of the fund,
entered into sub-advisory agreements with Fidelity Management & Research (U.K.) Inc., Fidelity Management & Research (Far East) Inc., and Fidelity International
Investment Advisors (FIIA). Under the sub-advisory arrangements, FMR may receive investment advice and research services and may grant the sub-advisers
investment management authority to buy and sell securities. FMR pays its sub-advisers either a portion of its management fee or a fee based on costs incurred for
these services.
Distribution and Service Plan. In accordance with Rule 12b-1 of the 1940 Act, the Board of Trustees have adopted separate Distribution and Service Plans with respect to each class of shares (collectively referred to as "the Plans"). Under certain of the Plans, the class pays Fidelity Distributors Corporation (FDC), an affiliate of FMR, a 12b-1 fee. A portion of this fee may be reallowed to securities dealers, banks and other financial institutions for the distribution of each class of shares and providing shareholder support services. For the period, this fee was based on the following annual rates of the average net assets of each applicable class:
|
Class A |
.25% |
|
Class T |
.50% |
|
Class B |
1.00%* |
|
Class C |
1.00%* |
* .75% represents a distribution fee and .25% represents a shareholder service fee.
For the period, each class paid FDC the following amounts, a portion of which was retained by FDC:
|
|
Paid to |
Retained |
|
Class A |
$ 96,000 |
$ - |
|
Class T |
8,766,000 |
42,000 |
|
Class B |
1,226,000 |
920,000 |
|
Class C |
616,000 |
337,000 |
|
|
$ 10,704,000 |
$ 1,299,000 |
Sales Load. FDC receives a front-end sales charge of up to 5.75% for selling Class A shares, and 3.50% for selling Class T shares of the fund. FDC receives the proceeds of contingent deferred sales charges levied on Class B share redemptions occurring within six years of purchase and Class C share redemptions occurring within one year of purchase. Contingent deferred sales charges are based on declining rates ranging from 5% to 1% for Class B and 1% for Class C, of the lesser of the cost of shares at the
Annual Report
Notes to Financial Statements - continued
4. Fees and Other Transactions with Affiliates - continued
Sales Load - continued
initial date of purchase or the net asset value of the redeemed shares, excluding any reinvested dividends and capital gains. In addition, purchases of Class A and Class T shares that were subject to a finder's fee bear a contingent deferred sales charge on assets that do not remain in the fund for at least one year. The Class A and Class T contingent deferred sales charge is based on 0.25% of the lesser of the cost of shares at the initial date of purchase or the net asset value of the redeemed shares, excluding any reinvested dividends and capital gains. A portion of the sales charges paid to FDC is paid to securities dealers, banks and other financial institutions.
For the period, sales charge amounts paid to and retained by FDC were as follows:
|
|
Paid to |
Retained |
|
Class A |
$ 271,000 |
$ 120,000 |
|
Class T |
553,000 |
196,000 |
|
Class B |
247,000 |
247,000 * |
|
Class C |
29,000 |
29,000 * |
|
|
$ 1,100,000 |
$ 592,000 |
* When Class B and Class C shares are initially sold, FDC pays commissions from its own resources to securities dealers,
banks, and other financial institutions through which the sales are made.
Transfer Agent Fees. Fidelity Investments Institutional Operations Company, Inc., (FIIOC), an affiliate of FMR, is the transfer, dividend disbursing and shareholder servicing agent (collectively referred to as the transfer agent) for each class of the fund. FIIOC receives account fees and asset-based fees that vary according to the account size and type of account of the shareholders of the respective classes of the fund. FIIOC pays for typesetting, printing and mailing of all shareholder reports, except proxy statements. For the period, the following amounts were paid to FIIOC:
|
|
Amount |
% of |
|
Class A |
$ 107,000 |
.28 |
|
Class T |
3,767,000 |
.21 |
|
Class B |
382,000 |
.31 |
|
Class C |
162,000 |
.26 |
|
Institutional Class |
183,000 |
.18 |
|
|
$ 4,601,000 |
|
Accounting and Security Lending Fees. Fidelity Service Company, Inc., an affiliate of FMR, maintains the fund's accounting records and administers the security lending program. The security lending fee is based on the number and duration of lending transactions. The accounting fee is based on the level of average net assets for the month plus out-of-pocket expenses.
Annual Report
Notes to Financial Statements - continued
4. Fees and Other Transactions with Affiliates - continued
Fidelity Cash Central Fund. Pursuant to an Exemptive Order issued by the SEC, the fund may invest in the Fidelity Cash Central Fund (the Cash Fund) managed by Fidelity Investments Money Management, Inc., an affiliate of FMR. The Cash Fund is an open-end money market fund available only to investment companies and other accounts managed by FMR and its affiliates. The Cash Fund seeks preservation of capital, liquidity, and current income. Income distributions from the Cash Fund are declared daily and paid monthly from net investment income. Income distributions earned by the fund are recorded as interest income in the accompanying financial statements.
Brokerage Commissions. The fund placed a portion of its portfolio transactions with brokerage firms which are affiliates of FMR. The commissions paid to these affiliated firms were $20,000 for the period.
5. Security Lending.
The fund lends portfolio securities from time to time in order to earn additional income. The fund receives collateral in the form of U.S. Treasury obligations, letters of credit, and/or cash against the loaned securities, and maintains collateral in an amount not less than 100% of the market value of the loaned securities during the period of the loan. The market value of the loaned securities is determined at the close of business of the fund and any additional required collateral is delivered to the fund on the next business day. If the borrower defaults on its obligation to return the securities loaned because of insolvency or other reasons, the fund could experience delays and costs in recovering the securities loaned or in gaining access to the collateral. At period end, the value of the securities loaned amounted to $20,884,000. The fund received cash collateral of $21,300,000 which was invested in the Central Cash Collateral Fund.
6. Expense Reductions.
FMR has directed certain portfolio trades to brokers who paid a portion of the fund's expenses. For the period, the fund's expenses were reduced by $437,000 under this arrangement.
In addition, through an arrangement with the fund's custodian, credits realized as a result of uninvested cash balances were used to reduce a portion of expenses. During the period, the fund's custodian fees were reduced by $7,000 under the custodian arrangement.
7. Beneficial Interest.
At the end of the period, one shareholder was record owner of approximately 13% of the total outstanding shares of the fund.
Annual Report
Notes to Financial Statements - continued
8. Distributions to Shareholders.
Distributions to shareholders of each class were as follows:
|
Amounts in thousands |
Years ended October 31, |
|
|
|
2000 |
1999 |
|
From net investment income |
|
|
|
Class A |
$ 95 |
$ 78 |
|
Class T |
4,533 |
2,595 |
|
Class B |
132 |
- |
|
Class C |
76 |
50 |
|
Institutional Class |
454 |
722 |
|
Total |
$ 5,290 |
$ 3,445 |
|
In excess of net investment income |
|
|
|
Class A |
$ 99 |
$ - |
|
Class T |
4,748 |
- |
|
Class B |
138 |
- |
|
Class C |
79 |
- |
|
Institutional Class |
475 |
- |
|
Total |
$ 5,539 |
$ - |
|
From net realized gain |
|
|
|
Class A |
$ 1,120 |
$ 99 |
|
Class T |
69,969 |
9,084 |
|
Class B |
4,396 |
507 |
|
Class C |
1,690 |
116 |
|
Institutional Class |
4,333 |
632 |
|
Total |
$ 81,508 |
$ 10,438 |
|
|
$ 92,337 |
$ 13,883 |
Annual Report
Notes to Financial Statements - continued
9. Share Transactions.
Transactions for each class of shares were as follows:
|
|
Shares |
Dollars |
||
|
Amounts in thousands |
Year ended October 31, |
Year ended October 31, |
Year ended October 31, |
Year ended October 31, |
|
|
2000 |
1999 |
2000 |
1999 |
|
|
|
|
|
|
|
Class A |
4,566 |
4,183 |
$ 100,132 |
$ 76,263 |
|
Reinvestment of distributions |
57 |
11 |
1,222 |
173 |
|
Shares redeemed |
(3,543) |
(3,818) |
(78,300) |
(69,891) |
|
Net increase (decrease) |
1,080 |
376 |
$ 23,054 |
$ 6,545 |
|
Class T |
50,328 |
100,980 |
$ 1,122,012 |
$ 1,884,019 |
|
Reinvestment of distributions |
3,494 |
648 |
75,183 |
10,982 |
|
Shares redeemed |
(41,478) |
(96,495) |
(926,640) |
(1,796,038) |
|
Net increase (decrease) |
12,344 |
5,133 |
$ 270,555 |
$ 98,963 |
|
Class B |
2,974 |
2,267 |
$ 64,992 |
$ 41,143 |
|
Reinvestment of distributions |
196 |
27 |
4,107 |
454 |
|
Shares redeemed |
(1,177) |
(1,520) |
(25,357) |
(27,409) |
|
Net increase (decrease) |
1,993 |
774 |
$ 43,742 |
$ 14,188 |
|
Class C |
3,639 |
8,406 |
$ 80,303 |
$ 153,485 |
|
Reinvestment of distributions |
76 |
9 |
1,630 |
143 |
|
Shares redeemed |
(1,582) |
(7,619) |
(34,658) |
(139,603) |
|
Net increase (decrease) |
2,133 |
796 |
$ 47,275 |
$ 14,025 |
|
Institutional Class |
2,113 |
3,272 |
$ 47,118 |
$ 59,739 |
|
Reinvestment of distributions |
99 |
36 |
2,115 |
602 |
|
Shares redeemed |
(2,077) |
(3,637) |
(45,836) |
(66,268) |
|
Net increase (decrease) |
135 |
(329) |
$ 3,397 |
$ (5,927) |
Annual Report
To the Trustees of Fidelity Advisor Series VIII and the Shareholders of Fidelity Advisor Overseas Fund:
In our opinion, the accompanying statement of assets and liabilities, including the schedule of investments, and the related statements of operations and of changes in net assets and the financial highlights present fairly, in all material respects, the financial position of Fidelity Advisor Overseas Fund (a fund of Fidelity Advisor Series VIII) at October 31, 2000, and the results of its operations, the changes in its net assets and the financial highlights for the periods indicated, in conformity with accounting principles generally accepted in the United States of America. These financial statements and financial highlights (hereafter referred to as "financial statements") are the responsibility of the Fidelity Advisor Overseas Fund's management; our responsibility is to express an opinion on these financial statements based on our audits. We conducted our audits of these financial statements in accordance with auditing standards generally accepted in the United States of America which require that we plan and perform the audit to obtain reasonable assurance about whether the financial statements are free of material misstatement. An audit includes examining, on a test basis, evidence supporting the amounts and disclosures in the financial statements, assessing the accounting principles used and significant estimates made by management, and evaluating the overall financial statement presentation. We believe that our audits, which included confirmation of securities at October 31, 2000 by correspondence with the custodian and brokers, provide a reasonable basis for our opinion.
/s/PricewaterhouseCoopers LLP
PricewaterhouseCoopers LLP
Boston, Massachusetts
December 8, 2000
Annual Report
The Board of Trustees of Fidelity Advisor Overseas voted to pay to shareholders of record at the opening of business on record date, the following distributions per share derived from capital gains realized from sales of portfolio securities, and dividends derived from net investment income:
|
|
Pay Date |
Record Date |
Dividends |
Capital Gains |
|
Class A |
12/11/00 |
12/8/00 |
$.43 |
$1.72 |
|
Class T |
12/11/00 |
12/8/00 |
$.35 |
$1.72 |
|
Class B |
12/11/00 |
12/8/00 |
$.25 |
$1.72 |
|
Class C |
12/11/00 |
12/8/00 |
$.30 |
$1.72 |
The fund hereby designates 100% of the long-term capital gain dividends distributed during the fiscal year as 20%-rate capital gain dividends.
The amounts per share which represent income derived from sources within, and taxes paid to, foreign countries or possessions of the United States are as follows:
|
|
Pay Date |
Income |
Taxes |
|
|
Class A |
12/6/99 |
$.310 |
$.036 |
|
|
Class T |
12/6/99 |
$.283 |
$.036 |
|
|
Class B |
12/6/99 |
$.235 |
$.036 |
|
|
Class C |
12/6/99 |
$.256 |
$.036 |
|
The fund will notify shareholders in January 2001 of amounts for use in preparing 2000 income tax returns.
Annual Report
Annual Report
Annual Report
Annual Report
Annual Report
Investment Adviser
Fidelity Management & Research Company
Boston, MA
Investment Sub-Advisers
Fidelity Management & Research
(U.K.) Inc.
Fidelity Management & Research
(Far East) Inc.
Fidelity Investments Japan Limited
Fidelity International Investment Advisors
Fidelity International Investment Advisors (U.K.) Limited
Officers
Edward C. Johnson 3d, President
Robert C. Pozen, Senior Vice President
Richard A. Spillane, Jr., Vice President
Richard R. Mace, Jr., Vice President
Eric D. Roiter, Secretary
Robert A. Dwight, Treasurer
Maria F. Dwyer, Deputy Treasurer
John H. Costello, Assistant Treasurer
Thomas J. Simpson, Assistant Treasurer
Board of Trustees
Ralph F. Cox *
Phyllis Burke Davis *
Robert M. Gates *
Edward C. Johnson 3d
Donald J. Kirk *
Ned C. Lautenbach *
Peter S. Lynch
Marvin L. Mann *
William O. McCoy *
Gerald C. McDonough *
Robert C. Pozen
Thomas R. Williams *
Advisory Board
J. Michael Cook
Abigail P. Johnson
Marie L. Knowles
General Distributor
Fidelity Distributors Corporation
Boston, MA
Transfer and Shareholder
Servicing Agent
Fidelity Investments Institutional Operations Company, Inc.
Boston, MA
Custodian
The Chase Manhattan Bank
New York, NY
* Independent trustees
Annual Report
Focus Funds
Fidelity Advisor Consumer
Industries Fund
Fidelity Advisor Cyclical
Industries Fund
Fidelity Advisor Financial
Services Fund
Fidelity Advisor Health Care Fund
Fidelity Advisor Natural
Resources Fund
Fidelity Advisor Technology Fund
Fidelity Advisor Telecommunications & Utilities Growth Fund
Growth Funds
Fidelity Advisor Korea Fund
Fidelity Advisor Emerging Asia Fund
Fidelity Advisor Latin America Fund
Fidelity Advisor Japan Fund
Fidelity Advisor Europe Capital Appreciation Fund
Fidelity Advisor International
Capital Appreciation Fund
Fidelity Advisor Overseas Fund
Fidelity Advisor Diversified International Fund
Fidelity Advisor Global Equity Fund
Fidelity Advisor TechnoQuant ®
Growth Fund
Fidelity Advisor Small Cap Fund
Fidelity Advisor Value Strategies Fund
Fidelity Advisor Mid Cap Fund
Fidelity Advisor Dynamic Capital Appreciation Fund
Fidelity Advisor Equity Growth Fund
Fidelity Advisor Large Cap Fund
Fidelity Advisor Dividend Growth Fund
Fidelity Advisor Growth
Opportunities Fund
Growth and Income Funds
Fidelity Advisor Growth & Income Fund
Fidelity Advisor Equity Income Fund
Fidelity Advisor Asset Allocation Fund
Fidelity Advisor Balanced Fund
Taxable Income Funds
Fidelity Advisor Emerging Markets Income Fund
Fidelity Advisor High Yield Fund
Fidelity Advisor High Income Fund
Fidelity Advisor Strategic Income Fund
Fidelity Advisor Mortgage
Securities Fund
Fidelity Advisor Government Investment Fund
Fidelity Advisor Intermediate Bond Fund
Fidelity Advisor Short Fixed-Income Fund
Municipal Funds
Fidelity Advisor Municipal Income Fund
Money Market Funds
Prime Fund
Treasury Fund
Tax-Exempt Fund
OS-ANN-1200 118696
1.538536.103
(Fidelity Investment logo)(registered trademark)
Fidelity® Advisor
Fund - Institutional Class
Annual Report
October 31, 2000
(2_fidelity_logos)(registered trademark)
|
President's Message |
Ned Johnson on investing strategies. |
|
|
Performance |
How the fund has done over time. |
|
|
Fund Talk |
The manager's review of fund performance, strategy and outlook. |
|
|
Investment Changes |
A summary of major shifts in the fund's investments over the past six months. |
|
|
Investments |
A complete list of the fund's investments with their market values. |
|
|
Financial Statements |
Statements of assets and liabilities,
operations, and changes in net assets, |
|
|
Notes |
Notes to the financial statements. |
|
|
Report of Independent Accountants |
The auditors' opinion. |
|
|
Distributions |
|
Standard & Poor's, S&P and S&P 500 are registered service marks of The McGraw-Hill Companies, Inc. and have been licensed for use by Fidelity Distributors Corporation.
Other third party marks appearing herein are the property of their respective owners.
All other marks appearing herein are registered or unregistered trademarks or service marks of FMR Corp. or an affiliated company.
(Recycle graphic) This report is printed on recycled paper using soy-based inks.
This report and the financial statements contained herein are submitted for the general information of the shareholders of the fund. This report is not authorized for distribution to prospective investors in the fund unless preceded or accompanied by an effective prospectus.
Mutual fund shares are not deposits or obligations of, or guaranteed by, any depository institution. Shares are not insured by the FDIC, Federal Reserve Board or any other agency, and are subject to investment risks, including possible loss of principal amount invested.
Neither the fund nor Fidelity Distributors Corporation is a bank.
For more information on any Fidelity Advisor fund, including charges and expenses, contact your investment professional for a free prospectus. Read it carefully before you invest or send money.
Annual Report
(photo_of_Edward_C_Johnson_3d)
Dear Shareholder:
A sixth-straight year of double-digit positive returns for the Dow Jones Industrial Average, NASDAQ and S&P 500® could be in jeopardy unless the U.S. stock market shows marked improvement in the final two months of 2000. Through October, all three indexes had negative year-to-date returns. On the other hand, most fixed-income sectors were solidly in the black. Treasuries and other long-term government securities led the way, returning nearly 14%.
While it's impossible to predict the future direction of the markets with any degree of certainty, there are certain basic principles that can help investors plan for their future needs.
First, investors are encouraged to take a long-term view of their portfolios. If you can afford to leave your money invested through the inevitable up and down cycles of the financial markets, you will greatly reduce your vulnerability to any single decline. We know from experience, for example, that stock prices have gone up over longer periods of time, have significantly outperformed other types of investments and have stayed ahead of inflation.
Second, you can further manage your investing risk through diversification. A stock mutual fund, for instance, is already diversified, because it invests in many different companies. You can increase your diversification further by investing in a number of different stock funds, or in such other investment categories as bonds. If you have a short investment time horizon, you might want to consider moving some of your investment into a money market fund, which seeks income and a stable share price by investing in high-quality, short-term investments. Of course, it's important to remember that an investment in a money market fund is not insured or guaranteed by the Federal Deposit Insurance Corporation or any other government agency. Although money market funds seek to preserve the value of your investment at $1.00 per share, it is possible to lose money by investing in these types of funds.
Finally, no matter what your time horizon or portfolio diversity, it makes good sense to follow a regular investment plan, investing a certain amount of money in a fund at the same time each month or quarter and periodically reviewing your overall portfolio. By doing so, you won't get caught up in the excitement of a rapidly rising market, nor will you buy all your shares at market highs. While this strategy - known as dollar cost averaging - won't assure a profit or protect you from a loss in a declining market, it should help you lower the average cost of your purchases. Of course, you should consider your financial ability to continue your purchases through periods of low price levels before undertaking such a strategy.
Remember to contact your investment professional if you need help with your investments.
Best regards,
/s/Edward C. Johnson 3d
Edward C. Johnson 3d
Annual Report
Fidelity Advisor Overseas Fund - Institutional Class
There are several ways to evaluate historical performance. You can look at the total percentage change in value, the average annual percentage change or the growth of a hypothetical $10,000 investment. Total return reflects the change in the value of an investment, assuming reinvestment of the class' dividend income and capital gains (the profits earned upon the sale of securities that have grown in value). The initial offering of Institutional Class shares took place on July 3, 1995. Institutional Class shares are sold to eligible investors without a sales load or 12b-1 fee. Returns prior to July 3, 1995 are those of Class T, the original class of the fund, and reflect Class T shares' prior 0.65% 12b-1 fee. If Fidelity had not reimbursed certain class expenses, the past five year and past 10 year total returns would have been lower. Prior to December 1, 1992, Fidelity Advisor Overseas Fund operated under a different investment objective. Accordingly, the fund's historical performance may not represent its current investment policies.
Cumulative Total Returns
|
Periods ended October 31, 2000 |
|
Past 1 |
Past 5 |
Past 10 |
|
Fidelity Adv Overseas - Inst CL |
|
2.18% |
77.57% |
171.16% |
|
MSCI EAFE® |
|
-2.72% |
52.63% |
113.59% |
|
International Funds Average |
|
2.70% |
62.88% |
149.02% |
Cumulative total returns show Institutional Class performance in percentage terms over a set period - in this case, one year, five years or 10 years. For example, if you had invested $1,000 in a fund that had a 5% return over the past year, the value of your investment would be $1,050. You can compare Institutional Class' returns to the performance of the Morgan Stanley Capital International Europe, Australasia, Far East Index (MSCI EAFE®) - a market capitalization-weighted index that is designed to represent the performance of developed stock markets outside the United States and Canada. As of October 31, 2000, the index included over 840 equity securities of companies domiciled in 20 countries. To measure how Institutional Class' performance stacked up against its peers, you can compare it to the international funds average, which reflects the performance of mutual funds with similar objectives tracked by Lipper Inc. The past one year average represents a peer group of 666 mutual funds. These benchmarks include reinvested dividends and capital gains, if any, and exclude the effect of sales charges.
Average Annual Total Returns
|
Periods ended October 31, 2000 |
Past 1 |
Past 5 |
Past 10 |
|
Fidelity Adv Overseas - Inst CL |
2.18% |
12.17% |
10.49% |
|
MSCI EAFE |
-2.72% |
8.82% |
7.88% |
|
International Funds Average |
2.70% |
9.93% |
9.30% |
Average annual total returns take Institutional Class' cumulative return and show you what would have happened if Institutional Class shares had performed at a constant rate each year.
Annual Report
$10,000 Over 10 Years
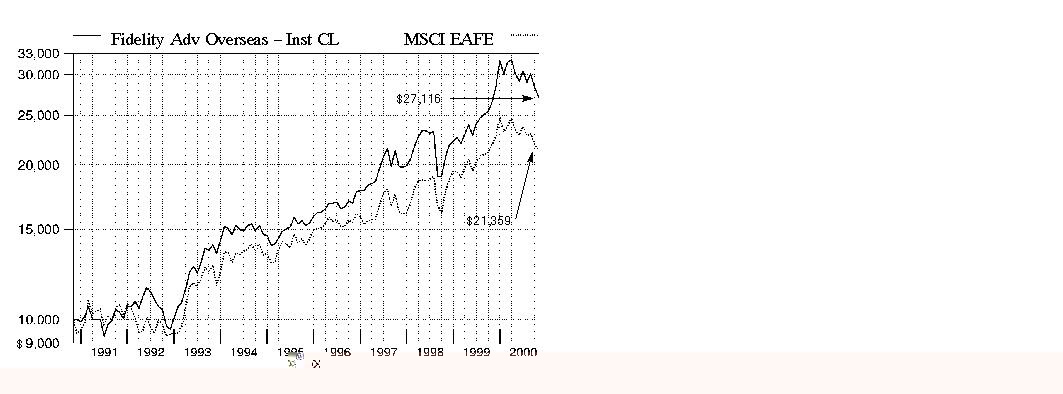
$10,000 Over 10 Years: Let's say hypothetically that $10,000 was invested in Fidelity Advisor Overseas Fund - Institutional Class on October 31, 2000, 1990. As the chart shows, by October 31, 2000, the value of the investment would have grown to $27,116 - a 171.16% increase on the initial investment. For comparison, look at how the MSCI EAFE Index did over the same period. With dividends reinvested, the same $10,000 would have grown to $21,359 - a 113.59% increase.
Understanding
Performance
Many markets around the globe offer the potential for significant growth over time; however, investing in foreign markets means assuming greater risks than investing in the United States. Factors like changes in a country's financial markets, its local political and economic climate, and the fluctuating value of its currency create these risks. For these reasons an international fund's performance may be more volatile than a fund that invests exclusively in the United States. Past performance is no guarantee of future results and you may have a gain or loss when you sell your shares.
3Annual Report
Market Recap
Currency disparities, the see-saw performance of technology and telecommunications stocks and increased uncertainty over the direction of energy prices contributed to volatile world markets for the 12-month period that ended October 31, 2000. Through the first half of the period, foreign investors enjoyed handsome returns from technology and telecommunications holdings. These gains disappeared down the stretch, however, as the dollar continued to outperform the struggling euro - the uniform currency of 11 European nations - and the Japanese yen by wide margins. Soaring oil and gas prices also added to the volatility. The Morgan Stanley EAFE® index - which tracks the performance of stock markets in Europe, Australasia and the Far East - fell 2.72% during the period. Europe's economic recovery remained on course, but the euro's continued weakness proved to be a millstone. The Morgan Stanley Europe index had a 12-month return of 1.16%. Japan's economic recovery, on the other hand, appeared to be short-lived, or at least very, very slow in the making. The Morgan Stanley Japan index declined 11.61% during the period. Emerging markets, meanwhile, were unable to sustain the momentum they carried into early 2000 - the Morgan Stanley Emerging Markets Free index tumbled 10.33%.
(Portfolio Manager photograph)
An interview with Rick Mace,
Portfolio Manager of Fidelity
Advisor Overseas Fund
Q. How did the fund perform, Rick?
A. For the 12-month period that ended October 31, 2000, the fund's Institutional Class shares returned 2.18%. For the same period, the Morgan Stanley Capital International (MSCI) EAFE Index, a broad measure of stock performance in Europe, Australasia and the Far East, declined 2.72%. The fund also compares its performance against the Lipper Inc. international funds average, which was up 2.70% during the past year.
Annual Report
Fund Talk: The Manager's Overview - continued
Q. What factors helped the fund outperform its index during the 12-month period?
A. Overweightings and favorable stock selection in the industrial machinery, telecommunications, and transportation and shipping industries were the major factors. More specifically, our positions in Furukawa Electric, a company that manufactures optic fiber used in high-capacity telecommunications networks, and Kyocera, a producer of internal components for cellular handsets, provided a significant boost to performance. Many telephone holdings also aided performance, such as our positions in Mannesmann - later bought by Vodafone Group - and China Mobile, which were particular standouts. The fund also benefited from an early entrance into transportation and shipping stocks, such as Teekay Shipping and Overseas Shipholding, which rose sharply on an increase in worldwide demand for oil. Among energy stocks, French producer TotalFinaElf and several smaller Canadian holdings, such as Talisman, made strong contributions. From a country perspective, being slightly underweighted in the poor-performing Japanese market, particularly during the past six months, proved helpful. Meanwhile, holding significant out-of-benchmark stakes in the relatively strong-performing markets in Canada, Mexico and the U.S. fueled the fund's overall performance.
Q. What other investment strategies did you employ?
A. During the past year, I reduced the fund's total number of stocks to focus more on the positions I felt offered the best value and potential for growth. This strategy increased the fund's top-10 holdings to roughly 26% of the fund's net assets, from about 20% at the beginning of 2000. I recently pared back the fund's telecommunications positions, particularly in equipment manufacturers where competitive pricing pressures and weakening handset demand threatened to hurt profits. Similarly, I cut back on a number of telephone holdings due to rising concerns over the prices that some of these companies were paying for recent acquisitions. I also was concerned by the high prices that many of these companies were bidding for G3 spectrum licenses to accommodate the next generation of wireless communications. Additionally, I generally took some profits across the board among our energy holdings due to less-favorable projections of supply and demand. At the same time, I increased the fund's exposure to pharmaceuticals and European consumer stocks, such as Unilever and Nestle, because of the relatively stable earnings growth those sectors historically provide.
Q. The fund's financial services weighting rose to 17.7% from 13.3% six months ago. What was your strategy there?
A. I increased our positions in Nomura Securities and Nikko Securities because I believed the trend of Japanese investors using the securities markets for wealth building was in the initial stage of a long-term growth trend. With the recent deregulation of financial services in Japan, these stocks could benefit going forward. As the period progressed, I opportunistically added to the fund's holdings in selected bank stocks, such as Royal Bank of Scotland and Lloyd's TSB Group in the United Kingdom, which reached such low levels that I couldn't ignore them.
Q. What were some of the fund's top performers? What stocks disappointed?
A. Despite a profit warning at the end of the period, Nokia, the Finnish cellular handset manufacturer, was rewarded for its industry leadership position. In addition, TotalFinaElf performed well as a result of the rising global demand for oil. Asian semiconductor holdings were among the fund's biggest disappointments as the price of main memory chips slid to a three-month low in September. South Korea's Samsung Electronics and Hyundai Electronics were among the fund's biggest detractors.
Annual Report
Fund Talk: The Manager's Overview - continued
Q. What's your outlook for the next six months, Rick?
A. I expect the volatility we've experienced in the markets during the past six months to continue. The euro has shown little evidence of strengthening, and slowing global economies could hinder corporate profits. Global demand for PCs, handsets and other hardware appears to be slower than previously expected while, at the same time, there is an oversupply of internal components in the marketplace. Given these factors, I believe the performance of overseas stocks going forward will be closely tied to corporate earnings and fundamentals.
The views expressed in this report reflect those of the portfolio manager only through the end of the period of the report as stated on the cover and do not necessarily represent the views of Fidelity or any other person in the Fidelity organization. Any such views are subject to change at any time based upon market or other conditions and Fidelity disclaims any responsibility to update such views. These views may not be relied on as investment advice and, because investment decisions for a Fidelity fund are based on numerous factors, may not be relied on as an indication of trading intent on behalf of any Fidelity fund.
Fund Facts
Goal: seeks growth of capital primarily through investments in foreign securities
Start date: April 23, 1990
Size: as of October 31, 2000, more than $2.0 billion
Manager: Rick Mace, since 1996; joined Fidelity in 1987
3Rick Mace on the recent
volatility in global markets:
"As we've seen during the past six months, volatility in the equity markets - both domestically and internationally - has increased this year. I believe it is here to stay for a while.
"It's important to realize that today volatility is truly global, influenced a great deal by economic conditions in the United States. When the U.S. economy cools, the rest of the world freezes. When U.S. markets warm, the rest of the world catches fire. Part of the reason volatility is global is that merger and acquisition activity is sweeping the world. Companies are buying one another not just within their own geographic markets, but on a global basis. This acquisition activity suggests that industries also are consolidating around the world.
"Turning to individual markets, I think we will see the European and Japanese economies sputter along in the short term. However, looking with a longer perspective, the corporate cultures in both Europe and Japan are changing - for the better. For example, an increasing number of companies are offering stock options to senior employees, a move that should improve bottom lines and add value for shareholders. Additionally, the increase in M&A activity is driving efficiency into companies and improving returns for shareholders. In the emerging markets, the outlook is mixed. Although Southeast Asian economies have stabilized, the rise in oil costs could hinder short-term growth. There is a slightly better outlook in Latin America, because a number of countries are self-sufficient in energy production.
"Understandably, most people fear volatility. But in my opinion, volatility can be a good thing, because it creates opportunities to buy and sell."
Annual Report
|
Top Five Stocks as of October 31, 2000 |
||
|
|
% of fund's |
% of fund's net assets |
|
Nokia AB (Finland, Communications Equipment) |
4.9 |
3.6 |
|
Vodafone Group PLC (United Kingdom, Cellular) |
3.6 |
3.9 |
|
TotalFinaElf SA Class B (France, Oil & Gas) |
3.5 |
3.8 |
|
Sony Corp. (Japan, Consumer Electronics) |
2.2 |
0.7 |
|
Nippon Telegraph & Telephone Corp. |
2.1 |
1.1 |
|
|
16.3 |
13.1 |
|
Top Five Market Sectors as of October 31, 2000 |
||
|
|
% of fund's |
% of fund's net assets |
|
Finance |
17.7 |
13.3 |
|
Technology |
15.0 |
20.5 |
|
Utilities |
14.6 |
19.7 |
|
Energy |
6.6 |
8.5 |
|
Health |
6.5 |
3.9 |
|
Top Five Countries as of October 31, 2000 |
||
|
(excluding cash equivalents) |
% of fund's |
% of fund's net assets |
|
Japan |
22.7 |
23.8 |
|
United Kingdom |
14.0 |
15.4 |
|
France |
10.0 |
10.3 |
|
Finland |
6.9 |
4.7 |
|
Switzerland |
6.0 |
3.6 |
|
Percentages are adjusted for the effect of open futures contracts, if applicable. |
|
Asset Allocation (% of fund's net assets) |
|||||||
|
As of October 31, 2000 |
As of April 30, 2000 |
||||||
|
Stocks, Investment
Companies and |
|
|
Stocks and |
|
||
|
Bonds 0.2% |
|
|
Bonds 0.2% |
|
||
|
Short-Term |
|
|
Short-Term |
|
||

Annual Report
Showing Percentage of Net Assets
|
Common Stocks - 89.5% |
|||
|
Shares |
Value (Note 1) (000s) |
||
|
Australia - 1.0% |
|||
|
BHP Ltd. |
482,140 |
$ 4,690 |
|
|
Cable & Wireless Optus Ltd. (a) |
2,036,300 |
4,328 |
|
|
News Corp. Ltd. |
565,237 |
6,076 |
|
|
News Corp. Ltd. sponsored ADR (preferred ltd. vtg.) |
118,900 |
4,303 |
|
|
TOTAL AUSTRALIA |
19,397 |
||
|
Brazil - 0.2% |
|||
|
Telesp Celular Participacoes SA ADR |
100,000 |
3,163 |
|
|
Canada - 2.4% |
|||
|
Alberta Energy Co. Ltd. |
146,100 |
5,398 |
|
|
Alcan Aluminium Ltd. |
132,800 |
4,191 |
|
|
BCE, Inc. |
145,500 |
3,918 |
|
|
Canadian Natural Resources Ltd. (a) |
335,000 |
9,901 |
|
|
Ensign Resource Service Group, Inc. |
22,600 |
609 |
|
|
Nortel Networks Corp. |
67,369 |
3,065 |
|
|
Rio Alto Exploration Ltd. (a) |
443,500 |
7,545 |
|
|
Suncor Energy, Inc. |
15,500 |
303 |
|
|
Talisman Energy, Inc. (a) |
409,400 |
12,894 |
|
|
TOTAL CANADA |
47,824 |
||
|
Finland - 6.9% |
|||
|
Nokia AB |
2,328,100 |
99,528 |
|
|
Sampo Insurance Co. Ltd. (A Shares) |
93,000 |
3,789 |
|
|
Sonera Corp. |
155,100 |
3,418 |
|
|
UPM-Kymmene Corp. |
1,113,100 |
31,509 |
|
|
TOTAL FINLAND |
138,244 |
||
|
France - 10.0% |
|||
|
Alcatel SA (RFD) (a) |
218,500 |
13,629 |
|
|
Aventis SA (France) |
147,814 |
10,652 |
|
|
AXA SA de CV |
118,690 |
15,716 |
|
|
BNP Paribas SA |
114,345 |
9,861 |
|
|
Canal Plus SA |
20,700 |
2,996 |
|
|
Castorama Dubois Investissements SA |
86,430 |
17,577 |
|
|
France Telecom SA |
120,600 |
12,611 |
|
|
Sanofi-Synthelabo SA |
189,500 |
9,973 |
|
|
Suez Lyonnaise des Eaux (France) |
34,800 |
5,311 |
|
|
Television Francaise 1 SA (a) |
82,630 |
4,510 |
|
|
TotalFinaElf SA Class B |
492,596 |
70,564 |
|
|
Common Stocks - continued |
|||
|
Shares |
Value (Note 1) (000s) |
||
|
France - continued |
|||
|
Vivendi Environment (a) |
351,200 |
$ 13,116 |
|
|
Vivendi SA |
203,700 |
14,645 |
|
|
TOTAL FRANCE |
201,161 |
||
|
Germany - 2.4% |
|||
|
Allianz AG (Reg.) |
38,700 |
13,125 |
|
|
BASF AG |
372,800 |
14,619 |
|
|
Bayerische Hypo-und Vereinsbank AG |
80,500 |
4,424 |
|
|
Deutsche Lufthansa AG (Reg.) |
145,800 |
2,846 |
|
|
Kali Und Salz Beteiligungs AG |
363,500 |
5,245 |
|
|
Muenchener Ruckversicherungs-Gesellschaft AG (Reg.) |
20,100 |
6,321 |
|
|
United Internet AG (a) |
155,000 |
997 |
|
|
TOTAL GERMANY |
47,577 |
||
|
Hong Kong - 2.1% |
|||
|
China Mobile (Hong Kong) Ltd. (a) |
4,417,000 |
27,054 |
|
|
Hutchison Whampoa Ltd. |
905,200 |
11,231 |
|
|
Johnson Electric Holdings Ltd. |
2,498,000 |
4,965 |
|
|
TOTAL HONG KONG |
43,250 |
||
|
Ireland - 0.4% |
|||
|
Bank of Ireland, Inc. |
982,520 |
7,572 |
|
|
Italy - 1.4% |
|||
|
Banca Intesa Spa |
1,482,481 |
6,197 |
|
|
Olivetti Spa |
1,353,000 |
4,118 |
|
|
San Paolo IMI Spa |
351,300 |
5,658 |
|
|
Telecom Italia Spa |
1,003,828 |
11,795 |
|
|
TOTAL ITALY |
27,768 |
||
|
Japan - 22.4% |
|||
|
Advantest Corp. |
27,500 |
3,587 |
|
|
Asahi Chemical Industry Co. Ltd. (a) |
383,000 |
2,373 |
|
|
Canon, Inc. |
243,000 |
9,857 |
|
|
Daiwa Securities Group, Inc. |
1,469,000 |
16,277 |
|
|
DDI Corp. |
425 |
1,994 |
|
|
Fujitsu Ltd. |
463,000 |
8,249 |
|
|
Furukawa Electric Co. Ltd. |
1,154,000 |
30,355 |
|
|
Hitachi Chemical Co. Ltd. |
95,000 |
2,386 |
|
|
Hitachi Zosen Corp. (a) |
3,043,000 |
2,315 |
|
|
Ito-Yokado Co. Ltd. |
272,000 |
12,290 |
|
|
Kyocera Corp. |
77,700 |
10,392 |
|
|
Matsushita Electric Industrial Co. Ltd. |
374,000 |
10,930 |
|
|
Common Stocks - continued |
|||
|
Shares |
Value (Note 1) (000s) |
||
|
Japan - continued |
|||
|
Mitsubishi Electric Corp. |
502,000 |
$ 3,607 |
|
|
Mitsubishi Estate Co. Ltd. (a) |
444,000 |
4,720 |
|
|
Mitsui Fudosan Co. Ltd. |
198,000 |
2,399 |
|
|
NEC Corp. |
860,000 |
16,394 |
|
|
Net One Systems Co. Ltd. |
111 |
3,296 |
|
|
NGK Insulators Ltd. |
263,000 |
3,483 |
|
|
Nikko Securities Co. Ltd. |
4,221,000 |
36,442 |
|
|
Nikon Corp. |
246,000 |
3,576 |
|
|
Nintendo Co. Ltd. |
27,800 |
4,599 |
|
|
Nippon Telegraph & Telephone Corp. |
4,566 |
41,555 |
|
|
Nomura Securities Co. Ltd. |
1,810,000 |
38,403 |
|
|
NTT DoCoMo, Inc. |
745 |
18,367 |
|
|
Oki Electric Industry Co. Ltd. (a) |
513,000 |
3,051 |
|
|
Omron Corp. |
563,000 |
13,880 |
|
|
ORIX Corp. |
59,800 |
6,275 |
|
|
Rohm Co. Ltd. |
17,100 |
4,311 |
|
|
Softbank Corp. |
229,900 |
13,801 |
|
|
Sony Corp. |
521,400 |
43,276 |
|
|
Takeda Chemical Industries Ltd. |
346,000 |
22,800 |
|
|
Toko, Inc. |
423,000 |
2,210 |
|
|
Tokyo Broadcasting System, Inc. |
98,000 |
3,835 |
|
|
Tokyo Electron Ltd. |
46,400 |
3,632 |
|
|
Toshiba Corp. |
1,429,000 |
10,216 |
|
|
Toyota Motor Corp. |
786,400 |
31,424 |
|
|
Trans Cosmos, Inc. |
11,100 |
803 |
|
|
Yamanouchi Pharmaceutical Co. Ltd. |
84,000 |
3,803 |
|
|
TOTAL JAPAN |
451,163 |
||
|
Korea (South) - 2.7% |
|||
|
Hyundai Electronics Industries Co. Ltd. (a) |
1,592,480 |
9,786 |
|
|
Kookmin Bank |
319,000 |
3,646 |
|
|
Samsung Electronics Co. Ltd. |
281,600 |
35,277 |
|
|
Samsung Heavy Industries Ltd. (a) |
489,100 |
1,522 |
|
|
SK Telecom Co. Ltd. sponsored ADR |
181,100 |
4,539 |
|
|
TOTAL KOREA (SOUTH) |
54,770 |
||
|
Marshall Islands - 0.6% |
|||
|
Teekay Shipping Corp. |
342,000 |
12,782 |
|
|
Mexico - 1.7% |
|||
|
Grupo Televisa SA de CV sponsored GDR |
85,900 |
4,649 |
|
|
Common Stocks - continued |
|||
|
Shares |
Value (Note 1) (000s) |
||
|
Mexico - continued |
|||
|
Telefonos de Mexico SA de CV Series L sponsored ADR |
259,800 |
$ 14,013 |
|
|
TV Azteca SA de CV sponsored ADR |
1,234,800 |
15,435 |
|
|
TOTAL MEXICO |
34,097 |
||
|
Netherlands - 5.4% |
|||
|
ABN AMRO Holding NV |
288,700 |
6,690 |
|
|
Akzo Nobel NV |
185,600 |
8,452 |
|
|
Heineken NV |
67,900 |
3,689 |
|
|
ING Groep NV (Certificaten Van Aandelen) |
321,273 |
22,067 |
|
|
Koninklijke Ahold NV |
631,330 |
18,343 |
|
|
Koninklijke Philips Electronics NV |
166,258 |
6,535 |
|
|
Nutreco Holding NV |
90,104 |
3,885 |
|
|
Royal Dutch Petroleum Co. (Hague Registry) |
162,700 |
9,660 |
|
|
Unilever NV (Certificaten Van Aandelen) (a) |
243,300 |
12,205 |
|
|
United Pan-Europe Communications NV Class A (a) |
264,600 |
4,638 |
|
|
Vendex KBB NV |
436,900 |
5,481 |
|
|
VNU NV |
78,400 |
3,717 |
|
|
Wolters Kluwer NV (Certificaten Van Aandelen) |
171,900 |
3,869 |
|
|
TOTAL NETHERLANDS |
109,231 |
||
|
Norway - 1.7% |
|||
|
Bergesen dy ASA: |
|
|
|
|
(A Shares) |
492,900 |
9,813 |
|
|
(B Shares) |
401,300 |
7,342 |
|
|
DNB Holding ASA |
1,536,618 |
6,664 |
|
|
Frontline Ltd. (a) |
659,800 |
10,864 |
|
|
TOTAL NORWAY |
34,683 |
||
|
Singapore - 0.3% |
|||
|
Overseas Union Bank Ltd. |
631,272 |
3,058 |
|
|
United Overseas Bank Ltd. |
381,488 |
2,827 |
|
|
TOTAL SINGAPORE |
5,885 |
||
|
Spain - 2.4% |
|||
|
Altadis SA |
177,481 |
2,659 |
|
|
Banco Santander Central Hispano SA |
1,789,260 |
17,344 |
|
|
Telefonica SA (a) |
1,497,900 |
28,569 |
|
|
TOTAL SPAIN |
48,572 |
||
|
Sweden - 1.4% |
|||
|
Telefonaktiebolaget LM Ericsson (B Shares) |
2,059,800 |
28,580 |
|
|
Common Stocks - continued |
|||
|
Shares |
Value (Note 1) (000s) |
||
|
Switzerland - 6.0% |
|||
|
Credit Suisse Group (Reg.) |
130,678 |
$ 24,500 |
|
|
Julius Baer Holding AG |
927 |
4,590 |
|
|
Nestle SA (Reg.) |
19,953 |
41,349 |
|
|
Novartis AG (Reg.) |
6,923 |
10,503 |
|
|
The Swatch Group AG (Reg.) |
39,900 |
10,855 |
|
|
UBS AG |
78,778 |
10,913 |
|
|
Zurich Financial Services Group AG |
36,510 |
17,671 |
|
|
TOTAL SWITZERLAND |
120,381 |
||
|
Taiwan - 0.7% |
|||
|
Taiwan Semiconductor Manufacturing Co. Ltd. (a) |
2,821,451 |
8,560 |
|
|
United Microelectronics Corp. (a) |
3,303,600 |
5,830 |
|
|
TOTAL TAIWAN |
14,390 |
||
|
United Kingdom - 14.0% |
|||
|
Amvescap PLC |
400,300 |
8,937 |
|
|
AstraZeneca Group PLC (United Kingdom) |
100,800 |
4,807 |
|
|
BAE Systems PLC |
1,136,718 |
6,452 |
|
|
Barclays PLC |
193,300 |
5,526 |
|
|
BBA Group PLC |
428,300 |
2,350 |
|
|
Billiton PLC |
1,249,300 |
4,763 |
|
|
BP Amoco PLC |
1,966,660 |
16,696 |
|
|
British Telecommunications PLC |
937,900 |
11,161 |
|
|
Cable & Wireless PLC |
366,700 |
5,183 |
|
|
Carlton Communications PLC |
762,300 |
6,133 |
|
|
Diageo PLC |
456,800 |
4,308 |
|
|
Glaxo Wellcome PLC |
432,900 |
12,595 |
|
|
Granada Compass PLC (a) |
386,330 |
3,327 |
|
|
HSBC Holdings PLC (United Kingdom) (Reg.) |
687,667 |
9,916 |
|
|
Lloyds TSB Group PLC |
1,773,800 |
18,052 |
|
|
Marconi PLC |
256,500 |
3,235 |
|
|
Misys PLC |
550,900 |
5,734 |
|
|
Reed International PLC |
385,000 |
3,555 |
|
|
Reuters Group PLC |
692,700 |
13,609 |
|
|
Rio Tinto PLC (Reg. D) |
680,700 |
11,003 |
|
|
Royal Bank of Scotland Group PLC |
1,027,900 |
23,053 |
|
|
SMG PLC |
564,400 |
2,209 |
|
|
SmithKline Beecham PLC |
1,341,102 |
17,485 |
|
|
SSL International PLC |
339,300 |
3,947 |
|
|
Unilever PLC |
193,300 |
1,347 |
|
|
Common Stocks - continued |
|||
|
Shares |
Value (Note 1) (000s) |
||
|
United Kingdom - continued |
|||
|
Vodafone Group PLC |
17,106,916 |
$ 72,811 |
|
|
WPP Group PLC |
325,200 |
4,361 |
|
|
TOTAL UNITED KINGDOM |
282,555 |
||
|
United States of America - 3.4% |
|||
|
Bristol-Myers Squibb Co. |
249,900 |
15,228 |
|
|
Eli Lilly & Co. |
86,300 |
7,713 |
|
|
OMI Corp. (a) |
430,300 |
2,985 |
|
|
Overseas Shipholding Group, Inc. |
374,600 |
8,990 |
|
|
Pfizer, Inc. |
222,900 |
9,626 |
|
|
Schering-Plough Corp. |
249,900 |
12,917 |
|
|
VoiceStream Wireless Corp. (a) |
75,700 |
9,955 |
|
|
TOTAL UNITED STATES OF AMERICA |
67,414 |
||
|
TOTAL COMMON STOCKS (Cost $1,628,367) |
1,800,459 |
||
|
Investment Companies - 0.1% |
|||
|
|
|
|
|
|
Multi-National - 0.1% |
|||
|
European Warrant Fund, Inc. |
220,200 |
2,945 |
|
|
Convertible Bonds - 0.2% |
|||||
|
Moody's Ratings (unaudited) |
Principal Amount (000s) |
|
|||
|
Hong Kong - 0.2% |
|||||
|
China Mobile (Hong Kong) Ltd. 2.25% 11/3/05 |
Baa2 |
|
$ 3,439 |
3,439 |
|
|
Government Obligations - 0.0% |
|||||
|
|
|||||
|
United States of America - 0.0% |
|||||
|
U.S. Treasury Bills, yield at date of purchase
6.14% to 6.16% 11/9/00 to 1/11/01 (c) |
- |
|
475 |
471 |
|
|
Cash Equivalents - 9.6% |
|||
|
Shares |
Value (Note 1) (000s) |
||
|
Fidelity Cash Central Fund, 6.61% (b) |
171,742,079 |
$ 171,742 |
|
|
Fidelity Securities Lending Cash Central Fund, 6.66% (b) |
21,299,550 |
21,300 |
|
|
TOTAL CASH EQUIVALENTS (Cost $193,042) |
193,042 |
||
|
TOTAL INVESTMENT PORTFOLIO - 99.4% (Cost $1,828,962) |
2,000,356 |
||
|
NET OTHER ASSETS - 0.6% |
12,102 |
||
|
NET ASSETS - 100% |
$ 2,012,458 |
||
|
Futures Contracts |
|||||
|
|
Expiration Date |
Underlying Face Amount at Value (000s) |
Unrealized
Gain/(Loss) |
||
|
Purchased |
|||||
|
90 Nikkei 225 Index Contracts (Japan) |
Dec. 2000 |
$ 6,640 |
$ (754) |
||
|
|
|
The face value of futures purchased as a percentage of net assets - 0.3% |
|
Legend |
|
(a) Non-income producing |
|
(b) The rate quoted is the annualized seven-day yield of the fund at period end. A complete listing of the fund's holdings as of its most recent fiscal year end is available upon request. |
|
(c) Security or a portion of the security was pledged to cover margin requirements for futures contracts. At the period end, the value of securities pledged amounted to $471,000. |
|
Income Tax Information |
|
At October 31, 2000, the aggregate |
|
The fund hereby designates approximately $92,559,000 as a capital gain dividend for the purpose of the dividend paid deduction. |
See accompanying notes which are an integral part of the financial statements.
Annual Report
Statement of Assets and Liabilities
|
Amounts in thousands |
October 31, 2000 |
|
|
Asset |
|
|
|
Investment in securities, at value (cost $1,828,962) - |
|
$ 2,000,356 |
|
Cash |
|
325 |
|
Foreign currency held at value (cost $612) |
|
607 |
|
Receivable for investments sold |
|
54,685 |
|
Receivable for fund shares sold |
|
10,018 |
|
Dividends receivable |
|
2,764 |
|
Interest receivable |
|
966 |
|
Receivable for daily variation on futures contracts |
|
101 |
|
Other receivables |
|
21 |
|
Total assets |
|
2,069,843 |
|
Liabilities |
|
|
|
Payable for investments purchased |
$ 28,013 |
|
|
Payable for fund shares redeemed |
5,213 |
|
|
Accrued management fee |
1,280 |
|
|
Distribution fees payable |
872 |
|
|
Other payables and accrued expenses |
707 |
|
|
Collateral on securities loaned, at value |
21,300 |
|
|
Total liabilities |
|
57,385 |
|
Net Assets |
|
$ 2,012,458 |
|
Net Assets consist of: |
|
|
|
Paid in capital |
|
$ 1,635,481 |
|
Undistributed net investment income |
|
57,980 |
|
Accumulated undistributed net realized gain (loss) on investments and foreign currency transactions |
|
148,519 |
|
Net unrealized appreciation (depreciation) on investments and assets and liabilities in foreign currencies |
|
170,478 |
|
Net Assets |
|
$ 2,012,458 |
See accompanying notes which are an integral part of the financial statements.
Annual Report
Financial Statements - continued
Statement of Assets and Liabilities - continued
|
Amounts in thousands (except per-share amounts) |
October 31, 2000 |
|
|
Calculation of Maximum Offering Price |
|
$19.88 |
|
Maximum offering price per share (100/94.25 of $19.88) |
|
$21.09 |
|
Class T: |
|
$20.13 |
|
Maximum offering price per share (100/96.50 of $20.13) |
|
$20.86 |
|
Class B: |
|
$19.49 |
|
Class C: |
|
$19.80 |
|
Institutional Class: |
|
$19.95 |
A Redemption price per share is equal to net asset value less any applicable contingent deferred sales charge.
See accompanying notes which are an integral part of the financial statements.
Annual Report
Financial Statements - continued
Statement of Operations
|
Amounts in thousands |
Year ended October 31, 2000 |
|
|
Investment Income Dividends |
|
$ 25,315 |
|
Special dividend from BCE, Inc. |
|
3,831 |
|
Interest |
|
9,802 |
|
Security lending |
|
513 |
|
|
|
39,461 |
|
Less foreign taxes withheld |
|
(3,134) |
|
Total income |
|
36,327 |
|
Expenses |
|
|
|
Management fee |
$ 15,078 |
|
|
Performance adjustment |
2,434 |
|
|
Transfer agent fees |
4,601 |
|
|
Distribution fees |
10,704 |
|
|
Accounting and security lending fees |
1,003 |
|
|
Non-interested trustees' compensation |
6 |
|
|
Custodian fees and expenses |
993 |
|
|
Registration fees |
251 |
|
|
Audit |
54 |
|
|
Legal |
52 |
|
|
Miscellaneous |
22 |
|
|
Total expenses before reductions |
35,198 |
|
|
Expense reductions |
(444) |
34,754 |
|
Net investment income |
|
1,573 |
|
Realized and Unrealized Gain (Loss) Net realized gain (loss) on: |
|
|
|
Investment securities |
217,443 |
|
|
Foreign currency transactions |
(1,080) |
|
|
Futures contracts |
1,389 |
217,752 |
|
Change in net unrealized appreciation (depreciation) on: |
|
|
|
Investment securities |
(218,049) |
|
|
Assets and liabilities in foreign currencies |
(225) |
|
|
Futures contracts |
(1,136) |
(219,410) |
|
Net gain (loss) |
|
(1,658) |
|
Net increase (decrease) in net assets resulting |
|
$ (85) |
See accompanying notes which are an integral part of the financial statements.
Annual Report
Financial Statements - continued
Statement of Changes in Net Assets
|
Amounts in thousands |
Year ended |
Year ended |
|
Increase (Decrease) in Net Assets |
|
|
|
Operations |
$ 1,573 |
$ 5,488 |
|
Net realized gain (loss) |
217,752 |
133,044 |
|
Change in net unrealized appreciation (depreciation) |
(219,410) |
216,537 |
|
Net increase (decrease) in net assets resulting |
(85) |
355,069 |
|
Distributions to shareholders |
(5,290) |
(3,445) |
|
In excess of net investment income |
(5,539) |
- |
|
From net realized gain |
(81,508) |
(10,438) |
|
Total distributions |
(92,337) |
(13,883) |
|
Share transactions - net increase (decrease) |
388,023 |
127,794 |
|
Total increase (decrease) in net assets |
295,601 |
468,980 |
|
Net Assets |
|
|
|
Beginning of period |
1,716,857 |
1,247,877 |
|
End of period (including undistributed net investment income of $57,980 and $10,177, respectively) |
$ 2,012,458 |
$ 1,716,857 |
See accompanying notes which are an integral part of the financial statements.
Annual Report
Financial Highlights - Class A
|
Years ended October 31, |
2000 |
1999 |
1998 |
1997 |
1996 E |
|
Selected Per-Share Data |
|
|
|
|
|
|
Net asset value, beginning |
$ 20.59 |
$ 16.32 |
$ 16.89 |
$ 15.29 |
$ 14.98 |
|
Income from |
|
|
|
|
|
|
Net investment income D |
.06 H |
.10 |
.09 |
.09 |
.04 |
|
Net realized and unrealized gain (loss) |
.38 I |
4.42 |
.51 |
2.39 |
.27 |
|
Total from |
.44 |
4.52 |
.60 |
2.48 |
.31 |
|
Less Distributions |
|
|
|
|
|
|
From net investment income |
(.08) |
(.11) |
(.21) |
(.25) |
- |
|
In excess of |
(.09) |
- |
- |
- |
- |
|
From net realized gain |
(.98) |
(.14) |
(.96) |
(.63) |
- |
|
Total distributions |
(1.15) |
(.25) |
(1.17) |
(.88) |
- |
|
Net asset value, end of period |
$ 19.88 |
$ 20.59 |
$ 16.32 |
$ 16.89 |
$ 15.29 |
|
Total Return B, C |
1.78% |
28.05% |
3.73% |
16.95% |
2.07% |
|
Ratios and Supplemental Data |
|
|
|
|
|
|
Net assets, end of period |
$ 44 |
$ 23 |
$ 12 |
$ 5 |
$ 1 |
|
Ratio of expenses to |
1.49% |
1.55% |
1.55% F |
1.90% F |
1.16% A, F |
|
Ratio of expenses to average net assets after expense reductions |
1.46% G |
1.52% G |
1.54% G |
1.89% G |
1.16% A |
|
Ratio of net investment income to average net assets |
.28% |
.57% |
.51% |
.53% |
1.74% A |
|
Portfolio turnover |
132% |
85% |
74% |
70% |
82% |
A Annualized
B The total returns would have been lower had certain expenses not been reduced during the periods shown.
C Total returns do not include the one time sales charge and for periods of less than one year are not annualized.
D Net investment income per share has been calculated based on average shares outstanding during the period.
E For the period September 3, 1996 (commencement of sale of Class A shares) to October 31, 1996.
F FMR agreed to reimburse a portion of the class' expenses during the period. Without this reimbursement, the class' expense ratio would have been higher.
G FMR or the fund has entered into varying arrangements with third parties who either paid or reduced a portion of the class' expenses.
H Investment income per share reflects a special dividend (from BCE, Inc.) which amounted to $.04 per share.
I The amount shown for a share outstanding does not correspond with the aggregate net loss on investments for the period due to the timing of sales and repurchases of class shares in relation to fluctuating market values of the investments of the fund.
See accompanying notes which are an integral part of the financial statements.
Annual Report
Financial Highlights - Class T
|
Years ended October 31, |
2000 |
1999 |
1998 |
1997 |
1996 |
|
Selected Per-Share Data |
|
|
|
|
|
|
Net asset value, beginning |
$ 20.83 |
$ 16.48 |
$ 17.02 |
$ 15.30 |
$ 13.92 |
|
Income from |
|
|
|
|
|
|
Net investment income C |
.02 F |
.07 |
.06 |
.13 |
.19 D |
|
Net realized and |
.39 G |
4.46 |
.52 |
2.38 |
1.29 |
|
Total from |
.41 |
4.53 |
.58 |
2.51 |
1.48 |
|
Less Distributions |
|
|
|
|
|
|
From net |
(.06) |
(.04) |
(.16) |
(.16) |
(.09) |
|
In excess of |
(.07) |
- |
- |
- |
- |
|
From net realized gain |
(.98) |
(.14) |
(.96) |
(.63) |
(.01) |
|
Total distributions |
(1.11) |
(.18) |
(1.12) |
(.79) |
(.10) |
|
Net asset value, end |
$ 20.13 |
$ 20.83 |
$ 16.48 |
$ 17.02 |
$ 15.30 |
|
Total Return A, B |
1.62% |
27.74% |
3.57% |
17.07% |
10.69% |
|
Ratios and Supplemental Data |
|
|
|
|
|
|
Net assets, end of period |
$ 1,678 |
$ 1,480 |
$ 1,086 |
$ 1,111 |
$ 995 |
|
Ratio of expenses to average net assets |
1.67% |
1.72% |
1.74% |
1.66% |
1.61% |
|
Ratio of expenses to average net assets after expense reductions |
1.65% E |
1.69% E |
1.72% E |
1.65% E |
1.60% E |
|
Ratio of net investment income to average |
.10% |
.39% |
.35% |
.80% |
1.30% |
|
Portfolio turnover |
132% |
85% |
74% |
70% |
82% |
A The total returns would have been lower had certain expenses not been reduced during the periods shown.
B Total returns do not include the one time sales charge.
C Net investment income per share has been calculated based on average shares outstanding during the period.
D Investment income per share reflects a special dividend which amounted to $.04 per share.
E FMR or the fund has entered into varying arrangements with third parties who either paid or reduced a portion of the class' expenses.
F Investment income per share reflects a special dividend (from BCE, Inc.) which amounted to $.04 per share.
G The amount shown for a share outstanding does not correspond with the aggregate net loss on investments for the period due to the timing of sales and repurchases of class shares in relation to fluctuating market values of the investments of the fund.
See accompanying notes which are an integral part of the financial statements.
Annual Report
Financial Highlights - Class B
|
Years ended October 31, |
2000 |
1999 |
1998 |
1997 |
1996 |
|
Selected Per-Share Data |
|
|
|
|
|
|
Net asset value, beginning |
$ 20.25 |
$ 16.08 |
$ 16.69 |
$ 15.06 |
$ 13.92 |
|
Income from |
|
|
|
|
|
|
Net investment income (loss) C |
(.11) G |
(.03) |
(.03) |
.02 |
.08 D |
|
Net realized and unrealized gain (loss) |
.39 H |
4.34 |
.51 |
2.36 |
1.26 |
|
Total from investment operations |
.28 |
4.31 |
.48 |
2.38 |
1.34 |
|
Less Distributions |
|
|
|
|
|
|
From net investment income |
(.03) |
- |
(.13) |
(.12) |
(.19) |
|
In excess of |
(.03) |
- |
- |
- |
- |
|
From net realized gain |
(.98) |
(.14) |
(.96) |
(.63) |
(.01) |
|
Total distributions |
(1.04) |
(.14) |
(1.09) |
(.75) |
(.20) |
|
Net asset value, end of period |
$ 19.49 |
$ 20.25 |
$ 16.08 |
$ 16.69 |
$ 15.06 |
|
Total Return A, B |
1.02% |
27.00% |
3.00% |
16.41% |
9.73% |
|
Ratios and Supplemental Data |
|
|
|
|
|
|
Net assets, end of period |
$ 125 |
$ 89 |
$ 58 |
$ 40 |
$ 19 |
|
Ratio of expenses to average |
2.27% |
2.29% E |
2.30% E |
2.30% |
2.37% |
|
Ratio of expenses to average net assets after expense reductions |
2.25% F |
2.26% F |
2.29% F |
2.29% F |
2.37% |
|
Ratio of net investment income (loss) to average net assets |
(.50)% |
(.18)% |
(.19)% |
.15% |
.53% |
|
Portfolio turnover |
132% |
85% |
74% |
70% |
82% |
A The total returns would have been lower had certain expenses not been reduced during the periods shown.
B Total returns do not include the contingent deferred sales charge.
C Net investment income (loss) per share has been calculated based on average shares outstanding during the period.
D Investment income per share reflects a special dividend which amounted to $.04 per share.
E FMR agreed to reimburse a portion of the class' expenses during the period. Without this reimbursement, the class' expense ratio would have been higher.
F FMR or the fund has entered into varying arrangements with third parties who either paid or reduced a portion of the class' expenses.
G Investment income per share reflects a special dividend (from BCE, Inc.) which amounted to $.04 per share.
H The amount shown for a share outstanding does not correspond with the aggregate net loss on investments for the period due to the timing of sales and repurchases of class shares in relation to fluctuating market values of the investments of the fund.
See accompanying notes which are an integral part of the financial statements.
Annual Report
Financial Highlights - Class C
|
Years ended October 31, |
2000 |
1999 |
1998 E |
|
Selected Per-Share Data |
|
|
|
|
Net asset value, beginning of period |
$ 20.58 |
$ 16.37 |
$ 17.23 |
|
Income from Investment Operations |
|
|
|
|
Net investment income (loss) D |
(.10) H |
(.02) |
(.03) |
|
Net realized and unrealized gain (loss) |
.39 I |
4.43 |
.29 |
|
Total from investment operations |
.29 |
4.41 |
.26 |
|
Less Distributions |
|
|
|
|
From net investment income |
(.04) |
(.06) |
(.16) |
|
In excess of net investment income |
(.05) |
- |
- |
|
From net realized gain |
(.98) |
(.14) |
(.96) |
|
Total distributions |
(1.07) |
(.20) |
(1.12) |
|
Net asset value, end of period |
$ 19.80 |
$ 20.58 |
$ 16.37 |
|
Total Return B, C |
1.05% |
27.21% |
2.84% |
|
Ratios and Supplemental Data |
|
|
|
|
Net assets, end of period (in millions) |
$ 76 |
$ 35 |
$ 15 |
|
Ratio of expenses to average net assets |
2.22% |
2.25% F |
2.30% A, F |
|
Ratio of expenses to average net assets after |
2.20% G |
2.22% G |
2.30% A |
|
Ratio of net investment income (loss) to average net assets |
(.45)% |
(.13)% |
(.20)% A |
|
Portfolio turnover |
132% |
85% |
74% |
A Annualized
B The total returns would have been lower had certain expenses not been reduced during the periods shown.
C Total returns do not include the contingent deferred sales charge and for periods of less than one year are not annualized.
D Net investment income (loss) per share has been calculated based on average shares outstanding during the period.
E For the period November 3, 1997 (commencement of sale of Class C shares) to October 31, 1998.
F FMR agreed to reimburse a portion of the class' expenses during the period. Without this reimbursement, the class' expense ratio would have been higher.
G FMR or the fund has entered into varying arrangements with third parties who either paid or reduced a portion of the class' expenses.
H Investment income per share reflects a special dividend (from BCE, Inc.) which amounted to $.04 per share.
I The amount shown for a share outstanding does not correspond with the aggregate net loss on investments for the period due to the timing of sales and repurchases of class shares in relation to fluctuating market values of the investments of the fund.
See accompanying notes which are an integral part of the financial statements.
Annual Report
Financial Highlights - Institutional Class
|
Years ended October 31, |
2000 |
1999 |
1998 |
1997 |
1996 |
|
Selected Per-Share Data |
|
|
|
|
|
|
Net asset value, beginning |
$ 20.62 |
$ 16.36 |
$ 16.92 |
$ 15.20 |
$ 13.97 |
|
Income from |
|
|
|
|
|
|
Net investment income B |
.14 D |
.17 |
.13 |
.22 |
.21 C |
|
Net realized and unrealized gain (loss) |
.38 F |
4.39 |
.53 |
2.36 |
1.24 |
|
Total from investment operations |
.52 |
4.56 |
.66 |
2.58 |
1.45 |
|
Less Distributions |
|
|
|
|
|
|
From net investment income |
(.10) |
(.16) |
(.26) |
(.23) |
(.21) |
|
In excess of |
(.11) |
- |
- |
- |
- |
|
From net realized gain |
(.98) |
(.14) |
(.96) |
(.63) |
(.01) |
|
Total distributions |
(1.19) |
(.30) |
(1.22) |
(.86) |
(.22) |
|
Net asset value, end of period |
$ 19.95 |
$ 20.62 |
$ 16.36 |
$ 16.92 |
$ 15.20 |
|
Total Return A |
2.18% |
28.30% |
4.11% |
17.73% |
10.51% |
|
Ratios and Supplemental Data |
|
|
|
|
|
|
Net assets, end of period |
$ 90 |
$ 90 |
$ 77 |
$ 38 |
$ 16 |
|
Ratio of expenses to average |
1.13% |
1.18% |
1.26% |
1.17% |
1.44% |
|
Ratio of expenses to average net assets after expense reductions |
1.11% E |
1.15% E |
1.24% E |
1.16% E |
1.43% E |
|
Ratio of net investment income to average net assets |
.63% |
.94% |
.76% |
1.31% |
1.46% |
|
Portfolio turnover |
132% |
85% |
74% |
70% |
82% |
A The total returns would have been lower had certain expenses not been reduced during the periods shown.
B Net investment income per share has been calculated based on average shares outstanding during the period.
C Investment income per share reflects a special dividend which amounted to $.04 per share.
D Investment income per share reflects a special dividend (from BCE, Inc.) which amounted to $.04 per share.
E FMR or the fund has entered into varying arrangements with third parties who either paid or reduced a portion of the class' expenses.
F The amount shown for a share outstanding does not correspond with the aggregate net loss on investments for the period due to the timing of sales and repurchases of class shares in relation to fluctuating market values of the investments of the fund.
See accompanying notes which are an integral part of the financial statements.
Annual Report
For the period ended October 31, 2000
1. Significant Accounting Policies.
Fidelity Advisor Overseas Fund(the fund) is a fund of Fidelity Advisor Series VIII(the trust) and is authorized to issue an unlimited number of shares. The trust is registered under the Investment Company Act of 1940, as amended (the 1940 Act), as an open-end management investment company organized as a Massachusetts business trust.
The fund offers Class A, Class T, Class B, Class C, and Institutional Class shares, each of which has equal rights as to assets and voting privileges. Each class has exclusive voting rights with respect to matters that affect that class. Class B shares will automatically convert to Class A shares after a holding period of seven years from the initial date of purchase. Investment income, realized and unrealized capital gains and losses, the common expenses of the fund, and certain fund-level expense reductions, if any, are allocated on a pro rata basis to each class based on the relative net assets of each class to the total net assets of the fund. Each class of shares differs in its respective distribution, transfer agent, and certain other class-specific fees, expenses, and expense reductions.
The financial statements have been prepared in conformity with generally accepted accounting principles which require management to make certain estimates and assumptions at the date of the financial statements. The following summarizes the significant accounting policies of the fund:
Security Valuation. Securities for which quotations are readily available are valued using the official closing price or at the last sale price in the principal market in which they are traded. If the last sale price (on the local exchange) is unavailable, the last evaluated quote or closing bid price normally is used. If trading or events occurring in other markets after the close of the principal market in which securities are traded are expected to materially affect the value of those securities, then they are valued at their fair value taking this trading or these events into account. Fair value is determined in good faith under consistently applied procedures under the general supervision of the Board of Trustees. Securities (including restricted securities) for which quotations are not readily available are valued primarily using dealer-supplied valuations or at their fair value. Short-term securities with remaining maturities of sixty days or less for which quotations are not readily available are valued at amortized cost or original cost plus accrued interest, both of which approximate current value. Investments in open-end investment companies are valued at their net asset value each business day.
Foreign Currency Translation. The accounting records of the fund are maintained in U.S. dollars. Investment securities and other assets and liabilities denominated in a foreign currency are translated into U.S. dollars at the prevailing rates of exchange at period end. Purchases and sales of securities, income receipts and expense payments are translated into U.S. dollars at the prevailing exchange rate on the respective dates of the transactions.
Annual Report
Notes to Financial Statements - continued
1. Significant Accounting Policies - continued
Foreign Currency Translation - continued
Net realized gains and losses on foreign currency transactions represent net gains and losses from sales and maturities of foreign currency contracts, disposition of foreign currencies, the difference between the amount of net investment income accrued and the U.S. dollar amount actually received, and gains and losses between trade and settlement date on purchases and sales of securities. The effects of changes in foreign currency exchange rates on investments in securities are included with the net realized and unrealized gain or loss on investment securities.
Income Taxes. As a qualified regulated investment company under Subchapter M of the Internal Revenue Code, the fund is not subject to U.S. federal income taxes to the extent that it distributes substantially all of its taxable income for its fiscal year. The fund may be subject to foreign taxes on income and gains on investments which are accrued based upon the fund's understanding of the tax rules and regulations that exist in the markets in which it invests. Foreign governments may also impose taxes on other payments or transactions with respect to foreign securities. The fund accrues such taxes as applicable. The schedule of investments includes information regarding income taxes under the caption "Income Tax Information."
Investment Income. Dividend income is recorded on the ex-dividend date, except certain dividends from foreign securities where the ex-dividend date may have passed, are recorded as soon as the fund is informed of the ex-dividend date. Non-cash dividends included in dividend income, if any, are recorded at the fair market value of the securities received. Interest income is accrued as earned. Investment income is recorded net of foreign taxes withheld where recovery of such taxes is uncertain.
Expenses. Most expenses of the trust can be directly attributed to a fund. Expenses which cannot be directly attributed are apportioned among the funds in the trust.
Distributions to Shareholders. Distributions are recorded on the ex-dividend date. Income dividends and capital gain distributions are declared separately for each class.
Income and capital gain distributions are determined in accordance with income tax regulations which may differ from generally accepted accounting principles. These differences, which may result in distribution reclassifications, are primarily due to differing treatments for, futures transactions, foreign currency transactions, passive foreign investment companies (PFIC), non-taxable dividends and losses deferred due to wash sales. The fund also utilized earnings and profits distributed to shareholders on redemption of shares as a part of the dividends paid deduction for income tax purposes.
Annual Report
Notes to Financial Statements - continued
1. Significant Accounting Policies - continued
Distributions to Shareholders - continued
Permanent book and tax basis differences relating to shareholder distributions will result in reclassifications to paid in capital. Undistributed net investment income and accumulated undistributed net realized gain (loss) on investments and foreign currency transactions may include temporary book and tax basis differences which will reverse in a subsequent period. Any taxable income or gain remaining at fiscal year end is distributed in the following year.
Security Transactions. Security transactions are accounted for as of trade date. Gains and losses on securities sold are determined on the basis of identified cost.
2. Operating Policies.
Foreign Currency Contracts. The fund generally uses foreign currency contracts to facilitate transactions in foreign-denominated securities. Losses may arise from changes in the value of the foreign currency or if the counterparties do not perform under the contracts' terms. The U.S. dollar value of foreign currency contracts is determined using contractual currency exchange rates established at the time of each trade.
Joint Trading Account. Pursuant to an Exemptive Order issued by the Securities and Exchange Commission (the SEC), the fund, along with other affiliated entities of Fidelity Management & Research Company (FMR), may transfer uninvested cash balances into one or more joint trading accounts. These balances are invested in one or more repurchase agreements for U.S. Treasury or Federal Agency obligations.
Repurchase Agreements. The underlying U.S. Treasury, Federal Agency, or other obligations found to be satisfactory by FMR are transferred to an account of the fund, or to the Joint Trading Account, at a custodian bank. The securities are marked-to-market daily and maintained at a value at least equal to the principal amount of the repurchase agreement (including accrued interest). FMR, the fund's investment adviser, is responsible for determining that the value of the underlying securities remains in accordance with the market value requirements stated above.
Futures Contracts. The fund may use futures contracts to manage its exposure to the stock market and to fluctuations in currency values. Buying futures tends to increase the fund's exposure to the underlying instrument, while selling futures tends to decrease the fund's exposure to the underlying instrument or hedge other fund investments. Futures contracts involve, to varying degrees, risk of loss in excess of the futures variation margin reflected in the Statement of Assets and Liabilities. The underlying face amount at value of any open futures contracts at period end is shown in the schedule of investments
Annual Report
Notes to Financial Statements - continued
2. Operating Policies - continued
Futures Contracts - continued
under the caption "Futures Contracts." This amount reflects each contract's exposure to the underlying instrument at period end. Losses may arise from changes in the value of the underlying instruments or if the counterparties do not perform under the contracts' terms. Gains (losses) are realized upon the expiration or closing of the futures contracts. Futures contracts are valued at the settlement price established each day by the board of trade or exchange on which they are traded.
Restricted Securities. The fund is permitted to invest in securities that are subject to legal or contractual restrictions on resale. These securities generally may be resold in transactions exempt from registration or to the public if the securities are registered. Disposal of these securities may involve time-consuming negotiations and expense, and prompt sale at an acceptable price may be difficult. At the end of the period, the fund had no investments in restricted securities (excluding 144A issues).
3. Purchases and Sales of Investments.
Purchases and sales of securities, other than short-term securities, aggregated $2,739,133,000 and $2,502,270,000, respectively, of which U.S. government and government agency obligations aggregated $0 and $3,405,000, respectively.
The market value of futures contracts opened and closed during the period amounted to $26,938,000 and $31,192,000, respectively.
4. Fees and Other Transactions with Affiliates.
Management Fee. As the fund's investment adviser, FMR receives a monthly basic fee that is calculated on the basis of a group fee rate plus a fixed individual fund fee rate applied to the average net assets of the fund. The group fee rate is the weighted average of a series of rates and is based on the monthly average net assets of all the mutual funds advised by FMR. The rates ranged from .2167% to .5200% for the period. The annual individual fund fee rate is .45%. In the event that these rates were lower than the contractual rates in effect during the period, FMR voluntarily implemented the above rates, as they resulted in the same or a lower management fee. The basic fee is subject to a performance adjustment (up to a maximum of ±.20% of the fund's average net assets over the performance period) based on the fund's investment performance as compared to the appropriate index over a specified period of time. For the period, the management fee was equivalent to an annual rate of .84% of average net assets after the performance adjustment.
Annual Report
Notes to Financial Statements - continued
4. Fees and Other Transactions with Affiliates - continued
Sub-Adviser Fee.Beginning January 1, 2001, FMR Co. (FMRC) will serve as a sub-
adviser for the fund. FMRC may provide investment research and advice and may also provide investment advisory services for the fund. FMR, on behalf of the fund,
entered into sub-advisory agreements with Fidelity Management & Research (U.K.) Inc., Fidelity Management & Research (Far East) Inc., and Fidelity International
Investment Advisors (FIIA). Under the sub-advisory arrangements, FMR may receive investment advice and research services and may grant the sub-advisers
investment management authority to buy and sell securities. FMR pays its sub-advisers either a portion of its management fee or a fee based on costs incurred for
these services.
Distribution and Service Plan. In accordance with Rule 12b-1 of the 1940 Act, the Board of Trustees have adopted separate Distribution and Service Plans with respect to each class of shares (collectively referred to as "the Plans"). Under certain of the Plans, the class pays Fidelity Distributors Corporation (FDC), an affiliate of FMR, a 12b-1 fee. A portion of this fee may be reallowed to securities dealers, banks and other financial institutions for the distribution of each class of shares and providing shareholder support services. For the period, this fee was based on the following annual rates of the average net assets of each applicable class:
|
Class A |
.25% |
|
Class T |
.50% |
|
Class B |
1.00%* |
|
Class C |
1.00%* |
* .75% represents a distribution fee and .25% represents a shareholder service fee.
For the period, each class paid FDC the following amounts, a portion of which was retained by FDC:
|
|
Paid to |
Retained |
|
Class A |
$ 96,000 |
$ - |
|
Class T |
8,766,000 |
42,000 |
|
Class B |
1,226,000 |
920,000 |
|
Class C |
616,000 |
337,000 |
|
|
$ 10,704,000 |
$ 1,299,000 |
Sales Load. FDC receives a front-end sales charge of up to 5.75% for selling Class A shares, and 3.50% for selling Class T shares of the fund. FDC receives the proceeds of contingent deferred sales charges levied on Class B share redemptions occurring within six years of purchase and Class C share redemptions occurring within one year of purchase. Contingent deferred sales charges are based on declining rates ranging from 5% to 1% for Class B and 1% for Class C, of the lesser of the cost of shares at the
Annual Report
Notes to Financial Statements - continued
4. Fees and Other Transactions with Affiliates - continued
Sales Load - continued
initial date of purchase or the net asset value of the redeemed shares, excluding any reinvested dividends and capital gains. In addition, purchases of Class A and Class T shares that were subject to a finder's fee bear a contingent deferred sales charge on assets that do not remain in the fund for at least one year. The Class A and Class T contingent deferred sales charge is based on 0.25% of the lesser of the cost of shares at the initial date of purchase or the net asset value of the redeemed shares, excluding any reinvested dividends and capital gains. A portion of the sales charges paid to FDC is paid to securities dealers, banks and other financial institutions.
For the period, sales charge amounts paid to and retained by FDC were as follows:
|
|
Paid to |
Retained |
|
Class A |
$ 271,000 |
$ 120,000 |
|
Class T |
553,000 |
196,000 |
|
Class B |
247,000 |
247,000 * |
|
Class C |
29,000 |
29,000 * |
|
|
$ 1,100,000 |
$ 592,000 |
* When Class B and Class C shares are initially sold, FDC pays commissions from its own resources to securities dealers,
banks, and other financial institutions through which the sales are made.
Transfer Agent Fees. Fidelity Investments Institutional Operations Company, Inc., (FIIOC), an affiliate of FMR, is the transfer, dividend disbursing and shareholder servicing agent (collectively referred to as the transfer agent) for each class of the fund. FIIOC receives account fees and asset-based fees that vary according to the account size and type of account of the shareholders of the respective classes of the fund. FIIOC pays for typesetting, printing and mailing of all shareholder reports, except proxy statements. For the period, the following amounts were paid to FIIOC:
|
|
Amount |
% of |
|
Class A |
$ 107,000 |
.28 |
|
Class T |
3,767,000 |
.21 |
|
Class B |
382,000 |
.31 |
|
Class C |
162,000 |
.26 |
|
Institutional Class |
183,000 |
.18 |
|
|
$ 4,601,000 |
|
Accounting and Security Lending Fees. Fidelity Service Company, Inc., an affiliate of FMR, maintains the fund's accounting records and administers the security lending program. The security lending fee is based on the number and duration of lending transactions. The accounting fee is based on the level of average net assets for the month plus out-of-pocket expenses.
Annual Report
Notes to Financial Statements - continued
4. Fees and Other Transactions with Affiliates - continued
Fidelity Cash Central Fund. Pursuant to an Exemptive Order issued by the SEC, the fund may invest in the Fidelity Cash Central Fund (the Cash Fund) managed by Fidelity Investments Money Management, Inc., an affiliate of FMR. The Cash Fund is an open-end money market fund available only to investment companies and other accounts managed by FMR and its affiliates. The Cash Fund seeks preservation of capital, liquidity, and current income. Income distributions from the Cash Fund are declared daily and paid monthly from net investment income. Income distributions earned by the fund are recorded as interest income in the accompanying financial statements.
Brokerage Commissions. The fund placed a portion of its portfolio transactions with brokerage firms which are affiliates of FMR. The commissions paid to these affiliated firms were $20,000 for the period.
5. Security Lending.
The fund lends portfolio securities from time to time in order to earn additional income. The fund receives collateral in the form of U.S. Treasury obligations, letters of credit, and/or cash against the loaned securities, and maintains collateral in an amount not less than 100% of the market value of the loaned securities during the period of the loan. The market value of the loaned securities is determined at the close of business of the fund and any additional required collateral is delivered to the fund on the next business day. If the borrower defaults on its obligation to return the securities loaned because of insolvency or other reasons, the fund could experience delays and costs in recovering the securities loaned or in gaining access to the collateral. At period end, the value of the securities loaned amounted to $20,884,000. The fund received cash collateral of $21,300,000 which was invested in the Central Cash Collateral Fund.
6. Expense Reductions.
FMR has directed certain portfolio trades to brokers who paid a portion of the fund's expenses. For the period, the fund's expenses were reduced by $437,000 under this arrangement.
In addition, through an arrangement with the fund's custodian, credits realized as a result of uninvested cash balances were used to reduce a portion of expenses. During the period, the fund's custodian fees were reduced by $7,000 under the custodian arrangement.
7. Beneficial Interest.
At the end of the period, one shareholder was record owner of approximately 13% of the total outstanding shares of the fund.
Annual Report
Notes to Financial Statements - continued
8. Distributions to Shareholders.
Distributions to shareholders of each class were as follows:
|
Amounts in thousands |
Years ended October 31, |
|
|
|
2000 |
1999 |
|
From net investment income |
|
|
|
Class A |
$ 95 |
$ 78 |
|
Class T |
4,533 |
2,595 |
|
Class B |
132 |
- |
|
Class C |
76 |
50 |
|
Institutional Class |
454 |
722 |
|
Total |
$ 5,290 |
$ 3,445 |
|
In excess of net investment income |
|
|
|
Class A |
$ 99 |
$ - |
|
Class T |
4,748 |
- |
|
Class B |
138 |
- |
|
Class C |
79 |
- |
|
Institutional Class |
475 |
- |
|
Total |
$ 5,539 |
$ - |
|
From net realized gain |
|
|
|
Class A |
$ 1,120 |
$ 99 |
|
Class T |
69,969 |
9,084 |
|
Class B |
4,396 |
507 |
|
Class C |
1,690 |
116 |
|
Institutional Class |
4,333 |
632 |
|
Total |
$ 81,508 |
$ 10,438 |
|
|
$ 92,337 |
$ 13,883 |
Annual Report
Notes to Financial Statements - continued
9. Share Transactions.
Transactions for each class of shares were as follows:
|
|
Shares |
Dollars |
||
|
Amounts in thousands |
Year ended October 31, |
Year ended October 31, |
Year ended October 31, |
Year ended October 31, |
|
|
2000 |
1999 |
2000 |
1999 |
|
|
|
|
|
|
|
Class A |
4,566 |
4,183 |
$ 100,132 |
$ 76,263 |
|
Reinvestment of distributions |
57 |
11 |
1,222 |
173 |
|
Shares redeemed |
(3,543) |
(3,818) |
(78,300) |
(69,891) |
|
Net increase (decrease) |
1,080 |
376 |
$ 23,054 |
$ 6,545 |
|
Class T |
50,328 |
100,980 |
$ 1,122,012 |
$ 1,884,019 |
|
Reinvestment of distributions |
3,494 |
648 |
75,183 |
10,982 |
|
Shares redeemed |
(41,478) |
(96,495) |
(926,640) |
(1,796,038) |
|
Net increase (decrease) |
12,344 |
5,133 |
$ 270,555 |
$ 98,963 |
|
Class B |
2,974 |
2,267 |
$ 64,992 |
$ 41,143 |
|
Reinvestment of distributions |
196 |
27 |
4,107 |
454 |
|
Shares redeemed |
(1,177) |
(1,520) |
(25,357) |
(27,409) |
|
Net increase (decrease) |
1,993 |
774 |
$ 43,742 |
$ 14,188 |
|
Class C |
3,639 |
8,406 |
$ 80,303 |
$ 153,485 |
|
Reinvestment of distributions |
76 |
9 |
1,630 |
143 |
|
Shares redeemed |
(1,582) |
(7,619) |
(34,658) |
(139,603) |
|
Net increase (decrease) |
2,133 |
796 |
$ 47,275 |
$ 14,025 |
|
Institutional Class |
2,113 |
3,272 |
$ 47,118 |
$ 59,739 |
|
Reinvestment of distributions |
99 |
36 |
2,115 |
602 |
|
Shares redeemed |
(2,077) |
(3,637) |
(45,836) |
(66,268) |
|
Net increase (decrease) |
135 |
(329) |
$ 3,397 |
$ (5,927) |
Annual Report
To the Trustees of Fidelity Advisor Series VIII and the Shareholders of Fidelity Advisor Overseas Fund:
In our opinion, the accompanying statement of assets and liabilities, including the schedule of investments, and the related statements of operations and of changes in net assets and the financial highlights present fairly, in all material respects, the financial position of Fidelity Advisor Overseas Fund (a fund of Fidelity Advisor Series VIII) at October 31, 2000, and the results of its operations, the changes in its net assets and the financial highlights for the periods indicated, in conformity with accounting principles generally accepted in the United States of America. These financial statements and financial highlights (hereafter referred to as "financial statements") are the responsibility of the Fidelity Advisor Overseas Fund's management; our responsibility is to express an opinion on these financial statements based on our audits. We conducted our audits of these financial statements in accordance with auditing standards generally accepted in the United States of America which require that we plan and perform the audit to obtain reasonable assurance about whether the financial statements are free of material misstatement. An audit includes examining, on a test basis, evidence supporting the amounts and disclosures in the financial statements, assessing the accounting principles used and significant estimates made by management, and evaluating the overall financial statement presentation. We believe that our audits, which included confirmation of securities at October 31, 2000 by correspondence with the custodian and brokers, provide a reasonable basis for our opinion.
/s/PricewaterhouseCoopers LLP
PricewaterhouseCoopers LLP
Boston, Massachusetts
December 8, 2000
Annual Report
The Board of Trustees of Fidelity Advisor Overseas voted to pay to shareholders of record at the opening of business on record date, the following distributions per share derived from capital gains realized from sales of portfolio securities, and dividends derived from net investment income:
|
|
Pay Date |
Record Date |
Dividends |
Capital Gains |
|
Institutional Class |
12/11/00 |
12/8/00 |
$.47 |
$1.72 |
The fund hereby designates 100% of the long-term capital gain dividends distributed during the fiscal year as 20%-rate capital gain dividends.
The amounts per share which represent income derived from sources within, and taxes paid to, foreign countries or possessions of the United States are as follows:
|
|
Pay Date |
Income |
Taxes |
|
|
Institutional Class |
12/6/99 |
$.337 |
$.036 |
|
The fund will notify shareholders in January 2001 of amounts for use in preparing 2000 income tax returns.
Annual Report
Annual Report
Annual Report
Investment Adviser
Fidelity Management & Research Company
Boston, MA
Investment Sub-Advisers
Fidelity Management & Research
(U.K.) Inc.
Fidelity Management & Research
(Far East) Inc.
Fidelity Investments Japan Limited
Fidelity International Investment Advisors
Fidelity International Investment Advisors (U.K.) Limited
Officers
Edward C. Johnson 3d, President
Robert C. Pozen, Senior Vice President
Richard A. Spillane, Jr., Vice President
Richard R. Mace, Jr., Vice President
Eric D. Roiter, Secretary
Robert A. Dwight, Treasurer
Maria F. Dwyer, Deputy Treasurer
John H. Costello, Assistant Treasurer
Thomas J. Simpson, Assistant Treasurer
Board of Trustees
Ralph F. Cox *
Phyllis Burke Davis *
Robert M. Gates *
Edward C. Johnson 3d
Donald J. Kirk *
Ned C. Lautenbach *
Peter S. Lynch
William J. McCoy *
Marvin L. Mann *
Gerald C. McDonough *
Robert C. Pozen
Thomas R. Williams *
Advisory Board
J. Michael Cook
Abigail P. Johnson
Marie L. Knowles
General Distributor
Fidelity Distributors Corporation
Boston, MA
Transfer and Shareholder
Servicing Agent
Fidelity Investments Institutional
Operations Company, Inc.
Boston, MA
Custodian
The Chase Manhattan Bank
New York, NY
* Independent trustees
Annual Report
Focus Funds
Fidelity Advisor Consumer
Industries Fund
Fidelity Advisor Cyclical
Industries Fund
Fidelity Advisor Financial
Services Fund
Fidelity Advisor Health Care Fund
Fidelity Advisor Natural
Resources Fund
Fidelity Advisor Technology Fund
Fidelity Advisor Telecommunications & Utilities Growth Fund
Growth Funds
Fidelity Advisor Korea Fund
Fidelity Advisor Emerging Asia Fund
Fidelity Advisor Latin America Fund
Fidelity Advisor Japan Fund
Fidelity Advisor Europe Capital Appreciation Fund
Fidelity Advisor International
Capital Appreciation Fund
Fidelity Advisor Overseas Fund
Fidelity Advisor Diversified International Fund
Fidelity Advisor Global Equity Fund
Fidelity Advisor TechnoQuant ®
Growth Fund
Fidelity Advisor Small Cap Fund
Fidelity Advisor Value Strategies Fund
Fidelity Advisor Mid Cap Fund
Fidelity Advisor Dynamic Capital Appreciation Fund
Fidelity Advisor Equity Growth Fund
Fidelity Advisor Large Cap Fund
Fidelity Advisor Dividend Growth Fund
Fidelity Advisor Growth
Opportunities Fund
Growth and Income Funds
Fidelity Advisor Growth & Income Fund
Fidelity Advisor Equity Income Fund
Fidelity Advisor Asset Allocation Fund
Fidelity Advisor Balanced Fund
Taxable Income Funds
Fidelity Advisor Emerging Markets Income Fund
Fidelity Advisor High Yield Fund
Fidelity Advisor High Income Fund
Fidelity Advisor Strategic Income Fund
Fidelity Advisor Mortgage
Securities Fund
Fidelity Advisor Government Investment Fund
Fidelity Advisor Intermediate Bond Fund
Fidelity Advisor Short Fixed-Income Fund
Municipal Funds
Fidelity Advisor Municipal Income Fund
Money Market Funds
Prime Fund
Treasury Fund
Tax-Exempt Fund
OSI-ANN-1200 118710
1.538538.103
(Fidelity Investment logo)(registered trademark)
Fidelity® Advisor
Fund - Class A, Class T, Class B
and Class C
Annual Report
October 31, 2000
(2_fidelity_logos)(registered trademark)
|
President's Message |
Ned Johnson on investing strategies. |
|
|
Performance |
How the fund has done over time. |
|
|
Fund Talk |
The manager's review of fund performance, strategy and outlook. |
|
|
Investment Changes |
A summary of major shifts in the fund's investments over the past six months. |
|
|
Investments |
A complete list of the fund's investments with their market values. |
|
|
Financial Statements |
Statements of assets and liabilities,
operations, and changes in net assets, |
|
|
Notes |
Notes to the financial statements. |
|
|
Report of Independent Accountants |
The auditors' opinion. |
|
|
Distributions |
|
Standard & Poor's, S&P and S&P 500 are registered service marks of The McGraw-Hill Companies, Inc. and have been licensed for use by Fidelity Distributors Corporation.
Other third party marks appearing herein are the property of their respective owners.
All other marks appearing herein are registered or unregistered trademarks or service marks of FMR Corp. or an affiliated company.
(Recycle graphic) This report is printed on recycled paper using soy-based inks.
This report and the financial statements contained herein are submitted for the general information of the shareholders of the fund. This report is not authorized for distribution to prospective investors in the fund unless preceded or accompanied by an effective prospectus.
Mutual fund shares are not deposits or obligations of, or guaranteed by, any depository institution. Shares are not insured by the FDIC, Federal Reserve Board or any other agency, and are subject to investment risks, including possible loss of principal amount invested.
Neither the fund nor Fidelity Distributors Corporation is a bank.
For more information on any Fidelity Advisor fund, including charges and expenses, contact your investment professional for a free prospectus. Read it carefully before you invest or send money.
Annual Report
(photo_of_Edward_C_Johnson_3d)
Dear Shareholder:
A sixth-straight year of double-digit positive returns for the Dow Jones Industrial Average, NASDAQ and S&P 500® could be in jeopardy unless the U.S. stock market shows marked improvement in the final two months of 2000. Through October, all three indexes had negative year-to-date returns. On the other hand, most fixed-income sectors were solidly in the black. Treasuries and other long-term government securities led the way, returning nearly 14%.
While it's impossible to predict the future direction of the markets with any degree of certainty, there are certain basic principles that can help investors plan for their future needs.
First, investors are encouraged to take a long-term view of their portfolios. If you can afford to leave your money invested through the inevitable up and down cycles of the financial markets, you will greatly reduce your vulnerability to any single decline. We know from experience, for example, that stock prices have gone up over longer periods of time, have significantly outperformed other types of investments and have stayed ahead of inflation.
Second, you can further manage your investing risk through diversification. A stock mutual fund, for instance, is already diversified, because it invests in many different companies. You can increase your diversification further by investing in a number of different stock funds, or in such other investment categories as bonds. If you have a short investment time horizon, you might want to consider moving some of your investment into a money market fund, which seeks income and a stable share price by investing in high-quality, short-term investments. Of course, it's important to remember that an investment in a money market fund is not insured or guaranteed by the Federal Deposit Insurance Corporation or any other government agency. Although money market funds seek to preserve the value of your investment at $1.00 per share, it is possible to lose money by investing in these types of funds.
Finally, no matter what your time horizon or portfolio diversity, it makes good sense to follow a regular investment plan, investing a certain amount of money in a fund at the same time each month or quarter and periodically reviewing your overall portfolio. By doing so, you won't get caught up in the excitement of a rapidly rising market, nor will you buy all your shares at market highs. While this strategy - known as dollar cost averaging - won't assure a profit or protect you from a loss in a declining market, it should help you lower the average cost of your purchases. Of course, you should consider your financial ability to continue your purchases through periods of low price levels before undertaking such a strategy.
Remember to contact your investment professional if you need help with your investments.
Best regards,
/s/Edward C. Johnson 3d
Edward C. Johnson 3d
Annual Report
Fidelity Advisor Latin America Fund - Class A
There are several ways to evaluate historical performance. You can look at the total percentage change in value, the average annual percentage change or the growth of a hypothetical $10,000 investment. Total return reflects the change in the value of an investment, assuming reinvestment of the class' dividend income and capital gains (the profits earned upon the sale of securities that have grown in value). If Fidelity had not reimbursed certain class expenses, the total returns would have been lower.
Cumulative Total Returns
|
Periods ended October 31, 2000 |
|
Past 1 |
Life of |
|
Fidelity Adv Latin America - CL A |
|
13.92% |
32.60% |
|
Fidelity Adv Latin America - CL A |
|
7.37% |
24.98% |
|
MSCI EMF - Latin America |
|
14.24% |
37.74% |
|
Latin American Funds Average |
|
20.19% |
n/a* |
Cumulative total returns show Class A's performance in percentage terms over a set period - in this case, one year or since the fund started on December 21, 1998. For example, if you had invested $1,000 in a fund that had a 5% return over the past year, the value of your investment would be $1,050. You can compare Class A's returns to the performance of the Morgan Stanley Capital International Emerging Markets Free - Latin America Index - a market capitalization-weighted index of approximately 160 stocks traded in seven Latin American markets. To measure how Class A's performance stacked up against its peers, you can compare it to the Latin American funds average, which reflects the performance of mutual funds with similar objectives tracked by Lipper Inc. The past one year average represents a peer group of 42 mutual funds. These benchmarks include reinvested dividends and capital gains, if any, and exclude the effect of sales charges.
Average Annual Total Returns
|
Periods ended October 31, 2000 |
|
Past 1 |
Life of |
|
Fidelity Adv Latin America - CL A |
|
13.92% |
16.35% |
|
Fidelity Adv Latin America - CL A |
|
7.37% |
12.71% |
|
MSCI EMF - Latin America |
|
14.24% |
18.75% |
|
Latin American Funds Average |
|
20.19% |
n/a* |
Average annual total returns take Class A shares' cumulative return and show you what would have happened if Class A shares had performed at a constant rate each year.
* Not available
Annual Report
$10,000 Over Life of Fund
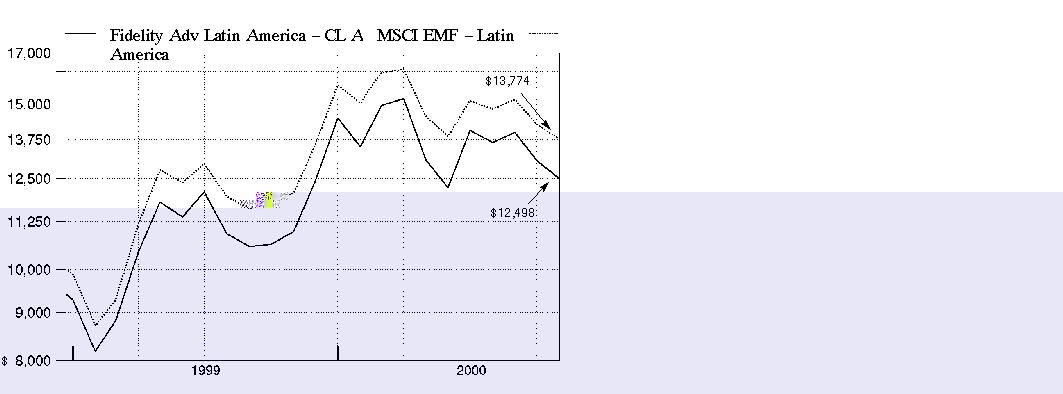
$10,000 Over Life of Fund: Let's say hypothetically that $10,000 was invested in Fidelity Advisor Latin America Fund - Class A on December 21, 1998, when the fund started, and the current 5.75% sales charge was paid. As the chart shows, by October 31, 2000 the value of the investment would have grown to $12,498 - a 24.98% increase on the initial investment. For comparison, look at how the MSCI EMF - Latin America Index did over the same period. With dividends reinvested, the same $10,000 would have grown to $13,774 - a 37.74% increase.
Understanding
Performance
Many markets around the globe offer the potential for significant growth over time; however, investing in foreign markets means assuming greater risks than investing in the United States. Factors like changes in a country's financial markets, its local political and economic climate, and the fluctuating value of its currency create these risks. For these reasons an international fund's performance may be more volatile than a fund that invests exclusively in the United States. Past performance is no guarantee of future results and you may have a gain or loss when you sell your shares.
3Annual Report
Fidelity Advisor Latin America Fund - Class T
There are several ways to evaluate historical performance. You can look at the total percentage change in value, the average annual percentage change or the growth of a hypothetical $10,000 investment. Total return reflects the change in the value of an investment, assuming reinvestment of the class' dividend income and capital gains (the profits earned upon the sale of securities that have grown in value). If Fidelity had not reimbursed certain class expenses, the total returns would have been lower.
Cumulative Total Returns
|
Periods ended October 31, 2000 |
|
Past 1 |
Life of |
|
Fidelity Adv Latin America - CL T |
|
13.68% |
32.10% |
|
Fidelity Adv Latin America - CL T |
|
9.70% |
27.48% |
|
MSCI EMF - Latin America |
|
14.24% |
37.74% |
|
Latin American Funds Average |
|
20.19% |
n/a* |
Cumulative total returns show Class T's performance in percentage terms over a set period - in this case, one year or since the fund started on December 21, 1998. For example, if you had invested $1,000 in a fund that had a 5% return over the past year, the value of your investment would be $1,050. You can compare Class T's returns to the performance of the Morgan Stanley Capital International Emerging Markets Free - Latin America Index - a market capitalization-weighted index of approximately 160 stocks traded in seven Latin American markets. To measure how Class T's performance stacked up against its peers, you can compare it to the Latin American funds average, which reflects the performance of mutual funds with similar objectives tracked by Lipper Inc. The past one year average represents a peer group of 42 mutual funds. These benchmarks include reinvested dividends and capital gains, if any, and exclude the effect of sales charges.
Average Annual Total Returns
|
Periods ended October 31, 2000 |
|
Past 1 |
Life of |
|
Fidelity Adv Latin America - CL T |
|
13.68% |
16.12% |
|
Fidelity Adv Latin America - CL T |
|
9.70% |
13.92% |
|
MSCI EMF - Latin America |
|
14.24% |
18.75% |
|
Latin American Funds Average |
|
20.19% |
n/a* |
Average annual total returns take Class T shares' cumulative return and show you what would have happened if Class T shares had performed at a constant rate each year.
* Not available
Annual Report
$10,000 Over Life of Fund
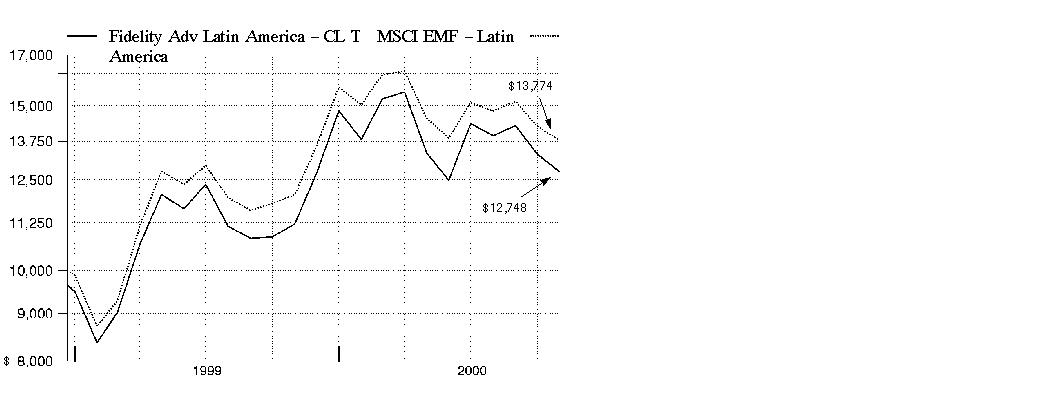
$10,000 Over Life of Fund: Let's say hypothetically that $10,000 was invested in Fidelity Advisor Latin America Fund - Class T on December 21, 1998, when the fund started, and the current 3.50% sales charge was paid. As the chart shows, by October 31, 2000, the value of the investment would have grown to $12,748 - a 27.48% increase on the initial investment. For comparison, look at how the MSCI EMF - Latin America Index did over the same period. With dividends reinvested, the same $10,000 would have grown to $13,774 - a 37.74% increase.
Understanding
Performance
Many markets around the globe offer the potential for significant growth over time; however, investing in foreign markets means assuming greater risks than investing in the United States. Factors like changes in a country's financial markets, its local political and economic climate, and the fluctuating value of its currency create these risks. For these reasons an international fund's performance may be more volatile than a fund that invests exclusively in the United States. Past performance is no guarantee of future results and you may have a gain or loss when you sell your shares.
3Annual Report
Fidelity Advisor Latin America Fund - Class B
There are several ways to evaluate historical performance. You can look at the total percentage change in value, the average annual percentage change or the growth of a hypothetical $10,000 investment. Total return reflects the change in the value of an investment, assuming reinvestment of the class' dividend income and capital gains (the profits earned upon the sale of securities that have grown in value). Class B shares' contingent deferred sales charge included in the past one year and life of fund total return figures are 5% and 4%, respectively. If Fidelity had not reimbursed certain class expenses, the total returns would have been lower.
Cumulative Total Returns
|
Periods ended October 31, 2000 |
|
Past 1 |
Life of |
|
Fidelity Adv Latin America - CL B |
|
12.95% |
30.80% |
|
Fidelity Adv Latin America - CL B |
|
7.95% |
26.80% |
|
MSCI EMF - Latin America |
|
14.24% |
37.74% |
|
Latin American Funds Average |
|
20.19% |
n/a* |
Cumulative total returns show Class B's performance in percentage terms over a set period - in this case, one year or since the fund started on December 21, 1998. For example, if you had invested $1,000 in a fund that had a 5% return over the past year, the value of your investment would be $1,050. You can compare Class B's returns to the performance of the Morgan Stanley Capital International Emerging Markets Free - Latin America Index - a market capitalization-weighted index of approximately 160 stocks traded in seven Latin American markets. To measure how Class B's performance stacked up against its peers, you can compare it to the Latin American funds average, which reflects the performance of mutual funds with similar objectives tracked by Lipper Inc. The past one year average represents a peer group of 42 mutual funds. These benchmarks include reinvested dividends and capital gains, if any, and exclude the effect of sales charges.
Average Annual Total Returns
|
Periods ended October 31, 2000 |
|
Past 1 |
Life of |
|
Fidelity Adv Latin America - CL B |
|
12.95% |
15.50% |
|
Fidelity Adv Latin America - CL B |
|
7.95% |
13.59% |
|
MSCI EMF - Latin America |
|
14.24% |
18.75% |
|
Latin American Funds Average |
|
20.19% |
n/a* |
Average annual total returns take Class B shares' cumulative return and show you what would have happened if Class B shares had performed at a constant rate each year.
* Not available
Annual Report
$10,000 Over Life of Fund
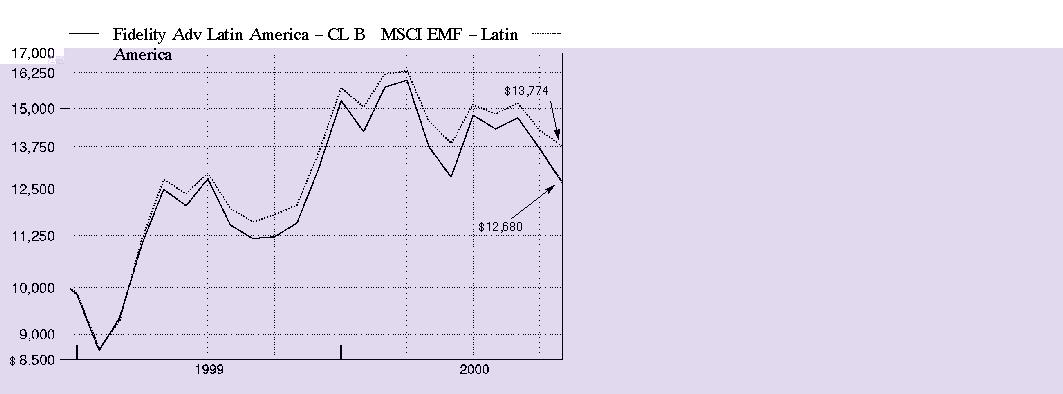
$10,000 Over Life of Fund: Let's say hypothetically that $10,000 was invested in Fidelity Advisor Latin America Fund - Class B on December 21, 1998, when the fund started. As the chart shows, by October 31, 2000, the value of the investment, including the effect of the applicable contingent deferred sales charge, would have grown to $12,680 - a 26.80% increase on the initial investment. For comparison, look at how the MSCI EMF - Latin America Index did over the same period. With dividends reinvested, the same $10,000 would have grown to $13,774 - a 37.74% increase.
Understanding
Performance
Many markets around the globe offer the potential for significant growth over time; however, investing in foreign markets means assuming greater risks than investing in the United States. Factors like changes in a country's financial markets, its local political and economic climate, and the fluctuating value of its currency create these risks. For these reasons an international fund's performance may be more volatile than a fund that invests exclusively in the United States. Past performance is no guarantee of future results and you may have a gain or loss when you sell your shares.
3Annual Report
Fidelity Advisor Latin America Fund - Class C
There are several ways to evaluate historical performance. You can look at the total percentage change in value, the average annual percentage change or the growth of a hypothetical $10,000 investment. Total return reflects the change in the value of an investment, assuming reinvestment of the class' dividend income and capital gains (the profits earned upon the sale of securities that have grown in value). Class C shares' contingent deferred sales charge included in the past one year and life of fund total return figures are 1% and 0%, respectively. If Fidelity had not reimbursed certain class expenses, the total returns would have been lower.
Cumulative Total Returns
|
Periods ended October 31, 2000 |
|
Past 1 |
Life of |
|
Fidelity Adv Latin America - CL C |
|
12.96% |
30.70% |
|
Fidelity Adv Latin America - CL C |
|
11.96% |
30.70% |
|
MSCI EMF - Latin America |
|
14.24% |
37.74% |
|
Latin American Funds Average |
|
20.19% |
n/a* |
Cumulative total returns show Class C's performance in percentage terms over a set period - in this case, one year or since the fund started on December 21, 1998. For example, if you had invested $1,000 in a fund that had a 5% return over the past year, the value of your investment would be $1,050. You can compare Class C's returns to the performance of the Morgan Stanley Capital International Emerging Markets Free - Latin America Index - a market capitalization-weighted index of approximately 160 stocks traded in seven Latin American markets. To measure how Class C's performance stacked up against its peers, you can compare it to the Latin American funds average, which reflects the performance of mutual funds with similar objectives tracked by Lipper Inc. The past one year average represents a peer group of 42 mutual funds. These benchmarks include reinvested dividends and capital gains, if any, and exclude the effect of sales charges.
Average Annual Total Returns
|
Periods ended October 31, 2000 |
|
Past 1 |
Life of |
|
Fidelity Adv Latin America - CL C |
|
12.96% |
15.46% |
|
Fidelity Adv Latin America - CL C |
|
11.96% |
15.46% |
|
MSCI EMF - Latin America |
|
14.24% |
18.75% |
|
Latin American Funds Average |
|
20.19% |
n/a* |
Average annual total returns take Class C shares' cumulative return and show you what would have happened if Class C shares had performed at a constant rate each year.
* Not available
Annual Report
$10,000 Over Life of Fund
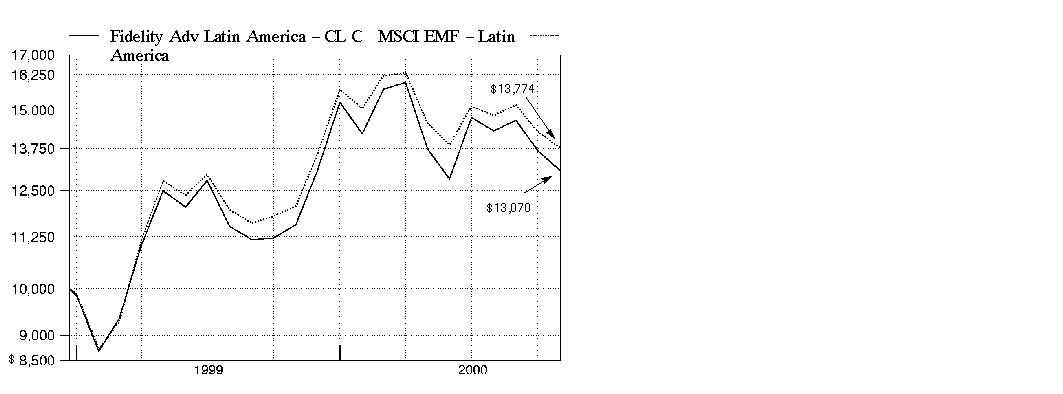
$10,000 Over Life of Fund: Let's say hypothetically that $10,000 was invested in Fidelity Advisor Latin America Fund - Class C on December 21, 1998, when the fund started. As the chart shows, by October 31, 2000, the value of the investment would have grown to $13,070 - a 30.70% increase on the initial investment. For comparison, look at how the MSCI EMF - Latin America Index did over the same period. With dividends reinvested, the same $10,000 would have grown to $13,774 - a 37.74% increase.
Understanding
Performance
Many markets around the globe offer the potential for significant growth over time; however, investing in foreign markets means assuming greater risks than investing in the United States. Factors like changes in a country's financial markets, its local political and economic climate, and the fluctuating value of its currency create these risks. For these reasons an international fund's performance may be more volatile than a fund that invests exclusively in the United States. Past performance is no guarantee of future results and you may have a gain or loss when you sell your shares.
3Annual Report
Market Recap
Currency disparities, the see-saw performance of technology and telecommunications stocks and increased uncertainty over the direction of energy prices contributed to volatile world markets for the 12-month period that ended October 31, 2000. Through the first half of the period, foreign investors enjoyed handsome returns from technology and telecommunications holdings. These gains disappeared down the stretch, however, as the dollar continued to outperform the struggling euro - the uniform currency of 11 European nations - and the Japanese yen by wide margins. Soaring oil and gas prices also added to the volatility. The Morgan Stanley EAFE® index - which tracks the performance of stock markets in Europe, Australasia and the Far East - fell 2.72% during the period. Europe's economic recovery remained on course, but the euro's continued weakness proved to be a millstone. The Morgan Stanley Europe index had a 12-month return of 1.16%. Japan's economic recovery, on the other hand, appeared to be short-lived, or at least very, very slow in the making. The Morgan Stanley Japan index declined 11.61% during the period. Emerging markets, meanwhile, were unable to sustain the momentum they carried into early 2000 - the Morgan Stanley Emerging Markets Free index tumbled 10.33%.
(Portfolio Manager photograph)
An interview with Patti Satterthwaite, Portfolio Manager of Fidelity Advisor Latin America Fund
Q. How did the fund perform, Patti?
A. For the 12-month period that ended October 31, 2000, the fund's Class A, Class T, Class B and Class C shares returned 13.92%, 13.68%, 12.95% and 12.96%, respectively. For the same period, the Morgan Stanley Capital International Emerging Markets Free - Latin America Index returned 14.24%, while the Latin America funds average tracked by Lipper Inc., returned 20.19%.
Q. What was the investment climate like in Latin America during the past 12 months?
A. Recovery among major Latin American economies progressed, albeit at varying speeds. Mexico was the brightest star in the region, spurred by higher oil prices, strong export growth and rising consumer demand. The country also received an important credit rating upgrade from Moody's Investors Services in March, which was followed by a successful democratic presidential election in July. Mexico pretty much had everything going for it during the 12-month period. Brazil - the largest economy in the Latin American region - directly benefited from Mexico's good fortune, though its recovery was hampered by concerns about inflation and declining confidence in Brazil's currency, the real. Still, Brazil remained an attractive value play due to cheap stock prices. Meanwhile, Argentina struggled to emerge from last year's recession, while Chile enjoyed some economic expansion, though weak consumer spending slowed its recovery efforts.
Annual Report
Fund Talk: The Manager's Overview - continued
Q. What factors helped shape fund performance during the period?
A. Strong stock picking in Mexico was a big positive for the fund relative to the index. Having ample exposure to banks proved particularly beneficial. Reaching the end of a five-year restructuring period, banks turned their attention to such key business drivers as loan growth, which is critical in a strengthening economy. Investors, drawn to the industry's improving fundamentals, pushed the prices of holdings such as Grupo Financiero BBVA Bancomer and Banacci sharply higher during the period. The fund also benefited from overweighting a handful of media stocks that did well, namely TV Azteca and Grupo Televisa. However, we paid the price for not owning enough Telefonos de Mexico (Telmex), the fund's largest holding, which accounted for more than 14% of the index on average. Its stock price was up more than 28% despite the downside volatility that plagued most telecom stocks worldwide during the latter half of the period. Having an out-of-benchmark position in Carso Global Telecom - a holding company for Telmex - which performed poorly, further compounded our problem. On the Lipper front, we owned some "new economy" stocks that detracted from performance, including Impsat Fiber Networks, an emerging telecommunications company with operations throughout the region, and Internet portal El Sitio.
Q. How did your strategy in Brazil play out for the fund?
A. Remaining generally market-weighted in Brazil relative to the index, we focused our energy on finding the best stocks. We had some success with beverage stocks such as Brahma Cervejaria, which merged with another local company in the summer to form the world's third-largest brewer - AmBev. Our results in the telecom sector were mixed, although we tended to own more losers than winners. Fixed-line provider Tele Norte Leste helped, while Telesp Celular hurt.
Q. What was your approach to countries other than Mexico and Brazil?
A. I continued to underweight the rest of the region - which represented only about 25% of the index on average during the period - primarily on liquidity concerns. Specifically, I kept the fund underexposed to Chile because I felt that its status as a safe haven had been slightly obscured by Mexico's credit rating upgrade. This strategy paid off for us during the period.
Annual Report
Fund Talk: The Manager's Overview - continued
Q. What's your outlook?
A. I'm generally positive overall. I feel that valuations remain extremely attractive relative to the rest of the world, given that economic recovery is expected to lead to stronger earnings growth throughout Latin America. Despite positive fundamentals, however, stocks in the region remain extremely vulnerable to global market volatility and further deceleration in the U.S. economy.
The views expressed in this report reflect those of the portfolio manager only through the end of the period of the report as stated on the cover and do not necessarily represent the views of Fidelity or any other person in the Fidelity organization. Any such views are subject to change at any time based upon market or other conditions and Fidelity disclaims any responsibility to update such views. These views may not be relied on as investment advice and, because investment decisions for a Fidelity fund are based on numerous factors, may not be relied on as an indication of trading intent on behalf of any Fidelity fund.
Fund Facts
Goal: seeks high total investment return
Start date: December 21, 1998
Size: as of October 31, 2000, more than $6 million
Manager: Patti Satterthwaite, since inception; joined Fidelity in 1986
3Patti Satterthwaite reflects on the correlation between U.S. and Latin American stock markets:
"Latin American markets tracked the movements of U.S. stocks for much of the 12-month period, albeit with less drama. Telecom and media stocks rose sharply early on, only to reverse course following the end of the global tech rally. Investors flocked to less volatile areas of the market, namely banks, consumer stocks and some utilities. Concerns about interest rates rising further in the U.S., persistently high energy prices and a protracted slowdown in the global economy kept Latin American markets off balance during the second half of the period. Considering the close correlation of the IPC - the benchmark for the Mexican stock market - to the NASDAQ in the U.S., I may consider reducing the fund's exposure to Mexico while pursuing less volatile alternatives elsewhere."
Note to shareholders:
Fidelity Advisor Latin America Fund may invest up to 35% of its total assets in any industry that represents more than 20% of the Latin American market. As of October 31, 2000, 26% of the fund's total assets were invested in telephone service companies, which accounted for approximately 23% of the Latin American market as of October 31, 2000, as represented by the Morgan Stanley Capital International (MSCI) Emerging Markets Free - Latin America Index.
Annual Report
|
Top Five Stocks as of October 31, 2000 |
||
|
|
% of fund's |
% of fund's net assets |
|
Telefonos de Mexico SA de CV Series L sponsored ADR (Mexico, Telephone Services) |
12.2 |
10.4 |
|
Companhia de Bebidas das Americas (AmBev) sponsored ADR (Brazil, Beverages) |
7.9 |
0.0 |
|
Petrobras SA (PN) (Brazil, Oil & Gas) |
6.4 |
5.1 |
|
Wal-Mart de Mexico SA de CV Series C (Mexico, General Merchandise Stores) |
6.0 |
5.6 |
|
Banacci SA de CV Series O (Mexico, Banks) |
5.5 |
2.7 |
|
|
38.0 |
23.8 |
|
Top Five Market Sectors as of October 31, 2000 |
||
|
|
% of fund's |
% of fund's net assets |
|
Utilities |
33.1 |
39.2 |
|
Nondurables |
14.4 |
11.5 |
|
Finance |
14.0 |
9.3 |
|
Media & Leisure |
11.8 |
9.3 |
|
Retail & Wholesale |
9.7 |
7.4 |
|
Top Five Countries as of October 31, 2000 |
||
|
(excluding cash equivalents) |
% of fund's |
% of fund's net assets |
|
Mexico |
44.7 |
43.4 |
|
Brazil |
39.3 |
34.7 |
|
Chile |
4.6 |
4.2 |
|
Argentina |
3.2 |
2.3 |
|
Venezuela |
1.9 |
2.7 |
|
Percentages are adjusted for the effect of open futures contracts, if applicable. |
|
Asset Allocation (% of fund's net assets) |
|||||||
|
As of October 31, 2000 |
As of April 30, 2000 |
||||||
|
Stocks 98.1% |
|
|
Stocks 95.0% |
|
||
|
Short-Term |
|
|
Short-Term |
|
||

Annual Report
Showing Percentage of Net Assets
|
Common Stocks - 98.1% |
|||
|
Shares |
Value (Note 1) |
||
|
Argentina - 3.2% |
|||
|
Inversiones y Representacions SA sponsored GDR (a) |
586 |
$ 12,196 |
|
|
Perez Companc SA sponsored ADR |
8,077 |
116,107 |
|
|
Telecom Argentina Stet-France Telecom SA sponsored ADR Class B |
4,200 |
72,188 |
|
|
|
200,491 |
||
|
Brazil - 39.3% |
|||
|
Banco Bradesco SA (PN) |
19,659,000 |
122,093 |
|
|
Banco Itau SA |
2,399,000 |
187,501 |
|
|
Companhia Brasileira de Distribuicao Grupo Pao de Acucar sponsored ADR |
2,900 |
103,313 |
|
|
Companhia de Bebidas das Americas (AmBev) sponsored ADR |
22,000 |
496,375 |
|
|
Companhia Siderurgica Nacional ADR |
1,900 |
52,606 |
|
|
Companhia Vale do Rio Doce (PN-A) |
7,400 |
171,368 |
|
|
Compania Energertica Minas Gerais |
2,916,000 |
44,477 |
|
|
Embratel Participacoes SA ADR |
9,300 |
150,544 |
|
|
Petrobras SA (PN) |
15,210 |
405,146 |
|
|
Tele Norte Leste Participacoes SA ADR |
9,531 |
210,873 |
|
|
Telesp Celular Participacoes SA ADR |
10,461 |
330,829 |
|
|
Uniao de Bancos Brasileiros SA (Unibanco) GDR |
3,200 |
80,800 |
|
|
Votorantim Celulose e Papel SA (PN Reg.) |
3,742,000 |
125,652 |
|
|
|
2,481,577 |
||
|
British Virgin Islands - 0.2% |
|||
|
El Sitio, Inc. |
4,200 |
14,044 |
|
|
Chile - 4.6% |
|||
|
Banco Santander Chile sponsored ADR |
2,300 |
30,906 |
|
|
Banco Santiago SA sponsored ADR |
2,200 |
43,450 |
|
|
Distribucion Y Servicio D&S SA sponsored ADR |
7,500 |
134,063 |
|
|
Embotelladora Andina sponsored ADR Class A |
2,850 |
34,200 |
|
|
Enersis SA sponsored ADR (a) |
309 |
5,485 |
|
|
Vina Concha Stet y Toro SA sponsored ADR |
1,150 |
44,131 |
|
|
|
292,235 |
||
|
Colombia - 0.1% |
|||
|
Banco Ganadero SA sponsored ADR Class C |
600 |
1,350 |
|
|
Suramericana de Inversiones SA |
7,000 |
4,258 |
|
|
|
5,608 |
||
|
Luxembourg - 0.8% |
|||
|
Quilmes Industrial SA sponsored ADR |
6,300 |
51,975 |
|
|
Common Stocks - continued |
|||
|
Shares |
Value (Note 1) |
||
|
Mexico - 44.7% |
|||
|
Banacci SA de CV Series O (a) |
225,000 |
$ 349,428 |
|
|
Carso Global Telecom SA de CV Series A1 (a) |
124,000 |
277,327 |
|
|
Corporacion Interamericana de Entretenimiento SA de CV Series B (a) |
17,581 |
79,007 |
|
|
Fomento Economico Mexicano SA de CV sponsored ADR |
1,800 |
68,738 |
|
|
Grupo Carso SA de CV Series A1 (a) |
39,000 |
121,461 |
|
|
Grupo Financiero BBVA Bancomer SA de CV (GFB) (a) |
98,000 |
60,632 |
|
|
Grupo Iusacell SA de CV sponsored ADR (a) |
7,900 |
102,700 |
|
|
Grupo Televisa SA de CV sponsored GDR |
6,450 |
349,106 |
|
|
Telefonos de Mexico SA de CV Series L sponsored ADR |
14,275 |
769,958 |
|
|
TV Azteca SA de CV sponsored ADR |
21,000 |
262,500 |
|
|
Wal-Mart de Mexico SA de CV Series C (a) |
168,000 |
380,122 |
|
|
|
2,820,979 |
||
|
Panama - 1.6% |
|||
|
Banco Latin Americano de Exporaciones SA (BLADEX) Series E |
400 |
10,025 |
|
|
Panamerican Beverages, Inc. Class A |
5,600 |
92,400 |
|
|
|
102,425 |
||
|
Peru - 0.9% |
|||
|
Compania de Minas Buenaventura SA |
4,200 |
54,075 |
|
|
United States of America - 0.8% |
|||
|
Impsat Fiber Networks, Inc. |
4,400 |
52,800 |
|
|
Venezuela - 1.9% |
|||
|
Compania Anonima Nacional Telefono de Venezuela sponsored ADR |
6,200 |
117,800 |
|
|
TOTAL COMMON STOCKS (Cost $5,756,211) |
6,194,009 |
||
|
Cash Equivalents - 2.1% |
|||
|
Maturity Amount |
Value |
||
|
Investments in repurchase agreements (U.S. Treasury Obligations), in a joint trading account at 6.56%, dated 10/31/00 due 11/1/00 |
$ 36,007 |
$ 36,000 |
|
|
Shares |
|
||
|
Fidelity Cash Central Fund, 6.61% (b) |
92,683 |
92,683 |
|
|
TOTAL CASH EQUIVALENTS (Cost $128,683) |
128,683 |
||
|
TOTAL INVESTMENT PORTFOLIO - 100.2% (Cost $5,884,894) |
6,322,692 |
||
|
NET OTHER ASSETS - (0.2)% |
(12,461) |
||
|
NET ASSETS - 100% |
$ 6,310,231 |
||
|
Legend |
|
(a) Non-income producing |
|
(b) The rate quoted is the annualized seven-day yield of the fund at period end. A complete listing of the fund's holdings as of its most recent fiscal year end is available upon request. |
|
Income Tax Information |
|
At October 31, 2000, the aggregate cost of investment securities for income tax purposes was $5,887,807. Net unrealized appreciation aggregated $434,885, of which $1,278,181 related to appreciated investment securities and $843,296 related to depreciated investment securities. |
|
The fund hereby designates approximately $21,000 as a capital gain dividend for the purpose of the dividend paid deduction. |
See accompanying notes which are an integral part of the financial statements.
Annual Report
Statement of Assets and Liabilities
|
|
October 31, 2000 |
|
|
Assets |
|
|
|
Investment in securities, at value (including repurchase agreements of $36,000) (cost $5,884,894) - |
|
$ 6,322,692 |
|
Cash |
|
454 |
|
Receivable for fund shares sold |
|
5,824 |
|
Dividends receivable |
|
8,524 |
|
Interest receivable |
|
901 |
|
Receivable from investment adviser for expense reductions |
|
5,310 |
|
Total assets |
|
6,343,705 |
|
Liabilities |
|
|
|
Payable for fund shares redeemed |
$ 3,449 |
|
|
Distribution fees payable |
3,343 |
|
|
Other payables and accrued expenses |
26,682 |
|
|
Total liabilities |
|
33,474 |
|
Net Assets |
|
$ 6,310,231 |
|
Net Assets consist of: |
|
|
|
Paid in capital |
|
$ 5,822,213 |
|
Accumulated undistributed net realized gain (loss) on investments and foreign currency transactions |
|
50,387 |
|
Net unrealized appreciation (depreciation) on investments and assets and liabilities in foreign currencies |
|
437,631 |
|
Net Assets |
|
$ 6,310,231 |
See accompanying notes which are an integral part of the financial statements.
Annual Report
Financial Statements - continued
Statement of Assets and Liabilities - continued
|
|
October 31, 2000 |
|
|
Calculation of Maximum Offering Price |
|
$13.26 |
|
Maximum offering price per share (100/94.25 of $13.26) |
|
$14.07 |
|
Class T: |
|
$13.21 |
|
Maximum offering price per share (100/96.50 of $13.21) |
|
$13.69 |
|
Class B: |
|
$13.08 |
|
Class C: |
|
$13.07 |
|
Institutional Class: |
|
$13.32 |
A Redemption price per share is equal to net asset value less any applicable contingent deferred sales charge.
See accompanying notes which are an integral part of the financial statements.
Annual Report
Financial Statements - continued
Statement of Operations
|
|
Year ended October 31, 2000 |
|
|
Investment Income Dividends |
|
$ 93,997 |
|
Interest |
|
17,109 |
|
|
|
111,106 |
|
Less foreign taxes withheld |
|
(7,640) |
|
Total income |
|
103,466 |
|
Expenses |
|
|
|
Management fee |
$ 48,581 |
|
|
Transfer agent fees |
25,335 |
|
|
Distribution fees |
42,983 |
|
|
Accounting fees and expenses |
60,057 |
|
|
Non-interested trustees' compensation |
21 |
|
|
Custodian fees and expenses |
21,974 |
|
|
Registration fees |
66,543 |
|
|
Audit |
23,615 |
|
|
Legal |
78 |
|
|
Foreign tax expenses |
4,398 |
|
|
Miscellaneous |
46 |
|
|
Total expenses before reductions |
293,631 |
|
|
Expense reductions |
(130,355) |
163,276 |
|
Net investment income (loss) |
|
(59,810) |
|
Realized and Unrealized Gain (Loss) Net realized gain (loss) on: |
|
|
|
Investment securities |
57,624 |
|
|
Foreign currency transactions |
(5,396) |
52,228 |
|
Change in net unrealized appreciation (depreciation) on: |
|
|
|
Investment securities |
180,028 |
|
|
Assets and liabilities in foreign currencies |
1,229 |
181,257 |
|
Net gain (loss) |
|
233,485 |
|
Net increase (decrease) in net assets resulting |
|
$ 173,675 |
See accompanying notes which are an integral part of the financial statements.
Annual Report
Financial Statements - continued
Statement of Changes in Net Assets
|
|
Year ended |
December 21, 1998 |
|
Increase (Decrease) in Net Assets |
|
|
|
Operations |
$ (59,810) |
$ 4,112 |
|
Net realized gain (loss) |
52,228 |
(15,197) |
|
Change in net unrealized appreciation (depreciation) |
181,257 |
256,374 |
|
Net increase (decrease) in net assets resulting |
173,675 |
245,289 |
|
Share transactions - net increase (decrease) |
2,224,797 |
3,666,470 |
|
Total increase (decrease) in net assets |
2,398,472 |
3,911,759 |
|
Net Assets |
|
|
|
Beginning of period |
3,911,759 |
- |
|
End of period |
$ 6,310,231 |
$ 3,911,759 |
See accompanying notes which are an integral part of the financial statements.
Annual Report
Financial Highlights - Class A
|
Years ended October 31, |
2000 |
1999 E |
|
Selected Per-Share Data |
|
|
|
Net asset value, beginning of period |
$ 11.64 |
$ 10.00 |
|
Income from Investment Operations |
|
|
|
Net investment income (loss) D |
(.07) |
.05 |
|
Net realized and unrealized gain (loss) |
1.69 |
1.59 |
|
Total from investment operations |
1.62 |
1.64 |
|
Net asset value, end of period |
$ 13.26 |
$ 11.64 |
|
Total Return B, C |
13.92% |
16.40% |
|
Ratios and Supplemental Data |
|
|
|
Net assets, end of period (000 omitted) |
$ 921 |
$ 756 |
|
Ratio of expenses to average net assets |
2.06% F |
2.01% A, F |
|
Ratio of expenses to average net assets after expense reductions |
2.04% G |
1.99% A, G |
|
Ratio of net investment income (loss) to average net assets |
(.50)% |
.50% A |
|
Portfolio turnover |
52% |
50% A |
A Annualized
B The total returns would have been lower had certain expenses not been reduced during the periods shown.
C Total returns do not include the one time sales charge and for periods of less than one year are not annualized.
D Net investment income (loss) per share has been calculated based on average shares outstanding during the period.
E For the period December 21, 1998 (commencement of operations) to October 31, 1999.
F FMR agreed to reimburse a portion of the class' expenses during the period. Without this reimbursement, the class' expense ratio would have been higher.
G FMR or the fund has entered into varying arrangements with third parties who either paid or reduced a portion of the class' expenses.
See accompanying notes which are an integral part of the financial statements.
Annual Report
Financial Highlights - Class T
|
Years ended October 31, |
2000 |
1999 E |
|
Selected Per-Share Data |
|
|
|
Net asset value, beginning of period |
$ 11.62 |
$ 10.00 |
|
Income from Investment Operations |
|
|
|
Net investment income (loss) D |
(.11) |
.02 |
|
Net realized and unrealized gain (loss) |
1.70 |
1.60 |
|
Total from investment operations |
1.59 |
1.62 |
|
Net asset value, end of period |
$ 13.21 |
$ 11.62 |
|
Total Return B, C |
13.68% |
16.20% |
|
Ratios and Supplemental Data |
|
|
|
Net assets, end of period (000 omitted) |
$ 2,041 |
$ 1,065 |
|
Ratio of expenses to average net assets |
2.32% F |
2.26% A, F |
|
Ratio of expenses to average net assets after expense reductions |
2.30% G |
2.24% A, G |
|
Ratio of net investment income (loss) to average net assets |
(.75)% |
.25% A |
|
Portfolio turnover |
52% |
50% A |
A Annualized
B The total returns would have been lower had certain expenses not been reduced during the periods shown.
C Total returns do not include the one time sales charge and for periods of less than one year are not annualized.
D Net investment income (loss) per share has been calculated based on average shares outstanding during the period.
E For the period December 21, 1998 (commencement of operations) to October 31, 1999.
F FMR agreed to reimburse a portion of the class' expenses during the period. Without this reimbursement, the class' expense ratio would have been higher.
G FMR or the fund has entered into varying arrangements with third parties who either paid or reduced a portion of the class' expenses.
See accompanying notes which are an integral part of the financial statements.
Annual Report
Financial Highlights - Class B
|
Years ended October 31, |
2000 |
1999 E |
|
Selected Per-Share Data |
|
|
|
Net asset value, beginning of period |
$ 11.58 |
$ 10.00 |
|
Income from Investment Operations |
|
|
|
Net investment income (loss) D |
(.18) |
(.02) |
|
Net realized and unrealized gain (loss) |
1.68 |
1.60 |
|
Total from investment operations |
1.50 |
1.58 |
|
Net asset value, end of period |
$ 13.08 |
$ 11.58 |
|
Total Return B, C |
12.95% |
15.80% |
|
Ratios and Supplemental Data |
|
|
|
Net assets, end of period (000 omitted) |
$ 1,659 |
$ 912 |
|
Ratio of expenses to average net assets |
2.82% F |
2.76% A, F |
|
Ratio of expenses to average net assets after expense reductions |
2.80% G |
2.74% A, G |
|
Ratio of net investment income (loss) to average net assets |
(1.25)% |
(.25)% A |
|
Portfolio turnover |
52% |
50% A |
A Annualized
B The total returns would have been lower had certain expenses not been reduced during the periods shown.
C Total returns do not include the contingent deferred sales charge and for periods of less than one year are not annualized.
D Net investment income (loss) per share has been calculated based on average shares outstanding during the period.
E For the period December 21, 1998 (commencement of operations) to October 31, 1999.
F FMR agreed to reimburse a portion of the class' expenses during the period. Without this reimbursement, the class' expense ratio would have been higher.
G FMR or the fund has entered into varying arrangements with third parties who either paid or reduced a portion of the class' expenses.
See accompanying notes which are an integral part of the financial statements.
Annual Report
Financial Highlights - Class C
|
Years ended October 31, |
2000 |
1999 E |
|
Selected Per-Share Data |
|
|
|
Net asset value, beginning of period |
$ 11.57 |
$ 10.00 |
|
Income from Investment Operations |
|
|
|
Net investment income (loss) D |
(.18) |
(.02) |
|
Net realized and unrealized gain (loss) |
1.68 |
1.59 |
|
Total from investment operations |
1.50 |
1.57 |
|
Net asset value, end of period |
$ 13.07 |
$ 11.57 |
|
Total Return B, C |
12.96% |
15.70% |
|
Ratios and Supplemental Data |
|
|
|
Net assets, end of period (000 omitted) |
$ 1,165 |
$ 708 |
|
Ratio of expenses to average net assets |
2.82% F |
2.76% A, F |
|
Ratio of expenses to average net assets after expense reductions |
2.80% G |
2.74% A, G |
|
Ratio of net investment income (loss) to average net assets |
(1.25)% |
(.25)% A |
|
Portfolio turnover |
52% |
50% A |
A Annualized
B The total returns would have been lower had certain expenses not been reduced during the periods shown.
C Total returns do not include the contingent deferred sales charge and for periods of less than one year are not annualized.
D Net investment income (loss) per share has been calculated based on average shares outstanding during the period.
E For the period December 21, 1998 (commencement of operations) to October 31, 1999.
F FMR agreed to reimburse a portion of the class' expenses during the period. Without this reimbursement, the class' expense ratio would have been higher.
G FMR or the fund has entered into varying arrangements with third parties who either paid or reduced a portion of the class' expenses.
See accompanying notes which are an integral part of the financial statements.
Annual Report
Financial Highlights - Institutional Class
|
Years ended October 31, |
2000 |
1999 E |
|
Selected Per-Share Data |
|
|
|
Net asset value, beginning of period |
$ 11.67 |
$ 10.00 |
|
Income from Investment Operations |
|
|
|
Net investment income (loss) D |
(.04) |
.07 |
|
Net realized and unrealized gain (loss) |
1.69 |
1.60 |
|
Total from investment operations |
1.65 |
1.67 |
|
Net asset value, end of period |
$ 13.32 |
$ 11.67 |
|
Total Return B, C |
14.14% |
16.70% |
|
Ratios and Supplemental Data |
|
|
|
Net assets, end of period (000 omitted) |
$ 524 |
$ 472 |
|
Ratio of expenses to average net assets |
1.81% F |
1.76% A, F |
|
Ratio of expenses to average net assets after expense reductions |
1.79% G |
1.74% A, G |
|
Ratio of net investment income (loss) to average net assets |
(.25)% |
.75% A |
|
Portfolio turnover |
52% |
50% A |
A Annualized
B The total returns would have been lower had certain expenses not been reduced during the periods shown.
C Total returns for periods of less than one year are not annualized.
D Net investment income (loss) per share has been calculated based on average shares outstanding during the period.
E For the period December 21, 1998 (commencement of operations) to October 31, 1999.
F FMR agreed to reimburse a portion of the class' expenses during the period. Without this reimbursement, the class' expense ratio would have been higher.
G FMR or the fund has entered into varying arrangements with third parties who either paid or reduced a portion of the class' expenses.
See accompanying notes which are an integral part of the financial statements.
Annual Report
For the period ended October 31, 2000
1. Significant Accounting Policies.
Fidelity Advisor Latin America Fund (the fund) is a fund of Fidelity Advisor Series VIII (the trust) and is authorized to issue an unlimited number of shares. The trust is registered under the Investment Company Act of 1940, as amended (the 1940 Act), as an open-end management investment company organized as a Massachusetts business trust.
The fund offers Class A, Class T, Class B, Class C, and Institutional Class shares, each of which has equal rights as to assets and voting privileges. Each class has exclusive voting rights with respect to matters that affect that class. Class B shares will automatically convert to Class A shares after a holding period of seven years from the initial date of purchase. Investment income, realized and unrealized capital gains and losses, the common expenses of the fund, and certain fund-level expense reductions, if any, are allocated on a pro rata basis to each class based on the relative net assets of each class to the total net assets of the fund. Each class of shares differs in its respective distribution, transfer agent, and certain other class-specific fees, expenses, and expense reductions.
The fund's investments in emerging markets can be subject to social, economic, regulatory, and political uncertainties and can be extremely volatile.
The financial statements have been prepared in conformity with generally accepted accounting principles which require management to make certain estimates and assumptions at the date of the financial statements. The following summarizes the significant accounting policies of the fund:
Security Valuation. Securities for which quotations are readily available are valued using the official closing price or at the last sale price in the principal market in which they are traded. If the last sale price (on the local exchange) is unavailable, the last evaluated quote or closing bid price normally is used. If trading or events occurring in other markets after the close of the principal market in which securities are traded are expected to materially affect the value of those securities, then they are valued at their fair value taking this trading or these events into account. Fair value is determined in good faith under consistently applied procedures under the general supervision of the Board of Trustees. Securities for which quotations are not readily available are valued primarily using dealer-supplied valuations or at their fair value. Short-term securities with remaining maturities of sixty days or less for which quotations are not readily available are valued at amortized cost or original cost plus accrued interest, both of which approximate current value. Investments in open-end investment companies are valued at their net asset value each business day.
Foreign Currency Translation. The accounting records of the fund are maintained in U.S. dollars. Investment securities and other assets and liabilities denominated in a foreign currency are translated into U.S. dollars at the prevailing rates of exchange at period end. Purchases and sales of securities, income receipts and expense payments are translated into U.S. dollars at the prevailing exchange rate on the respective dates of the transactions.
Annual Report
Notes to Financial Statements - continued
1. Significant Accounting Policies - continued
Foreign Currency Translation - continued
Net realized gains and losses on foreign currency transactions represent net gains and losses from sales and maturities of foreign currency contracts, disposition of foreign currencies, the difference between the amount of net investment income accrued and the U.S. dollar amount actually received, and gains and losses between trade and settlement date on purchases and sales of securities. The effects of changes in foreign currency exchange rates on investments in securities are included with the net realized and unrealized gain or loss on investment securities.
Income Taxes. As a qualified regulated investment company under Subchapter M of the Internal Revenue Code, the fund is not subject to U.S. federal income taxes to the extent that it distributes substantially all of its taxable income for its fiscal year. The fund may be subject to foreign taxes on income and gains on investments which are accrued based upon the fund's understanding of the tax rules and regulations that exist in the markets in which it invests. Foreign governments may also impose taxes on other payments or transactions with respect to foreign securities. The fund accrues such taxes as applicable. The schedule of investments includes information regarding income taxes under the caption "Income Tax Information."
Investment Income. Dividend income is recorded on the ex-dividend date, except certain dividends from foreign securities where the ex-dividend date may have passed, are recorded as soon as the fund is informed of the ex-dividend date. Non-cash dividends included in dividend income, if any, are recorded at the fair market value of the securities received. Interest income is accrued as earned. Investment income is recorded net of foreign taxes withheld where recovery of such taxes is uncertain.
Expenses. Most expenses of the trust can be directly attributed to a fund. Expenses which cannot be directly attributed are apportioned among the funds in the trust.
Distributions to Shareholders. Distributions are recorded on the ex-dividend date. Income dividends and capital gain distributions are declared separately for each class.
Income and capital gain distributions are determined in accordance with income tax regulations which may differ from generally accepted accounting principles. These differences, which may result in distribution reclassifications, are primarily due to differing treatments for foreign currency transactions, net operating losses and losses deferred due to wash sales. The fund also utilized earnings and profits distributed to shareholders on redemption of shares as part of the dividends paid deduction for income tax purposes.
Permanent book and tax basis differences relating to shareholder distributions will result in reclassifications to paid in capital. Accumulated undistributed net realized gain (loss) on investments and foreign currency transactions may include temporary book and tax basis differences which will reverse in a subsequent period. Any taxable income or gain remaining at fiscal year end is distributed in the following year.
Annual Report
Notes to Financial Statements - continued
1. Significant Accounting Policies - continued
Security Transactions. Security transactions are accounted for as of trade date. Gains and losses on securities sold are determined on the basis of identified cost.
2. Operating Policies.
Foreign Currency Contracts. The fund generally uses foreign currency contracts to facilitate transactions in foreign-denominated securities. Losses may arise from changes in the value of the foreign currency or if the counterparties do not perform under the contracts' terms. The U.S. dollar value of foreign currency contracts is determined using contractual currency exchange rates established at the time of each trade.
Joint Trading Account. Pursuant to an Exemptive Order issued by the Securities and Exchange Commission (the SEC), the fund, along with other affiliated entities of Fidelity Management & Research Company (FMR), may transfer uninvested cash balances into one or more joint trading accounts. These balances are invested in one or more repurchase agreements for U.S. Treasury or Federal Agency obligations.
Repurchase Agreements. The underlying U.S. Treasury, Federal Agency, or other obligations found to be satisfactory by FMR are transferred to an account of the fund, or to the Joint Trading Account, at a custodian bank. The securities are marked-to-market daily and maintained at a value at least equal to the principal amount of the repurchase agreement (including accrued interest). FMR, the fund's investment adviser, is responsible for determining that the value of the underlying securities remains in accordance with the market value requirements stated above.
3. Purchases and Sales of Investments.
Purchases and sales of securities, other than short-term securities, aggregated $5,441,225 and $3,234,340, respectively.
4. Fees and Other Transactions with Affiliates.
Management Fee. As the fund's investment adviser, FMR receives a monthly fee that is calculated on the basis of a group fee rate plus a fixed individual fund fee rate applied to the average net assets of the fund. The group fee rate is the weighted average of a series of rates and is based on the monthly average net assets of all the mutual funds advised by FMR. The rates ranged from .2167% to .5200% for the period. The annual individual fund fee rate is .45%. In the event that these rates were lower than the contractual rates in effect during the period, FMR voluntarily implemented the above rates, as they resulted in the same or a lower management fee. For the period, the management fee was equivalent to an annual rate of .72% of average net assets.
Annual Report
Notes to Financial Statements - continued
4. Fees and Other Transactions with Affiliates - continued
Sub-Adviser Fee. Beginning January 1, 2001, FMR Co. (FMRC) will serve as a sub-
advisor for the fund. FMRC may provide investment research and advice and may also provide investment advisory services for the fund. FMR, on behalf of the fund,
entered into sub-advisory agreements with Fidelity Management & Research (U.K.) Inc., Fidelity Management & Research (Far East) Inc., and Fidelity International
Investment Advisors (FIIA). Under the sub-advisory arrangements, FMR may receive investment advice and research services and may grant the sub-advisers
investment management authority to buy and sell securities. FMR pays its sub-advisers either a portion of its management fee or a fee based on costs incurred for these
services.
Distribution and Service Plan. In accordance with Rule 12b-1 of the 1940 Act, the Board of Trustees have adopted separate Distribution and Service Plans with respect to each class of shares (collectively referred to as "the Plans"). Under certain of the Plans, the class pays Fidelity Distributors Corporation (FDC), an affiliate of FMR, a 12b-1 fee. A portion of this fee may be reallowed to securities dealers, banks and other financial institutions for the distribution of each class of shares and providing shareholder support services. For the period, this fee was based on the following annual rates of the average net assets of each applicable class:
|
Class A |
.25% |
|
Class T |
.50% |
|
Class B |
1.00% * |
|
Class C |
1.00% * |
* .75% represents a distribution fee and .25% represents a shareholder service fee.
For the period, each class paid FDC the following amounts, a portion of which was retained by FDC:
|
|
Paid to |
Retained |
|
Class A |
$ 2,548 |
$ 1,429 |
|
Class T |
10,495 |
2,812 |
|
Class B |
17,581 |
14,565 |
|
Class C |
12,359 |
10,231 |
|
|
$ 42,983 |
$ 29,037 |
Sales Load. FDC receives a front-end sales charge of up to 5.75% for selling Class A shares, and 3.50% for selling Class T shares of the fund. FDC receives the proceeds of contingent deferred sales charges levied on Class B share redemptions occurring within six years of purchase and Class C share redemptions occurring within one year of purchase. Contingent deferred sales charges are based on declining rates ranging from 5% to 1% for Class B and 1% for Class C, of the lesser of the cost of shares at the initial date of purchase or the net asset value of the redeemed shares, excluding any reinvested dividends and capital
Annual Report
Notes to Financial Statements - continued
4. Fees and Other Transactions with Affiliates - continued
Sales Load - continued
gains. In addition, purchases of Class A and Class T shares that were subject to a finder's fee bear a contingent deferred sales charge on assets that do not remain in the fund for at least one year. The Class A and Class T contingent deferred sales charge is based on 0.25% of the lesser of the cost of shares at the initial date of purchase or the net asset value of the redeemed shares, excluding any reinvested dividends and capital gains. A portion of the sales charges paid to FDC is paid to securities dealers, banks and other financial institutions.
For the period, sales charge amounts paid to and retained by FDC were as follows:
|
|
Paid to |
Retained |
|
Class A |
$ 4,516 |
$ 1,650 |
|
Class T |
8,059 |
1,972 |
|
Class B |
10,708 |
10,708* |
|
Class C |
1,100 |
1,100* |
|
|
$ 24,383 |
$ 15,430 |
* When Class B and Class C shares are initially sold, FDC pays commissions from its own resources to securities dealers,
banks, and other financial institutions through which the sales are made.
Transfer Agent Fees. Fidelity Investments Institutional Operations Company, Inc., (FIIOC), an affiliate of FMR, is the transfer, dividend disbursing and shareholder servicing agent (collectively referred to as the transfer agent) for the fund's Class A, Class T, Class B, Class C and Institutional Class Shares. FIIOC receives account fees and asset-based fees that vary according to the account size and type of account of the shareholders of the respective classes of the fund. FIIOC pays for typesetting, printing and mailing of all shareholder reports, except proxy statements. For the period, the following amounts were paid to FIIOC:
|
|
Amount |
% of |
|
Class A |
$ 3,482 |
.34 |
|
Class T |
8,394 |
.40 |
|
Class B |
7,335 |
.42 |
|
Class C |
4,945 |
.40 |
|
Institutional Class |
1,179 |
.20 |
|
|
$ 25,335 |
|
Accounting Fees. Fidelity Service Company, Inc., an affiliate of FMR, maintains the fund's accounting records. The fee is based on the level of average net assets for the month plus out-of-pocket expenses.
Annual Report
Notes to Financial Statements - continued
4. Fees and Other Transactions with Affiliates - continued
Fidelity Cash Central Fund. Pursuant to an Exemptive Order issued by the SEC, the fund may invest in the Fidelity Cash Central Fund (the Cash Fund) managed by Fidelity Investments Money Management, Inc., an affiliate of FMR. The Cash Fund is an open-end money market fund available only to investment companies and other accounts managed by FMR and its affiliates. The Cash Fund seeks preservation of capital, liquidity, and current income. Income distributions from the Cash Fund are declared daily and paid monthly from net investment income. Income distributions earned by the fund are recorded as interest income in the accompanying financial statements.
5. Expense Reductions.
FMR voluntarily agreed to reimburse operating expenses (excluding interest, taxes, certain securities lending fees, brokerage commissions and extraordinary expenses, if any) above the following annual rates or range of annual rates of average net assets for each of the following classes:
|
|
FMR |
Reimbursement |
|
Class A |
2.00% |
$ 19,271 |
|
Class T |
2.25% |
40,817 |
|
Class B |
2.75% |
34,532 |
|
Class C |
2.75% |
24,057 |
|
Institutional Class |
1.75% |
10,293 |
|
|
|
$ 128,970 |
FMR has also directed certain portfolio trades to brokers who paid a portion of the fund's expenses. For the period, the fund's expenses were reduced by $1,385 under this arrangement.
6. Beneficial Interest.
At the end of the period, FMR and its affiliates were record owners of approximately 37% of the total outstanding shares of the fund.
Annual Report
Notes to Financial Statements - continued
7. Share Transactions.
Transactions for each class of shares were as follows:
|
|
Shares |
Dollars |
||
|
|
Year ended October 31, |
Year ended October 31, |
Year ended October 31, |
Year ended October 31, |
|
|
2000 |
1999 A |
2000 |
1999 A |
|
|
|
|
|
|
|
Class A |
38,689 |
65,380 |
$ 580,476 |
$ 711,107 |
|
Shares redeemed |
(34,125) |
(489) |
(491,740) |
(5,527) |
|
Net increase (decrease) |
4,564 |
64,891 |
$ 88,736 |
$ 705,580 |
|
Class T |
136,912 |
134,413 |
$ 2,067,473 |
$ 1,468,015 |
|
Shares redeemed |
(73,981) |
(42,837) |
(1,109,302) |
(447,894) |
|
Net increase (decrease) |
62,931 |
91,576 |
$ 958,171 |
$ 1,020,121 |
|
Class B |
90,656 |
100,677 |
$ 1,339,079 |
$ 1,121,618 |
|
Shares redeemed |
(42,640) |
(21,906) |
(605,663) |
(257,607) |
|
Net increase (decrease) |
48,016 |
78,771 |
$ 733,416 |
$ 864,011 |
|
Class C |
60,119 |
81,526 |
$ 913,707 |
$ 903,646 |
|
Shares redeemed |
(32,146) |
(20,355) |
(452,494) |
(231,930) |
|
Net increase (decrease) |
27,973 |
61,171 |
$ 461,213 |
$ 671,716 |
|
Institutional Class |
1,218 |
40,574 |
$ 18,000 |
$ 407,034 |
|
Shares redeemed |
(2,287) |
(158) |
(34,739) |
(1,992) |
|
Net increase (decrease) |
(1,069) |
40,416 |
$ (16,739) |
$ 405,042 |
B Share transactions are for the period December 21, 1998 (commencement of sale of shares) to October 31, 1999
Annual Report
To the Trustees of Fidelity Advisor Series VIII and the Shareholders of Fidelity Advisor Latin America Fund:
In our opinion, the accompanying statement of assets and liabilities, including the schedule of investments, and the related statements of operations and of changes in net assets and the financial highlights present fairly, in all material respects, the financial position of Fidelity Advisor Latin America Fund (a fund of Fidelity Advisor Series VIII) at October 31, 2000, and the results of its operations, the changes in its net assets and the financial highlights for the periods indicated, in conformity with accounting principles generally accepted in the United States of America. These financial statements and financial highlights (hereafter referred to as "financial statements") are the responsibility of the Fidelity Advisor Latin America Fund's management; our responsibility is to express an opinion on these financial statements based on our audits. We conducted our audits of these financial statements in accordance with auditing standards generally accepted in the United States of America which require that we plan and perform the audit to obtain reasonable assurance about whether the financial statements are free of material misstatement. An audit includes examining, on a test basis, evidence supporting the amounts and disclosures in the financial statements, assessing the accounting principles used and significant estimates made by management, and evaluating the overall financial statement presentation. We believe that our audits, which included confirmation of securities at October 31, 2000 by correspondence with the custodian and brokers, provide a reasonable basis for our opinion.
/s/PricewaterhouseCoopers LLP
PricewaterhouseCoopers LLP
Boston, Massachusetts
December 8, 2000
Annual Report
The Board of Trustees of Fidelity Advisor Latin America Fund voted to pay to shareholders of record at the opening of business on record date, the following distributions per share derived from capital gains realized from sales of portfolio securities:
|
|
Pay Date |
Record Date |
Dividends |
Capital Gains |
|
Class A |
12/18/00 |
12/15/00 |
$.00 |
$.08 |
|
Class T |
12/18/00 |
12/15/00 |
$.00 |
$.08 |
|
Class B |
12/18/00 |
12/15/00 |
$.00 |
$.08 |
|
Class C |
12/18/00 |
12/15/00 |
$.00 |
$.08 |
The fund hereby designates 100% of the long-term capital gain dividends distributed during the fiscal year as 20%-rate capital gain dividends.
The fund will notify shareholders in January 2001 of amounts for use in preparing 2000 income tax returns.
Annual Report
Annual Report
Annual Report
Investment Adviser
Fidelity Management & Research Company
Boston, MA
Investment Sub-Advisers
Fidelity Management & Research
(U.K.) Inc.
Fidelity Management & Research
(Far East) Inc.
Fidelity International
Investment Advisors
Fidelity International
Investment Advisors
(U.K.) Limited
Fidelity Investments Japan Limited
Officers
Edward C. Johnson 3d, President
Robert C. Pozen, Senior Vice President
Richard A. Spillane, Jr., Vice President
Patricia Satterthwaite, Vice President
Eric D. Roiter, Secretary
Robert A. Dwight, Treasurer
Maria F. Dwyer, Deputy Treasurer
John H. Costello, Assistant Treasurer
Thomas J. Simpson, Assistant Treasurer
Board of Trustees
Ralph F. Cox *
Phyllis Burke Davis *
Robert M. Gates *
Edward C. Johnson 3d
Donald J. Kirk *
Ned C. Lautenbach *
Peter S. Lynch
Marvin L. Mann *
William O. McCoy *
Gerald C. McDonough *
Robert C. Pozen
Thomas R. Williams *
Advisory Board
J. Michael Cook
Abigail P. Johnson
Marie L. Knowles
General Distributor
Fidelity Distributors Corporation
Boston, MA
Transfer and Shareholder
Servicing Agent
Fidelity Investments Institutional Operations Company, Inc.
Boston, MA
Custodian
State Street Bank and Trust Company
Quincy, MA
* Independent trustees
Annual Report
Focus Funds
Fidelity Advisor Consumer
Industries Fund
Fidelity Advisor Cyclical
Industries Fund
Fidelity Advisor Financial
Services Fund
Fidelity Advisor Health Care Fund
Fidelity Advisor Natural
Resources Fund
Fidelity Advisor Technology Fund
Fidelity Advisor Telecommunications & Utilities Growth Fund
Growth Funds
Fidelity Advisor Korea Fund
Fidelity Advisor Emerging Asia Fund
Fidelity Advisor Latin America Fund
Fidelity Advisor Japan Fund
Fidelity Advisor Europe Capital Appreciation Fund
Fidelity Advisor International
Capital Appreciation Fund
Fidelity Advisor Overseas Fund
Fidelity Advisor Diversified International Fund
Fidelity Advisor Global Equity Fund
Fidelity Advisor TechnoQuant ®
Growth Fund
Fidelity Advisor Small Cap Fund
Fidelity Advisor Value Strategies Fund
Fidelity Advisor Mid Cap Fund
Fidelity Advisor Dynamic
Capital Appreciation Fund
Fidelity Advisor Equity Growth Fund
Fidelity Advisor Large Cap Fund
Fidelity Advisor Dividend Growth Fund
Fidelity Advisor Growth
Opportunities Fund
Growth and Income Funds
Fidelity Advisor Growth & Income Fund
Fidelity Advisor Equity Income Fund
Fidelity Advisor Asset Allocation Fund
Fidelity Advisor Balanced Fund
Taxable Income Funds
Fidelity Advisor Emerging Markets Income Fund
Fidelity Advisor High Yield Fund
Fidelity Advisor High Income Fund
Fidelity Advisor Strategic Income Fund
Fidelity Advisor Mortgage
Securities Fund
Fidelity Advisor Government Investment Fund
Fidelity Advisor Intermediate Bond Fund
Fidelity Advisor Short Fixed-Income Fund
Municipal Funds
Fidelity Advisor Municipal Income Fund
Money Market Funds
Prime Fund
Treasury Fund
Tax-Exempt Fund
ALAF-ANN-1200 118698
1.728719.101
(Fidelity Investment logo)(registered trademark)
Fidelity® Advisor
Fund - Institutional Class
Annual Report
October 31, 2000
(2_fidelity_logos)(registered trademark)
|
President's Message |
Ned Johnson on investing strategies. |
|
|
Performance |
How the fund has done over time. |
|
|
Fund Talk |
The manager's review of fund performance, strategy and outlook. |
|
|
Investment Changes |
A summary of the fund's investments. |
|
|
Investments |
A complete list of the fund's investments with their market values. |
|
|
Financial Statements |
Statements of assets and liabilities,
operations, and changes in net assets, |
|
|
Notes |
Notes to the financial statements. |
|
|
Report of Independent Accountants |
The auditors' opinion. |
|
|
Distributions |
|
Standard & Poor's, S&P and S&P 500 are registered service marks of The McGraw-Hill Companies, Inc. and have been licensed for use by Fidelity Distributors Corporation.
Other third party marks appearing herein are the property of their respective owners.
All other marks appearing herein are registered or unregistered trademarks or service marks of FMR Corp. or an affiliated company.
(Recycle graphic) This report is printed on recycled paper using soy-based inks.
This report and the financial statements contained herein are submitted for the general information of the shareholders of the fund. This report is not authorized for distribution to prospective investors in the fund unless preceded or accompanied by an effective prospectus.
Mutual fund shares are not deposits or obligations of, or guaranteed by, any depository institution. Shares are not insured by the FDIC, Federal Reserve Board or any other agency, and are subject to investment risks, including possible loss of principal amount invested.
Neither the fund nor Fidelity Distributors Corporation is a bank.
For more information on any Fidelity Advisor fund, including charges and expenses, contact your investment professional for a free prospectus. Read it carefully before you invest or send money.
Annual Report
(photo_of_Edward_C_Johnson_3d)
Dear Shareholder:
A sixth-straight year of double-digit positive returns for the Dow Jones Industrial Average, NASDAQ and S&P 500® could be in jeopardy unless the U.S. stock market shows marked improvement in the final two months of 2000. Through October, all three indexes had negative year-to-date returns. On the other hand, most fixed-income sectors were solidly in the black. Treasuries and other long-term government securities led the way, returning nearly 14%.
While it's impossible to predict the future direction of the markets with any degree of certainty, there are certain basic principles that can help investors plan for their future needs.
First, investors are encouraged to take a long-term view of their portfolios. If you can afford to leave your money invested through the inevitable up and down cycles of the financial markets, you will greatly reduce your vulnerability to any single decline. We know from experience, for example, that stock prices have gone up over longer periods of time, have significantly outperformed other types of investments and have stayed ahead of inflation.
Second, you can further manage your investing risk through diversification. A stock mutual fund, for instance, is already diversified, because it invests in many different companies. You can increase your diversification further by investing in a number of different stock funds, or in such other investment categories as bonds. If you have a short investment time horizon, you might want to consider moving some of your investment into a money market fund, which seeks income and a stable share price by investing in high-quality, short-term investments. Of course, it's important to remember that an investment in a money market fund is not insured or guaranteed by the Federal Deposit Insurance Corporation or any other government agency. Although money market funds seek to preserve the value of your investment at $1.00 per share, it is possible to lose money by investing in these types of funds.
Finally, no matter what your time horizon or portfolio diversity, it makes good sense to follow a regular investment plan, investing a certain amount of money in a fund at the same time each month or quarter and periodically reviewing your overall portfolio. By doing so, you won't get caught up in the excitement of a rapidly rising market, nor will you buy all your shares at market highs. While this strategy - known as dollar cost averaging - won't assure a profit or protect you from a loss in a declining market, it should help you lower the average cost of your purchases. Of course, you should consider your financial ability to continue your purchases through periods of low price levels before undertaking such a strategy.
Remember to contact your investment professional if you need help with your investments.
Best regards,
/s/Edward C. Johnson 3d
Edward C. Johnson 3d
Annual Report
Fidelity Advisor Latin America Fund - Institutional Class
There are several ways to evaluate historical performance. You can look at the total percentage change in value, the average annual percentage change or the growth of a hypothetical $10,000 investment. Total return reflects the change in the value of an investment, assuming reinvestment of the class' dividend income and capital gains (the profits earned upon the sale of securities that have grown in value). If Fidelity had not reimbursed certain class expenses, the total returns would have been lower.
Cumulative Total Returns
|
Periods ended October 31, 2000 |
|
Past 1 |
Life of |
|
Fidelity Adv Latin America - Institutional CL |
|
14.14% |
33.20% |
|
MSCI EMF - Latin America |
|
14.24% |
37.74% |
|
Latin American Funds Average |
|
20.19% |
n/a* |
Cumulative total returns show Institutional Class' performance in percentage terms over a set period - in this case, one year or since the fund started on December 21, 1998. For example, if you had invested $1,000 in a fund that had a 5% return over the past year, the value of your investment would be $1,050. You can compare Institutional Class' returns to the performance of the Morgan Stanley Capital International Emerging Markets Free - Latin America Index - a market capitalization-weighted index of approximately 160 stocks traded in seven Latin American markets. To measure how Institutional Class' performance stacked up against its peers, you can compare it to the Latin American funds average, which reflects the performance of mutual funds with similar objectives tracked by Lipper Inc. The past one year average represents a peer group of 42 mutual funds. These benchmarks include reinvested dividends and capital gains, if any, and exclude the effect of sales charges.
Average Annual Total Returns
|
Periods ended October 31, 2000 |
|
Past 1 |
Life of |
|
Fidelity Adv Latin America - Institutional CL |
|
14.14% |
16.64% |
|
MSCI EMF - Latin America |
|
14.24% |
18.75% |
|
Latin American Funds Average |
|
20.19% |
n/a* |
Average annual total returns take Institutional Class shares' cumulative return and show you what would have happened if Institutional Class shares had performed at a constant rate each year.
* Not available
Annual Report
$10,000 Over Life of Fund
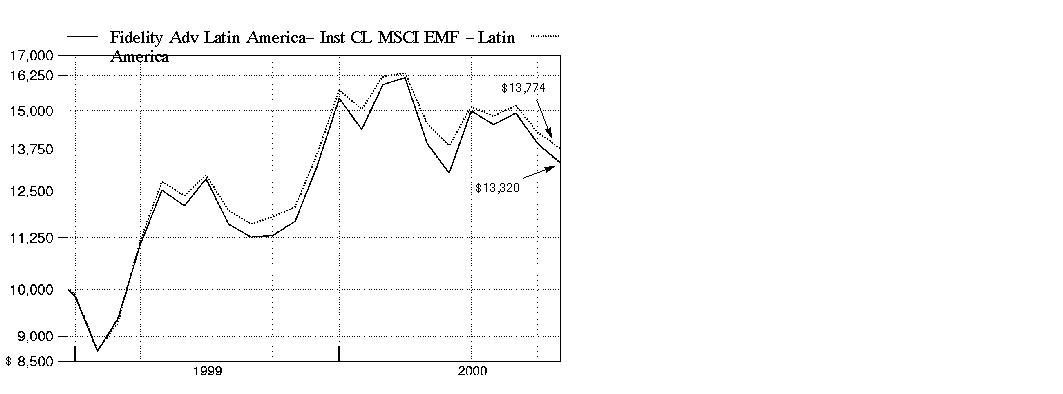
$10,000 Over Life of Fund: Let's say hypothetically that $10,000 was invested in Fidelity Advisor Latin America Fund - Institutional Class on December 21, 1998, when the fund started. As the chart shows, by October 31, 2000, the value of the investment would have grown to $13,320 - a 33.20% increase on the initial investment. For comparison, look at how the MSCI EMF - Latin America Index did over the same period. With dividends reinvested, the same $10,000 would have grown to $13,774 - a 37.74% increase.
Understanding
Performance
Many markets around the globe offer the potential for significant growth over time; however, investing in foreign markets means assuming greater risks than investing in the United States. Factors like changes in a country's financial markets, its local political and economic climate, and the fluctuating value of its currency create these risks. For these reasons an international fund's performance may be more volatile than a fund that invests exclusively in the United States. Past performance is no guarantee of future results and you may have a gain or loss when you sell your shares.
3Annual Report
Market Recap
Currency disparities, the see-saw performance of technology and telecommunications stocks and increased uncertainty over the direction of energy prices contributed to volatile world markets for the 12-month period that ended October 31, 2000. Through the first half of the period, foreign investors enjoyed handsome returns from technology and telecommunications holdings. These gains disappeared down the stretch, however, as the dollar continued to outperform the struggling euro - the uniform currency of 11 European nations - and the Japanese yen by wide margins. Soaring oil and gas prices also added to the volatility. The Morgan Stanley EAFE® index - which tracks the performance of stock markets in Europe, Australasia and the Far East - fell 2.72% during the period. Europe's economic recovery remained on course, but the euro's continued weakness proved to be a millstone. The Morgan Stanley Europe index had a 12-month return of 1.16%. Japan's economic recovery, on the other hand, appeared to be short-lived, or at least very, very slow in the making. The Morgan Stanley Japan index declined 11.61% during the period. Emerging markets, meanwhile, were unable to sustain the momentum they carried into early 2000 - the Morgan Stanley Emerging Markets Free index tumbled 10.33%.
(Portfolio Manager photograph)
An interview with Patti Satterthwaite, Portfolio Manager of Fidelity Advisor Latin America Fund
Q. How did the fund perform, Patti?
A. For the 12-month period that ended October 31, 2000, the fund's Institutional Class shares returned 14.14%, falling short of the Morgan Stanley Capital International Emerging Markets Free - Latin America Index, which returned 14.24%. For the same period, the Latin America funds average tracked by Lipper Inc. returned 20.19%.
Q. What was the investment climate like in Latin America during the past 12 months?
A. Recovery among major Latin American economies progressed, albeit at varying speeds. Mexico was the brightest star in the region, spurred by higher oil prices, strong export growth and rising consumer demand. The country also received an important credit rating upgrade from Moody's Investors Services in March, which was followed by a successful democratic presidential election in July. Mexico pretty much had everything going for it during the 12-month period. Brazil - the largest economy in the Latin American region - directly benefited from Mexico's good fortune, though its recovery was hampered by concerns about inflation and declining confidence in Brazil's currency, the real. Still, Brazil remained an attractive value play due to cheap stock prices. Meanwhile, Argentina struggled to emerge from last year's recession, while Chile enjoyed some economic expansion, though weak consumer spending slowed its recovery efforts.
Annual Report
Fund Talk: The Manager's Overview - continued
Q. What factors helped shape fund performance during the period?
A. Strong stock picking in Mexico was a big positive for the fund relative to the index. Having ample exposure to banks proved particularly beneficial. Reaching the end of a five-year restructuring period, banks turned their attention to such key business drivers as loan growth, which is critical in a strengthening economy. Investors, drawn to the industry's improving fundamentals, pushed the prices of holdings such as Grupo Financiero BBVA Bancomer and Banacci sharply higher during the period. The fund also benefited from overweighting a handful of media stocks that did well, namely TV Azteca and Grupo Televisa. However, we paid the price for not owning enough Telefonos de Mexico (Telmex), the fund's largest holding, which accounted for more than 14% of the index on average. Its stock price was up more than 28% despite the downside volatility that plagued most telecom stocks worldwide during the latter half of the period. Having an out-of-benchmark position in Carso Global Telecom - a holding company for Telmex - which performed poorly, further compounded our problem. On the Lipper front, we owned some "new economy" stocks that detracted from performance, including Impsat Fiber Networks, an emerging telecommunications company with operations throughout the region, and Internet portal El Sitio.
Q. How did your strategy in Brazil play out for the fund?
A. Remaining generally market-weighted in Brazil relative to the index, we focused our energy on finding the best stocks. We had some success with beverage stocks such as Brahma Cervejaria, which merged with another local company in the summer to form the world's third-largest brewer - AmBev. Our results in the telecom sector were mixed, although we tended to own more losers than winners. Fixed-line provider Tele Norte Leste helped, while Telesp Celular hurt.
Q. What was your approach to countries other than Mexico and Brazil?
A. I continued to underweight the rest of the region - which represented only about 25% of the index on average during the period - primarily on liquidity concerns. Specifically, I kept the fund underexposed to Chile because I felt that its status as a safe haven had been slightly obscured by Mexico's credit rating upgrade. This strategy paid off for us during the period.
Annual Report
Fund Talk: The Manager's Overview - continued
Q. What's your outlook?
A. I'm generally positive overall. I feel that valuations remain extremely attractive relative to the rest of the world, given that economic recovery is expected to lead to stronger earnings growth throughout Latin America. Despite positive fundamentals, however, stocks in the region remain extremely vulnerable to global market volatility and further deceleration in the U.S. economy.
The views expressed in this report reflect those of the portfolio manager only through the end of the period of the report as stated on the cover and do not necessarily represent the views of Fidelity or any other person in the Fidelity organization. Any such views are subject to change at any time based upon market or other conditions and Fidelity disclaims any responsibility to update such views. These views may not be relied on as investment advice and, because investment decisions for a Fidelity fund are based on numerous factors, may not be relied on as an indication of trading intent on behalf of any Fidelity fund.
Fund Facts
Goal: seeks high total investment return
Start date: December 21, 1998
Size: as of October 31, 2000, more than $6 million
Manager: Patti Satterthwaite, since inception; joined Fidelity in 1986
3Patti Satterthwaite reflects on the correlation between U.S. and Latin American stock markets:
"Latin American markets tracked the movements of U.S. stocks for much of the 12-month period, albeit with less drama. Telecom and media stocks rose sharply early on, only to reverse course following the end of the global tech rally. Investors flocked to less volatile areas of the market, namely banks, consumer stocks and some utilities. Concerns about interest rates rising further in the U.S., persistently high energy prices and a protracted slowdown in the global economy kept Latin American markets off balance during the second half of the period. Considering the close correlation of the IPC - the benchmark for the Mexican stock market - to the NASDAQ in the U.S., I may consider reducing the fund's exposure to Mexico while pursuing less volatile alternatives elsewhere."
Note to shareholders:
Fidelity Advisor Latin America Fund may invest up to 35% of its total assets in any industry that represents more than 20% of the Latin American market. As of October 31, 2000, 26% of the fund's total assets were invested in telephone service companies, which accounted for approximately 23% of the Latin American market as of October 31, 2000, as represented by the Morgan Stanley Capital International (MSCI) Emerging Markets Free - Latin America Index.
Annual Report
|
Top Five Stocks as of October 31, 2000 |
||
|
|
% of fund's |
% of fund's net assets |
|
Telefonos de Mexico SA de CV Series L sponsored ADR (Mexico, Telephone Services) |
12.2 |
10.4 |
|
Companhia de Bebidas das Americas (AmBev) sponsored ADR (Brazil, Beverages) |
7.9 |
0.0 |
|
Petrobras SA (PN) (Brazil, Oil & Gas) |
6.4 |
5.1 |
|
Wal-Mart de Mexico SA de CV Series C (Mexico, General Merchandise Stores) |
6.0 |
5.6 |
|
Banacci SA de CV Series O (Mexico, Banks) |
5.5 |
2.7 |
|
|
38.0 |
23.8 |
|
Top Five Market Sectors as of October 31, 2000 |
||
|
|
% of fund's |
% of fund's net assets |
|
Utilities |
33.1 |
39.2 |
|
Nondurables |
14.4 |
11.5 |
|
Finance |
14.0 |
9.3 |
|
Media & Leisure |
11.8 |
9.3 |
|
Retail & Wholesale |
9.7 |
7.4 |
|
Top Five Countries as of October 31, 2000 |
||
|
(excluding cash equivalents) |
% of fund's |
% of fund's net assets |
|
Mexico |
44.7 |
43.4 |
|
Brazil |
39.3 |
34.7 |
|
Chile |
4.6 |
4.2 |
|
Argentina |
3.2 |
2.3 |
|
Venezuela |
1.9 |
2.7 |
|
Percentages are adjusted for the effect of open futures contracts, if applicable. |
|
Asset Allocation (% of fund's net assets) |
|||||||
|
As of October 31, 2000 |
As of April 30, 2000 |
||||||
|
Stocks 98.1% |
|
|
Stocks 95.0% |
|
||
|
Short-Term |
|
|
Short-Term |
|
||
Annual Report
Showing Percentage of Net Assets
|
Common Stocks - 98.1% |
|||
|
Shares |
Value (Note 1) |
||
|
Argentina - 3.2% |
|||
|
Inversiones y Representacions SA sponsored GDR (a) |
586 |
$ 12,196 |
|
|
Perez Companc SA sponsored ADR |
8,077 |
116,107 |
|
|
Telecom Argentina Stet-France Telecom SA sponsored ADR Class B |
4,200 |
72,188 |
|
|
|
200,491 |
||
|
Brazil - 39.3% |
|||
|
Banco Bradesco SA (PN) |
19,659,000 |
122,093 |
|
|
Banco Itau SA |
2,399,000 |
187,501 |
|
|
Companhia Brasileira de Distribuicao Grupo Pao de Acucar sponsored ADR |
2,900 |
103,313 |
|
|
Companhia de Bebidas das Americas (AmBev) sponsored ADR |
22,000 |
496,375 |
|
|
Companhia Siderurgica Nacional ADR |
1,900 |
52,606 |
|
|
Companhia Vale do Rio Doce (PN-A) |
7,400 |
171,368 |
|
|
Compania Energertica Minas Gerais |
2,916,000 |
44,477 |
|
|
Embratel Participacoes SA ADR |
9,300 |
150,544 |
|
|
Petrobras SA (PN) |
15,210 |
405,146 |
|
|
Tele Norte Leste Participacoes SA ADR |
9,531 |
210,873 |
|
|
Telesp Celular Participacoes SA ADR |
10,461 |
330,829 |
|
|
Uniao de Bancos Brasileiros SA (Unibanco) GDR |
3,200 |
80,800 |
|
|
Votorantim Celulose e Papel SA (PN Reg.) |
3,742,000 |
125,652 |
|
|
|
2,481,577 |
||
|
British Virgin Islands - 0.2% |
|||
|
El Sitio, Inc. |
4,200 |
14,044 |
|
|
Chile - 4.6% |
|||
|
Banco Santander Chile sponsored ADR |
2,300 |
30,906 |
|
|
Banco Santiago SA sponsored ADR |
2,200 |
43,450 |
|
|
Distribucion Y Servicio D&S SA sponsored ADR |
7,500 |
134,063 |
|
|
Embotelladora Andina sponsored ADR Class A |
2,850 |
34,200 |
|
|
Enersis SA sponsored ADR (a) |
309 |
5,485 |
|
|
Vina Concha Stet y Toro SA sponsored ADR |
1,150 |
44,131 |
|
|
|
292,235 |
||
|
Colombia - 0.1% |
|||
|
Banco Ganadero SA sponsored ADR Class C |
600 |
1,350 |
|
|
Suramericana de Inversiones SA |
7,000 |
4,258 |
|
|
|
5,608 |
||
|
Luxembourg - 0.8% |
|||
|
Quilmes Industrial SA sponsored ADR |
6,300 |
51,975 |
|
|
Common Stocks - continued |
|||
|
Shares |
Value (Note 1) |
||
|
Mexico - 44.7% |
|||
|
Banacci SA de CV Series O (a) |
225,000 |
$ 349,428 |
|
|
Carso Global Telecom SA de CV Series A1 (a) |
124,000 |
277,327 |
|
|
Corporacion Interamericana de Entretenimiento SA de CV Series B (a) |
17,581 |
79,007 |
|
|
Fomento Economico Mexicano SA de CV sponsored ADR |
1,800 |
68,738 |
|
|
Grupo Carso SA de CV Series A1 (a) |
39,000 |
121,461 |
|
|
Grupo Financiero BBVA Bancomer SA de CV (GFB) (a) |
98,000 |
60,632 |
|
|
Grupo Iusacell SA de CV sponsored ADR (a) |
7,900 |
102,700 |
|
|
Grupo Televisa SA de CV sponsored GDR |
6,450 |
349,106 |
|
|
Telefonos de Mexico SA de CV Series L sponsored ADR |
14,275 |
769,958 |
|
|
TV Azteca SA de CV sponsored ADR |
21,000 |
262,500 |
|
|
Wal-Mart de Mexico SA de CV Series C (a) |
168,000 |
380,122 |
|
|
|
2,820,979 |
||
|
Panama - 1.6% |
|||
|
Banco Latin Americano de Exporaciones SA (BLADEX) Series E |
400 |
10,025 |
|
|
Panamerican Beverages, Inc. Class A |
5,600 |
92,400 |
|
|
|
102,425 |
||
|
Peru - 0.9% |
|||
|
Compania de Minas Buenaventura SA |
4,200 |
54,075 |
|
|
United States of America - 0.8% |
|||
|
Impsat Fiber Networks, Inc. |
4,400 |
52,800 |
|
|
Venezuela - 1.9% |
|||
|
Compania Anonima Nacional Telefono de Venezuela sponsored ADR |
6,200 |
117,800 |
|
|
TOTAL COMMON STOCKS (Cost $5,756,211) |
6,194,009 |
||
|
Cash Equivalents - 2.1% |
|||
|
Maturity Amount |
Value |
||
|
Investments in repurchase agreements (U.S. Treasury Obligations), in a joint trading account at 6.56%, dated 10/31/00 due 11/1/00 |
$ 36,007 |
$ 36,000 |
|
|
Shares |
|
||
|
Fidelity Cash Central Fund, 6.61% (b) |
92,683 |
92,683 |
|
|
TOTAL CASH EQUIVALENTS (Cost $128,683) |
128,683 |
||
|
TOTAL INVESTMENT PORTFOLIO - 100.2% (Cost $5,884,894) |
6,322,692 |
||
|
NET OTHER ASSETS - (0.2)% |
(12,461) |
||
|
NET ASSETS - 100% |
$ 6,310,231 |
||
|
Legend |
|
(a) Non-income producing |
|
(b) The rate quoted is the annualized seven-day yield of the fund at period end. A complete listing of the fund's holdings as of its most recent fiscal year end is available upon request. |
|
Income Tax Information |
|
At October 31, 2000, the aggregate cost of investment securities for income tax purposes was $5,887,807. Net unrealized appreciation aggregated $434,885, of which $1,278,181 related to appreciated investment securities and $843,296 related to depreciated investment securities. |
|
The fund hereby designates approximately $21,000 as a capital gain dividend for the purpose of the dividend paid deduction. |
See accompanying notes which are an integral part of the financial statements.
Annual Report
Statement of Assets and Liabilities
|
|
October 31, 2000 |
|
|
Assets |
|
|
|
Investment in securities, at value (including repurchase agreements of $36,000) (cost $5,884,894) - |
|
$ 6,322,692 |
|
Cash |
|
454 |
|
Receivable for fund shares sold |
|
5,824 |
|
Dividends receivable |
|
8,524 |
|
Interest receivable |
|
901 |
|
Receivable from investment adviser for expense reductions |
|
5,310 |
|
Total assets |
|
6,343,705 |
|
Liabilities |
|
|
|
Payable for fund shares redeemed |
$ 3,449 |
|
|
Distribution fees payable |
3,343 |
|
|
Other payables and accrued expenses |
26,682 |
|
|
Total liabilities |
|
33,474 |
|
Net Assets |
|
$ 6,310,231 |
|
Net Assets consist of: |
|
|
|
Paid in capital |
|
$ 5,822,213 |
|
Accumulated undistributed net realized gain (loss) on investments and foreign currency transactions |
|
50,387 |
|
Net unrealized appreciation (depreciation) on investments and assets and liabilities in foreign currencies |
|
437,631 |
|
Net Assets |
|
$ 6,310,231 |
See accompanying notes which are an integral part of the financial statements.
Annual Report
Financial Statements - continued
Statement of Assets and Liabilities - continued
|
|
October 31, 2000 |
|
|
Calculation of Maximum Offering Price |
|
$13.26 |
|
Maximum offering price per share (100/94.25 of $13.26) |
|
$14.07 |
|
Class T: |
|
$13.21 |
|
Maximum offering price per share (100/96.50 of $13.21) |
|
$13.69 |
|
Class B: |
|
$13.08 |
|
Class C: |
|
$13.07 |
|
Institutional Class: |
|
$13.32 |
A Redemption price per share is equal to net asset value less any applicable contingent deferred sales charge.
See accompanying notes which are an integral part of the financial statements.
Annual Report
Financial Statements - continued
Statement of Operations
|
|
Year ended October 31, 2000 |
|
|
Investment Income Dividends |
|
$ 93,997 |
|
Interest |
|
17,109 |
|
|
|
111,106 |
|
Less foreign taxes withheld |
|
(7,640) |
|
Total income |
|
103,466 |
|
Expenses |
|
|
|
Management fee |
$ 48,581 |
|
|
Transfer agent fees |
25,335 |
|
|
Distribution fees |
42,983 |
|
|
Accounting fees and expenses |
60,057 |
|
|
Non-interested trustees' compensation |
21 |
|
|
Custodian fees and expenses |
21,974 |
|
|
Registration fees |
66,543 |
|
|
Audit |
23,615 |
|
|
Legal |
78 |
|
|
Foreign tax expenses |
4,398 |
|
|
Miscellaneous |
46 |
|
|
Total expenses before reductions |
293,631 |
|
|
Expense reductions |
(130,355) |
163,276 |
|
Net investment income (loss) |
|
(59,810) |
|
Realized and Unrealized Gain (Loss) Net realized gain (loss) on: |
|
|
|
Investment securities |
57,624 |
|
|
Foreign currency transactions |
(5,396) |
52,228 |
|
Change in net unrealized appreciation (depreciation) on: |
|
|
|
Investment securities |
180,028 |
|
|
Assets and liabilities in foreign currencies |
1,229 |
181,257 |
|
Net gain (loss) |
|
233,485 |
|
Net increase (decrease) in net assets resulting |
|
$ 173,675 |
See accompanying notes which are an integral part of the financial statements.
Annual Report
Financial Statements - continued
Statement of Changes in Net Assets
|
|
Year ended |
December 21, 1998 |
|
Increase (Decrease) in Net Assets |
|
|
|
Operations |
$ (59,810) |
$ 4,112 |
|
Net realized gain (loss) |
52,228 |
(15,197) |
|
Change in net unrealized appreciation (depreciation) |
181,257 |
256,374 |
|
Net increase (decrease) in net assets resulting |
173,675 |
245,289 |
|
Share transactions - net increase (decrease) |
2,224,797 |
3,666,470 |
|
Total increase (decrease) in net assets |
2,398,472 |
3,911,759 |
|
Net Assets |
|
|
|
Beginning of period |
3,911,759 |
- |
|
End of period |
$ 6,310,231 |
$ 3,911,759 |
See accompanying notes which are an integral part of the financial statements.
Annual Report
Financial Highlights - Class A
|
Years ended October 31, |
2000 |
1999 E |
|
Selected Per-Share Data |
|
|
|
Net asset value, beginning of period |
$ 11.64 |
$ 10.00 |
|
Income from Investment Operations |
|
|
|
Net investment income (loss) D |
(.07) |
.05 |
|
Net realized and unrealized gain (loss) |
1.69 |
1.59 |
|
Total from investment operations |
1.62 |
1.64 |
|
Net asset value, end of period |
$ 13.26 |
$ 11.64 |
|
Total Return B, C |
13.92% |
16.40% |
|
Ratios and Supplemental Data |
|
|
|
Net assets, end of period (000 omitted) |
$ 921 |
$ 756 |
|
Ratio of expenses to average net assets |
2.06% F |
2.01% A, F |
|
Ratio of expenses to average net assets after expense reductions |
2.04% G |
1.99% A, G |
|
Ratio of net investment income (loss) to average net assets |
(.50)% |
.50% A |
|
Portfolio turnover |
52% |
50% A |
A Annualized
B The total returns would have been lower had certain expenses not been reduced during the periods shown.
C Total returns do not include the one time sales charge and for periods of less than one year are not annualized.
D Net investment income (loss) per share has been calculated based on average shares outstanding during the period.
E For the period December 21, 1998 (commencement of operations) to October 31, 1999.
F FMR agreed to reimburse a portion of the class' expenses during the period. Without this reimbursement, the class' expense ratio would have been higher.
G FMR or the fund has entered into varying arrangements with third parties who either paid or reduced a portion of the class' expenses.
See accompanying notes which are an integral part of the financial statements.
Annual Report
Financial Highlights - Class T
|
Years ended October 31, |
2000 |
1999 E |
|
Selected Per-Share Data |
|
|
|
Net asset value, beginning of period |
$ 11.62 |
$ 10.00 |
|
Income from Investment Operations |
|
|
|
Net investment income (loss) D |
(.11) |
.02 |
|
Net realized and unrealized gain (loss) |
1.70 |
1.60 |
|
Total from investment operations |
1.59 |
1.62 |
|
Net asset value, end of period |
$ 13.21 |
$ 11.62 |
|
Total Return B, C |
13.68% |
16.20% |
|
Ratios and Supplemental Data |
|
|
|
Net assets, end of period (000 omitted) |
$ 2,041 |
$ 1,065 |
|
Ratio of expenses to average net assets |
2.32% F |
2.26% A, F |
|
Ratio of expenses to average net assets after expense reductions |
2.30% G |
2.24% A, G |
|
Ratio of net investment income (loss) to average net assets |
(.75)% |
.25% A |
|
Portfolio turnover |
52% |
50% A |
A Annualized
B The total returns would have been lower had certain expenses not been reduced during the periods shown.
C Total returns do not include the one time sales charge and for periods of less than one year are not annualized.
D Net investment income (loss) per share has been calculated based on average shares outstanding during the period.
E For the period December 21, 1998 (commencement of operations) to October 31, 1999.
F FMR agreed to reimburse a portion of the class' expenses during the period. Without this reimbursement, the class' expense ratio would have been higher.
G FMR or the fund has entered into varying arrangements with third parties who either paid or reduced a portion of the class' expenses.
See accompanying notes which are an integral part of the financial statements.
Annual Report
Financial Highlights - Class B
|
Years ended October 31, |
2000 |
1999 E |
|
Selected Per-Share Data |
|
|
|
Net asset value, beginning of period |
$ 11.58 |
$ 10.00 |
|
Income from Investment Operations |
|
|
|
Net investment income (loss) D |
(.18) |
(.02) |
|
Net realized and unrealized gain (loss) |
1.68 |
1.60 |
|
Total from investment operations |
1.50 |
1.58 |
|
Net asset value, end of period |
$ 13.08 |
$ 11.58 |
|
Total Return B, C |
12.95% |
15.80% |
|
Ratios and Supplemental Data |
|
|
|
Net assets, end of period (000 omitted) |
$ 1,659 |
$ 912 |
|
Ratio of expenses to average net assets |
2.82% F |
2.76% A, F |
|
Ratio of expenses to average net assets after expense reductions |
2.80% G |
2.74% A, G |
|
Ratio of net investment income (loss) to average net assets |
(1.25)% |
(.25)% A |
|
Portfolio turnover |
52% |
50% A |
A Annualized
B The total returns would have been lower had certain expenses not been reduced during the periods shown.
C Total returns do not include the contingent deferred sales charge and for periods of less than one year are not annualized.
D Net investment income (loss) per share has been calculated based on average shares outstanding during the period.
E For the period December 21, 1998 (commencement of operations) to October 31, 1999.
F FMR agreed to reimburse a portion of the class' expenses during the period. Without this reimbursement, the class' expense ratio would have been higher.
G FMR or the fund has entered into varying arrangements with third parties who either paid or reduced a portion of the class' expenses.
See accompanying notes which are an integral part of the financial statements.
Annual Report
Financial Highlights - Class C
|
Years ended October 31, |
2000 |
1999 E |
|
Selected Per-Share Data |
|
|
|
Net asset value, beginning of period |
$ 11.57 |
$ 10.00 |
|
Income from Investment Operations |
|
|
|
Net investment income (loss) D |
(.18) |
(.02) |
|
Net realized and unrealized gain (loss) |
1.68 |
1.59 |
|
Total from investment operations |
1.50 |
1.57 |
|
Net asset value, end of period |
$ 13.07 |
$ 11.57 |
|
Total Return B, C |
12.96% |
15.70% |
|
Ratios and Supplemental Data |
|
|
|
Net assets, end of period (000 omitted) |
$ 1,165 |
$ 708 |
|
Ratio of expenses to average net assets |
2.82% F |
2.76% A, F |
|
Ratio of expenses to average net assets after expense reductions |
2.80% G |
2.74% A, G |
|
Ratio of net investment income (loss) to average net assets |
(1.25)% |
(.25)% A |
|
Portfolio turnover |
52% |
50% A |
A Annualized
B The total returns would have been lower had certain expenses not been reduced during the periods shown.
C Total returns do not include the contingent deferred sales charge and for periods of less than one year are not annualized.
D Net investment income (loss) per share has been calculated based on average shares outstanding during the period.
E For the period December 21, 1998 (commencement of operations) to October 31, 1999.
F FMR agreed to reimburse a portion of the class' expenses during the period. Without this reimbursement, the class' expense ratio would have been higher.
G FMR or the fund has entered into varying arrangements with third parties who either paid or reduced a portion of the class' expenses.
See accompanying notes which are an integral part of the financial statements.
Annual Report
Financial Highlights - Institutional Class
|
Years ended October 31, |
2000 |
1999 E |
|
Selected Per-Share Data |
|
|
|
Net asset value, beginning of period |
$ 11.67 |
$ 10.00 |
|
Income from Investment Operations |
|
|
|
Net investment income (loss) D |
(.04) |
.07 |
|
Net realized and unrealized gain (loss) |
1.69 |
1.60 |
|
Total from investment operations |
1.65 |
1.67 |
|
Net asset value, end of period |
$ 13.32 |
$ 11.67 |
|
Total Return B, C |
14.14% |
16.70% |
|
Ratios and Supplemental Data |
|
|
|
Net assets, end of period (000 omitted) |
$ 524 |
$ 472 |
|
Ratio of expenses to average net assets |
1.81% F |
1.76% A, F |
|
Ratio of expenses to average net assets after expense reductions |
1.79% G |
1.74% A, G |
|
Ratio of net investment income (loss) to average net assets |
(.25)% |
.75% A |
|
Portfolio turnover |
52% |
50% A |
A Annualized
B The total returns would have been lower had certain expenses not been reduced during the periods shown.
C Total returns for periods of less than one year are not annualized.
D Net investment income (loss) per share has been calculated based on average shares outstanding during the period.
E For the period December 21, 1998 (commencement of operations) to October 31, 1999.
F FMR agreed to reimburse a portion of the class' expenses during the period. Without this reimbursement, the class' expense ratio would have been higher.
G FMR or the fund has entered into varying arrangements with third parties who either paid or reduced a portion of the class' expenses.
See accompanying notes which are an integral part of the financial statements.
Annual Report
For the period ended October 31, 2000
1. Significant Accounting Policies.
Fidelity Advisor Latin America Fund (the fund) is a fund of Fidelity Advisor Series VIII (the trust) and is authorized to issue an unlimited number of shares. The trust is registered under the Investment Company Act of 1940, as amended (the 1940 Act), as an open-end management investment company organized as a Massachusetts business trust.
The fund offers Class A, Class T, Class B, Class C, and Institutional Class shares, each of which has equal rights as to assets and voting privileges. Each class has exclusive voting rights with respect to matters that affect that class. Class B shares will automatically convert to Class A shares after a holding period of seven years from the initial date of purchase. Investment income, realized and unrealized capital gains and losses, the common expenses of the fund, and certain fund-level expense reductions, if any, are allocated on a pro rata basis to each class based on the relative net assets of each class to the total net assets of the fund. Each class of shares differs in its respective distribution, transfer agent, and certain other class-specific fees, expenses, and expense reductions.
The fund's investments in emerging markets can be subject to social, economic, regulatory, and political uncertainties and can be extremely volatile.
The financial statements have been prepared in conformity with generally accepted accounting principles which require management to make certain estimates and assumptions at the date of the financial statements. The following summarizes the significant accounting policies of the fund:
Security Valuation. Securities for which quotations are readily available are valued using the official closing price or at the last sale price in the principal market in which they are traded. If the last sale price (on the local exchange) is unavailable, the last evaluated quote or closing bid price normally is used. If trading or events occurring in other markets after the close of the principal market in which securities are traded are expected to materially affect the value of those securities, then they are valued at their fair value taking this trading or these events into account. Fair value is determined in good faith under consistently applied procedures under the general supervision of the Board of Trustees. Securities for which quotations are not readily available are valued primarily using dealer-supplied valuations or at their fair value. Short-term securities with remaining maturities of sixty days or less for which quotations are not readily available are valued at amortized cost or original cost plus accrued interest, both of which approximate current value. Investments in open-end investment companies are valued at their net asset value each business day.
Foreign Currency Translation. The accounting records of the fund are maintained in U.S. dollars. Investment securities and other assets and liabilities denominated in a foreign currency are translated into U.S. dollars at the prevailing rates of exchange at period end. Purchases and sales of securities, income receipts and expense payments are translated into U.S. dollars at the prevailing exchange rate on the respective dates of the transactions.
Annual Report
Notes to Financial Statements - continued
1. Significant Accounting Policies - continued
Foreign Currency Translation - continued
Net realized gains and losses on foreign currency transactions represent net gains and losses from sales and maturities of foreign currency contracts, disposition of foreign currencies, the difference between the amount of net investment income accrued and the U.S. dollar amount actually received, and gains and losses between trade and settlement date on purchases and sales of securities. The effects of changes in foreign currency exchange rates on investments in securities are included with the net realized and unrealized gain or loss on investment securities.
Income Taxes. As a qualified regulated investment company under Subchapter M of the Internal Revenue Code, the fund is not subject to U.S. federal income taxes to the extent that it distributes substantially all of its taxable income for its fiscal year. The fund may be subject to foreign taxes on income and gains on investments which are accrued based upon the fund's understanding of the tax rules and regulations that exist in the markets in which it invests. Foreign governments may also impose taxes on other payments or transactions with respect to foreign securities. The fund accrues such taxes as applicable. The schedule of investments includes information regarding income taxes under the caption "Income Tax Information."
Investment Income. Dividend income is recorded on the ex-dividend date, except certain dividends from foreign securities where the ex-dividend date may have passed, are recorded as soon as the fund is informed of the ex-dividend date. Non-cash dividends included in dividend income, if any, are recorded at the fair market value of the securities received. Interest income is accrued as earned. Investment income is recorded net of foreign taxes withheld where recovery of such taxes is uncertain.
Expenses. Most expenses of the trust can be directly attributed to a fund. Expenses which cannot be directly attributed are apportioned among the funds in the trust.
Distributions to Shareholders. Distributions are recorded on the ex-dividend date. Income dividends and capital gain distributions are declared separately for each class.
Income and capital gain distributions are determined in accordance with income tax regulations which may differ from generally accepted accounting principles. These differences, which may result in distribution reclassifications, are primarily due to differing treatments for foreign currency transactions, net operating losses and losses deferred due to wash sales. The fund also utilized earnings and profits distributed to shareholders on redemption of shares as part of the dividends paid deduction for income tax purposes.
Permanent book and tax basis differences relating to shareholder distributions will result in reclassifications to paid in capital. Accumulated undistributed net realized gain (loss) on investments and foreign currency transactions may include temporary book and tax basis differences which will reverse in a subsequent period. Any taxable income or gain remaining at fiscal year end is distributed in the following year.
Annual Report
Notes to Financial Statements - continued
1. Significant Accounting Policies - continued
Security Transactions. Security transactions are accounted for as of trade date. Gains and losses on securities sold are determined on the basis of identified cost.
2. Operating Policies.
Foreign Currency Contracts. The fund generally uses foreign currency contracts to facilitate transactions in foreign-denominated securities. Losses may arise from changes in the value of the foreign currency or if the counterparties do not perform under the contracts' terms. The U.S. dollar value of foreign currency contracts is determined using contractual currency exchange rates established at the time of each trade.
Joint Trading Account. Pursuant to an Exemptive Order issued by the Securities and Exchange Commission (the SEC), the fund, along with other affiliated entities of Fidelity Management & Research Company (FMR), may transfer uninvested cash balances into one or more joint trading accounts. These balances are invested in one or more repurchase agreements for U.S. Treasury or Federal Agency obligations.
Repurchase Agreements. The underlying U.S. Treasury, Federal Agency, or other obligations found to be satisfactory by FMR are transferred to an account of the fund, or to the Joint Trading Account, at a custodian bank. The securities are marked-to-market daily and maintained at a value at least equal to the principal amount of the repurchase agreement (including accrued interest). FMR, the fund's investment adviser, is responsible for determining that the value of the underlying securities remains in accordance with the market value requirements stated above.
3. Purchases and Sales of Investments.
Purchases and sales of securities, other than short-term securities, aggregated $5,441,225 and $3,234,340, respectively.
4. Fees and Other Transactions with Affiliates.
Management Fee. As the fund's investment adviser, FMR receives a monthly fee that is calculated on the basis of a group fee rate plus a fixed individual fund fee rate applied to the average net assets of the fund. The group fee rate is the weighted average of a series of rates and is based on the monthly average net assets of all the mutual funds advised by FMR. The rates ranged from .2167% to .5200% for the period. The annual individual fund fee rate is .45%. In the event that these rates were lower than the contractual rates in effect during the period, FMR voluntarily implemented the above rates, as they resulted in the same or a lower management fee. For the period, the management fee was equivalent to an annual rate of .72% of average net assets.
Annual Report
Notes to Financial Statements - continued
4. Fees and Other Transactions with Affiliates - continued
Sub-Adviser Fee. Beginning January 1, 2001, FMR Co. (FMRC) will serve as a sub-
advisor for the fund. FMRC may provide investment research and advice and may also provide investment advisory services for the fund. FMR, on behalf of the fund,
entered into sub-advisory agreements with Fidelity Management & Research (U.K.) Inc., Fidelity Management & Research (Far East) Inc., and Fidelity International
Investment Advisors (FIIA). Under the sub-advisory arrangements, FMR may receive investment advice and research services and may grant the sub-advisers
investment management authority to buy and sell securities. FMR pays its sub-advisers either a portion of its management fee or a fee based on costs incurred for these
services.
Distribution and Service Plan. In accordance with Rule 12b-1 of the 1940 Act, the Board of Trustees have adopted separate Distribution and Service Plans with respect to each class of shares (collectively referred to as "the Plans"). Under certain of the Plans, the class pays Fidelity Distributors Corporation (FDC), an affiliate of FMR, a 12b-1 fee. A portion of this fee may be reallowed to securities dealers, banks and other financial institutions for the distribution of each class of shares and providing shareholder support services. For the period, this fee was based on the following annual rates of the average net assets of each applicable class:
|
Class A |
.25% |
|
Class T |
.50% |
|
Class B |
1.00% * |
|
Class C |
1.00% * |
* .75% represents a distribution fee and .25% represents a shareholder service fee.
For the period, each class paid FDC the following amounts, a portion of which was retained by FDC:
|
|
Paid to |
Retained |
|
Class A |
$ 2,548 |
$ 1,429 |
|
Class T |
10,495 |
2,812 |
|
Class B |
17,581 |
14,565 |
|
Class C |
12,359 |
10,231 |
|
|
$ 42,983 |
$ 29,037 |
Sales Load. FDC receives a front-end sales charge of up to 5.75% for selling Class A shares, and 3.50% for selling Class T shares of the fund. FDC receives the proceeds of contingent deferred sales charges levied on Class B share redemptions occurring within six years of purchase and Class C share redemptions occurring within one year of purchase. Contingent deferred sales charges are based on declining rates ranging from 5% to 1% for Class B and 1% for Class C, of the lesser of the cost of shares at the initial date of purchase or the net asset value of the redeemed shares, excluding any reinvested dividends and capital
Annual Report
Notes to Financial Statements - continued
4. Fees and Other Transactions with Affiliates - continued
Sales Load - continued
gains. In addition, purchases of Class A and Class T shares that were subject to a finder's fee bear a contingent deferred sales charge on assets that do not remain in the fund for at least one year. The Class A and Class T contingent deferred sales charge is based on 0.25% of the lesser of the cost of shares at the initial date of purchase or the net asset value of the redeemed shares, excluding any reinvested dividends and capital gains. A portion of the sales charges paid to FDC is paid to securities dealers, banks and other financial institutions.
For the period, sales charge amounts paid to and retained by FDC were as follows:
|
|
Paid to |
Retained |
|
Class A |
$ 4,516 |
$ 1,650 |
|
Class T |
8,059 |
1,972 |
|
Class B |
10,708 |
10,708* |
|
Class C |
1,100 |
1,100* |
|
|
$ 24,383 |
$ 15,430 |
* When Class B and Class C shares are initially sold, FDC pays commissions from its own resources to securities dealers,
banks, and other financial institutions through which the sales are made.
Transfer Agent Fees. Fidelity Investments Institutional Operations Company, Inc., (FIIOC), an affiliate of FMR, is the transfer, dividend disbursing and shareholder servicing agent (collectively referred to as the transfer agent) for the fund's Class A, Class T, Class B, Class C and Institutional Class Shares. FIIOC receives account fees and asset-based fees that vary according to the account size and type of account of the shareholders of the respective classes of the fund. FIIOC pays for typesetting, printing and mailing of all shareholder reports, except proxy statements. For the period, the following amounts were paid to FIIOC:
|
|
Amount |
% of |
|
Class A |
$ 3,482 |
.34 |
|
Class T |
8,394 |
.40 |
|
Class B |
7,335 |
.42 |
|
Class C |
4,945 |
.40 |
|
Institutional Class |
1,179 |
.20 |
|
|
$ 25,335 |
|
Accounting Fees. Fidelity Service Company, Inc., an affiliate of FMR, maintains the fund's accounting records. The fee is based on the level of average net assets for the month plus out-of-pocket expenses.
Annual Report
Notes to Financial Statements - continued
4. Fees and Other Transactions with Affiliates - continued
Fidelity Cash Central Fund. Pursuant to an Exemptive Order issued by the SEC, the fund may invest in the Fidelity Cash Central Fund (the Cash Fund) managed by Fidelity Investments Money Management, Inc., an affiliate of FMR. The Cash Fund is an open-end money market fund available only to investment companies and other accounts managed by FMR and its affiliates. The Cash Fund seeks preservation of capital, liquidity, and current income. Income distributions from the Cash Fund are declared daily and paid monthly from net investment income. Income distributions earned by the fund are recorded as interest income in the accompanying financial statements.
5. Expense Reductions.
FMR voluntarily agreed to reimburse operating expenses (excluding interest, taxes, certain securities lending fees, brokerage commissions and extraordinary expenses, if any) above the following annual rates or range of annual rates of average net assets for each of the following classes:
|
|
FMR |
Reimbursement |
|
Class A |
2.00% |
$ 19,271 |
|
Class T |
2.25% |
40,817 |
|
Class B |
2.75% |
34,532 |
|
Class C |
2.75% |
24,057 |
|
Institutional Class |
1.75% |
10,293 |
|
|
|
$ 128,970 |
FMR has also directed certain portfolio trades to brokers who paid a portion of the fund's expenses. For the period, the fund's expenses were reduced by $1,385 under this arrangement.
6. Beneficial Interest.
At the end of the period, FMR and its affiliates were record owners of approximately 37% of the total outstanding shares of the fund.
Annual Report
Notes to Financial Statements - continued
7. Share Transactions.
Transactions for each class of shares were as follows:
|
|
Shares |
Dollars |
||
|
|
Year ended October 31, |
Year ended October 31, |
Year ended October 31, |
Year ended October 31, |
|
|
2000 |
1999 A |
2000 |
1999 A |
|
|
|
|
|
|
|
Class A |
38,689 |
65,380 |
$ 580,476 |
$ 711,107 |
|
Shares redeemed |
(34,125) |
(489) |
(491,740) |
(5,527) |
|
Net increase (decrease) |
4,564 |
64,891 |
$ 88,736 |
$ 705,580 |
|
Class T |
136,912 |
134,413 |
$ 2,067,473 |
$ 1,468,015 |
|
Shares redeemed |
(73,981) |
(42,837) |
(1,109,302) |
(447,894) |
|
Net increase (decrease) |
62,931 |
91,576 |
$ 958,171 |
$ 1,020,121 |
|
Class B |
90,656 |
100,677 |
$ 1,339,079 |
$ 1,121,618 |
|
Shares redeemed |
(42,640) |
(21,906) |
(605,663) |
(257,607) |
|
Net increase (decrease) |
48,016 |
78,771 |
$ 733,416 |
$ 864,011 |
|
Class C |
60,119 |
81,526 |
$ 913,707 |
$ 903,646 |
|
Shares redeemed |
(32,146) |
(20,355) |
(452,494) |
(231,930) |
|
Net increase (decrease) |
27,973 |
61,171 |
$ 461,213 |
$ 671,716 |
|
Institutional Class |
1,218 |
40,574 |
$ 18,000 |
$ 407,034 |
|
Shares redeemed |
(2,287) |
(158) |
(34,739) |
(1,992) |
|
Net increase (decrease) |
(1,069) |
40,416 |
$ (16,739) |
$ 405,042 |
D Share transactions are for the period December 21, 1998 (commencement of sale of shares) to October 31, 1999
Annual Report
To the Trustees of Fidelity Advisor Series VIII and the Shareholders of Fidelity Advisor Latin America Fund:
In our opinion, the accompanying statement of assets and liabilities, including the schedule of investments, and the related statements of operations and of changes in net assets and the financial highlights present fairly, in all material respects, the financial position of Fidelity Advisor Latin America Fund (a fund of Fidelity Advisor Series VIII) at October 31, 2000, and the results of its operations, the changes in its net assets and the financial highlights for the periods indicated, in conformity with accounting principles generally accepted in the United States of America. These financial statements and financial highlights (hereafter referred to as "financial statements") are the responsibility of the Fidelity Advisor Latin America Fund's management; our responsibility is to express an opinion on these financial statements based on our audits. We conducted our audits of these financial statements in accordance with auditing standards generally accepted in the United States of America which require that we plan and perform the audit to obtain reasonable assurance about whether the financial statements are free of material misstatement. An audit includes examining, on a test basis, evidence supporting the amounts and disclosures in the financial statements, assessing the accounting principles used and significant estimates made by management, and evaluating the overall financial statement presentation. We believe that our audits, which included confirmation of securities at October 31, 2000 by correspondence with the custodian and brokers, provide a reasonable basis for our opinion.
/s/PricewaterhouseCoopers LLP
PricewaterhouseCoopers LLP
Boston, Massachusetts
December 8, 2000
Annual Report
The Board of Trustees of Fidelity Advisor Latin America Fund voted to pay to shareholders of record at the opening of business on record date, the following distributions per share derived from capital gains realized from sales of portfolio securities:
|
|
Pay Date |
Record Date |
Dividends |
Capital Gains |
|
Institutional Class |
12/18/00 |
12/15/00 |
$.00 |
$.08 |
The fund hereby designates 100% of the long-term capital gain dividends distributed during the fiscal year as 20%-rate capital gain dividends.
The fund will notify shareholders in January 2001 of amounts for use in preparing 2000 income tax returns.
Annual Report
Investment Adviser
Fidelity Management & Research Company
Boston, MA
Investment Sub-Advisers
Fidelity Management & Research
(U.K.) Inc.
Fidelity Management & Research
(Far East) Inc.
Fidelity International
Investment Advisors
Fidelity International
Investment Advisors
(U.K.) Limited
Fidelity Investments Japan Limited
Officers
Edward C. Johnson 3d, President
Robert C. Pozen, Senior Vice President
Richard A. Spillane, Jr., Vice President
Patricia Satterthwaite, Vice President
Eric D. Roiter, Secretary
Robert A. Dwight, Treasurer
Maria F. Dwyer, Deputy Treasurer
John H. Costello, Assistant Treasurer
Thomas J. Simpson, Assistant Treasurer
Board of Trustees
Ralph F. Cox *
Phyllis Burke Davis *
Robert M. Gates *
Edward C. Johnson 3d
Donald J. Kirk *
Ned C. Lautenbach *
Peter S. Lynch
Marvin L. Mann *
William O. McCoy *
Gerald C. McDonough *
Robert C. Pozen
Thomas R. Williams *
Advisory Board
J. Michael Cook
Abigail P. Johnson
Marie L. Knowles
General Distributor
Fidelity Distributors Corporation
Boston, MA
Transfer and Shareholder
Servicing Agent
Fidelity Investments Institutional Operations Company, Inc.
Boston, MA
Custodian
State Street Bank and Trust Company
Quincy, MA
* Independent trustees
Annual Report
Focus Funds
Fidelity Advisor Consumer
Industries Fund
Fidelity Advisor Cyclical
Industries Fund
Fidelity Advisor Financial
Services Fund
Fidelity Advisor Health Care Fund
Fidelity Advisor Natural
Resources Fund
Fidelity Advisor Technology Fund
Fidelity Advisor Telecommunications & Utilities Growth Fund
Growth Funds
Fidelity Advisor Korea Fund
Fidelity Advisor Emerging Asia Fund
Fidelity Advisor Latin America Fund
Fidelity Advisor Japan Fund
Fidelity Advisor Europe Capital Appreciation Fund
Fidelity Advisor International
Capital Appreciation Fund
Fidelity Advisor Overseas Fund
Fidelity Advisor Diversified International Fund
Fidelity Advisor Global Equity Fund
Fidelity Advisor TechnoQuant ®
Growth Fund
Fidelity Advisor Small Cap Fund
Fidelity Advisor Value Strategies Fund
Fidelity Advisor Mid Cap Fund
Fidelity Advisor Dynamic
Capital Appreciation Fund
Fidelity Advisor Equity Growth Fund
Fidelity Advisor Large Cap Fund
Fidelity Advisor Dividend Growth Fund
Fidelity Advisor Growth
Opportunities Fund
Growth and Income Funds
Fidelity Advisor Growth & Income Fund
Fidelity Advisor Equity Income Fund
Fidelity Advisor Asset Allocation Fund
Fidelity Advisor Balanced Fund
Taxable Income Funds
Fidelity Advisor Emerging Markets Income Fund
Fidelity Advisor High Yield Fund
Fidelity Advisor High Income Fund
Fidelity Advisor Strategic Income Fund
Fidelity Advisor Mortgage
Securities Fund
Fidelity Advisor Government Investment Fund
Fidelity Advisor Intermediate Bond Fund
Fidelity Advisor Short Fixed-Income Fund
Municipal Funds
Fidelity Advisor Municipal Income Fund
Money Market Funds
Prime Fund
Treasury Fund
Tax-Exempt Fund
ALAFI-ANN-1200 118705
1.728720.101
(Fidelity Investment logo)(registered trademark)
Fidelity® Advisor
Class A, Class T, Class B and Class C
Annual Reports
September 30, 2000
and the one-month period
ended October 31, 2000
(2_fidelity_logos)(registered trademark)
|
President's Message |
Ned Johnson on investing strategies. |
|
|
Performance |
How the fund has done over time. |
|
|
Performance |
How the fund has done over time. |
|
|
Fund Talk |
The manager's review of fund performance, strategy and outlook. |
|
|
Investment Changes |
A summary of major shifts in the |
|
|
Investments |
A complete list of the fund's investments with their market values. |
|
|
Investments |
A complete list of the fund's investments with their market values. |
|
|
Financial Statements |
Statements of assets and liabilities,
operations, and changes in net assets, |
|
|
Notes |
Notes to the financial statements. |
|
|
Report of Independent Accountants |
The auditors' opinion. |
Note to shareholders: The fiscal year end for Fidelity Advisor Korea Fund recently changed from September 30 to October 31. This change was made in order to align the fund's fiscal year end more closely with other similar Fidelity funds. To reduce expenses and provide you with a comprehensive report covering both periods ended September 30 and October 31, we've combined both annual reports into one document.
Standard & Poor's, S&P and S&P 500 are registered service marks of The McGraw-Hill Companies, Inc. and have been licensed for use by Fidelity Distributors Corporation.
Other third party marks appearing herein are the property of their respective owners.
All other marks appearing herein are registered or unregistered trademarks or service marks of FMR Corp. or an affiliated company.
(Recycle graphic) This report is printed on recycled paper using soy-based inks. This report and the financial statements contained herein are submitted for the
general information
of the shareholders of the fund. This report is not authorized for distribution to prospective investors
in the fund unless preceded or accompanied by an effective prospectus.
Mutual fund shares are not deposits or obligations of, or guaranteed by, any depository institution. Shares are not insured by the FDIC, Federal Reserve Board or any other agency, and are subject to investment risks, including possible loss of principal amount invested.
Neither the fund nor Fidelity Distributors Corporation is a bank.
For more information on any Fidelity fund, including charges and expenses, call 1-800-544-6666 for a free prospectus. Read it carefully before you invest or send money.
Annual Report
(photo_of_Edward_C_Johnson_3d)
Dear Shareholder:
A sixth-straight year of double-digit positive returns for the Dow Jones Industrial Average, NASDAQ and S&P 500® could be in jeopardy unless the U.S. stock market shows marked improvement in the final two months of 2000. Through October, all three indexes had negative year-to-date returns. On the other hand, most fixed-income sectors were solidly in the black. Treasuries and other long-term government securities led the way, returning nearly 14%.
While it's impossible to predict the future direction of the markets with any degree of certainty, there are certain basic principles that can help investors plan for their future needs.
First, investors are encouraged to take a long-term view of their portfolios. If you can afford to leave your money invested through the inevitable up and down cycles of the financial markets, you will greatly reduce your vulnerability to any single decline. We know from experience, for example, that stock prices have gone up over longer periods of time, have significantly outperformed other types of investments and have stayed ahead of inflation.
Second, you can further manage your investing risk through diversification. A stock mutual fund, for instance, is already diversified, because it invests in many different companies. You can increase your diversification further by investing in a number of different stock funds, or in such other investment categories as bonds. If you have a short investment time horizon, you might want to consider moving some of your investment into a money market fund, which seeks income and a stable share price by investing in high-quality, short-term investments. Of course, it's important to remember that an investment in a money market fund is not insured or guaranteed by the Federal Deposit Insurance Corporation or any other government agency. Although money market funds seek to preserve the value of your investment at $1.00 per share, it is possible to lose money by investing in these types of funds.
Finally, no matter what your time horizon or portfolio diversity, it makes good sense to follow a regular investment plan, investing a certain amount of money in a fund at the same time each month or quarter and periodically reviewing your overall portfolio. By doing so, you won't get caught up in the excitement of a rapidly rising market, nor will you buy all your shares at market highs. While this strategy - known as dollar cost averaging - won't assure a profit or protect you from a loss in a declining market, it should help you lower the average cost of your purchases. Of course, you should consider your financial ability to continue your purchases through periods of low price levels before undertaking such a strategy.
Remember to contact your investment professional if you need help with your investments.
Best regards,
/s/Edward C. Johnson 3d
Edward C. Johnson 3d
Annual Report
Fidelity Advisor Korea Fund - Class A
There are several ways to evaluate historical performance. You can look at the total percentage change in value, the average annual percentage change or the growth of a hypothetical $10,000 investment. Total return reflects the change in the value of an investment, assuming reinvestment of the class' dividend income and capital gains (the profits earned upon the sale of securities that have grown in value). The initial offering of Class A shares took place on July 3, 2000. Class A shares bear a 0.25% 12b-1 fee that is reflected in returns after June 30, 2000. Returns between October 31, 1994 and June 30, 2000 are those of Fidelity Advisor Korea, Inc., (the Closed-End Fund). On June 30, 2000, the Closed-End Fund reorganized as an open-end fund through a transfer of all its assets and liabilities to Fidelity Advisor Korea Fund (the fund). Shareholders of the Closed-End Fund received Class A shares of the fund in exchange for their shares of the Closed-End Fund. If Class A shares' total expenses, including its 0.25% 12b-1 fee had been reflected in the Closed-End Fund's performance, Class A's returns prior to July 3, 2000 may have been lower. If Fidelity had not reimbursed certain class expenses, the total returns would have been lower.
Cumulative Total Returns
|
Periods ended October 31, 2000 |
|
Past 1 |
Past 5 |
Life of |
|
|
Fidelity Adv Korea - CL A |
|
-33.63% |
-38.78% |
-44.47% |
|
|
Fidelity Adv Korea - CL A |
|
-37.45% |
-42.30% |
-47.66% |
|
|
KOSPI |
|
-34.61% |
-62.86% |
-64.95% |
|
|
Pacific Region ex Japan Funds Average |
|
-11.65% |
-17.16% |
n/a* |
|
Cumulative total returns show Class A's performance in percentage terms over a set period - in this case, one year, five years or since the Closed-End Fund started on October 31, 1994. For example, if you had invested $1,000 in a fund that had a 5% return over the past year, the value of your investment would be $1,050. You can compare Class A's returns to the performance of the Korea Composite Stock Price Index (KOSPI) - a market capitalization-weighted index of all common stocks listed on the Korean Stock Exchange. To measure how Class A's performance stacked up against its peers, you can compare it to the Pacific Region ex Japan funds average, which reflects the performance of mutual funds with similar objectives tracked by Lipper Inc. The past one year average represents a peer group of 84 mutual funds. These benchmarks include reinvested dividends and capital gains, if any, and exclude the effect of sales charges.
Average Annual Total Returns
|
Periods ended October 31, 2000 |
Past 1 |
Past 5 |
Life of |
|
|
Fidelity Adv Korea - CL A |
-33.63% |
-9.35% |
-9.34% |
|
|
Fidelity Adv Korea - CL A |
-37.45% |
-10.42% |
-10.23% |
|
|
KOSPI |
-34.61% |
-17.97% |
-16.03% |
|
|
Pacific Region ex Japan Funds Average |
-11.65% |
-4.29% |
n/a* |
|
Average annual total returns take Class A shares' cumulative return and show you what would have happened if Class A shares had performed at a constant rate each year.
* Not available
Annual Report
$10,000 Over Life of Fund
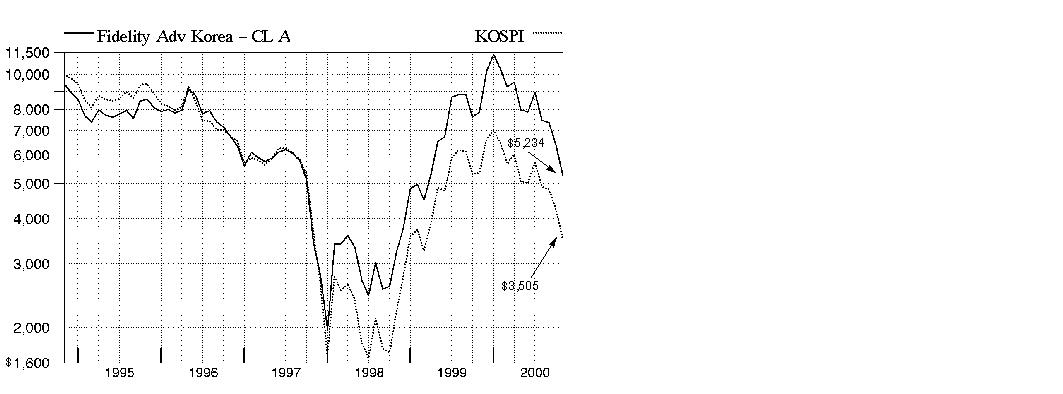
$10,000 Over Life of Fund: Let's say hypothetically that $10,000 was invested in Fidelity Advisor Korea Fund - Class A on October 31, 1994, when the Closed-End Fund started, and the current 5.75% sales charge was paid. As the chart shows, by October 31, 2000, the value of the investment would have been $5,234 - a 47.66% decrease on the initial investment. For comparison, look at how the Korea Composite Stock Price Index did over the same period. With dividends reinvested, the same $10,000 would have been $3,505 - a 64.95% decrease.
Understanding
Performance
Many markets around the globe offer the potential for significant growth over time; however, investing in foreign markets means assuming greater risks than investing in the United States. Factors like changes in a country's financial markets, its local political and economic climate, and the fluctuating value of its currency create these risks. For these reasons an international fund's performance may be more volatile than a fund that invests exclusively in the United States. Past performance is no guarantee of future results and you may have a gain or loss when you sell your shares.
3Annual Report
Fidelity Advisor Korea Fund - Class T
There are several ways to evaluate historical performance. You can look at the total percentage change in value, the average annual percentage change or the growth of a hypothetical $10,000 investment. Total return reflects the change in the value of an investment, assuming reinvestment of the class' dividend income and capital gains (the profits earned upon the sale of securities that have grown in value). The initial offering of Class T shares took place on July 3, 2000. Class T shares bear a 0.50% 12b-1 fee that is reflected in returns after June 30, 2000. Returns between October 31, 1994 and June 30, 2000 are those of Fidelity Advisor Korea, Inc., (the Closed-End Fund). On June 30, 2000, the Closed-End Fund reorganized as an open-end fund through a transfer of all of its assets and liabilities to the fund. Shareholders of the Closed-End Fund received Class A shares of the fund in exchange for their shares of the Closed-End Fund. If Class T shares total expenses, including its 0.50% 12b-1 fee, had been reflected in the Closed-End Fund's performance, Class T's returns prior to July 3, 2000 may have been lower. If Fidelity had not reimbursed certain class expenses, the total returns would have been lower.
Cumulative Total Returns
|
Periods ended October 31, 2000 |
|
Past 1 |
Past 5 |
Life of |
|
|
Fidelity Adv Korea - CL T |
|
-33.72% |
-38.87% |
-44.55% |
|
|
Fidelity Adv Korea - CL T |
|
-36.04% |
-41.01% |
-46.49% |
|
|
KOSPI |
|
-34.61% |
-62.86% |
-64.95% |
|
|
Pacific Region ex Japan Funds Average |
|
-11.65% |
-17.16% |
n/a* |
|
Cumulative total returns show Class T's performance in percentage terms over a set period - in this case, one year, five years or since the Closed-End Fund started on October 31, 1994. For example, if you had invested $1,000 in a fund that had a 5% return over the past year, the value of your investment would be $1,050. You can compare Class T's returns to the performance of the Korea Composite Stock Price Index (KOSPI) - a market capitalization-weighted index of all common stocks listed on the Korean Stock Exchange. To measure how Class T's performance stacked up against its peers, you can compare it to the Pacific Region ex Japan funds average, which reflects the performance of mutual funds with similar objectives tracked by Lipper Inc. The past one year average represents a peer group of 84 mutual funds. These benchmarks include reinvested dividends and capital gains, if any, and exclude the effect of sales charges.
Average Annual Total Returns
|
Periods ended October 31, 2000 |
Past 1 |
Past 5 years |
Life of |
|
|
Fidelity Adv Korea - CL T |
-33.72% |
-9.37% |
-9.36% |
|
|
Fidelity Adv Korea - CL T |
-36.04% |
-10.02% |
-9.90% |
|
|
KOSPI |
-34.61% |
-17.97% |
-16.03% |
|
|
Pacific Region ex Japan Funds Average |
-11.65% |
-4.29% |
n/a* |
|
Average annual total returns take Class T shares' cumulative return and show you what would have happened if Class T shares had performed at a constant rate each year.
* Not available
Annual Report
$10,000 Over Life of Fund
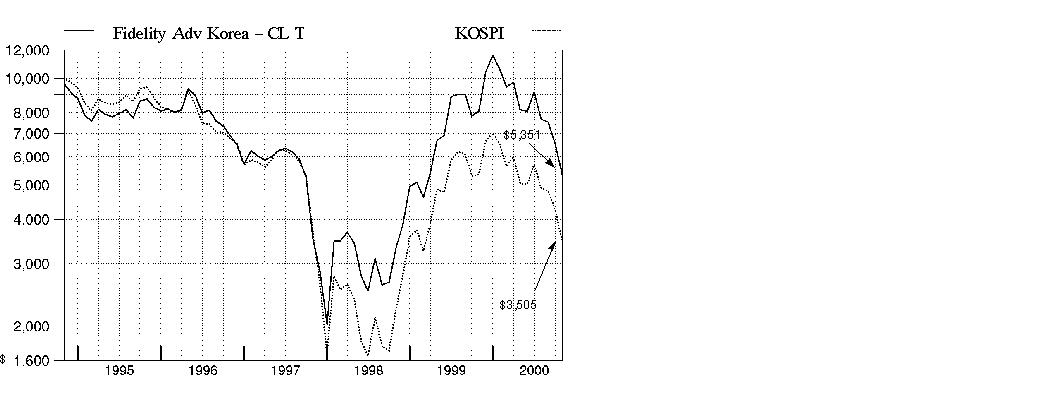
$10,000 Over Life of Fund: Let's say hypothetically that $10,000 was invested in Fidelity Advisor Korea Fund - Class T on October 31, 1994, when the Closed-End Fund started, and the current 3.50% sales charge was paid. As the chart shows, by October 31, 2000, the value of the investment would have been $5,351 - a 46.49% decrease on the initial investment. For comparison, look at how the Korea Composite Stock Price Index did over the same period. With dividends reinvested, the same $10,000 would have been $3,505 - a 64.95% decrease.
Understanding
Performance
Many markets around the globe offer the potential for significant growth over time; however, investing in foreign markets means assuming greater risks than investing in the United States. Factors like changes in a country's financial markets, its local political and economic climate, and the fluctuating value of its currency create these risks. For these reasons an international fund's performance may be more volatile than a fund that invests exclusively in the United States. Past performance is no guarantee of future results and you may have a gain or loss when you sell your shares.
3Annual Report
Fidelity Advisor Korea Fund - Class B
There are several ways to evaluate historical performance. You can look at the total percentage change in value, the average annual percentage change or the growth of a hypothetical $10,000 investment. Total return reflects the change in the value of an investment, assuming reinvestment of the class' dividend income and capital gains (the profits earned upon the sale of securities that have grown in value). The initial offering of Class B shares took place on July 3, 2000. Class B shares bear a 1.00% 12b-1 fee that is reflected in returns after June 30, 2000. Returns between October 31, 1994 and June 30, 2000 are those of Fidelity Advisor Korea, Inc., (the Closed-End Fund). On June 30, 2000, the Closed-End Fund reorganized as an open-end fund through a transfer of all of its assets and liabilities to the fund. Shareholders of the Closed-End Fund received Class A shares of the fund in exchange for their shares of the Closed-End Fund. If Class B shares' total expenses, including its 1.00% 12b-1 fee had been reflected in the Closed-End Fund's performance, Class B's returns, prior to July 3, 2000 may have been lower. Class B shares' contingent deferred sales charges included in the past one year, past five year and life of fund total return figures are 5%, 2%, and 1%, respectively. If Fidelity had not reimbursed certain class expenses, the total returns would have been lower.
Cumulative Total Returns
|
Periods ended October 31, 2000 |
|
Past 1 |
Past 5 |
Life of |
|
|
Fidelity Adv Korea - CL B |
|
-33.81% |
-38.95% |
-44.62% |
|
|
Fidelity Adv Korea - CL B |
|
-37.12% |
-40.10% |
-45.14% |
|
|
KOSPI |
|
-34.61% |
-62.86% |
-64.95% |
|
|
Pacific Region ex Japan Funds Average |
|
-11.65% |
-17.16% |
n/a* |
|
Cumulative total returns show Class B's performance in percentage terms over a set period - in this case, one year, five years or since the Closed-End Fund started on October 31, 1994. For example, if you had invested $1,000 in a fund that had a 5% return over the past year, the value of your investment would be $1,050. You can compare Class B's returns to the performance of the Korea Composite Stock Price Index (KOSPI) - a market capitalization-weighted index of all common stocks listed on the Korean Stock Exchange. To measure how Class B's performance stacked up against its peers, you can compare it to the Pacific Region ex Japan funds average, which reflects the performance of mutual funds with similar objectives tracked by Lipper Inc. The past one year average represents a peer group of 84 mutual funds. These benchmarks include reinvested dividends and capital gains, if any, and exclude the effect of sales charges.
Average Annual Total Returns
|
Periods ended October 31, 2000 |
Past 1 |
Past 5 |
Life of |
|
|
Fidelity Adv Korea - CL B |
-33.81% |
-9.40% |
-9.38% |
|
|
Fidelity Adv Korea - CL B |
-37.12% |
-9.74% |
-9.52% |
|
|
KOSPI |
-34.61% |
-17.97% |
-16.03% |
|
|
Pacific Region ex Japan Funds Average |
-11.65% |
-4.29% |
n/a* |
|
Average annual total returns take Class B shares' cumulative return and show you what would have happened if Class B shares had performed at a constant rate each year.
* Not available
Annual Report
$10,000 Over Life of Fund
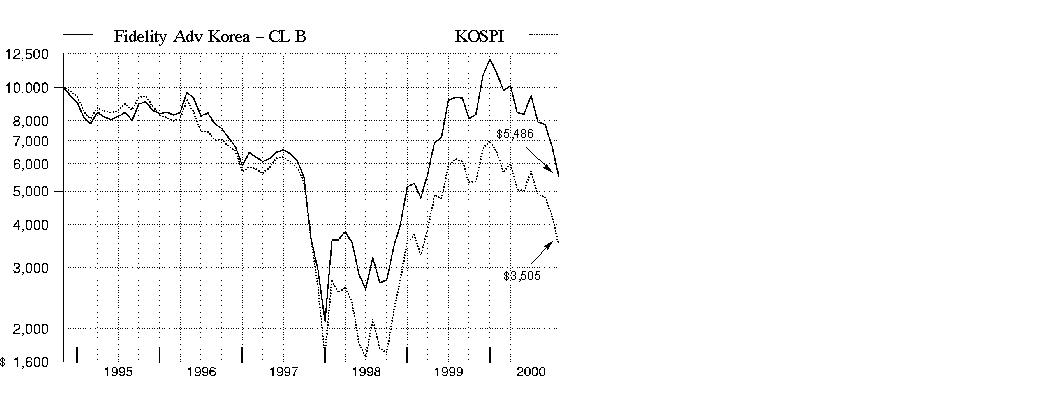
$10,000 Over Life of Fund: Let's say hypothetically that $10,000 was invested in Fidelity Advisor Korea Fund - Class B on October 31, 1994, when the Closed-End Fund started. As the chart shows, by October 31, 2000, the value of the investment, would have been $5,486 - a 45.14% decrease on the initial investment. For comparison, look at how the Korea Composite Stock Price Index did over the same period. With dividends reinvested, the same $10,000 would have been $3,505 - a 64.95% decrease.
Understanding
Performance
Many markets around the globe offer the potential for significant growth over time; however, investing in foreign markets means assuming greater risks than investing in the United States. Factors like changes in a country's financial markets, its local political and economic climate, and the fluctuating value of its currency create these risks. For these reasons an international fund's performance may be more volatile than a fund that invests exclusively in the United States. Past performance is no guarantee of future results and you may have a gain or loss when you sell your shares.
3Annual Report
Fidelity Advisor Korea Fund - Class C
There are several ways to evaluate historical performance. You can look at the total percentage change in value, the average annual percentage change or the growth of a hypothetical $10,000 investment. Total return reflects the change in the value of an investment, assuming reinvestment of the class' dividend income and capital gains (the profits earned upon the sale of securities that have grown in value). The initial offering of Class C shares took place on July 3, 2000. Class C shares bear a 1.00% 12b-1 fee that is reflected in returns after June 30, 2000. Returns between October 31, 1994 and June 30, 2000 are those of Fidelity Advisor Korea, Inc., (the Closed-End Fund). On June 30, 2000, the Closed-End Fund reorganized as an open-end fund through a transfer of all of its assets and liabilities to the fund. Shareholders of the Closed-End Fund received Class A shares of the fund in exchange for their shares of the Closed-End Fund. If Class C shares' total expenses, including its 1.00% 12b-1 fee, had been reflected in the Closed-End Fund's performance, Class C's returns, prior to July 3, 2000 may have been lower. Class C shares' contingent deferred sales charges included in the past one year, past five year and life of fund total return figures are 1%, 0%, and 0%, respectively. If Fidelity had not reimbursed certain class expenses, the total returns would have been lower.
Cumulative Total Returns
|
Periods ended October 31, 2000 |
|
Past 1 |
Past 5 |
Life of |
|
|
Fidelity Adv Korea - CL C |
|
-33.81% |
-38.95% |
-44.62% |
|
|
Fidelity Adv Korea - CL C |
|
-34.47% |
-38.95% |
-44.62% |
|
|
KOSPI |
|
-34.61% |
-62.86% |
-64.95% |
|
|
Pacific Region ex Japan Funds Average |
|
-11.65% |
-17.16% |
n/a* |
|
Cumulative total returns show Class C's performance in percentage terms over a set period - in this case, one year, five years or since the Closed-End Fund started on October 31, 1994. For example, if you had invested $1,000 in a fund that had a 5% return over the past year, the value of your investment would be $1,050. You can compare Class C's returns to the performance of the Korea Composite Stock Price Index (KOSPI) - a market capitalization-weighted index of all common stocks listed on the Korean Stock Exchange. To measure how Class C's performance stacked up against its peers, you can compare it to the Pacific Region ex Japan funds average, which reflects the performance of mutual funds with similar objectives tracked by Lipper Inc. The past one year average represents a peer group of 84 mutual funds. These benchmarks include reinvested dividends and capital gains, if any, and exclude the effect of sales charges.
Average Annual Total Returns
|
Periods ended October 31, 2000 |
Past 1 |
Past 5 |
Life of |
|
|
Fidelity Adv Korea - CL C |
-33.81% |
-9.40% |
-9.38% |
|
|
Fidelity Adv Korea - CL C |
-34.47% |
-9.40% |
-9.38% |
|
|
KOSPI |
-34.61% |
-17.97% |
-16.03% |
|
|
Pacific Region ex Japan Funds Average |
-11.65% |
-4.29% |
n/a* |
|
Average annual total returns take Class C shares' cumulative return and show you what would have happened if Class C shares had performed at a constant rate each year.
* Not available
Annual Report
$10,000 Over Life of Fund
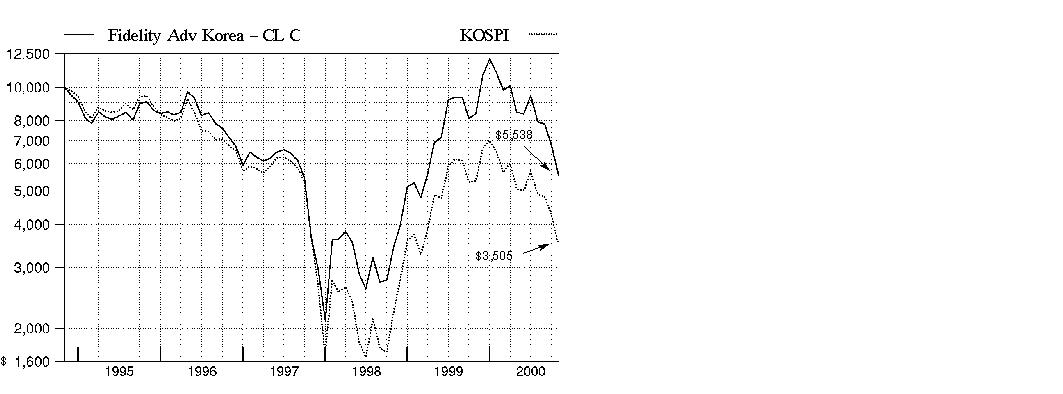
$10,000 Over Life of Fund: Let's say hypothetically that $10,000 was invested in Fidelity Advisor Korea Fund - Class C on October 31, 1994, when the Closed-End Fund started. As the chart shows, by October 31, 2000, the value of the investment, would have been $5,538 - a 44.62% decrease on the initial investment. For comparison, look at how the Korea Composite Stock Price Index did over the same period. With dividends reinvested, the same $10,000 would have been $3,505 - a 64.95% decrease.
Understanding
Performance
Many markets around the globe offer the potential for significant growth over time; however, investing in foreign markets means assuming greater risks than investing in the United States. Factors like changes in a country's financial markets, its local political and economic climate, and the fluctuating value of its currency create these risks. For these reasons an international fund's performance may be more volatile than a fund that invests exclusively in the United States. Past performance is no guarantee of future results and you may have a gain or loss when you sell your shares.
3Annual Report
Fidelity Advisor Korea Fund - Class A
There are several ways to evaluate historical performance. You can look at the total percentage change in value, the average annual percentage change or the growth of a hypothetical $10,000 investment. Total return reflects the change in the value of an investment, assuming reinvestment of the class' dividend income and capital gains (the profits earned upon the sale of securities that have grown in value). The initial offering of Class A shares took place on July 3, 2000. Class A shares bear a 0.25% 12b-1 fee that is reflected in returns after June 30, 2000. Returns between October 31, 1994 and June 30, 2000 are those of Fidelity Advisor Korea, Inc., (the Closed-End Fund). On June 30, 2000, the Closed-End Fund reorganized as an open-end fund through a transfer of all its assets and liabilities to Fidelity Advisor Korea Fund (the fund). Shareholders of the Closed-End Fund received Class A shares of the fund in exchange for their shares of the Closed-End Fund. If Class A shares' total expenses, including its 0.25% 12b-1 fee had been reflected in the Closed-End Fund's performance, Class A's returns prior to July 3, 2000 may have been lower. If Fidelity had not reimbursed certain class expenses, the total returns would have been lower.
Cumulative Total Returns
|
Periods ended September 30, 2000 |
|
Past 1 |
Past 5 |
Life of |
|
|
Fidelity Adv Korea - CL A |
|
-16.60% |
-24.42% |
-32.36% |
|
|
Fidelity Adv Korea - CL A |
|
-21.40% |
-28.77% |
-36.25% |
|
|
KOSPI |
|
-19.59% |
-54.48% |
-57.39% |
|
|
Pacific Region ex Japan Funds Average |
|
0.50% |
-10.84% |
n/a* |
|
Cumulative total returns show Class A's performance in percentage terms over a set period - in this case, one year, five years or since the Closed-End Fund started on October 31, 1994. For example, if you had invested $1,000 in a fund that had a 5% return over the past year, the value of your investment would be $1,050. You can compare Class A's returns to the performance of the Korea Composite Stock Price Index (KOSPI) - a market capitalization-weighted index of all common stocks listed on the Korean Stock Exchange. To measure how Class A's performance stacked up against its peers, you can compare it to the Pacific Region ex Japan funds average, which reflects the performance of mutual funds with similar objectives tracked by Lipper Inc. The past one year average represents a peer group of 81 mutual funds. These benchmarks include reinvested dividends and capital gains, if any, and exclude the effect of sales charges.
Average Annual Total Returns
|
Periods ended September 30, 2000 |
Past 1 |
Past 5 |
Life of |
|
|
Fidelity Adv Korea - CL A |
-16.60% |
-5.45% |
-6.39% |
|
|
Fidelity Adv Korea - CL A |
-21.40% |
-6.56% |
-7.33% |
|
|
KOSPI |
-19.59% |
-14.56% |
-13.43% |
|
|
Pacific Region ex Japan Funds Average |
0.50% |
-2.81% |
n/a* |
|
Average annual total returns take Class A shares' cumulative return and show you what would have happened if Class A shares had performed at a constant rate each year.
* Not available
Annual Report
$10,000 Over Life of Fund
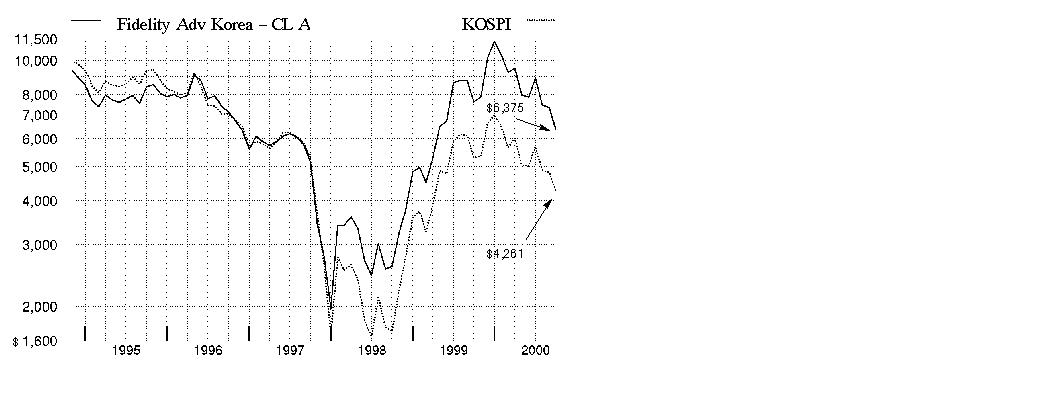
$10,000 Over Life of Fund: Let's say hypothetically that $10,000 was invested in Fidelity Advisor Korea Fund - Class A on October 31, 1994, when the Closed-End Fund started, and the current 5.75% sales charge was paid. As the chart shows, by September 30, 2000, the value of the investment would have been $6,375 - a 36.25% decrease on the initial investment. For comparison, look at how the Korea Composite Stock Price Index did over the same period. With dividends reinvested, the same $10,000 would have been $4,261 - a 57.39% decrease.
Understanding
Performance
Many markets around the globe offer the potential for significant growth over time; however, investing in foreign markets means assuming greater risks than investing in the United States. Factors like changes in a country's financial markets, its local political and economic climate, and the fluctuating value of its currency create these risks. For these reasons an international fund's performance may be more volatile than a fund that invests exclusively in the United States. Past performance is no guarantee of future results and you may have a gain or loss when you sell your shares.
3Annual Report
Fidelity Advisor Korea Fund - Class T
There are several ways to evaluate historical performance. You can look at the total percentage change in value, the average annual percentage change or the growth of a hypothetical $10,000 investment. Total return reflects the change in the value of an investment, assuming reinvestment of the class' dividend income and capital gains (the profits earned upon the sale of securities that have grown in value). The initial offering of Class T shares took place on July 3, 2000. Class T shares bear a 0.50% 12b-1 fee that is reflected in returns after June 30, 2000. Returns between October 31, 1994 and June 30, 2000 are those of Fidelity Advisor Korea, Inc., (the Closed-End Fund). On June 30, 2000, the Closed-End Fund reorganized as an open-end fund through a transfer of all of its assets and liabilities to the fund. Shareholders of the Closed-End Fund received Class A shares of the fund in exchange for their shares of the Closed-End Fund. If Class T shares total expenses, including its 0.50% 12b-1 fee, had been reflected in the Closed-End Fund's performance, Class T's returns prior to July 3, 2000 may have been lower. If Fidelity had not reimbursed certain class expenses, the total returns would have been lower.
Cumulative Total Returns
|
Periods ended September 30, 2000 |
|
Past 1 |
Past 5 |
Life of |
|
|
Fidelity Adv Korea - CL T |
|
-16.60% |
-24.42% |
-32.36% |
|
|
Fidelity Adv Korea - CL T |
|
-19.52% |
-27.07% |
-34.72% |
|
|
KOSPI |
|
-19.59% |
-54.48% |
-57.39% |
|
|
Pacific Region ex Japan Funds Average |
|
0.50% |
-10.84% |
n/a* |
|
Cumulative total returns show Class T's performance in percentage terms over a set period - in this case, one year, five years or since the Closed-End Fund started on October 31, 1994. For example, if you had invested $1,000 in a fund that had a 5% return over the past year, the value of your investment would be $1,050. You can compare Class T's returns to the performance of the Korea Composite Stock Price Index (KOSPI) - a market capitalization-weighted index of all common stocks listed on the Korean Stock Exchange. To measure how Class T's performance stacked up against its peers, you can compare it to the Pacific Region ex Japan funds average, which reflects the performance of mutual funds with similar objectives tracked by Lipper Inc. The past one year average represents a peer group of 81 mutual funds. These benchmarks include reinvested dividends and capital gains, if any, and exclude the effect of sales charges.
Average Annual Total Returns
|
Periods ended September 30, 2000 |
Past 1 |
Past 5 years |
Life of |
|
|
Fidelity Adv Korea - CL T |
-16.60% |
-5.45% |
-6.39% |
|
|
Fidelity Adv Korea - CL T |
-19.52% |
-6.12% |
-6.96% |
|
|
KOSPI |
-19.59% |
-14.56% |
-13.43% |
|
|
Pacific Region ex Japan Funds Average |
0.50% |
-2.81% |
n/a* |
|
Average annual total returns take Class T shares' cumulative return and show you what would have happened if Class T shares had performed at a constant rate each year.
* Not available
Annual Report
$10,000 Over Life of Fund
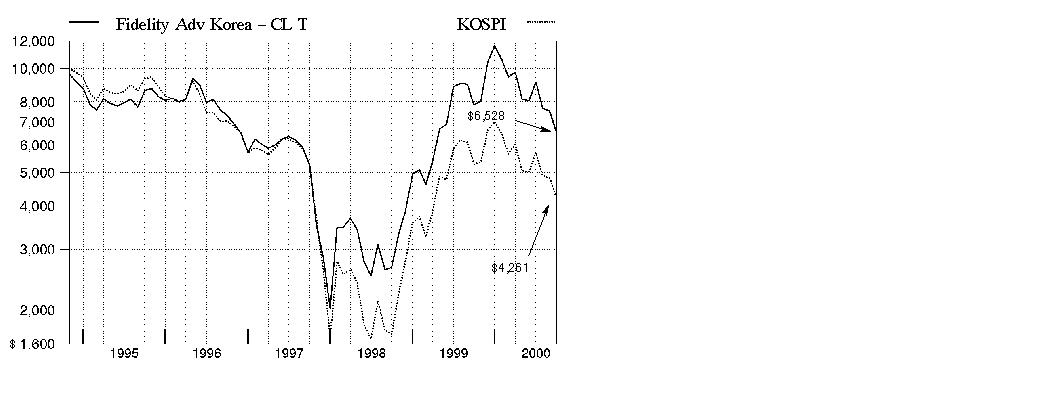
$10,000 Over Life of Fund: Let's say hypothetically that $10,000 was invested in Fidelity Advisor Korea Fund - Class T on October 31, 1994, when the Closed-End Fund started, and the current 3.50% sales charge was paid. As the chart shows, by September 30, 2000, the value of the investment would have been $6,528 - a 34.72% decrease on the initial investment. For comparison, look at how the Korea Composite Stock Price Index did over the same period. With dividends reinvested, the same $10,000 would have been $4,261 - a 57.39% decrease.
Understanding
Performance
Many markets around the globe offer the potential for significant growth over time; however, investing in foreign markets means assuming greater risks than investing in the United States. Factors like changes in a country's financial markets, its local political and economic climate, and the fluctuating value of its currency create these risks. For these reasons an international fund's performance may be more volatile than a fund that invests exclusively in the United States. Past performance is no guarantee of future results and you may have a gain or loss when you sell your shares.
3Annual Report
Fidelity Advisor Korea Fund - Class B
There are several ways to evaluate historical performance. You can look at the total percentage change in value, the average annual percentage change or the growth of a hypothetical $10,000 investment. Total return reflects the change in the value of an investment, assuming reinvestment of the class' dividend income and capital gains (the profits earned upon the sale of securities that have grown in value). The initial offering of Class B shares took place on July 3, 2000. Class B shares bear a 1.00% 12b-1 fee that is reflected in returns after June 30, 2000. Returns between October 31, 1994 and June 30, 2000 are those of Fidelity Advisor Korea, Inc., (the Closed-End Fund). On June 30, 2000, the Closed-End Fund reorganized as an open-end fund through a transfer of all of its assets and liabilities to the fund. Shareholders of the Closed-End Fund received Class A shares of the fund in exchange for their shares of the Closed-End Fund. If Class B shares' total expenses, including its 1.00% 12b-1 fee had been reflected in the Closed-End Fund's performance, Class B's returns, prior to July 3, 2000 may have been lower. Class B shares' contingent deferred sales charges included in the past one year, past five year and life of fund total return figures are 5%, 2%, and 1%, respectively. If Fidelity had not reimbursed certain class expenses, the total returns would have been lower.
Cumulative Total Returns
|
Periods ended September 30, 2000 |
|
Past 1 |
Past 5 |
Life of |
|
|
Fidelity Adv Korea - CL B |
|
-16.70% |
-24.51% |
-32.43% |
|
|
Fidelity Adv Korea - CL B |
|
-20.86% |
-25.93% |
-33.07% |
|
|
KOSPI |
|
-19.59% |
-54.48% |
-57.39% |
|
|
Pacific Region ex Japan Funds Average |
|
0.50% |
-10.84% |
n/a* |
|
Cumulative total returns show Class B's performance in percentage terms over a set period - in this case, one year, five years or since the Closed-End Fund started on October 31, 1994. For example, if you had invested $1,000 in a fund that had a 5% return over the past year, the value of your investment would be $1,050. You can compare Class B's returns to the performance of the Korea Composite Stock Price Index (KOSPI) - a market capitalization-weighted index of all common stocks listed on the Korean Stock Exchange. To measure how Class B's performance stacked up against its peers, you can compare it to the Pacific Region ex Japan funds average, which reflects the performance of mutual funds with similar objectives tracked by Lipper Inc. The past one year average represents a peer group of 81 mutual funds. These benchmarks include reinvested dividends and capital gains, if any, and exclude the effect of sales charges.
Average Annual Total Returns
|
Periods ended September 30, 2000 |
Past 1 |
Past 5 |
Life of |
|
|
Fidelity Adv Korea - CL B |
-16.70% |
-5.47% |
-6.41% |
|
|
Fidelity Adv Korea - CL B |
-20.86% |
-5.83% |
-6.56% |
|
|
KOSPI |
-19.59% |
-14.56% |
-13.43% |
|
|
Pacific Region ex Japan Funds Average |
0.50% |
-2.81% |
n/a* |
|
Average annual total returns take Class B shares' cumulative return and show you what would have happened if Class B shares had performed at a constant rate each year.
* Not available
Annual Report
$10,000 Over Life of Fund
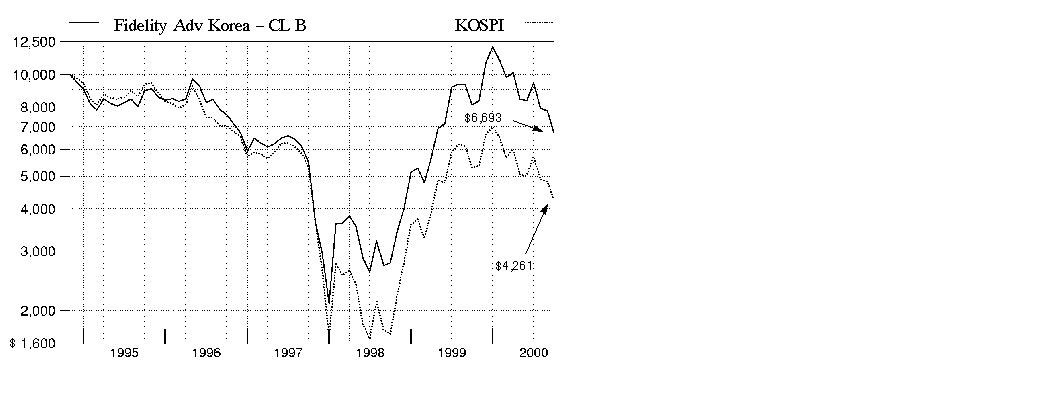
$10,000 Over Life of Fund: Let's say hypothetically that $10,000 was invested in Fidelity Advisor Korea Fund - Class B on October 31, 1994, when the Closed-End Fund started. As the chart shows, by September 30, 2000, the value of the investment, would have been $6,693 - a 33.07% decrease on the initial investment. For comparison, look at how the Korea Composite Stock Price Index did over the same period. With dividends reinvested, the same $10,000 would have been $4,261 - a 57.39% decrease.
Understanding
Performance
Many markets around the globe offer the potential for significant growth over time; however, investing in foreign markets means assuming greater risks than investing in the United States. Factors like changes in a country's financial markets, its local political and economic climate, and the fluctuating value of its currency create these risks. For these reasons an international fund's performance may be more volatile than a fund that invests exclusively in the United States. Past performance is no guarantee of future results and you may have a gain or loss when you sell your shares.
3Annual Report
Fidelity Advisor Korea Fund - Class C
There are several ways to evaluate historical performance. You can look at the total percentage change in value, the average annual percentage change or the growth of a hypothetical $10,000 investment. Total return reflects the change in the value of an investment, assuming reinvestment of the class' dividend income and capital gains (the profits earned upon the sale of securities that have grown in value). The initial offering of Class C shares took place on July 3, 2000. Class C shares bear a 1.00% 12b-1 fee that is reflected in returns after June 30, 2000. Returns between October 31, 1994 and June 30, 2000 are those of Fidelity Advisor Korea, Inc., (the Closed-End Fund). On June 30, 2000, the Closed-End Fund reorganized as an open-end fund through a transfer of all of its assets and liabilities to the fund. Shareholders of the Closed-End Fund received Class A shares of the fund in exchange for their shares of the Closed-End Fund. If Class C shares' total expenses, including its 1.00% 12b-1 fee, had been reflected in the Closed-End Fund's performance, Class C's returns, prior to July 3, 2000 may have been lower. Class C shares' contingent deferred sales charges included in the past one year, past five year and life of fund total return figures are 1%, 0%, and 0%, respectively. If Fidelity had not reimbursed certain class expenses, the total returns would have been lower.
Cumulative Total Returns
|
Periods ended September 30, 2000 |
|
Past 1 |
Past 5 |
Life of |
|
|
Fidelity Adv Korea - CL C |
|
-16.70% |
-24.51% |
-32.43% |
|
|
Fidelity Adv Korea - CL C |
|
-17.53% |
-24.51% |
-32.43% |
|
|
KOSPI |
|
-19.59% |
-54.48% |
-57.39% |
|
|
Pacific Region ex Japan Funds Average |
|
0.50% |
-10.84% |
n/a* |
|
Cumulative total returns show Class C's performance in percentage terms over a set period - in this case, one year, five years or since the Closed-End Fund started on October 31, 1994. For example, if you had invested $1,000 in a fund that had a 5% return over the past year, the value of your investment would be $1,050. You can compare Class C's returns to the performance of the Korea Composite Stock Price Index (KOSPI) - a market capitalization-weighted index of all common stocks listed on the Korean Stock Exchange. To measure how Class C's performance stacked up against its peers, you can compare it to the Pacific Region ex Japan funds average, which reflects the performance of mutual funds with similar objectives tracked by Lipper Inc. The past one year average represents a peer group of 81 mutual funds. These benchmarks include reinvested dividends and capital gains, if any, and exclude the effect of sales charges.
Average Annual Total Returns
|
Periods ended September 30, 2000 |
Past 1 |
Past 5 |
Life of |
|
|
Fidelity Adv Korea - CL C |
-16.70% |
-5.47% |
-6.41% |
|
|
Fidelity Adv Korea - CL C |
-17.53% |
-5.47% |
-6.41% |
|
|
KOSPI |
-19.59% |
-14.56% |
-13.43% |
|
|
Pacific Region ex Japan Funds Average |
0.50% |
-2.81% |
n/a* |
|
Average annual total returns take Class C shares' cumulative return and show you what would have happened if Class C shares had performed at a constant rate each year.
* Not available
Annual Report
$10,000 Over Life of Fund
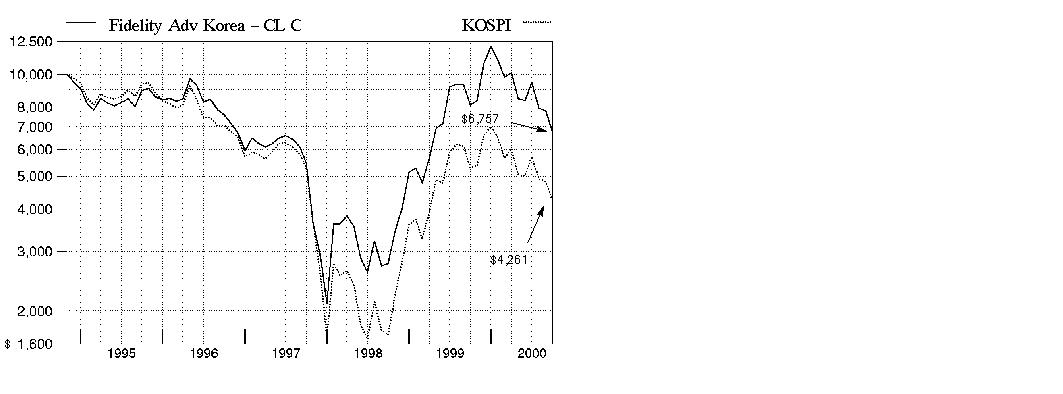
$10,000 Over Life of Fund: Let's say hypothetically that $10,000 was invested in Fidelity Advisor Korea Fund - Class C on October 31, 1994, when the Closed-End Fund started. As the chart shows, by September 30, 2000, the value of the investment, would have been $6,757 - a 32.43% decrease on the initial investment. For comparison, look at how the Korea Composite Stock Price Index did over the same period. With dividends reinvested, the same $10,000 would have been $4,261 - a 57.39% decrease.
Understanding
Performance
Many markets around the globe offer the potential for significant growth over time; however, investing in foreign markets means assuming greater risks than investing in the United States. Factors like changes in a country's financial markets, its local political and economic climate, and the fluctuating value of its currency create these risks. For these reasons an international fund's performance may be more volatile than a fund that invests exclusively in the United States. Past performance is no guarantee of future results and you may have a gain or loss when you sell your shares.
3Annual Report
(Portfolio Manager photograph)
An interview with Hokeun Chung, Portfolio Manager of Fidelity
Advisor Korea Fund
Q. How did the fund perform, Hokeun?
A. For the 12-month period that ended September 30, 2000, the fund's Class A, Class T, Class B and Class C shares returned -16.60%, -16.60%, -16.70% and -16.70%, respectively. These returns outperformed the Korean Stock Exchange Composite Price Index (KOSPI), which returned -19.59% during the same period. Shareholders should be aware that the fund's fiscal year end has changed to October 31. For the 12 months that ended October 31, 2000, the fund's Class A, Class T, Class B and Class C shares returned -33.63%, -33.72%, -33.81% and -33.81%, respectively, while the KOSPI returned -34.61% during the same time frame.
Q. What factors hindered the market's performance during the 12-month period that ended September 30, 2000?
A. Since the beginning of 2000, the South Korean stock market has been hurt by a slowdown in the government's efforts to restructure bad corporate debt and
recapitalize the banking sector. This slowdown weakened investors' confidence in the nation's ongoing economic recovery. Additionally, the sharp rise in crude oil
prices - which hit historically high levels - was of particular concern given the country's heavy reliance on oil: Korea is the sixth-largest consumer of oil in the world
(See callout box at the end of this interview). Further, a global pullback in the technology sector - particularly in the market for dynamic random access memory
(DRAM), which represents the bulk of the country's technology exports - dampened the optimism surrounding Korea's shift to a high-tech-based economy from a
state-managed industrial economy. Unfortunately, this technology correction coincided with the Korean government's aggressive courtship of the Internet through an
ongoing $35 billion public plan to improve the country's Internet infrastructure. The global technology slowdown - particularly in the U.S., Korea's biggest market for
high-tech products - also hurt Korea's large export market for its information tech-
nology products.
Q. Despite these obstacles, the fund still outperformed its benchmark. Why?
A. The difference in performance was the result of good individual stock selection during the first half of the period and an overweighting in strong-performing technology and telecommunications stocks. During the fourth quarter of 1999, overweighting these sectors significantly boosted performance as investors viewed the government's many incentives - such as tax breaks and low-cost loans to information technology start-up firms - in a positive vein. For the majority of this year, however, the fund's overweighting in these two sectors hurt relative performance as a result of the global technology slowdown mentioned previously. Those losses, though, weren't substantial enough to offset our otherwise strong relative performance for the period.
Annual Report
Fund Talk: The Manager's Overview - continued
Q. Did the fund's conversion to open-end status in June alter your management strategy in any way?
A. Yes, it did. First, the fund's conversion from a closed-end portfolio to an open-end portfolio spurred an increase in redemption activity, which was expected. Second, the rise in redemptions coincided with a declining Korean stock market, based on the macroeconomic reasons I mentioned earlier. These two factors - an increase in redemptions and declining stock prices - collectively hindered the fund's short-term performance. Meanwhile, I used this redemption activity as an opportunity to reposition the fund, reducing the number of holdings to focus on the companies I felt most strongly about at the time, such as Samsung Electronics. I also increased the fund's weighting in more defensive areas, such as food and beverage stocks, at the expense of other areas, such as financial stocks. However, I maintained some overweighted positions in selected banks that I felt had the best fundamentals, such as Shinhan Bank.
Q. What specific stocks performed well?
A. SK Telecom, Korea's largest provider of wireless communications, was the fund's top performer. The company continued to benefit from Korea's technology revolution and its growing appetite for wireless data products and Internet access. Investors also reacted favorably to Housing & Commercial Bank and Shinhan Bank for their fiscal discipline within the banking sector.
Q. Which stocks were disappointing?
A. Samsung Electronics, the country's leading manufacturer of DRAM, suffered from the slowing global demand for semiconductors, particularly during the past six months. Korea Electric Power, a company with very low valuations, continued to underperform due to a delay in the expected government approval of the privatization of the firm.
Q. The fund's fiscal year-end changed from September 30 to October 31. Can you tell us how the fund fared in October?
A. The fund's Class A, Class T, Class B and Class C shares returned -17.91%, -18.02%, -18.04% and -18.04%, respectively, during the month. In comparison, the KOSPI returned -17.75%. The fund's overweighting in the utilities and technology sectors continued to hurt short-term performance as a result of the global factors I mentioned earlier. However, I believed the fund's selected stocks in these sectors still offered the best opportunity to achieve superior long-term performance.
Annual Report
Fund Talk: The Manager's Overview - continued
Q. What's your outlook?
A. The Korean stock market remains very cheap in terms of historical valuation, as well as regional comparisons. However, the success of the government's efforts to help the old industrial companies acquire new technology - through low-interest loans and incentives - remains to be seen. The government must continue to inject public money into the banking sector for restructuring. Until these reform efforts play out, we will continue to see market volatility in the immediate future. What's more, the country's recent history of low inflation could come under pressure if oil prices remain high.
The views expressed in this report reflect those of the portfolio manager only through the end of the period of the report as stated on the cover and do not necessarily represent the views of Fidelity or any other person in the Fidelity organization. Any such views are subject to change at any time based upon market or other conditions and Fidelity disclaims any responsibility to update such views. These views may not be relied on as investment advice and, because investment decisions for a Fidelity fund are based on numerous factors, may not be relied on as an indication of trading intent on behalf of any Fidelity fund.
Note to shareholders: Fidelity Advisor Korea Fund may invest up to 35% of its total assets in any industry that represents more than 20% of the Korean market. As of October 31, 2000, the fund did not have more than 25% of its assets invested in any one industry.
Fund Facts
Goal: to achieve long-term capital appreciation through investments in equity and debt securities of Korean issuers
Start date: October 31, 1994 (Closed-End Fund)
Size: as of October 31, 2000, more than $19 million
Manager: Hokeun Chung, since 1996; joined Fidelity in 1994
3Hokeun Chung on how rising oil prices affect the Korean stock market:
"Historically, the Korean Stock Exchange Composite Price Index (KOSPI) has had an inverse relation to the price of oil - meaning that when oil prices rise, stocks tend to suffer, and vice versa. That's because rising crude oil prices affect the Korean economy more severely than countries that have the ability to harness a portion of their own oil and other energy sources. Korea imports 100% of its oil supply, which makes the country's economy particularly vulnerable to price increases.
"Specifically, a $10 per barrel increase in the price of crude oil results in a 2.2% decline in gross domestic product (GDP) output and a 2.2% rise in inflation, according to a recent industry study. With oil rising to $37 per barrel last winter and again this fall - a historically high price - the profits of Korean companies were sharply reduced.
"As a result, investors have reacted with caution to Korean stocks this year, largely because of the threat of inflation due to these rising oil prices. Not helping matters is the fact that Korea's use of oil is currently growing at a faster rate than any other country in the world. Therefore, the stabilization and decline of crude oil prices are crucial to the ongoing growth of the Korean stock market."
Annual Report
|
Top Ten Stocks as of October 31, 2000 |
|||
|
|
% of fund's net assets as of |
||
|
|
October 31, 2000 |
September 30, 2000 |
March 31, 2000 |
|
Samsung Electronics Co. Ltd. |
16.3 |
23.1 |
21.7 |
|
Korea Telecom |
11.4 |
12.8 |
9.0 |
|
SK Telecom Co. Ltd. |
11.2 |
13.8 |
11.1 |
|
Korea Electric Power Corp. |
7.9 |
10.0 |
7.2 |
|
H&CB |
4.8 |
4.0 |
0.0 |
|
Kookmin Bank |
4.6 |
5.2 |
1.6 |
|
Shinhan Bank |
4.0 |
4.9 |
1.9 |
|
Hyundai Electronics Industries Co. Ltd. |
3.7 |
8.2 |
3.2 |
|
Korea Tobacco & Ginseng |
2.6 |
1.6 |
0.6 |
|
Pohang Iron & Steel Co. Ltd. |
2.5 |
3.5 |
4.5 |
|
|
69.0 |
87.1 |
60.8 |
|
Top Ten Market Sectors as of October 31, 2000 |
|||
|
|
% of fund's net assets as of |
||
|
|
October 31, 2000 |
September 30, 2000 |
March 31, 2000 |
|
Utilities |
30.5 |
36.6 |
33.7 |
|
Technology |
23.1 |
34.6 |
33.6 |
|
Finance |
16.1 |
15.6 |
8.3 |
|
Durables |
4.5 |
5.5 |
3.1 |
|
Construction & Real Estate |
3.8 |
3.4 |
0.4 |
|
Nondurables |
3.5 |
2.5 |
2.1 |
|
Basic Industries |
3.5 |
4.8 |
7.7 |
|
Retail & Wholesale |
2.5 |
2.1 |
1.7 |
|
Industrial Machinery |
2.3 |
2.0 |
3.5 |
|
Services |
1.3 |
1.2 |
1.5 |
|
Asset Allocation (% of fund's net assets) |
|||
As of October 31, 2000 As of September 30, 2000 As of March 31, 2000

* Not included in the pie chart.
Annual Report
Showing Percentage of Net Assets
|
Common Stocks - 92.3% |
|||
|
Shares |
Value (Note 1) |
||
|
BASIC INDUSTRIES - 3.5% |
|||
|
Chemicals & Plastics - 1.0% |
|||
|
LG Chemical Ltd. |
19,620 |
$ 193,182 |
|
|
Iron & Steel - 2.5% |
|||
|
Pohang Iron & Steel Co. Ltd. |
8,580 |
498,583 |
|
|
TOTAL BASIC INDUSTRIES |
691,765 |
||
|
CONSTRUCTION & REAL ESTATE - 3.8% |
|||
|
Building Materials - 3.8% |
|||
|
Hankuk Electric Glass Co. Ltd. |
4,500 |
284,835 |
|
|
Samsung Heavy Industries Ltd. (a) |
154,500 |
480,818 |
|
|
|
765,653 |
||
|
DURABLES - 4.5% |
|||
|
Autos, Tires, & Accessories - 2.4% |
|||
|
Hankook Tire Co. Ltd. |
39,080 |
73,866 |
|
|
Hyundai Motor Co. Ltd. |
35,000 |
400,000 |
|
|
|
473,866 |
||
|
Consumer Electronics - 1.4% |
|||
|
LG Electronics, Inc. |
20,060 |
279,517 |
|
|
Textiles & Apparel - 0.7% |
|||
|
Cheil Industries, Inc. |
32,300 |
140,558 |
|
|
TOTAL DURABLES |
893,941 |
||
|
ENERGY - 1.2% |
|||
|
Oil & Gas - 1.2% |
|||
|
S-Oil Corp. |
10,000 |
248,791 |
|
|
FINANCE - 16.1% |
|||
|
Banks - 13.4% |
|||
|
H&CB |
39,750 |
955,747 |
|
|
Kookmin Bank |
79,940 |
913,600 |
|
|
Shinhan Bank |
80,240 |
804,164 |
|
|
|
2,673,511 |
||
|
Credit & Other Finance - 1.8% |
|||
|
Kookmin Credit Card Co. Ltd. |
12,590 |
274,490 |
|
|
Samsung Securities Co. Ltd. |
4,940 |
89,463 |
|
|
|
363,953 |
||
|
Common Stocks - continued |
|||
|
Shares |
Value (Note 1) |
||
|
FINANCE - continued |
|||
|
Insurance - 0.9% |
|||
|
Samsung Fire & Marine Insurance |
7,270 |
$ 168,728 |
|
|
TOTAL FINANCE |
3,206,192 |
||
|
INDUSTRIAL MACHINERY & EQUIPMENT - 2.3% |
|||
|
Electrical Equipment - 2.3% |
|||
|
Samsung Electro-Mechanics Co. (a) |
14,500 |
464,000 |
|
|
NONDURABLES - 3.5% |
|||
|
Agriculture - 2.6% |
|||
|
Korea Tobacco & Ginseng Co. Ltd. |
32,540 |
516,349 |
|
|
Foods - 0.9% |
|||
|
Cheil Jedang Corp. |
6,470 |
189,408 |
|
|
TOTAL NONDURABLES |
705,757 |
||
|
RETAIL & WHOLESALE - 2.5% |
|||
|
General Merchandise Stores - 2.5% |
|||
|
Shinsegae Department Store |
10,770 |
496,130 |
|
|
SERVICES - 1.3% |
|||
|
Advertising - 0.9% |
|||
|
Cheil Communications, Inc. |
2,820 |
180,976 |
|
|
Services - 0.4% |
|||
|
S1 Corp. |
6,660 |
69,088 |
|
|
TOTAL SERVICES |
250,064 |
||
|
TECHNOLOGY - 23.1% |
|||
|
Computer Services & Software - 1.0% |
|||
|
NCsoft Corp. |
2,460 |
190,961 |
|
|
Electronics - 22.1% |
|||
|
Hyundai Electronics Industries Co. Ltd. (a) |
120,000 |
737,407 |
|
|
Samsung Electronics Co. Ltd. |
26,000 |
3,257,143 |
|
|
Samsung SDI Co. Ltd. |
10,900 |
424,501 |
|
|
|
4,419,051 |
||
|
TOTAL TECHNOLOGY |
4,610,012 |
||
|
Common Stocks - continued |
|||
|
Shares |
Value (Note 1) |
||
|
UTILITIES - 30.5% |
|||
|
Cellular - 11.2% |
|||
|
SK Telecom Co. Ltd. |
10,460 |
$ 2,229,934 |
|
|
Electric Utility - 7.9% |
|||
|
Korea Electric Power Corp. |
70,960 |
1,584,514 |
|
|
Telephone Services - 11.4% |
|||
|
Korea Telecom |
38,840 |
2,287,719 |
|
|
TOTAL UTILITIES |
6,102,167 |
||
|
TOTAL COMMON STOCKS (Cost $12,359,321) |
18,434,472 |
||
|
Nonconvertible Bonds - 0.0% |
|||||
|
Moody's Ratings (unaudited) |
|
|
|||
|
FINANCE - 0.0% |
|||||
|
Banks - 0.0% |
|||||
|
Shinhan Bank 0% 12/31/48 unit |
- |
|
6,493 |
71 |
|
|
Cash Equivalents - 6.4% |
|||
|
|
|
||
|
Fidelity Cash Central Fund, 6.61% (b) |
1,287,484 |
1,287,484 |
|
|
|
|
||
|
TOTAL INVESTMENT PORTFOLIO - 98.7% (Cost $13,646,854) |
19,722,027 |
||
|
NET OTHER ASSETS - 1.3% |
253,665 |
||
|
NET ASSETS - 100% |
$ 19,975,692 |
||
|
Legend |
|
(a) Non-income producing |
|
(b) The rate quoted is the annualized seven-day yield of the fund at period end. A complete listing of the fund's holdings as of its most recent fiscal year end is available upon request. |
|
(c) Amounts represent units held. |
|
Income Tax Information |
|
At October 31, 2000, the aggregate cost of investment securities for income tax purposes was $14,247,261. Net unrealized appreciation aggregated $5,474,766, of which $7,758,559 related to appreciated investment securities and $2,283,793 related to depreciated investment securities. |
|
At October 31, 2000, the fund |
See accompanying notes which are an integral part of the financial statements.
Annual Report
Showing Percentage of Net Assets
|
Common Stocks - 108.3% |
|||
|
Shares |
Value (Note 1) |
||
|
BASIC INDUSTRIES - 4.8% |
|||
|
Chemicals & Plastics - 1.3% |
|||
|
LG Chemical Ltd. |
27,000 |
$ 336,547 |
|
|
Iron & Steel - 3.5% |
|||
|
Pohang Iron & Steel Co. Ltd. |
11,800 |
878,267 |
|
|
TOTAL BASIC INDUSTRIES |
1,214,814 |
||
|
CONSTRUCTION & REAL ESTATE - 3.4% |
|||
|
Building Materials - 3.4% |
|||
|
Hankuk Electric Glass Co. Ltd. |
3,900 |
220,329 |
|
|
Samsung Heavy Industries Ltd. (a) |
186,850 |
630,848 |
|
|
|
851,177 |
||
|
DURABLES - 5.5% |
|||
|
Autos, Tires, & Accessories - 3.2% |
|||
|
Hankook Tire Co. Ltd. |
53,780 |
107,545 |
|
|
Hyundai Motor Co. Ltd. |
53,730 |
698,637 |
|
|
|
806,182 |
||
|
Consumer Electronics - 1.7% |
|||
|
LG Electronics, Inc. |
22,100 |
430,050 |
|
|
Textiles & Apparel - 0.6% |
|||
|
Cheil Industries, Inc. |
30,000 |
166,256 |
|
|
TOTAL DURABLES |
1,402,488 |
||
|
FINANCE - 15.6% |
|||
|
Banks - 14.1% |
|||
|
H&CB |
43,000 |
1,017,979 |
|
|
Kookmin Bank |
110,000 |
1,311,931 |
|
|
Shinhan Bank |
110,410 |
1,237,613 |
|
|
|
3,567,523 |
||
|
Credit & Other Finance - 0.5% |
|||
|
Samsung Securities Co. Ltd. |
6,800 |
137,506 |
|
|
Insurance - 1.0% |
|||
|
Samsung Fire & Marine Insurance |
10,000 |
260,055 |
|
|
TOTAL FINANCE |
3,965,084 |
||
|
INDUSTRIAL MACHINERY & EQUIPMENT - 2.0% |
|||
|
Electrical Equipment - 2.0% |
|||
|
Samsung Electro-Mechanics Co. (a) |
15,000 |
507,106 |
|
|
Common Stocks - continued |
|||
|
Shares |
Value (Note 1) |
||
|
NONDURABLES - 2.5% |
|||
|
Agriculture - 1.6% |
|||
|
Korea Tobacco & Ginseng Co. Ltd. |
25,000 |
$ 408,017 |
|
|
Foods - 0.9% |
|||
|
Cheil Jedang Corp. |
6,120 |
221,717 |
|
|
TOTAL NONDURABLES |
629,734 |
||
|
RETAIL & WHOLESALE - 2.1% |
|||
|
General Merchandise Stores - 2.1% |
|||
|
Shinsegae Department Store |
10,000 |
542,528 |
|
|
SERVICES - 1.2% |
|||
|
Advertising - 0.8% |
|||
|
Cheil Communications, Inc. |
2,500 |
210,734 |
|
|
Services - 0.4% |
|||
|
S1 Corp. |
9,170 |
95,799 |
|
|
TOTAL SERVICES |
306,533 |
||
|
TECHNOLOGY - 34.6% |
|||
|
Computer Services & Software - 0.7% |
|||
|
NCsoft Corp. |
1,500 |
160,068 |
|
|
Electronic Instruments - 0.3% |
|||
|
Mirae Corp. |
30,580 |
76,782 |
|
|
Electronics - 33.6% |
|||
|
Hyundai Electronics Industries Co. Ltd. (a) |
145,800 |
2,085,378 |
|
|
Samsung Electronics Co. Ltd. |
32,280 |
5,847,247 |
|
|
Samsung SDI Co. Ltd. |
15,000 |
593,194 |
|
|
|
8,525,819 |
||
|
TOTAL TECHNOLOGY |
8,762,669 |
||
|
UTILITIES - 36.6% |
|||
|
Cellular - 13.8% |
|||
|
SK Telecom Co. Ltd. |
14,400 |
3,512,351 |
|
|
Electric Utility - 10.0% |
|||
|
Korea Electric Power Corp. |
97,630 |
2,547,668 |
|
|
Common Stocks - continued |
|||
|
Shares |
Value (Note 1) |
||
|
UTILITIES - continued |
|||
|
Telephone Services - 12.8% |
|||
|
Korea Telecom |
53,460 |
$ 3,234,397 |
|
|
TOTAL UTILITIES |
9,294,416 |
||
|
TOTAL COMMON STOCKS (Cost $16,100,142) |
27,476,549 |
||
|
Nonconvertible Bonds - 0.0% |
|||||
|
Moody's Ratings (unaudited) |
|
|
|||
|
FINANCE - 0.0% |
|||||
|
Banks - 0.0% |
|||||
|
Shinhan Bank 0% 12/31/48 unit |
- |
|
6,493 |
84 |
|
|
Cash Equivalents - 4.1% |
|||
|
|
|
||
|
Fidelity Cash Central Fund, 6.60% (b) |
1,040,914 |
1,040,914 |
|
|
TOTAL INVESTMENT PORTFOLIO - 112.4% (Cost $17,141,105) |
28,517,547 |
||
|
NET OTHER ASSETS - (12.4)% |
(3,150,696) |
||
|
NET ASSETS - 100% |
$ 25,366,851 |
||
|
Legend |
|
(a) Non-income producing |
|
(b) The rate quoted is the annualized seven-day yield of the fund at period end. A complete listing of the fund's holdings as of its most recent fiscal year end is available upon request. |
|
(c) Amounts represent units held. |
|
Income Tax Information |
|
At September 30, 2000, the aggregate cost of investment securities for income tax purposes was $17,547,620. Net unrealized appreciation aggregated $10,969,927, of which $12,294,738 related to appreciated investment securities and $1,324,811 related to depreciated investment securities. |
|
At September 30, 2000, the fund had a capital loss carryforward of approximately $21,144,000 of which $9,029,000 and $12,115,000 will expire on September 30, 2006 and September 30, 2007, respectively. |
See accompanying notes which are an integral part of the financial statements.
Annual Report
Statement of Assets and Liabilities
|
|
October 31,2000 |
September 30, 2000 |
|
Assets |
|
|
|
Investment in securities, at value (cost $13,646,854 and $17,141,105, respectively) - |
$ 19,722,027 |
$ 28,517,547 |
|
Receivable for fund shares sold |
361,566 |
- |
|
Dividends receivable |
1,050 |
5,751 |
|
Interest receivable |
6,568 |
5,946 |
|
Redemption fees receivable |
29 |
53 |
|
Total assets |
20,091,240 |
28,529,297 |
|
Liabilities |
|
|
|
Payable for investments purchased |
- |
200,188 |
|
Payable for fund shares redeemed |
2,116 |
2,817,908 |
|
Accrued management fee |
11,557 |
747 |
|
Distribution fees payable |
4,639 |
5,793 |
|
Other payables and accrued expenses |
97,236 |
137,810 |
|
Total liabilities |
115,548 |
3,162,446 |
|
Net Assets |
$ 19,975,692 |
$ 25,366,851 |
|
Net Assets consist of: |
|
|
|
Paid in capital |
$ 34,569,666 |
$ 35,534,742 |
|
Accumulated undistributed net realized gain (loss) on investments and foreign currency transactions |
(20,669,127) |
(21,544,222) |
|
Net unrealized appreciation (depreciation) on investments and assets and liabilities in foreign currencies |
6,075,153 |
11,376,331 |
|
Net Assets |
$ 19,975,692 |
$ 25,366,851 |
See accompanying notes which are an integral part of the financial statements.
Annual Report
Financial Statements - continued
Statement of Assets and Liabilities - continued
|
|
October 31, 2000 |
September 30, 2000 |
|
Calculation of Maximum Offering Price |
$7.38 |
$8.99 |
|
Maximum offering price per share (100/94.25 of $7.38 and $8.99), respectively |
$7.83 |
$9.54 |
|
Class T: |
$7.37 |
$8.99 |
|
Maximum offering price per share (100/96.50 of $7.37 and $8.99), respectively |
$7.64 |
$9.32 |
|
Class B: |
$7.36 |
$8.98 |
|
Class C: |
$7.36 |
$8.98 |
|
Institutional Class: |
$7.39 |
$8.99 |
A Redemption price per share is equal to net asset value less any applicable contingent deferred sales charge.
See accompanying notes which are an integral part of the financial statements.
Annual Report
Financial Statements - continued
Statement of Operations
|
|
One month ended |
Year ended |
|
Investment Income Dividends |
$ 705 |
$ 842,306 |
|
Interest |
6,568 |
50,635 |
|
|
7,273 |
892,941 |
|
Less foreign taxes withheld |
(116) |
(139,956) |
|
Total income |
7,157 |
752,985 |
|
Expenses |
|
|
|
Management fee |
15,231 |
629,634 |
|
Transfer agent fees |
5,434 |
36,642 |
|
Distribution fees |
4,639 |
13,595 |
|
Accounting fees and expenses |
5,000 |
125,040 |
|
Non-interested trustees' compensation |
8 |
66,116 |
|
Custodian fees and expenses |
5,009 |
121,825 |
|
Registration fees |
6,938 |
46,655 |
|
Audit |
153 |
43,969 |
|
Legal |
- |
116,925 |
|
Amortization of organization expenses |
- |
2,278 |
|
Interest |
- |
2,078 |
|
Reports to shareholders |
- |
61,161 |
|
Miscellaneous |
- |
7,529 |
|
Total expenses before reductions |
42,412 |
1,273,447 |
|
Expense reductions |
(3,674) |
(50,322) |
|
|
38,738 |
1,223,125 |
|
Net investment income (loss) |
(31,581) |
(470,140) |
|
Realized and Unrealized Gain (Loss) Net realized gain (loss) on: |
|
|
|
Investment securities |
875,095 |
9,731,272 |
|
Foreign currency transactions |
(40,556) |
(84,767) |
|
|
834,539 |
9,646,505 |
|
Change in net unrealized appreciation (depreciation) on: |
|
|
|
Investment securities |
(5,301,269) |
(11,683,796) |
|
Assets and liabilities in foreign currencies |
91 |
(13,880) |
|
|
(5,301,178) |
(11,697,676) |
|
Net gain (loss) |
(4,466,639) |
(2,051,171) |
|
Net increase (decrease) in net assets resulting |
$ (4,498,220) |
$ (2,521,311) |
See accompanying notes which are an integral part of the financial statements.
Annual Report
Financial Statements - continued
Statement of Changes in Net Assets
|
|
One month ended
October 31, |
Year ended September 30, 2000 |
Year ended September 30, 1999 |
|
Increase (Decrease) in Net Assets |
|
|
|
|
Operations |
$ (31,581) |
$ (470,140) |
$ (211,518) |
|
Net realized gain (loss) |
834,539 |
9,646,505 |
7,027,931 |
|
Change in net unrealized |
(5,301,178) |
(11,697,676) |
35,458,966 |
|
Net increase (decrease) in net assets resulting from operations |
(4,498,220) |
(2,521,311) |
42,275,379 |
|
Share transactions - |
(955,611) |
(34,086,003) |
(4,639,364) |
|
Redemption fees |
62,672 |
1,372,965 |
50,478 |
|
Total increase (decrease) in |
(5,391,159) |
(35,234,349) |
37,686,493 |
|
Net Assets |
|
|
|
|
Beginning of period |
25,366,851 |
60,601,200 |
22,914,707 |
|
End of period |
$ 19,975,692 |
$ 25,366,851 |
$ 60,601,200 |
See accompanying notes which are an integral part of the financial statements.
Annual Report
|
|
One month ended |
Years ended September 30, |
(automated graphic) | ||||
|
Selected Per-Share Data |
2000 |
2000 H |
1999 |
1998 |
1997 |
1996 |
|
|
Net asset value, beginning of period |
$ 8.99 |
$ 10.78 |
$ 3.67 |
$ 7.26 |
$ 10.71 |
$ 12.62 |
|
|
Income from Investment Operations |
|
|
|
|
|
|
|
|
Net investment income (loss) C |
(.01) |
(.09) |
(.04) G |
(.05) |
(.06) |
(.08) |
|
|
Net realized and unrealized gain (loss) |
(1.62) |
(1.97) |
7.15 |
(3.54) |
(3.14) |
(1.83) |
|
|
Total from investment operations |
(1.63) |
(2.06) |
7.11 |
(3.59) |
(3.20) |
(1.91) |
|
|
Dilution resulting from common stock issued through |
- |
- |
- |
- |
(.19) |
- |
|
|
Offering expenses |
- |
- |
- |
- |
(.06) |
- |
|
|
Redemption fees added to paid in capital |
.02 |
.27 |
- |
- |
- |
- |
|
|
Net asset value, end of period |
$ 7.38 |
$ 8.99 |
$ 10.78 F |
$ 3.67 |
$ 7.26 |
$ 10.71 |
|
|
Total Return A, B |
(17.91)% |
(16.60)% |
193.73% |
(49.45)% |
(28.08)% I |
(15.13)% |
|
|
Ratios and Supplemental Data |
|
|
|
|
|
|
|
|
Net assets, end of period (000 omitted) |
$ 19,279 |
$ 25,017 |
$ 60,601 |
$ 22,915 |
$ 45,312 |
$ 47,181 |
|
|
Ratio of expenses to average net assets |
2.10% D, J |
1.91% D |
1.75% |
2.32% |
1.88% |
1.80% |
|
|
Ratio of expenses to average net assets after |
2.10% J |
1.89% E |
1.61% E, G |
2.30% E |
1.88% |
1.79% E |
|
|
Ratio of net investment income (loss) to average net assets |
(1.71)% J |
(.73)% |
(.42)% |
(1.22)% |
(.64)% |
(.68)% |
|
|
Portfolio turnover rate |
121% J |
39% |
58% |
65% |
51% |
28% |
|
|
A The total returns would have been lower had certain expenses not been reduced during the periods shown. B Total returns do not include the one time sales charge and for periods of less
than one year are not annualized. |
|||||||
Financial Highlights - Class T
|
|
One month ended |
Period ended |
|
Selected Per-Share Data |
|
|
|
Net asset value, beginning of period |
$ 8.99 |
$ 12.58 |
|
Income from Investment Operations |
|
|
|
Net investment income (loss) D |
(.01) |
(.03) |
|
Net realized and unrealized gain (loss) |
(1.61) |
(3.56) |
|
Total from investment operations |
(1.62) |
(3.59) |
|
Net asset value, end of period |
$ 7.37 |
$ 8.99 |
|
Total Return B, C |
(18.02)% |
(28.54)% |
|
Ratios and Supplemental Data |
|
|
|
Net assets, end of period (000 omitted) |
$ 473 |
$ 108 |
|
Ratio of expenses to average net assets |
2.35% A, F |
2.35% A, F |
|
Ratio of expenses to average net assets after |
2.35% A |
2.32% A, G |
|
Ratio of net investment income (loss) to average net assets |
(1.96)% A |
(1.16)% A |
|
Portfolio turnover rate |
121% A |
39% |
A Annualized
B The total returns would have been lower had certain expenses not been reduced during the periods shown.
C Total returns do not include the one time sales charge and for periods of less than one year are not annualized.
D Net investment income (loss) per share has been calculated based on average shares outstanding during the period.
E For the period July 3, 2000 (commencement of sale of Class T shares) to September 30, 2000.
F FMR agreed to reimburse a portion of the class' expenses during the period. Without this reimbursement, the class' expense ratio would have been higher.
G FMR or the fund has entered into varying arrangements with third parties who either paid or reduced a portion of the class' expenses.
See accompanying notes which are an integral part of the financial statements.
Annual Report
Financial Highlights - Class B
|
|
One month ended |
Period ended |
|
Selected Per-Share Data |
|
|
|
Net asset value, beginning of period |
$ 8.98 |
$ 12.58 |
|
Income from Investment Operations |
|
|
|
Net investment income (loss) D |
(.02) |
(.04) |
|
Net realized and unrealized gain (loss) |
(1.60) |
(3.56) |
|
Total from investment operations |
(1.62) |
(3.60) |
|
Net asset value, end of period |
$ 7.36 |
$ 8.98 |
|
Total Return B, C |
(18.04)% |
(28.62)% |
|
Ratios and Supplemental Data |
|
|
|
Net assets, end of period (000 omitted) |
$ 83 |
$ 80 |
|
Ratio of expenses to average net assets |
2.85% A, F |
2.85% A, F |
|
Ratio of expenses to average net assets after |
2.85% A |
2.83% A, G |
|
Ratio of net investment income (loss) to average net assets |
(2.45)% A |
(1.67)% A |
|
Portfolio turnover rate |
121% A |
39% |
A Annualized
B The total returns would have been lower had certain expenses not been reduced during the periods shown.
C Total returns do not include the contingent deferred sales charge and for periods of less than one year are not annualized.
D Net investment income (loss) per share has been calculated based on average shares outstanding during the period.
E For the period July 3, 2000 (commencement of sale of Class B shares) to September 30, 2000.
F FMR agreed to reimburse a portion of the class' expenses during the period. Without this reimbursement, the class' expense ratio would have been higher.
G FMR or the fund has entered into varying arrangements with third parties who either paid or reduced a portion of the class' expenses.
See accompanying notes which are an integral part of the financial statements.
Annual Report
Financial Highlights - Class C
|
|
One month ended |
Period ended |
|
Selected Per-Share Data |
|
|
|
Net asset value, beginning of period |
$ 8.98 |
$ 12.58 |
|
Income from Investment Operations |
|
|
|
Net investment income (loss) D |
(.02) |
(.04) |
|
Net realized and unrealized gain (loss) |
(1.60) |
(3.56) |
|
Total from investment operations |
(1.62) |
(3.60) |
|
Net asset value, end of period |
$ 7.36 |
$ 8.98 |
|
Total Return B, C |
(18.04)% |
(28.62)% |
|
Ratios and Supplemental Data |
|
|
|
Net assets, end of period (000 omitted) |
$ 82 |
$ 90 |
|
Ratio of expenses to average net assets |
2.85% A, F |
2.85% A, F |
|
Ratio of expenses to average net assets after |
2.85% A |
2.82% A , G |
|
Ratio of net investment income (loss) to average net assets |
(2.46)% A |
(1.66)% A |
|
Portfolio turnover rate |
121% A |
39% |
A Annualized
B The total returns would have been lower had certain expenses not been reduced during the periods shown.
C Total returns do not include the contingent deferred sales charge and for periods of less than one year are not annualized.
D Net investment income (loss) per share has been calculated based on average shares outstanding during the period.
E For the period July 3, 2000 (commencement of sale of Class C shares) to September 30, 2000.
F FMR agreed to reimburse a portion of the class' expenses during the period. Without this reimbursement, the class' expense ratio would have been higher.
G FMR or the fund has entered into varying arrangements with third parties who either paid or reduced a portion of the class' expenses.
See accompanying notes which are an integral part of the financial statements.
Annual Report
Financial Highlights - Institutional Class
|
|
One month ended |
Period ended |
|
Selected Per-Share Data |
|
|
|
Net asset value, beginning of period |
$ 8.99 |
$ 12.58 |
|
Income from Investment Operations |
|
|
|
Net investment income (loss) D |
(.01) |
(.01) |
|
Net realized and unrealized gain (loss) |
(1.59) |
(3.58) |
|
Total from investment operations |
(1.60) |
(3.59) |
|
Net asset value, end of period |
$ 7.39 |
$ 8.99 |
|
Total Return B, C |
(17.80)% |
(28.54)% |
|
Ratios and Supplemental Data |
|
|
|
Net assets, end of period (000 omitted) |
$ 59 |
$ 71 |
|
Ratio of expenses to average net assets |
1.77% A |
1.85% A, F |
|
Ratio of expenses to average net assets after |
1.77% A |
1.84% A, G |
|
Ratio of net investment income (loss) to average net assets |
(1.38)% A |
(.68)% A |
|
Portfolio turnover rate |
121% A |
39% |
A Annualized
B The total returns would have been lower had certain expenses not been reduced during the periods shown.
C Total returns for periods of less than one year are not annualized.
D Net investment income (loss) per share has been calculated based on average shares outstanding during the period.
E For the period July 3, 2000 (commencement of sale of Institutional Class shares) to September 30, 2000.
F FMR agreed to reimburse a portion of the class' expenses during the period. Without this reimbursement, the class' expense ratio would have been higher.
G FMR or the fund has entered into varying arrangements with third parties who either paid or reduced a portion of the class' expenses.
See accompanying notes which are an integral part of the financial statements.
Annual Report
For the periods ended October 31, 2000 and September 30, 2000
1. Significant Accounting Policies.
Fidelity Advisor Korea Fund (the fund) is a fund of Fidelity Advisor Series VIII (the trust) and is authorized to issue an unlimited number of shares. The trust is registered under the Investment Company Act of 1940, as amended (the 1940 Act), as an open-end management investment company organized as a Massachusetts business trust. Prior to June 30, 2000, the fund operated as Fidelity Advisor Korea Fund, Inc. (the Closed-End Fund), a closed end fund with the same investment objective and substantially similar investment policies. On June 30, 2000, the Closed-End Fund was reorganized as an open-end fund through a transfer of all of its assets and liabilities to the fund. Shareholders of the Closed-End Fund received Class A shares of the fund in exchange for their shares of the Closed-End Fund. Class A, Class T, Class B, Class C and Institutional Class shares of the fund were not offered prior to July 3, 2000.
The fund offers Class A, Class T, Class B, Class C, and Institutional Class shares, each of which has equal rights as to assets and voting privileges. Each class has exclusive voting rights with respect to matters that affect that class. Class B shares will automatically convert to Class A shares after a holding period of seven years from the initial date of purchase. Investment income, realized and unrealized capital gains and losses, the common expenses of the fund, and certain fund-level expense reductions, if any, are allocated on a pro rata basis to each class based on the relative net assets of each class to the total net assets of the fund. Each class of shares differs in its respective distribution, transfer agent, and certain other class-specific fees, expenses, and expense reductions.
The fund's investments in emerging markets can be subject to social, economic, regulatory, and political uncertainties and can be extremely volatile.
The financial statements have been prepared in conformity with generally accepted accounting principles which require management to make certain estimates and assumptions at the date of the financial statements. On May 18, 2000, the Board of Trustees approved a change in the fiscal year-end of the trust to October 31. Accordingly, the financial statements of the fund are presented as of and for the year ended September 30, 2000 and as of and for the one-month period ended October 31, 2000. The following summarizes the significant accounting policies of the fund:
Security Valuation. Securities for which exchange quotations are readily available are valued at the last sale price, or if no sale price, at the closing bid price. Foreign securities are valued based on quotations from the principal market in which such securities are normally traded. If trading or events occurring in other markets after the close of the principal market in which foreign securities are traded, and before the close of the business of the fund, are expected to materially affect the value of those securities, then they are valued at their fair value taking this trading or these events into account. Fair value is determined in good faith under consistently applied procedures under the general supervision of the Board of Trustees. Securities for which exchange quotations are not readily available (and in certain cases debt securities which trade on an exchange)
Annual Report
Notes to Financial Statements - continued
1. Significant Accounting Policies - continued
Security Valuation - continued
are valued primarily using dealer-supplied valuations or at their fair value. Short-term securities with remaining maturities of sixty days or less for which quotations are not readily available are valued at amortized cost or original cost plus accrued interest, both of which approximate current value. Investments in open-end investment companies are valued at their net asset value each business day.
Foreign Currency Translation. The accounting records of the fund are maintained in U.S. dollars. Investment securities and other assets and liabilities denominated in a foreign currency are translated into U.S. dollars at the prevailing rates of exchange at period end. Purchases and sales of securities, income receipts and expense payments are translated into U.S. dollars at the prevailing exchange rate on the respective dates of the transactions.
Net realized gains and losses on foreign currency transactions represent net gains and losses from sales and maturities of foreign currency contracts, disposition of foreign currencies, the difference between the amount of net investment income accrued and the U.S. dollar amount actually received, and gains and losses between trade and settlement date on purchases and sales of securities. The effects of changes in foreign currency exchange rates on investments in securities are included with the net realized and unrealized gain or loss on investment securities.
Income Taxes. As a qualified regulated investment company under Subchapter M of the Internal Revenue Code, the fund is not subject to U.S. federal income taxes to the extent that it distributes substantially all of its taxable income for its fiscal year. The fund may be subject to foreign taxes on income and gains on investments which are accrued based upon the fund's understanding of the tax rules and regulations that exist in the markets in which it invests. Foreign governments may also impose taxes on other payments or transactions with respect to foreign securities. The fund accrues such taxes as applicable. The schedule of investments includes information regarding income taxes under the caption "Income Tax Information."
Investment Income. Dividend income is recorded on the ex-dividend date, except certain dividends from foreign securities where the ex-dividend date may have passed, are recorded as soon as the fund is informed of the ex-dividend date. Non-cash dividends included in dividend income, if any, are recorded at the fair market value of the securities received. Interest income is accrued as earned. Investment income is recorded net of foreign taxes withheld where recovery of such taxes is uncertain.
Expenses. Most expenses of the trust can be directly attributed to a fund. Expenses which cannot be directly attributed are apportioned among the funds in the trust.
Annual Report
Notes to Financial Statements - continued
1. Significant Accounting Policies - continued
Expenses - continued
The fund incurred organization expenses in connection with its initial issuance of shares. The organization expenses of $157,276 were amortized on a straight-line basis for a five-year period beginning at the commencement of operations of the fund. The organization expenses have been fully amortized as of March 31, 2000.
Distributions to Shareholders. Distributions are recorded on the ex-dividend date. Income dividends and capital gain distributions are declared separately for each class.
Income and capital gain distributions are determined in accordance with income tax regulations which may differ from generally accepted accounting principles. These differences, which may result in distribution reclassifications, are primarily due to differing treatments for foreign currency transactions, net operating losses, capital loss carryforwards and losses deferred due to wash sales.
Permanent book and tax basis differences relating to shareholder distributions will result in reclassifications to paid in capital. Accumulated undistributed net realized gain (loss) on investments and foreign currency transactions may include temporary book and tax basis differences which will reverse in a subsequent period. Any taxable income or gain remaining at fiscal year end is distributed in the following year.
Short-Term Trading (Redemption) Fees. Class A shares received in connection with the reorganization and redeemed within 200 days of the reorganization are subject to a 4% short-term trading fee. The fee, which is retained by the fund, is accounted for as an addition to paid in capital.
Security Transactions. Security transactions are accounted for as of trade date. Gains and losses on securities sold are determined on the basis of identified cost.
The fund invests in new securities offered by some foreign companies by making applications in the public offering. Either all, or a portion, of the issue price is paid at the time of the application and recorded as application money for new issues. Upon allotment, this amount, plus the remaining amount of issue price, is recorded as cost of investments.
2. Operating Policies.
Foreign Currency Contracts. The fund generally uses foreign currency contracts to facilitate transactions in foreign-denominated securities. Losses may arise from changes in the value of the foreign currency or if the counterparties do not perform under the contracts' terms. The U.S. dollar value of foreign currency contracts is determined using contractual currency exchange rates established at the time of each trade.
Annual Report
Notes to Financial Statements - continued
2. Operating Policies - continued
Joint Trading Account. Pursuant to an Exemptive Order issued by the Securities and Exchange Commission (the SEC), the fund, along with other affiliated entities of FMR, may transfer uninvested cash balances into one or more joint trading accounts. These balances are invested in one or more repurchase agreements for U.S. Treasury or Federal Agency obligations.
Repurchase Agreements. The underlying U.S. Treasury, Federal Agency, or other obligations found to be satisfactory by FMR are transferred to an account of the fund, or to the Joint Trading Account, at a custodian bank. The securities are marked-to-market daily and maintained at a value at least equal to the principal amount of the repurchase agreement (including accrued interest). FMR, the fund's investment adviser, is responsible for determining that the value of the underlying securities remains in accordance with the market value requirements stated above.
3. Purchase and Sales of Investments.
For the one month period ended October 31, 2000, purchases and sales of securities, other than short-term securities, aggregated $2,323,077 and $6,938,992, respectively.
For the year ended September 30, 2000, purchases and sales of securities, other than short-term securities, aggregated $23,746,920 and $54,212,753, respectively.
4. Fees and Other Transactions with Affiliates.
Management Fee. As the fund's investment adviser, FMR receives a monthly fee that is calculated on the basis of a group fee rate plus a fixed individual fund fee rate applied to the average net assets of the fund. The group fee rate is the weighted average of a series of rates and is based on the monthly average net assets of all the mutual funds advised by FMR. The rates ranged from .2167% to .5200% for the period. The annual individual fund fee rate is 0.55%. In the event that these rates were lower than the contractual rates in effect during the period, FMR voluntarily implemented the above rates, as they resulted in the same or a lower management fee. Prior to the reorganization on June 30, 2000, FMR received a fee that was computed daily at an annual rate of 1.00% of the fund's average net assets. For the one-month period ended October 31, 2000, the management fee was equivalent to an annualized rate of .83% of average net assets. For the year ended September 30, 2000, the management fee was equivalent to an annual rate of .97% of average net assets.
Sub-Adviser Fee. FMR, on behalf of the fund, entered into sub-advisory agreements with Fidelity Management & Research (U.K.) Inc., Fidelity Management & Research (Far East) Inc., and Fidelity International Investment Advisors (FIIA). Under the sub-advisory arrangements, FMR may receive investment advice and research services and may grant the
Annual Report
Notes to Financial Statements - continued
4. Fees and Other Transactions with Affiliates - continued
Sub-Adviser Fee - continued
sub-advisers investment management authority to buy and sell securities. FMR pays its sub-advisers either a portion of its management fee or a fee based on costs incurred for these services.
Distribution and Service Plan. Effective July 3, 2000, in accordance with Rule 12b-1 of the 1940 Act, the Board of Trustees have adopted separate Distribution and Service Plans with respect to each class of shares (collectively referred to as "the Plans"). Under certain of the Plans, the class pays Fidelity Distributors Corporation (FDC), an affiliate of FMR, a 12b-1 fee. A portion of this fee may be reallowed to securities dealers, banks and other financial institutions for the distribution of each class of shares and providing shareholder support services. For the period, this fee was based on the following annual rates of the average net assets of each applicable class:
|
Class A |
.25% |
|
Class T |
.50% |
|
Class B |
1.00% * |
|
Class C |
1.00% * |
* .75% represents a distribution fee and .25% represents a shareholder service fee.
For the period, each class paid FDC the following amounts, a portion of which was retained by FDC:
|
|
One month ended |
Year ended |
||
|
|
Paid to |
Retained by FDC |
Paid to |
Retained by FDC |
|
Class A |
$ 4,436 |
$ 723 |
$ 13,026 |
$ 4,092 |
|
Class T |
73 |
13 |
119 |
107 |
|
Class B |
63 |
60 |
224 |
222 |
|
Class C |
67 |
65 |
226 |
226 |
|
|
$ 4,639 |
$ 861 |
$ 13,595 |
$ 4,647 |
Sales Load. FDC receives a front-end sales charge of up to 5.75% for selling Class A shares, and 3.50% for selling Class T shares of the fund. FDC receives the proceeds of contingent deferred sales charges levied on Class B share redemptions occurring within six years of purchase and Class C share redemptions occurring within one year of purchase. Contingent deferred sales charges are based on declining rates ranging from 5% to 1% for Class B and 1% for Class C, of the lesser of the cost of shares at the initial date of purchase or the net asset value of the redeemed shares, excluding any reinvested dividends and capital gains. In addition, purchases of Class A and Class T shares that were subject to a finder's fee bear a contingent deferred sales charge on assets that do not remain in the fund for at least one year. The Class A and Class T
Annual Report
Notes to Financial Statements - continued
4. Fees and Other Transactions with Affiliates - continued
Sales Load - continued
contingent deferred sales charge is based on 0.25% of the lesser of the cost of shares at the initial date of purchase or the net asset value of the redeemed shares, excluding any reinvested dividends and capital gains. A portion of the sales charges paid to FDC is paid to securities dealers, banks and other financial institutions.
For the period, sales charge amounts paid to and retained by FDC were as follows:
|
|
One month ended |
Year ended |
||
|
|
Paid to |
Retained by FDC |
Paid to |
Retained by FDC |
|
Class A |
$ 12 |
$ 12 |
$ 600 |
$ 600 |
|
Class T |
4 |
0 |
118 |
18 |
|
Class B |
0 |
0* |
0 |
0 * |
|
Class C |
0 |
0* |
0 |
0 * |
|
|
$ 16 |
$ 12 |
$ 718 |
$ 618 |
* When Class B and Class C shares are initially sold, FDC pays commissions from its own resources to securities dealers,
banks, and other financial institutions through which the sales are made.
Transfer Agent Fees. Effective July 3, 2000, the fund entered into an arrangement with Fidelity Investments Institutional Operations Company, Inc., (FIIOC). FIIOC, an affiliate of FMR, is the transfer, dividend disbursing and shareholder servicing agent (collectively referred to as the transfer agent) for each class of the fund. FIIOC receives account fees and asset-based fees that vary according to the account size and type of account of the shareholders of the respective classes of the fund. FIIOC pays for typesetting, printing and mailing of all shareholder reports, except proxy statements. For the period, the following amounts were paid to FIIOC:
|
|
One month ended |
Year ended |
||
|
|
Amount |
% of |
Amount |
% of |
|
Class A |
$ 5,368 |
.30* |
$ 36,137 |
.06 |
|
Class T |
36 |
.25* |
37 |
.16 * |
|
Class B |
13 |
.20* |
27 |
.12 * |
|
Class C |
11 |
.16* |
25 |
.11 * |
|
Institutional Class |
6 |
.01* |
416 |
.65 * |
|
|
$ 5,434 |
|
$ 36,642 |
|
* Annualized
Annual Report
Notes to Financial Statements - continued
4. Fees and Other Transactions with Affiliates - continued
Accounting Fees. FSC, an affiliate of FMR, maintains the fund's accounting records. The fee is based on the level of average net assets for the month plus out-of-pocket expenses.
Prior to July 3, 2000, Fidelity Service Company, Inc. (FSC), a division of FMR Corp., entered into a Fund Management Agreement with the fund to provide, or arrange to provide, administrative services to the fund including maintaining the fund's accounting records. As the fund's administrative manager, FSC received a monthly fee at an annual rate of .20% of the fund's average net assets.
Fidelity Cash Central Fund. Pursuant to an Exemptive Order issued by the SEC, the fund may invest in the Fidelity Cash Central Fund (the Cash Fund) managed by Fidelity Investments Money Management, Inc., an affiliate of FMR. The Cash Fund is an open-end money market fund available only to investment companies and other accounts managed by FMR and its affiliates. The Cash Fund seeks preservation of capital, liquidity, and current income. Income distributions from the Cash Fund are declared daily and paid monthly from net interest income. Income distributions earned by the fund are recorded as interest income in the accompanying financial statements.
5. Bank Borrowings.
The fund is permitted to have bank borrowings for temporary or emergency purposes to fund shareholder redemptions. The fund has established borrowing arrangements with certain banks. The interest rate on the borrowings is the bank's base rate, as revised from time to time. The average daily loan balance during the period ended September 30, 2000 for which the loan was outstanding amounted to $2,724,000. The weighted average interest rate was 6.87%. At the periods ended September 30, 2000 and October 31, 2000 there were no bank borrowings outstanding.
Annual Report
Notes to Financial Statements - continued
6. Expense Reductions.
Effective June 30, 2000, FMR voluntarily agreed to reimburse operating expenses (excluding interest, taxes, certain securities lending fees, brokerage commissions and extraordinary expenses, if any) above the following annual rates or range of annual rates of average net assets for each of the following classes:
|
|
FMR |
One month ended |
Year ended |
|
Class A |
2.10% |
$ 3,641 |
$ 40,280 |
|
Class T |
2.35% |
22 |
48 |
|
Class B |
2.85% |
7 |
38 |
|
Class C |
2.85% |
4 |
36 |
|
Institutional Class |
1.85% |
- |
441 |
|
|
|
$ 3,674 |
$ 40,843 |
FMR has also directed certain portfolio trades to brokers who paid a portion of the fund's expenses. For the periods ended October 31, 2000 and September 30, 2000, the fund's expenses were reduced by $0 and $9,479, respectively, under this arrangement.
7. Beneficial Interest.
For the periods ended October 31, 2000 and September 30, 2000, FMR and its affiliates were record owners of approximately 16% and 24% of the total outstanding shares of the fund, respectively. In addition, for the period ended October 31, 2000, one unaffiliated shareholder was record owner of approximately 12% of the total outstanding shares of the fund. For the period ended September 30, 2000, two unaffiliated shareholders were each record owner of more than 10% of the total outstanding shares of the fund, totaling 25%.
Annual Report
Notes to Financial Statements - continued
8. Share Transactions.
Transactions for each class of shares were as follows:
|
|
Shares |
Dollars |
||
|
|
One month |
Year ended September 30, |
One month |
Year ended September 30, |
|
|
2000 |
2000A |
2000 |
2000A |
|
Class A |
28,338 |
13,790 |
$ 228,701 |
$ 127,878 |
|
Shares redeemed |
(197,871) |
(2,851,362) |
(1,609,896) |
(34,387,602) |
|
Net increase (decrease) |
(169,533) |
(2,837,572) |
$ (1,381,195) |
$ (34,259,724) |
|
Class T |
117,493 |
11,991 |
$ 870,922 |
$ 139,769 |
|
Shares redeemed |
(65,285) |
- |
(506,623) |
- |
|
Net increase (decrease) |
52,208 |
11,991 |
$ 364,299 |
$ 139,769 |
|
Class B |
2,340 |
8,957 |
$ 18,301 |
$ 110,185 |
|
Net increase (decrease) |
2,340 |
8,957 |
$ 18,301 |
$ 110,185 |
|
Class C |
1,116 |
10,024 |
$ 8,338 |
$ 120,415 |
|
Net increase (decrease) |
1,116 |
10,024 |
$ 8,338 |
$ 120,415 |
|
Institutional Class Shares sold |
205,747 |
318,509 |
$ 1,789,668 |
$ 2,601,489 |
|
Shares redeemed |
(205,747) |
(310,559) |
(1,755,022) |
(2,798,137) |
|
Net increase (decrease) |
0 |
7,950 |
$ 34,646 |
$ (196,648) |
F Amounts shown for Class T, Class B, Class C and Institutional Class are for the period July 3, 2000 (commencement of sale of shares)
to September 30, 2000.
For the period ended September 30, 1999, the Closed-End Fund repurchased 624,338 shares of common stock with a value of $4,639,364 in connection with its repurchase offer. The value of these shares has been included with the repurchase offer expenses and included in paid in capital. In addition, redemption fees of $50,478 collected as part of the repurchase offer, were accounted for as an addition to paid in capital.
Annual Report
To the Trustees of Fidelity Advisor
Series VIII and the Shareholders
of Fidelity Advisor Korea Fund:
In our opinion, the accompanying statement of assets and liabilities, including the schedule of investments, and the related statements of operations and of changes in net assets and the financial highlights present fairly, in all material respects, the financial position of Fidelity Advisor Korea Fund (a fund of Fidelity Advisor Series VIII) at September 30, 2000 and October 31, 2000, and the results of its operations, the changes in its net assets and the financial highlights for the periods indicated, in conformity with accounting principles generally accepted in the United States of America. These financial statements and financial highlights (hereafter referred to as "financial statements") are the responsibility of Fidelity Advisor Korea Fund's management; our responsibility is to express an opinion on these financial statements based on our audits. We conducted our audits of these financial statements in accordance with auditing standards generally accepted in the United States of America which require that we plan and perform the audit to obtain reasonable assurance about whether the financial statements are free of material misstatement. An audit includes examining, on a test basis, evidence supporting the amounts and disclosures in the financial statements, assessing the accounting principles used and significant estimates made by management, and evaluating the overall financial statement presentation. We believe that our audits, which included confirmation of securities at September 30, 2000 and October 31, 2000 by correspondence with the custodian and brokers, provide a reasonable basis for our opinion.
/s/PricewaterhouseCoopers LLP
PricewaterhouseCoopers LLP
Boston, Massachusetts
December 1, 2000
Annual Report
Annual Report
Annual Report
Annual Report
Annual Report
Investment Adviser
Fidelity Management & Research Company
Boston, MA
Investment Sub-Advisers
Fidelity International
Investment Advisors
Fidelity International
Investment Advisors (U.K.) Limited
Fidelity Management & Research
(U.K.) Inc.
Fidelity Management & Research
(Far East) Inc.
Fidelity Investments Japan Limited
Officers
Edward C. Johnson 3d, President
Robert C. Pozen, Senior Vice President
Eric D. Roiter, Secretary
Robert A. Dwight, Treasurer
Maria F. Dwyer, Deputy Treasurer
John H. Costello, Assistant Treasurer
Thomas J. Simpson, Assistant Treasurer
Board of Trustees
Ralph F. Cox *
Phyllis Burke Davis *
Robert M. Gates *
Edward C. Johnson 3d
Donald J. Kirk *
Ned C. Lautenbach *
Peter S. Lynch
Marvin L. Mann *
William O. McCoy *
Gerald C. McDonough *
Robert C. Pozen
Thomas R. Williams *
Advisory Board
J. Michael Cook
Abigail P. Johnson
Marie L. Knowles
General Distributor
Fidelity Distributors Corporation
Boston, MA
Transfer and Shareholder
Servicing Agents
Fidelity Investments Institutional
Operations Company, Inc.
Boston, MA
Custodian
The Chase Manhattan Bank
New York, NY
* Independent trustees
Annual Report
Focus Funds
Fidelity Advisor Consumer
Industries Fund
Fidelity Advisor Cyclical
Industries Fund
Fidelity Advisor Financial
Services Fund
Fidelity Advisor Health Care Fund
Fidelity Advisor Natural
Resources Fund
Fidelity Advisor Technology Fund
Fidelity Advisor Telecommunications and Utilities Growth Fund
Growth Funds
Fidelity Advisor Korea Fund
Fidelity Advisor Emerging Asia Fund
Fidelity Advisor Latin America Fund
Fidelity Advisor Japan Fund
Fidelity Advisor Europe Capital Appreciation Fund
Fidelity Advisor International Capital Appreciation Fund
Fidelity Advisor Overseas Fund
Fidelity Advisor Diversified International Fund
Fidelity Advisor Global Equity Fund
Fidelity Advisor TechnoQuant ®
Growth Fund
Fidelity Advisor Small Cap Fund
Fidelity Advisor Value Strategies Fund
Fidelity Advisor Mid Cap Fund
Fidelity Advisor Dynamic Capital Appreciation Fund
Fidelity Advisor Equity Growth Fund
Fidelity Advisor Large Cap Fund
Fidelity Advisor Dividend Growth Fund
Fidelity Advisor Growth
Opportunities Fund
Growth and Income Funds
Fidelity Advisor Growth & Income Fund
Fidelity Advisor Equity Income Fund
Fidelity Advisor Asset Allocation Fund
Fidelity Advisor Balanced Fund
Taxable Income Funds
Fidelity Advisor Emerging Markets Income Fund
Fidelity Advisor High Yield Fund
Fidelity Advisor High Income Fund
Fidelity Advisor Strategic Income Fund
Fidelity Advisor Mortgage Securities Fund
Fidelity Advisor Government Investment Fund
Fidelity Advisor Intermediate Bond Fund
Fidelity Advisor Short Fixed-Income Fund
Municipal Funds
Fidelity Advisor Municipal Income Fund
Money Market Funds
Prime Fund
Treasury Fund
Tax-Exempt Fund
AKOR-ANN-1200 118897
1.748533.100
(Fidelity Investment logo)(registered trademark)
Fidelity® Advisor
Institutional Class
Annual Reports
September 30, 2000
and the one-month period
ended October 31, 2000
(2_fidelity_logos)(registered trademark)
|
President's Message |
Ned Johnson on investing strategies. |
|
|
Performance |
How the fund has done over time. |
|
|
Performance |
How the fund has done over time. |
|
|
Fund Talk |
The manager's review of fund performance, strategy and outlook. |
|
|
Investment Changes |
A summary of major shifts in the |
|
|
Investments |
A complete list of the fund's investments with their market values. |
|
|
Investments |
A complete list of the fund's investments with their market values. |
|
|
Financial Statements |
Statements of assets and liabilities,
operations, and changes in net assets, |
|
|
Notes |
Notes to the financial statements. |
|
|
Report of Independent Accountants |
The auditors' opinion. |
Note to shareholders: The fiscal year end for Fidelity Advisor Korea Fund recently changed from September 30 to October 31. This change was made in order to align the fund's fiscal year end more closely with other similar Fidelity funds. To reduce expenses and provide you with a comprehensive report covering both periods ended September 30 and October 31, we've combined both annual reports into one document.
Standard & Poor's, S&P and S&P 500 are registered service marks of The McGraw-Hill Companies, Inc. and have been licensed for use by Fidelity Distributors Corporation.
Other third party marks appearing herein are the property of their respective owners.
All other marks appearing herein are registered or unregistered trademarks or service marks of FMR Corp. or an affiliated company.
(Recycle graphic) This report is printed on recycled paper using soy-based inks. This report and the financial statements contained herein are submitted for the
general information
of the shareholders of the fund. This report is not authorized for distribution to prospective investors
in the fund unless preceded or accompanied by an effective prospectus.
Mutual fund shares are not deposits or obligations of, or guaranteed by, any depository institution. Shares are not insured by the FDIC, Federal Reserve Board or any other agency, and are subject to investment risks, including possible loss of principal amount invested.
Neither the fund nor Fidelity Distributors Corporation is a bank.
For more information on any Fidelity fund, including charges and expenses, call 1-800-544-6666 for a free prospectus. Read it carefully before you invest or send money.
Annual Report
(photo_of_Edward_C_Johnson_3d)
Dear Shareholder:
A sixth-straight year of double-digit positive returns for the Dow Jones Industrial Average, NASDAQ and S&P 500® could be in jeopardy unless the U.S. stock market shows marked improvement in the final two months of 2000. Through October, all three indexes had negative year-to-date returns. On the other hand, most fixed-income sectors were solidly in the black. Treasuries and other long-term government securities led the way, returning nearly 14%.
While it's impossible to predict the future direction of the markets with any degree of certainty, there are certain basic principles that can help investors plan for their future needs.
First, investors are encouraged to take a long-term view of their portfolios. If you can afford to leave your money invested through the inevitable up and down cycles of the financial markets, you will greatly reduce your vulnerability to any single decline. We know from experience, for example, that stock prices have gone up over longer periods of time, have significantly outperformed other types of investments and have stayed ahead of inflation.
Second, you can further manage your investing risk through diversification. A stock mutual fund, for instance, is already diversified, because it invests in many different companies. You can increase your diversification further by investing in a number of different stock funds, or in such other investment categories as bonds. If you have a short investment time horizon, you might want to consider moving some of your investment into a money market fund, which seeks income and a stable share price by investing in high-quality, short-term investments. Of course, it's important to remember that an investment in a money market fund is not insured or guaranteed by the Federal Deposit Insurance Corporation or any other government agency. Although money market funds seek to preserve the value of your investment at $1.00 per share, it is possible to lose money by investing in these types of funds.
Finally, no matter what your time horizon or portfolio diversity, it makes good sense to follow a regular investment plan, investing a certain amount of money in a fund at the same time each month or quarter and periodically reviewing your overall portfolio. By doing so, you won't get caught up in the excitement of a rapidly rising market, nor will you buy all your shares at market highs. While this strategy - known as dollar cost averaging - won't assure a profit or protect you from a loss in a declining market, it should help you lower the average cost of your purchases. Of course, you should consider your financial ability to continue your purchases through periods of low price levels before undertaking such a strategy.
Remember to contact your investment professional if you need help with your investments.
Best regards,
/s/Edward C. Johnson 3d
Edward C. Johnson 3d
Annual Report
Fidelity Advisor Korea Fund - Institutional Class
There are several ways to evaluate historical performance. You can look at the total percentage change in value, the average annual percentage change or the growth of a hypothetical $10,000 investment. Total return reflects the change in the value of an investment, assuming reinvestment of the class' dividend income and capital gains (the profits earned upon the sale of securities that have grown in value). The initial offering of Institutional Class shares took place on July 3, 2000. Institutional Class shares are sold to eligible investors without a sales load or 12b-1 fee. Returns between October 31, 1994 and June 30, 2000 are those of Fidelity Advisor Korea, Inc., (the Closed-End Fund). On June 30, 2000, the Closed-End Fund reorganized as an open-end fund through a transfer of all of its assets and liabilities to Fidelity Advisor Korea Fund (the fund). Shareholders of the Closed-End Fund received Class A shares of the fund in exchange for their shares of the Closed-End fund. If the effect of Institutional Class expenses was reflected, returns may be lower than shown because Institutional Class shares of the fund may have higher total expenses than the Closed-End Fund. If Fidelity had not reimbursed certain class expenses, the total returns would have been lower.
Cumulative Total Returns
|
Periods ended October 31, 2000 |
|
Past 1 |
Past 5 |
Life of |
|
|
Fidelity Adv Korea - Inst CL |
|
-33.54% |
-38.70% |
-44.40% |
|
|
KOSPI |
|
-34.61% |
-62.86% |
-64.95% |
|
|
Pacific Region ex Japan Funds Average |
|
-11.65% |
-17.16% |
n/a* |
|
Cumulative total returns show Institutional Class performance in percentage terms over a set period - in this case, one year, five years or since the Closed-End Fund started on October 31, 1994. For example, if you had invested $1,000 in a fund that had a 5% return over the past year, the value of your investment would be $1,050. You can compare Institutional Class' returns to the performance of the Korea Composite Stock Price Index (KOSPI) - a market capitalization-weighted index of all common stocks listed on the Korean Stock Exchange. To measure how Institutional Class' performance stacked up against its peers, you can compare it to the Pacific Region ex Japan funds average, which reflects the performance of mutual funds with similar objectives tracked by Lipper Inc. The past one year average represents a peer group of 84 mutual funds. These benchmarks include reinvested dividends and capital gains, if any, and exclude the effect of sales charges.
Average Annual Total Returns
|
Periods ended October 31, 2000 |
Past 1 |
Past 5 |
Life of |
|
|
Fidelity Adv Korea - Inst CL |
-33.54% |
-9.32% |
-9.32% |
|
|
KOSPI |
-34.61% |
-17.97% |
-16.03% |
|
|
Pacific Region ex Japan Funds Average |
-11.65% |
-4.29% |
n/a* |
|
Average annual total returns take Institutional Class' cumulative return and show you what would have happened if Institutional Class shares' had performed at a constant rate each year.
* Not available
Annual Report
$10,000 Over Life of Fund
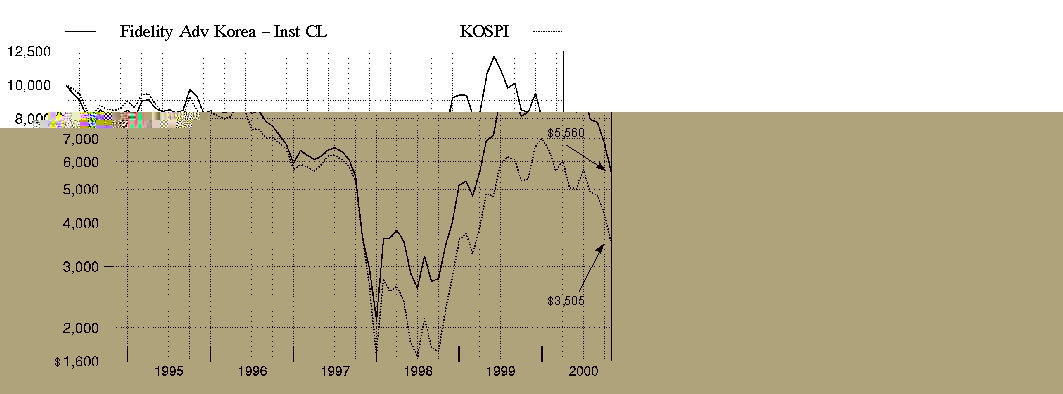
$10,000 Over Life of Fund: Let's say hypothetically that $10,000 was invested in Fidelity Advisor Korea Fund - Institutional Class on October 31, 1994, when the Closed-End Fund started. As the chart shows, by October 31, 2000, the value of the investment would have been $5,560 - a 44.40% decrease on the initial investment. For comparison, look at how the Korean Composite Stock Price Index did over the same period. With dividends reinvested, the same $10,000 would have been $3,505 - a 64.95% decrease.
Understanding
Performance
Many markets around the globe offer the potential for significant growth over time; however, investing in foreign markets means assuming greater risks than investing in the United States. Factors like changes in a country's financial markets, its local political and economic climate, and the fluctuating value of its currency create these risks. For these reasons an international fund's performance may be more volatile than a fund that invests exclusively in the United States. Past performance is no guarantee of future results and you may have a gain or loss when you sell your shares.
3Annual Report
Fidelity Advisor Korea Fund - Institutional Class
There are several ways to evaluate historical performance. You can look at the total percentage change in value, the average annual percentage change or the growth of a hypothetical $10,000 investment. Total return reflects the change in the value of an investment, assuming reinvestment of the class' dividend income and capital gains (the profits earned upon the sale of securities that have grown in value). The initial offering of Institutional Class shares took place on July 3, 2000. Institutional Class shares are sold to eligible investors without a sales load or 12b-1 fee. Returns between October 31, 1994 and June 30, 2000 are those of Fidelity Advisor Korea, Inc., (the Closed-End Fund). On June 30, 2000, the Closed-End Fund reorganized as an open-end fund through a transfer of all of its assets and liabilities to Fidelity Advisor Korea Fund (the fund). Shareholders of the Closed-End Fund received Class A shares of the fund in exchange for their shares of the Closed-End fund. If the effect of Institutional Class expenses was reflected, returns may be lower than shown because Institutional Class shares of the fund may have higher total expenses than the Closed-End Fund. If Fidelity had not reimbursed certain class expenses, the total returns would have been lower.
Cumulative Total Returns
|
Periods ended September 30, 2000 |
|
Past 1 |
Past 5 |
Life of |
|
|
Fidelity Adv Korea - Inst CL |
|
-16.60% |
-24.42% |
-32.36% |
|
|
KOSPI |
|
-19.59% |
-54.48% |
-57.39% |
|
|
Pacific Region ex Japan Funds Average |
|
0.50% |
-10.84% |
n/a* |
|
Cumulative total returns show Institutional Class performance in percentage terms over a set period - in this case, one year, five years or since the Closed-End Fund started on October 31, 1994. For example, if you had invested $1,000 in a fund that had a 5% return over the past year, the value of your investment would be $1,050. You can compare Institutional Class' returns to the performance of the Korea Composite Stock Price Index (KOSPI) - a market capitalization-weighted index of all common stocks listed on the Korean Stock Exchange. To measure how Institutional Class' performance stacked up against its peers, you can compare it to the Pacific Region ex Japan funds average, which reflects the performance of mutual funds with similar objectives tracked by Lipper Inc. The past one year average represents a peer group of 81 mutual funds. These benchmarks include reinvested dividends and capital gains, if any, and exclude the effect of sales charges.
Average Annual Total Returns
|
Periods ended September 30, 2000 |
Past 1 |
Past 5 |
Life of |
|
|
Fidelity Adv Korea - Inst CL |
-16.60% |
-5.45% |
-6.39% |
|
|
KOSPI |
-19.59% |
-14.56% |
-13.43% |
|
|
Pacific Region ex Japan Funds Average |
0.50% |
-2.81% |
n/a* |
|
Average annual total returns take Institutional Class' cumulative return and show you what would have happened if Institutional Class shares' had performed at a constant rate each year.
* Not available
Annual Report
$10,000 Over Life of Fund
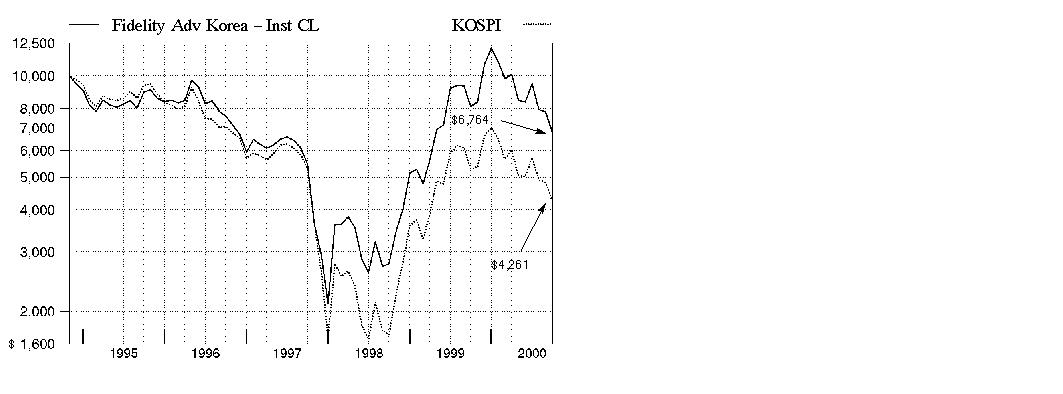
$10,000 Over Life of Fund: Let's say hypothetically that $10,000 was invested in Fidelity Advisor Korea Fund - Institutional Class on October 31, 1994, when the Closed-End Fund started. As the chart shows, by September 30, 2000, the value of the investment would have been $6,764 - a 32.36% decrease on the initial investment. For comparison, look at how the Korean Composite Stock Price Index did over the same period. With dividends reinvested, the same $10,000 would have been $4,261 - a 57.39% decrease.
Understanding
Performance
Many markets around the globe offer the potential for significant growth over time; however, investing in foreign markets means assuming greater risks than investing in the United States. Factors like changes in a country's financial markets, its local political and economic climate, and the fluctuating value of its currency create these risks. For these reasons an international fund's performance may be more volatile than a fund that invests exclusively in the United States. Past performance is no guarantee of future results and you may have a gain or loss when you sell your shares.
3Annual Report
(Portfolio Manager photograph)
An interview with Hokeun Chung, Portfolio Manager of Fidelity
Advisor Korea Fund
Q. How did the fund perform, Hokeun?
A. For the 12-month period that ended September 30, 2000, the fund's Institutional Class shares returned -16.60%. The Korean Stock Exchange Composite Price Index (KOSPI) returned -19.59% during the same period. Shareholders should be aware that the fund's year end has changed to October 31. For the 12 months that ended October 31, 2000, the fund's Institutional Class shares returned -33.54%, while the KOSPI returned -34.61% during the same time frame.
Q. What factors hindered the market's performance during the 12-month period that ended September 30, 2000?
A. Since the beginning of 2000, the South Korean stock market has been hurt by a slowdown in the government's efforts to restructure bad corporate debt and
recapitalize the banking sector. This slowdown weakened investors' confidence in the nation's ongoing economic recovery. Additionally, the sharp rise in crude oil
prices - which hit historically high levels - was of particular concern given the country's heavy reliance on oil: Korea is the sixth-largest consumer of oil in the world
(See callout box at the end of this interview). Further, a global pullback in the technology sector - particularly in the market for dynamic random access memory
(DRAM), which represents the bulk of the country's technology exports - dampened the optimism surrounding Korea's shift to a high-tech-based economy from a
state-managed industrial economy. Unfortunately, this technology correction coincided with the Korean government's aggressive courtship of the Internet through an
ongoing $35 billion public plan to improve the country's Internet infrastructure. The global technology slowdown - particularly in the U.S., Korea's biggest market for
high-tech products - also hurt Korea's large export market for its information tech-
nology products.
Q. Despite these obstacles, the fund still outperformed its benchmark. Why?
A. The difference in performance was the result of good individual stock selection during the first half of the period and an overweighting in strong-performing technology and telecommunications stocks. During the fourth quarter of 1999, overweighting these sectors significantly boosted performance as investors viewed the government's many incentives - such as tax breaks and low-cost loans to information technology start-up firms - in a positive vein. For the majority of this year, however, the fund's overweighting in these two sectors hurt relative performance as a result of the global technology slowdown mentioned previously. Those losses, though, weren't substantial enough to offset our otherwise strong relative performance for the period.
Annual Report
Fund Talk: The Manager's Overview - continued
Q. Did the fund's conversion to open-end status in June alter your management strategy in any way?
A. Yes, it did. First, the fund's conversion from a closed-end portfolio to an open-end portfolio spurred an increase in redemption activity, which was expected. Second, the rise in redemptions coincided with a declining Korean stock market, based on the macroeconomic reasons I mentioned earlier. These two factors - an increase in redemptions and declining stock prices - collectively hindered the fund's short-term performance. Meanwhile, I used this redemption activity as an opportunity to reposition the fund, reducing the number of holdings to focus on the companies I felt most strongly about at the time, such as Samsung Electronics. I also increased the fund's weighting in more defensive areas, such as food and beverage stocks, at the expense of other areas, such as financial stocks. However, I maintained some overweighted positions in selected banks that I felt had the best fundamentals, such as Shinhan Bank.
Q. What specific stocks performed well?
A. SK Telecom, Korea's largest provider of wireless communications, was the fund's top performer. The company continued to benefit from Korea's technology revolution and its growing appetite for wireless data products and Internet access. Investors also reacted favorably to Housing & Commercial Bank and Shinhan Bank for their fiscal discipline within the banking sector.
Q. Which stocks were disappointing?
A. Samsung Electronics, the country's leading manufacturer of DRAM, suffered from the slowing global demand for semiconductors, particularly during the past six months. Korea Electric Power, a company with very low valuations, continued to underperform due to a delay in the expected government approval of the privatization of the firm.
Q. The fund's fiscal year-end changed from September 30 to October 31. Can you tell us how the fund fared in October?
A. The fund's Institutional Class shares returned -17.80% during the month, compared to a -17.75% return for the KOSPI. The fund's overweighting in the utilities and technology sectors continued to hurt short-term performance as a result of the global factors I mentioned earlier. However, I believed the fund's selected stocks in these sectors still offered the best opportunity to achieve superior long-term performance.
Annual Report
Fund Talk: The Manager's Overview - continued
Q. What's your outlook?
A. The Korean stock market remains very cheap in terms of historical valuation, as well as regional comparisons. However, the success of the government's efforts to help the old industrial companies acquire new technology - through low-interest loans and incentives - remains to be seen. The government must continue to inject public money into the banking sector for restructuring. Until these reform efforts play out, we will continue to see market volatility in the immediate future. What's more, the country's recent history of low inflation could come under pressure if oil prices remain high.
The views expressed in this report reflect those of the portfolio manager only through the end of the period of the report as stated on the cover and do not necessarily represent the views of Fidelity or any other person in the Fidelity organization. Any such views are subject to change at any time based upon market or other conditions and Fidelity disclaims any responsibility to update such views. These views may not be relied on as investment advice and, because investment decisions for a Fidelity fund are based on numerous factors, may not be relied on as an indication of trading intent on behalf of any Fidelity fund.
Note to shareholders: Fidelity Advisor Korea Fund may invest up to 35% of its total assets in any industry that represents more than 20% of the Korean market. As of October 31, 2000, the fund did not have more than 25% of its assets invested in any one industry.
Fund Facts
Goal: to achieve long-term capital appreciation through investments in equity and debt securities of Korean issuers
Start date: October 31, 1994 (Closed-End Fund)
Size: as of October 31, 2000, more than $19 million
Manager: Hokeun Chung, since 1996; joined Fidelity in 1994
3Hokeun Chung on how rising oil prices affect the Korean stock market:
"Historically, the Korean Stock Exchange Composite Price Index (KOSPI) has had an inverse relation to the price of oil - meaning that when oil prices rise, stocks tend to suffer, and vice versa. That's because rising crude oil prices affect the Korean economy more severely than countries that have the ability to harness a portion of their own oil and other energy sources. Korea imports 100% of its oil supply, which makes the country's economy particularly vulnerable to price increases.
"Specifically, a $10 per barrel increase in the price of crude oil results in a 2.2% decline in gross domestic product (GDP) output and a 2.2% rise in inflation, according to a recent industry study. With oil rising to $37 per barrel last winter and again this fall - a historically high price - the profits of Korean companies were sharply reduced.
"As a result, investors have reacted with caution to Korean stocks this year, largely because of the threat of inflation due to these rising oil prices. Not helping matters is the fact that Korea's use of oil is currently growing at a faster rate than any other country in the world. Therefore, the stabilization and decline of crude oil prices are crucial to the ongoing growth of the Korean stock market."
Annual Report
|
Top Ten Stocks as of October 31, 2000 |
|||
|
|
% of fund's net assets as of |
||
|
|
October 31, 2000 |
September 30, 2000 |
March 31, 2000 |
|
Samsung Electronics Co. Ltd. |
16.3 |
23.1 |
21.7 |
|
Korea Telecom |
11.4 |
12.8 |
9.0 |
|
SK Telecom Co. Ltd. |
11.2 |
13.8 |
11.1 |
|
Korea Electric Power Corp. |
7.9 |
10.0 |
7.2 |
|
H&CB |
4.8 |
4.0 |
0.0 |
|
Kookmin Bank |
4.6 |
5.2 |
1.6 |
|
Shinhan Bank |
4.0 |
4.9 |
1.9 |
|
Hyundai Electronics Industries Co. Ltd. |
3.7 |
8.2 |
3.2 |
|
Korea Tobacco & Ginseng |
2.6 |
1.6 |
0.6 |
|
Pohang Iron & Steel Co. Ltd. |
2.5 |
3.5 |
4.5 |
|
|
69.0 |
87.1 |
60.8 |
|
Top Ten Market Sectors as of October 31, 2000 |
|||
|
|
% of fund's net assets as of |
||
|
|
October 31, 2000 |
September 30, 2000 |
March 31, 2000 |
|
Utilities |
30.5 |
36.6 |
33.7 |
|
Technology |
23.1 |
34.6 |
33.6 |
|
Finance |
16.1 |
15.6 |
8.3 |
|
Durables |
4.5 |
5.5 |
3.1 |
|
Construction & Real Estate |
3.8 |
3.4 |
0.4 |
|
Nondurables |
3.5 |
2.5 |
2.1 |
|
Basic Industries |
3.5 |
4.8 |
7.7 |
|
Retail & Wholesale |
2.5 |
2.1 |
1.7 |
|
Industrial Machinery |
2.3 |
2.0 |
3.5 |
|
Services |
1.3 |
1.2 |
1.5 |
|
Asset Allocation (% of fund's net assets) |
|||
As of October 31, 2000 As of September 30, 2000 As of March 31, 2000
* Not included in the pie chart.
Annual Report
Showing Percentage of Net Assets
|
Common Stocks - 92.3% |
|||
|
Shares |
Value (Note 1) |
||
|
BASIC INDUSTRIES - 3.5% |
|||
|
Chemicals & Plastics - 1.0% |
|||
|
LG Chemical Ltd. |
19,620 |
$ 193,182 |
|
|
Iron & Steel - 2.5% |
|||
|
Pohang Iron & Steel Co. Ltd. |
8,580 |
498,583 |
|
|
TOTAL BASIC INDUSTRIES |
691,765 |
||
|
CONSTRUCTION & REAL ESTATE - 3.8% |
|||
|
Building Materials - 3.8% |
|||
|
Hankuk Electric Glass Co. Ltd. |
4,500 |
284,835 |
|
|
Samsung Heavy Industries Ltd. (a) |
154,500 |
480,818 |
|
|
|
765,653 |
||
|
DURABLES - 4.5% |
|||
|
Autos, Tires, & Accessories - 2.4% |
|||
|
Hankook Tire Co. Ltd. |
39,080 |
73,866 |
|
|
Hyundai Motor Co. Ltd. |
35,000 |
400,000 |
|
|
|
473,866 |
||
|
Consumer Electronics - 1.4% |
|||
|
LG Electronics, Inc. |
20,060 |
279,517 |
|
|
Textiles & Apparel - 0.7% |
|||
|
Cheil Industries, Inc. |
32,300 |
140,558 |
|
|
TOTAL DURABLES |
893,941 |
||
|
ENERGY - 1.2% |
|||
|
Oil & Gas - 1.2% |
|||
|
S-Oil Corp. |
10,000 |
248,791 |
|
|
FINANCE - 16.1% |
|||
|
Banks - 13.4% |
|||
|
H&CB |
39,750 |
955,747 |
|
|
Kookmin Bank |
79,940 |
913,600 |
|
|
Shinhan Bank |
80,240 |
804,164 |
|
|
|
2,673,511 |
||
|
Credit & Other Finance - 1.8% |
|||
|
Kookmin Credit Card Co. Ltd. |
12,590 |
274,490 |
|
|
Samsung Securities Co. Ltd. |
4,940 |
89,463 |
|
|
|
363,953 |
||
|
Common Stocks - continued |
|||
|
Shares |
Value (Note 1) |
||
|
FINANCE - continued |
|||
|
Insurance - 0.9% |
|||
|
Samsung Fire & Marine Insurance |
7,270 |
$ 168,728 |
|
|
TOTAL FINANCE |
3,206,192 |
||
|
INDUSTRIAL MACHINERY & EQUIPMENT - 2.3% |
|||
|
Electrical Equipment - 2.3% |
|||
|
Samsung Electro-Mechanics Co. (a) |
14,500 |
464,000 |
|
|
NONDURABLES - 3.5% |
|||
|
Agriculture - 2.6% |
|||
|
Korea Tobacco & Ginseng Co. Ltd. |
32,540 |
516,349 |
|
|
Foods - 0.9% |
|||
|
Cheil Jedang Corp. |
6,470 |
189,408 |
|
|
TOTAL NONDURABLES |
705,757 |
||
|
RETAIL & WHOLESALE - 2.5% |
|||
|
General Merchandise Stores - 2.5% |
|||
|
Shinsegae Department Store |
10,770 |
496,130 |
|
|
SERVICES - 1.3% |
|||
|
Advertising - 0.9% |
|||
|
Cheil Communications, Inc. |
2,820 |
180,976 |
|
|
Services - 0.4% |
|||
|
S1 Corp. |
6,660 |
69,088 |
|
|
TOTAL SERVICES |
250,064 |
||
|
TECHNOLOGY - 23.1% |
|||
|
Computer Services & Software - 1.0% |
|||
|
NCsoft Corp. |
2,460 |
190,961 |
|
|
Electronics - 22.1% |
|||
|
Hyundai Electronics Industries Co. Ltd. (a) |
120,000 |
737,407 |
|
|
Samsung Electronics Co. Ltd. |
26,000 |
3,257,143 |
|
|
Samsung SDI Co. Ltd. |
10,900 |
424,501 |
|
|
|
4,419,051 |
||
|
TOTAL TECHNOLOGY |
4,610,012 |
||
|
Common Stocks - continued |
|||
|
Shares |
Value (Note 1) |
||
|
UTILITIES - 30.5% |
|||
|
Cellular - 11.2% |
|||
|
SK Telecom Co. Ltd. |
10,460 |
$ 2,229,934 |
|
|
Electric Utility - 7.9% |
|||
|
Korea Electric Power Corp. |
70,960 |
1,584,514 |
|
|
Telephone Services - 11.4% |
|||
|
Korea Telecom |
38,840 |
2,287,719 |
|
|
TOTAL UTILITIES |
6,102,167 |
||
|
TOTAL COMMON STOCKS (Cost $12,359,321) |
18,434,472 |
||
|
Nonconvertible Bonds - 0.0% |
|||||
|
Moody's Ratings (unaudited) |
|
|
|||
|
FINANCE - 0.0% |
|||||
|
Banks - 0.0% |
|||||
|
Shinhan Bank 0% 12/31/48 unit |
- |
|
6,493 |
71 |
|
|
Cash Equivalents - 6.4% |
|||
|
|
|
||
|
Fidelity Cash Central Fund, 6.61% (b) |
1,287,484 |
1,287,484 |
|
|
|
|
||
|
TOTAL INVESTMENT PORTFOLIO - 98.7% (Cost $13,646,854) |
19,722,027 |
||
|
NET OTHER ASSETS - 1.3% |
253,665 |
||
|
NET ASSETS - 100% |
$ 19,975,692 |
||
|
Legend |
|
(a) Non-income producing |
|
(b) The rate quoted is the annualized seven-day yield of the fund at period end. A complete listing of the fund's holdings as of its most recent fiscal year end is available upon request. |
|
(c) Amounts represent units held. |
|
Income Tax Information |
|
At October 31, 2000, the aggregate cost of investment securities for income tax purposes was $14,247,261. Net unrealized appreciation aggregated $5,474,766, of which $7,758,559 related to appreciated investment securities and $2,283,793 related to depreciated investment securities. |
|
At October 31, 2000, the fund |
See accompanying notes which are an integral part of the financial statements.
Annual Report
Showing Percentage of Net Assets
|
Common Stocks - 108.3% |
|||
|
Shares |
Value (Note 1) |
||
|
BASIC INDUSTRIES - 4.8% |
|||
|
Chemicals & Plastics - 1.3% |
|||
|
LG Chemical Ltd. |
27,000 |
$ 336,547 |
|
|
Iron & Steel - 3.5% |
|||
|
Pohang Iron & Steel Co. Ltd. |
11,800 |
878,267 |
|
|
TOTAL BASIC INDUSTRIES |
1,214,814 |
||
|
CONSTRUCTION & REAL ESTATE - 3.4% |
|||
|
Building Materials - 3.4% |
|||
|
Hankuk Electric Glass Co. Ltd. |
3,900 |
220,329 |
|
|
Samsung Heavy Industries Ltd. (a) |
186,850 |
630,848 |
|
|
|
851,177 |
||
|
DURABLES - 5.5% |
|||
|
Autos, Tires, & Accessories - 3.2% |
|||
|
Hankook Tire Co. Ltd. |
53,780 |
107,545 |
|
|
Hyundai Motor Co. Ltd. |
53,730 |
698,637 |
|
|
|
806,182 |
||
|
Consumer Electronics - 1.7% |
|||
|
LG Electronics, Inc. |
22,100 |
430,050 |
|
|
Textiles & Apparel - 0.6% |
|||
|
Cheil Industries, Inc. |
30,000 |
166,256 |
|
|
TOTAL DURABLES |
1,402,488 |
||
|
FINANCE - 15.6% |
|||
|
Banks - 14.1% |
|||
|
H&CB |
43,000 |
1,017,979 |
|
|
Kookmin Bank |
110,000 |
1,311,931 |
|
|
Shinhan Bank |
110,410 |
1,237,613 |
|
|
|
3,567,523 |
||
|
Credit & Other Finance - 0.5% |
|||
|
Samsung Securities Co. Ltd. |
6,800 |
137,506 |
|
|
Insurance - 1.0% |
|||
|
Samsung Fire & Marine Insurance |
10,000 |
260,055 |
|
|
TOTAL FINANCE |
3,965,084 |
||
|
INDUSTRIAL MACHINERY & EQUIPMENT - 2.0% |
|||
|
Electrical Equipment - 2.0% |
|||
|
Samsung Electro-Mechanics Co. (a) |
15,000 |
507,106 |
|
|
Common Stocks - continued |
|||
|
Shares |
Value (Note 1) |
||
|
NONDURABLES - 2.5% |
|||
|
Agriculture - 1.6% |
|||
|
Korea Tobacco & Ginseng Co. Ltd. |
25,000 |
$ 408,017 |
|
|
Foods - 0.9% |
|||
|
Cheil Jedang Corp. |
6,120 |
221,717 |
|
|
TOTAL NONDURABLES |
629,734 |
||
|
RETAIL & WHOLESALE - 2.1% |
|||
|
General Merchandise Stores - 2.1% |
|||
|
Shinsegae Department Store |
10,000 |
542,528 |
|
|
SERVICES - 1.2% |
|||
|
Advertising - 0.8% |
|||
|
Cheil Communications, Inc. |
2,500 |
210,734 |
|
|
Services - 0.4% |
|||
|
S1 Corp. |
9,170 |
95,799 |
|
|
TOTAL SERVICES |
306,533 |
||
|
TECHNOLOGY - 34.6% |
|||
|
Computer Services & Software - 0.7% |
|||
|
NCsoft Corp. |
1,500 |
160,068 |
|
|
Electronic Instruments - 0.3% |
|||
|
Mirae Corp. |
30,580 |
76,782 |
|
|
Electronics - 33.6% |
|||
|
Hyundai Electronics Industries Co. Ltd. (a) |
145,800 |
2,085,378 |
|
|
Samsung Electronics Co. Ltd. |
32,280 |
5,847,247 |
|
|
Samsung SDI Co. Ltd. |
15,000 |
593,194 |
|
|
|
8,525,819 |
||
|
TOTAL TECHNOLOGY |
8,762,669 |
||
|
UTILITIES - 36.6% |
|||
|
Cellular - 13.8% |
|||
|
SK Telecom Co. Ltd. |
14,400 |
3,512,351 |
|
|
Electric Utility - 10.0% |
|||
|
Korea Electric Power Corp. |
97,630 |
2,547,668 |
|
|
Common Stocks - continued |
|||
|
Shares |
Value (Note 1) |
||
|
UTILITIES - continued |
|||
|
Telephone Services - 12.8% |
|||
|
Korea Telecom |
53,460 |
$ 3,234,397 |
|
|
TOTAL UTILITIES |
9,294,416 |
||
|
TOTAL COMMON STOCKS (Cost $16,100,142) |
27,476,549 |
||
|
Nonconvertible Bonds - 0.0% |
|||||
|
Moody's Ratings (unaudited) |
|
|
|||
|
FINANCE - 0.0% |
|||||
|
Banks - 0.0% |
|||||
|
Shinhan Bank 0% 12/31/48 unit |
- |
|
6,493 |
84 |
|
|
Cash Equivalents - 4.1% |
|||
|
|
|
||
|
Fidelity Cash Central Fund, 6.60% (b) |
1,040,914 |
1,040,914 |
|
|
TOTAL INVESTMENT PORTFOLIO - 112.4% (Cost $17,141,105) |
28,517,547 |
||
|
NET OTHER ASSETS - (12.4)% |
(3,150,696) |
||
|
NET ASSETS - 100% |
$ 25,366,851 |
||
|
Legend |
|
(a) Non-income producing |
|
(b) The rate quoted is the annualized seven-day yield of the fund at period end. A complete listing of the fund's holdings as of its most recent fiscal year end is available upon request. |
|
(c) Amounts represent units held. |
|
Income Tax Information |
|
At September 30, 2000, the aggregate cost of investment securities for income tax purposes was $17,547,620. Net unrealized appreciation aggregated $10,969,927, of which $12,294,738 related to appreciated investment securities and $1,324,811 related to depreciated investment securities. |
|
At September 30, 2000, the fund had a capital loss carryforward of approximately $21,144,000 of which $9,029,000 and $12,115,000 will expire on September 30, 2006 and September 30, 2007, respectively. |
See accompanying notes which are an integral part of the financial statements.
Annual Report
Statement of Assets and Liabilities
|
|
Ocober 31, 2000 |
September 30, 2000 |
|
Assets |
|
|
|
Investment in securities, at value (cost $13,646,854 and $17,141,105, respectively) - |
$ 19,722,027 |
$ 28,517,547 |
|
Receivable for fund shares sold |
361,566 |
- |
|
Dividends receivable |
1,050 |
5,751 |
|
Interest receivable |
6,568 |
5,946 |
|
Redemption fees receivable |
29 |
53 |
|
Total assets |
20,091,240 |
28,529,297 |
|
Liabilities |
|
|
|
Payable for investments purchased |
- |
200,188 |
|
Payable for fund shares redeemed |
2,116 |
2,817,908 |
|
Accrued management fee |
11,557 |
747 |
|
Distribution fees payable |
4,639 |
5,793 |
|
Other payables and accrued expenses |
97,236 |
137,810 |
|
Total liabilities |
115,548 |
3,162,446 |
|
Net Assets |
$ 19,975,692 |
$ 25,366,851 |
|
Net Assets consist of: |
|
|
|
Paid in capital |
$ 34,569,666 |
$ 35,534,742 |
|
Accumulated undistributed net realized gain (loss) on investments and foreign currency transactions |
(20,669,127) |
(21,544,222) |
|
Net unrealized appreciation (depreciation) on investments and assets and liabilities in foreign currencies |
6,075,153 |
11,376,331 |
|
Net Assets |
$ 19,975,692 |
$ 25,366,851 |
See accompanying notes which are an integral part of the financial statements.
Annual Report
Financial Statements - continued
Statement of Assets and Liabilities - continued
|
|
October 31, 2000 |
September 30, 2000 |
|
Calculation of Maximum Offering Price |
$7.38 |
$8.99 |
|
Maximum offering price per share (100/94.25 of $7.38 and $8.99), respectively |
$7.83 |
$9.54 |
|
Class T: |
$7.37 |
$8.99 |
|
Maximum offering price per share (100/96.50 of $7.37 and $8.99), respectively |
$7.64 |
$9.32 |
|
Class B: |
$7.36 |
$8.98 |
|
Class C: |
$7.36 |
$8.98 |
|
Institutional Class: |
$7.39 |
$8.99 |
A Redemption price per share is equal to net asset value less any applicable contingent deferred sales charge.
See accompanying notes which are an integral part of the financial statements.
Annual Report
Financial Statements - continued
Statement of Operations
|
|
One month ended |
Year ended |
|
Investment Income Dividends |
$ 705 |
$ 842,306 |
|
Interest |
6,568 |
50,635 |
|
|
7,273 |
892,941 |
|
Less foreign taxes withheld |
(116) |
(139,956) |
|
Total income |
7,157 |
752,985 |
|
Expenses |
|
|
|
Management fee |
15,231 |
629,634 |
|
Transfer agent fees |
5,434 |
36,642 |
|
Distribution fees |
4,639 |
13,595 |
|
Accounting fees and expenses |
5,000 |
125,040 |
|
Non-interested trustees' compensation |
8 |
66,116 |
|
Custodian fees and expenses |
5,009 |
121,825 |
|
Registration fees |
6,938 |
46,655 |
|
Audit |
153 |
43,969 |
|
Legal |
- |
116,925 |
|
Amortization of organization expenses |
- |
2,278 |
|
Interest |
- |
2,078 |
|
Reports to shareholders |
- |
61,161 |
|
Miscellaneous |
- |
7,529 |
|
Total expenses before reductions |
42,412 |
1,273,447 |
|
Expense reductions |
(3,674) |
(50,322) |
|
|
38,738 |
1,223,125 |
|
Net investment income (loss) |
(31,581) |
(470,140) |
|
Realized and Unrealized Gain (Loss) Net realized gain (loss) on: |
|
|
|
Investment securities |
875,095 |
9,731,272 |
|
Foreign currency transactions |
(40,556) |
(84,767) |
|
|
834,539 |
9,646,505 |
|
Change in net unrealized appreciation (depreciation) on: |
|
|
|
Investment securities |
(5,301,269) |
(11,683,796) |
|
Assets and liabilities in foreign currencies |
91 |
(13,880) |
|
|
(5,301,178) |
(11,697,676) |
|
Net gain (loss) |
(4,466,639) |
(2,051,171) |
|
Net increase (decrease) in net assets resulting |
$ (4,498,220) |
$ (2,521,311) |
See accompanying notes which are an integral part of the financial statements.
Annual Report
Financial Statements - continued
Statement of Changes in Net Assets
|
|
One month ended
October 31, |
Year ended September 30, 2000 |
Year ended September 30, 1999 |
|
Increase (Decrease) in Net Assets |
|
|
|
|
Operations |
$ (31,581) |
$ (470,140) |
$ (211,518) |
|
Net realized gain (loss) |
834,539 |
9,646,505 |
7,027,931 |
|
Change in net unrealized |
(5,301,178) |
(11,697,676) |
35,458,966 |
|
Net increase (decrease) in net assets resulting from operations |
(4,498,220) |
(2,521,311) |
42,275,379 |
|
Share transactions - |
(955,611) |
(34,086,003) |
(4,639,364) |
|
Redemption fees |
62,672 |
1,372,965 |
50,478 |
|
Total increase (decrease) in |
(5,391,159) |
(35,234,349) |
37,686,493 |
|
Net Assets |
|
|
|
|
Beginning of period |
25,366,851 |
60,601,200 |
22,914,707 |
|
End of period |
$ 19,975,692 |
$ 25,366,851 |
$ 60,601,200 |
See accompanying notes which are an integral part of the financial statements.
Annual Report
|
|
One month ended |
Years ended September 30, |
(automated graphic) | ||||
|
Selected Per-Share Data |
2000 |
2000 H |
1999 |
1998 |
1997 |
1996 |
|
|
Net asset value, beginning of period |
$ 8.99 |
$ 10.78 |
$ 3.67 |
$ 7.26 |
$ 10.71 |
$ 12.62 |
|
|
Income from Investment Operations |
|
|
|
|
|
|
|
|
Net investment income (loss) C |
(.01) |
(.09) |
(.04) G |
(.05) |
(.06) |
(.08) |
|
|
Net realized and unrealized gain (loss) |
(1.62) |
(1.97) |
7.15 |
(3.54) |
(3.14) |
(1.83) |
|
|
Total from investment operations |
(1.63) |
(2.06) |
7.11 |
(3.59) |
(3.20) |
(1.91) |
|
|
Dilution resulting from common stock issued through |
- |
- |
- |
- |
(.19) |
- |
|
|
Offering expenses |
- |
- |
- |
- |
(.06) |
- |
|
|
Redemption fees added to paid in capital |
.02 |
.27 |
- |
- |
- |
- |
|
|
Net asset value, end of period |
$ 7.38 |
$ 8.99 |
$ 10.78 F |
$ 3.67 |
$ 7.26 |
$ 10.71 |
|
|
Total Return A, B |
(17.91)% |
(16.60)% |
193.73% |
(49.45)% |
(28.08)% I |
(15.13)% |
|
|
Ratios and Supplemental Data |
|
|
|
|
|
|
|
|
Net assets, end of period (000 omitted) |
$ 19,279 |
$ 25,017 |
$ 60,601 |
$ 22,915 |
$ 45,312 |
$ 47,181 |
|
|
Ratio of expenses to average net assets |
2.10% D, J |
1.91% D |
1.75% |
2.32% |
1.88% |
1.80% |
|
|
Ratio of expenses to average net assets after |
2.10% J |
1.89% E |
1.61% E, G |
2.30% E |
1.88% |
1.79% E |
|
|
Ratio of net investment income (loss) to average net assets |
(1.71)% J |
(.73)% |
(.42)% |
(1.22)% |
(.64)% |
(.68)% |
|
|
Portfolio turnover rate |
121% J |
39% |
58% |
65% |
51% |
28% |
|
|
A The total returns would have been lower had certain expenses not been reduced during the periods shown. B Total returns do not include the one time sales charge and for periods of less
than one year are not annualized. |
|||||||
Financial Highlights - Class T
|
|
One month ended |
Period ended |
|
Selected Per-Share Data |
|
|
|
Net asset value, beginning of period |
$ 8.99 |
$ 12.58 |
|
Income from Investment Operations |
|
|
|
Net investment income (loss) D |
(.01) |
(.03) |
|
Net realized and unrealized gain (loss) |
(1.61) |
(3.56) |
|
Total from investment operations |
(1.62) |
(3.59) |
|
Net asset value, end of period |
$ 7.37 |
$ 8.99 |
|
Total Return B, C |
(18.02)% |
(28.54)% |
|
Ratios and Supplemental Data |
|
|
|
Net assets, end of period (000 omitted) |
$ 473 |
$ 108 |
|
Ratio of expenses to average net assets |
2.35% A, F |
2.35% A, F |
|
Ratio of expenses to average net assets after |
2.35% A |
2.32% A, G |
|
Ratio of net investment income (loss) to average net assets |
(1.96)% A |
(1.16)% A |
|
Portfolio turnover rate |
121% A |
39% |
A Annualized
B The total returns would have been lower had certain expenses not been reduced during the periods shown.
C Total returns do not include the one time sales charge and for periods of less than one year are not annualized.
D Net investment income (loss) per share has been calculated based on average shares outstanding during the period.
E For the period July 3, 2000 (commencement of sale of Class T shares) to September 30, 2000.
F FMR agreed to reimburse a portion of the class' expenses during the period. Without this reimbursement, the class' expense ratio would have been higher.
G FMR or the fund has entered into varying arrangements with third parties who either paid or reduced a portion of the class' expenses.
See accompanying notes which are an integral part of the financial statements.
Annual Report
Financial Highlights - Class B
|
|
One month ended |
Period ended |
|
Selected Per-Share Data |
|
|
|
Net asset value, beginning of period |
$ 8.98 |
$ 12.58 |
|
Income from Investment Operations |
|
|
|
Net investment income (loss) D |
(.02) |
(.04) |
|
Net realized and unrealized gain (loss) |
(1.60) |
(3.56) |
|
Total from investment operations |
(1.62) |
(3.60) |
|
Net asset value, end of period |
$ 7.36 |
$ 8.98 |
|
Total Return B, C |
(18.04)% |
(28.62)% |
|
Ratios and Supplemental Data |
|
|
|
Net assets, end of period (000 omitted) |
$ 83 |
$ 80 |
|
Ratio of expenses to average net assets |
2.85% A, F |
2.85% A, F |
|
Ratio of expenses to average net assets after |
2.85% A |
2.83% A, G |
|
Ratio of net investment income (loss) to average net assets |
(2.45)% A |
(1.67)% A |
|
Portfolio turnover rate |
121% A |
39% |
A Annualized
B The total returns would have been lower had certain expenses not been reduced during the periods shown.
C Total returns do not include the contingent deferred sales charge and for periods of less than one year are not annualized.
D Net investment income (loss) per share has been calculated based on average shares outstanding during the period.
E For the period July 3, 2000 (commencement of sale of Class B shares) to September 30, 2000.
F FMR agreed to reimburse a portion of the class' expenses during the period. Without this reimbursement, the class' expense ratio would have been higher.
G FMR or the fund has entered into varying arrangements with third parties who either paid or reduced a portion of the class' expenses.
See accompanying notes which are an integral part of the financial statements.
Annual Report
Financial Highlights - Class C
|
|
One month ended |
Period ended |
|
Selected Per-Share Data |
|
|
|
Net asset value, beginning of period |
$ 8.98 |
$ 12.58 |
|
Income from Investment Operations |
|
|
|
Net investment income (loss) D |
(.02) |
(.04) |
|
Net realized and unrealized gain (loss) |
(1.60) |
(3.56) |
|
Total from investment operations |
(1.62) |
(3.60) |
|
Net asset value, end of period |
$ 7.36 |
$ 8.98 |
|
Total Return B, C |
(18.04)% |
(28.62)% |
|
Ratios and Supplemental Data |
|
|
|
Net assets, end of period (000 omitted) |
$ 82 |
$ 90 |
|
Ratio of expenses to average net assets |
2.85% A, F |
2.85% A, F |
|
Ratio of expenses to average net assets after |
2.85% A |
2.82% A , G |
|
Ratio of net investment income (loss) to average net assets |
(2.46)% A |
(1.66)% A |
|
Portfolio turnover rate |
121% A |
39% |
A Annualized
B The total returns would have been lower had certain expenses not been reduced during the periods shown.
C Total returns do not include the contingent deferred sales charge and for periods of less than one year are not annualized.
D Net investment income (loss) per share has been calculated based on average shares outstanding during the period.
E For the period July 3, 2000 (commencement of sale of Class C shares) to September 30, 2000.
F FMR agreed to reimburse a portion of the class' expenses during the period. Without this reimbursement, the class' expense ratio would have been higher.
G FMR or the fund has entered into varying arrangements with third parties who either paid or reduced a portion of the class' expenses.
See accompanying notes which are an integral part of the financial statements.
Annual Report
Financial Highlights - Institutional Class
|
|
One month ended |
Period ended |
|
Selected Per-Share Data |
|
|
|
Net asset value, beginning of period |
$ 8.99 |
$ 12.58 |
|
Income from Investment Operations |
|
|
|
Net investment income (loss) D |
(.01) |
(.01) |
|
Net realized and unrealized gain (loss) |
(1.59) |
(3.58) |
|
Total from investment operations |
(1.60) |
(3.59) |
|
Net asset value, end of period |
$ 7.39 |
$ 8.99 |
|
Total Return B, C |
(17.80)% |
(28.54)% |
|
Ratios and Supplemental Data |
|
|
|
Net assets, end of period (000 omitted) |
$ 59 |
$ 71 |
|
Ratio of expenses to average net assets |
1.77% A |
1.85% A, F |
|
Ratio of expenses to average net assets after |
1.77% A |
1.84% A, G |
|
Ratio of net investment income (loss) to average net assets |
(1.38)% A |
(.68)% A |
|
Portfolio turnover rate |
121% A |
39% |
A Annualized
B The total returns would have been lower had certain expenses not been reduced during the periods shown.
C Total returns for periods of less than one year are not annualized.
D Net investment income (loss) per share has been calculated based on average shares outstanding during the period.
E For the period July 3, 2000 (commencement of sale of Institutional Class shares) to September 30, 2000.
F FMR agreed to reimburse a portion of the class' expenses during the period. Without this reimbursement, the class' expense ratio would have been higher.
G FMR or the fund has entered into varying arrangements with third parties who either paid or reduced a portion of the class' expenses.
See accompanying notes which are an integral part of the financial statements.
Annual Report
For the periods ended October 31, 2000 and September 30, 2000
1. Significant Accounting Policies.
Fidelity Advisor Korea Fund (the fund) is a fund of Fidelity Advisor Series VIII (the trust) and is authorized to issue an unlimited number of shares. The trust is registered under the Investment Company Act of 1940, as amended (the 1940 Act), as an open-end management investment company organized as a Massachusetts business trust. Prior to June 30, 2000, the fund operated as Fidelity Advisor Korea Fund, Inc. (the Closed-End Fund), a closed end fund with the same investment objective and substantially similar investment policies. On June 30, 2000, the Closed-End Fund was reorganized as an open-end fund through a transfer of all of its assets and liabilities to the fund. Shareholders of the Closed-End Fund received Class A shares of the fund in exchange for their shares of the Closed-End Fund. Class A, Class T, Class B, Class C and Institutional Class shares of the fund were not offered prior to July 3, 2000.
The fund offers Class A, Class T, Class B, Class C, and Institutional Class shares, each of which has equal rights as to assets and voting privileges. Each class has exclusive voting rights with respect to matters that affect that class. Class B shares will automatically convert to Class A shares after a holding period of seven years from the initial date of purchase. Investment income, realized and unrealized capital gains and losses, the common expenses of the fund, and certain fund-level expense reductions, if any, are allocated on a pro rata basis to each class based on the relative net assets of each class to the total net assets of the fund. Each class of shares differs in its respective distribution, transfer agent, and certain other class-specific fees, expenses, and expense reductions.
The fund's investments in emerging markets can be subject to social, economic, regulatory, and political uncertainties and can be extremely volatile.
The financial statements have been prepared in conformity with generally accepted accounting principles which require management to make certain estimates and assumptions at the date of the financial statements. On May 18, 2000, the Board of Trustees approved a change in the fiscal year-end of the trust to October 31. Accordingly, the financial statements of the fund are presented as of and for the year ended September 30, 2000 and as of and for the one-month period ended October 31, 2000. The following summarizes the significant accounting policies of the fund:
Security Valuation. Securities for which exchange quotations are readily available are valued at the last sale price, or if no sale price, at the closing bid price. Foreign securities are valued based on quotations from the principal market in which such securities are normally traded. If trading or events occurring in other markets after the close of the principal market in which foreign securities are traded, and before the close of the business of the fund, are expected to materially affect the value of those securities, then they are valued at their fair value taking this trading or these events into account. Fair value is determined in good faith under consistently applied procedures under the general supervision of the Board of Trustees. Securities for which exchange quotations are not readily available (and in certain cases debt securities which trade on an exchange)
Annual Report
Notes to Financial Statements - continued
1. Significant Accounting Policies - continued
Security Valuation - continued
are valued primarily using dealer-supplied valuations or at their fair value. Short-term securities with remaining maturities of sixty days or less for which quotations are not readily available are valued at amortized cost or original cost plus accrued interest, both of which approximate current value. Investments in open-end investment companies are valued at their net asset value each business day.
Foreign Currency Translation. The accounting records of the fund are maintained in U.S. dollars. Investment securities and other assets and liabilities denominated in a foreign currency are translated into U.S. dollars at the prevailing rates of exchange at period end. Purchases and sales of securities, income receipts and expense payments are translated into U.S. dollars at the prevailing exchange rate on the respective dates of the transactions.
Net realized gains and losses on foreign currency transactions represent net gains and losses from sales and maturities of foreign currency contracts, disposition of foreign currencies, the difference between the amount of net investment income accrued and the U.S. dollar amount actually received, and gains and losses between trade and settlement date on purchases and sales of securities. The effects of changes in foreign currency exchange rates on investments in securities are included with the net realized and unrealized gain or loss on investment securities.
Income Taxes. As a qualified regulated investment company under Subchapter M of the Internal Revenue Code, the fund is not subject to U.S. federal income taxes to the extent that it distributes substantially all of its taxable income for its fiscal year. The fund may be subject to foreign taxes on income and gains on investments which are accrued based upon the fund's understanding of the tax rules and regulations that exist in the markets in which it invests. Foreign governments may also impose taxes on other payments or transactions with respect to foreign securities. The fund accrues such taxes as applicable. The schedule of investments includes information regarding income taxes under the caption "Income Tax Information."
Investment Income. Dividend income is recorded on the ex-dividend date, except certain dividends from foreign securities where the ex-dividend date may have passed, are recorded as soon as the fund is informed of the ex-dividend date. Non-cash dividends included in dividend income, if any, are recorded at the fair market value of the securities received. Interest income is accrued as earned. Investment income is recorded net of foreign taxes withheld where recovery of such taxes is uncertain.
Expenses. Most expenses of the trust can be directly attributed to a fund. Expenses which cannot be directly attributed are apportioned among the funds in the trust.
Annual Report
Notes to Financial Statements - continued
1. Significant Accounting Policies - continued
Expenses - continued
The fund incurred organization expenses in connection with its initial issuance of shares. The organization expenses of $157,276 were amortized on a straight-line basis for a five-year period beginning at the commencement of operations of the fund. The organization expenses have been fully amortized as of March 31, 2000.
Distributions to Shareholders. Distributions are recorded on the ex-dividend date. Income dividends and capital gain distributions are declared separately for each class.
Income and capital gain distributions are determined in accordance with income tax regulations which may differ from generally accepted accounting principles. These differences, which may result in distribution reclassifications, are primarily due to differing treatments for foreign currency transactions, net operating losses, capital loss carryforwards and losses deferred due to wash sales.
Permanent book and tax basis differences relating to shareholder distributions will result in reclassifications to paid in capital. Accumulated undistributed net realized gain (loss) on investments and foreign currency transactions may include temporary book and tax basis differences which will reverse in a subsequent period. Any taxable income or gain remaining at fiscal year end is distributed in the following year.
Short-Term Trading (Redemption) Fees. Class A shares received in connection with the reorganization and redeemed within 200 days of the reorganization are subject to a 4% short-term trading fee. The fee, which is retained by the fund, is accounted for as an addition to paid in capital.
Security Transactions. Security transactions are accounted for as of trade date. Gains and losses on securities sold are determined on the basis of identified cost.
The fund invests in new securities offered by some foreign companies by making applications in the public offering. Either all, or a portion, of the issue price is paid at the time of the application and recorded as application money for new issues. Upon allotment, this amount, plus the remaining amount of issue price, is recorded as cost of investments.
2. Operating Policies.
Foreign Currency Contracts. The fund generally uses foreign currency contracts to facilitate transactions in foreign-denominated securities. Losses may arise from changes in the value of the foreign currency or if the counterparties do not perform under the contracts' terms. The U.S. dollar value of foreign currency contracts is determined using contractual currency exchange rates established at the time of each trade.
Annual Report
Notes to Financial Statements - continued
2. Operating Policies - continued
Joint Trading Account. Pursuant to an Exemptive Order issued by the Securities and Exchange Commission (the SEC), the fund, along with other affiliated entities of FMR, may transfer uninvested cash balances into one or more joint trading accounts. These balances are invested in one or more repurchase agreements for U.S. Treasury or Federal Agency obligations.
Repurchase Agreements. The underlying U.S. Treasury, Federal Agency, or other obligations found to be satisfactory by FMR are transferred to an account of the fund, or to the Joint Trading Account, at a custodian bank. The securities are marked-to-market daily and maintained at a value at least equal to the principal amount of the repurchase agreement (including accrued interest). FMR, the fund's investment adviser, is responsible for determining that the value of the underlying securities remains in accordance with the market value requirements stated above.
3. Purchase and Sales of Investments.
For the one month period ended October 31, 2000, purchases and sales of securities, other than short-term securities, aggregated $2,323,077 and $6,938,992, respectively.
For the year ended September 30, 2000, purchases and sales of securities, other than short-term securities, aggregated $23,746,920 and $54,212,753, respectively.
4. Fees and Other Transactions with Affiliates.
Management Fee. As the fund's investment adviser, FMR receives a monthly fee that is calculated on the basis of a group fee rate plus a fixed individual fund fee rate applied to the average net assets of the fund. The group fee rate is the weighted average of a series of rates and is based on the monthly average net assets of all the mutual funds advised by FMR. The rates ranged from .2167% to .5200% for the period. The annual individual fund fee rate is 0.55%. In the event that these rates were lower than the contractual rates in effect during the period, FMR voluntarily implemented the above rates, as they resulted in the same or a lower management fee. Prior to the reorganization on June 30, 2000, FMR received a fee that was computed daily at an annual rate of 1.00% of the fund's average net assets. For the one-month period ended October 31, 2000, the management fee was equivalent to an annualized rate of .83% of average net assets. For the year ended September 30, 2000, the management fee was equivalent to an annual rate of .97% of average net assets.
Sub-Adviser Fee. FMR, on behalf of the fund, entered into sub-advisory agreements with Fidelity Management & Research (U.K.) Inc., Fidelity Management & Research (Far East) Inc., and Fidelity International Investment Advisors (FIIA). Under the sub-advisory arrangements, FMR may receive investment advice and research services and may grant the
Annual Report
Notes to Financial Statements - continued
4. Fees and Other Transactions with Affiliates - continued
Sub-Adviser Fee - continued
sub-advisers investment management authority to buy and sell securities. FMR pays its sub-advisers either a portion of its management fee or a fee based on costs incurred for these services.
Distribution and Service Plan. Effective July 3, 2000, in accordance with Rule 12b-1 of the 1940 Act, the Board of Trustees have adopted separate Distribution and Service Plans with respect to each class of shares (collectively referred to as "the Plans"). Under certain of the Plans, the class pays Fidelity Distributors Corporation (FDC), an affiliate of FMR, a 12b-1 fee. A portion of this fee may be reallowed to securities dealers, banks and other financial institutions for the distribution of each class of shares and providing shareholder support services. For the period, this fee was based on the following annual rates of the average net assets of each applicable class:
|
Class A |
.25% |
|
Class T |
.50% |
|
Class B |
1.00% * |
|
Class C |
1.00% * |
* .75% represents a distribution fee and .25% represents a shareholder service fee.
For the period, each class paid FDC the following amounts, a portion of which was retained by FDC:
|
|
One month ended |
Year ended |
||
|
|
Paid to |
Retained by FDC |
Paid to |
Retained by FDC |
|
Class A |
$ 4,436 |
$ 723 |
$ 13,026 |
$ 4,092 |
|
Class T |
73 |
13 |
119 |
107 |
|
Class B |
63 |
60 |
224 |
222 |
|
Class C |
67 |
65 |
226 |
226 |
|
|
$ 4,639 |
$ 861 |
$ 13,595 |
$ 4,647 |
Sales Load. FDC receives a front-end sales charge of up to 5.75% for selling Class A shares, and 3.50% for selling Class T shares of the fund. FDC receives the proceeds of contingent deferred sales charges levied on Class B share redemptions occurring within six years of purchase and Class C share redemptions occurring within one year of purchase. Contingent deferred sales charges are based on declining rates ranging from 5% to 1% for Class B and 1% for Class C, of the lesser of the cost of shares at the initial date of purchase or the net asset value of the redeemed shares, excluding any reinvested dividends and capital gains. In addition, purchases of Class A and Class T shares that were subject to a finder's fee bear a contingent deferred sales charge on assets that do not remain in the fund for at least one year. The Class A and Class T
Annual Report
Notes to Financial Statements - continued
4. Fees and Other Transactions with Affiliates - continued
Sales Load - continued
contingent deferred sales charge is based on 0.25% of the lesser of the cost of shares at the initial date of purchase or the net asset value of the redeemed shares, excluding any reinvested dividends and capital gains. A portion of the sales charges paid to FDC is paid to securities dealers, banks and other financial institutions.
For the period, sales charge amounts paid to and retained by FDC were as follows:
|
|
One month ended |
Year ended |
||
|
|
Paid to |
Retained by FDC |
Paid to |
Retained by FDC |
|
Class A |
$ 12 |
$ 12 |
$ 600 |
$ 600 |
|
Class T |
4 |
0 |
118 |
18 |
|
Class B |
0 |
0* |
0 |
0 * |
|
Class C |
0 |
0* |
0 |
0 * |
|
|
$ 16 |
$ 12 |
$ 718 |
$ 618 |
* When Class B and Class C shares are initially sold, FDC pays commissions from its own resources to securities dealers,
banks, and other financial institutions through which the sales are made.
Transfer Agent Fees. Effective July 3, 2000, the fund entered into an arrangement with Fidelity Investments Institutional Operations Company, Inc., (FIIOC). FIIOC, an affiliate of FMR, is the transfer, dividend disbursing and shareholder servicing agent (collectively referred to as the transfer agent) for each class of the fund. FIIOC receives account fees and asset-based fees that vary according to the account size and type of account of the shareholders of the respective classes of the fund. FIIOC pays for typesetting, printing and mailing of all shareholder reports, except proxy statements. For the period, the following amounts were paid to FIIOC:
|
|
One month ended |
Year ended |
||
|
|
Amount |
% of |
Amount |
% of |
|
Class A |
$ 5,368 |
.30* |
$ 36,137 |
.06 |
|
Class T |
36 |
.25* |
37 |
.16 * |
|
Class B |
13 |
.20* |
27 |
.12 * |
|
Class C |
11 |
.16* |
25 |
.11 * |
|
Institutional Class |
6 |
.01* |
416 |
.65 * |
|
|
$ 5,434 |
|
$ 36,642 |
|
* Annualized
Annual Report
Notes to Financial Statements - continued
4. Fees and Other Transactions with Affiliates - continued
Accounting Fees. FSC, an affiliate of FMR, maintains the fund's accounting records. The fee is based on the level of average net assets for the month plus out-of-pocket expenses.
Prior to July 3, 2000, Fidelity Service Company, Inc. (FSC), a division of FMR Corp., entered into a Fund Management Agreement with the fund to provide, or arrange to provide, administrative services to the fund including maintaining the fund's accounting records. As the fund's administrative manager, FSC received a monthly fee at an annual rate of .20% of the fund's average net assets.
Fidelity Cash Central Fund. Pursuant to an Exemptive Order issued by the SEC, the fund may invest in the Fidelity Cash Central Fund (the Cash Fund) managed by Fidelity Investments Money Management, Inc., an affiliate of FMR. The Cash Fund is an open-end money market fund available only to investment companies and other accounts managed by FMR and its affiliates. The Cash Fund seeks preservation of capital, liquidity, and current income. Income distributions from the Cash Fund are declared daily and paid monthly from net interest income. Income distributions earned by the fund are recorded as interest income in the accompanying financial statements.
5. Bank Borrowings.
The fund is permitted to have bank borrowings for temporary or emergency purposes to fund shareholder redemptions. The fund has established borrowing arrangements with certain banks. The interest rate on the borrowings is the bank's base rate, as revised from time to time. The average daily loan balance during the period ended September 30, 2000 for which the loan was outstanding amounted to $2,724,000. The weighted average interest rate was 6.87%. At the periods ended September 30, 2000 and October 31, 2000 there were no bank borrowings outstanding.
Annual Report
Notes to Financial Statements - continued
6. Expense Reductions.
Effective June 30, 2000, FMR voluntarily agreed to reimburse operating expenses (excluding interest, taxes, certain securities lending fees, brokerage commissions and extraordinary expenses, if any) above the following annual rates or range of annual rates of average net assets for each of the following classes:
|
|
FMR |
One month ended |
Year ended |
|
Class A |
2.10% |
$ 3,641 |
$ 40,280 |
|
Class T |
2.35% |
22 |
48 |
|
Class B |
2.85% |
7 |
38 |
|
Class C |
2.85% |
4 |
36 |
|
Institutional Class |
1.85% |
- |
441 |
|
|
|
$ 3,674 |
$ 40,843 |
FMR has also directed certain portfolio trades to brokers who paid a portion of the fund's expenses. For the periods ended October 31, 2000 and September 30, 2000, the fund's expenses were reduced by $0 and $9,479, respectively, under this arrangement.
7. Beneficial Interest.
For the periods ended October 31, 2000 and September 30, 2000, FMR and its affiliates were record owners of approximately 16% and 24% of the total outstanding shares of the fund, respectively. In addition, for the period ended October 31, 2000, one unaffiliated shareholder was record owner of approximately 12% of the total outstanding shares of the fund. For the period ended September 30, 2000, two unaffiliated shareholders were each record owner of more than 10% of the total outstanding shares of the fund, totaling 25%.
Annual Report
Notes to Financial Statements - continued
8. Share Transactions.
Transactions for each class of shares were as follows:
|
|
Shares |
Dollars |
||
|
|
One month |
Year ended September 30, |
One month |
Year ended September 30, |
|
|
2000 |
2000A |
2000 |
2000A |
|
Class A |
28,338 |
13,790 |
$ 228,701 |
$ 127,878 |
|
Shares redeemed |
(197,871) |
(2,851,362) |
(1,609,896) |
(34,387,602) |
|
Net increase (decrease) |
(169,533) |
(2,837,572) |
$ (1,381,195) |
$ (34,259,724) |
|
Class T |
117,493 |
11,991 |
$ 870,922 |
$ 139,769 |
|
Shares redeemed |
(65,285) |
- |
(506,623) |
- |
|
Net increase (decrease) |
52,208 |
11,991 |
$ 364,299 |
$ 139,769 |
|
Class B |
2,340 |
8,957 |
$ 18,301 |
$ 110,185 |
|
Net increase (decrease) |
2,340 |
8,957 |
$ 18,301 |
$ 110,185 |
|
Class C |
1,116 |
10,024 |
$ 8,338 |
$ 120,415 |
|
Net increase (decrease) |
1,116 |
10,024 |
$ 8,338 |
$ 120,415 |
|
Institutional Class Shares sold |
205,747 |
318,509 |
$ 1,789,668 |
$ 2,601,489 |
|
Shares redeemed |
(205,747) |
(310,559) |
(1,755,022) |
(2,798,137) |
|
Net increase (decrease) |
0 |
7,950 |
$ 34,646 |
$ (196,648) |
H Amounts shown for Class T, Class B, Class C and Institutional Class are for the period July 3, 2000 (commencement of sale of shares)
to September 30, 2000.
For the period ended September 30, 1999, the Closed-End Fund repurchased 624,338 shares of common stock with a value of $4,639,364 in connection with its repurchase offer. The value of these shares has been included with the repurchase offer expenses and included in paid in capital. In addition, redemption fees of $50,478 collected as part of the repurchase offer, were accounted for as an addition to paid in capital.
Annual Report
To the Trustees of Fidelity Advisor
Series VIII and the Shareholders
of Fidelity Advisor Korea Fund:
In our opinion, the accompanying statement of assets and liabilities, including the schedule of investments, and the related statements of operations and of changes in net assets and the financial highlights present fairly, in all material respects, the financial position of Fidelity Advisor Korea Fund (a fund of Fidelity Advisor Series VIII) at September 30, 2000 and October 31, 2000, and the results of its operations, the changes in its net assets and the financial highlights for the periods indicated, in conformity with accounting principles generally accepted in the United States of America. These financial statements and financial highlights (hereafter referred to as "financial statements") are the responsibility of Fidelity Advisor Korea Fund's management; our responsibility is to express an opinion on these financial statements based on our audits. We conducted our audits of these financial statements in accordance with auditing standards generally accepted in the United States of America which require that we plan and perform the audit to obtain reasonable assurance about whether the financial statements are free of material misstatement. An audit includes examining, on a test basis, evidence supporting the amounts and disclosures in the financial statements, assessing the accounting principles used and significant estimates made by management, and evaluating the overall financial statement presentation. We believe that our audits, which included confirmation of securities at September 30, 2000 and October 31, 2000 by correspondence with the custodian and brokers, provide a reasonable basis for our opinion.
/s/PricewaterhouseCoopers LLP
PricewaterhouseCoopers LLP
Boston, Massachusetts
December 1, 2000
Annual Report
Investment Adviser
Fidelity Management & Research Company
Boston, MA
Investment Sub-Advisers
Fidelity International
Investment Advisors
Fidelity International
Investment Advisors (U.K.) Limited
Fidelity Management & Research
(U.K.) Inc.
Fidelity Management & Research
(Far East) Inc.
Fidelity Investments Japan Limited
Officers
Edward C. Johnson 3d, President
Robert C. Pozen, Senior Vice President
Eric D. Roiter, Secretary
Robert A. Dwight, Treasurer
Maria F. Dwyer, Deputy Treasurer
John H. Costello, Assistant Treasurer
Thomas J. Simpson, Assistant Treasurer
Board of Trustees
Ralph F. Cox *
Phyllis Burke Davis *
Robert M. Gates *
Edward C. Johnson 3d
Donald J. Kirk *
Ned C. Lautenbach *
Peter S. Lynch
Marvin L. Mann *
William O. McCoy *
Gerald C. McDonough *
Robert C. Pozen
Thomas R. Williams *
Advisory Board
J. Michael Cook
Abigail P. Johnson
Marie L. Knowles
General Distributor
Fidelity Distributors Corporation
Boston, MA
Transfer and Shareholder
Servicing Agents
Fidelity Investments Institutional
Operations Company, Inc.
Boston, MA
Custodian
The Chase Manhattan Bank
New York, NY
* Independent trustees
Annual Report
Focus Funds
Fidelity Advisor Consumer
Industries Fund
Fidelity Advisor Cyclical
Industries Fund
Fidelity Advisor Financial
Services Fund
Fidelity Advisor Health Care Fund
Fidelity Advisor Natural
Resources Fund
Fidelity Advisor Technology Fund
Fidelity Advisor Telecommunications and Utilities Growth Fund
Growth Funds
Fidelity Advisor Korea Fund
Fidelity Advisor Emerging Asia Fund
Fidelity Advisor Latin America Fund
Fidelity Advisor Japan Fund
Fidelity Advisor Europe Capital Appreciation Fund
Fidelity Advisor International Capital Appreciation Fund
Fidelity Advisor Overseas Fund
Fidelity Advisor Diversified International Fund
Fidelity Advisor Global Equity Fund
Fidelity Advisor TechnoQuant ®
Growth Fund
Fidelity Advisor Small Cap Fund
Fidelity Advisor Value Strategies Fund
Fidelity Advisor Mid Cap Fund
Fidelity Advisor Dynamic Capital Appreciation Fund
Fidelity Advisor Equity Growth Fund
Fidelity Advisor Large Cap Fund
Fidelity Advisor Dividend Growth Fund
Fidelity Advisor Growth
Opportunities Fund
Growth and Income Funds
Fidelity Advisor Growth & Income Fund
Fidelity Advisor Equity Income Fund
Fidelity Advisor Asset Allocation Fund
Fidelity Advisor Balanced Fund
Taxable Income Funds
Fidelity Advisor Emerging Markets Income Fund
Fidelity Advisor High Yield Fund
Fidelity Advisor High Income Fund
Fidelity Advisor Strategic Income Fund
Fidelity Advisor Mortgage
Securities Fund
Fidelity Advisor Government Investment Fund
Fidelity Advisor Intermediate Bond Fund
Fidelity Advisor Short Fixed-Income Fund
Municipal Funds
Fidelity Advisor Municipal Income Fund
Money Market Funds
Prime Fund
Treasury Fund
Tax-Exempt Fund
AKORI-ANN-1200 118902
1.748534.100
(Fidelity Investment logo)(registered trademark)
Fidelity® Advisor
Fund - Class A, Class T, Class B
and Class C
Annual Report
October 31, 2000
(2_fidelity_logos)(registered trademark)
|
President's Message |
Ned Johnson on investing strategies. |
|
|
Performance |
How the fund has done over time. |
|
|
Fund Talk |
The manager's review of fund performance, strategy and outlook. |
|
|
Investment Changes |
A summary of major shifts in the fund's investments over the past six months. |
|
|
Investments |
A complete list of the fund's investments with their market values. |
|
|
Financial Statements |
Statements of assets and liabilities,
operations, and changes in net assets, |
|
|
Notes |
Notes to the financial statements. |
|
|
Report of Independent Accountants |
The auditors' opinion. |
|
|
Distributions |
|
Standard & Poor's, S&P and S&P 500 are registered service marks of The McGraw-Hill Companies, Inc. and have been licensed for use by Fidelity Distributors Corporation.
Third party marks appearing herein are the property of their respective owners.
All other marks appearing herein are registered or unregistered trademarks or service marks of FMR Corp. or an affiliated company.
(Recycle graphic) This report is printed on recycled paper using soy-based inks.
This report and the financial statements contained herein are submitted for the general information of the shareholders of the fund. This report is not authorized for distribution to prospective investors in the fund unless preceded or accompanied by an effective prospectus.
Mutual fund shares are not deposits or obligations of, or guaranteed by, any depository institution. Shares are not insured by the FDIC, Federal Reserve Board or any other agency, and are subject to investment risks, including possible loss of principal amount invested.
Neither the fund nor Fidelity Distributors Corporation is a bank.
For more information on any Fidelity Advisor fund, including charges and expenses, contact your investment professional for a free prospectus. Read it carefully before you invest or send money.
Annual Report
(photo_of_Edward_C_Johnson_3d)
Dear Shareholder:
A sixth-straight year of double-digit positive returns for the Dow Jones Industrial Average, NASDAQ and S&P 500® could be in jeopardy unless the U.S. stock market shows marked improvement in the final two months of 2000. Through October, all three indexes had negative year-to-date returns. On the other hand, most fixed-income sectors were solidly in the black. Treasuries and other long-term government securities led the way, returning nearly 14%.
While it's impossible to predict the future direction of the markets with any degree of certainty, there are certain basic principles that can help investors plan for their future needs.
First, investors are encouraged to take a long-term view of their portfolios. If you can afford to leave your money invested through the inevitable up and down cycles of the financial markets, you will greatly reduce your vulnerability to any single decline. We know from experience, for example, that stock prices have gone up over longer periods of time, have significantly outperformed other types of investments and have stayed ahead of inflation.
Second, you can further manage your investing risk through diversification. A stock mutual fund, for instance, is already diversified, because it invests in many different companies. You can increase your diversification further by investing in a number of different stock funds, or in such other investment categories as bonds. If you have a short investment time horizon, you might want to consider moving some of your investment into a money market fund, which seeks income and a stable share price by investing in high-quality, short-term investments. Of course, it's important to remember that an investment in a money market fund is not insured or guaranteed by the Federal Deposit Insurance Corporation or any other government agency. Although money market funds seek to preserve the value of your investment at $1.00 per share, it is possible to lose money by investing in these types of funds.
Finally, no matter what your time horizon or portfolio diversity, it makes good sense to follow a regular investment plan, investing a certain amount of money in a fund at the same time each month or quarter and periodically reviewing your overall portfolio. By doing so, you won't get caught up in the excitement of a rapidly rising market, nor will you buy all your shares at market highs. While this strategy - known as dollar cost averaging - won't assure a profit or protect you from a loss in a declining market, it should help you lower the average cost of your purchases. Of course, you should consider your financial ability to continue your purchases through periods of low price levels before undertaking such a strategy.
Remember to contact your investment professional if you need help with your investments.
Best regards,
/s/Edward C. Johnson 3d
Edward C. Johnson 3d
Annual Report
Fidelity Advisor Global Equity Fund - Class A
There are several ways to evaluate historical performance. You can look at the total percentage change in value, the average annual percentage change or the growth of a hypothetical $10,000 investment. Total return reflects the change in the value of an investment, assuming reinvestment of the class' dividend income and capital gains (the profits earned upon the sale of securities that have grown in value). If Fidelity had not reimbursed certain class expenses, the total returns would have been lower.
Cumulative Total Returns
|
Periods ended October 31, 2000 |
|
Past 1 |
Life of |
|
Fidelity Adv Global Equity - CL A |
|
9.28% |
28.84% |
|
Fidelity Adv Global Equity - CL A |
|
3.00% |
21.44% |
|
MSCI World |
|
1.09% |
18.32% |
|
Global Funds Average |
|
10.26% |
n/a* |
Cumulative total returns show Class A's performance in percentage terms over a set period - in this case, one year or since the fund started on December 17, 1998. For example, if you had invested $1,000 in a fund that had a 5% return over the past year, the value of your investment would be $1,050. You can compare Class A's returns to the performance of the Morgan Stanley Capital International World Index (MSCI World) - a market capitalization-weighted index that is designed to represent the performance of developed stock markets throughout the world. As of October 31, 2000, the index included over 1,300 equity securities of companies domiciled in 22 countries. To measure how Class A's performance stacked up against its peers, you can compare it to the global funds average, which reflects the performance of mutual funds with similar objectives tracked by Lipper Inc. The past one year average represents a peer group of 261 mutual funds. These benchmarks include reinvested dividends and capital gains, if any, and exclude the effect of sales charges.
Average Annual Total Returns
|
Periods ended October 31, 2000 |
|
Past 1 |
Life of |
|
Fidelity Adv Global Equity - CL A |
|
9.28% |
14.48% |
|
Fidelity Adv Global Equity - CL A |
|
3.00% |
10.92% |
|
MSCI World |
|
1.09% |
9.39% |
|
Global Funds Average |
|
10.26% |
n/a* |
Average annual total returns take Class A shares' cumulative return and show you what would have happened if Class A shares had performed at a constant rate each year.
* Not available
Annual Report
$10,000 Over Life of Fund
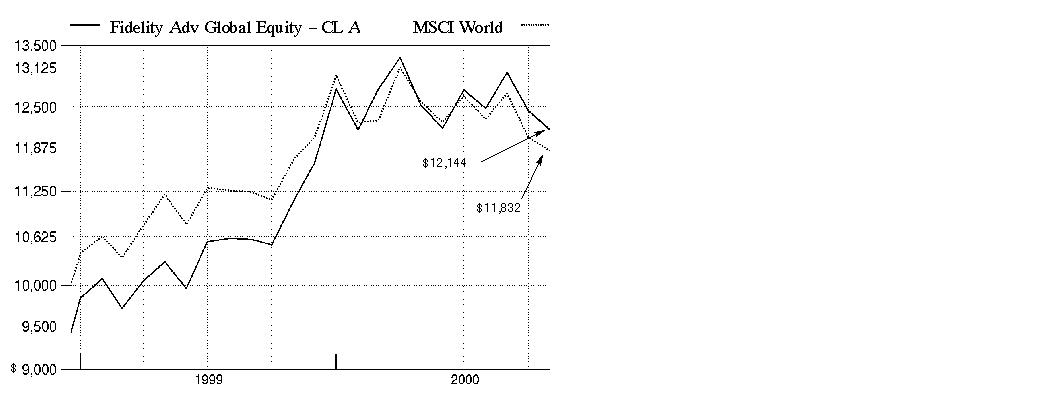
$10,000 Over Life of Fund: Let's say hypothetically that $10,000 was invested in Fidelity Advisor Global Equity Fund - Class A on December 17, 1998, when the fund started, and the current 5.75% sales charge was paid. As the chart shows, by October 31, 2000, the value of the investment would have grown to $12,144 - a 21.44% increase on the initial investment. For comparison, look at how the MSCI World Index did over the same period. With dividends reinvested, the same $10,000 would have grown to $11,832 - an 18.32% increase.
Understanding
Performance
Many markets around the globe offer the potential for significant growth over time; however, investing in foreign markets means assuming greater risks than investing in the United States. Factors like changes in a country's financial markets, its local political and economic climate, and the fluctuating value of its currency create these risks. For these reasons an international fund's performance may be more volatile than a fund that invests exclusively in the United States. Past performance is no guarantee of future results and you may have a gain or loss when you sell your shares.
3Annual Report
Fidelity Advisor Global Equity Fund - Class T
There are several ways to evaluate historical performance. You can look at the total percentage change in value, the average annual percentage change or the growth of a hypothetical $10,000 investment. Total return reflects the change in the value of an investment, assuming reinvestment of the class' dividend income and capital gains (the profits earned upon the sale of securities that have grown in value). If Fidelity had not reimbursed certain class expenses, the total returns would have been lower.
Cumulative Total Returns
|
Periods ended October 31, 2000 |
|
Past 1 |
Life of |
|
Fidelity Adv Global Equity - CL T |
|
9.12% |
28.44% |
|
Fidelity Adv Global Equity - CL T |
|
5.30% |
23.94% |
|
MSCI World |
|
1.09% |
18.32% |
|
Global Funds Average |
|
10.26% |
n/a* |
Cumulative total returns show Class T's performance in percentage terms over a set period - in this case, one year or since the fund started on December 17, 1998. For example, if you had invested $1,000 in a fund that had a 5% return over the past year, the value of your investment would be $1,050. You can compare Class T's returns to the performance of the Morgan Stanley Capital International World Index (MSCI World) - a market capitalization-weighted index that is designed to represent the performance of developed stock markets throughout the world. As of October 31, 2000, the index included over 1,300 equity securities of companies domiciled in 22 countries. To measure how Class T's performance stacked up against its peers, you can compare it to the global funds average, which reflects the performance of mutual funds with similar objectives tracked by Lipper Inc. The past one year average represents a peer group of 261 mutual funds. These benchmarks include reinvested dividends and capital gains, if any, and exclude the effect of sales charges.
Average Annual Total Returns
|
Periods ended October 31, 2000 |
|
Past 1 |
Life of |
|
Fidelity Adv Global Equity - CL T |
|
9.12% |
14.29% |
|
Fidelity Adv Global Equity - CL T |
|
5.30% |
12.14% |
|
MSCI World |
|
1.09% |
9.39% |
|
Global Funds Average |
|
10.26% |
n/a* |
Average annual total returns take Class T shares' cumulative return and show you what would have happened if Class T shares had performed at a constant rate each year.
* Not available
Annual Report
$10,000 Over Life of Fund
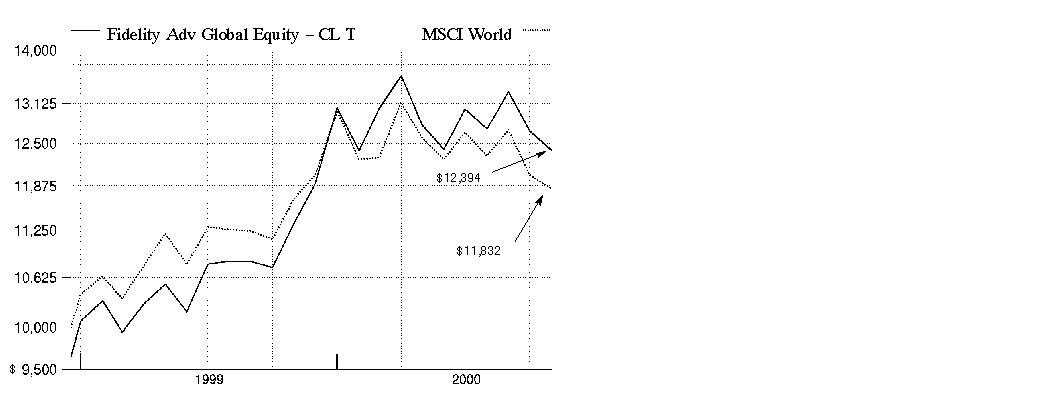
$10,000 Over Life of Fund: Let's say hypothetically that $10,000 was invested in Fidelity Advisor Global Equity Fund - Class T on December 17, 1998, when the fund started, and the current 3.50% sales charge was paid. As the chart shows, by October 31, 2000, the value of the investment would have grown to $12,394 - a 23.94% increase on the initial investment. For comparison, look at how the MSCI World Index did over the same period. With dividends reinvested, the same $10,000 would have grown to $11,832 - an 18.32% increase.
Understanding
Performance
Many markets around the globe offer the potential for significant growth over time; however, investing in foreign markets means assuming greater risks than investing in the United States. Factors like changes in a country's financial markets, its local political and economic climate, and the fluctuating value of its currency create these risks. For these reasons an international fund's performance may be more volatile than a fund that invests exclusively in the United States. Past performance is no guarantee of future results and you may have a gain or loss when you sell your shares.
3Annual Report
Fidelity Advisor Global Equity Fund - Class B
There are several ways to evaluate historical performance. You can look at the total percentage change in value, the average annual percentage change or the growth of a hypothetical $10,000 investment. Total return reflects the change in the value of an investment, assuming reinvestment of the class' dividend income and capital gains (the profits earned upon the sale of securities that have grown in value). Class B shares' contingent deferred sales charge included in the past one year and life of fund total return figures are 5% and 4%, respectively. If Fidelity had not reimbursed certain class expenses, the total returns would have been lower.
Cumulative Total Returns
|
Periods ended October 31, 2000 |
|
Past 1 |
Life of |
|
Fidelity Adv Global Equity - CL B |
|
8.56% |
27.13% |
|
Fidelity Adv Global Equity - CL B |
|
3.56% |
23.13% |
|
MSCI World |
|
1.09% |
18.32% |
|
Global Funds Average |
|
10.26% |
n/a* |
Cumulative total returns show Class B's performance in percentage terms over a set period - in this case, one year or since the fund started on December 17, 1998. For example, if you had invested $1,000 in a fund that had a 5% return over the past year, the value of your investment would be $1,050. You can compare Class B's returns to the performance of the Morgan Stanley Capital International World Index (MSCI World) - a market capitalization-weighted index that is designed to represent the performance of developed stock markets throughout the world. As of October 31, 2000, the index included over 1,300 equity securities of companies domiciled in 22 countries. To measure how Class B's performance stacked up against its peers, you can compare it to the global funds average, which reflects the performance of mutual funds with similar objectives tracked by Lipper Inc. The past one year average represents a peer group of 261 mutual funds. These benchmarks include reinvested dividends and capital gains, if any, and exclude the effect of sales charges.
Average Annual Total Returns
|
Periods ended October 31, 2000 |
|
Past 1 |
Life of |
|
Fidelity Adv Global Equity - CL B |
|
8.56% |
13.66% |
|
Fidelity Adv Global Equity - CL B |
|
3.56% |
11.74% |
|
MSCI World |
|
1.09% |
9.39% |
|
Global Funds Average |
|
10.26% |
n/a* |
Average annual total returns take Class B shares' cumulative return and show you what would have happened if Class B shares had performed at a constant rate each year.
* Not available
Annual Report
$10,000 Over Life of Fund
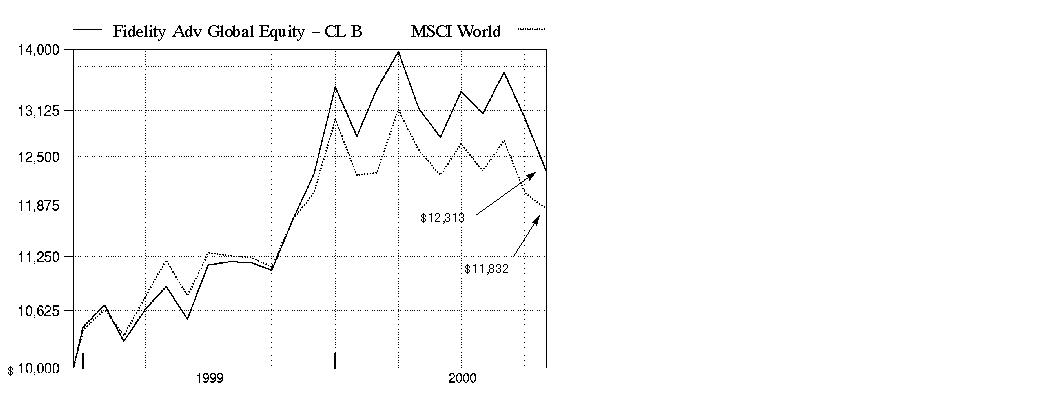
$10,000 Over Life of Fund: Let's say hypothetically that $10,000 was invested in Fidelity Advisor Global Equity Fund - Class B on December 17, 1998, when the fund started. As the chart shows, by October 31, 2000, the value of the investment, including the effect of the applicable contingent deferred sales charge, would have grown to $12,313 - a 23.13% increase on the initial investment. For comparison, look at how the MSCI World Index did over the same period. With dividends reinvested, the same $10,000 would have grown to $11,832 - an 18.32% increase.
Understanding
Performance
Many markets around the globe offer the potential for significant growth over time; however, investing in foreign markets means assuming greater risks than investing in the United States. Factors like changes in a country's financial markets, its local political and economic climate, and the fluctuating value of its currency create these risks. For these reasons an international fund's performance may be more volatile than a fund that invests exclusively in the United States. Past performance is no guarantee of future results and you may have a gain or loss when you sell your shares.
3Annual Report
Fidelity Advisor Global Equity Fund - Class C
There are several ways to evaluate historical performance. You can look at the total percentage change in value, the average annual percentage change or the growth of a hypothetical $10,000 investment. Total return reflects the change in the value of an investment, assuming reinvestment of the class' dividend income and capital gains (the profits earned upon the sale of securities that have grown in value). Class C shares' contingent deferred sales charge included in the past one year and life of fund total return figures are 1% and 0%, respectively. If Fidelity had not reimbursed certain class expenses, the total returns would have been lower.
Cumulative Total Returns
|
Periods ended October 31, 2000 |
|
Past 1 |
Life of |
|
Fidelity Adv Global Equity - CL C |
|
8.65% |
27.23% |
|
Fidelity Adv Global Equity - CL C |
|
7.65% |
27.23% |
|
MSCI World |
|
1.09% |
18.32% |
|
Global Funds Average |
|
10.26% |
n/a* |
Cumulative total returns show Class C's performance in percentage terms over a set period - in this case, one year or since the fund started on December 17, 1998. For example, if you had invested $1,000 in a fund that had a 5% return over the past year, the value of your investment would be $1,050. You can compare Class C's returns to the performance of the Morgan Stanley Capital International World Index (MSCI World) - a market capitalization-weighted index that is designed to represent the performance of developed stock markets throughout the world. As of October 31, 2000, the index included over 1,300 equity securities of companies domiciled in 22 countries. To measure how Class C's performance stacked up against its peers, you can compare it to the global funds average, which reflects the performance of mutual funds with similar objectives tracked by Lipper Inc. The past one year average represents a peer group of 261 mutual funds. These benchmarks include reinvested dividends and capital gains, if any, and exclude the effect of sales charges.
Average Annual Total Returns
|
Periods ended October 31, 2000 |
|
Past 1 |
Life of |
|
Fidelity Adv Global Equity - CL C |
|
8.65% |
13.71% |
|
Fidelity Adv Global Equity - CL C |
|
7.65% |
13.71% |
|
MSCI World |
|
1.09% |
9.39% |
|
Global Funds Average |
|
10.26% |
n/a* |
Average annual total returns take Class C shares' cumulative return and show you what would have happened if Class C shares had performed at a constant rate each year.
* Not available
Annual Report
$10,000 Over Life of Fund
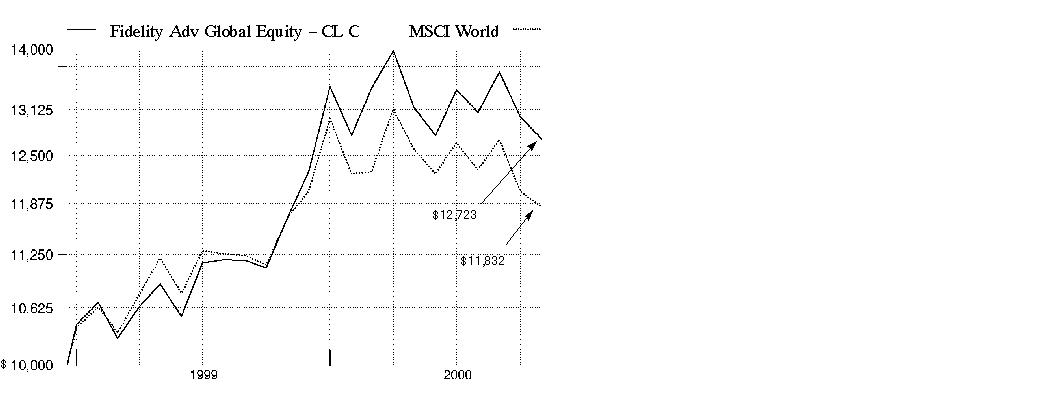
$10,000 Over Life of Fund: Let's say hypothetically that $10,000 was invested in Fidelity Advisor Global Equity Fund - Class C on December 17, 1998, when the fund started. As the chart shows, by October 31, 2000, the value of the investment would have grown to $12,723 - a 27.23% increase on the initial investment. For comparison, look at how the MSCI World Index did over the same period. With dividends reinvested, the same $10,000 would have grown to $11,832 - an 18.32% increase.
Understanding
Performance
Many markets around the globe offer the potential for significant growth over time; however, investing in foreign markets means assuming greater risks than investing in the United States. Factors like changes in a country's financial markets, its local political and economic climate, and the fluctuating value of its currency create these risks. For these reasons an international fund's performance may be more volatile than a fund that invests exclusively in the United States. Past performance is no guarantee of future results and you may have a gain or loss when you sell your shares.
3Annual Report
Market Recap
Currency disparities, the see-saw performance of technology and telecommunications stocks and increased uncertainty over the direction of energy prices contributed to volatile world markets for the 12-month period that ended October 31, 2000. Through the first half of the period, foreign investors enjoyed handsome returns from technology and telecommunications holdings. These gains disappeared down the stretch, however, as the dollar continued to outperform the struggling euro - the uniform currency of 11 European nations - and the Japanese yen by wide margins. Soaring oil and gas prices also added to the volatility. The Morgan Stanley EAFE® index - which tracks the performance of stock markets in Europe, Australasia and the Far East - fell 2.72% during the period. Europe's economic recovery remained on course, but the euro's continued weakness proved to be a millstone. The Morgan Stanley Europe index had a 12-month return of 1.16%. Japan's economic recovery, on the other hand, appeared to be short-lived, or at least very, very slow in the making. The Morgan Stanley Japan index declined 11.61% during the period. Emerging markets, meanwhile, were unable to sustain the momentum they carried into early 2000 - the Morgan Stanley Emerging Markets Free index tumbled 10.33%.
(Portfolio Manager photograph)
An interview with Richard Habermann, Portfolio Manager of Fidelity Advisor Global Equity Fund
Q. How did the fund perform, Dick?
A. Reasonably well. For the 12 months that ended October 31, 2000, the fund's Class A, Class T, Class B and Class C shares returned 9.28%, 9.12%, 8.56% and 8.65%, respectively. For the same period, the Morgan Stanley Capital International World Index produced a return of 1.09%, while the global funds average, as measured by Lipper Inc., returned 10.26%.
Q. What factors drove global equity markets during the 12-month period?
A. Generally, global markets overcame sharply rising interest rates and unusually high levels of volatility to post positive returns during the past year. Worldwide economic growth fueled corporate earnings, which, along with swelling investor enthusiasm for technology, media and telecommunications (TMT) stocks, supported the advances of major world indexes early in the period. A lack of confidence in the valuation levels of TMT stocks, coupled with concerns about a slowdown in the pace of economic growth due to further rate hikes and persistently higher energy prices, induced a series of dramatic declines in the spring. Growing increasingly risk-averse, investors around the world adopted a more defensive posture, seeking out safer havens elsewhere in the market, most notably within the health, finance and energy sectors.
Annual Report
Fund Talk: The Manager's Overview - continued
Q. Why did the fund handily outpace its index, yet fall just shy of its peer group?
A. Strong security selection, along with favorable regional positioning, played a big role in our success relative to the index. Maintaining a modest underweighting in the U.S. helped, considering the extreme downside volatility that plagued the nation's stock markets for much of the year. Having broader, better participation from a diverse group of sectors relative to the index, which tended to be highly concentrated in a small group of large tech stocks, gave us an edge. By holding a large number of stocks, we managed to reduce the risk level of the fund, which was key in this uncertain environment. The protection we got on the downside more than offset what we lost on the upside - our underexposure to Oracle and Intel hurt, while holding less Microsoft and Lucent than the index helped. Given the fund's large-cap bias, we came up short relative to our Lipper peers, which generally made more aggressive bets on smaller-cap tech stocks - a group that produced some of the period's best performers.
Q. How did some of your other moves influence performance?
A. Successful stock picking and timely trading in other world markets, particularly Europe and Japan, helped widen our lead over the index. Having ample exposure to the Canadian market, which led most world markets by wide margins during the period, further bolstered fund performance. Technology and energy stocks were our focus there. Sensing trouble on the horizon early in 2000, we decided to shed some of our overall TMT exposure to lock in profits, and replace them with more defensive issues. This strategy paid off for us as world markets trended from growth to value during the second half of the period.
Q. Which stocks helped the most? Which hurt?
A. The U.S. produced a handful of winners from the high-tech arena, most notably Juniper and EMC, while Japan chipped in with Furukawa Electric and Germany with Epcos. European wireless stocks, including Finnish-based Nokia and Sweden's Ericsson, traversed a rocky road, yet still were solid gainers. Other contributors included Swedish insurance carrier Skandia Foersaekrings, French broadcaster TF1 and U.S. power provider AES. Additionally, because we maintained small positions in a large number of stocks, we didn't have any big disasters, which limited our downside. However, we had our fair share of telecom stocks that disappointed, including Britain's Vodafone, Japan's Nippon Telegraph and Italy's Telecom Italia, as well as AT&T. We also had very small out-of-benchmark positions in Mexico and Brazil that hurt.
Annual Report
Fund Talk: The Manager's Overview - continued
Q. What's your outlook?
A. It's still unclear to me as to whether or not the U.S. market will be able to shake its concerns about an economic slowdown and the potential effect on companies' bottom lines. If the U.S. can successfully achieve a soft landing, we could see lower interest rates and a pickup in demand, which could stimulate global markets. Since there's no way to know for sure what will happen, I plan to maintain our emphasis on the defensive areas of the market until I can see a catalyst that can reverse the tide.
The views expressed in this report reflect those of the portfolio manager only through the end of the period of the report as stated on the cover and do not necessarily represent the views of Fidelity or any other person in the Fidelity organization. Any such views are subject to change at any time based upon market or other conditions and Fidelity disclaims any responsibility to update such views. These views may not be relied on as investment advice and, because investment decisions for a Fidelity fund are based on numerous factors, may not be relied on as an indication of trading intent on behalf of any Fidelity fund.
Fund Facts
Goal: seeks long-term growth of capital
Start date: December 17, 1998
Size: as of October 31, 2000, more than $22 million
Manager: Richard Habermann, since inception; joined Fidelity in 1968
3Dick Habermann reflects on recent market volatility:
"There's a lot of uncertainty in the world today, and it's finding its way into the equity markets. Thankfully, the fund's exposure was generally more defensive in nature toward the tail end of the period, when conditions really started to deteriorate. We didn't want to be on the sidelines holding a large cash position, but we also didn't want to make any commitments that we didn't have a lot of confidence in. So, we chose to be somewhat neutral until we felt we saw some light at the end of the tunnel.
"What's particularly troubling for markets these days are shock events. Take the recent crisis in the Middle East, for example. With higher oil prices and inflation fears already weighing on the minds of investors, escalating tensions in that area of the world roiled the markets. There have been many events like this one over the past decade, including the emerging-markets crisis in 1998 and the Gulf War in 1990. As a money manager, it's important for me to anticipate what might be considered less-than-perfect times and, when they are in fact occurring, assess them and decide what to do. So far, we've completed the first part by anticipating difficult times. Early recognition of an uncertain market climate allowed us to lessen our technology exposure, which was key."
Annual Report
|
Top Five Stocks as of October 31, 2000 |
||
|
|
% of fund's |
% of fund's net assets |
|
General Electric Co. (United States of America, Electrical Equipment) |
2.3 |
1.9 |
|
Vodafone Group PLC |
1.9 |
2.4 |
|
Cisco Systems, Inc. (United States of America, Communications Equipment) |
1.5 |
1.6 |
|
Exxon Mobil Corp. |
1.1 |
1.1 |
|
Pfizer, Inc. (United States of America, |
1.1 |
0.9 |
|
|
7.9 |
7.9 |
|
Top Five Market Sectors as of October 31, 2000 |
||
|
|
% of fund's |
% of fund's net assets |
|
Finance |
18.7 |
15.1 |
|
Technology |
18.1 |
23.3 |
|
Health |
9.5 |
6.9 |
|
Utilities |
9.0 |
14.4 |
|
Energy |
6.3 |
6.2 |
|
Top Five Countries as of October 31, 2000 |
||
|
(excluding cash equivalents) |
% of fund's |
% of fund's net assets |
|
United States of America |
46.2 |
41.5 |
|
Japan |
10.8 |
13.3 |
|
United Kingdom |
8.2 |
9.5 |
|
France |
4.6 |
5.2 |
|
Germany |
3.6 |
3.7 |
|
Percentages are adjusted for the effect of open futures contracts, if applicable. |
|
Asset Allocation (% of fund's net assets) |
|||||||
|
As of October 31, 2000 |
As of April 30, 2000 |
||||||
|
Stocks 90.4% |
|
|
Stocks 95.5% |
|
||
|
Short-Term |
|
|
Short-Term |
|
||

Annual Report
Showing Percentage of Net Assets
|
Common Stocks - 88.8% |
|||
|
Shares |
Value (Note 1) |
||
|
Australia - 0.7% |
|||
|
Australia & New Zealand Banking Group Ltd. |
2,700 |
$ 20,013 |
|
|
BHP Ltd. |
2,657 |
25,844 |
|
|
Brambles Industries Ltd. |
300 |
7,805 |
|
|
Cable & Wireless Optus Ltd. (a) |
5,700 |
12,114 |
|
|
CI Technologies Group Ltd. |
1,000 |
1,821 |
|
|
John Fairfax Holdings Ltd. |
2,800 |
6,379 |
|
|
National Australia Bank Ltd. |
1,100 |
15,334 |
|
|
News Corp. Ltd. |
2,984 |
32,078 |
|
|
OneSteel Ltd. (a) |
498 |
238 |
|
|
Publishing & Broadcasting Ltd. |
1,400 |
9,591 |
|
|
Telstra Corp. Ltd. |
3,900 |
12,772 |
|
|
Westpac Banking Corp. |
300 |
2,056 |
|
|
TOTAL AUSTRALIA |
146,045 |
||
|
Brazil - 0.1% |
|||
|
Telesp Celular Participacoes SA ADR |
910 |
28,779 |
|
|
Canada - 2.4% |
|||
|
Abitibi-Consolidated, Inc. |
410 |
3,595 |
|
|
AGF Management Ltd. Class B (non-vtg.) |
240 |
4,004 |
|
|
Alberta Energy Co. Ltd. |
170 |
6,281 |
|
|
Alcan Aluminium Ltd. |
220 |
6,943 |
|
|
Aliant, Inc. |
130 |
2,758 |
|
|
Anderson Exploration Ltd. (a) |
170 |
3,126 |
|
|
Angiotech Pharmaceuticals, Inc. (a) |
50 |
2,742 |
|
|
ATS Automation Tooling Systems, Inc. (a) |
180 |
3,204 |
|
|
Ballard Power Systems, Inc. (a) |
80 |
8,617 |
|
|
Bank of Montreal |
200 |
9,261 |
|
|
Bank of Nova Scotia |
270 |
7,714 |
|
|
Barrick Gold Corp. |
800 |
10,640 |
|
|
BCE, Inc. |
600 |
16,158 |
|
|
Biochem Pharma, Inc. (a) |
130 |
3,198 |
|
|
Biovail Corp. (a) |
130 |
5,550 |
|
|
Bombardier, Inc. Class B (sub. vtg.) |
1,070 |
16,832 |
|
|
C-Mac Industries, Inc. (a) |
180 |
10,167 |
|
|
C.I. Fund Management, Inc. |
250 |
5,230 |
|
|
CAE, Inc. |
230 |
2,931 |
|
|
Canada Occidental Petroleum Ltd. |
180 |
4,333 |
|
|
Canadian Hunter Exploration Ltd. (a) |
140 |
2,943 |
|
|
Canadian Imperial Bank of Commerce |
310 |
9,855 |
|
|
Canadian National Railway Co. |
220 |
6,936 |
|
|
Canadian Natural Resources Ltd. (a) |
150 |
4,434 |
|
|
Canadian Pacific Ltd. |
390 |
11,335 |
|
|
Common Stocks - continued |
|||
|
Shares |
Value (Note 1) |
||
|
Canada - continued |
|||
|
Celestica, Inc. (sub. vtg.) (a) |
180 |
$ 12,863 |
|
|
Cognos, Inc. (a) |
190 |
7,987 |
|
|
Enbridge, Inc. |
230 |
6,194 |
|
|
Falconbridge Ltd. |
400 |
4,755 |
|
|
Four Seasons Hotels, Inc. |
70 |
5,131 |
|
|
GSI Lumonics, Inc. (a) |
190 |
2,458 |
|
|
Imperial Oil Ltd. |
180 |
4,552 |
|
|
Inco Ltd. (a) |
210 |
3,269 |
|
|
JDS Uniphase Canada Ltd. (a) |
90 |
7,386 |
|
|
Loblaw Companies Ltd. |
180 |
6,171 |
|
|
Mackenzie Financial Corp. |
200 |
2,693 |
|
|
Magna International, Inc. Class A |
100 |
4,486 |
|
|
Manitoba Telecom Services, Inc. |
360 |
7,448 |
|
|
Manulife Financial Corp. |
340 |
8,843 |
|
|
Microcell Telecommunications, Inc. Class B (non-vtg.) (a) |
90 |
2,527 |
|
|
Molson, Inc. Class A |
170 |
4,293 |
|
|
Mosaic Group, Inc. (a) |
270 |
2,039 |
|
|
National Bank of Canada |
320 |
5,244 |
|
|
Nortel Networks Corp. |
2,810 |
127,855 |
|
|
NOVA Chemicals Corp. |
140 |
2,887 |
|
|
Onex Corp. |
170 |
2,702 |
|
|
Petro-Canada |
310 |
6,516 |
|
|
Placer Dome, Inc. |
460 |
3,822 |
|
|
Power Corp. of Canada |
180 |
4,079 |
|
|
Power Financial Corp. |
160 |
3,373 |
|
|
Precision Drilling Corp. (a) |
110 |
3,146 |
|
|
Research in Motion Ltd. (a) |
60 |
5,990 |
|
|
Rio Alto Exploration Ltd. (a) |
130 |
2,211 |
|
|
Royal Bank of Canada |
1,000 |
31,724 |
|
|
Seagram Co. Ltd. |
230 |
13,139 |
|
|
Shaw Communications, Inc. Class B |
420 |
8,621 |
|
|
Sun Life Financial Services Canada, Inc. |
690 |
14,276 |
|
|
Suncor Energy, Inc. |
260 |
5,080 |
|
|
Talisman Energy, Inc. (a) |
220 |
6,929 |
|
|
Tembec, Inc. Class A (a) |
290 |
2,562 |
|
|
Thomson Corp. |
200 |
8,079 |
|
|
Toronto Dominion Bank |
570 |
15,705 |
|
|
Transalta Corp. |
340 |
4,422 |
|
|
Tundra Semiconductor Corp. Ltd. (a) |
60 |
2,167 |
|
|
Westcoast Energy, Inc. |
260 |
5,806 |
|
|
Weston George Ltd. |
80 |
3,988 |
|
|
TOTAL CANADA |
552,205 |
||
|
Common Stocks - continued |
|||
|
Shares |
Value (Note 1) |
||
|
Cayman Islands - 0.1% |
|||
|
XL Capital Ltd. Class A |
240 |
$ 18,450 |
|
|
Denmark - 0.8% |
|||
|
ISS AS (a) |
1,758 |
108,305 |
|
|
Novo-Nordisk AS Series B (a) |
310 |
65,783 |
|
|
TOTAL DENMARK |
174,088 |
||
|
Finland - 0.8% |
|||
|
Nokia AB |
2,060 |
88,065 |
|
|
Sampo Insurance Co. Ltd. (A Shares) |
1,707 |
69,547 |
|
|
UPM-Kymmene Corp. |
1,115 |
31,563 |
|
|
TOTAL FINLAND |
189,175 |
||
|
France - 4.6% |
|||
|
Alcatel SA (RFD) (a) |
1,434 |
89,446 |
|
|
Aventis SA |
3,375 |
243,211 |
|
|
BNP Paribas SA |
824 |
71,060 |
|
|
Bouygues SA |
680 |
34,631 |
|
|
Castorama Dubois Investissements SA |
130 |
26,438 |
|
|
Credit Lyonnais SA |
847 |
28,980 |
|
|
Sanofi-Synthelabo SA |
2,333 |
122,776 |
|
|
Schneider Electric SA |
441 |
28,729 |
|
|
Societe Generale Class A (a) |
1,048 |
59,510 |
|
|
Suez Lyonnaise des Eaux |
185 |
28,234 |
|
|
TotalFinaElf SA Class B |
1,768 |
253,266 |
|
|
Vivendi SA |
656 |
47,162 |
|
|
TOTAL FRANCE |
1,033,443 |
||
|
Germany - 2.5% |
|||
|
BASF AG |
1,300 |
50,979 |
|
|
Bayer AG |
1,000 |
43,416 |
|
|
Bayerische Motoren Werke AG (BMW) |
600 |
19,872 |
|
|
Deutsche Bank AG |
1,200 |
98,271 |
|
|
Deutsche Telekom AG |
840 |
31,550 |
|
|
Muenchener Ruckversicherungs-Gesellschaft AG (Reg.) |
486 |
152,837 |
|
|
Schering AG (a) |
1,790 |
100,277 |
|
|
SGL Carbon AG (a) |
360 |
22,004 |
|
|
Software AG |
600 |
42,983 |
|
|
United Internet AG (a) |
1,000 |
6,434 |
|
|
TOTAL GERMANY |
568,623 |
||
|
Hong Kong - 1.0% |
|||
|
Asat Holdings Ltd. sponsored ADR |
1,900 |
12,588 |
|
|
Common Stocks - continued |
|||
|
Shares |
Value (Note 1) |
||
|
Hong Kong - continued |
|||
|
Cheung Kong Holdings Ltd. |
3,000 |
$ 33,182 |
|
|
China Mobile Ltd. (a) |
8,000 |
49,000 |
|
|
CLP Holdings Ltd. |
2,000 |
9,336 |
|
|
Hang Seng Bank Ltd. |
1,800 |
21,179 |
|
|
Hong Kong & China Gas Co. Ltd. |
6,000 |
7,579 |
|
|
Hutchison Whampoa Ltd. |
4,600 |
57,073 |
|
|
Johnson Electric Holdings Ltd. |
8,000 |
15,902 |
|
|
Li & Fung Ltd. |
4,000 |
7,438 |
|
|
Sun Hung Kai Properties Ltd. |
2,000 |
16,543 |
|
|
Television Broadcasts Ltd. |
1,000 |
5,476 |
|
|
TOTAL HONG KONG |
235,296 |
||
|
Ireland - 0.4% |
|||
|
Bank of Ireland, Inc. |
4,888 |
37,672 |
|
|
CRH PLC |
3,487 |
53,572 |
|
|
TOTAL IRELAND |
91,244 |
||
|
Italy - 1.1% |
|||
|
Banca Nazionale del Lavoro (BNL) |
11,500 |
37,093 |
|
|
Bulgari Spa |
2,100 |
24,661 |
|
|
Eni Spa |
12,916 |
69,835 |
|
|
Mediolanum Spa |
3,600 |
52,769 |
|
|
San Paolo IMI Spa |
3,861 |
62,188 |
|
|
TOTAL ITALY |
246,546 |
||
|
Japan - 10.8% |
|||
|
Aeon Credit Service Ltd. |
200 |
11,218 |
|
|
Aiwa Co. Ltd. |
1,000 |
8,469 |
|
|
Ajinomoto Co., Inc. |
1,000 |
11,181 |
|
|
Anritsu Corp. |
1,000 |
21,996 |
|
|
Asahi Chemical Industry Co. Ltd. (a) |
6,000 |
37,174 |
|
|
Asahi Glass Co. Ltd. |
2,000 |
20,530 |
|
|
Bank of Tokyo-Mitsubishi Ltd. |
1,000 |
11,997 |
|
|
Bridgestone Corp. (a) |
3,000 |
29,750 |
|
|
Canon, Inc. |
1,000 |
40,563 |
|
|
Casio Computer Co. Ltd. |
1,000 |
10,082 |
|
|
Dai Nippon Printing Co. Ltd. |
1,000 |
15,672 |
|
|
Dainippon Pharmaceutical Co. |
1,000 |
12,822 |
|
|
Daito Trust Construction Co. |
1,600 |
26,982 |
|
|
Daiwa House Industry Co. Ltd. |
2,000 |
12,556 |
|
|
Daiwa Securities Group, Inc. |
1,000 |
11,081 |
|
|
DDI Corp. |
4 |
18,770 |
|
|
FamilyMart Co. Ltd. |
500 |
13,244 |
|
|
Common Stocks - continued |
|||
|
Shares |
Value (Note 1) |
||
|
Japan - continued |
|||
|
Fancl Corp. |
100 |
$ 6,324 |
|
|
Fanuc Ltd. |
200 |
17,964 |
|
|
Fuji Photo Film Co. Ltd. |
2,000 |
74,237 |
|
|
Fujikura Ltd. |
1,000 |
8,817 |
|
|
Fujitsu Ltd. |
2,000 |
35,634 |
|
|
Fujitsu Support & Service, Inc. (FSAS) |
100 |
12,153 |
|
|
Furukawa Electric Co. Ltd. |
2,000 |
52,607 |
|
|
Hitachi Cable Ltd. |
1,000 |
11,786 |
|
|
Hitachi Ltd. |
1,000 |
11,150 |
|
|
Hitachi Zosen Corp. (a) |
16,000 |
12,171 |
|
|
Honda Motor Co. Ltd. (a) |
1,000 |
34,594 |
|
|
Ito En Ltd. |
300 |
21,584 |
|
|
Ito-Yokado Co. Ltd. |
1,000 |
45,184 |
|
|
Japan Tobacco, Inc. |
1 |
6,874 |
|
|
Kaneka Corp. |
1,000 |
9,715 |
|
|
Kao Corp. |
1,000 |
29,970 |
|
|
Komatsu Ltd. |
3,000 |
13,308 |
|
|
Konami Co. Ltd. |
300 |
25,296 |
|
|
Kuraray Co. Ltd. |
1,000 |
9,394 |
|
|
Kyocera Corp. |
400 |
53,500 |
|
|
Matsushita Communication Industrial Co. Ltd. |
100 |
13,106 |
|
|
Matsushita Electric Industrial Co. Ltd. |
2,000 |
58,450 |
|
|
Minolta Co. Ltd. |
2,000 |
8,872 |
|
|
Mitsubishi Electric Corp. |
2,000 |
14,371 |
|
|
Mitsubishi Trust & Banking Corp. |
1,000 |
8,111 |
|
|
Mitsui Mining & Smelting Co. Ltd. |
1,000 |
8,432 |
|
|
Mitsumi Electric Co. Ltd. |
1,000 |
32,994 |
|
|
Mizuho Holdings, Inc. |
6 |
46,137 |
|
|
NEC Corp. |
1,000 |
19,063 |
|
|
Nichicon Corp. |
1,000 |
17,863 |
|
|
Nikko Securities Co. Ltd. |
1,000 |
8,633 |
|
|
Nintendo Co. Ltd. |
200 |
33,086 |
|
|
Nippon Computer Systems Corp. |
1,000 |
19,247 |
|
|
Nippon Paper Industries Co. Ltd. |
4,000 |
22,803 |
|
|
Nippon Sheet Glass Co. Ltd. |
2,000 |
30,428 |
|
|
Nippon System Development Co. Ltd. |
100 |
10,842 |
|
|
Nippon Telegraph & Telephone Corp. |
12 |
109,211 |
|
|
Nissan Motor Co. Ltd. (a) |
3,000 |
21,000 |
|
|
Nitto Denko Corp. |
1,000 |
33,819 |
|
|
Nomura Securities Co. Ltd. |
2,000 |
42,434 |
|
|
NTT DoCoMo, Inc. |
2 |
49,308 |
|
|
Oki Electric Industry Co. Ltd. (a) |
4,000 |
23,793 |
|
|
Common Stocks - continued |
|||
|
Shares |
Value (Note 1) |
||
|
Japan - continued |
|||
|
Omron Corp. |
1,000 |
$ 24,654 |
|
|
Oriental Land Co. Ltd. |
800 |
48,392 |
|
|
ORIX Corp. |
200 |
20,988 |
|
|
Ricoh Co. Ltd. |
1,000 |
15,397 |
|
|
Rohm Co. Ltd. |
200 |
50,426 |
|
|
Sakura Bank Ltd. |
6,000 |
43,717 |
|
|
Sanden Corp. |
1,000 |
4,821 |
|
|
Sanyo Electric Co. Ltd. |
2,000 |
15,214 |
|
|
Senshukai Co. Ltd. |
1,000 |
4,995 |
|
|
Shinko Electric Industries Co.Ltd. |
1,000 |
36,477 |
|
|
Shiseido Co. Ltd. |
1,000 |
12,923 |
|
|
SMC Corp. |
100 |
14,151 |
|
|
Softbank Corp. |
300 |
18,009 |
|
|
Sony Corp. |
1,000 |
83,000 |
|
|
Square Co. Ltd. |
300 |
10,448 |
|
|
Sumitomo Bank Ltd. |
1,000 |
12,144 |
|
|
Sumitomo Electric Industries Ltd. |
3,000 |
55,403 |
|
|
Sumitomo Heavy Industries Ltd. |
8,000 |
15,617 |
|
|
Sumitomo Trust & Banking Ltd. |
2,000 |
15,397 |
|
|
Suzuki Motor Corp. |
1,000 |
10,723 |
|
|
Takeda Chemical Industries Ltd. |
1,000 |
65,897 |
|
|
Terumo Corp. |
1,000 |
28,320 |
|
|
The Suruga Bank Ltd. |
3,000 |
41,188 |
|
|
THK Co. Ltd. |
500 |
12,373 |
|
|
Tokai Corp. |
1,000 |
6,636 |
|
|
Tokyo Seimitsu Co. Ltd. |
200 |
14,114 |
|
|
Toppan Forms Co. Ltd. |
500 |
8,886 |
|
|
Toshiba Corp. |
2,000 |
14,298 |
|
|
Toyota Motor Corp. |
4,000 |
159,839 |
|
|
Tsubaki Nakashima Co. Ltd. |
1,000 |
12,529 |
|
|
Uni-Charm Corp |
300 |
12,840 |
|
|
Union Tool Co. (a) |
100 |
6,874 |
|
|
Welfide Corp. |
1,000 |
7,195 |
|
|
World Co. Ltd. |
100 |
3,721 |
|
|
Yamaha Motor Co. Ltd. |
2,000 |
15,562 |
|
|
Yamanouchi Pharmaceutical Co. Ltd. |
1,000 |
45,275 |
|
|
Yamato Transport Co. Ltd. |
1,000 |
20,209 |
|
|
Zeon Corp. |
1,000 |
4,335 |
|
|
TOTAL JAPAN |
2,431,339 |
||
|
Mexico - 0.0% |
|||
|
TV Azteca SA de CV sponsored ADR |
340 |
4,250 |
|
|
Common Stocks - continued |
|||
|
Shares |
Value (Note 1) |
||
|
Netherlands - 2.1% |
|||
|
Buhrmann NV |
1,300 |
$ 35,531 |
|
|
Equant NV (a) |
580 |
19,684 |
|
|
Heineken Holding NV (A Shares) |
400 |
14,260 |
|
|
Heineken NV |
800 |
43,459 |
|
|
ING Groep NV (Certificaten Van Aandelen) |
2,100 |
144,238 |
|
|
Koninklijke Ahold NV |
2,294 |
66,651 |
|
|
Numico NV |
2,200 |
102,892 |
|
|
United Pan-Europe Communications NV Class A (a) |
2,000 |
35,055 |
|
|
TOTAL NETHERLANDS |
461,770 |
||
|
Portugal - 0.1% |
|||
|
Telecel Comunicacoes Pessoais SA (a) |
1,930 |
21,165 |
|
|
Singapore - 0.3% |
|||
|
City Developments Ltd. |
1,000 |
4,617 |
|
|
Datacraft Asia Ltd. |
40 |
274 |
|
|
DBS Group Holdings Ltd. |
1,000 |
11,798 |
|
|
Flextronics International Ltd. (a) |
300 |
11,400 |
|
|
Oversea-Chinese Banking Corp. Ltd. |
1,050 |
6,703 |
|
|
Singapore Airlines Ltd. |
1,000 |
10,031 |
|
|
Singapore Press Holdings Ltd. |
400 |
5,722 |
|
|
Singapore Technologies Engineering Ltd. |
3,000 |
4,839 |
|
|
Singapore Telecommunications Ltd. |
5,000 |
8,293 |
|
|
United Overseas Bank Ltd. |
1,056 |
7,824 |
|
|
TOTAL SINGAPORE |
71,501 |
||
|
Spain - 1.7% |
|||
|
Altadis SA |
7,990 |
119,701 |
|
|
Banco Santander Central Hispano SA |
6,900 |
66,884 |
|
|
Telefonica SA (a) |
8,817 |
168,163 |
|
|
Union Electrica Fenosa SA |
1,600 |
29,593 |
|
|
TOTAL SPAIN |
384,341 |
||
|
Sweden - 1.6% |
|||
|
Assa Abloy AB (B Shares) |
5,922 |
108,997 |
|
|
Securitas AB (B Shares) |
1,400 |
29,829 |
|
|
Skandia Foersaekrings AB |
2,835 |
48,068 |
|
|
Svenska Handelsbanken AB (A Shares) |
2,837 |
44,554 |
|
|
Telefonaktiebolaget LM Ericsson (B Shares) |
8,514 |
118,132 |
|
|
TOTAL SWEDEN |
349,580 |
||
|
Switzerland - 3.3% |
|||
|
Credit Suisse Group (Reg.) |
418 |
78,368 |
|
|
Common Stocks - continued |
|||
|
Shares |
Value (Note 1) |
||
|
Switzerland - continued |
|||
|
Julius Baer Holding AG |
24 |
$ 118,832 |
|
|
Kuoni Reisen Holding AG Class B (Reg.) |
78 |
33,413 |
|
|
Nestle SA (Reg.) |
64 |
132,629 |
|
|
Novartis AG (Reg.) |
103 |
156,262 |
|
|
Richemont Compagnie Financier Class A unit |
12 |
33,380 |
|
|
Swiss Reinsurance Co. (Reg.) |
17 |
33,527 |
|
|
Zurich Financial Services Group AG |
316 |
152,946 |
|
|
TOTAL SWITZERLAND |
739,357 |
||
|
United Kingdom - 8.2% |
|||
|
3i Group PLC |
3,200 |
72,601 |
|
|
AstraZeneca Group PLC |
1,872 |
88,385 |
|
|
Bank of Scotland |
2,900 |
27,033 |
|
|
Barclays PLC |
2,700 |
77,188 |
|
|
BBA Group PLC |
7,000 |
38,410 |
|
|
BP Amoco PLC |
22,700 |
192,714 |
|
|
British Telecommunications PLC |
2,900 |
34,510 |
|
|
Computacenter PLC |
2,700 |
15,657 |
|
|
Energis PLC (a) |
2,800 |
23,929 |
|
|
Granada Compass PLC (a) |
7,300 |
62,862 |
|
|
HSBC Holdings PLC: |
|
|
|
|
(Hong Kong) (Reg.) |
5,844 |
84,270 |
|
|
(United Kingdom) (Reg.) |
3,700 |
53,354 |
|
|
Jazztel PLC (a) |
900 |
16,233 |
|
|
Lloyds TSB Group PLC |
3,500 |
35,619 |
|
|
Misys PLC |
3,200 |
33,308 |
|
|
National Grid Group PLC |
5,500 |
47,641 |
|
|
Reed International PLC |
7,800 |
72,030 |
|
|
Shell Transport & Trading Co. PLC (Reg.) |
28,400 |
232,821 |
|
|
SmithKline Beecham PLC |
10,100 |
131,679 |
|
|
United News & Media PLC |
2,900 |
36,261 |
|
|
Vodafone Group PLC |
99,654 |
424,152 |
|
|
WPP Group PLC |
3,000 |
40,229 |
|
|
TOTAL UNITED KINGDOM |
1,840,886 |
||
|
United States of America - 46.2% |
|||
|
Abbott Laboratories |
1,970 |
104,041 |
|
|
Adobe Systems, Inc. |
760 |
57,808 |
|
|
Adolph Coors Co. Class B |
170 |
10,827 |
|
|
AES Corp. (a) |
1,810 |
102,265 |
|
|
Affiliated Computer Services, Inc. Class A (a) |
470 |
26,173 |
|
|
AFLAC, Inc. |
450 |
32,878 |
|
|
Common Stocks - continued |
|||
|
Shares |
Value (Note 1) |
||
|
United States of America - continued |
|||
|
Agilent Technologies, Inc. |
450 |
$ 20,841 |
|
|
Allmerica Financial Corp. |
1,040 |
65,585 |
|
|
Allstate Corp. |
660 |
26,565 |
|
|
AMBAC Financial Group, Inc. |
1,300 |
103,756 |
|
|
America Online, Inc. (a) |
380 |
19,163 |
|
|
American Express Co. |
860 |
51,600 |
|
|
American Home Products Corp. |
430 |
27,305 |
|
|
American International Group, Inc. |
1,748 |
171,304 |
|
|
Amgen, Inc. (a) |
280 |
16,223 |
|
|
Anadarko Petroleum Corp. |
190 |
12,170 |
|
|
Analog Devices, Inc. (a) |
290 |
18,850 |
|
|
AnnTaylor Stores Corp. (a) |
490 |
14,700 |
|
|
Apache Corp. |
90 |
4,978 |
|
|
Apple Computer, Inc. (a) |
400 |
7,825 |
|
|
Applied Materials, Inc. (a) |
190 |
10,094 |
|
|
Ariba, Inc. (a) |
220 |
27,803 |
|
|
Art Technology Group, Inc. (a) |
230 |
14,433 |
|
|
AsiaInfo Holdings, Inc. |
200 |
2,425 |
|
|
Associates First Capital Corp. Class A |
1,940 |
72,023 |
|
|
AT&T Corp. |
2,846 |
65,992 |
|
|
AT&T Corp.: |
|
|
|
|
Liberty Media Group Class A (a) |
460 |
8,280 |
|
|
Wireless Group |
1,270 |
31,671 |
|
|
AutoNation, Inc. |
1,430 |
9,653 |
|
|
Avery Dennison Corp. |
290 |
14,645 |
|
|
Avon Products, Inc. |
1,210 |
58,685 |
|
|
Bank of New York Co., Inc. |
2,490 |
143,331 |
|
|
Bank One Corp. |
840 |
30,660 |
|
|
BEA Systems, Inc. (a) |
430 |
30,853 |
|
|
Bear Stearns Companies, Inc. |
270 |
16,369 |
|
|
Bed Bath & Beyond, Inc. (a) |
680 |
17,553 |
|
|
BellSouth Corp. |
1,010 |
48,796 |
|
|
BFGoodrich Co. |
1,050 |
42,984 |
|
|
Biomet, Inc. |
525 |
18,998 |
|
|
BJ's Wholesale Club, Inc. (a) |
470 |
15,481 |
|
|
Boeing Co. |
460 |
31,194 |
|
|
Bristol-Myers Squibb Co. |
2,960 |
180,375 |
|
|
Broadcom Corp. Class A (a) |
170 |
37,804 |
|
|
Brocade Communications Systems, Inc. (a) |
110 |
25,011 |
|
|
Burlington Northern Santa Fe Corp. |
290 |
7,703 |
|
|
Burlington Resources, Inc. |
470 |
16,920 |
|
|
Calpine Corp. (a) |
260 |
20,524 |
|
|
Common Stocks - continued |
|||
|
Shares |
Value (Note 1) |
||
|
United States of America - continued |
|||
|
Cardinal Health, Inc. |
630 |
$ 59,693 |
|
|
Caterpillar, Inc. |
490 |
17,181 |
|
|
CDW Computer Centers, Inc. (a) |
60 |
3,866 |
|
|
Ceridian Corp. (a) |
1,600 |
40,000 |
|
|
Charles Schwab Corp. |
1,595 |
56,024 |
|
|
Chevron Corp. |
860 |
70,628 |
|
|
Ciena Corp. (a) |
680 |
71,485 |
|
|
CIGNA Corp. |
830 |
101,219 |
|
|
Cisco Systems, Inc. (a) |
6,220 |
335,103 |
|
|
Citigroup, Inc. |
3,633 |
191,187 |
|
|
Citizens Communications Co. (a) |
960 |
13,920 |
|
|
Clear Channel Communications, Inc. (a) |
1,104 |
66,309 |
|
|
Colgate-Palmolive Co. |
440 |
25,854 |
|
|
Comerica, Inc. |
60 |
3,619 |
|
|
Compaq Computer Corp. |
1,490 |
45,311 |
|
|
Comverse Technology, Inc. (a) |
200 |
22,350 |
|
|
Conoco, Inc. Class B |
2,240 |
60,900 |
|
|
Consolidated Stores Corp. (a) |
440 |
5,225 |
|
|
COR Therapeutics, Inc. (a) |
280 |
15,820 |
|
|
Corning, Inc. |
800 |
61,200 |
|
|
Dell Computer Corp. (a) |
3,800 |
112,100 |
|
|
Devon Energy Corp. |
715 |
36,036 |
|
|
Ditech Communications Corp. (a) |
70 |
2,411 |
|
|
Dynegy, Inc. Class A |
620 |
28,714 |
|
|
E.I. du Pont de Nemours and Co. |
570 |
25,864 |
|
|
Ecolab, Inc. |
500 |
19,594 |
|
|
Eli Lilly & Co. |
830 |
74,181 |
|
|
EMC Corp. (a) |
2,150 |
191,484 |
|
|
Emerson Electric Co. |
310 |
22,766 |
|
|
ENSCO International, Inc. |
900 |
29,925 |
|
|
Estee Lauder Companies, Inc. Class A |
810 |
37,614 |
|
|
Exodus Communications, Inc. (a) |
470 |
15,774 |
|
|
Exxon Mobil Corp. |
2,892 |
257,930 |
|
|
Fannie Mae |
1,970 |
151,690 |
|
|
Firstar Corp. |
1,330 |
26,184 |
|
|
Fluor Corp. |
530 |
18,550 |
|
|
FMC Corp. (a) |
400 |
30,400 |
|
|
Fox Entertainment Group, Inc. Class A (a) |
1,710 |
36,765 |
|
|
Freddie Mac |
2,720 |
163,200 |
|
|
Gateway, Inc. (a) |
210 |
10,838 |
|
|
Genentech, Inc. (a) |
120 |
9,900 |
|
|
General Dynamics Corp. |
1,300 |
93,031 |
|
|
Common Stocks - continued |
|||
|
Shares |
Value (Note 1) |
||
|
United States of America - continued |
|||
|
General Electric Co. |
9,230 |
$ 505,898 |
|
|
General Motors Corp. |
390 |
24,229 |
|
|
General Motors Corp. Class H |
744 |
24,106 |
|
|
Gillette Co. |
1,470 |
51,266 |
|
|
Grant Prideco, Inc. (a) |
1,680 |
31,185 |
|
|
Halliburton Co. |
340 |
12,601 |
|
|
Hartford Financial Services Group, Inc. |
970 |
72,204 |
|
|
HCA - The Healthcare Co. |
970 |
38,739 |
|
|
Hewlett-Packard Co. |
880 |
40,865 |
|
|
Home Depot, Inc. |
2,240 |
96,320 |
|
|
Household International, Inc. |
500 |
25,156 |
|
|
Illinois Tool Works, Inc. |
410 |
22,781 |
|
|
Immunex Corp. (a) |
420 |
17,876 |
|
|
Ingersoll-Rand Co. |
250 |
9,438 |
|
|
Intel Corp. |
5,420 |
243,900 |
|
|
International Business Machines Corp. |
900 |
88,650 |
|
|
International Paper Co. |
740 |
27,103 |
|
|
J.D. Edwards & Co. (a) |
1,550 |
40,106 |
|
|
Jabil Circuit, Inc. (a) |
260 |
14,836 |
|
|
Johnson & Johnson |
590 |
54,354 |
|
|
Juniper Networks, Inc. (a) |
390 |
76,050 |
|
|
Keebler Foods Co. |
1,170 |
47,385 |
|
|
Kimberly-Clark Corp. |
890 |
58,740 |
|
|
Kinder Morgan, Inc. |
1,080 |
41,648 |
|
|
Kohls Corp. (a) |
810 |
43,892 |
|
|
LAM Research Corp. (a) |
230 |
4,456 |
|
|
Lexmark International Group, Inc. Class A (a) |
190 |
7,790 |
|
|
LSI Logic Corp. (a) |
360 |
11,835 |
|
|
Macromedia, Inc. (a) |
630 |
48,549 |
|
|
Marsh & McLennan Companies, Inc. |
330 |
43,148 |
|
|
Medtronic, Inc. |
600 |
32,588 |
|
|
Mellon Financial Corp. |
850 |
41,013 |
|
|
Merck & Co., Inc. |
1,600 |
143,900 |
|
|
Micromuse, Inc. (a) |
140 |
23,756 |
|
|
Microsoft Corp. (a) |
3,450 |
237,619 |
|
|
Millennium Chemicals, Inc. |
600 |
9,675 |
|
|
Millipore Corp. |
130 |
6,825 |
|
|
Minnesota Mining & Manufacturing Co. |
330 |
31,886 |
|
|
Morgan Stanley Dean Witter & Co. |
1,060 |
85,131 |
|
|
Motorola, Inc. |
920 |
22,943 |
|
|
Nabors Industries, Inc. (a) |
960 |
48,864 |
|
|
National-Oilwell, Inc. (a) |
430 |
12,578 |
|
|
Common Stocks - continued |
|||
|
Shares |
Value (Note 1) |
||
|
United States of America - continued |
|||
|
Navistar International Corp. (a) |
450 |
$ 14,878 |
|
|
Network Appliance, Inc. (a) |
330 |
39,270 |
|
|
Nextel Communications, Inc. Class A (a) |
750 |
28,828 |
|
|
Northwest Airlines Corp. Class A (a) |
350 |
9,975 |
|
|
Omnicom Group, Inc. |
420 |
38,745 |
|
|
Oracle Corp. (a) |
3,720 |
122,760 |
|
|
Outback Steakhouse, Inc. (a) |
370 |
10,545 |
|
|
Parker-Hannifin Corp. |
520 |
21,515 |
|
|
PE Corp. - Celera Genomics Group (a) |
100 |
6,750 |
|
|
PeopleSoft, Inc. (a) |
820 |
35,785 |
|
|
PepsiCo, Inc. |
890 |
43,109 |
|
|
Pfizer, Inc. |
5,912 |
255,324 |
|
|
Philip Morris Companies, Inc. |
2,490 |
91,196 |
|
|
Phone.com, Inc. (a) |
260 |
24,066 |
|
|
PMC-Sierra, Inc. (a) |
150 |
25,425 |
|
|
PNC Financial Services Group, Inc. |
280 |
18,725 |
|
|
Praxair, Inc. |
1,250 |
46,563 |
|
|
Procter & Gamble Co. |
2,130 |
152,162 |
|
|
Protein Design Labs, Inc. (a) |
120 |
16,209 |
|
|
Quaker Oats Co. |
770 |
62,803 |
|
|
Qwest Communications International, Inc. (a) |
1,240 |
60,295 |
|
|
Rational Software Corp. (a) |
360 |
21,488 |
|
|
Redback Networks, Inc. (a) |
120 |
12,773 |
|
|
Republic Services, Inc. (a) |
840 |
11,288 |
|
|
Safeway, Inc. (a) |
390 |
21,328 |
|
|
Santa Fe International Corp. |
230 |
8,395 |
|
|
SBA Communications Corp. Class A (a) |
630 |
31,579 |
|
|
SBC Communications, Inc. |
1,980 |
114,221 |
|
|
Schering-Plough Corp. |
1,990 |
102,858 |
|
|
Scientific-Atlanta, Inc. |
510 |
34,903 |
|
|
Siebel Systems, Inc. (a) |
300 |
31,481 |
|
|
Smith International, Inc. (a) |
250 |
17,625 |
|
|
Software.com, Inc. (a) |
120 |
17,880 |
|
|
Sprint Corp. - PCS Group Series 1 (a) |
1,370 |
52,231 |
|
|
State Street Corp. |
120 |
14,969 |
|
|
Summit Bancorp |
460 |
17,250 |
|
|
Sun Microsystems, Inc. (a) |
1,520 |
168,530 |
|
|
Sybase, Inc. (a) |
630 |
13,191 |
|
|
TCF Financial Corp. |
590 |
23,858 |
|
|
Tenet Healthcare Corp. |
1,080 |
42,458 |
|
|
Texaco, Inc. |
700 |
41,344 |
|
|
Texas Instruments, Inc. |
1,810 |
88,803 |
|
|
Common Stocks - continued |
|||
|
Shares |
Value (Note 1) |
||
|
United States of America - continued |
|||
|
The Chubb Corp. |
460 |
$ 38,841 |
|
|
The Coca-Cola Co. |
2,300 |
138,863 |
|
|
Thermo Electron Corp. (a) |
1,460 |
42,340 |
|
|
Time Warner Telecom, Inc. Class A (a) |
290 |
17,291 |
|
|
Time Warner, Inc. |
770 |
58,451 |
|
|
Tyco International Ltd. |
230 |
13,038 |
|
|
Union Pacific Corp. |
420 |
19,688 |
|
|
United Technologies Corp. |
1,260 |
87,964 |
|
|
UnitedHealth Group, Inc. |
280 |
30,625 |
|
|
UnumProvident Corp. |
850 |
24,013 |
|
|
VeriSign, Inc. (a) |
410 |
54,120 |
|
|
VERITAS Software Corp. (a) |
340 |
47,945 |
|
|
Vertex Pharmaceuticals, Inc. (a) |
160 |
14,898 |
|
|
Viacom, Inc. Class B (non-vtg.) (a) |
1,711 |
97,313 |
|
|
Vignette Corp. (a) |
820 |
24,446 |
|
|
VoiceStream Wireless Corp. (a) |
491 |
64,567 |
|
|
Waddell & Reed Financial, Inc. Class A |
300 |
9,563 |
|
|
Wal-Mart Stores, Inc. |
2,380 |
107,993 |
|
|
Walgreen Co. |
2,180 |
99,463 |
|
|
Walt Disney Co. |
2,740 |
98,126 |
|
|
Washington Mutual, Inc. |
660 |
29,040 |
|
|
Watson Pharmaceuticals, Inc. (a) |
160 |
10,010 |
|
|
Wellpoint Health Networks, Inc. (a) |
160 |
18,710 |
|
|
Wells Fargo & Co. |
2,190 |
101,424 |
|
|
WorldCom, Inc. (a) |
1,940 |
46,075 |
|
|
TOTAL UNITED STATES OF AMERICA |
10,387,034 |
||
|
TOTAL COMMON STOCKS (Cost $18,252,567) |
19,975,117 |
||
|
Nonconvertible Preferred Stocks - 1.6% |
|||
|
|
|
|
|
|
Germany - 1.1% |
|||
|
Hugo Boss AG |
369 |
94,087 |
|
|
ProSieben Sat.1 Media AG (a) |
1,600 |
50,385 |
|
|
Wella AG |
2,742 |
109,970 |
|
|
TOTAL GERMANY |
254,442 |
||
|
Italy - 0.5% |
|||
|
Telecom Italia Spa Risp |
19,600 |
106,939 |
|
|
TOTAL NONCONVERTIBLE PREFERRED STOCKS (Cost $296,030) |
361,381 |
||
|
Nonconvertible Bonds - 0.0% |
|||||
|
Moody's Ratings (unaudited) |
Principal Amount |
Value |
|||
|
United Kingdom - 0.0% |
|||||
|
BAE Systems PLC 7.45% 11/30/03 |
- |
GBP |
433 |
$ 609 |
|
|
Cash Equivalents - 9.6% |
|||
|
Shares |
|
||
|
Fidelity Cash Central Fund, 6.61% (b) |
2,147,079 |
2,147,079 |
|
|
TOTAL INVESTMENT PORTFOLIO - 100.0% (Cost $20,696,109) |
22,484,186 |
||
|
NET OTHER ASSETS - 0.0% |
(7,523) |
||
|
NET ASSETS - 100% |
$ 22,476,663 |
||
|
Currency Abbreviations |
||
|
GBP |
- |
British pound |
|
Legend |
|
(a) Non-income producing |
|
(b) The rate quoted is the annualized seven-day yield of the fund at period end. A complete listing of the fund's holdings as of its most recent fiscal year end is available upon request. |
|
Income Tax Information |
|
At October 31, 2000, the aggregate |
|
At October 31, 2000, the fund had a capital loss carryforward of approximately $413,000 all of which will expire on October 31, 2008. |
See accompanying notes which are an integral part of the financial statements.
Annual Report
Statement of Assets and Liabilities
|
|
October 31, 2000 |
|
|
Assets |
|
|
|
Investment in securities, at value (cost $20,696,109) - |
|
$ 22,484,186 |
|
Foreign currency held at value (cost $6) |
|
6 |
|
Receivable for investments sold |
|
169,757 |
|
Receivable for fund shares sold |
|
107,484 |
|
Dividends receivable |
|
19,532 |
|
Interest receivable |
|
8,711 |
|
Other receivables |
|
497 |
|
Total assets |
|
22,790,173 |
|
Liabilities |
|
|
|
Payable for investments purchased |
$ 249,215 |
|
|
Payable for fund shares redeemed |
5,177 |
|
|
Accrued management fee |
13,794 |
|
|
Distribution fees payable |
12,019 |
|
|
Other payables and accrued expenses |
33,305 |
|
|
Total liabilities |
|
313,510 |
|
Net Assets |
|
$ 22,476,663 |
|
Net Assets consist of: |
|
|
|
Paid in capital |
|
$ 21,332,612 |
|
Accumulated net investment loss |
|
(42,698) |
|
Accumulated undistributed net realized gain loss on investments and foreign currency transactions |
|
(600,340) |
|
Net unrealized appreciation (depreciation) on investments and assets and liabilities in foreign currencies |
|
1,787,089 |
|
Net Assets |
|
$ 22,476,663 |
See accompanying notes which are an integral part of the financial statements.
Annual Report
Financial Statements - continued
Statement of Assets and Liabilities - continued
|
|
October 31, 2000 |
|
|
Calculation of Maximum Offering Price |
|
$12.62 |
|
Maximum offering price per share (100/94.25 of $12.62) |
|
$13.39 |
|
Class T: |
|
$12.60 |
|
Maximum offering price per share (100/96.50 of $12.60) |
|
$13.06 |
|
Class B: |
|
$12.48 |
|
Class C: |
|
$12.49 |
|
Institutional Class: |
|
$12.68 |
A Redemption price per share is equal to net asset value less any applicable contingent deferred sales charge.
See accompanying notes which are an integral part of the financial statements.
Annual Report
Financial Statements - continued
Statement of Operations
|
|
Year ended October 31, 2000 |
|
|
Investment Income Dividends |
|
$ 226,304 |
|
Special dividend from BCE, Inc. |
|
48,823 |
|
Interest |
|
61,426 |
|
|
|
336,553 |
|
Less foreign taxes withheld |
|
(18,668) |
|
Total income |
|
317,885 |
|
Expenses |
|
|
|
Management fee |
$ 139,409 |
|
|
Transfer agent fees |
57,040 |
|
|
Distribution fees |
121,557 |
|
|
Accounting fees and expenses |
60,077 |
|
|
Non-interested trustees' compensation |
59 |
|
|
Custodian fees and expenses |
64,394 |
|
|
Registration fees |
69,353 |
|
|
Audit |
23,969 |
|
|
Legal |
196 |
|
|
Miscellaneous |
219 |
|
|
Total expenses before reductions |
536,273 |
|
|
Expense reductions |
(80,516) |
455,757 |
|
Net investment income (loss) |
|
(137,872) |
|
Realized and Unrealized Gain (Loss) Net realized gain (loss) on: |
|
|
|
Investment securities |
(426,841) |
|
|
Foreign currency transactions |
(35) |
(426,876) |
|
Change in net unrealized appreciation (depreciation) on: |
|
|
|
Investment securities |
696,237 |
|
|
Assets and liabilities in foreign currencies |
(638) |
695,599 |
|
Net gain (loss) |
|
268,723 |
|
Net increase (decrease) in net assets resulting |
|
$ 130,851 |
See accompanying notes which are an integral part of the financial statements.
Annual Report
Financial Statements - continued
Statement of Changes in Net Assets
|
|
Year ended |
December 17, 1998 |
|
Increase (Decrease) in Net Assets |
|
|
|
Operations |
$ (137,872) |
$ (55,754) |
|
Net realized gain (loss) |
(426,876) |
218,581 |
|
Change in net unrealized appreciation (depreciation) |
695,599 |
1,091,490 |
|
Net increase (decrease) in net assets resulting |
130,851 |
1,254,317 |
|
Distributions to shareholders |
|
|
|
From net realized gain |
(179,139) |
- |
|
In excess of net realized gain |
(59,365) |
- |
|
Total distributions |
(238,504) |
- |
|
Share transactions - net increase (decrease) |
11,427,176 |
9,902,823 |
|
Total increase (decrease) in net assets |
11,319,523 |
11,157,140 |
|
Net Assets |
|
|
|
Beginning of period |
11,157,140 |
- |
|
End of period (including accumulated net investment |
$ 22,476,663 |
$ 11,157,140 |
See accompanying notes which are an integral part of the financial statements.
Annual Report
Financial Highlights - Class A
|
Years ended October 31, |
2000 |
1999 E |
|
Selected Per-Share Data |
|
|
|
Net asset value, beginning of period |
$ 11.79 |
$ 10.00 |
|
Income from Investment Operations |
|
|
|
Net investment income (loss) D |
(.04) H |
(.04) |
|
Net realized and unrealized gain (loss) |
1.13 |
1.83 |
|
Total from investment operations |
1.09 |
1.79 |
|
Less Distributions |
|
|
|
From net realized gain |
(.20) |
- |
|
In excess of net realized gain |
(.06) |
- |
|
Total distributions |
(.26) |
- |
|
Net asset value, end of period |
$ 12.62 |
$ 11.79 |
|
Total Return B, C |
9.28% |
17.90% |
|
Ratios and Supplemental Data |
|
|
|
Net assets, end of period (000 omitted) |
$ 2,868 |
$ 1,853 |
|
Ratio of expenses to average net assets |
2.00% F |
2.00% A, F |
|
Ratio of expenses to average net assets after expense reductions |
1.99% G |
1.99% A, G |
|
Ratio of net investment income (loss) to average net assets |
(.33)% |
(.47)% A |
|
Portfolio turnover |
106% |
69% A |
A Annualized
B The total returns would have been lower had certain expenses not been reduced during the periods shown.
C Total returns do not include the one time sales charge and for periods of less than one year are not annualized.
D Net investment income (loss) per share has been calculated based on average shares outstanding during the period.
E For the period December 17, 1998 (commencement of operations) to October 31, 1999.
F FMR agreed to reimburse a portion of the class' expenses during the period. Without this reimbursement, the class' expense ratio would have been higher.
G FMR or the fund has entered into varying arrangements with third parties who either paid or reduced a portion of the class' expenses.
H Investment income per share reflects a special dividend from BCE, Inc. which amounted to $.03 per share.
See accompanying notes which are an integral part of the financial statements.
Annual Report
Financial Highlights - Class T
|
Years ended October 31, |
2000 |
1999 E |
|
Selected Per-Share Data |
|
|
|
Net asset value, beginning of period |
$ 11.77 |
$ 10.00 |
|
Income from Investment Operations |
|
|
|
Net investment income (loss) D |
(.08) H |
(.07) |
|
Net realized and unrealized gain (loss) |
1.15 |
1.84 |
|
Total from investment operations |
1.07 |
1.77 |
|
Less Distributions |
|
|
|
From net realized gain |
(.18) |
- |
|
In excess of net realized gain |
(.06) |
- |
|
Total distributions |
(.24) |
- |
|
Net asset value, end of period |
$ 12.60 |
$ 11.77 |
|
Total Return B, C |
9.12% |
17.70% |
|
Ratios and Supplemental Data |
|
|
|
Net assets, end of period (000 omitted) |
$ 8,019 |
$ 3,204 |
|
Ratio of expenses to average net assets |
2.25% F |
2.25% A, F |
|
Ratio of expenses to average net assets after expense reductions |
2.24% G |
2.24% A, G |
|
Ratio of net investment income (loss) to average net assets |
(.58)% |
(.72)% A |
|
Portfolio turnover |
106% |
69% A |
A Annualized
B The total returns would have been lower had certain expenses not been reduced during the periods shown.
C Total returns do not include the one time sales charge and for periods of less than one year are not annualized.
D Net investment income (loss) per share has been calculated based on average shares outstanding during the period.
E For the period December 17, 1998 (commencement of operations) to October 31, 1999.
F FMR agreed to reimburse a portion of the class' expenses during the period. Without this reimbursement, the class' expense ratio would have been higher.
G FMR or the fund has entered into varying arrangements with third parties who either paid or reduced a portion of the class' expenses.
H Investment income per share reflects a special dividend from BCE, Inc. which amounted to $.03 per share.
See accompanying notes which are an integral part of the financial statements.
Annual Report
Financial Highlights - Class B
|
Years ended October 31, |
2000 |
1999 E |
|
Selected Per-Share Data |
|
|
|
Net asset value, beginning of period |
$ 11.71 |
$ 10.00 |
|
Income from Investment Operations |
|
|
|
Net investment income (loss) D |
(.14) H |
(.12) |
|
Net realized and unrealized gain (loss) |
1.14 |
1.83 |
|
Total from investment operations |
1.00 |
1.71 |
|
Less Distributions |
|
|
|
From net realized gain |
(.17) |
- |
|
In excess of net realized gain |
(.06) |
- |
|
Total distributions |
(.23) |
- |
|
Net asset value, end of period |
$ 12.48 |
$ 11.71 |
|
Total Return B, C |
8.56% |
17.10% |
|
Ratios and Supplemental Data |
|
|
|
Net assets, end of period (000 omitted) |
$ 5,187 |
$ 2,268 |
|
Ratio of expenses to average net assets |
2.75% F |
2.75% A, F |
|
Ratio of expenses to average net assets after expense reductions |
2.74% G |
2.74% A, G |
|
Ratio of net investment income (loss) to average net assets |
(1.08)% |
(1.22)% A |
|
Portfolio turnover |
106% |
69% A |
A Annualized
B The total returns would have been lower had certain expenses not been reduced during the periods shown.
C Total returns do not include the contingent deferred sales charge and for periods of less than one year are not annualized.
D Net investment income (loss) per share has been calculated based on average shares outstanding during the period.
E For the period December 17, 1998 (commencement of operations) to October 31, 1999.
F FMR agreed to reimburse a portion of the class' expenses during the period. Without this reimbursement, the class' expense ratio would have been higher.
G FMR or the fund has entered into varying arrangements with third parties who either paid or reduced a portion of the class' expenses.
H Investment income per share reflects a special dividend from BCE, Inc. which amounted to $.03 per share.
See accompanying notes which are an integral part of the financial statements.
Annual Report
Financial Highlights - Class C
|
Years ended October 31, |
2000 |
1999 E |
|
Selected Per-Share Data |
|
|
|
Net asset value, beginning of period |
$ 11.71 |
$ 10.00 |
|
Income from Investment Operations |
|
|
|
Net investment income (loss) D |
(.14) H |
(.12) |
|
Net realized and unrealized gain (loss) |
1.15 |
1.83 |
|
Total from investment operations |
1.01 |
1.71 |
|
Less Distributions |
|
|
|
From net realized gain |
(.17) |
- |
|
In excess of net realized gain |
(.06) |
- |
|
Total distributions |
(.23) |
- |
|
Net asset value, end of period |
$ 12.49 |
$ 11.71 |
|
Total Return B, C |
8.65% |
17.10% |
|
Ratios and Supplemental Data |
|
|
|
Net assets, end of period (000 omitted) |
$ 5,146 |
$ 2,649 |
|
Ratio of expenses to average net assets |
2.75% F |
2.75% A, F |
|
Ratio of expenses to average net assets after expense reductions |
2.74% G |
2.74% A, G |
|
Ratio of net investment income (loss) to average net assets |
(1.08)% |
(1.22)% A |
|
Portfolio turnover |
106% |
69% A |
A Annualized
B The total returns would have been lower had certain expenses not been reduced during the periods shown.
C Total returns do not include the contingent deferred sales charge and for periods of less than one year are not annualized.
D Net investment income (loss) per share has been calculated based on average shares outstanding during the period.
E For the period December 17, 1998 (commencement of operations) to October 31, 1999.
F FMR agreed to reimburse a portion of the class' expenses during the period. Without this reimbursement, the class' expense ratio would have been higher.
G FMR or the fund has entered into varying arrangements with third parties who either paid or reduced a portion of the class' expenses.
H Investment income per share reflects a special dividend from BCE, Inc. which amounted to $.03 per share.
See accompanying notes which are an integral part of the financial statements.
Annual Report
Financial Highlights - Institutional Class
|
Years ended October 31, |
2000 |
1999 E |
|
Selected Per-Share Data |
|
|
|
Net asset value, beginning of period |
$ 11.81 |
$ 10.00 |
|
Income from Investment Operations |
|
|
|
Net investment income (loss) D |
(.01) H |
(.02) |
|
Net realized and unrealized gain (loss) |
1.16 |
1.83 |
|
Total from investment operations |
1.15 |
1.81 |
|
Less Distributions |
|
|
|
From net realized gain |
(.21) |
- |
|
In excess of net realized gain |
(.07) |
- |
|
Total distributions |
(.28) |
- |
|
Net asset value, end of period |
$ 12.68 |
$ 11.81 |
|
Total Return B, C |
9.79% |
18.10% |
|
Ratios and Supplemental Data |
|
|
|
Net assets, end of period (000 omitted) |
$ 1,256 |
$ 1,182 |
|
Ratio of expenses to average net assets |
1.75% F |
1.75% A, F |
|
Ratio of expenses to average net assets after expense reductions |
1.74% G |
1.74% A, G |
|
Ratio of net investment income (loss) to average net assets |
(.08)% |
(.22)% A |
|
Portfolio turnover |
106% |
69% A |
A Annualized
B The total returns would have been lower had certain expenses not been reduced during the periods shown.
C Total returns for periods of less than one year are not annualized.
D Net investment income (loss) per share has been calculated based on average shares outstanding during the period.
E For the period December 17, 1998 (commencement of operations) to October 31, 1999.
F FMR agreed to reimburse a portion of the class' expenses during the period. Without this reimbursement, the class' expense ratio would have been higher.
G FMR or the fund has entered into varying arrangements with third parties who either paid or reduced a portion of the class' expenses.
H Investment income per share reflects a special dividend from BCE, Inc. which amounted to $.03 per share.
See accompanying notes which are an integral part of the financial statements.
Annual Report
For the period ended October 31, 2000
1. Significant Accounting Policies.
Fidelity Advisor Global Equity Fund (the fund) is a fund of Fidelity Advisor Series VIII (the trust) and is authorized to issue an unlimited number of shares. The trust is registered under the Investment Company Act of 1940, as amended (the 1940 Act), as an open-end management investment company organized as a Massachusetts business trust.
The fund offers Class A, Class T, Class B, Class C, and Institutional Class shares, each of which has equal rights as to assets and voting privileges. Each class has exclusive voting rights with respect to matters that affect that class. Class B shares will automatically convert to Class A shares after a holding period of seven years from the initial date of purchase. Investment income, realized and unrealized capital gains and losses, the common expenses of the fund, and certain fund-level expense reductions, if any, are allocated on a pro rata basis to each class based on the relative net assets of each class to the total net assets of the fund. Each class of shares differs in its respective distribution, transfer agent, and certain other class-specific fees, expenses, and expense reductions.
The financial statements have been prepared in conformity with generally accepted accounting principles which require management to make certain estimates and assumptions at the date of the financial statements. The following summarizes the significant accounting policies of the fund:
Security Valuation. Securities for which quotations are readily available are valued using the official closing price or at the last sale price in the principal market in which they are traded. If the last sale price (on the local exchange) is unavailable, the last evaluated quote or closing bid price normally is used. If trading or events occurring in other markets after the close of the principal market in which securities are traded are expected to materially affect the value of those securities, then they are valued at their fair value taking this trading or these events into account. Fair value is determined in good faith under consistently applied procedures under the general supervision of the Board of Trustees. Securities for which quotations are not readily available are valued primarily using dealer-supplied valuations or at their fair value. Short-term securities with remaining maturities of sixty days or less for which quotations are not readily available are valued at amortized cost or original cost plus accrued interest, both of which approximate current value. Investments in open-end investment companies are valued at their net asset value each business day.
Foreign Currency Translation. The accounting records of the fund are maintained in U.S. dollars. Investment securities and other assets and liabilities denominated in a foreign currency are translated into U.S. dollars at the prevailing rates of exchange at period end. Purchases and sales of securities, income receipts and expense payments are translated into U.S. dollars at the prevailing exchange rate on the respective dates of the transactions.
Annual Report
Notes to Financial Statements - continued
1. Significant Accounting Policies - continued
Foreign Currency Translation - continued
Net realized gains and losses on foreign currency transactions represent net gains and losses from sales and maturities of foreign currency contracts, disposition of foreign currencies, the difference between the amount of net investment income accrued and the U.S. dollar amount actually received, and gains and losses between trade and settlement date on purchases and sales of securities. The effects of changes in foreign currency exchange rates on investments in securities are included with the net realized and unrealized gain or loss on investment securities.
Income Taxes. As a qualified regulated investment company under Subchapter M of the Internal Revenue Code, the fund is not subject to U.S. federal income taxes to the extent that it distributes substantially all of its taxable income for its fiscal year. The fund may be subject to foreign taxes on income and gains on investments which are accrued based upon the fund's understanding of the tax rules and regulations that exist in the markets in which it invests. Foreign governments may also impose taxes on other payments or transactions with respect to foreign securities. The fund accrues such taxes as applicable. The schedule of investments includes information regarding income taxes under the caption "Income Tax Information."
Investment Income. Dividend income is recorded on the ex-dividend date, except certain dividends from foreign securities where the ex-dividend date may have passed, are recorded as soon as the fund is informed of the ex-dividend date. Non-cash dividends included in dividend income, if any, are recorded at the fair market value of the securities received. Interest income is accrued as earned. Investment income is recorded net of foreign taxes withheld where recovery of such taxes is uncertain.
Expenses. Most expenses of the trust can be directly attributed to a fund. Expenses which cannot be directly attributed are apportioned among the funds in the trust.
Distributions to Shareholders. Distributions are recorded on the ex-dividend date. Income dividends and capital gain distributions are declared separately for each class.
Income and capital gain distributions are determined in accordance with income tax regulations which may differ from generally accepted accounting principles. These differences, which may result in distribution reclassifications, are primarily due to differing treatments for foreign currency transactions, passive foreign investment companies (PFIC), net operating losses, capital loss carryforwards and losses deferred due to wash sales. The fund also utilized earnings and profits distributed to shareholders on redemption of shares as a part of the dividends paid deduction for income tax purposes.
Annual Report
Notes to Financial Statements - continued
1. Significant Accounting Policies - continued
Distributions to Shareholders - continued
Permanent book and tax basis differences relating to shareholder distributions will result in reclassifications to paid in capital. Accumulated net investment loss and accumulated undistributed net realized gain (loss) on investments and foreign currency transactions may include temporary book and tax basis differences which will reverse in a subsequent period. Any taxable income or gain remaining at fiscal year end is distributed in the following year.
Security Transactions. Security transactions are accounted for as of trade date. Gains and losses on securities sold are determined on the basis of identified cost.
2. Operating Policies.
Foreign Currency Contracts. The fund generally uses foreign currency contracts to facilitate transactions in foreign-denominated securities. Losses may arise from changes in the value of the foreign currency or if the counterparties do not perform under the contracts' terms. The U.S. dollar value of foreign currency contracts is determined using contractual currency exchange rates established at the time of each trade.
Joint Trading Account. Pursuant to an Exemptive Order issued by the Securities and Exchange Commission (the SEC), the fund, along with other affiliated entities of Fidelity Management & Research Company (FMR), may transfer uninvested cash balances into one or more joint trading accounts. These balances are invested in one or more repurchase agreements for U.S. Treasury or Federal Agency obligations.
Repurchase Agreements. The underlying U.S. Treasury, Federal Agency, or other obligations found to be satisfactory by FMR are transferred to an account of the fund, or to the Joint Trading Account, at a custodian bank. The securities are marked-to-market daily and maintained at a value at least equal to the principal amount of the repurchase agreement (including accrued interest). FMR, the fund's investment adviser, is responsible for determining that the value of the underlying securities remains in accordance with the market value requirements stated above.
3. Purchases and Sales of Investments.
Purchases and sales of securities, other than short-term securities, aggregated $28,719,741 and $19,281,147, respectively.
Annual Report
Notes to Financial Statements - continued
4. Fees and Other Transactions with Affiliates.
Management Fee. As the fund's investment adviser, FMR receives a monthly fee that is calculated on the basis of a group fee rate plus a fixed individual fund fee rate applied to the average net assets of the fund. The group fee rate is the weighted average of a series of rates and is based on the monthly average net assets of all the mutual funds advised by FMR. The rates ranged from .2167% to .5200% for the period. The annual individual fund fee rate is .45%. In the event that these rates were lower than the contractual rates in effect during the period, FMR voluntarily implemented the above rates, as they resulted in the same or a lower management fee. For the period, the management fee was equivalent to an annual rate of .73% of average net assets.
Sub-Adviser Fee. Beginning January 1, 2001, FMR Co. (FMRC) will serve as a sub-
adviser for the fund. FMRC may provide investment research and advice and may also provide investment advisory services for the fund. FMR, on behalf of the fund,
entered into sub-advisory agreements with Fidelity Management & Research (U.K.) Inc., Fidelity Management & Research (Far East) Inc., and Fidelity International
Investment Advisors (FIIA). Under the sub-advisory arrangements, FMR may receive investment advice and research services and may grant the sub-advisers
investment management authority to buy and sell securities. FMR pays its sub-advisers either a portion of its management fee or a fee based on costs incurred for
these services.
Distribution and Service Plan. In accordance with Rule 12b-1 of the 1940 Act, the Board of Trustees have adopted separate Distribution and Service Plans with respect to each class of shares (collectively referred to as "the Plans"). Under certain of the Plans, the class pays Fidelity Distributors Corporation (FDC), an affiliate of FMR, a 12b-1 fee. A portion of this fee may be reallowed to securities dealers, banks and other financial institutions for the distribution of each class of shares and providing shareholder support services. For the period, this fee was based on the following annual rates of the average net assets of each applicable class:
|
Class A |
.25% |
|
Class T |
.50% |
|
Class B |
1.00%* |
|
Class C |
1.00%* |
* .75% represents a distribution fee and .25% represents a shareholder service fee.
Annual Report
Notes to Financial Statements - continued
4. Fees and Other Transactions with Affiliates - continued
Distribution and Service Plan - continued
For the period, each class paid FDC the following amounts, a portion of which was retained by FDC:
|
|
Paid to |
Retained |
|
Class A |
$ 9,846 |
$ 3,287 |
|
Class T |
27,824 |
6,157 |
|
Class B |
41,103 |
33,944 |
|
Class C |
42,784 |
30,843 |
|
|
$ 121,557 |
$ 74,231 |
Sales Load. FDC receives a front-end sales charge of up to 5.75% for selling Class A shares, and 3.50% for selling Class T shares of the fund. FDC receives the proceeds of contingent deferred sales charges levied on Class B share redemptions occurring within six years of purchase and Class C share redemptions occurring within one year of purchase. Contingent deferred sales charges are based on declining rates ranging from 5% to 1% for Class B and 1% for Class C, of the lesser of the cost of shares at the initial date of purchase or the net asset value of the redeemed shares, excluding any reinvested dividends and capital gains. In addition, purchases of Class A and Class T shares that were subject to a finder's fee bear a contingent deferred sales charge on assets that do not remain in the fund for at least one year. The Class A and Class T contingent deferred sales charge is based on 0.25% of the lesser of the cost of shares at the initial date of purchase or the net asset value of the redeemed shares, excluding any reinvested dividends and capital gains. A portion of the sales charges paid to FDC is paid to securities dealers, banks and other financial institutions.
For the period, sales charge amounts paid to and retained by FDC were as follows:
|
|
Paid to |
Retained |
|
Class A |
$ 22,453 |
$ 6,505 |
|
Class T |
26,191 |
6,904 |
|
Class B |
3,353 |
3,353* |
|
Class C |
1,086 |
1,086* |
|
|
$ 53,083 |
$ 17,848 |
* When Class B and Class C shares are initially sold, FDC pays commissions from its own resources to securities dealers,
banks, and other financial institutions through which the sales are made.
Transfer Agent Fees. Fidelity Investments Institutional Operations Company, Inc., (FIIOC), an affiliate of FMR, is the transfer, dividend disbursing and shareholder servicing agent (collectively referred to as the transfer agent) for each class of the fund. FIIOC receives account fees and asset-based fees that vary according to the account size and
Annual Report
Notes to Financial Statements - continued
4. Fees and Other Transactions with Affiliates - continued
Transfer Agent Fees - continued
type of account of the shareholders of the respective classes of the fund. FIIOC pays for typesetting, printing and mailing of all shareholder reports, except proxy statements. For the period, the following amounts were paid to FIIOC:
|
|
Amount |
% of |
|
Class A |
$ 8,088 |
.21 |
|
Class T |
19,004 |
.34 |
|
Class B |
15,729 |
.38 |
|
Class C |
11,575 |
.27 |
|
Institutional Class |
2,644 |
.20 |
|
|
$ 57,040 |
|
Accounting Fees. Fidelity Service Company, Inc., an affiliate of FMR, maintains the fund's accounting records. The fee is based on the level of average net assets for the month plus out-of-pocket expenses.
Fidelity Cash Central Fund. Pursuant to an Exemptive Order issued by the SEC, the fund may invest in the Fidelity Cash Central Fund (the Cash Fund) managed by Fidelity Investments Money Management, Inc., an affiliate of FMR. The Cash Fund is an open-end money market fund available only to investment companies and other accounts managed by FMR and its affiliates. The Cash Fund seeks preservation of capital, liquidity, and current income. Income distributions from the Cash Fund are declared daily and paid monthly from net investment income. Income distributions earned by the fund are recorded as interest income in the accompanying financial statements.
Brokerage Commissions. The fund placed a portion of its portfolio transactions with brokerage firms which are affiliates of FMR. The commissions paid to these affiliated firms were $991 for the period.
Annual Report
Notes to Financial Statements - continued
5. Expense Reductions.
FMR voluntarily agreed to reimburse operating expenses (excluding interest, taxes, certain securities lending fees, brokerage commissions and extraordinary expenses, if any) above the following annual rates or range of annual rates of average net assets for each of the following classes:
|
|
FMR |
Reimbursement |
|
Class A |
2.00% |
$ 12,486 |
|
Class T |
2.25% |
25,119 |
|
Class B |
2.75% |
20,195 |
|
Class C |
2.75% |
16,242 |
|
Institutional Class |
1.75% |
4,118 |
|
|
|
$ 78,160 |
FMR has directed certain portfolio trades to brokers who paid a portion of the fund's expenses. For the period, the fund's expenses were reduced by $2,356 under this arrangement.
6. Beneficial Interest.
At the end of the period, FMR and its affiliates were record owners of approximately 24% of the total outstanding shares of the fund.
7. Distributions to Shareholders.
Distributions to shareholders of each class were as follows:
|
|
Year ended October 31, 2000 |
December 17, 1998 |
|
From net realized gain |
|
|
|
Class A |
$ 31,783 |
$ - |
|
Class T |
49,590 |
- |
|
Class B |
36,686 |
- |
|
Class C |
39,947 |
- |
|
Institutional Class |
21,133 |
- |
|
Total |
$ 179,139 |
$ - |
|
In excess of net realized gain |
|
|
|
Class A |
$ 10,533 |
$ - |
|
Class T |
16,434 |
- |
|
Class B |
12,158 |
- |
|
Class C |
13,237 |
- |
|
Institutional Class |
7,003 |
- |
|
Total |
$ 59,365 |
$ - |
|
|
$ 238,504 |
$ - |
Annual Report
Notes to Financial Statements - continued
8. Share Transactions.
Transactions for each class of shares were as follows:
|
|
Shares |
Dollars |
||
|
|
Year ended October 31, |
December 17, 1998 |
Year ended October 31, |
December 17, 1998 |
|
|
2000 |
1999 |
2000 |
1999 |
|
|
|
|
|
|
|
Class A |
713,812 |
204,600 |
$ 9,666,300 |
$ 2,159,660 |
|
Reinvestment of distributions |
3,410 |
- |
42,316 |
- |
|
Shares redeemed |
(647,219) |
(47,401) |
(8,217,175) |
(538,542) |
|
Net increase (decrease) |
70,003 |
157,199 |
$ 1,491,441 |
$ 1,621,118 |
|
Class T |
523,847 |
308,848 |
$ 6,821,221 |
$ 3,281,859 |
|
Reinvestment of distributions |
5,110 |
- |
63,360 |
- |
|
Shares redeemed |
(164,779) |
(36,520) |
(2,166,598) |
(399,799) |
|
Net increase (decrease) |
364,178 |
272,328 |
$ 4,717,983 |
$ 2,882,060 |
|
Class B |
271,776 |
195,520 |
$ 3,515,035 |
$ 2,047,118 |
|
Reinvestment of distributions |
3,807 |
- |
46,976 |
- |
|
Shares redeemed |
(53,848) |
(1,787) |
(699,801) |
(19,401) |
|
Net increase (decrease) |
221,735 |
193,733 |
$ 2,862,210 |
$ 2,027,717 |
|
Class C |
230,974 |
227,333 |
$ 2,964,989 |
$ 2,384,524 |
|
Reinvestment of distributions |
3,366 |
- |
41,574 |
- |
|
Shares redeemed |
(48,512) |
(1,196) |
(635,133) |
(13,207) |
|
Net increase (decrease) |
185,828 |
226,137 |
$ 2,371,430 |
$ 2,371,317 |
|
Institutional Class |
1,889 |
100,058 |
$ 24,700 |
$ 1,000,611 |
|
Reinvestment of distributions |
2,256 |
- |
28,016 |
- |
|
Shares redeemed |
(5,122) |
- |
(68,604) |
- |
|
Net increase (decrease) |
(977) |
100,058 |
$ (15,888) |
$ 1,000,611 |
Annual Report
To the Trustees of Fidelity Advisor Series VIII and the Shareholders of Fidelity Advisor Global Equity Fund:
In our opinion, the accompanying statement of assets and liabilities, including the schedule of investments, and the related statements of operations and of changes in net assets and the financial highlights present fairly, in all material respects, the financial position of Fidelity Advisor Global Equity Fund (a fund of Fidelity Advisor Series VIII) at October 31, 2000, and the results of its operations, the changes in its net assets and the financial highlights for the periods indicated, in conformity with accounting principles generally accepted in the United States of America. These financial statements and financial highlights (hereafter referred to as "financial statements") are the responsibility of the Fidelity Advisor Global Equity Fund's management; our responsibility is to express an opinion on these financial statements based on our audits. We conducted our audits of these financial statements in accordance with auditing standards generally accepted in the United States of America which require that we plan and perform the audit to obtain reasonable assurance about whether the financial statements are free of material misstatement. An audit includes examining, on a test basis, evidence supporting the amounts and disclosures in the financial statements, assessing the accounting principles used and significant estimates made by management, and evaluating the overall financial statement presentation. We believe that our audits, which included confirmation of securities at October 31, 2000 by correspondence with the custodian and brokers, provide a reasonable basis for our opinion.
/s/PricewaterhouseCoopers LLP
PricewaterhouseCoopers LLP
Boston, Massachusetts
December 8, 2000
Annual Report
A total of 17%, 19%, 19% and 20% of the dividends distributed by Class A, Class T, Class B and Class C, respectively during the fiscal year qualifies for the dividends-received deduction for corporate shareholders.
The fund will notify shareholders in January 2001 of amounts for use in preparing 2000 income tax returns.
Annual Report
Annual Report
Annual Report
Annual Report
Annual Report
Annual Report
Annual Report
Investment Adviser
Fidelity Management & Research Company
Boston, MA
Investment Sub-Advisers
Fidelity Management & Research
(U.K.) Inc.
Fidelity Management & Research
(Far East) Inc.
Fidelity International
Investment Advisors
Fidelity International Investments Advisors (U.K.) Limited
Fidelity Investments Japan Limited
Officers
Edward C. Johnson 3d, President
Robert C. Pozen, Senior Vice President
Robert A. Lawrence, Vice President
Richard C. Habermann, Vice President
Eric D. Roiter, Secretary
Robert A. Dwight, Treasurer
Maria F. Dwyer, Deputy Treasurer
John H. Costello, Assistant Treasurer
Thomas J. Simpson, Assistant Treasurer
Board of Trustees
Ralph F. Cox *
Phyllis Burke Davis *
Robert M. Gates *
Edward C. Johnson 3d
Donald J. Kirk *
Ned C. Lautenbach *
Peter S. Lynch
Marvin L. Mann *
William O. McCoy *
Gerald C. McDonough *
Robert C. Pozen
Thomas R. Williams *
Advisory Board
J. Michael Cook
Abigail P. Johnson
Marie L. Knowles
General Distributor
Fidelity Distributors Corporation
Boston, MA
Transfer and Shareholder
Servicing Agents
Fidelity Investments Institutional Operations Company, Inc.
Boston, MA
Custodian
State Street Bank and Trust Company
Quincy, MA
* Independent trustees
Annual Report
Focus Funds
Fidelity Advisor Consumer
Industries Fund
Fidelity Advisor Cyclical
Industries Fund
Fidelity Advisor Financial
Services Fund
Fidelity Advisor Health Care Fund
Fidelity Advisor Natural
Resources Fund
Fidelity Advisor Technology Fund
Fidelity Advisor Telecommunications & Utilities Growth Fund
Growth Funds
Fidelity Advisor Korea Fund
Fidelity Advisor Emerging Asia Fund
Fidelity Advisor Latin America Fund
Fidelity Advisor Japan Fund
Fidelity Advisor Europe Capital Appreciation Fund
Fidelity Advisor International
Capital Appreciation Fund
Fidelity Advisor Overseas Fund
Fidelity Advisor Diversified International Fund
Fidelity Advisor Global Equity Fund
Fidelity Advisor TechnoQuant ®
Growth Fund
Fidelity Advisor Small Cap Fund
Fidelity Advisor Value
Strategies Fund
Fidelity Advisor Mid Cap Fund
Fidelity Advisor Dynamic Capital Appreciation Fund
Fidelity Advisor Equity Growth Fund
Fidelity Advisor Large Cap Fund
Fidelity Advisor Dividend Growth Fund
Fidelity Advisor Growth
Opportunities Fund
Growth and Income Funds
Fidelity Advisor Growth & Income Fund
Fidelity Advisor Equity Income Fund
Fidelity Advisor Asset Allocation Fund
Fidelity Advisor Balanced Fund
Taxable Income Funds
Fidelity Advisor Emerging Markets Income Fund
Fidelity Advisor High Yield Fund
Fidelity Advisor High Income Fund
Fidelity Advisor Strategic Income Fund
Fidelity Advisor Mortgage
Securities Fund
Fidelity Advisor Government Investment Fund
Fidelity Advisor Intermediate Bond Fund
Fidelity Advisor Short Fixed-Income Fund
Municipal Funds
Fidelity Advisor Municipal Income Fund
Money Market Funds
Prime Fund
Treasury Fund
Tax-Exempt Fund
AGLO-ANN-1200 118650
1.728713.101
(Fidelity Investment logo)(registered trademark)
Fidelity® Advisor
Fund - Institutional Class
Annual Report
October 31, 2000
(2_fidelity_logos)(registered trademark)
|
President's Message |
Ned Johnson on investing strategies. |
|
|
Performance |
How the fund has done over time. |
|
|
Fund Talk |
The manager's review of fund performance, strategy and outlook. |
|
|
Investment Changes |
A summary of major shifts in the fund's investments over the past six months. |
|
|
Investments |
A complete list of the fund's investments with their market values. |
|
|
Financial Statements |
Statements of assets and liabilities,
operations, and changes in net assets, |
|
|
Notes |
Notes to the financial statements. |
|
|
Report of Independent Accountants |
The auditors' opinion. |
|
|
Distributions |
|
Standard & Poor's, S&P and S&P 500 are registered service marks of The McGraw-Hill Companies, Inc. and have been licensed for use by Fidelity Distributors Corporation.
Third party marks appearing herein are the property of their respective owners.
All other marks appearing herein are registered or unregistered trademarks or service marks of FMR Corp. or an affiliated company.
(Recycle graphic) This report is printed on recycled paper using soy-based inks.
This report and the financial statements contained herein are submitted for the general information of the shareholders of the fund. This report is not authorized for distribution to prospective investors in the fund unless preceded or accompanied by an effective prospectus.
Mutual fund shares are not deposits or obligations of, or guaranteed by, any depository institution. Shares are not insured by the FDIC, Federal Reserve Board or any other agency, and are subject to investment risks, including possible loss of principal amount invested.
Neither the fund nor Fidelity Distributors Corporation is a bank.
For more information on any Fidelity Advisor fund, including charges and expenses, contact your investment professional for a free prospectus. Read it carefully before you invest or send money.
Annual Report
(photo_of_Edward_C_Johnson_3d)
Dear Shareholder:
A sixth-straight year of double-digit positive returns for the Dow Jones Industrial Average, NASDAQ and S&P 500® could be in jeopardy unless the U.S. stock market shows marked improvement in the final two months of 2000. Through October, all three indexes had negative year-to-date returns. On the other hand, most fixed-income sectors were solidly in the black. Treasuries and other long-term government securities led the way, returning nearly 14%.
While it's impossible to predict the future direction of the markets with any degree of certainty, there are certain basic principles that can help investors plan for their future needs.
First, investors are encouraged to take a long-term view of their portfolios. If you can afford to leave your money invested through the inevitable up and down cycles of the financial markets, you will greatly reduce your vulnerability to any single decline. We know from experience, for example, that stock prices have gone up over longer periods of time, have significantly outperformed other types of investments and have stayed ahead of inflation.
Second, you can further manage your investing risk through diversification. A stock mutual fund, for instance, is already diversified, because it invests in many different companies. You can increase your diversification further by investing in a number of different stock funds, or in such other investment categories as bonds. If you have a short investment time horizon, you might want to consider moving some of your investment into a money market fund, which seeks income and a stable share price by investing in high-quality, short-term investments. Of course, it's important to remember that an investment in a money market fund is not insured or guaranteed by the Federal Deposit Insurance Corporation or any other government agency. Although money market funds seek to preserve the value of your investment at $1.00 per share, it is possible to lose money by investing in these types of funds.
Finally, no matter what your time horizon or portfolio diversity, it makes good sense to follow a regular investment plan, investing a certain amount of money in a fund at the same time each month or quarter and periodically reviewing your overall portfolio. By doing so, you won't get caught up in the excitement of a rapidly rising market, nor will you buy all your shares at market highs. While this strategy - known as dollar cost averaging - won't assure a profit or protect you from a loss in a declining market, it should help you lower the average cost of your purchases. Of course, you should consider your financial ability to continue your purchases through periods of low price levels before undertaking such a strategy.
Remember to contact your investment professional if you need help with your investments.
Best regards,
/s/Edward C. Johnson 3d
Edward C. Johnson 3d
Annual Report
Fidelity Advisor Global Equity Fund - Institutional Class
There are several ways to evaluate historical performance. You can look at the total percentage change in value, the average annual percentage change or the growth of a hypothetical $10,000 investment. Total return reflects the change in the value of an investment, assuming reinvestment of the class' dividend income and capital gains (the profits earned upon the sale of securities that have grown in value). If Fidelity had not reimbursed certain class expenses, the total returns would have been lower.
Cumulative Total Returns
|
Periods ended October 31, 2000 |
|
Past 1 |
Life of |
|
Fidelity Adv Global Equity - Inst CL |
|
9.79% |
29.66% |
|
MSCI World |
|
1.09% |
18.32% |
|
Global Funds Average |
|
10.26% |
n/a* |
Cumulative total returns show Institutional Class' performance in percentage terms over a set period - in this case, one year or since the fund started on December 17, 1998. For example, if you had invested $1,000 in a fund that had a 5% return over the past year, the value of your investment would be $1,050. You can compare Institutional Class' returns to the performance of the Morgan Stanley Capital International World Index (MSCI World) - a market capitalization-weighted index that is designed to represent the performance of developed stock markets throughout the world. As of October 31, 2000, the index included over 1,300 equity securities of companies domiciled in 22 countries. To measure how Institutional Class' performance stacked up against its peers, you can compare it to the global funds average, which reflects the performance of mutual funds with similar objectives tracked by Lipper Inc. The past one year average represents a peer group of 261 mutual funds. These benchmarks include reinvested dividends and capital gains, if any, and exclude the effect of sales charges.
Average Annual Total Returns
|
Periods ended October 31, 2000 |
|
Past 1 |
Life of |
|
Fidelity Adv Global Equity - Inst CL |
|
9.79% |
14.87% |
|
MSCI World |
|
1.09% |
9.39% |
|
Global Funds Average |
|
10.26% |
n/a* |
Average annual total returns take Institutional Class shares' cumulative return and show you what would have happened if Institutional Class shares had performed at a constant rate each year.
* Not available
Semiannual Report
$10,000 Over Life of Fund
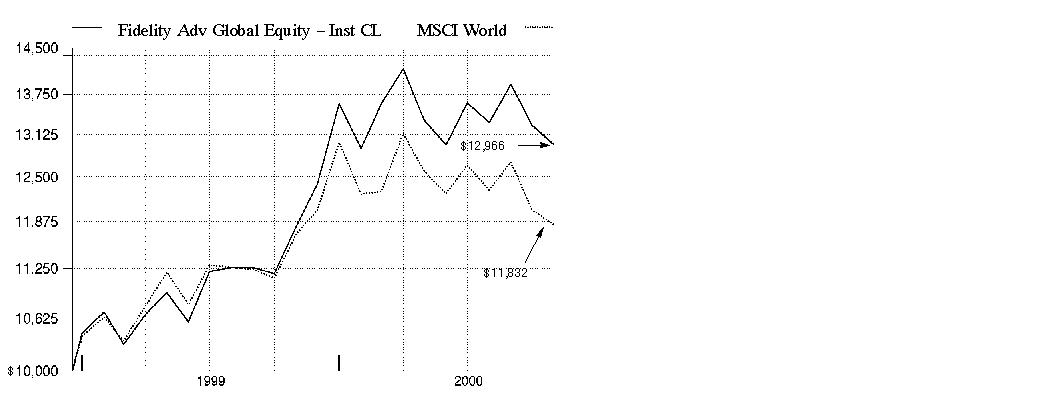
$10,000 Over Life of Fund: Let's say hypothetically that $10,000 was invested in Fidelity Advisor Global Equity Fund - Institutional Class on December 17, 1998, when the fund started. As the chart shows, by October 31, 2000, the value of the investment would have grown to $12,966 - a 29.66% increase on the initial investment. For comparison, look at how the MSCI World Index did over the same period. With dividends reinvested, the same $10,000 would have grown to $11,832 - an 18.32% increase.
Understanding
Performance
Many markets around the globe offer the potential for significant growth over time; however, investing in foreign markets means assuming greater risks than investing in the United States. Factors like changes in a country's financial markets, its local political and economic climate, and the fluctuating value of its currency create these risks. For these reasons an international fund's performance may be more volatile than a fund that invests exclusively in the United States. Past performance is no guarantee of future results and you may have a gain or loss when you sell your shares.
3Annual Report
Market Recap
Currency disparities, the see-saw performance of technology and telecommunications stocks and increased uncertainty over the direction of energy prices contributed to volatile world markets for the 12-month period that ended October 31, 2000. Through the first half of the period, foreign investors enjoyed handsome returns from technology and telecommunications holdings. These gains disappeared down the stretch, however, as the dollar continued to outperform the struggling euro - the uniform currency of 11 European nations - and the Japanese yen by wide margins. Soaring oil and gas prices also added to the volatility. The Morgan Stanley EAFE® index - which tracks the performance of stock markets in Europe, Australasia and the Far East - fell 2.72% during the period. Europe's economic recovery remained on course, but the euro's continued weakness proved to be a millstone. The Morgan Stanley Europe index had a 12-month return of 1.16%. Japan's economic recovery, on the other hand, appeared to be short-lived, or at least very, very slow in the making. The Morgan Stanley Japan index declined 11.61% during the period. Emerging markets, meanwhile, were unable to sustain the momentum they carried into early 2000 - the Morgan Stanley Emerging Markets Free index tumbled 10.33%.
(Portfolio Manager photograph)
An interview with Richard Habermann, Portfolio Manager of Fidelity Advisor Global Equity Fund
Q. How did the fund perform, Dick?
A. Reasonably well. For the 12 months that ended October 31, 2000, the fund's Institutional Class shares returned 9.79%. For the same period, the Morgan Stanley Capital International World Index produced a return of 1.09%, while the global funds average, as measured by Lipper Inc., returned 10.26%.
Q. What factors drove global equity markets during the 12-month period?
A. Generally, global markets overcame sharply rising interest rates and unusually high levels of volatility to post positive returns during the past year. Worldwide economic growth fueled corporate earnings, which, along with swelling investor enthusiasm for technology, media and telecommunications (TMT) stocks, supported the advances of major world indexes early in the period. A lack of confidence in the valuation levels of TMT stocks, coupled with concerns about a slowdown in the pace of economic growth due to further rate hikes and persistently higher energy prices, induced a series of dramatic declines in the spring. Growing increasingly risk-averse, investors around the world adopted a more defensive posture, seeking out safer havens elsewhere in the market, most notably within the health, finance and energy sectors.
Annual Report
Fund Talk: The Manager's Overview - continued
Q. Why did the fund handily outpace its index, yet fall just shy of its peer group?
A. Strong security selection, along with favorable regional positioning, played a big role in our success relative to the index. Maintaining a modest underweighting in the U.S. helped, considering the extreme downside volatility that plagued the nation's stock markets for much of the year. Having broader, better participation from a diverse group of sectors relative to the index, which tended to be highly concentrated in a small group of large tech stocks, gave us an edge. By holding a large number of stocks, we managed to reduce the risk level of the fund, which was key in this uncertain environment. The protection we got on the downside more than offset what we lost on the upside - our underexposure to Oracle and Intel hurt, while holding less Microsoft and Lucent than the index helped. Given the fund's large-cap bias, we came up short relative to our Lipper peers, which generally made more aggressive bets on smaller-cap tech stocks - a group that produced some of the period's best performers.
Q. How did some of your other moves influence performance?
A. Successful stock picking and timely trading in other world markets, particularly Europe and Japan, helped widen our lead over the index. Having ample exposure to the Canadian market, which led most world markets by wide margins during the period, further bolstered fund performance. Technology and energy stocks were our focus there. Sensing trouble on the horizon early in 2000, we decided to shed some of our overall TMT exposure to lock in profits, and replace them with more defensive issues. This strategy paid off for us as world markets trended from growth to value during the second half of the period.
Q. Which stocks helped the most? Which hurt?
A. The U.S. produced a handful of winners from the high-tech arena, most notably Juniper and EMC, while Japan chipped in with Furukawa Electric and Germany with Epcos. European wireless stocks, including Finnish-based Nokia and Sweden's Ericsson, traversed a rocky road, yet still were solid gainers. Other contributors included Swedish insurance carrier Skandia Foersaekrings, French broadcaster TF1 and U.S. power provider AES. Additionally, because we maintained small positions in a large number of stocks, we didn't have any big disasters, which limited our downside. However, we had our fair share of telecom stocks that disappointed, including Britain's Vodafone, Japan's Nippon Telegraph and Italy's Telecom Italia, as well as AT&T. We also had very small out-of-benchmark positions in Mexico and Brazil that hurt.
Annual Report
Fund Talk: The Manager's Overview - continued
Q. What's your outlook?
A. It's still unclear to me as to whether or not the U.S. market will be able to shake its concerns about an economic slowdown and the potential effect on companies' bottom lines. If the U.S. can successfully achieve a soft landing, we could see lower interest rates and a pickup in demand, which could stimulate global markets. Since there's no way to know for sure what will happen, I plan to maintain our emphasis on the defensive areas of the market until I can see a catalyst that can reverse the tide.
The views expressed in this report reflect those of the portfolio manager only through the end of the period of the report as stated on the cover and do not necessarily represent the views of Fidelity or any other person in the Fidelity organization. Any such views are subject to change at any time based upon market or other conditions and Fidelity disclaims any responsibility to update such views. These views may not be relied on as investment advice and, because investment decisions for a Fidelity fund are based on numerous factors, may not be relied on as an indication of trading intent on behalf of any Fidelity fund.
Fund Facts
Goal: seeks long-term growth of capital
Start date: December 17, 1998
Size: as of October 31, 2000, more than $22 million
Manager: Richard Habermann, since inception; joined Fidelity in 1968
3Dick Habermann reflects on recent market volatility:
"There's a lot of uncertainty in the world today, and it's finding its way into the equity markets. Thankfully, the fund's exposure was generally more defensive in nature toward the tail end of the period, when conditions really started to deteriorate. We didn't want to be on the sidelines holding a large cash position, but we also didn't want to make any commitments that we didn't have a lot of confidence in. So, we chose to be somewhat neutral until we felt we saw some light at the end of the tunnel.
"What's particularly troubling for markets these days are shock events. Take the recent crisis in the Middle East, for example. With higher oil prices and inflation fears already weighing on the minds of investors, escalating tensions in that area of the world roiled the markets. There have been many events like this one over the past decade, including the emerging-markets crisis in 1998 and the Gulf War in 1990. As a money manager, it's important for me to anticipate what might be considered less-than-perfect times and, when they are in fact occurring, assess them and decide what to do. So far, we've completed the first part by anticipating difficult times. Early recognition of an uncertain market climate allowed us to lessen our technology exposure, which was key."
Annual Report
|
Top Five Stocks as of October 31, 2000 |
||
|
|
% of fund's |
% of fund's net assets |
|
General Electric Co. (United States of America, Electrical Equipment) |
2.3 |
1.9 |
|
Vodafone Group PLC |
1.9 |
2.4 |
|
Cisco Systems, Inc. (United States of America, Communications Equipment) |
1.5 |
1.6 |
|
Exxon Mobil Corp. |
1.1 |
1.1 |
|
Pfizer, Inc. (United States of America, |
1.1 |
0.9 |
|
|
7.9 |
7.9 |
|
Top Five Market Sectors as of October 31, 2000 |
||
|
|
% of fund's |
% of fund's net assets |
|
Finance |
18.7 |
15.1 |
|
Technology |
18.1 |
23.3 |
|
Health |
9.5 |
6.9 |
|
Utilities |
9.0 |
14.4 |
|
Energy |
6.3 |
6.2 |
|
Top Five Countries as of October 31, 2000 |
||
|
(excluding cash equivalents) |
% of fund's |
% of fund's net assets |
|
United States of America |
46.2 |
41.5 |
|
Japan |
10.8 |
13.3 |
|
United Kingdom |
8.2 |
9.5 |
|
France |
4.6 |
5.2 |
|
Germany |
3.6 |
3.7 |
|
Percentages are adjusted for the effect of open futures contracts, if applicable. |
|
Asset Allocation (% of fund's net assets) |
|||||||
|
As of October 31, 2000 |
As of April 30, 2000 |
||||||
|
Stocks 90.4% |
|
|
Stocks 95.5% |
|
||
|
Short-Term |
|
|
Short-Term |
|
||
Annual Report
Showing Percentage of Net Assets
|
Common Stocks - 88.8% |
|||
|
Shares |
Value (Note 1) |
||
|
Australia - 0.7% |
|||
|
Australia & New Zealand Banking Group Ltd. |
2,700 |
$ 20,013 |
|
|
BHP Ltd. |
2,657 |
25,844 |
|
|
Brambles Industries Ltd. |
300 |
7,805 |
|
|
Cable & Wireless Optus Ltd. (a) |
5,700 |
12,114 |
|
|
CI Technologies Group Ltd. |
1,000 |
1,821 |
|
|
John Fairfax Holdings Ltd. |
2,800 |
6,379 |
|
|
National Australia Bank Ltd. |
1,100 |
15,334 |
|
|
News Corp. Ltd. |
2,984 |
32,078 |
|
|
OneSteel Ltd. (a) |
498 |
238 |
|
|
Publishing & Broadcasting Ltd. |
1,400 |
9,591 |
|
|
Telstra Corp. Ltd. |
3,900 |
12,772 |
|
|
Westpac Banking Corp. |
300 |
2,056 |
|
|
TOTAL AUSTRALIA |
146,045 |
||
|
Brazil - 0.1% |
|||
|
Telesp Celular Participacoes SA ADR |
910 |
28,779 |
|
|
Canada - 2.4% |
|||
|
Abitibi-Consolidated, Inc. |
410 |
3,595 |
|
|
AGF Management Ltd. Class B (non-vtg.) |
240 |
4,004 |
|
|
Alberta Energy Co. Ltd. |
170 |
6,281 |
|
|
Alcan Aluminium Ltd. |
220 |
6,943 |
|
|
Aliant, Inc. |
130 |
2,758 |
|
|
Anderson Exploration Ltd. (a) |
170 |
3,126 |
|
|
Angiotech Pharmaceuticals, Inc. (a) |
50 |
2,742 |
|
|
ATS Automation Tooling Systems, Inc. (a) |
180 |
3,204 |
|
|
Ballard Power Systems, Inc. (a) |
80 |
8,617 |
|
|
Bank of Montreal |
200 |
9,261 |
|
|
Bank of Nova Scotia |
270 |
7,714 |
|
|
Barrick Gold Corp. |
800 |
10,640 |
|
|
BCE, Inc. |
600 |
16,158 |
|
|
Biochem Pharma, Inc. (a) |
130 |
3,198 |
|
|
Biovail Corp. (a) |
130 |
5,550 |
|
|
Bombardier, Inc. Class B (sub. vtg.) |
1,070 |
16,832 |
|
|
C-Mac Industries, Inc. (a) |
180 |
10,167 |
|
|
C.I. Fund Management, Inc. |
250 |
5,230 |
|
|
CAE, Inc. |
230 |
2,931 |
|
|
Canada Occidental Petroleum Ltd. |
180 |
4,333 |
|
|
Canadian Hunter Exploration Ltd. (a) |
140 |
2,943 |
|
|
Canadian Imperial Bank of Commerce |
310 |
9,855 |
|
|
Canadian National Railway Co. |
220 |
6,936 |
|
|
Canadian Natural Resources Ltd. (a) |
150 |
4,434 |
|
|
Canadian Pacific Ltd. |
390 |
11,335 |
|
|
Common Stocks - continued |
|||
|
Shares |
Value (Note 1) |
||
|
Canada - continued |
|||
|
Celestica, Inc. (sub. vtg.) (a) |
180 |
$ 12,863 |
|
|
Cognos, Inc. (a) |
190 |
7,987 |
|
|
Enbridge, Inc. |
230 |
6,194 |
|
|
Falconbridge Ltd. |
400 |
4,755 |
|
|
Four Seasons Hotels, Inc. |
70 |
5,131 |
|
|
GSI Lumonics, Inc. (a) |
190 |
2,458 |
|
|
Imperial Oil Ltd. |
180 |
4,552 |
|
|
Inco Ltd. (a) |
210 |
3,269 |
|
|
JDS Uniphase Canada Ltd. (a) |
90 |
7,386 |
|
|
Loblaw Companies Ltd. |
180 |
6,171 |
|
|
Mackenzie Financial Corp. |
200 |
2,693 |
|
|
Magna International, Inc. Class A |
100 |
4,486 |
|
|
Manitoba Telecom Services, Inc. |
360 |
7,448 |
|
|
Manulife Financial Corp. |
340 |
8,843 |
|
|
Microcell Telecommunications, Inc. Class B (non-vtg.) (a) |
90 |
2,527 |
|
|
Molson, Inc. Class A |
170 |
4,293 |
|
|
Mosaic Group, Inc. (a) |
270 |
2,039 |
|
|
National Bank of Canada |
320 |
5,244 |
|
|
Nortel Networks Corp. |
2,810 |
127,855 |
|
|
NOVA Chemicals Corp. |
140 |
2,887 |
|
|
Onex Corp. |
170 |
2,702 |
|
|
Petro-Canada |
310 |
6,516 |
|
|
Placer Dome, Inc. |
460 |
3,822 |
|
|
Power Corp. of Canada |
180 |
4,079 |
|
|
Power Financial Corp. |
160 |
3,373 |
|
|
Precision Drilling Corp. (a) |
110 |
3,146 |
|
|
Research in Motion Ltd. (a) |
60 |
5,990 |
|
|
Rio Alto Exploration Ltd. (a) |
130 |
2,211 |
|
|
Royal Bank of Canada |
1,000 |
31,724 |
|
|
Seagram Co. Ltd. |
230 |
13,139 |
|
|
Shaw Communications, Inc. Class B |
420 |
8,621 |
|
|
Sun Life Financial Services Canada, Inc. |
690 |
14,276 |
|
|
Suncor Energy, Inc. |
260 |
5,080 |
|
|
Talisman Energy, Inc. (a) |
220 |
6,929 |
|
|
Tembec, Inc. Class A (a) |
290 |
2,562 |
|
|
Thomson Corp. |
200 |
8,079 |
|
|
Toronto Dominion Bank |
570 |
15,705 |
|
|
Transalta Corp. |
340 |
4,422 |
|
|
Tundra Semiconductor Corp. Ltd. (a) |
60 |
2,167 |
|
|
Westcoast Energy, Inc. |
260 |
5,806 |
|
|
Weston George Ltd. |
80 |
3,988 |
|
|
TOTAL CANADA |
552,205 |
||
|
Common Stocks - continued |
|||
|
Shares |
Value (Note 1) |
||
|
Cayman Islands - 0.1% |
|||
|
XL Capital Ltd. Class A |
240 |
$ 18,450 |
|
|
Denmark - 0.8% |
|||
|
ISS AS (a) |
1,758 |
108,305 |
|
|
Novo-Nordisk AS Series B (a) |
310 |
65,783 |
|
|
TOTAL DENMARK |
174,088 |
||
|
Finland - 0.8% |
|||
|
Nokia AB |
2,060 |
88,065 |
|
|
Sampo Insurance Co. Ltd. (A Shares) |
1,707 |
69,547 |
|
|
UPM-Kymmene Corp. |
1,115 |
31,563 |
|
|
TOTAL FINLAND |
189,175 |
||
|
France - 4.6% |
|||
|
Alcatel SA (RFD) (a) |
1,434 |
89,446 |
|
|
Aventis SA |
3,375 |
243,211 |
|
|
BNP Paribas SA |
824 |
71,060 |
|
|
Bouygues SA |
680 |
34,631 |
|
|
Castorama Dubois Investissements SA |
130 |
26,438 |
|
|
Credit Lyonnais SA |
847 |
28,980 |
|
|
Sanofi-Synthelabo SA |
2,333 |
122,776 |
|
|
Schneider Electric SA |
441 |
28,729 |
|
|
Societe Generale Class A (a) |
1,048 |
59,510 |
|
|
Suez Lyonnaise des Eaux |
185 |
28,234 |
|
|
TotalFinaElf SA Class B |
1,768 |
253,266 |
|
|
Vivendi SA |
656 |
47,162 |
|
|
TOTAL FRANCE |
1,033,443 |
||
|
Germany - 2.5% |
|||
|
BASF AG |
1,300 |
50,979 |
|
|
Bayer AG |
1,000 |
43,416 |
|
|
Bayerische Motoren Werke AG (BMW) |
600 |
19,872 |
|
|
Deutsche Bank AG |
1,200 |
98,271 |
|
|
Deutsche Telekom AG |
840 |
31,550 |
|
|
Muenchener Ruckversicherungs-Gesellschaft AG (Reg.) |
486 |
152,837 |
|
|
Schering AG (a) |
1,790 |
100,277 |
|
|
SGL Carbon AG (a) |
360 |
22,004 |
|
|
Software AG |
600 |
42,983 |
|
|
United Internet AG (a) |
1,000 |
6,434 |
|
|
TOTAL GERMANY |
568,623 |
||
|
Hong Kong - 1.0% |
|||
|
Asat Holdings Ltd. sponsored ADR |
1,900 |
12,588 |
|
|
Common Stocks - continued |
|||
|
Shares |
Value (Note 1) |
||
|
Hong Kong - continued |
|||
|
Cheung Kong Holdings Ltd. |
3,000 |
$ 33,182 |
|
|
China Mobile Ltd. (a) |
8,000 |
49,000 |
|
|
CLP Holdings Ltd. |
2,000 |
9,336 |
|
|
Hang Seng Bank Ltd. |
1,800 |
21,179 |
|
|
Hong Kong & China Gas Co. Ltd. |
6,000 |
7,579 |
|
|
Hutchison Whampoa Ltd. |
4,600 |
57,073 |
|
|
Johnson Electric Holdings Ltd. |
8,000 |
15,902 |
|
|
Li & Fung Ltd. |
4,000 |
7,438 |
|
|
Sun Hung Kai Properties Ltd. |
2,000 |
16,543 |
|
|
Television Broadcasts Ltd. |
1,000 |
5,476 |
|
|
TOTAL HONG KONG |
235,296 |
||
|
Ireland - 0.4% |
|||
|
Bank of Ireland, Inc. |
4,888 |
37,672 |
|
|
CRH PLC |
3,487 |
53,572 |
|
|
TOTAL IRELAND |
91,244 |
||
|
Italy - 1.1% |
|||
|
Banca Nazionale del Lavoro (BNL) |
11,500 |
37,093 |
|
|
Bulgari Spa |
2,100 |
24,661 |
|
|
Eni Spa |
12,916 |
69,835 |
|
|
Mediolanum Spa |
3,600 |
52,769 |
|
|
San Paolo IMI Spa |
3,861 |
62,188 |
|
|
TOTAL ITALY |
246,546 |
||
|
Japan - 10.8% |
|||
|
Aeon Credit Service Ltd. |
200 |
11,218 |
|
|
Aiwa Co. Ltd. |
1,000 |
8,469 |
|
|
Ajinomoto Co., Inc. |
1,000 |
11,181 |
|
|
Anritsu Corp. |
1,000 |
21,996 |
|
|
Asahi Chemical Industry Co. Ltd. (a) |
6,000 |
37,174 |
|
|
Asahi Glass Co. Ltd. |
2,000 |
20,530 |
|
|
Bank of Tokyo-Mitsubishi Ltd. |
1,000 |
11,997 |
|
|
Bridgestone Corp. (a) |
3,000 |
29,750 |
|
|
Canon, Inc. |
1,000 |
40,563 |
|
|
Casio Computer Co. Ltd. |
1,000 |
10,082 |
|
|
Dai Nippon Printing Co. Ltd. |
1,000 |
15,672 |
|
|
Dainippon Pharmaceutical Co. |
1,000 |
12,822 |
|
|
Daito Trust Construction Co. |
1,600 |
26,982 |
|
|
Daiwa House Industry Co. Ltd. |
2,000 |
12,556 |
|
|
Daiwa Securities Group, Inc. |
1,000 |
11,081 |
|
|
DDI Corp. |
4 |
18,770 |
|
|
FamilyMart Co. Ltd. |
500 |
13,244 |
|
|
Common Stocks - continued |
|||
|
Shares |
Value (Note 1) |
||
|
Japan - continued |
|||
|
Fancl Corp. |
100 |
$ 6,324 |
|
|
Fanuc Ltd. |
200 |
17,964 |
|
|
Fuji Photo Film Co. Ltd. |
2,000 |
74,237 |
|
|
Fujikura Ltd. |
1,000 |
8,817 |
|
|
Fujitsu Ltd. |
2,000 |
35,634 |
|
|
Fujitsu Support & Service, Inc. (FSAS) |
100 |
12,153 |
|
|
Furukawa Electric Co. Ltd. |
2,000 |
52,607 |
|
|
Hitachi Cable Ltd. |
1,000 |
11,786 |
|
|
Hitachi Ltd. |
1,000 |
11,150 |
|
|
Hitachi Zosen Corp. (a) |
16,000 |
12,171 |
|
|
Honda Motor Co. Ltd. (a) |
1,000 |
34,594 |
|
|
Ito En Ltd. |
300 |
21,584 |
|
|
Ito-Yokado Co. Ltd. |
1,000 |
45,184 |
|
|
Japan Tobacco, Inc. |
1 |
6,874 |
|
|
Kaneka Corp. |
1,000 |
9,715 |
|
|
Kao Corp. |
1,000 |
29,970 |
|
|
Komatsu Ltd. |
3,000 |
13,308 |
|
|
Konami Co. Ltd. |
300 |
25,296 |
|
|
Kuraray Co. Ltd. |
1,000 |
9,394 |
|
|
Kyocera Corp. |
400 |
53,500 |
|
|
Matsushita Communication Industrial Co. Ltd. |
100 |
13,106 |
|
|
Matsushita Electric Industrial Co. Ltd. |
2,000 |
58,450 |
|
|
Minolta Co. Ltd. |
2,000 |
8,872 |
|
|
Mitsubishi Electric Corp. |
2,000 |
14,371 |
|
|
Mitsubishi Trust & Banking Corp. |
1,000 |
8,111 |
|
|
Mitsui Mining & Smelting Co. Ltd. |
1,000 |
8,432 |
|
|
Mitsumi Electric Co. Ltd. |
1,000 |
32,994 |
|
|
Mizuho Holdings, Inc. |
6 |
46,137 |
|
|
NEC Corp. |
1,000 |
19,063 |
|
|
Nichicon Corp. |
1,000 |
17,863 |
|
|
Nikko Securities Co. Ltd. |
1,000 |
8,633 |
|
|
Nintendo Co. Ltd. |
200 |
33,086 |
|
|
Nippon Computer Systems Corp. |
1,000 |
19,247 |
|
|
Nippon Paper Industries Co. Ltd. |
4,000 |
22,803 |
|
|
Nippon Sheet Glass Co. Ltd. |
2,000 |
30,428 |
|
|
Nippon System Development Co. Ltd. |
100 |
10,842 |
|
|
Nippon Telegraph & Telephone Corp. |
12 |
109,211 |
|
|
Nissan Motor Co. Ltd. (a) |
3,000 |
21,000 |
|
|
Nitto Denko Corp. |
1,000 |
33,819 |
|
|
Nomura Securities Co. Ltd. |
2,000 |
42,434 |
|
|
NTT DoCoMo, Inc. |
2 |
49,308 |
|
|
Oki Electric Industry Co. Ltd. (a) |
4,000 |
23,793 |
|
|
Common Stocks - continued |
|||
|
Shares |
Value (Note 1) |
||
|
Japan - continued |
|||
|
Omron Corp. |
1,000 |
$ 24,654 |
|
|
Oriental Land Co. Ltd. |
800 |
48,392 |
|
|
ORIX Corp. |
200 |
20,988 |
|
|
Ricoh Co. Ltd. |
1,000 |
15,397 |
|
|
Rohm Co. Ltd. |
200 |
50,426 |
|
|
Sakura Bank Ltd. |
6,000 |
43,717 |
|
|
Sanden Corp. |
1,000 |
4,821 |
|
|
Sanyo Electric Co. Ltd. |
2,000 |
15,214 |
|
|
Senshukai Co. Ltd. |
1,000 |
4,995 |
|
|
Shinko Electric Industries Co.Ltd. |
1,000 |
36,477 |
|
|
Shiseido Co. Ltd. |
1,000 |
12,923 |
|
|
SMC Corp. |
100 |
14,151 |
|
|
Softbank Corp. |
300 |
18,009 |
|
|
Sony Corp. |
1,000 |
83,000 |
|
|
Square Co. Ltd. |
300 |
10,448 |
|
|
Sumitomo Bank Ltd. |
1,000 |
12,144 |
|
|
Sumitomo Electric Industries Ltd. |
3,000 |
55,403 |
|
|
Sumitomo Heavy Industries Ltd. |
8,000 |
15,617 |
|
|
Sumitomo Trust & Banking Ltd. |
2,000 |
15,397 |
|
|
Suzuki Motor Corp. |
1,000 |
10,723 |
|
|
Takeda Chemical Industries Ltd. |
1,000 |
65,897 |
|
|
Terumo Corp. |
1,000 |
28,320 |
|
|
The Suruga Bank Ltd. |
3,000 |
41,188 |
|
|
THK Co. Ltd. |
500 |
12,373 |
|
|
Tokai Corp. |
1,000 |
6,636 |
|
|
Tokyo Seimitsu Co. Ltd. |
200 |
14,114 |
|
|
Toppan Forms Co. Ltd. |
500 |
8,886 |
|
|
Toshiba Corp. |
2,000 |
14,298 |
|
|
Toyota Motor Corp. |
4,000 |
159,839 |
|
|
Tsubaki Nakashima Co. Ltd. |
1,000 |
12,529 |
|
|
Uni-Charm Corp |
300 |
12,840 |
|
|
Union Tool Co. (a) |
100 |
6,874 |
|
|
Welfide Corp. |
1,000 |
7,195 |
|
|
World Co. Ltd. |
100 |
3,721 |
|
|
Yamaha Motor Co. Ltd. |
2,000 |
15,562 |
|
|
Yamanouchi Pharmaceutical Co. Ltd. |
1,000 |
45,275 |
|
|
Yamato Transport Co. Ltd. |
1,000 |
20,209 |
|
|
Zeon Corp. |
1,000 |
4,335 |
|
|
TOTAL JAPAN |
2,431,339 |
||
|
Mexico - 0.0% |
|||
|
TV Azteca SA de CV sponsored ADR |
340 |
4,250 |
|
|
Common Stocks - continued |
|||
|
Shares |
Value (Note 1) |
||
|
Netherlands - 2.1% |
|||
|
Buhrmann NV |
1,300 |
$ 35,531 |
|
|
Equant NV (a) |
580 |
19,684 |
|
|
Heineken Holding NV (A Shares) |
400 |
14,260 |
|
|
Heineken NV |
800 |
43,459 |
|
|
ING Groep NV (Certificaten Van Aandelen) |
2,100 |
144,238 |
|
|
Koninklijke Ahold NV |
2,294 |
66,651 |
|
|
Numico NV |
2,200 |
102,892 |
|
|
United Pan-Europe Communications NV Class A (a) |
2,000 |
35,055 |
|
|
TOTAL NETHERLANDS |
461,770 |
||
|
Portugal - 0.1% |
|||
|
Telecel Comunicacoes Pessoais SA (a) |
1,930 |
21,165 |
|
|
Singapore - 0.3% |
|||
|
City Developments Ltd. |
1,000 |
4,617 |
|
|
Datacraft Asia Ltd. |
40 |
274 |
|
|
DBS Group Holdings Ltd. |
1,000 |
11,798 |
|
|
Flextronics International Ltd. (a) |
300 |
11,400 |
|
|
Oversea-Chinese Banking Corp. Ltd. |
1,050 |
6,703 |
|
|
Singapore Airlines Ltd. |
1,000 |
10,031 |
|
|
Singapore Press Holdings Ltd. |
400 |
5,722 |
|
|
Singapore Technologies Engineering Ltd. |
3,000 |
4,839 |
|
|
Singapore Telecommunications Ltd. |
5,000 |
8,293 |
|
|
United Overseas Bank Ltd. |
1,056 |
7,824 |
|
|
TOTAL SINGAPORE |
71,501 |
||
|
Spain - 1.7% |
|||
|
Altadis SA |
7,990 |
119,701 |
|
|
Banco Santander Central Hispano SA |
6,900 |
66,884 |
|
|
Telefonica SA (a) |
8,817 |
168,163 |
|
|
Union Electrica Fenosa SA |
1,600 |
29,593 |
|
|
TOTAL SPAIN |
384,341 |
||
|
Sweden - 1.6% |
|||
|
Assa Abloy AB (B Shares) |
5,922 |
108,997 |
|
|
Securitas AB (B Shares) |
1,400 |
29,829 |
|
|
Skandia Foersaekrings AB |
2,835 |
48,068 |
|
|
Svenska Handelsbanken AB (A Shares) |
2,837 |
44,554 |
|
|
Telefonaktiebolaget LM Ericsson (B Shares) |
8,514 |
118,132 |
|
|
TOTAL SWEDEN |
349,580 |
||
|
Switzerland - 3.3% |
|||
|
Credit Suisse Group (Reg.) |
418 |
78,368 |
|
|
Common Stocks - continued |
|||
|
Shares |
Value (Note 1) |
||
|
Switzerland - continued |
|||
|
Julius Baer Holding AG |
24 |
$ 118,832 |
|
|
Kuoni Reisen Holding AG Class B (Reg.) |
78 |
33,413 |
|
|
Nestle SA (Reg.) |
64 |
132,629 |
|
|
Novartis AG (Reg.) |
103 |
156,262 |
|
|
Richemont Compagnie Financier Class A unit |
12 |
33,380 |
|
|
Swiss Reinsurance Co. (Reg.) |
17 |
33,527 |
|
|
Zurich Financial Services Group AG |
316 |
152,946 |
|
|
TOTAL SWITZERLAND |
739,357 |
||
|
United Kingdom - 8.2% |
|||
|
3i Group PLC |
3,200 |
72,601 |
|
|
AstraZeneca Group PLC |
1,872 |
88,385 |
|
|
Bank of Scotland |
2,900 |
27,033 |
|
|
Barclays PLC |
2,700 |
77,188 |
|
|
BBA Group PLC |
7,000 |
38,410 |
|
|
BP Amoco PLC |
22,700 |
192,714 |
|
|
British Telecommunications PLC |
2,900 |
34,510 |
|
|
Computacenter PLC |
2,700 |
15,657 |
|
|
Energis PLC (a) |
2,800 |
23,929 |
|
|
Granada Compass PLC (a) |
7,300 |
62,862 |
|
|
HSBC Holdings PLC: |
|
|
|
|
(Hong Kong) (Reg.) |
5,844 |
84,270 |
|
|
(United Kingdom) (Reg.) |
3,700 |
53,354 |
|
|
Jazztel PLC (a) |
900 |
16,233 |
|
|
Lloyds TSB Group PLC |
3,500 |
35,619 |
|
|
Misys PLC |
3,200 |
33,308 |
|
|
National Grid Group PLC |
5,500 |
47,641 |
|
|
Reed International PLC |
7,800 |
72,030 |
|
|
Shell Transport & Trading Co. PLC (Reg.) |
28,400 |
232,821 |
|
|
SmithKline Beecham PLC |
10,100 |
131,679 |
|
|
United News & Media PLC |
2,900 |
36,261 |
|
|
Vodafone Group PLC |
99,654 |
424,152 |
|
|
WPP Group PLC |
3,000 |
40,229 |
|
|
TOTAL UNITED KINGDOM |
1,840,886 |
||
|
United States of America - 46.2% |
|||
|
Abbott Laboratories |
1,970 |
104,041 |
|
|
Adobe Systems, Inc. |
760 |
57,808 |
|
|
Adolph Coors Co. Class B |
170 |
10,827 |
|
|
AES Corp. (a) |
1,810 |
102,265 |
|
|
Affiliated Computer Services, Inc. Class A (a) |
470 |
26,173 |
|
|
AFLAC, Inc. |
450 |
32,878 |
|
|
Common Stocks - continued |
|||
|
Shares |
Value (Note 1) |
||
|
United States of America - continued |
|||
|
Agilent Technologies, Inc. |
450 |
$ 20,841 |
|
|
Allmerica Financial Corp. |
1,040 |
65,585 |
|
|
Allstate Corp. |
660 |
26,565 |
|
|
AMBAC Financial Group, Inc. |
1,300 |
103,756 |
|
|
America Online, Inc. (a) |
380 |
19,163 |
|
|
American Express Co. |
860 |
51,600 |
|
|
American Home Products Corp. |
430 |
27,305 |
|
|
American International Group, Inc. |
1,748 |
171,304 |
|
|
Amgen, Inc. (a) |
280 |
16,223 |
|
|
Anadarko Petroleum Corp. |
190 |
12,170 |
|
|
Analog Devices, Inc. (a) |
290 |
18,850 |
|
|
AnnTaylor Stores Corp. (a) |
490 |
14,700 |
|
|
Apache Corp. |
90 |
4,978 |
|
|
Apple Computer, Inc. (a) |
400 |
7,825 |
|
|
Applied Materials, Inc. (a) |
190 |
10,094 |
|
|
Ariba, Inc. (a) |
220 |
27,803 |
|
|
Art Technology Group, Inc. (a) |
230 |
14,433 |
|
|
AsiaInfo Holdings, Inc. |
200 |
2,425 |
|
|
Associates First Capital Corp. Class A |
1,940 |
72,023 |
|
|
AT&T Corp. |
2,846 |
65,992 |
|
|
AT&T Corp.: |
|
|
|
|
Liberty Media Group Class A (a) |
460 |
8,280 |
|
|
Wireless Group |
1,270 |
31,671 |
|
|
AutoNation, Inc. |
1,430 |
9,653 |
|
|
Avery Dennison Corp. |
290 |
14,645 |
|
|
Avon Products, Inc. |
1,210 |
58,685 |
|
|
Bank of New York Co., Inc. |
2,490 |
143,331 |
|
|
Bank One Corp. |
840 |
30,660 |
|
|
BEA Systems, Inc. (a) |
430 |
30,853 |
|
|
Bear Stearns Companies, Inc. |
270 |
16,369 |
|
|
Bed Bath & Beyond, Inc. (a) |
680 |
17,553 |
|
|
BellSouth Corp. |
1,010 |
48,796 |
|
|
BFGoodrich Co. |
1,050 |
42,984 |
|
|
Biomet, Inc. |
525 |
18,998 |
|
|
BJ's Wholesale Club, Inc. (a) |
470 |
15,481 |
|
|
Boeing Co. |
460 |
31,194 |
|
|
Bristol-Myers Squibb Co. |
2,960 |
180,375 |
|
|
Broadcom Corp. Class A (a) |
170 |
37,804 |
|
|
Brocade Communications Systems, Inc. (a) |
110 |
25,011 |
|
|
Burlington Northern Santa Fe Corp. |
290 |
7,703 |
|
|
Burlington Resources, Inc. |
470 |
16,920 |
|
|
Calpine Corp. (a) |
260 |
20,524 |
|
|
Common Stocks - continued |
|||
|
Shares |
Value (Note 1) |
||
|
United States of America - continued |
|||
|
Cardinal Health, Inc. |
630 |
$ 59,693 |
|
|
Caterpillar, Inc. |
490 |
17,181 |
|
|
CDW Computer Centers, Inc. (a) |
60 |
3,866 |
|
|
Ceridian Corp. (a) |
1,600 |
40,000 |
|
|
Charles Schwab Corp. |
1,595 |
56,024 |
|
|
Chevron Corp. |
860 |
70,628 |
|
|
Ciena Corp. (a) |
680 |
71,485 |
|
|
CIGNA Corp. |
830 |
101,219 |
|
|
Cisco Systems, Inc. (a) |
6,220 |
335,103 |
|
|
Citigroup, Inc. |
3,633 |
191,187 |
|
|
Citizens Communications Co. (a) |
960 |
13,920 |
|
|
Clear Channel Communications, Inc. (a) |
1,104 |
66,309 |
|
|
Colgate-Palmolive Co. |
440 |
25,854 |
|
|
Comerica, Inc. |
60 |
3,619 |
|
|
Compaq Computer Corp. |
1,490 |
45,311 |
|
|
Comverse Technology, Inc. (a) |
200 |
22,350 |
|
|
Conoco, Inc. Class B |
2,240 |
60,900 |
|
|
Consolidated Stores Corp. (a) |
440 |
5,225 |
|
|
COR Therapeutics, Inc. (a) |
280 |
15,820 |
|
|
Corning, Inc. |
800 |
61,200 |
|
|
Dell Computer Corp. (a) |
3,800 |
112,100 |
|
|
Devon Energy Corp. |
715 |
36,036 |
|
|
Ditech Communications Corp. (a) |
70 |
2,411 |
|
|
Dynegy, Inc. Class A |
620 |
28,714 |
|
|
E.I. du Pont de Nemours and Co. |
570 |
25,864 |
|
|
Ecolab, Inc. |
500 |
19,594 |
|
|
Eli Lilly & Co. |
830 |
74,181 |
|
|
EMC Corp. (a) |
2,150 |
191,484 |
|
|
Emerson Electric Co. |
310 |
22,766 |
|
|
ENSCO International, Inc. |
900 |
29,925 |
|
|
Estee Lauder Companies, Inc. Class A |
810 |
37,614 |
|
|
Exodus Communications, Inc. (a) |
470 |
15,774 |
|
|
Exxon Mobil Corp. |
2,892 |
257,930 |
|
|
Fannie Mae |
1,970 |
151,690 |
|
|
Firstar Corp. |
1,330 |
26,184 |
|
|
Fluor Corp. |
530 |
18,550 |
|
|
FMC Corp. (a) |
400 |
30,400 |
|
|
Fox Entertainment Group, Inc. Class A (a) |
1,710 |
36,765 |
|
|
Freddie Mac |
2,720 |
163,200 |
|
|
Gateway, Inc. (a) |
210 |
10,838 |
|
|
Genentech, Inc. (a) |
120 |
9,900 |
|
|
General Dynamics Corp. |
1,300 |
93,031 |
|
|
Common Stocks - continued |
|||
|
Shares |
Value (Note 1) |
||
|
United States of America - continued |
|||
|
General Electric Co. |
9,230 |
$ 505,898 |
|
|
General Motors Corp. |
390 |
24,229 |
|
|
General Motors Corp. Class H |
744 |
24,106 |
|
|
Gillette Co. |
1,470 |
51,266 |
|
|
Grant Prideco, Inc. (a) |
1,680 |
31,185 |
|
|
Halliburton Co. |
340 |
12,601 |
|
|
Hartford Financial Services Group, Inc. |
970 |
72,204 |
|
|
HCA - The Healthcare Co. |
970 |
38,739 |
|
|
Hewlett-Packard Co. |
880 |
40,865 |
|
|
Home Depot, Inc. |
2,240 |
96,320 |
|
|
Household International, Inc. |
500 |
25,156 |
|
|
Illinois Tool Works, Inc. |
410 |
22,781 |
|
|
Immunex Corp. (a) |
420 |
17,876 |
|
|
Ingersoll-Rand Co. |
250 |
9,438 |
|
|
Intel Corp. |
5,420 |
243,900 |
|
|
International Business Machines Corp. |
900 |
88,650 |
|
|
International Paper Co. |
740 |
27,103 |
|
|
J.D. Edwards & Co. (a) |
1,550 |
40,106 |
|
|
Jabil Circuit, Inc. (a) |
260 |
14,836 |
|
|
Johnson & Johnson |
590 |
54,354 |
|
|
Juniper Networks, Inc. (a) |
390 |
76,050 |
|
|
Keebler Foods Co. |
1,170 |
47,385 |
|
|
Kimberly-Clark Corp. |
890 |
58,740 |
|
|
Kinder Morgan, Inc. |
1,080 |
41,648 |
|
|
Kohls Corp. (a) |
810 |
43,892 |
|
|
LAM Research Corp. (a) |
230 |
4,456 |
|
|
Lexmark International Group, Inc. Class A (a) |
190 |
7,790 |
|
|
LSI Logic Corp. (a) |
360 |
11,835 |
|
|
Macromedia, Inc. (a) |
630 |
48,549 |
|
|
Marsh & McLennan Companies, Inc. |
330 |
43,148 |
|
|
Medtronic, Inc. |
600 |
32,588 |
|
|
Mellon Financial Corp. |
850 |
41,013 |
|
|
Merck & Co., Inc. |
1,600 |
143,900 |
|
|
Micromuse, Inc. (a) |
140 |
23,756 |
|
|
Microsoft Corp. (a) |
3,450 |
237,619 |
|
|
Millennium Chemicals, Inc. |
600 |
9,675 |
|
|
Millipore Corp. |
130 |
6,825 |
|
|
Minnesota Mining & Manufacturing Co. |
330 |
31,886 |
|
|
Morgan Stanley Dean Witter & Co. |
1,060 |
85,131 |
|
|
Motorola, Inc. |
920 |
22,943 |
|
|
Nabors Industries, Inc. (a) |
960 |
48,864 |
|
|
National-Oilwell, Inc. (a) |
430 |
12,578 |
|
|
Common Stocks - continued |
|||
|
Shares |
Value (Note 1) |
||
|
United States of America - continued |
|||
|
Navistar International Corp. (a) |
450 |
$ 14,878 |
|
|
Network Appliance, Inc. (a) |
330 |
39,270 |
|
|
Nextel Communications, Inc. Class A (a) |
750 |
28,828 |
|
|
Northwest Airlines Corp. Class A (a) |
350 |
9,975 |
|
|
Omnicom Group, Inc. |
420 |
38,745 |
|
|
Oracle Corp. (a) |
3,720 |
122,760 |
|
|
Outback Steakhouse, Inc. (a) |
370 |
10,545 |
|
|
Parker-Hannifin Corp. |
520 |
21,515 |
|
|
PE Corp. - Celera Genomics Group (a) |
100 |
6,750 |
|
|
PeopleSoft, Inc. (a) |
820 |
35,785 |
|
|
PepsiCo, Inc. |
890 |
43,109 |
|
|
Pfizer, Inc. |
5,912 |
255,324 |
|
|
Philip Morris Companies, Inc. |
2,490 |
91,196 |
|
|
Phone.com, Inc. (a) |
260 |
24,066 |
|
|
PMC-Sierra, Inc. (a) |
150 |
25,425 |
|
|
PNC Financial Services Group, Inc. |
280 |
18,725 |
|
|
Praxair, Inc. |
1,250 |
46,563 |
|
|
Procter & Gamble Co. |
2,130 |
152,162 |
|
|
Protein Design Labs, Inc. (a) |
120 |
16,209 |
|
|
Quaker Oats Co. |
770 |
62,803 |
|
|
Qwest Communications International, Inc. (a) |
1,240 |
60,295 |
|
|
Rational Software Corp. (a) |
360 |
21,488 |
|
|
Redback Networks, Inc. (a) |
120 |
12,773 |
|
|
Republic Services, Inc. (a) |
840 |
11,288 |
|
|
Safeway, Inc. (a) |
390 |
21,328 |
|
|
Santa Fe International Corp. |
230 |
8,395 |
|
|
SBA Communications Corp. Class A (a) |
630 |
31,579 |
|
|
SBC Communications, Inc. |
1,980 |
114,221 |
|
|
Schering-Plough Corp. |
1,990 |
102,858 |
|
|
Scientific-Atlanta, Inc. |
510 |
34,903 |
|
|
Siebel Systems, Inc. (a) |
300 |
31,481 |
|
|
Smith International, Inc. (a) |
250 |
17,625 |
|
|
Software.com, Inc. (a) |
120 |
17,880 |
|
|
Sprint Corp. - PCS Group Series 1 (a) |
1,370 |
52,231 |
|
|
State Street Corp. |
120 |
14,969 |
|
|
Summit Bancorp |
460 |
17,250 |
|
|
Sun Microsystems, Inc. (a) |
1,520 |
168,530 |
|
|
Sybase, Inc. (a) |
630 |
13,191 |
|
|
TCF Financial Corp. |
590 |
23,858 |
|
|
Tenet Healthcare Corp. |
1,080 |
42,458 |
|
|
Texaco, Inc. |
700 |
41,344 |
|
|
Texas Instruments, Inc. |
1,810 |
88,803 |
|
|
Common Stocks - continued |
|||
|
Shares |
Value (Note 1) |
||
|
United States of America - continued |
|||
|
The Chubb Corp. |
460 |
$ 38,841 |
|
|
The Coca-Cola Co. |
2,300 |
138,863 |
|
|
Thermo Electron Corp. (a) |
1,460 |
42,340 |
|
|
Time Warner Telecom, Inc. Class A (a) |
290 |
17,291 |
|
|
Time Warner, Inc. |
770 |
58,451 |
|
|
Tyco International Ltd. |
230 |
13,038 |
|
|
Union Pacific Corp. |
420 |
19,688 |
|
|
United Technologies Corp. |
1,260 |
87,964 |
|
|
UnitedHealth Group, Inc. |
280 |
30,625 |
|
|
UnumProvident Corp. |
850 |
24,013 |
|
|
VeriSign, Inc. (a) |
410 |
54,120 |
|
|
VERITAS Software Corp. (a) |
340 |
47,945 |
|
|
Vertex Pharmaceuticals, Inc. (a) |
160 |
14,898 |
|
|
Viacom, Inc. Class B (non-vtg.) (a) |
1,711 |
97,313 |
|
|
Vignette Corp. (a) |
820 |
24,446 |
|
|
VoiceStream Wireless Corp. (a) |
491 |
64,567 |
|
|
Waddell & Reed Financial, Inc. Class A |
300 |
9,563 |
|
|
Wal-Mart Stores, Inc. |
2,380 |
107,993 |
|
|
Walgreen Co. |
2,180 |
99,463 |
|
|
Walt Disney Co. |
2,740 |
98,126 |
|
|
Washington Mutual, Inc. |
660 |
29,040 |
|
|
Watson Pharmaceuticals, Inc. (a) |
160 |
10,010 |
|
|
Wellpoint Health Networks, Inc. (a) |
160 |
18,710 |
|
|
Wells Fargo & Co. |
2,190 |
101,424 |
|
|
WorldCom, Inc. (a) |
1,940 |
46,075 |
|
|
TOTAL UNITED STATES OF AMERICA |
10,387,034 |
||
|
TOTAL COMMON STOCKS (Cost $18,252,567) |
19,975,117 |
||
|
Nonconvertible Preferred Stocks - 1.6% |
|||
|
|
|
|
|
|
Germany - 1.1% |
|||
|
Hugo Boss AG |
369 |
94,087 |
|
|
ProSieben Sat.1 Media AG (a) |
1,600 |
50,385 |
|
|
Wella AG |
2,742 |
109,970 |
|
|
TOTAL GERMANY |
254,442 |
||
|
Italy - 0.5% |
|||
|
Telecom Italia Spa Risp |
19,600 |
106,939 |
|
|
TOTAL NONCONVERTIBLE PREFERRED STOCKS (Cost $296,030) |
361,381 |
||
|
Nonconvertible Bonds - 0.0% |
|||||
|
Moody's Ratings (unaudited) |
Principal Amount |
Value |
|||
|
United Kingdom - 0.0% |
|||||
|
BAE Systems PLC 7.45% 11/30/03 |
- |
GBP |
433 |
$ 609 |
|
|
Cash Equivalents - 9.6% |
|||
|
Shares |
|
||
|
Fidelity Cash Central Fund, 6.61% (b) |
2,147,079 |
2,147,079 |
|
|
TOTAL INVESTMENT PORTFOLIO - 100.0% (Cost $20,696,109) |
22,484,186 |
||
|
NET OTHER ASSETS - 0.0% |
(7,523) |
||
|
NET ASSETS - 100% |
$ 22,476,663 |
||
|
Currency Abbreviations |
||
|
GBP |
- |
British pound |
|
Legend |
|
(a) Non-income producing |
|
(b) The rate quoted is the annualized seven-day yield of the fund at period end. A complete listing of the fund's holdings as of its most recent fiscal year end is available upon request. |
|
Income Tax Information |
|
At October 31, 2000, the aggregate |
|
At October 31, 2000, the fund had a capital loss carryforward of approximately $413,000 all of which will expire on October 31, 2008. |
See accompanying notes which are an integral part of the financial statements.
Annual Report
Statement of Assets and Liabilities
|
|
October 31, 2000 |
|
|
Assets |
|
|
|
Investment in securities, at value (cost $20,696,109) - |
|
$ 22,484,186 |
|
Foreign currency held at value (cost $6) |
|
6 |
|
Receivable for investments sold |
|
169,757 |
|
Receivable for fund shares sold |
|
107,484 |
|
Dividends receivable |
|
19,532 |
|
Interest receivable |
|
8,711 |
|
Other receivables |
|
497 |
|
Total assets |
|
22,790,173 |
|
Liabilities |
|
|
|
Payable for investments purchased |
$ 249,215 |
|
|
Payable for fund shares redeemed |
5,177 |
|
|
Accrued management fee |
13,794 |
|
|
Distribution fees payable |
12,019 |
|
|
Other payables and accrued expenses |
33,305 |
|
|
Total liabilities |
|
313,510 |
|
Net Assets |
|
$ 22,476,663 |
|
Net Assets consist of: |
|
|
|
Paid in capital |
|
$ 21,332,612 |
|
Accumulated net investment loss |
|
(42,698) |
|
Accumulated undistributed net realized gain loss on investments and foreign currency transactions |
|
(600,340) |
|
Net unrealized appreciation (depreciation) on investments and assets and liabilities in foreign currencies |
|
1,787,089 |
|
Net Assets |
|
$ 22,476,663 |
See accompanying notes which are an integral part of the financial statements.
Annual Report
Financial Statements - continued
Statement of Assets and Liabilities - continued
|
|
October 31, 2000 |
|
|
Calculation of Maximum Offering Price |
|
$12.62 |
|
Maximum offering price per share (100/94.25 of $12.62) |
|
$13.39 |
|
Class T: |
|
$12.60 |
|
Maximum offering price per share (100/96.50 of $12.60) |
|
$13.06 |
|
Class B: |
|
$12.48 |
|
Class C: |
|
$12.49 |
|
Institutional Class: |
|
$12.68 |
A Redemption price per share is equal to net asset value less any applicable contingent deferred sales charge.
See accompanying notes which are an integral part of the financial statements.
Annual Report
Financial Statements - continued
Statement of Operations
|
|
Year ended October 31, 2000 |
|
|
Investment Income Dividends |
|
$ 226,304 |
|
Special dividend from BCE, Inc. |
|
48,823 |
|
Interest |
|
61,426 |
|
|
|
336,553 |
|
Less foreign taxes withheld |
|
(18,668) |
|
Total income |
|
317,885 |
|
Expenses |
|
|
|
Management fee |
$ 139,409 |
|
|
Transfer agent fees |
57,040 |
|
|
Distribution fees |
121,557 |
|
|
Accounting fees and expenses |
60,077 |
|
|
Non-interested trustees' compensation |
59 |
|
|
Custodian fees and expenses |
64,394 |
|
|
Registration fees |
69,353 |
|
|
Audit |
23,969 |
|
|
Legal |
196 |
|
|
Miscellaneous |
219 |
|
|
Total expenses before reductions |
536,273 |
|
|
Expense reductions |
(80,516) |
455,757 |
|
Net investment income (loss) |
|
(137,872) |
|
Realized and Unrealized Gain (Loss) Net realized gain (loss) on: |
|
|
|
Investment securities |
(426,841) |
|
|
Foreign currency transactions |
(35) |
(426,876) |
|
Change in net unrealized appreciation (depreciation) on: |
|
|
|
Investment securities |
696,237 |
|
|
Assets and liabilities in foreign currencies |
(638) |
695,599 |
|
Net gain (loss) |
|
268,723 |
|
Net increase (decrease) in net assets resulting |
|
$ 130,851 |
See accompanying notes which are an integral part of the financial statements.
Annual Report
Financial Statements - continued
Statement of Changes in Net Assets
|
|
Year ended |
December 17, 1998 |
|
Increase (Decrease) in Net Assets |
|
|
|
Operations |
$ (137,872) |
$ (55,754) |
|
Net realized gain (loss) |
(426,876) |
218,581 |
|
Change in net unrealized appreciation (depreciation) |
695,599 |
1,091,490 |
|
Net increase (decrease) in net assets resulting |
130,851 |
1,254,317 |
|
Distributions to shareholders |
|
|
|
From net realized gain |
(179,139) |
- |
|
In excess of net realized gain |
(59,365) |
- |
|
Total distributions |
(238,504) |
- |
|
Share transactions - net increase (decrease) |
11,427,176 |
9,902,823 |
|
Total increase (decrease) in net assets |
11,319,523 |
11,157,140 |
|
Net Assets |
|
|
|
Beginning of period |
11,157,140 |
- |
|
End of period (including accumulated net investment |
$ 22,476,663 |
$ 11,157,140 |
See accompanying notes which are an integral part of the financial statements.
Annual Report
Financial Highlights - Class A
|
Years ended October 31, |
2000 |
1999 E |
|
Selected Per-Share Data |
|
|
|
Net asset value, beginning of period |
$ 11.79 |
$ 10.00 |
|
Income from Investment Operations |
|
|
|
Net investment income (loss) D |
(.04) H |
(.04) |
|
Net realized and unrealized gain (loss) |
1.13 |
1.83 |
|
Total from investment operations |
1.09 |
1.79 |
|
Less Distributions |
|
|
|
From net realized gain |
(.20) |
- |
|
In excess of net realized gain |
(.06) |
- |
|
Total distributions |
(.26) |
- |
|
Net asset value, end of period |
$ 12.62 |
$ 11.79 |
|
Total Return B, C |
9.28% |
17.90% |
|
Ratios and Supplemental Data |
|
|
|
Net assets, end of period (000 omitted) |
$ 2,868 |
$ 1,853 |
|
Ratio of expenses to average net assets |
2.00% F |
2.00% A, F |
|
Ratio of expenses to average net assets after expense reductions |
1.99% G |
1.99% A, G |
|
Ratio of net investment income (loss) to average net assets |
(.33)% |
(.47)% A |
|
Portfolio turnover |
106% |
69% A |
A Annualized
B The total returns would have been lower had certain expenses not been reduced during the periods shown.
C Total returns do not include the one time sales charge and for periods of less than one year are not annualized.
D Net investment income (loss) per share has been calculated based on average shares outstanding during the period.
E For the period December 17, 1998 (commencement of operations) to October 31, 1999.
F FMR agreed to reimburse a portion of the class' expenses during the period. Without this reimbursement, the class' expense ratio would have been higher.
G FMR or the fund has entered into varying arrangements with third parties who either paid or reduced a portion of the class' expenses.
H Investment income per share reflects a special dividend from BCE, Inc. which amounted to $.03 per share.
See accompanying notes which are an integral part of the financial statements.
Annual Report
Financial Highlights - Class T
|
Years ended October 31, |
2000 |
1999 E |
|
Selected Per-Share Data |
|
|
|
Net asset value, beginning of period |
$ 11.77 |
$ 10.00 |
|
Income from Investment Operations |
|
|
|
Net investment income (loss) D |
(.08) H |
(.07) |
|
Net realized and unrealized gain (loss) |
1.15 |
1.84 |
|
Total from investment operations |
1.07 |
1.77 |
|
Less Distributions |
|
|
|
From net realized gain |
(.18) |
- |
|
In excess of net realized gain |
(.06) |
- |
|
Total distributions |
(.24) |
- |
|
Net asset value, end of period |
$ 12.60 |
$ 11.77 |
|
Total Return B, C |
9.12% |
17.70% |
|
Ratios and Supplemental Data |
|
|
|
Net assets, end of period (000 omitted) |
$ 8,019 |
$ 3,204 |
|
Ratio of expenses to average net assets |
2.25% F |
2.25% A, F |
|
Ratio of expenses to average net assets after expense reductions |
2.24% G |
2.24% A, G |
|
Ratio of net investment income (loss) to average net assets |
(.58)% |
(.72)% A |
|
Portfolio turnover |
106% |
69% A |
A Annualized
B The total returns would have been lower had certain expenses not been reduced during the periods shown.
C Total returns do not include the one time sales charge and for periods of less than one year are not annualized.
D Net investment income (loss) per share has been calculated based on average shares outstanding during the period.
E For the period December 17, 1998 (commencement of operations) to October 31, 1999.
F FMR agreed to reimburse a portion of the class' expenses during the period. Without this reimbursement, the class' expense ratio would have been higher.
G FMR or the fund has entered into varying arrangements with third parties who either paid or reduced a portion of the class' expenses.
H Investment income per share reflects a special dividend from BCE, Inc. which amounted to $.03 per share.
See accompanying notes which are an integral part of the financial statements.
Annual Report
Financial Highlights - Class B
|
Years ended October 31, |
2000 |
1999 E |
|
Selected Per-Share Data |
|
|
|
Net asset value, beginning of period |
$ 11.71 |
$ 10.00 |
|
Income from Investment Operations |
|
|
|
Net investment income (loss) D |
(.14) H |
(.12) |
|
Net realized and unrealized gain (loss) |
1.14 |
1.83 |
|
Total from investment operations |
1.00 |
1.71 |
|
Less Distributions |
|
|
|
From net realized gain |
(.17) |
- |
|
In excess of net realized gain |
(.06) |
- |
|
Total distributions |
(.23) |
- |
|
Net asset value, end of period |
$ 12.48 |
$ 11.71 |
|
Total Return B, C |
8.56% |
17.10% |
|
Ratios and Supplemental Data |
|
|
|
Net assets, end of period (000 omitted) |
$ 5,187 |
$ 2,268 |
|
Ratio of expenses to average net assets |
2.75% F |
2.75% A, F |
|
Ratio of expenses to average net assets after expense reductions |
2.74% G |
2.74% A, G |
|
Ratio of net investment income (loss) to average net assets |
(1.08)% |
(1.22)% A |
|
Portfolio turnover |
106% |
69% A |
A Annualized
B The total returns would have been lower had certain expenses not been reduced during the periods shown.
C Total returns do not include the contingent deferred sales charge and for periods of less than one year are not annualized.
D Net investment income (loss) per share has been calculated based on average shares outstanding during the period.
E For the period December 17, 1998 (commencement of operations) to October 31, 1999.
F FMR agreed to reimburse a portion of the class' expenses during the period. Without this reimbursement, the class' expense ratio would have been higher.
G FMR or the fund has entered into varying arrangements with third parties who either paid or reduced a portion of the class' expenses.
H Investment income per share reflects a special dividend from BCE, Inc. which amounted to $.03 per share.
See accompanying notes which are an integral part of the financial statements.
Annual Report
Financial Highlights - Class C
|
Years ended October 31, |
2000 |
1999 E |
|
Selected Per-Share Data |
|
|
|
Net asset value, beginning of period |
$ 11.71 |
$ 10.00 |
|
Income from Investment Operations |
|
|
|
Net investment income (loss) D |
(.14) H |
(.12) |
|
Net realized and unrealized gain (loss) |
1.15 |
1.83 |
|
Total from investment operations |
1.01 |
1.71 |
|
Less Distributions |
|
|
|
From net realized gain |
(.17) |
- |
|
In excess of net realized gain |
(.06) |
- |
|
Total distributions |
(.23) |
- |
|
Net asset value, end of period |
$ 12.49 |
$ 11.71 |
|
Total Return B, C |
8.65% |
17.10% |
|
Ratios and Supplemental Data |
|
|
|
Net assets, end of period (000 omitted) |
$ 5,146 |
$ 2,649 |
|
Ratio of expenses to average net assets |
2.75% F |
2.75% A, F |
|
Ratio of expenses to average net assets after expense reductions |
2.74% G |
2.74% A, G |
|
Ratio of net investment income (loss) to average net assets |
(1.08)% |
(1.22)% A |
|
Portfolio turnover |
106% |
69% A |
A Annualized
B The total returns would have been lower had certain expenses not been reduced during the periods shown.
C Total returns do not include the contingent deferred sales charge and for periods of less than one year are not annualized.
D Net investment income (loss) per share has been calculated based on average shares outstanding during the period.
E For the period December 17, 1998 (commencement of operations) to October 31, 1999.
F FMR agreed to reimburse a portion of the class' expenses during the period. Without this reimbursement, the class' expense ratio would have been higher.
G FMR or the fund has entered into varying arrangements with third parties who either paid or reduced a portion of the class' expenses.
H Investment income per share reflects a special dividend from BCE, Inc. which amounted to $.03 per share.
See accompanying notes which are an integral part of the financial statements.
Annual Report
Financial Highlights - Institutional Class
|
Years ended October 31, |
2000 |
1999 E |
|
Selected Per-Share Data |
|
|
|
Net asset value, beginning of period |
$ 11.81 |
$ 10.00 |
|
Income from Investment Operations |
|
|
|
Net investment income (loss) D |
(.01) H |
(.02) |
|
Net realized and unrealized gain (loss) |
1.16 |
1.83 |
|
Total from investment operations |
1.15 |
1.81 |
|
Less Distributions |
|
|
|
From net realized gain |
(.21) |
- |
|
In excess of net realized gain |
(.07) |
- |
|
Total distributions |
(.28) |
- |
|
Net asset value, end of period |
$ 12.68 |
$ 11.81 |
|
Total Return B, C |
9.79% |
18.10% |
|
Ratios and Supplemental Data |
|
|
|
Net assets, end of period (000 omitted) |
$ 1,256 |
$ 1,182 |
|
Ratio of expenses to average net assets |
1.75% F |
1.75% A, F |
|
Ratio of expenses to average net assets after expense reductions |
1.74% G |
1.74% A, G |
|
Ratio of net investment income (loss) to average net assets |
(.08)% |
(.22)% A |
|
Portfolio turnover |
106% |
69% A |
A Annualized
B The total returns would have been lower had certain expenses not been reduced during the periods shown.
C Total returns for periods of less than one year are not annualized.
D Net investment income (loss) per share has been calculated based on average shares outstanding during the period.
E For the period December 17, 1998 (commencement of operations) to October 31, 1999.
F FMR agreed to reimburse a portion of the class' expenses during the period. Without this reimbursement, the class' expense ratio would have been higher.
G FMR or the fund has entered into varying arrangements with third parties who either paid or reduced a portion of the class' expenses.
H Investment income per share reflects a special dividend from BCE, Inc. which amounted to $.03 per share.
See accompanying notes which are an integral part of the financial statements.
Annual Report
For the period ended October 31, 2000
1. Significant Accounting Policies.
Fidelity Advisor Global Equity Fund (the fund) is a fund of Fidelity Advisor Series VIII (the trust) and is authorized to issue an unlimited number of shares. The trust is registered under the Investment Company Act of 1940, as amended (the 1940 Act), as an open-end management investment company organized as a Massachusetts business trust.
The fund offers Class A, Class T, Class B, Class C, and Institutional Class shares, each of which has equal rights as to assets and voting privileges. Each class has exclusive voting rights with respect to matters that affect that class. Class B shares will automatically convert to Class A shares after a holding period of seven years from the initial date of purchase. Investment income, realized and unrealized capital gains and losses, the common expenses of the fund, and certain fund-level expense reductions, if any, are allocated on a pro rata basis to each class based on the relative net assets of each class to the total net assets of the fund. Each class of shares differs in its respective distribution, transfer agent, and certain other class-specific fees, expenses, and expense reductions.
The financial statements have been prepared in conformity with generally accepted accounting principles which require management to make certain estimates and assumptions at the date of the financial statements. The following summarizes the significant accounting policies of the fund:
Security Valuation. Securities for which quotations are readily available are valued using the official closing price or at the last sale price in the principal market in which they are traded. If the last sale price (on the local exchange) is unavailable, the last evaluated quote or closing bid price normally is used. If trading or events occurring in other markets after the close of the principal market in which securities are traded are expected to materially affect the value of those securities, then they are valued at their fair value taking this trading or these events into account. Fair value is determined in good faith under consistently applied procedures under the general supervision of the Board of Trustees. Securities for which quotations are not readily available are valued primarily using dealer-supplied valuations or at their fair value. Short-term securities with remaining maturities of sixty days or less for which quotations are not readily available are valued at amortized cost or original cost plus accrued interest, both of which approximate current value. Investments in open-end investment companies are valued at their net asset value each business day.
Foreign Currency Translation. The accounting records of the fund are maintained in U.S. dollars. Investment securities and other assets and liabilities denominated in a foreign currency are translated into U.S. dollars at the prevailing rates of exchange at period end. Purchases and sales of securities, income receipts and expense payments are translated into U.S. dollars at the prevailing exchange rate on the respective dates of the transactions.
Annual Report
Notes to Financial Statements - continued
1. Significant Accounting Policies - continued
Foreign Currency Translation - continued
Net realized gains and losses on foreign currency transactions represent net gains and losses from sales and maturities of foreign currency contracts, disposition of foreign currencies, the difference between the amount of net investment income accrued and the U.S. dollar amount actually received, and gains and losses between trade and settlement date on purchases and sales of securities. The effects of changes in foreign currency exchange rates on investments in securities are included with the net realized and unrealized gain or loss on investment securities.
Income Taxes. As a qualified regulated investment company under Subchapter M of the Internal Revenue Code, the fund is not subject to U.S. federal income taxes to the extent that it distributes substantially all of its taxable income for its fiscal year. The fund may be subject to foreign taxes on income and gains on investments which are accrued based upon the fund's understanding of the tax rules and regulations that exist in the markets in which it invests. Foreign governments may also impose taxes on other payments or transactions with respect to foreign securities. The fund accrues such taxes as applicable. The schedule of investments includes information regarding income taxes under the caption "Income Tax Information."
Investment Income. Dividend income is recorded on the ex-dividend date, except certain dividends from foreign securities where the ex-dividend date may have passed, are recorded as soon as the fund is informed of the ex-dividend date. Non-cash dividends included in dividend income, if any, are recorded at the fair market value of the securities received. Interest income is accrued as earned. Investment income is recorded net of foreign taxes withheld where recovery of such taxes is uncertain.
Expenses. Most expenses of the trust can be directly attributed to a fund. Expenses which cannot be directly attributed are apportioned among the funds in the trust.
Distributions to Shareholders. Distributions are recorded on the ex-dividend date. Income dividends and capital gain distributions are declared separately for each class.
Income and capital gain distributions are determined in accordance with income tax regulations which may differ from generally accepted accounting principles. These differences, which may result in distribution reclassifications, are primarily due to differing treatments for foreign currency transactions, passive foreign investment companies (PFIC), net operating losses, capital loss carryforwards and losses deferred due to wash sales. The fund also utilized earnings and profits distributed to shareholders on redemption of shares as a part of the dividends paid deduction for income tax purposes.
Annual Report
Notes to Financial Statements - continued
1. Significant Accounting Policies - continued
Distributions to Shareholders - continued
Permanent book and tax basis differences relating to shareholder distributions will result in reclassifications to paid in capital. Accumulated net investment loss and accumulated undistributed net realized gain (loss) on investments and foreign currency transactions may include temporary book and tax basis differences which will reverse in a subsequent period. Any taxable income or gain remaining at fiscal year end is distributed in the following year.
Security Transactions. Security transactions are accounted for as of trade date. Gains and losses on securities sold are determined on the basis of identified cost.
2. Operating Policies.
Foreign Currency Contracts. The fund generally uses foreign currency contracts to facilitate transactions in foreign-denominated securities. Losses may arise from changes in the value of the foreign currency or if the counterparties do not perform under the contracts' terms. The U.S. dollar value of foreign currency contracts is determined using contractual currency exchange rates established at the time of each trade.
Joint Trading Account. Pursuant to an Exemptive Order issued by the Securities and Exchange Commission (the SEC), the fund, along with other affiliated entities of Fidelity Management & Research Company (FMR), may transfer uninvested cash balances into one or more joint trading accounts. These balances are invested in one or more repurchase agreements for U.S. Treasury or Federal Agency obligations.
Repurchase Agreements. The underlying U.S. Treasury, Federal Agency, or other obligations found to be satisfactory by FMR are transferred to an account of the fund, or to the Joint Trading Account, at a custodian bank. The securities are marked-to-market daily and maintained at a value at least equal to the principal amount of the repurchase agreement (including accrued interest). FMR, the fund's investment adviser, is responsible for determining that the value of the underlying securities remains in accordance with the market value requirements stated above.
3. Purchases and Sales of Investments.
Purchases and sales of securities, other than short-term securities, aggregated $28,719,741 and $19,281,147, respectively.
Annual Report
Notes to Financial Statements - continued
4. Fees and Other Transactions with Affiliates.
Management Fee. As the fund's investment adviser, FMR receives a monthly fee that is calculated on the basis of a group fee rate plus a fixed individual fund fee rate applied to the average net assets of the fund. The group fee rate is the weighted average of a series of rates and is based on the monthly average net assets of all the mutual funds advised by FMR. The rates ranged from .2167% to .5200% for the period. The annual individual fund fee rate is .45%. In the event that these rates were lower than the contractual rates in effect during the period, FMR voluntarily implemented the above rates, as they resulted in the same or a lower management fee. For the period, the management fee was equivalent to an annual rate of .73% of average net assets.
Sub-Adviser Fee. Beginning January 1, 2001, FMR Co. (FMRC) will serve as a sub-
adviser for the fund. FMRC may provide investment research and advice and may also provide investment advisory services for the fund. FMR, on behalf of the fund,
entered into sub-advisory agreements with Fidelity Management & Research (U.K.) Inc., Fidelity Management & Research (Far East) Inc., and Fidelity International
Investment Advisors (FIIA). Under the sub-advisory arrangements, FMR may receive investment advice and research services and may grant the sub-advisers
investment management authority to buy and sell securities. FMR pays its sub-advisers either a portion of its management fee or a fee based on costs incurred for
these services.
Distribution and Service Plan. In accordance with Rule 12b-1 of the 1940 Act, the Board of Trustees have adopted separate Distribution and Service Plans with respect to each class of shares (collectively referred to as "the Plans"). Under certain of the Plans, the class pays Fidelity Distributors Corporation (FDC), an affiliate of FMR, a 12b-1 fee. A portion of this fee may be reallowed to securities dealers, banks and other financial institutions for the distribution of each class of shares and providing shareholder support services. For the period, this fee was based on the following annual rates of the average net assets of each applicable class:
|
Class A |
.25% |
|
Class T |
.50% |
|
Class B |
1.00%* |
|
Class C |
1.00%* |
* .75% represents a distribution fee and .25% represents a shareholder service fee.
Annual Report
Notes to Financial Statements - continued
4. Fees and Other Transactions with Affiliates - continued
Distribution and Service Plan - continued
For the period, each class paid FDC the following amounts, a portion of which was retained by FDC:
|
|
Paid to |
Retained |
|
Class A |
$ 9,846 |
$ 3,287 |
|
Class T |
27,824 |
6,157 |
|
Class B |
41,103 |
33,944 |
|
Class C |
42,784 |
30,843 |
|
|
$ 121,557 |
$ 74,231 |
Sales Load. FDC receives a front-end sales charge of up to 5.75% for selling Class A shares, and 3.50% for selling Class T shares of the fund. FDC receives the proceeds of contingent deferred sales charges levied on Class B share redemptions occurring within six years of purchase and Class C share redemptions occurring within one year of purchase. Contingent deferred sales charges are based on declining rates ranging from 5% to 1% for Class B and 1% for Class C, of the lesser of the cost of shares at the initial date of purchase or the net asset value of the redeemed shares, excluding any reinvested dividends and capital gains. In addition, purchases of Class A and Class T shares that were subject to a finder's fee bear a contingent deferred sales charge on assets that do not remain in the fund for at least one year. The Class A and Class T contingent deferred sales charge is based on 0.25% of the lesser of the cost of shares at the initial date of purchase or the net asset value of the redeemed shares, excluding any reinvested dividends and capital gains. A portion of the sales charges paid to FDC is paid to securities dealers, banks and other financial institutions.
For the period, sales charge amounts paid to and retained by FDC were as follows:
|
|
Paid to |
Retained |
|
Class A |
$ 22,453 |
$ 6,505 |
|
Class T |
26,191 |
6,904 |
|
Class B |
3,353 |
3,353* |
|
Class C |
1,086 |
1,086* |
|
|
$ 53,083 |
$ 17,848 |
* When Class B and Class C shares are initially sold, FDC pays commissions from its own resources to securities dealers,
banks, and other financial institutions through which the sales are made.
Transfer Agent Fees. Fidelity Investments Institutional Operations Company, Inc., (FIIOC), an affiliate of FMR, is the transfer, dividend disbursing and shareholder servicing agent (collectively referred to as the transfer agent) for each class of the fund. FIIOC receives account fees and asset-based fees that vary according to the account size and
Annual Report
Notes to Financial Statements - continued
4. Fees and Other Transactions with Affiliates - continued
Transfer Agent Fees - continued
type of account of the shareholders of the respective classes of the fund. FIIOC pays for typesetting, printing and mailing of all shareholder reports, except proxy statements. For the period, the following amounts were paid to FIIOC:
|
|
Amount |
% of |
|
Class A |
$ 8,088 |
.21 |
|
Class T |
19,004 |
.34 |
|
Class B |
15,729 |
.38 |
|
Class C |
11,575 |
.27 |
|
Institutional Class |
2,644 |
.20 |
|
|
$ 57,040 |
|
Accounting Fees. Fidelity Service Company, Inc., an affiliate of FMR, maintains the fund's accounting records. The fee is based on the level of average net assets for the month plus out-of-pocket expenses.
Fidelity Cash Central Fund. Pursuant to an Exemptive Order issued by the SEC, the fund may invest in the Fidelity Cash Central Fund (the Cash Fund) managed by Fidelity Investments Money Management, Inc., an affiliate of FMR. The Cash Fund is an open-end money market fund available only to investment companies and other accounts managed by FMR and its affiliates. The Cash Fund seeks preservation of capital, liquidity, and current income. Income distributions from the Cash Fund are declared daily and paid monthly from net investment income. Income distributions earned by the fund are recorded as interest income in the accompanying financial statements.
Brokerage Commissions. The fund placed a portion of its portfolio transactions with brokerage firms which are affiliates of FMR. The commissions paid to these affiliated firms were $991 for the period.
Annual Report
Notes to Financial Statements - continued
5. Expense Reductions.
FMR voluntarily agreed to reimburse operating expenses (excluding interest, taxes, certain securities lending fees, brokerage commissions and extraordinary expenses, if any) above the following annual rates or range of annual rates of average net assets for each of the following classes:
|
|
FMR |
Reimbursement |
|
Class A |
2.00% |
$ 12,486 |
|
Class T |
2.25% |
25,119 |
|
Class B |
2.75% |
20,195 |
|
Class C |
2.75% |
16,242 |
|
Institutional Class |
1.75% |
4,118 |
|
|
|
$ 78,160 |
FMR has directed certain portfolio trades to brokers who paid a portion of the fund's expenses. For the period, the fund's expenses were reduced by $2,356 under this arrangement.
6. Beneficial Interest.
At the end of the period, FMR and its affiliates were record owners of approximately 24% of the total outstanding shares of the fund.
7. Distributions to Shareholders.
Distributions to shareholders of each class were as follows:
|
|
Year ended October 31, 2000 |
December 17, 1998 |
|
From net realized gain |
|
|
|
Class A |
$ 31,783 |
$ - |
|
Class T |
49,590 |
- |
|
Class B |
36,686 |
- |
|
Class C |
39,947 |
- |
|
Institutional Class |
21,133 |
- |
|
Total |
$ 179,139 |
$ - |
|
In excess of net realized gain |
|
|
|
Class A |
$ 10,533 |
$ - |
|
Class T |
16,434 |
- |
|
Class B |
12,158 |
- |
|
Class C |
13,237 |
- |
|
Institutional Class |
7,003 |
- |
|
Total |
$ 59,365 |
$ - |
|
|
$ 238,504 |
$ - |
Annual Report
Notes to Financial Statements - continued
8. Share Transactions.
Transactions for each class of shares were as follows:
|
|
Shares |
Dollars |
||
|
|
Year ended October 31, |
December 17, 1998 |
Year ended October 31, |
December 17, 1998 |
|
|
2000 |
1999 |
2000 |
1999 |
|
|
|
|
|
|
|
Class A |
713,812 |
204,600 |
$ 9,666,300 |
$ 2,159,660 |
|
Reinvestment of distributions |
3,410 |
- |
42,316 |
- |
|
Shares redeemed |
(647,219) |
(47,401) |
(8,217,175) |
(538,542) |
|
Net increase (decrease) |
70,003 |
157,199 |
$ 1,491,441 |
$ 1,621,118 |
|
Class T |
523,847 |
308,848 |
$ 6,821,221 |
$ 3,281,859 |
|
Reinvestment of distributions |
5,110 |
- |
63,360 |
- |
|
Shares redeemed |
(164,779) |
(36,520) |
(2,166,598) |
(399,799) |
|
Net increase (decrease) |
364,178 |
272,328 |
$ 4,717,983 |
$ 2,882,060 |
|
Class B |
271,776 |
195,520 |
$ 3,515,035 |
$ 2,047,118 |
|
Reinvestment of distributions |
3,807 |
- |
46,976 |
- |
|
Shares redeemed |
(53,848) |
(1,787) |
(699,801) |
(19,401) |
|
Net increase (decrease) |
221,735 |
193,733 |
$ 2,862,210 |
$ 2,027,717 |
|
Class C |
230,974 |
227,333 |
$ 2,964,989 |
$ 2,384,524 |
|
Reinvestment of distributions |
3,366 |
- |
41,574 |
- |
|
Shares redeemed |
(48,512) |
(1,196) |
(635,133) |
(13,207) |
|
Net increase (decrease) |
185,828 |
226,137 |
$ 2,371,430 |
$ 2,371,317 |
|
Institutional Class |
1,889 |
100,058 |
$ 24,700 |
$ 1,000,611 |
|
Reinvestment of distributions |
2,256 |
- |
28,016 |
- |
|
Shares redeemed |
(5,122) |
- |
(68,604) |
- |
|
Net increase (decrease) |
(977) |
100,058 |
$ (15,888) |
$ 1,000,611 |
Annual Report
To the Trustees of Fidelity Advisor Series VIII and the Shareholders of Fidelity Advisor Global Equity Fund:
In our opinion, the accompanying statement of assets and liabilities, including the schedule of investments, and the related statements of operations and of changes in net assets and the financial highlights present fairly, in all material respects, the financial position of Fidelity Advisor Global Equity Fund (a fund of Fidelity Advisor Series VIII) at October 31, 2000, and the results of its operations, the changes in its net assets and the financial highlights for the periods indicated, in conformity with accounting principles generally accepted in the United States of America. These financial statements and financial highlights (hereafter referred to as "financial statements") are the responsibility of the Fidelity Advisor Global Equity Fund's management; our responsibility is to express an opinion on these financial statements based on our audits. We conducted our audits of these financial statements in accordance with auditing standards generally accepted in the United States of America which require that we plan and perform the audit to obtain reasonable assurance about whether the financial statements are free of material misstatement. An audit includes examining, on a test basis, evidence supporting the amounts and disclosures in the financial statements, assessing the accounting principles used and significant estimates made by management, and evaluating the overall financial statement presentation. We believe that our audits, which included confirmation of securities at October 31, 2000 by correspondence with the custodian and brokers, provide a reasonable basis for our opinion.
/s/PricewaterhouseCoopers LLP
PricewaterhouseCoopers LLP
Boston, Massachusetts
December 8, 2000
Annual Report
A total of 16% of the dividends distributed by the Institutional Class during the fiscal year qualifies for the dividends-received deduction for corporate shareholders.
The fund will notify shareholders in January 2001 of amounts for use in preparing 2000 income tax returns.
Annual Report
Annual Report
Annual Report
Annual Report
Annual Report
Investment Adviser
Fidelity Management & Research Company
Boston, MA
Investment Sub-Advisers
Fidelity Management & Research
(U.K.) Inc.
Fidelity Management & Research
(Far East) Inc.
Fidelity International
Investment Advisors
Fidelity International Investments Advisors (U.K.) Limited
Fidelity Investments Japan Limited
Officers
Edward C. Johnson 3d, President
Robert C. Pozen, Senior Vice President
Robert A. Lawrence, Vice President
Richard C. Habermann, Vice President
Eric D. Roiter, Secretary
Robert A. Dwight, Treasurer
Maria F. Dwyer, Deputy Treasurer
John H. Costello, Assistant Treasurer
Thomas J. Simpson, Assistant Treasurer
Board of Trustees
Ralph F. Cox *
Phyllis Burke Davis *
Robert M. Gates *
Edward C. Johnson 3d
Donald J. Kirk *
Ned C. Lautenbach *
Peter S. Lynch
Marvin L. Mann *
William O. McCoy *
Gerald C. McDonough *
Robert C. Pozen
Thomas R. Williams *
Advisory Board
J. Michael Cook
Abigail P. Johnson
Marie L. Knowles
General Distributor
Fidelity Distributors Corporation
Boston, MA
Transfer and Shareholder
Servicing Agents
Fidelity Investments Institutional Operations Company, Inc.
Boston, MA
Custodian
State Street Bank and Trust Company
Quincy, MA
* Independent trustees
Annual Report
Focus Funds
Fidelity Advisor Consumer
Industries Fund
Fidelity Advisor Cyclical
Industries Fund
Fidelity Advisor Financial
Services Fund
Fidelity Advisor Health Care Fund
Fidelity Advisor Natural
Resources Fund
Fidelity Advisor Technology Fund
Fidelity Advisor Telecommunications & Utilities Growth Fund
Growth Funds
Fidelity Advisor Korea Fund
Fidelity Advisor Emerging Asia Fund
Fidelity Advisor Latin America Fund
Fidelity Advisor Japan Fund
Fidelity Advisor Europe Capital Appreciation Fund
Fidelity Advisor International
Capital Appreciation Fund
Fidelity Advisor Overseas Fund
Fidelity Advisor Diversified International Fund
Fidelity Advisor Global Equity Fund
Fidelity Advisor TechnoQuant ®
Growth Fund
Fidelity Advisor Small Cap Fund
Fidelity Advisor Value
Strategies Fund
Fidelity Advisor Mid Cap Fund
Fidelity Advisor Dynamic Capital Appreciation Fund
Fidelity Advisor Equity Growth Fund
Fidelity Advisor Large Cap Fund
Fidelity Advisor Dividend Growth Fund
Fidelity Advisor Growth
Opportunities Fund
Growth and Income Funds
Fidelity Advisor Growth & Income Fund
Fidelity Advisor Equity Income Fund
Fidelity Advisor Asset Allocation Fund
Fidelity Advisor Balanced Fund
Taxable Income Funds
Fidelity Advisor Emerging Markets Income Fund
Fidelity Advisor High Yield Fund
Fidelity Advisor High Income Fund
Fidelity Advisor Strategic Income Fund
Fidelity Advisor Mortgage
Securities Fund
Fidelity Advisor Government Investment Fund
Fidelity Advisor Intermediate Bond Fund
Fidelity Advisor Short Fixed-Income Fund
Municipal Funds
Fidelity Advisor Municipal Income Fund
Money Market Funds
Prime Fund
Treasury Fund
Tax-Exempt Fund
AGLOI-ANN-1200 118652
1.728714.101
(Fidelity Investment logo)(registered trademark)
Fidelity® Advisor
Fund - Class A, Class T, Class B
and Class C
Annual Report
October 31, 2000
(2_fidelity_logos)(registered trademark)
|
President's Message |
Ned Johnson on investing strategies. |
|
|
Performance |
How the fund has done over time. |
|
|
Fund Talk |
The manager's review of fund performance, strategy and outlook. |
|
|
Investment Changes |
A summary of major shifts in the fund's investments over the past six months. |
|
|
Investments |
A complete list of the fund's investments with their market values. |
|
|
Financial Statements |
Statements of assets and liabilities,
operations, and changes in net assets, |
|
|
Notes |
Notes to the financial statements. |
|
|
Independent Auditors' Report |
The auditors' opinion. |
|
|
Distributions |
|
Standard & Poor's, S&P and S&P 500 are registered service marks of The McGraw-Hill Companies, Inc. and have been licensed for use by Fidelity Distributors Corporation.
Other third party marks appearing herein are the property of their respective owners.
All other marks appearing herein are registered or unregistered trademarks or service marks of FMR Corp. or an affiliated company.
(Recycle graphic) This report is printed on recycled paper using soy-based inks.
This report and the financial statements contained herein are submitted for the general information of the shareholders of the fund. This report is not authorized for distribution to prospective investors in the fund unless preceded or accompanied by an effective prospectus.
Mutual fund shares are not deposits or obligations of, or guaranteed by, any depository institution. Shares are not insured by the FDIC, Federal Reserve Board or any other agency, and are subject to investment risks, including possible loss of principal amount invested.
Neither the fund nor Fidelity Distributors Corporation is a bank.
For more information on any Fidelity Advisor fund, including charges and expenses, contact your investment professional for a free prospectus. Read it carefully before you invest or send money.
Annual Report
(photo_of_Edward_C_Johnson_3d)
Dear Shareholder:
A sixth-straight year of double-digit positive returns for the Dow Jones Industrial Average, NASDAQ and S&P 500® could be in jeopardy unless the U.S. stock market shows marked improvement in the final two months of 2000. Through October, all three indexes had negative year-to-date returns. On the other hand, most fixed-income sectors were solidly in the black. Treasuries and other long-term government securities led the way, returning nearly 14%.
While it's impossible to predict the future direction of the markets with any degree of certainty, there are certain basic principles that can help investors plan for their future needs.
First, investors are encouraged to take a long-term view of their portfolios. If you can afford to leave your money invested through the inevitable up and down cycles of the financial markets, you will greatly reduce your vulnerability to any single decline. We know from experience, for example, that stock prices have gone up over longer periods of time, have significantly outperformed other types of investments and have stayed ahead of inflation.
Second, you can further manage your investing risk through diversification. A stock mutual fund, for instance, is already diversified, because it invests in many different companies. You can increase your diversification further by investing in a number of different stock funds, or in such other investment categories as bonds. If you have a short investment time horizon, you might want to consider moving some of your investment into a money market fund, which seeks income and a stable share price by investing in high-quality, short-term investments. Of course, it's important to remember that an investment in a money market fund is not insured or guaranteed by the Federal Deposit Insurance Corporation or any other government agency. Although money market funds seek to preserve the value of your investment at $1.00 per share, it is possible to lose money by investing in these types of funds.
Finally, no matter what your time horizon or portfolio diversity, it makes good sense to follow a regular investment plan, investing a certain amount of money in a fund at the same time each month or quarter and periodically reviewing your overall portfolio. By doing so, you won't get caught up in the excitement of a rapidly rising market, nor will you buy all your shares at market highs. While this strategy - known as dollar cost averaging - won't assure a profit or protect you from a loss in a declining market, it should help you lower the average cost of your purchases. Of course, you should consider your financial ability to continue your purchases through periods of low price levels before undertaking such a strategy.
Remember to contact your investment professional if you need help with your investments.
Best regards,
/s/Edward C. Johnson 3d
Edward C. Johnson 3d
Annual Report
Fidelity Advisor Europe Capital Appreciation Fund - Class A
There are several ways to evaluate historical performance. You can look at the total percentage change in value, the average annual percentage change or the growth of a hypothetical $10,000 investment. Total return reflects the change in the value of an investment, assuming reinvestment of the class' dividend income and capital gains (the profits earned upon the sale of securities that have grown in value). If Fidelity had not reimbursed certain class expenses, the life of fund total returns would have been lower.
Cumulative Total Returns
|
Periods ended October 31, 2000 |
|
Past 1 |
Life of |
|
Fidelity Adv Europe Cap App - CL A |
|
5.67% |
11.59% |
|
Fidelity Adv Europe Cap App - CL A |
|
-0.40% |
5.18% |
|
MSCI Europe |
|
1.16% |
8.03% |
|
European Region Funds Average |
|
12.53% |
n/a* |
Cumulative total returns show Class A's performance in percentage terms over a set period - in this case, one year or since the fund started on December 17, 1998. For example, if you had invested $1,000 in a fund that had a 5% return over the past year, the value of your investment would be $1,050. You can compare Class A's returns to the performance of the Morgan Stanley Capital International Europe Index (MSCI Europe) - a market capitalization-weighted index that is designed to represent the performance of developed stock markets in Europe. As of October 31, 2000, the index included over 400 equity securities of countries domiciled in 15 European countries. To measure how Class A's performance stacked up against its peers, you can compare it to the European region funds average, which reflects the performance of mutual funds with similar objectives tracked by Lipper Inc. The past one year average represents a peer group of 151 mutual funds. These benchmarks include reinvested dividends and capital gains, if any, and exclude the effect of sales charges.
Average Annual Total Returns
|
Periods ended October 31, 2000 |
|
Past 1 |
Life of |
|
Fidelity Adv Europe Cap App - CL A |
|
5.67% |
6.03% |
|
Fidelity Adv Europe Cap App - CL A |
|
-0.40% |
2.73% |
|
MSCI Europe |
|
1.16% |
4.21% |
|
European Region Funds Average |
|
12.53% |
n/a* |
Average annual total returns take Class A shares' cumulative return and show you what would have happened if Class A shares had performed at a constant rate each year.
* Not available
Annual Report
$10,000 Over Life of Fund
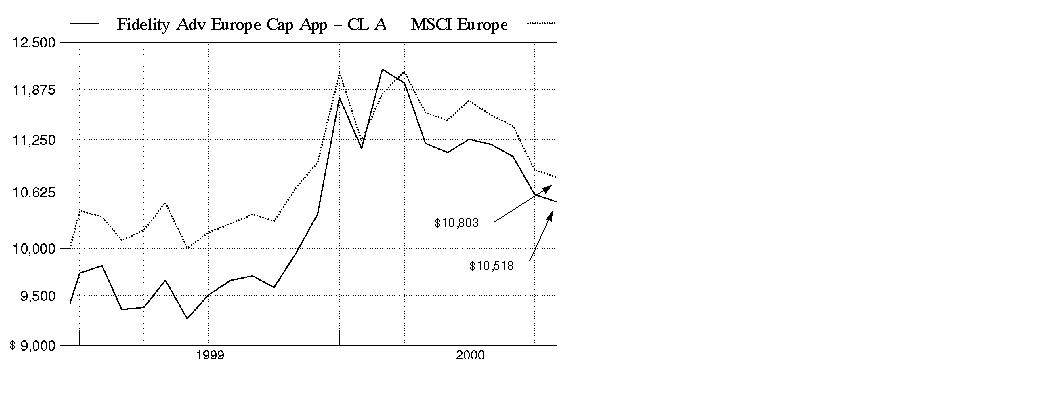
$10,000 Over Life of Fund: Let's say hypothetically that $10,000 was invested in Fidelity Advisor Europe Capital Appreciation Fund - Class A on December 17, 1998, when the fund started, and the current 5.75% sales charge was paid. As the chart shows, by October 31, 2000, the value of the investment would have grown to $10,518 - a 5.18% increase on the initial investment. For comparison, look at how the MSCI Europe Index did over the same period. With dividends reinvested, the same $10,000 would have grown to $10,803 - an 8.03% increase.
Understanding
Performance
Many markets around the globe offer the potential for significant growth over time; however, investing in foreign markets means assuming greater risks than investing in the United States. Factors like changes in a country's financial markets, its local political and economic climate, and the fluctuating value of its currency create these risks. For these reasons an international fund's performance may be more volatile than a fund that invests exclusively in the United States. Past performance is no guarantee of future results and you may have a gain or loss when you sell your shares.
3Annual Report
Fidelity Advisor Europe Capital Appreciation Fund - Class T
There are several ways to evaluate historical performance. You can look at the total percentage change in value, the average annual percentage change or the growth of a hypothetical $10,000 investment. Total return reflects the change in the value of an investment, assuming reinvestment of the class' dividend income and capital gains (the profits earned upon the sale of securities that have grown in value). If Fidelity had not reimbursed certain class expenses, the life of fund total returns would have been lower.
Cumulative Total Returns
|
Periods ended October 31, 2000 |
|
Past 1 |
Life of |
|
Fidelity Adv Europe Cap App - CL T |
|
5.40% |
11.09% |
|
Fidelity Adv Europe Cap App - CL T |
|
1.71% |
7.21% |
|
MSCI Europe |
|
1.16% |
8.03% |
|
European Region Funds Average |
|
12.53% |
n/a* |
Cumulative total returns show Class T's performance in percentage terms over a set period - in this case, one year or since the fund started on December 17, 1998. For example, if you had invested $1,000 in a fund that had a 5% return over the past year, the value of your investment would be $1,050. You can compare Class T's returns to the performance of the Morgan Stanley Capital International Europe Index (MSCI Europe) - a market capitalization-weighted index that is designed to represent the performance of developed stock markets in Europe. As of October 31, 2000, the index included over 400 equity securities of countries domiciled in 15 European countries. To measure how Class T's performance stacked up against its peers, you can compare it to the European region funds average, which reflects the performance of mutual funds with similar objectives tracked by Lipper Inc. The past one year average represents a peer group of 151 mutual funds. These benchmarks include reinvested dividends and capital gains, if any, and exclude the effect of sales charges.
Average Annual Total Returns
|
Periods ended October 31, 2000 |
|
Past 1 |
Life of |
|
Fidelity Adv Europe Cap App - CL T |
|
5.40% |
5.77% |
|
Fidelity Adv Europe Cap App - CL T |
|
1.71% |
3.78% |
|
MSCI Europe |
|
1.16% |
4.21% |
|
European Region Funds Average |
|
12.53% |
n/a* |
Average annual total returns take Class T shares' cumulative return and show you what would have happened if Class T shares had performed at a constant rate each year.
* Not available
Annual Report
$10,000 Over Life of Fund
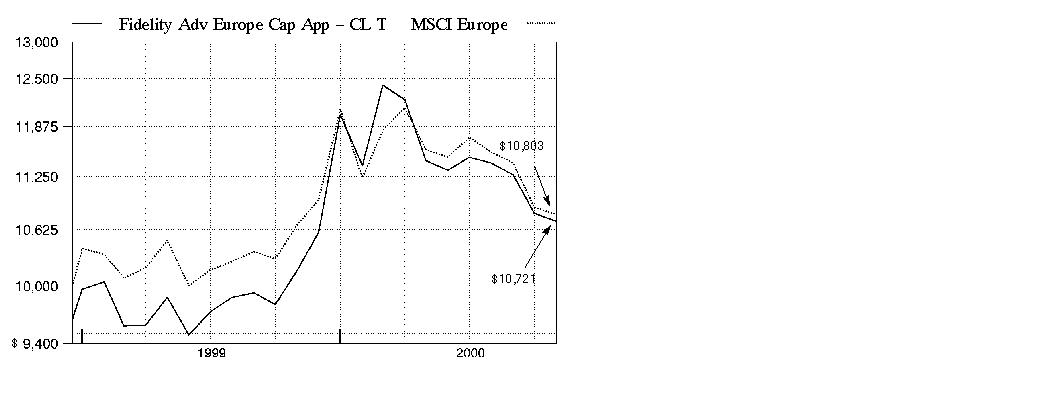
$10,000 Over Life of Fund: Let's say hypothetically that $10,000 was invested in Fidelity Advisor Europe Capital Appreciation Fund - Class T on December 17, 1998, when the fund started, and the current 3.50% sales charge was paid. As the chart shows, by October 31, 2000, the value of the investment would have grown to $10,721 - a 7.21% increase on the initial investment. For comparison, look at how the MSCI Europe Index did over the same period. With dividends reinvested, the same $10,000 would have grown to $10,803 - an 8.03% increase.
Understanding
Performance
Many markets around the globe offer the potential for significant growth over time; however, investing in foreign markets means assuming greater risks than investing in the United States. Factors like changes in a country's financial markets, its local political and economic climate, and the fluctuating value of its currency create these risks. For these reasons an international fund's performance may be more volatile than a fund that invests exclusively in the United States. Past performance is no guarantee of future results and you may have a gain or loss when you sell your shares.
3Annual Report
Fidelity Advisor Europe Capital Appreciation Fund - Class B
There are several ways to evaluate historical performance. You can look at the total percentage change in value, the average annual percentage change or the growth of a hypothetical $10,000 investment. Total return reflects the change in the value of an investment, assuming reinvestment of the class' dividend income and capital gains (the profits earned upon the sale of securities that have grown in value). Class B shares' contingent deferred sales charge included in the past one year and life of fund total return figures are 5%, and 4%, respectively. If Fidelity had not reimbursed certain class expenses, the total returns would have been lower.
Cumulative Total Returns
|
Periods ended October 31, 2000 |
|
Past 1 |
Life of |
|
Fidelity Adv Europe Cap App - CL B |
|
4.87% |
9.90% |
|
Fidelity Adv Europe Cap App - CL B |
|
-0.13% |
5.90% |
|
MSCI Europe |
|
1.16% |
8.03% |
|
European Region Funds Average |
|
12.53% |
n/a* |
Cumulative total returns show Class B's performance in percentage terms over a set period - in this case, one year or since the fund started on December 17, 1998. For example, if you had invested $1,000 in a fund that had a 5% return over the past year, the value of your investment would be $1,050. You can compare Class B's returns to the performance of the Morgan Stanley Capital International Europe Index (MSCI Europe) - a market capitalization-weighted index that is designed to represent the performance of developed stock markets in Europe. As of October 31, 2000, the index included over 400 equity securities of countries domiciled in 15 European countries. To measure how Class B's performance stacked up against its peers, you can compare it to the European region funds average, which reflects the performance of mutual funds with similar objectives tracked by Lipper Inc. The past one year average represents a peer group of 151 mutual funds. These benchmarks include reinvested dividends and capital gains, if any, and exclude the effect of sales charges.
Average Annual Total Returns
|
Periods ended October 31, 2000 |
|
Past 1 |
Life of |
|
Fidelity Adv Europe Cap App - CL B |
|
4.87% |
5.17% |
|
Fidelity Adv Europe Cap App - CL B |
|
-0.13% |
3.11% |
|
MSCI Europe |
|
1.16% |
4.21% |
|
European Region Funds Average |
|
12.53% |
n/a* |
Average annual total returns take Class B shares' cumulative return and show you what would have happened if Class B shares had performed at a constant rate each year.
* Not available
Annual Report
$10,000 Over Life of Fund
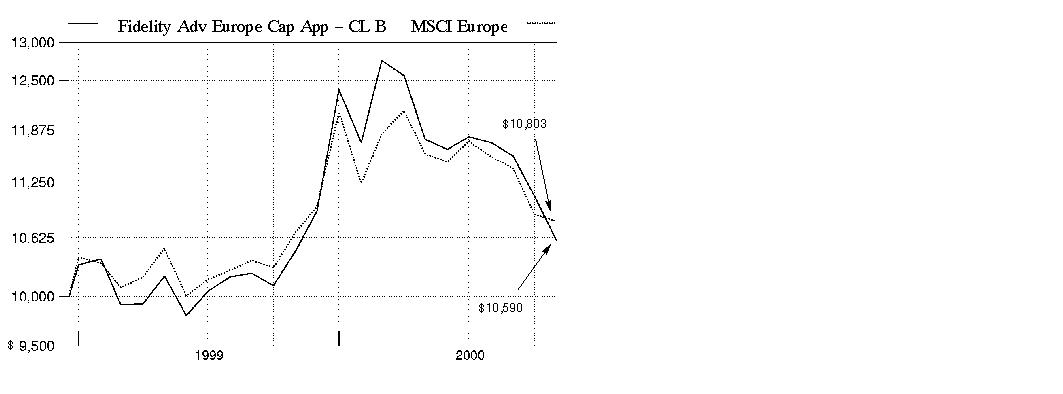
$10,000 Over Life of Fund: Let's say hypothetically that $10,000 was invested in Fidelity Advisor Europe Capital Appreciation Fund - Class B on December 17, 1998, when the fund started. As the chart shows, by October 31, 2000, the value of the investment, including the effect of the applicable contingent deferred sales charge, would have grown to $10,590 - a 5.90% increase on the initial investment. For comparison, look at how the MSCI Europe Index did over the same period. With dividends reinvested, the same $10,000 would have grown to $10,803 - an 8.03% increase.
Understanding
Performance
Many markets around the globe offer the potential for significant growth over time; however, investing in foreign markets means assuming greater risks than investing in the United States. Factors like changes in a country's financial markets, its local political and economic climate, and the fluctuating value of its currency create these risks. For these reasons an international fund's performance may be more volatile than a fund that invests exclusively in the United States. Past performance is no guarantee of future results and you may have a gain or loss when you sell your shares.
3Annual Report
Fidelity Advisor Europe Capital Appreciation Fund - Class C
There are several ways to evaluate historical performance. You can look at the total percentage change in value, the average annual percentage change or the growth of a hypothetical $10,000 investment. Total return reflects the change in the value of an investment, assuming reinvestment of the class' dividend income and capital gains (the profits earned upon the sale of securities that have grown in value). Class C shares' contingent deferred sales charge included in the past one year and life of fund total return figures are 1%, and 0%, respectively. If Fidelity had not reimbursed certain class expenses, the life of fund total returns would have been lower.
Cumulative Total Returns
|
Periods ended October 31, 2000 |
|
Past 1 |
Life of |
|
Fidelity Adv Europe Cap App - CL C |
|
4.96% |
10.10% |
|
Fidelity Adv Europe Cap App - CL C |
|
3.96% |
10.10% |
|
MSCI Europe |
|
1.16% |
8.03% |
|
European Region Funds Average |
|
12.53% |
n/a* |
Cumulative total returns show Class C's performance in percentage terms over a set period - in this case, one year or since the fund started on December 17, 1998. For example, if you had invested $1,000 in a fund that had a 5% return over the past year, the value of your investment would be $1,050. You can compare Class C's returns to the performance of the Morgan Stanley Capital International Europe Index (MSCI Europe) - a market capitalization-weighted index that is designed to represent the performance of developed stock markets in Europe. As of October 31, 2000, the index included over 400 equity securities of countries domiciled in 15 European countries. To measure how Class C's performance stacked up against its peers, you can compare it to the European region funds average, which reflects the performance of mutual funds with similar objectives tracked by Lipper Inc. The past one year average represents a peer group of 151 mutual funds. These benchmarks include reinvested dividends and capital gains, if any, and exclude the effect of sales charges.
Average Annual Total Returns
|
Periods ended October 31, 2000 |
|
Past 1 |
Life of |
|
Fidelity Adv Europe Cap App - CL C |
|
4.96% |
5.27% |
|
Fidelity Adv Europe Cap App - CL C |
|
3.96% |
5.27% |
|
MSCI Europe |
|
1.16% |
4.21% |
|
European Region Funds Average |
|
12.53% |
n/a* |
Average annual total returns take Class C shares' cumulative return and show you what would have happened if Class C shares had performed at a constant rate each year.
* Not available
Annual Report
$10,000 Over Life of Fund
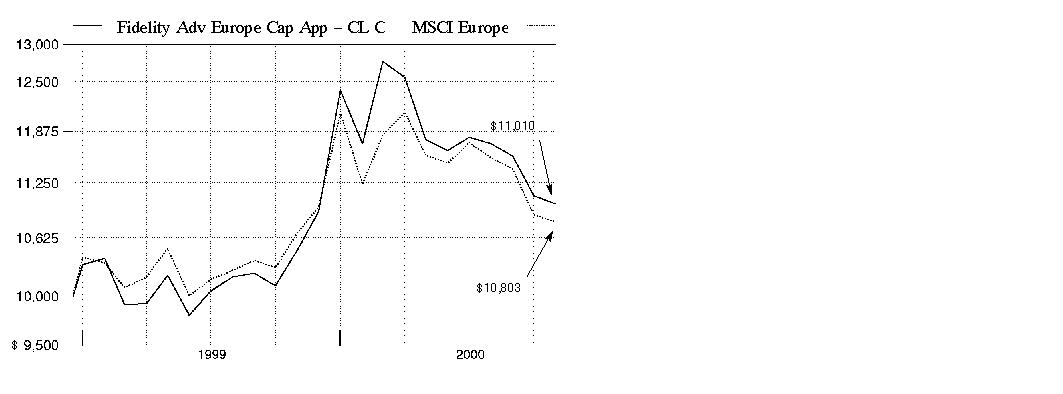
$10,000 Over Life of Fund: Let's say hypothetically that $10,000 was invested in Fidelity Advisor Europe Capital Appreciation Fund - Class C on December 17, 1998, when the fund started. As the chart shows, by October 31, 2000, the value of the investment would have grown to $11,010 - a 10.10% increase on the initial investment. For comparison, look at how the MSCI Europe Index did over the same period. With dividends reinvested, the same $10,000 would have grown to $10,803 - an 8.03% increase.
Understanding
Performance
Many markets around the globe offer the potential for significant growth over time; however, investing in foreign markets means assuming greater risks than investing in the United States. Factors like changes in a country's financial markets, its local political and economic climate, and the fluctuating value of its currency create these risks. For these reasons an international fund's performance may be more volatile than a fund that invests exclusively in the United States. Past performance is no guarantee of future results and you may have a gain or loss when you sell your shares.
3Annual Report
Market Recap
Currency disparities, the see-saw performance of technology and telecommunications stocks and increased uncertainty over the direction of energy prices contributed to volatile world markets for the 12-month period that ended October 31, 2000. Through the first half of the period, foreign investors enjoyed handsome returns from technology and telecommunications holdings. These gains disappeared down the stretch, however, as the dollar continued to outperform the struggling euro - the uniform currency of 11 European nations - and the Japanese yen by wide margins. Soaring oil and gas prices also added to the volatility. The Morgan Stanley EAFE® index - which tracks the performance of stock markets in Europe, Australasia and the Far East - fell 2.72% during the period. Europe's economic recovery remained on course, but the euro's continued weakness proved to be a millstone. The Morgan Stanley Europe index had a 12-month return of 1.16%. Japan's economic recovery, on the other hand, appeared to be short-lived, or at least very, very slow in the making. The Morgan Stanley Japan index declined 11.61% during the period. Emerging markets, meanwhile, were unable to sustain the momentum they carried into early 2000 - the Morgan Stanley Emerging Markets Free index tumbled 10.33%.
(Portfolio Manager photograph)
An interview with Ian Hart, Portfolio Manager of Fidelity Advisor Europe Capital Appreciation Fund
Q. How did the fund perform, Ian?
A. For the 12-month period that ended October 31, 2000, the fund's Class A, Class T, Class B and Class C shares returned 5.67%, 5.40%, 4.87% and 4.96%, respectively. By comparison, the Morgan Stanley Capital International Europe Index posted a total return of 1.16% for the same period, while the European region funds average, as tracked by Lipper Inc., returned 12.53%.
Q. What were the major factors that influenced this performance?
A. The fund lost some of its earlier gains during the second half of the period. This came as a result of the major downward correction that began in U.S. markets at mid-year and led to downward momentum in Europe and elsewhere. The bubble burst for many of the technology, media and telecommunications names that had contributed so greatly to performance in the past couple of years. Fortunately, by underweighting the fund's exposure to these sectors, it missed some of the downside. The markets remained volatile, and there really were no clear sector themes driving performance. The fund was able to beat the index almost entirely because of favorable stock picking. I found positive company stories in a variety of sectors, including financial services, pharmaceuticals, consumer goods and even in technology. The markets were very unforgiving of companies that missed their earnings projections, so with assistance from Fidelity's European research team based in London, I focused even more intently on owning attractively priced companies that I felt were not going to disappoint on their numbers. The fund lagged the Lipper average, which was more aggressively positioned in the high-growth sectors that drove performance early in the period.
Annual Report
Fund Talk: The Manager's Overview - continued
Q. What else did you do to position the fund for this period of market correction and volatility?
A. I became for the most part sector-agnostic and focused on companies that I believed would deliver growth at a reasonable price. However, as mentioned earlier, I did reduce the fund's overall exposure to the telecommunications, media and technology sectors, where it previously was overweighted, and I also reduced its positions in the energy sector. At the same time, I increased holdings in the retail and financial services sectors, but did so on the basis of company-specific stories, rather than part of any broad sector themes.
Q. Which individual holdings helped performance the most during the period?
A. Swatch, the Swiss watch manufacturer, made a strong contribution as the company continued to deliver earnings that exceeded the market's expectations. Nutreco, a Dutch fish farming and animal foods company, also showed surprisingly attractive earnings growth, and its stock price rose as the market began to recognize the company's growth potential. Wella, a German hair care company, was able to benefit from internal improvements that helped drive attractive earnings growth and was rewarded with robust stock price appreciation. Amvescap, a U.K.-based fund manager with significant business in the U.S., also did extremely well as its profitability improved.
Q. What holdings were disappointments - especially in the latter part of the period?
A. Germany's Deutsche Telekom, which I've since sold, and the U.K.'s Vodaphone Group were two telecommunications concerns that were caught in the second-half's downdraft. But, of course, many of the high-flying stocks in the telecom, media and technology sectors have come down quite a lot from their recent historical highs. Valuations for many of these companies were quite high, but when the growth assumptions that supported those valuations began to be downgraded, the bubble finally burst. And as I said earlier, companies that missed their earnings targets were punished severely.
Annual Report
Fund Talk: The Manager's Overview - continued
Q. What's your outlook for the next six months, Ian?
A. Despite the likelihood of continued volatility in the broad market, I think there are still plenty of attractive investment opportunities in Europe. I will remain focused on bottom-up stock picking, looking for ideas across a wide range of industry sectors. I am greatly assisted in this task by Fidelity's European research team in London. This invaluable research asset gives me many more feet on the ground in Europe, kicking the tires and providing the necessary due diligence that allows me to both keep on top of existing stocks and generate new stock ideas.
The views expressed in this report reflect those of the portfolio manager only through the end of the period of the report as stated on the cover and do not necessarily represent the views of Fidelity or any other person in the Fidelity organization. Any such views are subject to change at any time based upon market or other conditions and Fidelity disclaims any responsibility to update such views. These views may not be relied on as investment advice and, because investment decisions for a Fidelity fund are based on numerous factors, may not be relied on as an indication of trading intent on behalf of any Fidelity fund.
Fund Facts
Goal: long-term capital appreciation by investing mainly in equity securities of European issuers
Start date: December 17, 1998
Size: as of October 31, 2000, more than $35 million
Manager: Ian Hart, since April 2000; international equity analyst, 1997-2000; European equity analyst in U.K., 1994-1997; joined Fidelity in 1994
3Ian Hart discusses Europe's investment environment:
"There's some truth in the adage ´When the U.S. sneezes, the rest of the world catches cold.' The European markets certainly take their lead from the U.S., and in current terms that means that the markets on the Continent are somewhat volatile as well. Beyond this near-term volatility, I think the longer-term economic situation in Europe is relatively benign. It does not appear that the Continent is headed into recession, although it is fair to say that economic growth in Europe is forecast to lag that of the U.S. over the next 12 months.
"Economic recovery in Europe has been more a case of slow, steady improvement. Long-term, I remain positive about the structural developments that are now underway in Europe. I think it's encouraging that many European companies and politicians are looking to the U.S. business and economic models to help them solve some of their more pressing structural problems, such as reducing unemployment and improving productivity. European governments are pursuing such issues as tax reform, deregulation and privatization of industry, pension reform, and a whole range of initiatives aimed at moving Europe toward the free-market type of economy that exists in the U.S. I think this bodes well for economic growth in the region over the long term."
Annual Report
|
Top Five Stocks as of October 31, 2000 |
||
|
|
% of fund's |
% of fund's net assets |
|
TotalFinaElf SA Class B (France, Oil & Gas) |
6.0 |
5.4 |
|
Vodafone Group PLC (United Kingdom, Cellular) |
5.1 |
5.1 |
|
Royal Dutch Petroleum Co. (Hague Registry) (Netherlands, Oil & Gas) |
3.8 |
2.3 |
|
Castorama Dubois Investissements SA (France, Retail & Wholesale, Miscellaneous) |
3.5 |
1.1 |
|
Nokia AB (Finland, Communications Equipment) |
3.5 |
3.2 |
|
|
21.9 |
17.1 |
|
Top Five Market Sectors as of October 31, 2000 |
||
|
|
% of fund's |
% of fund's net assets |
|
Finance |
26.1 |
16.7 |
|
Retail & Wholesale |
12.5 |
3.2 |
|
Utilities |
11.6 |
20.3 |
|
Energy |
10.6 |
10.9 |
|
Technology |
8.1 |
13.2 |
|
Top Five Countries as of October 31, 2000 |
||
|
(excluding cash equivalents) |
% of fund's |
% of fund's net assets |
|
United Kingdom |
24.2 |
28.2 |
|
France |
21.4 |
20.3 |
|
Netherlands |
12.0 |
9.3 |
|
Switzerland |
9.6 |
6.4 |
|
Germany |
8.1 |
10.2 |
|
Percentages are adjusted for the effect of open futures contracts, if applicable. |
|
Asset Allocation (% of fund's net assets) |
|||||||
|
As of October 31, 2000 |
As of April 30, 2000 |
||||||
|
Stocks 98.6% |
|
|
Stocks 93.4% |
|
||
|
Short-Term |
|
|
Short-Term |
|
||

Annual Report
Showing Percentage of Net Assets
|
Common Stocks - 98.3% |
|||
|
Shares |
Value (Note 1) |
||
|
Belgium - 0.4% |
|||
|
KBC Bancassurance Holding NV |
3,600 |
$ 149,117 |
|
|
Denmark - 1.4% |
|||
|
Bang & Olufsen Holding AS |
3,500 |
170,902 |
|
|
Novo-Nordisk AS Series B (a) |
1,551 |
329,125 |
|
|
TOTAL DENMARK |
500,027 |
||
|
Finland - 4.1% |
|||
|
Nokia AB |
28,840 |
1,232,910 |
|
|
UPM-Kymmene Corp. |
7,400 |
209,475 |
|
|
TOTAL FINLAND |
1,442,385 |
||
|
France - 21.4% |
|||
|
Alcatel SA (RFD) (a) |
8,206 |
511,849 |
|
|
Aventis SA (France) |
5,000 |
360,313 |
|
|
AXA SA de CV |
4,635 |
613,733 |
|
|
BNP Paribas SA |
5,523 |
476,293 |
|
|
Castorama Dubois Investissements SA |
6,146 |
1,249,927 |
|
|
Groupe Danone (a) |
940 |
131,489 |
|
|
ILOG SA sponsored ADR (a) |
5,200 |
156,000 |
|
|
Integra SA (a) |
8,400 |
68,091 |
|
|
Pernod-Ricard |
3,100 |
142,089 |
|
|
Royal Canin SA |
1,600 |
144,636 |
|
|
Sanofi-Synthelabo SA |
7,000 |
368,379 |
|
|
Societe Generale Class A (a) |
2,104 |
119,475 |
|
|
Suez Lyonnaise des Eaux (France) |
1,908 |
291,188 |
|
|
Television Francaise 1 SA (a) |
1,710 |
93,328 |
|
|
TotalFinaElf SA Class B |
14,917 |
2,136,857 |
|
|
Vivendi Environment (a) |
9,100 |
339,860 |
|
|
Vivendi SA |
5,125 |
368,453 |
|
|
TOTAL FRANCE |
7,571,960 |
||
|
Germany - 7.8% |
|||
|
ACG AG |
1,200 |
63,151 |
|
|
Allianz AG (Reg.) |
1,333 |
452,071 |
|
|
Deutsche Lufthansa AG (Reg.) |
13,500 |
263,552 |
|
|
Douglas Holding AG |
3,100 |
92,358 |
|
|
Fresenius Medical Care AG |
2,900 |
230,817 |
|
|
Fresenius Medical Care AG sponsored ADR |
1 |
27 |
|
|
Karstadt Quelle AG |
24,000 |
783,476 |
|
|
Muenchener Ruckversicherungs-Gesellschaft AG (Reg.) |
1,067 |
335,551 |
|
|
Software AG |
1,700 |
121,786 |
|
|
Common Stocks - continued |
|||
|
Shares |
Value (Note 1) |
||
|
Germany - continued |
|||
|
United Internet AG (a) |
3,000 |
$ 19,302 |
|
|
Wella AG |
11,090 |
421,711 |
|
|
TOTAL GERMANY |
2,783,802 |
||
|
Greece - 0.6% |
|||
|
Antenna TV SA sponsored ADR (a) |
10,800 |
213,300 |
|
|
Ireland - 0.7% |
|||
|
Irish Life & Permanent PLC |
24,200 |
242,589 |
|
|
Israel - 0.3% |
|||
|
Orad Hi-Tech Systems Ltd. |
3,200 |
96,016 |
|
|
Italy - 5.6% |
|||
|
Alleanza Assicurazioni Spa |
48,800 |
644,766 |
|
|
Banca Intesa Spa |
112,300 |
469,452 |
|
|
Banca Nazionale del Lavoro (BNL) |
51,300 |
165,465 |
|
|
Saipem Spa |
20,500 |
107,726 |
|
|
Telecom Italia Mobile Spa |
39,600 |
336,965 |
|
|
Telecom Italia Spa |
21,400 |
251,450 |
|
|
TOTAL ITALY |
1,975,824 |
||
|
Netherlands - 12.0% |
|||
|
Hunter Douglas NV |
4,800 |
137,709 |
|
|
ING Groep NV (Certificaten Van Aandelen) |
12,553 |
862,201 |
|
|
Koninklijke Ahold NV |
35,584 |
1,033,873 |
|
|
Koninklijke Philips Electronics NV |
3,510 |
137,971 |
|
|
Numico NV |
4,300 |
201,106 |
|
|
Nutreco Holding NV |
7,800 |
336,329 |
|
|
Oce NV |
12,900 |
192,164 |
|
|
Royal Dutch Petroleum Co. (Hague Registry) |
22,800 |
1,353,750 |
|
|
TOTAL NETHERLANDS |
4,255,103 |
||
|
Norway - 1.6% |
|||
|
Norsk Hydro AS (a) |
7,200 |
285,923 |
|
|
TANDBERG ASA (a) |
10,400 |
275,334 |
|
|
TOTAL NORWAY |
561,257 |
||
|
Spain - 5.7% |
|||
|
Aldeasa SA |
3,200 |
60,570 |
|
|
Altadis SA |
20,300 |
304,121 |
|
|
Banco Santander Central Hispano SA |
71,160 |
689,775 |
|
|
Cortefiel SA |
8,800 |
157,979 |
|
|
Common Stocks - continued |
|||
|
Shares |
Value (Note 1) |
||
|
Spain - continued |
|||
|
Sogecable SA (a) |
3,100 |
$ 75,781 |
|
|
Telefonica SA (a) |
38,105 |
726,759 |
|
|
TOTAL SPAIN |
2,014,985 |
||
|
Sweden - 1.6% |
|||
|
Tele1 Europe Holding AB (a) |
11,900 |
91,658 |
|
|
Telefonaktiebolaget LM Ericsson (B Shares) |
34,500 |
478,688 |
|
|
TOTAL SWEDEN |
570,346 |
||
|
Switzerland - 9.6% |
|||
|
Credit Suisse Group (Reg.) |
3,350 |
628,067 |
|
|
Gretag Imaging Holding AG (Reg. D) |
474 |
85,175 |
|
|
Julius Baer Holding AG |
68 |
336,690 |
|
|
Nestle SA (Reg.) |
175 |
362,656 |
|
|
Novartis AG (Reg.) |
158 |
239,703 |
|
|
PubliGroupe SA (Reg.) |
3 |
1,761 |
|
|
The Swatch Group AG (Bearer) |
331 |
438,264 |
|
|
UBS AG |
2,451 |
339,527 |
|
|
Zurich Financial Services Group AG |
1,995 |
965,591 |
|
|
TOTAL SWITZERLAND |
3,397,434 |
||
|
United Kingdom - 24.2% |
|||
|
3i Group PLC |
13,300 |
301,748 |
|
|
Amvescap PLC |
18,300 |
408,554 |
|
|
AstraZeneca Group PLC (United Kingdom) |
4,900 |
233,669 |
|
|
Barclays PLC |
6,900 |
197,258 |
|
|
Boots Co. PLC |
76,680 |
611,396 |
|
|
British Land Co. PLC |
26,700 |
159,473 |
|
|
British Telecommunications PLC |
21,200 |
252,280 |
|
|
Cable & Wireless PLC |
16,900 |
238,874 |
|
|
Carlton Communications PLC |
18,600 |
149,653 |
|
|
Diageo PLC |
50,600 |
477,173 |
|
|
Lloyds TSB Group PLC |
79,700 |
811,098 |
|
|
Marconi PLC |
8,300 |
104,683 |
|
|
Rank Group PLC Class L |
46,800 |
116,017 |
|
|
Reuters Group PLC |
15,900 |
312,369 |
|
|
SMG PLC |
128,600 |
503,365 |
|
|
Smith & Nephew PLC |
36,300 |
148,926 |
|
|
SmithKline Beecham PLC |
34,300 |
447,186 |
|
|
Somerfield PLC |
138,600 |
154,715 |
|
|
SSL International PLC |
46,900 |
545,627 |
|
|
Telewest Communications PLC (a) |
60,900 |
100,647 |
|
|
Vodafone Group PLC |
427,010 |
1,817,460 |
|
|
Common Stocks - continued |
|||
|
Shares |
Value (Note 1) |
||
|
United Kingdom - continued |
|||
|
W.H. Smith PLC |
55,700 |
$ 327,031 |
|
|
WPP Group PLC |
12,900 |
172,985 |
|
|
TOTAL UNITED KINGDOM |
8,592,187 |
||
|
United States of America - 1.3% |
|||
|
Bristol-Myers Squibb Co. |
4,700 |
286,406 |
|
|
Jupiter Media Metrix, Inc. (a) |
4,900 |
66,763 |
|
|
Scientific-Atlanta, Inc. |
1,700 |
116,344 |
|
|
TOTAL UNITED STATES OF AMERICA |
469,513 |
||
|
TOTAL COMMON STOCKS (Cost $33,229,693) |
34,835,845 |
||
|
Nonconvertible Preferred Stocks - 0.3% |
|||
|
|
|
|
|
|
Germany - 0.3% |
|||
|
ProSieben Sat.1 Media AG (a) |
4,000 |
125,962 |
|
|
Cash Equivalents - 2.4% |
|||
|
|
|
|
|
|
Fidelity Cash Central Fund, 6.61% (b) |
846,203 |
846,203 |
|
|
TOTAL INVESTMENT PORTFOLIO - 101.0% (Cost $34,219,107) |
35,808,010 |
||
|
NET OTHER ASSETS - (1.0)% |
(358,649) |
||
|
NET ASSETS - 100% |
$ 35,449,361 |
||
|
Legend |
|
(a) Non-income producing |
|
(b) The rate quoted is the annualized seven-day yield of the fund at period end. A complete listing of the fund's holdings as of its most recent fiscal year end is available upon request. |
|
Income Tax Information |
|
At October 31, 2000, the aggregate |
|
At October 31, 2000, the fund had a capital loss carryforward of approx- |
See accompanying notes which are an integral part of the financial statements.
Annual Report
Statement of Assets and Liabilities
|
|
October 31, 2000 |
|
|
Assets |
|
|
|
Investment in securities, at value (cost $34,219,107) - |
|
$ 35,808,010 |
|
Receivable for investments sold |
|
685,855 |
|
Receivable for fund shares sold |
|
44,602 |
|
Dividends receivable |
|
107,811 |
|
Interest receivable |
|
7,819 |
|
Total assets |
|
36,654,097 |
|
Liabilities |
|
|
|
Payable for investments purchased |
$ 1,036,613 |
|
|
Payable for fund shares redeemed |
77,014 |
|
|
Accrued management fee |
27,549 |
|
|
Distribution fees payable |
19,529 |
|
|
Other payables and accrued expenses |
44,031 |
|
|
Total liabilities |
|
1,204,736 |
|
Net Assets |
|
$ 35,449,361 |
|
Net Assets consist of: |
|
|
|
Paid in capital |
|
$ 34,664,052 |
|
Distributions in excess of net investment income |
|
(5,530) |
|
Accumulated undistributed net realized gain (loss) on investments and foreign currency transactions |
|
(793,708) |
|
Net unrealized appreciation (depreciation) on investments and assets and liabilities in foreign currencies |
|
1,584,547 |
|
Net Assets |
|
$ 35,449,361 |
See accompanying notes which are an integral part of the financial statements.
Annual Report
Financial Statements - continued
Statement of Assets and Liabilities - continued
|
|
October 31, 2000 |
|
|
Calculation of Maximum Offering Price |
|
$11.13 |
|
Maximum offering price per share (100/94.25 of $11.13) |
|
$11.81 |
|
Class T: |
|
$11.09 |
|
Maximum offering price per share (100/96.50 of $11.09) |
|
$11.49 |
|
Class B: |
|
$10.99 |
|
Class C: |
|
$11.01 |
|
Institutional Class: |
|
$11.16 |
A Redemption price per share is equal to net asset value less any applicable contingent deferred sales charge.
See accompanying notes which are an integral part of the financial statements.
Annual Report
Financial Statements - continued
Statement of Operations
|
|
Year ended October 31, 2000 |
|
|
Investment Income Dividends |
|
$ 513,661 |
|
Interest |
|
152,952 |
|
|
|
666,613 |
|
Less foreign taxes withheld |
|
(70,512) |
|
Total income |
|
596,101 |
|
Expenses |
|
|
|
Management fee |
$ 240,209 |
|
|
Transfer agent fees |
105,666 |
|
|
Distribution fees |
217,265 |
|
|
Accounting fees and expenses |
60,452 |
|
|
Non-interested trustees' compensation |
102 |
|
|
Custodian fees and expenses |
70,051 |
|
|
Registration fees |
70,915 |
|
|
Audit |
29,131 |
|
|
Legal |
596 |
|
|
Miscellaneous |
363 |
|
|
Total expenses before reductions |
794,750 |
|
|
Expense reductions |
(17,756) |
776,994 |
|
Net investment income (loss) |
|
(180,893) |
|
Realized and Unrealized Gain (Loss) Net realized gain (loss) on: |
|
|
|
Investment securities |
50,042 |
|
|
Foreign currency transactions |
(233) |
49,809 |
|
Change in net unrealized appreciation (depreciation) on: |
|
|
|
Investment securities |
(18,260) |
|
|
Assets and liabilities in foreign currencies |
(4,201) |
(22,461) |
|
Net gain (loss) |
|
27,348 |
|
Net increase (decrease) in net assets resulting |
|
$ (153,545) |
See accompanying notes which are an integral part of the financial statements.
Annual Report
Financial Statements - continued
Statement of Changes in Net Assets
|
|
Year ended |
December 17, 1998 |
|
Increase (Decrease) in Net Assets |
|
|
|
Operations |
$ (180,893) |
$ 25,819 |
|
Net realized gain (loss) |
49,809 |
(845,281) |
|
Change in net unrealized appreciation (depreciation) |
(22,461) |
1,607,008 |
|
Net increase (decrease) in net assets resulting |
(153,545) |
787,546 |
|
Distributions to shareholders from net investment income |
(30,237) |
- |
|
Share transactions - net increase (decrease) |
12,733,299 |
22,112,298 |
|
Total increase (decrease) in net assets |
12,549,517 |
22,899,844 |
|
Net Assets |
|
|
|
Beginning of period |
22,899,844 |
- |
|
End of period (including under (over) |
$ 35,449,361 |
$ 22,899,844 |
See accompanying notes which are an integral part of the financial statements.
Annual Report
Financial Highlights - Class A
|
Years ended October 31, |
2000 |
1999 E |
|
Selected Per-Share Data |
|
|
|
Net asset value, beginning of period |
$ 10.56 |
$ 10.00 |
|
Income from Investment Operations |
|
|
|
Net investment income (loss) D |
(.02) |
.05 |
|
Net realized and unrealized gain (loss) |
.62 |
.51 |
|
Total from investment operations |
.60 |
.56 |
|
Less Distributions |
|
|
|
From net investment income |
(.03) |
- |
|
Net asset value, end of period |
$ 11.13 |
$ 10.56 |
|
Total Return B, C |
5.67% |
5.60% |
|
Ratios and Supplemental Data |
|
|
|
Net assets, end of period (000 omitted) |
$ 3,501 |
$ 2,060 |
|
Ratio of expenses to average net assets |
1.97% |
2.00% A, F |
|
Ratio of expenses to average net assets after expense reductions |
1.93% G |
1.96% A, G |
|
Ratio of net investment income (loss) to average net assets |
(.14)% |
.56% A |
|
Portfolio turnover |
151% |
164% A |
A Annualized
B The total returns would have been lower had certain expenses not been reduced during the periods shown.
C Total returns do not include the one time sales charge and for periods of less than one year are not annualized.
D Net investment income (loss) per share has been calculated based on average shares outstanding during the period.
E For the period December 17, 1998 (commencement of operations) to October 31, 1999.
F FMR agreed to reimburse a portion of the class' expenses during the period. Without this reimbursement, the class' expense ratio would have been higher.
G FMR or the fund has entered into varying arrangements with third parties who either paid or reduced a portion of the class' expenses.
See accompanying notes which are an integral part of the financial statements.
Annual Report
Financial Highlights - Class T
|
Years ended October 31, |
2000 |
1999 E |
|
Selected Per-Share Data |
|
|
|
Net asset value, beginning of period |
$ 10.54 |
$ 10.00 |
|
Income from Investment Operations |
|
|
|
Net investment income (loss) D |
(.05) |
.03 |
|
Net realized and unrealized gain (loss) |
.62 |
.51 |
|
Total from investment operations |
.57 |
.54 |
|
Less Distributions |
|
|
|
From net investment income |
(.02) |
- |
|
Net asset value, end of period |
$ 11.09 |
$ 10.54 |
|
Total Return B, C |
5.40% |
5.40% |
|
Ratios and Supplemental Data |
|
|
|
Net assets, end of period (000 omitted) |
$ 15,505 |
$ 12,343 |
|
Ratio of expenses to average net assets |
2.24% |
2.25% A, F |
|
Ratio of expenses to average net assets after expense reductions |
2.20% G |
2.21% A, G |
|
Ratio of net investment income (loss) to average net assets |
(.41)% |
.31% A |
|
Portfolio turnover |
151% |
164% A |
A Annualized
B The total returns would have been lower had certain expenses not been reduced during the periods shown.
C Total returns do not include the one time sales charge and for periods of less than one year are not annualized.
D Net investment income (loss) per share has been calculated based on average shares outstanding during the period.
E For the period December 17, 1998 (commencement of operations) to October 31, 1999.
F FMR agreed to reimburse a portion of the class' expenses during the period. Without this reimbursement, the class' expense ratio would have been higher.
G FMR or the fund has entered into varying arrangements with third parties who either paid or reduced a portion of the class' expenses.
See accompanying notes which are an integral part of the financial statements.
Annual Report
Financial Highlights - Class B
|
Years ended October 31, |
2000 |
1999 E |
|
Selected Per-Share Data |
|
|
|
Net asset value, beginning of period |
$ 10.48 |
$ 10.00 |
|
Income from Investment Operations |
|
|
|
Net investment income (loss) D |
(.11) |
(.02) |
|
Net realized and unrealized gain (loss) |
.62 |
.50 |
|
Total from investment operations |
.51 |
.48 |
|
Net asset value, end of period |
$ 10.99 |
$ 10.48 |
|
Total Return B, C |
4.87% |
4.80% |
|
Ratios and Supplemental Data |
|
|
|
Net assets, end of period (000 omitted) |
$ 8,132 |
$ 3,765 |
|
Ratio of expenses to average net assets |
2.75% F |
2.75% A, F |
|
Ratio of expenses to average net assets after expense reductions |
2.71% G |
2.71% A, G |
|
Ratio of net investment income (loss) to average net assets |
(.91)% |
(.19)% A |
|
Portfolio turnover |
151% |
164% A |
A Annualized
B The total returns would have been lower had certain expenses not been reduced during the periods shown.
C Total returns do not include the contingent deferred sales charge and for periods of less than one year are not annualized.
D Net investment income (loss) per share has been calculated based on average shares outstanding during the period.
E For the period December 17, 1998 (commencement of operations) to October 31, 1999.
F FMR agreed to reimburse a portion of the class' expenses during the period. Without this reimbursement, the class' expense ratio would have been higher.
G FMR or the fund has entered into varying arrangements with third parties who either paid or reduced a portion of the class' expenses.
See accompanying notes which are an integral part of the financial statements.
Annual Report
Financial Highlights - Class C
|
Years ended October 31, |
2000 |
1999 E |
|
Selected Per-Share Data |
|
|
|
Net asset value, beginning of period |
$ 10.49 |
$ 10.00 |
|
Income from Investment Operations |
|
|
|
Net investment income (loss) D |
(.10) |
(.02) |
|
Net realized and unrealized gain (loss) |
.62 |
.51 |
|
Total from investment operations |
.52 |
.49 |
|
Net asset value, end of period |
$ 11.01 |
$ 10.49 |
|
Total Return B, C |
4.96% |
4.90% |
|
Ratios and Supplemental Data |
|
|
|
Net assets, end of period (000 omitted) |
$ 7,117 |
$ 3,894 |
|
Ratio of expenses to average net assets |
2.67% |
2.75% A, F |
|
Ratio of expenses to average net assets after expense reductions |
2.63% G |
2.71% A, G |
|
Ratio of net investment income (loss) to average net assets |
(.84)% |
(.19)% A |
|
Portfolio turnover |
151% |
164% A |
A Annualized
B The total returns would have been lower had certain expenses not been reduced during the periods shown.
C Total returns do not include the contingent deferred sales charge and for periods of less than one year are not annualized.
D Net investment income (loss) per share has been calculated based on average shares outstanding during the period.
E For the period December 17, 1998 (commencement of operations) to October 31, 1999.
F FMR agreed to reimburse a portion of the class' expenses during the period. Without this reimbursement, the class' expense ratio would have been higher.
G FMR or the fund has entered into varying arrangements with third parties who either paid or reduced a portion of the class' expenses.
See accompanying notes which are an integral part of the financial statements.
Annual Report
Financial Highlights - Institutional Class
|
Years ended October 31, |
2000 |
1999 E |
|
Selected Per-Share Data |
|
|
|
Net asset value, beginning of period |
$ 10.58 |
$ 10.00 |
|
Income from Investment Operations |
|
|
|
Net investment income D |
.02 |
.07 |
|
Net realized and unrealized gain (loss) |
.61 |
.51 |
|
Total from investment operations |
.63 |
.58 |
|
Less Distributions |
|
|
|
From net investment income |
(.05) |
- |
|
Net asset value, end of period |
$ 11.16 |
$ 10.58 |
|
Total Return B, C |
5.94% |
5.80% |
|
Ratios and Supplemental Data |
|
|
|
Net assets, end of period (000 omitted) |
$ 1,193 |
$ 838 |
|
Ratio of expenses to average net assets |
1.70% |
1.75% A, F |
|
Ratio of expenses to average net assets after expense reductions |
1.66% G |
1.71% A, G |
|
Ratio of net investment income to average net assets |
.14% |
.81% A |
|
Portfolio turnover |
151% |
164% A |
A Annualized
B Total returns for periods of less than one year are not annualized.
C The total returns would have been lower had certain expenses not been reduced during the periods shown.
D Net investment income per share has been calculated based on average shares outstanding during the period.
E For the period December 17, 1998 (commencement of operations) to October 31, 1999.
F FMR agreed to reimburse a portion of the class' expenses during the period. Without this reimbursement, the class' expense ratio would have been higher.
G FMR or the fund has entered into varying arrangements with third parties who either paid or reduced a portion of the class' expenses.
See accompanying notes which are an integral part of the financial statements.
Annual Report
For the period ended October 31, 2000
1. Significant Accounting Policies.
Fidelity Advisor Europe Capital Appreciation Fund(the fund) is a fund of Fidelity Advisor Series VIII(the trust) and is authorized to issue an unlimited number of shares. The trust is registered under the Investment Company Act of 1940, as amended (the 1940 Act), as an open-end management investment company organized as a Massachusetts business trust.
The fund offers Class A, Class T, Class B, Class C, and Institutional Class shares, each of which has equal rights as to assets and voting privileges. Each class has exclusive voting rights with respect to matters that affect that class. Class B shares will automatically convert to Class A shares after a holding period of seven years from the initial date of purchase. Investment income, realized and unrealized capital gains and losses, the common expenses of the fund, and certain fund-level expense reductions, if any, are allocated on a pro rata basis to each class based on the relative net assets of each class to the total net assets of the fund. Each class of shares differs in its respective distribution, transfer agent, and certain other class-specific fees, expenses, and expense reductions.
The financial statements have been prepared in conformity with generally accepted accounting principles which require management to make certain estimates and assumptions at the date of the financial statements. The following summarizes the significant accounting policies of the fund:
Security Valuation. Securities for which quotations are readily available are valued using the official closing price or at the last sale price in the principal market in which they are traded. If the last sale price (on the local exchange) is unavailable, the last evaluated quote or closing bid price normally is used. If trading or events occurring in other markets after the close of the principal market in which securities are traded are expected to materially affect the value of those securities, then they are valued at their fair value taking this trading or these events into account. Fair value is determined in good faith under consistently applied procedures under the general supervision of the Board of Trustees. Securities for which quotations are not readily available are valued primarily using dealer-supplied valuations or at their fair value. Short-term securities with remaining maturities of sixty days or less for which quotations are not readily available are valued at amortized cost or original cost plus accrued interest, both of which approximate current value. Investments in open-end investment companies are valued at their net asset value each business day.
Foreign Currency Translation. The accounting records of the fund are maintained in U.S. dollars. Investment securities and other assets and liabilities denominated in a foreign currency are translated into U.S. dollars at the prevailing rates of exchange at period end. Purchases and sales of securities, income receipts and expense payments are translated into U.S. dollars at the prevailing exchange rate on the respective dates of the transactions.
Annual Report
Notes to Financial Statements - continued
1. Significant Accounting Policies - continued
Foreign Currency Translation - continued
Net realized gains and losses on foreign currency transactions represent net gains and losses from sales and maturities of foreign currency contracts, disposition of foreign currencies, the difference between the amount of net investment income accrued and the U.S. dollar amount actually received, and gains and losses between trade and settlement date on purchases and sales of securities. The effects of changes in foreign currency exchange rates on investments in securities are included with the net realized and unrealized gain or loss on investment securities.
Income Taxes. As a qualified regulated investment company under Subchapter M of the Internal Revenue Code, the fund is not subject to U.S. federal income taxes to the extent that it distributes substantially all of its taxable income for its fiscal year. The fund may be subject to foreign taxes on income and gains on investments which are accrued based upon the fund's understanding of the tax rules and regulations that exist in the markets in which it invests. Foreign governments may also impose taxes on other payments or transactions with respect to foreign securities. The fund accrues such taxes as applicable. The schedule of investments includes information regarding income taxes under the caption "Income Tax Information."
Investment Income. Dividend income is recorded on the ex-dividend date, except certain dividends from foreign securities where the ex-dividend date may have passed, are recorded as soon as the fund is informed of the ex-dividend date. Non-cash dividends included in dividend income, if any, are recorded at the fair market value of the securities received. Interest income is accrued as earned. Investment income is recorded net of foreign taxes withheld where recovery of such taxes is uncertain.
Expenses. Most expenses of the trust can be directly attributed to a fund. Expenses which cannot be directly attributed are apportioned among the funds in the trust.
Distributions to Shareholders. Distributions are recorded on the ex-dividend date. Income dividends and capital gain distributions are declared separately for each class.
Income and capital gain distributions are determined in accordance with income tax regulations which may differ from generally accepted accounting principles. These differences, which may result in distribution reclassifications, are primarily due to differing treatments for foreign currency transactions, passive foreign investment companies (PFIC), net operating losses and losses deferred due to wash sales.
Permanent book and tax basis differences relating to shareholder distributions will result in reclassifications to paid in capital. Distributions in excess of net investment income and accumulated undistributed net realized gain (loss) on investments and foreign currency transactions may include temporary book and tax basis differences which will reverse in a subsequent period. Any taxable income or gain remaining at fiscal year end is distributed in the following year.
Annual Report
Notes to Financial Statements - continued
1. Significant Accounting Policies - continued
Security Transactions. Security transactions are accounted for as of trade date. Gains and losses on securities sold are determined on the basis of identified cost.
2. Operating Policies.
Foreign Currency Contracts. The fund generally uses foreign currency contracts to facilitate transactions in foreign-denominated securities. Losses may arise from changes in the value of the foreign currency or if the counterparties do not perform under the contracts' terms. The U.S. dollar value of foreign currency contracts is determined using contractual currency exchange rates established at the time of each trade.
Joint Trading Account. Pursuant to an Exemptive Order issued by the Securities and Exchange Commission (the SEC), the fund, along with other affiliated entities of Fidelity Management & Research Company (FMR), may transfer uninvested cash balances into one or more joint trading accounts. These balances are invested in one or more repurchase agreements for U.S. Treasury or Federal Agency obligations.
Repurchase Agreements. The underlying U.S. Treasury, Federal Agency, or other obligations found to be satisfactory by FMR are transferred to an account of the fund, or to the Joint Trading Account, at a custodian bank. The securities are marked-to-market daily and maintained at a value at least equal to the principal amount of the repurchase agreement (including accrued interest). FMR, the fund's investment adviser, is responsible for determining that the value of the underlying securities remains in accordance with the market value requirements stated above.
3. Purchases and Sales of Investments.
Purchases and sales of securities, other than short-term securities, aggregated $59,439,802 and $46,738,099, respectively.
4. Fees and Other Transactions with Affiliates.
Management Fee. As the fund's investment adviser, FMR receives a monthly fee that is calculated on the basis of a group fee rate plus a fixed individual fund fee rate applied to the average net assets of the fund. The group fee rate is the weighted average of a series of rates and is based on the monthly average net assets of all the mutual funds advised by FMR. The rates ranged from .2167% to .5200% for the period. The annual individual fund fee rate is .45%. In the event that these rates were lower than the contractual rates in effect during the period, FMR voluntarily implemented the above rates, as they resulted in the same or a lower management fee. For the period, the management fee was equivalent to an annual rate of .72% of average net assets.
Annual Report
Notes to Financial Statements - continued
4. Fees and Other Transactions with Affiliates - continued
Sub-Adviser Fee. Beginning January 1, 2001, FMR Co. (FMRC) will serve as a sub-adviser for the fund. FMRC may provide investment research and advice and may also provide investment advisory services for the fund. FMR, on behalf of the fund, entered into sub-advisory agreements with Fidelity Management & Research (U.K.) Inc., Fidelity Management & Research (Far East) Inc., and Fidelity International Investment Advisors (FIIA). Under the sub-advisory arrangements, FMR may receive investment advice and research services and may grant the sub-advisers investment management authority to buy and sell securities. FMR pays its sub-advisers either a portion of its management fee or a fee based on costs incurred for these services.
Distribution and Service Plan. In accordance with Rule 12b-1 of the 1940 Act, the Board of Trustees have adopted separate Distribution and Service Plans with respect to each class of shares(collectively referred to as "the Plans"). Under certain of the Plans, the class pays Fidelity Distributors Corporation (FDC), an affiliate of FMR, a 12b-1 fee. A portion of this fee may be reallowed to securities dealers, banks and other financial institutions for the distribution of each class of shares and providing shareholder support services. For the period, this fee was based on the following annual rates of the average net assets of each applicable class:
|
Class A |
.25% |
|
Class T |
.50% |
|
Class B |
1.00% * |
|
Class C |
1.00% * |
* .75% represents a distribution fee and .25% represents a shareholder service fee.
For the period, each class paid FDC the following amounts, a portion of which was retained by FDC:
|
|
Paid to |
Retained |
|
Class A |
$ 9,134 |
$ 1,089 |
|
Class T |
74,158 |
677 |
|
Class B |
70,840 |
53,445 |
|
Class C |
63,133 |
29,221 |
|
|
$ 217,265 |
$ 84,432 |
Annual Report
Notes to Financial Statements - continued
4. Fees and Other Transactions with Affiliates - continued
Sales Load. FDC receives a front-end sales charge of up to 5.75% for selling Class A shares, and 3.50% for selling Class T shares of the fund. FDC receives the proceeds of contingent deferred sales charges levied on Class B share redemptions occurring within six years of purchase and Class C share redemptions occurring within one year of purchase. Contingent deferred sales charges are based on declining rates ranging from 5% to 1% for Class B and 1% for Class C, of the lesser of the cost of shares at the initial date of purchase or the net asset value of the redeemed shares, excluding any reinvested dividends and capital gains. In addition, purchases of Class A and Class T shares that were subject to a finder's fee bear a contingent deferred sales charge on assets that do not remain in the fund for at least one year. The Class A and Class T contingent deferred sales charge is based on 0.25% of the lesser of the cost of shares at the initial date of purchase or the net asset value of the redeemed shares, excluding any reinvested dividends and capital gains. A portion of the sales charges paid to FDC is paid to securities dealers, banks and other financial institutions.
For the period, sales charge amounts paid to and retained by FDC were as follows:
|
|
Paid to |
Retained |
|
Class A |
$ 30,764 |
$ 16,053 |
|
Class T |
41,937 |
11,422 |
|
Class B |
23,439 |
23,439 * |
|
Class C |
4,979 |
4,979 * |
|
|
$ 101,119 |
$ 55,893 |
* When Class B and Class C shares are initially sold, FDC pays commissions from its own resources to securities dealers,
banks, and other financial institutions through which the sales are made.
Transfer Agent Fees. Fidelity Investments Institutional Operations Company, Inc., (FIIOC), an affiliate of FMR, is the transfer, dividend disbursing and shareholder servicing agent (collectively referred to as the transfer agent) for each class of the fund. FIIOC receives account fees and asset-based fees that vary according to the account size and
Annual Report
Notes to Financial Statements - continued
4. Fees and Other Transactions with Affiliates - continued
Transfer Agent Fees - continued
type of account of the shareholders of the respective classes of the fund. FIIOC pays for typesetting, printing and mailing of all shareholder reports, except proxy statements. For the period, the following amounts were paid to FIIOC:
|
|
Amount |
% of |
|
Class A |
$ 11,018 |
.30 |
|
Class T |
47,502 |
.32 |
|
Class B |
27,872 |
.39 |
|
Class C |
15,847 |
.25 |
|
Institutional Class |
3,427 |
.28 |
|
|
$ 105,666 |
|
Accounting Fees. Fidelity Service Company, Inc., an affiliate of FMR, maintains the fund's accounting records. The fee is based on the level of average net assets for the month plus out-of-pocket expenses.
Fidelity Cash Central Fund. Pursuant to an Exemptive Order issued by the SEC, the fund may invest in the Fidelity Cash Central Fund (the Cash Fund) managed by Fidelity Investments Money Management, Inc., an affiliate of FMR. The Cash Fund is an open-end money market fund available only to investment companies and other accounts managed by FMR and its affiliates. The Cash Fund seeks preservation of capital, liquidity, and current income. Income distributions from the Cash Fund are declared daily and paid monthly from net investment income. Income distributions earned by the fund are recorded as interest income in the accompanying financial statements.
Brokerage Commissions. The fund placed a portion of its portfolio transactions with brokerage firms which are affiliates of FMR. The commissions paid to these affiliated firms were $26 for the period.
Annual Report
Notes to Financial Statements - continued
5. Expense Reductions.
FMR voluntarily agreed to reimburse operating expenses (excluding interest, taxes, certain securities lending fees, brokerage commissions and extraordinary expenses, if any) above the following annual rates or range of annual rates of average net assets for each of the following classes:
|
|
FMR |
Reimbursement |
|
Class B |
2.75% |
$ 4,817 |
FMR has also directed certain portfolio trades to brokers who paid a portion of the fund's expenses. For the period, the fund's expenses were reduced by $12,939 under this arrangement.
6. Distributions to Shareholders.
Distributions to shareholders of each class were as follows:
|
|
Year ended October 31, |
|
|
2000 |
|
From net investment income |
|
|
Class A |
$ 6,069 |
|
Class T |
20,045 |
|
Institutional Class |
4,123 |
|
Total |
$ 30,237 |
Annual Report
Notes to Financial Statements - continued
7. Share Transactions.
Transactions for each class of shares were as follows:
|
|
Shares |
Dollars |
||
|
|
Year ended October 31, |
December 17, 1998 |
Year ended October 31, |
December 17, 1998 |
|
|
2000 |
1999 |
2000 |
1999 |
|
|
|
|
|
|
|
Class A |
373,657 |
242,665 |
$ 4,565,707 |
$ 2,460,326 |
|
Reinvestment of distributions |
506 |
- |
5,777 |
- |
|
Shares redeemed |
(254,574) |
(47,628) |
(3,013,956) |
(483,630) |
|
Net increase (decrease) |
119,589 |
195,037 |
$ 1,557,528 |
$ 1,976,696 |
|
Class T |
1,077,009 |
1,472,795 |
$ 12,883,109 |
$ 14,972,579 |
|
Reinvestment of distributions |
1,710 |
- |
19,490 |
- |
|
Shares redeemed |
(851,689) |
(301,829) |
(9,965,209) |
(3,050,024) |
|
Net increase (decrease) |
227,030 |
1,170,966 |
$ 2,937,390 |
$ 11,922,555 |
|
Class B |
588,134 |
399,772 |
$ 7,107,623 |
$ 4,048,052 |
|
Shares redeemed |
(207,224) |
(40,709) |
(2,542,655) |
(414,433) |
|
Net increase (decrease) |
380,910 |
359,063 |
$ 4,564,968 |
$ 3,633,619 |
|
Class C |
438,409 |
395,362 |
$ 5,321,772 |
$ 4,017,324 |
|
Shares redeemed |
(163,047) |
(24,007) |
(1,979,745) |
(243,373) |
|
Net increase (decrease) |
275,362 |
371,355 |
$ 3,342,027 |
$ 3,773,951 |
|
Institutional Class |
63,574 |
375,401 |
$ 753,492 |
$ 3,858,159 |
|
Reinvestment of distributions |
216 |
- |
2,469 |
- |
|
Shares redeemed |
(36,090) |
(296,195) |
(424,575) |
(3,052,682) |
|
Net increase (decrease) |
27,700 |
79,206 |
$ 331,386 |
$ 805,477 |
Annual Report
To the Trustees of Fidelity Advisor Series VIII and Shareholders of Fidelity Advisor Europe Capital Appreciation Fund:
We have audited the accompanying statement of assets and liabilities of Fidelity Advisor Europe Capital Appreciation Fund, (the Fund), a fund of Fidelity Advisor Series VIII (the Trust), including the portfolio of investments, as of October 31, 2000, and the related statement of operations for the year then ended, the statement of changes in net assets, and the financial highlights for each of the two years in the period then ended. These financial statements and financial highlights are the responsibility of the Fund's management. Our responsibility is to express an opinion on these financial statements and financial highlights based on our audits.
We conducted our audits in accordance with auditing standards generally accepted in the United States of America. Those standards require that we plan and perform the audit to obtain reasonable assurance about whether the financial statements and financial highlights are free of material misstatement. An audit includes examining, on a test basis, evidence supporting the amounts and disclosures in the financial statements. Our procedures included con-firmation of securities owned as of October 31, 2000, by correspondence with the custodian and brokers; where replies were not received from brokers, we performed other auditing procedures. An audit also includes assessing the accounting principles used and significant estimates made by management, as well as evaluating the overall financial statement presentation. We believe that our audits provide a reasonable basis for our opinion.
In our opinion, the financial statements and financial highlights referred to above present fairly, in all material respects, the financial position of Fidelity Advisor Europe Capital Appreciation Fund as of October 31, 2000, the results of its operations for the year then ended, the changes in its net assets, and its financial highlights for each of the two years in the period then ended, in conformity with accounting principles generally accepted in the United States of America.
/s/DELOITTE & TOUCHE LLP
DELOITTE & TOUCHE LLP
Boston, Massachusetts
December 8, 2000
Annual Report
The amounts per share which represent income derived from sources within, and taxes paid to, foreign countries or possessions of the United States are as follows:
|
|
Pay Date |
Income |
Taxes |
|
|
Class A |
12/6/99 |
$0.05 |
$0.02 |
|
|
Class T |
12/6/99 |
$0.04 |
$0.02 |
|
The fund will notify shareholders in January 2001 of amounts for use in preparing 2000 income tax returns.
Annual Report
Annual Report
Annual Report
Annual Report
Annual Report
Annual Report
Annual Report
Annual Report
Investment Adviser
Fidelity Management & Research Company
Boston, MA
Investment Sub-Advisers
Fidelity Management & Research
(U.K.) Inc.
Fidelity Management & Research
(Far East) Inc.
Fidelity International
Investment Advisors
Fidelity International Investment Advisors (U.K.) Limited
Fidelity Investments Japan Limited
Officers
Edward C. Johnson 3d, President
Robert C. Pozen, Senior Vice President
Richard Spillane, Jr., Vice President
Kevin McCarey, Vice President
Eric D. Roiter, Secretary
Robert A. Dwight, Treasurer
Maria F. Dwyer, Deputy Treasurer
John H. Costello, Assistant Treasurer
Thomas J. Simpson, Assistant Treasurer
Board of Trustees
Ralph F. Cox *
Phyllis Burke Davis *
Robert M. Gates *
Edward C. Johnson 3d
Donald J. Kirk *
Ned C. Lautenbach *
Peter S. Lynch
Marvin L. Mann *
William O. McCoy *
Gerald C. McDonough *
Robert C. Pozen
Thomas R. Williams *
Advisory Board
J. Michael Cook
Abigail P. Johnson
Marie L. Knowles
General Distributor
Fidelity Distributors Corporation
Boston, MA
Transfer and Shareholder
Servicing Agent
Fidelity Investments Institutional Operations Company, Inc.
Boston, MA
Custodian
State Street Bank and Trust Company
Quincy, MA
* Independent trustees
Annual Report
Focus Funds
Fidelity Advisor Consumer
Industries Fund
Fidelity Advisor Cyclical
Industries Fund
Fidelity Advisor Financial
Services Fund
Fidelity Advisor Health Care Fund
Fidelity Advisor Natural
Resources Fund
Fidelity Advisor Technology Fund
Fidelity Advisor Telecommunications & Utilities Growth Fund
Growth Funds
Fidelity Advisor Korea Fund
Fidelity Advisor Emerging Asia Fund
Fidelity Advisor Latin America Fund
Fidelity Advisor Japan Fund
Fidelity Advisor Europe Capital Appreciation Fund
Fidelity Advisor International
Capital Appreciation Fund
Fidelity Advisor Overseas Fund
Fidelity Advisor Diversified International Fund
Fidelity Advisor Global Equity Fund
Fidelity Advisor TechnoQuant®
Growth Fund
Fidelity Advisor Small Cap Fund
Fidelity Advisor Value Strategies Fund
Fidelity Advisor Mid Cap Fund
Fidelity Advisor Dynamic Capital Appreciation Fund
Fidelity Advisor Equity Growth Fund
Fidelity Advisor Large Cap Fund
Fidelity Advisor Dividend Growth Fund
Fidelity Advisor Growth
Opportunities Fund
Growth and Income Funds
Fidelity Advisor Growth & Income Fund
Fidelity Advisor Equity Income Fund
Fidelity Advisor Asset Allocation Fund
Fidelity Advisor Balanced Fund
Taxable Income Funds
Fidelity Advisor Emerging Markets Income Fund
Fidelity Advisor High Income Fund
Fidelity Advisor High Yield Fund
Fidelity Advisor Strategic Income Fund
Fidelity Advisor Mortgage
Securities Fund
Fidelity Advisor Government Investment Fund
Fidelity Advisor Intermediate Bond Fund
Fidelity Advisor Short Fixed-Income Fund
Municipal Funds
Fidelity Advisor Municipal Income Fund
Money Market Funds
Prime Fund
Treasury Fund
Tax-Exempt Fund
AEUR-ANN-1200 118643
1.728711.101
(Fidelity Investment logo)(registered trademark)
Fidelity® Advisor
Fund - Institutional Class
Annual Report
October 31, 2000
(2_fidelity_logos)(registered trademark)
|
President's Message |
Ned Johnson on investing strategies. |
|
|
Performance |
How the fund has done over time. |
|
|
Fund Talk |
The manager's review of fund performance, strategy and outlook. |
|
|
Investment Changes |
A summary of major shifts in the fund's investments over the past six months. |
|
|
Investments |
A complete list of the fund's investments with their market values. |
|
|
Financial Statements |
Statements of assets and liabilities,
operations, and changes in net assets, |
|
|
Notes |
Notes to the financial statements. |
|
|
Independent Auditors' Report |
The auditors' opinion. |
|
|
Distributions |
|
Standard & Poor's, S&P and S&P 500 are registered service marks of The McGraw-Hill Companies, Inc. and have been licensed for use by Fidelity Distributors Corporation.
Other third party marks appearing herein are the property of their respective owners.
All other marks appearing herein are registered or unregistered trademarks or service marks of FMR Corp. or an affiliated company.
(Recycle graphic) This report is printed on recycled paper using soy-based inks.
This report and the financial statements contained herein are submitted for the general information of the shareholders of the fund. This report is not authorized for distribution to prospective investors in the fund unless preceded or accompanied by an effective prospectus.
Mutual fund shares are not deposits or obligations of, or guaranteed by, any depository institution. Shares are not insured by the FDIC, Federal Reserve Board or any other agency, and are subject to investment risks, including possible loss of principal amount invested.
Neither the fund nor Fidelity Distributors Corporation is a bank.
For more information on any Fidelity Advisor fund, including charges and expenses, contact your investment professional for a free prospectus. Read it carefully before you invest or send money.
Annual Report
(photo_of_Edward_C_Johnson_3d)
Dear Shareholder:
A sixth-straight year of double-digit positive returns for the Dow Jones Industrial Average, NASDAQ and S&P 500® could be in jeopardy unless the U.S. stock market shows marked improvement in the final two months of 2000. Through October, all three indexes had negative year-to-date returns. On the other hand, most fixed-income sectors were solidly in the black. Treasuries and other long-term government securities led the way, returning nearly 14%.
While it's impossible to predict the future direction of the markets with any degree of certainty, there are certain basic principles that can help investors plan for their future needs.
First, investors are encouraged to take a long-term view of their portfolios. If you can afford to leave your money invested through the inevitable up and down cycles of the financial markets, you will greatly reduce your vulnerability to any single decline. We know from experience, for example, that stock prices have gone up over longer periods of time, have significantly outperformed other types of investments and have stayed ahead of inflation.
Second, you can further manage your investing risk through diversification. A stock mutual fund, for instance, is already diversified, because it invests in many different companies. You can increase your diversification further by investing in a number of different stock funds, or in such other investment categories as bonds. If you have a short investment time horizon, you might want to consider moving some of your investment into a money market fund, which seeks income and a stable share price by investing in high-quality, short-term investments. Of course, it's important to remember that an investment in a money market fund is not insured or guaranteed by the Federal Deposit Insurance Corporation or any other government agency. Although money market funds seek to preserve the value of your investment at $1.00 per share, it is possible to lose money by investing in these types of funds.
Finally, no matter what your time horizon or portfolio diversity, it makes good sense to follow a regular investment plan, investing a certain amount of money in a fund at the same time each month or quarter and periodically reviewing your overall portfolio. By doing so, you won't get caught up in the excitement of a rapidly rising market, nor will you buy all your shares at market highs. While this strategy - known as dollar cost averaging - won't assure a profit or protect you from a loss in a declining market, it should help you lower the average cost of your purchases. Of course, you should consider your financial ability to continue your purchases through periods of low price levels before undertaking such a strategy.
Remember to contact your investment professional if you need help with your investments.
Best regards,
/s/Edward C. Johnson 3d
Edward C. Johnson 3d
Annual Report
Fidelity Advisor Europe Capital Appreciation Fund - Institutional Class
There are several ways to evaluate historical performance. You can look at the total percentage change in value, the average annual percentage change or the growth of a hypothetical $10,000 investment. Total return reflects the change in the value of an investment, assuming reinvestment of the class' dividend income and capital gains (the profits earned upon the sale of securities that have grown in value). If Fidelity had not reimbursed certain class expenses, the life of fund total returns would have been lower.
Cumulative Total Returns
|
Periods ended October 31, 2000 |
|
Past 1 |
Life of |
|
Fidelity Adv Europe Cap App - Inst CL |
|
5.94% |
12.09% |
|
MSCI Europe |
|
1.16% |
8.03% |
|
European Region Funds Average |
|
12.53% |
n/a* |
Cumulative total returns show Institutional Class' performance in percentage terms over a set period - in this case, one year or since the fund started on December 17, 1998. For example, if you had invested $1,000 in a fund that had a 5% return over the past year, the value of your investment would be $1,050. You can compare Institutional Class' return to the performance of the Morgan Stanley Capital International Europe Index (MSCI Europe) - a market capitalization-weighted index that is designed to represent the performance of developed stock markets in Europe. As of October 31, 2000, the index included over 400 equity securities of countries domiciled in 15 European countries. To measure how Institutional Class' performance stacked up against its peers, you can compare it to the European region funds average, which reflects the performance of mutual funds with similar objectives tracked by Lipper Inc. The past one year average represents a peer group of 151 mutual funds. These benchmarks include reinvested dividends and capital gains, if any, and exclude the effect of sales charges.
Average Annual Total Returns
|
Periods ended October 31, 2000 |
|
Past 1 |
Life of |
|
Fidelity Adv Europe Cap App - Inst CL |
|
5.94% |
6.28% |
|
MSCI Europe |
|
1.16% |
4.21% |
|
European Region Funds Average |
|
12.53% |
n/a* |
Average annual total returns take Institutional Class shares' cumulative return and show you what would have happened if Institutional Class shares had performed at a constant rate each year.
* Not available
Annual Report
$10,000 Over Life of Fund
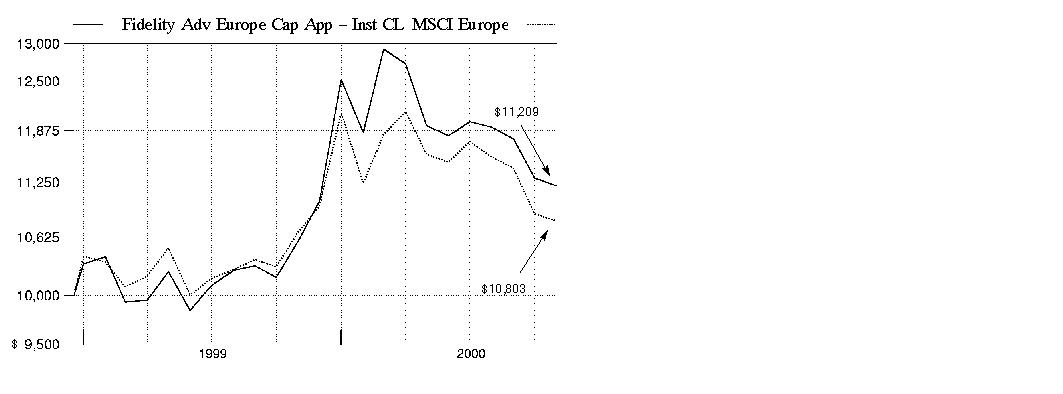
$10,000 Over Life of Fund: Let's say hypothetically that $10,000 was invested in Fidelity Advisor Europe Capital Appreciation Fund - Institutional Class on December 17, 1998, when the fund started. As the chart shows, by October 31, 2000, the value of the investment would have grown to $11,209 - a 12.09% increase on the initial investment. For comparison, look at how the MSCI Europe Index did over the same period. With dividends reinvested, the same $10,000 would have grown to $10,803 - an 8.03% increase.
Understanding
Performance
Many markets around the globe offer the potential for significant growth over time; however, investing in foreign markets means assuming greater risks than investing in the United States. Factors like changes in a country's financial markets, its local political and economic climate, and the fluctuating value of its currency create these risks. For these reasons an international fund's performance may be more volatile than a fund that invests exclusively in the United States. Past performance is no guarantee of future results and you may have a gain or loss when you sell your shares.
3Annual Report
Market Recap
Currency disparities, the see-saw performance of technology and telecommunications stocks and increased uncertainty over the direction of energy prices contributed to volatile world markets for the 12-month period that ended October 31, 2000. Through the first half of the period, foreign investors enjoyed handsome returns from technology and telecommunications holdings. These gains disappeared down the stretch, however, as the dollar continued to outperform the struggling euro - the uniform currency of 11 European nations - and the Japanese yen by wide margins. Soaring oil and gas prices also added to the volatility. The Morgan Stanley EAFE® index - which tracks the performance of stock markets in Europe, Australasia and the Far East - fell 2.72% during the period. Europe's economic recovery remained on course, but the euro's continued weakness proved to be a millstone. The Morgan Stanley Europe index had a 12-month return of 1.16%. Japan's economic recovery, on the other hand, appeared to be short-lived, or at least very, very slow in the making. The Morgan Stanley Japan index declined 11.61% during the period. Emerging markets, meanwhile, were unable to sustain the momentum they carried into early 2000 - the Morgan Stanley Emerging Markets Free index tumbled 10.33%.
(Portfolio Manager photograph)
An interview with Ian Hart, Portfolio Manager of Fidelity Advisor Europe Capital Appreciation Fund
Q. How did the fund perform, Ian?
A. For the 12-month period that ended October 31, 2000, the fund's Institutional Class shares posted a total return of 5.94%. By comparison, the Morgan Stanley Capital International Europe Index returned 1.16% for the same period, while the European funds average, as tracked by Lipper Inc., returned 12.53%.
Q. What were the major factors that influenced this performance?
A. The fund lost some of its earlier gains during the second half of the period. This came as a result of the major downward correction that began in U.S. markets at mid-year and led to downward momentum in Europe and elsewhere. The bubble burst for many of the technology, media and telecommunications names that had contributed so greatly to performance in the past couple of years. Fortunately, by underweighting the fund's exposure to these sectors, it missed some of the downside. The markets remained volatile, and there really were no clear sector themes driving performance. The fund was able to beat the index almost entirely because of favorable stock picking. I found positive company stories in a variety of sectors, including financial services, pharmaceuticals, consumer goods and even in technology. The markets were very unforgiving of companies that missed their earnings projections, so with assistance from Fidelity's European research team based in London, I focused even more intently on owning attractively priced companies that I felt were not going to disappoint on their numbers. The fund lagged the Lipper average, which was more aggressively positioned in the high-growth sectors that drove performance early in the period.
Annual Report
Fund Talk: The Manager's Overview - continued
Q. What else did you do to position the fund for this period of market correction and volatility?
A. I became for the most part sector-agnostic and focused on companies that I believed would deliver growth at a reasonable price. However, as mentioned earlier, I did reduce the fund's overall exposure to the telecommunications, media and technology sectors, where it previously was overweighted, and I also reduced its positions in the energy sector. At the same time, I increased holdings in the retail and financial services sectors, but did so on the basis of company-specific stories, rather than part of any broad sector themes.
Q. Which individual holdings helped performance the most during the period?
A. Swatch, the Swiss watch manufacturer, made a strong contribution as the company continued to deliver earnings that exceeded the market's expectations. Nutreco, a Dutch fish farming and animal foods company, also showed surprisingly attractive earnings growth, and its stock price rose as the market began to recognize the company's growth potential. Wella, a German hair care company, was able to benefit from internal improvements that helped drive attractive earnings growth and was rewarded with robust stock price appreciation. Amvescap, a U.K.-based fund manager with significant business in the U.S., also did extremely well as its profitability improved.
Q. What holdings were disappointments - especially in the latter part of the period?
A. Germany's Deutsche Telekom, which I've since sold, and the U.K.'s Vodaphone Group were two telecommunications concerns that were caught in the second-half's downdraft. But, of course, many of the high-flying stocks in the telecom, media and technology sectors have come down quite a lot from their recent historical highs. Valuations for many of these companies were quite high, but when the growth assumptions that supported those valuations began to be downgraded, the bubble finally burst. And as I said earlier, companies that missed their earnings targets were punished severely.
Annual Report
Fund Talk: The Manager's Overview - continued
Q. What's your outlook for the next six months, Ian?
A. Despite the likelihood of continued volatility in the broad market, I think there are still plenty of attractive investment opportunities in Europe. I will remain focused on bottom-up stock picking, looking for ideas across a wide range of industry sectors. I am greatly assisted in this task by Fidelity's European research team in London. This invaluable research asset gives me many more feet on the ground in Europe, kicking the tires and providing the necessary due diligence that allows me to both keep on top of existing stocks and generate new stock ideas.
The views expressed in this report reflect those of the portfolio manager only through the end of the period of the report as stated on the cover and do not necessarily represent the views of Fidelity or any other person in the Fidelity organization. Any such views are subject to change at any time based upon market or other conditions and Fidelity disclaims any responsibility to update such views. These views may not be relied on as investment advice and, because investment decisions for a Fidelity fund are based on numerous factors, may not be relied on as an indication of trading intent on behalf of any Fidelity fund.
Fund Facts
Goal: long-term capital appreciation by investing mainly in equity securities of European issuers
Start date: December 17, 1998
Size: as of October 31, 2000, more than $35 million
Manager: Ian Hart, since April 2000; international equity analyst, 1997-2000; European equity analyst in U.K., 1994-1997; joined Fidelity in 1994
3Ian Hart discusses Europe's investment environment:
"There's some truth in the adage ´When the U.S. sneezes, the rest of the world catches cold.' The European markets certainly take their lead from the U.S., and in current terms that means that the markets on the Continent are somewhat volatile as well. Beyond this near-term volatility, I think the longer-term economic situation in Europe is relatively benign. It does not appear that the Continent is headed into recession, although it is fair to say that economic growth in Europe is forecast to lag that of the U.S. over the next 12 months.
"Economic recovery in Europe has been more a case of slow, steady improvement. Long-term, I remain positive about the structural developments that are now underway in Europe. I think it's encouraging that many European companies and politicians are looking to the U.S. business and economic models to help them solve some of their more pressing structural problems, such as reducing unemployment and improving productivity. European governments are pursuing such issues as tax reform, deregulation and privatization of industry, pension reform, and a whole range of initiatives aimed at moving Europe toward the free-market type of economy that exists in the U.S. I think this bodes well for economic growth in the region over the long term."
Annual Report
|
Top Five Stocks as of October 31, 2000 |
||
|
|
% of fund's |
% of fund's net assets |
|
TotalFinaElf SA Class B (France, Oil & Gas) |
6.0 |
5.4 |
|
Vodafone Group PLC (United Kingdom, Cellular) |
5.1 |
5.1 |
|
Royal Dutch Petroleum Co. (Hague Registry) (Netherlands, Oil & Gas) |
3.8 |
2.3 |
|
Castorama Dubois Investissements SA (France, Retail & Wholesale, Miscellaneous) |
3.5 |
1.1 |
|
Nokia AB (Finland, Communications Equipment) |
3.5 |
3.2 |
|
|
21.9 |
17.1 |
|
Top Five Market Sectors as of October 31, 2000 |
||
|
|
% of fund's |
% of fund's net assets |
|
Finance |
26.1 |
16.7 |
|
Retail & Wholesale |
12.5 |
3.2 |
|
Utilities |
11.6 |
20.3 |
|
Energy |
10.6 |
10.9 |
|
Technology |
8.1 |
13.2 |
|
Top Five Countries as of October 31, 2000 |
||
|
(excluding cash equivalents) |
% of fund's |
% of fund's net assets |
|
United Kingdom |
24.2 |
28.2 |
|
France |
21.4 |
20.3 |
|
Netherlands |
12.0 |
9.3 |
|
Switzerland |
9.6 |
6.4 |
|
Germany |
8.1 |
10.2 |
|
Percentages are adjusted for the effect of open futures contracts, if applicable. |
|
Asset Allocation (% of fund's net assets) |
|||||||
|
As of October 31, 2000 |
As of April 30, 2000 |
||||||
|
Stocks 98.6% |
|
|
Stocks 93.4% |
|
||
|
Short-Term |
|
|
Short-Term |
|
||
Annual Report
Showing Percentage of Net Assets
|
Common Stocks - 98.3% |
|||
|
Shares |
Value (Note 1) |
||
|
Belgium - 0.4% |
|||
|
KBC Bancassurance Holding NV |
3,600 |
$ 149,117 |
|
|
Denmark - 1.4% |
|||
|
Bang & Olufsen Holding AS |
3,500 |
170,902 |
|
|
Novo-Nordisk AS Series B (a) |
1,551 |
329,125 |
|
|
TOTAL DENMARK |
500,027 |
||
|
Finland - 4.1% |
|||
|
Nokia AB |
28,840 |
1,232,910 |
|
|
UPM-Kymmene Corp. |
7,400 |
209,475 |
|
|
TOTAL FINLAND |
1,442,385 |
||
|
France - 21.4% |
|||
|
Alcatel SA (RFD) (a) |
8,206 |
511,849 |
|
|
Aventis SA (France) |
5,000 |
360,313 |
|
|
AXA SA de CV |
4,635 |
613,733 |
|
|
BNP Paribas SA |
5,523 |
476,293 |
|
|
Castorama Dubois Investissements SA |
6,146 |
1,249,927 |
|
|
Groupe Danone (a) |
940 |
131,489 |
|
|
ILOG SA sponsored ADR (a) |
5,200 |
156,000 |
|
|
Integra SA (a) |
8,400 |
68,091 |
|
|
Pernod-Ricard |
3,100 |
142,089 |
|
|
Royal Canin SA |
1,600 |
144,636 |
|
|
Sanofi-Synthelabo SA |
7,000 |
368,379 |
|
|
Societe Generale Class A (a) |
2,104 |
119,475 |
|
|
Suez Lyonnaise des Eaux (France) |
1,908 |
291,188 |
|
|
Television Francaise 1 SA (a) |
1,710 |
93,328 |
|
|
TotalFinaElf SA Class B |
14,917 |
2,136,857 |
|
|
Vivendi Environment (a) |
9,100 |
339,860 |
|
|
Vivendi SA |
5,125 |
368,453 |
|
|
TOTAL FRANCE |
7,571,960 |
||
|
Germany - 7.8% |
|||
|
ACG AG |
1,200 |
63,151 |
|
|
Allianz AG (Reg.) |
1,333 |
452,071 |
|
|
Deutsche Lufthansa AG (Reg.) |
13,500 |
263,552 |
|
|
Douglas Holding AG |
3,100 |
92,358 |
|
|
Fresenius Medical Care AG |
2,900 |
230,817 |
|
|
Fresenius Medical Care AG sponsored ADR |
1 |
27 |
|
|
Karstadt Quelle AG |
24,000 |
783,476 |
|
|
Muenchener Ruckversicherungs-Gesellschaft AG (Reg.) |
1,067 |
335,551 |
|
|
Software AG |
1,700 |
121,786 |
|
|
Common Stocks - continued |
|||
|
Shares |
Value (Note 1) |
||
|
Germany - continued |
|||
|
United Internet AG (a) |
3,000 |
$ 19,302 |
|
|
Wella AG |
11,090 |
421,711 |
|
|
TOTAL GERMANY |
2,783,802 |
||
|
Greece - 0.6% |
|||
|
Antenna TV SA sponsored ADR (a) |
10,800 |
213,300 |
|
|
Ireland - 0.7% |
|||
|
Irish Life & Permanent PLC |
24,200 |
242,589 |
|
|
Israel - 0.3% |
|||
|
Orad Hi-Tech Systems Ltd. |
3,200 |
96,016 |
|
|
Italy - 5.6% |
|||
|
Alleanza Assicurazioni Spa |
48,800 |
644,766 |
|
|
Banca Intesa Spa |
112,300 |
469,452 |
|
|
Banca Nazionale del Lavoro (BNL) |
51,300 |
165,465 |
|
|
Saipem Spa |
20,500 |
107,726 |
|
|
Telecom Italia Mobile Spa |
39,600 |
336,965 |
|
|
Telecom Italia Spa |
21,400 |
251,450 |
|
|
TOTAL ITALY |
1,975,824 |
||
|
Netherlands - 12.0% |
|||
|
Hunter Douglas NV |
4,800 |
137,709 |
|
|
ING Groep NV (Certificaten Van Aandelen) |
12,553 |
862,201 |
|
|
Koninklijke Ahold NV |
35,584 |
1,033,873 |
|
|
Koninklijke Philips Electronics NV |
3,510 |
137,971 |
|
|
Numico NV |
4,300 |
201,106 |
|
|
Nutreco Holding NV |
7,800 |
336,329 |
|
|
Oce NV |
12,900 |
192,164 |
|
|
Royal Dutch Petroleum Co. (Hague Registry) |
22,800 |
1,353,750 |
|
|
TOTAL NETHERLANDS |
4,255,103 |
||
|
Norway - 1.6% |
|||
|
Norsk Hydro AS (a) |
7,200 |
285,923 |
|
|
TANDBERG ASA (a) |
10,400 |
275,334 |
|
|
TOTAL NORWAY |
561,257 |
||
|
Spain - 5.7% |
|||
|
Aldeasa SA |
3,200 |
60,570 |
|
|
Altadis SA |
20,300 |
304,121 |
|
|
Banco Santander Central Hispano SA |
71,160 |
689,775 |
|
|
Cortefiel SA |
8,800 |
157,979 |
|
|
Common Stocks - continued |
|||
|
Shares |
Value (Note 1) |
||
|
Spain - continued |
|||
|
Sogecable SA (a) |
3,100 |
$ 75,781 |
|
|
Telefonica SA (a) |
38,105 |
726,759 |
|
|
TOTAL SPAIN |
2,014,985 |
||
|
Sweden - 1.6% |
|||
|
Tele1 Europe Holding AB (a) |
11,900 |
91,658 |
|
|
Telefonaktiebolaget LM Ericsson (B Shares) |
34,500 |
478,688 |
|
|
TOTAL SWEDEN |
570,346 |
||
|
Switzerland - 9.6% |
|||
|
Credit Suisse Group (Reg.) |
3,350 |
628,067 |
|
|
Gretag Imaging Holding AG (Reg. D) |
474 |
85,175 |
|
|
Julius Baer Holding AG |
68 |
336,690 |
|
|
Nestle SA (Reg.) |
175 |
362,656 |
|
|
Novartis AG (Reg.) |
158 |
239,703 |
|
|
PubliGroupe SA (Reg.) |
3 |
1,761 |
|
|
The Swatch Group AG (Bearer) |
331 |
438,264 |
|
|
UBS AG |
2,451 |
339,527 |
|
|
Zurich Financial Services Group AG |
1,995 |
965,591 |
|
|
TOTAL SWITZERLAND |
3,397,434 |
||
|
United Kingdom - 24.2% |
|||
|
3i Group PLC |
13,300 |
301,748 |
|
|
Amvescap PLC |
18,300 |
408,554 |
|
|
AstraZeneca Group PLC (United Kingdom) |
4,900 |
233,669 |
|
|
Barclays PLC |
6,900 |
197,258 |
|
|
Boots Co. PLC |
76,680 |
611,396 |
|
|
British Land Co. PLC |
26,700 |
159,473 |
|
|
British Telecommunications PLC |
21,200 |
252,280 |
|
|
Cable & Wireless PLC |
16,900 |
238,874 |
|
|
Carlton Communications PLC |
18,600 |
149,653 |
|
|
Diageo PLC |
50,600 |
477,173 |
|
|
Lloyds TSB Group PLC |
79,700 |
811,098 |
|
|
Marconi PLC |
8,300 |
104,683 |
|
|
Rank Group PLC Class L |
46,800 |
116,017 |
|
|
Reuters Group PLC |
15,900 |
312,369 |
|
|
SMG PLC |
128,600 |
503,365 |
|
|
Smith & Nephew PLC |
36,300 |
148,926 |
|
|
SmithKline Beecham PLC |
34,300 |
447,186 |
|
|
Somerfield PLC |
138,600 |
154,715 |
|
|
SSL International PLC |
46,900 |
545,627 |
|
|
Telewest Communications PLC (a) |
60,900 |
100,647 |
|
|
Vodafone Group PLC |
427,010 |
1,817,460 |
|
|
Common Stocks - continued |
|||
|
Shares |
Value (Note 1) |
||
|
United Kingdom - continued |
|||
|
W.H. Smith PLC |
55,700 |
$ 327,031 |
|
|
WPP Group PLC |
12,900 |
172,985 |
|
|
TOTAL UNITED KINGDOM |
8,592,187 |
||
|
United States of America - 1.3% |
|||
|
Bristol-Myers Squibb Co. |
4,700 |
286,406 |
|
|
Jupiter Media Metrix, Inc. (a) |
4,900 |
66,763 |
|
|
Scientific-Atlanta, Inc. |
1,700 |
116,344 |
|
|
TOTAL UNITED STATES OF AMERICA |
469,513 |
||
|
TOTAL COMMON STOCKS (Cost $33,229,693) |
34,835,845 |
||
|
Nonconvertible Preferred Stocks - 0.3% |
|||
|
|
|
|
|
|
Germany - 0.3% |
|||
|
ProSieben Sat.1 Media AG (a) |
4,000 |
125,962 |
|
|
Cash Equivalents - 2.4% |
|||
|
|
|
|
|
|
Fidelity Cash Central Fund, 6.61% (b) |
846,203 |
846,203 |
|
|
TOTAL INVESTMENT PORTFOLIO - 101.0% (Cost $34,219,107) |
35,808,010 |
||
|
NET OTHER ASSETS - (1.0)% |
(358,649) |
||
|
NET ASSETS - 100% |
$ 35,449,361 |
||
|
Legend |
|
(a) Non-income producing |
|
(b) The rate quoted is the annualized seven-day yield of the fund at period end. A complete listing of the fund's holdings as of its most recent fiscal year end is available upon request. |
|
Income Tax Information |
|
At October 31, 2000, the aggregate |
|
At October 31, 2000, the fund had a capital loss carryforward of approx- |
See accompanying notes which are an integral part of the financial statements.
Annual Report
Statement of Assets and Liabilities
|
|
October 31, 2000 |
|
|
Assets |
|
|
|
Investment in securities, at value (cost $34,219,107) - |
|
$ 35,808,010 |
|
Receivable for investments sold |
|
685,855 |
|
Receivable for fund shares sold |
|
44,602 |
|
Dividends receivable |
|
107,811 |
|
Interest receivable |
|
7,819 |
|
Total assets |
|
36,654,097 |
|
Liabilities |
|
|
|
Payable for investments purchased |
$ 1,036,613 |
|
|
Payable for fund shares redeemed |
77,014 |
|
|
Accrued management fee |
27,549 |
|
|
Distribution fees payable |
19,529 |
|
|
Other payables and accrued expenses |
44,031 |
|
|
Total liabilities |
|
1,204,736 |
|
Net Assets |
|
$ 35,449,361 |
|
Net Assets consist of: |
|
|
|
Paid in capital |
|
$ 34,664,052 |
|
Distributions in excess of net investment income |
|
(5,530) |
|
Accumulated undistributed net realized gain (loss) on investments and foreign currency transactions |
|
(793,708) |
|
Net unrealized appreciation (depreciation) on investments and assets and liabilities in foreign currencies |
|
1,584,547 |
|
Net Assets |
|
$ 35,449,361 |
See accompanying notes which are an integral part of the financial statements.
Annual Report
Financial Statements - continued
Statement of Assets and Liabilities - continued
|
|
October 31, 2000 |
|
|
Calculation of Maximum Offering Price |
|
$11.13 |
|
Maximum offering price per share (100/94.25 of $11.13) |
|
$11.81 |
|
Class T: |
|
$11.09 |
|
Maximum offering price per share (100/96.50 of $11.09) |
|
$11.49 |
|
Class B: |
|
$10.99 |
|
Class C: |
|
$11.01 |
|
Institutional Class: |
|
$11.16 |
A Redemption price per share is equal to net asset value less any applicable contingent deferred sales charge.
See accompanying notes which are an integral part of the financial statements.
Annual Report
Financial Statements - continued
Statement of Operations
|
|
Year ended October 31, 2000 |
|
|
Investment Income Dividends |
|
$ 513,661 |
|
Interest |
|
152,952 |
|
|
|
666,613 |
|
Less foreign taxes withheld |
|
(70,512) |
|
Total income |
|
596,101 |
|
Expenses |
|
|
|
Management fee |
$ 240,209 |
|
|
Transfer agent fees |
105,666 |
|
|
Distribution fees |
217,265 |
|
|
Accounting fees and expenses |
60,452 |
|
|
Non-interested trustees' compensation |
102 |
|
|
Custodian fees and expenses |
70,051 |
|
|
Registration fees |
70,915 |
|
|
Audit |
29,131 |
|
|
Legal |
596 |
|
|
Miscellaneous |
363 |
|
|
Total expenses before reductions |
794,750 |
|
|
Expense reductions |
(17,756) |
776,994 |
|
Net investment income (loss) |
|
(180,893) |
|
Realized and Unrealized Gain (Loss) Net realized gain (loss) on: |
|
|
|
Investment securities |
50,042 |
|
|
Foreign currency transactions |
(233) |
49,809 |
|
Change in net unrealized appreciation (depreciation) on: |
|
|
|
Investment securities |
(18,260) |
|
|
Assets and liabilities in foreign currencies |
(4,201) |
(22,461) |
|
Net gain (loss) |
|
27,348 |
|
Net increase (decrease) in net assets resulting |
|
$ (153,545) |
See accompanying notes which are an integral part of the financial statements.
Annual Report
Financial Statements - continued
Statement of Changes in Net Assets
|
|
Year ended |
December 17, 1998 |
|
Increase (Decrease) in Net Assets |
|
|
|
Operations |
$ (180,893) |
$ 25,819 |
|
Net realized gain (loss) |
49,809 |
(845,281) |
|
Change in net unrealized appreciation (depreciation) |
(22,461) |
1,607,008 |
|
Net increase (decrease) in net assets resulting |
(153,545) |
787,546 |
|
Distributions to shareholders from net investment income |
(30,237) |
- |
|
Share transactions - net increase (decrease) |
12,733,299 |
22,112,298 |
|
Total increase (decrease) in net assets |
12,549,517 |
22,899,844 |
|
Net Assets |
|
|
|
Beginning of period |
22,899,844 |
- |
|
End of period (including under (over) |
$ 35,449,361 |
$ 22,899,844 |
See accompanying notes which are an integral part of the financial statements.
Annual Report
Financial Highlights - Class A
|
Years ended October 31, |
2000 |
1999 E |
|
Selected Per-Share Data |
|
|
|
Net asset value, beginning of period |
$ 10.56 |
$ 10.00 |
|
Income from Investment Operations |
|
|
|
Net investment income (loss) D |
(.02) |
.05 |
|
Net realized and unrealized gain (loss) |
.62 |
.51 |
|
Total from investment operations |
.60 |
.56 |
|
Less Distributions |
|
|
|
From net investment income |
(.03) |
- |
|
Net asset value, end of period |
$ 11.13 |
$ 10.56 |
|
Total Return B, C |
5.67% |
5.60% |
|
Ratios and Supplemental Data |
|
|
|
Net assets, end of period (000 omitted) |
$ 3,501 |
$ 2,060 |
|
Ratio of expenses to average net assets |
1.97% |
2.00% A, F |
|
Ratio of expenses to average net assets after expense reductions |
1.93% G |
1.96% A, G |
|
Ratio of net investment income (loss) to average net assets |
(.14)% |
.56% A |
|
Portfolio turnover |
151% |
164% A |
A Annualized
B The total returns would have been lower had certain expenses not been reduced during the periods shown.
C Total returns do not include the one time sales charge and for periods of less than one year are not annualized.
D Net investment income (loss) per share has been calculated based on average shares outstanding during the period.
E For the period December 17, 1998 (commencement of operations) to October 31, 1999.
F FMR agreed to reimburse a portion of the class' expenses during the period. Without this reimbursement, the class' expense ratio would have been higher.
G FMR or the fund has entered into varying arrangements with third parties who either paid or reduced a portion of the class' expenses.
See accompanying notes which are an integral part of the financial statements.
Annual Report
Financial Highlights - Class T
|
Years ended October 31, |
2000 |
1999 E |
|
Selected Per-Share Data |
|
|
|
Net asset value, beginning of period |
$ 10.54 |
$ 10.00 |
|
Income from Investment Operations |
|
|
|
Net investment income (loss) D |
(.05) |
.03 |
|
Net realized and unrealized gain (loss) |
.62 |
.51 |
|
Total from investment operations |
.57 |
.54 |
|
Less Distributions |
|
|
|
From net investment income |
(.02) |
- |
|
Net asset value, end of period |
$ 11.09 |
$ 10.54 |
|
Total Return B, C |
5.40% |
5.40% |
|
Ratios and Supplemental Data |
|
|
|
Net assets, end of period (000 omitted) |
$ 15,505 |
$ 12,343 |
|
Ratio of expenses to average net assets |
2.24% |
2.25% A, F |
|
Ratio of expenses to average net assets after expense reductions |
2.20% G |
2.21% A, G |
|
Ratio of net investment income (loss) to average net assets |
(.41)% |
.31% A |
|
Portfolio turnover |
151% |
164% A |
A Annualized
B The total returns would have been lower had certain expenses not been reduced during the periods shown.
C Total returns do not include the one time sales charge and for periods of less than one year are not annualized.
D Net investment income (loss) per share has been calculated based on average shares outstanding during the period.
E For the period December 17, 1998 (commencement of operations) to October 31, 1999.
F FMR agreed to reimburse a portion of the class' expenses during the period. Without this reimbursement, the class' expense ratio would have been higher.
G FMR or the fund has entered into varying arrangements with third parties who either paid or reduced a portion of the class' expenses.
See accompanying notes which are an integral part of the financial statements.
Annual Report
Financial Highlights - Class B
|
Years ended October 31, |
2000 |
1999 E |
|
Selected Per-Share Data |
|
|
|
Net asset value, beginning of period |
$ 10.48 |
$ 10.00 |
|
Income from Investment Operations |
|
|
|
Net investment income (loss) D |
(.11) |
(.02) |
|
Net realized and unrealized gain (loss) |
.62 |
.50 |
|
Total from investment operations |
.51 |
.48 |
|
Net asset value, end of period |
$ 10.99 |
$ 10.48 |
|
Total Return B, C |
4.87% |
4.80% |
|
Ratios and Supplemental Data |
|
|
|
Net assets, end of period (000 omitted) |
$ 8,132 |
$ 3,765 |
|
Ratio of expenses to average net assets |
2.75% F |
2.75% A, F |
|
Ratio of expenses to average net assets after expense reductions |
2.71% G |
2.71% A, G |
|
Ratio of net investment income (loss) to average net assets |
(.91)% |
(.19)% A |
|
Portfolio turnover |
151% |
164% A |
A Annualized
B The total returns would have been lower had certain expenses not been reduced during the periods shown.
C Total returns do not include the contingent deferred sales charge and for periods of less than one year are not annualized.
D Net investment income (loss) per share has been calculated based on average shares outstanding during the period.
E For the period December 17, 1998 (commencement of operations) to October 31, 1999.
F FMR agreed to reimburse a portion of the class' expenses during the period. Without this reimbursement, the class' expense ratio would have been higher.
G FMR or the fund has entered into varying arrangements with third parties who either paid or reduced a portion of the class' expenses.
See accompanying notes which are an integral part of the financial statements.
Annual Report
Financial Highlights - Class C
|
Years ended October 31, |
2000 |
1999 E |
|
Selected Per-Share Data |
|
|
|
Net asset value, beginning of period |
$ 10.49 |
$ 10.00 |
|
Income from Investment Operations |
|
|
|
Net investment income (loss) D |
(.10) |
(.02) |
|
Net realized and unrealized gain (loss) |
.62 |
.51 |
|
Total from investment operations |
.52 |
.49 |
|
Net asset value, end of period |
$ 11.01 |
$ 10.49 |
|
Total Return B, C |
4.96% |
4.90% |
|
Ratios and Supplemental Data |
|
|
|
Net assets, end of period (000 omitted) |
$ 7,117 |
$ 3,894 |
|
Ratio of expenses to average net assets |
2.67% |
2.75% A, F |
|
Ratio of expenses to average net assets after expense reductions |
2.63% G |
2.71% A, G |
|
Ratio of net investment income (loss) to average net assets |
(.84)% |
(.19)% A |
|
Portfolio turnover |
151% |
164% A |
A Annualized
B The total returns would have been lower had certain expenses not been reduced during the periods shown.
C Total returns do not include the contingent deferred sales charge and for periods of less than one year are not annualized.
D Net investment income (loss) per share has been calculated based on average shares outstanding during the period.
E For the period December 17, 1998 (commencement of operations) to October 31, 1999.
F FMR agreed to reimburse a portion of the class' expenses during the period. Without this reimbursement, the class' expense ratio would have been higher.
G FMR or the fund has entered into varying arrangements with third parties who either paid or reduced a portion of the class' expenses.
See accompanying notes which are an integral part of the financial statements.
Annual Report
Financial Highlights - Institutional Class
|
Years ended October 31, |
2000 |
1999 E |
|
Selected Per-Share Data |
|
|
|
Net asset value, beginning of period |
$ 10.58 |
$ 10.00 |
|
Income from Investment Operations |
|
|
|
Net investment income D |
.02 |
.07 |
|
Net realized and unrealized gain (loss) |
.61 |
.51 |
|
Total from investment operations |
.63 |
.58 |
|
Less Distributions |
|
|
|
From net investment income |
(.05) |
- |
|
Net asset value, end of period |
$ 11.16 |
$ 10.58 |
|
Total Return B, C |
5.94% |
5.80% |
|
Ratios and Supplemental Data |
|
|
|
Net assets, end of period (000 omitted) |
$ 1,193 |
$ 838 |
|
Ratio of expenses to average net assets |
1.70% |
1.75% A, F |
|
Ratio of expenses to average net assets after expense reductions |
1.66% G |
1.71% A, G |
|
Ratio of net investment income to average net assets |
.14% |
.81% A |
|
Portfolio turnover |
151% |
164% A |
A Annualized
B Total returns for periods of less than one year are not annualized.
C The total returns would have been lower had certain expenses not been reduced during the periods shown.
D Net investment income per share has been calculated based on average shares outstanding during the period.
E For the period December 17, 1998 (commencement of operations) to October 31, 1999.
F FMR agreed to reimburse a portion of the class' expenses during the period. Without this reimbursement, the class' expense ratio would have been higher.
G FMR or the fund has entered into varying arrangements with third parties who either paid or reduced a portion of the class' expenses.
See accompanying notes which are an integral part of the financial statements.
Annual Report
For the period ended October 31, 2000
1. Significant Accounting Policies.
Fidelity Advisor Europe Capital Appreciation Fund(the fund) is a fund of Fidelity Advisor Series VIII(the trust) and is authorized to issue an unlimited number of shares. The trust is registered under the Investment Company Act of 1940, as amended (the 1940 Act), as an open-end management investment company organized as a Massachusetts business trust.
The fund offers Class A, Class T, Class B, Class C, and Institutional Class shares, each of which has equal rights as to assets and voting privileges. Each class has exclusive voting rights with respect to matters that affect that class. Class B shares will automatically convert to Class A shares after a holding period of seven years from the initial date of purchase. Investment income, realized and unrealized capital gains and losses, the common expenses of the fund, and certain fund-level expense reductions, if any, are allocated on a pro rata basis to each class based on the relative net assets of each class to the total net assets of the fund. Each class of shares differs in its respective distribution, transfer agent, and certain other class-specific fees, expenses, and expense reductions.
The financial statements have been prepared in conformity with generally accepted accounting principles which require management to make certain estimates and assumptions at the date of the financial statements. The following summarizes the significant accounting policies of the fund:
Security Valuation. Securities for which quotations are readily available are valued using the official closing price or at the last sale price in the principal market in which they are traded. If the last sale price (on the local exchange) is unavailable, the last evaluated quote or closing bid price normally is used. If trading or events occurring in other markets after the close of the principal market in which securities are traded are expected to materially affect the value of those securities, then they are valued at their fair value taking this trading or these events into account. Fair value is determined in good faith under consistently applied procedures under the general supervision of the Board of Trustees. Securities for which quotations are not readily available are valued primarily using dealer-supplied valuations or at their fair value. Short-term securities with remaining maturities of sixty days or less for which quotations are not readily available are valued at amortized cost or original cost plus accrued interest, both of which approximate current value. Investments in open-end investment companies are valued at their net asset value each business day.
Foreign Currency Translation. The accounting records of the fund are maintained in U.S. dollars. Investment securities and other assets and liabilities denominated in a foreign currency are translated into U.S. dollars at the prevailing rates of exchange at period end. Purchases and sales of securities, income receipts and expense payments are translated into U.S. dollars at the prevailing exchange rate on the respective dates of the transactions.
Annual Report
Notes to Financial Statements - continued
1. Significant Accounting Policies - continued
Foreign Currency Translation - continued
Net realized gains and losses on foreign currency transactions represent net gains and losses from sales and maturities of foreign currency contracts, disposition of foreign currencies, the difference between the amount of net investment income accrued and the U.S. dollar amount actually received, and gains and losses between trade and settlement date on purchases and sales of securities. The effects of changes in foreign currency exchange rates on investments in securities are included with the net realized and unrealized gain or loss on investment securities.
Income Taxes. As a qualified regulated investment company under Subchapter M of the Internal Revenue Code, the fund is not subject to U.S. federal income taxes to the extent that it distributes substantially all of its taxable income for its fiscal year. The fund may be subject to foreign taxes on income and gains on investments which are accrued based upon the fund's understanding of the tax rules and regulations that exist in the markets in which it invests. Foreign governments may also impose taxes on other payments or transactions with respect to foreign securities. The fund accrues such taxes as applicable. The schedule of investments includes information regarding income taxes under the caption "Income Tax Information."
Investment Income. Dividend income is recorded on the ex-dividend date, except certain dividends from foreign securities where the ex-dividend date may have passed, are recorded as soon as the fund is informed of the ex-dividend date. Non-cash dividends included in dividend income, if any, are recorded at the fair market value of the securities received. Interest income is accrued as earned. Investment income is recorded net of foreign taxes withheld where recovery of such taxes is uncertain.
Expenses. Most expenses of the trust can be directly attributed to a fund. Expenses which cannot be directly attributed are apportioned among the funds in the trust.
Distributions to Shareholders. Distributions are recorded on the ex-dividend date. Income dividends and capital gain distributions are declared separately for each class.
Income and capital gain distributions are determined in accordance with income tax regulations which may differ from generally accepted accounting principles. These differences, which may result in distribution reclassifications, are primarily due to differing treatments for foreign currency transactions, passive foreign investment companies (PFIC), net operating losses and losses deferred due to wash sales.
Permanent book and tax basis differences relating to shareholder distributions will result in reclassifications to paid in capital. Distributions in excess of net investment income and accumulated undistributed net realized gain (loss) on investments and foreign currency transactions may include temporary book and tax basis differences which will reverse in a subsequent period. Any taxable income or gain remaining at fiscal year end is distributed in the following year.
Annual Report
Notes to Financial Statements - continued
1. Significant Accounting Policies - continued
Security Transactions. Security transactions are accounted for as of trade date. Gains and losses on securities sold are determined on the basis of identified cost.
2. Operating Policies.
Foreign Currency Contracts. The fund generally uses foreign currency contracts to facilitate transactions in foreign-denominated securities. Losses may arise from changes in the value of the foreign currency or if the counterparties do not perform under the contracts' terms. The U.S. dollar value of foreign currency contracts is determined using contractual currency exchange rates established at the time of each trade.
Joint Trading Account. Pursuant to an Exemptive Order issued by the Securities and Exchange Commission (the SEC), the fund, along with other affiliated entities of Fidelity Management & Research Company (FMR), may transfer uninvested cash balances into one or more joint trading accounts. These balances are invested in one or more repurchase agreements for U.S. Treasury or Federal Agency obligations.
Repurchase Agreements. The underlying U.S. Treasury, Federal Agency, or other obligations found to be satisfactory by FMR are transferred to an account of the fund, or to the Joint Trading Account, at a custodian bank. The securities are marked-to-market daily and maintained at a value at least equal to the principal amount of the repurchase agreement (including accrued interest). FMR, the fund's investment adviser, is responsible for determining that the value of the underlying securities remains in accordance with the market value requirements stated above.
3. Purchases and Sales of Investments.
Purchases and sales of securities, other than short-term securities, aggregated $59,439,802 and $46,738,099, respectively.
4. Fees and Other Transactions with Affiliates.
Management Fee. As the fund's investment adviser, FMR receives a monthly fee that is calculated on the basis of a group fee rate plus a fixed individual fund fee rate applied to the average net assets of the fund. The group fee rate is the weighted average of a series of rates and is based on the monthly average net assets of all the mutual funds advised by FMR. The rates ranged from .2167% to .5200% for the period. The annual individual fund fee rate is .45%. In the event that these rates were lower than the contractual rates in effect during the period, FMR voluntarily implemented the above rates, as they resulted in the same or a lower management fee. For the period, the management fee was equivalent to an annual rate of .72% of average net assets.
Annual Report
Notes to Financial Statements - continued
4. Fees and Other Transactions with Affiliates - continued
Sub-Adviser Fee. Beginning January 1, 2001, FMR Co. (FMRC) will serve as a sub-adviser for the fund. FMRC may provide investment research and advice and may also provide investment advisory services for the fund. FMR, on behalf of the fund, entered into sub-advisory agreements with Fidelity Management & Research (U.K.) Inc., Fidelity Management & Research (Far East) Inc., and Fidelity International Investment Advisors (FIIA). Under the sub-advisory arrangements, FMR may receive investment advice and research services and may grant the sub-advisers investment management authority to buy and sell securities. FMR pays its sub-advisers either a portion of its management fee or a fee based on costs incurred for these services.
Distribution and Service Plan. In accordance with Rule 12b-1 of the 1940 Act, the Board of Trustees have adopted separate Distribution and Service Plans with respect to each class of shares(collectively referred to as "the Plans"). Under certain of the Plans, the class pays Fidelity Distributors Corporation (FDC), an affiliate of FMR, a 12b-1 fee. A portion of this fee may be reallowed to securities dealers, banks and other financial institutions for the distribution of each class of shares and providing shareholder support services. For the period, this fee was based on the following annual rates of the average net assets of each applicable class:
|
Class A |
.25% |
|
Class T |
.50% |
|
Class B |
1.00% * |
|
Class C |
1.00% * |
* .75% represents a distribution fee and .25% represents a shareholder service fee.
For the period, each class paid FDC the following amounts, a portion of which was retained by FDC:
|
|
Paid to |
Retained |
|
Class A |
$ 9,134 |
$ 1,089 |
|
Class T |
74,158 |
677 |
|
Class B |
70,840 |
53,445 |
|
Class C |
63,133 |
29,221 |
|
|
$ 217,265 |
$ 84,432 |
Annual Report
Notes to Financial Statements - continued
4. Fees and Other Transactions with Affiliates - continued
Sales Load. FDC receives a front-end sales charge of up to 5.75% for selling Class A shares, and 3.50% for selling Class T shares of the fund. FDC receives the proceeds of contingent deferred sales charges levied on Class B share redemptions occurring within six years of purchase and Class C share redemptions occurring within one year of purchase. Contingent deferred sales charges are based on declining rates ranging from 5% to 1% for Class B and 1% for Class C, of the lesser of the cost of shares at the initial date of purchase or the net asset value of the redeemed shares, excluding any reinvested dividends and capital gains. In addition, purchases of Class A and Class T shares that were subject to a finder's fee bear a contingent deferred sales charge on assets that do not remain in the fund for at least one year. The Class A and Class T contingent deferred sales charge is based on 0.25% of the lesser of the cost of shares at the initial date of purchase or the net asset value of the redeemed shares, excluding any reinvested dividends and capital gains. A portion of the sales charges paid to FDC is paid to securities dealers, banks and other financial institutions.
For the period, sales charge amounts paid to and retained by FDC were as follows:
|
|
Paid to |
Retained |
|
Class A |
$ 30,764 |
$ 16,053 |
|
Class T |
41,937 |
11,422 |
|
Class B |
23,439 |
23,439 * |
|
Class C |
4,979 |
4,979 * |
|
|
$ 101,119 |
$ 55,893 |
* When Class B and Class C shares are initially sold, FDC pays commissions from its own resources to securities dealers,
banks, and other financial institutions through which the sales are made.
Transfer Agent Fees. Fidelity Investments Institutional Operations Company, Inc., (FIIOC), an affiliate of FMR, is the transfer, dividend disbursing and shareholder servicing agent (collectively referred to as the transfer agent) for each class of the fund. FIIOC receives account fees and asset-based fees that vary according to the account size and
Annual Report
Notes to Financial Statements - continued
4. Fees and Other Transactions with Affiliates - continued
Transfer Agent Fees - continued
type of account of the shareholders of the respective classes of the fund. FIIOC pays for typesetting, printing and mailing of all shareholder reports, except proxy statements. For the period, the following amounts were paid to FIIOC:
|
|
Amount |
% of |
|
Class A |
$ 11,018 |
.30 |
|
Class T |
47,502 |
.32 |
|
Class B |
27,872 |
.39 |
|
Class C |
15,847 |
.25 |
|
Institutional Class |
3,427 |
.28 |
|
|
$ 105,666 |
|
Accounting Fees. Fidelity Service Company, Inc., an affiliate of FMR, maintains the fund's accounting records. The fee is based on the level of average net assets for the month plus out-of-pocket expenses.
Fidelity Cash Central Fund. Pursuant to an Exemptive Order issued by the SEC, the fund may invest in the Fidelity Cash Central Fund (the Cash Fund) managed by Fidelity Investments Money Management, Inc., an affiliate of FMR. The Cash Fund is an open-end money market fund available only to investment companies and other accounts managed by FMR and its affiliates. The Cash Fund seeks preservation of capital, liquidity, and current income. Income distributions from the Cash Fund are declared daily and paid monthly from net investment income. Income distributions earned by the fund are recorded as interest income in the accompanying financial statements.
Brokerage Commissions. The fund placed a portion of its portfolio transactions with brokerage firms which are affiliates of FMR. The commissions paid to these affiliated firms were $26 for the period.
Annual Report
Notes to Financial Statements - continued
5. Expense Reductions.
FMR voluntarily agreed to reimburse operating expenses (excluding interest, taxes, certain securities lending fees, brokerage commissions and extraordinary expenses, if any) above the following annual rates or range of annual rates of average net assets for each of the following classes:
|
|
FMR |
Reimbursement |
|
Class B |
2.75% |
$ 4,817 |
FMR has also directed certain portfolio trades to brokers who paid a portion of the fund's expenses. For the period, the fund's expenses were reduced by $12,939 under this arrangement.
6. Distributions to Shareholders.
Distributions to shareholders of each class were as follows:
|
|
Year ended October 31, |
|
|
2000 |
|
From net investment income |
|
|
Class A |
$ 6,069 |
|
Class T |
20,045 |
|
Institutional Class |
4,123 |
|
Total |
$ 30,237 |
Annual Report
Notes to Financial Statements - continued
7. Share Transactions.
Transactions for each class of shares were as follows:
|
|
Shares |
Dollars |
||
|
|
Year ended October 31, |
December 17, 1998 |
Year ended October 31, |
December 17, 1998 |
|
|
2000 |
1999 |
2000 |
1999 |
|
|
|
|
|
|
|
Class A |
373,657 |
242,665 |
$ 4,565,707 |
$ 2,460,326 |
|
Reinvestment of distributions |
506 |
- |
5,777 |
- |
|
Shares redeemed |
(254,574) |
(47,628) |
(3,013,956) |
(483,630) |
|
Net increase (decrease) |
119,589 |
195,037 |
$ 1,557,528 |
$ 1,976,696 |
|
Class T |
1,077,009 |
1,472,795 |
$ 12,883,109 |
$ 14,972,579 |
|
Reinvestment of distributions |
1,710 |
- |
19,490 |
- |
|
Shares redeemed |
(851,689) |
(301,829) |
(9,965,209) |
(3,050,024) |
|
Net increase (decrease) |
227,030 |
1,170,966 |
$ 2,937,390 |
$ 11,922,555 |
|
Class B |
588,134 |
399,772 |
$ 7,107,623 |
$ 4,048,052 |
|
Shares redeemed |
(207,224) |
(40,709) |
(2,542,655) |
(414,433) |
|
Net increase (decrease) |
380,910 |
359,063 |
$ 4,564,968 |
$ 3,633,619 |
|
Class C |
438,409 |
395,362 |
$ 5,321,772 |
$ 4,017,324 |
|
Shares redeemed |
(163,047) |
(24,007) |
(1,979,745) |
(243,373) |
|
Net increase (decrease) |
275,362 |
371,355 |
$ 3,342,027 |
$ 3,773,951 |
|
Institutional Class |
63,574 |
375,401 |
$ 753,492 |
$ 3,858,159 |
|
Reinvestment of distributions |
216 |
- |
2,469 |
- |
|
Shares redeemed |
(36,090) |
(296,195) |
(424,575) |
(3,052,682) |
|
Net increase (decrease) |
27,700 |
79,206 |
$ 331,386 |
$ 805,477 |
Annual Report
To the Trustees of Fidelity Advisor Series VIII and Shareholders of Fidelity Advisor Europe Capital Appreciation Fund:
We have audited the accompanying statement of assets and liabilities of Fidelity Advisor Europe Capital Appreciation Fund, (the Fund), a fund of Fidelity Advisor Series VIII (the Trust), including the portfolio of investments, as of October 31, 2000, and the related statement of operations for the year then ended, the statement of changes in net assets, and the financial highlights for each of the two years in the period then ended. These financial statements and financial highlights are the responsibility of the Fund's management. Our responsibility is to express an opinion on these financial statements and financial highlights based on our audits.
We conducted our audits in accordance with auditing standards generally accepted in the United States of America. Those standards require that we plan and perform the audit to obtain reasonable assurance about whether the financial statements and financial highlights are free of material misstatement. An audit includes examining, on a test basis, evidence supporting the amounts and disclosures in the financial statements. Our procedures included con-firmation of securities owned as of October 31, 2000, by correspondence with the custodian and brokers; where replies were not received from brokers, we performed other auditing procedures. An audit also includes assessing the accounting principles used and significant estimates made by management, as well as evaluating the overall financial statement presentation. We believe that our audits provide a reasonable basis for our opinion.
In our opinion, the financial statements and financial highlights referred to above present fairly, in all material respects, the financial position of Fidelity Advisor Europe Capital Appreciation Fund as of October 31, 2000, the results of its operations for the year then ended, the changes in its net assets, and its financial highlights for each of the two years in the period then ended, in conformity with accounting principles generally accepted in the United States of America.
/s/DELOITTE & TOUCHE LLP
DELOITTE & TOUCHE LLP
Boston, Massachusetts
December 8, 2000
Annual Report
The amounts per share which represent income derived from sources within, and taxes paid to, foreign countries or possessions of the United States are as follows:
|
|
Pay Date |
Income |
Taxes |
|
|
Institutional Class |
12/6/99 |
$0.07 |
$0.02 |
|
The fund will notify shareholders in January 2001 of amounts for use in preparing 2000 income tax returns.
Annual Report
Annual Report
Annual Report
Annual Report
Annual Report
Annual Report
Investment Adviser
Fidelity Management & Research Company
Boston, MA
Investment Sub-Advisers
Fidelity Management & Research
(U.K.) Inc.
Fidelity Management & Research
(Far East) Inc.
Fidelity International
Investment Advisors
Fidelity Investments Japan Limited
Fidelity International Investment Advisors (U.K.) Limited
Officers
Edward C. Johnson 3d, President
Robert C. Pozen, Senior Vice President
Robert A. Lawrence, Vice President
Greg Fraser, Vice President
Eric D. Roiter, Secretary
Robert A. Dwight, Treasurer
Maria F. Dwyer, Deputy Treasurer
John H. Costello, Assistant Treasurer
Thomas J. Simpson, Assistant Treasurer
Board of Trustees
Ralph F. Cox *
Phyllis Burke Davis *
Robert M. Gates *
Edward C. Johnson 3d
Donald J. Kirk *
Peter S. Lynch
Ned C. Lautenbach *
Marvin L. Mann *
William O. McCoy *
Gerald C. McDonough *
Robert C. Pozen
Thomas R. Williams *
Advisory Board
J. Michael Cook
Abigail P. Johnson
Marie L. Knowles
General Distributor
Fidelity Distributors Corporation
Boston, MA
Transfer and Shareholder
Servicing Agents
Fidelity Investments Institutional Operations Company, Inc.
Boston, MA
Custodian
State Street Bank and Trust Company
Quincy, MA
* Independent trustees
Annual Report
Focus Funds
Fidelity Advisor Consumer
Industries Fund
Fidelity Advisor Cyclical
Industries Fund
Fidelity Advisor Financial
Services Fund
Fidelity Advisor Health Care Fund
Fidelity Advisor Natural
Resources Fund
Fidelity Advisor Technology Fund
Fidelity Advisor Telecommunications & Utilities Growth Fund
Growth Funds
Fidelity Advisor Korea Fund
Fidelity Advisor Emerging Asia Fund
Fidelity Advisor Latin America Fund
Fidelity Advisor Japan Fund
Fidelity Advisor Europe Capital Appreciation Fund
Fidelity Advisor International
Capital Appreciation Fund
Fidelity Advisor Overseas Fund
Fidelity Advisor Diversified International Fund
Fidelity Advisor Global Equity Fund
Fidelity Advisor TechnoQuant®
Growth Fund
Fidelity Advisor Small Cap Fund
Fidelity Advisor Value Strategies Fund
Fidelity Advisor Mid Cap Fund
Fidelity Advisor Dynamic Capital Appreciation Fund
Fidelity Advisor Equity Growth Fund
Fidelity Advisor Large Cap Fund
Fidelity Advisor Dividend Growth Fund
Fidelity Advisor Growth
Opportunities Fund
Growth and Income Funds
Fidelity Advisor Growth & Income Fund
Fidelity Advisor Equity Income Fund
Fidelity Advisor Asset Allocation Fund
Fidelity Advisor Balanced Fund
Taxable Income Funds
Fidelity Advisor Emerging Markets Income Fund
Fidelity Advisor High Yield Fund
Fidelity Advisor High Income Fund
Fidelity Advisor Strategic Income Fund
Fidelity Advisor Mortgage
Securities Fund
Fidelity Advisor Government Investment Fund
Fidelity Advisor Intermediate Bond Fund
Fidelity Advisor Short Fixed-Income Fund
Municipal Funds
Fidelity Advisor Municipal Income Fund
Money Market Funds
Prime Fund
Treasury Fund
Tax-Exempt Fund
AEURI-ANN-1200 118644
1.728712.101
(Fidelity Investment logo)(registered trademark)
Fidelity® Advisor
Fund - Class A, Class T, Class B
and Class C
Annual Report
October 31, 2000
(2_fidelity_logos)(registered trademark)
|
President's Message |
Ned Johnson on investing strategies. |
|
|
Performance |
How the fund has done over time. |
|
|
Fund Talk |
The manager's review of fund performance, strategy and outlook. |
|
|
Investment Changes |
A summary of major shifts in the fund's investments over the past six months. |
|
|
Investments |
A complete list of the fund's investments with their market values. |
|
|
Financial Statements |
Statements of assets and liabilities,
operations, and changes in net assets, |
|
|
Notes |
Notes to the financial statements. |
|
|
Report of Independent Accountants |
The auditors' opinion. |
Standard & Poor's, S&P and S&P 500 are registered service marks of The McGraw-Hill Companies, Inc. and have been licensed for use by Fidelity Distributors Corporation.
Other third party marks appearing herein are the property of their respective owners.
All other marks appearing herein are registered or unregistered trademarks or service marks of FMR Corp. or an affiliated company.
(Recycle graphic) This report is printed on recycled paper using soy-based inks.
This report and the financial statements contained herein are submitted for the general information of the shareholders of the fund. This report is not authorized for distribution to prospective investors in the fund unless preceded or accompanied by an effective prospectus.
Mutual fund shares are not deposits or obligations of, or guaranteed by, any depository institution. Shares are not insured by the FDIC, Federal Reserve Board or any other agency, and are subject to investment risks, including possible loss of principal amount invested.
Neither the fund nor Fidelity Distributors Corporation is a bank.
For more information on any Fidelity Advisor fund, including charges and expenses, contact your investment professional for a free prospectus. Read it carefully before you invest or send money.
Annual Report
(photo_of_Edward_C_Johnson_3d)
Dear Shareholder:
A sixth-straight year of double-digit positive returns for the Dow Jones Industrial Average, NASDAQ and S&P 500® could be in jeopardy unless the U.S. stock market shows marked improvement in the final two months of 2000. Through October, all three indexes had negative year-to-date returns. On the other hand, most fixed-income sectors were solidly in the black. Treasuries and other long-term government securities led the way, returning nearly 14%.
While it's impossible to predict the future direction of the markets with any degree of certainty, there are certain basic principles that can help investors plan for their future needs.
First, investors are encouraged to take a long-term view of their portfolios. If you can afford to leave your money invested through the inevitable up and down cycles of the financial markets, you will greatly reduce your vulnerability to any single decline. We know from experience, for example, that stock prices have gone up over longer periods of time, have significantly outperformed other types of investments and have stayed ahead of inflation.
Second, you can further manage your investing risk through diversification. A stock mutual fund, for instance, is already diversified, because it invests in many different companies. You can increase your diversification further by investing in a number of different stock funds, or in such other investment categories as bonds. If you have a short investment time horizon, you might want to consider moving some of your investment into a money market fund, which seeks income and a stable share price by investing in high-quality, short-term investments. Of course, it's important to remember that an investment in a money market fund is not insured or guaranteed by the Federal Deposit Insurance Corporation or any other government agency. Although money market funds seek to preserve the value of your investment at $1.00 per share, it is possible to lose money by investing in these types of funds.
Finally, no matter what your time horizon or portfolio diversity, it makes good sense to follow a regular investment plan, investing a certain amount of money in a fund at the same time each month or quarter and periodically reviewing your overall portfolio. By doing so, you won't get caught up in the excitement of a rapidly rising market, nor will you buy all your shares at market highs. While this strategy - known as dollar cost averaging - won't assure a profit or protect you from a loss in a declining market, it should help you lower the average cost of your purchases. Of course, you should consider your financial ability to continue your purchases through periods of low price levels before undertaking such a strategy.
Remember to contact your investment professional if you need help with your investments.
Best regards,
/s/Edward C. Johnson 3d
Edward C. Johnson 3d
Annual Report
Fidelity Advisor Emerging Asia Fund - Class A
There are several ways to evaluate historical performance. You can look at the total percentage change in value, the average annual percentage change or the growth of a hypothetical $10,000 investment. Total return reflects the change in the value of an investment, assuming reinvestment of the class' dividend income and capital gains (the profits earned upon the sale of securities that have grown in value). The initial offering of Class A shares took place on June 16, 1999. Class A shares bear a 0.25% 12b-1 fee that is reflected in returns after June 16, 1999. Returns between March 25, 1994 and June 16, 1999 are those of Fidelity Advisor Emerging Asia Fund, Inc., the Closed-End Fund. On June 15, 1999, the Closed-End Fund reorganized as an open-end fund through a transfer of all its assets and liabilities to Fidelity Advisor Emerging Asia Fund (the fund). Shareholders of the Closed-End Fund received Class A shares of the fund in exchange for their shares of the Closed-End Fund. If Class A shares' total expenses, including its 0.25% 12b-1 fee had been reflected in the Closed-End Fund's performance, Class A's returns, prior to June 16, 1999 may have been lower. If Fidelity had not reimbursed certain class expenses, the past five year and life of fund total returns would have been lower.
Cumulative Total Returns
|
Periods ended October 31, 2000 |
|
Past 1 |
Past 5 |
Life of |
|
|
Fidelity Adv Emerging Asia - CL A |
|
-18.12% |
-6.05% |
-5.42% |
|
|
Fidelity Adv Emerging Asia - CL A |
|
-22.83% |
-11.45% |
-10.86% |
|
|
MSCI AC Asia Free ex Japan |
|
-20.11% |
-30.96% |
-27.54% |
|
|
Pacific Region ex Japan Funds Average |
|
-11.65% |
-17.16% |
n/a* |
|
Cumulative total returns show Class A's performance in percentage terms over a set period - in this case, one year, five years or since the Closed-End Fund started on March 25, 1994. For example, if you had invested $1,000 in a fund that had a 5% return over the past year, the value of your investment would be $1,050. You can compare Class A's returns to the performance of the Morgan Stanley Capital International AC (All Country) Asia Free ex Japan Index - a market capitalization-weighted index of over 491 stocks traded in 12 Asian markets, excluding Japan. To measure how Class A's performance stacked up against its peers, you can compare it to the Pacific Region ex Japan funds average, which reflects the performance of mutual funds with similar objectives tracked by Lipper Inc. The past one year average represents a peer group of 84 mutual funds. These benchmarks include reinvested dividends and capital gains, if any, and exclude the effect of sales charges.
Average Annual Total Returns
|
Periods ended October 31, 2000 |
Past 1 |
Past 5 |
Life of |
|
|
Fidelity Adv Emerging Asia - CL A |
-18.12% |
-1.24% |
-0.84% |
|
|
Fidelity Adv Emerging Asia - CL A |
-22.83% |
-2.40% |
-1.72% |
|
|
MSCI AC Asia Free ex Japan |
-20.11% |
-7.14% |
-4.76% |
|
|
Pacific Region ex Japan Funds Average |
-11.65% |
-4.29% |
n/a* |
|
Average annual total returns take Class A shares' cumulative return and show you what would have happened if Class A shares had performed at a constant rate each year.
* Not available
Annual Report
$10,000 Over Life of Fund
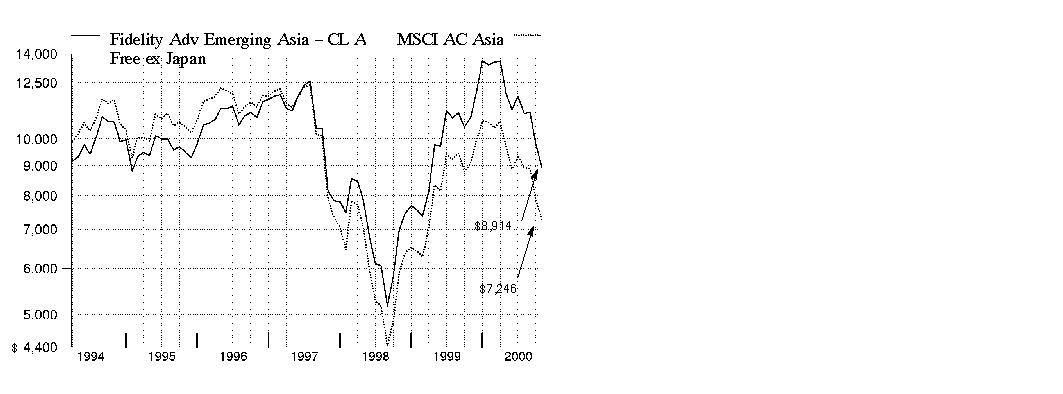
$10,000 Over Life of Fund: Let's say hypothetically that $10,000 was invested in Fidelity Advisor Emerging Asia Fund - Class A on March 25, 1994, when the Closed-End Fund started, and the current 5.75% sales charge was paid. As the chart shows, by October 31, 2000, the value of the investment would have been $8,914 - a 10.86% decrease on the initial investment. For comparison, look at how the Morgan Stanley Capital International AC Asia Free ex Japan Index did over the same period. With dividends reinvested, the same $10,000 would have been $7,246 - a 27.54% decrease.
Understanding
Performance
Many markets around the globe offer the potential for significant growth over time; however, investing in foreign markets means assuming greater risks than investing in the United States. Factors like changes in a country's financial markets, its local political and economic climate, and the fluctuating value of its currency create these risks. For these reasons an international fund's performance may be more volatile than a fund that invests exclusively in the United States. Past performance is no guarantee of future results and you may have a gain or loss when you sell your shares.
3Annual Report
Fidelity Advisor Emerging Asia Fund - Class T
There are several ways to evaluate historical performance. You can look at the total percentage change in value, the average annual percentage change or the growth of a hypothetical $10,000 investment. Total return reflects the change in the value of an investment, assuming reinvestment of the class' dividend income and capital gains (the profits earned upon the sale of securities that have grown in value). The initial offering of Class T shares took place on June 16, 1999. Class T shares bear a 0.50% 12b-1 fee that is reflected in returns after June 16, 1999. Returns between March 25, 1994 and June 16, 1999 are those of Fidelity Advisor Emerging Asia, Inc., the Closed-End Fund. On June 15, 1999, the Closed-End Fund reorganized as an open-end fund through a transfer of all of its assets and liabilities to the fund. Shareholders of the Closed-End Fund received Class A shares of the fund in exchange for their shares of the Closed-End Fund. If Class T shares total expenses, including its 0.50% 12b-1 fee, had been reflected in the Closed-End Fund's performance, Class T's returns, prior to June 16, 1999 may have been lower. If Fidelity had not reimbursed certain class expenses, the past five year and life of fund total returns would have been lower.
Cumulative Total Returns
|
Periods ended October 31, 2000 |
|
Past 1 |
Past 5 |
Life of |
|
|
Fidelity Adv Emerging Asia - CL T |
|
-18.39% |
-6.36% |
-5.73% |
|
|
Fidelity Adv Emerging Asia - CL T |
|
-21.24% |
-9.63% |
-9.03% |
|
|
MSCI AC Asia Free ex Japan |
|
-20.11% |
-30.96% |
-27.54% |
|
|
Pacific Region ex Japan Funds Average |
|
-11.65% |
-17.16% |
n/a* |
|
Cumulative total returns show Class T's performance in percentage terms over a set period - in this case, one year, five years or since the Closed-End Fund started on March 25, 1994. For example, if you had invested $1,000 in a fund that had a 5% return over the past year, the value of your investment would be $1,050. You can compare Class T's returns to the performance of the Morgan Stanley Capital International AC (All Country) Asia Free ex Japan Index - a market capitalization-weighted index of over 491 stocks traded in 12 Asian markets, excluding Japan. To measure how Class T's performance stacked up against its peers, you can compare it to the Pacific Region ex Japan funds average, which reflects the performance of mutual funds with similar objectives tracked by Lipper Inc. The past one year average represents a peer group of 84 mutual funds. These benchmarks include reinvested dividends and capital gains, if any, and exclude the effect of sales charges.
Average Annual Total Returns
|
Periods ended October 31, 2000 |
Past 1 |
Past 5 |
Life of |
|
|
Fidelity Adv Emerging Asia - CL T |
-18.39% |
-1.30% |
-0.89% |
|
|
Fidelity Adv Emerging Asia - CL T |
-21.24% |
-2.01% |
-1.42% |
|
|
MSCI AC Asia Free ex Japan |
-20.11% |
-7.14% |
-4.76% |
|
|
Pacific Region ex Japan Funds Average |
-11.65% |
-4.29% |
n/a* |
|
Average annual total returns take Class T shares' cumulative return and show you what would have happened if Class T shares had performed at a constant rate each year.
* Not available
Annual Report
$10,000 Over Life of Fund
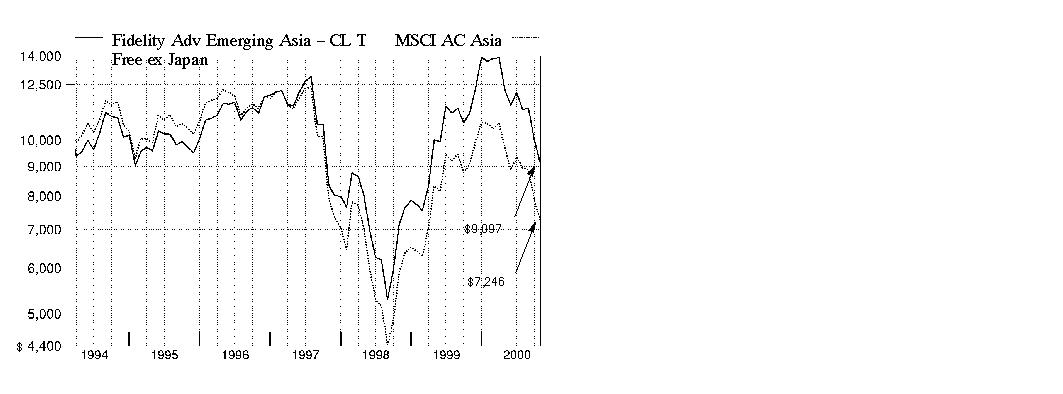
$10,000 Over Life of Fund: Let's say hypothetically that $10,000 was invested in Fidelity Advisor Emerging Asia Fund - Class T on March 25, 1994, when the Closed-End Fund started, and the current 3.50% sales charge was paid. As the chart shows, by October 31, 2000, the value of the investment would have been $9,097 - a 9.03% decrease on the initial investment. For comparison, look at how the Morgan Stanley Capital International AC Asia Free ex Japan Index did over the same period. With dividends reinvested, the same $10,000 would have been $7,246 - a 27.54% decrease.
Understanding
Performance
Many markets around the globe offer the potential for significant growth over time; however, investing in foreign markets means assuming greater risks than investing in the United States. Factors like changes in a country's financial markets, its local political and economic climate, and the fluctuating value of its currency create these risks. For these reasons an international fund's performance may be more volatile than a fund that invests exclusively in the United States. Past performance is no guarantee of future results and you may have a gain or loss when you sell your shares.
3Annual Report
Fidelity Advisor Emerging Asia Fund - Class B
There are several ways to evaluate historical performance. You can look at the total percentage change in value, the average annual percentage change or the growth of a hypothetical $10,000 investment. Total return reflects the change in the value of an investment, assuming reinvestment of the class' dividend income and capital gains (the profits earned upon the sale of securities that have grown in value). The initial offering of Class B shares took place on June 16, 1999. Class B shares bear a 1.00% 12b-1 fee that is reflected in returns after June 16, 1999. Returns between March 25, 1994 and June 16, 1999 are those of Fidelity Advisor Emerging Asia, Inc., the Closed-End Fund. On June 15, 1999, the Closed-End Fund reorganized as an open-end fund through a transfer of all of its assets and liabilities to the fund. Shareholders of the Closed-End Fund received Class A shares of the fund in exchange for their shares of the Closed-End Fund. If Class B shares' total expenses, including its 1.00% 12b-1 fee had been reflected in the Closed-End Fund's performance, Class B's returns, prior to June 16, 1999 may have been lower. Class B shares' contingent deferred sales charges included in the, past one year, past 5 year and life of fund total return figures are 5%, 2% and 0%, respectively. If Fidelity had not reimbursed certain class expenses, the past five year and life of fund total returns would have been lower.
Cumulative Total Returns
|
Periods ended October 31, 2000 |
|
Past 1 |
Past 5 |
Life of |
|
|
Fidelity Adv Emerging Asia - CL B |
|
-18.89% |
-7.12% |
-6.50% |
|
|
Fidelity Adv Emerging Asia - CL B |
|
-22.95% |
-8.86% |
-6.50% |
|
|
MSCI AC Asia Free ex Japan |
|
-20.11% |
-30.96% |
-27.54% |
|
|
Pacific Region ex Japan Funds Average |
|
-11.65% |
-17.16% |
n/a* |
|
Cumulative total returns show Class B's performance in percentage terms over a set period - in this case, one year, five years or since the Closed-End Fund started on March 25, 1994. For example, if you had invested $1,000 in a fund that had a 5% return over the past year, the value of your investment would be $1,050. You can compare Class B's returns to the performance of the Morgan Stanley Capital International AC (All Country) Asia Free ex Japan Index - a market capitalization-weighted index of over 491 stocks traded in 12 Asian markets, excluding Japan. To measure how Class B's performance stacked up against its peers, you can compare it to the Pacific Region ex Japan funds average, which reflects the performance of mutual funds with similar objectives tracked by Lipper Inc. The past one year average represents a peer group of 84 mutual funds. These benchmarks include reinvested dividends and capital gains, if any, and exclude the effect of sales charges.
Average Annual Total Returns
|
Periods ended October 31, 2000 |
Past 1 |
Past 5 |
Life of |
|
|
Fidelity Adv Emerging Asia - CL B |
-18.89% |
-1.47% |
-1.01% |
|
|
Fidelity Adv Emerging Asia - CL B |
-22.95% |
-1.84% |
-1.01% |
|
|
MSCI AC Asia Free ex Japan |
-20.11% |
-7.14% |
-4.76% |
|
|
Pacific Region ex Japan Funds Average |
-11.65% |
-4.29% |
n/a* |
|
Average annual total returns take Class B shares' cumulative return and show you what would have happened if Class B shares had performed at a constant rate each year.
* Not available
Annual Report
$10,000 Over Life of Fund
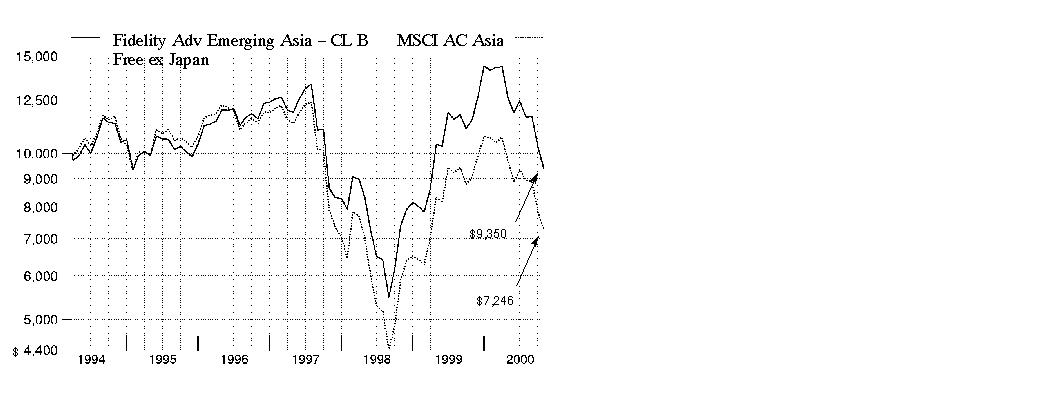
$10,000 Over Life of Fund: Let's say hypothetically that $10,000 was invested in Fidelity Advisor Emerging Asia Fund - Class B on March 25, 1994, when the Closed-End Fund started. As the chart shows, by October 31, 2000, the value of the investment, would have been $9,350 - a 6.50% decrease on the initial investment. For comparison, look at how the Morgan Stanley Capital International AC Asia Free ex Japan Index did over the same period. With dividends reinvested, the same $10,000 would have been $7,246 - a 27.54% decrease.
Understanding
Performance
Many markets around the globe offer the potential for significant growth over time; however, investing in foreign markets means assuming greater risks than investing in the United States. Factors like changes in a country's financial markets, its local political and economic climate, and the fluctuating value of its currency create these risks. For these reasons an international fund's performance may be more volatile than a fund that invests exclusively in the United States. Past performance is no guarantee of future results and you may have a gain or loss when you sell your shares.
3Annual Report
Fidelity Advisor Emerging Asia Fund - Class C
There are several ways to evaluate historical performance. You can look at the total percentage change in value, the average annual percentage change or the growth of a hypothetical $10,000 investment. Total return reflects the change in the value of an investment, assuming reinvestment of the class' dividend income and capital gains (the profits earned upon the sale of securities that have grown in value). The initial offering of Class C shares took place on June 16, 1999. Class C shares bear a 1.00% 12b-1 fee that is reflected in returns after June 16, 1999. Returns between March 25, 1994 and June 16, 1999 are those of Fidelity Advisor Emerging Asia, Inc., the Closed-End Fund. On June 15, 1999, the Closed-End Fund reorganized as an open-end fund through a transfer of all of its assets and liabilities to the fund. Shareholders of the Closed-End Fund received Class A shares of the fund in exchange for their shares of the Closed-End Fund. If Class C shares' total expenses, including its 1.00% 12b-1 fee, had been reflected in the Closed-End Fund's performance, Class C's returns, prior to June 16, 1999 may have been lower. Class C shares' contingent deferred sales charges included in the past one year, past 5 year and life of fund total return figures are 1%, 0% and 0%, respectively. If Fidelity had not reimbursed certain class expenses, the past five year and life of fund total returns would have been lower.
Cumulative Total Returns
|
Periods ended October 31, 2000 |
|
Past 1 |
Past 5 |
Life of |
|
|
Fidelity Adv Emerging Asia - CL C |
|
-18.77% |
-7.04% |
-6.42% |
|
|
Fidelity Adv Emerging Asia - CL C |
|
-19.58% |
-7.04% |
-6.42% |
|
|
MSCI AC Asia Free ex Japan |
|
-20.11% |
-30.96% |
-27.54% |
|
|
Pacific Region ex Japan Funds Average |
|
-11.65% |
-17.16% |
n/a* |
|
Cumulative total returns show Class C's performance in percentage terms over a set period - in this case, one year, five years or since the Closed-End Fund started on March 25, 1994. For example, if you had invested $1,000 in a fund that had a 5% return over the past year, the value of your investment would be $1,050. You can compare Class C's returns to the performance of the Morgan Stanley Capital International AC (All Country) Asia Free ex Japan Index - a market capitalization-weighted index of over 491 stocks traded in 12 Asian markets, excluding Japan. To measure how Class C's performance stacked up against its peers, you can compare it to the Pacific Region ex Japan funds average, which reflects the performance of mutual funds with similar objectives tracked by Lipper Inc. The past one year average represents a peer group of 84 mutual funds. These benchmarks include reinvested dividends and capital gains, if any, and exclude the effect of sales charges.
Average Annual Total Returns
|
Periods ended October 31, 2000 |
Past 1 |
Past 5 |
Life of |
|
|
Fidelity Adv Emerging Asia - CL C |
-18.77% |
-1.45% |
-1.00% |
|
|
Fidelity Adv Emerging Asia - CL C |
-19.58% |
-1.45% |
-1.00% |
|
|
MSCI AC Asia Free ex Japan |
-20.11% |
-7.14% |
-4.76% |
|
|
Pacific Region ex Japan Funds Average |
-11.65% |
-4.29% |
n/a* |
|
Average annual total returns take Class C shares' cumulative return and show you what would have happened if Class C shares had performed at a constant rate each year.
* Not available
Annual Report
$10,000 Over Life of Fund
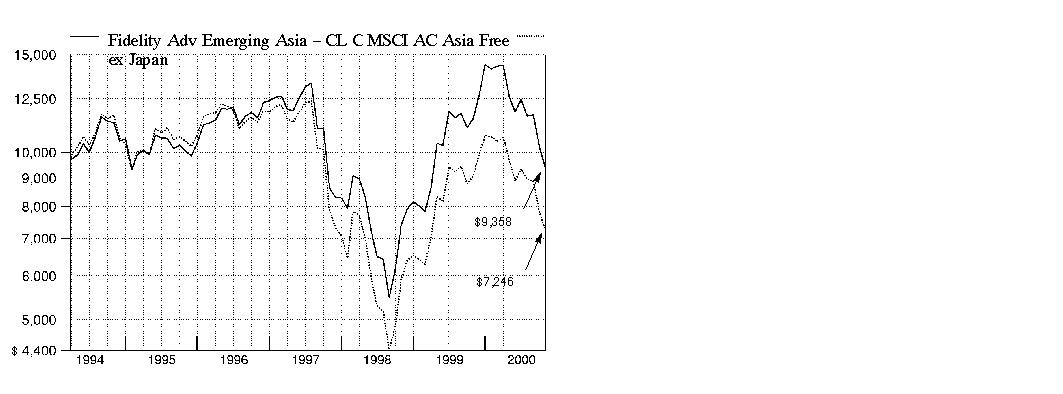
$10,000 Over Life of Fund: Let's say hypothetically that $10,000 was invested in Fidelity Advisor Emerging Asia Fund - Class C on March 25, 1994, when the Closed-End Fund started. As the chart shows, by October 31, 2000, the value of the investment, would have been $9,358 - a 6.42% decrease on the initial investment. For comparison, look at how the Morgan Stanley Capital International AC Asia Free ex Japan Index did over the same period. With dividends reinvested, the same $10,000 would have been $7,246 - a 27.54% decrease.
Understanding
Performance
Many markets around the globe offer the potential for significant growth over time; however, investing in foreign markets means assuming greater risks than investing in the United States. Factors like changes in a country's financial markets, its local political and economic climate, and the fluctuating value of its currency create these risks. For these reasons an international fund's performance may be more volatile than a fund that invests exclusively in the United States. Past performance is no guarantee of future results and you may have a gain or loss when you sell your shares.
3Annual Report
Market Recap
Emerging Asian nations - which include Hong Kong, South Korea, India, Taiwan, Singapore and Malaysia, among others - faced a 12-month stock market and economic environment remarkably similar to what U.S. investors experienced during the year ending October 31, 2000. The early months of the period were characterized by surging stock markets bolstered by new economy technology stocks and strong global economies. But in March, those prevailing conditions were skewered by a rapidly descending NASDAQ Composite Index - the shockwaves of which hit many technology-dependent emerging Asian economies. Rapidly escalating oil prices played further havoc with the stock markets of these nations, as reflected in the 12-month return of the Morgan Stanley Capital International All Country Asia Free ex Japan Index - a market capitalization-weighted index of over 500 stocks traded in 11 Asian markets, excluding Japan. The index, which gained 64.67% in 1999, fell 20.11% for the 12 months ending October 31, 2000. Country-specific difficulties compounded the challenging market environment. A weak euro depressed corporate earnings in Hong Kong. South Korea and India, which import 100% and 70% of their respective oil needs, fell prey to the high price of the commodity. Taiwan's investor sentiment suffered from belligerent statements from China about reunification, while Singapore - a major exporter of semiconductors - was tripped up by a slowdown in personal computer demand.
(Portfolio Manager photograph)
An interview with Yosawadee Polcharoen, Portfolio Manager of Fidelity Advisor Emerging Asia Fund
Q. How did the fund perform, Yosawadee?
A. During the 12 months that ended October 31, 2000, the fund's Class A, Class T, Class B and Class C shares returned -18.12%, -18.39%, -18.89% and -18.77%, respectively. This compares to a total return of -20.11% for the Morgan Stanley Capital International (MSCI) All Country Asia Free ex Japan Index. Meanwhile, the Pacific Region ex Japan funds average tracked by Lipper Inc. returned -11.65%.
Fund Talk: The Manager's Overview - continued
Q. Why did the fund perform better than the index?
Annual Report
A. It was partially due to the fund's relatively large exposure to Hong Kong, which was a stronger performer than most during the period. The Hong Kong market benefited from its low exposure to the volatile telecommunications, media and technology (TMT) sectors, as well as its strength in the property sector. The fund's comparatively lower weightings in smaller markets such as the Philippines, Indonesia and Thailand, all of which fell sharply during the period, also contributed positively to relative performance.
Q. What contributed to the fund's underperformance of its peers?
A. The fund's competitors generally had a greater exposure to the technology sector, which performed strongly in the beginning of the year. Although the fund did overweight this sector, it was more diversified than its peers.
Q. What specific sectors helped performance?
A. As I mentioned, the fund's relatively large exposure to Hong Kong property companies, especially investment companies, helped performance. These companies performed strongly as the outlook for the sector improved. This was particularly true in the office sector, where rents have been rising strongly, while new supply is expected to be limited during the next few years. One example was Cheung Kong Holdings, which saw its share price rise by 21.9% during the year. Strong stock picking in telecommunications stocks also helped fund performance. Some examples of standout performers included China Mobile and SK Telecom in South Korea. These companies' share prices rose sharply as a result of strong subscriber growth arising from domestic economic recovery, lower handset prices and increased data traffic.
Q. What would you highlight as disappointments for the fund in the past year?
A. The fund's relatively large exposure to India and its relatively small exposure to the Malaysian market hurt fund performance. The Indian market performed poorly during the year because of weakness among software companies, which were in turn hurt by the downturn in the U.S. NASDAQ market. In contrast, Malaysia performed relatively well because of its re-inclusion in the Morgan Stanley index. Finally, the fund's relatively large position in Samsung Electronics of South Korea hurt performance, as investors grew concerned that personal computer and semiconductor demand growth was slowing.
Q. What changes did you make to the fund during the 12-month period?
A. I increased the fund's exposure to selected property companies in Hong Kong and Singapore, given the improved outlook for the sector. I also increased the fund's exposure to selected pharmaceutical companies in India because of strong growth in both the domestic and overseas markets, as well as their attractive valuations. In turn, I reduced the fund's investments in petrochemical companies because of excess supply coming from the Middle East.
Annual Report
Fund Talk: The Manager's Overview - continued
Q. What's your outlook for the Southeast Asian markets?
A. In the short term, I remain cautious as markets are likely to remain volatile. I think they'll continue to be affected by the volatility in the NASDAQ market and by concerns over the impact of slowing U.S. economic growth on Asia. In the smaller markets in Asia, the disappointing pace of recovery and political uncertainty are likely to continue to hurt stock performance. Still, over the longer term, there are many reasons to be positive about the Southeast Asian markets. Valuations continue to be attractive, and the larger Asian economies are still recovering. This is especially true in China, which is experiencing strong growth in its economy and domestic consumption, and could further benefit from its inclusion in the World Trade Organization (WTO). Therefore, the potential for strong long-term growth in Asia remains positive.
The views expressed in this report reflect those of the portfolio manager only through the end of the period of the report as stated on the cover and do not necessarily represent the views of Fidelity or any other person in the Fidelity organization. Any such views are subject to change at any time based upon market or other conditions and Fidelity disclaims any responsibility to update such views. These views may not be relied on as investment advice and, because investment decisions for a Fidelity fund are based on numerous factors, may not be relied on as an indication of trading intent on behalf of any Fidelity fund.
Fund Facts
Goal: to achieve long-term capital appreciation through investments in equity and debt securities of Asian emerging market issuers
Start date: March 25, 1994
Size: as of October 31, 2000, more than $42 million
Manager: Yosawadee Polcharoen, since 1999; joined Fidelity in 1992
3Yosawadee Polcharoen on the increased trend toward outsourcing:
"Outsourcing has been a major theme in the fund, as American companies have increasingly looked to Asia to supply a wide array of products and components. Companies in the U.S. recognize that outsourcing enables them to reduce costs and capital expenditure and to become more efficient. There is great potential for growth in this arena. Currently, outsourcing demand from Europe and Japan has been relatively light, but could grow sharply in the next few years. Asia has many globally competitive companies and thus is likely to benefit from the increased outsourcing trend.
"Two examples of the outsourcing theme are Li & Fung of Hong Kong and Infosys Technologies of India. Li & Fung's and Infosys Technologies' share prices rose 113.2% and 91.2%, respectively, during the period and contributed strongly to fund performance. One of the fund's top-10 holdings, Li & Fung, is an export-trading operator and manages the supply chain network between buyers and factories. It has emerged as a major outsourcing company because its existing and potential customers are increasingly inclined to build their own brands by developing private labels. Software company Infosys Technologies - the fund's top holding in India - also is benefiting from the outsourcing trend, which has helped make it one of the strongest companies in its sector, with high margins and return on equity levels."
Annual Report
|
Top Ten Stocks as of October 31, 2000 |
||
|
|
% of fund's |
% of fund's net assets |
|
Hutchison Whampoa Ltd. |
8.0 |
7.5 |
|
China Mobile Ltd. |
6.1 |
0.0 |
|
SK Telecom Co. Ltd. |
4.2 |
1.9 |
|
Samsung Electronics Co. Ltd. |
3.9 |
6.3 |
|
Cheung Kong Holdings Ltd. |
3.8 |
2.8 |
|
Taiwan Semiconductor Manufacturing Co. Ltd. |
3.6 |
4.1 |
|
Sun Hung Kai Properties Ltd. |
2.6 |
1.4 |
|
United Microelectronics Corp. |
2.4 |
2.8 |
|
Li & Fung Ltd. |
2.2 |
1.0 |
|
DBS Group Holdings Ltd. |
2.2 |
1.8 |
|
|
39.0 |
29.6 |
|
Top Five Market Sectors as of October 31, 2000 |
||
|
|
% of fund's |
% of fund's net assets |
|
Technology |
21.4 |
31.6 |
|
Utilities |
20.2 |
18.2 |
|
Finance |
15.5 |
13.8 |
|
Construction & Real Estate |
9.7 |
5.4 |
|
Industrial Machinery & Equipment |
8.4 |
9.7 |
|
Asset Allocation (% of fund's net assets) |
|||||||
|
As of October 31, 2000 |
As of April 30, 2000 |
||||||
|
Stocks 93.1% |
|
|
Stocks 95.7% |
|
||
|
Short-Term |
|
|
Short-Term |
|
||

Annual Report
Showing Percentage of Net Assets
|
Common Stocks - 93.0% |
|||
|
Shares |
Value (Note 1) |
||
|
China - 0.6% |
|||
|
China Petroleum & Chemical Corp. (H Shares) |
640,000 |
$ 125,571 |
|
|
PetroChina Co. Ltd. (H Shares) |
562,000 |
118,195 |
|
|
TOTAL CHINA |
243,766 |
||
|
Hong Kong - 34.1% |
|||
|
Asia Satellite Telecommunications Holdings Ltd. |
42,000 |
85,099 |
|
|
Bank of East Asia Ltd. |
134,000 |
303,298 |
|
|
Cathay Pacific Airways Ltd. |
258,000 |
468,162 |
|
|
Cheung Kong Holdings Ltd. |
148,000 |
1,636,969 |
|
|
China Mobile Ltd. (a) |
427,000 |
2,615,375 |
|
|
Citic Pacific Ltd. |
81,000 |
325,124 |
|
|
CLP Holdings Ltd. |
97,000 |
452,786 |
|
|
Dao Heng Bank Group Ltd. |
47,000 |
237,473 |
|
|
Hang Seng Bank Ltd. |
53,000 |
623,593 |
|
|
Henderson Land Development Co. Ltd. |
82,000 |
353,324 |
|
|
Hong Kong & China Gas Co. Ltd. |
260,000 |
328,420 |
|
|
Hong Kong Exchanges & Clearing Ltd. |
94,000 |
163,941 |
|
|
Hongkong Land Holdings Ltd. |
225,100 |
416,435 |
|
|
Hutchison Whampoa Ltd. |
277,000 |
3,436,765 |
|
|
i-CABLE Communications Ltd. |
309,800 |
113,226 |
|
|
Johnson Electric Holdings Ltd. |
83,000 |
164,979 |
|
|
Legend Holdings Ltd. |
272,000 |
230,214 |
|
|
Li & Fung Ltd. |
506,000 |
940,888 |
|
|
Pacific Century Cyberworks Ltd. (a) |
456,320 |
351,108 |
|
|
Pacific Century Cyberworks Ltd. rights 12/15/00 |
13,689 |
0 |
|
|
Sun Hung Kai Properties Ltd. |
137,000 |
1,133,182 |
|
|
Television Broadcasts Ltd. |
44,000 |
240,935 |
|
|
TOTAL HONG KONG |
14,621,296 |
||
|
India - 11.5% |
|||
|
Dr. Reddy's Laboratories Ltd. |
11,700 |
350,138 |
|
|
HCL Technologies Ltd. |
9,800 |
248,855 |
|
|
Hero Honda Motors Ltd. |
4,000 |
75,389 |
|
|
Hindalco Industries Ltd. |
5,800 |
88,501 |
|
|
Hindustan Lever Ltd. |
144,050 |
546,587 |
|
|
Housing Development Finance Corp. Ltd. |
29,980 |
301,336 |
|
|
Hughes Software Systems Ltd. |
12,800 |
289,294 |
|
|
ICICI Bank Ltd. sponsored ADR |
33,200 |
157,700 |
|
|
Infosys Technologies Ltd. |
5,400 |
826,444 |
|
|
ITC Ltd. |
24,200 |
393,518 |
|
|
NIIT Ltd. |
4,000 |
134,640 |
|
|
Pentamedia Graphics Ltd. |
9,900 |
73,608 |
|
|
Common Stocks - continued |
|||
|
Shares |
Value (Note 1) |
||
|
India - continued |
|||
|
Ranbaxy Laboratories Ltd. |
29,000 |
$ 431,734 |
|
|
Reliance Industries Ltd. |
35,200 |
227,791 |
|
|
Satyam Infoway Ltd. sponsored ADR |
9,400 |
73,438 |
|
|
Sri Adhikari Brothers Television Network Ltd. |
3,100 |
19,803 |
|
|
State Bank of India (a) |
41,355 |
144,780 |
|
|
Sun Pharmaceutical Industries Ltd. (a) |
14,000 |
162,878 |
|
|
Videsh Sanchar Nigam Ltd. |
16,500 |
74,320 |
|
|
Wipro Ltd. |
4,000 |
203,377 |
|
|
Zee Telefilms Ltd. |
19,700 |
121,409 |
|
|
TOTAL INDIA |
4,945,540 |
||
|
Indonesia - 0.6% |
|||
|
Astra International PT (a) |
231,500 |
53,247 |
|
|
Gudang Garam PT Perusahaan |
42,000 |
45,156 |
|
|
PT Indofood Sukses Makmur (a) |
1,190,000 |
98,662 |
|
|
PT Telkomunikasi Indonesia |
56,000 |
14,378 |
|
|
Sampoerna, Hanjaya Mandala |
52,000 |
61,193 |
|
|
TOTAL INDONESIA |
272,636 |
||
|
Korea (South) - 14.1% |
|||
|
H&CB |
15,150 |
364,266 |
|
|
Hyundai Motor Co. Ltd. |
6,000 |
68,571 |
|
|
Kookmin Bank |
26,070 |
297,943 |
|
|
Kookmin Credit Card Co. Ltd. |
7,590 |
165,479 |
|
|
Korea Electric Power Corp. |
34,330 |
766,578 |
|
|
Korea Telecom |
9,700 |
571,341 |
|
|
Pohang Iron & Steel Co. Ltd. |
4,480 |
260,332 |
|
|
Samsung Electronics Co. Ltd. |
13,187 |
1,651,998 |
|
|
Samsung Securities Co. Ltd. |
4,762 |
86,239 |
|
|
SK Telecom Co. Ltd. |
8,410 |
1,792,901 |
|
|
TOTAL KOREA (SOUTH) |
6,025,648 |
||
|
Malaysia - 5.9% |
|||
|
British American Tobacco BHD |
17,000 |
155,461 |
|
|
Commerce Asset Holding BHD |
94,000 |
238,711 |
|
|
DiGi.com BHD (a) |
143,000 |
214,500 |
|
|
Edaran Otomobil Nasional BHD (EON) |
37,000 |
67,184 |
|
|
Malakoff BHD |
49,000 |
120,566 |
|
|
Malayan Banking BHD |
118,000 |
472,000 |
|
|
Public Bank BHD (For. Reg.) |
170,000 |
145,842 |
|
|
Star Publications BHD |
53,000 |
167,368 |
|
|
Tanjong PLC |
49,000 |
91,553 |
|
|
Technology Resources Industries BHD (a) |
280,000 |
226,947 |
|
|
Common Stocks - continued |
|||
|
Shares |
Value (Note 1) |
||
|
Malaysia - continued |
|||
|
Telekom Malaysia BHD |
80,000 |
$ 246,316 |
|
|
Tenaga Nasional BHD |
118,000 |
381,947 |
|
|
TOTAL MALAYSIA |
2,528,395 |
||
|
Philippines - 0.8% |
|||
|
ABS CBN Broadcasting Corp. unit |
155,000 |
119,697 |
|
|
Bank of the Phillipene Island (BPI) |
48,750 |
50,037 |
|
|
Manila Electric Co. Class B |
51,144 |
41,995 |
|
|
Philippine Long Distance Telephone |
10,000 |
151,515 |
|
|
TOTAL PHILIPPINES |
363,244 |
||
|
Singapore - 11.4% |
|||
|
Chartered Semiconductor Manufacturing Ltd. |
30,000 |
129,952 |
|
|
City Developments Ltd. |
69,000 |
318,552 |
|
|
Datacraft Asia Ltd. |
83,800 |
574,030 |
|
|
DBS Group Holdings Ltd. |
78,463 |
925,725 |
|
|
Keppel Land Ltd. |
173,000 |
258,341 |
|
|
Oversea-Chinese Banking Corp. Ltd. |
81,604 |
520,926 |
|
|
Singapore Airlines Ltd. |
70,000 |
702,194 |
|
|
Singapore Press Holdings Ltd. |
26,298 |
376,221 |
|
|
Singapore Telecommunications Ltd. |
310,000 |
514,164 |
|
|
SMRT Corp. Ltd. |
332,500 |
130,764 |
|
|
United Overseas Bank Ltd. |
56,470 |
418,416 |
|
|
TOTAL SINGAPORE |
4,869,285 |
||
|
Taiwan - 11.4% |
|||
|
Acer, Inc. |
237,500 |
197,059 |
|
|
Advanced Semiconductor Engineering, Inc. (a) |
158,195 |
181,704 |
|
|
Asustek Computer, Inc. (a) |
69,413 |
345,990 |
|
|
Bank Sinopac (a) |
275,212 |
114,601 |
|
|
Cathay Life Insurance Co. Ltd. |
61,053 |
109,631 |
|
|
Far Eastern Textile Ltd. |
117,846 |
97,050 |
|
|
GigaMedia Ltd. |
6,650 |
32,419 |
|
|
Hon Hai Precision Industries Co. Ltd. GDR (a)(c) |
14,680 |
165,884 |
|
|
Macronix International Co. Ltd. (a) |
131,580 |
187,389 |
|
|
Realtek Semiconductor Corp. |
37,000 |
138,034 |
|
|
Siliconware Precision Industries Co. Ltd. (a) |
219,296 |
167,018 |
|
|
Taishin International Bank (a) |
331,892 |
155,157 |
|
|
Taiwan Cellular Corp. |
41,000 |
85,681 |
|
|
Taiwan Semiconductor Manufacturing Co. Ltd. (a) |
514,054 |
1,559,668 |
|
|
United Microelectronics Corp. (a) |
579,400 |
1,022,471 |
|
|
Common Stocks - continued |
|||
|
Shares |
Value (Note 1) |
||
|
Taiwan - continued |
|||
|
Via Technologies, Inc. (a) |
18,000 |
$ 129,288 |
|
|
Winbond Electronics Corp. sponsored GDR (a)(c) |
21,043 |
200,961 |
|
|
TOTAL TAIWAN |
4,890,005 |
||
|
Thailand - 1.4% |
|||
|
Advanced Info Service PCL (For. Reg.) (a) |
11,400 |
94,058 |
|
|
Bangkok Bank Ltd. PCL (For. Reg.) (a) |
88,500 |
75,641 |
|
|
BEC World PCL (For. Reg.) |
21,000 |
100,513 |
|
|
PTT Exploration & Production PCL (For. Reg.) |
33,000 |
80,479 |
|
|
Siam Cement PCL (For. Reg.) (a) |
6,100 |
57,559 |
|
|
TelecomAsia Corp. PCL (a) |
174,400 |
105,336 |
|
|
TelecomAsia Corp. PCL rights 4/30/08 (a) |
190,863 |
43,594 |
|
|
Thai Farmers Bank PCL (For. Reg.) (a) |
123,000 |
63,778 |
|
|
TOTAL THAILAND |
620,958 |
||
|
United Kingdom - 1.2% |
|||
|
HSBC Holdings PLC (Reg.) |
34,176 |
492,818 |
|
|
TOTAL COMMON STOCKS (Cost $36,986,894) |
39,873,591 |
||
|
Nonconvertible Preferred Stocks - 0.1% |
|||
|
|
|
|
|
|
Taiwan - 0.1% |
|||
|
Taishin International Bank |
143,628 |
44,022 |
|
|
Cash Equivalents - 4.3% |
|||
|
|
|
|
|
|
Fidelity Cash Central Fund, 6.61% (b) |
1,812,680 |
1,812,680 |
|
|
TOTAL INVESTMENT PORTFOLIO - 97.4% (Cost $38,844,768) |
41,730,293 |
||
|
NET OTHER ASSETS - 2.6% |
1,131,280 |
||
|
NET ASSETS - 100% |
$ 42,861,573 |
||
|
Legend |
|
(a) Non-income producing |
|
(b) The rate quoted is the annualized seven-day yield of the fund at period end. A complete listing of the fund's holdings as of its most recent fiscal year end is available upon request. |
|
(c) Security exempt from registration under Rule 144A of the Securities Act of 1933. These securities may be resold in transactions exempt from registration, normally to qualified institutional buyers. At the period end, the value of these securities amounted to $366,845 or 0.9% of net assets. |
|
Income Tax Information |
|
At October 31, 2000, the aggregate |
|
At October 31, 2000, the fund had a capital loss carryforward of approximately $3,098,000 all of which will expire on October 31, 2006. |
See accompanying notes which are an integral part of the financial statements.
Annual Report
Statement of Assets and Liabilities
|
|
October 31, 2000 |
|
|
Assets |
|
|
|
Investment in securities, at value (cost $38,844,768) - |
|
$ 41,730,293 |
|
Foreign currency held at value (cost $1,151,306) |
|
1,150,901 |
|
Receivable for investments sold |
|
479,670 |
|
Receivable for fund shares sold |
|
271,474 |
|
Dividends receivable |
|
25,065 |
|
Interest receivable |
|
3,729 |
|
Total assets |
|
43,661,132 |
|
Liabilities |
|
|
|
Payable for investments purchased |
$ 470,357 |
|
|
Payable for fund shares redeemed |
24,662 |
|
|
Accrued management fee |
26,185 |
|
|
Distribution fees payable |
13,495 |
|
|
Other payables and accrued expenses |
264,860 |
|
|
Total liabilities |
|
799,559 |
|
Net Assets |
|
$ 42,861,573 |
|
Net Assets consist of: |
|
|
|
Paid in capital |
|
$ 43,907,077 |
|
Accumulated net investment (loss) |
|
(57,141) |
|
Accumulated undistributed net realized gain (loss) on investments and foreign currency transactions |
|
(3,744,996) |
|
Net unrealized appreciation (depreciation) on investments and assets and liabilities in foreign currencies |
|
2,756,633 |
|
Net Assets |
|
$ 42,861,573 |
See accompanying notes which are an integral part of the financial statements.
Annual Report
Financial Statements - continued
Statement of Assets and Liabilities - continued
|
|
October 31, 2000 |
|
|
Calculation of Maximum Offering Price |
|
$12.29 |
|
Maximum offering price per share (100/94.25 of $12.29) |
|
$13.04 |
|
Class T: |
|
$12.25 |
|
Maximum offering price per share (100/96.50 of $12.25) |
|
$12.69 |
|
Class B: |
|
$12.15 |
|
Class C: |
|
$12.16 |
|
Institutional Class: |
|
$12.34 |
A Redemption price per share is equal to net asset value less any applicable contingent deferred sales charge.
See accompanying notes which are an integral part of the financial statements.
Annual Report
Financial Statements - continued
Statement of Operations
|
|
Year ended October 31, 2000 |
|
|
Investment Income Dividends |
|
$ 839,305 |
|
Interest |
|
123,682 |
|
|
|
962,987 |
|
Less foreign taxes withheld |
|
(78,562) |
|
Total income |
|
884,425 |
|
Expenses |
|
|
|
Management fee |
$ 506,862 |
|
|
Transfer agent fees |
180,436 |
|
|
Distribution fees |
233,028 |
|
|
Accounting fees and expenses |
60,478 |
|
|
Non-interested trustees' compensation |
18,231 |
|
|
Custodian fees and expenses |
264,583 |
|
|
Registration fees |
50,269 |
|
|
Audit |
94,799 |
|
|
Interest |
14,940 |
|
|
Total expenses before reductions |
1,423,626 |
|
|
Expense reductions |
(14,639) |
1,408,987 |
|
Net investment income (loss) |
|
(524,562) |
|
Realized and Unrealized Gain (Loss) Net realized gain (loss) on: |
|
|
|
Investment securities (net of foreign taxes of $1,025,377) |
5,534,848 |
|
|
Foreign currency transactions |
51,170 |
5,586,018 |
|
Change in net unrealized appreciation (depreciation) on: |
|
|
|
Investment securities |
(14,945,217) |
|
|
Assets and liabilities in foreign currencies |
(47,470) |
(14,992,687) |
|
Net gain (loss) |
|
(9,406,669) |
|
Net increase (decrease) in net assets resulting |
|
$ (9,931,231) |
See accompanying notes which are an integral part of the financial statements.
Annual Report
Financial Statements - continued
Statement of Changes in Net Assets
|
|
Year ended
October 31, |
Year ended
October 31, |
|
Increase (Decrease) in Net Assets |
|
|
|
Operations |
$ (524,562) |
$ (167,945) |
|
Net realized gain (loss) |
5,586,018 |
5,313,599 |
|
Change in net unrealized appreciation (depreciation) |
(14,992,687) |
31,215,024 |
|
Net increase (decrease) in net assets resulting |
(9,931,231) |
36,360,678 |
|
Share transactions - net increase (decrease) |
(32,866,520) |
(17,308,082) |
|
Redemption fees |
- |
856,162 |
|
Total increase (decrease) in net assets |
(42,797,751) |
19,908,758 |
|
Net Assets |
|
|
|
Beginning of period |
85,659,324 |
65,750,566 |
|
End of period (including accumulated net investment loss of $57,141 and $40,690, respectively) |
$ 42,861,573 |
$ 85,659,324 |
See accompanying notes which are an integral part of the financial statements.
Annual Report
Financial Highlights - Class A
|
Years ended October 31, |
2000 |
1999 H |
1998 |
1997 |
1996 |
|
Selected Per-Share Data |
|
|
|
|
|
|
Net asset value, beginning |
$ 15.01 |
$ 9.61 |
$ 11.59 |
$ 15.94 |
$ 13.94 |
|
Income from Investment Operations |
|
|
|
|
|
|
Net investment income (loss) C |
(.12) |
(.03) |
.03 |
.01 |
.01 |
|
Net realized and unrealized gain (loss) |
(2.60) |
5.30 |
(1.73) |
(3.94) |
2.05 |
|
Total from investment operations |
(2.72) |
5.27 |
(1.70) |
(3.93) |
2.06 |
|
Less Distributions |
|
|
|
|
|
|
From net investment income |
- |
- |
(.07) |
(.01) |
(.01) |
|
In excess of net |
- |
- |
(.03) |
- |
(.05) |
|
From net realized gain |
- |
- |
(.13) |
(.41) |
- |
|
In excess of net realized gain |
- |
- |
(.06) |
- |
- |
|
Total distributions |
- |
- |
(.29) |
(.42) |
(.06) |
|
Redemption fees added to |
- |
.13 |
.01 G |
- F |
- |
|
Net asset value, end of period |
$ 12.29 |
$ 15.01 |
$ 9.61 |
$ 11.59 |
$ 15.94 |
|
Total Return A, B |
(18.12)% |
56.19% |
(14.43)% |
(25.23)% |
14.81% |
|
Ratios and Supplemental Data |
|
|
|
|
|
|
Net assets, end of period |
$ 31,386 |
$ 82,492 |
$ 65,751 |
$ 88,102 |
$ 134,614 |
|
Ratio of expenses to average |
1.98% |
2.04% D |
2.57% |
1.72% |
1.63% |
|
Ratio of expenses to average net assets after expense reductions |
1.96% E |
2.03% E |
2.54% E |
1.71% E |
1.63% |
|
Ratio of net investment income (loss) to average net assets |
(.69)% |
(.22)% |
.30% |
.03% |
.09% |
|
Portfolio turnover |
96% |
62% |
42% |
55% |
63% |
A The total returns would have been lower had certain expenses not been reduced during the periods shown.
B Total returns do not include the one time sales charge.
C Net investment income (loss) per share has been calculated based on average shares outstanding during the period.
D FMR agreed to reimburse a portion of the class' expenses during the period. Without this reimbursement, the class' expense ratio would have been higher.
E FMR or the fund has entered into varying arrangements with third parties who either paid or reduced a portion of the class' expenses.
F The fund incurred expenses of $.01 per share in connection with its tender offer which were offset by redemption fees collected as part of the tender offer.
G The fund incurred expenses of $.005 per share in connection with its tender offer which were offset by redemption fees collected as part of the tender offer.
H Prior to June 16, 1999, the fund operated as a closed-end management company. Shares of the fund existing at the time of its conversion to an open-ended management investment company were exchanged for Class A shares.
See accompanying notes which are an integral part of the financial statements.
Annual Report
Financial Highlights - Class T
|
Years ended October 31, |
2000 |
1999 E |
|
Selected Per-Share Data |
|
|
|
Net asset value, beginning of period |
$ 15.01 |
$ 14.44 |
|
Income from Investment Operations |
|
|
|
Net investment income (loss) D |
(.14) |
.13 |
|
Net realized and unrealized gain (loss) |
(2.62) |
.44 |
|
Total from investment operations |
(2.76) |
.57 |
|
Net asset value, end of period |
$ 12.25 |
$ 15.01 |
|
Total Return B, C |
(18.39)% |
3.95% |
|
Ratios and Supplemental Data |
|
|
|
Net assets, end of period (000 omitted) |
$ 4,165 |
$ 1,405 |
|
Ratio of expenses to average net assets |
2.17% |
2.25% A, F |
|
Ratio of expenses to average net assets after expense reductions |
2.15% G |
2.25% A |
|
Ratio of net investment income (loss) to average net assets |
(.88)% |
2.34% A |
|
Portfolio turnover |
96% |
62% |
A Annualized
B The total returns would have been lower had certain expenses not been reduced during the periods shown.
C Total returns do not include the one time sales charge and for periods of less than one year are not annualized.
D Net investment income (loss) per share has been calculated based on average shares outstanding during the period.
E For the period June 16, 1999 (commencement of sale of Class T shares) to October 31, 1999.
F FMR agreed to reimburse a portion of the class' expenses during the period. Without this reimbursement, the class' expense ratio would have been higher.
G FMR or the fund has entered into varying arrangements with third parties who either paid or reduced a portion of the class' expenses.
See accompanying notes which are an integral part of the financial statements.
Annual Report
Financial Highlights - Class B
|
Years ended October 31, |
2000 |
1999 E |
|
Selected Per-Share Data |
|
|
|
Net asset value, beginning of period |
$ 14.98 |
$ 14.44 |
|
Income from Investment Operations |
|
|
|
Net investment income (loss) D |
(.24) |
.08 |
|
Net realized and unrealized gain (loss) |
(2.59) |
.46 |
|
Total from investment operations |
(2.83) |
.54 |
|
Net asset value, end of period |
$ 12.15 |
$ 14.98 |
|
Total Return B, C |
(18.89)% |
3.74% |
|
Ratios and Supplemental Data |
|
|
|
Net assets, end of period (000 omitted) |
$ 3,664 |
$ 977 |
|
Ratio of expenses to average net assets |
2.77% |
2.75% A, F |
|
Ratio of expenses to average net assets after expense reductions |
2.75% G |
2.75% A |
|
Ratio of net investment income (loss) to average net assets |
(1.48)% |
1.38% A |
|
Portfolio turnover |
96% |
62% |
A Annualized
B The total returns would have been lower had certain expenses not been reduced during the periods shown.
C Total returns do not include the contingent deferred sales charge and for periods of less than one year are not annualized.
D Net investment income (loss) per share has been calculated based on average shares outstanding during the period.
E For the period June 16, 1999 (commencement of sale of Class B shares) to October 31, 1999.
F FMR agreed to reimburse a portion of the class' expenses during the period. Without this reimbursement, the class' expense ratio would have been higher.
G FMR or the fund has entered into varying arrangements with third parties who either paid or reduced a portion of the class' expenses.
See accompanying notes which are an integral part of the financial statements.
Annual Report
Financial Highlights - Class C
|
Years ended October 31, |
2000 |
1999 E |
|
Selected Per-Share Data |
|
|
|
Net asset value, beginning of period |
$ 14.97 |
$ 14.44 |
|
Income from Investment Operations |
|
|
|
Net investment income (loss) D |
(.23) |
.04 |
|
Net realized and unrealized gain (loss) |
(2.58) |
.49 |
|
Total from investment operations |
(2.81) |
.53 |
|
Net asset value, end of period |
$ 12.16 |
$ 14.97 |
|
Total Return B, C |
(18.77)% |
3.67% |
|
Ratios and Supplemental Data |
|
|
|
Net assets, end of period (000 omitted) |
$ 2,124 |
$ 614 |
|
Ratio of expenses to average net assets |
2.68% |
2.75% A, F |
|
Ratio of expenses to average net assets after expense reductions |
2.66% G |
2.75% A |
|
Ratio of net investment income (loss) to average net assets |
(1.40)% |
.75% A |
|
Portfolio turnover |
96% |
62% |
A Annualized
B The total returns would have been lower had certain expenses not been reduced during the periods shown.
C Total returns do not include the contingent deferred sales charge and for periods of less than one year are not annualized.
D Net investment income (loss) per share has been calculated based on average shares outstanding during the period.
E For the period June 16, 1999 (commencement of sale of Class C shares) to October 31, 1999.
F FMR agreed to reimburse a portion of the class' expenses during the period. Without this reimbursement, the class' expense ratio would have been higher.
G FMR or the fund has entered into varying arrangements with third parties who either paid or reduced a portion of the class' expenses.
See accompanying notes which are an integral part of the financial statements.
Annual Report
Financial Highlights - Institutional Class
|
Years ended October 31, |
2000 |
1999 E |
|
Selected Per-Share Data |
|
|
|
Net asset value, beginning of period |
$ 15.03 |
$ 14.44 |
|
Income from Investment Operations |
|
|
|
Net investment income (loss) D |
(.03) |
.05 |
|
Net realized and unrealized gain (loss) |
(2.66) |
.54 |
|
Total from investment operations |
(2.69) |
.59 |
|
Net asset value, end of period |
$ 12.34 |
$ 15.03 |
|
Total Return B, C |
(17.90)% |
4.09% |
|
Ratios and Supplemental Data |
|
|
|
Net assets, end of period (000 omitted) |
$ 1,523 |
$ 172 |
|
Ratio of expenses to average net assets |
1.45% |
1.75% A, F |
|
Ratio of expenses to average net assets after expense reductions |
1.42% G |
1.75% A |
|
Ratio of net investment income (loss) to average net assets |
(.16)% |
.90% A |
|
Portfolio turnover |
96% |
62% |
A Annualized
B The total returns would have been lower had certain expenses not been reduced during the periods shown.
C Total returns for periods of less than one year are not annualized.
D Net investment income (loss) per share has been calculated based on average shares outstanding during the period.
E For the period June 16, 1999 (commencement of sale of Institutional Class shares) to October 31, 1999.
F FMR agreed to reimburse a portion of the class' expenses during the period. Without this reimbursement, the class' expense ratio would have been higher.
G FMR or the fund has entered into varying arrangements with third parties who either paid or reduced a portion of the class' expenses.
See accompanying notes which are an integral part of the financial statements.
Annual Report
For the period ended October 31, 2000
1. Significant Accounting Policies.
Fidelity Advisor Emerging Asia Fund (the fund) is a fund of Fidelity Advisor Series VIII (the trust) and is authorized to issue an unlimited number of shares. The trust is registered under the Investment Company Act of 1940, as amended (the 1940 Act), as an open-end management investment company organized as a Massachusetts business trust.
The fund offers Class A, Class T, Class B, Class C, and Institutional Class shares, each of which has equal rights as to assets and voting privileges. Each class has exclusive voting rights with respect to matters that affect that class. Class B shares will automatically convert to Class A shares after a holding period of seven years from the initial date of purchase. Investment income, realized and unrealized capital gains and losses, the common expenses of the fund, and certain fund-level expense reductions, if any, are allocated on a pro rata basis to each class based on the relative net assets of each class to the total net assets of the fund. Each class of shares differs in its respective distribution, transfer agent, and certain other class-specific fees, expenses, and expense reductions.
The fund's investments in emerging markets can be subject to social, economic, regulatory, and political uncertainties and can be extremely volatile. The financial statements have been prepared in conformity with generally accepted accounting principles which require management to make certain estimates and assumptions at the date of the financial statements. The following summarizes the significant accounting policies of the fund:
Security Valuation. Securities for which quotations are readily available are valued using the official closing price or at the last sale price in the principal market in which they are traded. If the last sale price (on the local exchange) is unavailable, the last evaluated quote or closing bid price normally is used. If trading or events occurring in other markets after the close of the principal market in which securities are traded are expected to materially affect the value of those securities, then they are valued at their fair value taking this trading or these events into account. Fair value is determined in good faith under consistently applied procedures under the general supervision of the Board of Trustees. Securities (including restricted securities) for which quotations are not readily available are valued primarily using dealer-supplied valuations or at their fair value. Short-term securities with remaining maturities of sixty days or less for which quotations are not readily available are valued at amortized cost or original cost plus accrued interest, both of which approximate current value. Investments in open-end investment companies are valued at their net asset value each business day.
Foreign Currency Translation. The accounting records of the fund are maintained in U.S. dollars. Investment securities and other assets and liabilities denominated in a foreign currency are translated into U.S. dollars at the prevailing rates of exchange at period end. Purchases and sales of securities, income receipts and expense payments are translated into U.S. dollars at the prevailing exchange rate on the respective dates of the transactions.
Annual Report
Notes to Financial Statements - continued
1. Significant Accounting Policies - continued
Foreign Currency Translation - continued
Net realized gains and losses on foreign currency transactions represent net gains and losses from sales and maturities of foreign currency contracts, disposition of foreign currencies, the difference between the amount of net investment income accrued and the U.S. dollar amount actually received, and gains and losses between trade and settlement date on purchases and sales of securities. The effects of changes in foreign currency exchange rates on investments in securities are included with the net realized and unrealized gain or loss on investment securities.
Income Taxes. As a qualified regulated investment company under Subchapter M of the Internal Revenue Code, the fund is not subject to U.S. federal income taxes to the extent that it distributes substantially all of its taxable income for its fiscal year. The fund may be subject to foreign taxes on income and gains on investments which are accrued based upon the fund's understanding of the tax rules and regulations that exist in the markets in which it invests. Foreign governments may also impose taxes on other payments or transactions with respect to foreign securities. The fund accrues such taxes as applicable. The schedule of investments includes information regarding income taxes under the caption "Income Tax Information."
Investment Income. Dividend income is recorded on the ex-dividend date, except certain dividends from foreign securities where the ex-dividend date may have passed, are recorded as soon as the fund is informed of the ex-dividend date. Non-cash dividends included in dividend income, if any, are recorded at the fair market value of the securities received. Interest income is accrued as earned. Investment income is recorded net of foreign taxes withheld where recovery of such taxes is uncertain.
Expenses. Most expenses of the trust can be directly attributed to a fund. Expenses which cannot be directly attributed are apportioned among the funds in the trust.
Distributions to Shareholders. Distributions are recorded on the ex-dividend date. Income dividends and capital gain distributions are declared separately for each class.
Income and capital gain distributions are determined in accordance with income tax regulations which may differ from generally accepted accounting principles. These differences, which may result in distribution reclassifications, are primarily due to differing treatments for losses on certain securities, foreign currency transactions, certain foreign taxes, passive foreign investment companies (PFIC), net operating losses, capital loss carryforwards and losses deferred due to wash sales.
Annual Report
Notes to Financial Statements - continued
1. Significant Accounting Policies - continued
Distributions to Shareholders - continued
Permanent book and tax basis differences relating to shareholder distributions will result in reclassifications to paid in capital. Accumulated net investment loss and accumulated undistributed net realized gain (loss) on investments and foreign currency transactions may include temporary book and tax basis differences which will reverse in a subsequent period. Any taxable income or gain remaining at fiscal year end is distributed in the following year.
Security Transactions. Security transactions are accounted for as of trade date. Gains and losses on securities sold are determined on the basis of identified cost.
2. Operating Policies.
Foreign Currency Contracts. The fund generally uses foreign currency contracts to facilitate transactions in foreign-denominated securities. Losses may arise from changes in the value of the foreign currency or if the counterparties do not perform under the contracts' terms. The U.S. dollar value of foreign currency contracts is determined using contractual currency exchange rates established at the time of each trade.
Joint Trading Account. Pursuant to an Exemptive Order issued by the Securities and Exchange Commission (the SEC), the fund, along with other affiliated entities of Fidelity Management & Research Company (FMR), may transfer uninvested cash balances into one or more joint trading accounts. These balances are invested in one or more repurchase agreements for U.S. Treasury or Federal Agency obligations.
Repurchase Agreements. The underlying U.S. Treasury, Federal Agency, or other obligations found to be satisfactory by FMR are transferred to an account of the fund, or to the Joint Trading Account, at a custodian bank. The securities are marked-to-market daily and maintained at a value at least equal to the principal amount of the repurchase agreement (including accrued interest). FMR, the fund's investment adviser, is responsible for determining that the value of the underlying securities remains in accordance with the market value requirements stated above.
Interfund Lending Program. Pursuant to an Exemptive Order issued by the SEC, the fund, along with other registered investment companies having management contracts with FMR, may participate in an interfund lending program. This program provides an alternative credit facility allowing the fund to borrow from, or lend money to, other participating funds.
Restricted Securities. The fund is permitted to invest in securities that are subject to legal or contractual restrictions on resale. These securities generally may be resold in
Annual Report
Notes to Financial Statements - continued
2. Operating Policies - continued
Restricted Securities - continued
transactions exempt from registration or to the public if the securities are registered. Disposal of these securities may involve time-consuming negotiations and expense, and prompt sale at an acceptable price may be difficult. At the end of the period, the fund had no investments in restricted securities (excluding 144A issues).
3. Purchases and Sales of Investments.
Purchases and sales of securities, other than short-term securities, aggregated $63,509,138 and $95,341,231, respectively.
4. Fees and Other Transactions with Affiliates.
Management Fee. As the fund's investment adviser, FMR receives a monthly fee that is calculated on the basis of a group fee rate plus a fixed individual fund fee rate applied to the average net assets of the fund. The group fee rate is the weighted average of a series of rates and is based on the monthly average net assets of all the mutual funds advised by FMR. The rates ranged from .2167% to .5200% for the period. The annual individual fund fee rate is .45%. In the event that these rates were lower than the contractual rates in effect during the period, FMR voluntarily implemented the above rates, as they resulted in the same or a lower management fee. For the period, the management fee was equivalent to an annual rate of .73% of average net assets.
Sub-Adviser Fee. Beginning January 1, 2001, FMR Co. (FMRC) will serve as a sub-adviser for the fund. FMRC may provide investment research and advice and may also provide investment advisory services for the fund. FMR, on behalf of the fund, entered into sub-advisory agreements with Fidelity Management & Research (U.K.) Inc., Fidelity Management & Research (Far East) Inc., and Fidelity International Investment Advisors (FIIA). Under the sub-advisory arrangements, FMR may receive investment advice and research services and may grant the sub-advisers investment management authority to buy and sell securities. FMR pays its sub-advisers either a portion of its management fee or a fee based on costs incurred for these services.
Distribution and Service Plan. In accordance with Rule 12b-1 of the 1940 Act, the Board of Trustees have adopted separate Distribution and Service Plans with respect to each class of shares (collectively referred to as "the Plans"). Under certain of the Plans, the class pays Fidelity Distributors Corporation (FDC), an affiliate of FMR, a 12b-1 fee. A portion of this fee may be reallowed to securities dealers, banks and other financial institutions for the
Annual Report
Notes to Financial Statements - continued
4. Fees and Other Transactions with Affiliates - continued
Distribution and Service Plan - continued
distribution of each class of shares and providing shareholder support services. For the period, this fee was based on the following annual rates of the average net assets of each applicable class:
|
Class A |
.25% |
|
Class T |
.50% |
|
Class B |
1.00%* |
|
Class C |
1.00%* |
* .75% represents a distribution fee and .25% represents a shareholder service fee.
For the period, each class paid FDC the following amounts, a portion of which was retained by FDC:
|
|
Paid to |
Retained |
|
Class A |
$ 128,165 |
$ 22,798 |
|
Class T |
37,937 |
- |
|
Class B |
41,771 |
31,365 |
|
Class C |
25,155 |
23,935 |
|
|
$ 233,028 |
$ 78,098 |
Sales Load. FDC receives a front-end sales charge of up to 5.75% for selling Class A shares, and 3.50% for selling Class T shares of the fund. FDC receives the proceeds of contingent deferred sales charges levied on Class B share redemptions occurring within six years of purchase and Class C share redemptions occurring within one year of purchase. Contingent deferred sales charges are based on declining rates ranging from 5% to 1% for Class B and 1% for Class C, of the lesser of the cost of shares at the initial date of purchase or the net asset value of the redeemed shares, excluding any reinvested dividends and capital gains. In addition, purchases of Class A and Class T shares that were subject to a finder's fee bear a contingent deferred sales charge on assets that do not remain in the fund for at least one year. The Class A and Class T contingent deferred sales charge is based on 0.25% of the lesser of the cost of shares at the initial date of purchase or the net asset value of the redeemed shares, excluding any reinvested dividends and capital gains. A portion of the sales charges paid to FDC is paid to securities dealers, banks and other financial institutions.
Annual Report
Notes to Financial Statements - continued
4. Fees and Other Transactions with Affiliates - continued
Sales Load - continued
For the period, sales charge amounts paid to and retained by FDC were as follows:
|
|
Paid to |
Retained |
|
Class A |
$ 42,021 |
$ 23,623 |
|
Class T |
27,032 |
9,369 |
|
Class B |
28,330 |
28,330* |
|
Class C |
4,369 |
4,369* |
|
|
$ 101,752 |
$ 65,691 |
* When Class B and Class C shares are initially sold, FDC pays commissions from its own resources to securities dealers,
banks, and other financial institutions through which the sales are made.
Transfer Agent Fees. Fidelity Investments Institutional Operations Company, Inc., (FIIOC), an affiliate of FMR, is the transfer, dividend disbursing and shareholder servicing agent (collectively referred to as the transfer agent) for each class of the fund. FIIOC receives account fees and asset-based fees that vary according to the account size and type of account of the shareholders of the respective classes of the fund. FIIOC pays for typesetting, printing and mailing of all shareholder reports, except proxy statements. For the period, the following amounts were paid to FIIOC:
|
|
Amount |
% of |
|
Class A |
$ 116,930 |
.23 |
|
Class T |
29,924 |
.39 |
|
Class B |
17,774 |
.43 |
|
Class C |
7,973 |
.32 |
|
Institutional Class |
7,835 |
.18 |
|
|
$ 180,436 |
|
Accounting Fees. Fidelity Service Company, Inc., an affiliate of FMR, maintains the fund's accounting records. The fee is based on the level of average net assets for the month plus out-of-pocket expenses.
Fidelity Cash Central Fund. Pursuant to an Exemptive Order issued by the SEC, the fund may invest in the Fidelity Cash Central Fund (the Cash Fund) managed by Fidelity Investments Money Management, Inc., an affiliate of FMR. The Cash Fund is an open-end money market fund available only to investment companies and other accounts managed by FMR and its affiliates. The Cash Fund seeks preservation of capital, liquidity, and current income. Income distributions from the Cash Fund are declared daily and paid monthly from net investment income. Income distributions earned by the fund are recorded as interest income in the accompanying financial statements.
Annual Report
Notes to Financial Statements - continued
5. Interfund Lending Program.
The fund participated in the interfund lending program as a borrower. The average daily loan balance during the period for which loans were outstanding amounted to $8,702,600. The weighted average interest rate was 5.34%. Interest expense includes $12,899 paid under the interfund lending program. At period end there were no interfund loans outstanding.
6. Bank Borrowings.
The fund is permitted to have bank borrowings for temporary or emergency purposes to fund shareholder redemptions. The fund has established borrowing arrangements with certain banks. The interest rate on the borrowings is the bank's base rate, as revised from time to time. The average daily loan balance during the period for which loans were outstanding amounted to $1,793,667. The weighted average interest rate was 6.83%. Interest expense includes $2,041 paid under the bank borrowing program. At period end there were no bank borrowings outstanding.
7. Expense Reductions.
FMR has directed certain portfolio trades to brokers who paid a portion of the fund's expenses. For the period, the fund's expenses were reduced by $13,538 under this arrangement.
In addition, through an arrangement with each class' transfer agent, credits realized as a result of uninvested cash balances were used to reduce a portion of expenses. During the period, each applicable class' expenses were reduced as follows under the transfer agent arrangements:
|
|
Transfer |
|
Class A |
$ 673 |
|
Institutional Class |
428 |
|
|
$ 1,101 |
8. Beneficial Interest.
At the end of the period, FMR and its affiliates were record owners of approximately 6% of the total outstanding shares of the fund. In addition, one unaffiliated shareholder was record owner of more than 10% of the total outstanding shares of the fund.
Annual Report
Notes to Financial Statements - continued
9. Share Transactions.
Transactions for each class of shares were as follows:
|
|
Shares |
Dollars |
||
|
|
Year ended October 31, |
Year ended October 31, |
Year ended October 31, |
Year ended October 31, |
|
|
2000 |
1999 |
2000 |
1999 |
|
|
|
|
|
|
|
Class A |
1,912,449 |
88,023 |
$ 29,597,357 |
$ 1,327,477 |
|
Shares redeemed |
(4,852,685) |
(1,435,809) |
(78,076,464) |
(21,783,079) |
|
Net increase (decrease) |
(2,940,236) |
(1,347,786) |
$ (48,479,107) |
$ (20,455,602) |
|
Class T A |
1,038,267 |
173,217 |
$ 17,970,116 |
$ 2,566,076 |
|
Shares redeemed |
(791,822) |
(79,577) |
(12,268,997) |
(1,175,670) |
|
Net increase (decrease) |
246,445 |
93,640 |
$ 5,701,119 |
$ 1,390,406 |
|
Class B A |
386,873 |
82,132 |
$ 6,798,112 |
$ 1,228,722 |
|
Shares redeemed |
(150,617) |
(16,928) |
(2,546,582) |
(254,139) |
|
Net increase (decrease) |
236,256 |
65,204 |
$ 4,251,530 |
$ 974,583 |
|
Class C A |
203,787 |
44,256 |
$ 3,606,641 |
$ 662,150 |
|
Shares redeemed |
(70,124) |
(3,244) |
(1,157,683) |
(46,879) |
|
Net increase (decrease) |
133,663 |
41,012 |
$ 2,448,958 |
$ 615,271 |
|
Institutional Class A |
576,464 |
11,433 |
$ 10,570,991 |
$ 167,260 |
|
Shares redeemed |
(464,547) |
- |
(7,360,011) |
- |
|
Net increase (decrease) |
111,917 |
11,433 |
$ 3,210,980 |
$ 167,260 |
J For the year ended October 31, 1999, amounts shown are for the period June 16, 1999 to October 31, 1999.
Annual Report
To the Trustees of Fidelity Advisor Series VIII and the Shareholders of Fidelity Advisor Emerging Asia Fund:
In our opinion, the accompanying statement of assets and liabilities, including the schedule of investments, and the related statements of operations and of changes in net assets and the financial highlights present fairly, in all material respects, the financial position of Fidelity Advisor Emerging Asia Fund (a fund of Fidelity Advisor Series VIII) at October 31, 2000, and the results of its operations, the changes in its net assets and the financial highlights for the periods indicated, in conformity with accounting principles generally accepted in the United States of America. These financial statements and financial highlights (hereafter referred to as "financial statements") are the responsibility of the Fidelity Advisor Emerging Asia Fund's management; our responsibility is to express an opinion on these financial statements based on our audits. We conducted our audits of these financial statements in accordance with auditing standards generally accepted in the United States of America which require that we plan and perform the audit to obtain reasonable assurance about whether the financial statements are free of material misstatement. An audit includes examining, on a test basis, evidence supporting the amounts and disclosures in the financial statements, assessing the accounting principles used and significant estimates made by management, and evaluating the overall financial statement presentation. We believe that our audits, which included confirmation of securities at October 31, 2000 by correspondence with the custodian and brokers, provide a reasonable basis for our opinion.
/s/PricewaterhouseCoopers LLP
PricewaterhouseCoopers LLP
Boston, Massachusetts
December 8, 2000
Annual Report
Annual Report
Annual Report
Annual Report
Annual Report
Annual Report
Annual Report
Annual Report
Annual Report
Investment Adviser
Fidelity Management & Research Company
Boston, MA
Investment Sub-Advisers
Fidelity Management & Research
(U.K.) Inc.
Fidelity Management & Research
(Far East) Inc.
Fidelity International
Investment Advisors
Fidelity Investments Japan Limited
Fidelity International Investment Advisors (U.K.) Limited
Officers
Edward C. Johnson 3d, President
Robert C. Pozen, Senior Vice President
Richard Spillane, Vice President
Eric D. Roiter, Secretary
Robert A. Dwight, Treasurer
Maria F. Dwyer, Deputy Treasurer
John H. Costello, Assistant Treasurer
Thomas J. Simpson, Assistant Treasurer
Board of Trustees
Ralph F. Cox *
Phyllis Burke Davis *
Robert M. Gates *
Edward C. Johnson 3d
Donald J. Kirk *
Ned C. Lautenbach *
Peter S. Lynch
Marvin L. Mann *
William O. McCoy *
Gerald C. McDonough *
Robert C. Pozen
Thomas R. Williams *
Advisory Board
J. Michael Cook
Abigail P. Johnson
Marie L. Knowles
General Distributor
Fidelity Distributors Corp.
Boston, MA
Transfer and Shareholder
Servicing Agents
Fidelity Investments Institutional Operations Company, Inc.
Boston, MA
Custodian
Brown Brothers Harriman & Co.
Boston, MA
* Independent trustees
Annual Report
Focus Funds
Fidelity Advisor Consumer
Industries Fund
Fidelity Advisor Cyclical
Industries Fund
Fidelity Advisor Financial
Services Fund
Fidelity Advisor Health Care Fund
Fidelity Advisor Natural
Resources Fund
Fidelity Advisor Technology Fund
Fidelity Advisor Telecommunications
& Utilities Growth Fund
Growth Funds
Fidelity Advisor Korea Fund
Fidelity Advisor Emerging Asia Fund
Fidelity Advisor Latin America Fund
Fidelity Advisor Japan Fund
Fidelity Advisor Europe Capital Appreciation Fund
Fidelity Advisor International
Capital Appreciation Fund
Fidelity Advisor Overseas Fund
Fidelity Advisor Diversified International Fund
Fidelity Advisor Global Equity Fund
Fidelity Advisor TechnoQuant®
Growth Fund
Fidelity Advisor Small Cap Fund
Fidelity Advisor Value Strategies Fund
Fidelity Advisor Mid Cap Fund
Fidelity Advisor Dynamic Capital Appreciation Fund
Fidelity Advisor Equity Growth Fund
Fidelity Advisor Large Cap Fund
Fidelity Advisor Dividend Growth Fund
Fidelity Advisor Growth
Opportunities Fund
Growth and Income Funds
Fidelity Advisor Growth & Income Fund
Fidelity Advisor Equity Income Fund
Fidelity Advisor Asset Allocation Fund
Fidelity Advisor Balanced Fund
Taxable Income Funds
Fidelity Advisor Emerging Markets Income Fund
Fidelity Advisor High Yield Fund
Fidelity Advisor High Income Fund
Fidelity Advisor Strategic Income Fund
Fidelity Advisor Mortgage
Securities Fund
Fidelity Advisor Government Investment Fund
Fidelity Advisor Intermediate Bond Fund
Fidelity Advisor Short Fixed-Income Fund
Municipal Fund
Fidelity Advisor Municipal Income Fund
Money Market Funds
Prime Fund
Treasury Fund
Tax-Exempt Fund
AEA-ANN-1200 118667
1.703376.103
(Fidelity Investment logo)(registered trademark)
Fidelity® Advisor
Fund - Institutional Class
Annual Report
October 31, 2000
(2_fidelity_logos)(registered trademark)
|
President's Message |
Ned Johnson on investing strategies. |
|
|
Performance |
How the fund has done over time. |
|
|
Fund Talk |
The manager's review of fund performance, strategy and outlook. |
|
|
Investment Changes |
A summary of major shifts in the fund's investments over the past six months. |
|
|
Investments |
A complete list of the fund's investments with their market values. |
|
|
Financial Statements |
Statements of assets and liabilities,
operations, and changes in net assets, |
|
|
Notes |
Notes to the financial statements. |
|
|
Report of Independent Accountants |
The auditors' opinion. |
Standard & Poor's, S&P and S&P 500 are registered service marks of The McGraw-Hill Companies, Inc. and have been licensed for use by Fidelity Distributors Corporation.
Other third party marks appearing herein are the property of their respective owners.
All other marks appearing herein are registered or unregistered trademarks or service marks of FMR Corp. or an affiliated company.
(Recycle graphic) This report is printed on recycled paper using soy-based inks.
This report and the financial statements contained herein are submitted for the general information of the shareholders of the fund. This report is not authorized for distribution to prospective investors in the fund unless preceded or accompanied by an effective prospectus.
Mutual fund shares are not deposits or obligations of, or guaranteed by, any depository institution. Shares are not insured by the FDIC, Federal Reserve Board or any other agency, and are subject to investment risks, including possible loss of principal amount invested.
Neither the fund nor Fidelity Distributors Corporation is a bank.
For more information on any Fidelity Advisor fund, including charges and expenses, contact your investment professional for a free prospectus. Read it carefully before you invest or send money.
Annual Report
(photo_of_Edward_C_Johnson_3d)
Dear Shareholder:
A sixth-straight year of double-digit positive returns for the Dow Jones Industrial Average, NASDAQ and S&P 500® could be in jeopardy unless the U.S. stock market shows marked improvement in the final two months of 2000. Through October, all three indexes had negative year-to-date returns. On the other hand, most fixed-income sectors were solidly in the black. Treasuries and other long-term government securities led the way, returning nearly 14%.
While it's impossible to predict the future direction of the markets with any degree of certainty, there are certain basic principles that can help investors plan for their future needs.
First, investors are encouraged to take a long-term view of their portfolios. If you can afford to leave your money invested through the inevitable up and down cycles of the financial markets, you will greatly reduce your vulnerability to any single decline. We know from experience, for example, that stock prices have gone up over longer periods of time, have significantly outperformed other types of investments and have stayed ahead of inflation.
Second, you can further manage your investing risk through diversification. A stock mutual fund, for instance, is already diversified, because it invests in many different companies. You can increase your diversification further by investing in a number of different stock funds, or in such other investment categories as bonds. If you have a short investment time horizon, you might want to consider moving some of your investment into a money market fund, which seeks income and a stable share price by investing in high-quality, short-term investments. Of course, it's important to remember that an investment in a money market fund is not insured or guaranteed by the Federal Deposit Insurance Corporation or any other government agency. Although money market funds seek to preserve the value of your investment at $1.00 per share, it is possible to lose money by investing in these types of funds.
Finally, no matter what your time horizon or portfolio diversity, it makes good sense to follow a regular investment plan, investing a certain amount of money in a fund at the same time each month or quarter and periodically reviewing your overall portfolio. By doing so, you won't get caught up in the excitement of a rapidly rising market, nor will you buy all your shares at market highs. While this strategy - known as dollar cost averaging - won't assure a profit or protect you from a loss in a declining market, it should help you lower the average cost of your purchases. Of course, you should consider your financial ability to continue your purchases through periods of low price levels before undertaking such a strategy.
Remember to contact your investment professional if you need help with your investments.
Best regards,
/s/Edward C. Johnson 3d
Edward C. Johnson 3d
Annual Report
Fidelity Advisor Emerging Asia Fund - Institutional Class
There are several ways to evaluate historical performance. You can look at the total percentage change in value, the average annual percentage change or the growth of a hypothetical $10,000 investment. Total return reflects the change in the value of an investment, assuming reinvestment of the class' dividend income and capital gains (the profits earned upon the sale of securities that have grown in value). The initial offering of Institutional Class shares took place on June 16, 1999. Institutional Class shares are sold to eligible investors without a sales load or 12b-1 fee. Returns between March 25, 1994 and June 16, 1999 are those of Fidelity Advisor Emerging Asia Fund, Inc., the Closed-End Fund. On June 15, 1999, the Closed-End Fund reorganized as an open-end fund through a transfer of all of its assets and liabilities to Fidelity Advisor Emerging Asia Fund (the fund). Shareholders of the Closed-End Fund received Class A shares of the fund in exchange for their shares of the Closed-End fund. If the effect of Institutional Class expenses was reflected, returns may be lower than shown because Institutional Class shares of the fund may have higher total expenses than the Closed-End Fund. If Fidelity had not reimbursed certain class expenses, the past five year and life of fund total returns would have been lower.
Cumulative Total Returns
|
Periods ended October 31, 2000 |
|
Past 1 |
Past 5 |
Life of |
|
|
Fidelity Adv Emerging Asia - Inst CL |
|
-17.90% |
-5.67% |
-5.03% |
|
|
MSCI AC Asia Free ex Japan |
|
-20.11% |
-30.96% |
-27.54% |
|
|
Pacific Region ex Japan Funds Average |
|
-11.65% |
-17.16% |
n/a* |
|
Cumulative total returns show Institutional Class performance in percentage terms over a set period - in this case, one year, five years or since the Closed-End Fund started on March 25, 1994. For example, if you had invested $1,000 in a fund that had a 5% return over the past year, the value of your investment would be $1,050. You can compare Institutional Class' returns to the performance of the Morgan Stanley Capital International AC (All Country) Asia Free ex Japan Index - a market capitalization-weighted index of over 491 stocks traded in 12 Asian markets, excluding Japan. To measure how Institutional Class' performance stacked up against its peers, you can compare it to the Pacific Region ex Japan funds average, which reflects the performance of mutual funds with similar objectives tracked by Lipper Inc. The past one year average represents a peer group of 84 mutual funds. These benchmarks include reinvested dividends and capital gains, if any, and exclude the effect of sales charges.
Average Annual Total Returns
|
Periods ended October 31, 2000 |
Past 1 |
Past 5 |
Life of |
|
|
Fidelity Adv Emerging Asia - Inst CL |
-17.90% |
-1.16% |
-0.78% |
|
|
MSCI AC Asia Free ex Japan |
-20.11% |
-7.14% |
-4.76% |
|
|
Pacific Region ex Japan Funds Average |
-11.65% |
-4.29% |
n/a* |
|
Average annual total returns take Institutional Class' cumulative return and show you what would have happened if Institutional Class shares' had performed at a constant rate each year.
* Not available
Annual Report
$10,000 Over Life of Fund
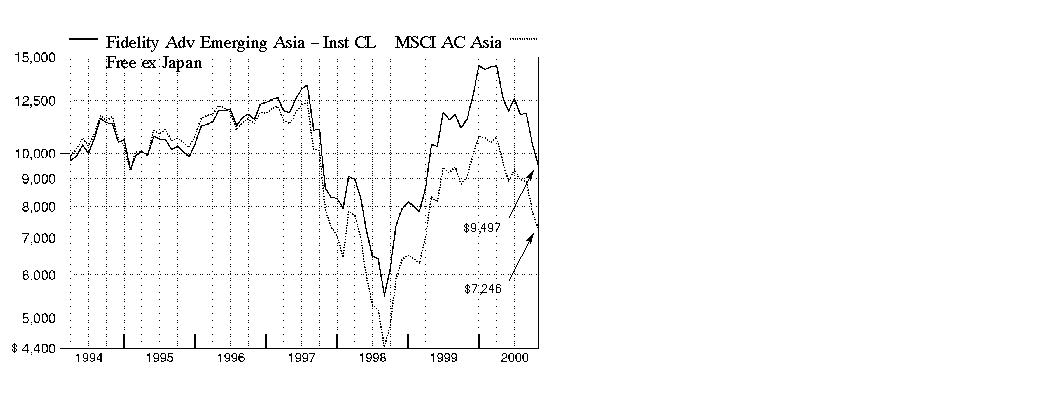
$10,000 Over Life of Fund: Let's say hypothetically that $10,000 was invested in Fidelity Advisor Emerging Asia Fund - Institutional Class on March 25, 1994, when the Closed-End Fund started. As the chart shows, by October 31, 2000, the value of the investment would have been $9,497 - a 5.03% decrease on the initial investment. For comparison, look at how the Morgan Stanley Capital International AC Asia Free ex Japan Index did over the same period. With dividends reinvested, the same $10,000 would have been $7,246 - a 27.54% decrease.
Understanding
Performance
Many markets around the globe offer the potential for significant growth over time; however, investing in foreign markets means assuming greater risks than investing in the United States. Factors like changes in a country's financial markets, its local political and economic climate, and the fluctuating value of its currency create these risks. For these reasons an international fund's performance may be more volatile than a fund that invests exclusively in the United States. Past performance is no guarantee of future results and you may have a gain or loss when you sell your shares.
3Annual Report
Market Recap
Emerging Asian nations - which include Hong Kong, South Korea, India, Taiwan, Singapore and Malaysia, among others - faced a 12-month stock market and economic environment remarkably similar to what U.S. investors experienced during the year ending October 31, 2000. The early months of the period were characterized by surging stock markets bolstered by new economy technology stocks and strong global economies. But in March, those prevailing conditions were skewered by a rapidly descending NASDAQ Composite Index - the shockwaves of which hit many technology-dependent emerging Asian economies. Rapidly escalating oil prices played further havoc with the stock markets of these nations, as reflected in the 12-month return of the Morgan Stanley Capital International All Country Asia Free ex Japan Index - a market capitalization-weighted index of over 500 stocks traded in 11 Asian markets, excluding Japan. The index, which gained 64.67% in 1999, fell 20.11% for the 12 months ending October 31, 2000. Country-specific difficulties compounded the challenging market environment. A weak euro depressed corporate earnings in Hong Kong. South Korea and India, which import 100% and 70% of their respective oil needs, fell prey to the high price of the commodity. Taiwan's investor sentiment suffered from belligerent statements from China about reunification, while Singapore - a major exporter of semiconductors - was tripped up by a slowdown in personal computer demand.
(Portfolio Manager photograph)
An interview with Yosawadee Polcharoen, Portfolio Manager of Fidelity Advisor Emerging Asia Fund
Q. How did the fund perform, Yosawadee?
A. During the 12 months that ended October 31, 2000, the fund's Institutional Class shares returned -17.90%. This compares to a total return of -20.11% for the Morgan Stanley Capital International (MSCI) All Country Asia Free ex Japan Index. Meanwhile, the Pacific region ex Japan funds average tracked by Lipper Inc. returned -11.65%.
Annual Report
Fund Talk: The Manager's Overview - continued
Q. Why did the fund perform better than the index?
A. It was partially due to the fund's relatively large exposure to Hong Kong, which was a stronger performer than most during the period. The Hong Kong market benefited from its low exposure to the volatile telecommunications, media and technology (TMT) sectors, as well as its strength in the property sector. The fund's comparatively lower weightings in smaller markets such as the Philippines, Indonesia and Thailand, all of which fell sharply during the period, also contributed positively to relative performance.
Q. What contributed to the fund's underperformance of its peers?
A. The fund's competitors generally had a greater exposure to the technology sector, which performed strongly in the beginning of the year. Although the fund did overweight this sector, it was more diversified than its peers.
Q. What specific sectors helped performance?
A. As I mentioned, the fund's relatively large exposure to Hong Kong property companies, especially investment companies, helped performance. These companies performed strongly as the outlook for the sector improved. This was particularly true in the office sector, where rents have been rising strongly, while new supply is expected to be limited during the next few years. One example was Cheung Kong Holdings, which saw its share price rise by 21.9% during the year. Strong stock picking in telecommunications stocks also helped fund performance. Some examples of standout performers included China Mobile and SK Telecom in South Korea. These companies' share prices rose sharply as a result of strong subscriber growth arising from domestic economic recovery, lower handset prices and increased data traffic.
Q. What would you highlight as disappointments for the fund in the past year?
A. The fund's relatively large exposure to India and its relatively small exposure to the Malaysian market hurt fund performance. The Indian market performed poorly during the year because of weakness among software companies, which were in turn hurt by the downturn in the U.S. NASDAQ market. In contrast, Malaysia performed relatively well because of its re-inclusion in the Morgan Stanley index. Finally, the fund's relatively large position in Samsung Electronics of South Korea hurt performance, as investors grew concerned that personal computer and semiconductor demand growth was slowing.
Q. What changes did you make to the fund during the 12-month period?
A. I increased the fund's exposure to selected property companies in Hong Kong and Singapore, given the improved outlook for the sector. I also increased the fund's exposure to selected pharmaceutical companies in India because of strong growth in both the domestic and overseas markets, as well as their attractive valuations. In turn, I reduced the fund's investments in petrochemical companies because of excess supply coming from the Middle East.
Annual Report
Fund Talk: The Manager's Overview - continued
Q. What's your outlook for the Southeast Asian markets?
A. In the short term, I remain cautious as markets are likely to remain volatile. I think they'll continue to be affected by the volatility in the NASDAQ market and by concerns over the impact of slowing U.S. economic growth on Asia. In the smaller markets in Asia, the disappointing pace of recovery and political uncertainty are likely to continue to hurt stock performance. Still, over the longer term, there are many reasons to be positive about the Southeast Asian markets. Valuations continue to be attractive, and the larger Asian economies are still recovering. This is especially true in China, which is experiencing strong growth in its economy and domestic consumption, and could further benefit from its inclusion in the World Trade Organization (WTO). Therefore, the potential for strong long-term growth in Asia remains positive.
The views expressed in this report reflect those of the portfolio manager only through the end of the period of the report as stated on the cover and do not necessarily represent the views of Fidelity or any other person in the Fidelity organization. Any such views are subject to change at any time based upon market or other conditions and Fidelity disclaims any responsibility to update such views. These views may not be relied on as investment advice and, because investment decisions for a Fidelity fund are based on numerous factors, may not be relied on as an indication of trading intent on behalf of any Fidelity fund.
Fund Facts
Goal: to achieve long-term capital appreciation through investments in equity and debt securities of Asian emerging market issuers
Start date: March 25, 1994
Size: as of October 31, 2000, more than $42 million
Manager: Yosawadee Polcharoen, since 1999; joined Fidelity in 1992
3Yosawadee Polcharoen on the increased trend toward outsourcing:
"Outsourcing has been a major theme in the fund, as American companies have increasingly looked to Asia to supply a wide array of products and components. Companies in the U.S. recognize that outsourcing enables them to reduce costs and capital expenditure and to become more efficient. There is great potential for growth in this arena. Currently, outsourcing demand from Europe and Japan has been relatively light, but could grow sharply in the next few years. Asia has many globally competitive companies and thus is likely to benefit from the increased outsourcing trend.
"Two examples of the outsourcing theme are Li & Fung of Hong Kong and Infosys Technologies of India. Li & Fung's and Infosys Technologies' share prices rose 113.2% and 91.2%, respectively, during the period and contributed strongly to fund performance. One of the fund's top-10 holdings, Li & Fung, is an export-trading operator and manages the supply chain network between buyers and factories. It has emerged as a major outsourcing company because its existing and potential customers are increasingly inclined to build their own brands by developing private labels. Software company Infosys Technologies - the fund's top holding in India - also is benefiting from the outsourcing trend, which has helped make it one of the strongest companies in its sector, with high margins and return on equity levels."
Annual Report
|
Top Ten Stocks as of October 31, 2000 |
||
|
|
% of fund's |
% of fund's net assets |
|
Hutchison Whampoa Ltd. |
8.0 |
7.5 |
|
China Mobile Ltd. |
6.1 |
0.0 |
|
SK Telecom Co. Ltd. |
4.2 |
1.9 |
|
Samsung Electronics Co. Ltd. |
3.9 |
6.3 |
|
Cheung Kong Holdings Ltd. |
3.8 |
2.8 |
|
Taiwan Semiconductor Manufacturing Co. Ltd. |
3.6 |
4.1 |
|
Sun Hung Kai Properties Ltd. |
2.6 |
1.4 |
|
United Microelectronics Corp. |
2.4 |
2.8 |
|
Li & Fung Ltd. |
2.2 |
1.0 |
|
DBS Group Holdings Ltd. |
2.2 |
1.8 |
|
|
39.0 |
29.6 |
|
Top Five Market Sectors as of October 31, 2000 |
||
|
|
% of fund's |
% of fund's net assets |
|
Technology |
21.4 |
31.6 |
|
Utilities |
20.2 |
18.2 |
|
Finance |
15.5 |
13.8 |
|
Construction & Real Estate |
9.7 |
5.4 |
|
Industrial Machinery & Equipment |
8.4 |
9.7 |
|
Asset Allocation (% of fund's net assets) |
|||||||
|
As of October 31, 2000 |
As of April 30, 2000 |
||||||
|
Stocks 93.1% |
|
|
Stocks 95.7% |
|
||
|
Short-Term |
|
|
Short-Term |
|
||
Annual Report
Showing Percentage of Net Assets
|
Common Stocks - 93.0% |
|||
|
Shares |
Value (Note 1) |
||
|
China - 0.6% |
|||
|
China Petroleum & Chemical Corp. (H Shares) |
640,000 |
$ 125,571 |
|
|
PetroChina Co. Ltd. (H Shares) |
562,000 |
118,195 |
|
|
TOTAL CHINA |
243,766 |
||
|
Hong Kong - 34.1% |
|||
|
Asia Satellite Telecommunications Holdings Ltd. |
42,000 |
85,099 |
|
|
Bank of East Asia Ltd. |
134,000 |
303,298 |
|
|
Cathay Pacific Airways Ltd. |
258,000 |
468,162 |
|
|
Cheung Kong Holdings Ltd. |
148,000 |
1,636,969 |
|
|
China Mobile Ltd. (a) |
427,000 |
2,615,375 |
|
|
Citic Pacific Ltd. |
81,000 |
325,124 |
|
|
CLP Holdings Ltd. |
97,000 |
452,786 |
|
|
Dao Heng Bank Group Ltd. |
47,000 |
237,473 |
|
|
Hang Seng Bank Ltd. |
53,000 |
623,593 |
|
|
Henderson Land Development Co. Ltd. |
82,000 |
353,324 |
|
|
Hong Kong & China Gas Co. Ltd. |
260,000 |
328,420 |
|
|
Hong Kong Exchanges & Clearing Ltd. |
94,000 |
163,941 |
|
|
Hongkong Land Holdings Ltd. |
225,100 |
416,435 |
|
|
Hutchison Whampoa Ltd. |
277,000 |
3,436,765 |
|
|
i-CABLE Communications Ltd. |
309,800 |
113,226 |
|
|
Johnson Electric Holdings Ltd. |
83,000 |
164,979 |
|
|
Legend Holdings Ltd. |
272,000 |
230,214 |
|
|
Li & Fung Ltd. |
506,000 |
940,888 |
|
|
Pacific Century Cyberworks Ltd. (a) |
456,320 |
351,108 |
|
|
Pacific Century Cyberworks Ltd. rights 12/15/00 |
13,689 |
0 |
|
|
Sun Hung Kai Properties Ltd. |
137,000 |
1,133,182 |
|
|
Television Broadcasts Ltd. |
44,000 |
240,935 |
|
|
TOTAL HONG KONG |
14,621,296 |
||
|
India - 11.5% |
|||
|
Dr. Reddy's Laboratories Ltd. |
11,700 |
350,138 |
|
|
HCL Technologies Ltd. |
9,800 |
248,855 |
|
|
Hero Honda Motors Ltd. |
4,000 |
75,389 |
|
|
Hindalco Industries Ltd. |
5,800 |
88,501 |
|
|
Hindustan Lever Ltd. |
144,050 |
546,587 |
|
|
Housing Development Finance Corp. Ltd. |
29,980 |
301,336 |
|
|
Hughes Software Systems Ltd. |
12,800 |
289,294 |
|
|
ICICI Bank Ltd. sponsored ADR |
33,200 |
157,700 |
|
|
Infosys Technologies Ltd. |
5,400 |
826,444 |
|
|
ITC Ltd. |
24,200 |
393,518 |
|
|
NIIT Ltd. |
4,000 |
134,640 |
|
|
Pentamedia Graphics Ltd. |
9,900 |
73,608 |
|
|
Common Stocks - continued |
|||
|
Shares |
Value (Note 1) |
||
|
India - continued |
|||
|
Ranbaxy Laboratories Ltd. |
29,000 |
$ 431,734 |
|
|
Reliance Industries Ltd. |
35,200 |
227,791 |
|
|
Satyam Infoway Ltd. sponsored ADR |
9,400 |
73,438 |
|
|
Sri Adhikari Brothers Television Network Ltd. |
3,100 |
19,803 |
|
|
State Bank of India (a) |
41,355 |
144,780 |
|
|
Sun Pharmaceutical Industries Ltd. (a) |
14,000 |
162,878 |
|
|
Videsh Sanchar Nigam Ltd. |
16,500 |
74,320 |
|
|
Wipro Ltd. |
4,000 |
203,377 |
|
|
Zee Telefilms Ltd. |
19,700 |
121,409 |
|
|
TOTAL INDIA |
4,945,540 |
||
|
Indonesia - 0.6% |
|||
|
Astra International PT (a) |
231,500 |
53,247 |
|
|
Gudang Garam PT Perusahaan |
42,000 |
45,156 |
|
|
PT Indofood Sukses Makmur (a) |
1,190,000 |
98,662 |
|
|
PT Telkomunikasi Indonesia |
56,000 |
14,378 |
|
|
Sampoerna, Hanjaya Mandala |
52,000 |
61,193 |
|
|
TOTAL INDONESIA |
272,636 |
||
|
Korea (South) - 14.1% |
|||
|
H&CB |
15,150 |
364,266 |
|
|
Hyundai Motor Co. Ltd. |
6,000 |
68,571 |
|
|
Kookmin Bank |
26,070 |
297,943 |
|
|
Kookmin Credit Card Co. Ltd. |
7,590 |
165,479 |
|
|
Korea Electric Power Corp. |
34,330 |
766,578 |
|
|
Korea Telecom |
9,700 |
571,341 |
|
|
Pohang Iron & Steel Co. Ltd. |
4,480 |
260,332 |
|
|
Samsung Electronics Co. Ltd. |
13,187 |
1,651,998 |
|
|
Samsung Securities Co. Ltd. |
4,762 |
86,239 |
|
|
SK Telecom Co. Ltd. |
8,410 |
1,792,901 |
|
|
TOTAL KOREA (SOUTH) |
6,025,648 |
||
|
Malaysia - 5.9% |
|||
|
British American Tobacco BHD |
17,000 |
155,461 |
|
|
Commerce Asset Holding BHD |
94,000 |
238,711 |
|
|
DiGi.com BHD (a) |
143,000 |
214,500 |
|
|
Edaran Otomobil Nasional BHD (EON) |
37,000 |
67,184 |
|
|
Malakoff BHD |
49,000 |
120,566 |
|
|
Malayan Banking BHD |
118,000 |
472,000 |
|
|
Public Bank BHD (For. Reg.) |
170,000 |
145,842 |
|
|
Star Publications BHD |
53,000 |
167,368 |
|
|
Tanjong PLC |
49,000 |
91,553 |
|
|
Technology Resources Industries BHD (a) |
280,000 |
226,947 |
|
|
Common Stocks - continued |
|||
|
Shares |
Value (Note 1) |
||
|
Malaysia - continued |
|||
|
Telekom Malaysia BHD |
80,000 |
$ 246,316 |
|
|
Tenaga Nasional BHD |
118,000 |
381,947 |
|
|
TOTAL MALAYSIA |
2,528,395 |
||
|
Philippines - 0.8% |
|||
|
ABS CBN Broadcasting Corp. unit |
155,000 |
119,697 |
|
|
Bank of the Phillipene Island (BPI) |
48,750 |
50,037 |
|
|
Manila Electric Co. Class B |
51,144 |
41,995 |
|
|
Philippine Long Distance Telephone |
10,000 |
151,515 |
|
|
TOTAL PHILIPPINES |
363,244 |
||
|
Singapore - 11.4% |
|||
|
Chartered Semiconductor Manufacturing Ltd. |
30,000 |
129,952 |
|
|
City Developments Ltd. |
69,000 |
318,552 |
|
|
Datacraft Asia Ltd. |
83,800 |
574,030 |
|
|
DBS Group Holdings Ltd. |
78,463 |
925,725 |
|
|
Keppel Land Ltd. |
173,000 |
258,341 |
|
|
Oversea-Chinese Banking Corp. Ltd. |
81,604 |
520,926 |
|
|
Singapore Airlines Ltd. |
70,000 |
702,194 |
|
|
Singapore Press Holdings Ltd. |
26,298 |
376,221 |
|
|
Singapore Telecommunications Ltd. |
310,000 |
514,164 |
|
|
SMRT Corp. Ltd. |
332,500 |
130,764 |
|
|
United Overseas Bank Ltd. |
56,470 |
418,416 |
|
|
TOTAL SINGAPORE |
4,869,285 |
||
|
Taiwan - 11.4% |
|||
|
Acer, Inc. |
237,500 |
197,059 |
|
|
Advanced Semiconductor Engineering, Inc. (a) |
158,195 |
181,704 |
|
|
Asustek Computer, Inc. (a) |
69,413 |
345,990 |
|
|
Bank Sinopac (a) |
275,212 |
114,601 |
|
|
Cathay Life Insurance Co. Ltd. |
61,053 |
109,631 |
|
|
Far Eastern Textile Ltd. |
117,846 |
97,050 |
|
|
GigaMedia Ltd. |
6,650 |
32,419 |
|
|
Hon Hai Precision Industries Co. Ltd. GDR (a)(c) |
14,680 |
165,884 |
|
|
Macronix International Co. Ltd. (a) |
131,580 |
187,389 |
|
|
Realtek Semiconductor Corp. |
37,000 |
138,034 |
|
|
Siliconware Precision Industries Co. Ltd. (a) |
219,296 |
167,018 |
|
|
Taishin International Bank (a) |
331,892 |
155,157 |
|
|
Taiwan Cellular Corp. |
41,000 |
85,681 |
|
|
Taiwan Semiconductor Manufacturing Co. Ltd. (a) |
514,054 |
1,559,668 |
|
|
United Microelectronics Corp. (a) |
579,400 |
1,022,471 |
|
|
Common Stocks - continued |
|||
|
Shares |
Value (Note 1) |
||
|
Taiwan - continued |
|||
|
Via Technologies, Inc. (a) |
18,000 |
$ 129,288 |
|
|
Winbond Electronics Corp. sponsored GDR (a)(c) |
21,043 |
200,961 |
|
|
TOTAL TAIWAN |
4,890,005 |
||
|
Thailand - 1.4% |
|||
|
Advanced Info Service PCL (For. Reg.) (a) |
11,400 |
94,058 |
|
|
Bangkok Bank Ltd. PCL (For. Reg.) (a) |
88,500 |
75,641 |
|
|
BEC World PCL (For. Reg.) |
21,000 |
100,513 |
|
|
PTT Exploration & Production PCL (For. Reg.) |
33,000 |
80,479 |
|
|
Siam Cement PCL (For. Reg.) (a) |
6,100 |
57,559 |
|
|
TelecomAsia Corp. PCL (a) |
174,400 |
105,336 |
|
|
TelecomAsia Corp. PCL rights 4/30/08 (a) |
190,863 |
43,594 |
|
|
Thai Farmers Bank PCL (For. Reg.) (a) |
123,000 |
63,778 |
|
|
TOTAL THAILAND |
620,958 |
||
|
United Kingdom - 1.2% |
|||
|
HSBC Holdings PLC (Reg.) |
34,176 |
492,818 |
|
|
TOTAL COMMON STOCKS (Cost $36,986,894) |
39,873,591 |
||
|
Nonconvertible Preferred Stocks - 0.1% |
|||
|
|
|
|
|
|
Taiwan - 0.1% |
|||
|
Taishin International Bank |
143,628 |
44,022 |
|
|
Cash Equivalents - 4.3% |
|||
|
|
|
|
|
|
Fidelity Cash Central Fund, 6.61% (b) |
1,812,680 |
1,812,680 |
|
|
TOTAL INVESTMENT PORTFOLIO - 97.4% (Cost $38,844,768) |
41,730,293 |
||
|
NET OTHER ASSETS - 2.6% |
1,131,280 |
||
|
NET ASSETS - 100% |
$ 42,861,573 |
||
|
Legend |
|
(a) Non-income producing |
|
(b) The rate quoted is the annualized seven-day yield of the fund at period end. A complete listing of the fund's holdings as of its most recent fiscal year end is available upon request. |
|
(c) Security exempt from registration under Rule 144A of the Securities Act of 1933. These securities may be resold in transactions exempt from registration, normally to qualified institutional buyers. At the period end, the value of these securities amounted to $366,845 or 0.9% of net assets. |
|
Income Tax Information |
|
At October 31, 2000, the aggregate |
|
At October 31, 2000, the fund had a capital loss carryforward of approximately $3,098,000 all of which will expire on October 31, 2006. |
See accompanying notes which are an integral part of the financial statements.
Annual Report
Statement of Assets and Liabilities
|
|
October 31, 2000 |
|
|
Assets |
|
|
|
Investment in securities, at value (cost $38,844,768) - |
|
$ 41,730,293 |
|
Foreign currency held at value (cost $1,151,306) |
|
1,150,901 |
|
Receivable for investments sold |
|
479,670 |
|
Receivable for fund shares sold |
|
271,474 |
|
Dividends receivable |
|
25,065 |
|
Interest receivable |
|
3,729 |
|
Total assets |
|
43,661,132 |
|
Liabilities |
|
|
|
Payable for investments purchased |
$ 470,357 |
|
|
Payable for fund shares redeemed |
24,662 |
|
|
Accrued management fee |
26,185 |
|
|
Distribution fees payable |
13,495 |
|
|
Other payables and accrued expenses |
264,860 |
|
|
Total liabilities |
|
799,559 |
|
Net Assets |
|
$ 42,861,573 |
|
Net Assets consist of: |
|
|
|
Paid in capital |
|
$ 43,907,077 |
|
Accumulated net investment (loss) |
|
(57,141) |
|
Accumulated undistributed net realized gain (loss) on investments and foreign currency transactions |
|
(3,744,996) |
|
Net unrealized appreciation (depreciation) on investments and assets and liabilities in foreign currencies |
|
2,756,633 |
|
Net Assets |
|
$ 42,861,573 |
See accompanying notes which are an integral part of the financial statements.
Annual Report
Financial Statements - continued
Statement of Assets and Liabilities - continued
|
|
October 31, 2000 |
|
|
Calculation of Maximum Offering Price |
|
$12.29 |
|
Maximum offering price per share (100/94.25 of $12.29) |
|
$13.04 |
|
Class T: |
|
$12.25 |
|
Maximum offering price per share (100/96.50 of $12.25) |
|
$12.69 |
|
Class B: |
|
$12.15 |
|
Class C: |
|
$12.16 |
|
Institutional Class: |
|
$12.34 |
A Redemption price per share is equal to net asset value less any applicable contingent deferred sales charge.
See accompanying notes which are an integral part of the financial statements.
Annual Report
Financial Statements - continued
Statement of Operations
|
|
Year ended October 31, 2000 |
|
|
Investment Income Dividends |
|
$ 839,305 |
|
Interest |
|
123,682 |
|
|
|
962,987 |
|
Less foreign taxes withheld |
|
(78,562) |
|
Total income |
|
884,425 |
|
Expenses |
|
|
|
Management fee |
$ 506,862 |
|
|
Transfer agent fees |
180,436 |
|
|
Distribution fees |
233,028 |
|
|
Accounting fees and expenses |
60,478 |
|
|
Non-interested trustees' compensation |
18,231 |
|
|
Custodian fees and expenses |
264,583 |
|
|
Registration fees |
50,269 |
|
|
Audit |
94,799 |
|
|
Interest |
14,940 |
|
|
Total expenses before reductions |
1,423,626 |
|
|
Expense reductions |
(14,639) |
1,408,987 |
|
Net investment income (loss) |
|
(524,562) |
|
Realized and Unrealized Gain (Loss) Net realized gain (loss) on: |
|
|
|
Investment securities (net of foreign taxes of $1,025,377) |
5,534,848 |
|
|
Foreign currency transactions |
51,170 |
5,586,018 |
|
Change in net unrealized appreciation (depreciation) on: |
|
|
|
Investment securities |
(14,945,217) |
|
|
Assets and liabilities in foreign currencies |
(47,470) |
(14,992,687) |
|
Net gain (loss) |
|
(9,406,669) |
|
Net increase (decrease) in net assets resulting |
|
$ (9,931,231) |
See accompanying notes which are an integral part of the financial statements.
Annual Report
Financial Statements - continued
Statement of Changes in Net Assets
|
|
Year ended
October 31, |
Year ended
October 31, |
|
Increase (Decrease) in Net Assets |
|
|
|
Operations |
$ (524,562) |
$ (167,945) |
|
Net realized gain (loss) |
5,586,018 |
5,313,599 |
|
Change in net unrealized appreciation (depreciation) |
(14,992,687) |
31,215,024 |
|
Net increase (decrease) in net assets resulting |
(9,931,231) |
36,360,678 |
|
Share transactions - net increase (decrease) |
(32,866,520) |
(17,308,082) |
|
Redemption fees |
- |
856,162 |
|
Total increase (decrease) in net assets |
(42,797,751) |
19,908,758 |
|
Net Assets |
|
|
|
Beginning of period |
85,659,324 |
65,750,566 |
|
End of period (including accumulated net investment loss of $57,141 and $40,690, respectively) |
$ 42,861,573 |
$ 85,659,324 |
See accompanying notes which are an integral part of the financial statements.
Annual Report
Financial Highlights - Class A
|
Years ended October 31, |
2000 |
1999 H |
1998 |
1997 |
1996 |
|
Selected Per-Share Data |
|
|
|
|
|
|
Net asset value, beginning |
$ 15.01 |
$ 9.61 |
$ 11.59 |
$ 15.94 |
$ 13.94 |
|
Income from Investment Operations |
|
|
|
|
|
|
Net investment income (loss) C |
(.12) |
(.03) |
.03 |
.01 |
.01 |
|
Net realized and unrealized gain (loss) |
(2.60) |
5.30 |
(1.73) |
(3.94) |
2.05 |
|
Total from investment operations |
(2.72) |
5.27 |
(1.70) |
(3.93) |
2.06 |
|
Less Distributions |
|
|
|
|
|
|
From net investment income |
- |
- |
(.07) |
(.01) |
(.01) |
|
In excess of net |
- |
- |
(.03) |
- |
(.05) |
|
From net realized gain |
- |
- |
(.13) |
(.41) |
- |
|
In excess of net realized gain |
- |
- |
(.06) |
- |
- |
|
Total distributions |
- |
- |
(.29) |
(.42) |
(.06) |
|
Redemption fees added to |
- |
.13 |
.01 G |
- F |
- |
|
Net asset value, end of period |
$ 12.29 |
$ 15.01 |
$ 9.61 |
$ 11.59 |
$ 15.94 |
|
Total Return A, B |
(18.12)% |
56.19% |
(14.43)% |
(25.23)% |
14.81% |
|
Ratios and Supplemental Data |
|
|
|
|
|
|
Net assets, end of period |
$ 31,386 |
$ 82,492 |
$ 65,751 |
$ 88,102 |
$ 134,614 |
|
Ratio of expenses to average |
1.98% |
2.04% D |
2.57% |
1.72% |
1.63% |
|
Ratio of expenses to average net assets after expense reductions |
1.96% E |
2.03% E |
2.54% E |
1.71% E |
1.63% |
|
Ratio of net investment income (loss) to average net assets |
(.69)% |
(.22)% |
.30% |
.03% |
.09% |
|
Portfolio turnover |
96% |
62% |
42% |
55% |
63% |
A The total returns would have been lower had certain expenses not been reduced during the periods shown.
B Total returns do not include the one time sales charge.
C Net investment income (loss) per share has been calculated based on average shares outstanding during the period.
D FMR agreed to reimburse a portion of the class' expenses during the period. Without this reimbursement, the class' expense ratio would have been higher.
E FMR or the fund has entered into varying arrangements with third parties who either paid or reduced a portion of the class' expenses.
F The fund incurred expenses of $.01 per share in connection with its tender offer which were offset by redemption fees collected as part of the tender offer.
G The fund incurred expenses of $.005 per share in connection with its tender offer which were offset by redemption fees collected as part of the tender offer.
H Prior to June 16, 1999, the fund operated as a closed-end management company. Shares of the fund existing at the time of its conversion to an open-ended management investment company were exchanged for Class A shares.
See accompanying notes which are an integral part of the financial statements.
Annual Report
Financial Highlights - Class T
|
Years ended October 31, |
2000 |
1999 E |
|
Selected Per-Share Data |
|
|
|
Net asset value, beginning of period |
$ 15.01 |
$ 14.44 |
|
Income from Investment Operations |
|
|
|
Net investment income (loss) D |
(.14) |
.13 |
|
Net realized and unrealized gain (loss) |
(2.62) |
.44 |
|
Total from investment operations |
(2.76) |
.57 |
|
Net asset value, end of period |
$ 12.25 |
$ 15.01 |
|
Total Return B, C |
(18.39)% |
3.95% |
|
Ratios and Supplemental Data |
|
|
|
Net assets, end of period (000 omitted) |
$ 4,165 |
$ 1,405 |
|
Ratio of expenses to average net assets |
2.17% |
2.25% A, F |
|
Ratio of expenses to average net assets after expense reductions |
2.15% G |
2.25% A |
|
Ratio of net investment income (loss) to average net assets |
(.88)% |
2.34% A |
|
Portfolio turnover |
96% |
62% |
A Annualized
B The total returns would have been lower had certain expenses not been reduced during the periods shown.
C Total returns do not include the one time sales charge and for periods of less than one year are not annualized.
D Net investment income (loss) per share has been calculated based on average shares outstanding during the period.
E For the period June 16, 1999 (commencement of sale of Class T shares) to October 31, 1999.
F FMR agreed to reimburse a portion of the class' expenses during the period. Without this reimbursement, the class' expense ratio would have been higher.
G FMR or the fund has entered into varying arrangements with third parties who either paid or reduced a portion of the class' expenses.
See accompanying notes which are an integral part of the financial statements.
Annual Report
Financial Highlights - Class B
|
Years ended October 31, |
2000 |
1999 E |
|
Selected Per-Share Data |
|
|
|
Net asset value, beginning of period |
$ 14.98 |
$ 14.44 |
|
Income from Investment Operations |
|
|
|
Net investment income (loss) D |
(.24) |
.08 |
|
Net realized and unrealized gain (loss) |
(2.59) |
.46 |
|
Total from investment operations |
(2.83) |
.54 |
|
Net asset value, end of period |
$ 12.15 |
$ 14.98 |
|
Total Return B, C |
(18.89)% |
3.74% |
|
Ratios and Supplemental Data |
|
|
|
Net assets, end of period (000 omitted) |
$ 3,664 |
$ 977 |
|
Ratio of expenses to average net assets |
2.77% |
2.75% A, F |
|
Ratio of expenses to average net assets after expense reductions |
2.75% G |
2.75% A |
|
Ratio of net investment income (loss) to average net assets |
(1.48)% |
1.38% A |
|
Portfolio turnover |
96% |
62% |
A Annualized
B The total returns would have been lower had certain expenses not been reduced during the periods shown.
C Total returns do not include the contingent deferred sales charge and for periods of less than one year are not annualized.
D Net investment income (loss) per share has been calculated based on average shares outstanding during the period.
E For the period June 16, 1999 (commencement of sale of Class B shares) to October 31, 1999.
F FMR agreed to reimburse a portion of the class' expenses during the period. Without this reimbursement, the class' expense ratio would have been higher.
G FMR or the fund has entered into varying arrangements with third parties who either paid or reduced a portion of the class' expenses.
See accompanying notes which are an integral part of the financial statements.
Annual Report
Financial Highlights - Class C
|
Years ended October 31, |
2000 |
1999 E |
|
Selected Per-Share Data |
|
|
|
Net asset value, beginning of period |
$ 14.97 |
$ 14.44 |
|
Income from Investment Operations |
|
|
|
Net investment income (loss) D |
(.23) |
.04 |
|
Net realized and unrealized gain (loss) |
(2.58) |
.49 |
|
Total from investment operations |
(2.81) |
.53 |
|
Net asset value, end of period |
$ 12.16 |
$ 14.97 |
|
Total Return B, C |
(18.77)% |
3.67% |
|
Ratios and Supplemental Data |
|
|
|
Net assets, end of period (000 omitted) |
$ 2,124 |
$ 614 |
|
Ratio of expenses to average net assets |
2.68% |
2.75% A, F |
|
Ratio of expenses to average net assets after expense reductions |
2.66% G |
2.75% A |
|
Ratio of net investment income (loss) to average net assets |
(1.40)% |
.75% A |
|
Portfolio turnover |
96% |
62% |
A Annualized
B The total returns would have been lower had certain expenses not been reduced during the periods shown.
C Total returns do not include the contingent deferred sales charge and for periods of less than one year are not annualized.
D Net investment income (loss) per share has been calculated based on average shares outstanding during the period.
E For the period June 16, 1999 (commencement of sale of Class C shares) to October 31, 1999.
F FMR agreed to reimburse a portion of the class' expenses during the period. Without this reimbursement, the class' expense ratio would have been higher.
G FMR or the fund has entered into varying arrangements with third parties who either paid or reduced a portion of the class' expenses.
See accompanying notes which are an integral part of the financial statements.
Annual Report
Financial Highlights - Institutional Class
|
Years ended October 31, |
2000 |
1999 E |
|
Selected Per-Share Data |
|
|
|
Net asset value, beginning of period |
$ 15.03 |
$ 14.44 |
|
Income from Investment Operations |
|
|
|
Net investment income (loss) D |
(.03) |
.05 |
|
Net realized and unrealized gain (loss) |
(2.66) |
.54 |
|
Total from investment operations |
(2.69) |
.59 |
|
Net asset value, end of period |
$ 12.34 |
$ 15.03 |
|
Total Return B, C |
(17.90)% |
4.09% |
|
Ratios and Supplemental Data |
|
|
|
Net assets, end of period (000 omitted) |
$ 1,523 |
$ 172 |
|
Ratio of expenses to average net assets |
1.45% |
1.75% A, F |
|
Ratio of expenses to average net assets after expense reductions |
1.42% G |
1.75% A |
|
Ratio of net investment income (loss) to average net assets |
(.16)% |
.90% A |
|
Portfolio turnover |
96% |
62% |
A Annualized
B The total returns would have been lower had certain expenses not been reduced during the periods shown.
C Total returns for periods of less than one year are not annualized.
D Net investment income (loss) per share has been calculated based on average shares outstanding during the period.
E For the period June 16, 1999 (commencement of sale of Institutional Class shares) to October 31, 1999.
F FMR agreed to reimburse a portion of the class' expenses during the period. Without this reimbursement, the class' expense ratio would have been higher.
G FMR or the fund has entered into varying arrangements with third parties who either paid or reduced a portion of the class' expenses.
See accompanying notes which are an integral part of the financial statements.
Annual Report
For the period ended October 31, 2000
1. Significant Accounting Policies.
Fidelity Advisor Emerging Asia Fund (the fund) is a fund of Fidelity Advisor Series VIII (the trust) and is authorized to issue an unlimited number of shares. The trust is registered under the Investment Company Act of 1940, as amended (the 1940 Act), as an open-end management investment company organized as a Massachusetts business trust.
The fund offers Class A, Class T, Class B, Class C, and Institutional Class shares, each of which has equal rights as to assets and voting privileges. Each class has exclusive voting rights with respect to matters that affect that class. Class B shares will automatically convert to Class A shares after a holding period of seven years from the initial date of purchase. Investment income, realized and unrealized capital gains and losses, the common expenses of the fund, and certain fund-level expense reductions, if any, are allocated on a pro rata basis to each class based on the relative net assets of each class to the total net assets of the fund. Each class of shares differs in its respective distribution, transfer agent, and certain other class-specific fees, expenses, and expense reductions.
The fund's investments in emerging markets can be subject to social, economic, regulatory, and political uncertainties and can be extremely volatile. The financial statements have been prepared in conformity with generally accepted accounting principles which require management to make certain estimates and assumptions at the date of the financial statements. The following summarizes the significant accounting policies of the fund:
Security Valuation. Securities for which quotations are readily available are valued using the official closing price or at the last sale price in the principal market in which they are traded. If the last sale price (on the local exchange) is unavailable, the last evaluated quote or closing bid price normally is used. If trading or events occurring in other markets after the close of the principal market in which securities are traded are expected to materially affect the value of those securities, then they are valued at their fair value taking this trading or these events into account. Fair value is determined in good faith under consistently applied procedures under the general supervision of the Board of Trustees. Securities (including restricted securities) for which quotations are not readily available are valued primarily using dealer-supplied valuations or at their fair value. Short-term securities with remaining maturities of sixty days or less for which quotations are not readily available are valued at amortized cost or original cost plus accrued interest, both of which approximate current value. Investments in open-end investment companies are valued at their net asset value each business day.
Foreign Currency Translation. The accounting records of the fund are maintained in U.S. dollars. Investment securities and other assets and liabilities denominated in a foreign currency are translated into U.S. dollars at the prevailing rates of exchange at period end. Purchases and sales of securities, income receipts and expense payments are translated into U.S. dollars at the prevailing exchange rate on the respective dates of the transactions.
Annual Report
Notes to Financial Statements - continued
1. Significant Accounting Policies - continued
Foreign Currency Translation - continued
Net realized gains and losses on foreign currency transactions represent net gains and losses from sales and maturities of foreign currency contracts, disposition of foreign currencies, the difference between the amount of net investment income accrued and the U.S. dollar amount actually received, and gains and losses between trade and settlement date on purchases and sales of securities. The effects of changes in foreign currency exchange rates on investments in securities are included with the net realized and unrealized gain or loss on investment securities.
Income Taxes. As a qualified regulated investment company under Subchapter M of the Internal Revenue Code, the fund is not subject to U.S. federal income taxes to the extent that it distributes substantially all of its taxable income for its fiscal year. The fund may be subject to foreign taxes on income and gains on investments which are accrued based upon the fund's understanding of the tax rules and regulations that exist in the markets in which it invests. Foreign governments may also impose taxes on other payments or transactions with respect to foreign securities. The fund accrues such taxes as applicable. The schedule of investments includes information regarding income taxes under the caption "Income Tax Information."
Investment Income. Dividend income is recorded on the ex-dividend date, except certain dividends from foreign securities where the ex-dividend date may have passed, are recorded as soon as the fund is informed of the ex-dividend date. Non-cash dividends included in dividend income, if any, are recorded at the fair market value of the securities received. Interest income is accrued as earned. Investment income is recorded net of foreign taxes withheld where recovery of such taxes is uncertain.
Expenses. Most expenses of the trust can be directly attributed to a fund. Expenses which cannot be directly attributed are apportioned among the funds in the trust.
Distributions to Shareholders. Distributions are recorded on the ex-dividend date. Income dividends and capital gain distributions are declared separately for each class.
Income and capital gain distributions are determined in accordance with income tax regulations which may differ from generally accepted accounting principles. These differences, which may result in distribution reclassifications, are primarily due to differing treatments for losses on certain securities, foreign currency transactions, certain foreign taxes, passive foreign investment companies (PFIC), net operating losses, capital loss carryforwards and losses deferred due to wash sales.
Annual Report
Notes to Financial Statements - continued
1. Significant Accounting Policies - continued
Distributions to Shareholders - continued
Permanent book and tax basis differences relating to shareholder distributions will result in reclassifications to paid in capital. Accumulated net investment loss and accumulated undistributed net realized gain (loss) on investments and foreign currency transactions may include temporary book and tax basis differences which will reverse in a subsequent period. Any taxable income or gain remaining at fiscal year end is distributed in the following year.
Security Transactions. Security transactions are accounted for as of trade date. Gains and losses on securities sold are determined on the basis of identified cost.
2. Operating Policies.
Foreign Currency Contracts. The fund generally uses foreign currency contracts to facilitate transactions in foreign-denominated securities. Losses may arise from changes in the value of the foreign currency or if the counterparties do not perform under the contracts' terms. The U.S. dollar value of foreign currency contracts is determined using contractual currency exchange rates established at the time of each trade.
Joint Trading Account. Pursuant to an Exemptive Order issued by the Securities and Exchange Commission (the SEC), the fund, along with other affiliated entities of Fidelity Management & Research Company (FMR), may transfer uninvested cash balances into one or more joint trading accounts. These balances are invested in one or more repurchase agreements for U.S. Treasury or Federal Agency obligations.
Repurchase Agreements. The underlying U.S. Treasury, Federal Agency, or other obligations found to be satisfactory by FMR are transferred to an account of the fund, or to the Joint Trading Account, at a custodian bank. The securities are marked-to-market daily and maintained at a value at least equal to the principal amount of the repurchase agreement (including accrued interest). FMR, the fund's investment adviser, is responsible for determining that the value of the underlying securities remains in accordance with the market value requirements stated above.
Interfund Lending Program. Pursuant to an Exemptive Order issued by the SEC, the fund, along with other registered investment companies having management contracts with FMR, may participate in an interfund lending program. This program provides an alternative credit facility allowing the fund to borrow from, or lend money to, other participating funds.
Restricted Securities. The fund is permitted to invest in securities that are subject to legal or contractual restrictions on resale. These securities generally may be resold in
Annual Report
Notes to Financial Statements - continued
2. Operating Policies - continued
Restricted Securities - continued
transactions exempt from registration or to the public if the securities are registered. Disposal of these securities may involve time-consuming negotiations and expense, and prompt sale at an acceptable price may be difficult. At the end of the period, the fund had no investments in restricted securities (excluding 144A issues).
3. Purchases and Sales of Investments.
Purchases and sales of securities, other than short-term securities, aggregated $63,509,138 and $95,341,231, respectively.
4. Fees and Other Transactions with Affiliates.
Management Fee. As the fund's investment adviser, FMR receives a monthly fee that is calculated on the basis of a group fee rate plus a fixed individual fund fee rate applied to the average net assets of the fund. The group fee rate is the weighted average of a series of rates and is based on the monthly average net assets of all the mutual funds advised by FMR. The rates ranged from .2167% to .5200% for the period. The annual individual fund fee rate is .45%. In the event that these rates were lower than the contractual rates in effect during the period, FMR voluntarily implemented the above rates, as they resulted in the same or a lower management fee. For the period, the management fee was equivalent to an annual rate of .73% of average net assets.
Sub-Adviser Fee. Beginning January 1, 2001, FMR Co. (FMRC) will serve as a sub-adviser for the fund. FMRC may provide investment research and advice and may also provide investment advisory services for the fund. FMR, on behalf of the fund, entered into sub-advisory agreements with Fidelity Management & Research (U.K.) Inc., Fidelity Management & Research (Far East) Inc., and Fidelity International Investment Advisors (FIIA). Under the sub-advisory arrangements, FMR may receive investment advice and research services and may grant the sub-advisers investment management authority to buy and sell securities. FMR pays its sub-advisers either a portion of its management fee or a fee based on costs incurred for these services.
Distribution and Service Plan. In accordance with Rule 12b-1 of the 1940 Act, the Board of Trustees have adopted separate Distribution and Service Plans with respect to each class of shares (collectively referred to as "the Plans"). Under certain of the Plans, the class pays Fidelity Distributors Corporation (FDC), an affiliate of FMR, a 12b-1 fee. A portion of this fee may be reallowed to securities dealers, banks and other financial institutions for the
Annual Report
Notes to Financial Statements - continued
4. Fees and Other Transactions with Affiliates - continued
Distribution and Service Plan - continued
distribution of each class of shares and providing shareholder support services. For the period, this fee was based on the following annual rates of the average net assets of each applicable class:
|
Class A |
.25% |
|
Class T |
.50% |
|
Class B |
1.00%* |
|
Class C |
1.00%* |
* .75% represents a distribution fee and .25% represents a shareholder service fee.
For the period, each class paid FDC the following amounts, a portion of which was retained by FDC:
|
|
Paid to |
Retained |
|
Class A |
$ 128,165 |
$ 22,798 |
|
Class T |
37,937 |
- |
|
Class B |
41,771 |
31,365 |
|
Class C |
25,155 |
23,935 |
|
|
$ 233,028 |
$ 78,098 |
Sales Load. FDC receives a front-end sales charge of up to 5.75% for selling Class A shares, and 3.50% for selling Class T shares of the fund. FDC receives the proceeds of contingent deferred sales charges levied on Class B share redemptions occurring within six years of purchase and Class C share redemptions occurring within one year of purchase. Contingent deferred sales charges are based on declining rates ranging from 5% to 1% for Class B and 1% for Class C, of the lesser of the cost of shares at the initial date of purchase or the net asset value of the redeemed shares, excluding any reinvested dividends and capital gains. In addition, purchases of Class A and Class T shares that were subject to a finder's fee bear a contingent deferred sales charge on assets that do not remain in the fund for at least one year. The Class A and Class T contingent deferred sales charge is based on 0.25% of the lesser of the cost of shares at the initial date of purchase or the net asset value of the redeemed shares, excluding any reinvested dividends and capital gains. A portion of the sales charges paid to FDC is paid to securities dealers, banks and other financial institutions.
Annual Report
Notes to Financial Statements - continued
4. Fees and Other Transactions with Affiliates - continued
Sales Load - continued
For the period, sales charge amounts paid to and retained by FDC were as follows:
|
|
Paid to |
Retained |
|
Class A |
$ 42,021 |
$ 23,623 |
|
Class T |
27,032 |
9,369 |
|
Class B |
28,330 |
28,330* |
|
Class C |
4,369 |
4,369* |
|
|
$ 101,752 |
$ 65,691 |
* When Class B and Class C shares are initially sold, FDC pays commissions from its own resources to securities dealers,
banks, and other financial institutions through which the sales are made.
Transfer Agent Fees. Fidelity Investments Institutional Operations Company, Inc., (FIIOC), an affiliate of FMR, is the transfer, dividend disbursing and shareholder servicing agent (collectively referred to as the transfer agent) for each class of the fund. FIIOC receives account fees and asset-based fees that vary according to the account size and type of account of the shareholders of the respective classes of the fund. FIIOC pays for typesetting, printing and mailing of all shareholder reports, except proxy statements. For the period, the following amounts were paid to FIIOC:
|
|
Amount |
% of |
|
Class A |
$ 116,930 |
.23 |
|
Class T |
29,924 |
.39 |
|
Class B |
17,774 |
.43 |
|
Class C |
7,973 |
.32 |
|
Institutional Class |
7,835 |
.18 |
|
|
$ 180,436 |
|
Accounting Fees. Fidelity Service Company, Inc., an affiliate of FMR, maintains the fund's accounting records. The fee is based on the level of average net assets for the month plus out-of-pocket expenses.
Fidelity Cash Central Fund. Pursuant to an Exemptive Order issued by the SEC, the fund may invest in the Fidelity Cash Central Fund (the Cash Fund) managed by Fidelity Investments Money Management, Inc., an affiliate of FMR. The Cash Fund is an open-end money market fund available only to investment companies and other accounts managed by FMR and its affiliates. The Cash Fund seeks preservation of capital, liquidity, and current income. Income distributions from the Cash Fund are declared daily and paid monthly from net investment income. Income distributions earned by the fund are recorded as interest income in the accompanying financial statements.
Annual Report
Notes to Financial Statements - continued
5. Interfund Lending Program.
The fund participated in the interfund lending program as a borrower. The average daily loan balance during the period for which loans were outstanding amounted to $8,702,600. The weighted average interest rate was 5.34%. Interest expense includes $12,899 paid under the interfund lending program. At period end there were no interfund loans outstanding.
6. Bank Borrowings.
The fund is permitted to have bank borrowings for temporary or emergency purposes to fund shareholder redemptions. The fund has established borrowing arrangements with certain banks. The interest rate on the borrowings is the bank's base rate, as revised from time to time. The average daily loan balance during the period for which loans were outstanding amounted to $1,793,667. The weighted average interest rate was 6.83%. Interest expense includes $2,041 paid under the bank borrowing program. At period end there were no bank borrowings outstanding.
7. Expense Reductions.
FMR has directed certain portfolio trades to brokers who paid a portion of the fund's expenses. For the period, the fund's expenses were reduced by $13,538 under this arrangement.
In addition, through an arrangement with each class' transfer agent, credits realized as a result of uninvested cash balances were used to reduce a portion of expenses. During the period, each applicable class' expenses were reduced as follows under the transfer agent arrangements:
|
|
Transfer |
|
Class A |
$ 673 |
|
Institutional Class |
428 |
|
|
$ 1,101 |
8. Beneficial Interest.
At the end of the period, FMR and its affiliates were record owners of approximately 6% of the total outstanding shares of the fund. In addition, one unaffiliated shareholder was record owner of more than 10% of the total outstanding shares of the fund.
Annual Report
Notes to Financial Statements - continued
9. Share Transactions.
Transactions for each class of shares were as follows:
|
|
Shares |
Dollars |
||
|
|
Year ended October 31, |
Year ended October 31, |
Year ended October 31, |
Year ended October 31, |
|
|
2000 |
1999 |
2000 |
1999 |
|
|
|
|
|
|
|
Class A |
1,912,449 |
88,023 |
$ 29,597,357 |
$ 1,327,477 |
|
Shares redeemed |
(4,852,685) |
(1,435,809) |
(78,076,464) |
(21,783,079) |
|
Net increase (decrease) |
(2,940,236) |
(1,347,786) |
$ (48,479,107) |
$ (20,455,602) |
|
Class T A |
1,038,267 |
173,217 |
$ 17,970,116 |
$ 2,566,076 |
|
Shares redeemed |
(791,822) |
(79,577) |
(12,268,997) |
(1,175,670) |
|
Net increase (decrease) |
246,445 |
93,640 |
$ 5,701,119 |
$ 1,390,406 |
|
Class B A |
386,873 |
82,132 |
$ 6,798,112 |
$ 1,228,722 |
|
Shares redeemed |
(150,617) |
(16,928) |
(2,546,582) |
(254,139) |
|
Net increase (decrease) |
236,256 |
65,204 |
$ 4,251,530 |
$ 974,583 |
|
Class C A |
203,787 |
44,256 |
$ 3,606,641 |
$ 662,150 |
|
Shares redeemed |
(70,124) |
(3,244) |
(1,157,683) |
(46,879) |
|
Net increase (decrease) |
133,663 |
41,012 |
$ 2,448,958 |
$ 615,271 |
|
Institutional Class A |
576,464 |
11,433 |
$ 10,570,991 |
$ 167,260 |
|
Shares redeemed |
(464,547) |
- |
(7,360,011) |
- |
|
Net increase (decrease) |
111,917 |
11,433 |
$ 3,210,980 |
$ 167,260 |
L For the year ended October 31, 1999, amounts shown are for the period June 16, 1999 to October 31, 1999.
Annual Report
To the Trustees of Fidelity Advisor Series VIII and the Shareholders of Fidelity Advisor Emerging Asia Fund:
In our opinion, the accompanying statement of assets and liabilities, including the schedule of investments, and the related statements of operations and of changes in net assets and the financial highlights present fairly, in all material respects, the financial position of Fidelity Advisor Emerging Asia Fund (a fund of Fidelity Advisor Series VIII) at October 31, 2000, and the results of its operations, the changes in its net assets and the financial highlights for the periods indicated, in conformity with accounting principles generally accepted in the United States of America. These financial statements and financial highlights (hereafter referred to as "financial statements") are the responsibility of the Fidelity Advisor Emerging Asia Fund's management; our responsibility is to express an opinion on these financial statements based on our audits. We conducted our audits of these financial statements in accordance with auditing standards generally accepted in the United States of America which require that we plan and perform the audit to obtain reasonable assurance about whether the financial statements are free of material misstatement. An audit includes examining, on a test basis, evidence supporting the amounts and disclosures in the financial statements, assessing the accounting principles used and significant estimates made by management, and evaluating the overall financial statement presentation. We believe that our audits, which included confirmation of securities at October 31, 2000 by correspondence with the custodian and brokers, provide a reasonable basis for our opinion.
/s/PricewaterhouseCoopers LLP
PricewaterhouseCoopers LLP
Boston, Massachusetts
December 8, 2000
Annual Report
Annual Report
Annual Report
Annual Report
Annual Report
Annual Report
Annual Report
Investment Adviser
Fidelity Management & Research Company
Boston, MA
Investment Sub-Advisers
Fidelity Management & Research
(U.K.) Inc.
Fidelity Management & Research
(Far East) Inc.
Fidelity International
Investment Advisors
Fidelity Investments Japan Limited
Fidelity International Investment Advisors (U.K.) Limited
Officers
Edward C. Johnson 3d, President
Robert C. Pozen, Senior Vice President
Richard Spillane, Vice President
Eric D. Roiter, Secretary
Robert A. Dwight, Treasurer
Maria F. Dwyer, Deputy Treasurer
John H. Costello, Assistant Treasurer
Thomas J. Simpson, Assistant Treasurer
Board of Trustees
Ralph F. Cox *
Phyllis Burke Davis *
Robert M. Gates *
Edward C. Johnson 3d
Donald J. Kirk *
Peter S. Lynch
Ned C. Lautenbach *
Marvin L. Mann *
William O. McCoy *
Gerald C. McDonough *
Robert C. Pozen
Thomas R. Williams *
Advisory Board
J. Michael Cook
Abigail P. Johnson
Marie L. Knowles
General Distributor
Fidelity Distributors Corporation
Boston, MA
Transfer and Shareholder
Servicing Agents
Fidelity Investments Institutional Operations Company, Inc.
Boston, MA
Custodian
Brown Brothers Harriman & Co.
Boston, MA
* Independent trustees
Annual Report
Focus Funds
Fidelity Advisor Consumer
Industries Fund
Fidelity Advisor Cyclical
Industries Fund
Fidelity Advisor Financial
Services Fund
Fidelity Advisor Health Care Fund
Fidelity Advisor Natural
Resources Fund
Fidelity Advisor Technology Fund
Fidelity Advisor Telecommunications & Utilities Growth Fund
Growth Funds
Fidelity Advisor Korea Fund
Fidelity Advisor Emerging Asia Fund
Fidelity Advisor Latin America Fund
Fidelity Advisor Japan Fund
Fidelity Advisor Europe Capital Appreciation Fund
Fidelity Advisor International
Capital Appreciation Fund
Fidelity Advisor Overseas Fund
Fidelity Advisor Diversified International Fund
Fidelity Advisor Global Equity Fund
Fidelity Advisor TechnoQuant®
Growth Fund
Fidelity Advisor Small Cap Fund
Fidelity Advisor Value Strategies Fund
Fidelity Advisor Mid Cap Fund
Fidelity Advisor Dynamic Capital Appreciation Fund
Fidelity Advisor Equity Growth Fund
Fidelity Advisor Large Cap Fund
Fidelity Advisor Dividend Growth Fund
Fidelity Advisor Growth
Opportunities Fund
Growth and Income Funds
Fidelity Advisor Growth & Income Fund
Fidelity Advisor Equity Income Fund
Fidelity Advisor Asset Allocation Fund
Fidelity Advisor Balanced Fund
Taxable Income Funds
Fidelity Advisor Emerging Markets Income Fund
Fidelity Advisor High Yield Fund
Fidelity Advisor High Income Fund
Fidelity Advisor Strategic Income Fund
Fidelity Advisor Mortgage
Securities Fund
Fidelity Advisor Government Investment Fund
Fidelity Advisor Intermediate Bond Fund
Fidelity Advisor Short Fixed-Income Fund
Municipal Funds
Fidelity Advisor Municipal Income Fund
Money Market Funds
Prime Fund
Treasury Fund
Tax-Exempt Fund
AEAI-ANN-1200 118668
1.730185.101
(Fidelity Investment logo)(registered trademark)
Fidelity® Advisor
Fund - Class A, Class T, Class B
and Class C
Annual Report
October 31, 2000
(2_fidelity_logos)(registered trademark)
|
President's Message |
Ned Johnson on investing strategies. |
|
|
Performance |
How the fund has done over time. |
|
|
Fund Talk |
The manager's review of fund performance, strategy and outlook. |
|
|
Investment Changes |
A summary of major shifts in the fund's investments over the past six months. |
|
|
Investments |
A complete list of the fund's investments with their market values. |
|
|
Financial Statements |
Statements of assets and liabilities,
operations, and changes in net assets, |
|
|
Notes |
Notes to the financial statements. |
|
|
Report of Independent Accountants |
The auditors' opinion. |
|
|
Distributions |
|
Third party marks appearing herein are the property of their respective owners.
All other marks appearing herein are registered or unregistered trademarks or service marks of FMR Corp. or an affiliated company.
(Recycle graphic) This report is printed on recycled paper using soy-based inks.
This report and the financial statements contained herein are submitted for the general information of the shareholders of the fund. This report is not authorized for distribution to prospective investors in the fund unless preceded or accompanied by an effective prospectus.
Mutual fund shares are not deposits or obligations of, or guaranteed by, any depository institution. Shares are not insured by the FDIC, Federal Reserve Board or any other agency, and are subject to investment risks, including possible loss of principal amount invested.
Neither the fund nor Fidelity Distributors Corporation is a bank.
For more information on any Fidelity Advisor fund, including charges and expenses, contact your investment professional for a free prospectus. Read it carefully before you invest or send money.
Annual Report
(photo_of_Edward_C_Johnson_3d)
Dear Shareholder:
A sixth-straight year of double-digit positive returns for the Dow Jones Industrial Average, NASDAQ and S&P 500® could be in jeopardy unless the U.S. stock market shows marked improvement in the final two months of 2000. Through October, all three indexes had negative year-to-date returns. On the other hand, most fixed-income sectors were solidly in the black. Treasuries and other long-term government securities led the way, returning nearly 14%.
While it's impossible to predict the future direction of the markets with any degree of certainty, there are certain basic principles that can help investors plan for their future needs.
First, investors are encouraged to take a long-term view of their portfolios. If you can afford to leave your money invested through the inevitable up and down cycles of the financial markets, you will greatly reduce your vulnerability to any single decline. We know from experience, for example, that stock prices have gone up over longer periods of time, have significantly outperformed other types of investments and have stayed ahead of inflation.
Second, you can further manage your investing risk through diversification. A stock mutual fund, for instance, is already diversified, because it invests in many different companies. You can increase your diversification further by investing in a number of different stock funds, or in such other investment categories as bonds. If you have a short investment time horizon, you might want to consider moving some of your investment into a money market fund, which seeks income and a stable share price by investing in high-quality, short-term investments. Of course, it's important to remember that an investment in a money market fund is not insured or guaranteed by the Federal Deposit Insurance Corporation or any other government agency. Although money market funds seek to preserve the value of your investment at $1.00 per share, it is possible to lose money by investing in these types of funds.
Finally, no matter what your time horizon or portfolio diversity, it makes good sense to follow a regular investment plan, investing a certain amount of money in a fund at the same time each month or quarter and periodically reviewing your overall portfolio. By doing so, you won't get caught up in the excitement of a rapidly rising market, nor will you buy all your shares at market highs. While this strategy - known as dollar cost averaging - won't assure a profit or protect you from a loss in a declining market, it should help you lower the average cost of your purchases. Of course, you should consider your financial ability to continue your purchases through periods of low price levels before undertaking such a strategy.
Remember to contact your investment professional if you need help with your investments.
Best regards,
/s/Edward C. Johnson 3d
Edward C. Johnson 3d
Annual Report
Fidelity Advisor Diversified International Fund - Class A
There are several ways to evaluate historical performance. You can look at the total percentage change in value, the average annual percentage change or the growth of a hypothetical $10,000 investment. Total return reflects the change in the value of an investment, assuming reinvestment of the class' dividend income and capital gains (the profits earned upon the sale of securities that have grown in value). If Fidelity had not reimbursed certain class expenses, the life of fund total returns would have been lower.
Cumulative Total Returns
|
Periods ended October 31, 2000 |
|
|
Past 1 |
Life of |
|
Fidelity® Adv Diversified Intl - CL A |
|
|
13.13% |
47.64% |
|
Fidelity Adv Diversified Intl - CL A |
|
|
6.63% |
39.15% |
|
MSCI EAFE® |
|
|
-2.72% |
13.62% |
|
International Funds Average |
|
|
2.70% |
n/a* |
Cumulative total returns show Class A's performance in percentage terms over a set period - in this case, one year or since the fund started on December 17, 1998. For example, if you had invested $1,000 in a fund that had a 5% return over the past year, the value of your investment would be $1,050. You can compare Class A's returns to the performance of the Morgan Stanley Capital International Europe, Australasia, Far East (MSCI EAFE) Index - a market capitalization-weighted index that is designed to represent the performance of developed stock markets outside the United States and Canada. As of October 31, 2000, the index included over 800 equity securities of companies domiciled in 20 countries. To measure how Class A's performance stacked up against its peers, you can compare it to the international funds average, which reflects the performance of mutual funds with similar objectives tracked by Lipper Inc. The past one year average represents a peer group of 666 mutual funds. These benchmarks include reinvested dividends and capital gains, if any, and exclude the effect of sales charges.
Average Annual Total Returns
|
Periods ended October 31, 2000 |
Past 1 |
Life of |
|
Fidelity Adv Diversified Intl - CL A |
13.13% |
23.11% |
|
Fidelity Adv Diversified Intl - CL A |
6.63% |
19.28% |
|
MSCI EAFE |
-2.72% |
7.05% |
|
International Funds Average |
2.70% |
n/a* |
Average annual total returns take Class A shares' cumulative return and show you what would have happened if Class A shares had performed at a constant rate each year.
* Not available
Annual Report
$10,000 Over Life of Fund
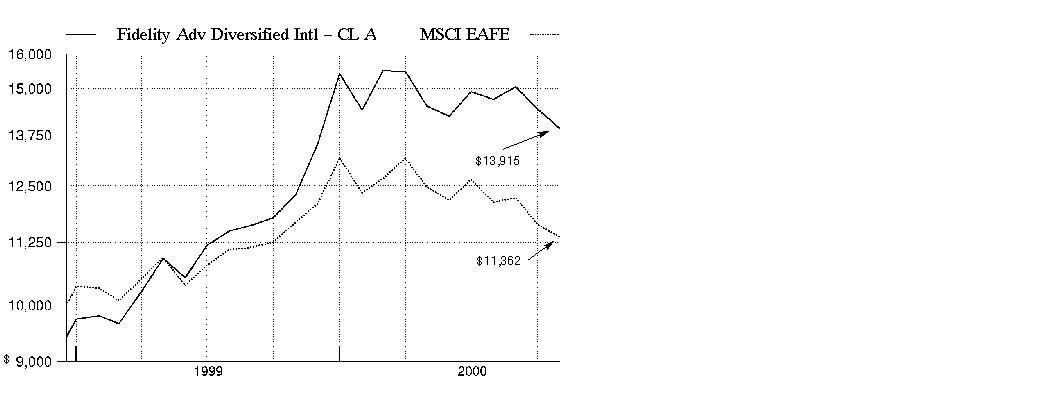
$10,000 Over Life of Fund: Let's say hypothetically that $10,000 was invested in Fidelity Advisor Diversified International Fund - Class A on December 17, 1998, when the fund started, and the current 5.75% sales charge was paid. As the chart shows, by October 31, 2000, the value of the investment would have grown to $13,915 - a 39.15% increase on the initial investment. For comparison, look at how the MSCI EAFE Index did over the same period. With dividends reinvested, the same $10,000 would have grown to $11,362 - a 13.62% increase.
Understanding
Performance
Many markets around the globe offer the potential for significant growth over time; however, investing in foreign markets means assuming greater risks than investing in the United States. Factors like changes in a country's financial markets, its local political and economic climate, and the fluctuating value of its currency create these risks. For these reasons an international fund's performance may be more volatile than a fund that invests exclusively in the United States. Past performance is no guarantee of future results and you may have a gain or loss when you sell your shares.
3Annual Report
Fidelity Advisor Diversified International Fund - Class T
There are several ways to evaluate historical performance. You can look at the total percentage change in value, the average annual percentage change or the growth of a hypothetical $10,000 investment. Total return reflects the change in the value of an investment, assuming reinvestment of the class' dividend income and capital gains (the profits earned upon the sale of securities that have grown in value). If Fidelity had not reimbursed certain class expenses, the life of fund total returns would have been lower.
Cumulative Total Returns
|
Periods ended October 31, 2000 |
|
Past 1 |
Life of |
|
Fidelity Adv Diversified Intl - CL T |
|
12.78% |
46.83% |
|
Fidelity Adv Diversified Intl - CL T |
|
8.83% |
41.69% |
|
MSCI EAFE |
|
-2.72% |
13.62% |
|
International Funds Average |
|
2.70% |
n/a* |
Cumulative total returns show Class T's performance in percentage terms over a set period - in this case, one year or since the fund started on December 17, 1998. For example, if you had invested $1,000 in a fund that had a 5% return over the past year, the value of your investment would be $1,050. You can compare Class T's returns to the performance of the Morgan Stanley Capital International Europe, Australasia, Far East (MSCI EAFE) Index - a market capitalization-weighted index that is designed to represent the performance of developed stock markets outside the United States and Canada. As of October 31, 2000, the index included over 800 equity securities of companies domiciled in 20 countries. To measure how Class T's performance stacked up against its peers, you can compare it to the international funds average, which reflects the performance of mutual funds with similar objectives tracked by Lipper Inc. The past one year average represents a peer group of 666 mutual funds. These benchmarks include reinvested dividends and capital gains, if any, and exclude the effect of sales charges.
Average Annual Total Returns
|
Periods ended October 31, 2000 |
Past 1 |
Life of |
|
Fidelity Adv Diversified Intl - CL T |
12.78% |
22.75% |
|
Fidelity Adv Diversified Intl - CL T |
8.83% |
20.44% |
|
MSCI EAFE |
-2.72% |
7.05% |
|
International Funds Average |
2.70% |
n/a* |
Average annual total returns take Class T shares' cumulative return and show you what would have happened if Class T shares had performed at a constant rate each year.
* Not available
Annual Report
$10,000 Over Life of Fund
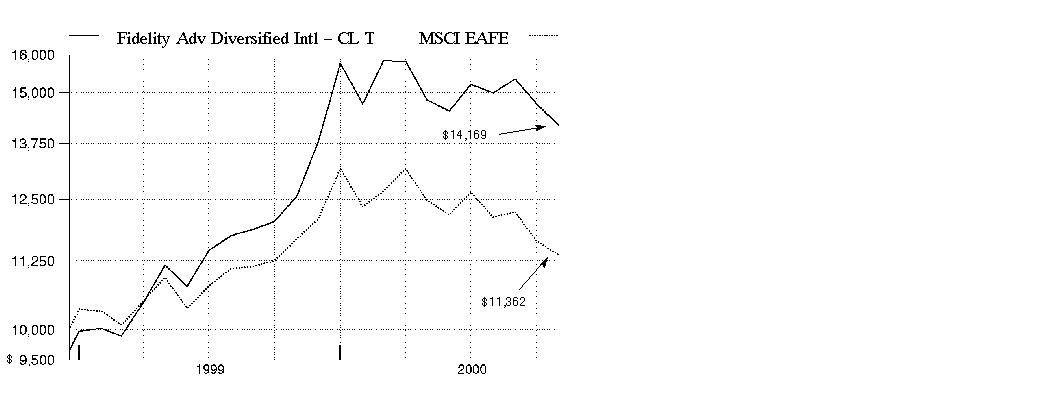
$10,000 Over Life of Fund: Let's say hypothetically that $10,000 was invested in Fidelity Advisor Diversified International Fund - Class T on December 17, 1998, when the fund started, and the current 3.50% sales charge was paid. As the chart shows, by October 31, 2000, the value of the investment would have grown to $14,169 - a 41.69% increase on the initial investment. For comparison, look at how the MSCI EAFE Index did over the same period. With dividends reinvested, the same $10,000 would have grown to $11,362 - a 13.62% increase.
Understanding
Performance
Many markets around the globe offer the potential for significant growth over time; however, investing in foreign markets means assuming greater risks than investing in the United States. Factors like changes in a country's financial markets, its local political and economic climate, and the fluctuating value of its currency create these risks. For these reasons an international fund's performance may be more volatile than a fund that invests exclusively in the United States. Past performance is no guarantee of future results and you may have a gain or loss when you sell your shares.
3Annual Report
Fidelity Advisor Diversified International Fund - Class B
There are several ways to evaluate historical performance. You can look at the total percentage change in value, the average annual percentage change or the growth of a hypothetical $10,000 investment. Total return reflects the change in the value of an investment, assuming reinvestment of the class' dividend income and capital gains (the profits earned upon the sale of securities that have grown in value). Class B shares' contingent deferred sales charge included in the past one year, and life of fund total return figures are 5% and 4%, respectively. If Fidelity had not reimbursed certain class expenses, the life of fund total returns would have been lower.
Cumulative Total Returns
|
Periods ended October 31, 2000 |
|
Past 1 |
Life of |
|
Fidelity Adv Diversified Intl - CL B |
|
12.21% |
45.42% |
|
Fidelity Adv Diversified Intl - CL B |
|
7.21% |
41.42% |
|
MSCI EAFE |
|
-2.72% |
13.62% |
|
International Funds Average |
|
2.70% |
n/a* |
Cumulative total returns show Class B's performance in percentage terms over a set period - in this case, one year or since the fund started on December 17, 1998. For example, if you had invested $1,000 in a fund that had a 5% return over the past year, the value of your investment would be $1,050. You can compare Class B's returns to the performance of the Morgan Stanley Capital International Europe, Australasia, Far East (MSCI EAFE) Index - a market capitalization-weighted index that is designed to represent the performance of developed stock markets outside the United States and Canada. As of October 31, 2000, the index included over 800 equity securities of companies domiciled in 20 countries. To measure how Class B's performance stacked up against its peers, you can compare it to the international funds average, which reflects the performance of mutual funds with similar objectives tracked by Lipper Inc. The past one year average represents a peer group of 666 mutual funds. These benchmarks include reinvested dividends and capital gains, if any, and exclude the effect of sales charges.
Average Annual Total Returns
|
Periods ended October 31, 2000 |
|
Past 1 |
Life of |
|
Fidelity Adv Diversified Intl - CL B |
|
12.21% |
22.12% |
|
Fidelity Adv Diversified Intl - CL B |
|
7.21% |
20.31% |
|
MSCI EAFE |
|
-2.72% |
7.05% |
|
International Funds Average |
|
2.70% |
n/a* |
Average annual total returns take Class B shares' cumulative return and show you what would have happened if Class B shares had performed at a constant rate each year.
* Not available
Annual Report
$10,000 Over Life of Fund
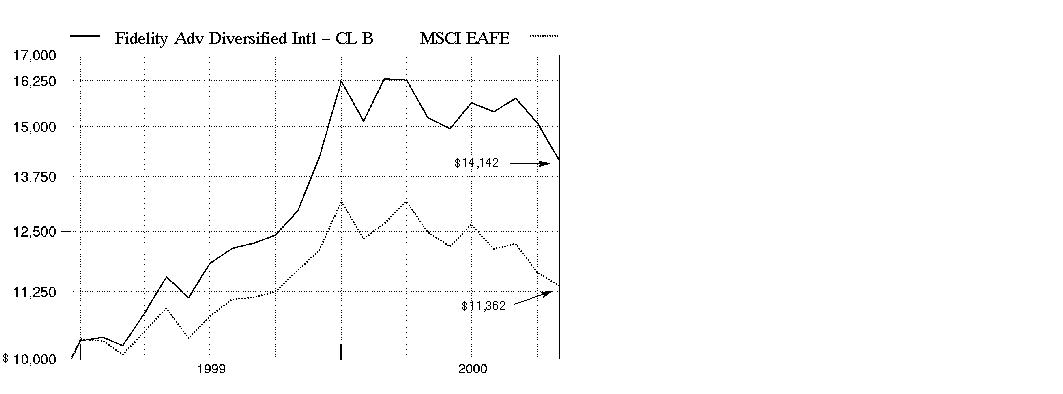
$10,000 Over Life of Fund: Let's say hypothetically that $10,000 was invested in Fidelity Advisor Diversified International Fund - Class B on December 17, 1998, when the fund started. As the chart shows, by October 31, 2000, the value of the investment, including the effect of the applicable contingent deferred sales charge, would have grown to $14,142 - a 41.42% increase on the initial investment. For comparison, look at how the MSCI EAFE Index did over the same period. With dividends reinvested, the same $10,000 would have grown to $11,362 - a 13.62% increase.
Understanding
Performance
Many markets around the globe offer the potential for significant growth over time; however, investing in foreign markets means assuming greater risks than investing in the United States. Factors like changes in a country's financial markets, its local political and economic climate, and the fluctuating value of its currency create these risks. For these reasons an international fund's performance may be more volatile than a fund that invests exclusively in the United States. Past performance is no guarantee of future results and you may have a gain or loss when you sell your shares.
3Annual Report
Fidelity Advisor Diversified International Fund - Class C
There are several ways to evaluate historical performance. You can look at the total percentage change in value, the average annual percentage change or the growth of a hypothetical $10,000 investment. Total return reflects the change in the value of an investment, assuming reinvestment of the class' dividend income and capital gains (the profits earned upon the sale of securities that have grown in value). Class C shares' contingent deferred sales charge included in the past one year, and life of fund total return figures are 1% and 0%, respectively. If Fidelity had not reimbursed certain class expenses, the life of fund total returns would have been lower.
Cumulative Total Returns
|
Periods ended October 31, 2000 |
|
Past 1 |
Life of |
|
Fidelity Adv Diversified Intl - CL C |
|
12.21% |
45.42% |
|
Fidelity Adv Diversified Intl - CL C |
|
11.21% |
45.42% |
|
MSCI EAFE |
|
-2.72% |
13.62% |
|
International Funds Average |
|
2.70% |
n/a* |
Cumulative total returns show Class C's performance in percentage terms over a set period - in this case, one year or since the fund started on December 17, 1998. For example, if you had invested $1,000 in a fund that had a 5% return over the past year, the value of your investment would be $1,050. You can compare Class C's returns to the performance of the Morgan Stanley Capital International Europe, Australasia, Far East (MSCI EAFE) Index - a market capitalization-weighted index that is designed to represent the performance of developed stock markets outside the United States and Canada. As of October 31, 2000, the index included over 800 equity securities of companies domiciled in 20 countries. To measure how Class C's performance stacked up against its peers, you can compare it to the international funds average, which reflects the performance of mutual funds with similar objectives tracked by Lipper Inc. The past one year average represents a peer group of 666 mutual funds. These benchmarks include reinvested dividends and capital gains, if any, and exclude the effect of sales charges.
Average Annual Total Returns
|
Periods ended October 31, 2000 |
|
Past 1 |
Life of |
|
Fidelity Adv Diversified Intl - CL C |
|
12.21% |
22.12% |
|
Fidelity Adv Diversified Intl - CL C |
|
11.21% |
22.12% |
|
MSCI EAFE |
|
-2.72% |
7.05% |
|
International Funds Average |
|
2.70% |
n/a* |
Average annual total returns take Class C shares' cumulative return and show you what would have happened if Class C shares had performed at a constant rate each year.
* Not available
Annual Report
$10,000 Over Life of Fund
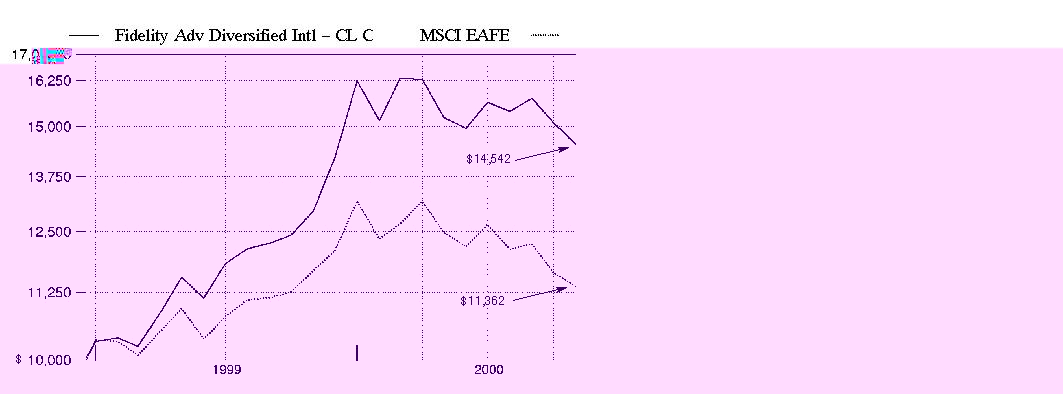
$10,000 Over Life of Fund: Let's say hypothetically that $10,000 was invested in Fidelity Advisor Diversified International Fund - Class C on December 17, 1998, when the fund started. As the chart shows, by October 31, 2000, the value of the investment would have grown to $14,542 - a 45.42% increase on the initial investment. For comparison, look at how the MSCI EAFE Index did over the same period. With dividends reinvested, the same $10,000 would have grown to $11,362 - a 13.62% increase.
Understanding
Performance
Many markets around the globe offer the potential for significant growth over time; however, investing in foreign markets means assuming greater risks than investing in the United States. Factors like changes in a country's financial markets, its local political and economic climate, and the fluctuating value of its currency create these risks. For these reasons an international fund's performance may be more volatile than a fund that invests exclusively in the United States. Past performance is no guarantee of future results and you may have a gain or loss when you sell your shares.
3Annual Report
Market Recap
Currency disparities, the see-saw performance of technology and telecommunications stocks and increased uncertainty over the direction of energy prices contributed to volatile world markets for the 12-month period that ended October 31, 2000. Through the first half of the period, foreign investors enjoyed handsome returns from technology and telecommunications holdings. These gains disappeared down the stretch, however, as the dollar continued to outperform the struggling euro - the uniform currency of 11 European nations - and the Japanese yen by wide margins. Soaring oil and gas prices also added to the volatility. The Morgan Stanley EAFE® index - which tracks the performance of stock markets in Europe, Australasia and the Far East - fell 2.72% during the period. Europe's economic recovery remained on course, but the euro's continued weakness proved to be a millstone. The Morgan Stanley Europe index had a 12-month return of 1.16%. Japan's economic recovery, on the other hand, appeared to be short-lived, or at least very, very slow in the making. The Morgan Stanley Japan index declined 11.61% during the period. Emerging markets, meanwhile, were unable to sustain the momentum they carried into early 2000 - the Morgan Stanley Emerging Markets Free index tumbled 10.33%.
(Portfolio Manager photograph)
An interview with Greg Fraser, Portfolio Manager of Fidelity Advisor Diversified International Fund
Q. How did the fund perform, Greg?
A. For the 12-month period that ended October 31, 2000, the fund's Class A, Class T, Class B and Class C shares returned 13.13%, 12.78%, 12.21% and 12.21%, respectively. For the same period, the capitalization-weighted Morgan Stanley Capital International (MSCI) EAFE Index - a broad measure of stock performance in Europe, Australasia and the Far East - fell 2.72%. The fund also compares its performance against the Lipper Inc. international funds average, which was up 2.70% during the past 12 months.
Annual Report
Fund Talk: The Manager's Overview - continued
Q. Why did the fund outperform its index and Lipper peer group during the past year?
A. Our underweighted position in Japan and favorable stock selection within the Japanese markets made the largest contribution to performance relative to the index. Despite a sell-off in Japanese technology and telecommunications stocks that began in the second quarter of 2000, the strong relative performance of our holdings in those sectors helped the fund. For example, rising demand from telecommunications companies eager to build out optical networks boosted the performance of Furukawa Electric. Additionally, the fund's out-of-benchmark stake in Canadian stocks proved beneficial. Compared to our Lipper peers, I probably reduced the fund's weightings in the technology and telecommunications sectors more quickly and aggressively than other funds did - a move that enhanced performance - as those areas were battered throughout the summer.
Q. Can you describe the international market environment during the period?
A. During the first half of the period, the fund had the wind at its back due to strong economic growth in many countries, generally stable interest rates and improving corporate earnings. That positive environment was altered significantly during the past six months, as a couple of key factors put heavy downward pressure on international equity prices. First, a rising interest-rate environment worldwide - particularly in European countries - contributed to slowing demand for products and services and began to hurt corporate profits. Specifically, there were growing concerns about slowing demand for certain technology products, such as personal computers and semiconductors, which hurt stocks in that sector. Meanwhile, an increase in energy prices to near historically high levels was seen as a detriment to the economies in many countries, such as South Korea, which imports nearly 100% of its oil.
Q. Could you highlight some of the fund's more important individual contributors?
A. In the consumer products industry, diversified companies such as Diageo and Nestle performed well as investors retreated from the technology sector. Most pharmaceutical companies did reasonably well, including fund holdings SmithKline Beecham and Glaxo Wellcome. Additionally, energy companies such as European holdings TotalFinaElf and Eni, as well as Canadian Natural Resources and Alberta Energy in Canada, did well given the positive supply and demand equation for oil.
Q. Which stocks disappointed?
A. There were several disappointments in the telecommunications sector, which suffered from global pricing pressures, higher-than-expected costs for licenses for the next generation of wireless communications, called 3G, and general slowing economic growth worldwide. Among these detractors were Nippon Telegraph, Vodafone Group, NTT DoCoMo, DDI and China Mobile. Additionally, Japanese electronics manufacturer Hikari Tsushin, which I sold off entirely during the period, and United Internet were hurt by the global correction in Internet-related stocks.
Annual Report
Fund Talk: The Manager's Overview - continued
Q. Greg, what's your outlook for the fund?
A. After the sharp decline of telecom and technology stocks during the past six months, there haven't been any areas of the market that have demonstrated clear leadership. Nevertheless, I will continue to look for reasonably valued stocks with improving fundamentals. I have increasing concerns about the funding environment for emerging companies. Many newer companies appear to have substantial capital needs and, if those needs become too difficult or too expensive to meet, the equities of those companies could fall dramatically in value. Shareholders should expect companies with strong balance sheets and good cash flow to become a larger part of the portfolio.
The views expressed in this report reflect those of the portfolio manager only through the end of the period of the report as stated on the cover and do not necessarily represent the views of Fidelity or any other person in the Fidelity organization. Any such views are subject to change at any time based upon market or other conditions and Fidelity disclaims any responsibility to update such views. These views may not be relied on as investment advice and, because investment decisions for a Fidelity fund are based on numerous factors, may not be relied on as an indication of trading intent on behalf of any Fidelity fund.
Fund Facts
Goal: seeks capital growth
Start date: December 17, 1998
Size: as of October 31, 2000, more than $268 million
Manager: Greg Fraser, since inception; joined Fidelity in 1986
3Greg Fraser discusses the possibility of a global bear market:
"By historical standards, U.S. equity returns have been substantially higher than normal during the past few years. Some specific sectors, such as technology, have seen spectacular returns - at least until March of 2000. Additionally, many investors who participated in initial public offerings (IPOs) for the first time experienced tremendous results. Because of these abnormal positive experiences and through media influence, many investors have been taught to buy more stocks on every dip in the market.
"It is important, therefore, to recognize that we might now either be in a bear market - a period of generally decreasing stock prices - or we soon could be in one. It's one thing to stay the course when equities quickly recover; it's quite another to actually stay the course if one's monthly statements show greater losses, month after month. History has shown that truly global bear markets leave few stocks unscathed.
"While I don't know whether or not we're in a bear market yet, shareholders should re-examine their portfolio allocations, making sure they don't have short-term investment money overexposed to these equity risks. Meanwhile, there is evidence that investing a percentage of one's portfolio in international stocks can provide an added layer of diversification that could enhance portfolio performance over the long term."
Annual Report
|
Top Five Stocks as of October 31, 2000 |
||
|
|
% of fund's |
% of fund's net assets |
|
Furukawa Electric Co. Ltd. (Japan, Electrical Equipment) |
1.7 |
1.4 |
|
Nippon Telegraph & Telephone Corp. sponsored ADR (Japan, Telephone Services) |
1.6 |
2.0 |
|
Shell Transport & Trading Co. PLC (Reg.) (United Kingdom, Oil & Gas) |
1.6 |
1.1 |
|
Nokia AB sponsored ADR (Finland, Communications Equipment) |
1.6 |
2.2 |
|
Vodafone Group PLC (United Kingdom, Cellular) |
1.5 |
2.0 |
|
|
8.0 |
8.7 |
|
Top Five Market Sectors as of October 31, 2000 |
||
|
|
% of fund's |
% of fund's net assets |
|
Finance |
20.6 |
12.0 |
|
Utilities |
9.7 |
17.3 |
|
Technology |
9.7 |
13.5 |
|
Health |
8.6 |
6.4 |
|
Energy |
8.3 |
7.9 |
|
Top Five Countries as of October 31, 2000 |
||
|
(excluding cash equivalents) |
% of fund's |
% of fund's net assets |
|
Japan |
15.0 |
21.4 |
|
United Kingdom |
12.2 |
10.3 |
|
Canada |
9.4 |
4.1 |
|
Switzerland |
8.5 |
7.7 |
|
France |
7.5 |
8.0 |
|
Percentages are adjusted for the effect of open futures contracts, if applicable. |
|
Asset Allocation (% of fund's net assets) |
|||||||
|
As of October 31, 2000 |
As of April 30, 2000 |
||||||
|
Stocks and Investment Companies 92.4% |
|
|
Stocks and Investment Companies 91.7% |
|
||
|
Bonds 0.2% |
|
|
Bonds 0.3% |
|
||
|
Short-Term |
|
|
Short-Term |
|
||

Annual Report
Showing Percentage of Net Assets
|
Common Stocks - 89.5% |
|||
|
Shares |
Value (Note 1) |
||
|
Australia - 2.3% |
|||
|
Australian Gas Light Co. |
46,000 |
$ 278,174 |
|
|
Australian Stock Exchange Ltd. |
11,900 |
72,978 |
|
|
AXA Asia Pacific Holdings Ltd. |
185,000 |
276,174 |
|
|
BHP Ltd. |
24,100 |
234,416 |
|
|
BMCMedia.com Ltd. (a) |
208,000 |
29,753 |
|
|
Cable & Wireless Optus Ltd. (a) |
133,200 |
283,094 |
|
|
Commonwealth Bank of Australia |
73,200 |
1,093,095 |
|
|
E*TRADE Australia Ltd. (a) |
45,000 |
46,814 |
|
|
F. H. Faulding & Co. Ltd. |
34,500 |
183,041 |
|
|
ISIS Communications Ltd. (a) |
185,000 |
28,387 |
|
|
John Fairfax Holdings Ltd. |
50,000 |
113,913 |
|
|
National Australia Bank Ltd. |
25,000 |
348,501 |
|
|
News Corp. Ltd. sponsored ADR (pfd. ltd. vtg.) |
39,300 |
1,422,169 |
|
|
Orbital Engine Co. Ltd. sponsored ADR (a) |
2,000 |
17,625 |
|
|
Securenet Ltd. (a) |
85,900 |
373,085 |
|
|
Westpac Banking Corp. |
50,300 |
344,679 |
|
|
WMC Ltd. |
297,300 |
1,140,474 |
|
|
TOTAL AUSTRALIA |
6,286,372 |
||
|
Austria - 0.2% |
|||
|
Bank Austria AG |
4,500 |
243,500 |
|
|
Flughafen Wien AG |
2,000 |
72,980 |
|
|
RHI AG |
10,871 |
230,683 |
|
|
TOTAL AUSTRIA |
547,163 |
||
|
Belgium - 0.2% |
|||
|
Dexia SA (a) |
512 |
9 |
|
|
Telindus Group NV |
32,000 |
626,075 |
|
|
Telindus Group NV (strip VVPR) (a) |
33 |
0 |
|
|
TOTAL BELGIUM |
626,084 |
||
|
Bermuda - 0.6% |
|||
|
ACE Ltd. |
5,700 |
223,725 |
|
|
Aquarius Platinum Ltd. (a) |
60,000 |
249,672 |
|
|
Asia Global Crossing Ltd. Class A |
35,000 |
245,000 |
|
|
Global Crossing Ltd. (a) |
12,000 |
283,500 |
|
|
Knightsbridge Tankers Ltd. |
13,100 |
282,469 |
|
|
RenaissanceRe Holdings Ltd. |
4,400 |
319,275 |
|
|
TOTAL BERMUDA |
1,603,641 |
||
|
Brazil - 0.2% |
|||
|
Banco Itau SA |
2,800,000 |
218,842 |
|
|
Companhia de Bebidas das Americas (AmBev) sponsored ADR |
1,000 |
22,563 |
|
|
Common Stocks - continued |
|||
|
Shares |
Value (Note 1) |
||
|
Brazil - continued |
|||
|
Telebras sponsored ADR (pfd. holder) |
5,100 |
$ 373,575 |
|
|
Telecomunicacoes de Sao Paulo SA sponsored ADR |
2,000 |
28,500 |
|
|
TOTAL BRAZIL |
643,480 |
||
|
Canada - 9.2% |
|||
|
Alberta Energy Co. Ltd. |
33,800 |
1,248,768 |
|
|
Bank of Montreal |
15,000 |
694,581 |
|
|
Bank of Nova Scotia |
45,600 |
1,302,857 |
|
|
Barrick Gold Corp. |
10,000 |
133,005 |
|
|
BCE, Inc. |
70,600 |
1,901,215 |
|
|
Canada Life Financial Corp. |
15,000 |
350,739 |
|
|
Canadian Imperial Bank of Commerce |
47,400 |
1,506,837 |
|
|
Canadian National Railway Co. |
32,000 |
1,008,867 |
|
|
Canadian Natural Resources Ltd. (a) |
40,800 |
1,205,911 |
|
|
Canadian Pacific Ltd. |
67,200 |
1,953,103 |
|
|
Celestica, Inc. (sub. vtg.) (a) |
10,000 |
714,614 |
|
|
COM DEV International Ltd. (a) |
8,000 |
90,640 |
|
|
Encal Energy Ltd. (a) |
5,000 |
30,378 |
|
|
Fairfax Financial Holdings Ltd. (a) |
8,000 |
1,066,667 |
|
|
Fletcher Challenge Canada Ltd. |
105,200 |
1,105,550 |
|
|
Gulf Canada Resources Ltd. (a) |
97,200 |
418,167 |
|
|
Harrowston, Inc. Class A (a) |
56,000 |
156,322 |
|
|
Industrial Alliance Life Insurance Co. (a) |
4,000 |
88,670 |
|
|
Manulife Financial Corp. |
4,000 |
104,039 |
|
|
Marsulex, Inc. (a) |
5,000 |
10,016 |
|
|
Metro, Inc. Class A |
12,000 |
163,941 |
|
|
National Bank of Canada |
26,000 |
426,076 |
|
|
Noranda, Inc. |
13,300 |
130,598 |
|
|
Nortel Networks Corp. |
7,900 |
359,450 |
|
|
Onex Corp. |
21,000 |
333,793 |
|
|
OZ Optics Ltd. unit (f) |
5,400 |
79,650 |
|
|
Pancanadian Petroleum Ltd. |
10,500 |
244,828 |
|
|
Petro-Canada |
45,800 |
962,627 |
|
|
Placer Dome, Inc. |
8,500 |
70,624 |
|
|
Power Corp. of Canada |
23,000 |
521,182 |
|
|
Research in Motion Ltd. (a) |
2,000 |
199,672 |
|
|
Rio Alto Exploration Ltd. (a) |
13,000 |
221,149 |
|
|
Royal Bank of Canada |
47,500 |
1,506,897 |
|
|
Sun Life Financial Services Canada, Inc. |
45,800 |
947,586 |
|
|
Suncor Energy, Inc. |
48,000 |
937,931 |
|
|
Talisman Energy, Inc. (a) |
13,000 |
409,425 |
|
|
TimberWest Forest Corp. unit |
55,800 |
386,660 |
|
|
Common Stocks - continued |
|||
|
Shares |
Value (Note 1) |
||
|
Canada - continued |
|||
|
Toronto Dominion Bank |
58,300 |
$ 1,606,361 |
|
|
Trizec Hahn Corp. (sub. vtg.) (a) |
8,000 |
120,066 |
|
|
TOTAL CANADA |
24,719,462 |
||
|
Denmark - 1.6% |
|||
|
Danske Bank AS |
2,000 |
289,781 |
|
|
GN Store Nordic AS |
50,800 |
985,254 |
|
|
Group 4 Falck AS |
5,400 |
659,194 |
|
|
NKT Holding AS |
1,000 |
236,730 |
|
|
Novo-Nordisk AS Series B (a) |
9,700 |
2,058,355 |
|
|
RTX Telecom AS |
2,100 |
88,646 |
|
|
TK Development AS |
800 |
26,468 |
|
|
TOTAL DENMARK |
4,344,428 |
||
|
Finland - 2.9% |
|||
|
Elisa Communications Corp. (A Shares) |
12,724 |
353,164 |
|
|
F-Secure Oyj (a) |
4,000 |
22,748 |
|
|
Fortum Oyj |
22,000 |
72,827 |
|
|
KCI Konecranes |
7,815 |
182,351 |
|
|
Kone Corp. |
4,000 |
234,269 |
|
|
Metsa Tissue Oyj |
26,400 |
268,900 |
|
|
Metsa-Serla Oyj (B Shares) |
20,590 |
129,328 |
|
|
Metso Oyj sponsored ADR |
23,700 |
186,638 |
|
|
Nokia AB sponsored ADR |
98,300 |
4,202,325 |
|
|
Sampo Insurance Co. Ltd. (A Shares) |
38,026 |
1,549,271 |
|
|
Sanoma-WSOY Oyj (B Shares) |
6,600 |
90,193 |
|
|
Sonera Corp. |
8,500 |
187,296 |
|
|
UPM-Kymmene Corp. |
10,955 |
310,108 |
|
|
TOTAL FINLAND |
7,789,418 |
||
|
France - 7.3% |
|||
|
Aventis SA (France) |
21,300 |
1,534,931 |
|
|
AXA SA de CV |
11,200 |
1,483,023 |
|
|
BNP Paribas SA |
17,400 |
1,500,543 |
|
|
Carbone Lorraine Group |
8,900 |
379,982 |
|
|
Castorama Dubois Investissements SA |
2,300 |
467,757 |
|
|
Christian Dior SA |
24,400 |
1,240,572 |
|
|
CNP Assurances |
23,900 |
742,276 |
|
|
Compagnie de St. Gobain |
1,000 |
132,328 |
|
|
Compagnie Generale d'Industrie et de Participations (CGIP) |
4,400 |
184,495 |
|
|
Compagnie Generale de Geophysique SA sponsored ADR (a) |
3,679 |
44,148 |
|
|
Eurafrance (Societe) |
1,330 |
799,828 |
|
|
Eurotunnel SA unit (a) |
30,000 |
27,246 |
|
|
Common Stocks - continued |
|||
|
Shares |
Value (Note 1) |
||
|
France - continued |
|||
|
France Telecom SA sponsored ADR |
14,700 |
$ 1,578,413 |
|
|
HighWave Optical Technologies |
2,000 |
305,398 |
|
|
Isis SA |
3,000 |
206,258 |
|
|
L'Oreal SA (a) |
1,750 |
133,686 |
|
|
Louis Vuitton Moet Hennessy (LVMH) |
4,500 |
328,486 |
|
|
Remy Cointreau SA |
3,000 |
100,328 |
|
|
Remy Cointreau SA (RFD) (a) |
71 |
2,374 |
|
|
Riber SA (d) |
13,000 |
277,846 |
|
|
Sanofi-Synthelabo SA |
22,900 |
1,205,126 |
|
|
Schneider Electric SA |
2,000 |
130,291 |
|
|
Silicon On Insulator TEChnologies SA (SOITEC) (a) |
9,000 |
203,967 |
|
|
Societe Generale Class A (a) |
17,400 |
988,054 |
|
|
TotalFinaElf SA: |
|
|
|
|
Class B |
12,400 |
1,776,300 |
|
|
sponsored ADR |
30,800 |
2,206,050 |
|
|
UBI Soft Entertainment (a) |
335 |
14,445 |
|
|
Vivendi Environment (a) |
20,600 |
769,352 |
|
|
Vivendi SA |
8,700 |
625,472 |
|
|
Wavecom SA sponsored ADR (a) |
1,000 |
87,000 |
|
|
TOTAL FRANCE |
19,475,975 |
||
|
Germany - 6.6% |
|||
|
Aachener & Muenchener Beteiligungs AG (AMB) |
2,000 |
179,946 |
|
|
ACG AG |
1,500 |
78,938 |
|
|
Allianz AG (Reg.) |
3,649 |
1,237,515 |
|
|
Altana AG |
11,400 |
1,373,263 |
|
|
Axel Springer Verlag |
180 |
145,145 |
|
|
Bayer AG |
31,300 |
1,358,925 |
|
|
Bayerische Motoren Werke AG (BMW) |
2,000 |
66,240 |
|
|
Beiersdorf AG |
5,700 |
546,712 |
|
|
Buderus AG |
17,300 |
327,899 |
|
|
Cybio AG |
2,500 |
301,218 |
|
|
Deutsche Bank AG |
17,400 |
1,424,925 |
|
|
Deutsche Lufthansa AG (Reg.) |
25,500 |
497,821 |
|
|
Deutsche Telekom AG |
25,500 |
957,765 |
|
|
DIS Deutscher Industrie Service AG (a) |
19,600 |
819,347 |
|
|
E.On AG |
8,900 |
452,353 |
|
|
Epcos AG |
2,000 |
151,630 |
|
|
ERGO Versicherungs Gruppe AG |
2,000 |
276,709 |
|
|
Fresenius Medical Care AG sponsored ADR |
22,900 |
609,713 |
|
|
Hannover Rueckversicherungs AG |
5,000 |
420,580 |
|
|
Heidelberger Druckmaschinen AG |
16,000 |
845,405 |
|
|
Common Stocks - continued |
|||
|
Shares |
Value (Note 1) |
||
|
Germany - continued |
|||
|
Infineon Technologies AG sponsored ADR (a) |
4,500 |
$ 192,938 |
|
|
Lion Bioscience AG sponsored ADR |
1,000 |
77,063 |
|
|
Muenchener Ruckversicherungs-Gesellschaft AG (Reg.) |
1,000 |
314,480 |
|
|
Pfeiffer Vacuum Technology AG |
3,000 |
118,408 |
|
|
Schering AG (a) |
28,010 |
1,569,143 |
|
|
SGL Carbon AG (a) |
8,600 |
525,650 |
|
|
Siemens AG |
7,800 |
993,427 |
|
|
Stinnes AG |
16,000 |
378,904 |
|
|
Suess MicroTec AG (a) |
4,000 |
112,721 |
|
|
Techem AG |
35,000 |
860,047 |
|
|
United Internet AG (a) |
13,100 |
84,284 |
|
|
WEB.DE AG |
8,000 |
124,264 |
|
|
Wella AG |
6,500 |
247,171 |
|
|
Winkler & Dunnebier AG |
5,000 |
62,811 |
|
|
TOTAL GERMANY |
17,733,360 |
||
|
Hong Kong - 1.0% |
|||
|
Asat Holdings Ltd. sponsored ADR |
16,000 |
106,000 |
|
|
Cathay Pacific Airways Ltd. |
40,000 |
72,583 |
|
|
China Mobile Ltd. (a) |
74,000 |
453,250 |
|
|
China Mobile Ltd. sponsored ADR (a) |
53,400 |
1,635,375 |
|
|
Hutchison Whampoa Ltd. |
24,900 |
308,937 |
|
|
Techpacific.com Ltd. |
80,000 |
2,975 |
|
|
TOTAL HONG KONG |
2,579,120 |
||
|
Indonesia - 0.0% |
|||
|
Gulf Indonesia Resources Ltd. (a) |
2,000 |
21,750 |
|
|
Ireland - 0.9% |
|||
|
Allied Irish Banks PLC |
20,000 |
203,712 |
|
|
Anglo-Irish Bank Corp. PLC |
72,200 |
167,469 |
|
|
Bank of Ireland, Inc. |
45,000 |
346,820 |
|
|
Elan Corp. PLC sponsored ADR (a) |
12,100 |
628,444 |
|
|
Independent Newspapers PLC (Ireland) |
77,400 |
239,795 |
|
|
Irish Life & Permanent PLC |
47,000 |
471,143 |
|
|
Ryanair Holdings PLC sponsored ADR (a) |
8,800 |
354,750 |
|
|
TOTAL IRELAND |
2,412,133 |
||
|
Israel - 0.3% |
|||
|
AudioCodes Ltd. (a) |
3,000 |
118,688 |
|
|
BackWeb Technologies Ltd. (a) |
2,000 |
17,875 |
|
|
BATM Advanced Communications Ltd. |
2,000 |
14,874 |
|
|
Common Stocks - continued |
|||
|
Shares |
Value (Note 1) |
||
|
Israel - continued |
|||
|
Lanoptics Ltd. (a) |
2,000 |
$ 47,250 |
|
|
Teva Pharmaceutical Industries Ltd. ADR |
10,400 |
614,900 |
|
|
TOTAL ISRAEL |
813,587 |
||
|
Italy - 2.2% |
|||
|
Alleanza Assicurazioni Spa |
8,000 |
105,699 |
|
|
Assicurazioni Generali Spa |
5,644 |
185,733 |
|
|
De Rigo Spa ADR (a) |
4,000 |
32,750 |
|
|
Ducati Motor Holding Spa (a) |
175,200 |
378,466 |
|
|
Enel Spa |
10,000 |
37,016 |
|
|
Eni Spa sponsored ADR |
35,500 |
1,921,438 |
|
|
Finmeccanica Spa (a) |
415,000 |
475,892 |
|
|
Industrie Natuzzi Spa ADR |
2,500 |
29,688 |
|
|
Luxottica Group Spa sponsored ADR |
20,000 |
288,750 |
|
|
SAES Getters Spa sponsored ADR |
14,000 |
126,000 |
|
|
San Paolo IMI Spa |
17,524 |
282,256 |
|
|
Telecom Italia Mobile Spa |
49,700 |
422,908 |
|
|
Telecom Italia Spa |
62,900 |
739,075 |
|
|
Unicredito Italiano Spa |
160,156 |
818,225 |
|
|
TOTAL ITALY |
5,843,896 |
||
|
Japan - 15.0% |
|||
|
Advantest Corp. |
2,000 |
260,838 |
|
|
Air Liquide Japan Ltd. |
8,000 |
37,980 |
|
|
Anritsu Corp. |
17,000 |
373,935 |
|
|
Canon, Inc. ADR |
7,100 |
287,994 |
|
|
Citizen Watch Co. Ltd. |
41,000 |
402,447 |
|
|
Daiichi Pharmaceutical Co. Ltd. |
8,000 |
227,294 |
|
|
Dainippon Pharmaceutical Co. |
8,000 |
102,575 |
|
|
DDI Corp. |
5 |
23,463 |
|
|
Fanuc Ltd. |
3,000 |
269,453 |
|
|
Fuji Coca-Cola Bottling Co. Ltd. |
20,000 |
156,723 |
|
|
Fuji Heavy Industries Ltd. |
44,000 |
306,480 |
|
|
Fuji Photo Film Co. Ltd. |
7,000 |
259,830 |
|
|
Fujikura Ltd. |
35,000 |
308,588 |
|
|
Fujisawa Pharmaceutical Co. Ltd. |
13,000 |
408,670 |
|
|
Fujitsu Ltd. |
35,000 |
623,591 |
|
|
Furukawa Electric Co. Ltd. |
170,000 |
4,471,609 |
|
|
Hakuto Co. Ltd. |
3,100 |
68,472 |
|
|
Hitachi Chemical Co. Ltd. |
4,000 |
100,449 |
|
|
Hokkaido Coca-Cola Bottling Co. Ltd. |
20,000 |
164,971 |
|
|
Hoya Corp. |
8,700 |
719,219 |
|
|
Common Stocks - continued |
|||
|
Shares |
Value (Note 1) |
||
|
Japan - continued |
|||
|
JAFCO Co. Ltd. |
400 |
$ 42,526 |
|
|
Japan Airlines Co. Ltd. |
40,000 |
160,205 |
|
|
Japan Aviation Electronics Industries (a) |
14,000 |
99,056 |
|
|
Kao Corp. |
16,000 |
479,516 |
|
|
Konica Corp. (a) |
64,000 |
494,473 |
|
|
Kyocera Corp. sponsored ADR |
10,800 |
1,444,500 |
|
|
Maruichi Steel Tube Ltd. |
5,000 |
70,983 |
|
|
Matsushita Communication Industrial Co. Ltd. |
2,000 |
262,121 |
|
|
Matsushita Electric Industrial Co. Ltd. ADR |
6,300 |
1,841,175 |
|
|
Mikasa Coca Cola Bottling Co. |
6,000 |
46,467 |
|
|
Mikuni Coca Cola Bottling Co. |
5,000 |
54,945 |
|
|
Mitsubishi Electric Corp. |
40,000 |
287,416 |
|
|
Mitsubishi Estate Co. Ltd. (a) |
20,000 |
212,629 |
|
|
Mitsubishi Rayon Co. Ltd. |
22,000 |
78,435 |
|
|
Mitsui Fudosan Co. Ltd. |
20,000 |
242,324 |
|
|
NEC Corp. |
72,000 |
1,372,560 |
|
|
Nichicon Corp. |
22,000 |
392,980 |
|
|
Nikko Securities Co. Ltd. |
42,000 |
362,607 |
|
|
Nintendo Co. Ltd. |
2,700 |
446,659 |
|
|
Nippon Electric Glass Co. Ltd. |
9,000 |
209,513 |
|
|
Nippon Sheet Glass Co. Ltd. |
23,000 |
349,922 |
|
|
Nippon Telegraph & Telephone Corp. sponsored ADR |
95,600 |
4,367,725 |
|
|
Nissan Motor Co. Ltd. (a) |
64,000 |
448,000 |
|
|
Nitto Denko Corp. |
6,000 |
202,914 |
|
|
NOK Corp. |
4,000 |
38,200 |
|
|
Nomura Securities Co. Ltd. |
55,000 |
1,166,942 |
|
|
North Pacific Bank Ltd. |
4,000 |
26,065 |
|
|
NTT DoCoMo, Inc. |
27 |
665,659 |
|
|
Olympus Optical Co. Ltd. |
16,000 |
221,135 |
|
|
Omron Corp. |
63,000 |
1,553,203 |
|
|
ORIX Corp. |
10,200 |
1,070,388 |
|
|
Osaka Gas Co. Ltd. |
40,000 |
98,616 |
|
|
Pioneer Corp. |
38,000 |
1,177,161 |
|
|
Rohm Co. Ltd. |
3,300 |
832,032 |
|
|
Sanyo Electric Co. Ltd. |
266,000 |
2,023,463 |
|
|
Sharp Corp. |
12,000 |
152,873 |
|
|
Shikoku Coca-Cola Bottling Co. Ltd. |
15,200 |
123,985 |
|
|
SKY Perfect Communications, Inc. (a) |
65 |
119,742 |
|
|
Softbank Corp. |
2,000 |
120,062 |
|
|
Sony Corp. sponsored ADR |
12,000 |
996,000 |
|
|
Stanley Electric Co. Ltd. |
8,000 |
82,852 |
|
|
Sumitomo Electric Industries Ltd. |
43,000 |
794,107 |
|
|
Common Stocks - continued |
|||
|
Shares |
Value (Note 1) |
||
|
Japan - continued |
|||
|
Sumitomo Realty & Development Co. Ltd. |
5,000 |
$ 28,687 |
|
|
Suzuken Co. Ltd. |
4,500 |
159,610 |
|
|
Takeda Chemical Industries Ltd. |
21,000 |
1,383,833 |
|
|
TDK Corp. |
4,000 |
403,263 |
|
|
Teikoku Hormone Manufacturing Co. Ltd. |
7,000 |
44,011 |
|
|
Tokyo Gas Co. Ltd. |
40,000 |
104,482 |
|
|
Tokyo Seimitsu Co. Ltd. |
4,100 |
289,341 |
|
|
Toshiba Corp. |
49,000 |
350,289 |
|
|
Toyo Corp. |
4,000 |
107,781 |
|
|
Toyoda Automatic Loom Works Ltd. |
37,000 |
669,737 |
|
|
Toyoda Machine Works Ltd. |
9,000 |
65,494 |
|
|
Toyota Motor Corp. |
40,200 |
1,606,379 |
|
|
West Japan Railway Co. |
20 |
82,119 |
|
|
Yokogawa Electric Corp. |
12,000 |
94,144 |
|
|
TOTAL JAPAN |
40,195,887 |
||
|
Korea (South) - 0.3% |
|||
|
Samsung Electronics Co. Ltd. |
6,900 |
864,396 |
|
|
Luxembourg - 0.3% |
|||
|
Espirito Santo Financial Holding SA ADR |
21,000 |
396,375 |
|
|
Metro International SA Swedish Depository Receipt (A Shares) |
4,000 |
41,212 |
|
|
Quilmes Industrial SA sponsored ADR |
11,000 |
90,750 |
|
|
RTL Group |
1,900 |
164,497 |
|
|
TOTAL LUXEMBOURG |
692,834 |
||
|
Mexico - 0.8% |
|||
|
Coca-Cola Femsa SA de CV ADR |
4,500 |
86,344 |
|
|
Elamex SA de CV (a) |
22,600 |
67,094 |
|
|
Grupo Radio Centro SA de CV sponsored ADR |
15,000 |
143,438 |
|
|
Telefonos de Mexico SA de CV Series L sponsored ADR |
16,800 |
906,150 |
|
|
Transport Maritima Mexicana SA de CV: |
|
|
|
|
sponsored ADR (a) |
40,000 |
337,500 |
|
|
Series L sponsored ADR (a) |
24,500 |
238,875 |
|
|
Wal-Mart de Mexico SA de CV Series C (a) |
130,000 |
294,142 |
|
|
TOTAL MEXICO |
2,073,543 |
||
|
Netherlands - 6.6% |
|||
|
ABN AMRO Holding NV |
78,200 |
1,812,069 |
|
|
Akzo Nobel NV |
25,200 |
1,147,561 |
|
|
ASM Lithography Holding NV (a) |
1,000 |
27,813 |
|
|
Buhrmann NV |
13,700 |
374,440 |
|
|
De Telegraaf Holding NV (Certificaten Van Aandelen) |
28,100 |
558,120 |
|
|
Common Stocks - continued |
|||
|
Shares |
Value (Note 1) |
||
|
Netherlands - continued |
|||
|
Draka Holding NV |
4,000 |
$ 234,099 |
|
|
Elsevier NV |
45,000 |
574,850 |
|
|
Fugro NV |
6,600 |
389,064 |
|
|
Heineken Holding NV (A Shares) |
32,000 |
1,140,787 |
|
|
Hollandsche Beton Groep NV |
4,000 |
34,801 |
|
|
Hunter Douglas NV |
29,700 |
852,076 |
|
|
IHC Caland NV |
9,416 |
415,600 |
|
|
ING Groep NV (Certificaten Van Aandelen) |
43,735 |
3,003,934 |
|
|
Jomed NV (a) |
22,416 |
1,371,772 |
|
|
KLM Royal Dutch Airlines NV (a) |
4,900 |
89,421 |
|
|
Koninklijke Ahold NV |
13,975 |
406,036 |
|
|
Koninklijke Boskalis Westminster NV |
13,000 |
308,963 |
|
|
Koninklijke Philips Electronics NV |
44,555 |
1,751,365 |
|
|
Koninklijke Wessanen NV |
8,000 |
93,368 |
|
|
KPNQwest NV |
2,600 |
64,025 |
|
|
New Skies Satellites NV (a) |
33,000 |
296,910 |
|
|
Numico NV |
6,000 |
280,613 |
|
|
Petroplus International NV |
22,400 |
298,506 |
|
|
Rodamco Asia NV |
7,238 |
86,318 |
|
|
Rodamco North America NV |
8,210 |
299,652 |
|
|
Smit International NV (Certificaten Van Aandelen) |
2,000 |
38,366 |
|
|
STMicroelectronics NV (NY Shares) |
11,800 |
612,863 |
|
|
Unilever NV (NY Shares) |
8,200 |
416,663 |
|
|
United Pan-Europe Communications NV sponsored ADR (a) |
10,000 |
182,500 |
|
|
Van der Moolen Holding NV |
2,000 |
161,696 |
|
|
Van Melle NV (Certificaten Van Aandelen) (a) |
7,148 |
174,433 |
|
|
Vendex KBB NV |
20,600 |
258,432 |
|
|
Vopak NV |
3,000 |
57,294 |
|
|
TOTAL NETHERLANDS |
17,814,410 |
||
|
New Zealand - 0.4% |
|||
|
Brierley Investments Ltd. |
335,000 |
45,395 |
|
|
Contact Energy Ltd. |
221,500 |
245,415 |
|
|
Fletcher Challenge Ltd.: |
|
|
|
|
Building Division |
240,400 |
172,461 |
|
|
Forestry Division |
1,101,600 |
162,446 |
|
|
Frucor Beverages Group Ltd. (a) |
140,000 |
109,920 |
|
|
Sky City Ltd. |
84,121 |
246,084 |
|
|
TOTAL NEW ZEALAND |
981,721 |
||
|
Norway - 2.1% |
|||
|
Bergesen dy ASA (A Shares) |
27,500 |
547,514 |
|
|
Common Stocks - continued |
|||
|
Shares |
Value (Note 1) |
||
|
Norway - continued |
|||
|
DNB Holding ASA |
226,200 |
$ 981,044 |
|
|
Eltek ASA |
4,200 |
157,749 |
|
|
Frontline Ltd. (a) |
45,800 |
754,133 |
|
|
Norsk Hydro AS (a) |
30,500 |
1,211,203 |
|
|
Opticom ASA (a) |
1,000 |
169,824 |
|
|
Orkla-Borregaard AS |
9,000 |
162,236 |
|
|
PhotoCure ASA (a) |
3,900 |
49,107 |
|
|
ProSafe ASA (a) |
24,200 |
385,450 |
|
|
Schibsted AS (B Shares) |
19,800 |
300,452 |
|
|
Smedvig ASA (A Shares) |
20,000 |
187,258 |
|
|
Sparebanken NOR (primary shares certificates) |
13,700 |
346,481 |
|
|
TANDBERG ASA (a) |
7,000 |
185,321 |
|
|
TANDBERG Television ASA (a) |
12,000 |
121,395 |
|
|
TOTAL NORWAY |
5,559,167 |
||
|
Panama - 0.3% |
|||
|
Banco Latin Americano de Exporaciones SA (BLADEX) Series E |
36,600 |
917,288 |
|
|
Papua New Guinea - 0.0% |
|||
|
Oil Search Ltd. (a) |
60,000 |
48,374 |
|
|
Poland - 0.1% |
|||
|
Agora SA unit (a) |
10,000 |
182,500 |
|
|
Portugal - 0.1% |
|||
|
Electricidade de Portugal SA |
55,000 |
149,389 |
|
|
Portugal Telecom SA |
25,800 |
229,940 |
|
|
Telecel Comunicacoes Pessoais SA (a) |
1,500 |
16,450 |
|
|
TOTAL PORTUGAL |
395,779 |
||
|
Singapore - 0.3% |
|||
|
Chartered Semiconductor Manufacturing Ltd. ADR |
2,500 |
116,250 |
|
|
Flextronics International Ltd. (a) |
12,400 |
471,200 |
|
|
Singapore Airlines Ltd. |
8,000 |
80,251 |
|
|
TOTAL SINGAPORE |
667,701 |
||
|
South Africa - 0.6% |
|||
|
Anglo American Platinum Corp. Ltd. |
22,900 |
893,585 |
|
|
Gold Fields Ltd. |
37,000 |
110,119 |
|
|
Impala Platinum Holdings Ltd. |
11,900 |
510,000 |
|
|
Sasol Ltd. |
8,000 |
61,270 |
|
|
TOTAL SOUTH AFRICA |
1,574,974 |
||
|
Spain - 2.3% |
|||
|
Altadis SA |
34,000 |
509,365 |
|
|
Common Stocks - continued |
|||
|
Shares |
Value (Note 1) |
||
|
Spain - continued |
|||
|
Banco Santander Central Hispano SA ADR |
156,200 |
$ 1,591,288 |
|
|
Endesa SA |
14,800 |
241,195 |
|
|
Grupo Auxiliar Metalurgico SA (Gamesa) (a) |
5,600 |
103,289 |
|
|
Prosegur Comp Securidad SA |
21,000 |
206,768 |
|
|
Repsol YPF SA sponsored ADR |
52,300 |
833,531 |
|
|
Telefonica SA sponsored ADR |
43,800 |
2,537,663 |
|
|
Union Electrica Fenosa SA |
15,000 |
277,430 |
|
|
TOTAL SPAIN |
6,300,529 |
||
|
Sweden - 3.3% |
|||
|
Artimplant AB (B Shares) (a) |
17,100 |
225,788 |
|
|
AssiDoman AB |
22,000 |
373,012 |
|
|
AssiDoman AB rights 11/16/00 (a) |
15,000 |
4,726 |
|
|
Atle AB |
17,900 |
247,094 |
|
|
AU-System AB (a)(d) |
39,900 |
257,432 |
|
|
Biacore International AB (a) |
3,800 |
161,168 |
|
|
Bure Equity AB |
47,000 |
286,786 |
|
|
Capio AB (a) |
23,500 |
148,094 |
|
|
Enea Data AB |
36,000 |
174,652 |
|
|
Gambro AB (A Shares) |
12,000 |
94,228 |
|
|
HIQ International AB |
24,000 |
194,458 |
|
|
Investor AB (B Shares) |
104,000 |
1,373,212 |
|
|
Kinnevik Investment AB (B Shares) (a) |
15,300 |
332,110 |
|
|
Kungsleden AB |
6,000 |
52,516 |
|
|
LGP Telecom Holding AB |
12,000 |
300,090 |
|
|
Micronic Laser Systems AB (a) |
2,000 |
59,618 |
|
|
Nobel Biocare AB |
6,800 |
153,046 |
|
|
Nordic Baltic Holding AB |
27,180 |
203,911 |
|
|
Partnertech AB |
5,100 |
77,543 |
|
|
Scandic Hotels AB |
10,000 |
102,031 |
|
|
Skandinaviska Enskilda Banken (A Shares) |
24,000 |
283,285 |
|
|
Svenska Cellulosa AB (SCA) (B Shares) |
45,800 |
939,182 |
|
|
Svenska Handelsbanken AB (A Shares) |
68,638 |
1,077,940 |
|
|
SwitchCore AB (a) |
4,000 |
19,806 |
|
|
Tele1 Europe Holding AB (a) |
16,000 |
123,237 |
|
|
Telefonaktiebolaget LM Ericsson sponsored ADR |
107,400 |
1,490,175 |
|
|
TV 4 AB (A Shares) |
5,300 |
161,168 |
|
|
TOTAL SWEDEN |
8,916,308 |
||
|
Switzerland - 8.4% |
|||
|
ABB Ltd. (Reg.) |
4,864 |
432,280 |
|
|
Adecco SA |
570 |
394,164 |
|
|
Common Stocks - continued |
|||
|
Shares |
Value (Note 1) |
||
|
Switzerland - continued |
|||
|
Baloise Holdings AG |
653 |
$ 646,279 |
|
|
Bank for International Settlements (BIS) |
39 |
340,640 |
|
|
Credit Suisse Group (Reg.) |
7,311 |
1,370,685 |
|
|
Disetronic Holding AG |
439 |
381,240 |
|
|
Edipresse SA (Bearer) |
1,700 |
685,675 |
|
|
Gretag Imaging Holding AG (Reg. D) |
1,796 |
322,730 |
|
|
Holderbank Financiere Glarus AG (Bearer) |
332 |
348,900 |
|
|
Julius Baer Holding AG |
92 |
455,522 |
|
|
Leica Geosystems AG |
700 |
198,609 |
|
|
Mikron Holding AG |
438 |
246,108 |
|
|
Nestle SA (Reg.) |
1,697 |
3,516,732 |
|
|
Novartis AG (Reg.) |
1,200 |
1,820,529 |
|
|
PubliGroupe SA (Reg.) |
1,320 |
774,743 |
|
|
Richemont Compagnie Financier Class A unit |
795 |
2,211,405 |
|
|
Roche Holding AG participation certificates |
87 |
794,737 |
|
|
Schindler Holding AG |
137 |
208,149 |
|
|
Serono SA sponsored ADR (a) |
5,500 |
124,438 |
|
|
Societe Generale de Surveillance Holding SA (SGS) (Bearer) |
196 |
239,889 |
|
|
Sulzer Medica AG (Reg.) |
4,205 |
1,064,409 |
|
|
Swiss Life |
500 |
388,873 |
|
|
Swiss Reinsurance Co. (Reg.) |
229 |
451,630 |
|
|
Tamedia AG (a) |
660 |
82,064 |
|
|
The Swatch Group AG (Reg.) |
6,513 |
1,771,826 |
|
|
UBS AG |
12,034 |
1,667,019 |
|
|
Zurich Financial Services Group AG |
3,547 |
1,716,768 |
|
|
TOTAL SWITZERLAND |
22,656,043 |
||
|
Taiwan - 0.1% |
|||
|
D-Link Corp. |
34,500 |
45,715 |
|
|
Taiwan Semiconductor Manufacturing Co. Ltd. (a) |
65,400 |
198,427 |
|
|
TOTAL TAIWAN |
244,142 |
||
|
United Kingdom - 12.2% |
|||
|
Aggreko PLC |
23,800 |
125,935 |
|
|
Allied Domecq PLC |
205,900 |
1,063,382 |
|
|
Antofagasta Holdings PLC |
43,200 |
255,957 |
|
|
ARM Holdings PLC sponsored ADR (a) |
5,000 |
150,000 |
|
|
AstraZeneca Group PLC sponsored ADR |
11,400 |
543,638 |
|
|
Avis Europe PLC |
30,000 |
78,284 |
|
|
BAA PLC |
12,000 |
99,681 |
|
|
Baltimore Technologies PLC sponsored ADR (a) |
4,000 |
64,000 |
|
|
Barclays PLC |
19,300 |
551,750 |
|
|
Common Stocks - continued |
|||
|
Shares |
Value (Note 1) |
||
|
United Kingdom - continued |
|||
|
Bass PLC |
51,800 |
$ 506,512 |
|
|
Billiton PLC |
93,000 |
354,582 |
|
|
BP Amoco PLC sponsored ADR |
47,200 |
2,404,250 |
|
|
British Energy PLC |
160,200 |
418,035 |
|
|
Cable & Wireless PLC |
12,000 |
169,615 |
|
|
Cambridge Antibody Technology Group PLC (a) |
6,000 |
374,023 |
|
|
Carlton Communications PLC |
33,900 |
272,754 |
|
|
Centrica PLC |
82,400 |
283,109 |
|
|
Chloride Group PLC |
30,000 |
89,157 |
|
|
Close Brothers Group PLC |
4,000 |
66,976 |
|
|
Diageo PLC |
116,300 |
1,096,744 |
|
|
Diageo PLC sponsored ADR |
17,700 |
665,963 |
|
|
Electronics Boutique PLC |
45,000 |
40,447 |
|
|
Glaxo Wellcome PLC sponsored ADR |
31,500 |
1,832,906 |
|
|
Guardian IT PLC |
21,000 |
281,604 |
|
|
Guinness Peat Group PLC |
160,000 |
98,203 |
|
|
Hanson PLC |
41,900 |
219,975 |
|
|
House of Fraser PLC |
40,000 |
26,095 |
|
|
HSBC Holdings PLC: |
|
|
|
|
(France) |
26,200 |
374,275 |
|
|
(United Kingdom) (Reg.) |
104,294 |
1,503,920 |
|
|
Intec Telecom Systems PLC (a) |
20,000 |
200,928 |
|
|
Johnson Matthey PLC |
41,600 |
648,306 |
|
|
Lloyds TSB Group PLC |
91,500 |
931,186 |
|
|
Logica PLC |
6,000 |
177,356 |
|
|
Logica PLC New |
600 |
17,222 |
|
|
Lonmin PLC |
15,000 |
184,837 |
|
|
Nycomed Amersham PLC |
31,200 |
279,073 |
|
|
Oxford Glycosciences PLC (a) |
3,000 |
109,597 |
|
|
Professional Staff PLC sponsored ADR (a) |
30,400 |
163,400 |
|
|
Provident Financial Group PLC |
24,700 |
314,749 |
|
|
Reckitt Benckiser PLC |
34,000 |
446,566 |
|
|
Rentokil Initial PLC |
220,000 |
507,105 |
|
|
Rexam PLC |
65,700 |
221,922 |
|
|
Ricardo PLC |
10,000 |
72,485 |
|
|
Rio Tinto PLC (Reg. D) |
43,500 |
703,141 |
|
|
Royal Bank of Scotland Group PLC |
43,900 |
984,539 |
|
|
Safeway PLC |
160,200 |
665,373 |
|
|
Shell Transport & Trading Co. PLC (Reg.) |
519,200 |
4,256,362 |
|
|
Smith & Nephew PLC |
38,800 |
159,183 |
|
|
SmithKline Beecham PLC sponsored ADR |
21,600 |
1,408,050 |
|
|
South African Breweries PLC |
41,900 |
251,067 |
|
|
Common Stocks - continued |
|||
|
Shares |
Value (Note 1) |
||
|
United Kingdom - continued |
|||
|
Spirent PLC |
8,000 |
$ 74,109 |
|
|
SSL International PLC |
50,000 |
581,692 |
|
|
Tesco PLC |
129,000 |
491,372 |
|
|
United News & Media PLC |
34,600 |
432,627 |
|
|
United Utilities PLC |
26,300 |
264,221 |
|
|
Vodafone Group PLC |
431,085 |
1,834,804 |
|
|
Vodafone Group PLC sponsored ADR |
52,500 |
2,234,531 |
|
|
Zen Research PLC (a)(d) |
23,200 |
68,275 |
|
|
TOTAL UNITED KINGDOM |
32,695,850 |
||
|
United States of America - 0.8% |
|||
|
Entravision Communications Corp. Class A |
1,000 |
17,688 |
|
|
Hollinger International, Inc. Class A |
36,500 |
563,469 |
|
|
Impsat Fiber Networks, Inc. |
5,000 |
60,000 |
|
|
JDS Uniphase Corp. (a) |
1,000 |
81,438 |
|
|
Medicines Co. |
600 |
18,075 |
|
|
OMI Corp. (a) |
35,800 |
248,363 |
|
|
Orthofix International NV (a) |
28,700 |
602,700 |
|
|
Pharmacia Corp. |
5,239 |
288,145 |
|
|
UnitedGlobalCom, Inc. Class A (a) |
9,000 |
286,313 |
|
|
TOTAL UNITED STATES OF AMERICA |
2,166,191 |
||
|
TOTAL COMMON STOCKS (Cost $236,276,950) |
240,387,506 |
||
|
Preferred Stocks - 0.6% |
|||
|
|
|
|
|
|
Convertible Preferred Stocks - 0.1% |
|||
|
Canada - 0.1% |
|||
|
ITF Optical Technologies, Inc. (f) |
857 |
89,985 |
|
|
Metrophotonics, Inc. Series 2 (f) |
8,500 |
85,000 |
|
|
TOTAL CANADA |
174,985 |
||
|
Nonconvertible Preferred Stocks - 0.5% |
|||
|
Germany - 0.5% |
|||
|
Marschollek Lautenschlaeger und Partner AG |
4,400 |
595,688 |
|
|
Preferred Stocks - continued |
|||
|
Shares |
Value (Note 1) |
||
|
Nonconvertible Preferred Stocks - continued |
|||
|
Germany - continued |
|||
|
ProSieben Sat.1 Media AG (a) |
25,600 |
$ 806,156 |
|
|
Rhoen Klinikum AG |
1,000 |
55,512 |
|
|
TOTAL GERMANY |
1,457,356 |
||
|
TOTAL PREFERRED STOCKS (Cost $1,367,215) |
1,632,341 |
||
|
Investment Companies - 2.3% |
|||
|
|
|
|
|
|
Argentina - 0.0% |
|||
|
Argentina Fund, Inc. |
11,000 |
114,813 |
|
|
Brazil - 0.1% |
|||
|
Brazil Fund, Inc. |
16,500 |
264,000 |
|
|
Canada - 0.1% |
|||
|
Economic Investment Trust Ltd. |
2,582 |
159,838 |
|
|
United Corporations Ltd. |
4,005 |
113,771 |
|
|
TOTAL CANADA |
273,609 |
||
|
Chile - 0.1% |
|||
|
Chile Fund, Inc. |
15,000 |
130,313 |
|
|
Five Arrows Chile Investment Trust Ltd. |
45,500 |
70,525 |
|
|
TOTAL CHILE |
200,838 |
||
|
China - 0.1% |
|||
|
China Fund, Inc. |
10,000 |
89,375 |
|
|
Jardine Fleming China Region Fund, Inc. |
8,500 |
63,750 |
|
|
Templeton China World Fund, Inc. |
2,000 |
14,250 |
|
|
TOTAL CHINA |
167,375 |
||
|
Emerging Markets - 0.3% |
|||
|
Asia Tigers Fund, Inc. |
23,000 |
162,438 |
|
|
Central European Equity Fund, Inc. |
8,100 |
96,188 |
|
|
Emerging Markets Infrastructure Fund, Inc. |
4,825 |
43,123 |
|
|
Emerging Markets Telecommunication Fund, Inc. |
8,000 |
71,000 |
|
|
Southern Africa Fund, Inc. |
1,399 |
17,050 |
|
|
Templeton Dragon Fund, Inc. |
47,800 |
361,488 |
|
|
TOTAL EMERGING MARKETS |
751,287 |
||
|
France - 0.1% |
|||
|
France Growth Fund, Inc. |
13,300 |
148,794 |
|
|
Investment Companies - continued |
|||
|
Shares |
Value (Note 1) |
||
|
Hong Kong - 0.1% |
|||
|
Asia Pacific Fund, Inc. |
21,900 |
$ 177,938 |
|
|
Greater China Fund, Inc. |
15,500 |
127,875 |
|
|
TOTAL HONG KONG |
305,813 |
||
|
India - 0.2% |
|||
|
India Fund |
34,200 |
365,513 |
|
|
India Growth Fund (a) |
12,900 |
131,419 |
|
|
Jardine Fleming India Fund, Inc. (a) |
6,865 |
62,214 |
|
|
Morgan Stanley Dean Witter India Investment Fund, Inc. |
9,000 |
95,063 |
|
|
TOTAL INDIA |
654,209 |
||
|
Italy - 0.0% |
|||
|
Italy Fund, Inc. (The) |
6,604 |
112,268 |
|
|
Korea (South) - 0.2% |
|||
|
Korea Fund, Inc. (The) |
34,700 |
382,047 |
|
|
Korean Investment Fund, Inc. |
1,500 |
6,938 |
|
|
TOTAL KOREA (SOUTH) |
388,985 |
||
|
Mexico - 0.3% |
|||
|
Mexico Fund, Inc. (The) |
50,300 |
795,369 |
|
|
Multi-National - 0.6% |
|||
|
Blackrock North American Government Income Trust, Inc. |
11,000 |
107,250 |
|
|
Latin America Equity Fund, Inc. |
11,400 |
131,813 |
|
|
Latin American Discovery Fund, Inc. |
10,000 |
100,000 |
|
|
Latin American Investment Fund, Inc. |
8,000 |
103,000 |
|
|
MFS Government Markets Income Trust |
44,300 |
274,106 |
|
|
Morgan Stanley Dean Witter Africa Investment Fund, Inc. |
2,109 |
16,081 |
|
|
Morgan Stanley Dean Witter Asia-Pacific Fund, Inc. |
41,200 |
365,650 |
|
|
RCM Strategic Global Government Fund, Inc. |
4,000 |
38,750 |
|
|
Strategic Global Income Fund, Inc. |
23,000 |
235,750 |
|
|
Templeton Global Income Fund, Inc. |
24,700 |
148,200 |
|
|
TOTAL MULTI-NATIONAL |
1,520,600 |
||
|
Portugal - 0.0% |
|||
|
Portugal Fund, Inc. |
6,100 |
60,619 |
|
|
Singapore - 0.0% |
|||
|
Singapore Fund, Inc. |
15,000 |
95,625 |
|
|
Switzerland - 0.1% |
|||
|
Swiss Helvetia Fund, Inc. |
17,500 |
249,375 |
|
|
Investment Companies - continued |
|||
|
Shares |
Value (Note 1) |
||
|
Taiwan - 0.0% |
|||
|
R.O.C. Taiwan Fund (SBI) |
4,000 |
$ 23,500 |
|
|
TOTAL INVESTMENT COMPANIES (Cost $6,943,750) |
6,127,079 |
||
|
Corporate Bonds - 0.2% |
|||||
|
Moody's Ratings (unaudited) |
Principal Amount (c) |
|
|||
|
Convertible Bonds - 0.1% |
|||||
|
Israel - 0.1% |
|||||
|
Tecnomatix Tech Ltd. 5.25% 8/15/04 |
- |
|
$ 129,000 |
74,498 |
|
|
United Kingdom - 0.0% |
|||||
|
Royal Bank of Scotland Group PLC euro 0% 12/1/03 (Reg. S) (e) |
- |
GBP |
40,900 |
48,324 |
|
|
TOTAL CONVERTIBLE BONDS |
122,822 |
||||
|
Nonconvertible Bonds - 0.1% |
|||||
|
France - 0.1% |
|||||
|
Eurotunnel Finance Ltd. euro 0% 4/30/40 (e) |
- |
EUR |
240 |
264,826 |
|
|
TOTAL CORPORATE BONDS (Cost $461,607) |
387,648 |
||||
|
Cash Equivalents - 6.9% |
|||
|
Shares |
|
||
|
Fidelity Cash Central Fund, 6.61% (b) |
18,475,534 |
18,475,534 |
|
|
TOTAL INVESTMENT PORTFOLIO - 99.5% (Cost $263,525,056) |
267,010,108 |
||
|
NET OTHER ASSETS - 0.5% |
1,475,000 |
||
|
NET ASSETS - 100% |
$ 268,485,108 |
||
|
Currency Abbreviations |
||
|
EUR |
- |
European Monetary Unit |
|
GBP |
- |
British pound |
|
Legend |
|
(a) Non-income producing |
|
(b) The rate quoted is the annualized seven-day yield of the fund at period end. A complete listing of the fund's holdings as of its most recent fiscal year end is available upon request. |
|
(c) Principal amount is stated in United States dollars unless otherwise noted. |
|
(d) Security exempt from registration under Rule 144A of the Securities Act of 1933. These securities may be resold in transactions exempt from registration, normally to qualified institutional buyers. At the period end, the value of these securities amounted to $603,553 or 0.2% of net assets. |
|
(e) The coupon rate shown on floating or adjustable rate securities represents the rate at period end. |
|
(f) Restricted securities - Investment in securities not registered under the Securities Act of 1933. |
|
Additional information on each holding |
|
Security |
Acquisition Date |
Acquisition Cost |
|
ITF Optical |
10/11/00 |
$ 89,985 |
|
Metrophotonics, |
9/29/00 |
$ 85,000 |
|
OZ Optics |
8/18/00 |
$ 79,704 |
|
Income Tax Information |
|
At October 31, 2000, the aggregate |
|
At October 31, 2000, the fund had a capital loss carryforward of approximately $6,955,000 all of which will expire on October 31, 2008. |
See accompanying notes which are an integral part of the financial statements.
Annual Report
Statement of Assets and Liabilities
|
|
October 31, 2000 |
|
|
Assets |
|
|
|
Investment in securities, at value (cost $263,525,056) - See accompanying schedule |
|
$ 267,010,108 |
|
Cash |
|
75,957 |
|
Foreign currency held at value (cost $4,466) |
|
4,454 |
|
Receivable for investments sold |
|
3,633,713 |
|
Receivable for fund shares sold |
|
1,293,144 |
|
Dividends receivable |
|
442,958 |
|
Interest receivable |
|
134,603 |
|
Other receivables |
|
384 |
|
Total assets |
|
272,595,321 |
|
Liabilities |
|
|
|
Payable for investments purchased |
$ 3,504,480 |
|
|
Payable for fund shares redeemed |
146,570 |
|
|
Accrued management fee |
159,771 |
|
|
Distribution fees payable |
129,404 |
|
|
Other payables and accrued expenses |
169,988 |
|
|
Total liabilities |
|
4,110,213 |
|
Net Assets |
|
$ 268,485,108 |
|
Net Assets consist of: |
|
|
|
Paid in capital |
|
$ 269,199,943 |
|
Undistributed net investment income |
|
3,949,570 |
|
Accumulated undistributed net realized gain (loss) on investments and foreign currency transactions |
|
(8,137,549) |
|
Net unrealized appreciation (depreciation) on investments and assets and liabilities in foreign currencies |
|
3,473,144 |
|
Net Assets |
|
$ 268,485,108 |
See accompanying notes which are an integral part of the financial statements.
Annual Report
Financial Statements - continued
Statement of Assets and Liabilities - continued
|
|
October 31, 2000 |
|
|
Calculation of Maximum Offering Price |
|
$14.54 |
|
Maximum offering price per share (100/94.25 of $14.54) |
|
$15.43 |
|
Class T: |
|
$14.46 |
|
Maximum offering price per share (100/96.50 of $14.46) |
|
$14.98 |
|
Class B: |
|
$14.33 |
|
Class C: |
|
$14.34 |
|
Institutional Class: |
|
$14.60 |
A Redemption price per share is equal to net asset value less any applicable contingent deferred sales charge.
See accompanying notes which are an integral part of the financial statements.
Annual Report
Financial Statements - continued
Statement of Operations
|
|
Year ended October 31, 2000 |
|
|
Investment Income Dividends |
|
$ 3,112,699 |
|
Special dividend from BCE, Inc. |
|
1,661,331 |
|
Interest |
|
1,119,208 |
|
Security lending |
|
40,082 |
|
|
|
5,933,320 |
|
Less foreign taxes withheld |
|
(366,838) |
|
Total income |
|
5,566,482 |
|
Expenses |
|
|
|
Management fee |
$ 1,367,430 |
|
|
Transfer agent fees |
501,516 |
|
|
Distribution fees |
1,121,901 |
|
|
Accounting and security lending fees |
120,095 |
|
|
Non-interested trustees' compensation |
554 |
|
|
Custodian fees and expenses |
330,543 |
|
|
Registration fees |
140,727 |
|
|
Audit |
25,010 |
|
|
Legal |
1,273 |
|
|
Miscellaneous |
3,596 |
|
|
Total expenses before reductions |
3,612,645 |
|
|
Expense reductions |
(41,499) |
3,571,146 |
|
Net investment income |
|
1,995,336 |
|
Realized and Unrealized Gain (Loss) Net realized gain (loss) on: |
|
|
|
Investment securities |
(5,861,806) |
|
|
Foreign currency transactions |
(54,688) |
(5,916,494) |
|
Change in net unrealized appreciation (depreciation) on: |
|
|
|
Investment securities |
(1,517,286) |
|
|
Assets and liabilities in foreign currencies |
(12,026) |
(1,529,312) |
|
Net gain (loss) |
|
(7,445,806) |
|
Net increase (decrease) in net assets resulting |
|
$ (5,450,470) |
See accompanying notes which are an integral part of the financial statements.
Annual Report
Financial Statements - continued
Statement of Changes in Net Assets
|
|
Year ended
October 31, |
December 17, 1998
(commencment |
|
Increase (Decrease) in Net Assets |
|
|
|
Operations |
$ 1,995,336 |
$ (59,944) |
|
Net realized gain (loss) |
(5,916,494) |
1,099,878 |
|
Change in net unrealized appreciation (depreciation) |
(1,529,312) |
5,002,456 |
|
Net increase (decrease) in net assets resulting |
(5,450,470) |
6,042,390 |
|
Distributions to shareholders |
(146,319) |
- |
|
From net realized gain |
(959,661) |
- |
|
In excess of net realized gain |
(100,992) |
- |
|
Total distributions |
(1,206,972) |
- |
|
Share transactions - net increase (decrease) |
216,006,366 |
53,093,794 |
|
Total increase (decrease) in net assets |
209,348,924 |
59,136,184 |
|
Net Assets |
|
|
|
Beginning of period |
59,136,184 |
- |
|
End of period (including under (over) distribution |
$ 268,485,108 |
$ 59,136,184 |
See accompanying notes which are an integral part of the financial statements.
Annual Report
Financial Highlights - Class A
|
Years ended October 31, |
2000 |
1999 E |
|
Selected Per-Share Data |
|
|
|
Net asset value, beginning of period |
$ 13.05 |
$ 10.00 |
|
Income from Investment Operations |
|
|
|
Net investment income D |
.22 H |
.01 |
|
Net realized and unrealized gain (loss) |
1.49 I |
3.04 |
|
Total from investment operations |
1.71 |
3.05 |
|
Less Distributions |
|
|
|
From net investment income |
(.03) |
- |
|
From net realized gain |
(.17) |
- |
|
In excess of net realized gain |
(.02) |
- |
|
Total distributions |
(.22) |
- |
|
Net asset value, end of period |
$ 14.54 |
$ 13.05 |
|
Total Return B, C |
13.13% |
30.50% |
|
Ratios and Supplemental Data |
|
|
|
Net assets, end of period (000 omitted) |
$ 27,314 |
$ 3,841 |
|
Ratio of expenses to average net assets |
1.52% |
2.00% A, F |
|
Ratio of expenses to average net assets after expense reductions |
1.50% G |
1.97% A, G |
|
Ratio of net investment income to average net assets |
1.44% |
.05% A |
|
Portfolio turnover |
87% |
78% A |
A Annualized
B The total returns would have been lower had certain expenses not been reduced during the periods shown.
C Total returns do not include the one time sales charge and for periods of less than one year are not annualized.
D Net investment income per share has been calculated based on average shares outstanding during the period.
E For the period December 17, 1998 (commencement of operations) to October 31, 1999.
F FMR agreed to reimburse a portion of the class' expenses during the period. Without this reimbursement, the class' expense ratio would have been higher.
G FMR or the fund has entered into varying arrangements with third parties who either paid or reduced a portion of the class' expenses.
H Investment income per share reflects a special dividend from BCE, Inc. which amounted to $.13 per share.
I The amount shown for a share outstanding does not correspond with the aggregate net gain (loss) on investments for the period due to the timing of sales and repurchases of class shares in relation to fluctuating market values of the investments of the fund.
See accompanying notes which are an integral part of the financial statements.
Annual Report
Financial Highlights - Class T
|
Years ended October 31, |
2000 |
1999 E |
|
Selected Per-Share Data |
|
|
|
Net asset value, beginning of period |
$ 13.02 |
$ 10.00 |
|
Income from Investment Operations |
|
|
|
Net investment income (loss) D |
.17 H |
(.02) |
|
Net realized and unrealized gain (loss) |
1.49 I |
3.04 |
|
Total from investment operations |
1.66 |
3.02 |
|
Less Distributions |
|
|
|
From net investment income |
(.03) |
- |
|
From net realized gain |
(.17) |
- |
|
In excess of net realized gain |
(.02) |
- |
|
Total distributions |
(.22) |
- |
|
Net asset value, end of period |
$ 14.46 |
$ 13.02 |
|
Total Return B, C |
12.78% |
30.20% |
|
Ratios and Supplemental Data |
|
|
|
Net assets, end of period (000 omitted) |
$ 139,347 |
$ 32,132 |
|
Ratio of expenses to average net assets |
1.82% |
2.25% A, F |
|
Ratio of expenses to average net assets after expense reductions |
1.80% G |
2.22% A, G |
|
Ratio of net investment income (loss) to average net assets |
1.15% |
(.20)% A |
|
Portfolio turnover |
87% |
78% A |
A Annualized
B The total returns would have been lower had certain expenses not been reduced during the periods shown.
C Total returns do not include the one time sales charge and for periods of less than one year are not annualized.
D Net investment income (loss) per share has been calculated based on average shares outstanding during the period.
E For the period December 17, 1998 (commencement of operations) to October 31, 1999.
F FMR agreed to reimburse a portion of the class' expenses during the period. Without this reimbursement, the class' expense ratio would have been higher.
G FMR or the fund has entered into varying arrangements with third parties who either paid or reduced a portion of the class' expenses.
H Investment income per share reflects a special dividend from BCE, Inc. which amounted to $.13 per share.
I The amount shown for a share outstanding does not correspond with the aggregate net gain (loss) on investments for the period due to the timing of sales and repurchases of class shares in relation to fluctuating market values of the investments of the fund.
See accompanying notes which are an integral part of the financial statements.
Annual Report
Financial Highlights - Class B
|
Years ended October 31, |
2000 |
1999 E |
|
Selected Per-Share Data |
|
|
|
Net asset value, beginning of period |
$ 12.96 |
$ 10.00 |
|
Income from Investment Operations |
|
|
|
Net investment income (loss) D |
.09 H |
(.07) |
|
Net realized and unrealized gain (loss) |
1.49 I |
3.03 |
|
Total from investment operations |
1.58 |
2.96 |
|
Less Distributions |
|
|
|
From net investment income |
(.02) |
- |
|
From net realized gain |
(.17) |
- |
|
In excess of net realized gain |
(.02) |
- |
|
Total distributions |
(.21) |
- |
|
Net asset value, end of period |
$ 14.33 |
$ 12.96 |
|
Total Return B, C |
12.21% |
29.60% |
|
Ratios and Supplemental Data |
|
|
|
Net assets, end of period (000 omitted) |
$ 43,758 |
$ 10,839 |
|
Ratio of expenses to average net assets |
2.36% |
2.75% A, F |
|
Ratio of expenses to average net assets after expense reductions |
2.34% G |
2.72% A, G |
|
Ratio of net investment income (loss) to average net assets |
.60% |
(.70)% A |
|
Portfolio turnover |
87% |
78% A |
A Annualized
B The total returns would have been lower had certain expenses not been reduced during the periods shown.
C Total returns do not include the contingent deferred sales charge and for periods of less than one year are not annualized.
D Net investment income (loss) per share has been calculated based on average shares outstanding during the period.
E For the period December 17, 1998 (commencement of operations) to October 31, 1999.
F FMR agreed to reimburse a portion of the class' expenses during the period. Without this reimbursement, the class' expense ratio would have been higher.
G FMR or the fund has entered into varying arrangements with third parties who either paid or reduced a portion of the class' expenses.
H Investment income per share reflects a special dividend from BCE, Inc. which amounted to $.13 per share.
I The amount shown for a share outstanding does not correspond with the aggregate net gain (loss) on investments for the period due to the timing of sales and repurchases of class shares in relation to fluctuating market values of the investments of the fund.
See accompanying notes which are an integral part of the financial statements.
Annual Report
Financial Highlights - Class C
|
Years ended October 31, |
2000 |
1999 E |
|
Selected Per-Share Data |
|
|
|
Net asset value, beginning of period |
$ 12.96 |
$ 10.00 |
|
Income from Investment Operations |
|
|
|
Net investment income (loss) D |
.10 H |
(.07) |
|
Net realized and unrealized gain (loss) |
1.48 I |
3.03 |
|
Total from investment operations |
1.58 |
2.96 |
|
Less Distributions |
|
|
|
From net investment income |
(.01) |
- |
|
From net realized gain |
(.17) |
- |
|
In excess of net realized gain |
(.02) |
- |
|
Total distributions |
(.20) |
- |
|
Net asset value, end of period |
$ 14.34 |
$ 12.96 |
|
Total Return B, C |
12.21% |
29.60% |
|
Ratios and Supplemental Data |
|
|
|
Net assets, end of period (000 omitted) |
$ 37,765 |
$ 8,142 |
|
Ratio of expenses to average net assets |
2.32% |
2.75% A, F |
|
Ratio of expenses to average net assets after expense reductions |
2.30% G |
2.72% A, G |
|
Ratio of net investment income (loss) to average net assets |
.65% |
(.70)% A |
|
Portfolio turnover |
87% |
78% A |
A Annualized
B The total returns would have been lower had certain expenses not been reduced during the periods shown.
C Total returns do not include the contingent deferred sales charge and for periods of less than one year are not annualized.
D Net investment income (loss) per share has been calculated based on average shares outstanding during the period.
E For the period December 17, 1998 (commencement of operations) to October 31, 1999.
F FMR agreed to reimburse a portion of the class' expenses during the period. Without this reimbursement, the class' expense ratio would have been higher.
G FMR or the fund has entered into varying arrangements with third parties who either paid or reduced a portion of the class' expenses.
H Investment income per share reflects a special dividend from BCE, Inc. which amounted to $.13 per share.
I The amount shown for a share outstanding does not correspond with the aggregate net gain (loss) on investments for the period due to the timing of sales and repurchases of class shares in relation to fluctuating market values of the investments of the fund.
See accompanying notes which are an integral part of the financial statements.
Annual Report
Financial Highlights - Institutional Class
|
Years ended October 31, |
2000 |
1999 E |
|
Selected Per-Share Data |
|
|
|
Net asset value, beginning of period |
$ 13.08 |
$ 10.00 |
|
Income from Investment Operations |
|
|
|
Net investment income D |
.26 H |
.03 |
|
Net realized and unrealized gain (loss) |
1.49 I |
3.05 |
|
Total from investment operations |
1.75 |
3.08 |
|
Less Distributions |
|
|
|
From net investment income |
(.04) |
- |
|
From net realized gain |
(.17) |
- |
|
In excess of net realized gain |
(.02) |
- |
|
Total distributions |
(.23) |
- |
|
Net asset value, end of period |
$ 14.60 |
$ 13.08 |
|
Total Return B, C |
13.42% |
30.80% |
|
Ratios and Supplemental Data |
|
|
|
Net assets, end of period (000 omitted) |
$ 20,300 |
$ 4,182 |
|
Ratio of expenses to average net assets |
1.24% |
1.75% A, F |
|
Ratio of expenses to average net assets after expense reductions |
1.22% G |
1.72% A, G |
|
Ratio of net investment income to average net assets |
1.73% |
.30% A |
|
Portfolio turnover |
87% |
78% A |
A Annualized
B The total returns would have been lower had certain expenses not been reduced during the periods shown.
C Total returns for periods of less than one year are not annualized.
D Net investment income per share has been calculated based on average shares outstanding during the period.
E For the period December 17, 1998 (commencement of operations) to October 31, 1999.
F FMR agreed to reimburse a portion of the class' expenses during the period. Without this reimbursement, the class' expense ratio would have been higher.
G FMR or the fund has entered into varying arrangements with third parties who either paid or reduced a portion of the class' expenses.
H Investment income per share reflects a special dividend from BCE, Inc. which amounted to $.13 per share.
I The amount shown for a share outstanding does not correspond with the aggregate net gain (loss) on investments for the period due to the timing of sales and repurchases of class shares in relation to fluctuating market values of the investments of the fund.
See accompanying notes which are an integral part of the financial statements.
Annual Report
For the period ended October 31, 2000
1. Significant Accounting Policies.
Fidelity Advisor Diversified International Fund (the fund) is a fund of Fidelity Advisor Series VIII (the trust) and is authorized to issue an unlimited number of shares. The trust is registered under the Investment Company Act of 1940, as amended (the 1940 Act), as an open-end management investment company organized as a Massachusetts business trust.
The fund offers Class A, Class T, Class B, Class C, and Institutional Class shares, each of which has equal rights as to assets and voting privileges. Each class has exclusive voting rights with respect to matters that affect that class. Class B shares will automatically convert to Class A shares after a holding period of seven years from the initial date of purchase. Investment income, realized and unrealized capital gains and losses, the common expenses of the fund, and certain fund-level expense reductions, if any, are allocated on a pro rata basis to each class based on the relative net assets of each class to the total net assets of the fund. Each class of shares differs in its respective distribution, transfer agent, and certain other class-specific fees, expenses, and expense reductions.
The financial statements have been prepared in conformity with generally accepted accounting principles which require management to make certain estimates and assumptions at the date of the financial statements. The following summarizes the significant accounting policies of the fund:
Security Valuation. Securities for which quotations are readily available are valued using the official closing price or at the last sale price in the principal market in which they are traded. If the last sale price (on the local exchange) is unavailable, the last evaluated quote or closing bid price normally is used. If trading or events occurring in other markets after the close of the principal market in which securities are traded are expected to materially affect the value of those securities, then they are valued at their fair value taking this trading or these events into account. Fair value is determined in good faith under consistently applied procedures under the general supervision of the Board of Trustees. Securities (including restricted securities) for which quotations are not readily available are valued primarily using dealer-supplied valuations or at their fair value. Short-term securities with remaining maturities of sixty days or less for which quotations are not readily available are valued at amortized cost or original cost plus accrued interest, both of which approximate current value. Investments in open-end investment companies are valued at their net asset value each business day.
Foreign Currency Translation. The accounting records of the fund are maintained in U.S. dollars. Investment securities and other assets and liabilities denominated in a foreign currency are translated into U.S. dollars at the prevailing rates of exchange at period end. Purchases and sales of securities, income receipts and expense payments are translated into U.S. dollars at the prevailing exchange rate on the respective dates of the transactions.
Annual Report
Notes to Financial Statements - continued
1. Significant Accounting Policies - continued
Foreign Currency Translation - continued
Net realized gains and losses on foreign currency transactions represent net gains and losses from sales and maturities of foreign currency contracts, disposition of foreign currencies, the difference between the amount of net investment income accrued and the U.S. dollar amount actually received, and gains and losses between trade and settlement date on purchases and sales of securities. The effects of changes in foreign currency exchange rates on investments in securities are included with the net realized and unrealized gain or loss on investment securities.
Income Taxes. As a qualified regulated investment company under Subchapter M of the Internal Revenue Code, the fund is not subject to U.S. federal income taxes to the extent that it distributes substantially all of its taxable income for its fiscal year. The fund may be subject to foreign taxes on income and gains on investments which are accrued based upon the fund's understanding of the tax rules and regulations that exist in the markets in which it invests. Foreign governments may also impose taxes on other payments or transactions with respect to foreign securities. The fund accrues such taxes as applicable. The schedule of investments includes information regarding income taxes under the caption "Income Tax Information."
Investment Income. Dividend income is recorded on the ex-dividend date, except certain dividends from foreign securities where the ex-dividend date may have passed, are recorded as soon as the fund is informed of the ex-dividend date. Non-cash dividends included in dividend income, if any, are recorded at the fair market value of the securities received. Interest income, which includes accretion of original issue discount, is accrued as earned. Investment income is recorded net of foreign taxes withheld where recovery of such taxes is uncertain.
Expenses. Most expenses of the trust can be directly attributed to a fund. Expenses which cannot be directly attributed are apportioned among the funds in the trust.
Distributions to Shareholders. Distributions are recorded on the ex-dividend date. Income dividends and capital gain distributions are declared separately for each class.
Income and capital gain distributions are determined in accordance with income tax regulations which may differ from generally accepted accounting principles. These differences, which may result in distribution reclassifications, are primarily due to differing treatments for foreign currency transactions, passive foreign investment companies (PFIC), non-taxable dividends and losses deferred due to wash sales. The fund also utilized earnings and profits distributed to shareholders on redemption of shares as a part of the dividends paid deduction for income tax purposes.
Annual Report
Notes to Financial Statements - continued
1. Significant Accounting Policies - continued
Distributions to Shareholders - continued
Permanent book and tax basis differences relating to shareholder distributions will result in reclassifications to paid in capital. Undistributed net investment income and accumulated undistributed net realized gain (loss) on investments and foreign currency transactions may include temporary book and tax basis differences which will reverse in a subsequent period. Any taxable income or gain remaining at fiscal year end is distributed in the following year.
Security Transactions. Security transactions are accounted for as of trade date. Gains and losses on securities sold are determined on the basis of identified cost.
2. Operating Policies.
Foreign Currency Contracts. The fund generally uses foreign currency contracts to facilitate transactions in foreign-denominated securities. Losses may arise from changes in the value of the foreign currency or if the counterparties do not perform under the contracts' terms. The U.S. dollar value of foreign currency contracts is determined using contractual currency exchange rates established at the time of each trade.
Joint Trading Account. Pursuant to an Exemptive Order issued by the Securities and Exchange Commission (the SEC), the fund, along with other affiliated entities of Fidelity Management & Research Company (FMR), may transfer uninvested cash balances into one or more joint trading accounts. These balances are invested in one or more repurchase agreements for U.S. Treasury or Federal Agency obligations.
Repurchase Agreements. The underlying U.S. Treasury, Federal Agency, or other obligations found to be satisfactory by FMR are transferred to an account of the fund, or to the Joint Trading Account, at a custodian bank. The securities are marked-to-market daily and maintained at a value at least equal to the principal amount of the repurchase agreement (including accrued interest). FMR, the fund's investment adviser, is responsible for determining that the value of the underlying securities remains in accordance with the market value requirements stated above.
Restricted Securities. The fund is permitted to invest in securities that are subject to legal or contractual restrictions on resale. These securities generally may be resold in transactions exempt from registration or to the public if the securities are registered. Disposal of these securities may involve time-consuming negotiations and expense, and prompt sale at an acceptable price may be difficult. At the end of the period, restricted securities (excluding 144A issues) amounted to $254,635 or 0.1% of net assets.
Annual Report
Notes to Financial Statements - continued
3. Purchases and Sales of Investments.
Purchases and sales of securities, other than short-term securities, aggregated $353,036,608 and $149,867,078, respectively.
4. Fees and Other Transactions with Affiliates.
Management Fee. As the fund's investment adviser, FMR receives a monthly fee that is calculated on the basis of a group fee rate plus a fixed individual fund fee rate applied to the average net assets of the fund. The group fee rate is the weighted average of a series of rates and is based on the monthly average net assets of all the mutual funds advised by FMR. The rates ranged from .2167% to .5200% for the period. The annual individual fund fee rate is .45%. In the event that these rates were lower than the contractual rates in effect during the period, FMR voluntarily implemented the above rates, as they resulted in the same or a lower management fee. For the period, the management fee was equivalent to an annual rate of .72% of average net assets.
Sub-Adviser Fee. Beginning January 1, 2001, FMR Co. (FMRC) will serve as a sub-adviser for the fund. FMRC may provide investment research and advice and may also provide investment advisory services for the fund. FMR, on behalf of the fund, entered into sub-advisory agreements with Fidelity Management & Research (U.K.) Inc., Fidelity Management & Research (Far East) Inc., and Fidelity International Investment Advisors (FIIA). Under the sub-advisory arrangements, FMR may receive investment advice and research services and may grant the sub-advisers investment management authority to buy and sell securities. FMR pays its sub-advisers either a portion of its management fee or a fee based on costs incurred for these services.
Distribution and Service Plan. In accordance with Rule 12b-1 of the 1940 Act, the Board of Trustees have adopted separate Distribution and Service Plans with respect to each class of shares (collectively referred to as "the Plans"). Under certain of the Plans, the class pays Fidelity Distributors Corporation (FDC), an affiliate of FMR, a 12b-1 fee. A portion of this fee may be reallowed to securities dealers, banks and other financial institutions for the distribution of each class of shares and providing shareholder support services. For the period, this fee was based on the following annual rates of the average net assets of each applicable class:
|
Class A |
.25% |
|
Class T |
.50% |
|
Class B |
1.00%* |
|
Class C |
1.00%* |
* .75% represents a distribution fee and .25% represents a shareholder service fee.
Annual Report
Notes to Financial Statements - continued
4. Fees and Other Transactions with Affiliates - continued
Distribution and Service Plan - continued
For the period, each class paid FDC the following amounts, a portion of which was retained by FDC:
|
|
Paid to |
Retained |
|
Class A |
$ 41,658 |
$ 3,951 |
|
Class T |
507,498 |
26 |
|
Class B |
316,688 |
238,227 |
|
Class C |
256,057 |
163,627 |
|
|
$ 1,121,901 |
$ 405,831 |
Sales Load. FDC receives a front-end sales charge of up to 5.75% for selling Class A shares, and 3.50% for selling Class T shares of the fund. FDC receives the proceeds of contingent deferred sales charges levied on Class B share redemptions occurring within six years of purchase and Class C share redemptions occurring within one year of purchase. Contingent deferred sales charges are based on declining rates ranging from 5% to 1% for Class B and 1% for Class C, of the lesser of the cost of shares at the initial date of purchase or the net asset value of the redeemed shares, excluding any reinvested dividends and capital gains. In addition, purchases of Class A and Class T shares that were subject to a finder's fee bear a contingent deferred sales charge on assets that do not remain in the fund for at least one year. The Class A and Class T contingent deferred sales charge is based on 0.25% of the lesser of the cost of shares at the initial date of purchase or the net asset value of the redeemed shares, excluding any reinvested dividends and capital gains. A portion of the sales charges paid to FDC is paid to securities dealers, banks and other financial institutions.
For the period, sales charge amounts paid to and retained by FDC were as follows:
|
|
Paid to |
Retained |
|
Class A |
$ 140,462 |
$ 53,353 |
|
Class T |
304,988 |
96,407 |
|
Class B |
45,443 |
45,443* |
|
Class C |
10,702 |
10,702* |
|
|
$ 501,595 |
$ 205,905 |
* When Class B and Class C shares are initially sold, FDC pays commissions from its own resources to securities dealers,
banks, and other financial institutions through which the sales are made.
Transfer Agent Fees. Fidelity Investments Institutional Operations Company, Inc., (FIIOC), an affiliate of FMR, is the transfer, dividend disbursing and shareholder servicing agent (collectively referred to as the transfer agent) for each class of the fund. FIIOC receives account fees and asset-based fees that vary according to the account size and
Annual Report
Notes to Financial Statements - continued
4. Fees and Other Transactions with Affiliates - continued
Transfer Agent Fees - continued
type of account of the shareholders of the respective classes of the fund. FIIOC pays for typesetting, printing and mailing of all shareholder reports, except proxy statements. For the period, the following amounts were paid to FIIOC:
|
|
Amount |
% of |
|
Class A |
$ 37,068 |
.22 |
|
Class T |
271,799 |
.27 |
|
Class B |
99,078 |
.31 |
|
Class C |
69,133 |
.27 |
|
Institutional Class |
24,438 |
.18 |
|
|
$ 501,516 |
|
Accounting and Security Lending Fees. Fidelity Service Company, Inc., an affiliate of FMR, maintains the fund's accounting records and administers the security lending program. The security lending fee is based on the number and duration of lending transactions. The accounting fee is based on the level of average net assets for the month plus out-of-pocket expenses.
Cash Central Funds. Pursuant to an Exemptive Order issued by the SEC, the fund may invest in the Fidelity Cash Central Fund and the Fidelity Securities Lending Cash Central Fund (the Cash Funds) managed by Fidelity Investments Money Management, Inc., an affiliate of FMR. The Cash Funds are open-end money market funds available only to investment companies and other accounts managed by FMR and its affiliates. The Cash Funds seek preservation of capital, liquidity, and current income. Income distributions from the Cash Funds are declared daily and paid monthly from net investment income. Income distributions earned by the fund are recorded as either interest income or security lending income in the accompanying financial statements.
Brokerage Commissions. The fund placed a portion of its portfolio transactions with brokerage firms which are affiliates of FMR. The commissions paid to these affiliated firms were $5,390 for the period.
Annual Report
Notes to Financial Statements - continued
5. Security Lending.
The fund lends portfolio securities from time to time in order to earn additional income. The fund receives collateral in the form of U.S. Treasury obligations, letters of credit, and/or cash against the loaned securities, and maintains collateral in an amount not less than 100% of the market value of the loaned securities during the period of the loan. The market value of the loaned securities is determined at the close of business of the fund and any additional required collateral is delivered to the fund on the next business day. If the borrower defaults on its obligation to return the securities loaned because of insolvency or other reasons, the fund could experience delays and costs in recovering the securities loaned or in gaining access to the collateral. At period end there were no security loans outstanding.
6. Expense Reductions.
FMR has directed certain portfolio trades to brokers who paid a portion of the fund's expenses. For the period, the fund's expenses were reduced by $40,463 under this arrangement.
In addition, through arrangements with the fund's custodian and each class' transfer agent, credits realized as a result of uninvested cash balances were used to reduce a portion of expenses. During the period, the fund's custodian fees were reduced by $282 under the custodian arrangement, and each applicable class' expenses were reduced as follows under the transfer agent arrangements:
|
|
Transfer |
|
Class T |
$ 754 |
Annual Report
Notes to Financial Statements - continued
7. Distributions to Shareholders.
Distributions to shareholders of each class were as follows:
|
|
Year ended October 31, 2000 |
December 17, 1998
(commencement |
|
From net investment income |
|
|
|
Class A |
$ 10,540 |
$ - |
|
Class T |
95,222 |
- |
|
Class B |
19,524 |
- |
|
Class C |
7,400 |
- |
|
Institutional Class |
13,633 |
- |
|
Total |
$ 146,319 |
$ - |
|
From net realized gain |
|
|
|
Class A |
$ 60,373 |
$ - |
|
Class T |
545,651 |
- |
|
Class B |
167,823 |
- |
|
Class C |
127,217 |
- |
|
Institutional Class |
58,597 |
- |
|
Total |
$ 959,661 |
$ - |
|
In excess of net realized gain |
|
|
|
Class A |
$ 6,354 |
$ - |
|
Class T |
57,423 |
- |
|
Class B |
17,661 |
- |
|
Class C |
13,388 |
- |
|
Institutional Class |
6,166 |
- |
|
Total |
$ 100,992 |
$ - |
|
|
$ 1,206,972 |
$ - |
Annual Report
Notes to Financial Statements - continued
8. Share Transactions.
Transactions for each class of shares were as follows:
|
|
Shares |
Dollars |
||
|
|
Year ended October 31, |
December 17, 1998
(commencement |
Year ended October 31, |
December 17, 1998
(commencement |
|
|
2000 |
1999 |
2000 |
1999 |
|
|
|
|
|
|
|
Class A |
2,673,616 |
368,962 |
$ 41,659,349 |
$ 4,258,738 |
|
Reinvestment of distributions |
5,306 |
- |
75,782 |
- |
|
Shares redeemed |
(1,094,417) |
(74,580) |
(16,670,468) |
(934,331) |
|
Net increase (decrease) |
1,584,505 |
294,382 |
$ 25,064,663 |
$ 3,324,407 |
|
Class T |
9,883,624 |
2,744,736 |
$ 151,684,553 |
$ 32,469,727 |
|
Reinvestment of distributions |
47,912 |
- |
682,269 |
- |
|
Shares redeemed |
(2,764,761) |
(276,769) |
(42,543,275) |
(3,437,679) |
|
Net increase (decrease) |
7,166,775 |
2,467,967 |
$ 109,823,547 |
$ 29,032,048 |
|
Class B |
2,519,471 |
859,540 |
$ 38,521,267 |
$ 10,054,769 |
|
Reinvestment of distributions |
12,633 |
- |
179,135 |
- |
|
Shares redeemed |
(315,547) |
(23,220) |
(4,887,648) |
(281,680) |
|
Net increase (decrease) |
2,216,557 |
836,320 |
$ 33,812,754 |
$ 9,773,089 |
|
Class C |
2,428,332 |
639,584 |
$ 37,048,372 |
$ 7,402,250 |
|
Reinvestment of distributions |
8,632 |
- |
122,491 |
- |
|
Shares redeemed |
(432,373) |
(11,302) |
(6,560,662) |
(138,947) |
|
Net increase (decrease) |
2,004,591 |
628,282 |
$ 30,610,201 |
$ 7,263,303 |
|
Institutional Class |
1,314,105 |
333,162 |
$ 20,387,308 |
$ 3,865,196 |
|
Reinvestment of distributions |
4,808 |
- |
68,755 |
- |
|
Shares redeemed |
(248,303) |
(13,385) |
(3,760,862) |
(164,249) |
|
Net increase (decrease) |
1,070,610 |
319,777 |
$ 16,695,201 |
$ 3,700,947 |
Annual Report
To the Trustees of Fidelity Advisor Series VIII and the Shareholders of Fidelity Advisor Diversified International Fund:
In our opinion, the accompanying statement of assets and liabilities, including the schedule of investments, and the related statements of operations and of changes in net assets and the financial highlights present fairly, in all material respects, the financial position of Fidelity Advisor Diversified International Fund (a fund of Fidelity Advisor Series VIII) at October 31, 2000, and the results of its operations, the changes in its net assets and the financial highlights for the periods indicated, in conformity with accounting principles generally accepted in the United States of America. These financial statements and financial highlights (hereafter referred to as "financial statements") are the responsibility of the Fidelity Advisor Diversified International Fund's management; our responsibility is to express an opinion on these financial statements based on our audits. We conducted our audits of these financial statements in accordance with auditing standards generally accepted in the United States of America which require that we plan and perform the audit to obtain reasonable assurance about whether the financial statements are free of material misstatement. An audit includes examining, on a test basis, evidence supporting the amounts and disclosures in the financial statements, assessing the accounting principles used and significant estimates made by management, and evaluating the overall financial statement presentation. We believe that our audits, which included confirmation of securities at October 31, 2000 by correspondence with the custodian and brokers, provide a reasonable basis for our opinion.
/s/PricewaterhouseCoopers LLP
PricewaterhouseCoopers LLP
Boston, Massachusetts
December 8, 2000
Annual Report
The amounts per share which represent income derived from sources within, and taxes paid to, foreign countries or possessions of the United States are as follows:
|
|
Pay Date |
Income |
Taxes |
|
|
Class A |
12/6/99 |
$.045 |
$.006 |
|
|
Class T |
12/6/99 |
$.045 |
$.006 |
|
|
Class B |
12/6/99 |
$.043 |
$.006 |
|
|
Class C |
12/6/99 |
$.041 |
$.006 |
|
The fund will notify shareholders in January 2001 of amounts for use in preparing 2000 income tax returns.
Annual Report
Annual Report
Investment Adviser
Fidelity Management & Research Company
Boston, MA
Investment Sub-Advisers
Fidelity Management & Research
(U.K.) Inc.
Fidelity Management & Research
(Far East) Inc.
Fidelity International
Investment Advisors
Fidelity Investments Japan Limited
Fidelity International Investment Advisors (U.K.) Limited
Officers
Edward C. Johnson 3d, President
Robert C. Pozen, Senior Vice President
Robert A. Lawrence, Vice President
Greg Fraser, Vice President
Eric D. Roiter, Secretary
Robert A. Dwight, Treasurer
Maria F. Dwyer, Deputy Treasurer
John H. Costello, Assistant Treasurer
Thomas J. Simpson, Assistant Treasurer
Board of Trustees
Ralph F. Cox *
Phyllis Burke Davis *
Robert M. Gates *
Edward C. Johnson 3d
Donald J. Kirk *
Ned C. Lautenbach *
Peter S. Lynch
Marvin L. Mann *
William O. McCoy *
Gerald C. McDonough *
Robert C. Pozen
Thomas R. Williams *
Advisory Board
J. Michael Cook
Abigail P. Johnson
Marie L. Knowles
General Distributor
Fidelity Distributors Corporation
Boston, MA
Transfer and Shareholder
Servicing Agents
Fidelity Investments Institutional Operations Company, Inc.
Boston, MA
Custodian
State Street Bank and Trust Company
Quincy, MA
* Independent trustees
Annual Report
Focus Funds
Fidelity Advisor Consumer
Industries Fund
Fidelity Advisor Cyclical
Industries Fund
Fidelity Advisor Financial
Services Fund
Fidelity Advisor Health Care Fund
Fidelity Advisor Natural
Resources Fund
Fidelity Advisor Technology Fund
Fidelity Advisor Telecommunications & Utilities Growth Fund
Growth Funds
Fidelity Advisor Korea Fund
Fidelity Advisor Emerging Asia Fund
Fidelity Advisor Latin America Fund
Fidelity Advisor Japan Fund
Fidelity Advisor Europe Capital Appreciation Fund
Fidelity Advisor International
Capital Appreciation Fund
Fidelity Advisor Overseas Fund
Fidelity Advisor Diversified International Fund
Fidelity Advisor Global Equity Fund
Fidelity Advisor TechnoQuant®
Growth Fund
Fidelity Advisor Small Cap Fund
Fidelity Advisor Value Strategies Fund
Fidelity Advisor Mid Cap Fund
Fidelity Advisor Dynamic Capital Appreciation Fund
Fidelity Advisor Equity Growth Fund
Fidelity Advisor Large Cap Fund
Fidelity Advisor Dividend Growth Fund
Fidelity Advisor Growth
Opportunities Fund
Growth and Income Funds
Fidelity Advisor Growth & Income Fund
Fidelity Advisor Equity Income Fund
Fidelity Advisor Asset Allocation Fund
Fidelity Advisor Balanced Fund
Taxable Income Funds
Fidelity Advisor Emerging Markets Income Fund
Fidelity Advisor High Yield Fund
Fidelity Advisor High Income Fund
Fidelity Advisor Strategic Income Fund
Fidelity Advisor Mortgage
Securities Fund
Fidelity Advisor Government Investment Fund
Fidelity Advisor Intermediate Bond Fund
Fidelity Advisor Short Fixed-Income Fund
Municipal Funds
Fidelity Advisor Municipal Income Fund
Money Market Funds
Prime Fund
Treasury Fund
Tax-Exempt Fund
ADIF-ANN-1200 118917
1.728709.101
(Fidelity Investment logo)(registered trademark)
Fidelity® Advisor
Fund - Institutional Class
Annual Report
October 31, 2000
(2_fidelity_logos)(registered trademark)
|
President's Message |
Ned Johnson on investing strategies. |
|
|
Performance |
How the fund has done over time. |
|
|
Fund Talk |
The manager's review of fund performance, strategy and outlook. |
|
|
Investment Changes |
A summary of major shifts in the fund's investments over the past six months. |
|
|
Investments |
A complete list of the fund's investments with their market values. |
|
|
Financial Statements |
Statements of assets and liabilities,
operations, and changes in net assets, |
|
|
Notes |
Notes to the financial statements. |
|
|
Report of Independent Accountants |
The auditors' opinion. |
|
|
Distributions |
|
Third party marks appearing herein are the property of their respective owners.
All other marks appearing herein are registered or unregistered trademarks or service marks of FMR Corp. or an affiliated company.
(Recycle graphic) This report is printed on recycled paper using soy-based inks.
This report and the financial statements contained herein are submitted for the general information of the shareholders of the fund. This report is not authorized for distribution to prospective investors in the fund unless preceded or accompanied by an effective prospectus.
Mutual fund shares are not deposits or obligations of, or guaranteed by, any depository institution. Shares are not insured by the FDIC, Federal Reserve Board or any other agency, and are subject to investment risks, including possible loss of principal amount invested.
Neither the fund nor Fidelity Distributors Corporation is a bank.
For more information on any Fidelity Advisor fund, including charges and expenses, contact your investment professional for a free prospectus. Read it carefully before you invest or send money.
Annual Report
(photo_of_Edward_C_Johnson_3d)
Dear Shareholder:
A sixth-straight year of double-digit positive returns for the Dow Jones Industrial Average, NASDAQ and S&P 500® could be in jeopardy unless the U.S. stock market shows marked improvement in the final two months of 2000. Through October, all three indexes had negative year-to-date returns. On the other hand, most fixed-income sectors were solidly in the black. Treasuries and other long-term government securities led the way, returning nearly 14%.
While it's impossible to predict the future direction of the markets with any degree of certainty, there are certain basic principles that can help investors plan for their future needs.
First, investors are encouraged to take a long-term view of their portfolios. If you can afford to leave your money invested through the inevitable up and down cycles of the financial markets, you will greatly reduce your vulnerability to any single decline. We know from experience, for example, that stock prices have gone up over longer periods of time, have significantly outperformed other types of investments and have stayed ahead of inflation.
Second, you can further manage your investing risk through diversification. A stock mutual fund, for instance, is already diversified, because it invests in many different companies. You can increase your diversification further by investing in a number of different stock funds, or in such other investment categories as bonds. If you have a short investment time horizon, you might want to consider moving some of your investment into a money market fund, which seeks income and a stable share price by investing in high-quality, short-term investments. Of course, it's important to remember that an investment in a money market fund is not insured or guaranteed by the Federal Deposit Insurance Corporation or any other government agency. Although money market funds seek to preserve the value of your investment at $1.00 per share, it is possible to lose money by investing in these types of funds.
Finally, no matter what your time horizon or portfolio diversity, it makes good sense to follow a regular investment plan, investing a certain amount of money in a fund at the same time each month or quarter and periodically reviewing your overall portfolio. By doing so, you won't get caught up in the excitement of a rapidly rising market, nor will you buy all your shares at market highs. While this strategy - known as dollar cost averaging - won't assure a profit or protect you from a loss in a declining market, it should help you lower the average cost of your purchases. Of course, you should consider your financial ability to continue your purchases through periods of low price levels before undertaking such a strategy.
Remember to contact your investment professional if you need help with your investments.
Best regards,
/s/Edward C. Johnson 3d
Edward C. Johnson 3d
Annual Report
Fidelity Advisor Diversified International Fund - Institutional Class
There are several ways to evaluate historical performance. You can look at the total percentage change in value, the average annual percentage change or the growth of a hypothetical $10,000 investment. Total return reflects the change in the value of an investment, assuming reinvestment of the class' dividend income and capital gains (the profits earned upon the sale of securities that have grown in value). If Fidelity had not reimbursed certain class expenses, the life of fund total returns would have been lower.
Cumulative Total Returns
|
Periods ended October 31, 2000 |
|
Past 1 |
Life of |
|
Fidelity® Adv Diversified Intl - Inst CL |
|
13.42% |
48.35% |
|
MSCI EAFE® |
|
-2.72% |
13.62% |
|
International Funds Average |
|
2.70% |
n/a* |
Cumulative total returns show Institutional Class' performance in percentage terms over a set period - in this case, one year or since the fund started on December 17, 1998. For example, if you had invested $1,000 in a fund that had a 5% return over the past year, the value of your investment would be $1,050. You can compare Institutional Class' returns to the performance of the Morgan Stanley Capital International Europe, Australasia, Far East (MSCI EAFE) Index - a market capitalization-weighted index that is designed to represent the performance of developed stock markets outside the United States and Canada. As of October 31, 2000, the index included over 800 equity securities of companies domiciled in 20 countries. To measure how Institutional Class' performance stacked up against its peers, you can compare it to the international funds average, which reflects the performance of mutual funds with similar objectives tracked by Lipper Inc. The past one year average represents a peer group of 666 mutual funds. These benchmarks include reinvested dividends and capital gains, if any, and exclude the effect of sales charges.
Average Annual Total Returns
|
Periods ended October 31, 2000 |
|
Past 1 |
Life of |
|
Fidelity Adv Diversified Intl - Inst CL |
|
13.42% |
23.42% |
|
MSCI EAFE |
|
-2.72% |
7.05% |
|
International Funds Average |
|
2.70% |
n/a* |
Average annual total returns take Institutional Class' shares' cumulative return and show you what would have happened if Institutional Class shares had performed at a constant rate each year.
* Not available
Annual Report
$10,000 Over Life of Fund
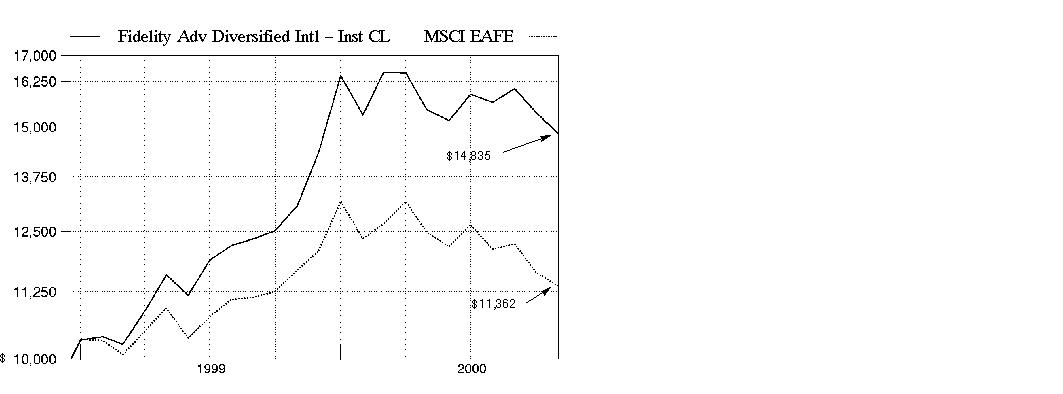
$10,000 Over Life of Fund: Let's say hypothetically that $10,000 was invested in Fidelity Advisor Diversified International Fund - Institutional Class on December 17, 1998, when the fund started. As the chart shows, by October 31, 2000, the value of the investment would have grown to $14,835 - a 48.35% increase on the initial investment. For comparison, look at how the MSCI EAFE Index did over the same period. With dividends reinvested, the same $10,000 would have grown to $11,362 - a 13.62% increase.
Understanding
Performance
Many markets around the globe offer the potential for significant growth over time; however, investing in foreign markets means assuming greater risks than investing in the United States. Factors like changes in a country's financial markets, its local political and economic climate, and the fluctuating value of its currency create these risks. For these reasons an international fund's performance may be more volatile than a fund that invests exclusively in the United States. Past performance is no guarantee of future results and you may have a gain or loss when you sell your shares.
3Annual Report
Market Recap
Currency disparities, the see-saw performance of technology and telecommunications stocks and increased uncertainty over the direction of energy prices contributed to volatile world markets for the 12-month period that ended October 31, 2000. Through the first half of the period, foreign investors enjoyed handsome returns from technology and telecommunications holdings. These gains disappeared down the stretch, however, as the dollar continued to outperform the struggling euro - the uniform currency of 11 European nations - and the Japanese yen by wide margins. Soaring oil and gas prices also added to the volatility. The Morgan Stanley EAFE® index - which tracks the performance of stock markets in Europe, Australasia and the Far East - fell 2.72% during the period. Europe's economic recovery remained on course, but the euro's continued weakness proved to be a millstone. The Morgan Stanley Europe index had a 12-month return of 1.16%. Japan's economic recovery, on the other hand, appeared to be short-lived, or at least very, very slow in the making. The Morgan Stanley Japan index declined 11.61% during the period. Emerging markets, meanwhile, were unable to sustain the momentum they carried into early 2000 - the Morgan Stanley Emerging Markets Free index tumbled 10.33%.
(Portfolio Manager photograph)
An interview with Greg Fraser, Portfolio Manager of Fidelity Advisor Diversified International Fund
Q. How did the fund perform, Greg?
A. For the 12-month period that ended October 31, 2000, the fund's Institutional Class shares returned 13.42%. For the same period, the capitalization-weighted Morgan Stanley Capital International (MSCI) EAFE Index - a broad measure of stock performance in Europe, Australasia and the Far East - fell 2.72%. The fund also compares its performance against the Lipper Inc. international funds average, which was up 2.70% during the past 12 months.
Annual Report
Fund Talk: The Manager's Overview - continued
Q. Why did the fund outperform its index and Lipper peer group during the past year?
A. Our underweighted position in Japan and favorable stock selection within the Japanese markets made the largest contribution to performance relative to the index. Despite a sell-off in Japanese technology and telecommunications stocks that began in the second quarter of 2000, the strong relative performance of our holdings in those sectors helped the fund. For example, rising demand from telecommunications companies eager to build out optical networks boosted the performance of Furukawa Electric. Additionally, the fund's out-of-benchmark stake in Canadian stocks proved beneficial. Compared to our Lipper peers, I probably reduced the fund's weightings in the technology and telecommunications sectors more quickly and aggressively than other funds did - a move that enhanced performance - as those areas were battered throughout the summer.
Q. Can you describe the international market environment during the period?
A. During the first half of the period, the fund had the wind at its back due to strong economic growth in many countries, generally stable interest rates and improving corporate earnings. That positive environment was altered significantly during the past six months, as a couple of key factors put heavy downward pressure on international equity prices. First, a rising interest-rate environment worldwide - particularly in European countries - contributed to slowing demand for products and services and began to hurt corporate profits. Specifically, there were growing concerns about slowing demand for certain technology products, such as personal computers and semiconductors, which hurt stocks in that sector. Meanwhile, an increase in energy prices to near historically high levels was seen as a detriment to the economies in many countries, such as South Korea, which imports nearly 100% of its oil.
Q. Could you highlight some of the fund's more important individual contributors?
A. In the consumer products industry, diversified companies such as Diageo and Nestle performed well as investors retreated from the technology sector. Most pharmaceutical companies did reasonably well, including fund holdings SmithKline Beecham and Glaxo Wellcome. Additionally, energy companies such as European holdings TotalFinaElf and Eni, as well as Canadian Natural Resources and Alberta Energy in Canada, did well given the positive supply and demand equation for oil.
Q. Which stocks disappointed?
A. There were several disappointments in the telecommunications sector, which suffered from global pricing pressures, higher-than-expected costs for licenses for the next generation of wireless communications, called 3G, and general slowing economic growth worldwide. Among these detractors were Nippon Telegraph, Vodafone Group, NTT DoCoMo, DDI and China Mobile. Additionally, Japanese electronics manufacturer Hikari Tsushin, which I sold off entirely during the period, and United Internet were hurt by the global correction in Internet-related stocks.
Annual Report
Fund Talk: The Manager's Overview - continued
Q. Greg, what's your outlook for the fund?
A. After the sharp decline of telecom and technology stocks during the past six months, there haven't been any areas of the market that have demonstrated clear leadership. Nevertheless, I will continue to look for reasonably valued stocks with improving fundamentals. I have increasing concerns about the funding environment for emerging companies. Many newer companies appear to have substantial capital needs and, if those needs become too difficult or too expensive to meet, the equities of those companies could fall dramatically in value. Shareholders should expect companies with strong balance sheets and good cash flow to become a larger part of the portfolio.
The views expressed in this report reflect those of the portfolio manager only through the end of the period of the report as stated on the cover and do not necessarily represent the views of Fidelity or any other person in the Fidelity organization. Any such views are subject to change at any time based upon market or other conditions and Fidelity disclaims any responsibility to update such views. These views may not be relied on as investment advice and, because investment decisions for a Fidelity fund are based on numerous factors, may not be relied on as an indication of trading intent on behalf of any Fidelity fund.
Fund Facts
Goal: seeks capital growth
Start date: December 17, 1998
Size: as of October 31, 2000, more than $268 million
Manager: Greg Fraser, since inception; joined Fidelity in 1986
3Greg Fraser discusses the possibility of a global bear market:
"By historical standards, U.S. equity returns have been substantially higher than normal during the past few years. Some specific sectors, such as technology, have seen spectacular returns - at least until March of 2000. Additionally, many investors who participated in initial public offerings (IPOs) for the first time experienced tremendous results. Because of these abnormal positive experiences and through media influence, many investors have been taught to buy more stocks on every dip in the market.
"It is important, therefore, to recognize that we might now either be in a bear market - a period of generally decreasing stock prices - or we soon could be in one. It's one thing to stay the course when equities quickly recover; it's quite another to actually stay the course if one's monthly statements show greater losses, month after month. History has shown that truly global bear markets leave few stocks unscathed.
"While I don't know whether or not we're in a bear market yet, shareholders should re-examine their portfolio allocations, making sure they don't have short-term investment money overexposed to these equity risks. Meanwhile, there is evidence that investing a percentage of one's portfolio in international stocks can provide an added layer of diversification that could enhance portfolio performance over the long term."
Annual Report
|
Top Five Stocks as of October 31, 2000 |
||
|
|
% of fund's |
% of fund's net assets |
|
Furukawa Electric Co. Ltd. (Japan, Electrical Equipment) |
1.7 |
1.4 |
|
Nippon Telegraph & Telephone Corp. sponsored ADR (Japan, Telephone Services) |
1.6 |
2.0 |
|
Shell Transport & Trading Co. PLC (Reg.) (United Kingdom, Oil & Gas) |
1.6 |
1.1 |
|
Nokia AB sponsored ADR (Finland, Communications Equipment) |
1.6 |
2.2 |
|
Vodafone Group PLC (United Kingdom, Cellular) |
1.5 |
2.0 |
|
|
8.0 |
8.7 |
|
Top Five Market Sectors as of October 31, 2000 |
||
|
|
% of fund's |
% of fund's net assets |
|
Finance |
20.6 |
12.0 |
|
Utilities |
9.7 |
17.3 |
|
Technology |
9.7 |
13.5 |
|
Health |
8.6 |
6.4 |
|
Energy |
8.3 |
7.9 |
|
Top Five Countries as of October 31, 2000 |
||
|
(excluding cash equivalents) |
% of fund's |
% of fund's net assets |
|
Japan |
15.0 |
21.4 |
|
United Kingdom |
12.2 |
10.3 |
|
Canada |
9.4 |
4.1 |
|
Switzerland |
8.5 |
7.7 |
|
France |
7.5 |
8.0 |
|
Percentages are adjusted for the effect of open futures contracts, if applicable. |
|
Asset Allocation (% of fund's net assets) |
|||||||
|
As of October 31, 2000 |
As of April 30, 2000 |
||||||
|
Stocks and Investment Companies 92.4% |
|
|
Stocks and Investment Companies 91.7% |
|
||
|
Bonds 0.2% |
|
|
Bonds 0.3% |
|
||
|
Short-Term |
|
|
Short-Term |
|
||
Annual Report
Showing Percentage of Net Assets
|
Common Stocks - 89.5% |
|||
|
Shares |
Value (Note 1) |
||
|
Australia - 2.3% |
|||
|
Australian Gas Light Co. |
46,000 |
$ 278,174 |
|
|
Australian Stock Exchange Ltd. |
11,900 |
72,978 |
|
|
AXA Asia Pacific Holdings Ltd. |
185,000 |
276,174 |
|
|
BHP Ltd. |
24,100 |
234,416 |
|
|
BMCMedia.com Ltd. (a) |
208,000 |
29,753 |
|
|
Cable & Wireless Optus Ltd. (a) |
133,200 |
283,094 |
|
|
Commonwealth Bank of Australia |
73,200 |
1,093,095 |
|
|
E*TRADE Australia Ltd. (a) |
45,000 |
46,814 |
|
|
F. H. Faulding & Co. Ltd. |
34,500 |
183,041 |
|
|
ISIS Communications Ltd. (a) |
185,000 |
28,387 |
|
|
John Fairfax Holdings Ltd. |
50,000 |
113,913 |
|
|
National Australia Bank Ltd. |
25,000 |
348,501 |
|
|
News Corp. Ltd. sponsored ADR (pfd. ltd. vtg.) |
39,300 |
1,422,169 |
|
|
Orbital Engine Co. Ltd. sponsored ADR (a) |
2,000 |
17,625 |
|
|
Securenet Ltd. (a) |
85,900 |
373,085 |
|
|
Westpac Banking Corp. |
50,300 |
344,679 |
|
|
WMC Ltd. |
297,300 |
1,140,474 |
|
|
TOTAL AUSTRALIA |
6,286,372 |
||
|
Austria - 0.2% |
|||
|
Bank Austria AG |
4,500 |
243,500 |
|
|
Flughafen Wien AG |
2,000 |
72,980 |
|
|
RHI AG |
10,871 |
230,683 |
|
|
TOTAL AUSTRIA |
547,163 |
||
|
Belgium - 0.2% |
|||
|
Dexia SA (a) |
512 |
9 |
|
|
Telindus Group NV |
32,000 |
626,075 |
|
|
Telindus Group NV (strip VVPR) (a) |
33 |
0 |
|
|
TOTAL BELGIUM |
626,084 |
||
|
Bermuda - 0.6% |
|||
|
ACE Ltd. |
5,700 |
223,725 |
|
|
Aquarius Platinum Ltd. (a) |
60,000 |
249,672 |
|
|
Asia Global Crossing Ltd. Class A |
35,000 |
245,000 |
|
|
Global Crossing Ltd. (a) |
12,000 |
283,500 |
|
|
Knightsbridge Tankers Ltd. |
13,100 |
282,469 |
|
|
RenaissanceRe Holdings Ltd. |
4,400 |
319,275 |
|
|
TOTAL BERMUDA |
1,603,641 |
||
|
Brazil - 0.2% |
|||
|
Banco Itau SA |
2,800,000 |
218,842 |
|
|
Companhia de Bebidas das Americas (AmBev) sponsored ADR |
1,000 |
22,563 |
|
|
Common Stocks - continued |
|||
|
Shares |
Value (Note 1) |
||
|
Brazil - continued |
|||
|
Telebras sponsored ADR (pfd. holder) |
5,100 |
$ 373,575 |
|
|
Telecomunicacoes de Sao Paulo SA sponsored ADR |
2,000 |
28,500 |
|
|
TOTAL BRAZIL |
643,480 |
||
|
Canada - 9.2% |
|||
|
Alberta Energy Co. Ltd. |
33,800 |
1,248,768 |
|
|
Bank of Montreal |
15,000 |
694,581 |
|
|
Bank of Nova Scotia |
45,600 |
1,302,857 |
|
|
Barrick Gold Corp. |
10,000 |
133,005 |
|
|
BCE, Inc. |
70,600 |
1,901,215 |
|
|
Canada Life Financial Corp. |
15,000 |
350,739 |
|
|
Canadian Imperial Bank of Commerce |
47,400 |
1,506,837 |
|
|
Canadian National Railway Co. |
32,000 |
1,008,867 |
|
|
Canadian Natural Resources Ltd. (a) |
40,800 |
1,205,911 |
|
|
Canadian Pacific Ltd. |
67,200 |
1,953,103 |
|
|
Celestica, Inc. (sub. vtg.) (a) |
10,000 |
714,614 |
|
|
COM DEV International Ltd. (a) |
8,000 |
90,640 |
|
|
Encal Energy Ltd. (a) |
5,000 |
30,378 |
|
|
Fairfax Financial Holdings Ltd. (a) |
8,000 |
1,066,667 |
|
|
Fletcher Challenge Canada Ltd. |
105,200 |
1,105,550 |
|
|
Gulf Canada Resources Ltd. (a) |
97,200 |
418,167 |
|
|
Harrowston, Inc. Class A (a) |
56,000 |
156,322 |
|
|
Industrial Alliance Life Insurance Co. (a) |
4,000 |
88,670 |
|
|
Manulife Financial Corp. |
4,000 |
104,039 |
|
|
Marsulex, Inc. (a) |
5,000 |
10,016 |
|
|
Metro, Inc. Class A |
12,000 |
163,941 |
|
|
National Bank of Canada |
26,000 |
426,076 |
|
|
Noranda, Inc. |
13,300 |
130,598 |
|
|
Nortel Networks Corp. |
7,900 |
359,450 |
|
|
Onex Corp. |
21,000 |
333,793 |
|
|
OZ Optics Ltd. unit (f) |
5,400 |
79,650 |
|
|
Pancanadian Petroleum Ltd. |
10,500 |
244,828 |
|
|
Petro-Canada |
45,800 |
962,627 |
|
|
Placer Dome, Inc. |
8,500 |
70,624 |
|
|
Power Corp. of Canada |
23,000 |
521,182 |
|
|
Research in Motion Ltd. (a) |
2,000 |
199,672 |
|
|
Rio Alto Exploration Ltd. (a) |
13,000 |
221,149 |
|
|
Royal Bank of Canada |
47,500 |
1,506,897 |
|
|
Sun Life Financial Services Canada, Inc. |
45,800 |
947,586 |
|
|
Suncor Energy, Inc. |
48,000 |
937,931 |
|
|
Talisman Energy, Inc. (a) |
13,000 |
409,425 |
|
|
TimberWest Forest Corp. unit |
55,800 |
386,660 |
|
|
Common Stocks - continued |
|||
|
Shares |
Value (Note 1) |
||
|
Canada - continued |
|||
|
Toronto Dominion Bank |
58,300 |
$ 1,606,361 |
|
|
Trizec Hahn Corp. (sub. vtg.) (a) |
8,000 |
120,066 |
|
|
TOTAL CANADA |
24,719,462 |
||
|
Denmark - 1.6% |
|||
|
Danske Bank AS |
2,000 |
289,781 |
|
|
GN Store Nordic AS |
50,800 |
985,254 |
|
|
Group 4 Falck AS |
5,400 |
659,194 |
|
|
NKT Holding AS |
1,000 |
236,730 |
|
|
Novo-Nordisk AS Series B (a) |
9,700 |
2,058,355 |
|
|
RTX Telecom AS |
2,100 |
88,646 |
|
|
TK Development AS |
800 |
26,468 |
|
|
TOTAL DENMARK |
4,344,428 |
||
|
Finland - 2.9% |
|||
|
Elisa Communications Corp. (A Shares) |
12,724 |
353,164 |
|
|
F-Secure Oyj (a) |
4,000 |
22,748 |
|
|
Fortum Oyj |
22,000 |
72,827 |
|
|
KCI Konecranes |
7,815 |
182,351 |
|
|
Kone Corp. |
4,000 |
234,269 |
|
|
Metsa Tissue Oyj |
26,400 |
268,900 |
|
|
Metsa-Serla Oyj (B Shares) |
20,590 |
129,328 |
|
|
Metso Oyj sponsored ADR |
23,700 |
186,638 |
|
|
Nokia AB sponsored ADR |
98,300 |
4,202,325 |
|
|
Sampo Insurance Co. Ltd. (A Shares) |
38,026 |
1,549,271 |
|
|
Sanoma-WSOY Oyj (B Shares) |
6,600 |
90,193 |
|
|
Sonera Corp. |
8,500 |
187,296 |
|
|
UPM-Kymmene Corp. |
10,955 |
310,108 |
|
|
TOTAL FINLAND |
7,789,418 |
||
|
France - 7.3% |
|||
|
Aventis SA (France) |
21,300 |
1,534,931 |
|
|
AXA SA de CV |
11,200 |
1,483,023 |
|
|
BNP Paribas SA |
17,400 |
1,500,543 |
|
|
Carbone Lorraine Group |
8,900 |
379,982 |
|
|
Castorama Dubois Investissements SA |
2,300 |
467,757 |
|
|
Christian Dior SA |
24,400 |
1,240,572 |
|
|
CNP Assurances |
23,900 |
742,276 |
|
|
Compagnie de St. Gobain |
1,000 |
132,328 |
|
|
Compagnie Generale d'Industrie et de Participations (CGIP) |
4,400 |
184,495 |
|
|
Compagnie Generale de Geophysique SA sponsored ADR (a) |
3,679 |
44,148 |
|
|
Eurafrance (Societe) |
1,330 |
799,828 |
|
|
Eurotunnel SA unit (a) |
30,000 |
27,246 |
|
|
Common Stocks - continued |
|||
|
Shares |
Value (Note 1) |
||
|
France - continued |
|||
|
France Telecom SA sponsored ADR |
14,700 |
$ 1,578,413 |
|
|
HighWave Optical Technologies |
2,000 |
305,398 |
|
|
Isis SA |
3,000 |
206,258 |
|
|
L'Oreal SA (a) |
1,750 |
133,686 |
|
|
Louis Vuitton Moet Hennessy (LVMH) |
4,500 |
328,486 |
|
|
Remy Cointreau SA |
3,000 |
100,328 |
|
|
Remy Cointreau SA (RFD) (a) |
71 |
2,374 |
|
|
Riber SA (d) |
13,000 |
277,846 |
|
|
Sanofi-Synthelabo SA |
22,900 |
1,205,126 |
|
|
Schneider Electric SA |
2,000 |
130,291 |
|
|
Silicon On Insulator TEChnologies SA (SOITEC) (a) |
9,000 |
203,967 |
|
|
Societe Generale Class A (a) |
17,400 |
988,054 |
|
|
TotalFinaElf SA: |
|
|
|
|
Class B |
12,400 |
1,776,300 |
|
|
sponsored ADR |
30,800 |
2,206,050 |
|
|
UBI Soft Entertainment (a) |
335 |
14,445 |
|
|
Vivendi Environment (a) |
20,600 |
769,352 |
|
|
Vivendi SA |
8,700 |
625,472 |
|
|
Wavecom SA sponsored ADR (a) |
1,000 |
87,000 |
|
|
TOTAL FRANCE |
19,475,975 |
||
|
Germany - 6.6% |
|||
|
Aachener & Muenchener Beteiligungs AG (AMB) |
2,000 |
179,946 |
|
|
ACG AG |
1,500 |
78,938 |
|
|
Allianz AG (Reg.) |
3,649 |
1,237,515 |
|
|
Altana AG |
11,400 |
1,373,263 |
|
|
Axel Springer Verlag |
180 |
145,145 |
|
|
Bayer AG |
31,300 |
1,358,925 |
|
|
Bayerische Motoren Werke AG (BMW) |
2,000 |
66,240 |
|
|
Beiersdorf AG |
5,700 |
546,712 |
|
|
Buderus AG |
17,300 |
327,899 |
|
|
Cybio AG |
2,500 |
301,218 |
|
|
Deutsche Bank AG |
17,400 |
1,424,925 |
|
|
Deutsche Lufthansa AG (Reg.) |
25,500 |
497,821 |
|
|
Deutsche Telekom AG |
25,500 |
957,765 |
|
|
DIS Deutscher Industrie Service AG (a) |
19,600 |
819,347 |
|
|
E.On AG |
8,900 |
452,353 |
|
|
Epcos AG |
2,000 |
151,630 |
|
|
ERGO Versicherungs Gruppe AG |
2,000 |
276,709 |
|
|
Fresenius Medical Care AG sponsored ADR |
22,900 |
609,713 |
|
|
Hannover Rueckversicherungs AG |
5,000 |
420,580 |
|
|
Heidelberger Druckmaschinen AG |
16,000 |
845,405 |
|
|
Common Stocks - continued |
|||
|
Shares |
Value (Note 1) |
||
|
Germany - continued |
|||
|
Infineon Technologies AG sponsored ADR (a) |
4,500 |
$ 192,938 |
|
|
Lion Bioscience AG sponsored ADR |
1,000 |
77,063 |
|
|
Muenchener Ruckversicherungs-Gesellschaft AG (Reg.) |
1,000 |
314,480 |
|
|
Pfeiffer Vacuum Technology AG |
3,000 |
118,408 |
|
|
Schering AG (a) |
28,010 |
1,569,143 |
|
|
SGL Carbon AG (a) |
8,600 |
525,650 |
|
|
Siemens AG |
7,800 |
993,427 |
|
|
Stinnes AG |
16,000 |
378,904 |
|
|
Suess MicroTec AG (a) |
4,000 |
112,721 |
|
|
Techem AG |
35,000 |
860,047 |
|
|
United Internet AG (a) |
13,100 |
84,284 |
|
|
WEB.DE AG |
8,000 |
124,264 |
|
|
Wella AG |
6,500 |
247,171 |
|
|
Winkler & Dunnebier AG |
5,000 |
62,811 |
|
|
TOTAL GERMANY |
17,733,360 |
||
|
Hong Kong - 1.0% |
|||
|
Asat Holdings Ltd. sponsored ADR |
16,000 |
106,000 |
|
|
Cathay Pacific Airways Ltd. |
40,000 |
72,583 |
|
|
China Mobile Ltd. (a) |
74,000 |
453,250 |
|
|
China Mobile Ltd. sponsored ADR (a) |
53,400 |
1,635,375 |
|
|
Hutchison Whampoa Ltd. |
24,900 |
308,937 |
|
|
Techpacific.com Ltd. |
80,000 |
2,975 |
|
|
TOTAL HONG KONG |
2,579,120 |
||
|
Indonesia - 0.0% |
|||
|
Gulf Indonesia Resources Ltd. (a) |
2,000 |
21,750 |
|
|
Ireland - 0.9% |
|||
|
Allied Irish Banks PLC |
20,000 |
203,712 |
|
|
Anglo-Irish Bank Corp. PLC |
72,200 |
167,469 |
|
|
Bank of Ireland, Inc. |
45,000 |
346,820 |
|
|
Elan Corp. PLC sponsored ADR (a) |
12,100 |
628,444 |
|
|
Independent Newspapers PLC (Ireland) |
77,400 |
239,795 |
|
|
Irish Life & Permanent PLC |
47,000 |
471,143 |
|
|
Ryanair Holdings PLC sponsored ADR (a) |
8,800 |
354,750 |
|
|
TOTAL IRELAND |
2,412,133 |
||
|
Israel - 0.3% |
|||
|
AudioCodes Ltd. (a) |
3,000 |
118,688 |
|
|
BackWeb Technologies Ltd. (a) |
2,000 |
17,875 |
|
|
BATM Advanced Communications Ltd. |
2,000 |
14,874 |
|
|
Common Stocks - continued |
|||
|
Shares |
Value (Note 1) |
||
|
Israel - continued |
|||
|
Lanoptics Ltd. (a) |
2,000 |
$ 47,250 |
|
|
Teva Pharmaceutical Industries Ltd. ADR |
10,400 |
614,900 |
|
|
TOTAL ISRAEL |
813,587 |
||
|
Italy - 2.2% |
|||
|
Alleanza Assicurazioni Spa |
8,000 |
105,699 |
|
|
Assicurazioni Generali Spa |
5,644 |
185,733 |
|
|
De Rigo Spa ADR (a) |
4,000 |
32,750 |
|
|
Ducati Motor Holding Spa (a) |
175,200 |
378,466 |
|
|
Enel Spa |
10,000 |
37,016 |
|
|
Eni Spa sponsored ADR |
35,500 |
1,921,438 |
|
|
Finmeccanica Spa (a) |
415,000 |
475,892 |
|
|
Industrie Natuzzi Spa ADR |
2,500 |
29,688 |
|
|
Luxottica Group Spa sponsored ADR |
20,000 |
288,750 |
|
|
SAES Getters Spa sponsored ADR |
14,000 |
126,000 |
|
|
San Paolo IMI Spa |
17,524 |
282,256 |
|
|
Telecom Italia Mobile Spa |
49,700 |
422,908 |
|
|
Telecom Italia Spa |
62,900 |
739,075 |
|
|
Unicredito Italiano Spa |
160,156 |
818,225 |
|
|
TOTAL ITALY |
5,843,896 |
||
|
Japan - 15.0% |
|||
|
Advantest Corp. |
2,000 |
260,838 |
|
|
Air Liquide Japan Ltd. |
8,000 |
37,980 |
|
|
Anritsu Corp. |
17,000 |
373,935 |
|
|
Canon, Inc. ADR |
7,100 |
287,994 |
|
|
Citizen Watch Co. Ltd. |
41,000 |
402,447 |
|
|
Daiichi Pharmaceutical Co. Ltd. |
8,000 |
227,294 |
|
|
Dainippon Pharmaceutical Co. |
8,000 |
102,575 |
|
|
DDI Corp. |
5 |
23,463 |
|
|
Fanuc Ltd. |
3,000 |
269,453 |
|
|
Fuji Coca-Cola Bottling Co. Ltd. |
20,000 |
156,723 |
|
|
Fuji Heavy Industries Ltd. |
44,000 |
306,480 |
|
|
Fuji Photo Film Co. Ltd. |
7,000 |
259,830 |
|
|
Fujikura Ltd. |
35,000 |
308,588 |
|
|
Fujisawa Pharmaceutical Co. Ltd. |
13,000 |
408,670 |
|
|
Fujitsu Ltd. |
35,000 |
623,591 |
|
|
Furukawa Electric Co. Ltd. |
170,000 |
4,471,609 |
|
|
Hakuto Co. Ltd. |
3,100 |
68,472 |
|
|
Hitachi Chemical Co. Ltd. |
4,000 |
100,449 |
|
|
Hokkaido Coca-Cola Bottling Co. Ltd. |
20,000 |
164,971 |
|
|
Hoya Corp. |
8,700 |
719,219 |
|
|
Common Stocks - continued |
|||
|
Shares |
Value (Note 1) |
||
|
Japan - continued |
|||
|
JAFCO Co. Ltd. |
400 |
$ 42,526 |
|
|
Japan Airlines Co. Ltd. |
40,000 |
160,205 |
|
|
Japan Aviation Electronics Industries (a) |
14,000 |
99,056 |
|
|
Kao Corp. |
16,000 |
479,516 |
|
|
Konica Corp. (a) |
64,000 |
494,473 |
|
|
Kyocera Corp. sponsored ADR |
10,800 |
1,444,500 |
|
|
Maruichi Steel Tube Ltd. |
5,000 |
70,983 |
|
|
Matsushita Communication Industrial Co. Ltd. |
2,000 |
262,121 |
|
|
Matsushita Electric Industrial Co. Ltd. ADR |
6,300 |
1,841,175 |
|
|
Mikasa Coca Cola Bottling Co. |
6,000 |
46,467 |
|
|
Mikuni Coca Cola Bottling Co. |
5,000 |
54,945 |
|
|
Mitsubishi Electric Corp. |
40,000 |
287,416 |
|
|
Mitsubishi Estate Co. Ltd. (a) |
20,000 |
212,629 |
|
|
Mitsubishi Rayon Co. Ltd. |
22,000 |
78,435 |
|
|
Mitsui Fudosan Co. Ltd. |
20,000 |
242,324 |
|
|
NEC Corp. |
72,000 |
1,372,560 |
|
|
Nichicon Corp. |
22,000 |
392,980 |
|
|
Nikko Securities Co. Ltd. |
42,000 |
362,607 |
|
|
Nintendo Co. Ltd. |
2,700 |
446,659 |
|
|
Nippon Electric Glass Co. Ltd. |
9,000 |
209,513 |
|
|
Nippon Sheet Glass Co. Ltd. |
23,000 |
349,922 |
|
|
Nippon Telegraph & Telephone Corp. sponsored ADR |
95,600 |
4,367,725 |
|
|
Nissan Motor Co. Ltd. (a) |
64,000 |
448,000 |
|
|
Nitto Denko Corp. |
6,000 |
202,914 |
|
|
NOK Corp. |
4,000 |
38,200 |
|
|
Nomura Securities Co. Ltd. |
55,000 |
1,166,942 |
|
|
North Pacific Bank Ltd. |
4,000 |
26,065 |
|
|
NTT DoCoMo, Inc. |
27 |
665,659 |
|
|
Olympus Optical Co. Ltd. |
16,000 |
221,135 |
|
|
Omron Corp. |
63,000 |
1,553,203 |
|
|
ORIX Corp. |
10,200 |
1,070,388 |
|
|
Osaka Gas Co. Ltd. |
40,000 |
98,616 |
|
|
Pioneer Corp. |
38,000 |
1,177,161 |
|
|
Rohm Co. Ltd. |
3,300 |
832,032 |
|
|
Sanyo Electric Co. Ltd. |
266,000 |
2,023,463 |
|
|
Sharp Corp. |
12,000 |
152,873 |
|
|
Shikoku Coca-Cola Bottling Co. Ltd. |
15,200 |
123,985 |
|
|
SKY Perfect Communications, Inc. (a) |
65 |
119,742 |
|
|
Softbank Corp. |
2,000 |
120,062 |
|
|
Sony Corp. sponsored ADR |
12,000 |
996,000 |
|
|
Stanley Electric Co. Ltd. |
8,000 |
82,852 |
|
|
Sumitomo Electric Industries Ltd. |
43,000 |
794,107 |
|
|
Common Stocks - continued |
|||
|
Shares |
Value (Note 1) |
||
|
Japan - continued |
|||
|
Sumitomo Realty & Development Co. Ltd. |
5,000 |
$ 28,687 |
|
|
Suzuken Co. Ltd. |
4,500 |
159,610 |
|
|
Takeda Chemical Industries Ltd. |
21,000 |
1,383,833 |
|
|
TDK Corp. |
4,000 |
403,263 |
|
|
Teikoku Hormone Manufacturing Co. Ltd. |
7,000 |
44,011 |
|
|
Tokyo Gas Co. Ltd. |
40,000 |
104,482 |
|
|
Tokyo Seimitsu Co. Ltd. |
4,100 |
289,341 |
|
|
Toshiba Corp. |
49,000 |
350,289 |
|
|
Toyo Corp. |
4,000 |
107,781 |
|
|
Toyoda Automatic Loom Works Ltd. |
37,000 |
669,737 |
|
|
Toyoda Machine Works Ltd. |
9,000 |
65,494 |
|
|
Toyota Motor Corp. |
40,200 |
1,606,379 |
|
|
West Japan Railway Co. |
20 |
82,119 |
|
|
Yokogawa Electric Corp. |
12,000 |
94,144 |
|
|
TOTAL JAPAN |
40,195,887 |
||
|
Korea (South) - 0.3% |
|||
|
Samsung Electronics Co. Ltd. |
6,900 |
864,396 |
|
|
Luxembourg - 0.3% |
|||
|
Espirito Santo Financial Holding SA ADR |
21,000 |
396,375 |
|
|
Metro International SA Swedish Depository Receipt (A Shares) |
4,000 |
41,212 |
|
|
Quilmes Industrial SA sponsored ADR |
11,000 |
90,750 |
|
|
RTL Group |
1,900 |
164,497 |
|
|
TOTAL LUXEMBOURG |
692,834 |
||
|
Mexico - 0.8% |
|||
|
Coca-Cola Femsa SA de CV ADR |
4,500 |
86,344 |
|
|
Elamex SA de CV (a) |
22,600 |
67,094 |
|
|
Grupo Radio Centro SA de CV sponsored ADR |
15,000 |
143,438 |
|
|
Telefonos de Mexico SA de CV Series L sponsored ADR |
16,800 |
906,150 |
|
|
Transport Maritima Mexicana SA de CV: |
|
|
|
|
sponsored ADR (a) |
40,000 |
337,500 |
|
|
Series L sponsored ADR (a) |
24,500 |
238,875 |
|
|
Wal-Mart de Mexico SA de CV Series C (a) |
130,000 |
294,142 |
|
|
TOTAL MEXICO |
2,073,543 |
||
|
Netherlands - 6.6% |
|||
|
ABN AMRO Holding NV |
78,200 |
1,812,069 |
|
|
Akzo Nobel NV |
25,200 |
1,147,561 |
|
|
ASM Lithography Holding NV (a) |
1,000 |
27,813 |
|
|
Buhrmann NV |
13,700 |
374,440 |
|
|
De Telegraaf Holding NV (Certificaten Van Aandelen) |
28,100 |
558,120 |
|
|
Common Stocks - continued |
|||
|
Shares |
Value (Note 1) |
||
|
Netherlands - continued |
|||
|
Draka Holding NV |
4,000 |
$ 234,099 |
|
|
Elsevier NV |
45,000 |
574,850 |
|
|
Fugro NV |
6,600 |
389,064 |
|
|
Heineken Holding NV (A Shares) |
32,000 |
1,140,787 |
|
|
Hollandsche Beton Groep NV |
4,000 |
34,801 |
|
|
Hunter Douglas NV |
29,700 |
852,076 |
|
|
IHC Caland NV |
9,416 |
415,600 |
|
|
ING Groep NV (Certificaten Van Aandelen) |
43,735 |
3,003,934 |
|
|
Jomed NV (a) |
22,416 |
1,371,772 |
|
|
KLM Royal Dutch Airlines NV (a) |
4,900 |
89,421 |
|
|
Koninklijke Ahold NV |
13,975 |
406,036 |
|
|
Koninklijke Boskalis Westminster NV |
13,000 |
308,963 |
|
|
Koninklijke Philips Electronics NV |
44,555 |
1,751,365 |
|
|
Koninklijke Wessanen NV |
8,000 |
93,368 |
|
|
KPNQwest NV |
2,600 |
64,025 |
|
|
New Skies Satellites NV (a) |
33,000 |
296,910 |
|
|
Numico NV |
6,000 |
280,613 |
|
|
Petroplus International NV |
22,400 |
298,506 |
|
|
Rodamco Asia NV |
7,238 |
86,318 |
|
|
Rodamco North America NV |
8,210 |
299,652 |
|
|
Smit International NV (Certificaten Van Aandelen) |
2,000 |
38,366 |
|
|
STMicroelectronics NV (NY Shares) |
11,800 |
612,863 |
|
|
Unilever NV (NY Shares) |
8,200 |
416,663 |
|
|
United Pan-Europe Communications NV sponsored ADR (a) |
10,000 |
182,500 |
|
|
Van der Moolen Holding NV |
2,000 |
161,696 |
|
|
Van Melle NV (Certificaten Van Aandelen) (a) |
7,148 |
174,433 |
|
|
Vendex KBB NV |
20,600 |
258,432 |
|
|
Vopak NV |
3,000 |
57,294 |
|
|
TOTAL NETHERLANDS |
17,814,410 |
||
|
New Zealand - 0.4% |
|||
|
Brierley Investments Ltd. |
335,000 |
45,395 |
|
|
Contact Energy Ltd. |
221,500 |
245,415 |
|
|
Fletcher Challenge Ltd.: |
|
|
|
|
Building Division |
240,400 |
172,461 |
|
|
Forestry Division |
1,101,600 |
162,446 |
|
|
Frucor Beverages Group Ltd. (a) |
140,000 |
109,920 |
|
|
Sky City Ltd. |
84,121 |
246,084 |
|
|
TOTAL NEW ZEALAND |
981,721 |
||
|
Norway - 2.1% |
|||
|
Bergesen dy ASA (A Shares) |
27,500 |
547,514 |
|
|
Common Stocks - continued |
|||
|
Shares |
Value (Note 1) |
||
|
Norway - continued |
|||
|
DNB Holding ASA |
226,200 |
$ 981,044 |
|
|
Eltek ASA |
4,200 |
157,749 |
|
|
Frontline Ltd. (a) |
45,800 |
754,133 |
|
|
Norsk Hydro AS (a) |
30,500 |
1,211,203 |
|
|
Opticom ASA (a) |
1,000 |
169,824 |
|
|
Orkla-Borregaard AS |
9,000 |
162,236 |
|
|
PhotoCure ASA (a) |
3,900 |
49,107 |
|
|
ProSafe ASA (a) |
24,200 |
385,450 |
|
|
Schibsted AS (B Shares) |
19,800 |
300,452 |
|
|
Smedvig ASA (A Shares) |
20,000 |
187,258 |
|
|
Sparebanken NOR (primary shares certificates) |
13,700 |
346,481 |
|
|
TANDBERG ASA (a) |
7,000 |
185,321 |
|
|
TANDBERG Television ASA (a) |
12,000 |
121,395 |
|
|
TOTAL NORWAY |
5,559,167 |
||
|
Panama - 0.3% |
|||
|
Banco Latin Americano de Exporaciones SA (BLADEX) Series E |
36,600 |
917,288 |
|
|
Papua New Guinea - 0.0% |
|||
|
Oil Search Ltd. (a) |
60,000 |
48,374 |
|
|
Poland - 0.1% |
|||
|
Agora SA unit (a) |
10,000 |
182,500 |
|
|
Portugal - 0.1% |
|||
|
Electricidade de Portugal SA |
55,000 |
149,389 |
|
|
Portugal Telecom SA |
25,800 |
229,940 |
|
|
Telecel Comunicacoes Pessoais SA (a) |
1,500 |
16,450 |
|
|
TOTAL PORTUGAL |
395,779 |
||
|
Singapore - 0.3% |
|||
|
Chartered Semiconductor Manufacturing Ltd. ADR |
2,500 |
116,250 |
|
|
Flextronics International Ltd. (a) |
12,400 |
471,200 |
|
|
Singapore Airlines Ltd. |
8,000 |
80,251 |
|
|
TOTAL SINGAPORE |
667,701 |
||
|
South Africa - 0.6% |
|||
|
Anglo American Platinum Corp. Ltd. |
22,900 |
893,585 |
|
|
Gold Fields Ltd. |
37,000 |
110,119 |
|
|
Impala Platinum Holdings Ltd. |
11,900 |
510,000 |
|
|
Sasol Ltd. |
8,000 |
61,270 |
|
|
TOTAL SOUTH AFRICA |
1,574,974 |
||
|
Spain - 2.3% |
|||
|
Altadis SA |
34,000 |
509,365 |
|
|
Common Stocks - continued |
|||
|
Shares |
Value (Note 1) |
||
|
Spain - continued |
|||
|
Banco Santander Central Hispano SA ADR |
156,200 |
$ 1,591,288 |
|
|
Endesa SA |
14,800 |
241,195 |
|
|
Grupo Auxiliar Metalurgico SA (Gamesa) (a) |
5,600 |
103,289 |
|
|
Prosegur Comp Securidad SA |
21,000 |
206,768 |
|
|
Repsol YPF SA sponsored ADR |
52,300 |
833,531 |
|
|
Telefonica SA sponsored ADR |
43,800 |
2,537,663 |
|
|
Union Electrica Fenosa SA |
15,000 |
277,430 |
|
|
TOTAL SPAIN |
6,300,529 |
||
|
Sweden - 3.3% |
|||
|
Artimplant AB (B Shares) (a) |
17,100 |
225,788 |
|
|
AssiDoman AB |
22,000 |
373,012 |
|
|
AssiDoman AB rights 11/16/00 (a) |
15,000 |
4,726 |
|
|
Atle AB |
17,900 |
247,094 |
|
|
AU-System AB (a)(d) |
39,900 |
257,432 |
|
|
Biacore International AB (a) |
3,800 |
161,168 |
|
|
Bure Equity AB |
47,000 |
286,786 |
|
|
Capio AB (a) |
23,500 |
148,094 |
|
|
Enea Data AB |
36,000 |
174,652 |
|
|
Gambro AB (A Shares) |
12,000 |
94,228 |
|
|
HIQ International AB |
24,000 |
194,458 |
|
|
Investor AB (B Shares) |
104,000 |
1,373,212 |
|
|
Kinnevik Investment AB (B Shares) (a) |
15,300 |
332,110 |
|
|
Kungsleden AB |
6,000 |
52,516 |
|
|
LGP Telecom Holding AB |
12,000 |
300,090 |
|
|
Micronic Laser Systems AB (a) |
2,000 |
59,618 |
|
|
Nobel Biocare AB |
6,800 |
153,046 |
|
|
Nordic Baltic Holding AB |
27,180 |
203,911 |
|
|
Partnertech AB |
5,100 |
77,543 |
|
|
Scandic Hotels AB |
10,000 |
102,031 |
|
|
Skandinaviska Enskilda Banken (A Shares) |
24,000 |
283,285 |
|
|
Svenska Cellulosa AB (SCA) (B Shares) |
45,800 |
939,182 |
|
|
Svenska Handelsbanken AB (A Shares) |
68,638 |
1,077,940 |
|
|
SwitchCore AB (a) |
4,000 |
19,806 |
|
|
Tele1 Europe Holding AB (a) |
16,000 |
123,237 |
|
|
Telefonaktiebolaget LM Ericsson sponsored ADR |
107,400 |
1,490,175 |
|
|
TV 4 AB (A Shares) |
5,300 |
161,168 |
|
|
TOTAL SWEDEN |
8,916,308 |
||
|
Switzerland - 8.4% |
|||
|
ABB Ltd. (Reg.) |
4,864 |
432,280 |
|
|
Adecco SA |
570 |
394,164 |
|
|
Common Stocks - continued |
|||
|
Shares |
Value (Note 1) |
||
|
Switzerland - continued |
|||
|
Baloise Holdings AG |
653 |
$ 646,279 |
|
|
Bank for International Settlements (BIS) |
39 |
340,640 |
|
|
Credit Suisse Group (Reg.) |
7,311 |
1,370,685 |
|
|
Disetronic Holding AG |
439 |
381,240 |
|
|
Edipresse SA (Bearer) |
1,700 |
685,675 |
|
|
Gretag Imaging Holding AG (Reg. D) |
1,796 |
322,730 |
|
|
Holderbank Financiere Glarus AG (Bearer) |
332 |
348,900 |
|
|
Julius Baer Holding AG |
92 |
455,522 |
|
|
Leica Geosystems AG |
700 |
198,609 |
|
|
Mikron Holding AG |
438 |
246,108 |
|
|
Nestle SA (Reg.) |
1,697 |
3,516,732 |
|
|
Novartis AG (Reg.) |
1,200 |
1,820,529 |
|
|
PubliGroupe SA (Reg.) |
1,320 |
774,743 |
|
|
Richemont Compagnie Financier Class A unit |
795 |
2,211,405 |
|
|
Roche Holding AG participation certificates |
87 |
794,737 |
|
|
Schindler Holding AG |
137 |
208,149 |
|
|
Serono SA sponsored ADR (a) |
5,500 |
124,438 |
|
|
Societe Generale de Surveillance Holding SA (SGS) (Bearer) |
196 |
239,889 |
|
|
Sulzer Medica AG (Reg.) |
4,205 |
1,064,409 |
|
|
Swiss Life |
500 |
388,873 |
|
|
Swiss Reinsurance Co. (Reg.) |
229 |
451,630 |
|
|
Tamedia AG (a) |
660 |
82,064 |
|
|
The Swatch Group AG (Reg.) |
6,513 |
1,771,826 |
|
|
UBS AG |
12,034 |
1,667,019 |
|
|
Zurich Financial Services Group AG |
3,547 |
1,716,768 |
|
|
TOTAL SWITZERLAND |
22,656,043 |
||
|
Taiwan - 0.1% |
|||
|
D-Link Corp. |
34,500 |
45,715 |
|
|
Taiwan Semiconductor Manufacturing Co. Ltd. (a) |
65,400 |
198,427 |
|
|
TOTAL TAIWAN |
244,142 |
||
|
United Kingdom - 12.2% |
|||
|
Aggreko PLC |
23,800 |
125,935 |
|
|
Allied Domecq PLC |
205,900 |
1,063,382 |
|
|
Antofagasta Holdings PLC |
43,200 |
255,957 |
|
|
ARM Holdings PLC sponsored ADR (a) |
5,000 |
150,000 |
|
|
AstraZeneca Group PLC sponsored ADR |
11,400 |
543,638 |
|
|
Avis Europe PLC |
30,000 |
78,284 |
|
|
BAA PLC |
12,000 |
99,681 |
|
|
Baltimore Technologies PLC sponsored ADR (a) |
4,000 |
64,000 |
|
|
Barclays PLC |
19,300 |
551,750 |
|
|
Common Stocks - continued |
|||
|
Shares |
Value (Note 1) |
||
|
United Kingdom - continued |
|||
|
Bass PLC |
51,800 |
$ 506,512 |
|
|
Billiton PLC |
93,000 |
354,582 |
|
|
BP Amoco PLC sponsored ADR |
47,200 |
2,404,250 |
|
|
British Energy PLC |
160,200 |
418,035 |
|
|
Cable & Wireless PLC |
12,000 |
169,615 |
|
|
Cambridge Antibody Technology Group PLC (a) |
6,000 |
374,023 |
|
|
Carlton Communications PLC |
33,900 |
272,754 |
|
|
Centrica PLC |
82,400 |
283,109 |
|
|
Chloride Group PLC |
30,000 |
89,157 |
|
|
Close Brothers Group PLC |
4,000 |
66,976 |
|
|
Diageo PLC |
116,300 |
1,096,744 |
|
|
Diageo PLC sponsored ADR |
17,700 |
665,963 |
|
|
Electronics Boutique PLC |
45,000 |
40,447 |
|
|
Glaxo Wellcome PLC sponsored ADR |
31,500 |
1,832,906 |
|
|
Guardian IT PLC |
21,000 |
281,604 |
|
|
Guinness Peat Group PLC |
160,000 |
98,203 |
|
|
Hanson PLC |
41,900 |
219,975 |
|
|
House of Fraser PLC |
40,000 |
26,095 |
|
|
HSBC Holdings PLC: |
|
|
|
|
(France) |
26,200 |
374,275 |
|
|
(United Kingdom) (Reg.) |
104,294 |
1,503,920 |
|
|
Intec Telecom Systems PLC (a) |
20,000 |
200,928 |
|
|
Johnson Matthey PLC |
41,600 |
648,306 |
|
|
Lloyds TSB Group PLC |
91,500 |
931,186 |
|
|
Logica PLC |
6,000 |
177,356 |
|
|
Logica PLC New |
600 |
17,222 |
|
|
Lonmin PLC |
15,000 |
184,837 |
|
|
Nycomed Amersham PLC |
31,200 |
279,073 |
|
|
Oxford Glycosciences PLC (a) |
3,000 |
109,597 |
|
|
Professional Staff PLC sponsored ADR (a) |
30,400 |
163,400 |
|
|
Provident Financial Group PLC |
24,700 |
314,749 |
|
|
Reckitt Benckiser PLC |
34,000 |
446,566 |
|
|
Rentokil Initial PLC |
220,000 |
507,105 |
|
|
Rexam PLC |
65,700 |
221,922 |
|
|
Ricardo PLC |
10,000 |
72,485 |
|
|
Rio Tinto PLC (Reg. D) |
43,500 |
703,141 |
|
|
Royal Bank of Scotland Group PLC |
43,900 |
984,539 |
|
|
Safeway PLC |
160,200 |
665,373 |
|
|
Shell Transport & Trading Co. PLC (Reg.) |
519,200 |
4,256,362 |
|
|
Smith & Nephew PLC |
38,800 |
159,183 |
|
|
SmithKline Beecham PLC sponsored ADR |
21,600 |
1,408,050 |
|
|
South African Breweries PLC |
41,900 |
251,067 |
|
|
Common Stocks - continued |
|||
|
Shares |
Value (Note 1) |
||
|
United Kingdom - continued |
|||
|
Spirent PLC |
8,000 |
$ 74,109 |
|
|
SSL International PLC |
50,000 |
581,692 |
|
|
Tesco PLC |
129,000 |
491,372 |
|
|
United News & Media PLC |
34,600 |
432,627 |
|
|
United Utilities PLC |
26,300 |
264,221 |
|
|
Vodafone Group PLC |
431,085 |
1,834,804 |
|
|
Vodafone Group PLC sponsored ADR |
52,500 |
2,234,531 |
|
|
Zen Research PLC (a)(d) |
23,200 |
68,275 |
|
|
TOTAL UNITED KINGDOM |
32,695,850 |
||
|
United States of America - 0.8% |
|||
|
Entravision Communications Corp. Class A |
1,000 |
17,688 |
|
|
Hollinger International, Inc. Class A |
36,500 |
563,469 |
|
|
Impsat Fiber Networks, Inc. |
5,000 |
60,000 |
|
|
JDS Uniphase Corp. (a) |
1,000 |
81,438 |
|
|
Medicines Co. |
600 |
18,075 |
|
|
OMI Corp. (a) |
35,800 |
248,363 |
|
|
Orthofix International NV (a) |
28,700 |
602,700 |
|
|
Pharmacia Corp. |
5,239 |
288,145 |
|
|
UnitedGlobalCom, Inc. Class A (a) |
9,000 |
286,313 |
|
|
TOTAL UNITED STATES OF AMERICA |
2,166,191 |
||
|
TOTAL COMMON STOCKS (Cost $236,276,950) |
240,387,506 |
||
|
Preferred Stocks - 0.6% |
|||
|
|
|
|
|
|
Convertible Preferred Stocks - 0.1% |
|||
|
Canada - 0.1% |
|||
|
ITF Optical Technologies, Inc. (f) |
857 |
89,985 |
|
|
Metrophotonics, Inc. Series 2 (f) |
8,500 |
85,000 |
|
|
TOTAL CANADA |
174,985 |
||
|
Nonconvertible Preferred Stocks - 0.5% |
|||
|
Germany - 0.5% |
|||
|
Marschollek Lautenschlaeger und Partner AG |
4,400 |
595,688 |
|
|
Preferred Stocks - continued |
|||
|
Shares |
Value (Note 1) |
||
|
Nonconvertible Preferred Stocks - continued |
|||
|
Germany - continued |
|||
|
ProSieben Sat.1 Media AG (a) |
25,600 |
$ 806,156 |
|
|
Rhoen Klinikum AG |
1,000 |
55,512 |
|
|
TOTAL GERMANY |
1,457,356 |
||
|
TOTAL PREFERRED STOCKS (Cost $1,367,215) |
1,632,341 |
||
|
Investment Companies - 2.3% |
|||
|
|
|
|
|
|
Argentina - 0.0% |
|||
|
Argentina Fund, Inc. |
11,000 |
114,813 |
|
|
Brazil - 0.1% |
|||
|
Brazil Fund, Inc. |
16,500 |
264,000 |
|
|
Canada - 0.1% |
|||
|
Economic Investment Trust Ltd. |
2,582 |
159,838 |
|
|
United Corporations Ltd. |
4,005 |
113,771 |
|
|
TOTAL CANADA |
273,609 |
||
|
Chile - 0.1% |
|||
|
Chile Fund, Inc. |
15,000 |
130,313 |
|
|
Five Arrows Chile Investment Trust Ltd. |
45,500 |
70,525 |
|
|
TOTAL CHILE |
200,838 |
||
|
China - 0.1% |
|||
|
China Fund, Inc. |
10,000 |
89,375 |
|
|
Jardine Fleming China Region Fund, Inc. |
8,500 |
63,750 |
|
|
Templeton China World Fund, Inc. |
2,000 |
14,250 |
|
|
TOTAL CHINA |
167,375 |
||
|
Emerging Markets - 0.3% |
|||
|
Asia Tigers Fund, Inc. |
23,000 |
162,438 |
|
|
Central European Equity Fund, Inc. |
8,100 |
96,188 |
|
|
Emerging Markets Infrastructure Fund, Inc. |
4,825 |
43,123 |
|
|
Emerging Markets Telecommunication Fund, Inc. |
8,000 |
71,000 |
|
|
Southern Africa Fund, Inc. |
1,399 |
17,050 |
|
|
Templeton Dragon Fund, Inc. |
47,800 |
361,488 |
|
|
TOTAL EMERGING MARKETS |
751,287 |
||
|
France - 0.1% |
|||
|
France Growth Fund, Inc. |
13,300 |
148,794 |
|
|
Investment Companies - continued |
|||
|
Shares |
Value (Note 1) |
||
|
Hong Kong - 0.1% |
|||
|
Asia Pacific Fund, Inc. |
21,900 |
$ 177,938 |
|
|
Greater China Fund, Inc. |
15,500 |
127,875 |
|
|
TOTAL HONG KONG |
305,813 |
||
|
India - 0.2% |
|||
|
India Fund |
34,200 |
365,513 |
|
|
India Growth Fund (a) |
12,900 |
131,419 |
|
|
Jardine Fleming India Fund, Inc. (a) |
6,865 |
62,214 |
|
|
Morgan Stanley Dean Witter India Investment Fund, Inc. |
9,000 |
95,063 |
|
|
TOTAL INDIA |
654,209 |
||
|
Italy - 0.0% |
|||
|
Italy Fund, Inc. (The) |
6,604 |
112,268 |
|
|
Korea (South) - 0.2% |
|||
|
Korea Fund, Inc. (The) |
34,700 |
382,047 |
|
|
Korean Investment Fund, Inc. |
1,500 |
6,938 |
|
|
TOTAL KOREA (SOUTH) |
388,985 |
||
|
Mexico - 0.3% |
|||
|
Mexico Fund, Inc. (The) |
50,300 |
795,369 |
|
|
Multi-National - 0.6% |
|||
|
Blackrock North American Government Income Trust, Inc. |
11,000 |
107,250 |
|
|
Latin America Equity Fund, Inc. |
11,400 |
131,813 |
|
|
Latin American Discovery Fund, Inc. |
10,000 |
100,000 |
|
|
Latin American Investment Fund, Inc. |
8,000 |
103,000 |
|
|
MFS Government Markets Income Trust |
44,300 |
274,106 |
|
|
Morgan Stanley Dean Witter Africa Investment Fund, Inc. |
2,109 |
16,081 |
|
|
Morgan Stanley Dean Witter Asia-Pacific Fund, Inc. |
41,200 |
365,650 |
|
|
RCM Strategic Global Government Fund, Inc. |
4,000 |
38,750 |
|
|
Strategic Global Income Fund, Inc. |
23,000 |
235,750 |
|
|
Templeton Global Income Fund, Inc. |
24,700 |
148,200 |
|
|
TOTAL MULTI-NATIONAL |
1,520,600 |
||
|
Portugal - 0.0% |
|||
|
Portugal Fund, Inc. |
6,100 |
60,619 |
|
|
Singapore - 0.0% |
|||
|
Singapore Fund, Inc. |
15,000 |
95,625 |
|
|
Switzerland - 0.1% |
|||
|
Swiss Helvetia Fund, Inc. |
17,500 |
249,375 |
|
|
Investment Companies - continued |
|||
|
Shares |
Value (Note 1) |
||
|
Taiwan - 0.0% |
|||
|
R.O.C. Taiwan Fund (SBI) |
4,000 |
$ 23,500 |
|
|
TOTAL INVESTMENT COMPANIES (Cost $6,943,750) |
6,127,079 |
||
|
Corporate Bonds - 0.2% |
|||||
|
Moody's Ratings (unaudited) |
Principal Amount (c) |
|
|||
|
Convertible Bonds - 0.1% |
|||||
|
Israel - 0.1% |
|||||
|
Tecnomatix Tech Ltd. 5.25% 8/15/04 |
- |
|
$ 129,000 |
74,498 |
|
|
United Kingdom - 0.0% |
|||||
|
Royal Bank of Scotland Group PLC euro 0% 12/1/03 (Reg. S) (e) |
- |
GBP |
40,900 |
48,324 |
|
|
TOTAL CONVERTIBLE BONDS |
122,822 |
||||
|
Nonconvertible Bonds - 0.1% |
|||||
|
France - 0.1% |
|||||
|
Eurotunnel Finance Ltd. euro 0% 4/30/40 (e) |
- |
EUR |
240 |
264,826 |
|
|
TOTAL CORPORATE BONDS (Cost $461,607) |
387,648 |
||||
|
Cash Equivalents - 6.9% |
|||
|
Shares |
|
||
|
Fidelity Cash Central Fund, 6.61% (b) |
18,475,534 |
18,475,534 |
|
|
TOTAL INVESTMENT PORTFOLIO - 99.5% (Cost $263,525,056) |
267,010,108 |
||
|
NET OTHER ASSETS - 0.5% |
1,475,000 |
||
|
NET ASSETS - 100% |
$ 268,485,108 |
||
|
Currency Abbreviations |
||
|
EUR |
- |
European Monetary Unit |
|
GBP |
- |
British pound |
|
Legend |
|
(a) Non-income producing |
|
(b) The rate quoted is the annualized seven-day yield of the fund at period end. A complete listing of the fund's holdings as of its most recent fiscal year end is available upon request. |
|
(c) Principal amount is stated in United States dollars unless otherwise noted. |
|
(d) Security exempt from registration under Rule 144A of the Securities Act of 1933. These securities may be resold in transactions exempt from registration, normally to qualified institutional buyers. At the period end, the value of these securities amounted to $603,553 or 0.2% of net assets. |
|
(e) The coupon rate shown on floating or adjustable rate securities represents the rate at period end. |
|
(f) Restricted securities - Investment in securities not registered under the Securities Act of 1933. |
|
Additional information on each holding |
|
Security |
Acquisition Date |
Acquisition Cost |
|
ITF Optical |
10/11/00 |
$ 89,985 |
|
Metrophotonics, |
9/29/00 |
$ 85,000 |
|
OZ Optics |
8/18/00 |
$ 79,704 |
|
Income Tax Information |
|
At October 31, 2000, the aggregate |
|
At October 31, 2000, the fund had a capital loss carryforward of approximately $6,955,000 all of which will expire on October 31, 2008. |
See accompanying notes which are an integral part of the financial statements.
Annual Report
Statement of Assets and Liabilities
|
|
October 31, 2000 |
|
|
Assets |
|
|
|
Investment in securities, at value (cost $263,525,056) - See accompanying schedule |
|
$ 267,010,108 |
|
Cash |
|
75,957 |
|
Foreign currency held at value (cost $4,466) |
|
4,454 |
|
Receivable for investments sold |
|
3,633,713 |
|
Receivable for fund shares sold |
|
1,293,144 |
|
Dividends receivable |
|
442,958 |
|
Interest receivable |
|
134,603 |
|
Other receivables |
|
384 |
|
Total assets |
|
272,595,321 |
|
Liabilities |
|
|
|
Payable for investments purchased |
$ 3,504,480 |
|
|
Payable for fund shares redeemed |
146,570 |
|
|
Accrued management fee |
159,771 |
|
|
Distribution fees payable |
129,404 |
|
|
Other payables and accrued expenses |
169,988 |
|
|
Total liabilities |
|
4,110,213 |
|
Net Assets |
|
$ 268,485,108 |
|
Net Assets consist of: |
|
|
|
Paid in capital |
|
$ 269,199,943 |
|
Undistributed net investment income |
|
3,949,570 |
|
Accumulated undistributed net realized gain (loss) on investments and foreign currency transactions |
|
(8,137,549) |
|
Net unrealized appreciation (depreciation) on investments and assets and liabilities in foreign currencies |
|
3,473,144 |
|
Net Assets |
|
$ 268,485,108 |
See accompanying notes which are an integral part of the financial statements.
Annual Report
Financial Statements - continued
Statement of Assets and Liabilities - continued
|
|
October 31, 2000 |
|
|
Calculation of Maximum Offering Price |
|
$14.54 |
|
Maximum offering price per share (100/94.25 of $14.54) |
|
$15.43 |
|
Class T: |
|
$14.46 |
|
Maximum offering price per share (100/96.50 of $14.46) |
|
$14.98 |
|
Class B: |
|
$14.33 |
|
Class C: |
|
$14.34 |
|
Institutional Class: |
|
$14.60 |
A Redemption price per share is equal to net asset value less any applicable contingent deferred sales charge.
See accompanying notes which are an integral part of the financial statements.
Annual Report
Financial Statements - continued
Statement of Operations
|
|
Year ended October 31, 2000 |
|
|
Investment Income Dividends |
|
$ 3,112,699 |
|
Special dividend from BCE, Inc. |
|
1,661,331 |
|
Interest |
|
1,119,208 |
|
Security lending |
|
40,082 |
|
|
|
5,933,320 |
|
Less foreign taxes withheld |
|
(366,838) |
|
Total income |
|
5,566,482 |
|
Expenses |
|
|
|
Management fee |
$ 1,367,430 |
|
|
Transfer agent fees |
501,516 |
|
|
Distribution fees |
1,121,901 |
|
|
Accounting and security lending fees |
120,095 |
|
|
Non-interested trustees' compensation |
554 |
|
|
Custodian fees and expenses |
330,543 |
|
|
Registration fees |
140,727 |
|
|
Audit |
25,010 |
|
|
Legal |
1,273 |
|
|
Miscellaneous |
3,596 |
|
|
Total expenses before reductions |
3,612,645 |
|
|
Expense reductions |
(41,499) |
3,571,146 |
|
Net investment income |
|
1,995,336 |
|
Realized and Unrealized Gain (Loss) Net realized gain (loss) on: |
|
|
|
Investment securities |
(5,861,806) |
|
|
Foreign currency transactions |
(54,688) |
(5,916,494) |
|
Change in net unrealized appreciation (depreciation) on: |
|
|
|
Investment securities |
(1,517,286) |
|
|
Assets and liabilities in foreign currencies |
(12,026) |
(1,529,312) |
|
Net gain (loss) |
|
(7,445,806) |
|
Net increase (decrease) in net assets resulting |
|
$ (5,450,470) |
See accompanying notes which are an integral part of the financial statements.
Annual Report
Financial Statements - continued
Statement of Changes in Net Assets
|
|
Year ended
October 31, |
December 17, 1998
(commencment |
|
Increase (Decrease) in Net Assets |
|
|
|
Operations |
$ 1,995,336 |
$ (59,944) |
|
Net realized gain (loss) |
(5,916,494) |
1,099,878 |
|
Change in net unrealized appreciation (depreciation) |
(1,529,312) |
5,002,456 |
|
Net increase (decrease) in net assets resulting |
(5,450,470) |
6,042,390 |
|
Distributions to shareholders |
(146,319) |
- |
|
From net realized gain |
(959,661) |
- |
|
In excess of net realized gain |
(100,992) |
- |
|
Total distributions |
(1,206,972) |
- |
|
Share transactions - net increase (decrease) |
216,006,366 |
53,093,794 |
|
Total increase (decrease) in net assets |
209,348,924 |
59,136,184 |
|
Net Assets |
|
|
|
Beginning of period |
59,136,184 |
- |
|
End of period (including under (over) distribution |
$ 268,485,108 |
$ 59,136,184 |
See accompanying notes which are an integral part of the financial statements.
Annual Report
Financial Highlights - Class A
|
Years ended October 31, |
2000 |
1999 E |
|
Selected Per-Share Data |
|
|
|
Net asset value, beginning of period |
$ 13.05 |
$ 10.00 |
|
Income from Investment Operations |
|
|
|
Net investment income D |
.22 H |
.01 |
|
Net realized and unrealized gain (loss) |
1.49 I |
3.04 |
|
Total from investment operations |
1.71 |
3.05 |
|
Less Distributions |
|
|
|
From net investment income |
(.03) |
- |
|
From net realized gain |
(.17) |
- |
|
In excess of net realized gain |
(.02) |
- |
|
Total distributions |
(.22) |
- |
|
Net asset value, end of period |
$ 14.54 |
$ 13.05 |
|
Total Return B, C |
13.13% |
30.50% |
|
Ratios and Supplemental Data |
|
|
|
Net assets, end of period (000 omitted) |
$ 27,314 |
$ 3,841 |
|
Ratio of expenses to average net assets |
1.52% |
2.00% A, F |
|
Ratio of expenses to average net assets after expense reductions |
1.50% G |
1.97% A, G |
|
Ratio of net investment income to average net assets |
1.44% |
.05% A |
|
Portfolio turnover |
87% |
78% A |
A Annualized
B The total returns would have been lower had certain expenses not been reduced during the periods shown.
C Total returns do not include the one time sales charge and for periods of less than one year are not annualized.
D Net investment income per share has been calculated based on average shares outstanding during the period.
E For the period December 17, 1998 (commencement of operations) to October 31, 1999.
F FMR agreed to reimburse a portion of the class' expenses during the period. Without this reimbursement, the class' expense ratio would have been higher.
G FMR or the fund has entered into varying arrangements with third parties who either paid or reduced a portion of the class' expenses.
H Investment income per share reflects a special dividend from BCE, Inc. which amounted to $.13 per share.
I The amount shown for a share outstanding does not correspond with the aggregate net gain (loss) on investments for the period due to the timing of sales and repurchases of class shares in relation to fluctuating market values of the investments of the fund.
See accompanying notes which are an integral part of the financial statements.
Annual Report
Financial Highlights - Class T
|
Years ended October 31, |
2000 |
1999 E |
|
Selected Per-Share Data |
|
|
|
Net asset value, beginning of period |
$ 13.02 |
$ 10.00 |
|
Income from Investment Operations |
|
|
|
Net investment income (loss) D |
.17 H |
(.02) |
|
Net realized and unrealized gain (loss) |
1.49 I |
3.04 |
|
Total from investment operations |
1.66 |
3.02 |
|
Less Distributions |
|
|
|
From net investment income |
(.03) |
- |
|
From net realized gain |
(.17) |
- |
|
In excess of net realized gain |
(.02) |
- |
|
Total distributions |
(.22) |
- |
|
Net asset value, end of period |
$ 14.46 |
$ 13.02 |
|
Total Return B, C |
12.78% |
30.20% |
|
Ratios and Supplemental Data |
|
|
|
Net assets, end of period (000 omitted) |
$ 139,347 |
$ 32,132 |
|
Ratio of expenses to average net assets |
1.82% |
2.25% A, F |
|
Ratio of expenses to average net assets after expense reductions |
1.80% G |
2.22% A, G |
|
Ratio of net investment income (loss) to average net assets |
1.15% |
(.20)% A |
|
Portfolio turnover |
87% |
78% A |
A Annualized
B The total returns would have been lower had certain expenses not been reduced during the periods shown.
C Total returns do not include the one time sales charge and for periods of less than one year are not annualized.
D Net investment income (loss) per share has been calculated based on average shares outstanding during the period.
E For the period December 17, 1998 (commencement of operations) to October 31, 1999.
F FMR agreed to reimburse a portion of the class' expenses during the period. Without this reimbursement, the class' expense ratio would have been higher.
G FMR or the fund has entered into varying arrangements with third parties who either paid or reduced a portion of the class' expenses.
H Investment income per share reflects a special dividend from BCE, Inc. which amounted to $.13 per share.
I The amount shown for a share outstanding does not correspond with the aggregate net gain (loss) on investments for the period due to the timing of sales and repurchases of class shares in relation to fluctuating market values of the investments of the fund.
See accompanying notes which are an integral part of the financial statements.
Annual Report
Financial Highlights - Class B
|
Years ended October 31, |
2000 |
1999 E |
|
Selected Per-Share Data |
|
|
|
Net asset value, beginning of period |
$ 12.96 |
$ 10.00 |
|
Income from Investment Operations |
|
|
|
Net investment income (loss) D |
.09 H |
(.07) |
|
Net realized and unrealized gain (loss) |
1.49 I |
3.03 |
|
Total from investment operations |
1.58 |
2.96 |
|
Less Distributions |
|
|
|
From net investment income |
(.02) |
- |
|
From net realized gain |
(.17) |
- |
|
In excess of net realized gain |
(.02) |
- |
|
Total distributions |
(.21) |
- |
|
Net asset value, end of period |
$ 14.33 |
$ 12.96 |
|
Total Return B, C |
12.21% |
29.60% |
|
Ratios and Supplemental Data |
|
|
|
Net assets, end of period (000 omitted) |
$ 43,758 |
$ 10,839 |
|
Ratio of expenses to average net assets |
2.36% |
2.75% A, F |
|
Ratio of expenses to average net assets after expense reductions |
2.34% G |
2.72% A, G |
|
Ratio of net investment income (loss) to average net assets |
.60% |
(.70)% A |
|
Portfolio turnover |
87% |
78% A |
A Annualized
B The total returns would have been lower had certain expenses not been reduced during the periods shown.
C Total returns do not include the contingent deferred sales charge and for periods of less than one year are not annualized.
D Net investment income (loss) per share has been calculated based on average shares outstanding during the period.
E For the period December 17, 1998 (commencement of operations) to October 31, 1999.
F FMR agreed to reimburse a portion of the class' expenses during the period. Without this reimbursement, the class' expense ratio would have been higher.
G FMR or the fund has entered into varying arrangements with third parties who either paid or reduced a portion of the class' expenses.
H Investment income per share reflects a special dividend from BCE, Inc. which amounted to $.13 per share.
I The amount shown for a share outstanding does not correspond with the aggregate net gain (loss) on investments for the period due to the timing of sales and repurchases of class shares in relation to fluctuating market values of the investments of the fund.
See accompanying notes which are an integral part of the financial statements.
Annual Report
Financial Highlights - Class C
|
Years ended October 31, |
2000 |
1999 E |
|
Selected Per-Share Data |
|
|
|
Net asset value, beginning of period |
$ 12.96 |
$ 10.00 |
|
Income from Investment Operations |
|
|
|
Net investment income (loss) D |
.10 H |
(.07) |
|
Net realized and unrealized gain (loss) |
1.48 I |
3.03 |
|
Total from investment operations |
1.58 |
2.96 |
|
Less Distributions |
|
|
|
From net investment income |
(.01) |
- |
|
From net realized gain |
(.17) |
- |
|
In excess of net realized gain |
(.02) |
- |
|
Total distributions |
(.20) |
- |
|
Net asset value, end of period |
$ 14.34 |
$ 12.96 |
|
Total Return B, C |
12.21% |
29.60% |
|
Ratios and Supplemental Data |
|
|
|
Net assets, end of period (000 omitted) |
$ 37,765 |
$ 8,142 |
|
Ratio of expenses to average net assets |
2.32% |
2.75% A, F |
|
Ratio of expenses to average net assets after expense reductions |
2.30% G |
2.72% A, G |
|
Ratio of net investment income (loss) to average net assets |
.65% |
(.70)% A |
|
Portfolio turnover |
87% |
78% A |
A Annualized
B The total returns would have been lower had certain expenses not been reduced during the periods shown.
C Total returns do not include the contingent deferred sales charge and for periods of less than one year are not annualized.
D Net investment income (loss) per share has been calculated based on average shares outstanding during the period.
E For the period December 17, 1998 (commencement of operations) to October 31, 1999.
F FMR agreed to reimburse a portion of the class' expenses during the period. Without this reimbursement, the class' expense ratio would have been higher.
G FMR or the fund has entered into varying arrangements with third parties who either paid or reduced a portion of the class' expenses.
H Investment income per share reflects a special dividend from BCE, Inc. which amounted to $.13 per share.
I The amount shown for a share outstanding does not correspond with the aggregate net gain (loss) on investments for the period due to the timing of sales and repurchases of class shares in relation to fluctuating market values of the investments of the fund.
See accompanying notes which are an integral part of the financial statements.
Annual Report
Financial Highlights - Institutional Class
|
Years ended October 31, |
2000 |
1999 E |
|
Selected Per-Share Data |
|
|
|
Net asset value, beginning of period |
$ 13.08 |
$ 10.00 |
|
Income from Investment Operations |
|
|
|
Net investment income D |
.26 H |
.03 |
|
Net realized and unrealized gain (loss) |
1.49 I |
3.05 |
|
Total from investment operations |
1.75 |
3.08 |
|
Less Distributions |
|
|
|
From net investment income |
(.04) |
- |
|
From net realized gain |
(.17) |
- |
|
In excess of net realized gain |
(.02) |
- |
|
Total distributions |
(.23) |
- |
|
Net asset value, end of period |
$ 14.60 |
$ 13.08 |
|
Total Return B, C |
13.42% |
30.80% |
|
Ratios and Supplemental Data |
|
|
|
Net assets, end of period (000 omitted) |
$ 20,300 |
$ 4,182 |
|
Ratio of expenses to average net assets |
1.24% |
1.75% A, F |
|
Ratio of expenses to average net assets after expense reductions |
1.22% G |
1.72% A, G |
|
Ratio of net investment income to average net assets |
1.73% |
.30% A |
|
Portfolio turnover |
87% |
78% A |
A Annualized
B The total returns would have been lower had certain expenses not been reduced during the periods shown.
C Total returns for periods of less than one year are not annualized.
D Net investment income per share has been calculated based on average shares outstanding during the period.
E For the period December 17, 1998 (commencement of operations) to October 31, 1999.
F FMR agreed to reimburse a portion of the class' expenses during the period. Without this reimbursement, the class' expense ratio would have been higher.
G FMR or the fund has entered into varying arrangements with third parties who either paid or reduced a portion of the class' expenses.
H Investment income per share reflects a special dividend from BCE, Inc. which amounted to $.13 per share.
I The amount shown for a share outstanding does not correspond with the aggregate net gain (loss) on investments for the period due to the timing of sales and repurchases of class shares in relation to fluctuating market values of the investments of the fund.
See accompanying notes which are an integral part of the financial statements.
Annual Report
For the period ended October 31, 2000
1. Significant Accounting Policies.
Fidelity Advisor Diversified International Fund (the fund) is a fund of Fidelity Advisor Series VIII (the trust) and is authorized to issue an unlimited number of shares. The trust is registered under the Investment Company Act of 1940, as amended (the 1940 Act), as an open-end management investment company organized as a Massachusetts business trust.
The fund offers Class A, Class T, Class B, Class C, and Institutional Class shares, each of which has equal rights as to assets and voting privileges. Each class has exclusive voting rights with respect to matters that affect that class. Class B shares will automatically convert to Class A shares after a holding period of seven years from the initial date of purchase. Investment income, realized and unrealized capital gains and losses, the common expenses of the fund, and certain fund-level expense reductions, if any, are allocated on a pro rata basis to each class based on the relative net assets of each class to the total net assets of the fund. Each class of shares differs in its respective distribution, transfer agent, and certain other class-specific fees, expenses, and expense reductions.
The financial statements have been prepared in conformity with generally accepted accounting principles which require management to make certain estimates and assumptions at the date of the financial statements. The following summarizes the significant accounting policies of the fund:
Security Valuation. Securities for which quotations are readily available are valued using the official closing price or at the last sale price in the principal market in which they are traded. If the last sale price (on the local exchange) is unavailable, the last evaluated quote or closing bid price normally is used. If trading or events occurring in other markets after the close of the principal market in which securities are traded are expected to materially affect the value of those securities, then they are valued at their fair value taking this trading or these events into account. Fair value is determined in good faith under consistently applied procedures under the general supervision of the Board of Trustees. Securities (including restricted securities) for which quotations are not readily available are valued primarily using dealer-supplied valuations or at their fair value. Short-term securities with remaining maturities of sixty days or less for which quotations are not readily available are valued at amortized cost or original cost plus accrued interest, both of which approximate current value. Investments in open-end investment companies are valued at their net asset value each business day.
Foreign Currency Translation. The accounting records of the fund are maintained in U.S. dollars. Investment securities and other assets and liabilities denominated in a foreign currency are translated into U.S. dollars at the prevailing rates of exchange at period end. Purchases and sales of securities, income receipts and expense payments are translated into U.S. dollars at the prevailing exchange rate on the respective dates of the transactions.
Annual Report
Notes to Financial Statements - continued
1. Significant Accounting Policies - continued
Foreign Currency Translation - continued
Net realized gains and losses on foreign currency transactions represent net gains and losses from sales and maturities of foreign currency contracts, disposition of foreign currencies, the difference between the amount of net investment income accrued and the U.S. dollar amount actually received, and gains and losses between trade and settlement date on purchases and sales of securities. The effects of changes in foreign currency exchange rates on investments in securities are included with the net realized and unrealized gain or loss on investment securities.
Income Taxes. As a qualified regulated investment company under Subchapter M of the Internal Revenue Code, the fund is not subject to U.S. federal income taxes to the extent that it distributes substantially all of its taxable income for its fiscal year. The fund may be subject to foreign taxes on income and gains on investments which are accrued based upon the fund's understanding of the tax rules and regulations that exist in the markets in which it invests. Foreign governments may also impose taxes on other payments or transactions with respect to foreign securities. The fund accrues such taxes as applicable. The schedule of investments includes information regarding income taxes under the caption "Income Tax Information."
Investment Income. Dividend income is recorded on the ex-dividend date, except certain dividends from foreign securities where the ex-dividend date may have passed, are recorded as soon as the fund is informed of the ex-dividend date. Non-cash dividends included in dividend income, if any, are recorded at the fair market value of the securities received. Interest income, which includes accretion of original issue discount, is accrued as earned. Investment income is recorded net of foreign taxes withheld where recovery of such taxes is uncertain.
Expenses. Most expenses of the trust can be directly attributed to a fund. Expenses which cannot be directly attributed are apportioned among the funds in the trust.
Distributions to Shareholders. Distributions are recorded on the ex-dividend date. Income dividends and capital gain distributions are declared separately for each class.
Income and capital gain distributions are determined in accordance with income tax regulations which may differ from generally accepted accounting principles. These differences, which may result in distribution reclassifications, are primarily due to differing treatments for foreign currency transactions, passive foreign investment companies (PFIC), non-taxable dividends and losses deferred due to wash sales. The fund also utilized earnings and profits distributed to shareholders on redemption of shares as a part of the dividends paid deduction for income tax purposes.
Annual Report
Notes to Financial Statements - continued
1. Significant Accounting Policies - continued
Distributions to Shareholders - continued
Permanent book and tax basis differences relating to shareholder distributions will result in reclassifications to paid in capital. Undistributed net investment income and accumulated undistributed net realized gain (loss) on investments and foreign currency transactions may include temporary book and tax basis differences which will reverse in a subsequent period. Any taxable income or gain remaining at fiscal year end is distributed in the following year.
Security Transactions. Security transactions are accounted for as of trade date. Gains and losses on securities sold are determined on the basis of identified cost.
2. Operating Policies.
Foreign Currency Contracts. The fund generally uses foreign currency contracts to facilitate transactions in foreign-denominated securities. Losses may arise from changes in the value of the foreign currency or if the counterparties do not perform under the contracts' terms. The U.S. dollar value of foreign currency contracts is determined using contractual currency exchange rates established at the time of each trade.
Joint Trading Account. Pursuant to an Exemptive Order issued by the Securities and Exchange Commission (the SEC), the fund, along with other affiliated entities of Fidelity Management & Research Company (FMR), may transfer uninvested cash balances into one or more joint trading accounts. These balances are invested in one or more repurchase agreements for U.S. Treasury or Federal Agency obligations.
Repurchase Agreements. The underlying U.S. Treasury, Federal Agency, or other obligations found to be satisfactory by FMR are transferred to an account of the fund, or to the Joint Trading Account, at a custodian bank. The securities are marked-to-market daily and maintained at a value at least equal to the principal amount of the repurchase agreement (including accrued interest). FMR, the fund's investment adviser, is responsible for determining that the value of the underlying securities remains in accordance with the market value requirements stated above.
Restricted Securities. The fund is permitted to invest in securities that are subject to legal or contractual restrictions on resale. These securities generally may be resold in transactions exempt from registration or to the public if the securities are registered. Disposal of these securities may involve time-consuming negotiations and expense, and prompt sale at an acceptable price may be difficult. At the end of the period, restricted securities (excluding 144A issues) amounted to $254,635 or 0.1% of net assets.
Annual Report
Notes to Financial Statements - continued
3. Purchases and Sales of Investments.
Purchases and sales of securities, other than short-term securities, aggregated $353,036,608 and $149,867,078, respectively.
4. Fees and Other Transactions with Affiliates.
Management Fee. As the fund's investment adviser, FMR receives a monthly fee that is calculated on the basis of a group fee rate plus a fixed individual fund fee rate applied to the average net assets of the fund. The group fee rate is the weighted average of a series of rates and is based on the monthly average net assets of all the mutual funds advised by FMR. The rates ranged from .2167% to .5200% for the period. The annual individual fund fee rate is .45%. In the event that these rates were lower than the contractual rates in effect during the period, FMR voluntarily implemented the above rates, as they resulted in the same or a lower management fee. For the period, the management fee was equivalent to an annual rate of .72% of average net assets.
Sub-Adviser Fee. Beginning January 1, 2001, FMR Co. (FMRC) will serve as a sub-adviser for the fund. FMRC may provide investment research and advice and may also provide investment advisory services for the fund. FMR, on behalf of the fund, entered into sub-advisory agreements with Fidelity Management & Research (U.K.) Inc., Fidelity Management & Research (Far East) Inc., and Fidelity International Investment Advisors (FIIA). Under the sub-advisory arrangements, FMR may receive investment advice and research services and may grant the sub-advisers investment management authority to buy and sell securities. FMR pays its sub-advisers either a portion of its management fee or a fee based on costs incurred for these services.
Distribution and Service Plan. In accordance with Rule 12b-1 of the 1940 Act, the Board of Trustees have adopted separate Distribution and Service Plans with respect to each class of shares (collectively referred to as "the Plans"). Under certain of the Plans, the class pays Fidelity Distributors Corporation (FDC), an affiliate of FMR, a 12b-1 fee. A portion of this fee may be reallowed to securities dealers, banks and other financial institutions for the distribution of each class of shares and providing shareholder support services. For the period, this fee was based on the following annual rates of the average net assets of each applicable class:
|
Class A |
.25% |
|
Class T |
.50% |
|
Class B |
1.00%* |
|
Class C |
1.00%* |
* .75% represents a distribution fee and .25% represents a shareholder service fee.
Annual Report
Notes to Financial Statements - continued
4. Fees and Other Transactions with Affiliates - continued
Distribution and Service Plan - continued
For the period, each class paid FDC the following amounts, a portion of which was retained by FDC:
|
|
Paid to |
Retained |
|
Class A |
$ 41,658 |
$ 3,951 |
|
Class T |
507,498 |
26 |
|
Class B |
316,688 |
238,227 |
|
Class C |
256,057 |
163,627 |
|
|
$ 1,121,901 |
$ 405,831 |
Sales Load. FDC receives a front-end sales charge of up to 5.75% for selling Class A shares, and 3.50% for selling Class T shares of the fund. FDC receives the proceeds of contingent deferred sales charges levied on Class B share redemptions occurring within six years of purchase and Class C share redemptions occurring within one year of purchase. Contingent deferred sales charges are based on declining rates ranging from 5% to 1% for Class B and 1% for Class C, of the lesser of the cost of shares at the initial date of purchase or the net asset value of the redeemed shares, excluding any reinvested dividends and capital gains. In addition, purchases of Class A and Class T shares that were subject to a finder's fee bear a contingent deferred sales charge on assets that do not remain in the fund for at least one year. The Class A and Class T contingent deferred sales charge is based on 0.25% of the lesser of the cost of shares at the initial date of purchase or the net asset value of the redeemed shares, excluding any reinvested dividends and capital gains. A portion of the sales charges paid to FDC is paid to securities dealers, banks and other financial institutions.
For the period, sales charge amounts paid to and retained by FDC were as follows:
|
|
Paid to |
Retained |
|
Class A |
$ 140,462 |
$ 53,353 |
|
Class T |
304,988 |
96,407 |
|
Class B |
45,443 |
45,443* |
|
Class C |
10,702 |
10,702* |
|
|
$ 501,595 |
$ 205,905 |
* When Class B and Class C shares are initially sold, FDC pays commissions from its own resources to securities dealers,
banks, and other financial institutions through which the sales are made.
Transfer Agent Fees. Fidelity Investments Institutional Operations Company, Inc., (FIIOC), an affiliate of FMR, is the transfer, dividend disbursing and shareholder servicing agent (collectively referred to as the transfer agent) for each class of the fund. FIIOC receives account fees and asset-based fees that vary according to the account size and
Annual Report
Notes to Financial Statements - continued
4. Fees and Other Transactions with Affiliates - continued
Transfer Agent Fees - continued
type of account of the shareholders of the respective classes of the fund. FIIOC pays for typesetting, printing and mailing of all shareholder reports, except proxy statements. For the period, the following amounts were paid to FIIOC:
|
|
Amount |
% of |
|
Class A |
$ 37,068 |
.22 |
|
Class T |
271,799 |
.27 |
|
Class B |
99,078 |
.31 |
|
Class C |
69,133 |
.27 |
|
Institutional Class |
24,438 |
.18 |
|
|
$ 501,516 |
|
Accounting and Security Lending Fees. Fidelity Service Company, Inc., an affiliate of FMR, maintains the fund's accounting records and administers the security lending program. The security lending fee is based on the number and duration of lending transactions. The accounting fee is based on the level of average net assets for the month plus out-of-pocket expenses.
Cash Central Funds. Pursuant to an Exemptive Order issued by the SEC, the fund may invest in the Fidelity Cash Central Fund and the Fidelity Securities Lending Cash Central Fund (the Cash Funds) managed by Fidelity Investments Money Management, Inc., an affiliate of FMR. The Cash Funds are open-end money market funds available only to investment companies and other accounts managed by FMR and its affiliates. The Cash Funds seek preservation of capital, liquidity, and current income. Income distributions from the Cash Funds are declared daily and paid monthly from net investment income. Income distributions earned by the fund are recorded as either interest income or security lending income in the accompanying financial statements.
Brokerage Commissions. The fund placed a portion of its portfolio transactions with brokerage firms which are affiliates of FMR. The commissions paid to these affiliated firms were $5,390 for the period.
Annual Report
Notes to Financial Statements - continued
5. Security Lending.
The fund lends portfolio securities from time to time in order to earn additional income. The fund receives collateral in the form of U.S. Treasury obligations, letters of credit, and/or cash against the loaned securities, and maintains collateral in an amount not less than 100% of the market value of the loaned securities during the period of the loan. The market value of the loaned securities is determined at the close of business of the fund and any additional required collateral is delivered to the fund on the next business day. If the borrower defaults on its obligation to return the securities loaned because of insolvency or other reasons, the fund could experience delays and costs in recovering the securities loaned or in gaining access to the collateral. At period end there were no security loans outstanding.
6. Expense Reductions.
FMR has directed certain portfolio trades to brokers who paid a portion of the fund's expenses. For the period, the fund's expenses were reduced by $40,463 under this arrangement.
In addition, through arrangements with the fund's custodian and each class' transfer agent, credits realized as a result of uninvested cash balances were used to reduce a portion of expenses. During the period, the fund's custodian fees were reduced by $282 under the custodian arrangement, and each applicable class' expenses were reduced as follows under the transfer agent arrangements:
|
|
Transfer |
|
Class T |
$ 754 |
Annual Report
Notes to Financial Statements - continued
7. Distributions to Shareholders.
Distributions to shareholders of each class were as follows:
|
|
Year ended October 31, 2000 |
December 17, 1998
(commencement |
|
From net investment income |
|
|
|
Class A |
$ 10,540 |
$ - |
|
Class T |
95,222 |
- |
|
Class B |
19,524 |
- |
|
Class C |
7,400 |
- |
|
Institutional Class |
13,633 |
- |
|
Total |
$ 146,319 |
$ - |
|
From net realized gain |
|
|
|
Class A |
$ 60,373 |
$ - |
|
Class T |
545,651 |
- |
|
Class B |
167,823 |
- |
|
Class C |
127,217 |
- |
|
Institutional Class |
58,597 |
- |
|
Total |
$ 959,661 |
$ - |
|
In excess of net realized gain |
|
|
|
Class A |
$ 6,354 |
$ - |
|
Class T |
57,423 |
- |
|
Class B |
17,661 |
- |
|
Class C |
13,388 |
- |
|
Institutional Class |
6,166 |
- |
|
Total |
$ 100,992 |
$ - |
|
|
$ 1,206,972 |
$ - |
Annual Report
Notes to Financial Statements - continued
8. Share Transactions.
Transactions for each class of shares were as follows:
|
|
Shares |
Dollars |
||
|
|
Year ended October 31, |
December 17, 1998
(commencement |
Year ended October 31, |
December 17, 1998
(commencement |
|
|
2000 |
1999 |
2000 |
1999 |
|
|
|
|
|
|
|
Class A |
2,673,616 |
368,962 |
$ 41,659,349 |
$ 4,258,738 |
|
Reinvestment of distributions |
5,306 |
- |
75,782 |
- |
|
Shares redeemed |
(1,094,417) |
(74,580) |
(16,670,468) |
(934,331) |
|
Net increase (decrease) |
1,584,505 |
294,382 |
$ 25,064,663 |
$ 3,324,407 |
|
Class T |
9,883,624 |
2,744,736 |
$ 151,684,553 |
$ 32,469,727 |
|
Reinvestment of distributions |
47,912 |
- |
682,269 |
- |
|
Shares redeemed |
(2,764,761) |
(276,769) |
(42,543,275) |
(3,437,679) |
|
Net increase (decrease) |
7,166,775 |
2,467,967 |
$ 109,823,547 |
$ 29,032,048 |
|
Class B |
2,519,471 |
859,540 |
$ 38,521,267 |
$ 10,054,769 |
|
Reinvestment of distributions |
12,633 |
- |
179,135 |
- |
|
Shares redeemed |
(315,547) |
(23,220) |
(4,887,648) |
(281,680) |
|
Net increase (decrease) |
2,216,557 |
836,320 |
$ 33,812,754 |
$ 9,773,089 |
|
Class C |
2,428,332 |
639,584 |
$ 37,048,372 |
$ 7,402,250 |
|
Reinvestment of distributions |
8,632 |
- |
122,491 |
- |
|
Shares redeemed |
(432,373) |
(11,302) |
(6,560,662) |
(138,947) |
|
Net increase (decrease) |
2,004,591 |
628,282 |
$ 30,610,201 |
$ 7,263,303 |
|
Institutional Class |
1,314,105 |
333,162 |
$ 20,387,308 |
$ 3,865,196 |
|
Reinvestment of distributions |
4,808 |
- |
68,755 |
- |
|
Shares redeemed |
(248,303) |
(13,385) |
(3,760,862) |
(164,249) |
|
Net increase (decrease) |
1,070,610 |
319,777 |
$ 16,695,201 |
$ 3,700,947 |
Annual Report
To the Trustees of Fidelity Advisor Series VIII and the Shareholders of Fidelity Advisor Diversified International Fund:
In our opinion, the accompanying statement of assets and liabilities, including the schedule of investments, and the related statements of operations and of changes in net assets and the financial highlights present fairly, in all material respects, the financial position of Fidelity Advisor Diversified International Fund (a fund of Fidelity Advisor Series VIII) at October 31, 2000, and the results of its operations, the changes in its net assets and the financial highlights for the periods indicated, in conformity with accounting principles generally accepted in the United States of America. These financial statements and financial highlights (hereafter referred to as "financial statements") are the responsibility of the Fidelity Advisor Diversified International Fund's management; our responsibility is to express an opinion on these financial statements based on our audits. We conducted our audits of these financial statements in accordance with auditing standards generally accepted in the United States of America which require that we plan and perform the audit to obtain reasonable assurance about whether the financial statements are free of material misstatement. An audit includes examining, on a test basis, evidence supporting the amounts and disclosures in the financial statements, assessing the accounting principles used and significant estimates made by management, and evaluating the overall financial statement presentation. We believe that our audits, which included confirmation of securities at October 31, 2000 by correspondence with the custodian and brokers, provide a reasonable basis for our opinion.
/s/PricewaterhouseCoopers LLP
PricewaterhouseCoopers LLP
Boston, Massachusetts
December 8, 2000
Annual Report
The amounts per share which represent income derived from sources within, and taxes paid to, foreign countries or possessions of the United States are as follows:
|
|
Pay Date |
Income |
Taxes |
|
|
Institutional Class |
12/6/99 |
$.047 |
$.006 |
|
The fund will notify shareholders in January 2001 of amounts for use in preparing 2000 income tax returns.
Annual Report
Annual Report
Annual Report
Annual Report
Annual Report
Annual Report
Annual Report
Annual Report
Investment Adviser
Fidelity Management & Research Company
Boston, MA
Investment Sub-Advisers
Fidelity Management & Research
(U.K.) Inc.
Fidelity Management & Research
(Far East) Inc.
Fidelity International
Investment Advisors
Fidelity Investments Japan Limited
Fidelity International Investment Advisors (U.K.) Limited
Officers
Edward C. Johnson 3d, President
Robert C. Pozen, Senior Vice President
Robert A. Lawrence, Vice President
Greg Fraser, Vice President
Eric D. Roiter, Secretary
Robert A. Dwight, Treasurer
Maria F. Dwyer, Deputy Treasurer
John H. Costello, Assistant Treasurer
Thomas J. Simpson, Assistant Treasurer
Board of Trustees
Ralph F. Cox *
Phyllis Burke Davis *
Robert M. Gates *
Edward C. Johnson 3d
Donald J. Kirk *
Ned C. Lautenbach *
Peter S. Lynch
Marvin L. Mann *
William O. McCoy *
Gerald C. McDonough *
Robert C. Pozen
Thomas R. Williams *
Advisory Board
J. Michael Cook
Abigail P. Johnson
Marie L. Knowles
General Distributor
Fidelity Distributors Corporation
Boston, MA
Transfer and Shareholder
Servicing Agents
Fidelity Investments Institutional Operations Company, Inc.
Boston, MA
Custodian
State Street Bank and Trust Company
Quincy, MA
* Independent trustees
Annual Report
Focus Funds
Fidelity Advisor Consumer
Industries Fund
Fidelity Advisor Cyclical
Industries Fund
Fidelity Advisor Financial
Services Fund
Fidelity Advisor Health Care Fund
Fidelity Advisor Natural
Resources Fund
Fidelity Advisor Technology Fund
Fidelity Advisor Telecommunications & Utilities Growth Fund
Growth Funds
Fidelity Advisor Korea Fund
Fidelity Advisor Emerging Asia Fund
Fidelity Advisor Latin America Fund
Fidelity Advisor Japan Fund
Fidelity Advisor Europe Capital Appreciation Fund
Fidelity Advisor International
Capital Appreciation Fund
Fidelity Advisor Overseas Fund
Fidelity Advisor Diversified International Fund
Fidelity Advisor Global Equity Fund
Fidelity Advisor TechnoQuant®
Growth Fund
Fidelity Advisor Small Cap Fund
Fidelity Advisor Value Strategies Fund
Fidelity Advisor Mid Cap Fund
Fidelity Advisor Dynamic Capital Appreciation Fund
Fidelity Advisor Equity Growth Fund
Fidelity Advisor Large Cap Fund
Fidelity Advisor Dividend Growth Fund
Fidelity Advisor Growth
Opportunities Fund
Growth and Income Funds
Fidelity Advisor Growth & Income Fund
Fidelity Advisor Equity Income Fund
Fidelity Advisor Asset Allocation Fund
Fidelity Advisor Balanced Fund
Taxable Income Funds
Fidelity Advisor Emerging Markets Income Fund
Fidelity Advisor High Yield Fund
Fidelity Advisor High Income Fund
Fidelity Advisor Strategic Income Fund
Fidelity Advisor Mortgage
Securities Fund
Fidelity Advisor Government Investment Fund
Fidelity Advisor Intermediate Bond Fund
Fidelity Advisor Short Fixed-Income Fund
Municipal Funds
Fidelity Advisor Municipal Income Fund
Money Market Funds
Prime Fund
Treasury Fund
Tax-Exempt Fund
ADIFI-ANN-1200 118918
1.728710.101
(Fidelity Investment logo)(registered trademark)
Fidelity® Advisor
Fund - Class A, Class T, Class B
and Class C
Annual Report
October 31, 2000
(2_fidelity_logos)(registered trademark)
|
President's Message |
Ned Johnson on investing strategies. |
|
|
Performance |
How the fund has done over time. |
|
|
Fund Talk |
The manager's review of fund performance, strategy and outlook. |
|
|
Investment Changes |
A summary of major shifts in the fund's investments over the past six months. |
|
|
Investments |
A complete list of the fund's investments with their market values. |
|
|
Financial Statements |
Statements of assets and liabilities,
operations, and changes in net assets, |
|
|
Notes |
Notes to the financial statements. |
|
|
Independent Auditors' Report |
The auditors' opinion. |
|
|
Distributions |
|
Standard & Poor's, S&P and S&P 500 are registered service marks of the McGraw-Hill Companies, Inc. and have been licensed for use by Fidelity Distributors Corporation.
Other third party marks appearing herein are the property of their respective owners.
All other marks appearing herein are registered or unregistered trademarks or service marks of FMR Corp. or an affiliated company.
(Recycle graphic) This report is printed on recycled paper using soy-based inks.
This report and the financial statements contained herein are submitted for the general information of the shareholders of the fund. This report is not authorized for distribution to prospective investors in the fund unless preceded or accompanied by an effective prospectus.
Mutual fund shares are not deposits or obligations of, or guaranteed by, any depository institution. Shares are not insured by the FDIC, Federal Reserve Board or any other agency, and are subject to investment risks, including possible loss of principal amount invested.
Neither the fund nor Fidelity Distributors Corporation is a bank.
For more information on any Fidelity Advisor fund, including charges and expenses, contact your investment professional for a free prospectus. Read it carefully before you invest or send money.
Annual Report
(photo_of_Edward_C_Johnson_3d)
Dear Shareholder:
A sixth-straight year of double-digit positive returns for the Dow Jones Industrial Average, NASDAQ and S&P 500® could be in jeopardy unless the U.S. stock market shows marked improvement in the final two months of 2000. Through October, all three indexes had negative year-to-date returns. On the other hand, most fixed-income sectors were solidly in the black. Treasuries and other long-term government securities led the way, returning nearly 14%.
While it's impossible to predict the future direction of the markets with any degree of certainty, there are certain basic principles that can help investors plan for their future needs.
First, investors are encouraged to take a long-term view of their portfolios. If you can afford to leave your money invested through the inevitable up and down cycles of the financial markets, you will greatly reduce your vulnerability to any single decline. We know from experience, for example, that stock prices have gone up over longer periods of time, have significantly outperformed other types of investments and have stayed ahead of inflation.
Second, you can further manage your investing risk through diversification. A stock mutual fund, for instance, is already diversified, because it invests in many different companies. You can increase your diversification further by investing in a number of different stock funds, or in such other investment categories as bonds. If you have a short investment time horizon, you might want to consider moving some of your investment into a money market fund, which seeks income and a stable share price by investing in high-quality, short-term investments. Of course, it's important to remember that an investment in a money market fund is not insured or guaranteed by the Federal Deposit Insurance Corporation or any other government agency. Although money market funds seek to preserve the value of your investment at $1.00 per share, it is possible to lose money by investing in these types of funds.
Finally, no matter what your time horizon or portfolio diversity, it makes good sense to follow a regular investment plan, investing a certain amount of money in a fund at the same time each month or quarter and periodically reviewing your overall portfolio. By doing so, you won't get caught up in the excitement of a rapidly rising market, nor will you buy all your shares at market highs. While this strategy - known as dollar cost averaging - won't assure a profit or protect you from a loss in a declining market, it should help you lower the average cost of your purchases. Of course, you should consider your financial ability to continue your purchases through periods of low price levels before undertaking such a strategy.
Remember to contact your investment professional if you need help with your investments.
Best regards,
/s/Edward C. Johnson 3d
Edward C. Johnson 3d
Annual Report
Fidelity Advisor International Capital Appreciation Fund - Class A
There are several ways to evaluate historical performance. You can look at the total percentage change in value, the average annual percentage change or the growth of a hypothetical $10,000 investment. Total return reflects the change in the value of an investment, assuming reinvestment of the class' dividend income and capital gains (the profits earned upon the sale of securities that have grown in value). If Fidelity had not reimbursed certain class expenses, the life of fund total returns would have been lower.
Cumulative Total Returns
|
Periods ended October 31, 2000 |
|
Past 1 |
Life of |
|
Fidelity Adv Intl Cap App - CL A |
|
5.31% |
58.60% |
|
Fidelity Adv Intl Cap App - CL A |
|
-0.74% |
49.48% |
|
MSCI World ex US |
|
-2.07% |
26.61% |
|
International Funds Average |
|
2.70% |
n/a* |
Cumulative total returns show Class A's performance in percentage terms over a set period - in this case, one year or since the fund started on November 3, 1997. For example, if you had invested $1,000 in a fund that had a 5% return over the past year, the value of your investment would be $1,050. You can compare Class A's returns to the performance of the Morgan Stanley Capital International AC World Index Free ex USA - a market capitalization-weighted index that is designed to represent the performance of developed stock markets, excluding the United States, throughout the world. To measure how Class A's performance stacked up against its peers, you can compare it to the international funds average, which reflects the performance of mutual funds with similar objectives tracked by Lipper Inc. The past one year average represents a peer group of 666 mutual funds. These benchmarks include reinvested dividends and capital gains, if any, and exclude the effect of sales charges.
Average Annual Total Returns
|
Periods ended October 31, 2000 |
|
Past 1 |
Life of |
|
Fidelity Adv Intl Cap App - CL A |
|
5.31% |
16.65% |
|
Fidelity Adv Intl Cap App - CL A |
|
-0.74% |
14.37% |
|
MSCI World ex US |
|
-2.07% |
8.20% |
|
International Funds Average |
|
2.70% |
n/a* |
Average annual total returns take Class A shares' cumulative return and show you what would have happened if Class A shares had performed at a constant rate each year.
* Not available
Annual Report
$10,000 Over Life of Fund
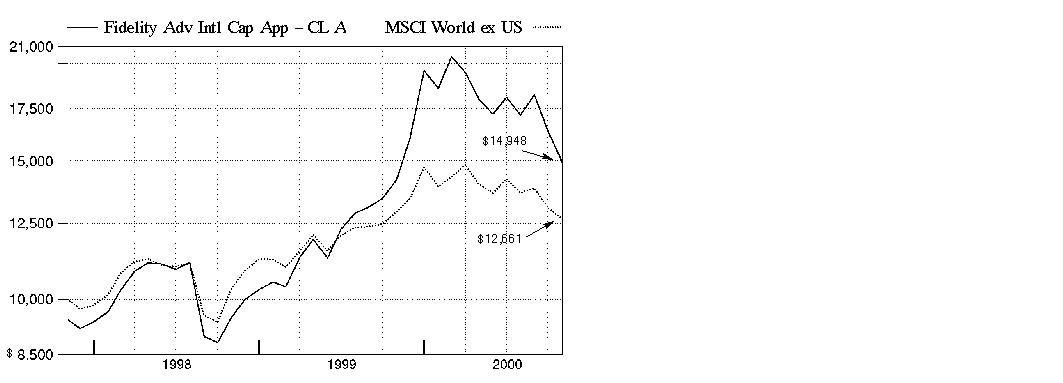
$10,000 Over Life of Fund: Let's say hypothetically that $10,000 was invested in Fidelity Advisor International Capital Appreciation Fund - Class A on November 3, 1997, when the fund started, and the current 5.75% sales charge was paid. As the chart shows, by October 31, 2000, the value of the investment would have grown to $14,948 - a 49.48% increase on the initial investment. For comparison, look at how the Morgan Stanley Capital International AC World Index Free ex USA did over the same period. With dividends reinvested, the same $10,000 would have grown to $12,661 - a 26.61% increase.
Understanding
Performance
Many markets around the globe offer the potential for significant growth over time; however, investing in foreign markets means assuming greater risks than investing in the United States. Factors like changes in a country's financial markets, its local political and economic climate, and the fluctuating value of its currency create these risks. For these reasons an international fund's performance may be more volatile than a fund that invests exclusively in the United States. Past performance is no guarantee of future results and you may have a gain or loss when you sell your shares.
3Annual Report
Fidelity Advisor International Capital Appreciation Fund - Class T
There are several ways to evaluate historical performance. You can look at the total percentage change in value, the average annual percentage change or the growth of a hypothetical $10,000 investment. Total return reflects the change in the value of an investment, assuming reinvestment of the class' dividend income and capital gains (the profits earned upon the sale of securities that have grown in value). If Fidelity had not reimbursed certain class expenses, the life of fund total returns would have been lower.
Cumulative Total Returns
|
Periods ended October 31, 2000 |
|
|
Past 1 |
Life of |
|
Fidelity Adv Intl Cap App - CL T |
|
|
5.13% |
57.91% |
|
Fidelity Adv Intl Cap App - CL T |
|
|
1.45% |
52.38% |
|
MSCI World ex US |
|
|
-2.07% |
26.61% |
|
International Funds Average |
|
|
2.70% |
n/a* |
Cumulative total returns show Class T's performance in percentage terms over a set period - in this case, one year or since the fund started on November 3, 1997. For example, if you had invested $1,000 in a fund that had a 5% return over the past year, the value of your investment would be $1,050. You can compare Class T's returns to the performance of the Morgan Stanley Capital International AC World Index Free ex USA - a market capitalization-weighted index that is designed to represent the performance of developed stock markets, excluding the United States, throughout the world. To measure how Class T's performance stacked up against its peers, you can compare it to the international funds average, which reflects the performance of mutual funds with similar objectives tracked by Lipper Inc. The past one year average represents a peer group of 666 mutual funds. These benchmarks include reinvested dividends and capital gains, if any, and exclude the effect of sales charges.
Average Annual Total Returns
|
Periods ended October 31, 2000 |
|
Past 1 |
Life of |
|
Fidelity Adv Intl Cap App - CL T |
|
5.13% |
16.48% |
|
Fidelity Adv Intl Cap App - CL T |
|
1.45% |
15.10% |
|
MSCI World ex US |
|
-2.07% |
8.20% |
|
International Funds Average |
|
2.70% |
n/a* |
Average annual total returns take Class T shares' cumulative return and show you what would have happened if Class T shares had performed at a constant rate each year.
* Not available
Annual Report
$10,000 Over Life of Fund

$10,000 Over Life of Fund: Let's say hypothetically that $10,000 was invested in Fidelity Advisor International Capital Appreciation Fund - Class T on November 3, 1997, when the fund started, and the current 3.50% sales charge was paid. As the chart shows, by October 31, 2000, the value of the investment would have grown to $15,238 - a 52.38% increase on the initial investment. For comparison, look at how the Morgan Stanley Capital International AC World Index Free ex USA did over the same period. With dividends reinvested, the same $10,000 would have grown to $12,661 - a 26.61% increase.
Understanding
Performance
Many markets around the globe offer the potential for significant growth over time; however, investing in foreign markets means assuming greater risks than investing in the United States. Factors like changes in a country's financial markets, its local political and economic climate, and the fluctuating value of its currency create these risks. For these reasons an international fund's performance may be more volatile than a fund that invests exclusively in the United States. Past performance is no guarantee of future results and you may have a gain or loss when you sell your shares.
3Annual Report
Fidelity Advisor International Capital Appreciation Fund - Class B
There are several ways to evaluate historical performance. You can look at the total percentage change in value, the average annual percentage change or the growth of a hypothetical $10,000 investment. Total return reflects the change in the value of an investment, assuming reinvestment of the class' dividend income and capital gains (the profits earned upon the sale of securities that have grown in value). Class B's contingent deferred sales charges included in the past one year and life of fund total return figures are 5% and 3%, respectively. If Fidelity had not reimbursed certain class expenses, the life of fund total returns would have been lower.
Cumulative Total Returns
|
Periods ended October 31, 2000 |
|
Past 1 |
Life of |
|
Fidelity Adv Intl Cap App - CL B |
|
4.60% |
55.01% |
|
Fidelity Adv Intl Cap App - CL B |
|
-0.40% |
52.01% |
|
MSCI World ex US |
|
-2.07% |
26.61% |
|
International Funds Average |
|
2.70% |
n/a* |
Cumulative total returns show Class B's performance in percentage terms over a set period - in this case, one year or since the fund started on November 3, 1997. For example, if you had invested $1,000 in a fund that had a 5% return over the past year, the value of your investment would be $1,050. You can compare Class B's returns to the performance of the Morgan Stanley Capital International AC World Index Free ex USA - a market capitalization-weighted index that is designed to represent the performance of developed stock markets, excluding the United States, throughout the world. To measure how Class B's performance stacked up against its peers, you can compare it to the international funds average, which reflects the performance of mutual funds with similar objectives tracked by Lipper Inc. The past one year average represents a peer group of 666 mutual funds. These benchmarks include reinvested dividends and capital gains, if any, and exclude the effect of sales charges.
Average Annual Total Returns
|
Periods ended October 31, 2000 |
|
Past 1 |
Life of |
|
Fidelity Adv Intl Cap App - CL B |
|
4.60% |
15.76% |
|
Fidelity Adv Intl Cap App - CL B |
|
-0.40% |
15.01% |
|
MSCI World ex US |
|
-2.07% |
8.20% |
|
International Funds Average |
|
2.70% |
n/a* |
Average annual total returns take Class B shares' cumulative return and show you what would have happened if Class B shares had performed at a constant rate each year.
* Not available
Annual Report
$10,000 Over Life of Fund
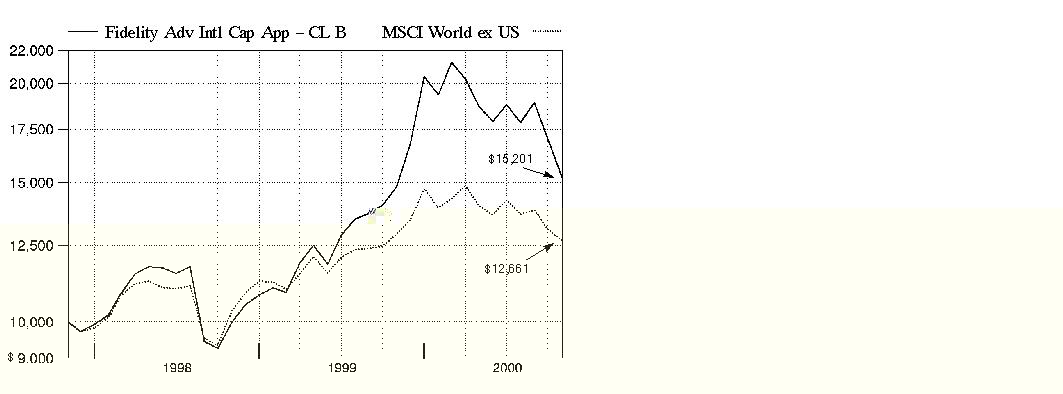
$10,000 Over Life of Fund: Let's say hypothetically that $10,000 was invested in Fidelity Advisor International Capital Appreciation Fund - Class B on November 3, 1997, when the fund started. As the chart shows, by October 31, 2000, the value of the investment, including the effect of the applicable contingent deferred sales charge, would have grown to $15,201 - a 52.01% increase on the initial investment. For comparison, look at how the Morgan Stanley Capital International AC World Index Free ex USA did over the same period. With dividends reinvested, the same $10,000 would have grown to $12,661 - a 26.61% increase.
Understanding
Performance
Many markets around the globe offer the potential for significant growth over time; however, investing in foreign markets means assuming greater risks than investing in the United States. Factors like changes in a country's financial markets, its local political and economic climate, and the fluctuating value of its currency create these risks. For these reasons an international fund's performance may be more volatile than a fund that invests exclusively in the United States. Past performance is no guarantee of future results and you may have a gain or loss when you sell your shares.
3Annual Report
Fidelity Advisor International Capital Appreciation Fund - Class C
There are several ways to evaluate historical performance. You can look at the total percentage change in value, the average annual percentage change or the growth of a hypothetical $10,000 investment. Total return reflects the change in the value of an investment, assuming reinvestment of the class' dividend income and capital gains (the profits earned upon the sale of securities that have grown in value). Class C's contingent deferred sales charges included in the past one year and life of fund total return figures are 1% and 0%, respectively. If Fidelity had not reimbursed certain class expenses, the life of fund total returns would have been lower.
Cumulative Total Returns
|
Periods ended October 31, 2000 |
|
|
Past 1 |
Life of |
|
Fidelity Adv Intl Cap App - CL C |
|
|
4.59% |
55.11% |
|
Fidelity Adv Intl Cap App - CL C |
|
3.59% |
55.11% |
|
|
MSCI World ex US |
|
|
-2.07% |
26.61% |
|
International Funds Average |
|
|
2.70% |
n/a* |
Cumulative total returns show Class C's performance in percentage terms over a set period - in this case, one year or since the fund started on November 3, 1997. For example, if you had invested $1,000 in a fund that had a 5% return over the past year, the value of your investment would be $1,050. You can compare Class C's returns to the performance of the Morgan Stanley Capital International AC World Index Free ex USA - a market capitalization-weighted index that is designed to represent the performance of developed stock markets, excluding the United States, throughout the world. To measure how Class C's performance stacked up against its peers, you can compare it to the international funds average, which reflects the performance of mutual funds with similar objectives tracked by Lipper Inc. The past one year average represents a peer group of 666 mutual funds. These benchmarks include reinvested dividends and capital gains, if any, and exclude the effect of sales charges.
Average Annual Total Returns
|
Periods ended October 31, 2000 |
|
|
Past 1 |
Life of |
|
Fidelity Adv Intl Cap App - CL C |
|
|
4.59% |
15.78% |
|
Fidelity Adv Intl Cap App - CL C |
|
3.59% |
15.78% |
|
|
MSCI World ex US |
|
|
-2.07% |
8.20% |
|
International Funds Average |
|
|
2.70% |
n/a* |
Average annual total returns take Class C shares' cumulative return and show you what would have happened if Class C shares had performed at a constant rate each year.
* Not available
Annual Report
$10,000 Over Life of Fund
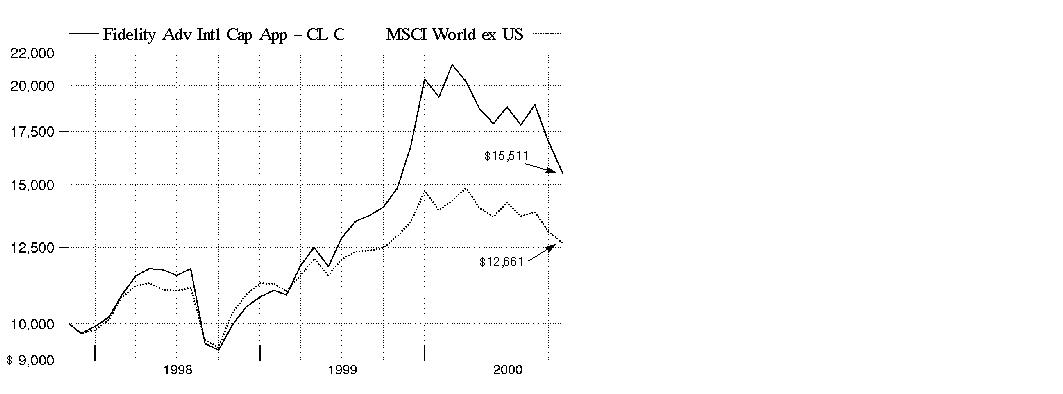
$10,000 Over Life of Fund: Let's say hypothetically that $10,000 was invested in Fidelity Advisor International Capital Appreciation Fund - Class C on November 3, 1997, when the fund started. As the chart shows, by October 31, 2000, the value of the investment would have grown to $15,511 - a 55.11% increase on the initial investment. For comparison, look at how the Morgan Stanley Capital International AC World Index Free ex USA did over the same period. With dividends reinvested, the same $10,000 would have grown to $12,661 - a 26.61% increase.
Understanding
Performance
Many markets around the globe offer the potential for significant growth over time; however, investing in foreign markets means assuming greater risks than investing in the United States. Factors like changes in a country's financial markets, its local political and economic climate, and the fluctuating value of its currency create these risks. For these reasons an international fund's performance may be more volatile than a fund that invests exclusively in the United States. Past performance is no guarantee of future results and you may have a gain or loss when you sell your shares.
3Annual Report
Market Recap
Currency disparities, the see-saw performance of technology and telecommunications stocks, and increased uncertainty over the direction of energy prices contributed to volatile world markets for the 12-month period that ended October 31, 2000. Through the first half of the period, foreign investors enjoyed handsome returns from technology and telecommunications holdings. These gains disappeared down the stretch, however, as the dollar continued to outperform the struggling euro - the uniform currency of 11 European nations - and the Japanese yen by wide margins. Soaring oil and gas prices also added to the volatility. The Morgan Stanley EAFE® index - which tracks the performance of stock markets in Europe, Australasia and the Far East - fell 2.72% during the period. Europe's economic recovery remained on course, but the euro's continued weakness proved to be a millstone. The Morgan Stanley Europe index had a 12-month return of 1.16%. Japan's economic recovery, on the other hand, appeared to be short-lived, or at least very, very slow in the making. The Morgan Stanley Japan index declined 11.61% during the period. Emerging markets, meanwhile, were unable to sustain the momentum they carried into early 2000, as the Morgan Stanley Emerging Markets Free index tumbled 10.33%.
(Portfolio Manager photograph)
An interview with Kevin McCarey, Portfolio Manager of Fidelity Advisor International Capital Appreciation Fund
Q. How did the fund perform, Kevin?
A. For the 12 months that ended October 31, 2000, the fund's Class A, Class T, Class B and Class C shares returned 5.31%, 5.13%, 4.60% and 4.59%, respectively. These returns beat the Morgan Stanley Capital International All Country World Index Free ex USA - which fell 2.07% during the period - as well as the international funds average, which returned 2.70% according to Lipper Inc.
Q. What factors influenced the fund's performance during the period?
A. Just as technology stocks dictated the direction of the U.S. market during the period, new economy stocks - namely, those in the technology, media and telecommunications areas - played a similar role overseas. Through the first six months of the period, risk-taking appetites were high, new economy stocks flourished and the fund - with an abundance of smaller- to medium-sized new economy stocks in its portfolio - benefited accordingly. Then came the March tech decline in the U.S., and new economy stocks fell in step. Investors instead shifted their attention to stocks of more established companies with proven earnings growth, and this trend hurt the fund. In fact, most of the fund's outperformance stems from good stock picking early in the period. During the second half of the period, the fund's technology weighting fell from around 34% to just over 22%, mostly from depreciation.
Annual Report
Fund Talk: The Manager's Overview - continued
Q. You sliced the fund's exposure to Japanese stocks in half during the year, from 34% to 17%. Why?
A. The honeymoon was basically over. The Japanese market performed extraordinarily well through most of 1999, mostly on the heels of a modest economic recovery. As the period wore on, though, a couple of things became clear. First, Japanese stock prices - not unlike dot-coms in the U.S. - had gotten too far ahead of themselves, and growth rate projections seemed overly optimistic. Second, the initial euphoria over a possible economic recovery had given way to the actual restructuring work that needed to be done to sustain the recovery. These trends hurt several of the Internet-related stocks that had boosted the fund's performance, including Softbank and JAFCO, both of which the fund no longer held at the end of the period. One Japanese stock that did perform well for the fund was Furukawa Electric, a leading maker of fiber-optic components.
Q. What was the story in Europe?
A. The big story in Europe was the fall from grace of the major telecommunications stocks. This group - including names such as Deutsche Telekom, France Telecom and Spain's Telefonica - had performed exceptionally well during the past few years, but fell hard when new economy stocks tumbled. Some of these companies had spun out separate Internet service provider divisions, and their stock prices had already been overextended prior to the new economy decline. I moved out of these stocks gradually, but some exposure still hurt the fund. On the plus side, I did find some pretty good stocks elsewhere in Europe. Wella AG - a German hair-care company - and Swatch, the Swiss watchmaker, both benefited from good earnings growth. The fund did not have a stake in Wella at the end of the period.
Q. What was your emerging-markets game plan?
A. Emerging markets weren't the best place to be, but the fund did get good returns from its investments in Mexican television stocks TV Azteca and Grupo Televisa early in the period. I also steered some money away from Japanese technology stocks to several Asian technology names, including Taiwan Semiconductor and South Korea's Samsung Electronics. Weak semiconductor demand hampered these stocks, but I still felt they offered better growth prospects than their Japanese counterparts. By the end of the period, I had sold off the fund's positions in Grupo Televisa and Samsung.
Q. Which other stocks performed well? Which were disappointing?
A. Amvescap, a leading asset manager based in the U.K., performed well, as did French software maker ILOG. Disappointments included Hikari Tsushin, a Japanese cellular phone retailer, and Jazztel, a Spanish telecommunications company, neither of which were owned by the fund at the end of the period.
Annual Report
Fund Talk: The Manager's Overview - continued
Q. What's your outlook?
A. The challenge I face during the next few months is to maintain enough exposure to aggressive growth stocks so that when the market does turn around, the fund can take advantage. Even though risk-taking fell out of favor during the period, my strategy remains the same - to find the faster-growing companies. Many of these opportunities may reside in the new economy area, and I'm confident that our global research team will help uncover the best stories.
The views expressed in this report reflect those of the portfolio manager only through the end of the period of the report as stated on the cover and do not necessarily represent the views of Fidelity or any other person in the Fidelity organization. Any such views are subject to change at any time based upon market or other conditions and Fidelity disclaims any responsibility to update such views. These views may not be relied on as investment advice and, because investment decisions for a Fidelity fund are based on numerous factors, may not be relied on as an indication of trading intent on behalf of any Fidelity fund.
Fund Facts
Goal: seeks capital appreciation by investing in securities of foreign issuers
Start date: November 3, 1997
Size: as of October 31, 2000, more than $263 million
Manager: Kevin McCarey, since inception; joined Fidelity in 1985
3Kevin McCarey covers a variety of subjects:
The falling euro: "The euro continued to fall in value versus the dollar, but I think that was more a reflection of the amazing resiliency of the U.S. economy than of any weakness in Europe. In terms of the fund, the weak euro didn't have much of an impact on stock picking. I tend to look at stock values in terms of local currencies."
Rising oil and gas prices: "The dramatically higher prices didn't really influence the fund's performance. Europe relies on natural gas shipped in from Russia and Eastern Europe, so it's not as dependent on oil price swings. One stock that did benefit from the higher prices was TotalFinaElf, the giant French energy conglomerate. The fund did not own a position in Total at the end of the period."
Broadcasting stocks: "Going into March, the fund had made a nice profit from its positions in several European broadcasting stocks, including Television Francaise 1 (TF1) in France. Much of that strong performance came from an increase in advertising revenue, partly from new economy companies. When new economy stocks stumbled, I moved out of broadcasting stocks, realizing that expectations for advertising revenues would probably be lowered."
Annual Report
|
Top Five Stocks as of October 31, 2000 |
||
|
|
% of fund's |
% of fund's net assets |
|
China Mobile (Hong Kong) Ltd. |
5.4 |
0.9 |
|
Castorama Dubois Investissements SA |
4.6 |
0.3 |
|
Furukawa Electric Co. Ltd. |
4.1 |
2.4 |
|
Nikko Securities Co. Ltd. |
3.7 |
1.2 |
|
Nomura Securities Co. Ltd. |
3.7 |
0.9 |
|
|
21.5 |
5.7 |
|
Top Five Market Sectors as of October 31, 2000 |
||
|
|
% of fund's |
% of fund's net assets |
|
Technology |
22.4 |
33.7 |
|
Finance |
22.2 |
9.7 |
|
Retail & Wholesale |
11.7 |
2.8 |
|
Industrial Machinery & Equipment |
9.1 |
13.7 |
|
Utilities |
6.6 |
17.7 |
|
Top Five Countries as of October 31, 2000 |
||
|
(excluding cash equivalents) |
% of fund's |
% of fund's net assets |
|
Japan |
17.0 |
24.0 |
|
United Kingdom |
13.0 |
10.7 |
|
Germany |
8.6 |
4.3 |
|
France |
7.9 |
8.6 |
|
Hong Kong |
7.1 |
2.4 |
|
Percentages are adjusted for the effect of open futures contracts, if applicable. |
|
Asset Allocation (% of fund's net assets) |
|||||||
|
As of October 31, 2000 |
As of April 30, 2000 |
||||||
|
Stocks 92.8% |
|
|
Stocks 96.9% |
|
||
|
Short-Term |
|
|
Short-Term |
|
||

Annual Report
Showing Percentage of Net Assets
|
Common Stocks - 90.1% |
|||
|
Shares |
Value (Note 1) |
||
|
Belgium - 0.6% |
|||
|
Fortis B |
52,100 |
$ 1,596,432 |
|
|
Canada - 5.3% |
|||
|
Canadian Natural Resources Ltd. (a) |
150,400 |
4,445,320 |
|
|
Nortel Networks Corp. |
115,400 |
5,250,700 |
|
|
Talisman Energy, Inc. (a) |
138,900 |
4,374,552 |
|
|
TOTAL CANADA |
14,070,572 |
||
|
Finland - 1.5% |
|||
|
JOT Automation Group Oyj |
533,000 |
1,854,883 |
|
|
TietoEnator Oyj |
107,400 |
2,064,799 |
|
|
TOTAL FINLAND |
3,919,682 |
||
|
France - 7.9% |
|||
|
Activcard SA (a) |
99,500 |
2,542,225 |
|
|
Castorama Dubois Investissements SA |
59,100 |
12,019,314 |
|
|
ILOG SA sponsored ADR (a) |
20,600 |
618,000 |
|
|
Integra SA (a) |
692,500 |
5,613,433 |
|
|
TOTAL FRANCE |
20,792,972 |
||
|
Germany - 5.9% |
|||
|
Beiersdorf AG |
16,300 |
1,563,405 |
|
|
Deutsche Lufthansa AG (Reg.) |
158,900 |
3,102,109 |
|
|
Hannover Rueckversicherungs AG |
42,100 |
3,541,287 |
|
|
Karstadt Quelle AG |
42,700 |
1,393,935 |
|
|
Software AG |
67,900 |
4,864,269 |
|
|
United Internet AG (a) |
177,400 |
1,141,375 |
|
|
TOTAL GERMANY |
15,606,380 |
||
|
Hong Kong - 7.1% |
|||
|
China Mobile (Hong Kong) Ltd. (a) |
2,310,500 |
14,151,806 |
|
|
Johnson Electric Holdings Ltd. |
1,878,000 |
3,732,904 |
|
|
Li & Fung Ltd. |
392,000 |
728,910 |
|
|
TOTAL HONG KONG |
18,613,620 |
||
|
India - 3.1% |
|||
|
Housing Development Finance Corp. Ltd. |
10,800 |
108,553 |
|
|
Infosys Technologies Ltd. |
29,800 |
4,560,745 |
|
|
Wipro Ltd. sponsored ADR |
64,300 |
3,383,788 |
|
|
TOTAL INDIA |
8,053,086 |
||
|
Common Stocks - continued |
|||
|
Shares |
Value (Note 1) |
||
|
Ireland - 1.6% |
|||
|
Bank of Ireland, Inc. |
273,400 |
$ 2,107,122 |
|
|
Irish Life & Permanent PLC |
213,600 |
2,141,196 |
|
|
TOTAL IRELAND |
4,248,318 |
||
|
Israel - 0.6% |
|||
|
Orad Hi-Tech Systems Ltd. |
51,500 |
1,545,262 |
|
|
Italy - 3.3% |
|||
|
Banca Nazionale del Lavoro (BNL) |
1,076,400 |
3,471,864 |
|
|
Bulgari Spa |
345,800 |
4,060,781 |
|
|
Luxottica Group Spa sponsored ADR |
71,400 |
1,030,838 |
|
|
Saipem Spa |
27,400 |
143,985 |
|
|
TOTAL ITALY |
8,707,468 |
||
|
Japan - 17.0% |
|||
|
DDI Corp. |
43 |
201,778 |
|
|
Furukawa Electric Co. Ltd. |
416,000 |
10,942,352 |
|
|
Nikko Securities Co. Ltd. |
1,140,000 |
9,842,178 |
|
|
Nomura Securities Co. Ltd. |
460,000 |
9,759,876 |
|
|
Omron Corp. |
143,000 |
3,525,525 |
|
|
Sanyo Electric Co. Ltd. |
246,000 |
1,871,323 |
|
|
Shinko Securities Co. Ltd. |
1,689,000 |
5,139,291 |
|
|
Sony Corp. |
14,900 |
1,236,700 |
|
|
Yakult Honsha Co. Ltd. |
215,000 |
2,451,288 |
|
|
TOTAL JAPAN |
44,970,311 |
||
|
Korea (South) - 0.6% |
|||
|
Kookmin Bank |
148,900 |
1,701,715 |
|
|
Mexico - 1.4% |
|||
|
TV Azteca SA de CV sponsored ADR |
297,100 |
3,713,750 |
|
|
Netherlands - 6.2% |
|||
|
Draka Holding NV |
11,700 |
684,740 |
|
|
IHC Caland NV |
54,200 |
2,392,258 |
|
|
Koninklijke Ahold NV |
139,470 |
4,052,221 |
|
|
Koninklijke Philips Electronics NV |
151,193 |
5,943,084 |
|
|
VNU NV |
68,600 |
3,252,016 |
|
|
TOTAL NETHERLANDS |
16,324,319 |
||
|
Spain - 2.5% |
|||
|
Banco Santander Central Hispano SA |
367,200 |
3,559,378 |
|
|
Telefonica SA (a) |
158,700 |
3,026,811 |
|
|
TOTAL SPAIN |
6,586,189 |
||
|
Common Stocks - continued |
|||
|
Shares |
Value (Note 1) |
||
|
Sweden - 3.2% |
|||
|
Adcore AB (a) |
488,200 |
$ 2,007,104 |
|
|
Telefonaktiebolaget LM Ericsson (B Shares) |
470,500 |
6,528,188 |
|
|
TOTAL SWEDEN |
8,535,292 |
||
|
Switzerland - 5.9% |
|||
|
Credit Suisse Group (Reg.) |
34,100 |
6,393,157 |
|
|
Swiss Reinsurance Co. (Reg.) |
1,600 |
3,155,494 |
|
|
The Swatch Group AG (Bearer) |
4,600 |
6,090,682 |
|
|
TOTAL SWITZERLAND |
15,639,333 |
||
|
Taiwan - 3.4% |
|||
|
Taiwan Semiconductor Manufacturing Co. Ltd. (a) |
1,980,000 |
6,007,430 |
|
|
United Microelectronics Corp. (a) |
1,670,000 |
2,947,059 |
|
|
TOTAL TAIWAN |
8,954,489 |
||
|
United Kingdom - 13.0% |
|||
|
Autonomy Corp. PLC (a) |
68,700 |
3,525,641 |
|
|
BAE Systems PLC |
375,900 |
2,133,449 |
|
|
Boots Co. PLC |
727,900 |
5,803,801 |
|
|
Carlton Communications PLC |
202,200 |
1,626,868 |
|
|
Dimension Data Holdings PLC (a) |
558,500 |
4,890,331 |
|
|
Filtronic PLC |
70,600 |
803,438 |
|
|
Hilton Group PLC |
489,500 |
1,358,938 |
|
|
Lloyds TSB Group PLC |
595,800 |
6,063,393 |
|
|
Reuters Group PLC |
122,400 |
2,404,649 |
|
|
Somerfield PLC |
2,479,800 |
2,768,124 |
|
|
SSL International PLC |
240,400 |
2,796,776 |
|
|
TOTAL UNITED KINGDOM |
34,175,408 |
||
|
TOTAL COMMON STOCKS (Cost $249,975,324) |
237,754,598 |
||
|
Nonconvertible Preferred Stocks - 2.7% |
|||
|
|
|
|
|
|
Germany - 2.7% |
|||
|
Wella AG |
179,900 |
7,215,033 |
|
|
Cash Equivalents - 7.9% |
|||
|
Shares |
Value (Note 1) |
||
|
Fidelity Cash Central Fund, 6.61% (b) |
20,698,882 |
$ 20,698,882 |
|
|
Fidelity Securities Lending Cash Central Fund, 6.66% (b) |
80,750 |
80,750 |
|
|
TOTAL CASH EQUIVALENTS (Cost $20,779,632) |
20,779,632 |
||
|
TOTAL INVESTMENT PORTFOLIO - 100.7% (Cost $276,809,576) |
265,749,263 |
||
|
NET OTHER ASSETS - (0.7)% |
(1,947,768) |
||
|
NET ASSETS - 100% |
$ 263,801,495 |
||
|
Legend |
|
(a) Non-income producing |
|
(b) The rate quoted is the annualized seven-day yield of the fund at period end. A complete listing of the fund's holdings as of its most recent fiscal year end is available upon request. |
|
Income Tax Information |
|
At October 31, 2000, the aggregate |
|
The fund hereby designates approximately $728,000 as a capital gain dividend for the purpose of the dividend paid deduction. |
|
At October 31, 2000, the fund had a capital loss carryforward of approximately $23,648,000, all of which will expire on October 31, 2008. |
See accompanying notes which are an integral part of the financial statements.
Annual Report
Statement of Assets and Liabilities
|
|
October 31, 2000 |
|
|
Assets |
|
|
|
Investment in securities, at value (cost $276,809,576) - See accompanying schedule |
|
$ 265,749,263 |
|
Foreign currency held at value (cost $3,179,458) |
|
3,167,716 |
|
Receivable for investments sold |
|
13,969,104 |
|
Receivable for fund shares sold |
|
2,775,998 |
|
Dividends receivable |
|
325,104 |
|
Interest receivable |
|
96,481 |
|
Other receivables |
|
4,454 |
|
Total assets |
|
286,088,120 |
|
Liabilities |
|
|
|
Payable for investments purchased |
$ 21,123,834 |
|
|
Payable for fund shares redeemed |
548,134 |
|
|
Accrued management fee |
169,140 |
|
|
Distribution fees payable |
149,195 |
|
|
Other payables and accrued expenses |
215,572 |
|
|
Collateral on securities loaned, at value |
80,750 |
|
|
Total liabilities |
|
22,286,625 |
|
Net Assets |
|
$ 263,801,495 |
|
Net Assets consist of: |
|
|
|
Paid in capital |
|
$ 297,485,391 |
|
Undistributed net investment income |
|
1,608,803 |
|
Accumulated undistributed net realized gain (loss) on investments and foreign currency transactions |
|
(24,219,362) |
|
Net unrealized appreciation (depreciation) on investments and assets and liabilities in foreign currencies |
|
(11,073,337) |
|
Net Assets |
|
$ 263,801,495 |
See accompanying notes which are an integral part of the financial statements.
Annual Report
Financial Statements - continued
Statement of Assets and Liabilities - continued
|
|
October 31, 2000 |
|
|
Calculation of Maximum Offering Price |
|
$15.26 |
|
Maximum offering price per share (100/94.25 of $15.26) |
|
$16.19 |
|
Class T: |
|
$15.21 |
|
Maximum offering price per share (100/96.50 of $15.21) |
|
$15.76 |
|
Class B: |
|
$14.96 |
|
Class C: |
|
$14.96 |
|
Institutional Class: |
|
$15.35 |
A Redemption price per share is equal to net asset value less any applicable contingent deferred sales charge.
See accompanying notes which are an integral part of the financial statements.
Annual Report
Financial Statements - continued
Statement of Operations
|
|
Year ended October 31, 2000 |
|
|
Investment Income Dividends |
|
$ 2,510,077 |
|
Interest |
|
1,120,172 |
|
Security lending |
|
49,114 |
|
|
|
3,679,363 |
|
Less foreign taxes withheld |
|
(329,520) |
|
Total income |
|
3,349,843 |
|
Expenses |
|
|
|
Management fee |
$ 1,805,011 |
|
|
Transfer agent fees |
675,787 |
|
|
Distribution fees |
1,548,239 |
|
|
Accounting and security lending fees |
151,756 |
|
|
Non-interested trustees' compensation |
744 |
|
|
Custodian fees and expenses |
263,414 |
|
|
Registration fees |
150,046 |
|
|
Audit |
31,520 |
|
|
Legal |
2,311 |
|
|
Miscellaneous |
10,477 |
|
|
Total expenses before reductions |
4,639,305 |
|
|
Expense reductions |
(113,353) |
4,525,952 |
|
Net investment income (loss) |
|
(1,176,109) |
|
Realized and Unrealized Gain (Loss) Net realized gain (loss) on: |
|
|
|
Investment securities |
(20,858,134) |
|
|
Foreign currency transactions |
(276,544) |
(21,134,678) |
|
Change in net unrealized appreciation (depreciation) on: |
|
|
|
Investment securities |
(20,988,173) |
|
|
Assets and liabilities in foreign currencies |
(24,250) |
(21,012,423) |
|
Net gain (loss) |
|
(42,147,101) |
|
Net increase (decrease) in net assets resulting |
|
$ (43,323,210) |
See accompanying notes which are an integral part of the financial statements.
Annual Report
Financial Statements - continued
Statement of Changes in Net Assets
|
|
Year ended
October 31, |
Year ended
October 31, |
|
Increase (Decrease) in Net Assets |
|
|
|
Operations |
$ (1,176,109) |
$ (132,984) |
|
Net realized gain (loss) |
(21,134,678) |
6,701,720 |
|
Change in net unrealized appreciation (depreciation) |
(21,012,423) |
9,215,926 |
|
Net increase (decrease) in net assets resulting |
(43,323,210) |
15,784,662 |
|
Distributions to shareholders |
(54,984) |
- |
|
From net realized gain |
(3,820,036) |
- |
|
Total distributions |
(3,875,020) |
- |
|
Share transactions - net increase (decrease) |
237,287,811 |
34,004,800 |
|
Total increase (decrease) in net assets |
190,089,581 |
49,789,462 |
|
Net Assets |
|
|
|
Beginning of period |
73,711,914 |
23,922,452 |
|
End of period (including under (over) distribution |
$ 263,801,495 |
$ 73,711,914 |
See accompanying notes which are an integral part of the financial statements.
Annual Report
Financial Highlights - Class A
|
Years ended October 31, |
2000 |
1999 |
1998 E |
|
Selected Per-Share Data |
|
|
|
|
Net asset value, beginning of period |
$ 15.06 |
$ 10.07 |
$ 10.00 |
|
Income from Investment Operations |
|
|
|
|
Net investment income (loss) D |
(.03) |
(.01) |
(.00) |
|
Net realized and unrealized gain (loss) |
.88 H |
5.00 |
.07 |
|
Total from investment operations |
.85 |
4.99 |
.07 |
|
Less Distributions |
|
|
|
|
In excess of net investment income |
(.02) I |
- |
- |
|
From net realized gain |
(.63) I |
- |
- |
|
Total distributions |
(.65) |
- |
- |
|
Net asset value, end of period |
$ 15.26 |
$ 15.06 |
$ 10.07 |
|
Total Return B, C |
5.31% |
49.55% |
0.70% |
|
Ratios and Supplemental Data |
|
|
|
|
Net assets, end of period (000 omitted) |
$ 15,348 |
$ 3,407 |
$ 860 |
|
Ratio of expenses to average net assets |
1.55% |
1.72% F |
2.06% A, F |
|
Ratio of expenses to average net assets |
1.50% G |
1.67% G |
2.06% A |
|
Ratio of net investment income (loss) to average net assets |
(.16)% |
(.06)% |
.03% A |
|
Portfolio turnover |
308% |
218% |
199% A |
A Annualized
B The total returns would have been lower had certain expenses not been reduced during the periods shown.
C Total returns do not include the one time sales charge and for periods of less than one year are not annualized.
D Net investment income (loss) per share has been calculated based on average shares outstanding during the period.
E For the period November 3, 1997 (commencement of operations) to October 31, 1998.
F FMR agreed to reimburse a portion of the class' expenses during the period. Without this reimbursement, the class' expense ratio would have been higher.
G FMR or the fund has entered into varying arrangements with third parties who either paid or reduced a portion of the class' expenses.
H The amount shown for a share outstanding does not correspond with the aggregate net loss on investments for the period due to the timing of sales and repurchases of class shares in relation to fluctuating market values of the investments of the fund.
I The amounts shown reflect certain reclassifications related to book to tax differences.
See accompanying notes which are an integral part of the financial statements.
Annual Report
Financial Highlights - Class T
|
Years ended October 31, |
2000 |
1999 |
1998 E |
|
Selected Per-Share Data |
|
|
|
|
Net asset value, beginning of period |
$ 15.02 |
$ 10.04 |
$ 10.00 |
|
Income from Investment Operations |
|
|
|
|
Net investment income (loss) D |
(.06) |
(.04) |
(.03) |
|
Net realized and unrealized gain (loss) |
.88 H |
5.02 |
.07 |
|
Total from investment operations |
.82 |
4.98 |
.04 |
|
Less Distributions |
|
|
|
|
In excess of net investment income |
(.01) I |
- |
- |
|
From net realized gain |
(.62) I |
- |
- |
|
Total distributions |
(.63) |
- |
- |
|
Net asset value, end of period |
$ 15.21 |
$ 15.02 |
$ 10.04 |
|
Total Return B, C |
5.13% |
49.60% |
0.40% |
|
Ratios and Supplemental Data |
|
|
|
|
Net assets, end of period (000 omitted) |
$ 145,721 |
$ 44,233 |
$ 12,117 |
|
Ratio of expenses to average net assets |
1.72% |
1.97% F |
2.31% A, F |
|
Ratio of expenses to average net assets |
1.67% G |
1.92% G |
2.31% A |
|
Ratio of net investment income (loss) to |
(.33)% |
(.31)% |
(.24)% A |
|
Portfolio turnover |
308% |
218% |
199% A |
A Annualized
B The total returns would have been lower had certain expenses not been reduced during the periods shown.
C Total returns do not include the one time sales charge and for periods of less than one year are not annualized.
D Net investment income (loss) per share has been calculated based on average shares outstanding during the period.
E For the period November 3, 1997 (commencement of operations) to October 31, 1998.
F FMR agreed to reimburse a portion of the class' expenses during the period. Without this reimbursement, the class' expense ratio would have been higher.
G FMR or the fund has entered into varying arrangements with third parties who either paid or reduced a portion of the class' expenses.
H The amount shown for a share outstanding does not correspond with the aggregate net loss on investments for the period due to the timing of sales and repurchases of class shares in relation to fluctuating market values of the investments of the fund.
I The amounts shown reflect certain reclassifications related to book to tax differences.
See accompanying notes which are an integral part of the financial statements.
Annual Report
Financial Highlights - Class B
|
Years ended October 31, |
2000 |
1999 |
1998 E |
|
Selected Per-Share Data |
|
|
|
|
Net asset value, beginning of period |
$ 14.82 |
$ 9.99 |
$ 10.00 |
|
Income from Investment Operations |
|
|
|
|
Net investment income (loss) D |
(.16) |
(.10) |
(.07) |
|
Net realized and unrealized gain (loss) |
.89 H |
4.93 |
.06 |
|
Total from investment operations |
.73 |
4.83 |
(.01) |
|
Less Distributions |
|
|
|
|
In excess of net investment income |
(.01) I |
- |
- |
|
From net realized gain |
(.58) I |
- |
- |
|
Total distributions |
(.59) |
- |
- |
|
Net asset value, end of period |
$ 14.96 |
$ 14.82 |
$ 9.99 |
|
Total Return B, C |
4.60% |
48.35% |
(0.10)% |
|
Ratios and Supplemental Data |
|
|
|
|
Net assets, end of period (000 omitted) |
$ 49,140 |
$ 11,098 |
$ 4,047 |
|
Ratio of expenses to average net assets |
2.30% |
2.47% F |
2.81% A, F |
|
Ratio of expenses to average net assets after |
2.26% G |
2.42% G |
2.81% A |
|
Ratio of net investment income (loss) |
(.92)% |
(.81)% |
(.70)% A |
|
Portfolio turnover |
308% |
218% |
199% A |
A Annualized
B The total returns would have been lower had certain expenses not been reduced during the periods shown.
C Total returns do not include the contingent deferred sales charge and for periods of less than one year are not annualized.
D Net investment income (loss) per share has been calculated based on average shares outstanding during the period.
E For the period November 3, 1997 (commencement of operations) to October 31, 1998.
F FMR agreed to reimburse a portion of the class' expenses during the period. Without this reimbursement, the class' expense ratio would have been higher.
G FMR or the fund has entered into varying arrangements with third parties who either paid or reduced a portion of the class' expenses.
H The amount shown for a share outstanding does not correspond with the aggregate net loss on investments for the period due to the timing of sales and repurchases of class shares in relation to fluctuating market values of the investments of the fund.
I The amounts shown reflect certain reclassifications related to book to tax differences.
See accompanying notes which are an integral part of the financial statements.
Annual Report
Financial Highlights - Class C
|
Years ended October 31, |
2000 |
1999 |
1998 E |
|
Selected Per-Share Data |
|
|
|
|
Net asset value, beginning of period |
$ 14.83 |
$ 9.98 |
$ 10.00 |
|
Income from Investment Operations |
|
|
|
|
Net investment income (loss) D |
(.15) |
(.10) |
(.08) |
|
Net realized and unrealized gain (loss) |
.88 H |
4.95 |
.06 |
|
Total from investment operations |
.73 |
4.85 |
(.02) |
|
Less Distributions |
|
|
|
|
In excess of net investment income |
(.01) I |
- |
- |
|
From net realized gain |
(.59) I |
- |
- |
|
Total distributions |
(.60) |
- |
- |
|
Net asset value, end of period |
$ 14.96 |
$ 14.83 |
$ 9.98 |
|
Total Return B, C |
4.59% |
48.60% |
(0.20)% |
|
Ratios and Supplemental Data |
|
|
|
|
Net assets, end of period (000 omitted) |
$ 44,041 |
$ 7,874 |
$ 2,217 |
|
Ratio of expenses to average net assets |
2.25% |
2.47% F |
2.81% A, F |
|
Ratio of expenses to average net assets after |
2.21% G |
2.42% G |
2.81% A |
|
Ratio of net investment income (loss) to average net assets |
(.86)% |
(.81)% |
(.75)% A |
|
Portfolio turnover |
308% |
218% |
199% A |
A Annualized
B The total returns would have been lower had certain expenses not been reduced during the periods shown.
C Total returns do not include the contingent deferred sales charge and for periods of less than one year are not annualized.
D Net investment income (loss) per share has been calculated based on average shares outstanding during the period.
E For the period November 3, 1997 (commencement of operations) to October 31, 1998.
F FMR agreed to reimburse a portion of the class' expenses during the period. Without this reimbursement, the class' expense ratio would have been higher.
G FMR or the fund has entered into varying arrangements with third parties who either paid or reduced a portion of the class' expenses.
H The amount shown for a share outstanding does not correspond with the aggregate net loss on investments for the period due to the timing of sales and repurchases of class shares in relation to fluctuating market values of the investments of the fund.
I The amounts shown reflect certain reclassifications related to book to tax differences.
See accompanying notes which are an integral part of the financial statements.
Annual Report
Financial Highlights - Institutional Class
|
Years ended October 31, |
2000 |
1999 |
1998 E |
|
Selected Per-Share Data |
|
|
|
|
Net asset value, beginning of period |
$ 15.09 |
$ 10.09 |
$ 10.00 |
|
Income from Investment Operations |
|
|
|
|
Net investment income D |
.04 |
.02 |
.04 |
|
Net realized and unrealized gain (loss) |
.88 H |
4.98 |
.05 |
|
Total from investment operations |
.92 |
5.00 |
.09 |
|
Less Distributions |
|
|
|
|
In excess of net investment income |
(.03) I |
- |
- |
|
From net realized gain |
(.63) I |
- |
- |
|
Total distributions |
(.66) |
- |
- |
|
Net asset value, end of period |
$ 15.35 |
$ 15.09 |
$ 10.09 |
|
Total Return B, C |
5.78% |
49.55% |
0.90% |
|
Ratios and Supplemental Data |
|
|
|
|
Net assets, end of period (000 omitted) |
$ 9,551 |
$ 7,099 |
$ 4,682 |
|
Ratio of expenses to average net assets |
1.15% |
1.47% F |
1.81% A, F |
|
Ratio of expenses to average net assets after |
1.10% G |
1.42% G |
1.81% A |
|
Ratio of net investment income to average net assets |
.24% |
.19% |
.34% A |
|
Portfolio turnover |
308% |
218% |
199% A |
A Annualized
B Total returns for periods of less than one year are not annualized.
C The total returns would have been lower had certain expenses not been reduced during the periods shown.
D Net investment income per share has been calculated based on average shares outstanding during the period.
E For the period November 3, 1997 (commencement of operations) to October 31, 1998.
F FMR agreed to reimburse a portion of the class' expenses during the period. Without this reimbursement, the class' expense ratio would have been higher.
G FMR or the fund has entered into varying arrangements with third parties who either paid or reduced a portion of the class' expenses.
H The amount shown for a share outstanding does not correspond with the aggregate net loss on investments for the period due to the timing of sales and repurchases of class shares in relation to fluctuating market values of the investments of the fund.
I The amounts shown reflect certain reclassifications related to book to tax differences.
See accompanying notes which are an integral part of the financial statements.
Annual Report
For the period ended October 31, 2000
1. Significant Accounting Policies.
Fidelity Advisor International Capital Appreciation Fund(the fund) is a fund of Fidelity Advisor Series VIII(the trust) and is authorized to issue an unlimited number of shares. The trust is registered under the Investment Company Act of 1940, as amended (the 1940 Act), as an open-end management investment company organized as a Massachusetts business trust.
The fund offers Class A, Class T, Class B, Class C, and Institutional Class shares, each of which has equal rights as to assets and voting privileges. Each class has exclusive voting rights with respect to matters that affect that class. Class B shares will automatically convert to Class A shares after a holding period of seven years from the initial date of purchase. Investment income, realized and unrealized capital gains and losses, the common expenses of the fund, and certain fund-level expense reductions, if any, are allocated on a pro rata basis to each class based on the relative net assets of each class to the total net assets of the fund. Each class of shares differs in its respective distribution, transfer agent, and certain other class-specific fees, expenses, and expense reductions.
The fund's investments in emerging markets can be subject to social, economic, regulatory, and political uncertainties and can be extremely volatile. The financial statements have been prepared in conformity with generally accepted accounting principles which require management to make certain estimates and assumptions at the date of the financial statements. The following summarizes the significant accounting policies of the fund:
Security Valuation. Securities for which quotations are readily available are valued using the official closing price or at the last sale price in the principal market in which they are traded. If the last sale price (on the local exchange) is unavailable, the last evaluated quote or closing bid price normally is used. If trading or events occurring in other markets after the close of the principal market in which securities are traded are expected to materially affect the value of those securities, then they are valued at their fair value taking this trading or these events into account. Fair value is determined in good faith under consistently applied procedures under the general supervision of the Board of Trustees. Securities for which quotations are not readily available are valued primarily using dealer-supplied valuations or at their fair value. Short-term securities with remaining maturities of sixty days or less for which quotations are not readily available are valued at amortized cost or original cost plus accrued interest, both of which approximate current value. Investments in open-end investment companies are valued at their net asset value each business day.
Foreign Currency Translation. The accounting records of the fund are maintained in U.S. dollars. Investment securities and other assets and liabilities denominated in a foreign currency are translated into U.S. dollars at the prevailing rates of exchange at period end. Purchases and sales of securities, income receipts and expense payments are translated into U.S. dollars at the prevailing exchange rate on the respective dates of the transactions.
Annual Report
Notes to Financial Statements - continued
1. Significant Accounting Policies - continued
Foreign Currency Translation - continued
Net realized gains and losses on foreign currency transactions represent net gains and losses from sales and maturities of foreign currency contracts, disposition of foreign currencies, the difference between the amount of net investment income accrued and the U.S. dollar amount actually received, and gains and losses between trade and settlement date on purchases and sales of securities. The effects of changes in foreign currency exchange rates on investments in securities are included with the net realized and unrealized gain or loss on investment securities.
Income Taxes. As a qualified regulated investment company under Subchapter M of the Internal Revenue Code, the fund is not subject to U.S. federal income taxes to the extent that it distributes substantially all of its taxable income for its fiscal year. The fund may be subject to foreign taxes on income and gains on investments which are accrued based upon the fund's understanding of the tax rules and regulations that exist in the markets in which it invests. Foreign governments may also impose taxes on other payments or transactions with respect to foreign securities. The fund accrues such taxes as applicable. The schedule of investments includes information regarding income taxes under the caption "Income Tax Information."
Investment Income. Dividend income is recorded on the ex-dividend date, except certain dividends from foreign securities where the ex-dividend date may have passed, are recorded as soon as the fund is informed of the ex-dividend date. Non-cash dividends included in dividend income, if any, are recorded at the fair market value of the securities received. Interest income is accrued as earned. Investment income is recorded net of foreign taxes withheld where recovery of such taxes is uncertain.
Expenses. Most expenses of the trust can be directly attributed to a fund. Expenses which cannot be directly attributed are apportioned among the funds in the trust.
Distributions to Shareholders. Distributions are recorded on the ex-dividend date. Income dividends and capital gain distributions are declared separately for each class.
Income and capital gain distributions are determined in accordance with income tax regulations which may differ from generally accepted accounting principles. These differences, which may result in distribution reclassifications, are primarily due to differing treatments for foreign currency transactions, passive foreign investment companies (PFIC) and losses deferred due to wash sales. The fund also utilized earnings and profits distributed to shareholders on redemption of shares as a part of the dividends paid deduction for income tax purposes.
Annual Report
Notes to Financial Statements - continued
1. Significant Accounting Policies - continued
Distributions to Shareholders - continued
Permanent book and tax basis differences relating to shareholder distributions will result in reclassifications to paid in capital. Undistributed net investment income and accumulated undistributed net realized gain (loss) on investments and foreign currency transactions may include temporary book and tax basis differences which will reverse in a subsequent period. Any taxable income or gain remaining at fiscal year end is distributed in the following year.
Security Transactions. Security transactions are accounted for as of trade date. Gains and losses on securities sold are determined on the basis of identified cost.
2. Operating Policies.
Foreign Currency Contracts. The fund generally uses foreign currency contracts to facilitate transactions in foreign-denominated securities. Losses may arise from changes in the value of the foreign currency or if the counterparties do not perform under the contracts' terms. The U.S. dollar value of foreign currency contracts is determined using contractual currency exchange rates established at the time of each trade.
Joint Trading Account. Pursuant to an Exemptive Order issued by the Securities and Exchange Commission (the SEC), the fund, along with other affiliated entities of Fidelity Management & Research Company (FMR), may transfer uninvested cash balances into one or more joint trading accounts. These balances are invested in one or more repurchase agreements for U.S. Treasury or Federal Agency obligations.
Repurchase Agreements. The underlying U.S. Treasury, Federal Agency, or other obligations found to be satisfactory by FMR are transferred to an account of the fund, or to the Joint Trading Account, at a custodian bank. The securities are marked-to-market daily and maintained at a value at least equal to the principal amount of the repurchase agreement (including accrued interest). FMR, the fund's investment adviser, is responsible for determining that the value of the underlying securities remains in accordance with the market value requirements stated above.
Restricted Securities. The fund is permitted to invest in securities that are subject to legal or contractual restrictions on resale. These securities generally may be resold in transactions exempt from registration or to the public if the securities are registered. Disposal of these securities may involve time-consuming negotiations and expense, and prompt sale at an acceptable price may be difficult. At the end of the period, the fund had no investments in restricted securities.
3. Purchases and Sales of Investments.
Purchases and sales of securities, other than short-term securities, aggregated $918,911,157 and $703,009,317, respectively.
Annual Report
Notes to Financial Statements - continued
4. Fees and Other Transactions with Affiliates.
Management Fee. As the fund's investment adviser, FMR receives a monthly fee that is calculated on the basis of a group fee rate plus a fixed individual fund fee rate applied to the average net assets of the fund. The group fee rate is the weighted average of a series of rates and is based on the monthly average net assets of all the mutual funds advised by FMR. The rates ranged from .2167% to .5200% for the period. The annual individual fund fee rate is .45%. In the event that these rates were lower than the contractual rates in effect during the period, FMR voluntarily implemented the above rates, as they resulted in the same or a lower management fee. For the period, the management fee was equivalent to an annual rate of .72% of average net assets.
Sub-Adviser Fee. Beginning January 1, 2001, FMR Co.(FMRC) will serve as a sub-adviser for the fund. FMRC may provide investment research and advice and may also provide investment advisory services for the fund. FMR, on behalf of the fund, entered into sub-advisory agreements with Fidelity Management & Research (U.K.) Inc., Fidelity Management & Research (Far East) Inc., and Fidelity International Investment Advisors (FIIA). Under the sub-advisory arrangements, FMR may receive investment advice and research services and may grant the sub-advisers investment management authority to buy and sell securities. FMR pays its sub-advisers either a portion of its management fee or a fee based on costs incurred for these services.
Distribution and Service Plan. In accordance with Rule 12b-1 of the 1940 Act, the Board of Trustees have adopted separate Distribution and Service Plans with respect to each class of shares (collectively referred to as "the Plans"). Under certain of the Plans, the class pays Fidelity Distributors Corporation (FDC), an affiliate of FMR, a 12b-1 fee. A portion of this fee may be reallowed to securities dealers, banks and other financial institutions for the distribution of each class of shares and providing shareholder support services. For the period, this fee was based on the following annual rates of the average net assets of each applicable class:
|
Class A |
.25% |
|
Class T |
.50% |
|
Class B |
1.00%* |
|
Class C |
1.00%* |
* .75% represents a distribution fee and .25% represents a shareholder service fee.
Annual Report
Notes to Financial Statements - continued
4. Fees and Other Transactions with Affiliates - continued
Distribution and Service Plan - continued
For the period, each class paid FDC the following amounts, a portion of which was retained by FDC:
|
|
Paid to |
Retained |
|
Class A |
$ 34,304 |
$ 0 |
|
Class T |
726,487 |
4,874 |
|
Class B |
434,547 |
325,910 |
|
Class C |
352,901 |
266,709 |
|
|
$ 1,548,239 |
$ 597,493 |
Sales Load. FDC receives a front-end sales charge of up to 5.75% for selling Class A shares, and 3.50% for selling Class T shares of the fund. FDC receives the proceeds of contingent deferred sales charges levied on Class B share redemptions occurring within six years of purchase and Class C share redemptions occurring within one year of purchase. Contingent deferred sales charges are based on declining rates ranging from 5% to 1% for Class B and 1% for Class C, of the lesser of the cost of shares at the initial date of purchase or the net asset value of the redeemed shares, excluding any reinvested dividends and capital gains. In addition, purchases of Class A and Class T shares that were subject to a finder's fee bear a contingent deferred sales charge on assets that do not remain in the fund for at least one year. The Class A and Class T contingent deferred sales charge is based on 0.25% of the lesser of the cost of shares at the initial date of purchase or the net asset value of the redeemed shares, excluding any reinvested dividends and capital gains. A portion of the sales charges paid to FDC is paid to securities dealers, banks and other financial institutions.
For the period, sales charge amounts paid to and retained by FDC were as follows:
|
|
Paid to |
Retained |
|
Class A |
$ 164,325 |
$ 62,199 |
|
Class T |
410,611 |
141,668 |
|
Class B |
75,608 |
75,608 * |
|
Class C |
58,603 |
58,603 * |
|
|
$ 709,147 |
$ 338,078 |
* When Class B and Class C shares are initially sold, FDC pays commissions from its own resources to securities dealers,
banks, and other financial institutions through which the sales are made.
Annual Report
Notes to Financial Statements - continued
4. Fees and Other Transactions with Affiliates - continued
Transfer Agent Fees. Fidelity Investments Institutional Operations Company, Inc., (FIIOC), an affiliate of FMR, is the transfer, dividend disbursing and shareholder servicing agent (collectively referred to as the transfer agent) for each class of the fund. FIIOC receives account fees and asset-based fees that vary according to the account size and type of account of the shareholders of the respective classes of the fund. FIIOC pays for typesetting, printing and mailing of all shareholder reports, except proxy statements. For the period, the following amounts were paid to FIIOC:
|
|
Amount |
% of |
|
Class A |
$ 45,472 |
.33 |
|
Class T |
361,400 |
.25 |
|
Class B |
147,272 |
.34 |
|
Class C |
101,734 |
.29 |
|
Institutional Class |
19,909 |
.18 |
|
|
$ 675,787 |
|
Accounting and Security Lending Fees. Fidelity Service Company, Inc., an affiliate of FMR, maintains the fund's accounting records and administers the security lending program. The security lending fee is based on the number and duration of lending transactions. The accounting fee is based on the level of average net assets for the month plus out-of-pocket expenses.
Cash Central Funds. Pursuant to an Exemptive Order issued by the SEC, the fund may invest in the Fidelity Cash Central Fund and the Fidelity Securities Lending Cash Central Fund (the Cash Funds) managed by Fidelity Investments Money Management, Inc., an affiliate of FMR. The Cash Funds are open-end money market funds available only to investment companies and other accounts managed by FMR and its affiliates. The Cash Funds seek preservation of capital, liquidity, and current income. Income distributions from the Cash Funds are declared daily and paid monthly from net investment income. Income distributions earned by the fund are recorded as either interest income or security lending income in the accompanying financial statements.
Brokerage Commissions. The fund placed a portion of its portfolio transactions with brokerage firms which are affiliates of FMR. The commissions paid to these affiliated firms were $13,320 for the period.
Annual Report
Notes to Financial Statements - continued
5. Security Lending.
The fund lends portfolio securities from time to time in order to earn additional income. The fund receives collateral in the form of U.S. Treasury obligations, letters of credit, and/or cash against the loaned securities, and maintains collateral in an amount not less than 100% of the market value of the loaned securities during the period of the loan. The market value of the loaned securities is determined at the close of business of the fund and any additional required collateral is delivered to the fund on the next business day. If the borrower defaults on its obligation to return the securities loaned because of insolvency or other reasons, the fund could experience delays and costs in recovering the securities loaned or in gaining access to the collateral. At period end, the value of the securities loaned amounted to $69,535. The fund received cash collateral of $80,750 which was invested in cash equivalents.
6. Expense Reductions.
FMR has directed certain portfolio trades to brokers who paid a portion of the fund's expenses. For the period, the fund's expenses were reduced by $111,348 under this arrangement.
In addition, through an arrangement with the fund's custodian, credits realized as a result of uninvested cash balances were used to reduce a portion of expenses. During the period, the fund's custodian fees were reduced by $2,005 under the custodian arrangement.
7. Distributions to Shareholders.
Distributions to shareholders of each class were as follows:
|
|
Year ended October 31, |
|
|
2000 |
|
In excess of net investment income |
|
|
Class A |
$ 4,983 |
|
Class T |
26,087 |
|
Class B |
5,868 |
|
Class C |
4,607 |
|
Institutional Class |
13,439 |
|
Total |
$ 54,984 |
|
From net realized gain |
|
|
Class A |
$ 185,477 |
|
Class T |
2,368,340 |
|
Class B |
532,713 |
|
Class C |
418,246 |
|
Institutional Class |
315,260 |
|
Total |
$ 3,820,036 |
|
|
$ 3,875,020 |
Annual Report
Notes to Financial Statements - continued
8. Share Transactions.
Transactions for each class of shares were as follows:
|
|
Shares |
Dollars |
||
|
|
Year ended October 31, |
Year ended October 31, |
Year ended October 31, |
Year ended October 31, |
|
|
2000 |
1999 |
2000 |
1999 |
|
|
|
|
|
|
|
Class A |
1,298,390 |
171,382 |
$ 24,276,500 |
$ 2,262,199 |
|
Reinvestment of distributions |
11,029 |
- |
182,210 |
- |
|
Shares redeemed |
(529,938) |
(30,537) |
(9,521,477) |
(375,127) |
|
Net increase (decrease) |
779,481 |
140,845 |
$ 14,937,233 |
$ 1,887,072 |
|
Class T |
10,643,173 |
2,655,095 |
$ 198,331,205 |
$ 35,017,679 |
|
Reinvestment of distributions |
139,588 |
- |
2,301,807 |
- |
|
Shares redeemed |
(4,147,046) |
(915,882) |
(73,453,339) |
(11,570,979) |
|
Net increase (decrease) |
6,635,715 |
1,739,213 |
$ 127,179,673 |
$ 23,446,700 |
|
Class B |
3,121,970 |
490,982 |
$ 58,110,416 |
$ 6,457,280 |
|
Reinvestment of distributions |
27,962 |
- |
455,782 |
- |
|
Shares redeemed |
(613,723) |
(147,536) |
(10,750,739) |
(1,813,165) |
|
Net increase (decrease) |
2,536,209 |
343,446 |
$ 47,815,459 |
$ 4,644,115 |
|
Class C |
3,154,880 |
381,866 |
$ 58,126,678 |
$ 5,012,400 |
|
Reinvestment of distributions |
23,657 |
- |
385,612 |
- |
|
Shares redeemed |
(765,264) |
(72,877) |
(13,960,952) |
(886,960) |
|
Net increase (decrease) |
2,413,273 |
308,989 |
$ 44,551,338 |
$ 4,125,440 |
|
Institutional Class |
318,946 |
898,968 |
$ 5,848,714 |
$ 10,922,948 |
|
Reinvestment of distributions |
18,789 |
- |
310,963 |
- |
|
Shares redeemed |
(185,886) |
(892,708) |
(3,355,569) |
(11,021,475) |
|
Net increase (decrease) |
151,849 |
6,260 |
$ 2,804,108 |
$ (98,527) |
Annual Report
To the Trustees of Fidelity Advisor Series VIII and Shareholders of Fidelity Advisor International Capital Appreciation Fund:
We have audited the accompanying statement of assets and liabilities of Fidelity Advisor International Capital Appreciation Fund, (the Fund), a fund of Fidelity Advisor Series VIII (the Trust), including the portfolio of investments, as of October 31, 2000, and the related statement of operations for the year then ended, the statement of changes in net assets for each of the two years in the period then ended, and the financial highlights for each of the three years in the period then ended. These financial statements and financial highlights are the responsibility of the Fund's management. Our responsibility is to express an opinion on these financial statements and financial highlights based on our audits.
We conducted our audits in accordance with auditing standards generally accepted in the United States of America. Those standards require that we plan and perform the audit to obtain reasonable assurance about whether the financial statements and financial highlights are free of material misstatement. An audit includes examining, on a test basis, evidence supporting the amounts and disclosures in the financial statements. Our procedures included confirmation of securities owned as of October 31, 2000, by correspondence with the custodian and brokers; where replies were not received from brokers, we performed other auditing procedures. An audit also includes assessing the accounting principles used and significant estimates made by management, as well as evaluating the overall financial statement presentation. We believe that our audits provide a reasonable basis for our opinion.
In our opinion, the financial statements and financial highlights referred to above present fairly, in all material respects, the financial position of Fidelity Advisor International Capital Appreciation Fund as of October 31, 2000, the results of its operations for the year then ended, the changes in its net assets for each of the two years in the period then ended, and its financial highlights for each of the three years in the period then ended, in conformity with accounting principles generally accepted in the United States of America.
/s/DELOITTE & TOUCHE LLP
DELOITTE & TOUCHE LLP
Boston, Massachusetts
December 8, 2000
Annual Report
The fund hereby designates 100% of the long-term capital gain dividends distributed during the fiscal year as 20%-rate capital gain dividends.
The amounts per share which represent income derived from sources within, and taxes paid to, foreign countries or possessions of the United States are as follows:
|
|
Pay Date |
Income |
Taxes |
|
|
Class A |
12/6/99 |
$0.080 |
$0.009 |
|
|
Class T |
12/6/99 |
$0.077 |
$0.009 |
|
|
Class B |
12/6/99 |
$0.071 |
$0.009 |
|
|
Class C |
12/6/99 |
$0.073 |
$0.009 |
|
The fund will notify shareholders in January 2001 of amounts for use in preparing 2000 income tax returns.
Annual Report
Investment Adviser
Fidelity Management & Research Company
Boston, MA
Investment Sub-Advisers
Fidelity Management & Research
(U.K.) Inc.
Fidelity Management & Research
(Far East) Inc.
Fidelity International Investment Advisors
Fidelity International Investment Advisors (U.K.) Limited
Fidelity Investments Japan Limited
Officers
Edward C. Johnson 3d, President
Robert C. Pozen, Senior Vice President
Richard Spillane, Jr., Vice President
Kevin McCarey, Vice President
Eric D. Roiter, Secretary
Robert A. Dwight, Treasurer
Maria F. Dwyer, Deputy Treasurer
John H. Costello, Assistant Treasurer
Thomas J. Simpson, Assistant Treasurer
Board of Trustees
Ralph F. Cox *
Phyllis Burke Davis *
Robert M. Gates *
Edward C. Johnson 3d
Donald J. Kirk *
Ned C. Lautenbach *
Peter S. Lynch
Marvin L. Mann *
William O. McCoy *
Gerald C. McDonough *
Robert C. Pozen
Thomas R. Williams *
Advisory Board
J. Michael Cook
Abigail P. Johnson
Marie L. Knowles
General Distributor
Fidelity Distributors Corporation
Boston, MA
Transfer and Shareholder
Servicing Agents
Fidelity Investments Institutional Operations Company, Inc.
Boston, MA
Custodian
Brown Brothers Harriman & Co.
Boston, MA
* Independent trustees
Annual Report
Focus Funds
Fidelity Advisor Consumer
Industries Fund
Fidelity Advisor Cyclical
Industries Fund
Fidelity Advisor Financial
Services Fund
Fidelity Advisor Health Care Fund
Fidelity Advisor Natural
Resources Fund
Fidelity Advisor Technology Fund
Fidelity Advisor Telecommunications & Utilities Growth Fund
Growth Funds
Fidelity Advisor Korea Fund
Fidelity Advisor Emerging Asia Fund
Fidelity Advisor Latin America Fund
Fidelity Advisor Japan Fund
Fidelity Advisor Europe Capital Appreciation Fund
Fidelity Advisor International
Capital Appreciation Fund
Fidelity Advisor Overseas Fund
Fidelity Advisor Diversified International Fund
Fidelity Advisor Global Equity Fund
Fidelity Advisor TechnoQuant®
Growth Fund
Fidelity Advisor Small Cap Fund
Fidelity Advisor Value Strategies Fund
Fidelity Advisor Mid Cap Fund
Fidelity Advisor Dynamic Capital Appreciation Fund
Fidelity Advisor Equity Growth Fund
Fidelity Advisor Large Cap Fund
Fidelity Advisor Dividend Growth Fund
Fidelity Advisor Growth
Opportunities Fund
Growth and Income Funds
Fidelity Advisor Growth & Income Fund
Fidelity Advisor Equity Income Fund
Fidelity Advisor Asset Allocation Fund
Fidelity Advisor Balanced Fund
Taxable Income Funds
Fidelity Advisor Emerging Markets Income Fund
Fidelity Advisor High Yield Fund
Fidelity Advisor High Income Fund
Fidelity Advisor Strategic Income Fund
Fidelity Advisor Mortgage
Securities Fund
Fidelity Advisor Government Investment Fund
Fidelity Advisor Intermediate Bond Fund
Fidelity Advisor Short Fixed-Income Fund
Municipal Funds
Fidelity Advisor Municipal Income Fund
Money Market Funds
Prime Fund
Treasury Fund
Tax-Exempt Fund
AICAP-ANN-1200 118945
1.711985.102
(Fidelity Investment logo)(registered trademark)
Fidelity® Advisor
Fund - Institutional Class
Annual Report
October 31, 2000
(2_fidelity_logos)(registered trademark)
|
President's Message |
Ned Johnson on investing strategies. |
|
|
Performance |
How the fund has done over time. |
|
|
Fund Talk |
The manager's review of fund performance, strategy and outlook. |
|
|
Investment Changes |
A summary of major shifts in the fund's investments over the past six months. |
|
|
Investments |
A complete list of the fund's investments with their market values. |
|
|
Financial Statements |
Statements of assets and liabilities,
operations, and changes in net assets, |
|
|
Notes |
Notes to the financial statements. |
|
|
Independent Auditors' Report |
The auditors' opinion. |
|
|
Distributions |
|
Standard & Poor's, S&P and S&P 500 are registered service marks of the McGraw-Hill Companies, Inc. and have been licensed for use by Fidelity Distributors Corporation.
Other third party marks appearing herein are the property of their respective owners.
All other marks appearing herein are registered or unregistered trademarks or service marks of FMR Corp. or an affiliated company.
(Recycle graphic) This report is printed on recycled paper using soy-based inks.
This report and the financial statements contained herein are submitted for the general information of the shareholders of the fund. This report is not authorized for distribution to prospective investors in the fund unless preceded or accompanied by an effective prospectus.
Mutual fund shares are not deposits or obligations of, or guaranteed by, any depository institution. Shares are not insured by the FDIC, Federal Reserve Board or any other agency, and are subject to investment risks, including possible loss of principal amount invested.
Neither the fund nor Fidelity Distributors Corporation is a bank.
For more information on any Fidelity Advisor fund, including charges and expenses, contact your investment professional for a free prospectus. Read it carefully before you invest or send money.
Annual Report
(photo_of_Edward_C_Johnson_3d)
Dear Shareholder:
A sixth-straight year of double-digit positive returns for the Dow Jones Industrial Average, NASDAQ and S&P 500® could be in jeopardy unless the U.S. stock market shows marked improvement in the final two months of 2000. Through October, all three indexes had negative year-to-date returns. On the other hand, most fixed-income sectors were solidly in the black. Treasuries and other long-term government securities led the way, returning nearly 14%.
While it's impossible to predict the future direction of the markets with any degree of certainty, there are certain basic principles that can help investors plan for their future needs.
First, investors are encouraged to take a long-term view of their portfolios. If you can afford to leave your money invested through the inevitable up and down cycles of the financial markets, you will greatly reduce your vulnerability to any single decline. We know from experience, for example, that stock prices have gone up over longer periods of time, have significantly outperformed other types of investments and have stayed ahead of inflation.
Second, you can further manage your investing risk through diversification. A stock mutual fund, for instance, is already diversified, because it invests in many different companies. You can increase your diversification further by investing in a number of different stock funds, or in such other investment categories as bonds. If you have a short investment time horizon, you might want to consider moving some of your investment into a money market fund, which seeks income and a stable share price by investing in high-quality, short-term investments. Of course, it's important to remember that an investment in a money market fund is not insured or guaranteed by the Federal Deposit Insurance Corporation or any other government agency. Although money market funds seek to preserve the value of your investment at $1.00 per share, it is possible to lose money by investing in these types of funds.
Finally, no matter what your time horizon or portfolio diversity, it makes good sense to follow a regular investment plan, investing a certain amount of money in a fund at the same time each month or quarter and periodically reviewing your overall portfolio. By doing so, you won't get caught up in the excitement of a rapidly rising market, nor will you buy all your shares at market highs. While this strategy - known as dollar cost averaging - won't assure a profit or protect you from a loss in a declining market, it should help you lower the average cost of your purchases. Of course, you should consider your financial ability to continue your purchases through periods of low price levels before undertaking such a strategy.
Remember to contact your investment professional if you need help with your investments.
Best regards,
/s/Edward C. Johnson 3d
Edward C. Johnson 3d
Annual Report
Fidelity Advisor International Capital Appreciation Fund -
Institutional Class
There are several ways to evaluate historical performance. You can look at the total percentage change in value, the average annual percentage change or the growth of a hypothetical $10,000 investment. Total return reflects the change in the value of an investment, assuming reinvestment of the class' dividend income and capital gains (the profits earned upon the sale of securities that have grown in value). If Fidelity had not reimbursed certain class expenses, the life of fund total returns would have been lower.
Cumulative Total Returns
|
Periods ended October 31, 2000 |
|
Past 1 |
Life of |
|
Fidelity Adv Intl Cap App - Inst CL |
|
5.78% |
59.62% |
|
MSCI World ex US |
|
-2.07% |
26.61% |
|
International Funds Average |
|
2.70% |
n/a* |
Cumulative total returns show Institutional Class performance in percentage terms over a set period - in this case, one year or since the fund started on November 3, 1997. For example, if you had invested $1,000 in a fund that had a 5% return over the past year, the value of your investment would be $1,050. You can compare Institutional Class' returns to the performance of the Morgan Stanley Capital International AC World Index Free ex USA - a market capitalization-weighted index that is designed to represent the performance of developed stock markets, excluding the United States, throughout the world. To measure how Institutional Class' performance stacked up against its peers, you can compare it to the international funds average, which reflects the performance of mutual funds with similar objectives tracked by Lipper Inc. The past one year average represents a peer group of 666 mutual funds. These benchmarks include reinvested dividends and capital gains, if any, and exclude the effect of sales charges.
Average Annual Total Returns
|
Periods ended October 31, 2000 |
|
|
Past 1 |
Life of |
|
Fidelity Adv Intl Cap App - Inst CL |
|
|
5.78% |
16.90% |
|
MSCI World ex US |
|
|
-2.07% |
8.20% |
|
International Funds Average |
|
|
2.70% |
n/a* |
Average annual total returns take Institutional Class' cumulative return and show you what would have happened if Institutional Class shares had performed at a constant rate each year.
* Not available
Annual Report
$10,000 Over Life of Fund
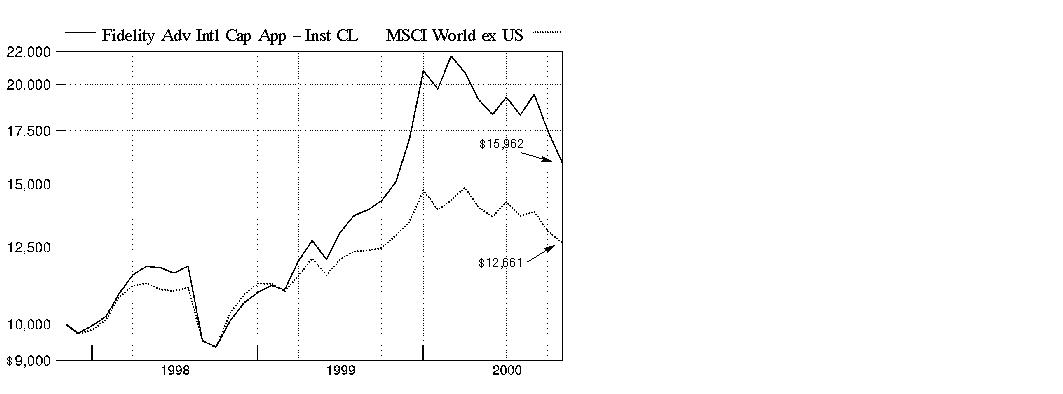
$10,000 Over Life of Fund: Let's say hypothetically that $10,000 was invested in Fidelity Advisor International Capital Appreciation Fund - Institutional Class on November 3, 1997, when the fund started. As the chart shows, by October 31, 2000, the value of the investment would have grown to $15,962 - a 59.62% increase on the initial investment. For comparison, look at how the Morgan Stanley Capital International AC World Index Free ex USA did over the same period. With dividends reinvested, the same $10,000 would have grown to $12,661 - a 26.61% increase.
Understanding
Performance
Many markets around the globe offer the potential for significant growth over time; however, investing in foreign markets means assuming greater risks than investing in the United States. Factors like changes in a country's financial markets, its local political and economic climate, and the fluctuating value of its currency create these risks. For these reasons an international fund's performance may be more volatile than a fund that invests exclusively in the United States. Past performance is no guarantee of future results and you may have a gain or loss when you sell your shares.
3Annual Report
Market Recap
Currency disparities, the see-saw performance of technology and telecommunications stocks, and increased uncertainty over the direction of energy prices contributed to volatile world markets for the 12-month period that ended October 31, 2000. Through the first half of the period, foreign investors enjoyed handsome returns from technology and telecommunications holdings. These gains disappeared down the stretch, however, as the dollar continued to outperform the struggling euro - the uniform currency of 11 European nations - and the Japanese yen by wide margins. Soaring oil and gas prices also added to the volatility. The Morgan Stanley EAFE® index - which tracks the performance of stock markets in Europe, Australasia and the Far East - fell 2.72% during the period. Europe's economic recovery remained on course, but the euro's continued weakness proved to be a millstone. The Morgan Stanley Europe index had a 12-month return of 1.16%. Japan's economic recovery, on the other hand, appeared to be short-lived, or at least very, very slow in the making. The Morgan Stanley Japan index declined 11.61% during the period. Emerging markets, meanwhile, were unable to sustain the momentum they carried into early 2000, as the Morgan Stanley Emerging Markets Free index tumbled 10.33%.
(Portfolio Manager photograph)
An interview with Kevin McCarey, Portfolio Manager of Fidelity Advisor International Capital Appreciation Fund
Q. How did the fund perform, Kevin?
A. For the 12 months that ended October 31, 2000, the fund's Institutional Class shares returned 5.78%. This topped the Morgan Stanley Capital International All Country World Index Free ex USA - which fell 2.07% during the period - as well as the international funds average, which returned 2.70% according to Lipper Inc.
Q. What factors influenced the fund's performance during the period?
A. Just as technology stocks dictated the direction of the U.S. market during the period, new economy stocks - namely, those in the technology, media and telecommunications areas - played a similar role overseas. Through the first six months of the period, risk-taking appetites were high, new economy stocks flourished and the fund - with an abundance of smaller- to medium-sized new economy stocks in its portfolio - benefited accordingly. Then came the March tech decline in the U.S., and new economy stocks fell in step. Investors instead shifted their attention to stocks of more established companies with proven earnings growth, and this trend hurt the fund. In fact, most of the fund's outperformance stems from good stock picking early in the period. During the second half of the period, the fund's technology weighting fell from around 34% to just over 22%, mostly from depreciation.
Annual Report
Fund Talk: The Manager's Overview - continued
Q. You sliced the fund's exposure to Japanese stocks in half during the year, from 34% to 17%. Why?
A. The honeymoon was basically over. The Japanese market performed extraordinarily well through most of 1999, mostly on the heels of a modest economic recovery. As the period wore on, though, a couple of things became clear. First, Japanese stock prices - not unlike dot-coms in the U.S. - had gotten too far ahead of themselves, and growth rate projections seemed overly optimistic. Second, the initial euphoria over a possible economic recovery had given way to the actual restructuring work that needed to be done to sustain the recovery. These trends hurt several of the Internet-related stocks that had boosted the fund's performance, including Softbank and JAFCO, both of which the fund no longer held at the end of the period. One Japanese stock that did perform well for the fund was Furukawa Electric, a leading maker of fiber-optic components.
Q. What was the story in Europe?
A. The big story in Europe was the fall from grace of the major telecommunications stocks. This group - including names such as Deutsche Telekom, France Telecom and Spain's Telefonica - had performed exceptionally well during the past few years, but fell hard when new economy stocks tumbled. Some of these companies had spun out separate Internet service provider divisions, and their stock prices had already been overextended prior to the new economy decline. I moved out of these stocks gradually, but some exposure still hurt the fund. On the plus side, I did find some pretty good stocks elsewhere in Europe. Wella AG - a German hair-care company - and Swatch, the Swiss watchmaker, both benefited from good earnings growth. The fund did not have a stake in Wella at the end of the period.
Q. What was your emerging-markets game plan?
A. Emerging markets weren't the best place to be, but the fund did get good returns from its investments in Mexican television stocks TV Azteca and Grupo Televisa early in the period. I also steered some money away from Japanese technology stocks to several Asian technology names, including Taiwan Semiconductor and South Korea's Samsung Electronics. Weak semiconductor demand hampered these stocks, but I still felt they offered better growth prospects than their Japanese counterparts. By the end of the period, I had sold off the fund's positions in Grupo Televisa and Samsung.
Q. Which other stocks performed well? Which were disappointing?
A. Amvescap, a leading asset manager based in the U.K., performed well, as did French software maker ILOG. Disappointments included Hikari Tsushin, a Japanese cellular phone retailer, and Jazztel, a Spanish telecommunications company, neither of which were owned by the fund at the end of the period.
Annual Report
Fund Talk: The Manager's Overview - continued
Q. What's your outlook?
A. The challenge I face during the next few months is to maintain enough exposure to aggressive growth stocks so that when the market does turn around, the fund can take advantage. Even though risk-taking fell out of favor during the period, my strategy remains the same - to find the faster-growing companies. Many of these opportunities may reside in the new economy area, and I'm confident that our global research team will help uncover the best stories.
The views expressed in this report reflect those of the portfolio manager only through the end of the period of the report as stated on the cover and do not necessarily represent the views of Fidelity or any other person in the Fidelity organization. Any such views are subject to change at any time based upon market or other conditions and Fidelity disclaims any responsibility to update such views. These views may not be relied on as investment advice and, because investment decisions for a Fidelity fund are based on numerous factors, may not be relied on as an indication of trading intent on behalf of any Fidelity fund.
Fund Facts
Goal: seeks capital appreciation by investing in securities of foreign issuers
Start date: November 3, 1997
Size: as of October 31, 2000, more than $263 million
Manager: Kevin McCarey, since inception; joined Fidelity in 1985
3Kevin McCarey covers a variety of subjects:
The falling euro: "The euro continued to fall in value versus the dollar, but I think that was more a reflection of the amazing resiliency of the U.S. economy than of any weakness in Europe. In terms of the fund, the weak euro didn't have much of an impact on stock picking. I tend to look at stock values in terms of local currencies."
Rising oil and gas prices: "The dramatically higher prices didn't really influence the fund's performance. Europe relies on natural gas shipped in from Russia and Eastern Europe, so it's not as dependent on oil price swings. One stock that did benefit from the higher prices was TotalFinaElf, the giant French energy conglomerate. The fund did not own a position in Total at the end of the period."
Broadcasting stocks: "Going into March, the fund had made a nice profit from its positions in several European broadcasting stocks, including Television Francaise 1 (TF1) in France. Much of that strong performance came from an increase in advertising revenue, partly from new economy companies. When new economy stocks stumbled, I moved out of broadcasting stocks, realizing that expectations for advertising revenues would probably be lowered."
Annual Report
|
Top Five Stocks as of October 31, 2000 |
||
|
|
% of fund's |
% of fund's net assets |
|
China Mobile (Hong Kong) Ltd. |
5.4 |
0.9 |
|
Castorama Dubois Investissements SA |
4.6 |
0.3 |
|
Furukawa Electric Co. Ltd. |
4.1 |
2.4 |
|
Nikko Securities Co. Ltd. |
3.7 |
1.2 |
|
Nomura Securities Co. Ltd. |
3.7 |
0.9 |
|
|
21.5 |
5.7 |
|
Top Five Market Sectors as of October 31, 2000 |
||
|
|
% of fund's |
% of fund's net assets |
|
Technology |
22.4 |
33.7 |
|
Finance |
22.2 |
9.7 |
|
Retail & Wholesale |
11.7 |
2.8 |
|
Industrial Machinery & Equipment |
9.1 |
13.7 |
|
Utilities |
6.6 |
17.7 |
|
Top Five Countries as of October 31, 2000 |
||
|
(excluding cash equivalents) |
% of fund's |
% of fund's net assets |
|
Japan |
17.0 |
24.0 |
|
United Kingdom |
13.0 |
10.7 |
|
Germany |
8.6 |
4.3 |
|
France |
7.9 |
8.6 |
|
Hong Kong |
7.1 |
2.4 |
|
Percentages are adjusted for the effect of open futures contracts, if applicable. |
|
Asset Allocation (% of fund's net assets) |
|||||||
|
As of October 31, 2000 |
As of April 30, 2000 |
||||||
|
Stocks 92.8% |
|
|
Stocks 96.9% |
|
||
|
Short-Term |
|
|
Short-Term |
|
||
Annual Report
Showing Percentage of Net Assets
|
Common Stocks - 90.1% |
|||
|
Shares |
Value (Note 1) |
||
|
Belgium - 0.6% |
|||
|
Fortis B |
52,100 |
$ 1,596,432 |
|
|
Canada - 5.3% |
|||
|
Canadian Natural Resources Ltd. (a) |
150,400 |
4,445,320 |
|
|
Nortel Networks Corp. |
115,400 |
5,250,700 |
|
|
Talisman Energy, Inc. (a) |
138,900 |
4,374,552 |
|
|
TOTAL CANADA |
14,070,572 |
||
|
Finland - 1.5% |
|||
|
JOT Automation Group Oyj |
533,000 |
1,854,883 |
|
|
TietoEnator Oyj |
107,400 |
2,064,799 |
|
|
TOTAL FINLAND |
3,919,682 |
||
|
France - 7.9% |
|||
|
Activcard SA (a) |
99,500 |
2,542,225 |
|
|
Castorama Dubois Investissements SA |
59,100 |
12,019,314 |
|
|
ILOG SA sponsored ADR (a) |
20,600 |
618,000 |
|
|
Integra SA (a) |
692,500 |
5,613,433 |
|
|
TOTAL FRANCE |
20,792,972 |
||
|
Germany - 5.9% |
|||
|
Beiersdorf AG |
16,300 |
1,563,405 |
|
|
Deutsche Lufthansa AG (Reg.) |
158,900 |
3,102,109 |
|
|
Hannover Rueckversicherungs AG |
42,100 |
3,541,287 |
|
|
Karstadt Quelle AG |
42,700 |
1,393,935 |
|
|
Software AG |
67,900 |
4,864,269 |
|
|
United Internet AG (a) |
177,400 |
1,141,375 |
|
|
TOTAL GERMANY |
15,606,380 |
||
|
Hong Kong - 7.1% |
|||
|
China Mobile (Hong Kong) Ltd. (a) |
2,310,500 |
14,151,806 |
|
|
Johnson Electric Holdings Ltd. |
1,878,000 |
3,732,904 |
|
|
Li & Fung Ltd. |
392,000 |
728,910 |
|
|
TOTAL HONG KONG |
18,613,620 |
||
|
India - 3.1% |
|||
|
Housing Development Finance Corp. Ltd. |
10,800 |
108,553 |
|
|
Infosys Technologies Ltd. |
29,800 |
4,560,745 |
|
|
Wipro Ltd. sponsored ADR |
64,300 |
3,383,788 |
|
|
TOTAL INDIA |
8,053,086 |
||
|
Common Stocks - continued |
|||
|
Shares |
Value (Note 1) |
||
|
Ireland - 1.6% |
|||
|
Bank of Ireland, Inc. |
273,400 |
$ 2,107,122 |
|
|
Irish Life & Permanent PLC |
213,600 |
2,141,196 |
|
|
TOTAL IRELAND |
4,248,318 |
||
|
Israel - 0.6% |
|||
|
Orad Hi-Tech Systems Ltd. |
51,500 |
1,545,262 |
|
|
Italy - 3.3% |
|||
|
Banca Nazionale del Lavoro (BNL) |
1,076,400 |
3,471,864 |
|
|
Bulgari Spa |
345,800 |
4,060,781 |
|
|
Luxottica Group Spa sponsored ADR |
71,400 |
1,030,838 |
|
|
Saipem Spa |
27,400 |
143,985 |
|
|
TOTAL ITALY |
8,707,468 |
||
|
Japan - 17.0% |
|||
|
DDI Corp. |
43 |
201,778 |
|
|
Furukawa Electric Co. Ltd. |
416,000 |
10,942,352 |
|
|
Nikko Securities Co. Ltd. |
1,140,000 |
9,842,178 |
|
|
Nomura Securities Co. Ltd. |
460,000 |
9,759,876 |
|
|
Omron Corp. |
143,000 |
3,525,525 |
|
|
Sanyo Electric Co. Ltd. |
246,000 |
1,871,323 |
|
|
Shinko Securities Co. Ltd. |
1,689,000 |
5,139,291 |
|
|
Sony Corp. |
14,900 |
1,236,700 |
|
|
Yakult Honsha Co. Ltd. |
215,000 |
2,451,288 |
|
|
TOTAL JAPAN |
44,970,311 |
||
|
Korea (South) - 0.6% |
|||
|
Kookmin Bank |
148,900 |
1,701,715 |
|
|
Mexico - 1.4% |
|||
|
TV Azteca SA de CV sponsored ADR |
297,100 |
3,713,750 |
|
|
Netherlands - 6.2% |
|||
|
Draka Holding NV |
11,700 |
684,740 |
|
|
IHC Caland NV |
54,200 |
2,392,258 |
|
|
Koninklijke Ahold NV |
139,470 |
4,052,221 |
|
|
Koninklijke Philips Electronics NV |
151,193 |
5,943,084 |
|
|
VNU NV |
68,600 |
3,252,016 |
|
|
TOTAL NETHERLANDS |
16,324,319 |
||
|
Spain - 2.5% |
|||
|
Banco Santander Central Hispano SA |
367,200 |
3,559,378 |
|
|
Telefonica SA (a) |
158,700 |
3,026,811 |
|
|
TOTAL SPAIN |
6,586,189 |
||
|
Common Stocks - continued |
|||
|
Shares |
Value (Note 1) |
||
|
Sweden - 3.2% |
|||
|
Adcore AB (a) |
488,200 |
$ 2,007,104 |
|
|
Telefonaktiebolaget LM Ericsson (B Shares) |
470,500 |
6,528,188 |
|
|
TOTAL SWEDEN |
8,535,292 |
||
|
Switzerland - 5.9% |
|||
|
Credit Suisse Group (Reg.) |
34,100 |
6,393,157 |
|
|
Swiss Reinsurance Co. (Reg.) |
1,600 |
3,155,494 |
|
|
The Swatch Group AG (Bearer) |
4,600 |
6,090,682 |
|
|
TOTAL SWITZERLAND |
15,639,333 |
||
|
Taiwan - 3.4% |
|||
|
Taiwan Semiconductor Manufacturing Co. Ltd. (a) |
1,980,000 |
6,007,430 |
|
|
United Microelectronics Corp. (a) |
1,670,000 |
2,947,059 |
|
|
TOTAL TAIWAN |
8,954,489 |
||
|
United Kingdom - 13.0% |
|||
|
Autonomy Corp. PLC (a) |
68,700 |
3,525,641 |
|
|
BAE Systems PLC |
375,900 |
2,133,449 |
|
|
Boots Co. PLC |
727,900 |
5,803,801 |
|
|
Carlton Communications PLC |
202,200 |
1,626,868 |
|
|
Dimension Data Holdings PLC (a) |
558,500 |
4,890,331 |
|
|
Filtronic PLC |
70,600 |
803,438 |
|
|
Hilton Group PLC |
489,500 |
1,358,938 |
|
|
Lloyds TSB Group PLC |
595,800 |
6,063,393 |
|
|
Reuters Group PLC |
122,400 |
2,404,649 |
|
|
Somerfield PLC |
2,479,800 |
2,768,124 |
|
|
SSL International PLC |
240,400 |
2,796,776 |
|
|
TOTAL UNITED KINGDOM |
34,175,408 |
||
|
TOTAL COMMON STOCKS (Cost $249,975,324) |
237,754,598 |
||
|
Nonconvertible Preferred Stocks - 2.7% |
|||
|
|
|
|
|
|
Germany - 2.7% |
|||
|
Wella AG |
179,900 |
7,215,033 |
|
|
Cash Equivalents - 7.9% |
|||
|
Shares |
Value (Note 1) |
||
|
Fidelity Cash Central Fund, 6.61% (b) |
20,698,882 |
$ 20,698,882 |
|
|
Fidelity Securities Lending Cash Central Fund, 6.66% (b) |
80,750 |
80,750 |
|
|
TOTAL CASH EQUIVALENTS (Cost $20,779,632) |
20,779,632 |
||
|
TOTAL INVESTMENT PORTFOLIO - 100.7% (Cost $276,809,576) |
265,749,263 |
||
|
NET OTHER ASSETS - (0.7)% |
(1,947,768) |
||
|
NET ASSETS - 100% |
$ 263,801,495 |
||
|
Legend |
|
(a) Non-income producing |
|
(b) The rate quoted is the annualized seven-day yield of the fund at period end. A complete listing of the fund's holdings as of its most recent fiscal year end is available upon request. |
|
Income Tax Information |
|
At October 31, 2000, the aggregate |
|
The fund hereby designates approximately $728,000 as a capital gain dividend for the purpose of the dividend paid deduction. |
|
At October 31, 2000, the fund had a capital loss carryforward of approximately $23,648,000, all of which will expire on October 31, 2008. |
See accompanying notes which are an integral part of the financial statements.
Annual Report
Statement of Assets and Liabilities
|
|
October 31, 2000 |
|
|
Assets |
|
|
|
Investment in securities, at value (cost $276,809,576) - See accompanying schedule |
|
$ 265,749,263 |
|
Foreign currency held at value (cost $3,179,458) |
|
3,167,716 |
|
Receivable for investments sold |
|
13,969,104 |
|
Receivable for fund shares sold |
|
2,775,998 |
|
Dividends receivable |
|
325,104 |
|
Interest receivable |
|
96,481 |
|
Other receivables |
|
4,454 |
|
Total assets |
|
286,088,120 |
|
Liabilities |
|
|
|
Payable for investments purchased |
$ 21,123,834 |
|
|
Payable for fund shares redeemed |
548,134 |
|
|
Accrued management fee |
169,140 |
|
|
Distribution fees payable |
149,195 |
|
|
Other payables and accrued expenses |
215,572 |
|
|
Collateral on securities loaned, at value |
80,750 |
|
|
Total liabilities |
|
22,286,625 |
|
Net Assets |
|
$ 263,801,495 |
|
Net Assets consist of: |
|
|
|
Paid in capital |
|
$ 297,485,391 |
|
Undistributed net investment income |
|
1,608,803 |
|
Accumulated undistributed net realized gain (loss) on investments and foreign currency transactions |
|
(24,219,362) |
|
Net unrealized appreciation (depreciation) on investments and assets and liabilities in foreign currencies |
|
(11,073,337) |
|
Net Assets |
|
$ 263,801,495 |
See accompanying notes which are an integral part of the financial statements.
Annual Report
Financial Statements - continued
Statement of Assets and Liabilities - continued
|
|
October 31, 2000 |
|
|
Calculation of Maximum Offering Price |
|
$15.26 |
|
Maximum offering price per share (100/94.25 of $15.26) |
|
$16.19 |
|
Class T: |
|
$15.21 |
|
Maximum offering price per share (100/96.50 of $15.21) |
|
$15.76 |
|
Class B: |
|
$14.96 |
|
Class C: |
|
$14.96 |
|
Institutional Class: |
|
$15.35 |
A Redemption price per share is equal to net asset value less any applicable contingent deferred sales charge.
See accompanying notes which are an integral part of the financial statements.
Annual Report
Financial Statements - continued
Statement of Operations
|
|
Year ended October 31, 2000 |
|
|
Investment Income Dividends |
|
$ 2,510,077 |
|
Interest |
|
1,120,172 |
|
Security lending |
|
49,114 |
|
|
|
3,679,363 |
|
Less foreign taxes withheld |
|
(329,520) |
|
Total income |
|
3,349,843 |
|
Expenses |
|
|
|
Management fee |
$ 1,805,011 |
|
|
Transfer agent fees |
675,787 |
|
|
Distribution fees |
1,548,239 |
|
|
Accounting and security lending fees |
151,756 |
|
|
Non-interested trustees' compensation |
744 |
|
|
Custodian fees and expenses |
263,414 |
|
|
Registration fees |
150,046 |
|
|
Audit |
31,520 |
|
|
Legal |
2,311 |
|
|
Miscellaneous |
10,477 |
|
|
Total expenses before reductions |
4,639,305 |
|
|
Expense reductions |
(113,353) |
4,525,952 |
|
Net investment income (loss) |
|
(1,176,109) |
|
Realized and Unrealized Gain (Loss) Net realized gain (loss) on: |
|
|
|
Investment securities |
(20,858,134) |
|
|
Foreign currency transactions |
(276,544) |
(21,134,678) |
|
Change in net unrealized appreciation (depreciation) on: |
|
|
|
Investment securities |
(20,988,173) |
|
|
Assets and liabilities in foreign currencies |
(24,250) |
(21,012,423) |
|
Net gain (loss) |
|
(42,147,101) |
|
Net increase (decrease) in net assets resulting |
|
$ (43,323,210) |
See accompanying notes which are an integral part of the financial statements.
Annual Report
Financial Statements - continued
Statement of Changes in Net Assets
|
|
Year ended
October 31, |
Year ended
October 31, |
|
Increase (Decrease) in Net Assets |
|
|
|
Operations |
$ (1,176,109) |
$ (132,984) |
|
Net realized gain (loss) |
(21,134,678) |
6,701,720 |
|
Change in net unrealized appreciation (depreciation) |
(21,012,423) |
9,215,926 |
|
Net increase (decrease) in net assets resulting |
(43,323,210) |
15,784,662 |
|
Distributions to shareholders |
(54,984) |
- |
|
From net realized gain |
(3,820,036) |
- |
|
Total distributions |
(3,875,020) |
- |
|
Share transactions - net increase (decrease) |
237,287,811 |
34,004,800 |
|
Total increase (decrease) in net assets |
190,089,581 |
49,789,462 |
|
Net Assets |
|
|
|
Beginning of period |
73,711,914 |
23,922,452 |
|
End of period (including under (over) distribution |
$ 263,801,495 |
$ 73,711,914 |
See accompanying notes which are an integral part of the financial statements.
Annual Report
Financial Highlights - Class A
|
Years ended October 31, |
2000 |
1999 |
1998 E |
|
Selected Per-Share Data |
|
|
|
|
Net asset value, beginning of period |
$ 15.06 |
$ 10.07 |
$ 10.00 |
|
Income from Investment Operations |
|
|
|
|
Net investment income (loss) D |
(.03) |
(.01) |
(.00) |
|
Net realized and unrealized gain (loss) |
.88 H |
5.00 |
.07 |
|
Total from investment operations |
.85 |
4.99 |
.07 |
|
Less Distributions |
|
|
|
|
In excess of net investment income |
(.02) I |
- |
- |
|
From net realized gain |
(.63) I |
- |
- |
|
Total distributions |
(.65) |
- |
- |
|
Net asset value, end of period |
$ 15.26 |
$ 15.06 |
$ 10.07 |
|
Total Return B, C |
5.31% |
49.55% |
0.70% |
|
Ratios and Supplemental Data |
|
|
|
|
Net assets, end of period (000 omitted) |
$ 15,348 |
$ 3,407 |
$ 860 |
|
Ratio of expenses to average net assets |
1.55% |
1.72% F |
2.06% A, F |
|
Ratio of expenses to average net assets |
1.50% G |
1.67% G |
2.06% A |
|
Ratio of net investment income (loss) to average net assets |
(.16)% |
(.06)% |
.03% A |
|
Portfolio turnover |
308% |
218% |
199% A |
A Annualized
B The total returns would have been lower had certain expenses not been reduced during the periods shown.
C Total returns do not include the one time sales charge and for periods of less than one year are not annualized.
D Net investment income (loss) per share has been calculated based on average shares outstanding during the period.
E For the period November 3, 1997 (commencement of operations) to October 31, 1998.
F FMR agreed to reimburse a portion of the class' expenses during the period. Without this reimbursement, the class' expense ratio would have been higher.
G FMR or the fund has entered into varying arrangements with third parties who either paid or reduced a portion of the class' expenses.
H The amount shown for a share outstanding does not correspond with the aggregate net loss on investments for the period due to the timing of sales and repurchases of class shares in relation to fluctuating market values of the investments of the fund.
I The amounts shown reflect certain reclassifications related to book to tax differences.
See accompanying notes which are an integral part of the financial statements.
Annual Report
Financial Highlights - Class T
|
Years ended October 31, |
2000 |
1999 |
1998 E |
|
Selected Per-Share Data |
|
|
|
|
Net asset value, beginning of period |
$ 15.02 |
$ 10.04 |
$ 10.00 |
|
Income from Investment Operations |
|
|
|
|
Net investment income (loss) D |
(.06) |
(.04) |
(.03) |
|
Net realized and unrealized gain (loss) |
.88 H |
5.02 |
.07 |
|
Total from investment operations |
.82 |
4.98 |
.04 |
|
Less Distributions |
|
|
|
|
In excess of net investment income |
(.01) I |
- |
- |
|
From net realized gain |
(.62) I |
- |
- |
|
Total distributions |
(.63) |
- |
- |
|
Net asset value, end of period |
$ 15.21 |
$ 15.02 |
$ 10.04 |
|
Total Return B, C |
5.13% |
49.60% |
0.40% |
|
Ratios and Supplemental Data |
|
|
|
|
Net assets, end of period (000 omitted) |
$ 145,721 |
$ 44,233 |
$ 12,117 |
|
Ratio of expenses to average net assets |
1.72% |
1.97% F |
2.31% A, F |
|
Ratio of expenses to average net assets |
1.67% G |
1.92% G |
2.31% A |
|
Ratio of net investment income (loss) to |
(.33)% |
(.31)% |
(.24)% A |
|
Portfolio turnover |
308% |
218% |
199% A |
A Annualized
B The total returns would have been lower had certain expenses not been reduced during the periods shown.
C Total returns do not include the one time sales charge and for periods of less than one year are not annualized.
D Net investment income (loss) per share has been calculated based on average shares outstanding during the period.
E For the period November 3, 1997 (commencement of operations) to October 31, 1998.
F FMR agreed to reimburse a portion of the class' expenses during the period. Without this reimbursement, the class' expense ratio would have been higher.
G FMR or the fund has entered into varying arrangements with third parties who either paid or reduced a portion of the class' expenses.
H The amount shown for a share outstanding does not correspond with the aggregate net loss on investments for the period due to the timing of sales and repurchases of class shares in relation to fluctuating market values of the investments of the fund.
I The amounts shown reflect certain reclassifications related to book to tax differences.
See accompanying notes which are an integral part of the financial statements.
Annual Report
Financial Highlights - Class B
|
Years ended October 31, |
2000 |
1999 |
1998 E |
|
Selected Per-Share Data |
|
|
|
|
Net asset value, beginning of period |
$ 14.82 |
$ 9.99 |
$ 10.00 |
|
Income from Investment Operations |
|
|
|
|
Net investment income (loss) D |
(.16) |
(.10) |
(.07) |
|
Net realized and unrealized gain (loss) |
.89 H |
4.93 |
.06 |
|
Total from investment operations |
.73 |
4.83 |
(.01) |
|
Less Distributions |
|
|
|
|
In excess of net investment income |
(.01) I |
- |
- |
|
From net realized gain |
(.58) I |
- |
- |
|
Total distributions |
(.59) |
- |
- |
|
Net asset value, end of period |
$ 14.96 |
$ 14.82 |
$ 9.99 |
|
Total Return B, C |
4.60% |
48.35% |
(0.10)% |
|
Ratios and Supplemental Data |
|
|
|
|
Net assets, end of period (000 omitted) |
$ 49,140 |
$ 11,098 |
$ 4,047 |
|
Ratio of expenses to average net assets |
2.30% |
2.47% F |
2.81% A, F |
|
Ratio of expenses to average net assets after |
2.26% G |
2.42% G |
2.81% A |
|
Ratio of net investment income (loss) |
(.92)% |
(.81)% |
(.70)% A |
|
Portfolio turnover |
308% |
218% |
199% A |
A Annualized
B The total returns would have been lower had certain expenses not been reduced during the periods shown.
C Total returns do not include the contingent deferred sales charge and for periods of less than one year are not annualized.
D Net investment income (loss) per share has been calculated based on average shares outstanding during the period.
E For the period November 3, 1997 (commencement of operations) to October 31, 1998.
F FMR agreed to reimburse a portion of the class' expenses during the period. Without this reimbursement, the class' expense ratio would have been higher.
G FMR or the fund has entered into varying arrangements with third parties who either paid or reduced a portion of the class' expenses.
H The amount shown for a share outstanding does not correspond with the aggregate net loss on investments for the period due to the timing of sales and repurchases of class shares in relation to fluctuating market values of the investments of the fund.
I The amounts shown reflect certain reclassifications related to book to tax differences.
See accompanying notes which are an integral part of the financial statements.
Annual Report
Financial Highlights - Class C
|
Years ended October 31, |
2000 |
1999 |
1998 E |
|
Selected Per-Share Data |
|
|
|
|
Net asset value, beginning of period |
$ 14.83 |
$ 9.98 |
$ 10.00 |
|
Income from Investment Operations |
|
|
|
|
Net investment income (loss) D |
(.15) |
(.10) |
(.08) |
|
Net realized and unrealized gain (loss) |
.88 H |
4.95 |
.06 |
|
Total from investment operations |
.73 |
4.85 |
(.02) |
|
Less Distributions |
|
|
|
|
In excess of net investment income |
(.01) I |
- |
- |
|
From net realized gain |
(.59) I |
- |
- |
|
Total distributions |
(.60) |
- |
- |
|
Net asset value, end of period |
$ 14.96 |
$ 14.83 |
$ 9.98 |
|
Total Return B, C |
4.59% |
48.60% |
(0.20)% |
|
Ratios and Supplemental Data |
|
|
|
|
Net assets, end of period (000 omitted) |
$ 44,041 |
$ 7,874 |
$ 2,217 |
|
Ratio of expenses to average net assets |
2.25% |
2.47% F |
2.81% A, F |
|
Ratio of expenses to average net assets after |
2.21% G |
2.42% G |
2.81% A |
|
Ratio of net investment income (loss) to average net assets |
(.86)% |
(.81)% |
(.75)% A |
|
Portfolio turnover |
308% |
218% |
199% A |
A Annualized
B The total returns would have been lower had certain expenses not been reduced during the periods shown.
C Total returns do not include the contingent deferred sales charge and for periods of less than one year are not annualized.
D Net investment income (loss) per share has been calculated based on average shares outstanding during the period.
E For the period November 3, 1997 (commencement of operations) to October 31, 1998.
F FMR agreed to reimburse a portion of the class' expenses during the period. Without this reimbursement, the class' expense ratio would have been higher.
G FMR or the fund has entered into varying arrangements with third parties who either paid or reduced a portion of the class' expenses.
H The amount shown for a share outstanding does not correspond with the aggregate net loss on investments for the period due to the timing of sales and repurchases of class shares in relation to fluctuating market values of the investments of the fund.
I The amounts shown reflect certain reclassifications related to book to tax differences.
See accompanying notes which are an integral part of the financial statements.
Annual Report
Financial Highlights - Institutional Class
|
Years ended October 31, |
2000 |
1999 |
1998 E |
|
Selected Per-Share Data |
|
|
|
|
Net asset value, beginning of period |
$ 15.09 |
$ 10.09 |
$ 10.00 |
|
Income from Investment Operations |
|
|
|
|
Net investment income D |
.04 |
.02 |
.04 |
|
Net realized and unrealized gain (loss) |
.88 H |
4.98 |
.05 |
|
Total from investment operations |
.92 |
5.00 |
.09 |
|
Less Distributions |
|
|
|
|
In excess of net investment income |
(.03) I |
- |
- |
|
From net realized gain |
(.63) I |
- |
- |
|
Total distributions |
(.66) |
- |
- |
|
Net asset value, end of period |
$ 15.35 |
$ 15.09 |
$ 10.09 |
|
Total Return B, C |
5.78% |
49.55% |
0.90% |
|
Ratios and Supplemental Data |
|
|
|
|
Net assets, end of period (000 omitted) |
$ 9,551 |
$ 7,099 |
$ 4,682 |
|
Ratio of expenses to average net assets |
1.15% |
1.47% F |
1.81% A, F |
|
Ratio of expenses to average net assets after |
1.10% G |
1.42% G |
1.81% A |
|
Ratio of net investment income to average net assets |
.24% |
.19% |
.34% A |
|
Portfolio turnover |
308% |
218% |
199% A |
A Annualized
B Total returns for periods of less than one year are not annualized.
C The total returns would have been lower had certain expenses not been reduced during the periods shown.
D Net investment income per share has been calculated based on average shares outstanding during the period.
E For the period November 3, 1997 (commencement of operations) to October 31, 1998.
F FMR agreed to reimburse a portion of the class' expenses during the period. Without this reimbursement, the class' expense ratio would have been higher.
G FMR or the fund has entered into varying arrangements with third parties who either paid or reduced a portion of the class' expenses.
H The amount shown for a share outstanding does not correspond with the aggregate net loss on investments for the period due to the timing of sales and repurchases of class shares in relation to fluctuating market values of the investments of the fund.
I The amounts shown reflect certain reclassifications related to book to tax differences.
See accompanying notes which are an integral part of the financial statements.
Annual Report
For the period ended October 31, 2000
1. Significant Accounting Policies.
Fidelity Advisor International Capital Appreciation Fund(the fund) is a fund of Fidelity Advisor Series VIII(the trust) and is authorized to issue an unlimited number of shares. The trust is registered under the Investment Company Act of 1940, as amended (the 1940 Act), as an open-end management investment company organized as a Massachusetts business trust.
The fund offers Class A, Class T, Class B, Class C, and Institutional Class shares, each of which has equal rights as to assets and voting privileges. Each class has exclusive voting rights with respect to matters that affect that class. Class B shares will automatically convert to Class A shares after a holding period of seven years from the initial date of purchase. Investment income, realized and unrealized capital gains and losses, the common expenses of the fund, and certain fund-level expense reductions, if any, are allocated on a pro rata basis to each class based on the relative net assets of each class to the total net assets of the fund. Each class of shares differs in its respective distribution, transfer agent, and certain other class-specific fees, expenses, and expense reductions.
The fund's investments in emerging markets can be subject to social, economic, regulatory, and political uncertainties and can be extremely volatile. The financial statements have been prepared in conformity with generally accepted accounting principles which require management to make certain estimates and assumptions at the date of the financial statements. The following summarizes the significant accounting policies of the fund:
Security Valuation. Securities for which quotations are readily available are valued using the official closing price or at the last sale price in the principal market in which they are traded. If the last sale price (on the local exchange) is unavailable, the last evaluated quote or closing bid price normally is used. If trading or events occurring in other markets after the close of the principal market in which securities are traded are expected to materially affect the value of those securities, then they are valued at their fair value taking this trading or these events into account. Fair value is determined in good faith under consistently applied procedures under the general supervision of the Board of Trustees. Securities for which quotations are not readily available are valued primarily using dealer-supplied valuations or at their fair value. Short-term securities with remaining maturities of sixty days or less for which quotations are not readily available are valued at amortized cost or original cost plus accrued interest, both of which approximate current value. Investments in open-end investment companies are valued at their net asset value each business day.
Foreign Currency Translation. The accounting records of the fund are maintained in U.S. dollars. Investment securities and other assets and liabilities denominated in a foreign currency are translated into U.S. dollars at the prevailing rates of exchange at period end. Purchases and sales of securities, income receipts and expense payments are translated into U.S. dollars at the prevailing exchange rate on the respective dates of the transactions.
Annual Report
Notes to Financial Statements - continued
1. Significant Accounting Policies - continued
Foreign Currency Translation - continued
Net realized gains and losses on foreign currency transactions represent net gains and losses from sales and maturities of foreign currency contracts, disposition of foreign currencies, the difference between the amount of net investment income accrued and the U.S. dollar amount actually received, and gains and losses between trade and settlement date on purchases and sales of securities. The effects of changes in foreign currency exchange rates on investments in securities are included with the net realized and unrealized gain or loss on investment securities.
Income Taxes. As a qualified regulated investment company under Subchapter M of the Internal Revenue Code, the fund is not subject to U.S. federal income taxes to the extent that it distributes substantially all of its taxable income for its fiscal year. The fund may be subject to foreign taxes on income and gains on investments which are accrued based upon the fund's understanding of the tax rules and regulations that exist in the markets in which it invests. Foreign governments may also impose taxes on other payments or transactions with respect to foreign securities. The fund accrues such taxes as applicable. The schedule of investments includes information regarding income taxes under the caption "Income Tax Information."
Investment Income. Dividend income is recorded on the ex-dividend date, except certain dividends from foreign securities where the ex-dividend date may have passed, are recorded as soon as the fund is informed of the ex-dividend date. Non-cash dividends included in dividend income, if any, are recorded at the fair market value of the securities received. Interest income is accrued as earned. Investment income is recorded net of foreign taxes withheld where recovery of such taxes is uncertain.
Expenses. Most expenses of the trust can be directly attributed to a fund. Expenses which cannot be directly attributed are apportioned among the funds in the trust.
Distributions to Shareholders. Distributions are recorded on the ex-dividend date. Income dividends and capital gain distributions are declared separately for each class.
Income and capital gain distributions are determined in accordance with income tax regulations which may differ from generally accepted accounting principles. These differences, which may result in distribution reclassifications, are primarily due to differing treatments for foreign currency transactions, passive foreign investment companies (PFIC) and losses deferred due to wash sales. The fund also utilized earnings and profits distributed to shareholders on redemption of shares as a part of the dividends paid deduction for income tax purposes.
Annual Report
Notes to Financial Statements - continued
1. Significant Accounting Policies - continued
Distributions to Shareholders - continued
Permanent book and tax basis differences relating to shareholder distributions will result in reclassifications to paid in capital. Undistributed net investment income and accumulated undistributed net realized gain (loss) on investments and foreign currency transactions may include temporary book and tax basis differences which will reverse in a subsequent period. Any taxable income or gain remaining at fiscal year end is distributed in the following year.
Security Transactions. Security transactions are accounted for as of trade date. Gains and losses on securities sold are determined on the basis of identified cost.
2. Operating Policies.
Foreign Currency Contracts. The fund generally uses foreign currency contracts to facilitate transactions in foreign-denominated securities. Losses may arise from changes in the value of the foreign currency or if the counterparties do not perform under the contracts' terms. The U.S. dollar value of foreign currency contracts is determined using contractual currency exchange rates established at the time of each trade.
Joint Trading Account. Pursuant to an Exemptive Order issued by the Securities and Exchange Commission (the SEC), the fund, along with other affiliated entities of Fidelity Management & Research Company (FMR), may transfer uninvested cash balances into one or more joint trading accounts. These balances are invested in one or more repurchase agreements for U.S. Treasury or Federal Agency obligations.
Repurchase Agreements. The underlying U.S. Treasury, Federal Agency, or other obligations found to be satisfactory by FMR are transferred to an account of the fund, or to the Joint Trading Account, at a custodian bank. The securities are marked-to-market daily and maintained at a value at least equal to the principal amount of the repurchase agreement (including accrued interest). FMR, the fund's investment adviser, is responsible for determining that the value of the underlying securities remains in accordance with the market value requirements stated above.
Restricted Securities. The fund is permitted to invest in securities that are subject to legal or contractual restrictions on resale. These securities generally may be resold in transactions exempt from registration or to the public if the securities are registered. Disposal of these securities may involve time-consuming negotiations and expense, and prompt sale at an acceptable price may be difficult. At the end of the period, the fund had no investments in restricted securities.
3. Purchases and Sales of Investments.
Purchases and sales of securities, other than short-term securities, aggregated $918,911,157 and $703,009,317, respectively.
Annual Report
Notes to Financial Statements - continued
4. Fees and Other Transactions with Affiliates.
Management Fee. As the fund's investment adviser, FMR receives a monthly fee that is calculated on the basis of a group fee rate plus a fixed individual fund fee rate applied to the average net assets of the fund. The group fee rate is the weighted average of a series of rates and is based on the monthly average net assets of all the mutual funds advised by FMR. The rates ranged from .2167% to .5200% for the period. The annual individual fund fee rate is .45%. In the event that these rates were lower than the contractual rates in effect during the period, FMR voluntarily implemented the above rates, as they resulted in the same or a lower management fee. For the period, the management fee was equivalent to an annual rate of .72% of average net assets.
Sub-Adviser Fee. Beginning January 1, 2001, FMR Co.(FMRC) will serve as a sub-adviser for the fund. FMRC may provide investment research and advice and may also provide investment advisory services for the fund. FMR, on behalf of the fund, entered into sub-advisory agreements with Fidelity Management & Research (U.K.) Inc., Fidelity Management & Research (Far East) Inc., and Fidelity International Investment Advisors (FIIA). Under the sub-advisory arrangements, FMR may receive investment advice and research services and may grant the sub-advisers investment management authority to buy and sell securities. FMR pays its sub-advisers either a portion of its management fee or a fee based on costs incurred for these services.
Distribution and Service Plan. In accordance with Rule 12b-1 of the 1940 Act, the Board of Trustees have adopted separate Distribution and Service Plans with respect to each class of shares (collectively referred to as "the Plans"). Under certain of the Plans, the class pays Fidelity Distributors Corporation (FDC), an affiliate of FMR, a 12b-1 fee. A portion of this fee may be reallowed to securities dealers, banks and other financial institutions for the distribution of each class of shares and providing shareholder support services. For the period, this fee was based on the following annual rates of the average net assets of each applicable class:
|
Class A |
.25% |
|
Class T |
.50% |
|
Class B |
1.00%* |
|
Class C |
1.00%* |
* .75% represents a distribution fee and .25% represents a shareholder service fee.
Annual Report
Notes to Financial Statements - continued
4. Fees and Other Transactions with Affiliates - continued
Distribution and Service Plan - continued
For the period, each class paid FDC the following amounts, a portion of which was retained by FDC:
|
|
Paid to |
Retained |
|
Class A |
$ 34,304 |
$ 0 |
|
Class T |
726,487 |
4,874 |
|
Class B |
434,547 |
325,910 |
|
Class C |
352,901 |
266,709 |
|
|
$ 1,548,239 |
$ 597,493 |
Sales Load. FDC receives a front-end sales charge of up to 5.75% for selling Class A shares, and 3.50% for selling Class T shares of the fund. FDC receives the proceeds of contingent deferred sales charges levied on Class B share redemptions occurring within six years of purchase and Class C share redemptions occurring within one year of purchase. Contingent deferred sales charges are based on declining rates ranging from 5% to 1% for Class B and 1% for Class C, of the lesser of the cost of shares at the initial date of purchase or the net asset value of the redeemed shares, excluding any reinvested dividends and capital gains. In addition, purchases of Class A and Class T shares that were subject to a finder's fee bear a contingent deferred sales charge on assets that do not remain in the fund for at least one year. The Class A and Class T contingent deferred sales charge is based on 0.25% of the lesser of the cost of shares at the initial date of purchase or the net asset value of the redeemed shares, excluding any reinvested dividends and capital gains. A portion of the sales charges paid to FDC is paid to securities dealers, banks and other financial institutions.
For the period, sales charge amounts paid to and retained by FDC were as follows:
|
|
Paid to |
Retained |
|
Class A |
$ 164,325 |
$ 62,199 |
|
Class T |
410,611 |
141,668 |
|
Class B |
75,608 |
75,608 * |
|
Class C |
58,603 |
58,603 * |
|
|
$ 709,147 |
$ 338,078 |
* When Class B and Class C shares are initially sold, FDC pays commissions from its own resources to securities dealers,
banks, and other financial institutions through which the sales are made.
Annual Report
Notes to Financial Statements - continued
4. Fees and Other Transactions with Affiliates - continued
Transfer Agent Fees. Fidelity Investments Institutional Operations Company, Inc., (FIIOC), an affiliate of FMR, is the transfer, dividend disbursing and shareholder servicing agent (collectively referred to as the transfer agent) for each class of the fund. FIIOC receives account fees and asset-based fees that vary according to the account size and type of account of the shareholders of the respective classes of the fund. FIIOC pays for typesetting, printing and mailing of all shareholder reports, except proxy statements. For the period, the following amounts were paid to FIIOC:
|
|
Amount |
% of |
|
Class A |
$ 45,472 |
.33 |
|
Class T |
361,400 |
.25 |
|
Class B |
147,272 |
.34 |
|
Class C |
101,734 |
.29 |
|
Institutional Class |
19,909 |
.18 |
|
|
$ 675,787 |
|
Accounting and Security Lending Fees. Fidelity Service Company, Inc., an affiliate of FMR, maintains the fund's accounting records and administers the security lending program. The security lending fee is based on the number and duration of lending transactions. The accounting fee is based on the level of average net assets for the month plus out-of-pocket expenses.
Cash Central Funds. Pursuant to an Exemptive Order issued by the SEC, the fund may invest in the Fidelity Cash Central Fund and the Fidelity Securities Lending Cash Central Fund (the Cash Funds) managed by Fidelity Investments Money Management, Inc., an affiliate of FMR. The Cash Funds are open-end money market funds available only to investment companies and other accounts managed by FMR and its affiliates. The Cash Funds seek preservation of capital, liquidity, and current income. Income distributions from the Cash Funds are declared daily and paid monthly from net investment income. Income distributions earned by the fund are recorded as either interest income or security lending income in the accompanying financial statements.
Brokerage Commissions. The fund placed a portion of its portfolio transactions with brokerage firms which are affiliates of FMR. The commissions paid to these affiliated firms were $13,320 for the period.
Annual Report
Notes to Financial Statements - continued
5. Security Lending.
The fund lends portfolio securities from time to time in order to earn additional income. The fund receives collateral in the form of U.S. Treasury obligations, letters of credit, and/or cash against the loaned securities, and maintains collateral in an amount not less than 100% of the market value of the loaned securities during the period of the loan. The market value of the loaned securities is determined at the close of business of the fund and any additional required collateral is delivered to the fund on the next business day. If the borrower defaults on its obligation to return the securities loaned because of insolvency or other reasons, the fund could experience delays and costs in recovering the securities loaned or in gaining access to the collateral. At period end, the value of the securities loaned amounted to $69,535. The fund received cash collateral of $80,750 which was invested in cash equivalents.
6. Expense Reductions.
FMR has directed certain portfolio trades to brokers who paid a portion of the fund's expenses. For the period, the fund's expenses were reduced by $111,348 under this arrangement.
In addition, through an arrangement with the fund's custodian, credits realized as a result of uninvested cash balances were used to reduce a portion of expenses. During the period, the fund's custodian fees were reduced by $2,005 under the custodian arrangement.
7. Distributions to Shareholders.
Distributions to shareholders of each class were as follows:
|
|
Year ended October 31, |
|
|
2000 |
|
In excess of net investment income |
|
|
Class A |
$ 4,983 |
|
Class T |
26,087 |
|
Class B |
5,868 |
|
Class C |
4,607 |
|
Institutional Class |
13,439 |
|
Total |
$ 54,984 |
|
From net realized gain |
|
|
Class A |
$ 185,477 |
|
Class T |
2,368,340 |
|
Class B |
532,713 |
|
Class C |
418,246 |
|
Institutional Class |
315,260 |
|
Total |
$ 3,820,036 |
|
|
$ 3,875,020 |
Annual Report
Notes to Financial Statements - continued
8. Share Transactions.
Transactions for each class of shares were as follows:
|
|
Shares |
Dollars |
||
|
|
Year ended October 31, |
Year ended October 31, |
Year ended October 31, |
Year ended October 31, |
|
|
2000 |
1999 |
2000 |
1999 |
|
|
|
|
|
|
|
Class A |
1,298,390 |
171,382 |
$ 24,276,500 |
$ 2,262,199 |
|
Reinvestment of distributions |
11,029 |
- |
182,210 |
- |
|
Shares redeemed |
(529,938) |
(30,537) |
(9,521,477) |
(375,127) |
|
Net increase (decrease) |
779,481 |
140,845 |
$ 14,937,233 |
$ 1,887,072 |
|
Class T |
10,643,173 |
2,655,095 |
$ 198,331,205 |
$ 35,017,679 |
|
Reinvestment of distributions |
139,588 |
- |
2,301,807 |
- |
|
Shares redeemed |
(4,147,046) |
(915,882) |
(73,453,339) |
(11,570,979) |
|
Net increase (decrease) |
6,635,715 |
1,739,213 |
$ 127,179,673 |
$ 23,446,700 |
|
Class B |
3,121,970 |
490,982 |
$ 58,110,416 |
$ 6,457,280 |
|
Reinvestment of distributions |
27,962 |
- |
455,782 |
- |
|
Shares redeemed |
(613,723) |
(147,536) |
(10,750,739) |
(1,813,165) |
|
Net increase (decrease) |
2,536,209 |
343,446 |
$ 47,815,459 |
$ 4,644,115 |
|
Class C |
3,154,880 |
381,866 |
$ 58,126,678 |
$ 5,012,400 |
|
Reinvestment of distributions |
23,657 |
- |
385,612 |
- |
|
Shares redeemed |
(765,264) |
(72,877) |
(13,960,952) |
(886,960) |
|
Net increase (decrease) |
2,413,273 |
308,989 |
$ 44,551,338 |
$ 4,125,440 |
|
Institutional Class |
318,946 |
898,968 |
$ 5,848,714 |
$ 10,922,948 |
|
Reinvestment of distributions |
18,789 |
- |
310,963 |
- |
|
Shares redeemed |
(185,886) |
(892,708) |
(3,355,569) |
(11,021,475) |
|
Net increase (decrease) |
151,849 |
6,260 |
$ 2,804,108 |
$ (98,527) |
Annual Report
To the Trustees of Fidelity Advisor Series VIII and Shareholders of Fidelity Advisor International Capital Appreciation Fund:
We have audited the accompanying statement of assets and liabilities of Fidelity Advisor International Capital Appreciation Fund, (the Fund), a fund of Fidelity Advisor Series VIII (the Trust), including the portfolio of investments, as of October 31, 2000, and the related statement of operations for the year then ended, the statement of changes in net assets for each of the two years in the period then ended, and the financial highlights for each of the three years in the period then ended. These financial statements and financial highlights are the responsibility of the Fund's management. Our responsibility is to express an opinion on these financial statements and financial highlights based on our audits.
We conducted our audits in accordance with auditing standards generally accepted in the United States of America. Those standards require that we plan and perform the audit to obtain reasonable assurance about whether the financial statements and financial highlights are free of material misstatement. An audit includes examining, on a test basis, evidence supporting the amounts and disclosures in the financial statements. Our procedures included confirmation of securities owned as of October 31, 2000, by correspondence with the custodian and brokers; where replies were not received from brokers, we performed other auditing procedures. An audit also includes assessing the accounting principles used and significant estimates made by management, as well as evaluating the overall financial statement presentation. We believe that our audits provide a reasonable basis for our opinion.
In our opinion, the financial statements and financial highlights referred to above present fairly, in all material respects, the financial position of Fidelity Advisor International Capital Appreciation Fund as of October 31, 2000, the results of its operations for the year then ended, the changes in its net assets for each of the two years in the period then ended, and its financial highlights for each of the three years in the period then ended, in conformity with accounting principles generally accepted in the United States of America.
/s/DELOITTE & TOUCHE LLP
DELOITTE & TOUCHE LLP
Boston, Massachusetts
December 8, 2000
Annual Report
The fund hereby designates 100% of the long-term capital gain dividends distributed during the fiscal year as 20%-rate capital gain dividends.
The amounts per share which represent income derived from sources within, and taxes paid to, foreign countries or possessions of the United States are as follows:
|
|
Pay Date |
Income |
Taxes |
|
|
Institutional Class |
12/6/99 |
$0.082 |
$0.009 |
|
The fund will notify shareholders in January 2001 of amounts for use in preparing 2000 income tax returns.
Annual Report
Annual Report
Annual Report
Annual Report
Annual Report
Annual Report
Annual Report
Investment Adviser
Fidelity Management & Research Company
Boston, MA
Investment Sub-Advisers
Fidelity Management & Research
(U.K.) Inc.
Fidelity Management & Research
(Far East) Inc.
Fidelity International Investment Advisors
Fidelity International Investment Advisors (U.K.) Limited
Fidelity Investments Japan Limited
Officers
Edward C. Johnson 3d, President
Robert C. Pozen, Senior Vice President
Richard Spillane, Jr., Vice President
Kevin McCarey, Vice President
Eric D. Roiter, Secretary
Robert A. Dwight, Treasurer
Maria F. Dwyer, Deputy Treasurer
John H. Costello, Assistant Treasurer
Thomas J. Simpson, Assistant Treasurer
Board of Trustees
Ralph F. Cox *
Phyllis Burke Davis *
Robert M. Gates *
Edward C. Johnson 3d
Donald J. Kirk *
Ned C. Lautenbach *
Peter S. Lynch
Marvin L. Mann *
William O. McCoy *
Gerald C. McDonough *
Robert C. Pozen
Thomas R. Williams *
Advisory Board
J. Michael Cook
Abigail P. Johnson
Marie L. Knowles
General Distributor
Fidelity Distributors Corporation
Boston, MA
Transfer and Shareholder
Servicing Agents
Fidelity Investments Institutional Operations Company, Inc.
Boston, MA
Custodian
Brown Brothers Harriman & Co.
Boston, MA
* Independent trustees
Annual Report
Focus Funds
Fidelity Advisor Consumer
Industries Fund
Fidelity Advisor Cyclical
Industries Fund
Fidelity Advisor Financial
Services Fund
Fidelity Advisor Health Care Fund
Fidelity Advisor Natural
Resources Fund
Fidelity Advisor Technology Fund
Fidelity Advisor Telecommunications & Utilities Growth Fund
Growth Funds
Fidelity Advisor Korea Fund
Fidelity Advisor Emerging Asia Fund
Fidelity Advisor Latin America Fund
Fidelity Advisor Japan Fund
Fidelity Advisor Europe Capital Appreciation Fund
Fidelity Advisor International
Capital Appreciation Fund
Fidelity Advisor Overseas Fund
Fidelity Advisor Diversified International Fund
Fidelity Advisor Global Equity Fund
Fidelity Advisor TechnoQuant®
Growth Fund
Fidelity Advisor Small Cap Fund
Fidelity Advisor Value Strategies Fund
Fidelity Advisor Mid Cap Fund
Fidelity Advisor Dynamic Capital Appreciation Fund
Fidelity Advisor Equity Growth Fund
Fidelity Advisor Large Cap Fund
Fidelity Advisor Dividend Growth Fund
Fidelity Advisor Growth
Opportunities Fund
Growth and Income Funds
Fidelity Advisor Growth & Income Fund
Fidelity Advisor Equity Income Fund
Fidelity Advisor Asset Allocation Fund
Fidelity Advisor Balanced Fund
Taxable Income Funds
Fidelity Advisor Emerging Markets Income Fund
Fidelity Advisor High Yield Fund
Fidelity Advisor High Income Fund
Fidelity Advisor Strategic Income Fund
Fidelity Advisor Mortgage
Securities Fund
Fidelity Advisor Government Investment Fund
Fidelity Advisor Intermediate Bond Fund
Fidelity Advisor Short Fixed-Income Fund
Municipal Funds
Fidelity Advisor Municipal Income Fund
Money Market Funds
Prime Fund
Treasury Fund
Tax-Exempt Fund
AICAPI-ANN-1200 118947
1.711986.102
(Fidelity Investment logo)(registered trademark)
Fidelity® Advisor
Fund - Class A, Class T, Class B
and Class C
Annual Report
October 31, 2000
(2_fidelity_logos)(registered trademark)
|
President's Message |
Ned Johnson on investing strategies. |
|
|
Performance |
How the fund has done over time. |
|
|
Fund Talk |
The manager's review of fund performance, strategy and outlook. |
|
|
Investment Changes |
A summary of major shifts in the fund's investments over the past six months. |
|
|
Investments |
A complete list of the fund's investments with their market values. |
|
|
Financial Statements |
Statements of assets and liabilities,
operations, and changes in net assets, |
|
|
Notes |
Notes to the financial statements. |
|
|
Report of Independent Accountants |
The auditors' opinion. |
|
|
Distributions |
|
Standard & Poor's, S&P and S&P 500 are registered service marks of The McGraw-Hill Companies, Inc. and have been licensed for use by Fidelity Distributors Corporation.
Other third party marks appearing herein are the property of their respective owners.
All other marks appearing herein are registered or unregistered trademarks or service marks of FMR Corp. or an affiliated company.
(Recycle graphic) This report is printed on recycled paper using soy-based inks.
This report and the financial statements contained herein are submitted for the general information of the shareholders of the fund. This report is not authorized for distribution to prospective investors in the fund unless preceded or accompanied by an effective prospectus.
Mutual fund shares are not deposits or obligations of, or guaranteed by, any depository institution. Shares are not insured by the FDIC, Federal Reserve Board or any other agency, and are subject to investment risks, including possible loss of principal amount invested.
Neither the fund nor Fidelity Distributors Corporation is a bank.
For more information on any Fidelity Advisor fund, including charges and expenses, contact your investment professional for a free prospectus. Read it carefully before you invest or send money.
Annual Report
(photo_of_Edward_C_Johnson_3d)
Dear Shareholder:
A sixth-straight year of double-digit positive returns for the Dow Jones Industrial Average, NASDAQ and S&P 500® could be in jeopardy unless the U.S. stock market shows marked improvement in the final two months of 2000. Through October, all three indexes had negative year-to-date returns. On the other hand, most fixed-income sectors were solidly in the black. Treasuries and other long-term government securities led the way, returning nearly 14%.
While it's impossible to predict the future direction of the markets with any degree of certainty, there are certain basic principles that can help investors plan for their future needs.
First, investors are encouraged to take a long-term view of their portfolios. If you can afford to leave your money invested through the inevitable up and down cycles of the financial markets, you will greatly reduce your vulnerability to any single decline. We know from experience, for example, that stock prices have gone up over longer periods of time, have significantly outperformed other types of investments and have stayed ahead of inflation.
Second, you can further manage your investing risk through diversification. A stock mutual fund, for instance, is already diversified, because it invests in many different companies. You can increase your diversification further by investing in a number of different stock funds, or in such other investment categories as bonds. If you have a short investment time horizon, you might want to consider moving some of your investment into a money market fund, which seeks income and a stable share price by investing in high-quality, short-term investments. Of course, it's important to remember that an investment in a money market fund is not insured or guaranteed by the Federal Deposit Insurance Corporation or any other government agency. Although money market funds seek to preserve the value of your investment at $1.00 per share, it is possible to lose money by investing in these types of funds.
Finally, no matter what your time horizon or portfolio diversity, it makes good sense to follow a regular investment plan, investing a certain amount of money in a fund at the same time each month or quarter and periodically reviewing your overall portfolio. By doing so, you won't get caught up in the excitement of a rapidly rising market, nor will you buy all your shares at market highs. While this strategy - known as dollar cost averaging - won't assure a profit or protect you from a loss in a declining market, it should help you lower the average cost of your purchases. Of course, you should consider your financial ability to continue your purchases through periods of low price levels before undertaking such a strategy.
Remember to contact your investment professional if you need help with your investments.
Best regards,
/s/Edward C. Johnson 3d
Edward C. Johnson 3d
Annual Report
Fidelity Advisor Japan Fund - Class A
There are several ways to evaluate historical performance. You can look at the total percentage change in value, the average annual percentage change or the growth of a hypothetical $10,000 investment. Total return reflects the change in the value of an investment, assuming reinvestment of the class' dividend income and capital gains (the profits earned upon the sale of securities that have grown in value). If Fidelity had not reimbursed certain class expenses, the life of fund total returns would have been lower.
Cumulative Total Returns
|
Periods ended October 31, 2000 |
Past 1 |
Life of |
|
Fidelity Adv Japan - CL A |
-5.07% |
80.75% |
|
Fidelity Adv Japan - CL A |
-10.53% |
70.35% |
|
TOPIX |
-15.16% |
35.94% |
|
Japanese Funds Average |
-16.10% |
n/a* |
Cumulative total returns show Class A's performance in percentage terms over a set period - in this case, one year or since the fund started on December 17, 1998. For example, if you had invested $1,000 in a fund that had a 5% return over the past year, the value of your investment would be $1,050. You can compare Class A's returns to the performance of the Tokyo Stock Exchange Index (TOPIX) - a market capitalization-weighted index of over 1,300 stocks traded in the Japanese market. To measure how Class A's performance stacked up against its peers, you can compare it to the Japanese funds average, which reflects the performance of mutual funds with similar objectives tracked by Lipper Inc. The past one year average represents a peer group of 48 mutual funds. These benchmarks include reinvested dividends and capital gains, if any, and exclude the effect of sales charges.
Average Annual Total Returns
|
Periods ended October 31, 2000 |
|
|
Past 1 |
Life of |
|
Fidelity Adv Japan - CL A |
|
|
-5.07% |
37.14% |
|
Fidelity Adv Japan - CL A |
|
|
-10.53% |
32.88% |
|
TOPIX |
|
|
-15.16% |
17.80% |
|
Japanese Funds Average |
|
|
-16.10% |
n/a* |
Average annual total returns take Class A shares' cumulative return and show you what would have happened if Class A shares had performed at a constant rate each year.
* Not available
Annual Report
$10,000 Over Life of Fund
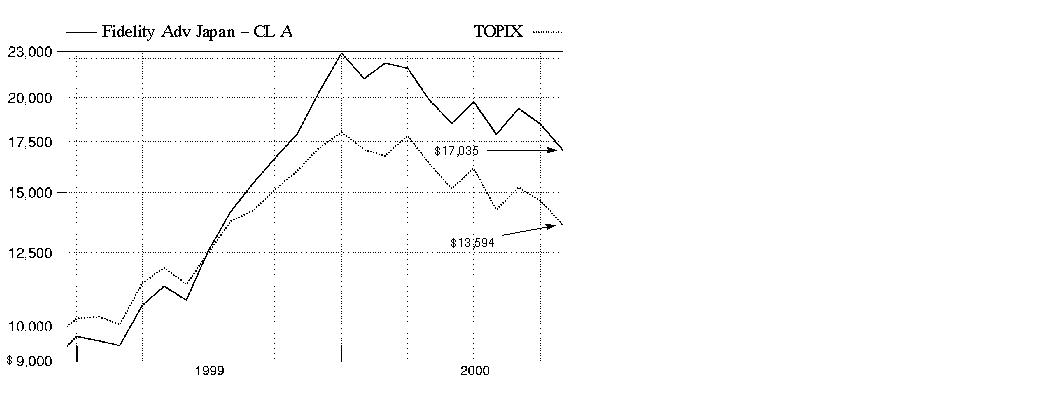
$10,000 Over Life of Fund: Let's say hypothetically that $10,000 was invested in Fidelity Advisor Japan Fund - Class A on December 17, 1998, when the fund started, and the current 5.75% sales charge was paid. As the chart shows, by October 31, 2000, the value of the investment would have grown to $17,035 - a 70.35% increase on the initial investment. For comparison, look at how the Tokyo Stock Exchange Index (TOPIX) did over the same period. With dividends reinvested, the same $10,000 would have grown to $13,594 - a 35.94% increase.
Understanding
Performance
Many markets around the globe offer the potential for significant growth over time; however, investing in foreign markets means assuming greater risks than investing in the United States. Factors like changes in a country's financial markets, its local political and economic climate, and the fluctuating value of its currency create these risks. For these reasons an international fund's performance may be more volatile than a fund that invests exclusively in the United States. Past performance is no guarantee of future results and you may have a gain or loss when you sell your shares.
3Annual Report
Fidelity Advisor Japan Fund - Class T
There are several ways to evaluate historical performance. You can look at the total percentage change in value, the average annual percentage change or the growth of a hypothetical $10,000 investment. Total return reflects the change in the value of an investment, assuming reinvestment of the class' dividend income and capital gains (the profits earned upon the sale of securities that have grown in value). If Fidelity had not reimbursed certain class expenses, the life of fund total returns would have been lower.
Cumulative Total Returns
|
Periods ended October 31, 2000 |
|
Past 1 |
Life of |
|
Fidelity Adv Japan - CL T |
|
-5.29% |
80.05% |
|
Fidelity Adv Japan - CL T |
|
-8.60% |
73.75% |
|
TOPIX |
|
-15.16% |
35.94% |
|
Japanese Funds Average |
|
-16.10% |
n/a* |
Cumulative total returns show Class T's performance in percentage terms over a set period - in this case, one year or since the fund started on December 17, 1998. For example, if you had invested $1,000 in a fund that had a 5% return over the past year, the value of your investment would be $1,050. You can compare Class T's returns to the performance of the Tokyo Stock Exchange Index (TOPIX) - a market capitalization-weighted index of over 1,300 stocks traded in the Japanese market. To measure how Class T's performance stacked up against its peers, you can compare it to the Japanese funds average, which reflects the performance of mutual funds with similar objectives tracked by Lipper Inc. The past one year average represents a peer group of 48 mutual funds. These benchmarks include reinvested dividends and capital gains, if any, and exclude the effect of sales charges.
Average Annual Total Returns
|
Periods ended October 31, 2000 |
|
Past 1 |
Life of |
|
Fidelity Adv Japan - CL T |
|
-5.29% |
36.86% |
|
Fidelity Adv Japan - CL T |
|
-8.60% |
34.29% |
|
TOPIX |
|
-15.16% |
17.80% |
|
Japanese Funds Average |
|
-16.10% |
n/a* |
Average annual total returns take Class T shares' cumulative return and show you what would have happened if Class T shares had performed at a constant rate each year.
* Not available
Annual Report
$10,000 Over Life of Fund
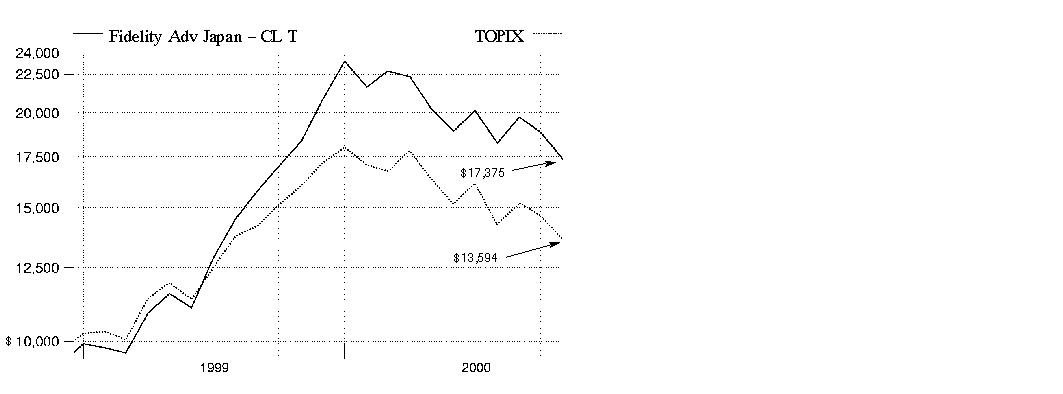
$10,000 Over Life of Fund: Let's say hypothetically that $10,000 was invested in Fidelity Advisor Japan Fund - Class T on December 17, 1998, when the fund started, and the current 3.50% sales charge was paid. As the chart shows, by October 31, 2000, the value of the investment would have grown to $17,375 - a 73.75% increase on the initial investment. For comparison, look at how the Tokyo Stock Exchange Index (TOPIX) did over the same period. With dividends reinvested, the same $10,000 would have grown to $13,594 - a 35.94% increase.
Understanding
Performance
Many markets around the globe offer the potential for significant growth over time; however, investing in foreign markets means assuming greater risks than investing in the United States. Factors like changes in a country's financial markets, its local political and economic climate, and the fluctuating value of its currency create these risks. For these reasons an international fund's performance may be more volatile than a fund that invests exclusively in the United States. Past performance is no guarantee of future results and you may have a gain or loss when you sell your shares.
3Annual Report
Fidelity Advisor Japan Fund - Class B
There are several ways to evaluate historical performance. You can look at the total percentage change in value, the average annual percentage change or the growth of a hypothetical $10,000 investment. Total return reflects the change in the value of an investment, assuming reinvestment of the class' dividend income and capital gains (the profits earned upon the sale of securities that have grown in value). Class B shares' contingent deferred sales charge included in the past one year and life of fund total return figures are 5% and 4%, respectively. If Fidelity had not reimbursed certain class expenses, the life of fund total returns would have been lower.
Cumulative Total Returns
|
Periods ended October 31, 2000 |
|
Past 1 |
Life of |
|
Fidelity Adv Japan - CL B |
|
-5.83% |
78.17% |
|
Fidelity Adv Japan - CL B |
|
-10.47% |
74.17% |
|
TOPIX |
|
-15.16% |
35.94% |
|
Japanese Funds Average |
|
-16.10% |
n/a* |
Cumulative total returns show Class B's performance in percentage terms over a set period - in this case, one year or since the fund started on December 17, 1998. For example, if you had invested $1,000 in a fund that had a 5% return over the past year, the value of your investment would be $1,050. You can compare Class B's returns to the performance of the Tokyo Stock Exchange Index (TOPIX) - a market capitalization-weighted index of over 1,300 stocks traded in the Japanese market. To measure how Class B's performance stacked up against its peers, you can compare it to the Japanese funds average, which reflects the performance of mutual funds with similar objectives tracked by Lipper Inc. The past one year average represents a peer group of 48 mutual funds. These benchmarks include reinvested dividends and capital gains, if any, and exclude the effect of sales charges.
Average Annual Total Returns
|
Periods ended October 31, 2000 |
|
Past 1 |
Life of |
|
Fidelity Adv Japan - CL B |
|
-5.83% |
36.10% |
|
Fidelity Adv Japan - CL B |
|
-10.47% |
34.46% |
|
TOPIX |
|
-15.16% |
17.80% |
|
Japanese Funds Average |
|
-16.10% |
n/a* |
Average annual total returns take Class B shares' cumulative return and show you what would have happened if Class B shares had performed at a constant rate each year.
* Not available
Annual Report
$10,000 Over Life of Fund
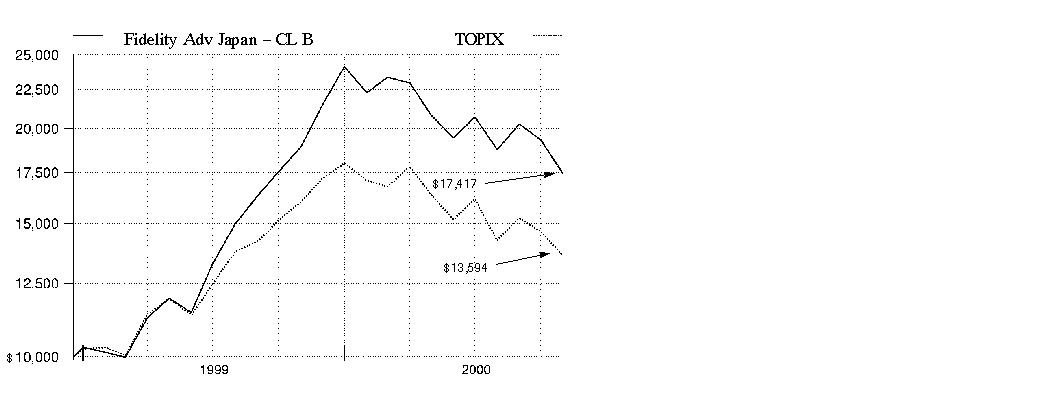
$10,000 Over Life of Fund: Let's say hypothetically that $10,000 was invested in Fidelity Advisor Japan Fund - Class B on December 17, 1998, when the fund started. As the chart shows, by October 31, 2000, the value of the investment, including the effect of the applicable contingent deferred sales charge, would have grown to $17,417 - a 74.17% increase on the initial investment. For comparison, look at how the Tokyo Stock Exchange Index (TOPIX) did over the same period. With dividends reinvested, the same $10,000 would have grown to $13,594 - a 35.94% increase.
Understanding
Performance
Many markets around the globe offer the potential for significant growth over time; however, investing in foreign markets means assuming greater risks than investing in the United States. Factors like changes in a country's financial markets, its local political and economic climate, and the fluctuating value of its currency create these risks. For these reasons an international fund's performance may be more volatile than a fund that invests exclusively in the United States. Past performance is no guarantee of future results and you may have a gain or loss when you sell your shares.
3Annual Report
Fidelity Advisor Japan Fund - Class C
There are several ways to evaluate historical performance. You can look at the total percentage change in value, the average annual percentage change or the growth of a hypothetical $10,000 investment. Total return reflects the change in the value of an investment, assuming reinvestment of the class' dividend income and capital gains (the profits earned upon the sale of securities that have grown in value). Class C shares' contingent deferred sales charge included in the past one year and life of fund total return figures are 1% and 0%, respectively. If Fidelity had not reimbursed certain class expenses, the life of fund total returns would have been lower.
Cumulative Total Returns
|
Periods ended October 31, 2000 |
|
Past 1 |
Life of |
|
Fidelity Adv Japan - CL C |
|
-5.72% |
78.47% |
|
Fidelity Adv Japan - CL C |
|
-6.65% |
78.47% |
|
TOPIX |
|
-15.16% |
35.94% |
|
Japanese Funds Average |
|
-16.10% |
n/a* |
Cumulative total returns show Class C's performance in percentage terms over a set period - in this case, one year or since the fund started on December 17, 1998. For example, if you had invested $1,000 in a fund that had a 5% return over the past year, the value of your investment would be $1,050. You can compare Class C's returns to the performance of the Tokyo Stock Exchange Index (TOPIX) - a market capitalization-weighted index of over 1,300 stocks traded in the Japanese market. To measure how Class C's performance stacked up against its peers, you can compare it to the Japanese funds average, which reflects the performance of mutual funds with similar objectives tracked by Lipper Inc. The past one year average represents a peer group of 48 mutual funds. These benchmarks include reinvested dividends and capital gains, if any, and exclude the effect of sales charges.
Average Annual Total Returns
|
Periods ended October 31, 2000 |
|
Past 1 |
Life of |
|
Fidelity Adv Japan - CL C |
|
-5.72% |
36.22% |
|
Fidelity Adv Japan - CL C |
|
-6.65% |
36.22% |
|
TOPIX |
|
-15.16% |
17.80% |
|
Japanese Funds Average |
|
-16.10% |
n/a* |
Average annual total returns take Class C shares' cumulative return and show you what would have happened if Class C shares had performed at a constant rate each year.
* Not available
Annual Report
$10,000 Over Life of Fund
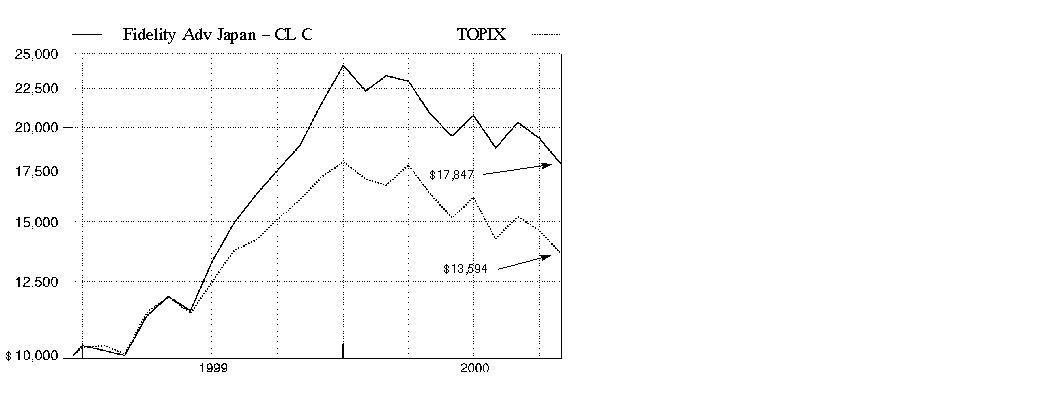
$10,000 Over Life of Fund: Let's say hypothetically that $10,000 was invested in Fidelity Advisor Japan Fund - Class C on December 17, 1998, when the fund started. As the chart shows, by October 31, 2000, the value of the investment would have grown to $17,847 - a 78.47% increase on the initial investment. For comparison, look at how the Tokyo Stock Exchange Index (TOPIX) did over the same period. With dividends reinvested, the same $10,000 would have grown to $13,594 - a 35.94% increase.
Understanding
Performance
Many markets around the globe offer the potential for significant growth over time; however, investing in foreign markets means assuming greater risks than investing in the United States. Factors like changes in a country's financial markets, its local political and economic climate, and the fluctuating value of its currency create these risks. For these reasons an international fund's performance may be more volatile than a fund that invests exclusively in the United States. Past performance is no guarantee of future results and you may have a gain or loss when you sell your shares.
3Annual Report
Market Recap
Currency disparities, the see-saw performance of technology and telecommunications stocks, and increased uncertainty over the direction of energy prices contributed to volatile world markets for the 12-month period that ended October 31, 2000. Through the first half of the period, foreign investors enjoyed handsome returns from technology and telecommunications holdings. These gains disappeared down the stretch, however, as the dollar continued to outperform the struggling euro - the uniform currency of 11 European nations - and the Japanese yen by wide margins. Soaring oil and gas prices also added to the volatility. The Morgan Stanley EAFE® index - which tracks the performance of stock markets in Europe, Australasia and the Far East - fell 2.72% during the period. Europe's economic recovery remained on course, but the euro's continued weakness proved to be a millstone. The Morgan Stanley Europe index had a 12-month return of 1.16%. Japan's economic recovery, on the other hand, appeared to be short-lived, or at least very, very slow in the making. The Morgan Stanley Japan index declined 11.61% during the period. Emerging markets, meanwhile, were unable to sustain the momentum they carried into early 2000, as the Morgan Stanley Emerging Markets Free index tumbled 10.33%.
(Portfolio Manager photograph)
Note to shareholders: William Kennedy became Portfolio Manager of Fidelity Advisor Japan Fund on June 16, 2000.
Q. How did the fund perform, Bill?
A. Although returns were negative, the fund managed to outperform its benchmarks by substantial margins. For the 12 months that ended October 31, 2000, the fund's Class A, Class T, Class B and Class C shares returned -5.07%, -5.29%, -5.83% and -5.72%, respectively. By comparison, the Tokyo Stock Exchange Index (TOPIX) and the Japanese funds average monitored by Lipper Inc. had returns of -15.16% and -16.10%, respectively.
Q. What factors affected the fund's absolute and relative returns?
A. Taking their cue from U.S. markets, Japanese technology and telecommunications stocks experienced a severe correction last spring following a substantial run-up from November through mid-March. After recovering to some extent during the summer, these sectors came under renewed downward pressure in September and October, as investors worried about a deceleration in the demand for semiconductors and personal computers. Telecommunications stocks also suffered from intense competitive pressures worldwide and, in the case of cellular stocks, concerns about excessive corporate spending for third-generation cellular licenses. The fund had a substantial technology overweighting for much of the period, which helped performance until mid-March but hurt relative performance thereafter. The fund also benefited from strong stock selection, particularly with respect to companies making fiber-optic components.
Annual Report
Fund Talk: The Manager's Overview - continued
Q. You're new to this fund. Can you expain your management style?
A. I plan to emphasize two main themes. On the one hand, I'm looking for good companies offering strong and accelerating earnings and revenue growth. I'm willing to pay for good growth, although I'm aware that there are limits to what the market will bear for growth stock valuations, as we saw in the spring. The other theme that will guide the fund's investments is restructuring. Japan is changing rapidly, and the market is rewarding companies that are moving in the right direction. Evidence of "doing the right thing" includes cutting costs, closing down unprofitable businesses and investing in those with high profit potential, repurchasing shares and rewarding management with stock options. Companies that demonstrate they are serious about these initiatives get my attention.
Q. What stocks performed well for the fund?
A. Furukawa Electric was the fund's best performer and also one of its largest holdings during the period. The company's businesses in fiber-optic cable and wave division multiplexing (WDM) - that is, using lasers and mirrors to split light into its component parts and increase the capacity of fiber-optic pathways - benefited from robust demand. Fiber-optic networks are playing a central role in expanding the Internet and accommodating the explosive growth of data communications. Another strong performer, Nippon Sheet Glass, experienced rapid growth in its division that manufactures the lenses used in fiber-optics equipment.
Q. What stocks were disappointing?
A. NTT DoCoMo - the largest cellular carrier in Japan - was the worst detractor from performance. The stock was caught in the technology and telecommunications meltdown earlier in the period, and then was hurt by uncertainty about demand for cellular service as the period drew to a close. However, the company's i-mode service, providing Internet access via cellular phones, was a runaway hit in Japan, and the company is positioning itself for expansion to other countries. As a result, I used the stock's weakness to add to the position. Nippon Telegraph & Telephone (NTT) also underperformed during the period. Like many incumbent telephone service companies worldwide, NTT faced increasing competitive threats in its core long-distance and local-service businesses. Toshiba and NEC, both of which have significant interests in semiconductor manufacturing, responded negatively to investors' pessimistic outlook for that market in September and October.
Annual Report
Fund Talk: The Manager's Overview - continued
Q. What's your outlook, Bill?
A. In the short term, we may see continued choppiness as growth stocks in the technology and telecommunications sectors struggle with the prospect of decelerating growth. Much of the slowdown in demand appears to be emanating from the U.S., where growth has moderated due to a series of six increases in short-term interest rates during the past 18 months. However, many Japanese stocks are good values right now, and I will view any short-term weakness as an excellent buying opportunity. In addition, restructuring will likely continue to be a source of attractive opportunities for the fund.
The views expressed in this report reflect those of the portfolio manager only through the end of the period of the report as stated on the cover and do not necessarily represent the views of Fidelity or any other person in the Fidelity organization. Any such views are subject to change at any time based upon market or other conditions and Fidelity disclaims any responsibility to update such views. These views may not be relied on as investment advice and, because investment decisions for a Fidelity fund are based on numerous factors, may not be relied on as an indication of trading intent on behalf of any Fidelity fund
.
Fund Facts
Goal: long-term growth of capital by investing mainly in equity securities of Japanese issuers
Start date: December 17, 1998
Size: as of October 31, 2000, more than $108 million
Manager: William Kennedy,
since June 2000; manager,
Fidelity Pacific Basin Fund,
since 1998; Hong Kong
research director, 1996-1998;
analyst, regional power sector
and Indian companies, 1994-
1996; joined Fidelity in 1994
Bill Kennedy on restructuring in Japan:
"Restructuring in Japan has occurred by means of a ripple effect, beginning with the government, spreading to the banking system and finally reaching companies in other industries. In the wake of the banking crisis several years ago, the government stepped in and recapitalized the banks. At the same time, however, banks were given strong incentives to clean up their balance sheets and tighten their loan approval processes. Formerly, loans were available to virtually any company that wanted them.
"With loans becoming increasingly difficult to obtain, Japanese companies realized that they needed to restructure their operations. This was especially true of companies in the New Japan - information technology, semiconductors and the like. These companies must compete with peers in the U.S. and Europe that are extremely well-run and shareholder-friendly. Japanese managers are realizing that running a tight ship will attract more investors, resulting in a higher share price and more equity with which to make acquisitions or fund research and development. Therefore, unless there is backsliding in the banking sector, which I don't foresee, the ripples of restructuring should continue to extend their reach throughout the Japanese economy."
Annual Report
|
Top Ten Stocks as of October 31, 2000 |
||
|
|
% of fund's |
% of fund's net assets |
|
NTT DoCoMo, Inc. |
8.0 |
8.2 |
|
Toyota Motor Corp. |
4.2 |
4.2 |
|
Takeda Chemical Industries Ltd. |
4.0 |
2.6 |
|
Sony Corp. |
3.2 |
2.8 |
|
Toyoda Gosei Co. Ltd. |
3.1 |
1.3 |
|
Canon, Inc. |
2.7 |
1.3 |
|
Furukawa Electric Co. Ltd. |
2.6 |
3.0 |
|
Sanyo Electric Co. Ltd. |
2.3 |
0.0 |
|
Sakura Bank Ltd. |
2.2 |
0.7 |
|
Nippon Sheet Glass Co. Ltd. |
2.2 |
1.1 |
|
|
34.5 |
25.2 |
|
Top Five Market Sectors as of October 31, 2000 |
||
|
|
% of fund's |
% of fund's net assets |
|
Technology |
20.1 |
23.5 |
|
Durables |
16.8 |
12.3 |
|
Finance |
12.7 |
9.1 |
|
Utilities |
10.3 |
12.4 |
|
Health |
9.1 |
8.4 |
|
Asset Allocation (% of fund's net assets) |
|||||||
|
As of October 31, 2000 |
As of April 30, 2000 |
||||||
|
Stocks 90.8% |
|
|
Stocks 95.2% |
|
||
|
Short-Term |
|
|
Short-Term |
|
||

Annual Report
Showing Percentage of Net Assets
|
Common Stocks - 90.8% |
|||
|
Shares |
Value (Note 1) |
||
|
BASIC INDUSTRIES - 3.0% |
|||
|
Chemicals & Plastics - 2.6% |
|||
|
Hitachi Chemical Co. Ltd. |
51,500 |
$ 1,293,282 |
|
|
Nissan Chemical Industries Co. Ltd. |
136,000 |
1,003,391 |
|
|
Shin-Etsu Chemical Co. Ltd. |
12,000 |
492,714 |
|
|
|
2,789,387 |
||
|
Paper & Forest Products - 0.4% |
|||
|
Nippon Paper Industries Co. Ltd. |
76,000 |
433,251 |
|
|
TOTAL BASIC INDUSTRIES |
3,222,638 |
||
|
CONSTRUCTION & REAL ESTATE - 4.6% |
|||
|
Building Materials - 2.5% |
|||
|
Central Glass Co. Ltd. |
62,000 |
283,549 |
|
|
Nippon Sheet Glass Co. Ltd. |
155,000 |
2,358,171 |
|
|
|
2,641,720 |
||
|
Construction - 1.2% |
|||
|
Daito Trust Construction Co. |
63,700 |
1,074,219 |
|
|
HUNET, Inc. |
28,000 |
236,092 |
|
|
|
1,310,311 |
||
|
Real Estate - 0.9% |
|||
|
Mitsubishi Estate Co. Ltd. (a) |
66,000 |
701,677 |
|
|
Mitsui Fudosan Co. Ltd. |
26,000 |
315,022 |
|
|
|
1,016,699 |
||
|
TOTAL CONSTRUCTION & REAL ESTATE |
4,968,730 |
||
|
DURABLES - 16.8% |
|||
|
Autos, Tires, & Accessories - 8.1% |
|||
|
Honda Motor Co. Ltd. (a) |
26,000 |
899,438 |
|
|
Toyoda Gosei Co. Ltd. |
54,000 |
3,306,021 |
|
|
Toyota Motor Corp. |
114,300 |
4,567,391 |
|
|
|
8,772,850 |
||
|
Consumer Durables - 0.7% |
|||
|
Asahi Techno Glass Corp. |
87,000 |
693,704 |
|
|
Consumer Electronics - 8.0% |
|||
|
Matsushita Electric Industrial Co. Ltd. |
46,000 |
1,344,350 |
|
|
Pioneer Corp. |
45,000 |
1,394,006 |
|
|
Common Stocks - continued |
|||
|
Shares |
Value (Note 1) |
||
|
DURABLES - continued |
|||
|
Consumer Electronics - continued |
|||
|
Sanyo Electric Co. Ltd. |
325,000 |
$ 2,472,276 |
|
|
Sony Corp. |
41,600 |
3,452,800 |
|
|
|
8,663,432 |
||
|
TOTAL DURABLES |
18,129,986 |
||
|
FINANCE - 12.7% |
|||
|
Banks - 6.9% |
|||
|
Bank of Tokyo-Mitsubishi Ltd. |
85,000 |
1,019,751 |
|
|
Sakura Bank Ltd. |
330,000 |
2,404,454 |
|
|
Sumitomo Bank Ltd. |
103,000 |
1,250,802 |
|
|
Sumitomo Trust & Banking Ltd. |
99,000 |
762,167 |
|
|
The Suruga Bank Ltd. |
119,000 |
1,633,782 |
|
|
Tokyo Tomin Bank Ltd. |
15,000 |
419,302 |
|
|
|
7,490,258 |
||
|
Credit & Other Finance - 2.5% |
|||
|
Aeon Credit Service Ltd. |
20,900 |
1,172,285 |
|
|
Credit Saison Co. Ltd. |
30,200 |
639,373 |
|
|
ORIX Corp. |
8,100 |
850,014 |
|
|
|
2,661,672 |
||
|
Securities Industry - 3.3% |
|||
|
Daiwa Securities Group, Inc. |
51,000 |
565,109 |
|
|
Nikko Securities Co. Ltd. |
173,000 |
1,493,594 |
|
|
Nomura Securities Co. Ltd. |
74,000 |
1,570,067 |
|
|
|
3,628,770 |
||
|
TOTAL FINANCE |
13,780,700 |
||
|
HEALTH - 9.1% |
|||
|
Drugs & Pharmaceuticals - 6.3% |
|||
|
Fujisawa Pharmaceutical Co. Ltd. |
50,000 |
1,571,808 |
|
|
Takeda Chemical Industries Ltd. |
66,000 |
4,349,189 |
|
|
Yamanouchi Pharmaceutical Co. Ltd. |
21,000 |
950,784 |
|
|
|
6,871,781 |
||
|
Medical Equipment & Supplies - 2.8% |
|||
|
Hogy Medical Co. |
8,400 |
538,906 |
|
|
Common Stocks - continued |
|||
|
Shares |
Value (Note 1) |
||
|
HEALTH - continued |
|||
|
Medical Equipment & Supplies - continued |
|||
|
Hoya Corp. |
20,000 |
$ 1,653,377 |
|
|
Japan Medical Dynamic Marketing, Inc. |
24,800 |
820,530 |
|
|
|
3,012,813 |
||
|
TOTAL HEALTH |
9,884,594 |
||
|
INDUSTRIAL MACHINERY & EQUIPMENT - 5.3% |
|||
|
Electrical Equipment - 4.0% |
|||
|
Furukawa Electric Co. Ltd. |
109,000 |
2,867,107 |
|
|
Omron Corp. |
60,000 |
1,479,241 |
|
|
|
4,346,348 |
||
|
Industrial Machinery & Equipment - 1.3% |
|||
|
Furukawa Co. Ltd. |
212,000 |
435,231 |
|
|
THK Co. Ltd. |
20,500 |
507,286 |
|
|
Tsubaki Nakashima Co. Ltd. |
33,000 |
413,445 |
|
|
|
1,355,962 |
||
|
TOTAL INDUSTRIAL MACHINERY & EQUIPMENT |
5,702,310 |
||
|
MEDIA & LEISURE - 5.0% |
|||
|
Broadcasting - 1.1% |
|||
|
SKY Perfect Communications, Inc. (a) |
21 |
38,686 |
|
|
Tokyo Broadcasting System, Inc. |
29,000 |
1,134,910 |
|
|
|
1,173,596 |
||
|
Leisure Durables & Toys - 1.1% |
|||
|
Nintendo Co. Ltd. |
7,400 |
1,224,177 |
|
|
Restaurants - 2.8% |
|||
|
Kappa Create Co. Ltd. |
33,000 |
1,073,687 |
|
|
Saizeriya Co. Ltd. |
17,640 |
986,197 |
|
|
Skylark Co. Ltd. |
24,000 |
846,852 |
|
|
Yoshinoya D&C Co. Ltd. |
73 |
137,155 |
|
|
|
3,043,891 |
||
|
TOTAL MEDIA & LEISURE |
5,441,664 |
||
|
NONDURABLES - 1.8% |
|||
|
Beverages - 0.5% |
|||
|
Kirin Beverage Corp. |
22,000 |
546,421 |
|
|
Common Stocks - continued |
|||
|
Shares |
Value (Note 1) |
||
|
NONDURABLES - continued |
|||
|
Foods - 0.5% |
|||
|
Ajinomoto Co., Inc. |
29,000 |
$ 324,260 |
|
|
Yakult Honsha Co. Ltd. |
17,000 |
193,823 |
|
|
|
518,083 |
||
|
Household Products - 0.5% |
|||
|
Shiseido Co. Ltd. |
46,000 |
594,446 |
|
|
Tobacco - 0.3% |
|||
|
Japan Tobacco, Inc. |
40 |
274,952 |
|
|
TOTAL NONDURABLES |
1,933,902 |
||
|
RETAIL & WHOLESALE - 2.1% |
|||
|
General Merchandise Stores - 0.6% |
|||
|
Seven Eleven Japan Co. Ltd. |
10,000 |
650,719 |
|
|
Retail & Wholesale, Miscellaneous - 1.5% |
|||
|
Yamada Denki Co. Ltd. |
18,300 |
1,610,118 |
|
|
TOTAL RETAIL & WHOLESALE |
2,260,837 |
||
|
TECHNOLOGY - 20.1% |
|||
|
Communications Equipment - 2.1% |
|||
|
NEC Corp. |
117,000 |
2,230,410 |
|
|
Computer Services & Software - 3.3% |
|||
|
Capcom Co. Ltd. |
20,000 |
773,531 |
|
|
Ines Corp. |
20,900 |
261,274 |
|
|
Konami Co. Ltd. |
26,300 |
2,217,579 |
|
|
Trend Micro, Inc. (a) |
3,500 |
330,401 |
|
|
|
3,582,785 |
||
|
Computers & Office Equipment - 4.6% |
|||
|
Canon, Inc. |
71,000 |
2,879,938 |
|
|
Oki Electric Industry Co. Ltd. (a) |
174,000 |
1,034,974 |
|
|
Ricoh Co. Ltd. |
55,000 |
846,852 |
|
|
Softbank Corp. |
3,200 |
192,100 |
|
|
|
4,953,864 |
||
|
Electronic Instruments - 1.8% |
|||
|
Anritsu Corp. |
90,000 |
1,979,654 |
|
|
Electronics - 7.4% |
|||
|
Kyocera Corp. |
9,200 |
1,230,500 |
|
|
Mitsubishi Electric Corp. |
101,000 |
725,726 |
|
|
Mitsumi Electric Co. Ltd. |
24,000 |
791,861 |
|
|
Common Stocks - continued |
|||
|
Shares |
Value (Note 1) |
||
|
TECHNOLOGY - continued |
|||
|
Electronics - continued |
|||
|
Nitto Denko Corp. |
42,000 |
$ 1,420,401 |
|
|
Rohm Co. Ltd. |
7,300 |
1,840,555 |
|
|
Toshiba Corp. |
278,000 |
1,987,352 |
|
|
|
7,996,395 |
||
|
Photographic Equipment - 0.9% |
|||
|
Konica Corp. (a) |
124,000 |
958,042 |
|
|
TOTAL TECHNOLOGY |
21,701,150 |
||
|
UTILITIES - 10.3% |
|||
|
Cellular - 8.0% |
|||
|
NTT DoCoMo, Inc. |
348 |
8,579,595 |
|
|
Telephone Services - 2.3% |
|||
|
DDI Corp. |
126 |
591,257 |
|
|
Nippon Telegraph & Telephone Corp. |
210 |
1,911,191 |
|
|
|
2,502,448 |
||
|
TOTAL UTILITIES |
11,082,043 |
||
|
TOTAL COMMON STOCKS (Cost $92,170,930) |
98,108,554 |
||
|
Cash Equivalents - 9.0% |
|||
|
|
|
|
|
|
Fidelity Cash Central Fund, 6.61% (b) |
9,703,906 |
9,703,906 |
|
|
TOTAL INVESTMENT PORTFOLIO - 99.8% (Cost $101,874,836) |
107,812,460 |
||
|
NET OTHER ASSETS - 0.2% |
245,515 |
||
|
NET ASSETS - 100% |
$ 108,057,975 |
||
|
Legend |
|
(a) Non-income producing |
|
(b) The rate quoted is the annualized seven-day yield of the fund at period end. A complete listing of the fund's holdings as of its most recent fiscal year end is available upon request. |
|
Income Tax Information |
|
At October 31, 2000, the aggregate cost of investment securities for income tax purposes was $102,317,025. Net unrealized appreciation aggregated $5,495,435, of which $14,846,174 related to appreciated investment securities and $9,350,739 related to depreciated investment securities. |
|
At October 31, 2000, the fund had a capital loss carryforward of approximately $4,503,000 all of which will expire on October 31, 2008. |
See accompanying notes which are an integral part of the financial statements.
Annual Report
Statement of Assets and Liabilities
|
|
October 31, 2000 |
|
|
Assets |
|
|
|
Investment in securities, at value (cost $101,874,836) - See accompanying schedule |
|
$ 107,812,460 |
|
Receivable for investments sold |
|
268,620 |
|
Receivable for fund shares sold |
|
526,328 |
|
Dividends receivable |
|
169,335 |
|
Interest receivable |
|
48,641 |
|
Total assets |
|
108,825,384 |
|
Liabilities |
|
|
|
Payable for investments purchased |
$ 36,401 |
|
|
Payable for fund shares redeemed |
521,893 |
|
|
Accrued management fee |
69,979 |
|
|
Distribution fees payable |
69,442 |
|
|
Other payables and accrued expenses |
69,694 |
|
|
Total liabilities |
|
767,409 |
|
Net Assets |
|
$ 108,057,975 |
|
Net Assets consist of: |
|
|
|
Paid in capital |
|
$ 102,210,196 |
|
Undistributed net investment income |
|
4,826,267 |
|
Accumulated undistributed net realized gain (loss) on investments and foreign currency transactions |
|
(4,913,959) |
|
Net unrealized appreciation (depreciation) on investments and assets and liabilities in foreign currencies |
|
5,935,471 |
|
Net Assets |
|
$ 108,057,975 |
See accompanying notes which are an integral part of the financial statements.
Annual Report
Financial Statements - continued
Statement of Assets and Liabilities - continued
|
|
October 31, 2000 |
|
|
Calculation of Maximum Offering Price |
|
$17.78 |
|
Maximum offering price per share (100/94.25 of $17.78) |
|
$18.86 |
|
Class T: |
|
$17.72 |
|
Maximum offering price per share (100/96.50 of $17.72) |
|
$18.36 |
|
Class B: |
|
$17.55 |
|
Class C: |
|
$17.58 |
|
Institutional Class: |
|
$17.88 |
A Redemption price per share is equal to net asset value less any applicable contingent deferred sales charge.
See accompanying notes which are an integral part of the financial statements.
Annual Report
Financial Statements - continued
Statement of Operations
|
|
Year ended October 31, 2000 |
|
|
Investment Income Dividends |
|
$ 545,320 |
|
Interest |
|
476,581 |
|
|
|
1,021,901 |
|
Less foreign taxes withheld |
|
(81,798) |
|
Total income |
|
940,103 |
|
Expenses |
|
|
|
Management fee |
$ 1,037,015 |
|
|
Transfer agent fees |
381,746 |
|
|
Distribution fees |
1,025,128 |
|
|
Accounting fees and expenses |
86,675 |
|
|
Non-interested trustees' compensation |
440 |
|
|
Custodian fees and expenses |
92,916 |
|
|
Registration fees |
83,509 |
|
|
Audit |
25,325 |
|
|
Legal |
1,636 |
|
|
Interest |
724 |
|
|
Miscellaneous |
2,055 |
|
|
Total expenses before reductions |
2,737,169 |
|
|
Expense reductions |
(21,894) |
2,715,275 |
|
Net investment income (loss) |
|
(1,775,172) |
|
Realized and Unrealized Gain (Loss) Net realized gain (loss) on: |
|
|
|
Investment securities |
2,951,179 |
|
|
Foreign currency transactions |
(417,255) |
2,533,924 |
|
Change in net unrealized appreciation (depreciation) on: |
|
|
|
Investment securities |
(12,121,872) |
|
|
Assets and liabilities in foreign currencies |
(2,705) |
(12,124,577) |
|
Net gain (loss) |
|
(9,590,653) |
|
Net increase (decrease) in net assets resulting |
|
$ (11,365,825) |
See accompanying notes which are an integral part of the financial statements.
Annual Report
Financial Statements - continued
Statement of Changes in Net Assets
|
|
Year ended |
December 17, 1998 1999 |
|
Increase (Decrease) in Net Assets |
|
|
|
Operations |
$ (1,775,172) |
$ (312,413) |
|
Net realized gain (loss) |
2,533,924 |
1,426,579 |
|
Change in net unrealized appreciation (depreciation) |
(12,124,577) |
18,060,048 |
|
Net increase (decrease) in net assets resulting |
(11,365,825) |
19,174,214 |
|
Distributions to shareholders |
(170,831) |
- |
|
In excess of net investment income |
(389,931) |
- |
|
From net realized gain |
(1,285,442) |
- |
|
Total distributions |
(1,846,204) |
- |
|
Share transactions - net increase (decrease) |
42,592,329 |
59,503,461 |
|
Total increase (decrease) in net assets |
29,380,300 |
78,677,675 |
|
Net Assets |
|
|
|
Beginning of period |
78,677,675 |
- |
|
End of period (including undistributed net investment income of $4,826,267 and $200,753, respectively) |
$ 108,057,975 |
$ 78,677,675 |
See accompanying notes which are an integral part of the financial statements.
Annual Report
Financial Highlights - Class A
|
Years ended October 31, |
2000 |
1999 E |
|
Selected Per-Share Data |
|
|
|
Net asset value, beginning of period |
$ 19.04 |
$ 10.00 |
|
Income from Investment Operations |
|
|
|
Net investment income (loss) D |
(.16) |
(.13) |
|
Net realized and unrealized gain (loss) |
(.76) |
9.17 |
|
Total from investment operations |
(.92) |
9.04 |
|
Less Distributions |
|
|
|
From net investment income |
(.04) H |
- |
|
In excess of net investment income |
(.08) |
- |
|
From net realized gain |
(.22) H |
- |
|
Total distributions |
(.34) |
- |
|
Net asset value, end of period |
$ 17.78 |
$ 19.04 |
|
Total Return B, C |
(5.07)% |
90.40% |
|
Ratios and Supplemental Data |
|
|
|
Net assets, end of period (000 omitted) |
$ 18,657 |
$ 7,130 |
|
Ratio of expenses to average net assets |
1.44% |
2.02% A, F |
|
Ratio of expenses to average net assets after expense reductions |
1.42% G |
2.01% A, G |
|
Ratio of net investment income (loss) to average net assets |
(.76)% |
(1.04)% A |
|
Portfolio turnover |
169% |
152% A |
A Annualized
B The total returns would have been lower had certain expenses not been reduced during the periods shown.
C Total returns do not include the one time sales charge and for periods of less than one year are not annualized.
D Net investment income (loss) per share has been calculated based on average shares outstanding during the period.
E For the period December 17, 1998 (commencement of operations) to October 31, 1999.
F FMR agreed to reimburse a portion of the class' expenses during the period. Without this reimbursement, the class' expense ratio would have been higher.
G FMR or the fund has entered into varying arrangements with third parties who either paid or reduced a portion of the class' expenses.
H The amounts shown reflect certain reclassifications related to book to tax differences.
See accompanying notes which are an integral part of the financial statements.
Annual Report
Financial Highlights - Class T
|
Years ended October 31, |
2000 |
1999 E |
|
Selected Per-Share Data |
|
|
|
Net asset value, beginning of period |
$ 19.01 |
$ 10.00 |
|
Income from Investment Operations |
|
|
|
Net investment income (loss) D |
(.21) |
(.17) |
|
Net realized and unrealized gain (loss) |
(.75) |
9.18 |
|
Total from investment operations |
(.96) |
9.01 |
|
Less Distributions |
|
|
|
From net investment income |
(.03) H |
- |
|
In excess of net investment income |
(.08) |
- |
|
From net realized gain |
(.22) H |
- |
|
Total distributions |
(.33) |
- |
|
Net asset value, end of period |
$ 17.72 |
$ 19.01 |
|
Total Return B, C |
(5.29)% |
90.10% |
|
Ratios and Supplemental Data |
|
|
|
Net assets, end of period (000 omitted) |
$ 29,840 |
$ 25,682 |
|
Ratio of expenses to average net assets |
1.71% |
2.27% A, F |
|
Ratio of expenses to average net assets after expense reductions |
1.69% G |
2.26% A, G |
|
Ratio of net investment income (loss) to average net assets |
(1.03)% |
(1.29)% A |
|
Portfolio turnover |
169% |
152% A |
A Annualized
B The total returns would have been lower had certain expenses not been reduced during the periods shown.
C Total returns do not include the one time sales charge and for periods of less than one year are not annualized.
D Net investment income (loss) per share has been calculated based on average shares outstanding during the period.
E For the period December 17, 1998 (commencement of operations) to October 31, 1999.
F FMR agreed to reimburse a portion of the class' expenses during the period. Without this reimbursement, the class' expense ratio would have been higher.
G FMR or the fund has entered into varying arrangements with third parties who either paid or reduced a portion of the class' expenses.
H The amounts shown reflect certain reclassifications related to book to tax differences.
See accompanying notes which are an integral part of the financial statements.
Annual Report
Financial Highlights - Class B
|
Years ended October 31, |
2000 |
1999 E |
|
Selected Per-Share Data |
|
|
|
Net asset value, beginning of period |
$ 18.92 |
$ 10.00 |
|
Income from Investment Operations |
|
|
|
Net investment income (loss) D |
(.32) |
(.23) |
|
Net realized and unrealized gain (loss) |
(.74) |
9.15 |
|
Total from investment operations |
(1.06) |
8.92 |
|
Less Distributions |
|
|
|
From net investment income |
(.03) H |
- |
|
In excess of net investment income |
(.06) |
- |
|
From net realized gain |
(.22) H |
- |
|
Total distributions |
(.31) |
- |
|
Net asset value, end of period |
$ 17.55 |
$ 18.92 |
|
Total Return B, C |
(5.83)% |
89.20% |
|
Ratios and Supplemental Data |
|
|
|
Net assets, end of period (000 omitted) |
$ 31,334 |
$ 20,667 |
|
Ratio of expenses to average net assets |
2.25% |
2.78% A, F |
|
Ratio of expenses to average net assets after expense reductions |
2.23% G |
2.77% A, G |
|
Ratio of net investment income (loss) to average net assets |
(1.57)% |
(1.79)% A |
|
Portfolio turnover |
169% |
152% A |
A Annualized
B The total returns would have been lower had certain expenses not been reduced during the periods shown.
C Total returns do not include the contingent deferred sales charge and for periods of less than one year are not annualized.
D Net investment income (loss) per share has been calculated based on average shares outstanding during the period.
E For the period December 17, 1998 (commencement of operations) to October 31, 1999.
F FMR agreed to reimburse a portion of the class' expenses during the period. Without this reimbursement, the class' expense ratio would have been higher.
G FMR or the fund has entered into varying arrangements with third parties who either paid or reduced a portion of the class' expenses.
H The amounts shown reflect certain reclassifications related to book to tax differences.
See accompanying notes which are an integral part of the financial statements.
Annual Report
Financial Highlights - Class C
|
Years ended October 31, |
2000 |
1999 E |
|
Selected Per-Share Data |
|
|
|
Net asset value, beginning of period |
$ 18.93 |
$ 10.00 |
|
Income from Investment Operations |
|
|
|
Net investment income (loss) D |
(.31) |
(.24) |
|
Net realized and unrealized gain (loss) |
(.73) |
9.17 |
|
Total from investment operations |
(1.04) |
8.93 |
|
Less Distributions |
|
|
|
From net investment income |
(.03) H |
- |
|
In excess of net investment income |
(.06) |
- |
|
From net realized gain |
(.22) H |
- |
|
Total distributions |
(.31) |
- |
|
Net asset value, end of period |
$ 17.58 |
$ 18.93 |
|
Total Return B, C |
(5.72)% |
89.30% |
|
Ratios and Supplemental Data |
|
|
|
Net assets, end of period (000 omitted) |
$ 25,481 |
$ 22,213 |
|
Ratio of expenses to average net assets |
2.16% |
2.78% A, F |
|
Ratio of expenses to average net assets after expense reductions |
2.15% G |
2.76% A, G |
|
Ratio of net investment income (loss) to average net assets |
(1.49)% |
(1.79)% A |
|
Portfolio turnover |
169% |
152% A |
A Annualized
B The total returns would have been lower had certain expenses not been reduced during the periods shown.
C Total returns do not include the contingent deferred sales charge and for periods of less than one year are not annualized.
D Net investment income (loss) per share has been calculated based on average shares outstanding during the period.
E For the period December 17, 1998 (commencement of operations) to October 31, 1999.
F FMR agreed to reimburse a portion of the class' expenses during the period. Without this reimbursement, the class' expense ratio would have been higher.
G FMR or the fund has entered into varying arrangements with third parties who either paid or reduced a portion of the class' expenses.
H The amounts shown reflect certain reclassifications related to book to tax differences.
See accompanying notes which are an integral part of the financial statements.
Annual Report
Financial Highlights - Institutional Class
|
Years ended October 31, |
2000 |
1999 E |
|
Selected Per-Share Data |
|
|
|
Net asset value, beginning of period |
$ 19.09 |
$ 10.00 |
|
Income from Investment Operations |
|
|
|
Net investment income (loss) D |
(.09) |
(.10) |
|
Net realized and unrealized gain (loss) |
(.77) |
9.19 |
|
Total from investment operations |
(.86) |
9.09 |
|
Less Distributions |
|
|
|
From net investment income |
(.04) H |
- |
|
In excess of net investment income |
(.09) |
- |
|
From net realized gain |
(.22) H |
- |
|
Total distributions |
(.35) |
- |
|
Net asset value, end of period |
$ 17.88 |
$ 19.09 |
|
Total Return B, C |
(4.75)% |
90.90% |
|
Ratios and Supplemental Data |
|
|
|
Net assets, end of period (000 omitted) |
$ 2,746 |
$ 2,986 |
|
Ratio of expenses to average net assets |
1.13% |
1.77% A, F |
|
Ratio of expenses to average net assets after expense reductions |
1.11% G |
1.76% A, G |
|
Ratio of net investment income (loss) to average net assets |
(.45)% |
(.78)% A |
|
Portfolio turnover |
169% |
152% A |
A Annualized
B The total returns would have been lower had certain expenses not been reduced during the periods shown.
C Total returns for periods of less than one year are not annualized.
D Net investment income (loss) per share has been calculated based on average shares outstanding during the period.
E For the period December 17, 1998 (commencement of operations) to October 31, 1999.
F FMR agreed to reimburse a portion of the class' expenses during the period. Without this reimbursement, the class' expense ratio would have been higher.
G FMR or the fund has entered into varying arrangements with third parties who either paid or reduced a portion of the class' expenses.
H The amounts shown reflect certain reclassifications related to book to tax differences.
See accompanying notes which are an integral part of the financial statements.
Annual Report
For the period ended October 31, 2000
1. Significant Accounting Policies.
Fidelity Advisor Japan Fund(the fund) is a fund of Fidelity Advisor Series VIII(the trust) and is authorized to issue an unlimited number of shares. The trust is registered under the Investment Company Act of 1940, as amended (the 1940 Act), as an open-end management investment company organized as a Massachusetts business trust.
The fund offers Class A, Class T, Class B, Class C, and Institutional Class shares, each of which has equal rights as to assets and voting privileges. Each class has exclusive voting rights with respect to matters that affect that class. Class B shares will automatically convert to Class A shares after a holding period of seven years from the initial date of purchase. Investment income, realized and unrealized capital gains and losses, the common expenses of the fund, and certain fund-level expense reductions, if any, are allocated on a pro rata basis to each class based on the relative net assets of each class to the total net assets of the fund. Each class of shares differs in its respective distribution, transfer agent, and certain other class-specific fees, expenses, and expense reductions.
The financial statements have been prepared in conformity with generally accepted accounting principles which require management to make certain estimates and assumptions at the date of the financial statements. The following summarizes the significant accounting policies of the fund:
Security Valuation. Securities for which quotations are readily available are valued using the official closing price or at the last sale price in the principal market in which they are traded. If the last sale price (on the local exchange) is unavailable, the last evaluated quote or closing bid price normally is used. If trading or events occurring in other markets after the close of the principal market in which securities are traded are expected to materially affect the value of those securities, then they are valued at their fair value taking this trading or these events into account. Fair value is determined in good faith under consistently applied procedures under the general supervision of the Board of Trustees. Securities for which quotations are not readily available are valued primarily using dealer-supplied valuations or at their fair value. Short-term securities with remaining maturities of sixty days or less for which quotations are not readily available are valued at amortized cost or original cost plus accrued interest, both of which approximate current value. Investments in open-end investment companies are valued at their net asset value each business day.
Foreign Currency Translation. The accounting records of the fund are maintained in U.S. dollars. Investment securities and other assets and liabilities denominated in a foreign currency are translated into U.S. dollars at the prevailing rates of exchange at period end. Purchases and sales of securities, income receipts and expense payments are translated into U.S. dollars at the prevailing exchange rate on the respective dates of the transactions.
Annual Report
Notes to Financial Statements - continued
1. Significant Accounting Policies - continued
Foreign Currency Translation - continued
Net realized gains and losses on foreign currency transactions represent net gains and losses from sales and maturities of foreign currency contracts, disposition of foreign currencies, the difference between the amount of net investment income accrued and the U.S. dollar amount actually received, and gains and losses between trade and settlement date on purchases and sales of securities. The effects of changes in foreign currency exchange rates on investments in securities are included with the net realized and unrealized gain or loss on investment securities.
Income Taxes. As a qualified regulated investment company under Subchapter M of the Internal Revenue Code, the fund is not subject to U.S. federal income taxes to the extent that it distributes substantially all of its taxable income for its fiscal year. The fund may be subject to foreign taxes on income and gains on investments which are accrued based upon the fund's understanding of the tax rules and regulations that exist in the markets in which it invests. Foreign governments may also impose taxes on other payments or transactions with respect to foreign securities. The fund accrues such taxes as applicable. The schedule of investments includes information regarding income taxes under the caption "Income Tax Information."
Investment Income. Dividend income is recorded on the ex-dividend date, except certain dividends from foreign securities where the ex-dividend date may have passed, are recorded as soon as the fund is informed of the ex-dividend date. Non-cash dividends included in dividend income, if any, are recorded at the fair market value of the securities received. Interest income is accrued as earned. Investment income is recorded net of foreign taxes withheld where recovery of such taxes is uncertain.
Expenses. Most expenses of the trust can be directly attributed to a fund. Expenses which cannot be directly attributed are apportioned among the funds in the trust.
Distributions to Shareholders. Distributions are recorded on the ex-dividend date. Income dividends and capital gain distributions are declared separately for each class.
Income and capital gain distributions are determined in accordance with income tax regulations which may differ from generally accepted accounting principles. These differences, which may result in distribution reclassifications, are primarily due to differing treatments for foreign currency transactions, passive foreign investment companies (PFIC), capital loss carryforwards and losses deferred due to wash sales. The fund also utilized earnings and profits distributed to shareholders on redemption of shares as a part of the dividends paid deduction for income tax purposes.
Annual Report
Notes to Financial Statements - continued
1. Significant Accounting Policies - continued
Distributions to Shareholders - continued
Permanent book and tax basis differences relating to shareholder distributions will result in reclassifications to paid in capital. Undistributed net investment income and accumulated undistributed net realized gain (loss) on investments and foreign currency transactions may include temporary book and tax basis differences which will reverse in a subsequent period. Any taxable income or gain remaining at fiscal year end is distributed in the following year.
Security Transactions. Security transactions are accounted for as of trade date. Gains and losses on securities sold are determined on the basis of identified cost.
2. Operating Policies.
Foreign Currency Contracts. The fund generally uses foreign currency contracts to facilitate transactions in foreign-denominated securities. Losses may arise from changes in the value of the foreign currency or if the counterparties do not perform under the contracts' terms. The U.S. dollar value of foreign currency contracts is determined using contractual currency exchange rates established at the time of each trade.
Joint Trading Account. Pursuant to an Exemptive Order issued by the Securities and Exchange Commission (the SEC), the fund, along with other affiliated entities of Fidelity Management & Research Company (FMR), may transfer uninvested cash balances into one or more joint trading accounts. These balances are invested in one or more repurchase agreements for U.S. Treasury or Federal Agency obligations.
Repurchase Agreements. The underlying U.S. Treasury, Federal Agency, or other obligations found to be satisfactory by FMR are transferred to an account of the fund, or to the Joint Trading Account, at a custodian bank. The securities are marked-to-market daily and maintained at a value at least equal to the principal amount of the repurchase agreement (including accrued interest). FMR, the fund's investment adviser, is responsible for determining that the value of the underlying securities remains in accordance with the market value requirements stated above.
3. Purchases and Sales of Investments.
Purchases and sales of securities, other than short-term securities, aggregated $256,952,144 and $224,327,637, respectively.
Annual Report
Notes to Financial Statements - continued
4. Fees and Other Transactions with Affiliates.
Management Fee. As the fund's investment adviser, FMR receives a monthly fee that is calculated on the basis of a group fee rate plus a fixed individual fund fee rate applied to the average net assets of the fund. The group fee rate is the weighted average of a series of rates and is based on the monthly average net assets of all the mutual funds advised by FMR. The rates ranged from .2167% to .5200% for the period. The annual individual fund fee rate is .45%. In the event that these rates were lower than the contractual rates in effect during the period, FMR voluntarily implemented the above rates, as they resulted in the same or a lower management fee. For the period, the management fee was equivalent to an annual rate of .73% of average net assets.
Sub-Adviser Fee. Beginning January 1, 2001, FMR Co. (FMRC) will serve as a sub-adviser for the fund. FMRC may provide investment research and advice and may also provide investment advisory services for the fund. FMR, on behalf of the fund, entered into sub-advisory agreements with Fidelity Management & Research (U.K.) Inc., Fidelity Management & Research (Far East) Inc., and Fidelity International Investment Advisors (FIIA). Under the sub-advisory arrangements, FMR may receive investment advice and research services and may grant the sub-advisers investment management authority to buy and sell securities. FMR pays its sub-advisers either a portion of its management fee or a fee based on costs incurred for these services.
Distribution and Service Plan. In accordance with Rule 12b-1 of the 1940 Act, the Board of Trustees have adopted separate Distribution and Service Plans with respect to each class of shares (collectively referred to as "the Plans"). Under certain of the Plans, the class pays Fidelity Distributors Corporation (FDC), an affiliate of FMR, a 12b-1 fee. A portion of this fee may be reallowed to securities dealers, banks and other financial institutions for the distribution of each class of shares and providing shareholder support services. For the period, this fee was based on the following annual rates of the average net assets of each applicable class:
|
Class A |
.25% |
|
Class T |
.50% |
|
Class B |
1.00%* |
|
Class C |
1.00%* |
* .75% represents a distribution fee and .25% represents a shareholder service fee.
Annual Report
Notes to Financial Statements - continued
4. Fees and Other Transactions with Affiliates - continued
Distribution and Service Plan - continued
For the period, each class paid FDC the following amounts, a portion of which was retained by FDC:
|
|
Paid to |
Retained |
|
Class A |
$ 46,511 |
$ 788 |
|
Class T |
224,012 |
1,554 |
|
Class B |
385,265 |
289,665 |
|
Class C |
369,340 |
191,544 |
|
|
$ 1,025,128 |
$ 483,551 |
Sales Load. FDC receives a front-end sales charge of up to 5.75% for selling Class A shares, and 3.50% for selling Class T shares of the fund. FDC receives the proceeds of contingent deferred sales charges levied on Class B share redemptions occurring within six years of purchase and Class C share redemptions occurring within one year of purchase. Contingent deferred sales charges are based on declining rates ranging from 5% to 1% for Class B and 1% for Class C, of the lesser of the cost of shares at the initial date of purchase or the net asset value of the redeemed shares, excluding any reinvested dividends and capital gains. In addition, purchases of Class A and Class T shares that were subject to a finder's fee bear a contingent deferred sales charge on assets that do not remain in the fund for at least one year. The Class A and Class T contingent deferred sales charge is based on 0.25% of the lesser of the cost of shares at the initial date of purchase or the net asset value of the redeemed shares, excluding any reinvested dividends and capital gains. A portion of the sales charges paid to FDC is paid to securities dealers, banks and other financial institutions.
For the period, sales charge amounts paid to and retained by FDC were as follows:
|
|
Paid to |
Retained |
|
Class A |
$ 118,054 |
$ 60,910 |
|
Class T |
127,974 |
39,075 |
|
Class B |
214,070 |
214,070* |
|
Class C |
50,797 |
50,797* |
|
|
$ 510,895 |
$ 364,852 |
* When Class B and Class C shares are initially sold, FDC pays commissions from its own resources to securities dealers,
banks, and other financial institutions through which the sales are made.
Annual Report
Notes to Financial Statements - continued
4. Fees and Other Transactions with Affiliates - continued
Transfer Agent Fees. Fidelity Investments Institutional Operations Company, Inc., (FIIOC), an affiliate of FMR, is the transfer, dividend disbursing and shareholder servicing agent (collectively referred to as the transfer agent) for each class of the fund. FIIOC receives account fees and asset-based fees that vary according to the account size and type of account of the shareholders of the respective classes of the fund. FIIOC pays for typesetting, printing and mailing of all shareholder reports, except proxy statements. For the period, the following amounts were paid to FIIOC:
|
|
Amount |
% of |
|
Class A |
$ 47,438 |
.26 |
|
Class T |
122,385 |
.27 |
|
Class B |
121,026 |
.31 |
|
Class C |
82,954 |
.23 |
|
Institutional Class |
7,943 |
.19 |
|
|
$ 381,746 |
|
Accounting Fees. Fidelity Service Company, Inc. (FSC), an affiliate of FMR, maintains the fund's accounting records. The fee is based on the level of average net assets for the month plus out-of-pocket expenses.
Fidelity Cash Central Fund. Pursuant to an Exemptive Order issued by the SEC, the fund may invest in the Fidelity Cash Central Fund (the Cash Fund) managed by Fidelity Investments Money Management, Inc., an affiliate of FMR. The Cash Fund is an open-end money market fund available only to investment companies and other accounts managed by FMR and its affiliates. The Cash Fund seeks preservation of capital, liquidity, and current income. Income distributions from the Cash Fund are declared daily and paid monthly from net investment income. Income distributions earned by the fund are recorded as interest income in the accompanying financial statements.
Brokerage Commissions. The fund placed a portion of its portfolio transactions with brokerage firms which are affiliates of FMR. The commissions paid to these affiliated firms were $11,558 for the period.
5. Bank Borrowings.
The fund is permitted to have bank borrowings for temporary or emergency purposes to fund shareholder redemptions. The fund has established borrowing arrangements with certain banks. The interest rate on the borrowings is the bank's base rate, as revised from time to time. The average daily loan balance during the period for which the loan was outstanding amounted to $4,234,000. The weighted average interest rate was 6.16%. At period end there were no bank borrowings outstanding.
Annual Report
Notes to Financial Statements - continued
6. Expense Reductions.
FMR has directed certain portfolio trades to brokers who paid a portion of the fund's expenses. For the period, the fund's expenses were reduced by $21,894 under this arrangement.
7. Beneficial Interest.
At the end of the period, one shareholder was record owner of approximately 19% of the total outstanding shares of the fund.
8. Distributions to Shareholders.
Distributions to shareholders of each class were as follows:
|
|
Years ended October 31, |
December 17,
1998
(commencement |
|
|
2000 |
1999 |
|
From net investment income |
|
|
|
Class A |
$ 16,488 |
$ - |
|
Class T |
64,977 |
- |
|
Class B |
36,651 |
- |
|
Class C |
45,632 |
- |
|
Institutional Class |
7,083 |
- |
|
Total |
$ 170,831 |
$ - |
|
In excess of net investment income |
|
|
|
Class A |
$ 37,636, |
$ - |
|
Class T |
148,314 |
- |
|
Class B |
83,658 |
- |
|
Class C |
104,156 |
- |
|
Institutional Class |
16,167 |
- |
|
Total |
$ 389,931 |
$ - |
|
From net realized gain |
|
|
|
Class A |
$ 103,486 |
$ - |
|
Class T |
446,016 |
- |
|
Class B |
309,561 |
- |
|
Class C |
385,432 |
- |
|
Institutional Class |
40,947 |
- |
|
Total |
$ 1,285,442 |
$ - |
|
|
$ 1,846,204 |
$ - |
Annual Report
Notes to Financial Statements - continued
9. Share Transactions.
Transactions for each class of shares were as follows:
|
|
Shares |
Dollars |
||
|
|
Year ended October 31, |
December 17, 1998 |
Year ended October 31, |
December 17, 1998
(commencement |
|
|
2000 |
1999 |
2000 |
1999 |
|
|
|
|
|
|
|
Class A |
1,393,696 |
423,324 |
$ 29,537,765 |
$ 5,943,698 |
|
Reinvestment of distributions |
6,298 |
- |
129,235 |
- |
|
Shares redeemed |
(724,895) |
(48,921) |
(15,092,310) |
(679,705) |
|
Net increase (decrease) |
675,099 |
374,403 |
$ 14,574,690 |
$ 5,263,993 |
|
Class T |
2,445,004 |
1,859,477 |
$ 51,226,682 |
$ 27,451,689 |
|
Reinvestment of distributions |
23,648 |
- |
484,784 |
- |
|
Shares redeemed |
(2,135,042) |
(508,852) |
(44,979,563) |
(8,433,226) |
|
Net increase (decrease) |
333,610 |
1,350,625 |
$ 6,731,903 |
$ 19,018,463 |
|
Class B |
1,744,414 |
1,232,591 |
$ 37,410,476 |
$ 18,325,581 |
|
Reinvestment of distributions |
16,916 |
- |
345,265 |
- |
|
Shares redeemed |
(1,067,718) |
(140,459) |
(22,035,769) |
(2,237,447) |
|
Net increase (decrease) |
693,612 |
1,092,132 |
$ 15,719,972 |
$ 16,088,134 |
|
Class C |
1,980,688 |
1,586,570 |
$ 41,677,320 |
$ 23,987,260 |
|
Reinvestment of distributions |
18,312 |
- |
373,936 |
- |
|
Shares redeemed |
(1,722,716) |
(413,316) |
(36,468,183) |
(6,867,482) |
|
Net increase (decrease) |
276,284 |
1,173,254 |
$ 5,583,073 |
$ 17,119,778 |
|
Institutional Class |
160,195 |
164,732 |
$ 3,419,324 |
$ 2,149,856 |
|
Reinvestment of distributions |
1,495 |
- |
30,777 |
- |
|
Shares redeemed |
(164,450) |
(8,380) |
(3,467,410) |
(136,763) |
|
Net increase (decrease) |
(2,760) |
156,352 |
$ (17,309) |
$ 2,013,093 |
Annual Report
To the Trustees of Fidelity Advisor Series VIII and the Shareholders of Fidelity Advisor Japan Fund:
In our opinion, the accompanying statement of assets and liabilities, including the schedule of investments, and the related statements of operations and of changes in net assets and the financial highlights present fairly, in all material respects, the financial position of Fidelity Advisor Japan Fund (a fund of Fidelity Advisor Series VIII) at October 31, 2000, and the results of its operations, the changes in its net assets and the financial highlights for the periods indicated, in conformity with accounting principles generally accepted in the United States of America. These financial statements and financial highlights (hereafter referred to as "financial statements") are the responsibility of the Fidelity Advisor Japan Fund's management; our responsibility is to express an opinion on these financial statements based on our audits. We conducted our audits of these financial statements in accordance with auditing standards generally accepted in the United States of America which require that we plan and perform the audit to obtain reasonable assurance about whether the financial statements are free of material misstatement. An audit includes examining, on a test basis, evidence supporting the amounts and disclosures in the financial statements, assessing the accounting principles used and significant estimates made by management, and evaluating the overall financial statement presentation. We believe that our audits, which included confirmation of securities at October 31, 2000 by correspondence with the custodian and brokers, provide a reasonable basis for our opinion.
/s/PricewaterhouseCoopers LLP
PricewaterhouseCoopers LLP
Boston, Massachusetts
December 8, 2000
Annual Report
The amounts per share which represent income derived from sources within, and taxes paid to, foreign countries or possessions of the United States are as follows:
|
|
Pay Date |
Income |
Taxes |
|
|
Class A |
12/6/99 |
$.021 |
$.003 |
|
|
Class T |
12/6/99 |
$.021 |
$.003 |
|
|
Class B |
12/6/99 |
$.019 |
$.003 |
|
|
Class C |
12/6/99 |
$.019 |
$.003 |
|
The fund will notify shareholders in January 2001 of amounts for use in preparing 2000 income tax returns.
Annual Report
Annual Report
Annual Report
Annual Report
Annual Report
Annual Report
Annual Report
Investment Adviser
Fidelity Management & Research Company
Boston, MA
Investment Sub-Advisers
Fidelity Management & Research
(U.K.) Inc.
Fidelity Management & Research
(Far East) Inc.
Fidelity International
Investment Advisors
Fidelity International
Investment Advisors
(U.K.) Limited
Fidelity Investments Japan Limited
Officers
Edward C. Johnson 3d, President
Robert C. Pozen, Senior Vice President
William Kennedy, Vice President
Richard A. Spillane, Jr., Vice President
Eric D. Roiter, Secretary
Robert A. Dwight, Treasurer
Maria F. Dwyer, Deputy Treasurer
John H. Costello, Assistant Treasurer
Thomas J. Simpson, Assistant Treasurer
Board of Trustees
Ralph F. Cox *
Phyllis Burke Davis *
Robert M. Gates *
Edward C. Johnson 3d
Donald J. Kirk *
Ned C. Lautenbach *
Peter S. Lynch
Marvin L. Mann *
William O. McCoy *
Gerald C. McDonough *
Robert C. Pozen
Thomas R. Williams *
Advisory Board
J. Michael Cook
Abigail P. Johnson
Marie L. Knowles
General Distributor
Fidelity Distributors Corporation
Boston, MA
Transfer and Shareholder
Servicing Agent
Fidelity Investments Institutional Operations Company, Inc.
Boston, MA
Custodian
State Street Bank and Trust Company
Quincy, MA
* Independent trustees
Annual Report
Focus Funds
Fidelity Advisor Consumer
Industries Fund
Fidelity Advisor Cyclical
Industries Fund
Fidelity Advisor Financial
Services Fund
Fidelity Advisor Health Care Fund
Fidelity Advisor Natural
Resources Fund
Fidelity Advisor Technology Fund
Fidelity Advisor Telecommunications and Utilities Growth Fund
Growth Funds
Fidelity Advisor Korea Fund
Fidelity Advisor Emerging Asia Fund
Fidelity Advisor Latin America Fund
Fidelity Advisor Japan Fund
Fidelity Advisor Europe Capital Appreciation Fund
Fidelity Advisor International
Capital Appreciation Fund
Fidelity Advisor Overseas Fund
Fidelity Advisor Diversified International Fund
Fidelity Advisor Global Equity Fund
Fidelity Advisor TechnoQuant®
Growth Fund
Fidelity Advisor Small Cap Fund
Fidelity Advisor Value Strategies Fund
Fidelity Advisor Mid Cap Fund
Fidelity Advisor Dynamic Capital Appreciation Fund
Fidelity Advisor Equity Growth Fund
Fidelity Advisor Large Cap Fund
Fidelity Advisor Dividend Growth Fund
Fidelity Advisor Growth
Opportunities Fund
Growth and Income Funds
Fidelity Advisor Growth & Income Fund
Fidelity Advisor Equity Income Fund
Fidelity Advisor Asset Allocation Fund
Fidelity Advisor Balanced Fund
Taxable Income Funds
Fidelity Advisor Emerging Markets Income Fund
Fidelity Advisor High Yield Fund
Fidelity Advisor High Income Fund
Fidelity Advisor Strategic Income Fund
Fidelity Advisor Mortgage
Securities Fund
Fidelity Advisor Government Investment Fund
Fidelity Advisor Intermediate Bond Fund
Fidelity Advisor Short Fixed-Income Fund
Municipal Funds
Fidelity Advisor Municipal Income Fund
Money Market Funds
Prime Fund
Treasury Fund
Tax-Exempt Fund
AJAF-ANN-1200 118659
1.728717.101
(Fidelity Investment logo)(registered trademark)
Fidelity® Advisor
Fund - Institutional Class
Annual Report
October 31, 2000
(2_fidelity_logos)(registered trademark)
|
President's Message |
Ned Johnson on investing strategies. |
|
|
Performance |
How the fund has done over time. |
|
|
Fund Talk |
The manager's review of fund performance, strategy and outlook. |
|
|
Investment Changes |
A summary of major shifts in the fund's investments over the past six months. |
|
|
Investments |
A complete list of the fund's investments with their market values. |
|
|
Financial Statements |
Statements of assets and liabilities,
operations, and changes in net assets, |
|
|
Notes |
Notes to the financial statements. |
|
|
Report of Independent Accountants |
The auditors' opinion. |
|
|
Distributions |
|
Standard & Poor's, S&P and S&P 500 are registered service marks of The McGraw-Hill Companies, Inc. and have been licensed for use by Fidelity Distributors Corporation.
Other third party marks appearing herein are the property of their respective owners.
All other marks appearing herein are registered or unregistered trademarks or service marks of FMR Corp. or an affiliated company.
(Recycle graphic) This report is printed on recycled paper using soy-based inks.
This report and the financial statements contained herein are submitted for the general information of the shareholders of the fund. This report is not authorized for distribution to prospective investors in the fund unless preceded or accompanied by an effective prospectus.
Mutual fund shares are not deposits or obligations of, or guaranteed by, any depository institution. Shares are not insured by the FDIC, Federal Reserve Board or any other agency, and are subject to investment risks, including possible loss of principal amount invested.
Neither the fund nor Fidelity Distributors Corporation is a bank.
For more information on any Fidelity Advisor fund, including charges and expenses, contact your investment professional for a free prospectus. Read it carefully before you invest or send money.
Annual Report
(photo_of_Edward_C_Johnson_3d)
Dear Shareholder:
A sixth-straight year of double-digit positive returns for the Dow Jones Industrial Average, NASDAQ and S&P 500® could be in jeopardy unless the U.S. stock market shows marked improvement in the final two months of 2000. Through October, all three indexes had negative year-to-date returns. On the other hand, most fixed-income sectors were solidly in the black. Treasuries and other long-term government securities led the way, returning nearly 14%.
While it's impossible to predict the future direction of the markets with any degree of certainty, there are certain basic principles that can help investors plan for their future needs.
First, investors are encouraged to take a long-term view of their portfolios. If you can afford to leave your money invested through the inevitable up and down cycles of the financial markets, you will greatly reduce your vulnerability to any single decline. We know from experience, for example, that stock prices have gone up over longer periods of time, have significantly outperformed other types of investments and have stayed ahead of inflation.
Second, you can further manage your investing risk through diversification. A stock mutual fund, for instance, is already diversified, because it invests in many different companies. You can increase your diversification further by investing in a number of different stock funds, or in such other investment categories as bonds. If you have a short investment time horizon, you might want to consider moving some of your investment into a money market fund, which seeks income and a stable share price by investing in high-quality, short-term investments. Of course, it's important to remember that an investment in a money market fund is not insured or guaranteed by the Federal Deposit Insurance Corporation or any other government agency. Although money market funds seek to preserve the value of your investment at $1.00 per share, it is possible to lose money by investing in these types of funds.
Finally, no matter what your time horizon or portfolio diversity, it makes good sense to follow a regular investment plan, investing a certain amount of money in a fund at the same time each month or quarter and periodically reviewing your overall portfolio. By doing so, you won't get caught up in the excitement of a rapidly rising market, nor will you buy all your shares at market highs. While this strategy - known as dollar cost averaging - won't assure a profit or protect you from a loss in a declining market, it should help you lower the average cost of your purchases. Of course, you should consider your financial ability to continue your purchases through periods of low price levels before undertaking such a strategy.
Remember to contact your investment professional if you need help with your investments.
Best regards,
/s/Edward C. Johnson 3d
Edward C. Johnson 3d
Annual Report
Fidelity Advisor Japan Fund - Institutional Class
There are several ways to evaluate historical performance. You can look at the total percentage change in value, the average annual percentage change or the growth of a hypothetical $10,000 investment. Total return reflects the change in the value of an investment, assuming reinvestment of the class' dividend income and capital gains (the profits earned upon the sale of securities that have grown in value). If Fidelity had not reimbursed certain class expenses, the life of fund total returns would have been lower.
Cumulative Total Returns
|
Periods ended October 31, 2000 |
|
Past 1 |
Life of |
|
Fidelity Adv Japan - Inst CL |
|
-4.75% |
81.84% |
|
TOPIX |
|
-15.16% |
35.94% |
|
Japanese Funds Average |
|
-16.10% |
n/a* |
Cumulative total returns show Institutional Class' performance in percentage terms over a set period - in this case, one year or since the fund started on December 17, 1998. For example, if you had invested $1,000 in a fund that had a 5% return over the past year, the value of your investment would be $1,050. You can compare Institutional Class' returns to the performance of the Tokyo Stock Exchange Index (TOPIX) - a market capitalization-weighted index of over 1,300 stocks traded in the Japanese market. To measure how Institutional Class' performance stacked up against its peers, you can compare it to the Japanese funds average, which reflects the performance of mutual funds with similar objectives tracked by Lipper Inc. The past one year average represents a peer group of 48 mutual funds. These benchmarks include reinvested dividends and capital gains, if any, and exclude the effect of sales charges.
Average Annual Total Returns
|
Periods ended October 31, 2000 |
|
Past 1 |
Life of |
|
Fidelity Adv Japan - Inst CL |
|
-4.75% |
37.59% |
|
TOPIX |
|
-15.16% |
17.80% |
|
Japanese Funds Average |
|
-16.10% |
n/a* |
Average annual total returns take Institutional Class shares' cumulative return and show you what would have happened if Institutional Class shares had performed at a constant rate each year.
* Not available
Annual Report
$10,000 Over Life of Fund
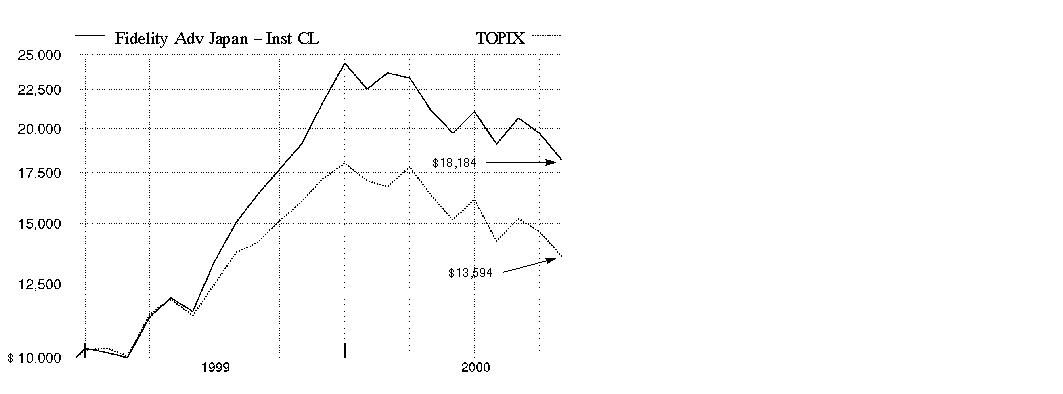
$10,000 Over Life of Fund: Let's say hypothetically that $10,000 was invested in Fidelity Advisor Japan Fund - Institutional Class on December 17, 1998, when the fund started. As the chart shows, by October 31, 2000, the value of the investment would have grown to $18,184 - an 81.84% increase on the initial investment. For comparison, look at how the Tokyo Stock Exchange Index (TOPIX) did over the same period. With dividends reinvested, the same $10,000 would have grown to $13,594 - a 35.94% increase.
Understanding
Performance
Many markets around the globe offer the potential for significant growth over time; however, investing in foreign markets means assuming greater risks than investing in the United States. Factors like changes in a country's financial markets, its local political and economic climate, and the fluctuating value of its currency create these risks. For these reasons an international fund's performance may be more volatile than a fund that invests exclusively in the United States. Past performance is no guarantee of future results and you may have a gain or loss when you sell your shares.
3Annual Report
Market Recap
Currency disparities, the see-saw performance of technology and telecommunications stocks, and increased uncertainty over the direction of energy prices contributed to volatile world markets for the 12-month period that ended October 31, 2000. Through the first half of the period, foreign investors enjoyed handsome returns from technology and telecommunications holdings. These gains disappeared down the stretch, however, as the dollar continued to outperform the struggling euro - the uniform currency of 11 European nations - and the Japanese yen by wide margins. Soaring oil and gas prices also added to the volatility. The Morgan Stanley EAFE® index - which tracks the performance of stock markets in Europe, Australasia and the Far East - fell 2.72% during the period. Europe's economic recovery remained on course, but the euro's continued weakness proved to be a millstone. The Morgan Stanley Europe index had a 12-month return of 1.16%. Japan's economic recovery, on the other hand, appeared to be short-lived, or at least very, very slow in the making. The Morgan Stanley Japan index declined 11.61% during the period. Emerging markets, meanwhile, were unable to sustain the momentum they carried into early 2000, as the Morgan Stanley Emerging Markets Free index tumbled 10.33%.
(Portfolio Manager photograph)
Note to shareholders: William Kennedy became Portfolio Manager of Fidelity Advisor Japan Fund on June 16, 2000.
Q. How did the fund perform, Bill?
A. Although returns were negative, the fund managed to outperform its benchmarks by substantial margins. For the 12 months that ended October 31, 2000, the fund's Institutional Class shares returned -4.75%. By comparison, the Tokyo Stock Exchange Index (TOPIX) and the Japanese funds average tracked by Lipper Inc. had returns of -15.16% and -16.10%, respectively.
Q. What factors affected the fund's absolute and relative returns?
A. Taking their cue from U.S. markets, Japanese technology and telecommunications stocks experienced a severe correction last spring following a substantial run-up from November through mid-March. After recovering to some extent during the summer, these sectors came under renewed downward pressure in September and October, as investors worried about a deceleration in the demand for semiconductors and personal computers. Telecommunications stocks also suffered from intense competitive pressures worldwide and, in the case of cellular stocks, concerns about excessive corporate spending for third-generation cellular licenses. The fund had a substantial technology overweighting for much of the period, which helped performance until mid-March but hurt relative performance thereafter. The fund also benefited from strong stock selection, particularly with respect to companies making fiber-optic components.
Annual Report
Fund Talk: The Manager's Overview - continued
Q. You're new to this fund. Can you expain your management style?
A. I plan to emphasize two main themes. On the one hand, I'm looking for good companies offering strong and accelerating earnings and revenue growth. I'm willing to pay for good growth, although I'm aware that there are limits to what the market will bear for growth stock valuations, as we saw in the spring. The other theme that will guide the fund's investments is restructuring. Japan is changing rapidly, and the market is rewarding companies that are moving in the right direction. Evidence of "doing the right thing" includes cutting costs, closing down unprofitable businesses and investing in those with high profit potential, repurchasing shares and rewarding management with stock options. Companies that demonstrate they are serious about these initiatives get my attention.
Q. What stocks performed well for the fund?
A. Furukawa Electric was the fund's best performer and also one of its largest holdings during the period. The company's businesses in fiber-optic cable and wave division multiplexing (WDM) - that is, using lasers and mirrors to split light into its component parts and increase the capacity of fiber-optic pathways - benefited from robust demand. Fiber-optic networks are playing a central role in expanding the Internet and accommodating the explosive growth of data communications. Another strong performer, Nippon Sheet Glass, experienced rapid growth in its division that manufactures the lenses used in fiber-optics equipment.
Q. What stocks were disappointing?
A. NTT DoCoMo - the largest cellular carrier in Japan - was the worst detractor from performance. The stock was caught in the technology and telecommunications meltdown earlier in the period, and then was hurt by uncertainty about demand for cellular service as the period drew to a close. However, the company's i-mode service, providing Internet access via cellular phones, was a runaway hit in Japan, and the company is positioning itself for expansion to other countries. As a result, I used the stock's weakness to add to the position. Nippon Telegraph & Telephone (NTT) also underperformed during the period. Like many incumbent telephone service companies worldwide, NTT faced increasing competitive threats in its core long-distance and local-service businesses. Toshiba and NEC, both of which have significant interests in semiconductor manufacturing, responded negatively to investors' pessimistic outlook for that market in September and October.
Annual Report
Fund Talk: The Manager's Overview - continued
Q. What's your outlook, Bill?
A. In the short term, we may see continued choppiness as growth stocks in the technology and telecommunications sectors struggle with the prospect of decelerating growth. Much of the slowdown in demand appears to be emanating from the U.S., where growth has moderated due to a series of six increases in short-term interest rates during the past 18 months. However, many Japanese stocks are good values right now, and I will view any short-term weakness as an excellent buying opportunity. In addition, restructuring will likely continue to be a source of attractive opportunities for the fund.
The views expressed in this report reflect those of the portfolio manager only through the end of the period of the report as stated on the cover and do not necessarily represent the views of Fidelity or any other person in the Fidelity organization. Any such views are subject to change at any time based upon market or other conditions and Fidelity disclaims any responsibility to update such views. These views may not be relied on as investment advice and, because investment decisions for a Fidelity fund are based on numerous factors, may not be relied on as an indication of trading intent on behalf of any Fidelity fund
.
Fund Facts
Goal: long-term growth of capital by investing mainly in equity securities of Japanese issuers
Start date: December 17, 1998
Size: as of October 31, 2000, more than $108 million
Manager: William Kennedy,
since June 2000; manager,
Fidelity Pacific Basin Fund,
since 1998; Hong Kong
research director, 1996-1998;
analyst, regional power sector
and Indian companies, 1994-
1996; joined Fidelity in 1994
Bill Kennedy on restructuring in Japan:
"Restructuring in Japan has occurred by means of a ripple effect, beginning with the government, spreading to the banking system and finally reaching companies in other industries. In the wake of the banking crisis several years ago, the government stepped in and recapitalized the banks. At the same time, however, banks were given strong incentives to clean up their balance sheets and tighten their loan approval processes. Formerly, loans were available to virtually any company that wanted them.
"With loans becoming increasingly difficult to obtain, Japanese companies realized that they needed to restructure their operations. This was especially true of companies in the New Japan - information technology, semiconductors and the like. These companies must compete with peers in the U.S. and Europe that are extremely well-run and shareholder-friendly. Japanese managers are realizing that running a tight ship will attract more investors, resulting in a higher share price and more equity with which to make acquisitions or fund research and development. Therefore, unless there is backsliding in the banking sector, which I don't foresee, the ripples of restructuring should continue to extend their reach throughout the Japanese economy."
Annual Report
|
Top Ten Stocks as of October 31, 2000 |
||
|
|
% of fund's |
% of fund's net assets |
|
NTT DoCoMo, Inc. |
8.0 |
8.2 |
|
Toyota Motor Corp. |
4.2 |
4.2 |
|
Takeda Chemical Industries Ltd. |
4.0 |
2.6 |
|
Sony Corp. |
3.2 |
2.8 |
|
Toyoda Gosei Co. Ltd. |
3.1 |
1.3 |
|
Canon, Inc. |
2.7 |
1.3 |
|
Furukawa Electric Co. Ltd. |
2.6 |
3.0 |
|
Sanyo Electric Co. Ltd. |
2.3 |
0.0 |
|
Sakura Bank Ltd. |
2.2 |
0.7 |
|
Nippon Sheet Glass Co. Ltd. |
2.2 |
1.1 |
|
|
34.5 |
25.2 |
|
Top Five Market Sectors as of October 31, 2000 |
||
|
|
% of fund's |
% of fund's net assets |
|
Technology |
20.1 |
23.5 |
|
Durables |
16.8 |
12.3 |
|
Finance |
12.7 |
9.1 |
|
Utilities |
10.3 |
12.4 |
|
Health |
9.1 |
8.4 |
|
Asset Allocation (% of fund's net assets) |
|||||||
|
As of October 31, 2000 |
As of April 30, 2000 |
||||||
|
Stocks 90.8% |
|
|
Stocks 95.2% |
|
||
|
Short-Term |
|
|
Short-Term |
|
||
Annual Report
Showing Percentage of Net Assets
|
Common Stocks - 90.8% |
|||
|
Shares |
Value (Note 1) |
||
|
BASIC INDUSTRIES - 3.0% |
|||
|
Chemicals & Plastics - 2.6% |
|||
|
Hitachi Chemical Co. Ltd. |
51,500 |
$ 1,293,282 |
|
|
Nissan Chemical Industries Co. Ltd. |
136,000 |
1,003,391 |
|
|
Shin-Etsu Chemical Co. Ltd. |
12,000 |
492,714 |
|
|
|
2,789,387 |
||
|
Paper & Forest Products - 0.4% |
|||
|
Nippon Paper Industries Co. Ltd. |
76,000 |
433,251 |
|
|
TOTAL BASIC INDUSTRIES |
3,222,638 |
||
|
CONSTRUCTION & REAL ESTATE - 4.6% |
|||
|
Building Materials - 2.5% |
|||
|
Central Glass Co. Ltd. |
62,000 |
283,549 |
|
|
Nippon Sheet Glass Co. Ltd. |
155,000 |
2,358,171 |
|
|
|
2,641,720 |
||
|
Construction - 1.2% |
|||
|
Daito Trust Construction Co. |
63,700 |
1,074,219 |
|
|
HUNET, Inc. |
28,000 |
236,092 |
|
|
|
1,310,311 |
||
|
Real Estate - 0.9% |
|||
|
Mitsubishi Estate Co. Ltd. (a) |
66,000 |
701,677 |
|
|
Mitsui Fudosan Co. Ltd. |
26,000 |
315,022 |
|
|
|
1,016,699 |
||
|
TOTAL CONSTRUCTION & REAL ESTATE |
4,968,730 |
||
|
DURABLES - 16.8% |
|||
|
Autos, Tires, & Accessories - 8.1% |
|||
|
Honda Motor Co. Ltd. (a) |
26,000 |
899,438 |
|
|
Toyoda Gosei Co. Ltd. |
54,000 |
3,306,021 |
|
|
Toyota Motor Corp. |
114,300 |
4,567,391 |
|
|
|
8,772,850 |
||
|
Consumer Durables - 0.7% |
|||
|
Asahi Techno Glass Corp. |
87,000 |
693,704 |
|
|
Consumer Electronics - 8.0% |
|||
|
Matsushita Electric Industrial Co. Ltd. |
46,000 |
1,344,350 |
|
|
Pioneer Corp. |
45,000 |
1,394,006 |
|
|
Common Stocks - continued |
|||
|
Shares |
Value (Note 1) |
||
|
DURABLES - continued |
|||
|
Consumer Electronics - continued |
|||
|
Sanyo Electric Co. Ltd. |
325,000 |
$ 2,472,276 |
|
|
Sony Corp. |
41,600 |
3,452,800 |
|
|
|
8,663,432 |
||
|
TOTAL DURABLES |
18,129,986 |
||
|
FINANCE - 12.7% |
|||
|
Banks - 6.9% |
|||
|
Bank of Tokyo-Mitsubishi Ltd. |
85,000 |
1,019,751 |
|
|
Sakura Bank Ltd. |
330,000 |
2,404,454 |
|
|
Sumitomo Bank Ltd. |
103,000 |
1,250,802 |
|
|
Sumitomo Trust & Banking Ltd. |
99,000 |
762,167 |
|
|
The Suruga Bank Ltd. |
119,000 |
1,633,782 |
|
|
Tokyo Tomin Bank Ltd. |
15,000 |
419,302 |
|
|
|
7,490,258 |
||
|
Credit & Other Finance - 2.5% |
|||
|
Aeon Credit Service Ltd. |
20,900 |
1,172,285 |
|
|
Credit Saison Co. Ltd. |
30,200 |
639,373 |
|
|
ORIX Corp. |
8,100 |
850,014 |
|
|
|
2,661,672 |
||
|
Securities Industry - 3.3% |
|||
|
Daiwa Securities Group, Inc. |
51,000 |
565,109 |
|
|
Nikko Securities Co. Ltd. |
173,000 |
1,493,594 |
|
|
Nomura Securities Co. Ltd. |
74,000 |
1,570,067 |
|
|
|
3,628,770 |
||
|
TOTAL FINANCE |
13,780,700 |
||
|
HEALTH - 9.1% |
|||
|
Drugs & Pharmaceuticals - 6.3% |
|||
|
Fujisawa Pharmaceutical Co. Ltd. |
50,000 |
1,571,808 |
|
|
Takeda Chemical Industries Ltd. |
66,000 |
4,349,189 |
|
|
Yamanouchi Pharmaceutical Co. Ltd. |
21,000 |
950,784 |
|
|
|
6,871,781 |
||
|
Medical Equipment & Supplies - 2.8% |
|||
|
Hogy Medical Co. |
8,400 |
538,906 |
|
|
Common Stocks - continued |
|||
|
Shares |
Value (Note 1) |
||
|
HEALTH - continued |
|||
|
Medical Equipment & Supplies - continued |
|||
|
Hoya Corp. |
20,000 |
$ 1,653,377 |
|
|
Japan Medical Dynamic Marketing, Inc. |
24,800 |
820,530 |
|
|
|
3,012,813 |
||
|
TOTAL HEALTH |
9,884,594 |
||
|
INDUSTRIAL MACHINERY & EQUIPMENT - 5.3% |
|||
|
Electrical Equipment - 4.0% |
|||
|
Furukawa Electric Co. Ltd. |
109,000 |
2,867,107 |
|
|
Omron Corp. |
60,000 |
1,479,241 |
|
|
|
4,346,348 |
||
|
Industrial Machinery & Equipment - 1.3% |
|||
|
Furukawa Co. Ltd. |
212,000 |
435,231 |
|
|
THK Co. Ltd. |
20,500 |
507,286 |
|
|
Tsubaki Nakashima Co. Ltd. |
33,000 |
413,445 |
|
|
|
1,355,962 |
||
|
TOTAL INDUSTRIAL MACHINERY & EQUIPMENT |
5,702,310 |
||
|
MEDIA & LEISURE - 5.0% |
|||
|
Broadcasting - 1.1% |
|||
|
SKY Perfect Communications, Inc. (a) |
21 |
38,686 |
|
|
Tokyo Broadcasting System, Inc. |
29,000 |
1,134,910 |
|
|
|
1,173,596 |
||
|
Leisure Durables & Toys - 1.1% |
|||
|
Nintendo Co. Ltd. |
7,400 |
1,224,177 |
|
|
Restaurants - 2.8% |
|||
|
Kappa Create Co. Ltd. |
33,000 |
1,073,687 |
|
|
Saizeriya Co. Ltd. |
17,640 |
986,197 |
|
|
Skylark Co. Ltd. |
24,000 |
846,852 |
|
|
Yoshinoya D&C Co. Ltd. |
73 |
137,155 |
|
|
|
3,043,891 |
||
|
TOTAL MEDIA & LEISURE |
5,441,664 |
||
|
NONDURABLES - 1.8% |
|||
|
Beverages - 0.5% |
|||
|
Kirin Beverage Corp. |
22,000 |
546,421 |
|
|
Common Stocks - continued |
|||
|
Shares |
Value (Note 1) |
||
|
NONDURABLES - continued |
|||
|
Foods - 0.5% |
|||
|
Ajinomoto Co., Inc. |
29,000 |
$ 324,260 |
|
|
Yakult Honsha Co. Ltd. |
17,000 |
193,823 |
|
|
|
518,083 |
||
|
Household Products - 0.5% |
|||
|
Shiseido Co. Ltd. |
46,000 |
594,446 |
|
|
Tobacco - 0.3% |
|||
|
Japan Tobacco, Inc. |
40 |
274,952 |
|
|
TOTAL NONDURABLES |
1,933,902 |
||
|
RETAIL & WHOLESALE - 2.1% |
|||
|
General Merchandise Stores - 0.6% |
|||
|
Seven Eleven Japan Co. Ltd. |
10,000 |
650,719 |
|
|
Retail & Wholesale, Miscellaneous - 1.5% |
|||
|
Yamada Denki Co. Ltd. |
18,300 |
1,610,118 |
|
|
TOTAL RETAIL & WHOLESALE |
2,260,837 |
||
|
TECHNOLOGY - 20.1% |
|||
|
Communications Equipment - 2.1% |
|||
|
NEC Corp. |
117,000 |
2,230,410 |
|
|
Computer Services & Software - 3.3% |
|||
|
Capcom Co. Ltd. |
20,000 |
773,531 |
|
|
Ines Corp. |
20,900 |
261,274 |
|
|
Konami Co. Ltd. |
26,300 |
2,217,579 |
|
|
Trend Micro, Inc. (a) |
3,500 |
330,401 |
|
|
|
3,582,785 |
||
|
Computers & Office Equipment - 4.6% |
|||
|
Canon, Inc. |
71,000 |
2,879,938 |
|
|
Oki Electric Industry Co. Ltd. (a) |
174,000 |
1,034,974 |
|
|
Ricoh Co. Ltd. |
55,000 |
846,852 |
|
|
Softbank Corp. |
3,200 |
192,100 |
|
|
|
4,953,864 |
||
|
Electronic Instruments - 1.8% |
|||
|
Anritsu Corp. |
90,000 |
1,979,654 |
|
|
Electronics - 7.4% |
|||
|
Kyocera Corp. |
9,200 |
1,230,500 |
|
|
Mitsubishi Electric Corp. |
101,000 |
725,726 |
|
|
Mitsumi Electric Co. Ltd. |
24,000 |
791,861 |
|
|
Common Stocks - continued |
|||
|
Shares |
Value (Note 1) |
||
|
TECHNOLOGY - continued |
|||
|
Electronics - continued |
|||
|
Nitto Denko Corp. |
42,000 |
$ 1,420,401 |
|
|
Rohm Co. Ltd. |
7,300 |
1,840,555 |
|
|
Toshiba Corp. |
278,000 |
1,987,352 |
|
|
|
7,996,395 |
||
|
Photographic Equipment - 0.9% |
|||
|
Konica Corp. (a) |
124,000 |
958,042 |
|
|
TOTAL TECHNOLOGY |
21,701,150 |
||
|
UTILITIES - 10.3% |
|||
|
Cellular - 8.0% |
|||
|
NTT DoCoMo, Inc. |
348 |
8,579,595 |
|
|
Telephone Services - 2.3% |
|||
|
DDI Corp. |
126 |
591,257 |
|
|
Nippon Telegraph & Telephone Corp. |
210 |
1,911,191 |
|
|
|
2,502,448 |
||
|
TOTAL UTILITIES |
11,082,043 |
||
|
TOTAL COMMON STOCKS (Cost $92,170,930) |
98,108,554 |
||
|
Cash Equivalents - 9.0% |
|||
|
|
|
|
|
|
Fidelity Cash Central Fund, 6.61% (b) |
9,703,906 |
9,703,906 |
|
|
TOTAL INVESTMENT PORTFOLIO - 99.8% (Cost $101,874,836) |
107,812,460 |
||
|
NET OTHER ASSETS - 0.2% |
245,515 |
||
|
NET ASSETS - 100% |
$ 108,057,975 |
||
|
Legend |
|
(a) Non-income producing |
|
(b) The rate quoted is the annualized seven-day yield of the fund at period end. A complete listing of the fund's holdings as of its most recent fiscal year end is available upon request. |
|
Income Tax Information |
|
At October 31, 2000, the aggregate cost of investment securities for income tax purposes was $102,317,025. Net unrealized appreciation aggregated $5,495,435, of which $14,846,174 related to appreciated investment securities and $9,350,739 related to depreciated investment securities. |
|
At October 31, 2000, the fund had a capital loss carryforward of approximately $4,503,000 all of which will expire on October 31, 2008. |
See accompanying notes which are an integral part of the financial statements.
Annual Report
Statement of Assets and Liabilities
|
|
October 31, 2000 |
|
|
Assets |
|
|
|
Investment in securities, at value (cost $101,874,836) - See accompanying schedule |
|
$ 107,812,460 |
|
Receivable for investments sold |
|
268,620 |
|
Receivable for fund shares sold |
|
526,328 |
|
Dividends receivable |
|
169,335 |
|
Interest receivable |
|
48,641 |
|
Total assets |
|
108,825,384 |
|
Liabilities |
|
|
|
Payable for investments purchased |
$ 36,401 |
|
|
Payable for fund shares redeemed |
521,893 |
|
|
Accrued management fee |
69,979 |
|
|
Distribution fees payable |
69,442 |
|
|
Other payables and accrued expenses |
69,694 |
|
|
Total liabilities |
|
767,409 |
|
Net Assets |
|
$ 108,057,975 |
|
Net Assets consist of: |
|
|
|
Paid in capital |
|
$ 102,210,196 |
|
Undistributed net investment income |
|
4,826,267 |
|
Accumulated undistributed net realized gain (loss) on investments and foreign currency transactions |
|
(4,913,959) |
|
Net unrealized appreciation (depreciation) on investments and assets and liabilities in foreign currencies |
|
5,935,471 |
|
Net Assets |
|
$ 108,057,975 |
See accompanying notes which are an integral part of the financial statements.
Annual Report
Financial Statements - continued
Statement of Assets and Liabilities - continued
|
|
October 31, 2000 |
|
|
Calculation of Maximum Offering Price |
|
$17.78 |
|
Maximum offering price per share (100/94.25 of $17.78) |
|
$18.86 |
|
Class T: |
|
$17.72 |
|
Maximum offering price per share (100/96.50 of $17.72) |
|
$18.36 |
|
Class B: |
|
$17.55 |
|
Class C: |
|
$17.58 |
|
Institutional Class: |
|
$17.88 |
A Redemption price per share is equal to net asset value less any applicable contingent deferred sales charge.
See accompanying notes which are an integral part of the financial statements.
Annual Report
Financial Statements - continued
Statement of Operations
|
|
Year ended October 31, 2000 |
|
|
Investment Income Dividends |
|
$ 545,320 |
|
Interest |
|
476,581 |
|
|
|
1,021,901 |
|
Less foreign taxes withheld |
|
(81,798) |
|
Total income |
|
940,103 |
|
Expenses |
|
|
|
Management fee |
$ 1,037,015 |
|
|
Transfer agent fees |
381,746 |
|
|
Distribution fees |
1,025,128 |
|
|
Accounting fees and expenses |
86,675 |
|
|
Non-interested trustees' compensation |
440 |
|
|
Custodian fees and expenses |
92,916 |
|
|
Registration fees |
83,509 |
|
|
Audit |
25,325 |
|
|
Legal |
1,636 |
|
|
Interest |
724 |
|
|
Miscellaneous |
2,055 |
|
|
Total expenses before reductions |
2,737,169 |
|
|
Expense reductions |
(21,894) |
2,715,275 |
|
Net investment income (loss) |
|
(1,775,172) |
|
Realized and Unrealized Gain (Loss) Net realized gain (loss) on: |
|
|
|
Investment securities |
2,951,179 |
|
|
Foreign currency transactions |
(417,255) |
2,533,924 |
|
Change in net unrealized appreciation (depreciation) on: |
|
|
|
Investment securities |
(12,121,872) |
|
|
Assets and liabilities in foreign currencies |
(2,705) |
(12,124,577) |
|
Net gain (loss) |
|
(9,590,653) |
|
Net increase (decrease) in net assets resulting |
|
$ (11,365,825) |
See accompanying notes which are an integral part of the financial statements.
Annual Report
Financial Statements - continued
Statement of Changes in Net Assets
|
|
Year ended |
December 17, 1998 1999 |
|
Increase (Decrease) in Net Assets |
|
|
|
Operations |
$ (1,775,172) |
$ (312,413) |
|
Net realized gain (loss) |
2,533,924 |
1,426,579 |
|
Change in net unrealized appreciation (depreciation) |
(12,124,577) |
18,060,048 |
|
Net increase (decrease) in net assets resulting |
(11,365,825) |
19,174,214 |
|
Distributions to shareholders |
(170,831) |
- |
|
In excess of net investment income |
(389,931) |
- |
|
From net realized gain |
(1,285,442) |
- |
|
Total distributions |
(1,846,204) |
- |
|
Share transactions - net increase (decrease) |
42,592,329 |
59,503,461 |
|
Total increase (decrease) in net assets |
29,380,300 |
78,677,675 |
|
Net Assets |
|
|
|
Beginning of period |
78,677,675 |
- |
|
End of period (including undistributed net investment income of $4,826,267 and $200,753, respectively) |
$ 108,057,975 |
$ 78,677,675 |
See accompanying notes which are an integral part of the financial statements.
Annual Report
Financial Highlights - Class A
|
Years ended October 31, |
2000 |
1999 E |
|
Selected Per-Share Data |
|
|
|
Net asset value, beginning of period |
$ 19.04 |
$ 10.00 |
|
Income from Investment Operations |
|
|
|
Net investment income (loss) D |
(.16) |
(.13) |
|
Net realized and unrealized gain (loss) |
(.76) |
9.17 |
|
Total from investment operations |
(.92) |
9.04 |
|
Less Distributions |
|
|
|
From net investment income |
(.04) H |
- |
|
In excess of net investment income |
(.08) |
- |
|
From net realized gain |
(.22) H |
- |
|
Total distributions |
(.34) |
- |
|
Net asset value, end of period |
$ 17.78 |
$ 19.04 |
|
Total Return B, C |
(5.07)% |
90.40% |
|
Ratios and Supplemental Data |
|
|
|
Net assets, end of period (000 omitted) |
$ 18,657 |
$ 7,130 |
|
Ratio of expenses to average net assets |
1.44% |
2.02% A, F |
|
Ratio of expenses to average net assets after expense reductions |
1.42% G |
2.01% A, G |
|
Ratio of net investment income (loss) to average net assets |
(.76)% |
(1.04)% A |
|
Portfolio turnover |
169% |
152% A |
A Annualized
B The total returns would have been lower had certain expenses not been reduced during the periods shown.
C Total returns do not include the one time sales charge and for periods of less than one year are not annualized.
D Net investment income (loss) per share has been calculated based on average shares outstanding during the period.
E For the period December 17, 1998 (commencement of operations) to October 31, 1999.
F FMR agreed to reimburse a portion of the class' expenses during the period. Without this reimbursement, the class' expense ratio would have been higher.
G FMR or the fund has entered into varying arrangements with third parties who either paid or reduced a portion of the class' expenses.
H The amounts shown reflect certain reclassifications related to book to tax differences.
See accompanying notes which are an integral part of the financial statements.
Annual Report
Financial Highlights - Class T
|
Years ended October 31, |
2000 |
1999 E |
|
Selected Per-Share Data |
|
|
|
Net asset value, beginning of period |
$ 19.01 |
$ 10.00 |
|
Income from Investment Operations |
|
|
|
Net investment income (loss) D |
(.21) |
(.17) |
|
Net realized and unrealized gain (loss) |
(.75) |
9.18 |
|
Total from investment operations |
(.96) |
9.01 |
|
Less Distributions |
|
|
|
From net investment income |
(.03) H |
- |
|
In excess of net investment income |
(.08) |
- |
|
From net realized gain |
(.22) H |
- |
|
Total distributions |
(.33) |
- |
|
Net asset value, end of period |
$ 17.72 |
$ 19.01 |
|
Total Return B, C |
(5.29)% |
90.10% |
|
Ratios and Supplemental Data |
|
|
|
Net assets, end of period (000 omitted) |
$ 29,840 |
$ 25,682 |
|
Ratio of expenses to average net assets |
1.71% |
2.27% A, F |
|
Ratio of expenses to average net assets after expense reductions |
1.69% G |
2.26% A, G |
|
Ratio of net investment income (loss) to average net assets |
(1.03)% |
(1.29)% A |
|
Portfolio turnover |
169% |
152% A |
A Annualized
B The total returns would have been lower had certain expenses not been reduced during the periods shown.
C Total returns do not include the one time sales charge and for periods of less than one year are not annualized.
D Net investment income (loss) per share has been calculated based on average shares outstanding during the period.
E For the period December 17, 1998 (commencement of operations) to October 31, 1999.
F FMR agreed to reimburse a portion of the class' expenses during the period. Without this reimbursement, the class' expense ratio would have been higher.
G FMR or the fund has entered into varying arrangements with third parties who either paid or reduced a portion of the class' expenses.
H The amounts shown reflect certain reclassifications related to book to tax differences.
See accompanying notes which are an integral part of the financial statements.
Annual Report
Financial Highlights - Class B
|
Years ended October 31, |
2000 |
1999 E |
|
Selected Per-Share Data |
|
|
|
Net asset value, beginning of period |
$ 18.92 |
$ 10.00 |
|
Income from Investment Operations |
|
|
|
Net investment income (loss) D |
(.32) |
(.23) |
|
Net realized and unrealized gain (loss) |
(.74) |
9.15 |
|
Total from investment operations |
(1.06) |
8.92 |
|
Less Distributions |
|
|
|
From net investment income |
(.03) H |
- |
|
In excess of net investment income |
(.06) |
- |
|
From net realized gain |
(.22) H |
- |
|
Total distributions |
(.31) |
- |
|
Net asset value, end of period |
$ 17.55 |
$ 18.92 |
|
Total Return B, C |
(5.83)% |
89.20% |
|
Ratios and Supplemental Data |
|
|
|
Net assets, end of period (000 omitted) |
$ 31,334 |
$ 20,667 |
|
Ratio of expenses to average net assets |
2.25% |
2.78% A, F |
|
Ratio of expenses to average net assets after expense reductions |
2.23% G |
2.77% A, G |
|
Ratio of net investment income (loss) to average net assets |
(1.57)% |
(1.79)% A |
|
Portfolio turnover |
169% |
152% A |
A Annualized
B The total returns would have been lower had certain expenses not been reduced during the periods shown.
C Total returns do not include the contingent deferred sales charge and for periods of less than one year are not annualized.
D Net investment income (loss) per share has been calculated based on average shares outstanding during the period.
E For the period December 17, 1998 (commencement of operations) to October 31, 1999.
F FMR agreed to reimburse a portion of the class' expenses during the period. Without this reimbursement, the class' expense ratio would have been higher.
G FMR or the fund has entered into varying arrangements with third parties who either paid or reduced a portion of the class' expenses.
H The amounts shown reflect certain reclassifications related to book to tax differences.
See accompanying notes which are an integral part of the financial statements.
Annual Report
Financial Highlights - Class C
|
Years ended October 31, |
2000 |
1999 E |
|
Selected Per-Share Data |
|
|
|
Net asset value, beginning of period |
$ 18.93 |
$ 10.00 |
|
Income from Investment Operations |
|
|
|
Net investment income (loss) D |
(.31) |
(.24) |
|
Net realized and unrealized gain (loss) |
(.73) |
9.17 |
|
Total from investment operations |
(1.04) |
8.93 |
|
Less Distributions |
|
|
|
From net investment income |
(.03) H |
- |
|
In excess of net investment income |
(.06) |
- |
|
From net realized gain |
(.22) H |
- |
|
Total distributions |
(.31) |
- |
|
Net asset value, end of period |
$ 17.58 |
$ 18.93 |
|
Total Return B, C |
(5.72)% |
89.30% |
|
Ratios and Supplemental Data |
|
|
|
Net assets, end of period (000 omitted) |
$ 25,481 |
$ 22,213 |
|
Ratio of expenses to average net assets |
2.16% |
2.78% A, F |
|
Ratio of expenses to average net assets after expense reductions |
2.15% G |
2.76% A, G |
|
Ratio of net investment income (loss) to average net assets |
(1.49)% |
(1.79)% A |
|
Portfolio turnover |
169% |
152% A |
A Annualized
B The total returns would have been lower had certain expenses not been reduced during the periods shown.
C Total returns do not include the contingent deferred sales charge and for periods of less than one year are not annualized.
D Net investment income (loss) per share has been calculated based on average shares outstanding during the period.
E For the period December 17, 1998 (commencement of operations) to October 31, 1999.
F FMR agreed to reimburse a portion of the class' expenses during the period. Without this reimbursement, the class' expense ratio would have been higher.
G FMR or the fund has entered into varying arrangements with third parties who either paid or reduced a portion of the class' expenses.
H The amounts shown reflect certain reclassifications related to book to tax differences.
See accompanying notes which are an integral part of the financial statements.
Annual Report
Financial Highlights - Institutional Class
|
Years ended October 31, |
2000 |
1999 E |
|
Selected Per-Share Data |
|
|
|
Net asset value, beginning of period |
$ 19.09 |
$ 10.00 |
|
Income from Investment Operations |
|
|
|
Net investment income (loss) D |
(.09) |
(.10) |
|
Net realized and unrealized gain (loss) |
(.77) |
9.19 |
|
Total from investment operations |
(.86) |
9.09 |
|
Less Distributions |
|
|
|
From net investment income |
(.04) H |
- |
|
In excess of net investment income |
(.09) |
- |
|
From net realized gain |
(.22) H |
- |
|
Total distributions |
(.35) |
- |
|
Net asset value, end of period |
$ 17.88 |
$ 19.09 |
|
Total Return B, C |
(4.75)% |
90.90% |
|
Ratios and Supplemental Data |
|
|
|
Net assets, end of period (000 omitted) |
$ 2,746 |
$ 2,986 |
|
Ratio of expenses to average net assets |
1.13% |
1.77% A, F |
|
Ratio of expenses to average net assets after expense reductions |
1.11% G |
1.76% A, G |
|
Ratio of net investment income (loss) to average net assets |
(.45)% |
(.78)% A |
|
Portfolio turnover |
169% |
152% A |
A Annualized
B The total returns would have been lower had certain expenses not been reduced during the periods shown.
C Total returns for periods of less than one year are not annualized.
D Net investment income (loss) per share has been calculated based on average shares outstanding during the period.
E For the period December 17, 1998 (commencement of operations) to October 31, 1999.
F FMR agreed to reimburse a portion of the class' expenses during the period. Without this reimbursement, the class' expense ratio would have been higher.
G FMR or the fund has entered into varying arrangements with third parties who either paid or reduced a portion of the class' expenses.
H The amounts shown reflect certain reclassifications related to book to tax differences.
See accompanying notes which are an integral part of the financial statements.
Annual Report
For the period ended October 31, 2000
1. Significant Accounting Policies.
Fidelity Advisor Japan Fund(the fund) is a fund of Fidelity Advisor Series VIII(the trust) and is authorized to issue an unlimited number of shares. The trust is registered under the Investment Company Act of 1940, as amended (the 1940 Act), as an open-end management investment company organized as a Massachusetts business trust.
The fund offers Class A, Class T, Class B, Class C, and Institutional Class shares, each of which has equal rights as to assets and voting privileges. Each class has exclusive voting rights with respect to matters that affect that class. Class B shares will automatically convert to Class A shares after a holding period of seven years from the initial date of purchase. Investment income, realized and unrealized capital gains and losses, the common expenses of the fund, and certain fund-level expense reductions, if any, are allocated on a pro rata basis to each class based on the relative net assets of each class to the total net assets of the fund. Each class of shares differs in its respective distribution, transfer agent, and certain other class-specific fees, expenses, and expense reductions.
The financial statements have been prepared in conformity with generally accepted accounting principles which require management to make certain estimates and assumptions at the date of the financial statements. The following summarizes the significant accounting policies of the fund:
Security Valuation. Securities for which quotations are readily available are valued using the official closing price or at the last sale price in the principal market in which they are traded. If the last sale price (on the local exchange) is unavailable, the last evaluated quote or closing bid price normally is used. If trading or events occurring in other markets after the close of the principal market in which securities are traded are expected to materially affect the value of those securities, then they are valued at their fair value taking this trading or these events into account. Fair value is determined in good faith under consistently applied procedures under the general supervision of the Board of Trustees. Securities for which quotations are not readily available are valued primarily using dealer-supplied valuations or at their fair value. Short-term securities with remaining maturities of sixty days or less for which quotations are not readily available are valued at amortized cost or original cost plus accrued interest, both of which approximate current value. Investments in open-end investment companies are valued at their net asset value each business day.
Foreign Currency Translation. The accounting records of the fund are maintained in U.S. dollars. Investment securities and other assets and liabilities denominated in a foreign currency are translated into U.S. dollars at the prevailing rates of exchange at period end. Purchases and sales of securities, income receipts and expense payments are translated into U.S. dollars at the prevailing exchange rate on the respective dates of the transactions.
Annual Report
Notes to Financial Statements - continued
1. Significant Accounting Policies - continued
Foreign Currency Translation - continued
Net realized gains and losses on foreign currency transactions represent net gains and losses from sales and maturities of foreign currency contracts, disposition of foreign currencies, the difference between the amount of net investment income accrued and the U.S. dollar amount actually received, and gains and losses between trade and settlement date on purchases and sales of securities. The effects of changes in foreign currency exchange rates on investments in securities are included with the net realized and unrealized gain or loss on investment securities.
Income Taxes. As a qualified regulated investment company under Subchapter M of the Internal Revenue Code, the fund is not subject to U.S. federal income taxes to the extent that it distributes substantially all of its taxable income for its fiscal year. The fund may be subject to foreign taxes on income and gains on investments which are accrued based upon the fund's understanding of the tax rules and regulations that exist in the markets in which it invests. Foreign governments may also impose taxes on other payments or transactions with respect to foreign securities. The fund accrues such taxes as applicable. The schedule of investments includes information regarding income taxes under the caption "Income Tax Information."
Investment Income. Dividend income is recorded on the ex-dividend date, except certain dividends from foreign securities where the ex-dividend date may have passed, are recorded as soon as the fund is informed of the ex-dividend date. Non-cash dividends included in dividend income, if any, are recorded at the fair market value of the securities received. Interest income is accrued as earned. Investment income is recorded net of foreign taxes withheld where recovery of such taxes is uncertain.
Expenses. Most expenses of the trust can be directly attributed to a fund. Expenses which cannot be directly attributed are apportioned among the funds in the trust.
Distributions to Shareholders. Distributions are recorded on the ex-dividend date. Income dividends and capital gain distributions are declared separately for each class.
Income and capital gain distributions are determined in accordance with income tax regulations which may differ from generally accepted accounting principles. These differences, which may result in distribution reclassifications, are primarily due to differing treatments for foreign currency transactions, passive foreign investment companies (PFIC), capital loss carryforwards and losses deferred due to wash sales. The fund also utilized earnings and profits distributed to shareholders on redemption of shares as a part of the dividends paid deduction for income tax purposes.
Annual Report
Notes to Financial Statements - continued
1. Significant Accounting Policies - continued
Distributions to Shareholders - continued
Permanent book and tax basis differences relating to shareholder distributions will result in reclassifications to paid in capital. Undistributed net investment income and accumulated undistributed net realized gain (loss) on investments and foreign currency transactions may include temporary book and tax basis differences which will reverse in a subsequent period. Any taxable income or gain remaining at fiscal year end is distributed in the following year.
Security Transactions. Security transactions are accounted for as of trade date. Gains and losses on securities sold are determined on the basis of identified cost.
2. Operating Policies.
Foreign Currency Contracts. The fund generally uses foreign currency contracts to facilitate transactions in foreign-denominated securities. Losses may arise from changes in the value of the foreign currency or if the counterparties do not perform under the contracts' terms. The U.S. dollar value of foreign currency contracts is determined using contractual currency exchange rates established at the time of each trade.
Joint Trading Account. Pursuant to an Exemptive Order issued by the Securities and Exchange Commission (the SEC), the fund, along with other affiliated entities of Fidelity Management & Research Company (FMR), may transfer uninvested cash balances into one or more joint trading accounts. These balances are invested in one or more repurchase agreements for U.S. Treasury or Federal Agency obligations.
Repurchase Agreements. The underlying U.S. Treasury, Federal Agency, or other obligations found to be satisfactory by FMR are transferred to an account of the fund, or to the Joint Trading Account, at a custodian bank. The securities are marked-to-market daily and maintained at a value at least equal to the principal amount of the repurchase agreement (including accrued interest). FMR, the fund's investment adviser, is responsible for determining that the value of the underlying securities remains in accordance with the market value requirements stated above.
3. Purchases and Sales of Investments.
Purchases and sales of securities, other than short-term securities, aggregated $256,952,144 and $224,327,637, respectively.
Annual Report
Notes to Financial Statements - continued
4. Fees and Other Transactions with Affiliates.
Management Fee. As the fund's investment adviser, FMR receives a monthly fee that is calculated on the basis of a group fee rate plus a fixed individual fund fee rate applied to the average net assets of the fund. The group fee rate is the weighted average of a series of rates and is based on the monthly average net assets of all the mutual funds advised by FMR. The rates ranged from .2167% to .5200% for the period. The annual individual fund fee rate is .45%. In the event that these rates were lower than the contractual rates in effect during the period, FMR voluntarily implemented the above rates, as they resulted in the same or a lower management fee. For the period, the management fee was equivalent to an annual rate of .73% of average net assets.
Sub-Adviser Fee. Beginning January 1, 2001, FMR Co. (FMRC) will serve as a sub-adviser for the fund. FMRC may provide investment research and advice and may also provide investment advisory services for the fund. FMR, on behalf of the fund, entered into sub-advisory agreements with Fidelity Management & Research (U.K.) Inc., Fidelity Management & Research (Far East) Inc., and Fidelity International Investment Advisors (FIIA). Under the sub-advisory arrangements, FMR may receive investment advice and research services and may grant the sub-advisers investment management authority to buy and sell securities. FMR pays its sub-advisers either a portion of its management fee or a fee based on costs incurred for these services.
Distribution and Service Plan. In accordance with Rule 12b-1 of the 1940 Act, the Board of Trustees have adopted separate Distribution and Service Plans with respect to each class of shares (collectively referred to as "the Plans"). Under certain of the Plans, the class pays Fidelity Distributors Corporation (FDC), an affiliate of FMR, a 12b-1 fee. A portion of this fee may be reallowed to securities dealers, banks and other financial institutions for the distribution of each class of shares and providing shareholder support services. For the period, this fee was based on the following annual rates of the average net assets of each applicable class:
|
Class A |
.25% |
|
Class T |
.50% |
|
Class B |
1.00%* |
|
Class C |
1.00%* |
* .75% represents a distribution fee and .25% represents a shareholder service fee.
Annual Report
Notes to Financial Statements - continued
4. Fees and Other Transactions with Affiliates - continued
Distribution and Service Plan - continued
For the period, each class paid FDC the following amounts, a portion of which was retained by FDC:
|
|
Paid to |
Retained |
|
Class A |
$ 46,511 |
$ 788 |
|
Class T |
224,012 |
1,554 |
|
Class B |
385,265 |
289,665 |
|
Class C |
369,340 |
191,544 |
|
|
$ 1,025,128 |
$ 483,551 |
Sales Load. FDC receives a front-end sales charge of up to 5.75% for selling Class A shares, and 3.50% for selling Class T shares of the fund. FDC receives the proceeds of contingent deferred sales charges levied on Class B share redemptions occurring within six years of purchase and Class C share redemptions occurring within one year of purchase. Contingent deferred sales charges are based on declining rates ranging from 5% to 1% for Class B and 1% for Class C, of the lesser of the cost of shares at the initial date of purchase or the net asset value of the redeemed shares, excluding any reinvested dividends and capital gains. In addition, purchases of Class A and Class T shares that were subject to a finder's fee bear a contingent deferred sales charge on assets that do not remain in the fund for at least one year. The Class A and Class T contingent deferred sales charge is based on 0.25% of the lesser of the cost of shares at the initial date of purchase or the net asset value of the redeemed shares, excluding any reinvested dividends and capital gains. A portion of the sales charges paid to FDC is paid to securities dealers, banks and other financial institutions.
For the period, sales charge amounts paid to and retained by FDC were as follows:
|
|
Paid to |
Retained |
|
Class A |
$ 118,054 |
$ 60,910 |
|
Class T |
127,974 |
39,075 |
|
Class B |
214,070 |
214,070* |
|
Class C |
50,797 |
50,797* |
|
|
$ 510,895 |
$ 364,852 |
* When Class B and Class C shares are initially sold, FDC pays commissions from its own resources to securities dealers,
banks, and other financial institutions through which the sales are made.
Annual Report
Notes to Financial Statements - continued
4. Fees and Other Transactions with Affiliates - continued
Transfer Agent Fees. Fidelity Investments Institutional Operations Company, Inc., (FIIOC), an affiliate of FMR, is the transfer, dividend disbursing and shareholder servicing agent (collectively referred to as the transfer agent) for each class of the fund. FIIOC receives account fees and asset-based fees that vary according to the account size and type of account of the shareholders of the respective classes of the fund. FIIOC pays for typesetting, printing and mailing of all shareholder reports, except proxy statements. For the period, the following amounts were paid to FIIOC:
|
|
Amount |
% of |
|
Class A |
$ 47,438 |
.26 |
|
Class T |
122,385 |
.27 |
|
Class B |
121,026 |
.31 |
|
Class C |
82,954 |
.23 |
|
Institutional Class |
7,943 |
.19 |
|
|
$ 381,746 |
|
Accounting Fees. Fidelity Service Company, Inc. (FSC), an affiliate of FMR, maintains the fund's accounting records. The fee is based on the level of average net assets for the month plus out-of-pocket expenses.
Fidelity Cash Central Fund. Pursuant to an Exemptive Order issued by the SEC, the fund may invest in the Fidelity Cash Central Fund (the Cash Fund) managed by Fidelity Investments Money Management, Inc., an affiliate of FMR. The Cash Fund is an open-end money market fund available only to investment companies and other accounts managed by FMR and its affiliates. The Cash Fund seeks preservation of capital, liquidity, and current income. Income distributions from the Cash Fund are declared daily and paid monthly from net investment income. Income distributions earned by the fund are recorded as interest income in the accompanying financial statements.
Brokerage Commissions. The fund placed a portion of its portfolio transactions with brokerage firms which are affiliates of FMR. The commissions paid to these affiliated firms were $11,558 for the period.
5. Bank Borrowings.
The fund is permitted to have bank borrowings for temporary or emergency purposes to fund shareholder redemptions. The fund has established borrowing arrangements with certain banks. The interest rate on the borrowings is the bank's base rate, as revised from time to time. The average daily loan balance during the period for which the loan was outstanding amounted to $4,234,000. The weighted average interest rate was 6.16%. At period end there were no bank borrowings outstanding.
Annual Report
Notes to Financial Statements - continued
6. Expense Reductions.
FMR has directed certain portfolio trades to brokers who paid a portion of the fund's expenses. For the period, the fund's expenses were reduced by $21,894 under this arrangement.
7. Beneficial Interest.
At the end of the period, one shareholder was record owner of approximately 19% of the total outstanding shares of the fund.
8. Distributions to Shareholders.
Distributions to shareholders of each class were as follows:
|
|
Years ended October 31, |
December 17,
1998
(commencement |
|
|
2000 |
1999 |
|
From net investment income |
|
|
|
Class A |
$ 16,488 |
$ - |
|
Class T |
64,977 |
- |
|
Class B |
36,651 |
- |
|
Class C |
45,632 |
- |
|
Institutional Class |
7,083 |
- |
|
Total |
$ 170,831 |
$ - |
|
In excess of net investment income |
|
|
|
Class A |
$ 37,636, |
$ - |
|
Class T |
148,314 |
- |
|
Class B |
83,658 |
- |
|
Class C |
104,156 |
- |
|
Institutional Class |
16,167 |
- |
|
Total |
$ 389,931 |
$ - |
|
From net realized gain |
|
|
|
Class A |
$ 103,486 |
$ - |
|
Class T |
446,016 |
- |
|
Class B |
309,561 |
- |
|
Class C |
385,432 |
- |
|
Institutional Class |
40,947 |
- |
|
Total |
$ 1,285,442 |
$ - |
|
|
$ 1,846,204 |
$ - |
Annual Report
Notes to Financial Statements - continued
9. Share Transactions.
Transactions for each class of shares were as follows:
|
|
Shares |
Dollars |
||
|
|
Year ended October 31, |
December 17, 1998 |
Year ended October 31, |
December 17, 1998
(commencement |
|
|
2000 |
1999 |
2000 |
1999 |
|
|
|
|
|
|
|
Class A |
1,393,696 |
423,324 |
$ 29,537,765 |
$ 5,943,698 |
|
Reinvestment of distributions |
6,298 |
- |
129,235 |
- |
|
Shares redeemed |
(724,895) |
(48,921) |
(15,092,310) |
(679,705) |
|
Net increase (decrease) |
675,099 |
374,403 |
$ 14,574,690 |
$ 5,263,993 |
|
Class T |
2,445,004 |
1,859,477 |
$ 51,226,682 |
$ 27,451,689 |
|
Reinvestment of distributions |
23,648 |
- |
484,784 |
- |
|
Shares redeemed |
(2,135,042) |
(508,852) |
(44,979,563) |
(8,433,226) |
|
Net increase (decrease) |
333,610 |
1,350,625 |
$ 6,731,903 |
$ 19,018,463 |
|
Class B |
1,744,414 |
1,232,591 |
$ 37,410,476 |
$ 18,325,581 |
|
Reinvestment of distributions |
16,916 |
- |
345,265 |
- |
|
Shares redeemed |
(1,067,718) |
(140,459) |
(22,035,769) |
(2,237,447) |
|
Net increase (decrease) |
693,612 |
1,092,132 |
$ 15,719,972 |
$ 16,088,134 |
|
Class C |
1,980,688 |
1,586,570 |
$ 41,677,320 |
$ 23,987,260 |
|
Reinvestment of distributions |
18,312 |
- |
373,936 |
- |
|
Shares redeemed |
(1,722,716) |
(413,316) |
(36,468,183) |
(6,867,482) |
|
Net increase (decrease) |
276,284 |
1,173,254 |
$ 5,583,073 |
$ 17,119,778 |
|
Institutional Class |
160,195 |
164,732 |
$ 3,419,324 |
$ 2,149,856 |
|
Reinvestment of distributions |
1,495 |
- |
30,777 |
- |
|
Shares redeemed |
(164,450) |
(8,380) |
(3,467,410) |
(136,763) |
|
Net increase (decrease) |
(2,760) |
156,352 |
$ (17,309) |
$ 2,013,093 |
Annual Report
To the Trustees of Fidelity Advisor Series VIII and the Shareholders of Fidelity Advisor Japan Fund:
In our opinion, the accompanying statement of assets and liabilities, including the schedule of investments, and the related statements of operations and of changes in net assets and the financial highlights present fairly, in all material respects, the financial position of Fidelity Advisor Japan Fund (a fund of Fidelity Advisor Series VIII) at October 31, 2000, and the results of its operations, the changes in its net assets and the financial highlights for the periods indicated, in conformity with accounting principles generally accepted in the United States of America. These financial statements and financial highlights (hereafter referred to as "financial statements") are the responsibility of the Fidelity Advisor Japan Fund's management; our responsibility is to express an opinion on these financial statements based on our audits. We conducted our audits of these financial statements in accordance with auditing standards generally accepted in the United States of America which require that we plan and perform the audit to obtain reasonable assurance about whether the financial statements are free of material misstatement. An audit includes examining, on a test basis, evidence supporting the amounts and disclosures in the financial statements, assessing the accounting principles used and significant estimates made by management, and evaluating the overall financial statement presentation. We believe that our audits, which included confirmation of securities at October 31, 2000 by correspondence with the custodian and brokers, provide a reasonable basis for our opinion.
/s/PricewaterhouseCoopers LLP
PricewaterhouseCoopers LLP
Boston, Massachusetts
December 8, 2000
Annual Report
The amounts per share which represent income derived from sources within, and taxes paid to, foreign countries or possessions of the United States are as follows:
|
|
Pay Date |
Income |
Taxes |
|
|
Institutional Class |
12/6/99 |
$.022 |
$.003 |
|
The fund will notify shareholders in January 2001 of amounts for use in preparing 2000 income tax returns.
Annual Report
Annual Report
Annual Report
Annual Report
Annual Report
Investment Adviser
Fidelity Management & Research Company
Boston, MA
Investment Sub-Advisers
Fidelity Management & Research
(U.K.) Inc.
Fidelity Management & Research
(Far East) Inc.
Fidelity International
Investment Advisors
Fidelity International
Investment Advisors
(U.K.) Limited
Fidelity Investments Japan Limited
Officers
Edward C. Johnson 3d, President
Robert C. Pozen, Senior Vice President
William Kennedy, Vice President
Richard A. Spillane, Jr., Vice President
Eric D. Roiter, Secretary
Robert A. Dwight, Treasurer
Maria F. Dwyer, Deputy Treasurer
John H. Costello, Assistant Treasurer
Thomas J. Simpson, Assistant Treasurer
Board of Trustees
Ralph F. Cox *
Phyllis Burke Davis *
Robert M. Gates *
Edward C. Johnson 3d
Donald J. Kirk *
Ned C. Lautenbach *
Peter S. Lynch
Marvin L. Mann *
William O. McCoy *
Gerald C. McDonough *
Robert C. Pozen
Thomas R. Williams *
Advisory Board
J. Michael Cook
Abigail P. Johnson
Marie L. Knowles
General Distributor
Fidelity Distributors Corporation
Boston, MA
Transfer and Shareholder
Servicing Agent
Fidelity Investments Institutional Operations Company, Inc.
Boston, MA
Custodian
State Street Bank and Trust Company
Quincy, MA
* Independent trustees
Annual Report
Focus Funds
Fidelity Advisor Consumer
Industries Fund
Fidelity Advisor Cyclical
Industries Fund
Fidelity Advisor Financial
Services Fund
Fidelity Advisor Health Care Fund
Fidelity Advisor Natural
Resources Fund
Fidelity Advisor Technology Fund
Fidelity Advisor Telecommunications and Utilities Growth Fund
Growth Funds
Fidelity Advisor Korea Fund
Fidelity Advisor Emerging Asia Fund
Fidelity Advisor Latin America Fund
Fidelity Advisor Japan Fund
Fidelity Advisor Europe Capital Appreciation Fund
Fidelity Advisor International
Capital Appreciation Fund
Fidelity Advisor Overseas Fund
Fidelity Advisor Diversified International Fund
Fidelity Advisor Global Equity Fund
Fidelity Advisor TechnoQuant®
Growth Fund
Fidelity Advisor Small Cap Fund
Fidelity Advisor Value Strategies Fund
Fidelity Advisor Mid Cap Fund
Fidelity Advisor Dynamic Capital Appreciation Fund
Fidelity Advisor Equity Growth Fund
Fidelity Advisor Large Cap Fund
Fidelity Advisor Dividend Growth Fund
Fidelity Advisor Growth
Opportunities Fund
Growth and Income Funds
Fidelity Advisor Growth & Income Fund
Fidelity Advisor Equity Income Fund
Fidelity Advisor Asset Allocation Fund
Fidelity Advisor Balanced Fund
Taxable Income Funds
Fidelity Advisor Emerging Markets Income Fund
Fidelity Advisor High Yield Fund
Fidelity Advisor High Income Fund
Fidelity Advisor Strategic Income Fund
Fidelity Advisor Mortgage
Securities Fund
Fidelity Advisor Government Investment Fund
Fidelity Advisor Intermediate Bond Fund
Fidelity Advisor Short Fixed-Income Fund
Municipal Funds
Fidelity Advisor Municipal Income Fund
Money Market Funds
Prime Fund
Treasury Fund
Tax-Exempt Fund
AJAFI-ANN-1200 118662
1.728718.101
(Fidelity Investment logo)(registered trademark)
|
|