
|
|
|
|
|
|
|
|
|
|
Previous: FISCHER IMAGING CORP, S-3, EX-23.1, 2000-09-22 |
Next: FIDELITY INCOME FUND /MA/, 485BPOS, 2000-09-22 |
Fidelity® Ginnie Mae Fund
Annual Report
July 31, 2000
(2_fidelity_logos) (Registered_Trademark)
|
President's Message |
3 |
Ned Johnson on investing strategies |
|
Fidelity Ginnie Mae Fund |
||
|
|
4 |
Performance |
|
|
7 |
Fund Talk: The Manager's Overview |
|
|
10 |
Investment Changes |
|
|
11 |
Investments |
|
|
14 |
Financial Statements |
|
Fidelity Government Income Fund |
||
|
|
18 |
Performance |
|
|
21 |
Fund Talk: The Manager's Overview |
|
|
24 |
Investment Changes |
|
|
25 |
Investments |
|
|
30 |
Financial Statements |
|
Fidelity Intermediate Government Income Fund |
||
|
|
34 |
Performance |
|
|
37 |
Fund Talk: The Manager's Overview |
|
|
40 |
Investment Changes |
|
|
41 |
Investments |
|
|
47 |
Financial Statements |
|
Notes |
51 |
Notes to the financial statements |
|
Report of Independent Accountants |
56 |
The auditors' opinion. |
Standard & Poor's, S&P and S&P 500 are registered service marks of The McGraw-Hill Companies, Inc. and have been licensed for use by Fidelity Distributors Corporation.
Other third party marks appearing herein are the property of their respective owners.
All other marks appearing herein are registered or unregistered trademarks or service marks of FMR Corp. or an affiliated company.
(Recycle graphic) This report is printed on recycled paper using soy-based inks.
This report and the financial statements contained herein are submitted for the general information of the shareholders of the funds. This report is not authorized for distribution to prospective investors in the funds unless preceded or accompanied by an effective prospectus.
Mutual fund shares are not deposits or obligations of, or guaranteed by, any depository institution. Shares are not insured by the FDIC, Federal Reserve Board or any other agency, and are subject to investment risks, including possible loss of principal amount invested.
Neither the funds nor Fidelity Distributors Corporation is a bank.
For more information on any Fidelity fund, including charges and expenses, call 1-800-544-6666 for a free prospectus. Read it carefully before you invest or send money.
Annual Report
(photo_of_Edward_C_Johnson_3d)
Dear Shareholder:
The Federal Reserve Board's effort to keep inflation in check without over-cooling the U.S. economy has taken a toll on the stock market. Through July 2000, bellwether equity indexes such as the Dow Jones Industrial Average, NASDAQ and S&P 500® have negative returns for the year. On the other hand, fixed-income markets are enjoying strong performance. Except for high-yield, most bond sectors - corporates, mortgages, Treasuries and agencies - have returned 4%-6% year to date.
While it's impossible to predict the future direction of the markets with any degree of certainty, there are certain basic principles that can help investors plan for their future needs.
The longer your investment time frame, the less likely it is that you will be affected by short-term market volatility. A 10-year investment horizon appropriate for saving for a college education, for example, enables you to weather market cycles in a long-term fund, which may have a higher risk potential, but also has a higher potential rate of return.
An intermediate-length fund could make sense if your investment horizon is two to four years, while a short-term bond fund could be the right choice if you need your money in one or two years.
If your time horizon is less than a year, you might want to consider moving some of your bond investment into a money market fund. These funds seek income and a stable share price by investing in high-quality, short-term investments. Of course, it's important to remember that an investment in a money market fund is not insured or guaranteed by the Federal Deposit Insurance Corporation or any other government agency. Although money market funds seek to preserve the value of your investment at $1.00 per share, it is possible to lose money by investing in these types of funds.
Finally, no matter what your time horizon or portfolio diversity, it makes good sense to follow a regular investment plan, investing a certain amount of money in a fund at the same time each month or quarter and periodically reviewing your overall portfolio. By doing so, you won't get caught up in the excitement of a rapidly rising market, nor will you buy all your shares at market highs. While this strategy - known as dollar cost averaging - won't assure a profit or protect you from a loss in a declining market, it should help you lower the average cost of your purchases. Of course, you should consider your financial ability to continue your purchases through periods of low price levels before undertaking such a strategy.
If you have questions, please call us at 1-800-544-6666, or visit our web site at www.fidelity.com. We are available 24 hours a day, seven days a week to provide you the information you need to make the investments that are right for you.
Best regards,
/s/Edward C. Johnson 3d
Edward C. Johnson 3d
Annual Report
Fidelity Ginnie Mae Fund
There are several ways to evaluate a fund's historical performance. You can look at the total percentage change in value, the average annual percentage change or the growth of a hypothetical $10,000 investment. Total return reflects the change in the value of an investment, assuming reinvestment of the fund's dividend income and capital gains (the profits earned upon the sale of securities that have grown in value). You can also look at the fund's income, as reflected in its yield, to measure performance. If Fidelity had not reimbursed certain fund expenses, the total returns and dividends would have been lower.
Cumulative Total Returns
|
Periods ended July 31, 2000 |
|
Past 1 |
Past 5 |
Past 10 |
|
Fidelity Ginnie Mae Fund |
|
6.42% |
34.85% |
98.80% |
|
LB GNMA |
|
6.78% |
38.95% |
111.31% |
|
GNMA Funds Average |
|
5.53% |
32.33% |
96.14% |
Cumulative total returns show the fund's performance in percentage terms over a set period - in this case, one year, five years or 10 years. For example, if you had invested $1,000 in a fund that had a 5% return over the past year, the value of your investment would be $1,050. You can compare the fund's returns to the performance of the Lehman Brothers GNMA Index - a market value-weighted index of fixed-rate securities that represent interests in pools of mortgage loans with original terms of 15 and 30 years and are issued by the Government National Mortgage Association (GNMA). To measure how the fund's performance stacked up against its peers, you can compare it to the GNMA funds average, which reflects the performance of mutual funds with similar objectives tracked by Lipper Inc. The past one year average represents a peer group of 54 mutual funds. These benchmarks include reinvested dividends and capital gains, if any, and exclude the effect of sales charges.
Average Annual Total Returns
|
Periods ended July 31, 2000 |
Past 1 |
Past 5 |
Past 10 |
|
Fidelity Ginnie Mae Fund |
6.42% |
6.16% |
7.11% |
|
LB GNMA |
6.78% |
6.80% |
7.77% |
|
GNMA Funds Average |
5.53% |
5.76% |
6.96% |
Average annual total returns take the fund's cumulative return and show you what would have happened if the fund had performed at a constant rate each year. (Note: Lipper calculates average annual total returns by annualizing each fund's total return, then taking an arithmetic average. This may produce a different figure than that obtained by averaging the cumulative total returns and annualizing the result.)
Annual Report
Fidelity Ginnie Mae Fund
Performance - continued
$10,000 Over 10 Years
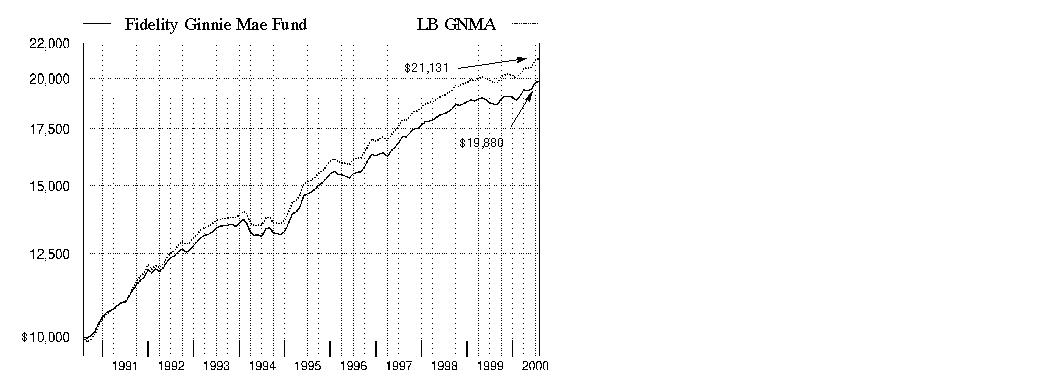
$10,000 Over 10 Years: Let's say hypothetically that $10,000 was invested in Fidelity Ginnie Mae Fund on July 31, 1990. As the chart shows, by July 31, 2000, the value of the investment would have grown to $19,880 - a 98.80% increase on the initial investment. For comparison, look at how the Lehman Brothers GNMA Index did over the same period. With dividends and capital gains, if any, reinvested the same $10,000 investment would have grown to $21,131 - a 111.31% increase.
Understanding
Performance
How a fund did yesterday is no guarantee of how it will do tomorrow. Bond prices, for example, generally move in the opposite direction of interest rates. In turn, the share price, return and yield of a fund that invests in bonds will vary. That means if you sell your shares during a market downturn, you might lose money. But if you can ride out the market's ups and downs, you may have a gain.
3Annual Report
Fidelity Ginnie Mae Fund
Performance - continued
Total Return Components
|
|
|
Years ended July 31, |
||||
|
|
|
2000 |
1999 |
1998 |
1997 |
1996 |
|
Dividend returns |
|
6.80% |
5.85% |
6.63% |
7.07% |
6.58% |
|
Capital returns |
|
-0.38% |
-3.77% |
0.18% |
3.04% |
-1.03% |
|
Total returns |
|
6.42% |
2.08% |
6.81% |
10.11% |
5.55% |
Total return components include both dividend returns and capital returns. A dividend return reflects the actual dividends paid by the fund. A capital return reflects both the amount paid by the fund to shareholders as capital gain distributions and changes in the fund's share price. Both returns assume the dividends or capital gains, if any, paid by the fund are reinvested.
Dividends and Yield
|
Periods ended July 31, 2000 |
Past 1 |
Past 6 |
Past 1 |
|
Dividends per share |
5.66 ¢ |
33.93 ¢ |
68.79 ¢ |
|
Annualized dividend rate |
6.39% |
6.58% |
6.63% |
|
30-day annualized yield |
6.66% |
- |
- |
Dividends per share show the income paid by the fund for a set period. If you annualize this number, based on an average share price of $10.43 over the past one month, $10.34 over the past six months and $10.38 over the past one year, you can compare the fund's income over these three periods. The 30-day annualized yield is a standard formula for all bond funds based on the yields of the bonds in the fund, averaged over the past 30 days. This figure shows you the yield characteristics of the fund's investments at the end of the period. It also helps you compare funds from different companies on an equal basis.
Annual Report
Fidelity Ginnie Mae Fund
Market Recap
Despite facing the challenge of five interest-rate increases during the 12-month period that ended July 31, 2000, the taxable bond market - as measured by the Lehman Brothers Aggregate Bond Index - returned 5.97%. The Federal Reserve Board's tightening policy, adopted to help slow down an overheated U.S. economy and ward off inflation, made for a sometimes difficult investing environment for bonds. During the first half of the period, the brunt of the Fed's action was felt by Treasuries, as they underperformed higher-yielding investment-grade spread sectors, such as corporate bonds and mortgage and government agency securities. In January, however, the momentum turned after the Treasury announced a plan to repurchase long-term debt and curtail future issuance. Treasury prices soared in response, sending their yields lower. This shift helped the Lehman Brothers Treasury Index return 6.48% during the period. At the same time, the Lehman Brothers Credit Bond Index - a measure of corporate bond performance - and the Lehman Brothers Mortgage-Backed Securities and U.S. Agency indexes returned 4.83%, 6.43% and 5.19%, respectively. Mortgage-backed securities rallied in the spring as a result of reduced supply, slower origination and a favorable prepayment environment. Elsewhere, rising default rates caused high-yield bonds to suffer more than most bonds, as the Merrill Lynch High Yield Master II Index returned -0.57% for the 12-month period.
(Portfolio Manager photograph)
An interview with Tom Silvia, Portfolio Manager of Fidelity Ginnie Mae Fund
Q. How did the fund perform, Tom?
A. For the 12-month period that ended July 31, 2000, the fund provided a total return of 6.42%. To get a sense of how the fund did relative to its competitors, the GNMA funds average returned 5.53% for the same 12-month period, according to Lipper Inc. Additionally, the Lehman Brothers GNMA Index - which tracks the types of securities in which the fund invests - returned 6.78% for the same 12-month period.
Q. It was a pretty good year for Ginnie Mae securities compared with other mortgage securities. What drove their relatively strong performance?
A. A senior Treasury official shook up the mortgage market when he urged Congress to cut off long-standing but never-used lines of credit that give Fannie Mae and Freddie Mac securities implicit government backing. Fannie Mae and Freddie Mac are government sponsored enterprises, which enjoy the benefit of a $4.5 billion line of credit from the U.S. Treasury, giving the companies an "indirect" backing of the government. He also asked Congress to repeal "exceptions that let banks hold so much" of those securities. Although it remained unclear whether those recommendations would translate into actual policy, investors reacted to these and similar comments from members of Congress by selling Fannie Mae and Freddie Mac securities and buying Ginnie Maes - which are backed directly by the U.S. Treasury - instead.
Annual Report
Fidelity Ginnie Mae Fund
Fund Talk: The Manager's Overview - continued
Q. What helped the fund outpace its peers during the past six months?
A. The fund's outperformance was almost completely due to its above-average weighting in Ginnie Mae securities. Ginnie Maes made up between 95% and 98% of the fund's net assets throughout most of the period. Additionally, the fund held few of the poorer-performing Fannie Mae and Freddie Mac securities. The fund's performance also was helped by its comparatively large weighting in securities with coupons of about 7.0%, which outpaced higher-coupon securities.
Q. Were there any disappointments during the period?
A. There weren't any specific holdings that performed dramatically worse than the overall Ginnie Mae market. So I'd have to say that the only disappointment was the poor performance of the few Fannie Mae and Freddie Mac securities the fund owned. That said, I sold some Ginnie Mae holdings to lock in their relatively strong performance. I replaced them with additional Freddie Mac and Fannie Mae securities, which I felt had been unduly punished and offered attractive yields at relatively cheap prices as a result. By the end of the period, Fannie Mae and Freddie Mac securities offered yields as much as 15 basis points (0.15%) higher than their Ginnie Mae counterparts.
Q. Interest rates moved around a bit during the period. Given that backdrop, how did you manage the fund's sensitivity to interest-rate changes?
A. I kept the fund's duration - a gauge of interest-rate sensitivity - in line with the Ginnie Mae market as a whole as measured by the Lehman Brothers GNMA Index. The duration of the index, and, therefore, of the fund, tends to be shorter than the average of the fund's peers. The shorter a fund's duration, the less its share price will fall as interest rates rise. As rates rose during the past six months, the fund benefited from its shorter-than-average duration.
Q. What's your outlook for the next several months, Tom?
A. We may see some slowing in the housing market if the economy slows. Even so, I think housing turnover activity could remain reasonably strong. Given that, I think that Ginnie Mae securities offer very attractive values at current levels, offering yields well in excess of U.S. Treasury securities and other fixed-income alternatives.
The views expressed in this report reflect those of the portfolio manager only through the end of the period of the report as stated on the cover and do not necessarily represent the views of Fidelity or any other person in the Fidelity organization. Any such views are subject to change at any time based upon market or other conditions and Fidelity disclaims any responsibility to update such views. These views may not be relied on as investment advice and, because investment decisions for a Fidelity fund are based on numerous factors, may not be relied on as an indication of trading intent on behalf of any Fidelity fund.
Annual Report
Fidelity Ginnie Mae Fund
Fund Talk: The Manager's Overview - continued
Fund Facts
Goal: to provide a high level of current income consistent with prudent investment risk by investing mainly in mortgage securities issued by the Government National Mortgage Association (Ginnie Mae)
Fund number: 015
Trading symbol: FGMNX
Start date: November 8, 1985
Size: as of July 31, 2000, more than $1.7 billion
Manager: Tom Silvia, since 1998; manager, various Fidelity and Spartan government bond funds; joined Fidelity in 1993
3Tom Silvia on the strength of the housing market and its effect on the Ginnie Mae market:
"The strong housing market, fueled by the robust economy, favorable employment growth and rising personal incomes, benefited the Ginnie Mae market during the past year. Thanks to a significant wave of refinancing activity in 1998 and early 1999, a large portion of mortgages outstanding 12 months ago carried interest rates of 6.5% to 7.0%. As interest rates climbed throughout the past year, these bonds started to trade below their par value of $100. Essentially, investors weren't willing to pay full price - or par - for a bond that paid less income when they could buy a newly issued bond with a higher income. As a result, 6.5% to 7.0% mortgage securities began to trade at discount prices ranging from $92 to $96. But given the fact that the housing market was strong and an unusually large number of homeowners decided to move into other homes, many of those mortgage securities were paid off at a par ($100), resulting in fairly good performance for the mortgage market as a whole."
Annual Report
Fidelity Ginnie Mae Fund
|
Coupon Distribution as of July 31, 2000 |
||
|
|
% of fund's investments |
% of fund's investments |
|
6 - 6.99% |
25.4 |
27.6 |
|
7 - 7.99% |
50.5 |
52.0 |
|
8 - 8.99% |
21.2 |
13.4 |
|
9 - 9.99% |
1.7 |
3.9 |
|
10% and over |
0.9 |
2.2 |
|
Coupon distribution shows the range of stated interest rates on the fund's investments, excluding short-term investments. |
|
Average Years to Maturity as of July 31, 2000 |
||
|
|
|
6 months ago |
|
Years |
8.5 |
8.7 |
|
Average years to maturity is based on the average time remaining until principal payments are expected from each of the fund's bonds, weighted by dollar amount. |
|
Duration as of July 31, 2000 |
||
|
|
|
6 months ago |
|
Years |
3.9 |
5.3 |
|
Duration shows how much a bond fund's price fluctuates with changes in comparable interest rates. |
|
Asset Allocation (% of fund's net assets) |
|||||||
|
As of July 31, 2000 |
As of January 31, 2000 |
||||||
 |
Mortgage |
|
|
Mortgage |
|
||
 |
CMOs and Other Mortgage Related Securities 2.7% |
|
|
CMOs and Other Mortgage Related Securities 0.0% |
|
||
 |
U.S. Government |
|
|
U.S. Government |
|
||
 |
Short-Term Investments |
|
|
Short-Term Investments |
|
||
|
* GNMA Securities |
94.8% |
|
** GNMA Securities |
97.5% |
|
||

*** Short-term Investments and Net Other Assets are not included in the pie chart.
Annual Report
Fidelity Ginnie Mae Fund
Showing Percentage of Net Assets
|
U.S. Government and Government Agency Obligations - 0.3% |
||||
|
|
Principal Amount (000s) |
Value (Note 1) (000s) |
||
|
U.S. Government Agency Obligations - 0.3% |
||||
|
Fannie Mae 6.5% 4/29/09 |
|
$ 5,000 |
$ 4,673 |
|
|
U.S. Government Agency - Mortgage Securities - 97.5% |
||||
|
|
||||
|
Fannie Mae - 0.5% |
||||
|
6.5% 12/1/28 to 2/1/30 |
|
6,853 |
6,477 |
|
|
9% 10/1/11 |
|
85 |
86 |
|
|
10.25% 10/1/18 |
|
250 |
264 |
|
|
11.5% 5/1/14 to 9/1/15 |
|
138 |
150 |
|
|
12.5% 11/1/13 to 7/1/16 |
|
528 |
584 |
|
|
13.25% 9/1/11 |
|
212 |
238 |
|
|
14% 11/1/12 |
|
8 |
9 |
|
|
|
7,808 |
|||
|
Freddie Mac - 2.2% |
||||
|
8.5% 2/1/04 to 5/1/30 |
|
22,097 |
22,496 |
|
|
8.5% 8/1/30 (a) |
|
3,300 |
3,360 |
|
|
9% 7/1/08 to 7/1/21 |
|
3,308 |
3,370 |
|
|
9.75% 12/1/08 to 4/1/13 |
|
140 |
146 |
|
|
10% 10/1/04 to 11/1/20 |
|
4,896 |
5,124 |
|
|
10.25% 2/1/09 to 11/1/16 |
|
1,944 |
2,023 |
|
|
10.5% 5/1/10 |
|
39 |
41 |
|
|
11.25% 2/1/10 |
|
147 |
156 |
|
|
11.75% 11/1/11 |
|
68 |
72 |
|
|
12% 5/1/10 to 2/1/17 |
|
401 |
439 |
|
|
12.5% 11/1/12 to 5/1/15 |
|
705 |
777 |
|
|
13% 11/1/12 to 11/1/14 |
|
105 |
118 |
|
|
13.5% 1/1/13 to 12/1/14 |
|
39 |
44 |
|
|
|
38,166 |
|||
|
Government National Mortgage Association - 94.8% |
||||
|
6% 10/15/23 to 5/15/29 |
|
104,654 |
96,355 |
|
|
6% 6/15/29 |
|
1,336 |
1,229 |
|
|
6.5% 6/15/23 to 3/15/29 |
|
328,776 |
311,920 |
|
|
7% 3/15/22 to 2/15/29 |
|
611,423 |
594,542 |
|
|
7.5% 6/15/02 to 6/15/30 |
|
245,794 |
244,351 |
|
|
8% 7/15/01 to 2/15/30 |
|
174,166 |
175,955 |
|
|
8.5% 2/15/05 to 7/15/30 |
|
140,690 |
143,903 |
|
|
8.5% 8/1/30 (a) |
|
19,000 |
19,398 |
|
|
9% 5/15/08 to 12/15/24 |
|
18,191 |
18,804 |
|
|
9.5% 4/15/01 to 1/15/23 |
|
6,466 |
6,709 |
|
|
10% 5/15/01 to 6/15/05 |
|
30 |
31 |
|
|
U.S. Government Agency - Mortgage Securities - continued |
||||
|
|
Principal Amount (000s) |
Value (Note 1) (000s) |
||
|
Government National Mortgage Association - continued |
||||
|
10.5% 11/15/00 to 9/15/19 |
|
$ 3,530 |
$ 3,781 |
|
|
13% 2/15/11 to 5/15/15 |
|
537 |
608 |
|
|
13.5% 5/15/10 to 1/15/15 |
|
232 |
261 |
|
|
|
1,617,847 |
|||
|
TOTAL U.S. GOVERNMENT AGENCY - MORTGAGE SECURITIES (Cost $1,712,508) |
1,663,821 |
|||
|
Collateralized Mortgage Obligations - 2.7% |
||||
|
|
||||
|
U.S. Government Agency - 2.7% |
||||
|
Fannie Mae sequential pay planned amortization class Series 1998-30 Class B, 6.5% 8/20/24 |
|
5,758 |
5,316 |
|
|
Government National Mortgage Association REMIC sequential pay: |
|
|
|
|
|
Series 1999-2 Class D, 6.5% 10/20/26 |
|
7,319 |
6,703 |
|
|
Series 1999-23 Class B, 6.5% 7/20/25 |
|
5,000 |
4,621 |
|
|
Series 2000-5 Class PD: |
|
|
|
|
|
7% 1/1/29 |
|
18,300 |
17,614 |
|
|
7.5% 4/1/29 |
|
12,800 |
12,646 |
|
|
TOTAL COLLATERALIZED MORTGAGE OBLIGATIONS (Cost $46,657) |
46,900 |
|||
|
Cash Equivalents - 0.3% |
|||
|
Maturity Amount (000s) |
|
||
|
Investments in repurchase agreements (U.S. Government Obligations), in a joint trading account at 6.65%, dated 7/31/00 due 8/1/00 |
$ 4,281 |
4,280 |
|
|
TOTAL INVESTMENT PORTFOLIO - 100.8% (Cost $1,768,084) |
1,719,674 |
||
|
NET OTHER ASSETS - (0.8)% |
(13,655) |
||
|
NET ASSETS - 100% |
$ 1,706,019 |
||
|
Legend |
|
(a) Security purchased on a delayed delivery or when-issued basis. |
|
Other Information |
|
Purchases and sales of long-term U.S. government and government agency obligations aggregated $1,297,001,000 and $1,440,683,000, respectively. |
|
Income Tax Information |
|
At July 31, 2000, the aggregate cost of investment securities for income tax purposes was $1,771,862,000. Net unrealized depreciation aggregated $52,188,000, of which $4,739,000 related to appreciated investment securities and $56,927,000 related to depreciated investment securities. |
|
At July 31, 2000, the fund had a capital loss carryforward of approximately $35,074,000 of which $9,123,000, $10,722,000, $4,754,000, $414,000 and $10,061,000 will expire on July 31, 2002, 2003, 2004, 2007 and 2008, respectively. Approximately $9,858,000, of which $9,123,000, and $735,000 will expire on July 31, 2002 and 2003, respectively, was acquired in the mergers and is available to offset future capital gains of the fund to the extent provided by regulations. |
See accompanying notes which are an integral part of the financial statements.
Annual Report
Fidelity Ginnie Mae Fund
Statement of Assets and Liabilities
|
|
||
|
(except per-share amount) |
|
July 31, 2000 |
|
Assets |
|
|
|
Investment in securities, at value (including repurchase agreements of $4,280) (cost $1,768,084) - |
|
$ 1,719,674 |
|
Commitment to sell securities on a delayed delivery basis |
$ (36,977) |
|
|
Receivable for securities sold on a delayed delivery basis |
37,062 |
85 |
|
Receivable for investments sold, regular delivery |
|
5,235 |
|
Cash |
|
1,235 |
|
Receivable for fund shares sold |
|
6,960 |
|
Interest receivable |
|
10,134 |
|
Total assets |
|
1,743,323 |
|
Liabilities |
|
|
|
Payable for investments purchased |
1,234 |
|
|
Delayed delivery |
22,889 |
|
|
Payable for fund shares redeemed |
10,513 |
|
|
Distributions payable |
1,640 |
|
|
Accrued management fee |
677 |
|
|
Other payables and accrued expenses |
351 |
|
|
Total liabilities |
|
37,304 |
|
Net Assets |
|
$ 1,706,019 |
|
Net Assets consist of: |
|
|
|
Paid in capital |
|
$ 1,801,275 |
|
Undistributed net investment income |
|
2,556 |
|
Accumulated undistributed net realized gain (loss) |
|
(49,487) |
|
Net unrealized appreciation (depreciation) on investments |
|
(48,325) |
|
Net Assets, for 163,652 shares outstanding |
|
$ 1,706,019 |
|
Net Asset Value, offering price and redemption price per share ($1,706,019 ÷ 163,652 shares) |
|
$10.42 |
See accompanying notes which are an integral part of the financial statements.
Annual Report
Fidelity Ginnie Mae Fund
Financial Statements - continued
Statement of Operations
|
Amounts in thousands |
Year ended July 31, 2000 |
|
|
Investment Income Interest |
|
$ 127,090 |
|
Expenses |
|
|
|
Management fee |
$ 7,433 |
|
|
Transfer agent fees |
2,688 |
|
|
Accounting fees and expenses |
453 |
|
|
Non-interested trustees' compensation |
6 |
|
|
Custodian fees and expenses |
337 |
|
|
Registration fees |
62 |
|
|
Audit |
45 |
|
|
Legal |
12 |
|
|
Miscellaneous |
6 |
|
|
Total expenses before reductions |
11,042 |
|
|
Expense reductions |
(117) |
10,925 |
|
Net investment income |
|
116,165 |
|
Realized and Unrealized Gain (Loss) Net realized gain (loss) on investment securities |
|
(14,320) |
|
Change in net unrealized appreciation (depreciation) on: |
|
|
|
Investment securities |
6,155 |
|
|
Delayed delivery commitments |
85 |
6,240 |
|
Net gain (loss) |
|
(8,080) |
|
Net increase (decrease) in net assets resulting |
|
$ 108,085 |
|
Other information |
|
|
|
Expense reductions: |
|
$ 67 |
|
Custodian credits |
|
11 |
|
Transfer agent credits |
|
39 |
|
|
|
$ 117 |
See accompanying notes which are an integral part of the financial statements.
Annual Report
Fidelity Ginnie Mae Fund
Financial Statements - continued
Statement of Changes in Net Assets
|
|
Year ended |
Year ended |
|
Increase (Decrease) in Net Assets |
|
|
|
Operations |
$ 116,165 |
$ 79,191 |
|
Net realized gain (loss) |
(14,320) |
(3,194) |
|
Change in net unrealized appreciation (depreciation) |
6,240 |
(65,621) |
|
Net increase (decrease) in net assets resulting |
108,085 |
10,376 |
|
Distributions to shareholders from net investment income |
(115,349) |
(73,154) |
|
Share transactions |
472,850 |
875,680 |
|
Net asset value of shares issued in exchange for the |
- |
609,769 |
|
Reinvestment of distributions |
94,264 |
62,728 |
|
Cost of shares redeemed |
(695,269) |
(561,191) |
|
Net increase (decrease) in net assets resulting |
(128,155) |
986,986 |
|
Total increase (decrease) in net assets |
(135,419) |
924,208 |
|
Net Assets |
|
|
|
Beginning of period |
1,841,438 |
917,230 |
|
End of period (including undistributed net investment income of $2,556 and $2,216, respectively) |
$ 1,706,019 |
$ 1,841,438 |
|
Other Information Shares |
|
|
|
Sold |
45,541 |
80,985 |
|
Issued in exchange for shares of |
- |
56,971 |
|
Issued in reinvestment of distributions |
9,074 |
5,828 |
|
Redeemed |
(67,040) |
(52,070) |
|
Net increase (decrease) |
(12,425) |
91,714 |
See accompanying notes which are an integral part of the financial statements.
Annual Report
Financial Highlights
|
Years ended July 31, |
2000 |
1999 |
1998 |
1997 |
1996 |
|
Selected Per-Share Data |
|
|
|
|
|
|
Net asset value, |
$ 10.460 |
$ 10.870 |
$ 10.850 |
$ 10.530 |
$ 10.640 |
|
Income from Investment Operations |
.691 B |
.689 B |
.714 B |
.720 B |
.688 |
|
Net realized and unrealized gain (loss) |
(.043) |
(.460) |
.004 |
.310 |
(.107) |
|
Total from investment |
.648 |
.229 |
.718 |
1.030 |
.581 |
|
Less Distributions |
|
|
|
|
|
|
From net investment income |
(.688) |
(.639) |
(.698) |
(.710) |
(.691) |
|
Net asset value, end of period |
$ 10.420 |
$ 10.460 |
$ 10.870 |
$ 10.850 |
$ 10.530 |
|
Total Return A |
6.42% |
2.08% |
6.81% |
10.11% |
5.55% |
|
Ratios and Supplemental Data |
|
|
|
|
|
|
Net assets, end of period |
$ 1,706 |
$ 1,841 |
$ 917 |
$ 822 |
$ 790 |
|
Ratio of expenses to average |
.63% C |
.64% C |
.72% C |
.76% |
.76% |
|
Ratio of expenses to |
.63% |
.64% |
.72% |
.75% D |
.75% D |
|
Ratio of net investment income |
6.67% |
6.43% |
6.58% |
6.75% |
6.69% |
|
Portfolio turnover rate |
75% |
73% E |
172% |
98% |
107% |
A The total returns would have been lower had certain expenses not been reduced during the periods shown.
B Net investment income per share has been calculated based on average shares outstanding during the period.
C FMR agreed to reimburse a portion of the fund's expenses during the period. Without this reimbursement, the fund's expense ratio would have been higher.
D FMR or the fund has entered into varying arrangements with third parties who either paid or reduced a portion of the fund's expenses.
E The portfolio turnover rate does not include the assets acquired in the merger.
See accompanying notes which are an integral part of the financial statements.
Annual Report
Fidelity Government Income Fund
There are several ways to evaluate a fund's historical performance. You can look at the total percentage change in value, the average annual percentage change or the growth of a hypothetical $10,000 investment. Total return reflects the change in the value of an investment, assuming reinvestment of the fund's dividend income and capital gains (the profits earned upon the sale of securities that have grown in value). You can also look at the fund's income, as reflected in the fund's yield, to measure performance.
Cumulative Total Returns
|
Periods ended July 31, 2000 |
|
Past 1 |
Past 5 |
Past 10 |
|
Fidelity Government Income |
|
5.81% |
32.49% |
106.71% |
|
LB Government Bond |
|
6.18% |
36.93% |
110.65% |
|
General U.S. Government Funds Average |
|
4.97% |
30.36% |
92.86% |
Cumulative total returns show the fund's performance in percentage terms over a set period - in this case, one year, five years or 10 years. For example, if you had invested $1,000 in a fund that had a 5% return over the past year, the value of your investment would be $1,050. You can compare the fund's returns to the performance of the Lehman Brothers Government Bond Index - a market value-weighted index of U.S. Government and government agency securities (other than mortgage securities) with maturities of one year or more. To measure how the fund's performance stacked up against its peers, you can compare it to the general U.S. Government funds average, which reflects the performance of mutual funds with similar objectives tracked by Lipper Inc. The past one year average represents a peer group of 183 mutual funds. These benchmarks include reinvested dividends and capital gains, if any, and exclude the effect of sales charges.
Average Annual Total Returns
|
Periods ended July 31, 2000 |
Past 1 |
Past 5 |
Past 10 |
|
Fidelity Government Income |
5.81% |
5.79% |
7.53% |
|
LB Government Bond |
6.18% |
6.49% |
7.73% |
|
General U.S. Government Funds Average |
4.97% |
5.44% |
6.77% |
Average annual total returns take the fund's cumulative return and show you what would have happened if the fund had performed at a constant rate each year. (Note: Lipper calculates average annual total returns by annualizing each fund's total return, then taking an arithmetic average. This may produce a different figure than that obtained by averaging the cumulative total returns and annualizing the result.)
Annual Report
Fidelity Government Income Fund
Performance - continued
$10,000 Over 10 Years
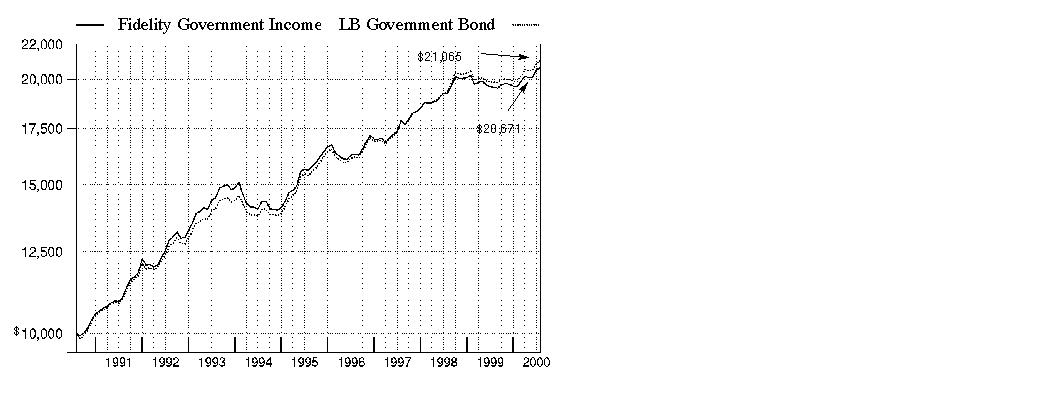
$10,000 Over 10 Years: Let's say hypothetically that $10,000 was invested in Fidelity Government Income Fund on July 31, 1990. As the chart shows, by July 31, 2000, the value of the investment would have grown to $20,671 - a 106.71% increase on the initial investment. For comparison, look at how the Lehman Brothers Government Bond Index did over the same period. With dividends and capital gains, if any, reinvested, the same $10,000 investment would have grown to $21,065 - a 110.65% increase.
Understanding
Performance
How a fund did yesterday is no guarantee of how it will do tomorrow. Bond prices, for example, generally move in the opposite direction of interest rates. In turn, the share price, return and yield of a fund that invests in bonds will vary. That means if you sell your shares during a market downturn, you might lose money. But if you can ride out the market's ups and downs, you may have a gain.
3Annual Report
Fidelity Government Income Fund
Performance - continued
Total Return Components
|
|
|
Years ended July 31, |
||||
|
|
|
2000 |
1999 |
1998 |
1997 |
1996 |
|
Dividend returns |
|
6.33% |
5.89% |
6.04% |
7.22% |
6.58% |
|
Capital returns |
|
-0.52% |
-4.41% |
1.63% |
2.40% |
-2.04% |
|
Total returns |
|
5.81% |
1.48% |
7.67% |
9.62% |
4.54% |
Total return components include both dividend returns and capital returns. A dividend return reflects the actual dividends paid by the fund. A capital return reflects both the amount paid by the fund to shareholders as capital gain distributions and changes in the fund's share price. Both returns assume the dividends or capital gains, if any, paid by the fund, are reinvested.
Dividends and Yield
|
Periods ended July 31, 2000 |
Past 1 |
Past 6 |
Past 1 |
|
Dividends per share |
5.04 ¢ |
29.41 ¢ |
58.34 ¢ |
|
Annualized dividend rate |
6.26% |
6.27% |
6.19% |
|
30-day annualized yield |
6.37% |
- |
- |
Dividends per share show the income paid by the fund for a set period. If you annualize this number, based on an average share price of $9.48 over the past one month, $9.40 over the past six months and $9.42 over the past one year, you can compare the fund's income over these three periods. The 30-day annualized yield is a standard formula for all bond funds based on the yields of the bonds in the fund, averaged over the past 30 days. This figure shows you the yield characteristics of the fund's investments at the end of the period. It also helps you compare funds from different companies on an equal basis.
Annual Report
Fidelity Government Income Fund
Market Recap
Despite facing the challenge of five interest-rate increases during the 12-month period that ended July 31, 2000, the taxable bond market - as measured by the Lehman Brothers Aggregate Bond Index - returned 5.97%. The Federal Reserve Board's tightening policy, adopted to help slow down an overheated U.S. economy and ward off inflation, made for a sometimes difficult investing environment for bonds. During the first half of the period, the brunt of the Fed's action was felt by Treasuries, as they underperformed higher-yielding investment-grade spread sectors, such as corporate bonds and mortgage and government agency securities. In January, however, the momentum turned after the Treasury announced a plan to repurchase long-term debt and curtail future issuance. Treasury prices soared in response, sending their yields lower. This shift helped the Lehman Brothers Treasury Index return 6.48% during the period. At the same time, the Lehman Brothers Credit Bond Index - a measure of corporate bond performance - and the Lehman Brothers Mortgage-Backed Securities and U.S. Agency indexes returned 4.83%, 6.43% and 5.19%, respectively. Mortgage-backed securities rallied in the spring as a result of reduced supply, slower origination and a favorable prepayment environment. Elsewhere, rising default rates caused high-yield bonds to suffer more than most bonds, as the Merrill Lynch High Yield Master II Index returned -0.57% for the 12-month period.
(Portfolio Manager photograph)
An interview with Tom Silvia, Portfolio Manager of Fidelity Government Income Fund
Q. How did the fund perform, Tom?
A. For the 12-month period that ended July 31, 2000, the fund provided a total return of 5.81%. To get a sense of how the fund did relative to its competitors, the general U.S. government funds average returned 4.97% for the same 12-month period, according to Lipper Inc. Additionally, the Lehman Brothers Government Bond Index - which tracks the types of securities in which the fund invests - returned 6.18% for the same 12-month period.
Q. Why did the fund outpace its peers?
A. One of the major factors behind the fund's outperformance was its larger-than-average stake in mortgage securities, which have enjoyed relatively strong performance during the past several months thanks to reduced supply, a favorable prepayment environment and their high yields. The fund was helped by its comparatively large stake in long-maturity Treasury securities, which outpaced their shorter-term counterparts during the period.
Annual Report
Fidelity Government Income Fund
Fund Talk: The Manager's Overview - continued
Q. Why did long-term Treasuries perform better than shorter-term ones?
A. As federal budget deficits were replaced by budget surpluses, the U.S. government cut back on the size and frequency of new bond offerings. Furthermore, the government began to buy back outstanding longer-term bonds. As a result, the longer-term securities started trading in relation to expectations about supply and demand rather than on the basis of predictions about future interest rates. Anticipating a scarcity of longer-term bonds, investors pushed 30-year bond yields lower and their prices higher even as short-term interest rates and Treasury yields rose.
Q. The reduction in supply of Treasuries, coupled with expectations that supply would diminish further, created an unusual situation . . .
A. That's true. The difference in the performances and yields between short- and long-term Treasuries caused the Treasury yield curve - a graphical representation of the yields offered by various bond maturities - to "invert" for the first time since 1990. Usually, investors demand higher yields on longer-term bonds than on shorter-term ones, reflecting the greater risk in lending money over a longer period of time. But because of the reduction in supply of long-term securities over the past six months, the yield on the 30-year bond fell to more than half a percentage point lower than the yield on the two-year Treasury note during the spring.
Q. How did the fund's stake in agencies - which made up about 45% of net assets at the end of the period - perform?
A. Agency securities definitely had their ups and downs during the year. In the initial months of the period, they gained ground on Treasuries as the supply of agency securities dwindled. But in early 2000, a senior Treasury official shook up the market when he urged Congress to limit the long-standing but never-used lines of credit that give some agencies - particularly mortgage security issuers Fannie Mae and Freddie Mac - implicit government backing. Although it remained unclear whether those recommendations would translate into actual reform, investors generally avoided agency securities. Despite these tribulations, agencies overall posted decent one-year returns, thanks mostly to their relatively high levels of income.
Q. Were there any disappointments?
A. I wouldn't single out any particular security that performed poorly during the period. However, the fund's stake in short-term Treasury and agency securities didn't perform as well as I expected due to rising interest rates.
Q. What's your outlook?
A. I believe that mortgage and agency securities continue to offer very attractive long-term values. The current yield advantage they enjoy over Treasuries helps position them to perform better than those securities, in my view. That's why I plan to keep relatively large weightings in them. To the extent that their spread relationship relative to Treasuries returns to more normal levels, they can do well. Even if the current spread relationship remains constant, their yield advantage should help them gain ground on Treasuries.
Fund Facts
Goal: high current income with preservation of principal
Fund number: 054
Trading symbol: FGOVX
Start date: April 4, 1979
Size: as of July 31, 2000, more than $1.4 billion
Manager: Tom Silvia, since 1998; manager, various Fidelity and Spartan government bond funds; joined Fidelity in 1993
3Tom Silvia on recent developments in the agency market:
"Fannie Mae and Freddie Mac are government-sponsored enterprises (GSEs) and, as such, enjoy certain benefits, including a $4.5 billion line of credit from the U.S. Treasury. They purchase home loans from originators such as banks, thrifts and mortgage banks, which they hold for their own investment portfolios. They also pool home loans into mortgage securities. Whether they hold mortgages for their own portfolios or whether they package them as securities, the effect is that cash is freed up so that originators can make new loans. As a result, Fannie Mae and Freddie Mac securities make up a fast-growing share of the government debt markets at a time when the Treasury is limiting its issuance.
"Although its emergency line of credit to the U.S. Treasury has never been tapped, it carries symbolic significance because it traditionally has allowed Fannie Mae and Freddie Mac to borrow at interest rates close to the U.S. government's rate. Renewed government interest in curbing Fannie's and Freddie's line of credit and limiting how much of their securities commercial banks can own have caused these securities to perform poorly recently."
Annual Report
Fidelity Government Income Fund
Fund Talk: The Manager's Overview - continued
The views expressed in this report reflect those of the portfolio manager only through the end of the period of the report as stated on the cover and do not necessarily represent the views of Fidelity or any other person in the Fidelity organization. Any such views are subject to change at any time based upon market or other conditions and Fidelity disclaims any responsibility to update such views. These views may not be relied on as investment advice and, because investment decisions for a Fidelity fund are based on numerous factors, may not be relied on as an indication of trading intent on behalf of any Fidelity fund.
Annual Report
Fidelity Government Income Fund
|
Coupon Distribution as of July 31, 2000 |
||
|
|
% of fund's investments |
% of fund's investments |
|
Less than 5% |
0.1 |
0.1 |
|
5 - 5.99% |
16.6 |
20.7 |
|
6 - 6.99% |
27.9 |
23.6 |
|
7 - 7.99% |
16.4 |
14.7 |
|
8 - 8.99% |
27.7 |
27.3 |
|
9 - 9.99% |
6.1 |
7.7 |
|
10% and over |
2.2 |
3.8 |
|
Coupon distribution shows the range of stated interest rates on the fund's investments, excluding short-term investments. |
|
Average Years to Maturity as of July 31, 2000 |
||
|
|
|
6 months ago |
|
Years |
9.1 |
9.1 |
|
Average years to maturity is based on the average time remaining until principal payments are expected from each of the fund's bonds, weighted by dollar amount. |
|
Duration as of July 31, 2000 |
||
|
|
|
6 months ago |
|
Years |
5.1 |
5.1 |
|
Duration shows how much a bond fund's price fluctuates with changes in comparable interest rates. |
|
Asset Allocation (% of fund's net assets) |
|||||||
|
As of July 31, 2000 |
As of January 31, 2000 |
||||||
|
Mortgage |
|
|
Mortgage |
|
||
|
CMOs and Other Mortgage Related Securities 3.8% |
|
|
CMOs and Other Mortgage Related Securities 1.8% |
|
||
|
U.S. Treasury |
|
|
U.S. Treasury |
|
||
 |
U.S. Government |
|
|
U.S. Government |
|
||
|
Short-Term |
|
|
Short-Term |
|
||

Annual Report
Fidelity Government Income Fund
Showing Percentage of Net Assets
|
U.S. Government and Government Agency Obligations - 70.7% |
||||
|
|
Principal Amount (000s) |
Value (Note 1) (000s) |
||
|
U.S. Government Agency Obligations - 44.7% |
||||
|
Fannie Mae: |
|
|
|
|
|
5.125% 2/13/04 |
|
$ 5,667 |
$ 5,339 |
|
|
5.25% 1/15/09 |
|
21,000 |
18,493 |
|
|
5.45% 2/4/02 |
|
12,000 |
11,710 |
|
|
6% 5/15/08 |
|
3,000 |
2,797 |
|
|
6.5% 4/29/09 |
|
103,780 |
96,986 |
|
|
7.25% 5/15/30 |
|
38,115 |
39,144 |
|
|
Farm Credit Systems Financial Assistance Corp.: |
|
|
|
|
|
8.8% 6/10/05 |
|
13,733 |
14,703 |
|
|
9.375% 7/21/03 |
|
23,087 |
24,526 |
|
|
Federal Agricultural Mortgage Corp. 8.07% |
|
3,000 |
3,138 |
|
|
Federal Home Loan Bank: |
|
|
|
|
|
6.07% 5/2/06 |
|
1,500 |
1,429 |
|
|
9.5% 2/25/04 |
|
2,355 |
2,535 |
|
|
Financing Corp. - coupon STRIPS |
|
|
|
|
|
0% 8/3/05 |
|
1,989 |
1,397 |
|
|
Freddie Mac: |
|
|
|
|
|
5.75% 3/15/09 |
|
28,000 |
25,480 |
|
|
6.25% 7/15/04 |
|
16,000 |
15,590 |
|
|
6.45% 4/29/09 |
|
57,000 |
53,143 |
|
|
7.625% 9/9/09 |
|
18,625 |
18,372 |
|
|
Government Loan Trusts (assets of Trust guaranteed by U.S. Government through Agency for International Development) 8.5% 4/1/06 |
|
8,290 |
8,636 |
|
|
Government Trust Certificates (assets of Trust guaranteed by U.S. Government through Defense Security Assistance Agency): |
|
|
|
|
|
Class 1-C, 9.25% 11/15/01 |
|
23,475 |
23,891 |
|
|
Class 2-E, 9.4% 5/15/02 |
|
6,504 |
6,586 |
|
|
Class 3-T, 9.625% 5/15/02 |
|
5,572 |
5,661 |
|
|
Guaranteed Export Trust Certificates (assets of Trust guaranteed by U.S. Government through Export- |
|
|
|
|
|
Series 1994-A, 7.12% 4/15/06 |
|
9,926 |
9,969 |
|
|
Series 1994-F, 8.187% 12/15/04 |
|
7,403 |
7,536 |
|
|
Series 1995-A, 6.28% 6/15/04 |
|
7,882 |
7,744 |
|
|
Series 1995-B, 6.13% 6/15/04 |
|
17,219 |
16,866 |
|
|
Series 1996-A, 6.55% 6/15/04 |
|
10,482 |
10,352 |
|
|
U.S. Government and Government Agency Obligations - continued |
||||
|
|
Principal Amount (000s) |
Value (Note 1) (000s) |
||
|
U.S. Government Agency Obligations - continued |
||||
|
Guaranteed Trade Trust Certificates (assets of Trust guaranteed by U.S. Government through Export- |
|
$ 6,430 |
$ 6,490 |
|
|
Israel Export Trust Certificates (assets of Trust guaranteed by U.S. Government through Export-Import Bank) Series 1994-1, 6.88% 1/26/03 |
|
5,168 |
5,155 |
|
|
Overseas Private Investment Corp. U.S. Government guaranteed participation certificate: |
|
|
|
|
|
Series 1994-195, 6.08% 8/15/04 (callable) |
|
7,013 |
6,916 |
|
|
Series 1998-196A, 5.926% 6/15/05 (callable) |
|
11,185 |
10,953 |
|
|
Private Export Funding Corp.: |
|
|
|
|
|
secured: |
|
|
|
|
|
5.31% 11/15/03 (a) |
|
41,500 |
39,524 |
|
|
5.8% 2/1/04 |
|
1,368 |
1,339 |
|
|
5.82% 6/15/03 (a) |
|
21,500 |
20,691 |
|
|
7.65% 5/15/06 |
|
12,300 |
12,561 |
|
|
State of Israel (guaranteed by U.S. Government through Agency for International Development): |
|
|
|
|
|
5.625% 9/15/03 |
|
40,680 |
39,240 |
|
|
6.6% 2/15/08 |
|
25,515 |
25,084 |
|
|
Student Loan Marketing Association 6.125% 12/1/05 |
|
4,190 |
4,013 |
|
|
Tennessee Valley Authority 7.125% 5/1/30 |
|
8,085 |
8,119 |
|
|
U.S. Department of Housing and Urban Development government guaranteed participation certificates Series 1999-A: |
|
|
|
|
|
5.75% 8/1/06 |
|
9,300 |
8,781 |
|
|
5.96% 8/1/09 |
|
9,930 |
9,288 |
|
|
U.S. Trade Trust Certificates (assets of Trust guaranteed by U.S. Government through Export-Import Bank) 8.17% 1/15/07 |
|
4,049 |
4,198 |
|
|
TOTAL U.S. GOVERNMENT AGENCY OBLIGATIONS |
634,375 |
|||
|
U.S. Treasury Obligations - 26.0% |
||||
|
U.S. Treasury Bonds: |
|
|
|
|
|
8% 11/15/21 |
|
24,090 |
29,461 |
|
|
8.75% 5/15/17 |
|
187,565 |
238,296 |
|
|
8.875% 8/15/17 |
|
28,200 |
36,259 |
|
|
14% 11/15/11 |
|
14,600 |
20,255 |
|
|
U.S. Government and Government Agency Obligations - continued |
||||
|
|
Principal Amount (000s) |
Value (Note 1) (000s) |
||
|
U.S. Treasury Obligations - continued |
||||
|
U.S. Treasury Notes: |
|
|
|
|
|
5.5% 8/31/01 |
|
$ 22,600 |
$ 22,374 |
|
|
5.875% 11/15/04 |
|
10,700 |
10,563 |
|
|
7% 7/15/06 |
|
12,000 |
12,465 |
|
|
TOTAL U.S. TREASURY OBLIGATIONS |
369,673 |
|||
|
TOTAL U.S. GOVERNMENT AND (Cost $1,017,353) |
1,004,048 |
|||
|
U.S. Government Agency - Mortgage Securities - 21.9% |
||||
|
|
||||
|
Fannie Mae - 15.8% |
||||
|
5.5% 5/1/09 to 3/1/24 |
|
6,908 |
6,297 |
|
|
6% 11/1/09 to 5/1/30 |
|
32,161 |
30,015 |
|
|
6.5% 10/1/28 to 10/1/29 |
|
42,738 |
40,406 |
|
|
7% 7/1/13 to 8/1/30 |
|
35,519 |
34,336 |
|
|
7.5% 3/1/29 to 7/1/30 |
|
80,587 |
79,417 |
|
|
8% 1/1/22 |
|
734 |
743 |
|
|
9% 5/1/14 |
|
10,725 |
10,799 |
|
|
9.5% 11/15/09 to 10/1/20 |
|
10,201 |
10,649 |
|
|
10% 8/1/10 |
|
608 |
630 |
|
|
11% 3/1/10 |
|
312 |
325 |
|
|
11.5% 6/1/19 to 5/1/28 |
|
10,333 |
11,319 |
|
|
|
224,936 |
|||
|
Freddie Mac - 1.3% |
||||
|
5% 1/1/09 to 6/1/09 |
|
4,301 |
4,005 |
|
|
7% 4/1/11 |
|
96 |
96 |
|
|
8% 1/1/10 to 6/1/11 |
|
615 |
616 |
|
|
8.5% 8/1/08 to 4/1/30 |
|
2,894 |
2,946 |
|
|
8.5% 8/1/30 (b) |
|
10,000 |
10,181 |
|
|
9% 8/1/09 to 12/1/10 |
|
609 |
619 |
|
|
9.75% 8/1/14 |
|
686 |
715 |
|
|
|
19,178 |
|||
|
Government National Mortgage Association - 4.8% |
||||
|
6% 7/15/08 to 12/15/10 |
|
33,855 |
32,684 |
|
|
8% 11/15/06 to 12/15/23 |
|
18,171 |
18,398 |
|
|
U.S. Government Agency - Mortgage Securities - continued |
||||
|
|
Principal Amount (000s) |
Value (Note 1) (000s) |
||
|
Government National Mortgage Association - continued |
||||
|
8.5% 10/15/08 to 3/15/30 |
|
$ 16,165 |
$ 16,505 |
|
|
9.5% 2/15/25 |
|
23 |
24 |
|
|
|
67,611 |
|||
|
TOTAL U.S. GOVERNMENT AGENCY - MORTGAGE SECURITIES (Cost $316,288) |
311,725 |
|||
|
Collateralized Mortgage Obligations - 3.8% |
||||
|
|
||||
|
U.S. Government Agency - 3.8% |
||||
|
Fannie Mae: |
|
|
|
|
|
planned amortization class Series 92-186 Class J, 7% 8/25/07 |
|
6,000 |
5,963 |
|
|
REMIC planned amortization class: |
|
|
|
|
|
Series 1993-160 Class PK, 6.5% 11/25/22 |
|
27,000 |
25,929 |
|
|
Series 1994-72 Class G, 6% 10/25/19 |
|
14,425 |
14,137 |
|
|
Federal Home Loan Mortgage Corp. planned amortization class Series 1698 Class E, 6% |
|
4,918 |
4,883 |
|
|
Freddie Mac planned amortization class Series 1455 Class M, 7% 12/15/22 |
|
4,453 |
3,897 |
|
|
TOTAL COLLATERALIZED MORTGAGE OBLIGATIONS (Cost $54,713) |
54,809 |
|||
|
Cash Equivalents - 2.9% |
|||
|
Maturity Amount (000s) |
|
||
|
Investments in repurchase agreements (U.S. Government Obligations), in a joint trading account at 6.65%, dated 7/31/00 due 8/1/00 |
$ 40,902 |
40,894 |
|
|
TOTAL INVESTMENT PORTFOLIO - 99.3% (Cost $1,429,248) |
1,411,476 |
||
|
NET OTHER ASSETS - 0.7% |
9,281 |
||
|
NET ASSETS - 100% |
$ 1,420,757 |
||
|
Legend |
|
(a) Security exempt from registration under Rule 144A of the Securities Act of 1933. These securities may be resold in transactions exempt from registration, normally to qualified institutional buyers. At the period end, the value of these securities amounted to $60,215,000 or 4.2% of net assets. |
|
(b) Security purchased on a delayed delivery or when-issued basis. |
|
Other Information |
|
Purchases and sales of long-term U.S. government and government agency obligations aggregated $1,956,959,000 and $2,112,115,000, respectively. |
|
Income Tax Information |
|
At July 31, 2000, the aggregate cost of investment securities for income tax purposes was $1,433,743,000. Net unrealized depreciation aggregated $22,267,000, of which $9,013,000 related to appreciated investment securities and $31,280,000 related to depreciated investment securities. |
|
At July 31, 2000, the fund had a capital loss carryforward of approximately $22,104,000 all of which will expire on July 31, 2008. |
|
The fund intends to elect to defer to its fiscal year ending July 31, 2001 approximately $38,189,000 of losses recognized during the period November 1, 1999 to July 31, 2000. |
|
A total of 32.84% of the dividends distributed during the fiscal year was derived from interest on U.S. Government securities which is generally exempt from state income tax. The fund will notify shareholders in January 2001 of amounts for use in preparing 2000 income tax returns (unaudited). |
See accompanying notes which are an integral part of the financial statements.
Annual Report
Fidelity Government Income Fund
Statement of Assets and Liabilities
|
|
||
|
(except per-share amount) |
July 31, 2000 |
|
|
Assets |
|
|
|
Investment in securities, at value (including repurchase agreements of $40,894) (cost $1,429,248) - |
|
$ 1,411,476 |
|
Receivable for investments sold |
|
167 |
|
Receivable for fund shares sold |
|
4,324 |
|
Interest receivable |
|
18,474 |
|
Total assets |
|
1,434,441 |
|
Liabilities |
|
|
|
Payable for investments purchased |
$ 40 |
|
|
Delayed delivery |
10,203 |
|
|
Payable for fund shares redeemed |
2,013 |
|
|
Distributions payable |
596 |
|
|
Accrued management fee |
503 |
|
|
Other payables and accrued expenses |
329 |
|
|
Total liabilities |
|
13,684 |
|
Net Assets |
|
$ 1,420,757 |
|
Net Assets consist of: |
|
|
|
Paid in capital |
|
$ 1,498,363 |
|
Undistributed net investment income |
|
4,953 |
|
Accumulated undistributed net realized gain (loss) |
|
(64,787) |
|
Net unrealized appreciation (depreciation) on investments |
|
(17,772) |
|
Net Assets, for 149,648 shares outstanding |
|
$ 1,420,757 |
|
Net Asset Value, offering price and redemption price |
|
$9.49 |
See accompanying notes which are an integral part of the financial statements.
Annual Report
Fidelity Government Income Fund
Financial Statements - continued
Statement of Operations
|
Amounts in thousands |
Year ended July 31, 2000 |
|
|
Investment Income Interest |
|
$ 107,262 |
|
Security lending |
|
56 |
|
Total income |
|
107,318 |
|
Expenses |
|
|
|
Management fee |
$ 6,619 |
|
|
Transfer agent fees |
3,072 |
|
|
Accounting and security lending fees |
346 |
|
|
Non-interested trustees' compensation |
5 |
|
|
Custodian fees and expenses |
94 |
|
|
Registration fees |
35 |
|
|
Audit |
35 |
|
|
Legal |
12 |
|
|
Miscellaneous |
4 |
|
|
Total expenses before reductions |
10,222 |
|
|
Expense reductions |
(114) |
10,108 |
|
Net investment income |
|
97,210 |
|
Realized and Unrealized Gain (Loss) Net realized gain (loss) on investment securities |
|
(46,391) |
|
Change in net unrealized appreciation (depreciation) |
|
36,196 |
|
Net gain (loss) |
|
(10,195) |
|
Net increase (decrease) in net assets resulting |
|
$ 87,015 |
|
Other information |
|
|
|
Expense reductions: |
|
$ 7 |
|
Transfer agent credits |
|
107 |
|
|
|
$ 114 |
See accompanying notes which are an integral part of the financial statements.
Annual Report
Fidelity Government Income Fund
Financial Statements - continued
Statement of Changes in Net Assets
|
Amounts in thousands |
Year ended |
Year ended |
|
Increase (Decrease) in Net Assets |
|
|
|
Operations |
$ 97,210 |
$ 92,703 |
|
Net realized gain (loss) |
(46,391) |
(11,048) |
|
Change in net unrealized appreciation (depreciation) |
36,196 |
(67,679) |
|
Net increase (decrease) in net assets resulting |
87,015 |
13,976 |
|
Distributions to shareholders from net investment income |
(95,925) |
(94,127) |
|
Share transactions |
843,446 |
1,430,122 |
|
Reinvestment of distributions |
87,605 |
85,177 |
|
Cost of shares redeemed |
(1,081,616) |
(1,107,827) |
|
Net increase (decrease) in net assets resulting |
(150,565) |
407,472 |
|
Total increase (decrease) in net assets |
(159,475) |
327,321 |
|
Net Assets |
|
|
|
Beginning of period |
1,580,232 |
1,252,911 |
|
End of period (including undistributed net investment income of $4,953 and $3,297, respectively) |
$ 1,420,757 |
$ 1,580,232 |
|
Other Information Shares |
|
|
|
Sold |
89,534 |
142,123 |
|
Issued in reinvestment of distributions |
9,295 |
8,543 |
|
Redeemed |
(114,789) |
(110,604) |
|
Net increase (decrease) |
(15,960) |
40,062 |
See accompanying notes which are an integral part of the financial statements.
Annual Report
Financial Highlights
|
Years ended July 31, |
2000 |
1999 |
1998 F |
1997 G |
1996 G |
1995 G |
|
Selected Per-Share Data |
|
|
|
|
|
|
|
Net asset value, beginning of period |
$ 9.540 |
$ 9.980 |
$ 9.760 |
$ 9.620 |
$ 9.890 |
$ 9.330 |
|
Income from Investment
Operations |
.592 D |
.588 D |
.481 D |
.625 D |
.670 |
.625 |
|
Net realized |
(.059) |
(.429) |
.208 |
.175 |
(.299) |
.564 |
|
Total from investment operations |
.533 |
.159 |
.689 |
.800 |
.371 |
1.189 |
|
Less Distributions |
|
|
|
|
|
|
|
From net investment income |
(.583) |
(.599) |
(.469) |
(.660) |
(.641) |
(.609) |
|
In excess of net |
- |
- |
- |
- |
- |
(.020) |
|
Total distributions |
(.583) |
(.599) |
(.469) |
(.660) |
(.641) |
(.629) |
|
Net asset value, |
$ 9.490 |
$ 9.540 |
$ 9.980 |
$ 9.760 |
$ 9.620 |
$ 9.890 |
|
Total Return B, C |
5.81% |
1.48% |
7.19% |
8.61% |
3.82% |
13.21% |
|
Ratios and Supplemental Data |
|
|
|
|
|
|
|
Net assets, end of period (in millions) |
$ 1,421 |
$ 1,580 |
$ 1,253 |
$ 1,023 |
$ 949 |
$ 897 |
|
Ratio of expenses to average net assets |
.66% |
.68% |
.69% A |
.73% |
.72% |
.71% |
|
Ratio of expenses to average net assets after expense reductions |
.65% E |
.67% E |
.68% A, E |
.72% E |
.71% E |
.71% |
|
Ratio of net invest- |
6.27% |
5.91% |
5.82% A |
6.48% |
6.52% |
6.36% |
|
Portfolio turnover rate |
131% |
168% |
289% A |
199% |
124% |
391% |
A Annualized
B Total returns for periods of less than one year are not annualized.
C The total returns would have been lower had certain expenses not been reduced during the periods shown.
D Net investment income per share has been calculated based on average shares outstanding during the period.
E FMR or the fund has entered into varying arrangements with third parties who either paid or reduced a portion of the fund's expenses.
F For the ten months ended July 31, 1998.
G Years ended September 30.
See accompanying notes which are an integral part of the financial statements.
Annual Report
Fidelity Intermediate Government Income Fund
There are several ways to evaluate a fund's historical performance. You can look at the total percentage change in value, the average annual percentage change or the growth of a hypothetical $10,000 investment. Total return reflects the change in the value of an investment, assuming reinvestment of the fund's dividend income and capital gains (the profits earned upon the sale of securities that have grown in value). You can also look at the fund's income, as reflected in its yield, to measure performance. If Fidelity had not reimbursed certain fund expenses, the total returns and dividends would have been lower.
Cumulative Total Returns
|
Periods ended July 31, 2000 |
|
Past 1 |
Past 5 |
Past 10 |
|
Fidelity Intermediate Govt Income |
|
5.11% |
32.64% |
87.11% |
|
LB Int Government Bond |
|
5.16% |
33.52% |
98.13% |
|
Short-Intermediate U.S. |
|
4.42% |
28.28% |
85.54% |
Cumulative total returns show the fund's performance in percentage terms over a set period - in this case, one year, five years or 10 years. For example, if you had invested $1,000 in a fund that had a 5% return over the past year, the value of your investment would be $1,050. You can compare the fund's returns to the Lehman Brothers Intermediate Government Bond Index - a market value-weighted index of U.S. Government fixed-rate debt issues with maturities between one and 10 years. To measure how the fund's performance stacked up against its peers, you can compare it to the short-intermediate U.S. Government funds average, which reflects the performance of mutual funds with similar objectives tracked by Lipper, Inc. The past one year average represents a peer group of 91 mutual funds. These benchmarks include reinvested dividends and capital gains, if any, and exclude the effect of sales charges.
Average Annual Total Returns
|
Periods ended July 31, 2000 |
Past 1 |
Past 5 |
Past 10 |
|
Fidelity Intermediate Govt Income |
5.11% |
5.81% |
6.47% |
|
LB Int Government Bond |
5.16% |
5.95% |
7.08% |
|
Short-Intermediate U.S. |
4.42% |
5.10% |
6.37% |
Average annual total returns take the fund's cumulative return and show you what would have happened if the fund had performed at a constant rate each year. (Note: Lipper calculates average annual total returns by annualizing each fund's total return, then taking an arithmetic average. This may produce a different figure than that obtained by averaging the cumulative total returns and annualizing the result.)
Annual Report
Fidelity Intermediate Government Income Fund
Performance - continued
$10,000 Over 10 Years
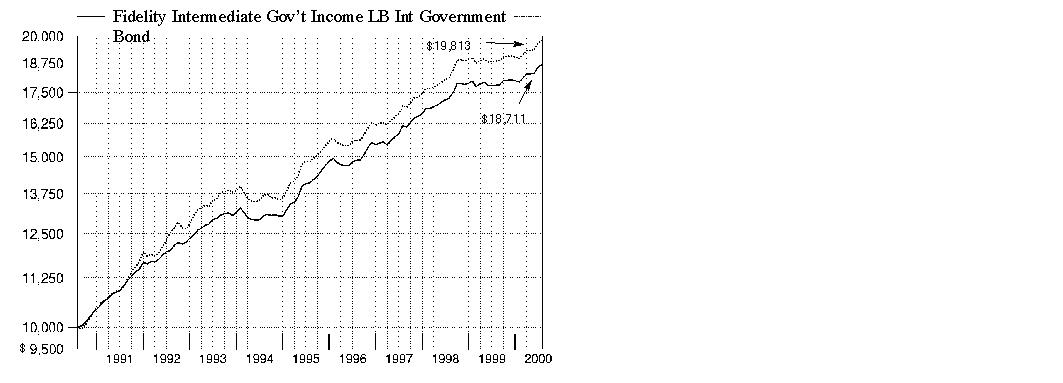
$10,000 Over 10 Years: Let's say hypothetically that $10,000 was invested in Fidelity Intermediate Government Income Fund on July 31, 1990. As the chart shows, by July 31, 2000, the value of the investment would have grown to $18,711 - an 87.11% increase on the initial investment. For comparison, look at how the Lehman Brothers Intermediate Government Bond Index did over the same period. With dividends and capital gains, if any, reinvested, the same $10,000 would have grown to $19,813 - a 98.13% increase.
Understanding
Performance
How a fund did yesterday is no guarantee of how it will do tomorrow. Bond prices, for example, generally move in the opposite direction of interest rates. In turn, the share price, return and yield of a fund that invests in bonds will vary. That means if you sell your shares during a market downturn, you might lose money. But if you can ride out the market's ups and downs, you may have a gain.
3Annual Report
Fidelity Intermediate Government Income Fund
Performance - continued
Total Return Components
|
|
|
Years ended July 31, |
||||
|
|
|
2000 |
1999 |
1998 |
1997 |
1996 |
|
Dividend returns |
|
6.59% |
6.47% |
6.88% |
7.11% |
6.62% |
|
Capital returns |
|
-1.48% |
-3.27% |
-0.10% |
1.45% |
-1.13% |
|
Total returns |
|
5.11% |
3.20% |
6.78% |
8.56% |
5.49% |
Total return components include both dividend returns and capital returns. A dividend return reflects the actual dividends paid by the fund. A capital return reflects both the amount paid by the fund to shareholders as capital gain distributions and changes in the fund's share price. Both returns assume the dividends or capital gains, if any, paid by the fund are reinvested.
Dividends and Yield
|
Periods ended July 31, 2000 |
Past 1 |
Past 6 |
Past 1 |
|
Dividends per share |
5.09 ¢ |
30.11 ¢ |
60.51 ¢ |
|
Annualized dividend rate |
6.43% |
6.51% |
6.49% |
|
30-day annualized yield |
6.56% |
- |
- |
Dividends per share show the income paid by the fund for a set period. If you annualize this number, based on an average share price of $9.32 over the past one month, $9.27 over the past six months and $9.33 over the past one year, you can compare the fund's income over these three periods. The 30-day annualized yield is a standard formula for all bond funds based on the yields of the bonds in the fund, averaged over the past 30 days. This figure shows you the yield characteristics of the fund's investments at the end of the period. It also helps you compare funds from different companies on an equal basis. If Fidelity had not reimbursed certain fund expenses, the yield would have been 6.54%.
Annual Report
Fidelity Intermediate Government Income Fund
Market Recap
Despite facing the challenge of five interest-rate increases during the 12-month period that ended July 31, 2000, the taxable bond market - as measured by the Lehman Brothers Aggregate Bond Index - returned 5.97%. The Federal Reserve Board's tightening policy, adopted to help slow down an overheated U.S. economy and ward off inflation, made for a sometimes difficult investing environment for bonds. During the first half of the period, the brunt of the Fed's action was felt by Treasuries, as they underperformed higher-yielding investment-grade spread sectors, such as corporate bonds and mortgage and government agency securities. In January, however, the momentum turned after the Treasury announced a plan to repurchase long-term debt and curtail future issuance. Treasury prices soared in response, sending their yields lower. This shift helped the Lehman Brothers Treasury Index return 6.48% during the period. At the same time, the Lehman Brothers Credit Bond Index - a measure of corporate bond performance - and the Lehman Brothers Mortgage-Backed Securities and U.S. Agency indexes returned 4.83%, 6.43% and 5.19%, respectively. Mortgage-backed securities rallied in the spring as a result of reduced supply, slower origination and a favorable prepayment environment. Elsewhere, rising default rates caused high-yield bonds to suffer more than most bonds, as the Merrill Lynch High Yield Master II Index returned -0.57% for the 12-month period.
(Portfolio Manager photograph)
An interview with Andrew Dudley, Portfolio Manager of Fidelity Intermediate Government Income Fund
Q. How did the fund perform, Andy?
A. For the 12-month period that ended July 31, 2000, the fund provided a total return of 5.11%. To get a sense of how the fund did relative to its competitors, the short-intermediate U.S. government funds average returned 4.42% for the same 12-month period, according to Lipper Inc. Additionally, the Lehman Brothers Intermediate Government Bond Index, which tracks the types of securities in which the fund invests, returned 5.16% for the same 12-month period.
Q. There were quite a few interesting developments in the government bond market during the past year. Can you tell us about those and how they affected the fund's performance?
A. Sure. The interest-rate environment was probably the most influential factor on performance. During the first half of the period, a series of interest-rate hikes and ongoing inflationary concerns muted government bond returns and, by extension, the fund's performance. And even though the Federal Reserve Board continued to raise interest rates in the second half of the period, government bonds - and the fund - performed much better than in the first half. The fact that the U.S. Treasury department scaled back its auctions of new debt and repurchased several billion dollars of outstanding Treasuries provided a more positive overall tone for the bond market. Furthermore, investors began to anticipate that the Fed was nearing the end of its nearly yearlong campaign of interest-rate hikes, given that some economic indicators suggested the economy was beginning to slow.
Annual Report
Fidelity Intermediate Government Income Fund
Fund Talk: The Manager's Overview - continued
Q. What helped the fund outpace its peers during the past year?
A. One of the key factors behind the fund's outperformance was its larger-than-average stake in short-term agency securities. Agency securities struggled under the weight of more supply as the various agencies increased their issuance. In addition, the agency market experienced some uncertainty as key legislators and other government officials began to re-examine the agencies' relationship with the U.S. government. Although expanding supply and uncertainty put pressure on all agency prices, shorter-term agencies outpaced longer-term ones, which was a plus for the fund's performance. That said, the fund did own some longer-term agency securities, which proved to be the biggest disappointment for the year.
Q. Which agency securities did you emphasize?
A. I continued to shift more of the fund's agency holdings into securities issued by the four top-tier agency issuers: Fannie Mae, Freddie Mac, Federal Home Loan Bank and Federal Farm Credit Bureau. I liked them because their liquidity means I can more easily buy and sell them as I see opportunities in the marketplace.
Q. Where were the opportunities in the mortgage market?
A. Early in the period - when mortgage prepayment activity was relatively intense - I held onto discount mortgages, which carry interest rates below prevailing rates - about 7.0% - and sell at a price below their face, or "par" value. Despite the fact that mortgage rates rose in response to higher interest rates and refinancing activity slowed as a result, housing turnover remained robust. The strong economy and rising personal income prompted many existing homeowners to upgrade. Discount mortgages performed well because a larger-than-expected number of loans were prepaid due to housing turnover, despite the fact that prevailing rates were higher, that was a positive event for holders of discount securities. In the second half, I felt that many discount bonds had approached their fair value. So I started to shift some holdings away from discounts and into par and premium bonds - those with interest rates between 7.5% and 8.5% - because they offered more attractive levels of income.
Q. What's ahead for the fund?
A. Because they represent such attractive values - relative to their historic prices and to other government security alternatives - I plan to keep the majority of the fund's holdings in agency securities. By the end of the period, the yield difference - the "spread" - between five-year Treasuries and five-year agency securities was about 75 basis points (0.75%), which is very wide on a historic basis. Since I believe that much of the uncertainty surrounding agency securities is currently priced in, I think that this large amount of additional yield adequately rewards investors.
Fund Facts
Goal: high level of current income consistent with preservation of capital by investing mainly in U.S. government and agency securities while maintaining a dollar weighted average maturity between three and 10 years
Fund number: 452
Trading symbol: FSTGX
Start date: May 2, 1988
Size: as of July 31, 2000, more than $728 million
Manager: Andrew Dudley, since 1998; manager, various Fidelity and Spartan government and mortgage funds; joined Fidelity in 1996
3Andrew Dudley on the potential reform of the U.S. agency market:
"Over the past several months, political crosscurrents have agitated the U.S. agency security market. Some government officials and legislators have indicated their desire to re-examine the relationship between the U.S. Treasury Department's indirect backing of some governmental agencies, including Fannie Mae and Freddie Mac. While the upcoming presidential election likely will delay any passage of reform this year, debate will continue and some changes eventually may be made. The question becomes: ´How far will that reform go?' One possible outcome is that the agencies' long-standing but never-used lines of credit from the government somehow will be tied to how closely they adhere to their missions. It's a situation that may have further effects on the agency market, and one I'll continue to monitor very closely. In the end, I believe that some type of reform is a positive development. Some additional oversight and measures of control likely will encourage the agencies to maintain aggressive risk management practices."
Annual Report
Fidelity Intermediate Government Income Fund
Fund Talk: The Manager's Overview - continued
The views expressed in this report reflect those of the portfolio manager only through the end of the period of the report as stated on the cover and do not necessarily represent the views of Fidelity or any other person in the Fidelity organization. Any such views are subject to change at any time based upon market or other conditions and Fidelity disclaims any responsibility to update such views. These views may not be relied on as investment advice and, because investment decisions for a Fidelity fund are based on numerous factors, may not be relied on as an indication of trading intent on behalf of any Fidelity fund.
Annual Report
Fidelity Intermediate Government Income Fund
|
Coupon Distribution as of July 31, 2000 |
||
|
|
% of fund's investments |
% of fund's investments |
|
Less than 5% |
0.9 |
1.8 |
|
5 - 5.99% |
16.9 |
17.6 |
|
6 - 6.99% |
36.6 |
35.7 |
|
7 - 7.99% |
14.6 |
8.5 |
|
8 - 8.99% |
5.2 |
5.6 |
|
9 - 9.99% |
10.8 |
13.0 |
|
10 - 10.99% |
1.9 |
3.0 |
|
11 - 11.99% |
3.3 |
6.1 |
|
12 - 12.99% |
6.2 |
6.1 |
|
13% and over |
2.1 |
2.1 |
|
Coupon distribution shows the range of stated interest rates on the fund's investments, excluding short-term investments. |
|
Average Years to Maturity as of July 31, 2000 |
||
|
|
|
6 months ago |
|
Years |
5.0 |
5.1 |
|
Average years to maturity is based on the average time remaining until principal payments are expected from each of the fund's bonds, weighted by dollar amount. |
|
Duration as of July 31, 2000 |
||
|
|
|
6 months ago |
|
Years |
3.0 |
3.1 |
|
Duration shows how much a bond fund's price fluctuates with changes in comparable interest rates. |
|
Asset Allocation (% of fund's net assets) |
|||||||
|
As of July 31, 2000 |
As of January 31, 2000 |
||||||
|
Mortgage |
|
|
Mortgage |
|
||
|
CMOs and Other Mortgage Related Securities 5.2% |
|
|
CMOs and Other Mortgage Related Securities 3.8% |
|
||
|
U.S. Treasury |
|
|
U.S. Treasury |
|
||
|
U.S. Government |
|
|
U.S. Government |
|
||
|
Short-Term |
|
|
Short-Term |
|
||

Annual Report
Fidelity Intermediate Government Income Fund
Showing Percentage of Net Assets
|
U.S. Government and Government Agency Obligations - 74.0% |
||||
|
|
Principal Amount (000s) |
Value (Note 1) (000s) |
||
|
U.S. Government Agency Obligations - 60.6% |
||||
|
Fannie Mae: |
|
|
|
|
|
5.25% 1/15/09 |
|
$ 9,000 |
$ 7,926 |
|
|
5.625% 5/14/04 |
|
4,870 |
4,650 |
|
|
5.75% 4/15/03 |
|
3,300 |
3,203 |
|
|
5.75% 6/15/05 |
|
8,800 |
8,352 |
|
|
6.25% 11/15/02 |
|
17,000 |
16,772 |
|
|
6.5% 8/15/04 |
|
7,000 |
6,879 |
|
|
6.5% 4/29/09 |
|
36,700 |
34,297 |
|
|
7% 7/15/05 |
|
20,440 |
20,456 |
|
|
Farm Credit Systems Financial Assistance Corp. 9.375% 7/21/03 |
|
33,770 |
35,868 |
|
|
Federal Agricultural Mortgage Corp.: |
|
|
|
|
|
6.92% 2/10/02 |
|
350 |
350 |
|
|
7.04% 8/10/05 |
|
2,050 |
2,048 |
|
|
Federal Farm Credit Bank: |
|
|
|
|
|
5.54% 9/10/03 |
|
1,300 |
1,246 |
|
|
9.15% 2/14/05 |
|
500 |
541 |
|
|
Federal Home Loan Bank: |
|
|
|
|
|
5.717% 8/25/03 |
|
4,500 |
4,335 |
|
|
6% 8/15/02 |
|
2,000 |
1,966 |
|
|
6.75% 5/1/02 |
|
29,300 |
29,222 |
|
|
6.75% 4/10/06 |
|
1,000 |
990 |
|
|
Financing Corp. - coupon STRIPS 0% 4/6/01 |
|
5,000 |
4,768 |
|
|
Freddie Mac: |
|
|
|
|
|
6.25% 7/15/04 |
|
17,700 |
17,246 |
|
|
6.99% 7/5/06 |
|
2,000 |
1,989 |
|
|
7% 2/15/03 |
|
1,500 |
1,502 |
|
|
7% 7/15/05 |
|
5,000 |
5,002 |
|
|
7.375% 5/15/03 |
|
13,470 |
13,611 |
|
|
Government Loan Trusts (assets of Trust guaranteed by U.S. Government through Agency for International Development) 8.5% 4/1/06 |
|
9,752 |
10,159 |
|
|
Government Trust Certificates (assets of Trust guaranteed by U.S. Government through Defense Security Assistance Agency): |
|
|
|
|
|
Class 1-C, 9.25% 11/15/01 |
|
25,054 |
25,498 |
|
|
Class 2-E, 9.4% 5/15/02 |
|
5,104 |
5,168 |
|
|
Class 3-T, 9.625% 5/15/02 |
|
2,483 |
2,523 |
|
|
Guaranteed Export Trust Certificates (assets of Trust guaranteed by U.S. Government through Export- |
|
|
|
|
|
Series 1993-C, 5.2% 10/15/04 |
|
928 |
892 |
|
|
U.S. Government and Government Agency Obligations - continued |
||||
|
|
Principal Amount (000s) |
Value (Note 1) (000s) |
||
|
U.S. Government Agency Obligations - continued |
||||
|
Guaranteed Export Trust Certificates (assets of Trust guaranteed by U.S. Government through Export- |
|
|
|
|
|
Series 1993-D, 5.23% 5/15/05 |
|
$ 736 |
$ 706 |
|
|
Series 1994-F, 8.187% 12/15/04 |
|
3,930 |
4,001 |
|
|
Series 1995-A, 6.28% 6/15/04 |
|
3,393 |
3,333 |
|
|
Series 1996-A, 6.55% 6/15/04 |
|
6,179 |
6,102 |
|
|
Guaranteed Trade Trust Certificates (assets of Trust guaranteed by U.S. Government through Export- |
|
|
|
|
|
Series 1992-A, 7.02% 9/1/04 |
|
4,695 |
4,680 |
|
|
Series 1994-A, 7.39% 6/26/06 |
|
6,000 |
6,053 |
|
|
Series 1994-B, 7.5% 1/26/06 |
|
637 |
643 |
|
|
Series 1997-A, 6.104% 7/15/03 |
|
9,691 |
9,538 |
|
|
Israel Export Trust Certificates (assets of Trust guaranteed by U.S. Government through Export-Import Bank) Series 1994-1, 6.88% 1/26/03 |
|
4,029 |
4,020 |
|
|
Overseas Private Investment Corp. U.S. Government guaranteed participation certificate: |
|
|
|
|
|
Series 1994-195, 6.08% 8/15/04 (callable) |
|
6,508 |
6,418 |
|
|
Series 1996-A1, 6.726% 9/15/10 (callable) |
|
3,652 |
3,648 |
|
|
Private Export Funding Corp. secured: |
|
|
|
|
|
5.31% 11/15/03 (a) |
|
4,000 |
3,810 |
|
|
5.48% 9/15/03 |
|
1,715 |
1,674 |
|
|
5.65% 3/15/03 |
|
2,049 |
2,014 |
|
|
5.8% 2/1/04 |
|
4,472 |
4,377 |
|
|
5.82% 6/15/03 (a) |
|
7,130 |
6,862 |
|
|
6.86% 4/30/04 |
|
1,666 |
1,656 |
|
|
8.35% 1/31/01 |
|
3,800 |
3,829 |
|
|
State of Israel (guaranteed by U.S. Government through Agency for International Development): |
|
|
|
|
|
5.625% 9/15/03 |
|
19,564 |
18,872 |
|
|
6.6% 2/15/08 |
|
27,910 |
27,438 |
|
|
6.625% 8/15/03 |
|
26,675 |
26,474 |
|
|
Tennessee Valley Authority 6% 11/1/00 |
|
4,060 |
4,055 |
|
|
U.S. Department of Housing and Urban Development government guaranteed participation certificates Series 1999-A: |
|
|
|
|
|
5.75% 8/1/06 |
|
10,000 |
9,442 |
|
|
U.S. Government and Government Agency Obligations - continued |
||||
|
|
Principal Amount (000s) |
Value (Note 1) (000s) |
||
|
U.S. Government Agency Obligations - continued |
||||
|
U.S. Department of Housing and Urban Development government guaranteed participation certificates Series 1999-A: - continued |
|
|
|
|
|
6.06% 8/1/10 |
|
$ 10,000 |
$ 9,375 |
|
|
U.S. Trade Trust Certificates (assets of Trust guaranteed by U.S. Government through Export-Import Bank) 8.17% 1/15/07 |
|
4,182 |
4,336 |
|
|
TOTAL U.S. GOVERNMENT AGENCY OBLIGATIONS |
440,815 |
|||
|
U.S. Treasury Obligations - 13.4% |
||||
|
U.S. Treasury Bonds: |
|
|
|
|
|
11.75% 2/15/10 (callable) |
|
13,099 |
15,778 |
|
|
12% 8/15/13 |
|
24,400 |
32,917 |
|
|
14% 11/15/11 |
|
8,075 |
11,203 |
|
|
U.S. Treasury Notes: |
|
|
|
|
|
5.5% 5/31/03 |
|
5,000 |
4,896 |
|
|
5.5% 2/15/08 |
|
25,385 |
24,382 |
|
|
6.625% 4/30/02 |
|
7,000 |
7,027 |
|
|
U.S. Treasury Notes - coupon STRIPS: |
|
|
|
|
|
0% 9/30/00 |
|
300 |
297 |
|
|
0% 10/31/00 |
|
142 |
140 |
|
|
0% 4/30/01 |
|
142 |
136 |
|
|
0% 5/31/01 |
|
207 |
197 |
|
|
0% 9/30/01 |
|
300 |
279 |
|
|
0% 4/30/02 |
|
142 |
128 |
|
|
0% 5/31/02 |
|
207 |
185 |
|
|
0% 9/30/02 |
|
200 |
176 |
|
|
TOTAL U.S. TREASURY OBLIGATIONS |
97,741 |
|||
|
TOTAL U.S. GOVERNMENT AND (Cost $552,317) |
538,556 |
|||
|
U.S. Government Agency - Mortgage Securities - 17.9% |
||||
|
|
||||
|
Fannie Mae - 12.2% |
||||
|
5.5% 1/1/09 to 2/1/09 |
|
6,816 |
6,451 |
|
|
6% 10/1/08 to 11/1/09 |
|
15,591 |
15,056 |
|
|
7% 9/1/27 to 10/1/29 |
|
25,009 |
24,165 |
|
|
7.5% 1/1/30 to 7/1/30 |
|
24,000 |
23,648 |
|
|
8.25% 12/1/01 |
|
5,254 |
5,262 |
|
|
U.S. Government Agency - Mortgage Securities - continued |
||||
|
|
Principal Amount (000s) |
Value (Note 1) (000s) |
||
|
Fannie Mae - continued |
||||
|
9% 2/1/13 |
|
$ 786 |
$ 807 |
|
|
9.5% 11/15/09 |
|
1,875 |
1,965 |
|
|
10% 1/1/20 |
|
52 |
55 |
|
|
10.25% 10/1/09 to 10/1/18 |
|
193 |
203 |
|
|
11% 8/1/10 to 1/1/16 |
|
3,175 |
3,407 |
|
|
11.25% 1/1/11 to 1/1/16 |
|
533 |
578 |
|
|
11.5% 9/1/11 to 6/1/19 |
|
2,101 |
2,292 |
|
|
11.75% 7/1/13 |
|
36 |
40 |
|
|
12.25% 10/1/10 to 5/1/15 |
|
697 |
768 |
|
|
12.5% 9/1/07 to 7/1/16 |
|
1,587 |
1,761 |
|
|
12.75% 10/1/11 to 6/1/15 |
|
796 |
884 |
|
|
13% 6/1/11 to 7/1/15 |
|
699 |
777 |
|
|
13.25% 9/1/11 to 9/1/13 |
|
408 |
459 |
|
|
13.5% 11/1/14 to 12/1/14 |
|
22 |
25 |
|
|
14% 10/1/14 |
|
57 |
64 |
|
|
14.5% 7/1/14 |
|
19 |
21 |
|
|
15% 4/1/12 |
|
19 |
22 |
|
|
|
88,710 |
|||
|
Freddie Mac - 3.6% |
||||
|
6.5% 5/1/08 |
|
1,404 |
1,373 |
|
|
8.5% 6/1/14 to 9/1/17 |
|
1,800 |
1,825 |
|
|
9% 11/1/09 to 8/1/16 |
|
560 |
567 |
|
|
9.5% 7/1/16 to 8/1/21 |
|
3,363 |
3,495 |
|
|
10% 12/1/00 to 3/1/21 |
|
6,281 |
6,598 |
|
|
10.5% 9/1/09 to 5/1/21 |
|
993 |
1,059 |
|
|
10.75% 7/1/13 |
|
74 |
78 |
|
|
11% 8/1/00 to 9/1/20 |
|
464 |
501 |
|
|
11.25% 2/1/10 to 10/1/14 |
|
551 |
590 |
|
|
11.5% 10/1/15 to 8/1/19 |
|
349 |
379 |
|
|
11.75% 1/1/10 to 7/1/15 |
|
129 |
138 |
|
|
12% 10/1/09 to 11/1/19 |
|
1,164 |
1,266 |
|
|
12.25% 2/1/11 to 8/1/15 |
|
409 |
448 |
|
|
12.5% 10/1/09 to 6/1/19 |
|
5,760 |
6,355 |
|
|
12.75% 2/1/10 to 1/1/11 |
|
138 |
152 |
|
|
13% 9/1/10 to 5/1/17 |
|
892 |
998 |
|
|
13.25% 11/1/10 to 12/1/14 |
|
104 |
116 |
|
|
13.5% 11/1/10 to 10/1/14 |
|
159 |
179 |
|
|
13.75% 10/1/14 |
|
2 |
3 |
|
|
14% 11/1/12 to 4/1/16 |
|
26 |
30 |
|
|
14.5% 12/1/10 to 9/1/12 |
|
64 |
73 |
|
|
U.S. Government Agency - Mortgage Securities - continued |
||||
|
|
Principal Amount (000s) |
Value (Note 1) (000s) |
||
|
Freddie Mac - continued |
||||
|
14.75% 3/1/10 |
|
$ 15 |
$ 17 |
|
|
16.25% 7/1/11 |
|
6 |
7 |
|
|
|
26,247 |
|||
|
Government National Mortgage Association - 2.1% |
||||
|
8% 9/15/06 to 12/15/23 |
|
7,747 |
7,838 |
|
|
8.5% 4/15/16 to 7/15/17 |
|
82 |
84 |
|
|
10.5% 2/15/14 to 2/15/25 |
|
5,340 |
5,727 |
|
|
10.75% 12/15/09 to 3/15/10 |
|
154 |
164 |
|
|
11% 9/15/00 to 1/20/21 |
|
321 |
345 |
|
|
12.25% 1/15/14 |
|
48 |
51 |
|
|
12.5% 12/15/10 |
|
13 |
14 |
|
|
13% 1/15/11 to 12/15/14 |
|
509 |
575 |
|
|
13.25% 9/15/13 to 10/15/14 |
|
64 |
69 |
|
|
13.5% 5/15/10 to 12/15/14 |
|
281 |
314 |
|
|
14% 6/15/11 to 12/15/14 |
|
48 |
55 |
|
|
16% 4/15/13 |
|
37 |
45 |
|
|
17% 12/15/11 |
|
3 |
4 |
|
|
|
15,285 |
|||
|
TOTAL U.S. GOVERNMENT AGENCY - MORTGAGE SECURITIES (Cost $131,401) |
130,242 |
|||
|
Collateralized Mortgage Obligations - 5.2% |
||||
|
|
||||
|
U.S. Government Agency - 5.2% |
||||
|
Fannie Mae: |
|
|
|
|
|
planned amortization class Series 92-192 Class J, 6.5% 8/25/07 |
|
5,800 |
5,683 |
|
|
REMIC planned amortization class: |
|
|
|
|
|
Series 1988-21 Class G, 9.5% 8/25/18 |
|
825 |
847 |
|
|
Series 1993-192 Class E, 5.95% 11/25/07 |
|
7,000 |
6,915 |
|
|
Series 1994-72 Class G, 6% 10/25/19 |
|
7,800 |
7,644 |
|
|
Series 1999-25 Class PA, 6% 2/25/20 |
|
6,312 |
6,195 |
|
|
Series 93-188 Class PH, 6.25% 3/25/13 |
|
4,346 |
4,232 |
|
|
Freddie Mac: |
|
|
|
|
|
REMIC accretion directed Series 1462 Class PT, 7.5% 1/15/03 |
|
2,754 |
2,762 |
|
|
REMIC planned amortization class Series 1639 |
|
3,820 |
3,755 |
|
|
TOTAL COLLATERALIZED MORTGAGE OBLIGATIONS (Cost $38,503) |
38,033 |
|||
|
Cash Equivalents - 1.5% |
|||
|
Maturity Amount (000s) |
Value (Note 1) (000s) |
||
|
Investments in repurchase agreements (U.S. Government Obligations), in a joint trading account at 6.65%, dated 7/31/00 due 8/1/00 |
$ 11,165 |
$ 11,163 |
|
|
TOTAL INVESTMENT PORTFOLIO - 98.6% (Cost $733,384) |
717,994 |
||
|
NET OTHER ASSETS - 1.4% |
10,124 |
||
|
NET ASSETS - 100% |
$ 728,118 |
||
|
Legend |
|
(a) Security exempt from registration under Rule 144A of the Securities Act of 1933. These securities may be resold in transactions exempt from registration, normally to qualified
institutional buyers. At the period end, the value of these securities amounted to $10,672,000 |
|
Other Information |
|
Purchases and sales of long-term U.S. government and government agency obligations aggregated $509,256,000 |
|
Income Tax Information |
|
At July 31, 2000, the aggregate cost of investment securities for income tax purposes was $733,793,000. Net unrealized depreciation aggregated $15,799,000, of which $2,354,000 related to appreciated investment securities and $18,153,000 related to depreciated investment securities. |
|
At July 31, 2000, the fund had a capital loss carryforward of approximately $78,026,000 of which $631,000, $6,681,000, $46,313,000, $8,517,000, $3,974,000 and $11,910,000 will expire on July 31, 2001, 2002, 2003, 2004, 2005 and 2008, respectively. Approximately $12,884,000 of which $631,000, $6,681,000, $2,987,000, $1,883,000 and $702,000 will expire on July 31, 2001, 2002, 2003, 2004 and 2005, respectively, was acquired in the mergers and is available to offset future capital gains of the fund to the extent provided by regulations. |
|
The fund intends to elect to defer to its fiscal year ending July 31, 2001 approximately $12,340,000 of losses recognized during the period November 1, 1999 to July 31, 2000. |
|
A total of 21.69% of the dividends distributed during the fiscal year was derived from interest on U.S. Government securities which is generally exempt from state income tax. The fund will notify shareholders in January 2001 of amounts for use in preparing 2000 income tax returns (unaudited). |
See accompanying notes which are an integral part of the financial statements.
Annual Report
Fidelity Intermediate Government Income Fund
Statement of Assets and Liabilities
|
|
||
|
Amounts in thousands (except per-share amount) |
July 31, 2000 |
|
|
Assets |
|
|
|
Investment in securities, at value (including repurchase agreements of $11,163) (cost $733,384) - |
|
$ 717,994 |
|
Cash |
|
1 |
|
Receivable for investments sold |
|
231 |
|
Receivable for fund shares sold |
|
344 |
|
Interest receivable |
|
11,250 |
|
Total assets |
|
729,820 |
|
Liabilities |
|
|
|
Payable for fund shares redeemed |
$ 675 |
|
|
Distributions payable |
649 |
|
|
Accrued management fee |
370 |
|
|
Other payables and accrued expenses |
8 |
|
|
Total liabilities |
|
1,702 |
|
Net Assets |
|
$ 728,118 |
|
Net Assets consist of: |
|
|
|
Paid in capital |
|
$ 834,072 |
|
Undistributed net investment income |
|
210 |
|
Accumulated undistributed net realized |
|
(90,774) |
|
Net unrealized appreciation (depreciation) on investments |
|
(15,390) |
|
Net Assets, for 78,122 shares outstanding |
|
$ 728,118 |
|
Net Asset Value, offering price and redemption price per share ($728,118 ÷ 78,122 shares) |
|
$9.32 |
See accompanying notes which are an integral part of the financial statements.
Annual Report
Fidelity Intermediate Government Income Fund
Financial Statements - continued
Statement of Operations
|
Amounts in thousands |
Year ended July 31, 2000 |
|
|
Investment Income Interest |
|
$ 57,067 |
|
Security lending |
|
58 |
|
Total income |
|
57,125 |
|
Expenses |
|
|
|
Management fee |
$ 5,144 |
|
|
Non-interested trustees' compensation |
2 |
|
|
Total expenses before reductions |
5,146 |
|
|
Expense reductions |
(195) |
4,951 |
|
Net investment income |
|
52,174 |
|
Realized and Unrealized Gain (Loss) Net realized gain (loss) on investment securities |
|
(17,900) |
|
Change in net unrealized appreciation (depreciation) on investment securities |
|
3,532 |
|
Net gain (loss) |
|
(14,368) |
|
Net increase (decrease) in net assets resulting |
|
$ 37,806 |
See accompanying notes which are an integral part of the financial statements.
Annual Report
Fidelity Intermediate Government Income Fund
Financial Statements - continued
Statement of Changes in Net Assets
|
Amounts in thousands |
Year ended |
Year ended |
|
Increase (Decrease) in Net Assets |
|
|
|
Operations |
$ 52,174 |
$ 51,652 |
|
Net realized gain (loss) |
(17,900) |
(5,246) |
|
Change in net unrealized appreciation (depreciation) |
3,532 |
(24,881) |
|
Net increase (decrease) in net assets resulting |
37,806 |
21,525 |
|
Distributions to shareholders from net investment income |
(51,274) |
(50,841) |
|
Share transactions |
110,093 |
284,648 |
|
Net asset value of shares issued in exchange for the net |
- |
71,358 |
|
Net asset value of shares issued in exchange for the net |
- |
122,989 |
|
Reinvestment of distributions |
42,243 |
41,707 |
|
Cost of shares redeemed |
(285,078) |
(320,889) |
|
Net increase (decrease) in net assets resulting |
(132,742) |
199,813 |
|
Total increase (decrease) in net assets |
(146,210) |
170,497 |
|
Net Assets |
|
|
|
Beginning of period |
874,328 |
703,831 |
|
End of period (including undistributed net investment income of $210 and $441, respectively) |
$ 728,118 |
$ 874,328 |
|
Other Information Shares |
|
|
|
Sold |
11,788 |
29,025 |
|
Issued in exchange for shares of Spartan |
- |
7,363 |
|
Issued in exchange for shares of Fidelity |
- |
12,662 |
|
Issued in reinvestment of distributions |
4,530 |
4,281 |
|
Redeemed |
(30,595) |
(32,874) |
|
Net increase (decrease) |
(14,277) |
20,457 |
See accompanying notes which are an integral part of the financial statements.
Annual Report
Financial Highlights
|
Years ended July 31, |
2000 |
1999 |
1998 |
1997 |
1996 |
|
Selected Per-Share Data |
|
|
|
|
|
|
Net asset value, beginning |
$ 9.460 |
$ 9.780 |
$ 9.790 |
$ 9.650 |
$ 9.760 |
|
Income from Investment Operations |
.616 B |
.640 B |
.652 B |
.675 B |
.678 |
|
Net realized and unrealized gain (loss) |
(.151) |
(.326) |
(.008) |
.124 |
(.150) |
|
Total from investment operations |
.465 |
.314 |
.644 |
.799 |
.528 |
|
Less Distributions |
|
|
|
|
|
|
From net investment income |
(.605) |
(.634) |
(.654) |
(.659) |
(.638) |
|
Net asset value, end of period |
$ 9.320 |
$ 9.460 |
$ 9.780 |
$ 9.790 |
$ 9.650 |
|
Total Return A |
5.11% |
3.20% |
6.78% |
8.56% |
5.49% |
|
Ratios and Supplemental Data |
|
|
|
|
|
|
Net assets, end of period |
$ 728 |
$ 874 |
$ 704 |
$ 704 |
$ 740 |
|
Ratio of expenses to average |
.63% C |
.53% C |
.38% C |
.54% C |
.63% C |
|
Ratio of expenses to average net assets after expense reductions |
.63% |
.53% |
.38% |
.54% |
.62% D |
|
Ratio of net investment income to average net assets |
6.59% |
6.58% |
6.65% |
6.96% |
6.89% |
|
Portfolio turnover rate |
66% |
117% E |
188% |
105% |
105% |
A The total returns would have been lower had certain expenses not been reduced during the periods shown.
B Net investment income per share has been calculated based on average shares outstanding during the period.
C FMR agreed to reimburse a portion of the fund's expenses during the period. Without this reimbursement, the fund's expense ratio
would have been higher.
D FMR or the fund has entered into varying arrangements with third parties who either paid or reduced a portion of the fund's expenses.
E The portfolio turnover rate does not include the assets acquired in the merger.
See accompanying notes which are an integral part of the financial statements.
Annual Report
For the period ended July 31, 2000
1. Significant Accounting Policies.
Fidelity Ginnie Mae Fund, Fidelity Government Income Fund and Fidelity Intermediate Government Income Fund (the funds) are funds of Fidelity Income Fund (the trust). The trust is registered under the Investment Company Act of 1940, as amended, as an open-end management investment company organized as a Massachusetts business trust. Each fund is authorized to issue an unlimited number of shares. The financial statements have been prepared in conformity with generally accepted accounting principles which require management to make certain estimates and assumptions at the date of the financial statements. The following summarizes the significant accounting policies of the funds:
Security Valuation. Securities are valued based upon a computerized matrix system and/or appraisals by a pricing service, both of which consider market transactions and dealer-supplied valuations. Securities (including restricted securities) for which market quotations are not readily available are valued at their fair value as determined in good faith under consistently applied procedures under the general supervision of the Board of Trustees. Short-term securities with remaining maturities of sixty days or less for which quotations are not readily available are valued at amortized cost or original cost plus accrued interest, both of which approximate current value.
Income Taxes. As a qualified regulated investment company under Subchapter M of the Internal Revenue Code, each fund is not subject to income taxes to the extent that it distributes substantially all of its taxable income for the fiscal year. The schedules of investments include information regarding income taxes under the caption "Income Tax Information."
Investment Income. Interest income, which includes accretion of original issue discount, is accrued as earned.
Expenses. Most expenses of the trust can be directly attributed to a fund. Expenses which cannot be directly attributed are apportioned among the funds in the trust.
Distributions to Shareholders. Dividends are declared daily and paid monthly from net investment income. Distributions to shareholders from realized capital gains on investments, if any, are recorded on the ex-dividend date.
Income and capital gain distributions are determined in accordance with income tax regulations which may differ from generally accepted accounting principles. These differences, which may result in distribution reclassifications, are primarily due to differing treatments for paydown gains/losses on certain securities, market discount, capital loss carryforwards and losses deferred due to wash sales and excise tax regulations.
Permanent book and tax basis differences relating to shareholder distributions will result in reclassifications to paid in capital. Undistributed net investment income and accumulated undistributed net realized gain (loss) on investments may include temporary book and tax basis differences which will reverse in a subsequent period. Any taxable income or gain remaining at fiscal year end is distributed in the following year.
Annual Report
Notes to Financial Statements - continued
1. Significant Accounting
Policies - continued
Security Transactions. Security transactions are accounted for as of trade date. Gains and losses on securities sold are determined on the basis of identified cost.
2. Operating Policies.
Joint Trading Account. Pursuant to an Exemptive Order issued by the Securities and Exchange Commission, the funds, along with other affiliated entities of Fidelity Management & Research Company (FMR), may transfer uninvested cash balances into one or more joint trading accounts. These balances are invested in one or more repurchase agreements for U.S. Treasury or Federal Agency obligations.
Repurchase Agreements. The underlying U.S. Treasury, Federal Agency, or other obligations found to be satisfactory by FMR are transferred to an account of the funds, or to the Joint Trading Account, at a custodian bank. The securities are marked-to-market daily and maintained at a value at least equal to the principal amount of the repurchase agreement (including accrued interest). FMR, the funds' investment adviser, is responsible for determining that the value of the underlying securities remains in accordance with the market value requirements stated above.
Delayed Delivery Transactions. Each fund may purchase or sell securities on a delayed delivery basis. Payment and delivery may take place after the customary settlement period for that security. The price of the underlying securities
and the date when the securities will be delivered and paid for are fixed at the time the transaction is negotiated. The market values of the securities purchased on a delayed delivery basis are identified as such in each applicable fund's schedule of investments. Each fund may receive compensation for interest forgone in the purchase of a delayed delivery security. With respect to purchase commitments, each fund identifies securities as segregated in its records with a value at least equal to the amount of the commitment. Losses may arise due to changes in the market value of the underlying securities or if the counterparty does not perform under the contract.
Restricted Securities. Certain funds are permitted to invest in securities that are subject to legal or contractual restrictions on resale. These securities generally may be resold in transactions exempt from registration or to the public if the securities are registered. Disposal of these securities may involve time-consuming negotiations and expense, and prompt sale at an acceptable price may be difficult. At the end of the period no funds had investments in restricted securities (excluding 144A issues).
3. Purchases and Sales of Investments.
Information regarding purchases and sales of securities (other than short-term securities), is included under the caption "Other Information" at the end of each applicable fund's schedule of investments.
Annual Report
Notes to Financial Statements - continued
4. Fees and Other Transactions with Affiliates.
Management Fee. As the investment adviser for Fidelity Ginnie Mae Fund and Fidelity Government Income Fund, FMR receives a monthly fee that is calculated on the basis of a group fee rate plus a fixed individual fund fee rate applied to the average net assets of each fund. The group fee rate is the weighted average of a series of rates and is based on the monthly average net assets of all the mutual funds advised by FMR. The rates ranged from .0920% to .3700% for the period. The annual individual fund fee rate is .30%. In the event that these rates were lower than the contractual rates in effect during the period, FMR voluntarily implemented the above rates, as they resulted in the same or a lower management fee. For the period, the management fees were equivalent to annual rates of .43% of average net assets for the Fidelity Ginnie Mae Fund and Fidelity Government Income Fund.
As the investment adviser for Fidelity Intermediate Government Income Fund, FMR receives a fee that is computed daily at an annual rate of .65% of the fund's average net assets. FMR pays all other expenses, except the compensation of the non-interested Trustees and certain exceptions such as interest, taxes, brokerage commissions and extraordinary expenses. The management fee paid to FMR by the fund is reduced by an amount equal to the fees and expenses paid by the fund to the non-interested Trustees.
Sub-Adviser Fee. FMR, on behalf of each fund, has entered into a sub-advisory agreement with Fidelity Investments Money Management, Inc. (FIMM), a wholly owned subsidiary of FMR. For its services, FIMM receives a fee from FMR of 50% of the management fee payable to FMR. The fee is paid prior to any voluntary expense reimbursements which may be in effect.
Transfer Agent Fees. Fidelity Service Company, Inc. (FSC), an affiliate of FMR, is the funds' transfer, dividend disbursing and shareholder servicing agent, for Fidelity Ginnie Mae Fund and Fidelity Government Income Fund. FSC receives account fees and asset-based fees that vary according to account size and type of account. FSC pays for typesetting, printing and mailing of all shareholder reports, except proxy statements. For the period, the transfer agent fees were equivalent to an annual rate of .15% and .20% of the average net assets of Fidelity Ginnie Mae Fund and Fidelity Government Income Fund, respectively.
Accounting and Security Lending Fees. FSC maintains each fund's accounting records for Fidelity Ginnie Mae and Fidelity Government Income Fund and administers the security lending program. The security lending fee is based on the number and duration of lending transactions. The accounting fee is based on the level of average net assets for the month plus out-of-pocket expenses.
5. Security Lending.
Certain funds lend portfolio securities from time to time in order to earn additional income. Each applicable fund receives collateral(in the form of U.S. Treasury obligations, letters of credit and/or cash) against the loaned securities and maintains collateral in an amount not
Annual Report
Notes to Financial Statements - continued
5. Security Lending -
continued
less than 100% of the market value of the loaned securities during the period of the loan. The market value of the loaned securities is determined at the close of business of the funds and any additional required collateral is delivered to the funds on the next business day. If the borrower defaults on its obligation to return the securities loaned because of insolvency or other reasons, a fund could experience delays and costs in recovering the securities loaned or in gaining access to the collateral. At period end there were no security loans outstanding.
6. Expense Reductions.
For Fidelity Ginnie Mae Fund and Fidelity Intermediate Government Income Fund, FMR voluntarily agreed to reimburse the funds' operating expenses (excluding interest, taxes, certain securities lending fees, brokerage commissions and extraordinary expenses, if any) above a specified percentage of average net assets.
(i) Fidelity Ginnie Mae Fund. For the period, this expense limitation was 0.63% of average net assets and the reimbursement reduced expenses by $67,000. Through June 30, 2001 FMR has agreed to limit the fund's operating expenses to an annual rate of 0.63% of average net assets.
(ii) Fidelity Intermediate Government Income Fund. For the period, this expense limitation ranged from an annual rate of 0.61% to 0.63% of average net assets and the reimbursement reduced expenses by $171,000. Through January 1, 2001 FMR has agreed to limit the fund's total operating expense to an annual rate of 0.61% of average net assets.
In addition, through arrangements with Fidelity Ginnie Mae Fund's and Fidelity Government Income Fund's custodian and transfer agent, credits realized as a result of uninvested cash balances were used to reduce a portion of each applicable fund's expenses. For the period, the reductions under these arrangements are shown under the caption "Other Information" on each applicable fund's Statement of Operations.
Through arrangements with Fidelity Intermediate Government Income Fund's custodian and transfer agent, credits realized as a result of uninvested cash balances were used to reduce a portion of the fund's expenses. During the period, the fund's expenses were reduced by $24,000 under these arrangements.
7. Merger Information.
On April 22, 1999, Fidelity Intermediate Government Income Fund acquired all of the assets and assumed all of the liabilities of Spartan Short-Intermediate Government Fund. The acquisition, which was approved by the shareholders of Spartan Short-Intermediate Government Fund on April 14, 1999, was accomplished by an exchange of 7,363,405 shares of the Fidelity Intermediate Government Income Fund (each valued at $9.69) for the 7,680,451 shares then outstanding (each valued at $9.29) of Spartan Short-Intermediate Government Fund. Based on the opinion of fund counsel, the reorganization qualified as a tax-free reorganization for federal
Annual Report
Notes to Financial Statements - continued
7. Merger Information -
continued
income tax purposes with no gain or loss recognized to the funds or their shareholders. Spartan Short-Intermediate Government Fund's net assets, including $638,690 of unrealized depreciation, were combined with Fidelity Intermediate Government Income Fund for total net assets after the acquisition of $803,238,766.
On April 29, 1999, Fidelity Intermediate Government Income Fund acquired all of the assets and assumed all of the liabilities of Fidelity Short-Intermediate Government Fund. The acquisition, which was approved by the shareholders of Fidelity Short-Intermediate Government Fund on April 14, 1999, was accomplished by an exchange of 12,662,423 shares of the Fidelity Intermediate Government Income Fund (each valued at $9.71) for the 13,292,122 shares then outstanding (each valued at $9.25) of Fidelity Short-Intermediate Government Fund. Based on the opinion of fund counsel, the reorganization qualified as a tax-free reorganization for federal income tax purposes with no gain or loss recognized to the funds or their shareholders. Fidelity Short-Intermediate Government Fund's net assets, including $674,931 of unrealized depreciation, were combined with Fidelity Intermediate Government Income Fund for total net assets after the acquisition of $924,822,820.
On May 27, 1999, Fidelity Ginnie Mae Fund acquired all of the assets and assumed all of the liabilities of Spartan Ginnie Mae Fund. The acquisition, which was approved by the shareholders of Spartan Ginnie Mae Fund on May 19, 1999, was accomplished by an exchange of 56,971,308 shares of the Fidelity Ginnie Mae Fund (each valued at $10.70) for the 60,959,299 shares then outstanding (each valued at $10.00) of Spartan Ginnie Mae Fund. Based on the opinion of fund counsel, the reorganization qualified as a tax-free reorganization for federal income tax purposes with no gain or loss recognized to the funds or their shareholders. Spartan Ginnie Mae Fund's net assets, including $3,850,708 of unrealized depreciation, were combined with Fidelity Ginnie Mae Fund for total net assets after the acquisition of $1,873,723,094.
8. Beneficial Interest.
At the end of the period, FMR was record owner of approximately 32% of the total outstanding shares of Fidelity Government Income Fund.
Annual Report
To the Trustees of Fidelity Income Fund and the Shareholders of Fidelity Ginnie Mae Fund, Fidelity Government Income Fund and Fidelity Intermediate Government Income Fund:
In our opinion, the accompanying statements of assets and liabilities, including the schedules of investments, and the related statements of operations and of changes in net assets and the financial highlights present fairly, in all material respects, the financial position of Fidelity Ginnie Mae Fund, Fidelity Government Income Fund and Fidelity Intermediate Income Fund (funds of Fidelity Income Fund) at July 31, 2000, and the results of their operations, the changes in their net assets and the financial highlights for the periods indicated, in conformity with accounting principles generally accepted in the United States. These financial statements and financial highlights (hereafter referred to as "financial statements") are the responsibility of Fidelity Income Fund's management; our responsibility is to express an opinion on these financial statements based on our audits. We conducted our audits of these financial statements in accordance with auditing standards generally accepted in the United States which require that we plan and perform the audit to obtain reasonable assurance about whether the financial statements are free of material misstatement. An audit includes examining, on a test basis, evidence supporting the amounts and disclosures in the financial statements, assessing the accounting principles used and significant estimates made by management, and evaluating the overall financial statement presentation. We believe that our audits, which included confirmation of securities at July 31, 2000 by correspondence with the custodian and brokers, provide a reasonable basis for the opinion expressed above.
/s/PricewaterhouseCoopers LLP
PricewaterhouseCoopers LLP
Boston, Massachusetts
September 8, 2000
Annual Report
Fidelity offers several ways to conveniently manage your personal investments via your telephone or PC. You can access your account information, conduct trades and research your investments 24 hours a day.
By Phone
Fidelity Automated Service Telephone provides a single toll-free number to access account balances, positions, quotes and trading. It's easy to navigate the service, and on your first call, the system will help you create a personal identification number (PIN) for security.
(phone_graphic)
Fidelity Automated
Service Telephone (FAST®)
1-800-544-5555
Press
1 For mutual fund and brokerage trading.
2 For quotes.*
3 For account balances and holdings.
4 To review orders and mutual
fund activity.
5 To change your PIN.
*0 To speak to a Fidelity representative.
By PC
Fidelity's web site on the Internet provides a wide range of information, including daily financial news, fund performance, interactive planning tools and news about Fidelity products and services.
(computer_graphic)
Fidelity's Web Site
www.fidelity.com
If you are not currently on the Internet, call EarthLink Sprint at 1-800-288-2967, and be sure to ask for registration number SMD004 to receive a special Fidelity package that includes 30 days of free Internet access. EarthLink is North America's #1 independent Internet access provider.
(computer_graphic)
Fidelity On-line Xpress+®
Fidelity On-line Xpress+ software for Windows combines comprehensive portfolio management capabilities, securities trading and access to research and analysis tools . . . all on your desktop. Call Fidelity at 1-800-544-0240 or visit our web site for more information on how to manage your investments via your PC.
* When you call the quotes line, please remember that a fund's yield and return will vary and, except for money market funds, share price will also vary. This means that you may have a gain or loss when you sell your shares. There is no assurance that money market funds will be able to maintain a stable $1 share price; an investment in a money market fund is not insured or guaranteed by the U.S. government. Total returns are historical and include changes in share price, reinvestment of dividends and capital gains, and the effects of any sales charges.
Annual Report
For directions and hours,
please call 1-800-544-9797.
Arizona
7373 N. Scottsdale Road
Scottsdale, AZ
California
815 East Birch Street
Brea, CA
851 East Hamilton Avenue
Campbell, CA
527 North Brand Boulevard
Glendale, CA
19200 Von Karman Avenue
Irvine, CA
10100 Santa Monica Blvd.
Los Angeles, CA
251 University Avenue
Palo Alto, CA
1760 Challenge Way
Sacramento, CA
7676 Hazard Center Drive
San Diego, CA
8 Montgomery Street
San Francisco, CA
950 Northgate Drive
San Rafael, CA
1400 Civic Drive
Walnut Creek, CA
6300 Canoga Avenue
Woodland Hills, CA
Colorado
1625 Broadway
Denver, CO
Connecticut
48 West Putnam Avenue
Greenwich, CT
265 Church Street
New Haven, CT
300 Atlantic Street
Stamford, CT
29 South Main Street
West Hartford, CT
Delaware
222 Delaware Avenue
Wilmington, DE
Florida
4400 N. Federal Highway
Boca Raton, FL
90 Alhambra Plaza
Coral Gables, FL
4090 N. Ocean Boulevard
Ft. Lauderdale, FL
1907 West State Road 434
Longwood, FL
8880 Tamiami Trail, North
Naples, FL
2401 PGA Boulevard
Palm Beach Gardens, FL
8065 Beneva Road
Sarasota, FL
1502 N. Westshore Blvd.
Tampa, FL
Georgia
3445 Peachtree Road, N.E.
Atlanta, GA
1000 Abernathy Road
Atlanta, GA
Illinois
One North Franklin Street
Chicago, IL
1415 West 22nd Street
Oak Brook, IL
1700 East Golf Road
Schaumburg, IL
3232 Lake Avenue
Wilmette, IL
Indiana
4729 East 82nd Street
Indianapolis, IN
Maine
Three Canal Plaza
Portland, ME
Maryland
7401 Wisconsin Avenue
Bethesda, MD
One W. Pennsylvania Ave.
Towson, MD
Massachusetts
801 Boylston Street
Boston, MA
155 Congress Street
Boston, MA
25 State Street
Boston, MA
300 Granite Street
Braintree, MA
44 Mall Road
Burlington, MA
416 Belmont Street
Worcester, MA
Annual Report
Michigan
280 Old N. Woodward Ave.
Birmingham, MI
29155 Northwestern Hwy.
Southfield, MI
Minnesota
7600 France Avenue South
Edina, MN
Missouri
700 West 47th Street
Kansas City, MO
8885 Ladue Road
Ladue, MO
New Jersey
150 Essex Street
Millburn, NJ
56 South Street
Morristown, NJ
501 Route 17, South
Paramus, NJ
New York
1055 Franklin Avenue
Garden City, NY
999 Walt Whitman Road
Melville, L.I., NY
1271 Avenue of the Americas
New York, NY
71 Broadway
New York, NY
350 Park Avenue
New York, NY
North Carolina
4611 Sharon Road
Charlotte, NC
Ohio
600 Vine Street
Cincinnati, OH
28699 Chagrin Boulevard
Woodmere Village, OH
Oregon
16850 SW 72nd Avenue
Tigard, OR
Pennsylvania
1735 Market Street
Philadelphia, PA
439 Fifth Avenue
Pittsburgh, PA
Rhode Island
47 Providence Place
Providence, RI
Tennessee
6150 Poplar Avenue
Memphis, TN
Texas
10000 Research Boulevard
Austin, TX
4017 Northwest Parkway
Dallas, TX
1155 Dairy Ashford Street
Houston, TX
2701 Drexel Drive
Houston, TX
400 East Las Colinas Blvd.
Irving, TX
14100 San Pedro
San Antonio, TX
19740 IH 45 North
Spring, TX
Utah
215 South State Street
Salt Lake City, UT
Virginia
1861 International Drive
McLean, VA
Washington
411 108th Avenue, N.E.
Bellevue, WA
511 Pine Street
Seattle, WA
Washington, DC
1900 K Street, N.W.
Washington, DC
Wisconsin
595 North Barker Road
Brookfield, WI
Fidelity Brokerage Services, Inc., 100 Summer St., Boston, MA 02110 Member NYSE/SIPC
Annual Report
If more than one address is listed, please locate the address that is closest to you. We'll give your correspondence immediate attention and send you written confirmation upon completion of your request.
(letter_graphic)
Making Changes
To Your Account
(such as changing name, address, bank, etc.)
Fidelity Investments
P.O. Box 770001
Cincinnati, OH 45277-0002
(letter_graphic)
For Non-Retirement
Accounts
Buying shares
Fidelity Investments
P.O. Box 770001
Cincinnati, OH 45277-0003
Overnight Express
Fidelity Investments
2300 Litton Lane - KH1A
Hebron, KY 41048
Selling shares
Fidelity Investments
P.O. Box 660602
Dallas, TX 75266-0602
Overnight Express
Fidelity Investments
Attn: Redemptions - CP6I
400 East Las Colinas Blvd.
Irving, TX 75039-5587
General Correspondence
Fidelity Investments
P.O. Box 500
Merrimack, NH 03054-0500
(letter_graphic)
For Retirement
Accounts
Buying shares
Fidelity Investments
P.O. Box 770001
Cincinnati, OH 45277-0003
Selling shares
Fidelity Investments
P.O. Box 660602
Dallas, TX 75266-0602
Overnight Express
Fidelity Investments
Attn: Redemptions - CP6R
400 East Las Colinas Blvd.
Irving, TX 75039-5587
General Correspondence
Fidelity Investments
P.O. Box 500
Merrimack, NH 03054-0500
Annual Report
Annual Report
Annual Report
Annual Report
Investment Adviser
Fidelity Management & Research Company
Boston, MA
Investment Sub-Advisers
Fidelity Management & Research
(U.K.) Inc.; Ginnie Mae and
Intermediate Government Income
Fidelity Management & Research
(Far East) Inc.; Ginnie Mae and
Intermediate Government Income
Fidelity Investments
Money Management, Inc.
Fidelity Investments Japan Limited;
Ginnie Mae and Intermediate
Government Income
Officers
Edward C. Johnson 3d, President
Robert C. Pozen, Senior Vice President
Dwight D. Churchill, Vice President
David L. Murphy, Vice President
Andrew J. Dudley, Vice President,
Intermediate Government Income
Thomas J. Silvia, Vice President,
Ginnie Mae and Government Income
Stanley N. Griffith, Assistant
Vice President
Eric D. Roiter, Secretary
Robert A. Dwight, Treasurer
Maria F. Dwyer, Deputy Treasurer
John H. Costello, Assistant Treasurer
Thomas J. Simpson, Assistant Treasurer
Board of Trustees
Ralph F. Cox *
Phyllis Burke Davis *
Robert M. Gates *
Edward C. Johnson 3d
Donald J. Kirk *
Ned C. Lautenbach *
Peter S. Lynch
Marvin L. Mann *
William O. McCoy *
Gerald C. McDonough *
Robert C. Pozen
Thomas R. Williams *
* Independent trustees
Advisory Board
J. Michael Cook
Abigail P. Johnson
Marie L. Knowles
General Distributor
Fidelity Distributors Corporation
Boston, MA
Transfer and Shareholder
Servicing Agent
Fidelity Service Company, Inc.
Boston, MA
Custodian
The Bank of New York
New York, NY
Fidelity's Taxable Bond Funds
Capital & Income
Ginnie Mae
Government Income
High Income
Intermediate Bond
Intermediate Government Income
International Bond
Investment Grade Bond
New Markets Income
Short-Term Bond
Spartan® Government Income
Spartan Investment Grade Bond
Strategic Income
Target TimelineSM 2001 & 2003
The Fidelity Telephone Connection
Mutual Fund 24-Hour Service
Exchanges/Redemptions
and Account Assistance 1-800-544-6666
Product Information 1-800-544-6666
Retirement Accounts 1-800-544-4774
(8 a.m. - 9 p.m.)
TDD Service 1-800-544-0118
for the deaf and hearing impaired
(9 a.m. - 9 p.m. Eastern time)
Fidelity Automated Service
Telephone (FAST®) (automated graphic) 1-800-544-5555
(automated graphic) Automated line for quickest service
GVT-ANN-0900 110768
1.537760.103
(Fidelity Investment logo)(registered trademark)
Corporate Headquarters
82 Devonshire St., Boston, MA 02109
www.fidelity.com
|
|