
|
|
|
|
|
|
|
|
|
|
Previous: ENERGY PARTNERS LTD, S-1/A, EX-99.1, 2000-09-21 |
Next: TRANSMONTAIGNE INC, 10-K, 2000-09-21 |
Fidelity®
Fund
Annual Report
July 31, 2000
(2_fidelity_logos) (Registered_Trademark)
|
President's Message |
3 |
Ned Johnson on investing strategies. |
|
Performance |
4 |
How the fund has done over time. |
|
Fund Talk |
6 |
The manager's review of fund performance, strategy and outlook. |
|
Investment Changes |
10 |
A summary of major shifts in the fund's investments over the past six months. |
|
Investments |
11 |
A complete list of the fund's investments with their market values. |
|
Financial Statements |
20 |
Statements of assets and liabilities,
operations, and changes in net assets, |
|
Notes |
24 |
Notes to the financial statements. |
|
Independent Auditors' |
28 |
The auditors' opinion. |
|
Distributions |
29 |
|
|
Proxy Voting Results |
30 |
|
Standard & Poor's, S&P and S&P 500 are registered service marks of The McGraw-Hill Companies, Inc. and have been licensed for use by Fidelity Distributors Corporation.
Other third party marks appearing herein are the property of their respective owners.
All other marks appearing herein are registered or unregistered trademarks or service marks of FMR Corp. or an affiliated company.
(Recycle graphic) This report is printed on recycled paper using soy-based inks.
This report and the financial statements contained herein are submitted for the general information of the shareholders of the fund. This report is not authorized for distribution to prospective investors in the fund unless preceded or accompanied by an effective prospectus.
Mutual fund shares are not deposits or obligations of, or guaranteed
by, any depository institution. Shares are not insured by the FDIC,
Federal Reserve Board or any other agency, and are subject to
investment risks, including possible loss of principal amount invested.
Neither the fund nor Fidelity Distributors Corporation is a bank.
For more information on any Fidelity fund, including charges and expenses, call 1-800-544-6666 for a free prospectus. Read it carefully before you invest or send money.
Annual Report
(Photograph of Edward C. Johnson 3d.)
Dear Shareholder:
The Federal Reserve Board's effort to keep inflation in check without over-cooling the U.S. economy has taken a toll on the stock market. Through July 2000, bellwether equity indexes such as the Dow Jones Industrial Average, NASDAQ and S&P 500® have negative returns for the year. On the other hand, fixed-income markets are enjoying strong performance. Except for high-yield, most bond sectors - corporates, mortgages, Treasuries and agencies - have returned 4%-6% year to date.
While it's impossible to predict the future direction of the markets with any degree of certainty, there are certain basic principles that can help investors plan for their future needs.
First, investors are encouraged to take a long-term view of their portfolios. If you can afford to leave your money invested through the inevitable up and down cycles of the financial markets, you will greatly reduce your vulnerability to any single decline. We know from experience, for example, that stock prices have gone up over longer periods of time, have significantly outperformed other types of investments and have stayed ahead of inflation.
Second, you can further manage your investing risk through diversification. A stock mutual fund, for instance, is already diversified, because it invests in many different companies. You can increase your diversification further by investing in a number of different stock funds, or in such other investment categories as bonds. If you have a short investment time horizon, you might want to consider moving some of your investment into a money market fund, which seeks income and a stable share price by investing in high-quality, short-term investments. Of course, it's important to remember that an investment in a money market fund is not insured or guaranteed by the Federal Deposit Insurance Corporation or any other government agency. Although money market funds seek to preserve the value of your investment at $1.00 per share, it is possible to lose money by investing in these types of funds.
Finally, no matter what your time horizon or portfolio diversity, it makes good sense to follow a regular investment plan, investing a certain amount of money in a fund at the same time each month or quarter and periodically reviewing your overall portfolio. By doing so, you won't get caught up in the excitement of a rapidly rising market, nor will you buy all your shares at market highs. While this strategy - known as dollar cost averaging - won't assure a profit or protect you from a loss in a declining market, it should help you lower the average cost of your purchases. Of course, you should consider your financial ability to continue your purchases through periods of low price levels before undertaking such a strategy.
If you have questions, please call us at 1-800-544-6666, or visit our web site at www.fidelity.com. We are available 24 hours a day, seven days a week to provide you the information you need to make the investments that are right for you.
Best regards,
/s/Edward C. Johnson 3d
Edward C. Johnson 3d
Annual Report
There are several ways to evaluate a fund's historical performance. You can look at the total percentage change in value, the average annual percentage change or the growth of a hypothetical $10,000 investment. Total return reflects the change in the value of an investment, assuming reinvestment of the fund's dividend income and capital gains (the profits earned upon the sale of securities that have grown in value).
Cumulative Total Returns
|
Periods ended July 31, 2000 |
|
Past 1 |
Past 5 |
Past 10 |
|
Fidelity Blue Chip Growth |
|
17.97% |
151.44% |
575.27% |
|
S&P 500 |
|
8.98% |
177.11% |
408.31% |
|
Growth Funds Average |
|
20.80% |
157.45% |
369.44% |
Cumulative total returns show the fund's performance in percentage terms over a set period - in this case, one year, five years or 10 years. For example, if you had invested $1,000 in a fund that had a 5% return over the past year, the value of your investment would be $1,050. You can compare the fund's returns to the performance of the Standard & Poor's 500SM Index - a market capitalization-weighted index of common stocks. To measure how the fund's performance stacked up against its peers, you can compare it to the growth funds average, which reflects the performance of mutual funds with similar objectives tracked by Lipper Inc. The past one year average represents a peer group of 1,280 mutual funds. These benchmarks include reinvested dividends and capital gains, if any, and exclude the effect of sales charges. Lipper has created new comparison categories that group funds according to portfolio characteristics and capitalization, as well as by capitalization only. These averages are listed on page 5 of this report.*
Average Annual Total Returns
|
Periods ended July 31, 2000 |
|
Past 1 |
Past 5 |
Past 10 |
|
Fidelity Blue Chip Growth |
|
17.97% |
20.25% |
21.05% |
|
S&P 500 |
|
8.98% |
22.61% |
17.65% |
|
Growth Funds Average |
|
20.80% |
20.27% |
16.25% |
Average annual total returns take the fund's cumulative return and show you what would have happened if the fund had performed at a constant rate each year. (Note: Lipper calculates average annual total returns by annualizing each fund's total return, then taking an arithmetic average. This may produce a different figure than that obtained by averaging the cumulative total returns and annualizing the result.)
Annual Report
$10,000 Over 10 Years
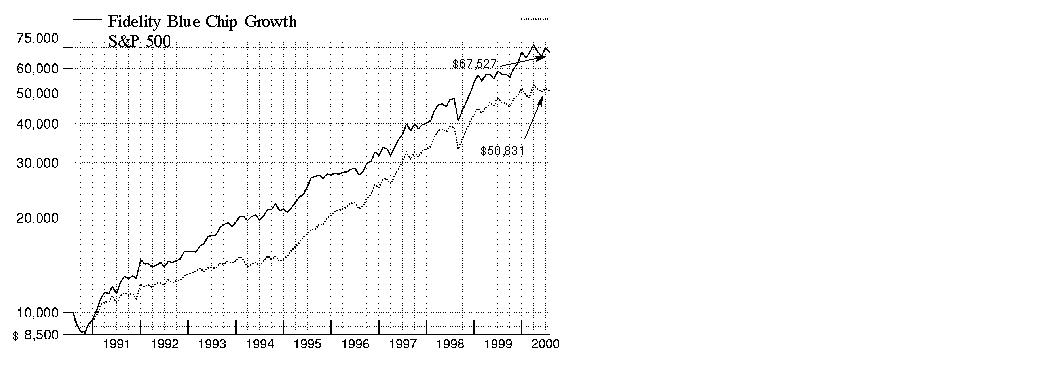
$10,000 Over 10 Years: Let's say hypothetically that $10,000 was invested in Fidelity Blue Chip Growth Fund on July 31, 1990. As the chart shows, by July 31, 2000, the value of the investment would have grown to $67,527 - a 575.27% increase on the initial investment. For comparison, look at how the S&P 500 did over the same period. With dividends and capital gains, if any, reinvested, the same $10,000 would have grown to $50,831 - a 408.31% increase.
Understanding
Performance
How a fund did yesterday is no guarantee of how it will do tomorrow. The stock market, for example, has a history of long-term growth and short-term volatility. In turn, the share price and return of a fund that invests in stocks will vary. That means if you sell your shares during a market downturn, you might lose money. But if you can ride out the market's ups and downs, you may have a gain.
3* The Lipper large-cap core funds average reflects the performance (excluding sales charges) of mutual funds with similar portfolio characteristics and capitalization. The Lipper large-cap supergroup average reflects the performance (excluding sales charges) of mutual funds with similar capitalization. As of July 31, 2000, the one year, five year and 10 year cumulative total returns for the large-cap core funds average were 12.94%, 155.74% and 353.17%, respectively. The one year, five year and 10 year average annual total returns were 12.94%, 20.52%, and 16.13%, respectively. The one year, five year and 10 year cumulative total returns for the large-cap supergroup average were 15.42%, 160.21%, and 372.19%, respectively. The one year, five year and 10 year average annual total returns were 15.42%, 20.70%, and 16.50%, respectively.
Annual Report
Market Recap
During the 12-month period that ended July 31, 2000, the U.S. equity markets struggled to break free from the grip of the Federal Reserve Board, whose effort to cool the overheated economy was delivered via a series of five interest-rate hikes. With every clench of its fist, the Fed's effort - which raised the federal funds rate by a combined total of 1.50% during the period - gradually tempered the robust optimism toward stocks as the period progressed. Most of the effect of the Fed's tightening, coupled with the market's concerns about corporate earnings, took its toll in the period's second half. The Dow Jones Industrial Average - a benchmark of blue chip stocks - returned 0.27% during the overall period, but has declined 7.65% during the past seven months. Similarly, the Standard & Poor's 500 Index, an index of 500 larger companies, returned 8.98% for the past year, but feeling the impact of the Fed's action, has lost 1.98% year to date. Even the seemingly invincible NASDAQ Composite Index, which finished the period with a 43.08% gain, has given back 7.33% in 2000. Growing concerns about a potential economic slowdown during the second half of the period also affected small-cap stocks, as evidenced by the Russell 2000®'s 13.77% advance for the 12-month period, compared to its weak -0.28% return year to date.
SM(Portfolio Manager photograph)
An interview with John McDowell, Portfolio Manager of Fidelity
Blue Chip Growth Fund
Q. How did the fund perform, John?
A. For the 12 months that ended July 31, 2000, the fund returned 17.97%. During the same period, the Standard & Poor's 500 Index returned 8.98%, while the growth
funds average tracked by
Lipper Inc. returned 20.80%.
Q. Why did the fund double the return of its index, yet lag its peer group during the past 12 months?
A. In a word, technology. First off, it's important to point out that - in absolute terms - technology accounted for nearly 90% of the fund's total return, half of which came from just a handful of heavyweights, namely Cisco, Intel, EMC, Sun Microsystems and Corning. It was an extremely unusual environment in the sense that so few stocks provided so much of the return. However, they weren't the only tech stocks at the party. During a period when the S&P 500 was up just shy of 9%, we held dozens of tech names that delivered triple-digit returns, some even in the 300%-500% range. We certainly didn't own all of the winners in the group, but what we did own made all the difference in the world relative to the index. Our strategy of surrounding the fund's core bellwether S&P tech holdings with smaller positions in some of the more aggressive NASDAQ stocks, such as Siebel Systems, VeriSign and PMC-Sierra, was beneficial for the fund. However, from a competitive standpoint, the fund's larger-cap bias kept performance below that turned in by its Lipper peers, a group that tended to hold even more of the high-octane, smaller-cap technology names on average.
Annual Report
Fund Talk: The Manager's Overview - continued
Q. What were your principal strategies during a period marked by extreme volatility?
A. To effectively manage risk, I chose to take a more balanced approach, steering clear of big concentrated positions in some of the relatively new, or emerging growth, tech stocks. Although this posture clipped our upside potential, it surely helped limit our exposure to the downdraft in the spring. Market turbulence helped reinforce the importance of consistently emphasizing downside risk, not just upside opportunity. The fund benefited from sticking to a strict valuation discipline, selling many highly priced tech names prior to their decline and jumping into compelling relative values that emerged in the broader market as a result of the run-up in tech. I stayed fully invested for the most part throughout the period and avoided making any broad sector bets. However, I did bump up our tech exposure a bit during the second quarter of 2000, using the volatility as an opportunity to add to some of the stocks I liked. I continued to pursue good growth stories outside of tech, an approach that began to pay off during the past few months as the market returned to many of the stocks it had abandoned earlier in the period.
Q. Did you find what you were looking for in health stocks?
A. We sure did. Several large drug holdings - including Warner-Lambert, which merged with Pfizer toward the end of the period, and Eli Lilly - enjoyed a nice rebound from the doldrums of 1999, thanks to continued strong earnings growth, attractive product pipelines and industry consolidation. Investors shrugged off election-year rhetoric threatening increased government regulation and flocked to the health sector en masse as a safe haven from the downturn in tech shares and a perceived slowdown in the economy.
Q. What other factors influenced performance?
A. Our decision to underweight several large banks, such as Bank of America, was a good one, as the group fell prey to rising interest rates and falling pricing power due to increased competition. The fund's emphasis on growth required us to identify companies with unique franchises and compelling business models that allow them to generate above-average returns. Home loan financers Fannie Mae and Freddie Mac fit the billing as higher-growth financials, although they failed to produce due to proposed legislation that threatened to sever their lines of credit with the federal government. In utilities, our underexposure to traditional telecommunications companies helped, as many of these issues wilted in response to pricing pressures in their consumer long-distance businesses.
Annual Report
Fund Talk: The Manager's Overview - continued
Q. What were some of the stocks that helped?
A. We identified a number of top players, such as JDS Uniphase, that emerged as leaders in optical networking, an area critical to the build-out of Internet infrastructure. Veritas led the way in meeting the growing demand for data storage. Linear Technology, Altera and Conexant were the big winners in the communications semiconductor space. Elsewhere, we took profits and sold off our holdings in PE Biosystems - which sells equipment that allows biotechnology companies to engage in genetic research - when it appeared the stock was running miles ahead of fundamentals. The move was timely, with the stock proceeding to correct sharply in March and April. Independent power producer Calpine benefited from strong demand for electricity in the face of tightening supply.
Q. Which stocks were a drag on the fund's returns?
A. Microsoft was plagued by a slowdown in earnings momentum related to a disappointing release for its Windows 2000 operating system. The company struggled further with its antitrust dispute with the U.S. Department of Justice, which culminated in April with a proposed break-up of the software giant. Lucent trended lower after missing a key product cycle and reporting disappointing earnings. Pitney-Bowes slipped on its exposure to a decline in the office equipment segment. Consumer nondurables generally suffered from deteriorating fundamentals, with Procter & Gamble feeling the most pain. Philip Morris continued to languish from ongoing tobacco litigation against it.
Q. John, what's your outlook?
A. I'm still bullish on technology stocks, and I expect to remain overweighted in the sector in the months ahead. Rising technology-related spending as a share of gross domestic product is expected to further fuel productivity growth and, thus, enhance corporate profitability. That being said, I foresee some of the most compelling growth opportunities by far to emerge from this space going forward. For now, there are several blue-chip growth stocks outside of the tech sector trading at very low valuations, relatively speaking, thanks to the tremendous run-up in tech stocks during the period, and we intend to take positions in those issues with the strongest fundamentals. With valuation levels still quite high for tech stocks, I feel it's imperative for us to effectively manage overall portfolio risk by maintaining our balanced approach and staying close to our valuation discipline.
The views expressed in this report reflect those of the portfolio manager only through the end of the period of the report as stated on the cover and do not necessarily represent the views of Fidelity or any other person in the Fidelity organization. Any such views are subject to change at any time based upon market or other conditions and Fidelity disclaims any responsibility to update such views. These views may not be relied on as investment advice and, because investment decisions for a Fidelity fund are based on numerous factors, may not be relied on as an indication of trading intent on behalf of any Fidelity fund.
Annual Report
Fund Talk: The Manager's Overview - continued
Fund Facts
Goal: seeks growth of capital over the long term by investing mainly in common stocks of well-known and established companies
Fund number: 312
Trading symbol: FBGRX
Start date: December 31, 1987
Size: as of July 31, 2000, more than $29.1 billion
Manager: John McDowell, since 1996; leader, Fidelity Growth Funds Group; manager, Fidelity Large Cap Stock Fund, 1995-1996; joined Fidelity in 1985
3John McDowell on emerging blue-chip issues:
"Given the fund's emphasis on seeking out attractive blue-chip growth stocks, we're constantly looking at newer growth industries from the bottom up, trying to identify the leaders in their respective spaces. Perhaps we'll even take small positions in those companies we consider to be potential blue chips of the future - or in larger-sized companies that are not necessarily the most well-known or established names, but are the ones we think have a reasonable expectation of becoming dominant players in their respective markets. Over time, several of these companies could prove to be big money makers for the fund. Consequently, we want to give the fund's shareholders exposure to some of these ´bluer-chip' stocks, but perhaps less than smaller-cap, more aggressive growth funds.
"It's also important for investors themselves to employ greater selectivity in their quest for tomorrow's winners. Today, we're facing a new-era economy that requires investors to filter through all of the clutter and the noise in a crowded tech market in search of those companies with solid, sustainable business models. These are firms that can really build franchise value and create wealth over a longer period of time, as opposed to those that are fueled by nothing other than speculative excesses. I'm heartened by the fact that many investors are beginning to realize that not all tech stocks are created equal."
Annual Report
|
Top Ten Stocks as of July 31, 2000 |
||
|
|
% of fund's |
% of fund's net assets |
|
Cisco Systems, Inc. |
4.8 |
4.1 |
|
General Electric Co. |
4.7 |
4.3 |
|
Intel Corp. |
4.4 |
3.1 |
|
Pfizer, Inc. |
2.9 |
0.9 |
|
Microsoft Corp. |
2.7 |
4.4 |
|
EMC Corp. |
2.0 |
1.2 |
|
Sun Microsystems, Inc. |
1.9 |
1.2 |
|
Wal-Mart Stores, Inc. |
1.8 |
1.7 |
|
Eli Lilly & Co. |
1.7 |
1.2 |
|
Home Depot, Inc. |
1.6 |
1.8 |
|
|
28.5 |
23.9 |
|
Top Five Market Sectors as of July 31, 2000 |
||
|
|
% of fund's |
% of fund's net assets |
|
Technology |
41.1 |
37.7 |
|
Health |
12.4 |
12.3 |
|
Finance |
8.8 |
8.6 |
|
Retail & Wholesale |
6.4 |
7.7 |
|
Industrial Machinery & Equipment |
6.0 |
5.1 |
|
Asset Allocation (% of fund's net assets) |
|||||||
|
As of July 31, 2000 * |
As of January 31, 2000 ** |
||||||
 |
Stocks 97.8% |
|
|
Stocks 97.1% |
|
||
 |
Short-Term |
|
|
Short-Term |
|
||
|
* Foreign |
4.0% |
|
** Foreign investments |
3.1% |
|
||

Annual Report
Showing Percentage of Net Assets
|
Common Stocks - 97.8% |
|||
|
Shares |
Value (Note 1) (000s) |
||
|
AEROSPACE & DEFENSE - 0.9% |
|||
|
Aerospace & Defense - 0.6% |
|||
|
Boeing Co. |
803,100 |
$ 39,352 |
|
|
Textron, Inc. |
1,137,320 |
64,898 |
|
|
United Technologies Corp. |
1,171,000 |
68,357 |
|
|
|
172,607 |
||
|
Ship Building & Repair - 0.3% |
|||
|
General Dynamics Corp. |
1,409,900 |
79,571 |
|
|
TOTAL AEROSPACE & DEFENSE |
252,178 |
||
|
BASIC INDUSTRIES - 0.8% |
|||
|
Chemicals & Plastics - 0.2% |
|||
|
Pharmacia Corp. |
1,080,500 |
59,157 |
|
|
Packaging & Containers - 0.1% |
|||
|
Owens-Illinois, Inc. (a) |
2,990,400 |
39,810 |
|
|
Paper & Forest Products - 0.5% |
|||
|
Kimberly-Clark Corp. |
2,258,700 |
129,734 |
|
|
TOTAL BASIC INDUSTRIES |
228,701 |
||
|
DURABLES - 1.1% |
|||
|
Autos, Tires, & Accessories - 0.2% |
|||
|
Danaher Corp. |
1,125,500 |
57,330 |
|
|
Consumer Durables - 0.4% |
|||
|
Minnesota Mining & Manufacturing Co. |
1,206,400 |
108,651 |
|
|
Consumer Electronics - 0.4% |
|||
|
General Motors Corp. Class H (a) |
2,805,300 |
72,587 |
|
|
Sony Corp. |
510,000 |
47,908 |
|
|
|
120,495 |
||
|
Home Furnishings - 0.1% |
|||
|
Leggett & Platt, Inc. |
1,494,300 |
26,150 |
|
|
TOTAL DURABLES |
312,626 |
||
|
ENERGY - 4.0% |
|||
|
Energy Services - 1.4% |
|||
|
Baker Hughes, Inc. |
1,568,000 |
54,292 |
|
|
Halliburton Co. |
2,273,600 |
104,870 |
|
|
Noble Drilling Corp. (a) |
506,600 |
22,069 |
|
|
Common Stocks - continued |
|||
|
Shares |
Value (Note 1) (000s) |
||
|
ENERGY - continued |
|||
|
Energy Services - continued |
|||
|
Schlumberger Ltd. (NY Shares) |
1,879,100 |
$ 138,936 |
|
|
Transocean Sedco Forex, Inc. |
2,027,400 |
100,356 |
|
|
|
420,523 |
||
|
Oil & Gas - 2.6% |
|||
|
Anadarko Petroleum Corp. |
1,588,000 |
75,926 |
|
|
Apache Corp. |
515,200 |
25,631 |
|
|
Chevron Corp. |
1,962,100 |
155,006 |
|
|
Devon Energy Corp. |
2,060,000 |
94,245 |
|
|
Exxon Mobil Corp. |
2,613,100 |
209,048 |
|
|
TotalFinaElf SA Class B |
779,300 |
114,655 |
|
|
USX - Marathon Group |
3,251,300 |
79,047 |
|
|
|
753,558 |
||
|
TOTAL ENERGY |
1,174,081 |
||
|
FINANCE - 8.8% |
|||
|
Banks - 1.0% |
|||
|
Bank of New York Co., Inc. |
2,217,000 |
103,783 |
|
|
Northern Trust Corp. |
1,788,300 |
133,899 |
|
|
State Street Corp. |
405,400 |
40,692 |
|
|
|
278,374 |
||
|
Credit & Other Finance - 2.2% |
|||
|
American Express Co. |
4,185,029 |
237,239 |
|
|
Associates First Capital Corp. Class A |
2,442,700 |
63,968 |
|
|
Citigroup, Inc. |
4,764,100 |
336,167 |
|
|
|
637,374 |
||
|
Federal Sponsored Credit - 1.7% |
|||
|
Fannie Mae |
5,293,800 |
264,028 |
|
|
Freddie Mac |
5,490,100 |
216,516 |
|
|
|
480,544 |
||
|
Insurance - 3.0% |
|||
|
AFLAC, Inc. |
1,747,400 |
90,756 |
|
|
AMBAC Financial Group, Inc. |
2,241,800 |
144,456 |
|
|
American International Group, Inc. |
5,120,455 |
449,000 |
|
|
CIGNA Corp. |
1,155,600 |
115,416 |
|
|
MBIA, Inc. |
788,500 |
43,910 |
|
|
Common Stocks - continued |
|||
|
Shares |
Value (Note 1) (000s) |
||
|
FINANCE - continued |
|||
|
Insurance - continued |
|||
|
The Chubb Corp. |
299,600 |
$ 22,170 |
|
|
The St. Paul Companies, Inc. |
481,700 |
21,406 |
|
|
|
887,114 |
||
|
Securities Industry - 0.9% |
|||
|
Charles Schwab Corp. |
3,644,400 |
131,654 |
|
|
Morgan Stanley Dean Witter & Co. |
952,300 |
86,897 |
|
|
Nikko Securities Co. Ltd. |
3,478,000 |
26,680 |
|
|
Nomura Securities Co. Ltd. |
1,550,000 |
30,399 |
|
|
|
275,630 |
||
|
TOTAL FINANCE |
2,559,036 |
||
|
HEALTH - 12.4% |
|||
|
Drugs & Pharmaceuticals - 9.9% |
|||
|
American Home Products Corp. |
1,565,600 |
83,075 |
|
|
Amgen, Inc. (a) |
2,872,200 |
186,513 |
|
|
Bristol-Myers Squibb Co. |
7,726,800 |
383,442 |
|
|
Eli Lilly & Co. |
4,732,300 |
491,568 |
|
|
Genentech, Inc. |
732,000 |
111,356 |
|
|
Human Genome Sciences, Inc. (a) |
255,400 |
30,856 |
|
|
Immunex Corp. (a) |
1,363,200 |
69,097 |
|
|
Merck & Co., Inc. |
5,423,900 |
388,826 |
|
|
Millennium Pharmaceuticals, Inc. (a) |
420,300 |
40,454 |
|
|
Pfizer, Inc. |
19,704,400 |
849,752 |
|
|
Protein Design Labs, Inc. (a) |
167,300 |
20,275 |
|
|
Schering-Plough Corp. |
5,017,300 |
216,685 |
|
|
|
2,871,899 |
||
|
Medical Equipment & Supplies - 2.4% |
|||
|
Abbott Laboratories |
3,541,200 |
147,402 |
|
|
Cardinal Health, Inc. |
1,349,350 |
99,177 |
|
|
Johnson & Johnson |
2,764,100 |
257,234 |
|
|
Medtronic, Inc. |
4,000,800 |
204,291 |
|
|
|
708,104 |
||
|
Medical Facilities Management - 0.1% |
|||
|
HCA - The Healthcare Co. |
857,600 |
29,158 |
|
|
TOTAL HEALTH |
3,609,161 |
||
|
Common Stocks - continued |
|||
|
Shares |
Value (Note 1) (000s) |
||
|
INDUSTRIAL MACHINERY & EQUIPMENT - 6.0% |
|||
|
Electrical Equipment - 4.7% |
|||
|
General Electric Co. |
26,966,000 |
$ 1,387,064 |
|
|
Industrial Machinery & Equipment - 1.3% |
|||
|
Illinois Tool Works, Inc. |
764,100 |
43,745 |
|
|
Ingersoll-Rand Co. |
1,630,450 |
63,995 |
|
|
Parker-Hannifin Corp. |
1,166,500 |
41,484 |
|
|
Tyco International Ltd. |
4,162,400 |
222,688 |
|
|
|
371,912 |
||
|
TOTAL INDUSTRIAL MACHINERY & EQUIPMENT |
1,758,976 |
||
|
MEDIA & LEISURE - 5.1% |
|||
|
Broadcasting - 2.8% |
|||
|
AT&T Corp. - Liberty Media Group Class A (a) |
6,314,200 |
140,491 |
|
|
Clear Channel Communications, Inc. (a) |
1,524,300 |
116,133 |
|
|
Comcast Corp. Class A (special) (a) |
2,330,800 |
79,284 |
|
|
Cox Communications, Inc. Class A (a) |
2,274,200 |
84,003 |
|
|
EchoStar Communications Corp. Class A (a) |
861,600 |
33,979 |
|
|
Time Warner, Inc. |
4,724,288 |
362,294 |
|
|
|
816,184 |
||
|
Entertainment - 1.7% |
|||
|
Viacom, Inc. Class B (non-vtg.) (a) |
4,727,996 |
313,525 |
|
|
Walt Disney Co. |
4,461,500 |
172,604 |
|
|
|
486,129 |
||
|
Leisure Durables & Toys - 0.2% |
|||
|
Harley-Davidson, Inc. |
1,140,100 |
51,162 |
|
|
Publishing - 0.2% |
|||
|
McGraw-Hill Companies, Inc. |
1,229,500 |
73,078 |
|
|
Restaurants - 0.2% |
|||
|
McDonald's Corp. |
1,929,100 |
60,767 |
|
|
TOTAL MEDIA & LEISURE |
1,487,320 |
||
|
NONDURABLES - 5.7% |
|||
|
Beverages - 1.8% |
|||
|
Anheuser-Busch Companies, Inc. |
1,935,500 |
155,808 |
|
|
The Coca-Cola Co. |
6,240,900 |
382,645 |
|
|
|
538,453 |
||
|
Foods - 1.2% |
|||
|
Nabisco Group Holdings Corp. |
1,599,800 |
42,395 |
|
|
Common Stocks - continued |
|||
|
Shares |
Value (Note 1) (000s) |
||
|
NONDURABLES - continued |
|||
|
Foods - continued |
|||
|
PepsiCo, Inc. |
3,925,290 |
$ 179,827 |
|
|
Quaker Oats Co. |
1,970,640 |
132,526 |
|
|
|
354,748 |
||
|
Household Products - 1.6% |
|||
|
Clorox Co. |
1,443,400 |
59,630 |
|
|
Colgate-Palmolive Co. |
1,563,300 |
87,056 |
|
|
Estee Lauder Companies, Inc. Class A |
979,500 |
43,098 |
|
|
Gillette Co. |
3,367,200 |
98,280 |
|
|
Procter & Gamble Co. |
3,228,300 |
183,610 |
|
|
|
471,674 |
||
|
Tobacco - 1.1% |
|||
|
Philip Morris Companies, Inc. |
12,143,300 |
306,618 |
|
|
TOTAL NONDURABLES |
1,671,493 |
||
|
RETAIL & WHOLESALE - 6.4% |
|||
|
Apparel Stores - 0.5% |
|||
|
Gap, Inc. |
2,185,700 |
78,275 |
|
|
The Limited, Inc. |
3,605,400 |
73,685 |
|
|
|
151,960 |
||
|
Drug Stores - 0.5% |
|||
|
Walgreen Co. |
4,943,400 |
154,172 |
|
|
General Merchandise Stores - 2.9% |
|||
|
Kohls Corp. (a) |
2,247,300 |
127,534 |
|
|
Target Corp. |
5,472,800 |
158,711 |
|
|
Wal-Mart Stores, Inc. |
9,807,000 |
538,772 |
|
|
|
825,017 |
||
|
Grocery Stores - 0.3% |
|||
|
Safeway, Inc. (a) |
1,899,900 |
85,614 |
|
|
Retail & Wholesale, Miscellaneous - 2.2% |
|||
|
Best Buy Co., Inc. (a) |
1,355,200 |
98,591 |
|
|
Home Depot, Inc. |
8,767,100 |
453,697 |
|
|
Lowe's Companies, Inc. |
2,203,300 |
92,952 |
|
|
|
645,240 |
||
|
TOTAL RETAIL & WHOLESALE |
1,862,003 |
||
|
Common Stocks - continued |
|||
|
Shares |
Value (Note 1) (000s) |
||
|
SERVICES - 0.8% |
|||
|
Advertising - 0.6% |
|||
|
Omnicom Group, Inc. |
2,171,200 |
$ 184,552 |
|
|
Services - 0.2% |
|||
|
Ecolab, Inc. |
1,385,800 |
49,629 |
|
|
TOTAL SERVICES |
234,181 |
||
|
TECHNOLOGY - 41.1% |
|||
|
Communications Equipment - 8.5% |
|||
|
Cisco Systems, Inc. (a) |
21,480,200 |
1,405,610 |
|
|
Comverse Technology, Inc. (a) |
1,345,500 |
118,068 |
|
|
Corning, Inc. |
1,285,700 |
300,773 |
|
|
Lucent Technologies, Inc. |
6,636,714 |
290,356 |
|
|
Nokia AB sponsored ADR |
1,392,000 |
61,683 |
|
|
Nortel Networks Corp. |
4,154,000 |
308,954 |
|
|
Sycamore Networks, Inc. |
23,100 |
2,849 |
|
|
|
2,488,293 |
||
|
Computer Services & Software - 10.5% |
|||
|
Adobe Systems, Inc. |
987,334 |
113,050 |
|
|
Akamai Technologies, Inc. |
8,600 |
678 |
|
|
America Online, Inc. (a) |
4,607,400 |
245,632 |
|
|
Ariba, Inc. |
708,300 |
82,119 |
|
|
Automatic Data Processing, Inc. |
2,312,880 |
114,632 |
|
|
BEA Systems, Inc. (a) |
2,784,700 |
119,916 |
|
|
Cadence Design Systems, Inc. (a) |
1,253,800 |
26,173 |
|
|
CNET Networks, Inc. (a) |
426,600 |
12,771 |
|
|
Computer Associates International, Inc. |
1,200,200 |
29,780 |
|
|
Computer Sciences Corp. (a) |
1,360,400 |
85,025 |
|
|
DST Systems, Inc. (a) |
1,069,200 |
99,837 |
|
|
Electronic Data Systems Corp. |
1,075,100 |
46,229 |
|
|
Exodus Communications, Inc. (a) |
2,309,000 |
102,606 |
|
|
First Data Corp. |
200,500 |
9,236 |
|
|
Healtheon/WebMD Corp. (a) |
1,290,600 |
17,181 |
|
|
Inktomi Corp. (a) |
601,800 |
64,393 |
|
|
Intuit, Inc. (a) |
2,157,000 |
73,338 |
|
|
Mercury Interactive Corp. (a) |
249,000 |
24,717 |
|
|
Micromuse, Inc. (a) |
248,400 |
32,226 |
|
|
Microsoft Corp. (a) |
11,343,600 |
791,925 |
|
|
Oracle Corp. (a) |
5,633,800 |
423,591 |
|
|
PeopleSoft, Inc. (a) |
1,278,000 |
27,876 |
|
|
Phone.com, Inc. |
210,870 |
16,843 |
|
|
Common Stocks - continued |
|||
|
Shares |
Value (Note 1) (000s) |
||
|
TECHNOLOGY - continued |
|||
|
Computer Services & Software - continued |
|||
|
Priceline.com, Inc. (a) |
455,000 |
$ 10,749 |
|
|
Rational Software Corp. (a) |
378,800 |
38,543 |
|
|
Siebel Systems, Inc. (a) |
173,598 |
25,172 |
|
|
Software.com, Inc. |
713,800 |
72,005 |
|
|
StorageNetworks, Inc. |
15,800 |
1,724 |
|
|
VeriSign, Inc. (a) |
541,600 |
85,945 |
|
|
VERITAS Software Corp. (a) |
1,326,665 |
135,237 |
|
|
Vignette Corp. (a) |
1,861,500 |
63,058 |
|
|
Yahoo!, Inc. (a) |
434,100 |
55,863 |
|
|
|
3,048,070 |
||
|
Computers & Office Equipment - 9.5% |
|||
|
Brocade Communications Systems, Inc. (a) |
446,200 |
79,702 |
|
|
Comdisco, Inc. |
319,800 |
8,275 |
|
|
Compaq Computer Corp. |
2,645,500 |
74,239 |
|
|
Dell Computer Corp. (a) |
6,903,800 |
303,336 |
|
|
EMC Corp. (a) |
6,799,400 |
578,799 |
|
|
Gateway, Inc. (a) |
1,105,400 |
61,004 |
|
|
Hewlett-Packard Co. |
2,017,400 |
220,275 |
|
|
International Business Machines Corp. |
3,847,000 |
432,547 |
|
|
Juniper Networks, Inc. (a) |
815,400 |
116,144 |
|
|
Lexmark International Group, Inc. Class A (a) |
716,180 |
32,273 |
|
|
Network Appliance, Inc. (a) |
1,584,484 |
136,563 |
|
|
Pitney Bowes, Inc. |
3,228,100 |
111,773 |
|
|
Ricoh Co. Ltd. |
1,809,000 |
32,121 |
|
|
Sun Microsystems, Inc. (a) |
5,120,800 |
539,924 |
|
|
Symbol Technologies, Inc. |
714,500 |
28,491 |
|
|
|
2,755,466 |
||
|
Electronic Instruments - 1.3% |
|||
|
Agilent Technologies, Inc. |
2,762,474 |
112,571 |
|
|
Applied Materials, Inc. (a) |
1,321,800 |
100,292 |
|
|
KLA-Tencor Corp. (a) |
1,447,400 |
77,074 |
|
|
Novellus Systems, Inc. (a) |
1,516,700 |
81,807 |
|
|
|
371,744 |
||
|
Electronics - 11.3% |
|||
|
Altera Corp. (a) |
820,200 |
80,533 |
|
|
Analog Devices, Inc. (a) |
1,189,900 |
79,575 |
|
|
Broadcom Corp. Class A (a) |
450,200 |
100,957 |
|
|
Chartered Semiconductor Manufacturing Ltd. ADR |
44,100 |
3,175 |
|
|
Flextronics International Ltd. (a) |
765,700 |
54,209 |
|
|
Common Stocks - continued |
|||
|
Shares |
Value (Note 1) (000s) |
||
|
TECHNOLOGY - continued |
|||
|
Electronics - continued |
|||
|
Integrated Device Technology, Inc. (a) |
1,025,900 |
$ 54,373 |
|
|
Intel Corp. |
19,186,040 |
1,280,668 |
|
|
International Rectifier Corp. (a) |
1,288,000 |
71,243 |
|
|
JDS Uniphase Corp. (a) |
2,121,100 |
250,555 |
|
|
Linear Technology Corp. |
2,357,860 |
130,272 |
|
|
LSI Logic Corp. (a) |
2,591,200 |
87,777 |
|
|
Micron Technology, Inc. (a) |
2,273,700 |
185,307 |
|
|
Motorola, Inc. |
4,759,100 |
157,348 |
|
|
PMC-Sierra, Inc. (a) |
474,600 |
91,983 |
|
|
Sanmina Corp. (a) |
1,036,000 |
96,219 |
|
|
SDL, Inc. (a) |
322,500 |
111,928 |
|
|
Texas Instruments, Inc. |
5,798,200 |
340,282 |
|
|
Vitesse Semiconductor Corp. (a) |
974,200 |
58,087 |
|
|
Xilinx, Inc. (a) |
986,100 |
74,019 |
|
|
|
3,308,510 |
||
|
TOTAL TECHNOLOGY |
11,972,083 |
||
|
UTILITIES - 4.7% |
|||
|
Cellular - 2.5% |
|||
|
China Mobile (Hong Kong) Ltd. sponsored ADR (a) |
2,493,200 |
103,935 |
|
|
China Unicom Ltd. sponsored ADR (a) |
2,189,300 |
51,585 |
|
|
Nextel Communications, Inc. Class A (a) |
2,848,800 |
159,355 |
|
|
QUALCOMM, Inc. (a) |
523,600 |
34,001 |
|
|
Sprint Corp. - PCS Group Series 1 (a) |
2,781,300 |
153,667 |
|
|
Vodafone Group PLC sponsored ADR |
3,782,750 |
163,131 |
|
|
VoiceStream Wireless Corp. (a) |
613,900 |
78,733 |
|
|
|
744,407 |
||
|
Electric Utility - 1.2% |
|||
|
AES Corp. (a) |
3,159,200 |
168,820 |
|
|
Calpine Corp. (a) |
2,161,200 |
153,986 |
|
|
NRG Energy, Inc. |
720,000 |
16,875 |
|
|
|
339,681 |
||
|
Telephone Services - 1.0% |
|||
|
AT&T Corp. |
1,727,524 |
53,445 |
|
|
McLeodUSA, Inc. Class A (a) |
2,818,600 |
47,740 |
|
|
Metromedia Fiber Network, Inc. Class A (a) |
2,084,500 |
73,218 |
|
|
Common Stocks - continued |
|||
|
Shares |
Value (Note 1) (000s) |
||
|
UTILITIES - continued |
|||
|
Telephone Services - continued |
|||
|
Qwest Communications International, Inc. (a) |
856,000 |
$ 40,179 |
|
|
WorldCom, Inc. (a) |
2,100,399 |
82,047 |
|
|
|
296,629 |
||
|
TOTAL UTILITIES |
1,380,717 |
||
|
TOTAL COMMON STOCKS (Cost $17,671,187) |
28,502,556 |
||
|
Cash Equivalents - 2.4% |
|||
|
|
|
|
|
|
Fidelity Cash Central Fund, 6.57% (b) |
642,344,626 |
642,345 |
|
|
Fidelity Securities Lending Cash Central Fund, 6.65% (b) |
55,877,200 |
55,877 |
|
|
TOTAL CASH EQUIVALENTS (Cost $698,222) |
698,222 |
||
|
TOTAL INVESTMENT PORTFOLIO - 100.2% (Cost $18,369,409) |
29,200,778 |
||
|
NET OTHER ASSETS - (0.2)% |
(46,714) |
||
|
NET ASSETS - 100% |
$ 29,154,064 |
||
|
Legend |
|
(a) Non-income producing |
|
(b) The rate quoted is the annualized seven-day yield of the fund at |
|
Income Tax Information |
|
At July 31, 2000, the aggregate cost |
|
The fund hereby designates approximately $918,501,000 as a capital gain dividend for the purpose of the dividend paid deduction. |
See accompanying notes which are an integral part of the financial statements.
Annual Report
Statement of Assets and Liabilities
|
Amounts in thousands (except per-share amount) |
July 31, 2000 |
|
|
Assets |
|
|
|
Investment in securities, at value (cost $18,369,409) - |
|
$ 29,200,778 |
|
Receivable for investments sold |
|
292,647 |
|
Receivable for fund shares sold |
|
36,501 |
|
Dividends receivable |
|
10,172 |
|
Interest receivable |
|
2,887 |
|
Other receivables |
|
151 |
|
Total assets |
|
29,543,136 |
|
Liabilities |
|
|
|
Payable for investments purchased |
$ 256,326 |
|
|
Payable for fund shares redeemed |
53,449 |
|
|
Accrued management fee |
17,934 |
|
|
Other payables and accrued expenses |
5,486 |
|
|
Collateral on securities loaned, at value |
55,877 |
|
|
Total liabilities |
|
389,072 |
|
Net Assets |
|
$ 29,154,064 |
|
Net Assets consist of: |
|
|
|
Paid in capital |
|
$ 17,372,138 |
|
Accumulated undistributed net realized gain (loss) on investments and foreign currency transactions |
|
950,608 |
|
Net unrealized appreciation (depreciation) on investments and assets and liabilities in foreign currencies |
|
10,831,318 |
|
Net Assets, for 483,871 shares outstanding |
|
$ 29,154,064 |
|
Net Asset Value, offering price and redemption price |
|
$60.25 |
See accompanying notes which are an integral part of the financial statements.
Annual Report
Financial Statements - continued
Statement of Operations
|
Amounts in thousands |
Year ended July 31, 2000 |
|
|
Investment Income Dividends |
|
$ 186,443 |
|
Interest |
|
42,515 |
|
Security lending |
|
155 |
|
Total income |
|
229,113 |
|
Expenses |
|
|
|
Management fee |
$ 156,564 |
|
|
Performance adjustment |
18,092 |
|
|
Transfer agent fees |
57,672 |
|
|
Accounting and security lending fees |
1,383 |
|
|
Non-interested trustees' compensation |
129 |
|
|
Custodian fees and expenses |
614 |
|
|
Registration fees |
1,625 |
|
|
Audit |
120 |
|
|
Legal |
129 |
|
|
Reports to shareholders |
1,446 |
|
|
Miscellaneous |
54 |
|
|
Total expenses before reductions |
237,828 |
|
|
Expense reductions |
(4,400) |
233,428 |
|
Net investment income (loss) |
|
(4,315) |
|
Realized and Unrealized Gain (Loss) Net realized gain (loss) on: |
|
|
|
Investment securities |
972,471 |
|
|
Foreign currency transactions |
(245) |
972,226 |
|
Change in net unrealized appreciation (depreciation) on: |
|
|
|
Investment securities |
3,324,207 |
|
|
Assets and liabilities in foreign currencies |
(103) |
3,324,104 |
|
Net gain (loss) |
|
4,296,330 |
|
Net increase (decrease) in net assets resulting |
|
$ 4,292,015 |
See accompanying notes which are an integral part of the financial statements.
Annual Report
Financial Statements - continued
Statement of Changes in Net Assets
|
Amounts in thousands |
Year ended |
Year ended |
|
Increase (Decrease) in Net Assets |
|
|
|
Operations |
$ (4,315) |
$ 64,596 |
|
Net realized gain (loss) |
972,226 |
994,671 |
|
Change in net unrealized appreciation (depreciation) |
3,324,104 |
2,337,286 |
|
Net increase (decrease) in net assets resulting |
4,292,015 |
3,396,553 |
|
Distributions to shareholders |
(62,509) |
(36,306) |
|
From net realized gain |
(924,054) |
(747,879) |
|
Total distributions |
(986,563) |
(784,185) |
|
Share transactions |
8,736,745 |
8,609,208 |
|
Reinvestment of distributions |
966,621 |
766,939 |
|
Cost of shares redeemed |
(7,538,958) |
(5,310,552) |
|
Net increase (decrease) in net assets resulting |
2,164,408 |
4,065,595 |
|
Total increase (decrease) in net assets |
5,469,860 |
6,677,963 |
|
Net Assets |
|
|
|
Beginning of period |
23,684,204 |
17,006,241 |
|
End of period (including undistributed net investment income of $0 and $64,832, respectively) |
$ 29,154,064 |
$ 23,684,204 |
|
Other Information Shares |
|
|
|
Sold |
150,185 |
172,671 |
|
Issued in reinvestment of distributions |
18,221 |
19,630 |
|
Redeemed |
(129,754) |
(108,433) |
|
Net increase (decrease) |
38,652 |
83,868 |
See accompanying notes which are an integral part of the financial statements.
Annual Report
Financial Highlights
|
Years ended July 31, |
2000 |
1999 |
1998 |
1997 |
1996 |
|
Selected Per-Share Data |
|
|
|
|
|
|
Net asset value, |
$ 53.20 |
$ 47.06 |
$ 41.21 |
$ 30.76 |
$ 32.59 |
|
Income from Investment Operations |
|
|
|
|
|
|
Net investment income (loss) |
(.01) C |
.16 C |
.22 C |
.28 C |
.34 |
|
Net realized and unrealized gain (loss) |
9.27 |
8.14 |
7.64 |
12.70 |
.42 |
|
Total from investment operations |
9.26 |
8.30 |
7.86 |
12.98 |
.76 |
|
Less Distributions |
|
|
|
|
|
|
From net investment income |
(.14) |
(.10) |
(.26) |
(.28) |
(.12) |
|
From net realized gain |
(2.07) |
(2.06) |
(1.75) |
(2.25) |
(2.47) |
|
Total distributions |
(2.21) |
(2.16) |
(2.01) |
(2.53) |
(2.59) |
|
Net asset value, end of period |
$ 60.25 |
$ 53.20 |
$ 47.06 |
$ 41.21 |
$ 30.76 |
|
Total Return A, B |
17.97% |
19.30% |
20.17% |
45.50% |
2.19% |
|
Ratios and Supplemental Data |
|
|
|
|
|
|
Net assets, end of period |
$ 29,154 |
$ 23,684 |
$ 17,006 |
$ 12,877 |
$ 8,179 |
|
Ratio of expenses to average |
.88% |
.71% |
.72% |
.80% |
.98% |
|
Ratio of expenses to average net assets after expense reductions |
.86% D |
.70% D |
.70% D |
.78% D |
.95% D |
|
Ratio of net investment income (loss) to average net assets |
(.02)% |
.32% |
.52% |
.81% |
1.10% |
|
Portfolio turnover rate |
40% |
38% |
49% |
51% |
206% |
A The total returns would have been lower had certain expenses not been reduced during the periods shown.
B Total returns do not include the former one time sales charge.
C Net investment income (loss) per share has been calculated based on average shares outstanding during the period.
D FMR or the fund has entered into varying arrangements with third parties who either paid or reduced a portion of the fund's expenses.
See accompanying notes which are an integral part of the financial statements.
Annual Report
For the period ended July 31, 2000
1. Significant Accounting Policies.
Fidelity Blue Chip Growth Fund (the fund) is a fund of Fidelity Securities Fund (the trust) and is authorized to issue an unlimited number of shares. The trust is registered under the Investment Company Act of 1940, as amended, as an open-end management investment company organized as a Massachusetts business trust. The financial statements have been prepared in conformity with generally accepted accounting principles which require management to make certain estimates and assumptions at the date of the financial statements. The following summarizes the significant accounting policies of the fund:
Security Valuation. Securities for which exchange quotations are readily available are valued at the last sale price, or if no sale price, at the closing bid price. Foreign securities are valued based on quotations from the principal market in which such securities are normally traded. If trading or events occurring in other markets after the close of the principal market in which foreign securities are traded, and before the close of the business of the fund, are expected to materially affect the value of those securities, then they are valued at their fair value taking this trading or these events into account. Fair value is determined in good faith under consistently applied procedures under the general supervision of the Board of Trustees. Securities for which exchange quotations are not readily available (and in certain cases debt securities which trade on an exchange) are valued primarily using dealer-supplied valuations or at their fair value. Short-term securities with remaining maturities of sixty days or less for which quotations are not readily available are valued at amortized cost or original cost plus accrued interest, both of which approximate current value.
Foreign Currency Translation. The accounting records of the fund are maintained in U.S. dollars. Investment securities and other assets and liabilities denominated in a foreign currency are translated into U.S. dollars at the prevailing rates of exchange at period end. Purchases and sales of securities, income receipts and expense payments are translated into U.S. dollars at the prevailing exchange rate on the respective dates of the transactions.
Net realized gains and losses on foreign currency transactions represent net gains and losses from sales and maturities of foreign currency contracts, disposition of foreign currencies, the difference between the amount of net investment income accrued and the U.S. dollar amount actually received, and gains and losses between trade and settlement date on purchases and sales of securities. The effects of changes in foreign currency exchange rates on investments in securities are included with the net realized and unrealized gain or loss on investment securities.
Income Taxes. As a qualified regulated investment company under Subchapter M of the Internal Revenue Code, the fund is not subject to income taxes to the extent that it distributes substantially all of its taxable income for its fiscal year. The schedule of investments includes information regarding income taxes under the caption "Income Tax Information."
Annual Report
Notes to Financial Statements - continued
1. Significant Accounting Policies - continued
Investment Income. Dividend income is recorded on the ex-dividend date, except certain dividends from foreign securities where the ex-dividend date may have passed, are recorded as soon as the fund is informed of the ex-dividend date. Non-cash dividends included in dividend income, if any, are recorded at the fair market value of the securities received. Interest income is accrued as earned. Investment income is recorded net of foreign taxes withheld where recovery of such taxes is uncertain.
Expenses. Most expenses of the trust can be directly attributed to a fund. Expenses which cannot be directly attributed are apportioned among the funds in the trust.
Deferred Trustee Compensation. Under a Deferred Compensation Plan (the Plan) non-interested Trustees must defer receipt of a portion of, and may elect to defer receipt of an additional portion of, their annual compensation. Deferred amounts are treated as though equivalent dollar amounts had been invested in shares of the fund or are invested in a cross-section of other Fidelity funds. Deferred amounts remain in the fund until distributed in accordance with the Plan.
Distributions to Shareholders. Distributions are recorded on the ex-dividend date.
Income and capital gain distributions are determined in accordance with income tax regulations which may differ from generally accepted accounting principles. These differences, which may result in distribution reclassifications, are primarily due to differing treatments for litigation proceeds, foreign currency transactions and losses deferred due to wash sales. The fund also utilized earnings and profits distributed to shareholders on redemption of shares as a part of the dividends paid deduction for income tax purposes.
Permanent book and tax basis differences relating to shareholder distributions will result in reclassifications to paid in capital. Accumulated undistributed net realized gain (loss) on investments and foreign currency transactions may include temporary book and tax basis differences which will reverse in a subsequent period. Any taxable income or gain remaining at fiscal year end is distributed in the following year.
Security Transactions. Security transactions are accounted for as of trade date. Gains and losses on securities sold are determined on the basis of identified cost.
2. Operating Policies.
Foreign Currency Contracts. The fund generally uses foreign currency contracts to facilitate transactions in foreign-denominated securities. Losses may arise from changes in the value of the foreign currency or if the counterparties do not perform under the contracts' terms. The U.S. dollar value of foreign currency contracts is determined using contractual currency exchange rates established at the time of each trade.
Joint Trading Account. Pursuant to an Exemptive Order issued by the Securities and Exchange Commission (the SEC), the fund, along with other affiliated entities of Fidelity Management & Research
Annual Report
Notes to Financial Statements - continued
2. Operating Policies - continued
Joint Trading Account - continued
Company (FMR), may transfer uninvested cash balances into one or more joint trading accounts. These balances are invested in one or more repurchase agreements for U.S. Treasury or Federal Agency obligations.
Repurchase Agreements. The underlying U.S. Treasury, Federal Agency, or other obligations found to be satisfactory by FMR are transferred to an account of the fund, or to the Joint Trading Account, at a custodian bank. The securities are marked-to-market daily and maintained at a value at least equal to the principal amount of the repurchase agreement (including accrued interest). FMR, the fund's investment adviser, is responsible for determining that the value of the underlying securities remains in accordance with the market value requirements stated above.
Cash Central Funds. Pursuant to an Exemptive Order issued by the SEC, the fund may invest in the Fidelity Cash Central Fund and the Fidelity Securities Lending Cash Central Fund (the Cash Funds) managed by Fidelity Investments Money Management, Inc., an affiliate of FMR. The Cash Funds are open-end money market funds available only to investment companies and other accounts managed by FMR and its affiliates. The Cash Funds seek preservation of capital, liquidity, and current income. Income distributions from the Cash Funds are declared daily and paid monthly from net interest income. Income distributions earned by the fund are recorded as either interest income or security lending income in the accompanying financial statements.
3. Purchases and Sales of Investments.
Purchases and sales of securities, other than short-term securities, aggregated $11,963,841,000 and $10,595,131,000, respectively.
4. Fees and Other Transactions with Affiliates.
Management Fee. As the fund's investment adviser, FMR receives a monthly basic fee that is calculated on the basis of a group fee rate plus a fixed individual fund fee rate applied to the average net assets of the fund. The group fee rate is the weighted average of a series of rates and is based on the monthly average net assets of all the mutual funds advised by FMR. The rates ranged from .2167% to .5200% for the period. The annual individual fund fee rate is .30%. In the event that these rates were lower than the contractual rates in effect during the period, FMR voluntarily implemented the above rates, as they resulted in the same or a lower management fee. The basic fee is subject to a performance adjustment (up to a maximum of ±.20% of the fund's average net assets over the performance period) based on the fund's investment performance as compared to the appropriate index over a specified period of time. For the period, the management fee was equivalent to an annual rate of .64% of average net assets after the performance adjustment.
Annual Report
Notes to Financial Statements - continued
4. Fees and Other Transactions with Affiliates - continued
Sales Load. Fidelity Distributors Corporation (FDC), an affiliate of FMR, is the general distributor of the fund. Shares purchased before October 12, 1990 are subject to a 1% deferred sales charge upon redemption. For the period, FDC received deferred sales charges of $28,000 on redemption of shares of the fund.
Transfer Agent Fees. Fidelity Service Company, Inc. (FSC), an affiliate of FMR, is the fund's transfer, dividend disbursing and shareholder servicing agent. FSC receives account fees and asset-based fees that vary according to account size and type of account. FSC pays for typesetting, printing and mailing of all shareholder reports, except proxy statements. For the period, the transfer agent fees were equivalent to an annual rate of .21% of average net assets.
Accounting and Security Lending Fees. FSC, an affiliate of FMR, maintains the fund's accounting records and administers the security lending program. The security lending fee is based on the number and duration of lending transactions. The accounting fee is based on the level of average net assets for the month plus out-of-pocket expenses.
Brokerage Commissions. The fund placed a portion of its portfolio transactions with brokerage firms which are affiliates of FMR. The commissions paid to these affiliated firms were $584,000 for the period.
5. Security Lending.
The fund lends portfolio securities from time to time in order to earn additional income. The fund receives collateral in the form of U.S. Treasury obligations, letters of credit, and/or cash against the loaned securities, and maintains collateral in an amount not less than 100% of the market value of the loaned securities during the period of the loan. The market value of the loaned securities is determined at the close of business of the fund and any additional required collateral is delivered to the fund on the next business day. If the borrower defaults on its obligation to return the securities loaned because of insolvency or other reasons, the fund could experience delays and costs in recovering the securities loaned or in gaining access to the collateral. At period end, the value of the securities loaned amounted to $55,363,000. The fund received cash collateral of $55,877,000 which was invested in cash equivalents.
6. Expense Reductions.
FMR has directed certain portfolio trades to brokers who paid a portion of the fund's expenses. For the period, the fund's expenses were reduced by $2,570,000 under this arrangement.
In addition, through arrangements with the fund's custodian and transfer agent, credits realized as a result of uninvested cash balances were used to reduce a portion of the fund's expenses. During the period, the fund's custodian and transfer agent fees were reduced by $4,000 and $1,826,000, respectively, under these arrangements
Annual Report
To the Trustees of Fidelity Securities Fund and Shareholders of
Fidelity Blue Chip Growth Fund:
We have audited the accompanying statement of assets and liabilities of Fidelity Blue Chip Growth Fund (the Fund), a fund of Fidelity Securities Fund (the Trust), including the portfolio of investments, as of July 31, 2000, and the related statements of operations, changes in net assets, and financial highlights for the year then ended. These financial statements and financial highlights are the responsibility of the Fund's management. Our responsibility is to express an opinion on these financial statements and financial highlights based on our audit. The statement of changes in net assets for the year ended July 31, 1999, and the financial highlights for each of the four years in the period then ended were audited by other auditors whose report, dated September 8, 1999, expressed an unqualified opinion on those statements and financial highlights.
We conducted our audit in accordance with auditing standards generally accepted in the United States of America . Those standards require that we plan and perform the audit to obtain reasonable assurance about whether the financial statements and financial highlights are free of material misstatement. An audit includes examining, on a test basis, evidence supporting the amounts and disclosures in the financial statements. Our procedures included confirmation of securities owned as of July 31, 2000, by correspondence with the custodian and brokers; where replies were not received from brokers, we performed other auditing procedures. An audit also includes assessing the accounting principles used and significant estimates made by management, as well as evaluating the overall financial statement presentation. We believe that our audit provides a reasonable basis for our opinion.
In our opinion, the financial statements and financial highlights referred to above present fairly, in all material respects, the financial position of Fidelity Blue Chip Growth Fund as of July 31, 2000, the results of its operations, the changes in its net assets, and the financial highlights for the year then ended, in conformity with accounting principles generally accepted in the United States of America .
/s/DELOITTE & TOUCHE LLP
DELOITTE & TOUCHE LLP
Boston, Massachusetts
September 1, 2000
Annual Report
The Board of Trustees of Blue Chip Growth Fund voted to pay on September 11, 2000, to shareholders of record at the opening of business on September 8, 2000, a distribution of $1.82 per share derived from capital gains realized from sales of portfolio securities.
The fund hereby designates 100% of the long-term capital gain dividends distributed during the fiscal year as 20%-rate capital gain dividends.
A total of 100% of the dividends distributed during the fiscal year qualifies for the dividends-received deduction for corporate shareholders.
The fund will notify shareholders in January 2001 of amounts for use in preparing 2000 income tax returns.
Annual Report
A special meeting of the fund's shareholders was held on June 14, 2000. The results of votes taken among shareholders on proposals before them are reported below. Each vote reported represents one dollar of net asset value held on the record date for the meeting.
PROPOSAL 1
To elect as Trustees the twelve nominees presented in proposal 1.*
|
|
# of |
% of |
|
Ralph F. Cox |
||
|
Affirmative |
45,879,831,565.22 |
97.815 |
|
Withheld |
1,025,023,341.61 |
2.185 |
|
TOTAL |
46,904,854,906.83 |
100.000 |
|
Phyllis Burke Davis |
||
|
Affirmative |
45,860,078,281.02 |
97.773 |
|
Withheld |
1,044,776,625.81 |
2.227 |
|
TOTAL |
46,904,854,906.83 |
100.000 |
|
Robert M. Gates |
||
|
Affirmative |
45,855,277,358.57 |
97.762 |
|
Withheld |
1,049,577,548.26 |
2.238 |
|
TOTAL |
46,904,854,906.83 |
100.000 |
|
Edward C. Johnson 3d |
||
|
Affirmative |
45,870,463,926.34 |
97.795 |
|
Withheld |
1,034,390,980.49 |
2.205 |
|
TOTAL |
46,904,854,906.83 |
100.000 |
|
Donald J. Kirk |
||
|
Affirmative |
45,885,184,726.69 |
97.826 |
|
Withheld |
1,019,670,180.14 |
2.174 |
|
TOTAL |
46,904,854,906.83 |
100.000 |
|
Ned C. Lautenbach |
||
|
Affirmative |
45,908,380,446.26 |
97.876 |
|
Withheld |
996,474,460.57 |
2.124 |
|
TOTAL |
46,904,854,906.83 |
100.000 |
|
|
# of |
% of |
|
Peter S. Lynch |
||
|
Affirmative |
45,908,650,981.55 |
97.876 |
|
Withheld |
996,203,925.28 |
2.124 |
|
TOTAL |
46,904,854,906.83 |
100.000 |
|
William O. McCoy |
||
|
Affirmative |
45,884,024,635.43 |
97.824 |
|
Withheld |
1,020,830,271.40 |
2.176 |
|
TOTAL |
46,904,854,906.83 |
100.000 |
|
Gerald C. McDonough |
||
|
Affirmative |
45,813,850,456.73 |
97.674 |
|
Withheld |
1,091,004,450.10 |
2.326 |
|
TOTAL |
46,904,854,906.83 |
100.000 |
|
Marvin L. Mann |
||
|
Affirmative |
45,890,658,904.13 |
97.838 |
|
Withheld |
1,014,196,002.70 |
2.162 |
|
TOTAL |
46,904,854,906.83 |
100.000 |
|
Robert C. Pozen |
||
|
Affirmative |
45,900,540,034.23 |
97.859 |
|
Withheld |
1,004,314,872.60 |
2.141 |
|
TOTAL |
46,904,854,906.83 |
100.000 |
|
Thomas R. Williams |
||
|
Affirmative |
45,827,262,492.26 |
97.703 |
|
Withheld |
1,077,592,414.57 |
2.297 |
|
TOTAL |
46,904,854,906.83 |
100.000 |
|
PROPOSAL 2 |
||
|
To ratify the selection of Deloitte & Touche LLP as independent accountants of the fund. |
||
|
|
# of |
% of |
|
Affirmative |
13,610,083,626.77 |
95.759 |
|
Against |
161,273,292.74 |
1.135 |
|
Abstain |
441,483,850.06 |
3.106 |
|
TOTAL |
14,212,840,769.57 |
100.000 |
|
PROPOSAL 3 |
||
|
To authorize the Trustees to adopt an Amended and Restated Declaration of Trust.* |
||
|
|
# of |
% of |
|
Affirmative |
41,410,483,631.45 |
88.286 |
|
Against |
2,396,147,050.82 |
5.109 |
|
Abstain |
3,098,224,224.56 |
6.605 |
|
TOTAL |
46,904,854,906.83 |
100.000 |
|
PROPOSAL 4 |
||
|
To approve an amended management contract for the fund. |
||
|
|
# of |
% of |
|
Affirmative |
12,963,867,029.03 |
91.212 |
|
Against |
617,136,891.50 |
4.342 |
|
Abstain |
631,836,849.04 |
4.446 |
|
TOTAL |
14,212,840,769.57 |
100.000 |
|
PROPOSAL 6 |
||
|
To approve an amended sub-advisory agreement with FMR Far East for the fund. |
||
|
|
# of |
% of |
|
Affirmative |
12,945,427,825.51 |
91.083 |
|
Against |
599,612,866.16 |
4.218 |
|
Abstain |
667,800,077.90 |
4.699 |
|
TOTAL |
14,212,840,769.57 |
100.000 |
|
PROPOSAL 7 |
||
|
To approve an amended sub-advisory agreement with FMR U.K. for the fund. |
||
|
|
# of |
% of |
|
Affirmative |
12,959,260,304.34 |
91.180 |
|
Against |
586,957,409.98 |
4.130 |
|
Abstain |
666,623,055.25 |
4.690 |
|
TOTAL |
14,212,840,769.57 |
100.000 |
|
PROPOSAL 8 |
||
|
To approve a Distribution and Service Plan pursuant to Rule 12b-1 for the fund. |
||
|
|
# of |
% of |
|
Affirmative |
12,731,958,845.37 |
89.581 |
|
Against |
702,474,808.90 |
4.942 |
|
Abstain |
778,407,115.30 |
5.477 |
|
TOTAL |
14,212,840,769.57 |
100.000 |
|
PROPOSAL 14 |
||
|
To amend the fundamental investment limitation concerning diversification for the fund to exclude "securities of other investment companies" from |
||
|
|
# of |
% of |
|
Affirmative |
12,746,963,554.53 |
89.686 |
|
Against |
814,435,076.47 |
5.731 |
|
Abstain |
651,442,138.57 |
4.583 |
|
TOTAL |
14,212,840,769.57 |
100.000 |
Annual Report
Investment Adviser
Fidelity Management & Research Company
Boston, MA
Investment Sub-Advisers
Fidelity Management & Research
(U.K.) Inc.
Fidelity Management & Research
(Far East) Inc.
Fidelity Investments Japan Limited
Officers
Edward C. Johnson 3d, President
Robert C. Pozen, Senior Vice President
Abigail P. Johnson, Vice President
John McDowell, Vice President
Eric D. Roiter, Secretary
Robert A. Dwight, Treasurer
Maria F. Dwyer, Deputy Treasurer
John H. Costello, Assistant Treasurer
Board of Trustees
Ralph F. Cox *
Phyllis Burke Davis *
Robert M. Gates *
Edward C. Johnson 3d
Donald J. Kirk *
Ned C. Lautenbach *
Peter S. Lynch
Marvin L. Mann *
William O. McCoy *
Gerald C. McDonough *
Robert C. Pozen
Thomas R. Williams *
Advisory Board
J. Michael Cook
Marie L. Knowles
General Distributor
Fidelity Distributors Corporation
Boston, MA
Transfer and Shareholder
Servicing Agent
Fidelity Service Company, Inc.
Boston, MA
* Independent trustees
Custodian
Brown Brothers Harriman & Co.
Boston, MA
Fidelity's Growth Funds
Aggressive Growth Fund
Blue Chip Growth Fund
Capital Appreciation Fund
Contrafund ®
Contrafund®II
Disciplined Equity Fund
Dividend Growth Fund
Export and Multinational Fund
Fidelity Fifty ®
Growth Company Fund
Large Cap Stock Fund
Low-Priced Stock Fund
Magellan® Fund
Mid-Cap Stock Fund
New Millennium Fund®
OTC Portfolio
Retirement Growth Fund
Small Cap Selector
Small Cap Stock Fund
Stock Selector
Tax Managed Stock Fund
TechnoQuant® Growth Fund
Trend Fund
Value Fund
The Fidelity Telephone Connection
Mutual Fund 24-Hour Service
Exchanges/Redemptions
and Account Assistance 1-800-544-6666
Product Information 1-800-544-6666
Retirement Accounts 1-800-544-4774
(8 a.m. - 9 p.m.)
TDD Service 1-800-544-0118
for the deaf and hearing impaired
(9 a.m. - 9 p.m. Eastern time)
Fidelity Automated Service
Telephone (FAST®) (automated graphic) 1-800-544-5555
(automated graphic) Automated line for quickest service
BCF-ANN-0900 111443
1.536058.103
(Fidelity Investment logo)(registered trademark)
Corporate Headquarters
82 Devonshire St., Boston, MA 02109
www.fidelity.com
Fidelity®
Fund
Annual Report
July 31, 2000
(2_fidelity_logos) (Registered_Trademark)
|
President's Message |
3 |
Ned Johnson on investing strategies. |
|
Performance |
4 |
How the fund has done over time. |
|
Fund Talk |
6 |
The manager's review of fund performance, strategy and outlook. |
|
Investment Changes |
9 |
A summary of major shifts in the fund's investments over the past 12 months. |
|
Investments |
10 |
A complete list of the fund's investments with their market values. |
|
Financial Statements |
18 |
Statements of assets and liabilities,
operations, and changes in net assets, |
|
Notes |
22 |
Notes to the financial statements. |
|
Report of Independent Accountants |
27 |
The auditors' opinion. |
|
Distributions |
28 |
|
|
Proxy Voting Results |
29 |
|
Standard & Poor's, S&P and S&P 500 are registered service marks of The McGraw-Hill Companies, Inc. and have been licensed for use by Fidelity Distributors Corporation.
Other third party marks appearing herein are the property of their respective owners.
All other marks appearing herein are registered or unregistered trademarks or service marks of FMR Corp. or an affiliated company.
(Recycle graphic) This report is printed on recycled paper using soy-based inks.
This report and the financial statements contained herein are submitted for the general information of the shareholders of the fund. This report is not authorized for distribution to prospective investors in the fund unless preceded or accompanied by an effective prospectus.
Mutual fund shares are not deposits or obligations of, or guaranteed by, any depository institution. Shares are not insured by the FDIC, Federal Reserve Board or any other agency, and are subject to investment risks, including possible loss of principal amount invested.
Neither the fund nor Fidelity Distributors Corporation is a bank.
For more information on any Fidelity fund, including charges and expenses, call 1-800-544-6666 for a free prospectus. Read it carefully before you invest or send money.
Annual Report
(Photograph of Edward C. Johnson 3d.)
Dear Shareholder:
The Federal Reserve Board's effort to keep inflation in check without over-cooling the U.S. economy has taken a toll on the stock market. Through July 2000, bellwether equity indexes such as the Dow Jones Industrial Average, NASDAQ and S&P 500® have negative returns for the year. On the other hand, fixed-income markets are enjoying strong performance. Except for high-yield, most bond sectors - corporates, mortgages, Treasuries and agencies - have returned 4%-6% year to date.
While it's impossible to predict the future direction of the markets with any degree of certainty, there are certain basic principles that can help investors plan for their future needs.
First, investors are encouraged to take a long-term view of their portfolios. If you can afford to leave your money invested through the inevitable up and down cycles of the financial markets, you will greatly reduce your vulnerability to any single decline. We know from experience, for example, that stock prices have gone up over longer periods of time, have significantly outperformed other types of investments and have stayed ahead of inflation.
Second, you can further manage your investing risk through diversification. A stock mutual fund, for instance, is already diversified, because it invests in many different companies. You can increase your diversification further by investing in a number of different stock funds, or in such other investment categories as bonds. If you have a short investment time horizon, you might want to consider moving some of your investment into a money market fund, which seeks income and a stable share price by investing in high-quality, short-term investments. Of course, it's important to remember that an investment in a money market fund is not insured or guaranteed by the Federal Deposit Insurance Corporation or any other government agency. Although money market funds seek to preserve the value of your investment at $1.00 per share, it is possible to lose money by investing in these types of funds.
Finally, no matter what your time horizon or portfolio diversity, it makes good sense to follow a regular investment plan, investing a certain amount of money in a fund at the same time each month or quarter and periodically reviewing your overall portfolio. By doing so, you won't get caught up in the excitement of a rapidly rising market, nor will you buy all your shares at market highs. While this strategy - known as dollar cost averaging - won't assure a profit or protect you from a loss in a declining market, it should help you lower the average cost of your purchases. Of course, you should consider your financial ability to continue your purchases through periods of low price levels before undertaking such a strategy.
If you have questions, please call us at 1-800-544-6666, or visit our web site at www.fidelity.com. We are available 24 hours a day, seven days a week to provide you the information you need to make the investments that are right for you.
Best regards,
/s/Edward C. Johnson 3d
Edward C. Johnson 3d
Annual Report
There are several ways to evaluate a fund's historical performance. You can look at the total percentage change in value, the average annual percentage change or the growth of a hypothetical $10,000 investment. Total return reflects the change in the value of an investment, assuming reinvestment of the fund's dividend income and capital gains (the profits earned upon the sale of securities that have grown in value).
Cumulative Total Returns
|
Periods ended July 31, 2000 |
|
Past 1 |
Past 5 |
Life of |
|
Fidelity Dividend Growth |
|
7.00% |
178.16% |
357.76% |
|
S&P 500 ® |
|
8.98% |
177.11% |
278.82% |
|
Growth Funds Average |
|
20.80% |
157.45% |
n/a * |
Cumulative total returns show the fund's performance in percentage terms over a set period - in this case, one year, five years or since the fund started on April 27, 1993. For example, if you had invested $1,000 in a fund that had a 5% return over the past year, the value of your investment would be $1,050. You can compare the fund's returns to the performance of the Standard & Poor's 500SM Index - a market capitalization-weighted index of common stocks. To measure how the fund's performance stacked up against its peers, you can compare it to the growth funds average, which reflects the performance of mutual funds with similar objectives tracked by Lipper Inc. The past one year average represents a peer group of 1,280 mutual funds. These benchmarks include reinvested dividends and capital gains, if any, and exclude the effect of sales charges. Lipper has created new comparison categories that group funds according to portfolio characteristics and capitalization, as well as by capitalization only. These averages are listed on page 5 of this report.*
Average Annual Total Returns
|
Periods ended July 31, 2000 |
|
Past 1 |
Past 5 |
Life of |
|
Fidelity Dividend Growth |
|
7.00% |
22.70% |
23.29% |
|
S&P 500 |
|
8.98% |
22.61% |
20.12% |
|
Growth Funds Average |
|
20.80% |
20.27% |
n/a * |
Average annual total returns take the fund's cumulative return and show you what would have happened if the fund had performed at a constant rate each year. (Note: Lipper calculates average annual total returns by annualizing each fund's total return, then taking an arithmetic average. This may produce a different figure than that obtained by averaging the cumulative total returns and annualizing the result.)
* Not available
Annual Report
$10,000 Over Life of Fund
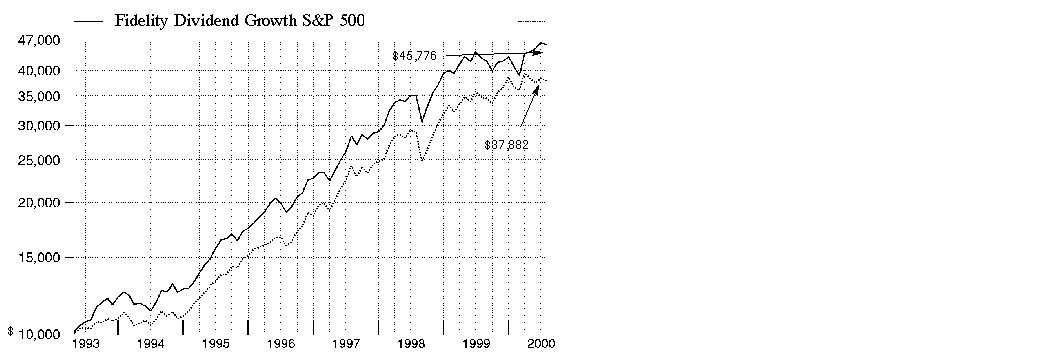
$10,000 Over Life of Fund: Let's say hypothetically that $10,000 was invested in Fidelity ® Dividend Growth Fund on April 27, 1993, when the fund started. As the chart shows, by July 31, 2000, the value of the investment would have grown to $45,776 - a 357.76% increase on the initial investment. For comparison, look at how the Standard & Poor's 500 Index did over the same period. With dividends and capital gains, if any, reinvested, the same $10,000 would have grown to $37,882 - a 278.82% increase.
Understanding
Performance
How a fund did yesterday is no guarantee of how it will do tomorrow. The stock market, for example, has a history of long-term growth and short-term volatility. In turn, the share price and return of a fund that invests in stocks will vary. That means if you sell your shares during a market downturn, you might lose money. But if you can ride out the market's ups and downs, you may have a gain.
3* The Lipper large-cap value funds average reflects the performance (excluding sales charges) of mutual funds with similar portfolio characteristics and capitalization. The Lipper large-cap supergroup average reflects the performance (excluding sales charges) of mutual funds with similar capitalization. As of July 31, 2000, the one year, and five year cumulative total returns for the large-cap value funds average were 1.56% and 120.68% respectively. The one year and five year average annual total returns were 1.56% and 16.98%, respectively. The one year and five year cumulative total returns for the large-cap supergroup average were 15.42% and 160.21%, respectively. The one year and five year average annual total returns were 15.42% and 20.70%, respectively.
Annual Report
Market Recap
During the 12-month period that ended July 31, 2000, the U.S. equity markets struggled to break free from the grip of the Federal Reserve Board, whose effort to cool the overheated economy was delivered via a series of five interest-rate hikes. With every clench of its fist, the Fed's effort - which raised the federal funds rate by a combined total of 1.50% during the period - gradually tempered the robust optimism toward stocks as the period progressed. Most of the effect of the Fed's tightening, coupled with the market's concerns about corporate earnings, took its toll in the period's second half. The Dow Jones Industrial Average - a benchmark of blue chip stocks - returned 0.27% during the overall period, but has declined 7.65% during the past seven months. Similarly, the Standard & Poor's 500 Index, an index of 500 larger companies, returned 8.98% for the past year, but feeling the impact of the Fed's action, has lost 1.98% year to date. Even the seemingly invincible NASDAQ Composite Index, which finished the period with a 43.08% gain, has given back 7.33% in 2000. Growing concerns about a potential economic slowdown during the second half of the period also affected small-cap stocks, as evidenced by the Russell 2000®'s 13.77% advance for the 12-month period, compared to its weak -0.28% return year to date.
SM(Portfolio Manager photograph)
An interview with Charles Mangum, Portfolio Manager of Fidelity Dividend Growth Fund
Q. How did the fund perform, Charles?
A. For the 12 months that ended July 31, 2000, the fund returned 7.00%. This trailed the Standard & Poor's 500 Index - which returned 8.98% during that time - as well as the growth funds average, which returned 20.80% according to Lipper Inc.
Q. What were the major factors behind the fund's performance?
A. The fund's less-than-index weighting in technology stocks continued to undermine performance. Technology stocks maintained their market dominance through the first half of the period and, since the majority of the fund pursued stable growth via dividend-paying stocks in industries such as health and finance, this ongoing trend hurt. The second half of the period was a bit kinder to stable-growth stocks. The technology group endured a steep decline in April and May, and many concerned investors reacquainted themselves with stable-growth names. As a result, health stocks performed well and this helped bring the fund's return more in line with that of the index.
Annual Report
Fund Talk: The Manager's Overview - continued
Q. Despite the fund's underweighting in technology, its exposure to the sector increased during the period. Where did you find opportunities?
A. A big part of the fund's increased weighting was simply the appreciation of several names, including Intel, Cisco and EMC. These companies not only held significant market shares in their respective fields, but also had attractive cash flow situations. Each stock was among the fund's top-10 performers for the period. I did add to the fund's positions in companies that offer technology-related services and solutions. Many of these stocks - such as Electronic Data Systems and NCR - struggled when Y2K spending dried up in the second half of 1999. Now that companies are out of the Y2K woods, spending should get back to more normal levels and these companies could find themselves back in demand.
Q. What was the story with the fund's health-related investments?
A. Health stocks performed very well following the technology decline. In fact, the fund's best performer for the period was drug stock Eli Lilly. The company had been in the early trial stages of testing a new drug designed to fight sepsis, a condition that ultimately leads to organ failure. The results were so extraordinary that Lilly expects to file for expedited federal approval of the drug. Another strong performer was Cardinal Health. As technology-weary investors sought growth in other areas, Cardinal Health - with its consistent earnings growth track record - was one stock that stood out.
Q. Which other stocks helped performance? Which stocks were disappointing?
A. On the plus side, the fund's investments in semiconductor-related stocks such as Linear Technology and Texas Instruments fared nicely. Energy services stocks such as ENSCO and Smith International also performed well. Disappointments included SBC Communications and AT&T, both of which missed earnings goals.
Q. What's your outlook, Charles?
A. If the signs we've seen during the second half of this period - namely, a slowing economy and a higher level of confidence in stable-growth investments - have staying power, it should bode very well for the fund. Having said that, however, we need to remember that six months of change doesn't necessarily translate into a concrete pattern. There's still a lot of speculation over which direction technology stocks are heading, and much attention will be paid to retail consumer trends as well as further actions taken by the Federal Reserve Board. Through it all, my discipline will remain the same: find good companies with attractive price tags and earnings growth potential.
The views expressed in this report reflect those of the portfolio manager only through the end of the period of the report as stated on the cover and do not necessarily represent the views of Fidelity or any other person in the Fidelity organization. Any such views are subject to change at any time based upon market or other conditions and Fidelity disclaims any responsibility to update such views. These views may not be relied on as investment advice and, because investment decisions for a Fidelity fund are based on numerous factors, may not be relied on as an indication of trading intent on behalf of any Fidelity fund.
Annual Report
Fund Talk: The Manager's Overview - continued
Fund Facts
Goal: to increase the value of the fund's shares by investing mainly in equity securities of companies that have the potential to increase their current dividend or begin paying a dividend
Fund number: 330
Trading symbol: FDGFX
Start date: April 27, 1993
Size: as of July 31, 2000, more than $10.4 billion
Manager: Charles Mangum, since 1997; manager, Fidelity OTC Portfolio, 1996-1997; Fidelity Convertible Securities Fund, 1995-1996; Fidelity Select Health Care Portfolio, 1992-1995; joined Fidelity in 1990
3Charles Mangum discusses more portfolio strategies:
"One area of finance that I've been attracted to is fee-based banks, those that derive more of their revenues from charging fees than from credit spreads. PNC Financial is a great example of this. By being more fee-based, these types of banks are less susceptible to credit cycle risks.
"I've also positioned the fund to take advantage of a potential increase in demand for gas and oil. The fund has investments in several energy exploration and production companies, which could benefit as earnings increase. A prime example is Conoco, a fairly new company that was spun off from DuPont. Conoco had an attractive valuation, high relative returns, a good production profile and a solid management team.
"There's been a lot of talk about where the economy is heading - whether we're in for a recession, or a soft landing in which the slowdown occurs gradually. I've begun to look for companies that I'd call ´soft cyclicals,' or those that are less likely to lose a lot of money in a slowdown. One example is Ingersoll-Rand, an industrial manufacturer with lines of business in industries such as automotive, construction, utilities, housing and transportation."
Annual Report
|
Top Ten Stocks as of July 31, 2000 |
||
|
|
% of fund's |
% of fund's net assets |
|
Cardinal Health, Inc. |
7.5 |
4.7 |
|
Schering-Plough Corp. |
5.0 |
5.6 |
|
Fannie Mae |
4.4 |
4.3 |
|
Eli Lilly & Co. |
4.3 |
3.1 |
|
Cisco Systems, Inc. |
4.0 |
2.4 |
|
General Electric Co. |
3.4 |
2.8 |
|
Comerica, Inc. |
2.7 |
2.2 |
|
Conoco, Inc. Class B |
2.6 |
1.1 |
|
EMC Corp. |
2.2 |
1.0 |
|
Intel Corp. |
2.1 |
1.7 |
|
|
38.2 |
28.9 |
|
Top Five Market Sectors as of July 31, 2000 |
||
|
|
% of fund's |
% of fund's net assets |
|
Technology |
23.2 |
19.3 |
|
Health |
19.5 |
18.0 |
|
Finance |
17.6 |
15.5 |
|
Industrial Machinery & Equipment |
6.6 |
3.6 |
|
Energy |
6.6 |
7.0 |
|
Asset Allocation (% of fund's net assets) |
|||||||
|
As of July 31, 2000 * |
As of January 31, 2000 ** |
||||||
|
Stocks 96.1% |
|
|
Stocks 96.1% |
|
||
 |
Convertible |
|
|
Convertible |
|
||
|
Short-Term |
|
|
Short-Term |
|
||
|
* Foreign |
4.0% |
|
** Foreign investments |
2.6% |
|
||

Annual Report
Showing Percentage of Net Assets
|
Common Stocks - 96.1% |
|||
|
Shares |
Value (Note 1) (000s) |
||
|
AEROSPACE & DEFENSE - 1.6% |
|||
|
Aerospace & Defense - 0.4% |
|||
|
Honeywell International, Inc. |
927,187 |
$ 31,177 |
|
|
Textron, Inc. |
231,700 |
13,221 |
|
|
|
44,398 |
||
|
Ship Building & Repair - 1.2% |
|||
|
General Dynamics Corp. |
2,212,850 |
124,888 |
|
|
TOTAL AEROSPACE & DEFENSE |
169,286 |
||
|
BASIC INDUSTRIES - 1.3% |
|||
|
Chemicals & Plastics - 0.9% |
|||
|
E.I. du Pont de Nemours and Co. |
900,000 |
40,781 |
|
|
FMC Corp. (a) |
200,000 |
12,050 |
|
|
Praxair, Inc. |
270,500 |
10,702 |
|
|
Solutia, Inc. |
739,000 |
10,577 |
|
|
Union Carbide Corp. |
330,100 |
14,793 |
|
|
|
88,903 |
||
|
Metals & Mining - 0.4% |
|||
|
Alcoa, Inc. |
1,487,100 |
44,985 |
|
|
TOTAL BASIC INDUSTRIES |
133,888 |
||
|
CONSTRUCTION & REAL ESTATE - 0.2% |
|||
|
Building Materials - 0.2% |
|||
|
Masco Corp. |
883,300 |
17,445 |
|
|
DURABLES - 0.8% |
|||
|
Autos, Tires, & Accessories - 0.2% |
|||
|
Goodyear Tire & Rubber Co. |
1,000,000 |
19,938 |
|
|
Consumer Durables - 0.5% |
|||
|
Minnesota Mining & Manufacturing Co. |
600,000 |
54,038 |
|
|
Home Furnishings - 0.1% |
|||
|
Leggett & Platt, Inc. |
87,000 |
1,523 |
|
|
Newell Rubbermaid, Inc. |
429,272 |
11,564 |
|
|
|
13,087 |
||
|
TOTAL DURABLES |
87,063 |
||
|
Common Stocks - continued |
|||
|
Shares |
Value (Note 1) (000s) |
||
|
ENERGY - 6.6% |
|||
|
Energy Services - 0.8% |
|||
|
ENSCO International, Inc. |
211,320 |
$ 7,132 |
|
|
Halliburton Co. |
1,261,200 |
58,173 |
|
|
Smith International, Inc. (a) |
178,500 |
12,740 |
|
|
|
78,045 |
||
|
Oil & Gas - 5.8% |
|||
|
Chevron Corp. |
421,200 |
33,275 |
|
|
Conoco, Inc. Class B |
11,962,552 |
275,886 |
|
|
Cooper Cameron Corp. (a) |
659,960 |
42,650 |
|
|
Devon Energy Corp. |
213,400 |
9,763 |
|
|
Exxon Mobil Corp. |
1,800,045 |
144,004 |
|
|
Santa Fe Snyder Corp. (a)(c) |
10,291,915 |
102,919 |
|
|
|
608,497 |
||
|
TOTAL ENERGY |
686,542 |
||
|
FINANCE - 17.4% |
|||
|
Banks - 5.3% |
|||
|
Bank of America Corp. |
350,000 |
16,581 |
|
|
Bank of New York Co., Inc. |
400,000 |
18,725 |
|
|
Comerica, Inc. |
5,437,445 |
277,310 |
|
|
FleetBoston Financial Corp. |
584,600 |
20,936 |
|
|
PNC Financial Services Group, Inc. |
3,381,800 |
172,049 |
|
|
Synovus Finanical Corp. |
480,800 |
8,654 |
|
|
Wells Fargo & Co. |
861,100 |
35,574 |
|
|
|
549,829 |
||
|
Credit & Other Finance - 1.4% |
|||
|
Associates First Capital Corp. Class A |
2,860,274 |
74,903 |
|
|
Household International, Inc. |
1,642,500 |
73,194 |
|
|
|
148,097 |
||
|
Federal Sponsored Credit - 4.4% |
|||
|
Fannie Mae |
9,181,600 |
457,932 |
|
|
Insurance - 5.6% |
|||
|
ACE Ltd. |
950,000 |
34,200 |
|
|
AFLAC, Inc. |
1,011,600 |
52,540 |
|
|
Allmerica Financial Corp. |
1,614,700 |
95,469 |
|
|
American International Group, Inc. |
600,000 |
52,613 |
|
|
ChoicePoint, Inc. (a) |
1,043,660 |
45,399 |
|
|
CIGNA Corp. |
500,000 |
49,938 |
|
|
Conseco, Inc. |
1,432,500 |
11,281 |
|
|
Common Stocks - continued |
|||
|
Shares |
Value (Note 1) (000s) |
||
|
FINANCE - continued |
|||
|
Insurance - continued |
|||
|
Everest Re Group Ltd. |
927,300 |
$ 36,802 |
|
|
Hartford Financial Services Group, Inc. |
1,414,500 |
90,882 |
|
|
MetLife, Inc. |
1,421,500 |
29,852 |
|
|
PartnerRe Ltd. |
404,000 |
16,009 |
|
|
RenaissanceRe Holdings Ltd. |
322,800 |
15,030 |
|
|
The Chubb Corp. |
198,900 |
14,719 |
|
|
XL Capital Ltd. Class A |
634,500 |
41,877 |
|
|
|
586,611 |
||
|
Securities Industry - 0.7% |
|||
|
Charles Schwab Corp. |
1,100,000 |
39,738 |
|
|
Morgan Stanley Dean Witter & Co. |
355,600 |
32,449 |
|
|
|
72,187 |
||
|
TOTAL FINANCE |
1,814,656 |
||
|
HEALTH - 19.5% |
|||
|
Drugs & Pharmaceuticals - 10.7% |
|||
|
Bristol-Myers Squibb Co. |
3,032,900 |
150,508 |
|
|
Eli Lilly & Co. |
4,348,500 |
451,700 |
|
|
Schering-Plough Corp. |
11,972,600 |
517,067 |
|
|
|
1,119,275 |
||
|
Medical Equipment & Supplies - 8.8% |
|||
|
Abbott Laboratories |
2,826,200 |
117,641 |
|
|
Baxter International, Inc. |
192,000 |
14,928 |
|
|
Cardinal Health, Inc. |
10,617,980 |
780,413 |
|
|
|
912,982 |
||
|
TOTAL HEALTH |
2,032,257 |
||
|
INDUSTRIAL MACHINERY & EQUIPMENT - 6.6% |
|||
|
Electrical Equipment - 4.2% |
|||
|
Emerson Electric Co. |
623,700 |
38,085 |
|
|
General Electric Co. |
6,823,200 |
350,968 |
|
|
Koninklijke Philips Electronics NV sponsored ADR |
1,024,112 |
46,021 |
|
|
|
435,074 |
||
|
Industrial Machinery & Equipment - 2.4% |
|||
|
Illinois Tool Works, Inc. |
521,600 |
29,862 |
|
|
Ingersoll-Rand Co. |
1,771,400 |
69,527 |
|
|
Parker-Hannifin Corp. |
1,045,900 |
37,195 |
|
|
Common Stocks - continued |
|||
|
Shares |
Value (Note 1) (000s) |
||
|
INDUSTRIAL MACHINERY & EQUIPMENT - continued |
|||
|
Industrial Machinery & Equipment - continued |
|||
|
The Stanley Works |
157,200 |
$ 4,117 |
|
|
Tyco International Ltd. |
2,150,000 |
115,025 |
|
|
|
255,726 |
||
|
TOTAL INDUSTRIAL MACHINERY & EQUIPMENT |
690,800 |
||
|
MEDIA & LEISURE - 4.1% |
|||
|
Broadcasting - 2.2% |
|||
|
AMFM, Inc. (a) |
800,000 |
57,150 |
|
|
AT&T Corp. - Liberty Media Group Class A (a) |
1,200,000 |
26,700 |
|
|
Clear Channel Communications, Inc. (a) |
1,050,000 |
79,997 |
|
|
Time Warner, Inc. |
806,988 |
61,886 |
|
|
|
225,733 |
||
|
Entertainment - 0.6% |
|||
|
Carnival Corp. |
600,000 |
11,213 |
|
|
Viacom, Inc. Class B (non-vtg.) (a) |
871,800 |
57,811 |
|
|
|
69,024 |
||
|
Lodging & Gaming - 0.1% |
|||
|
Starwood Hotels & Resorts Worldwide, Inc. unit |
272,400 |
9,296 |
|
|
Restaurants - 1.2% |
|||
|
Jack in the Box, Inc. (a) |
1,135,400 |
24,340 |
|
|
McDonald's Corp. |
525,500 |
16,553 |
|
|
Tricon Global Restaurants, Inc. (a) |
2,184,600 |
52,840 |
|
|
Wendy's International, Inc. |
1,813,400 |
30,714 |
|
|
|
124,447 |
||
|
TOTAL MEDIA & LEISURE |
428,500 |
||
|
NONDURABLES - 2.7% |
|||
|
Beverages - 0.9% |
|||
|
Coca-Cola Enterprises, Inc. |
502,600 |
9,644 |
|
|
The Coca-Cola Co. |
1,433,200 |
87,873 |
|
|
|
97,517 |
||
|
Foods - 0.4% |
|||
|
Quaker Oats Co. |
657,300 |
44,203 |
|
|
Household Products - 0.8% |
|||
|
Clorox Co. |
502,826 |
20,773 |
|
|
Common Stocks - continued |
|||
|
Shares |
Value (Note 1) (000s) |
||
|
NONDURABLES - continued |
|||
|
Household Products - continued |
|||
|
Gillette Co. |
1,212,100 |
$ 35,378 |
|
|
Procter & Gamble Co. |
420,800 |
23,933 |
|
|
|
80,084 |
||
|
Tobacco - 0.6% |
|||
|
Philip Morris Companies, Inc. |
2,399,500 |
60,587 |
|
|
TOTAL NONDURABLES |
282,391 |
||
|
RETAIL & WHOLESALE - 5.4% |
|||
|
Apparel Stores - 0.0% |
|||
|
Gap, Inc. |
110,637 |
3,962 |
|
|
General Merchandise Stores - 1.8% |
|||
|
Saks, Inc. (a) |
1,427,454 |
14,453 |
|
|
Target Corp. |
1,915,000 |
55,535 |
|
|
Wal-Mart Stores, Inc. |
2,170,400 |
119,236 |
|
|
|
189,224 |
||
|
Grocery Stores - 0.7% |
|||
|
Safeway, Inc. (a) |
1,617,800 |
72,902 |
|
|
Retail & Wholesale, Miscellaneous - 2.9% |
|||
|
Alberto-Culver Co. Class A (c) |
4,336,500 |
110,039 |
|
|
Home Depot, Inc. |
2,066,450 |
106,939 |
|
|
Lowe's Companies, Inc. |
1,202,500 |
50,730 |
|
|
Staples, Inc. (a) |
2,185,400 |
30,186 |
|
|
|
297,894 |
||
|
TOTAL RETAIL & WHOLESALE |
563,982 |
||
|
SERVICES - 0.4% |
|||
|
Advertising - 0.3% |
|||
|
Omnicom Group, Inc. |
428,500 |
36,423 |
|
|
Services - 0.1% |
|||
|
Robert Half International, Inc. (a) |
244,000 |
8,388 |
|
|
TOTAL SERVICES |
44,811 |
||
|
TECHNOLOGY - 23.2% |
|||
|
Communications Equipment - 6.9% |
|||
|
Cisco Systems, Inc. (a) |
6,343,200 |
415,083 |
|
|
Comverse Technology, Inc. (a) |
417,700 |
36,653 |
|
|
Common Stocks - continued |
|||
|
Shares |
Value (Note 1) (000s) |
||
|
TECHNOLOGY - continued |
|||
|
Communications Equipment - continued |
|||
|
Lucent Technologies, Inc. |
1,201,200 |
$ 52,553 |
|
|
Nokia AB sponsored ADR |
790,000 |
35,007 |
|
|
Nortel Networks Corp. |
2,428,400 |
180,612 |
|
|
|
719,908 |
||
|
Computer Services & Software - 4.6% |
|||
|
Automatic Data Processing, Inc. |
450,900 |
22,348 |
|
|
BEA Systems, Inc. (a) |
114,500 |
4,931 |
|
|
Cadence Design Systems, Inc. (a) |
346,200 |
7,227 |
|
|
Computer Associates International, Inc. |
2,500,000 |
62,031 |
|
|
Computer Sciences Corp. (a) |
59,000 |
3,688 |
|
|
DST Systems, Inc. (a) |
415,600 |
38,807 |
|
|
Electronic Data Systems Corp. |
1,699,500 |
73,079 |
|
|
Microsoft Corp. (a) |
2,510,200 |
175,243 |
|
|
NCR Corp. (a) |
1,976,800 |
70,053 |
|
|
Phone.com, Inc. |
205,000 |
16,374 |
|
|
|
473,781 |
||
|
Computers & Office Equipment - 6.7% |
|||
|
Compaq Computer Corp. |
1,800,000 |
50,513 |
|
|
Dell Computer Corp. (a) |
2,500,000 |
109,844 |
|
|
EMC Corp. (a) |
2,650,000 |
225,581 |
|
|
Hewlett-Packard Co. |
631,700 |
68,974 |
|
|
International Business Machines Corp. |
1,300,000 |
146,169 |
|
|
Lexmark International Group, Inc. Class A (a) |
500,000 |
22,531 |
|
|
Sun Microsystems, Inc. (a) |
700,000 |
73,806 |
|
|
|
697,418 |
||
|
Electronic Instruments - 0.0% |
|||
|
Agilent Technologies, Inc. |
140 |
6 |
|
|
Electronics - 5.0% |
|||
|
Intel Corp. |
3,253,600 |
217,178 |
|
|
JDS Uniphase Corp. (a) |
396,700 |
46,860 |
|
|
Linear Technology Corp. |
2,114,500 |
116,826 |
|
|
LSI Logic Corp. (a) |
500,000 |
16,938 |
|
|
Solectron Corp. (a) |
300,000 |
12,094 |
|
|
Texas Instruments, Inc. |
1,937,900 |
113,731 |
|
|
|
523,627 |
||
|
TOTAL TECHNOLOGY |
2,414,740 |
||
|
Common Stocks - continued |
|||
|
Shares |
Value (Note 1) (000s) |
||
|
TRANSPORTATION - 0.9% |
|||
|
Railroads - 0.9% |
|||
|
Burlington Northern Santa Fe Corp. |
4,008,600 |
$ 97,960 |
|
|
UTILITIES - 5.4% |
|||
|
Cellular - 0.3% |
|||
|
QUALCOMM, Inc. (a) |
260,000 |
16,884 |
|
|
Vodafone Group PLC sponsored ADR |
200,000 |
8,625 |
|
|
|
25,509 |
||
|
Electric Utility - 0.4% |
|||
|
AES Corp. (a) |
253,200 |
13,530 |
|
|
IPALCO Enterprises, Inc. |
1,416,200 |
32,042 |
|
|
|
45,572 |
||
|
Gas - 0.2% |
|||
|
Dynegy, Inc. Class A |
282,400 |
19,874 |
|
|
Telephone Services - 4.5% |
|||
|
AT&T Corp. |
2,131,781 |
65,952 |
|
|
BellSouth Corp. |
2,321,000 |
92,405 |
|
|
Qwest Communications International, Inc. (a) |
1,345,501 |
63,154 |
|
|
SBC Communications, Inc. |
4,281,791 |
182,244 |
|
|
Sprint Corp. - FON Group |
145,140 |
5,171 |
|
|
Verizon Communications |
98,200 |
4,615 |
|
|
WorldCom, Inc. (a) |
1,481,413 |
57,868 |
|
|
|
471,409 |
||
|
TOTAL UTILITIES |
562,364 |
||
|
TOTAL COMMON STOCKS (Cost $8,194,603) |
10,026,685 |
||
|
Convertible Preferred Stocks - 0.6% |
|||
|
|
|
|
|
|
FINANCE - 0.2% |
|||
|
Credit & Other Finance - 0.2% |
|||
|
Caremark Rx Capital Trust I $3.50 TOPRS (d) |
374,300 |
23,253 |
|
|
MEDIA & LEISURE - 0.4% |
|||
|
Broadcasting - 0.4% |
|||
|
Comcast Corp. $1.63 ZONES (a) |
392,000 |
41,552 |
|
|
TOTAL CONVERTIBLE PREFERRED STOCKS (Cost $52,441) |
64,805 |
||
|
Cash Equivalents - 3.5% |
|||
|
Maturity Amount (000s) |
Value (Note 1) |
||
|
Investments in repurchase agreements (U.S. Treasury Obligations), in a joint trading account at 6.45%, dated 7/31/00 due 8/1/00 |
$ 10,983 |
$ 10,981 |
|
|
Shares |
|
||
|
Fidelity Cash Central Fund, 6.57% (b) |
342,658,077 |
342,658 |
|
|
Fidelity Securities Lending Cash Central Fund, 6.65% (b) |
8,979,300 |
8,979 |
|
|
TOTAL CASH EQUIVALENTS (Cost $362,618) |
362,618 |
||
|
TOTAL INVESTMENT PORTFOLIO - 100.2% (Cost $8,609,662) |
10,454,108 |
||
|
NET OTHER ASSETS - (0.2)% |
(22,537) |
||
|
NET ASSETS - 100% |
$ 10,431,571 |
||
|
Security Type Abbreviations |
||
|
TOPRS |
- |
Trust Originated Preferred Securities |
|
ZONES |
- |
Zero Premium Option Exchangeable Securities |
|
Legend |
|
(a) Non-income producing |
|
(b) The rate quoted is the annualized seven-day yield of the fund at period end. |
|
(c) Affiliated company |
|
(d) Security exempt from registration under Rule 144A of the Securities Act of 1933. These securities may be resold in transactions exempt from registration, normally to qualified institutional buyers. At the period end, the value of these securities amounted to $23,253,000 or 0.2% of net assets. |
|
Income Tax Information |
|
At July 31, 2000, the aggregate cost of investment securities for income tax purposes was $8,664,975,000. Net unrealized appreciation aggregated $1,789,133,000, of which $2,336,366,000 related to appreciated investment securities and $547,233,000 related to depreciated investment securities. |
|
The fund hereby designates approximately $425,016,000 as a capital gain dividend for the purpose of the dividend paid deduction. |
See accompanying notes which are an integral part of the financial statements.
Annual Report
Statement of Assets and Liabilities
|
Amounts in thousands (except per-share amount) |
July 31, 2000 |
|
|
Assets |
|
|
|
Investment in securities, at value (including repurchase agreements of $10,981) (cost $8,609,662) - |
|
$ 10,454,108 |
|
Cash |
|
1 |
|
Receivable for investments sold |
|
41,687 |
|
Receivable for fund shares sold |
|
17,440 |
|
Dividends receivable |
|
8,642 |
|
Interest receivable |
|
2,239 |
|
Other receivables |
|
357 |
|
Total assets |
|
10,524,474 |
|
Liabilities |
|
|
|
Payable for investments purchased |
$ 58,467 |
|
|
Payable for fund shares redeemed |
18,168 |
|
|
Accrued management fee |
5,878 |
|
|
Other payables and accrued expenses |
1,411 |
|
|
Collateral on securities loaned, at value |
8,979 |
|
|
Total liabilities |
|
92,903 |
|
Net Assets |
|
$ 10,431,571 |
|
Net Assets consist of: |
|
|
|
Paid in capital |
|
$ 8,010,088 |
|
Undistributed net investment income |
|
45,276 |
|
Accumulated undistributed net realized gain (loss) on investments and foreign currency transactions |
|
531,761 |
|
Net unrealized appreciation (depreciation) on investments |
|
1,844,446 |
|
Net Assets, for 337,614 shares outstanding |
|
$ 10,431,571 |
|
Net Asset Value, offering price and redemption price |
|
$30.90 |
See accompanying notes which are an integral part of the financial statements.
Annual Report
Financial Statements - continued
Statement of Operations
|
Amounts in thousands |
Year ended July 31, 2000 |
|
|
Investment Income Dividends (including $3,325 received from affiliated issuers) |
|
$ 128,389 |
|
Interest |
|
19,055 |
|
Security lending |
|
42 |
|
Total income |
|
147,486 |
|
Expenses |
|
|
|
Management fee |
$ 67,245 |
|
|
Performance adjustment |
(4,346) |
|
|
Transfer agent fees |
24,862 |
|
|
Accounting and security lending fees |
945 |
|
|
Non-interested trustees' compensation |
35 |
|
|
Custodian fees and expenses |
233 |
|
|
Registration fees |
183 |
|
|
Audit |
73 |
|
|
Legal |
65 |
|
|
Reports to shareholders |
637 |
|
|
Miscellaneous |
34 |
|
|
Total expenses before reductions |
89,966 |
|
|
Expense reductions |
(3,705) |
86,261 |
|
Net investment income |
|
61,225 |
|
Realized and Unrealized Gain (Loss) Net realized gain (loss) on: |
|
|
|
Investment securities (including realized gain (loss) of |
573,408 |
|
|
Foreign currency transactions |
(229) |
573,179 |
|
Change in net unrealized appreciation (depreciation) on investment securities |
|
(137,084) |
|
Net gain (loss) |
|
436,095 |
|
Net increase (decrease) in net assets resulting |
|
$ 497,320 |
See accompanying notes which are an integral part of the financial statements.
Annual Report
Financial Statements - continued
Statement of Changes in Net Assets
|
Amounts in thousands |
Year ended |
Year ended |
|
Increase (Decrease) in Net Assets |
|
|
|
Operations |
$ 61,225 |
$ 62,989 |
|
Net realized gain (loss) |
573,179 |
1,195,042 |
|
Change in net unrealized appreciation (depreciation) |
(137,084) |
801,977 |
|
Net increase (decrease) in net assets resulting |
497,320 |
2,060,008 |
|
Distributions to shareholders |
(64,187) |
(38,407) |
|
From net realized gain |
(983,902) |
(597,854) |
|
Total distributions |
(1,048,089) |
(636,261) |
|
Share transactions |
4,054,819 |
9,445,534 |
|
Reinvestment of distributions |
1,017,521 |
617,315 |
|
Cost of shares redeemed |
(8,373,498) |
(4,574,330) |
|
Net increase (decrease) in net assets resulting |
(3,301,158) |
5,488,519 |
|
Total increase (decrease) in net assets |
(3,851,927) |
6,912,266 |
|
Net Assets |
|
|
|
Beginning of period |
14,283,498 |
7,371,232 |
|
End of period (including undistributed net investment income of $45,276 and $45,206, respectively) |
$ 10,431,571 |
$ 14,283,498 |
|
Other Information Shares |
|
|
|
Sold |
139,366 |
331,300 |
|
Issued in reinvestment of distributions |
34,903 |
26,258 |
|
Redeemed |
(295,310) |
(161,099) |
|
Net increase (decrease) |
(121,041) |
196,459 |
See accompanying notes which are an integral part of the financial statements.
Annual Report
Financial Highlights
|
Years ended July 31, |
2000 |
1999 |
1998 |
1997 |
1996 |
|
Selected Per-Share Data |
|
|
|
|
|
|
Net asset value, |
$ 31.14 |
$ 28.11 |
$ 25.07 |
$ 17.24 |
$ 16.04 |
|
Income from |
|
|
|
|
|
|
Net investment income |
.15 B |
.17 B |
.17 B |
.20 B |
.11 |
|
Net realized and |
1.89 |
5.18 |
5.21 |
8.09 |
2.25 |
|
Total from investment operations |
2.04 |
5.35 |
5.38 |
8.29 |
2.36 |
|
Less Distributions |
|
|
|
|
|
|
From net investment income |
(.14) |
(.13) |
(.15) |
(.09) |
(.09) |
|
From net realized gain |
(2.14) |
(2.19) |
(2.19) |
(.37) |
(1.07) |
|
Total distributions |
(2.28) |
(2.32) |
(2.34) |
(.46) |
(1.16) |
|
Net asset value, end of period |
$ 30.90 |
$ 31.14 |
$ 28.11 |
$ 25.07 |
$ 17.24 |
|
Total Return A |
7.00% |
21.90% |
23.81% |
49.21% |
15.44% |
|
Ratios and Supplemental Data |
|
|
|
|
|
|
Net assets, end of period |
$ 10,432 |
$ 14,283 |
$ 7,371 |
$ 4,368 |
$ 1,220 |
|
Ratio of expenses to average |
.77% |
.87% |
.89% |
.95% |
1.02% |
|
Ratio of expenses to average net assets after expense reductions |
.74% C |
.84% C |
.86% C |
.92% C |
.99% C |
|
Ratio of net investment income to average net assets |
.52% |
.58% |
.64% |
.99% |
.86% |
|
Portfolio turnover rate |
86% |
104% |
109% |
141% |
129% |
A The total returns would have been lower had certain expenses not been reduced during the periods shown.
B Net investment income per share has been calculated based on average shares outstanding during the period.
C FMR or the fund has entered into varying arrangements with third parties who either paid or reduced a portion of the fund's expenses.
See accompanying notes which are an integral part of the financial statements.
Annual Report
For the period ended July 31, 2000
1. Significant Accounting Policies.
Fidelity Dividend Growth Fund (the fund) is a fund of Fidelity Securities Fund (the trust) and is authorized to issue an unlimited number of shares. The trust is registered under the Investment Company Act of 1940, as amended, as an open-end management investment company organized as a Massachusetts business trust. The financial statements have been prepared in conformity with generally accepted accounting principles which require management to make certain estimates and assumptions at the date of the financial statements. The following summarizes the significant accounting policies of the fund:
Security Valuation. Securities for which exchange quotations are readily available are valued at the last sale price, or if no sale price, at the closing bid price. Foreign securities are valued based on quotations from the principal market in which such securities are normally traded. If trading or events occurring in other markets after the close of the principal market in which foreign securities are traded, and before the close of the business of the fund, are expected to materially affect the value of those securities, then they are valued at their fair value taking this trading or these events into account. Fair value is determined in good faith under consistently applied procedures under the general supervision of the Board of Trustees. Securities (including restricted securities) for which exchange quotations are not readily available (and in certain cases debt securities which trade on an exchange) are valued primarily using dealer-supplied valuations or at their fair value. Short-term securities with remaining maturities of sixty days or less for which quotations are not readily available are valued at amortized cost or original cost plus accrued interest, both of which approximate current value.
Foreign Currency Translation. The accounting records of the fund are maintained in U.S. dollars. Investment securities and other assets and liabilities denominated in a foreign currency are translated into U.S. dollars at the prevailing rates of exchange at period end. Purchases and sales of securities, income receipts and expense payments are translated into U.S. dollars at the prevailing exchange rate on the respective dates of the transactions.
Net realized gains and losses on foreign currency transactions represent net gains and losses from sales and maturities of foreign currency contracts, disposition of foreign currencies, the difference between the amount of net investment income accrued and the U.S. dollar amount actually received, and gains and losses between trade and settlement date on purchases and sales of securities. The effects of changes in foreign currency exchange rates on investments in securities are included with the net realized and unrealized gain or loss on investment securities.
Income Taxes. As a qualified regulated investment company under Subchapter M of the Internal Revenue Code, the fund is not subject to income taxes to the extent
Annual Report
Notes to Financial Statements - continued
1. Significant Accounting Policies - continued
Income Taxes - continued
that it distributes substantially all of its taxable income for its fiscal year. The schedule of investments includes information regarding income taxes under the caption "Income Tax Information."
Investment Income. Dividend income is recorded on the ex-dividend date, except certain dividends from foreign securities where the ex-dividend date may have passed, are recorded as soon as the fund is informed of the ex-dividend date. Non-cash dividends included in dividend income, if any, are recorded at the fair market value of the securities received. Interest income is accrued as earned. Investment income is recorded net of foreign taxes withheld where recovery of such taxes is uncertain.
Expenses. Most expenses of the trust can be directly attributed to a fund. Expenses which cannot be directly attributed are apportioned among the funds in the trust.
Distributions to Shareholders. Distributions are recorded on the ex-dividend date.
Income and capital gain distributions are determined in accordance with income tax regulations which may differ from generally accepted accounting principles. These differences, which may result in distribution reclassifications, are primarily due to differing treatments for litigation proceeds, foreign currency transactions, contingent interest, non-taxable dividends and losses deferred due to wash sales. The fund also utilized earnings and profits distributed to shareholders on redemption of shares as a part of the dividends paid deduction for income tax purposes.
Permanent book and tax basis differences relating to shareholder distributions will result in reclassifications to paid in capital. Undistributed net investment income and accumulated undistributed net realized gain (loss) on investments and foreign currency transactions may include temporary book and tax basis differences which will reverse in a subsequent period. Any taxable income or gain remaining at fiscal year end is distributed in the following year.
Security Transactions. Security transactions are accounted for as of trade date. Gains and losses on securities sold are determined on the basis of identified cost.
2. Operating Policies.
Foreign Currency Contracts. The fund generally uses foreign currency contracts to facilitate transactions in foreign-denominated securities. Losses may arise from changes in the value of the foreign currency or if the counterparties do not perform under the contracts' terms. The U.S. dollar value of foreign currency contracts is determined using contractual currency exchange rates established at the time of each trade.
Joint Trading Account. Pursuant to an Exemptive Order issued by the Securities and Exchange Commission (the SEC), the fund, along with other affiliated entities of Fidelity Management & Research Company (FMR), may transfer uninvested cash balances into one or more joint trading accounts. These balances are invested in one or more repurchase agreements for U.S. Treasury or Federal Agency obligations.
Annual Report
Notes to Financial Statements - continued
2. Operating Policies - continued
Repurchase Agreements. The underlying U.S. Treasury, Federal Agency, or other obligations found to be satisfactory by FMR are transferred to an account of the fund, or to the Joint Trading Account, at a custodian bank. The securities are marked-to-market daily and maintained at a value at least equal to the principal amount of the repurchase agreement (including accrued interest). FMR, the fund's investment adviser, is responsible for determining that the value of the underlying securities remains in accordance with the market value requirements stated above.
Cash Central Funds. Pursuant to an Exemptive Order issued by the SEC, the fund may invest in the Fidelity Cash Central Fund and the Fidelity Securities Lending Cash Central Fund (the Cash Funds) managed by Fidelity Investments Money Management, Inc. , an affiliate of FMR. The Cash Funds are open-end money market funds available only to investment companies and other accounts managed by FMR and its affiliates. The Cash Funds seek preservation of capital, liquidity, and current income. Income distributions from the Cash Funds are declared daily and paid monthly from net interest income. Income distributions earned by the fund are recorded as either interest income or security lending income in the accompanying financial statements.
Restricted Securities. The fund is permitted to invest in securities that are subject to legal or contractual restrictions on resale. These securities generally may be resold in transactions exempt from registration or to the public if the securities are registered. Disposal of these securities may involve time-consuming negotiations and expense, and prompt sale at an acceptable price may be difficult. At the end of the period, the fund had no investments in restricted securities (excluding 144A issues).
3. Purchases and Sales of Investments.
Purchases and sales of securities, other than short-term securities, aggregated $9,687,376,000 and $13,815,390,000, respectively.
4. Fees and Other Transactions with Affiliates.
Management Fee. As the fund's investment adviser, FMR receives a monthly basic fee that is calculated on the basis of a group fee rate plus a fixed individual fund fee rate applied to the average net assets of the fund. The group fee rate is the weighted average of a series of rates and is based on the monthly average net assets of all the mutual funds advised by FMR. The rates ranged from .2167% to .5200% for the period. The annual individual fund fee rate is .30%. In the event that these rates were lower than the contractual rates in effect during the period, FMR voluntarily implemented the above rates, as they resulted in the same or a lower management fee. The basic fee is subject to a performance adjustment (up to a maximum of ±.20% of the fund's average net assets over the performance period) based on the fund's investment performance as compared to the appropriate index
Annual Report
Notes to Financial Statements - continued
4. Fees and Other Transactions with Affiliates - continued
Management Fee - continued
over a specified period of time. For the period, the management fee was equivalent to an annual rate of .54% of average net assets after the performance adjustment.
Transfer Agent Fees. Fidelity Service Company, Inc. (FSC), an affiliate of FMR, is the fund's transfer, dividend disbursing and shareholder servicing agent. FSC receives account fees and asset-based fees that vary according to account size and type of account. FSC pays for typesetting, printing and mailing of all shareholder reports, except proxy statements. For the period, the transfer agent fees were equivalent to an annual rate of .21% of average net assets.
Accounting and Security Lending Fees. FSC, an affiliate of FMR, maintains the fund's accounting records and administers the security lending program. The security lending fee is based on the number and duration of lending transactions. The accounting fee is based on the level of average net assets for the month plus out-of-pocket expenses.
Brokerage Commissions. The fund placed a portion of its portfolio transactions with brokerage firms which are affiliates of FMR. The commissions paid to these affiliated firms were $636,000 for the period.
5. Security Lending.
The fund lends portfolio securities from time to time in order to earn additional income. The fund receives collateral in the form of U.S. Treasury obligations, letters of credit, and/or cash against the loaned securities, and maintains collateral in an amount not less than 100% of the market value of the loaned securities during the period of the loan. The market value of the loaned securities is determined at the close of business of the fund and any additional required collateral is delivered to the fund on the next business day. If the borrower defaults on its obligation to return the securities loaned because of insolvency or other reasons, the fund could experience delays and costs in recovering the securities loaned or in gaining access to the collateral. At period end, the value of the securities loaned amounted to $7,857,000. The fund received cash collateral of $8,979,000 which was invested in cash equivalents.
6. Expense Reductions.
FMR has directed certain portfolio trades to brokers who paid a portion of the fund's expenses. For the period, the fund's expenses were reduced by $3,149,000 under this arrangement.
In addition, through arrangements with the fund's custodian and transfer agent, credits realized as a result of uninvested cash balances were used to reduce a portion of the fund's expenses. During the period, the fund's custodian and transfer agent fees were reduced by $4,000 and $552,000, respectively, under these arrangements.
Annual Report
Notes to Financial Statements - continued
7. Transactions with Affiliated Companies.
An affiliated company is a company in which the fund has ownership of at least 5% of the voting securities. Transactions during the period with companies which are or were affiliates are as follows:
|
Summary of Transactions with Affiliated Companies |
||||||||
|
Amounts in thousands Affiliate |
|
Purchase |
|
Sales |
|
Dividend |
|
Value |
|
Alberto-Culver Co. Class A |
|
$ - |
|
$ - |
|
$ 932 |
|
$ 110,039 |
|
Cordant Technologies, Inc. |
|
12,775 |
|
59,576 |
|
931 |
|
- |
|
Forrester Research, Inc. |
|
- |
|
2,347 |
|
- |
|
- |
|
Glenborough Realty Trust, Inc. |
|
- |
|
5,361 |
|
1,462 |
|
- |
|
Santa Fe Snyder Corp. |
|
27,501 |
|
41,432 |
|
- |
|
102,919 |
|
TOTALS |
|
$ 40,276 |
|
$ 108,716 |
|
$ 3,325 |
|
$ 212,958 |
Annual Report
To the Trustees of Fidelity Securities Fund and the Shareholders of
Fidelity Dividend Growth Fund:
In our opinion, the accompanying statement of assets and liabilities, including the schedule of investments, and the related statements of operations and of changes in net assets and the financial highlights present fairly, in all material respects, the financial position of Fidelity Dividend Growth Fund (a fund of Fidelity Securities Fund) at July 31, 2000, and the results of its operations, the changes in its net assets and the financial highlights for the periods indicated, in conformity with accounting principles generally accepted in the United States. These financial statements and financial highlights (hereafter referred to as "financial statements") are the responsibility of the Fidelity Dividend Growth Fund's management; our responsibility is to express an opinion on these financial statements based on our audits. We conducted our audits of these financial statements in accordance with auditing standards generally accepted in the United States which require that we plan and perform the audit to obtain reasonable assurance about whether the financial statements are free of material misstatement. An audit includes examining, on a test basis, evidence supporting the amounts and disclosures in the financial statements, assessing the accounting principles used and significant estimates made by management, and evaluating the overall financial statement presentation. We believe that our audits, which included confirmation of securities at July 31, 2000 by correspondence with the custodian and brokers, provide a reasonable basis for the opinion expressed above.
/s/PricewaterhouseCoopers LLP
PricewaterhouseCoopers LLP
Boston, Massachusetts
September 8, 2000
Annual Report
The Board of Trustees of Fidelity Dividend Growth Fund voted to pay on September 11, 2000, to shareholders of record at the opening of business on September 8, 2000, a distribution of $1.62 per share derived from capital gains realized from sales of portfolio securities and a dividend of $.13 per share from net investment income.
A total of 21% of the dividends distributed during the fiscal year qualifies for the dividends-received deduction for corporate shareholders.
The fund hereby designates 100% of the long-term capital gain dividends distributed during the fiscal year as 20%-rate capital gain dividends.
The fund will notify shareholders in January 2001 of amounts for use in preparing 2000 income tax returns.
Annual Report
A special meeting of the fund's shareholders was held on June 14, 2000. The results of votes taken among shareholders on proposals before them are reported below. Each vote reported represents one dollar of net asset value held on the record date for the meeting.
PROPOSAL 1
To elect as Trustees the following twelve nominees.*
|
|
# of |
% of |
|
Ralph F. Cox |
||
|
Affirmative |
4,655,971,408.75 |
97.542 |
|
Against |
00.000 |
00.000 |
|
Withheld |
117,321,034.33 |
2.458 |
|
Abstain |
00.000 |
00.000 |
|
TOTAL |
4,773,292,443.08 |
100.000 |
|
Phyllis Burke Davis |
||
|
Affirmative |
4,652,477,766.86 |
97.469 |
|
Against |
00.000 |
00.000 |
|
Withheld |
120,814,676.22 |
2.531 |
|
Abstain |
00.000 |
00.000 |
|
TOTAL |
4,773,292,443.08 |
100.000 |
|
Robert M. Gates |
||
|
Affirmative |
4,653,157,851.50 |
97.483 |
|
Against |
00.000 |
00.000 |
|
Withheld |
120,134,591.58 |
2.517 |
|
Abstain |
00.000 |
00.000 |
|
TOTAL |
4,773,292,443.08 |
100.000 |
|
Edward C. Johnson 3d |
||
|
Affirmative |
4,655,132,961.06 |
97.525 |
|
Against |
00.000 |
00.000 |
|
Withheld |
118,159,482.02 |
2.475 |
|
Abstain |
00.000 |
00.000 |
|
TOTAL |
4,773,292,443.08 |
100.000 |
|
Donald J. Kirk |
||
|
Affirmative |
4,657,089,742.16 |
97.566 |
|
Against |
00.000 |
00.000 |
|
Withheld |
116,202,700.92 |
2.434 |
|
Abstain |
00.000 |
00.000 |
|
TOTAL |
4,773,292,443.08 |
100.000 |
|
|
# of |
% of |
|
Ned C. Lautenbach |
||
|
Affirmative |
4,660,738,103.83 |
97.642 |
|
Against |
00.000 |
00.000 |
|
Withheld |
112,554,339.25 |
2.358 |
|
Abstain |
00.000 |
00.000 |
|
TOTAL |
4,773,292,443.08 |
100.000 |
|
Peter S. Lynch |
||
|
Affirmative |
4,660,447,333.37 |
97.636 |
|
Against |
00.000 |
00.000 |
|
Withheld |
112,845,109.71 |
2.364 |
|
Abstain |
00.000 |
00.000 |
|
TOTAL |
4,773,292,443.08 |
100.000 |
|
William O. McCoy |
||
|
Affirmative |
4,656,178,436.31 |
97.546 |
|
Against |
00.000 |
00.000 |
|
Withheld |
117,114,006.77 |
2.454 |
|
Abstain |
00.000 |
00.000 |
|
TOTAL |
4,773,292,443.08 |
100.000 |
|
Gerald C. McDonough |
||
|
Affirmative |
4,646,920,290.05 |
97.353 |
|
Against |
00.000 |
00.000 |
|
Withheld |
126,372,153.03 |
2.647 |
|
Abstain |
00.000 |
00.000 |
|
TOTAL |
4,773,292,443.08 |
100.000 |
|
Marvin L. Mann |
||
|
Affirmative |
4,658,855,752.60 |
97.603 |
|
Against |
00.000 |
00.000 |
|
Withheld |
114,436,690.48 |
2.397 |
|
Abstain |
00.000 |
00.000 |
|
TOTAL |
4,773,292,443.08 |
100.000 |
Annual Report
Proxy Voting Results - continued
PROPOSAL 1 - continued
|
|
# of |
% of |
|
Robert C. Pozen |
||
|
Affirmative |
4,659,749,443.93 |
97.621 |
|
Against |
00.000 |
00.000 |
|
Withheld |
113,542,999.15 |
2.379 |
|
Abstain |
00.000 |
00.000 |
|
TOTAL |
4,773,292,443.08 |
100.000 |
|
Thomas R. Williams |
||
|
Affirmative |
4,647,586,775.58 |
97.366 |
|
Against |
00.000 |
00.000 |
|
Withheld |
125,705,667.50 |
2.634 |
|
Abstain |
00.000 |
00.000 |
|
TOTAL |
4,773,292,443.08 |
100.000 |
|
PROPOSAL 2 |
||
|
To ratify the selection of Pricewaterhouse- |
||
|
|
# of |
% of |
|
Affirmative |
4,568,367,741.61 |
95.707 |
|
Against |
65,352,418.81 |
1.369 |
|
Withheld |
00.000 |
00.000 |
|
Abstain |
139,572,282.66 |
2.924 |
|
TOTAL |
4,773,292,443.08 |
100.000 |
|
PROPOSAL 3 |
||
|
To authorize the Trustees to adopt an Amended and Restated Declaration of Trust.* |
||
|
|
# of |
% of |
|
Affirmative |
4,321,058,861.17 |
90.526 |
|
Against |
245,784,889.70 |
5.149 |
|
Withheld |
00.000 |
00.000 |
|
Abstain |
206,448,692.21 |
4.325 |
|
TOTAL |
4,773,292,443.08 |
100.000 |
|
PROPOSAL 4 |
||
|
To approve an amended management contract for the fund that would reduce the management fee payable to FMR by the fund as FMR's assets under management increase, modify the performance adjustment rounding method for the fund, and modify the fund's agreement subject to the requirements of the Investment Company Act of 1940. |
||
|
|
# of |
% of |
|
Affirmative |
4,386,300,091.57 |
91.893 |
|
Against |
175,630,955.93 |
3.679 |
|
Withheld |
00.000 |
00.000 |
|
Abstain |
211,361,395.58 |
4.428 |
|
TOTAL |
4,773,292,443.08 |
100.000 |
|
PROPOSAL 5 |
||
|
To approve an amended sub-advisory agreement with FMR Far East to allow FMR, FMR Far East, and the trust, on behalf of the fund, to modify the agreement subject to the requirements of the Investment Company Act of 1940. |
||
|
|
# of |
% of |
|
Affirmative |
4,350,063,340.54 |
91.133 |
|
Against |
167,396,989.28 |
3.507 |
|
Withheld |
00.000 |
00.000 |
|
Abstain |
255,832,113.26 |
5.360 |
|
TOTAL |
4,773,292,443.08 |
100.000 |
|
PROPOSAL 6 |
||
|
To approve an amended sub-advisory agreement with FMR U.K. to allow FMR, FMR U.K., and the trust, on behalf of each fund, to modify the agreement subject to the requirements of the Investment Company Act of 1940. |
||
|
|
# of |
% of |
|
Affirmative |
4,349,683,025.76 |
91.125 |
|
Against |
167,171,233.07 |
3.503 |
|
Withheld |
00.000 |
00.000 |
|
Abstain |
256,438,184.25 |
5.372 |
|
TOTAL |
4,773,292,443.08 |
100.000 |
|
PROPOSAL 14 |
||
|
To amend the fundamental investment limitation concerning diversification for the fund to exclude "securities of other investment companies" from the limitation. |
||
|
|
# of |
% of |
|
Affirmative |
4,272,734,588.84 |
89.513 |
|
Against |
250,650,269.10 |
5.251 |
|
Withheld |
00.000 |
00.000 |
|
Abstain |
249,907,585.14 |
5.236 |
|
TOTAL |
4,773,292,443.08 |
100.000 |
* Denotes trust-wide proposals and voting results.
Annual Report
Investment Adviser
Fidelity Management & Research Company
Boston, MA
Investment Sub Advisers
Fidelity Management & Research
(U.K.) Inc.
Fidelity Management & Research
(Far East) Inc.
Fidelity Investments Japan Limited
Officers
Edward C. Johnson 3d, President
Robert C. Pozen, Senior Vice President
Abigail P. Johnson, Vice President
Charles A. Mangum, Vice President
Eric D. Roiter, Secretary
Robert A. Dwight, Treasurer
Maria F. Dwyer, Deputy Treasurer
John H. Costello, Assistant Treasurer
Board of Trustees
Ralph F. Cox *
Phyllis Burke Davis *
Robert M. Gates *
Edward C. Johnson 3d
Donald J. Kirk *
Ned C. Lautenbach *
Peter S. Lynch
Marvin L. Mann *
William O. McCoy *
Gerald C. McDonough *
Robert C. Pozen
Thomas R. Williams *
Advisory Board
J. Michael Cook
Marie L. Knowles
General Distributor
Fidelity Distributors Corporation
Boston, MA
Transfer and Shareholder
Servicing Agent
Fidelity Service Company, Inc.
Boston, MA
* Independent trustees
Custodian
Brown Brothers Harriman & Co.
Boston, MA
Fidelity's Growth Funds
Aggressive Growth Fund
Blue Chip Growth Fund
Capital Appreciation Fund
Contrafund®
Contrafund®II
Disciplined Equity Fund
Dividend Growth Fund
Export and Multinational Fund
Fidelity Fifty ®
Growth Company Fund
Large Cap Stock Fund
Low-Priced Stock Fund
Magellan® Fund
Mid-Cap Stock Fund
New Millennium Fund®
OTC Portfolio
Retirement Growth Fund
Small Cap Selector
Small Cap Stock Fund
Stock Selector
Tax Managed Stock Fund
TechnoQuant ® Growth Fund
Trend Fund
Value Fund
The Fidelity Telephone Connection
Mutual Fund 24-Hour Service
Exchanges/Redemptions
and Account Assistance 1-800-544-6666
Product Information 1-800-544-6666
Retirement Accounts 1-800-544-4774
(8 a.m. - 9 p.m.)
TDD Service 1-800-544-0118
for the deaf and hearing impaired
(9 a.m. - 9 p.m. Eastern time)
Fidelity Automated Service
Telephone (FAST ®) (automated graphic) 1-800-544-5555
(automated graphic) Automated line for quickest service
DGF-ANN-0900 111434
1.536090.103
(Fidelity Investment logo)(registered trademark)
Corporate Headquarters
82 Devonshire St., Boston, MA 02109
www.fidelity.com
Fidelity®
Portfolio
Annual Report
July 31, 2000
(2_fidelity_logos) (Registered_Trademark)
|
President's Message |
3 |
Ned Johnson on investing strategies. |
|
Performance |
4 |
How the fund has done over time. |
|
Fund Talk |
6 |
The manager's review of fund performance, strategy and outlook. |
|
Investment Changes |
9 |
A summary of major shifts in the fund's investments over the past six months. |
|
Investments |
10 |
A complete list of the fund's investments with their market values. |
|
Financial Statements |
22 |
Statements of assets and liabilities,
operations, and changes in net assets, |
|
Notes |
26 |
Notes to the financial statements. |
|
Report of Independent Accountants |
32 |
The auditors' opinion. |
|
Distributions |
33 |
|
|
Proxy Voting Results |
34 |
|
Standard & Poor's, S&P and S&P 500 are registered service marks of The McGraw-Hill Companies, Inc. and have been licensed for use by Fidelity Distributors Corporation.
Other third party marks appearing herein are the property of their respective owners.
All other marks appearing herein are registered or unregistered trademarks or service marks of FMR Corp. or an affiliated company.
(Recycle graphic) This report is printed on recycled paper using soy-based inks.
This report and the financial statements contained herein are submitted for the general information of the shareholders of the fund. This report is not authorized for distribution to prospective investors in the fund unless preceded or accompanied by an effective prospectus.
Mutual fund shares are not deposits or obligations of, or guaranteed by, any depository institution. Shares are not insured by the FDIC, Federal Reserve Board or any other agency, and are subject to investment risks, including possible loss of principal amount invested.
Neither the fund nor Fidelity Distributors Corporation is a bank.
For more information on any Fidelity fund, including charges and expenses, call 1-800-544-6666 for a free prospectus. Read it carefully before you invest or send money.
Annual Report
(Photograph of Edward C. Johnson 3d.)
Dear Shareholder:
The Federal Reserve Board's effort to keep inflation in check without over-cooling the U.S. economy has taken a toll on the stock market. Through July 2000, bellwether equity indexes such as the Dow Jones Industrial Average, NASDAQ and S&P 500® have negative returns for the year. On the other hand, fixed-income markets are enjoying strong performance. Except for high-yield, most bond sectors - corporates, mortgages, Treasuries and agencies - have returned 4%-6% year to date.
While it's impossible to predict the future direction of the markets with any degree of certainty, there are certain basic principles that can help investors plan for their future needs.
First, investors are encouraged to take a long-term view of their portfolios. If you can afford to leave your money invested through the inevitable up and down cycles of the financial markets, you will greatly reduce your vulnerability to any single decline. We know from experience, for example, that stock prices have gone up over longer periods of time, have significantly outperformed other types of investments and have stayed ahead of inflation.
Second, you can further manage your investing risk through diversification. A stock mutual fund, for instance, is already diversified, because it invests in many different companies. You can increase your diversification further by investing in a number of different stock funds, or in such other investment categories as bonds. If you have a short investment time horizon, you might want to consider moving some of your investment into a money market fund, which seeks income and a stable share price by investing in high-quality, short-term investments. Of course, it's important to remember that an investment in a money market fund is not insured or guaranteed by the Federal Deposit Insurance Corporation or any other government agency. Although money market funds seek to preserve the value of your investment at $1.00 per share, it is possible to lose money by investing in these types of funds.
Finally, no matter what your time horizon or portfolio diversity, it makes good sense to follow a regular investment plan, investing a certain amount of money in a fund at the same time each month or quarter and periodically reviewing your overall portfolio. By doing so, you won't get caught up in the excitement of a rapidly rising market, nor will you buy all your shares at market highs. While this strategy - known as dollar cost averaging - won't assure a profit or protect you from a loss in a declining market, it should help you lower the average cost of your purchases. Of course, you should consider your financial ability to continue your purchases through periods of low price levels before undertaking such a strategy.
If you have questions, please call us at 1-800-544-6666, or visit our web site at www.fidelity.com. We are available 24 hours a day, seven days a week to provide you the information you need to make the investments that are right for you.
Best regards,
/s/Edward C. Johnson 3d
Edward C. Johnson 3d
Annual Report
There are several ways to evaluate a fund's historical performance. You can look at the total percentage change in value, the average annual percentage change or the growth of a hypothetical $10,000 investment. Total return reflects the change in the value of an investment, assuming reinvestment of the fund's dividend income and capital gains (the profits earned upon the sale of securities that have grown in value).
Cumulative Total Returns
|
Periods ended July 31, 2000 |
|
Past 1 |
Past 5 |
Past 10 |
|
Fidelity Growth & Income |
|
6.34% |
148.92% |
432.00% |
|
S&P 500 |
|
8.98% |
177.11% |
408.31% |
|
Growth & Income Funds Average |
|
4.35% |
118.85% |
284.86% |
Cumulative total returns show the fund's performance in percentage terms over a set period - in this case, one year, five years or 10 years. For example, if you had invested $1,000 in a fund that had a 5% return over the past year, the value of your investment would be $1,050. You can compare the fund's returns to the performance of the Standard & Poor's 500SM Index - a market capitalization-weighted index of common stocks. To measure how the fund's performance stacked up against its peers, you can compare it to the growth and income funds average, which reflects the performance of mutual funds with similar objectives tracked by Lipper Inc. The past one year average represents a peer group of 970 mutual funds. These benchmarks include reinvested dividends and capital gains, if any, and exclude the effect of sales charges. Lipper has created new comparison categories that group funds according to portfolio characteristics and capitalization, as well as by capitalization only. These averages are listed on page 5 of this report.*
Average Annual Total Returns
|
Periods ended July 31, 2000 |
|
Past 1 |
Past 5 |
Past 10 |
|
Fidelity Growth & Income |
|
6.34% |
20.01% |
18.19% |
|
S&P 500 |
|
8.98% |
22.61% |
17.65% |
|
Growth & Income Funds Average |
|
4.35% |
16.57% |
14.16% |
Average annual total returns take the fund's cumulative return and show you what would have happened if the fund had performed at a constant rate each year. (Note: Lipper calculates average annual total returns by annualizing each fund's total return, then taking an arithmetic average. This may produce a different figure than that obtained by averaging the cumulative total returns and annualizing the result.)
Annual Report
$10,000 Over 10 Years
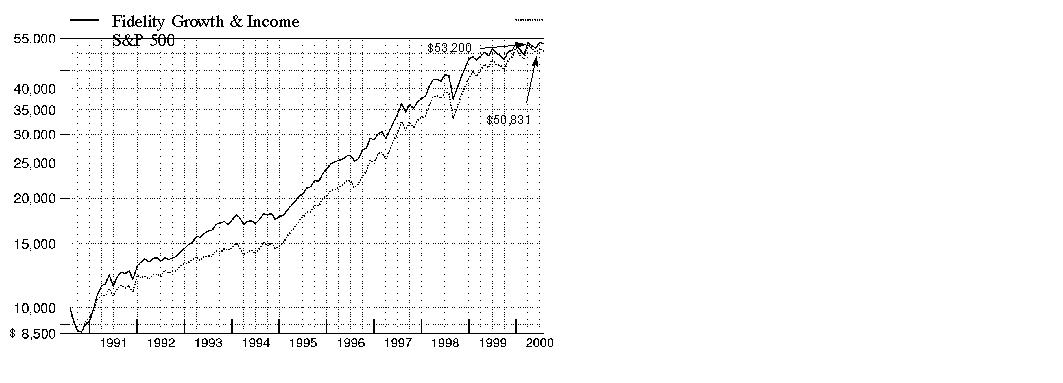
$10,000 Over 10 Years: Let's say hypothetically that $10,000 was invested in Fidelity Growth & Income Portfolio on July 31, 1990. As the chart shows, by July 31, 2000, the value of the investment would have grown to $53,200 - a 432.00% increase on the initial investment. For comparison, look at how the Standard & Poor's 500 Index did over the same period. With dividends and capital gains, if any, reinvested, the same $10,000 would have grown to $50,831 - a 408.31% increase.
Understanding
Performance
How a fund did yesterday is no guarantee of how it will do tomorrow. The stock market, for example, has a history of long-term growth and short-term volatility. In turn, the share price and return of a fund that invests in stocks will vary. That means if you sell your shares during a market downturn, you might lose money. But if you can ride out the market's ups and downs, you may have a gain.
3* The Lipper large-cap value funds average reflects the performance (excluding sales charges) of mutual funds with similar portfolio characteristics and capitalization. The Lipper large-cap supergroup average reflects the performance (excluding sales charges) of mutual funds with similar capitalization. As of July 31, 2000, the one year, five year and 10 year cumulative total returns for the large-cap value funds average were 1.56%, 120.68%, and 300.31%, respectively. The one year, five year and 10 year average annual total returns were 1.56%, 16.98%, and 14.74%, respectively. The one year, five year and 10 year cumulative total returns for the large-cap supergroup average were 15.42%, 160.21% and 372.19%, respectively. The one year, five year and 10 year average annual total returns were 15.42%, 20.70%, and 16.50%, respectively.
Annual Report
Market Recap
During the 12-month period that ended July 31, 2000, the U.S. equity markets struggled to break free from the grip of the Federal Reserve Board, whose effort to cool the overheated economy was delivered via a series of five interest-rate hikes. With every clench of its fist, the Fed's effort - which raised the federal funds rate by a combined total of 1.50% during the period - gradually tempered the robust optimism toward stocks as the period progressed. Most of the effect of the Fed's tightening, coupled with the market's concerns about corporate earnings, took its toll in the period's second half. The Dow Jones Industrial Average - a benchmark of blue chip stocks - returned 0.27% during the overall period, but has declined 7.65% during the past seven months. Similarly, the Standard & Poor's 500 Index, an index of 500 larger companies, returned 8.98% for the past year, but feeling the impact of the Fed's action, has lost 1.98% year to date. Even the seemingly invincible NASDAQ Composite Index, which finished the period with a 43.08% gain, has given back 7.33% in 2000. Growing concerns about a potential economic slowdown during the second half of the period also affected small-cap stocks, as evidenced by the Russell 2000®'s 13.77% advance for the 12-month period, compared to its weak -0.28% return year to date.
SM(Portfolio Manager photograph)
An interview with Steven Kaye, Portfolio Manager of Fidelity Growth & Income Portfolio
Q. How did the fund perform during the past year, Steve?
A. The first six months were pretty difficult, but the fund rebounded well in the latter half of the period. Overall, the fund gained 6.34% during the 12 months that ended July 31, 2000, which beat the growth and income funds average return of 4.35%, as tracked by Lipper Inc., but trailed the Standard & Poor's 500 Index's return of 8.98% for the past year.
Q. In broad terms, how was the fund positioned during the past 12 months, and how did that positioning affect its performance?
A. The technology and wireless sectors dominated the market in the first half of the period. Unfortunately, the fund was underweighted in those sectors because, frankly, their price tags were just too high. True, many of the tech stocks had excellent fundamentals, but not many could justify their valuations. I did increase the fund's tech weighting, but judiciously so. I focused on large-cap, high-quality names such as Cisco and Intel and tried to avoid the "go-go" names - Qualcomm, for example - that had no earnings history to support their valuations. While underweighting tech was responsible for the fund's overall 12-month relative underperformance, it proved very beneficial during the second half of the period.
Annual Report
Fund Talk: The Manager's Overview - continued
Q. How so?
A. Beginning in mid-March and lasting through the rest of the period, technology stocks suffered a steep correction. Investors began to recognize that valuations for these stocks had gotten out of hand and, in light of the Federal Reserve Board's series of interest-rate hikes, it became fairly clear that an economic slowdown was on the horizon. Even high-growth technology companies are not immune to economic slowdowns. In fact, the sector started to reflect more realistic expectations toward the end of the period.
Q. How did you position the fund at this juncture?
A. The fund was positioned for a tech sell-off several months before it happened. As mentioned in the report to shareholders six months ago, I increased the fund's exposure to the health sector, particularly large-cap pharmaceutical stocks such as Eli Lilly and Pfizer. Historically, this sector offers steady growth rates and holds up well in a slowing economy. So, when tech stocks went south in March, we were well-positioned for a rotation to the health sector. That strategy, and avoiding some of the riskier tech names that were hit hardest during the sector's decline, have helped the fund outperform the S&P 500 year to date.
Q. What were some of the fund's best-performing stocks during the past year?
A. Several of the fund's health care picks were among the best relative
contributors to performance, including Warner-Lambert, whose stock received a boost when the company merged with Pfizer during the period. General Electric, the
fund's largest holding at the end of the period, also performed exceptionally well. A strong worldwide economy benefited many of its subsidiary enterprises, and the
performance of GE Capital continued to be strong. Tyco International was a great turnaround story. This diversified manufacturer of electronic components was hurt
early in the period by reports of questionable accounting practices. Those concerns were later proved to be unfounded and the stock rallied to a 52-week high on July
24.
Q. What stocks would you consider disappointments?
A. I'd have to include Microsoft on that list, but not solely because of its well-publicized antitrust case. To me, the real issue was simply that Microsoft did not make its earnings numbers due to the slow start of its Windows 2000 product. Fannie Mae was hampered by spiraling interest rates and noise out of Washington about the future of the company's implied government backing. However, I continue to believe in the stock's fundamentals.
Q. What's your outlook, Steve?
A. I expect that we'll continue to see a slowdown in the economy, and I will position the fund accordingly. Remaining overweighted in the health sector and finding other consistent growers will be part of that effort. Likewise, I'll continue to be wary of stocks with excessive valuations, such as some of the riskier investments in technology. Avoiding big company "blow-ups" will be a key to maintaining the fund's momentum of the past several months.
Annual Report
Fund Talk: The Manager's Overview - continued
The views expressed in this report reflect those of the portfolio manager only through the end of the period of the report as stated on the cover and do not necessarily represent the views of Fidelity or any other person in the Fidelity organization. Any such views are subject to change at any time based upon market or other conditions and Fidelity disclaims any responsibility to update such views. These views may not be relied on as investment advice and, because investment decisions for a Fidelity fund are based on numerous factors, may not be relied on as an indication of trading intent on behalf of any Fidelity fund.
Fund Facts
Goal: to seek a high total return through a combination of current income and capital appreciation
Fund number: 027
Trading symbol: FGRIX
Start date: December 30, 1985
Size: as of July 31, 2000, more than $41.4 billion
Manager: Steven Kaye, since
1993; manager, Fidelity Blue
Chip Growth Fund, 1990-
1992; Fidelity Select Energy
Services, Biotechnology and
Health Care Portfolios, 1986-
1990; joined Fidelity in 1985
Steven Kaye on
various market sectors:
Retailers: "Unfortunately, I think retailers will be fighting an uphill battle for the next several months. With the economy slowing, it will be difficult for stores to maintain strong same-store sales growth. I plan to continue to focus on high-quality names such as Home Depot and Wal-Mart, both of which have excellent fundamentals and were solid contributors to the fund's performance during the period."
Consumer nondurables: "In the past, this sector has tended to be a safe haven in a down market, offering good, defensive growth. But given the blow-ups in this sector of late, including Coca-Cola, Procter & Gamble and Gillette, I'm not finding a lot of investment opportunities here. For now, I'll rely on the health sector for defensive growth exposure."
Finance: "If the Fed determines that it doesn't need to hike rates for the remainder of 2000, which seemed to be a fairly good prospect at the end of the period, then I think that some areas of the finance sector could take off, including government-sponsored enterprises (GSEs) such as Fannie Mae and Freddie Mac. However, I plan to continue to underweight those areas with significant credit risks, such as banks."
Annual Report
|
Top Ten Stocks as of July 31, 2000 |
||
|
|
% of fund's |
% of fund's net assets |
|
General Electric Co. |
5.1 |
4.8 |
|
Cisco Systems, Inc. |
3.8 |
2.9 |
|
Intel Corp. |
3.5 |
2.2 |
|
Exxon Mobil Corp. |
3.5 |
3.7 |
|
Eli Lilly & Co. |
2.8 |
1.4 |
|
Pfizer, Inc. |
2.5 |
2.0 |
|
Microsoft Corp. |
2.5 |
4.8 |
|
Fannie Mae |
2.0 |
2.1 |
|
Wal-Mart Stores, Inc. |
1.9 |
2.1 |
|
Citigroup, Inc. |
1.9 |
0.9 |
|
|
29.5 |
26.9 |
|
Top Five Market Sectors as of July 31, 2000 |
||
|
|
% of fund's |
% of fund's net assets |
|
Technology |
28.0 |
25.5 |
|
Finance |
15.0 |
14.4 |
|
Health |
14.4 |
13.8 |
|
Industrial Machinery & Equipment |
7.1 |
5.1 |
|
Utilities |
6.8 |
7.2 |
|
Asset Allocation (% of fund's net assets) |
|||||||
|
As of July 31, 2000 * |
As of January 31, 2000 ** |
||||||
|
Stocks and |
|
|
Stocks and |
|
||
|
Convertible |
|
|
Convertible |
|
||
|
Short-Term |
|
|
Short-Term |
|
||
|
* Foreign investments |
3.9% |
|
** Foreign investments |
3.8% |
|
||

Annual Report
Showing Percentage of Net Assets
|
Common Stocks - 96.2% |
|||
|
Shares |
Value (Note 1) (000s) |
||
|
AEROSPACE & DEFENSE - 1.5% |
|||
|
Aerospace & Defense - 1.0% |
|||
|
Boeing Co. |
3,654,500 |
$ 179,071 |
|
|
Honeywell International, Inc. |
2,605,512 |
87,610 |
|
|
Northrop Grumman Corp. |
721,500 |
51,272 |
|
|
Textron, Inc. |
811,400 |
46,301 |
|
|
United Technologies Corp. |
1,212,100 |
70,756 |
|
|
|
435,010 |
||
|
Defense Electronics - 0.1% |
|||
|
Raytheon Co. Class B |
850,900 |
20,634 |
|
|
Ship Building & Repair - 0.4% |
|||
|
General Dynamics Corp. |
3,208,100 |
181,057 |
|
|
TOTAL AEROSPACE & DEFENSE |
636,701 |
||
|
BASIC INDUSTRIES - 1.1% |
|||
|
Chemicals & Plastics - 1.0% |
|||
|
E.I. du Pont de Nemours and Co. |
2,142,000 |
97,059 |
|
|
IMC Global, Inc. |
4,611,000 |
63,689 |
|
|
Pharmacia Corp. |
3,570,700 |
195,496 |
|
|
Union Carbide Corp. |
1,344,400 |
60,246 |
|
|
|
416,490 |
||
|
Metals & Mining - 0.1% |
|||
|
Alcoa, Inc. |
1,304,400 |
39,458 |
|
|
TOTAL BASIC INDUSTRIES |
455,948 |
||
|
CONSTRUCTION & REAL ESTATE - 1.3% |
|||
|
Building Materials - 0.0% |
|||
|
Fortune Brands, Inc. |
397,200 |
8,937 |
|
|
Real Estate Investment Trusts - 1.3% |
|||
|
CBL & Associates Properties, Inc. (d) |
1,951,900 |
48,798 |
|
|
Equity Office Properties Trust |
6,446,590 |
196,621 |
|
|
Equity Residential Properties Trust (SBI) |
3,577,365 |
178,421 |
|
|
Manufactured Home Communities, Inc. |
921,400 |
22,114 |
|
|
Public Storage, Inc. |
2,181,400 |
55,898 |
|
|
Urban Shopping Centers, Inc. |
716,400 |
23,731 |
|
|
|
525,583 |
||
|
TOTAL CONSTRUCTION & REAL ESTATE |
534,520 |
||
|
Common Stocks - continued |
|||
|
Shares |
Value (Note 1) (000s) |
||
|
DURABLES - 1.3% |
|||
|
Autos, Tires, & Accessories - 0.6% |
|||
|
Ford Motor Co. |
3,138,700 |
$ 146,146 |
|
|
General Motors Corp. |
759,542 |
43,246 |
|
|
TRW, Inc. |
1,013,800 |
45,558 |
|
|
|
234,950 |
||
|
Consumer Durables - 0.4% |
|||
|
Minnesota Mining & Manufacturing Co. |
1,947,800 |
175,424 |
|
|
Consumer Electronics - 0.2% |
|||
|
General Motors Corp. Class H (a) |
2,651,427 |
68,606 |
|
|
Textiles & Apparel - 0.1% |
|||
|
Unifi, Inc. (a)(d) |
4,316,800 |
48,834 |
|
|
TOTAL DURABLES |
527,814 |
||
|
ENERGY - 5.6% |
|||
|
Energy Services - 0.3% |
|||
|
Schlumberger Ltd. (NY Shares) |
1,800,800 |
133,147 |
|
|
Oil & Gas - 5.3% |
|||
|
BP Amoco PLC sponsored ADR |
4,962,720 |
259,612 |
|
|
Burlington Resources, Inc. |
1,675,000 |
54,647 |
|
|
Chevron Corp. |
1,730,900 |
136,741 |
|
|
Exxon Mobil Corp. |
17,913,647 |
1,433,092 |
|
|
Royal Dutch Petroleum Co. (NY Shares) |
4,806,000 |
279,950 |
|
|
The Coastal Corp. |
704,600 |
40,691 |
|
|
|
2,204,733 |
||
|
TOTAL ENERGY |
2,337,880 |
||
|
FINANCE - 14.9% |
|||
|
Banks - 2.5% |
|||
|
Bank of America Corp. |
1,480,106 |
70,120 |
|
|
Bank of New York Co., Inc. |
9,639,908 |
451,268 |
|
|
Bank One Corp. |
1,110,300 |
35,321 |
|
|
Chase Manhattan Corp. |
1,348,400 |
66,999 |
|
|
FleetBoston Financial Corp. |
1,514,198 |
54,227 |
|
|
Mellon Financial Corp. |
2,768,300 |
104,330 |
|
|
Northern Trust Corp. |
746,300 |
55,879 |
|
|
Wachovia Corp. |
787,800 |
43,329 |
|
|
Wells Fargo & Co. |
3,568,900 |
147,440 |
|
|
|
1,028,913 |
||
|
Common Stocks - continued |
|||
|
Shares |
Value (Note 1) (000s) |
||
|
FINANCE - continued |
|||
|
Credit & Other Finance - 4.0% |
|||
|
American Express Co. |
10,325,790 |
$ 585,343 |
|
|
Associates First Capital Corp. Class A |
7,911,438 |
207,181 |
|
|
Capital Trust, Inc. Class A (a) |
635,782 |
2,662 |
|
|
Citigroup, Inc. |
11,164,895 |
787,823 |
|
|
Household International, Inc. |
1,184,640 |
52,791 |
|
|
|
1,635,800 |
||
|
Federal Sponsored Credit - 4.3% |
|||
|
Fannie Mae |
16,374,900 |
816,698 |
|
|
Freddie Mac |
10,961,500 |
432,294 |
|
|
SLM Holding Corp. (d) |
12,803,950 |
551,370 |
|
|
|
1,800,362 |
||
|
Insurance - 2.9% |
|||
|
Allmerica Financial Corp. |
1,216,100 |
71,902 |
|
|
American International Group, Inc. |
8,485,200 |
744,046 |
|
|
ChoicePoint, Inc. (a) |
262,500 |
11,419 |
|
|
Hartford Financial Services Group, Inc. |
1,842,400 |
118,374 |
|
|
MBIA, Inc. |
3,362,700 |
187,260 |
|
|
The Chubb Corp. |
837,000 |
61,938 |
|
|
|
1,194,939 |
||
|
Securities Industry - 1.2% |
|||
|
Charles Schwab Corp. |
3,283,900 |
118,631 |
|
|
Morgan Stanley Dean Witter & Co. |
4,104,300 |
374,517 |
|
|
|
493,148 |
||
|
TOTAL FINANCE |
6,153,162 |
||
|
HEALTH - 14.4% |
|||
|
Drugs & Pharmaceuticals - 11.1% |
|||
|
Allergan, Inc. |
3,432,000 |
229,730 |
|
|
American Home Products Corp. |
4,503,300 |
238,956 |
|
|
Amgen, Inc. (a) |
3,949,400 |
256,464 |
|
|
Antigenics, Inc. |
7,300 |
128 |
|
|
Bristol-Myers Squibb Co. |
10,148,300 |
503,609 |
|
|
COR Therapeutics, Inc. (a) |
425,000 |
34,558 |
|
|
Eli Lilly & Co. |
11,164,532 |
1,159,716 |
|
|
Merck & Co., Inc. |
8,737,500 |
626,370 |
|
|
Mylan Laboratories, Inc. |
2,080,000 |
44,200 |
|
|
Pfizer, Inc. |
23,962,449 |
1,033,381 |
|
|
QLT, Inc. (a) |
501,300 |
33,033 |
|
|
Common Stocks - continued |
|||
|
Shares |
Value (Note 1) (000s) |
||
|
HEALTH - continued |
|||
|
Drugs & Pharmaceuticals - continued |
|||
|
Schering-Plough Corp. |
3,275,500 |
$ 141,461 |
|
|
Teva Pharmaceutical Industries Ltd. ADR |
3,128,000 |
190,026 |
|
|
Watson Pharmaceuticals, Inc. (a) |
1,770,200 |
97,804 |
|
|
|
4,589,436 |
||
|
Medical Equipment & Supplies - 2.4% |
|||
|
Baxter International, Inc. |
2,997,900 |
233,087 |
|
|
Becton, Dickinson & Co. |
2,186,500 |
55,209 |
|
|
C.R. Bard, Inc. (d) |
4,131,200 |
206,818 |
|
|
Cardinal Health, Inc. |
1,194,400 |
87,788 |
|
|
Guidant Corp. (a) |
515,200 |
29,044 |
|
|
Johnson & Johnson |
1,052,500 |
97,948 |
|
|
McKesson HBOC, Inc. |
1,600,000 |
38,900 |
|
|
Medtronic, Inc. |
2,243,790 |
114,574 |
|
|
Stryker Corp. |
3,008,400 |
129,173 |
|
|
|
992,541 |
||
|
Medical Facilities Management - 0.9% |
|||
|
HCA - The Healthcare Co. |
1,975,300 |
67,160 |
|
|
UnitedHealth Group, Inc. |
2,567,000 |
210,013 |
|
|
Wellpoint Health Networks, Inc. (a) |
1,324,900 |
115,515 |
|
|
|
392,688 |
||
|
TOTAL HEALTH |
5,974,665 |
||
|
INDUSTRIAL MACHINERY & EQUIPMENT - 7.1% |
|||
|
Electrical Equipment - 5.2% |
|||
|
Emerson Electric Co. |
1,024,000 |
62,528 |
|
|
General Electric Co. |
40,695,200 |
2,093,257 |
|
|
|
2,155,785 |
||
|
Industrial Machinery & Equipment - 1.9% |
|||
|
Caterpillar, Inc. |
341,400 |
11,629 |
|
|
Illinois Tool Works, Inc. |
385,400 |
22,064 |
|
|
Ingersoll-Rand Co. |
846,100 |
33,209 |
|
|
Tyco International Ltd. |
13,215,700 |
707,040 |
|
|
|
773,942 |
||
|
TOTAL INDUSTRIAL MACHINERY & EQUIPMENT |
2,929,727 |
||
|
Common Stocks - continued |
|||
|
Shares |
Value (Note 1) (000s) |
||
|
MEDIA & LEISURE - 3.1% |
|||
|
Broadcasting - 1.1% |
|||
|
AT&T Corp. - Liberty Media Group Class A (a) |
1,500,000 |
$ 33,375 |
|
|
Clear Channel Communications, Inc. (a) |
1,350,000 |
102,853 |
|
|
Comcast Corp. Class A (special) (a) |
1,563,800 |
53,194 |
|
|
Infinity Broadcasting Corp. Class A (a) |
2,696,000 |
95,034 |
|
|
Time Warner, Inc. |
1,913,964 |
146,777 |
|
|
Univision Communications, Inc. Class A (a) |
100,000 |
12,425 |
|
|
|
443,658 |
||
|
Entertainment - 1.4% |
|||
|
Fox Entertainment Group, Inc. Class A (a) |
265,000 |
8,116 |
|
|
MGM Grand, Inc. |
850,000 |
30,547 |
|
|
Viacom, Inc. Class B (non-vtg.) (a) |
3,886,816 |
257,744 |
|
|
Walt Disney Co. |
7,347,800 |
284,268 |
|
|
|
580,675 |
||
|
Leisure Durables & Toys - 0.1% |
|||
|
Harley-Davidson, Inc. |
950,000 |
42,631 |
|
|
Lodging & Gaming - 0.3% |
|||
|
Starwood Hotels & Resorts Worldwide, Inc. unit |
4,433,043 |
151,278 |
|
|
Restaurants - 0.2% |
|||
|
McDonald's Corp. |
1,446,200 |
45,555 |
|
|
Starbucks Corp. (a) |
668,100 |
25,054 |
|
|
Tricon Global Restaurants, Inc. (a) |
168,610 |
4,078 |
|
|
|
74,687 |
||
|
TOTAL MEDIA & LEISURE |
1,292,929 |
||
|
NONDURABLES - 5.0% |
|||
|
Beverages - 1.5% |
|||
|
Anheuser-Busch Companies, Inc. |
2,024,700 |
162,988 |
|
|
Seagram Co. Ltd. |
200,000 |
11,213 |
|
|
The Coca-Cola Co. |
5,753,600 |
352,768 |
|
|
Whitman Corp. |
5,197,800 |
77,642 |
|
|
|
604,611 |
||
|
Foods - 1.9% |
|||
|
Bestfoods |
2,027,500 |
141,165 |
|
|
PepsiCo, Inc. |
6,248,400 |
286,255 |
|
|
Quaker Oats Co. |
2,186,090 |
147,015 |
|
|
Sysco Corp. |
5,398,100 |
212,550 |
|
|
|
786,985 |
||
|
Common Stocks - continued |
|||
|
Shares |
Value (Note 1) (000s) |
||
|
NONDURABLES - continued |
|||
|
Household Products - 0.8% |
|||
|
Avon Products, Inc. |
1,363,600 |
$ 54,118 |
|
|
Colgate-Palmolive Co. |
2,410,100 |
134,212 |
|
|
Gillette Co. |
1,811,500 |
52,873 |
|
|
Procter & Gamble Co. |
1,467,300 |
83,453 |
|
|
|
324,656 |
||
|
Tobacco - 0.8% |
|||
|
Philip Morris Companies, Inc. |
14,053,200 |
354,843 |
|
|
TOTAL NONDURABLES |
2,071,095 |
||
|
RETAIL & WHOLESALE - 5.0% |
|||
|
Apparel Stores - 0.3% |
|||
|
Gap, Inc. |
200,000 |
7,163 |
|
|
The Limited, Inc. |
5,595,600 |
114,360 |
|
|
|
121,523 |
||
|
Drug Stores - 0.7% |
|||
|
CVS Corp. |
434,468 |
17,134 |
|
|
Walgreen Co. |
8,397,800 |
261,906 |
|
|
|
279,040 |
||
|
General Merchandise Stores - 2.2% |
|||
|
Kohls Corp. (a) |
1,637,400 |
92,922 |
|
|
Target Corp. |
575,200 |
16,681 |
|
|
Wal-Mart Stores, Inc. |
14,482,500 |
795,632 |
|
|
|
905,235 |
||
|
Grocery Stores - 0.2% |
|||
|
Safeway, Inc. (a) |
1,557,500 |
70,185 |
|
|
Retail & Wholesale, Miscellaneous - 1.6% |
|||
|
Best Buy Co., Inc. (a) |
1,157,600 |
84,215 |
|
|
Home Depot, Inc. |
11,319,250 |
585,771 |
|
|
Staples, Inc. (a) |
1,558,700 |
21,530 |
|
|
|
691,516 |
||
|
TOTAL RETAIL & WHOLESALE |
2,067,499 |
||
|
Common Stocks - continued |
|||
|
Shares |
Value (Note 1) (000s) |
||
|
SERVICES - 0.9% |
|||
|
Advertising - 0.5% |
|||
|
Interpublic Group of Companies, Inc. |
2,284,334 |
$ 91,516 |
|
|
Omnicom Group, Inc. |
1,381,400 |
117,419 |
|
|
|
208,935 |
||
|
Printing - 0.0% |
|||
|
Deluxe Corp. |
693,800 |
14,917 |
|
|
Services - 0.4% |
|||
|
ACNielsen Corp. (a) |
541,332 |
13,263 |
|
|
Ecolab, Inc. |
958,900 |
34,341 |
|
|
Robert Half International, Inc. (a) |
465,400 |
15,998 |
|
|
Viad Corp. |
3,377,700 |
88,031 |
|
|
|
151,633 |
||
|
TOTAL SERVICES |
375,485 |
||
|
TECHNOLOGY - 27.8% |
|||
|
Communications Equipment - 7.2% |
|||
|
3Com Corp. |
1,150,000 |
15,597 |
|
|
ADC Telecommunications, Inc. (a) |
5,386,800 |
225,909 |
|
|
Cisco Systems, Inc. (a) |
23,949,700 |
1,567,208 |
|
|
Comverse Technology, Inc. (a) |
645,800 |
56,669 |
|
|
Corning, Inc. |
920,300 |
215,293 |
|
|
Lucent Technologies, Inc. |
5,050,729 |
220,969 |
|
|
Nokia AB sponsored ADR |
1,111,300 |
49,244 |
|
|
Nortel Networks Corp. |
7,568,554 |
562,911 |
|
|
Tellabs, Inc. (a) |
953,100 |
61,952 |
|
|
|
2,975,752 |
||
|
Computer Services & Software - 7.1% |
|||
|
Adobe Systems, Inc. |
1,169,600 |
133,919 |
|
|
America Online, Inc. (a) |
3,438,400 |
183,310 |
|
|
Ariba, Inc. |
150,000 |
17,391 |
|
|
Automatic Data Processing, Inc. |
3,144,300 |
155,839 |
|
|
BEA Systems, Inc. (a) |
1,044,900 |
44,996 |
|
|
Cadence Design Systems, Inc. (a) |
922,000 |
19,247 |
|
|
Ceridian Corp. (a)(d) |
7,531,800 |
171,348 |
|
|
Computer Associates International, Inc. |
824,200 |
20,450 |
|
|
DST Systems, Inc. (a) |
842,800 |
78,696 |
|
|
Electronic Data Systems Corp. |
1,871,300 |
80,466 |
|
|
Exodus Communications, Inc. (a) |
650,000 |
28,884 |
|
|
First Data Corp. |
1,516,300 |
69,845 |
|
|
Common Stocks - continued |
|||
|
Shares |
Value (Note 1) (000s) |
||
|
TECHNOLOGY - continued |
|||
|
Computer Services & Software - continued |
|||
|
Healtheon/WebMD Corp. (a) |
574,030 |
$ 7,642 |
|
|
IMS Health, Inc. |
11,943,600 |
215,731 |
|
|
Microsoft Corp. (a) |
14,593,600 |
1,018,816 |
|
|
Oracle Corp. (a) |
8,255,320 |
620,697 |
|
|
Siebel Systems, Inc. (a) |
275,000 |
39,875 |
|
|
VeriSign, Inc. (a) |
75,000 |
11,902 |
|
|
Yahoo!, Inc. (a) |
268,800 |
34,591 |
|
|
|
2,953,645 |
||
|
Computers & Office Equipment - 6.9% |
|||
|
Apple Computer, Inc. (a) |
422,800 |
21,484 |
|
|
Brocade Communications Systems, Inc. (a) |
315,700 |
56,392 |
|
|
Compaq Computer Corp. |
6,852,600 |
192,301 |
|
|
Dell Computer Corp. (a) |
4,189,200 |
184,063 |
|
|
EMC Corp. (a) |
7,522,000 |
640,310 |
|
|
Hewlett-Packard Co. |
3,244,200 |
354,226 |
|
|
International Business Machines Corp. |
2,994,800 |
336,728 |
|
|
Palm, Inc. |
1,705,689 |
66,522 |
|
|
Pitney Bowes, Inc. |
8,307,720 |
287,655 |
|
|
Seagate Technology, Inc. (a) |
2,258,900 |
114,498 |
|
|
Sun Microsystems, Inc. (a) |
5,943,200 |
626,636 |
|
|
|
2,880,815 |
||
|
Electronic Instruments - 0.5% |
|||
|
Agilent Technologies, Inc. |
1,437,579 |
58,581 |
|
|
Applied Materials, Inc. (a) |
1,451,600 |
110,140 |
|
|
KLA-Tencor Corp. (a) |
764,700 |
40,720 |
|
|
|
209,441 |
||
|
Electronics - 6.1% |
|||
|
Advanced Micro Devices, Inc. (a) |
1,420,300 |
102,173 |
|
|
Analog Devices, Inc. (a) |
1,564,400 |
104,619 |
|
|
Avnet, Inc. |
158,500 |
9,025 |
|
|
Intel Corp. |
21,883,600 |
1,460,730 |
|
|
JDS Uniphase Corp. (a) |
548,200 |
64,756 |
|
|
Linear Technology Corp. |
982,000 |
54,256 |
|
|
LSI Logic Corp. (a) |
1,029,600 |
34,878 |
|
|
Micron Technology, Inc. (a) |
2,362,152 |
192,515 |
|
|
Motorola, Inc. |
2,315,000 |
76,540 |
|
|
NVIDIA Corp. (a) |
444,500 |
26,670 |
|
|
Samsung Electronics Co. Ltd. |
29,000 |
7,661 |
|
|
SDL, Inc. (a) |
95,000 |
32,971 |
|
|
Common Stocks - continued |
|||
|
Shares |
Value (Note 1) (000s) |
||
|
TECHNOLOGY - continued |
|||
|
Electronics - continued |
|||
|
Texas Instruments, Inc. |
5,676,800 |
$ 333,157 |
|
|
TyCom Ltd. |
313,500 |
10,679 |
|
|
|
2,510,630 |
||
|
TOTAL TECHNOLOGY |
11,530,283 |
||
|
TRANSPORTATION - 0.6% |
|||
|
Air Transportation - 0.4% |
|||
|
AMR Corp. |
375,300 |
12,408 |
|
|
Southwest Airlines Co. |
6,919,362 |
163,470 |
|
|
|
175,878 |
||
|
Railroads - 0.2% |
|||
|
Burlington Northern Santa Fe Corp. |
2,555,600 |
62,452 |
|
|
TOTAL TRANSPORTATION |
238,330 |
||
|
UTILITIES - 6.6% |
|||
|
Cellular - 1.7% |
|||
|
ALLTEL Corp. |
725,300 |
44,697 |
|
|
AT&T Corp. - Wireless Group |
4,221,900 |
116,102 |
|
|
Nextel Communications, Inc. Class A (a) |
3,244,200 |
181,472 |
|
|
QUALCOMM, Inc. (a) |
668,300 |
43,398 |
|
|
Sprint Corp. - PCS Group Series 1 (a) |
3,600,000 |
198,900 |
|
|
Vodafone Group PLC sponsored ADR |
2,402,850 |
103,623 |
|
|
VoiceStream Wireless Corp. (a) |
327,820 |
42,043 |
|
|
|
730,235 |
||
|
Gas - 0.6% |
|||
|
El Paso Energy Corp. |
1,119,500 |
54,156 |
|
|
Enron Corp. |
2,113,100 |
155,577 |
|
|
Williams Companies, Inc. |
751,500 |
31,375 |
|
|
|
241,108 |
||
|
Telephone Services - 4.3% |
|||
|
Allegiance Telecom, Inc. (a) |
250,000 |
13,891 |
|
|
AT&T Corp. |
7,293,914 |
225,655 |
|
|
BellSouth Corp. |
8,369,700 |
333,219 |
|
|
Level 3 Communications, Inc. (a) |
175,000 |
11,977 |
|
|
NEXTLINK Communications, Inc. Class A (a) |
300,000 |
9,919 |
|
|
Qwest Communications International, Inc. (a) |
5,579,828 |
261,903 |
|
|
SBC Communications, Inc. |
12,359,300 |
526,043 |
|
|
Common Stocks - continued |
|||
|
Shares |
Value (Note 1) (000s) |
||
|
UTILITIES - continued |
|||
|
Telephone Services - continued |
|||
|
Sprint Corp. - FON Group |
875,600 |
$ 31,193 |
|
|
Verizon Communications |
4,108,140 |
193,083 |
|
|
WorldCom, Inc. (a) |
4,509,514 |
176,153 |
|
|
|
1,783,036 |
||
|
TOTAL UTILITIES |
2,754,379 |
||
|
TOTAL COMMON STOCKS (Cost $22,196,717) |
39,880,417 |
||
|
Convertible Preferred Stocks - 0.1% |
|||
|
|
|
|
|
|
FINANCE - 0.1% |
|||
|
Credit & Other Finance - 0.1% |
|||
|
Union Pacific Capital Trust $3.125 TIDES (e) |
1,377,000 |
58,006 |
|
|
Convertible Bonds - 0.4% |
|||||
|
Moody's Ratings (unaudited) (b) |
Principal Amount (000s) |
|
|||
|
TECHNOLOGY - 0.2% |
|||||
|
Computers & Office Equipment - 0.1% |
|||||
|
Juniper Networks, Inc. 4.75% 3/15/07 |
B- |
|
$ 28,800 |
31,626 |
|
|
Electronics - 0.1% |
|||||
|
Vitesse Semiconductor Corp. 4% 3/15/05 (e) |
B2 |
|
36,697 |
30,550 |
|
|
TOTAL TECHNOLOGY |
62,176 |
||||
|
UTILITIES - 0.2% |
|||||
|
Cellular - 0.1% |
|||||
|
Nextel Communications, Inc. 5.25% 1/15/10 (e) |
B1 |
|
50,000 |
50,250 |
|
|
Telephone Services - 0.1% |
|||||
|
Level 3 Communications, Inc. 6% 3/15/10 |
Caa1 |
|
42,370 |
33,896 |
|
|
TOTAL UTILITIES |
84,146 |
||||
|
TOTAL CONVERTIBLE BONDS (Cost $157,137) |
146,322 |
||||
|
U.S. Treasury Obligations - 0.1% |
|||||
|
Moody's Ratings (unaudited) (b) |
Principal Amount (000s) |
Value (Note 1) (000s) |
|||
|
U.S. Treasury Bills, yield at date of purchase 6.03% 8/10/00 (f) |
- |
|
$ 12,500 |
$ 12,482 |
|
|
U.S. Treasury Bonds 8.125% 8/15/19 |
Aaa |
|
10,000 |
12,220 |
|
|
TOTAL U.S. TREASURY OBLIGATIONS (Cost $22,738) |
24,702 |
||||
|
Cash Equivalents - 3.1% |
|||
|
Shares |
|
||
|
Fidelity Cash Central Fund, 6.57% (c) |
1,292,662,656 |
1,292,663 |
|
|
Fidelity Securities Lending Cash Central Fund, 6.65% (c) |
3,609,456 |
3,609 |
|
|
TOTAL CASH EQUIVALENTS (Cost $1,296,272) |
1,296,272 |
||
|
TOTAL INVESTMENT PORTFOLIO - 99.9% (Cost $23,741,714) |
41,405,719 |
||
|
NET OTHER ASSETS - 0.1% |
34,232 |
||
|
NET ASSETS - 100% |
$ 41,439,951 |
||
|
Futures Contracts |
|||||
|
|
Expiration Date |
Underlying Face Amount at Value (000s) |
Unrealized Gain/Loss (000s) |
||
|
Purchased |
|||||
|
600 S&P 500 Stock Index Contracts |
Sept. 2000 |
$ 215,835 |
$ (6,811) |
||
|
The face value of futures purchased as a percentage of net assets - 0.5% |
|
Security Type Abbreviations |
||
|
TIDES |
- |
Term Income Deferred Equity Securities |
|
Legend |
|
(a) Non-income producing |
|
(b) S&P® credit ratings are used in the absence of a rating by Moody's Investors Service, Inc. |
|
(c) The rate quoted is the annualized seven-day yield of the fund at period end. |
|
(d) Affiliated company |
|
(e) Security exempt from registration under Rule 144A of the Securities Act of 1933. These securities may be resold in transactions exempt from registration, normally to qualified institutional buyers. At the period end, the value of these securities amounted to $138,806,000 or 0.3% of net assets. |
|
(f) Security or a portion of the security was pledged to cover margin requirements for futures contracts. At the period end, the value of securities pledged amounted to $12,482,000. |
|
Income Tax Information |
|
At July 31, 2000, the aggregate cost of investment securities for income tax purposes was $23,838,645,000. Net unrealized appreciation aggregated $17,567,074,000, of which $18,660,989,000 related to appreciated investment securities and $1,093,915,000 related to depreciated investment securities. |
|
The fund hereby designates approximately $3,426,974,000 as a capital gain dividend for the purpose of the dividend paid deduction. |
See accompanying notes which are an integral part of the financial statements.
Annual Report
Statement of Assets and Liabilities
|
Amounts in thousands (except per-share amount) |
July 31, 2000 |
|
|
Assets |
|
|
|
Investment in securities, at value (cost $23,741,714) - |
|
$ 41,405,719 |
|
Cash |
|
289 |
|
Receivable for investments sold |
|
136,734 |
|
Receivable for fund shares sold |
|
23,077 |
|
Dividends receivable |
|
23,545 |
|
Interest receivable |
|
11,606 |
|
Receivable for daily variation on futures contracts |
|
1,035 |
|
Other receivables |
|
1,719 |
|
Total assets |
|
41,603,724 |
|
Liabilities |
|
|
|
Payable for investments purchased |
$ 42,397 |
|
|
Payable for fund shares redeemed |
94,756 |
|
|
Accrued management fee |
16,829 |
|
|
Other payables and accrued expenses |
6,182 |
|
|
Collateral on securities loaned, at value |
3,609 |
|
|
Total liabilities |
|
163,773 |
|
Net Assets |
|
$ 41,439,951 |
|
Net Assets consist of: |
|
|
|
Paid in capital |
|
$ 20,657,228 |
|
Undistributed net investment income |
|
31,244 |
|
Accumulated undistributed net realized gain (loss) on investments and foreign currency transactions |
|
3,094,307 |
|
Net unrealized appreciation (depreciation) on investments and assets and liabilities in foreign currencies |
|
17,657,172 |
|
Net Assets, for 884,902 shares outstanding |
|
$ 41,439,951 |
|
Net Asset Value, offering price and redemption price |
|
$46.83 |
See accompanying notes which are an integral part of the financial statements.
Annual Report
Financial Statements - continued
Statement of Operations
|
Amounts in thousands |
Year ended July 31, 2000 |
|
|
Investment Income Dividends (including $20,646 received from |
|
$ 513,714 |
|
Interest |
|
151,715 |
|
Security lending |
|
1,092 |
|
Total income |
|
666,521 |
|
Expenses |
|
|
|
Management fee |
$ 215,201 |
|
|
Transfer agent fees |
84,159 |
|
|
Accounting and security lending fees |
1,580 |
|
|
Non-interested trustees' compensation |
184 |
|
|
Custodian fees and expenses |
569 |
|
|
Registration fees |
279 |
|
|
Audit |
230 |
|
|
Legal |
243 |
|
|
Reports to shareholders |
1,777 |
|
|
Miscellaneous |
95 |
|
|
Total expenses before reductions |
304,317 |
|
|
Expense reductions |
(8,644) |
295,673 |
|
Net investment income |
|
370,848 |
|
Realized and Unrealized Gain (Loss) Net realized gain (loss) on: |
|
|
|
Investment securities (including realized loss of $52,637 on sales of investments in affiliated issuers) |
3,589,675 |
|
|
Foreign currency transactions |
(185) |
|
|
Futures contracts |
(11,411) |
3,578,079 |
|
Change in net unrealized appreciation (depreciation) on: |
|
|
|
Investment securities |
(1,204,123) |
|
|
Assets and liabilities in foreign currencies |
(76) |
|
|
Futures contracts |
(6,811) |
(1,211,010) |
|
Net gain (loss) |
|
2,367,069 |
|
Net increase (decrease) in net assets resulting |
|
$ 2,737,917 |
See accompanying notes which are an integral part of the financial statements.
Annual Report
Financial Statements - continued
Statement of Changes in Net Assets
|
Amounts in thousands |
Year ended |
Year ended |
|
Increase (Decrease) in Net Assets |
|
|
|
Operations |
$ 370,848 |
$ 410,496 |
|
Net realized gain (loss) |
3,578,079 |
3,291,211 |
|
Change in net unrealized appreciation (depreciation) |
(1,211,010) |
2,872,590 |
|
Net increase (decrease) in net assets resulting |
2,737,917 |
6,574,297 |
|
Distributions to shareholders |
(380,427) |
(393,528) |
|
From net realized gain |
(2,962,705) |
(2,186,858) |
|
Total distributions |
(3,343,132) |
(2,580,386) |
|
Share transactions |
5,444,336 |
8,258,120 |
|
Reinvestment of distributions |
3,243,498 |
2,512,407 |
|
Cost of shares redeemed |
(15,237,863) |
(10,529,866) |
|
Net increase (decrease) in net assets resulting |
(6,550,029) |
240,661 |
|
Total increase (decrease) in net assets |
(7,155,244) |
4,234,572 |
|
Net Assets |
|
|
|
Beginning of period |
48,595,195 |
44,360,623 |
|
End of period (including undistributed net investment income of $31,244 and $46,468, respectively) |
$ 41,439,951 |
$ 48,595,195 |
|
Other Information Shares |
|
|
|
Sold |
118,963 |
186,270 |
|
Issued in reinvestment of distributions |
71,370 |
63,951 |
|
Redeemed |
(333,505) |
(236,535) |
|
Net increase (decrease) |
(143,172) |
13,686 |
See accompanying notes which are an integral part of the financial statements.
Annual Report
Financial Highlights
|
Years ended July 31, |
2000 |
1999 |
1998 |
1997 |
1996 |
|
Selected Per-Share Data |
|
|
|
|
|
|
Net asset value, |
$ 47.27 |
$ 43.73 |
$ 38.50 |
$ 28.20 |
$ 25.10 |
|
Income from |
|
|
|
|
|
|
Net investment income |
.38 B |
.39 B |
.41 B |
.46 B |
.49 |
|
Net realized and |
2.47 |
5.69 |
6.59 |
11.44 |
3.99 |
|
Total from investment operations |
2.85 |
6.08 |
7.00 |
11.90 |
4.48 |
|
Less Distributions |
|
|
|
|
|
|
From net investment income |
(.39) |
(.38) |
(.41) |
(.48) |
(.48) |
|
From net realized gain |
(2.90) |
(2.16) |
(1.36) |
(1.12) |
(.90) |
|
Total distributions |
(3.29) |
(2.54) |
(1.77) |
(1.60) |
(1.38) |
|
Net asset value, end of period |
$ 46.83 |
$ 47.27 |
$ 43.73 |
$ 38.50 |
$ 28.20 |
|
Total Return A |
6.34% |
15.20% |
19.06% |
44.16% |
18.39% |
|
Ratios and Supplemental Data |
|
|
|
|
|
|
Net assets, end of period |
$ 41,440 |
$ 48,595 |
$ 44,361 |
$ 34,284 |
$ 19,206 |
|
Ratio of expenses to |
.67% |
.68% |
.69% |
.73% |
.75% |
|
Ratio of expenses to average net assets after expense reductions |
.66% C |
.66% C |
.68% C |
.71% C |
.74% C |
|
Ratio of net investment income to average net assets |
.82% |
.88% |
1.02% |
1.43% |
1.82% |
|
Portfolio turnover rate |
41% |
35% |
32% |
38% |
41% |
A The total returns would have been lower had certain expenses not been reduced during the periods shown.
B Net investment income per share has been calculated based on average shares outstanding during the period.
C FMR or the fund has entered into varying arrangements with third parties who either paid or reduced a portion of the fund's expenses.
See accompanying notes which are an integral part of the financial statements.
Annual Report
For the period ended July 31, 2000
1. Significant Accounting Policies.
Fidelity Growth & Income Portfolio (the fund) is a fund of Fidelity Securities Fund (the trust) and is authorized to issue an unlimited number of shares. The trust is registered under the Investment Company Act of 1940, as amended, as an open-end management investment company organized as a Massachusetts business trust. Effective to close of business on April 3, 1998, the fund was closed to new accounts. The financial statements have been prepared in conformity with generally accepted accounting principles which require management to make certain estimates and assumptions at the date of the financial statements. The following summarizes the significant accounting policies of the fund:
Security Valuation. Securities for which exchange quotations are readily available are valued at the last sale price, or if no sale price, at the closing bid price. Foreign securities are valued based on quotations from the principal market in which such securities are normally traded. If trading or events occurring in other markets after the close of the principal market in which foreign securities are traded, and before the close of the business of the fund, are expected to materially affect the value of those securities, then they are valued at their fair value taking this trading or these events into account. Fair value is determined in good faith under consistently applied procedures under the general supervision of the Board of Trustees. Securities (including restricted securities) for which exchange quotations are not readily available (and in certain cases debt securities which trade on an exchange) are valued primarily using dealer-supplied valuations or at their fair value. Short-term securities with remaining maturities of sixty days or less for which quotations are not readily available are valued at amortized cost or original cost plus accrued interest, both of which approximate current value.
Foreign Currency Translation. The accounting records of the fund are maintained in U.S. dollars. Investment securities and other assets and liabilities denominated in a foreign currency are translated into U.S. dollars at the prevailing rates of exchange at period end. Purchases and sales of securities, income receipts and expense payments are translated into U.S. dollars at the prevailing exchange rate on the respective dates of the transactions.
Net realized gains and losses on foreign currency transactions represent net gains and losses from sales and maturities of foreign currency contracts, disposition of foreign currencies, the difference between the amount of net investment income accrued and the U.S. dollar amount actually received, and gains and losses between trade and settlement date on purchases and sales of securities. The effects of changes in foreign currency exchange rates on investments in securities are included with the net realized and unrealized gain or loss on investment securities.
Annual Report
Notes to Financial Statements - continued
1. Significant Accounting Policies - continued
Income Taxes. As a qualified regulated investment company under Subchapter M of the Internal Revenue Code, the fund is not subject to income taxes to the extent that it distributes substantially all of its taxable income for its fiscal year. The schedule of investments includes information regarding income taxes under the caption "Income Tax Information."
Investment Income. Dividend income is recorded on the ex-dividend date, except certain dividends from foreign securities where the ex-dividend date may have passed, are recorded as soon as the fund is informed of the ex-dividend date. Non-cash dividends included in dividend income, if any, are recorded at the fair market value of the securities received. Interest income is accrued as earned. Investment income is recorded net of foreign taxes withheld where recovery of such taxes is uncertain.
Expenses. Most expenses of the trust can be directly attributed to a fund. Expenses which cannot be directly attributed are apportioned among the funds in the trust.
Deferred Trustee Compensation. Under a Deferred Compensation Plan (the Plan) non-interested Trustees must defer receipt of a portion of, and may elect to defer receipt of an additional portion of, their annual compensation. Deferred amounts are treated as though
equivalent dollar amounts had been invested in a cross-section of other Fidelity funds. Deferred amounts remain in the fund until distributed in accordance with the Plan.
Distributions to Shareholders. Distributions are recorded on the ex-dividend date.
Income and capital gain distributions are determined in accordance with income tax regulations which may differ from generally accepted accounting principles. These differences, which may result in distribution reclassifications, are primarily due to differing treatments for litigation proceeds, futures transactions, foreign currency transactions, non-taxable dividends and losses deferred due to wash sales. The fund also utilized earnings and profits distributed to shareholders on redemption of shares as a part of the dividends paid deduction for income tax purposes.
Permanent book and tax basis differences relating to shareholder distributions will result in reclassifications to paid in capital. Undistributed net investment income and accumulated undistributed net realized gain (loss) on investments and foreign currency transactions may include temporary book and tax basis differences which will reverse in a subsequent period. Any taxable income or gain remaining at fiscal year end is distributed in the following year.
Security Transactions. Security transactions are accounted for as of trade date. Gains and losses on securities sold are determined on the basis of identified cost.
Annual Report
Notes to Financial Statements - continued
2. Operating Policies.
Foreign Currency Contracts. The fund generally uses foreign currency contracts to facilitate transactions in foreign-denominated securities. Losses may arise from changes in the value of the foreign currency or if the counterparties do not perform under the contracts' terms. The U.S. dollar value of foreign currency contracts is determined using contractual currency exchange rates established at the time of each trade.
Joint Trading Account. Pursuant to an Exemptive Order issued by the Securities and Exchange Commission (the SEC), the fund, along with other affiliated entities of Fidelity Management & Research Company (FMR), may transfer uninvested cash balances into one or more joint trading accounts. These balances are invested in one or more repurchase agreements for U.S. Treasury or Federal Agency obligations.
Repurchase Agreements. The underlying U.S. Treasury, Federal Agency, or other obligations found to be satisfactory by FMR are transferred to an account of the fund, or to the Joint Trading Account, at a custodian bank. The securities are marked-to-market daily and maintained at a value at least equal to the principal amount of the repurchase agreement (including accrued interest). FMR, the fund's investment adviser, is responsible for determining that the value of the underlying securities remains in accordance with the market value requirements stated above.
Cash Central Funds. Pursuant to an Exemptive Order issued by the SEC, the fund may invest in the Fidelity Cash Central Fund and the Fidelity Securities Lending Cash Central Fund (the Cash Funds) managed by Fidelity Investments Money Management, Inc., an affiliate of FMR. The Cash Funds are open-end money market funds available only to investment companies and other accounts managed by FMR and its affiliates. The Cash Funds seek preservation of capital, liquidity, and current income. Income distributions from the Cash Funds are declared daily and paid monthly from net interest income. Income distributions earned by the fund are recorded as either interest income or security lending income in the accompanying financial statements.
Futures Contracts. The fund may use futures contracts to manage its exposure to the stock market. Buying futures tends to increase the fund's exposure to the underlying instrument, while selling futures tends to decrease the fund's exposure to the underlying instrument or hedge other fund investments. Futures contracts involve, to varying degrees, risk of loss in excess of the futures variation margin reflected in the Statement of Assets and Liabilities. The underlying face amount at value of any open futures contracts at period end is shown in the schedule of investments under the caption "Futures Contracts." This amount reflects each contract's exposure to the underlying instrument at period end. Losses may arise from changes in the value of the underlying instruments or if the counterparties do not
Annual Report
Notes to Financial Statements - continued
2. Operating Policies - continued
Futures Contracts - continued
perform under the contracts' terms. Gains (losses) are realized upon the expiration or closing of the futures contracts. Futures contracts are valued at the settlement price established each day by the board of trade or exchange on which they are traded.
Restricted Securities. The fund is permitted to invest in securities that are subject to legal or contractual restrictions on resale. These securities generally may be resold in transactions exempt from registration or to the public if the securities are registered. Disposal of these securities may involve time-consuming negotiations and expense, and prompt sale at an acceptable price may be difficult. At the end of the period, the fund had no investments in restricted securities (excluding 144A issues).
3. Purchases and Sales of Investments.
Purchases and sales of securities, other than short-term securities, aggregated $17,518,084,000 and $25,556,761,000, respectively, of which U.S. government and government agency obligations aggregated $0 and $155,951,000, respectively.
The market value of futures contracts opened and closed during the period amounted to $1,204,646,000 and $970,589,000, respectively.
4. Fees and Other Transactions with Affiliates.
Management Fee. As the fund's investment adviser, FMR receives a monthly fee that is calculated on the basis of a group fee rate plus a fixed individual fund fee rate applied to the average net assets of the fund. The group fee rate is the weighted average of a series of rates and is based on the monthly average net assets of all the mutual funds advised by FMR. The rates ranged from .2167% to .5200% for the period. The annual individual fund fee rate is .20%. In the event that these rates were lower than the contractual rates in effect during the period, FMR voluntarily implemented the above rates, as they resulted in the same or a lower management fee. For the period, the management fee was equivalent to an annual rate of .48% of average net assets.
Transfer Agent Fees. Fidelity Service Company, Inc. (FSC), an affiliate of FMR, is the fund's transfer, dividend disbursing and shareholder servicing agent. FSC receives account fees and asset-based fees that vary according to account size and type of account. FSC pays for typesetting, printing and mailing of all shareholder reports, except proxy statements. For the period, the transfer agent fees were equivalent to an annual rate of .19% of average net assets.
Annual Report
Notes to Financial Statements - continued
4. Fees and Other Transactions with Affiliates - continued
Accounting and Security Lending Fees. FSC, maintains the fund's accounting records and administers the security lending program. The security lending fee is based on the number and duration of lending transactions. The accounting fee is based on the level of average net assets for the month plus out-of-pocket expenses.
Brokerage Commissions. The fund placed a portion of its portfolio transactions with brokerage firms which are affiliates of FMR. The commissions paid to these affiliated firms were $1,067,000 for the period.
5. Security Lending.
The fund lends portfolio securities from time to time in order to earn additional income. The fund receives collateral in the form of U.S. Treasury obligations, letters of credit, and/or cash against the loaned securities, and maintains collateral in an amount not less than 100% of the market value of the loaned securities during the period of the loan. The market value of the loaned securities is determined at the close of business of the fund and any additional required collateral is delivered to the fund on the next business day. If the borrower defaults on its obligation to return the securities loaned because of insolvency or other reasons, the fund could experience delays and costs in recovering the securities loaned or in gaining access to the collateral. At period end, the value of the securities loaned amounted to $3,538,000. The fund received cash collateral of $3,609,000 which was invested in cash equivalents.
6. Expense Reductions.
FMR has directed certain portfolio trades to brokers who paid a portion of the fund's expenses. For the period, the fund's expenses were reduced by $5,841,000 under this arrangement.
In addition, through arrangements with the fund's custodian and transfer agent, credits realized as a result of uninvested cash balances were used to reduce a portion of the fund's expenses. During the period, the fund's custodian and transfer agent fees were reduced by $2,000 and $2,801,000, respectively, under these arrangements.
Annual Report
Notes to Financial Statements - continued
7. Transactions with Affiliated Companies.
An affiliated company is a company in which the fund has ownership of at least 5% of the voting securities. Transactions during the period with companies which are or were affiliates are as follows:
|
Summary of Transactions with Affiliated Companies |
||||||||
|
Amounts in thousands Affiliate |
|
Purchase |
|
Sales |
|
Dividend |
|
Value |
|
C.R. Bard, Inc. |
|
$ 16,538 |
|
$ 22,021 |
|
$ 3,560 |
|
$ 206,818 |
|
CBL & Associates Properties, Inc. |
|
- |
|
5,122 |
|
4,293 |
|
48,798 |
|
Capital Trust, Inc. Class A |
|
- |
|
6,818 |
|
- |
|
- |
|
Ceridian Corp. |
|
11,351 |
|
16,935 |
|
- |
|
171,348 |
|
H&R Block, Inc. |
|
- |
|
34,449 |
|
4,316 |
|
- |
|
IMS Health, Inc. |
|
23,436 |
|
87,219 |
|
669 |
|
- |
|
Litton Industries, Inc. |
|
1,412 |
|
54,243 |
|
- |
|
- |
|
SLM Holding Corp. |
|
73,630 |
|
53,838 |
|
7,808 |
|
551,370 |
|
Unifi, Inc. |
|
9,141 |
|
17,262 |
|
- |
|
48,834 |
|
TOTALS |
|
$ 135,508 |
|
$ 297,907 |
|
$ 20,646 |
|
$ 1,027,168 |
Annual Report
To the Trustees of Fidelity Securities Fund and the Shareholders of Fidelity Growth & Income Portfolio:
In our opinion, the accompanying statement of assets and liabilities, including the schedule of investments, and the related statements of operations and of changes in net assets and the financial highlights present fairly, in all material respects, the financial position of Fidelity Growth & Income Portfolio (a fund of Fidelity Securities Fund) at July 31, 2000, and the results of its operations, the changes in its net assets and the financial highlights for the periods indicated, in conformity with accounting principles generally accepted in the United States. These financial statements and financial highlights (hereafter referred to as "financial statements") are the responsibility of the Fidelity Growth & Income Portfolio's management; our responsibility is to express an opinion on these financial statements based on our audits. We conducted our audits of these financial statements in accordance with auditing standards generally accepted in the United States which require that we plan and perform the audit to obtain reasonable assurance about whether the financial statements are free of material misstatement. An audit includes examining, on a test basis, evidence supporting the amounts and disclosures in the financial statements, assessing the accounting principles used and significant estimates made by management, and evaluating the overall financial statement presentation. We believe that our audits, which included confirmation of securities at July 31, 2000 by correspondence with the custodian and brokers, provide a reasonable basis for the opinion expressed above.
/s/PricewaterhouseCoopers LLP
PricewaterhouseCoopers LLP
Boston, Massachusetts
September 8, 2000
Annual Report
The Board of Trustees of Fidelity Growth & Income Portfolio voted to pay on September 11, 2000, to shareholders of record at the opening of business on September 8, 2000, a distribution of $3.09 per share derived from capital gains realized from sales of portfolio securities and a dividend of $.08 per share from net investment income.
A total of 100% of the dividends distributed during the fiscal year qualifies for the dividends-received deduction for corporate shareholders.
A total of 6.70% of the dividends distributed during the fiscal year was derived from interest on U.S. Government securities which is generally exempt from state income tax.
The fund hereby designates 100% of the long-term capital gain dividends distributed during the fiscal year as 20%-rate capital gain dividends.
The fund will notify shareholders in January 2001 of amounts for use in preparing 2000 income tax returns.
Annual Report
A special meeting of the fund's shareholders was held on June 14, 2000. The results of votes taken among shareholders on proposals before them are reported below. Each vote reported represents one dollar of net asset value held on the record date for the meeting.
|
PROPOSAL 1 |
||
|
To elect a Board of Trustees.* |
||
|
|
# of |
% of |
|
Ralph F. Cox |
||
|
Affirmative |
45,879,831,565.22 |
97.815 |
|
Withheld |
1,025,023,341.61 |
2.185 |
|
TOTAL |
46,904,854,906.83 |
100.000 |
|
Phyllis Burke Davis |
||
|
Affirmative |
45,860,078,281.02 |
97.773 |
|
Withheld |
1,044,776,625.81 |
2.227 |
|
TOTAL |
46,904,854,906.83 |
100.000 |
|
Robert M. Gates |
||
|
Affirmative |
45,855,277,358.57 |
97.762 |
|
Withheld |
1,049,577,548.26 |
2.238 |
|
TOTAL |
46,904,854,906.83 |
100.000 |
|
Edward C. Johnson 3d |
||
|
Affirmative |
45,870,463,926.34 |
97.795 |
|
Withheld |
1,034,390,980.49 |
2.205 |
|
TOTAL |
46,904,854,906.83 |
100.000 |
|
Ned C. Lautenbach |
||
|
Affirmative |
45,908,380,446.26 |
97.876 |
|
Withheld |
996,474,460.57 |
2.124 |
|
TOTAL |
46,904,854,906.83 |
100.000 |
|
Donald J. Kirk |
||
|
Affirmative |
45,885,184,726.69 |
97.826 |
|
Withheld |
1,019,670,180.14 |
2.174 |
|
TOTAL |
46,904,854,906.83 |
100.000 |
|
|
||
|
|
||
|
|
# of |
% of |
|
Peter S. Lynch |
||
|
Affirmative |
45,908,650,981.55 |
97.876 |
|
Withheld |
996,203,925.28 |
2.124 |
|
TOTAL |
46,904,854,906.83 |
100.000 |
|
William O. McCoy |
||
|
Affirmative |
45,884,024,635.43 |
97.824 |
|
Withheld |
1,020,830,271.40 |
2.176 |
|
TOTAL |
46,904,854,906.83 |
100.000 |
|
Gerald C. McDonough |
||
|
Affirmative |
45,813,850,456.73 |
97.674 |
|
Withheld |
1,091,004,450.10 |
2.326 |
|
TOTAL |
46,904,854,906.83 |
100.000 |
|
Marvin L. Mann |
||
|
Affirmative |
45,890,658,904.13 |
97.838 |
|
Withheld |
1,014,196,002.70 |
2.162 |
|
TOTAL |
46,904,854,906.83 |
100.000 |
|
Robert C. Pozen |
||
|
Affirmative |
45,900,540,034.23 |
97.859 |
|
Withheld |
1,004,314,872.60 |
2.141 |
|
TOTAL |
46,904,854,906.83 |
100.000 |
|
Thomas R. Williams |
||
|
Affirmative |
45,827,262,492.26 |
97.703 |
|
Withheld |
1,077,592,414.57 |
2.297 |
|
TOTAL |
46,904,854,906.83 |
100.000 |
|
PROPOSAL 2 |
||
|
To ratify the selection of PricewaterhouseCoopers LLP as independent accountant of the fund. |
||
|
|
# of |
% of |
|
Affirmative |
19,600,770,357.02 |
92.614 |
|
Against |
267,428,302.72 |
1.264 |
|
Abstain |
1,295,645,232.21 |
6.122 |
|
TOTAL |
21,163,843,891.95 |
100.000 |
|
PROPOSAL 3 |
||
|
To authorize the Trustees to adopt an amended and restated Declaration of Trust.* |
||
|
|
# of |
% of |
|
Affirmative |
41,410,483,631.45 |
88.286 |
|
Against |
2,396,147,050.82 |
5.109 |
|
Abstain |
3,098,224,224.56 |
6.605 |
|
TOTAL |
46,904,854,906.83 |
100.000 |
|
PROPOSAL 4 |
||
|
To approve an amended management contract for the fund. |
||
|
|
# of |
% of |
|
Affirmative |
18,768,284,152.15 |
88.681 |
|
Against |
755,523,571.23 |
3.570 |
|
Abstain |
1,640,036,168.57 |
7.749 |
|
TOTAL |
21,163,843,891.95 |
100.000 |
|
PROPOSAL 5 |
||
|
To approve an amended sub-advisory agreement with Fidelity Management & Research (Far East) Inc. for the fund. |
||
|
|
# of |
% of |
|
Affirmative |
18,667,453,548.12 |
88.204 |
|
Against |
787,217,423.79 |
3.720 |
|
Abstain |
1,709,172,920.04 |
8.076 |
|
TOTAL |
21,163,843,891.95 |
100.000 |
|
PROPOSAL 6 |
||
|
To approve an amended sub-advisory agreement with Fidelity Management & Research (U.K.) for the fund. |
||
|
|
# of |
% of |
|
Affirmative |
18,686,271,553.56 |
88.293 |
|
Against |
771,817,958.90 |
3.647 |
|
Abstain |
1,705,754,379.49 |
8.060 |
|
TOTAL |
21,163,843,891.95 |
100.000 |
|
PROPOSAL 7 |
||
|
To approve a Distribution and Service Plan pursuant to Rule 12b-1 for the fund. |
||
|
|
# of |
% of |
|
Affirmative |
18,435,191,820.38 |
87.107 |
|
Against |
1,015,689,440.52 |
4.799 |
|
Abstain |
1,712,962,631.05 |
8.094 |
|
TOTAL |
21,163,843,891.95 |
100.000 |
|
PROPOSAL 8 |
||
|
To amend the fund's fundamental investment limitation concerning diversification for the fund to exclude "securities of other investment companies" from the limitation. |
||
|
|
# of |
% of |
|
Affirmative |
18,405,331,032.70 |
86.966 |
|
Against |
1,079,393,491.71 |
5.100 |
|
Abstain |
1,679,119,367.54 |
7.934 |
|
TOTAL |
21,163,843,891.95 |
100.000 |
* Denotes trust-wide proposals and voting results.
Annual Report
Fidelity offers several ways to conveniently manage your personal investments via your telephone or PC. You can access your account information, conduct trades and research your investments 24 hours a day.
By Phone
Fidelity Automated Service Telephone provides a single toll-free number to access account balances, positions, quotes and trading. It's easy to navigate the service, and on your first call, the system will help you create a personal identification number (PIN) for security.
(phone_graphic)
Fidelity Automated
Service Telephone (FAST®)
1-800-544-5555
Press
1 For mutual fund and brokerage trading.
2 For quotes.*
3 For account balances and holdings.
4 To review orders and mutual
fund activity.
5 To change your PIN.
*0 To speak to a Fidelity representative.
By PC
Fidelity's web site on the Internet provides a wide range of information, including daily financial news, fund performance, interactive planning tools and news about Fidelity products and services.
(computer_graphic)
Fidelity's Web Site
www.fidelity.com
If you are not currently on the Internet, call EarthLink Sprint at 1-800-288-2967, and be sure to ask for registration number SMD004 to receive a special Fidelity package that includes 30 days of free Internet access. EarthLink is North America's #1 independent Internet access provider.
(computer_graphic)
Fidelity On-line Xpress+®
Fidelity On-line Xpress+ software for Windows combines comprehensive portfolio management capabilities, securities trading and access to research and analysis tools . . . all on your desktop. Call Fidelity at 1-800-544-0240 or visit our web site for more information on how to manage your investments via your PC.
* When you call the quotes line, please remember that a fund's yield and return will vary and, except for money market funds, share price will also vary. This means that you may have a gain or loss when you sell your shares. There is no assurance that money market funds will be able to maintain a stable $1 share price; an investment in a money market fund is not insured or guaranteed by the U.S. government. Total returns are historical and include changes in share price, reinvestment of dividends and capital gains, and the effects of any sales charges.
Annual Report
If more than one address is listed, please locate the address that is closest to you. We'll give your correspondence immediate attention and send you written confirmation upon completion of your request.
(letter_graphic)
Making Changes
To Your Account
(such as changing name, address, bank, etc.)
Fidelity Investments
P.O. Box 770001
Cincinnati, OH 45277-0002
(letter_graphic)
For Non-Retirement
Accounts
Buying shares
Fidelity Investments
P.O. Box 770001
Cincinnati, OH 45277-0003
Overnight Express
Fidelity Investments
2300 Litton Lane - KH1A
Hebron, KY 41048
Selling shares
Fidelity Investments
P.O. Box 660602
Dallas, TX 75266-0602
Overnight Express
Fidelity Investments
Attn: Redemptions - CP6I
400 East Las Colinas Blvd.
Irving, TX 75039-5587
General Correspondence
Fidelity Investments
P.O. Box 500
Merrimack, NH 03054-0500
(letter_graphic)
For Retirement
Accounts
Buying shares
Fidelity Investments
P.O. Box 770001
Cincinnati, OH 45277-0003
Selling shares
Fidelity Investments
P.O. Box 660602
Dallas, TX 75266-0602
Overnight Express
Fidelity Investments
Attn: Redemptions - CP6R
400 East Las Colinas Blvd.
Irving, TX 75039-5587
General Correspondence
Fidelity Investments
P.O. Box 500
Merrimack, NH 03054-0500
Annual Report
For directions and hours,
please call 1-800-544-9797.
Arizona
7373 N. Scottsdale Road
Scottsdale, AZ
California
815 East Birch Street
Brea, CA
851 East Hamilton Avenue
Campbell, CA
527 North Brand Boulevard
Glendale, CA
19200 Von Karman Avenue
Irvine, CA
10100 Santa Monica Blvd.
Los Angeles, CA
251 University Avenue
Palo Alto, CA
1760 Challenge Way
Sacramento, CA
7676 Hazard Center Drive
San Diego, CA
8 Montgomery Street
San Francisco, CA
950 Northgate Drive
San Rafael, CA
1400 Civic Drive
Walnut Creek, CA
6300 Canoga Avenue
Woodland Hills, CA
Colorado
1625 Broadway
Denver, CO
Connecticut
48 West Putnam Avenue
Greenwich, CT
265 Church Street
New Haven, CT
300 Atlantic Street
Stamford, CT
29 South Main Street
West Hartford, CT
Delaware
222 Delaware Avenue
Wilmington, DE
Florida
4400 N. Federal Highway
Boca Raton, FL
90 Alhambra Plaza
Coral Gables, FL
4090 N. Ocean Boulevard
Ft. Lauderdale, FL
1907 West State Road 434
Longwood, FL
8880 Tamiami Trail, North
Naples, FL
2401 PGA Boulevard
Palm Beach Gardens, FL
8065 Beneva Road
Sarasota, FL
1502 N. Westshore Blvd.
Tampa, FL
Georgia
3445 Peachtree Road, N.E.
Atlanta, GA
1000 Abernathy Road
Atlanta, GA
Illinois
One North Franklin Street
Chicago, IL
1415 West 22nd Street
Oak Brook, IL
1700 East Golf Road
Schaumburg, IL
3232 Lake Avenue
Wilmette, IL
Indiana
4729 East 82nd Street
Indianapolis, IN
Maine
Three Canal Plaza
Portland, ME
Maryland
7401 Wisconsin Avenue
Bethesda, MD
One W. Pennsylvania Ave.
Towson, MD
Massachusetts
801 Boylston Street
Boston, MA
155 Congress Street
Boston, MA
25 State Street
Boston, MA
300 Granite Street
Braintree, MA
44 Mall Road
Burlington, MA
416 Belmont Street
Worcester, MA
Annual Report
Michigan
280 Old N. Woodward Ave.
Birmingham, MI
29155 Northwestern Hwy.
Southfield, MI
Minnesota
7600 France Avenue South
Edina, MN
Missouri
700 West 47th Street
Kansas City, MO
8885 Ladue Road
Ladue, MO
New Jersey
150 Essex Street
Millburn, NJ
56 South Street
Morristown, NJ
501 Route 17, South
Paramus, NJ
New York
1055 Franklin Avenue
Garden City, NY
999 Walt Whitman Road
Melville, L.I., NY
1271 Avenue of the Americas
New York, NY
71 Broadway
New York, NY
350 Park Avenue
New York, NY
North Carolina
4611 Sharon Road
Charlotte, NC
Ohio
600 Vine Street
Cincinnati, OH
28699 Chagrin Boulevard
Woodmere Village, OH
Oregon
16850 SW 72nd Avenue
Tigard, OR
Pennsylvania
1735 Market Street
Philadelphia, PA
439 Fifth Avenue
Pittsburgh, PA
Rhode Island
47 Providence Place
Providence, RI
Tennessee
6150 Poplar Avenue
Memphis, TN
Texas
10000 Research Boulevard
Austin, TX
4017 Northwest Parkway
Dallas, TX
1155 Dairy Ashford Street
Houston, TX
2701 Drexel Drive
Houston, TX
400 East Las Colinas Blvd.
Irving, TX
14100 San Pedro
San Antonio, TX
19740 IH 45 North
Spring, TX
Utah
215 South State Street
Salt Lake City, UT
Virginia
1861 International Drive
McLean, VA
Washington
411 108th Avenue, N.E.
Bellevue, WA
511 Pine Street
Seattle, WA
Washington, DC
1900 K Street, N.W.
Washington, DC
Wisconsin
595 North Barker Road
Brookfield, WI
Fidelity Brokerage Services, Inc., 100 Summer St., Boston, MA 02110 Member NYSE/SIPC
Annual Report
Investment Adviser
Fidelity Management & Research Company
Boston, MA
Investment Sub-Advisers
Fidelity Management & Research
(U.K.) Inc.
Fidelity Management & Research
(Far East) Inc.
Fidelity Investments Japan Limited
Officers
Edward C. Johnson 3d, President
Robert C. Pozen, Senior Vice President
Richard A. Spillane Jr., Vice President
Steven Kaye, Vice President
Eric D. Roiter, Secretary
Robert A. Dwight, Treasurer
Maria F. Dwyer, Deputy Treasurer
John H. Costello, Assistant Treasurer
Board of Trustees
Ralph F. Cox *
Phyllis Burke Davis *
Robert M. Gates *
Edward C. Johnson 3d
Donald J. Kirk *
Ned C. Lautenbach *
Peter S. Lynch
Marvin L. Mann *
William O. McCoy *
Gerald C. McDonough *
Robert C. Pozen
Thomas R. Williams *
Advisory Board
J. Michael Cook
Marie L. Knowles
* Independent trustees
General Distributor
Fidelity Distributors Corporation
Boston, MA
Transfer and Shareholder
Servicing Agent
Fidelity Service Company, Inc.
Boston, MA
Custodian
The Chase Manhattan Bank
New York, NY
Fidelity's Growth and Income Funds
Balanced Fund
Convertible Securities Fund
Equity-Income Fund
Equity-Income II Fund
Fidelity ® Fund
Global Balanced Fund
Growth & Income Portfolio
Growth & Income II Portfolio
Puritan ® Fund
Real Estate Investment Portfolio
Utilities Fund
The Fidelity Telephone Connection
Mutual Fund 24-Hour Service
Exchanges/Redemptions
and Account Assistance 1-800-544-6666
Product Information 1-800-544-6666
Retirement Accounts 1-800-544-4774
(8 a.m. - 9 p.m.)
TDD Service 1-800-544-0118
for the deaf and hearing impaired
(9 a.m. - 9 p.m. Eastern time)
Fidelity Automated Service
Telephone (FAST®) (automated graphic) 1-800-544-5555
(automated graphic) Automated line for quickest service
GAI-ANN-0900 111445
1.536189.103
(Fidelity Investment logo)(registered trademark)
Corporate Headquarters
82 Devonshire St., Boston, MA 02109
www.fidelity.com
|
|