
|
|
|
|
|
|
|
|
|
|
Previous: CANTERBURY INFORMATION TECHNOLOGY INC, 424B1, 2000-12-22 |
Next: GABELLI WESTWOOD FUNDS, 24F-2NT, 2000-12-22 |
Fidelity® Advisor
Annual Report
October 31, 2000
(2_fidelity_logos)
|
President's Message |
3 |
Ned Johnson on investing strategies. |
|
Performance |
4 |
How the fund has done over time. |
|
Fund Talk |
7 |
The manager's review of fund performance, strategy and outlook. |
|
Investment Changes |
10 |
A summary of major shifts in the fund's investments over the past six months. |
|
Investments |
11 |
A complete list of the fund's investments with their market values. |
|
Financial Statements |
15 |
Statements of assets and liabilities,
operations, and changes in net assets, |
|
Notes |
24 |
Notes to financial statements. |
|
Report of Independent Accountants |
31 |
The auditors' opinion. |
Standard & Poor's, S&P and S&P 500 are registered service marks of The McGraw-Hill Companies, Inc. and have been licensed for use by Fidelity Distributors Corporation.
Other third party marks appearing herein are the property of their respective owners.
All other marks appearing herein are registered or unregistered trademarks or service marks of FMR Corp. or an affiliated company.
(Recycle graphic) This report is printed on recycled paper using soy-based inks.
This report and the financial statements contained herein are submitted for the general information of the shareholders of the fund. This report is not authorized for distribution to prospective investors in the fund unless preceded or accompanied by an effective prospectus.
Mutual fund shares are not deposits or obligations of, or guaranteed by, any depository institution. Shares are not insured by the FDIC, Federal Reserve Board or any other agency, and are subject to investment risks, including possible loss of principal amount invested.
Neither the fund nor Fidelity Distributors Corporation is a bank.
For more information on any Fidelity Advisor fund, including charges and expenses, contact your investment professional for a free prospectus. Read it carefully before you invest or send money.
Annual Report
(photo_of_Edward_C_Johnson_3d)
Dear Shareholder:
A sixth-straight year of double-digit positive returns for the Dow Jones Industrial Average, NASDAQ and S&P 500® could be in jeopardy unless the U.S. stock market shows marked improvement in the final two months of 2000. Through October, all three indexes had negative year-to-date returns. On the other hand, most fixed-income sectors were solidly in the black. Treasuries and other long-term government securities led the way, returning nearly 14%.
While it's impossible to predict the future direction of the markets with any degree of certainty, there are certain basic principles that can help investors plan for their future needs.
The longer your investment time frame, the less likely it is that you will be affected by short-term market volatility. A 10-year investment horizon appropriate for saving for a college education, for example, enables you to weather market cycles in a long-term fund, which may have a higher risk potential, but also has a higher potential rate of return.
An intermediate-length fund could make sense if your investment horizon is two to four years, while a short-term bond fund could be the right choice if you need your money in one or two years.
If your time horizon is less than a year, you might want to consider moving some of your bond investment into a money market fund. These funds seek income and a stable share price by investing in high-quality, short-term investments. Of course, it's important to remember that an investment in a money market fund is not insured or guaranteed by the Federal Deposit Insurance Corporation or any other government agency. Although money market funds seek to preserve the value of your investment at $1.00 per share, it is possible to lose money by investing in these types of funds.
Finally, no matter what your time horizon or portfolio diversity, it makes good sense to follow a regular investment plan, investing a certain amount of money in a fund at the same time each month or quarter and periodically reviewing your overall portfolio. By doing so, you won't get caught up in the excitement of a rapidly rising market, nor will you buy all your shares at market highs. While this strategy - known as dollar cost averaging - won't assure a profit or protect you from a loss in a declining market, it should help you lower the average cost of your purchases. Of course, you should consider your financial ability to continue your purchases through periods of low price levels before undertaking such a strategy.
Remember to contact your investment professional if you need help with your investments.
Best regards,
/s/Edward C. Johnson 3d
Edward C. Johnson 3d
Annual Report
There are several ways to evaluate historical performance. You can look at the total percentage change in value, the average annual percentage change or the growth of a hypothetical $10,000 investment. Total return reflects the change in the value of an investment, assuming reinvestment of the class' dividend income and capital gains (the profits earned upon the sale of securities that have grown in value). You can also look at the class' income, as reflected in its yield, to measure performance. The initial offering of Institutional Class shares took place on March 3, 1997. Returns prior to March 3, 1997 are those of Initial Class, the original class of the fund. If Fidelity had not reimbursed certain class expenses, the past five year, and past 10 year total returns would have been lower.
Cumulative Total Returns
|
Periods ended October 31, 2000 |
|
Past 1 |
Past 5 |
Past 10 |
|
Fidelity Adv Mortgage Securities - Inst CL |
|
7.64% |
36.36% |
111.49% |
|
LB Mortgage |
|
7.57% |
38.70% |
113.69% |
|
US Mortgage Funds Average |
|
6.73% |
32.12% |
98.71% |
Cumulative total returns show Institutional Class' performance in percentage terms over a set period - in this case, one year, five years or 10 years. For example, if you had invested $1,000 in a fund that had a 5% return over the past year, the value of your investment would be $1,050. You can compare Institutional Class' returns to the performance of the Lehman Brothers Mortgage-Backed Securities Index - a market value-weighted index of fixed-rate securities that represent interests in pools of mortgage loans with original terms of 15 and 30 years that are issued by the Government National Mortgage Association (GNMA), the Federal National Mortgage Association (FNMA), and the Federal Home Loan Mortgage Corp. (FHLMC), and balloon mortgages with fixed-rate coupons. To measure how Institutional Class' performance stacked up against its peers, you can compare it to the U.S. mortgage funds average, which reflects the performance of mutual funds with similar objectives tracked by Lipper Inc. The past one year average represents a peer group of 64 mutual funds. These benchmarks reflect reinvestment of dividends and capital gains, if any, and exclude the effect of sales charges.
Average Annual Total Returns
|
Periods ended October 31, 2000 |
Past 1 |
Past 5 |
Past 10 |
|
Fidelity Adv Mortgage Securities - Inst CL |
7.64% |
6.40% |
7.78% |
|
LB Mortgage |
7.57% |
6.76% |
7.89% |
|
US Mortgage Funds Average |
6.73% |
5.72% |
7.10% |
Average annual total returns take Institutional Class' cumulative return and show you what would have happened if Institutional Class had performed at a constant rate each year.
Annual Report
Performance - continued
$10,000 Over 10 Years
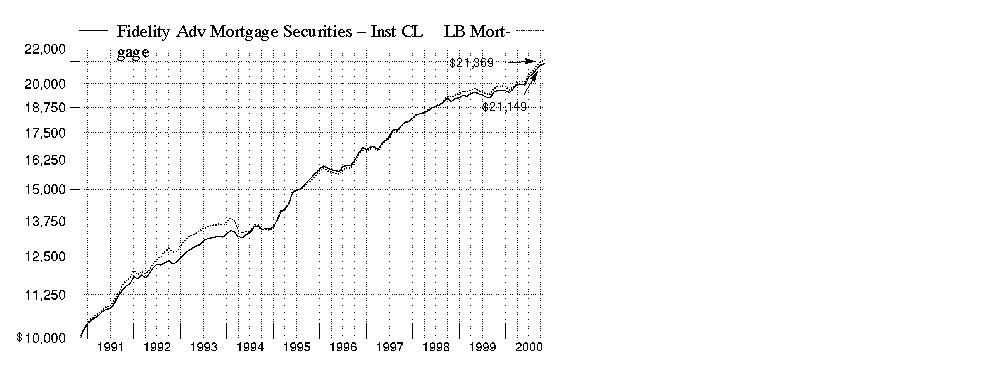
$10,000 Over 10 years: Let's say hypothetically that $10,000 was invested in Fidelity Advisor Mortgage Securities Fund - Institutional Class on October 31, 1990. As the chart shows, by October 31, 2000, the value of the investment would have grown to $21,149 - a 111.49% increase on the initial investment. For comparison, look at how the Lehman Brothers Mortgage-Backed Securities Index did over the same period. With dividends and capital gains, if any, reinvested, the same $10,000 would have grown to $21,369 - a 113.69% increase.
Understanding
Performance
How a fund did yesterday is no guarantee of how it will do tomorrow. Bond prices, for example, generally move in the opposite direction of interest rates. In turn, the share price, return and yield of a fund that invests in bonds will vary. That means if you sell your shares during a market downturn, you might lose money. But if you can ride out the market's ups and downs, you may have a gain.
3Annual Report
Performance - continued
Total Return Components
|
|
Years ended October 31, |
March 3, 1997 (commencement of sale of Institutional Class shares) to October 31, |
|||
|
|
2000 |
1999 |
1998 |
1997 |
|
|
Dividend returns |
7.16% |
6.14% |
6.13% |
4.30% |
|
|
Capital returns |
0.48% |
-3.05% |
-0.27% |
2.43% |
|
|
Total returns |
7.64% |
3.09% |
5.86% |
6.73% |
|
Total return components include both dividend returns and capital returns. A dividend return reflects the actual dividends paid by the class. A capital return reflects both the amount paid by the class to shareholders as capital gain distributions and changes in the class' share price. Both returns assume the dividends or capital gains paid by the class are reinvested, if any.
Dividends and Yield
|
Periods ended October 31, 2000 |
Past 1 |
Past 6 |
Past 1 |
|
Dividends per share |
5.80¢ |
34.50¢ |
71.45¢ |
|
Annualized dividend rate |
6.49% |
6.59% |
6.90% |
|
30-day annualized yield |
6.71% |
- |
- |
Dividends per share show the income paid by the class for a set period. If you annualize this number, based on an average share price of $10.52 over the past one month, $10.38 over the past six months, and $10.35 over the past one year, you can compare the class' income over these three periods. The 30-day annualized yield is a standard formula for all bond funds based on the yields of the bonds in the fund, averaged over the past 30 days. This figure shows you the yield characteristics of the fund's investments at the end of the period. It also helps you compare funds from different companies on an equal basis.
Annual Report
Market Recap
Strong technical factors in the market helped most investment-grade bonds overcome sharply rising interest rates and volatile market conditions, enabling them to outperform a number of major U.S. equity indexes during the 12-month period that ended October 31, 2000. The Lehman Brothers Aggregate Bond Index - a popular measure of taxable-bond performance - returned 7.30% during this time frame. Following a bullish fourth quarter of 1999 for the spread sectors - namely corporate bonds, mortgage and agency securities - Treasuries usurped market leadership not long after the millennium changeover. A growing federal surplus spurred the U.S. government in January to begin buying back outstanding debt and reducing future issuance. The scarcity premium created by a shrinking supply of long-dated Treasuries sent prices soaring and yields plummeting, thereby inducing an inverted yield curve - which occurs when short-term bonds outyield longer-dated securities. Anticipation that the Fed was finished raising interest rates entering the summer, combined with persistent flights-to-safety from risk-averse investors concerned about volatility in equity markets, further bolstered the long bond, helping the Lehman Brothers Treasury Index return 8.22% during the period. Mortgages made up some ground late in the period behind strong housing turnover. Agencies, too, staged a late rally in response to reduced political risk surrounding government-sponsored enterprises. However, corporates had little to celebrate, plagued by deteriorating credit conditions and growing supply pressures. For the overall period, the Lehman Brothers Mortgage-Backed Securities, U.S. Agency and Credit Bond indexes returned 7.57%, 7.30% and 5.48%, respectively.
(Portfolio Manager photograph)
An interview with Tom Silvia, Portfolio Manager of Fidelity Advisor Mortgage Securities Fund
Q. How did the fund perform, Tom?
A. For the 12 months ending October 31, 2000, the fund's Institutional Class shares returned 7.64%. To get a sense of how the fund did relative to its competitors, the U.S. mortgage funds average returned 6.73% for the same period, according to Lipper Inc. Meanwhile, the Lehman Brothers Mortgage-Backed Securities Index - which tracks the types of securities in which the fund invests - returned 7.57%.
Q. What factors influenced the fund's performance?
A. In the plus column was the fund's relatively large weighting in commercial mortgage-backed securities (CMBS) - which accounted for about 15% of the fund's net assets at the end of the period. CMBS are bonds that are collateralized by mortgage loans on commercial real estate - such as office buildings, shopping malls, hotels and apartment buildings. They seemingly had the wind at their backs during the past year. Rising interest rates, which hurt many other fixed-income securities, boosted outstanding CMBS by limiting issuance of new securities. Second, there was overall improvement in the credit quality of the sector thanks to the strong economy and better commercial real estate fundamentals as rents and occupancies increased. Finally, the Labor Department proposed allowing private pension funds to buy some mortgage securities that had been off-limits.
Annual Report
Fund Talk: The Manager's Overview - continued
Q. How did mortgage securities made up of home loans - those issued by Fannie Mae, Freddie Mac and Ginnie Mae - perform during the year?
A. Generally speaking, they performed poorly early on but improved quite a bit in the second half of the year. At first, rising interest rates were a drag on the performance of these mortgage securities, pushing their yields higher and their prices lower. At the same time, good economic conditions translated into a strong housing market, prompting more mortgage prepayment. More recently, mortgage security prices firmed as it became evident that previous interest-rate hikes had helped slow the economy. In response, mortgage prepayments fell and the outstanding supply was reduced. Against that backdrop, various types of mortgage securities fell in and out of favor during the year. For instance, Ginnie Mae securities - which accounted for a smaller portion of the fund than of the Lehman Brothers index - outpaced Fannie Mae and Freddie Mac securities during much of the year. That was due to a very small supply of Ginnie Mae securities. Some legislators floated the idea of even cutting off their longstanding but never-used lines of credit. Having a relatively small weighting in Ginnie Mae securities probably was the biggest disappointment for the year.
Q. What helped Fannie Mae and Freddie Mac securities regain their footing?
A. The yield advantage offered by Fannie Mae and Freddie Mac securities - as much as 10 basis points (0.10 percentage points) - over Ginnie Maes was one factor that helped them rebound. Also, the legislative pressure on the agencies eased when Fannie Mae and Freddie Mac made some concessions to legislators, adopting measures to improve their capital structure and allow more scrutiny of their books. In response, demand for their securities improved as more investors became attracted to their relatively high yields and cheap prices.
Q. Interest rates have been relatively volatile over the past year. How did you manage the fund's sensitivity to interest-rate changes?
A. I kept the fund's duration - a gauge of its interest-rate sensitivity - in line with the mortgage securities market as a whole as measured by the Lehman Brothers Mortgage-Backed Securities Index. That meant I avoided positioning the fund with more or less sensitivity based on my view of where interest rates were headed.
Q. What's your outlook?
A. I'm optimistic about the prospects for mortgage securities. Even though there's the possibility that interest rates will move lower, I don't see a large wave of mortgage prepayment in the future. By my calculations, mortgage rates would have to decline at least one full percentage point from current levels in order for prepayments to accelerate at a meaningful level. Given that, I think that mortgage securities offer very attractive values at current levels, offering yields that are well in excess of U.S. Treasury securities.
Annual Report
Fund Talk: The Manager's Overview - continued
The views expressed in this report reflect those of the portfolio manager only through the end of the period of the report as stated on the cover and do not necessarily represent the views of Fidelity or any other person in the Fidelity organization. Any such views are subject to change at any time based upon market or other conditions and Fidelity disclaims any responsibility to update such views. These views may not be relied on as investment advice and, because investment decisions for a Fidelity fund are based on numerous factors, may not be relied on as an indication of trading intent on behalf of any Fidelity fund.
Fund Facts
Goal: seeks a high level of current income, consistent with prudent investment risk; the fund may also consider the potential for capital gain
Start date: December 31, 1984
Size: as of October 31, 2000, more than $466 million
Manager: Tom Silvia, since 1997; joined Fidelity in 1993
3Tom Silvia on the strength of the housing market and its effect on mortgage securities:
"Sometimes, significant interest-rate volatility - such as we've seen during the past year - can lead to an increase in the rate of mortgage prepayments, which can have negative implications for the mortgage market. This past year, however, that was not the case. The strong housing market, fueled by the robust economy, favorable employment growth and rising personal incomes, benefited the mortgage market during the past year. Thanks to a significant wave of refinancing activity in 1998 and early 1999, the vast majority of mortgages outstanding 12 months ago carried interest rates of 6.5% to 7.0%. As interest rates climbed throughout the past year, these bonds started to trade below their par value of $100. Essentially, investors weren't willing to pay full price - or par - for a bond that paid less income when they could buy a newly issued bond with a higher income. As a result, 6.5% to 7.0% mortgage securities began to trade at discount prices ranging from $92 to $96. But given the fact that the housing market was strong and many homeowners decided to move into other homes, many of those mortgage securities were paid off at par, resulting in fairly good performance for the mortgage market as a whole."
Annual Report
|
Coupon Distribution as of October 31, 2000 |
||
|
|
% of fund's investments |
% of fund's investments |
|
Less than 6% |
0.4 |
0.5 |
|
6 - 6.99% |
32.6 |
45.0 |
|
7 - 7.99% |
43.7 |
38.4 |
|
8 - 8.99% |
14.0 |
9.9 |
|
9% and over |
2.8 |
4.2 |
|
Coupon distribution shows the range of stated interest rates on the fund's investments, excluding short-term investments. |
|
Average Years to Maturity as of October 31, 2000 |
||
|
|
|
6 months ago |
|
Years |
7.1 |
8.0 |
|
Average years to maturity is based on the average time remaining until principal payments are expected from each of the fund's bonds, weighted by dollar amount. |
|
Duration as of October 31, 2000 |
||
|
|
|
6 months ago |
|
Years |
3.7 |
4.7 |
|
Duration shows how much a bond fund's price fluctuates with changes in comparable interest rates. If rates rise 1%, for example, a fund with a five-year duration is likely to lose about 5% of its value. Other factors also can influence a bond fund's performance and share price. Accordingly, a bond fund's actual performance may differ from this example. |
|
Asset Allocation (% of fund's net assets) |
|||||||
|
As of October 31, 2000 |
As of April 30, 2000 |
||||||
 |
Mortgage |
|
|
Mortgage |
|
||
 |
CMOs and Other Mortgage Related Securities 19.3% |
|
|
CMOs and Other Mortgage Related Securities 21.8% |
|
||
 |
U.S. Government |
|
|
U.S. Government |
|
||
 |
Short-Term |
|
|
Short-Term |
|
||

* Short-term investments and net other assets are not included in the pie chart.
Annual Report
Showing Percentage of Net Assets
|
U.S. Government and Government Agency Obligations - 3.1% |
||||
|
|
Principal Amount |
Value |
||
|
U.S. Government Agency Obligations - 3.1% |
||||
|
Fannie Mae 6.5% 4/29/09 |
|
$ 15,440,000 |
$ 14,701,814 |
|
|
U.S. Government Agency - Mortgage Securities - 77.3% |
||||
|
|
||||
|
Fannie Mae - 48.5% |
||||
|
6% 2/1/14 to 6/1/29 |
|
17,285,396 |
16,223,096 |
|
|
6.5% 9/1/10 to 2/1/30 |
|
66,387,810 |
63,905,089 |
|
|
7% 3/1/19 to 10/1/30 |
|
71,013,814 |
69,662,626 |
|
|
7% 11/1/30 (b) |
|
15,000,000 |
14,695,313 |
|
|
7.5% 3/1/22 to 11/1/30 |
|
40,259,542 |
40,213,187 |
|
|
8% 1/1/07 to 7/1/30 |
|
13,049,020 |
13,209,123 |
|
|
8.25% 1/1/13 |
|
54,630 |
55,566 |
|
|
8.5% 6/1/16 to 11/1/23 |
|
2,946,350 |
3,021,512 |
|
|
8.75% 11/1/08 to 7/1/09 |
|
122,645 |
125,817 |
|
|
9% 1/1/08 to 2/1/13 |
|
497,626 |
512,597 |
|
|
9.5% 5/1/03 to 8/1/22 |
|
2,747,955 |
2,835,347 |
|
|
11% 12/1/02 to 8/1/10 |
|
834,963 |
905,168 |
|
|
12.25% 5/1/13 to 6/1/15 |
|
146,833 |
164,723 |
|
|
12.5% 11/1/14 to 3/1/16 |
|
279,804 |
316,089 |
|
|
12.75% 2/1/14 to 6/1/15 |
|
44,209 |
49,029 |
|
|
13.5% 9/1/13 to 12/1/14 |
|
129,910 |
149,843 |
|
|
14% 11/1/14 |
|
40,901 |
47,586 |
|
|
|
226,091,711 |
|||
|
Freddie Mac - 12.1% |
||||
|
5% 7/1/10 |
|
2,010,726 |
1,866,834 |
|
|
6% 2/1/29 to 7/1/29 |
|
4,606,402 |
4,321,358 |
|
|
6.5% 1/1/24 to 9/1/24 |
|
20,168,922 |
19,511,494 |
|
|
7% 7/1/29 to 9/1/29 |
|
7,508,084 |
7,360,249 |
|
|
7.5% 6/1/26 to 11/1/30 |
|
6,307,591 |
6,309,623 |
|
|
7.5% 11/1/30 (b) |
|
7,275,000 |
7,270,453 |
|
|
8% 10/1/07 to 4/1/21 |
|
487,909 |
493,337 |
|
|
8.5% 11/1/03 to 5/1/30 |
|
2,741,499 |
2,801,348 |
|
|
9% 9/1/08 to 5/1/21 |
|
3,334,308 |
3,434,549 |
|
|
10% 1/1/09 to 5/1/19 |
|
930,499 |
974,266 |
|
|
10.5% 8/1/10 to 2/1/16 |
|
83,810 |
88,684 |
|
|
11.5% 4/1/12 |
|
54,722 |
59,735 |
|
|
12.25% 6/1/14 to 7/1/15 |
|
106,234 |
119,159 |
|
|
12.5% 5/1/12 to 12/1/14 |
|
521,724 |
580,346 |
|
|
U.S. Government Agency - Mortgage Securities - continued |
||||
|
|
Principal Amount |
Value |
||
|
Freddie Mac - continued |
||||
|
12.75% 6/1/05 to 3/1/15 |
|
$ 55,553 |
$ 60,251 |
|
|
13% 1/1/11 to 6/1/15 |
|
865,615 |
995,218 |
|
|
|
56,246,904 |
|||
|
Government National Mortgage Association - 16.7% |
||||
|
6.5% 5/15/28 to 1/15/29 |
|
4,059,163 |
3,918,350 |
|
|
7% 1/15/26 to 6/15/29 (d) |
|
16,431,436 |
16,196,453 |
|
|
7.5% 7/15/05 to 9/15/27 |
|
12,034,063 |
12,123,749 |
|
|
8% 4/15/02 to 12/15/25 |
|
7,861,876 |
8,003,375 |
|
|
8.5% 7/15/16 to 10/15/30 |
|
35,803,208 |
36,731,278 |
|
|
9% 9/20/16 to 4/20/18 |
|
60,050 |
61,959 |
|
|
9.5% 8/15/09 to 12/15/24 |
|
72,451 |
76,491 |
|
|
10.5% 1/15/01 to 2/20/18 |
|
487,533 |
519,050 |
|
|
13% 10/15/13 |
|
43,913 |
50,431 |
|
|
13.5% 7/15/11 to 10/15/14 |
|
56,959 |
65,227 |
|
|
|
77,746,363 |
|||
|
TOTAL U.S. GOVERNMENT AGENCY - MORTGAGE SECURITIES (Cost $362,314,237) |
360,084,978 |
|||
|
Collateralized Mortgage Obligations - 4.3% |
||||
|
|
||||
|
U.S. Government Agency - 4.3% |
||||
|
Fannie Mae REMIC planned amortization class: |
|
|
|
|
|
Series 1999-1 Class PJ, 6.5% 2/25/29 |
|
10,049,260 |
9,369,247 |
|
|
Series 1999-51 Class LK, 6.5% 8/25/29 |
|
10,000,000 |
9,128,100 |
|
|
Freddie Mac REMIC planned amortization class |
|
1,404,060 |
1,445,298 |
|
|
TOTAL COLLATERALIZED MORTGAGE OBLIGATIONS (Cost $19,677,765) |
19,942,645 |
|||
|
Commercial Mortgage Securities - 15.0% |
||||
|
|
||||
|
Bankers Trust II Series 1999-S1A Class D, 8.81% 2/28/14 (a)(c) |
|
5,000,000 |
5,010,938 |
|
|
CBM Funding Corp. sequential pay Series 1996-1 |
|
2,300,000 |
2,296,586 |
|
|
CS First Boston Mortgage Securities Corp. |
|
2,000,000 |
1,902,938 |
|
|
Deutsche Mortgage & Asset Receiving Corp. |
|
10,200,000 |
9,431,813 |
|
|
Federal Deposit Insurance Corp. REMIC Trust sequential pay Series 1996-C1 Class 1A, 6.75% 7/25/26 |
|
2,242,680 |
2,220,078 |
|
|
Commercial Mortgage Securities - continued |
||||
|
|
Principal Amount |
Value |
||
|
GS Mortgage Securities Corp. II Series 1998-GLII |
|
$ 1,600,000 |
$ 1,450,500 |
|
|
Nomura Asset Securities Corp. weighted average coupon Series 1998-D6 Class A4, 7.3619% 3/17/28 (c) |
|
15,000,000 |
14,067,188 |
|
|
Nomura Depositor Trust floater Series 1998-ST1A: |
|
|
|
|
|
Class A4, 7.5213% 2/15/34 (a)(c) |
|
7,900,000 |
7,755,579 |
|
|
Class A5, 7.8713% 2/15/34 (a)(c) |
|
5,278,196 |
5,156,138 |
|
|
Structured Asset Securities Corp. Series 1992-M1 |
|
3,192,522 |
3,097,744 |
|
|
Thirteen Affiliates of General Growth Properties, Inc. Series 1 Class D1, 6.917% 12/15/07 (a) |
|
18,200,000 |
17,531,720 |
|
|
TOTAL COMMERCIAL MORTGAGE SECURITIES (Cost $72,038,810) |
69,921,222 |
|||
|
Cash Equivalents - 7.0% |
|||
|
Maturity Amount |
|
||
|
Investments in repurchase agreements (U.S. Government Obligations), in a joint trading account at 6.62%, dated 10/31/00 due
11/1/00 |
$ 32,828,035 |
32,822,000 |
|
|
TOTAL INVESTMENT PORTFOLIO - 106.7% (Cost $501,145,620) |
497,472,659 |
||
|
NET OTHER ASSETS - (6.7)% |
(31,448,023) |
||
|
NET ASSETS - 100% |
$ 466,024,636 |
||
|
Legend |
|
(a) Security exempt from registration under Rule 144A of the Securities Act of 1933. These securities may be resold in transactions exempt from registration, normally to qualified institutional buyers. At the period end, the value of these securities amounted to $36,904,875 or 7.9% of net assets. |
|
(b) Security purchased on a delayed delivery or when-issued basis. |
|
(c) The coupon rate shown on floating or adjustable rate securities represents the rate at period end. |
|
(d) A portion of this security is subject to a forward commitment to sell. |
|
Income Tax Information |
|
At October 31, 2000, the aggregate cost of investment securities for income tax purposes was $501,225,418. Net unrealized depreciation aggregated $3,752,759, of which $3,729,911 related to appreciated investment securities and $7,482,670 related to depreciated investment securities. |
|
At October 31, 2000, the fund had a capital loss carryforward of approximately $8,706,000 of which $5,050,000 and $3,656,000 will expire on October 31, 2007 and 2008, respectively. |
See accompanying notes which are an integral part of the financial statements.
Annual Report
Statement of Assets and Liabilities
|
|
October 31, 2000 |
|
|
Assets |
|
|
|
Investment in securities, at value (including repurchase agreements of $32,822,000) (cost $501,145,620) - See accompanying schedule |
|
$ 497,472,659 |
|
Commitment to sell securities on a delayed delivery basis |
$ (14,775,000) |
|
|
Receivable for securities sold on a delayed delivery basis |
14,906,250 |
131,250 |
|
Receivable for investments sold, regular delivery |
|
113,202 |
|
Cash |
|
485 |
|
Receivable for fund shares sold |
|
182,244 |
|
Interest receivable |
|
2,409,643 |
|
Total assets |
|
500,309,483 |
|
Liabilities |
|
|
|
Payable for investments purchased |
8,232,107 |
|
|
Delayed delivery |
22,113,125 |
|
|
Payable for fund shares redeemed |
3,103,942 |
|
|
Distributions payable |
505,453 |
|
|
Accrued management fee |
168,882 |
|
|
Distribution fees payable |
27,900 |
|
|
Other payables and accrued expenses |
133,438 |
|
|
Total liabilities |
|
34,284,847 |
|
Net Assets |
|
$ 466,024,636 |
|
Net Assets consist of: |
|
|
|
Paid in capital |
|
$ 477,537,240 |
|
Undistributed net investment income |
|
813,267 |
|
Accumulated undistributed net realized |
|
(8,784,160) |
|
Net unrealized appreciation (depreciation) on investments |
|
(3,541,711) |
|
Net Assets |
|
$ 466,024,636 |
See accompanying notes which are an integral part of the financial statements.
Annual Report
Financial Statements - continued
Statement of Assets and Liabilities - continued
|
|
October 31, 2000 |
|
|
Calculation of Maximum Offering Price |
|
$10.53 |
|
Maximum offering price per share (100/95.25 of $10.53) |
|
$11.06 |
|
Class T: |
|
$10.54 |
|
Maximum offering price per share (100/96.50 of $10.54) |
|
$10.92 |
|
Class B: |
|
$10.53 |
|
Initial Class: |
|
$10.54 |
|
Institutional Class: |
|
$10.52 |
A Redemption price per share is equal to net asset value less any applicable contingent deferred sales charge.
See accompanying notes which are an integral part of the financial statements.
Annual Report
Financial Statements - continued
Statement of Operations
|
|
Year ended October 31, 2000 |
|
|
Investment Income Interest |
|
$ 32,656,104 |
|
Expenses |
|
|
|
Management fee |
$ 1,899,545 |
|
|
Transfer agent fees |
759,081 |
|
|
Distribution fees |
261,047 |
|
|
Accounting fees and expenses |
143,998 |
|
|
Non-interested trustees' compensation |
1,585 |
|
|
Custodian fees and expenses |
69,446 |
|
|
Registration fees |
93,364 |
|
|
Audit |
54,560 |
|
|
Legal |
7,135 |
|
|
Miscellaneous |
2,586 |
|
|
Total expenses before reductions |
3,292,347 |
|
|
Expense reductions |
(12,991) |
3,279,356 |
|
Net investment income |
|
29,376,748 |
|
Realized and Unrealized Gain (Loss) Net realized gain (loss) on investment securities |
|
(3,442,334) |
|
Change in net unrealized appreciation (depreciation) on: |
|
|
|
Investment securities |
6,356,250 |
|
|
Delayed delivery commitments |
131,250 |
6,487,500 |
|
Net gain (loss) |
|
3,045,166 |
|
Net increase (decrease) in net assets resulting |
|
$ 32,421,914 |
See accompanying notes which are an integral part of the financial statements.
Annual Report
Financial Statements - continued
Statement of Changes in Net Assets
|
|
Year ended
October 31, |
Year ended
October 31, |
|
Increase (Decrease) in Net Assets |
|
|
|
Operations |
$ 29,376,748 |
$ 30,638,885 |
|
Net realized gain (loss) |
(3,442,334) |
(5,620,586) |
|
Change in net unrealized appreciation (depreciation) |
6,487,500 |
(10,190,965) |
|
Net increase (decrease) in net assets resulting |
32,421,914 |
14,827,334 |
|
Distributions to shareholders |
(30,637,049) |
(30,183,549) |
|
From net realized gain |
- |
(6,924,572) |
|
Total distributions |
(30,637,049) |
(37,108,121) |
|
Share transactions - net increase (decrease) |
(9,263,825) |
(14,273,306) |
|
Total increase (decrease) in net assets |
(7,478,960) |
(36,554,093) |
|
Net Assets |
|
|
|
Beginning of period |
473,503,596 |
510,057,689 |
|
End of period (including undistributed net investment income of $813,267 and $1,901,973, respectively) |
$ 466,024,636 |
$ 473,503,596 |
See accompanying notes which are an integral part of the financial statements.
Annual Report
Financial Highlights - Class A
|
Years ended October 31, |
2000 |
1999 |
1998 |
1997 G |
1997 F |
|
Selected Per-Share Data |
|
|
|
|
|
|
Net asset value, beginning of period |
$ 10.480 |
$ 10.960 |
$ 11.020 |
$ 11.050 |
$ 10.830 |
|
Income from Investment Operations |
|
|
|
|
|
|
Net investment income D |
.665 |
.646 |
.669 |
.170 |
.268 |
|
Net realized and unrealized gain (loss) |
.086 |
(.336) |
(.061) |
.048 |
.224 |
|
Total from investment |
.751 |
.310 |
.608 |
.218 |
.492 |
|
Less Distributions |
|
|
|
|
|
|
From net investment |
(.701) |
(.640) |
(.638) |
(.168) |
(.272) |
|
From net realized gain |
- |
(.150) |
(.030) |
(.080) |
- |
|
Total distributions |
(.701) |
(.790) |
(.668) |
(.248) |
(.272) |
|
Net asset value, end |
$ 10.530 |
$ 10.480 |
$ 10.960 |
$ 11.020 |
$ 11.050 |
|
Total Return B, C |
7.49% |
2.93% |
5.65% |
2.00% |
4.61% |
|
Ratios and Supplemental Data |
|
|
|
|
|
|
Net assets, end of period (000 omitted) |
$ 4,610 |
$ 3,090 |
$ 1,865 |
$ 1,648 |
$ 1,586 |
|
Ratio of expenses to average net assets |
.88% |
.90% E |
.90% E |
.90% A, E |
.90% A, E |
|
Ratio of net investment income to average |
6.44% |
6.09% |
6.01% |
6.18% A |
6.09% A |
|
Portfolio turnover rate |
99% |
183% |
262% |
125% A |
149% |
A Annualized
B The total returns would have been lower had certain expenses not been reduced during the periods shown.
C Total returns do not include the one time sales charge and for periods of less than one year are not annualized.
D Net investment income per share has been calculated based on average shares outstanding during the period.
E FMR agreed to reimburse a portion of the class' expenses during the period. Without this reimbursement, the class' expense ratio would have been higher.
F For the period March 3, 1997 (commencement of sale of Class A shares) to July 31, 1997.
G Three months ended October 31
See accompanying notes which are an integral part of the financial statements.
Annual Report
Financial Highlights - Class T
|
Years ended October 31, |
2000 |
1999 |
1998 |
1997 G |
1997 F |
|
Selected Per-Share Data |
|
|
|
|
|
|
Net asset value, beginning |
$ 10.480 |
$ 10.960 |
$ 11.020 |
$ 11.050 |
$ 10.830 |
|
Income from Investment Operations |
|
|
|
|
|
|
Net investment income D |
.653 |
.637 |
.665 |
.167 |
.255 |
|
Net realized and unrealized gain (loss) |
.092 |
(.338) |
(.063) |
.048 |
.233 |
|
Total from investment |
.745 |
.299 |
.602 |
.215 |
.488 |
|
Less Distributions |
|
|
|
|
|
|
From net investment income |
(.685) |
(.629) |
(.632) |
(.165) |
(.268) |
|
From net realized gain |
- |
(.150) |
(.030) |
(.080) |
- |
|
Total distributions |
(.685) |
(.779) |
(.662) |
(.245) |
(.268) |
|
Net asset value, end of period |
$ 10.540 |
$ 10.480 |
$ 10.960 |
$ 11.020 |
$ 11.050 |
|
Total Return B, C |
7.42% |
2.82% |
5.60% |
1.98% |
4.57% |
|
Ratios and Supplemental Data |
|
|
|
|
|
|
Net assets, end of period |
$ 61,359 |
$ 29,052 |
$ 19,103 |
$ 14,649 |
$ 12,193 |
|
Ratio of expenses to average net assets |
1.00% |
1.00% E |
1.00% E |
1.00% A, E |
1.00% A, E |
|
Ratio of net investment income to average net assets |
6.33% |
5.99% |
6.05% |
6.10% A |
5.99% A |
|
Portfolio turnover rate |
99% |
183% |
262% |
125% A |
149% |
A Annualized
B The total returns would have been lower had certain expenses not been reduced during the periods shown.
C Total returns do not include the one time sales charge and for periods of less than one year are not annualized.
D Net investment income per share has been calculated based on average shares outstanding during the period.
E FMR agreed to reimburse a portion of the class' expenses during the period. Without this reimbursement, the class' expense ratio would have been higher.
F For the period March 3, 1997 (commencement of sale of Class T shares) to July 31, 1997.
G Three months ended October 31
See accompanying notes which are an integral part of the financial statements.
Annual Report
Financial Highlights - Class B
|
Years ended October 31, |
2000 |
1999 |
1998 |
1997 G |
1997 F |
|
Selected Per-Share Data |
|
|
|
|
|
|
Net asset value, beginning |
$ 10.480 |
$ 10.950 |
$ 11.020 |
$ 11.040 |
$ 10.830 |
|
Income from Investment Operations |
|
|
|
|
|
|
Net investment income D |
.593 |
.567 |
.584 |
.142 |
.234 |
|
Net realized and unrealized gain (loss) |
.081 |
(.324) |
(.064) |
.065 |
.214 |
|
Total from investment |
.674 |
.243 |
.520 |
.207 |
.448 |
|
Less Distributions |
|
|
|
|
|
|
From net investment income |
(.624) |
(.563) |
(.560) |
(.147) |
(.238) |
|
From net realized gain |
- |
(.150) |
(.030) |
(.080) |
- |
|
Total distributions |
(.624) |
(.713) |
(.590) |
(.227) |
(.238) |
|
Net asset value, end of period |
$ 10.530 |
$ 10.480 |
$ 10.950 |
$ 11.020 |
$ 11.040 |
|
Total Return B, C |
6.70% |
2.29% |
4.82% |
1.90% |
4.20% |
|
Ratios and Supplemental Data |
|
|
|
|
|
|
Net assets, end of period |
$ 19,911 |
$ 19,101 |
$ 7,840 |
$ 1,587 |
$ 823 |
|
Ratio of expenses to average |
1.60% |
1.62% |
1.65% E |
1.65% A, E |
1.65% A, E |
|
Ratio of net investment income to average net assets |
5.73% |
5.37% |
5.37% |
5.32% A |
5.34% A |
|
Portfolio turnover rate |
99% |
183% |
262% |
125% A |
149% |
A Annualized
B The total returns would have been lower had certain expenses not been reduced during the periods shown.
C Total returns do not include the contingent deferred sales charge and for periods of less than one year are not annualized.
D Net investment income per share has been calculated based on average shares outstanding during the period.
E FMR agreed to reimburse a portion of the class' expenses during the period. Without this reimbursement, the class' expense ratio would have been higher.
F For the period March 3, 1997 (commencement of sale of Class B shares) to July 31, 1997.
G Three months ended October 31
See accompanying notes which are an integral part of the financial statements.
Annual Report
Financial Highlights - Initial Class
|
Years ended October 31, |
2000 |
1999 |
1998 |
1997 F |
1997 G |
1996 G |
|
Selected Per-Share Data |
|
|
|
|
|
|
|
Net asset value, beginning of period |
$ 10.490 |
$ 10.970 |
$ 11.020 |
$ 11.050 |
$ 10.780 |
$ 10.890 |
|
Income from Investment Operations |
|
|
|
|
|
|
|
Net investment income |
.690 D |
.674 D |
.700 D |
.176 D |
.678 D |
.729 |
|
Net realized and unrealized gain (loss) |
.078 |
(.342) |
(.056) |
.047 |
.391 |
(.015) |
|
Total from investment operations |
.768 |
.332 |
.644 |
.223 |
1.069 |
.714 |
|
Less Distributions |
|
|
|
|
|
|
|
From net investment |
(.718) |
(.662) |
(.664) |
(.173) |
(.689) |
(.724) |
|
From net realized gain |
- |
(.150) |
(.030) |
(.080) |
(.110) |
(.100) |
|
Total distributions |
(.718) |
(.812) |
(.694) |
(.253) |
(.799) |
(.824) |
|
Net asset value, end |
$ 10.540 |
$ 10.490 |
$ 10.970 |
$ 11.020 |
$ 11.050 |
$ 10.780 |
|
Total Return B, C |
7.66% |
3.14% |
5.99% |
2.05% |
10.34% |
6.72% |
|
Ratios and Supplemental Data |
|
|
|
|
|
|
|
Net assets, end of period |
$ 371,107 |
$ 406,839 |
$ 459,212 |
$ 494,304 |
$ 506,113 |
$ 488,162 |
|
Ratio of expenses to average net assets |
.67% |
.70% |
.71% |
.72% A |
.73% |
.74% |
|
Ratio of expenses to average net assets after expense reductions |
.67% |
.70% |
.71% |
.72% A |
.73% |
.73% E |
|
Ratio of net investment
income to average |
6.65% |
6.29% |
6.34% |
6.36% A |
6.26% |
6.75% |
|
Portfolio turnover rate |
99% |
183% |
262% |
125% A |
149% |
221% |
A Annualized
B Total returns for periods of less than one year are not annualized.
C The total returns would have been lower had certain expenses not been reduced during the periods shown.
D Net investment income per share has been calculated based on average shares outstanding during the period.
E FMR or the fund has entered into varying arrangements with third parties who either paid or reduced a portion of the class' expenses.
F Three months ended October 31
G Year ended July 31
See accompanying notes which are an integral part of the financial statements.
Annual Report
Financial Highlights - Institutional Class
|
Years ended October 31, |
2000 |
1999 |
1998 |
1997 H |
1997 G |
|
Selected Per-Share Data |
|
|
|
|
|
|
Net asset value, beginning |
$ 10.470 |
$ 10.950 |
$ 11.010 |
$ 11.040 |
$ 10.830 |
|
Income from Investment Operations |
|
|
|
|
|
|
Net investment income D |
.684 |
.669 |
.693 |
.172 |
.263 |
|
Net realized and unrealized gain (loss) |
.080 |
(.343) |
(.063) |
.050 |
.226 |
|
Total from investment |
.764 |
.326 |
.630 |
.222 |
.489 |
|
Less Distributions |
|
|
|
|
|
|
From net investment income |
(.714) |
(.656) |
(.660) |
(.172) |
(.279) |
|
From net realized gain |
- |
(.150) |
(.030) |
(.080) |
- |
|
Total distributions |
(.714) |
(.806) |
(.690) |
(.252) |
(.279) |
|
Net asset value, end of period |
$ 10.520 |
$ 10.470 |
$ 10.950 |
$ 11.010 |
$ 11.040 |
|
Total Return B, C |
7.64% |
3.09% |
5.86% |
2.05% |
4.59% |
|
Ratios and Supplemental Data |
|
|
|
|
|
|
Net assets, end of period |
$ 9,038 |
$ 15,422 |
$ 22,038 |
$ 19,718 |
$ 13,177 |
|
Ratio of expenses to average net assets |
.73% |
.75% E |
.75% E |
.75% A, E |
.75% A, E |
|
Ratio of expenses to average net assets after expense reductions |
.72% F |
.75% |
.75% |
.75% A |
.70% A, F |
|
Ratio of net investment income to average net assets |
6.60% |
6.24% |
6.30% |
6.35% A |
6.29% A |
|
Portfolio turnover rate |
99% |
183% |
262% |
125% A |
149% |
A Annualized
B Total returns for periods of less than one year are not annualized.
C The total returns would have been lower had certain expenses not been reduced during the periods shown.
D Net investment income per share has been calculated based on average shares outstanding during the period.
E FMR agreed to reimburse a portion of the class' expenses during the period. Without this reimbursement, the class' expense ratio would have been higher.
F FMR or the fund has entered into varying arrangements with third parties who either paid or reduced a portion of the class' expenses.
G For the period March 3, 1997 (commencement of sale of Institutional Class shares) to July 31, 1997.
H Three months ended October 31
See accompanying notes which are an integral part of the financial statements.
Annual Report
For the period ended October 31, 2000
1. Significant Accounting Policies.
Fidelity Advisor Mortgage Securities Fund (the fund) is a fund of Fidelity Advisor Series II (the trust) and is authorized to issue an unlimited number of shares. Effective the close of business on February 28,1997, the fund's Initial Class was closed to new accounts. The trust is registered under the Investment Company Act of 1940, as amended (the 1940 Act), as an open-end management investment company organized as a Massachusetts business trust.
The fund offers Class A, Class T, Class B, Initial Class, and Institutional Class shares, each of which has equal rights as to assets and voting privileges. Each class has exclusive voting rights with respect to matters that affect that class. Class B shares will automatically convert to Class A shares after a holding period of seven years from the initial date of purchase. Investment income, realized and unrealized capital gains and losses, the common expenses of the fund, and certain fund-level expense reductions, if any, are allocated on a pro rata basis to each class based on the relative net assets of each class to the total net assets of the fund. Each class of shares differs in its respective distribution, transfer agent, and certain other class-specific fees, expenses, and expense reductions.
The financial statements have been prepared in conformity with generally accepted accounting principles which require management to make certain estimates and assumptions at the date of the financial statements. The following summarizes the significant accounting policies of the fund:
Security Valuation. Securities are valued based upon a computerized matrix system and/or appraisals by a pricing service, both of which consider market transactions and dealer-supplied valuations. Securities (including restricted securities) for which market quotations are not readily available are valued at their fair value as determined in good faith under consistently applied procedures under the general supervision of the Board of Trustees. Short-term securities with remaining maturities of sixty days or less for which quotations are not readily available are valued at amortized cost or original cost plus accrued interest, both of which approximate current value. Investments in open-end investment companies are valued at their net asset value each business day.
Income Taxes. As a qualified regulated investment company under Subchapter M of the Internal Revenue Code, the fund is not subject to income taxes to the extent that it distributes substantially all of its taxable income for its fiscal year. The schedule of investments includes information regarding income taxes under the caption "Income Tax Information."
Investment Income. Interest income, which includes accretion of original issue discount, is accrued as earned.
Expenses. Most expenses of the trust can be directly attributed to a fund. Expenses which cannot be directly attributed are apportioned among the funds in the trust.
Annual Report
Notes to Financial Statements - continued
1. Significant Accounting Policies - continued
Distributions to Shareholders. Distributions are declared daily and paid monthly from net investment income. Distributions from realized gains, if any, are recorded on the ex-dividend date. Income dividends and capital gain distributions are declared separately for each class.
Income and capital gain distributions are determined in accordance with income tax regulations which may differ from generally accepted accounting principles. These differences, which may result in distribution reclassifications, are primarily due to differing treatments for paydown gains/losses on certain securities, market discount, capital loss carryforwards and losses deferred due to wash sales.
Permanent book and tax basis differences relating to shareholder distributions will result in reclassifications to paid in capital. Undistributed net investment income and accumulated undistributed net realized gain (loss) on investments may include temporary book and tax basis differences which will reverse in a subsequent period. Any taxable income or gain remaining at fiscal year end is distributed in the following year.
Security Transactions. Security transactions are accounted for as of trade date. Gains and losses on securities sold are determined on the basis of identified cost.
2. Operating Policies.
Joint Trading Account. Pursuant to an Exemptive Order issued by the Securities and Exchange Commission, the fund, along with other affiliated entities of Fidelity Management & Research Company (FMR), may transfer uninvested cash balances into one or more joint trading accounts. These balances are invested in one or more repurchase agreements for U.S. Treasury or Federal Agency obligations.
Repurchase Agreements. The underlying U.S. Treasury, Federal Agency, or other obligations found to be satisfactory by FMR are transferred to an account of the fund, or to the Joint Trading Account, at a custodian bank. The securities are marked-to-market daily and maintained at a value at least equal to the principal amount of the repurchase agreement (including accrued interest). FMR, the fund's investment adviser, is responsible for determining that the value of the underlying securities remains in accordance with the market value requirements stated above.
Delayed Delivery Transactions. The fund may purchase or sell securities on a delayed delivery basis. Payment and delivery may take place after the customary settlement period for that security. The price of the underlying securities and the date when the securities will be delivered and paid for are fixed at the time the transaction is negotiated. The market values of the securities purchased on a delayed delivery basis are identified as such in the fund's schedule of investments. The fund may receive compensation for interest forgone in the purchase of a delayed delivery security. With respect to
Annual Report
Notes to Financial Statements - continued
2. Operating Policies - continued
Delayed Delivery Transactions - continued
purchase commitments, the fund identifies securities as segregated in its records with a value at least equal to the amount of the commitment. Losses may arise due to changes in the market value of the underlying securities or if the counterparty does not perform under the contract.
Restricted Securities. The fund is permitted to invest in securities that are subject to legal or contractual restrictions on resale. These securities generally may be resold in transactions exempt from registration or to the public if the securities are registered. Disposal of these securities may involve time-consuming negotiations and expense, and prompt sale at an acceptable price may be difficult. At the end of the period, the fund had no investments in restricted securities (excluding 144A issues).
3. Purchases and Sales of Investments.
Purchases and sales of securities, other than short-term securities, aggregated $455,603,228 and $472,388,211, respectively, of which U.S. government and government agency obligations aggregated $439,935,274 and $444,362,092, respectively.
4. Fees and Other Transactions with Affiliates.
Management Fee. As the fund's investment adviser, FMR receives a monthly fee that is calculated on the basis of a group fee rate plus a fixed individual fund fee rate applied to the average net assets of the fund. The group fee rate is the weighted average of a series of rates and is based on the monthly average net assets of all the mutual funds advised by FMR. The rates ranged from .0920% to .3700% for the period. The annual individual fund fee rate is .30%. In the event that these rates were lower than the contractual rates in effect during the period, FMR voluntarily implemented the above rates, as they resulted in the same or a lower management fee. For the period, the management fee was equivalent to an annual rate of .43% of average net assets.
Sub-Adviser Fee. FMR, on behalf of the fund, has entered into a sub-advisory agreement with Fidelity Investments Money Management, Inc. (FIMM), a wholly owned subsidiary of FMR. For its services, FIMM receives a fee from FMR of 50% of the management fee payable to FMR. The fee is paid prior to any voluntary expense reimbursements which may be in effect.
Distribution and Service Plan. In accordance with Rule 12b-1 of the 1940 Act, the Board of Trustees has adopted separate Distribution and Service Plans with respect to each class of shares (collectively referred to as "the Plans"). Under certain of the Plans, the class pays Fidelity Distributors Corporation (FDC), an affiliate of FMR, a 12b-1 fee. A portion of this fee may be reallowed to securities dealers, banks and other financial institutions for the distribution of each class of shares and providing shareholder support
Annual Report
Notes to Financial Statements - continued
4. Fees and Other Transactions with Affiliates - continued
Distribution and Service Plan - continued
services. For the period, this fee was based on the following annual rates of the average net assets of each applicable class:
|
Class A |
.15% |
|
Class T |
.25% |
|
Class B |
.90%* |
* .65% represents a distribution fee and .25% represents a shareholder service fee.
For the period, each class paid FDC the following amounts, a portion of which was retained by FDC:
|
|
Paid to |
Retained |
|
Class A |
$ 5,801 |
$ 9 |
|
Class T |
82,308 |
1,661 |
|
Class B |
172,938 |
124,900 |
|
|
$ 261,047 |
$ 126,570 |
Sales Load. FDC receives a front-end sales charge of up to 4.75% for selling Class A shares, and 3.50% for selling Class T shares of the fund. FDC receives the proceeds of contingent deferred sales charges levied on Class B share redemptions occurring within six years of purchase. The Class B charge is based on declining rates ranging from 5% to 1% of the lesser of the cost of shares at the initial date of purchase or the net asset value of the redeemed shares, excluding any reinvested dividends and capital gains. In addition, purchases of Class A and Class T shares that were subject to a finder's fee bear a contingent deferred sales charge on assets that do not remain in the fund for at least one year. The Class A and Class T contingent deferred sales charge is based on 0.25% of the lesser of the cost of shares at the initial date of purchase or the net asset value of the redeemed shares, excluding any reinvested dividends and capital gains. A portion of the sales charges paid to FDC is paid to securities dealers, banks and other financial institutions.
For the period, sales charge amounts paid to and retained by FDC were as follows:
|
|
Paid to |
Retained |
|
Class A |
$ 19,275 |
$ 5,275 |
|
Class T |
45,570 |
13,922 |
|
Class B |
104,949 |
104,949* |
|
|
$ 169,794 |
$ 124,146 |
* When Class B shares are initially sold, FDC pays commissions from its own resources to securities dealers,
banks, and other financial institutions through which the sales are made.
Annual Report
Notes to Financial Statements - continued
4. Fees and Other Transactions with Affiliates - continued
Transfer Agent Fees. Fidelity Investments Institutional Operations Company, Inc., (FIIOC), an affiliate of FMR, is the transfer, dividend disbursing and shareholder servicing agent (collectively referred to as the transfer agent) for the fund's Class A, Class T, Class B, and Institutional Class Shares. Fidelity Service Company, Inc. (FSC), an affiliate of FMR, is the transfer agent for the Initial Class Shares. FIIOC and FSC receive account fees and asset-based fees that vary according to the account size and type of account of the shareholders of the respective classes of the fund. FIIOC and FSC pay for typesetting, printing and mailing of all shareholder reports, except proxy statements. For the period, the following amounts were paid to FIIOC or FSC:
|
|
Amount |
% of |
|
Class A |
$ 8,617 |
.22 |
|
Class T |
78,644 |
.24 |
|
Class B |
36,267 |
.19 |
|
Initial Class |
607,430 |
.16 |
|
Institutional Class |
28,123 |
.22 |
|
|
$ 759,081 |
|
Accounting Fees. FSC maintains the fund's accounting records. The fee is based on the level of average net assets for the month plus out-of-pocket expenses.
5. Expense Reductions.
Through arrangements with the fund's custodian and each class' transfer agent, credits realized as a result of uninvested cash balances were used to reduce a portion of expenses. During the period, the fund's custodian fees were reduced by $12,619 under the custodian arrangement, and Initial Class' transfer agent expenses were reduced by $372 under the transfer agent arrangement.
Annual Report
Notes to Financial Statements - continued
6. Distributions to Shareholders.
Distributions to shareholders of each class were as follows:
|
|
Years ended October 31, |
|
|
|
2000 |
1999 |
|
From net investment income |
|
|
|
Class A |
$ 259,663 |
$ 153,223 |
|
Class T |
2,169,235 |
1,450,107 |
|
Class B |
1,158,837 |
724,614 |
|
Initial Class |
26,148,441 |
26,727,640 |
|
Institutional Class |
900,873 |
1,127,965 |
|
Total |
$ 30,637,049 |
$ 30,183,549 |
|
From net realized gain |
|
|
|
Class A |
$ - |
$ 26,293 |
|
Class T |
- |
278,709 |
|
Class B |
- |
132,050 |
|
Initial Class |
- |
6,182,269 |
|
Institutional Class |
- |
305,251 |
|
Total |
$ - |
$ 6,924,572 |
7. Share Transactions.
Transactions for each class of shares were as follows:
|
|
Shares |
Dollars |
||
|
|
Year ended October 31, |
Year ended October 31, |
Year ended October 31, |
Year ended October 31, |
|
|
2000 |
1999 |
2000 |
1999 |
|
Class A |
215,111 |
233,326 |
$ 2,232,936 |
$ 2,488,784 |
|
Reinvestment of distributions |
18,825 |
11,952 |
195,149 |
127,329 |
|
Shares redeemed |
(90,958) |
(120,472) |
(941,418) |
(1,280,382) |
|
Net increase (decrease) |
142,978 |
124,806 |
$ 1,486,667 |
$ 1,335,731 |
|
Class T |
4,402,524 |
2,003,369 |
$ 45,948,619 |
$ 21,386,352 |
|
Reinvestment of distributions |
163,509 |
148,336 |
1,696,640 |
1,582,559 |
|
Shares redeemed |
(1,514,665) |
(1,122,570) |
(15,663,958) |
(11,947,707) |
|
Net increase (decrease) |
3,051,368 |
1,029,135 |
$ 31,981,301 |
$ 11,021,204 |
Annual Report
Notes to Financial Statements - continued
7. Share Transactions - continued
|
|
Shares |
Dollars |
||
|
|
Year ended October 31, |
Year ended October 31, |
Year ended October 31, |
Year ended October 31, |
|
|
2000 |
1999 |
2000 |
1999 |
|
Class B |
652,666 |
1,505,268 |
$ 6,775,572 |
$ 16,049,817 |
|
Reinvestment of distributions |
85,020 |
63,855 |
880,755 |
679,689 |
|
Shares redeemed |
(669,424) |
(461,420) |
(6,925,550) |
(4,891,488) |
|
Net increase (decrease) |
68,262 |
1,107,703 |
$ 730,777 |
$ 11,838,018 |
|
Initial Class |
3,201,394 |
3,914,002 |
$ 33,214,158 |
$ 41,964,545 |
|
Reinvestment of distributions |
2,034,985 |
2,515,203 |
21,102,123 |
26,913,754 |
|
Shares redeemed |
(8,824,923) |
(9,502,966) |
(91,371,208) |
(101,601,425) |
|
Net increase (decrease) |
(3,588,544) |
(3,073,761) |
$ (37,054,927) |
$ (32,723,126) |
|
Institutional Class |
827,963 |
667,600 |
$ 8,501,722 |
$ 7,141,162 |
|
Reinvestment of distributions |
43,983 |
70,535 |
454,723 |
754,625 |
|
Shares redeemed |
(1,486,148) |
(1,277,677) |
(15,364,088) |
(13,640,920) |
|
Net increase (decrease) |
(614,202) |
(539,542) |
$ (6,407,643) |
$ (5,745,133) |
Annual Report
To the Trustees of Fidelity Advisor Series II and the Shareholders of Fidelity Advisor Mortgage Securities Fund:
In our opinion, the accompanying statement of assets and liabilities, including the schedule of investments, and the related statements of operations and of changes in net assets and the financial highlights present fairly, in all material respects, the financial position of Fidelity Advisor Mortgage Securities Fund (a fund of Fidelity Advisor Series II) at October 31, 2000, and the results of its operations, the changes in its net assets and the financial highlights for the periods indicated, in conformity with accounting principles generally accepted in the United States of America. These financial statements and financial highlights (hereafter referred to as "financial statements") are the responsibility of the Fidelity Advisor Mortgage Securities Fund's management; our responsibility is to express an opinion on these financial statements based on our audits. We conducted our audits of these financial statements in accordance with auditing standards generally accepted in the United States of America which require that we plan and perform the audit to obtain reasonable assurance about whether the financial statements are free of material misstatement. An audit includes examining, on a test basis, evidence supporting the amounts and disclosures in the financial statements, assessing the accounting principles used and significant estimates made by management, and evaluating the overall financial statement presentation. We believe that our audits, which included confirmation of securities at October 31, 2000 by correspondence with the custodian and brokers, provide a reasonable basis for our opinion.
/s/PricewaterhouseCoopers LLP
PricewaterhouseCoopers LLP
Boston, Massachusetts
December 11, 2000
Annual Report
Investment Adviser
Fidelity Management & Research Company
Boston, MA
Investment Sub-Advisers
Fidelity Investment Money
Management Inc.
Fidelity Management & Research
(U.K.) Inc.
Fidelity Management & Research
(Far East) Inc.
Fidelity Investment Japan Limited
Officers
Edward C. Johnson 3d, President
Robert C. Pozen, Senior Vice President
Dwight D. Churchill, Vice President
David L. Murphy, Vice President
Thomas J. Silvia, Vice President
Stanley N. Griffith, Assistant Vice President
Eric D. Roiter, Secretary
Robert A. Dwight, Treasurer
Maria F. Dwyer, Deputy Treasurer
John H. Costello, Assistant Treasurer
Thomas J. Simpson, Assistant Treasurer
Board of Trustees
Ralph F. Cox *
Phyllis Burke Davis *
Robert M. Gates *
Edward C. Johnson 3d
Donald J. Kirk *
Ned C. Lautenbach *
Peter S. Lynch
Marvin L. Mann *
William O. McCoy *
Gerald C. McDonough *
Robert C. Pozen
Thomas R. Williams *
* Independent trustees
Advisory Board
J. Michael Cook
Abigail P. Johnson
Marie L. Knowles
General Distributor
Fidelity Distributors Corporation
Boston, MA
Transfer and Shareholder
Servicing Agent
Fidelity Investments Institutional Operations Company, Inc.
Boston, MA
Custodian
The Bank of New York
New York, NY
|
AMORI-ANN-1200 |
119005 |
|
1.538544.103 |
|
(Fidelity Investment logo)(registered trademark)
Fidelity® Advisor
Annual Report
October 31, 2000
(2_fidelity_logos)
|
President's Message |
3 |
Ned Johnson on investing strategies. |
|
Performance |
4 |
How the fund has done over time. |
|
Fund Talk |
15 |
The manager's review of fund performance, strategy and outlook. |
|
Investment Changes |
18 |
A summary of major shifts in the fund's investments over the past six months. |
|
Investments |
19 |
A complete list of the fund's investments with their market values. |
|
Financial Statements |
23 |
Statements of assets and liabilities,
operations, and changes in net assets, |
|
Notes |
32 |
Notes to the financial statements. |
|
Report of Independent Accountants |
39 |
The auditors' opinion. |
|
|
|
|
Standard & Poor's, S&P and S&P 500 are registered service marks of The McGraw-Hill Companies, Inc. and have been licensed for use by Fidelity Distributors Corporation.
Other third party marks appearing herein are the property of their respective owners.
All other marks appearing herein are registered or unregistered trademarks or service marks of FMR Corp. or an affiliated company.
(Recycle graphic) This report is printed on recycled paper using soy-based inks.
This report and the financial statements contained herein are submitted for the general information of the shareholders of the fund. This report is not authorized for distribution to prospective investors in the fund unless preceded or accompanied by an effective prospectus.
Mutual fund shares are not deposits or obligations of, or guaranteed by, any depository institution. Shares are not insured by the FDIC, Federal Reserve Board or any other agency, and are subject to investment risks, including possible loss of principal amount invested.
Neither the fund nor Fidelity Distributors Corporation is a bank.
For more information on any Fidelity Advisor fund, including charges and expenses, contact
your investment professional for a free prospectus. Read it carefully before you invest or
send money.
Annual Report
(photo_of_Edward_C_Johnson_3d)
Dear Shareholder:
A sixth-straight year of double-digit positive returns for the Dow Jones Industrial Average, NASDAQ and S&P 500® could be in jeopardy unless the U.S. stock market shows marked improvement in the final two months of 2000. Through October, all three indexes had negative year-to-date returns. On the other hand, most fixed-income sectors were solidly in the black. Treasuries and other long-term government securities led the way, returning nearly 14%.
While it's impossible to predict the future direction of the markets with any degree of certainty, there are certain basic principles that can help investors plan for their future needs.
The longer your investment time frame, the less likely it is that you will be affected by short-term market volatility. A 10-year investment horizon appropriate for saving for a college education, for example, enables you to weather market cycles in a long-term fund, which may have a higher risk potential, but also has a higher potential rate of return.
An intermediate-length fund could make sense if your investment horizon is two to four years, while a short-term bond fund could be the right choice if you need your money in one or two years.
If your time horizon is less than a year, you might want to consider moving some of your bond investment into a money market fund. These funds seek income and a stable share price by investing in high-quality, short-term investments. Of course, it's important to remember that an investment in a money market fund is not insured or guaranteed by the Federal Deposit Insurance Corporation or any other government agency. Although money market funds seek to preserve the value of your investment at $1.00 per share, it is possible to lose money by investing in these types of funds.
Finally, no matter what your time horizon or portfolio diversity, it makes good sense to follow a regular investment plan, investing a certain amount of money in a fund at the same time each month or quarter and periodically reviewing your overall portfolio. By doing so, you won't get caught up in the excitement of a rapidly rising market, nor will you buy all your shares at market highs. While this strategy - known as dollar cost averaging - won't assure a profit or protect you from a loss in a declining market, it should help you lower the average cost of your purchases. Of course, you should consider your financial ability to continue your purchases through periods of low price levels before undertaking such a strategy.
Remember to contact your investment professional if you need help with your investments.
Best regards,
/s/Edward C. Johnson 3d
Edward C. Johnson 3d
Annual Report
There are several ways to evaluate historical performance. You can look at the total percentage change in value, the average annual percentage change or the growth of a hypothetical $10,000 investment. Total return reflects the change in the value of an investment, assuming reinvestment of the class' dividend income and capital gains (the profits earned upon the sale of securities that have grown in value). You can also look at the class' income, as reflected in its yield, to measure performance. The initial offering of Class A shares took place on March 3, 1997. Class A shares bear a 0.15% 12b-1 fee. Returns prior to March 3, 1997 are those of Initial Class, the original class of the fund, which does not bear a 12b-1 fee. Had Class A shares' 12b-1 fee been reflected, returns prior to March 3, 1997 would have been lower. If Fidelity had not reimbursed certain class expenses, the past five year and past 10 year total returns would have been lower.
Cumulative Total Returns
|
Periods ended October 31, 2000 |
|
Past 1 |
Past 5 |
Past 10 |
|
Fidelity Adv Mortgage Securities - CL A |
|
7.49% |
35.67% |
110.41% |
|
Fidelity Adv Mortgage Securities - CL A |
|
2.38% |
29.22% |
100.42% |
|
LB Mortgage |
|
7.57% |
38.70% |
113.69% |
|
US Mortgage Funds Average |
|
6.73% |
32.12% |
98.71% |
Cumulative total returns show Class A's performance in percentage terms over a set period - in this case, one year, five years or 10 years. For example, if you had invested $1,000 in a fund that had a 5% return over the past year, the value of your investment would be $1,050. You can compare Class A's returns to the performance of the Lehman Brothers Mortgage-Backed Securities Index - a market value-weighted index of fixed-rate securities that represent interests in pools of mortgage loans with original terms of 15 and 30 years that are issued by the Government National Mortgage Association (GNMA), the Federal National Mortgage Association (FNMA), and the Federal Home Loan Mortgage Corp. (FHLMC), and balloon mortgages with fixed-rate coupons. To measure how Class A's performance stacked up against its peers, you can compare it to the U.S. mortgage funds average, which reflects the performance of mutual funds with similar objectives tracked by Lipper Inc. The past one year average represents a peer group of 64 mutual funds. These benchmarks reflect reinvestment of dividends and capital gains, if any, and exclude the effect of sales charges.
Average Annual Total Returns
|
Periods ended October 31, 2000 |
Past 1 |
Past 5 |
Past 10 |
|
Fidelity Adv Mortgage Securities - CL A |
7.49% |
6.29% |
7.72% |
|
Fidelity Adv Mortgage Securities - CL A |
2.38% |
5.26% |
7.20% |
|
LB Mortgage |
7.57% |
6.76% |
7.89% |
|
US Mortgage Funds Average |
6.73% |
5.72% |
7.10% |
Average annual total returns take Class A shares' cumulative return and show you what would have happened if Class A had performed at a constant rate each year.
Annual Report
Performance - continued
$10,000 Over 10 Years
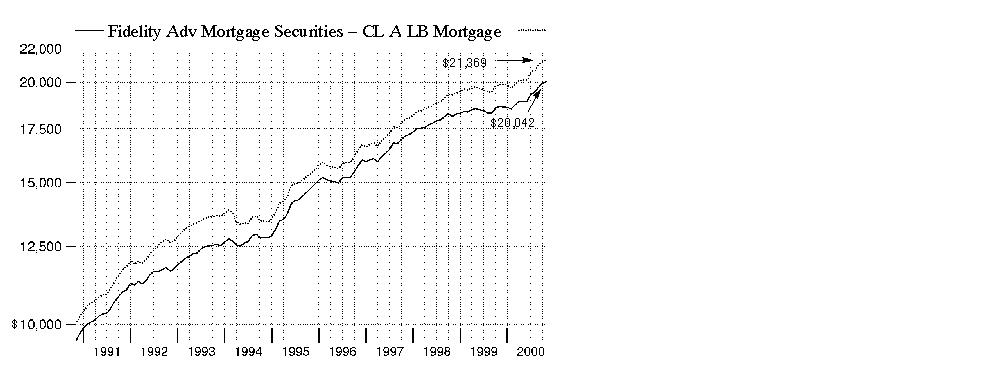
$10,000 Over 10 years: Let's say hypothetically that $10,000 was invested in Fidelity Advisor Mortgage Securities Fund - Class A on October 31, 1990, and the current 4.75% sales charge was paid. As the chart shows, by October 31, 2000, the value of the investment would have grown to $20,042 - an 100.42% increase on the initial investment. For comparison, look at how the Lehman Brothers Mortgage-Backed Securities Index did over the same period. With dividends and capital gains, if any, reinvested, the same $10,000 would have grown to $21,369 - a 113.69% increase.
Understanding
Performance
How a fund did yesterday is no guarantee of how it will do tomorrow. Bond prices, for example, generally move in the opposite direction of interest rates. In turn, the share price, return and yield of a fund that invests in bonds will vary. That means if you sell your shares during a market downturn, you might lose money. But if you can ride out the market's ups and downs, you may have a gain.
3Annual Report
Performance - continued
Total Return Components
|
|
Years ended October 31, |
March 3, 1997
(commencement of
sale of Class A
shares) to |
|||
|
|
2000 |
1999 |
1998 |
1997 |
|
|
Dividend returns |
7.01% |
5.98% |
5.92% |
4.18% |
|
|
Capital returns |
0.48% |
-3.05% |
-0.27% |
2.53% |
|
|
Total returns |
7.49% |
2.93% |
5.65% |
6.71% |
|
Total return components include both dividend returns and capital returns. A dividend return reflects the actual dividends paid by the class. A capital return reflects both the amount paid by the class to shareholders as capital gain distributions and changes in the class' share price. Both returns assume the dividends or capital gains paid by the class are reinvested, if any, and exclude the effect of sales charges.
Dividends and Yield
|
Periods ended October 31, 2000 |
Past 1 |
Past 6 |
Past 1 |
|
Dividends per share |
5.70¢ |
33.96¢ |
70.09¢ |
|
Annualized dividend rate |
6.37% |
6.48% |
6.77% |
|
30-day annualized yield |
6.28% |
- |
- |
Dividends per share show the income paid by the class for a set period. If you annualize this number, based on an average share price of $10.53 over the past one month, $10.39 over the past six months, and $10.36 over the past one year, you can compare the class' income over these three periods. The 30-day annualized yield is a standard formula for all bond funds based on the yields of the bonds in the fund, averaged over the past 30 days. This figure shows you the yield characteristics of the fund's investments at the end of the period. It also helps you compare funds from different companies on an equal basis. The offering share price used in the calculation of the yield includes the effect of Class A's current 4.75% sales charge.
Annual Report
There are several ways to evaluate historical performance. You can look at the total percentage change in value, the average annual percentage change or the growth of a hypothetical $10,000 investment. Total return reflects the change in the value of an investment, assuming reinvestment of the class' dividend income and capital gains (the profits earned upon the sale of securities that have grown in value). You can also look at the class' income, as reflected in its yield, to measure performance. The initial offering of Class T shares took place on March 3, 1997. Class T shares bear a 0.25% 12b-1 fee. Returns prior to March 3, 1997 are those of Initial Class, the original class of the fund, which does not bear a 12b-1 fee. Had Class T shares' 12b-1 fee been reflected, returns prior to March 3, 1997 would have been lower. If Fidelity had not reimbursed certain class expenses, the past five year and 10 year total returns would have been lower.
Cumulative Total Returns
|
Periods ended October 31, 2000 |
|
Past 1 |
Past 5 |
Past 10 |
|
Fidelity Adv Mortgage Securities - CL T |
|
7.42% |
35.29% |
109.82% |
|
Fidelity Adv Mortgage Securities - CL T |
|
3.66% |
30.55% |
102.48% |
|
LB Mortgage |
|
7.57% |
38.70% |
113.69% |
|
US Mortgage Funds Average |
|
6.73% |
32.12% |
98.71% |
Cumulative total returns show Class T's performance in percentage terms over a set period - in this case, one year, five years or 10 years. For example, if you had invested $1,000 in a fund that had a 5% return over the past year, the value of your investment would be $1,050. You can compare Class T's returns to the performance of the Lehman Brothers Mortgage-Backed Securities Index - a market value-weighted index of fixed-rate securities that represent interests in pools of mortgage loans with original terms of 15 and 30 years that are issued by the Government National Mortgage Association (GNMA), the Federal National Mortgage Association (FNMA), and the Federal Home Loan Mortgage Corp. (FHLMC), and balloon mortgages with fixed-rate coupons. To measure how Class T's performance stacked up against its peers, you can compare it to the U.S. mortgage funds average, which reflects the performance of mutual funds with similar objectives tracked by Lipper Inc. The past one year average represents a peer group of 64 mutual funds. These benchmarks reflect reinvestment of dividends and capital gains, if any, and exclude the effect of sales charges.
Annual Report
Performance - continued
Average Annual Total Returns
|
Periods ended October 31, 2000 |
Past 1 |
Past 5 |
Past 10 |
|
Fidelity Adv Mortgage Securities - CL T |
7.42% |
6.23% |
7.69% |
|
Fidelity Adv Mortgage Securities - CL T |
3.66% |
5.48% |
7.31% |
|
LB Mortgage |
7.57% |
6.76% |
7.89% |
|
US Mortgage Funds Average |
6.73% |
5.72% |
7.10% |
Average annual total returns take Class T shares' cumulative return and show you what would have happened if Class T had performed at a constant rate each year.
Annual Report
Performance - continued
$10,000 Over 10 Years
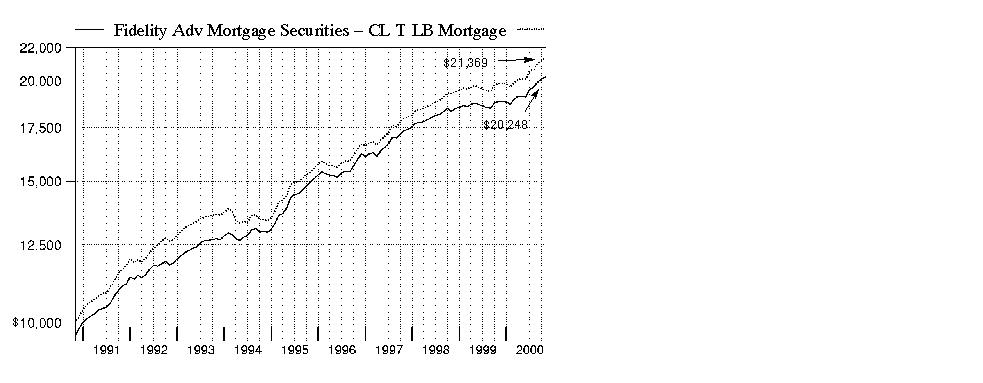
$10,000 Over 10 years: Let's say hypothetically that $10,000 was invested in Fidelity Advisor Mortgage Securities Fund - Class T on October 31, 1990, and the current 3.50% sales charge was paid. As the chart shows, by October 31, 2000, the value of the investment would have grown to $20,248 - a 102.48% increase on the initial investment. For comparison, look at how the Lehman Brothers Mortgage-Backed Securities Index did over the same period. With dividends and capital gains, if any, reinvested, the same $10,000 would have grown to $21,369 - a 113.69% increase.
Understanding
Performance
How a fund did yesterday is no guarantee of how it will do tomorrow. Bond prices, for example, generally move in the opposite direction of interest rates. In turn, the share price, return and yield of a fund that invests in bonds will vary. That means if you sell your shares during a market downturn, you might lose money. But if you can ride out the market's ups and downs, you may have a gain.
3Annual Report
Performance - continued
Total Return Components
|
|
Years ended October 31, |
March 3, 1997
(commencement of
sale of Class T
shares) to |
||
|
|
2000 |
1999 |
1998 |
1997 |
|
Dividend returns |
6.85% |
5.87% |
5.87% |
4.12% |
|
Capital returns |
0.57% |
-3.05% |
-0.27% |
2.53% |
|
Total returns |
7.42% |
2.82% |
5.60% |
6.65% |
Total return components include both dividend returns and capital returns. A dividend return reflects the actual dividends paid by the class. A capital return reflects both the amount paid by the class to shareholders as capital gain distributions and changes in the class' share price. Both returns assume the dividends or capital gains paid by the class are reinvested, if any, and exclude the effect of sales charges.
Dividends and Yield
|
Periods ended October 31, 2000 |
Past 1 |
Past 6 |
Past 1 |
|
Dividends per share |
5.54¢ |
32.99¢ |
68.46¢ |
|
Annualized dividend rate |
6.19% |
6.29% |
6.60% |
|
30-day annualized yield |
6.21% |
- |
- |
Dividends per share show the income paid by the class for a set period. If you annualize this number, based on an average share price of $10.54 over the past one month, $10.40 over the past six months, and $10.37 over the past one year, you can compare the class' income over these three periods. The 30-day annualized yield is a standard formula for all bond funds based on the yields of the bonds in the fund, averaged over the past 30 days. This figure shows you the yield characteristics of the fund's investments at the end of the period. It also helps you compare funds from different companies on an equal basis. The offering share price used in the calculation of the yield includes the effect of Class T's current 3.50% sales charge.
Annual Report
There are several ways to evaluate historical performance. You can look at the total percentage change in value, the average annual percentage change or the growth of a hypothetical $10,000 investment. Total return reflects the change in the value of an investment, assuming reinvestment of the class' dividend income and capital gains (the profits earned upon the sale of securities that have grown in value). You can also look at the class' income, as reflected in its yield, to measure performance. The initial offering of Class B shares took place on March 3, 1997. Class B shares bear a .90% 12b-1 fee. Returns prior to March 3, 1997 are those of Initial Class, the original class of the fund, which does not bear a 12b-1 fee. Had Class B shares' 12b-1 fee been reflected, returns prior to March 3, 1997 would have been lower. Class B's contingent deferred sales charges included in the past one year, past five year and past 10 year total return figures are 5%, 2% and 0%, respectively. If Fidelity had not reimbursed certain class expenses, the past five year and past 10 year total returns would have been lower.
Cumulative Total Returns
|
Periods ended October 31, 2000 |
|
Past 1 |
Past 5 |
Past 10 |
|
Fidelity Adv Mortgage Securities - CL B |
|
6.70% |
32.12% |
104.91% |
|
Fidelity Adv Mortgage Securities - CL B |
|
1.70% |
30.20% |
104.91% |
|
LB Mortgage |
|
7.57% |
38.70% |
113.69% |
|
US Mortgage Funds Average |
|
6.73% |
32.12% |
98.71% |
Cumulative total returns show Class B's performance in percentage terms over a set period - in this case, one year, five years or 10 years. For example, if you had invested $1,000 in a fund that had a 5% return over the past year, the value of your investment would be $1,050. You can compare Class B's returns to the performance of the Lehman Brothers Mortgage-Backed Securities Index - a market value-weighted index of fixed-rate securities that represent interests in pools of mortgage loans with original terms of 15 and 30 years that are issued by the Government National Mortgage Association (GNMA), the Federal National Mortgage Association (FNMA), and the Federal Home Loan Mortgage Corp. (FHLMC), and balloon mortgages with fixed-rate coupons. To measure how Class B's performance stacked up against its peers, you can compare it to the U.S. mortgage funds average, which reflects the performance of mutual funds with similar objectives tracked by Lipper Inc. The past one year average represents a peer group of 64 mutual funds. These benchmarks reflect reinvestment of dividends and capital gains, if any, and exclude the effect of sales charges.
Annual Report
Performance - continued
Average Annual Total Returns
|
Periods ended October 31, 2000 |
Past 1 |
Past 5 |
Past 10 |
|
Fidelity Adv Mortgage Securities - CL B |
6.70% |
5.73% |
7.44% |
|
Fidelity Adv Mortgage Securities - CL B |
1.70% |
5.42% |
7.44% |
|
LB Mortgage |
7.57% |
6.76% |
7.89% |
|
US Mortgage Funds Average |
6.73% |
5.72% |
7.10% |
Average annual total returns take Class B shares' cumulative return and show you what would have happened if Class B had performed at a constant rate each year.
Annual Report
Performance - continued
$10,000 Over 10 Years
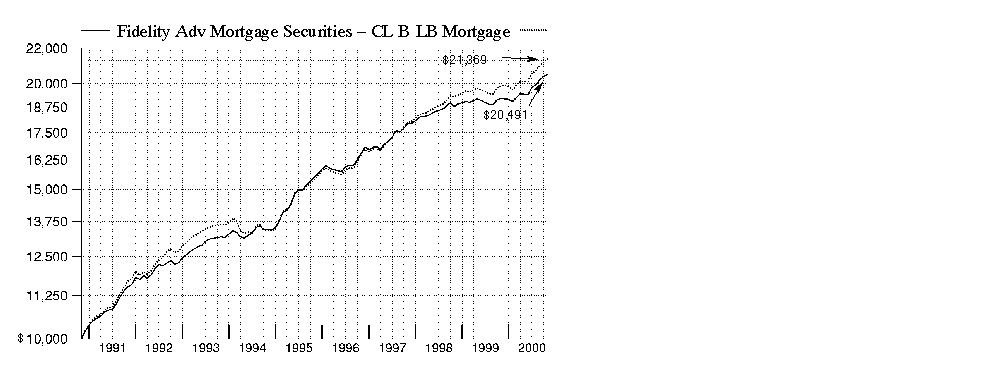
$10,000 Over 10 years: Let's say hypothetically that $10,000 was invested in Fidelity Advisor Mortgage Securities Fund - Class B on October 31, 1990. As the chart shows, by October 31, 2000, the value of the investment would have grown to $20,491 - a 104.91% increase on the initial investment. For comparison, look at how the Lehman Brothers Mortgage-Backed Securities Index did over the same period. With dividends and capital gains, if any, reinvested, the same $10,000 would have grown to $21,369 a 113.69% increase.
Understanding
Performance
How a fund did yesterday is no guarantee of how it will do tomorrow. Bond prices, for example, generally move in the opposite direction of interest rates. In turn, the share price, return and yield of a fund that invests in bonds will vary. That means if you sell your shares during a market downturn, you might lose money. But if you can ride out the market's ups and downs, you may have a gain.
3Annual Report
Performance - continued
Total Return Components
|
|
Years ended October 31, |
March 3, 1997
(commencement of
sale of Class B
shares) to |
|||
|
|
2000 |
1999 |
1998 |
1997 |
|
|
Dividend returns |
6.22% |
5.25% |
5.19% |
3.66% |
|
|
Capital returns |
0.48% |
-2.96% |
-0.37% |
2.52% |
|
|
Total returns |
6.70% |
2.29% |
4.82% |
6.18% |
|
Total return components include both dividend returns and capital returns. A dividend return reflects the actual dividends paid by the class. A capital return reflects both the amount paid by the class to shareholders as capital gain distributions and changes in the class' share price. Both returns assume the dividends or capital gains paid by the class are reinvested, if any, and exclude the effect of sales charges.
Dividends and Yield
|
Periods ended October 31, 2000 |
Past 1 |
Past 6 |
Past 1 |
|
Dividends per share |
5.03¢ |
30.03¢ |
62.41¢ |
|
Annualized dividend rate |
5.62% |
5.73% |
6.02% |
|
30-day annualized yield |
5.84% |
- |
- |
Dividends per share show the income paid by the class for a set period. If you annualize this number, based on an average share price of $10.53 over the past one month, $10.39 over the past six months, and $10.36 over the past one year, you can compare the class' income over these three periods. The 30-day annualized yield is a standard formula for all bond funds based on the yields of the bonds in the fund, averaged over the past 30 days. This figure shows you the yield characteristics of the fund's investments at the end of the period. It also helps you compare funds from different companies on an equal basis. The offering share price used in the calculation of the yield excludes the effect of Class B's contingent deferred sales charge.
Annual Report
Market Recap
Strong technical factors in the market helped most investment-grade bonds overcome sharply rising interest rates and volatile market conditions, enabling them to outperform a number of major U.S. equity indexes during the 12-month period that ended October 31, 2000. The Lehman Brothers Aggregate Bond Index - a popular measure of taxable-bond performance - returned 7.30% during this time frame. Following a bullish fourth quarter of 1999 for the spread sectors - namely corporate bonds, mortgage and agency securities - Treasuries usurped market leadership not long after the millennium changeover. A growing federal surplus spurred the U.S. government in January to begin buying back outstanding debt and reducing future issuance. The scarcity premium created by a shrinking supply of long-dated Treasuries sent prices soaring and yields plummeting, thereby inducing an inverted yield curve - which occurs when short-term bonds outyield longer-dated securities. Anticipation that the Fed was finished raising interest rates entering the summer, combined with persistent flights-to-safety from risk-averse investors concerned about volatility in equity markets, further bolstered the long bond, helping the Lehman Brothers Treasury Index return 8.22% during the period. Mortgages made up some ground late in the period behind strong housing turnover. Agencies, too, staged a late rally in response to reduced political risk surrounding government-sponsored enterprises. However, corporates had little to celebrate, plagued by deteriorating credit conditions and growing supply pressures. For the overall period, the Lehman Brothers Mortgage-Backed Securities, U.S. Agency and Credit Bond indexes returned 7.57%, 7.30% and 5.48%, respectively.
(Portfolio Manager photograph)
An interview with Tom Silvia, Portfolio Manager of Fidelity Advisor Mortgage Securities Fund
Q. How did the fund perform, Tom?
Fund Talk: The Manager's Overview - continued
A. For the 12 months ending October 31, 2000, the fund's Class A, Class T and Class B shares returned 7.49%, 7.42% and 6.70%, respectively. To get a sense of how these returns did relative to the fund's competitors, the U.S. mortgage funds average returned 6.73% for the same period, according to Lipper Inc. Meanwhile, the Lehman Brothers Mortgage-Backed Securities Index - which tracks the types of securities in which the fund invests - returned 7.57%.
Annual Report
Q. What factors influenced the fund's performance?
A. In the plus column was the fund's relatively large weighting in commercial mortgage-backed securities (CMBS) - which accounted for about 15% of the fund's net assets at the end of the period. CMBS are bonds that are collateralized by mortgage loans on commercial real estate - such as office buildings, shopping malls, hotels and apartment buildings. They seemingly had the wind at their backs during the past year. Rising interest rates, which hurt many other fixed-income securities, boosted outstanding CMBS by limiting issuance of new securities. Second, there was overall improvement in the credit quality of the sector thanks to the strong economy and better commercial real estate fundamentals as rents and occupancies increased. Finally, the Labor Department proposed allowing private pension funds to buy some mortgage securities that had been off-limits.
Q. How did mortgage securities made up of home loans - those issued by Fannie Mae, Freddie Mac and Ginnie Mae - perform during the year?
A. Generally speaking, they performed poorly early on but improved quite a bit in the second half of the year. At first, rising interest rates were a drag on the performance of these mortgage securities, pushing their yields higher and their prices lower. At the same time, good economic conditions translated into a strong housing market, prompting more mortgage prepayment. More recently, mortgage security prices firmed as it became evident that previous interest-rate hikes had helped slow the economy. In response, mortgage prepayments fell and the outstanding supply was reduced. Against that backdrop, various types of mortgage securities fell in and out of favor during the year. For instance, Ginnie Mae securities - which accounted for a smaller portion of the fund than of the Lehman Brothers index - outpaced Fannie Mae and Freddie Mac securities during much of the year. That was due to a very small supply of Ginnie Mae securities. Some legislators floated the idea of even cutting off their longstanding but never-used lines of credit. Having a relatively small weighting in Ginnie Mae securities probably was the biggest disappointment for the year.
Q. What helped Fannie Mae and Freddie Mac securities regain their footing?
A. The yield advantage offered by Fannie Mae and Freddie Mac securities - as much as 10 basis points (0.10 percentage points) - over Ginnie Maes was one factor that helped them rebound. Also, the legislative pressure on the agencies eased when Fannie Mae and Freddie Mac made some concessions to legislators, adopting measures to improve their capital structure and allow more scrutiny of their books. In response, demand for their securities improved as more investors became attracted to their relatively high yields and cheap prices.
Annual Report
Fund Talk: The Manager's Overview - continued
Q. Interest rates have been relatively volatile over the past year. How did you manage the fund's sensitivity to interest-rate changes?
A. I kept the fund's duration - a gauge of its interest-rate sensitivity - in line with the mortgage securities market as a whole as measured by the Lehman Brothers Mortgage-Backed Securities Index. That meant I avoided positioning the fund with more or less sensitivity based on my view of where interest rates were headed.
Q. What's your outlook?
A. I'm optimistic about the prospects for mortgage securities. Even though there's the possibility that interest rates will move lower, I don't see a large wave of mortgage prepayment in the future. By my calculations, mortgage rates would have to decline at least one full percentage point from current levels in order for prepayments to accelerate at a meaningful level. Given that, I think that mortgage securities offer very attractive values at current levels, offering yields that are well in excess of U.S. Treasury securities.
The views expressed in this report reflect those of the portfolio manager only through the end of the period of the report as stated on the cover and do not necessarily represent the views of Fidelity or any other person in the Fidelity organization. Any such views are subject to change at any time based upon market or other conditions and Fidelity disclaims any responsibility to update such views. These views may not be relied on as investment advice and, because investment decisions for a Fidelity fund are based on numerous factors, may not be relied on as an indication of trading intent on behalf of any Fidelity fund.
Fund Facts
Goal: seeks a high level of current income, consistent with prudent investment risk; the fund may also consider the potential for capital gain
Start date: December 31, 1984
Size: as of October 31, 2000, more than $466 million
Manager: Tom Silvia, since 1997; joined Fidelity in 1993
3Tom Silvia on the strength of the housing market and its effect on mortgage securities:
"Sometimes, significant interest-rate volatility - such as we've seen during the past year - can lead to an increase in the rate of mortgage prepayments, which can have negative implications for the mortgage market. This past year, however, that was not the case. The strong housing market, fueled by the robust economy, favorable employment growth and rising personal incomes, benefited the mortgage market during the past year. Thanks to a significant wave of refinancing activity in 1998 and early 1999, the vast majority of mortgages outstanding 12 months ago carried interest rates of 6.5% to 7.0%. As interest rates climbed throughout the past year, these bonds started to trade below their par value of $100. Essentially, investors weren't willing to pay full price - or par - for a bond that paid less income when they could buy a newly issued bond with a higher income. As a result, 6.5% to 7.0% mortgage securities began to trade at discount prices ranging from $92 to $96. But given the fact that the housing market was strong and many homeowners decided to move into other homes, many of those mortgage securities were paid off at par, resulting in fairly good performance for the mortgage market as a whole."
Annual Report
|
Coupon Distribution as of October 31, 2000 |
||
|
|
% of fund's investments |
% of fund's investments |
|
Less than 6% |
0.4 |
0.5 |
|
6 - 6.99% |
32.6 |
45.0 |
|
7 - 7.99% |
43.7 |
38.4 |
|
8 - 8.99% |
14.0 |
9.9 |
|
9% and over |
2.8 |
4.2 |
|
Coupon distribution shows the range of stated interest rates on the fund's investments, excluding short-term investments. |
|
Average Years to Maturity as of October 31, 2000 |
||
|
|
|
6 months ago |
|
Years |
7.1 |
8.0 |
|
Average years to maturity is based on the average time remaining until principal payments are expected from each of the fund's bonds, weighted by dollar amount. |
|
Duration as of October 31, 2000 |
||
|
|
|
6 months ago |
|
Years |
3.7 |
4.7 |
|
Duration shows how much a bond fund's price fluctuates with changes in comparable interest rates. If rates rise 1%, for example, a fund with a five-year duration is likely to lose about 5% of its value. Other factors also can influence a bond fund's performance and share price. Accordingly, a bond fund's actual performance may differ from this example. |
|
Asset Allocation (% of fund's net assets) |
|||||||
|
As of October 31, 2000 |
As of April 30, 2000 |
||||||
|
Mortgage |
|
|
Mortgage |
|
||
|
CMOs and Other Mortgage Related Securities 19.3% |
|
|
CMOs and Other Mortgage Related Securities 21.8% |
|
||
|
U.S. Government |
|
|
U.S. Government |
|
||
|
Short-Term |
|
|
Short-Term |
|
||
* Short-term investments and net other assets are not included in the pie chart.
Annual Report
Showing Percentage of Net Assets
|
U.S. Government and Government Agency Obligations - 3.1% |
||||
|
|
Principal Amount |
Value |
||
|
U.S. Government Agency Obligations - 3.1% |
||||
|
Fannie Mae 6.5% 4/29/09 |
|
$ 15,440,000 |
$ 14,701,814 |
|
|
U.S. Government Agency - Mortgage Securities - 77.3% |
||||
|
|
||||
|
Fannie Mae - 48.5% |
||||
|
6% 2/1/14 to 6/1/29 |
|
17,285,396 |
16,223,096 |
|
|
6.5% 9/1/10 to 2/1/30 |
|
66,387,810 |
63,905,089 |
|
|
7% 3/1/19 to 10/1/30 |
|
71,013,814 |
69,662,626 |
|
|
7% 11/1/30 (b) |
|
15,000,000 |
14,695,313 |
|
|
7.5% 3/1/22 to 11/1/30 |
|
40,259,542 |
40,213,187 |
|
|
8% 1/1/07 to 7/1/30 |
|
13,049,020 |
13,209,123 |
|
|
8.25% 1/1/13 |
|
54,630 |
55,566 |
|
|
8.5% 6/1/16 to 11/1/23 |
|
2,946,350 |
3,021,512 |
|
|
8.75% 11/1/08 to 7/1/09 |
|
122,645 |
125,817 |
|
|
9% 1/1/08 to 2/1/13 |
|
497,626 |
512,597 |
|
|
9.5% 5/1/03 to 8/1/22 |
|
2,747,955 |
2,835,347 |
|
|
11% 12/1/02 to 8/1/10 |
|
834,963 |
905,168 |
|
|
12.25% 5/1/13 to 6/1/15 |
|
146,833 |
164,723 |
|
|
12.5% 11/1/14 to 3/1/16 |
|
279,804 |
316,089 |
|
|
12.75% 2/1/14 to 6/1/15 |
|
44,209 |
49,029 |
|
|
13.5% 9/1/13 to 12/1/14 |
|
129,910 |
149,843 |
|
|
14% 11/1/14 |
|
40,901 |
47,586 |
|
|
|
226,091,711 |
|||
|
Freddie Mac - 12.1% |
||||
|
5% 7/1/10 |
|
2,010,726 |
1,866,834 |
|
|
6% 2/1/29 to 7/1/29 |
|
4,606,402 |
4,321,358 |
|
|
6.5% 1/1/24 to 9/1/24 |
|
20,168,922 |
19,511,494 |
|
|
7% 7/1/29 to 9/1/29 |
|
7,508,084 |
7,360,249 |
|
|
7.5% 6/1/26 to 11/1/30 |
|
6,307,591 |
6,309,623 |
|
|
7.5% 11/1/30 (b) |
|
7,275,000 |
7,270,453 |
|
|
8% 10/1/07 to 4/1/21 |
|
487,909 |
493,337 |
|
|
8.5% 11/1/03 to 5/1/30 |
|
2,741,499 |
2,801,348 |
|
|
9% 9/1/08 to 5/1/21 |
|
3,334,308 |
3,434,549 |
|
|
10% 1/1/09 to 5/1/19 |
|
930,499 |
974,266 |
|
|
10.5% 8/1/10 to 2/1/16 |
|
83,810 |
88,684 |
|
|
11.5% 4/1/12 |
|
54,722 |
59,735 |
|
|
12.25% 6/1/14 to 7/1/15 |
|
106,234 |
119,159 |
|
|
12.5% 5/1/12 to 12/1/14 |
|
521,724 |
580,346 |
|
|
U.S. Government Agency - Mortgage Securities - continued |
||||
|
|
Principal Amount |
Value |
||
|
Freddie Mac - continued |
||||
|
12.75% 6/1/05 to 3/1/15 |
|
$ 55,553 |
$ 60,251 |
|
|
13% 1/1/11 to 6/1/15 |
|
865,615 |
995,218 |
|
|
|
56,246,904 |
|||
|
Government National Mortgage Association - 16.7% |
||||
|
6.5% 5/15/28 to 1/15/29 |
|
4,059,163 |
3,918,350 |
|
|
7% 1/15/26 to 6/15/29 (d) |
|
16,431,436 |
16,196,453 |
|
|
7.5% 7/15/05 to 9/15/27 |
|
12,034,063 |
12,123,749 |
|
|
8% 4/15/02 to 12/15/25 |
|
7,861,876 |
8,003,375 |
|
|
8.5% 7/15/16 to 10/15/30 |
|
35,803,208 |
36,731,278 |
|
|
9% 9/20/16 to 4/20/18 |
|
60,050 |
61,959 |
|
|
9.5% 8/15/09 to 12/15/24 |
|
72,451 |
76,491 |
|
|
10.5% 1/15/01 to 2/20/18 |
|
487,533 |
519,050 |
|
|
13% 10/15/13 |
|
43,913 |
50,431 |
|
|
13.5% 7/15/11 to 10/15/14 |
|
56,959 |
65,227 |
|
|
|
77,746,363 |
|||
|
TOTAL U.S. GOVERNMENT AGENCY - MORTGAGE SECURITIES (Cost $362,314,237) |
360,084,978 |
|||
|
Collateralized Mortgage Obligations - 4.3% |
||||
|
|
||||
|
U.S. Government Agency - 4.3% |
||||
|
Fannie Mae REMIC planned amortization class: |
|
|
|
|
|
Series 1999-1 Class PJ, 6.5% 2/25/29 |
|
10,049,260 |
9,369,247 |
|
|
Series 1999-51 Class LK, 6.5% 8/25/29 |
|
10,000,000 |
9,128,100 |
|
|
Freddie Mac REMIC planned amortization class |
|
1,404,060 |
1,445,298 |
|
|
TOTAL COLLATERALIZED MORTGAGE OBLIGATIONS (Cost $19,677,765) |
19,942,645 |
|||
|
Commercial Mortgage Securities - 15.0% |
||||
|
|
||||
|
Bankers Trust II Series 1999-S1A Class D, 8.81% 2/28/14 (a)(c) |
|
5,000,000 |
5,010,938 |
|
|
CBM Funding Corp. sequential pay Series 1996-1 |
|
2,300,000 |
2,296,586 |
|
|
CS First Boston Mortgage Securities Corp. |
|
2,000,000 |
1,902,938 |
|
|
Deutsche Mortgage & Asset Receiving Corp. |
|
10,200,000 |
9,431,813 |
|
|
Federal Deposit Insurance Corp. REMIC Trust sequential pay Series 1996-C1 Class 1A, 6.75% 7/25/26 |
|
2,242,680 |
2,220,078 |
|
|
Commercial Mortgage Securities - continued |
||||
|
|
Principal Amount |
Value |
||
|
GS Mortgage Securities Corp. II Series 1998-GLII |
|
$ 1,600,000 |
$ 1,450,500 |
|
|
Nomura Asset Securities Corp. weighted average coupon Series 1998-D6 Class A4, 7.3619% 3/17/28 (c) |
|
15,000,000 |
14,067,188 |
|
|
Nomura Depositor Trust floater Series 1998-ST1A: |
|
|
|
|
|
Class A4, 7.5213% 2/15/34 (a)(c) |
|
7,900,000 |
7,755,579 |
|
|
Class A5, 7.8713% 2/15/34 (a)(c) |
|
5,278,196 |
5,156,138 |
|
|
Structured Asset Securities Corp. Series 1992-M1 |
|
3,192,522 |
3,097,744 |
|
|
Thirteen Affiliates of General Growth Properties, Inc. Series 1 Class D1, 6.917% 12/15/07 (a) |
|
18,200,000 |
17,531,720 |
|
|
TOTAL COMMERCIAL MORTGAGE SECURITIES (Cost $72,038,810) |
69,921,222 |
|||
|
Cash Equivalents - 7.0% |
|||
|
Maturity Amount |
|
||
|
Investments in repurchase agreements (U.S. Government Obligations), in a joint trading account at 6.62%, dated 10/31/00 due
11/1/00 |
$ 32,828,035 |
32,822,000 |
|
|
TOTAL INVESTMENT PORTFOLIO - 106.7% (Cost $501,145,620) |
497,472,659 |
||
|
NET OTHER ASSETS - (6.7)% |
(31,448,023) |
||
|
NET ASSETS - 100% |
$ 466,024,636 |
||
|
Legend |
|
(a) Security exempt from registration under Rule 144A of the Securities Act of 1933. These securities may be resold in transactions exempt from registration, normally to qualified institutional buyers. At the period end, the value of these securities amounted to $36,904,875 or 7.9% of net assets. |
|
(b) Security purchased on a delayed delivery or when-issued basis. |
|
(c) The coupon rate shown on floating or adjustable rate securities represents the rate at period end. |
|
(d) A portion of this security is subject to a forward commitment to sell. |
|
Income Tax Information |
|
At October 31, 2000, the aggregate cost of investment securities for income tax purposes was $501,225,418. Net unrealized depreciation aggregated $3,752,759, of which $3,729,911 related to appreciated investment securities and $7,482,670 related to depreciated investment securities. |
|
At October 31, 2000, the fund had a capital loss carryforward of approximately $8,706,000 of which $5,050,000 and $3,656,000 will expire on October 31, 2007 and 2008, respectively. |
See accompanying notes which are an integral part of the financial statements.
Annual Report
Statement of Assets and Liabilities
|
|
October 31, 2000 |
|
|
Assets |
|
|
|
Investment in securities, at value (including repurchase agreements of $32,822,000) (cost $501,145,620) - See accompanying schedule |
|
$ 497,472,659 |
|
Commitment to sell securities on a delayed delivery basis |
$ (14,775,000) |
|
|
Receivable for securities sold on a delayed delivery basis |
14,906,250 |
131,250 |
|
Receivable for investments sold, regular delivery |
|
113,202 |
|
Cash |
|
485 |
|
Receivable for fund shares sold |
|
182,244 |
|
Interest receivable |
|
2,409,643 |
|
Total assets |
|
500,309,483 |
|
Liabilities |
|
|
|
Payable for investments purchased |
8,232,107 |
|
|
Delayed delivery |
22,113,125 |
|
|
Payable for fund shares redeemed |
3,103,942 |
|
|
Distributions payable |
505,453 |
|
|
Accrued management fee |
168,882 |
|
|
Distribution fees payable |
27,900 |
|
|
Other payables and accrued expenses |
133,438 |
|
|
Total liabilities |
|
34,284,847 |
|
Net Assets |
|
$ 466,024,636 |
|
Net Assets consist of: |
|
|
|
Paid in capital |
|
$ 477,537,240 |
|
Undistributed net investment income |
|
813,267 |
|
Accumulated undistributed net realized |
|
(8,784,160) |
|
Net unrealized appreciation (depreciation) on investments |
|
(3,541,711) |
|
Net Assets |
|
$ 466,024,636 |
See accompanying notes which are an integral part of the financial statements.
Annual Report
Financial Statements - continued
Statement of Assets and Liabilities - continued
|
|
October 31, 2000 |
|
|
Calculation of Maximum Offering Price |
|
$10.53 |
|
Maximum offering price per share (100/95.25 of $10.53) |
|
$11.06 |
|
Class T: |
|
$10.54 |
|
Maximum offering price per share (100/96.50 of $10.54) |
|
$10.92 |
|
Class B: |
|
$10.53 |
|
Initial Class: |
|
$10.54 |
|
Institutional Class: |
|
$10.52 |
A Redemption price per share is equal to net asset value less any applicable contingent deferred sales charge.
See accompanying notes which are an integral part of the financial statements.
Annual Report
Financial Statements - continued
Statement of Operations
|
|
Year ended October 31, 2000 |
|
|
Investment Income Interest |
|
$ 32,656,104 |
|
Expenses |
|
|
|
Management fee |
$ 1,899,545 |
|
|
Transfer agent fees |
759,081 |
|
|
Distribution fees |
261,047 |
|
|
Accounting fees and expenses |
143,998 |
|
|
Non-interested trustees' compensation |
1,585 |
|
|
Custodian fees and expenses |
69,446 |
|
|
Registration fees |
93,364 |
|
|
Audit |
54,560 |
|
|
Legal |
7,135 |
|
|
Miscellaneous |
2,586 |
|
|
Total expenses before reductions |
3,292,347 |
|
|
Expense reductions |
(12,991) |
3,279,356 |
|
Net investment income |
|
29,376,748 |
|
Realized and Unrealized Gain (Loss) Net realized gain (loss) on investment securities |
|
(3,442,334) |
|
Change in net unrealized appreciation (depreciation) on: |
|
|
|
Investment securities |
6,356,250 |
|
|
Delayed delivery commitments |
131,250 |
6,487,500 |
|
Net gain (loss) |
|
3,045,166 |
|
Net increase (decrease) in net assets resulting |
|
$ 32,421,914 |
See accompanying notes which are an integral part of the financial statements.
Annual Report
Financial Statements - continued
Statement of Changes in Net Assets
|
|
Year ended
October 31, |
Year ended
October 31, |
|
Increase (Decrease) in Net Assets |
|
|
|
Operations |
$ 29,376,748 |
$ 30,638,885 |
|
Net realized gain (loss) |
(3,442,334) |
(5,620,586) |
|
Change in net unrealized appreciation (depreciation) |
6,487,500 |
(10,190,965) |
|
Net increase (decrease) in net assets resulting |
32,421,914 |
14,827,334 |
|
Distributions to shareholders |
(30,637,049) |
(30,183,549) |
|
From net realized gain |
- |
(6,924,572) |
|
Total distributions |
(30,637,049) |
(37,108,121) |
|
Share transactions - net increase (decrease) |
(9,263,825) |
(14,273,306) |
|
Total increase (decrease) in net assets |
(7,478,960) |
(36,554,093) |
|
Net Assets |
|
|
|
Beginning of period |
473,503,596 |
510,057,689 |
|
End of period (including undistributed net investment income of $813,267 and $1,901,973, respectively) |
$ 466,024,636 |
$ 473,503,596 |
See accompanying notes which are an integral part of the financial statements.
Annual Report
Financial Highlights - Class A
|
Years ended October 31, |
2000 |
1999 |
1998 |
1997 G |
1997 F |
|
Selected Per-Share Data |
|
|
|
|
|
|
Net asset value, beginning of period |
$ 10.480 |
$ 10.960 |
$ 11.020 |
$ 11.050 |
$ 10.830 |
|
Income from Investment Operations |
|
|
|
|
|
|
Net investment income D |
.665 |
.646 |
.669 |
.170 |
.268 |
|
Net realized and unrealized gain (loss) |
.086 |
(.336) |
(.061) |
.048 |
.224 |
|
Total from investment |
.751 |
.310 |
.608 |
.218 |
.492 |
|
Less Distributions |
|
|
|
|
|
|
From net investment |
(.701) |
(.640) |
(.638) |
(.168) |
(.272) |
|
From net realized gain |
- |
(.150) |
(.030) |
(.080) |
- |
|
Total distributions |
(.701) |
(.790) |
(.668) |
(.248) |
(.272) |
|
Net asset value, end |
$ 10.530 |
$ 10.480 |
$ 10.960 |
$ 11.020 |
$ 11.050 |
|
Total Return B, C |
7.49% |
2.93% |
5.65% |
2.00% |
4.61% |
|
Ratios and Supplemental Data |
|
|
|
|
|
|
Net assets, end of period (000 omitted) |
$ 4,610 |
$ 3,090 |
$ 1,865 |
$ 1,648 |
$ 1,586 |
|
Ratio of expenses to average net assets |
.88% |
.90% E |
.90% E |
.90% A, E |
.90% A, E |
|
Ratio of net investment income to average |
6.44% |
6.09% |
6.01% |
6.18% A |
6.09% A |
|
Portfolio turnover rate |
99% |
183% |
262% |
125% A |
149% |
A Annualized
B The total returns would have been lower had certain expenses not been reduced during the periods shown.
C Total returns do not include the one time sales charge and for periods of less than one year are not annualized.
D Net investment income per share has been calculated based on average shares outstanding during the period.
E FMR agreed to reimburse a portion of the class' expenses during the period. Without this reimbursement, the class' expense ratio would have been higher.
F For the period March 3, 1997 (commencement of sale of Class A shares) to July 31, 1997.
G Three months ended October 31
See accompanying notes which are an integral part of the financial statements.
Annual Report
Financial Highlights - Class T
|
Years ended October 31, |
2000 |
1999 |
1998 |
1997 G |
1997 F |
|
Selected Per-Share Data |
|
|
|
|
|
|
Net asset value, beginning |
$ 10.480 |
$ 10.960 |
$ 11.020 |
$ 11.050 |
$ 10.830 |
|
Income from Investment Operations |
|
|
|
|
|
|
Net investment income D |
.653 |
.637 |
.665 |
.167 |
.255 |
|
Net realized and unrealized gain (loss) |
.092 |
(.338) |
(.063) |
.048 |
.233 |
|
Total from investment |
.745 |
.299 |
.602 |
.215 |
.488 |
|
Less Distributions |
|
|
|
|
|
|
From net investment income |
(.685) |
(.629) |
(.632) |
(.165) |
(.268) |
|
From net realized gain |
- |
(.150) |
(.030) |
(.080) |
- |
|
Total distributions |
(.685) |
(.779) |
(.662) |
(.245) |
(.268) |
|
Net asset value, end of period |
$ 10.540 |
$ 10.480 |
$ 10.960 |
$ 11.020 |
$ 11.050 |
|
Total Return B, C |
7.42% |
2.82% |
5.60% |
1.98% |
4.57% |
|
Ratios and Supplemental Data |
|
|
|
|
|
|
Net assets, end of period |
$ 61,359 |
$ 29,052 |
$ 19,103 |
$ 14,649 |
$ 12,193 |
|
Ratio of expenses to average net assets |
1.00% |
1.00% E |
1.00% E |
1.00% A, E |
1.00% A, E |
|
Ratio of net investment income to average net assets |
6.33% |
5.99% |
6.05% |
6.10% A |
5.99% A |
|
Portfolio turnover rate |
99% |
183% |
262% |
125% A |
149% |
A Annualized
B The total returns would have been lower had certain expenses not been reduced during the periods shown.
C Total returns do not include the one time sales charge and for periods of less than one year are not annualized.
D Net investment income per share has been calculated based on average shares outstanding during the period.
E FMR agreed to reimburse a portion of the class' expenses during the period. Without this reimbursement, the class' expense ratio would have been higher.
F For the period March 3, 1997 (commencement of sale of Class T shares) to July 31, 1997.
G Three months ended October 31
See accompanying notes which are an integral part of the financial statements.
Annual Report
Financial Highlights - Class B
|
Years ended October 31, |
2000 |
1999 |
1998 |
1997 G |
1997 F |
|
Selected Per-Share Data |
|
|
|
|
|
|
Net asset value, beginning |
$ 10.480 |
$ 10.950 |
$ 11.020 |
$ 11.040 |
$ 10.830 |
|
Income from Investment Operations |
|
|
|
|
|
|
Net investment income D |
.593 |
.567 |
.584 |
.142 |
.234 |
|
Net realized and unrealized gain (loss) |
.081 |
(.324) |
(.064) |
.065 |
.214 |
|
Total from investment |
.674 |
.243 |
.520 |
.207 |
.448 |
|
Less Distributions |
|
|
|
|
|
|
From net investment income |
(.624) |
(.563) |
(.560) |
(.147) |
(.238) |
|
From net realized gain |
- |
(.150) |
(.030) |
(.080) |
- |
|
Total distributions |
(.624) |
(.713) |
(.590) |
(.227) |
(.238) |
|
Net asset value, end of period |
$ 10.530 |
$ 10.480 |
$ 10.950 |
$ 11.020 |
$ 11.040 |
|
Total Return B, C |
6.70% |
2.29% |
4.82% |
1.90% |
4.20% |
|
Ratios and Supplemental Data |
|
|
|
|
|
|
Net assets, end of period |
$ 19,911 |
$ 19,101 |
$ 7,840 |
$ 1,587 |
$ 823 |
|
Ratio of expenses to average |
1.60% |
1.62% |
1.65% E |
1.65% A, E |
1.65% A, E |
|
Ratio of net investment income to average net assets |
5.73% |
5.37% |
5.37% |
5.32% A |
5.34% A |
|
Portfolio turnover rate |
99% |
183% |
262% |
125% A |
149% |
A Annualized
B The total returns would have been lower had certain expenses not been reduced during the periods shown.
C Total returns do not include the contingent deferred sales charge and for periods of less than one year are not annualized.
D Net investment income per share has been calculated based on average shares outstanding during the period.
E FMR agreed to reimburse a portion of the class' expenses during the period. Without this reimbursement, the class' expense ratio would have been higher.
F For the period March 3, 1997 (commencement of sale of Class B shares) to July 31, 1997.
G Three months ended October 31
See accompanying notes which are an integral part of the financial statements.
Annual Report
Financial Highlights - Initial Class
|
Years ended October 31, |
2000 |
1999 |
1998 |
1997 F |
1997 G |
1996 G |
|
Selected Per-Share Data |
|
|
|
|
|
|
|
Net asset value, beginning of period |
$ 10.490 |
$ 10.970 |
$ 11.020 |
$ 11.050 |
$ 10.780 |
$ 10.890 |
|
Income from Investment Operations |
|
|
|
|
|
|
|
Net investment income |
.690 D |
.674 D |
.700 D |
.176 D |
.678 D |
.729 |
|
Net realized and unrealized gain (loss) |
.078 |
(.342) |
(.056) |
.047 |
.391 |
(.015) |
|
Total from investment operations |
.768 |
.332 |
.644 |
.223 |
1.069 |
.714 |
|
Less Distributions |
|
|
|
|
|
|
|
From net investment |
(.718) |
(.662) |
(.664) |
(.173) |
(.689) |
(.724) |
|
From net realized gain |
- |
(.150) |
(.030) |
(.080) |
(.110) |
(.100) |
|
Total distributions |
(.718) |
(.812) |
(.694) |
(.253) |
(.799) |
(.824) |
|
Net asset value, end |
$ 10.540 |
$ 10.490 |
$ 10.970 |
$ 11.020 |
$ 11.050 |
$ 10.780 |
|
Total Return B, C |
7.66% |
3.14% |
5.99% |
2.05% |
10.34% |
6.72% |
|
Ratios and Supplemental Data |
|
|
|
|
|
|
|
Net assets, end of period |
$ 371,107 |
$ 406,839 |
$ 459,212 |
$ 494,304 |
$ 506,113 |
$ 488,162 |
|
Ratio of expenses to average net assets |
.67% |
.70% |
.71% |
.72% A |
.73% |
.74% |
|
Ratio of expenses to average net assets after expense reductions |
.67% |
.70% |
.71% |
.72% A |
.73% |
.73% E |
|
Ratio of net investment
income to average |
6.65% |
6.29% |
6.34% |
6.36% A |
6.26% |
6.75% |
|
Portfolio turnover rate |
99% |
183% |
262% |
125% A |
149% |
221% |
A Annualized
B Total returns for periods of less than one year are not annualized.
C The total returns would have been lower had certain expenses not been reduced during the periods shown.
D Net investment income per share has been calculated based on average shares outstanding during the period.
E FMR or the fund has entered into varying arrangements with third parties who either paid or reduced a portion of the class' expenses.
F Three months ended October 31
G Year ended July 31
See accompanying notes which are an integral part of the financial statements.
Annual Report
Financial Highlights - Institutional Class
|
Years ended October 31, |
2000 |
1999 |
1998 |
1997 H |
1997 G |
|
Selected Per-Share Data |
|
|
|
|
|
|
Net asset value, beginning |
$ 10.470 |
$ 10.950 |
$ 11.010 |
$ 11.040 |
$ 10.830 |
|
Income from Investment Operations |
|
|
|
|
|
|
Net investment income D |
.684 |
.669 |
.693 |
.172 |
.263 |
|
Net realized and unrealized gain (loss) |
.080 |
(.343) |
(.063) |
.050 |
.226 |
|
Total from investment |
.764 |
.326 |
.630 |
.222 |
.489 |
|
Less Distributions |
|
|
|
|
|
|
From net investment income |
(.714) |
(.656) |
(.660) |
(.172) |
(.279) |
|
From net realized gain |
- |
(.150) |
(.030) |
(.080) |
- |
|
Total distributions |
(.714) |
(.806) |
(.690) |
(.252) |
(.279) |
|
Net asset value, end of period |
$ 10.520 |
$ 10.470 |
$ 10.950 |
$ 11.010 |
$ 11.040 |
|
Total Return B, C |
7.64% |
3.09% |
5.86% |
2.05% |
4.59% |
|
Ratios and Supplemental Data |
|
|
|
|
|
|
Net assets, end of period |
$ 9,038 |
$ 15,422 |
$ 22,038 |
$ 19,718 |
$ 13,177 |
|
Ratio of expenses to average net assets |
.73% |
.75% E |
.75% E |
.75% A, E |
.75% A, E |
|
Ratio of expenses to average net assets after expense reductions |
.72% F |
.75% |
.75% |
.75% A |
.70% A, F |
|
Ratio of net investment income to average net assets |
6.60% |
6.24% |
6.30% |
6.35% A |
6.29% A |
|
Portfolio turnover rate |
99% |
183% |
262% |
125% A |
149% |
A Annualized
B Total returns for periods of less than one year are not annualized.
C The total returns would have been lower had certain expenses not been reduced during the periods shown.
D Net investment income per share has been calculated based on average shares outstanding during the period.
E FMR agreed to reimburse a portion of the class' expenses during the period. Without this reimbursement, the class' expense ratio would have been higher.
F FMR or the fund has entered into varying arrangements with third parties who either paid or reduced a portion of the class' expenses.
G For the period March 3, 1997 (commencement of sale of Institutional Class shares) to July 31, 1997.
H Three months ended October 31
See accompanying notes which are an integral part of the financial statements.
Annual Report
For the period ended October 31, 2000
1. Significant Accounting Policies.
Fidelity Advisor Mortgage Securities Fund (the fund) is a fund of Fidelity Advisor Series II (the trust) and is authorized to issue an unlimited number of shares. Effective the close of business on February 28,1997, the fund's Initial Class was closed to new accounts. The trust is registered under the Investment Company Act of 1940, as amended (the 1940 Act), as an open-end management investment company organized as a Massachusetts business trust.
The fund offers Class A, Class T, Class B, Initial Class, and Institutional Class shares, each of which has equal rights as to assets and voting privileges. Each class has exclusive voting rights with respect to matters that affect that class. Class B shares will automatically convert to Class A shares after a holding period of seven years from the initial date of purchase. Investment income, realized and unrealized capital gains and losses, the common expenses of the fund, and certain fund-level expense reductions, if any, are allocated on a pro rata basis to each class based on the relative net assets of each class to the total net assets of the fund. Each class of shares differs in its respective distribution, transfer agent, and certain other class-specific fees, expenses, and expense reductions.
The financial statements have been prepared in conformity with generally accepted accounting principles which require management to make certain estimates and assumptions at the date of the financial statements. The following summarizes the significant accounting policies of the fund:
Security Valuation. Securities are valued based upon a computerized matrix system and/or appraisals by a pricing service, both of which consider market transactions and dealer-supplied valuations. Securities (including restricted securities) for which market quotations are not readily available are valued at their fair value as determined in good faith under consistently applied procedures under the general supervision of the Board of Trustees. Short-term securities with remaining maturities of sixty days or less for which quotations are not readily available are valued at amortized cost or original cost plus accrued interest, both of which approximate current value. Investments in open-end investment companies are valued at their net asset value each business day.
Income Taxes. As a qualified regulated investment company under Subchapter M of the Internal Revenue Code, the fund is not subject to income taxes to the extent that it distributes substantially all of its taxable income for its fiscal year. The schedule of investments includes information regarding income taxes under the caption "Income Tax Information."
Investment Income. Interest income, which includes accretion of original issue discount, is accrued as earned.
Expenses. Most expenses of the trust can be directly attributed to a fund. Expenses which cannot be directly attributed are apportioned among the funds in the trust.
Annual Report
Notes to Financial Statements - continued
1. Significant Accounting Policies - continued
Distributions to Shareholders. Distributions are declared daily and paid monthly from net investment income. Distributions from realized gains, if any, are recorded on the ex-dividend date. Income dividends and capital gain distributions are declared separately for each class.
Income and capital gain distributions are determined in accordance with income tax regulations which may differ from generally accepted accounting principles. These differences, which may result in distribution reclassifications, are primarily due to differing treatments for paydown gains/losses on certain securities, market discount, capital loss carryforwards and losses deferred due to wash sales.
Permanent book and tax basis differences relating to shareholder distributions will result in reclassifications to paid in capital. Undistributed net investment income and accumulated undistributed net realized gain (loss) on investments may include temporary book and tax basis differences which will reverse in a subsequent period. Any taxable income or gain remaining at fiscal year end is distributed in the following year.
Security Transactions. Security transactions are accounted for as of trade date. Gains and losses on securities sold are determined on the basis of identified cost.
2. Operating Policies.
Joint Trading Account. Pursuant to an Exemptive Order issued by the Securities and Exchange Commission, the fund, along with other affiliated entities of Fidelity Management & Research Company (FMR), may transfer uninvested cash balances into one or more joint trading accounts. These balances are invested in one or more repurchase agreements for U.S. Treasury or Federal Agency obligations.
Repurchase Agreements. The underlying U.S. Treasury, Federal Agency, or other obligations found to be satisfactory by FMR are transferred to an account of the fund, or to the Joint Trading Account, at a custodian bank. The securities are marked-to-market daily and maintained at a value at least equal to the principal amount of the repurchase agreement (including accrued interest). FMR, the fund's investment adviser, is responsible for determining that the value of the underlying securities remains in accordance with the market value requirements stated above.
Delayed Delivery Transactions. The fund may purchase or sell securities on a delayed delivery basis. Payment and delivery may take place after the customary settlement period for that security. The price of the underlying securities and the date when the securities will be delivered and paid for are fixed at the time the transaction is negotiated. The market values of the securities purchased on a delayed delivery basis are identified as such in the fund's schedule of investments. The fund may receive compensation for interest forgone in the purchase of a delayed delivery security. With respect to
Annual Report
Notes to Financial Statements - continued
2. Operating Policies - continued
Delayed Delivery Transactions - continued
purchase commitments, the fund identifies securities as segregated in its records with a value at least equal to the amount of the commitment. Losses may arise due to changes in the market value of the underlying securities or if the counterparty does not perform under the contract.
Restricted Securities. The fund is permitted to invest in securities that are subject to legal or contractual restrictions on resale. These securities generally may be resold in transactions exempt from registration or to the public if the securities are registered. Disposal of these securities may involve time-consuming negotiations and expense, and prompt sale at an acceptable price may be difficult. At the end of the period, the fund had no investments in restricted securities (excluding 144A issues).
3. Purchases and Sales of Investments.
Purchases and sales of securities, other than short-term securities, aggregated $455,603,228 and $472,388,211, respectively, of which U.S. government and government agency obligations aggregated $439,935,274 and $444,362,092, respectively.
4. Fees and Other Transactions with Affiliates.
Management Fee. As the fund's investment adviser, FMR receives a monthly fee that is calculated on the basis of a group fee rate plus a fixed individual fund fee rate applied to the average net assets of the fund. The group fee rate is the weighted average of a series of rates and is based on the monthly average net assets of all the mutual funds advised by FMR. The rates ranged from .0920% to .3700% for the period. The annual individual fund fee rate is .30%. In the event that these rates were lower than the contractual rates in effect during the period, FMR voluntarily implemented the above rates, as they resulted in the same or a lower management fee. For the period, the management fee was equivalent to an annual rate of .43% of average net assets.
Sub-Adviser Fee. FMR, on behalf of the fund, has entered into a sub-advisory agreement with Fidelity Investments Money Management, Inc. (FIMM), a wholly owned subsidiary of FMR. For its services, FIMM receives a fee from FMR of 50% of the management fee payable to FMR. The fee is paid prior to any voluntary expense reimbursements which may be in effect.
Distribution and Service Plan. In accordance with Rule 12b-1 of the 1940 Act, the Board of Trustees has adopted separate Distribution and Service Plans with respect to each class of shares (collectively referred to as "the Plans"). Under certain of the Plans, the class pays Fidelity Distributors Corporation (FDC), an affiliate of FMR, a 12b-1 fee. A portion of this fee may be reallowed to securities dealers, banks and other financial institutions for the distribution of each class of shares and providing shareholder support
Annual Report
Notes to Financial Statements - continued
4. Fees and Other Transactions with Affiliates - continued
Distribution and Service Plan - continued
services. For the period, this fee was based on the following annual rates of the average net assets of each applicable class:
|
Class A |
.15% |
|
Class T |
.25% |
|
Class B |
.90%* |
* .65% represents a distribution fee and .25% represents a shareholder service fee.
For the period, each class paid FDC the following amounts, a portion of which was retained by FDC:
|
|
Paid to |
Retained |
|
Class A |
$ 5,801 |
$ 9 |
|
Class T |
82,308 |
1,661 |
|
Class B |
172,938 |
124,900 |
|
|
$ 261,047 |
$ 126,570 |
Sales Load. FDC receives a front-end sales charge of up to 4.75% for selling Class A shares, and 3.50% for selling Class T shares of the fund. FDC receives the proceeds of contingent deferred sales charges levied on Class B share redemptions occurring within six years of purchase. The Class B charge is based on declining rates ranging from 5% to 1% of the lesser of the cost of shares at the initial date of purchase or the net asset value of the redeemed shares, excluding any reinvested dividends and capital gains. In addition, purchases of Class A and Class T shares that were subject to a finder's fee bear a contingent deferred sales charge on assets that do not remain in the fund for at least one year. The Class A and Class T contingent deferred sales charge is based on 0.25% of the lesser of the cost of shares at the initial date of purchase or the net asset value of the redeemed shares, excluding any reinvested dividends and capital gains. A portion of the sales charges paid to FDC is paid to securities dealers, banks and other financial institutions.
For the period, sales charge amounts paid to and retained by FDC were as follows:
|
|
Paid to |
Retained |
|
Class A |
$ 19,275 |
$ 5,275 |
|
Class T |
45,570 |
13,922 |
|
Class B |
104,949 |
104,949* |
|
|
$ 169,794 |
$ 124,146 |
* When Class B shares are initially sold, FDC pays commissions from its own resources to securities dealers,
banks, and other financial institutions through which the sales are made.
Annual Report
Notes to Financial Statements - continued
4. Fees and Other Transactions with Affiliates - continued
Transfer Agent Fees. Fidelity Investments Institutional Operations Company, Inc., (FIIOC), an affiliate of FMR, is the transfer, dividend disbursing and shareholder servicing agent (collectively referred to as the transfer agent) for the fund's Class A, Class T, Class B, and Institutional Class Shares. Fidelity Service Company, Inc. (FSC), an affiliate of FMR, is the transfer agent for the Initial Class Shares. FIIOC and FSC receive account fees and asset-based fees that vary according to the account size and type of account of the shareholders of the respective classes of the fund. FIIOC and FSC pay for typesetting, printing and mailing of all shareholder reports, except proxy statements. For the period, the following amounts were paid to FIIOC or FSC:
|
|
Amount |
% of |
|
Class A |
$ 8,617 |
.22 |
|
Class T |
78,644 |
.24 |
|
Class B |
36,267 |
.19 |
|
Initial Class |
607,430 |
.16 |
|
Institutional Class |
28,123 |
.22 |
|
|
$ 759,081 |
|
Accounting Fees. FSC maintains the fund's accounting records. The fee is based on the level of average net assets for the month plus out-of-pocket expenses.
5. Expense Reductions.
Through arrangements with the fund's custodian and each class' transfer agent, credits realized as a result of uninvested cash balances were used to reduce a portion of expenses. During the period, the fund's custodian fees were reduced by $12,619 under the custodian arrangement, and Initial Class' transfer agent expenses were reduced by $372 under the transfer agent arrangement.
Annual Report
Notes to Financial Statements - continued
6. Distributions to Shareholders.
Distributions to shareholders of each class were as follows:
|
|
Years ended October 31, |
|
|
|
2000 |
1999 |
|
From net investment income |
|
|
|
Class A |
$ 259,663 |
$ 153,223 |
|
Class T |
2,169,235 |
1,450,107 |
|
Class B |
1,158,837 |
724,614 |
|
Initial Class |
26,148,441 |
26,727,640 |
|
Institutional Class |
900,873 |
1,127,965 |
|
Total |
$ 30,637,049 |
$ 30,183,549 |
|
From net realized gain |
|
|
|
Class A |
$ - |
$ 26,293 |
|
Class T |
- |
278,709 |
|
Class B |
- |
132,050 |
|
Initial Class |
- |
6,182,269 |
|
Institutional Class |
- |
305,251 |
|
Total |
$ - |
$ 6,924,572 |
7. Share Transactions.
Transactions for each class of shares were as follows:
|
|
Shares |
Dollars |
||
|
|
Year ended October 31, |
Year ended October 31, |
Year ended October 31, |
Year ended October 31, |
|
|
2000 |
1999 |
2000 |
1999 |
|
Class A |
215,111 |
233,326 |
$ 2,232,936 |
$ 2,488,784 |
|
Reinvestment of distributions |
18,825 |
11,952 |
195,149 |
127,329 |
|
Shares redeemed |
(90,958) |
(120,472) |
(941,418) |
(1,280,382) |
|
Net increase (decrease) |
142,978 |
124,806 |
$ 1,486,667 |
$ 1,335,731 |
|
Class T |
4,402,524 |
2,003,369 |
$ 45,948,619 |
$ 21,386,352 |
|
Reinvestment of distributions |
163,509 |
148,336 |
1,696,640 |
1,582,559 |
|
Shares redeemed |
(1,514,665) |
(1,122,570) |
(15,663,958) |
(11,947,707) |
|
Net increase (decrease) |
3,051,368 |
1,029,135 |
$ 31,981,301 |
$ 11,021,204 |
Annual Report
Notes to Financial Statements - continued
7. Share Transactions - continued
|
|
Shares |
Dollars |
||
|
|
Year ended October 31, |
Year ended October 31, |
Year ended October 31, |
Year ended October 31, |
|
|
2000 |
1999 |
2000 |
1999 |
|
Class B |
652,666 |
1,505,268 |
$ 6,775,572 |
$ 16,049,817 |
|
Reinvestment of distributions |
85,020 |
63,855 |
880,755 |
679,689 |
|
Shares redeemed |
(669,424) |
(461,420) |
(6,925,550) |
(4,891,488) |
|
Net increase (decrease) |
68,262 |
1,107,703 |
$ 730,777 |
$ 11,838,018 |
|
Initial Class |
3,201,394 |
3,914,002 |
$ 33,214,158 |
$ 41,964,545 |
|
Reinvestment of distributions |
2,034,985 |
2,515,203 |
21,102,123 |
26,913,754 |
|
Shares redeemed |
(8,824,923) |
(9,502,966) |
(91,371,208) |
(101,601,425) |
|
Net increase (decrease) |
(3,588,544) |
(3,073,761) |
$ (37,054,927) |
$ (32,723,126) |
|
Institutional Class |
827,963 |
667,600 |
$ 8,501,722 |
$ 7,141,162 |
|
Reinvestment of distributions |
43,983 |
70,535 |
454,723 |
754,625 |
|
Shares redeemed |
(1,486,148) |
(1,277,677) |
(15,364,088) |
(13,640,920) |
|
Net increase (decrease) |
(614,202) |
(539,542) |
$ (6,407,643) |
$ (5,745,133) |
Annual Report
To the Trustees of Fidelity Advisor Series II and the Shareholders of Fidelity Advisor Mortgage Securities Fund:
In our opinion, the accompanying statement of assets and liabilities, including the schedule of investments, and the related statements of operations and of changes in net assets and the financial highlights present fairly, in all material respects, the financial position of Fidelity Advisor Mortgage Securities Fund (a fund of Fidelity Advisor Series II) at October 31, 2000, and the results of its operations, the changes in its net assets and the financial highlights for the periods indicated, in conformity with accounting principles generally accepted in the United States of America. These financial statements and financial highlights (hereafter referred to as "financial statements") are the responsibility of the Fidelity Advisor Mortgage Securities Fund's management; our responsibility is to express an opinion on these financial statements based on our audits. We conducted our audits of these financial statements in accordance with auditing standards generally accepted in the United States of America which require that we plan and perform the audit to obtain reasonable assurance about whether the financial statements are free of material misstatement. An audit includes examining, on a test basis, evidence supporting the amounts and disclosures in the financial statements, assessing the accounting principles used and significant estimates made by management, and evaluating the overall financial statement presentation. We believe that our audits, which included confirmation of securities at October 31, 2000 by correspondence with the custodian and brokers, provide a reasonable basis for our opinion.
/s/PricewaterhouseCoopers LLP
PricewaterhouseCoopers LLP
Boston, Massachusetts
December 11, 2000
Annual Report
Investment Adviser
Fidelity Management & Research Company
Boston, MA
Investment Sub-Advisers
Fidelity Investment Money
Management Inc.
Fidelity Management & Research
(U.K.) Inc.
Fidelity Management & Research
(Far East) Inc.
Fidelity Investment Japan Limited
Officers
Edward C. Johnson 3d, President
Robert C. Pozen, Senior Vice President
Dwight D. Churchill, Vice President
David L. Murphy, Vice President
Thomas J. Silvia, Vice President
Stanley N. Griffith, Assistant Vice President
Eric D. Roiter, Secretary
Robert A. Dwight, Treasurer
Maria F. Dwyer, Deputy Treasurer
John H. Costello, Assistant Treasurer
Thomas J. Simpson, Assistant Treasurer
Board of Trustees
Ralph F. Cox *
Phyllis Burke Davis *
Robert M. Gates *
Edward C. Johnson 3d
Donald J. Kirk *
Ned C. Lautenbach *
Peter S. Lynch
Marvin L. Mann *
William O. McCoy *
Gerald C. McDonough *
Robert C. Pozen
Thomas R. Williams *
* Independent trustees
Advisory Board
J. Michael Cook
Abigail P. Johnson
Marie L. Knowles
General Distributor
Fidelity Distributors Corporation
Boston, MA
Transfer and Shareholder
Servicing Agent
Fidelity Investments Institutional Operations Company, Inc.
Boston, MA
Custodian
The Bank of New York
New York, NY
|
AMOR-ANN-1200 |
119003 |
|
1.704047.103 |
|
(Fidelity Investment logo)(registered trademark)
Fidelity® Advisor
Annual Report
October 31, 2000
(2_fidelity_logos)
|
President's Message |
3 |
Ned Johnson on investing strategies. |
|
Performance |
4 |
How the fund has done over time. |
|
Fund Talk |
19 |
The manager's review of fund performance, strategy and outlook. |
|
Investment Changes |
22 |
A summary of major shifts in the fund's investments over the past six months. |
|
Investments |
23 |
A complete list of the fund's investments with their market values. |
|
Financial Statements |
38 |
Statements of assets and liabilities,
operations, and changes in net assets, |
|
Notes |
47 |
Notes to the financial statements. |
|
Report of Independent Accountants |
54 |
The auditors' opinion. |
|
|
|
|
Standard & Poor's, S&P and S&P 500 are registered service marks of The McGraw-Hill Companies, Inc. and have been licensed for use by Fidelity Distributors Corporation.
Other third party marks appearing herein are the property of their respective owners.
All other marks appearing herein are registered or unregistered trademarks or service marks of FMR Corp. or an affiliated company.
(Recycle graphic) This report is printed on recycled paper using soy-based inks.
This report and the financial statements contained herein are submitted for the general information of the shareholders of the fund. This report is not authorized for distribution to prospective investors in the fund unless preceded or accompanied by an effective prospectus.
Mutual fund shares are not deposits or obligations of, or guaranteed by, any depository institution. Shares are not insured by the FDIC, Federal Reserve Board or any other agency, and are subject to investment risks, including possible loss of principal amount invested.
Neither the fund nor Fidelity Distributors Corporation is a bank.
For more information on any Fidelity Advisor fund, including charges and expenses, contact your investment professional for a free prospectus. Read it carefully before you invest or send money.
Annual Report
(photo_of_Edward_C_Johnson_3d)
Dear Shareholder:
A sixth-straight year of double-digit positive returns for the Dow Jones Industrial Average, NASDAQ and S&P 500® could be in jeopardy unless the U.S. stock market shows marked improvement in the final two months of 2000. Through October, all three indexes had negative year-to-date returns. On the other hand, most fixed-income sectors were solidly in the black. Treasuries and other long-term government securities led the way, returning nearly 14%.
While it's impossible to predict the future direction of the markets with any degree of certainty, there are certain basic principles that can help investors plan for their future needs.
The longer your investment time frame, the less likely it is that you will be affected by short-term market volatility. A 10-year investment horizon appropriate for saving for a college education, for example, enables you to weather market cycles in a long-term fund, which may have a higher risk potential, but also has a higher potential rate of return.
An intermediate-length fund could make sense if your investment horizon is two to four years, while a short-term bond fund could be the right choice if you need your money in one or two years.
If your time horizon is less than a year, you might want to consider moving some of your bond investment into a money market fund. These funds seek income and a stable share price by investing in high-quality, short-term investments. Of course, it's important to remember that an investment in a money market fund is not insured or guaranteed by the Federal Deposit Insurance Corporation or any other government agency. Although money market funds seek to preserve the value of your investment at $1.00 per share, it is possible to lose money by investing in these types of funds.
Finally, no matter what your time horizon or portfolio diversity, it makes good sense to follow a regular investment plan, investing a certain amount of money in a fund at the same time each month or quarter and periodically reviewing your overall portfolio. By doing so, you won't get caught up in the excitement of a rapidly rising market, nor will you buy all your shares at market highs. While this strategy - known as dollar cost averaging - won't assure a profit or protect you from a loss in a declining market, it should help you lower the average cost of your purchases. Of course, you should consider your financial ability to continue your purchases through periods of low price levels before undertaking such a strategy.
Remember to contact your investment professional if you need help with your investments.
Best regards,
/s/Edward C. Johnson 3d
Edward C. Johnson 3d
Annual Report
There are several ways to evaluate historical performance. You can look at the total percentage change in value, the average annual percentage change or the growth of a hypothetical $10,000 investment. Total return reflects the change in the value of an investment, assuming reinvestment of the class' dividend income and capital gains (the profits earned upon the sale of securities that have grown in value). You can also look at the class' income, as reflected in its yield, to measure performance. The initial offering of Class A shares took place on September 3, 1996. Class A shares bear a 0.15% 12b-1 fee. Returns prior to September 3, 1996 are those of Class T, the original class of the fund, and reflect Class T shares' 0.25% 12b-1 fee. If Fidelity had not reimbursed certain class expenses, the past five year and past 10 year total returns would have been lower.
Cumulative Total Returns
|
Periods ended October 31, 2000 |
|
Past 1 |
Past 5 |
Past 10 |
|
Fidelity Adv Municipal Income - CL A |
|
8.17% |
30.02% |
98.47% |
|
Fidelity Adv Municipal Income - CL A |
|
3.03% |
23.84% |
89.04% |
|
LB 3 Plus Year Municipal Bond |
|
9.09% |
32.62% |
n/a* |
|
General Municipal Debt Funds Average |
|
7.36% |
25.48% |
90.37% |
Cumulative total returns show Class A's performance in percentage terms over a set period - in this case, one year, five years or 10 years. For example, if you had invested $1,000 in a fund that had a 5% return over the past year, the value of your investment would be $1,050. You can compare Class A's returns to those of the Lehman Brothers Municipal 3 Plus Year Bond Index - a market value-weighted index of investment-grade municipal bonds with maturities of three years or more. To measure how Class A's performance stacked up against its peers, you can compare it to the general municipal debt funds average, which reflects the performance of mutual funds with similar objectives tracked by Lipper Inc. The past one year average represents a peer group of 265 mutual funds. These benchmarks include reinvested dividends and capital gains, if any, and exclude the effect of sales charges.
Average Annual Total Returns
|
Periods ended October 31, 2000 |
Past 1 |
Past 5 |
Past 10 |
|
Fidelity Adv Municipal Income - CL A |
8.17% |
5.39% |
7.09% |
|
Fidelity Adv Municipal Income - CL A |
3.03% |
4.37% |
6.57% |
|
LB 3 Plus Year Municipal Bond |
9.09% |
5.81% |
n/a* |
|
General Municipal Debt Funds Average |
7.36% |
4.64% |
6.64% |
Average annual total returns take Class A shares' cumulative return and show you what would have happened if Class A shares had performed at a constant rate each year.
* Not available
Annual Report
Fidelity Advisor Municipal Income Fund - Class A
Performance - continued
$10,000 Over 10 Years
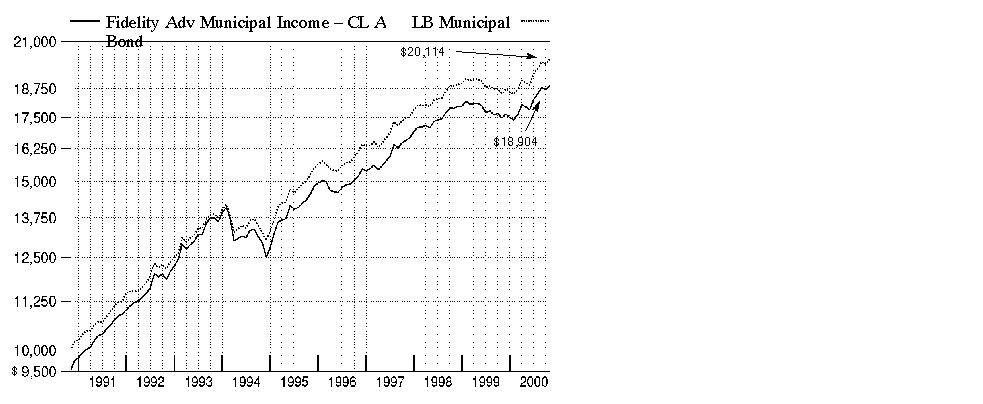
$10,000 Over 10 Years: Let's say hypothetically that $10,000 was invested in Fidelity Advisor Municipal Income Fund - Class A on October 31, 1990, and the current 4.75% sales charge was paid. As the chart shows, by October 31, 2000, the value of the investment would have grown to $18,904 - an 89.04% increase on the initial investment. For comparison, look at how the Lehman Brothers Municipal Bond Index - a market value-weighted index of investment grade bonds with maturities of one year or more - did over the same period. With dividends reinvested, the same $10,000 would have grown to $20,114 - a 101.14% increase.
Understanding
Performance
How a fund did yesterday is no guarantee of how it will do tomorrow. Bond prices, for example, generally move in the opposite direction of interest rates. In turn, the share price, return and yield of a fund that invests in bonds will vary. That means if you sell your shares during a market downturn, you might lose money. But if you can ride out the market's ups and downs, you may have a gain.
3Annual Report
Fidelity Advisor Municipal Income Fund - Class A
Performance - continued
Total Return Components
|
|
Years ended October 31, |
September 3, 1996
(commencement of
sale of Class A
shares) to |
|||
|
|
Years ended October 31, |
September 3, 1996
(commencement of
sale of Class A
shares) to |
|||
|
|
2000 |
1999 |
1998 |
1997 |
1996 |
|
Dividend returns |
5.35% |
4.42% |
4.86% |
5.51% |
0.89% |
|
Capital returns |
2.82% |
-6.78% |
3.21% |
3.51% |
0.95% |
|
Total returns |
8.17% |
-2.36% |
8.07% |
9.02% |
1.84% |
Total return components include both dividend returns and capital returns. A dividend return reflects the actual dividends paid by the class. A capital return reflects both the amount paid by the class to shareholders as capital gain distributions and changes in the class' share price. Both returns assume the dividends or capital gains, if any, paid by the class are reinvested and exclude the effect of sales charges.
Dividends and Yield
|
Periods ended October 31, 2000 |
Past 1 |
Past 6 |
Past 1 |
|
Dividends per share |
5.00¢ |
30.10¢ |
59.80¢ |
|
Annualized dividend rate |
4.91% |
5.03% |
5.08% |
|
30-day annualized yield |
4.64% |
- |
- |
|
30-day annualized tax-equivalent yield |
7.25% |
- |
- |
Dividends per share show the income paid by the class for a set period and do not reflect any tax reclassifications. If you annualize this number, based on an average share price of $11.98 over the past one month, $11.87 over the past six months and $11.77 over the past one year, you can compare the class' income over these three periods. The 30-day annualized yield is a standard formula for all bond funds based on the yields of the bonds in the fund, averaged over the past 30 days. This figure shows you the yield characteristics of the fund's investments at the end of the period. It also helps you compare funds from different companies on an equal basis. The offering share price used in the calculation of the yield includes the effect of Class A's current 4.75% sales charge. The tax-equivalent yield shows what you would have to earn on a taxable investment to equal the class' tax-free yield, if you're in the 36% federal tax bracket, but does not reflect payment of the federal alternative minimum tax, if applicable.
Annual Report
There are several ways to evaluate historical performance. You can look at the total percentage change in value, the average annual percentage change or the growth of a hypothetical $10,000 investment. Total return reflects the change in the value of an investment, assuming reinvestment of the class' dividend income and capital gains (the profits earned upon the sale of securities that have grown in value). You can also look at the class' income, as reflected in its yield, to measure performance. If Fidelity had not reimbursed certain class expenses, the past 10 year total returns would have been lower.
Cumulative Total Returns
|
Periods ended October 31, 2000 |
|
Past 1 |
Past 5 |
Past 10 |
|
Fidelity Adv Municipal Income - CL T |
|
8.14% |
29.94% |
98.34% |
|
Fidelity Adv Municipal Income - CL T |
|
4.35% |
25.39% |
91.40% |
|
LB 3 Plus Year Municipal Bond |
|
9.09% |
32.62% |
n/a* |
|
General Municipal Debt Funds Average |
|
7.36% |
25.48% |
90.37% |
Cumulative total returns show Class T's performance in percentage terms over a set period - in this case, one year, five years or 10 years. For example, if you had invested $1,000 in a fund that had a 5% return over the past year, the value of your investment would be $1,050. You can compare Class T's returns to those of the Lehman Brothers 3 Plus Year Municipal Bond Index - a market value-weighted index of investment-grade municipal bonds with maturities of three years or more. To measure how Class T's performance stacked up against its peers, you can compare it to the general municipal debt funds average, which reflects the performance of mutual funds with similar objectives tracked by Lipper Inc. The past one year average represents a peer group of 265 mutual funds. These benchmarks include reinvested dividends and capital gains, if any, and exclude the effect of sales charges.
Annual Report
Fidelity Advisor Municipal Income Fund - Class T
Performance - continued
Average Annual Total Returns
|
Periods ended October 31, 2000 |
Past 1 |
Past 5 |
Past 10 |
|
Fidelity Adv Municipal Income - CL T |
8.14% |
5.38% |
7.09% |
|
Fidelity Adv Municipal Income - CL T |
4.35% |
4.63% |
6.71% |
|
LB 3 Plus Year Municipal Bond |
9.09% |
5.81% |
n/a* |
|
General Municipal Debt Funds Average |
7.36% |
4.64% |
6.64% |
Average annual total returns take Class T shares' cumulative return and show you what would have happened if Class T shares had performed at a constant rate each year.
* Not available
Annual Report
Fidelity Advisor Municipal Income Fund - Class T
Performance - continued
$10,000 Over 10 Years
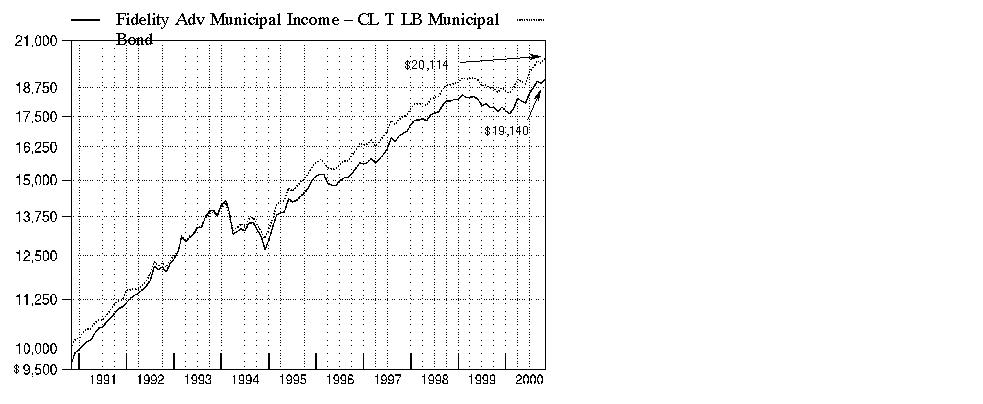
$10,000 Over 10 Years: Let's say hypothetically that $10,000 was invested in Fidelity Advisor Municipal Income Fund - Class T on October 31, 1990, and the current 3.50% sales charge was paid. As the chart shows, by October 31, 2000, the value of the investment would have grown to $19,140 - a 91.40% increase on the initial investment. For comparison, look at how the Lehman Brothers Municipal Bond Index - a market value-weighted index of investment grade bonds with maturities of one year or more - did over the same period. With dividends reinvested, the same $10,000 would have grown to $20,114 - a 101.14% increase.
Understanding
Performance
How a fund did yesterday is no guarantee of how it will do tomorrow. Bond prices, for example, generally move in the opposite direction of interest rates. In turn, the share price, return and yield of a fund that invests in bonds will vary. That means if you sell your shares during a market downturn, you might lose money. But if you can ride out the market's ups and downs, you may have a gain.
3Annual Report
Fidelity Advisor Municipal Income Fund - Class T
Performance - continued
Total Return Components
|
|
|
Years ended October 31, |
||||
|
|
|
2000 |
1999 |
1998 |
1997 |
1996 |
|
Dividend returns |
|
5.23% |
4.32% |
4.86% |
5.47% |
5.69% |
|
Capital returns |
|
2.91% |
-6.85% |
3.29% |
3.42% |
-1.01% |
|
Total returns |
|
8.14% |
-2.53% |
8.15% |
8.89% |
4.68% |
Total return components include both dividend returns and capital returns. A dividend return reflects the actual dividends paid by the class. A capital return reflects both the amount paid by the class to shareholders as capital gain distributions and changes in the class' share price. Both returns assume the dividends or capital gains, if any, paid by the class are reinvested and exclude the effect of sales charges.
Dividends and Yield
|
Periods ended October 31, 2000 |
Past 1 |
Past 6 |
Past 1 |
|
Dividends per share |
4.89¢ |
29.46¢ |
58.58¢ |
|
Annualized dividend rate |
4.80% |
4.92% |
4.97% |
|
30-day annualized yield |
4.60% |
- |
- |
|
30-day annualized tax-equivalent yield |
7.19% |
- |
- |
Dividends per share show the income paid by the class for a set period and do not reflect any tax reclassifications. If you annualize this number, based on an average share price of $11.99 over the past one month, $11.88 over the past six months and $11.78 over the past one year, you can compare the class' income over these three periods. The 30-day annualized yield is a standard formula for all bond funds based on the yields of the bonds in the fund, averaged over the past 30 days. This figure shows you the yield characteristics of the fund's investments at the end of the period. It also helps you compare funds from different companies on an equal basis. The offering share price used in the calculation of the yield includes the effect of Class T's current 3.50% sales charge. The tax-equivalent yield shows what you would have to earn on a taxable investment to equal the class' tax-free yield, if you're in the 36% federal tax bracket, but does not reflect payment of the federal alternative minimum tax, if applicable.
Annual Report
There are several ways to evaluate historical performance. You can look at the total percentage change in value, the average annual percentage change or the growth of a hypothetical $10,000 investment. Total return reflects the change in the value of an investment, assuming reinvestment of the class' dividend income and capital gains (the profits earned upon the sale of securities that have grown in value). You can also look at the class' income, as reflected in its yield, to measure performance. The initial offering of Class B shares took place on June 30, 1994. Class B shares bear a 0.90% 12b-1 fee (1.00% prior to January 1, 1996). Returns prior to June 30, 1994 are those of Class T, the original class of the fund, and reflect Class T shares' 0.25% 12b-1 fee. Had Class B shares' 12b-1 fee been reflected, returns prior to June 30, 1994 would have been lower. Class B shares' contingent deferred sales charges included in the past one year, past five year and past 10 year total return figures are 5%, 2% and 0%, respectively. If Fidelity had not reimbursed certain class expenses, the past 10 year total returns would have been lower.
Cumulative Total Returns
|
Periods ended October 31, 2000 |
|
Past 1 |
Past 5 |
Past 10 |
|
Fidelity Adv Municipal Income - CL B |
|
7.38% |
25.67% |
89.34% |
|
Fidelity Adv Municipal Income - CL B |
|
2.38% |
23.67% |
89.34% |
|
LB 3 Plus Year Municipal Bond |
|
9.09% |
32.62% |
n/a* |
|
General Municipal Debt Funds Average |
|
7.36% |
25.48% |
90.37% |
Cumulative total returns show Class B's performance in percentage terms over a set period - in this case, one year, five years or 10 years. For example, if you had invested $1,000 in a fund that had a 5% return over the past year, the value of your investment would be $1,050. You can compare Class B's returns to those of the Lehman Brothers 3 Plus Year Municipal Bond Index - a market value-weighted index of investment-grade municipal bonds with maturities of three years or more. To measure how Class B's performance stacked up against its peers, you can compare it to the general municipal debt funds average, which reflects the performance of mutual funds with similar objectives tracked by Lipper Inc. The past one year average represents a peer group of 265 mutual funds. These benchmarks include reinvested dividends and capital gains, if any, and exclude the effect of sales charges.
Annual Report
Fidelity Advisor Municipal Income Fund - Class B
Performance - continued
Average Annual Total Returns
|
Periods ended October 31, 2000 |
Past 1 |
Past 5 |
Past 10 |
|
Fidelity Adv Municipal Income - CL B |
7.38% |
4.68% |
6.59% |
|
Fidelity Adv Municipal Income - CL B |
2.38% |
4.34% |
6.59% |
|
LB 3 Plus Year Municipal Bond |
9.09% |
5.81% |
n/a* |
|
General Municipal Debt Funds Average |
7.36% |
4.64% |
6.64% |
Average annual total returns take Class B shares' cumulative return and show you what would have happened if Class B shares had performed at a constant rate each year.
* Not available
Annual Report
Fidelity Advisor Municipal Income Fund - Class B
Performance - continued
$10,000 Over 10 Years
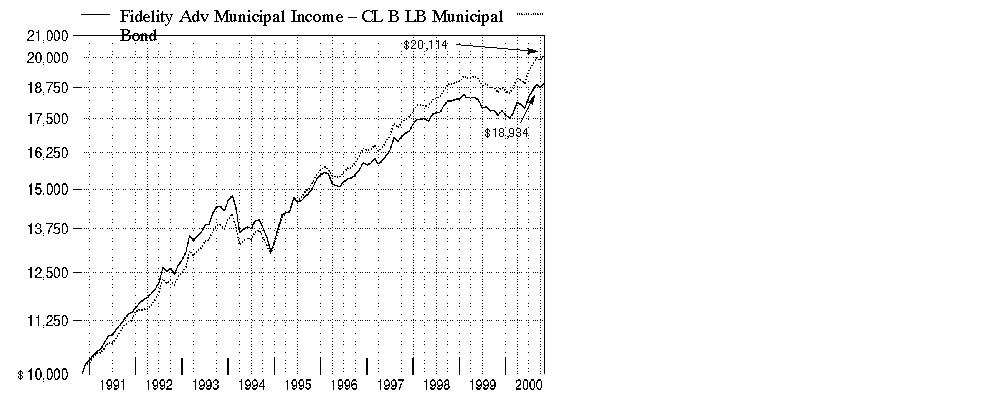
$10,000 Over 10 Years: Let's say hypothetically that $10,000 was invested in Fidelity Advisor Municipal Income Fund - Class B on October 31, 1990. As the chart shows, by October 31, 2000, the value of the investment would have grown to $18,934 - an 89.34% increase on the initial investment. For comparison, look at how the Lehman Brothers Municipal Bond Index - a market value-weighted index of investment grade bonds with maturities of one year or more - did over the same period. With dividends reinvested, the same $10,000 would have grown to $20,114 - a 101.14% increase.
Understanding
Performance
How a fund did yesterday is no guarantee of how it will do tomorrow. Bond prices, for example, generally move in the opposite direction of interest rates. In turn, the share price, return and yield of a fund that invests in bonds will vary. That means if you sell your shares during a market downturn, you might lose money. But if you can ride out the market's ups and downs, you may have a gain.
3Annual Report
Fidelity Advisor Municipal Income Fund - Class B
Performance - continued
Total Return Components
|
|
|
Years ended October 31, |
||||
|
|
|
2000 |
1999 |
1998 |
1997 |
1996 |
|
Dividend returns |
|
4.55% |
3.69% |
4.17% |
4.81% |
4.99% |
|
Capital returns |
|
2.83% |
-6.85% |
3.30% |
3.34% |
-1.01% |
|
Total returns |
|
7.38% |
-3.16% |
7.47% |
8.15% |
3.98% |
Total return components include both dividend returns and capital returns. A dividend return reflects the actual dividends paid by the class. A capital return reflects both the amount paid by the class to shareholders as capital gain distributions and changes in the class' share price. Both returns assume the dividends or capital gains, if any, paid by the class are reinvested and exclude the effect of sales charges.
Dividends and Yield
|
Periods ended October 31, 2000 |
Past 1 |
Past 6 |
Past 1 |
|
Dividends per share |
4.25¢ |
25.64¢ |
51.00¢ |
|
Annualized dividend rate |
4.18% |
4.29% |
4.34% |
|
30-day annualized yield |
4.14% |
- |
- |
|
30-day annualized tax-equivalent yield |
6.47% |
- |
- |
Dividends per share show the income paid by the class for a set period and do not reflect any tax reclassifications. If you annualize this number, based on an average share price of $11.96 over the past one month, $11.85 over the past six months, and $11.75 over the past one year, you can compare the class' income over these three periods. The 30-day annualized yield is a standard formula for all bond funds based on the yields of the bonds in the fund, averaged over the past 30 days. This figure shows you the yield characteristics of the fund's investments at the end of the period. It also helps you compare funds from different companies on an equal basis. The offering share price used in the calculation of the yield excludes the effect of Class B's contingent deferred sales charge. The tax-equivalent yield shows what you would have to earn on a taxable investment to equal the class' tax-free yield, if you're in the 36% federal tax bracket, but does not reflect payment of the federal alternative minimum tax, if applicable.
Annual Report
There are several ways to evaluate historical performance. You can look at the total percentage change in value, the average annual percentage change or the growth of a hypothetical $10,000 investment. Total return reflects the change in the value of an investment, assuming reinvestment of the class' dividend income and capital gains (the profits earned upon the sale of securities that have grown in value). You can also look at the class' income, as reflected in its yield, to measure performance. The initial offering of Class C shares took place on November 3, 1997. Class C shares bear a 1.00% 12b-1 fee. Returns between June 30, 1994 and November 3, 1997 are those of Class B shares and reflect Class B shares' 0.90% (1.00% prior to January 1, 1996) 12b-1 fee. Returns prior to June 30, 1994 are those of Class T, the original class of the fund, and reflect Class T shares' 0.25% 12b-1 fee. Had Class C shares' 12b-1 fee been reflected, returns between November 3, 1997 and January 1, 1996 and prior to June 30, 1994 would have been lower. Class C shares' contingent deferred sales charge included in the past one year, past five year and past 10 year total return figures are 1%, 0%, and 0%, respectively. If Fidelity had not reimbursed certain class expenses, the past five year and past 10 year total returns would have been lower.
Cumulative Total Returns
|
Periods ended October 31, 2000 |
|
Past 1 |
Past 5 |
Past 10 |
|
Fidelity Adv Municipal Income - CL C |
|
7.34% |
25.18% |
88.60% |
|
Fidelity Adv Municipal Income - CL C |
|
6.34% |
25.18% |
88.60% |
|
LB 3 Plus Year Municipal Bond |
|
9.09% |
32.62% |
n/a* |
|
General Municipal Debt Funds Average |
|
7.36% |
25.48% |
90.37% |
Cumulative total returns show Class C's performance in percentage terms over a set period - in this case, one year, five years or 10 years. For example, if you had invested $1,000 in a fund that had a 5% return over the past year, the value of your investment would be $1,050. You can compare Class C's returns to those of the Lehman Brothers 3 Plus Year Municipal Bond Index - a market value-weighted index of investment-grade municipal bonds with maturities of three years or more. To measure how Class C's performance stacked up against its peers, you can compare it to the general municipal debt funds average, which reflects the performance of mutual funds with similar objectives tracked by Lipper Inc. The past one year average represents a peer group of 265 mutual funds. These benchmarks include reinvested dividends and capital gains, if any, and exclude the effect of sales charges.
Annual Report
Fidelity Advisor Municipal Income Fund - Class C
Performance - continued
Average Annual Total Returns
|
Periods ended October 31, 2000 |
Past 1 |
Past 5 |
Past 10 |
|
Fidelity Adv Municipal Income - CL C |
7.34% |
4.59% |
6.55% |
|
Fidelity Adv Municipal Income - CL C |
6.34% |
4.59% |
6.55% |
|
LB 3 Plus Year Municipal Bond |
9.09% |
5.81% |
n/a* |
|
General Municipal Debt Funds Average |
7.36% |
4.64% |
6.64% |
Average annual total returns take Class C shares' cumulative return and show you what would have happened if Class C shares had performed at a constant rate each year.
* Not available
Annual Report
Fidelity Advisor Municipal Income Fund - Class C
Performance - continued
$10,000 Over 10 Years
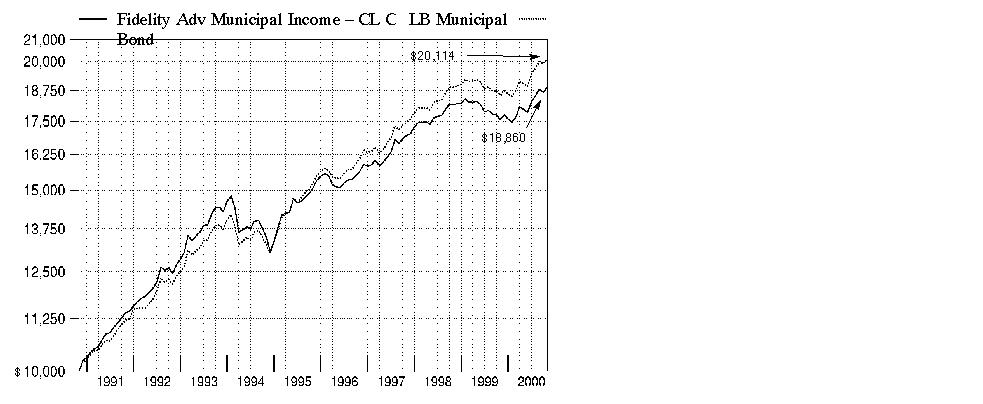
$10,000 Over 10 Years: Let's say hypothetically that $10,000 was invested in Fidelity Advisor Municipal Income Fund - Class C on October 31, 1990. As the chart shows, by October 31, 2000, the value of the investment would have grown to $18,860 - an 88.60% increase on the initial investment. For comparison, look at how the Lehman Brothers Municipal Bond Index - a market value-weighted index of investment grade bonds with maturities of one year or more - did over the same period. With dividends reinvested, the same $10,000 would have grown to $20,114 - a 101.14% increase.
Understanding
Performance
How a fund did yesterday is no guarantee of how it will do tomorrow. Bond prices, for example, generally move in the opposite direction of interest rates. In turn, the share price, return and yield of a fund that invests in bonds will vary. That means if you sell your shares during a market downturn, you might lose money. But if you can ride out the market's ups and downs, you may have a gain.
3Annual Report
Fidelity Advisor Municipal Income Fund - Class C
Performance - continued
Total Return Components
|
|
Years ended October 31, |
November 3, 1997
(commencement of |
|
|
|
2000 |
1999 |
1998 |
|
Dividend returns |
4.43% |
3.61% |
3.87% |
|
Capital returns |
2.91% |
-6.85% |
3.54% |
|
Total returns |
7.34% |
-3.24% |
7.41% |
Total return components include both dividend returns and capital returns. A dividend return reflects the actual dividends paid by the class. A capital return reflects both the amount paid by the class to shareholders as capital gain distributions and changes in the class' share price. Both returns assume the dividends or capital gains, if any, paid by the class are reinvested and exclude the effect of sales charges.
Dividends and Yield
|
Periods ended October 31, 2000 |
Past 1 |
Past 6 |
Past 1 |
|
Dividends per share |
4.15¢ |
25.05¢ |
49.81¢ |
|
Annualized dividend rate |
4.08% |
4.18% |
4.23% |
|
30-day annualized yield |
4.03% |
- |
- |
|
30-day annualized tax-equivalent yield |
6.30% |
- |
- |
Dividends per share show the income paid by the class for a set period and do not reflect any tax reclassifications. If you annualize this number, based on an average share price of $11.99 over the past one month, $11.88 over the past six months, and $11.78 over the past one year, you can compare the class' income over these three periods. The 30-day annualized yield is a standard formula for all bond funds based on the yields of the bonds in the fund, averaged over the past 30 days. This figure shows you the yield characteristics of the fund's investments at the end of the period. It also helps you compare funds from different companies on an equal basis. The offering share price used in the calculation of the yield excludes the effect of Class C's contingent deferred sales charge. The tax-equivalent yield shows what you would have to earn on a taxable investment to equal the class' tax-free yield, if you're in the 36% federal tax bracket, but does not reflect payment of the federal alternative minimum tax, if applicable.
Annual Report
Market Recap
While 1999 proved to be a most difficult year for the municipal bond market - its worst year, in fact, since 1994 - the sector soared during the first three quarters of 2000. Year to date through the end of October, the Lehman Brothers Municipal Bond Index - an index of over 35,000 investment-grade, fixed-rate, tax-exempt bonds - returned 8.17%. For the one-year period ending October 31, 2000, the index showed a gain of 8.51%. As the 12-month period opened, municipal bond prices were pressured by the series of interest-rate hikes made by the Federal Reserve Board and by the more attractive returns of the U.S. equity markets. But that scenario began to turn around in early 2000. Among the factors that spurred municipal bonds' revival were a better technical environment - meaning reduced supply met by increased demand - as well as credit upgrades for many municipal bond issuers due to the strength of the economy. Munis also benefited as a safe haven when equity markets began to churn. Individual investors were particularly attracted to the generally higher yields municipal bonds offered. Compared to the overall taxable bond market, as measured by the Lehman Brothers Aggregate Bond Index, the municipal bond market finished comfortably ahead of that index's 7.30% return for the 12 months ending October 31, 2000.
(Portfolio Manager photograph)
An interview with Christine Thompson, Portfolio Manager of Fidelity Advisor Municipal Income Fund
Q. How did the fund perform, Christine?
A. For the 12-month period that ended October 31, 2000, the fund's Class A, Class T, Class B and Class C shares returned 8.17%, 8.14%, 7.38% and 7.34%, respectively. To get a sense of how the fund did relative to its competitors, the general municipal debt funds average returned 7.36% for the same 12-month period, according to Lipper Inc. Additionally, the Lehman Brothers 3 Plus Year Municipal Bond Index, which tracks the types of securities in which the fund invests, returned 9.09% for the same 12-month period.
Fund Talk: The Manager's Overview - continued
Q. What were some of the main forces behind the fund's performance during the year?
Annual Report
A. Changing expectations about economic growth, inflation and interest rates caused the municipal market to reverse course several times during the past year. In the early months of the period, the municipal market and the fund came under pressure due to inflationary fears and rising interest rates. Performance of the market and the fund improved throughout the first several months of 2000, although municipals sold off in May when economic growth proved stronger than originally expected. That was followed by a summer bond market rally, which was fueled by relief that inflation appeared to be in check. The tug of war between a belief that the economy was on a slow, non-inflationary growth track and a concern that robust conditions would incite inflation continued throughout the fall, with municipals performing accordingly.
Q. What helped the fund's performance relative to its peers?
A. In keeping with Fidelity's investment approach, I didn't lengthen or shorten duration - that is, I didn't make the fund more or less interest-rate sensitive - based on where I thought interest rates would be at some point down the road. Instead, I managed the fund's duration to be in line with the municipal market as a whole as measured by the Lehman Brothers index. Given that interest rates were pretty volatile during the period, some peers may have suffered if they were positioned with too little or too much interest-rate sensitivity at the wrong time. Rather than make a bet on interest rates, I position the fund to emphasize the best value opportunities based on their performance potential in a variety of possible interest-rate scenarios.
Q. Were there other strategies that helped the fund's performance relative to its peers?
A. The fund benefited from its relatively large position in premium coupon bonds, which pay interest rates above prevailing market rates and trade at prices that are above their face - or par - value. Their premium gives them protection under the "market discount rule" that can take effect during rising interest-rate environments. As interest rates rose and bond prices fell, more and more bonds fell to levels subjecting them to this adverse tax rule and investors punished them accordingly.
Q. Which bonds were the most disappointing during the period?
A. The fund's stake in strong-performing California bonds was smaller - at 2.5% of net assets - than many of our peers, which hurt relative performance. These bonds started the period with higher prices than similar bonds from other states. Even so, gains in personal income in the state prompted strong investor interest in tax-free California bonds and they performed well as a result.
Q. What choices did you make in terms of credit quality and why?
A. As of October 31, 2000, more than half of the fund's investments were in bonds with the highest credit rating of AAA or Aaa. In addition, more than 92% of the fund's investments were in bonds rated "investment-grade," with a rating of Baa or higher by Moody's; or BBB- by Standard & Poor's. The fund's emphasis on investment-grade and high-quality bonds reflected that, for the most part, I didn't feel that lower-quality bonds offered enough incentive by way of additional yield for owning them.
Annual Report
Fund Talk: The Manager's Overview - continued
Q. What's ahead for the municipal market?
A. The market appears to be factoring in the potential for interest rates to hold steady, if not fall, now that economic growth shows some signs of slowing and inflation is apparently moderate. If short-term interest rates stabilize or fall, municipal bonds most likely would benefit. My outlook for the technical aspects of supply and demand is favorable. The supply of municipals has continued to decline in response to rising interest rates because many issuers now find it too expensive to issue new or refinance old debt. Given the relatively high tax-equivalent yields of municipal bonds, I believe that demand will remain strong.
The views expressed in this report reflect those of the portfolio manager only through the end of the period of the report as stated on the cover and do not necessarily represent the views of Fidelity or any other person in the Fidelity organization. Any such views are subject to change at any time based upon market or other conditions and Fidelity disclaims any responsibility to update such views. These views may not be relied on as investment advice and, because investment decisions for a Fidelity fund are based on numerous factors, may not be relied on as an indication of trading intent on behalf of any Fidelity fund.
Fund Facts
Goal: seeks to provide a high current yield exempt from federal income tax
Start date: September 16, 1987
Size: as of October 31, 2000, more than $457 million
Manager: Christine Thompson, since 1998; joined Fidelity in 1985
3Christine Thompson on her investment approach:
"At Fidelity, one of the key strategies we use in managing municipal bond funds is to opportunistically purchase and sell bonds of various maturities. The demand for municipals can vary a great deal in response to the behavior of various market participants. Corporations, individual investors and trust accounts tend to favor short-term securities, which are less interest-rate sensitive and, therefore, tend to be less volatile than the overall municipal market. Individual investors, along with mutual funds and insurance companies - which invest the insurance premiums they collect - are the primary purchasers of intermediate-maturity bonds. Higher-yielding, longer-term securities, which tend to be the most volatile, generally are the domain of long-maturity mutual funds, hedge funds and other investors known as ´arbitrageurs,' who seek to exploit small differences between various fixed-income investments. At a given point in time, a given municipal bond maturity range may look cheap or expensive as different categories of investors embrace them or step aside. With the help of Fidelity's research team, I try to take advantage of the anomalies that can occur by investing in bond maturities that look cheap due to weak demand and selling those that have performed well in response to strong demand."
Annual Report
|
Top Five States as of October 31, 2000 |
||
|
|
% of fund's |
% of fund's net assets |
|
New York |
16.6 |
17.4 |
|
Pennsylvania |
6.3 |
5.6 |
|
Washington |
6.3 |
4.2 |
|
North Carolina |
5.9 |
6.0 |
|
Illinois |
5.7 |
5.1 |
|
Top Five Sectors as of October 31, 2000 |
||
|
|
% of fund's |
% of fund's net assets |
|
Health Care |
17.6 |
16.2 |
|
General Obligations |
17.2 |
15.5 |
|
Electric Utilities |
15.8 |
17.2 |
|
Transportation |
12.3 |
14.7 |
|
Water & Sewer |
10.6 |
10.5 |
|
Average Years to Maturity as of October 31, 2000 |
||
|
|
|
6 months ago |
|
Years |
16.4 |
16.7 |
|
Average years to maturity is based on the average time remaining until principal payments are expected from each of the fund's bonds, weighted by dollar amount. |
|
Duration as of October 31, 2000 |
||
|
|
|
6 months ago |
|
Years |
7.2 |
7.3 |
|
Duration shows how much a bond fund's price fluctuates with changes in comparable interest rates. If rates rise 1%, for example, a fund with a five-year duration is likely to lose about 5% of its value. Other factors also can influence a bond fund's performance and share price. Accordingly, a bond fund's actual performance may differ from this example. |
|
Quality Diversification (Moody's Ratings) |
As of October 31, 2000 As of April 30, 2000
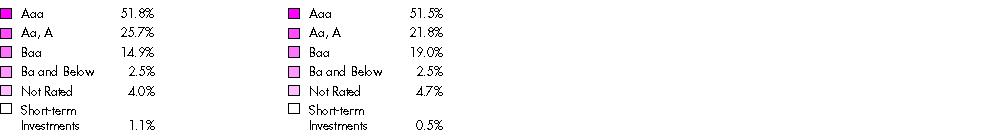

|
Where Moody's ratings are not available, we have used S&P ® ratings. Amounts shown are as a percentage of the fund's investments. |
Annual Report
Showing Percentage of Net Assets
|
Municipal Bonds - 98.6% |
|||||
|
Moody's Ratings (unaudited) (a) |
Principal Amount |
Value |
|||
|
Alabama - 0.9% |
|||||
|
Shelby County Gen. Oblig. Series A, |
- |
|
$ 4,000,000 |
$ 4,204,000 |
|
|
Alaska - 1.9% |
|||||
|
Alaska Hsg. Fin. Corp. Series A, 5.4% 12/1/13 |
Aa2 |
|
5,490,000 |
5,531,779 |
|
|
Alaska Student Ln. Corp. Student Ln. Rev. |
|
|
|
|
|
|
5.25% 7/1/07 (AMBAC Insured) (d) |
Aaa |
|
1,500,000 |
1,512,090 |
|
|
5.45% 7/1/09 (AMBAC Insured) (d) |
Aaa |
|
1,500,000 |
1,520,400 |
|
|
|
8,564,269 |
||||
|
Arizona - 1.2% |
|||||
|
Arizona Student Ln. Aquisition Auth. Student Ln. Rev. Series A1, 5.875% 5/1/18 (d) |
Aaa |
|
1,300,000 |
1,321,528 |
|
|
Maricopa County Ind. Dev. Auth. Health Facilities
Rev. (Catholic Health Care West Proj.) |
Baa1 |
|
4,495,000 |
4,303,153 |
|
|
|
5,624,681 |
||||
|
California - 2.5% |
|||||
|
California Hsg. Fin. Agcy. Rev. |
|
|
|
|
|
|
Series B, 5.2% 8/1/26 (MBIA Insured) (d) |
Aaa |
|
670,000 |
670,576 |
|
|
Series R: |
|
|
|
|
|
|
5.35% 8/1/07 (MBIA Insured) (d) |
Aaa |
|
1,000,000 |
1,048,310 |
|
|
6.15% 8/1/27 (MBIA Insured) (d) |
Aaa |
|
1,500,000 |
1,529,265 |
|
|
California Poll. Cont. Fing. Auth. Resource
Recovery Rev. (Waste Mgmt., Inc. Proj.) |
Ba1 |
|
500,000 |
511,200 |
|
|
California Univ. Rev. (Hsg. Sys. Proj.) Series 1999 AY, 5.875% 11/1/30 (FGIC Insured) |
Aaa |
|
1,000,000 |
1,037,740 |
|
|
Central Valley Fing. Auth. Cogeneration Proj. Rev. (Carson Ice Gen. Proj.) 6% 7/1/09 |
BBB- |
|
4,500,000 |
4,688,550 |
|
|
Sacramento Cogeneration Auth. Cogeneration Proj. Rev. (Procter & Gamble Proj.) 6.375% 7/1/10 |
BBB- |
|
500,000 |
531,245 |
|
|
Sacramento Pwr. Auth. Cogeneration Proj. Rev.: |
|
|
|
|
|
|
6% 7/1/02 |
BBB- |
|
1,000,000 |
1,025,770 |
|
|
6.5% 7/1/08 |
BBB- |
|
300,000 |
328,425 |
|
|
|
11,371,081 |
||||
|
Colorado - 4.8% |
|||||
|
Arapaho County Cap. Impt. Trust Fund Hwy. Rev. Series C, 0% 8/31/26 (Pre-Refunded to 8/31/05 @ 20.8626) (e) |
Aaa |
|
3,620,000 |
601,499 |
|
|
Municipal Bonds - continued |
|||||
|
Moody's Ratings (unaudited) (a) |
Principal Amount |
Value |
|||
|
Colorado - continued |
|||||
|
Arapaho County School District #5 Cherry Creek 6% 12/15/15 |
Aa1 |
|
$ 1,250,000 |
$ 1,334,263 |
|
|
Colorado Health Facilities Auth. Rev.: |
|
|
|
|
|
|
(Nat'l. Benevolent Assoc. Proj.) Series A, |
Baa2 |
|
1,360,000 |
1,303,410 |
|
|
(Rocky Mountain Adventist Proj.): |
|
|
|
|
|
|
6.25% 2/1/04 |
Ba1 |
|
400,000 |
393,068 |
|
|
6.625% 2/1/13 |
Ba1 |
|
6,900,000 |
6,788,151 |
|
|
6.625% 2/1/22 |
Ba1 |
|
4,000,000 |
3,765,920 |
|
|
Colorado Springs Arpt. Rev. Series C: |
|
|
|
|
|
|
0% 1/1/06 (MBIA Insured) |
Aaa |
|
1,405,000 |
1,093,174 |
|
|
0% 1/1/08 (MBIA Insured) |
Aaa |
|
870,000 |
610,183 |
|
|
Denver City & County Arpt. Rev.: |
|
|
|
|
|
|
Series A: |
|
|
|
|
|
|
0% 11/15/02 (MBIA Insured) (d) |
Aaa |
|
2,115,000 |
1,918,263 |
|
|
7.5% 11/15/23 (d) |
A2 |
|
2,070,000 |
2,212,809 |
|
|
7.5% 11/15/23 (Pre-Refunded to 11/15/04 @ 102) (d)(e) |
Aaa |
|
430,000 |
481,226 |
|
|
Series D, 0% 11/15/04 (MBIA Insured) (d) |
Aaa |
|
1,700,000 |
1,394,697 |
|
|
|
21,896,663 |
||||
|
Connecticut - 1.3% |
|||||
|
Connecticut Health & Edl. Facilities Auth. |
AAA |
|
1,920,000 |
2,020,339 |
|
|
Eastern Connecticut Resources Recovery Auth. Solid Waste Rev. (Wheelabrator Lisbon Proj.) Series A, 5.5% 1/1/20 (d) |
BBB |
|
3,350,000 |
2,784,654 |
|
|
Univ. of Connecticut Rev. (Student Fee Prog.) Series A, 5.75% 11/15/29 (FGIC Insured) |
Aaa |
|
1,000,000 |
1,019,200 |
|
|
|
5,824,193 |
||||
|
District of Columbia - 2.8% |
|||||
|
District of Columbia Gen. Oblig.: |
|
|
|
|
|
|
Series A, 6% 6/1/07 (MBIA Insured) (Escrowed to Maturity) (e) |
Aaa |
|
150,000 |
160,917 |
|
|
Series B, 5.25% 6/1/26 (FSA Insured) |
Aaa |
|
6,000,000 |
5,570,100 |
|
|
District of Columbia Hosp. Rev. (Hosp. for Sick Children Proj.) Series A, 8.875% 1/1/21 |
- |
|
925,000 |
945,702 |
|
|
District of Columbia Redev. Land Agcy. Washington D.C. Sports Arena Spl. Tax Rev.: |
|
|
|
|
|
|
5.4% 11/1/00 |
Baa |
|
500,000 |
500,000 |
|
|
Municipal Bonds - continued |
|||||
|
Moody's Ratings (unaudited) (a) |
Principal Amount |
Value |
|||
|
District of Columbia - continued |
|||||
|
District of Columbia Redev. Land Agcy. Washington D.C. Sports Arena Spl. Tax Rev.: - continued |
|
|
|
|
|
|
5.625% 11/1/10 |
Baa |
|
$ 385,000 |
$ 387,114 |
|
|
District of Columbia Rev.: |
|
|
|
|
|
|
(George Washington Univ. Proj.) Series A, 5.75% 9/15/20 (MBIA Insured) |
Aaa |
|
1,000,000 |
1,014,830 |
|
|
(Georgetown Univ. Proj.) Series A, 5.95% 4/1/14 (MBIA Insured) |
Aaa |
|
2,000,000 |
2,101,820 |
|
|
(Nat'l. Academy of Science Proj.) Series A, 5% 1/1/19 (AMBAC Insured) |
Aaa |
|
2,500,000 |
2,329,775 |
|
|
|
13,010,258 |
||||
|
Florida - 2.3% |
|||||
|
Broward County Resource Recovery Rev. (SES Broward Co. LP South Proj.) 7.95% 12/1/08 |
A3 |
|
950,000 |
971,375 |
|
|
Dade County Aviation Rev. Series D, 5.75% 10/1/09 (AMBAC Insured) (d) |
Aaa |
|
5,000,000 |
5,246,100 |
|
|
Florida Mid-Bay Bridge Auth. Rev. Series A, 7.5% 10/1/17 |
- |
|
2,500,000 |
2,626,750 |
|
|
Tampa Florida Guaranteed Entitlement Rev. 6% 10/1/08 (AMBAC Insured) (f) |
Aaa |
|
1,500,000 |
1,592,055 |
|
|
|
10,436,280 |
||||
|
Illinois - 5.7% |
|||||
|
Chicago Board of Ed. (Chicago School Reform Proj.) 5.75% 12/1/27 (AMBAC Insured) |
Aaa |
|
10,500,000 |
10,530,555 |
|
|
Chicago Midway Arpt. Rev.: |
|
|
|
|
|
|
Series A, 5.5% 1/1/29 (MBIA Insured) |
Aaa |
|
1,500,000 |
1,458,225 |
|
|
Series B, 6% 1/1/09 (MBIA Insured) (d) |
Aaa |
|
300,000 |
318,045 |
|
|
Chicago O'Hare Int'l. Arpt. Rev. (Gen. Arpt. Proj.) Series A: |
|
|
|
|
|
|
6.25% 1/1/09 (AMBAC Insured) (d) |
Aaa |
|
3,700,000 |
3,998,479 |
|
|
6.375% 1/1/15 (MBIA Insured) |
Aaa |
|
1,400,000 |
1,477,266 |
|
|
Chicago O'Hare Int'l. Arpt. Spl. Facilities Rev. (American Airlines, Inc. Proj.) 8.2% 12/1/24 |
Baa2 |
|
1,000,000 |
1,105,090 |
|
|
Illinois Health Facilities Auth. Rev.: |
|
|
|
|
|
|
(Condell Med. Ctr. Proj.) 6.5% 5/15/30 |
A3 |
|
3,000,000 |
3,001,470 |
|
|
(Memorial Hosp. Proj.): |
|
|
|
|
|
|
7.125% 5/1/10 (Pre-Refunded to 5/1/02 @ 102) (e) |
- |
|
1,000,000 |
1,056,540 |
|
|
7.25% 5/1/22 (Pre-Refunded to 5/1/02 @ 102) (e) |
- |
|
1,000,000 |
1,058,330 |
|
|
Municipal Bonds - continued |
|||||
|
Moody's Ratings (unaudited) (a) |
Principal Amount |
Value |
|||
|
Illinois - continued |
|||||
|
Illinois Health Facilities Auth. Rev.: - continued |
|
|
|
|
|
|
(Riverside Health Sys. Proj.) 6.8% 11/15/20 |
A3 |
|
$ 1,500,000 |
$ 1,542,210 |
|
|
Metro. Pier & Exposition Auth. Dedicated Tax Rev. Series A: |
|
|
|
|
|
|
0% 6/15/09 (FGIC Insured) |
Aaa |
|
1,000,000 |
648,340 |
|
|
0% 6/15/09 (FGIC Insured) (Escrowed to Maturity) (e) |
Aaa |
|
65,000 |
42,544 |
|
|
|
26,237,094 |
||||
|
Indiana - 0.2% |
|||||
|
Indianapolis Econ. Dev. Rev. (Nat'l. Benevolent Assoc. Proj.) 7.625% 10/1/22 |
Baa2 |
|
1,000,000 |
1,035,090 |
|
|
Iowa - 1.1% |
|||||
|
Iowa Student Ln. Liquidity Corp. Student Ln. Rev.: |
|
|
|
|
|
|
Series A, 6.35% 3/1/01 |
Aa1 |
|
1,500,000 |
1,508,970 |
|
|
Series B, 5.75% 12/1/07 (d) |
Aaa |
|
3,500,000 |
3,576,475 |
|
|
|
5,085,445 |
||||
|
Kansas - 1.7% |
|||||
|
Kansas Dev. Fin. Auth. Health Facilities Rev. (Sister of Charity Proj.) Series J, 6.25% 12/1/28 |
Aa3 |
|
1,500,000 |
1,543,680 |
|
|
Kansas Dev. Fin. Auth. Rev. (Sisters of Charity Leavenworth Health Svc. Co. Proj.): |
|
|
|
|
|
|
5% 12/1/13 (MBIA Insured) |
Aaa |
|
2,390,000 |
2,344,184 |
|
|
5% 12/1/14 (MBIA Insured) |
Aaa |
|
500,000 |
486,055 |
|
|
5.25% 12/1/09 (MBIA Insured) |
Aaa |
|
1,385,000 |
1,400,374 |
|
|
5.25% 12/1/11 (MBIA Insured) |
Aaa |
|
1,750,000 |
1,762,163 |
|
|
|
7,536,456 |
||||
|
Kentucky - 2.6% |
|||||
|
Kenton County Arpt. Board Arpt. Rev. (Delta Air Lines, Inc. Proj.) Series A, 7.5% 2/1/20 (d) |
Baa3 |
|
2,000,000 |
2,077,240 |
|
|
Kentucky Property & Bldgs. Commission Rev.: |
|
|
|
|
|
|
5.625% 9/1/13 |
Aa3 |
|
2,170,000 |
2,262,854 |
|
|
5.625% 9/1/14 |
Aa3 |
|
1,500,000 |
1,555,935 |
|
|
Louisville & Jefferson Swr. Sys. Rev. Series A, 5.75% 5/15/33 (FGIC Insured) |
Aaa |
|
6,050,000 |
6,131,131 |
|
|
|
12,027,160 |
||||
|
Louisiana - 0.4% |
|||||
|
Louisiana Pub. Facilities Auth. Rev. (Student Ln. Prog.) Sr. Series A1, 6.2% 3/1/01 |
Aaa |
|
1,825,000 |
1,834,727 |
|
|
Municipal Bonds - continued |
|||||
|
Moody's Ratings (unaudited) (a) |
Principal Amount |
Value |
|||
|
Maryland - 0.6% |
|||||
|
Maryland Health & Higher Edl. Facilities Auth. Rev. (Good Samaritan Hosp. Proj.): |
|
|
|
|
|
|
5.75% 7/1/13 (AMBAC Insured) (Escrowed to Maturity) (e) |
Aaa |
|
$ 1,015,000 |
$ 1,073,667 |
|
|
5.75% 7/1/13 (Escrowed to Maturity) (e) |
A1 |
|
1,665,000 |
1,761,237 |
|
|
|
2,834,904 |
||||
|
Massachusetts - 5.3% |
|||||
|
Massachusetts Bay Trans. Auth.: |
|
|
|
|
|
|
Series 1997 D, 5% 3/1/27 |
Aa2 |
|
2,000,000 |
1,802,620 |
|
|
Series A: |
|
|
|
|
|
|
5.375% 3/1/19 |
Aa2 |
|
1,000,000 |
987,760 |
|
|
5.75% 3/1/26 (FGIC Insured) |
Aa2 |
|
2,000,000 |
2,023,740 |
|
|
Massachusetts Health & Edl. Facilities Auth. Rev.: |
|
|
|
|
|
|
(Bentley College Proj.) Series J, 5% 7/1/17 (MBIA Insured) |
Aaa |
|
1,000,000 |
950,870 |
|
|
(Fairview Extended Care Proj.) Series B, 4.55% 1/1/21 (MBIA Insured) |
Aaa |
|
700,000 |
698,264 |
|
|
(Harvard Univ. Issue Proj.) Series W, 6% 7/1/35 |
Aaa |
|
1,000,000 |
1,065,200 |
|
|
(Hebrew Rehab. Ctr. for Aged Proj.) Series C, 5.25% 7/1/17 |
A |
|
2,000,000 |
1,820,060 |
|
|
(New England Med. Ctr. Hosp. Proj.) Series G, 5.375% 7/1/24 (MBIA Insured) |
Aaa |
|
500,000 |
474,015 |
|
|
Massachusetts Ind. Fin. Agcy. Resource Recovery Rev. (Ogden Haverhill Proj.) Series 1992 A, 4.7% 12/1/03 |
BBB |
|
1,000,000 |
983,680 |
|
|
Massachusetts Ind. Fin. Agcy. Rev. (Massachusetts Biomedical Research Corp. Proj.): |
|
|
|
|
|
|
Series A1, 0% 8/1/02 |
A+ |
|
1,600,000 |
1,473,184 |
|
|
Series A2: |
|
|
|
|
|
|
0% 8/1/08 |
A+ |
|
800,000 |
542,688 |
|
|
0% 8/1/10 |
- |
|
4,500,000 |
2,707,605 |
|
|
Massachusetts Muni. Wholesale Elec. Co. Pwr. Supply Sys. Rev. Series C, 6.5% 7/1/03 |
Baa2 |
|
1,000,000 |
1,045,470 |
|
|
Massachusetts Tpk. Auth. Western Tpk. Rev. Series A, 5.55% 1/1/17 (MBIA Insured) |
Aaa |
|
550,000 |
550,006 |
|
|
Municipal Bonds - continued |
|||||
|
Moody's Ratings (unaudited) (a) |
Principal Amount |
Value |
|||
|
Massachusetts - continued |
|||||
|
Massachusetts Wtr. Poll. Abatement Trust Wtr.
Poll. Abatement Rev. (MWRA Ln. Prog.) |
Aa1 |
|
$ 10,000 |
$ 10,078 |
|
|
Massachusetts Wtr. Resources Auth. Rev. |
Aaa |
|
7,000,000 |
7,062,020 |
|
|
|
24,197,260 |
||||
|
Michigan - 3.0% |
|||||
|
Detroit Wtr. Supply Sys. Rev. Sr. Lien Series A: |
|
|
|
|
|
|
5.75% 7/1/26 (FGIC Insured) |
Aaa |
|
1,400,000 |
1,414,224 |
|
|
5.875% 7/1/22 (FGIC Insured) |
Aaa |
|
1,700,000 |
1,741,820 |
|
|
5.875% 7/1/29 (FGIC Insured) |
Aaa |
|
1,100,000 |
1,120,636 |
|
|
Holt Pub. Schools Series 2000 A, 5.5% 5/1/23 (FGIC Insured) |
Aaa |
|
1,250,000 |
1,226,288 |
|
|
Howell Pub. Schools 5.875% 5/1/22 |
Aaa |
|
2,225,000 |
2,281,270 |
|
|
Michigan Hosp. Fin. Auth. Rev.: |
|
|
|
|
|
|
(McLaren Health Care Corp. Proj.) Series A, 5% 6/1/19 |
A1 |
|
2,000,000 |
1,725,120 |
|
|
(Mercy Health Svcs. Proj.) Series S, 5.75% 8/15/05 |
Aa3 |
|
200,000 |
205,110 |
|
|
(Pontiac Osteopathic Hosp. Proj.) Series A, |
Baa2 |
|
2,000,000 |
1,678,480 |
|
|
Royal Oak Hosp. Fin. Auth. Rev. (William Beaumont Hosp. Proj.) 6.25% 1/1/09 |
Aa3 |
|
2,310,000 |
2,466,849 |
|
|
|
13,859,797 |
||||
|
Minnesota - 1.5% |
|||||
|
Minneapolis & Saint Paul Hsg. & Redev. Auth. Health Care Sys. Rev. (Healthspan Corp. Proj.) Series A, 4.75% 11/15/18 (AMBAC Insured) |
Aaa |
|
1,800,000 |
1,629,216 |
|
|
Minnesota Hsg. Fin. Agcy. (Single Family Mtg. Prog.) Series D, 6.4% 7/1/15 (d) |
Aa1 |
|
1,840,000 |
1,911,760 |
|
|
Rochester Health Care Facilities Rev. (Mayo Foundation Proj.) Series A, 5.5% 11/15/27 |
AA+ |
|
1,500,000 |
1,453,095 |
|
|
Saint Cloud Health Care Rev. (Saint Cloud Hosp. Group Oblig. Proj.) Series A, 5.875% 5/1/30 (FSA Insured) |
Aaa |
|
2,000,000 |
2,036,860 |
|
|
|
7,030,931 |
||||
|
Nebraska - 0.5% |
|||||
|
Lancaster County School District #1 (Lincoln Pub. Schools Proj.) 5.25% 7/15/19 |
Aa2 |
|
2,100,000 |
2,048,319 |
|
|
Municipal Bonds - continued |
|||||
|
Moody's Ratings (unaudited) (a) |
Principal Amount |
Value |
|||
|
Nevada - 0.7% |
|||||
|
Clark County School District Series A, 9.75% 6/1/01 (MBIA Insured) |
Aaa |
|
$ 500,000 |
$ 514,970 |
|
|
Las Vegas Downtown Redev. Agcy. |
|
|
|
|
|
|
Series A, 6% 6/15/10 |
BBB+ |
|
1,500,000 |
1,530,930 |
|
|
Sub Lien Series A, 6.1% 6/15/14 |
BBB+ |
|
1,000,000 |
1,014,790 |
|
|
|
3,060,690 |
||||
|
New Jersey - 0.8% |
|||||
|
New Jersey Econ. Dev. Auth. Wtr. Facilities Rev. (American Wtr. Co., Inc. Proj.) Series 1997 B, 5.375% 5/1/32 (FGIC Insured) (d) |
Aaa |
|
1,635,000 |
1,541,936 |
|
|
New Jersey Trans. Trust Fund Auth. (Trans. Sys. Proj.) Series A, 5.5% 6/15/11 (MBIA Insured) |
Aaa |
|
2,000,000 |
2,073,660 |
|
|
|
3,615,596 |
||||
|
New Mexico - 2.1% |
|||||
|
Albuquerque Arpt. Rev.: |
|
|
|
|
|
|
6.7% 7/1/18 (AMBAC Insured) (d) |
Aaa |
|
3,970,000 |
4,317,534 |
|
|
6.75% 7/1/09 (AMBAC Insured) (d) |
Aaa |
|
450,000 |
507,245 |
|
|
6.75% 7/1/11 (AMBAC Insured) (d) |
Aaa |
|
1,805,000 |
2,053,151 |
|
|
New Mexico Edl. Assistance Foundation Student Ln. Rev.: |
|
|
|
|
|
|
Series B, 5.25% 4/1/05 (AMBAC Insured) (d) |
Aaa |
|
1,100,000 |
1,106,127 |
|
|
Series IV A2, 6.65% 3/1/07 |
Aaa |
|
1,700,000 |
1,760,282 |
|
|
|
9,744,339 |
||||
|
New York - 16.6% |
|||||
|
Metro. Trans. Auth. Commuter Facilities Rev.: |
|
|
|
|
|
|
Series A: |
|
|
|
|
|
|
5.625% 7/1/27 (MBIA Insured) |
Aaa |
|
2,000,000 |
1,999,360 |
|
|
6.125% 7/1/29 |
Baa1 |
|
6,750,000 |
6,930,225 |
|
|
Series B, 4.75% 7/1/26 (FGIC Insured) |
Aaa |
|
2,000,000 |
1,732,660 |
|
|
Metro. Trans. Auth. Dedicated Tax Fund Series A: |
|
|
|
|
|
|
5% 4/1/23 (FGIC Insured) |
Aaa |
|
2,565,000 |
2,366,546 |
|
|
5% 4/1/29 (FSA Insured) |
Aaa |
|
2,200,000 |
1,993,134 |
|
|
5.25% 4/1/26 (MBIA Insured) |
Aaa |
|
1,000,000 |
943,800 |
|
|
Metro. Trans. Auth. Svc. Contract Rev.: |
|
|
|
|
|
|
(Commuter Facilities Proj.) Series O, 5.75% 7/1/13 |
Baa1 |
|
700,000 |
734,454 |
|
|
(Trans. Facilities Proj.): |
|
|
|
|
|
|
Series 7, 5.625% 7/1/16 |
Baa1 |
|
1,000,000 |
1,002,930 |
|
|
Series P, 5.75% 7/1/15 |
Baa1 |
|
1,010,000 |
1,023,049 |
|
|
Municipal Bonds - continued |
|||||
|
Moody's Ratings (unaudited) (a) |
Principal Amount |
Value |
|||
|
New York - continued |
|||||
|
Metro. Trans. Auth. Trans. Facilities Rev.: |
|
|
|
|
|
|
(Svc. Contract Proj.) Series 8: |
|
|
|
|
|
|
5.25% 7/1/17 |
Baa1 |
|
$ 1,000,000 |
$ 963,170 |
|
|
5.375% 7/1/21 (FSA Insured) |
Aaa |
|
700,000 |
680,764 |
|
|
Series B, 4.75% 7/1/26 (FGIC Insured) |
Aaa |
|
1,000,000 |
866,330 |
|
|
Series C, 4.75% 7/1/16 (FSA Insured) |
Aaa |
|
500,000 |
459,210 |
|
|
New York City Gen. Oblig.: |
|
|
|
|
|
|
Series B, 5.7% 8/15/02 |
A3 |
|
35,000 |
35,794 |
|
|
Series H: |
|
|
|
|
|
|
6.875% 2/1/02 |
A3 |
|
160,000 |
164,554 |
|
|
6.875% 2/1/02 (Escrowed to Maturity) (e) |
Aaa |
|
80,000 |
82,454 |
|
|
New York City Ind. Dev. Agcy. Ind. Dev. Rev. (Japan Airlines Co. Ltd. Proj.) Series 1991, 6% 11/1/15 (FSA Insured) (d) |
Aaa |
|
965,000 |
1,011,812 |
|
|
New York City Ind. Dev. Agcy. Spl. Facilities Rev. (Term. One Group Assoc. Proj.) 5.9% 1/1/06 (d) |
A3 |
|
8,680,000 |
9,087,092 |
|
|
New York City Muni. Wtr. Fin. Auth. Wtr. & Swr. Sys. Rev. Series B: |
|
|
|
|
|
|
5.5% 6/15/27 (MBIA Insured) |
Aaa |
|
3,500,000 |
3,423,560 |
|
|
5.75% 6/15/26 |
Aa3 |
|
5,000,000 |
5,039,400 |
|
|
5.75% 6/15/29 |
Aa3 |
|
5,000,000 |
5,033,200 |
|
|
5.75% 6/15/29 (MBIA Insured) |
Aaa |
|
1,500,000 |
1,504,440 |
|
|
6% 6/15/33 |
Aa3 |
|
5,800,000 |
6,037,452 |
|
|
New York City Transitional Fin. Auth. Rev.: |
|
|
|
|
|
|
Series A, 5.75% 8/15/24 |
Aa2 |
|
3,000,000 |
3,036,870 |
|
|
Series B, 6% 11/15/29 |
Aa2 |
|
1,000,000 |
1,043,620 |
|
|
New York State Dorm. Auth. Rev.: |
|
|
|
|
|
|
(City Univ. Sys. Proj.) Series C, 7.5% 7/1/10 |
Baa1 |
|
500,000 |
575,930 |
|
|
(Jamaica Hosp. Med. Ctr. Proj.) Series F, 5.2% 2/15/14 (MBIA Insured) |
Aaa |
|
6,150,000 |
6,095,265 |
|
|
(State Univ. Edl. Facilities Proj.): |
|
|
|
|
|
|
Series A, 4.75% 5/15/25 (MBIA Insured) |
Aaa |
|
1,750,000 |
1,525,405 |
|
|
5.95% 5/15/29 (FGIC Insured) |
Aaa |
|
5,000,000 |
5,153,700 |
|
|
New York State Envir. Facilities Corp. Clean Wtr. & Drinking Wtr. Rev. (State Wtr. Revolving Funds Prog.) Series F: |
|
|
|
|
|
|
4.875% 6/15/18 |
Aa1 |
|
1,500,000 |
1,397,925 |
|
|
4.875% 6/15/20 |
Aa1 |
|
1,300,000 |
1,188,395 |
|
|
5% 6/15/15 |
Aa1 |
|
700,000 |
680,680 |
|
|
Municipal Bonds - continued |
|||||
|
Moody's Ratings (unaudited) (a) |
Principal Amount |
Value |
|||
|
New York - continued |
|||||
|
New York State Envir. Facilities Corp. Poll. Cont.
Rev. (State Wtr. Revolving Fund Prog.) |
Aa1 |
|
$ 1,000,000 |
$ 957,580 |
|
|
New York State Local Govt. Assistance Corp. Series A, 0% 4/1/08 |
A3 |
|
1,000,000 |
690,250 |
|
|
Triborough Bridge & Tunnel Auth. Spl. Oblig. Series A, 5.25% 1/1/11 (FGIC Insured) |
Aaa |
|
500,000 |
513,250 |
|
|
|
75,974,260 |
||||
|
North Carolina - 5.9% |
|||||
|
North Carolina Eastern Muni. Pwr. Agcy. Pwr. Sys. Rev.: |
|
|
|
|
|
|
Series A, 5.5% 1/1/05 (MBIA Insured) |
Aaa |
|
4,000,000 |
4,117,440 |
|
|
Series B: |
|
|
|
|
|
|
5.875% 1/1/21 (MBIA Insured) |
Aaa |
|
3,050,000 |
3,100,264 |
|
|
6% 1/1/06 |
Baa3 |
|
5,490,000 |
5,669,249 |
|
|
6% 1/1/14 |
Baa3 |
|
1,000,000 |
1,001,930 |
|
|
7.25% 1/1/07 |
Baa3 |
|
1,000,000 |
1,097,810 |
|
|
Series C: |
|
|
|
|
|
|
5.125% 1/1/03 |
Baa1 |
|
2,700,000 |
2,701,161 |
|
|
5.25% 1/1/04 |
Baa1 |
|
1,365,000 |
1,367,266 |
|
|
5.5% 1/1/07 |
Baa3 |
|
700,000 |
704,886 |
|
|
5.5% 1/1/07 (MBIA Insured) |
Aaa |
|
2,000,000 |
2,068,040 |
|
|
Series D, 6.7% 1/1/19 |
Baa3 |
|
1,115,000 |
1,159,310 |
|
|
North Carolina Muni. Pwr. Agcy. #1 Catawba Elec. Rev.: |
|
|
|
|
|
|
5.75% 1/1/02 |
Baa1 |
|
2,500,000 |
2,523,225 |
|
|
5.9% 1/1/03 |
Baa1 |
|
250,000 |
254,228 |
|
|
6.25% 1/1/17 (AMBAC Insured) |
Aaa |
|
1,150,000 |
1,185,317 |
|
|
|
26,950,126 |
||||
|
Ohio - 3.3% |
|||||
|
Cincinnati Student Ln. Fdg. Corp. Student Ln. Rev. Series B, 8.875% 8/1/08 (d) |
- |
|
1,005,000 |
1,015,995 |
|
|
Delaware County Gen. Oblig. 6% 12/1/25 |
Aa2 |
|
1,000,000 |
1,040,600 |
|
|
Fairborn City School District (School Impt. Proj.) 5.75% 12/1/26 (FSA Insured) |
Aaa |
|
1,000,000 |
1,015,080 |
|
|
Franklin County Hosp. Rev. (Doctor's Ohio Health Corp. Proj.) Series A, 4.75% 12/1/03 |
Baa3 |
|
4,160,000 |
3,917,722 |
|
|
Gateway Economic Dev. Corp. Greater Cleveland Stadium Rev. Series 1990, 6.5% 9/15/14 (d) |
- |
|
3,000,000 |
3,005,820 |
|
|
Municipal Bonds - continued |
|||||
|
Moody's Ratings (unaudited) (a) |
Principal Amount |
Value |
|||
|
Ohio - continued |
|||||
|
Marion County Hosp. Impt. Rev. (Cmnty. Hosp. Proj.) 5.6% 5/15/01 |
BBB+ |
|
$ 1,000,000 |
$ 997,750 |
|
|
Plain Local School District 6% 12/1/25 |
Aaa |
|
2,000,000 |
2,083,400 |
|
|
Summit County Gen. Oblig. 6% 12/1/21 |
Aaa |
|
2,000,000 |
2,099,880 |
|
|
|
15,176,247 |
||||
|
Oklahoma - 2.8% |
|||||
|
Oklahoma Industries Auth. Rev.: |
|
|
|
|
|
|
(Health Sys. Oblig. Group Proj.) Series A, 5.75% 8/15/29 (MBIA Insured) |
Aaa |
|
1,500,000 |
1,481,325 |
|
|
6% 8/15/19 (MBIA Insured) |
Aaa |
|
3,000,000 |
3,087,210 |
|
|
Sapulpa Muni. Auth. Util. Rev. 5.75% 4/1/23 (FGIC Insured) |
Aaa |
|
1,000,000 |
1,009,500 |
|
|
Tulsa Indl. Auth. Rev. (Univ. of Tulsa Proj.) 5.75% 10/1/25 (MBIA Insured) |
Aaa |
|
3,000,000 |
3,043,620 |
|
|
Tulsa Muni. Arpt. Trust Rev. (American Airlines Corp. Proj.) 7.35% 12/1/11 |
Baa2 |
|
4,000,000 |
4,170,520 |
|
|
|
12,792,175 |
||||
|
Oregon - 0.7% |
|||||
|
Tri-County Metro. Trans. District Rev. Series A: |
|
|
|
|
|
|
5.75% 8/1/18 |
Aa3 |
|
1,000,000 |
1,025,670 |
|
|
5.75% 8/1/19 |
Aa3 |
|
2,080,000 |
2,125,469 |
|
|
|
3,151,139 |
||||
|
Pennsylvania - 6.3% |
|||||
|
Allegheny County Arpt. Rev. (Pittsburgh Int'l.
Arpt. Proj.) Series A1, 5.75% 1/1/07 |
Aaa |
|
1,000,000 |
1,048,290 |
|
|
Allegheny County Ind. Dev. Auth. Rev. |
- |
|
310,000 |
318,172 |
|
|
Allegheny County Port Auth. Spl. Rev. 6.125% 3/1/29 (MBIA Insured) |
Aaa |
|
4,460,000 |
4,628,900 |
|
|
Butler County Ind. Dev. Auth. Health Ctr. Rev. (Sherwood Oaks Proj.) 5.75% 6/1/11 |
A |
|
3,000,000 |
2,957,310 |
|
|
Cumberland County Muni. Auth. Rev. |
|
|
|
|
|
|
6.8% 11/15/14 |
Baa3 |
|
3,250,000 |
2,918,923 |
|
|
6.8% 11/15/23 |
Baa3 |
|
1,000,000 |
863,670 |
|
|
Delaware County Auth. College Rev. (Haverford College Proj.) 5.75% 11/15/29 |
Aa3 |
|
3,500,000 |
3,541,055 |
|
|
Municipal Bonds - continued |
|||||
|
Moody's Ratings (unaudited) (a) |
Principal Amount |
Value |
|||
|
Pennsylvania - continued |
|||||
|
Delaware County Auth. Rev. (First Mtg. Riddle Village Proj.): |
|
|
|
|
|
|
Series 1992, 8.75% 6/1/10 (Pre-Refunded to |
Aaa |
|
$ 2,705,000 |
$ 2,930,218 |
|
|
8.25% 6/1/22 (Escrowed to Maturity) (e) |
Aaa |
|
2,250,000 |
2,560,365 |
|
|
Pennsylvania Higher Edl. Facilities Auth. Rev.: |
|
|
|
|
|
|
(Lafayette College Proj.) 6% 5/1/30 |
Aa3 |
|
3,065,000 |
3,157,318 |
|
|
(UPMC Health Sys. Proj.) Series A, 5% 8/1/29 (FSA Insured) |
Aaa |
|
3,000,000 |
2,640,780 |
|
|
Pennsylvania Hsg. Fin. Agcy. (Residential Dev. Section 8 Proj.) Series A, 7% 7/1/01 |
Aa3 |
|
515,000 |
516,916 |
|
|
Philadelphia Hosp. & Higher Ed. Facilities Auth. Health Sys. Rev. (Jefferson Health Sys. Proj.) Series A, 5.125% 5/15/21 (MBIA Insured) |
Aaa |
|
1,000,000 |
926,240 |
|
|
|
29,008,157 |
||||
|
Rhode Island - 1.4% |
|||||
|
Rhode Island Health & Edl. Bldg. Corp. Rev. (Higher Ed./Johnson & Wales Proj.) 5% 4/1/29 (MBIA Insured) |
Aaa |
|
640,000 |
566,886 |
|
|
Rhode Island Port Auth. & Economic Dev. |
Aaa |
|
4,000,000 |
4,701,160 |
|
|
Rhode Island Student Ln. Auth. Student Ln. Rev. Series A, 6.55% 12/1/00 |
A |
|
1,000,000 |
1,001,380 |
|
|
|
6,269,426 |
||||
|
South Carolina - 1.1% |
|||||
|
Piedmont Muni. Pwr. Agcy. Elec. Rev. Series A, 6.25% 1/1/05 (FGIC Insured) |
Aaa |
|
1,715,000 |
1,818,192 |
|
|
South Carolina Ed. Assistance Auth. Rev. (Guaranteed Student Ln. Prog.): |
|
|
|
|
|
|
Sr. Lien Series A2, 5.4% 9/1/02 |
AAA |
|
1,250,000 |
1,260,713 |
|
|
Sub Lien Series B, 5.7% 9/1/05 (d) |
A |
|
1,000,000 |
1,021,520 |
|
|
South Carolina Jobs Econ. Dev. Auth. Hosp. Facilities Rev. (Palmetto Health Alliance Proj.) Series A, 7.375% 12/15/21 |
Baa1 |
|
1,000,000 |
1,031,810 |
|
|
|
5,132,235 |
||||
|
Tennessee - 0.2% |
|||||
|
Metro. Govt. Nashville & Davidson County Elec. Rev. Series A, 0% 5/15/06 (MBIA Insured) |
Aaa |
|
1,000,000 |
764,590 |
|
|
Municipal Bonds - continued |
|||||
|
Moody's Ratings (unaudited) (a) |
Principal Amount |
Value |
|||
|
Texas - 5.1% |
|||||
|
Brazos Higher Ed. Auth., Inc. Student Ln. Rev. Series A1, 6.05% 12/1/01 (d) |
Aaa |
|
$ 435,000 |
$ 441,999 |
|
|
Conroe Independent School District Series B, 0% 2/15/09 |
Aaa |
|
750,000 |
496,058 |
|
|
El Paso Gen. Oblig. 5.75% 8/15/25 |
Aaa |
|
4,500,000 |
4,516,470 |
|
|
Hurst Euless Bedford Independent School District 0% 8/15/11 |
Aaa |
|
1,000,000 |
575,460 |
|
|
Los Fresnos Independent School District: |
|
|
|
|
|
|
5.75% 8/15/13 |
Aaa |
|
1,040,000 |
1,088,537 |
|
|
5.75% 8/15/14 |
Aaa |
|
1,100,000 |
1,144,462 |
|
|
San Antonio Elec. & Gas Rev. 5.5% 2/1/20 (Pre-Refunded to 2/1/07 @ 101) (e) |
Aa1 |
|
75,000 |
78,978 |
|
|
Texas Gen. Oblig. (Pub. Fin. Auth. Proj.) |
Aa1 |
|
5,000,000 |
4,876,050 |
|
|
Texas Muni. Pwr. Agcy. Rev. 0% 9/1/11 (AMBAC Insured) |
Aaa |
|
3,930,000 |
2,256,410 |
|
|
Texas Pub. Fin. Auth. Bldg. Rev. (Texas Technical College Proj.) 6.25% 8/1/09 (MBIA Insured) |
Aaa |
|
1,000,000 |
1,098,220 |
|
|
Travis County Health Facilities Dev. Corp. Rev. (Ascension Health Ctr. Prog.) Series A, 6.25% 11/15/19 (MBIA Insured) |
Aaa |
|
4,000,000 |
4,204,960 |
|
|
Yselta Independent School District 0% 8/15/09 |
Aaa |
|
4,065,000 |
2,622,535 |
|
|
|
23,400,139 |
||||
|
Utah - 2.9% |
|||||
|
Intermountain Pwr. Agcy. Pwr. Supply Rev.: |
|
|
|
|
|
|
Series A: |
|
|
|
|
|
|
0% 7/1/06 (MBIA Insured) |
Aaa |
|
2,860,000 |
2,174,117 |
|
|
6.5% 7/1/09 (AMBAC Insured) |
Aaa |
|
365,000 |
407,515 |
|
|
6.5% 7/1/09 (AMBAC Insured) |
Aaa |
|
635,000 |
712,629 |
|
|
Series B: |
|
|
|
|
|
|
5.75% 7/1/16 (MBIA Insured) |
Aaa |
|
2,500,000 |
2,572,250 |
|
|
6% 7/1/16 (MBIA Insured) |
Aaa |
|
7,000,000 |
7,313,810 |
|
|
South Salt Lake City Ind. Rev. (Price Savers Wholesale Club Proj.) 9% 11/15/13 |
- |
|
250,000 |
261,598 |
|
|
|
13,441,919 |
||||
|
Virginia - 1.3% |
|||||
|
Loudoun County Ind. Dev. Auth. Residential Care Facilities Rev. (Falcons Landing Proj.) Series A, 9.25% 11/1/04 (Escrowed to Maturity) (e) |
- |
|
880,000 |
971,731 |
|
|
Municipal Bonds - continued |
|||||
|
Moody's Ratings (unaudited) (a) |
Principal Amount |
Value |
|||
|
Virginia - continued |
|||||
|
Virginia Commonwealth Trans. Board Trans. Rev. (U.S. Route 58 Corridor Dev. Prog.) Series B, 5.75% 5/15/21 |
Aa1 |
|
$ 1,965,000 |
$ 2,002,944 |
|
|
Virginia State Resources Auth. Clean Wtr. Rev.: |
|
|
|
|
|
|
(State Revolving Funds Proj.) |
Aaa |
|
1,750,000 |
1,806,473 |
|
|
5.625% 10/1/22 |
Aaa |
|
1,250,000 |
1,264,950 |
|
|
|
6,046,098 |
||||
|
Washington - 6.3% |
|||||
|
Grant County Pub. Util. District No. 2 (Priest Rapids Hydro-Elec. Proj.) Second Series B, 5.375% 1/1/16 (MBIA Insured) (d) |
Aaa |
|
1,715,000 |
1,690,870 |
|
|
Port Seattle Passenger Facilities Charge |
Aaa |
|
3,000,000 |
2,952,150 |
|
|
Thurston County School District #333 Series B, 0% 12/1/10 (FGIC Insured) |
Aaa |
|
4,000,000 |
2,410,040 |
|
|
Univ. Wash Univ. Revs. (Student Facilities Fee Prog.) 5.8% 6/1/30 (FSA Insured) |
Aaa |
|
3,000,000 |
3,012,570 |
|
|
Washington Pub. Pwr. Supply Sys. Nuclear |
|
|
|
|
|
|
Series A, 0% 7/1/06 (MBIA Insured) |
Aaa |
|
2,700,000 |
2,035,854 |
|
|
5.4% 7/1/12 |
Aa1 |
|
16,000,000 |
16,112,151 |
|
|
Washington Pub. Pwr. Supply Sys. Nuclear |
Aa1 |
|
500,000 |
508,095 |
|
|
|
28,721,730 |
||||
|
Wisconsin - 0.8% |
|||||
|
Fond Du Lac School District 5.75% 4/1/13 (FGIC Insured) |
A1 |
|
1,300,000 |
1,358,864 |
|
|
Milwaukee County Series A, 0% 12/1/10 |
Aaa |
|
3,500,000 |
2,102,555 |
|
|
|
3,461,419 |
||||
|
TOTAL MUNICIPAL BONDS (Cost $441,814,363) |
451,368,893 |
||||
|
Cash Equivalents - 1.1% |
|||
|
Shares |
Value |
||
|
Fidelity Municipal Cash Central Fund, 4.49% (b)(c) |
5,053,609 |
$ 5,053,609 |
|
|
TOTAL INVESTMENT PORTFOLIO - 99.7% (Cost $446,867,972) |
456,422,502 |
||
|
NET OTHER ASSETS - 0.3% |
1,330,279 |
||
|
NET ASSETS - 100% |
$ 457,752,781 |
||
|
Legend |
|
(a) S&P credit ratings are used in the absence of a rating by Moody's Investors Service, Inc. |
|
(b) Information in this report regarding holdings by state and security types does not reflect the holdings of the Fidelity Municipal Cash Central Fund. |
|
(c) The rate quoted is the annualized seven-day yield of the fund at period end. A complete listing of the fund's holdings as of its most recent fiscal year end is available upon request. |
|
(d) Private activity obligations whose interest is subject to the federal alternative minimum tax for individuals. |
|
(e) Security collateralized by an amount sufficient to pay interest and principal. |
|
(f) Security purchased on a delayed delivery or when-issued basis. |
|
(g) Restricted securities - Investment in securities not registered under the Securities Act of 1933. |
|
Additional information on each holding is as follows: |
|
Security |
Acquisition Date |
Acquisition Cost |
|
Allegheny County
Ind. Dev. Auth. Rev |
3/13/90 |
$ 310,000 |
|
Other Information |
|
The composition of long-term debt holdings as a percentage of total value of investments in securities, is as follows (ratings are unaudited): |
|
Moody's Ratings |
S&P Ratings |
|||
|
Aaa, Aa, A |
74.8% |
|
AAA, AA, A |
73.4% |
|
Baa |
11.8% |
|
BBB |
11.4% |
|
Ba |
2.5% |
|
BB |
2.4% |
|
B |
0.0% |
|
B |
0.0% |
|
Caa |
0.0% |
|
CCC |
0.0% |
|
Ca, C |
0.0% |
|
CC, C |
0.0% |
|
|
|
|
D |
0.0% |
|
The percentage not rated by Moody's or S&P amounted to 4%. |
|
The distribution of municipal securities by revenue source, as a percentage of total net assets, is as follows: |
|
Health Care |
17.6% |
|
General Obligations |
17.2 |
|
Electric Utilities |
15.8 |
|
Transportation |
12.3 |
|
Water & Sewer |
10.6 |
|
Education |
8.8 |
|
Others* (individually less than 5%) |
17.7 |
|
|
100.0% |
|
* Includes cash equivalents and net other assets |
|
|
Income Tax Information |
|
At October 31, 2000, the aggregate cost of investment securities for income tax purposes was $446,867,972. Net unrealized appreciation aggregated $9,554,530, of which $13,352,990 related to appreciated investment securities and $3,798,460 related to depreciated investment securities. |
|
At October 31, 2000, the fund had a capital loss carryforward of approximately $16,212,000 of which $7,417,000, $6,268,000 and $2,527,000 will expire on October 31, 2003, 2004 and 2008, respectively. Of the loss carryforwards expiring on October 31, 2008, $432,000 was acquired in the merger and is available to offset future capital gains of the fund to the extent provided by regulations. |
|
During the fiscal year ended October 31, 2000, 100% of the fund's income dividends was free from federal income tax, and 18.61% of the fund's income dividends was subject to the federal alternative minimum tax (unaudited). |
See accompanying notes which are an integral part of the financial statements.
Annual Report
Statement of Assets and Liabilities
|
|
October 31, 2000 |
|
|
Assets |
|
|
|
Investment in securities, at value (cost $446,867,972) - See accompanying schedule |
|
$ 456,422,502 |
|
Receivable for fund shares sold |
|
277,480 |
|
Interest receivable |
|
8,109,397 |
|
Other receivables |
|
22,338 |
|
Total assets |
|
464,831,717 |
|
Liabilities |
|
|
|
Payable for investments purchased |
$ 3,404,918 |
|
|
Delayed delivery |
1,603,005 |
|
|
Payable for fund shares redeemed |
1,018,075 |
|
|
Distributions payable |
680,374 |
|
|
Accrued management fee |
142,580 |
|
|
Distribution fees payable |
139,316 |
|
|
Other payables and accrued expenses |
90,668 |
|
|
Total liabilities |
|
7,078,936 |
|
Net Assets |
|
$ 457,752,781 |
|
Net Assets consist of: |
|
|
|
Paid in capital |
|
$ 465,034,413 |
|
Distributions in excess of net investment income |
|
(76,089) |
|
Accumulated undistributed net realized gain (loss) |
|
(16,760,073) |
|
Net unrealized appreciation (depreciation) on investments |
|
9,554,530 |
|
Net Assets |
|
$ 457,752,781 |
See accompanying notes which are an integral part of the financial statements.
Annual Report
Financial Statements - continued
Statement of Assets and Liabilities - continued
|
|
October 31, 2000 |
|
|
Calculation of Maximum Offering Price |
|
$12.02 |
|
Maximum offering price per share (100/95.25 of $12.02) |
|
$12.62 |
|
Class T: |
|
$12.04 |
|
Maximum offering price per share (100/96.50 of $12.04) |
|
$12.48 |
|
Class B: |
|
$12.00 |
|
Class C: |
|
$12.04 |
|
Institutional Class: |
|
$11.98 |
A Redemption price per share is equal to net asset value less any applicable contingent deferred sales charge.
See accompanying notes which are an integral part of the financial statements.
Annual Report
Financial Statements - continued
Statement of Operations
|
|
Year ended October 31, 2000 |
|
|
Investment Income Interest |
|
$ 24,369,233 |
|
Expenses |
|
|
|
Management fee |
$ 1,595,755 |
|
|
Transfer agent fees |
453,437 |
|
|
Distribution fees |
1,565,812 |
|
|
Accounting fees and expenses |
134,731 |
|
|
Non-interested trustees' compensation |
619 |
|
|
Custodian fees and expenses |
10,834 |
|
|
Registration fees |
111,456 |
|
|
Audit |
44,033 |
|
|
Legal |
14,566 |
|
|
Miscellaneous |
16,181 |
|
|
Total expenses before reductions |
3,947,424 |
|
|
Expense reductions |
(4,966) |
3,942,458 |
|
Net investment income |
|
20,426,775 |
|
Realized and Unrealized Gain (Loss) Net realized gain (loss) on investment securities |
|
(2,014,047) |
|
Change in net unrealized appreciation (depreciation) |
|
15,974,733 |
|
Net gain (loss) |
|
13,960,686 |
|
Net increase (decrease) in net assets resulting |
|
$ 34,387,461 |
See accompanying notes which are an integral part of the financial statements.
Annual Report
Financial Statements - continued
Statement of Changes in Net Assets
|
|
Year ended
October 31, |
Year ended
October 31, |
|
Increase (Decrease) in Net Assets |
|
|
|
Operations |
$ 20,426,775 |
$ 19,650,204 |
|
Net realized gain (loss) |
(2,014,047) |
2,481,428 |
|
Change in net unrealized appreciation (depreciation) |
15,974,733 |
(33,690,142) |
|
Net increase (decrease) in net assets resulting |
34,387,461 |
(11,558,510) |
|
Distributions to shareholders from net investment income |
(20,623,031) |
(19,650,204) |
|
Share transactions - net increase (decrease) |
23,373,862 |
(1,025,834) |
|
Total increase (decrease) in net assets |
37,138,292 |
(32,234,548) |
|
Net Assets |
|
|
|
Beginning of period |
420,614,489 |
452,849,037 |
|
End of period (including distributions in excess of net investment income of $76,089 and $0, respectively) |
$ 457,752,781 |
$ 420,614,489 |
See accompanying notes which are an integral part of the financial statements.
Annual Report
Financial Highlights - Class A
|
Years ended October 31, |
2000 |
1999 |
1998 |
1997 |
1996 F |
|
Selected Per-Share Data |
|
|
|
|
|
|
Net asset value, beginning |
$ 11.690 |
$ 12.540 |
$ 12.150 |
$ 11.740 |
$ 11.630 |
|
Income from Investment Operations |
|
|
|
|
|
|
Net investment income |
.591 D |
.567 |
.571 |
.583 D |
.105 D, E |
|
Net realized and unrealized gain (loss) |
.337 |
(.850) |
.390 |
.445 |
.109 |
|
Total from investment |
.928 |
(.283) |
.961 |
1.028 |
.214 |
|
Less Distributions |
|
|
|
|
|
|
From net investment income |
(.598) |
(.567) |
(.571) |
(.616) E |
(.104) |
|
In excess of net |
- |
- |
- |
(.002) |
- |
|
Total distributions |
(.598) |
(.567) |
(.571) |
(.618) |
(.104) |
|
Net asset value, end of period |
$ 12.020 |
$ 11.690 |
$ 12.540 |
$ 12.150 |
$ 11.740 |
|
Total Return B, C |
8.17% |
(2.36)% |
8.07% |
9.02% |
1.84% |
|
Ratios and Supplemental Data |
|
|
|
|
|
|
Net assets, end of period |
$ 22,780 |
$ 10,722 |
$ 6,721 |
$ 3,755 |
$ 202 |
|
Ratio of expenses to average |
.72% |
.72% |
.90% G |
.90% G |
.90% A, G |
|
Ratio of net investment income to average net assets |
5.02% |
4.62% |
4.57% |
4.87% |
5.73% A |
|
Portfolio turnover rate |
39% H |
23% |
36% |
36% |
49% |
A Annualized
B The total returns would have been lower had certain expenses not been reduced during the periods shown.
C Total returns do not include the one time sales charge and for periods of less than one year are not annualized.
D Net investment income per share has been calculated based on average shares outstanding during the period.
E Net investment income per share in 1996 reflects a payment received from an issuer in bankruptcy which was distributed in 1997.
F For the period September 3, 1996 (commencement of sale of Class A shares) to October 31, 1996.
G FMR agreed to reimburse a portion of the class' expenses during the period. Without this reimbursement, the class' expense ratio would have been higher.
H The portfolio turnover rate does not include the assets acquired in the merger.
See accompanying notes which are an integral part of the financial statements.
Annual Report
Financial Highlights - Class T
|
Years ended October 31, |
2000 |
1999 |
1998 |
1997 |
1996 |
|
Selected Per-Share Data |
|
|
|
|
|
|
Net asset value, beginning |
$ 11.700 |
$ 12.560 |
$ 12.150 |
$ 11.760 |
$ 11.880 |
|
Income from Investment Operations |
|
|
|
|
|
|
Net investment income |
.583 B |
.555 |
.571 |
.597 B |
.677 B, C |
|
Net realized and unrealized gain (loss) |
.343 |
(.860) |
.410 |
.407 |
(.136) |
|
Total from investment operations |
.926 |
(.305) |
.981 |
1.004 |
.541 |
|
Less Distributions |
|
|
|
|
|
|
From net investment income |
(.586) |
(.555) |
(.571) |
(.612) C |
(.661) |
|
In excess of net |
- |
- |
- |
(.002) |
- |
|
Total distributions |
(.586) |
(.555) |
(.571) |
(.614) |
(.661) |
|
Net asset value, end of period |
$ 12.040 |
$ 11.700 |
$ 12.560 |
$ 12.150 |
$ 11.760 |
|
Total Return A |
8.14% |
(2.53)% |
8.15% |
8.89% |
4.68% |
|
Ratios and Supplemental Data |
|
|
|
|
|
|
Net assets, end of period |
$ 340,959 |
$ 329,926 |
$ 380,325 |
$ 392,075 |
$ 480,432 |
|
Ratio of expenses to average |
.81% |
.81% |
.87% |
.89% |
.89% |
|
Ratio of net investment income |
4.93% |
4.51% |
4.62% |
5.04% |
5.74% |
|
Portfolio turnover rate |
39% D |
23% |
36% |
36% |
49% |
A Total returns do not include the one time sales charge.
B Net investment income per share has been calculated based on average shares outstanding during the period.
C Net investment income per share in 1996 reflects a payment received from an issuer in bankruptcy which was distributed in 1997.
D The portfolio turnover rate does not include the assets acquired in the merger.
See accompanying notes which are an integral part of the financial statements.
Annual Report
Financial Highlights - Class B
|
Years ended October 31, |
2000 |
1999 |
1998 |
1997 |
1996 |
|
Selected Per-Share Data |
|
|
|
|
|
|
Net asset value, beginning |
$ 11.670 |
$ 12.530 |
$ 12.130 |
$ 11.740 |
$ 11.860 |
|
Income from Investment Operations |
|
|
|
|
|
|
Net investment income |
.504 B |
.476 |
.491 |
.515 B |
.596 B, C |
|
Net realized and unrealized gain (loss) |
.336 |
(.860) |
.400 |
.416 |
(.136) |
|
Total from investment operations |
.840 |
(.384) |
.891 |
.931 |
.460 |
|
Less Distributions |
|
|
|
|
|
|
From net investment income |
(.510) |
(.476) |
(.491) |
(.539) C |
(.580) |
|
In excess of net investment |
- |
- |
- |
(.002) |
- |
|
Total distributions |
(.510) |
(.476) |
(.491) |
(.541) |
(.580) |
|
Net asset value, end of period |
$ 12.000 |
$ 11.670 |
$ 12.530 |
$ 12.130 |
$ 11.740 |
|
Total Return A |
7.38% |
(3.16)% |
7.47% |
8.15% |
3.98% |
|
Ratios and Supplemental Data |
|
|
|
|
|
|
Net assets, end of period |
$ 68,571 |
$ 63,464 |
$ 55,032 |
$ 41,024 |
$ 39,389 |
|
Ratio of expenses to average |
1.46% |
1.46% |
1.53% |
1.56% |
1.57% |
|
Ratio of net investment income |
4.28% |
3.88% |
3.96% |
4.35% |
5.06% |
|
Portfolio turnover rate |
39% D |
23% |
36% |
36% |
49% |
A Total returns do not include the contingent deferred sales charge.
B Net investment income per share has been calculated based on average shares outstanding during the period.
C Net investment income per share in 1996 reflects a payment received from an issuer in bankruptcy which was distributed in 1997.
D The portfolio turnover rate does not include the assets acquired in the merger.
See accompanying notes which are an integral part of the financial statements.
Annual Report
Financial Highlights - Class C
|
Years ended October 31, |
2000 |
1999 |
1998 E |
|
Selected Per-Share Data |
|
|
|
|
Net asset value, beginning of period |
$ 11.700 |
$ 12.560 |
$ 12.130 |
|
Income from Investment Operations |
|
|
|
|
Net investment income |
.493 D |
.465 |
.455 |
|
Net realized and unrealized gain (loss) |
.345 |
(.860) |
.430 |
|
Total from investment operations |
.838 |
(.395) |
.885 |
|
Less Distributions |
|
|
|
|
From net investment income |
(.498) |
(.465) |
(.455) |
|
Net asset value, end of period |
$ 12.040 |
$ 11.700 |
$ 12.560 |
|
Total Return B, C |
7.34% |
(3.24)% |
7.41% |
|
Ratios and Supplemental Data |
|
|
|
|
Net assets, end of period (000 omitted) |
$ 17,120 |
$ 13,071 |
$ 7,031 |
|
Ratio of expenses to average net assets |
1.56% |
1.56% |
1.75% A, F |
|
Ratio of net investment income to average net assets |
4.18% |
3.79% |
3.60% A |
|
Portfolio turnover rate |
39% G |
23% |
36% |
A Annualized
B The total returns would have been lower had certain expenses not been reduced during the periods shown.
C Total returns do not include the contingent deferred sales charge and for periods of less than one year are not annualized.
D Net investment income per share has been calculated based on average shares outstanding during the period.
E For the period November 3, 1997 (commencement of sale of Class C shares) to October 31, 1998.
F FMR agreed to reimburse a portion of the class' expenses during the period. Without this reimbursement, the class' expense ratio would have been higher.
G The portfolio turnover rate does not include the assets acquired in the merger.
See accompanying notes which are an integral part of the financial statements.
Annual Report
Financial Highlights - Institutional Class
|
Years ended October 31, |
2000 |
1999 |
1998 |
1997 |
1996 |
|
Selected Per-Share Data |
|
|
|
|
|
|
Net asset value, beginning |
$ 11.650 |
$ 12.510 |
$ 12.120 |
$ 11.720 |
$ 11.880 |
|
Income from Investment Operations |
|
|
|
|
|
|
Net investment income |
.604 B |
.584 |
.592 |
.609 B |
.707 B, C |
|
Net realized and unrealized gain (loss) |
.339 |
(.860) |
.390 |
.464 |
(.197) |
|
Total from investment operations |
.943 |
(.276) |
.982 |
1.073 |
.510 |
|
Less Distributions |
|
|
|
|
|
|
From net investment income |
(.613) |
(.584) |
(.592) |
(.671) C |
(.670) |
|
In excess of net |
- |
- |
- |
(.002) |
- |
|
Total distributions |
(.613) |
(.584) |
(.592) |
(.673) |
(.670) |
|
Net asset value, end of period |
$ 11.980 |
$ 11.650 |
$ 12.510 |
$ 12.120 |
$ 11.720 |
|
Total Return A |
8.34% |
(2.31)% |
8.28% |
9.44% |
4.41% |
|
Ratios and Supplemental Data |
|
|
|
|
|
|
Net assets, end of period |
$ 8,324 |
$ 3,431 |
$ 3,741 |
$ 1,511 |
$ 927 |
|
Ratio of expenses to average |
.61% |
.60% |
.75% D |
.75% D |
.75% D |
|
Ratio of net investment income to average net assets |
5.13% |
4.75% |
4.75% |
5.11% |
5.88% |
|
Portfolio turnover rate |
39% E |
23% |
36% |
36% |
49% |
A The total returns would have been lower had certain expenses not been reduced during the periods shown.
B Net investment income per share has been calculated based on average shares outstanding during the period.
C Net investment income per share in 1996 reflects a payment received from an issuer in bankruptcy which was distributed in 1997.
D FMR agreed to reimburse a portion of the class' expenses during the period. Without this reimbursement, the class' expense ratio would have been higher.
E The portfolio turnover rate does not include the assets acquired in the merger.
See accompanying notes which are an integral part of the financial statements.
Annual Report
For the period ended October 31, 2000
1. Significant Accounting Policies.
Fidelity Advisor Municipal Income Fund (the fund) is a fund of Fidelity Advisor Series II (the trust) and is authorized to issue an unlimited number of shares. The trust is registered under the Investment Company Act of 1940, as amended (the 1940 Act), as an open-end management investment company organized as a Massachusetts business trust.
The fund offers Class A, Class T, Class B, Class C and Institutional Class shares, each of which has equal rights as to assets and voting privileges. Each class has exclusive voting rights with respect to matters that affect that class. Class B shares will automatically convert to Class A shares after a holding period of seven years from the initial date of purchase. Investment income, realized and unrealized capital gains and losses, the common expenses of the fund, and certain fund-level expense reductions, if any, are allocated on a pro rata basis to each class based on the relative net assets of each class to the total net assets of the fund. Each class of shares differs in its respective distribution, transfer agent, and certain other class-specific fees, expenses, and expense reductions.
The financial statements have been prepared in conformity with generally accepted accounting principles which require management to make certain estimates and assumptions at the date of the financial statements. The following summarizes the significant accounting policies of the fund:
Security Valuation. Securities are valued based upon a computerized matrix system and/or appraisals by a pricing service, both of which consider market transactions and dealer-supplied valuations. Securities for which quotations are not readily available are valued at their fair value as determined in good faith under consistently applied procedures under the general supervision of the Board of Trustees. Short-term securities with remaining maturities of sixty days or less for which quotations are not readily available are valued at amortized cost or original cost plus accrued interest, both of which approximate current value. Investments in open-end investment companies are valued at their net asset value each business day.
Income Taxes. As a qualified regulated investment company under Subchapter M of the Internal Revenue Code, the fund is not subject to income taxes to the extent that it distributes substantially all of its taxable income for its fiscal year. The schedule of investments includes information regarding income taxes under the caption "Income Tax Information."
Investment Income. Interest income, which includes amortization of premium and accretion of original issue discount, is accrued as earned.
Expenses. Most expenses of the trust can be directly attributed to a fund. Expenses which cannot be directly attributed are apportioned among the funds in the trust.
Annual Report
Notes to Financial Statements - continued
1. Significant Accounting Policies - continued
Distributions to Shareholders. Distributions are declared daily and paid monthly from net investment income. Distributions from realized gains, if any, are recorded on the ex-dividend date. Income dividends and capital gain distributions are declared separately for each class.
Income and capital gain distributions are determined in accordance with income tax regulations which may differ from generally accepted accounting principles. These differences, which may result in distribution reclassifications, are primarily due to differing treatments for futures transactions, market discount, capital loss carryforwards and losses deferred due to futures transactions. The fund also utilized earnings and profits distributed to shareholders on redemption of shares as a part of the dividends paid deduction for income tax purposes.
Permanent book and tax basis differences relating to shareholder distributions will result in reclassifications to paid in capital. Distributions in excess of net investment income and accumulated undistributed net realized gain (loss) on investments may include temporary book and tax basis differences which will reverse in a subsequent period. Any taxable income or gain remaining at fiscal year end is distributed in the following year.
Security Transactions. Security transactions are accounted for as of trade date. Gains and losses on securities sold are determined on the basis of identified cost.
2. Operating Policies.
When-Issued Securities. The fund may purchase or sell securities on a when-issued basis. Payment and delivery may take place after the customary settlement period for that security. The price of the underlying securities is fixed at the time the transaction is negotiated. The market values of the securities purchased on a when-issued or forward commitment basis are identified as such in the fund's schedule of investments. The fund may receive compensation for interest forgone in the purchase of a when-issued security. With respect to purchase commitments, the fund identifies securities as segregated in its records with a value at least equal to the amount of the commitment. Losses may arise due to changes in the market value of the underlying securities, if the counterparty does not perform under the contract, or if the issuer does not issue the securities due to political, economic, or other factors.
Restricted Securities. The fund is permitted to invest in securities that are subject to legal or contractual restrictions on resale. These securities generally may be resold in transactions exempt from registration or to the public if the securities are registered. Disposal of these securities may involve time-consuming negotiations and expense, and prompt sale at an acceptable price may be difficult. At the end of the period, restricted securities (excluding 144A issues) amounted to $318,172 or 0.1% of net assets.
3. Purchases and Sales of Investments.
Purchases and sales of securities, other than short-term securities, aggregated $164,700,158 and $192,112,546, respectively.
Annual Report
Notes to Financial Statements - continued
4. Fees and Other Transactions with Affiliates.
Management Fee. As the fund's investment adviser, Fidelity Management & Research Company (FMR) receives a monthly fee that is calculated on the basis of a group fee rate plus a fixed individual fund fee rate applied to the average net assets of the fund. The group fee rate is the weighted average of a series of rates and is based on the monthly average net assets of all the mutual funds advised by FMR. The rates ranged from .0920% to .3700% for the period. The annual individual fund fee rate is .25%. In the event that these rates were lower than the contractual rates in effect during the period, FMR voluntarily implemented the above rates, as they resulted in the same or a lower management fee. For the period, the management fee was equivalent to an annual rate of .38% of average net assets.
Sub-Adviser Fee. FMR, on behalf of the fund, has entered into a sub-advisory agreement with Fidelity Investments Money Management, Inc. (FIMM), a wholly owned subsidiary of FMR. For its services, FIMM receives a fee from FMR of 50% of the management fee payable to FMR. The fee is paid prior to any voluntary expense reimbursements which may be in effect.
Distribution and Service Plan. In accordance with Rule 12b-1 of the 1940 Act, the Board of Trustees has adopted separate Distribution and Service Plans with respect to each class of shares (collectively referred to as "the Plans"). Under certain of the Plans, the class pays Fidelity Distributors Corporation (FDC), an affiliate of FMR, a 12b-1 fee. A portion of this fee may be reallowed to securities dealers, banks and other financial institutions for the distribution of each class of shares and providing shareholder support services. For the period, this fee was based on the following annual rates of the average net assets of each applicable class:
|
Class A |
.15% |
|
Class T |
.25% |
|
Class B |
.90%* |
|
Class C |
1.00%** |
* .65% represents a distribution fee and .25% represents a shareholder service fee.
** .75% represents a distribution fee and .25% represents a shareholder service fee.
For the period, each class paid FDC the following amounts, a portion of which was retained by FDC:
|
|
Paid to |
Retained |
|
Class A |
$ 21,161 |
$ 43 |
|
Class T |
815,119 |
8,802 |
|
Class B |
584,010 |
422,224 |
|
Class C |
145,522 |
63,271 |
|
|
$ 1,565,812 |
$ 494,340 |
Sales Load. FDC receives a front-end sales charge of up to 4.75% for selling Class A shares, and 3.50% for selling Class T shares of the fund. FDC receives the proceeds of
Annual Report
Notes to Financial Statements - continued
4. Fees and Other Transactions with Affiliates - continued
Sales Load - continued
contingent deferred sales charges levied on Class B share redemptions occurring within six years of purchase and Class C share redemptions occurring within one year of purchase. Contingent deferred sales charges are based on declining rates ranging from 5% to 1% for Class B and 1% for Class C, of the lesser of the cost of shares at the initial date of purchase or the net asset value of the redeemed shares, excluding any reinvested dividends and capital gains. In addition, purchases of Class A and Class T shares that were subject to a finder's fee bear a contingent deferred sales charge on assets that do not remain in the fund for at least one year. The Class A and Class T contingent deferred sales charge is based on 0.25% of the lesser of the cost of shares at the initial date of purchase or the net asset value of the redeemed shares, excluding any reinvested dividends and capital gains. A portion of the sales charges paid to FDC is paid to securities dealers, banks and other financial institutions.
For the period, sales charge amounts paid to and retained by FDC were as follows:
|
|
Paid to |
Retained |
|
Class A |
$ 85,146 |
$ 27,474 |
|
Class T |
144,387 |
50,758 |
|
Class B |
259,197 |
259,197* |
|
Class C |
11,127 |
11,127* |
|
|
$ 499,857 |
$ 348,556 |
* When Class B and Class C shares are initially sold, FDC pays commissions from its own resources to securities dealers,
banks, and other financial institutions through which the sales are made.
Transfer Agent and Accounting Fees. Citibank, N.A.(Citibank) is the custodian, transfer agent, and shareholder servicing agent for the fund's Class A, Class T, Class B, Class C, and Institutional Class shares. Citibank has entered into a sub-arrangement with Fidelity Investments Institutional Operations Company, Inc. (FIIOC) with respect to all classes of the fund to perform the transfer, dividend disbursing, and shareholder servicing agent functions. FIIOC, an affiliate of FMR, receives account fees and asset-based fees that vary according to the account size and type of account of the shareholders of the respective classes of the fund. All fees are paid to FIIOC by Citibank, which is reimbursed by each class for such payments. FIIOC pays for typesetting, printing and mailing of all shareholder reports, except proxy statements. For the period, each class paid the following transfer agent fees:
|
|
Amount |
% of |
|
Class A |
$ 15,735 |
.11 |
|
Class T |
345,728 |
.11 |
|
Class B |
68,630 |
.11 |
|
Class C |
15,680 |
.11 |
|
Institutional Class |
7,664 |
.15 |
|
|
$ 453,437 |
|
Annual Report
Notes to Financial Statements - continued
4. Fees and Other Transactions with Affiliates - continued
Fidelity Municipal Cash Central Fund. Pursuant to an Exemptive Order issued by the Securities and Exchange Commission, the fund may invest in the Fidelity Municipal Cash Central Fund (the Cash Fund) managed by FIMM, an affiliate of FMR. The Cash Fund is an open-end money market fund available only to investment companies and other accounts managed by FMR and its affiliates. The Cash Fund seeks preservation of capital, liquidity, and current income by investing in high-quality, short-term municipal securities of various states and municipalities. Income distributions from the Cash Fund are declared daily and paid monthly from net investment income. Income distributions earned by the fund are recorded as interest income in the accompanying financial statements.
5. Expense Reductions.
Through arrangements with the fund's custodian and each class' transfer agent, credits realized as a result of uninvested cash balances were used to reduce a portion of expenses. During the period, the fund's custodian fees were reduced by $234 under the custodian arrangement and Class T's transfer agent fees were reduced by $4,732 under the transfer agent arrangement.
6. Distributions to Shareholders.
Distributions to shareholders of each class were as follows:
|
|
Years ended October 31, |
|
|
|
2000 |
1999 |
|
From net investment income |
|
|
|
Class A |
$ 712,048 |
$ 439,029 |
|
Class T |
16,217,959 |
16,229,661 |
|
Class B |
2,815,400 |
2,381,487 |
|
Class C |
614,742 |
421,752 |
|
Institutional Class |
262,882 |
178,275 |
|
Total |
$ 20,623,031 |
$ 19,650,204 |
Annual Report
Notes to Financial Statements - continued
7. Share Transactions.
Transactions for each class of shares were as follows:
|
|
Shares |
Dollars |
||
|
|
Years ended October 31, |
Years ended October 31, |
||
|
|
2000 |
1999 |
2000 |
1999 |
|
|
|
|
|
|
|
Class A |
1,280,562 |
565,331 |
$ 15,201,152 |
$ 6,989,179 |
|
Issued in exchange for shares of Fidelity Advisor Intermediate Municipal Income Fund Class A |
314,140 |
- |
3,612,609 |
- |
|
Reinvestment of distributions |
40,864 |
25,296 |
482,684 |
307,568 |
|
Shares redeemed |
(658,536) |
(208,996) |
(7,799,948) |
(2,558,328) |
|
Net increase (decrease) |
977,030 |
381,631 |
$ 11,496,497 |
$ 4,738,419 |
|
Class T |
5,871,344 |
3,793,311 |
$ 69,198,493 |
$ 46,774,471 |
|
Issued in exchange for shares of Fidelity Advisor Intermediate Municipal Income Fund Class T |
3,316,008 |
- |
38,167,257 |
- |
|
Reinvestment of distributions |
861,078 |
835,205 |
10,155,440 |
10,221,698 |
|
Shares redeemed |
(9,924,270) |
(6,722,556) |
(116,868,899) |
(82,551,608) |
|
Net increase (decrease) |
124,160 |
(2,094,040) |
$ 652,291 |
$ (25,555,439) |
|
Class B |
1,533,458 |
2,125,759 |
$ 18,027,417 |
$ 26,076,418 |
|
Issued in exchange for shares of Fidelity Advisor Intermediate Municipal Income Fund Class B |
776,254 |
- |
8,911,393 |
- |
|
Reinvestment of distributions |
138,033 |
115,598 |
1,623,281 |
1,407,504 |
|
Shares redeemed |
(2,173,697) |
(1,196,611) |
(25,534,174) |
(14,568,680) |
|
Net increase (decrease) |
274,048 |
1,044,746 |
$ 3,027,917 |
$ 12,915,242 |
|
Class C |
761,618 |
871,985 |
$ 8,992,554 |
$ 10,752,375 |
|
Issued in exchange for shares of Fidelity Advisor Intermediate Municipal Income Fund Class C |
114,599 |
- |
1,319,029 |
- |
|
Reinvestment of distributions |
33,650 |
22,987 |
397,120 |
280,065 |
|
Shares redeemed |
(604,764) |
(337,753) |
(7,119,022) |
(4,112,814) |
|
Net increase (decrease) |
305,103 |
557,219 |
$ 3,589,681 |
$ 6,919,626 |
Annual Report
Notes to Financial Statements - continued
7. Share Transactions - continued
|
|
Shares |
Dollars |
||
|
|
Years ended October 31, |
Years ended October 31, |
||
|
|
2000 |
1999 |
2000 |
1999 |
|
|
|
|
|
|
|
Institutional Class |
247,204 |
103,836 |
$ 2,915,763 |
$ 1,286,178 |
|
Issued in exchange for shares of Fidelity Advisor Inter- |
420,609 |
- |
4,820,174 |
- |
|
Reinvestment of distributions |
8,738 |
7,731 |
103,106 |
93,765 |
|
Shares redeemed |
(276,387) |
(116,192) |
(3,231,567) |
(1,423,625) |
|
Net increase (decrease) |
400,164 |
(4,625) |
$ 4,607,476 |
$ (43,682) |
8. Merger Information.
On May 25, 2000, Class A, Class T, Class B, Class C, and Institutional Class of the fund acquired all of the assets and assumed all of the liabilities of Fidelity Advisor Intermediate Municipal Income Fund Class A, Class T, Class B, Class C, and Institutional Class, respectively. Each acquisition was approved by the shareholders of each class of Fidelity Advisor Intermediate Municipal Income Fund on April 19, 2000. Based on the opinion of fund counsel, the reorganization qualified as a tax-free reorganization for federal income tax purposes with no gain or loss recognized to the funds or their shareholders.
Class A's acquisition of Fidelity Advisor Intermediate Municipal Income Fund Class A was accomplished by an exchange of 314,140 shares of Class A for the 360,900 shares then outstanding of Fidelity Advisor Intermediate Municipal Income Fund Class A (each valued at $10.01). Class T's acquisition of Fidelity Advisor Intermediate Municipal Income Fund Class T was accomplished by an exchange of 3,316,008 shares of Class T for the 3,816,726 shares then outstanding of Fidelity Advisor Intermediate Municipal Income Fund Class T (each valued at $10.00). Class B's acquisition of Fidelity Advisor Intermediate Municipal Income Fund Class B was accomplished by an exchange of 776,254 shares of Class B for the 892,031 shares then outstanding of Fidelity Advisor Intermediate Municipal Income Fund Class B (each valued at $9.99). Class C's acquisition of Fidelity Advisor Intermediate Municipal Income Fund Class C was accomplished by an exchange of 114,599 shares of Class C for the 131,903 shares then outstanding of Fidelity Advisor Intermediate Municipal Income Fund Class C (each valued at $10.00). Institutional Class' acquisition of Fidelity Advisor Intermediate Municipal Income Fund Institutional Class was accomplished by an exchange of 420,609 shares of Institutional Class for the 482,017 shares then outstanding of Fidelity Advisor Intermediate Municipal Income Fund Institutional Class (each valued at $10.00).
Fidelity Advisor Intermediate Municipal Income Fund's net assets, including $1,412,949 of unrealized depreciation, were combined with the fund for total net assets after the acquisition of $438,952,773.
Annual Report
To the Trustees of Advisor Series II and the Shareholders of Fidelity Advisor Municipal Income Fund:
In our opinion, the accompanying statement of assets and liabilities, including the schedule of investments, and the related statements of operations and of changes in net assets and the financial highlights present fairly, in all material respects, the financial position of Fidelity Advisor Municipal Income Fund (a fund of Advisor Series II) at October 31, 2000, and the results of its operations, the changes in its net assets and the financial highlights for the periods indicated, in conformity with accounting principles generally accepted in the United States of America. These financial statements and financial highlights (hereafter referred to as "financial statements") are the responsibility of the Fidelity Advisor Municipal Income Fund's management; our responsibility is to express an opinion on these financial statements based on our audits. We conducted our audits of these financial statements in accordance with auditing standards generally accepted in the United States of America which require that we plan and perform the audit to obtain reasonable assurance about whether the financial statements are free of material misstatement. An audit includes examining, on a test basis, evidence supporting the amounts and disclosures in the financial statements, assessing the accounting principles used and significant estimates made by management, and evaluating the overall financial statement presentation. We believe that our audits, which included confirmation of securities at October 31, 2000 by correspondence with the custodian and brokers, provide a reasonable basis for our opinion.
/s/PricewaterhouseCoopers LLP
PricewaterhouseCoopers LLP
Boston, Massachusetts
December 11, 2000
Annual Report
Investment Adviser
Fidelity Management & Research Company
Boston, MA
Investment Sub-Adviser
Fidelity Investments Money
Management, Inc.
Officers
Edward C. Johnson 3d, President
Robert C. Pozen, Senior Vice President
Dwight D. Churchill, Vice President
Boyce I. Greer, Vice President
Christine J. Thompson, Vice President
Eric D. Roiter, Secretary
Robert A. Dwight, Treasurer
Maria F. Dwyer, Deputy Treasurer
Stanley N. Griffith, Assistant Vice President
John H. Costello, Assistant Treasurer
Thomas J. Simpson, Assistant Treasurer
Board of Trustees
Ralph F. Cox *
Phyllis Burke Davis *
Robert M. Gates *
Edward C. Johnson 3d
Donald J. Kirk *
Ned C. Lautenbach *
Peter S. Lynch
Marvin L. Mann *
William O. McCoy *
Gerald C. McDonough *
Robert C. Pozen
Thomas R. Williams *
* Independent trustees
Advisory Board
J. Michael Cook
Abigail P. Johnson
Marie L. Knowles
General Distributor
Fidelity Distributors Corporation
Boston, MA
Transfer and Shareholder
Servicing Agents
Citibank, N.A.
New York, NY
Fidelity Investments Institutional Operations Company, Inc.
Boston, MA
Custodian
Citibank, N.A.
New York, NY
Annual Report
Focus Funds
Fidelity Advisor Consumer
Industries Fund
Fidelity Advisor Cyclical
Industries Fund
Fidelity Advisor Financial
Services Fund
Fidelity Advisor Health Care Fund
Fidelity Advisor Natural
Resources Fund
Fidelity Advisor Technology Fund
Fidelity Advisor Utilities Growth Fund
Growth Funds
Fidelity Advisor Korea Fund
Fidelity Advisor Emerging Asia Fund
Fidelity Advisor Latin America Fund
Fidelity Advisor Japan Fund
Fidelity Advisor Europe Capital Appreciation Fund
Fidelity Advisor International
Capital Appreciation Fund
Fidelity Advisor Overseas Fund
Fidelity Advisor Diversified International Fund
Fidelity Advisor Global Equity Fund
Fidelity Advisor TechnoQuant®
Growth Fund
Fidelity Advisor Small Cap Fund
Fidelity Advisor Value Strategies Fund
Fidelity Advisor Mid Cap Fund
Fidelity Advisor Retirement Growth Fund
Fidelity Advisor Equity Growth Fund
Fidelity Advisor Large Cap Fund
Fidelity Advisor Dividend Growth Fund
Fidelity Advisor Growth
Opportunities Fund
Growth and Income Funds
Fidelity Advisor Growth & Income Fund
Fidelity Advisor Equity Income Fund
Fidelity Advisor Asset Allocation Fund
Fidelity Advisor Balanced Fund
Taxable Income Funds
Fidelity Advisor Emerging Markets Income Fund
Fidelity Advisor High Yield Fund
Fidelity Advisor High Income Fund
Fidelity Advisor Strategic Income Fund
Fidelity Advisor Mortgage
Securities Fund
Fidelity Advisor Government Investment Fund
Fidelity Advisor Intermediate Bond Fund
Fidelity Advisor Short Fixed-Income Fund
Municipal Funds
Fidelity Advisor Municipal Income Fund
Money Market Funds
Prime Fund
Treasury Fund
Tax-Exempt Fund
|
HIM-ANN-1200 |
118985 |
|
1.538412.103 |
|
(Fidelity Investment logo)(registered trademark)
Fidelity® Advisor
Institutional Class
Annual Report
October 31, 2000
(2_fidelity_logos)
|
President's Message |
3 |
Ned Johnson on investing strategies. |
|
Performance |
4 |
How the fund has done over time. |
|
Fund Talk |
7 |
The manager's review of fund performance, strategy and outlook. |
|
Investment Changes |
10 |
A summary of major shifts in the fund's investments over the past six months. |
|
Investments |
11 |
A complete list of the fund's investments with their market values. |
|
Financial Statements |
26 |
Statements of assets and liabilities,
operations, and changes in net assets, |
|
Notes |
35 |
Notes to the financial statements. |
|
Report of Independent Accountants |
42 |
The auditors' opinion. |
|
|
|
|
Standard & Poor's, S&P and S&P 500 are registered service marks of The McGraw-Hill Companies, Inc. and have been licensed for use by Fidelity Distributors Corporation.
Other third party marks appearing herein are the property of their respective owners.
All other marks appearing herein are registered or unregistered trademarks or service marks of FMR Corp. or an affiliated company.
(Recycle graphic) This report is printed on recycled paper using soy-based inks.
This report and the financial statements contained herein are submitted for the general information of the shareholders of the fund. This report is not authorized for distribution to prospective investors in the fund unless preceded or accompanied by an effective prospectus.
Mutual fund shares are not deposits or obligations of, or guaranteed by, any depository institution. Shares are not insured by the FDIC, Federal Reserve Board or any other agency, and are subject to investment risks, including possible loss of principal amount invested.
Neither the fund nor Fidelity Distributors Corporation is a bank.
For more information on any Fidelity Advisor fund, including charges and expenses, contact your investment professional for a free prospectus. Read it carefully before you invest or send money.
Annual Report
(photo_of_Edward_C_Johnson_3d)
Dear Shareholder:
A sixth-straight year of double-digit positive returns for the Dow Jones Industrial Average, NASDAQ and S&P 500® could be in jeopardy unless the U.S. stock market shows marked improvement in the final two months of 2000. Through October, all three indexes had negative year-to-date returns. On the other hand, most fixed-income sectors were solidly in the black. Treasuries and other long-term government securities led the way, returning nearly 14%.
While it's impossible to predict the future direction of the markets with any degree of certainty, there are certain basic principles that can help investors plan for their future needs.
The longer your investment time frame, the less likely it is that you will be affected by short-term market volatility. A 10-year investment horizon appropriate for saving for a college education, for example, enables you to weather market cycles in a long-term fund, which may have a higher risk potential, but also has a higher potential rate of return.
An intermediate-length fund could make sense if your investment horizon is two to four years, while a short-term bond fund could be the right choice if you need your money in one or two years.
If your time horizon is less than a year, you might want to consider moving some of your bond investment into a money market fund. These funds seek income and a stable share price by investing in high-quality, short-term investments. Of course, it's important to remember that an investment in a money market fund is not insured or guaranteed by the Federal Deposit Insurance Corporation or any other government agency. Although money market funds seek to preserve the value of your investment at $1.00 per share, it is possible to lose money by investing in these types of funds.
Finally, no matter what your time horizon or portfolio diversity, it makes good sense to follow a regular investment plan, investing a certain amount of money in a fund at the same time each month or quarter and periodically reviewing your overall portfolio. By doing so, you won't get caught up in the excitement of a rapidly rising market, nor will you buy all your shares at market highs. While this strategy - known as dollar cost averaging - won't assure a profit or protect you from a loss in a declining market, it should help you lower the average cost of your purchases. Of course, you should consider your financial ability to continue your purchases through periods of low price levels before undertaking such a strategy.
Remember to contact your investment professional if you need help with your investments.
Best regards,
/s/Edward C. Johnson 3d
Edward C. Johnson 3d
Annual Report
There are several ways to evaluate historical performance. You can look at the total percentage change in value, the average annual percentage change or the growth of a hypothetical $10,000 investment. Total return reflects the change in the value of an investment, assuming reinvestment of the class' dividend income and capital gains (the profits earned upon the sale of securities that have grown in value). You can also look at the class' income, as reflected in its yield, to measure performance. The initial offering of Institutional Class shares took place on July 3, 1995. Institutional Class shares are sold to eligible investors without a sales load or 12b-1 fee. Returns prior to July 3, 1995 are those of Class T, the original class of the fund, and reflect Class T shares' 0.25% 12b-1 fee. If Fidelity had not reimbursed certain class expenses, the past five year and past 10 year total returns would have been lower.
Cumulative Total Returns
|
Periods ended October 31, 2000 |
|
Past 1 |
Past 5 |
Past 10 |
|
Fidelity Adv Municipal Income - Inst CL |
|
8.34% |
30.95% |
100.04% |
|
LB 3 Plus Year Municipal Bond |
|
9.09% |
32.62% |
n/a* |
|
General Municipal Debt Funds Average |
|
7.36% |
25.48% |
90.37% |
Cumulative total returns show Institutional Class' performance in percentage terms over a set period - in this case, one year, five years or 10 years. For example, if you had invested $1,000 in a fund that had a 5% return over the past year, the value of your investment would be $1,050. You can compare Institutional Class' returns to those of the Lehman Brothers 3 Plus Year Municipal Bond Index - a market value-weighted index of investment-grade municipal bonds with maturities of three years or more. To measure how Institutional Class' performance stacked up against its peers, you can compare it to the general municipal debt funds average, which reflects the performance of mutual funds with similar objectives tracked by Lipper Inc. The past one year average represents a peer group of 265 mutual funds. These benchmarks include reinvested dividends and capital gains, if any, and exclude the effect of sales charges.
Average Annual Total Returns
|
Periods ended October 31, 2000 |
Past 1 |
Past 5 |
Past 10 |
|
Fidelity Adv Municipal Income - Inst CL |
8.34% |
5.54% |
7.18% |
|
LB 3 Plus Year Municipal Bond |
9.09% |
5.81% |
n/a* |
|
General Municipal Debt Funds Average |
7.36% |
4.64% |
6.64% |
Average annual total returns take Institutional Class shares' cumulative return and show you what would have happened if Institutional Class shares had performed at a constant rate each year.
* Not available
Annual Report
Fidelity Advisor Municipal Income Fund - Institutional Class
Performance - continued
$10,000 Over 10 Years
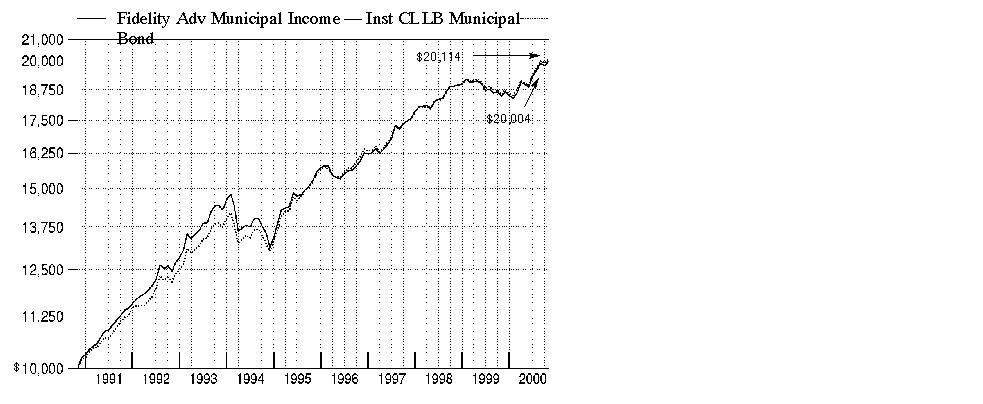
$10,000 Over 10 Years: Let's say hypothetically that $10,000 was invested in Fidelity Advisor Municipal Income Fund - Institutional Class on October 31, 1990. As the chart shows, by October 31, 2000, the value of the investment would have grown to $20,004 - a 100.04% increase on the initial investment. For comparison, look at how the Lehman Brothers Municipal Bond Index - a market value-weighted index of investment grade bonds with maturities of one year or more - did over the same period. With dividends reinvested, the same $10,000 would have grown to $20,114 - a 101.14% increase.
Understanding
Performance
How a fund did yesterday is no guarantee of how it will do tomorrow. Bond prices, for example, generally move in the opposite direction of interest rates. In turn, the share price, return and yield of a fund that invests in bonds will vary. That means if you sell your shares during a market downturn, you might lose money. But if you can ride out the market's ups and downs, you may have a gain.
3Annual Report
Fidelity Advisor Municipal Income Fund - Institutional Class
Performance - continued
Total Return Components
|
|
Years ended October 31, |
July 3, 1995 |
||||
|
|
2000 |
1999 |
1998 |
1997 |
1996 |
1995 |
|
Dividend returns |
5.51% |
4.56% |
5.06% |
6.01% |
5.76% |
2.01% |
|
Capital returns |
2.83% |
-6.87% |
3.22% |
3.43% |
-1.35% |
1.54% |
|
Total returns |
8.34% |
-2.31% |
8.28% |
9.44% |
4.41% |
3.55% |
Total return components include both dividend returns and capital returns. A dividend return reflects the actual dividends paid by the class. A capital return reflects both the amount paid by the class to shareholders as capital gain distributions and changes in the class' share price. Both returns assume the dividends or capital gains, if any, paid by the class are reinvested.
Dividends and Yield
|
Periods ended October 31, 2000 |
Past 1 |
Past 6 |
Past 1 |
|
Dividends per share |
5.13¢ |
30.88¢ |
61.33¢ |
|
Annualized dividend rate |
5.06% |
5.18% |
5.23% |
|
30-day annualized yield |
5.02% |
- |
- |
|
30-day annualized tax-equivalent yield |
7.84% |
- |
- |
Dividends per share show the income paid by the class for a set period and do not reflect any tax reclassifications. If you annualize this number, based on an average net asset value of $11.94 over the past one month, $11.82 over the past six months, and $11.73 over the past one year, you can compare the class' income over these three periods. The 30-day annualized yield is a standard formula for all bond funds based on the yields of the bonds in the fund, averaged over the past 30 days. This figure shows you the yield characteristics of the fund's investments at the end of the period. It also helps you compare funds from different companies on an equal basis. The tax-equivalent yield shows what you would have to earn on a taxable investment to equal the class' tax-free yield, if you're in the 36% federal tax bracket, but does not reflect payment of the federal alternative minimum tax, if applicable.
Annual Report
Market Recap
While 1999 proved to be a most difficult year for the municipal bond market - its worst year, in fact, since 1994 - the sector soared during the first three quarters of 2000. Year to date through the end of October, the Lehman Brothers Municipal Bond Index - an index of over 35,000 investment-grade, fixed-rate, tax-exempt bonds - returned 8.17%. For the one-year period ending October 31, 2000, the index showed a gain of 8.51%. As the 12-month period opened, municipal bond prices were pressured by the series of interest-rate hikes made by the Federal Reserve Board and by the more attractive returns of the U.S. equity markets. But that scenario began to turn around in early 2000. Among the factors that spurred municipal bonds' revival were a better technical environment - meaning reduced supply met by increased demand - as well as credit upgrades for many municipal bond issuers due to the strength of the economy. Munis also benefited as a safe haven when equity markets began to churn. Individual investors were particularly attracted to the generally higher yields municipal bonds offered. Compared to the overall taxable bond market, as measured by the Lehman Brothers Aggregate Bond Index, the municipal bond market finished comfortably ahead of that index's 7.30% return for the 12 months ending October 31, 2000.
(Portfolio Manager photograph)
An interview with Christine Thompson, Portfolio Manager of Fidelity Advisor Municipal Income Fund
Q. How did the fund perform, Christine?
A. For the 12-month period that ended October 31, 2000, the fund's Institutional Class shares returned 8.34%. To get a sense of how the fund did relative to its competitors, the general municipal debt funds average returned 7.36% for the same 12-month period, according to Lipper Inc. Additionally, the Lehman Brothers 3 Plus Year Municipal Bond Index, which tracks the types of securities in which the fund invests, returned 9.09% for the same 12-month period.
Annual Report
Fund Talk: The Manager's Overview - continued
Q. What were some of the main forces behind the fund's performance during the year?
A. Changing expectations about economic growth, inflation and interest rates caused the municipal market to reverse course several times during the past year. In the early months of the period, the municipal market and the fund came under pressure due to inflationary fears and rising interest rates. Performance of the market and the fund improved throughout the first several months of 2000, although municipals sold off in May when economic growth proved stronger than originally expected. That was followed by a summer bond market rally, which was fueled by relief that inflation appeared to be in check. The tug of war between a belief that the economy was on a slow, non-inflationary growth track and a concern that robust conditions would incite inflation continued throughout the fall, with municipals performing accordingly.
Q. What helped the fund's performance relative to its peers?
A. In keeping with Fidelity's investment approach, I didn't lengthen or shorten duration - that is, I didn't make the fund more or less interest-rate sensitive - based on where I thought interest rates would be at some point down the road. Instead, I managed the fund's duration to be in line with the municipal market as a whole as measured by the Lehman Brothers index. Given that interest rates were pretty volatile during the period, some peers may have suffered if they were positioned with too little or too much interest-rate sensitivity at the wrong time. Rather than make a bet on interest rates, I position the fund to emphasize the best value opportunities based on their performance potential in a variety of possible interest-rate scenarios.
Q. Were there other strategies that helped the fund's performance relative to its peers?
A. The fund benefited from its relatively large position in premium coupon bonds, which pay interest rates above prevailing market rates and trade at prices that are above their face - or par - value. Their premium gives them protection under the "market discount rule" that can take effect during rising interest-rate environments. As interest rates rose and bond prices fell, more and more bonds fell to levels subjecting them to this adverse tax rule and investors punished them accordingly.
Q. Which bonds were the most disappointing during the period?
A. The fund's stake in strong-performing California bonds was smaller - at 2.5% of net assets - than many of our peers, which hurt relative performance. These bonds started the period with higher prices than similar bonds from other states. Even so, gains in personal income in the state prompted strong investor interest in tax-free California bonds and they performed well as a result.
Q. What choices did you make in terms of credit quality and why?
A. As of October 31, 2000, more than half of the fund's investments were in bonds with the highest credit rating of AAA or Aaa. In addition, more than 92% of the fund's investments were in bonds rated "investment-grade," with a rating of Baa or higher by Moody's; or BBB- by Standard & Poor's. The fund's emphasis on investment-grade and high-quality bonds reflected that, for the most part, I didn't feel that lower-quality bonds offered enough incentive by way of additional yield for owning them.
Annual Report
Fund Talk: The Manager's Overview - continued
Q. What's ahead for the municipal market?
A. The market appears to be factoring in the potential for interest rates to hold steady, if not fall, now that economic growth shows some signs of slowing and inflation is apparently moderate. If short-term interest rates stabilize or fall, municipal bonds most likely would benefit. My outlook for the technical aspects of supply and demand is favorable. The supply of municipals has continued to decline in response to rising interest rates because many issuers now find it too expensive to issue new or refinance old debt. Given the relatively high tax-equivalent yields of municipal bonds, I believe that demand will remain strong.
The views expressed in this report reflect those of the portfolio manager only through the end of the period of the report as stated on the cover and do not necessarily represent the views of Fidelity or any other person in the Fidelity organization. Any such views are subject to change at any time based upon market or other conditions and Fidelity disclaims any responsibility to update such views. These views may not be relied on as investment advice and, because investment decisions for a Fidelity fund are based on numerous factors, may not be relied on as an indication of trading intent on behalf of any Fidelity fund.
Fund Facts
Goal: seeks to provide a high current yield exempt from federal income tax
Start date: September 16, 1987
Size: as of October 31, 2000, more than $457 million
Manager: Christine Thompson, since 1998; joined Fidelity in 1985
3Christine Thompson on her investment approach:
"At Fidelity, one of the key strategies we use in managing municipal bond funds is to opportunistically purchase and sell bonds of various maturities. The demand for municipals can vary a great deal in response to the behavior of various market participants. Corporations, individual investors and trust accounts tend to favor short-term securities, which are less interest-rate sensitive and, therefore, tend to be less volatile than the overall municipal market. Individual investors, along with mutual funds and insurance companies - which invest the insurance premiums they collect - are the primary purchasers of intermediate-maturity bonds. Higher-yielding, longer-term securities, which tend to be the most volatile, generally are the domain of long-maturity mutual funds, hedge funds and other investors known as ´arbitrageurs,' who seek to exploit small differences between various fixed-income investments. At a given point in time, a given municipal bond maturity range may look cheap or expensive as different categories of investors embrace them or step aside. With the help of Fidelity's research team, I try to take advantage of the anomalies that can occur by investing in bond maturities that look cheap due to weak demand and selling those that have performed well in response to strong demand."
Annual Report
|
Top Five States as of October 31, 2000 |
||
|
|
% of fund's |
% of fund's net assets |
|
New York |
16.6 |
17.4 |
|
Pennsylvania |
6.3 |
5.6 |
|
Washington |
6.3 |
4.2 |
|
North Carolina |
5.9 |
6.0 |
|
Illinois |
5.7 |
5.1 |
|
Top Five Sectors as of October 31, 2000 |
||
|
|
% of fund's |
% of fund's net assets |
|
Health Care |
17.6 |
16.2 |
|
General Obligations |
17.2 |
15.5 |
|
Electric Utilities |
15.8 |
17.2 |
|
Transportation |
12.3 |
14.7 |
|
Water & Sewer |
10.6 |
10.5 |
|
Average Years to Maturity as of October 31, 2000 |
||
|
|
|
6 months ago |
|
Years |
16.4 |
16.7 |
|
Average years to maturity is based on the average time remaining until principal payments are expected from each of the fund's bonds, weighted by dollar amount. |
|
Duration as of October 31, 2000 |
||
|
|
|
6 months ago |
|
Years |
7.2 |
7.3 |
|
Duration shows how much a bond fund's price fluctuates with changes in comparable interest rates. If rates rise 1%, for example, a fund with a five-year duration is likely to lose about 5% of its value. Other factors also can influence a bond fund's performance and share price. Accordingly, a bond fund's actual performance may differ from this example. |
|
Quality Diversification (Moody's Ratings) |
As of October 31, 2000 As of April 30, 2000
|
Where Moody's ratings are not available, we have used S&P ® ratings. Amounts shown are as a percentage of the fund's investments. |
Annual Report
Showing Percentage of Net Assets
|
Municipal Bonds - 98.6% |
|||||
|
Moody's Ratings (unaudited) (a) |
Principal Amount |
Value |
|||
|
Alabama - 0.9% |
|||||
|
Shelby County Gen. Oblig. Series A, |
- |
|
$ 4,000,000 |
$ 4,204,000 |
|
|
Alaska - 1.9% |
|||||
|
Alaska Hsg. Fin. Corp. Series A, 5.4% 12/1/13 |
Aa2 |
|
5,490,000 |
5,531,779 |
|
|
Alaska Student Ln. Corp. Student Ln. Rev. |
|
|
|
|
|
|
5.25% 7/1/07 (AMBAC Insured) (d) |
Aaa |
|
1,500,000 |
1,512,090 |
|
|
5.45% 7/1/09 (AMBAC Insured) (d) |
Aaa |
|
1,500,000 |
1,520,400 |
|
|
|
8,564,269 |
||||
|
Arizona - 1.2% |
|||||
|
Arizona Student Ln. Aquisition Auth. Student Ln. Rev. Series A1, 5.875% 5/1/18 (d) |
Aaa |
|
1,300,000 |
1,321,528 |
|
|
Maricopa County Ind. Dev. Auth. Health Facilities
Rev. (Catholic Health Care West Proj.) |
Baa1 |
|
4,495,000 |
4,303,153 |
|
|
|
5,624,681 |
||||
|
California - 2.5% |
|||||
|
California Hsg. Fin. Agcy. Rev. |
|
|
|
|
|
|
Series B, 5.2% 8/1/26 (MBIA Insured) (d) |
Aaa |
|
670,000 |
670,576 |
|
|
Series R: |
|
|
|
|
|
|
5.35% 8/1/07 (MBIA Insured) (d) |
Aaa |
|
1,000,000 |
1,048,310 |
|
|
6.15% 8/1/27 (MBIA Insured) (d) |
Aaa |
|
1,500,000 |
1,529,265 |
|
|
California Poll. Cont. Fing. Auth. Resource
Recovery Rev. (Waste Mgmt., Inc. Proj.) |
Ba1 |
|
500,000 |
511,200 |
|
|
California Univ. Rev. (Hsg. Sys. Proj.) Series 1999 AY, 5.875% 11/1/30 (FGIC Insured) |
Aaa |
|
1,000,000 |
1,037,740 |
|
|
Central Valley Fing. Auth. Cogeneration Proj. Rev. (Carson Ice Gen. Proj.) 6% 7/1/09 |
BBB- |
|
4,500,000 |
4,688,550 |
|
|
Sacramento Cogeneration Auth. Cogeneration Proj. Rev. (Procter & Gamble Proj.) 6.375% 7/1/10 |
BBB- |
|
500,000 |
531,245 |
|
|
Sacramento Pwr. Auth. Cogeneration Proj. Rev.: |
|
|
|
|
|
|
6% 7/1/02 |
BBB- |
|
1,000,000 |
1,025,770 |
|
|
6.5% 7/1/08 |
BBB- |
|
300,000 |
328,425 |
|
|
|
11,371,081 |
||||
|
Colorado - 4.8% |
|||||
|
Arapaho County Cap. Impt. Trust Fund Hwy. Rev. Series C, 0% 8/31/26 (Pre-Refunded to 8/31/05 @ 20.8626) (e) |
Aaa |
|
3,620,000 |
601,499 |
|
|
Municipal Bonds - continued |
|||||
|
Moody's Ratings (unaudited) (a) |
Principal Amount |
Value |
|||
|
Colorado - continued |
|||||
|
Arapaho County School District #5 Cherry Creek 6% 12/15/15 |
Aa1 |
|
$ 1,250,000 |
$ 1,334,263 |
|
|
Colorado Health Facilities Auth. Rev.: |
|
|
|
|
|
|
(Nat'l. Benevolent Assoc. Proj.) Series A, |
Baa2 |
|
1,360,000 |
1,303,410 |
|
|
(Rocky Mountain Adventist Proj.): |
|
|
|
|
|
|
6.25% 2/1/04 |
Ba1 |
|
400,000 |
393,068 |
|
|
6.625% 2/1/13 |
Ba1 |
|
6,900,000 |
6,788,151 |
|
|
6.625% 2/1/22 |
Ba1 |
|
4,000,000 |
3,765,920 |
|
|
Colorado Springs Arpt. Rev. Series C: |
|
|
|
|
|
|
0% 1/1/06 (MBIA Insured) |
Aaa |
|
1,405,000 |
1,093,174 |
|
|
0% 1/1/08 (MBIA Insured) |
Aaa |
|
870,000 |
610,183 |
|
|
Denver City & County Arpt. Rev.: |
|
|
|
|
|
|
Series A: |
|
|
|
|
|
|
0% 11/15/02 (MBIA Insured) (d) |
Aaa |
|
2,115,000 |
1,918,263 |
|
|
7.5% 11/15/23 (d) |
A2 |
|
2,070,000 |
2,212,809 |
|
|
7.5% 11/15/23 (Pre-Refunded to 11/15/04 @ 102) (d)(e) |
Aaa |
|
430,000 |
481,226 |
|
|
Series D, 0% 11/15/04 (MBIA Insured) (d) |
Aaa |
|
1,700,000 |
1,394,697 |
|
|
|
21,896,663 |
||||
|
Connecticut - 1.3% |
|||||
|
Connecticut Health & Edl. Facilities Auth. |
AAA |
|
1,920,000 |
2,020,339 |
|
|
Eastern Connecticut Resources Recovery Auth. Solid Waste Rev. (Wheelabrator Lisbon Proj.) Series A, 5.5% 1/1/20 (d) |
BBB |
|
3,350,000 |
2,784,654 |
|
|
Univ. of Connecticut Rev. (Student Fee Prog.) Series A, 5.75% 11/15/29 (FGIC Insured) |
Aaa |
|
1,000,000 |
1,019,200 |
|
|
|
5,824,193 |
||||
|
District of Columbia - 2.8% |
|||||
|
District of Columbia Gen. Oblig.: |
|
|
|
|
|
|
Series A, 6% 6/1/07 (MBIA Insured) (Escrowed to Maturity) (e) |
Aaa |
|
150,000 |
160,917 |
|
|
Series B, 5.25% 6/1/26 (FSA Insured) |
Aaa |
|
6,000,000 |
5,570,100 |
|
|
District of Columbia Hosp. Rev. (Hosp. for Sick Children Proj.) Series A, 8.875% 1/1/21 |
- |
|
925,000 |
945,702 |
|
|
District of Columbia Redev. Land Agcy. Washington D.C. Sports Arena Spl. Tax Rev.: |
|
|
|
|
|
|
5.4% 11/1/00 |
Baa |
|
500,000 |
500,000 |
|
|
Municipal Bonds - continued |
|||||
|
Moody's Ratings (unaudited) (a) |
Principal Amount |
Value |
|||
|
District of Columbia - continued |
|||||
|
District of Columbia Redev. Land Agcy. Washington D.C. Sports Arena Spl. Tax Rev.: - continued |
|
|
|
|
|
|
5.625% 11/1/10 |
Baa |
|
$ 385,000 |
$ 387,114 |
|
|
District of Columbia Rev.: |
|
|
|
|
|
|
(George Washington Univ. Proj.) Series A, 5.75% 9/15/20 (MBIA Insured) |
Aaa |
|
1,000,000 |
1,014,830 |
|
|
(Georgetown Univ. Proj.) Series A, 5.95% 4/1/14 (MBIA Insured) |
Aaa |
|
2,000,000 |
2,101,820 |
|
|
(Nat'l. Academy of Science Proj.) Series A, 5% 1/1/19 (AMBAC Insured) |
Aaa |
|
2,500,000 |
2,329,775 |
|
|
|
13,010,258 |
||||
|
Florida - 2.3% |
|||||
|
Broward County Resource Recovery Rev. (SES Broward Co. LP South Proj.) 7.95% 12/1/08 |
A3 |
|
950,000 |
971,375 |
|
|
Dade County Aviation Rev. Series D, 5.75% 10/1/09 (AMBAC Insured) (d) |
Aaa |
|
5,000,000 |
5,246,100 |
|
|
Florida Mid-Bay Bridge Auth. Rev. Series A, 7.5% 10/1/17 |
- |
|
2,500,000 |
2,626,750 |
|
|
Tampa Florida Guaranteed Entitlement Rev. 6% 10/1/08 (AMBAC Insured) (f) |
Aaa |
|
1,500,000 |
1,592,055 |
|
|
|
10,436,280 |
||||
|
Illinois - 5.7% |
|||||
|
Chicago Board of Ed. (Chicago School Reform Proj.) 5.75% 12/1/27 (AMBAC Insured) |
Aaa |
|
10,500,000 |
10,530,555 |
|
|
Chicago Midway Arpt. Rev.: |
|
|
|
|
|
|
Series A, 5.5% 1/1/29 (MBIA Insured) |
Aaa |
|
1,500,000 |
1,458,225 |
|
|
Series B, 6% 1/1/09 (MBIA Insured) (d) |
Aaa |
|
300,000 |
318,045 |
|
|
Chicago O'Hare Int'l. Arpt. Rev. (Gen. Arpt. Proj.) Series A: |
|
|
|
|
|
|
6.25% 1/1/09 (AMBAC Insured) (d) |
Aaa |
|
3,700,000 |
3,998,479 |
|
|
6.375% 1/1/15 (MBIA Insured) |
Aaa |
|
1,400,000 |
1,477,266 |
|
|
Chicago O'Hare Int'l. Arpt. Spl. Facilities Rev. (American Airlines, Inc. Proj.) 8.2% 12/1/24 |
Baa2 |
|
1,000,000 |
1,105,090 |
|
|
Illinois Health Facilities Auth. Rev.: |
|
|
|
|
|
|
(Condell Med. Ctr. Proj.) 6.5% 5/15/30 |
A3 |
|
3,000,000 |
3,001,470 |
|
|
(Memorial Hosp. Proj.): |
|
|
|
|
|
|
7.125% 5/1/10 (Pre-Refunded to 5/1/02 @ 102) (e) |
- |
|
1,000,000 |
1,056,540 |
|
|
7.25% 5/1/22 (Pre-Refunded to 5/1/02 @ 102) (e) |
- |
|
1,000,000 |
1,058,330 |
|
|
Municipal Bonds - continued |
|||||
|
Moody's Ratings (unaudited) (a) |
Principal Amount |
Value |
|||
|
Illinois - continued |
|||||
|
Illinois Health Facilities Auth. Rev.: - continued |
|
|
|
|
|
|
(Riverside Health Sys. Proj.) 6.8% 11/15/20 |
A3 |
|
$ 1,500,000 |
$ 1,542,210 |
|
|
Metro. Pier & Exposition Auth. Dedicated Tax Rev. Series A: |
|
|
|
|
|
|
0% 6/15/09 (FGIC Insured) |
Aaa |
|
1,000,000 |
648,340 |
|
|
0% 6/15/09 (FGIC Insured) (Escrowed to Maturity) (e) |
Aaa |
|
65,000 |
42,544 |
|
|
|
26,237,094 |
||||
|
Indiana - 0.2% |
|||||
|
Indianapolis Econ. Dev. Rev. (Nat'l. Benevolent Assoc. Proj.) 7.625% 10/1/22 |
Baa2 |
|
1,000,000 |
1,035,090 |
|
|
Iowa - 1.1% |
|||||
|
Iowa Student Ln. Liquidity Corp. Student Ln. Rev.: |
|
|
|
|
|
|
Series A, 6.35% 3/1/01 |
Aa1 |
|
1,500,000 |
1,508,970 |
|
|
Series B, 5.75% 12/1/07 (d) |
Aaa |
|
3,500,000 |
3,576,475 |
|
|
|
5,085,445 |
||||
|
Kansas - 1.7% |
|||||
|
Kansas Dev. Fin. Auth. Health Facilities Rev. (Sister of Charity Proj.) Series J, 6.25% 12/1/28 |
Aa3 |
|
1,500,000 |
1,543,680 |
|
|
Kansas Dev. Fin. Auth. Rev. (Sisters of Charity Leavenworth Health Svc. Co. Proj.): |
|
|
|
|
|
|
5% 12/1/13 (MBIA Insured) |
Aaa |
|
2,390,000 |
2,344,184 |
|
|
5% 12/1/14 (MBIA Insured) |
Aaa |
|
500,000 |
486,055 |
|
|
5.25% 12/1/09 (MBIA Insured) |
Aaa |
|
1,385,000 |
1,400,374 |
|
|
5.25% 12/1/11 (MBIA Insured) |
Aaa |
|
1,750,000 |
1,762,163 |
|
|
|
7,536,456 |
||||
|
Kentucky - 2.6% |
|||||
|
Kenton County Arpt. Board Arpt. Rev. (Delta Air Lines, Inc. Proj.) Series A, 7.5% 2/1/20 (d) |
Baa3 |
|
2,000,000 |
2,077,240 |
|
|
Kentucky Property & Bldgs. Commission Rev.: |
|
|
|
|
|
|
5.625% 9/1/13 |
Aa3 |
|
2,170,000 |
2,262,854 |
|
|
5.625% 9/1/14 |
Aa3 |
|
1,500,000 |
1,555,935 |
|
|
Louisville & Jefferson Swr. Sys. Rev. Series A, 5.75% 5/15/33 (FGIC Insured) |
Aaa |
|
6,050,000 |
6,131,131 |
|
|
|
12,027,160 |
||||
|
Louisiana - 0.4% |
|||||
|
Louisiana Pub. Facilities Auth. Rev. (Student Ln. Prog.) Sr. Series A1, 6.2% 3/1/01 |
Aaa |
|
1,825,000 |
1,834,727 |
|
|
Municipal Bonds - continued |
|||||
|
Moody's Ratings (unaudited) (a) |
Principal Amount |
Value |
|||
|
Maryland - 0.6% |
|||||
|
Maryland Health & Higher Edl. Facilities Auth. Rev. (Good Samaritan Hosp. Proj.): |
|
|
|
|
|
|
5.75% 7/1/13 (AMBAC Insured) (Escrowed to Maturity) (e) |
Aaa |
|
$ 1,015,000 |
$ 1,073,667 |
|
|
5.75% 7/1/13 (Escrowed to Maturity) (e) |
A1 |
|
1,665,000 |
1,761,237 |
|
|
|
2,834,904 |
||||
|
Massachusetts - 5.3% |
|||||
|
Massachusetts Bay Trans. Auth.: |
|
|
|
|
|
|
Series 1997 D, 5% 3/1/27 |
Aa2 |
|
2,000,000 |
1,802,620 |
|
|
Series A: |
|
|
|
|
|
|
5.375% 3/1/19 |
Aa2 |
|
1,000,000 |
987,760 |
|
|
5.75% 3/1/26 (FGIC Insured) |
Aa2 |
|
2,000,000 |
2,023,740 |
|
|
Massachusetts Health & Edl. Facilities Auth. Rev.: |
|
|
|
|
|
|
(Bentley College Proj.) Series J, 5% 7/1/17 (MBIA Insured) |
Aaa |
|
1,000,000 |
950,870 |
|
|
(Fairview Extended Care Proj.) Series B, 4.55% 1/1/21 (MBIA Insured) |
Aaa |
|
700,000 |
698,264 |
|
|
(Harvard Univ. Issue Proj.) Series W, 6% 7/1/35 |
Aaa |
|
1,000,000 |
1,065,200 |
|
|
(Hebrew Rehab. Ctr. for Aged Proj.) Series C, 5.25% 7/1/17 |
A |
|
2,000,000 |
1,820,060 |
|
|
(New England Med. Ctr. Hosp. Proj.) Series G, 5.375% 7/1/24 (MBIA Insured) |
Aaa |
|
500,000 |
474,015 |
|
|
Massachusetts Ind. Fin. Agcy. Resource Recovery Rev. (Ogden Haverhill Proj.) Series 1992 A, 4.7% 12/1/03 |
BBB |
|
1,000,000 |
983,680 |
|
|
Massachusetts Ind. Fin. Agcy. Rev. (Massachusetts Biomedical Research Corp. Proj.): |
|
|
|
|
|
|
Series A1, 0% 8/1/02 |
A+ |
|
1,600,000 |
1,473,184 |
|
|
Series A2: |
|
|
|
|
|
|
0% 8/1/08 |
A+ |
|
800,000 |
542,688 |
|
|
0% 8/1/10 |
- |
|
4,500,000 |
2,707,605 |
|
|
Massachusetts Muni. Wholesale Elec. Co. Pwr. Supply Sys. Rev. Series C, 6.5% 7/1/03 |
Baa2 |
|
1,000,000 |
1,045,470 |
|
|
Massachusetts Tpk. Auth. Western Tpk. Rev. Series A, 5.55% 1/1/17 (MBIA Insured) |
Aaa |
|
550,000 |
550,006 |
|
|
Municipal Bonds - continued |
|||||
|
Moody's Ratings (unaudited) (a) |
Principal Amount |
Value |
|||
|
Massachusetts - continued |
|||||
|
Massachusetts Wtr. Poll. Abatement Trust Wtr.
Poll. Abatement Rev. (MWRA Ln. Prog.) |
Aa1 |
|
$ 10,000 |
$ 10,078 |
|
|
Massachusetts Wtr. Resources Auth. Rev. |
Aaa |
|
7,000,000 |
7,062,020 |
|
|
|
24,197,260 |
||||
|
Michigan - 3.0% |
|||||
|
Detroit Wtr. Supply Sys. Rev. Sr. Lien Series A: |
|
|
|
|
|
|
5.75% 7/1/26 (FGIC Insured) |
Aaa |
|
1,400,000 |
1,414,224 |
|
|
5.875% 7/1/22 (FGIC Insured) |
Aaa |
|
1,700,000 |
1,741,820 |
|
|
5.875% 7/1/29 (FGIC Insured) |
Aaa |
|
1,100,000 |
1,120,636 |
|
|
Holt Pub. Schools Series 2000 A, 5.5% 5/1/23 (FGIC Insured) |
Aaa |
|
1,250,000 |
1,226,288 |
|
|
Howell Pub. Schools 5.875% 5/1/22 |
Aaa |
|
2,225,000 |
2,281,270 |
|
|
Michigan Hosp. Fin. Auth. Rev.: |
|
|
|
|
|
|
(McLaren Health Care Corp. Proj.) Series A, 5% 6/1/19 |
A1 |
|
2,000,000 |
1,725,120 |
|
|
(Mercy Health Svcs. Proj.) Series S, 5.75% 8/15/05 |
Aa3 |
|
200,000 |
205,110 |
|
|
(Pontiac Osteopathic Hosp. Proj.) Series A, |
Baa2 |
|
2,000,000 |
1,678,480 |
|
|
Royal Oak Hosp. Fin. Auth. Rev. (William Beaumont Hosp. Proj.) 6.25% 1/1/09 |
Aa3 |
|
2,310,000 |
2,466,849 |
|
|
|
13,859,797 |
||||
|
Minnesota - 1.5% |
|||||
|
Minneapolis & Saint Paul Hsg. & Redev. Auth. Health Care Sys. Rev. (Healthspan Corp. Proj.) Series A, 4.75% 11/15/18 (AMBAC Insured) |
Aaa |
|
1,800,000 |
1,629,216 |
|
|
Minnesota Hsg. Fin. Agcy. (Single Family Mtg. Prog.) Series D, 6.4% 7/1/15 (d) |
Aa1 |
|
1,840,000 |
1,911,760 |
|
|
Rochester Health Care Facilities Rev. (Mayo Foundation Proj.) Series A, 5.5% 11/15/27 |
AA+ |
|
1,500,000 |
1,453,095 |
|
|
Saint Cloud Health Care Rev. (Saint Cloud Hosp. Group Oblig. Proj.) Series A, 5.875% 5/1/30 (FSA Insured) |
Aaa |
|
2,000,000 |
2,036,860 |
|
|
|
7,030,931 |
||||
|
Nebraska - 0.5% |
|||||
|
Lancaster County School District #1 (Lincoln Pub. Schools Proj.) 5.25% 7/15/19 |
Aa2 |
|
2,100,000 |
2,048,319 |
|
|
Municipal Bonds - continued |
|||||
|
Moody's Ratings (unaudited) (a) |
Principal Amount |
Value |
|||
|
Nevada - 0.7% |
|||||
|
Clark County School District Series A, 9.75% 6/1/01 (MBIA Insured) |
Aaa |
|
$ 500,000 |
$ 514,970 |
|
|
Las Vegas Downtown Redev. Agcy. |
|
|
|
|
|
|
Series A, 6% 6/15/10 |
BBB+ |
|
1,500,000 |
1,530,930 |
|
|
Sub Lien Series A, 6.1% 6/15/14 |
BBB+ |
|
1,000,000 |
1,014,790 |
|
|
|
3,060,690 |
||||
|
New Jersey - 0.8% |
|||||
|
New Jersey Econ. Dev. Auth. Wtr. Facilities Rev. (American Wtr. Co., Inc. Proj.) Series 1997 B, 5.375% 5/1/32 (FGIC Insured) (d) |
Aaa |
|
1,635,000 |
1,541,936 |
|
|
New Jersey Trans. Trust Fund Auth. (Trans. Sys. Proj.) Series A, 5.5% 6/15/11 (MBIA Insured) |
Aaa |
|
2,000,000 |
2,073,660 |
|
|
|
3,615,596 |
||||
|
New Mexico - 2.1% |
|||||
|
Albuquerque Arpt. Rev.: |
|
|
|
|
|
|
6.7% 7/1/18 (AMBAC Insured) (d) |
Aaa |
|
3,970,000 |
4,317,534 |
|
|
6.75% 7/1/09 (AMBAC Insured) (d) |
Aaa |
|
450,000 |
507,245 |
|
|
6.75% 7/1/11 (AMBAC Insured) (d) |
Aaa |
|
1,805,000 |
2,053,151 |
|
|
New Mexico Edl. Assistance Foundation Student Ln. Rev.: |
|
|
|
|
|
|
Series B, 5.25% 4/1/05 (AMBAC Insured) (d) |
Aaa |
|
1,100,000 |
1,106,127 |
|
|
Series IV A2, 6.65% 3/1/07 |
Aaa |
|
1,700,000 |
1,760,282 |
|
|
|
9,744,339 |
||||
|
New York - 16.6% |
|||||
|
Metro. Trans. Auth. Commuter Facilities Rev.: |
|
|
|
|
|
|
Series A: |
|
|
|
|
|
|
5.625% 7/1/27 (MBIA Insured) |
Aaa |
|
2,000,000 |
1,999,360 |
|
|
6.125% 7/1/29 |
Baa1 |
|
6,750,000 |
6,930,225 |
|
|
Series B, 4.75% 7/1/26 (FGIC Insured) |
Aaa |
|
2,000,000 |
1,732,660 |
|
|
Metro. Trans. Auth. Dedicated Tax Fund Series A: |
|
|
|
|
|
|
5% 4/1/23 (FGIC Insured) |
Aaa |
|
2,565,000 |
2,366,546 |
|
|
5% 4/1/29 (FSA Insured) |
Aaa |
|
2,200,000 |
1,993,134 |
|
|
5.25% 4/1/26 (MBIA Insured) |
Aaa |
|
1,000,000 |
943,800 |
|
|
Metro. Trans. Auth. Svc. Contract Rev.: |
|
|
|
|
|
|
(Commuter Facilities Proj.) Series O, 5.75% 7/1/13 |
Baa1 |
|
700,000 |
734,454 |
|
|
(Trans. Facilities Proj.): |
|
|
|
|
|
|
Series 7, 5.625% 7/1/16 |
Baa1 |
|
1,000,000 |
1,002,930 |
|
|
Series P, 5.75% 7/1/15 |
Baa1 |
|
1,010,000 |
1,023,049 |
|
|
Municipal Bonds - continued |
|||||
|
Moody's Ratings (unaudited) (a) |
Principal Amount |
Value |
|||
|
New York - continued |
|||||
|
Metro. Trans. Auth. Trans. Facilities Rev.: |
|
|
|
|
|
|
(Svc. Contract Proj.) Series 8: |
|
|
|
|
|
|
5.25% 7/1/17 |
Baa1 |
|
$ 1,000,000 |
$ 963,170 |
|
|
5.375% 7/1/21 (FSA Insured) |
Aaa |
|
700,000 |
680,764 |
|
|
Series B, 4.75% 7/1/26 (FGIC Insured) |
Aaa |
|
1,000,000 |
866,330 |
|
|
Series C, 4.75% 7/1/16 (FSA Insured) |
Aaa |
|
500,000 |
459,210 |
|
|
New York City Gen. Oblig.: |
|
|
|
|
|
|
Series B, 5.7% 8/15/02 |
A3 |
|
35,000 |
35,794 |
|
|
Series H: |
|
|
|
|
|
|
6.875% 2/1/02 |
A3 |
|
160,000 |
164,554 |
|
|
6.875% 2/1/02 (Escrowed to Maturity) (e) |
Aaa |
|
80,000 |
82,454 |
|
|
New York City Ind. Dev. Agcy. Ind. Dev. Rev. (Japan Airlines Co. Ltd. Proj.) Series 1991, 6% 11/1/15 (FSA Insured) (d) |
Aaa |
|
965,000 |
1,011,812 |
|
|
New York City Ind. Dev. Agcy. Spl. Facilities Rev. (Term. One Group Assoc. Proj.) 5.9% 1/1/06 (d) |
A3 |
|
8,680,000 |
9,087,092 |
|
|
New York City Muni. Wtr. Fin. Auth. Wtr. & Swr. Sys. Rev. Series B: |
|
|
|
|
|
|
5.5% 6/15/27 (MBIA Insured) |
Aaa |
|
3,500,000 |
3,423,560 |
|
|
5.75% 6/15/26 |
Aa3 |
|
5,000,000 |
5,039,400 |
|
|
5.75% 6/15/29 |
Aa3 |
|
5,000,000 |
5,033,200 |
|
|
5.75% 6/15/29 (MBIA Insured) |
Aaa |
|
1,500,000 |
1,504,440 |
|
|
6% 6/15/33 |
Aa3 |
|
5,800,000 |
6,037,452 |
|
|
New York City Transitional Fin. Auth. Rev.: |
|
|
|
|
|
|
Series A, 5.75% 8/15/24 |
Aa2 |
|
3,000,000 |
3,036,870 |
|
|
Series B, 6% 11/15/29 |
Aa2 |
|
1,000,000 |
1,043,620 |
|
|
New York State Dorm. Auth. Rev.: |
|
|
|
|
|
|
(City Univ. Sys. Proj.) Series C, 7.5% 7/1/10 |
Baa1 |
|
500,000 |
575,930 |
|
|
(Jamaica Hosp. Med. Ctr. Proj.) Series F, 5.2% 2/15/14 (MBIA Insured) |
Aaa |
|
6,150,000 |
6,095,265 |
|
|
(State Univ. Edl. Facilities Proj.): |
|
|
|
|
|
|
Series A, 4.75% 5/15/25 (MBIA Insured) |
Aaa |
|
1,750,000 |
1,525,405 |
|
|
5.95% 5/15/29 (FGIC Insured) |
Aaa |
|
5,000,000 |
5,153,700 |
|
|
New York State Envir. Facilities Corp. Clean Wtr. & Drinking Wtr. Rev. (State Wtr. Revolving Funds Prog.) Series F: |
|
|
|
|
|
|
4.875% 6/15/18 |
Aa1 |
|
1,500,000 |
1,397,925 |
|
|
4.875% 6/15/20 |
Aa1 |
|
1,300,000 |
1,188,395 |
|
|
5% 6/15/15 |
Aa1 |
|
700,000 |
680,680 |
|
|
Municipal Bonds - continued |
|||||
|
Moody's Ratings (unaudited) (a) |
Principal Amount |
Value |
|||
|
New York - continued |
|||||
|
New York State Envir. Facilities Corp. Poll. Cont.
Rev. (State Wtr. Revolving Fund Prog.) |
Aa1 |
|
$ 1,000,000 |
$ 957,580 |
|
|
New York State Local Govt. Assistance Corp. Series A, 0% 4/1/08 |
A3 |
|
1,000,000 |
690,250 |
|
|
Triborough Bridge & Tunnel Auth. Spl. Oblig. Series A, 5.25% 1/1/11 (FGIC Insured) |
Aaa |
|
500,000 |
513,250 |
|
|
|
75,974,260 |
||||
|
North Carolina - 5.9% |
|||||
|
North Carolina Eastern Muni. Pwr. Agcy. Pwr. Sys. Rev.: |
|
|
|
|
|
|
Series A, 5.5% 1/1/05 (MBIA Insured) |
Aaa |
|
4,000,000 |
4,117,440 |
|
|
Series B: |
|
|
|
|
|
|
5.875% 1/1/21 (MBIA Insured) |
Aaa |
|
3,050,000 |
3,100,264 |
|
|
6% 1/1/06 |
Baa3 |
|
5,490,000 |
5,669,249 |
|
|
6% 1/1/14 |
Baa3 |
|
1,000,000 |
1,001,930 |
|
|
7.25% 1/1/07 |
Baa3 |
|
1,000,000 |
1,097,810 |
|
|
Series C: |
|
|
|
|
|
|
5.125% 1/1/03 |
Baa1 |
|
2,700,000 |
2,701,161 |
|
|
5.25% 1/1/04 |
Baa1 |
|
1,365,000 |
1,367,266 |
|
|
5.5% 1/1/07 |
Baa3 |
|
700,000 |
704,886 |
|
|
5.5% 1/1/07 (MBIA Insured) |
Aaa |
|
2,000,000 |
2,068,040 |
|
|
Series D, 6.7% 1/1/19 |
Baa3 |
|
1,115,000 |
1,159,310 |
|
|
North Carolina Muni. Pwr. Agcy. #1 Catawba Elec. Rev.: |
|
|
|
|
|
|
5.75% 1/1/02 |
Baa1 |
|
2,500,000 |
2,523,225 |
|
|
5.9% 1/1/03 |
Baa1 |
|
250,000 |
254,228 |
|
|
6.25% 1/1/17 (AMBAC Insured) |
Aaa |
|
1,150,000 |
1,185,317 |
|
|
|
26,950,126 |
||||
|
Ohio - 3.3% |
|||||
|
Cincinnati Student Ln. Fdg. Corp. Student Ln. Rev. Series B, 8.875% 8/1/08 (d) |
- |
|
1,005,000 |
1,015,995 |
|
|
Delaware County Gen. Oblig. 6% 12/1/25 |
Aa2 |
|
1,000,000 |
1,040,600 |
|
|
Fairborn City School District (School Impt. Proj.) 5.75% 12/1/26 (FSA Insured) |
Aaa |
|
1,000,000 |
1,015,080 |
|
|
Franklin County Hosp. Rev. (Doctor's Ohio Health Corp. Proj.) Series A, 4.75% 12/1/03 |
Baa3 |
|
4,160,000 |
3,917,722 |
|
|
Gateway Economic Dev. Corp. Greater Cleveland Stadium Rev. Series 1990, 6.5% 9/15/14 (d) |
- |
|
3,000,000 |
3,005,820 |
|
|
Municipal Bonds - continued |
|||||
|
Moody's Ratings (unaudited) (a) |
Principal Amount |
Value |
|||
|
Ohio - continued |
|||||
|
Marion County Hosp. Impt. Rev. (Cmnty. Hosp. Proj.) 5.6% 5/15/01 |
BBB+ |
|
$ 1,000,000 |
$ 997,750 |
|
|
Plain Local School District 6% 12/1/25 |
Aaa |
|
2,000,000 |
2,083,400 |
|
|
Summit County Gen. Oblig. 6% 12/1/21 |
Aaa |
|
2,000,000 |
2,099,880 |
|
|
|
15,176,247 |
||||
|
Oklahoma - 2.8% |
|||||
|
Oklahoma Industries Auth. Rev.: |
|
|
|
|
|
|
(Health Sys. Oblig. Group Proj.) Series A, 5.75% 8/15/29 (MBIA Insured) |
Aaa |
|
1,500,000 |
1,481,325 |
|
|
6% 8/15/19 (MBIA Insured) |
Aaa |
|
3,000,000 |
3,087,210 |
|
|
Sapulpa Muni. Auth. Util. Rev. 5.75% 4/1/23 (FGIC Insured) |
Aaa |
|
1,000,000 |
1,009,500 |
|
|
Tulsa Indl. Auth. Rev. (Univ. of Tulsa Proj.) 5.75% 10/1/25 (MBIA Insured) |
Aaa |
|
3,000,000 |
3,043,620 |
|
|
Tulsa Muni. Arpt. Trust Rev. (American Airlines Corp. Proj.) 7.35% 12/1/11 |
Baa2 |
|
4,000,000 |
4,170,520 |
|
|
|
12,792,175 |
||||
|
Oregon - 0.7% |
|||||
|
Tri-County Metro. Trans. District Rev. Series A: |
|
|
|
|
|
|
5.75% 8/1/18 |
Aa3 |
|
1,000,000 |
1,025,670 |
|
|
5.75% 8/1/19 |
Aa3 |
|
2,080,000 |
2,125,469 |
|
|
|
3,151,139 |
||||
|
Pennsylvania - 6.3% |
|||||
|
Allegheny County Arpt. Rev. (Pittsburgh Int'l.
Arpt. Proj.) Series A1, 5.75% 1/1/07 |
Aaa |
|
1,000,000 |
1,048,290 |
|
|
Allegheny County Ind. Dev. Auth. Rev. |
- |
|
310,000 |
318,172 |
|
|
Allegheny County Port Auth. Spl. Rev. 6.125% 3/1/29 (MBIA Insured) |
Aaa |
|
4,460,000 |
4,628,900 |
|
|
Butler County Ind. Dev. Auth. Health Ctr. Rev. (Sherwood Oaks Proj.) 5.75% 6/1/11 |
A |
|
3,000,000 |
2,957,310 |
|
|
Cumberland County Muni. Auth. Rev. |
|
|
|
|
|
|
6.8% 11/15/14 |
Baa3 |
|
3,250,000 |
2,918,923 |
|
|
6.8% 11/15/23 |
Baa3 |
|
1,000,000 |
863,670 |
|
|
Delaware County Auth. College Rev. (Haverford College Proj.) 5.75% 11/15/29 |
Aa3 |
|
3,500,000 |
3,541,055 |
|
|
Municipal Bonds - continued |
|||||
|
Moody's Ratings (unaudited) (a) |
Principal Amount |
Value |
|||
|
Pennsylvania - continued |
|||||
|
Delaware County Auth. Rev. (First Mtg. Riddle Village Proj.): |
|
|
|
|
|
|
Series 1992, 8.75% 6/1/10 (Pre-Refunded to |
Aaa |
|
$ 2,705,000 |
$ 2,930,218 |
|
|
8.25% 6/1/22 (Escrowed to Maturity) (e) |
Aaa |
|
2,250,000 |
2,560,365 |
|
|
Pennsylvania Higher Edl. Facilities Auth. Rev.: |
|
|
|
|
|
|
(Lafayette College Proj.) 6% 5/1/30 |
Aa3 |
|
3,065,000 |
3,157,318 |
|
|
(UPMC Health Sys. Proj.) Series A, 5% 8/1/29 (FSA Insured) |
Aaa |
|
3,000,000 |
2,640,780 |
|
|
Pennsylvania Hsg. Fin. Agcy. (Residential Dev. Section 8 Proj.) Series A, 7% 7/1/01 |
Aa3 |
|
515,000 |
516,916 |
|
|
Philadelphia Hosp. & Higher Ed. Facilities Auth. Health Sys. Rev. (Jefferson Health Sys. Proj.) Series A, 5.125% 5/15/21 (MBIA Insured) |
Aaa |
|
1,000,000 |
926,240 |
|
|
|
29,008,157 |
||||
|
Rhode Island - 1.4% |
|||||
|
Rhode Island Health & Edl. Bldg. Corp. Rev. (Higher Ed./Johnson & Wales Proj.) 5% 4/1/29 (MBIA Insured) |
Aaa |
|
640,000 |
566,886 |
|
|
Rhode Island Port Auth. & Economic Dev. |
Aaa |
|
4,000,000 |
4,701,160 |
|
|
Rhode Island Student Ln. Auth. Student Ln. Rev. Series A, 6.55% 12/1/00 |
A |
|
1,000,000 |
1,001,380 |
|
|
|
6,269,426 |
||||
|
South Carolina - 1.1% |
|||||
|
Piedmont Muni. Pwr. Agcy. Elec. Rev. Series A, 6.25% 1/1/05 (FGIC Insured) |
Aaa |
|
1,715,000 |
1,818,192 |
|
|
South Carolina Ed. Assistance Auth. Rev. (Guaranteed Student Ln. Prog.): |
|
|
|
|
|
|
Sr. Lien Series A2, 5.4% 9/1/02 |
AAA |
|
1,250,000 |
1,260,713 |
|
|
Sub Lien Series B, 5.7% 9/1/05 (d) |
A |
|
1,000,000 |
1,021,520 |
|
|
South Carolina Jobs Econ. Dev. Auth. Hosp. Facilities Rev. (Palmetto Health Alliance Proj.) Series A, 7.375% 12/15/21 |
Baa1 |
|
1,000,000 |
1,031,810 |
|
|
|
5,132,235 |
||||
|
Tennessee - 0.2% |
|||||
|
Metro. Govt. Nashville & Davidson County Elec. Rev. Series A, 0% 5/15/06 (MBIA Insured) |
Aaa |
|
1,000,000 |
764,590 |
|
|
Municipal Bonds - continued |
|||||
|
Moody's Ratings (unaudited) (a) |
Principal Amount |
Value |
|||
|
Texas - 5.1% |
|||||
|
Brazos Higher Ed. Auth., Inc. Student Ln. Rev. Series A1, 6.05% 12/1/01 (d) |
Aaa |
|
$ 435,000 |
$ 441,999 |
|
|
Conroe Independent School District Series B, 0% 2/15/09 |
Aaa |
|
750,000 |
496,058 |
|
|
El Paso Gen. Oblig. 5.75% 8/15/25 |
Aaa |
|
4,500,000 |
4,516,470 |
|
|
Hurst Euless Bedford Independent School District 0% 8/15/11 |
Aaa |
|
1,000,000 |
575,460 |
|
|
Los Fresnos Independent School District: |
|
|
|
|
|
|
5.75% 8/15/13 |
Aaa |
|
1,040,000 |
1,088,537 |
|
|
5.75% 8/15/14 |
Aaa |
|
1,100,000 |
1,144,462 |
|
|
San Antonio Elec. & Gas Rev. 5.5% 2/1/20 (Pre-Refunded to 2/1/07 @ 101) (e) |
Aa1 |
|
75,000 |
78,978 |
|
|
Texas Gen. Oblig. (Pub. Fin. Auth. Proj.) |
Aa1 |
|
5,000,000 |
4,876,050 |
|
|
Texas Muni. Pwr. Agcy. Rev. 0% 9/1/11 (AMBAC Insured) |
Aaa |
|
3,930,000 |
2,256,410 |
|
|
Texas Pub. Fin. Auth. Bldg. Rev. (Texas Technical College Proj.) 6.25% 8/1/09 (MBIA Insured) |
Aaa |
|
1,000,000 |
1,098,220 |
|
|
Travis County Health Facilities Dev. Corp. Rev. (Ascension Health Ctr. Prog.) Series A, 6.25% 11/15/19 (MBIA Insured) |
Aaa |
|
4,000,000 |
4,204,960 |
|
|
Yselta Independent School District 0% 8/15/09 |
Aaa |
|
4,065,000 |
2,622,535 |
|
|
|
23,400,139 |
||||
|
Utah - 2.9% |
|||||
|
Intermountain Pwr. Agcy. Pwr. Supply Rev.: |
|
|
|
|
|
|
Series A: |
|
|
|
|
|
|
0% 7/1/06 (MBIA Insured) |
Aaa |
|
2,860,000 |
2,174,117 |
|
|
6.5% 7/1/09 (AMBAC Insured) |
Aaa |
|
365,000 |
407,515 |
|
|
6.5% 7/1/09 (AMBAC Insured) |
Aaa |
|
635,000 |
712,629 |
|
|
Series B: |
|
|
|
|
|
|
5.75% 7/1/16 (MBIA Insured) |
Aaa |
|
2,500,000 |
2,572,250 |
|
|
6% 7/1/16 (MBIA Insured) |
Aaa |
|
7,000,000 |
7,313,810 |
|
|
South Salt Lake City Ind. Rev. (Price Savers Wholesale Club Proj.) 9% 11/15/13 |
- |
|
250,000 |
261,598 |
|
|
|
13,441,919 |
||||
|
Virginia - 1.3% |
|||||
|
Loudoun County Ind. Dev. Auth. Residential Care Facilities Rev. (Falcons Landing Proj.) Series A, 9.25% 11/1/04 (Escrowed to Maturity) (e) |
- |
|
880,000 |
971,731 |
|
|
Municipal Bonds - continued |
|||||
|
Moody's Ratings (unaudited) (a) |
Principal Amount |
Value |
|||
|
Virginia - continued |
|||||
|
Virginia Commonwealth Trans. Board Trans. Rev. (U.S. Route 58 Corridor Dev. Prog.) Series B, 5.75% 5/15/21 |
Aa1 |
|
$ 1,965,000 |
$ 2,002,944 |
|
|
Virginia State Resources Auth. Clean Wtr. Rev.: |
|
|
|
|
|
|
(State Revolving Funds Proj.) |
Aaa |
|
1,750,000 |
1,806,473 |
|
|
5.625% 10/1/22 |
Aaa |
|
1,250,000 |
1,264,950 |
|
|
|
6,046,098 |
||||
|
Washington - 6.3% |
|||||
|
Grant County Pub. Util. District No. 2 (Priest Rapids Hydro-Elec. Proj.) Second Series B, 5.375% 1/1/16 (MBIA Insured) (d) |
Aaa |
|
1,715,000 |
1,690,870 |
|
|
Port Seattle Passenger Facilities Charge |
Aaa |
|
3,000,000 |
2,952,150 |
|
|
Thurston County School District #333 Series B, 0% 12/1/10 (FGIC Insured) |
Aaa |
|
4,000,000 |
2,410,040 |
|
|
Univ. Wash Univ. Revs. (Student Facilities Fee Prog.) 5.8% 6/1/30 (FSA Insured) |
Aaa |
|
3,000,000 |
3,012,570 |
|
|
Washington Pub. Pwr. Supply Sys. Nuclear |
|
|
|
|
|
|
Series A, 0% 7/1/06 (MBIA Insured) |
Aaa |
|
2,700,000 |
2,035,854 |
|
|
5.4% 7/1/12 |
Aa1 |
|
16,000,000 |
16,112,151 |
|
|
Washington Pub. Pwr. Supply Sys. Nuclear |
Aa1 |
|
500,000 |
508,095 |
|
|
|
28,721,730 |
||||
|
Wisconsin - 0.8% |
|||||
|
Fond Du Lac School District 5.75% 4/1/13 (FGIC Insured) |
A1 |
|
1,300,000 |
1,358,864 |
|
|
Milwaukee County Series A, 0% 12/1/10 |
Aaa |
|
3,500,000 |
2,102,555 |
|
|
|
3,461,419 |
||||
|
TOTAL MUNICIPAL BONDS (Cost $441,814,363) |
451,368,893 |
||||
|
Cash Equivalents - 1.1% |
|||
|
Shares |
Value |
||
|
Fidelity Municipal Cash Central Fund, 4.49% (b)(c) |
5,053,609 |
$ 5,053,609 |
|
|
TOTAL INVESTMENT PORTFOLIO - 99.7% (Cost $446,867,972) |
456,422,502 |
||
|
NET OTHER ASSETS - 0.3% |
1,330,279 |
||
|
NET ASSETS - 100% |
$ 457,752,781 |
||
|
Legend |
|
(a) S&P credit ratings are used in the absence of a rating by Moody's Investors Service, Inc. |
|
(b) Information in this report regarding holdings by state and security types does not reflect the holdings of the Fidelity Municipal Cash Central Fund. |
|
(c) The rate quoted is the annualized seven-day yield of the fund at period end. A complete listing of the fund's holdings as of its most recent fiscal year end is available upon request. |
|
(d) Private activity obligations whose interest is subject to the federal alternative minimum tax for individuals. |
|
(e) Security collateralized by an amount sufficient to pay interest and principal. |
|
(f) Security purchased on a delayed delivery or when-issued basis. |
|
(g) Restricted securities - Investment in securities not registered under the Securities Act of 1933. |
|
Additional information on each holding is as follows: |
|
Security |
Acquisition Date |
Acquisition Cost |
|
Allegheny County
Ind. Dev. Auth. Rev |
3/13/90 |
$ 310,000 |
|
Other Information |
|
The composition of long-term debt holdings as a percentage of total value of investments in securities, is as follows (ratings are unaudited): |
|
Moody's Ratings |
S&P Ratings |
|||
|
Aaa, Aa, A |
74.8% |
|
AAA, AA, A |
73.4% |
|
Baa |
11.8% |
|
BBB |
11.4% |
|
Ba |
2.5% |
|
BB |
2.4% |
|
B |
0.0% |
|
B |
0.0% |
|
Caa |
0.0% |
|
CCC |
0.0% |
|
Ca, C |
0.0% |
|
CC, C |
0.0% |
|
|
|
|
D |
0.0% |
|
The percentage not rated by Moody's or S&P amounted to 4%. |
|
The distribution of municipal securities by revenue source, as a percentage of total net assets, is as follows: |
|
Health Care |
17.6% |
|
General Obligations |
17.2 |
|
Electric Utilities |
15.8 |
|
Transportation |
12.3 |
|
Water & Sewer |
10.6 |
|
Education |
8.8 |
|
Others* (individually less than 5%) |
17.7 |
|
|
100.0% |
|
* Includes cash equivalents and net other assets |
|
|
Income Tax Information |
|
At October 31, 2000, the aggregate cost of investment securities for income tax purposes was $446,867,972. Net unrealized appreciation aggregated $9,554,530, of which $13,352,990 related to appreciated investment securities and $3,798,460 related to depreciated investment securities. |
|
At October 31, 2000, the fund had a capital loss carryforward of approximately $16,212,000 of which $7,417,000, $6,268,000 and $2,527,000 will expire on October 31, 2003, 2004 and 2008, respectively. Of the loss carryforwards expiring on October 31, 2008, $432,000 was acquired in the merger and is available to offset future capital gains of the fund to the extent provided by regulations. |
|
During the fiscal year ended October 31, 2000, 100% of the fund's income dividends was free from federal income tax, and 18.61% of the fund's income dividends was subject to the federal alternative minimum tax (unaudited). |
See accompanying notes which are an integral part of the financial statements.
Annual Report
Statement of Assets and Liabilities
|
|
October 31, 2000 |
|
|
Assets |
|
|
|
Investment in securities, at value (cost $446,867,972) - See accompanying schedule |
|
$ 456,422,502 |
|
Receivable for fund shares sold |
|
277,480 |
|
Interest receivable |
|
8,109,397 |
|
Other receivables |
|
22,338 |
|
Total assets |
|
464,831,717 |
|
Liabilities |
|
|
|
Payable for investments purchased |
$ 3,404,918 |
|
|
Delayed delivery |
1,603,005 |
|
|
Payable for fund shares redeemed |
1,018,075 |
|
|
Distributions payable |
680,374 |
|
|
Accrued management fee |
142,580 |
|
|
Distribution fees payable |
139,316 |
|
|
Other payables and accrued expenses |
90,668 |
|
|
Total liabilities |
|
7,078,936 |
|
Net Assets |
|
$ 457,752,781 |
|
Net Assets consist of: |
|
|
|
Paid in capital |
|
$ 465,034,413 |
|
Distributions in excess of net investment income |
|
(76,089) |
|
Accumulated undistributed net realized gain (loss) |
|
(16,760,073) |
|
Net unrealized appreciation (depreciation) on investments |
|
9,554,530 |
|
Net Assets |
|
$ 457,752,781 |
See accompanying notes which are an integral part of the financial statements.
Annual Report
Financial Statements - continued
Statement of Assets and Liabilities - continued
|
|
October 31, 2000 |
|
|
Calculation of Maximum Offering Price |
|
$12.02 |
|
Maximum offering price per share (100/95.25 of $12.02) |
|
$12.62 |
|
Class T: |
|
$12.04 |
|
Maximum offering price per share (100/96.50 of $12.04) |
|
$12.48 |
|
Class B: |
|
$12.00 |
|
Class C: |
|
$12.04 |
|
Institutional Class: |
|
$11.98 |
A Redemption price per share is equal to net asset value less any applicable contingent deferred sales charge.
See accompanying notes which are an integral part of the financial statements.
Annual Report
Financial Statements - continued
Statement of Operations
|
|
Year ended October 31, 2000 |
|
|
Investment Income Interest |
|
$ 24,369,233 |
|
Expenses |
|
|
|
Management fee |
$ 1,595,755 |
|
|
Transfer agent fees |
453,437 |
|
|
Distribution fees |
1,565,812 |
|
|
Accounting fees and expenses |
134,731 |
|
|
Non-interested trustees' compensation |
619 |
|
|
Custodian fees and expenses |
10,834 |
|
|
Registration fees |
111,456 |
|
|
Audit |
44,033 |
|
|
Legal |
14,566 |
|
|
Miscellaneous |
16,181 |
|
|
Total expenses before reductions |
3,947,424 |
|
|
Expense reductions |
(4,966) |
3,942,458 |
|
Net investment income |
|
20,426,775 |
|
Realized and Unrealized Gain (Loss) Net realized gain (loss) on investment securities |
|
(2,014,047) |
|
Change in net unrealized appreciation (depreciation) |
|
15,974,733 |
|
Net gain (loss) |
|
13,960,686 |
|
Net increase (decrease) in net assets resulting |
|
$ 34,387,461 |
See accompanying notes which are an integral part of the financial statements.
Annual Report
Financial Statements - continued
Statement of Changes in Net Assets
|
|
Year ended
October 31, |
Year ended
October 31, |
|
Increase (Decrease) in Net Assets |
|
|
|
Operations |
$ 20,426,775 |
$ 19,650,204 |
|
Net realized gain (loss) |
(2,014,047) |
2,481,428 |
|
Change in net unrealized appreciation (depreciation) |
15,974,733 |
(33,690,142) |
|
Net increase (decrease) in net assets resulting |
34,387,461 |
(11,558,510) |
|
Distributions to shareholders from net investment income |
(20,623,031) |
(19,650,204) |
|
Share transactions - net increase (decrease) |
23,373,862 |
(1,025,834) |
|
Total increase (decrease) in net assets |
37,138,292 |
(32,234,548) |
|
Net Assets |
|
|
|
Beginning of period |
420,614,489 |
452,849,037 |
|
End of period (including distributions in excess of net investment income of $76,089 and $0, respectively) |
$ 457,752,781 |
$ 420,614,489 |
See accompanying notes which are an integral part of the financial statements.
Annual Report
Financial Highlights - Class A
|
Years ended October 31, |
2000 |
1999 |
1998 |
1997 |
1996 F |
|
Selected Per-Share Data |
|
|
|
|
|
|
Net asset value, beginning |
$ 11.690 |
$ 12.540 |
$ 12.150 |
$ 11.740 |
$ 11.630 |
|
Income from Investment Operations |
|
|
|
|
|
|
Net investment income |
.591 D |
.567 |
.571 |
.583 D |
.105 D, E |
|
Net realized and unrealized gain (loss) |
.337 |
(.850) |
.390 |
.445 |
.109 |
|
Total from investment |
.928 |
(.283) |
.961 |
1.028 |
.214 |
|
Less Distributions |
|
|
|
|
|
|
From net investment income |
(.598) |
(.567) |
(.571) |
(.616) E |
(.104) |
|
In excess of net |
- |
- |
- |
(.002) |
- |
|
Total distributions |
(.598) |
(.567) |
(.571) |
(.618) |
(.104) |
|
Net asset value, end of period |
$ 12.020 |
$ 11.690 |
$ 12.540 |
$ 12.150 |
$ 11.740 |
|
Total Return B, C |
8.17% |
(2.36)% |
8.07% |
9.02% |
1.84% |
|
Ratios and Supplemental Data |
|
|
|
|
|
|
Net assets, end of period |
$ 22,780 |
$ 10,722 |
$ 6,721 |
$ 3,755 |
$ 202 |
|
Ratio of expenses to average |
.72% |
.72% |
.90% G |
.90% G |
.90% A, G |
|
Ratio of net investment income to average net assets |
5.02% |
4.62% |
4.57% |
4.87% |
5.73% A |
|
Portfolio turnover rate |
39% H |
23% |
36% |
36% |
49% |
A Annualized
B The total returns would have been lower had certain expenses not been reduced during the periods shown.
C Total returns do not include the one time sales charge and for periods of less than one year are not annualized.
D Net investment income per share has been calculated based on average shares outstanding during the period.
E Net investment income per share in 1996 reflects a payment received from an issuer in bankruptcy which was distributed in 1997.
F For the period September 3, 1996 (commencement of sale of Class A shares) to October 31, 1996.
G FMR agreed to reimburse a portion of the class' expenses during the period. Without this reimbursement, the class' expense ratio would have been higher.
H The portfolio turnover rate does not include the assets acquired in the merger.
See accompanying notes which are an integral part of the financial statements.
Annual Report
Financial Highlights - Class T
|
Years ended October 31, |
2000 |
1999 |
1998 |
1997 |
1996 |
|
Selected Per-Share Data |
|
|
|
|
|
|
Net asset value, beginning |
$ 11.700 |
$ 12.560 |
$ 12.150 |
$ 11.760 |
$ 11.880 |
|
Income from Investment Operations |
|
|
|
|
|
|
Net investment income |
.583 B |
.555 |
.571 |
.597 B |
.677 B, C |
|
Net realized and unrealized gain (loss) |
.343 |
(.860) |
.410 |
.407 |
(.136) |
|
Total from investment operations |
.926 |
(.305) |
.981 |
1.004 |
.541 |
|
Less Distributions |
|
|
|
|
|
|
From net investment income |
(.586) |
(.555) |
(.571) |
(.612) C |
(.661) |
|
In excess of net |
- |
- |
- |
(.002) |
- |
|
Total distributions |
(.586) |
(.555) |
(.571) |
(.614) |
(.661) |
|
Net asset value, end of period |
$ 12.040 |
$ 11.700 |
$ 12.560 |
$ 12.150 |
$ 11.760 |
|
Total Return A |
8.14% |
(2.53)% |
8.15% |
8.89% |
4.68% |
|
Ratios and Supplemental Data |
|
|
|
|
|
|
Net assets, end of period |
$ 340,959 |
$ 329,926 |
$ 380,325 |
$ 392,075 |
$ 480,432 |
|
Ratio of expenses to average |
.81% |
.81% |
.87% |
.89% |
.89% |
|
Ratio of net investment income |
4.93% |
4.51% |
4.62% |
5.04% |
5.74% |
|
Portfolio turnover rate |
39% D |
23% |
36% |
36% |
49% |
A Total returns do not include the one time sales charge.
B Net investment income per share has been calculated based on average shares outstanding during the period.
C Net investment income per share in 1996 reflects a payment received from an issuer in bankruptcy which was distributed in 1997.
D The portfolio turnover rate does not include the assets acquired in the merger.
See accompanying notes which are an integral part of the financial statements.
Annual Report
Financial Highlights - Class B
|
Years ended October 31, |
2000 |
1999 |
1998 |
1997 |
1996 |
|
Selected Per-Share Data |
|
|
|
|
|
|
Net asset value, beginning |
$ 11.670 |
$ 12.530 |
$ 12.130 |
$ 11.740 |
$ 11.860 |
|
Income from Investment Operations |
|
|
|
|
|
|
Net investment income |
.504 B |
.476 |
.491 |
.515 B |
.596 B, C |
|
Net realized and unrealized gain (loss) |
.336 |
(.860) |
.400 |
.416 |
(.136) |
|
Total from investment operations |
.840 |
(.384) |
.891 |
.931 |
.460 |
|
Less Distributions |
|
|
|
|
|
|
From net investment income |
(.510) |
(.476) |
(.491) |
(.539) C |
(.580) |
|
In excess of net investment |
- |
- |
- |
(.002) |
- |
|
Total distributions |
(.510) |
(.476) |
(.491) |
(.541) |
(.580) |
|
Net asset value, end of period |
$ 12.000 |
$ 11.670 |
$ 12.530 |
$ 12.130 |
$ 11.740 |
|
Total Return A |
7.38% |
(3.16)% |
7.47% |
8.15% |
3.98% |
|
Ratios and Supplemental Data |
|
|
|
|
|
|
Net assets, end of period |
$ 68,571 |
$ 63,464 |
$ 55,032 |
$ 41,024 |
$ 39,389 |
|
Ratio of expenses to average |
1.46% |
1.46% |
1.53% |
1.56% |
1.57% |
|
Ratio of net investment income |
4.28% |
3.88% |
3.96% |
4.35% |
5.06% |
|
Portfolio turnover rate |
39% D |
23% |
36% |
36% |
49% |
A Total returns do not include the contingent deferred sales charge.
B Net investment income per share has been calculated based on average shares outstanding during the period.
C Net investment income per share in 1996 reflects a payment received from an issuer in bankruptcy which was distributed in 1997.
D The portfolio turnover rate does not include the assets acquired in the merger.
See accompanying notes which are an integral part of the financial statements.
Annual Report
Financial Highlights - Class C
|
Years ended October 31, |
2000 |
1999 |
1998 E |
|
Selected Per-Share Data |
|
|
|
|
Net asset value, beginning of period |
$ 11.700 |
$ 12.560 |
$ 12.130 |
|
Income from Investment Operations |
|
|
|
|
Net investment income |
.493 D |
.465 |
.455 |
|
Net realized and unrealized gain (loss) |
.345 |
(.860) |
.430 |
|
Total from investment operations |
.838 |
(.395) |
.885 |
|
Less Distributions |
|
|
|
|
From net investment income |
(.498) |
(.465) |
(.455) |
|
Net asset value, end of period |
$ 12.040 |
$ 11.700 |
$ 12.560 |
|
Total Return B, C |
7.34% |
(3.24)% |
7.41% |
|
Ratios and Supplemental Data |
|
|
|
|
Net assets, end of period (000 omitted) |
$ 17,120 |
$ 13,071 |
$ 7,031 |
|
Ratio of expenses to average net assets |
1.56% |
1.56% |
1.75% A, F |
|
Ratio of net investment income to average net assets |
4.18% |
3.79% |
3.60% A |
|
Portfolio turnover rate |
39% G |
23% |
36% |
A Annualized
B The total returns would have been lower had certain expenses not been reduced during the periods shown.
C Total returns do not include the contingent deferred sales charge and for periods of less than one year are not annualized.
D Net investment income per share has been calculated based on average shares outstanding during the period.
E For the period November 3, 1997 (commencement of sale of Class C shares) to October 31, 1998.
F FMR agreed to reimburse a portion of the class' expenses during the period. Without this reimbursement, the class' expense ratio would have been higher.
G The portfolio turnover rate does not include the assets acquired in the merger.
See accompanying notes which are an integral part of the financial statements.
Annual Report
Financial Highlights - Institutional Class
|
Years ended October 31, |
2000 |
1999 |
1998 |
1997 |
1996 |
|
Selected Per-Share Data |
|
|
|
|
|
|
Net asset value, beginning |
$ 11.650 |
$ 12.510 |
$ 12.120 |
$ 11.720 |
$ 11.880 |
|
Income from Investment Operations |
|
|
|
|
|
|
Net investment income |
.604 B |
.584 |
.592 |
.609 B |
.707 B, C |
|
Net realized and unrealized gain (loss) |
.339 |
(.860) |
.390 |
.464 |
(.197) |
|
Total from investment operations |
.943 |
(.276) |
.982 |
1.073 |
.510 |
|
Less Distributions |
|
|
|
|
|
|
From net investment income |
(.613) |
(.584) |
(.592) |
(.671) C |
(.670) |
|
In excess of net |
- |
- |
- |
(.002) |
- |
|
Total distributions |
(.613) |
(.584) |
(.592) |
(.673) |
(.670) |
|
Net asset value, end of period |
$ 11.980 |
$ 11.650 |
$ 12.510 |
$ 12.120 |
$ 11.720 |
|
Total Return A |
8.34% |
(2.31)% |
8.28% |
9.44% |
4.41% |
|
Ratios and Supplemental Data |
|
|
|
|
|
|
Net assets, end of period |
$ 8,324 |
$ 3,431 |
$ 3,741 |
$ 1,511 |
$ 927 |
|
Ratio of expenses to average |
.61% |
.60% |
.75% D |
.75% D |
.75% D |
|
Ratio of net investment income to average net assets |
5.13% |
4.75% |
4.75% |
5.11% |
5.88% |
|
Portfolio turnover rate |
39% E |
23% |
36% |
36% |
49% |
A The total returns would have been lower had certain expenses not been reduced during the periods shown.
B Net investment income per share has been calculated based on average shares outstanding during the period.
C Net investment income per share in 1996 reflects a payment received from an issuer in bankruptcy which was distributed in 1997.
D FMR agreed to reimburse a portion of the class' expenses during the period. Without this reimbursement, the class' expense ratio would have been higher.
E The portfolio turnover rate does not include the assets acquired in the merger.
See accompanying notes which are an integral part of the financial statements.
Annual Report
For the period ended October 31, 2000
1. Significant Accounting Policies.
Fidelity Advisor Municipal Income Fund (the fund) is a fund of Fidelity Advisor Series II (the trust) and is authorized to issue an unlimited number of shares. The trust is registered under the Investment Company Act of 1940, as amended (the 1940 Act), as an open-end management investment company organized as a Massachusetts business trust.
The fund offers Class A, Class T, Class B, Class C and Institutional Class shares, each of which has equal rights as to assets and voting privileges. Each class has exclusive voting rights with respect to matters that affect that class. Class B shares will automatically convert to Class A shares after a holding period of seven years from the initial date of purchase. Investment income, realized and unrealized capital gains and losses, the common expenses of the fund, and certain fund-level expense reductions, if any, are allocated on a pro rata basis to each class based on the relative net assets of each class to the total net assets of the fund. Each class of shares differs in its respective distribution, transfer agent, and certain other class-specific fees, expenses, and expense reductions.
The financial statements have been prepared in conformity with generally accepted accounting principles which require management to make certain estimates and assumptions at the date of the financial statements. The following summarizes the significant accounting policies of the fund:
Security Valuation. Securities are valued based upon a computerized matrix system and/or appraisals by a pricing service, both of which consider market transactions and dealer-supplied valuations. Securities for which quotations are not readily available are valued at their fair value as determined in good faith under consistently applied procedures under the general supervision of the Board of Trustees. Short-term securities with remaining maturities of sixty days or less for which quotations are not readily available are valued at amortized cost or original cost plus accrued interest, both of which approximate current value. Investments in open-end investment companies are valued at their net asset value each business day.
Income Taxes. As a qualified regulated investment company under Subchapter M of the Internal Revenue Code, the fund is not subject to income taxes to the extent that it distributes substantially all of its taxable income for its fiscal year. The schedule of investments includes information regarding income taxes under the caption "Income Tax Information."
Investment Income. Interest income, which includes amortization of premium and accretion of original issue discount, is accrued as earned.
Expenses. Most expenses of the trust can be directly attributed to a fund. Expenses which cannot be directly attributed are apportioned among the funds in the trust.
Annual Report
Notes to Financial Statements - continued
1. Significant Accounting Policies - continued
Distributions to Shareholders. Distributions are declared daily and paid monthly from net investment income. Distributions from realized gains, if any, are recorded on the ex-dividend date. Income dividends and capital gain distributions are declared separately for each class.
Income and capital gain distributions are determined in accordance with income tax regulations which may differ from generally accepted accounting principles. These differences, which may result in distribution reclassifications, are primarily due to differing treatments for futures transactions, market discount, capital loss carryforwards and losses deferred due to futures transactions. The fund also utilized earnings and profits distributed to shareholders on redemption of shares as a part of the dividends paid deduction for income tax purposes.
Permanent book and tax basis differences relating to shareholder distributions will result in reclassifications to paid in capital. Distributions in excess of net investment income and accumulated undistributed net realized gain (loss) on investments may include temporary book and tax basis differences which will reverse in a subsequent period. Any taxable income or gain remaining at fiscal year end is distributed in the following year.
Security Transactions. Security transactions are accounted for as of trade date. Gains and losses on securities sold are determined on the basis of identified cost.
2. Operating Policies.
When-Issued Securities. The fund may purchase or sell securities on a when-issued basis. Payment and delivery may take place after the customary settlement period for that security. The price of the underlying securities is fixed at the time the transaction is negotiated. The market values of the securities purchased on a when-issued or forward commitment basis are identified as such in the fund's schedule of investments. The fund may receive compensation for interest forgone in the purchase of a when-issued security. With respect to purchase commitments, the fund identifies securities as segregated in its records with a value at least equal to the amount of the commitment. Losses may arise due to changes in the market value of the underlying securities, if the counterparty does not perform under the contract, or if the issuer does not issue the securities due to political, economic, or other factors.
Restricted Securities. The fund is permitted to invest in securities that are subject to legal or contractual restrictions on resale. These securities generally may be resold in transactions exempt from registration or to the public if the securities are registered. Disposal of these securities may involve time-consuming negotiations and expense, and prompt sale at an acceptable price may be difficult. At the end of the period, restricted securities (excluding 144A issues) amounted to $318,172 or 0.1% of net assets.
3. Purchases and Sales of Investments.
Purchases and sales of securities, other than short-term securities, aggregated $164,700,158 and $192,112,546, respectively.
Annual Report
Notes to Financial Statements - continued
4. Fees and Other Transactions with Affiliates.
Management Fee. As the fund's investment adviser, Fidelity Management & Research Company (FMR) receives a monthly fee that is calculated on the basis of a group fee rate plus a fixed individual fund fee rate applied to the average net assets of the fund. The group fee rate is the weighted average of a series of rates and is based on the monthly average net assets of all the mutual funds advised by FMR. The rates ranged from .0920% to .3700% for the period. The annual individual fund fee rate is .25%. In the event that these rates were lower than the contractual rates in effect during the period, FMR voluntarily implemented the above rates, as they resulted in the same or a lower management fee. For the period, the management fee was equivalent to an annual rate of .38% of average net assets.
Sub-Adviser Fee. FMR, on behalf of the fund, has entered into a sub-advisory agreement with Fidelity Investments Money Management, Inc. (FIMM), a wholly owned subsidiary of FMR. For its services, FIMM receives a fee from FMR of 50% of the management fee payable to FMR. The fee is paid prior to any voluntary expense reimbursements which may be in effect.
Distribution and Service Plan. In accordance with Rule 12b-1 of the 1940 Act, the Board of Trustees has adopted separate Distribution and Service Plans with respect to each class of shares (collectively referred to as "the Plans"). Under certain of the Plans, the class pays Fidelity Distributors Corporation (FDC), an affiliate of FMR, a 12b-1 fee. A portion of this fee may be reallowed to securities dealers, banks and other financial institutions for the distribution of each class of shares and providing shareholder support services. For the period, this fee was based on the following annual rates of the average net assets of each applicable class:
|
Class A |
.15% |
|
Class T |
.25% |
|
Class B |
.90%* |
|
Class C |
1.00%** |
* .65% represents a distribution fee and .25% represents a shareholder service fee.
** .75% represents a distribution fee and .25% represents a shareholder service fee.
For the period, each class paid FDC the following amounts, a portion of which was retained by FDC:
|
|
Paid to |
Retained |
|
Class A |
$ 21,161 |
$ 43 |
|
Class T |
815,119 |
8,802 |
|
Class B |
584,010 |
422,224 |
|
Class C |
145,522 |
63,271 |
|
|
$ 1,565,812 |
$ 494,340 |
Sales Load. FDC receives a front-end sales charge of up to 4.75% for selling Class A shares, and 3.50% for selling Class T shares of the fund. FDC receives the proceeds of
Annual Report
Notes to Financial Statements - continued
4. Fees and Other Transactions with Affiliates - continued
Sales Load - continued
contingent deferred sales charges levied on Class B share redemptions occurring within six years of purchase and Class C share redemptions occurring within one year of purchase. Contingent deferred sales charges are based on declining rates ranging from 5% to 1% for Class B and 1% for Class C, of the lesser of the cost of shares at the initial date of purchase or the net asset value of the redeemed shares, excluding any reinvested dividends and capital gains. In addition, purchases of Class A and Class T shares that were subject to a finder's fee bear a contingent deferred sales charge on assets that do not remain in the fund for at least one year. The Class A and Class T contingent deferred sales charge is based on 0.25% of the lesser of the cost of shares at the initial date of purchase or the net asset value of the redeemed shares, excluding any reinvested dividends and capital gains. A portion of the sales charges paid to FDC is paid to securities dealers, banks and other financial institutions.
For the period, sales charge amounts paid to and retained by FDC were as follows:
|
|
Paid to |
Retained |
|
Class A |
$ 85,146 |
$ 27,474 |
|
Class T |
144,387 |
50,758 |
|
Class B |
259,197 |
259,197* |
|
Class C |
11,127 |
11,127* |
|
|
$ 499,857 |
$ 348,556 |
* When Class B and Class C shares are initially sold, FDC pays commissions from its own resources to securities dealers,
banks, and other financial institutions through which the sales are made.
Transfer Agent and Accounting Fees. Citibank, N.A.(Citibank) is the custodian, transfer agent, and shareholder servicing agent for the fund's Class A, Class T, Class B, Class C, and Institutional Class shares. Citibank has entered into a sub-arrangement with Fidelity Investments Institutional Operations Company, Inc. (FIIOC) with respect to all classes of the fund to perform the transfer, dividend disbursing, and shareholder servicing agent functions. FIIOC, an affiliate of FMR, receives account fees and asset-based fees that vary according to the account size and type of account of the shareholders of the respective classes of the fund. All fees are paid to FIIOC by Citibank, which is reimbursed by each class for such payments. FIIOC pays for typesetting, printing and mailing of all shareholder reports, except proxy statements. For the period, each class paid the following transfer agent fees:
|
|
Amount |
% of |
|
Class A |
$ 15,735 |
.11 |
|
Class T |
345,728 |
.11 |
|
Class B |
68,630 |
.11 |
|
Class C |
15,680 |
.11 |
|
Institutional Class |
7,664 |
.15 |
|
|
$ 453,437 |
|
Annual Report
Notes to Financial Statements - continued
4. Fees and Other Transactions with Affiliates - continued
Fidelity Municipal Cash Central Fund. Pursuant to an Exemptive Order issued by the Securities and Exchange Commission, the fund may invest in the Fidelity Municipal Cash Central Fund (the Cash Fund) managed by FIMM, an affiliate of FMR. The Cash Fund is an open-end money market fund available only to investment companies and other accounts managed by FMR and its affiliates. The Cash Fund seeks preservation of capital, liquidity, and current income by investing in high-quality, short-term municipal securities of various states and municipalities. Income distributions from the Cash Fund are declared daily and paid monthly from net investment income. Income distributions earned by the fund are recorded as interest income in the accompanying financial statements.
5. Expense Reductions.
Through arrangements with the fund's custodian and each class' transfer agent, credits realized as a result of uninvested cash balances were used to reduce a portion of expenses. During the period, the fund's custodian fees were reduced by $234 under the custodian arrangement and Class T's transfer agent fees were reduced by $4,732 under the transfer agent arrangement.
6. Distributions to Shareholders.
Distributions to shareholders of each class were as follows:
|
|
Years ended October 31, |
|
|
|
2000 |
1999 |
|
From net investment income |
|
|
|
Class A |
$ 712,048 |
$ 439,029 |
|
Class T |
16,217,959 |
16,229,661 |
|
Class B |
2,815,400 |
2,381,487 |
|
Class C |
614,742 |
421,752 |
|
Institutional Class |
262,882 |
178,275 |
|
Total |
$ 20,623,031 |
$ 19,650,204 |
Annual Report
Notes to Financial Statements - continued
7. Share Transactions.
Transactions for each class of shares were as follows:
|
|
Shares |
Dollars |
||
|
|
Years ended October 31, |
Years ended October 31, |
||
|
|
2000 |
1999 |
2000 |
1999 |
|
|
|
|
|
|
|
Class A |
1,280,562 |
565,331 |
$ 15,201,152 |
$ 6,989,179 |
|
Issued in exchange for shares of Fidelity Advisor Intermediate Municipal Income Fund Class A |
314,140 |
- |
3,612,609 |
- |
|
Reinvestment of distributions |
40,864 |
25,296 |
482,684 |
307,568 |
|
Shares redeemed |
(658,536) |
(208,996) |
(7,799,948) |
(2,558,328) |
|
Net increase (decrease) |
977,030 |
381,631 |
$ 11,496,497 |
$ 4,738,419 |
|
Class T |
5,871,344 |
3,793,311 |
$ 69,198,493 |
$ 46,774,471 |
|
Issued in exchange for shares of Fidelity Advisor Intermediate Municipal Income Fund Class T |
3,316,008 |
- |
38,167,257 |
- |
|
Reinvestment of distributions |
861,078 |
835,205 |
10,155,440 |
10,221,698 |
|
Shares redeemed |
(9,924,270) |
(6,722,556) |
(116,868,899) |
(82,551,608) |
|
Net increase (decrease) |
124,160 |
(2,094,040) |
$ 652,291 |
$ (25,555,439) |
|
Class B |
1,533,458 |
2,125,759 |
$ 18,027,417 |
$ 26,076,418 |
|
Issued in exchange for shares of Fidelity Advisor Intermediate Municipal Income Fund Class B |
776,254 |
- |
8,911,393 |
- |
|
Reinvestment of distributions |
138,033 |
115,598 |
1,623,281 |
1,407,504 |
|
Shares redeemed |
(2,173,697) |
(1,196,611) |
(25,534,174) |
(14,568,680) |
|
Net increase (decrease) |
274,048 |
1,044,746 |
$ 3,027,917 |
$ 12,915,242 |
|
Class C |
761,618 |
871,985 |
$ 8,992,554 |
$ 10,752,375 |
|
Issued in exchange for shares of Fidelity Advisor Intermediate Municipal Income Fund Class C |
114,599 |
- |
1,319,029 |
- |
|
Reinvestment of distributions |
33,650 |
22,987 |
397,120 |
280,065 |
|
Shares redeemed |
(604,764) |
(337,753) |
(7,119,022) |
(4,112,814) |
|
Net increase (decrease) |
305,103 |
557,219 |
$ 3,589,681 |
$ 6,919,626 |
Annual Report
Notes to Financial Statements - continued
7. Share Transactions - continued
|
|
Shares |
Dollars |
||
|
|
Years ended October 31, |
Years ended October 31, |
||
|
|
2000 |
1999 |
2000 |
1999 |
|
|
|
|
|
|
|
Institutional Class |
247,204 |
103,836 |
$ 2,915,763 |
$ 1,286,178 |
|
Issued in exchange for shares of Fidelity Advisor Inter- |
420,609 |
- |
4,820,174 |
- |
|
Reinvestment of distributions |
8,738 |
7,731 |
103,106 |
93,765 |
|
Shares redeemed |
(276,387) |
(116,192) |
(3,231,567) |
(1,423,625) |
|
Net increase (decrease) |
400,164 |
(4,625) |
$ 4,607,476 |
$ (43,682) |
8. Merger Information.
On May 25, 2000, Class A, Class T, Class B, Class C, and Institutional Class of the fund acquired all of the assets and assumed all of the liabilities of Fidelity Advisor Intermediate Municipal Income Fund Class A, Class T, Class B, Class C, and Institutional Class, respectively. Each acquisition was approved by the shareholders of each class of Fidelity Advisor Intermediate Municipal Income Fund on April 19, 2000. Based on the opinion of fund counsel, the reorganization qualified as a tax-free reorganization for federal income tax purposes with no gain or loss recognized to the funds or their shareholders.
Class A's acquisition of Fidelity Advisor Intermediate Municipal Income Fund Class A was accomplished by an exchange of 314,140 shares of Class A for the 360,900 shares then outstanding of Fidelity Advisor Intermediate Municipal Income Fund Class A (each valued at $10.01). Class T's acquisition of Fidelity Advisor Intermediate Municipal Income Fund Class T was accomplished by an exchange of 3,316,008 shares of Class T for the 3,816,726 shares then outstanding of Fidelity Advisor Intermediate Municipal Income Fund Class T (each valued at $10.00). Class B's acquisition of Fidelity Advisor Intermediate Municipal Income Fund Class B was accomplished by an exchange of 776,254 shares of Class B for the 892,031 shares then outstanding of Fidelity Advisor Intermediate Municipal Income Fund Class B (each valued at $9.99). Class C's acquisition of Fidelity Advisor Intermediate Municipal Income Fund Class C was accomplished by an exchange of 114,599 shares of Class C for the 131,903 shares then outstanding of Fidelity Advisor Intermediate Municipal Income Fund Class C (each valued at $10.00). Institutional Class' acquisition of Fidelity Advisor Intermediate Municipal Income Fund Institutional Class was accomplished by an exchange of 420,609 shares of Institutional Class for the 482,017 shares then outstanding of Fidelity Advisor Intermediate Municipal Income Fund Institutional Class (each valued at $10.00).
Fidelity Advisor Intermediate Municipal Income Fund's net assets, including $1,412,949 of unrealized depreciation, were combined with the fund for total net assets after the acquisition of $438,952,773.
Annual Report
To the Trustees of Advisor Series II and the Shareholders of Fidelity Advisor Municipal Income Fund:
In our opinion, the accompanying statement of assets and liabilities, including the schedule of investments, and the related statements of operations and of changes in net assets and the financial highlights present fairly, in all material respects, the financial position of Fidelity Advisor Municipal Income Fund (a fund of Advisor Series II) at October 31, 2000, and the results of its operations, the changes in its net assets and the financial highlights for the periods indicated, in conformity with accounting principles generally accepted in the United States of America. These financial statements and financial highlights (hereafter referred to as "financial statements") are the responsibility of the Fidelity Advisor Municipal Income Fund's management; our responsibility is to express an opinion on these financial statements based on our audits. We conducted our audits of these financial statements in accordance with auditing standards generally accepted in the United States of America which require that we plan and perform the audit to obtain reasonable assurance about whether the financial statements are free of material misstatement. An audit includes examining, on a test basis, evidence supporting the amounts and disclosures in the financial statements, assessing the accounting principles used and significant estimates made by management, and evaluating the overall financial statement presentation. We believe that our audits, which included confirmation of securities at October 31, 2000 by correspondence with the custodian and brokers, provide a reasonable basis for our opinion.
/s/PricewaterhouseCoopers LLP
PricewaterhouseCoopers LLP
Boston, Massachusetts
December 11, 2000
Annual Report
Annual Report
Annual Report
Annual Report
Annual Report
Investment Adviser
Fidelity Management & Research Company
Boston, MA
Investment Sub-Adviser
Fidelity Investments Money
Management, Inc.
Officers
Edward C. Johnson 3d, President
Robert C. Pozen, Senior Vice President
Dwight D. Churchill, Vice President
Boyce I. Greer, Vice President
Christine J. Thompson, Vice President
Eric D. Roiter, Secretary
Robert A. Dwight, Treasurer
Maria F. Dwyer, Deputy Treasurer
Stanley N. Griffith, Assistant Vice President
John H. Costello, Assistant Treasurer
Thomas J. Simpson, Assistant Treasurer
Board of Trustees
Ralph F. Cox *
Phyllis Burke Davis *
Robert M. Gates *
Edward C. Johnson 3d
Donald J. Kirk *
Ned C. Lautenbach *
Peter S. Lynch
Marvin L. Mann *
William O. McCoy *
Gerald C. McDonough *
Robert C. Pozen
Thomas R. Williams *
* Independent trustees
Advisory Board
J. Michael Cook
Abigail P. Johnson
Marie L. Knowles
General Distributor
Fidelity Distributors Corporation
Boston, MA
Transfer and Shareholder
Servicing Agents
Citibank, N.A.
New York, NY
Fidelity Investments Institutional Operations Company, Inc.
Boston, MA
Custodian
Citibank, N.A.
New York, NY
Semiannual Report
Focus Funds
Fidelity Advisor Consumer
Industries Fund
Fidelity Advisor Cyclical
Industries Fund
Fidelity Advisor Financial
Services Fund
Fidelity Advisor Health Care Fund
Fidelity Advisor Natural
Resources Fund
Fidelity Advisor Technology Fund
Fidelity Advisor Utilities Growth Fund
Growth Funds
Fidelity Advisor Korea Fund
Fidelity Advisor Emerging Asia Fund
Fidelity Advisor Latin America Fund
Fidelity Advisor Japan Fund
Fidelity Advisor Europe Capital Appreciation Fund
Fidelity Advisor International
Capital Appreciation Fund
Fidelity Advisor Overseas Fund
Fidelity Advisor Diversified International Fund
Fidelity Advisor Global Equity Fund
Fidelity Advisor TechnoQuant®
Growth Fund
Fidelity Advisor Small Cap Fund
Fidelity Advisor Value Strategies Fund
Fidelity Advisor Mid Cap Fund
Fidelity Advisor Retirement Growth Fund
Fidelity Advisor Equity Growth Fund
Fidelity Advisor Large Cap Fund
Fidelity Advisor Dividend Growth Fund
Fidelity Advisor Growth
Opportunities Fund
Growth and Income Funds
Fidelity Advisor Growth & Income Fund
Fidelity Advisor Equity Income Fund
Fidelity Advisor Asset Allocation Fund
Fidelity Advisor Balanced Fund
Taxable Income Funds
Fidelity Advisor Emerging Markets Income Fund
Fidelity Advisor High Yield Fund
Fidelity Advisor High Income Fund
Fidelity Advisor Strategic Income Fund
Fidelity Advisor Mortgage
Securities Fund
Fidelity Advisor Government Investment Fund
Fidelity Advisor Intermediate Bond Fund
Fidelity Advisor Short Fixed-Income Fund
Municipal Funds
Fidelity Advisor Municipal Income Fund
Money Market Funds
Prime Fund
Treasury Fund
Tax-Exempt Fund
|
HIMI-SANN-0600 |
118987 |
|
1.538417.103 |
|
(Fidelity Investment logo)(registered trademark)
Fidelity® Advisor
Fund - Class A, Class T, Class B
and Class C
Annual Report
October 31, 2000
(2_fidelity_logos)
|
President's Message |
3 |
Ned Johnson on investing strategies. |
|
Performance |
4 |
How the fund has done over time. |
|
Fund Talk |
21 |
The manager's review of fund performance, strategy and outlook. |
|
Investment Changes |
24 |
A summary of major shifts in the fund's investments over the past six months. |
|
Investments |
25 |
A complete list of the fund's investments with their market values. |
|
Financial Statements |
43 |
Statements of assets and liabilities,
operations, and changes in net assets, |
|
Notes |
52 |
Notes to the financial statements. |
|
Report of Independent Accountants |
60 |
The auditors' opinion. |
|
Distributions |
61 |
|
Standard & Poor's, S&P and S&P 500 are registered service marks of The McGraw-Hill Companies, Inc. and have been licensed for use by Fidelity Distributors Corporation.
Third party marks appearing herein are the property of their respective owners.
All other marks appearing herein are registered or unregistered trademarks or service marks of FMR Corp. or an affiliated company.
(Recycle graphic) This report is printed on recycled paper using soy-based inks.
This report and the financial statements contained herein are submitted for the general information of the shareholders of the fund. This report is not authorized for distribution to prospective investors in the fund unless preceded or accompanied by an effective prospectus.
Mutual fund shares are not deposits or obligations of, or guaranteed by, any depository institution. Shares are not insured by the FDIC, Federal Reserve Board or any other agency, and are subject to investment risks, including possible loss of principal amount invested.
Neither the fund nor Fidelity Distributors Corporation is a bank.
For more information on any Fidelity Advisor fund, including charges and expenses, contact your investment professional for a free prospectus. Read it carefully before you invest or send money.
Annual Report
(photo_of_Edward_C_Johnson_3d)
Dear Shareholder:
A sixth-straight year of double-digit positive returns for the Dow Jones Industrial Average, NASDAQ and S&P 500® could be in jeopardy unless the U.S. stock market shows marked improvement in the final two months of 2000. Through October, all three indexes had negative year-to-date returns. On the other hand, most fixed-income sectors were solidly in the black. Treasuries and other long-term government securities led the way, returning nearly 14%.
While it's impossible to predict the future direction of the markets with any degree of certainty, there are certain basic principles that can help investors plan for their future needs.
The longer your investment time frame, the less likely it is that you will be affected by short-term market volatility. A 10-year investment horizon appropriate for saving for a college education, for example, enables you to weather market cycles in a long-term fund, which may have a higher risk potential, but also has a higher potential rate of return.
An intermediate-length fund could make sense if your investment horizon is two to four years, while a short-term bond fund could be the right choice if you need your money in one or two years.
If your time horizon is less than a year, you might want to consider moving some of your bond investment into a money market fund. These funds seek income and a stable share price by investing in high-quality, short-term investments. Of course, it's important to remember that an investment in a money market fund is not insured or guaranteed by the Federal Deposit Insurance Corporation or any other government agency. Although money market funds seek to preserve the value of your investment at $1.00 per share, it is possible to lose money by investing in these types of funds.
Finally, no matter what your time horizon or portfolio diversity, it makes good sense to follow a regular investment plan, investing a certain amount of money in a fund at the same time each month or quarter and periodically reviewing your overall portfolio. By doing so, you won't get caught up in the excitement of a rapidly rising market, nor will you buy all your shares at market highs. While this strategy - known as dollar cost averaging - won't assure a profit or protect you from a loss in a declining market, it should help you lower the average cost of your purchases. Of course, you should consider your financial ability to continue your purchases through periods of low price levels before undertaking such a strategy.
Remember to contact your investment professional if you need help with your investments.
Best regards,
/s/Edward C. Johnson 3d
Edward C. Johnson 3d
Annual Report
Fidelity Advisor High Yield Fund - Class A
There are several ways to evaluate historical performance. You can look at the total percentage change in value, the average annual percentage change or the growth of a hypothetical $10,000 investment. Total return reflects the change in the value of an investment, assuming reinvestment of the class' dividend income and capital gains (the profits earned upon the sale of securities that have grown in value). You can also look at the class' income, as reflected in its yield, to measure performance. The initial offering of Class A shares took place on September 3, 1996. Class A shares bear a 0.15% 12b-1 fee. Returns prior to September 3, 1996 are those of Class T, the original class of the fund, and reflect Class T shares' 0.25% 12b-1 fee. If Fidelity had not reimbursed certain class expenses during the periods shown, the past five year and the past 10 year total returns would have been lower.
Annual Report
Fidelity Advisor High Yield Fund - Class A
Performance - continued
Cumulative Total Returns
|
Periods ended October 31, 2000 |
|
Past 1 |
Past 5 |
Past 10 |
|
Fidelity Adv High Yield - CL A |
|
-5.66% |
30.97% |
217.41% |
|
Fidelity Adv High Yield - CL A |
|
-10.14% |
24.75% |
202.33% |
|
ML High Yield Master II |
|
-1.68% |
31.76% |
199.32% |
|
High Current Yield Funds Average |
|
-2.77% |
25.45% |
173.70% |
Cumulative total returns show Class A's performance in percentage terms over a set period - in this case, one year, five years or 10 years. For example, if you had invested $1,000 in a fund that had a 5% return over the past year, the value of your investment would be $1,050. You can compare Class A's returns to those of the Merrill Lynch High Yield Master II Index - a market value-weighted index of all domestic and yankee high-yield bonds, including deferred interest bonds and payment-in-kind securities. Issues included in the index have maturities of one year or more and have a credit rating lower than BBB-/Baa3, but are not in default. To measure how Class A's performance stacked up against its peers, you can compare it to the high current yield funds average, which reflects the performance of mutual funds with similar objectives tracked by Lipper Inc. The past one year average represents a peer group of 357 mutual funds. These benchmarks include reinvested dividends and capital gains, if any, and exclude the effect of sales charges.
Annual Report
Fidelity Advisor High Yield Fund - Class A
Performance - continued
Average Annual Total Returns
|
Periods ended October 31, 2000 |
Past 1 |
Past 5 |
Past 10 |
|
Fidelity Adv High Yield - CL A |
-5.66% |
5.54% |
12.24% |
|
Fidelity Adv High Yield - CL A |
-10.14% |
4.52% |
11.70% |
|
ML High Yield Master II |
-1.68% |
5.67% |
11.59% |
|
High Current Yield Funds Average |
-2.77% |
4.55% |
10.51% |
Average annual total returns take Class A shares' cumulative return and show you what would have happened if Class A shares had performed at a constant rate each year.
Annual Report
Fidelity Advisor High Yield Fund - Class A
Performance - continued
$10,000 Over 10 Years
$10,000 Over 10 Years: Let's say hypothetically that $10,000 was invested in Fidelity Advisor High Yield Fund - Class A on October 31, 1990, and the current 4.75% sales charge was paid. As the chart shows, by October 31, 2000, the value of the investment would have grown to $30,233 - a 202.33% increase on the initial investment. For comparison, look at how the Merrill Lynch High Yield Master II Index did over the same period. With dividends reinvested, the same $10,000 would have grown to $29,932 - a 199.32% increase.
Understanding
Performance
How a fund did yesterday is no guarantee of how it will do tomorrow. Bond prices, for example, generally move in the opposite direction of interest rates. In turn, the share price, return and yield of a fund that invests in bonds will vary. That means if you sell your shares during a market downturn, you might lose money. But if you can ride out the market's ups and downs, you may have a gain.
3Annual Report
Fidelity Advisor High Yield Fund - Class A
Performance - continued
Total Return Components
|
|
Years ended October 31, |
September 3, 1996 |
|||
|
|
2000 |
1999 |
1998 |
1997 |
1996 |
|
Dividend returns |
7.65% |
10.58% |
7.65% |
9.54% |
1.17% |
|
Capital returns |
-13.31% |
1.40% |
-12.20% |
5.64% |
2.41% |
|
Total returns |
-5.66% |
11.98% |
-4.55% |
15.18% |
3.58% |
Total return components include both dividend returns and capital returns. A dividend return reflects the actual dividends paid by the class. A capital return reflects both the amount paid by the class to shareholders as capital gain distributions and changes in the class' share price. Both returns assume the dividends or capital gains, if any, paid by the class are reinvested, and exclude the effects of sales charges.
Dividends and Yield
|
Periods ended October 31, 2000 |
Past 1 |
Past 6 |
Past 1 |
|
Dividends per share |
6.99¢ |
44.12¢ |
90.50¢ |
|
Annualized dividend rate |
8.40% |
8.49% |
8.42% |
|
30-day annualized yield |
10.94% |
- |
- |
Dividends per share show the income paid by the class for a set period and do not reflect any tax reclassifications. If you annualize this number, based on an average share price of $9.80 over the past one month, $10.31 over the past six months and $10.75 over the past one year, you can compare the class' income over these three periods. The 30-day annualized yield is a standard formula based on the yields of the securities in the fund, averaged over the past 30 days. This figure shows you the yield characteristics of the fund's investments at the end of the period. It also helps you compare funds from different companies on an equal basis. The offering share price used in the calculation of the yield includes the effect of Class A's current 4.75% sales charge.
Annual Report
Fidelity Advisor High Yield Fund - Class T
There are several ways to evaluate historical performance. You can look at the total percentage change in value, the average annual percentage change or the growth of a hypothetical $10,000 investment. Total return reflects the change in the value of an investment, assuming reinvestment of the class' dividend income and capital gains (the profits earned upon the sale of securities that have grown in value). You can also look at the class' income, as reflected in its yield, to measure performance. If Fidelity had not reimbursed certain class expenses during the periods shown, the past 10 year total returns would have been lower.
Cumulative Total Returns
|
Periods ended October 31, 2000 |
|
Past 1 |
Past 5 |
Past 10 |
|
Fidelity Adv High Yield - CL T |
|
-5.73% |
30.91% |
217.26% |
|
Fidelity Adv High Yield - CL T |
|
-9.03% |
26.33% |
206.15% |
|
ML High Yield Master II |
|
-1.68% |
31.76% |
199.32% |
|
High Current Yield Funds Average |
|
-2.77% |
25.45% |
173.70% |
Cumulative total returns show Class T's performance in percentage terms over a set period - in this case, one year, five years or 10 years. For example, if you had invested $1,000 in a fund that had a 5% return over the past year, the value of your investment would be $1,050. You can compare Class T's returns to those of the Merrill Lynch High Yield Master II Index - a market value-weighted index of all domestic and yankee high-yield bonds, including deferred interest bonds and payment-in-kind securities. Issues included in the index have maturities of one year or more and have a credit rating lower than BBB-/Baa3, but are not in default. To measure how Class T's performance stacked up against its peers, you can compare it to the high current yield funds average, which reflects the performance of mutual funds with similar objectives tracked by Lipper Inc. The past one year average represents a peer group of 357 mutual funds. These benchmarks include reinvested dividends and capital gains, if any, and exclude the effect of sales charges.
Annual Report
Fidelity Advisor High Yield Fund - Class T
Performance - continued
Average Annual Total Returns
|
Periods ended October 31, 2000 |
Past 1 |
Past 5 |
Past 10 |
|
Fidelity Adv High Yield - CL T |
-5.73% |
5.53% |
12.24% |
|
Fidelity Adv High Yield - CL T |
-9.03% |
4.79% |
11.84% |
|
ML High Yield Master II |
-1.68% |
5.67% |
11.59% |
|
High Current Yield Funds Average |
-2.77% |
4.55% |
10.51% |
Average annual total returns take Class T shares' cumulative return and show you what would have happened if Class T shares had performed at a constant rate each year.
Annual Report
Fidelity Advisor High Yield Fund - Class T
Performance - continued
$10,000 Over 10 Years
$10,000 Over 10 Years: Let's say hypothetically that $10,000 was invested in Fidelity Advisor High Yield Fund - Class T on October 31, 1990, and the current 3.50% sales charge was paid. As the chart shows, by October 31, 2000, the value of the investment would have grown to $30,615 - a 206.15% increase on the initial investment. For comparison, look at how the Merrill Lynch High Yield Master II Index did over the same period. With dividends reinvested, the same $10,000 would have grown to $29,932 - a 199.32% increase.
Understanding
Performance
How a fund did yesterday is no guarantee of how it will do tomorrow. Bond prices, for example, generally move in the opposite direction of interest rates. In turn, the share price, return and yield of a fund that invests in bonds will vary. That means if you sell your shares during a market downturn, you might lose money. But if you can ride out the market's ups and downs, you may have a gain.
3Annual Report
Fidelity Advisor High Yield Fund - Class T
Performance - continued
Total Return Components
|
|
Years ended October 31, |
|||||
|
|
2000 |
1999 |
1998 |
1997 |
1996 |
|
|
Dividend returns |
7.56% |
10.43% |
7.57% |
9.57% |
9.56% |
|
Capital returns |
-13.29% |
1.40% |
-12.11% |
5.64% |
3.36% |
|
Total returns |
-5.73% |
11.83% |
-4.54% |
15.21% |
12.92% |
Total return components include both dividend returns and capital returns. A dividend return reflects the actual dividends paid by the class. A capital return reflects both the amount paid by the class to shareholders as capital gain distributions and changes in the class' share price. Both returns assume the dividends or capital gains, if any, paid by the class are reinvested, and exclude the effects of sales charges.
Dividends and Yield
|
Periods ended October 31, 2000 |
Past 1 |
Past 6 |
Past 1 |
|
Dividends per share |
6.92¢ |
43.65¢ |
89.50¢ |
|
Annualized dividend rate |
8.31% |
8.38% |
8.31% |
|
30-day annualized yield |
10.98% |
- |
- |
Dividends per share show the income paid by the class for a set period and do not reflect any tax reclassifications. If you annualize this number, based on an average share price of $9.81 over the past one month, $10.33 over the past six months and $10.77 over the past one year, you can compare the class' income over these three periods. The 30-day annualized yield is a standard formula based on the yields of the securities in the fund, averaged over the past 30 days. This figure shows you the yield characteristics of the fund's investments at the end of the period. It also helps you compare funds from different companies on an equal basis. The offering share price used in the calculation of the yield includes the effect of Class T's current 3.50% sales charge.
Annual Report
Fidelity Advisor High Yield Fund - Class B
There are several ways to evaluate historical performance. You can look at the total percentage change in value, the average annual percentage change or the growth of a hypothetical $10,000 investment. Total return reflects the change in the value of an investment, assuming reinvestment of the class' dividend income and capital gains (the profits earned upon the sale of securities that have grown in value). You can also look at the class' income, as reflected in its yield, to measure performance. The initial offering of Class B shares took place on June 30, 1994. Class B shares bear a 0.90% 12b-1 fee (1.00% prior to January 1, 1996). Returns prior to June 30, 1994 are those of Class T, the original class of the fund, and reflect Class T shares' 0.25% 12b-1 fee. Had Class B shares' 12b-1 fee been reflected, returns prior to June 30, 1994 would have been lower. Class B shares' contingent deferred sales charges included in the past one year, past five year and past 10 year total return figures are 5%, 2% and 0%, respectively. If Fidelity had not reimbursed certain class expenses during the periods shown, the past 10 year total returns would have been lower.
Cumulative Total Returns
|
Periods ended October 31, 2000 |
|
Past 1 |
Past 5 |
Past 10 |
|
Fidelity Adv High Yield - CL B |
|
-6.39% |
26.50% |
202.59% |
|
Fidelity Adv High Yield - CL B |
|
-10.72% |
24.88% |
202.59% |
|
ML High Yield Master II |
|
-1.68% |
31.76% |
199.32% |
|
High Current Yield Funds Average |
|
-2.77% |
25.45% |
173.70% |
Cumulative total returns show Class B's performance in percentage terms over a set period - in this case, one year, five years or 10 years. For example, if you had invested $1,000 in a fund that had a 5% return over the past year, the value of your investment would be $1,050. You can compare Class B's returns to those of the Merrill Lynch High Yield Master II Index - a market value-weighted index of all domestic and yankee high-yield bonds, including deferred interest bonds and payment-in-kind securities. Issues included in the index have maturities of one year or more and have a credit rating lower than BBB-/Baa3, but are not in default. To measure how Class B's performance stacked up against its peers, you can compare it to the high current yield funds average, which reflects the performance of mutual funds with similar objectives tracked by Lipper Inc. The past one year average represents a peer group of 357 mutual funds. These benchmarks include reinvested dividends and capital gains, if any, and exclude the effect of sales charges.
Annual Report
Fidelity Advisor High Yield Fund - Class B
Performance - continued
Average Annual Total Returns
|
Periods ended October 31, 2000 |
Past 1 |
Past 5 |
Past 10 |
|
Fidelity Adv High Yield - CL B |
-6.39% |
4.81% |
11.71% |
|
Fidelity Adv High Yield - CL B |
-10.72% |
4.54% |
11.71% |
|
ML High Yield Master II |
-1.68% |
5.67% |
11.59% |
|
High Current Yield Funds Average |
-2.77% |
4.55% |
10.51% |
Average annual total returns take Class B shares' cumulative return and show you what would have happened if Class B shares had performed at a constant rate each year.
Annual Report
Fidelity Advisor High Yield Fund - Class B
Performance - continued
$10,000 Over 10 Years

$10,000 Over 10 Years: Let's say hypothetically that $10,000 was invested in Fidelity Advisor High Yield Fund - Class B on October 31, 1990. As the chart shows, by October 31, 2000, the value of the investment would have grown to $30,259 - a 202.59% increase on the initial investment. For comparison, look at how the Merrill Lynch High Yield Master II Index did over the same period. With dividends reinvested, the same $10,000 would have grown to $29,932 - a 199.32% increase.
Understanding
Performance
How a fund did yesterday is no guarantee of how it will do tomorrow. Bond prices, for example, generally move in the opposite direction of interest rates. In turn, the share price, return and yield of a fund that invests in bonds will vary. That means if you sell your shares during a market downturn, you might lose money. But if you can ride out the market's ups and downs, you may have a gain.
3Annual Report
Fidelity Advisor High Yield Fund - Class B
Performance - continued
Total Return Components
|
|
Years ended October 31, |
|||||
|
|
2000 |
1999 |
1998 |
1997 |
1996 |
|
|
Dividend |
6.96% |
9.79% |
6.98% |
8.85% |
8.82% |
|
Capital returns |
-13.35% |
1.31% |
-12.08% |
5.49% |
3.28% |
|
Total returns |
-6.39% |
11.10% |
-5.10% |
14.34% |
12.10% |
Total return components include both dividend returns and capital returns. A dividend return reflects the actual dividends paid by the class. A capital return reflects both the amount paid by the class to shareholders as capital gain distributions and changes in the class' share price. Both returns assume the dividends or capital gains, if any, paid by the class are reinvested and exclude the effects of sales charges.
Dividends and Yield
|
Periods ended October 31, 2000 |
Past 1 |
Past 6 |
Past 1 |
|
Dividends per share |
6.37¢ |
40.22¢ |
82.38¢ |
|
Annualized dividend rate |
7.68% |
7.75% |
7.68% |
|
30-day annualized yield |
10.75% |
- |
- |
Dividends per share show the income paid by the class for a set period and do not reflect any tax reclassifications. If you annualize this number, based on an average share price of $9.77 over the past one month, $10.29 over the past six months, and $10.72 over the past one year, you can compare the class' income over these three periods. The 30-day annualized yield is a standard formula based on the yields of the securities in the fund, averaged over the past 30 days. This figure shows you the yield characteristics of the fund's investments at the end of the period. It also helps you compare funds from different companies on an equal basis. The offering share price used in the calculation of the yield excludes the effect of Class B's contingent deferred sales charge.
Annual Report
Fidelity Advisor High Yield Fund - Class C
There are several ways to evaluate historical performance. You can look at the total percentage change in value, the average annual percentage change or the growth of a hypothetical $10,000 investment. Total return reflects the change in the value of an investment, assuming reinvestment of the class' dividend income and capital gains (the profits earned upon the sale of securities that have grown in value). You can also look at the class' income, as reflected in its yield, to measure performance. The initial offering of Class C shares took place on November 3, 1997. Class C shares bear a 1.00% 12b-1 fee. Returns between June 30, 1994 and November 3, 1997 are those of Class B and reflect Class B shares' 0.90% 12b-1 fee (1.00% prior to January 1, 1996). Returns prior to June 30, 1994 are those of Class T and reflect Class T shares' 0.25% 12b-1 fee. Had Class C shares' 12b-1 fee been reflected, returns between January 1, 1996 and November 3, 1997 and prior to June 30, 1994 would have been lower. Class C shares' contingent deferred sales charge included in the past one year, past five year and past 10 year total return figures are 1%, 0% and 0%, respectively. If Fidelity had not reimbursed certain class expenses during the periods shown, the past 10 year total returns would have been lower.
Cumulative Total Returns
|
Periods ended October 31, 2000 |
|
Past 1 |
Past 5 |
Past 10 |
|
Fidelity Adv High Yield - CL C |
|
-6.45% |
26.02% |
201.45% |
|
Fidelity Adv High Yield - CL C |
|
-7.32% |
26.02% |
201.45% |
|
ML High Yield Master II |
|
-1.68% |
31.76% |
199.32% |
|
High Current Yield Funds Average |
|
-2.77% |
25.45% |
173.70% |
Cumulative total returns show Class C's performance in percentage terms over a set period - in this case, one year, five years or 10 years. For example, if you had invested $1,000 in a fund that had a 5% return over the past year, the value of your investment would be $1,050. You can compare Class C's returns to those of the Merrill Lynch High Yield Master II Index - a market value-weighted index of all domestic and yankee high-yield bonds, including deferred interest bonds and payment-in-kind securities. Issues included in the index have maturities of one year or more and have a credit rating lower than BBB-/Baa3, but are not in default. To measure how Class C's performance stacked up against its peers, you can compare it to the high current yield funds average, which reflects the performance of mutual funds with similar objectives tracked by Lipper Inc. The past one year average represents a peer group of 357 mutual funds. These benchmarks include reinvested dividends and capital gains, if any, and exclude the effect of sales charges.
Annual Report
Fidelity Advisor High Yield Fund - Class C
Performance - continued
Average Annual Total Returns
|
Periods ended October 31, 2000 |
Past 1 |
Past 5 |
Past 10 |
|
Fidelity Adv High Yield - CL C |
-6.45% |
4.73% |
11.67% |
|
Fidelity Adv High Yield - CL C |
-7.32% |
4.73% |
11.67% |
|
ML High Yield Master II |
-1.68% |
5.67% |
11.59% |
|
High Current Yield Funds Average |
-2.77% |
4.55% |
10.51% |
Average annual total returns take Class C shares' cumulative return and show you what would have happened if Class C shares had performed at a constant rate each year.
Annual Report
Fidelity Advisor High Yield Fund - Class C
Performance - continued
$10,000 Over 10 Years
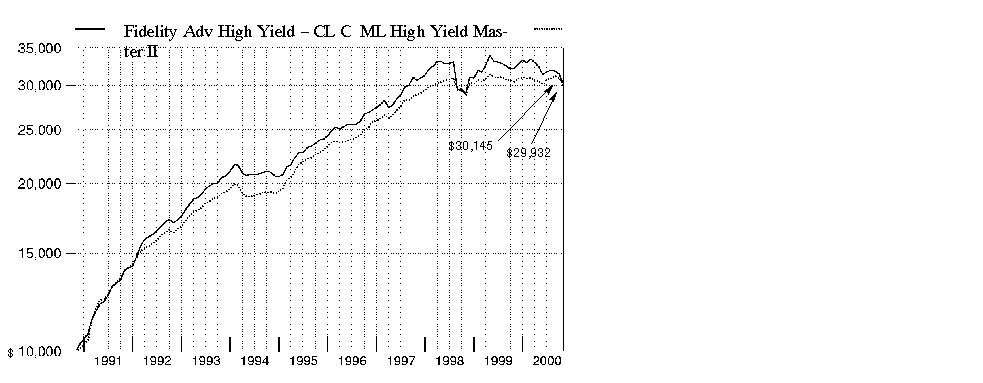
$10,000 Over 10 Years: Let's say hypothetically that $10,000 was invested in Fidelity Advisor High Yield Fund - Class C on October 31, 1990. As the chart shows, by October 31, 2000, the value of the investment would have been $30,145 - a 201.45% increase on the initial investment. For comparison, look at how the Merrill Lynch High Yield Master II Index did over the same period. With dividends reinvested, the same $10,000 would have grown to $29,932 - a 199.32% increase.
Understanding
Performance
How a fund did yesterday is no guarantee of how it will do tomorrow. Bond prices, for example, generally move in the opposite direction of interest rates. In turn, the share price, return and yield of a fund that invests in bonds will vary. That means if you sell your shares during a market downturn, you might lose money. But if you can ride out the market's ups and downs, you may have a gain.
3Annual Report
Fidelity Advisor High Yield Fund - Class C
Performance - continued
Total Return Components
|
|
|
November 3, 1997 |
||
|
|
2000 |
1999 |
1998 |
|
|
Dividend returns |
6.87% |
9.69% |
6.74% |
|
Capital returns |
-13.32% |
1.31% |
-12.47% |
|
Total returns |
-6.45% |
11.00% |
-5.73% |
Total return components include both dividend returns and capital returns. A dividend return reflects the actual dividends paid by the class. A capital return reflects both the amount paid by the class to shareholders as capital gain distributions and changes in the class' share price. Both returns assume the dividends or capital gains, if any, paid by the class are reinvested, and exclude the effects of sales charges.
Dividends and Yield
|
Periods ended October 31, 2000 |
Past 1 |
Past 6 |
Past 1 |
|
Dividends per share |
6.31¢ |
39.88¢ |
81.52¢ |
|
Annualized dividend rate |
7.59% |
7.67% |
7.59% |
|
30-day annualized yield |
10.66% |
- |
- |
Dividends per share show the income paid by the class for a set period and do not reflect any tax reclassifications. If you annualize this number, based on an average share price of $9.79 over the past one month, $10.31 over the past six months and $10.74 over the past one year, you can compare the class' income over these three periods. The 30-day annualized yield is a standard formula based on the yields of the securities in the fund, averaged over the past 30 days. This figure shows you the yield characteristics of the fund's investments at the end of the period. It also helps you compare funds from different companies on an equal basis. The offering share price used in the calculation of the yield excludes the effect of Class C's contingent deferred sales charge.
Annual Report
Market Recap
With a negative return for the 12-month period ending October 31, 2000, the high-yield market can be viewed in one of two ways: as a distressed market that perhaps has not reached its bottom, or as an opportunity for investors to take advantage of attractively low prices. Early in the period, high-yield securities suffered in comparison to the high-flying NASDAQ market. High-yield debt suffered again when the NASDAQ tumbled and an economic slowdown loomed, resulting in a series of corporate earnings disappointments. Technical factors - abundant supply in the face of weak demand - further hampered performance. As the high-yield default rate crept higher, investors turned to the relative safety of investment-grade bonds. For the one-year period ending October 31, 2000, the Merrill Lynch High Yield Master II Index - a broad measure of high-yield market performance - fell 1.68%. This return lagged the overall U.S. taxable bond market as measured by the Lehman Brothers Aggregate Bond Index, which gained 7.30% during the past 12 months. A potential catalyst for improved performance could be a continued increase in merger and acquisition activity. From July to August, $90 billion in M&A activity took place where the target company was in the high-yield universe. Not only do these deals reduce the supply of high-yield credits, they also establish benchmark valuations for some sectors of the market.
(Portfolio Manager photograph)
Note to shareholders: Tom Soviero became Portfolio Manager of Fidelity Advisor High Yield Fund on June 1, 2000.
Q. How did the fund perform, Tom?
A. For the 12 months that ended October 31, 2000, the fund's Class A, Class T, Class B and Class C shares returned -5.66%, -5.73%, -6.39%, and -6.45%, respectively. In comparison, the high current yield funds average tracked by Lipper Inc. fell 2.77%, while the overall high-yield market, as measured by the Merrill Lynch High Yield Master II Index, dropped 1.68% for the same 12-month period.
Q. How would you characterize the investment environment for high-yield bonds?
A. In a word, challenging. Weak market conditions were specific to the high-yield asset class, rather than in response to external shocks, such as the Asian currency crisis in 1998. A good proxy for the high-yield market's malaise is the distressed ratio, the proportion of securities yielding at least 10 percentage points more than Treasuries, which had a yield of approximately 6% at the end of the period. Nearly 25% of securities in the high-yield market were yielding at least 16%, suggesting that one out of every four high-yield bonds was experiencing significant fundamental problems. This environment led investors to seek higher-quality investment alternatives by moving up the credit spectrum within the high-yield sector, or moving out of high-yield bonds altogether.
Annual Report
Fund Talk: The Manager's Overview - continued
Q. As the fund's new manager, what investment strategies did you implement?
A. First, I think it's important to understand my investment philosophy, which emphasizes sector and security selection based on fundamental credit research. This philosophy drove my core strategy during the past months. Despite a rocky transition environment, I was able to reduce the portfolio's exposure to weaker players within certain sectors, such as telecommunications, at relatively attractive prices. Structurally, I maintained an average credit quality of "B," although I did invest along the entire quality spectrum. I also invested in all levels of the capital structure, including opportunistic investments in common stocks, almost always of high-yield issuers. I am a firm believer that volatility creates opportunity, particularly when bond prices fall below their fundamental values.
Q. What drove the fund's underperformance during the past year?
A. Credit problems were the biggest factor, including the portfolio's overweighting in the telecommunications sector, where several lower-tier companies performed poorly. For example, ICG Communications, an Internet access provider, had problems servicing key customers and serious management turmoil that led to declining financial health. GST Telecommunications, a competitive local exchange carrier, also suffered from internal conflict and management changes. Several retail chains fared badly, including Pathmark Stores and Rite Aid. Pathmark deteriorated in response to a failed merger, which led to liquidity problems and a debt-restructuring program. Rite Aid, a turnaround play, hasn't yet met my expectations. Despite an improving balance sheet, Rite Aid's profitability remained weak, a concern in light of its substantial debt load. Another disappointment was Gaylord Container, which issued a poor September quarterly earnings report as a result of increased raw material prices. The market overreacted, and the bonds fell substantially. However, Gaylord's fundamental prospects remained strong and I purchased more at attractive prices shortly thereafter.
Q. What holdings helped the fund's return?
A. Selling lower-tier telecom bonds and replacing them in part with top-tier issuers, such as Nextel, helped returns. Nextel, the portfolio's largest holding at the end of the period, held up extremely well based on strong subscriber growth at above-average revenue and low disconnect rates. A common stock investment in Laboratory Corp. of America - also a high-yield issuer - benefited from a successful turnaround strategy and favorable macro trends that drove a strong health care diagnostics sector move. Increasing merger and acquisition activity in the high-yield arena benefited several holdings that were acquired by investment-grade entities.
Annual Report
Fund Talk: The Manager's Overview - continued
Q. What's your outlook for the months ahead?
A. The past months have been disappointing. However, from a valuation perspective, credit spreads are at their widest - with a lower default rate - since 1991 when we began to emerge from the recession. At that time, we saw non-traditional sources of capital enter the high-yield market, including hedge funds and equity players. If recent merger and acquisition activity is any indication, we may be approaching a point where such non-traditional players may re-enter the high-yield market in order to capture potential gains from fundamentally sound companies selling at prices below their intrinsic value.
The views expressed in this report reflect those of the portfolio manager only through the end of the period of the report as stated on the cover and do not necessarily represent the views of Fidelity or any other person in the Fidelity organization. Any such views are subject to change at any time based upon market or other conditions and Fidelity disclaims any responsibility to update such views. These views may not be relied on as investment advice and, because investment decisions for a Fidelity fund are based on numerous factors, may not be relied on as an indication of trading intent on behalf of any Fidelity fund.
Fund Facts
Goal: seeks a combination of a high level of income and potential for capital gains
Start date: January 5, 1987
Size: as of October 31, 2000, more than $3.2 billion
Manager: Tom Soviero, since June 2000; joined Fidelity in 1989
3Tom Soviero on the role of mergers and acquisitions:
"Merger and acquisition (M&A) activity in the high-yield bond market can play a significant role for investors seeking to capture the intrinsic value of a company and its business prospects. At no time is this more important than during weak investment environments. As credit spreads widen and market sentiment deteriorates, a high-yield company's access to capital may become constrained or simply too expensive. Without access to adequate, affordable financing, companies may find that they can no longer support the growth necessary to become - or remain - competitive.
"Recently, M&A activity has been on the rise as a number of well-established global companies have taken advantage of attractive prices for high-yield companies. Several of the fund's holdings have been acquired, or have acquisitions pending, by investment-grade entities including R&B Falcon, Repap, VoiceStream and Intermedia. These examples are diversified across sectors and may signal a use of M&A as a quasi-financing tool to achieve the size and balance sheet strength necessary to compete and survive over a longer term. These examples also illustrate the broad-based upside potential in the high-yield market - as transactions multiply, demand and prices for high-yield bonds may improve to reflect companies' current value and future prospects."
Annual Report
|
Top Five Holdings as of October 31, 2000 |
||
|
(by issuer, excluding cash equivalents) |
% of fund's |
% of fund's net assets |
|
Nextel Communications, Inc. |
4.7 |
1.9 |
|
Laboratory Corp. of America Holdings |
4.4 |
0.0 |
|
Intermedia Communications, Inc. |
2.7 |
2.5 |
|
CSC Holdings, Inc. |
2.6 |
2.1 |
|
United Pan-Europe Communications NV |
2.5 |
2.5 |
|
|
16.9 |
9.0 |
|
Top Five Market Sectors as of October 31, 2000 |
||
|
|
% of fund's |
% of fund's net assets |
|
Media & Leisure |
28.3 |
29.6 |
|
Utilities |
26.3 |
28.9 |
|
Health |
9.3 |
3.2 |
|
Basic Industries |
7.6 |
8.3 |
|
Energy |
3.4 |
4.2 |
|
Quality Diversification as of October 31, 2000 |
||
|
(Moody's Ratings) |
% of fund's investments |
% of fund's investments |
|
Aaa, Aa, A |
0.2 |
0.5 |
|
Baa |
0.8 |
0.5 |
|
Ba |
6.0 |
5.1 |
|
B |
50.4 |
55.2 |
|
Caa, Ca, C |
10.7 |
13.5 |
|
D |
0.0 |
0.2 |
|
Not Rated |
2.7 |
5.6 |
|
Table excludes short-term investments. Where Moody's ratings are not available, we have used S&P ratings. Unrated debt securities that are equivalent to Ba and below at October 31, 2000 and April 30, 2000 account for 2.7% and 5.6%, respectively, of the fund's investments. |
|
Asset Allocation (% of fund's net assets) |
|||||||
|
As of October 31, 2000 * |
As of April 30, 2000 ** |
||||||
|
Nonconvertible |
|
|
Nonconvertible |
|
||
|
Convertible Bonds, Preferred Stocks 16.6% |
|
|
Convertible Bonds, Preferred Stocks 11.2% |
|
||
 |
Common Stocks 9.8% |
|
|
Common Stocks 4.7% |
|
||
 |
Other Investments 1.9% |
|
|
Other Investments 1.3% |
|
||
|
Short-Term |
|
|
Short-Term |
|
||
|
* Foreign |
11.9% |
|
** Foreign |
12.6% |
|
||

Annual Report
Showing Percentage of Net Assets
|
Corporate Bonds - 66.6% |
|||||
|
Moody's Ratings (unaudited) (b) |
Principal Amount (000s) |
Value (Note 1) (000s) |
|||
|
Convertible Bonds - 2.2% |
|||||
|
CONSTRUCTION & REAL ESTATE - 0.4% |
|||||
|
Building Materials - 0.1% |
|||||
|
Hexcel Corp. 7% 8/1/03 |
B3 |
|
$ 2,220 |
$ 2,020 |
|
|
Real Estate Investment Trusts - 0.3% |
|||||
|
Rockefeller Center Properties, Inc. 0% 12/31/00 |
- |
|
12,700 |
10,795 |
|
|
TOTAL CONSTRUCTION & REAL ESTATE |
12,815 |
||||
|
FINANCE - 0.3% |
|||||
|
Securities Industry - 0.3% |
|||||
|
Ameritrade Holding Corp. 5.75% 8/1/04 |
CCC+ |
|
14,820 |
10,004 |
|
|
HEALTH - 1.5% |
|||||
|
Medical Facilities Management - 1.5% |
|||||
|
HEALTHSOUTH Corp. 3.25% 4/1/03 |
Ba3 |
|
13,240 |
11,304 |
|
|
Total Renal Care Holdings, Inc.: |
|
|
|
|
|
|
7% 5/15/09 |
B3 |
|
25,300 |
18,722 |
|
|
7% 5/15/09 (e) |
B3 |
|
24,020 |
17,775 |
|
|
|
47,801 |
||||
|
TOTAL CONVERTIBLE BONDS |
70,620 |
||||
|
Nonconvertible Bonds - 64.4% |
|||||
|
BASIC INDUSTRIES - 7.1% |
|||||
|
Chemicals & Plastics - 3.9% |
|||||
|
Avecia Group PLC 11% 7/1/09 |
B2 |
|
26,890 |
25,546 |
|
|
Geo Specialty Chemicals, Inc. 10.125% 8/1/08 |
B3 |
|
745 |
596 |
|
|
Huntsman Corp.: |
|
|
|
|
|
|
9.5% 7/1/07 (e) |
B2 |
|
16,270 |
9,762 |
|
|
9.5% 7/1/07 (e) |
B2 |
|
23,525 |
14,115 |
|
|
Huntsman ICI Chemicals LLC 10.125% 7/1/09 |
B2 |
|
23,790 |
22,482 |
|
|
Lyondell Chemical Co.: |
|
|
|
|
|
|
9.625% 5/1/07 |
Ba3 |
|
7,905 |
7,707 |
|
|
9.875% 5/1/07 |
Ba3 |
|
12,710 |
12,392 |
|
|
10.875% 5/1/09 |
B2 |
|
32,730 |
31,421 |
|
|
Sterling Chemicals, Inc. 12.375% 7/15/06 |
B3 |
|
3,000 |
2,865 |
|
|
|
126,886 |
||||
|
Metals & Mining - 0.1% |
|||||
|
Metallurg, Inc. 11% 12/1/07 |
B3 |
|
4,735 |
3,693 |
|
|
Corporate Bonds - continued |
|||||
|
Moody's Ratings (unaudited) (b) |
Principal Amount (000s) |
Value (Note 1) (000s) |
|||
|
Nonconvertible Bonds - continued |
|||||
|
BASIC INDUSTRIES - continued |
|||||
|
Packaging & Containers - 1.4% |
|||||
|
Gaylord Container Corp.: |
|
|
|
|
|
|
9.375% 6/15/07 |
Caa1 |
|
$ 17,510 |
$ 11,382 |
|
|
9.75% 6/15/07 |
Caa1 |
|
16,030 |
10,740 |
|
|
9.875% 2/15/08 |
Caa3 |
|
63,880 |
19,164 |
|
|
Sweetheart Cup, Inc. 10.5% 9/1/03 |
Caa1 |
|
2,525 |
2,273 |
|
|
U.S. Can Corp. 12.375% 10/1/10 (e) |
B3 |
|
3,280 |
3,214 |
|
|
|
46,773 |
||||
|
Paper & Forest Products - 1.7% |
|||||
|
Abitibi-Consolidated, Inc. 7.4% 4/1/18 |
Baa3 |
|
16,780 |
14,614 |
|
|
Container Corp. of America gtd.: |
|
|
|
|
|
|
9.75% 4/1/03 |
B2 |
|
3,490 |
3,490 |
|
|
11.25% 5/1/04 |
B2 |
|
4,550 |
4,561 |
|
|
Riverwood International Corp. 10.875% 4/1/08 |
Caa1 |
|
4,445 |
4,001 |
|
|
SF Holdings Group, Inc. 0% 3/15/08 (d) |
Caa2 |
|
17,151 |
8,919 |
|
|
Stone Container Corp. 12.58% 8/1/16 (f) |
B2 |
|
18,740 |
18,740 |
|
|
|
54,325 |
||||
|
TOTAL BASIC INDUSTRIES |
231,677 |
||||
|
CONSTRUCTION & REAL ESTATE - 1.2% |
|||||
|
Building Materials - 0.6% |
|||||
|
Flowserve Corp. 12.25% 8/15/10 (e) |
B3 |
|
13,440 |
13,440 |
|
|
Numatics, Inc. 9.625% 4/1/08 |
B3 |
|
10,385 |
7,996 |
|
|
|
21,436 |
||||
|
Construction - 0.1% |
|||||
|
Blount, Inc. 13% 8/1/09 |
B3 |
|
3,790 |
3,184 |
|
|
Real Estate - 0.1% |
|||||
|
Stewart Enterprises, Inc. 6.4% 5/5/13 |
Ba3 |
|
2,970 |
1,901 |
|
|
Real Estate Investment Trusts - 0.4% |
|||||
|
Ocwen Asset Investment Corp. 11.5% 7/1/05 |
- |
|
15,000 |
11,700 |
|
|
TOTAL CONSTRUCTION & REAL ESTATE |
38,221 |
||||
|
DURABLES - 1.2% |
|||||
|
Home Furnishings - 0.7% |
|||||
|
Sealy Corp., Inc. 10% 12/18/08 pay-in-kind (g) |
- |
|
14,222 |
10,880 |
|
|
Corporate Bonds - continued |
|||||
|
Moody's Ratings (unaudited) (b) |
Principal Amount (000s) |
Value (Note 1) (000s) |
|||
|
Nonconvertible Bonds - continued |
|||||
|
DURABLES - continued |
|||||
|
Home Furnishings - continued |
|||||
|
Sealy Mattress Co.: |
|
|
|
|
|
|
0% 12/15/07 (d) |
B3 |
|
$ 6,930 |
$ 5,163 |
|
|
9.875% 12/15/07 |
B3 |
|
6,190 |
5,881 |
|
|
|
21,924 |
||||
|
Textiles & Apparel - 0.5% |
|||||
|
Levi Strauss & Co.: |
|
|
|
|
|
|
6.8% 11/1/03 |
Ba3 |
|
11,665 |
9,565 |
|
|
7% 11/1/06 |
Ba3 |
|
9,895 |
7,322 |
|
|
Pillowtex Corp.: |
|
|
|
|
|
|
9% 12/15/07 |
Ca |
|
5,340 |
641 |
|
|
10% 11/15/06 |
Ca |
|
4,370 |
524 |
|
|
|
18,052 |
||||
|
TOTAL DURABLES |
39,976 |
||||
|
ENERGY - 2.8% |
|||||
|
Coal - 0.5% |
|||||
|
P&L Coal Holdings Corp. 9.625% 5/15/08 |
B2 |
|
15,310 |
14,966 |
|
|
Energy Services - 1.5% |
|||||
|
R&B Falcon Corp.: |
|
|
|
|
|
|
6.5% 4/15/03 |
Ba3 |
|
4,345 |
4,128 |
|
|
6.75% 4/15/05 |
Ba3 |
|
2,160 |
2,009 |
|
|
6.95% 4/15/08 |
Ba3 |
|
320 |
291 |
|
|
9.5% 12/15/08 |
Ba3 |
|
20,820 |
21,861 |
|
|
12.25% 3/15/06 |
Ba3 |
|
6,570 |
7,687 |
|
|
RBF Finance Co. 11.375% 3/15/09 |
Ba3 |
|
10,650 |
12,168 |
|
|
|
48,144 |
||||
|
Oil & Gas - 0.8% |
|||||
|
Lomak Petroleum, Inc. 8.75% 1/15/07 |
B3 |
|
8,777 |
8,294 |
|
|
Swift Energy Co. 10.25% 8/1/09 |
B2 |
|
4,000 |
4,060 |
|
|
Tesoro Petroleum Corp. 9% 7/1/08 |
B1 |
|
16,330 |
15,718 |
|
|
|
28,072 |
||||
|
TOTAL ENERGY |
91,182 |
||||
|
Corporate Bonds - continued |
|||||
|
Moody's Ratings (unaudited) (b) |
Principal Amount (000s) |
Value (Note 1) (000s) |
|||
|
Nonconvertible Bonds - continued |
|||||
|
FINANCE - 2.1% |
|||||
|
Credit & Other Finance - 2.1% |
|||||
|
Arch Escrow Corp. 13.75% 4/15/08 |
B3 |
|
$ 26,120 |
$ 13,321 |
|
|
Denbury Management, Inc. 9% 3/1/08 |
B3 |
|
16,470 |
14,494 |
|
|
Dobson/Sygnet Communications Co. 12.25% 12/15/08 |
B3 |
|
8,070 |
7,989 |
|
|
GS Escrow Corp. 7.125% 8/1/05 |
Ba1 |
|
9,700 |
8,899 |
|
|
Macsaver Financial Services, Inc.: |
|
|
|
|
|
|
7.4% 2/15/02 (c) |
Ca |
|
6,670 |
800 |
|
|
7.6% 8/1/07 (c) |
Ca |
|
6,970 |
836 |
|
|
Stone Container Finance Co. 11.5% 8/15/06 (e) |
B2 |
|
8,330 |
8,497 |
|
|
Venetian Casino Resort LLC/Las Vegas Sands, Inc. 12.25% 11/15/04 |
Caa1 |
|
15,770 |
16,007 |
|
|
|
70,843 |
||||
|
HEALTH - 3.1% |
|||||
|
Medical Equipment & Supplies - 0.3% |
|||||
|
PharMerica, Inc. 8.375% 4/1/08 |
B3 |
|
12,205 |
9,154 |
|
|
Medical Facilities Management - 2.8% |
|||||
|
Everest Healthcare Services, Inc. 9.75% 5/1/08 |
B3 |
|
3,740 |
3,516 |
|
|
HEALTHSOUTH Corp. 7% 6/15/08 |
Ba1 |
|
20,375 |
17,140 |
|
|
Iasis Healthcare Corp. 13% 10/15/09 |
B3 |
|
14,690 |
13,441 |
|
|
Manor Care, Inc. 7.5% 6/15/06 |
Ba1 |
|
3,700 |
3,219 |
|
|
Oxford Health Plans, Inc. 11% 5/15/05 |
B2 |
|
29,600 |
32,264 |
|
|
Unilab Corp. 12.75% 10/1/09 |
B3 |
|
20,624 |
22,068 |
|
|
|
91,648 |
||||
|
TOTAL HEALTH |
100,802 |
||||
|
INDUSTRIAL MACHINERY & EQUIPMENT - 2.3% |
|||||
|
Electrical Equipment - 0.3% |
|||||
|
L-3 Communications Corp. 8% 8/1/08 |
B2 |
|
10,600 |
9,593 |
|
|
Industrial Machinery & Equipment - 0.1% |
|||||
|
Dunlop Standard Aero Holdings PLC 11.875% 5/15/09 |
B3 |
|
1,460 |
1,453 |
|
|
International Knife & Saw, Inc. 11.375% 11/15/06 |
Caa1 |
|
2,155 |
1,013 |
|
|
Tenneco Automotive, Inc. 11.625% 10/15/09 |
B2 |
|
945 |
548 |
|
|
|
3,014 |
||||
|
Corporate Bonds - continued |
|||||
|
Moody's Ratings (unaudited) (b) |
Principal Amount (000s) |
Value (Note 1) (000s) |
|||
|
Nonconvertible Bonds - continued |
|||||
|
INDUSTRIAL MACHINERY & EQUIPMENT - continued |
|||||
|
Pollution Control - 1.9% |
|||||
|
Allied Waste North America, Inc. 10% 8/1/09 |
B2 |
|
$ 73,385 |
$ 62,194 |
|
|
TOTAL INDUSTRIAL MACHINERY & EQUIPMENT |
74,801 |
||||
|
MEDIA & LEISURE - 19.1% |
|||||
|
Broadcasting - 16.4% |
|||||
|
360networks, Inc. 13% 5/1/08 |
B3 |
|
34,070 |
27,086 |
|
|
ACME Television LLC/ACME Financial Corp. 10.875% 9/30/04 |
B3 |
|
13,932 |
12,887 |
|
|
Ascent Entertainment Group, Inc. 0% 12/15/04 (d) |
Ba1 |
|
11,280 |
9,306 |
|
|
Callahan Nordrhein Westfalen 14% 7/15/10 (e) |
B3 |
|
10,230 |
9,821 |
|
|
Comcast UK Cable Partners Ltd. 0% 11/15/07 (d) |
B2 |
|
5,370 |
4,833 |
|
|
Diamond Cable Communications PLC yankee |
B2 |
|
34,145 |
30,816 |
|
|
EchoStar DBS Corp. 9.375% 2/1/09 |
B1 |
|
56,555 |
55,424 |
|
|
Fox Family Worldwide, Inc. 0% 11/1/07 (d) |
B1 |
|
10,210 |
7,300 |
|
|
FrontierVision Holdings LP/FrontierVision Holdings Capital Corp. 0% 9/15/07 (d) |
B2 |
|
6,100 |
5,078 |
|
|
FrontierVision Holdings LP/FrontierVision Holdings Capital II Corp. 0% 9/15/07 (d) |
Caa1 |
|
14,478 |
12,053 |
|
|
Golden Sky DBS, Inc. 0% 3/1/07 (d) |
Caa1 |
|
24,025 |
16,337 |
|
|
Impsat Fiber Networks, Inc. 13.75% 2/15/05 |
B3 |
|
30,195 |
21,740 |
|
|
International Cabletel, Inc. 0% 2/1/06 (d) |
B2 |
|
51,577 |
45,388 |
|
|
Knology Holding, Inc. 0% 10/15/07 (d) |
- |
|
9,035 |
2,801 |
|
|
LIN Holdings Corp. 0% 3/1/08 (d) |
B3 |
|
6,905 |
4,868 |
|
|
NTL Communications Corp.: |
|
|
|
|
|
|
0% 10/1/08 (d) |
B3 |
|
30,780 |
17,622 |
|
|
11.5% 10/1/08 |
B3 |
|
35,980 |
32,202 |
|
|
11.875% 10/1/10 (e) |
B2 |
|
3,280 |
3,034 |
|
|
NTL, Inc. 10% 2/15/07 |
B2 |
|
20,160 |
17,539 |
|
|
Pegasus Communications Corp.: |
|
|
|
|
|
|
9.625% 10/15/05 |
B3 |
|
2,770 |
2,701 |
|
|
9.75% 12/1/06 |
B3 |
|
7,495 |
7,308 |
|
|
12.5% 8/1/17 |
B3 |
|
12,450 |
12,948 |
|
|
Satelites Mexicanos SA de CV: |
|
|
|
|
|
|
10.125% 11/1/04 |
B3 |
|
34,360 |
21,647 |
|
|
11.28% 6/30/04 (e)(f) |
B1 |
|
13,115 |
11,476 |
|
|
Corporate Bonds - continued |
|||||
|
Moody's Ratings (unaudited) (b) |
Principal Amount (000s) |
Value (Note 1) (000s) |
|||
|
Nonconvertible Bonds - continued |
|||||
|
MEDIA & LEISURE - continued |
|||||
|
Broadcasting - continued |
|||||
|
Telemundo Holdings, Inc. 0% 8/15/08 (d) |
Caa1 |
|
$ 11,320 |
$ 7,924 |
|
|
Telewest Communications PLC 11.25% 11/1/08 |
B1 |
|
5,360 |
4,824 |
|
|
Telewest PLC: |
|
|
|
|
|
|
yankee 9.625% 10/1/06 |
B1 |
|
9,260 |
7,593 |
|
|
11% 10/1/07 |
B1 |
|
31,970 |
28,773 |
|
|
United International Holdings, Inc. |
B3 |
|
25,735 |
14,926 |
|
|
United Pan-Europe Communications NV: |
|
|
|
|
|
|
0% 8/1/09 (d) |
B2 |
|
2,860 |
1,115 |
|
|
0% 11/1/09 (d) |
B2 |
|
52,150 |
19,556 |
|
|
10.875% 8/1/09 |
B2 |
|
23,150 |
16,784 |
|
|
11.25% 11/1/09 |
B2 |
|
31,010 |
23,413 |
|
|
11.25% 2/1/10 |
B2 |
|
12,775 |
9,581 |
|
|
11.5% 2/1/10 |
B2 |
|
17,030 |
12,943 |
|
|
|
539,647 |
||||
|
Entertainment - 1.2% |
|||||
|
AMC Entertainment, Inc.: |
|
|
|
|
|
|
9.5% 3/15/09 |
Caa3 |
|
25,820 |
12,394 |
|
|
9.5% 2/1/11 |
Caa3 |
|
25,010 |
11,755 |
|
|
Cinemark USA, Inc. 8.5% 8/1/08 |
B2 |
|
4,985 |
2,044 |
|
|
Livent, Inc. 9.375% 10/15/04 (c) |
- |
|
11,100 |
2,220 |
|
|
Waterford Gaming LLC/Waterford Gaming Finance Corp. 9.5% 3/15/10 (e) |
B1 |
|
10,545 |
10,281 |
|
|
|
38,694 |
||||
|
Lodging & Gaming - 1.5% |
|||||
|
Florida Panthers Holdings, Inc. 9.875% 4/15/09 |
B2 |
|
4,960 |
4,675 |
|
|
Horseshoe Gaming LLC 8.625% 5/15/09 |
B2 |
|
37,840 |
36,894 |
|
|
ITT Corp. 6.75% 11/15/05 |
Ba1 |
|
4,465 |
4,119 |
|
|
Mohegan Tribal Gaming Authority 8.75% 1/1/09 |
Ba3 |
|
3,630 |
3,548 |
|
|
|
49,236 |
||||
|
TOTAL MEDIA & LEISURE |
627,577 |
||||
|
Corporate Bonds - continued |
|||||
|
Moody's Ratings (unaudited) (b) |
Principal Amount (000s) |
Value (Note 1) (000s) |
|||
|
Nonconvertible Bonds - continued |
|||||
|
NONDURABLES - 0.6% |
|||||
|
Foods - 0.4% |
|||||
|
Del Monte Corp. 12.25% 4/15/07 |
B3 |
|
$ 6,355 |
$ 6,514 |
|
|
Del Monte Foods Co. 0% 12/15/07 (d) |
Caa1 |
|
7,584 |
5,631 |
|
|
|
12,145 |
||||
|
Household Products - 0.2% |
|||||
|
AKI Holding Corp. 0% 7/1/09 (d) |
Caa1 |
|
17,930 |
6,724 |
|
|
TOTAL NONDURABLES |
18,869 |
||||
|
RETAIL & WHOLESALE - 1.1% |
|||||
|
Drug Stores - 0.4% |
|||||
|
Rite Aid Corp.: |
|
|
|
|
|
|
6.125% 12/15/08 (e) |
Caa1 |
|
3,705 |
889 |
|
|
6.5% 12/15/05 (e) |
Caa1 |
|
13,360 |
3,340 |
|
|
7.125% 1/15/07 |
Caa1 |
|
22,370 |
5,593 |
|
|
10.5% 9/15/02 (e) |
- |
|
5,515 |
3,419 |
|
|
|
13,241 |
||||
|
Grocery Stores - 0.7% |
|||||
|
Disco SA 9.875% 5/15/08 |
B1 |
|
15,000 |
12,000 |
|
|
Fleming Companies, Inc.: |
|
|
|
|
|
|
Series B, 10.625% 7/31/07 |
B3 |
|
6,020 |
4,515 |
|
|
10.5% 12/1/04 |
B3 |
|
9,950 |
8,458 |
|
|
|
24,973 |
||||
|
TOTAL RETAIL & WHOLESALE |
38,214 |
||||
|
SERVICES - 1.1% |
|||||
|
Printing - 0.8% |
|||||
|
American Color Graphics, Inc. 12.75% 8/1/05 |
Caa1 |
|
15,420 |
14,572 |
|
|
World Color Press, Inc. 8.375% 11/15/08 |
Baa3 |
|
11,330 |
10,565 |
|
|
|
25,137 |
||||
|
Services - 0.3% |
|||||
|
Iron Mountain, Inc. 8.75% 9/30/09 |
B2 |
|
6,990 |
6,710 |
|
|
SITEL Corp. 9.25% 3/15/06 |
B3 |
|
4,150 |
3,185 |
|
|
|
9,895 |
||||
|
TOTAL SERVICES |
35,032 |
||||
|
Corporate Bonds - continued |
|||||
|
Moody's Ratings (unaudited) (b) |
Principal Amount (000s) |
Value (Note 1) (000s) |
|||
|
Nonconvertible Bonds - continued |
|||||
|
TECHNOLOGY - 3.1% |
|||||
|
Computer Services & Software - 2.2% |
|||||
|
Colo.com 13.875% 3/15/10 unit (e) |
- |
|
$ 20,750 |
$ 15,563 |
|
|
Concentric Network Corp. 12.75% 12/15/07 |
B |
|
27,280 |
27,144 |
|
|
Covad Communications Group, Inc.: |
|
|
|
|
|
|
0% 3/15/08 (d) |
B3 |
|
27,070 |
7,309 |
|
|
12% 2/15/10 |
B3 |
|
8,245 |
3,834 |
|
|
12.5% 2/15/09 |
B3 |
|
22,410 |
10,981 |
|
|
Exodus Communications, Inc. 10.75% 12/15/09 |
B3 |
|
9,725 |
8,947 |
|
|
|
73,778 |
||||
|
Electronic Instruments - 0.4% |
|||||
|
Telecommunications Techniques Co. LLC 9.75% 5/15/08 |
B3 |
|
14,655 |
13,043 |
|
|
Electronics - 0.4% |
|||||
|
Details, Inc. 10% 11/15/05 |
B3 |
|
3,555 |
3,448 |
|
|
Intersil Corp. 13.25% 8/15/09 |
B1 |
|
6,445 |
7,412 |
|
|
Viasystems, Inc. 9.75% 6/1/07 |
B3 |
|
1,290 |
1,155 |
|
|
|
12,015 |
||||
|
Photographic Equipment - 0.1% |
|||||
|
IMAX Corp. 7.875% 12/1/05 |
Ba2 |
|
5,120 |
2,918 |
|
|
TOTAL TECHNOLOGY |
101,754 |
||||
|
TRANSPORTATION - 0.5% |
|||||
|
Railroads - 0.5% |
|||||
|
TFM SA de CV 0% 6/15/09 (d) |
B2 |
|
22,700 |
16,685 |
|
|
UTILITIES - 19.1% |
|||||
|
Cellular - 11.2% |
|||||
|
Arch Communications Group 12.75% 7/1/07 |
B3 |
|
3,825 |
1,913 |
|
|
Crown Castle International Corp. 10.75% 8/1/11 |
B3 |
|
10,650 |
10,863 |
|
|
CTI Holdings SA 0% 4/15/08 (d) |
B1 |
|
25,000 |
12,750 |
|
|
Echostar Broadband Corp. 10.375% 10/1/07 (e) |
B3 |
|
29,640 |
29,640 |
|
|
ICO Global Communications Holdings Ltd. |
- |
|
14,125 |
8,616 |
|
|
Intercel, Inc. 0% 2/1/06 (d) |
B2 |
|
5,190 |
5,086 |
|
|
Leap Wireless International, Inc. 12.5% 4/15/10 |
Caa2 |
|
12,825 |
8,465 |
|
|
McCaw International Ltd. 0% 4/15/07 (d) |
Caa1 |
|
50,600 |
35,420 |
|
|
Corporate Bonds - continued |
|||||
|
Moody's Ratings (unaudited) (b) |
Principal Amount (000s) |
Value (Note 1) (000s) |
|||
|
Nonconvertible Bonds - continued |
|||||
|
UTILITIES - continued |
|||||
|
Cellular - continued |
|||||
|
Metrocall, Inc.: |
|
|
|
|
|
|
9.75% 11/1/07 |
B3 |
|
$ 4,180 |
$ 1,672 |
|
|
10.375% 10/1/07 |
B3 |
|
12,175 |
4,870 |
|
|
11% 9/15/08 |
B3 |
|
16,685 |
6,674 |
|
|
Millicom International Cellular SA 0% 6/1/06 (d) |
Caa1 |
|
34,725 |
27,780 |
|
|
Nextel Communications, Inc.: |
|
|
|
|
|
|
0% 9/15/07 (d) |
B1 |
|
21,280 |
17,237 |
|
|
12% 11/1/08 |
B1 |
|
22,320 |
23,659 |
|
|
Nextel International, Inc.: |
|
|
|
|
|
|
0% 4/15/08 (d) |
Caa1 |
|
8,345 |
5,007 |
|
|
12.75% 8/1/10 (e) |
Caa1 |
|
41,370 |
38,060 |
|
|
Orbital Imaging Corp. 11.625% 3/1/05 |
CCC |
|
8,016 |
1,523 |
|
|
Paging Network, Inc.: |
|
|
|
|
|
|
8.875% 2/1/06 (c) |
Caa3 |
|
1,695 |
356 |
|
|
10% 10/15/08 (c) |
Caa3 |
|
17,995 |
3,779 |
|
|
10.125% 8/1/07 (c) |
Caa3 |
|
21,510 |
4,517 |
|
|
ProNet, Inc. 11.875% 6/15/05 |
B3 |
|
5,825 |
2,330 |
|
|
Rogers Cantel, Inc. 8.8% 10/1/07 |
Ba2 |
|
10,630 |
10,311 |
|
|
TeleCorp PCS, Inc.: |
|
|
|
|
|
|
0% 4/15/09 (d) |
B3 |
|
51,970 |
33,391 |
|
|
10.625% 7/15/10 |
B3 |
|
6,580 |
6,531 |
|
|
Tritel PCS, Inc. 0% 5/15/09 (d) |
B3 |
|
50,540 |
32,598 |
|
|
USA Mobile Communication, Inc. II 9.5% 2/1/04 |
B3 |
|
13,915 |
8,071 |
|
|
VoiceStream Wireless Corp.: |
|
|
|
|
|
|
10.375% 11/15/09 |
B2 |
|
18,358 |
19,643 |
|
|
11.5% 9/15/09 |
B2 |
|
6,050 |
6,716 |
|
|
|
367,478 |
||||
|
Telephone Services - 7.9% |
|||||
|
Alestra SA de RL de CV 12.625% 5/15/09 |
B2 |
|
12,800 |
10,816 |
|
|
Allegiance Telecom, Inc.: |
|
|
|
|
|
|
0% 2/15/08 (d) |
B3 |
|
16,681 |
11,343 |
|
|
12.875% 5/15/08 |
B3 |
|
17,580 |
17,580 |
|
|
Asia Global Crossing Ltd. 13.375% 10/15/10 (e) |
B2 |
|
11,015 |
10,299 |
|
|
Call-Net Enterprises, Inc.: |
|
|
|
|
|
|
0% 5/15/09 (d) |
B2 |
|
2,990 |
718 |
|
|
Corporate Bonds - continued |
|||||
|
Moody's Ratings (unaudited) (b) |
Principal Amount (000s) |
Value (Note 1) (000s) |
|||
|
Nonconvertible Bonds - continued |
|||||
|
UTILITIES - continued |
|||||
|
Telephone Services - continued |
|||||
|
Call-Net Enterprises, Inc.: - continued |
|
|
|
|
|
|
8% 8/15/08 |
B2 |
|
$ 4,615 |
$ 1,846 |
|
|
9.375% 5/15/09 |
B2 |
|
6,600 |
2,772 |
|
|
Esat Telecom Group PLC 0% 2/1/07 (d) |
A2 |
|
7,530 |
7,266 |
|
|
Global Crossing Holdings Ltd. 9.5% 11/15/09 |
Ba2 |
|
1,190 |
1,139 |
|
|
Global TeleSystems, Inc. 9.875% 2/15/05 |
Caa1 |
|
5,165 |
1,601 |
|
|
Hermes Europe Railtel BV 11.5% 8/15/07 |
B3 |
|
20,320 |
10,160 |
|
|
Hyperion Telecommunications, Inc. |
Caa1 |
|
1,690 |
930 |
|
|
Intermedia Communications, Inc.: |
|
|
|
|
|
|
0% 5/15/06 (d) |
B2 |
|
2,000 |
1,890 |
|
|
0% 7/15/07 (d) |
B2 |
|
16,875 |
13,922 |
|
|
0% 3/1/09 (d) |
B3 |
|
19,000 |
11,970 |
|
|
KMC Telecom Holdings, Inc.: |
|
|
|
|
|
|
0% 2/15/08 (d) |
Caa2 |
|
26,410 |
3,697 |
|
|
13.5% 5/15/09 |
Caa2 |
|
9,140 |
2,833 |
|
|
Level 3 Communications, Inc.: |
|
|
|
|
|
|
9.125% 5/1/08 |
B3 |
|
20,255 |
16,508 |
|
|
11% 3/15/08 |
B3 |
|
20,620 |
18,610 |
|
|
Metromedia Fiber Network, Inc.: |
|
|
|
|
|
|
10% 11/15/08 |
B2 |
|
14,497 |
12,757 |
|
|
10% 12/15/09 |
B2 |
|
9,740 |
8,571 |
|
|
NEXTLINK Communications LLC 12.5% 4/15/06 |
B2 |
|
28,040 |
26,498 |
|
|
NEXTLINK Communications, Inc. |
B2 |
|
10,590 |
9,319 |
|
|
Ono Finance PLC 13% 5/1/09 |
Caa1 |
|
14,500 |
11,165 |
|
|
Primus Telecommunications Group, Inc. |
B3 |
|
5,000 |
2,500 |
|
|
Viatel, Inc.: |
|
|
|
|
|
|
0% 4/15/08 (d) |
B3 |
|
6,650 |
1,995 |
|
|
11.25% 4/15/08 |
B3 |
|
13,290 |
6,512 |
|
|
11.5% 3/15/09 |
B3 |
|
4,220 |
2,110 |
|
|
WinStar Communications, Inc.: |
|
|
|
|
|
|
0% 4/15/10 (d) |
B3 |
|
1,883 |
603 |
|
|
12.5% 4/15/08 |
B3 |
|
22,276 |
16,373 |
|
|
Corporate Bonds - continued |
|||||
|
Moody's Ratings (unaudited) (b) |
Principal Amount (000s) |
Value (Note 1) (000s) |
|||
|
Nonconvertible Bonds - continued |
|||||
|
UTILITIES - continued |
|||||
|
Telephone Services - continued |
|||||
|
WinStar Communications, Inc.: - continued |
|
|
|
|
|
|
12.75% 4/15/10 |
B3 |
|
$ 10,199 |
$ 7,343 |
|
|
Worldwide Fiber, Inc. 12% 8/1/09 |
B3 |
|
10,205 |
7,705 |
|
|
|
259,351 |
||||
|
TOTAL UTILITIES |
626,829 |
||||
|
TOTAL NONCONVERTIBLE BONDS |
2,112,462 |
||||
|
TOTAL CORPORATE BONDS (Cost $2,580,045) |
2,183,082 |
||||
|
Asset-Backed Securities - 0.4% |
|||||
|
|
|||||
|
Airplanes pass through trust 10.875% 3/15/19 |
Ba2 |
|
18,188 |
13,459 |
|
|
Commercial Mortgage Securities - 0.7% |
|||||
|
|
|||||
|
First Chicago/Lennar Trust I Series 1997-CHL1 Class E, 8.0835% 4/1/39 (f) |
- |
|
10,700 |
8,155 |
|
|
Structured Asset Securities Corp.: |
|
|
|
|
|
|
Series 1995-C1: |
|
|
|
|
|
|
Class E, 7.375% 9/25/24 (e) |
BB |
|
4,000 |
3,794 |
|
|
Class F, 7.375% 9/25/24 (e) |
- |
|
2,500 |
2,039 |
|
|
Series 1996-CFL Class G, 7.75% 2/25/28 (e) |
BB |
|
9,260 |
8,618 |
|
|
TOTAL COMMERCIAL MORTGAGE SECURITIES (Cost $20,069) |
22,606 |
||||
|
Common Stocks - 9.8% |
|||
|
Shares |
|
||
|
BASIC INDUSTRIES - 0.1% |
|||
|
Chemicals & Plastics - 0.0% |
|||
|
Trivest 1992 Special Fund Ltd. (h) |
3 |
181 |
|
|
Iron & Steel - 0.1% |
|||
|
AK Steel Holding Corp. |
269,600 |
2,494 |
|
|
Common Stocks - continued |
|||
|
Shares |
Value (Note 1) (000s) |
||
|
BASIC INDUSTRIES - continued |
|||
|
Paper & Forest Products - 0.0% |
|||
|
SF Holdings Group, Inc. Class C (a)(e) |
3,095 |
$ 0 |
|
|
TOTAL BASIC INDUSTRIES |
2,675 |
||
|
CONSTRUCTION & REAL ESTATE - 0.0% |
|||
|
Construction - 0.0% |
|||
|
Capital Pacific Holdings, Inc. warrants 5/1/02 (a)(e) |
24,095 |
6 |
|
|
DURABLES - 0.0% |
|||
|
Textiles & Apparel - 0.0% |
|||
|
Arena Brands Holdings Corp. Class B |
42,253 |
1,056 |
|
|
ENERGY - 0.5% |
|||
|
Oil & Gas - 0.5% |
|||
|
Chesapeake Energy Corp. (a) |
1,927,021 |
10,839 |
|
|
DevX Energy, Inc. (a) |
500,000 |
3,500 |
|
|
|
14,339 |
||
|
FINANCE - 0.0% |
|||
|
Securities Industry - 0.0% |
|||
|
ECM Corp. LP (a)(e) |
900 |
76 |
|
|
HEALTH - 4.4% |
|||
|
Medical Facilities Management - 4.4% |
|||
|
Laboratory Corp. of America Holdings (a) |
1,075,000 |
144,984 |
|
|
INDUSTRIAL MACHINERY & EQUIPMENT - 0.1% |
|||
|
Industrial Machinery & Equipment - 0.0% |
|||
|
Exide Corp. warrants 3/18/06 (a) |
15,720 |
31 |
|
|
Pollution Control - 0.1% |
|||
|
Allied Waste Industries, Inc. (a) |
327,000 |
3,025 |
|
|
TOTAL INDUSTRIAL MACHINERY & EQUIPMENT |
3,056 |
||
|
MEDIA & LEISURE - 2.7% |
|||
|
Broadcasting - 2.6% |
|||
|
Citadel Communications Corp. (a) |
300,200 |
3,640 |
|
|
CS Wireless Systems, Inc. (a)(e) |
439 |
0 |
|
|
EchoStar Communications Corp. Class A (a) |
1,664,996 |
75,341 |
|
|
Common Stocks - continued |
|||
|
Shares |
Value (Note 1) (000s) |
||
|
MEDIA & LEISURE - continued |
|||
|
Broadcasting - continued |
|||
|
NTL, Inc. (a) |
1 |
$ 0 |
|
|
Pegasus Communications Corp. unit |
6,509 |
6,802 |
|
|
|
85,783 |
||
|
Entertainment - 0.0% |
|||
|
Livent, Inc. (a) |
125,200 |
1 |
|
|
Lodging & Gaming - 0.1% |
|||
|
Prime Hospitality Corp. (a) |
400,000 |
3,800 |
|
|
TOTAL MEDIA & LEISURE |
89,584 |
||
|
RETAIL & WHOLESALE - 1.4% |
|||
|
Grocery Stores - 1.4% |
|||
|
Pathmark Stores, Inc. (a) |
2,669,378 |
41,876 |
|
|
Pathmark Stores, Inc. warrants 9/19/10 (a) |
747,828 |
3,365 |
|
|
|
45,241 |
||
|
TECHNOLOGY - 0.1% |
|||
|
Computer Services & Software - 0.1% |
|||
|
Concentric Network Corp. warrants 12/15/07 (a)(e) |
8,680 |
4,132 |
|
|
DecisionOne Corp. (a) |
63,872 |
1 |
|
|
DecisionOne Corp.: |
|
|
|
|
Class A warrants 4/18/07 (a) |
36,096 |
0 |
|
|
Class B warrants 4/18/07 (a) |
62,195 |
0 |
|
|
Class C warrants 4/18/07 (a) |
36,890 |
0 |
|
|
|
4,133 |
||
|
UTILITIES - 0.5% |
|||
|
Cellular - 0.2% |
|||
|
Leap Wireless International, Inc. warrants 4/15/10 |
12,825 |
128 |
|
|
Loral Orion Network Systems, Inc.: |
|
|
|
|
warrants 1/15/07 (CV ratio .47) (a) |
19,560 |
44 |
|
|
warrants 1/15/07 (CV ratio .6) (a) |
18,480 |
60 |
|
|
McCaw International Ltd. warrants 4/16/07 (a)(e) |
66,290 |
994 |
|
|
Orbital Imaging Corp. warrants 3/1/05 (a)(e) |
5,276 |
26 |
|
|
Powertel, Inc. warrants 2/1/06 (a) |
85,408 |
4,270 |
|
|
|
5,522 |
||
|
Telephone Services - 0.3% |
|||
|
AT&T Latin America Corp. (a) |
1,283,200 |
9,143 |
|
|
FirstWorld Communications, Inc. warrants 4/15/08 (a)(e) |
1,635 |
21 |
|
|
Common Stocks - continued |
|||
|
Shares |
Value (Note 1) (000s) |
||
|
UTILITIES - continued |
|||
|
Telephone Services - continued |
|||
|
KMC Telecom Holdings, Inc. warrants 4/15/08 (a)(e) |
37,830 |
$ 76 |
|
|
McLeodUSA, Inc. Class A (a) |
1 |
0 |
|
|
Mpower Communications Corp. (e) |
30,880 |
201 |
|
|
Ono Finance PLC rights 5/31/09 (a)(e) |
850 |
6 |
|
|
RSL Communications Ltd./RSL Communications PLC warrants 11/15/06 (a)(e) |
25,710 |
64 |
|
|
XO Communications, Inc. Class A (a) |
1 |
0 |
|
|
|
9,511 |
||
|
TOTAL UTILITIES |
15,033 |
||
|
TOTAL COMMON STOCKS (Cost $254,002) |
320,183 |
||
|
Preferred Stocks - 14.4% |
|||
|
|
|
|
|
|
Convertible Preferred Stocks - 0.6% |
|||
|
BASIC INDUSTRIES - 0.4% |
|||
|
Chemicals & Plastics - 0.4% |
|||
|
Sealed Air Corp. Series A, $2.00 |
300,000 |
14,138 |
|
|
ENERGY - 0.1% |
|||
|
Oil & Gas - 0.1% |
|||
|
Tesoro Petroleum Corp. $1.1552 PIES |
163,400 |
1,757 |
|
|
UTILITIES - 0.1% |
|||
|
Telephone Services - 0.1% |
|||
|
BroadWing, Inc. $3.375 |
100,000 |
4,856 |
|
|
TOTAL CONVERTIBLE PREFERRED STOCKS |
20,751 |
||
|
Nonconvertible Preferred Stocks - 13.8% |
|||
|
CONSTRUCTION & REAL ESTATE - 0.4% |
|||
|
Real Estate Investment Trusts - 0.4% |
|||
|
California Federal Preferred Capital Corp. $2.2812 |
533,897 |
11,879 |
|
|
FINANCE - 0.3% |
|||
|
Insurance - 0.3% |
|||
|
American Annuity Group Capital Trust II 8.875% |
10,340 |
9,852 |
|
|
Preferred Stocks - continued |
|||
|
Shares |
Value (Note 1) (000s) |
||
|
Nonconvertible Preferred Stocks - continued |
|||
|
HEALTH - 0.3% |
|||
|
Medical Facilities Management - 0.3% |
|||
|
Fresenius Medical Care Capital Trust 9% |
9,847 |
$ 9,805 |
|
|
MEDIA & LEISURE - 6.2% |
|||
|
Broadcasting - 5.2% |
|||
|
Adelphia Communications Corp. $13.00 |
200,386 |
18,035 |
|
|
Benedek Communications Corp. $11.50 pay-in-kind |
11,347 |
5,674 |
|
|
Citadel Broadcasting Co. Series B, 13.25% pay-in-kind |
77,536 |
7,443 |
|
|
CSC Holdings, Inc.: |
|
|
|
|
Series H, 11.75% pay-in-kind |
202,712 |
21,893 |
|
|
Series M, 11.125% pay-in-kind |
596,624 |
63,242 |
|
|
Granite Broadcasting Corp. 12.75% pay-in-kind |
29,789 |
15,490 |
|
|
NTL, Inc. 13% pay-in-kind |
39,073 |
34,384 |
|
|
Pegasus Communications Corp. 12.75% pay-in-kind |
2,915 |
3,046 |
|
|
|
169,207 |
||
|
Publishing - 1.0% |
|||
|
PRIMEDIA, Inc.: |
|
|
|
|
$9.20 |
76,000 |
6,232 |
|
|
8.625% |
16,735 |
1,356 |
|
|
Series D, $10.00 |
309,863 |
26,958 |
|
|
|
34,546 |
||
|
TOTAL MEDIA & LEISURE |
203,753 |
||
|
TECHNOLOGY - 0.0% |
|||
|
Computers & Office Equipment - 0.0% |
|||
|
Ampex Corp. 8% non-cumulative |
149 |
232 |
|
|
UTILITIES - 6.6% |
|||
|
Cellular - 3.6% |
|||
|
Dobson Communications Corp. 13 % pay-in-kind |
2,273 |
2,057 |
|
|
Nextel Communications, Inc.: |
|
|
|
|
11.125% pay-in-kind |
15,571 |
14,403 |
|
|
Series D, 13% pay-in-kind |
101,816 |
101,307 |
|
|
|
117,767 |
||
|
Telephone Services - 3.0% |
|||
|
Broadwing Communications, Inc. Series B, $12.50 pay-in-kind |
26,660 |
26,393 |
|
|
e.spire Communications, Inc. $127.50 pay-in-kind |
28,372 |
4,256 |
|
|
Preferred Stocks - continued |
|||
|
Shares |
Value (Note 1) (000s) |
||
|
Nonconvertible Preferred Stocks - continued |
|||
|
UTILITIES - continued |
|||
|
Telephone Services - continued |
|||
|
ICG Holdings, Inc. 14.25% pay-in-kind |
6,883 |
$ 103 |
|
|
Intermedia Communications, Inc. 13.5% pay-in-kind |
69,042 |
58,686 |
|
|
Source Media, Inc. 13.50% pay-in-kind |
128,080 |
448 |
|
|
XO Communications, Inc.: |
|
|
|
|
$7.00 pay-in-kind |
57,629 |
2,305 |
|
|
13% pay-in-kind |
9,831 |
7,078 |
|
|
|
99,269 |
||
|
TOTAL UTILITIES |
217,036 |
||
|
TOTAL NONCONVERTIBLE PREFERRED STOCKS |
452,557 |
||
|
TOTAL PREFERRED STOCKS (Cost $567,683) |
473,308 |
||
|
Floating Rate Loans - 0.8% |
|||||
|
Moody's Ratings (unaudited) (b) |
Principal Amount (000s) |
|
|||
|
DURABLES - 0.2% |
|||||
|
Textiles & Apparel - 0.2% |
|||||
|
Synthetic Industries, Inc. term loan |
- |
|
$ 6,200 |
5,704 |
|
|
INDUSTRIAL MACHINERY & EQUIPMENT - 0.3% |
|||||
|
Industrial Machinery & Equipment - 0.2% |
|||||
|
Exide Corp. Tranche B term loan |
- |
|
5,000 |
4,925 |
|
|
Pollution Control - 0.1% |
|||||
|
Allied Waste North America, Inc.: |
|
|
|
|
|
|
Tranche B term loan 9.4375% 7/21/06 (f) |
Ba3 |
|
2,273 |
2,142 |
|
|
Tranche C term loan 9.7042% 7/21/07 (f) |
Ba3 |
|
2,727 |
2,570 |
|
|
|
4,712 |
||||
|
TOTAL INDUSTRIAL MACHINERY & EQUIPMENT |
9,637 |
||||
|
Floating Rate Loans - continued |
|||||
|
Moody's Ratings (unaudited) (b) |
Principal Amount (000s) |
Value (Note 1) (000s) |
|||
|
MEDIA & LEISURE - 0.3% |
|||||
|
Entertainment - 0.3% |
|||||
|
Regal Cinemas, Inc.: |
|
|
|
|
|
|
Tranche A term loan 8.93% 6/15/05 (f) |
Caa1 |
|
$ 5,480 |
$ 3,836 |
|
|
Tranche B term loan 9.18% 6/15/06 (f) |
Caa1 |
|
2,946 |
2,092 |
|
|
Tranche C term loan 9.43% 6/15/07 (f) |
Caa1 |
|
7,973 |
5,661 |
|
|
|
11,589 |
||||
|
TOTAL FLOATING RATE LOANS (Cost $28,468) |
26,930 |
||||
|
Cash Equivalents - 4.0% |
|||
|
Maturity Amount (000s) |
|
||
|
Investments in repurchase agreements (U.S. Treasury Obligations), in a joint trading account at 6.56%, dated 10/31/00 due
11/1/00 |
$ 131,168 |
131,144 |
|
|
TOTAL INVESTMENT PORTFOLIO - 96.7% (Cost $3,600,558) |
3,170,712 |
||
|
NET OTHER ASSETS - 3.3% |
107,232 |
||
|
NET ASSETS - 100% |
$ 3,277,944 |
||
|
Security Type Abbreviations |
|
PIES |
- |
Premium Income |
|
Legend |
|
(a) Non-income producing |
|
(b) S&P credit ratings are used in the absence of a rating by Moody's Investors Service, Inc. |
|
(c) Non-income producing - issuer filed for protection under the Federal Bankruptcy Code or is in default of interest payment. |
|
(d) Debt obligation initially issued in zero coupon form which converts to coupon form at a specified rate and date. The rate shown is the rate at period end. |
|
(e) Security exempt from registration under Rule 144A of the Securities Act of 1933. These securities may be resold in transactions exempt from registration, normally to qualified institutional buyers. At the period end, the value of these securities amounted to $222,806,000 or 6.8% of net assets. |
|
(f) The coupon rate shown on floating or adjustable rate securities represents the rate at period end. |
|
(g) Restricted securities - Investment in securities not registered under the Securities Act of 1933. |
|
Additional information on each holding |
|
Security |
Acquisition Date |
Acquisition Cost (000s) |
|
Sealy Corp., Inc. 10% 12/18/08 pay-in-kind |
2/23/98 - 9/30/00 |
$ 13,506 |
|
(h) Share amount represents number of units held. |
|
Other Information |
|
The composition of long-term debt holdings as a percentage of total value of investments in securities, is as follows (ratings are unaudited): |
|
Moody's Ratings |
S&P Ratings |
|||
|
Aaa, Aa, A |
0.2% |
|
AAA, AA, A |
0.0% |
|
Baa |
0.8% |
|
BBB |
1.6% |
|
Ba |
5.6% |
|
BB |
4.6% |
|
B |
49.5% |
|
B |
50.2% |
|
Caa |
10.3% |
|
CCC |
5.3% |
|
Ca, C |
0.1% |
|
CC, C |
0.0% |
|
|
|
|
D |
0.3% |
|
The percentage not rated by Moody's or S&P amounted to 2.7%. FMR has determined that unrated debt securities that are lower quality account for 2.7% of the total value of investment in securities. |
|
Distribution of investments by country of issue, as a percentage of total net assets, |
|
United States of America |
88.1% |
|
United Kingdom |
3.2% |
|
Netherlands |
2.8% |
|
Canada |
2.3% |
|
Mexico |
1.9% |
|
Others (individually less than 1%) |
1.7% |
|
|
100.0% |
|
Income Tax Information |
|
At October 31, 2000, the aggregate cost of investment securities for income tax purposes was $3,603,993,000. Net unrealized depreciation aggregated $433,281,000, of which $185,916,000 related to appreciated investment securities and $619,197,000 related to depreciated investment securities. |
|
At October 31, 2000, the fund had a capital loss carryforward of approximately $522,914,000 of which $34,735,000 and $488,179,000 will expire on October 31, 2007 and 2008, respectively. |
See accompanying notes which are an integral part of the financial statements.
Annual Report
Statement of Assets and Liabilities
|
Amounts in thousands (except per-share amounts) |
October 31, 2000 |
|
|
Assets |
|
|
|
Investment in securities, at value (including repurchase agreements of $131,144) (cost $3,600,558) - |
|
$ 3,170,712 |
|
Receivable for investments sold |
|
62,381 |
|
Receivable for fund shares sold |
|
7,003 |
|
Dividends receivable |
|
1,985 |
|
Interest receivable |
|
61,204 |
|
Other receivables |
|
42 |
|
Total assets |
|
3,303,327 |
|
Liabilities |
|
|
|
Payable for investments purchased |
$ 5,410 |
|
|
Payable for fund shares redeemed |
10,420 |
|
|
Distributions payable |
6,077 |
|
|
Accrued management fee |
1,618 |
|
|
Distribution fees payable |
1,356 |
|
|
Other payables and accrued expenses |
502 |
|
|
Total liabilities |
|
25,383 |
|
Net Assets |
|
$ 3,277,944 |
|
Net Assets consist of: |
|
|
|
Paid in capital |
|
$ 4,137,833 |
|
Undistributed net investment income |
|
94,399 |
|
Accumulated undistributed net realized gain (loss) on investments and foreign currency transactions |
|
(524,455) |
|
Net unrealized appreciation (depreciation) on investments and assets and liabilities in foreign currencies |
|
(429,833) |
|
Net Assets |
|
$ 3,277,944 |
See accompanying notes which are an integral part of the financial statements.
Annual Report
Financial Statements - continued
Statement of Assets and Liabilities - continued
|
Amounts in thousands (except per-share amounts) |
October 31, 2000 |
|
|
Calculation of Maximum Offering Price |
|
$9.64 |
|
Maximum offering price per share (100/95.25 of $9.64) |
|
$10.12 |
|
Class T: |
|
$9.66 |
|
Maximum offering price per share (100/96.50 of $9.66) |
|
$10.01 |
|
Class B: |
|
$9.61 |
|
Class C: |
|
$9.63 |
|
Institutional Class: |
|
$9.43 |
A Redemption price per share is equal to net asset value less any applicable contingent deferred sales charge.
See accompanying notes which are an integral part of the financial statements.
Annual Report
Financial Statements - continued
Statement of Operations
|
Amounts in thousands |
Year ended October 31, 2000 |
|
|
Investment Income Dividends |
|
$ 52,761 |
|
Interest |
|
375,318 |
|
Total income |
|
428,079 |
|
Expenses |
|
|
|
Management fee |
$ 22,838 |
|
|
Transfer agent fees |
6,981 |
|
|
Distribution fees |
18,855 |
|
|
Accounting fees and expenses |
813 |
|
|
Non-interested trustees' compensation |
17 |
|
|
Custodian fees and expenses |
110 |
|
|
Registration fees |
247 |
|
|
Audit |
54 |
|
|
Legal |
141 |
|
|
Miscellaneous |
41 |
|
|
Total expenses before reductions |
50,097 |
|
|
Expense reductions |
(41) |
50,056 |
|
Net investment income |
|
378,023 |
|
Realized and Unrealized Gain (Loss) Net realized gain (loss) on: |
|
|
|
Investment securities |
(503,656) |
|
|
Foreign currency transactions |
(4) |
(503,660) |
|
Change in net unrealized appreciation (depreciation) on: |
|
|
|
Investment securities |
(83,305) |
|
|
Assets and liabilities in foreign currencies |
(26) |
(83,331) |
|
Net gain (loss) |
|
(586,991) |
|
Net increase (decrease) in net assets resulting |
|
$ (208,968) |
See accompanying notes which are an integral part of the financial statements.
Annual Report
Financial Statements - continued
Statement of Changes in Net Assets
|
Amounts in thousands |
Year ended
October 31, |
Year ended
October 31, |
|
Increase (Decrease) in Net Assets |
|
|
|
Operations |
$ 378,023 |
$ 358,470 |
|
Net realized gain (loss) |
(503,660) |
(56,481) |
|
Change in net unrealized appreciation (depreciation) |
(83,331) |
120,312 |
|
Net increase (decrease) in net assets resulting |
(208,968) |
422,301 |
|
Distributions to shareholders |
(320,749) |
(352,867) |
|
From net realized gain |
- |
(40,674) |
|
In excess of net realized gain |
- |
(29,684) |
|
Return of capital |
- |
(16,824) |
|
Total distributions |
(320,749) |
(440,049) |
|
Share transactions - net increase (decrease) |
(348,559) |
568,709 |
|
Total increase (decrease) in net assets |
(878,276) |
550,961 |
|
Net Assets |
|
|
|
Beginning of period |
4,156,220 |
3,605,259 |
|
End of period (including undistributed net investment income of $94,399 and $52,902, respectively) |
$ 3,277,944 |
$ 4,156,220 |
See accompanying notes which are an integral part of the financial statements.
Annual Report
Financial Highlights - Class A
|
Years ended October 31, |
2000 |
1999 |
1998 |
1997 |
1996 E |
|
Selected Per-Share Data |
|
|
|
|
|
|
Net asset value, |
$ 11.120 |
$ 11.090 |
$ 12.930 |
$ 12.300 |
$ 12.010 |
|
Income from Investment Operations |
|
|
|
|
|
|
Net investment income D |
1.059 |
1.022 |
1.111 |
1.058 |
.163 |
|
Net realized and unrealized gain (loss) |
(1.634) |
.287 |
(1.603) |
.710 |
.267 |
|
Total from investment operations |
(.575) |
1.309 |
(.492) |
1.768 |
.430 |
|
Less Distributions |
|
|
|
|
|
|
From net investment income |
(.905) |
(1.030) |
(1.048) |
(1.078) |
(.140) |
|
From net realized gain |
- |
(.120) |
(.300) |
(.060) |
- |
|
In excess of net realized gain |
- |
(.080) |
- |
- |
- |
|
Return of capital |
- |
(.049) |
- |
- |
- |
|
Total distributions |
(.905) |
(1.279) |
(1.348) |
(1.138) |
(.140) |
|
Net asset value, end of period |
$ 9.640 |
$ 11.120 |
$ 11.090 |
$ 12.930 |
$ 12.30 |
|
Total Return B, C |
(5.66)% |
11.98% |
(4.55)% |
15.18% |
3.58% |
|
Ratios and Supplemental Data |
|
|
|
|
|
|
Net assets, end of period |
$ 209 |
$ 221 |
$ 117 |
$ 44 |
$ 4 |
|
Ratio of expenses to average |
.94% |
.95% |
1.01% |
1.15% |
1.25% A, F |
|
Ratio of expenses to average net assets after expense reductions |
.94% |
.95% |
1.00% G |
1.14% G |
1.25% A |
|
Ratio of net investment income |
9.86% |
8.89% |
9.03% |
8.58% |
9.06% A |
|
Portfolio turnover rate |
63% |
61% |
75% |
105% |
121% |
A Annualized
B The total returns would have been lower had certain expenses not been reduced during the periods shown.
C Total returns do not include the one time sales charge and for periods of less than one year are not annualized.
D Net investment income per share has been calculated based on average shares outstanding during the period.
E For the period September 3, 1996 (commencement of sale of Class A shares) to October 31, 1996.
F FMR agreed to reimburse a portion of the class' expenses during the period. Without this reimbursement, the class' expense ratio would have been higher.
G FMR or the fund has entered into varying arrangements with third parties who either paid or reduced a portion of the class' expenses.
See accompanying notes which are an integral part of the financial statements.
Annual Report
Financial Highlights - Class T
|
Years ended October 31, |
2000 |
1999 |
1998 |
1997 |
1996 |
|
Selected Per-Share Data |
|
|
|
|
|
|
Net asset value, |
$ 11.140 |
$ 11.110 |
$ 12.940 |
$ 12.310 |
$ 11.910 |
|
Income from Investment Operations |
|
|
|
|
|
|
Net investment income C |
1.055 |
1.021 |
1.119 |
1.086 |
1.105 |
|
Net realized and unrealized gain (loss) |
(1.640) |
.274 |
(1.612) |
.686 |
.364 |
|
Total from investment operations |
(.585) |
1.295 |
(.493) |
1.772 |
1.469 |
|
Less Distributions |
|
|
|
|
|
|
From net investment income |
(.895) |
(1.017) |
(1.037) |
(1.082) |
(1.069) |
|
From net realized gain |
- |
(.120) |
(.300) |
(.060) |
- |
|
In excess of net realized gain |
- |
(.080) |
- |
- |
- |
|
Return of capital |
- |
(.048) |
- |
- |
- |
|
Total distributions |
(.895) |
(1.265) |
(1.337) |
(1.142) |
(1.069) |
|
Net asset value, end of period |
$ 9.660 |
$ 11.140 |
$ 11.110 |
$ 12.940 |
$ 12.310 |
|
Total Return A, B |
(5.73)% |
11.83% |
(4.54)% |
15.21% |
12.92% |
|
Ratios and Supplemental Data |
|
|
|
|
|
|
Net assets, end of period |
$ 1,777 |
$ 2,351 |
$ 2,322 |
$ 2,208 |
$ 1,709 |
|
Ratio of expenses to average |
1.03% |
1.04% |
1.07% |
1.09% |
1.12% |
|
Ratio of expenses to average net assets after expense reductions |
1.03% |
1.04% |
1.07% |
1.08% D |
1.11% D |
|
Ratio of net investment income |
9.76% |
8.80% |
8.91% |
8.72% |
9.20% |
|
Portfolio turnover rate |
63% |
61% |
75% |
105% |
121% |
A The total returns would have been lower had certain expenses not been reduced during the periods shown.
B Total returns do not include the one time sales charge.
C Net investment income per share has been calculated based on average shares outstanding during the period.
D FMR or the fund has entered into varying arrangements with third parties who either paid or reduced a portion of the class' expenses.
See accompanying notes which are an integral part of the financial statements.
Annual Report
Financial Highlights - Class B
|
Years ended October 31, |
2000 |
1999 |
1998 |
1997 |
1996 |
|
Selected Per-Share Data |
|
|
|
|
|
|
Net asset value, |
$ 11.090 |
$ 11.070 |
$ 12.890 |
$ 12.280 |
$ 11.890 |
|
Income from Investment Operations |
|
|
|
|
|
|
Net investment income C |
.978 |
.938 |
1.024 |
.998 |
1.017 |
|
Net realized and unrealized gain (loss) |
(1.634) |
.276 |
(1.588) |
.674 |
.361 |
|
Total from investment operations |
(.656) |
1.214 |
(.564) |
1.672 |
1.378 |
|
Less Distributions |
|
|
|
|
|
|
From net investment income |
(.824) |
(.949) |
(.956) |
(1.002) |
(.988) |
|
From net realized gain |
- |
(.120) |
(.300) |
(.060) |
- |
|
In excess of net realized gain |
- |
(.080) |
- |
- |
- |
|
Return of capital |
- |
(.045) |
- |
- |
- |
|
Total distributions |
(.824) |
(1.194) |
(1.256) |
(1.062) |
(.988) |
|
Net asset value, end of period |
$ 9.610 |
$ 11.090 |
$ 11.070 |
$ 12.890 |
$ 12.280 |
|
Total Return A, B |
(6.39)% |
11.10% |
(5.10)% |
14.34% |
12.10% |
|
Ratios and Supplemental Data |
|
|
|
|
|
|
Net assets, end of period |
$ 956 |
$ 1,192 |
$ 923 |
$ 593 |
$ 344 |
|
Ratio of expenses to average |
1.70% |
1.70% |
1.74% |
1.74% |
1.79% |
|
Ratio of expenses to average net assets after expense reductions |
1.70% |
1.69% D |
1.74% |
1.74% |
1.79% |
|
Ratio of net investment income |
9.10% |
8.15% |
8.25% |
8.04% |
8.52% |
|
Portfolio turnover rate |
63% |
61% |
75% |
105% |
121% |
A The total returns would have been lower had certain expenses not been reduced during the periods shown.
B Total returns do not include the contingent deferred sales charge.
C Net investment income per share has been calculated based on average shares outstanding during the period.
D FMR or the fund has entered into varying arrangements with third parties who either paid or reduced a portion of the class' expenses.
See accompanying notes which are an integral part of the financial statements.
Annual Report
Financial Highlights - Class C
|
Years ended October 31, |
2000 |
1999 |
1998 E |
|
Selected Per-Share Data |
|
|
|
|
Net asset value, beginning of period |
$ 11.110 |
$ 11.090 |
$ 12.970 |
|
Income from Investment Operations |
|
|
|
|
Net investment income D |
.969 |
.926 |
.988 |
|
Net realized and unrealized gain (loss) |
(1.634) |
.280 |
(1.639) |
|
Total from investment operations |
(.665) |
1.206 |
(.651) |
|
Less Distributions |
|
|
|
|
From net investment income |
(.815) |
(.941) |
(.929) |
|
From net realized gain |
- |
(.120) |
(.300) |
|
In excess of net realized gain |
- |
(.080) |
- |
|
Return of capital |
- |
(.045) |
- |
|
Total distributions |
(.815) |
(1.186) |
(1.229) |
|
Net asset value, end of period |
$ 9.630 |
$ 11.110 |
$ 11.090 |
|
Total Return B, C |
(6.45)% |
11.00% |
(5.73)% |
|
Ratios and Supplemental Data |
|
|
|
|
Net assets, end of period (in millions) |
$ 247 |
$ 269 |
$ 130 |
|
Ratio of expenses to average net assets |
1.78% |
1.78% |
1.86% A |
|
Ratio of expenses to average net assets after |
1.78% |
1.78% |
1.86% A |
|
Ratio of net investment income to average net assets |
9.02% |
8.06% |
8.21% A |
|
Portfolio turnover rate |
63% |
61% |
75% |
A Annualized
B The total returns would have been lower had certain expenses not been reduced during the periods shown.
C Total returns do not include the contingent deferred sales charge and for periods of less than one year are not annualized.
D Net investment income per share has been calculated based on average shares outstanding during the period.
E For the period November 3, 1997 (commencement of sale of Class C shares) to October 31, 1998.
See accompanying notes which are an integral part of the financial statements.
Annual Report
Financial Highlights - Institutional Class
|
Years ended October 31, |
2000 |
1999 |
1998 |
1997 |
1996 |
|
Selected Per-Share Data |
|
|
|
|
|
|
Net asset value, beginning |
$ 10.900 |
$ 10.900 |
$ 12.710 |
$ 12.120 |
$ 11.760 |
|
Income from Investment Operations |
|
|
|
|
|
|
Net investment income B |
1.055 |
1.024 |
1.123 |
1.094 |
1.070 |
|
Net realized and unrealized gain (loss) |
(1.606) |
.269 |
(1.562) |
.671 |
.368 |
|
Total from investment operations |
(.551) |
1.293 |
(.439) |
1.765 |
1.438 |
|
Less Distributions |
|
|
|
|
|
|
From net investment income |
(.919) |
(1.044) |
(1.071) |
(1.115) |
(1.078) |
|
From net realized gain |
- |
(.120) |
(.300) |
(.060) |
- |
|
In excess of net realized gain |
- |
(.080) |
- |
- |
- |
|
Return of capital |
- |
(.049) |
- |
- |
- |
|
Total distributions |
(.919) |
(1.293) |
(1.371) |
(1.175) |
(1.078) |
|
Net asset value, end of period |
$ 9.430 |
$ 10.900 |
$ 10.900 |
$ 12.710 |
$ 12.120 |
|
Total Return A |
(5.56)% |
12.05% |
(4.21)% |
15.42% |
12.81% |
|
Ratios and Supplemental Data |
|
|
|
|
|
|
Net assets, end of period |
$ 89 |
$ 123 |
$ 113 |
$ 76 |
$ 38 |
|
Ratio of expenses to average |
.82% |
.82% |
.83% |
.85% |
1.10% |
|
Ratio of expenses to average net assets after expense reductions |
.82% |
.81% C |
.83% |
.85% |
1.05% C |
|
Ratio of net investment income |
9.98% |
9.03% |
9.12% |
8.96% |
9.26% |
|
Portfolio turnover rate |
63% |
61% |
75% |
105% |
121% |
A The total returns would have been lower had certain expenses not been reduced during the periods shown.
B Net investment income per share has been calculated based on average shares outstanding during the period.
C FMR or the fund has entered into varying arrangements with third parties who either paid or reduced a portion of the class' expenses.
See accompanying notes which are an integral part of the financial statements.
Annual Report
For the period ended October 31, 2000
1. Significant Accounting Policies.
Fidelity Advisor High Yield Fund (the fund) is a fund of Fidelity Advisor Series II(the trust) and is authorized to issue an unlimited number of shares. The trust is registered under the Investment Company Act of 1940, as amended (the 1940 Act), as an open-end management investment company organized as a Massachusetts business trust.
The fund offers Class A, Class T, Class B, Class C, and Institutional Class shares, each of which has equal rights as to assets and voting privileges. Each class has exclusive voting rights with respect to matters that affect that class. Class B shares will automatically convert to Class A shares after a holding period of seven years from the initial date of purchase. Investment income, realized and unrealized capital gains and losses, the common expenses of the fund, and certain fund-level expense reductions, if any, are allocated on a pro rata basis to each class based on the relative net assets of each class to the total net assets of the fund. Each class of shares differs in its respective distribution, transfer agent, and certain other class-specific fees, expenses, and expense reductions.
The financial statements have been prepared in conformity with generally accepted accounting principles which require management to make certain estimates and assumptions at the date of the financial statements. The following summarizes the significant accounting policies of the fund:
Security Valuation. Securities for which quotations are readily available are valued by a pricing service at their market values as determined by their most recent bid prices in the principal market (sales prices if the principal market is an exchange) in which such securities are normally traded. Securities (including restricted securities) for which market quotations are not readily available are valued at their fair value as determined in good faith under consistently applied procedures under the general supervision of the Board of Trustees. Short-term securities with remaining maturities of sixty days or less for which quotations are not readily available are valued at amortized cost or original cost plus accrued interest, both of which approximate current value. Investments in open-end investment companies are valued at their net asset value each business day.
Foreign Currency Translation. The accounting records of the fund are maintained in U.S. dollars. Investment securities and other assets and liabilities denominated in a foreign currency are translated into U.S. dollars at the prevailing rates of exchange at period end. Purchases and sales of securities, income receipts and expense payments are translated into U.S. dollars at the prevailing exchange rate on the respective dates of the transactions.
Net realized gains and losses on foreign currency transactions represent net gains and losses from sales and maturities of foreign currency contracts, disposition of foreign currencies, the difference between the amount of net investment income accrued and the U.S. dollar amount actually received, and gains and losses between trade and settlement
Annual Report
Notes to Financial Statements - continued
1. Significant Accounting Policies - continued
Foreign Currency Translation - continued
date on purchases and sales of securities. The effects of changes in foreign currency exchange rates on investments in securities are included with the net realized and unrealized gain or loss on investment securities.
Income Taxes. As a qualified regulated investment company under Subchapter M of the Internal Revenue Code, the fund is not subject to income taxes to the extent that it distributes substantially all of its taxable income for its fiscal year. The schedule of investments includes information regarding income taxes under the caption "Income Tax Information."
Investment Income. Dividend income is recorded on the ex-dividend date, except certain dividends from foreign securities where the ex-dividend date may have passed, are recorded as soon as the fund is informed of the ex-dividend date. Non-cash dividends included in dividend income, if any, are recorded at the fair market value of the securities received. Interest income, which includes accretion of original issue discount, is accrued as earned. Investment income is recorded net of foreign taxes withheld where recovery of such taxes is uncertain. The fund may place a debt obligation on non-accrual status and reduce related interest income by ceasing current accruals and writing off interest receivables when the collection of all or a portion of interest has become doubtful based on consistently applied procedures, under the general supervision of the Board of Trustees of the fund. A debt obligation is removed from non-accrual status when the issuer resumes interest payments or when collectibility of interest is reasonably assured.
Expenses. Most expenses of the trust can be directly attributed to a fund. Expenses which cannot be directly attributed are apportioned among the funds in the trust.
Deferred Trustee Compensation. Under a Deferred Compensation Plan (the Plan) non-interested Trustees must defer receipt of a portion of, and may elect to defer receipt of an additional portion of, their annual compensation. Deferred amounts are treated as though equivalent dollar amounts had been invested in shares of the fund or are invested in a cross-section of other Fidelity funds. Deferred amounts remain in the fund until distributed in accordance with the Plan.
Distributions to Shareholders. Distributions are declared daily and paid monthly from net investment income. Distributions from realized gains, if any, are recorded on the ex-dividend date. Income dividends and capital gain distributions are declared separately for each class.
Income and capital gain distributions are determined in accordance with income tax regulations which may differ from generally accepted accounting principles. These differences, which may result in distribution reclassifications, are primarily due to
Annual Report
Notes to Financial Statements - continued
1. Significant Accounting Policies - continued
Distributions to Shareholders - continued
differing treatments for litigation proceeds, paydown gains/losses on certain securities, foreign currency transactions, market discount, partnerships, non-taxable dividends, capital loss carryforwards and losses deferred due to wash sales.
Permanent book and tax basis differences relating to shareholder distributions will result in reclassifications to paid in capital. Undistributed net investment income and accumulated undistributed net realized gain (loss) on investments and foreign currency transactions may include temporary book and tax basis differences which will reverse in a subsequent period. Any taxable income or gain remaining at fiscal year end is distributed in the following year.
Security Transactions. Security transactions are accounted for as of trade date. Gains and losses on securities sold are determined on the basis of identified cost.
2. Operating Policies.
Foreign Currency Contracts. The fund generally uses foreign currency contracts to facilitate transactions in foreign-denominated securities. Losses may arise from changes in the value of the foreign currency or if the counterparties do not perform under the contracts' terms. The U.S. dollar value of foreign currency contracts is determined using contractual currency exchange rates established at the time of each trade.
Joint Trading Account. Pursuant to an Exemptive Order issued by the Securities and Exchange Commission (the SEC), the fund, along with other affiliated entities of Fidelity Management & Research Company (FMR), may transfer uninvested cash balances into one or more joint trading accounts. These balances are invested in one or more repurchase agreements for U.S. Treasury or Federal Agency obligations.
Repurchase Agreements. The underlying U.S. Treasury, Federal Agency, or other obligations found to be satisfactory by FMR are transferred to an account of the fund, or to the Joint Trading Account, at a custodian bank. The securities are marked-to-market daily and maintained at a value at least equal to the principal amount of the repurchase agreement (including accrued interest). FMR, the fund's investment adviser, is responsible for determining that the value of the underlying securities remains in accordance with the market value requirements stated above.
Interfund Lending Program. Pursuant to an Exemptive Order issued by the SEC, the fund, along with other registered investment companies having management contracts with FMR, may participate in an interfund lending program. This program provides an alternative credit facility allowing the fund to borrow from, or lend money to, other participating funds.
Annual Report
Notes to Financial Statements - continued
2. Operating Policies - continued
Restricted Securities. The fund is permitted to invest in securities that are subject to legal or contractual restrictions on resale. These securities generally may be resold in transactions exempt from registration or to the public if the securities are registered. Disposal of these securities may involve time-consuming negotiations and expense, and prompt sale at an acceptable price may be difficult. At the end of the period, restricted securities (excluding 144A issues) amounted to $10,880,000 or 0.3% of net assets.
Loans and Other Direct Debt Instruments. The fund is permitted to invest in loans and loan participations, trade claims or other receivables. These investments may include standby financing commitments that obligate the fund to supply additional cash to the borrower on demand. Loan participations involve a risk of insolvency of the lending bank or other financial intermediary. At the end of the period, these investments amounted to $26,930,000 or 0.8% of net assets.
3. Purchases and Sales of Investments.
Purchases and sales of securities, other than short-term securities, aggregated $2,335,081,000 and $2,751,035,000, respectively.
4. Fees and Other Transactions with Affiliates.
Management Fee. As the fund's investment adviser, FMR receives a monthly fee that is calculated on the basis of a group fee rate plus a fixed individual fund fee rate applied to the average net assets of the fund. The group fee rate is the weighted average of a series of rates and is based on the monthly average net assets of all the mutual funds advised by FMR. The rates ranged from .0920% to .3700% for the period. The annual individual fund fee rate is 0.45%. In the event that these rates were lower than the contractual rates in effect during the period, FMR voluntarily implemented the above rates, as they resulted in the same or a lower management fee. For the period, the management fee was equivalent to an annual rate of .58% of average net assets.
Sub-Adviser Fee. Beginning January 1, 2001, FMR Co. (FMRC) will serve as sub-adviser for the fund. FMRC is a wholly owned subsidiary of FMR and will receive a fee from FMR of 50% of the management fee payable to FMR with respect to that portion of the fund's assets that will be managed by FMRC.
Distribution and Service Plan. In accordance with Rule 12b-1 of the 1940 Act, the Board of Trustees has adopted separate Distribution and Service Plans with respect to each class of shares (collectively referred to as "the Plans"). Under certain of the Plans, the class pays Fidelity Distributors Corporation (FDC), an affiliate of FMR, a 12b-1 fee. A portion of this fee may be reallowed to securities dealers, banks and other financial institutions for the distribution of each class of shares and providing shareholder support services. For the
Annual Report
Notes to Financial Statements - continued
4. Fees and Other Transactions with Affiliates - continued
Distribution and Service Plan - continued
period, this fee was based on the following annual rates of the average net assets of each applicable class:
|
Class A |
.15% |
|
Class T |
.25% |
|
Class B |
.90%* |
|
Class C |
1.00%** |
* .65% represents a distribution fee and .25% represents a shareholder service fee.
** .75% represents a distribution fee and .25% represents a shareholder service fee.
For the period, each class paid FDC the following amounts, a portion of which was retained by FDC:
|
|
Paid to |
Retained |
|
Class A |
$ 351,000 |
$ 1,000 |
|
Class T |
5,500,000 |
84,000 |
|
Class B |
10,182,000 |
7,360,000 |
|
Class C |
2,822,000 |
1,334,000 |
|
|
$ 18,855,000 |
$ 8,779,000 |
Sales Load. FDC receives a front-end sales charge of up to 4.75% for selling Class A shares, and 3.50% for selling Class T shares of the fund. FDC receives the proceeds of contingent deferred sales charges levied on Class B share redemptions occurring within six years of purchase and Class C share redemptions occurring within one year of purchase. Contingent deferred sales charges are based on declining rates ranging from 5% to 1% for Class B and 1% for Class C, of the lesser of the cost of shares at the initial date of purchase or the net asset value of the redeemed shares, excluding any reinvested dividends and capital gains. In addition, purchases of Class A and Class T shares that were subject to a finder's fee bear a contingent deferred sales charge on assets that do not remain in the fund for at least one year. The Class A and Class T contingent deferred sales charge is based on 0.25% of the lesser of the cost of shares at the initial date of purchase or the net asset value of the redeemed shares, excluding any reinvested dividends and capital gains. A portion of the sales charges paid to FDC is paid to securities dealers, banks and other financial institutions.
Annual Report
Notes to Financial Statements - continued
4. Fees and Other Transactions with Affiliates - continued
Sales Load - continued
For the period, sales charge amounts paid to and retained by FDC were as follows:
|
|
Paid to |
Retained |
|
Class A |
$ 422,000 |
$ 167,000 |
|
Class T |
898,000 |
358,000 |
|
Class B |
4,065,000 |
4,065,000* |
|
Class C |
157,000 |
157,000* |
|
Total |
$ 5,542,000 |
$ 4,747,000 |
* When Class B and Class C shares are initially sold, FDC pays commissions from its own resources to securities dealers,
banks, and other financial institutions through which the sales are made.
Transfer Agent Fees. Fidelity Investments Institutional Operations Company, Inc., (FIIOC), an affiliate of FMR, is the transfer, dividend disbursing and shareholder servicing agent (collectively referred to as the transfer agent) for each class of the fund. FIIOC receives account fees and asset-based fees that vary according to the account size and type of account of the shareholders of the respective classes of the fund. FIIOC pays for typesetting, printing and mailing of all shareholder reports, except proxy statements. For the period, the following amounts were paid to FIIOC:
|
|
Amount |
% of |
|
Class A |
$ 419,000 |
.18 |
|
Class T |
3,763,000 |
.17 |
|
Class B |
2,091,000 |
.18 |
|
Class C |
464,000 |
.16 |
|
Institutional Class |
244,000 |
.21 |
|
|
$ 6,981,000 |
|
Accounting Fees. Fidelity Service Company, Inc., an affiliate of FMR, maintains the fund's accounting records. The fee is based on the level of average net assets for the month plus out-of-pocket expenses.
Brokerage Commissions. The fund placed a portion of its portfolio transactions with brokerage firms which are affiliates of FMR. The commissions paid to these affiliated firms were $12,000 for the period.
5. Interfund Lending Program.
The fund participated in the interfund lending program as a lender. The average daily loan balance during the period for which loans were outstanding amounted to $23,520,000. The weighted average interest rate was 6.16%. Interest earned from the interfund lending program amounted to $28,000 and is included in interest income on the Statement of Operations.
Annual Report
Notes to Financial Statements - continued
6. Expense Reductions.
FMR has directed certain portfolio trades to brokers who paid a portion of the fund's expenses. For the period, the fund's expenses were reduced by $17,000 under this arrangement.
In addition, through an arrangement with the fund's custodian, credits realized as a result of uninvested cash balances were used to reduce a portion of expenses. During the period, the fund's custodian fees were reduced by $24,000 under the custodian arrangement.
7. Distributions to Shareholders.
Distributions to shareholders of each class were as follows:
|
Amounts in thousands |
Years ended October 31, |
|
|
|
2000 |
1999 |
|
From net investment income |
|
|
|
Class A |
$ 19,732 |
$ 14,241 |
|
Class T |
182,570 |
218,969 |
|
Class B |
86,748 |
91,163 |
|
Class C |
21,383 |
16,708 |
|
Institutional Class |
10,316 |
11,786 |
|
Total |
$ 320,749 |
$ 352,867 |
|
Return of Capital |
|
|
|
Class A |
$ - |
$ 679 |
|
Class T |
- |
10,440 |
|
Class B |
- |
4,346 |
|
Class C |
- |
797 |
|
Institutional Class |
- |
562 |
|
Total |
$ - |
$ 16,824 |
|
From net realized gain |
|
|
|
Class A |
$ - |
$ 1,446 |
|
Class T |
- |
25,543 |
|
Class B |
- |
10,501 |
|
Class C |
- |
1,751 |
|
Institutional Class |
- |
1,433 |
|
Total |
$ - |
$ 40,674 |
|
In excess of net realized gain |
|
|
|
Class A |
$ - |
$ 1,056 |
|
Class T |
- |
18,641 |
|
Class B |
- |
7,663 |
|
Class C |
- |
1,278 |
|
Institutional Class |
- |
1,046 |
|
Total |
$ - |
$ 29,684 |
|
|
$ 320,749 |
$ 440,049 |
Annual Report
Notes to Financial Statements - continued
8. Share Transactions.
Transactions for each class of shares were as follows:
|
Amounts in thousands |
Shares |
Dollars |
||
|
|
Year ended October 31, |
Year ended October 31, |
Year ended October 31, |
Year ended October 31, |
|
|
2000 |
1999 |
2000 |
1999 |
|
|
|
|
|
|
|
Class A |
10,756 |
13,700 |
$ 117,740 |
$ 158,674 |
|
Reinvestment of distributions |
1,144 |
1,173 |
12,198 |
13,495 |
|
Shares redeemed |
(10,139) |
(5,559) |
(109,658) |
(64,643) |
|
Net increase (decrease) |
1,761 |
9,314 |
$ 20,280 |
$ 107,526 |
|
Class T |
80,648 |
101,408 |
$ 877,876 |
$ 1,178,382 |
|
Reinvestment of distributions |
13,081 |
18,746 |
139,965 |
216,117 |
|
Shares redeemed |
(120,833) |
(118,096) |
(1,303,448) |
(1,367,579) |
|
Net increase (decrease) |
(27,104) |
2,058 |
$ (285,607) |
$ 26,920 |
|
Class B |
22,283 |
43,832 |
$ 242,700 |
$ 507,464 |
|
Reinvestment of distributions |
5,027 |
6,459 |
53,537 |
74,128 |
|
Shares redeemed |
(35,314) |
(26,213) |
(379,926) |
(302,213) |
|
Net increase (decrease) |
(8,004) |
24,078 |
$ (83,689) |
$ 279,379 |
|
Class C |
13,456 |
20,267 |
$ 146,823 |
$ 234,940 |
|
Reinvestment of distributions |
1,115 |
1,004 |
11,868 |
11,541 |
|
Shares redeemed |
(13,098) |
(8,802) |
(141,107) |
(101,978) |
|
Net increase (decrease) |
1,473 |
12,469 |
$ 17,584 |
$ 144,503 |
|
Institutional Class |
5,154 |
11,210 |
$ 55,289 |
$ 127,339 |
|
Reinvestment of distributions |
709 |
981 |
7,434 |
11,076 |
|
Shares redeemed |
(7,642) |
(11,277) |
(79,850) |
(128,034) |
|
Net increase (decrease) |
(1,779) |
914 |
$ (17,127) |
$ 10,381 |
Annual Report
To the Trustees of Fidelity Advisor Series II and Shareholders of Fidelity Advisor High Yield Fund:
We have audited the accompanying statement of assets and liabilities of Fidelity Advisor High Yield Fund (the Fund), a fund of Fidelity Advisor Series II (the Trust), including the portfolio of investments, as of October 31, 2000, and the related statement of operations for the year then ended, the statement of changes in net assets for each of the two years in the period then ended, and the financial highlights for each of the five years in the period then ended. These financial statements and financial highlights are the responsibility of the Fund's management. Our responsibility is to express an opinion on these financial statements and financial highlights based on our audits.
We conducted our audits in accordance with auditing standards generally accepted in the United States of America. Those standards require that we plan and perform the audit to obtain reasonable assurance about whether the financial statements and financial highlights are free of material misstatement. An audit includes examining, on a test basis, evidence supporting the amounts and disclosures in the financial statements. Our procedures included confirmation of securities owned as of October 31, 2000, by correspondence with the custodian and brokers; where replies were not received from brokers, we performed other auditing procedures. An audit also includes assessing the accounting principles used and significant estimates made by management, as well as evaluating the overall financial statement presentation. We believe that our audits provide a reasonable basis for our opinion.
In our opinion, the financial statements and financial highlights referred to above present fairly, in all material respects, the financial position of Fidelity Advisor High Yield Fund as of October 31, 2000, the results of its operations for the year then ended, the changes in its net assets for each of the two years in the period then ended, and its financial highlights for each of the five years in the period then ended, in conformity with accounting principles generally accepted in the United States of America.
/s/DELOITTE & TOUCHE LLP
DELOITTE & TOUCHE LLP
Boston, Massachusetts
December 8, 2000
A total of 3% of the dividends distributed during the fiscal year qualifies for the dividends-received deduction for corporate shareholders.
The fund will notify shareholders in January 2001 of amounts for use in preparing 2000 income tax returns.
Annual Report
Annual Report
Investment Adviser
Fidelity Management & Research Company
Boston, MA
Investment Sub-Advisers
Fidelity Management & Research
(U.K.) Inc.
Fidelity Management & Research
(Far East) Inc.
Fidelity Investments Japan Limited
Officers
Edward C. Johnson 3d, President
Robert C. Pozen, Senior Vice President
Robert A. Lawrence, Vice President
Thomas T. Soviero, Vice President
Eric D. Roiter, Secretary
Robert A. Dwight, Treasurer
Maria F. Dwyer, Deputy Treasurer
John H. Costello, Assistant Treasurer
Thomas J. Simpson, Assistant Treasurer
Board of Trustees
Ralph F. Cox *
Phyllis Burke Davis *
Robert M. Gates *
Edward C. Johnson 3d
Donald J. Kirk *
Ned C. Lautenbach *
Peter S. Lynch
Marvin L. Mann *
William O. McCoy *
Gerald C. McDonough *
Robert C. Pozen
Thomas R. Williams *
Advisory Board
J. Michael Cook
Abigail P. Johnson
Marie L. Knowles
General Distributor
Fidelity Distributors Corporation
Boston, MA
Transfer and Shareholder
Servicing Agent
Fidelity Investments Institutional Operations Company, Inc.
Boston, MA
Custodian
The Bank of New York
New York, NY
* Independent trustees
Annual Report
Focus Funds
Fidelity Advisor Consumer
Industries Fund
Fidelity Advisor Cyclical
Industries Fund
Fidelity Advisor Financial
Services Fund
Fidelity Advisor Health Care Fund
Fidelity Advisor Natural
Resources Fund
Fidelity Advisor Technology Fund
Fidelity Advisor Telecommunications & Utilities Growth Fund
Growth Funds
Fidelity Advisor Korea Fund
Fidelity Advisor Emerging Asia Fund
Fidelity Advisor Latin America Fund
Fidelity Advisor Japan Fund
Fidelity Advisor Europe Capital Appreciation Fund
Fidelity Advisor International
Capital Appreciation Fund
Fidelity Advisor Overseas Fund
Fidelity Advisor Diversified International Fund
Fidelity Advisor Global Equity Fund
Fidelity Advisor TechnoQuant®
Growth Fund
Fidelity Advisor Small Cap Fund
Fidelity Advisor Value Strategies Fund
Fidelity Advisor Mid Cap Fund
Fidelity Advisor Dynamic Capital Appreciation Fund
Fidelity Advisor Equity Growth Fund
Fidelity Advisor Large Cap Fund
Fidelity Advisor Dividend Growth Fund
Fidelity Advisor Growth
Opportunities Fund
Growth and Income Funds
Fidelity Advisor Growth & Income Fund
Fidelity Advisor Equity Income Fund
Fidelity Advisor Asset Allocation Fund
Fidelity Advisor Balanced Fund
Taxable Income Funds
Fidelity Advisor Emerging Markets Income Fund
Fidelity Advisor High Yield Fund
Fidelity Advisor High Income Fund
Fidelity Advisor Strategic Income Fund
Fidelity Advisor Mortgage
Securities Fund
Fidelity Advisor Government Investment Fund
Fidelity Advisor Intermediate Bond Fund
Fidelity Advisor Short Fixed-Income Fund
Municipal Funds
Fidelity Advisor Municipal Income Fund
Money Market Funds
Prime Fund
Treasury Fund
Tax-Exempt Fund
|
HY-ANN-1200 |
118948 |
|
1.538463.103 |
|
(Fidelity Investment logo)(registered trademark)
Fidelity® Advisor
Fund - Institutional Class
Annual Report
October 31, 2000
(2_fidelity_logos)
|
President's Message |
3 |
Ned Johnson on investing strategies. |
|
Performance |
4 |
How the fund has done over time. |
|
Fund Talk |
9 |
The manager's review of fund performance, strategy and outlook. |
|
Investment Changes |
12 |
A summary of major shifts in the fund's investments over the past six months. |
|
Investments |
13 |
A complete list of the fund's investments with their market values. |
|
Financial Statements |
31 |
Statements of assets and liabilities,
operations, and changes in net assets, |
|
Notes |
40 |
Notes to the financial statements. |
|
Report of Independent Accountants |
48 |
The auditors' opinion. |
|
Distributions |
49 |
|
Standard & Poor's, S&P and S&P 500 are registered service marks of The McGraw-Hill Companies, Inc. and have been licensed for use by Fidelity Distributors Corporation.
Third party marks appearing herein are the property of their respective owners.
All other marks appearing herein are registered or unregistered trademarks or service marks of FMR Corp. or an affiliated company.
(Recycle graphic) This report is printed on recycled paper using soy-based inks.
This report and the financial statements contained herein are submitted for the general information of the shareholders of the fund. This report is not authorized for distribution to prospective investors in the fund unless preceded or accompanied by an effective prospectus.
Mutual fund shares are not deposits or obligations of, or guaranteed by, any depository institution. Shares are not insured by the FDIC, Federal Reserve Board or any other agency, and are subject to investment risks, including possible loss of principal amount invested.
Neither the fund nor Fidelity Distributors Corporation is a bank.
For more information on any Fidelity Advisor fund, including charges and expenses, contact your investment professional for a free prospectus. Read it carefully before you invest or send money.
Annual Report
(photo_of_Edward_C_Johnson_3d)
Dear Shareholder:
A sixth-straight year of double-digit positive returns for the Dow Jones Industrial Average, NASDAQ and S&P 500® could be in jeopardy unless the U.S. stock market shows marked improvement in the final two months of 2000. Through October, all three indexes had negative year-to-date returns. On the other hand, most fixed-income sectors were solidly in the black. Treasuries and other long-term government securities led the way, returning nearly 14%.
While it's impossible to predict the future direction of the markets with any degree of certainty, there are certain basic principles that can help investors plan for their future needs.
The longer your investment time frame, the less likely it is that you will be affected by short-term market volatility. A 10-year investment horizon appropriate for saving for a college education, for example, enables you to weather market cycles in a long-term fund, which may have a higher risk potential, but also has a higher potential rate of return.
An intermediate-length fund could make sense if your investment horizon is two to four years, while a short-term bond fund could be the right choice if you need your money in one or two years.
If your time horizon is less than a year, you might want to consider moving some of your bond investment into a money market fund. These funds seek income and a stable share price by investing in high-quality, short-term investments. Of course, it's important to remember that an investment in a money market fund is not insured or guaranteed by the Federal Deposit Insurance Corporation or any other government agency. Although money market funds seek to preserve the value of your investment at $1.00 per share, it is possible to lose money by investing in these types of funds.
Finally, no matter what your time horizon or portfolio diversity, it makes good sense to follow a regular investment plan, investing a certain amount of money in a fund at the same time each month or quarter and periodically reviewing your overall portfolio. By doing so, you won't get caught up in the excitement of a rapidly rising market, nor will you buy all your shares at market highs. While this strategy - known as dollar cost averaging - won't assure a profit or protect you from a loss in a declining market, it should help you lower the average cost of your purchases. Of course, you should consider your financial ability to continue your purchases through periods of low price levels before undertaking such a strategy.
Remember to contact your investment professional if you need help with your investments.
Best regards,
/s/Edward C. Johnson 3d
Edward C. Johnson 3d
Annual Report
Fidelity Advisor High Yield Fund - Institutional Class
There are several ways to evaluate historical performance. You can look at the total percentage change in value, the average annual percentage change or the growth of a hypothetical $10,000 investment. Total return reflects the change in the value of an investment, assuming reinvestment of the class' dividend income and capital gains (the profits earned upon the sale of securities that have grown in value). You can also look at the class' income, as reflected in its yield, to measure performance. The initial offering of Institutional Class shares took place on July 3, 1995. Institutional Class shares are sold to eligible investors without a sales load or 12b-1 fee. Returns prior to July 3, 1995 are those of Class T, the original class of the fund, and reflect Class T shares' 0.25% 12b-1 fee. If Fidelity had not reimbursed certain class expenses during the periods shown, the past 10 year total returns would have been lower.
Annual Report
Fidelity Advisor High Yield Fund - Institutional Class
Performance - continued
Cumulative Total Returns
|
Periods ended October 31, 2000 |
|
Past 1 |
Past 5 |
Past 10 |
|
Fidelity Adv High Yield - Inst CL |
|
-5.56% |
31.99% |
218.33% |
|
ML High Yield Master II |
|
-1.68% |
31.76% |
199.32% |
|
High Current Yield Funds Average |
|
-2.77% |
25.45% |
173.70% |
Cumulative total returns show Institutional Class' performance in percentage terms over a set period - in this case, one year, five years or 10 years. For example, if you had invested $1,000 in a fund that had a 5% return over the past year, the value of your investment would be $1,050. You can compare Institutional Class' returns to those of the Merrill Lynch High Yield Master II Index - a market value-weighted index of all domestic and yankee high-yield bonds, including deferred interest bonds and payment-in-kind securities. Issues included in the index have maturities of one year or more and have a credit rating lower than BBB-/Baa3, but are not in default. To measure how Institutional Class' performance stacked up against its peers, you can compare it to the high current yield funds average, which reflects the performance of mutual funds with similar objectives tracked by Lipper Inc. The past one year average represents a peer group of 357 mutual funds. These benchmarks include reinvested dividends and capital gains, if any, and exclude the effect of sales charges.
Annual Report
Fidelity Advisor High Yield Fund - Institutional Class
Performance - continued
Average Annual Total Returns
|
Periods ended October 31, 2000 |
Past 1 |
Past 5 |
Past 10 |
|
Fidelity Adv High Yield - Inst CL |
-5.56% |
5.71% |
12.28% |
|
ML High Yield Master II |
-1.68% |
5.67% |
11.59% |
|
High Current Yield Funds Average |
-2.77% |
4.55% |
10.51% |
Average annual total returns take Institutional Class' cumulative return and show you what would have happened if Institutional Class shares had performed at a constant rate each year.
Annual Report
Fidelity Advisor High Yield Fund - Institutional Class
Performance - continued
$10,000 Over 10 Years

$10,000 Over 10 Years: Let's say hypothetically that $10,000 was invested in Fidelity Advisor High Yield Fund - Institutional Class on October 31, 1990. As the chart shows, by October 31, 2000, the value of the investment would have grown to $31,833 - a 218.33% increase on the initial investment. For comparison, look at how the Merrill Lynch High Yield Master II Index did over the same period. With dividends reinvested, the same $10,000 investment would have grown to $29,932 - a 199.32% increase.
Understanding
Performance
How a fund did yesterday is no guarantee of how it will do tomorrow. Bond prices, for example, generally move in the opposite direction of interest rates. In turn, the share price, return and yield of a fund that invests in bonds will vary. That means if you sell your shares during a market downturn, you might lose money. But if you can ride out the market's ups and downs, you may have a gain.
3Annual Report
Fidelity Advisor High Yield Fund - Institutional Class
Performance - continued
Total Return Components
|
|
Years ended |
Years ended October 31, |
||||
|
|
2000 |
1999 |
1998 |
1997 |
1996 |
|
|
Dividend returns |
7.93% |
10.90% |
7.97% |
10.03% |
9.75% |
|
Capital returns |
-13.49% |
1.15% |
-12.18% |
5.39% |
3.06% |
|
Total returns |
-5.56% |
12.05% |
-4.21% |
15.42% |
12.81% |
Total return components include both dividend returns and capital returns. A dividend return reflects the actual dividends paid by the class. A capital return reflects both the amount paid by the class to shareholders as capital gain distributions and changes in the class' share price. Both returns assume the dividends or capital gains, if any, paid by the class are reinvested.
Dividends and Yield
|
Periods ended October 31, 2000 |
Past 1 |
Past 6 |
Past 1 |
|
Dividends per share |
7.08¢ |
44.72¢ |
91.86¢ |
|
Annualized dividend rate |
8.69% |
8.79% |
8.72% |
|
30-day annualized yield |
11.88% |
- |
- |
Dividends per share show the income paid by the class for a set period and do not reflect any tax reclassifications. If you annualize this number, based on an average share price of $9.59 over the past one month, $10.09 over the past six months, and $10.53 over the past one year, you can compare the class' income over these three periods. The 30-day annualized yield is a standard formula based on the yields of the securities in the fund, averaged over the past 30 days. This figure shows you the yield characteristics of the fund's investments at the end of the period. It also helps you compare funds from different companies on an equal basis.
Annual Report
Market Recap
With a negative return for the 12-month period ending October 31, 2000, the high-yield market can be viewed in one of two ways: as a distressed market that perhaps has not reached its bottom, or as an opportunity for investors to take advantage of attractively low prices. Early in the period, high-yield securities suffered in comparison to the high-flying NASDAQ market. High-yield debt suffered again when the NASDAQ tumbled and an economic slowdown loomed, resulting in a series of corporate earnings disappointments. Technical factors - abundant supply in the face of weak demand - further hampered performance. As the high-yield default rate crept higher, investors turned to the relative safety of investment-grade bonds. For the one-year period ending October 31, 2000, the Merrill Lynch High Yield Master II Index - a broad measure of high-yield market performance - fell 1.68%. This return lagged the overall U.S. taxable bond market as measured by the Lehman Brothers Aggregate Bond Index, which gained 7.30% during the past 12 months. A potential catalyst for improved performance could be a continued increase in merger and acquisition activity. From July to August, $90 billion in M&A activity took place where the target company was in the high-yield universe. Not only do these deals reduce the supply of high-yield credits, they also establish benchmark valuations for some sectors of the market.
(Portfolio Manager photograph)
Note to shareholders: Tom Soviero became Portfolio Manager of Fidelity Advisor High Yield Fund on June 1, 2000.
Q. How did the fund perform, Tom?
A. For the 12 months that ended October 31, 2000, the fund's Institutional Class shares returned -5.56%. In comparison, the high current yield funds average tracked by Lipper Inc. fell 2.77%, while the overall high-yield market, as measured by the Merrill Lynch High Yield Master II Index, dropped 1.68% for the same 12-month period.
Q. How would you characterize the investment environment for high-yield bonds?
A. In a word, challenging. Weak market conditions were specific to the high-yield asset class, rather than in response to external shocks, such as the Asian currency crisis in 1998. A good proxy for the high-yield market's malaise is the distressed ratio, the proportion of securities yielding at least 10 percentage points more than Treasuries, which had a yield of approximately 6% at the end of the period. Nearly 25% of securities in the high-yield market were yielding at least 16%, suggesting that one out of every four high-yield bonds was experiencing significant fundamental problems. This environment led investors to seek higher-quality investment alternatives by moving up the credit spectrum within the high-yield sector, or moving out of high-yield bonds altogether.
Annual Report
Fund Talk: The Manager's Overview - continued
Q. As the fund's new manager, what investment strategies did you implement?
A. First, I think it's important to understand my investment philosophy, which emphasizes sector and security selection based on fundamental credit research. This philosophy drove my core strategy during the past months. Despite a rocky transition environment, I was able to reduce the portfolio's exposure to weaker players within certain sectors, such as telecommunications, at relatively attractive prices. Structurally, I maintained an average credit quality of "B," although I did invest along the entire quality spectrum. I also invested in all levels of the capital structure, including opportunistic investments in common stocks, almost always of high-yield issuers. I am a firm believer that volatility creates opportunity, particularly when bond prices fall below their fundamental values.
Q. What drove the fund's underperformance during the past year?
A. Credit problems were the biggest factor, including the portfolio's overweighting in the telecommunications sector, where several lower-tier companies performed poorly. For example, ICG Communications, an Internet access provider, had problems servicing key customers and serious management turmoil that led to declining financial health. GST Telecommunications, a competitive local exchange carrier, also suffered from internal conflict and management changes. Several retail chains fared badly, including Pathmark Stores and Rite Aid. Pathmark deteriorated in response to a failed merger, which led to liquidity problems and a debt-restructuring program. Rite Aid, a turnaround play, hasn't yet met my expectations. Despite an improving balance sheet, Rite Aid's profitability remained weak, a concern in light of its substantial debt load. Another disappointment was Gaylord Container, which issued a poor September quarterly earnings report as a result of increased raw material prices. The market overreacted, and the bonds fell substantially. However, Gaylord's fundamental prospects remained strong and I purchased more at attractive prices shortly thereafter.
Q. What holdings helped the fund's return?
A. Selling lower-tier telecom bonds and replacing them in part with top-tier issuers, such as Nextel, helped returns. Nextel, the portfolio's largest holding at the end of the period, held up extremely well based on strong subscriber growth at above-average revenue and low disconnect rates. A common stock investment in Laboratory Corp. of America - also a high-yield issuer - benefited from a successful turnaround strategy and favorable macro trends that drove a strong health care diagnostics sector move. Increasing merger and acquisition activity in the high-yield arena benefited several holdings that were acquired by investment-grade entities.
Annual Report
Fund Talk: The Manager's Overview - continued
Q. What's your outlook for the months ahead?
A. The past months have been disappointing. However, from a valuation perspective, credit spreads are at their widest - with a lower default rate - since 1991 when we began to emerge from the recession. At that time, we saw non-traditional sources of capital enter the high-yield market, including hedge funds and equity players. If recent merger and acquisition activity is any indication, we may be approaching a point where such non-traditional players may re-enter the high-yield market in order to capture potential gains from fundamentally sound companies selling at prices below their intrinsic value.
The views expressed in this report reflect those of the portfolio manager only through the end of the period of the report as stated on the cover and do not necessarily represent the views of Fidelity or any other person in the Fidelity organization. Any such views are subject to change at any time based upon market or other conditions and Fidelity disclaims any responsibility to update such views. These views may not be relied on as investment advice and, because investment decisions for a Fidelity fund are based on numerous factors, may not be relied on as an indication of trading intent on behalf of any Fidelity fund.
Fund Facts
Goal: seeks a combination of a high level of income and potential for capital gains
Start date: January 5, 1987
Size: as of October 31, 2000, more than $3.2 billion
Manager: Tom Soviero, since June 2000; joined Fidelity in 1989
3Tom Soviero on the role of mergers and acquisitions:
"Merger and acquisition (M&A) activity in the high-yield bond market can play a significant role for investors seeking to capture the intrinsic value of a company and its business prospects. At no time is this more important than during weak investment environments. As credit spreads widen and market sentiment deteriorates, a high-yield company's access to capital may become constrained or simply too expensive. Without access to adequate, affordable financing, companies may find that they can no longer support the growth necessary to become - or remain - competitive.
"Recently, M&A activity has been on the rise as a number of well-established global companies have taken advantage of attractive prices for high-yield companies. Several of the fund's holdings have been acquired, or have acquisitions pending, by investment-grade entities including R&B Falcon, Repap, VoiceStream and Intermedia. These examples are diversified across sectors and may signal a use of M&A as a quasi-financing tool to achieve the size and balance sheet strength necessary to compete and survive over a longer term. These examples also illustrate the broad-based upside potential in the high-yield market - as transactions multiply, demand and prices for high-yield bonds may improve to reflect companies' current value and future prospects."
Annual Report
|
Top Five Holdings as of October 31, 2000 |
||
|
(by issuer, excluding cash equivalents) |
% of fund's |
% of fund's net assets |
|
Nextel Communications, Inc. |
4.7 |
1.9 |
|
Laboratory Corp. of America Holdings |
4.4 |
0.0 |
|
Intermedia Communications, Inc. |
2.7 |
2.5 |
|
CSC Holdings, Inc. |
2.6 |
2.1 |
|
United Pan-Europe Communications NV |
2.5 |
2.5 |
|
|
16.9 |
9.0 |
|
Top Five Market Sectors as of October 31, 2000 |
||
|
|
% of fund's |
% of fund's net assets |
|
Media & Leisure |
28.3 |
29.6 |
|
Utilities |
26.3 |
28.9 |
|
Health |
9.3 |
3.2 |
|
Basic Industries |
7.6 |
8.3 |
|
Energy |
3.4 |
4.2 |
|
Quality Diversification as of October 31, 2000 |
||
|
(Moody's Ratings) |
% of fund's investments |
% of fund's investments |
|
Aaa, Aa, A |
0.2 |
0.5 |
|
Baa |
0.8 |
0.5 |
|
Ba |
6.0 |
5.1 |
|
B |
50.4 |
55.2 |
|
Caa, Ca, C |
10.7 |
13.5 |
|
D |
0.0 |
0.2 |
|
Not Rated |
2.7 |
5.6 |
|
Table excludes short-term investments. Where Moody's ratings are not available, we have used S&P ratings. Unrated debt securities that are equivalent to Ba and below at October 31, 2000 and April 30, 2000 account for 2.7% and 5.6%, respectively, of the fund's investments. |
|
Asset Allocation (% of fund's net assets) |
|||||||
|
As of October 31, 2000 * |
As of April 30, 2000 ** |
||||||
|
Nonconvertible |
|
|
Nonconvertible |
|
||
|
Convertible Bonds, Preferred Stocks 16.6% |
|
|
Convertible Bonds, Preferred Stocks 11.2% |
|
||
|
Common Stocks 9.8% |
|
|
Common Stocks 4.7% |
|
||
|
Other Investments 1.9% |
|
|
Other Investments 1.3% |
|
||
|
Short-Term |
|
|
Short-Term |
|
||
|
* Foreign |
11.9% |
|
** Foreign |
12.6% |
|
||
Annual Report
Showing Percentage of Net Assets
|
Corporate Bonds - 66.6% |
|||||
|
Moody's Ratings (unaudited) (b) |
Principal Amount (000s) |
Value (Note 1) (000s) |
|||
|
Convertible Bonds - 2.2% |
|||||
|
CONSTRUCTION & REAL ESTATE - 0.4% |
|||||
|
Building Materials - 0.1% |
|||||
|
Hexcel Corp. 7% 8/1/03 |
B3 |
|
$ 2,220 |
$ 2,020 |
|
|
Real Estate Investment Trusts - 0.3% |
|||||
|
Rockefeller Center Properties, Inc. 0% 12/31/00 |
- |
|
12,700 |
10,795 |
|
|
TOTAL CONSTRUCTION & REAL ESTATE |
12,815 |
||||
|
FINANCE - 0.3% |
|||||
|
Securities Industry - 0.3% |
|||||
|
Ameritrade Holding Corp. 5.75% 8/1/04 |
CCC+ |
|
14,820 |
10,004 |
|
|
HEALTH - 1.5% |
|||||
|
Medical Facilities Management - 1.5% |
|||||
|
HEALTHSOUTH Corp. 3.25% 4/1/03 |
Ba3 |
|
13,240 |
11,304 |
|
|
Total Renal Care Holdings, Inc.: |
|
|
|
|
|
|
7% 5/15/09 |
B3 |
|
25,300 |
18,722 |
|
|
7% 5/15/09 (e) |
B3 |
|
24,020 |
17,775 |
|
|
|
47,801 |
||||
|
TOTAL CONVERTIBLE BONDS |
70,620 |
||||
|
Nonconvertible Bonds - 64.4% |
|||||
|
BASIC INDUSTRIES - 7.1% |
|||||
|
Chemicals & Plastics - 3.9% |
|||||
|
Avecia Group PLC 11% 7/1/09 |
B2 |
|
26,890 |
25,546 |
|
|
Geo Specialty Chemicals, Inc. 10.125% 8/1/08 |
B3 |
|
745 |
596 |
|
|
Huntsman Corp.: |
|
|
|
|
|
|
9.5% 7/1/07 (e) |
B2 |
|
16,270 |
9,762 |
|
|
9.5% 7/1/07 (e) |
B2 |
|
23,525 |
14,115 |
|
|
Huntsman ICI Chemicals LLC 10.125% 7/1/09 |
B2 |
|
23,790 |
22,482 |
|
|
Lyondell Chemical Co.: |
|
|
|
|
|
|
9.625% 5/1/07 |
Ba3 |
|
7,905 |
7,707 |
|
|
9.875% 5/1/07 |
Ba3 |
|
12,710 |
12,392 |
|
|
10.875% 5/1/09 |
B2 |
|
32,730 |
31,421 |
|
|
Sterling Chemicals, Inc. 12.375% 7/15/06 |
B3 |
|
3,000 |
2,865 |
|
|
|
126,886 |
||||
|
Metals & Mining - 0.1% |
|||||
|
Metallurg, Inc. 11% 12/1/07 |
B3 |
|
4,735 |
3,693 |
|
|
Corporate Bonds - continued |
|||||
|
Moody's Ratings (unaudited) (b) |
Principal Amount (000s) |
Value (Note 1) (000s) |
|||
|
Nonconvertible Bonds - continued |
|||||
|
BASIC INDUSTRIES - continued |
|||||
|
Packaging & Containers - 1.4% |
|||||
|
Gaylord Container Corp.: |
|
|
|
|
|
|
9.375% 6/15/07 |
Caa1 |
|
$ 17,510 |
$ 11,382 |
|
|
9.75% 6/15/07 |
Caa1 |
|
16,030 |
10,740 |
|
|
9.875% 2/15/08 |
Caa3 |
|
63,880 |
19,164 |
|
|
Sweetheart Cup, Inc. 10.5% 9/1/03 |
Caa1 |
|
2,525 |
2,273 |
|
|
U.S. Can Corp. 12.375% 10/1/10 (e) |
B3 |
|
3,280 |
3,214 |
|
|
|
46,773 |
||||
|
Paper & Forest Products - 1.7% |
|||||
|
Abitibi-Consolidated, Inc. 7.4% 4/1/18 |
Baa3 |
|
16,780 |
14,614 |
|
|
Container Corp. of America gtd.: |
|
|
|
|
|
|
9.75% 4/1/03 |
B2 |
|
3,490 |
3,490 |
|
|
11.25% 5/1/04 |
B2 |
|
4,550 |
4,561 |
|
|
Riverwood International Corp. 10.875% 4/1/08 |
Caa1 |
|
4,445 |
4,001 |
|
|
SF Holdings Group, Inc. 0% 3/15/08 (d) |
Caa2 |
|
17,151 |
8,919 |
|
|
Stone Container Corp. 12.58% 8/1/16 (f) |
B2 |
|
18,740 |
18,740 |
|
|
|
54,325 |
||||
|
TOTAL BASIC INDUSTRIES |
231,677 |
||||
|
CONSTRUCTION & REAL ESTATE - 1.2% |
|||||
|
Building Materials - 0.6% |
|||||
|
Flowserve Corp. 12.25% 8/15/10 (e) |
B3 |
|
13,440 |
13,440 |
|
|
Numatics, Inc. 9.625% 4/1/08 |
B3 |
|
10,385 |
7,996 |
|
|
|
21,436 |
||||
|
Construction - 0.1% |
|||||
|
Blount, Inc. 13% 8/1/09 |
B3 |
|
3,790 |
3,184 |
|
|
Real Estate - 0.1% |
|||||
|
Stewart Enterprises, Inc. 6.4% 5/5/13 |
Ba3 |
|
2,970 |
1,901 |
|
|
Real Estate Investment Trusts - 0.4% |
|||||
|
Ocwen Asset Investment Corp. 11.5% 7/1/05 |
- |
|
15,000 |
11,700 |
|
|
TOTAL CONSTRUCTION & REAL ESTATE |
38,221 |
||||
|
DURABLES - 1.2% |
|||||
|
Home Furnishings - 0.7% |
|||||
|
Sealy Corp., Inc. 10% 12/18/08 pay-in-kind (g) |
- |
|
14,222 |
10,880 |
|
|
Corporate Bonds - continued |
|||||
|
Moody's Ratings (unaudited) (b) |
Principal Amount (000s) |
Value (Note 1) (000s) |
|||
|
Nonconvertible Bonds - continued |
|||||
|
DURABLES - continued |
|||||
|
Home Furnishings - continued |
|||||
|
Sealy Mattress Co.: |
|
|
|
|
|
|
0% 12/15/07 (d) |
B3 |
|
$ 6,930 |
$ 5,163 |
|
|
9.875% 12/15/07 |
B3 |
|
6,190 |
5,881 |
|
|
|
21,924 |
||||
|
Textiles & Apparel - 0.5% |
|||||
|
Levi Strauss & Co.: |
|
|
|
|
|
|
6.8% 11/1/03 |
Ba3 |
|
11,665 |
9,565 |
|
|
7% 11/1/06 |
Ba3 |
|
9,895 |
7,322 |
|
|
Pillowtex Corp.: |
|
|
|
|
|
|
9% 12/15/07 |
Ca |
|
5,340 |
641 |
|
|
10% 11/15/06 |
Ca |
|
4,370 |
524 |
|
|
|
18,052 |
||||
|
TOTAL DURABLES |
39,976 |
||||
|
ENERGY - 2.8% |
|||||
|
Coal - 0.5% |
|||||
|
P&L Coal Holdings Corp. 9.625% 5/15/08 |
B2 |
|
15,310 |
14,966 |
|
|
Energy Services - 1.5% |
|||||
|
R&B Falcon Corp.: |
|
|
|
|
|
|
6.5% 4/15/03 |
Ba3 |
|
4,345 |
4,128 |
|
|
6.75% 4/15/05 |
Ba3 |
|
2,160 |
2,009 |
|
|
6.95% 4/15/08 |
Ba3 |
|
320 |
291 |
|
|
9.5% 12/15/08 |
Ba3 |
|
20,820 |
21,861 |
|
|
12.25% 3/15/06 |
Ba3 |
|
6,570 |
7,687 |
|
|
RBF Finance Co. 11.375% 3/15/09 |
Ba3 |
|
10,650 |
12,168 |
|
|
|
48,144 |
||||
|
Oil & Gas - 0.8% |
|||||
|
Lomak Petroleum, Inc. 8.75% 1/15/07 |
B3 |
|
8,777 |
8,294 |
|
|
Swift Energy Co. 10.25% 8/1/09 |
B2 |
|
4,000 |
4,060 |
|
|
Tesoro Petroleum Corp. 9% 7/1/08 |
B1 |
|
16,330 |
15,718 |
|
|
|
28,072 |
||||
|
TOTAL ENERGY |
91,182 |
||||
|
Corporate Bonds - continued |
|||||
|
Moody's Ratings (unaudited) (b) |
Principal Amount (000s) |
Value (Note 1) (000s) |
|||
|
Nonconvertible Bonds - continued |
|||||
|
FINANCE - 2.1% |
|||||
|
Credit & Other Finance - 2.1% |
|||||
|
Arch Escrow Corp. 13.75% 4/15/08 |
B3 |
|
$ 26,120 |
$ 13,321 |
|
|
Denbury Management, Inc. 9% 3/1/08 |
B3 |
|
16,470 |
14,494 |
|
|
Dobson/Sygnet Communications Co. 12.25% 12/15/08 |
B3 |
|
8,070 |
7,989 |
|
|
GS Escrow Corp. 7.125% 8/1/05 |
Ba1 |
|
9,700 |
8,899 |
|
|
Macsaver Financial Services, Inc.: |
|
|
|
|
|
|
7.4% 2/15/02 (c) |
Ca |
|
6,670 |
800 |
|
|
7.6% 8/1/07 (c) |
Ca |
|
6,970 |
836 |
|
|
Stone Container Finance Co. 11.5% 8/15/06 (e) |
B2 |
|
8,330 |
8,497 |
|
|
Venetian Casino Resort LLC/Las Vegas Sands, Inc. 12.25% 11/15/04 |
Caa1 |
|
15,770 |
16,007 |
|
|
|
70,843 |
||||
|
HEALTH - 3.1% |
|||||
|
Medical Equipment & Supplies - 0.3% |
|||||
|
PharMerica, Inc. 8.375% 4/1/08 |
B3 |
|
12,205 |
9,154 |
|
|
Medical Facilities Management - 2.8% |
|||||
|
Everest Healthcare Services, Inc. 9.75% 5/1/08 |
B3 |
|
3,740 |
3,516 |
|
|
HEALTHSOUTH Corp. 7% 6/15/08 |
Ba1 |
|
20,375 |
17,140 |
|
|
Iasis Healthcare Corp. 13% 10/15/09 |
B3 |
|
14,690 |
13,441 |
|
|
Manor Care, Inc. 7.5% 6/15/06 |
Ba1 |
|
3,700 |
3,219 |
|
|
Oxford Health Plans, Inc. 11% 5/15/05 |
B2 |
|
29,600 |
32,264 |
|
|
Unilab Corp. 12.75% 10/1/09 |
B3 |
|
20,624 |
22,068 |
|
|
|
91,648 |
||||
|
TOTAL HEALTH |
100,802 |
||||
|
INDUSTRIAL MACHINERY & EQUIPMENT - 2.3% |
|||||
|
Electrical Equipment - 0.3% |
|||||
|
L-3 Communications Corp. 8% 8/1/08 |
B2 |
|
10,600 |
9,593 |
|
|
Industrial Machinery & Equipment - 0.1% |
|||||
|
Dunlop Standard Aero Holdings PLC 11.875% 5/15/09 |
B3 |
|
1,460 |
1,453 |
|
|
International Knife & Saw, Inc. 11.375% 11/15/06 |
Caa1 |
|
2,155 |
1,013 |
|
|
Tenneco Automotive, Inc. 11.625% 10/15/09 |
B2 |
|
945 |
548 |
|
|
|
3,014 |
||||
|
Corporate Bonds - continued |
|||||
|
Moody's Ratings (unaudited) (b) |
Principal Amount (000s) |
Value (Note 1) (000s) |
|||
|
Nonconvertible Bonds - continued |
|||||
|
INDUSTRIAL MACHINERY & EQUIPMENT - continued |
|||||
|
Pollution Control - 1.9% |
|||||
|
Allied Waste North America, Inc. 10% 8/1/09 |
B2 |
|
$ 73,385 |
$ 62,194 |
|
|
TOTAL INDUSTRIAL MACHINERY & EQUIPMENT |
74,801 |
||||
|
MEDIA & LEISURE - 19.1% |
|||||
|
Broadcasting - 16.4% |
|||||
|
360networks, Inc. 13% 5/1/08 |
B3 |
|
34,070 |
27,086 |
|
|
ACME Television LLC/ACME Financial Corp. 10.875% 9/30/04 |
B3 |
|
13,932 |
12,887 |
|
|
Ascent Entertainment Group, Inc. 0% 12/15/04 (d) |
Ba1 |
|
11,280 |
9,306 |
|
|
Callahan Nordrhein Westfalen 14% 7/15/10 (e) |
B3 |
|
10,230 |
9,821 |
|
|
Comcast UK Cable Partners Ltd. 0% 11/15/07 (d) |
B2 |
|
5,370 |
4,833 |
|
|
Diamond Cable Communications PLC yankee |
B2 |
|
34,145 |
30,816 |
|
|
EchoStar DBS Corp. 9.375% 2/1/09 |
B1 |
|
56,555 |
55,424 |
|
|
Fox Family Worldwide, Inc. 0% 11/1/07 (d) |
B1 |
|
10,210 |
7,300 |
|
|
FrontierVision Holdings LP/FrontierVision Holdings Capital Corp. 0% 9/15/07 (d) |
B2 |
|
6,100 |
5,078 |
|
|
FrontierVision Holdings LP/FrontierVision Holdings Capital II Corp. 0% 9/15/07 (d) |
Caa1 |
|
14,478 |
12,053 |
|
|
Golden Sky DBS, Inc. 0% 3/1/07 (d) |
Caa1 |
|
24,025 |
16,337 |
|
|
Impsat Fiber Networks, Inc. 13.75% 2/15/05 |
B3 |
|
30,195 |
21,740 |
|
|
International Cabletel, Inc. 0% 2/1/06 (d) |
B2 |
|
51,577 |
45,388 |
|
|
Knology Holding, Inc. 0% 10/15/07 (d) |
- |
|
9,035 |
2,801 |
|
|
LIN Holdings Corp. 0% 3/1/08 (d) |
B3 |
|
6,905 |
4,868 |
|
|
NTL Communications Corp.: |
|
|
|
|
|
|
0% 10/1/08 (d) |
B3 |
|
30,780 |
17,622 |
|
|
11.5% 10/1/08 |
B3 |
|
35,980 |
32,202 |
|
|
11.875% 10/1/10 (e) |
B2 |
|
3,280 |
3,034 |
|
|
NTL, Inc. 10% 2/15/07 |
B2 |
|
20,160 |
17,539 |
|
|
Pegasus Communications Corp.: |
|
|
|
|
|
|
9.625% 10/15/05 |
B3 |
|
2,770 |
2,701 |
|
|
9.75% 12/1/06 |
B3 |
|
7,495 |
7,308 |
|
|
12.5% 8/1/17 |
B3 |
|
12,450 |
12,948 |
|
|
Satelites Mexicanos SA de CV: |
|
|
|
|
|
|
10.125% 11/1/04 |
B3 |
|
34,360 |
21,647 |
|
|
11.28% 6/30/04 (e)(f) |
B1 |
|
13,115 |
11,476 |
|
|
Corporate Bonds - continued |
|||||
|
Moody's Ratings (unaudited) (b) |
Principal Amount (000s) |
Value (Note 1) (000s) |
|||
|
Nonconvertible Bonds - continued |
|||||
|
MEDIA & LEISURE - continued |
|||||
|
Broadcasting - continued |
|||||
|
Telemundo Holdings, Inc. 0% 8/15/08 (d) |
Caa1 |
|
$ 11,320 |
$ 7,924 |
|
|
Telewest Communications PLC 11.25% 11/1/08 |
B1 |
|
5,360 |
4,824 |
|
|
Telewest PLC: |
|
|
|
|
|
|
yankee 9.625% 10/1/06 |
B1 |
|
9,260 |
7,593 |
|
|
11% 10/1/07 |
B1 |
|
31,970 |
28,773 |
|
|
United International Holdings, Inc. |
B3 |
|
25,735 |
14,926 |
|
|
United Pan-Europe Communications NV: |
|
|
|
|
|
|
0% 8/1/09 (d) |
B2 |
|
2,860 |
1,115 |
|
|
0% 11/1/09 (d) |
B2 |
|
52,150 |
19,556 |
|
|
10.875% 8/1/09 |
B2 |
|
23,150 |
16,784 |
|
|
11.25% 11/1/09 |
B2 |
|
31,010 |
23,413 |
|
|
11.25% 2/1/10 |
B2 |
|
12,775 |
9,581 |
|
|
11.5% 2/1/10 |
B2 |
|
17,030 |
12,943 |
|
|
|
539,647 |
||||
|
Entertainment - 1.2% |
|||||
|
AMC Entertainment, Inc.: |
|
|
|
|
|
|
9.5% 3/15/09 |
Caa3 |
|
25,820 |
12,394 |
|
|
9.5% 2/1/11 |
Caa3 |
|
25,010 |
11,755 |
|
|
Cinemark USA, Inc. 8.5% 8/1/08 |
B2 |
|
4,985 |
2,044 |
|
|
Livent, Inc. 9.375% 10/15/04 (c) |
- |
|
11,100 |
2,220 |
|
|
Waterford Gaming LLC/Waterford Gaming Finance Corp. 9.5% 3/15/10 (e) |
B1 |
|
10,545 |
10,281 |
|
|
|
38,694 |
||||
|
Lodging & Gaming - 1.5% |
|||||
|
Florida Panthers Holdings, Inc. 9.875% 4/15/09 |
B2 |
|
4,960 |
4,675 |
|
|
Horseshoe Gaming LLC 8.625% 5/15/09 |
B2 |
|
37,840 |
36,894 |
|
|
ITT Corp. 6.75% 11/15/05 |
Ba1 |
|
4,465 |
4,119 |
|
|
Mohegan Tribal Gaming Authority 8.75% 1/1/09 |
Ba3 |
|
3,630 |
3,548 |
|
|
|
49,236 |
||||
|
TOTAL MEDIA & LEISURE |
627,577 |
||||
|
Corporate Bonds - continued |
|||||
|
Moody's Ratings (unaudited) (b) |
Principal Amount (000s) |
Value (Note 1) (000s) |
|||
|
Nonconvertible Bonds - continued |
|||||
|
NONDURABLES - 0.6% |
|||||
|
Foods - 0.4% |
|||||
|
Del Monte Corp. 12.25% 4/15/07 |
B3 |
|
$ 6,355 |
$ 6,514 |
|
|
Del Monte Foods Co. 0% 12/15/07 (d) |
Caa1 |
|
7,584 |
5,631 |
|
|
|
12,145 |
||||
|
Household Products - 0.2% |
|||||
|
AKI Holding Corp. 0% 7/1/09 (d) |
Caa1 |
|
17,930 |
6,724 |
|
|
TOTAL NONDURABLES |
18,869 |
||||
|
RETAIL & WHOLESALE - 1.1% |
|||||
|
Drug Stores - 0.4% |
|||||
|
Rite Aid Corp.: |
|
|
|
|
|
|
6.125% 12/15/08 (e) |
Caa1 |
|
3,705 |
889 |
|
|
6.5% 12/15/05 (e) |
Caa1 |
|
13,360 |
3,340 |
|
|
7.125% 1/15/07 |
Caa1 |
|
22,370 |
5,593 |
|
|
10.5% 9/15/02 (e) |
- |
|
5,515 |
3,419 |
|
|
|
13,241 |
||||
|
Grocery Stores - 0.7% |
|||||
|
Disco SA 9.875% 5/15/08 |
B1 |
|
15,000 |
12,000 |
|
|
Fleming Companies, Inc.: |
|
|
|
|
|
|
Series B, 10.625% 7/31/07 |
B3 |
|
6,020 |
4,515 |
|
|
10.5% 12/1/04 |
B3 |
|
9,950 |
8,458 |
|
|
|
24,973 |
||||
|
TOTAL RETAIL & WHOLESALE |
38,214 |
||||
|
SERVICES - 1.1% |
|||||
|
Printing - 0.8% |
|||||
|
American Color Graphics, Inc. 12.75% 8/1/05 |
Caa1 |
|
15,420 |
14,572 |
|
|
World Color Press, Inc. 8.375% 11/15/08 |
Baa3 |
|
11,330 |
10,565 |
|
|
|
25,137 |
||||
|
Services - 0.3% |
|||||
|
Iron Mountain, Inc. 8.75% 9/30/09 |
B2 |
|
6,990 |
6,710 |
|
|
SITEL Corp. 9.25% 3/15/06 |
B3 |
|
4,150 |
3,185 |
|
|
|
9,895 |
||||
|
TOTAL SERVICES |
35,032 |
||||
|
Corporate Bonds - continued |
|||||
|
Moody's Ratings (unaudited) (b) |
Principal Amount (000s) |
Value (Note 1) (000s) |
|||
|
Nonconvertible Bonds - continued |
|||||
|
TECHNOLOGY - 3.1% |
|||||
|
Computer Services & Software - 2.2% |
|||||
|
Colo.com 13.875% 3/15/10 unit (e) |
- |
|
$ 20,750 |
$ 15,563 |
|
|
Concentric Network Corp. 12.75% 12/15/07 |
B |
|
27,280 |
27,144 |
|
|
Covad Communications Group, Inc.: |
|
|
|
|
|
|
0% 3/15/08 (d) |
B3 |
|
27,070 |
7,309 |
|
|
12% 2/15/10 |
B3 |
|
8,245 |
3,834 |
|
|
12.5% 2/15/09 |
B3 |
|
22,410 |
10,981 |
|
|
Exodus Communications, Inc. 10.75% 12/15/09 |
B3 |
|
9,725 |
8,947 |
|
|
|
73,778 |
||||
|
Electronic Instruments - 0.4% |
|||||
|
Telecommunications Techniques Co. LLC 9.75% 5/15/08 |
B3 |
|
14,655 |
13,043 |
|
|
Electronics - 0.4% |
|||||
|
Details, Inc. 10% 11/15/05 |
B3 |
|
3,555 |
3,448 |
|
|
Intersil Corp. 13.25% 8/15/09 |
B1 |
|
6,445 |
7,412 |
|
|
Viasystems, Inc. 9.75% 6/1/07 |
B3 |
|
1,290 |
1,155 |
|
|
|
12,015 |
||||
|
Photographic Equipment - 0.1% |
|||||
|
IMAX Corp. 7.875% 12/1/05 |
Ba2 |
|
5,120 |
2,918 |
|
|
TOTAL TECHNOLOGY |
101,754 |
||||
|
TRANSPORTATION - 0.5% |
|||||
|
Railroads - 0.5% |
|||||
|
TFM SA de CV 0% 6/15/09 (d) |
B2 |
|
22,700 |
16,685 |
|
|
UTILITIES - 19.1% |
|||||
|
Cellular - 11.2% |
|||||
|
Arch Communications Group 12.75% 7/1/07 |
B3 |
|
3,825 |
1,913 |
|
|
Crown Castle International Corp. 10.75% 8/1/11 |
B3 |
|
10,650 |
10,863 |
|
|
CTI Holdings SA 0% 4/15/08 (d) |
B1 |
|
25,000 |
12,750 |
|
|
Echostar Broadband Corp. 10.375% 10/1/07 (e) |
B3 |
|
29,640 |
29,640 |
|
|
ICO Global Communications Holdings Ltd. |
- |
|
14,125 |
8,616 |
|
|
Intercel, Inc. 0% 2/1/06 (d) |
B2 |
|
5,190 |
5,086 |
|
|
Leap Wireless International, Inc. 12.5% 4/15/10 |
Caa2 |
|
12,825 |
8,465 |
|
|
McCaw International Ltd. 0% 4/15/07 (d) |
Caa1 |
|
50,600 |
35,420 |
|
|
Corporate Bonds - continued |
|||||
|
Moody's Ratings (unaudited) (b) |
Principal Amount (000s) |
Value (Note 1) (000s) |
|||
|
Nonconvertible Bonds - continued |
|||||
|
UTILITIES - continued |
|||||
|
Cellular - continued |
|||||
|
Metrocall, Inc.: |
|
|
|
|
|
|
9.75% 11/1/07 |
B3 |
|
$ 4,180 |
$ 1,672 |
|
|
10.375% 10/1/07 |
B3 |
|
12,175 |
4,870 |
|
|
11% 9/15/08 |
B3 |
|
16,685 |
6,674 |
|
|
Millicom International Cellular SA 0% 6/1/06 (d) |
Caa1 |
|
34,725 |
27,780 |
|
|
Nextel Communications, Inc.: |
|
|
|
|
|
|
0% 9/15/07 (d) |
B1 |
|
21,280 |
17,237 |
|
|
12% 11/1/08 |
B1 |
|
22,320 |
23,659 |
|
|
Nextel International, Inc.: |
|
|
|
|
|
|
0% 4/15/08 (d) |
Caa1 |
|
8,345 |
5,007 |
|
|
12.75% 8/1/10 (e) |
Caa1 |
|
41,370 |
38,060 |
|
|
Orbital Imaging Corp. 11.625% 3/1/05 |
CCC |
|
8,016 |
1,523 |
|
|
Paging Network, Inc.: |
|
|
|
|
|
|
8.875% 2/1/06 (c) |
Caa3 |
|
1,695 |
356 |
|
|
10% 10/15/08 (c) |
Caa3 |
|
17,995 |
3,779 |
|
|
10.125% 8/1/07 (c) |
Caa3 |
|
21,510 |
4,517 |
|
|
ProNet, Inc. 11.875% 6/15/05 |
B3 |
|
5,825 |
2,330 |
|
|
Rogers Cantel, Inc. 8.8% 10/1/07 |
Ba2 |
|
10,630 |
10,311 |
|
|
TeleCorp PCS, Inc.: |
|
|
|
|
|
|
0% 4/15/09 (d) |
B3 |
|
51,970 |
33,391 |
|
|
10.625% 7/15/10 |
B3 |
|
6,580 |
6,531 |
|
|
Tritel PCS, Inc. 0% 5/15/09 (d) |
B3 |
|
50,540 |
32,598 |
|
|
USA Mobile Communication, Inc. II 9.5% 2/1/04 |
B3 |
|
13,915 |
8,071 |
|
|
VoiceStream Wireless Corp.: |
|
|
|
|
|
|
10.375% 11/15/09 |
B2 |
|
18,358 |
19,643 |
|
|
11.5% 9/15/09 |
B2 |
|
6,050 |
6,716 |
|
|
|
367,478 |
||||
|
Telephone Services - 7.9% |
|||||
|
Alestra SA de RL de CV 12.625% 5/15/09 |
B2 |
|
12,800 |
10,816 |
|
|
Allegiance Telecom, Inc.: |
|
|
|
|
|
|
0% 2/15/08 (d) |
B3 |
|
16,681 |
11,343 |
|
|
12.875% 5/15/08 |
B3 |
|
17,580 |
17,580 |
|
|
Asia Global Crossing Ltd. 13.375% 10/15/10 (e) |
B2 |
|
11,015 |
10,299 |
|
|
Call-Net Enterprises, Inc.: |
|
|
|
|
|
|
0% 5/15/09 (d) |
B2 |
|
2,990 |
718 |
|
|
Corporate Bonds - continued |
|||||
|
Moody's Ratings (unaudited) (b) |
Principal Amount (000s) |
Value (Note 1) (000s) |
|||
|
Nonconvertible Bonds - continued |
|||||
|
UTILITIES - continued |
|||||
|
Telephone Services - continued |
|||||
|
Call-Net Enterprises, Inc.: - continued |
|
|
|
|
|
|
8% 8/15/08 |
B2 |
|
$ 4,615 |
$ 1,846 |
|
|
9.375% 5/15/09 |
B2 |
|
6,600 |
2,772 |
|
|
Esat Telecom Group PLC 0% 2/1/07 (d) |
A2 |
|
7,530 |
7,266 |
|
|
Global Crossing Holdings Ltd. 9.5% 11/15/09 |
Ba2 |
|
1,190 |
1,139 |
|
|
Global TeleSystems, Inc. 9.875% 2/15/05 |
Caa1 |
|
5,165 |
1,601 |
|
|
Hermes Europe Railtel BV 11.5% 8/15/07 |
B3 |
|
20,320 |
10,160 |
|
|
Hyperion Telecommunications, Inc. |
Caa1 |
|
1,690 |
930 |
|
|
Intermedia Communications, Inc.: |
|
|
|
|
|
|
0% 5/15/06 (d) |
B2 |
|
2,000 |
1,890 |
|
|
0% 7/15/07 (d) |
B2 |
|
16,875 |
13,922 |
|
|
0% 3/1/09 (d) |
B3 |
|
19,000 |
11,970 |
|
|
KMC Telecom Holdings, Inc.: |
|
|
|
|
|
|
0% 2/15/08 (d) |
Caa2 |
|
26,410 |
3,697 |
|
|
13.5% 5/15/09 |
Caa2 |
|
9,140 |
2,833 |
|
|
Level 3 Communications, Inc.: |
|
|
|
|
|
|
9.125% 5/1/08 |
B3 |
|
20,255 |
16,508 |
|
|
11% 3/15/08 |
B3 |
|
20,620 |
18,610 |
|
|
Metromedia Fiber Network, Inc.: |
|
|
|
|
|
|
10% 11/15/08 |
B2 |
|
14,497 |
12,757 |
|
|
10% 12/15/09 |
B2 |
|
9,740 |
8,571 |
|
|
NEXTLINK Communications LLC 12.5% 4/15/06 |
B2 |
|
28,040 |
26,498 |
|
|
NEXTLINK Communications, Inc. |
B2 |
|
10,590 |
9,319 |
|
|
Ono Finance PLC 13% 5/1/09 |
Caa1 |
|
14,500 |
11,165 |
|
|
Primus Telecommunications Group, Inc. |
B3 |
|
5,000 |
2,500 |
|
|
Viatel, Inc.: |
|
|
|
|
|
|
0% 4/15/08 (d) |
B3 |
|
6,650 |
1,995 |
|
|
11.25% 4/15/08 |
B3 |
|
13,290 |
6,512 |
|
|
11.5% 3/15/09 |
B3 |
|
4,220 |
2,110 |
|
|
WinStar Communications, Inc.: |
|
|
|
|
|
|
0% 4/15/10 (d) |
B3 |
|
1,883 |
603 |
|
|
12.5% 4/15/08 |
B3 |
|
22,276 |
16,373 |
|
|
Corporate Bonds - continued |
|||||
|
Moody's Ratings (unaudited) (b) |
Principal Amount (000s) |
Value (Note 1) (000s) |
|||
|
Nonconvertible Bonds - continued |
|||||
|
UTILITIES - continued |
|||||
|
Telephone Services - continued |
|||||
|
WinStar Communications, Inc.: - continued |
|
|
|
|
|
|
12.75% 4/15/10 |
B3 |
|
$ 10,199 |
$ 7,343 |
|
|
Worldwide Fiber, Inc. 12% 8/1/09 |
B3 |
|
10,205 |
7,705 |
|
|
|
259,351 |
||||
|
TOTAL UTILITIES |
626,829 |
||||
|
TOTAL NONCONVERTIBLE BONDS |
2,112,462 |
||||
|
TOTAL CORPORATE BONDS (Cost $2,580,045) |
2,183,082 |
||||
|
Asset-Backed Securities - 0.4% |
|||||
|
|
|||||
|
Airplanes pass through trust 10.875% 3/15/19 |
Ba2 |
|
18,188 |
13,459 |
|
|
Commercial Mortgage Securities - 0.7% |
|||||
|
|
|||||
|
First Chicago/Lennar Trust I Series 1997-CHL1 Class E, 8.0835% 4/1/39 (f) |
- |
|
10,700 |
8,155 |
|
|
Structured Asset Securities Corp.: |
|
|
|
|
|
|
Series 1995-C1: |
|
|
|
|
|
|
Class E, 7.375% 9/25/24 (e) |
BB |
|
4,000 |
3,794 |
|
|
Class F, 7.375% 9/25/24 (e) |
- |
|
2,500 |
2,039 |
|
|
Series 1996-CFL Class G, 7.75% 2/25/28 (e) |
BB |
|
9,260 |
8,618 |
|
|
TOTAL COMMERCIAL MORTGAGE SECURITIES (Cost $20,069) |
22,606 |
||||
|
Common Stocks - 9.8% |
|||
|
Shares |
|
||
|
BASIC INDUSTRIES - 0.1% |
|||
|
Chemicals & Plastics - 0.0% |
|||
|
Trivest 1992 Special Fund Ltd. (h) |
3 |
181 |
|
|
Iron & Steel - 0.1% |
|||
|
AK Steel Holding Corp. |
269,600 |
2,494 |
|
|
Common Stocks - continued |
|||
|
Shares |
Value (Note 1) (000s) |
||
|
BASIC INDUSTRIES - continued |
|||
|
Paper & Forest Products - 0.0% |
|||
|
SF Holdings Group, Inc. Class C (a)(e) |
3,095 |
$ 0 |
|
|
TOTAL BASIC INDUSTRIES |
2,675 |
||
|
CONSTRUCTION & REAL ESTATE - 0.0% |
|||
|
Construction - 0.0% |
|||
|
Capital Pacific Holdings, Inc. warrants 5/1/02 (a)(e) |
24,095 |
6 |
|
|
DURABLES - 0.0% |
|||
|
Textiles & Apparel - 0.0% |
|||
|
Arena Brands Holdings Corp. Class B |
42,253 |
1,056 |
|
|
ENERGY - 0.5% |
|||
|
Oil & Gas - 0.5% |
|||
|
Chesapeake Energy Corp. (a) |
1,927,021 |
10,839 |
|
|
DevX Energy, Inc. (a) |
500,000 |
3,500 |
|
|
|
14,339 |
||
|
FINANCE - 0.0% |
|||
|
Securities Industry - 0.0% |
|||
|
ECM Corp. LP (a)(e) |
900 |
76 |
|
|
HEALTH - 4.4% |
|||
|
Medical Facilities Management - 4.4% |
|||
|
Laboratory Corp. of America Holdings (a) |
1,075,000 |
144,984 |
|
|
INDUSTRIAL MACHINERY & EQUIPMENT - 0.1% |
|||
|
Industrial Machinery & Equipment - 0.0% |
|||
|
Exide Corp. warrants 3/18/06 (a) |
15,720 |
31 |
|
|
Pollution Control - 0.1% |
|||
|
Allied Waste Industries, Inc. (a) |
327,000 |
3,025 |
|
|
TOTAL INDUSTRIAL MACHINERY & EQUIPMENT |
3,056 |
||
|
MEDIA & LEISURE - 2.7% |
|||
|
Broadcasting - 2.6% |
|||
|
Citadel Communications Corp. (a) |
300,200 |
3,640 |
|
|
CS Wireless Systems, Inc. (a)(e) |
439 |
0 |
|
|
EchoStar Communications Corp. Class A (a) |
1,664,996 |
75,341 |
|
|
Common Stocks - continued |
|||
|
Shares |
Value (Note 1) (000s) |
||
|
MEDIA & LEISURE - continued |
|||
|
Broadcasting - continued |
|||
|
NTL, Inc. (a) |
1 |
$ 0 |
|
|
Pegasus Communications Corp. unit |
6,509 |
6,802 |
|
|
|
85,783 |
||
|
Entertainment - 0.0% |
|||
|
Livent, Inc. (a) |
125,200 |
1 |
|
|
Lodging & Gaming - 0.1% |
|||
|
Prime Hospitality Corp. (a) |
400,000 |
3,800 |
|
|
TOTAL MEDIA & LEISURE |
89,584 |
||
|
RETAIL & WHOLESALE - 1.4% |
|||
|
Grocery Stores - 1.4% |
|||
|
Pathmark Stores, Inc. (a) |
2,669,378 |
41,876 |
|
|
Pathmark Stores, Inc. warrants 9/19/10 (a) |
747,828 |
3,365 |
|
|
|
45,241 |
||
|
TECHNOLOGY - 0.1% |
|||
|
Computer Services & Software - 0.1% |
|||
|
Concentric Network Corp. warrants 12/15/07 (a)(e) |
8,680 |
4,132 |
|
|
DecisionOne Corp. (a) |
63,872 |
1 |
|
|
DecisionOne Corp.: |
|
|
|
|
Class A warrants 4/18/07 (a) |
36,096 |
0 |
|
|
Class B warrants 4/18/07 (a) |
62,195 |
0 |
|
|
Class C warrants 4/18/07 (a) |
36,890 |
0 |
|
|
|
4,133 |
||
|
UTILITIES - 0.5% |
|||
|
Cellular - 0.2% |
|||
|
Leap Wireless International, Inc. warrants 4/15/10 |
12,825 |
128 |
|
|
Loral Orion Network Systems, Inc.: |
|
|
|
|
warrants 1/15/07 (CV ratio .47) (a) |
19,560 |
44 |
|
|
warrants 1/15/07 (CV ratio .6) (a) |
18,480 |
60 |
|
|
McCaw International Ltd. warrants 4/16/07 (a)(e) |
66,290 |
994 |
|
|
Orbital Imaging Corp. warrants 3/1/05 (a)(e) |
5,276 |
26 |
|
|
Powertel, Inc. warrants 2/1/06 (a) |
85,408 |
4,270 |
|
|
|
5,522 |
||
|
Telephone Services - 0.3% |
|||
|
AT&T Latin America Corp. (a) |
1,283,200 |
9,143 |
|
|
FirstWorld Communications, Inc. warrants 4/15/08 (a)(e) |
1,635 |
21 |
|
|
Common Stocks - continued |
|||
|
Shares |
Value (Note 1) (000s) |
||
|
UTILITIES - continued |
|||
|
Telephone Services - continued |
|||
|
KMC Telecom Holdings, Inc. warrants 4/15/08 (a)(e) |
37,830 |
$ 76 |
|
|
McLeodUSA, Inc. Class A (a) |
1 |
0 |
|
|
Mpower Communications Corp. (e) |
30,880 |
201 |
|
|
Ono Finance PLC rights 5/31/09 (a)(e) |
850 |
6 |
|
|
RSL Communications Ltd./RSL Communications PLC warrants 11/15/06 (a)(e) |
25,710 |
64 |
|
|
XO Communications, Inc. Class A (a) |
1 |
0 |
|
|
|
9,511 |
||
|
TOTAL UTILITIES |
15,033 |
||
|
TOTAL COMMON STOCKS (Cost $254,002) |
320,183 |
||
|
Preferred Stocks - 14.4% |
|||
|
|
|
|
|
|
Convertible Preferred Stocks - 0.6% |
|||
|
BASIC INDUSTRIES - 0.4% |
|||
|
Chemicals & Plastics - 0.4% |
|||
|
Sealed Air Corp. Series A, $2.00 |
300,000 |
14,138 |
|
|
ENERGY - 0.1% |
|||
|
Oil & Gas - 0.1% |
|||
|
Tesoro Petroleum Corp. $1.1552 PIES |
163,400 |
1,757 |
|
|
UTILITIES - 0.1% |
|||
|
Telephone Services - 0.1% |
|||
|
BroadWing, Inc. $3.375 |
100,000 |
4,856 |
|
|
TOTAL CONVERTIBLE PREFERRED STOCKS |
20,751 |
||
|
Nonconvertible Preferred Stocks - 13.8% |
|||
|
CONSTRUCTION & REAL ESTATE - 0.4% |
|||
|
Real Estate Investment Trusts - 0.4% |
|||
|
California Federal Preferred Capital Corp. $2.2812 |
533,897 |
11,879 |
|
|
FINANCE - 0.3% |
|||
|
Insurance - 0.3% |
|||
|
American Annuity Group Capital Trust II 8.875% |
10,340 |
9,852 |
|
|
Preferred Stocks - continued |
|||
|
Shares |
Value (Note 1) (000s) |
||
|
Nonconvertible Preferred Stocks - continued |
|||
|
HEALTH - 0.3% |
|||
|
Medical Facilities Management - 0.3% |
|||
|
Fresenius Medical Care Capital Trust 9% |
9,847 |
$ 9,805 |
|
|
MEDIA & LEISURE - 6.2% |
|||
|
Broadcasting - 5.2% |
|||
|
Adelphia Communications Corp. $13.00 |
200,386 |
18,035 |
|
|
Benedek Communications Corp. $11.50 pay-in-kind |
11,347 |
5,674 |
|
|
Citadel Broadcasting Co. Series B, 13.25% pay-in-kind |
77,536 |
7,443 |
|
|
CSC Holdings, Inc.: |
|
|
|
|
Series H, 11.75% pay-in-kind |
202,712 |
21,893 |
|
|
Series M, 11.125% pay-in-kind |
596,624 |
63,242 |
|
|
Granite Broadcasting Corp. 12.75% pay-in-kind |
29,789 |
15,490 |
|
|
NTL, Inc. 13% pay-in-kind |
39,073 |
34,384 |
|
|
Pegasus Communications Corp. 12.75% pay-in-kind |
2,915 |
3,046 |
|
|
|
169,207 |
||
|
Publishing - 1.0% |
|||
|
PRIMEDIA, Inc.: |
|
|
|
|
$9.20 |
76,000 |
6,232 |
|
|
8.625% |
16,735 |
1,356 |
|
|
Series D, $10.00 |
309,863 |
26,958 |
|
|
|
34,546 |
||
|
TOTAL MEDIA & LEISURE |
203,753 |
||
|
TECHNOLOGY - 0.0% |
|||
|
Computers & Office Equipment - 0.0% |
|||
|
Ampex Corp. 8% non-cumulative |
149 |
232 |
|
|
UTILITIES - 6.6% |
|||
|
Cellular - 3.6% |
|||
|
Dobson Communications Corp. 13 % pay-in-kind |
2,273 |
2,057 |
|
|
Nextel Communications, Inc.: |
|
|
|
|
11.125% pay-in-kind |
15,571 |
14,403 |
|
|
Series D, 13% pay-in-kind |
101,816 |
101,307 |
|
|
|
117,767 |
||
|
Telephone Services - 3.0% |
|||
|
Broadwing Communications, Inc. Series B, $12.50 pay-in-kind |
26,660 |
26,393 |
|
|
e.spire Communications, Inc. $127.50 pay-in-kind |
28,372 |
4,256 |
|
|
Preferred Stocks - continued |
|||
|
Shares |
Value (Note 1) (000s) |
||
|
Nonconvertible Preferred Stocks - continued |
|||
|
UTILITIES - continued |
|||
|
Telephone Services - continued |
|||
|
ICG Holdings, Inc. 14.25% pay-in-kind |
6,883 |
$ 103 |
|
|
Intermedia Communications, Inc. 13.5% pay-in-kind |
69,042 |
58,686 |
|
|
Source Media, Inc. 13.50% pay-in-kind |
128,080 |
448 |
|
|
XO Communications, Inc.: |
|
|
|
|
$7.00 pay-in-kind |
57,629 |
2,305 |
|
|
13% pay-in-kind |
9,831 |
7,078 |
|
|
|
99,269 |
||
|
TOTAL UTILITIES |
217,036 |
||
|
TOTAL NONCONVERTIBLE PREFERRED STOCKS |
452,557 |
||
|
TOTAL PREFERRED STOCKS (Cost $567,683) |
473,308 |
||
|
Floating Rate Loans - 0.8% |
|||||
|
Moody's Ratings (unaudited) (b) |
Principal Amount (000s) |
|
|||
|
DURABLES - 0.2% |
|||||
|
Textiles & Apparel - 0.2% |
|||||
|
Synthetic Industries, Inc. term loan |
- |
|
$ 6,200 |
5,704 |
|
|
INDUSTRIAL MACHINERY & EQUIPMENT - 0.3% |
|||||
|
Industrial Machinery & Equipment - 0.2% |
|||||
|
Exide Corp. Tranche B term loan |
- |
|
5,000 |
4,925 |
|
|
Pollution Control - 0.1% |
|||||
|
Allied Waste North America, Inc.: |
|
|
|
|
|
|
Tranche B term loan 9.4375% 7/21/06 (f) |
Ba3 |
|
2,273 |
2,142 |
|
|
Tranche C term loan 9.7042% 7/21/07 (f) |
Ba3 |
|
2,727 |
2,570 |
|
|
|
4,712 |
||||
|
TOTAL INDUSTRIAL MACHINERY & EQUIPMENT |
9,637 |
||||
|
Floating Rate Loans - continued |
|||||
|
Moody's Ratings (unaudited) (b) |
Principal Amount (000s) |
Value (Note 1) (000s) |
|||
|
MEDIA & LEISURE - 0.3% |
|||||
|
Entertainment - 0.3% |
|||||
|
Regal Cinemas, Inc.: |
|
|
|
|
|
|
Tranche A term loan 8.93% 6/15/05 (f) |
Caa1 |
|
$ 5,480 |
$ 3,836 |
|
|
Tranche B term loan 9.18% 6/15/06 (f) |
Caa1 |
|
2,946 |
2,092 |
|
|
Tranche C term loan 9.43% 6/15/07 (f) |
Caa1 |
|
7,973 |
5,661 |
|
|
|
11,589 |
||||
|
TOTAL FLOATING RATE LOANS (Cost $28,468) |
26,930 |
||||
|
Cash Equivalents - 4.0% |
|||
|
Maturity Amount (000s) |
|
||
|
Investments in repurchase agreements (U.S. Treasury Obligations), in a joint trading account at 6.56%, dated 10/31/00 due
11/1/00 |
$ 131,168 |
131,144 |
|
|
TOTAL INVESTMENT PORTFOLIO - 96.7% (Cost $3,600,558) |
3,170,712 |
||
|
NET OTHER ASSETS - 3.3% |
107,232 |
||
|
NET ASSETS - 100% |
$ 3,277,944 |
||
|
Security Type Abbreviations |
|
PIES |
- |
Premium Income |
|
Legend |
|
(a) Non-income producing |
|
(b) S&P credit ratings are used in the absence of a rating by Moody's Investors Service, Inc. |
|
(c) Non-income producing - issuer filed for protection under the Federal Bankruptcy Code or is in default of interest payment. |
|
(d) Debt obligation initially issued in zero coupon form which converts to coupon form at a specified rate and date. The rate shown is the rate at period end. |
|
(e) Security exempt from registration under Rule 144A of the Securities Act of 1933. These securities may be resold in transactions exempt from registration, normally to qualified institutional buyers. At the period end, the value of these securities amounted to $222,806,000 or 6.8% of net assets. |
|
(f) The coupon rate shown on floating or adjustable rate securities represents the rate at period end. |
|
(g) Restricted securities - Investment in securities not registered under the Securities Act of 1933. |
|
Additional information on each holding |
|
Security |
Acquisition Date |
Acquisition Cost (000s) |
|
Sealy Corp., Inc. 10% 12/18/08 pay-in-kind |
2/23/98 - 9/30/00 |
$ 13,506 |
|
(h) Share amount represents number of units held. |
|
Other Information |
|
The composition of long-term debt holdings as a percentage of total value of investments in securities, is as follows (ratings are unaudited): |
|
Moody's Ratings |
S&P Ratings |
|||
|
Aaa, Aa, A |
0.2% |
|
AAA, AA, A |
0.0% |
|
Baa |
0.8% |
|
BBB |
1.6% |
|
Ba |
5.6% |
|
BB |
4.6% |
|
B |
49.5% |
|
B |
50.2% |
|
Caa |
10.3% |
|
CCC |
5.3% |
|
Ca, C |
0.1% |
|
CC, C |
0.0% |
|
|
|
|
D |
0.3% |
|
The percentage not rated by Moody's or S&P amounted to 2.7%. FMR has determined that unrated debt securities that are lower quality account for 2.7% of the total value of investment in securities. |
|
Distribution of investments by country of issue, as a percentage of total net assets, |
|
United States of America |
88.1% |
|
United Kingdom |
3.2% |
|
Netherlands |
2.8% |
|
Canada |
2.3% |
|
Mexico |
1.9% |
|
Others (individually less than 1%) |
1.7% |
|
|
100.0% |
|
Income Tax Information |
|
At October 31, 2000, the aggregate cost of investment securities for income tax purposes was $3,603,993,000. Net unrealized depreciation aggregated $433,281,000, of which $185,916,000 related to appreciated investment securities and $619,197,000 related to depreciated investment securities. |
|
At October 31, 2000, the fund had a capital loss carryforward of approximately $522,914,000 of which $34,735,000 and $488,179,000 will expire on October 31, 2007 and 2008, respectively. |
See accompanying notes which are an integral part of the financial statements.
Annual Report
Statement of Assets and Liabilities
|
Amounts in thousands (except per-share amounts) |
October 31, 2000 |
|
|
Assets |
|
|
|
Investment in securities, at value (including repurchase agreements of $131,144) (cost $3,600,558) - |
|
$ 3,170,712 |
|
Receivable for investments sold |
|
62,381 |
|
Receivable for fund shares sold |
|
7,003 |
|
Dividends receivable |
|
1,985 |
|
Interest receivable |
|
61,204 |
|
Other receivables |
|
42 |
|
Total assets |
|
3,303,327 |
|
Liabilities |
|
|
|
Payable for investments purchased |
$ 5,410 |
|
|
Payable for fund shares redeemed |
10,420 |
|
|
Distributions payable |
6,077 |
|
|
Accrued management fee |
1,618 |
|
|
Distribution fees payable |
1,356 |
|
|
Other payables and accrued expenses |
502 |
|
|
Total liabilities |
|
25,383 |
|
Net Assets |
|
$ 3,277,944 |
|
Net Assets consist of: |
|
|
|
Paid in capital |
|
$ 4,137,833 |
|
Undistributed net investment income |
|
94,399 |
|
Accumulated undistributed net realized gain (loss) on investments and foreign currency transactions |
|
(524,455) |
|
Net unrealized appreciation (depreciation) on investments and assets and liabilities in foreign currencies |
|
(429,833) |
|
Net Assets |
|
$ 3,277,944 |
See accompanying notes which are an integral part of the financial statements.
Annual Report
Financial Statements - continued
Statement of Assets and Liabilities - continued
|
Amounts in thousands (except per-share amounts) |
October 31, 2000 |
|
|
Calculation of Maximum Offering Price |
|
$9.64 |
|
Maximum offering price per share (100/95.25 of $9.64) |
|
$10.12 |
|
Class T: |
|
$9.66 |
|
Maximum offering price per share (100/96.50 of $9.66) |
|
$10.01 |
|
Class B: |
|
$9.61 |
|
Class C: |
|
$9.63 |
|
Institutional Class: |
|
$9.43 |
A Redemption price per share is equal to net asset value less any applicable contingent deferred sales charge.
See accompanying notes which are an integral part of the financial statements.
Annual Report
Financial Statements - continued
Statement of Operations
|
Amounts in thousands |
Year ended October 31, 2000 |
|
|
Investment Income Dividends |
|
$ 52,761 |
|
Interest |
|
375,318 |
|
Total income |
|
428,079 |
|
Expenses |
|
|
|
Management fee |
$ 22,838 |
|
|
Transfer agent fees |
6,981 |
|
|
Distribution fees |
18,855 |
|
|
Accounting fees and expenses |
813 |
|
|
Non-interested trustees' compensation |
17 |
|
|
Custodian fees and expenses |
110 |
|
|
Registration fees |
247 |
|
|
Audit |
54 |
|
|
Legal |
141 |
|
|
Miscellaneous |
41 |
|
|
Total expenses before reductions |
50,097 |
|
|
Expense reductions |
(41) |
50,056 |
|
Net investment income |
|
378,023 |
|
Realized and Unrealized Gain (Loss) Net realized gain (loss) on: |
|
|
|
Investment securities |
(503,656) |
|
|
Foreign currency transactions |
(4) |
(503,660) |
|
Change in net unrealized appreciation (depreciation) on: |
|
|
|
Investment securities |
(83,305) |
|
|
Assets and liabilities in foreign currencies |
(26) |
(83,331) |
|
Net gain (loss) |
|
(586,991) |
|
Net increase (decrease) in net assets resulting |
|
$ (208,968) |
See accompanying notes which are an integral part of the financial statements.
Annual Report
Financial Statements - continued
Statement of Changes in Net Assets
|
Amounts in thousands |
Year ended
October 31, |
Year ended
October 31, |
|
Increase (Decrease) in Net Assets |
|
|
|
Operations |
$ 378,023 |
$ 358,470 |
|
Net realized gain (loss) |
(503,660) |
(56,481) |
|
Change in net unrealized appreciation (depreciation) |
(83,331) |
120,312 |
|
Net increase (decrease) in net assets resulting |
(208,968) |
422,301 |
|
Distributions to shareholders |
(320,749) |
(352,867) |
|
From net realized gain |
- |
(40,674) |
|
In excess of net realized gain |
- |
(29,684) |
|
Return of capital |
- |
(16,824) |
|
Total distributions |
(320,749) |
(440,049) |
|
Share transactions - net increase (decrease) |
(348,559) |
568,709 |
|
Total increase (decrease) in net assets |
(878,276) |
550,961 |
|
Net Assets |
|
|
|
Beginning of period |
4,156,220 |
3,605,259 |
|
End of period (including undistributed net investment income of $94,399 and $52,902, respectively) |
$ 3,277,944 |
$ 4,156,220 |
See accompanying notes which are an integral part of the financial statements.
Annual Report
Financial Highlights - Class A
|
Years ended October 31, |
2000 |
1999 |
1998 |
1997 |
1996 E |
|
Selected Per-Share Data |
|
|
|
|
|
|
Net asset value, |
$ 11.120 |
$ 11.090 |
$ 12.930 |
$ 12.300 |
$ 12.010 |
|
Income from Investment Operations |
|
|
|
|
|
|
Net investment income D |
1.059 |
1.022 |
1.111 |
1.058 |
.163 |
|
Net realized and unrealized gain (loss) |
(1.634) |
.287 |
(1.603) |
.710 |
.267 |
|
Total from investment operations |
(.575) |
1.309 |
(.492) |
1.768 |
.430 |
|
Less Distributions |
|
|
|
|
|
|
From net investment income |
(.905) |
(1.030) |
(1.048) |
(1.078) |
(.140) |
|
From net realized gain |
- |
(.120) |
(.300) |
(.060) |
- |
|
In excess of net realized gain |
- |
(.080) |
- |
- |
- |
|
Return of capital |
- |
(.049) |
- |
- |
- |
|
Total distributions |
(.905) |
(1.279) |
(1.348) |
(1.138) |
(.140) |
|
Net asset value, end of period |
$ 9.640 |
$ 11.120 |
$ 11.090 |
$ 12.930 |
$ 12.30 |
|
Total Return B, C |
(5.66)% |
11.98% |
(4.55)% |
15.18% |
3.58% |
|
Ratios and Supplemental Data |
|
|
|
|
|
|
Net assets, end of period |
$ 209 |
$ 221 |
$ 117 |
$ 44 |
$ 4 |
|
Ratio of expenses to average |
.94% |
.95% |
1.01% |
1.15% |
1.25% A, F |
|
Ratio of expenses to average net assets after expense reductions |
.94% |
.95% |
1.00% G |
1.14% G |
1.25% A |
|
Ratio of net investment income |
9.86% |
8.89% |
9.03% |
8.58% |
9.06% A |
|
Portfolio turnover rate |
63% |
61% |
75% |
105% |
121% |
A Annualized
B The total returns would have been lower had certain expenses not been reduced during the periods shown.
C Total returns do not include the one time sales charge and for periods of less than one year are not annualized.
D Net investment income per share has been calculated based on average shares outstanding during the period.
E For the period September 3, 1996 (commencement of sale of Class A shares) to October 31, 1996.
F FMR agreed to reimburse a portion of the class' expenses during the period. Without this reimbursement, the class' expense ratio would have been higher.
G FMR or the fund has entered into varying arrangements with third parties who either paid or reduced a portion of the class' expenses.
See accompanying notes which are an integral part of the financial statements.
Annual Report
Financial Highlights - Class T
|
Years ended October 31, |
2000 |
1999 |
1998 |
1997 |
1996 |
|
Selected Per-Share Data |
|
|
|
|
|
|
Net asset value, |
$ 11.140 |
$ 11.110 |
$ 12.940 |
$ 12.310 |
$ 11.910 |
|
Income from Investment Operations |
|
|
|
|
|
|
Net investment income C |
1.055 |
1.021 |
1.119 |
1.086 |
1.105 |
|
Net realized and unrealized gain (loss) |
(1.640) |
.274 |
(1.612) |
.686 |
.364 |
|
Total from investment operations |
(.585) |
1.295 |
(.493) |
1.772 |
1.469 |
|
Less Distributions |
|
|
|
|
|
|
From net investment income |
(.895) |
(1.017) |
(1.037) |
(1.082) |
(1.069) |
|
From net realized gain |
- |
(.120) |
(.300) |
(.060) |
- |
|
In excess of net realized gain |
- |
(.080) |
- |
- |
- |
|
Return of capital |
- |
(.048) |
- |
- |
- |
|
Total distributions |
(.895) |
(1.265) |
(1.337) |
(1.142) |
(1.069) |
|
Net asset value, end of period |
$ 9.660 |
$ 11.140 |
$ 11.110 |
$ 12.940 |
$ 12.310 |
|
Total Return A, B |
(5.73)% |
11.83% |
(4.54)% |
15.21% |
12.92% |
|
Ratios and Supplemental Data |
|
|
|
|
|
|
Net assets, end of period |
$ 1,777 |
$ 2,351 |
$ 2,322 |
$ 2,208 |
$ 1,709 |
|
Ratio of expenses to average |
1.03% |
1.04% |
1.07% |
1.09% |
1.12% |
|
Ratio of expenses to average net assets after expense reductions |
1.03% |
1.04% |
1.07% |
1.08% D |
1.11% D |
|
Ratio of net investment income |
9.76% |
8.80% |
8.91% |
8.72% |
9.20% |
|
Portfolio turnover rate |
63% |
61% |
75% |
105% |
121% |
A The total returns would have been lower had certain expenses not been reduced during the periods shown.
B Total returns do not include the one time sales charge.
C Net investment income per share has been calculated based on average shares outstanding during the period.
D FMR or the fund has entered into varying arrangements with third parties who either paid or reduced a portion of the class' expenses.
See accompanying notes which are an integral part of the financial statements.
Annual Report
Financial Highlights - Class B
|
Years ended October 31, |
2000 |
1999 |
1998 |
1997 |
1996 |
|
Selected Per-Share Data |
|
|
|
|
|
|
Net asset value, |
$ 11.090 |
$ 11.070 |
$ 12.890 |
$ 12.280 |
$ 11.890 |
|
Income from Investment Operations |
|
|
|
|
|
|
Net investment income C |
.978 |
.938 |
1.024 |
.998 |
1.017 |
|
Net realized and unrealized gain (loss) |
(1.634) |
.276 |
(1.588) |
.674 |
.361 |
|
Total from investment operations |
(.656) |
1.214 |
(.564) |
1.672 |
1.378 |
|
Less Distributions |
|
|
|
|
|
|
From net investment income |
(.824) |
(.949) |
(.956) |
(1.002) |
(.988) |
|
From net realized gain |
- |
(.120) |
(.300) |
(.060) |
- |
|
In excess of net realized gain |
- |
(.080) |
- |
- |
- |
|
Return of capital |
- |
(.045) |
- |
- |
- |
|
Total distributions |
(.824) |
(1.194) |
(1.256) |
(1.062) |
(.988) |
|
Net asset value, end of period |
$ 9.610 |
$ 11.090 |
$ 11.070 |
$ 12.890 |
$ 12.280 |
|
Total Return A, B |
(6.39)% |
11.10% |
(5.10)% |
14.34% |
12.10% |
|
Ratios and Supplemental Data |
|
|
|
|
|
|
Net assets, end of period |
$ 956 |
$ 1,192 |
$ 923 |
$ 593 |
$ 344 |
|
Ratio of expenses to average |
1.70% |
1.70% |
1.74% |
1.74% |
1.79% |
|
Ratio of expenses to average net assets after expense reductions |
1.70% |
1.69% D |
1.74% |
1.74% |
1.79% |
|
Ratio of net investment income |
9.10% |
8.15% |
8.25% |
8.04% |
8.52% |
|
Portfolio turnover rate |
63% |
61% |
75% |
105% |
121% |
A The total returns would have been lower had certain expenses not been reduced during the periods shown.
B Total returns do not include the contingent deferred sales charge.
C Net investment income per share has been calculated based on average shares outstanding during the period.
D FMR or the fund has entered into varying arrangements with third parties who either paid or reduced a portion of the class' expenses.
See accompanying notes which are an integral part of the financial statements.
Annual Report
Financial Highlights - Class C
|
Years ended October 31, |
2000 |
1999 |
1998 E |
|
Selected Per-Share Data |
|
|
|
|
Net asset value, beginning of period |
$ 11.110 |
$ 11.090 |
$ 12.970 |
|
Income from Investment Operations |
|
|
|
|
Net investment income D |
.969 |
.926 |
.988 |
|
Net realized and unrealized gain (loss) |
(1.634) |
.280 |
(1.639) |
|
Total from investment operations |
(.665) |
1.206 |
(.651) |
|
Less Distributions |
|
|
|
|
From net investment income |
(.815) |
(.941) |
(.929) |
|
From net realized gain |
- |
(.120) |
(.300) |
|
In excess of net realized gain |
- |
(.080) |
- |
|
Return of capital |
- |
(.045) |
- |
|
Total distributions |
(.815) |
(1.186) |
(1.229) |
|
Net asset value, end of period |
$ 9.630 |
$ 11.110 |
$ 11.090 |
|
Total Return B, C |
(6.45)% |
11.00% |
(5.73)% |
|
Ratios and Supplemental Data |
|
|
|
|
Net assets, end of period (in millions) |
$ 247 |
$ 269 |
$ 130 |
|
Ratio of expenses to average net assets |
1.78% |
1.78% |
1.86% A |
|
Ratio of expenses to average net assets after |
1.78% |
1.78% |
1.86% A |
|
Ratio of net investment income to average net assets |
9.02% |
8.06% |
8.21% A |
|
Portfolio turnover rate |
63% |
61% |
75% |
A Annualized
B The total returns would have been lower had certain expenses not been reduced during the periods shown.
C Total returns do not include the contingent deferred sales charge and for periods of less than one year are not annualized.
D Net investment income per share has been calculated based on average shares outstanding during the period.
E For the period November 3, 1997 (commencement of sale of Class C shares) to October 31, 1998.
See accompanying notes which are an integral part of the financial statements.
Annual Report
Financial Highlights - Institutional Class
|
Years ended October 31, |
2000 |
1999 |
1998 |
1997 |
1996 |
|
Selected Per-Share Data |
|
|
|
|
|
|
Net asset value, beginning |
$ 10.900 |
$ 10.900 |
$ 12.710 |
$ 12.120 |
$ 11.760 |
|
Income from Investment Operations |
|
|
|
|
|
|
Net investment income B |
1.055 |
1.024 |
1.123 |
1.094 |
1.070 |
|
Net realized and unrealized gain (loss) |
(1.606) |
.269 |
(1.562) |
.671 |
.368 |
|
Total from investment operations |
(.551) |
1.293 |
(.439) |
1.765 |
1.438 |
|
Less Distributions |
|
|
|
|
|
|
From net investment income |
(.919) |
(1.044) |
(1.071) |
(1.115) |
(1.078) |
|
From net realized gain |
- |
(.120) |
(.300) |
(.060) |
- |
|
In excess of net realized gain |
- |
(.080) |
- |
- |
- |
|
Return of capital |
- |
(.049) |
- |
- |
- |
|
Total distributions |
(.919) |
(1.293) |
(1.371) |
(1.175) |
(1.078) |
|
Net asset value, end of period |
$ 9.430 |
$ 10.900 |
$ 10.900 |
$ 12.710 |
$ 12.120 |
|
Total Return A |
(5.56)% |
12.05% |
(4.21)% |
15.42% |
12.81% |
|
Ratios and Supplemental Data |
|
|
|
|
|
|
Net assets, end of period |
$ 89 |
$ 123 |
$ 113 |
$ 76 |
$ 38 |
|
Ratio of expenses to average |
.82% |
.82% |
.83% |
.85% |
1.10% |
|
Ratio of expenses to average net assets after expense reductions |
.82% |
.81% C |
.83% |
.85% |
1.05% C |
|
Ratio of net investment income |
9.98% |
9.03% |
9.12% |
8.96% |
9.26% |
|
Portfolio turnover rate |
63% |
61% |
75% |
105% |
121% |
A The total returns would have been lower had certain expenses not been reduced during the periods shown.
B Net investment income per share has been calculated based on average shares outstanding during the period.
C FMR or the fund has entered into varying arrangements with third parties who either paid or reduced a portion of the class' expenses.
See accompanying notes which are an integral part of the financial statements.
Annual Report
For the period ended October 31, 2000
1. Significant Accounting Policies.
Fidelity Advisor High Yield Fund (the fund) is a fund of Fidelity Advisor Series II(the trust) and is authorized to issue an unlimited number of shares. The trust is registered under the Investment Company Act of 1940, as amended (the 1940 Act), as an open-end management investment company organized as a Massachusetts business trust.
The fund offers Class A, Class T, Class B, Class C, and Institutional Class shares, each of which has equal rights as to assets and voting privileges. Each class has exclusive voting rights with respect to matters that affect that class. Class B shares will automatically convert to Class A shares after a holding period of seven years from the initial date of purchase. Investment income, realized and unrealized capital gains and losses, the common expenses of the fund, and certain fund-level expense reductions, if any, are allocated on a pro rata basis to each class based on the relative net assets of each class to the total net assets of the fund. Each class of shares differs in its respective distribution, transfer agent, and certain other class-specific fees, expenses, and expense reductions.
The financial statements have been prepared in conformity with generally accepted accounting principles which require management to make certain estimates and assumptions at the date of the financial statements. The following summarizes the significant accounting policies of the fund:
Security Valuation. Securities for which quotations are readily available are valued by a pricing service at their market values as determined by their most recent bid prices in the principal market (sales prices if the principal market is an exchange) in which such securities are normally traded. Securities (including restricted securities) for which market quotations are not readily available are valued at their fair value as determined in good faith under consistently applied procedures under the general supervision of the Board of Trustees. Short-term securities with remaining maturities of sixty days or less for which quotations are not readily available are valued at amortized cost or original cost plus accrued interest, both of which approximate current value. Investments in open-end investment companies are valued at their net asset value each business day.
Foreign Currency Translation. The accounting records of the fund are maintained in U.S. dollars. Investment securities and other assets and liabilities denominated in a foreign currency are translated into U.S. dollars at the prevailing rates of exchange at period end. Purchases and sales of securities, income receipts and expense payments are translated into U.S. dollars at the prevailing exchange rate on the respective dates of the transactions.
Net realized gains and losses on foreign currency transactions represent net gains and losses from sales and maturities of foreign currency contracts, disposition of foreign currencies, the difference between the amount of net investment income accrued and the U.S. dollar amount actually received, and gains and losses between trade and settlement
Annual Report
Notes to Financial Statements - continued
1. Significant Accounting Policies - continued
Foreign Currency Translation - continued
date on purchases and sales of securities. The effects of changes in foreign currency exchange rates on investments in securities are included with the net realized and unrealized gain or loss on investment securities.
Income Taxes. As a qualified regulated investment company under Subchapter M of the Internal Revenue Code, the fund is not subject to income taxes to the extent that it distributes substantially all of its taxable income for its fiscal year. The schedule of investments includes information regarding income taxes under the caption "Income Tax Information."
Investment Income. Dividend income is recorded on the ex-dividend date, except certain dividends from foreign securities where the ex-dividend date may have passed, are recorded as soon as the fund is informed of the ex-dividend date. Non-cash dividends included in dividend income, if any, are recorded at the fair market value of the securities received. Interest income, which includes accretion of original issue discount, is accrued as earned. Investment income is recorded net of foreign taxes withheld where recovery of such taxes is uncertain. The fund may place a debt obligation on non-accrual status and reduce related interest income by ceasing current accruals and writing off interest receivables when the collection of all or a portion of interest has become doubtful based on consistently applied procedures, under the general supervision of the Board of Trustees of the fund. A debt obligation is removed from non-accrual status when the issuer resumes interest payments or when collectibility of interest is reasonably assured.
Expenses. Most expenses of the trust can be directly attributed to a fund. Expenses which cannot be directly attributed are apportioned among the funds in the trust.
Deferred Trustee Compensation. Under a Deferred Compensation Plan (the Plan) non-interested Trustees must defer receipt of a portion of, and may elect to defer receipt of an additional portion of, their annual compensation. Deferred amounts are treated as though equivalent dollar amounts had been invested in shares of the fund or are invested in a cross-section of other Fidelity funds. Deferred amounts remain in the fund until distributed in accordance with the Plan.
Distributions to Shareholders. Distributions are declared daily and paid monthly from net investment income. Distributions from realized gains, if any, are recorded on the ex-dividend date. Income dividends and capital gain distributions are declared separately for each class.
Income and capital gain distributions are determined in accordance with income tax regulations which may differ from generally accepted accounting principles. These differences, which may result in distribution reclassifications, are primarily due to
Annual Report
Notes to Financial Statements - continued
1. Significant Accounting Policies - continued
Distributions to Shareholders - continued
differing treatments for litigation proceeds, paydown gains/losses on certain securities, foreign currency transactions, market discount, partnerships, non-taxable dividends, capital loss carryforwards and losses deferred due to wash sales.
Permanent book and tax basis differences relating to shareholder distributions will result in reclassifications to paid in capital. Undistributed net investment income and accumulated undistributed net realized gain (loss) on investments and foreign currency transactions may include temporary book and tax basis differences which will reverse in a subsequent period. Any taxable income or gain remaining at fiscal year end is distributed in the following year.
Security Transactions. Security transactions are accounted for as of trade date. Gains and losses on securities sold are determined on the basis of identified cost.
2. Operating Policies.
Foreign Currency Contracts. The fund generally uses foreign currency contracts to facilitate transactions in foreign-denominated securities. Losses may arise from changes in the value of the foreign currency or if the counterparties do not perform under the contracts' terms. The U.S. dollar value of foreign currency contracts is determined using contractual currency exchange rates established at the time of each trade.
Joint Trading Account. Pursuant to an Exemptive Order issued by the Securities and Exchange Commission (the SEC), the fund, along with other affiliated entities of Fidelity Management & Research Company (FMR), may transfer uninvested cash balances into one or more joint trading accounts. These balances are invested in one or more repurchase agreements for U.S. Treasury or Federal Agency obligations.
Repurchase Agreements. The underlying U.S. Treasury, Federal Agency, or other obligations found to be satisfactory by FMR are transferred to an account of the fund, or to the Joint Trading Account, at a custodian bank. The securities are marked-to-market daily and maintained at a value at least equal to the principal amount of the repurchase agreement (including accrued interest). FMR, the fund's investment adviser, is responsible for determining that the value of the underlying securities remains in accordance with the market value requirements stated above.
Interfund Lending Program. Pursuant to an Exemptive Order issued by the SEC, the fund, along with other registered investment companies having management contracts with FMR, may participate in an interfund lending program. This program provides an alternative credit facility allowing the fund to borrow from, or lend money to, other participating funds.
Annual Report
Notes to Financial Statements - continued
2. Operating Policies - continued
Restricted Securities. The fund is permitted to invest in securities that are subject to legal or contractual restrictions on resale. These securities generally may be resold in transactions exempt from registration or to the public if the securities are registered. Disposal of these securities may involve time-consuming negotiations and expense, and prompt sale at an acceptable price may be difficult. At the end of the period, restricted securities (excluding 144A issues) amounted to $10,880,000 or 0.3% of net assets.
Loans and Other Direct Debt Instruments. The fund is permitted to invest in loans and loan participations, trade claims or other receivables. These investments may include standby financing commitments that obligate the fund to supply additional cash to the borrower on demand. Loan participations involve a risk of insolvency of the lending bank or other financial intermediary. At the end of the period, these investments amounted to $26,930,000 or 0.8% of net assets.
3. Purchases and Sales of Investments.
Purchases and sales of securities, other than short-term securities, aggregated $2,335,081,000 and $2,751,035,000, respectively.
4. Fees and Other Transactions with Affiliates.
Management Fee. As the fund's investment adviser, FMR receives a monthly fee that is calculated on the basis of a group fee rate plus a fixed individual fund fee rate applied to the average net assets of the fund. The group fee rate is the weighted average of a series of rates and is based on the monthly average net assets of all the mutual funds advised by FMR. The rates ranged from .0920% to .3700% for the period. The annual individual fund fee rate is 0.45%. In the event that these rates were lower than the contractual rates in effect during the period, FMR voluntarily implemented the above rates, as they resulted in the same or a lower management fee. For the period, the management fee was equivalent to an annual rate of .58% of average net assets.
Sub-Adviser Fee. Beginning January 1, 2001, FMR Co. (FMRC) will serve as sub-adviser for the fund. FMRC is a wholly owned subsidiary of FMR and will receive a fee from FMR of 50% of the management fee payable to FMR with respect to that portion of the fund's assets that will be managed by FMRC.
Distribution and Service Plan. In accordance with Rule 12b-1 of the 1940 Act, the Board of Trustees has adopted separate Distribution and Service Plans with respect to each class of shares (collectively referred to as "the Plans"). Under certain of the Plans, the class pays Fidelity Distributors Corporation (FDC), an affiliate of FMR, a 12b-1 fee. A portion of this fee may be reallowed to securities dealers, banks and other financial institutions for the distribution of each class of shares and providing shareholder support services. For the
Annual Report
Notes to Financial Statements - continued
4. Fees and Other Transactions with Affiliates - continued
Distribution and Service Plan - continued
period, this fee was based on the following annual rates of the average net assets of each applicable class:
|
Class A |
.15% |
|
Class T |
.25% |
|
Class B |
.90%* |
|
Class C |
1.00%** |
* .65% represents a distribution fee and .25% represents a shareholder service fee.
** .75% represents a distribution fee and .25% represents a shareholder service fee.
For the period, each class paid FDC the following amounts, a portion of which was retained by FDC:
|
|
Paid to |
Retained |
|
Class A |
$ 351,000 |
$ 1,000 |
|
Class T |
5,500,000 |
84,000 |
|
Class B |
10,182,000 |
7,360,000 |
|
Class C |
2,822,000 |
1,334,000 |
|
|
$ 18,855,000 |
$ 8,779,000 |
Sales Load. FDC receives a front-end sales charge of up to 4.75% for selling Class A shares, and 3.50% for selling Class T shares of the fund. FDC receives the proceeds of contingent deferred sales charges levied on Class B share redemptions occurring within six years of purchase and Class C share redemptions occurring within one year of purchase. Contingent deferred sales charges are based on declining rates ranging from 5% to 1% for Class B and 1% for Class C, of the lesser of the cost of shares at the initial date of purchase or the net asset value of the redeemed shares, excluding any reinvested dividends and capital gains. In addition, purchases of Class A and Class T shares that were subject to a finder's fee bear a contingent deferred sales charge on assets that do not remain in the fund for at least one year. The Class A and Class T contingent deferred sales charge is based on 0.25% of the lesser of the cost of shares at the initial date of purchase or the net asset value of the redeemed shares, excluding any reinvested dividends and capital gains. A portion of the sales charges paid to FDC is paid to securities dealers, banks and other financial institutions.
Annual Report
Notes to Financial Statements - continued
4. Fees and Other Transactions with Affiliates - continued
Sales Load - continued
For the period, sales charge amounts paid to and retained by FDC were as follows:
|
|
Paid to |
Retained |
|
Class A |
$ 422,000 |
$ 167,000 |
|
Class T |
898,000 |
358,000 |
|
Class B |
4,065,000 |
4,065,000* |
|
Class C |
157,000 |
157,000* |
|
Total |
$ 5,542,000 |
$ 4,747,000 |
* When Class B and Class C shares are initially sold, FDC pays commissions from its own resources to securities dealers,
banks, and other financial institutions through which the sales are made.
Transfer Agent Fees. Fidelity Investments Institutional Operations Company, Inc., (FIIOC), an affiliate of FMR, is the transfer, dividend disbursing and shareholder servicing agent (collectively referred to as the transfer agent) for each class of the fund. FIIOC receives account fees and asset-based fees that vary according to the account size and type of account of the shareholders of the respective classes of the fund. FIIOC pays for typesetting, printing and mailing of all shareholder reports, except proxy statements. For the period, the following amounts were paid to FIIOC:
|
|
Amount |
% of |
|
Class A |
$ 419,000 |
.18 |
|
Class T |
3,763,000 |
.17 |
|
Class B |
2,091,000 |
.18 |
|
Class C |
464,000 |
.16 |
|
Institutional Class |
244,000 |
.21 |
|
|
$ 6,981,000 |
|
Accounting Fees. Fidelity Service Company, Inc., an affiliate of FMR, maintains the fund's accounting records. The fee is based on the level of average net assets for the month plus out-of-pocket expenses.
Brokerage Commissions. The fund placed a portion of its portfolio transactions with brokerage firms which are affiliates of FMR. The commissions paid to these affiliated firms were $12,000 for the period.
5. Interfund Lending Program.
The fund participated in the interfund lending program as a lender. The average daily loan balance during the period for which loans were outstanding amounted to $23,520,000. The weighted average interest rate was 6.16%. Interest earned from the interfund lending program amounted to $28,000 and is included in interest income on the Statement of Operations.
Annual Report
Notes to Financial Statements - continued
6. Expense Reductions.
FMR has directed certain portfolio trades to brokers who paid a portion of the fund's expenses. For the period, the fund's expenses were reduced by $17,000 under this arrangement.
In addition, through an arrangement with the fund's custodian, credits realized as a result of uninvested cash balances were used to reduce a portion of expenses. During the period, the fund's custodian fees were reduced by $24,000 under the custodian arrangement.
7. Distributions to Shareholders.
Distributions to shareholders of each class were as follows:
|
Amounts in thousands |
Years ended October 31, |
|
|
|
2000 |
1999 |
|
From net investment income |
|
|
|
Class A |
$ 19,732 |
$ 14,241 |
|
Class T |
182,570 |
218,969 |
|
Class B |
86,748 |
91,163 |
|
Class C |
21,383 |
16,708 |
|
Institutional Class |
10,316 |
11,786 |
|
Total |
$ 320,749 |
$ 352,867 |
|
Return of Capital |
|
|
|
Class A |
$ - |
$ 679 |
|
Class T |
- |
10,440 |
|
Class B |
- |
4,346 |
|
Class C |
- |
797 |
|
Institutional Class |
- |
562 |
|
Total |
$ - |
$ 16,824 |
|
From net realized gain |
|
|
|
Class A |
$ - |
$ 1,446 |
|
Class T |
- |
25,543 |
|
Class B |
- |
10,501 |
|
Class C |
- |
1,751 |
|
Institutional Class |
- |
1,433 |
|
Total |
$ - |
$ 40,674 |
|
In excess of net realized gain |
|
|
|
Class A |
$ - |
$ 1,056 |
|
Class T |
- |
18,641 |
|
Class B |
- |
7,663 |
|
Class C |
- |
1,278 |
|
Institutional Class |
- |
1,046 |
|
Total |
$ - |
$ 29,684 |
|
|
$ 320,749 |
$ 440,049 |
Annual Report
Notes to Financial Statements - continued
8. Share Transactions.
Transactions for each class of shares were as follows:
|
Amounts in thousands |
Shares |
Dollars |
||
|
|
Year ended October 31, |
Year ended October 31, |
Year ended October 31, |
Year ended October 31, |
|
|
2000 |
1999 |
2000 |
1999 |
|
|
|
|
|
|
|
Class A |
10,756 |
13,700 |
$ 117,740 |
$ 158,674 |
|
Reinvestment of distributions |
1,144 |
1,173 |
12,198 |
13,495 |
|
Shares redeemed |
(10,139) |
(5,559) |
(109,658) |
(64,643) |
|
Net increase (decrease) |
1,761 |
9,314 |
$ 20,280 |
$ 107,526 |
|
Class T |
80,648 |
101,408 |
$ 877,876 |
$ 1,178,382 |
|
Reinvestment of distributions |
13,081 |
18,746 |
139,965 |
216,117 |
|
Shares redeemed |
(120,833) |
(118,096) |
(1,303,448) |
(1,367,579) |
|
Net increase (decrease) |
(27,104) |
2,058 |
$ (285,607) |
$ 26,920 |
|
Class B |
22,283 |
43,832 |
$ 242,700 |
$ 507,464 |
|
Reinvestment of distributions |
5,027 |
6,459 |
53,537 |
74,128 |
|
Shares redeemed |
(35,314) |
(26,213) |
(379,926) |
(302,213) |
|
Net increase (decrease) |
(8,004) |
24,078 |
$ (83,689) |
$ 279,379 |
|
Class C |
13,456 |
20,267 |
$ 146,823 |
$ 234,940 |
|
Reinvestment of distributions |
1,115 |
1,004 |
11,868 |
11,541 |
|
Shares redeemed |
(13,098) |
(8,802) |
(141,107) |
(101,978) |
|
Net increase (decrease) |
1,473 |
12,469 |
$ 17,584 |
$ 144,503 |
|
Institutional Class |
5,154 |
11,210 |
$ 55,289 |
$ 127,339 |
|
Reinvestment of distributions |
709 |
981 |
7,434 |
11,076 |
|
Shares redeemed |
(7,642) |
(11,277) |
(79,850) |
(128,034) |
|
Net increase (decrease) |
(1,779) |
914 |
$ (17,127) |
$ 10,381 |
Annual Report
To the Trustees of Fidelity Advisor Series II and Shareholders of Fidelity Advisor High Yield Fund:
We have audited the accompanying statement of assets and liabilities of Fidelity Advisor High Yield Fund (the Fund), a fund of Fidelity Advisor Series II (the Trust), including the portfolio of investments, as of October 31, 2000, and the related statement of operations for the year then ended, the statement of changes in net assets for each of the two years in the period then ended, and the financial highlights for each of the five years in the period then ended. These financial statements and financial highlights are the responsibility of the Fund's management. Our responsibility is to express an opinion on these financial statements and financial highlights based on our audits.
We conducted our audits in accordance with auditing standards generally accepted in the United States of America. Those standards require that we plan and perform the audit to obtain reasonable assurance about whether the financial statements and financial highlights are free of material misstatement. An audit includes examining, on a test basis, evidence supporting the amounts and disclosures in the financial statements. Our procedures included confirmation of securities owned as of October 31, 2000, by correspondence with the custodian and brokers; where replies were not received from brokers, we performed other auditing procedures. An audit also includes assessing the accounting principles used and significant estimates made by management, as well as evaluating the overall financial statement presentation. We believe that our audits provide a reasonable basis for our opinion.
In our opinion, the financial statements and financial highlights referred to above present fairly, in all material respects, the financial position of Fidelity Advisor High Yield Fund as of October 31, 2000, the results of its operations for the year then ended, the changes in its net assets for each of the two years in the period then ended, and its financial highlights for each of the five years in the period then ended, in conformity with accounting principles generally accepted in the United States of America.
/s/DELOITTE & TOUCHE LLP
DELOITTE & TOUCHE LLP
Boston, Massachusetts
December 8, 2000
Annual Report
A total of 3% of the dividends distributed during the fiscal year qualifies for the dividends-received deduction for corporate shareholders.
The fund will notify shareholders in January 2001 of amounts for use in preparing 2000 income tax returns.
Annual Report
Annual Report
Annual Report
Annual Report
Annual Report
Annual Report
Investment Adviser
Fidelity Management & Research Company
Boston, MA
Investment Sub-Advisers
Fidelity Management & Research
(U.K.) Inc.
Fidelity Management & Research
(Far East) Inc.
Fidelity Investments Japan Limited
Officers
Edward C. Johnson 3d, President
Robert C. Pozen, Senior Vice President
Robert A. Lawrence, Vice President
Thomas T. Soviero, Vice President
Eric D. Roiter, Secretary
Robert A. Dwight, Treasurer
Maria F. Dwyer, Deputy Treasurer
John H. Costello, Assistant Treasurer
Thomas J. Simpson, Assistant Treasurer
Board of Trustees
Ralph F. Cox *
Phyllis Burke Davis *
Robert M. Gates *
Edward C. Johnson 3d
Donald J. Kirk *
Ned C. Lautenbach *
Peter S. Lynch
Marvin L. Mann *
William O. McCoy *
Gerald C. McDonough *
Robert C. Pozen
Thomas R. Williams *
Advisory Board
J. Michael Cook
Abigail P. Johnson
Marie L. Knowles
General Distributor
Fidelity Distributors Corporation
Boston, MA
Transfer and Shareholder
Servicing Agent
Fidelity Investments Institutional Operations Company, Inc.
Boston, MA
Custodian
The Bank of New York
New York, NY
* Independent trustees
Annual Report
Focus Funds
Fidelity Advisor Consumer
Industries Fund
Fidelity Advisor Cyclical
Industries Fund
Fidelity Advisor Financial
Services Fund
Fidelity Advisor Health Care Fund
Fidelity Advisor Natural
Resources Fund
Fidelity Advisor Technology Fund
Fidelity Advisor Telecommunications & Utilities Growth Fund
Growth Funds
Fidelity Advisor Korea Fund
Fidelity Advisor Emerging Asia Fund
Fidelity Advisor Latin America Fund
Fidelity Advisor Japan Fund
Fidelity Advisor Europe Capital Appreciation Fund
Fidelity Advisor International
Capital Appreciation Fund
Fidelity Advisor Overseas Fund
Fidelity Advisor Diversified International Fund
Fidelity Advisor Global Equity Fund
Fidelity Advisor TechnoQuant®
Growth Fund
Fidelity Advisor Small Cap Fund
Fidelity Advisor Value Strategies Fund
Fidelity Advisor Mid Cap Fund
Fidelity Advisor Dynamic Capital Appreciation Fund
Fidelity Advisor Equity Growth Fund
Fidelity Advisor Large Cap Fund
Fidelity Advisor Dividend Growth Fund
Fidelity Advisor Growth
Opportunities Fund
Growth and Income Funds
Fidelity Advisor Growth & Income Fund
Fidelity Advisor Equity Income Fund
Fidelity Advisor Asset Allocation Fund
Fidelity Advisor Balanced Fund
Taxable Income Funds
Fidelity Advisor Emerging Markets Income Fund
Fidelity Advisor High Yield Fund
Fidelity Advisor High Income Fund
Fidelity Advisor Strategic Income Fund
Fidelity Advisor Mortgage
Securities Fund
Fidelity Advisor Government Investment Fund
Fidelity Advisor Intermediate Bond Fund
Fidelity Advisor Short Fixed-Income Fund
Municipal Funds
Fidelity Advisor Municipal Income Fund
Money Market Funds
Prime Fund
Treasury Fund
Tax-Exempt Fund
|
HYI-ANN-1200 |
118950 |
|
1.538465.103 |
|
(Fidelity Investment logo)(registered trademark)
Fidelity® Advisor
Fund - Class A, Class T, Class B
and Class C
Annual Report
October 31, 2000
(2_fidelity_logos)(Registered_Trademark)
|
President's Message |
3 |
Ned Johnson on investing strategies. |
|
Performance |
4 |
How the fund has done over time. |
|
Fund Talk |
21 |
The manager's review of fund performance, strategy and outlook. |
|
Investment Changes |
24 |
A summary of major shifts in the fund's investments over the past six months. |
|
Investments |
25 |
A complete list of the fund's investments with their market values. |
|
Financial Statements |
37 |
Statements of assets and liabilities, operations, and changes in net assets, as well as financial highlights. |
|
Notes |
46 |
Notes to the financial statements. |
|
Report of Independent Accountants |
53 |
The auditors' opinion. |
|
Distributions |
54 |
|
|
|
|
|
Standard & Poor's, S&P and S&P 500 are registered service marks of The McGraw-Hill Companies, Inc. and have been licensed for use by Fidelity Distributors Corporation.
Other third party marks appearing herein are the property of their respective owners.
All other marks appearing herein are registered or unregistered trademarks or service marks of FMR Corp. or an affiliated company.
(Recycle graphic) This report is printed on recycled paper using soy-based inks.
This report and the financial statements contained herein are submitted for the general information of the shareholders of the fund. This report is not authorized for distribution to prospective investors in the fund unless preceded or accompanied by an effective prospectus.
Mutual fund shares are not deposits or obligations of, or guaranteed by, any depository institution. Shares are not insured by the FDIC, Federal Reserve Board or any other agency, and are subject to investment risks, including possible loss of principal amount invested.
Neither the fund nor Fidelity Distributors Corporation is a bank.
For more information on any Fidelity Advisor fund, including charges and expenses, contact your investment professional for a free prospectus. Read it carefully before you invest or send money.
Annual Report
(photo_of_Edward_C_Johnson_3d)
Dear Shareholder:
A sixth-straight year of double-digit positive returns for the Dow Jones Industrial Average, NASDAQ and S&P 500® could be in jeopardy unless the U.S. stock market shows marked improvement in the final two months of 2000. Through October, all three indexes had negative year-to-date returns. On the other hand, most fixed-income sectors were solidly in the black. Treasuries and other long-term government securities led the way, returning nearly 14%.
While it's impossible to predict the future direction of the markets with any degree of certainty, there are certain basic principles that can help investors plan for their future needs.
The longer your investment time frame, the less likely it is that you will be affected by short-term market volatility. A 10-year investment horizon appropriate for saving for a college education, for example, enables you to weather market cycles in a long-term fund, which may have a higher risk potential, but also has a higher potential rate of return.
An intermediate-length fund could make sense if your investment horizon is two to four years, while a short-term bond fund could be the right choice if you need your money in one or two years.
If your time horizon is less than a year, you might want to consider moving some of your bond investment into a money market fund. These funds seek income and a stable share price by investing in high-quality, short-term investments. Of course, it's important to remember that an investment in a money market fund is not insured or guaranteed by the Federal Deposit Insurance Corporation or any other government agency. Although money market funds seek to preserve the value of your investment at $1.00 per share, it is possible to lose money by investing in these types of funds.
Finally, no matter what your time horizon or portfolio diversity, it makes good sense to follow a regular investment plan, investing a certain amount of money in a fund at the same time each month or quarter and periodically reviewing your overall portfolio. By doing so, you won't get caught up in the excitement of a rapidly rising market, nor will you buy all your shares at market highs. While this strategy - known as dollar cost averaging - won't assure a profit or protect you from a loss in a declining market, it should help you lower the average cost of your purchases. Of course, you should consider your financial ability to continue your purchases through periods of low price levels before undertaking such a strategy.
Remember to contact your investment professional if you need help with your investments.
Best regards,
/s/Edward C. Johnson 3d
Edward C. Johnson 3d
Annual Report
Fidelity Advisor Intermediate Bond Fund - Class A
There are several ways to evaluate historical performance. You can look at the total percentage change in value, the average annual percentage change or the growth of a hypothetical $10,000 investment. Total return reflects the change in the value of an investment, assuming reinvestment of the class' dividend income and capital gains (the profits earned upon the sale of securities that have grown in value). You can also look at the class' income, as reflected in its yield, to measure performance. The initial offering of Class A shares took place on September 3, 1996. Class A shares bear a 0.15% 12b-1 fee that is reflected in returns after September 3, 1996. Returns between September 10, 1992 (the date Class T shares were first offered) and September 3, 1996 are those of Class T and reflect Class T shares' 0.25% 12b-1 fee. Returns prior to September 10, 1992 are those of the Institutional Class, the original class of the fund, which does not bear a 12b-1 fee. Had Class A shares' 12b-1 fee been reflected, returns prior to September 10, 1992 would have been lower. If Fidelity had not reimbursed certain class expenses, the past five year and past 10 year total returns would have been lower.
Annual Report
Fidelity Advisor Intermediate Bond Fund - Class A
Performance - continued
Cumulative Total Returns
|
Periods ended October 31, 2000 |
|
Past 1 |
Past 5 |
Past 10 |
|
|
Fidelity Adv Int Bond - CL A |
|
6.32% |
29.31% |
96.55% |
|
|
Fidelity Adv Int Bond - CL A |
|
2.33% |
24.46% |
89.18% |
|
|
LB Int Govt/Credit Bond |
|
6.46% |
33.43% |
102.72% |
|
|
Short-Intermediate Investment Grade |
|
5.69% |
29.18% |
89.40% |
|
Cumulative total returns show Class A's performance in percentage terms over a set period - in this case, one year, five years or 10 years. For example, if you had invested $1,000 in a fund that had a 5% return over the past year, the value of your investment would be $1,050. You can compare Class A's returns to those of the Lehman Brothers Intermediate Government/Credit Bond Index - a market value-weighted index of government and investment-grade corporate fixed-rate debt issues with maturities between one and 10 years. To measure how Class A's performance stacked up against its peers, you can compare it to the short-intermediate investment grade debt funds average, which reflects the performance of mutual funds with similar objectives tracked by Lipper Inc. The past one year average represents a peer group of 117 mutual funds. These benchmarks include reinvested dividends and capital gains, if any, and exclude the effect of sales charges.
Annual Report
Fidelity Advisor Intermediate Bond Fund - Class A
Performance - continued
Average Annual Total Returns
|
Periods ended October 31, 2000 |
Past 1 |
Past 5 |
Past 10 |
|
Fidelity Adv Int Bond - CL A |
6.32% |
5.28% |
6.99% |
|
Fidelity Adv Int Bond - CL A |
2.33% |
4.47% |
6.58% |
|
LB Int Gov/Credit Bond |
6.46% |
5.94% |
7.32% |
|
Short-Intermediate Investment Grade |
5.69% |
5.25% |
6.59% |
Average annual total returns take Class A's cumulative return and show you what would have happened if Class A had performed at a constant rate each year.
Annual Report
Fidelity Advisor Intermediate Bond Fund - Class A
Performance - continued
$10,000 Over 10 Years
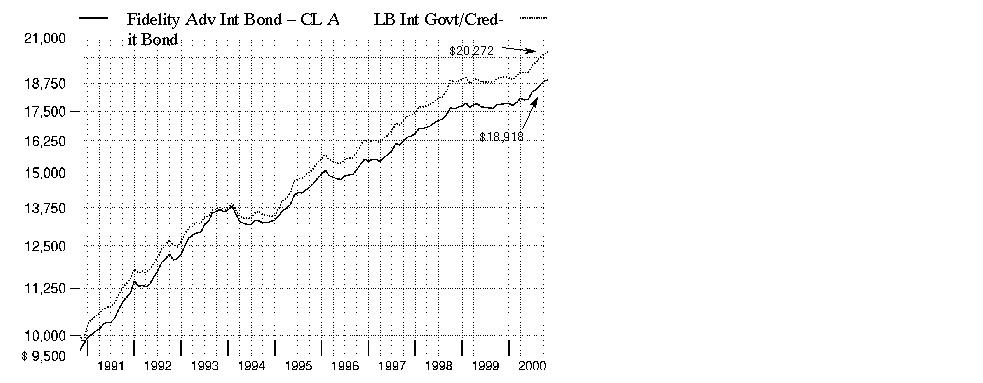
$10,000 Over 10 Years: Let's say hypothetically that $10,000 was invested in Fidelity Advisor Intermediate Bond Fund - Class A on October 31, 1990, and the current 3.75% sales charge was paid. As the chart shows, by October 31, 2000, the value of the investment would have grown to $18,918 - an 89.18% increase on the initial investment. For comparison, look at how the Lehman Brothers Intermediate Government/Credit Bond Index did over the same period. With dividends and capital gains, if any, reinvested, the same $10,000 investment would have grown to $20,272 - a 102.72% increase.
Understanding
Performance
How a fund did yesterday is no guarantee of how it will do tomorrow. Bond prices, for example, generally move in the opposite direction of interest rates. In turn, the share price, return and yield of a fund that invests in bonds will vary. That means if you sell your shares during a market downturn, you might lose money. But if you can ride out the market's ups and downs, you may have a gain.
3Annual Report
Fidelity Advisor Intermediate Bond Fund - Class A
Performance - continued
Total Return Components
|
|
Years ended October 31, |
September 3, 1996
(commencement of
sale of Class A
shares) to |
|||
|
|
2000 |
1999 |
1998 |
1997 |
1996 |
|
Dividend returns |
6.32% |
5.36% |
5.71% |
6.16% |
1.00% |
|
Capital returns |
0.00% |
-4.36% |
1.70% |
0.67% |
1.64% |
|
Total returns |
6.32% |
1.00% |
7.41% |
6.83% |
2.64% |
Total return components include both dividend returns and capital returns. A dividend return reflects the actual dividends paid by the class. A capital return reflects both the amount paid by the class to shareholders as capital gain distributions and changes in the class' share price. Both returns assume the dividends or capital gains, if any, paid by the class are reinvested and exclude the effect of sales charges.
Dividends and Yield
|
Periods ended October 31, 2000 |
Past 1 |
Past 6 |
Past 1 |
|
Dividends per share |
5.48¢ |
32.24¢ |
62.71¢ |
|
Annualized dividend rate |
6.25% |
6.26% |
6.14% |
|
30-day annualized yield |
6.23% |
- |
- |
Dividends per share show the income paid by the class for a set period and do not reflect any tax reclassifications. If you annualize this number, based on an average share price of $10.32 over the past one month, $10.21 over the past six months and $10.21 over the past one year, you can compare the class' income over these three periods. The 30-day annualized yield is a standard formula for all bond funds based on the yields of the bonds in the fund, averaged over the past 30 days. This figure shows you the yield characteristics of the fund's investments at the end of the period. It also helps you compare funds from different companies on an equal basis. The offering share price used in the calculation of the yield includes the effect of Class A's current 3.75% sales charge.
Annual Report
Fidelity Advisor Intermediate Bond Fund - Class T
There are several ways to evaluate historical performance. You can look at the total percentage change in value, the average annual percentage change or the growth of a hypothetical $10,000 investment. Total return reflects the change in the value of an investment, assuming reinvestment of the class' dividend income and capital gains (the profits earned upon the sale of securities that have grown in value). You can also look at the class' income, as reflected in its yield, to measure performance. The initial offering of Class T shares, took place on September 10, 1992. Class T shares bear a 0.25% 12b-1 fee that is reflected in returns after September 10, 1992. Returns prior to that date are those of the Institutional Class, the original class of the fund, which does not bear a 12b-1 fee. Had Class T shares' 12b-1 fee been reflected, returns prior to September 10, 1992 would have been lower. If Fidelity had not reimbursed certain class expenses, the past five year and past 10 year total returns would have been lower.
Cumulative Total Returns
|
Periods ended October 31, 2000 |
|
Past 1 |
Past 5 |
Past 10 |
|
Fidelity Adv Int Bond - CL T |
|
6.18% |
28.96% |
96.01% |
|
Fidelity Adv Int Bond - CL T |
|
3.26% |
25.41% |
90.62% |
|
LB Int Govt/Credit Bond |
|
6.46% |
33.43% |
102.72% |
|
Short-Intermediate Investment Grade |
|
5.69% |
29.18% |
89.40% |
Cumulative total returns show Class T's performance in percentage terms over a set period - in this case, one year, five years or 10 years. For example, if you had invested $1,000 in a fund that had a 5% return over the past year, the value of your investment would be $1,050. You can compare Class T's returns to those of the Lehman Brothers Intermediate Government/Credit Bond Index - a market value-weighted index of government and investment-grade corporate fixed-rate debt issues with maturities between one and 10 years. To measure how Class T's performance stacked up against its peers, you can compare it to the short-intermediate investment grade debt funds average, which reflects the performance of mutual funds with similar objectives tracked by Lipper Inc. The past one year average represents a peer group of 117 mutual funds. These benchmarks include reinvested dividends and capital gains, if any, and exclude the effect of sales charges.
Annual Report
Fidelity Advisor Intermediate Bond Fund - Class T
Performance - continued
Average Annual Total Returns
|
Periods ended October 31, 2000 |
Past 1 |
Past 5 |
Past 10 |
|
Fidelity Adv Int Bond - CL T |
6.18% |
5.22% |
6.96% |
|
Fidelity Adv Int Bond - CL T |
3.26% |
4.63% |
6.66% |
|
LB Int Govt/Credit Bond |
6.46% |
5.94% |
7.32% |
|
Short-Intermediate Investment Grade |
5.69% |
5.25% |
6.59% |
Average annual total returns take Class T's cumulative return and show you what would have happened if Class T had performed at a constant rate each year.
Annual Report
Fidelity Advisor Intermediate Bond Fund - Class T
Performance - continued
$10,000 Over 10 Years
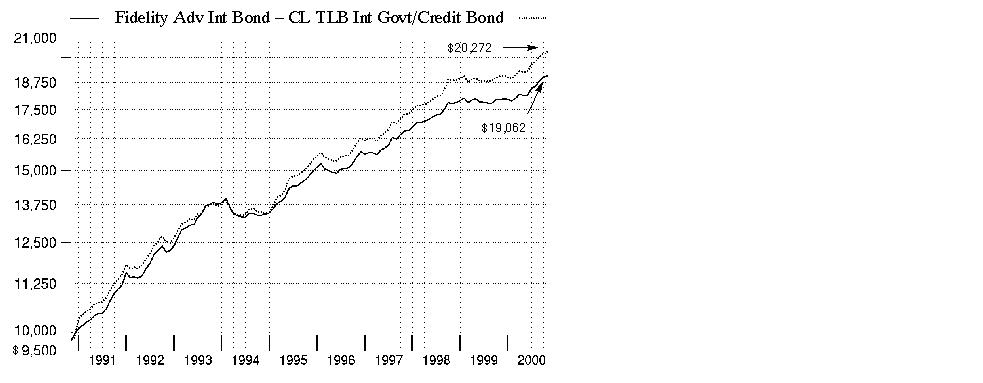
$10,000 Over 10 Years: Let's say hypothetically that $10,000 was invested in Fidelity Advisor Intermediate Bond Fund - Class T on October 31, 1990, and the current 2.75% sales charge was paid. As the chart shows, by October 31, 2000, the value of the investment would have grown to $19,062 - a 90.62% increase on the initial investment. For comparison, look at how the Lehman Brothers Intermediate Government/Credit Bond Index did over the same period. With dividends and capital gains, if any, reinvested, the same $10,000 investment would have grown to $20,272- a 102.72% increase.
Understanding
Performance
How a fund did yesterday is no guarantee of how it will do tomorrow. Bond prices, for example, generally move in the opposite direction of interest rates. In turn, the share price, return and yield of a fund that invests in bonds will vary. That means if you sell your shares during a market downturn, you might lose money. But if you can ride out the market's ups and downs, you may have a gain.
3Annual Report
Fidelity Advisor Intermediate Bond Fund - Class T
Performance - continued
Total Return Components
|
|
|
Years ended October 31, |
||||
|
|
|
2000 |
1999 |
1998 |
1997 |
1996 |
|
Dividend returns |
|
6.18% |
5.25% |
5.64% |
6.12% |
6.53% |
|
Capital returns |
|
0.00% |
-4.27% |
1.60% |
0.66% |
-1.50% |
|
Total returns |
|
6.18% |
0.98% |
7.24% |
6.78% |
5.03% |
Total return components include both dividend returns and capital returns. A dividend return reflects the actual dividends paid by the class. A capital return reflects both the amount paid by the class to shareholders as capital gain distributions and changes in the class' share price. Both returns assume the dividends or capital gains, if any, paid by the class are reinvested and exclude the effect of sales charges.
Dividends and Yield
|
Periods ended October 31, 2000 |
Past 1 |
Past 6 |
Past 1 |
|
Dividends per share |
5.37¢ |
31.55¢ |
61.41¢ |
|
Annualized dividend rate |
6.12% |
6.13% |
6.01% |
|
30-day annualized yield |
6.16% |
- |
- |
Dividends per share show the income paid by the class for a set period and do not reflect any tax reclassifications. If you annualize this number, based on an average share price of $10.33 over the past one month, $10.21 over the past six months and $10.21 over the past one year, you can compare the class' income over these three periods. The 30-day annualized yield is a standard formula for all bond funds based on the yields of the bonds in the fund, averaged over the past 30 days. This figure shows you the yield characteristics of the fund's investments at the end of the period. It also helps you compare funds from different companies on an equal basis. The offering share price used in the calculation of the yield includes the effect of Class T's current 2.75% sales charge.
Annual Report
Fidelity Advisor Intermediate Bond Fund - Class B
There are several ways to evaluate historical performance. You can look at the total percentage change in value, the average annual percentage change or the growth of a hypothetical $10,000 investment. Total return reflects the change in the value of an investment, assuming reinvestment of the class' dividend income and capital gains (the profits earned upon the sale of securities that have grown in value). You can also look at the class' income, as reflected in its yield, to measure performance.
The initial offering of Class B shares took place on June 30, 1994. Class B shares bear a 0.90% 12b-1 fee (1.00% prior to January 1, 1996) that is reflected in returns after June 30, 1994. Returns between September 10, 1992 (the date Class T shares were first offered) and June 30, 1994 are those of Class T and reflect Class T shares' 0.25% 12b-1 fee. Returns prior to September 10, 1992 are those of the Institutional Class, the original class of the fund, which does not bear a 12b-1 fee. Had Class B shares' 12b-1 fee been reflected, returns prior to June 30, 1994 would have been lower. Class B shares' contingent deferred sales charges included in the past one year, past five year and past 10 year total return figures are 3%, 0% and 0%, respectively. If Fidelity had not reimbursed certain class expenses, the past five year and past 10 year total returns would have been lower.
Cumulative Total Returns
|
Periods ended October 31, 2000 |
|
Past 1 |
Past 5 |
Past 10 |
|
Fidelity Adv Int Bond - CL B |
|
5.50% |
24.80% |
87.52% |
|
Fidelity Adv Int Bond - CL B |
|
2.50% |
24.80% |
87.52% |
|
LB Int Govt/Credit Bond |
|
6.46% |
33.43% |
102.72% |
|
Short-Intermediate Investment Grade |
|
5.69% |
29.18% |
89.40% |
Cumulative total returns show Class B's performance in percentage terms over a set period - in this case, one year, five years or 10 years. For example, if you had invested $1,000 in a fund that had a 5% return over the past year, the value of your investment would be $1,050. You can compare Class B's returns to those of the Lehman Brothers Intermediate Government/Credit Bond Index - a market value-weighted index of government and investment-grade corporate fixed-rate debt issues with maturities between one and 10 years. To measure how Class B's performance stacked up against its peers, you can compare it to the short-intermediate investment grade debt funds average, which reflects the performance of mutual funds with similar objectives tracked by Lipper Inc. The past one year average represents a peer group of 117 mutual funds. These benchmarks include reinvested dividends and capital gains, if any, and exclude the effect of sales charges.
Annual Report
Fidelity Advisor Intermediate Bond Fund - Class B
Performance - continued
Average Annual Total Returns
|
Periods ended October 31, 2000 |
Past 1 |
Past 5 |
Past 10 |
|
Fidelity Adv Int Bond - CL B |
5.50% |
4.53% |
6.49% |
|
Fidelity Adv Int Bond - CL B |
2.50% |
4.53% |
6.49% |
|
LB Int Govt/Credit Bond |
6.46% |
5.94% |
7.32% |
|
Short-Intermediate Investment Grade |
5.69% |
5.25% |
6.59% |
Average annual total returns take Class B's cumulative return and show you what would have happened if Class B had performed at a constant rate each year.
Annual Report
Fidelity Advisor Intermediate Bond Fund - Class B
Performance - continued
$10,000 Over 10 Years
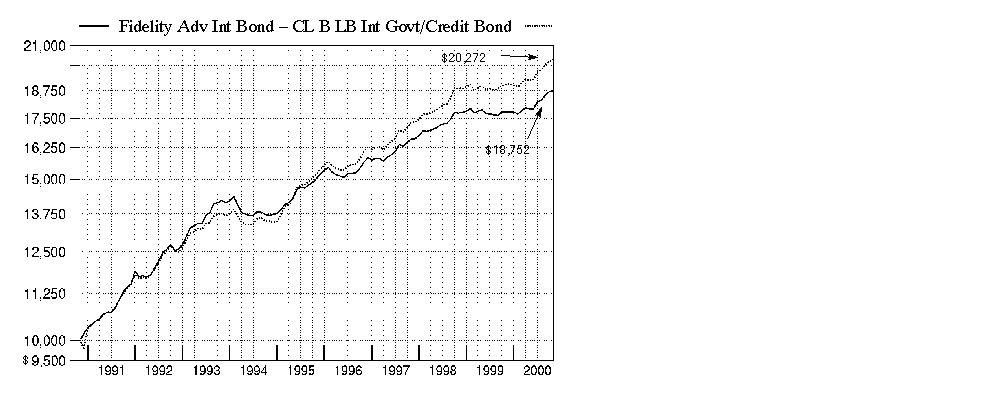
$10,000 Over 10 Years: Let's say hypothetically that $10,000 was invested in Fidelity Advisor Intermediate Bond Fund - Class B on October 31, 1990. As the chart shows, by October 31, 2000 the value of the investment would have been $18,752 - an 87.52% increase on the initial investment. For comparison, look at how the Lehman Brothers Intermediate Government/Credit Bond Index did over the same period. With dividends and capital gains, if any, reinvested, the same $10,000 investment would have grown to $20,272 - a 102.72% increase.
Understanding
Performance
How a fund did yesterday is no guarantee of how it will do tomorrow. Bond prices, for example, generally move in the opposite direction of interest rates. In turn, the share price, return and yield of a fund that invests in bonds will vary. That means if you sell your shares during a market downturn, you might lose money. But if you can ride out the market's ups and downs, you may have a gain.
3Annual Report
Fidelity Advisor Intermediate Bond Fund - Class B
Performance - continued
Total Return Components
|
|
|
Years ended October 31, |
||||
|
|
|
2000 |
1999 |
1998 |
1997 |
1996 |
|
Dividend returns |
|
5.50% |
4.65% |
4.93% |
5.38% |
5.83% |
|
Capital returns |
|
0.00% |
-4.28% |
1.70% |
0.57% |
-1.50% |
|
Total returns |
|
5.50% |
0.37% |
6.63% |
5.95% |
4.33% |
Total return components include both dividend returns and capital returns. A dividend return reflects the actual dividends paid by the class. A capital return reflects both the amount paid by the class to shareholders as capital gain distributions and changes in the class' share price. Both returns assume the dividends or capital gains, if any, paid by the class are reinvested and exclude the effect of sales charges.
Dividends and Yield
|
Periods ended October 31, 2000 |
Past 1 |
Past 6 |
Past 1 |
|
Dividends per share |
4.79¢ |
28.14¢ |
54.68¢ |
|
Annualized dividend rate |
5.47% |
5.47% |
5.36% |
|
30-day annualized yield |
5.68% |
- |
- |
Dividends per share show the income paid by the class for a set period and do not reflect any tax reclassifications. If you annualize this number, based on an average share price of $10.31 over the past one month, $10.20 over the past six months and $10.20 over the past one year, you can compare the class' income over these three periods. The 30-day annualized yield is a standard formula for all bond funds based on the yields of the bonds in the fund, averaged over the past 30 days. This figure shows you the yield characteristics of the fund's investments at the end of the period. It also helps you compare funds from different companies on an equal basis. The offering share price used in the calculation of the yield excludes the effect of Class B's contingent deferred sales charge.
Annual Report
Fidelity Advisor Intermediate Bond Fund - Class C
There are several ways to evaluate historical performance. You can look at the total percentage change in value, the average annual percentage change or the growth of a hypothetical $10,000 investment. Total return reflects the change in the value of an investment, assuming reinvestment of the class' dividend income and capital gains (the profits earned upon the sale of securities that have grown in value). You can also look at the class' income, as reflected in its yield, to measure performance.
The initial offering of Class C shares took place on November 3, 1997. Class C shares bear a 1.00% 12b-1 fee that is reflected in returns after November 3, 1997. Returns between June 30, 1994 (the date Class B shares were first offered) and November 3, 1997 are those of Class B and reflect Class B shares' 0.90% 12b-1 fee (1.00% prior to January 1, 1996). Returns between September 10, 1992 (the date Class T shares were first offered) and June 30, 1994 are those of Class T and reflect Class T shares' 0.25% 12b-1 fee. Returns prior to September 10, 1992 are those of the Institutional Class, the original class of the fund, which does not bear a 12b-1 fee. Had Class C shares' 12b-1 fee been reflected, returns between November 3, 1997 and January 1, 1996 and prior to June 30, 1994 would have been lower. Class C shares' contingent deferred sales charge included in the past one year, past five year and past 10 year total return figures are 1%, 0% and 0%, respectively. If Fidelity had not reimbursed certain class expenses, the past five year and past 10 year total returns would have been lower.
Annual Report
Fidelity Advisor Intermediate Bond Fund - Class C
Performance - continued
Cumulative Total Returns
|
Periods ended October 31, 2000 |
|
Past 1 |
Past 5 |
Past 10 |
|
Fidelity Adv Int Bond - CL C |
|
5.42% |
24.12% |
86.49% |
|
Fidelity Adv Int Bond - CL C |
|
4.42% |
24.12% |
86.49% |
|
LB Int Govt/Credit Bond |
|
6.46% |
33.43% |
102.72% |
|
Short-Intermediate Investment Grade |
|
5.69% |
29.18% |
89.40% |
Cumulative total returns show Class C's performance in percentage terms over a set period - in this case, one year, five years or 10 years. For example, if you had invested $1,000 in a fund that had a 5% return over the past year, the value of your investment would be $1,050. You can compare Class C's returns to those of the Lehman Brothers Intermediate Government/Credit Bond Index - a market value-weighted index of government and investment-grade corporate fixed-rate debt issues with maturities between one and 10 years. To measure how Class C's performance stacked up against its peers, you can compare it to the short-intermediate investment grade debt funds average, which reflects the performance of mutual funds with similar objectives tracked by Lipper Inc. The past one year average represents a peer group of 117 mutual funds. These benchmarks include reinvested dividends and capital gains, if any, and exclude the effect of sales charges.
Average Annual Total Returns
|
Periods ended October 31, 2000 |
Past 1 |
Past 5 |
Past 10 |
|
Fidelity Adv Int Bond - CL C |
5.42% |
4.42% |
6.43% |
|
Fidelity Adv Int Bond - CL C |
4.42% |
4.42% |
6.43% |
|
LB Int Govt/Credit Bond |
6.46% |
5.94% |
7.32% |
|
Short-Intermediate Investment Grade |
5.69% |
5.25% |
6.59% |
Average annual total returns take Class C's cumulative return and show you what would have happened if Class C had performed at a constant rate each year.
Annual Report
Fidelity Advisor Intermediate Bond Fund - Class C
Performance - continued
$10,000 Over 10 Years
$10,000 Over 10 Years: Let's say hypothetically that $10,000 was invested in Fidelity Advisor Intermediate Bond Fund - Class C on October 31, 1990. As the chart shows, by October 31, 2000 the value of the investment would have been $18,649 - an 86.49% increase on the initial investment. For comparison, look at how the Lehman Brothers Intermediate Government/Credit Bond Index did over the same period. With dividends and capital gains, if any, reinvested, the same $10,000 investment would have grown to $20,272 - a 102.72% increase.
Understanding
Performance
How a fund did yesterday is no guarantee of how it will do tomorrow. Bond prices, for example, generally move in the opposite direction of interest rates. In turn, the share price, return and yield of a fund that invests in bonds will vary. That means if you sell your shares during a market downturn, you might lose money. But if you can ride out the market's ups and downs, you may have a gain.
3Annual Report
Fidelity Advisor Intermediate Bond Fund - Class C
Performance - continued
Total Return Components
|
|
Years ended October 31, |
November 3, 1997
(commencement of
sale of Class C
shares) to |
|
|
|
2000 |
1999 |
1998 |
|
Dividend returns |
5.42% |
4.56% |
4.77% |
|
Capital returns |
0.00% |
-4.37% |
1.80% |
|
Total returns |
5.42% |
0.19% |
6.57% |
Total return components include both dividend returns and capital returns. A dividend return reflects the actual dividends paid by the class. A capital return reflects both the amount paid by the class to shareholders as capital gain distributions and changes in the class' share price. Both returns assume the dividends or capital gains, if any, paid by the class are reinvested and exclude the effect of sales charges.
Dividends and Yield
|
Period ended October 31, 2000 |
Past 1 |
Past 6 |
Past 1 |
|
Dividends per share |
4.75¢ |
27.85¢ |
53.98¢ |
|
Annualized dividend rate |
5.42% |
5.42% |
5.29% |
|
30-day annualized yield |
5.64% |
- |
- |
Dividends per share show the income paid by the class for a set period and do not reflect any tax reclassifications. If you annualize this number, based on an average share price of $10.31 over the past one month, $10.20 over the past six months and $10.20 over the past one year, you can compare the class' income over these three periods. The 30-day annualized yield is a standard formula for all bond funds based on the yields of the bonds in the fund, averaged over the past 30 days. This figure shows you the yield characteristics of the fund's investments at the end of the period. It also helps you compare funds from different companies on an equal basis. The offering share price used in the calculation of the yield excludes the effect of Class C's contingent deferred sales charge.
Annual Report
Market Recap
Strong technical factors in the market helped most investment-grade bonds overcome sharply rising interest rates and volatile market conditions, enabling them to outperform a number of major U.S. equity indexes during the 12-month period that ended October 31, 2000. The Lehman Brothers Aggregate Bond Index - a popular measure of taxable-bond performance - returned 7.30% during this time frame. Following a bullish fourth quarter of 1999 for the spread sectors - namely corporate bonds, mortgage and agency securities - Treasuries usurped market leadership not long after the millennium changeover. A growing federal surplus spurred the U.S. government in January to begin buying back outstanding debt and reducing future issuance. The scarcity premium created by a shrinking supply of long-dated Treasuries sent prices soaring and yields plummeting, thereby inducing an inverted yield curve - which occurs when short-term bonds outyield longer-dated securities. Anticipation that the Fed was finished raising interest rates entering the summer, combined with persistent flights-to-safety from risk-averse investors concerned about volatility in equity markets, further bolstered the long bond, helping the Lehman Brothers Treasury Index return 8.22% during the period. Mortgages made up some ground late in the period behind strong housing turnover. Agencies, too, staged a late rally in response to reduced political risk surrounding government-sponsored enterprises. However, corporates had little to celebrate, plagued by deteriorating credit conditions and growing supply pressures. For the overall period, the Lehman Brothers Mortgage-Backed Securities, U.S. Agency and Credit Bond indexes returned 7.57%, 7.30% and 5.48%, respectively.
(Portfolio Manager photograph)
An interview with Andrew Dudley, Portfolio Manager of Fidelity Advisor Intermediate Bond Fund
Q. How did the fund perform, Andy?
A. For the 12 months that ended October 31, 2000, the fund's Class A, Class T, Class B and Class C shares returned 6.32%, 6.18%, 5.50% and 5.42%, respectively. By comparison, the Lehman Brothers Intermediate Government/Credit Bond Index returned 6.46% during the same period, while the short-intermediate investment grade debt funds average was up 5.69%, as tracked by Lipper Inc.
Q. What was the investment environment like during the period?
A. Treasury securities were the best-performing sector in the fixed-income market for the overall period, as the reduction in the deficit enabled the federal government to buy back debt, which led to a rally in Treasuries as yields fell and prices rose. Late in 1999, corporate securities also staged a brief rally as fears about potential Y2K computer problems receded and investors entered 2000 with a sense of optimism. However, we saw a turn in investors' attitudes about credit risk during the second half of the 12-month period. Many believed we were approaching the end of a cycle of business expansion and the beginning of a slowdown in economic growth, which potentially could be negative for corporate bonds. At the same time, the heightened focus on stock market performance created pressures among many company managements to support their companies' stock prices. This has encouraged steps such as stock buyback programs and other activities that potentially could cause the credit trends of the companies to deteriorate. Meanwhile, rapidly rising energy prices created another uncertainty for bond investors. In combination, these factors added up to a negative environment for corporate bonds. In contrast, government agency bonds, mortgages and, in particular, asset-backed securities tended to perform well during the period. Among corporate subsectors, defensive areas such as real estate investment trusts (REITs) and utility and energy company bonds tended to perform somewhat better than the overall corporate bond market.
Annual Report
Fund Talk: The Manager's Overview - continued
Q. What were your principal strategies, and how did they affect performance?
A. I emphasized the spread sectors - those parts of the fixed-income market that offer a yield advantage, or spread, over Treasury securities. I overweighted mortgages, asset-backed securities and corporate bonds, while underweighting government agency bonds and Treasury securities. While I emphasized corporate securities, which accounted for approximately 44% of net assets on October 31, 2000, I was relatively defensive within the corporate bond sector. For example, I modestly shortened the duration of our corporate bond allocation and increased diversification so the fund was less vulnerable to problems with any individual security. I focused on sound credit analysis and also evaluated individual securities based on the market's heightened sensitivity to deteriorating credit quality. I looked for better credit quality and emphasized defensive sectors. Consistent with our policy, I did not bet on changes in the direction of interest rates and tended to have an interest-rate sensitivity, or duration, close to that of the Lehman Brothers benchmark index.
Q. What specific areas particularly helped performance, and what areas hurt?
A. Our overweighting of mortgages, including commercial mortgage-backed securities, helped performance, as did our investments in REITs and asset-backed securities. Our underweighted position in government agency bonds and our overweighted position in corporate securities hurt. While our overall security selection of corporate bonds tended to be good, we did have some individual laggards. One noteworthy disappointment was our investment in Finova, a commercial finance company. The credit quality of the company has deteriorated, in part because the company was unable to extend its line of credit with its banks. We have sold our position in Finova bonds as of the end of the period.
Annual Report
Fund Talk: The Manager's Overview - continued
Q. What's your outlook?
A. I believe we have entered a new period of heightened volatility among the spread sectors as fixed-income investors search for a new equilibrium in setting valuations for credit risk. This volatility, however, is less dramatic among the shorter-term securities in which we invest, and we believe it still makes sense to invest in corporate bonds because of their yield advantages. At the same time, mortgages and asset-backed securities continue to appear very attractive. I have positioned the fund so it is not overly exposed to shifts in the relationships of yields of shorter-term bonds to the yields of longer-term securities.
Fund Facts
Goal: high current income; may also seek capital appreciation
Start date: February 2, 1984
Size: as of October 31, 2000, more than $534 million
Manager: Andrew Dudley, since 1999; joined Fidelity in 1996
3Andrew Dudley on the bond market's perceptions of the national elections:
"From the perspective of fixed-income investors, the most important outcome of the elections is that there likely will not be any broad, sweeping mandate for change. The results of both the presidential election and the fight for control of Congress are likely to be so close that it will be difficult for anyone to make dramatic shifts in policy. The financial markets would like that result. They don't like the prospect of broad sweeping changes that create uncertainty in the market.
"The new Congress is likely to be almost evenly split between Republicans and Democrats. That means that the defection of just one member, for any reason, can jeopardize the outcome of a vote on any issue. That is not an environment for major change, particularly if you also have a president who has been narrowly elected. The bond market was most fearful of a Republican president with a mandate for cutting taxes and clear Republican control in both houses of Congress. That would have increased the potential for large tax cuts, which could reduce or eliminate the federal surplus, causing an increase in the issuance of Treasury securities, higher interest rates and greater volatility in the bond market. To the extent there was no broad, sweeping mandate, there would be less uncertainty for the bond market to worry about."
The views expressed in this report reflect those of the portfolio manager only through the end of the period of the report as stated on the cover and do not necessarily represent the views of Fidelity or any other person in the Fidelity organization. Any such views are subject to change at any time based upon market or other conditions and Fidelity disclaims any responsibility to update such views. These views may not be relied on as investment advice and, because investment decisions for a Fidelity fund are based on numerous factors, may not be relied on as an indication of trading intent on behalf of any Fidelity fund.
Annual Report
|
Quality Diversification as of October 31, 2000 |
||
|
(Moody's Ratings) |
% of fund's investments |
% of fund's investments |
|
Aaa |
47.6 |
41.6 |
|
Aa |
5.4 |
4.7 |
|
A |
21.0 |
25.0 |
|
Baa |
21.1 |
20.5 |
|
Ba and Below |
0.4 |
0.9 |
|
Not Rated |
0.7 |
0.7 |
|
Table excludes short-term investments. Where Moody's ratings are not available, we have used S&P ® ratings. Securities rated as Ba or below were rated investment grade by other nationally recognized rating agencies or assigned an investment grade rating at the time of acquisition by Fidelity. |
|
Average Years to Maturity as of October 31, 2000 |
||
|
|
|
6 months ago |
|
Years |
5.9 |
5.5 |
|
Average years to maturity is based on the average time remaining until principal payments are expected from each of the fund's bonds, weighted by dollar amount. |
|
Duration as of October 31, 2000 |
||
|
|
|
6 months ago |
|
Years |
3.5 |
3.5 |
|
Duration shows how much a bond fund's price fluctuates with changes in comparable interest rates. If rates rise 1%, for example, a fund with a five-year duration is likely to lose about 5% of its value. Other factors also can influence a bond fund's performance and share price. Accordingly, a bond fund's actual performance may differ from this example. |
|
Asset Allocation (% of fund's net assets) |
|||||||
|
As of October 31, 2000 * |
As of April 30, 2000 ** |
||||||
|
Corporate Bonds 44.1% |
|
|
Corporate Bonds 47.1% |
|
||
 |
U.S. Government and Government Agency Obligations 32.4% |
|
|
U.S. Government and Government Agency Obligations 31.6% |
|
||
 |
Asset-Backed |
|
|
Asset-Backed |
|
||
|
CMOs and Other Mortgage Related Securities 7.0% |
|
|
CMOs and Other Mortgage Related Securities 4.2% |
|
||
|
Other Investments 5.0% |
|
|
Other Investments 5.6% |
|
||
|
Short-Term |
|
|
Short-Term |
|
||
|
* Foreign investments |
11.7% |
|
** Foreign investments |
13.3% |
|
||

Annual Report
Showing Percentage of Net Assets
|
Nonconvertible Bonds - 44.1% |
|||||
|
Moody's Ratings |
Principal Amount |
Value |
|||
|
BASIC INDUSTRIES - 1.0% |
|||||
|
Chemicals & Plastics - 0.5% |
|||||
|
Praxair, Inc. 6.15% 4/15/03 |
A3 |
|
$ 2,640,000 |
$ 2,568,588 |
|
|
Paper & Forest Products - 0.5% |
|||||
|
Abitibi-Consolidated, Inc. yankee: |
|
|
|
|
|
|
8.3% 8/1/05 |
Baa3 |
|
570,000 |
576,253 |
|
|
8.55% 8/1/10 |
Baa3 |
|
1,800,000 |
1,774,926 |
|
|
Fort James Corp. 6.625% 9/15/04 |
Baa2 |
|
255,000 |
243,038 |
|
|
|
2,594,217 |
||||
|
TOTAL BASIC INDUSTRIES |
5,162,805 |
||||
|
CONSTRUCTION & REAL ESTATE - 2.4% |
|||||
|
Real Estate - 0.8% |
|||||
|
Arden Realty LP 8.875% 3/1/05 |
Baa3 |
|
1,090,000 |
1,110,296 |
|
|
Duke Realty LP 7.3% 6/30/03 |
Baa1 |
|
3,000,000 |
2,981,940 |
|
|
|
4,092,236 |
||||
|
Real Estate Investment Trusts - 1.6% |
|||||
|
Avalonbay Communities, Inc. 8.25% 7/15/08 |
Baa1 |
|
1,500,000 |
1,524,315 |
|
|
CenterPoint Properties Trust: |
|
|
|
|
|
|
6.75% 4/1/05 |
Baa2 |
|
640,000 |
608,032 |
|
|
7.9% 1/15/03 |
Baa2 |
|
2,700,000 |
2,708,532 |
|
|
Equity Office Properties Trust 6.5% 1/15/04 |
Baa1 |
|
3,000,000 |
2,908,440 |
|
|
ProLogis Trust 6.7% 4/15/04 |
Baa1 |
|
415,000 |
402,450 |
|
|
Spieker Properties LP 6.8% 5/1/04 |
Baa2 |
|
535,000 |
520,271 |
|
|
|
8,672,040 |
||||
|
TOTAL CONSTRUCTION & REAL ESTATE |
12,764,276 |
||||
|
DURABLES - 1.5% |
|||||
|
Autos, Tires, & Accessories - 1.5% |
|||||
|
Daimler-Chrysler North America Holding Corp. 7.4% 1/20/05 |
A1 |
|
5,000,000 |
5,014,000 |
|
|
TRW, Inc. 6.625% 6/1/04 |
Baa1 |
|
3,000,000 |
2,882,340 |
|
|
|
7,896,340 |
||||
|
ENERGY - 2.0% |
|||||
|
Oil & Gas - 2.0% |
|||||
|
Apache Finance Property Ltd. 6.5% 12/15/07 |
Baa1 |
|
700,000 |
666,995 |
|
|
Canada Occidental Petroleum Ltd. 7.125% 2/4/04 |
Baa2 |
|
2,000,000 |
1,974,600 |
|
|
Nonconvertible Bonds - continued |
|||||
|
Moody's Ratings |
Principal Amount |
Value |
|||
|
ENERGY - continued |
|||||
|
Oil & Gas - continued |
|||||
|
Conoco, Inc. 5.9% 4/15/04 |
A3 |
|
$ 600,000 |
$ 582,060 |
|
|
Oryx Energy Co. 8.125% 10/15/05 |
Baa1 |
|
2,465,000 |
2,566,262 |
|
|
Ras Laffan Liquid Natural Gas Co. Ltd. yankee 8.294% 3/15/14 (c) |
Baa3 |
|
2,100,000 |
2,011,443 |
|
|
Union Pacific Resources Group, Inc. 7% 10/15/06 |
Baa1 |
|
2,700,000 |
2,677,914 |
|
|
|
10,479,274 |
||||
|
FINANCE - 20.0% |
|||||
|
Banks - 8.1% |
|||||
|
ABN-Amro Bank NV, Chicago 6.625% 10/31/01 |
A1 |
|
2,750,000 |
2,739,110 |
|
|
Australia & New Zealand Banking Group Ltd. yankee 6.25% 2/1/04 |
A1 |
|
1,200,000 |
1,168,020 |
|
|
Banc One Corp. 7.25% 8/1/02 |
A1 |
|
2,500,000 |
2,508,000 |
|
|
Bank of America Corp. 7.8% 2/15/10 |
Aa3 |
|
4,500,000 |
4,568,220 |
|
|
Bank One Corp. 7.875% 8/1/10 |
A1 |
|
2,950,000 |
2,968,349 |
|
|
BankBoston Corp. 6.625% 2/1/04 |
A3 |
|
3,200,000 |
3,137,920 |
|
|
BanPonce Financial Corp. 6.75% 8/9/01 |
A3 |
|
3,850,000 |
3,839,413 |
|
|
Barclays Bank PLC yankee 5.95% 7/15/01 |
A1 |
|
2,400,000 |
2,386,080 |
|
|
Capital One Bank 6.76% 7/23/02 |
Baa2 |
|
4,500,000 |
4,422,285 |
|
|
Capital One Financial Corp. 7.125% 8/1/08 |
Baa3 |
|
1,390,000 |
1,319,346 |
|
|
HSBC Finance Nederland BV 7.4% 4/15/03 (c) |
A1 |
|
250,000 |
252,205 |
|
|
Kansallis-Osake-Pankki (NY Branch) yankee |
A1 |
|
650,000 |
674,921 |
|
|
Korea Development Bank: |
|
|
|
|
|
|
7.125% 4/22/04 |
Baa2 |
|
175,000 |
170,195 |
|
|
7.375% 9/17/04 |
Baa2 |
|
1,110,000 |
1,083,959 |
|
|
MBNA Corp. 6.34% 6/2/03 |
Baa2 |
|
450,000 |
434,430 |
|
|
Midland Bank PLC 8.625% 12/15/04 |
Aa3 |
|
2,700,000 |
2,845,449 |
|
|
NationsBank Corp. 8.125% 6/15/02 |
Aa3 |
|
3,000,000 |
3,059,910 |
|
|
Royal Bank of Scotland Group PLC 9.118% 3/31/49 |
A1 |
|
2,000,000 |
2,083,200 |
|
|
U.S. Bancorp 7.5% 6/1/26 |
A2 |
|
2,000,000 |
2,016,880 |
|
|
Union Planters National Bank 6.81% 8/20/01 |
A3 |
|
1,500,000 |
1,498,320 |
|
|
|
43,176,212 |
||||
|
Credit & Other Finance - 9.8% |
|||||
|
Associates Corp. of North America: |
|
|
|
|
|
|
5.875% 7/15/02 |
A1 |
|
3,000,000 |
2,945,640 |
|
|
6% 4/15/03 |
A1 |
|
1,350,000 |
1,320,327 |
|
|
Nonconvertible Bonds - continued |
|||||
|
Moody's Ratings |
Principal Amount |
Value |
|||
|
FINANCE - continued |
|||||
|
Credit & Other Finance - continued |
|||||
|
CIT Group, Inc. 5.5% 2/15/04 |
A1 |
|
$ 290,000 |
$ 272,542 |
|
|
Citigroup, Inc. 7.25% 10/1/10 |
Aa3 |
|
2,700,000 |
2,678,616 |
|
|
Commercial Credit Group, Inc. 6.5% 8/1/04 |
Aa3 |
|
3,000,000 |
2,949,930 |
|
|
Daimler-Chrysler NA Holding Corp. 6.59% 6/18/02 |
A1 |
|
350,000 |
347,624 |
|
|
Duke Capital Corp. 7.5% 10/1/09 |
A3 |
|
1,800,000 |
1,810,134 |
|
|
ERP Operating LP: |
|
|
|
|
|
|
6.55% 11/15/01 |
A3 |
|
470,000 |
466,334 |
|
|
7.1% 6/23/04 |
A3 |
|
3,000,000 |
2,964,510 |
|
|
Ford Motor Credit Co.: |
|
|
|
|
|
|
5.75% 2/23/04 |
A2 |
|
2,800,000 |
2,673,832 |
|
|
7.75% 11/15/02 |
A2 |
|
100,000 |
101,233 |
|
|
General Electric Capital Corp. 6.65% 9/3/02 |
Aaa |
|
5,400,000 |
5,393,466 |
|
|
General Motors Acceptance Corp.: |
|
|
|
|
|
|
7.625% 6/15/04 |
A2 |
|
1,700,000 |
1,727,302 |
|
|
9% 10/15/02 |
A2 |
|
1,000,000 |
1,037,040 |
|
|
GS Escrow Corp. 7.125% 8/1/05 |
Ba1 |
|
550,000 |
504,565 |
|
|
Household Finance Corp. 8% 5/9/05 |
A2 |
|
1,900,000 |
1,942,997 |
|
|
HSBC Capital Funding LP 9.547% 12/31/49 (b)(c) |
A1 |
|
2,000,000 |
2,104,000 |
|
|
Newcourt Credit Group, Inc. 6.875% 2/16/05 |
A1 |
|
1,265,000 |
1,222,091 |
|
|
PNC Funding Corp. 6.95% 9/1/02 |
A2 |
|
5,000,000 |
5,002,200 |
|
|
Popular North America, Inc. 7.375% 9/15/01 |
A3 |
|
2,250,000 |
2,245,725 |
|
|
Qwest Capital Funding, Inc. 7.9% 8/15/10 (c) |
Baa1 |
|
3,000,000 |
3,043,650 |
|
|
RBSG Capital Corp. 10.125% 3/1/04 |
A2 |
|
1,500,000 |
1,619,565 |
|
|
Sears Roebuck Acceptance Corp. 6% 3/20/03 |
A3 |
|
1,725,000 |
1,681,427 |
|
|
Spear, Leeds & Kellogg LP/SLK Capital Corp. 8.25% 8/15/05 (c) |
A3 |
|
900,000 |
931,554 |
|
|
Sprint Capital Corp.: |
|
|
|
|
|
|
5.7% 11/15/03 |
Baa1 |
|
1,160,000 |
1,109,992 |
|
|
6.375% 5/1/09 |
Baa1 |
|
2,000,000 |
1,789,800 |
|
|
Trizec Finance Ltd. yankee 10.875% 10/15/05 |
Baa3 |
|
590,000 |
595,900 |
|
|
UBS Preferred Funding Trust 1 8.622% 12/29/49 |
Aa2 |
|
1,300,000 |
1,313,000 |
|
|
Unicredito Italiano Capital Trust II yankee 9.2% 10/29/49 (b)(c) |
A1 |
|
500,000 |
496,880 |
|
|
|
52,291,876 |
||||
|
Insurance - 0.2% |
|||||
|
The St. Paul Companies, Inc. 7.875% 4/15/05 |
A1 |
|
1,100,000 |
1,127,390 |
|
|
Nonconvertible Bonds - continued |
|||||
|
Moody's Ratings |
Principal Amount |
Value |
|||
|
FINANCE - continued |
|||||
|
Savings & Loans - 0.1% |
|||||
|
Long Island Savings Bank FSB 6.2% 4/2/01 |
Baa3 |
|
$ 900,000 |
$ 893,844 |
|
|
Securities Industry - 1.8% |
|||||
|
Amvescap PLC yankee 6.6% 5/15/05 |
A2 |
|
700,000 |
669,046 |
|
|
Goldman Sachs Group, Inc. 7.625% 8/17/05 |
A1 |
|
4,550,000 |
4,604,418 |
|
|
Merrill Lynch & Co., Inc. 8.3% 11/1/02 |
Aa3 |
|
2,750,000 |
2,818,255 |
|
|
Morgan Stanley Dean Witter & Co. 7.125% 1/15/03 |
Aa3 |
|
1,500,000 |
1,505,775 |
|
|
|
9,597,494 |
||||
|
TOTAL FINANCE |
107,086,816 |
||||
|
INDUSTRIAL MACHINERY & EQUIPMENT - 0.7% |
|||||
|
Tyco International Group SA: |
|
|
|
|
|
|
6.875% 9/5/02 |
Baa1 |
|
1,600,000 |
1,587,920 |
|
|
yankee: |
|
|
|
|
|
|
6.125% 6/15/01 |
Baa1 |
|
1,200,000 |
1,189,260 |
|
|
6.375% 6/15/05 |
Baa1 |
|
1,000,000 |
964,100 |
|
|
TOTAL INDUSTRIAL MACHINERY & EQUIPMENT |
3,741,280 |
||||
|
MEDIA & LEISURE - 3.3% |
|||||
|
Broadcasting - 1.7% |
|||||
|
British Sky Broadcasting Group PLC 7.3% 10/15/06 |
Ba1 |
|
2,000,000 |
1,814,620 |
|
|
Clear Channel Communications, Inc. 7.875% 6/15/05 |
Baa3 |
|
2,900,000 |
2,922,736 |
|
|
Continental Cablevision, Inc. 8.3% 5/15/06 |
A2 |
|
2,370,000 |
2,427,378 |
|
|
Hearst-Argyle Television, Inc. 7% 11/15/07 |
Baa3 |
|
1,000,000 |
948,720 |
|
|
TCI Communications, Inc. 8.65% 9/15/04 |
A2 |
|
900,000 |
932,841 |
|
|
|
9,046,295 |
||||
|
Entertainment - 0.4% |
|||||
|
Walt Disney Co. 7.3% 2/8/05 |
A2 |
|
2,000,000 |
2,031,000 |
|
|
Publishing - 1.2% |
|||||
|
News America Holdings, Inc. 8.5% 2/15/05 |
Baa3 |
|
2,765,000 |
2,855,498 |
|
|
Time Warner Entertainment Co. LP 7.25% 9/1/08 |
Baa2 |
|
3,900,000 |
3,844,659 |
|
|
|
6,700,157 |
||||
|
TOTAL MEDIA & LEISURE |
17,777,452 |
||||
|
Nonconvertible Bonds - continued |
|||||
|
Moody's Ratings |
Principal Amount |
Value |
|||
|
NONDURABLES - 2.7% |
|||||
|
Beverages - 0.8% |
|||||
|
Seagram JE & Sons, Inc.: |
|
|
|
|
|
|
6.4% 12/15/03 |
Baa3 |
|
$ 3,000,000 |
$ 2,999,760 |
|
|
6.625% 12/15/05 |
Baa3 |
|
1,285,000 |
1,293,815 |
|
|
|
4,293,575 |
||||
|
Foods - 1.1% |
|||||
|
ConAgra Foods, Inc. 7.875% 9/15/10 |
Baa1 |
|
3,200,000 |
3,247,488 |
|
|
Nabisco, Inc. 6.85% 6/15/05 |
Baa2 |
|
2,700,000 |
2,588,274 |
|
|
|
5,835,762 |
||||
|
Tobacco - 0.8% |
|||||
|
Philip Morris Companies, Inc.: |
|
|
|
|
|
|
7% 7/15/05 |
A2 |
|
2,700,000 |
2,596,212 |
|
|
7.5% 4/1/04 |
A2 |
|
750,000 |
740,955 |
|
|
RJ Reynolds Tobacco Holdings, Inc. 7.375% 5/15/03 |
Baa2 |
|
1,300,000 |
1,230,229 |
|
|
|
4,567,396 |
||||
|
TOTAL NONDURABLES |
14,696,733 |
||||
|
RETAIL & WHOLESALE - 0.7% |
|||||
|
General Merchandise Stores - 0.7% |
|||||
|
Federated Department Stores, Inc.: |
|
|
|
|
|
|
8.5% 6/15/03 |
Baa1 |
|
1,375,000 |
1,365,348 |
|
|
8.5% 6/1/10 |
Baa1 |
|
2,300,000 |
2,220,834 |
|
|
|
3,586,182 |
||||
|
TECHNOLOGY - 1.0% |
|||||
|
Communications Equipment - 0.5% |
|||||
|
Marconi PLC yankee 7.75% 9/15/10 |
A3 |
|
2,700,000 |
2,599,182 |
|
|
Computers & Office Equipment - 0.5% |
|||||
|
Comdisco, Inc. 5.95% 4/30/02 |
Baa2 |
|
2,000,000 |
1,460,000 |
|
|
Compaq Computer Corp. 7.45% 8/1/02 |
Baa2 |
|
1,500,000 |
1,497,765 |
|
|
|
2,957,765 |
||||
|
TOTAL TECHNOLOGY |
5,556,947 |
||||
|
Nonconvertible Bonds - continued |
|||||
|
Moody's Ratings |
Principal Amount |
Value |
|||
|
TRANSPORTATION - 0.5% |
|||||
|
Air Transportation - 0.5% |
|||||
|
Continental Airlines, Inc. pass thru trust certificates: |
|
|
|
|
|
|
7.434% 3/15/06 |
Baa1 |
|
$ 435,000 |
$ 426,605 |
|
|
7.73% 9/15/12 |
Baa1 |
|
158,342 |
154,589 |
|
|
Delta Air Lines, Inc. 7.7% 12/15/05 |
Baa3 |
|
2,000,000 |
1,931,180 |
|
|
|
2,512,374 |
||||
|
UTILITIES - 8.3% |
|||||
|
Cellular - 0.6% |
|||||
|
Vodafone AirTouch PLC 7.75% 2/15/10 (c) |
A2 |
|
3,000,000 |
3,045,870 |
|
|
Electric Utility - 2.8% |
|||||
|
Avon Energy Partners Holdings 6.46% 3/4/08 (c) |
Baa2 |
|
2,000,000 |
1,804,220 |
|
|
Dominion Resources, Inc. 7.625% 7/15/05 |
Baa1 |
|
2,000,000 |
2,019,840 |
|
|
DR Investments UK PLC yankee 7.1% 5/15/02 (c) |
A2 |
|
5,000,000 |
4,974,550 |
|
|
Niagara Mohawk Power Corp. 8.875% 5/15/07 |
Baa3 |
|
400,000 |
420,400 |
|
|
NSTAR Companies 8% 2/15/10 |
A2 |
|
2,400,000 |
2,421,216 |
|
|
Philadelphia Electric Co. 6.5% 5/1/03 |
Baa1 |
|
2,050,000 |
2,015,355 |
|
|
Texas Utilities Electric Co. 8% 6/1/02 |
A3 |
|
1,475,000 |
1,496,919 |
|
|
|
15,152,500 |
||||
|
Gas - 1.7% |
|||||
|
Enron Corp.: |
|
|
|
|
|
|
6.5% 8/1/02 |
Baa1 |
|
1,000,000 |
988,700 |
|
|
9.875% 6/15/03 |
Baa1 |
|
3,800,000 |
4,055,892 |
|
|
Reliant Energy Resources Corp. 8.125% 7/15/05 (c) |
Baa1 |
|
2,000,000 |
2,024,020 |
|
|
Sempra Energy 7.95% 3/1/10 |
A2 |
|
1,800,000 |
1,816,272 |
|
|
|
8,884,884 |
||||
|
Telephone Services - 3.2% |
|||||
|
Cable & Wireless Optus Ltd. 8% 6/22/10 (c) |
Baa1 |
|
2,000,000 |
2,065,300 |
|
|
Telecomunicaciones de Puerto Rico, Inc.: |
|
|
|
|
|
|
6.15% 5/15/02 |
Baa2 |
|
3,650,000 |
3,583,716 |
|
|
6.65% 5/15/06 |
Baa2 |
|
1,330,000 |
1,263,952 |
|
|
Nonconvertible Bonds - continued |
|||||
|
Moody's Ratings |
Principal Amount |
Value |
|||
|
UTILITIES - continued |
|||||
|
Telephone Services - continued |
|||||
|
Telefonica Europe BV 7.75% 9/15/10 |
A2 |
|
$ 2,700,000 |
$ 2,716,308 |
|
|
Teleglobe Canada, Inc.: |
|
|
|
|
|
|
7.2% 7/20/09 |
Baa1 |
|
3,745,000 |
3,589,508 |
|
|
7.7% 7/20/29 |
Baa1 |
|
1,000,000 |
943,530 |
|
|
WorldCom, Inc.: |
|
|
|
|
|
|
6.4% 8/15/05 |
A3 |
|
900,000 |
867,663 |
|
|
7.75% 4/1/07 |
A3 |
|
300,000 |
303,564 |
|
|
8.25% 5/15/10 |
A3 |
|
2,000,000 |
2,082,900 |
|
|
|
17,416,441 |
||||
|
TOTAL UTILITIES |
44,499,695 |
||||
|
TOTAL NONCONVERTIBLE BONDS (Cost $236,299,705) |
235,760,174 |
||||
|
U.S. Government and Government Agency Obligations - 19.0% |
|||||
|
|
|||||
|
U.S. Government Agency Obligations - 7.7% |
|||||
|
Fannie Mae: |
|
|
|
|
|
|
6.375% 10/15/02 |
Aaa |
|
3,000,000 |
2,998,590 |
|
|
6.5% 4/29/09 |
Aaa |
|
14,410,000 |
13,721,058 |
|
|
7% 7/15/05 |
Aaa |
|
2,260,000 |
2,302,737 |
|
|
7.125% 2/15/05 |
Aaa |
|
3,120,000 |
3,188,234 |
|
|
Farm Credit Systems Financial Assistance Corp. 9.375% 7/21/03 |
Aaa |
|
1,800,000 |
1,927,116 |
|
|
Freddie Mac: |
|
|
|
|
|
|
6.875% 1/15/05 |
Aaa |
|
980,000 |
992,554 |
|
|
7% 7/15/05 |
Aaa |
|
15,625,000 |
15,917,969 |
|
|
Government Trust Certificates (assets of Trust guaranteed by U.S. Government through Defense Security Assistance Agency) Class 2-E, 9.4% 5/15/02 |
Aaa |
|
274,886 |
277,071 |
|
|
TOTAL U.S. GOVERNMENT AGENCY OBLIGATIONS |
41,325,329 |
||||
|
U.S. Government and Government Agency Obligations - continued |
|||||
|
Moody's Ratings |
Principal Amount |
Value |
|||
|
U.S. Treasury Obligations - 11.3% |
|||||
|
U.S. Treasury Bonds: |
|
|
|
|
|
|
11.25% 2/15/15 |
Aaa |
|
$ 5,325,000 |
$ 7,984,145 |
|
|
12% 8/15/13 |
Aaa |
|
10,390,000 |
14,200,221 |
|
|
14% 11/15/11 |
Aaa |
|
1,510,000 |
2,112,581 |
|
|
U.S. Treasury Notes: |
|
|
|
|
|
|
5.25% 5/31/01 |
Aaa |
|
6,700,000 |
6,654,581 |
|
|
5.5% 2/15/08 |
Aaa |
|
11,715,000 |
11,466,056 |
|
|
7.5% 11/15/01 |
Aaa |
|
6,190,000 |
6,262,547 |
|
|
7.875% 8/15/01 |
Aaa |
|
11,300,000 |
11,427,125 |
|
|
TOTAL U.S. TREASURY OBLIGATIONS |
60,107,256 |
||||
|
TOTAL U.S. GOVERNMENT AND (Cost $101,084,590) |
101,432,585 |
||||
|
U.S. Government Agency - Mortgage Securities - 13.4% |
|||||
|
|
|||||
|
Fannie Mae - 8.4% |
|||||
|
5.5% 9/1/10 to 5/1/11 |
Aaa |
|
1,295,278 |
1,230,959 |
|
|
6% 3/1/11 to 2/1/14 |
Aaa |
|
11,375,526 |
10,956,555 |
|
|
6.5% 4/1/29 to 12/1/29 |
Aaa |
|
3,486,058 |
3,350,149 |
|
|
7% 12/1/23 to 12/1/28 |
Aaa |
|
2,835,758 |
2,786,977 |
|
|
7.5% 8/1/17 to 6/1/29 |
Aaa |
|
16,338,324 |
16,337,395 |
|
|
8% 1/1/30 to 8/1/30 |
Aaa |
|
6,226,687 |
6,302,528 |
|
|
8.5% 6/1/11 to 9/1/25 |
Aaa |
|
1,241,623 |
1,271,745 |
|
|
9.5% 2/1/25 |
Aaa |
|
1,231,926 |
1,295,444 |
|
|
10% 1/1/20 |
Aaa |
|
29,544 |
31,658 |
|
|
10.5% 7/1/11 to 8/1/20 |
Aaa |
|
175,191 |
187,868 |
|
|
11% 8/1/15 |
Aaa |
|
1,063,827 |
1,153,848 |
|
|
12.5% 2/1/11 to 4/1/15 |
Aaa |
|
51,859 |
58,486 |
|
|
TOTAL FANNIE MAE |
44,963,612 |
||||
|
Freddie Mac - 1.1% |
|||||
|
7.5% 9/1/30 to 11/1/30 |
Aaa |
|
3,919,611 |
3,917,141 |
|
|
8.5% 9/1/24 to 8/1/27 |
Aaa |
|
1,225,336 |
1,255,732 |
|
|
9.5% 1/1/17 |
Aaa |
|
13,647 |
14,261 |
|
|
10% 4/1/06 to 8/1/10 |
Aaa |
|
93,655 |
96,088 |
|
|
10.25% 12/1/09 |
Aaa |
|
21,954 |
23,067 |
|
|
10.5% 5/1/21 |
Aaa |
|
256,433 |
276,981 |
|
|
11% 12/1/11 |
Aaa |
|
15,120 |
16,135 |
|
|
U.S. Government Agency - Mortgage Securities - continued |
|||||
|
Moody's Ratings |
Principal Amount |
Value |
|||
|
Freddie Mac - continued |
|||||
|
11.5% 10/1/15 |
Aaa |
|
$ 52,250 |
$ 57,015 |
|
|
11.75% 10/1/10 |
Aaa |
|
31,649 |
34,009 |
|
|
TOTAL FREDDIE MAC |
5,690,429 |
||||
|
Government National Mortgage Association - 3.9% |
|||||
|
6.5% 2/15/29 |
Aaa |
|
4,411,018 |
4,258,000 |
|
|
7.5% 2/15/28 to 10/15/28 |
Aaa |
|
295,545 |
296,583 |
|
|
8% 2/15/02 to 6/15/25 |
Aaa |
|
1,547,162 |
1,570,358 |
|
|
8.5% 4/15/17 to 10/15/30 |
Aaa |
|
13,983,380 |
14,342,594 |
|
|
11% 7/20/19 to 8/20/19 |
Aaa |
|
186,224 |
200,829 |
|
|
TOTAL GOVERNMENT NATIONAL MORTGAGE ASSOCIATION |
20,668,364 |
||||
|
TOTAL U.S. GOVERNMENT AGENCY - MORTGAGE SECURITIES (Cost $72,051,847) |
71,322,405 |
||||
|
Asset-Backed Securities - 7.9% |
|||||
|
|
|||||
|
American Express Credit Account Master Trust 6.1% 12/15/06 |
A1 |
|
1,100,000 |
1,073,182 |
|
|
Americredit Automobile Receivables Trust 7.15% 8/15/04 |
Aaa |
|
4,000,000 |
4,017,500 |
|
|
Associates Auto Receivables Trust 6.9% |
Aaa |
|
3,000,000 |
3,007,500 |
|
|
Capital One Master Trust 7.1% 4/17/06 |
Aaa |
|
4,000,000 |
4,040,000 |
|
|
Chase Manhattan Grantor Trust 6.76% |
A3 |
|
75,071 |
75,000 |
|
|
Conseco Finance Securitizations Corp. 7.3% 5/1/31 |
Aaa |
|
3,500,000 |
3,518,585 |
|
|
Discover Card Master Trust I 5.85% 11/16/04 |
A2 |
|
2,000,000 |
1,973,438 |
|
|
Ford Credit Auto Owner Trust: |
|
|
|
|
|
|
6.4% 12/15/02 |
Aa2 |
|
590,000 |
587,004 |
|
|
7.03% 11/15/03 |
Aaa |
|
332,000 |
334,646 |
|
|
MBNA Master Credit Card Trust II 7.35% 7/16/07 |
Aaa |
|
4,500,000 |
4,609,160 |
|
|
Orix Credit Alliance Receivables Trust 7.12% 5/15/04 |
Aaa |
|
2,500,000 |
2,503,906 |
|
|
Premier Auto Trust 5.59% 2/9/04 |
Aaa |
|
5,000,000 |
4,909,350 |
|
|
Asset-Backed Securities - continued |
|||||
|
Moody's Ratings |
Principal Amount |
Value |
|||
|
Sears Credit Account Master Trust II: |
|
|
|
|
|
|
5.65% 3/17/09 |
Aaa |
|
$ 2,000,000 |
$ 1,938,740 |
|
|
7% 7/15/08 |
Aaa |
|
5,100,000 |
5,133,456 |
|
|
West Penn Funding LLC 6.81% 9/25/08 |
Aaa |
|
4,500,000 |
4,493,496 |
|
|
TOTAL ASSET-BACKED SECURITIES (Cost $41,955,888) |
42,214,963 |
||||
|
Collateralized Mortgage Obligations - 1.1% |
|||||
|
|
|||||
|
U.S. Government Agency - 1.1% |
|||||
|
Freddie Mac sequential pay Series 2061 Class J, 6.5% 9/20/22 |
Aaa |
|
2,176,882 |
2,142,182 |
|
|
Government National Mortgage Association sequential pay Series 1998-19 Class B, 6.5% 2/20/23 |
Aaa |
|
3,933,991 |
3,862,668 |
|
|
TOTAL COLLATERALIZED MORTGAGE OBLIGATIONS (Cost $5,998,964) |
6,004,850 |
||||
|
Commercial Mortgage Securities - 5.9% |
|||||
|
|
|||||
|
Commercial Mortgage Asset Trust sequential pay Series 1999-C2 Class A1, 7.285% 12/17/07 |
Aaa |
|
3,559,129 |
3,602,506 |
|
|
CS First Boston Mortgage Securities Corp.: |
|
|
|
|
|
|
sequential pay Series 1997-SPICE Class D, 7.332% 4/20/08 |
- |
|
4,000,000 |
3,934,376 |
|
|
sequential pay Series 2000-C1 Class A1, 7.325% 4/15/62 |
AAA |
|
2,075,821 |
2,103,450 |
|
|
Series 1995-WF1 Class A2, 6.648% 12/21/27 |
AAA |
|
2,519,592 |
2,484,162 |
|
|
Series 1998-FL1: |
|
|
|
|
|
|
Class D, 7.1188% 12/10/00 (c)(d) |
Aa1 |
|
1,600,000 |
1,599,875 |
|
|
Class E, 7.4688% 1/10/13 (c)(d) |
Baa1 |
|
2,970,000 |
3,022,670 |
|
|
Equitable Life Assurance Society of the United States Series 174 Class C1, 7.52% 5/15/06 (c) |
A2 |
|
1,000,000 |
1,003,125 |
|
|
Heller Financial Commercial Mortgage Asset Corp. sequential pay Series 2000-PH1 Class A1, 7.715% 9/15/08 |
Aaa |
|
3,588,974 |
3,687,671 |
|
|
Hilton Hotel Pool Trust Series 2000 HLT Class A1, 7.055% 10/3/10 |
Aaa |
|
2,000,000 |
2,004,942 |
|
|
JP Morgan Commercial Mortgage Finance Corp. Series 2000-C10 Class A1, 7.1075% 8/15/32 |
Aaa |
|
2,753,184 |
2,767,272 |
|
|
Commercial Mortgage Securities - continued |
|||||
|
Moody's Ratings |
Principal Amount |
Value |
|||
|
LB-UBS Commercial Mortgage Trust |
Aaa |
|
$ 2,874,661 |
$ 2,989,647 |
|
|
Thirteen Affiliates of General Growth |
Aaa |
|
2,500,000 |
2,460,840 |
|
|
TOTAL COMMERCIAL MORTGAGE SECURITIES (Cost $31,267,822) |
31,660,536 |
||||
|
Foreign Government and Government Agency Obligations (e) - 3.2% |
|||||
|
|
|||||
|
Canadian Government 6.125% 7/15/02 |
Aa1 |
|
5,000,000 |
4,972,500 |
|
|
Chile Republic 6.875% 4/28/09 |
Baa1 |
|
2,700,000 |
2,494,773 |
|
|
Korean Republic yankee: |
|
|
|
|
|
|
8.75% 4/15/03 |
Baa2 |
|
550,000 |
562,265 |
|
|
8.875% 4/15/08 |
Baa2 |
|
2,000,000 |
2,079,920 |
|
|
New Brunswick Province yankee 7.125% 10/1/02 |
A1 |
|
2,250,000 |
2,268,878 |
|
|
Quebec Province 5.75% 2/15/09 |
A2 |
|
2,500,000 |
2,292,000 |
|
|
United Mexican States 8.5% 2/1/06 |
Baa3 |
|
2,400,000 |
2,392,800 |
|
|
TOTAL FOREIGN GOVERNMENT AND (Cost $16,972,631) |
17,063,136 |
||||
|
Supranational Obligations - 1.8% |
|||||
|
|
|||||
|
Inter-American Development Bank yankee |
Aaa |
|
10,000,000 |
9,753,200 |
|
|
Cash Equivalents - 3.7% |
|||
|
Maturity Amount |
|
||
|
Investments in repurchase agreements (U.S. Government Obligations), in a joint trading account at 6.62%, |
$ 19,954,668 |
$ 19,951,000 |
|
|
TOTAL INVESTMENT PORTFOLIO - 100.1% (Cost $535,519,547) |
535,162,849 |
||
|
NET OTHER ASSETS - (0.1)% |
(635,358) |
||
|
NET ASSETS - 100% |
$ 534,527,491 |
||
|
Legend |
|
(a) S&P credit ratings are used in the absence of a rating by Moody's Investors Service, Inc. |
|
(b) Debt obligation initially issued at one coupon which converts to a higher coupon at a specified date. The rate shown is the rate at period end. |
|
(c) Security exempt from registration under Rule 144A of the Securities Act of 1933. These securities may be resold in transactions exempt from registration, normally to qualified institutional buyers. At the period end, the value of these securities amounted to $30,840,202 or 5.8% of net assets. |
|
(d) The coupon rate shown on floating or adjustable rate securities represents the rate at period end. |
|
(e) For foreign government obligations not individually rated by S&P or Moody's, the ratings listed have been assigned by FMR, the fund's investment adviser, based principally on S&P and Moody's ratings of the sovereign credit of the issuing government. |
|
Other Information |
|
The composition of long-term debt holdings as a percentage of total value of investments in securities, is as follows (ratings are unaudited): |
|
Moody's Ratings |
S&P Ratings |
|||
|
Aaa, Aa, A |
73.1% |
|
AAA, AA, A |
62.5% |
|
Baa |
21.1% |
|
BBB |
21.8% |
|
Ba |
0.4% |
|
BB |
1.2% |
|
B |
0.0% |
|
B |
0.0% |
|
Caa |
0.0% |
|
CCC |
0.0% |
|
Ca, C |
0.0% |
|
CC, C |
0.0% |
|
|
|
|
D |
0.0% |
|
The percentage not rated by Moody's or S&P amounted to 0.7%. |
|
Distribution of investments by country of issue, as a percentage of total net assets, is as follows: |
|
United States of America |
88.3% |
|
United Kingdom |
3.8 |
|
Canada |
2.8 |
|
Multi-National |
1.8 |
|
Others (individually less than 1%) |
3.3 |
|
|
100.0% |
|
Income Tax Information |
|
At October 31, 2000, the aggregate cost of investment securities for income tax purposes was $535,849,274. Net unrealized depreciation aggregated $686,425, of which $4,342,505 related to appreciated investment securities and $5,028,930 related to depreciated investment securities. |
|
At October 31, 2000, the fund had a capital loss carryforward of approximately $27,085,000 of which $9,361,000, $1,410,000, $3,985,000 and $12,329,000 will expire on October 31, 2004, 2005, 2007 and 2008, respectively. |
See accompanying notes which are an integral part of the financial statements.
Annual Report
Statement of Assets and Liabilities
|
|
October 31, 2000 |
|
|
Assets |
|
|
|
Investment in securities, at value (including repurchase agreements of $19,951,000) (cost $535,519,547) - See accompanying schedule |
|
$ 535,162,849 |
|
Cash |
|
26,317 |
|
Receivable for investments sold |
|
6,656,487 |
|
Receivable for fund shares sold |
|
1,215,361 |
|
Interest receivable |
|
7,576,522 |
|
Total assets |
|
550,637,536 |
|
Liabilities |
|
|
|
Payable for investments purchased |
$ 10,989,196 |
|
|
Payable for fund shares redeemed |
4,319,908 |
|
|
Distributions payable |
318,030 |
|
|
Accrued management fee |
191,174 |
|
|
Distribution fees payable |
136,942 |
|
|
Other payables and accrued expenses |
154,795 |
|
|
Total liabilities |
|
16,110,045 |
|
Net Assets |
|
$ 534,527,491 |
|
Net Assets consist of: |
|
|
|
Paid in capital |
|
$ 562,970,197 |
|
Distributions in excess of net investment income |
|
(696,903) |
|
Accumulated undistributed net realized gain (loss) on investments and foreign currency transactions |
|
(27,389,105) |
|
Net unrealized appreciation (depreciation) on investments |
|
(356,698) |
|
Net Assets |
|
$ 534,527,491 |
See accompanying notes which are an integral part of the financial statements.
Annual Report
Financial Statements - continued
Statement of Assets and Liabilities - continued
|
|
October 31, 2000 |
|
|
Calculation of Maximum Offering Price |
|
$10.30 |
|
Maximum offering price per share (100/96.25 of $10.30) |
|
$10.70 |
|
Class T: |
|
$10.31 |
|
Maximum offering price per share (100/97.25 of $10.31) |
|
$10.60 |
|
Class B: |
|
$10.30 |
|
Class C: |
|
$10.29 |
|
Institutional Class: |
|
$10.32 |
A Redemption price per share is equal to net asset value less any applicable contingent deferred sales charge.
See accompanying notes which are an integral part of the financial statements.
Annual Report
Financial Statements - continued
Statement of Operations
|
|
Year ended October 31, 2000 |
|
|
Investment Income Interest |
|
$ 37,609,266 |
|
Security lending |
|
43,742 |
|
Total Income |
|
37,653,008 |
|
Expenses |
|
|
|
Management fee |
$ 2,277,055 |
|
|
Transfer agent fees |
1,113,985 |
|
|
Distribution fees |
1,590,192 |
|
|
Accounting and security lending fees |
158,368 |
|
|
Non-interested trustees' compensation |
1,802 |
|
|
Custodian fees and expenses |
36,706 |
|
|
Registration fees |
122,115 |
|
|
Audit |
36,950 |
|
|
Legal |
8,534 |
|
|
Miscellaneous |
5,072 |
|
|
Total expenses before reductions |
5,350,779 |
|
|
Expense reductions |
(4,493) |
5,346,286 |
|
Net investment income |
|
32,306,722 |
|
Realized and Unrealized Gain (Loss) Net realized gain (loss) on investment securities |
|
(12,232,243) |
|
Change in net unrealized appreciation (depreciation) |
|
11,362,314 |
|
Net gain (loss) |
|
(869,929) |
|
Net increase (decrease) in net assets resulting |
|
$ 31,436,793 |
See accompanying notes which are an integral part of the financial statements.
Annual Report
Financial Statements - continued
Statement of Changes in Net Assets
|
|
Year ended
October 31, |
Year ended
October 31, |
|
Increase (Decrease) in Net Assets |
|
|
|
Operations |
$ 32,306,722 |
$ 30,133,116 |
|
Net realized gain (loss) |
(12,232,243) |
(4,437,550) |
|
Change in net unrealized appreciation (depreciation) |
11,362,314 |
(20,620,170) |
|
Net increase (decrease) in net assets resulting |
31,436,793 |
5,075,396 |
|
Distributions to shareholders from net investment income |
(31,864,025) |
(29,409,259) |
|
Share transactions - net increase (decrease) |
(41,785,512) |
91,347,340 |
|
Total increase (decrease) in net assets |
(42,212,744) |
67,013,477 |
|
Net Assets |
|
|
|
Beginning of period |
576,740,235 |
509,726,758 |
|
End of period (including distributions in excess of |
$ 534,527,491 |
$ 576,740,235 |
See accompanying notes which are an integral part of the financial statements.
Annual Report
Financial Highlights - Class A
|
Years ended October 31, |
2000 |
1999 |
1998 H |
1997 I |
1996 E |
|
Selected Per-Share Data |
|
|
|
|
|
|
Net asset value, |
$ 10.300 |
$ 10.770 |
$ 10.560 |
$ 10.590 |
$ 10.350 |
|
Income from Investment Operations |
|
|
|
|
|
|
Net investment income D |
.629 |
.580 |
.537 |
.615 |
.159 |
|
Net realized and unrealized gain (loss) |
(.002) |
(.474) |
.207 |
(.023) |
.235 |
|
Total from investment |
.627 |
.106 |
.744 |
.592 |
.394 |
|
Less Distributions |
|
|
|
|
|
|
From net investment income |
(.627) |
(.576) |
(.534) |
(.622) |
(.154) |
|
Net asset value, end of period |
$ 10.300 |
$ 10.300 |
$ 10.770 |
$ 10.560 |
$ 10.590 |
|
Total Return B, C |
6.32% |
1.00% |
7.21% |
5.81% |
3.83% |
|
Ratios and Supplemental Data |
|
|
|
|
|
|
Net assets, end of period |
$ 48,177 |
$ 22,628 |
$ 8,217 |
$ 3,819 |
$ 687 |
|
Ratio of expenses to average |
.84% |
.87% |
.90% A, F |
.90% F |
.90% A, F |
|
Ratio of expenses to average |
.84% |
.86% G |
.90% A |
.90% |
.90% A |
|
Ratio of net investment income |
6.20% |
5.58% |
5.51% A |
5.93% |
6.45% A |
|
Portfolio turnover rate |
153% |
138% |
176% A |
138% |
200% |
A Annualized
B The total returns would have been lower had certain expenses not been reduced during the periods shown.
C Total returns do not include the one time sales charge and for periods of less than one year are not annualized.
D Net investment income per share has been calculated based on average shares outstanding during the period.
E For the period September 3, 1996 (commencement of sale of Class A shares) to November 30, 1996.
F FMR agreed to reimburse a portion of the class' expenses during the period. Without this reimbursement, the class' expense ratio would have been higher.
G FMR or the fund has entered into varying arrangements with third parties who either paid or reduced a portion of the class' expenses.
H Eleven months ended October 31
I Year ended November 30
See accompanying notes which are an integral part of the financial statements.
Annual Report
Financial Highlights - Class T
|
Years ended October 31, |
2000 |
1999 |
1998 G |
1997 H |
1996 H |
1995 H |
|
Selected Per-Share Data |
|
|
|
|
|
|
|
Net asset value, |
$ 10.310 |
$ 10.770 |
$ 10.560 |
$ 10.610 |
$ 10.760 |
$ 10.260 |
|
Income from Investment Operations |
|
|
|
|
|
|
|
Net investment income |
.620 D |
.576 D |
.537 D |
.625 D |
.671 D |
.649 |
|
Net realized and |
(.006) |
(.473) |
.201 |
(.058) |
(.147) |
.491 |
|
Total from investment operations |
.614 |
.103 |
.738 |
.567 |
.524 |
1.140 |
|
Less Distributions |
|
|
|
|
|
|
|
From net investment |
(.614) |
(.563) |
(.528) |
(.617) |
(.674) |
(.640) |
|
Net asset value, |
$ 10.310 |
$ 10.310 |
$ 10.770 |
$ 10.560 |
$ 10.610 |
$ 10.760 |
|
Total Return B, C |
6.18% |
0.98% |
7.15% |
5.56% |
5.10% |
11.43% |
|
Ratios and Supplemental Data |
|
|
|
|
|
|
|
Net assets, end of period (000 omitted) |
$ 313,887 |
$ 315,350 |
$ 287,734 |
$ 278,869 |
$ 262,103 |
$ 228,439 |
|
Ratio of expenses to average net assets |
.97% |
.97% |
.98% A |
.96% |
.97% |
.94% E |
|
Ratio of expenses to average net assets after expense reductions |
.97% |
.97% |
.98% A |
.96% |
.96% F |
.94% |
|
Ratio of net investment
income to average |
6.07% |
5.48% |
5.48% A |
5.97% |
6.38% |
6.20% |
|
Portfolio turnover rate |
153% |
138% |
176% A |
138% |
200% |
189% |
A Annualized
B The total returns would have been lower had certain expenses not been reduced during the periods shown.
C Total returns do not include the one time sales charge and for periods of less than one year are not annualized.
D Net investment income per share has been calculated based on average shares outstanding during the period.
E FMR agreed to reimburse a portion of the class' expenses during the period. Without this reimbursement, the class' expense ratio would have been higher.
F FMR or the fund has entered into varying arrangements with third parties who either paid or reduced a portion of the class' expenses.
G Eleven months ended October 31
H Year ended November 30
See accompanying notes which are an integral part of the financial statements.
Annual Report
Financial Highlights - Class B
|
Years ended October 31, |
2000 |
1999 |
1998 F |
1997 G |
1996 G |
1995 G |
|
Selected Per-Share Data |
|
|
|
|
|
|
|
Net asset value, beginning of period |
$ 10.300 |
$ 10.760 |
$ 10.540 |
$ 10.590 |
$ 10.750 |
$ 10.250 |
|
Income from Investment Operations |
|
|
|
|
|
|
|
Net investment |
.553 D |
.506 D |
.468 D |
.551 D |
.597 D |
.579 |
|
Net realized |
(.006) |
(.467) |
.214 |
(.057) |
(.153) |
.483 |
|
Total from investment operations |
.547 |
.039 |
.682 |
.494 |
.444 |
1.062 |
|
Less Distributions |
|
|
|
|
|
|
|
From net investment income |
(.547) |
(.499) |
(.462) |
(.544) |
(.604) |
(.562) |
|
Net asset value, |
$ 10.300 |
$ 10.300 |
$ 10.760 |
$ 10.540 |
$ 10.590 |
$ 10.750 |
|
Total Return B, C |
5.50% |
0.37% |
6.60% |
4.83% |
4.32% |
10.62% |
|
Ratios and Supplemental Data |
|
|
|
|
|
|
|
Net assets, end of period (000 omitted) |
$ 63,584 |
$ 64,532 |
$ 39,657 |
$ 22,201 |
$ 18,972 |
$ 15,830 |
|
Ratio of expenses to average net assets |
1.62% |
1.61% |
1.65% A, E |
1.65% E |
1.66% E |
1.70% E |
|
Ratio of net investment
income to average |
5.42% |
4.83% |
4.79% A |
5.27% |
5.69% |
5.44% |
|
Portfolio turnover rate |
153% |
138% |
176% A |
138% |
200% |
189% |
A Annualized
B The total returns would have been lower had certain expenses not been reduced during the periods shown.
C Total returns do not include the contingent deferred sales charge and for periods of less than one year are not annualized.
D Net investment income per share has been calculated based on average shares outstanding during the period.
E FMR agreed to reimburse a portion of the class' expenses during the period. Without this reimbursement, the class' expense ratio would have been higher.
F Eleven months ended October 31
G Year ended November 30
See accompanying notes which are an integral part of the financial statements.
Annual Report
Financial Highlights - Class C
|
Years ended October 31, |
2000 |
1999 |
1998 H |
1997 E |
|
Selected Per-Share Data |
|
|
|
|
|
Net asset value, beginning of period |
$ 10.290 |
$ 10.760 |
$ 10.560 |
$ 10.570 |
|
Income from Investment Operations |
|
|
|
|
|
Net investment income D |
.545 |
.492 |
.453 |
.031 |
|
Net realized and unrealized gain (loss) |
(.005) |
(.472) |
.199 |
(.005) |
|
Total from investment operations |
.540 |
.020 |
.652 |
.026 |
|
Less Distributions |
|
|
|
|
|
From net investment income |
(.540) |
(.490) |
(.452) |
(.036) |
|
Net asset value, end of period |
$ 10.290 |
$ 10.290 |
$ 10.760 |
$ 10.560 |
|
Total Return B, C |
5.42% |
0.19% |
6.30% |
0.25% |
|
Ratios and Supplemental Data |
|
|
|
|
|
Net assets, end of period (000 omitted) |
$ 20,530 |
$ 17,099 |
$ 6,100 |
$ 160 |
|
Ratio of expenses to average net assets |
1.69% |
1.71% |
1.75% A, F |
1.75% A, F |
|
Ratio of expenses to average net assets |
1.69% |
1.71% |
1.75% A |
1.73% A, G |
|
Ratio of net investment income to average |
5.35% |
4.73% |
4.67% A |
4.42% A |
|
Portfolio turnover rate |
153% |
138% |
176% A |
138% |
A Annualized
B The total returns would have been lower had certain expenses not been reduced during the periods shown.
C Total returns do not include the contingent deferred sales charge and for periods of less than one year are not annualized.
D Net investment income per share has been calculated based on average shares outstanding during the period.
E For the period November 3, 1997 (commencement of sale of Class C shares) to November 30, 1997.
F FMR agreed to reimburse a portion of the class' expenses during the period. Without this reimbursement, the class' expense ratio would have been higher.
G FMR or the fund has entered into varying arrangements with third parties who either paid or reduced a portion of the class' expenses.
H Eleven months ended October 31
See accompanying notes which are an integral part of the financial statements.
Annual Report
Financial Highlights - Institutional Class
|
Years ended October 31, |
2000 |
1999 |
1998 F |
1997 G |
1996 G |
1995 G |
|
Selected Per-Share Data |
|
|
|
|
|
|
|
Net asset value, beginning of period |
$ 10.310 |
$ 10.780 |
$ 10.570 |
$ 10.620 |
$ 10.770 |
$ 10.270 |
|
Income from Investment Operations |
|
|
|
|
|
|
|
Net investment income |
.656 D |
.610 D |
.566 D |
.658 D |
.705 D |
.671 |
|
Net realized |
(.002) |
(.485) |
.201 |
(.060) |
(.151) |
.499 |
|
Total from investment operations |
.654 |
.125 |
.767 |
.598 |
.554 |
1.170 |
|
Less Distributions |
|
|
|
|
|
|
|
From net investment income |
(.644) |
(.595) |
(.557) |
(.648) |
(.704) |
(.670) |
|
Net asset value, |
$ 10.320 |
$ 10.310 |
$ 10.780 |
$ 10.570 |
$ 10.620 |
$ 10.770 |
|
Total Return B, C |
6.59% |
1.19% |
7.44% |
5.86% |
5.40% |
11.73% |
|
Ratios and Supplemental Data |
|
|
|
|
|
|
|
Net assets, end of period (000 omitted) |
$ 88,350 |
$ 157,131 |
$ 168,019 |
$ 177,427 |
$ 211,866 |
$ 208,861 |
|
Ratio of expenses to average net assets |
.65% |
.66% |
.68% A |
.67% |
.66% |
.67% E |
|
Ratio of net investment
income to average |
6.39% |
5.78% |
5.78% A |
6.27% |
6.69% |
6.47% |
|
Portfolio turnover rate |
153% |
138% |
176% A |
138% |
200% |
189% |
A Annualized
B Total returns for periods of less than one year are not annualized.
C The total returns would have been lower had certain expenses not been reduced during the periods shown.
D Net investment income per share has been calculated based on average shares outstanding during the period.
E FMR agreed to reimburse a portion of the class' expenses during the period. Without this reimbursement, the class' expense ratio would have been higher.
F Eleven months ended October 31
G Year ended November 30
See accompanying notes which are an integral part of the financial statements.
Annual Report
For the period ended October 31, 2000
1. Significant Accounting Policies.
Fidelity Advisor Intermediate Bond Fund (the fund) is a fund of Fidelity Advisor Series II (the trust) and is authorized to issue an unlimited number of shares. The trust is registered under the Investment Company Act of 1940, as amended (the 1940 Act), as an open-end management investment company organized as a Massachusetts business trust.
The fund offers Class A, Class T, Class B, Class C, and Institutional Class shares, each of which has equal rights as to assets and voting privileges. Each class has exclusive voting rights with respect to matters that affect that class. Class B shares will automatically convert to Class A shares after a holding period of four years from the initial date of purchase. Investment income, realized and unrealized capital gains and losses, the common expenses of the fund, and certain fund-level expense reductions, if any, are allocated on a pro rata basis to each class based on the relative net assets of each class to the total net assets of the fund. Each class of shares differs in its respective distribution, transfer agent, and certain other class-specific fees, expenses, and expense reductions.
The financial statements have been prepared in conformity with generally accepted accounting principles which require management to make certain estimates and assumptions at the date of the financial statements. The following summarizes the significant accounting policies of the fund:
Security Valuation. Securities are valued based upon a computerized matrix system and/or appraisals by a pricing service, both of which consider market transactions and dealer-supplied valuations. Securities (including restricted securities) for which market quotations are not readily available are valued at their fair value as determined in good faith under consistently applied procedures under the general supervision of the Board of Trustees. Short-term securities with remaining maturities of sixty days or less for which quotations are not readily available are valued at amortized cost or original cost plus accrued interest, both of which approximate current value. Investments in open-end investment companies are valued at their net asset value each business day.
Income Taxes. As a qualified regulated investment company under Subchapter M of the Internal Revenue Code, the fund is not subject to income taxes to the extent that it distributes substantially all of its taxable income for its fiscal year. The schedule of investments includes information regarding income taxes under the caption "Income Tax Information."
Investment Income. Interest income, which includes accretion of original issue discount, is accrued as earned.
Expenses. Most expenses of the trust can be directly attributed to a fund. Expenses which cannot be directly attributed are apportioned among the funds in the trust.
Annual Report
Notes to Financial Statements - continued
1. Significant Accounting Policies - continued
Distributions to Shareholders. Distributions are declared daily and paid monthly from net investment income. Distributions from realized gains, if any, are recorded on the ex-dividend date. Income dividends and capital gain distributions are declared separately for each class.
Income and capital gain distributions are determined in accordance with income tax regulations which may differ from generally accepted accounting principles. These differences, which may result in distribution reclassifications, are primarily due to differing treatments for paydown gains/losses on certain securities, market discount, capital loss carryforwards and losses deferred due to wash sales.
Permanent book and tax basis differences relating to shareholder distributions will result in reclassifications to paid in capital. Distributions in excess of net investment income and accumulated undistributed net realized gain (loss) on investments and foreign currency transactions may include temporary book and tax basis differences which will reverse in a subsequent period. Any taxable income or gain remaining at fiscal year end is distributed in the following year.
Security Transactions. Security transactions are accounted for as of trade date. Gains and losses on securities sold are determined on the basis of identified cost.
2. Operating Policies.
Joint Trading Account. Pursuant to an Exemptive Order issued by the Securities and Exchange Commission (the SEC), the fund, along with other affiliated entities of Fidelity Management & Research Company (FMR), may transfer uninvested cash balances into one or more joint trading accounts. These balances are invested in one or more repurchase agreements for U.S. Treasury or Federal Agency obligations.
Repurchase Agreements. The underlying U.S. Treasury, Federal Agency, or other obligations found to be satisfactory by FMR are transferred to an account of the fund, or to the Joint Trading Account, at a custodian bank. The securities are marked-to-market daily and maintained at a value at least equal to the principal amount of the repurchase agreement (including accrued interest). FMR, the fund's investment adviser, is responsible for determining that the value of the underlying securities remains in accordance with the market value requirements stated above.
Interfund Lending Program. Pursuant to an Exemptive Order issued by the SEC, the fund, along with other registered investment companies having management contracts with FMR, may participate in an interfund lending program. This program provides an alternative credit facility allowing the fund to borrow from, or lend money to, other participating funds.
Annual Report
Notes to Financial Statements - continued
2. Operating Policies - continued
Delayed Delivery Transactions. The fund may purchase or sell securities on a delayed delivery basis. Payment and delivery may take place after the customary settlement period for that security. The price of the underlying securities and the date when the securities will be delivered and paid for are fixed at the time the transaction is negotiated. The fund may receive compensation for interest forgone in the purchase of a delayed delivery security. With respect to purchase commitments, the fund identifies securities as segregated in its records with a value at least equal to the amount of the commitment. Losses may arise due to changes in the market value of the underlying securities or if the counterparty does not perform under the contract.
Restricted Securities. The fund is permitted to invest in securities that are subject to legal or contractual restrictions on resale. These securities generally may be resold in transactions exempt from registration or to the public if the securities are registered. Disposal of these securities may involve time-consuming negotiations and expense, and prompt sale at an acceptable price may be difficult. At the end of the period, the fund had no investments in restricted securities (excluding 144A issues).
3. Purchases and Sales of Investments.
Purchases and sales of securities, other than short-term securities, aggregated $786,313,099 and $810,362,389, respectively, of which U.S. government and government agency obligations aggregated $412,986,897 and $523,990,897, respectively.
4. Fees and Other Transactions with Affiliates.
Management Fee. As the fund's investment adviser, FMR receives a monthly fee that is calculated on the basis of a group fee rate plus a fixed individual fund fee rate applied to the average net assets of the fund. The group fee rate is the weighted average of a series of rates and is based on the monthly average net assets of all the mutual funds advised by FMR. The rates ranged from .0920% to .3700% for the period. The annual individual fund fee rate is .30%. In the event that these rates were lower than the contractual rates in effect during the period, FMR voluntarily implemented the above rates, as they resulted in the same or a lower management fee. For the period, the management fee was equivalent to an annual rate of .43% of average net assets.
Sub-Adviser Fee. FMR, on behalf of the fund, has entered into a sub-advisory agreement with Fidelity Investments Money Management, Inc. (FIMM), a wholly owned subsidiary of FMR. For its services, FIMM receives a fee from FMR of 50% of the management fee payable to FMR. The fee is paid prior to any voluntary expense reimbursements which may be in effect.
Annual Report
Notes to Financial Statements - continued
4. Fees and Other Transactions with Affiliates - continued
Distribution and Service Plan. In accordance with Rule 12b-1 of the 1940 Act, the Board of Trustees has adopted separate Distribution and Service Plans with respect to each class of shares (collectively referred to as "the Plans"). Under certain of the Plans, the class pays Fidelity Distributors Corporation (FDC), an affiliate of FMR, a 12b-1 fee. A portion of this fee may be reallowed to securities dealers, banks and other financial institutions for the distribution of each class of shares and providing shareholder support services. For the period, this fee was based on the following annual rates of the average net assets of each applicable class:
|
Class A |
.15% |
|
Class T |
.25% |
|
Class B |
.90%* |
|
Class C |
1.00%** |
* .65% represents a distribution fee and .25% represents a shareholder service fee.
** .75% represents a distribution fee and .25% represents a shareholder service fee.
For the period, each class paid FDC the following amounts, a portion of which was retained by FDC:
|
|
Paid to |
Retained |
|
Class A |
$ 51,294 |
$ 35 |
|
Class T |
773,580 |
7,103 |
|
Class B |
586,959 |
424,280 |
|
Class C |
178,359 |
97,655 |
|
|
$ 1,590,192 |
$ 529,073 |
Sales Load. FDC receives a front-end sales charge of up to 3.75% for selling Class A shares, and 2.75% for selling Class T shares of the fund. FDC receives the proceeds of contingent deferred sales charges levied on Class B share redemptions occurring within three years of purchase and Class C share redemptions occurring within one year of purchase. Contingent deferred sales charges are based on declining rates ranging from 3% to 1% for Class B and 1% for Class C, of the lesser of the cost of shares at the initial date of purchase or the net asset value of the redeemed shares, excluding any reinvested dividends and capital gains. In addition, purchases of Class A and Class T shares that were subject to a finder's fee bear a contingent deferred sales charge on assets that do not remain in the fund for at least one year. The Class A and Class T contingent deferred sales charge is based on 0.25% of the lesser of the cost of shares at the initial date of purchase or the net asset value of the redeemed shares, excluding any reinvested dividends and capital gains. A portion of the sales charges paid to FDC is paid to securities dealers, banks and other financial institutions.
Annual Report
Notes to Financial Statements - continued
4. Fees and Other Transactions with Affiliates - continued
Sales Load - continued
For the period, sales charge amounts paid to and retained by FDC were as follows:
|
|
Paid to |
Retained |
|
Class A |
$ 93,134 |
$ 39,488 |
|
Class T |
79,827 |
30,178 |
|
Class B |
140,980 |
140,980* |
|
Class C |
8,151 |
8,151* |
|
|
$ 322,092 |
$ 218,797 |
* When Class B and Class C shares are initially sold, FDC pays commissions from its own resources to securities dealers,
banks, and other financial institutions through which the sales are made.
Transfer Agent Fees. Fidelity Investments Institutional Operations Company, Inc., (FIIOC), an affiliate of FMR, is the transfer, dividend disbursing and shareholder servicing agent (collectively referred to as the transfer agent) for each class of the fund. FIIOC receives account fees and asset-based fees that vary according to the account size and type of account of the shareholders of the respective classes of the fund. FIIOC pays for typesetting, printing and mailing of all shareholder reports, except proxy statements. For the period, the following amounts were paid to FIIOC:
|
|
Amount |
% of |
|
Class A |
$ 68,231 |
.20 |
|
Class T |
692,611 |
.22 |
|
Class B |
147,247 |
.23 |
|
Class C |
35,553 |
.20 |
|
Institutional Class |
170,343 |
.16 |
|
|
$ 1,113,985 |
|
Accounting and Security Lending Fees. Fidelity Service Company, Inc., an affiliate of FMR, maintains the fund's accounting records and administers the security lending program. The security lending fee is based on the number and duration of lending transactions. The accounting fee is based on the level of average net assets for the month plus out-of-pocket expenses.
5. Interfund Lending Program.
The fund participated in the interfund lending program as a lender. The average daily loan balance during the period for which loans were outstanding amounted to $16,326,400. The weighted average interest rate was 6.00%. Interest earned from the interfund lending program amounted to $27,210 and is included in interest income on the Statement of Operations. At period end there were no interfund loans outstanding.
Annual Report
Notes to Financial Statements - continued
6. Security Lending.
The fund lends portfolio securities from time to time in order to earn additional income. The fund receives collateral in the form of U.S. Treasury obligations, letters of credit, and/or cash against the loaned securities, and maintains collateral in an amount not less than 100% of the market value of the loaned securities during the period of the loan. The market value of the loaned securities is determined at the close of business of the fund and any additional required collateral is delivered to the fund on the next business day. If the borrower defaults on its obligation to return the securities loaned because of insolvency or other reasons, the fund could experience delays and costs in recovering the securities loaned or in gaining access to the collateral. At period end there were no security loans outstanding.
7. Expense Reductions.
Through an arrangement with the fund's custodian, credits realized as a result of uninvested cash balances were used to reduce a portion of expenses. During the period, the fund's custodian fees were reduced by $4,493 under the custodian arrangement.
8. Distributions to Shareholders.
Distributions to shareholders of each class were as follows:
|
|
Years ended October 31, |
|
|
|
2000 |
1999 |
|
From net investment income |
|
|
|
Class A |
$ 2,118,454 |
$ 868,429 |
|
Class T |
18,584,382 |
16,224,315 |
|
Class B |
3,494,654 |
2,508,941 |
|
Class C |
942,822 |
528,467 |
|
Institutional Class |
6,723,713 |
9,279,107 |
|
Total |
$ 31,864,025 |
$ 29,409,259 |
Annual Report
Notes to Financial Statements - continued
9. Share Transactions.
Transactions for each class of shares were as follows:
|
|
Shares |
Dollars |
||
|
|
Years ended October 31, |
Years ended October 31, |
||
|
|
2000 |
1999 |
2000 |
1999 |
|
|
|
|
|
|
|
Class A |
4,902,349 |
3,357,531 |
$ 50,077,303 |
$ 35,356,066 |
|
Reinvestment of distributions |
193,209 |
72,714 |
1,973,473 |
761,419 |
|
Shares redeemed |
(2,616,153) |
(1,997,004) |
(26,717,363) |
(20,973,090) |
|
Net increase (decrease) |
2,479,405 |
1,433,241 |
$ 25,333,413 |
$ 15,144,395 |
|
Class T |
14,704,629 |
17,948,549 |
$ 150,170,581 |
$ 189,451,401 |
|
Reinvestment of distributions |
1,661,438 |
1,383,474 |
16,962,342 |
14,555,972 |
|
Shares redeemed |
(16,507,172) |
(15,455,120) |
(168,525,179) |
(162,894,381) |
|
Net increase (decrease) |
(141,105) |
3,876,903 |
$ (1,392,256) |
$ 41,112,992 |
|
Class B |
2,796,903 |
4,797,807 |
$ 28,571,712 |
$ 50,576,586 |
|
Reinvestment of distributions |
280,308 |
191,805 |
2,858,231 |
2,011,162 |
|
Shares redeemed |
(3,169,406) |
(2,406,744) |
(32,309,883) |
(25,318,778) |
|
Net increase (decrease) |
(92,195) |
2,582,868 |
$ (879,940) |
$ 27,268,970 |
|
Class C |
1,610,410 |
1,681,953 |
$ 16,444,630 |
$ 17,687,270 |
|
Reinvestment of distributions |
70,863 |
38,404 |
722,809 |
402,151 |
|
Shares redeemed |
(1,347,947) |
(626,095) |
(13,729,963) |
(6,595,292) |
|
Net increase (decrease) |
333,326 |
1,094,262 |
$ 3,437,476 |
$ 11,494,129 |
|
Institutional Class |
1,678,500 |
5,199,325 |
$ 17,149,282 |
$ 54,855,022 |
|
Reinvestment of distributions |
340,111 |
401,855 |
3,475,461 |
4,235,018 |
|
Shares redeemed |
(8,691,446) |
(5,956,114) |
(88,908,948) |
(62,763,186) |
|
Net increase (decrease) |
(6,672,835) |
(354,934) |
$ (68,284,205) |
$ (3,673,146) |
Annual Report
To the Trustees of Fidelity Advisor Series II and the Shareholders of Fidelity Advisor Intermediate Bond Fund:
In our opinion, the accompanying statement of assets and liabilities, including the schedule of investments, and the related statements of operations and of changes in net assets and the financial highlights present fairly, in all material respects, the financial position of Fidelity Advisor Intermediate Bond Fund (a fund of Fidelity Advisor Series II) at October 31, 2000, and the results of its operations, the changes in its net assets and the financial highlights for the periods indicated, in conformity with accounting principles generally accepted in the United States of America. These financial statements and financial highlights (hereafter referred to as "financial statements") are the responsibility of the Fidelity Advisor Intermediate Bond Fund's management; our responsibility is to express an opinion on these financial statements based on our audits. We conducted our audits of these financial statements in accordance with auditing standards generally accepted in the United States of America which require that we plan and perform the audit to obtain reasonable assurance about whether the financial statements are free of material misstatement. An audit includes examining, on a test basis, evidence supporting the amounts and disclosures in the financial statements, assessing the accounting principles used and significant estimates made by management, and evaluating the overall financial statement presentation. We believe that our audits, which included confirmation of securities at October 31, 2000 by correspondence with the custodian and brokers, provide a reasonable basis for our opinion.
/s/PricewaterhouseCoopers LLP
PricewaterhouseCoopers LLP
Boston, Massachusetts
December 11, 2000
Annual Report
A total of 10.38% of the dividends distributed during the fiscal year was derived from interest on U.S. Government securities which is generally exempt from state income tax.
The fund will notify shareholders in January 2001 of amounts for use in preparing 2000 income tax returns.
Annual Report
Investment Adviser
Fidelity Management & Research Company
Boston, MA
Investment Sub-Advisers
Fidelity Management & Research (U.K.) Inc.
Fidelity Management & Research
(Far East) Inc.
Fidelity Investments Money
Management, Inc.
Fidelity Investments Japan Limited
Officers
Edward C. Johnson 3d, President
Robert C. Pozen, Senior Vice President
Dwight D. Churchill, Vice President
David L. Murphy, Vice President
Eric D. Roiter, Secretary
Robert A. Dwight, Treasurer
Maria F. Dwyer, Deputy Treasurer
Stanley N. Griffith, Assistant Vice President
John H. Costello, Assistant Treasurer
Thomas J. Simpson, Assistant Treasurer
Board of Trustees
Ralph F. Cox *
Phyllis Burke Davis *
Robert M. Gates *
Edward C. Johnson 3d
Donald J. Kirk *
Ned C. Lautenbach *
Peter S. Lynch
Marvin L. Mann *
William O. McCoy *
Gerald C. McDonough *
Robert C. Pozen
Thomas R. Williams *
Advisory Board
J. Michael Cook
Abigail P. Johnson
Marie L. Knowles
General Distributor
Fidelity Distributors Corporation
Boston, MA
Transfer and Shareholder
Servicing Agent
Fidelity Investments Institutional Operations Company, Inc.
Boston, MA
Custodian
The Bank of New York
New York, NY
* Independent trustees
Annual Report
Focus Funds
Fidelity Advisor Consumer
Industries Fund
Fidelity Advisor Cyclical
Industries Fund
Fidelity Advisor Financial
Services Fund
Fidelity Advisor Health Care Fund
Fidelity Advisor Natural
Resources Fund
Fidelity Advisor Technology Fund
Fidelity Advisor Telecommunications & Utilities Growth Fund
Growth Funds
Fidelity Advisor Korea Fund
Fidelity Advisor Emerging Asia Fund
Fidelity Advisor Latin America Fund
Fidelity Advisor Japan Fund
Fidelity Advisor Europe Capital Appreciation Fund
Fidelity Advisor International
Capital Appreciation Fund
Fidelity Advisor Overseas Fund
Fidelity Advisor Diversified International Fund
Fidelity Advisor Global Equity Fund
Fidelity Advisor TechnoQuant®
Growth Fund
Fidelity Advisor Small Cap Fund
Fidelity Advisor Value Strategies Fund
Fidelity Advisor Mid Cap Fund
Fidelity Advisor Dynamic Capital Appreciation Fund
Fidelity Advisor Equity Growth Fund
Fidelity Advisor Large Cap Fund
Fidelity Advisor Dividend Growth Fund
Fidelity Advisor Growth
Opportunities Fund
Growth and Income Funds
Fidelity Advisor Growth & Income Fund
Fidelity Advisor Equity Income Fund
Fidelity Advisor Asset Allocation Fund
Fidelity Advisor Balanced Fund
Taxable Income Funds
Fidelity Advisor Emerging Markets Income Fund
Fidelity Advisor High Yield Fund
Fidelity Advisor High Income Fund
Fidelity Advisor Strategic Income Fund
Fidelity Advisor Mortgage
Securities Fund
Fidelity Advisor Government Investment Fund
Fidelity Advisor Intermediate Bond Fund
Fidelity Advisor Short Fixed-Income Fund
Municipal Funds
Fidelity Advisor Municipal Income Fund
Money Market Funds
Prime Fund
Treasury Fund
Tax-Exempt Fund
|
LTB-ANN-1200 |
118714 |
|
1.539398.103 |
|
(Fidelity Investment logo)(registered trademark)
Fidelity® Advisor
Fund - Institutional Class
Annual Report
October 31, 2000
(2_fidelity_logos)(Registered_Trademark)
|
President's Message |
3 |
Ned Johnson on investing strategies. |
|
Performance |
4 |
How the fund has done over time. |
|
Fund Talk |
7 |
The manager's review of fund performance, strategy and outlook. |
|
Investment Changes |
10 |
A summary of major shifts in the fund's investments over the past six months. |
|
Investments |
11 |
A complete list of the fund's investments with their market values. |
|
Financial Statements |
23 |
Statements of assets and liabilities, operations, and changes in net assets, as well as financial highlights. |
|
Notes |
32 |
Notes to the financial statements. |
|
Report of Independent Accountants |
39 |
The auditors' opinion. |
|
Distributions |
40 |
|
|
|
|
|
Standard & Poor's, S&P and S&P 500 are registered service marks of The McGraw-Hill Companies, Inc. and have been licensed for use by Fidelity Distributors Corporation.
Other third party marks appearing herein are the property of their respective owners.
All other marks appearing herein are registered or unregistered trademarks or service marks of FMR Corp. or an affiliated company.
(Recycle graphic) This report is printed on recycled paper using soy-based inks.
This report and the financial statements contained herein are submitted for the general information of the shareholders of the fund. This report is not authorized for distribution to prospective investors in the fund unless preceded or accompanied by an effective prospectus.
Mutual fund shares are not deposits or obligations of, or guaranteed by, any depository institution. Shares are not insured by FDIC, Federal Reserve Board or any other agency, and are subject to investment risks, including possible loss of principal amount invested.
Neither the fund nor Fidelity Distributors Corporation is a bank.
For more information on any Fidelity Advisor fund, including charges and expenses, contact your investment professional for a free prospectus. Read it carefully before you invest or send money.
Annual Report
(photo_of_Edward_C_Johnson_3d)
Dear Shareholder:
A sixth-straight year of double-digit positive returns for the Dow Jones Industrial Average, NASDAQ and S&P 500® could be in jeopardy unless the U.S. stock market shows marked improvement in the final two months of 2000. Through October, all three indexes had negative year-to-date returns. On the other hand, most fixed-income sectors were solidly in the black. Treasuries and other long-term government securities led the way, returning nearly 14%.
While it's impossible to predict the future direction of the markets with any degree of certainty, there are certain basic principles that can help investors plan for their future needs.
The longer your investment time frame, the less likely it is that you will be affected by short-term market volatility. A 10-year investment horizon appropriate for saving for a college education, for example, enables you to weather market cycles in a long-term fund, which may have a higher risk potential, but also has a higher potential rate of return.
An intermediate-length fund could make sense if your investment horizon is two to four years, while a short-term bond fund could be the right choice if you need your money in one or two years.
If your time horizon is less than a year, you might want to consider moving some of your bond investment into a money market fund. These funds seek income and a stable share price by investing in high-quality, short-term investments. Of course, it's important to remember that an investment in a money market fund is not insured or guaranteed by the Federal Deposit Insurance Corporation or any other government agency. Although money market funds seek to preserve the value of your investment at $1.00 per share, it is possible to lose money by investing in these types of funds.
Finally, no matter what your time horizon or portfolio diversity, it makes good sense to follow a regular investment plan, investing a certain amount of money in a fund at the same time each month or quarter and periodically reviewing your overall portfolio. By doing so, you won't get caught up in the excitement of a rapidly rising market, nor will you buy all your shares at market highs. While this strategy - known as dollar cost averaging - won't assure a profit or protect you from a loss in a declining market, it should help you lower the average cost of your purchases. Of course, you should consider your financial ability to continue your purchases through periods of low price levels before undertaking such a strategy.
Remember to contact your investment professional if you need help with your investments.
Best regards,
/s/Edward C. Johnson 3d
Edward C. Johnson 3d
Annual Report
Fidelity Advisor Intermediate Bond Fund - Institutional Class
There are several ways to evaluate historical performance. You can look at the total percentage change in value, the average annual percentage change or the growth of a hypothetical $10,000 investment. Total return reflects the change in the value of an investment, assuming reinvestment of the class' dividend income and capital gains (the profits earned upon the sale of securities that have grown in value). You can also look at the class' income, as reflected in its yield, to measure performance. If Fidelity had not reimbursed certain class expenses, the past five year and past 10 year total returns would have been lower.
Cumulative Total Returns
|
Periods ended October 31, 2000 |
|
Past 1 |
Past 5 |
Past 10 |
|
|
Fidelity Adv Int Bond - Inst CL |
|
6.59% |
30.84% |
101.57% |
|
|
LB Int Govt/Credit Bond |
|
6.46% |
33.43% |
102.72% |
|
|
Short-Intermediate Investment Grade Debt |
|
5.69% |
29.18% |
89.40% |
|
Cumulative total returns show Institutional Class' performance in percentage terms over a set period - in this case, one year, five years or 10 years. For example, if you had invested $1,000 in a fund that had a 5% return over the past year, the value of your investment would be $1,050. You can compare Institutional Class' returns to those of the Lehman Brothers Intermediate Government/Credit Bond Index - a market value-weighted index of government and investment-grade corporate fixed-rate debt issues with maturities between one and 10 years. To measure how Institutional Class' performance stacked up against its peers, you can compare it to the short-intermediate investment grade debt funds average, which reflects the performance of mutual funds with similar objectives tracked by Lipper Inc. The past one year average represents a peer group of 117 mutual funds. These benchmarks include reinvested dividends and capital gains, if any, and exclude the effect of sales charges.
Average Annual Total Returns
|
Periods ended October 31, 2000 |
Past 1 |
Past 5 |
Past 10 |
|
Fidelity Adv Int Bond - Inst CL |
6.59% |
5.52% |
7.26% |
|
LB Int Govt/Credit Bond |
6.46% |
5.94% |
7.32% |
|
Short-Intermediate Investment Grade Debt |
5.69% |
5.25% |
6.59% |
Average annual total returns take Institutional Class' cumulative return and show you what would have happened if Institutional Class had performed at a constant rate each year.
Annual Report
Fidelity Advisor Intermediate Bond Fund - Institutional Class
Performance - continued
$10,000 Over 10 Years
$10,000 Over 10 Years: Let's say hypothetically that $10,000 was invested in Fidelity Advisor Intermediate Bond Fund - Institutional Class on October 31, 1990. As the chart shows, by October 31, 2000, the value of the investment would have grown to $20,157 - a 101.57% increase on the initial investment. For comparison, look at how the Lehman Brothers Intermediate Government/Credit Bond Index did over the same period. With dividends and capital gains, if any, reinvested, the same $10,000 investment would have grown to $20,272 - a 102.72% increase.
Understanding
Performance
How a fund did yesterday is no guarantee of how it will do tomorrow. Bond prices, for example, generally move in the opposite direction of interest rates. In turn, the share price, return and yield of a fund that invests in bonds will vary. That means if you sell your shares during a market downturn, you might lose money. But if you can ride out the market's ups and downs, you may have a gain.
3Annual Report
Fidelity Advisor Intermediate Bond Fund - Institutional Class
Performance - continued
Total Return Components
|
|
|
Years ended October 31, |
||||
|
|
|
2000 |
1999 |
1998 |
1997 |
1996 |
|
Dividend returns |
|
6.49% |
5.55% |
5.96% |
6.41% |
6.83% |
|
Capital returns |
|
0.10% |
-4.36% |
1.70% |
0.57% |
-1.50% |
|
Total returns |
|
6.59% |
1.19% |
7.66% |
6.98% |
5.33% |
Total return components include both dividend returns and capital returns. A dividend return reflects the actual dividends paid by the class. A capital return reflects both the amount paid by the class to shareholders as capital gain distributions and changes in the class' share price. Both returns assume the dividends or capital gains, if any, paid by the class are reinvested.
Dividends and Yield
|
Periods ended October 31, 2000 |
Past 1 |
Past 6 |
Past 1 |
|
Dividends per share |
5.64¢ |
33.12¢ |
64.42¢ |
|
Annualized dividend rate |
6.42% |
6.42% |
6.30% |
|
30-day annualized yield |
6.65% |
- |
- |
Dividends per share show the income paid by the class for a set period and do not reflect any tax reclassifications. If you annualize this number, based on an average share price of $10.34 over the past one month, $10.23 over the past six months and $10.22 over the past one year, you can compare the class' income over these three periods. The 30-day annualized yield is a standard formula for all bond funds based on the yields of the bonds in the fund, averaged over the past 30 days. This figure shows you the yield characteristics of the fund's investments at the end of the period. It also helps you compare funds from different companies on an equal basis.
Annual Report
Market Recap
Strong technical factors in the market helped most investment-grade bonds overcome sharply rising interest rates and volatile market conditions, enabling them to outperform a number of major U.S. equity indexes during the 12-month period that ended October 31, 2000. The Lehman Brothers Aggregate Bond Index - a popular measure of taxable-bond performance - returned 7.30% during this time frame. Following a bullish fourth quarter of 1999 for the spread sectors - namely corporate bonds, mortgage and agency securities - Treasuries usurped market leadership not long after the millennium changeover. A growing federal surplus spurred the U.S. government in January to begin buying back outstanding debt and reducing future issuance. The scarcity premium created by a shrinking supply of long-dated Treasuries sent prices soaring and yields plummeting, thereby inducing an inverted yield curve - which occurs when short-term bonds outyield longer-dated securities. Anticipation that the Fed was finished raising interest rates entering the summer, combined with persistent flights-to-safety from risk-averse investors concerned about volatility in equity markets, further bolstered the long bond, helping the Lehman Brothers Treasury Index return 8.22% during the period. Mortgages made up some ground late in the period behind strong housing turnover. Agencies, too, staged a late rally in response to reduced political risk surrounding government-sponsored enterprises. However, corporates had little to celebrate, plagued by deteriorating credit conditions and growing supply pressures. For the overall period, the Lehman Brothers Mortgage-Backed Securities, U.S. Agency and Credit Bond indexes returned 7.57%, 7.30% and 5.48%, respectively.
(Portfolio Manager photograph)
An interview with Andrew Dudley, Portfolio Manager of Fidelity Advisor Intermediate Bond Fund
Q. How did the fund perform, Andy?
A. For the 12 months that ended October 31, 2000, the fund's Institutional Class shares returned 6.59%. By comparison, the Lehman Brothers Intermediate Government/Credit Bond Index returned 6.46% during the same period, while the short-intermediate investment grade debt funds average was up 5.69%, as tracked by Lipper Inc.
Q. What was the investment environment like during the period?
A. Treasury securities were the best-performing sector in the fixed-income market for the overall period, as the reduction in the deficit enabled the federal government to buy back debt, which led to a rally in Treasuries as yields fell and prices rose. Late in 1999, corporate securities also staged a brief rally as fears about potential Y2K computer problems receded and investors entered 2000 with a sense of optimism. However, we saw a turn in investors' attitudes about credit risk during the second half of the 12-month period. Many believed we were approaching the end of a cycle of business expansion and the beginning of a slowdown in economic growth, which potentially could be negative for corporate bonds. At the same time, the heightened focus on stock market performance created pressures among many company managements to support their companies' stock prices. This has encouraged steps such as stock buyback programs and other activities that potentially could cause the credit trends of the companies to deteriorate. Meanwhile, rapidly rising energy prices created another uncertainty for bond investors. In combination, these factors added up to a negative environment for corporate bonds. In contrast, government agency bonds, mortgages and, in particular, asset-backed securities tended to perform well during the period. Among corporate subsectors, defensive areas such as real estate investment trusts (REITs) and utility and energy company bonds tended to perform somewhat better than the overall corporate bond market.
Annual Report
Fund Talk: The Manager's Overview - continued
Q. What were your principal strategies, and how did they affect performance?
A. I emphasized the spread sectors - those parts of the fixed-income market that offer a yield advantage, or spread, over Treasury securities. I overweighted mortgages, asset-backed securities and corporate bonds, while underweighting government agency bonds and Treasury securities. While I emphasized corporate securities, which accounted for approximately 44% of net assets on October 31, 2000, I was relatively defensive within the corporate bond sector. For example, I modestly shortened the duration of our corporate bond allocation and increased diversification so the fund was less vulnerable to problems with any individual security. I focused on sound credit analysis and also evaluated individual securities based on the market's heightened sensitivity to deteriorating credit quality. I looked for better credit quality and emphasized defensive sectors. Consistent with our policy, I did not bet on changes in the direction of interest rates and tended to have an interest-rate sensitivity, or duration, close to that of the Lehman Brothers benchmark index.
Q. What specific areas particularly helped performance, and what areas hurt?
A. Our overweighting of mortgages, including commercial mortgage-backed securities, helped performance, as did our investments in REITs and asset-backed securities. Our underweighted position in government agency bonds and our overweighted position in corporate securities hurt. While our overall security selection of corporate bonds tended to be good, we did have some individual laggards. One noteworthy disappointment was our investment in Finova, a commercial finance company. The credit quality of the company has deteriorated, in part because the company was unable to extend its line of credit with its banks. We have sold our position in Finova bonds as of the end of the period.
Annual Report
Fund Talk: The Manager's Overview - continued
Q. What's your outlook?
A. I believe we have entered a new period of heightened volatility among the spread sectors as fixed-income investors search for a new equilibrium in setting valuations for credit risk. This volatility, however, is less dramatic among the shorter-term securities in which we invest, and we believe it still makes sense to invest in corporate bonds because of their yield advantages. At the same time, mortgages and asset-backed securities continue to appear very attractive. I have positioned the fund so it is not overly exposed to shifts in the relationships of yields of shorter-term bonds to the yields of longer-term securities.
Fund Facts
Goal: high current income; may also seek capital appreciation
Start date: February 2, 1984
Size: as of October 31, 2000, more than $534 million
Manager: Andrew Dudley, since 1999; joined Fidelity in 1996
3Andrew Dudley on the bond market's perceptions of the national elections:
"From the perspective of fixed-income investors, the most important outcome of the elections is that there likely will not be any broad, sweeping mandate for change. The results of both the presidential election and the fight for control of Congress are likely to be so close that it will be difficult for anyone to make dramatic shifts in policy. The financial markets would like that result. They don't like the prospect of broad sweeping changes that create uncertainty in the market.
"The new Congress is likely to be almost evenly split between Republicans and Democrats. That means that the defection of just one member, for any reason, can jeopardize the outcome of a vote on any issue. That is not an environment for major change, particularly if you also have a president who has been narrowly elected. The bond market was most fearful of a Republican president with a mandate for cutting taxes and clear Republican control in both houses of Congress. That would have increased the potential for large tax cuts, which could reduce or eliminate the federal surplus, causing an increase in the issuance of Treasury securities, higher interest rates and greater volatility in the bond market. To the extent there was no broad, sweeping mandate, there would be less uncertainty for the bond market to worry about."
The views expressed in this report reflect those of the portfolio manager only through the end of the period of the report as stated on the cover and do not necessarily represent the views of Fidelity or any other person in the Fidelity organization. Any such views are subject to change at any time based upon market or other conditions and Fidelity disclaims any responsibility to update such views. These views may not be relied on as investment advice and, because investment decisions for a Fidelity fund are based on numerous factors, may not be relied on as an indication of trading intent on behalf of any Fidelity fund.
Annual Report
|
Quality Diversification as of October 31, 2000 |
||
|
(Moody's Ratings) |
% of fund's investments |
% of fund's investments |
|
Aaa |
47.6 |
41.6 |
|
Aa |
5.4 |
4.7 |
|
A |
21.0 |
25.0 |
|
Baa |
21.1 |
20.5 |
|
Ba and Below |
0.4 |
0.9 |
|
Not Rated |
0.7 |
0.7 |
|
Table excludes short-term investments. Where Moody's ratings are not available, we have used S&P ® ratings. Securities rated as Ba or below were rated investment grade by other nationally recognized rating agencies or assigned an investment grade rating at the time of acquisition by Fidelity. |
|
Average Years to Maturity as of October 31, 2000 |
||
|
|
|
6 months ago |
|
Years |
5.9 |
5.5 |
|
Average years to maturity is based on the average time remaining until principal payments are expected from each of the fund's bonds, weighted by dollar amount. |
|
Duration as of October 31, 2000 |
||
|
|
|
6 months ago |
|
Years |
3.5 |
3.5 |
|
Duration shows how much a bond fund's price fluctuates with changes in comparable interest rates. If rates rise 1%, for example, a fund with a five-year duration is likely to lose about 5% of its value. Other factors also can influence a bond fund's performance and share price. Accordingly, a bond fund's actual performance may differ from this example. |
|
Asset Allocation (% of fund's net assets) |
|||||||
|
As of October 31, 2000 * |
As of April 30, 2000 ** |
||||||
|
Corporate Bonds 44.1% |
|
|
Corporate Bonds 47.1% |
|
||
|
U.S. Government and Government Agency Obligations 32.4% |
|
|
U.S. Government and Government Agency Obligations 31.6% |
|
||
|
Asset-Backed |
|
|
Asset-Backed |
|
||
|
CMOs and Other Mortgage Related Securities 7.0% |
|
|
CMOs and Other Mortgage Related Securities 4.2% |
|
||
|
Other Investments 5.0% |
|
|
Other Investments 5.6% |
|
||
|
Short-Term |
|
|
Short-Term |
|
||
|
* Foreign investments |
11.7% |
|
** Foreign investments |
13.3% |
|
||
Annual Report
Showing Percentage of Net Assets
|
Nonconvertible Bonds - 44.1% |
|||||
|
Moody's Ratings |
Principal Amount |
Value |
|||
|
BASIC INDUSTRIES - 1.0% |
|||||
|
Chemicals & Plastics - 0.5% |
|||||
|
Praxair, Inc. 6.15% 4/15/03 |
A3 |
|
$ 2,640,000 |
$ 2,568,588 |
|
|
Paper & Forest Products - 0.5% |
|||||
|
Abitibi-Consolidated, Inc. yankee: |
|
|
|
|
|
|
8.3% 8/1/05 |
Baa3 |
|
570,000 |
576,253 |
|
|
8.55% 8/1/10 |
Baa3 |
|
1,800,000 |
1,774,926 |
|
|
Fort James Corp. 6.625% 9/15/04 |
Baa2 |
|
255,000 |
243,038 |
|
|
|
2,594,217 |
||||
|
TOTAL BASIC INDUSTRIES |
5,162,805 |
||||
|
CONSTRUCTION & REAL ESTATE - 2.4% |
|||||
|
Real Estate - 0.8% |
|||||
|
Arden Realty LP 8.875% 3/1/05 |
Baa3 |
|
1,090,000 |
1,110,296 |
|
|
Duke Realty LP 7.3% 6/30/03 |
Baa1 |
|
3,000,000 |
2,981,940 |
|
|
|
4,092,236 |
||||
|
Real Estate Investment Trusts - 1.6% |
|||||
|
Avalonbay Communities, Inc. 8.25% 7/15/08 |
Baa1 |
|
1,500,000 |
1,524,315 |
|
|
CenterPoint Properties Trust: |
|
|
|
|
|
|
6.75% 4/1/05 |
Baa2 |
|
640,000 |
608,032 |
|
|
7.9% 1/15/03 |
Baa2 |
|
2,700,000 |
2,708,532 |
|
|
Equity Office Properties Trust 6.5% 1/15/04 |
Baa1 |
|
3,000,000 |
2,908,440 |
|
|
ProLogis Trust 6.7% 4/15/04 |
Baa1 |
|
415,000 |
402,450 |
|
|
Spieker Properties LP 6.8% 5/1/04 |
Baa2 |
|
535,000 |
520,271 |
|
|
|
8,672,040 |
||||
|
TOTAL CONSTRUCTION & REAL ESTATE |
12,764,276 |
||||
|
DURABLES - 1.5% |
|||||
|
Autos, Tires, & Accessories - 1.5% |
|||||
|
Daimler-Chrysler North America Holding Corp. 7.4% 1/20/05 |
A1 |
|
5,000,000 |
5,014,000 |
|
|
TRW, Inc. 6.625% 6/1/04 |
Baa1 |
|
3,000,000 |
2,882,340 |
|
|
|
7,896,340 |
||||
|
ENERGY - 2.0% |
|||||
|
Oil & Gas - 2.0% |
|||||
|
Apache Finance Property Ltd. 6.5% 12/15/07 |
Baa1 |
|
700,000 |
666,995 |
|
|
Canada Occidental Petroleum Ltd. 7.125% 2/4/04 |
Baa2 |
|
2,000,000 |
1,974,600 |
|
|
Nonconvertible Bonds - continued |
|||||
|
Moody's Ratings |
Principal Amount |
Value |
|||
|
ENERGY - continued |
|||||
|
Oil & Gas - continued |
|||||
|
Conoco, Inc. 5.9% 4/15/04 |
A3 |
|
$ 600,000 |
$ 582,060 |
|
|
Oryx Energy Co. 8.125% 10/15/05 |
Baa1 |
|
2,465,000 |
2,566,262 |
|
|
Ras Laffan Liquid Natural Gas Co. Ltd. yankee 8.294% 3/15/14 (c) |
Baa3 |
|
2,100,000 |
2,011,443 |
|
|
Union Pacific Resources Group, Inc. 7% 10/15/06 |
Baa1 |
|
2,700,000 |
2,677,914 |
|
|
|
10,479,274 |
||||
|
FINANCE - 20.0% |
|||||
|
Banks - 8.1% |
|||||
|
ABN-Amro Bank NV, Chicago 6.625% 10/31/01 |
A1 |
|
2,750,000 |
2,739,110 |
|
|
Australia & New Zealand Banking Group Ltd. yankee 6.25% 2/1/04 |
A1 |
|
1,200,000 |
1,168,020 |
|
|
Banc One Corp. 7.25% 8/1/02 |
A1 |
|
2,500,000 |
2,508,000 |
|
|
Bank of America Corp. 7.8% 2/15/10 |
Aa3 |
|
4,500,000 |
4,568,220 |
|
|
Bank One Corp. 7.875% 8/1/10 |
A1 |
|
2,950,000 |
2,968,349 |
|
|
BankBoston Corp. 6.625% 2/1/04 |
A3 |
|
3,200,000 |
3,137,920 |
|
|
BanPonce Financial Corp. 6.75% 8/9/01 |
A3 |
|
3,850,000 |
3,839,413 |
|
|
Barclays Bank PLC yankee 5.95% 7/15/01 |
A1 |
|
2,400,000 |
2,386,080 |
|
|
Capital One Bank 6.76% 7/23/02 |
Baa2 |
|
4,500,000 |
4,422,285 |
|
|
Capital One Financial Corp. 7.125% 8/1/08 |
Baa3 |
|
1,390,000 |
1,319,346 |
|
|
HSBC Finance Nederland BV 7.4% 4/15/03 (c) |
A1 |
|
250,000 |
252,205 |
|
|
Kansallis-Osake-Pankki (NY Branch) yankee |
A1 |
|
650,000 |
674,921 |
|
|
Korea Development Bank: |
|
|
|
|
|
|
7.125% 4/22/04 |
Baa2 |
|
175,000 |
170,195 |
|
|
7.375% 9/17/04 |
Baa2 |
|
1,110,000 |
1,083,959 |
|
|
MBNA Corp. 6.34% 6/2/03 |
Baa2 |
|
450,000 |
434,430 |
|
|
Midland Bank PLC 8.625% 12/15/04 |
Aa3 |
|
2,700,000 |
2,845,449 |
|
|
NationsBank Corp. 8.125% 6/15/02 |
Aa3 |
|
3,000,000 |
3,059,910 |
|
|
Royal Bank of Scotland Group PLC 9.118% 3/31/49 |
A1 |
|
2,000,000 |
2,083,200 |
|
|
U.S. Bancorp 7.5% 6/1/26 |
A2 |
|
2,000,000 |
2,016,880 |
|
|
Union Planters National Bank 6.81% 8/20/01 |
A3 |
|
1,500,000 |
1,498,320 |
|
|
|
43,176,212 |
||||
|
Credit & Other Finance - 9.8% |
|||||
|
Associates Corp. of North America: |
|
|
|
|
|
|
5.875% 7/15/02 |
A1 |
|
3,000,000 |
2,945,640 |
|
|
6% 4/15/03 |
A1 |
|
1,350,000 |
1,320,327 |
|
|
Nonconvertible Bonds - continued |
|||||
|
Moody's Ratings |
Principal Amount |
Value |
|||
|
FINANCE - continued |
|||||
|
Credit & Other Finance - continued |
|||||
|
CIT Group, Inc. 5.5% 2/15/04 |
A1 |
|
$ 290,000 |
$ 272,542 |
|
|
Citigroup, Inc. 7.25% 10/1/10 |
Aa3 |
|
2,700,000 |
2,678,616 |
|
|
Commercial Credit Group, Inc. 6.5% 8/1/04 |
Aa3 |
|
3,000,000 |
2,949,930 |
|
|
Daimler-Chrysler NA Holding Corp. 6.59% 6/18/02 |
A1 |
|
350,000 |
347,624 |
|
|
Duke Capital Corp. 7.5% 10/1/09 |
A3 |
|
1,800,000 |
1,810,134 |
|
|
ERP Operating LP: |
|
|
|
|
|
|
6.55% 11/15/01 |
A3 |
|
470,000 |
466,334 |
|
|
7.1% 6/23/04 |
A3 |
|
3,000,000 |
2,964,510 |
|
|
Ford Motor Credit Co.: |
|
|
|
|
|
|
5.75% 2/23/04 |
A2 |
|
2,800,000 |
2,673,832 |
|
|
7.75% 11/15/02 |
A2 |
|
100,000 |
101,233 |
|
|
General Electric Capital Corp. 6.65% 9/3/02 |
Aaa |
|
5,400,000 |
5,393,466 |
|
|
General Motors Acceptance Corp.: |
|
|
|
|
|
|
7.625% 6/15/04 |
A2 |
|
1,700,000 |
1,727,302 |
|
|
9% 10/15/02 |
A2 |
|
1,000,000 |
1,037,040 |
|
|
GS Escrow Corp. 7.125% 8/1/05 |
Ba1 |
|
550,000 |
504,565 |
|
|
Household Finance Corp. 8% 5/9/05 |
A2 |
|
1,900,000 |
1,942,997 |
|
|
HSBC Capital Funding LP 9.547% 12/31/49 (b)(c) |
A1 |
|
2,000,000 |
2,104,000 |
|
|
Newcourt Credit Group, Inc. 6.875% 2/16/05 |
A1 |
|
1,265,000 |
1,222,091 |
|
|
PNC Funding Corp. 6.95% 9/1/02 |
A2 |
|
5,000,000 |
5,002,200 |
|
|
Popular North America, Inc. 7.375% 9/15/01 |
A3 |
|
2,250,000 |
2,245,725 |
|
|
Qwest Capital Funding, Inc. 7.9% 8/15/10 (c) |
Baa1 |
|
3,000,000 |
3,043,650 |
|
|
RBSG Capital Corp. 10.125% 3/1/04 |
A2 |
|
1,500,000 |
1,619,565 |
|
|
Sears Roebuck Acceptance Corp. 6% 3/20/03 |
A3 |
|
1,725,000 |
1,681,427 |
|
|
Spear, Leeds & Kellogg LP/SLK Capital Corp. 8.25% 8/15/05 (c) |
A3 |
|
900,000 |
931,554 |
|
|
Sprint Capital Corp.: |
|
|
|
|
|
|
5.7% 11/15/03 |
Baa1 |
|
1,160,000 |
1,109,992 |
|
|
6.375% 5/1/09 |
Baa1 |
|
2,000,000 |
1,789,800 |
|
|
Trizec Finance Ltd. yankee 10.875% 10/15/05 |
Baa3 |
|
590,000 |
595,900 |
|
|
UBS Preferred Funding Trust 1 8.622% 12/29/49 |
Aa2 |
|
1,300,000 |
1,313,000 |
|
|
Unicredito Italiano Capital Trust II yankee 9.2% 10/29/49 (b)(c) |
A1 |
|
500,000 |
496,880 |
|
|
|
52,291,876 |
||||
|
Insurance - 0.2% |
|||||
|
The St. Paul Companies, Inc. 7.875% 4/15/05 |
A1 |
|
1,100,000 |
1,127,390 |
|
|
Nonconvertible Bonds - continued |
|||||
|
Moody's Ratings |
Principal Amount |
Value |
|||
|
FINANCE - continued |
|||||
|
Savings & Loans - 0.1% |
|||||
|
Long Island Savings Bank FSB 6.2% 4/2/01 |
Baa3 |
|
$ 900,000 |
$ 893,844 |
|
|
Securities Industry - 1.8% |
|||||
|
Amvescap PLC yankee 6.6% 5/15/05 |
A2 |
|
700,000 |
669,046 |
|
|
Goldman Sachs Group, Inc. 7.625% 8/17/05 |
A1 |
|
4,550,000 |
4,604,418 |
|
|
Merrill Lynch & Co., Inc. 8.3% 11/1/02 |
Aa3 |
|
2,750,000 |
2,818,255 |
|
|
Morgan Stanley Dean Witter & Co. 7.125% 1/15/03 |
Aa3 |
|
1,500,000 |
1,505,775 |
|
|
|
9,597,494 |
||||
|
TOTAL FINANCE |
107,086,816 |
||||
|
INDUSTRIAL MACHINERY & EQUIPMENT - 0.7% |
|||||
|
Tyco International Group SA: |
|
|
|
|
|
|
6.875% 9/5/02 |
Baa1 |
|
1,600,000 |
1,587,920 |
|
|
yankee: |
|
|
|
|
|
|
6.125% 6/15/01 |
Baa1 |
|
1,200,000 |
1,189,260 |
|
|
6.375% 6/15/05 |
Baa1 |
|
1,000,000 |
964,100 |
|
|
TOTAL INDUSTRIAL MACHINERY & EQUIPMENT |
3,741,280 |
||||
|
MEDIA & LEISURE - 3.3% |
|||||
|
Broadcasting - 1.7% |
|||||
|
British Sky Broadcasting Group PLC 7.3% 10/15/06 |
Ba1 |
|
2,000,000 |
1,814,620 |
|
|
Clear Channel Communications, Inc. 7.875% 6/15/05 |
Baa3 |
|
2,900,000 |
2,922,736 |
|
|
Continental Cablevision, Inc. 8.3% 5/15/06 |
A2 |
|
2,370,000 |
2,427,378 |
|
|
Hearst-Argyle Television, Inc. 7% 11/15/07 |
Baa3 |
|
1,000,000 |
948,720 |
|
|
TCI Communications, Inc. 8.65% 9/15/04 |
A2 |
|
900,000 |
932,841 |
|
|
|
9,046,295 |
||||
|
Entertainment - 0.4% |
|||||
|
Walt Disney Co. 7.3% 2/8/05 |
A2 |
|
2,000,000 |
2,031,000 |
|
|
Publishing - 1.2% |
|||||
|
News America Holdings, Inc. 8.5% 2/15/05 |
Baa3 |
|
2,765,000 |
2,855,498 |
|
|
Time Warner Entertainment Co. LP 7.25% 9/1/08 |
Baa2 |
|
3,900,000 |
3,844,659 |
|
|
|
6,700,157 |
||||
|
TOTAL MEDIA & LEISURE |
17,777,452 |
||||
|
Nonconvertible Bonds - continued |
|||||
|
Moody's Ratings |
Principal Amount |
Value |
|||
|
NONDURABLES - 2.7% |
|||||
|
Beverages - 0.8% |
|||||
|
Seagram JE & Sons, Inc.: |
|
|
|
|
|
|
6.4% 12/15/03 |
Baa3 |
|
$ 3,000,000 |
$ 2,999,760 |
|
|
6.625% 12/15/05 |
Baa3 |
|
1,285,000 |
1,293,815 |
|
|
|
4,293,575 |
||||
|
Foods - 1.1% |
|||||
|
ConAgra Foods, Inc. 7.875% 9/15/10 |
Baa1 |
|
3,200,000 |
3,247,488 |
|
|
Nabisco, Inc. 6.85% 6/15/05 |
Baa2 |
|
2,700,000 |
2,588,274 |
|
|
|
5,835,762 |
||||
|
Tobacco - 0.8% |
|||||
|
Philip Morris Companies, Inc.: |
|
|
|
|
|
|
7% 7/15/05 |
A2 |
|
2,700,000 |
2,596,212 |
|
|
7.5% 4/1/04 |
A2 |
|
750,000 |
740,955 |
|
|
RJ Reynolds Tobacco Holdings, Inc. 7.375% 5/15/03 |
Baa2 |
|
1,300,000 |
1,230,229 |
|
|
|
4,567,396 |
||||
|
TOTAL NONDURABLES |
14,696,733 |
||||
|
RETAIL & WHOLESALE - 0.7% |
|||||
|
General Merchandise Stores - 0.7% |
|||||
|
Federated Department Stores, Inc.: |
|
|
|
|
|
|
8.5% 6/15/03 |
Baa1 |
|
1,375,000 |
1,365,348 |
|
|
8.5% 6/1/10 |
Baa1 |
|
2,300,000 |
2,220,834 |
|
|
|
3,586,182 |
||||
|
TECHNOLOGY - 1.0% |
|||||
|
Communications Equipment - 0.5% |
|||||
|
Marconi PLC yankee 7.75% 9/15/10 |
A3 |
|
2,700,000 |
2,599,182 |
|
|
Computers & Office Equipment - 0.5% |
|||||
|
Comdisco, Inc. 5.95% 4/30/02 |
Baa2 |
|
2,000,000 |
1,460,000 |
|
|
Compaq Computer Corp. 7.45% 8/1/02 |
Baa2 |
|
1,500,000 |
1,497,765 |
|
|
|
2,957,765 |
||||
|
TOTAL TECHNOLOGY |
5,556,947 |
||||
|
Nonconvertible Bonds - continued |
|||||
|
Moody's Ratings |
Principal Amount |
Value |
|||
|
TRANSPORTATION - 0.5% |
|||||
|
Air Transportation - 0.5% |
|||||
|
Continental Airlines, Inc. pass thru trust certificates: |
|
|
|
|
|
|
7.434% 3/15/06 |
Baa1 |
|
$ 435,000 |
$ 426,605 |
|
|
7.73% 9/15/12 |
Baa1 |
|
158,342 |
154,589 |
|
|
Delta Air Lines, Inc. 7.7% 12/15/05 |
Baa3 |
|
2,000,000 |
1,931,180 |
|
|
|
2,512,374 |
||||
|
UTILITIES - 8.3% |
|||||
|
Cellular - 0.6% |
|||||
|
Vodafone AirTouch PLC 7.75% 2/15/10 (c) |
A2 |
|
3,000,000 |
3,045,870 |
|
|
Electric Utility - 2.8% |
|||||
|
Avon Energy Partners Holdings 6.46% 3/4/08 (c) |
Baa2 |
|
2,000,000 |
1,804,220 |
|
|
Dominion Resources, Inc. 7.625% 7/15/05 |
Baa1 |
|
2,000,000 |
2,019,840 |
|
|
DR Investments UK PLC yankee 7.1% 5/15/02 (c) |
A2 |
|
5,000,000 |
4,974,550 |
|
|
Niagara Mohawk Power Corp. 8.875% 5/15/07 |
Baa3 |
|
400,000 |
420,400 |
|
|
NSTAR Companies 8% 2/15/10 |
A2 |
|
2,400,000 |
2,421,216 |
|
|
Philadelphia Electric Co. 6.5% 5/1/03 |
Baa1 |
|
2,050,000 |
2,015,355 |
|
|
Texas Utilities Electric Co. 8% 6/1/02 |
A3 |
|
1,475,000 |
1,496,919 |
|
|
|
15,152,500 |
||||
|
Gas - 1.7% |
|||||
|
Enron Corp.: |
|
|
|
|
|
|
6.5% 8/1/02 |
Baa1 |
|
1,000,000 |
988,700 |
|
|
9.875% 6/15/03 |
Baa1 |
|
3,800,000 |
4,055,892 |
|
|
Reliant Energy Resources Corp. 8.125% 7/15/05 (c) |
Baa1 |
|
2,000,000 |
2,024,020 |
|
|
Sempra Energy 7.95% 3/1/10 |
A2 |
|
1,800,000 |
1,816,272 |
|
|
|
8,884,884 |
||||
|
Telephone Services - 3.2% |
|||||
|
Cable & Wireless Optus Ltd. 8% 6/22/10 (c) |
Baa1 |
|
2,000,000 |
2,065,300 |
|
|
Telecomunicaciones de Puerto Rico, Inc.: |
|
|
|
|
|
|
6.15% 5/15/02 |
Baa2 |
|
3,650,000 |
3,583,716 |
|
|
6.65% 5/15/06 |
Baa2 |
|
1,330,000 |
1,263,952 |
|
|
Nonconvertible Bonds - continued |
|||||
|
Moody's Ratings |
Principal Amount |
Value |
|||
|
UTILITIES - continued |
|||||
|
Telephone Services - continued |
|||||
|
Telefonica Europe BV 7.75% 9/15/10 |
A2 |
|
$ 2,700,000 |
$ 2,716,308 |
|
|
Teleglobe Canada, Inc.: |
|
|
|
|
|
|
7.2% 7/20/09 |
Baa1 |
|
3,745,000 |
3,589,508 |
|
|
7.7% 7/20/29 |
Baa1 |
|
1,000,000 |
943,530 |
|
|
WorldCom, Inc.: |
|
|
|
|
|
|
6.4% 8/15/05 |
A3 |
|
900,000 |
867,663 |
|
|
7.75% 4/1/07 |
A3 |
|
300,000 |
303,564 |
|
|
8.25% 5/15/10 |
A3 |
|
2,000,000 |
2,082,900 |
|
|
|
17,416,441 |
||||
|
TOTAL UTILITIES |
44,499,695 |
||||
|
TOTAL NONCONVERTIBLE BONDS (Cost $236,299,705) |
235,760,174 |
||||
|
U.S. Government and Government Agency Obligations - 19.0% |
|||||
|
|
|||||
|
U.S. Government Agency Obligations - 7.7% |
|||||
|
Fannie Mae: |
|
|
|
|
|
|
6.375% 10/15/02 |
Aaa |
|
3,000,000 |
2,998,590 |
|
|
6.5% 4/29/09 |
Aaa |
|
14,410,000 |
13,721,058 |
|
|
7% 7/15/05 |
Aaa |
|
2,260,000 |
2,302,737 |
|
|
7.125% 2/15/05 |
Aaa |
|
3,120,000 |
3,188,234 |
|
|
Farm Credit Systems Financial Assistance Corp. 9.375% 7/21/03 |
Aaa |
|
1,800,000 |
1,927,116 |
|
|
Freddie Mac: |
|
|
|
|
|
|
6.875% 1/15/05 |
Aaa |
|
980,000 |
992,554 |
|
|
7% 7/15/05 |
Aaa |
|
15,625,000 |
15,917,969 |
|
|
Government Trust Certificates (assets of Trust guaranteed by U.S. Government through Defense Security Assistance Agency) Class 2-E, 9.4% 5/15/02 |
Aaa |
|
274,886 |
277,071 |
|
|
TOTAL U.S. GOVERNMENT AGENCY OBLIGATIONS |
41,325,329 |
||||
|
U.S. Government and Government Agency Obligations - continued |
|||||
|
Moody's Ratings |
Principal Amount |
Value |
|||
|
U.S. Treasury Obligations - 11.3% |
|||||
|
U.S. Treasury Bonds: |
|
|
|
|
|
|
11.25% 2/15/15 |
Aaa |
|
$ 5,325,000 |
$ 7,984,145 |
|
|
12% 8/15/13 |
Aaa |
|
10,390,000 |
14,200,221 |
|
|
14% 11/15/11 |
Aaa |
|
1,510,000 |
2,112,581 |
|
|
U.S. Treasury Notes: |
|
|
|
|
|
|
5.25% 5/31/01 |
Aaa |
|
6,700,000 |
6,654,581 |
|
|
5.5% 2/15/08 |
Aaa |
|
11,715,000 |
11,466,056 |
|
|
7.5% 11/15/01 |
Aaa |
|
6,190,000 |
6,262,547 |
|
|
7.875% 8/15/01 |
Aaa |
|
11,300,000 |
11,427,125 |
|
|
TOTAL U.S. TREASURY OBLIGATIONS |
60,107,256 |
||||
|
TOTAL U.S. GOVERNMENT AND (Cost $101,084,590) |
101,432,585 |
||||
|
U.S. Government Agency - Mortgage Securities - 13.4% |
|||||
|
|
|||||
|
Fannie Mae - 8.4% |
|||||
|
5.5% 9/1/10 to 5/1/11 |
Aaa |
|
1,295,278 |
1,230,959 |
|
|
6% 3/1/11 to 2/1/14 |
Aaa |
|
11,375,526 |
10,956,555 |
|
|
6.5% 4/1/29 to 12/1/29 |
Aaa |
|
3,486,058 |
3,350,149 |
|
|
7% 12/1/23 to 12/1/28 |
Aaa |
|
2,835,758 |
2,786,977 |
|
|
7.5% 8/1/17 to 6/1/29 |
Aaa |
|
16,338,324 |
16,337,395 |
|
|
8% 1/1/30 to 8/1/30 |
Aaa |
|
6,226,687 |
6,302,528 |
|
|
8.5% 6/1/11 to 9/1/25 |
Aaa |
|
1,241,623 |
1,271,745 |
|
|
9.5% 2/1/25 |
Aaa |
|
1,231,926 |
1,295,444 |
|
|
10% 1/1/20 |
Aaa |
|
29,544 |
31,658 |
|
|
10.5% 7/1/11 to 8/1/20 |
Aaa |
|
175,191 |
187,868 |
|
|
11% 8/1/15 |
Aaa |
|
1,063,827 |
1,153,848 |
|
|
12.5% 2/1/11 to 4/1/15 |
Aaa |
|
51,859 |
58,486 |
|
|
TOTAL FANNIE MAE |
44,963,612 |
||||
|
Freddie Mac - 1.1% |
|||||
|
7.5% 9/1/30 to 11/1/30 |
Aaa |
|
3,919,611 |
3,917,141 |
|
|
8.5% 9/1/24 to 8/1/27 |
Aaa |
|
1,225,336 |
1,255,732 |
|
|
9.5% 1/1/17 |
Aaa |
|
13,647 |
14,261 |
|
|
10% 4/1/06 to 8/1/10 |
Aaa |
|
93,655 |
96,088 |
|
|
10.25% 12/1/09 |
Aaa |
|
21,954 |
23,067 |
|
|
10.5% 5/1/21 |
Aaa |
|
256,433 |
276,981 |
|
|
11% 12/1/11 |
Aaa |
|
15,120 |
16,135 |
|
|
U.S. Government Agency - Mortgage Securities - continued |
|||||
|
Moody's Ratings |
Principal Amount |
Value |
|||
|
Freddie Mac - continued |
|||||
|
11.5% 10/1/15 |
Aaa |
|
$ 52,250 |
$ 57,015 |
|
|
11.75% 10/1/10 |
Aaa |
|
31,649 |
34,009 |
|
|
TOTAL FREDDIE MAC |
5,690,429 |
||||
|
Government National Mortgage Association - 3.9% |
|||||
|
6.5% 2/15/29 |
Aaa |
|
4,411,018 |
4,258,000 |
|
|
7.5% 2/15/28 to 10/15/28 |
Aaa |
|
295,545 |
296,583 |
|
|
8% 2/15/02 to 6/15/25 |
Aaa |
|
1,547,162 |
1,570,358 |
|
|
8.5% 4/15/17 to 10/15/30 |
Aaa |
|
13,983,380 |
14,342,594 |
|
|
11% 7/20/19 to 8/20/19 |
Aaa |
|
186,224 |
200,829 |
|
|
TOTAL GOVERNMENT NATIONAL MORTGAGE ASSOCIATION |
20,668,364 |
||||
|
TOTAL U.S. GOVERNMENT AGENCY - MORTGAGE SECURITIES (Cost $72,051,847) |
71,322,405 |
||||
|
Asset-Backed Securities - 7.9% |
|||||
|
|
|||||
|
American Express Credit Account Master Trust 6.1% 12/15/06 |
A1 |
|
1,100,000 |
1,073,182 |
|
|
Americredit Automobile Receivables Trust 7.15% 8/15/04 |
Aaa |
|
4,000,000 |
4,017,500 |
|
|
Associates Auto Receivables Trust 6.9% |
Aaa |
|
3,000,000 |
3,007,500 |
|
|
Capital One Master Trust 7.1% 4/17/06 |
Aaa |
|
4,000,000 |
4,040,000 |
|
|
Chase Manhattan Grantor Trust 6.76% |
A3 |
|
75,071 |
75,000 |
|
|
Conseco Finance Securitizations Corp. 7.3% 5/1/31 |
Aaa |
|
3,500,000 |
3,518,585 |
|
|
Discover Card Master Trust I 5.85% 11/16/04 |
A2 |
|
2,000,000 |
1,973,438 |
|
|
Ford Credit Auto Owner Trust: |
|
|
|
|
|
|
6.4% 12/15/02 |
Aa2 |
|
590,000 |
587,004 |
|
|
7.03% 11/15/03 |
Aaa |
|
332,000 |
334,646 |
|
|
MBNA Master Credit Card Trust II 7.35% 7/16/07 |
Aaa |
|
4,500,000 |
4,609,160 |
|
|
Orix Credit Alliance Receivables Trust 7.12% 5/15/04 |
Aaa |
|
2,500,000 |
2,503,906 |
|
|
Premier Auto Trust 5.59% 2/9/04 |
Aaa |
|
5,000,000 |
4,909,350 |
|
|
Asset-Backed Securities - continued |
|||||
|
Moody's Ratings |
Principal Amount |
Value |
|||
|
Sears Credit Account Master Trust II: |
|
|
|
|
|
|
5.65% 3/17/09 |
Aaa |
|
$ 2,000,000 |
$ 1,938,740 |
|
|
7% 7/15/08 |
Aaa |
|
5,100,000 |
5,133,456 |
|
|
West Penn Funding LLC 6.81% 9/25/08 |
Aaa |
|
4,500,000 |
4,493,496 |
|
|
TOTAL ASSET-BACKED SECURITIES (Cost $41,955,888) |
42,214,963 |
||||
|
Collateralized Mortgage Obligations - 1.1% |
|||||
|
|
|||||
|
U.S. Government Agency - 1.1% |
|||||
|
Freddie Mac sequential pay Series 2061 Class J, 6.5% 9/20/22 |
Aaa |
|
2,176,882 |
2,142,182 |
|
|
Government National Mortgage Association sequential pay Series 1998-19 Class B, 6.5% 2/20/23 |
Aaa |
|
3,933,991 |
3,862,668 |
|
|
TOTAL COLLATERALIZED MORTGAGE OBLIGATIONS (Cost $5,998,964) |
6,004,850 |
||||
|
Commercial Mortgage Securities - 5.9% |
|||||
|
|
|||||
|
Commercial Mortgage Asset Trust sequential pay Series 1999-C2 Class A1, 7.285% 12/17/07 |
Aaa |
|
3,559,129 |
3,602,506 |
|
|
CS First Boston Mortgage Securities Corp.: |
|
|
|
|
|
|
sequential pay Series 1997-SPICE Class D, 7.332% 4/20/08 |
- |
|
4,000,000 |
3,934,376 |
|
|
sequential pay Series 2000-C1 Class A1, 7.325% 4/15/62 |
AAA |
|
2,075,821 |
2,103,450 |
|
|
Series 1995-WF1 Class A2, 6.648% 12/21/27 |
AAA |
|
2,519,592 |
2,484,162 |
|
|
Series 1998-FL1: |
|
|
|
|
|
|
Class D, 7.1188% 12/10/00 (c)(d) |
Aa1 |
|
1,600,000 |
1,599,875 |
|
|
Class E, 7.4688% 1/10/13 (c)(d) |
Baa1 |
|
2,970,000 |
3,022,670 |
|
|
Equitable Life Assurance Society of the United States Series 174 Class C1, 7.52% 5/15/06 (c) |
A2 |
|
1,000,000 |
1,003,125 |
|
|
Heller Financial Commercial Mortgage Asset Corp. sequential pay Series 2000-PH1 Class A1, 7.715% 9/15/08 |
Aaa |
|
3,588,974 |
3,687,671 |
|
|
Hilton Hotel Pool Trust Series 2000 HLT Class A1, 7.055% 10/3/10 |
Aaa |
|
2,000,000 |
2,004,942 |
|
|
JP Morgan Commercial Mortgage Finance Corp. Series 2000-C10 Class A1, 7.1075% 8/15/32 |
Aaa |
|
2,753,184 |
2,767,272 |
|
|
Commercial Mortgage Securities - continued |
|||||
|
Moody's Ratings |
Principal Amount |
Value |
|||
|
LB-UBS Commercial Mortgage Trust |
Aaa |
|
$ 2,874,661 |
$ 2,989,647 |
|
|
Thirteen Affiliates of General Growth |
Aaa |
|
2,500,000 |
2,460,840 |
|
|
TOTAL COMMERCIAL MORTGAGE SECURITIES (Cost $31,267,822) |
31,660,536 |
||||
|
Foreign Government and Government Agency Obligations (e) - 3.2% |
|||||
|
|
|||||
|
Canadian Government 6.125% 7/15/02 |
Aa1 |
|
5,000,000 |
4,972,500 |
|
|
Chile Republic 6.875% 4/28/09 |
Baa1 |
|
2,700,000 |
2,494,773 |
|
|
Korean Republic yankee: |
|
|
|
|
|
|
8.75% 4/15/03 |
Baa2 |
|
550,000 |
562,265 |
|
|
8.875% 4/15/08 |
Baa2 |
|
2,000,000 |
2,079,920 |
|
|
New Brunswick Province yankee 7.125% 10/1/02 |
A1 |
|
2,250,000 |
2,268,878 |
|
|
Quebec Province 5.75% 2/15/09 |
A2 |
|
2,500,000 |
2,292,000 |
|
|
United Mexican States 8.5% 2/1/06 |
Baa3 |
|
2,400,000 |
2,392,800 |
|
|
TOTAL FOREIGN GOVERNMENT AND (Cost $16,972,631) |
17,063,136 |
||||
|
Supranational Obligations - 1.8% |
|||||
|
|
|||||
|
Inter-American Development Bank yankee |
Aaa |
|
10,000,000 |
9,753,200 |
|
|
Cash Equivalents - 3.7% |
|||
|
Maturity Amount |
|
||
|
Investments in repurchase agreements (U.S. Government Obligations), in a joint trading account at 6.62%, |
$ 19,954,668 |
$ 19,951,000 |
|
|
TOTAL INVESTMENT PORTFOLIO - 100.1% (Cost $535,519,547) |
535,162,849 |
||
|
NET OTHER ASSETS - (0.1)% |
(635,358) |
||
|
NET ASSETS - 100% |
$ 534,527,491 |
||
|
Legend |
|
(a) S&P credit ratings are used in the absence of a rating by Moody's Investors Service, Inc. |
|
(b) Debt obligation initially issued at one coupon which converts to a higher coupon at a specified date. The rate shown is the rate at period end. |
|
(c) Security exempt from registration under Rule 144A of the Securities Act of 1933. These securities may be resold in transactions exempt from registration, normally to qualified institutional buyers. At the period end, the value of these securities amounted to $30,840,202 or 5.8% of net assets. |
|
(d) The coupon rate shown on floating or adjustable rate securities represents the rate at period end. |
|
(e) For foreign government obligations not individually rated by S&P or Moody's, the ratings listed have been assigned by FMR, the fund's investment adviser, based principally on S&P and Moody's ratings of the sovereign credit of the issuing government. |
|
Other Information |
|
The composition of long-term debt holdings as a percentage of total value of investments in securities, is as follows (ratings are unaudited): |
|
Moody's Ratings |
S&P Ratings |
|||
|
Aaa, Aa, A |
73.1% |
|
AAA, AA, A |
62.5% |
|
Baa |
21.1% |
|
BBB |
21.8% |
|
Ba |
0.4% |
|
BB |
1.2% |
|
B |
0.0% |
|
B |
0.0% |
|
Caa |
0.0% |
|
CCC |
0.0% |
|
Ca, C |
0.0% |
|
CC, C |
0.0% |
|
|
|
|
D |
0.0% |
|
The percentage not rated by Moody's or S&P amounted to 0.7%. |
|
Distribution of investments by country of issue, as a percentage of total net assets, is as follows: |
|
United States of America |
88.3% |
|
United Kingdom |
3.8 |
|
Canada |
2.8 |
|
Multi-National |
1.8 |
|
Others (individually less than 1%) |
3.3 |
|
|
100.0% |
|
Income Tax Information |
|
At October 31, 2000, the aggregate cost of investment securities for income tax purposes was $535,849,274. Net unrealized depreciation aggregated $686,425, of which $4,342,505 related to appreciated investment securities and $5,028,930 related to depreciated investment securities. |
|
At October 31, 2000, the fund had a capital loss carryforward of approximately $27,085,000 of which $9,361,000, $1,410,000, $3,985,000 and $12,329,000 will expire on October 31, 2004, 2005, 2007 and 2008, respectively. |
See accompanying notes which are an integral part of the financial statements.
Annual Report
Statement of Assets and Liabilities
|
|
October 31, 2000 |
|
|
Assets |
|
|
|
Investment in securities, at value (including repurchase agreements of $19,951,000) (cost $535,519,547) - See accompanying schedule |
|
$ 535,162,849 |
|
Cash |
|
26,317 |
|
Receivable for investments sold |
|
6,656,487 |
|
Receivable for fund shares sold |
|
1,215,361 |
|
Interest receivable |
|
7,576,522 |
|
Total assets |
|
550,637,536 |
|
Liabilities |
|
|
|
Payable for investments purchased |
$ 10,989,196 |
|
|
Payable for fund shares redeemed |
4,319,908 |
|
|
Distributions payable |
318,030 |
|
|
Accrued management fee |
191,174 |
|
|
Distribution fees payable |
136,942 |
|
|
Other payables and accrued expenses |
154,795 |
|
|
Total liabilities |
|
16,110,045 |
|
Net Assets |
|
$ 534,527,491 |
|
Net Assets consist of: |
|
|
|
Paid in capital |
|
$ 562,970,197 |
|
Distributions in excess of net investment income |
|
(696,903) |
|
Accumulated undistributed net realized gain (loss) on investments and foreign currency transactions |
|
(27,389,105) |
|
Net unrealized appreciation (depreciation) on investments |
|
(356,698) |
|
Net Assets |
|
$ 534,527,491 |
See accompanying notes which are an integral part of the financial statements.
Annual Report
Financial Statements - continued
Statement of Assets and Liabilities - continued
|
|
October 31, 2000 |
|
|
Calculation of Maximum Offering Price |
|
$10.30 |
|
Maximum offering price per share (100/96.25 of $10.30) |
|
$10.70 |
|
Class T: |
|
$10.31 |
|
Maximum offering price per share (100/97.25 of $10.31) |
|
$10.60 |
|
Class B: |
|
$10.30 |
|
Class C: |
|
$10.29 |
|
Institutional Class: |
|
$10.32 |
A Redemption price per share is equal to net asset value less any applicable contingent deferred sales charge.
See accompanying notes which are an integral part of the financial statements.
Annual Report
Financial Statements - continued
Statement of Operations
|
|
Year ended October 31, 2000 |
|
|
Investment Income Interest |
|
$ 37,609,266 |
|
Security lending |
|
43,742 |
|
Total Income |
|
37,653,008 |
|
Expenses |
|
|
|
Management fee |
$ 2,277,055 |
|
|
Transfer agent fees |
1,113,985 |
|
|
Distribution fees |
1,590,192 |
|
|
Accounting and security lending fees |
158,368 |
|
|
Non-interested trustees' compensation |
1,802 |
|
|
Custodian fees and expenses |
36,706 |
|
|
Registration fees |
122,115 |
|
|
Audit |
36,950 |
|
|
Legal |
8,534 |
|
|
Miscellaneous |
5,072 |
|
|
Total expenses before reductions |
5,350,779 |
|
|
Expense reductions |
(4,493) |
5,346,286 |
|
Net investment income |
|
32,306,722 |
|
Realized and Unrealized Gain (Loss) Net realized gain (loss) on investment securities |
|
(12,232,243) |
|
Change in net unrealized appreciation (depreciation) |
|
11,362,314 |
|
Net gain (loss) |
|
(869,929) |
|
Net increase (decrease) in net assets resulting |
|
$ 31,436,793 |
See accompanying notes which are an integral part of the financial statements.
Annual Report
Financial Statements - continued
Statement of Changes in Net Assets
|
|
Year ended
October 31, |
Year ended
October 31, |
|
Increase (Decrease) in Net Assets |
|
|
|
Operations |
$ 32,306,722 |
$ 30,133,116 |
|
Net realized gain (loss) |
(12,232,243) |
(4,437,550) |
|
Change in net unrealized appreciation (depreciation) |
11,362,314 |
(20,620,170) |
|
Net increase (decrease) in net assets resulting |
31,436,793 |
5,075,396 |
|
Distributions to shareholders from net investment income |
(31,864,025) |
(29,409,259) |
|
Share transactions - net increase (decrease) |
(41,785,512) |
91,347,340 |
|
Total increase (decrease) in net assets |
(42,212,744) |
67,013,477 |
|
Net Assets |
|
|
|
Beginning of period |
576,740,235 |
509,726,758 |
|
End of period (including distributions in excess of |
$ 534,527,491 |
$ 576,740,235 |
See accompanying notes which are an integral part of the financial statements.
Annual Report
Financial Highlights - Class A
|
Years ended October 31, |
2000 |
1999 |
1998 H |
1997 I |
1996 E |
|
Selected Per-Share Data |
|
|
|
|
|
|
Net asset value, |
$ 10.300 |
$ 10.770 |
$ 10.560 |
$ 10.590 |
$ 10.350 |
|
Income from Investment Operations |
|
|
|
|
|
|
Net investment income D |
.629 |
.580 |
.537 |
.615 |
.159 |
|
Net realized and unrealized gain (loss) |
(.002) |
(.474) |
.207 |
(.023) |
.235 |
|
Total from investment |
.627 |
.106 |
.744 |
.592 |
.394 |
|
Less Distributions |
|
|
|
|
|
|
From net investment income |
(.627) |
(.576) |
(.534) |
(.622) |
(.154) |
|
Net asset value, end of period |
$ 10.300 |
$ 10.300 |
$ 10.770 |
$ 10.560 |
$ 10.590 |
|
Total Return B, C |
6.32% |
1.00% |
7.21% |
5.81% |
3.83% |
|
Ratios and Supplemental Data |
|
|
|
|
|
|
Net assets, end of period |
$ 48,177 |
$ 22,628 |
$ 8,217 |
$ 3,819 |
$ 687 |
|
Ratio of expenses to average |
.84% |
.87% |
.90% A, F |
.90% F |
.90% A, F |
|
Ratio of expenses to average |
.84% |
.86% G |
.90% A |
.90% |
.90% A |
|
Ratio of net investment income |
6.20% |
5.58% |
5.51% A |
5.93% |
6.45% A |
|
Portfolio turnover rate |
153% |
138% |
176% A |
138% |
200% |
A Annualized
B The total returns would have been lower had certain expenses not been reduced during the periods shown.
C Total returns do not include the one time sales charge and for periods of less than one year are not annualized.
D Net investment income per share has been calculated based on average shares outstanding during the period.
E For the period September 3, 1996 (commencement of sale of Class A shares) to November 30, 1996.
F FMR agreed to reimburse a portion of the class' expenses during the period. Without this reimbursement, the class' expense ratio would have been higher.
G FMR or the fund has entered into varying arrangements with third parties who either paid or reduced a portion of the class' expenses.
H Eleven months ended October 31
I Year ended November 30
See accompanying notes which are an integral part of the financial statements.
Annual Report
Financial Highlights - Class T
|
Years ended October 31, |
2000 |
1999 |
1998 G |
1997 H |
1996 H |
1995 H |
|
Selected Per-Share Data |
|
|
|
|
|
|
|
Net asset value, |
$ 10.310 |
$ 10.770 |
$ 10.560 |
$ 10.610 |
$ 10.760 |
$ 10.260 |
|
Income from Investment Operations |
|
|
|
|
|
|
|
Net investment income |
.620 D |
.576 D |
.537 D |
.625 D |
.671 D |
.649 |
|
Net realized and |
(.006) |
(.473) |
.201 |
(.058) |
(.147) |
.491 |
|
Total from investment operations |
.614 |
.103 |
.738 |
.567 |
.524 |
1.140 |
|
Less Distributions |
|
|
|
|
|
|
|
From net investment |
(.614) |
(.563) |
(.528) |
(.617) |
(.674) |
(.640) |
|
Net asset value, |
$ 10.310 |
$ 10.310 |
$ 10.770 |
$ 10.560 |
$ 10.610 |
$ 10.760 |
|
Total Return B, C |
6.18% |
0.98% |
7.15% |
5.56% |
5.10% |
11.43% |
|
Ratios and Supplemental Data |
|
|
|
|
|
|
|
Net assets, end of period (000 omitted) |
$ 313,887 |
$ 315,350 |
$ 287,734 |
$ 278,869 |
$ 262,103 |
$ 228,439 |
|
Ratio of expenses to average net assets |
.97% |
.97% |
.98% A |
.96% |
.97% |
.94% E |
|
Ratio of expenses to average net assets after expense reductions |
.97% |
.97% |
.98% A |
.96% |
.96% F |
.94% |
|
Ratio of net investment
income to average |
6.07% |
5.48% |
5.48% A |
5.97% |
6.38% |
6.20% |
|
Portfolio turnover rate |
153% |
138% |
176% A |
138% |
200% |
189% |
A Annualized
B The total returns would have been lower had certain expenses not been reduced during the periods shown.
C Total returns do not include the one time sales charge and for periods of less than one year are not annualized.
D Net investment income per share has been calculated based on average shares outstanding during the period.
E FMR agreed to reimburse a portion of the class' expenses during the period. Without this reimbursement, the class' expense ratio would have been higher.
F FMR or the fund has entered into varying arrangements with third parties who either paid or reduced a portion of the class' expenses.
G Eleven months ended October 31
H Year ended November 30
See accompanying notes which are an integral part of the financial statements.
Annual Report
Financial Highlights - Class B
|
Years ended October 31, |
2000 |
1999 |
1998 F |
1997 G |
1996 G |
1995 G |
|
Selected Per-Share Data |
|
|
|
|
|
|
|
Net asset value, beginning of period |
$ 10.300 |
$ 10.760 |
$ 10.540 |
$ 10.590 |
$ 10.750 |
$ 10.250 |
|
Income from Investment Operations |
|
|
|
|
|
|
|
Net investment |
.553 D |
.506 D |
.468 D |
.551 D |
.597 D |
.579 |
|
Net realized |
(.006) |
(.467) |
.214 |
(.057) |
(.153) |
.483 |
|
Total from investment operations |
.547 |
.039 |
.682 |
.494 |
.444 |
1.062 |
|
Less Distributions |
|
|
|
|
|
|
|
From net investment income |
(.547) |
(.499) |
(.462) |
(.544) |
(.604) |
(.562) |
|
Net asset value, |
$ 10.300 |
$ 10.300 |
$ 10.760 |
$ 10.540 |
$ 10.590 |
$ 10.750 |
|
Total Return B, C |
5.50% |
0.37% |
6.60% |
4.83% |
4.32% |
10.62% |
|
Ratios and Supplemental Data |
|
|
|
|
|
|
|
Net assets, end of period (000 omitted) |
$ 63,584 |
$ 64,532 |
$ 39,657 |
$ 22,201 |
$ 18,972 |
$ 15,830 |
|
Ratio of expenses to average net assets |
1.62% |
1.61% |
1.65% A, E |
1.65% E |
1.66% E |
1.70% E |
|
Ratio of net investment
income to average |
5.42% |
4.83% |
4.79% A |
5.27% |
5.69% |
5.44% |
|
Portfolio turnover rate |
153% |
138% |
176% A |
138% |
200% |
189% |
A Annualized
B The total returns would have been lower had certain expenses not been reduced during the periods shown.
C Total returns do not include the contingent deferred sales charge and for periods of less than one year are not annualized.
D Net investment income per share has been calculated based on average shares outstanding during the period.
E FMR agreed to reimburse a portion of the class' expenses during the period. Without this reimbursement, the class' expense ratio would have been higher.
F Eleven months ended October 31
G Year ended November 30
See accompanying notes which are an integral part of the financial statements.
Annual Report
Financial Highlights - Class C
|
Years ended October 31, |
2000 |
1999 |
1998 H |
1997 E |
|
Selected Per-Share Data |
|
|
|
|
|
Net asset value, beginning of period |
$ 10.290 |
$ 10.760 |
$ 10.560 |
$ 10.570 |
|
Income from Investment Operations |
|
|
|
|
|
Net investment income D |
.545 |
.492 |
.453 |
.031 |
|
Net realized and unrealized gain (loss) |
(.005) |
(.472) |
.199 |
(.005) |
|
Total from investment operations |
.540 |
.020 |
.652 |
.026 |
|
Less Distributions |
|
|
|
|
|
From net investment income |
(.540) |
(.490) |
(.452) |
(.036) |
|
Net asset value, end of period |
$ 10.290 |
$ 10.290 |
$ 10.760 |
$ 10.560 |
|
Total Return B, C |
5.42% |
0.19% |
6.30% |
0.25% |
|
Ratios and Supplemental Data |
|
|
|
|
|
Net assets, end of period (000 omitted) |
$ 20,530 |
$ 17,099 |
$ 6,100 |
$ 160 |
|
Ratio of expenses to average net assets |
1.69% |
1.71% |
1.75% A, F |
1.75% A, F |
|
Ratio of expenses to average net assets |
1.69% |
1.71% |
1.75% A |
1.73% A, G |
|
Ratio of net investment income to average |
5.35% |
4.73% |
4.67% A |
4.42% A |
|
Portfolio turnover rate |
153% |
138% |
176% A |
138% |
A Annualized
B The total returns would have been lower had certain expenses not been reduced during the periods shown.
C Total returns do not include the contingent deferred sales charge and for periods of less than one year are not annualized.
D Net investment income per share has been calculated based on average shares outstanding during the period.
E For the period November 3, 1997 (commencement of sale of Class C shares) to November 30, 1997.
F FMR agreed to reimburse a portion of the class' expenses during the period. Without this reimbursement, the class' expense ratio would have been higher.
G FMR or the fund has entered into varying arrangements with third parties who either paid or reduced a portion of the class' expenses.
H Eleven months ended October 31
See accompanying notes which are an integral part of the financial statements.
Annual Report
Financial Highlights - Institutional Class
|
Years ended October 31, |
2000 |
1999 |
1998 F |
1997 G |
1996 G |
1995 G |
|
Selected Per-Share Data |
|
|
|
|
|
|
|
Net asset value, beginning of period |
$ 10.310 |
$ 10.780 |
$ 10.570 |
$ 10.620 |
$ 10.770 |
$ 10.270 |
|
Income from Investment Operations |
|
|
|
|
|
|
|
Net investment income |
.656 D |
.610 D |
.566 D |
.658 D |
.705 D |
.671 |
|
Net realized |
(.002) |
(.485) |
.201 |
(.060) |
(.151) |
.499 |
|
Total from investment operations |
.654 |
.125 |
.767 |
.598 |
.554 |
1.170 |
|
Less Distributions |
|
|
|
|
|
|
|
From net investment income |
(.644) |
(.595) |
(.557) |
(.648) |
(.704) |
(.670) |
|
Net asset value, |
$ 10.320 |
$ 10.310 |
$ 10.780 |
$ 10.570 |
$ 10.620 |
$ 10.770 |
|
Total Return B, C |
6.59% |
1.19% |
7.44% |
5.86% |
5.40% |
11.73% |
|
Ratios and Supplemental Data |
|
|
|
|
|
|
|
Net assets, end of period (000 omitted) |
$ 88,350 |
$ 157,131 |
$ 168,019 |
$ 177,427 |
$ 211,866 |
$ 208,861 |
|
Ratio of expenses to average net assets |
.65% |
.66% |
.68% A |
.67% |
.66% |
.67% E |
|
Ratio of net investment
income to average |
6.39% |
5.78% |
5.78% A |
6.27% |
6.69% |
6.47% |
|
Portfolio turnover rate |
153% |
138% |
176% A |
138% |
200% |
189% |
A Annualized
B Total returns for periods of less than one year are not annualized.
C The total returns would have been lower had certain expenses not been reduced during the periods shown.
D Net investment income per share has been calculated based on average shares outstanding during the period.
E FMR agreed to reimburse a portion of the class' expenses during the period. Without this reimbursement, the class' expense ratio would have been higher.
F Eleven months ended October 31
G Year ended November 30
See accompanying notes which are an integral part of the financial statements.
Annual Report
For the period ended October 31, 2000
1. Significant Accounting Policies.
Fidelity Advisor Intermediate Bond Fund (the fund) is a fund of Fidelity Advisor Series II (the trust) and is authorized to issue an unlimited number of shares. The trust is registered under the Investment Company Act of 1940, as amended (the 1940 Act), as an open-end management investment company organized as a Massachusetts business trust.
The fund offers Class A, Class T, Class B, Class C, and Institutional Class shares, each of which has equal rights as to assets and voting privileges. Each class has exclusive voting rights with respect to matters that affect that class. Class B shares will automatically convert to Class A shares after a holding period of four years from the initial date of purchase. Investment income, realized and unrealized capital gains and losses, the common expenses of the fund, and certain fund-level expense reductions, if any, are allocated on a pro rata basis to each class based on the relative net assets of each class to the total net assets of the fund. Each class of shares differs in its respective distribution, transfer agent, and certain other class-specific fees, expenses, and expense reductions.
The financial statements have been prepared in conformity with generally accepted accounting principles which require management to make certain estimates and assumptions at the date of the financial statements. The following summarizes the significant accounting policies of the fund:
Security Valuation. Securities are valued based upon a computerized matrix system and/or appraisals by a pricing service, both of which consider market transactions and dealer-supplied valuations. Securities (including restricted securities) for which market quotations are not readily available are valued at their fair value as determined in good faith under consistently applied procedures under the general supervision of the Board of Trustees. Short-term securities with remaining maturities of sixty days or less for which quotations are not readily available are valued at amortized cost or original cost plus accrued interest, both of which approximate current value. Investments in open-end investment companies are valued at their net asset value each business day.
Income Taxes. As a qualified regulated investment company under Subchapter M of the Internal Revenue Code, the fund is not subject to income taxes to the extent that it distributes substantially all of its taxable income for its fiscal year. The schedule of investments includes information regarding income taxes under the caption "Income Tax Information."
Investment Income. Interest income, which includes accretion of original issue discount, is accrued as earned.
Expenses. Most expenses of the trust can be directly attributed to a fund. Expenses which cannot be directly attributed are apportioned among the funds in the trust.
Annual Report
Notes to Financial Statements - continued
1. Significant Accounting Policies - continued
Distributions to Shareholders. Distributions are declared daily and paid monthly from net investment income. Distributions from realized gains, if any, are recorded on the ex-dividend date. Income dividends and capital gain distributions are declared separately for each class.
Income and capital gain distributions are determined in accordance with income tax regulations which may differ from generally accepted accounting principles. These differences, which may result in distribution reclassifications, are primarily due to differing treatments for paydown gains/losses on certain securities, market discount, capital loss carryforwards and losses deferred due to wash sales.
Permanent book and tax basis differences relating to shareholder distributions will result in reclassifications to paid in capital. Distributions in excess of net investment income and accumulated undistributed net realized gain (loss) on investments and foreign currency transactions may include temporary book and tax basis differences which will reverse in a subsequent period. Any taxable income or gain remaining at fiscal year end is distributed in the following year.
Security Transactions. Security transactions are accounted for as of trade date. Gains and losses on securities sold are determined on the basis of identified cost.
2. Operating Policies.
Joint Trading Account. Pursuant to an Exemptive Order issued by the Securities and Exchange Commission (the SEC), the fund, along with other affiliated entities of Fidelity Management & Research Company (FMR), may transfer uninvested cash balances into one or more joint trading accounts. These balances are invested in one or more repurchase agreements for U.S. Treasury or Federal Agency obligations.
Repurchase Agreements. The underlying U.S. Treasury, Federal Agency, or other obligations found to be satisfactory by FMR are transferred to an account of the fund, or to the Joint Trading Account, at a custodian bank. The securities are marked-to-market daily and maintained at a value at least equal to the principal amount of the repurchase agreement (including accrued interest). FMR, the fund's investment adviser, is responsible for determining that the value of the underlying securities remains in accordance with the market value requirements stated above.
Interfund Lending Program. Pursuant to an Exemptive Order issued by the SEC, the fund, along with other registered investment companies having management contracts with FMR, may participate in an interfund lending program. This program provides an alternative credit facility allowing the fund to borrow from, or lend money to, other participating funds.
Annual Report
Notes to Financial Statements - continued
2. Operating Policies - continued
Delayed Delivery Transactions. The fund may purchase or sell securities on a delayed delivery basis. Payment and delivery may take place after the customary settlement period for that security. The price of the underlying securities and the date when the securities will be delivered and paid for are fixed at the time the transaction is negotiated. The fund may receive compensation for interest forgone in the purchase of a delayed delivery security. With respect to purchase commitments, the fund identifies securities as segregated in its records with a value at least equal to the amount of the commitment. Losses may arise due to changes in the market value of the underlying securities or if the counterparty does not perform under the contract.
Restricted Securities. The fund is permitted to invest in securities that are subject to legal or contractual restrictions on resale. These securities generally may be resold in transactions exempt from registration or to the public if the securities are registered. Disposal of these securities may involve time-consuming negotiations and expense, and prompt sale at an acceptable price may be difficult. At the end of the period, the fund had no investments in restricted securities (excluding 144A issues).
3. Purchases and Sales of Investments.
Purchases and sales of securities, other than short-term securities, aggregated $786,313,099 and $810,362,389, respectively, of which U.S. government and government agency obligations aggregated $412,986,897 and $523,990,897, respectively.
4. Fees and Other Transactions with Affiliates.
Management Fee. As the fund's investment adviser, FMR receives a monthly fee that is calculated on the basis of a group fee rate plus a fixed individual fund fee rate applied to the average net assets of the fund. The group fee rate is the weighted average of a series of rates and is based on the monthly average net assets of all the mutual funds advised by FMR. The rates ranged from .0920% to .3700% for the period. The annual individual fund fee rate is .30%. In the event that these rates were lower than the contractual rates in effect during the period, FMR voluntarily implemented the above rates, as they resulted in the same or a lower management fee. For the period, the management fee was equivalent to an annual rate of .43% of average net assets.
Sub-Adviser Fee. FMR, on behalf of the fund, has entered into a sub-advisory agreement with Fidelity Investments Money Management, Inc. (FIMM), a wholly owned subsidiary of FMR. For its services, FIMM receives a fee from FMR of 50% of the management fee payable to FMR. The fee is paid prior to any voluntary expense reimbursements which may be in effect.
Annual Report
Notes to Financial Statements - continued
4. Fees and Other Transactions with Affiliates - continued
Distribution and Service Plan. In accordance with Rule 12b-1 of the 1940 Act, the Board of Trustees has adopted separate Distribution and Service Plans with respect to each class of shares (collectively referred to as "the Plans"). Under certain of the Plans, the class pays Fidelity Distributors Corporation (FDC), an affiliate of FMR, a 12b-1 fee. A portion of this fee may be reallowed to securities dealers, banks and other financial institutions for the distribution of each class of shares and providing shareholder support services. For the period, this fee was based on the following annual rates of the average net assets of each applicable class:
|
Class A |
.15% |
|
Class T |
.25% |
|
Class B |
.90%* |
|
Class C |
1.00%** |
* .65% represents a distribution fee and .25% represents a shareholder service fee.
** .75% represents a distribution fee and .25% represents a shareholder service fee.
For the period, each class paid FDC the following amounts, a portion of which was retained by FDC:
|
|
Paid to |
Retained |
|
Class A |
$ 51,294 |
$ 35 |
|
Class T |
773,580 |
7,103 |
|
Class B |
586,959 |
424,280 |
|
Class C |
178,359 |
97,655 |
|
|
$ 1,590,192 |
$ 529,073 |
Sales Load. FDC receives a front-end sales charge of up to 3.75% for selling Class A shares, and 2.75% for selling Class T shares of the fund. FDC receives the proceeds of contingent deferred sales charges levied on Class B share redemptions occurring within three years of purchase and Class C share redemptions occurring within one year of purchase. Contingent deferred sales charges are based on declining rates ranging from 3% to 1% for Class B and 1% for Class C, of the lesser of the cost of shares at the initial date of purchase or the net asset value of the redeemed shares, excluding any reinvested dividends and capital gains. In addition, purchases of Class A and Class T shares that were subject to a finder's fee bear a contingent deferred sales charge on assets that do not remain in the fund for at least one year. The Class A and Class T contingent deferred sales charge is based on 0.25% of the lesser of the cost of shares at the initial date of purchase or the net asset value of the redeemed shares, excluding any reinvested dividends and capital gains. A portion of the sales charges paid to FDC is paid to securities dealers, banks and other financial institutions.
Annual Report
Notes to Financial Statements - continued
4. Fees and Other Transactions with Affiliates - continued
Sales Load - continued
For the period, sales charge amounts paid to and retained by FDC were as follows:
|
|
Paid to |
Retained |
|
Class A |
$ 93,134 |
$ 39,488 |
|
Class T |
79,827 |
30,178 |
|
Class B |
140,980 |
140,980* |
|
Class C |
8,151 |
8,151* |
|
|
$ 322,092 |
$ 218,797 |
* When Class B and Class C shares are initially sold, FDC pays commissions from its own resources to securities dealers,
banks, and other financial institutions through which the sales are made.
Transfer Agent Fees. Fidelity Investments Institutional Operations Company, Inc., (FIIOC), an affiliate of FMR, is the transfer, dividend disbursing and shareholder servicing agent (collectively referred to as the transfer agent) for each class of the fund. FIIOC receives account fees and asset-based fees that vary according to the account size and type of account of the shareholders of the respective classes of the fund. FIIOC pays for typesetting, printing and mailing of all shareholder reports, except proxy statements. For the period, the following amounts were paid to FIIOC:
|
|
Amount |
% of |
|
Class A |
$ 68,231 |
.20 |
|
Class T |
692,611 |
.22 |
|
Class B |
147,247 |
.23 |
|
Class C |
35,553 |
.20 |
|
Institutional Class |
170,343 |
.16 |
|
|
$ 1,113,985 |
|
Accounting and Security Lending Fees. Fidelity Service Company, Inc., an affiliate of FMR, maintains the fund's accounting records and administers the security lending program. The security lending fee is based on the number and duration of lending transactions. The accounting fee is based on the level of average net assets for the month plus out-of-pocket expenses.
5. Interfund Lending Program.
The fund participated in the interfund lending program as a lender. The average daily loan balance during the period for which loans were outstanding amounted to $16,326,400. The weighted average interest rate was 6.00%. Interest earned from the interfund lending program amounted to $27,210 and is included in interest income on the Statement of Operations. At period end there were no interfund loans outstanding.
Annual Report
Notes to Financial Statements - continued
6. Security Lending.
The fund lends portfolio securities from time to time in order to earn additional income. The fund receives collateral in the form of U.S. Treasury obligations, letters of credit, and/or cash against the loaned securities, and maintains collateral in an amount not less than 100% of the market value of the loaned securities during the period of the loan. The market value of the loaned securities is determined at the close of business of the fund and any additional required collateral is delivered to the fund on the next business day. If the borrower defaults on its obligation to return the securities loaned because of insolvency or other reasons, the fund could experience delays and costs in recovering the securities loaned or in gaining access to the collateral. At period end there were no security loans outstanding.
7. Expense Reductions.
Through an arrangement with the fund's custodian, credits realized as a result of uninvested cash balances were used to reduce a portion of expenses. During the period, the fund's custodian fees were reduced by $4,493 under the custodian arrangement.
8. Distributions to Shareholders.
Distributions to shareholders of each class were as follows:
|
|
Years ended October 31, |
|
|
|
2000 |
1999 |
|
From net investment income |
|
|
|
Class A |
$ 2,118,454 |
$ 868,429 |
|
Class T |
18,584,382 |
16,224,315 |
|
Class B |
3,494,654 |
2,508,941 |
|
Class C |
942,822 |
528,467 |
|
Institutional Class |
6,723,713 |
9,279,107 |
|
Total |
$ 31,864,025 |
$ 29,409,259 |
Annual Report
Notes to Financial Statements - continued
9. Share Transactions.
Transactions for each class of shares were as follows:
|
|
Shares |
Dollars |
||
|
|
Years ended October 31, |
Years ended October 31, |
||
|
|
2000 |
1999 |
2000 |
1999 |
|
|
|
|
|
|
|
Class A |
4,902,349 |
3,357,531 |
$ 50,077,303 |
$ 35,356,066 |
|
Reinvestment of distributions |
193,209 |
72,714 |
1,973,473 |
761,419 |
|
Shares redeemed |
(2,616,153) |
(1,997,004) |
(26,717,363) |
(20,973,090) |
|
Net increase (decrease) |
2,479,405 |
1,433,241 |
$ 25,333,413 |
$ 15,144,395 |
|
Class T |
14,704,629 |
17,948,549 |
$ 150,170,581 |
$ 189,451,401 |
|
Reinvestment of distributions |
1,661,438 |
1,383,474 |
16,962,342 |
14,555,972 |
|
Shares redeemed |
(16,507,172) |
(15,455,120) |
(168,525,179) |
(162,894,381) |
|
Net increase (decrease) |
(141,105) |
3,876,903 |
$ (1,392,256) |
$ 41,112,992 |
|
Class B |
2,796,903 |
4,797,807 |
$ 28,571,712 |
$ 50,576,586 |
|
Reinvestment of distributions |
280,308 |
191,805 |
2,858,231 |
2,011,162 |
|
Shares redeemed |
(3,169,406) |
(2,406,744) |
(32,309,883) |
(25,318,778) |
|
Net increase (decrease) |
(92,195) |
2,582,868 |
$ (879,940) |
$ 27,268,970 |
|
Class C |
1,610,410 |
1,681,953 |
$ 16,444,630 |
$ 17,687,270 |
|
Reinvestment of distributions |
70,863 |
38,404 |
722,809 |
402,151 |
|
Shares redeemed |
(1,347,947) |
(626,095) |
(13,729,963) |
(6,595,292) |
|
Net increase (decrease) |
333,326 |
1,094,262 |
$ 3,437,476 |
$ 11,494,129 |
|
Institutional Class |
1,678,500 |
5,199,325 |
$ 17,149,282 |
$ 54,855,022 |
|
Reinvestment of distributions |
340,111 |
401,855 |
3,475,461 |
4,235,018 |
|
Shares redeemed |
(8,691,446) |
(5,956,114) |
(88,908,948) |
(62,763,186) |
|
Net increase (decrease) |
(6,672,835) |
(354,934) |
$ (68,284,205) |
$ (3,673,146) |
Annual Report
To the Trustees of Fidelity Advisor Series II and the Shareholders of Fidelity Advisor Intermediate Bond Fund:
In our opinion, the accompanying statement of assets and liabilities, including the schedule of investments, and the related statements of operations and of changes in net assets and the financial highlights present fairly, in all material respects, the financial position of Fidelity Advisor Intermediate Bond Fund (a fund of Fidelity Advisor Series II) at October 31, 2000, and the results of its operations, the changes in its net assets and the financial highlights for the periods indicated, in conformity with accounting principles generally accepted in the United States of America. These financial statements and financial highlights (hereafter referred to as "financial statements") are the responsibility of the Fidelity Advisor Intermediate Bond Fund's management; our responsibility is to express an opinion on these financial statements based on our audits. We conducted our audits of these financial statements in accordance with auditing standards generally accepted in the United States of America which require that we plan and perform the audit to obtain reasonable assurance about whether the financial statements are free of material misstatement. An audit includes examining, on a test basis, evidence supporting the amounts and disclosures in the financial statements, assessing the accounting principles used and significant estimates made by management, and evaluating the overall financial statement presentation. We believe that our audits, which included confirmation of securities at October 31, 2000 by correspondence with the custodian and brokers, provide a reasonable basis for our opinion.
/s/PricewaterhouseCoopers LLP
PricewaterhouseCoopers LLP
Boston, Massachusetts
December 11, 2000
Annual Report
A total of 10.38% of the dividends distributed during the fiscal year was derived from interest on U.S. Government securities which is generally exempt from state income tax.
The fund will notify shareholders in January 2001 of amounts for use in preparing 2000 income tax returns.
Annual Report
Annual Report
Annual Report
Annual Report
Annual Report
Annual Report
Annual Report
Investment Adviser
Fidelity Management & Research Company
Boston, MA
Investment Sub-Advisers
Fidelity Management & Research (U.K.) Inc.
Fidelity Management & Research
(Far East) Inc.
Fidelity Investments Money
Management, Inc.
Fidelity Investments Japan Limited
Officers
Edward C. Johnson 3d, President
Robert C. Pozen, Senior Vice President
Dwight D. Churchill, Vice President
David L. Murphy, Vice President
Eric D. Roiter, Secretary
Robert A. Dwight, Treasurer
Maria F. Dwyer, Deputy Treasurer
Stanley N. Griffith, Assistant Vice President
John H. Costello, Assistant Treasurer
Thomas J. Simpson, Assistant Treasurer
Board of Trustees
Ralph F. Cox *
Phyllis Burke Davis *
Robert M. Gates *
Edward C. Johnson 3d
Donald J. Kirk *
Ned C. Lautenbach *
Peter S. Lynch
Marvin L. Mann *
William O. McCoy *
Gerald C. McDonough *
Robert C. Pozen
Thomas R. Williams *
Advisory Board
J. Michael Cook
Abigail P. Johnson
Marie L. Knowles
General Distributor
Fidelity Distributors Corporation
Boston, MA
Transfer and Shareholder
Servicing Agent
Fidelity Investments Institutional Operations Company, Inc.
Boston, MA
Custodian
The Bank of New York
New York, NY
* Independent trustees
Annual Report
Focus Funds
Fidelity Advisor Consumer
Industries Fund
Fidelity Advisor Cyclical
Industries Fund
Fidelity Advisor Financial
Services Fund
Fidelity Advisor Health Care Fund
Fidelity Advisor Natural
Resources Fund
Fidelity Advisor Technology Fund
Fidelity Advisor Telecommunications & Utilities Growth Fund
Growth Funds
Fidelity Advisor Korea Fund
Fidelity Advisor Emerging Asia Fund
Fidelity Advisor Latin America Fund
Fidelity Advisor Japan Fund
Fidelity Advisor Europe Capital Appreciation Fund
Fidelity Advisor International
Capital Appreciation Fund
Fidelity Advisor Overseas Fund
Fidelity Advisor Diversified International Fund
Fidelity Advisor Global Equity Fund
Fidelity Advisor TechnoQuant®
Growth Fund
Fidelity Advisor Small Cap Fund
Fidelity Advisor Value Strategies Fund
Fidelity Advisor Mid Cap Fund
Fidelity Advisor Dynamic Capital Appreciation Fund
Fidelity Advisor Equity Growth Fund
Fidelity Advisor Large Cap Fund
Fidelity Advisor Dividend Growth Fund
Fidelity Advisor Growth
Opportunities Fund
Growth and Income Funds
Fidelity Advisor Growth & Income Fund
Fidelity Advisor Equity Income Fund
Fidelity Advisor Asset Allocation Fund
Fidelity Advisor Balanced Fund
Taxable Income Funds
Fidelity Advisor Emerging Markets Income Fund
Fidelity Advisor High Yield Fund
Fidelity Advisor High Income Fund
Fidelity Advisor Strategic Income Fund
Fidelity Advisor Mortgage
Securities Fund
Fidelity Advisor Government Investment Fund
Fidelity Advisor Intermediate Bond Fund
Fidelity Advisor Short Fixed-Income Fund
Municipal Funds
Fidelity Advisor Municipal Income Fund
Money Market Funds
Prime Fund
Treasury Fund
Tax-Exempt Fund
|
LTBI-ANN-1200 |
118715 |
|
1.539399.103 |
|
(Fidelity Investment logo)(registered trademark)
Fidelity®
Annual Report
October 31, 2000
(2_fidelity_logos)
|
President's Message |
3 |
Ned Johnson on investing strategies. |
|
Performance |
4 |
How the fund has done over time. |
|
Fund Talk |
7 |
The manager's review of fund performance, strategy and outlook. |
|
Investment Changes |
10 |
A summary of major shifts in the fund's investments over the past six months. |
|
Investments |
11 |
A complete list of the fund's investments with their market values. |
|
Financial Statements |
15 |
Statements of assets and liabilities,
operations, and changes in net assets, |
|
Notes |
24 |
Notes to the financial statements. |
|
Report of Independent Accountants |
31 |
The auditors' opinion. |
Standard & Poor's, S&P and S&P 500 are registered service marks of The McGraw-Hill Companies, Inc. and have been licensed for use by Fidelity Distributors Corporation.
Other third party marks appearing herein are the property of their respective owners.
All other marks appearing herein are registered or unregistered trademarks or service marks of FMR Corp. or an affiliated company.
(Recycle graphic) This report is printed on recycled paper using soy-based inks.
This report and the financial statements contained herein are submitted for the general information of the shareholders of the fund. This report is not authorized for distribution to prospective investors in the fund unless preceded or accompanied by an effective prospectus.
Mutual fund shares are not deposits or obligations of, or guaranteed by, any depository institution. Shares are not insured by the FDIC, Federal Reserve Board or any other agency, and are subject to investment risks, including possible loss of principal amount invested.
Neither the fund nor Fidelity Distributors Corporation is a bank.
For more information on any Fidelity fund, including charges and expenses, call 1-800-544-6666 for a free prospectus. Read it carefully before you invest or send money.
Annual Report
(photo_of_Edward_C_Johnson_3d)
Dear Shareholder:
A sixth-straight year of double-digit positive returns for the Dow Jones Industrial Average, NASDAQ and S&P 500® could be in jeopardy unless the U.S. stock market shows marked improvement in the final two months of 2000. Through October, all three indexes had negative year-to-date returns. On the other hand, most fixed-income sectors were solidly in the black. Treasuries and other long-term government securities led the way, returning nearly 14%.
While it's impossible to predict the future direction of the markets with any degree of certainty, there are certain basic principles that can help investors plan for their future needs.
The longer your investment time frame, the less likely it is that you will be affected by short-term market volatility. A 10-year investment horizon appropriate for saving for a college education, for example, enables you to weather market cycles in a long-term fund, which may have a higher risk potential, but also has a higher potential rate of return.
An intermediate-length fund could make sense if your investment horizon is two to four years, while a short-term bond fund could be the right choice if you need your money in one or two years.
If your time horizon is less than a year, you might want to consider moving some of your bond investment into a money market fund. These funds seek income and a stable share price by investing in high-quality, short-term investments. Of course, it's important to remember that an investment in a money market fund is not insured or guaranteed by the Federal Deposit Insurance Corporation or any other government agency. Although money market funds seek to preserve the value of your investment at $1.00 per share, it is possible to lose money by investing in these types of funds.
Finally, no matter what your time horizon or portfolio diversity, it makes good sense to follow a regular investment plan, investing a certain amount of money in a fund at the same time each month or quarter and periodically reviewing your overall portfolio. By doing so, you won't get caught up in the excitement of a rapidly rising market, nor will you buy all your shares at market highs. While this strategy - known as dollar cost averaging - won't assure a profit or protect you from a loss in a declining market, it should help you lower the average cost of your purchases. Of course, you should consider your financial ability to continue your purchases through periods of low price levels before undertaking such a strategy.
If you have questions, please call us at 1-800-544-6666, or visit our web site at www.fidelity.com. We are available 24 hours a day, seven days a week to provide you the information you need to make the investments that are right for you.
Best regards,
/s/Edward C. Johnson 3d
Edward C. Johnson 3d
Annual Report
There are several ways to evaluate historical performance. You can look at the total percentage change in value, the average annual percentage change or the growth of a hypothetical $10,000 investment. Total return reflects the change in the value of an investment, assuming reinvestment of the class' dividend income and capital gains (the profits earned upon the sale of securities that have grown in value). You can also look at the class' income, as reflected in its yield, to measure performance.
Cumulative Total Returns
|
Periods ended October 31, 2000 |
|
Past 1 |
Past 5 |
Past 10 |
|
Fidelity Mortgage Securities - Initial CL |
|
7.66% |
36.76% |
112.10% |
|
LB Mortgage |
|
7.57% |
38.70% |
113.69% |
|
US Mortgage Funds Average |
|
6.73% |
32.12% |
98.71% |
Cumulative total returns show Initial Class' performance in percentage terms over a set period - in this case, one year, five years or 10 years. For example, if you had invested $1,000 in a fund that had a 5% return over the past year, the value of your investment would be $1,050. You can compare Initial Class' returns to the performance of the Lehman Brothers Mortgage-Backed Securities Index - a market value-weighted index of fixed-rate securities that represent interests in pools of mortgage loans with original terms of 15 and 30 years that are issued by the Government National Mortgage Association (GNMA), the Federal National Mortgage Association (FNMA), and the Federal Home Loan Mortgage Corp. (FHLMC), and balloon mortgages with fixed-rate coupons. To measure how Initial Class' performance stacked up against its peers, you can compare it to the U.S. mortgage funds average, which reflects the performance of mutual funds with similar objectives tracked by Lipper Inc. The past one year average represents a peer group of 64 mutual funds. These benchmarks reflect reinvestment of dividends and capital gains, if any, and exclude the effect of sales charges.
Average Annual Total Returns
|
Periods ended October 31, 2000 |
Past 1 |
Past 5 |
Past 10 |
|
Fidelity Mortgage Securities - Initial CL |
7.66% |
6.46% |
7.81% |
|
LB Mortgage |
7.57% |
6.76% |
7.89% |
|
US Mortgage Funds Average |
6.73% |
5.72% |
7.10% |
Average annual total returns take Initial Class' cumulative return and show you what would have happened if Initial Class had performed at a constant rate each year.
Annual Report
Performance - continued
$10,000 Over 10 Years

$10,000 Over 10 years: Let's say hypothetically that $10,000 was invested in Fidelity Mortgage Securities Fund - Initial Class on October 31, 1990. As the chart shows, by October 31, 2000, the value of the investment would have grown to $21,210 - a 112.10% increase on the initial investment. For comparison, look at how the Lehman Brothers Mortgage-Backed Securities Index did over the same period. With dividends and capital gains, if any, reinvested, the same $10,000 would have grown to $21,369 - a 113.69% increase.
Understanding
Performance
How a fund did yesterday is no guarantee of how it will do tomorrow. Bond prices, for example, generally move in the opposite direction of interest rates. In turn, the share price, return and yield of a fund that invests in bonds will vary. That means if you sell your shares during a market downturn, you might lose money. But if you can ride out the market's ups and downs, you may have a gain.
3Annual Report
Performance - continued
Total Return Components
|
|
|
Years ended October 31, |
||||
|
|
|
2000 |
1999 |
1998 |
1997 |
1996 |
|
Dividend returns |
|
7.18% |
6.19% |
6.17% |
6.60% |
6.66% |
|
Capital returns |
|
0.48% |
-3.05% |
-0.18% |
2.26% |
0.08% |
|
Total returns |
|
7.66% |
3.14% |
5.99% |
8.86% |
6.74% |
Total return components include both dividend returns and capital returns. A dividend return reflects the actual dividends paid by the class. A capital return reflects both the amount paid by the class to shareholders as capital gain distributions and changes in the class' share price. Both returns assume the dividends or capital gains paid by the class are reinvested, if any.
Dividends and Yield
|
Periods ended October 31, 2000 |
Past 1 |
Past 6 |
Past 1 |
|
Dividends per share |
5.84¢ |
34.80¢ |
71.83¢ |
|
Annualized dividend rate |
6.52% |
6.64% |
6.93% |
|
30-day annualized yield |
6.77% |
- |
- |
Dividends per share show the income paid by the class for a set period. If you annualize this number, based on an average share price of $10.54 over the past one month, $10.40 over the past six months and $10.37 over the past one year, you can compare the class' income over these three periods. The 30-day annualized yield is a standard formula for all bond funds based on the yields of the bonds in the fund, averaged over the past 30 days. This figure shows you the yield characteristics of the fund's investments at the end of the period. It also helps you compare funds from different companies on an equal basis.
Annual Report
Market Recap
Strong technical factors in the market helped most investment-grade bonds overcome sharply rising interest rates and volatile market conditions, enabling them to outperform a number of major U.S. equity indexes during the 12-month period that ended October 31, 2000. The Lehman Brothers Aggregate Bond Index - a popular measure of taxable-bond performance - returned 7.30% during this time frame. Following a bullish fourth quarter of 1999 for the spread sectors - namely corporate bonds, mortgage and agency securities - Treasuries usurped market leadership not long after the millennium changeover. A growing federal surplus spurred the U.S. government in January to begin buying back outstanding debt and reducing future issuance. The scarcity premium created by a shrinking supply of long-dated Treasuries sent prices soaring and yields plummeting, thereby inducing an inverted yield curve - which occurs when short-term bonds outyield longer-dated securities. Anticipation that the Fed was finished raising interest rates entering the summer, combined with persistent flights-to-safety from risk-averse investors concerned about volatility in equity markets, further bolstered the long bond, helping the Lehman Brothers Treasury Index return 8.22% during the period. Mortgages made up some ground late in the period behind strong housing turnover. Agencies, too, staged a late rally in response to reduced political risk surrounding government-sponsored enterprises. However, corporates had little to celebrate, plagued by deteriorating credit conditions and growing supply pressures. For the overall period, the Lehman Brothers Mortgage-Backed Securities, U.S. Agency and Credit Bond indexes returned 7.57%, 7.30% and 5.48%, respectively.
(Portfolio Manager photograph)
An interview with Tom Silvia, Portfolio Manager of Fidelity Advisor Mortgage Securities Fund
Q. How did the fund perform, Tom?
A. For the 12 months ending October 31, 2000, the fund's Initial Class shares returned 7.66%. To get a sense of how the fund did relative to its competitors, the U.S. mortgage funds average returned 6.73% for the same period, according to Lipper Inc. Meanwhile, the Lehman Brothers Mortgage-Backed Securities Index - which tracks the types of securities in which the fund invests - returned 7.57%.
Fund Talk: The Manager's Overview - continued
Q. What factors influenced the fund's performance?
Annual Report
A. In the plus column was the fund's relatively large weighting in commercial mortgage-backed securities (CMBS) - which accounted for about 15% of the fund's net assets at the end of the period. CMBS are bonds that are collateralized by mortgage loans on commercial real estate - such as office buildings, shopping malls, hotels and apartment buildings. They seemingly had the wind at their backs during the past year. Rising interest rates, which hurt many other fixed-income securities, boosted outstanding CMBS by limiting issuance of new securities. Second, there was overall improvement in the credit quality of the sector thanks to the strong economy and better commercial real estate fundamentals as rents and occupancies increased. Finally, the Labor Department proposed allowing private pension funds to buy some mortgage securities that had been off-limits.
Q. How did mortgage securities made up of home loans - those issued by Fannie Mae, Freddie Mac and Ginnie Mae - perform during the year?
A. Generally speaking, they performed poorly early on but improved quite a bit in the second half of the year. At first, rising interest rates were a drag on the performance of these mortgage securities, pushing their yields higher and their prices lower. At the same time, good economic conditions translated into a strong housing market, prompting more mortgage prepayment. More recently, mortgage security prices firmed as it became evident that previous interest-rate hikes had helped slow the economy. In response, mortgage prepayments fell and the outstanding supply was reduced. Against that backdrop, various types of mortgage securities fell in and out of favor during the year. For instance, Ginnie Mae securities - which accounted for a smaller portion of the fund than of the Lehman Brothers index - outpaced Fannie Mae and Freddie Mac securities during much of the year. That was due to a very small supply of Ginnie Mae securities. Some legislators floated the idea of even cutting off their longstanding but never-used lines of credit. Having a relatively small weighting in Ginnie Mae securities probably was the biggest disappointment for the year.
Q. What helped Fannie Mae and Freddie Mac securities regain their footing?
A. The yield advantage offered by Fannie Mae and Freddie Mac securities - as much as 10 basis points (0.10 percentage points) - over Ginnie Maes was one factor that helped them rebound. Also, the legislative pressure on the agencies eased when Fannie Mae and Freddie Mac made some concessions to legislators, adopting measures to improve their capital structure and allow more scrutiny of their books. In response, demand for their securities improved as more investors became attracted to their relatively high yields and cheap prices.
Annual Report
Fund Talk: The Manager's Overview - continued
Q. Interest rates have been relatively volatile over the past year. How did you manage the fund's sensitivity to interest-rate changes?
A. I kept the fund's duration - a gauge of its interest-rate sensitivity - in line with the mortgage securities market as a whole as measured by the Lehman Brothers Mortgage-Backed Securities Index. That meant I avoided positioning the fund with more or less sensitivity based on my view of where interest rates were headed.
Q. What's your outlook?
A. I'm optimistic about the prospects for mortgage securities. Even though there's the possibility that interest rates will move lower, I don't see a large wave of mortgage prepayment in the future. By my calculations, mortgage rates would have to decline at least one full percentage point from current levels in order for prepayments to accelerate at a meaningful level. Given that, I think that mortgage securities offer very attractive values at current levels, offering yields that are well in excess of U.S. Treasury securities.
The views expressed in this report reflect those of the portfolio manager only through the end of the period of the report as stated on the cover and do not necessarily represent the views of Fidelity or any other person in the Fidelity organization. Any such views are subject to change at any time based upon market or other conditions and Fidelity disclaims any responsibility to update such views. These views may not be relied on as investment advice and, because investment decisions for a Fidelity fund are based on numerous factors, may not be relied on as an indication of trading intent on behalf of any Fidelity fund.
Fund Facts
Goal: seeks a high level of current income, consistent with prudent investment risk; the fund may also consider the potential for capital gain
Start date: December 31, 1984
Size: as of October 31, 2000, more than $466 million
Manager: Tom Silvia, since 1997; joined Fidelity in 1993
3Tom Silvia on the strength of the housing market and its effect on mortgage securities:
"Sometimes, significant interest-rate volatility - such as we've seen during the past year - can lead to an increase in the rate of mortgage prepayments, which can have negative implications for the mortgage market. This past year, however, that was not the case. The strong housing market, fueled by the robust economy, favorable employment growth and rising personal incomes, benefited the mortgage market during the past year. Thanks to a significant wave of refinancing activity in 1998 and early 1999, the vast majority of mortgages outstanding 12 months ago carried interest rates of 6.5% to 7.0%. As interest rates climbed throughout the past year, these bonds started to trade below their par value of $100. Essentially, investors weren't willing to pay full price - or par - for a bond that paid less income when they could buy a newly issued bond with a higher income. As a result, 6.5% to 7.0% mortgage securities began to trade at discount prices ranging from $92 to $96. But given the fact that the housing market was strong and many homeowners decided to move into other homes, many of those mortgage securities were paid off at par, resulting in fairly good performance for the mortgage market as a whole."
Annual Report
|
|
Coupon Distribution as of October 31, 2000 |
||
|
|
% of fund's investments |
% of fund's investments |
|
Less than 6% |
0.4 |
0.5 |
|
6 - 6.99% |
32.6 |
45.0 |
|
7 - 7.99% |
43.7 |
38.4 |
|
8 - 8.99% |
14.0 |
9.9 |
|
9% and over |
2.8 |
4.2 |
|
Coupon distribution shows the range of stated interest rates on the fund's investments, excluding short-term investments. |
|
Average Years to Maturity as of October 31, 2000 |
||
|
|
|
6 months ago |
|
Years |
7.1 |
8.0 |
|
Average years to maturity is based on the average time remaining until principal payments are expected from each of the fund's bonds, weighted by dollar amount. |
|
Duration as of October 31, 2000 |
||
|
|
|
6 months ago |
|
Years |
3.7 |
4.7 |
|
Duration shows how much a bond fund's price fluctuates with changes in comparable interest rates. If rates rise 1%, for example, a fund with a five-year duration is likely to lose about 5% of its value. Other factors also can influence a bond fund's performance and share price. Accordingly, a bond fund's actual performance may differ from this example. |
|
Asset Allocation (% of fund's net assets) |
|||||||
|
As of October 31, 2000 |
As of April 30, 2000 |
||||||
|
Mortgage |
|
|
Mortgage |
|
||
|
CMOs and Other Mortgage Related Securities 19.3% |
|
|
CMOs and Other Mortgage Related Securities 21.8% |
|
||
|
U.S. Government |
|
|
U.S. Government |
|
||
|
Short-Term |
|
|
Short-Term |
|
||
* Short-term investments and net other assets are not included in the pie chart.
Annual Report
Showing Percentage of Net Assets
|
U.S. Government and Government Agency Obligations - 3.1% |
||||
|
|
Principal Amount |
Value |
||
|
U.S. Government Agency Obligations - 3.1% |
||||
|
Fannie Mae 6.5% 4/29/09 |
|
$ 15,440,000 |
$ 14,701,814 |
|
|
U.S. Government Agency - Mortgage Securities - 77.3% |
||||
|
|
||||
|
Fannie Mae - 48.5% |
||||
|
6% 2/1/14 to 6/1/29 |
|
17,285,396 |
16,223,096 |
|
|
6.5% 9/1/10 to 2/1/30 |
|
66,387,810 |
63,905,089 |
|
|
7% 3/1/19 to 10/1/30 |
|
71,013,814 |
69,662,626 |
|
|
7% 11/1/30 (b) |
|
15,000,000 |
14,695,313 |
|
|
7.5% 3/1/22 to 11/1/30 |
|
40,259,542 |
40,213,187 |
|
|
8% 1/1/07 to 7/1/30 |
|
13,049,020 |
13,209,123 |
|
|
8.25% 1/1/13 |
|
54,630 |
55,566 |
|
|
8.5% 6/1/16 to 11/1/23 |
|
2,946,350 |
3,021,512 |
|
|
8.75% 11/1/08 to 7/1/09 |
|
122,645 |
125,817 |
|
|
9% 1/1/08 to 2/1/13 |
|
497,626 |
512,597 |
|
|
9.5% 5/1/03 to 8/1/22 |
|
2,747,955 |
2,835,347 |
|
|
11% 12/1/02 to 8/1/10 |
|
834,963 |
905,168 |
|
|
12.25% 5/1/13 to 6/1/15 |
|
146,833 |
164,723 |
|
|
12.5% 11/1/14 to 3/1/16 |
|
279,804 |
316,089 |
|
|
12.75% 2/1/14 to 6/1/15 |
|
44,209 |
49,029 |
|
|
13.5% 9/1/13 to 12/1/14 |
|
129,910 |
149,843 |
|
|
14% 11/1/14 |
|
40,901 |
47,586 |
|
|
|
226,091,711 |
|||
|
Freddie Mac - 12.1% |
||||
|
5% 7/1/10 |
|
2,010,726 |
1,866,834 |
|
|
6% 2/1/29 to 7/1/29 |
|
4,606,402 |
4,321,358 |
|
|
6.5% 1/1/24 to 9/1/24 |
|
20,168,922 |
19,511,494 |
|
|
7% 7/1/29 to 9/1/29 |
|
7,508,084 |
7,360,249 |
|
|
7.5% 6/1/26 to 11/1/30 |
|
6,307,591 |
6,309,623 |
|
|
7.5% 11/1/30 (b) |
|
7,275,000 |
7,270,453 |
|
|
8% 10/1/07 to 4/1/21 |
|
487,909 |
493,337 |
|
|
8.5% 11/1/03 to 5/1/30 |
|
2,741,499 |
2,801,348 |
|
|
9% 9/1/08 to 5/1/21 |
|
3,334,308 |
3,434,549 |
|
|
10% 1/1/09 to 5/1/19 |
|
930,499 |
974,266 |
|
|
10.5% 8/1/10 to 2/1/16 |
|
83,810 |
88,684 |
|
|
11.5% 4/1/12 |
|
54,722 |
59,735 |
|
|
12.25% 6/1/14 to 7/1/15 |
|
106,234 |
119,159 |
|
|
12.5% 5/1/12 to 12/1/14 |
|
521,724 |
580,346 |
|
|
U.S. Government Agency - Mortgage Securities - continued |
||||
|
|
Principal Amount |
Value |
||
|
Freddie Mac - continued |
||||
|
12.75% 6/1/05 to 3/1/15 |
|
$ 55,553 |
$ 60,251 |
|
|
13% 1/1/11 to 6/1/15 |
|
865,615 |
995,218 |
|
|
|
56,246,904 |
|||
|
Government National Mortgage Association - 16.7% |
||||
|
6.5% 5/15/28 to 1/15/29 |
|
4,059,163 |
3,918,350 |
|
|
7% 1/15/26 to 6/15/29 (d) |
|
16,431,436 |
16,196,453 |
|
|
7.5% 7/15/05 to 9/15/27 |
|
12,034,063 |
12,123,749 |
|
|
8% 4/15/02 to 12/15/25 |
|
7,861,876 |
8,003,375 |
|
|
8.5% 7/15/16 to 10/15/30 |
|
35,803,208 |
36,731,278 |
|
|
9% 9/20/16 to 4/20/18 |
|
60,050 |
61,959 |
|
|
9.5% 8/15/09 to 12/15/24 |
|
72,451 |
76,491 |
|
|
10.5% 1/15/01 to 2/20/18 |
|
487,533 |
519,050 |
|
|
13% 10/15/13 |
|
43,913 |
50,431 |
|
|
13.5% 7/15/11 to 10/15/14 |
|
56,959 |
65,227 |
|
|
|
77,746,363 |
|||
|
TOTAL U.S. GOVERNMENT AGENCY - MORTGAGE SECURITIES (Cost $362,314,237) |
360,084,978 |
|||
|
Collateralized Mortgage Obligations - 4.3% |
||||
|
|
||||
|
U.S. Government Agency - 4.3% |
||||
|
Fannie Mae REMIC planned amortization class: |
|
|
|
|
|
Series 1999-1 Class PJ, 6.5% 2/25/29 |
|
10,049,260 |
9,369,247 |
|
|
Series 1999-51 Class LK, 6.5% 8/25/29 |
|
10,000,000 |
9,128,100 |
|
|
Freddie Mac REMIC planned amortization class |
|
1,404,060 |
1,445,298 |
|
|
TOTAL COLLATERALIZED MORTGAGE OBLIGATIONS (Cost $19,677,765) |
19,942,645 |
|||
|
Commercial Mortgage Securities - 15.0% |
||||
|
|
||||
|
Bankers Trust II Series 1999-S1A Class D, 8.81% 2/28/14 (a)(c) |
|
5,000,000 |
5,010,938 |
|
|
CBM Funding Corp. sequential pay Series 1996-1 |
|
2,300,000 |
2,296,586 |
|
|
CS First Boston Mortgage Securities Corp. |
|
2,000,000 |
1,902,938 |
|
|
Deutsche Mortgage & Asset Receiving Corp. |
|
10,200,000 |
9,431,813 |
|
|
Federal Deposit Insurance Corp. REMIC Trust sequential pay Series 1996-C1 Class 1A, 6.75% 7/25/26 |
|
2,242,680 |
2,220,078 |
|
|
Commercial Mortgage Securities - continued |
||||
|
|
Principal Amount |
Value |
||
|
GS Mortgage Securities Corp. II Series 1998-GLII |
|
$ 1,600,000 |
$ 1,450,500 |
|
|
Nomura Asset Securities Corp. weighted average coupon Series 1998-D6 Class A4, 7.3619% 3/17/28 (c) |
|
15,000,000 |
14,067,188 |
|
|
Nomura Depositor Trust floater Series 1998-ST1A: |
|
|
|
|
|
Class A4, 7.5213% 2/15/34 (a)(c) |
|
7,900,000 |
7,755,579 |
|
|
Class A5, 7.8713% 2/15/34 (a)(c) |
|
5,278,196 |
5,156,138 |
|
|
Structured Asset Securities Corp. Series 1992-M1 |
|
3,192,522 |
3,097,744 |
|
|
Thirteen Affiliates of General Growth Properties, Inc. Series 1 Class D1, 6.917% 12/15/07 (a) |
|
18,200,000 |
17,531,720 |
|
|
TOTAL COMMERCIAL MORTGAGE SECURITIES (Cost $72,038,810) |
69,921,222 |
|||
|
Cash Equivalents - 7.0% |
|||
|
Maturity Amount |
|
||
|
Investments in repurchase agreements (U.S. Government Obligations), in a joint trading account at 6.62%, dated 10/31/00 due
11/1/00 |
$ 32,828,035 |
32,822,000 |
|
|
TOTAL INVESTMENT PORTFOLIO - 106.7% (Cost $501,145,620) |
497,472,659 |
||
|
NET OTHER ASSETS - (6.7)% |
(31,448,023) |
||
|
NET ASSETS - 100% |
$ 466,024,636 |
||
|
Legend |
|
(a) Security exempt from registration under Rule 144A of the Securities Act of 1933. These securities may be resold in transactions exempt from registration, normally to qualified institutional buyers. At the period end, the value of these securities amounted to $36,904,875 or 7.9% of net assets. |
|
(b) Security purchased on a delayed delivery or when-issued basis. |
|
(c) The coupon rate shown on floating or adjustable rate securities represents the rate at period end. |
|
(d) A portion of this security is subject to a forward commitment to sell. |
|
Income Tax Information |
|
At October 31, 2000, the aggregate cost of investment securities for income tax purposes was $501,225,418. Net unrealized depreciation aggregated $3,752,759, of which $3,729,911 related to appreciated investment securities and $7,482,670 related to depreciated investment securities. |
|
At October 31, 2000, the fund had a capital loss carryforward of approximately $8,706,000 of which $5,050,000 and $3,656,000 will expire on October 31, 2007 and 2008, respectively. |
See accompanying notes which are an integral part of the financial statements.
Annual Report
Statement of Assets and Liabilities
|
|
October 31, 2000 |
|
|
Assets |
|
|
|
Investment in securities, at value (including repurchase agreements of $32,822,000) (cost $501,145,620) - See accompanying schedule |
|
$ 497,472,659 |
|
Commitment to sell securities on a delayed delivery basis |
$ (14,775,000) |
|
|
Receivable for securities sold on a delayed delivery basis |
14,906,250 |
131,250 |
|
Receivable for investments sold, regular delivery |
|
113,202 |
|
Cash |
|
485 |
|
Receivable for fund shares sold |
|
182,244 |
|
Interest receivable |
|
2,409,643 |
|
Total assets |
|
500,309,483 |
|
Liabilities |
|
|
|
Payable for investments purchased |
8,232,107 |
|
|
Delayed delivery |
22,113,125 |
|
|
Payable for fund shares redeemed |
3,103,942 |
|
|
Distributions payable |
505,453 |
|
|
Accrued management fee |
168,882 |
|
|
Distribution fees payable |
27,900 |
|
|
Other payables and accrued expenses |
133,438 |
|
|
Total liabilities |
|
34,284,847 |
|
Net Assets |
|
$ 466,024,636 |
|
Net Assets consist of: |
|
|
|
Paid in capital |
|
$ 477,537,240 |
|
Undistributed net investment income |
|
813,267 |
|
Accumulated undistributed net realized |
|
(8,784,160) |
|
Net unrealized appreciation (depreciation) on investments |
|
(3,541,711) |
|
Net Assets |
|
$ 466,024,636 |
See accompanying notes which are an integral part of the financial statements.
Annual Report
Financial Statements - continued
Statement of Assets and Liabilities - continued
|
|
October 31, 2000 |
|
|
Calculation of Maximum Offering Price |
|
$10.53 |
|
Maximum offering price per share (100/95.25 of $10.53) |
|
$11.06 |
|
Class T: |
|
$10.54 |
|
Maximum offering price per share (100/96.50 of $10.54) |
|
$10.92 |
|
Class B: |
|
$10.53 |
|
Initial Class: |
|
$10.54 |
|
Institutional Class: |
|
$10.52 |
A Redemption price per share is equal to net asset value less any applicable contingent deferred sales charge.
See accompanying notes which are an integral part of the financial statements.
Annual Report
Financial Statements - continued
Statement of Operations
|
|
Year ended October 31, 2000 |
|
|
Investment Income Interest |
|
$ 32,656,104 |
|
Expenses |
|
|
|
Management fee |
$ 1,899,545 |
|
|
Transfer agent fees |
759,081 |
|
|
Distribution fees |
261,047 |
|
|
Accounting fees and expenses |
143,998 |
|
|
Non-interested trustees' compensation |
1,585 |
|
|
Custodian fees and expenses |
69,446 |
|
|
Registration fees |
93,364 |
|
|
Audit |
54,560 |
|
|
Legal |
7,135 |
|
|
Miscellaneous |
2,586 |
|
|
Total expenses before reductions |
3,292,347 |
|
|
Expense reductions |
(12,991) |
3,279,356 |
|
Net investment income |
|
29,376,748 |
|
Realized and Unrealized Gain (Loss) Net realized gain (loss) on investment securities |
|
(3,442,334) |
|
Change in net unrealized appreciation (depreciation) on: |
|
|
|
Investment securities |
6,356,250 |
|
|
Delayed delivery commitments |
131,250 |
6,487,500 |
|
Net gain (loss) |
|
3,045,166 |
|
Net increase (decrease) in net assets resulting |
|
$ 32,421,914 |
See accompanying notes which are an integral part of the financial statements.
Annual Report
Financial Statements - continued
Statement of Changes in Net Assets
|
|
Year ended
October 31, |
Year ended
October 31, |
|
Increase (Decrease) in Net Assets |
|
|
|
Operations |
$ 29,376,748 |
$ 30,638,885 |
|
Net realized gain (loss) |
(3,442,334) |
(5,620,586) |
|
Change in net unrealized appreciation (depreciation) |
6,487,500 |
(10,190,965) |
|
Net increase (decrease) in net assets resulting |
32,421,914 |
14,827,334 |
|
Distributions to shareholders |
(30,637,049) |
(30,183,549) |
|
From net realized gain |
- |
(6,924,572) |
|
Total distributions |
(30,637,049) |
(37,108,121) |
|
Share transactions - net increase (decrease) |
(9,263,825) |
(14,273,306) |
|
Total increase (decrease) in net assets |
(7,478,960) |
(36,554,093) |
|
Net Assets |
|
|
|
Beginning of period |
473,503,596 |
510,057,689 |
|
End of period (including undistributed net investment income of $813,267 and $1,901,973, respectively) |
$ 466,024,636 |
$ 473,503,596 |
See accompanying notes which are an integral part of the financial statements.
Annual Report
Financial Highlights - Class A
|
Years ended October 31, |
2000 |
1999 |
1998 |
1997 G |
1997 F |
|
Selected Per-Share Data |
|
|
|
|
|
|
Net asset value, beginning of period |
$ 10.480 |
$ 10.960 |
$ 11.020 |
$ 11.050 |
$ 10.830 |
|
Income from Investment Operations |
|
|
|
|
|
|
Net investment income D |
.665 |
.646 |
.669 |
.170 |
.268 |
|
Net realized and unrealized gain (loss) |
.086 |
(.336) |
(.061) |
.048 |
.224 |
|
Total from investment |
.751 |
.310 |
.608 |
.218 |
.492 |
|
Less Distributions |
|
|
|
|
|
|
From net investment |
(.701) |
(.640) |
(.638) |
(.168) |
(.272) |
|
From net realized gain |
- |
(.150) |
(.030) |
(.080) |
- |
|
Total distributions |
(.701) |
(.790) |
(.668) |
(.248) |
(.272) |
|
Net asset value, end |
$ 10.530 |
$ 10.480 |
$ 10.960 |
$ 11.020 |
$ 11.050 |
|
Total Return B, C |
7.49% |
2.93% |
5.65% |
2.00% |
4.61% |
|
Ratios and Supplemental Data |
|
|
|
|
|
|
Net assets, end of period (000 omitted) |
$ 4,610 |
$ 3,090 |
$ 1,865 |
$ 1,648 |
$ 1,586 |
|
Ratio of expenses to average net assets |
.88% |
.90% E |
.90% E |
.90% A, E |
.90% A, E |
|
Ratio of net investment income to average |
6.44% |
6.09% |
6.01% |
6.18% A |
6.09% A |
|
Portfolio turnover rate |
99% |
183% |
262% |
125% A |
149% |
A Annualized
B The total returns would have been lower had certain expenses not been reduced during the periods shown.
C Total returns do not include the one time sales charge and for periods of less than one year are not annualized.
D Net investment income per share has been calculated based on average shares outstanding during the period.
E FMR agreed to reimburse a portion of the class' expenses during the period. Without this reimbursement, the class' expense ratio would have been higher.
F For the period March 3, 1997 (commencement of sale of Class A shares) to July 31, 1997.
G Three months ended October 31
See accompanying notes which are an integral part of the financial statements.
Annual Report
Financial Highlights - Class T
|
Years ended October 31, |
2000 |
1999 |
1998 |
1997 G |
1997 F |
|
Selected Per-Share Data |
|
|
|
|
|
|
Net asset value, beginning |
$ 10.480 |
$ 10.960 |
$ 11.020 |
$ 11.050 |
$ 10.830 |
|
Income from Investment Operations |
|
|
|
|
|
|
Net investment income D |
.653 |
.637 |
.665 |
.167 |
.255 |
|
Net realized and unrealized gain (loss) |
.092 |
(.338) |
(.063) |
.048 |
.233 |
|
Total from investment |
.745 |
.299 |
.602 |
.215 |
.488 |
|
Less Distributions |
|
|
|
|
|
|
From net investment income |
(.685) |
(.629) |
(.632) |
(.165) |
(.268) |
|
From net realized gain |
- |
(.150) |
(.030) |
(.080) |
- |
|
Total distributions |
(.685) |
(.779) |
(.662) |
(.245) |
(.268) |
|
Net asset value, end of period |
$ 10.540 |
$ 10.480 |
$ 10.960 |
$ 11.020 |
$ 11.050 |
|
Total Return B, C |
7.42% |
2.82% |
5.60% |
1.98% |
4.57% |
|
Ratios and Supplemental Data |
|
|
|
|
|
|
Net assets, end of period |
$ 61,359 |
$ 29,052 |
$ 19,103 |
$ 14,649 |
$ 12,193 |
|
Ratio of expenses to average net assets |
1.00% |
1.00% E |
1.00% E |
1.00% A, E |
1.00% A, E |
|
Ratio of net investment income to average net assets |
6.33% |
5.99% |
6.05% |
6.10% A |
5.99% A |
|
Portfolio turnover rate |
99% |
183% |
262% |
125% A |
149% |
A Annualized
B The total returns would have been lower had certain expenses not been reduced during the periods shown.
C Total returns do not include the one time sales charge and for periods of less than one year are not annualized.
D Net investment income per share has been calculated based on average shares outstanding during the period.
E FMR agreed to reimburse a portion of the class' expenses during the period. Without this reimbursement, the class' expense ratio would have been higher.
F For the period March 3, 1997 (commencement of sale of Class T shares) to July 31, 1997.
G Three months ended October 31
See accompanying notes which are an integral part of the financial statements.
Annual Report
Financial Highlights - Class B
|
Years ended October 31, |
2000 |
1999 |
1998 |
1997 G |
1997 F |
|
Selected Per-Share Data |
|
|
|
|
|
|
Net asset value, beginning |
$ 10.480 |
$ 10.950 |
$ 11.020 |
$ 11.040 |
$ 10.830 |
|
Income from Investment Operations |
|
|
|
|
|
|
Net investment income D |
.593 |
.567 |
.584 |
.142 |
.234 |
|
Net realized and unrealized gain (loss) |
.081 |
(.324) |
(.064) |
.065 |
.214 |
|
Total from investment |
.674 |
.243 |
.520 |
.207 |
.448 |
|
Less Distributions |
|
|
|
|
|
|
From net investment income |
(.624) |
(.563) |
(.560) |
(.147) |
(.238) |
|
From net realized gain |
- |
(.150) |
(.030) |
(.080) |
- |
|
Total distributions |
(.624) |
(.713) |
(.590) |
(.227) |
(.238) |
|
Net asset value, end of period |
$ 10.530 |
$ 10.480 |
$ 10.950 |
$ 11.020 |
$ 11.040 |
|
Total Return B, C |
6.70% |
2.29% |
4.82% |
1.90% |
4.20% |
|
Ratios and Supplemental Data |
|
|
|
|
|
|
Net assets, end of period |
$ 19,911 |
$ 19,101 |
$ 7,840 |
$ 1,587 |
$ 823 |
|
Ratio of expenses to average |
1.60% |
1.62% |
1.65% E |
1.65% A, E |
1.65% A, E |
|
Ratio of net investment income to average net assets |
5.73% |
5.37% |
5.37% |
5.32% A |
5.34% A |
|
Portfolio turnover rate |
99% |
183% |
262% |
125% A |
149% |
A Annualized
B The total returns would have been lower had certain expenses not been reduced during the periods shown.
C Total returns do not include the contingent deferred sales charge and for periods of less than one year are not annualized.
D Net investment income per share has been calculated based on average shares outstanding during the period.
E FMR agreed to reimburse a portion of the class' expenses during the period. Without this reimbursement, the class' expense ratio would have been higher.
F For the period March 3, 1997 (commencement of sale of Class B shares) to July 31, 1997.
G Three months ended October 31
See accompanying notes which are an integral part of the financial statements.
Annual Report
Financial Highlights - Initial Class
|
Years ended October 31, |
2000 |
1999 |
1998 |
1997 F |
1997 G |
1996 G |
|
Selected Per-Share Data |
|
|
|
|
|
|
|
Net asset value, beginning of period |
$ 10.490 |
$ 10.970 |
$ 11.020 |
$ 11.050 |
$ 10.780 |
$ 10.890 |
|
Income from Investment Operations |
|
|
|
|
|
|
|
Net investment income |
.690 D |
.674 D |
.700 D |
.176 D |
.678 D |
.729 |
|
Net realized and unrealized gain (loss) |
.078 |
(.342) |
(.056) |
.047 |
.391 |
(.015) |
|
Total from investment operations |
.768 |
.332 |
.644 |
.223 |
1.069 |
.714 |
|
Less Distributions |
|
|
|
|
|
|
|
From net investment |
(.718) |
(.662) |
(.664) |
(.173) |
(.689) |
(.724) |
|
From net realized gain |
- |
(.150) |
(.030) |
(.080) |
(.110) |
(.100) |
|
Total distributions |
(.718) |
(.812) |
(.694) |
(.253) |
(.799) |
(.824) |
|
Net asset value, end |
$ 10.540 |
$ 10.490 |
$ 10.970 |
$ 11.020 |
$ 11.050 |
$ 10.780 |
|
Total Return B, C |
7.66% |
3.14% |
5.99% |
2.05% |
10.34% |
6.72% |
|
Ratios and Supplemental Data |
|
|
|
|
|
|
|
Net assets, end of period |
$ 371,107 |
$ 406,839 |
$ 459,212 |
$ 494,304 |
$ 506,113 |
$ 488,162 |
|
Ratio of expenses to average net assets |
.67% |
.70% |
.71% |
.72% A |
.73% |
.74% |
|
Ratio of expenses to average net assets after expense reductions |
.67% |
.70% |
.71% |
.72% A |
.73% |
.73% E |
|
Ratio of net investment
income to average |
6.65% |
6.29% |
6.34% |
6.36% A |
6.26% |
6.75% |
|
Portfolio turnover rate |
99% |
183% |
262% |
125% A |
149% |
221% |
A Annualized
B Total returns for periods of less than one year are not annualized.
C The total returns would have been lower had certain expenses not been reduced during the periods shown.
D Net investment income per share has been calculated based on average shares outstanding during the period.
E FMR or the fund has entered into varying arrangements with third parties who either paid or reduced a portion of the class' expenses.
F Three months ended October 31
G Year ended July 31
See accompanying notes which are an integral part of the financial statements.
Annual Report
Financial Highlights - Institutional Class
|
Years ended October 31, |
2000 |
1999 |
1998 |
1997 H |
1997 G |
|
Selected Per-Share Data |
|
|
|
|
|
|
Net asset value, beginning |
$ 10.470 |
$ 10.950 |
$ 11.010 |
$ 11.040 |
$ 10.830 |
|
Income from Investment Operations |
|
|
|
|
|
|
Net investment income D |
.684 |
.669 |
.693 |
.172 |
.263 |
|
Net realized and unrealized gain (loss) |
.080 |
(.343) |
(.063) |
.050 |
.226 |
|
Total from investment |
.764 |
.326 |
.630 |
.222 |
.489 |
|
Less Distributions |
|
|
|
|
|
|
From net investment income |
(.714) |
(.656) |
(.660) |
(.172) |
(.279) |
|
From net realized gain |
- |
(.150) |
(.030) |
(.080) |
- |
|
Total distributions |
(.714) |
(.806) |
(.690) |
(.252) |
(.279) |
|
Net asset value, end of period |
$ 10.520 |
$ 10.470 |
$ 10.950 |
$ 11.010 |
$ 11.040 |
|
Total Return B, C |
7.64% |
3.09% |
5.86% |
2.05% |
4.59% |
|
Ratios and Supplemental Data |
|
|
|
|
|
|
Net assets, end of period |
$ 9,038 |
$ 15,422 |
$ 22,038 |
$ 19,718 |
$ 13,177 |
|
Ratio of expenses to average net assets |
.73% |
.75% E |
.75% E |
.75% A, E |
.75% A, E |
|
Ratio of expenses to average net assets after expense reductions |
.72% F |
.75% |
.75% |
.75% A |
.70% A, F |
|
Ratio of net investment income to average net assets |
6.60% |
6.24% |
6.30% |
6.35% A |
6.29% A |
|
Portfolio turnover rate |
99% |
183% |
262% |
125% A |
149% |
A Annualized
B Total returns for periods of less than one year are not annualized.
C The total returns would have been lower had certain expenses not been reduced during the periods shown.
D Net investment income per share has been calculated based on average shares outstanding during the period.
E FMR agreed to reimburse a portion of the class' expenses during the period. Without this reimbursement, the class' expense ratio would have been higher.
F FMR or the fund has entered into varying arrangements with third parties who either paid or reduced a portion of the class' expenses.
G For the period March 3, 1997 (commencement of sale of Institutional Class shares) to July 31, 1997.
H Three months ended October 31
See accompanying notes which are an integral part of the financial statements.
Annual Report
For the period ended October 31, 2000
1. Significant Accounting Policies.
Fidelity Advisor Mortgage Securities Fund (the fund) is a fund of Fidelity Advisor Series II (the trust) and is authorized to issue an unlimited number of shares. Effective the close of business on February 28,1997, the fund's Initial Class was closed to new accounts. The trust is registered under the Investment Company Act of 1940, as amended (the 1940 Act), as an open-end management investment company organized as a Massachusetts business trust.
The fund offers Class A, Class T, Class B, Initial Class, and Institutional Class shares, each of which has equal rights as to assets and voting privileges. Each class has exclusive voting rights with respect to matters that affect that class. Class B shares will automatically convert to Class A shares after a holding period of seven years from the initial date of purchase. Investment income, realized and unrealized capital gains and losses, the common expenses of the fund, and certain fund-level expense reductions, if any, are allocated on a pro rata basis to each class based on the relative net assets of each class to the total net assets of the fund. Each class of shares differs in its respective distribution, transfer agent, and certain other class-specific fees, expenses, and expense reductions.
The financial statements have been prepared in conformity with generally accepted accounting principles which require management to make certain estimates and assumptions at the date of the financial statements. The following summarizes the significant accounting policies of the fund:
Security Valuation. Securities are valued based upon a computerized matrix system and/or appraisals by a pricing service, both of which consider market transactions and dealer-supplied valuations. Securities (including restricted securities) for which market quotations are not readily available are valued at their fair value as determined in good faith under consistently applied procedures under the general supervision of the Board of Trustees. Short-term securities with remaining maturities of sixty days or less for which quotations are not readily available are valued at amortized cost or original cost plus accrued interest, both of which approximate current value. Investments in open-end investment companies are valued at their net asset value each business day.
Income Taxes. As a qualified regulated investment company under Subchapter M of the Internal Revenue Code, the fund is not subject to income taxes to the extent that it distributes substantially all of its taxable income for its fiscal year. The schedule of investments includes information regarding income taxes under the caption "Income Tax Information."
Investment Income. Interest income, which includes accretion of original issue discount, is accrued as earned.
Expenses. Most expenses of the trust can be directly attributed to a fund. Expenses which cannot be directly attributed are apportioned among the funds in the trust.
Annual Report
Notes to Financial Statements - continued
1. Significant Accounting Policies - continued
Distributions to Shareholders. Distributions are declared daily and paid monthly from net investment income. Distributions from realized gains, if any, are recorded on the ex-dividend date. Income dividends and capital gain distributions are declared separately for each class.
Income and capital gain distributions are determined in accordance with income tax regulations which may differ from generally accepted accounting principles. These differences, which may result in distribution reclassifications, are primarily due to differing treatments for paydown gains/losses on certain securities, market discount, capital loss carryforwards and losses deferred due to wash sales.
Permanent book and tax basis differences relating to shareholder distributions will result in reclassifications to paid in capital. Undistributed net investment income and accumulated undistributed net realized gain (loss) on investments may include temporary book and tax basis differences which will reverse in a subsequent period. Any taxable income or gain remaining at fiscal year end is distributed in the following year.
Security Transactions. Security transactions are accounted for as of trade date. Gains and losses on securities sold are determined on the basis of identified cost.
2. Operating Policies.
Joint Trading Account. Pursuant to an Exemptive Order issued by the Securities and Exchange Commission, the fund, along with other affiliated entities of Fidelity Management & Research Company (FMR), may transfer uninvested cash balances into one or more joint trading accounts. These balances are invested in one or more repurchase agreements for U.S. Treasury or Federal Agency obligations.
Repurchase Agreements. The underlying U.S. Treasury, Federal Agency, or other obligations found to be satisfactory by FMR are transferred to an account of the fund, or to the Joint Trading Account, at a custodian bank. The securities are marked-to-market daily and maintained at a value at least equal to the principal amount of the repurchase agreement (including accrued interest). FMR, the fund's investment adviser, is responsible for determining that the value of the underlying securities remains in accordance with the market value requirements stated above.
Delayed Delivery Transactions. The fund may purchase or sell securities on a delayed delivery basis. Payment and delivery may take place after the customary settlement period for that security. The price of the underlying securities and the date when the securities will be delivered and paid for are fixed at the time the transaction is negotiated. The market values of the securities purchased on a delayed delivery basis are identified as such in the fund's schedule of investments. The fund may receive compensation for interest forgone in the purchase of a delayed delivery security. With respect to
Annual Report
Notes to Financial Statements - continued
2. Operating Policies - continued
Delayed Delivery Transactions - continued
purchase commitments, the fund identifies securities as segregated in its records with a value at least equal to the amount of the commitment. Losses may arise due to changes in the market value of the underlying securities or if the counterparty does not perform under the contract.
Restricted Securities. The fund is permitted to invest in securities that are subject to legal or contractual restrictions on resale. These securities generally may be resold in transactions exempt from registration or to the public if the securities are registered. Disposal of these securities may involve time-consuming negotiations and expense, and prompt sale at an acceptable price may be difficult. At the end of the period, the fund had no investments in restricted securities (excluding 144A issues).
3. Purchases and Sales of Investments.
Purchases and sales of securities, other than short-term securities, aggregated $455,603,228 and $472,388,211, respectively, of which U.S. government and government agency obligations aggregated $439,935,274 and $444,362,092, respectively.
4. Fees and Other Transactions with Affiliates.
Management Fee. As the fund's investment adviser, FMR receives a monthly fee that is calculated on the basis of a group fee rate plus a fixed individual fund fee rate applied to the average net assets of the fund. The group fee rate is the weighted average of a series of rates and is based on the monthly average net assets of all the mutual funds advised by FMR. The rates ranged from .0920% to .3700% for the period. The annual individual fund fee rate is .30%. In the event that these rates were lower than the contractual rates in effect during the period, FMR voluntarily implemented the above rates, as they resulted in the same or a lower management fee. For the period, the management fee was equivalent to an annual rate of .43% of average net assets.
Sub-Adviser Fee. FMR, on behalf of the fund, has entered into a sub-advisory agreement with Fidelity Investments Money Management, Inc. (FIMM), a wholly owned subsidiary of FMR. For its services, FIMM receives a fee from FMR of 50% of the management fee payable to FMR. The fee is paid prior to any voluntary expense reimbursements which may be in effect.
Distribution and Service Plan. In accordance with Rule 12b-1 of the 1940 Act, the Board of Trustees has adopted separate Distribution and Service Plans with respect to each class of shares (collectively referred to as "the Plans"). Under certain of the Plans, the class pays Fidelity Distributors Corporation (FDC), an affiliate of FMR, a 12b-1 fee. A portion of this fee may be reallowed to securities dealers, banks and other financial institutions for the distribution of each class of shares and providing shareholder support
Annual Report
Notes to Financial Statements - continued
4. Fees and Other Transactions with Affiliates - continued
Distribution and Service Plan - continued
services. For the period, this fee was based on the following annual rates of the average net assets of each applicable class:
|
Class A |
.15% |
|
Class T |
.25% |
|
Class B |
.90%* |
* .65% represents a distribution fee and .25% represents a shareholder service fee.
For the period, each class paid FDC the following amounts, a portion of which was retained by FDC:
|
|
Paid to |
Retained |
|
Class A |
$ 5,801 |
$ 9 |
|
Class T |
82,308 |
1,661 |
|
Class B |
172,938 |
124,900 |
|
|
$ 261,047 |
$ 126,570 |
Sales Load. FDC receives a front-end sales charge of up to 4.75% for selling Class A shares, and 3.50% for selling Class T shares of the fund. FDC receives the proceeds of contingent deferred sales charges levied on Class B share redemptions occurring within six years of purchase. The Class B charge is based on declining rates ranging from 5% to 1% of the lesser of the cost of shares at the initial date of purchase or the net asset value of the redeemed shares, excluding any reinvested dividends and capital gains. In addition, purchases of Class A and Class T shares that were subject to a finder's fee bear a contingent deferred sales charge on assets that do not remain in the fund for at least one year. The Class A and Class T contingent deferred sales charge is based on 0.25% of the lesser of the cost of shares at the initial date of purchase or the net asset value of the redeemed shares, excluding any reinvested dividends and capital gains. A portion of the sales charges paid to FDC is paid to securities dealers, banks and other financial institutions.
For the period, sales charge amounts paid to and retained by FDC were as follows:
|
|
Paid to |
Retained |
|
Class A |
$ 19,275 |
$ 5,275 |
|
Class T |
45,570 |
13,922 |
|
Class B |
104,949 |
104,949* |
|
|
$ 169,794 |
$ 124,146 |
* When Class B shares are initially sold, FDC pays commissions from its own resources to securities dealers,
banks, and other financial institutions through which the sales are made.
Annual Report
Notes to Financial Statements - continued
4. Fees and Other Transactions with Affiliates - continued
Transfer Agent Fees. Fidelity Investments Institutional Operations Company, Inc., (FIIOC), an affiliate of FMR, is the transfer, dividend disbursing and shareholder servicing agent (collectively referred to as the transfer agent) for the fund's Class A, Class T, Class B, and Institutional Class Shares. Fidelity Service Company, Inc. (FSC), an affiliate of FMR, is the transfer agent for the Initial Class Shares. FIIOC and FSC receive account fees and asset-based fees that vary according to the account size and type of account of the shareholders of the respective classes of the fund. FIIOC and FSC pay for typesetting, printing and mailing of all shareholder reports, except proxy statements. For the period, the following amounts were paid to FIIOC or FSC:
|
|
Amount |
% of |
|
Class A |
$ 8,617 |
.22 |
|
Class T |
78,644 |
.24 |
|
Class B |
36,267 |
.19 |
|
Initial Class |
607,430 |
.16 |
|
Institutional Class |
28,123 |
.22 |
|
|
$ 759,081 |
|
Accounting Fees. FSC maintains the fund's accounting records. The fee is based on the level of average net assets for the month plus out-of-pocket expenses.
5. Expense Reductions.
Through arrangements with the fund's custodian and each class' transfer agent, credits realized as a result of uninvested cash balances were used to reduce a portion of expenses. During the period, the fund's custodian fees were reduced by $12,619 under the custodian arrangement, and Initial Class' transfer agent expenses were reduced by $372 under the transfer agent arrangement.
Annual Report
Notes to Financial Statements - continued
6. Distributions to Shareholders.
Distributions to shareholders of each class were as follows:
|
|
Years ended October 31, |
|
|
|
2000 |
1999 |
|
From net investment income |
|
|
|
Class A |
$ 259,663 |
$ 153,223 |
|
Class T |
2,169,235 |
1,450,107 |
|
Class B |
1,158,837 |
724,614 |
|
Initial Class |
26,148,441 |
26,727,640 |
|
Institutional Class |
900,873 |
1,127,965 |
|
Total |
$ 30,637,049 |
$ 30,183,549 |
|
From net realized gain |
|
|
|
Class A |
$ - |
$ 26,293 |
|
Class T |
- |
278,709 |
|
Class B |
- |
132,050 |
|
Initial Class |
- |
6,182,269 |
|
Institutional Class |
- |
305,251 |
|
Total |
$ - |
$ 6,924,572 |
7. Share Transactions.
Transactions for each class of shares were as follows:
|
|
Shares |
Dollars |
||
|
|
Year ended October 31, |
Year ended October 31, |
Year ended October 31, |
Year ended October 31, |
|
|
2000 |
1999 |
2000 |
1999 |
|
Class A |
215,111 |
233,326 |
$ 2,232,936 |
$ 2,488,784 |
|
Reinvestment of distributions |
18,825 |
11,952 |
195,149 |
127,329 |
|
Shares redeemed |
(90,958) |
(120,472) |
(941,418) |
(1,280,382) |
|
Net increase (decrease) |
142,978 |
124,806 |
$ 1,486,667 |
$ 1,335,731 |
|
Class T |
4,402,524 |
2,003,369 |
$ 45,948,619 |
$ 21,386,352 |
|
Reinvestment of distributions |
163,509 |
148,336 |
1,696,640 |
1,582,559 |
|
Shares redeemed |
(1,514,665) |
(1,122,570) |
(15,663,958) |
(11,947,707) |
|
Net increase (decrease) |
3,051,368 |
1,029,135 |
$ 31,981,301 |
$ 11,021,204 |
Annual Report
Notes to Financial Statements - continued
7. Share Transactions - continued
|
|
Shares |
Dollars |
||
|
|
Year ended October 31, |
Year ended October 31, |
Year ended October 31, |
Year ended October 31, |
|
|
2000 |
1999 |
2000 |
1999 |
|
Class B |
652,666 |
1,505,268 |
$ 6,775,572 |
$ 16,049,817 |
|
Reinvestment of distributions |
85,020 |
63,855 |
880,755 |
679,689 |
|
Shares redeemed |
(669,424) |
(461,420) |
(6,925,550) |
(4,891,488) |
|
Net increase (decrease) |
68,262 |
1,107,703 |
$ 730,777 |
$ 11,838,018 |
|
Initial Class |
3,201,394 |
3,914,002 |
$ 33,214,158 |
$ 41,964,545 |
|
Reinvestment of distributions |
2,034,985 |
2,515,203 |
21,102,123 |
26,913,754 |
|
Shares redeemed |
(8,824,923) |
(9,502,966) |
(91,371,208) |
(101,601,425) |
|
Net increase (decrease) |
(3,588,544) |
(3,073,761) |
$ (37,054,927) |
$ (32,723,126) |
|
Institutional Class |
827,963 |
667,600 |
$ 8,501,722 |
$ 7,141,162 |
|
Reinvestment of distributions |
43,983 |
70,535 |
454,723 |
754,625 |
|
Shares redeemed |
(1,486,148) |
(1,277,677) |
(15,364,088) |
(13,640,920) |
|
Net increase (decrease) |
(614,202) |
(539,542) |
$ (6,407,643) |
$ (5,745,133) |
Annual Report
To the Trustees of Fidelity Advisor Series II and the Shareholders of Fidelity Advisor Mortgage Securities Fund:
In our opinion, the accompanying statement of assets and liabilities, including the schedule of investments, and the related statements of operations and of changes in net assets and the financial highlights present fairly, in all material respects, the financial position of Fidelity Advisor Mortgage Securities Fund (a fund of Fidelity Advisor Series II) at October 31, 2000, and the results of its operations, the changes in its net assets and the financial highlights for the periods indicated, in conformity with accounting principles generally accepted in the United States of America. These financial statements and financial highlights (hereafter referred to as "financial statements") are the responsibility of the Fidelity Advisor Mortgage Securities Fund's management; our responsibility is to express an opinion on these financial statements based on our audits. We conducted our audits of these financial statements in accordance with auditing standards generally accepted in the United States of America which require that we plan and perform the audit to obtain reasonable assurance about whether the financial statements are free of material misstatement. An audit includes examining, on a test basis, evidence supporting the amounts and disclosures in the financial statements, assessing the accounting principles used and significant estimates made by management, and evaluating the overall financial statement presentation. We believe that our audits, which included confirmation of securities at October 31, 2000 by correspondence with the custodian and brokers, provide a reasonable basis for our opinion.
/s/PricewaterhouseCoopers LLP
PricewaterhouseCoopers LLP
Boston, Massachusetts
December 11, 2000
Annual Report
Investment Adviser
Fidelity Management & Research Company
Boston, MA
Investment Sub-Advisers
Fidelity Investment Money
Management Inc.
Fidelity Management & Research (U.K.) Inc.
Fidelity Management & Research
(Far East) Inc.
Fidelity Investment Japan Limited
Officers
Edward C. Johnson 3d, President
Robert C. Pozen, Senior Vice President
Dwight D. Churchill, Vice President
David L. Murphy, Vice President
Thomas J. Silvia, Vice President
Stanley N. Griffith, Assistant Vice President
Eric D. Roiter, Secretary
Robert A. Dwight, Treasurer
Maria F. Dwyer, Deputy Treasurer
John H. Costello, Assistant Treasurer
Thomas J. Simpson, Assistant Treasurer
Board of Trustees
Ralph F. Cox *
Phyllis Burke Davis *
Robert M. Gates *
Edward C. Johnson 3d
Donald J. Kirk *
Ned C. Lautenbach *
Peter S. Lynch
Marvin L. Mann *
William O. McCoy *
Gerald C. McDonough *
Robert C. Pozen
Thomas R. Williams *
Advisory Board
J. Michael Cook
Abigail P. Johnson
Marie L. Knowles
* Independent trustees
General Distributor
Fidelity Distributors Corporation
Boston, MA
Transfer and Shareholder
Servicing Agent
Fidelity Service Company, Inc.
Boston, MA
Custodian
The Bank of New York
New York, NY
Fidelity's Taxable Bond Funds
Capital & Income
Ginnie Mae
Government Income
High Income
Intermediate Bond
Intermediate Government Income
International Bond
Investment Grade Bond
New Markets Income
Short-Term Bond
Spartan Government Income
Spartan Investment Grade Bond
Strategic Income
Target TimelineSM 2001 & 2003
The Fidelity Telephone Connection
Mutual Fund 24-Hour Service
Exchanges/Redemptions
and Account Assistance 1-800-544-6666
Product Information 1-800-544-6666
Retirement Accounts 1-800-544-4774
(8 a.m. - 9 p.m.)
TDD Service 1-800-544-0118
for the deaf and hearing impaired
(9 a.m. - 9 p.m. Eastern time)
Fidelity Automated Service
Telephone (FAST®) (automated graphic) 1-800-544-5555
(automated graphic) Automated line for quickest service
|
MOR-ANN-1200 |
119002 |
|
1.538542.103 |
|
(Fidelity Investment logo)(registered trademark)
Corporate Headquarters
82 Devonshire St., Boston, MA 02109
www.fidelity.com
Fidelity® Advisor
Fund - Class A, Class T and Class C
Annual Report
October 31, 2000
(2_fidelity_logos)(Registered_Trademark)
|
President's Message |
3 |
Ned Johnson on investing strategies. |
|
Performance |
4 |
How the fund has done over time. |
|
Fund Talk |
15 |
The manager's review of fund performance, strategy and outlook. |
|
Investment Changes |
18 |
A summary of major shifts in the fund's investments over the past six months. |
|
Investments |
19 |
A complete list of the fund's investments with their market values. |
|
Financial Statements |
33 |
Statements of assets and liabilities,
operations, and changes in net assets, |
|
Notes |
41 |
Notes to the financial statements. |
|
Independent Auditors' Report |
47 |
The auditors' opinion. |
|
|
|
|
Standard & Poor's, S&P and S&P 500 are registered service marks of The McGraw-Hill Companies, Inc. and have been licensed for use by Fidelity Distributors Corporation.
Third party marks appearing herein are the property of their respective owners.
All other marks appearing herein are registered or unregistered trademarks or service marks of FMR Corp. or an affiliated company.
(Recycle graphic) This report is printed on recycled paper using soy-based inks.
This report and the financial statements contained herein are submitted for the general information of the shareholders of the fund. This report is not authorized for distribution to prospective investors in the fund unless preceded or accompanied by an effective prospectus.
Mutual fund shares are not deposits or obligations of, or guaranteed by, any depository institution. Shares are not insured by the FDIC, Federal Reserve Board or any other agency, and are subject to investment risks, including possible loss of principal amount invested.
Neither the fund nor Fidelity Distributors Corporation is a bank.
For more information on any Fidelity Advisor fund, including charges and expenses, contact your investment professional for a free prospectus. Read it carefully before you invest or send money.
Annual Report
(photo_of_Edward_C_Johnson_3d)
Dear Shareholder:
A sixth-straight year of double-digit positive returns for the Dow Jones Industrial Average, NASDAQ and S&P 500® could be in jeopardy unless the U.S. stock market shows marked improvement in the final two months of 2000. Through October, all three indexes had negative year-to-date returns. On the other hand, most fixed-income sectors were solidly in the black. Treasuries and other long-term government securities led the way, returning nearly 14%.
While it's impossible to predict the future direction of the markets with any degree of certainty, there are certain basic principles that can help investors plan for their future needs.
The longer your investment time frame, the less likely it is that you will be affected by short-term market volatility. A 10-year investment horizon appropriate for saving for a college education, for example, enables you to weather market cycles in a long-term fund, which may have a higher risk potential, but also has a higher potential rate of return.
An intermediate-length fund could make sense if your investment horizon is two to four years, while a short-term bond fund could be the right choice if you need your money in one or two years.
If your time horizon is less than a year, you might want to consider moving some of your bond investment into a money market fund. These funds seek income and a stable share price by investing in high-quality, short-term investments. Of course, it's important to remember that an investment in a money market fund is not insured or guaranteed by the Federal Deposit Insurance Corporation or any other government agency. Although money market funds seek to preserve the value of your investment at $1.00 per share, it is possible to lose money by investing in these types of funds.
Finally, no matter what your time horizon or portfolio diversity, it makes good sense to follow a regular investment plan, investing a certain amount of money in a fund at the same time each month or quarter and periodically reviewing your overall portfolio. By doing so, you won't get caught up in the excitement of a rapidly rising market, nor will you buy all your shares at market highs. While this strategy - known as dollar cost averaging - won't assure a profit or protect you from a loss in a declining market, it should help you lower the average cost of your purchases. Of course, you should consider your financial ability to continue your purchases through periods of low price levels before undertaking such a strategy.
Remember to contact your investment professional if you need help with your investments.
Best regards,
/s/Edward C. Johnson 3d
Edward C. Johnson 3d
Annual Report
There are several ways to evaluate historical performance. You can look at the total percentage change in value, the average annual percentage change or the growth of a hypothetical $10,000 investment. Total return reflects the change in the value of an investment, assuming reinvestment of the class' dividend income and capital gains (the profits earned upon the sale of securities that have grown in value). You can also look at the class' income, as reflected in its yield, to measure performance. The initial offering of Class A shares took place on September 3, 1996. Class A shares bear a 0.15% 12b-1 fee. Returns prior to September 3, 1996 are those of Class T, the original class of the fund, and reflect Class T shares' 0.15% 12b-1 fee. If Fidelity had not reimbursed certain class expenses, the past five year and past 10 year total returns would have been lower.
Cumulative Total Returns
|
Periods ended October 31, 2000 |
|
Past 1 |
Past 5 |
Past 10 years |
|
Fidelity® Adv Short Fixed-Income - CL A |
|
5.91% |
29.53% |
83.65% |
|
Fidelity Adv Short Fixed-Income - CL A |
|
4.32% |
27.58% |
80.89% |
|
LB 1-3 Year Govt/Credit |
|
6.15% |
33.04% |
87.31% |
|
Short Investment Grade Debt Funds Average |
|
5.76% |
29.56% |
84.22% |
Cumulative total returns show Class A's performance in percentage terms over a set period - in this case, one year, five years or 10 years. For example, if you had invested $1,000 in a fund that had a 5% return over the past year, the value of your investment would be $1,050. You can compare Class A's returns to the performance of the Lehman Brothers 1-3 Year Government/Credit Bond Index - a market value-weighted index of government and investment-grade corporate fixed-rate debt issues with maturities between one and three years. To measure how Class A's performance stacked up against its peers, you can compare it to the short investment grade debt funds average, which reflects the performance of mutual funds with similar objectives tracked by Lipper Inc. The past one year average represents a peer group of 110 mutual funds. These benchmarks include reinvested dividends and capital gains, if any, and exclude the effect of sales charges.
Average Annual Total Returns
|
Periods ended October 31, 2000 |
Past 1 |
Past 5 |
Past 10 years |
|
Fidelity Adv Short Fixed-Income - CL A |
5.91% |
5.31% |
6.27% |
|
Fidelity Adv Short Fixed-Income - CL A |
4.32% |
4.99% |
6.11% |
|
LB 1-3 Year Govt/Credit |
6.15% |
5.88% |
6.48% |
|
Short Investment Grade Debt Funds Average |
5.76% |
5.31% |
6.29% |
Average annual total returns take Class A shares' cumulative return and show you what would have happened if Class A shares had performed at a constant rate each year.
Annual Report
Fidelity Advisor Short Fixed-Income Fund - Class A
Performance - continued
$10,000 Over 10 Years
$10,000 Over 10 Years: Let's say hypothetically that $10,000 was invested in Fidelity Advisor Short Fixed-Income Fund - Class A on October 31, 1990, and the current 1.50% sales charge was paid. As the chart shows, by October 31, 2000, the value of the investment would have grown to $18,089 - an 80.89% increase on the initial investment. For comparison, look at how the Lehman Brothers 1-3 Year Government/Credit Bond Index did over the same period. With dividends and capital gains, if any, reinvested, the same $10,000 would have grown to $18,731 - an 87.31% increase.
Understanding
Performance
How a fund did yesterday is no guarantee of how it will do tomorrow. Bond prices, for example, generally move in the opposite direction of interest rates. In turn, the share price, return and yield of a fund that invests in bonds will vary. That means if you sell your shares during a market downturn, you might lose money. But if you can ride out the market's ups and downs, you may have a gain.
3Annual Report
Fidelity Advisor Short Fixed-Income Fund - Class A
Performance - continued
Total Return Components
|
|
Years ended October 31, |
September 3, 1996 |
|||
|
|
2000 |
1999 |
1998 |
1997 |
1996 |
|
Dividend returns |
6.24% |
5.57% |
5.83% |
6.28% |
0.99% |
|
Capital returns |
-0.33% |
-2.45% |
0.75% |
-0.64% |
0.86% |
|
Total returns |
5.91% |
3.12% |
6.58% |
5.64% |
1.85% |
Total return components include both dividend returns and capital returns. A dividend return reflects the actual dividends paid by the class. A capital return reflects both the amount paid by the class to shareholders as capital gain distributions and changes in the class' share price. Both returns assume the dividends or capital gains, if any, paid by the class are reinvested, and exclude the effect of sales charges.
Dividends and Yield
|
Periods ended October 31, 2000 |
Past 1 |
Past 6 |
Past 1 |
|
Dividends per share |
4.74¢ |
28.33¢ |
55.29¢ |
|
Annualized dividend rate |
6.11% |
6.18% |
6.08% |
|
30-day annualized yield |
6.36% |
- |
- |
Dividends per share show the income paid by the class for a set period. If you annualize this number, based on an average share price of $9.14 over the past one month, $9.09 over the past six months, and $9.09 over the past one year, you can compare the class' income over these three periods. The 30-day annualized yield is a standard formula for all bond funds based on the yields of the bonds in the fund, averaged over the past 30 days. This figure shows you the yield characteristics of the fund's investments at the end of the period. It also helps you compare funds from different companies on an equal basis. The offering share price used in the calculation of the yield includes the effect of Class A's current 1.50% sales charge.
Annual Report
There are several ways to evaluate historical performance. You can look at the total percentage change in value, the average annual percentage change or the growth of a hypothetical $10,000 investment. Total return reflects the change in the value of an investment, assuming reinvestment of the class' dividend income and capital gains (the profits earned upon the sale of securities that have grown in value). You can also look at the class' income, as reflected in its yield, to measure performance. If Fidelity had not reimbursed certain class expenses, the past 10 year total returns would have been lower.
Cumulative Total Returns
|
Periods ended October 31, 2000 |
|
Past 1 |
Past 5 |
Past 10 |
|
Fidelity Adv Short Fixed-Income - CL T |
|
6.00% |
29.86% |
84.12% |
|
Fidelity Adv Short Fixed-Income - CL T |
|
4.41% |
27.92% |
81.36% |
|
LB 1-3 Year Govt/Credit |
|
6.15% |
33.04% |
87.31% |
|
Short Investment Grade Debt Funds Average |
|
5.76% |
29.56% |
84.22% |
Cumulative total returns show Class T's performance in percentage terms over a set period - in this case, one year, five years or 10 years. For example, if you had invested $1,000 in a fund that had a 5% return over the past year, the value of your investment would be $1,050. You can compare Class T's returns to the performance of the Lehman Brothers 1-3 Year Government/Credit Bond Index - a market value-weighted index of government and investment-grade corporate fixed-rate debt issues with maturities between one and three years. To measure how Class T's performance stacked up against its peers, you can compare it to the short investment grade debt funds average, which reflects the performance of mutual funds with similar objectives tracked by Lipper Inc. The past one year average represents a peer group of 110 mutual funds. These benchmarks include reinvested dividends and capital gains, if any, and exclude the effect of sales charges.
Annual Report
Fidelity Advisor Short Fixed-Income Fund - Class T
Performance - continued
Average Annual Total Returns
|
Periods ended October 31, 2000 |
Past 1 |
Past 5 |
Past 10 |
|
Fidelity Adv Short Fixed-Income - CL T |
6.00% |
5.37% |
6.29% |
|
Fidelity Adv Short Fixed-Income - CL T |
4.41% |
5.05% |
6.13% |
|
LB 1-3 Year Govt/Credit |
6.15% |
5.88% |
6.48% |
|
Short Investment Grade Debt Funds Average |
5.76% |
5.31% |
6.29% |
Average annual total returns take Class T shares' cumulative return and show you what would have happened
if Class T shares had performed at a constant rate each year.
Annual Report
Fidelity Advisor Short Fixed-Income Fund - Class T
Performance - continued
$10,000 Over 10 years
$10,000 Over 10 Years: Let's say hypothetically that $10,000 was invested in Fidelity Advisor Short Fixed-Income Fund - Class T on October 31, 1990, and the current 1.50% sales charge was paid. As the chart shows, by October 31, 2000, the value of the investment would have grown to $18,136 - an 81.36% increase on the initial investment. For comparison, look at how the Lehman Brothers 1-3 Year Government/Credit Bond Index did over the same period. With dividends, and capital gains, if any, reinvested, the same $10,000 would have grown to $18,731 - an 87.31% increase.
Understanding
Performance
How a fund did yesterday is no guarantee of how it will do tomorrow. Bond prices, for example, generally move in the opposite direction of interest rates. In turn, the share price, return and yield of a fund that invests in bonds will vary. That means if you sell your shares during a market downturn, you might lose money. But if you can ride out the market's ups and downs, you may have a gain.
3Annual Report
Fidelity Advisor Short Fixed-Income Fund - Class T
Performance - continued
Total Return Components
|
|
|
Years ended October 31, |
||||
|
|
|
2000 |
1999 |
1998 |
1997 |
1996 |
|
Dividend returns |
|
6.22% |
5.57% |
6.00% |
6.29% |
6.40% |
|
Capital returns |
|
-0.22% |
-2.45% |
0.32% |
-0.32% |
-0.95% |
|
Total returns |
|
6.00% |
3.12% |
6.32% |
5.97% |
5.45% |
Total return components include both dividend returns and capital returns. A dividend return reflects the actual dividends paid by the class. A capital return reflects both the amount paid by the class to shareholders as capital gain distributions and changes in the class' share price. Both returns assume the dividends or capital gains, if any, paid by the class are reinvested, and exclude the effects of sales charges.
Dividends and Yield
|
Periods ended October 31, 2000 |
Past 1 |
Past 6 |
Past 1 |
|
Dividends per share |
4.73¢ |
28.22¢ |
55.09¢ |
|
Annualized dividend rate |
6.09% |
6.16% |
6.05% |
|
30-day annualized yield |
6.35% |
- |
- |
Dividends per share show the income paid by the class for a set period. If you annualize this number, based on an average share price of $9.14 over the past one month, $9.09 over the past six months, and $9.10 over the past one year, you can compare the class' income over these three periods. The 30-day annualized yield is a standard formula for all bond funds based on the yields of the bonds in the fund, averaged over the past 30 days. This figure shows you the yield characteristics of the fund's investments at the end of the period. It also helps you compare funds from different companies on an equal basis. The offering share price used in the calculation of the yield includes the effect of Class T's current 1.50% sales charge.
Annual Report
There are several ways to evaluate historical performance. You can look at the total percentage change in value, the average annual percentage change or the growth of a hypothetical $10,000 investment. Total return reflects the change in the value of an investment, assuming reinvestment of the class' dividend income and capital gains (the profits earned upon the sale of securities that have grown in value). You can also look at the class' income, as reflected in its yield, to measure performance. The initial offering of Class C shares took place on November 3, 1997. Class C shares bear a 1.00% 12b-1 fee. Returns prior to November 3, 1997 are those of Class T, the original class of the fund, and reflect Class T shares' 0.15% 12b-1 fee. Had Class C shares' 12b-1 fee been reflected, returns prior to November 3, 1997 would have been lower. Class C shares' contingent deferred sales charge included in the past one year, past five year and past 10 year total return figures are 1%, 0% and 0%, respectively. If Fidelity had not reimbursed certain class expenses, the past five year and past 10 year total returns would have been lower.
Cumulative Total Returns
|
Periods ended October 31, 2000 |
|
Past 1 |
Past 5 |
Past 10 years |
|
Fidelity Adv Short Fixed-Income - CL C |
|
5.01% |
26.56% |
79.43% |
|
Fidelity Adv Short Fixed-Income - CL C |
|
4.01% |
26.56% |
79.43% |
|
LB 1-3 Year Govt/Credit |
|
6.15% |
33.04% |
87.31% |
|
Short Investment Grade Debt Funds Average |
|
5.76% |
29.56% |
84.22% |
Cumulative total returns show Class C's performance in percentage terms over a set period - in this case, one year, five years or 10 years. For example, if you had invested $1,000 in a fund that had a 5% return over the past year, the value of your investment would be $1,050. You can compare Class C's returns to the performance of the Lehman Brothers 1-3 Year Government/Credit Bond Index - a market value-weighted index of government and investment-grade corporate fixed-rate debt issues with maturities between one and three years. To measure how Class C's performance stacked up against its peers, you can compare it to the short investment grade debt funds average, which reflects the performance of mutual funds with similar objectives tracked by Lipper Inc. The past one year average represents a peer group of 110 mutual funds. These benchmarks include reinvested dividends and capital gains, if any, and exclude the effect of sales charges.
Annual Report
Fidelity Advisor Short Fixed-Income Fund - Class C
Performance - continued
Average Annual Total Returns
|
Periods ended October 31, 2000 |
Past 1 |
Past 5 |
Past 10 years |
|
Fidelity Adv Short Fixed-Income - CL C |
5.01% |
4.82% |
6.02% |
|
Fidelity Adv Short Fixed-Income - CL C |
4.01% |
4.82% |
6.02% |
|
LB 1-3 Year Govt/Credit |
6.15% |
5.88% |
6.48% |
|
Short Investment Grade Debt Funds Average |
5.76% |
5.31% |
6.29% |
Average annual total returns take Class C shares' cumulative return and show you what would have happened
if Class C shares had performed at a constant rate each year.
Annual Report
Fidelity Advisor Short Fixed-Income Fund - Class C
Performance - continued
$10,000 Over 10 Years
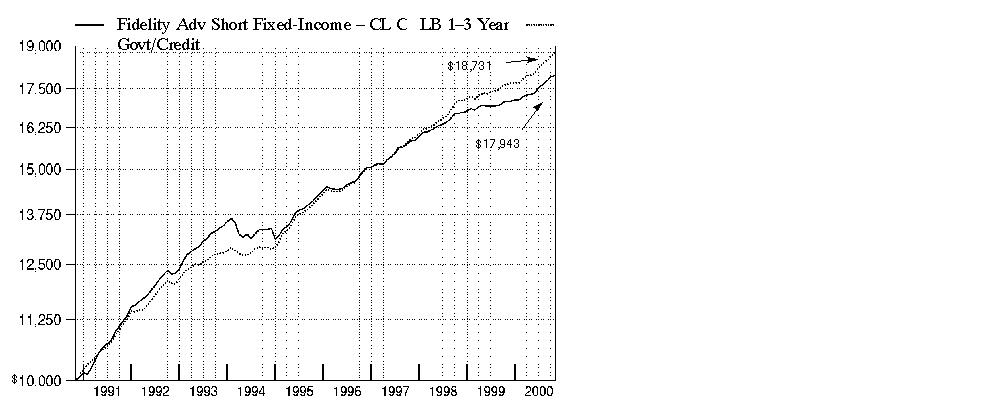
$10,000 Over 10 Years: Let's say hypothetically that $10,000 was invested in Fidelity Advisor Short Fixed-Income Fund - Class C on October 31, 1990. As the chart shows, by October 31, 2000, the value of the investment would have grown to $17,943 - a 79.43% increase on the initial investment. For comparison, look at how the Lehman Brothers 1-3 Year Government/Credit Bond Index did over the same period. With dividends and capital gains, if any, reinvested, the same $10,000 would have grown to $18,731 - an 87.31% increase.
Understanding
Performance
How a fund did yesterday is no guarantee of how it will do tomorrow. Bond prices, for example, generally move in the opposite direction of interest rates. In turn, the share price, return and yield of a fund that invests in bonds will vary. That means if you sell your shares during a market downturn, you might lose money. But if you can ride out the market's ups and downs, you may have a gain.
3Annual Report
Fidelity Advisor Short Fixed-Income Fund - Class C
Performance - continued
Total Return Components
|
|
Years ended October 31, |
November 3, 1997 |
|
|
|
2000 |
1999 |
1998 |
|
Dividend returns |
5.34% |
4.66% |
5.06% |
|
Capital returns |
-0.33% |
-2.35% |
0.43% |
|
Total returns |
5.01% |
2.31% |
5.49% |
Total return components include both dividend returns and capital returns. A dividend return reflects the actual dividends paid by the class. A capital return reflects both the amount paid by the class to shareholders as capital gain distributions and changes in the class' share price. Both returns assume the dividends or capital gains, if any, paid by the class are reinvested, and exclude the effects of sales charges.
Dividends and Yield
|
Periods ended October 31, 2000 |
Past 1 |
Past 6 |
Past 1 |
|
Dividends per share |
4.15¢ |
24.50¢ |
47.56¢ |
|
Annualized dividend rate |
5.34% |
5.34% |
5.23% |
|
30-day annualized yield |
5.68% |
- |
- |
Dividends per share show the income paid by the class for a set period. If you annualize this number, based on an average share price of $9.15 over the past one month, $9.10 over the past six months and $9.10 over the past one year, you can compare the class' income over these three periods. The 30-day annualized yield is a standard formula for all bond funds based on the yields of the bonds in the fund, averaged over the past 30 days. This figure shows you the yield characteristics of the fund's investments at the end of the period. It also helps you compare funds from different companies on an equal basis. The offering price used in the calculation of the yield excludes the effect of Class C's contingent deferred sales charge.
Annual Report
Market Recap
Strong technical factors in the market helped most investment-grade bonds overcome sharply rising interest rates and volatile market conditions, enabling them to outperform a number of major U.S. equity indexes during the 12-month period that ended October 31, 2000. The Lehman Brothers Aggregate Bond Index - a popular measure of taxable-bond performance - returned 7.30% during this time frame. Following a bullish fourth quarter of 1999 for the spread sectors - namely corporate bonds, mortgage and agency securities - Treasuries usurped market leadership not long after the millennium changeover. A growing federal surplus spurred the U.S. government in January to begin buying back outstanding debt and reducing future issuance. The scarcity premium created by a shrinking supply of long-dated Treasuries sent prices soaring and yields plummeting, thereby inducing an inverted yield curve - which occurs when short-term bonds outyield longer-dated securities. Anticipation that the Fed was finished raising interest rates entering the summer, combined with persistent flights-to-safety from risk-averse investors concerned about volatility in equity markets, further bolstered the long bond, helping the Lehman Brothers Treasury Index return 8.22% during the period. Mortgages made up some ground late in the period behind strong housing turnover. Agencies, too, staged a late rally in response to reduced political risk surrounding government-sponsored enterprises. However, corporates had little to celebrate, plagued by deteriorating credit conditions and growing supply pressures. For the overall period, the Lehman Brothers Mortgage-Backed Securities, U.S. Agency and Credit Bond indexes returned 7.57%, 7.30% and 5.48%, respectively.
(Portfolio Manager photograph)
An interview with Andrew Dudley, Portfolio Manager of Fidelity Advisor Short Fixed-Income Fund
Q. How did the fund perform, Andy?
A. For the 12 months that ended October 31, 2000, the fund's Class A, Class T and Class C shares returned 5.91%, 6.00% and 5.01%, respectively. By comparison, the Lehman Brothers 1-3 Year Government/Credit Bond Index returned 6.15% during the same period, while the short investment grade debt funds average return, as tracked by Lipper Inc., was up 5.76%.
Q. What was the investment environment like during the period?
A. Treasury securities were the best-performing sector in the fixed-income market for the overall period, as the reduction in the deficit enabled the federal government to buy back debt, which led to a rally in Treasuries as yields fell and prices rose. Late in 1999, corporate securities also staged a brief rally as fears about potential Y2K computer problems receded and investors entered 2000 with a sense of optimism. However, we saw a turn in investors' attitudes about credit risk during the second half of the 12-month period. Many believed we were approaching the end of a cycle of business expansion and the beginning of a slowdown in economic growth, which potentially could be negative for corporate bonds. At the same time, the heightened focus on stock market performance created pressures among many company managements to support their companies' stock prices. This has encouraged steps such as stock buyback programs and other activities that potentially could cause the credit trends of the companies to deteriorate. Meanwhile, rapidly rising energy prices created another uncertainty for bond investors. In combination, these factors added up to a negative environment for corporate bonds. Among corporate subsectors, defensive areas such as real estate investment trusts (REITs) and utility and energy company bonds tended to perform somewhat better than the overall corporate bond market. High-yield bonds, in which the fund does not invest, were particularly poor performers. In contrast, government agency bonds, mortgages and, in particular, asset-backed securities tended to perform well during the period.
Annual Report
Fund Talk: The Manager's Overview - continued
Q. What were your principal strategies, and how did they affect performance?
A. I emphasized spread sectors - those parts of the fixed-income market that offer a yield advantage, or spread, over Treasury securities. During the period, I overweighted mortgages, asset-backed securities and corporate bonds, while underweighting government agency bonds and Treasury securities. Helping performance were the overweighted positions in mortgages and asset-backed securities. Hurting performance were the underweighting in government agency bonds and the overweighting in corporate bonds. While I emphasized corporate securities, which at the end of the fiscal period totaled 40.5% of net assets, I was relatively defensive within the corporate bond sector. For example, I modestly shortened the duration of our corporate bond allocation and increased our diversification so the fund was less vulnerable to problems with any individual security. I focused on sound credit analysis and also evaluated individual securities based on the market's heightened sensitivity to deteriorating credit quality. I also looked for better credit quality and emphasized defensive sectors. Consistent with our policy, I did not bet on changes in the direction of interest rates and tended to have an interest-rate sensitivity, or duration, close to that of the Lehman Brothers benchmark index.
Q. What specific areas particularly helped performance, and what areas hurt?
A. Our investments in REITs and asset-backed securities, such as pools of consumer loans, helped the fund's returns, as did our emphasis on commercial mortgage securities, which typically were between 5% and 7% of net assets. As I mentioned before, our overweighted position in corporate securities hurt. While our overall security selection of corporate bonds tended to be good, we did have some individual laggards. One noteworthy disappointment was our investment in Finova, a commercial finance company. The credit quality of the company deteriorated, in part because the company was unable to extend its line of credit with its banks. We have sold our position in Finova bonds.
Annual Report
Fund Talk: The Manager's Overview - continued
Q. What's your outlook?
A. I believe we have entered a new period of heightened volatility among the spread sectors as fixed-income investors search for a new equilibrium in setting valuations for credit risk. This volatility, however, is less dramatic among the shorter-term securities in which I invest, and I believe it still makes sense to invest in corporate bonds because of their yield advantages. At the same time, mortgages and asset-backed securities continue to appear very attractive. I have positioned the fund so it is not overly exposed to shifts in the relationships of yields of shorter-term bonds to the yields of longer-term securities.
Fund Facts
Goal: high current income, consistent with preservation of capital, by investing primarily in a broad range of investment-grade, fixed-income securities
Start date: September 16, 1987
Size: as of October 31, 2000, more than $354 million
Manager: Andrew Dudley, since 1997; joined Fidelity in 1996
3Andrew Dudley on the bond market's perception of the national elections:
"From the perspective of fixed-income investors, the most important outcome of the elections is that there likely will not be any broad, sweeping mandate for change. The results of both the presidential election and the fight for control of Congress are likely to be so close that it will be difficult for anyone to make dramatic shifts in policy. The financial markets would like that result. They don't like the prospect of broad sweeping changes that create uncertainty in the market.
"The new Congress is likely to be almost evenly split between Republicans and Democrats. That means that the defection of just one member, for any reason, can jeopardize the outcome of a vote on any issue. That is not an environment for major change, particularly if you also have a president who has been narrowly elected. The bond market was most fearful of a Republican president with a mandate for cutting taxes and clear Republican control in both houses of Congress. That would have increased the potential for large tax cuts, which could reduce or eliminate the federal surplus, causing an increase in the issuance of Treasury securities, higher interest rates and greater volatility in the bond market. To the extent there was no broad, sweeping mandate, there would be less uncertainty for the bond market to worry about."
The views expressed in this report reflect those of the portfolio manager only through the end of the period of the report as stated on the cover and do not necessarily represent the views of Fidelity or any other person in the Fidelity organization. Any such views are subject to change at any time based upon market or other conditions and Fidelity disclaims any responsibility to update such views. These views may not be relied on as investment advice and, because investment decisions for a Fidelity fund are based on numerous factors, may not be relied on as an indication of trading intent on behalf of any Fidelity fund.
Annual Report
|
Quality Diversification as of October 31, 2000 |
||
|
(Moody's Ratings) |
% of fund's investments |
% of fund's investments |
|
Aaa |
49.4 |
35.1 |
|
Aa |
4.5 |
4.4 |
|
A |
17.9 |
17.8 |
|
Baa |
24.2 |
36.5 |
|
Ba and Below |
0.5 |
0.7 |
|
Not Rated |
0.1 |
0.3 |
|
Table excludes short-term investments. Where Moody's ratings are not available, we have used S&P ® ratings. Securities rated as Ba or below were rated investment grade by other nationally recognized rating agencies or assigned an investment grade rating at the time of acquisition by Fidelity |
|
Average Years to Maturity as of October 31, 2000 |
||
|
|
|
6 months ago |
|
Years |
2.5 |
2.5 |
|
Average years to maturity is based on the average time remaining until principal payments are expected from each of the fund's bonds, weighted by dollar amount. |
|
Duration as of October 31, 2000 |
||
|
|
|
6 months ago |
|
Years |
1.8 |
1.8 |
|
Duration shows how much a bond fund's price fluctuates with changes in comparable interest rates. If rates rise 1%, for example, a fund with a five-year duration is likely to lose about 5% of its value. Other factors also can influence a bond fund's performance and share price. Accordingly, a bond fund's actual performance may differ from this example. |
|
Asset Allocation (% of fund's net assets) |
|||||||
|
As of October 31, 2000 * |
As of April 30, 2000 ** |
||||||
|
Corporate Bonds 40.5% |
|
|
Corporate Bonds 49.7% |
|
||
|
U.S. Government |
|
|
U.S. Government |
|
||
|
Asset-Backed |
|
|
Asset-Backed |
|
||
|
CMOs and Other Mortgage Related Securities 10.1% |
|
|
CMOs and Other Mortgage Related Securities 7.7% |
|
||
|
Other Investments 1.1% |
|
|
Other Investments 1.7% |
|
||
|
Short-Term |
|
|
Short-Term |
|
||
|
* Foreign |
7.2% |
|
** Foreign investments |
6.7% |
|
||

Annual Report
Showing Percentage of Net Assets
|
Nonconvertible Bonds - 40.5% |
|||||
|
Moody's Ratings (unaudited) (a) |
Principal Amount |
Value |
|||
|
BASIC INDUSTRIES - 0.5% |
|||||
|
Chemicals & Plastics - 0.3% |
|||||
|
Praxair, Inc. 6.15% 4/15/03 |
A3 |
|
$ 1,000,000 |
$ 972,950 |
|
|
Paper & Forest Products - 0.2% |
|||||
|
Abitibi-Consolidated, Inc. yankee 8.3% 8/1/05 |
Baa3 |
|
310,000 |
313,401 |
|
|
Georgia-Pacific Corp. 9.95% 6/15/02 |
Baa2 |
|
500,000 |
515,930 |
|
|
|
829,331 |
||||
|
TOTAL BASIC INDUSTRIES |
1,802,281 |
||||
|
CONSTRUCTION & REAL ESTATE - 2.7% |
|||||
|
Real Estate - 0.6% |
|||||
|
Arden Realty LP 8.875% 3/1/05 |
Baa3 |
|
545,000 |
555,148 |
|
|
Cabot Industrial Property LP 7.125% 5/1/04 |
Baa2 |
|
575,000 |
558,383 |
|
|
Duke-Weeks Realty LP 6.875% 3/15/05 |
Baa2 |
|
1,200,000 |
1,171,452 |
|
|
|
2,284,983 |
||||
|
Real Estate Investment Trusts - 2.1% |
|||||
|
Avalonbay Communities, Inc.: |
|
|
|
|
|
|
6.58% 2/15/04 |
Baa1 |
|
705,000 |
686,903 |
|
|
8.25% 7/15/08 |
Baa1 |
|
500,000 |
508,105 |
|
|
CenterPoint Properties Trust: |
|
|
|
|
|
|
6.75% 4/1/05 |
Baa2 |
|
470,000 |
446,524 |
|
|
7.125% 3/15/04 |
Baa2 |
|
1,300,000 |
1,266,525 |
|
|
Equity Office Properties Trust 6.375% 1/15/02 |
Baa1 |
|
1,650,000 |
1,626,389 |
|
|
Merry Land & Investment Co., Inc. 7.25% 6/15/05 |
A3 |
|
600,000 |
584,610 |
|
|
ProLogis Trust 6.7% 4/15/04 |
Baa1 |
|
1,245,000 |
1,207,351 |
|
|
Spieker Properties LP 6.8% 5/1/04 |
Baa2 |
|
1,015,000 |
987,057 |
|
|
|
7,313,464 |
||||
|
TOTAL CONSTRUCTION & REAL ESTATE |
9,598,447 |
||||
|
DURABLES - 1.4% |
|||||
|
Autos, Tires, & Accessories - 0.6% |
|||||
|
Daimler-Chrysler North America Holding Corp. 6.96% 8/23/02 (c) |
A1 |
|
1,500,000 |
1,506,990 |
|
|
TRW, Inc. 6.625% 6/1/04 |
Baa1 |
|
600,000 |
576,468 |
|
|
|
2,083,458 |
||||
|
Nonconvertible Bonds - continued |
|||||
|
Moody's Ratings (unaudited) (a) |
Principal Amount |
Value |
|||
|
DURABLES - continued |
|||||
|
Textiles & Apparel - 0.8% |
|||||
|
Jones Apparel Group, Inc./Jones Apparel Group Hldgs., Inc./Jones Apparel Group USA, Inc. 6.25% 10/1/01 |
Baa2 |
|
$ 2,155,000 |
$ 2,109,443 |
|
|
Jones Apparel Group, Inc. 7.5% 6/15/04 |
Baa2 |
|
800,000 |
751,392 |
|
|
|
2,860,835 |
||||
|
TOTAL DURABLES |
4,944,293 |
||||
|
ENERGY - 1.4% |
|||||
|
Energy Services - 0.1% |
|||||
|
Petroliam Nasional BHD (Petronas) yankee 7.125% 10/18/06 (b) |
Baa2 |
|
575,000 |
548,320 |
|
|
Oil & Gas - 1.3% |
|||||
|
Canada Occidental Petroleum Ltd. 7.125% 2/4/04 |
Baa2 |
|
1,400,000 |
1,382,220 |
|
|
Oryx Energy Co.: |
|
|
|
|
|
|
8% 10/15/03 |
Baa1 |
|
685,000 |
697,494 |
|
|
8.125% 10/15/05 |
Baa1 |
|
800,000 |
832,864 |
|
|
The Coastal Corp. 6.2% 5/15/04 |
Baa2 |
|
1,700,000 |
1,650,190 |
|
|
|
4,562,768 |
||||
|
TOTAL ENERGY |
5,111,088 |
||||
|
FINANCE - 17.1% |
|||||
|
Banks - 5.8% |
|||||
|
Bank One Corp. 7.625% 8/1/05 |
Aa3 |
|
2,500,000 |
2,528,700 |
|
|
Capital One Bank: |
|
|
|
|
|
|
6.48% 6/28/02 |
Baa2 |
|
1,500,000 |
1,463,010 |
|
|
6.65% 3/15/04 |
Baa3 |
|
2,500,000 |
2,396,600 |
|
|
Chase Manhattan Corp. 5.75% 4/15/04 |
Aa3 |
|
600,000 |
575,976 |
|
|
Citicorp 8% 2/1/03 |
A1 |
|
2,000,000 |
2,047,260 |
|
|
Den Danske Bank Group AS yankee 6.55% 9/15/03 (b) |
A1 |
|
1,500,000 |
1,475,010 |
|
|
First Security Corp. 5.875% 11/1/03 |
Aa2 |
|
450,000 |
433,620 |
|
|
FleetBoston Financial Corp. 7.25% 9/15/05 |
A2 |
|
1,000,000 |
1,002,160 |
|
|
Korea Development Bank: |
|
|
|
|
|
|
7.125% 4/22/04 |
Baa2 |
|
700,000 |
680,778 |
|
|
7.375% 9/17/04 |
Baa2 |
|
810,000 |
790,997 |
|
|
Popular, Inc. 6.2% 4/30/01 |
A3 |
|
2,885,000 |
2,869,190 |
|
|
Nonconvertible Bonds - continued |
|||||
|
Moody's Ratings (unaudited) (a) |
Principal Amount |
Value |
|||
|
FINANCE - continued |
|||||
|
Banks - continued |
|||||
|
Providian National Bank: |
|
|
|
|
|
|
6.25% 5/7/01 |
Baa3 |
|
$ 1,010,000 |
$ 1,003,021 |
|
|
6.75% 3/15/02 |
Baa3 |
|
390,000 |
384,860 |
|
|
Summit Bancorp 8.625% 12/10/02 |
A3 |
|
1,000,000 |
1,025,490 |
|
|
Wells Fargo & Co.: |
|
|
|
|
|
|
6.5% 9/3/02 |
Aa2 |
|
1,500,000 |
1,493,535 |
|
|
7.2% 5/1/03 |
Aa2 |
|
550,000 |
553,779 |
|
|
|
20,723,986 |
||||
|
Credit & Other Finance - 7.5% |
|||||
|
Abbey National PLC 6.69% 10/17/05 |
Aa3 |
|
200,000 |
195,770 |
|
|
CIT Group Holdings, Inc. 6.5% 6/14/02 |
A1 |
|
470,000 |
462,701 |
|
|
Edison Mission Energy Funding Corp. 6.77% 9/15/03 (b) |
Baa1 |
|
1,410,694 |
1,370,348 |
|
|
ERP Operating LP: |
|
|
|
|
|
|
6.55% 11/15/01 |
A3 |
|
360,000 |
357,192 |
|
|
7.1% 6/23/04 |
A3 |
|
450,000 |
444,677 |
|
|
Ford Motor Credit Co.: |
|
|
|
|
|
|
7.0581% 7/16/02 (c) |
A2 |
|
3,200,000 |
3,200,480 |
|
|
7.6% 8/1/05 |
A2 |
|
1,300,000 |
1,306,890 |
|
|
General Electric Capital Corp. 6.65% 9/3/02 |
Aaa |
|
1,300,000 |
1,298,427 |
|
|
General Motors Acceptance Corp.: |
|
|
|
|
|
|
7.625% 6/15/04 |
A2 |
|
900,000 |
914,454 |
|
|
9% 10/15/02 |
A2 |
|
3,500,000 |
3,629,640 |
|
|
Heller Financial, Inc. 6.5% 7/22/02 |
A3 |
|
1,900,000 |
1,872,849 |
|
|
PNC Funding Corp. 6.95% 9/1/02 |
A2 |
|
1,800,000 |
1,800,792 |
|
|
Popular North America, Inc. 7.375% 9/15/01 |
A3 |
|
2,380,000 |
2,375,478 |
|
|
Qwest Capital Funding, Inc. 7.75% 8/15/06 (b) |
Baa1 |
|
1,700,000 |
1,723,630 |
|
|
Sears Roebuck Acceptance Corp. 6% 3/20/03 |
A3 |
|
550,000 |
536,107 |
|
|
Sprint Capital Corp. 5.7% 11/15/03 |
Baa1 |
|
1,880,000 |
1,798,953 |
|
|
The Money Store, Inc. 7.3% 12/1/02 |
A2 |
|
800,000 |
805,872 |
|
|
Trizec Finance Ltd. yankee 10.875% 10/15/05 |
Baa3 |
|
575,000 |
580,750 |
|
|
TXU Eastern Funding 6.15% 5/15/02 |
Baa1 |
|
1,800,000 |
1,761,660 |
|
|
|
26,436,670 |
||||
|
Insurance - 0.9% |
|||||
|
New York Life Insurance Co. 6.4% 12/15/03 (b) |
Aa3 |
|
1,200,000 |
1,176,960 |
|
|
The St. Paul Companies, Inc. 7.875% 4/15/05 |
A1 |
|
1,796,000 |
1,840,720 |
|
|
|
3,017,680 |
||||
|
Nonconvertible Bonds - continued |
|||||
|
Moody's Ratings (unaudited) (a) |
Principal Amount |
Value |
|||
|
FINANCE - continued |
|||||
|
Savings & Loans - 0.6% |
|||||
|
Long Island Savings Bank FSB 7% 6/13/02 |
Baa3 |
|
$ 1,250,000 |
$ 1,241,450 |
|
|
Sovereign Bancorp, Inc. 6.625% 3/15/01 |
Ba3 |
|
1,000,000 |
992,160 |
|
|
|
2,233,610 |
||||
|
Securities Industry - 2.3% |
|||||
|
Amvescap PLC yankee: |
|
|
|
|
|
|
6.375% 5/15/03 |
A2 |
|
2,450,000 |
2,373,805 |
|
|
6.6% 5/15/05 |
A2 |
|
600,000 |
573,468 |
|
|
Donaldson Lufkin & Jenrette, Inc. 6.25% 8/1/01 |
A3 |
|
2,600,000 |
2,586,662 |
|
|
Goldman Sachs Group LP 6.6% 7/15/02 (b) |
A1 |
|
500,000 |
492,910 |
|
|
Lehman Brothers Holdings 7% 5/15/03 |
A3 |
|
1,200,000 |
1,194,732 |
|
|
Morgan Stanley Dean Witter & Co. 7.75% 6/15/05 |
Aa3 |
|
1,000,000 |
1,023,110 |
|
|
|
8,244,687 |
||||
|
TOTAL FINANCE |
60,656,633 |
||||
|
INDUSTRIAL MACHINERY & EQUIPMENT - 0.9% |
|||||
|
Tyco International Group SA 6.875% 9/5/02 |
Baa1 |
|
3,040,000 |
3,017,048 |
|
|
MEDIA & LEISURE - 2.3% |
|||||
|
Broadcasting - 1.1% |
|||||
|
British Sky Broadcasting Group PLC 7.3% 10/15/06 |
Ba1 |
|
1,000,000 |
907,310 |
|
|
Clear Channel Communications, Inc. 7.875% 6/15/05 |
Baa3 |
|
2,300,000 |
2,318,032 |
|
|
TCI Communications, Inc. 8.65% 9/15/04 |
A2 |
|
600,000 |
621,894 |
|
|
|
3,847,236 |
||||
|
Publishing - 1.2% |
|||||
|
News America Holdings, Inc.: |
|
|
|
|
|
|
8.5% 2/15/05 |
Baa3 |
|
800,000 |
826,184 |
|
|
8.625% 2/1/03 |
Baa3 |
|
1,450,000 |
1,481,393 |
|
|
Time Warner Entertainment Co. LP 9.625% 5/1/02 |
Baa2 |
|
1,985,000 |
2,058,207 |
|
|
|
4,365,784 |
||||
|
TOTAL MEDIA & LEISURE |
8,213,020 |
||||
|
Nonconvertible Bonds - continued |
|||||
|
Moody's Ratings (unaudited) (a) |
Principal Amount |
Value |
|||
|
NONDURABLES - 2.3% |
|||||
|
Beverages - 0.9% |
|||||
|
Seagram JE & Sons, Inc.: |
|
|
|
|
|
|
5.79% 4/15/01 |
Baa3 |
|
$ 1,005,000 |
$ 996,508 |
|
|
6.4% 12/15/03 |
Baa3 |
|
2,200,000 |
2,199,824 |
|
|
|
3,196,332 |
||||
|
Foods - 0.1% |
|||||
|
ConAgra Foods, Inc. 7.5% 9/15/05 |
Baa1 |
|
400,000 |
403,824 |
|
|
Tobacco - 1.3% |
|||||
|
Philip Morris Companies, Inc.: |
|
|
|
|
|
|
7.25% 9/15/01 |
A2 |
|
1,125,000 |
1,116,911 |
|
|
7.625% 5/15/02 |
A2 |
|
1,750,000 |
1,742,353 |
|
|
8.75% 6/1/01 |
A2 |
|
1,000,000 |
1,003,190 |
|
|
RJ Reynolds Tobacco Holdings, Inc. 7.375% 5/15/03 |
Baa2 |
|
800,000 |
757,064 |
|
|
|
4,619,518 |
||||
|
TOTAL NONDURABLES |
8,219,674 |
||||
|
RETAIL & WHOLESALE - 1.0% |
|||||
|
General Merchandise Stores - 0.5% |
|||||
|
Federated Department Stores, Inc. 8.125% 10/15/02 |
Baa1 |
|
1,860,000 |
1,852,858 |
|
|
Grocery Stores - 0.5% |
|||||
|
Safeway, Inc. 7% 9/15/02 |
Baa2 |
|
1,700,000 |
1,696,090 |
|
|
TOTAL RETAIL & WHOLESALE |
3,548,948 |
||||
|
TECHNOLOGY - 0.8% |
|||||
|
Computers & Office Equipment - 0.8% |
|||||
|
Comdisco, Inc.: |
|
|
|
|
|
|
6.65% 11/13/01 |
Baa2 |
|
2,010,000 |
1,587,900 |
|
|
7.25% 9/1/02 |
Baa2 |
|
1,500,000 |
1,095,000 |
|
|
|
2,682,900 |
||||
|
TRANSPORTATION - 2.6% |
|||||
|
Air Transportation - 1.4% |
|||||
|
Continental Airlines, Inc. pass thru trust certificates: |
|
|
|
|
|
|
6.954% 2/2/11 |
Baa1 |
|
2,074,770 |
2,013,149 |
|
|
7.08% 11/1/04 |
Baa1 |
|
1,110,635 |
1,082,058 |
|
|
Nonconvertible Bonds - continued |
|||||
|
Moody's Ratings (unaudited) (a) |
Principal Amount |
Value |
|||
|
TRANSPORTATION - continued |
|||||
|
Air Transportation - continued |
|||||
|
Delta Air Lines 6.65% 3/15/04 |
Baa3 |
|
$ 660,000 |
$ 627,898 |
|
|
Qantas Airways Ltd. 7.5% 6/30/03 (b) |
Baa1 |
|
1,000,000 |
997,500 |
|
|
|
4,720,605 |
||||
|
Railroads - 0.7% |
|||||
|
CSX Corp. 7.05% 5/1/02 |
Baa2 |
|
1,600,000 |
1,591,376 |
|
|
Norfolk Southern Corp. 6.95% 5/1/02 |
Baa1 |
|
900,000 |
897,021 |
|
|
|
2,488,397 |
||||
|
Trucking & Freight - 0.5% |
|||||
|
Federal Express Corp. 7.53% 9/23/06 |
A3 |
|
1,873,058 |
1,866,072 |
|
|
TOTAL TRANSPORTATION |
9,075,074 |
||||
|
UTILITIES - 7.5% |
|||||
|
Cellular - 0.6% |
|||||
|
AirTouch Communications, Inc. 6.35% 6/1/05 |
A2 |
|
800,000 |
771,800 |
|
|
Vodafone AirTouch PLC 7.625% 2/15/05 (b) |
A2 |
|
1,300,000 |
1,318,850 |
|
|
|
2,090,650 |
||||
|
Electric Utility - 2.5% |
|||||
|
Avon Energy Partners Holdings 6.73% 12/11/02 (b) |
Baa2 |
|
2,300,000 |
2,246,778 |
|
|
Illinois Power Co. 6% 9/15/03 |
Baa1 |
|
850,000 |
825,240 |
|
|
Niagara Mohawk Power Corp. 7.375% 8/1/03 |
Baa2 |
|
780,000 |
787,082 |
|
|
Philadelphia Electric Co.: |
|
|
|
|
|
|
5.625% 11/1/01 |
Baa1 |
|
1,560,000 |
1,532,606 |
|
|
6.5% 5/1/03 |
Baa1 |
|
720,000 |
707,832 |
|
|
6.625% 3/1/03 |
Baa1 |
|
400,000 |
394,716 |
|
|
Texas Utilities Electric Co.: |
|
|
|
|
|
|
7.375% 8/1/01 |
A3 |
|
721,000 |
721,577 |
|
|
8% 6/1/02 |
A3 |
|
1,750,000 |
1,776,005 |
|
|
|
8,991,836 |
||||
|
Gas - 2.0% |
|||||
|
Consolidated Natural Gas Co. 7.375% 4/1/05 |
A2 |
|
1,100,000 |
1,104,554 |
|
|
Enron Corp.: |
|
|
|
|
|
|
6.45% 11/15/01 |
Baa1 |
|
1,050,000 |
1,043,490 |
|
|
6.5% 8/1/02 |
Baa1 |
|
1,350,000 |
1,334,745 |
|
|
9.875% 6/15/03 |
Baa1 |
|
1,160,000 |
1,238,114 |
|
|
Enserch Corp. 6.25% 1/1/03 |
Baa2 |
|
650,000 |
637,267 |
|
|
Nonconvertible Bonds - continued |
|||||
|
Moody's Ratings (unaudited) (a) |
Principal Amount |
Value |
|||
|
UTILITIES - continued |
|||||
|
Gas - continued |
|||||
|
Reliant Energy Resources Corp. 8.125% 7/15/05 (b) |
Baa1 |
|
$ 1,100,000 |
$ 1,113,211 |
|
|
Sonat, Inc. 6.875% 6/1/05 |
Baa2 |
|
520,000 |
512,002 |
|
|
|
6,983,383 |
||||
|
Telephone Services - 2.4% |
|||||
|
Telecomunicaciones de Puerto Rico, Inc. 6.15% 5/15/02 |
Baa2 |
|
2,430,000 |
2,385,871 |
|
|
Telefonica Europe BV 7.35% 9/15/05 |
A2 |
|
1,400,000 |
1,406,020 |
|
|
Teleglobe Canada, Inc. 7.2% 7/20/09 |
Baa1 |
|
1,550,000 |
1,485,644 |
|
|
US West Communications 7.2% 11/1/04 |
A2 |
|
1,500,000 |
1,491,270 |
|
|
WorldCom, Inc.: |
|
|
|
|
|
|
8% 5/16/06 |
A3 |
|
1,000,000 |
1,028,940 |
|
|
8.875% 1/15/06 |
A3 |
|
811,000 |
836,871 |
|
|
|
8,634,616 |
||||
|
TOTAL UTILITIES |
26,700,485 |
||||
|
TOTAL NONCONVERTIBLE BONDS (Cost $145,751,163) |
143,569,891 |
||||
|
U.S. Government and Government Agency Obligations - 24.1% |
|||||
|
|
|||||
|
U.S. Government Agency Obligations - 15.2% |
|||||
|
Fannie Mae 6.375% 10/15/02 |
Aaa |
|
20,000,000 |
19,990,594 |
|
|
Federal Home Loan Bank: |
|
|
|
|
|
|
6.75% 5/1/02 |
Aaa |
|
5,800,000 |
5,823,548 |
|
|
6.75% 8/15/02 |
Aaa |
|
7,000,000 |
7,033,880 |
|
|
Freddie Mac 7.375% 5/15/03 |
Aaa |
|
18,100,000 |
18,487,521 |
|
|
Government Trust Certificates (assets of Trust guaranteed by U.S. Government through Defense Security Assistance Agency) Class 3-T, 9.625% 5/15/02 |
Aaa |
|
120,002 |
121,159 |
|
|
Guaranteed Export Trust Certificates (assets of Trust guaranteed by U.S. Government through Export-Import Bank) Series 1995-A, 6.28% 6/15/04 |
Aaa |
|
1,411,765 |
1,399,713 |
|
|
U.S. Government and Government Agency Obligations - continued |
|||||
|
Moody's Ratings (unaudited) (a) |
Principal Amount |
Value |
|||
|
U.S. Government Agency Obligations - continued |
|||||
|
Israel Export Trust Certificates (assets of Trust
guaranteed by U.S. Government through |
Aaa |
|
$ 352,941 |
$ 352,327 |
|
|
Private Export Funding Corp. secured |
Aaa |
|
667,800 |
668,947 |
|
|
TOTAL U.S. GOVERNMENT AGENCY OBLIGATIONS |
53,877,689 |
||||
|
U.S. Treasury Obligations - 8.9% |
|||||
|
U.S. Treasury Notes: |
|
|
|
|
|
|
5.25% 5/31/01 |
Aaa |
|
14,250,000 |
14,153,399 |
|
|
5.75% 6/30/01 |
Aaa |
|
7,000,000 |
6,969,501 |
|
|
7.875% 8/15/01 |
Aaa |
|
10,300,000 |
10,415,875 |
|
|
TOTAL U.S. TREASURY OBLIGATIONS |
31,538,775 |
||||
|
TOTAL U.S. GOVERNMENT AND (Cost $85,516,602) |
85,416,464 |
||||
|
U.S. Government Agency - Mortgage Securities - 6.4% |
|||||
|
|
|||||
|
Fannie Mae - 1.0% |
|||||
|
6.5% 10/1/11 |
Aaa |
|
174,062 |
170,979 |
|
|
8% 7/1/30 |
Aaa |
|
2,974,532 |
3,010,761 |
|
|
11.5% 11/1/15 |
Aaa |
|
299,343 |
329,442 |
|
|
TOTAL FANNIE MAE |
3,511,182 |
||||
|
Freddie Mac - 1.4% |
|||||
|
7.5% 9/1/30 |
Aaa |
|
2,429,758 |
2,428,227 |
|
|
8.5% 5/1/26 to 7/1/28 |
Aaa |
|
2,440,796 |
2,502,787 |
|
|
12% 11/1/19 |
Aaa |
|
74,423 |
82,033 |
|
|
TOTAL FREDDIE MAC |
5,013,047 |
||||
|
U.S. Government Agency - Mortgage Securities - continued |
|||||
|
Moody's Ratings (unaudited) (a) |
Principal Amount |
Value |
|||
|
Government National Mortgage Association - 4.0% |
|||||
|
8% 9/15/29 to 10/15/29 |
Aaa |
|
$ 4,532,421 |
$ 4,607,478 |
|
|
8.5% 7/15/30 |
Aaa |
|
9,317,956 |
9,556,891 |
|
|
TOTAL GOVERNMENT NATIONAL MORTGAGE ASSOCIATION |
14,164,369 |
||||
|
TOTAL U.S. GOVERNMENT AGENCY - MORTGAGE SECURITIES (Cost $22,622,582) |
22,688,598 |
||||
|
Asset-Backed Securities - 16.6% |
|||||
|
|
|||||
|
Americredit Automobile Receivables Trust: |
|
|
|
|
|
|
7.02% 12/15/05 |
Aaa |
|
2,000,000 |
2,010,938 |
|
|
7.15% 8/15/04 |
Aaa |
|
1,300,000 |
1,305,688 |
|
|
ANRC Auto Owner Trust 7.06% 5/17/04 |
Aaa |
|
1,600,000 |
1,609,500 |
|
|
Arcadia Automobile Receivables Trust: |
|
|
|
|
|
|
5.67% 1/15/04 |
Aaa |
|
1,077,682 |
1,064,506 |
|
|
7.2% 6/15/07 |
Aaa |
|
1,232,570 |
1,241,622 |
|
|
ARG Funding Corp. 5.88% 5/20/03 (b) |
Aaa |
|
2,650,000 |
2,621,016 |
|
|
Associates Auto Receivables Trust 6.9% 8/15/05 |
Aaa |
|
2,000,000 |
2,005,000 |
|
|
Capita Equipment Receivables Trust 6.45% 8/15/02 |
Aa3 |
|
2,200,000 |
2,186,250 |
|
|
Capital One Master Trust 7.1% 4/17/06 |
Aaa |
|
2,000,000 |
2,020,000 |
|
|
Caterpillar Financial Asset Trust 6.2% 4/25/04 |
Aaa |
|
1,530,000 |
1,522,350 |
|
|
Chase Manhattan Marine Owner Trust 6.25% 4/16/07 |
Aaa |
|
377,733 |
377,261 |
|
|
Chevy Chase Auto Receivables Trust: |
|
|
|
|
|
|
5.97% 10/20/04 |
Aaa |
|
602,056 |
596,035 |
|
|
6.2% 3/20/04 |
Aaa |
|
223,766 |
222,087 |
|
|
Contimortgage Home Equity Loan Trust 6.3% 7/15/12 |
Aaa |
|
715,620 |
710,696 |
|
|
CS First Boston Mortgage Securities Corp. 7% 3/15/27 |
Aaa |
|
359,394 |
359,001 |
|
|
Daimlerchrysler Auto Trust: |
|
|
|
|
|
|
6.7% 6/8/03 |
Aaa |
|
3,300,000 |
3,299,974 |
|
|
6.85% 11/6/05 |
Aaa |
|
2,500,000 |
2,515,625 |
|
|
Discover Card Master Trust I 6.98% 7/18/05 (c) |
A2 |
|
5,250,000 |
5,255,742 |
|
|
Fidelity Funding Auto Trust 6.99% 11/15/02 (b) |
Aaa |
|
75,475 |
75,464 |
|
|
First Security Auto Owner Trust 6.2% 10/2/06 |
A3 |
|
928,020 |
913,665 |
|
|
Ford Credit Auto Owner Trust: |
|
|
|
|
|
|
6.15% 9/15/02 |
Aaa |
|
1,800,000 |
1,788,609 |
|
|
7.03% 11/15/03 |
Aaa |
|
933,000 |
940,435 |
|
|
7.5% 10/15/04 |
A1 |
|
1,700,000 |
1,721,777 |
|
|
Asset-Backed Securities - continued |
|||||
|
Moody's Ratings (unaudited) (a) |
Principal Amount |
Value |
|||
|
Honda Auto Receivables Owner Trust 6.62% 7/15/04 |
Aaa |
|
$ 1,400,000 |
$ 1,398,961 |
|
|
Key Auto Finance Trust: |
|
|
|
|
|
|
5.83% 1/15/07 |
Aaa |
|
2,200,000 |
2,167,000 |
|
|
6.65% 10/15/03 |
Baa3 |
|
74,023 |
73,757 |
|
|
Olympic Automobile Receivables Trust 6.125% 11/15/04 |
Aaa |
|
214,839 |
212,623 |
|
|
Onyx Acceptance Grantor Trust 5.95% 7/15/04 |
Aaa |
|
714,800 |
708,989 |
|
|
Onyx Acceptance Owner Trust 7.26% 5/15/07 |
Aaa |
|
2,000,000 |
2,023,500 |
|
|
Orix Credit Alliance Receivables Trust 7.12% 5/15/04 |
Aaa |
|
1,200,000 |
1,201,875 |
|
|
Petroleum Enhanced Trust Receivables Offering Petroleum Trust 7.12% 2/5/03 (b)(c) |
Baa2 |
|
815,698 |
813,149 |
|
|
Premier Auto Trust 5.7% 10/6/02 |
Aaa |
|
3,829,745 |
3,806,996 |
|
|
Prime Credit Card Master Trust 6.75% 11/15/05 |
Aaa |
|
1,000,000 |
1,000,310 |
|
|
Reliance Auto Receivables Corp., Inc. 6.1% 7/15/02 (b) |
Aaa |
|
17,991 |
17,980 |
|
|
Sears Credit Account Master Trust II: |
|
|
|
|
|
|
6.2% 7/16/07 |
Aaa |
|
2,700,000 |
2,674,674 |
|
|
7% 7/15/08 |
Aaa |
|
650,000 |
654,264 |
|
|
7.5% 11/15/07 |
A2 |
|
1,700,000 |
1,727,625 |
|
|
Toyota Auto Owners Trust 7.21% 4/15/07 |
Aaa |
|
1,400,000 |
1,417,500 |
|
|
Toyota Auto Receivables Owner Trust 6.76% 8/15/04 |
Aaa |
|
1,200,000 |
1,201,688 |
|
|
Tranex Auto Receivables Owner Trust 6.334% 8/15/03 (b) |
Aaa |
|
315,398 |
314,166 |
|
|
Triad Auto Receivables Owner Trust 5.98% 9/17/05 |
Aaa |
|
950,687 |
939,100 |
|
|
TOTAL ASSET-BACKED SECURITIES (Cost $58,682,134) |
58,717,398 |
||||
|
Collateralized Mortgage Obligations - 4.6% |
|||||
|
|
|||||
|
Private Sponsor - 0.3% |
|||||
|
GE Capital Mortgage Services, Inc. planned amortization class Series 1994-2 Class A4, 6% 1/25/09 |
Aaa |
|
192,514 |
190,889 |
|
|
Residential Funding Mortgage Securities I, Inc. planned amortization class Series 1994-S12 Class A2, 6.5% 4/25/09 |
Aaa |
|
680,667 |
675,344 |
|
|
TOTAL PRIVATE SPONSOR |
866,233 |
||||
|
Collateralized Mortgage Obligations - continued |
|||||
|
Moody's Ratings (unaudited) (a) |
Principal Amount |
Value |
|||
|
U.S. Government Agency - 4.3% |
|||||
|
Fannie Mae sequential pay Series 1998-2 Class DA, 6.5% 4/18/25 |
Aaa |
|
$ 1,974,933 |
$ 1,947,778 |
|
|
Freddie Mac: |
|
|
|
|
|
|
REMIC planned amortization class: |
|
|
|
|
|
|
Series 2134 Class PC, 5.725% 4/15/11 |
Aaa |
|
2,456,116 |
2,402,377 |
|
|
Series 2143 Class CH, 6% 2/15/19 |
Aaa |
|
1,627,952 |
1,607,603 |
|
|
sequential pay: |
|
|
|
|
|
|
Series 2134 Class H, 6.5% 12/15/24 |
Aaa |
|
1,946,879 |
1,910,375 |
|
|
Series 1815 Class B, 7% 1/15/21 |
Aaa |
|
1,398,194 |
1,395,999 |
|
|
Series 2061 Class J, 6.5% 9/20/22 |
Aaa |
|
2,184,090 |
2,149,275 |
|
|
Series 2070 Class A, 6% 8/15/24 |
Aaa |
|
2,497,737 |
2,397,029 |
|
|
Government National Mortgage Association sequential pay Series 1998-19 Class B, 6.5% 2/20/23 |
Aaa |
|
1,573,596 |
1,545,067 |
|
|
TOTAL U.S. GOVERNMENT AGENCY |
15,355,503 |
||||
|
TOTAL COLLATERALIZED MORTGAGE OBLIGATIONS (Cost $16,205,323) |
16,221,736 |
||||
|
Commercial Mortgage Securities - 5.5% |
|||||
|
|
|||||
|
Allied Capital Commercial Mortgage Trust sequential pay Series 1998-1 Class A, 6.31% 1/25/28 (b) |
Aaa |
|
422,718 |
418,424 |
|
|
Bankers Trust II Series 1999-S1A Class D, 8.81% 2/28/14 (b)(c) |
Baa2 |
|
2,200,000 |
2,204,813 |
|
|
CBM Funding Corp. sequential pay Series 1996-1B Class A2, 6.88% 7/1/02 |
AA |
|
792,580 |
789,825 |
|
|
CS First Boston Mortgage Securities Corp.: |
|
|
|
|
|
|
sequential pay Series 1997-SPICE Class A, 6.653% 8/20/36 (b) |
- |
|
461,710 |
459,834 |
|
|
sequential pay Series 2000-C1 Class A1, 7.325% 4/15/62 |
AAA |
|
1,186,183 |
1,201,971 |
|
|
Series 1998-FL1: |
|
|
|
|
|
|
Class D, 7.1188% 12/10/00 (b)(c) |
Aa1 |
|
1,000,000 |
999,922 |
|
|
Class E, 7.4688% 1/10/13 (b)(c) |
Baa1 |
|
2,700,000 |
2,747,882 |
|
|
Equitable Life Assurance Society of the United States floater Series 174 Class D2, 6.7063% 5/15/03 (b)(c) |
Baa2 |
|
1,183,784 |
1,154,929 |
|
|
Federal Deposit Insurance Corp. REMIC Trust sequential pay Series 1996-C1 Class 1A, 6.75% 7/25/26 |
Aaa |
|
657,544 |
650,917 |
|
|
Commercial Mortgage Securities - continued |
|||||
|
Moody's Ratings (unaudited) (a) |
Principal Amount |
Value |
|||
|
FMAC Loan Receivables Trust sequential pay Series 1998-C Class A1, 5.99% 9/15/20 (b) |
Aaa |
|
$ 551,319 |
$ 534,780 |
|
|
Franchise Loan Trust sequential pay Series 1998-I Class A1, 6.24% 7/15/20 (b) |
Aaa |
|
1,008,998 |
988,766 |
|
|
Hilton Hotel Pool Trust Series 2000 HLT Class A1, 7.055% 10/3/10 |
Aaa |
|
1,000,000 |
1,002,471 |
|
|
Host Marriot Pool Trust sequential pay Series 1999-HMTA Class A, 6.98% 8/1/15 |
Aaa |
|
917,917 |
916,052 |
|
|
Morgan Stanly Dean Witter Capital Trust sequential pay Series 2000-PRIN Class A1, 7.07% 4/23/06 |
Aaa |
|
1,484,769 |
1,490,337 |
|
|
Nomura Depositor Trust floater Series 1998-ST1A Class A4, 7.5213% 2/15/34 (b)(c) |
Baa2 |
|
2,290,000 |
2,248,136 |
|
|
Structured Asset Securities Corp. floater Series 1998-C2A Class C, 7.05% 1/25/13 (b)(c) |
Aa3 |
|
1,842,516 |
1,842,517 |
|
|
TOTAL COMMERCIAL MORTGAGE SECURITIES (Cost $19,706,283) |
19,651,576 |
||||
|
Foreign Government and Government Agency Obligations (d) - 0.7% |
|||||
|
|
|||||
|
Ontario Province yankee 7.75% 6/4/02 |
Aa3 |
|
1,200,000 |
1,217,412 |
|
|
United Mexican States 8.5% 2/1/06 |
Baa3 |
|
1,250,000 |
1,246,250 |
|
|
TOTAL FOREIGN GOVERNMENT AND (Cost $2,456,523) |
2,463,662 |
||||
|
Supranational Obligations - 0.4% |
|||||
|
|
|||||
|
African Development Bank 7.75% 12/15/01 |
Aa1 |
|
1,240,000 |
1,250,776 |
|
|
Commercial Paper - 0.5% |
||||
|
|
||||
|
British Telecom PLC 6.8525% 10/9/01 (b)(c) |
|
1,800,000 |
1,796,679 |
|
|
Cash Equivalents - 2.9% |
|||
|
Maturity Amount |
Value |
||
|
Investments in repurchase agreements (U.S. Government Obligations), in a joint trading account at 6.62%, dated 10/31/00 due
11/1/00 |
$ 10,398,912 |
$ 10,397,000 |
|
|
TOTAL INVESTMENT PORTFOLIO - 102.2% (Cost $364,443,779) |
362,173,780 |
||
|
NET OTHER ASSETS - (2.2)% |
(7,690,903) |
||
|
NET ASSETS - 100% |
$ 354,482,877 |
||
|
Legend |
|
(a) S&P credit ratings are used in the absence of a rating by Moody's Investors Service, Inc. |
|
(b) Security exempt from registration under Rule 144A of the Securities Act of 1933. These securities may be resold in transactions exempt from registration, normally to qualified institutional buyers. At the period end, the value of these securities amounted to $31,701,974 or 8.9% of net assets. |
|
(c) The coupon rate shown on floating or adjustable rate securities represents the rate at period end. |
|
(d) For foreign government obligations not individually rated by S&P or Moody's, the ratings listed have been assigned by FMR, the fund's investment adviser, based principally on S&P and Moody's ratings of the sovereign credit of the issuing government. |
|
Other Information |
|
The composition of long-term debt holdings as a percentage of total value of investments in securities, is as follows (ratings are unaudited): |
|
Moody's Ratings |
S&P Ratings |
|||
|
Aaa, Aa, A |
71.2% |
|
AAA, AA, A |
54.0% |
|
Baa |
24.2% |
|
BBB |
23.7% |
|
Ba |
0.5% |
|
BB |
1.0% |
|
B |
0.0% |
|
B |
0.0% |
|
Caa |
0.0% |
|
CCC |
0.0% |
|
Ca, C |
0.0% |
|
CC, C |
0.0% |
|
|
|
|
D |
0.0% |
|
The percentage not rated by Moody's or S&P amounted to 0.1%. |
|
Income Tax Information |
|
At October 31, 2000, the aggregate cost of investment securities for income tax purposes was $364,475,247. Net unrealized depreciation aggregated $2,301,467, of which $1,132,874 related to appreciated investment securities and $3,434,341 related to depreciated investment securities. |
|
At October 31, 2000, the fund had a capital loss carryforward of approximately $49,102,000 of which $336,000, $17,692,000, $19,457,000, $2,265,000, $3,149,000, $2,459,000 and $3,744,000 will expire on October 31, 2001, 2002, 2003, 2004, 2005, 2007 and 2008, respectively. |
|
A total of 10.27% of the dividends distributed during the fiscal year was derived from interest on U.S. Government securities which is generally exempt from state income tax. The fund will notify shareholders in January 2001 of amounts for use in preparing 2000 income tax returns (unaudited). |
See accompanying notes which are an integral part of the financial statements.
Annual Report
Statement of Assets and Liabilities
|
|
October 31, 2000 |
|
|
Assets |
|
|
|
Investment in securities, at value (including repurchase agreements of $10,397,000) (cost $364,443,779) - See accompanying schedule |
|
$ 362,173,780 |
|
Cash |
|
190 |
|
Receivable for investments sold |
|
9,007,549 |
|
Receivable for fund shares sold |
|
402,422 |
|
Interest receivable |
|
4,645,446 |
|
Total assets |
|
376,229,387 |
|
Liabilities |
|
|
|
Payable for investments purchased |
$ 14,705,335 |
|
|
Payable for fund shares redeemed |
6,571,031 |
|
|
Distributions payable |
207,733 |
|
|
Accrued management fee |
117,221 |
|
|
Distribution fees payable |
60,161 |
|
|
Other payables and accrued expenses |
85,029 |
|
|
Total liabilities |
|
21,746,510 |
|
Net Assets |
|
$ 354,482,877 |
|
Net Assets consist of: |
|
|
|
Paid in capital |
|
$ 405,748,528 |
|
Undistributed net investment income |
|
137,384 |
|
Accumulated undistributed net realized gain (loss) on investments and foreign currency transactions |
|
(49,133,036) |
|
Net unrealized appreciation (depreciation) on investments |
|
(2,269,999) |
|
Net Assets |
|
$ 354,482,877 |
See accompanying notes which are an integral part of the financial statements.
Annual Report
Financial Statements - continued
Statement of Assets and Liabilities - continued
|
|
October 31, 2000 |
|
|
Calculation of Maximum Offering Price |
|
$9.12 |
|
Maximum offering price per share (100/98.50 of $9.12) |
|
$9.26 |
|
Class T: |
|
$9.13 |
|
Maximum offering price per share (100/98.50 of $9.13) |
|
$9.27 |
|
Class C: |
|
$9.13 |
|
Institutional Class: |
|
$9.13 |
A Redemption price per share is equal to net asset value less any applicable contingent deferred sales charge.
See accompanying notes which are an integral part of the financial statements.
Annual Report
Financial Statements - continued
Statement of Operations
|
|
Year ended October 31, 2000 |
|
|
Investment Income Interest |
|
$ 21,170,780 |
|
Security lending |
|
9,988 |
|
Total Income |
|
21,180,768 |
|
Expenses |
|
|
|
Management fee |
$ 1,311,010 |
|
|
Transfer agent fees |
578,609 |
|
|
Distribution fees |
617,164 |
|
|
Accounting and security lending fees |
91,600 |
|
|
Non-interested trustees' compensation |
1,073 |
|
|
Custodian fees and expenses |
19,221 |
|
|
Registration fees |
69,709 |
|
|
Audit |
33,273 |
|
|
Legal |
3,737 |
|
|
Miscellaneous |
2,857 |
|
|
Total expenses before reductions |
2,728,253 |
|
|
Expense reductions |
(8,145) |
2,720,108 |
|
Net investment income |
|
18,460,660 |
|
Realized and Unrealized Gain (Loss) Net realized gain (loss) on investment securities |
|
(3,704,706) |
|
Change in net unrealized appreciation (depreciation) |
|
2,610,601 |
|
Net gain (loss) |
|
(1,094,105) |
|
Net increase (decrease) in net assets resulting |
|
$ 17,366,555 |
See accompanying notes which are an integral part of the financial statements.
Annual Report
Financial Statements - continued
Statement of Changes in Net Assets
|
|
Year ended
October 31, |
Year ended
October 31, |
|
Increase (Decrease) in Net Assets |
|
|
|
Operations |
$ 18,460,660 |
$ 19,052,975 |
|
Net realized gain (loss) |
(3,704,706) |
(2,605,978) |
|
Change in net unrealized appreciation (depreciation) |
2,610,601 |
(6,062,922) |
|
Net increase (decrease) in net assets resulting |
17,366,555 |
10,384,075 |
|
Distributions to shareholders from net investment income |
(18,468,559) |
(18,762,496) |
|
Share transactions - net increase (decrease) |
(9,153,093) |
15,720,432 |
|
Total increase (decrease) in net assets |
(10,255,097) |
7,342,011 |
|
Net Assets |
|
|
|
Beginning of period |
364,737,974 |
357,395,963 |
|
End of period (including undistributed net investment income of $137,384 and $128,689, respectively) |
$ 354,482,877 |
$ 364,737,974 |
See accompanying notes which are an integral part of the financial statements.
Annual Report
Financial Highlights - Class A
|
Years ended October 31, |
2000 |
1999 |
1998 |
1997 |
1996 E |
|
Selected Per-Share Data |
|
|
|
|
|
|
Net asset value, beginning |
$ 9.150 |
$ 9.380 |
$ 9.310 |
$ 9.370 |
$ 9.290 |
|
Income from Investment Operations |
|
|
|
|
|
|
Net investment income D |
.551 |
.518 |
.572 |
.532 |
.090 |
|
Net realized and unrealized gain (loss) |
(.028) |
(.233) |
.024 |
(.021) |
.081 |
|
Total from investment |
.523 |
.285 |
.596 |
.511 |
.171 |
|
Less Distributions |
|
|
|
|
|
|
From net investment income |
(.553) |
(.515) |
(.526) |
(.571) |
(.091) |
|
Net asset value, end of period |
$ 9.120 |
$ 9.150 |
$ 9.380 |
$ 9.310 |
$ 9.370 |
|
Total Return B, C |
5.91% |
3.12% |
6.58% |
5.64% |
1.85% |
|
Ratios and Supplemental Data |
|
|
|
|
|
|
Net assets, end of period |
$ 16,698 |
$ 17,835 |
$ 5,524 |
$ 19,726 |
$ 204 |
|
Ratio of expenses to average |
.83% |
.82% |
.90% F |
.90% F |
.90% A, F |
|
Ratio of expenses to average net assets after expense reductions |
.83% |
.80% G |
.90% |
.90% |
.90% A |
|
Ratio of net investment income to average net assets |
6.05% |
5.68% |
6.03% |
6.00% |
6.27% A |
|
Portfolio turnover rate |
115% |
139% |
124% |
105% |
124% |
A Annualized
B The total returns would have been lower had certain expenses not been reduced during the periods shown.
C Total returns do not include the one time sales charge and for periods of less than one year are not annualized.
D Net investment income per share has been calculated based on average shares outstanding during the period.
E For the period September 3, 1996 (commencement of sale of Class A shares) to October 31,1996.
F FMR agreed to reimburse a portion of the class' expenses during the period. Without this reimbursement, the class' expense ratio would have been higher.
G FMR or the fund has entered into varying arrangements with third parties who either paid or reduced a portion of the class' expenses.
See accompanying notes which are an integral part of the financial statements.
Annual Report
Financial Highlights - Class T
|
Years ended October 31, |
2000 |
1999 |
1998 |
1997 |
1996 |
|
Selected Per-Share Data |
|
|
|
|
|
|
Net asset value, beginning |
$ 9.150 |
$ 9.380 |
$ 9.350 |
$ 9.380 |
$ 9.470 |
|
Income from Investment Operations |
|
|
|
|
|
|
Net investment income C |
.550 |
.523 |
.555 |
.578 |
.594 |
|
Net realized and unrealized gain (loss) |
(.019) |
(.238) |
.019 |
(.036) |
(.094) |
|
Total from investment |
.531 |
.285 |
.574 |
.542 |
.500 |
|
Less Distributions |
|
|
|
|
|
|
From net investment income |
(.551) |
(.515) |
(.544) |
(.572) |
(.590) |
|
Net asset value, end of period |
$ 9.130 |
$ 9.150 |
$ 9.380 |
$ 9.350 |
$ 9.380 |
|
Total Return A, B |
6.00% |
3.12% |
6.32% |
5.97% |
5.45% |
|
Ratios and Supplemental Data |
|
|
|
|
|
|
Net assets, end of period |
$ 279,306 |
$ 309,670 |
$ 333,050 |
$ 351,614 |
$ 416,700 |
|
Ratio of expenses to average |
.84% |
.84% |
.89% |
.89% |
.88% |
|
Ratio of expenses to average net assets after expense reductions |
.83% D |
.83% D |
.89% |
.89% |
.88% |
|
Ratio of net investment income to average net assets |
6.05% |
5.64% |
5.93% |
6.19% |
6.29% |
|
Portfolio turnover rate |
115% |
139% |
124% |
105% |
124% |
A The total returns would have been lower had certain expenses not been reduced during the periods shown.
B Total returns do not include the one time sales charge.
C Net investment income per share has been calculated based on average shares outstanding during the period.
D FMR or the fund has entered into varying arrangements with third parties who either paid or reduced a portion of the class' expenses.
See accompanying notes which are an integral part of the financial statements.
Annual Report
Financial Highlights - Class C
|
Years ended October 31, |
2000 |
1999 |
1998 E |
|
Selected Per-Share Data |
|
|
|
|
Net asset value, beginning of period |
$ 9.160 |
$ 9.380 |
$ 9.340 |
|
Income from Investment Operations |
|
|
|
|
Net investment income D |
.467 |
.434 |
.437 |
|
Net realized and unrealized gain (loss) |
(.021) |
(.222) |
.064 |
|
Total from investment operations |
.446 |
.212 |
.501 |
|
Less Distributions |
|
|
|
|
From net investment income |
(.476) |
(.432) |
(.461) |
|
Net asset value, end of period |
$ 9.130 |
$ 9.160 |
$ 9.380 |
|
Total Return B, C |
5.01% |
2.31% |
5.49% |
|
Ratios and Supplemental Data |
|
|
|
|
Net assets, end of period (000 omitted) |
$ 50,824 |
$ 30,428 |
$ 11,795 |
|
Ratio of expenses to average net assets |
1.68% |
1.73% |
1.75% A, F |
|
Ratio of expenses to average net assets after |
1.67% G |
1.72% G |
1.75% A |
|
Ratio of net investment income to average net assets |
5.21% |
4.75% |
4.92% A |
|
Portfolio turnover rate |
115% |
139% |
124% |
A Annualized
B The total returns would have been lower had certain expenses not been reduced during the periods shown.
C Total returns do not include the contingent deferred sales charge and for periods of less than one year are not annualized.
D Net investment income per share has been calculated based on average shares outstanding during the period.
E For the period November 3, 1997 (commencement of sale of Class C shares) to October 31, 1998.
F FMR agreed to reimburse a portion of the class' expenses during the period. Without this reimbursement, the class' expense ratio would have been higher.
G FMR or the fund has entered into varying arrangements with third parties who either paid or reduced a portion of the class' expenses.
See accompanying notes which are an integral part of the financial statements.
Annual Report
Financial Highlights - Institutional Class
|
Years ended October 31, |
2000 |
1999 |
1998 |
1997 |
1996 |
|
Selected Per-Share Data |
|
|
|
|
|
|
Net asset value, beginning |
$ 9.150 |
$ 9.380 |
$ 9.350 |
$ 9.370 |
$ 9.470 |
|
Income from Investment Operations |
|
|
|
|
|
|
Net investment income B |
.564 |
.534 |
.566 |
.589 |
.598 |
|
Net realized and unrealized gain (loss) |
(.015) |
(.236) |
.021 |
(.023) |
(.098) |
|
Total from investment operations |
.549 |
.298 |
.587 |
.566 |
.500 |
|
Less Distributions |
|
|
|
|
|
|
From net investment income |
(.569) |
(.528) |
(.557) |
(.586) |
(.600) |
|
Net asset value, end of period |
$ 9.130 |
$ 9.150 |
$ 9.380 |
$ 9.350 |
$ 9.370 |
|
Total Return A |
6.21% |
3.27% |
6.47% |
6.24% |
5.45% |
|
Ratios and Supplemental Data |
|
|
|
|
|
|
Net assets, end of period |
$ 7,655 |
$ 6,805 |
$ 7,027 |
$ 6,750 |
$ 9,200 |
|
Ratio of expenses to average |
.67% |
.71% |
.75% C |
.75% C |
.80% C |
|
Ratio of expenses to average net assets after expense reductions |
.67% |
.70% D |
.75% |
.75% |
.80% |
|
Ratio of net investment income to average net assets |
6.21% |
5.77% |
6.06% |
6.30% |
6.37% |
|
Portfolio turnover rate |
115% |
139% |
124% |
105% |
124% |
A The total returns would have been lower had certain expenses not been reduced during the periods shown.
B Net investment income per share has been calculated based on average shares outstanding during the period.
C FMR agreed to reimburse a portion of the class' expenses during the period. Without this reimbursement, the class' expense ratio would have been higher.
D FMR or the fund has entered into varying arrangements with third parties who either paid or reduced a portion of the class' expenses.
See accompanying notes which are an integral part of the financial statements.
Annual Report
For the period ended October 31, 2000
1. Significant Accounting Policies.
Fidelity Advisor Short Fixed-Income Fund (the fund) is a fund of Fidelity Advisor Series II (the trust) and is authorized to issue an unlimited number of shares. The trust is registered under the Investment Company Act of 1940, as amended (the 1940 Act), as an open-end management investment company organized as a Massachusetts business trust.
The fund offers Class A, Class T, Class C, and Institutional Class shares, each of which has equal rights as to assets and voting privileges. Each class has exclusive voting rights with respect to matters that affect that class. Investment income, realized and unrealized capital gains and losses, the common expenses of the fund, and certain fund-level expense reductions, if any, are allocated on a pro rata basis to each class based on the relative net assets of each class to the total net assets of the fund. Each class of shares differs in its respective distribution, transfer agent, and certain other class-specific fees, expenses, and expense reductions.
The financial statements have been prepared in conformity with generally accepted accounting principles which require management to make certain estimates and assumptions at the date of the financial statements. The following summarizes the significant accounting policies of the fund:
Security Valuation. Securities are valued based upon a computerized matrix system and/or appraisals by a pricing service, both of which consider market transactions and dealer-supplied valuations. Securities (including restricted securities) for which market quotations are not readily available are valued at their fair value as determined in good faith under consistently applied procedures under the general supervision of the Board of Trustees. Short-term securities with remaining maturities of sixty days or less for which quotations are not readily available are valued at amortized cost or original cost plus accrued interest, both of which approximate current value. Investments in open-end investment companies are valued at their net asset value each business day.
Income Taxes. As a qualified regulated investment company under Subchapter M of the Internal Revenue Code, the fund is not subject to income taxes to the extent that it distributes substantially all of its taxable income for its fiscal year. The schedule of investments includes information regarding income taxes under the caption "Income Tax Information."
Investment Income. Interest income, which includes accretion of original issue discount, is accrued as earned.
Expenses. Most expenses of the trust can be directly attributed to a fund. Expenses which cannot be directly attributed are apportioned among the funds in the trust.
Distributions to Shareholders. Distributions are declared daily and paid monthly from net investment income. Distributions from realized gains, if any, are recorded on the ex-dividend date. Income dividends and capital gain distributions are declared separately for each class.
Annual Report
Notes to Financial Statements - continued
1. Significant Accounting Policies - continued
Distributions to Shareholders - continued
Income and capital gain distributions are determined in accordance with income tax regulations which may differ from generally accepted accounting principles. These differences, which may result in distribution reclassifications, are primarily due to differing treatments for paydown gains/losses on certain securities, market discount, capital loss carryforwards and losses deferred due to wash sales.
Permanent book and tax basis differences relating to shareholder distributions will result in reclassifications to paid in capital. Undistributed net investment income and accumulated undistributed net realized gain (loss) on investments and foreign currency transactions may include temporary book and tax basis differences which will reverse in a subsequent period. Any taxable income or gain remaining at fiscal year end is distributed in the following year.
Security Transactions. Security transactions are accounted for as of trade date. Gains and losses on securities sold are determined on the basis of identified cost.
2. Operating Policies.
Joint Trading Account. Pursuant to an Exemptive Order issued by the Securities and Exchange Commission, the fund, along with other affiliated entities of Fidelity Management & Research Company (FMR), may transfer uninvested cash balances into one or more joint trading accounts. These balances are invested in one or more repurchase agreements for U.S. Treasury or Federal Agency obligations.
Repurchase Agreements. The underlying U.S. Treasury, Federal Agency, or other obligations found to be satisfactory by FMR are transferred to an account of the fund, or to the Joint Trading Account, at a custodian bank. The securities are marked-to-market daily and maintained at a value at least equal to the principal amount of the repurchase agreement (including accrued interest). FMR, the fund's investment adviser, is responsible for determining that the value of the underlying securities remains in accordance with the market value requirements stated above.
Delayed Delivery Transactions. The fund may purchase or sell securities on a delayed delivery basis. Payment and delivery may take place after the customary settlement period for that security. The price of the underlying securities and the date when the securities will be delivered and paid for are fixed at the time the transaction is negotiated. The fund may receive compensation for interest forgone in the purchase of a delayed delivery security. With respect to purchase commitments, the fund identifies securities as segregated in its records with a value at least equal to the amount of the commitment. Losses may arise due to changes in the market value of the underlying securities or if the counterparty does not perform under the contract.
Annual Report
Notes to Financial Statements - continued
2. Operating Policies - continued
Restricted Securities. The fund is permitted to invest in securities that are subject to legal or contractual restrictions on resale. These securities generally may be resold in transactions exempt from registration or to the public if the securities are registered. Disposal of these securities may involve time-consuming negotiations and expense, and prompt sale at an acceptable price may be difficult. At the end of the period, the fund had no investments in restricted securities (excluding 144A issues).
3. Purchases and Sales of Investments.
Purchases and sales of securities, other than short-term securities, aggregated $348,990,250 and $353,630,303, respectively, of which U.S. government and government agency obligations aggregated $219,540,904 and $195,487,578, respectively.
4. Fees and Other Transactions with Affiliates.
Management Fee. As the fund's investment adviser, FMR receives a monthly fee that is calculated on the basis of a group fee rate plus a fixed individual fund fee rate applied to the average net assets of the fund. The group fee rate is the weighted average of a series of rates and is based on the monthly average net assets of all the mutual funds advised by FMR. The rates ranged from .0920% to .3700% for the period. The annual individual fund fee rate is .30%. In the event that these rates were lower than the contractual rates in effect during the period, FMR voluntarily implemented the above rates, as they resulted in the same or a lower management fee. For the period, the management fee was equivalent to an annual rate of .43% of average net assets.
Sub-Adviser Fee. FMR, on behalf of the fund, has entered into a sub-advisory agreement with Fidelity Investments Money Management, Inc. (FIMM), a wholly owned subsidiary of FMR. For its services, FIMM receives a fee from FMR of 50% of the management fee payable to FMR. The fee is paid prior to any voluntary expense reimbursements which may be in effect.
Distribution and Service Plan. In accordance with Rule 12b-1 of the 1940 Act, the Board of Trustees has adopted separate Distribution and Service Plans with respect to each class of shares (collectively referred to as "the Plans"). Under certain of the Plans, the class pays Fidelity Distributors Corporation (FDC), an affiliate of FMR, a 12b-1 fee. A portion of this fee may be reallowed to securities dealers, banks and other financial institutions for the distribution of each class of shares and providing shareholder support services. For the period, this fee was based on the following annual rates of the average net assets of each applicable class:
|
Class A |
.15% |
|
Class T |
.15% |
|
Class C |
1.00%* |
* .75% represents a distribution fee and .25% represents a shareholder service fee.
Annual Report
Notes to Financial Statements - continued
4. Fees and Other Transactions with Affiliates - continued
Distribution and Service Plan - continued
For the period, each class paid FDC the following amounts, a portion of which was retained by FDC:
|
|
Paid to |
Retained |
|
Class A |
$ 24,456 |
$ 23 |
|
Class T |
397,379 |
3,311 |
|
Class C |
195,329 |
118,568 |
|
|
$ 617,164 |
$ 121,902 |
Sales Load. FDC receives a front-end sales charge of up to 1.50% for selling Class A and Class T shares of the fund and the proceeds of a contingent deferred sales charge levied on Class C share redemptions occurring within one year of purchase. The Class C charge is 1% of the lesser of the cost of shares at the initial date of purchase or the net asset value of the redeemed shares, excluding any reinvested dividends and capital gains. A portion of the sales charges paid to FDC is paid to securities dealers, banks and other financial institutions.
For the period, sales charge amounts paid to and retained by FDC were as follows:
|
|
Paid to |
Retained |
|
Class A |
$ 37,079 |
$ 12,095 |
|
Class T |
162,595 |
42,212 |
|
Class C |
32,659 |
32,659 * |
|
|
$ 232,333 |
$ 86,966 |
* When Class C shares are initially sold, FDC pays commissions from its own resources to securities dealers,
banks, and other financial institutions through which the sales are made.
Transfer Agent Fees. Fidelity Investments Institutional Operations Company, Inc., (FIIOC), an affiliate of FMR, is the transfer, dividend disbursing and shareholder servicing agent (collectively referred to as the transfer agent) for each class of the fund. FIIOC receives account fees and asset-based fees that vary according to the account size and type of account of the shareholders of the respective classes of the fund. FIIOC pays for
Annual Report
Notes to Financial Statements - continued
4. Fees and Other Transactions with Affiliates - continued
Transfer Agent Fees - continued
typesetting, printing and mailing of all shareholder reports, except proxy statements. For the period, the following amounts were paid to FIIOC:
|
|
Amount |
% of |
|
Class A |
$ 29,797 |
.18 |
|
Class T |
501,124 |
.19 |
|
Class C |
35,098 |
.18 |
|
Institutional Class |
12,590 |
.18 |
|
|
$ 578,609 |
|
Accounting and Security Lending Fees. Fidelity Service Company, Inc. maintains the fund's accounting records and administers the security lending program. The security lending fee is based on the number and duration of lending transactions. The accounting fee is based on the level of average net assets for the month plus out-of-pocket expenses.
5. Security Lending.
The fund lends portfolio securities from time to time in order to earn additional income. The fund receives collateral in the form of U.S. Treasury obligations, letters of credit, and/or cash against the loaned securities, and maintains collateral in an amount not less than 100% of the market value of the loaned securities during the period of the loan. The market value of the loaned securities is determined at the close of business of the fund and any additional required collateral is delivered to the fund on the next business day. If the borrower defaults on its obligation to return the securities loaned because of insolvency or other reasons, the fund could experience delays and costs in recovering the securities loaned or in gaining access to the collateral. At period end there were no security loans outstanding.
6. Expense Reductions.
Through an arrangement with the fund's custodian, credits realized as a result of uninvested cash balances were used to reduce a portion of expenses. During the period, the fund's custodian fees were reduced by $8,145 under the custodian arrangement.
7. Beneficial Interest.
At the end of the period, one shareholder was record owner of approximately 20% of the total outstanding shares of the fund.
Annual Report
Notes to Financial Statements - continued
8. Distributions to Shareholders.
Distributions to shareholders of each class were as follows:
|
|
Years ended October 31, |
|
|
|
2000 |
1999 |
|
From net investment income |
|
|
|
Class A |
$ 989,950 |
$ 728,649 |
|
Class T |
16,008,757 |
17,079,838 |
|
Class C |
1,027,363 |
560,143 |
|
Institutional Class |
442,489 |
393,866 |
|
Total |
$ 18,468,559 |
$ 18,762,496 |
9. Share Transactions.
Transactions for each class of shares were as follows:
|
|
Shares |
Dollars |
||
|
|
Years ended October 31, |
Years ended October 31, |
||
|
|
2000 |
1999 |
2000 |
1999 |
|
|
|
|
|
|
|
Class A |
1,682,621 |
4,473,072 |
$ 15,278,451 |
$ 41,324,913 |
|
Reinvestment of distributions |
97,239 |
71,481 |
883,778 |
658,379 |
|
Shares redeemed |
(1,899,431) |
(3,183,911) |
(17,261,780) |
(29,310,347) |
|
Net increase (decrease) |
(119,571) |
1,360,642 |
$ (1,099,551) |
$ 12,672,945 |
|
Class T |
18,749,453 |
21,974,295 |
$ 170,697,136 |
$ 203,715,730 |
|
Reinvestment of distributions |
1,430,849 |
1,462,245 |
13,011,480 |
13,533,243 |
|
Shares redeemed |
(23,421,838) |
(25,110,949) |
(213,120,892) |
(233,084,712) |
|
Net increase (decrease) |
(3,241,536) |
(1,674,409) |
$ (29,412,276) |
$ (15,835,739) |
|
Class C |
5,686,664 |
4,501,972 |
$ 51,826,077 |
$ 41,508,375 |
|
Reinvestment of distributions |
87,059 |
46,606 |
792,111 |
430,046 |
|
Shares redeemed |
(3,532,168) |
(2,481,867) |
(32,118,065) |
(23,005,901) |
|
Net increase (decrease) |
2,241,555 |
2,066,711 |
$ 20,500,123 |
$ 18,932,520 |
|
Institutional Class |
304,332 |
527,018 |
$ 2,764,206 |
$ 4,875,430 |
|
Reinvestment of distributions |
42,066 |
36,799 |
382,542 |
340,500 |
|
Shares redeemed |
(251,563) |
(569,453) |
(2,288,137) |
(5,265,224) |
|
Net increase (decrease) |
94,835 |
(5,636) |
$ 858,611 |
$ (49,294) |
Annual Report
To the Trustees of Fidelity Advisor Series II and Shareholders of Fidelity Advisor Short Fixed-Income Fund:
We have audited the accompanying statement of assets and liabilities of Fidelity Advisor Short Fixed-Income Fund, (the fund), a fund of Fidelity Advisor Series II (the trust), including the portfolio of investments, as of October 31, 2000, and the related statement of operations for the year then ended, the statement of changes in net assets for each of the two years in the period then ended, and the financial highlights for each of the five years in the period then ended. These financial statements and financial highlights are the responsibility of the fund's management. Our responsibility is to express an opinion on these financial statements and financial highlights based on our audits.
We conducted our audits in accordance with auditing standards generally accepted in the United States of America. Those standards require that we plan and perform the audit to obtain reasonable assurance about whether the financial statements and financial highlights are free of material misstatement. An audit includes examining, on a test basis, evidence supporting the amounts and disclosures in the financial statements. Our procedures included confirmation of securities owned as of October 31, 2000, by correspondence with the custodian and brokers; where replies were not received from brokers, we performed other auditing procedures. An audit also includes assessing the accounting principles used and significant estimates made by management, as well as evaluating the overall financial statement presentation. We believe that our audits provide a reasonable basis for our opinion.
In our opinion, the financial statements and financial highlights referred to above present fairly, in all material respects, the financial position of Fidelity Advisor Short Fixed-Income Fund as of October 31, 2000, the results of its operations for the year then ended, the changes in its net assets for each of the two years in the period then ended, and its financial highlights for each of the five years in the period then ended, in conformity with accounting principles generally accepted in the United States of America.
/s/DELOITTE & TOUCHE LLP
DELOITTE & TOUCHE LLP
Boston, Massachusetts
December 8, 2000
Annual Report
Investment Adviser
Fidelity Management & Research Company
Boston, MA
Investment Sub-Advisers
Fidelity Management & Research
(U.K.) Inc.
Fidelity Management & Research
(Far East) Inc.
Fidelity Investments Money Management, Inc.
Fidelity Investments Japan Limited
Officers
Edward C. Johnson 3d, President
Robert C. Pozen, Senior Vice President
Andrew J. Dudley, Vice President
Dwight D. Churchill, Vice President
David L. Murphy, Vice President
Stanley N. Griffith, Assistant Vice President
Eric D. Roiter, Secretary
Robert A. Dwight, Treasurer
Maria F. Dwyer, Deputy Treasurer
John H. Costello, Assistant Treasurer
Thomas J. Simpson, Assistant Treasurer
Board of Trustees
Ralph F. Cox *
Phyllis Burke Davis *
Robert M. Gates *
Edward C. Johnson 3d
Donald J. Kirk *
Ned C. Lautenbach *
Peter S. Lynch
Ned C. Lautenbach *
Marvin L. Mann *
William O.McCoy *
Gerald C. McDonough *
Robert C. Pozen
Thomas R. Williams *
* Independent trustees
Advisory Board
J. Michael Cook
Abigail P. Johnson
Marie L. Knowles
General Distributor
Fidelity Distributors Corporation
Boston, MA
Transfer and Shareholder
Servicing Agent
Fidelity Investments Institutional Operations Company, Inc.
Boston, MA
Custodian
The Bank of New York
New York, NY
|
SFI-ANN-1200 |
118716 |
|
1.538430.103 |
|
(Fidelity Investment logo)(registered trademark)
Fidelity® Advisor
Fund - Institutional Class
Annual Report
October 31, 2000
(2_fidelity_logos)(Registered_Trademark)
|
President's Message |
3 |
Ned Johnson on investing strategies. |
|
Performance |
4 |
How the fund has done over time. |
|
Fund Talk |
7 |
The manager's review of fund performance, strategy and outlook. |
|
Investment Changes |
10 |
A summary of major shifts in the fund's investments over the past six months. |
|
Investments |
11 |
A complete list of the fund's investments with their market values. |
|
Financial Statements |
25 |
Statements of assets and liabilities,
operations, and changes in net assets, |
|
Notes |
33 |
Notes to the financial statements. |
|
Independent Auditors' Report |
39 |
The auditors' opinion. |
|
|
|
|
Standard & Poor's, S&P and S&P 500 are registered service marks of The McGraw-Hill Companies, Inc. and have been licensed for use by Fidelity Distributors Corporation.
Third party marks appearing herein are the property of their respective owners.
All other marks appearing herein are registered or unregistered trademarks or service marks of FMR Corp. or an affiliated company.
(Recycle graphic) This report is printed on recycled paper using soy-based inks.
This report and the financial statements contained herein are submitted for the general information of the shareholders of the fund. This report is not authorized for distribution to prospective investors in the fund unless preceded or accompanied by an effective prospectus.
Mutual fund shares are not deposits or obligations of, or guaranteed by, any depository institution. Shares are not insured by the FDIC, Federal Reserve Board or any other agency, and are subject to investment risks, including possible loss of principal amount invested.
Neither the fund nor Fidelity Distributors Corporation is a bank.
For more information on any Fidelity Advisor fund, including charges and expenses, contact your investment professional for a free prospectus. Read it carefully before you invest or send money.
Annual Report
(photo_of_Edward_C_Johnson_3d)
Dear Shareholder:
A sixth-straight year of double-digit positive returns for the Dow Jones Industrial Average, NASDAQ and S&P 500® could be in jeopardy unless the U.S. stock market shows marked improvement in the final two months of 2000. Through October, all three indexes had negative year-to-date returns. On the other hand, most fixed-income sectors were solidly in the black. Treasuries and other long-term government securities led the way, returning nearly 14%.
While it's impossible to predict the future direction of the markets with any degree of certainty, there are certain basic principles that can help investors plan for their future needs.
The longer your investment time frame, the less likely it is that you will be affected by short-term market volatility. A 10-year investment horizon appropriate for saving for a college education, for example, enables you to weather market cycles in a long-term fund, which may have a higher risk potential, but also has a higher potential rate of return.
An intermediate-length fund could make sense if your investment horizon is two to four years, while a short-term bond fund could be the right choice if you need your money in one or two years.
If your time horizon is less than a year, you might want to consider moving some of your bond investment into a money market fund. These funds seek income and a stable share price by investing in high-quality, short-term investments. Of course, it's important to remember that an investment in a money market fund is not insured or guaranteed by the Federal Deposit Insurance Corporation or any other government agency. Although money market funds seek to preserve the value of your investment at $1.00 per share, it is possible to lose money by investing in these types of funds.
Finally, no matter what your time horizon or portfolio diversity, it makes good sense to follow a regular investment plan, investing a certain amount of money in a fund at the same time each month or quarter and periodically reviewing your overall portfolio. By doing so, you won't get caught up in the excitement of a rapidly rising market, nor will you buy all your shares at market highs. While this strategy - known as dollar cost averaging - won't assure a profit or protect you from a loss in a declining market, it should help you lower the average cost of your purchases. Of course, you should consider your financial ability to continue your purchases through periods of low price levels before undertaking such a strategy.
Remember to contact your investment professional if you need help with your investments.
Best regards,
/s/Edward C. Johnson 3d
Edward C. Johnson 3d
Annual Report
There are several ways to evaluate historical performance. You can look at the total percentage change in value, the average annual percentage change, or the growth of a hypothetical $10,000 investment. Total return reflects the change in the value of an investment, assuming reinvestment of the class' dividend income and capital gains (the profits earned upon the sale of securities that have grown in value). You can also look at the class' income, as reflected in its yield, to measure performance. The initial offering of Institutional Class shares took place on July 3, 1995. Institutional Class shares are sold to eligible investors without a sales load or 12b-1 fee. Returns prior to July 3, 1995 are those of Class T, the original class of the fund, and reflect Class T shares' 0.15% 12b-1 fee. If Fidelity had not reimbursed certain class expenses, the past five year and past 10 year total returns would have been lower.
Cumulative Total Returns
|
Periods ended October 31, 2000 |
|
Past 1 |
Past 5 |
Past 10 years |
|
Fidelity® Adv Short Fixed-Income - Inst CL |
|
6.21% |
30.82% |
85.56% |
|
LB 1-3 Year Govt/Credit |
|
6.15% |
33.04% |
87.31% |
|
Short Investment Grade Debt Funds Average |
|
5.76% |
29.56% |
84.22% |
Cumulative total returns show Institutional Class' performance in percentage terms over a set period - in this case, one year, five years or 10 years. For example, if you had invested $1,000 in a fund that had a 5% return over the past year, the value of your investment would be $1,050. You can compare Institutional Class' returns to the performance of the Lehman Brothers 1-3 Year Government/Credit Bond Index - a market value-weighted index of government and investment-grade corporate fixed-rate debt issues with maturities between one and three years. To measure how Institutional Class' performance stacked up against its peers, you can compare it to the short investment grade debt funds average, which reflects the performance of mutual funds with similar objectives tracked by Lipper Inc. The past one year average represents a peer group of 110 mutual funds. These benchmarks include reinvested dividends and capital gains, if any, and exclude the effect of sales charges.
Average Annual Total Returns
|
Periods ended October 31, 2000 |
Past 1 |
Past 5 |
Past 10 years |
|
Fidelity Adv Short Fixed-Income - Inst CL |
6.21% |
5.52% |
6.38% |
|
LB 1-3 Year Govt/Credit |
6.15% |
5.88% |
6.48% |
|
Short Investment Grade Debt Funds Average |
5.76% |
5.31% |
6.29% |
Average annual total returns take Institutional Class shares' cumulative return and show you what would have
happened if Institutional Class shares had performed at a constant rate each year.
Annual Report
Fidelity Advisor Short Fixed-Income Fund - Institutional Class
Performance - continued
$10,000 Over 10 Years
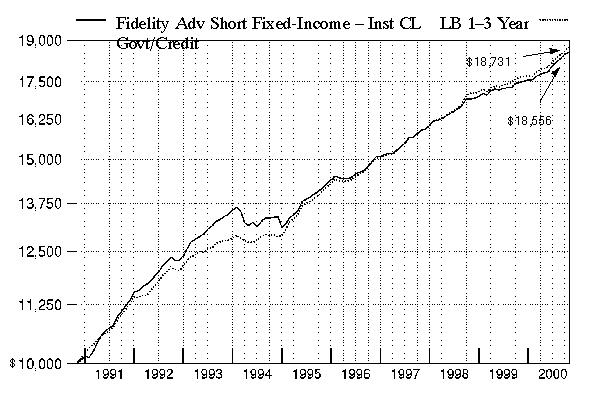
$10,000 Over 10 Years: Let's say hypothetically that $10,000 was invested in Fidelity Advisor Short Fixed-Income Fund - Institutional Class on October 31, 1990. As the chart shows, by October 31, 2000, the value of the investment would have grown to $18,556 - an 85.56% increase on the initial investment. For comparison, look at how the Lehman Brothers 1-3 Year Government/Credit Bond Index did over the same period. With dividends, and capital gains, if any, reinvested, the same $10,000 would have grown to $18,731 - an 87.31% increase.
Understanding
Performance
How a fund did yesterday is no guarantee of how it will do tomorrow. Bond prices, for example, generally move in the opposite direction of interest rates. In turn, the share price, return and yield of a fund that invests in bonds will vary. That means if you sell your shares during a market downturn, you might lose money. But if you can ride out the market's ups and downs, you may have a gain.
3Annual Report
Fidelity Advisor Short Fixed-Income Fund - Institutional Class
Performance - continued
Total Return Components
|
|
|
Years ended October 31, |
||||
|
|
|
2000 |
1999 |
1998 |
1997 |
1996 |
|
Dividend returns |
|
6.43% |
5.72% |
6.15% |
6.45% |
6.51% |
|
Capital returns |
|
-0.22% |
-2.45% |
0.32% |
-0.21% |
-1.06% |
|
Total returns |
|
6.21% |
3.27% |
6.47% |
6.24% |
5.45% |
Total return components include both dividend returns and capital returns. A dividend return reflects the actual dividends paid by the class. A capital return reflects both the amount paid by the class to shareholders as capital gain distributions and changes in the class' share price. Both returns assume the dividends or capital gains, if any, paid by the class are reinvested.
Dividends and Yield
|
Periods ended October 31, 2000 |
Past 1 |
Past 6 |
Past 1 |
|
Dividends per share |
4.87¢ |
29.16¢ |
56.90¢ |
|
Annualized dividend rate |
6.27% |
6.36% |
6.26% |
|
30-day annualized yield |
6.62% |
- |
- |
Dividends per share show the income paid by the class for a set period. If you annualize this number, based on an average share price of $9.14 over the past one month, $9.09 over the past six months, and $9.09 over the past one year, you can compare the class' income over these three periods. The 30-day annualized
yield is a standard formula for all bond funds based on the yields of the bonds in the fund, averaged over the past 30 days. This figure shows you the yield characteristics of the fund's investments at the end of the period. It also helps you compare funds from different companies on an equal basis.
Annual Report
Market Recap
Strong technical factors in the market helped most investment-grade bonds overcome sharply rising interest rates and volatile market conditions, enabling them to outperform a number of major U.S. equity indexes during the 12-month period that ended October 31, 2000. The Lehman Brothers Aggregate Bond Index - a popular measure of taxable-bond performance - returned 7.30% during this time frame. Following a bullish fourth quarter of 1999 for the spread sectors - namely corporate bonds, mortgage and agency securities - Treasuries usurped market leadership not long after the millennium changeover. A growing federal surplus spurred the U.S. government in January to begin buying back outstanding debt and reducing future issuance. The scarcity premium created by a shrinking supply of long-dated Treasuries sent prices soaring and yields plummeting, thereby inducing an inverted yield curve - which occurs when short-term bonds outyield longer-dated securities. Anticipation that the Fed was finished raising interest rates entering the summer, combined with persistent flights-to-safety from risk-averse investors concerned about volatility in equity markets, further bolstered the long bond, helping the Lehman Brothers Treasury Index return 8.22% during the period. Mortgages made up some ground late in the period behind strong housing turnover. Agencies, too, staged a late rally in response to reduced political risk surrounding government-sponsored enterprises. However, corporates had little to celebrate, plagued by deteriorating credit conditions and growing supply pressures. For the overall period, the Lehman Brothers Mortgage-Backed Securities, U.S. Agency and Credit Bond indexes returned 7.57%, 7.30% and 5.48%, respectively.
(Portfolio Manager photograph)
An interview with Andrew Dudley, Portfolio Manager of Fidelity Advisor Short Fixed-Income Fund
Q. How did the fund perform, Andy?
A. For the 12 months that ended October 31, 2000, the fund's Institutional Class shares returned 6.21%. By comparison, the Lehman Brothers 1-3 Year Government/Credit Bond Index returned 6.15% during the same period, while the short investment grade debt funds average return, as tracked by Lipper Inc., was up 5.76%.
Q. What was the investment environment like during the period?
A. Treasury securities were the best-performing sector in the fixed-income market for the overall period, as the reduction in the deficit enabled the federal government to buy back debt, which led to a rally in Treasuries as yields fell and prices rose. Late in 1999, corporate securities also staged a brief rally as fears about potential Y2K computer problems receded and investors entered 2000 with a sense of optimism. However, we saw a turn in investors' attitudes about credit risk during the second half of the 12-month period. Many believed we were approaching the end of a cycle of business expansion and the beginning of a slowdown in economic growth, which potentially could be negative for corporate bonds. At the same time, the heightened focus on stock market performance created pressures among many company managements to support their companies' stock prices. This has encouraged steps such as stock buyback programs and other activities that potentially could cause the credit trends of the companies to deteriorate. Meanwhile, rapidly rising energy prices created another uncertainty for bond investors. In combination, these factors added up to a negative environment for corporate bonds. Among corporate subsectors, defensive areas such as real estate investment trusts (REITs) and utility and energy company bonds tended to perform somewhat better than the overall corporate bond market. High-yield bonds, in which the fund does not invest, were particularly poor performers. In contrast, government agency bonds, mortgages and, in particular, asset-backed securities tended to perform well during the period.
Annual Report
Fund Talk: The Manager's Overview - continued
Q. What were your principal strategies, and how did they affect performance?
A. I emphasized spread sectors - those parts of the fixed-income market that offer a yield advantage, or spread, over Treasury securities. During the period, I overweighted mortgages, asset-backed securities and corporate bonds, while underweighting government agency bonds and Treasury securities. Helping performance were the overweighted positions in mortgages and asset-backed securities. Hurting performance were the underweighting in government agency bonds and the overweighting in corporate bonds. While I emphasized corporate securities, which at the end of the fiscal period totaled 40.5% of net assets, I was relatively defensive within the corporate bond sector. For example, I modestly shortened the duration of our corporate bond allocation and increased our diversification so the fund was less vulnerable to problems with any individual security. I focused on sound credit analysis and also evaluated individual securities based on the market's heightened sensitivity to deteriorating credit quality. I also looked for better credit quality and emphasized defensive sectors. Consistent with our policy, I did not bet on changes in the direction of interest rates and tended to have an interest-rate sensitivity, or duration, close to that of the Lehman Brothers benchmark index.
Q. What specific areas particularly helped performance, and what areas hurt?
A. Our investments in REITs and asset-backed securities, such as pools of consumer loans, helped the fund's returns, as did our emphasis on commercial mortgage securities, which typically were between 5% and 7% of net assets. As I mentioned before, our overweighted position in corporate securities hurt. While our overall security selection of corporate bonds tended to be good, we did have some individual laggards. One noteworthy disappointment was our investment in Finova, a commercial finance company. The credit quality of the company deteriorated, in part because the company was unable to extend its line of credit with its banks. We have sold our position in Finova bonds.
Annual Report
Fund Talk: The Manager's Overview - continued
Q. What's your outlook?
A. I believe we have entered a new period of heightened volatility among the spread sectors as fixed-income investors search for a new equilibrium in setting valuations for credit risk. This volatility, however, is less dramatic among the shorter-term securities in which I invest, and I believe it still makes sense to invest in corporate bonds because of their yield advantages. At the same time, mortgages and asset-backed securities continue to appear very attractive. I have positioned the fund so it is not overly exposed to shifts in the relationships of yields of shorter-term bonds to the yields of longer-term securities.
Fund Facts
Goal: high current income, consistent with preservation of capital, by investing primarily in a broad range of investment-grade, fixed-income securities
Start date: September 16, 1987
Size: as of October 31, 2000, more than $354 million
Manager: Andrew Dudley, since 1997; joined Fidelity in 1996
3Andrew Dudley on the bond market's perception of the national elections:
"From the perspective of fixed-income investors, the most important outcome of the elections is that there likely will not be any broad, sweeping mandate for change. The results of both the presidential election and the fight for control of Congress are likely to be so close that it will be difficult for anyone to make dramatic shifts in policy. The financial markets would like that result. They don't like the prospect of broad sweeping changes that create uncertainty in the market.
"The new Congress is likely to be almost evenly split between Republicans and Democrats. That means that the defection of just one member, for any reason, can jeopardize the outcome of a vote on any issue. That is not an environment for major change, particularly if you also have a president who has been narrowly elected. The bond market was most fearful of a Republican president with a mandate for cutting taxes and clear Republican control in both houses of Congress. That would have increased the potential for large tax cuts, which could reduce or eliminate the federal surplus, causing an increase in the issuance of Treasury securities, higher interest rates and greater volatility in the bond market. To the extent there was no broad, sweeping mandate, there would be less uncertainty for the bond market to worry about."
The views expressed in this report reflect those of the portfolio manager only through the end of the period of the report as stated on the cover and do not necessarily represent the views of Fidelity or any other person in the Fidelity organization. Any such views are subject to change at any time based upon market or other conditions and Fidelity disclaims any responsibility to update such views. These views may not be relied on as investment advice and, because investment decisions for a Fidelity fund are based on numerous factors, may not be relied on as an indication of trading intent on behalf of any Fidelity fund.
Annual Report
|
Quality Diversification as of October 31, 2000 |
||
|
(Moody's Ratings) |
% of fund's investments |
% of fund's investments |
|
Aaa |
49.4 |
35.1 |
|
Aa |
4.5 |
4.4 |
|
A |
17.9 |
17.8 |
|
Baa |
24.2 |
36.5 |
|
Ba and Below |
0.5 |
0.7 |
|
Not Rated |
0.1 |
0.3 |
|
Table excludes short-term investments. Where Moody's ratings are not available, we have used S&P ® ratings. Securities rated as Ba or below were rated investment grade by other nationally recognized rating agencies or assigned an investment grade rating at the time of acquisition by Fidelity |
|
Average Years to Maturity as of October 31, 2000 |
||
|
|
|
6 months ago |
|
Years |
2.5 |
2.5 |
|
Average years to maturity is based on the average time remaining until principal payments are expected from each of the fund's bonds, weighted by dollar amount. |
|
Duration as of October 31, 2000 |
||
|
|
|
6 months ago |
|
Years |
1.8 |
1.8 |
|
Duration shows how much a bond fund's price fluctuates with changes in comparable interest rates. If rates rise 1%, for example, a fund with a five-year duration is likely to lose about 5% of its value. Other factors also can influence a bond fund's performance and share price. Accordingly, a bond fund's actual performance may differ from this example. |
|
Asset Allocation (% of fund's net assets) |
|||||||
|
As of October 31, 2000 * |
As of April 30, 2000 ** |
||||||
|
Corporate Bonds 40.5% |
|
|
Corporate Bonds 49.7% |
|
||
|
U.S. Government |
|
|
U.S. Government |
|
||
|
Asset-Backed |
|
|
Asset-Backed |
|
||
|
CMOs and Other Mortgage Related Securities 10.1% |
|
|
CMOs and Other Mortgage Related Securities 7.7% |
|
||
|
Other Investments 1.1% |
|
|
Other Investments 1.7% |
|
||
|
Short-Term |
|
|
Short-Term |
|
||
|
* Foreign |
7.2% |
|
** Foreign investments |
6.7% |
|
||
Annual Report
Showing Percentage of Net Assets
|
Nonconvertible Bonds - 40.5% |
|||||
|
Moody's Ratings (unaudited) (a) |
Principal Amount |
Value |
|||
|
BASIC INDUSTRIES - 0.5% |
|||||
|
Chemicals & Plastics - 0.3% |
|||||
|
Praxair, Inc. 6.15% 4/15/03 |
A3 |
|
$ 1,000,000 |
$ 972,950 |
|
|
Paper & Forest Products - 0.2% |
|||||
|
Abitibi-Consolidated, Inc. yankee 8.3% 8/1/05 |
Baa3 |
|
310,000 |
313,401 |
|
|
Georgia-Pacific Corp. 9.95% 6/15/02 |
Baa2 |
|
500,000 |
515,930 |
|
|
|
829,331 |
||||
|
TOTAL BASIC INDUSTRIES |
1,802,281 |
||||
|
CONSTRUCTION & REAL ESTATE - 2.7% |
|||||
|
Real Estate - 0.6% |
|||||
|
Arden Realty LP 8.875% 3/1/05 |
Baa3 |
|
545,000 |
555,148 |
|
|
Cabot Industrial Property LP 7.125% 5/1/04 |
Baa2 |
|
575,000 |
558,383 |
|
|
Duke-Weeks Realty LP 6.875% 3/15/05 |
Baa2 |
|
1,200,000 |
1,171,452 |
|
|
|
2,284,983 |
||||
|
Real Estate Investment Trusts - 2.1% |
|||||
|
Avalonbay Communities, Inc.: |
|
|
|
|
|
|
6.58% 2/15/04 |
Baa1 |
|
705,000 |
686,903 |
|
|
8.25% 7/15/08 |
Baa1 |
|
500,000 |
508,105 |
|
|
CenterPoint Properties Trust: |
|
|
|
|
|
|
6.75% 4/1/05 |
Baa2 |
|
470,000 |
446,524 |
|
|
7.125% 3/15/04 |
Baa2 |
|
1,300,000 |
1,266,525 |
|
|
Equity Office Properties Trust 6.375% 1/15/02 |
Baa1 |
|
1,650,000 |
1,626,389 |
|
|
Merry Land & Investment Co., Inc. 7.25% 6/15/05 |
A3 |
|
600,000 |
584,610 |
|
|
ProLogis Trust 6.7% 4/15/04 |
Baa1 |
|
1,245,000 |
1,207,351 |
|
|
Spieker Properties LP 6.8% 5/1/04 |
Baa2 |
|
1,015,000 |
987,057 |
|
|
|
7,313,464 |
||||
|
TOTAL CONSTRUCTION & REAL ESTATE |
9,598,447 |
||||
|
DURABLES - 1.4% |
|||||
|
Autos, Tires, & Accessories - 0.6% |
|||||
|
Daimler-Chrysler North America Holding Corp. 6.96% 8/23/02 (c) |
A1 |
|
1,500,000 |
1,506,990 |
|
|
TRW, Inc. 6.625% 6/1/04 |
Baa1 |
|
600,000 |
576,468 |
|
|
|
2,083,458 |
||||
|
Nonconvertible Bonds - continued |
|||||
|
Moody's Ratings (unaudited) (a) |
Principal Amount |
Value |
|||
|
DURABLES - continued |
|||||
|
Textiles & Apparel - 0.8% |
|||||
|
Jones Apparel Group, Inc./Jones Apparel Group Hldgs., Inc./Jones Apparel Group USA, Inc. 6.25% 10/1/01 |
Baa2 |
|
$ 2,155,000 |
$ 2,109,443 |
|
|
Jones Apparel Group, Inc. 7.5% 6/15/04 |
Baa2 |
|
800,000 |
751,392 |
|
|
|
2,860,835 |
||||
|
TOTAL DURABLES |
4,944,293 |
||||
|
ENERGY - 1.4% |
|||||
|
Energy Services - 0.1% |
|||||
|
Petroliam Nasional BHD (Petronas) yankee 7.125% 10/18/06 (b) |
Baa2 |
|
575,000 |
548,320 |
|
|
Oil & Gas - 1.3% |
|||||
|
Canada Occidental Petroleum Ltd. 7.125% 2/4/04 |
Baa2 |
|
1,400,000 |
1,382,220 |
|
|
Oryx Energy Co.: |
|
|
|
|
|
|
8% 10/15/03 |
Baa1 |
|
685,000 |
697,494 |
|
|
8.125% 10/15/05 |
Baa1 |
|
800,000 |
832,864 |
|
|
The Coastal Corp. 6.2% 5/15/04 |
Baa2 |
|
1,700,000 |
1,650,190 |
|
|
|
4,562,768 |
||||
|
TOTAL ENERGY |
5,111,088 |
||||
|
FINANCE - 17.1% |
|||||
|
Banks - 5.8% |
|||||
|
Bank One Corp. 7.625% 8/1/05 |
Aa3 |
|
2,500,000 |
2,528,700 |
|
|
Capital One Bank: |
|
|
|
|
|
|
6.48% 6/28/02 |
Baa2 |
|
1,500,000 |
1,463,010 |
|
|
6.65% 3/15/04 |
Baa3 |
|
2,500,000 |
2,396,600 |
|
|
Chase Manhattan Corp. 5.75% 4/15/04 |
Aa3 |
|
600,000 |
575,976 |
|
|
Citicorp 8% 2/1/03 |
A1 |
|
2,000,000 |
2,047,260 |
|
|
Den Danske Bank Group AS yankee 6.55% 9/15/03 (b) |
A1 |
|
1,500,000 |
1,475,010 |
|
|
First Security Corp. 5.875% 11/1/03 |
Aa2 |
|
450,000 |
433,620 |
|
|
FleetBoston Financial Corp. 7.25% 9/15/05 |
A2 |
|
1,000,000 |
1,002,160 |
|
|
Korea Development Bank: |
|
|
|
|
|
|
7.125% 4/22/04 |
Baa2 |
|
700,000 |
680,778 |
|
|
7.375% 9/17/04 |
Baa2 |
|
810,000 |
790,997 |
|
|
Popular, Inc. 6.2% 4/30/01 |
A3 |
|
2,885,000 |
2,869,190 |
|
|
Nonconvertible Bonds - continued |
|||||
|
Moody's Ratings (unaudited) (a) |
Principal Amount |
Value |
|||
|
FINANCE - continued |
|||||
|
Banks - continued |
|||||
|
Providian National Bank: |
|
|
|
|
|
|
6.25% 5/7/01 |
Baa3 |
|
$ 1,010,000 |
$ 1,003,021 |
|
|
6.75% 3/15/02 |
Baa3 |
|
390,000 |
384,860 |
|
|
Summit Bancorp 8.625% 12/10/02 |
A3 |
|
1,000,000 |
1,025,490 |
|
|
Wells Fargo & Co.: |
|
|
|
|
|
|
6.5% 9/3/02 |
Aa2 |
|
1,500,000 |
1,493,535 |
|
|
7.2% 5/1/03 |
Aa2 |
|
550,000 |
553,779 |
|
|
|
20,723,986 |
||||
|
Credit & Other Finance - 7.5% |
|||||
|
Abbey National PLC 6.69% 10/17/05 |
Aa3 |
|
200,000 |
195,770 |
|
|
CIT Group Holdings, Inc. 6.5% 6/14/02 |
A1 |
|
470,000 |
462,701 |
|
|
Edison Mission Energy Funding Corp. 6.77% 9/15/03 (b) |
Baa1 |
|
1,410,694 |
1,370,348 |
|
|
ERP Operating LP: |
|
|
|
|
|
|
6.55% 11/15/01 |
A3 |
|
360,000 |
357,192 |
|
|
7.1% 6/23/04 |
A3 |
|
450,000 |
444,677 |
|
|
Ford Motor Credit Co.: |
|
|
|
|
|
|
7.0581% 7/16/02 (c) |
A2 |
|
3,200,000 |
3,200,480 |
|
|
7.6% 8/1/05 |
A2 |
|
1,300,000 |
1,306,890 |
|
|
General Electric Capital Corp. 6.65% 9/3/02 |
Aaa |
|
1,300,000 |
1,298,427 |
|
|
General Motors Acceptance Corp.: |
|
|
|
|
|
|
7.625% 6/15/04 |
A2 |
|
900,000 |
914,454 |
|
|
9% 10/15/02 |
A2 |
|
3,500,000 |
3,629,640 |
|
|
Heller Financial, Inc. 6.5% 7/22/02 |
A3 |
|
1,900,000 |
1,872,849 |
|
|
PNC Funding Corp. 6.95% 9/1/02 |
A2 |
|
1,800,000 |
1,800,792 |
|
|
Popular North America, Inc. 7.375% 9/15/01 |
A3 |
|
2,380,000 |
2,375,478 |
|
|
Qwest Capital Funding, Inc. 7.75% 8/15/06 (b) |
Baa1 |
|
1,700,000 |
1,723,630 |
|
|
Sears Roebuck Acceptance Corp. 6% 3/20/03 |
A3 |
|
550,000 |
536,107 |
|
|
Sprint Capital Corp. 5.7% 11/15/03 |
Baa1 |
|
1,880,000 |
1,798,953 |
|
|
The Money Store, Inc. 7.3% 12/1/02 |
A2 |
|
800,000 |
805,872 |
|
|
Trizec Finance Ltd. yankee 10.875% 10/15/05 |
Baa3 |
|
575,000 |
580,750 |
|
|
TXU Eastern Funding 6.15% 5/15/02 |
Baa1 |
|
1,800,000 |
1,761,660 |
|
|
|
26,436,670 |
||||
|
Insurance - 0.9% |
|||||
|
New York Life Insurance Co. 6.4% 12/15/03 (b) |
Aa3 |
|
1,200,000 |
1,176,960 |
|
|
The St. Paul Companies, Inc. 7.875% 4/15/05 |
A1 |
|
1,796,000 |
1,840,720 |
|
|
|
3,017,680 |
||||
|
Nonconvertible Bonds - continued |
|||||
|
Moody's Ratings (unaudited) (a) |
Principal Amount |
Value |
|||
|
FINANCE - continued |
|||||
|
Savings & Loans - 0.6% |
|||||
|
Long Island Savings Bank FSB 7% 6/13/02 |
Baa3 |
|
$ 1,250,000 |
$ 1,241,450 |
|
|
Sovereign Bancorp, Inc. 6.625% 3/15/01 |
Ba3 |
|
1,000,000 |
992,160 |
|
|
|
2,233,610 |
||||
|
Securities Industry - 2.3% |
|||||
|
Amvescap PLC yankee: |
|
|
|
|
|
|
6.375% 5/15/03 |
A2 |
|
2,450,000 |
2,373,805 |
|
|
6.6% 5/15/05 |
A2 |
|
600,000 |
573,468 |
|
|
Donaldson Lufkin & Jenrette, Inc. 6.25% 8/1/01 |
A3 |
|
2,600,000 |
2,586,662 |
|
|
Goldman Sachs Group LP 6.6% 7/15/02 (b) |
A1 |
|
500,000 |
492,910 |
|
|
Lehman Brothers Holdings 7% 5/15/03 |
A3 |
|
1,200,000 |
1,194,732 |
|
|
Morgan Stanley Dean Witter & Co. 7.75% 6/15/05 |
Aa3 |
|
1,000,000 |
1,023,110 |
|
|
|
8,244,687 |
||||
|
TOTAL FINANCE |
60,656,633 |
||||
|
INDUSTRIAL MACHINERY & EQUIPMENT - 0.9% |
|||||
|
Tyco International Group SA 6.875% 9/5/02 |
Baa1 |
|
3,040,000 |
3,017,048 |
|
|
MEDIA & LEISURE - 2.3% |
|||||
|
Broadcasting - 1.1% |
|||||
|
British Sky Broadcasting Group PLC 7.3% 10/15/06 |
Ba1 |
|
1,000,000 |
907,310 |
|
|
Clear Channel Communications, Inc. 7.875% 6/15/05 |
Baa3 |
|
2,300,000 |
2,318,032 |
|
|
TCI Communications, Inc. 8.65% 9/15/04 |
A2 |
|
600,000 |
621,894 |
|
|
|
3,847,236 |
||||
|
Publishing - 1.2% |
|||||
|
News America Holdings, Inc.: |
|
|
|
|
|
|
8.5% 2/15/05 |
Baa3 |
|
800,000 |
826,184 |
|
|
8.625% 2/1/03 |
Baa3 |
|
1,450,000 |
1,481,393 |
|
|
Time Warner Entertainment Co. LP 9.625% 5/1/02 |
Baa2 |
|
1,985,000 |
2,058,207 |
|
|
|
4,365,784 |
||||
|
TOTAL MEDIA & LEISURE |
8,213,020 |
||||
|
Nonconvertible Bonds - continued |
|||||
|
Moody's Ratings (unaudited) (a) |
Principal Amount |
Value |
|||
|
NONDURABLES - 2.3% |
|||||
|
Beverages - 0.9% |
|||||
|
Seagram JE & Sons, Inc.: |
|
|
|
|
|
|
5.79% 4/15/01 |
Baa3 |
|
$ 1,005,000 |
$ 996,508 |
|
|
6.4% 12/15/03 |
Baa3 |
|
2,200,000 |
2,199,824 |
|
|
|
3,196,332 |
||||
|
Foods - 0.1% |
|||||
|
ConAgra Foods, Inc. 7.5% 9/15/05 |
Baa1 |
|
400,000 |
403,824 |
|
|
Tobacco - 1.3% |
|||||
|
Philip Morris Companies, Inc.: |
|
|
|
|
|
|
7.25% 9/15/01 |
A2 |
|
1,125,000 |
1,116,911 |
|
|
7.625% 5/15/02 |
A2 |
|
1,750,000 |
1,742,353 |
|
|
8.75% 6/1/01 |
A2 |
|
1,000,000 |
1,003,190 |
|
|
RJ Reynolds Tobacco Holdings, Inc. 7.375% 5/15/03 |
Baa2 |
|
800,000 |
757,064 |
|
|
|
4,619,518 |
||||
|
TOTAL NONDURABLES |
8,219,674 |
||||
|
RETAIL & WHOLESALE - 1.0% |
|||||
|
General Merchandise Stores - 0.5% |
|||||
|
Federated Department Stores, Inc. 8.125% 10/15/02 |
Baa1 |
|
1,860,000 |
1,852,858 |
|
|
Grocery Stores - 0.5% |
|||||
|
Safeway, Inc. 7% 9/15/02 |
Baa2 |
|
1,700,000 |
1,696,090 |
|
|
TOTAL RETAIL & WHOLESALE |
3,548,948 |
||||
|
TECHNOLOGY - 0.8% |
|||||
|
Computers & Office Equipment - 0.8% |
|||||
|
Comdisco, Inc.: |
|
|
|
|
|
|
6.65% 11/13/01 |
Baa2 |
|
2,010,000 |
1,587,900 |
|
|
7.25% 9/1/02 |
Baa2 |
|
1,500,000 |
1,095,000 |
|
|
|
2,682,900 |
||||
|
TRANSPORTATION - 2.6% |
|||||
|
Air Transportation - 1.4% |
|||||
|
Continental Airlines, Inc. pass thru trust certificates: |
|
|
|
|
|
|
6.954% 2/2/11 |
Baa1 |
|
2,074,770 |
2,013,149 |
|
|
7.08% 11/1/04 |
Baa1 |
|
1,110,635 |
1,082,058 |
|
|
Nonconvertible Bonds - continued |
|||||
|
Moody's Ratings (unaudited) (a) |
Principal Amount |
Value |
|||
|
TRANSPORTATION - continued |
|||||
|
Air Transportation - continued |
|||||
|
Delta Air Lines 6.65% 3/15/04 |
Baa3 |
|
$ 660,000 |
$ 627,898 |
|
|
Qantas Airways Ltd. 7.5% 6/30/03 (b) |
Baa1 |
|
1,000,000 |
997,500 |
|
|
|
4,720,605 |
||||
|
Railroads - 0.7% |
|||||
|
CSX Corp. 7.05% 5/1/02 |
Baa2 |
|
1,600,000 |
1,591,376 |
|
|
Norfolk Southern Corp. 6.95% 5/1/02 |
Baa1 |
|
900,000 |
897,021 |
|
|
|
2,488,397 |
||||
|
Trucking & Freight - 0.5% |
|||||
|
Federal Express Corp. 7.53% 9/23/06 |
A3 |
|
1,873,058 |
1,866,072 |
|
|
TOTAL TRANSPORTATION |
9,075,074 |
||||
|
UTILITIES - 7.5% |
|||||
|
Cellular - 0.6% |
|||||
|
AirTouch Communications, Inc. 6.35% 6/1/05 |
A2 |
|
800,000 |
771,800 |
|
|
Vodafone AirTouch PLC 7.625% 2/15/05 (b) |
A2 |
|
1,300,000 |
1,318,850 |
|
|
|
2,090,650 |
||||
|
Electric Utility - 2.5% |
|||||
|
Avon Energy Partners Holdings 6.73% 12/11/02 (b) |
Baa2 |
|
2,300,000 |
2,246,778 |
|
|
Illinois Power Co. 6% 9/15/03 |
Baa1 |
|
850,000 |
825,240 |
|
|
Niagara Mohawk Power Corp. 7.375% 8/1/03 |
Baa2 |
|
780,000 |
787,082 |
|
|
Philadelphia Electric Co.: |
|
|
|
|
|
|
5.625% 11/1/01 |
Baa1 |
|
1,560,000 |
1,532,606 |
|
|
6.5% 5/1/03 |
Baa1 |
|
720,000 |
707,832 |
|
|
6.625% 3/1/03 |
Baa1 |
|
400,000 |
394,716 |
|
|
Texas Utilities Electric Co.: |
|
|
|
|
|
|
7.375% 8/1/01 |
A3 |
|
721,000 |
721,577 |
|
|
8% 6/1/02 |
A3 |
|
1,750,000 |
1,776,005 |
|
|
|
8,991,836 |
||||
|
Gas - 2.0% |
|||||
|
Consolidated Natural Gas Co. 7.375% 4/1/05 |
A2 |
|
1,100,000 |
1,104,554 |
|
|
Enron Corp.: |
|
|
|
|
|
|
6.45% 11/15/01 |
Baa1 |
|
1,050,000 |
1,043,490 |
|
|
6.5% 8/1/02 |
Baa1 |
|
1,350,000 |
1,334,745 |
|
|
9.875% 6/15/03 |
Baa1 |
|
1,160,000 |
1,238,114 |
|
|
Enserch Corp. 6.25% 1/1/03 |
Baa2 |
|
650,000 |
637,267 |
|
|
Nonconvertible Bonds - continued |
|||||
|
Moody's Ratings (unaudited) (a) |
Principal Amount |
Value |
|||
|
UTILITIES - continued |
|||||
|
Gas - continued |
|||||
|
Reliant Energy Resources Corp. 8.125% 7/15/05 (b) |
Baa1 |
|
$ 1,100,000 |
$ 1,113,211 |
|
|
Sonat, Inc. 6.875% 6/1/05 |
Baa2 |
|
520,000 |
512,002 |
|
|
|
6,983,383 |
||||
|
Telephone Services - 2.4% |
|||||
|
Telecomunicaciones de Puerto Rico, Inc. 6.15% 5/15/02 |
Baa2 |
|
2,430,000 |
2,385,871 |
|
|
Telefonica Europe BV 7.35% 9/15/05 |
A2 |
|
1,400,000 |
1,406,020 |
|
|
Teleglobe Canada, Inc. 7.2% 7/20/09 |
Baa1 |
|
1,550,000 |
1,485,644 |
|
|
US West Communications 7.2% 11/1/04 |
A2 |
|
1,500,000 |
1,491,270 |
|
|
WorldCom, Inc.: |
|
|
|
|
|
|
8% 5/16/06 |
A3 |
|
1,000,000 |
1,028,940 |
|
|
8.875% 1/15/06 |
A3 |
|
811,000 |
836,871 |
|
|
|
8,634,616 |
||||
|
TOTAL UTILITIES |
26,700,485 |
||||
|
TOTAL NONCONVERTIBLE BONDS (Cost $145,751,163) |
143,569,891 |
||||
|
U.S. Government and Government Agency Obligations - 24.1% |
|||||
|
|
|||||
|
U.S. Government Agency Obligations - 15.2% |
|||||
|
Fannie Mae 6.375% 10/15/02 |
Aaa |
|
20,000,000 |
19,990,594 |
|
|
Federal Home Loan Bank: |
|
|
|
|
|
|
6.75% 5/1/02 |
Aaa |
|
5,800,000 |
5,823,548 |
|
|
6.75% 8/15/02 |
Aaa |
|
7,000,000 |
7,033,880 |
|
|
Freddie Mac 7.375% 5/15/03 |
Aaa |
|
18,100,000 |
18,487,521 |
|
|
Government Trust Certificates (assets of Trust guaranteed by U.S. Government through Defense Security Assistance Agency) Class 3-T, 9.625% 5/15/02 |
Aaa |
|
120,002 |
121,159 |
|
|
Guaranteed Export Trust Certificates (assets of Trust guaranteed by U.S. Government through Export-Import Bank) Series 1995-A, 6.28% 6/15/04 |
Aaa |
|
1,411,765 |
1,399,713 |
|
|
U.S. Government and Government Agency Obligations - continued |
|||||
|
Moody's Ratings (unaudited) (a) |
Principal Amount |
Value |
|||
|
U.S. Government Agency Obligations - continued |
|||||
|
Israel Export Trust Certificates (assets of Trust
guaranteed by U.S. Government through |
Aaa |
|
$ 352,941 |
$ 352,327 |
|
|
Private Export Funding Corp. secured |
Aaa |
|
667,800 |
668,947 |
|
|
TOTAL U.S. GOVERNMENT AGENCY OBLIGATIONS |
53,877,689 |
||||
|
U.S. Treasury Obligations - 8.9% |
|||||
|
U.S. Treasury Notes: |
|
|
|
|
|
|
5.25% 5/31/01 |
Aaa |
|
14,250,000 |
14,153,399 |
|
|
5.75% 6/30/01 |
Aaa |
|
7,000,000 |
6,969,501 |
|
|
7.875% 8/15/01 |
Aaa |
|
10,300,000 |
10,415,875 |
|
|
TOTAL U.S. TREASURY OBLIGATIONS |
31,538,775 |
||||
|
TOTAL U.S. GOVERNMENT AND (Cost $85,516,602) |
85,416,464 |
||||
|
U.S. Government Agency - Mortgage Securities - 6.4% |
|||||
|
|
|||||
|
Fannie Mae - 1.0% |
|||||
|
6.5% 10/1/11 |
Aaa |
|
174,062 |
170,979 |
|
|
8% 7/1/30 |
Aaa |
|
2,974,532 |
3,010,761 |
|
|
11.5% 11/1/15 |
Aaa |
|
299,343 |
329,442 |
|
|
TOTAL FANNIE MAE |
3,511,182 |
||||
|
Freddie Mac - 1.4% |
|||||
|
7.5% 9/1/30 |
Aaa |
|
2,429,758 |
2,428,227 |
|
|
8.5% 5/1/26 to 7/1/28 |
Aaa |
|
2,440,796 |
2,502,787 |
|
|
12% 11/1/19 |
Aaa |
|
74,423 |
82,033 |
|
|
TOTAL FREDDIE MAC |
5,013,047 |
||||
|
U.S. Government Agency - Mortgage Securities - continued |
|||||
|
Moody's Ratings (unaudited) (a) |
Principal Amount |
Value |
|||
|
Government National Mortgage Association - 4.0% |
|||||
|
8% 9/15/29 to 10/15/29 |
Aaa |
|
$ 4,532,421 |
$ 4,607,478 |
|
|
8.5% 7/15/30 |
Aaa |
|
9,317,956 |
9,556,891 |
|
|
TOTAL GOVERNMENT NATIONAL MORTGAGE ASSOCIATION |
14,164,369 |
||||
|
TOTAL U.S. GOVERNMENT AGENCY - MORTGAGE SECURITIES (Cost $22,622,582) |
22,688,598 |
||||
|
Asset-Backed Securities - 16.6% |
|||||
|
|
|||||
|
Americredit Automobile Receivables Trust: |
|
|
|
|
|
|
7.02% 12/15/05 |
Aaa |
|
2,000,000 |
2,010,938 |
|
|
7.15% 8/15/04 |
Aaa |
|
1,300,000 |
1,305,688 |
|
|
ANRC Auto Owner Trust 7.06% 5/17/04 |
Aaa |
|
1,600,000 |
1,609,500 |
|
|
Arcadia Automobile Receivables Trust: |
|
|
|
|
|
|
5.67% 1/15/04 |
Aaa |
|
1,077,682 |
1,064,506 |
|
|
7.2% 6/15/07 |
Aaa |
|
1,232,570 |
1,241,622 |
|
|
ARG Funding Corp. 5.88% 5/20/03 (b) |
Aaa |
|
2,650,000 |
2,621,016 |
|
|
Associates Auto Receivables Trust 6.9% 8/15/05 |
Aaa |
|
2,000,000 |
2,005,000 |
|
|
Capita Equipment Receivables Trust 6.45% 8/15/02 |
Aa3 |
|
2,200,000 |
2,186,250 |
|
|
Capital One Master Trust 7.1% 4/17/06 |
Aaa |
|
2,000,000 |
2,020,000 |
|
|
Caterpillar Financial Asset Trust 6.2% 4/25/04 |
Aaa |
|
1,530,000 |
1,522,350 |
|
|
Chase Manhattan Marine Owner Trust 6.25% 4/16/07 |
Aaa |
|
377,733 |
377,261 |
|
|
Chevy Chase Auto Receivables Trust: |
|
|
|
|
|
|
5.97% 10/20/04 |
Aaa |
|
602,056 |
596,035 |
|
|
6.2% 3/20/04 |
Aaa |
|
223,766 |
222,087 |
|
|
Contimortgage Home Equity Loan Trust 6.3% 7/15/12 |
Aaa |
|
715,620 |
710,696 |
|
|
CS First Boston Mortgage Securities Corp. 7% 3/15/27 |
Aaa |
|
359,394 |
359,001 |
|
|
Daimlerchrysler Auto Trust: |
|
|
|
|
|
|
6.7% 6/8/03 |
Aaa |
|
3,300,000 |
3,299,974 |
|
|
6.85% 11/6/05 |
Aaa |
|
2,500,000 |
2,515,625 |
|
|
Discover Card Master Trust I 6.98% 7/18/05 (c) |
A2 |
|
5,250,000 |
5,255,742 |
|
|
Fidelity Funding Auto Trust 6.99% 11/15/02 (b) |
Aaa |
|
75,475 |
75,464 |
|
|
First Security Auto Owner Trust 6.2% 10/2/06 |
A3 |
|
928,020 |
913,665 |
|
|
Ford Credit Auto Owner Trust: |
|
|
|
|
|
|
6.15% 9/15/02 |
Aaa |
|
1,800,000 |
1,788,609 |
|
|
7.03% 11/15/03 |
Aaa |
|
933,000 |
940,435 |
|
|
7.5% 10/15/04 |
A1 |
|
1,700,000 |
1,721,777 |
|
|
Asset-Backed Securities - continued |
|||||
|
Moody's Ratings (unaudited) (a) |
Principal Amount |
Value |
|||
|
Honda Auto Receivables Owner Trust 6.62% 7/15/04 |
Aaa |
|
$ 1,400,000 |
$ 1,398,961 |
|
|
Key Auto Finance Trust: |
|
|
|
|
|
|
5.83% 1/15/07 |
Aaa |
|
2,200,000 |
2,167,000 |
|
|
6.65% 10/15/03 |
Baa3 |
|
74,023 |
73,757 |
|
|
Olympic Automobile Receivables Trust 6.125% 11/15/04 |
Aaa |
|
214,839 |
212,623 |
|
|
Onyx Acceptance Grantor Trust 5.95% 7/15/04 |
Aaa |
|
714,800 |
708,989 |
|
|
Onyx Acceptance Owner Trust 7.26% 5/15/07 |
Aaa |
|
2,000,000 |
2,023,500 |
|
|
Orix Credit Alliance Receivables Trust 7.12% 5/15/04 |
Aaa |
|
1,200,000 |
1,201,875 |
|
|
Petroleum Enhanced Trust Receivables Offering Petroleum Trust 7.12% 2/5/03 (b)(c) |
Baa2 |
|
815,698 |
813,149 |
|
|
Premier Auto Trust 5.7% 10/6/02 |
Aaa |
|
3,829,745 |
3,806,996 |
|
|
Prime Credit Card Master Trust 6.75% 11/15/05 |
Aaa |
|
1,000,000 |
1,000,310 |
|
|
Reliance Auto Receivables Corp., Inc. 6.1% 7/15/02 (b) |
Aaa |
|
17,991 |
17,980 |
|
|
Sears Credit Account Master Trust II: |
|
|
|
|
|
|
6.2% 7/16/07 |
Aaa |
|
2,700,000 |
2,674,674 |
|
|
7% 7/15/08 |
Aaa |
|
650,000 |
654,264 |
|
|
7.5% 11/15/07 |
A2 |
|
1,700,000 |
1,727,625 |
|
|
Toyota Auto Owners Trust 7.21% 4/15/07 |
Aaa |
|
1,400,000 |
1,417,500 |
|
|
Toyota Auto Receivables Owner Trust 6.76% 8/15/04 |
Aaa |
|
1,200,000 |
1,201,688 |
|
|
Tranex Auto Receivables Owner Trust 6.334% 8/15/03 (b) |
Aaa |
|
315,398 |
314,166 |
|
|
Triad Auto Receivables Owner Trust 5.98% 9/17/05 |
Aaa |
|
950,687 |
939,100 |
|
|
TOTAL ASSET-BACKED SECURITIES (Cost $58,682,134) |
58,717,398 |
||||
|
Collateralized Mortgage Obligations - 4.6% |
|||||
|
|
|||||
|
Private Sponsor - 0.3% |
|||||
|
GE Capital Mortgage Services, Inc. planned amortization class Series 1994-2 Class A4, 6% 1/25/09 |
Aaa |
|
192,514 |
190,889 |
|
|
Residential Funding Mortgage Securities I, Inc. planned amortization class Series 1994-S12 Class A2, 6.5% 4/25/09 |
Aaa |
|
680,667 |
675,344 |
|
|
TOTAL PRIVATE SPONSOR |
866,233 |
||||
|
Collateralized Mortgage Obligations - continued |
|||||
|
Moody's Ratings (unaudited) (a) |
Principal Amount |
Value |
|||
|
U.S. Government Agency - 4.3% |
|||||
|
Fannie Mae sequential pay Series 1998-2 Class DA, 6.5% 4/18/25 |
Aaa |
|
$ 1,974,933 |
$ 1,947,778 |
|
|
Freddie Mac: |
|
|
|
|
|
|
REMIC planned amortization class: |
|
|
|
|
|
|
Series 2134 Class PC, 5.725% 4/15/11 |
Aaa |
|
2,456,116 |
2,402,377 |
|
|
Series 2143 Class CH, 6% 2/15/19 |
Aaa |
|
1,627,952 |
1,607,603 |
|
|
sequential pay: |
|
|
|
|
|
|
Series 2134 Class H, 6.5% 12/15/24 |
Aaa |
|
1,946,879 |
1,910,375 |
|
|
Series 1815 Class B, 7% 1/15/21 |
Aaa |
|
1,398,194 |
1,395,999 |
|
|
Series 2061 Class J, 6.5% 9/20/22 |
Aaa |
|
2,184,090 |
2,149,275 |
|
|
Series 2070 Class A, 6% 8/15/24 |
Aaa |
|
2,497,737 |
2,397,029 |
|
|
Government National Mortgage Association sequential pay Series 1998-19 Class B, 6.5% 2/20/23 |
Aaa |
|
1,573,596 |
1,545,067 |
|
|
TOTAL U.S. GOVERNMENT AGENCY |
15,355,503 |
||||
|
TOTAL COLLATERALIZED MORTGAGE OBLIGATIONS (Cost $16,205,323) |
16,221,736 |
||||
|
Commercial Mortgage Securities - 5.5% |
|||||
|
|
|||||
|
Allied Capital Commercial Mortgage Trust sequential pay Series 1998-1 Class A, 6.31% 1/25/28 (b) |
Aaa |
|
422,718 |
418,424 |
|
|
Bankers Trust II Series 1999-S1A Class D, 8.81% 2/28/14 (b)(c) |
Baa2 |
|
2,200,000 |
2,204,813 |
|
|
CBM Funding Corp. sequential pay Series 1996-1B Class A2, 6.88% 7/1/02 |
AA |
|
792,580 |
789,825 |
|
|
CS First Boston Mortgage Securities Corp.: |
|
|
|
|
|
|
sequential pay Series 1997-SPICE Class A, 6.653% 8/20/36 (b) |
- |
|
461,710 |
459,834 |
|
|
sequential pay Series 2000-C1 Class A1, 7.325% 4/15/62 |
AAA |
|
1,186,183 |
1,201,971 |
|
|
Series 1998-FL1: |
|
|
|
|
|
|
Class D, 7.1188% 12/10/00 (b)(c) |
Aa1 |
|
1,000,000 |
999,922 |
|
|
Class E, 7.4688% 1/10/13 (b)(c) |
Baa1 |
|
2,700,000 |
2,747,882 |
|
|
Equitable Life Assurance Society of the United States floater Series 174 Class D2, 6.7063% 5/15/03 (b)(c) |
Baa2 |
|
1,183,784 |
1,154,929 |
|
|
Federal Deposit Insurance Corp. REMIC Trust sequential pay Series 1996-C1 Class 1A, 6.75% 7/25/26 |
Aaa |
|
657,544 |
650,917 |
|
|
Commercial Mortgage Securities - continued |
|||||
|
Moody's Ratings (unaudited) (a) |
Principal Amount |
Value |
|||
|
FMAC Loan Receivables Trust sequential pay Series 1998-C Class A1, 5.99% 9/15/20 (b) |
Aaa |
|
$ 551,319 |
$ 534,780 |
|
|
Franchise Loan Trust sequential pay Series 1998-I Class A1, 6.24% 7/15/20 (b) |
Aaa |
|
1,008,998 |
988,766 |
|
|
Hilton Hotel Pool Trust Series 2000 HLT Class A1, 7.055% 10/3/10 |
Aaa |
|
1,000,000 |
1,002,471 |
|
|
Host Marriot Pool Trust sequential pay Series 1999-HMTA Class A, 6.98% 8/1/15 |
Aaa |
|
917,917 |
916,052 |
|
|
Morgan Stanly Dean Witter Capital Trust sequential pay Series 2000-PRIN Class A1, 7.07% 4/23/06 |
Aaa |
|
1,484,769 |
1,490,337 |
|
|
Nomura Depositor Trust floater Series 1998-ST1A Class A4, 7.5213% 2/15/34 (b)(c) |
Baa2 |
|
2,290,000 |
2,248,136 |
|
|
Structured Asset Securities Corp. floater Series 1998-C2A Class C, 7.05% 1/25/13 (b)(c) |
Aa3 |
|
1,842,516 |
1,842,517 |
|
|
TOTAL COMMERCIAL MORTGAGE SECURITIES (Cost $19,706,283) |
19,651,576 |
||||
|
Foreign Government and Government Agency Obligations (d) - 0.7% |
|||||
|
|
|||||
|
Ontario Province yankee 7.75% 6/4/02 |
Aa3 |
|
1,200,000 |
1,217,412 |
|
|
United Mexican States 8.5% 2/1/06 |
Baa3 |
|
1,250,000 |
1,246,250 |
|
|
TOTAL FOREIGN GOVERNMENT AND (Cost $2,456,523) |
2,463,662 |
||||
|
Supranational Obligations - 0.4% |
|||||
|
|
|||||
|
African Development Bank 7.75% 12/15/01 |
Aa1 |
|
1,240,000 |
1,250,776 |
|
|
Commercial Paper - 0.5% |
||||
|
|
||||
|
British Telecom PLC 6.8525% 10/9/01 (b)(c) |
|
1,800,000 |
1,796,679 |
|
|
Cash Equivalents - 2.9% |
|||
|
Maturity Amount |
Value |
||
|
Investments in repurchase agreements (U.S. Government Obligations), in a joint trading account at 6.62%, dated 10/31/00 due
11/1/00 |
$ 10,398,912 |
$ 10,397,000 |
|
|
TOTAL INVESTMENT PORTFOLIO - 102.2% (Cost $364,443,779) |
362,173,780 |
||
|
NET OTHER ASSETS - (2.2)% |
(7,690,903) |
||
|
NET ASSETS - 100% |
$ 354,482,877 |
||
|
Legend |
|
(a) S&P credit ratings are used in the absence of a rating by Moody's Investors Service, Inc. |
|
(b) Security exempt from registration under Rule 144A of the Securities Act of 1933. These securities may be resold in transactions exempt from registration, normally to qualified institutional buyers. At the period end, the value of these securities amounted to $31,701,974 or 8.9% of net assets. |
|
(c) The coupon rate shown on floating or adjustable rate securities represents the rate at period end. |
|
(d) For foreign government obligations not individually rated by S&P or Moody's, the ratings listed have been assigned by FMR, the fund's investment adviser, based principally on S&P and Moody's ratings of the sovereign credit of the issuing government. |
|
Other Information |
|
The composition of long-term debt holdings as a percentage of total value of investments in securities, is as follows (ratings are unaudited): |
|
Moody's Ratings |
S&P Ratings |
|||
|
Aaa, Aa, A |
71.2% |
|
AAA, AA, A |
54.0% |
|
Baa |
24.2% |
|
BBB |
23.7% |
|
Ba |
0.5% |
|
BB |
1.0% |
|
B |
0.0% |
|
B |
0.0% |
|
Caa |
0.0% |
|
CCC |
0.0% |
|
Ca, C |
0.0% |
|
CC, C |
0.0% |
|
|
|
|
D |
0.0% |
|
The percentage not rated by Moody's or S&P amounted to 0.1%. |
|
Income Tax Information |
|
At October 31, 2000, the aggregate cost of investment securities for income tax purposes was $364,475,247. Net unrealized depreciation aggregated $2,301,467, of which $1,132,874 related to appreciated investment securities and $3,434,341 related to depreciated investment securities. |
|
At October 31, 2000, the fund had a capital loss carryforward of approximately $49,102,000 of which $336,000, $17,692,000, $19,457,000, $2,265,000, $3,149,000, $2,459,000 and $3,744,000 will expire on October 31, 2001, 2002, 2003, 2004, 2005, 2007 and 2008, respectively. |
|
A total of 10.27% of the dividends distributed during the fiscal year was derived from interest on U.S. Government securities which is generally exempt from state income tax. The fund will notify shareholders in January 2001 of amounts for use in preparing 2000 income tax returns (unaudited). |
See accompanying notes which are an integral part of the financial statements.
Annual Report
Statement of Assets and Liabilities
|
|
October 31, 2000 |
|
|
Assets |
|
|
|
Investment in securities, at value (including repurchase agreements of $10,397,000) (cost $364,443,779) - See accompanying schedule |
|
$ 362,173,780 |
|
Cash |
|
190 |
|
Receivable for investments sold |
|
9,007,549 |
|
Receivable for fund shares sold |
|
402,422 |
|
Interest receivable |
|
4,645,446 |
|
Total assets |
|
376,229,387 |
|
Liabilities |
|
|
|
Payable for investments purchased |
$ 14,705,335 |
|
|
Payable for fund shares redeemed |
6,571,031 |
|
|
Distributions payable |
207,733 |
|
|
Accrued management fee |
117,221 |
|
|
Distribution fees payable |
60,161 |
|
|
Other payables and accrued expenses |
85,029 |
|
|
Total liabilities |
|
21,746,510 |
|
Net Assets |
|
$ 354,482,877 |
|
Net Assets consist of: |
|
|
|
Paid in capital |
|
$ 405,748,528 |
|
Undistributed net investment income |
|
137,384 |
|
Accumulated undistributed net realized gain (loss) on investments and foreign currency transactions |
|
(49,133,036) |
|
Net unrealized appreciation (depreciation) on investments |
|
(2,269,999) |
|
Net Assets |
|
$ 354,482,877 |
See accompanying notes which are an integral part of the financial statements.
Annual Report
Financial Statements - continued
Statement of Assets and Liabilities - continued
|
|
October 31, 2000 |
|
|
Calculation of Maximum Offering Price |
|
$9.12 |
|
Maximum offering price per share (100/98.50 of $9.12) |
|
$9.26 |
|
Class T: |
|
$9.13 |
|
Maximum offering price per share (100/98.50 of $9.13) |
|
$9.27 |
|
Class C: |
|
$9.13 |
|
Institutional Class: |
|
$9.13 |
A Redemption price per share is equal to net asset value less any applicable contingent deferred sales charge.
See accompanying notes which are an integral part of the financial statements.
Annual Report
Financial Statements - continued
Statement of Operations
|
|
Year ended October 31, 2000 |
|
|
Investment Income Interest |
|
$ 21,170,780 |
|
Security lending |
|
9,988 |
|
Total Income |
|
21,180,768 |
|
Expenses |
|
|
|
Management fee |
$ 1,311,010 |
|
|
Transfer agent fees |
578,609 |
|
|
Distribution fees |
617,164 |
|
|
Accounting and security lending fees |
91,600 |
|
|
Non-interested trustees' compensation |
1,073 |
|
|
Custodian fees and expenses |
19,221 |
|
|
Registration fees |
69,709 |
|
|
Audit |
33,273 |
|
|
Legal |
3,737 |
|
|
Miscellaneous |
2,857 |
|
|
Total expenses before reductions |
2,728,253 |
|
|
Expense reductions |
(8,145) |
2,720,108 |
|
Net investment income |
|
18,460,660 |
|
Realized and Unrealized Gain (Loss) Net realized gain (loss) on investment securities |
|
(3,704,706) |
|
Change in net unrealized appreciation (depreciation) |
|
2,610,601 |
|
Net gain (loss) |
|
(1,094,105) |
|
Net increase (decrease) in net assets resulting |
|
$ 17,366,555 |
See accompanying notes which are an integral part of the financial statements.
Annual Report
Financial Statements - continued
Statement of Changes in Net Assets
|
|
Year ended
October 31, |
Year ended
October 31, |
|
Increase (Decrease) in Net Assets |
|
|
|
Operations |
$ 18,460,660 |
$ 19,052,975 |
|
Net realized gain (loss) |
(3,704,706) |
(2,605,978) |
|
Change in net unrealized appreciation (depreciation) |
2,610,601 |
(6,062,922) |
|
Net increase (decrease) in net assets resulting |
17,366,555 |
10,384,075 |
|
Distributions to shareholders from net investment income |
(18,468,559) |
(18,762,496) |
|
Share transactions - net increase (decrease) |
(9,153,093) |
15,720,432 |
|
Total increase (decrease) in net assets |
(10,255,097) |
7,342,011 |
|
Net Assets |
|
|
|
Beginning of period |
364,737,974 |
357,395,963 |
|
End of period (including undistributed net investment income of $137,384 and $128,689, respectively) |
$ 354,482,877 |
$ 364,737,974 |
See accompanying notes which are an integral part of the financial statements.
Annual Report
Financial Highlights - Class A
|
Years ended October 31, |
2000 |
1999 |
1998 |
1997 |
1996 E |
|
Selected Per-Share Data |
|
|
|
|
|
|
Net asset value, beginning |
$ 9.150 |
$ 9.380 |
$ 9.310 |
$ 9.370 |
$ 9.290 |
|
Income from Investment Operations |
|
|
|
|
|
|
Net investment income D |
.551 |
.518 |
.572 |
.532 |
.090 |
|
Net realized and unrealized gain (loss) |
(.028) |
(.233) |
.024 |
(.021) |
.081 |
|
Total from investment |
.523 |
.285 |
.596 |
.511 |
.171 |
|
Less Distributions |
|
|
|
|
|
|
From net investment income |
(.553) |
(.515) |
(.526) |
(.571) |
(.091) |
|
Net asset value, end of period |
$ 9.120 |
$ 9.150 |
$ 9.380 |
$ 9.310 |
$ 9.370 |
|
Total Return B, C |
5.91% |
3.12% |
6.58% |
5.64% |
1.85% |
|
Ratios and Supplemental Data |
|
|
|
|
|
|
Net assets, end of period |
$ 16,698 |
$ 17,835 |
$ 5,524 |
$ 19,726 |
$ 204 |
|
Ratio of expenses to average |
.83% |
.82% |
.90% F |
.90% F |
.90% A, F |
|
Ratio of expenses to average net assets after expense reductions |
.83% |
.80% G |
.90% |
.90% |
.90% A |
|
Ratio of net investment income to average net assets |
6.05% |
5.68% |
6.03% |
6.00% |
6.27% A |
|
Portfolio turnover rate |
115% |
139% |
124% |
105% |
124% |
A Annualized
B The total returns would have been lower had certain expenses not been reduced during the periods shown.
C Total returns do not include the one time sales charge and for periods of less than one year are not annualized.
D Net investment income per share has been calculated based on average shares outstanding during the period.
E For the period September 3, 1996 (commencement of sale of Class A shares) to October 31,1996.
F FMR agreed to reimburse a portion of the class' expenses during the period. Without this reimbursement, the class' expense ratio would have been higher.
G FMR or the fund has entered into varying arrangements with third parties who either paid or reduced a portion of the class' expenses.
See accompanying notes which are an integral part of the financial statements.
Annual Report
Financial Highlights - Class T
|
Years ended October 31, |
2000 |
1999 |
1998 |
1997 |
1996 |
|
Selected Per-Share Data |
|
|
|
|
|
|
Net asset value, beginning |
$ 9.150 |
$ 9.380 |
$ 9.350 |
$ 9.380 |
$ 9.470 |
|
Income from Investment Operations |
|
|
|
|
|
|
Net investment income C |
.550 |
.523 |
.555 |
.578 |
.594 |
|
Net realized and unrealized gain (loss) |
(.019) |
(.238) |
.019 |
(.036) |
(.094) |
|
Total from investment |
.531 |
.285 |
.574 |
.542 |
.500 |
|
Less Distributions |
|
|
|
|
|
|
From net investment income |
(.551) |
(.515) |
(.544) |
(.572) |
(.590) |
|
Net asset value, end of period |
$ 9.130 |
$ 9.150 |
$ 9.380 |
$ 9.350 |
$ 9.380 |
|
Total Return A, B |
6.00% |
3.12% |
6.32% |
5.97% |
5.45% |
|
Ratios and Supplemental Data |
|
|
|
|
|
|
Net assets, end of period |
$ 279,306 |
$ 309,670 |
$ 333,050 |
$ 351,614 |
$ 416,700 |
|
Ratio of expenses to average |
.84% |
.84% |
.89% |
.89% |
.88% |
|
Ratio of expenses to average net assets after expense reductions |
.83% D |
.83% D |
.89% |
.89% |
.88% |
|
Ratio of net investment income to average net assets |
6.05% |
5.64% |
5.93% |
6.19% |
6.29% |
|
Portfolio turnover rate |
115% |
139% |
124% |
105% |
124% |
A The total returns would have been lower had certain expenses not been reduced during the periods shown.
B Total returns do not include the one time sales charge.
C Net investment income per share has been calculated based on average shares outstanding during the period.
D FMR or the fund has entered into varying arrangements with third parties who either paid or reduced a portion of the class' expenses.
See accompanying notes which are an integral part of the financial statements.
Annual Report
Financial Highlights - Class C
|
Years ended October 31, |
2000 |
1999 |
1998 E |
|
Selected Per-Share Data |
|
|
|
|
Net asset value, beginning of period |
$ 9.160 |
$ 9.380 |
$ 9.340 |
|
Income from Investment Operations |
|
|
|
|
Net investment income D |
.467 |
.434 |
.437 |
|
Net realized and unrealized gain (loss) |
(.021) |
(.222) |
.064 |
|
Total from investment operations |
.446 |
.212 |
.501 |
|
Less Distributions |
|
|
|
|
From net investment income |
(.476) |
(.432) |
(.461) |
|
Net asset value, end of period |
$ 9.130 |
$ 9.160 |
$ 9.380 |
|
Total Return B, C |
5.01% |
2.31% |
5.49% |
|
Ratios and Supplemental Data |
|
|
|
|
Net assets, end of period (000 omitted) |
$ 50,824 |
$ 30,428 |
$ 11,795 |
|
Ratio of expenses to average net assets |
1.68% |
1.73% |
1.75% A, F |
|
Ratio of expenses to average net assets after |
1.67% G |
1.72% G |
1.75% A |
|
Ratio of net investment income to average net assets |
5.21% |
4.75% |
4.92% A |
|
Portfolio turnover rate |
115% |
139% |
124% |
A Annualized
B The total returns would have been lower had certain expenses not been reduced during the periods shown.
C Total returns do not include the contingent deferred sales charge and for periods of less than one year are not annualized.
D Net investment income per share has been calculated based on average shares outstanding during the period.
E For the period November 3, 1997 (commencement of sale of Class C shares) to October 31, 1998.
F FMR agreed to reimburse a portion of the class' expenses during the period. Without this reimbursement, the class' expense ratio would have been higher.
G FMR or the fund has entered into varying arrangements with third parties who either paid or reduced a portion of the class' expenses.
See accompanying notes which are an integral part of the financial statements.
Annual Report
Financial Highlights - Institutional Class
|
Years ended October 31, |
2000 |
1999 |
1998 |
1997 |
1996 |
|
Selected Per-Share Data |
|
|
|
|
|
|
Net asset value, beginning |
$ 9.150 |
$ 9.380 |
$ 9.350 |
$ 9.370 |
$ 9.470 |
|
Income from Investment Operations |
|
|
|
|
|
|
Net investment income B |
.564 |
.534 |
.566 |
.589 |
.598 |
|
Net realized and unrealized gain (loss) |
(.015) |
(.236) |
.021 |
(.023) |
(.098) |
|
Total from investment operations |
.549 |
.298 |
.587 |
.566 |
.500 |
|
Less Distributions |
|
|
|
|
|
|
From net investment income |
(.569) |
(.528) |
(.557) |
(.586) |
(.600) |
|
Net asset value, end of period |
$ 9.130 |
$ 9.150 |
$ 9.380 |
$ 9.350 |
$ 9.370 |
|
Total Return A |
6.21% |
3.27% |
6.47% |
6.24% |
5.45% |
|
Ratios and Supplemental Data |
|
|
|
|
|
|
Net assets, end of period |
$ 7,655 |
$ 6,805 |
$ 7,027 |
$ 6,750 |
$ 9,200 |
|
Ratio of expenses to average |
.67% |
.71% |
.75% C |
.75% C |
.80% C |
|
Ratio of expenses to average net assets after expense reductions |
.67% |
.70% D |
.75% |
.75% |
.80% |
|
Ratio of net investment income to average net assets |
6.21% |
5.77% |
6.06% |
6.30% |
6.37% |
|
Portfolio turnover rate |
115% |
139% |
124% |
105% |
124% |
A The total returns would have been lower had certain expenses not been reduced during the periods shown.
B Net investment income per share has been calculated based on average shares outstanding during the period.
C FMR agreed to reimburse a portion of the class' expenses during the period. Without this reimbursement, the class' expense ratio would have been higher.
D FMR or the fund has entered into varying arrangements with third parties who either paid or reduced a portion of the class' expenses.
See accompanying notes which are an integral part of the financial statements.
Annual Report
For the period ended October 31, 2000
1. Significant Accounting Policies.
Fidelity Advisor Short Fixed-Income Fund (the fund) is a fund of Fidelity Advisor Series II (the trust) and is authorized to issue an unlimited number of shares. The trust is registered under the Investment Company Act of 1940, as amended (the 1940 Act), as an open-end management investment company organized as a Massachusetts business trust.
The fund offers Class A, Class T, Class C, and Institutional Class shares, each of which has equal rights as to assets and voting privileges. Each class has exclusive voting rights with respect to matters that affect that class. Investment income, realized and unrealized capital gains and losses, the common expenses of the fund, and certain fund-level expense reductions, if any, are allocated on a pro rata basis to each class based on the relative net assets of each class to the total net assets of the fund. Each class of shares differs in its respective distribution, transfer agent, and certain other class-specific fees, expenses, and expense reductions.
The financial statements have been prepared in conformity with generally accepted accounting principles which require management to make certain estimates and assumptions at the date of the financial statements. The following summarizes the significant accounting policies of the fund:
Security Valuation. Securities are valued based upon a computerized matrix system and/or appraisals by a pricing service, both of which consider market transactions and dealer-supplied valuations. Securities (including restricted securities) for which market quotations are not readily available are valued at their fair value as determined in good faith under consistently applied procedures under the general supervision of the Board of Trustees. Short-term securities with remaining maturities of sixty days or less for which quotations are not readily available are valued at amortized cost or original cost plus accrued interest, both of which approximate current value. Investments in open-end investment companies are valued at their net asset value each business day.
Income Taxes. As a qualified regulated investment company under Subchapter M of the Internal Revenue Code, the fund is not subject to income taxes to the extent that it distributes substantially all of its taxable income for its fiscal year. The schedule of investments includes information regarding income taxes under the caption "Income Tax Information."
Investment Income. Interest income, which includes accretion of original issue discount, is accrued as earned.
Expenses. Most expenses of the trust can be directly attributed to a fund. Expenses which cannot be directly attributed are apportioned among the funds in the trust.
Distributions to Shareholders. Distributions are declared daily and paid monthly from net investment income. Distributions from realized gains, if any, are recorded on the ex-dividend date. Income dividends and capital gain distributions are declared separately for each class.
Annual Report
Notes to Financial Statements - continued
1. Significant Accounting Policies - continued
Distributions to Shareholders - continued
Income and capital gain distributions are determined in accordance with income tax regulations which may differ from generally accepted accounting principles. These differences, which may result in distribution reclassifications, are primarily due to differing treatments for paydown gains/losses on certain securities, market discount, capital loss carryforwards and losses deferred due to wash sales.
Permanent book and tax basis differences relating to shareholder distributions will result in reclassifications to paid in capital. Undistributed net investment income and accumulated undistributed net realized gain (loss) on investments and foreign currency transactions may include temporary book and tax basis differences which will reverse in a subsequent period. Any taxable income or gain remaining at fiscal year end is distributed in the following year.
Security Transactions. Security transactions are accounted for as of trade date. Gains and losses on securities sold are determined on the basis of identified cost.
2. Operating Policies.
Joint Trading Account. Pursuant to an Exemptive Order issued by the Securities and Exchange Commission, the fund, along with other affiliated entities of Fidelity Management & Research Company (FMR), may transfer uninvested cash balances into one or more joint trading accounts. These balances are invested in one or more repurchase agreements for U.S. Treasury or Federal Agency obligations.
Repurchase Agreements. The underlying U.S. Treasury, Federal Agency, or other obligations found to be satisfactory by FMR are transferred to an account of the fund, or to the Joint Trading Account, at a custodian bank. The securities are marked-to-market daily and maintained at a value at least equal to the principal amount of the repurchase agreement (including accrued interest). FMR, the fund's investment adviser, is responsible for determining that the value of the underlying securities remains in accordance with the market value requirements stated above.
Delayed Delivery Transactions. The fund may purchase or sell securities on a delayed delivery basis. Payment and delivery may take place after the customary settlement period for that security. The price of the underlying securities and the date when the securities will be delivered and paid for are fixed at the time the transaction is negotiated. The fund may receive compensation for interest forgone in the purchase of a delayed delivery security. With respect to purchase commitments, the fund identifies securities as segregated in its records with a value at least equal to the amount of the commitment. Losses may arise due to changes in the market value of the underlying securities or if the counterparty does not perform under the contract.
Annual Report
Notes to Financial Statements - continued
2. Operating Policies - continued
Restricted Securities. The fund is permitted to invest in securities that are subject to legal or contractual restrictions on resale. These securities generally may be resold in transactions exempt from registration or to the public if the securities are registered. Disposal of these securities may involve time-consuming negotiations and expense, and prompt sale at an acceptable price may be difficult. At the end of the period, the fund had no investments in restricted securities (excluding 144A issues).
3. Purchases and Sales of Investments.
Purchases and sales of securities, other than short-term securities, aggregated $348,990,250 and $353,630,303, respectively, of which U.S. government and government agency obligations aggregated $219,540,904 and $195,487,578, respectively.
4. Fees and Other Transactions with Affiliates.
Management Fee. As the fund's investment adviser, FMR receives a monthly fee that is calculated on the basis of a group fee rate plus a fixed individual fund fee rate applied to the average net assets of the fund. The group fee rate is the weighted average of a series of rates and is based on the monthly average net assets of all the mutual funds advised by FMR. The rates ranged from .0920% to .3700% for the period. The annual individual fund fee rate is .30%. In the event that these rates were lower than the contractual rates in effect during the period, FMR voluntarily implemented the above rates, as they resulted in the same or a lower management fee. For the period, the management fee was equivalent to an annual rate of .43% of average net assets.
Sub-Adviser Fee. FMR, on behalf of the fund, has entered into a sub-advisory agreement with Fidelity Investments Money Management, Inc. (FIMM), a wholly owned subsidiary of FMR. For its services, FIMM receives a fee from FMR of 50% of the management fee payable to FMR. The fee is paid prior to any voluntary expense reimbursements which may be in effect.
Distribution and Service Plan. In accordance with Rule 12b-1 of the 1940 Act, the Board of Trustees has adopted separate Distribution and Service Plans with respect to each class of shares (collectively referred to as "the Plans"). Under certain of the Plans, the class pays Fidelity Distributors Corporation (FDC), an affiliate of FMR, a 12b-1 fee. A portion of this fee may be reallowed to securities dealers, banks and other financial institutions for the distribution of each class of shares and providing shareholder support services. For the period, this fee was based on the following annual rates of the average net assets of each applicable class:
|
Class A |
.15% |
|
Class T |
.15% |
|
Class C |
1.00%* |
* .75% represents a distribution fee and .25% represents a shareholder service fee.
Annual Report
Notes to Financial Statements - continued
4. Fees and Other Transactions with Affiliates - continued
Distribution and Service Plan - continued
For the period, each class paid FDC the following amounts, a portion of which was retained by FDC:
|
|
Paid to |
Retained |
|
Class A |
$ 24,456 |
$ 23 |
|
Class T |
397,379 |
3,311 |
|
Class C |
195,329 |
118,568 |
|
|
$ 617,164 |
$ 121,902 |
Sales Load. FDC receives a front-end sales charge of up to 1.50% for selling Class A and Class T shares of the fund and the proceeds of a contingent deferred sales charge levied on Class C share redemptions occurring within one year of purchase. The Class C charge is 1% of the lesser of the cost of shares at the initial date of purchase or the net asset value of the redeemed shares, excluding any reinvested dividends and capital gains. A portion of the sales charges paid to FDC is paid to securities dealers, banks and other financial institutions.
For the period, sales charge amounts paid to and retained by FDC were as follows:
|
|
Paid to |
Retained |
|
Class A |
$ 37,079 |
$ 12,095 |
|
Class T |
162,595 |
42,212 |
|
Class C |
32,659 |
32,659 * |
|
|
$ 232,333 |
$ 86,966 |
* When Class C shares are initially sold, FDC pays commissions from its own resources to securities dealers,
banks, and other financial institutions through which the sales are made.
Transfer Agent Fees. Fidelity Investments Institutional Operations Company, Inc., (FIIOC), an affiliate of FMR, is the transfer, dividend disbursing and shareholder servicing agent (collectively referred to as the transfer agent) for each class of the fund. FIIOC receives account fees and asset-based fees that vary according to the account size and type of account of the shareholders of the respective classes of the fund. FIIOC pays for
Annual Report
Notes to Financial Statements - continued
4. Fees and Other Transactions with Affiliates - continued
Transfer Agent Fees - continued
typesetting, printing and mailing of all shareholder reports, except proxy statements. For the period, the following amounts were paid to FIIOC:
|
|
Amount |
% of |
|
Class A |
$ 29,797 |
.18 |
|
Class T |
501,124 |
.19 |
|
Class C |
35,098 |
.18 |
|
Institutional Class |
12,590 |
.18 |
|
|
$ 578,609 |
|
Accounting and Security Lending Fees. Fidelity Service Company, Inc. maintains the fund's accounting records and administers the security lending program. The security lending fee is based on the number and duration of lending transactions. The accounting fee is based on the level of average net assets for the month plus out-of-pocket expenses.
5. Security Lending.
The fund lends portfolio securities from time to time in order to earn additional income. The fund receives collateral in the form of U.S. Treasury obligations, letters of credit, and/or cash against the loaned securities, and maintains collateral in an amount not less than 100% of the market value of the loaned securities during the period of the loan. The market value of the loaned securities is determined at the close of business of the fund and any additional required collateral is delivered to the fund on the next business day. If the borrower defaults on its obligation to return the securities loaned because of insolvency or other reasons, the fund could experience delays and costs in recovering the securities loaned or in gaining access to the collateral. At period end there were no security loans outstanding.
6. Expense Reductions.
Through an arrangement with the fund's custodian, credits realized as a result of uninvested cash balances were used to reduce a portion of expenses. During the period, the fund's custodian fees were reduced by $8,145 under the custodian arrangement.
7. Beneficial Interest.
At the end of the period, one shareholder was record owner of approximately 20% of the total outstanding shares of the fund.
Annual Report
Notes to Financial Statements - continued
8. Distributions to Shareholders.
Distributions to shareholders of each class were as follows:
|
|
Years ended October 31, |
|
|
|
2000 |
1999 |
|
From net investment income |
|
|
|
Class A |
$ 989,950 |
$ 728,649 |
|
Class T |
16,008,757 |
17,079,838 |
|
Class C |
1,027,363 |
560,143 |
|
Institutional Class |
442,489 |
393,866 |
|
Total |
$ 18,468,559 |
$ 18,762,496 |
9. Share Transactions.
Transactions for each class of shares were as follows:
|
|
Shares |
Dollars |
||
|
|
Years ended October 31, |
Years ended October 31, |
||
|
|
2000 |
1999 |
2000 |
1999 |
|
|
|
|
|
|
|
Class A |
1,682,621 |
4,473,072 |
$ 15,278,451 |
$ 41,324,913 |
|
Reinvestment of distributions |
97,239 |
71,481 |
883,778 |
658,379 |
|
Shares redeemed |
(1,899,431) |
(3,183,911) |
(17,261,780) |
(29,310,347) |
|
Net increase (decrease) |
(119,571) |
1,360,642 |
$ (1,099,551) |
$ 12,672,945 |
|
Class T |
18,749,453 |
21,974,295 |
$ 170,697,136 |
$ 203,715,730 |
|
Reinvestment of distributions |
1,430,849 |
1,462,245 |
13,011,480 |
13,533,243 |
|
Shares redeemed |
(23,421,838) |
(25,110,949) |
(213,120,892) |
(233,084,712) |
|
Net increase (decrease) |
(3,241,536) |
(1,674,409) |
$ (29,412,276) |
$ (15,835,739) |
|
Class C |
5,686,664 |
4,501,972 |
$ 51,826,077 |
$ 41,508,375 |
|
Reinvestment of distributions |
87,059 |
46,606 |
792,111 |
430,046 |
|
Shares redeemed |
(3,532,168) |
(2,481,867) |
(32,118,065) |
(23,005,901) |
|
Net increase (decrease) |
2,241,555 |
2,066,711 |
$ 20,500,123 |
$ 18,932,520 |
|
Institutional Class |
304,332 |
527,018 |
$ 2,764,206 |
$ 4,875,430 |
|
Reinvestment of distributions |
42,066 |
36,799 |
382,542 |
340,500 |
|
Shares redeemed |
(251,563) |
(569,453) |
(2,288,137) |
(5,265,224) |
|
Net increase (decrease) |
94,835 |
(5,636) |
$ 858,611 |
$ (49,294) |
Annual Report
To the Trustees of Fidelity Advisor Series II and Shareholders of Fidelity Advisor Short Fixed-Income Fund:
We have audited the accompanying statement of assets and liabilities of Fidelity Advisor Short Fixed-Income Fund, (the fund), a fund of Fidelity Advisor Series II (the trust), including the portfolio of investments, as of October 31, 2000, and the related statement of operations for the year then ended, the statement of changes in net assets for each of the two years in the period then ended, and the financial highlights for each of the five years in the period then ended. These financial statements and financial highlights are the responsibility of the fund's management. Our responsibility is to express an opinion on these financial statements and financial highlights based on our audits.
We conducted our audits in accordance with auditing standards generally accepted in the United States of America. Those standards require that we plan and perform the audit to obtain reasonable assurance about whether the financial statements and financial highlights are free of material misstatement. An audit includes examining, on a test basis, evidence supporting the amounts and disclosures in the financial statements. Our procedures included confirmation of securities owned as of October 31, 2000, by correspondence with the custodian and brokers; where replies were not received from brokers, we performed other auditing procedures. An audit also includes assessing the accounting principles used and significant estimates made by management, as well as evaluating the overall financial statement presentation. We believe that our audits provide a reasonable basis for our opinion.
In our opinion, the financial statements and financial highlights referred to above present fairly, in all material respects, the financial position of Fidelity Advisor Short Fixed-Income Fund as of October 31, 2000, the results of its operations for the year then ended, the changes in its net assets for each of the two years in the period then ended, and its financial highlights for each of the five years in the period then ended, in conformity with accounting principles generally accepted in the United States of America.
/s/DELOITTE & TOUCHE LLP
DELOITTE & TOUCHE LLP
Boston, Massachusetts
December 8, 2000
Annual Report
Investment Adviser
Fidelity Management & Research Company
Boston, MA
Investment Sub-Advisers
Fidelity Management & Research
(U.K.) Inc.
Fidelity Management & Research
(Far East) Inc.
Fidelity Investments Money Management, Inc.
Fidelity Investments Japan Limited
Officers
Edward C. Johnson 3d, President
Robert C. Pozen, Senior Vice President
Andrew J. Dudley, Vice President
Dwight D. Churchill, Vice President
David L. Murphy, Vice President
Stanley N. Griffith, Assistant Vice President
Eric D. Roiter, Secretary
Robert A. Dwight, Treasurer
Maria F. Dwyer, Deputy Treasurer
John H. Costello, Assistant Treasurer
Thomas J. Simpson, Assistant Treasurer
Board of Trustees
Ralph F. Cox *
Phyllis Burke Davis *
Robert M. Gates *
Edward C. Johnson 3d
Donald J. Kirk *
Ned C. Lautenbach *
Peter S. Lynch
Ned C. Lautenbach *
Marvin L. Mann *
William O.McCoy *
Gerald C. McDonough *
Robert C. Pozen
Thomas R. Williams *
* Independent trustees
Advisory Board
J. Michael Cook
Abigail P. Johnson
Marie L. Knowles
General Distributor
Fidelity Distributors Corporation
Boston, MA
Transfer and Shareholder
Servicing Agent
Fidelity Investments Institutional Operations Company, Inc.
Boston, MA
Custodian
The Bank of New York
New York, NY
|
SFII-ANN-1200 |
118721 |
|
1.538432.103 |
|
(Fidelity Investment logo)(registered trademark)
Corporate Headquarters
82 Devonshire St., Boston, MA 02109
www.fidelity.com
Fidelity® Advisor
Fund - Class A, Class T, Class B
and Class C
Annual Report
October 31, 2000
(2_fidelity_logos)
|
President's Message |
3 |
Ned Johnson on investing strategies. |
|
Performance |
4 |
How the fund has done over time. |
|
Fund Talk |
12 |
The manager's review of fund performance, strategy and outlook. |
|
Investment Summary |
15 |
A summary of the fund's investments. |
|
Investments |
16 |
A complete list of the fund's investments with their market values. |
|
Financial Statements |
22 |
Statements of assets and liabilities,
operations, and changes in net assets, |
|
Notes |
31 |
Notes to the financial statements. |
|
Independent Auditors' Report |
39 |
The auditors' opinion. |
Standard & Poor's, S&P and S&P 500 are registered service marks of The McGraw-Hill Companies, Inc. and have been licensed for use by Fidelity Distributors Corporation.
Other third party marks appearing herein are the property of their respective owners.
All other marks appearing herein are registered or unregistered trademarks or service marks of FMR Corp. or an affiliated company.
(Recycle graphic) This report is printed on recycled paper using soy-based inks.
This report and the financial statements contained herein are submitted for the general information of the shareholders of the fund. This report is not authorized for distribution to prospective investors in the fund unless preceded or accompanied by an effective prospectus.
Mutual fund shares are not deposits or obligations of, or guaranteed by, any depository institution. Shares are not insured by the FDIC, Federal Reserve Board or any other agency, and are subject to investment risks, including possible loss of principal amount invested.
Neither the fund nor Fidelity Distributors Corporation is a bank.
For more information on any Fidelity Advisor fund, including charges and expenses, contact your investment professional for a free prospectus. Read it carefully before you invest or send money.
Annual Report
(photo_of_Edward_C_Johnson_3d)
Dear Shareholder:
A sixth-straight year of double-digit positive returns for the Dow Jones Industrial Average, NASDAQ and S&P 500® could be in jeopardy unless the U.S. stock market shows marked improvement in the final two months of 2000. Through October, all three indexes had negative year-to-date returns. On the other hand, most fixed-income sectors were solidly in the black. Treasuries and other long-term government securities led the way, returning nearly 14%.
While it's impossible to predict the future direction of the markets with any degree of certainty, there are certain basic principles that can help investors plan for their future needs.
The longer your investment time frame, the less likely it is that you will be affected by short-term market volatility. A 10-year investment horizon appropriate for saving for a college education, for example, enables you to weather market cycles in a long-term fund, which may have a higher risk potential, but also has a higher potential rate of return.
An intermediate-length fund could make sense if your investment horizon is two to four years, while a short-term bond fund could be the right choice if you need your money in one or two years.
If your time horizon is less than a year, you might want to consider moving some of your bond investment into a money market fund. These funds seek income and a stable share price by investing in high-quality, short-term investments. Of course, it's important to remember that an investment in a money market fund is not insured or guaranteed by the Federal Deposit Insurance Corporation or any other government agency. Although money market funds seek to preserve the value of your investment at $1.00 per share, it is possible to lose money by investing in these types of funds.
Finally, no matter what your time horizon or portfolio diversity, it makes good sense to follow a regular investment plan, investing a certain amount of money in a fund at the same time each month or quarter and periodically reviewing your overall portfolio. By doing so, you won't get caught up in the excitement of a rapidly rising market, nor will you buy all your shares at market highs. While this strategy - known as dollar cost averaging - won't assure a profit or protect you from a loss in a declining market, it should help you lower the average cost of your purchases. Of course, you should consider your financial ability to continue your purchases through periods of low price levels before undertaking such a strategy.
Remember to contact your investment professional if you need help with your investments.
Best regards,
/s/Edward C. Johnson 3d
Edward C. Johnson 3d
Annual Report
Fidelity Advisor Floating Rate High Income Fund - Class A
There are several ways to evaluate historical performance. You can look at the total percentage change in value, the average annual percentage change or the growth of a hypothetical $10,000 investment. Total return reflects the change in the value of an investment, assuming reinvestment of the class' dividend income and capital gains (the profits earned upon the sale of securities that have grown in value). If Fidelity had not reimbursed certain class expenses, the total returns and dividends would have been lower.
Cumulative Total Returns
|
Period ended October 31, 2000 |
|
|
Life of |
|
Fidelity® Adv Floating Rate High Income - CL A |
|
|
0.90% |
|
Fidelity Adv Floating Rate High Income - CL A |
|
|
-2.88% |
|
DLJ Leveraged Loan Plus |
|
|
0.62% |
Cumulative total returns show Class A's performance in percentage terms over a set period - in this case, since the fund started on August 16, 2000. For example, if you had invested $1,000 in a fund that had a 5% return over the past year, the value of your investment would be $1,050. You can compare Class A's returns to the performance of the Donaldson, Lufkin & Jenrette (DLJ) Leveraged Loan Index Plus - a market value-weighted index designed to represent the investable universe of the U.S. dollar denominated leveraged loan market. This benchmark includes reinvested dividends and capital gains, if any.
Average Annual Total Returns
Average annual total returns take Class A shares' cumulative return and show you what would have happened if Class A shares had performed at a constant rate each year. These numbers will be reported once the fund is a year old. In addition, the growth of the hypothetical $10,000 investment in the fund will appear in the fund's next report six months from now.
Annual Report
Fidelity Advisor Floating Rate High Income Fund - Class A
Performance - continued
Total Return Components
|
|
|
August 16, 2000 |
|
|
|
|
2000 |
|
|
Dividend returns |
|
1.50% |
|
Capital returns |
|
-0.60% |
|
Total returns |
|
0.90% |
Total return components include both dividend returns and capital returns. A dividend return reflects the actual dividends paid by the class. A capital return reflects both the amount paid by the class to shareholders as capital gain distributions and changes in the class' share price. Both returns assume the dividends or capital gains, if any, paid by the class are reinvested.
Dividends and Yield
|
Periods ended October 31, 2000 |
Past 1 |
Life of |
|
Dividends per share |
6.01¢ |
14.96¢ |
|
Annualized dividend rate |
7.11% |
7.21% |
|
30-day annualized yield |
- |
- |
Dividends per share show the income paid by the class for a set period. The annual dividend rate is based on an average share price of $9.95 over the past one month and $9.96 over the life of the class. The 30-day annualized yield is a standard formula based on the yields of the securities in the fund, averaged over the past 30 days. This figure shows you the yield characteristics of the fund's investments at the end of the period. It also helps you compare funds from different companies on an equal basis. Yield information will be reported once Class A has a longer more stable operating history.
Annual Report
Fidelity Advisor Floating Rate High Income Fund - Class T
There are several ways to evaluate historical performance. You can look at the total percentage change in value, the average annual percentage change or the growth of a hypothetical $10,000 investment. Total return reflects the change in the value of an investment, assuming reinvestment of the class' dividend income and capital gains (the profits earned upon the sale of securities that have grown in value). If Fidelity had not reimbursed certain class expenses, the total returns and dividends would have been lower.
Cumulative Total Returns
|
Period ended October 31, 2000 |
|
|
Life of |
|
Fidelity Adv Floating Rate High Income - CL T |
|
|
0.88% |
|
Fidelity Adv Floating Rate High Income - CL T |
|
|
-1.90% |
|
DLJ Leveraged Loan Plus |
|
|
0.62% |
Cumulative total returns show Class T's performance in percentage terms over a set period - in this case, since the fund started on August 16, 2000. For example, if you had invested $1,000 in a fund that had a 5% return over the past year, the value of your investment would be $1,050. You can compare Class T's returns to the performance of the Donaldson, Lufkin & Jenrette (DLJ) Leveraged Loan Index Plus - a market value-weighted index designed to represent the investable universe of the U.S. dollar denominated leveraged loan market. This benchmark includes reinvested dividends and capital gains, if any.
Average Annual Total Returns
Average annual total returns take Class T shares' cumulative return and show you what would have happened if Class T shares had performed at a constant rate each year. These numbers will be reported once the fund is a year old. In addition, the growth of the hypothetical $10,000 investment in the fund will appear in the fund's next report six months from now.
Annual Report
Total Return Components
|
|
|
August 16, 2000 |
|
|
|
|
2000 |
|
|
Dividend returns |
|
1.48% |
|
Capital returns |
|
-0.60% |
|
Total returns |
|
0.88% |
Total return components include both dividend returns and capital returns. A dividend return reflects the actual dividends paid by the class. A capital return reflects both the amount paid by the class to shareholders as capital gain distributions and changes in the class' share price. Both returns assume the dividends or capital gains, if any, paid by the class are reinvested.
Dividends and Yield
|
Periods ended October 31, 2000 |
Past 1 |
Life of |
|
Dividends per share |
5.92¢ |
14.71¢ |
|
Annualized dividend rate |
7.01% |
7.09% |
|
30-day annualized yield |
- |
- |
Dividends per share show the income paid by the class for a set period. The annual dividend rate is based on an average share price of $9.95 over the past one month and $9.96 over the life of the class. The 30-day annualized yield is a standard formula based on the yields of the securities in the fund, averaged over the past 30 days. This figure shows you the yield characteristics of the fund's investments at the end of the period. It also helps you compare funds from different companies on an equal basis. Yield information will be reported once Class T has a longer more stable operating history.
Annual Report
Fidelity Advisor Floating Rate High Income Fund - Class B
There are several ways to evaluate historical performance. You can look at the total percentage change in value, the average annual percentage change or the growth of a hypothetical $10,000 investment. Total return reflects the change in the value of an investment, assuming reinvestment of the class' dividend income and capital gains (the profits earned upon the sale of securities that have grown in value). Class B shares' contingent deferred sales charge included in the life of fund total return figure is 3.50%. If Fidelity had not reimbursed certain class expenses, the total returns and dividends would have been lower.
Cumulative Total Returns
|
Period ended October 31, 2000 |
|
|
Life of |
|
|
Fidelity Adv Floating Rate High Income - CL B |
|
|
0.79% |
|
|
Fidelity Adv Floating Rate High Income - CL B |
|
|
-2.69% |
|
|
DLJ Leveraged Loan Plus |
|
|
0.62% |
|
Cumulative total returns show Class B's performance in percentage terms over a set period - in this case, since the fund started on August 16, 2000. For example, if you had invested $1,000 in a fund that had a 5% return over the past year, the value of your investment would be $1,050. You can compare Class B's returns to the performance of the Donaldson, Lufkin & Jenrette (DLJ) Leveraged Loan Index Plus - a market value-weighted index designed to represent the investable universe of the U.S. dollar denominated leveraged loan market. This benchmark includes reinvested dividends and capital gains, if any.
Average Annual Total Returns
Average annual total returns take Class B shares' cumulative return and show you what would have happened if Class B shares had performed at a constant rate each year. These numbers will be reported once the fund is a year old. In addition, the growth of the hypothetical $10,000 investment in the fund will appear in the fund's next report six months from now.
Annual Report
Fidelity Advisor Floating Rate High Income Fund - Class B
Performance - continued
Total Return Components
|
|
|
August 16, 2000 |
|
|
|
|
2000 |
|
|
Dividend returns |
|
1.39% |
|
Capital returns |
|
-0.60% |
|
Total returns |
|
0.79% |
Total return components include both dividend returns and capital returns. A dividend return reflects the actual dividends paid by the class. A capital return reflects both the amount paid by the class to shareholders as capital gain distributions and changes in the class' share price. Both returns assume the dividends or capital gains, if any, paid by the class are reinvested.
Dividends and Yield
|
Periods ended October 31, 2000 |
Past 1 |
Life of |
|
Dividends per share |
5.53¢ |
13.89¢ |
|
Annualized dividend rate |
6.54% |
6.70% |
|
30-day annualized yield |
- |
- |
Dividends per share show the income paid by the class for a set period. The annual dividend rate is based on an average share price of $9.95 over the past one month and $9.95 over the life of the class. The 30-day annualized yield is a standard formula based on the yields of the securities in the fund, averaged over the past 30 days. This figure shows you the yield characteristics of the fund's investments at the end of the period. It also helps you compare funds from different companies on an equal basis. Yield information will be reported once Class B has a longer more stable operating history.
Annual Report
Fidelity Advisor Floating Rate High Income Fund - Class C
There are several ways to evaluate historical performance. You can look at the total percentage change in value, the average annual percentage change or the growth of a hypothetical $10,000 investment. Total return reflects the change in the value of an investment, assuming reinvestment of the class' dividend income and capital gains (the profits earned upon the sale of securities that have grown in value). Class C shares' contingent deferred sales charge included in the life of fund total return figure is 1%. If Fidelity had not reimbursed certain class expenses, the total returns and dividends would have been lower.
Cumulative Total Returns
|
Period ended October 31, 2000 |
|
|
Life of |
|
Fidelity Adv Floating Rate High Income - CL C |
|
|
0.76% |
|
Fidelity Adv Floating Rate High Income - CL C |
|
|
-0.24% |
|
DLJ Leveraged Loan Plus |
|
|
0.62% |
Cumulative total returns show Class C's performance in percentage terms over a set period - in this case, since the fund started on August 16, 2000. For example, if you had invested $1,000 in a fund that had a 5% return over the past year, the value of your investment would be $1,050. You can compare Class C's returns to the performance of the Donaldson, Lufkin & Jenrette (DLJ) Leveraged Loan Index Plus - a market value-weighted index designed to represent the investable universe of the U.S. dollar denominated leveraged loan market. This benchmark includes reinvested dividends and capital gains, if any.
Average Annual Total Returns
Average annual total returns take Class C shares' cumulative return and show you what would have happened if Class C shares had performed at a constant rate each year. These numbers will be reported once the fund is a year old. In addition, the growth of the hypothetical $10,000 investment in the fund will appear in the fund's next report six months from now.
Annual Report
Total Return Components
|
|
|
August 16, 2000 |
|
|
|
|
2000 |
|
|
Dividend returns |
|
1.36% |
|
Capital returns |
|
-0.60% |
|
Total returns |
|
0.76% |
Total return components include both dividend returns and capital returns. A dividend return reflects the actual dividends paid by the class. A capital return reflects both the amount paid by the class to shareholders as capital gain distributions and changes in the class' share price. Both returns assume the dividends or capital gains, if any, paid by the class are reinvested.
Dividends and Yield
|
Periods ended October 31, 2000 |
Past 1 |
Life of |
|
Dividends per share |
5.45¢ |
13.54¢ |
|
Annualized dividend rate |
6.45% |
6.53% |
|
30-day annualized yield |
- |
- |
Dividends per share show the income paid by the class for a set period. The annual dividend rate is based on an average share price of $9.95 over the past one month and $9.96 over the life of the class. The 30-day annualized yield is a standard formula based on the yields of the securities in the fund, averaged over the past 30 days. This figure shows you the yield characteristics of the fund's investments at the end of the period. It also helps you compare funds from different companies on an equal basis. Yield information will be reported once Class C has a longer more stable operating history.
Annual Report
Market Recap
The leveraged loan market, as measured by the DLJ Leveraged Loan Index Plus, generated a 5.37% return during the 12-month period that ended October 31, 2000. In a period when most sectors of the leveraged finance market were weak, as evidenced by the Merrill Lynch High Yield Master II Index's decline of 1.68%, the distinct characteristics of leveraged loans enabled them to post strong performance. The combination of seniority, security and floating rates helped reduce the price volatility of leveraged loans and therefore attracted investors seeking stability. That said, the yield spread for average new-issue leveraged loans rated BB/BB- and those rated B+/B by Standard & Poor's® did widen year-over-year. At the end of September 1999, the spread for BB/BB- issues was 302 basis points (or 3.02%) above London Interbank Offered Rate (LIBOR) versus 353 basis points above LIBOR at the end of October 2000. B+/B issues were 357 basis points above LIBOR versus 389 basis points above LIBOR during the same period. S&P/Portfolio Management Data estimates that there was $43.8 billion in new institutional leveraged loan syndications during the past year, representing 320 new-issue leveraged loans. Of this amount, telecommunications and industrial companies represented the largest industry group at 20% and 19% of new issuance, respectively, followed by services/retail at 15% and media at 13%.
(Portfolio Manager photograph)
An interview with Christine McConnell, Portfolio Manager of Fidelity Advisor Floating Rate High Income Fund
Q. How did the fund perform, Christine?
A. Since its inception on August 16, 2000, through October 31, 2000, the fund's Class A, Class T, Class B, and Class C shares returned 0.90%, 0.88%, 0.79% and 0.76%, respectively. The fund's benchmark, the DLJ Leveraged Loan Index Plus returned 0.62%. Going forward, we'll look at the fund's performance in six- and 12-month intervals and will compare its performance to a peer group of funds tracked by Lipper Inc.
Fund Talk: The Manager's Overview - continued
Q. What helped the fund outperform its index during the brief period?
Annual Report
A. Keeping in mind that the fund was still in a start-up phase and incurring cash flows, strong credit selection made a positive contribution to performance as did the fund's diversification.
Q. Can you give us an overview of the kinds of investments the fund will typically own?
A. Certainly. This is the industry's first open-end bank loan fund and provides investors with daily liquidity. The fund invests primarily in senior secured floating rate notes of non-investment grade companies. Additionally, up to 20% of the fund's total assets may be invested in investment-grade money market and short-term debt instruments to enhance the fund's liquidity. The leveraged bank loans in the fund represent companies' direct debt obligations, which are often used to finance working capital, capital expenditures, and mergers and acquisitions. The loans tend to be the most senior obligation in the company's capital structure and are often secured by the key assets of the company. Additionally, the loans have floating interest rates that are generally reset quarterly based on a premium spread to the 90-day London Interbank Offered Rate (LIBOR).
Q. Can you say more about the seniority of these loans?
A. As I mentioned, bank debt is typically the most senior claim in a company's capital structure. Accordingly, it gets paid back first before any value goes to holders of the company's more subordinate issues - including common stock, preferred stock and high-yield bonds. This senior claim helps reduce the underlying credit risk and, consequently, the price volatility of the investment.
Q. You mentioned security. Are these loans secured?
A. Bank debt is often secured by all the assets of a given company. Therefore, a bank debt holder can own title to the cash, receivables, property plant, and equipment, inventory and even real estate of the company. My research team and I spend a great deal of time focused on this collateral package, independently assessing the asset values. This security interest protects investors' downside and helps maximize recoveries in the event of a distressed situation.
Q. Can you explain how the floating rate feature of these loans works, and how it limits their interest-rate volatility?
A. Sure. It's a bit technical. Bank debt coupons are typically priced at a premium to LIBOR ranging between 250-375 basis points, or 2.5% to 3.75%. As floating rate instruments, the coupons are reset quarterly to reflect the existing LIBOR rate plus the premium. For example, at the end of the period the LIBOR rate was approximately 6.76%, suggesting that BB-rated bank debt was yielding approximately 9.5%, while lower-quality single B-rated bank debt yielded around 10.5%. Since the coupons are reset so frequently, this floating rate feature limits the interest-rate volatility of the security. Generally, the shorter the coupon reset period, the less effect interest-rate fluctuations will have.
Q. What's your outlook, Christine?
A. It's an interesting time to be involved with bank loans. Their strong relative performance has led to cash inflows into the market, and the increase in interest rates has resulted in higher yield payouts on these loans. However, the prices exacted by higher interest rates are a slowing economy and skittish capital markets. New issuance - a primary source of loan supply to the market - has slowed, reflecting difficulties raising capital in the high-yield market. Accordingly, investors have turned to the secondary market for investment opportunities. In the near term, these changes imply more-expensive and less-flexible financing for borrowers. Additionally, higher default rates have added to the price volatility in the market versus historic norms. However, given Fidelity's analytical and research strength, I'm confident that we'll be able to sort out the best opportunities for our shareholders.
Annual Report
Fund Talk: The Manager's Overview - continued
The views expressed in this report reflect those of the portfolio manager only through the end of the period of the report as stated on the cover and do not necessarily represent the views of Fidelity or any other person in the Fidelity organization. Any such views are subject to change at any time based upon market or other conditions and Fidelity disclaims any responsibility to update such views. These views may not be relied on as investment advice and, because investment decisions for a Fidelity fund are based on numerous factors, may not be relied on as an indication of trading intent on behalf of any Fidelity fund.
Fund Facts
Goal: seeks a high level of current income
Start date: August 16, 2000
Size: as of October 31, 2000, more than $106 million
Manager: Christine McConnell, since inception; joined Fidelity in 1987
3Christine McConnell on the fund's objective and investment philosophy:
"The fund's objective is to provide a high level of current income. Investment decisions are driven by basic fundamental research focused on the operating performance of a company and its management quality and depth, as well as its business strategy and execution, competition, industry dynamics and the macro-economic backdrop. Decisions also incorporate an assessment of the company's capital and corporate structure and the perceived value of the collateral package.
"We have taken a diversified posture with the fund focusing on: secular growth companies where collateral protection is strong, values are discernable and the market for the assets is tangible, liquid and well-funded; well-capitalized leveraged buyouts or old economy companies that demonstrate a relatively stable and predictable cash flow stream capable of retiring the bank debt in a timely manner; and large cyclical companies with a diversified manufacturing base and good collateral coverage based on trough valuations.
"While the fund is still in a start-up mode, I am comfortable with its diversification and am quite happy with the caliber of the companies we hold in the fund. Our portfolio strategy is targeted at capturing the benefits endemic to this asset class, including seniority and security, and we look to our expertise in credit selection to mitigate the fact that the issuers of these loans are below investment grade."
Annual Report
|
Top Five Holdings as of October 31, 2000 |
|
|
(by issuer, excluding cash equivalents) |
% of fund's |
|
Charter Communication Operating LLC |
5.6 |
|
Voicestream PCS Holding LLC |
4.9 |
|
Nextel Finance Co. |
3.4 |
|
Iron Mountain Inc. |
2.8 |
|
Pegasus Media & Communications Inc. |
2.8 |
|
|
19.5 |
|
Top Five Market Sectors as of October 31, 2000 |
|
|
|
% of fund's |
|
Utilities |
22.9 |
|
Media & Leisure |
20.2 |
|
Basic Industries |
13.6 |
|
Services |
5.6 |
|
Health |
4.3 |
|
Quality Diversification as of October 31, 2000 |
|
|
(Moody's Ratings) |
% of fund's investments |
|
Aaa, Aa, A |
1.0 |
|
Baa |
0.0 |
|
Ba |
30.1 |
|
B |
17.8 |
|
Caa, Ca, C |
0.0 |
|
Not Rated |
33.6 |
|
Table excludes short-term investments. Where Moody's ratings are not available, we have used S&P ® ratings. Unrated debt securities that are equivalent to Ba and below at October 31, 2000 account for 33.6% of the fund's investments. |
|
Asset Allocation (% of fund's net assets) |
As of October 31, 2000* 
Annual Report
Showing Percentage of Net Assets
|
Floating Rate Loans (e) - 75.3% |
|||||
|
Moody's Ratings (unaudited) (a) |
Principal Amount |
Value |
|||
|
BASIC INDUSTRIES - 13.6% |
|||||
|
Chemicals & Plastics - 7.2% |
|||||
|
CP Kelco: |
|
|
|
|
|
|
Tranche B term loan 10.0613% 3/31/08 (d) |
B1 |
|
$ 1,725,000 |
$ 1,737,937 |
|
|
Tranche C term loan 10.3113% 9/30/08 (d) |
B1 |
|
575,000 |
579,313 |
|
|
Huntsman ICI Chemicals LLC sr. secured: |
|
|
|
|
|
|
Tranche B term loan 9.6875% 6/30/07 (d) |
- |
|
1,250,000 |
1,262,500 |
|
|
Tranche C term loan 9.9375% 6/30/08 (d) |
- |
|
1,250,000 |
1,262,500 |
|
|
Lyondell Chemical Co. sr. secured Tranche E term loan 10.515% 5/17/06 (d) |
- |
|
2,796,203 |
2,880,089 |
|
|
|
7,722,339 |
||||
|
Packaging & Containers - 3.9% |
|||||
|
Ball Corp. Tranche B term loan 8.625% 3/10/06 (d) |
Ba2 |
|
1,000,000 |
1,007,500 |
|
|
Packaging Corp. of America Tranche B term loan 8.6614% 6/29/07 (d) |
- |
|
934,076 |
935,244 |
|
|
U.S. Can Corp. Tranche B term loan 10.2581% 10/4/08 (d) |
- |
|
2,200,000 |
2,216,500 |
|
|
|
4,159,244 |
||||
|
Paper & Forest Products - 2.5% |
|||||
|
Smurfit-Stone Container Corp. Tranche B term loan 9.875% 3/31/06 (d) |
Ba3 |
|
1,000,000 |
1,007,500 |
|
|
Stone Container Corp. Tranche E term loan 10.1875% 10/1/03 (d) |
B+ |
|
1,600,000 |
1,600,000 |
|
|
|
2,607,500 |
||||
|
TOTAL BASIC INDUSTRIES |
14,489,083 |
||||
|
DURABLES - 2.3% |
|||||
|
Consumer Durables - 1.4% |
|||||
|
Blount, Inc. Tranche B term loan 10.7222% 6/30/06 (d) |
B1 |
|
1,496,222 |
1,488,741 |
|
|
Home Furnishings - 0.9% |
|||||
|
Sealy Mattress Co.: |
|
|
|
|
|
|
Tranche B term loan 8.6875% 12/15/04 (d) |
Ba3 |
|
378,097 |
379,042 |
|
|
Tranche C term loan 8.9375% 12/15/05 (d) |
Ba3 |
|
272,487 |
273,168 |
|
|
Tranche D term loan 9.1875% 12/15/06 (d) |
Ba3 |
|
348,267 |
349,138 |
|
|
|
1,001,348 |
||||
|
TOTAL DURABLES |
2,490,089 |
||||
|
Floating Rate Loans (e) - continued |
|||||
|
Moody's Ratings (unaudited) (a) |
Principal Amount |
Value |
|||
|
ENERGY - 2.2% |
|||||
|
Coal - 2.2% |
|||||
|
P&L Coal Holdings Corp. Tranche B term loan 8.7673% 6/30/06 (d) |
- |
|
$ 2,324,561 |
$ 2,324,561 |
|
|
HEALTH - 4.3% |
|||||
|
Medical Facilities Management - 4.3% |
|||||
|
Quest Diagnostics, Inc.: |
|
|
|
|
|
|
Tranche B term loan 9.808% 6/15/06 (d) |
Ba3 |
|
1,041,800 |
1,049,614 |
|
|
Tranche C term loan 10.37% 6/15/06 (d) |
Ba3 |
|
958,200 |
965,386 |
|
|
Total Renal Care Holdings, Inc. term loan 10.4402% 3/31/06 (d) |
Ba2 |
|
1,282,666 |
1,266,633 |
|
|
Unilab Corp. Tranche B term loan 10.3125% 11/23/06 (d) |
B1 |
|
1,250,000 |
1,259,375 |
|
|
|
4,541,008 |
||||
|
INDUSTRIAL MACHINERY & EQUIPMENT - 1.2% |
|||||
|
Pollution Control - 1.2% |
|||||
|
Allied Waste North America, Inc.: |
|
|
|
|
|
|
Tranche B term loan 9.4375% 7/21/06 (d) |
Ba3 |
|
590,909 |
556,932 |
|
|
Tranche C term loan 9.7042% 7/21/07 (d) |
Ba3 |
|
709,091 |
668,318 |
|
|
|
1,225,250 |
||||
|
MEDIA & LEISURE - 20.2% |
|||||
|
Broadcasting - 16.2% |
|||||
|
Adelphia Communications Corp. Tranche B term loan 9.66% 6/30/09 (d) |
- |
|
1,500,000 |
1,494,375 |
|
|
American Tower L P Tranche B term loan 10.05% 12/31/07 (d) |
- |
|
2,000,000 |
2,015,000 |
|
|
Charter Communication Operating LLC Tranche B term loan 9.26% 3/18/08 (d) |
Ba3 |
|
6,000,000 |
5,977,500 |
|
|
Citadel Broadcasting Co. Tranche B term loan 9.875% 6/30/08 (d) |
BB- |
|
2,200,000 |
2,216,500 |
|
|
Entravision Communications Corp. Tranche B term loan 9.9375% 12/31/08 (d) |
- |
|
1,300,000 |
1,309,750 |
|
|
Pegasus Media & Communications, Inc. Tranche B term loan 10.125% 4/30/05 (d) |
- |
|
3,000,000 |
3,007,500 |
|
|
Telemundo Group, Inc. Tranche B term loan 8.785% 3/31/07 (d) |
B1 |
|
1,196,977 |
1,196,977 |
|
|
|
17,217,602 |
||||
|
Entertainment - 1.9% |
|||||
|
Six Flags Theme Park, Inc. Tranche B term loan 9.91% 9/30/05 (d) |
Ba2 |
|
2,000,000 |
2,015,000 |
|
|
Floating Rate Loans (e) - continued |
|||||
|
Moody's Ratings (unaudited) (a) |
Principal Amount |
Value |
|||
|
MEDIA & LEISURE - continued |
|||||
|
Publishing - 1.2% |
|||||
|
PRIMEDIA, Inc. Tranche B term loan 8.995% 7/31/04 (d) |
Ba3 |
|
$ 1,250,000 |
$ 1,253,125 |
|
|
Restaurants - 0.9% |
|||||
|
Domino's, Inc.: |
|
|
|
|
|
|
Tranche B term loan 10.1875% 12/21/06 (d) |
- |
|
499,543 |
504,538 |
|
|
Tranche C term loan 10.4375% 12/21/07 (d) |
- |
|
500,457 |
505,462 |
|
|
|
1,010,000 |
||||
|
TOTAL MEDIA & LEISURE |
21,495,727 |
||||
|
NONDURABLES - 1.9% |
|||||
|
Foods - 0.9% |
|||||
|
Del Monte Corp. Tranche B term loan 9.6875% 3/25/05 (d) |
- |
|
997,440 |
1,001,180 |
|
|
Tobacco - 1.0% |
|||||
|
UST, Inc. Tranche B term loan 9.125% 2/16/05 (d) |
A2 |
|
1,000,000 |
1,003,750 |
|
|
TOTAL NONDURABLES |
2,004,930 |
||||
|
RETAIL & WHOLESALE - 0.9% |
|||||
|
Drug Stores - 0.9% |
|||||
|
Duane Reade, Inc. Tranche B term loan 9.5606% 2/15/05 (d) |
- |
|
1,000,000 |
1,002,500 |
|
|
SERVICES - 5.6% |
|||||
|
Leasing & Rental - 2.8% |
|||||
|
Crown Castle Operating Co. Tranche B term loan 9.37% 3/15/08 (d) |
Ba3 |
|
2,000,000 |
2,010,000 |
|
|
Interpool, Inc. Tranche B term loan 8.8125% 10/24/02 (d) |
- |
|
1,000,000 |
1,002,500 |
|
|
|
3,012,500 |
||||
|
Services - 2.8% |
|||||
|
Iron Mountain, Inc. Tranche B term loan |
- |
|
3,000,000 |
3,022,500 |
|
|
TOTAL SERVICES |
6,035,000 |
||||
|
Floating Rate Loans (e) - continued |
|||||
|
Moody's Ratings (unaudited) (a) |
Principal Amount |
Value |
|||
|
TECHNOLOGY - 2.2% |
|||||
|
Computer Services & Software - 1.2% |
|||||
|
Exodus Communications, Inc. Tranche B term loan 11.75% 10/31/07 (d) |
B+ |
|
$ 1,300,000 |
$ 1,308,125 |
|
|
Electronic Instruments - 1.0% |
|||||
|
Dynatech LLC Tranche B term loan 9.89% 9/30/07 (d) |
- |
|
992,126 |
994,606 |
|
|
TOTAL TECHNOLOGY |
2,302,731 |
||||
|
UTILITIES - 20.9% |
|||||
|
Cellular - 16.2% |
|||||
|
Cook Inlet/Voicestream Op Co. LLC Tranche A term loan 10.38% 12/31/07 (d) |
B2 |
|
1,000,000 |
1,000,000 |
|
|
Nextel Finance Co.: |
|
|
|
|
|
|
Tranche B term loan 10% 6/30/08 (d) |
Ba2 |
|
1,750,000 |
1,754,375 |
|
|
Tranche C term loan 10.3125% 12/31/08 (d) |
Ba2 |
|
1,750,000 |
1,754,375 |
|
|
Powertel, Inc. Tranche A term loan 9.6875% 12/31/05 (d) |
- |
|
1,000,000 |
1,000,000 |
|
|
Tritel Holding Corp. Tranche B term loan 11.12% 12/31/07 (d) |
B2 |
|
2,000,000 |
2,010,000 |
|
|
Triton PCS, Inc. Tranche B term loan 9.625% 2/4/07 (d) |
- |
|
3,000,000 |
3,000,000 |
|
|
Voicestream PCS Holding LLC Tranche B term loan 9.62% 2/25/09 (d) |
B+ |
|
5,300,000 |
5,260,250 |
|
|
Western Wireless Corp. Tranche B term loan 9.41% 9/30/08 (d) |
Ba2 |
|
1,500,000 |
1,507,500 |
|
|
|
17,286,500 |
||||
|
Electric Utility - 1.9% |
|||||
|
AES Corp. Tranche B term loan 9.375% 4/24/01 (d) |
- |
|
2,000,000 |
2,005,000 |
|
|
Telephone Services - 2.8% |
|||||
|
Global Crossing Holdings Ltd. Tranche B term loan 9.38% 6/30/06 (d) |
- |
|
2,000,000 |
2,012,500 |
|
|
McLeodUSA, Inc. Tranche B term loan 9.62% 5/31/08 (d) |
Ba2 |
|
1,000,000 |
998,750 |
|
|
|
3,011,250 |
||||
|
TOTAL UTILITIES |
22,302,750 |
||||
|
TOTAL FLOATING RATE LOANS (Cost $80,434,225) |
80,213,629 |
||||
|
Nonconvertible Bonds - 4.8% |
|||||
|
Moody's Ratings (unaudited) (a) |
Principal Amount |
Value |
|||
|
ENERGY - 1.9% |
|||||
|
Energy Services - 1.9% |
|||||
|
Cliffs Drilling Co. Class B, 10.25% 5/15/03 |
Ba3 |
|
$ 2,000,000 |
$ 2,045,000 |
|
|
TRANSPORTATION - 0.9% |
|||||
|
Air Transportation - 0.9% |
|||||
|
US Air, Inc. 9.625% 2/1/01 |
B3 |
|
975,000 |
965,250 |
|
|
UTILITIES - 2.0% |
|||||
|
Cellular - 2.0% |
|||||
|
Clearnet Communications, Inc. yankee 0% 12/15/05 (c) |
Ba1 |
|
2,000,000 |
2,120,000 |
|
|
TOTAL NONCONVERTIBLE BONDS (Cost $5,144,861) |
5,130,250 |
||||
|
Cash Equivalents - 17.1% |
|||
|
Maturity Amount |
|
||
|
Investments in repurchase agreements (U.S. Treasury Obligations), in a joint trading account at 6.56%, dated 10/31/00 due 11/1/00 |
$ 10,249,867 |
10,248,000 |
|
|
Shares |
|
||
|
Fidelity Money Market Central Fund, 6.70% (b) |
8,000,000 |
8,000,000 |
|
|
TOTAL CASH EQUIVALENTS (Cost $18,248,000) |
18,248,000 |
||
|
TOTAL INVESTMENT PORTFOLIO - 97.2% (Cost $103,827,086) |
103,591,879 |
||
|
NET OTHER ASSETS - 2.8% |
3,014,263 |
||
|
NET ASSETS - 100% |
$ 106,606,142 |
||
|
Legend |
|
(a) S&P credit ratings are used in the absence of a rating by Moody's Investors Service, Inc. |
|
(b) The rate quoted is the annualized seven-day yield of the fund at period end. A complete listing of the fund's holdings as of its most recent fiscal year end is available upon request. |
|
(c) Debt obligation initially issued in zero coupon form which converts to coupon form at a specified rate and date. The rate shown is the rate at period end. |
|
(d) The coupon rate shown on floating or adjustable rate securities represents the rate at period end. |
|
(e) Remaining maturities of floating rate loans may be less than the stated maturities shown as a result of contractual or optional prepayments by the borrower. Such prepayments cannot be predicted with certainty. |
|
Other Information |
|
The composition of long-term debt holdings as a percentage of total value of investments in securities, is as follows (ratings are unaudited): |
|
Moody's Ratings |
S&P Ratings |
|||
|
Aaa, Aa, A |
1.0% |
|
AAA, AA, A |
1.0% |
|
Baa |
0.0% |
|
BBB |
0.0% |
|
Ba |
28.0% |
|
BB |
15.7% |
|
B |
9.9% |
|
B |
16.5% |
|
Caa |
0.0% |
|
CCC |
0.9% |
|
Ca, C |
0.0% |
|
CC, C |
0.0% |
|
|
|
|
D |
0.0% |
|
The percentage not rated by Moody's or S&P amounted to 33.6%. FMR has determined that unrated debt securities that are lower quality account for 33.6% of the total value of investment in securities. |
|
Income Tax Information |
|
At October 31, 2000, the aggregate cost of investment securities for income tax purposes was $103,827,086. Net unrealized depreciation aggregated $235,207, of which $87,333 related to appreciated investment securities and $322,540 related to depreciated investment securities. |
|
At October 31, 2000, the fund had a capital loss carryforward of approximately $5,000 all of which will expire on October 31, 2008. |
See accompanying notes which are an integral part of the financial statements.
Annual Report
Statement of Assets and Liabilities
|
|
October 31, 2000 |
|
|
Assets |
|
|
|
Investment in securities, at value (including repurchase agreements of $10,248,000) (cost $103,827,086) - See accompanying schedule |
|
$ 103,591,879 |
|
Cash |
|
3,524,411 |
|
Receivable for fund shares sold |
|
4,367,060 |
|
Interest receivable |
|
440,218 |
|
Prepaid expenses |
|
62,303 |
|
Total assets |
|
111,985,871 |
|
Liabilities |
|
|
|
Payable for investments purchased |
$ 4,977,000 |
|
|
Payable for fund shares redeemed |
74,361 |
|
|
Accrued management fee |
28,310 |
|
|
Distribution fees payable |
44,501 |
|
|
Other payables and accrued expenses |
255,557 |
|
|
Total liabilities |
|
5,379,729 |
|
Net Assets |
|
$ 106,606,142 |
|
Net Assets consist of: |
|
|
|
Paid in capital |
|
$ 106,829,910 |
|
Undistributed net investment income |
|
16,139 |
|
Accumulated undistributed net realized gain (loss) |
|
(4,700) |
|
Net unrealized appreciation (depreciation) on investments |
|
(235,207) |
|
Net Assets |
|
$ 106,606,142 |
See accompanying notes which are an integral part of the financial statements.
Annual Report
Financial Statements - continued
Statement of Assets and Liabilities - continued
|
|
October 31, 2000 |
|
|
Calculation of Maximum Offering Price |
|
$9.94 |
|
Maximum offering price per share (100/96.25 of $9.94) |
|
$10.33 |
|
Class T: |
|
$9.94 |
|
Maximum offering price per share (100/97.25 of $9.94) |
|
$10.22 |
|
Class B: |
|
$9.94 |
|
Class C: |
|
$9.94 |
|
Institutional Class: |
|
$9.94 |
A Redemption price per share is equal to net asset value less any applicable contingent deferred sales charge.
See accompanying notes which are an integral part of the financial statements.
Annual Report
Financial Statements - continued
Statement of Operations
|
|
August 16, 2000 (commencement of operations) to October 31, 2000 |
|
|
Investment Income Interest |
|
$ 954,324 |
|
Expenses |
|
|
|
Management fee |
$ 81,444 |
|
|
Transfer agent fees |
17,603 |
|
|
Distribution fees |
73,287 |
|
|
Accounting fees and expenses |
12,391 |
|
|
Custodian fees and expenses |
1,917 |
|
|
Registration fees |
48,527 |
|
|
Audit |
44,400 |
|
|
Miscellaneous |
500 |
|
|
Total expenses before reductions |
280,069 |
|
|
Expense reductions |
(134,198) |
145,871 |
|
Net investment income |
|
808,453 |
|
Realized and Unrealized Gain (Loss) Net realized gain (loss) on investment securities |
|
(5,558) |
|
Change in net unrealized appreciation (depreciation) on investment securities |
|
(235,207) |
|
Net gain (loss) |
|
(240,765) |
|
Net increase (decrease) in net assets |
|
$ 567,688 |
See accompanying notes which are an integral part of the financial statements.
Annual Report
Financial Statements - continued
Statement of Changes in Net Assets
|
|
August 16, 2000
(commencement |
|
Increase (Decrease) in Net Assets |
|
|
Operations |
$ 808,453 |
|
Net realized gain (loss) |
(5,558) |
|
Change in net unrealized appreciation (depreciation) |
(235,207) |
|
Net increase (decrease) in net assets resulting from operations |
567,688 |
|
Distributions to shareholders from net investment income |
(791,456) |
|
Share transactions - net increase (decrease) |
106,824,265 |
|
Redemption fees |
5,645 |
|
Total increase (decrease) in net assets |
106,606,142 |
|
Net Assets |
|
|
Beginning of period |
- |
|
End of period (including undistributed net investment income of $16,139) |
$ 106,606,142 |
See accompanying notes which are an integral part of the financial statements.
Annual Report
Financial Highlights - Class A
|
Year ended |
October 31, |
|
Selected Per-Share Data |
2000 E |
|
Net asset value, beginning of period |
$ 10.000 |
|
Income from Investment Operations |
|
|
Net investment income D |
.136 |
|
Net realized and unrealized gain (loss) |
(.047) |
|
Total from investment operations |
.089 |
|
Less Distributions |
|
|
From net investment income |
(.150) |
|
Redemption fees added to paid in capital |
.001 |
|
Net asset value, end of period |
$ 9.940 |
|
Total Return B, C |
0.90% |
|
Ratios and Supplemental Data |
|
|
Net assets, end of period (000 omitted) |
$ 9,409 |
|
Ratio of expenses to average net assets |
.78% A, F |
|
Ratio of expenses to average net assets after expense reductions |
.78% A |
|
Ratio of net investment income to average net assets |
7.21% A |
|
Portfolio turnover rate |
12% A |
A Annualized
B The total return would have been lower had certain expenses not been reduced during the period shown.
C Total returns do not include the one time sales charge and for periods of less than one year are not annualized.
D Net investment income per share has been calculated based on average shares outstanding during the period.
E For the period August 16, 2000 (commencement of operations) to October 31, 2000.
F FMR agreed to reimburse a portion of the class' expenses during the period. Without this reimbursement, the class' expense ratio would have been higher.
See accompanying notes which are an integral part of the financial statements.
Annual Report
Financial Highlights - Class T
|
Year ended |
October 31, |
|
Selected Per-Share Data |
2000 E |
|
Net asset value, beginning of period |
$ 10.000 |
|
Income from Investment Operations |
|
|
Net investment income D |
.131 |
|
Net realized and unrealized gain (loss) |
(.045) |
|
Total from investment operations |
.086 |
|
Less Distributions |
|
|
From net investment income |
(.147) |
|
Redemption fees added to paid in capital |
.001 |
|
Net asset value, end of period |
$ 9.940 |
|
Total Return B, C |
0.88% |
|
Ratios and Supplemental Data |
|
|
Net assets, end of period (000 omitted) |
$ 24,571 |
|
Ratio of expenses to average net assets |
.93% A, F |
|
Ratio of expenses to average net assets after expense reductions |
.93% A |
|
Ratio of net investment income to average net assets |
7.06% A |
|
Portfolio turnover rate |
12% A |
A Annualized
B The total return would have been lower had certain expenses not been reduced during the period shown.
C Total returns do not include the one time sales charge and for periods of less than one year are not annualized.
D Net investment income per share has been calculated based on average shares outstanding during the period.
E For the period August 16, 2000 (commencement of operations) to October 31, 2000.
F FMR agreed to reimburse a portion of the class' expenses during the period. Without this reimbursement, the class' expense ratio would have been higher.
See accompanying notes which are an integral part of the financial statements.
Annual Report
Financial Highlights - Class B
|
Year ended |
October 31, |
|
Selected Per-Share Data |
2000 E |
|
Net asset value, beginning of period |
$ 10.000 |
|
Income from Investment Operations |
|
|
Net investment income D |
.134 |
|
Net realized and unrealized gain (loss) |
(.056) |
|
Total from investment operations |
.078 |
|
Less Distributions |
|
|
From net investment income |
(.139) |
|
Redemption fees added to paid in capital |
.001 |
|
Net asset value, end of period |
$ 9.940 |
|
Total Return B, C |
0.79% |
|
Ratios and Supplemental Data |
|
|
Net assets, end of period (000 omitted) |
$ 24,044 |
|
Ratio of expenses to average net assets |
1.23% A, F |
|
Ratio of expenses to average net assets after expense reductions |
1.23% A |
|
Ratio of net investment income to average net assets |
6.75% A |
|
Portfolio turnover rate |
12% A |
A Annualized
B The total return would have been lower had certain expenses not been reduced during the period shown.
C Total returns do not reflect the contingent deferred sales charge and for periods of less than one year are not annualized.
D Net investment income per share has been calculated based on average shares outstanding during the period.
E For the period August 16, 2000 (commencement of operations) to October 31, 2000.
F FMR agreed to reimburse a portion of the class' expenses during the period. Without this reimbursement, the class' expense ratio would have been higher.
See accompanying notes which are an integral part of the financial statements.
Annual Report
Financial Highlights - Class C
|
Year ended |
October 31, |
|
Selected Per-Share Data |
2000 E |
|
Net asset value, beginning of period |
$ 10.000 |
|
Income from Investment Operations |
|
|
Net investment income D |
.125 |
|
Net realized and unrealized gain (loss) |
(.051) |
|
Total from investment operations |
.074 |
|
Less Distributions |
|
|
From net investment income |
(.135) |
|
Redemption fees added to paid in capital |
.001 |
|
Net asset value, end of period |
$ 9.940 |
|
Total Return B, C |
0.76% |
|
Ratios and Supplemental Data |
|
|
Net assets, end of period (000 omitted) |
$ 47,708 |
|
Ratio of expenses to average net assets |
1.44% A, F |
|
Ratio of expenses to average net assets after expense reductions |
1.44% A |
|
Ratio of net investment income to average net assets |
6.55% A |
|
Portfolio turnover rate |
12% A |
A Annualized
B The total return would have been lower had certain expenses not been reduced during the period shown.
C Total returns do not reflect the contingent deferred sales charge and for periods of less than one year are not annualized.
D Net investment income per share has been calculated based on average shares outstanding during the period.
E For the period August 16, 2000 (commencement of operations) to October 31, 2000.
F FMR agreed to reimburse a portion of the class' expenses during the period. Without this reimbursement, the class' expense ratio would have been higher.
See accompanying notes which are an integral part of the financial statements.
Annual Report
Financial Highlights - Institutional Class
|
Year ended |
October 31, |
|
Selected Per-Share Data |
2000 E |
|
Net asset value, beginning of period |
$ 10.000 |
|
Income from Investment Operations |
|
|
Net investment income D |
.151 |
|
Net realized and unrealized gain (loss) |
(.058) |
|
Total from investment operations |
.093 |
|
Less Distributions |
|
|
From net investment income |
(.154) |
|
Redemption fees added to paid in capital |
.001 |
|
Net asset value, end of period |
$ 9.940 |
|
Total Return B, C |
0.94% |
|
Ratios and Supplemental Data |
|
|
Net assets, end of period (000 omitted) |
$ 875 |
|
Ratio of expenses to average net assets |
.49% A, F |
|
Ratio of expenses to average net assets after expense reductions |
.49% A |
|
Ratio of net investment income to average net assets |
7.50% A |
|
Portfolio turnover rate |
12% A |
A Annualized
B The total return would have been lower had certain expenses not been reduced during the period shown.
C Total returns for periods of less than one year are not annualized.
D Net investment income per share has been calculated based on average shares outstanding during the period.
E For the period August 16, 2000 (commencement of operations) to October 31, 2000.
F FMR agreed to reimburse a portion of the class' expenses during the period. Without this reimbursement, the class' expense ratio would have been higher.
See accompanying notes which are an integral part of the financial statements.
Annual Report
For the period ended October 31, 2000
1. Significant Accounting Policies.
Fidelity Advisor Floating Rate High Income Fund (the fund) is a fund of Fidelity Advisor Series II (the trust) and is authorized to issue an unlimited number of shares. The trust is registered under the Investment Company Act of 1940, as amended (the 1940 Act), as an open-end management investment company organized as a Massachusetts business trust.
The fund offers Class A, Class T, Class B, Class C, and Institutional Class shares, each of which has equal rights as to assets and voting privileges. Each class has exclusive voting rights with respect to matters that affect that class. The fund commenced sale of shares on August 16, 2000. Class B shares will automatically convert to Class A shares after a holding period of seven years from the initial date of purchase. Investment income, realized and unrealized capital gains and losses, the common expenses of the fund, and certain fund-level expense reductions, if any, are allocated on a pro rata basis to each class based on the relative net assets of each class to the total net assets of the fund. Each class of shares differs in its respective distribution, transfer agent, and certain other class-specific fees, expenses, and expense reductions.
The financial statements have been prepared in conformity with generally accepted accounting principles which require management to make certain estimates and assumptions at the date of the financial statements. The following summarizes the significant accounting policies of the fund:
Security Valuation. Securities for which quotations are readily available are valued at their market values as determined by their most recent bid prices in the principal market (sales prices if the principal market is an exchange) in which such securities are normally traded. Securities for which market quotations are not readily available are valued at their fair value as determined in good faith under consistently applied procedures under the general supervision of the Board of Trustees. Short-term securities with remaining maturities of sixty days or less for which quotations are not readily available are valued at amortized cost or original cost plus accrued interest, both of which approximate current value. Investments in open-end investment companies are valued at their net asset value each business day.
Foreign Currency Translation. The accounting records of the fund are maintained in U.S. dollars. Investment securities and other assets and liabilities denominated in a foreign currency are translated into U.S. dollars at the prevailing rates of exchange at period end. Purchases and sales of securities, income receipts and expense payments are translated into U.S. dollars at the prevailing exchange rate on the respective dates of the transactions.
Net realized gains and losses on foreign currency transactions represent net gains and losses from sales and maturities of foreign currency contracts, disposition of foreign currencies, the difference between the amount of net investment income accrued and the U.S. dollar amount actually received, and gains and losses between trade and settlement date on
Annual Report
Notes to Financial Statements - continued
1. Significant Accounting Policies - continued
Foreign Currency Translation - continued
purchases and sales of securities. The effects of changes in foreign currency exchange rates on investments in securities are included with the net realized and unrealized gain or loss on investment securities.
Income Taxes. The fund intends to qualify as a regulated investment company under Subchapter M of the Internal Revenue Code. By so qualifying, the fund will not be subject to income taxes to the extent that it distributes substantially all of its taxable income for its fiscal year. The schedule of investments includes information regarding income taxes under the caption "Income Tax Information."
Investment Income. Interest income, which includes accretion of discount and amortization of premium, is accrued as earned. Investment income is recorded net of foreign taxes withheld where recovery of such taxes is uncertain. The fund may place a debt obligation on non-accrual status and reduce related interest income by ceasing current accruals and writing off interest receivables when the collection of all or a portion of interest has become doubtful based on consistently applied procedures, under the general supervision of the Board of Trustees of the fund. A debt obligation is removed from non-accrual status when the issuer resumes interest payments or when collectibility of interest is reasonably assured.
Expenses. Most expenses of the trust can be directly attributed to a fund. Expenses which cannot be directly attributed are apportioned among the funds in the trust.
Prepaid Expenses. Fidelity Management & Research Company (FMR) bears all organizational expenses of the fund except for the cost of registering and qualifying shares of each class for distribution under federal and state securities law. These registration expenses are borne by the fund and amortized over one year.
Distributions to Shareholders. Distributions are declared daily and paid monthly from net investment income. Distributions from realized gains, if any, are recorded on the ex-dividend date. Income dividends and capital gain distributions are declared separately for each class.
Income and capital gain distributions are determined in accordance with income tax regulations which may differ from generally accepted accounting principles. These differences, may result in distribution reclassifications.
Permanent book and tax basis differences relating to shareholder distributions will result in reclassifications to paid in capital. Undistributed net investment income and accumulated undistributed net realized gain (loss) on investments may include temporary book and tax basis differences which will reverse in a subsequent period. Any taxable income or gain remaining at fiscal year end is distributed in the following year.
Annual Report
Notes to Financial Statements - continued
1. Significant Accounting Policies - continued
Short-Term Trading (Redemption) Fees. Shares held in the fund less than 60 days are subject to a short-term trading fee equal to 1.00% of the proceeds of the redeemed shares. The fee, which is retained by the fund, is accounted for as an addition to paid in capital.
Security Transactions. Security transactions are accounted for as of trade date. Gains and losses on securities sold are determined on the basis of identified cost.
2. Operating Policies.
Foreign Currency Contracts. The fund generally uses foreign currency contracts to facilitate transactions in foreign-denominated securities. Losses may arise from changes in the value of the foreign currency or if the counterparties do not perform under the contracts' terms. The U.S. dollar value of foreign currency contracts is determined using contractual currency exchange rates established at the time of each trade.
Joint Trading Account. Pursuant to an Exemptive Order issued by the Securities and Exchange Commission (the SEC), the fund, along with other affiliated entities of FMR, may transfer uninvested cash balances into one or more joint trading accounts. These balances are invested in one or more repurchase agreements for U.S. Treasury or Federal Agency obligations.
Repurchase Agreements. The underlying U.S. Treasury, Federal Agency, or other obligations found to be satisfactory by FMR are transferred to an account of the fund, or to the Joint Trading Account, at a custodian bank. The securities are marked-to-market daily and maintained at a value at least equal to the principal amount of the repurchase agreement (including accrued interest). FMR, the fund's investment adviser, is responsible for determining that the value of the underlying securities remains in accordance with the market value requirements stated above.
Loans and Other Direct Debt Instruments. The fund invests in loans and loan participations, trade claims or other receivables, which may include standby financing commitments that obligate the fund to supply additional cash to the borrower on demand. Loan participations involve a risk of insolvency of the lending bank or other financial intermediary. The fund may be contractually obligated to receive approval from the agent bank and/or borrower prior to the sale of these investments. At period end, the fund had no investments in loan participations or loans involving standby financing commitments.
3. Purchases and Sales of Investments.
Purchases and sales of securities (including principal repayments of floating rate loans), other than short-term securities, aggregated $83,861,083 and $1,251,123, respectively.
Annual Report
Notes to Financial Statements - continued
4. Fees and Other Transactions with Affiliates.
Management Fee. As the fund's investment adviser, FMR receives a monthly fee that is calculated on the basis of a group fee rate plus a fixed individual fund fee rate applied to the average net assets of the fund. The group fee rate is the weighted average of a series of rates and is based on the monthly average net assets of all the mutual funds advised by FMR. The rates ranged from .0920% to .3700% for the period. The annual individual fund fee rate is .55%. In the event that these rates were lower than the contractual rates in effect during the period, FMR voluntarily implemented the above rates, as they resulted in the same or a lower management fee. For the period, the management fee was equivalent to an annualized rate of .68% of average net assets.
Sub-Adviser Fee. Beginning January 1, 2001, FMR Co.(FMRC) will serve as a sub-adviser for the fund. FMRC is a wholly owned subsidiary of FMR and will receive a fee from FMR of 50% of the management fee payable to FMR with respect to that portion of the fund's assets that will be managed by FMRC.
Distribution and Service Plan. In accordance with Rule 12b-1 of the 1940 Act, the Board of Trustees has adopted separate Distribution and Service Plans with respect to each class of shares (collectively referred to as "the Plans"). Under certain of the Plans, the class pays Fidelity Distributors Corporation (FDC), an affiliate of FMR, a 12b-1 fee. A portion of this fee may be reallowed to securities dealers, banks and other financial institutions for the distribution of each class of shares and providing shareholder support services. For the period, this fee was based on the following annual rates of the average net assets of each applicable class:
|
Class A |
.15% |
|
Class T |
.25% |
|
Class B |
.70%* |
|
Class C |
.80%** |
* .55% represents a distribution fee and .15% represents a shareholder service fee.
** .55% represents a distribution fee and .25% represents a shareholder service fee.
For the period, each class paid FDC the following amounts, a portion of which was retained by FDC:
|
|
Paid to |
Retained |
|
Class A |
$ 1,376 |
$ 73 |
|
Class T |
5,744 |
- |
|
Class B |
24,466 |
20,596 |
|
Class C |
41,701 |
37,596 |
|
|
$ 73,287 |
$ 58,265 |
Annual Report
Notes to Financial Statements - continued
4. Fees and Other Transactions with Affiliates - continued
Sales Load. FDC receives a front-end sales charge of up to 3.75% for selling Class A shares, and 2.75% for selling Class T shares of the fund. FDC receives the proceeds of contingent deferred sales charges levied on Class B share redemptions occurring within six years of purchase and Class C share redemptions occurring within 15 months of purchase. Contingent deferred sales charges are based on declining rates ranging from 3.50% to 1% for Class B and 1% for Class C, of the lesser of the cost of shares at the initial date of purchase or the net asset value of the redeemed shares, excluding any reinvested dividends and capital gains. In addition, purchases of Class A and Class T shares that were subject to a finder's fee bear a contingent deferred sales charge on assets that do not remain in the fund for at least one year. The Class A and Class T contingent deferred sales charge is based on 0.25% of the lesser of the cost of shares at the initial date of purchase or the net asset value of the redeemed shares, excluding any reinvested dividends and capital gains. A portion of the sales charges paid to FDC is paid to securities dealers, banks and other financial institutions.
For the period, sales charge amounts paid to and retained by FDC were as follows:
|
|
Paid to |
Retained |
|
Class A |
$ 25,423 |
$ 16,977 |
|
Class T |
29,740 |
12,357 |
|
Class B |
2,321 |
2,321* |
|
Class C |
1,481 |
1,481* |
|
|
$ 58,965 |
$ 33,136 |
* When Class B and Class C shares are initially sold, FDC pays commissions from its own resources to securities dealers,
banks, and other financial institutions through which the sales are made.
Transfer Agent Fees. Fidelity Investments Institutional Operations Company, Inc., (FIIOC), an affiliate of FMR, is the transfer, dividend disbursing and shareholder servicing agent (collectively referred to as the transfer agent) for each class of the fund. FIIOC receives account fees and asset-based fees that vary according to the account size and type of account of the shareholders of the respective classes of the fund. FIIOC pays for typesetting, printing and mailing of all shareholder reports, except proxy statements. For the period, the following amounts were paid to FIIOC:
|
|
Amount |
% of |
|
Class A |
$ 1,209 |
.13 |
|
Class T |
3,165 |
.14 |
|
Class B |
5,329 |
.15 |
|
Class C |
7,546 |
.15 |
|
Institutional Class |
354 |
.26 |
|
|
$ 17,603 |
|
* Annualized
Annual Report
Notes to Financial Statements - continued
4. Fees and Other Transactions with Affiliates - continued
Fidelity Money Market Central Fund. Pursuant to an Exemptive Order issued by the SEC, the fund may invest in the Fidelity Money Market Central Fund (the Central Fund) managed by Fidelity Investments Money Management, Inc., an affiliate of FMR. The Central Fund is an open-end money market fund available only to investment companies and other accounts managed by FMR and its affiliates. The Central Fund is principally used for the fund's strategic allocations to money market investments. The Central Fund seeks preservation of capital, liquidity, and current income. Income distributions from the Central Fund are declared daily and paid monthly from net investment income. Income distributions earned by the fund are recorded as interest income in the accompanying financial statements.
5. Expense Reductions.
FMR voluntarily agreed to reimburse operating expenses (excluding interest, taxes, certain securities lending fees, brokerage commissions and extraordinary expenses, if any) above the following annual rates or range of annual rates of average net assets for each of the following classes:
|
|
FMR |
Reimbursement |
|
Class A |
0.15% - 1.10% |
$ 8,821 |
|
Class T |
0.25% - 1.20% |
19,916 |
|
Class B |
0.70% - 1.65% |
52,666 |
|
Class C |
0.80% - 1.75% |
50,218 |
|
Institutional Class |
0% - 0.95% |
2,471 |
|
|
|
$ 134,092 |
In addition, through an arrangement with the fund's custodian, credits realized as a result of uninvested cash balances were used to reduce a portion of expenses. During the period, the fund's custodian fees were reduced by $106 under the custodian arrangement.
6. Beneficial Interest.
At the end of the period, FMR and its affiliates were record owners of approximately 9.6% of the total outstanding shares of the fund.
Annual Report
Notes to Financial Statements - continued
7. Distributions to Shareholders.
Distributions to shareholders of each class were as follows:
|
|
August 16, 2000
(commencement of
operations) to |
|
|
2000 |
|
From net investment income |
|
|
Class A |
$ 64,668 |
|
Class T |
160,974 |
|
Class B |
230,804 |
|
Class C |
325,083 |
|
Institutional Class |
9,927 |
|
Total |
$ 791,456 |
Annual Report
Notes to Financial Statements - continued
8. Share Transactions.
Transactions for each class of shares were as follows:
|
|
Shares |
Dollars |
|
|
Year ended October 31, |
Year ended October 31, |
|
|
2000 A |
2000 A |
|
|
|
|
|
Class A |
956,032 |
$ 9,517,522 |
|
Reinvestment of distributions |
5,713 |
56,832 |
|
Shares redeemed |
(15,453) |
(153,810) |
|
Net increase (decrease) |
946,292 |
$ 9,420,544 |
|
Class T |
2,479,164 |
$ 24,685,030 |
|
Reinvestment of distributions |
13,624 |
135,516 |
|
Shares redeemed |
(21,104) |
(209,675) |
|
Net increase (decrease) |
2,471,684 |
$ 24,610,871 |
|
Class B |
2,777,776 |
$ 27,690,876 |
|
Reinvestment of distributions |
20,634 |
205,302 |
|
Shares redeemed |
(379,062) |
(3,767,960) |
|
Net increase (decrease) |
2,419,348 |
$ 24,128,218 |
|
Class C |
4,923,527 |
$ 49,034,923 |
|
Reinvestment of distributions |
28,548 |
283,958 |
|
Shares redeemed |
(154,190) |
(1,532,861) |
|
Net increase (decrease) |
4,797,885 |
$ 47,786,020 |
|
Institutional Class |
89,211 |
$ 890,224 |
|
Reinvestment of distributions |
843 |
8,388 |
|
Shares redeemed |
(2,008) |
(20,000) |
|
Net increase (decrease) |
88,046 |
$ 878,612 |
A Share transactions are for the period August 16, 2000 (commencement of operations) to October 31, 2000.
Annual Report
To the Trustees of Fidelity Advisor Series II and Shareholders of Fidelity Advisor Floating Rate High Income Fund:
We have audited the accompanying statement of assets and liabilities of Fidelity Advisor Floating Rate High Income Fund, (the Fund), a fund of Fidelity Advisor Series II (the Trust), including the portfolio of investments, as of October 31, 2000, and the related statements of operations, changes in net assets, and financial highlights for the period August 16, 2000 (commencement of operations) to October 31, 2000. These financial statements and financial highlights are the responsibility of the Fund's management. Our responsibility is to express an opinion on these financial statements and financial highlights based on our audit.
We conducted our audit in accordance with auditing standards generally accepted in the United States of America. Those standards require that we plan and perform the audit to obtain reasonable assurance about whether the financial statements and financial highlights are free of material misstatement. An audit includes examining, on a test basis, evidence supporting the amounts and disclosures in the financial statements. Our procedures included confirmation of securities owned as of October 31, 2000, by correspondence with the custodian and brokers; where replies were not received from brokers and selling or agent banks, we performed other auditing procedures. An audit also includes assessing the accounting principles used and significant estimates made by management, as well as evaluating the overall financial statement presentation. We believe that our audit provides a reasonable basis for our opinion.
In our opinion, the financial statements and financial highlights referred to above present fairly, in all material respects, the financial position of Fidelity Advisor Floating Rate High Income Fund as of October 31, 2000, the results of its operations, the changes in its net assets, and its financial highlights for the period August 16, 2000 (commencement of operations) to October 31, 2000, in conformity with accounting principles generally accepted in the United States of America.
/s/DELOITTE & TOUCHE LLP
DELOITTE & TOUCHE LLP
Boston, Massachusetts
December 8, 2000
Annual Report
Annual Report
Annual Report
Annual Report
Annual Report
Annual Report
Annual Report
Annual Report
Investment Adviser
Fidelity Management & Research Company
Boston, MA
Investment Sub-Advisers
Fidelity Management & Research
(U.K.) Inc.
Fidelity Management & Research
(Far East) Inc.
Fidelity Investments Japan Limited
Officers
Edward C. Johnson 3d, President
Robert C. Pozen, Senior Vice President
Robert A. Lawrence, Vice President
Eric D. Roiter, Secretary
Robert A. Dwight, Treasurer
Maria F. Dwyer, Deputy Treasurer
John H. Costello, Assistant Treasurer
Thomas J. Simpson, Assistant Treasurer
Board of Trustees
Ralph F. Cox *
Phyllis Burke Davis *
Robert M. Gates *
Edward C. Johnson 3d
Donald J. Kirk *
Ned C. Lautenbach *
Peter S. Lynch
Marvin L. Mann *
William O. McCoy *
Gerald C. McDonough *
Robert C. Pozen
Thomas R. Williams *
Advisory Board
J. Michael Cook
Abigail P. Johnson
Marie L. Knowles
General Distributor
Fidelity Distributors Corporation
Boston, MA
Transfer and Shareholder
Servicing Agent
Fidelity Investments Institutional Operations Company, Inc.
Boston, MA
Custodian
The Bank of New York
New York, NY
* Independent trustees
Annual Report
Focus Funds
Fidelity Advisor Consumer
Industries Fund
Fidelity Advisor Cyclical
Industries Fund
Fidelity Advisor Financial
Services Fund
Fidelity Advisor Health Care Fund
Fidelity Advisor Natural
Resources Fund
Fidelity Advisor Technology Fund
Fidelity Advisor Telecommunications & Utilities Growth Fund
Growth Funds
Fidelity Advisor Korea Fund
Fidelity Advisor Emerging Asia Fund
Fidelity Advisor Latin America Fund
Fidelity Advisor Japan Fund
Fidelity Advisor Europe Capital Appreciation Fund
Fidelity Advisor International
Capital Appreciation Fund
Fidelity Advisor Overseas Fund
Fidelity Advisor Diversified International Fund
Fidelity Advisor Global Equity Fund
Fidelity Advisor TechnoQuant ®
Growth Fund
Fidelity Advisor Small Cap Fund
Fidelity Advisor Value Strategies Fund
Fidelity Advisor Mid Cap Fund
Fidelity Advisor Dynamic Capital Appreciation Fund
Fidelity Advisor Equity Growth Fund
Fidelity Advisor Large Cap Fund
Fidelity Advisor Dividend Growth Fund
Fidelity Advisor Growth
Opportunities Fund
Growth and Income Funds
Fidelity Advisor Growth & Income Fund
Fidelity Advisor Equity Income Fund
Fidelity Advisor Asset Allocation Fund
Fidelity Advisor Balanced Fund
Taxable Income Funds
Fidelity Advisor Emerging Markets Income Fund
Fidelity Advisor High Yield Fund
Fidelity Advisor High Income Fund
Fidelity Advisor Strategic Income Fund
Fidelity Advisor Mortgage
Securities Fund
Fidelity Advisor Government Investment Fund
Fidelity Advisor Intermediate Bond Fund
Fidelity Advisor Short Fixed-Income Fund
Municipal Funds
Fidelity Advisor Municipal Income Fund
Money Market Funds
Prime Fund
Treasury Fund
Tax-Exempt Fund
|
AFR-ANN-1200 |
120333 |
|
1.750077.100 |
|
(Fidelity Investment logo)(registered trademark)
Fidelity® Advisor
Fund - Institutional Class
Annual Report
October 31, 2000
(2_fidelity_logos)
|
President's Message |
3 |
Ned Johnson on investing strategies. |
|
Performance |
4 |
How the fund has done over time. |
|
Fund Talk |
6 |
The manager's review of fund performance, strategy and outlook. |
|
Investment Summary |
9 |
A summary of the fund's investments. |
|
Investments |
10 |
A complete list of the fund's investments with their market values. |
|
Financial Statements |
16 |
Statements of assets and liabilities,
operations, and changes in net assets, |
|
Notes |
25 |
Notes to the financial statements. |
|
Independent Auditors' Report |
33 |
The auditors' opinion. |
Standard & Poor's, S&P and S&P 500 are registered service marks of The McGraw-Hill Companies, Inc. and have been licensed for use by Fidelity Distributors Corporation.
Other third party marks appearing herein are the property of their respective owners.
All other marks appearing herein are registered or unregistered trademarks or service marks of FMR Corp. or an affiliated company.
(Recycle graphic) This report is printed on recycled paper using soy-based inks.
This report and the financial statements contained herein are submitted for the general information of the shareholders of the fund. This report is not authorized for distribution to prospective investors in the fund unless preceded or accompanied by an effective prospectus.
Mutual fund shares are not deposits or obligations of, or guaranteed by, any depository institution. Shares are not insured by the FDIC, Federal Reserve Board or any other agency, and are subject to investment risks, including possible loss of principal amount invested.
Neither the fund nor Fidelity Distributors Corporation is a bank.
For more information on any Fidelity Advisor fund, including charges and expenses, contact your investment professional for a free prospectus. Read it carefully before you invest or send money.
Annual Report
(photo_of_Edward_C_Johnson_3d)
Dear Shareholder:
A sixth-straight year of double-digit positive returns for the Dow Jones Industrial Average, NASDAQ and S&P 500® could be in jeopardy unless the U.S. stock market shows marked improvement in the final two months of 2000. Through October, all three indexes had negative year-to-date returns. On the other hand, most fixed-income sectors were solidly in the black. Treasuries and other long-term government securities led the way, returning nearly 14%.
While it's impossible to predict the future direction of the markets with any degree of certainty, there are certain basic principles that can help investors plan for their future needs.
The longer your investment time frame, the less likely it is that you will be affected by short-term market volatility. A 10-year investment horizon appropriate for saving for a college education, for example, enables you to weather market cycles in a long-term fund, which may have a higher risk potential, but also has a higher potential rate of return.
An intermediate-length fund could make sense if your investment horizon is two to four years, while a short-term bond fund could be the right choice if you need your money in one or two years.
If your time horizon is less than a year, you might want to consider moving some of your bond investment into a money market fund. These funds seek income and a stable share price by investing in high-quality, short-term investments. Of course, it's important to remember that an investment in a money market fund is not insured or guaranteed by the Federal Deposit Insurance Corporation or any other government agency. Although money market funds seek to preserve the value of your investment at $1.00 per share, it is possible to lose money by investing in these types of funds.
Finally, no matter what your time horizon or portfolio diversity, it makes good sense to follow a regular investment plan, investing a certain amount of money in a fund at the same time each month or quarter and periodically reviewing your overall portfolio. By doing so, you won't get caught up in the excitement of a rapidly rising market, nor will you buy all your shares at market highs. While this strategy - known as dollar cost averaging - won't assure a profit or protect you from a loss in a declining market, it should help you lower the average cost of your purchases. Of course, you should consider your financial ability to continue your purchases through periods of low price levels before undertaking such a strategy.
Remember to contact your investment professional if you need help with your investments.
Best regards,
/s/Edward C. Johnson 3d
Edward C. Johnson 3d
Annual Report
Fidelity Advisor Floating Rate High Income Fund - Institutional Class
There are several ways to evaluate historical performance. You can look at the total percentage change in value, the average annual percentage change or the growth of a hypothetical $10,000 investment. Total return reflects the change in the value of an investment, assuming reinvestment of the class' dividend income and capital gains (the profits earned upon the sale of securities that have grown in value). If Fidelity had not reimbursed certain class expenses, the total returns and dividends would have been lower.
Cumulative Total Returns
|
Period ended October 31, 2000 |
|
|
Life of |
|
Fidelity® Adv Floating Rate High Income - Inst CL |
|
|
0.94% |
|
DLJ Leveraged Loan Plus |
|
|
0.62% |
Cumulative total returns show Institutional Class' performance in percentage terms over a set period - in this case, since the fund started on August 16, 2000. For example, if you had invested $1,000 in a fund that had a 5% return over the past year, the value of your investment would be $1,050. You can compare Institutional Class' returns to the performance of the Donaldson, Lufkin & Jenrette (DLJ) Leveraged Loan Index Plus - a market value-weighted index designed to represent the investable universe of the U.S. dollar denominated leveraged loan market. This benchmark includes reinvested dividends and capital gains, if any.
Average Annual Total Returns
Average annual total returns take Institutional Class shares' cumulative return and show you what would have happened if Institutional Class shares had performed at a constant rate each year. These numbers will be reported once the fund is a year old. In addition, the growth of the hypothetical $10,000 investment in the fund will appear in the fund's next report six months from now.
Annual Report
Fidelity Advisor Floating Rate High Income Fund -
Institutional Class
Performance - continued
Total Return Components
|
|
|
August 16, 2000 |
|
|
Dividend returns |
|
1.54% |
|
Capital returns |
|
-0.60% |
|
Total returns |
|
0.94% |
Total return components include both dividend returns and capital returns. A dividend return reflects the actual dividends paid by the class. A capital return reflects both the amount paid by the class to shareholders as capital gain distributions and changes in the class' share price. Both returns assume the dividends or capital gains, if any, paid by the class are reinvested.
Dividends and Yield
|
Periods ended October 31, 2000 |
Past 1 |
Life of |
|
Dividends per share |
6.13¢ |
15.37¢ |
|
Annualized dividend rate |
7.25% |
7.42% |
|
30-day annualized yield |
- |
- |
Dividends per share show the income paid by the class for a set period. The annual dividend rate is based on an average share price of $9.95 over the past one month and $9.95 over the life of the class. The 30-day annualized yield is a standard formula based on the yields of the securities in the fund, averaged over the past 30 days. This figure shows you the yield characteristics of the fund's investments at the end of the period. It also helps you compare funds from different companies on an equal basis. Yield information will be reported once Institutional Class has a longer more stable operating history.
Annual Report
Market Recap
The leveraged loan market, as measured by the DLJ Leveraged Loan Index Plus, generated a 5.37% return during the 12-month period that ended October 31, 2000. In a period when most sectors of the leveraged finance market were weak, as evidenced by the Merrill Lynch High Yield Master II Index's decline of 1.68%, the distinct characteristics of leveraged loans enabled them to post strong performance. The combination of seniority, security and floating rates helped reduce the price volatility of leveraged loans and therefore attracted investors seeking stability. That said, the yield spread for average new-issue leveraged loans rated BB/BB- and those rated B+/B by Standard & Poor's® did widen year-over-year. At the end of September 1999, the spread for BB/BB- issues was 302 basis points (or 3.02%) above London Interbank Offered Rate (LIBOR) versus 353 basis points above LIBOR at the end of October 2000. B+/B issues were 357 basis points above LIBOR versus 389 basis points above LIBOR during the same period. S&P/Portfolio Management Data estimates that there was $43.8 billion in new institutional leveraged loan syndications during the past year, representing 320 new-issue leveraged loans. Of this amount, telecommunications and industrial companies represented the largest industry group at 20% and 19% of new issuance, respectively, followed by services/retail at 15% and media at 13%.
(Portfolio Manager photograph)
An interview with Christine McConnell, Portfolio Manager of Fidelity Advisor Floating Rate High Income Fund
Q. How did the fund perform, Christine?
A. Since its inception on August 16, 2000, through October 31, 2000, the fund's Institutional Class shares returned 0.94%. During the same time frame, the fund's benchmark - the DLJ Leveraged Loan Index Plus - returned 0.62%. Going forward, we'll look at the fund's performance in six-and 12-month intervals and will compare its performance to a peer group of funds tracked by Lipper Inc.
Annual Report
Fund Talk: The Manager's Overview - continued
Q. What helped the fund outperform its index during the brief period?
A. Keeping in mind that the fund was still in a start-up phase and incurring cash flows, strong credit selection made a positive contribution to performance as did the fund's diversification.
Q. Can you give us an overview of the kinds of investments the fund will typically own?
A. Certainly. This is the industry's first open-end bank loan fund and provides investors with daily liquidity. The fund invests primarily in senior secured floating rate notes of non-investment grade companies. Additionally, up to 20% of the fund's total assets may be invested in investment-grade money market and short-term debt instruments to enhance the fund's liquidity. The leveraged bank loans in the fund represent companies' direct debt obligations, which are often used to finance working capital, capital expenditures, and mergers and acquisitions. The loans tend to be the most senior obligation in the company's capital structure and are often secured by the key assets of the company. Additionally, the loans have floating interest rates that are generally reset quarterly based on a premium spread to the 90-day London Interbank Offered Rate (LIBOR).
Q. Can you say more about the seniority of these loans?
A. As I mentioned, bank debt is typically the most senior claim in a company's capital structure. Accordingly, it gets paid back first before any value goes to holders of the company's more subordinate issues - including common stock, preferred stock and high-yield bonds. This senior claim helps reduce the underlying credit risk and, consequently, the price volatility of the investment.
Q. You mentioned security. Are these loans secured?
A. Bank debt is often secured by all the assets of a given company. Therefore, a bank debt holder can own title to the cash, receivables, property plant, and equipment, inventory and even real estate of the company. My research team and I spend a great deal of time focused on this collateral package, independently assessing the asset values. This security interest protects investors' downside and helps maximize recoveries in the event of a distressed situation.
Q. Can you explain how the floating rate feature of these loans works, and how it limits their interest-rate volatility?
A. Sure. It's a bit technical. Bank debt coupons are typically priced at a premium to LIBOR ranging between 250-375 basis points, or 2.5% to 3.75%. As floating rate instruments, the coupons are reset quarterly to reflect the existing LIBOR rate plus the premium. For example, at the end of the period the LIBOR rate was approximately 6.76%, suggesting that BB-rated bank debt was yielding approximately 9.5%, while lower-quality single B-rated bank debt yielded around 10.5%. Since the coupons are reset so frequently, this floating rate feature limits the interest-rate volatility of the security. Generally, the shorter the coupon reset period, the less effect interest-rate fluctuations will have.
Q. What's your outlook, Christine?
A. It's an interesting time to be involved with bank loans. Their strong relative performance has led to cash inflows into the market, and the increase in interest rates has resulted in higher yield payouts on these loans. However, the prices exacted by higher interest rates are a slowing economy and skittish capital markets. New issuance - a primary source of loan supply to the market - has slowed, reflecting difficulties raising capital in the high-yield market. Accordingly, investors have turned to the secondary market for investment opportunities. In the near term, these changes imply more-expensive and less-flexible financing for borrowers. Additionally, higher default rates have added to the price volatility in the market versus historic norms. However, given Fidelity's analytical and research strength, I'm confident that we'll be able to sort out the best opportunities for our shareholders.
Annual Report
Fund Talk: The Manager's Overview - continued
The views expressed in this report reflect those of the portfolio manager only through the end of the period of the report as stated on the cover and do not necessarily represent the views of Fidelity or any other person in the Fidelity organization. Any such views are subject to change at any time based upon market or other conditions and Fidelity disclaims any responsibility to update such views. These views may not be relied on as investment advice and, because investment decisions for a Fidelity fund are based on numerous factors, may not be relied on as an indication of trading intent on behalf of any Fidelity fund.
Fund Facts
Goal: seeks a high level of current income
Start date: August 16, 2000
Size: as of October 31, 2000, more than $106 million
Manager: Christine McConnell, since inception; joined Fidelity in 1987
3Christine McConnell on the fund's objective and investment philosophy:
"The fund's objective is to provide a high level of current income. Investment decisions are driven by basic fundamental research focused on the operating performance of a company and its management quality and depth, as well as its business strategy and execution, competition, industry dynamics and the macro-economic backdrop. Decisions also incorporate an assessment of the company's capital and corporate structure and the perceived value of the collateral package.
"We have taken a diversified posture with the fund focusing on: secular growth companies where collateral protection is strong, values are discernable and the market for the assets is tangible, liquid and well-funded; well-capitalized leveraged buyouts or old economy companies that demonstrate a relatively stable and predictable cash flow stream capable of retiring the bank debt in a timely manner; and large cyclical companies with a diversified manufacturing base and good collateral coverage based on trough valuations.
"While the fund is still in a start-up mode, I am comfortable with its diversification and am quite happy with the caliber of the companies we hold in the fund. Our portfolio strategy is targeted at capturing the benefits endemic to this asset class, including seniority and security, and we look to our expertise in credit selection to mitigate the fact that the issuers of these loans are below investment grade."
Annual Report
|
Top Five Holdings as of October 31, 2000 |
|
|
(by issuer, excluding cash equivalents) |
% of fund's |
|
Charter Communication Operating LLC |
5.6 |
|
Voicestream PCS Holding LLC |
4.9 |
|
Nextel Finance Co. |
3.4 |
|
Iron Mountain Inc. |
2.8 |
|
Pegasus Media & Communications Inc. |
2.8 |
|
|
19.5 |
|
Top Five Market Sectors as of October 31, 2000 |
|
|
|
% of fund's |
|
Utilities |
22.9 |
|
Media & Leisure |
20.2 |
|
Basic Industries |
13.6 |
|
Services |
5.6 |
|
Health |
4.3 |
|
Quality Diversification as of October 31, 2000 |
|
|
(Moody's Ratings) |
% of fund's investments |
|
Aaa, Aa, A |
1.0 |
|
Baa |
0.0 |
|
Ba |
30.1 |
|
B |
17.8 |
|
Caa, Ca, C |
0.0 |
|
Not Rated |
33.6 |
|
Table excludes short-term investments. Where Moody's ratings are not available, we have used S&P ® ratings. Unrated debt securities that are equivalent to Ba and below at October 31, 2000 account for 33.6% of the fund's investments. |
|
Asset Allocation (% of fund's net assets) |
As of October 31, 2000*
Annual Report
Showing Percentage of Net Assets
|
Floating Rate Loans (e) - 75.3% |
|||||
|
Moody's Ratings (unaudited) (a) |
Principal Amount |
Value |
|||
|
BASIC INDUSTRIES - 13.6% |
|||||
|
Chemicals & Plastics - 7.2% |
|||||
|
CP Kelco: |
|
|
|
|
|
|
Tranche B term loan 10.0613% 3/31/08 (d) |
B1 |
|
$ 1,725,000 |
$ 1,737,937 |
|
|
Tranche C term loan 10.3113% 9/30/08 (d) |
B1 |
|
575,000 |
579,313 |
|
|
Huntsman ICI Chemicals LLC sr. secured: |
|
|
|
|
|
|
Tranche B term loan 9.6875% 6/30/07 (d) |
- |
|
1,250,000 |
1,262,500 |
|
|
Tranche C term loan 9.9375% 6/30/08 (d) |
- |
|
1,250,000 |
1,262,500 |
|
|
Lyondell Chemical Co. sr. secured Tranche E term loan 10.515% 5/17/06 (d) |
- |
|
2,796,203 |
2,880,089 |
|
|
|
7,722,339 |
||||
|
Packaging & Containers - 3.9% |
|||||
|
Ball Corp. Tranche B term loan 8.625% 3/10/06 (d) |
Ba2 |
|
1,000,000 |
1,007,500 |
|
|
Packaging Corp. of America Tranche B term loan 8.6614% 6/29/07 (d) |
- |
|
934,076 |
935,244 |
|
|
U.S. Can Corp. Tranche B term loan 10.2581% 10/4/08 (d) |
- |
|
2,200,000 |
2,216,500 |
|
|
|
4,159,244 |
||||
|
Paper & Forest Products - 2.5% |
|||||
|
Smurfit-Stone Container Corp. Tranche B term loan 9.875% 3/31/06 (d) |
Ba3 |
|
1,000,000 |
1,007,500 |
|
|
Stone Container Corp. Tranche E term loan 10.1875% 10/1/03 (d) |
B+ |
|
1,600,000 |
1,600,000 |
|
|
|
2,607,500 |
||||
|
TOTAL BASIC INDUSTRIES |
14,489,083 |
||||
|
DURABLES - 2.3% |
|||||
|
Consumer Durables - 1.4% |
|||||
|
Blount, Inc. Tranche B term loan 10.7222% 6/30/06 (d) |
B1 |
|
1,496,222 |
1,488,741 |
|
|
Home Furnishings - 0.9% |
|||||
|
Sealy Mattress Co.: |
|
|
|
|
|
|
Tranche B term loan 8.6875% 12/15/04 (d) |
Ba3 |
|
378,097 |
379,042 |
|
|
Tranche C term loan 8.9375% 12/15/05 (d) |
Ba3 |
|
272,487 |
273,168 |
|
|
Tranche D term loan 9.1875% 12/15/06 (d) |
Ba3 |
|
348,267 |
349,138 |
|
|
|
1,001,348 |
||||
|
TOTAL DURABLES |
2,490,089 |
||||
|
Floating Rate Loans (e) - continued |
|||||
|
Moody's Ratings (unaudited) (a) |
Principal Amount |
Value |
|||
|
ENERGY - 2.2% |
|||||
|
Coal - 2.2% |
|||||
|
P&L Coal Holdings Corp. Tranche B term loan 8.7673% 6/30/06 (d) |
- |
|
$ 2,324,561 |
$ 2,324,561 |
|
|
HEALTH - 4.3% |
|||||
|
Medical Facilities Management - 4.3% |
|||||
|
Quest Diagnostics, Inc.: |
|
|
|
|
|
|
Tranche B term loan 9.808% 6/15/06 (d) |
Ba3 |
|
1,041,800 |
1,049,614 |
|
|
Tranche C term loan 10.37% 6/15/06 (d) |
Ba3 |
|
958,200 |
965,386 |
|
|
Total Renal Care Holdings, Inc. term loan 10.4402% 3/31/06 (d) |
Ba2 |
|
1,282,666 |
1,266,633 |
|
|
Unilab Corp. Tranche B term loan 10.3125% 11/23/06 (d) |
B1 |
|
1,250,000 |
1,259,375 |
|
|
|
4,541,008 |
||||
|
INDUSTRIAL MACHINERY & EQUIPMENT - 1.2% |
|||||
|
Pollution Control - 1.2% |
|||||
|
Allied Waste North America, Inc.: |
|
|
|
|
|
|
Tranche B term loan 9.4375% 7/21/06 (d) |
Ba3 |
|
590,909 |
556,932 |
|
|
Tranche C term loan 9.7042% 7/21/07 (d) |
Ba3 |
|
709,091 |
668,318 |
|
|
|
1,225,250 |
||||
|
MEDIA & LEISURE - 20.2% |
|||||
|
Broadcasting - 16.2% |
|||||
|
Adelphia Communications Corp. Tranche B term loan 9.66% 6/30/09 (d) |
- |
|
1,500,000 |
1,494,375 |
|
|
American Tower L P Tranche B term loan 10.05% 12/31/07 (d) |
- |
|
2,000,000 |
2,015,000 |
|
|
Charter Communication Operating LLC Tranche B term loan 9.26% 3/18/08 (d) |
Ba3 |
|
6,000,000 |
5,977,500 |
|
|
Citadel Broadcasting Co. Tranche B term loan 9.875% 6/30/08 (d) |
BB- |
|
2,200,000 |
2,216,500 |
|
|
Entravision Communications Corp. Tranche B term loan 9.9375% 12/31/08 (d) |
- |
|
1,300,000 |
1,309,750 |
|
|
Pegasus Media & Communications, Inc. Tranche B term loan 10.125% 4/30/05 (d) |
- |
|
3,000,000 |
3,007,500 |
|
|
Telemundo Group, Inc. Tranche B term loan 8.785% 3/31/07 (d) |
B1 |
|
1,196,977 |
1,196,977 |
|
|
|
17,217,602 |
||||
|
Entertainment - 1.9% |
|||||
|
Six Flags Theme Park, Inc. Tranche B term loan 9.91% 9/30/05 (d) |
Ba2 |
|
2,000,000 |
2,015,000 |
|
|
Floating Rate Loans (e) - continued |
|||||
|
Moody's Ratings (unaudited) (a) |
Principal Amount |
Value |
|||
|
MEDIA & LEISURE - continued |
|||||
|
Publishing - 1.2% |
|||||
|
PRIMEDIA, Inc. Tranche B term loan 8.995% 7/31/04 (d) |
Ba3 |
|
$ 1,250,000 |
$ 1,253,125 |
|
|
Restaurants - 0.9% |
|||||
|
Domino's, Inc.: |
|
|
|
|
|
|
Tranche B term loan 10.1875% 12/21/06 (d) |
- |
|
499,543 |
504,538 |
|
|
Tranche C term loan 10.4375% 12/21/07 (d) |
- |
|
500,457 |
505,462 |
|
|
|
1,010,000 |
||||
|
TOTAL MEDIA & LEISURE |
21,495,727 |
||||
|
NONDURABLES - 1.9% |
|||||
|
Foods - 0.9% |
|||||
|
Del Monte Corp. Tranche B term loan 9.6875% 3/25/05 (d) |
- |
|
997,440 |
1,001,180 |
|
|
Tobacco - 1.0% |
|||||
|
UST, Inc. Tranche B term loan 9.125% 2/16/05 (d) |
A2 |
|
1,000,000 |
1,003,750 |
|
|
TOTAL NONDURABLES |
2,004,930 |
||||
|
RETAIL & WHOLESALE - 0.9% |
|||||
|
Drug Stores - 0.9% |
|||||
|
Duane Reade, Inc. Tranche B term loan 9.5606% 2/15/05 (d) |
- |
|
1,000,000 |
1,002,500 |
|
|
SERVICES - 5.6% |
|||||
|
Leasing & Rental - 2.8% |
|||||
|
Crown Castle Operating Co. Tranche B term loan 9.37% 3/15/08 (d) |
Ba3 |
|
2,000,000 |
2,010,000 |
|
|
Interpool, Inc. Tranche B term loan 8.8125% 10/24/02 (d) |
- |
|
1,000,000 |
1,002,500 |
|
|
|
3,012,500 |
||||
|
Services - 2.8% |
|||||
|
Iron Mountain, Inc. Tranche B term loan |
- |
|
3,000,000 |
3,022,500 |
|
|
TOTAL SERVICES |
6,035,000 |
||||
|
Floating Rate Loans (e) - continued |
|||||
|
Moody's Ratings (unaudited) (a) |
Principal Amount |
Value |
|||
|
TECHNOLOGY - 2.2% |
|||||
|
Computer Services & Software - 1.2% |
|||||
|
Exodus Communications, Inc. Tranche B term loan 11.75% 10/31/07 (d) |
B+ |
|
$ 1,300,000 |
$ 1,308,125 |
|
|
Electronic Instruments - 1.0% |
|||||
|
Dynatech LLC Tranche B term loan 9.89% 9/30/07 (d) |
- |
|
992,126 |
994,606 |
|
|
TOTAL TECHNOLOGY |
2,302,731 |
||||
|
UTILITIES - 20.9% |
|||||
|
Cellular - 16.2% |
|||||
|
Cook Inlet/Voicestream Op Co. LLC Tranche A term loan 10.38% 12/31/07 (d) |
B2 |
|
1,000,000 |
1,000,000 |
|
|
Nextel Finance Co.: |
|
|
|
|
|
|
Tranche B term loan 10% 6/30/08 (d) |
Ba2 |
|
1,750,000 |
1,754,375 |
|
|
Tranche C term loan 10.3125% 12/31/08 (d) |
Ba2 |
|
1,750,000 |
1,754,375 |
|
|
Powertel, Inc. Tranche A term loan 9.6875% 12/31/05 (d) |
- |
|
1,000,000 |
1,000,000 |
|
|
Tritel Holding Corp. Tranche B term loan 11.12% 12/31/07 (d) |
B2 |
|
2,000,000 |
2,010,000 |
|
|
Triton PCS, Inc. Tranche B term loan 9.625% 2/4/07 (d) |
- |
|
3,000,000 |
3,000,000 |
|
|
Voicestream PCS Holding LLC Tranche B term loan 9.62% 2/25/09 (d) |
B+ |
|
5,300,000 |
5,260,250 |
|
|
Western Wireless Corp. Tranche B term loan 9.41% 9/30/08 (d) |
Ba2 |
|
1,500,000 |
1,507,500 |
|
|
|
17,286,500 |
||||
|
Electric Utility - 1.9% |
|||||
|
AES Corp. Tranche B term loan 9.375% 4/24/01 (d) |
- |
|
2,000,000 |
2,005,000 |
|
|
Telephone Services - 2.8% |
|||||
|
Global Crossing Holdings Ltd. Tranche B term loan 9.38% 6/30/06 (d) |
- |
|
2,000,000 |
2,012,500 |
|
|
McLeodUSA, Inc. Tranche B term loan 9.62% 5/31/08 (d) |
Ba2 |
|
1,000,000 |
998,750 |
|
|
|
3,011,250 |
||||
|
TOTAL UTILITIES |
22,302,750 |
||||
|
TOTAL FLOATING RATE LOANS (Cost $80,434,225) |
80,213,629 |
||||
|
Nonconvertible Bonds - 4.8% |
|||||
|
Moody's Ratings (unaudited) (a) |
Principal Amount |
Value |
|||
|
ENERGY - 1.9% |
|||||
|
Energy Services - 1.9% |
|||||
|
Cliffs Drilling Co. Class B, 10.25% 5/15/03 |
Ba3 |
|
$ 2,000,000 |
$ 2,045,000 |
|
|
TRANSPORTATION - 0.9% |
|||||
|
Air Transportation - 0.9% |
|||||
|
US Air, Inc. 9.625% 2/1/01 |
B3 |
|
975,000 |
965,250 |
|
|
UTILITIES - 2.0% |
|||||
|
Cellular - 2.0% |
|||||
|
Clearnet Communications, Inc. yankee 0% 12/15/05 (c) |
Ba1 |
|
2,000,000 |
2,120,000 |
|
|
TOTAL NONCONVERTIBLE BONDS (Cost $5,144,861) |
5,130,250 |
||||
|
Cash Equivalents - 17.1% |
|||
|
Maturity Amount |
|
||
|
Investments in repurchase agreements (U.S. Treasury Obligations), in a joint trading account at 6.56%, dated 10/31/00 due 11/1/00 |
$ 10,249,867 |
10,248,000 |
|
|
Shares |
|
||
|
Fidelity Money Market Central Fund, 6.70% (b) |
8,000,000 |
8,000,000 |
|
|
TOTAL CASH EQUIVALENTS (Cost $18,248,000) |
18,248,000 |
||
|
TOTAL INVESTMENT PORTFOLIO - 97.2% (Cost $103,827,086) |
103,591,879 |
||
|
NET OTHER ASSETS - 2.8% |
3,014,263 |
||
|
NET ASSETS - 100% |
$ 106,606,142 |
||
|
Legend |
|
(a) S&P credit ratings are used in the absence of a rating by Moody's Investors Service, Inc. |
|
(b) The rate quoted is the annualized seven-day yield of the fund at period end. A complete listing of the fund's holdings as of its most recent fiscal year end is available upon request. |
|
(c) Debt obligation initially issued in zero coupon form which converts to coupon form at a specified rate and date. The rate shown is the rate at period end. |
|
(d) The coupon rate shown on floating or adjustable rate securities represents the rate at period end. |
|
(e) Remaining maturities of floating rate loans may be less than the stated maturities shown as a result of contractual or optional prepayments by the borrower. Such prepayments cannot be predicted with certainty. |
|
Other Information |
|
The composition of long-term debt holdings as a percentage of total value of investments in securities, is as follows (ratings are unaudited): |
|
Moody's Ratings |
S&P Ratings |
|||
|
Aaa, Aa, A |
1.0% |
|
AAA, AA, A |
1.0% |
|
Baa |
0.0% |
|
BBB |
0.0% |
|
Ba |
28.0% |
|
BB |
15.7% |
|
B |
9.9% |
|
B |
16.5% |
|
Caa |
0.0% |
|
CCC |
0.9% |
|
Ca, C |
0.0% |
|
CC, C |
0.0% |
|
|
|
|
D |
0.0% |
|
The percentage not rated by Moody's or S&P amounted to 33.6%. FMR has determined that unrated debt securities that are lower quality account for 33.6% of the total value of investment in securities. |
|
Income Tax Information |
|
At October 31, 2000, the aggregate cost of investment securities for income tax purposes was $103,827,086. Net unrealized depreciation aggregated $235,207, of which $87,333 related to appreciated investment securities and $322,540 related to depreciated investment securities. |
|
At October 31, 2000, the fund had a capital loss carryforward of approximately $5,000 all of which will expire on October 31, 2008. |
See accompanying notes which are an integral part of the financial statements.
Annual Report
Statement of Assets and Liabilities
|
|
October 31, 2000 |
|
|
Assets |
|
|
|
Investment in securities, at value (including repurchase agreements of $10,248,000) (cost $103,827,086) - See accompanying schedule |
|
$ 103,591,879 |
|
Cash |
|
3,524,411 |
|
Receivable for fund shares sold |
|
4,367,060 |
|
Interest receivable |
|
440,218 |
|
Prepaid expenses |
|
62,303 |
|
Total assets |
|
111,985,871 |
|
Liabilities |
|
|
|
Payable for investments purchased |
$ 4,977,000 |
|
|
Payable for fund shares redeemed |
74,361 |
|
|
Accrued management fee |
28,310 |
|
|
Distribution fees payable |
44,501 |
|
|
Other payables and accrued expenses |
255,557 |
|
|
Total liabilities |
|
5,379,729 |
|
Net Assets |
|
$ 106,606,142 |
|
Net Assets consist of: |
|
|
|
Paid in capital |
|
$ 106,829,910 |
|
Undistributed net investment income |
|
16,139 |
|
Accumulated undistributed net realized gain (loss) |
|
(4,700) |
|
Net unrealized appreciation (depreciation) on investments |
|
(235,207) |
|
Net Assets |
|
$ 106,606,142 |
See accompanying notes which are an integral part of the financial statements.
Annual Report
Financial Statements - continued
Statement of Assets and Liabilities - continued
|
|
October 31, 2000 |
|
|
Calculation of Maximum Offering Price |
|
$9.94 |
|
Maximum offering price per share (100/96.25 of $9.94) |
|
$10.33 |
|
Class T: |
|
$9.94 |
|
Maximum offering price per share (100/97.25 of $9.94) |
|
$10.22 |
|
Class B: |
|
$9.94 |
|
Class C: |
|
$9.94 |
|
Institutional Class: |
|
$9.94 |
A Redemption price per share is equal to net asset value less any applicable contingent deferred sales charge.
See accompanying notes which are an integral part of the financial statements.
Annual Report
Financial Statements - continued
Statement of Operations
|
|
August 16, 2000 (commencement of operations) to October 31, 2000 |
|
|
Investment Income Interest |
|
$ 954,324 |
|
Expenses |
|
|
|
Management fee |
$ 81,444 |
|
|
Transfer agent fees |
17,603 |
|
|
Distribution fees |
73,287 |
|
|
Accounting fees and expenses |
12,391 |
|
|
Custodian fees and expenses |
1,917 |
|
|
Registration fees |
48,527 |
|
|
Audit |
44,400 |
|
|
Miscellaneous |
500 |
|
|
Total expenses before reductions |
280,069 |
|
|
Expense reductions |
(134,198) |
145,871 |
|
Net investment income |
|
808,453 |
|
Realized and Unrealized Gain (Loss) Net realized gain (loss) on investment securities |
|
(5,558) |
|
Change in net unrealized appreciation (depreciation) on investment securities |
|
(235,207) |
|
Net gain (loss) |
|
(240,765) |
|
Net increase (decrease) in net assets |
|
$ 567,688 |
See accompanying notes which are an integral part of the financial statements.
Annual Report
Financial Statements - continued
Statement of Changes in Net Assets
|
|
August 16, 2000
(commencement |
|
Increase (Decrease) in Net Assets |
|
|
Operations |
$ 808,453 |
|
Net realized gain (loss) |
(5,558) |
|
Change in net unrealized appreciation (depreciation) |
(235,207) |
|
Net increase (decrease) in net assets resulting from operations |
567,688 |
|
Distributions to shareholders from net investment income |
(791,456) |
|
Share transactions - net increase (decrease) |
106,824,265 |
|
Redemption fees |
5,645 |
|
Total increase (decrease) in net assets |
106,606,142 |
|
Net Assets |
|
|
Beginning of period |
- |
|
End of period (including undistributed net investment income of $16,139) |
$ 106,606,142 |
See accompanying notes which are an integral part of the financial statements.
Annual Report
Financial Highlights - Class A
|
Year ended |
October 31, |
|
Selected Per-Share Data |
2000 E |
|
Net asset value, beginning of period |
$ 10.000 |
|
Income from Investment Operations |
|
|
Net investment income D |
.136 |
|
Net realized and unrealized gain (loss) |
(.047) |
|
Total from investment operations |
.089 |
|
Less Distributions |
|
|
From net investment income |
(.150) |
|
Redemption fees added to paid in capital |
.001 |
|
Net asset value, end of period |
$ 9.940 |
|
Total Return B, C |
0.90% |
|
Ratios and Supplemental Data |
|
|
Net assets, end of period (000 omitted) |
$ 9,409 |
|
Ratio of expenses to average net assets |
.78% A, F |
|
Ratio of expenses to average net assets after expense reductions |
.78% A |
|
Ratio of net investment income to average net assets |
7.21% A |
|
Portfolio turnover rate |
12% A |
A Annualized
B The total return would have been lower had certain expenses not been reduced during the period shown.
C Total returns do not include the one time sales charge and for periods of less than one year are not annualized.
D Net investment income per share has been calculated based on average shares outstanding during the period.
E For the period August 16, 2000 (commencement of operations) to October 31, 2000.
F FMR agreed to reimburse a portion of the class' expenses during the period. Without this reimbursement, the class' expense ratio would have been higher.
See accompanying notes which are an integral part of the financial statements.
Annual Report
Financial Highlights - Class T
|
Year ended |
October 31, |
|
Selected Per-Share Data |
2000 E |
|
Net asset value, beginning of period |
$ 10.000 |
|
Income from Investment Operations |
|
|
Net investment income D |
.131 |
|
Net realized and unrealized gain (loss) |
(.045) |
|
Total from investment operations |
.086 |
|
Less Distributions |
|
|
From net investment income |
(.147) |
|
Redemption fees added to paid in capital |
.001 |
|
Net asset value, end of period |
$ 9.940 |
|
Total Return B, C |
0.88% |
|
Ratios and Supplemental Data |
|
|
Net assets, end of period (000 omitted) |
$ 24,571 |
|
Ratio of expenses to average net assets |
.93% A, F |
|
Ratio of expenses to average net assets after expense reductions |
.93% A |
|
Ratio of net investment income to average net assets |
7.06% A |
|
Portfolio turnover rate |
12% A |
A Annualized
B The total return would have been lower had certain expenses not been reduced during the period shown.
C Total returns do not include the one time sales charge and for periods of less than one year are not annualized.
D Net investment income per share has been calculated based on average shares outstanding during the period.
E For the period August 16, 2000 (commencement of operations) to October 31, 2000.
F FMR agreed to reimburse a portion of the class' expenses during the period. Without this reimbursement, the class' expense ratio would have been higher.
See accompanying notes which are an integral part of the financial statements.
Annual Report
Financial Highlights - Class B
|
Year ended |
October 31, |
|
Selected Per-Share Data |
2000 E |
|
Net asset value, beginning of period |
$ 10.000 |
|
Income from Investment Operations |
|
|
Net investment income D |
.134 |
|
Net realized and unrealized gain (loss) |
(.056) |
|
Total from investment operations |
.078 |
|
Less Distributions |
|
|
From net investment income |
(.139) |
|
Redemption fees added to paid in capital |
.001 |
|
Net asset value, end of period |
$ 9.940 |
|
Total Return B, C |
0.79% |
|
Ratios and Supplemental Data |
|
|
Net assets, end of period (000 omitted) |
$ 24,044 |
|
Ratio of expenses to average net assets |
1.23% A, F |
|
Ratio of expenses to average net assets after expense reductions |
1.23% A |
|
Ratio of net investment income to average net assets |
6.75% A |
|
Portfolio turnover rate |
12% A |
A Annualized
B The total return would have been lower had certain expenses not been reduced during the period shown.
C Total returns do not reflect the contingent deferred sales charge and for periods of less than one year are not annualized.
D Net investment income per share has been calculated based on average shares outstanding during the period.
E For the period August 16, 2000 (commencement of operations) to October 31, 2000.
F FMR agreed to reimburse a portion of the class' expenses during the period. Without this reimbursement, the class' expense ratio would have been higher.
See accompanying notes which are an integral part of the financial statements.
Annual Report
Financial Highlights - Class C
|
Year ended |
October 31, |
|
Selected Per-Share Data |
2000 E |
|
Net asset value, beginning of period |
$ 10.000 |
|
Income from Investment Operations |
|
|
Net investment income D |
.125 |
|
Net realized and unrealized gain (loss) |
(.051) |
|
Total from investment operations |
.074 |
|
Less Distributions |
|
|
From net investment income |
(.135) |
|
Redemption fees added to paid in capital |
.001 |
|
Net asset value, end of period |
$ 9.940 |
|
Total Return B, C |
0.76% |
|
Ratios and Supplemental Data |
|
|
Net assets, end of period (000 omitted) |
$ 47,708 |
|
Ratio of expenses to average net assets |
1.44% A, F |
|
Ratio of expenses to average net assets after expense reductions |
1.44% A |
|
Ratio of net investment income to average net assets |
6.55% A |
|
Portfolio turnover rate |
12% A |
A Annualized
B The total return would have been lower had certain expenses not been reduced during the period shown.
C Total returns do not reflect the contingent deferred sales charge and for periods of less than one year are not annualized.
D Net investment income per share has been calculated based on average shares outstanding during the period.
E For the period August 16, 2000 (commencement of operations) to October 31, 2000.
F FMR agreed to reimburse a portion of the class' expenses during the period. Without this reimbursement, the class' expense ratio would have been higher.
See accompanying notes which are an integral part of the financial statements.
Annual Report
Financial Highlights - Institutional Class
|
Year ended |
October 31, |
|
Selected Per-Share Data |
2000 E |
|
Net asset value, beginning of period |
$ 10.000 |
|
Income from Investment Operations |
|
|
Net investment income D |
.151 |
|
Net realized and unrealized gain (loss) |
(.058) |
|
Total from investment operations |
.093 |
|
Less Distributions |
|
|
From net investment income |
(.154) |
|
Redemption fees added to paid in capital |
.001 |
|
Net asset value, end of period |
$ 9.940 |
|
Total Return B, C |
0.94% |
|
Ratios and Supplemental Data |
|
|
Net assets, end of period (000 omitted) |
$ 875 |
|
Ratio of expenses to average net assets |
.49% A, F |
|
Ratio of expenses to average net assets after expense reductions |
.49% A |
|
Ratio of net investment income to average net assets |
7.50% A |
|
Portfolio turnover rate |
12% A |
A Annualized
B The total return would have been lower had certain expenses not been reduced during the period shown.
C Total returns for periods of less than one year are not annualized.
D Net investment income per share has been calculated based on average shares outstanding during the period.
E For the period August 16, 2000 (commencement of operations) to October 31, 2000.
F FMR agreed to reimburse a portion of the class' expenses during the period. Without this reimbursement, the class' expense ratio would have been higher.
See accompanying notes which are an integral part of the financial statements.
Annual Report
For the period ended October 31, 2000
1. Significant Accounting Policies.
Fidelity Advisor Floating Rate High Income Fund (the fund) is a fund of Fidelity Advisor Series II (the trust) and is authorized to issue an unlimited number of shares. The trust is registered under the Investment Company Act of 1940, as amended (the 1940 Act), as an open-end management investment company organized as a Massachusetts business trust.
The fund offers Class A, Class T, Class B, Class C, and Institutional Class shares, each of which has equal rights as to assets and voting privileges. Each class has exclusive voting rights with respect to matters that affect that class. The fund commenced sale of shares on August 16, 2000. Class B shares will automatically convert to Class A shares after a holding period of seven years from the initial date of purchase. Investment income, realized and unrealized capital gains and losses, the common expenses of the fund, and certain fund-level expense reductions, if any, are allocated on a pro rata basis to each class based on the relative net assets of each class to the total net assets of the fund. Each class of shares differs in its respective distribution, transfer agent, and certain other class-specific fees, expenses, and expense reductions.
The financial statements have been prepared in conformity with generally accepted accounting principles which require management to make certain estimates and assumptions at the date of the financial statements. The following summarizes the significant accounting policies of the fund:
Security Valuation. Securities for which quotations are readily available are valued at their market values as determined by their most recent bid prices in the principal market (sales prices if the principal market is an exchange) in which such securities are normally traded. Securities for which market quotations are not readily available are valued at their fair value as determined in good faith under consistently applied procedures under the general supervision of the Board of Trustees. Short-term securities with remaining maturities of sixty days or less for which quotations are not readily available are valued at amortized cost or original cost plus accrued interest, both of which approximate current value. Investments in open-end investment companies are valued at their net asset value each business day.
Foreign Currency Translation. The accounting records of the fund are maintained in U.S. dollars. Investment securities and other assets and liabilities denominated in a foreign currency are translated into U.S. dollars at the prevailing rates of exchange at period end. Purchases and sales of securities, income receipts and expense payments are translated into U.S. dollars at the prevailing exchange rate on the respective dates of the transactions.
Net realized gains and losses on foreign currency transactions represent net gains and losses from sales and maturities of foreign currency contracts, disposition of foreign currencies, the difference between the amount of net investment income accrued and the U.S. dollar amount actually received, and gains and losses between trade and settlement date on
Annual Report
Notes to Financial Statements - continued
1. Significant Accounting Policies - continued
Foreign Currency Translation - continued
purchases and sales of securities. The effects of changes in foreign currency exchange rates on investments in securities are included with the net realized and unrealized gain or loss on investment securities.
Income Taxes. The fund intends to qualify as a regulated investment company under Subchapter M of the Internal Revenue Code. By so qualifying, the fund will not be subject to income taxes to the extent that it distributes substantially all of its taxable income for its fiscal year. The schedule of investments includes information regarding income taxes under the caption "Income Tax Information."
Investment Income. Interest income, which includes accretion of discount and amortization of premium, is accrued as earned. Investment income is recorded net of foreign taxes withheld where recovery of such taxes is uncertain. The fund may place a debt obligation on non-accrual status and reduce related interest income by ceasing current accruals and writing off interest receivables when the collection of all or a portion of interest has become doubtful based on consistently applied procedures, under the general supervision of the Board of Trustees of the fund. A debt obligation is removed from non-accrual status when the issuer resumes interest payments or when collectibility of interest is reasonably assured.
Expenses. Most expenses of the trust can be directly attributed to a fund. Expenses which cannot be directly attributed are apportioned among the funds in the trust.
Prepaid Expenses. Fidelity Management & Research Company (FMR) bears all organizational expenses of the fund except for the cost of registering and qualifying shares of each class for distribution under federal and state securities law. These registration expenses are borne by the fund and amortized over one year.
Distributions to Shareholders. Distributions are declared daily and paid monthly from net investment income. Distributions from realized gains, if any, are recorded on the ex-dividend date. Income dividends and capital gain distributions are declared separately for each class.
Income and capital gain distributions are determined in accordance with income tax regulations which may differ from generally accepted accounting principles. These differences, may result in distribution reclassifications.
Permanent book and tax basis differences relating to shareholder distributions will result in reclassifications to paid in capital. Undistributed net investment income and accumulated undistributed net realized gain (loss) on investments may include temporary book and tax basis differences which will reverse in a subsequent period. Any taxable income or gain remaining at fiscal year end is distributed in the following year.
Annual Report
Notes to Financial Statements - continued
1. Significant Accounting Policies - continued
Short-Term Trading (Redemption) Fees. Shares held in the fund less than 60 days are subject to a short-term trading fee equal to 1.00% of the proceeds of the redeemed shares. The fee, which is retained by the fund, is accounted for as an addition to paid in capital.
Security Transactions. Security transactions are accounted for as of trade date. Gains and losses on securities sold are determined on the basis of identified cost.
2. Operating Policies.
Foreign Currency Contracts. The fund generally uses foreign currency contracts to facilitate transactions in foreign-denominated securities. Losses may arise from changes in the value of the foreign currency or if the counterparties do not perform under the contracts' terms. The U.S. dollar value of foreign currency contracts is determined using contractual currency exchange rates established at the time of each trade.
Joint Trading Account. Pursuant to an Exemptive Order issued by the Securities and Exchange Commission (the SEC), the fund, along with other affiliated entities of FMR, may transfer uninvested cash balances into one or more joint trading accounts. These balances are invested in one or more repurchase agreements for U.S. Treasury or Federal Agency obligations.
Repurchase Agreements. The underlying U.S. Treasury, Federal Agency, or other obligations found to be satisfactory by FMR are transferred to an account of the fund, or to the Joint Trading Account, at a custodian bank. The securities are marked-to-market daily and maintained at a value at least equal to the principal amount of the repurchase agreement (including accrued interest). FMR, the fund's investment adviser, is responsible for determining that the value of the underlying securities remains in accordance with the market value requirements stated above.
Loans and Other Direct Debt Instruments. The fund invests in loans and loan participations, trade claims or other receivables, which may include standby financing commitments that obligate the fund to supply additional cash to the borrower on demand. Loan participations involve a risk of insolvency of the lending bank or other financial intermediary. The fund may be contractually obligated to receive approval from the agent bank and/or borrower prior to the sale of these investments. At period end, the fund had no investments in loan participations or loans involving standby financing commitments.
3. Purchases and Sales of Investments.
Purchases and sales of securities (including principal repayments of floating rate loans), other than short-term securities, aggregated $83,861,083 and $1,251,123, respectively.
Annual Report
Notes to Financial Statements - continued
4. Fees and Other Transactions with Affiliates.
Management Fee. As the fund's investment adviser, FMR receives a monthly fee that is calculated on the basis of a group fee rate plus a fixed individual fund fee rate applied to the average net assets of the fund. The group fee rate is the weighted average of a series of rates and is based on the monthly average net assets of all the mutual funds advised by FMR. The rates ranged from .0920% to .3700% for the period. The annual individual fund fee rate is .55%. In the event that these rates were lower than the contractual rates in effect during the period, FMR voluntarily implemented the above rates, as they resulted in the same or a lower management fee. For the period, the management fee was equivalent to an annualized rate of .68% of average net assets.
Sub-Adviser Fee. Beginning January 1, 2001, FMR Co.(FMRC) will serve as a sub-adviser for the fund. FMRC is a wholly owned subsidiary of FMR and will receive a fee from FMR of 50% of the management fee payable to FMR with respect to that portion of the fund's assets that will be managed by FMRC.
Distribution and Service Plan. In accordance with Rule 12b-1 of the 1940 Act, the Board of Trustees has adopted separate Distribution and Service Plans with respect to each class of shares (collectively referred to as "the Plans"). Under certain of the Plans, the class pays Fidelity Distributors Corporation (FDC), an affiliate of FMR, a 12b-1 fee. A portion of this fee may be reallowed to securities dealers, banks and other financial institutions for the distribution of each class of shares and providing shareholder support services. For the period, this fee was based on the following annual rates of the average net assets of each applicable class:
|
Class A |
.15% |
|
Class T |
.25% |
|
Class B |
.70%* |
|
Class C |
.80%** |
* .55% represents a distribution fee and .15% represents a shareholder service fee.
** .55% represents a distribution fee and .25% represents a shareholder service fee.
For the period, each class paid FDC the following amounts, a portion of which was retained by FDC:
|
|
Paid to |
Retained |
|
Class A |
$ 1,376 |
$ 73 |
|
Class T |
5,744 |
- |
|
Class B |
24,466 |
20,596 |
|
Class C |
41,701 |
37,596 |
|
|
$ 73,287 |
$ 58,265 |
Annual Report
Notes to Financial Statements - continued
4. Fees and Other Transactions with Affiliates - continued
Sales Load. FDC receives a front-end sales charge of up to 3.75% for selling Class A shares, and 2.75% for selling Class T shares of the fund. FDC receives the proceeds of contingent deferred sales charges levied on Class B share redemptions occurring within six years of purchase and Class C share redemptions occurring within 15 months of purchase. Contingent deferred sales charges are based on declining rates ranging from 3.50% to 1% for Class B and 1% for Class C, of the lesser of the cost of shares at the initial date of purchase or the net asset value of the redeemed shares, excluding any reinvested dividends and capital gains. In addition, purchases of Class A and Class T shares that were subject to a finder's fee bear a contingent deferred sales charge on assets that do not remain in the fund for at least one year. The Class A and Class T contingent deferred sales charge is based on 0.25% of the lesser of the cost of shares at the initial date of purchase or the net asset value of the redeemed shares, excluding any reinvested dividends and capital gains. A portion of the sales charges paid to FDC is paid to securities dealers, banks and other financial institutions.
For the period, sales charge amounts paid to and retained by FDC were as follows:
|
|
Paid to |
Retained |
|
Class A |
$ 25,423 |
$ 16,977 |
|
Class T |
29,740 |
12,357 |
|
Class B |
2,321 |
2,321* |
|
Class C |
1,481 |
1,481* |
|
|
$ 58,965 |
$ 33,136 |
* When Class B and Class C shares are initially sold, FDC pays commissions from its own resources to securities dealers,
banks, and other financial institutions through which the sales are made.
Transfer Agent Fees. Fidelity Investments Institutional Operations Company, Inc., (FIIOC), an affiliate of FMR, is the transfer, dividend disbursing and shareholder servicing agent (collectively referred to as the transfer agent) for each class of the fund. FIIOC receives account fees and asset-based fees that vary according to the account size and type of account of the shareholders of the respective classes of the fund. FIIOC pays for typesetting, printing and mailing of all shareholder reports, except proxy statements. For the period, the following amounts were paid to FIIOC:
|
|
Amount |
% of |
|
Class A |
$ 1,209 |
.13 |
|
Class T |
3,165 |
.14 |
|
Class B |
5,329 |
.15 |
|
Class C |
7,546 |
.15 |
|
Institutional Class |
354 |
.26 |
|
|
$ 17,603 |
|
* Annualized
Annual Report
Notes to Financial Statements - continued
4. Fees and Other Transactions with Affiliates - continued
Fidelity Money Market Central Fund. Pursuant to an Exemptive Order issued by the SEC, the fund may invest in the Fidelity Money Market Central Fund (the Central Fund) managed by Fidelity Investments Money Management, Inc., an affiliate of FMR. The Central Fund is an open-end money market fund available only to investment companies and other accounts managed by FMR and its affiliates. The Central Fund is principally used for the fund's strategic allocations to money market investments. The Central Fund seeks preservation of capital, liquidity, and current income. Income distributions from the Central Fund are declared daily and paid monthly from net investment income. Income distributions earned by the fund are recorded as interest income in the accompanying financial statements.
5. Expense Reductions.
FMR voluntarily agreed to reimburse operating expenses (excluding interest, taxes, certain securities lending fees, brokerage commissions and extraordinary expenses, if any) above the following annual rates or range of annual rates of average net assets for each of the following classes:
|
|
FMR |
Reimbursement |
|
Class A |
0.15% - 1.10% |
$ 8,821 |
|
Class T |
0.25% - 1.20% |
19,916 |
|
Class B |
0.70% - 1.65% |
52,666 |
|
Class C |
0.80% - 1.75% |
50,218 |
|
Institutional Class |
0% - 0.95% |
2,471 |
|
|
|
$ 134,092 |
In addition, through an arrangement with the fund's custodian, credits realized as a result of uninvested cash balances were used to reduce a portion of expenses. During the period, the fund's custodian fees were reduced by $106 under the custodian arrangement.
6. Beneficial Interest.
At the end of the period, FMR and its affiliates were record owners of approximately 9.6% of the total outstanding shares of the fund.
Annual Report
Notes to Financial Statements - continued
7. Distributions to Shareholders.
Distributions to shareholders of each class were as follows:
|
|
August 16, 2000
(commencement of
operations) to |
|
|
2000 |
|
From net investment income |
|
|
Class A |
$ 64,668 |
|
Class T |
160,974 |
|
Class B |
230,804 |
|
Class C |
325,083 |
|
Institutional Class |
9,927 |
|
Total |
$ 791,456 |
Annual Report
Notes to Financial Statements - continued
8. Share Transactions.
Transactions for each class of shares were as follows:
|
|
Shares |
Dollars |
|
|
Year ended October 31, |
Year ended October 31, |
|
|
2000 A |
2000 A |
|
|
|
|
|
Class A |
956,032 |
$ 9,517,522 |
|
Reinvestment of distributions |
5,713 |
56,832 |
|
Shares redeemed |
(15,453) |
(153,810) |
|
Net increase (decrease) |
946,292 |
$ 9,420,544 |
|
Class T |
2,479,164 |
$ 24,685,030 |
|
Reinvestment of distributions |
13,624 |
135,516 |
|
Shares redeemed |
(21,104) |
(209,675) |
|
Net increase (decrease) |
2,471,684 |
$ 24,610,871 |
|
Class B |
2,777,776 |
$ 27,690,876 |
|
Reinvestment of distributions |
20,634 |
205,302 |
|
Shares redeemed |
(379,062) |
(3,767,960) |
|
Net increase (decrease) |
2,419,348 |
$ 24,128,218 |
|
Class C |
4,923,527 |
$ 49,034,923 |
|
Reinvestment of distributions |
28,548 |
283,958 |
|
Shares redeemed |
(154,190) |
(1,532,861) |
|
Net increase (decrease) |
4,797,885 |
$ 47,786,020 |
|
Institutional Class |
89,211 |
$ 890,224 |
|
Reinvestment of distributions |
843 |
8,388 |
|
Shares redeemed |
(2,008) |
(20,000) |
|
Net increase (decrease) |
88,046 |
$ 878,612 |
A Share transactions are for the period August 16, 2000 (commencement of operations) to October 31, 2000.
Annual Report
To the Trustees of Fidelity Advisor Series II and Shareholders of Fidelity Advisor Floating Rate High Income Fund:
We have audited the accompanying statement of assets and liabilities of Fidelity Advisor Floating Rate High Income Fund, (the Fund), a fund of Fidelity Advisor Series II (the Trust), including the portfolio of investments, as of October 31, 2000, and the related statements of operations, changes in net assets, and financial highlights for the period August 16, 2000 (commencement of operations) to October 31, 2000. These financial statements and financial highlights are the responsibility of the Fund's management. Our responsibility is to express an opinion on these financial statements and financial highlights based on our audit.
We conducted our audit in accordance with auditing standards generally accepted in the United States of America. Those standards require that we plan and perform the audit to obtain reasonable assurance about whether the financial statements and financial highlights are free of material misstatement. An audit includes examining, on a test basis, evidence supporting the amounts and disclosures in the financial statements. Our procedures included confirmation of securities owned as of October 31, 2000, by correspondence with the custodian and brokers; where replies were not received from brokers and selling or agent banks, we performed other auditing procedures. An audit also includes assessing the accounting principles used and significant estimates made by management, as well as evaluating the overall financial statement presentation. We believe that our audit provides a reasonable basis for our opinion.
In our opinion, the financial statements and financial highlights referred to above present fairly, in all material respects, the financial position of Fidelity Advisor Floating Rate High Income Fund as of October 31, 2000, the results of its operations, the changes in its net assets, and its financial highlights for the period August 16, 2000 (commencement of operations) to October 31, 2000, in conformity with accounting principles generally accepted in the United States of America.
/s/DELOITTE & TOUCHE LLP
DELOITTE & TOUCHE LLP
Boston, Massachusetts
December 8, 2000
Annual Report
Annual Report
Annual Report
Annual Report
Annual Report
Annual Report
Investment Adviser
Fidelity Management & Research Company
Boston, MA
Investment Sub-Advisers
Fidelity Management & Research
(U.K.) Inc.
Fidelity Management & Research
(Far East) Inc.
Fidelity Investments Japan Limited
Officers
Edward C. Johnson 3d, President
Robert C. Pozen, Senior Vice President
Robert A. Lawrence, Vice President
Eric D. Roiter, Secretary
Robert A. Dwight, Treasurer
Maria F. Dwyer, Deputy Treasurer
John H. Costello, Assistant Treasurer
Thomas J. Simpson, Assistant Treasurer
Board of Trustees
Ralph F. Cox *
Phyllis Burke Davis *
Robert M. Gates *
Edward C. Johnson 3d
Donald J. Kirk *
Ned C. Lautenbach *
Peter S. Lynch
Marvin L. Mann *
William O. McCoy *
Gerald C. McDonough *
Robert C. Pozen
Thomas R. Williams *
Advisory Board
J. Michael Cook
Abigail P. Johnson
Marie L. Knowles
General Distributor
Fidelity Distributors Corporation
Boston, MA
Transfer and Shareholder
Servicing Agent
Fidelity Investments Institutional Operations Company, Inc.
Boston, MA
Custodian
The Bank of New York
New York, NY
* Independent trustees
Annual Report
Focus Funds
Fidelity Advisor Consumer
Industries Fund
Fidelity Advisor Cyclical
Industries Fund
Fidelity Advisor Financial
Services Fund
Fidelity Advisor Health Care Fund
Fidelity Advisor Natural
Resources Fund
Fidelity Advisor Technology Fund
Fidelity Advisor Telecommunications & Utilities Growth Fund
Growth Funds
Fidelity Advisor Korea Fund
Fidelity Advisor Emerging Asia Fund
Fidelity Advisor Latin America Fund
Fidelity Advisor Japan Fund
Fidelity Advisor Europe Capital Appreciation Fund
Fidelity Advisor International
Capital Appreciation Fund
Fidelity Advisor Overseas Fund
Fidelity Advisor Diversified International Fund
Fidelity Advisor Global Equity Fund
Fidelity Advisor TechnoQuant ®
Growth Fund
Fidelity Advisor Small Cap Fund
Fidelity Advisor Value Strategies Fund
Fidelity Advisor Mid Cap Fund
Fidelity Advisor Dynamic Capital Appreciation Fund
Fidelity Advisor Equity Growth Fund
Fidelity Advisor Large Cap Fund
Fidelity Advisor Dividend Growth Fund
Fidelity Advisor Growth
Opportunities Fund
Growth and Income Funds
Fidelity Advisor Growth & Income Fund
Fidelity Advisor Equity Income Fund
Fidelity Advisor Asset Allocation Fund
Fidelity Advisor Balanced Fund
Taxable Income Funds
Fidelity Advisor Emerging Markets Income Fund
Fidelity Advisor High Yield Fund
Fidelity Advisor High Income Fund
Fidelity Advisor Strategic Income Fund
Fidelity Advisor Mortgage
Securities Fund
Fidelity Advisor Government Investment Fund
Fidelity Advisor Intermediate Bond Fund
Fidelity Advisor Short Fixed-Income Fund
Municipal Funds
Fidelity Advisor Municipal Income Fund
Money Market Funds
Prime Fund
Treasury Fund
Tax-Exempt Fund
|
AFRI-ANN-1200 |
120334 |
|
1.750078.100 |
|
(Fidelity Investment logo)(registered trademark)
Fidelity® Advisor
Fund - Class A, Class T, Class B
and Class C
Annual Report
October 31, 2000
(2_fidelity_logos)
|
President's Message |
3 |
Ned Johnson on investing strategies. |
|
Performance |
4 |
How the fund has done over time. |
|
Fund Talk |
19 |
The manager's review of fund performance, strategy and outlook. |
|
Investment Changes |
22 |
A summary of major shifts in the fund's investments over the past six months. |
|
Investments |
23 |
A complete list of the fund's investments with their market values. |
|
Financial Statements |
28 |
Statements of assets and liabilities,
operations, and changes in net assets, |
|
Notes |
37 |
Notes to the financial statements. |
|
Independent Auditors' Report |
44 |
The auditors' opinion. |
|
|
|
|
Third party marks appearing herein are the property of their respective owners.
All other marks appearing herein are registered or unregistered trademarks or service marks of FMR Corp. or an affiliated company.
(Recycle graphic) This report is printed on recycled paper using soy-based inks.
This report and the financial statements contained herein are submitted for the general information of the shareholders of the fund. This report is not authorized for distribution to prospective investors in the fund unless preceded or accompanied by an effective prospectus.
Mutual fund shares are not deposits or obligations of, or guaranteed by, any depository institution. Shares are not insured by the FDIC, Federal Reserve Board or any other agency, and are subject to investment risks, including possible loss of principal amount invested.
Neither the fund nor Fidelity Distributors Corporation is a bank.
For more information on any Fidelity Advisor fund, including charges and expenses, contact your investment professional for a free prospectus. Read it carefully before you invest or send money.
Annual Report
(photo_of_Edward_C_Johnson_3d)
Dear Shareholder:
A sixth-straight year of double-digit positive returns for the Dow Jones Industrial Average, NASDAQ and S&P 500® could be in jeopardy unless the U.S. stock market shows marked improvement in the final two months of 2000. Through October, all three indexes had negative year-to-date returns. On the other hand, most fixed-income sectors were solidly in the black. Treasuries and other long-term government securities led the way, returning nearly 14%.
While it's impossible to predict the future direction of the markets with any degree of certainty, there are certain basic principles that can help investors plan for their future needs.
The longer your investment time frame, the less likely it is that you will be affected by short-term market volatility. A 10-year investment horizon appropriate for saving for a college education, for example, enables you to weather market cycles in a long-term fund, which may have a higher risk potential, but also has a higher potential rate of return.
An intermediate-length fund could make sense if your investment horizon is two to four years, while a short-term bond fund could be the right choice if you need your money in one or two years.
If your time horizon is less than a year, you might want to consider moving some of your bond investment into a money market fund. These funds seek income and a stable share price by investing in high-quality, short-term investments. Of course, it's important to remember that an investment in a money market fund is not insured or guaranteed by the Federal Deposit Insurance Corporation or any other government agency. Although money market funds seek to preserve the value of your investment at $1.00 per share, it is possible to lose money by investing in these types of funds.
Finally, no matter what your time horizon or portfolio diversity, it makes good sense to follow a regular investment plan, investing a certain amount of money in a fund at the same time each month or quarter and periodically reviewing your overall portfolio. By doing so, you won't get caught up in the excitement of a rapidly rising market, nor will you buy all your shares at market highs. While this strategy - known as dollar cost averaging - won't assure a profit or protect you from a loss in a declining market, it should help you lower the average cost of your purchases. Of course, you should consider your financial ability to continue your purchases through periods of low price levels before undertaking such a strategy.
Remember to contact your investment professional if you need help with your investments.
Best regards,
/s/Edward C. Johnson 3d
Edward C. Johnson 3d
Annual Report
Fidelity Advisor Government Investment Fund - Class A
There are several ways to evaluate historical performance. You can look at the total percentage change in value, the average annual percentage change or the growth of a hypothetical $10,000 investment. Total return reflects the change in the value of an investment, assuming reinvestment of the class' dividend income and capital gains (the profits earned upon the sale of securities that have grown in value). You can also look at the class' income, as reflected in its yield, to measure performance. The initial offering of Class A shares took place on September 3, 1996. Class A shares bear a 0.15% 12b-1 fee. Returns prior to September 3, 1996 are those of Class T, the original class of the fund, and reflect Class T shares' 0.25% 12b-1 fee. If Fidelity had not reimbursed certain class expenses, the past five year and past 10 year total returns would have been lower.
Cumulative Total Returns
|
Periods ended October 31, 2000 |
|
Past 1 |
Past 5 |
Past 10 |
|
Fidelity Adv Government Inv - CL A |
|
7.53% |
31.11% |
96.28% |
|
Fidelity Adv Government Inv - CL A |
|
2.42% |
24.89% |
86.96% |
|
LB Government Bond |
|
8.04% |
35.66% |
113.90% |
|
General US Government Funds Average |
|
6.77% |
29.13% |
96.96% |
Cumulative total returns show Class A's performance in percentage terms over a set period - in this case, one year, five years or 10 years. For example, if you had invested $1,000 in a fund that had a 5% return over the past year, the value of your investment would be $1,050. You can compare Class A's returns to those of the Lehman Brothers Government Bond Index - a market value-weighted index of U.S. government and government agency securities (other than mortgage securities) with maturities of one year or more. To measure how Class A's performance stacked up against its peers, you can compare it to the general U.S. government funds average, which reflects the performance of mutual funds with similar objectives tracked by Lipper Inc. The past one year average represents a peer group of 185 mutual funds. These benchmarks include reinvested dividends and capital gains, if any, and exclude the effect of sales charges.
Average Annual Total Returns
|
Periods ended October 31, 2000 |
Past 1 |
Past 5 |
Past 10 |
|
Fidelity Adv Government Inv - CL A |
7.53% |
5.57% |
6.98% |
|
Fidelity Adv Government Inv - CL A |
2.42% |
4.54% |
6.46% |
|
LB Government Bond |
8.04% |
6.29% |
7.90% |
|
General US Government Funds Average |
6.77% |
5.24% |
6.99% |
Average annual total returns take Class A shares' cumulative return and show you what would have happened if Class A shares had performed at a constant rate each year.
Annual Report
Fidelity Advisor Government Investment Fund - Class A
Performance - continued
$10,000 Over 10 Years
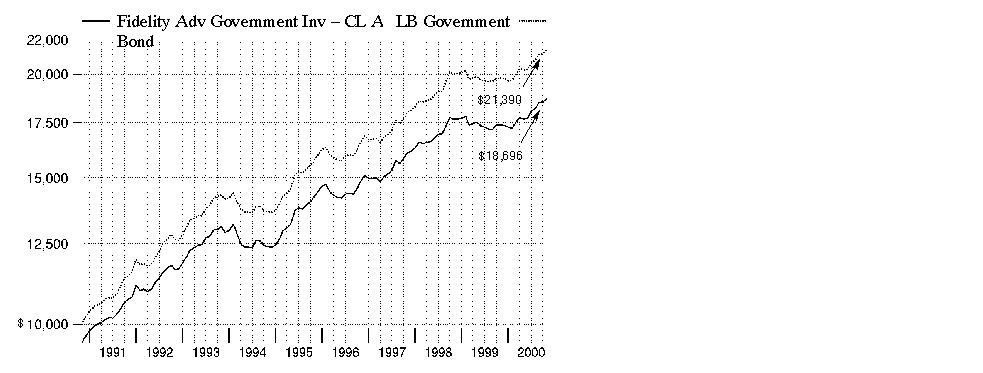
$10,000 Over 10 Years: Let's say hypothetically that $10,000 was invested in Fidelity Advisor Government Investment Fund - Class A on October 31, 1990, and the current 4.75% sales charge was paid. As the chart shows, by October 31, 2000, the value of the investment would have grown to $18,696 - an 86.96% increase on the initial investment. For comparison, look at how the Lehman Brothers Government Bond Index did over the same period. With dividends reinvested, the same $10,000 would have grown to $21,390 - a 113.90% increase.
Understanding
Performance
How a fund did yesterday is no guarantee of how it will do tomorrow. Bond prices, for example, generally move in the opposite direction of interest rates. In turn, the share price, return and yield of a fund that invests in bonds will vary. That means if you sell your shares during a market downturn, you might lose money. But if you can ride out the market's ups and downs, you may have a gain.
3Annual Report
Fidelity Advisor Government Investment Fund - Class A
Performance - continued
Total Return Components
|
|
|
Years ended October 31, |
September 3, 1996 |
|||
|
|
|
2000 |
1999 |
1998 |
1997 |
1996 |
|
Dividend returns |
|
6.35% |
5.56% |
6.12% |
6.19% |
0.99% |
|
Capital returns |
|
1.18% |
-7.09% |
3.62% |
1.90% |
2.59% |
|
Total returns |
|
7.53% |
-1.53% |
9.74% |
8.09% |
3.58% |
Total return components include both dividend returns and capital returns. A dividend return reflects the actual dividends paid by the class. A capital return reflects both the amount paid by the class to shareholders as capital gain distributions and changes in the class' share price. Both returns assume the dividends or capital gains, if any, paid by the class are reinvested, and exclude the effects of sales charges.
Dividends and Yield
|
Periods ended October 31, 2000 |
Past 1 |
Past 6 |
Past 1 |
|
Dividends per share |
4.63¢ |
27.94¢ |
56.39¢ |
|
Annualized dividend rate |
5.79% |
5.97% |
6.10% |
|
30-day annualized yield |
5.67% |
- |
- |
Dividends per share show the income paid by the class for a set period and do not reflect any tax reclassifications. If you annualize this number, based on an average share price of $9.42 over the past one month, $9.29 over the past six months and $9.25 over the past one year, you can compare the class' income over these three periods. The 30-day annualized yield is a standard formula for all bond funds based on the yields of the bonds in the fund, averaged over the past 30 days. This figure shows you the yield characteristics of the fund's investments at the end of the period. It also helps you compare funds from different companies on an equal basis. The offering price used in the calculation of the yield includes the effect of Class A's current 4.75% sales charge.
Annual Report
Fidelity Advisor Government Investment Fund - Class T
There are several ways to evaluate historical performance. You can look at the total percentage change in value, the average annual percentage change or the growth of a hypothetical $10,000 investment. Total return reflects the change in the value of an investment, assuming reinvestment of the class' dividend income and capital gains (the profits earned upon the sale of securities that have grown in value). You can also look at the class' income, as reflected in its yield, to measure performance. If Fidelity had not reimbursed certain class expenses, the past five year and past 10 year total returns would have been lower.
Annual Report
Fidelity Advisor Government Investment Fund - Class T
Performance - continued
Cumulative Total Returns
|
Periods ended October 31, 2000 |
|
Past 1 |
Past 5 |
Past 10 |
|
Fidelity Adv Government Inv - CL T |
|
7.41% |
30.36% |
95.15% |
|
Fidelity Adv Government Inv - CL T |
|
3.65% |
25.80% |
88.32% |
|
LB Government Bond |
|
8.04% |
35.66% |
113.90% |
|
General US Government Funds Average |
|
6.77% |
29.13% |
96.96% |
Cumulative total returns show Class T's performance in percentage terms over a set period - in this case, one year, five years or 10 years. For example, if you had invested $1,000 in a fund that had a 5% return over the past year, the value of your investment would be $1,050. You can compare Class T's returns to those of the Lehman Brothers Government Bond Index - a market value-weighted index of U.S. government and government agency securities (other than mortgage securities) with maturities of one year or more. To measure how Class T's performance stacked up against its peers, you can compare it to the general U.S. government funds average, which reflects the performance of mutual funds with similar objectives tracked by Lipper Inc. The past one year average represents a peer group of 185 mutual funds. These benchmarks include reinvested dividends and capital gains, if any, and exclude the effect of sales charges.
Average Annual Total Returns
|
Periods ended October 31, 2000 |
Past 1 |
Past 5 |
Past 10 |
|
Fidelity Adv Government Inv - CL T |
7.41% |
5.45% |
6.91% |
|
Fidelity Adv Government Inv - CL T |
3.65% |
4.70% |
6.53% |
|
LB Government Bond |
8.04% |
6.29% |
7.90% |
|
General US Government Funds Average |
6.77% |
5.24% |
6.99% |
Average annual total returns take Class T shares' cumulative return and show you what would have happened if Class T shares had performed at a constant rate each year.
Annual Report
Fidelity Advisor Government Investment Fund - Class T
Performance - continued
$10,000 Over 10 Years
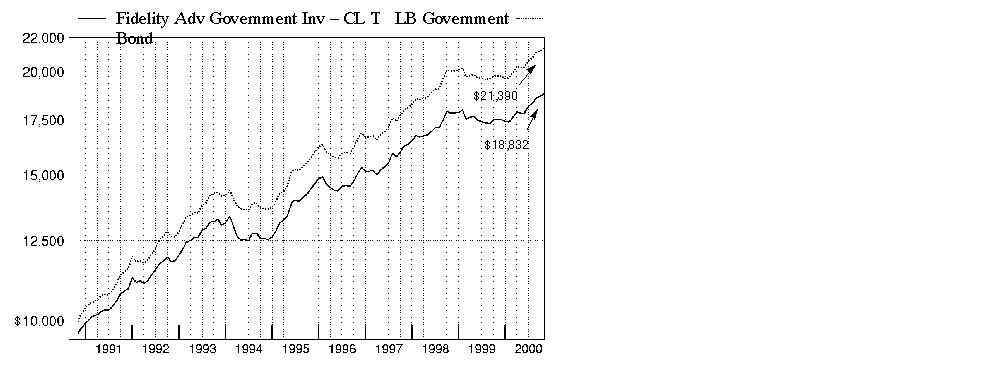
$10,000 Over 10 Years: Let's say hypothetically that $10,000 was invested in Fidelity Advisor Government Investment Fund - Class T on October 31, 1990, and the current 3.50% sales charge was paid. As the chart shows, by October 31, 2000 the value of the investment would have grown to $18,832 - an 88.32% increase on the initial investment. For comparison, look at how the Lehman Brothers Government Bond Index did over the same period. With dividends reinvested the same $10,000 would have grown to $21,390 - a 113.90% increase.
Understanding
Performance
How a fund did yesterday is no guarantee of how it will do tomorrow. Bond prices, for example, generally move in the opposite direction of interest rates. In turn, the share price, return and yield of a fund that invests in bonds will vary. That means if you sell your shares during a market downturn, you might lose money. But if you can ride out the market's ups and downs, you may have a gain.
3Annual Report
Fidelity Advisor Government Investment Fund - Class T
Performance - continued
Total Return Components
|
|
|
Years ended October 31, |
||||
|
|
|
2000 |
1999 |
1998 |
1997 |
1996 |
|
Dividend returns |
|
6.23% |
5.48% |
5.94% |
6.07% |
6.24% |
|
Capital returns |
|
1.18% |
-7.19% |
3.62% |
1.90% |
-1.86% |
|
Total returns |
|
7.41% |
-1.71% |
9.56% |
7.97% |
4.38% |
Total return components include both dividend returns and capital returns. A dividend return reflects the actual dividends paid by the class. A capital return reflects both the amount paid by the class to shareholders as capital gain distributions and changes in the class' share price. Both returns assume the dividends or capital gains, if any, paid by the class are reinvested and exclude the effects of sales charges.
Dividends and Yield
|
Periods ended October 31, 2000 |
Past 1 |
Past 6 |
Past 1 |
|
Dividends per share |
4.54¢ |
27.41¢ |
55.35¢ |
|
Annualized dividend rate |
5.87% |
5.85% |
5.99% |
|
30-day annualized yield |
5.64% |
- |
- |
Dividends per share show the income paid by the class for a set period and do not reflect any tax reclassifications. If you annualize this number, based on an average share price of $9.11 over the past one month, $9.29 over the past six months and $9.24 over the past one year, you can compare the class' income over these three periods. The 30-day annualized yield is a standard formula for all bond funds based on the yields of the bonds in the fund, averaged over the past 30 days. This figure shows you the yield characteristics of the fund's investments at the end of the period. It also helps you compare funds from different companies on an equal basis. The offering price used in the calculation of the yield includes the effect of Class T's current 3.50% sales charge.
Annual Report
Fidelity Advisor Government Investment Fund - Class B
There are several ways to evaluate historical performance. You can look at the total percentage change in value, the average annual percentage change or the growth of a hypothetical $10,000 investment. Total return reflects the change in the value of an investment, assuming reinvestment of the class' dividend income and capital gains (the profits earned upon the sale of securities that have grown in value). You can also look at the class' income, as reflected in its yield, to measure performance. The initial offering of Class B shares took place on June 30, 1994. Class B shares bear a 0.90% 12b-1 fee (1.00% prior to January 1, 1996). Returns prior to June 30, 1994 are those of Class T, the original class of the fund, and reflect Class T shares' 0.25% 12b-1 fee. Had Class B's 12b-1 fee been reflected, returns prior to June 30, 1994 would have been lower. Class B shares' contingent deferred sales charges included in the past one year, past five years and past 10 years total return figures are 5%, 2% and 0%, respectively. If Fidelity had not reimbursed certain class expenses, the past five year and past 10 year total returns would have been lower.
Annual Report
Fidelity Advisor Government Investment Fund - Class B
Performance - continued
Cumulative Total Returns
|
Periods ended October 31, 2000 |
|
Past 1 |
Past 5 |
Past 10 |
|
Fidelity Adv Government Inv - CL B |
|
6.73% |
26.28% |
87.06% |
|
Fidelity Adv Government Inv - CL B |
|
1.73% |
24.33% |
87.06% |
|
LB Government Bond |
|
8.04% |
35.66% |
113.90% |
|
General US Government Funds Average |
|
6.77% |
29.13% |
96.96% |
Cumulative total returns show Class B's performance in percentage terms over a set period - in this case, one year, five years or 10 years. For example, if you had invested $1,000 in a fund that had a 5% return over the past year, the value of your investment would be $1,050. You can compare Class B's returns to those of the Lehman Brothers Government Bond Index - a market value-weighted index of U.S. government and government agency securities (other than mortgage securities) with maturities of one year or more. To measure how Class B's performance stacked up against its peers, you can compare it to the general U.S. government funds average, which reflects the performance of mutual funds with similar objectives tracked by Lipper Inc. The past one year average represents a peer group of 185 mutual funds. These benchmarks include reinvested dividends and capital gains, if any, and exclude the effect of sales charges.
Average Annual Total Returns
|
Periods ended October 31, 2000 |
Past 1 |
Past 5 |
Past 10 |
|
Fidelity Adv Government Inv - CL B |
6.73% |
4.78% |
6.46% |
|
Fidelity Adv Government Inv - CL B |
1.73% |
4.45% |
6.46% |
|
LB Government Bond |
8.04% |
6.29% |
7.90% |
|
General US Government Funds Average |
6.77% |
5.24% |
6.99% |
Average annual total returns take Class B shares' cumulative return and show you what would have happened if Class B shares had performed at a constant rate each year.
Annual Report
Fidelity Advisor Government Investment Fund - Class B
Performance - continued
$10,000 Over 10 Years
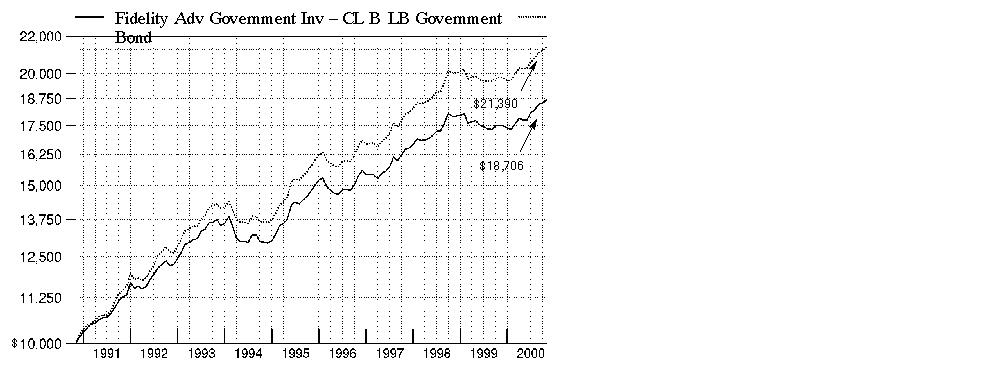
$10,000 Over 10 Years: Let's say hypothetically that $10,000 was invested in Fidelity Advisor Government Investment Fund - Class B on October 31, 1990. As the chart shows, by October 31, 2000, the value of the investment would have grown to $18,706 - an 87.06% increase on the initial investment. For comparison, look at how the Lehman Brothers Government Bond Index did over the same period. With dividends reinvested the same $10,000 would have grown to $21,390 - a 113.90% increase.
Understanding
Performance
How a fund did yesterday is no guarantee of how it will do tomorrow. Bond prices, for example, generally move in the opposite direction of interest rates. In turn, the share price, return and yield of a fund that invests in bonds will vary. That means if you sell your shares during a market downturn, you might lose money. But if you can ride out the market's ups and downs, you may have a gain.
3Annual Report
Fidelity Advisor Government Investment Fund - Class B
Performance - continued
Total Return Components
|
|
|
Years ended October 31, |
||||
|
|
|
2000 |
1999 |
1998 |
1997 |
1996 |
|
Dividend returns |
|
5.55% |
4.85% |
5.25% |
5.41% |
5.55% |
|
Capital returns |
|
1.18% |
-7.09% |
3.62% |
1.79% |
-1.86% |
|
Total returns |
|
6.73% |
-2.24% |
8.87% |
7.20% |
3.69% |
Total return components include both dividend returns and capital returns. A dividend return reflects the actual dividends paid by the class. A capital return reflects both the amount paid by the class to shareholders as capital gain distributions and changes in the class' share price. Both returns assume the dividends or capital gains, if any, paid by the class are reinvested and exclude the effects of sales charges.
Dividends and Yield
|
Periods ended October 31, 2000 |
Past 1 |
Past 6 |
Past 1 |
|
Dividends per share |
4.03¢ |
24.43¢ |
49.43¢ |
|
Annualized dividend rate |
5.04% |
5.22% |
5.35% |
|
30-day annualized yield |
5.21% |
- |
- |
Dividends per share show the income paid by the class for a set period and do not reflect any tax reclassifications. If you annualize this number, based on an average share price of $9.41 over the past one month, $9.28 over the past six months, and $9.24 over the past one year, you can compare the class' income over these three periods. The 30-day annualized yield is a standard formula for all bond funds based on the yields of the bonds in the fund, averaged over the past 30 days. This figure shows you the yield characteristics of the fund's investments at the end of the period. It also helps you compare funds from different companies on an equal basis. The offering share price used in the calculation of the yield excludes the effect of Class B's contingent deferred sales charge.
Annual Report
Fidelity Advisor Government Investment Fund - Class C
There are several ways to evaluate historical performance. You can look at the total percentage change in value, the average annual percentage change or the growth of a hypothetical $10,000 investment. Total return reflects the change in the value of an investment, assuming reinvestment of the class' dividend income and capital gains (the profits earned upon the sale of securities that have grown in value). You can also look at the class' income, as reflected in its yield, to measure performance. The initial offering of Class C shares took place on November 3, 1997. Class C shares bear a 1.00% 12b-1 fee. Returns between June 30, 1994 and November 3, 1997 are those of Class B shares and reflect Class B shares' 0.90% 12b-1 fee (1.00% prior to January 1, 1996). Returns prior to June 30, 1994 are those of Class T, the original class of the fund, and reflect Class T shares' 0.25% 12b-1 fee. Had Class C shares' 12b-1 fee been reflected, returns between November 3, 1997 and January 1, 1996 and prior to June 30, 1994 would have been lower. Class C shares' contingent deferred sales charge included in the past one year, past five years and past 10 years total return figures are 1%, 0%, and 0%, respectively. If Fidelity had not reimbursed certain class expenses, the past five year and past 10 year total returns would have been lower.
Annual Report
Fidelity Advisor Government Investment Fund - Class C
Performance - continued
Cumulative Total Returns
|
Periods ended October 31, 2000 |
|
Past 1 |
Past 5 |
Past 10 |
|
Fidelity Adv Government Inv - CL C |
|
6.64% |
25.75% |
86.28% |
|
Fidelity Adv Government Inv - CL C |
|
5.64% |
25.75% |
86.28% |
|
LB Government Bond |
|
8.04% |
35.66% |
113.90% |
|
General US Government Funds Average |
|
6.77% |
29.13% |
96.96% |
Cumulative total returns show Class C's performance in percentage terms over a set period - in this case, one year, five years or 10 years. For example, if you had invested $1,000 in a fund that had a 5% return over the past year, the value of your investment would be $1,050. You can compare Class C's returns to those of the Lehman Brothers Government Bond Index - a market value-weighted index of U.S. government and government agency securities (other than mortgage securities) with maturities of one year or more. To measure how Class C's performance stacked up against its peers, you can compare it to the general U.S. government funds average, which reflects the performance of mutual funds with similar objectives tracked by Lipper Inc. The past one year average represents a peer group of 185 mutual funds. These benchmarks include reinvested dividends and capital gains, if any, and exclude the effect of sales charges.
Average Annual Total Returns
|
Periods ended October 31, 2000 |
Past 1 |
Past 5 |
Past 10 |
|
Fidelity Adv Government Inv - CL C |
6.64% |
4.69% |
6.42% |
|
Fidelity Adv Government Inv - CL C |
5.64% |
4.69% |
6.42% |
|
LB Government Bond |
8.04% |
6.29% |
7.90% |
|
General US Government Funds Average |
6.77% |
5.24% |
6.99% |
Average annual total returns take Class C shares' cumulative return and show you what would have happened if Class C shares had performed at a constant rate each year.
Annual Report
Fidelity Advisor Government Investment Fund - Class C
Performance - continued
$10,000 Over 10 Years
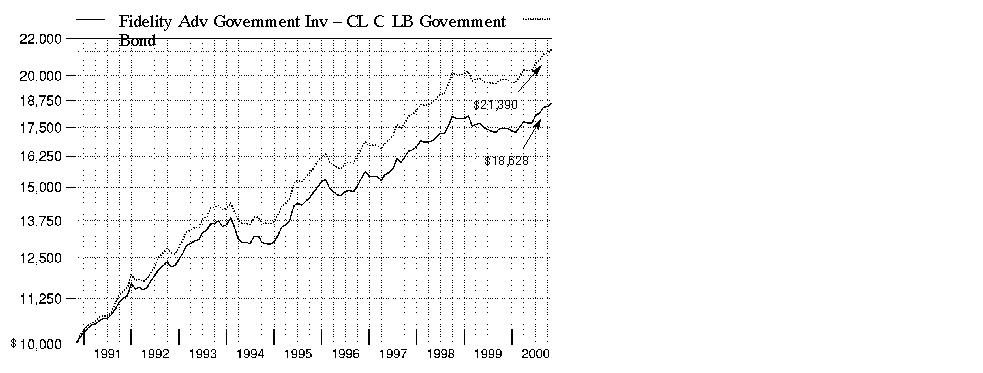
$10,000 Over 10 Years: Let's say hypothetically that $10,000 was invested in Fidelity Advisor Government Investment Fund - Class C on October 31, 1990. As the chart shows, by October 31, 2000, the value of the investment would have grown to $18,628 - an 86.28% increase on the initial investment. For comparison, look at how the Lehman Brothers Government Bond Index did over the same period. With dividends reinvested the same $10,000 would have grown to $21,390 - a 113.90% increase.
Understanding
Performance
How a fund did yesterday is no guarantee of how it will do tomorrow. Bond prices, for example, generally move in the opposite direction of interest rates. In turn, the share price, return and yield of a fund that invests in bonds will vary. That means if you sell your shares during a market downturn, you might lose money. But if you can ride out the market's ups and downs, you may have a gain.
3Annual Report
Fidelity Advisor Government Investment Fund - Class C
Performance - continued
Total Return Components
|
|
|
Years ended October 31, |
November 3, 1997
(commencement of
sale of Class C
shares) to |
|
|
|
|
2000 |
1999 |
1998 |
|
Dividend returns |
|
5.46% |
4.76% |
5.08% |
|
Capital returns |
|
1.18% |
-7.19% |
3.94% |
|
Total returns |
|
6.64% |
-2.43% |
9.02% |
Total return components include both dividend returns and capital returns. A dividend return reflects the actual dividends paid by the class. A capital return reflects both the amount paid by the class to shareholders as capital gain distributions and changes in the class' share price. Both returns assume the dividends or capital gains, if any, paid by the class are reinvested and exclude the effects of sales charges.
Dividends and Yield
|
Periods ended October 31, 2000 |
Past 1 |
Past 6 |
Past 1 |
|
Dividends per share |
3.97¢ |
24.06¢ |
48.68¢ |
|
Annualized dividend rate |
4.97% |
5.14% |
5.27% |
|
30-day annualized yield |
5.13% |
- |
- |
Dividends per share show the income paid by the class for a set period and do not reflect any tax reclassifications. If you annualize this number, based on an average share price of $9.41 over the past one month, $9.28 over the past six months, and $9.24 over the past one year, you can compare the class' income over these three periods. The 30-day annualized yield is a standard formula for all bond funds based on the yields of the bonds in the fund, averaged over the past 30 days. This figure shows you the yield characteristics of the fund's investments at the end of the period. It also helps you compare funds from different companies on an equal basis. The offering price used in the calculation of the yield excludes the effect of Class C's contingent deferred sales charge.
Annual Report
Market Recap
Strong technical factors in the market helped most investment-grade bonds overcome sharply rising interest rates and volatile market conditions, enabling them to outperform a number of major U.S. equity indexes during the 12-month period that ended October 31, 2000. The Lehman Brothers Aggregate Bond Index - a popular measure of taxable-bond performance - returned 7.30% during this time frame. Following a bullish fourth quarter of 1999 for the spread sectors - namely corporate bonds, mortgage and agency securities - Treasuries usurped market leadership not long after the millennium changeover. A growing federal surplus spurred the U.S. government in January to begin buying back outstanding debt and reducing future issuance. The scarcity premium created by a shrinking supply of long-dated Treasuries sent prices soaring and yields plummeting, thereby inducing an inverted yield curve - which occurs when short-term bonds outyield longer-dated securities. Anticipation that the Fed was finished raising interest rates entering the summer, combined with persistent flights-to-safety from risk-averse investors concerned about volatility in equity markets, further bolstered the long bond, helping the Lehman Brothers Treasury Index return 8.22% during the period. Mortgages made up some ground late in the period behind strong housing turnover. Agencies, too, staged a late rally in response to reduced political risk surrounding government-sponsored enterprises. However, corporates had little to celebrate, plagued by deteriorating credit conditions and growing supply pressures. For the overall period, the Lehman Brothers Mortgage-Backed Securities, U.S. Agency and Credit Bond indexes returned 7.57%, 7.30% and 5.48%, respectively.
(Portfolio Manager photograph)
An interview with Tom Silvia, Portfolio Manager of Fidelity Advisor Government Investment Fund
Q. How did the fund perform, Tom?
A. For the 12 months ending October 31, 2000, the fund's Class A, Class T, Class B and Class C shares returned 7.53%, 7.41%, 6.73% and 6.64%, respectively. To get a sense of how the fund did relative to its competitors, the general U.S. government funds average returned 6.77% for the same 12-month period, according to Lipper Inc. Additionally, the Lehman Brothers Government Bond Index - which tracks the types of securities in which the fund invests - returned 8.04% for the one-year period.
Fund Talk: The Manager's Overview - continued
Q. What factors contributed to the fund's performance?
Annual Report
A. The main factor, as always, was the direction of interest rates. At first, rising rates were a drag on performance. From November 1999 through May 2000, the Federal Reserve Board made a series of rate hikes in order to slow the economy and cool inflationary pressures. More recently, it became evident that those hikes had achieved their intended effect. The economy cooled significantly in the third quarter of 2000 and inflationary pressures seemingly diminished. As rates fell, bond yields declined and prices firmed, which was a plus for fund performance. The fund also was helped by its relatively large stake in longer-term Treasury securities, which posted strong gains for the year as the government bought back older, high-interest Treasury bonds and scaled back its number of auctions of new debt.
Q. The reduction in long-term U.S. Treasuries caused the Treasury yield curve to "invert." Can you explain that phenomenon and why it occurred?
A. Sure. The difference in the performances and yields between short- and long-term Treasuries caused the Treasury yield curve - a graphical representation of the yields offered by various bond maturities - to invert for the first time since 1990. Investors usually demand higher yields on longer-term bonds than on shorter-term ones, reflecting the greater risk in lending money over a longer period of time. But because of the relative scarcity of long-term securities, and the relatively strong demand for them, the yield on the 30-year bond fell to more than half a percentage point lower than the yield on the two-year Treasury note at one point. More recently, however, the yield curve began to revert back toward a more normal position due to evidence that economic growth was slowing, which dampened fears that the Fed would be forced to raise interest rates further. In response, short-term bond yields fell.
Q. How did mortgage securities - at 29.6% of net assets at the end of the period - perform?
A. Despite a rough start, the fund's mortgage holdings helped performance. The Treasury's debt reduction actions initially held some unpleasant consequences for the mortgage market. While the Treasury curtailed issuance and bought back debt, the mortgage market suffered from too much supply. Good economic conditions translated into a strong housing market and higher levels of mortgage prepayments, which can hurt mortgage securities. As evidence emerged that the economy was slowing, however, mortgage prepayments fell and the supply was reduced. The more favorable supply and demand backdrop, plus their relatively high yields, helped the fund's stake in long-term mortgage securities outpace comparable maturity Treasury securities.
Q. How did the fund's stake in agency obligations fare?
A. They were a bit of a disappointment throughout most of the year, although they've improved during the past couple of months. Like mortgages, agency obligations spent most of the year battling an unfavorable supply and demand backdrop. Just as the Treasury was cutting back its issuance, many agencies were expanding theirs. Furthermore, agency securities had to contend with the threat that Congress might cut off long-standing but never-used lines of credit that give some agencies - particularly mortgage securities issuers Fannie Mae and Freddie Mac - implicit government backing. More recently, however, these securities bounced back because they made some concessions to legislators, adopting measures to improve their capital structure and allow more scrutiny of their books.
Annual Report
Fund Talk: The Manager's Overview - continued
Q. What's your outlook?
A. I believe mortgage and agency securities continue to offer attractive long-term values. The current yield advantage they enjoy helps position them to perform better than Treasury securities, in my view. That's why I plan to keep relatively large weightings in each. To the extent that their spread relationship relative to Treasuries returns to more normal levels, agency and mortgage securities can do well. Even if the current spread relationship remains constant, their yield advantage should help them gain ground on Treasuries.
The views expressed in this report reflect those of the portfolio manager only through the end of the period of the report as stated on the cover and do not necessarily represent the views of Fidelity or any other person in the Fidelity organization. Any such views are subject to change at any time based upon market or other conditions and Fidelity disclaims any responsibility to update such views. These views may not be relied on as investment advice and, because investment decisions for a Fidelity fund are based on numerous factors, may not be relied on as an indication of trading intent on behalf of any Fidelity fund.
Fund Facts
Goal: seeks a high level of current income by investing in U.S. government securities and instruments related to U.S. government securities
Start date: January 7, 1987
Size: as of October 31, 2000, more than $326 million
Manager: Tom Silvia, since 1998; joined Fidelity in 1993
3Tom Silvia on the government's buyback of Treasury securities:
"As the federal budget deficits of the early 1990s morphed into federal budget surpluses during the past three years, the U.S. Treasury was able to make significant progress in reducing the nation's debt load. During the past three years, the government has paid down $363 billion of publicly held debt, which helped cut the nation's debt to 34% of gross domestic product, down from nearly 50% seven years ago. One way debt was reduced was through the buyback of outstanding Treasury securities. By the end of October 2000, the Treasury had conducted 16 debt buyback operations, redeeming $25 billion in debt. Additionally, the Treasury eliminated three- and seven-year Treasury notes and reduced the frequencies and sizes of remaining debt auctions. The Treasury Department already has announced that it expects to pay down another $23 billion in marketable debt during the October through December quarter of 2000. Beyond that, it's my view that the Treasury will continue to use buybacks as an important debt management tool. To the extent that more Treasury securities are bought back, the Treasury market should benefit, much as it has during the past year."
Annual Report
|
Coupon Distribution as of October 31, 2000 |
||
|
|
% of fund's investments |
% of fund's investments |
|
Zero coupon bonds |
1.3 |
1.3 |
|
5 - 5.99% |
9.3 |
14.4 |
|
6 - 6.99% |
44.7 |
26.6 |
|
7 - 7.99% |
17.6 |
27.4 |
|
8 - 8.99% |
16.4 |
21.6 |
|
9% and over |
3.7 |
6.1 |
|
Coupon distribution shows the range of stated interest rates on the fund's investments, excluding short-term investments. |
|
Average Years to Maturity as of October 31, 2000 |
||
|
|
|
6 months ago |
|
Years |
9.7 |
9.5 |
|
Average years to maturity is based on the average time remaining until principal payments are expected from each of the fund's bonds, weighted by dollar amount. |
|
Duration as of October 31, 2000 |
||
|
|
|
6 months ago |
|
Years |
5.1 |
5.3 |
|
Duration shows how much a bond fund's price fluctuates with changes in comparable interest rates. If rates rise 1%, for example, a fund with a five-year duration is likely to lose about 5% of its value. Other factors also can influence a bond fund's performance and share price. Accordingly, a bond fund's actual performance may differ from this example. |
|
Asset Allocation (% of fund's net assets) |
|||||||
|
As of October 31, 2000 |
As of April 30, 2000 |
||||||
|
Mortgage Securities 24.8% |
|
|
Mortgage Securities 30.2% |
|
||
|
CMOs and Other Mortgage Related Securities 4.8% |
|
|
CMOs and Other Mortgage Related Securities 3.6% |
|
||
|
U.S. Treasury |
|
|
U.S. Treasury |
|
||
|
U.S. Government |
|
|
U.S. Government |
|
||
|
Short-Term |
|
|
Short-Term |
|
||

Annual Report
Showing Percentage of Net Assets
|
U.S. Government and Government Agency Obligations - 64.2% |
||||
|
|
Principal Amount |
Value |
||
|
U.S. Government Agency Obligations - 33.8% |
||||
|
Fannie Mae: |
|
|
|
|
|
5.45% 2/4/02 |
|
$ 5,000,000 |
$ 4,924,338 |
|
|
6.5% 4/29/09 |
|
18,575,000 |
17,686,929 |
|
|
7.25% 5/15/30 |
|
7,190,000 |
7,633,846 |
|
|
Farm Credit Systems Financial Assistance Corp. 8.8% 6/10/05 |
|
390,000 |
423,638 |
|
|
Federal Home Loan Bank 5.125% 9/15/03 |
|
640,000 |
617,702 |
|
|
Financing Corp. - coupon STRIPS 0% 4/6/01 |
|
4,500,000 |
4,368,420 |
|
|
Freddie Mac: |
|
|
|
|
|
6.45% 4/29/09 |
|
18,000,000 |
17,083,620 |
|
|
6.75% 3/15/31 |
|
6,710,000 |
6,695,305 |
|
|
Government Loan Trusts (assets of Trust guaranteed by U.S. Government through Agency for International Development) 8.5% 4/1/06 |
|
863,292 |
906,914 |
|
|
Government Trust Certificates (assets of Trust guaranteed by U.S. Government through Defense Security Assistance Agency): |
|
|
|
|
|
Class 1-C, 9.25% 11/15/01 |
|
2,456,298 |
2,492,283 |
|
|
Class 2-E, 9.4% 5/15/02 |
|
294,698 |
297,040 |
|
|
Class 3-T, 9.625% 5/15/02 |
|
143,065 |
144,444 |
|
|
Guaranteed Export Trust Certificates (assets of Trust guaranteed by U.S. Government through Export-Import Bank): |
|
|
|
|
|
Series 1993-C, 5.2% 10/15/04 |
|
169,956 |
164,998 |
|
|
Series 1993-D, 5.23% 5/15/05 |
|
198,085 |
191,930 |
|
|
Series 1994-A, 7.12% 4/15/06 |
|
9,190,404 |
9,323,665 |
|
|
Series 1994-F, 8.187% 12/15/04 |
|
3,393,237 |
3,468,961 |
|
|
Series 1995-A, 6.28% 6/15/04 |
|
1,651,765 |
1,637,664 |
|
|
Guaranteed Trade Trust Certificates (assets of Trust guaranteed by U.S. Government through Export- |
|
|
|
|
|
Series 1994-A, 7.39% 6/26/06 |
|
4,500,000 |
4,580,550 |
|
|
Series 1994-B, 7.5% 1/26/06 |
|
174,475 |
177,900 |
|
|
Series 1997-A, 6.104% 7/15/03 |
|
2,000,000 |
1,983,000 |
|
|
Israel Export Trust Certificates (assets of Trust guaranteed by U.S. Government through Export- |
|
155,883 |
155,612 |
|
|
Overseas Private Investment Corp. U.S. Government guaranteed participation certificate: |
|
|
|
|
|
Series 1994-195, 6.08% 8/15/04 (callable) |
|
1,373,500 |
1,365,204 |
|
|
Series 1996-A1, 6.726% 9/15/10 (callable) |
|
1,739,130 |
1,762,243 |
|
|
Private Export Funding Corp. secured: |
|
|
|
|
|
5.31% 11/15/03 (a) |
|
1,060,000 |
1,021,543 |
|
|
U.S. Government and Government Agency Obligations - continued |
||||
|
|
Principal Amount |
Value |
||
|
U.S. Government Agency Obligations - continued |
||||
|
Private Export Funding Corp. secured: - continued |
|
|
|
|
|
5.65% 3/15/03 |
|
$ 428,750 |
$ 421,920 |
|
|
5.82% 6/15/03 (a) |
|
6,070,000 |
5,901,178 |
|
|
6.86% 4/30/04 |
|
705,250 |
706,461 |
|
|
State of Israel (guaranteed by U.S. Government through Agency for International Development) 6.6% 2/15/08 |
|
10,200,000 |
10,142,574 |
|
|
U.S. Department of Housing and Urban Development government guaranteed participation certificates Series 1999-A: |
|
|
|
|
|
5.75% 8/1/06 |
|
2,100,000 |
2,019,360 |
|
|
5.96% 8/1/09 |
|
1,800,000 |
1,708,650 |
|
|
U.S. Trade Trust Certificates (assets of Trust guaranteed by U.S. Government through Export-Import Bank) 8.17% 1/15/07 |
|
390,000 |
408,018 |
|
|
TOTAL U.S. GOVERNMENT AGENCY OBLIGATIONS |
110,415,910 |
|||
|
U.S. Treasury Obligations - 30.4% |
||||
|
U.S. Treasury Bonds: |
|
|
|
|
|
6.125% 11/15/27 |
|
7,100,000 |
7,253,076 |
|
|
6.125% 8/15/29 |
|
21,600,000 |
22,369,392 |
|
|
6.5% 11/15/26 |
|
3,000,000 |
3,206,730 |
|
|
8% 11/15/21 |
|
3,220,000 |
3,979,727 |
|
|
8.875% 8/15/17 |
|
24,611,000 |
31,994,300 |
|
|
14% 11/15/11 |
|
1,000,000 |
1,399,060 |
|
|
U.S. Treasury Notes: |
|
|
|
|
|
5.25% 5/31/01 |
|
12,000,000 |
11,918,652 |
|
|
6.5% 2/15/10 |
|
6,000,000 |
6,280,320 |
|
|
6.625% 6/30/01 |
|
10,750,000 |
10,765,674 |
|
|
TOTAL U.S. TREASURY OBLIGATIONS |
99,166,931 |
|||
|
TOTAL U.S. GOVERNMENT AND (Cost $209,293,272) |
209,582,841 |
|||
|
U.S. Government Agency - Mortgage Securities - 24.8% |
||||
|
|
||||
|
Fannie Mae - 18.7% |
||||
|
5.5% 7/1/09 |
|
1,781,106 |
1,710,414 |
|
|
6% 9/1/08 to 9/1/14 |
|
8,339,783 |
8,075,522 |
|
|
6.5% 6/1/07 to 11/1/30 |
|
12,592,556 |
12,126,531 |
|
|
7% 4/1/26 to 9/1/29 |
|
11,642,637 |
11,421,125 |
|
|
U.S. Government Agency - Mortgage Securities - continued |
||||
|
|
Principal Amount |
Value |
||
|
Fannie Mae - continued |
||||
|
7.5% 3/1/09 to 6/1/30 |
|
$ 18,740,837 |
$ 18,776,182 |
|
|
8% 7/1/29 to 7/1/30 |
|
3,829,059 |
3,875,697 |
|
|
8.25% 12/1/01 |
|
653,022 |
655,119 |
|
|
8.5% 9/1/16 to 1/1/17 |
|
65,397 |
67,101 |
|
|
9% 11/1/11 to 5/1/14 |
|
2,796,601 |
2,823,657 |
|
|
9.25% 9/1/16 |
|
32,359 |
33,705 |
|
|
9.5% 11/1/06 to 5/1/20 |
|
1,218,364 |
1,260,507 |
|
|
11.5% 6/1/19 |
|
248,404 |
275,729 |
|
|
12.5% 8/1/15 |
|
10,321 |
11,660 |
|
|
|
61,112,949 |
|||
|
Freddie Mac - 3.1% |
||||
|
6.5% 5/1/08 to 8/1/11 |
|
2,830,071 |
2,786,252 |
|
|
6.775% 11/15/03 |
|
4,600,068 |
4,576,887 |
|
|
7.5% 11/1/30 (b) |
|
950,000 |
949,406 |
|
|
8.5% 8/1/09 to 2/1/10 |
|
187,657 |
190,860 |
|
|
9% 10/1/08 to 10/1/20 |
|
649,820 |
668,959 |
|
|
9.5% 5/1/21 to 7/1/21 |
|
418,940 |
439,531 |
|
|
11% 7/1/13 to 5/1/14 |
|
274,142 |
296,228 |
|
|
12.5% 2/1/10 to 6/1/19 |
|
318,675 |
357,810 |
|
|
|
10,265,933 |
|||
|
Government National Mortgage Association - 3.0% |
||||
|
7.5% 9/15/06 to 1/15/08 |
|
1,249,394 |
1,268,453 |
|
|
8% 12/15/23 |
|
4,317,482 |
4,398,435 |
|
|
8.5% 9/15/30 to 10/15/30 |
|
3,399,760 |
3,486,862 |
|
|
9% 5/15/01 to 12/15/09 |
|
108,662 |
109,375 |
|
|
10.5% 8/15/16 to 1/20/18 |
|
367,862 |
396,776 |
|
|
13.5% 7/15/11 |
|
36,181 |
41,301 |
|
|
|
9,701,202 |
|||
|
TOTAL U.S. GOVERNMENT AGENCY - MORTGAGE SECURITIES (Cost $81,343,972) |
81,080,084 |
|||
|
Collateralized Mortgage Obligations - 4.4% |
||||
|
|
||||
|
U.S. Government Agency - 4.4% |
||||
|
Fannie Mae REMIC planned amortization class: |
|
|
|
|
|
Series 1993-134 Class GA, 6.5% 2/25/07 |
|
2,730,000 |
2,706,959 |
|
|
Series 1993-160 Class PK, 6.5% 11/25/22 |
|
5,413,000 |
5,299,928 |
|
|
Collateralized Mortgage Obligations - continued |
||||
|
|
Principal Amount |
Value |
||
|
U.S. Government Agency - continued |
||||
|
Freddie Mac: |
|
|
|
|
|
REMIC planned amortization class: |
|
|
|
|
|
Series 1141 Class G, 9% 9/15/21 |
|
$ 1,311,468 |
$ 1,360,648 |
|
|
Series 1727 Class H, 6.5% 8/15/23 |
|
2,600,000 |
2,492,750 |
|
|
sequential pay Series 1974 Class Z, 7% 8/15/20 |
|
2,609,626 |
2,509,312 |
|
|
TOTAL COLLATERALIZED MORTGAGE OBLIGATIONS (Cost $14,182,124) |
14,369,597 |
|||
|
Commercial Mortgage Securities - 0.4% |
||||
|
|
||||
|
Fannie Mae ACES sequential pay Series 1996-M5 Class A1, 7.141% 7/25/10 |
|
1,434,065 |
1,440,339 |
|
|
Cash Equivalents - 7.0% |
|||
|
Maturity Amount |
|
||
|
Investments in repurchase agreements (U.S. Government Obligations), in a joint trading account at 6.62%, dated 10/31/00 due
11/1/00 |
$ 22,901,210 |
22,897,000 |
|
|
|
|
|
|
TOTAL INVESTMENT PORTFOLIO - 100.8% (Cost $329,163,067) |
329,369,861 |
|
|
NET OTHER ASSETS - (0.8)% |
(2,643,545) |
|
|
NET ASSETS - 100% |
$ 326,726,316 |
|
|
Legend |
|
(a) Security exempt from registration under Rule 144A of the Securities Act of 1933. These securities may be resold in transactions exempt from registration, normally to qualified institutional buyers. At the period end, the value of these securities amounted to $6,922,721 or 2.1% of net assets. |
|
(b) Security purchased on a delayed delivery or when-issued basis. |
|
Income Tax Information |
|
At October 31, 2000, the aggregate cost of investment securities for income tax purposes was $329,491,385. Net unrealized depreciation aggregated $121,524, of which $2,926,760 related to appreciated investment securities and $3,048,284 related to depreciated investment securities. |
|
At October 31, 2000, the fund had a capital loss carryforward of approximately $16,824,000 of which $8,584,000 and $8,240,000 will expire on October 31, 2007 and 2008, respectively. |
|
A total of 26.60% of the dividends distributed during the fiscal year was derived from interest on U.S. Government securities which is generally exempt from state income tax. The fund will notify shareholders in January 2001 of amounts for use in preparing 2000 income tax returns (unaudited). |
See accompanying notes which are an integral part of the financial statements.
Annual Report
Statement of Assets and Liabilities
|
|
October 31, 2000 |
|
|
Assets |
|
|
|
Investment in securities, at value (including repurchase agreements of $22,897,000) (cost $329,163,067) - See accompanying schedule |
|
$ 329,369,861 |
|
Cash |
|
344 |
|
Receivable for investments sold |
|
2,022,017 |
|
Receivable for fund shares sold |
|
1,143,901 |
|
Interest receivable |
|
3,563,907 |
|
Total assets |
|
336,100,030 |
|
Liabilities |
|
|
|
Payable for investments purchased |
$ 4,667,996 |
|
|
Delayed delivery |
950,000 |
|
|
Payable for fund shares redeemed |
3,153,899 |
|
|
Distributions payable |
281,069 |
|
|
Accrued management fee |
113,900 |
|
|
Distribution fees payable |
121,046 |
|
|
Other payables and accrued expenses |
85,804 |
|
|
Total liabilities |
|
9,373,714 |
|
Net Assets |
|
$ 326,726,316 |
|
Net Assets consist of: |
|
|
|
Paid in capital |
|
$ 343,297,478 |
|
Undistributed net investment income |
|
373,990 |
|
Accumulated undistributed net realized gain (loss) |
|
(17,151,946) |
|
Net unrealized appreciation (depreciation) on investments |
|
206,794 |
|
Net Assets |
|
$ 326,726,316 |
See accompanying notes which are an integral part of the financial statements.
Annual Report
Financial Statements - continued
Statement of Assets and Liabilities - continued
|
|
October 31, 2000 |
|
|
Calculation of Maximum Offering Price |
|
$9.42 |
|
Maximum offering price per share (100/95.25 of $9.42) |
|
$9.89 |
|
Class T: |
|
$9.41 |
|
Maximum offering price per share (100/96.50 of $9.41) |
|
$9.75 |
|
Class B: |
|
$9.41 |
|
Class C: |
|
$9.41 |
|
Institutional Class: |
|
$9.38 |
A Redemption price per share is equal to net asset value less any applicable contingent deferred sales charge.
See accompanying notes which are an integral part of the financial statements.
Annual Report
Financial Statements - continued
Statement of Operations
|
|
Year ended October 31, 2000 |
|
|
Investment Income Interest |
|
$ 22,572,459 |
|
Security lending |
|
15,395 |
|
Total Income |
|
22,587,854 |
|
Expenses |
|
|
|
Management fee |
$ 1,400,721 |
|
|
Transfer agent fees |
611,505 |
|
|
Distribution fees |
1,496,927 |
|
|
Accounting and security lending fees |
97,883 |
|
|
Non-interested trustees' compensation |
1,074 |
|
|
Custodian fees and expenses |
22,144 |
|
|
Registration fees |
93,857 |
|
|
Audit |
36,298 |
|
|
Legal |
4,146 |
|
|
Miscellaneous |
3,567 |
|
|
Total expenses before reductions |
3,768,122 |
|
|
Expense reductions |
(3,939) |
3,764,183 |
|
Net investment income |
|
18,823,671 |
|
Realized and Unrealized Gain (Loss) Net realized gain (loss) on investment securities |
|
(7,732,333) |
|
Change in net unrealized appreciation (depreciation) |
|
10,308,785 |
|
Net gain (loss) |
|
2,576,452 |
|
Net increase (decrease) in net assets resulting |
|
$ 21,400,123 |
See accompanying notes which are an integral part of the financial statements.
Annual Report
Financial Statements - continued
Statement of Changes in Net Assets
|
|
Year ended
October 31, |
Year ended
October 31, |
|
Increase (Decrease) in Net Assets |
|
|
|
Operations |
$ 18,823,671 |
$ 19,798,129 |
|
Net realized gain (loss) |
(7,732,333) |
(9,202,613) |
|
Change in net unrealized appreciation (depreciation) |
10,308,785 |
(17,582,000) |
|
Net increase (decrease) in net assets resulting |
21,400,123 |
(6,986,484) |
|
Distributions to shareholders from net investment income |
(19,083,783) |
(20,097,409) |
|
Share transactions - net increase (decrease) |
(59,111,819) |
75,179,570 |
|
Total increase (decrease) in net assets |
(56,795,479) |
48,095,677 |
|
Net Assets |
|
|
|
Beginning of period |
383,521,795 |
335,426,118 |
|
End of period (including undistributed net investment income of $373,990 and $487,308, respectively) |
$ 326,726,316 |
$ 383,521,795 |
See accompanying notes which are an integral part of the financial statements.
Annual Report
Financial Highlights - Class A
|
Years ended October 31, |
2000 |
1999 |
1998 |
1997 |
1996 E |
|
Selected Per-Share Data |
|
|
|
|
|
|
Net asset value, beginning |
$ 9.310 |
$ 10.020 |
$ 9.670 |
$ 9.490 |
$ 9.250 |
|
Income from Investment Operations |
|
|
|
|
|
|
Net investment income D |
.559 |
.545 |
.545 |
.552 |
.090 |
|
Net realized and unrealized gain (loss) |
.115 |
(.696) |
.368 |
.187 |
.241 |
|
Total from investment |
.674 |
(.151) |
.913 |
.739 |
.331 |
|
Less Distributions |
|
|
|
|
|
|
From net investment income |
(.564) |
(.559) |
(.563) |
(.559) |
(.091) |
|
Net asset value, end of period |
$ 9.420 |
$ 9.310 |
$ 10.020 |
$ 9.670 |
$ 9.490 |
|
Total Return B, C |
7.53% |
(1.53)% |
9.74% |
8.09% |
3.58% |
|
Ratios and Supplemental Data |
|
|
|
|
|
|
Net assets, end of period |
$ 15,053 |
$ 15,273 |
$ 7,884 |
$ 1,582 |
$ 223 |
|
Ratio of expenses to average |
.85% |
.87% |
.90% F |
.90% F |
.90% A, F |
|
Ratio of net investment income to average net assets |
6.02% |
5.73% |
5.65% |
5.98% |
6.28% A |
|
Portfolio turnover rate |
155% |
174% |
243% |
136% |
153% |
A Annualized
B The total returns would have been lower had certain expenses not been reduced during the periods shown.
C Total returns do not include the one time sales charge and for periods of less than one year are not annualized.
D Net investment income per share has been calculated based on average shares outstanding during the period.
E For the period September 3,1996 (commencement of sale of Class A shares) to October 31, 1996.
F FMR agreed to reimburse a portion of the class' expenses during the period. Without this reimbursement, the class' expense ratio would have been higher.
See accompanying notes which are an integral part of the financial statements.
Annual Report
Financial Highlights - Class T
|
Years ended October 31, |
2000 |
1999 |
1998 |
1997 |
1996 |
|
Selected Per-Share Data |
|
|
|
|
|
|
Net asset value, beginning |
$ 9.300 |
$ 10.020 |
$ 9.670 |
$ 9.490 |
$ 9.670 |
|
Income from Investment Operations |
|
|
|
|
|
|
Net investment income C |
.549 |
.541 |
.546 |
.558 |
.586 |
|
Net realized and unrealized gain (loss) |
.114 |
(.710) |
.351 |
.171 |
(.180) |
|
Total from investment |
.663 |
(.169) |
.897 |
.729 |
.406 |
|
Less Distributions |
|
|
|
|
|
|
From net investment income |
(.553) |
(.551) |
(.547) |
(.549) |
(.586) |
|
Net asset value, end of period |
$ 9.410 |
$ 9.300 |
$ 10.020 |
$ 9.670 |
$ 9.490 |
|
Total Return A, B |
7.41% |
(1.71)% |
9.56% |
7.97% |
4.38% |
|
Ratios and Supplemental Data |
|
|
|
|
|
|
Net assets, end of period |
$ 182,049 |
$ 215,089 |
$ 212,933 |
$ 144,948 |
$ 217,883 |
|
Ratio of expenses to average |
.95% |
.96% |
1.00% D |
1.00% D |
1.00% |
|
Ratio of expenses to average net assets after expense reductions |
.95% |
.95% E |
1.00% |
1.00% |
.99% E |
|
Ratio of net investment income to average net assets |
5.92% |
5.65% |
5.59% |
5.88% |
6.19% |
|
Portfolio turnover rate |
155% |
174% |
243% |
136% |
153% |
A The total returns would have been lower had certain expenses not been reduced during the periods shown.
B Total returns do not include the one time sales charge.
C Net investment income per share has been calculated based on average shares outstanding during the period.
D FMR agreed to reimburse a portion of the class' expenses during the period. Without this reimbursement, the class' expense ratio would have been higher.
E FMR or the fund has entered into varying arrangements with third parties who either paid or reduced a portion of the class' expenses.
See accompanying notes which are an integral part of the financial statements.
Annual Report
Financial Highlights - Class B
|
Years ended October 31, |
2000 |
1999 |
1998 |
1997 |
1996 |
|
Selected Per-Share Data |
|
|
|
|
|
|
Net asset value, beginning |
$ 9.300 |
$ 10.010 |
$ 9.660 |
$ 9.490 |
$ 9.670 |
|
Income from Investment Operations |
|
|
|
|
|
|
Net investment income C |
.490 |
.479 |
.475 |
.494 |
.520 |
|
Net realized and unrealized gain (loss) |
.114 |
(.699) |
.359 |
.166 |
(.177) |
|
Total from investment |
.604 |
(.220) |
.834 |
.660 |
.343 |
|
Less Distributions |
|
|
|
|
|
|
From net investment income |
(.494) |
(.490) |
(.484) |
(.490) |
(.523) |
|
Net asset value, end of period |
$ 9.410 |
$ 9.300 |
$ 10.010 |
$ 9.660 |
$ 9.490 |
|
Total Return A, B |
6.73% |
(2.24)% |
8.87% |
7.20% |
3.69% |
|
Ratios and Supplemental Data |
|
|
|
|
|
|
Net assets, end of period |
$ 77,424 |
$ 94,871 |
$ 74,073 |
$ 18,782 |
$ 17,355 |
|
Ratio of expenses to average |
1.59% |
1.59% |
1.65% D |
1.65% D |
1.67% D |
|
Ratio of net investment income to average net assets |
5.28% |
5.01% |
4.92% |
5.24% |
5.51% |
|
Portfolio turnover rate |
155% |
174% |
243% |
136% |
153% |
A The total returns would have been lower had certain expenses not been reduced during the periods shown.
B Total returns do not include the contingent deferred sales charge.
C Net investment income per share has been calculated based on average shares outstanding during the period.
D FMR agreed to reimburse a portion of the class' expenses during the period. Without this reimbursement, the class' expense ratio would have been higher.
See accompanying notes which are an integral part of the financial statements.
Annual Report
Financial Highlights - Class C
|
Years ended October 31, |
2000 |
1999 |
1998 E |
|
Selected Per-Share Data |
|
|
|
|
Net asset value, beginning of period |
$ 9.300 |
$ 10.020 |
$ 9.640 |
|
Income from Investment Operations |
|
|
|
|
Net investment income D |
.482 |
.468 |
.450 |
|
Net realized and unrealized gain (loss) |
.115 |
(.708) |
.398 |
|
Total from investment operations |
.597 |
(.240) |
.848 |
|
Less Distributions |
|
|
|
|
From net investment income |
(.487) |
(.480) |
(.468) |
|
Net asset value, end of period |
$ 9.410 |
$ 9.300 |
$ 10.020 |
|
Total Return B, C |
6.64% |
(2.43)% |
9.02% |
|
Ratios and Supplemental Data |
|
|
|
|
Net assets, end of period (000 omitted) |
$ 30,133 |
$ 35,652 |
$ 14,954 |
|
Ratio of expenses to average net assets |
1.67% |
1.69% |
1.75% A, F |
|
Ratio of net investment income to average net assets |
5.20% |
4.91% |
4.74% A |
|
Portfolio turnover rate |
155% |
174% |
243% |
A Annualized
B The total returns would have been lower had certain expenses not been reduced during the periods shown.
C Total returns do not include the contingent deferred sales charge and for periods of less than one year are not annualized.
D Net investment income per share has been calculated based on average shares outstanding during the period.
E For the period November 3, 1997 (commencement of sale of Class C shares) to October 31, 1998.
F FMR agreed to reimburse a portion of the class' expenses during the period. Without this reimbursement, the class' expense ratio would have been higher.
See accompanying notes which are an integral part of the financial statements.
Annual Report
Financial Highlights - Institutional Class
|
Years ended October 31, |
2000 |
1999 |
1998 |
1997 |
1996 |
|
Selected Per-Share Data |
|
|
|
|
|
|
Net asset value, beginning |
$ 9.270 |
$ 10.000 |
$ 9.650 |
$ 9.480 |
$ 9.670 |
|
Income from Investment Operations |
|
|
|
|
|
|
Net investment income C |
.572 |
.567 |
.570 |
.580 |
.604 |
|
Net realized and unrealized gain (loss) |
.118 |
(.720) |
.352 |
.165 |
(.180) |
|
Total from investment |
.690 |
(.153) |
.922 |
.745 |
.424 |
|
Less Distributions |
|
|
|
|
|
|
From net investment income |
(.580) |
(.577) |
(.572) |
(.575) |
(.614) |
|
Net asset value, end of period |
$ 9.380 |
$ 9.270 |
$ 10.000 |
$ 9.650 |
$ 9.480 |
|
Total Return A, B |
7.75% |
(1.55)% |
9.86% |
8.18% |
4.58% |
|
Ratios and Supplemental Data |
|
|
|
|
|
|
Net assets, end of period |
$ 22,067 |
$ 22,636 |
$ 25,582 |
$ 20,366 |
$ 27,660 |
|
Ratio of expenses to average |
.66% |
.68% |
.75% D |
.75% D |
.75% D |
|
Ratio of net investment income to average net assets |
6.20% |
5.92% |
5.84% |
6.12% |
6.43% |
|
Portfolio turnover rate |
155% |
174% |
243% |
136% |
153% |
A Total returns for periods of less than one year are not annualized.
B The total returns would have been lower had certain expenses not been reduced during the periods shown.
C Net investment income per share has been calculated based on average shares outstanding during the period.
D FMR agreed to reimburse a portion of the class' expenses during the period. Without this reimbursement, the class' expense ratio would have been higher.
See accompanying notes which are an integral part of the financial statements.
Annual Report
For the period ended October 31, 2000
1. Significant Accounting Policies.
Fidelity Advisor Government Investment Fund (the fund) is a fund of Fidelity Advisor Series II (the trust) and is authorized to issue an unlimited number of shares. The trust is registered under the Investment Company Act of 1940, as amended, as an open-end management investment company organized as a Massachusetts business trust.
The fund offers Class A, Class T, Class B, Class C and Institutional Class shares, each of which has equal rights as to assets and voting privileges. Each class has exclusive voting rights with respect to matters that affect that class. Class B shares will automatically convert to Class A shares after a holding period of seven years from the initial date of purchase. Investment income, realized and unrealized capital gains and losses, the common expenses of the fund, and certain fund-level expense reductions, if any, are allocated on a pro rata basis to each class based on the relative net assets of each class to the total net assets of the fund. Each class of shares differs in its respective distribution, transfer agent, and certain other class-specific fees, expenses, and expense reductions.
The financial statements have been prepared in conformity with generally accepted accounting principles which require management to make certain estimates and assumptions at the date of the financial statements. The following summarizes the significant accounting policies of the fund:
Security Valuation. Securities are valued based upon a computerized matrix system and/or appraisals by a pricing service, both of which consider market transactions and dealer-supplied valuations. Securities (including restricted securities) for which market quotations are not readily available are valued at their fair value as determined in good faith under consistently applied procedures under the general supervision of the Board of Trustees. Short-term securities with remaining maturities of sixty days or less for which quotations are not readily available are valued at amortized cost or original cost plus accrued interest, both of which approximate current value. Investments in open-end investment companies are valued at their net asset value each business day.
Income Taxes. As a qualified regulated investment company under Subchapter M of the Internal Revenue Code, the fund is not subject to income taxes to the extent that it distributes substantially all of its taxable income for its fiscal year. The schedule of investments includes information regarding income taxes under the caption "Income Tax Information."
Investment Income. Interest income, which includes accretion of original issue discount, is accrued as earned.
Expenses. Most expenses of the trust can be directly attributed to a fund. Expenses which cannot be directly attributed are apportioned among the funds in the trust.
Annual Report
Notes to Financial Statements - continued
1. Significant Accounting Policies - continued
Distributions to Shareholders. Distributions are declared daily and paid monthly from net investment income. Distributions from realized gains, if any, are recorded on the ex-dividend date. Income dividends and capital gain distributions are declared separately for each class.
Income and capital gain distributions are determined in accordance with income tax regulations which may differ from generally accepted accounting principles. These differences, which may result in distribution reclassifications, are primarily due to differing treatments for paydown gains/losses on certain securities, market discount, capital loss carryforwards and losses deferred due to wash sales.
Permanent book and tax basis differences relating to shareholder distributions will result in reclassifications to paid in capital. Undistributed net investment income and accumulated undistributed net realized gain (loss) on investments may include temporary book and tax basis differences which will reverse in a subsequent period. Any taxable income or gain remaining at fiscal year end is distributed in the following year.
Security Transactions. Security transactions are accounted for as of trade date. Gains and losses on securities sold are determined on the basis of identified cost.
2. Operating Policies.
Joint Trading Account. Pursuant to an Exemptive Order issued by the Securities and Exchange Commission, the fund, along with other affiliated entities of Fidelity Management & Research Company (FMR), may transfer uninvested cash balances into one or more joint trading accounts. These balances are invested in one or more repurchase agreements for U.S. Treasury or Federal Agency obligations.
Repurchase Agreements. The underlying U.S. Treasury, Federal Agency, or other obligations found to be satisfactory by FMR are transferred to an account of the fund, or to the Joint Trading Account, at a custodian bank. The securities are marked-to-market daily and maintained at a value at least equal to the principal amount of the repurchase agreement (including accrued interest). FMR, the fund's investment adviser, is responsible for determining that the value of the underlying securities remains in accordance with the market value requirements stated above.
Delayed Delivery Transactions. The fund may purchase or sell securities on a delayed delivery basis. Payment and delivery may take place after the customary settlement period for that security. The price of the underlying securities and the date when the securities will be delivered and paid for are fixed at the time the transaction is negotiated. The market values of the securities purchased on a delayed delivery basis are identified as
Annual Report
Notes to Financial Statements - continued
2. Operating Policies - continued
Delayed Delivery Transactions - continued
such in the fund's schedule of investments. The fund may receive compensation for interest forgone in the purchase of a delayed delivery security. With respect to purchase commitments, the fund identifies securities as segregated in its records with a value at least equal to the amount of the commitment. Losses may arise due to changes in the market value of the underlying securities or if the counterparty does not perform under the contract.
Restricted Securities. The fund is permitted to invest in securities that are subject to legal or contractual restrictions on resale. These securities generally may be resold in transactions exempt from registration or to the public if the securities are registered. Disposal of these securities may involve time-consuming negotiations and expense, and prompt sale at an acceptable price may be difficult. At the end of the period, the fund had no investments in restricted securities (excluding 144A issues).
3. Purchases and Sales of Investments.
Purchases and sales of long-term U.S. government and government agency obligations aggregated $495,623,027 and $566,859,268, respectively.
4. Fees and Other Transactions with Affiliates.
Management Fee. As the fund's investment adviser, FMR receives a monthly fee that is calculated on the basis of a group fee rate plus a fixed individual fund fee rate applied to the average net assets of the fund. The group fee rate is the weighted average of a series of rates and is based on the monthly average net assets of all the mutual funds advised by FMR. The rates ranged from .0920% to .3700% for the period. The annual individual fund fee rate is .30%. In the event that these rates were lower than the contractual rates in effect during the period, FMR voluntarily implemented the above rates, as they resulted in the same or a lower management fee. For the period, the management fee was equivalent to an annual rate of .43% of average net assets.
Sub-Adviser Fee. FMR, on behalf of the fund, has entered into a sub-advisory agreement with Fidelity Investments Money Management, Inc. (FIMM), a wholly owned subsidiary of FMR. For its services, FIMM receives a fee from FMR of 50% of the management fee payable to FMR. The fee is paid prior to any voluntary expense reimbursements which may be in effect.
Distribution and Service Plan. In accordance with Rule 12b-1 of the 1940 Act, the Board of Trustees has adopted separate Distribution and Service Plans with respect to each class of shares (collectively referred to as "the Plans"). Under certain of the Plans, the class pays Fidelity Distributors Corporation (FDC), an affiliate of FMR, a 12b-1 fee. A portion of this
Annual Report
Notes to Financial Statements - continued
4. Fees and Other Transactions with Affiliates - continued
Distribution and Service Plan - continued
fee may be reallowed to securities dealers, banks and other financial institutions for the distribution of each class of shares and providing shareholder support services. For the period, this fee was based on the following annual rates of the average net assets of each applicable class:
|
Class A |
.15% |
|
Class T |
.25% |
|
Class B |
.90%* |
|
Class C |
1.00%** |
* .65% represents a distribution fee and .25% represents a shareholder service fee.
** .75% represents a distribution fee and .25% represents a shareholder service fee.
For the period, each class paid FDC the following amounts, a portion of which was retained by FDC:
|
|
Paid to |
Retained |
|
Class A |
$ 19,859 |
$ 82 |
|
Class T |
461,131 |
3,319 |
|
Class B |
704,800 |
509,971 |
|
Class C |
311,137 |
142,205 |
|
|
$ 1,496,927 |
$ 655,577 |
Sales Load. FDC receives a front-end sales charge of up to 4.75% for selling Class A shares, and 3.50% for selling Class T shares of the fund. FDC receives the proceeds of contingent deferred sales charges levied on Class B share redemptions occurring within six years of purchase and Class C share redemptions occurring within one year of purchase. Contingent deferred sales charges are based on declining rates ranging from 5% to 1% for Class B and 1% for Class C, of the lesser of the cost of shares at the initial date of purchase or the net asset value of the redeemed shares, excluding any reinvested dividends and capital gains. In addition, purchases of Class A and Class T shares that were subject to a finder's fee bear a contingent deferred sales charge on assets that do not remain in the fund for at least one year. The Class A and Class T contingent deferred sales charge is based on 0.25% of the lesser of the cost of shares at the initial date of purchase or the net asset value of the redeemed shares, excluding any reinvested dividends and capital gains. A portion of the sales charges paid to FDC is paid to securities dealers, banks and other financial institutions.
Annual Report
Notes to Financial Statements - continued
4. Fees and Other Transactions with Affiliates - continued
Sales Load - continued
For the period, sales charge amounts paid to and retained by FDC were as follows:
|
|
Paid to |
Retained |
|
Class A |
$ 68,430 |
$ 18,082 |
|
Class T |
126,803 |
37,921 |
|
Class B |
347,300 |
347,300* |
|
Class C |
19,050 |
19,050* |
|
|
$ 611,583 |
$ 472,353 |
* When Class B and Class C shares are initially sold, FDC pays commissions from its own resources to securities dealers,
banks, and other financial institutions through which the sales are made.
Transfer Agent Fees. Fidelity Investments Institutional Operations Company, Inc., (FIIOC), an affiliate of FMR, is the transfer, dividend disbursing and shareholder servicing agent (collectively referred to as the transfer agent) for each class of the fund. FIIOC receives account fees and asset-based fees that vary according to the account size and type of account of the shareholders of the respective classes of the fund. FIIOC pays for typesetting, printing and mailing of all shareholder reports, except proxy statements. For the period, the following amounts were paid to FIIOC:
|
|
Amount |
% of |
|
Class A |
$ 25,960 |
.20 |
|
Class T |
355,773 |
.19 |
|
Class B |
143,267 |
.18 |
|
Class C |
51,714 |
.17 |
|
Institutional Class |
34,791 |
.16 |
|
|
$ 611,505 |
|
Accounting and Security Lending Fees. Fidelity Service Company, Inc. maintains the fund's accounting records and administers the security lending program. The security lending fee is based on the number and duration of lending transactions. The accounting fee is based on the level of average net assets for the month plus out-of-pocket expenses.
Annual Report
Notes to Financial Statements - continued
5. Security Lending.
The fund lends portfolio securities from time to time in order to earn additional income. The fund receives collateral in the form of U.S. Treasury obligations, letters of credit, and/or cash against the loaned securities, and maintains collateral in an amount not less than 100% of the market value of the loaned securities during the period of the loan. The market value of the loaned securities is determined at the close of business of the fund and any additional required collateral is delivered to the fund on the next business day. If the borrower defaults on its obligation to return the securities loaned because of insolvency or other reasons, the fund could experience delays and costs in recovering the securities loaned or in gaining access to the collateral. At period end there were no security loans outstanding.
6. Expense Reductions.
Through an arrangement with the fund's custodian, credits realized as a result of uninvested cash balances were used to reduce a portion of expenses. During the period, the fund's custodian fees were reduced by $3,939 under the custodian arrangement.
7. Distributions to Shareholders.
Distributions to shareholders of each class were as follows:
|
|
Years ended October 31, |
|
|
|
2000 |
1999 |
|
From net investment income |
|
|
|
Class A |
$ 806,622 |
$ 712,354 |
|
Class T |
11,059,924 |
12,190,847 |
|
Class B |
4,198,487 |
4,349,049 |
|
Class C |
1,643,937 |
1,346,657 |
|
Institutional Class |
1,374,813 |
1,498,502 |
|
Total |
$ 19,083,783 |
$ 20,097,409 |
Annual Report
Notes to Financial Statements - continued
8. Share Transactions.
Transactions for each class of shares were as follows:
|
|
Shares |
Dollars |
||
|
|
Years ended October 31, |
Years ended October 31, |
||
|
|
2000 |
1999 |
2000 |
1999 |
|
|
|
|
|
|
|
Class A |
2,012,718 |
4,350,590 |
$ 18,684,237 |
$ 41,844,902 |
|
Reinvestment of distributions |
66,834 |
56,426 |
617,979 |
538,689 |
|
Shares redeemed |
(2,122,134) |
(3,552,941) |
(19,651,592) |
(34,104,460) |
|
Net increase (decrease) |
(42,582) |
854,075 |
$ (349,376) |
$ 8,279,131 |
|
Class T |
10,905,229 |
17,547,111 |
$ 100,626,377 |
$ 169,027,264 |
|
Reinvestment of distributions |
1,038,506 |
1,053,527 |
9,595,001 |
10,087,686 |
|
Shares redeemed |
(15,722,085) |
(16,736,818) |
(144,477,207) |
(160,930,470) |
|
Net increase (decrease) |
(3,778,350) |
1,863,820 |
$ (34,255,829) |
$ 18,184,480 |
|
Class B |
3,218,599 |
7,298,446 |
$ 29,796,775 |
$ 70,320,373 |
|
Reinvestment of distributions |
329,004 |
342,261 |
3,037,061 |
3,271,123 |
|
Shares redeemed |
(5,520,194) |
(4,835,159) |
(50,786,384) |
(46,429,578) |
|
Net increase (decrease) |
(1,972,591) |
2,805,548 |
$ (17,952,548) |
$ 27,161,918 |
|
Class C |
1,561,464 |
4,078,555 |
$ 14,444,151 |
$ 39,397,472 |
|
Reinvestment of distributions |
113,993 |
83,356 |
1,052,671 |
792,733 |
|
Shares redeemed |
(2,306,277) |
(1,822,180) |
(21,244,013) |
(17,548,890) |
|
Net increase (decrease) |
(630,820) |
2,339,731 |
$ (5,747,191) |
$ 22,641,315 |
|
Institutional Class |
1,467,235 |
894,248 |
$ 13,470,398 |
$ 8,576,171 |
|
Reinvestment of distributions |
123,396 |
129,392 |
1,136,418 |
1,237,833 |
|
Shares redeemed |
(1,678,386) |
(1,140,602) |
(15,413,691) |
(10,901,278) |
|
Net increase (decrease) |
(87,755) |
(116,962) |
$ (806,875) |
$ (1,087,274) |
Annual Report
To the Trustees of Advisor Series II and Shareholders of Fidelity Advisor Government Investment Fund:
We have audited the accompanying statement of assets and liabilities of Fidelity Advisor Government Investment Fund, (the Fund), a fund of Fidelity Advisor Series II (the Trust), including the portfolio of investments, as of October 31, 2000, and the related statement of operations for the year then ended, the statement of changes in net assets for each of the two years in the period then ended, and the financial highlights for each of the five years in the period then ended. These financial statements and financial highlights are the responsibility of the Fund's management. Our responsibility is to express an opinion on these financial statements and financial highlights based on our audits.
We conducted our audits in accordance with auditing standards generally accepted in the United States of America. Those standards require that we plan and perform the audit to obtain reasonable assurance about whether the financial statements and financial highlights are free of material misstatement. An audit includes examining, on a test basis, evidence supporting the amounts and disclosures in the financial statements. Our procedures included confirmation of securities owned as of October 31, 2000, by correspondence with the custodian and brokers; where replies were not received from brokers, we performed other auditing procedures. An audit also includes assessing the accounting principles used and significant estimates
made by management, as well as evaluating the overall financial statement presentation. We believe that our audits provide a reasonable basis for our opinion.
In our opinion, the financial statements and financial highlights referred to above present fairly, in all material respects, the financial position of Fidelity Advisor Government Investment Fund as of October 31, 2000, the results of its operations for the year then ended, the changes in its net assets for each of the two years in the period then ended, and its financial highlights for each of the five years in the period then ended, in conformity with accounting principles generally accepted in the United States of America.
/s/DELOITTE & TOUCHE LLP
DELOITTE & TOUCHE LLP
Boston, Massachusetts
December 8, 2000
Annual Report
Annual Report
Annual Report
Investment Adviser
Fidelity Management & Research Company
Boston, MA
Investment Sub-Advisers
Fidelity Investments Money
Management, Inc.
Officers
Edward C. Johnson 3d, President
Robert C. Pozen, Senior Vice President
Dwight D. Churchill, Vice President
Boyce I. Greer, Vice President
Stanley N. Griffith, Assistant Vice President
David L. Murphy, Vice President
Thomas J. Silvia, Vice President
Eric D. Roiter, Secretary
Robert A. Dwight, Treasurer
Maria F. Dwyer, Deputy Treasurer
John H. Costello, Assistant Treasurer
Thomas J. Simpson, Assistant Treasurer
Board of Trustees
Ralph F. Cox *
Phyllis Burke Davis *
Robert M. Gates *
Edward C. Johnson 3d
Donald J. Kirk *
Ned C. Lautenbach *
Peter S. Lynch
Marvin L. Mann *
William O. McCoy *
Gerald C. McDonough *
Robert C. Pozen
Thomas R. Williams *
Advisory Board
J. Michael Cook
Abigail P. Johnson
Marie L. Knowles
General Distributor
Fidelity Distributors Corporation
Boston, MA
Transfer and Shareholder
Servicing Agent
Fidelity Investments Institutional Operations Company, Inc.
Boston, MA
Custodian
The Bank of New York
New York, NY
* Independent trustees
Annual Report
Focus Funds
Fidelity Advisor Consumer
Industries Fund
Fidelity Advisor Cyclical
Industries Fund
Fidelity Advisor Financial
Services Fund
Fidelity Advisor Health Care Fund
Fidelity Advisor Natural
Resources Fund
Fidelity Advisor Technology Fund
Fidelity Advisor Utilities Growth Fund
Growth Funds
Fidelity Advisor Korea Fund
Fidelity Advisor Emerging Asia Fund
Fidelity Advisor Latin America Fund
Fidelity Advisor Japan Fund
Fidelity Advisor Europe Capital Appreciation Fund
Fidelity Advisor International
Capital Appreciation Fund
Fidelity Advisor Overseas Fund
Fidelity Advisor Diversified International Fund
Fidelity Advisor Global Equity Fund
Fidelity Advisor TechnoQuant®
Growth Fund
Fidelity Advisor Small Cap Fund
Fidelity Advisor Value Strategies Fund
Fidelity Advisor Mid Cap Fund
Fidelity Advisor Retirement Growth Fund
Fidelity Advisor Equity Growth Fund
Fidelity Advisor Large Cap Fund
Fidelity Advisor Dividend Growth Fund
Fidelity Advisor Growth
Opportunities Fund
Growth and Income Funds
Fidelity Advisor Growth & Income Fund
Fidelity Advisor Equity Income Fund
Fidelity Advisor Asset Allocation Fund
Fidelity Advisor Balanced Fund
Taxable Income Funds
Fidelity Advisor Emerging Markets Income Fund
Fidelity Advisor High Yield Fund
Fidelity Advisor Strategic Income Fund
Fidelity Advisor Mortgage
Securities Fund
Fidelity Advisor Government Investment Fund
Fidelity Advisor Intermediate Bond Fund
Fidelity Advisor Short Fixed-Income Fund
Municipal Funds
Fidelity Advisor Municipal Income Fund
Money Market Funds
Prime Fund
Treasury Fund
Tax-Exempt Fund
|
AGOV-ANN-1200 |
119038 |
|
1.538367.103 |
|
(Fidelity Investment logo)(registered trademark)
Fidelity® Advisor
Fund - Institutional Class
Annual Report
October 31, 2000
(2_fidelity_logos)
|
President's Message |
3 |
Ned Johnson on investing strategies. |
|
Performance |
4 |
How the fund has done over time. |
|
Fund Talk |
7 |
The manager's review of fund performance, strategy and outlook. |
|
Investment Changes |
10 |
A summary of major shifts in the fund's investments over the past six months. |
|
Investments |
11 |
A complete list of the fund's investments with their market values. |
|
Financial Statements |
16 |
Statements of assets and liabilities,
operations, and changes in net assets, |
|
Notes |
25 |
Notes to the financial statements. |
|
Independent Auditors' Report |
The auditors' opinion. |
|
|
|
|
|
Third party marks appearing herein are the property of their respective owners.
All other marks appearing herein are registered or unregistered trademarks or service marks of FMR Corp. or an affiliated company.
(Recycle graphic) This report is printed on recycled paper using soy-based inks.
This report and the financial statements contained herein are submitted for the general information of the shareholders of the fund. This report is not authorized for distribution to prospective investors in the fund unless preceded or accompanied by an effective prospectus.
Mutual fund shares are not deposits or obligations of, or guaranteed by, any depository institution. Shares are not insured by the FDIC, Federal Reserve Board or any other agency, and are subject to investment risks, including possible loss of principal amount invested.
Neither the fund nor Fidelity Distributors Corporation is a bank.
For more information on any Fidelity Advisor fund, including charges and expenses, contact your investment professional for a free prospectus. Read it carefully before you invest or send money.
Annual Report
(photo_of_Edward_C_Johnson_3d)
Dear Shareholder:
A sixth-straight year of double-digit positive returns for the Dow Jones Industrial Average, NASDAQ and S&P 500® could be in jeopardy unless the U.S. stock market shows marked improvement in the final two months of 2000. Through October, all three indexes had negative year-to-date returns. On the other hand, most fixed-income sectors were solidly in the black. Treasuries and other long-term government securities led the way, returning nearly 14%.
While it's impossible to predict the future direction of the markets with any degree of certainty, there are certain basic principles that can help investors plan for their future needs.
The longer your investment time frame, the less likely it is that you will be affected by short-term market volatility. A 10-year investment horizon appropriate for saving for a college education, for example, enables you to weather market cycles in a long-term fund, which may have a higher risk potential, but also has a higher potential rate of return.
An intermediate-length fund could make sense if your investment horizon is two to four years, while a short-term bond fund could be the right choice if you need your money in one or two years.
If your time horizon is less than a year, you might want to consider moving some of your bond investment into a money market fund. These funds seek income and a stable share price by investing in high-quality, short-term investments. Of course, it's important to remember that an investment in a money market fund is not insured or guaranteed by the Federal Deposit Insurance Corporation or any other government agency. Although money market funds seek to preserve the value of your investment at $1.00 per share, it is possible to lose money by investing in these types of funds.
Finally, no matter what your time horizon or portfolio diversity, it makes good sense to follow a regular investment plan, investing a certain amount of money in a fund at the same time each month or quarter and periodically reviewing your overall portfolio. By doing so, you won't get caught up in the excitement of a rapidly rising market, nor will you buy all your shares at market highs. While this strategy - known as dollar cost averaging - won't assure a profit or protect you from a loss in a declining market, it should help you lower the average cost of your purchases. Of course, you should consider your financial ability to continue your purchases through periods of low price levels before undertaking such a strategy.
Remember to contact your investment professional if you need help with your investments.
Best regards,
/s/Edward C. Johnson 3d
Edward C. Johnson 3d
Annual Report
Fidelity Advisor Government Investment Fund - Institutional Class
There are several ways to evaluate historical performance. You can look at the total percentage change in value, the average annual percentage change or the growth of a hypothetical $10,000 investment. Total return reflects the change in the value of an investment, assuming reinvestment of the class' dividend income and capital gains (the profits earned upon the sale of securities that have grown in value). You can also look at the class' income, as reflected in its yield, to measure performance. The initial offering of Institutional Class shares took place on July 3, 1995. Institutional Class shares are sold to eligible investors without a sales load or 12b-1 fee. Returns prior to July 3, 1995 are those of Class T, the original class of the fund, and reflect Class T shares' 0.25% 12b-1 fee. If Fidelity had not reimbursed certain class expenses, the past five year and past 10 year total returns would have been lower.
Cumulative Total Returns
|
Periods ended October 31, 2000 |
|
Past 1 |
Past 5 |
Past 10 years |
|
Fidelity Adv Government Inv - Inst CL |
|
7.75% |
31.84% |
97.57% |
|
LB Government Bond |
|
8.04% |
35.66% |
113.90% |
|
General US Government Funds Average |
|
6.77% |
29.13% |
96.96% |
Cumulative total returns show Institutional Class' performance in percentage terms over a set period - in this case, one year, five years or 10 years. For example, if you had invested $1,000 in a fund that had a 5% return over the past year, the value of your investment would be $1,050. You can compare Institutional Class' returns to those of the Lehman Brothers Government Bond Index - a market value-weighted index of U.S. government and government agency securities (other than mortgage securities) with maturities of one year or more. To measure how Institutional Class' performance stacked up against its peers, you can compare it to the general U.S. government funds average, which reflects the performance of mutual funds with similar objectives tracked by Lipper Inc. The past one year average represents a peer group of 185 mutual funds. These benchmarks include reinvested dividends and capital gains, if any, and exclude the effect of sales charges.
Average Annual Total Returns
|
Periods ended October 31, 2000 |
Past 1 |
Past 5 |
Past 10 years |
|
Fidelity Adv Government Inv - Inst CL |
7.75% |
5.68% |
7.05% |
|
LB Government Bond |
8.04% |
6.29% |
7.90% |
|
General US Government Funds Average |
6.77% |
5.24% |
6.99% |
Average annual total returns take Institutional Class' cumulative return and show you what would have happened if Institutional Class shares had performed at a constant rate each year.
Annual Report
Fidelity Advisor Government Investment Fund - Institutional Class
Performance - continued
$10,000 Over 10 Years
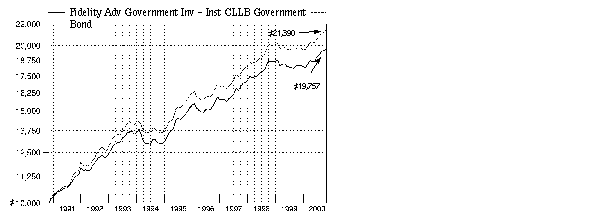
$10,000 Over 10 Years: Let's say hypothetically that $10,000 was invested in Fidelity Advisor Government Investment Fund - Institutional Class on October 31, 1990. As the chart shows, by October 31, 2000, the value of the investment would have grown to $19,757 - a 97.57% increase on the initial investment. For comparison, look at how the Lehman Brothers Government Bond Index did over the same period. With dividends reinvested the same $10,000 would have grown to $21,390- a 113.90% increase.
Understanding
Performance
How a fund did yesterday is no guarantee of how it will do tomorrow. Bond prices, for example, generally move in the opposite direction of interest rates. In turn, the share price, return and yield of a fund that invests in bonds will vary. That means if you sell your shares during a market downturn, you might lose money. But if you can ride out the market's ups and downs, you may have a gain.
3Annual Report
Fidelity Advisor Government Investment Fund - Institutional Class
Performance - continued
Total Return Components
|
|
|
Years ended October 31, |
||||
|
|
|
2000 |
1999 |
1998 |
1997 |
1996 |
|
Dividend returns |
|
6.56% |
5.75% |
6.23% |
6.39% |
6.54% |
|
Capital returns |
|
1.19% |
-7.30% |
3.63% |
1.79% |
-1.96% |
|
Total returns |
|
7.75% |
-1.55% |
9.86% |
8.18% |
4.58% |
Total return components include both dividend returns and capital returns. A dividend return reflects the actual dividends paid by the class. A capital return reflects both the amount paid by the class to shareholders as capital gain distributions and changes in the class' share price. Both returns assume the dividends or capital gains, if any, paid by the class are reinvested.
Dividends and Yield
|
Periods ended October 31, 2000 |
Past 1 |
Past 6 |
Past 1 |
|
Dividends per share |
4.77¢ |
28.76¢ |
58.04¢ |
|
Annualized dividend rate |
5.99% |
6.17% |
6.30% |
|
30-day annualized yield |
6.16% |
- |
- |
Dividends per share show the income paid by the class for a set period and do not reflect any tax reclassifications. If you annualize this number, based on an average share price of $9.38 over the past one month, $9.25 over the past six months, and $9.21 over the past one year, you can compare the class' income over these three periods. The 30-day annualized yield is a standard formula for all bond funds based on the yields of the bonds in the fund, averaged over the past 30 days. This figure shows you the yield characteristics of the fund's investments at the end of the period. It also helps you compare funds from different companies on an equal basis.
Annual Report
Market Recap
Strong technical factors in the market helped most investment-grade bonds overcome sharply rising interest rates and volatile market conditions, enabling them to outperform a number of major U.S. equity indexes during the 12-month period that ended October 31, 2000. The Lehman Brothers Aggregate Bond Index - a popular measure of taxable-bond performance - returned 7.30% during this time frame. Following a bullish fourth quarter of 1999 for the spread sectors - namely corporate bonds, mortgage and agency securities - Treasuries usurped market leadership not long after the millennium changeover. A growing federal surplus spurred the U.S. government in January to begin buying back outstanding debt and reducing future issuance. The scarcity premium created by a shrinking supply of long-dated Treasuries sent prices soaring and yields plummeting, thereby inducing an inverted yield curve - which occurs when short-term bonds outyield longer-dated securities. Anticipation that the Fed was finished raising interest rates entering the summer, combined with persistent flights-to-safety from risk-averse investors concerned about volatility in equity markets, further bolstered the long bond, helping the Lehman Brothers Treasury Index return 8.22% during the period. Mortgages made up some ground late in the period behind strong housing turnover. Agencies, too, staged a late rally in response to reduced political risk surrounding government-sponsored enterprises. However, corporates had little to celebrate, plagued by deteriorating credit conditions and growing supply pressures. For the overall period, the Lehman Brothers Mortgage-Backed Securities, U.S. Agency and Credit Bond indexes returned 7.57%, 7.30% and 5.48%, respectively.
(Portfolio Manager photograph)
An interview with Tom Silvia, Portfolio Manager of Fidelity Advisor Government Investment Fund
Q. How did the fund perform, Tom?
A. For the 12 months ending October 31, 2000, the fund's Institutional Class shares returned 7.75%. To get a sense of how the fund did relative to its competitors, the general U.S. government funds average returned 6.77% for the same 12-month period, according to Lipper Inc. Additionally, the Lehman Brothers Government Bond Index - which tracks the types of securities in which the fund invests - returned 8.04% for the one-year period.
Annual Report
Fund Talk: The Manager's Overview - continued
Q. What factors contributed to the fund's performance?
A. The main factor, as always, was the direction of interest rates. At first, rising rates were a drag on performance. From November 1999 through May 2000, the Federal Reserve Board made a series of rate hikes in order to slow the economy and cool inflationary pressures. More recently, it became evident that those hikes had achieved their intended effect. The economy cooled significantly in the third quarter of 2000 and inflationary pressures seemingly diminished. As rates fell, bond yields declined and prices firmed, which was a plus for fund performance. The fund also was helped by its relatively large stake in longer-term Treasury securities, which posted strong gains for the year as the government bought back older, high-interest Treasury bonds and scaled back its number of auctions of new debt.
Q. The reduction in long-term U.S. Treasuries caused the Treasury yield curve to "invert." Can you explain that phenomenon and why it occurred?
A. Sure. The difference in the performances and yields between short- and long-term Treasuries caused the Treasury yield curve - a graphical representation of the yields offered by various bond maturities - to invert for the first time since 1990. Investors usually demand higher yields on longer-term bonds than on shorter-term ones, reflecting the greater risk in lending money over a longer period of time. But because of the relative scarcity of long-term securities, and the relatively strong demand for them, the yield on the 30-year bond fell to more than half a percentage point lower than the yield on the two-year Treasury note at one point. More recently, however, the yield curve began to revert back toward a more normal position due to evidence that economic growth was slowing, which dampened fears that the Fed would be forced to raise interest rates further. In response, short-term bond yields fell.
Q. How did mortgage securities - at 29.6% of net assets at the end of the period - perform?
A. Despite a rough start, the fund's mortgage holdings helped performance. The Treasury's debt reduction actions initially held some unpleasant consequences for the mortgage market. While the Treasury curtailed issuance and bought back debt, the mortgage market suffered from too much supply. Good economic conditions translated into a strong housing market and higher levels of mortgage prepayments, which can hurt mortgage securities. As evidence emerged that the economy was slowing, however, mortgage prepayments fell and the supply was reduced. The more favorable supply and demand backdrop, plus their relatively high yields, helped the fund's stake in long-term mortgage securities outpace comparable maturity Treasury securities.
Q. How did the fund's stake in agency obligations fare?
A. They were a bit of a disappointment throughout most of the year, although they've improved during the past couple of months. Like mortgages, agency obligations spent most of the year battling an unfavorable supply and demand backdrop. Just as the Treasury was cutting back its issuance, many agencies were expanding theirs. Furthermore, agency securities had to contend with the threat that Congress might cut off long-standing but never-used lines of credit that give some agencies - particularly mortgage securities issuers Fannie Mae and Freddie Mac - implicit government backing. More recently, however, these securities bounced back because they made some concessions to legislators, adopting measures to improve their capital structure and allow more scrutiny of their books.
Annual Report
Fund Talk: The Manager's Overview - continued
Q. What's your outlook?
A. I believe mortgage and agency securities continue to offer attractive long-term values. The current yield advantage they enjoy helps position them to perform better than Treasury securities, in my view. That's why I plan to keep relatively large weightings in each. To the extent that their spread relationship relative to Treasuries returns to more normal levels, agency and mortgage securities can do well. Even if the current spread relationship remains constant, their yield advantage should help them gain ground on Treasuries.
The views expressed in this report reflect those of the portfolio manager only through the end of the period of the report as stated on the cover and do not necessarily represent the views of Fidelity or any other person in the Fidelity organization. Any such views are subject to change at any time based upon market or other conditions and Fidelity disclaims any responsibility to update such views. These views may not be relied on as investment advice and, because investment decisions for a Fidelity fund are based on numerous factors, may not be relied on as an indication of trading intent on behalf of any Fidelity fund.
Fund Facts
Goal: seeks a high level of current income by investing in U.S. government securities and instruments related to U.S. government securities
Start date: January 7, 1987
Size: as of October 31, 2000, more than $326 million
Manager: Tom Silvia, since 1998; joined Fidelity in 1993
3Tom Silvia on the government's buyback of Treasury securities:
"As the federal budget deficits of the early 1990s morphed into federal budget surpluses during the past three years, the U.S. Treasury was able to make significant progress in reducing the nation's debt load. During the past three years, the government has paid down $363 billion of publicly held debt, which helped cut the nation's debt to 34% of gross domestic product, down from nearly 50% seven years ago. One way debt was reduced was through the buyback of outstanding Treasury securities. By the end of October 2000, the Treasury had conducted 16 debt buyback operations, redeeming $25 billion in debt. Additionally, the Treasury eliminated three- and seven-year Treasury notes and reduced the frequencies and sizes of remaining debt auctions. The Treasury Department already has announced that it expects to pay down another $23 billion in marketable debt during the October through December quarter of 2000. Beyond that, it's my view that the Treasury will continue to use buybacks as an important debt management tool. To the extent that more Treasury securities are bought back, the Treasury market should benefit, much as it has during the past year."
Annual Report
|
Coupon Distribution as of October 31, 2000 |
||
|
|
% of fund's investments |
% of fund's investments |
|
Zero coupon bonds |
1.3 |
1.3 |
|
5 - 5.99% |
9.3 |
14.4 |
|
6 - 6.99% |
44.7 |
26.6 |
|
7 - 7.99% |
17.6 |
27.4 |
|
8 - 8.99% |
16.4 |
21.6 |
|
9% and over |
3.7 |
6.1 |
|
Coupon distribution shows the range of stated interest rates on the fund's investments, excluding short-term investments. |
|
Average Years to Maturity as of October 31, 2000 |
||
|
|
|
6 months ago |
|
Years |
9.7 |
9.5 |
|
Average years to maturity is based on the average time remaining until principal payments are expected from each of the fund's bonds, weighted by dollar amount. |
|
Duration as of October 31, 2000 |
||
|
|
|
6 months ago |
|
Years |
5.1 |
5.3 |
|
Duration shows how much a bond fund's price fluctuates with changes in comparable interest rates. If rates rise 1%, for example, a fund with a five-year duration is likely to lose about 5% of its value. Other factors also can influence a bond fund's performance and share price. Accordingly, a bond fund's actual performance may differ from this example. |
|
Asset Allocation (% of fund's net assets) |
|||||||
|
As of October 31, 2000 |
As of April 30, 2000 |
||||||
|
Mortgage Securities 24.8% |
|
|
Mortgage Securities 30.2% |
|
||
|
CMOs and Other Mortgage Related Securities 4.8% |
|
|
CMOs and Other Mortgage Related Securities 3.6% |
|
||
|
U.S. Treasury |
|
|
U.S. Treasury |
|
||
|
U.S. Government |
|
|
U.S. Government |
|
||
|
Short-Term |
|
|
Short-Term |
|
||
Annual Report
Showing Percentage of Net Assets
|
U.S. Government and Government Agency Obligations - 64.2% |
||||
|
|
Principal Amount |
Value |
||
|
U.S. Government Agency Obligations - 33.8% |
||||
|
Fannie Mae: |
|
|
|
|
|
5.45% 2/4/02 |
|
$ 5,000,000 |
$ 4,924,338 |
|
|
6.5% 4/29/09 |
|
18,575,000 |
17,686,929 |
|
|
7.25% 5/15/30 |
|
7,190,000 |
7,633,846 |
|
|
Farm Credit Systems Financial Assistance Corp. 8.8% 6/10/05 |
|
390,000 |
423,638 |
|
|
Federal Home Loan Bank 5.125% 9/15/03 |
|
640,000 |
617,702 |
|
|
Financing Corp. - coupon STRIPS 0% 4/6/01 |
|
4,500,000 |
4,368,420 |
|
|
Freddie Mac: |
|
|
|
|
|
6.45% 4/29/09 |
|
18,000,000 |
17,083,620 |
|
|
6.75% 3/15/31 |
|
6,710,000 |
6,695,305 |
|
|
Government Loan Trusts (assets of Trust guaranteed by U.S. Government through Agency for International Development) 8.5% 4/1/06 |
|
863,292 |
906,914 |
|
|
Government Trust Certificates (assets of Trust guaranteed by U.S. Government through Defense Security Assistance Agency): |
|
|
|
|
|
Class 1-C, 9.25% 11/15/01 |
|
2,456,298 |
2,492,283 |
|
|
Class 2-E, 9.4% 5/15/02 |
|
294,698 |
297,040 |
|
|
Class 3-T, 9.625% 5/15/02 |
|
143,065 |
144,444 |
|
|
Guaranteed Export Trust Certificates (assets of Trust guaranteed by U.S. Government through Export-Import Bank): |
|
|
|
|
|
Series 1993-C, 5.2% 10/15/04 |
|
169,956 |
164,998 |
|
|
Series 1993-D, 5.23% 5/15/05 |
|
198,085 |
191,930 |
|
|
Series 1994-A, 7.12% 4/15/06 |
|
9,190,404 |
9,323,665 |
|
|
Series 1994-F, 8.187% 12/15/04 |
|
3,393,237 |
3,468,961 |
|
|
Series 1995-A, 6.28% 6/15/04 |
|
1,651,765 |
1,637,664 |
|
|
Guaranteed Trade Trust Certificates (assets of Trust guaranteed by U.S. Government through Export- |
|
|
|
|
|
Series 1994-A, 7.39% 6/26/06 |
|
4,500,000 |
4,580,550 |
|
|
Series 1994-B, 7.5% 1/26/06 |
|
174,475 |
177,900 |
|
|
Series 1997-A, 6.104% 7/15/03 |
|
2,000,000 |
1,983,000 |
|
|
Israel Export Trust Certificates (assets of Trust guaranteed by U.S. Government through Export- |
|
155,883 |
155,612 |
|
|
Overseas Private Investment Corp. U.S. Government guaranteed participation certificate: |
|
|
|
|
|
Series 1994-195, 6.08% 8/15/04 (callable) |
|
1,373,500 |
1,365,204 |
|
|
Series 1996-A1, 6.726% 9/15/10 (callable) |
|
1,739,130 |
1,762,243 |
|
|
Private Export Funding Corp. secured: |
|
|
|
|
|
5.31% 11/15/03 (a) |
|
1,060,000 |
1,021,543 |
|
|
U.S. Government and Government Agency Obligations - continued |
||||
|
|
Principal Amount |
Value |
||
|
U.S. Government Agency Obligations - continued |
||||
|
Private Export Funding Corp. secured: - continued |
|
|
|
|
|
5.65% 3/15/03 |
|
$ 428,750 |
$ 421,920 |
|
|
5.82% 6/15/03 (a) |
|
6,070,000 |
5,901,178 |
|
|
6.86% 4/30/04 |
|
705,250 |
706,461 |
|
|
State of Israel (guaranteed by U.S. Government through Agency for International Development) 6.6% 2/15/08 |
|
10,200,000 |
10,142,574 |
|
|
U.S. Department of Housing and Urban Development government guaranteed participation certificates Series 1999-A: |
|
|
|
|
|
5.75% 8/1/06 |
|
2,100,000 |
2,019,360 |
|
|
5.96% 8/1/09 |
|
1,800,000 |
1,708,650 |
|
|
U.S. Trade Trust Certificates (assets of Trust guaranteed by U.S. Government through Export-Import Bank) 8.17% 1/15/07 |
|
390,000 |
408,018 |
|
|
TOTAL U.S. GOVERNMENT AGENCY OBLIGATIONS |
110,415,910 |
|||
|
U.S. Treasury Obligations - 30.4% |
||||
|
U.S. Treasury Bonds: |
|
|
|
|
|
6.125% 11/15/27 |
|
7,100,000 |
7,253,076 |
|
|
6.125% 8/15/29 |
|
21,600,000 |
22,369,392 |
|
|
6.5% 11/15/26 |
|
3,000,000 |
3,206,730 |
|
|
8% 11/15/21 |
|
3,220,000 |
3,979,727 |
|
|
8.875% 8/15/17 |
|
24,611,000 |
31,994,300 |
|
|
14% 11/15/11 |
|
1,000,000 |
1,399,060 |
|
|
U.S. Treasury Notes: |
|
|
|
|
|
5.25% 5/31/01 |
|
12,000,000 |
11,918,652 |
|
|
6.5% 2/15/10 |
|
6,000,000 |
6,280,320 |
|
|
6.625% 6/30/01 |
|
10,750,000 |
10,765,674 |
|
|
TOTAL U.S. TREASURY OBLIGATIONS |
99,166,931 |
|||
|
TOTAL U.S. GOVERNMENT AND (Cost $209,293,272) |
209,582,841 |
|||
|
U.S. Government Agency - Mortgage Securities - 24.8% |
||||
|
|
||||
|
Fannie Mae - 18.7% |
||||
|
5.5% 7/1/09 |
|
1,781,106 |
1,710,414 |
|
|
6% 9/1/08 to 9/1/14 |
|
8,339,783 |
8,075,522 |
|
|
6.5% 6/1/07 to 11/1/30 |
|
12,592,556 |
12,126,531 |
|
|
7% 4/1/26 to 9/1/29 |
|
11,642,637 |
11,421,125 |
|
|
U.S. Government Agency - Mortgage Securities - continued |
||||
|
|
Principal Amount |
Value |
||
|
Fannie Mae - continued |
||||
|
7.5% 3/1/09 to 6/1/30 |
|
$ 18,740,837 |
$ 18,776,182 |
|
|
8% 7/1/29 to 7/1/30 |
|
3,829,059 |
3,875,697 |
|
|
8.25% 12/1/01 |
|
653,022 |
655,119 |
|
|
8.5% 9/1/16 to 1/1/17 |
|
65,397 |
67,101 |
|
|
9% 11/1/11 to 5/1/14 |
|
2,796,601 |
2,823,657 |
|
|
9.25% 9/1/16 |
|
32,359 |
33,705 |
|
|
9.5% 11/1/06 to 5/1/20 |
|
1,218,364 |
1,260,507 |
|
|
11.5% 6/1/19 |
|
248,404 |
275,729 |
|
|
12.5% 8/1/15 |
|
10,321 |
11,660 |
|
|
|
61,112,949 |
|||
|
Freddie Mac - 3.1% |
||||
|
6.5% 5/1/08 to 8/1/11 |
|
2,830,071 |
2,786,252 |
|
|
6.775% 11/15/03 |
|
4,600,068 |
4,576,887 |
|
|
7.5% 11/1/30 (b) |
|
950,000 |
949,406 |
|
|
8.5% 8/1/09 to 2/1/10 |
|
187,657 |
190,860 |
|
|
9% 10/1/08 to 10/1/20 |
|
649,820 |
668,959 |
|
|
9.5% 5/1/21 to 7/1/21 |
|
418,940 |
439,531 |
|
|
11% 7/1/13 to 5/1/14 |
|
274,142 |
296,228 |
|
|
12.5% 2/1/10 to 6/1/19 |
|
318,675 |
357,810 |
|
|
|
10,265,933 |
|||
|
Government National Mortgage Association - 3.0% |
||||
|
7.5% 9/15/06 to 1/15/08 |
|
1,249,394 |
1,268,453 |
|
|
8% 12/15/23 |
|
4,317,482 |
4,398,435 |
|
|
8.5% 9/15/30 to 10/15/30 |
|
3,399,760 |
3,486,862 |
|
|
9% 5/15/01 to 12/15/09 |
|
108,662 |
109,375 |
|
|
10.5% 8/15/16 to 1/20/18 |
|
367,862 |
396,776 |
|
|
13.5% 7/15/11 |
|
36,181 |
41,301 |
|
|
|
9,701,202 |
|||
|
TOTAL U.S. GOVERNMENT AGENCY - MORTGAGE SECURITIES (Cost $81,343,972) |
81,080,084 |
|||
|
Collateralized Mortgage Obligations - 4.4% |
||||
|
|
||||
|
U.S. Government Agency - 4.4% |
||||
|
Fannie Mae REMIC planned amortization class: |
|
|
|
|
|
Series 1993-134 Class GA, 6.5% 2/25/07 |
|
2,730,000 |
2,706,959 |
|
|
Series 1993-160 Class PK, 6.5% 11/25/22 |
|
5,413,000 |
5,299,928 |
|
|
Collateralized Mortgage Obligations - continued |
||||
|
|
Principal Amount |
Value |
||
|
U.S. Government Agency - continued |
||||
|
Freddie Mac: |
|
|
|
|
|
REMIC planned amortization class: |
|
|
|
|
|
Series 1141 Class G, 9% 9/15/21 |
|
$ 1,311,468 |
$ 1,360,648 |
|
|
Series 1727 Class H, 6.5% 8/15/23 |
|
2,600,000 |
2,492,750 |
|
|
sequential pay Series 1974 Class Z, 7% 8/15/20 |
|
2,609,626 |
2,509,312 |
|
|
TOTAL COLLATERALIZED MORTGAGE OBLIGATIONS (Cost $14,182,124) |
14,369,597 |
|||
|
Commercial Mortgage Securities - 0.4% |
||||
|
|
||||
|
Fannie Mae ACES sequential pay Series 1996-M5 Class A1, 7.141% 7/25/10 |
|
1,434,065 |
1,440,339 |
|
|
Cash Equivalents - 7.0% |
|||
|
Maturity Amount |
|
||
|
Investments in repurchase agreements (U.S. Government Obligations), in a joint trading account at 6.62%, dated 10/31/00 due
11/1/00 |
$ 22,901,210 |
22,897,000 |
|
|
|
|
|
|
TOTAL INVESTMENT PORTFOLIO - 100.8% (Cost $329,163,067) |
329,369,861 |
|
|
NET OTHER ASSETS - (0.8)% |
(2,643,545) |
|
|
NET ASSETS - 100% |
$ 326,726,316 |
|
|
Legend |
|
(a) Security exempt from registration under Rule 144A of the Securities Act of 1933. These securities may be resold in transactions exempt from registration, normally to qualified institutional buyers. At the period end, the value of these securities amounted to $6,922,721 or 2.1% of net assets. |
|
(b) Security purchased on a delayed delivery or when-issued basis. |
|
Income Tax Information |
|
At October 31, 2000, the aggregate cost of investment securities for income tax purposes was $329,491,385. Net unrealized depreciation aggregated $121,524, of which $2,926,760 related to appreciated investment securities and $3,048,284 related to depreciated investment securities. |
|
At October 31, 2000, the fund had a capital loss carryforward of approximately $16,824,000 of which $8,584,000 and $8,240,000 will expire on October 31, 2007 and 2008, respectively. |
|
A total of 26.60% of the dividends distributed during the fiscal year was derived from interest on U.S. Government securities which is generally exempt from state income tax. The fund will notify shareholders in January 2001 of amounts for use in preparing 2000 income tax returns (unaudited). |
See accompanying notes which are an integral part of the financial statements.
Annual Report
Statement of Assets and Liabilities
|
|
October 31, 2000 |
|
|
Assets |
|
|
|
Investment in securities, at value (including repurchase agreements of $22,897,000) (cost $329,163,067) - See accompanying schedule |
|
$ 329,369,861 |
|
Cash |
|
344 |
|
Receivable for investments sold |
|
2,022,017 |
|
Receivable for fund shares sold |
|
1,143,901 |
|
Interest receivable |
|
3,563,907 |
|
Total assets |
|
336,100,030 |
|
Liabilities |
|
|
|
Payable for investments purchased |
$ 4,667,996 |
|
|
Delayed delivery |
950,000 |
|
|
Payable for fund shares redeemed |
3,153,899 |
|
|
Distributions payable |
281,069 |
|
|
Accrued management fee |
113,900 |
|
|
Distribution fees payable |
121,046 |
|
|
Other payables and accrued expenses |
85,804 |
|
|
Total liabilities |
|
9,373,714 |
|
Net Assets |
|
$ 326,726,316 |
|
Net Assets consist of: |
|
|
|
Paid in capital |
|
$ 343,297,478 |
|
Undistributed net investment income |
|
373,990 |
|
Accumulated undistributed net realized gain (loss) |
|
(17,151,946) |
|
Net unrealized appreciation (depreciation) on investments |
|
206,794 |
|
Net Assets |
|
$ 326,726,316 |
See accompanying notes which are an integral part of the financial statements.
Annual Report
Financial Statements - continued
Statement of Assets and Liabilities - continued
|
|
October 31, 2000 |
|
|
Calculation of Maximum Offering Price |
|
$9.42 |
|
Maximum offering price per share (100/95.25 of $9.42) |
|
$9.89 |
|
Class T: |
|
$9.41 |
|
Maximum offering price per share (100/96.50 of $9.41) |
|
$9.75 |
|
Class B: |
|
$9.41 |
|
Class C: |
|
$9.41 |
|
Institutional Class: |
|
$9.38 |
A Redemption price per share is equal to net asset value less any applicable contingent deferred sales charge.
See accompanying notes which are an integral part of the financial statements.
Annual Report
Financial Statements - continued
Statement of Operations
|
|
Year ended October 31, 2000 |
|
|
Investment Income Interest |
|
$ 22,572,459 |
|
Security lending |
|
15,395 |
|
Total Income |
|
22,587,854 |
|
Expenses |
|
|
|
Management fee |
$ 1,400,721 |
|
|
Transfer agent fees |
611,505 |
|
|
Distribution fees |
1,496,927 |
|
|
Accounting and security lending fees |
97,883 |
|
|
Non-interested trustees' compensation |
1,074 |
|
|
Custodian fees and expenses |
22,144 |
|
|
Registration fees |
93,857 |
|
|
Audit |
36,298 |
|
|
Legal |
4,146 |
|
|
Miscellaneous |
3,567 |
|
|
Total expenses before reductions |
3,768,122 |
|
|
Expense reductions |
(3,939) |
3,764,183 |
|
Net investment income |
|
18,823,671 |
|
Realized and Unrealized Gain (Loss) Net realized gain (loss) on investment securities |
|
(7,732,333) |
|
Change in net unrealized appreciation (depreciation) |
|
10,308,785 |
|
Net gain (loss) |
|
2,576,452 |
|
Net increase (decrease) in net assets resulting |
|
$ 21,400,123 |
See accompanying notes which are an integral part of the financial statements.
Annual Report
Financial Statements - continued
Statement of Changes in Net Assets
|
|
Year ended
October 31, |
Year ended
October 31, |
|
Increase (Decrease) in Net Assets |
|
|
|
Operations |
$ 18,823,671 |
$ 19,798,129 |
|
Net realized gain (loss) |
(7,732,333) |
(9,202,613) |
|
Change in net unrealized appreciation (depreciation) |
10,308,785 |
(17,582,000) |
|
Net increase (decrease) in net assets resulting |
21,400,123 |
(6,986,484) |
|
Distributions to shareholders from net investment income |
(19,083,783) |
(20,097,409) |
|
Share transactions - net increase (decrease) |
(59,111,819) |
75,179,570 |
|
Total increase (decrease) in net assets |
(56,795,479) |
48,095,677 |
|
Net Assets |
|
|
|
Beginning of period |
383,521,795 |
335,426,118 |
|
End of period (including undistributed net investment income of $373,990 and $487,308, respectively) |
$ 326,726,316 |
$ 383,521,795 |
See accompanying notes which are an integral part of the financial statements.
Annual Report
Financial Highlights - Class A
|
Years ended October 31, |
2000 |
1999 |
1998 |
1997 |
1996 E |
|
Selected Per-Share Data |
|
|
|
|
|
|
Net asset value, beginning |
$ 9.310 |
$ 10.020 |
$ 9.670 |
$ 9.490 |
$ 9.250 |
|
Income from Investment Operations |
|
|
|
|
|
|
Net investment income D |
.559 |
.545 |
.545 |
.552 |
.090 |
|
Net realized and unrealized gain (loss) |
.115 |
(.696) |
.368 |
.187 |
.241 |
|
Total from investment |
.674 |
(.151) |
.913 |
.739 |
.331 |
|
Less Distributions |
|
|
|
|
|
|
From net investment income |
(.564) |
(.559) |
(.563) |
(.559) |
(.091) |
|
Net asset value, end of period |
$ 9.420 |
$ 9.310 |
$ 10.020 |
$ 9.670 |
$ 9.490 |
|
Total Return B, C |
7.53% |
(1.53)% |
9.74% |
8.09% |
3.58% |
|
Ratios and Supplemental Data |
|
|
|
|
|
|
Net assets, end of period |
$ 15,053 |
$ 15,273 |
$ 7,884 |
$ 1,582 |
$ 223 |
|
Ratio of expenses to average |
.85% |
.87% |
.90% F |
.90% F |
.90% A, F |
|
Ratio of net investment income to average net assets |
6.02% |
5.73% |
5.65% |
5.98% |
6.28% A |
|
Portfolio turnover rate |
155% |
174% |
243% |
136% |
153% |
A Annualized
B The total returns would have been lower had certain expenses not been reduced during the periods shown.
C Total returns do not include the one time sales charge and for periods of less than one year are not annualized.
D Net investment income per share has been calculated based on average shares outstanding during the period.
E For the period September 3,1996 (commencement of sale of Class A shares) to October 31, 1996.
F FMR agreed to reimburse a portion of the class' expenses during the period. Without this reimbursement, the class' expense ratio would have been higher.
See accompanying notes which are an integral part of the financial statements.
Annual Report
Financial Highlights - Class T
|
Years ended October 31, |
2000 |
1999 |
1998 |
1997 |
1996 |
|
Selected Per-Share Data |
|
|
|
|
|
|
Net asset value, beginning |
$ 9.300 |
$ 10.020 |
$ 9.670 |
$ 9.490 |
$ 9.670 |
|
Income from Investment Operations |
|
|
|
|
|
|
Net investment income C |
.549 |
.541 |
.546 |
.558 |
.586 |
|
Net realized and unrealized gain (loss) |
.114 |
(.710) |
.351 |
.171 |
(.180) |
|
Total from investment |
.663 |
(.169) |
.897 |
.729 |
.406 |
|
Less Distributions |
|
|
|
|
|
|
From net investment income |
(.553) |
(.551) |
(.547) |
(.549) |
(.586) |
|
Net asset value, end of period |
$ 9.410 |
$ 9.300 |
$ 10.020 |
$ 9.670 |
$ 9.490 |
|
Total Return A, B |
7.41% |
(1.71)% |
9.56% |
7.97% |
4.38% |
|
Ratios and Supplemental Data |
|
|
|
|
|
|
Net assets, end of period |
$ 182,049 |
$ 215,089 |
$ 212,933 |
$ 144,948 |
$ 217,883 |
|
Ratio of expenses to average |
.95% |
.96% |
1.00% D |
1.00% D |
1.00% |
|
Ratio of expenses to average net assets after expense reductions |
.95% |
.95% E |
1.00% |
1.00% |
.99% E |
|
Ratio of net investment income to average net assets |
5.92% |
5.65% |
5.59% |
5.88% |
6.19% |
|
Portfolio turnover rate |
155% |
174% |
243% |
136% |
153% |
A The total returns would have been lower had certain expenses not been reduced during the periods shown.
B Total returns do not include the one time sales charge.
C Net investment income per share has been calculated based on average shares outstanding during the period.
D FMR agreed to reimburse a portion of the class' expenses during the period. Without this reimbursement, the class' expense ratio would have been higher.
E FMR or the fund has entered into varying arrangements with third parties who either paid or reduced a portion of the class' expenses.
See accompanying notes which are an integral part of the financial statements.
Annual Report
Financial Highlights - Class B
|
Years ended October 31, |
2000 |
1999 |
1998 |
1997 |
1996 |
|
Selected Per-Share Data |
|
|
|
|
|
|
Net asset value, beginning |
$ 9.300 |
$ 10.010 |
$ 9.660 |
$ 9.490 |
$ 9.670 |
|
Income from Investment Operations |
|
|
|
|
|
|
Net investment income C |
.490 |
.479 |
.475 |
.494 |
.520 |
|
Net realized and unrealized gain (loss) |
.114 |
(.699) |
.359 |
.166 |
(.177) |
|
Total from investment |
.604 |
(.220) |
.834 |
.660 |
.343 |
|
Less Distributions |
|
|
|
|
|
|
From net investment income |
(.494) |
(.490) |
(.484) |
(.490) |
(.523) |
|
Net asset value, end of period |
$ 9.410 |
$ 9.300 |
$ 10.010 |
$ 9.660 |
$ 9.490 |
|
Total Return A, B |
6.73% |
(2.24)% |
8.87% |
7.20% |
3.69% |
|
Ratios and Supplemental Data |
|
|
|
|
|
|
Net assets, end of period |
$ 77,424 |
$ 94,871 |
$ 74,073 |
$ 18,782 |
$ 17,355 |
|
Ratio of expenses to average |
1.59% |
1.59% |
1.65% D |
1.65% D |
1.67% D |
|
Ratio of net investment income to average net assets |
5.28% |
5.01% |
4.92% |
5.24% |
5.51% |
|
Portfolio turnover rate |
155% |
174% |
243% |
136% |
153% |
A The total returns would have been lower had certain expenses not been reduced during the periods shown.
B Total returns do not include the contingent deferred sales charge.
C Net investment income per share has been calculated based on average shares outstanding during the period.
D FMR agreed to reimburse a portion of the class' expenses during the period. Without this reimbursement, the class' expense ratio would have been higher.
See accompanying notes which are an integral part of the financial statements.
Annual Report
Financial Highlights - Class C
|
Years ended October 31, |
2000 |
1999 |
1998 E |
|
Selected Per-Share Data |
|
|
|
|
Net asset value, beginning of period |
$ 9.300 |
$ 10.020 |
$ 9.640 |
|
Income from Investment Operations |
|
|
|
|
Net investment income D |
.482 |
.468 |
.450 |
|
Net realized and unrealized gain (loss) |
.115 |
(.708) |
.398 |
|
Total from investment operations |
.597 |
(.240) |
.848 |
|
Less Distributions |
|
|
|
|
From net investment income |
(.487) |
(.480) |
(.468) |
|
Net asset value, end of period |
$ 9.410 |
$ 9.300 |
$ 10.020 |
|
Total Return B, C |
6.64% |
(2.43)% |
9.02% |
|
Ratios and Supplemental Data |
|
|
|
|
Net assets, end of period (000 omitted) |
$ 30,133 |
$ 35,652 |
$ 14,954 |
|
Ratio of expenses to average net assets |
1.67% |
1.69% |
1.75% A, F |
|
Ratio of net investment income to average net assets |
5.20% |
4.91% |
4.74% A |
|
Portfolio turnover rate |
155% |
174% |
243% |
A Annualized
B The total returns would have been lower had certain expenses not been reduced during the periods shown.
C Total returns do not include the contingent deferred sales charge and for periods of less than one year are not annualized.
D Net investment income per share has been calculated based on average shares outstanding during the period.
E For the period November 3, 1997 (commencement of sale of Class C shares) to October 31, 1998.
F FMR agreed to reimburse a portion of the class' expenses during the period. Without this reimbursement, the class' expense ratio would have been higher.
See accompanying notes which are an integral part of the financial statements.
Annual Report
Financial Highlights - Institutional Class
|
Years ended October 31, |
2000 |
1999 |
1998 |
1997 |
1996 |
|
Selected Per-Share Data |
|
|
|
|
|
|
Net asset value, beginning |
$ 9.270 |
$ 10.000 |
$ 9.650 |
$ 9.480 |
$ 9.670 |
|
Income from Investment Operations |
|
|
|
|
|
|
Net investment income C |
.572 |
.567 |
.570 |
.580 |
.604 |
|
Net realized and unrealized gain (loss) |
.118 |
(.720) |
.352 |
.165 |
(.180) |
|
Total from investment |
.690 |
(.153) |
.922 |
.745 |
.424 |
|
Less Distributions |
|
|
|
|
|
|
From net investment income |
(.580) |
(.577) |
(.572) |
(.575) |
(.614) |
|
Net asset value, end of period |
$ 9.380 |
$ 9.270 |
$ 10.000 |
$ 9.650 |
$ 9.480 |
|
Total Return A, B |
7.75% |
(1.55)% |
9.86% |
8.18% |
4.58% |
|
Ratios and Supplemental Data |
|
|
|
|
|
|
Net assets, end of period |
$ 22,067 |
$ 22,636 |
$ 25,582 |
$ 20,366 |
$ 27,660 |
|
Ratio of expenses to average |
.66% |
.68% |
.75% D |
.75% D |
.75% D |
|
Ratio of net investment income to average net assets |
6.20% |
5.92% |
5.84% |
6.12% |
6.43% |
|
Portfolio turnover rate |
155% |
174% |
243% |
136% |
153% |
A Total returns for periods of less than one year are not annualized.
B The total returns would have been lower had certain expenses not been reduced during the periods shown.
C Net investment income per share has been calculated based on average shares outstanding during the period.
D FMR agreed to reimburse a portion of the class' expenses during the period. Without this reimbursement, the class' expense ratio would have been higher.
See accompanying notes which are an integral part of the financial statements.
Annual Report
For the period ended October 31, 2000
1. Significant Accounting Policies.
Fidelity Advisor Government Investment Fund (the fund) is a fund of Fidelity Advisor Series II (the trust) and is authorized to issue an unlimited number of shares. The trust is registered under the Investment Company Act of 1940, as amended, as an open-end management investment company organized as a Massachusetts business trust.
The fund offers Class A, Class T, Class B, Class C and Institutional Class shares, each of which has equal rights as to assets and voting privileges. Each class has exclusive voting rights with respect to matters that affect that class. Class B shares will automatically convert to Class A shares after a holding period of seven years from the initial date of purchase. Investment income, realized and unrealized capital gains and losses, the common expenses of the fund, and certain fund-level expense reductions, if any, are allocated on a pro rata basis to each class based on the relative net assets of each class to the total net assets of the fund. Each class of shares differs in its respective distribution, transfer agent, and certain other class-specific fees, expenses, and expense reductions.
The financial statements have been prepared in conformity with generally accepted accounting principles which require management to make certain estimates and assumptions at the date of the financial statements. The following summarizes the significant accounting policies of the fund:
Security Valuation. Securities are valued based upon a computerized matrix system and/or appraisals by a pricing service, both of which consider market transactions and dealer-supplied valuations. Securities (including restricted securities) for which market quotations are not readily available are valued at their fair value as determined in good faith under consistently applied procedures under the general supervision of the Board of Trustees. Short-term securities with remaining maturities of sixty days or less for which quotations are not readily available are valued at amortized cost or original cost plus accrued interest, both of which approximate current value. Investments in open-end investment companies are valued at their net asset value each business day.
Income Taxes. As a qualified regulated investment company under Subchapter M of the Internal Revenue Code, the fund is not subject to income taxes to the extent that it distributes substantially all of its taxable income for its fiscal year. The schedule of investments includes information regarding income taxes under the caption "Income Tax Information."
Investment Income. Interest income, which includes accretion of original issue discount, is accrued as earned.
Expenses. Most expenses of the trust can be directly attributed to a fund. Expenses which cannot be directly attributed are apportioned among the funds in the trust.
Annual Report
Notes to Financial Statements - continued
1. Significant Accounting Policies - continued
Distributions to Shareholders. Distributions are declared daily and paid monthly from net investment income. Distributions from realized gains, if any, are recorded on the ex-dividend date. Income dividends and capital gain distributions are declared separately for each class.
Income and capital gain distributions are determined in accordance with income tax regulations which may differ from generally accepted accounting principles. These differences, which may result in distribution reclassifications, are primarily due to differing treatments for paydown gains/losses on certain securities, market discount, capital loss carryforwards and losses deferred due to wash sales.
Permanent book and tax basis differences relating to shareholder distributions will result in reclassifications to paid in capital. Undistributed net investment income and accumulated undistributed net realized gain (loss) on investments may include temporary book and tax basis differences which will reverse in a subsequent period. Any taxable income or gain remaining at fiscal year end is distributed in the following year.
Security Transactions. Security transactions are accounted for as of trade date. Gains and losses on securities sold are determined on the basis of identified cost.
2. Operating Policies.
Joint Trading Account. Pursuant to an Exemptive Order issued by the Securities and Exchange Commission, the fund, along with other affiliated entities of Fidelity Management & Research Company (FMR), may transfer uninvested cash balances into one or more joint trading accounts. These balances are invested in one or more repurchase agreements for U.S. Treasury or Federal Agency obligations.
Repurchase Agreements. The underlying U.S. Treasury, Federal Agency, or other obligations found to be satisfactory by FMR are transferred to an account of the fund, or to the Joint Trading Account, at a custodian bank. The securities are marked-to-market daily and maintained at a value at least equal to the principal amount of the repurchase agreement (including accrued interest). FMR, the fund's investment adviser, is responsible for determining that the value of the underlying securities remains in accordance with the market value requirements stated above.
Delayed Delivery Transactions. The fund may purchase or sell securities on a delayed delivery basis. Payment and delivery may take place after the customary settlement period for that security. The price of the underlying securities and the date when the securities will be delivered and paid for are fixed at the time the transaction is negotiated. The market values of the securities purchased on a delayed delivery basis are identified as
Annual Report
Notes to Financial Statements - continued
2. Operating Policies - continued
Delayed Delivery Transactions - continued
such in the fund's schedule of investments. The fund may receive compensation for interest forgone in the purchase of a delayed delivery security. With respect to purchase commitments, the fund identifies securities as segregated in its records with a value at least equal to the amount of the commitment. Losses may arise due to changes in the market value of the underlying securities or if the counterparty does not perform under the contract.
Restricted Securities. The fund is permitted to invest in securities that are subject to legal or contractual restrictions on resale. These securities generally may be resold in transactions exempt from registration or to the public if the securities are registered. Disposal of these securities may involve time-consuming negotiations and expense, and prompt sale at an acceptable price may be difficult. At the end of the period, the fund had no investments in restricted securities (excluding 144A issues).
3. Purchases and Sales of Investments.
Purchases and sales of long-term U.S. government and government agency obligations aggregated $495,623,027 and $566,859,268, respectively.
4. Fees and Other Transactions with Affiliates.
Management Fee. As the fund's investment adviser, FMR receives a monthly fee that is calculated on the basis of a group fee rate plus a fixed individual fund fee rate applied to the average net assets of the fund. The group fee rate is the weighted average of a series of rates and is based on the monthly average net assets of all the mutual funds advised by FMR. The rates ranged from .0920% to .3700% for the period. The annual individual fund fee rate is .30%. In the event that these rates were lower than the contractual rates in effect during the period, FMR voluntarily implemented the above rates, as they resulted in the same or a lower management fee. For the period, the management fee was equivalent to an annual rate of .43% of average net assets.
Sub-Adviser Fee. FMR, on behalf of the fund, has entered into a sub-advisory agreement with Fidelity Investments Money Management, Inc. (FIMM), a wholly owned subsidiary of FMR. For its services, FIMM receives a fee from FMR of 50% of the management fee payable to FMR. The fee is paid prior to any voluntary expense reimbursements which may be in effect.
Distribution and Service Plan. In accordance with Rule 12b-1 of the 1940 Act, the Board of Trustees has adopted separate Distribution and Service Plans with respect to each class of shares (collectively referred to as "the Plans"). Under certain of the Plans, the class pays Fidelity Distributors Corporation (FDC), an affiliate of FMR, a 12b-1 fee. A portion of this
Annual Report
Notes to Financial Statements - continued
4. Fees and Other Transactions with Affiliates - continued
Distribution and Service Plan - continued
fee may be reallowed to securities dealers, banks and other financial institutions for the distribution of each class of shares and providing shareholder support services. For the period, this fee was based on the following annual rates of the average net assets of each applicable class:
|
Class A |
.15% |
|
Class T |
.25% |
|
Class B |
.90%* |
|
Class C |
1.00%** |
* .65% represents a distribution fee and .25% represents a shareholder service fee.
** .75% represents a distribution fee and .25% represents a shareholder service fee.
For the period, each class paid FDC the following amounts, a portion of which was retained by FDC:
|
|
Paid to |
Retained |
|
Class A |
$ 19,859 |
$ 82 |
|
Class T |
461,131 |
3,319 |
|
Class B |
704,800 |
509,971 |
|
Class C |
311,137 |
142,205 |
|
|
$ 1,496,927 |
$ 655,577 |
Sales Load. FDC receives a front-end sales charge of up to 4.75% for selling Class A shares, and 3.50% for selling Class T shares of the fund. FDC receives the proceeds of contingent deferred sales charges levied on Class B share redemptions occurring within six years of purchase and Class C share redemptions occurring within one year of purchase. Contingent deferred sales charges are based on declining rates ranging from 5% to 1% for Class B and 1% for Class C, of the lesser of the cost of shares at the initial date of purchase or the net asset value of the redeemed shares, excluding any reinvested dividends and capital gains. In addition, purchases of Class A and Class T shares that were subject to a finder's fee bear a contingent deferred sales charge on assets that do not remain in the fund for at least one year. The Class A and Class T contingent deferred sales charge is based on 0.25% of the lesser of the cost of shares at the initial date of purchase or the net asset value of the redeemed shares, excluding any reinvested dividends and capital gains. A portion of the sales charges paid to FDC is paid to securities dealers, banks and other financial institutions.
Annual Report
Notes to Financial Statements - continued
4. Fees and Other Transactions with Affiliates - continued
Sales Load - continued
For the period, sales charge amounts paid to and retained by FDC were as follows:
|
|
Paid to |
Retained |
|
Class A |
$ 68,430 |
$ 18,082 |
|
Class T |
126,803 |
37,921 |
|
Class B |
347,300 |
347,300* |
|
Class C |
19,050 |
19,050* |
|
|
$ 611,583 |
$ 472,353 |
* When Class B and Class C shares are initially sold, FDC pays commissions from its own resources to securities dealers,
banks, and other financial institutions through which the sales are made.
Transfer Agent Fees. Fidelity Investments Institutional Operations Company, Inc., (FIIOC), an affiliate of FMR, is the transfer, dividend disbursing and shareholder servicing agent (collectively referred to as the transfer agent) for each class of the fund. FIIOC receives account fees and asset-based fees that vary according to the account size and type of account of the shareholders of the respective classes of the fund. FIIOC pays for typesetting, printing and mailing of all shareholder reports, except proxy statements. For the period, the following amounts were paid to FIIOC:
|
|
Amount |
% of |
|
Class A |
$ 25,960 |
.20 |
|
Class T |
355,773 |
.19 |
|
Class B |
143,267 |
.18 |
|
Class C |
51,714 |
.17 |
|
Institutional Class |
34,791 |
.16 |
|
|
$ 611,505 |
|
Accounting and Security Lending Fees. Fidelity Service Company, Inc. maintains the fund's accounting records and administers the security lending program. The security lending fee is based on the number and duration of lending transactions. The accounting fee is based on the level of average net assets for the month plus out-of-pocket expenses.
Annual Report
Notes to Financial Statements - continued
5. Security Lending.
The fund lends portfolio securities from time to time in order to earn additional income. The fund receives collateral in the form of U.S. Treasury obligations, letters of credit, and/or cash against the loaned securities, and maintains collateral in an amount not less than 100% of the market value of the loaned securities during the period of the loan. The market value of the loaned securities is determined at the close of business of the fund and any additional required collateral is delivered to the fund on the next business day. If the borrower defaults on its obligation to return the securities loaned because of insolvency or other reasons, the fund could experience delays and costs in recovering the securities loaned or in gaining access to the collateral. At period end there were no security loans outstanding.
6. Expense Reductions.
Through an arrangement with the fund's custodian, credits realized as a result of uninvested cash balances were used to reduce a portion of expenses. During the period, the fund's custodian fees were reduced by $3,939 under the custodian arrangement.
7. Distributions to Shareholders.
Distributions to shareholders of each class were as follows:
|
|
Years ended October 31, |
|
|
|
2000 |
1999 |
|
From net investment income |
|
|
|
Class A |
$ 806,622 |
$ 712,354 |
|
Class T |
11,059,924 |
12,190,847 |
|
Class B |
4,198,487 |
4,349,049 |
|
Class C |
1,643,937 |
1,346,657 |
|
Institutional Class |
1,374,813 |
1,498,502 |
|
Total |
$ 19,083,783 |
$ 20,097,409 |
Annual Report
Notes to Financial Statements - continued
8. Share Transactions.
Transactions for each class of shares were as follows:
|
|
Shares |
Dollars |
||
|
|
Years ended October 31, |
Years ended October 31, |
||
|
|
2000 |
1999 |
2000 |
1999 |
|
|
|
|
|
|
|
Class A |
2,012,718 |
4,350,590 |
$ 18,684,237 |
$ 41,844,902 |
|
Reinvestment of distributions |
66,834 |
56,426 |
617,979 |
538,689 |
|
Shares redeemed |
(2,122,134) |
(3,552,941) |
(19,651,592) |
(34,104,460) |
|
Net increase (decrease) |
(42,582) |
854,075 |
$ (349,376) |
$ 8,279,131 |
|
Class T |
10,905,229 |
17,547,111 |
$ 100,626,377 |
$ 169,027,264 |
|
Reinvestment of distributions |
1,038,506 |
1,053,527 |
9,595,001 |
10,087,686 |
|
Shares redeemed |
(15,722,085) |
(16,736,818) |
(144,477,207) |
(160,930,470) |
|
Net increase (decrease) |
(3,778,350) |
1,863,820 |
$ (34,255,829) |
$ 18,184,480 |
|
Class B |
3,218,599 |
7,298,446 |
$ 29,796,775 |
$ 70,320,373 |
|
Reinvestment of distributions |
329,004 |
342,261 |
3,037,061 |
3,271,123 |
|
Shares redeemed |
(5,520,194) |
(4,835,159) |
(50,786,384) |
(46,429,578) |
|
Net increase (decrease) |
(1,972,591) |
2,805,548 |
$ (17,952,548) |
$ 27,161,918 |
|
Class C |
1,561,464 |
4,078,555 |
$ 14,444,151 |
$ 39,397,472 |
|
Reinvestment of distributions |
113,993 |
83,356 |
1,052,671 |
792,733 |
|
Shares redeemed |
(2,306,277) |
(1,822,180) |
(21,244,013) |
(17,548,890) |
|
Net increase (decrease) |
(630,820) |
2,339,731 |
$ (5,747,191) |
$ 22,641,315 |
|
Institutional Class |
1,467,235 |
894,248 |
$ 13,470,398 |
$ 8,576,171 |
|
Reinvestment of distributions |
123,396 |
129,392 |
1,136,418 |
1,237,833 |
|
Shares redeemed |
(1,678,386) |
(1,140,602) |
(15,413,691) |
(10,901,278) |
|
Net increase (decrease) |
(87,755) |
(116,962) |
$ (806,875) |
$ (1,087,274) |
Annual Report
To the Trustees of Advisor Series II and Shareholders of Fidelity Advisor Government Investment Fund:
We have audited the accompanying statement of assets and liabilities of Fidelity Advisor Government Investment Fund, (the Fund), a fund of Fidelity Advisor Series II (the Trust), including the portfolio of investments, as of October 31, 2000, and the related statement of operations for the year then ended, the statement of changes in net assets for each of the two years in the period then ended, and the financial highlights for each of the five years in the period then ended. These financial statements and financial highlights are the responsibility of the Fund's management. Our responsibility is to express an opinion on these financial statements and financial highlights based on our audits.
We conducted our audits in accordance with auditing standards generally accepted in the United States of America. Those standards require that we plan and perform the audit to obtain reasonable assurance about whether the financial statements and financial highlights are free of material misstatement. An audit includes examining, on a test basis, evidence supporting the amounts and disclosures in the financial statements. Our procedures included confirmation of securities owned as of October 31, 2000, by correspondence with the custodian and brokers; where replies were not received from brokers, we performed other auditing procedures. An audit also includes assessing the accounting principles used and significant estimates
made by management, as well as evaluating the overall financial statement presentation. We believe that our audits provide a reasonable basis for our opinion.
In our opinion, the financial statements and financial highlights referred to above present fairly, in all material respects, the financial position of Fidelity
Advisor Government Investment Fund as of October 31, 2000, the results of its operations for the year then ended, the changes in its net assets for each of
the two years in the period then ended, and its financial highlights for each of the five years in the period then ended, in conformity with accounting
principles generally
accepted in the United States of America.
/s/DELOITTE & TOUCHE LLP
DELOITTE & TOUCHE LLP
Boston, Massachusetts
December 8, 2000
Annual Report
Annual Report
Annual Report
Annual Report
Annual Report
Annual Report
Annual Report
Investment Adviser
Fidelity Management & Research Company
Boston, MA
Investment Sub-Advisers
Fidelity Investments Money
Management, Inc.
Officers
Edward C. Johnson 3d, President
Robert C. Pozen, Senior Vice President
Dwight D. Churchill, Vice President
Boyce I. Greer, Vice President
Stanley N. Griffith, Assistant Vice President
David L. Murphy, Vice President
Thomas J. Silvia, Vice President
Eric D. Roiter, Secretary
Robert A. Dwight, Treasurer
Maria F. Dwyer, Deputy Treasurer
John H. Costello, Assistant Treasurer
Thomas J. Simpson, Assistant Treasurer
Board of Trustees
Ralph F. Cox *
Phyllis Burke Davis *
Robert M. Gates *
Edward C. Johnson 3d
Donald J. Kirk *
Ned C. Lautenbach *
Peter S. Lynch
Marvin L. Mann *
William O. McCoy *
Gerald C. McDonough *
Robert C. Pozen
Thomas R. Williams *
Advisory Board
J. Michael Cook
Abigail P. Johnson
Marie L. Knowles
General Distributor
Fidelity Distributors Corporation
Boston, MA
Transfer and Shareholder
Servicing Agent
Fidelity Investments Institutional Operations Company, Inc.
Boston, MA
Custodian
The Bank of New York
New York, NY
* Independent trustees
Annual Report
Focus Funds
Fidelity Advisor Consumer
Industries Fund
Fidelity Advisor Cyclical
Industries Fund
Fidelity Advisor Financial
Services Fund
Fidelity Advisor Health Care Fund
Fidelity Advisor Natural
Resources Fund
Fidelity Advisor Technology Fund
Fidelity Advisor Utilities Growth Fund
Growth Funds
Fidelity Advisor Korea Fund
Fidelity Advisor Emerging Asia Fund
Fidelity Advisor Latin America Fund
Fidelity Advisor Japan Fund
Fidelity Advisor Europe Capital Appreciation Fund
Fidelity Advisor International
Capital Appreciation Fund
Fidelity Advisor Overseas Fund
Fidelity Advisor Diversified International Fund
Fidelity Advisor Global Equity Fund
Fidelity Advisor TechnoQuant®
Growth Fund
Fidelity Advisor Small Cap Fund
Fidelity Advisor Value Strategies Fund
Fidelity Advisor Mid Cap Fund
Fidelity Advisor Retirement Growth Fund
Fidelity Advisor Equity Growth Fund
Fidelity Advisor Large Cap Fund
Fidelity Advisor Dividend Growth Fund
Fidelity Advisor Growth
Opportunities Fund
Growth and Income Funds
Fidelity Advisor Growth & Income Fund
Fidelity Advisor Equity Income Fund
Fidelity Advisor Asset Allocation Fund
Fidelity Advisor Balanced Fund
Taxable Income Funds
Fidelity Advisor Emerging Markets Income Fund
Fidelity Advisor High Yield Fund
Fidelity Advisor Strategic Income Fund
Fidelity Advisor Mortgage
Securities Fund
Fidelity Advisor Government Investment Fund
Fidelity Advisor Intermediate Bond Fund
Fidelity Advisor Short Fixed-Income Fund
Municipal Funds
Fidelity Advisor Municipal Income Fund
Money Market Funds
Prime Fund
Treasury Fund
Tax-Exempt Fund
|
AGOVI-ANN-1200 |
119039 |
|
1.538370.103 |
|
(Fidelity Investment logo)(registered trademark)
Fidelity® Advisor
Fund - Class A, Class T, Class B
and Class C
Annual Report
October 31, 2000
(2_fidelity_logos)
|
President's Message |
3 |
Ned Johnson on investing strategies. |
|
Performance |
4 |
How the fund has done over time. |
|
Fund Talk |
19 |
The manager's review of fund performance, strategy and outlook. |
|
Investment Changes |
22 |
A summary of major shifts in the fund's investments over the past six months. |
|
Investments |
23 |
A complete list of the fund's investments with their market values. |
|
Financial Statements |
38 |
Statements of assets and liabilities,
operations, and changes in net assets, |
|
Notes |
47 |
Notes to the financial statements. |
|
Independent Auditors' Report |
55 |
The auditors' opinion. |
Standard & Poor's, S&P and S&P 500 are registered service marks of The McGraw-Hill Companies, Inc. and have been licensed for use by Fidelity Distributors Corporation.
Other third party marks appearing herein are the property of their respective owners.
All other marks appearing herein are registered or unregistered trademarks or service marks of FMR Corp. or an affiliated company.
(Recycle graphic) This report is printed on recycled paper using soy-based inks.
This report and the financial statements contained herein are submitted for the general information of the shareholders of the fund. This report is not authorized for distribution to prospective investors in the fund unless preceded or accompanied by an effective prospectus.
Mutual fund shares are not deposits or obligations of, or guaranteed by, any depository institution. Shares are not insured by the FDIC, Federal Reserve Board or any other agency, and are subject to investment risks, including possible loss of principal amount invested.
Neither the fund nor Fidelity Distributors Corporation is a bank.
For more information on any Fidelity Advisor fund, including charges and expenses, contact your investment professional for a free prospectus. Read it carefully before you invest or send money.
Annual Report
(photo_of_Edward_C_Johnson_3d)
Dear Shareholder:
A sixth-straight year of double-digit positive returns for the Dow Jones Industrial Average, NASDAQ and S&P 500® could be in jeopardy unless the U.S. stock market shows marked improvement in the final two months of 2000. Through October, all three indexes had negative year-to-date returns. On the other hand, most fixed-income sectors were solidly in the black. Treasuries and other long-term government securities led the way, returning nearly 14%.
While it's impossible to predict the future direction of the markets with any degree of certainty, there are certain basic principles that can help investors plan for their future needs.
The longer your investment time frame, the less likely it is that you will be affected by short-term market volatility. A 10-year investment horizon appropriate for saving for a college education, for example, enables you to weather market cycles in a long-term fund, which may have a higher risk potential, but also has a higher potential rate of return.
An intermediate-length fund could make sense if your investment horizon is two to four years, while a short-term bond fund could be the right choice if you need your money in one or two years.
If your time horizon is less than a year, you might want to consider moving some of your bond investment into a money market fund. These funds seek income and a stable share price by investing in high-quality, short-term investments. Of course, it's important to remember that an investment in a money market fund is not insured or guaranteed by the Federal Deposit Insurance Corporation or any other government agency. Although money market funds seek to preserve the value of your investment at $1.00 per share, it is possible to lose money by investing in these types of funds.
Finally, no matter what your time horizon or portfolio diversity, it makes good sense to follow a regular investment plan, investing a certain amount of money in a fund at the same time each month or quarter and periodically reviewing your overall portfolio. By doing so, you won't get caught up in the excitement of a rapidly rising market, nor will you buy all your shares at market highs. While this strategy - known as dollar cost averaging - won't assure a profit or protect you from a loss in a declining market, it should help you lower the average cost of your purchases. Of course, you should consider your financial ability to continue your purchases through periods of low price levels before undertaking such a strategy.
Remember to contact your investment professional if you need help with your investments.
Best regards,
/s/Edward C. Johnson 3d
Edward C. Johnson 3d
Annual Report
Fidelity Advisor High Income Fund - Class A
There are several ways to evaluate historical performance. You can look at the total percentage change in value, the average annual percentage change or the growth of a hypothetical $10,000 investment. Total return reflects the change in the value of an investment, assuming reinvestment of the class' dividend income and capital gains (the profits earned upon the sale of securities that have grown in value). If Fidelity had not reimbursed certain class expenses, the total returns and dividends would have been lower.
Cumulative Total Returns
|
Periods ended October 31, 2000 |
|
Past 1 |
Life of |
|
Fidelity Adv High Income - CL A |
|
2.40% |
2.66% |
|
Fidelity Adv High Income - CL A |
|
-2.47% |
-2.22% |
|
ML High Yield Master II |
|
-1.68% |
-2.64% |
|
Lipper High Current Yield |
|
-2.77% |
n/a* |
Cumulative total returns show Class A's performance in percentage terms over a set period - in this case, one year or since the fund started on September 7, 1999. For example, if you had invested $1,000 in a fund that had a 5% return over the past year, the value of your investment would be $1,050. You can compare Class A's returns to the performance of the Merrill Lynch High Yield Master II Index - a market value-weighted index of all domestic and yankee high-yield bonds, including deferred interest bonds and payment-in-kind securities. Issues included in the index have maturities of one year or more and have a credit rating lower than BBB-/Baa3, but are not in default. To measure how Class A's performance stacked up against its peers, you can compare it to the high current yield funds average, which reflects the performance of mutual funds with similar objectives tracked by Lipper Inc. The past one year average represents a peer group of 357 mutual funds. These benchmarks include reinvested dividends and capital gains, if any and exclude the effect of sales charges.
Average Annual Total Returns
|
Periods ended October 31, 2000 |
|
Past 1 |
Life of |
|
Fidelity Adv High Income - CL A |
|
2.40% |
2.30% |
|
Fidelity Adv High Income - CL A |
|
-2.47% |
-1.93% |
|
ML High Yield Master II |
|
-1.68% |
-2.30% |
|
Lipper High Current Yield |
|
-2.77% |
n/a* |
Average annual total returns take Class A shares' cumulative return and show you what would have happened if Class A shares had performed at a constant rate each year.
* Not available
Annual Report
Fidelity Advisor High Income Fund - Class A
Performance - continued
$10,000 Over Life of Fund
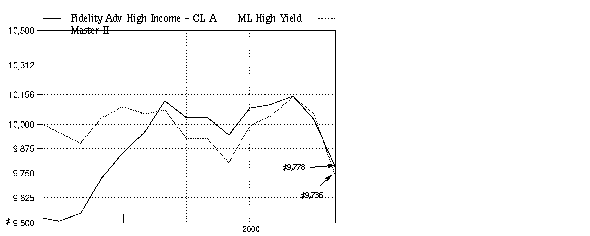
$10,000 Over Life of Fund: Let's say hypothetically that $10,000 was invested in Fidelity Advisor High Income Fund - Class A on September 7, 1999, when the fund started, and the current 4.75% sales charge was paid. As the chart shows, by October 31, 2000, the value of the investment would have been $9,778 - a 2.22% decrease on the initial investment. For comparison, look at how the Merrill Lynch High Yield Master II Index did over the same period. With dividends reinvested, the same $10,000 would have been $9,736 - a 2.64% decrease.
Understanding
Performance
How a fund did yesterday is no guarantee of how it will do tomorrow. Bond prices, for example, generally move in the opposite direction of interest rates. In turn, the share price, return and yield of a fund that invests in bonds will vary. That means if you sell your shares during a market downturn, you might lose money. But if you can ride out the market's ups and downs, you may have a gain.
3Annual Report
Fidelity Advisor High Income Fund - Class A
Performance - continued
Total Return Components
|
|
Year ended |
September 7, 1999 |
|
|
|
2000 |
1999 |
|
|
Dividend returns |
8.15% |
1.05% |
|
Capital returns |
-5.75% |
-0.80% |
|
Total returns |
2.40% |
0.25% |
Total return components include both dividend returns and capital returns. A dividend return reflects the actual dividends paid by the class. A capital return reflects both the amount paid by the class to shareholders as capital gain distributions and changes in the class' share price. Both returns assume the dividends or capital gains, if any, paid by the class are reinvested.
Dividends and Yield
|
Periods ended October 31, 2000 |
Past 1 |
Past 6 |
Past 1 |
|
Dividends per share |
7.20¢ |
42.21¢ |
82.49¢ |
|
Annualized dividend rate |
8.94% |
8.52% |
8.27% |
|
30-day annualized yield |
10.28% |
- |
- |
Dividends per share show the income paid by the class for a set period. The annual dividend rate is based on an average share price of $9.48 over the past one month, $9.83 over the past six months and $9.97 over the past one year. The 30-day annualized yield is a standard formula based on the yields of the securities in the fund, averaged over the past 30 days. This figure shows you the yield characteristics of the fund's investments at the end of the period. It also helps you compare funds from different companies on an equal basis. The offering share price used in the calculation of the yield includes the effect of Class A's current 4.75% sales charge. If Fidelity had not reimbursed certain fund expenses, the yield would have been 9.93%.
Annual Report
Fidelity Advisor High Income Fund - Class T
There are several ways to evaluate historical performance. You can look at the total percentage change in value, the average annual percentage change or the growth of a hypothetical $10,000 investment. Total return reflects the change in the value of an investment, assuming reinvestment of the class' dividend income and capital gains (the profits earned upon the sale of securities that have grown in value). If Fidelity had not reimbursed certain class expenses, the total returns and dividends would have been lower.
Cumulative Total Returns
|
Periods ended October 31, 2000 |
|
Past 1 |
Life of |
|
Fidelity Adv High Income - CL T |
|
2.27% |
2.51% |
|
Fidelity Adv High Income - CL T |
|
-1.31% |
-1.08% |
|
ML High Yield Master II |
|
-1.68% |
-2.64% |
|
Lipper High Current Yield |
|
-2.77% |
n/a* |
Cumulative total returns show Class T's performance in percentage terms over a set period - in this case, one year or since the fund started on September 7, 1999. For example, if you had invested $1,000 in a fund that had a 5% return over the past year, the value of your investment would be $1,050. You can compare Class T's returns to the performance of the Merrill Lynch High Yield Master II Index - a market value-weighted index of all domestic and yankee high-yield bonds, including deferred interest bonds and payment-in-kind securities. Issues included in the index have maturities of one year or more and have a credit rating lower than BBB-/Baa3, but are not in default. To measure how Class T's performance stacked up against its peers, you can compare it to the high current yield funds average, which reflects the performance of mutual funds with similar objectives tracked by Lipper Inc. The past one year average represents a peer group of 357 mutual funds. These benchmarks include reinvested dividends and capital gains, if any and exclude the effect of sales charges.
* Not available
Annual Report
Fidelity Advisor High Income Fund - Class T
Performance - continued
Average Annual Total Returns
|
Periods ended October 31, 2000 |
|
Past 1 |
Life of |
|
Fidelity Adv High Income - CL T |
|
2.27% |
2.18% |
|
Fidelity Adv High Income - CL T |
|
-1.31% |
-0.94% |
|
ML High Yield Master II |
|
-1.68% |
-2.30% |
|
Lipper High Current Yield |
|
-2.77% |
n/a* |
Average annual total returns take Class T shares' cumulative return and show you what would have happened if Class T shares had performed at a constant rate each year.
* Not available
Annual Report
Fidelity Advisor High Income Fund - Class T
Performance - continued
$10,000 Over Life of Fund

$10,000 Over Life of Fund: Let's say hypothetically that $10,000 was invested in Fidelity Advisor High Income Fund - Class T on September 7, 1999, when the fund started, and the current 3.50% sales charge was paid. As the chart shows, by October 31, 2000, the value of the investment would have been $9,892 - a 1.08% decrease on the initial investment. For comparison, look at how the Merrill Lynch High Yield Master II Index did over the same period. With dividends reinvested, the same $10,000 would have been $9,736 - a 2.64% decrease.
Understanding
Performance
How a fund did yesterday is no guarantee of how it will do tomorrow. Bond prices, for example, generally move in the opposite direction of interest rates. In turn, the share price, return and yield of a fund that invests in bonds will vary. That means if you sell your shares during a market downturn, you might lose money. But if you can ride out the market's ups and downs, you may have a gain.
3Annual Report
Fidelity Advisor High Income Fund - Class T
Performance - continued
Total Return Components
|
|
Year ended |
September 7, 1999 |
|
|
|
2000 |
1999 |
|
|
Dividend returns |
8.00% |
1.03% |
|
Capital returns |
-5.73% |
-0.80% |
|
Total returns |
2.27% |
0.23% |
Total return components include both dividend returns and capital returns. A dividend return reflects the actual dividends paid by the class. A capital return reflects both the amount paid by the class to shareholders as capital gain distributions and changes in the class' share price. Both returns assume the dividends or capital gains, if any, paid by the class are reinvested.
Dividends and Yield
|
Periods ended October 31, 2000 |
Past 1 |
Past 6 |
Past 1 |
|
Dividends per share |
7.12¢ |
41.72¢ |
81.22¢ |
|
Annualized dividend rate |
8.84% |
8.43% |
8.15% |
|
30-day annualized yield |
10.34% |
- |
- |
Dividends per share show the income paid by the class for a set period. The annual dividend rate is based on an average share price of $9.48 over the past one month, $9.82 over the past six months and $9.96 over the past one year. The 30-day annualized yield is a standard formula based on the yields of the securities in the fund, averaged over the past 30 days. This figure shows you the yield characteristics of the fund's investments at the end of the period. It also helps you compare funds from different companies on an equal basis. The offering share price used in the calculation of the yield includes the effect of Class T's current 3.50% sales charge.
Annual Report
Fidelity Advisor High Income Fund - Class B
There are several ways to evaluate historical performance. You can look at the total percentage change in value, the average annual percentage change or the growth of a hypothetical $10,000 investment. Total return reflects the change in the value of an investment, assuming reinvestment of the class' dividend income and capital gains (the profits earned upon the sale of securities that have grown in value). If Fidelity had not reimbursed certain class expenses, the total returns and dividends would have been lower. Class B shares' contingent deferred sales charges included in the past one year and life of fund total return figures are 5% and 4%, respectively.
Cumulative Total Returns
|
Periods ended October 31, 2000 |
|
Past 1 |
Life of |
|
|
Fidelity Adv High Income - CL B |
|
1.50% |
1.70% |
|
|
Fidelity Adv High Income - CL B |
|
-3.21% |
-2.04% |
|
|
ML High Yield Master II |
|
-1.68% |
-2.64% |
|
|
Lipper High Current Yield |
|
-2.77% |
n/a* |
|
Cumulative total returns show Class B's performance in percentage terms over a set period - in this case, one year or since the fund started on September 7, 1999. For example, if you had invested $1,000 in a fund that had a 5% return over the past year, the value of your investment would be $1,050. You can compare Class B's returns to the performance of the Merrill Lynch High Yield Master II Index - a market value-weighted index of all domestic and yankee high-yield bonds, including deferred interest bonds and payment-in-kind securities. Issues included in the index have maturities of one year or more and have a credit rating lower than BBB-/Baa3, but are not in default. To measure how Class B's performance stacked up against its peers, you can compare it to the high current yield funds average, which reflects the performance of mutual funds with similar objectives tracked by Lipper Inc. The past one year average represents a peer group of 357 mutual funds. These benchmarks include reinvested dividends and capital gains, if any and exclude the effect of sales charges.
* Not available
Annual Report
Fidelity Advisor High Income Fund - Class B
Performance - continued
Average Annual Total Returns
|
Periods ended October 31, 2000 |
|
Past 1 |
Life of |
|
|
Fidelity Adv High Income - CL B |
|
1.50% |
1.47% |
|
|
Fidelity Adv High Income - CL B |
|
-3.21% |
-1.78% |
|
|
ML High Yield Master II |
|
-1.68% |
-2.30% |
|
|
Lipper High Current Yield |
|
-2.77% |
n/a* |
|
Average annual total returns take Class B shares' cumulative return and show you what would have happened if Class B shares had performed at a constant rate each year.
* Not available
Annual Report
Fidelity Advisor High Income Fund - Class B
Performance - continued
$10,000 Over Life of Fund
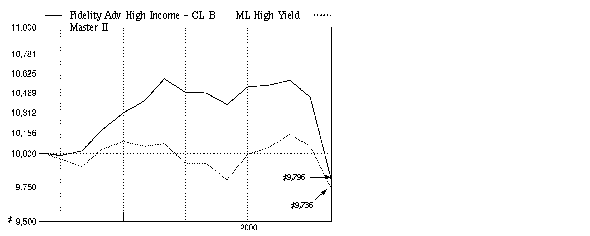
$10,000 Over Life of Fund: Let's say hypothetically that $10,000 was invested in Fidelity Advisor High Income Fund - Class B on September 7, 1999, when the fund started. As the chart shows, by October 31, 2000, the value of the investment, including the effect of the applicable contingent deferred sales charge, would have been $9,796 - a 2.04% decrease on the initial investment. For comparison, look at how the Merrill Lynch High Yield Master II Index did over the same period. With dividends reinvested, the same $10,000 would have been $9,736 - a 2.64% decrease.
Understanding
Performance
How a fund did yesterday is no guarantee of how it will do tomorrow. Bond prices, for example, generally move in the opposite direction of interest rates. In turn, the share price, return and yield of a fund that invests in bonds will vary. That means if you sell your shares during a market downturn, you might lose money. But if you can ride out the market's ups and downs, you may have a gain.
3Annual Report
Fidelity Advisor High Income Fund - Class B
Performance - continued
Total Return Components
|
|
Year ended |
September 7, 1999 |
|
|
|
2000 |
1999 |
|
|
Dividend returns |
7.35% |
0.99% |
|
Capital returns |
-5.85% |
-0.80% |
|
Total returns |
1.50% |
0.19% |
Total return components include both dividend returns and capital returns. A dividend return reflects the actual dividends paid by the class. A capital return reflects both the amount paid by the class to shareholders as capital gain distributions and changes in the class' share price. Both returns assume the dividends or capital gains, if any, paid by the class are reinvested.
Dividends and Yield
|
Periods ended October 31, 2000 |
Past 1 |
Past 6 |
Past 1 |
|
Dividends per share |
6.60¢ |
38.51¢ |
74.65¢ |
|
Annualized dividend rate |
8.21% |
7.78% |
7.49% |
|
30-day annualized yield |
10.04% |
- |
- |
Dividends per share show the income paid by the class for a set period. The annual dividend rate is based on an average share price of $9.47 over the past one month, $9.82 over the past six months and $9.96 over the past one year. The 30-day annualized yield is a standard formula based on the yields of the securities in the fund, averaged over the past 30 days. This figure shows you the yield characteristics of the fund's investments at the end of the period. It also helps you compare funds from different companies on an equal basis. The offering share price used in the calculation of the yield excludes the effect of Class B's contingent deferred sales charge. If Fidelity had not reimbursed certain fund expenses, the yield would have been 9.50%.
Annual Report
Fidelity Advisor High Income Fund - Class C
There are several ways to evaluate historical performance. You can look at the total percentage change in value, the average annual percentage change or the growth of a hypothetical $10,000 investment. Total return reflects the change in the value of an investment, assuming reinvestment of the class' dividend income and capital gains (the profits earned upon the sale of securities that have grown in value). If Fidelity had not reimbursed certain class expenses, the total returns and dividends would have been lower. Class C's contingent deferred sales charges included in the past one year and life of fund total return figures are 1% and 0%, respectively.
Cumulative Total Returns
|
Periods ended October 31, 2000 |
|
Past 1 |
Life of |
|
Fidelity Adv High Income - CL C |
|
1.60% |
1.68% |
|
Fidelity Adv High Income - CL C |
|
0.65% |
1.68% |
|
ML High Yield Master II |
|
-1.68% |
-2.64% |
|
Lipper High Current Yield |
|
-2.77% |
n/a* |
Cumulative total returns show Class C's performance in percentage terms over a set period - in this case, one year or since the fund started on September 7, 1999. For example, if you had invested $1,000 in a fund that had a 5% return over the past year, the value of your investment would be $1,050. You can compare Class C's returns to the performance of the Merrill Lynch High Yield Master II Index - a market value-weighted index of all domestic and yankee high-yield bonds, including deferred interest bonds and payment-in-kind securities. Issues included in the index have maturities of one year or more and have a credit rating lower than BBB-/Baa3, but are not in default. To measure how Class C's performance stacked up against its peers, you can compare it to the high current yield funds average, which reflects the performance of mutual funds with similar objectives tracked by Lipper Inc. The past one year average represents a peer group of 357 mutual funds. These benchmarks include reinvested dividends and capital gains, if any and exclude the effect of sales charges.
* Not available
Annual Report
Fidelity Advisor High Income Fund - Class C
Performance - continued
Average Annual Total Returns
|
Periods ended October 31, 2000 |
|
Past 1 |
Life of |
|
Fidelity Adv High Income - CL C |
|
1.60% |
1.45% |
|
Fidelity Adv High Income - CL C |
|
0.65% |
1.45% |
|
ML High Yield Master II |
|
-1.68% |
-2.30% |
|
Lipper High Current Yield |
|
-2.77% |
n/a* |
Average annual total returns take Class C shares' cumulative return and show you what would have happened if Class C shares had performed at a constant rate each year.
* Not available
Annual Report
Fidelity Advisor High Income Fund - Class C
Performance - continued
$10,000 Over Life of Fund
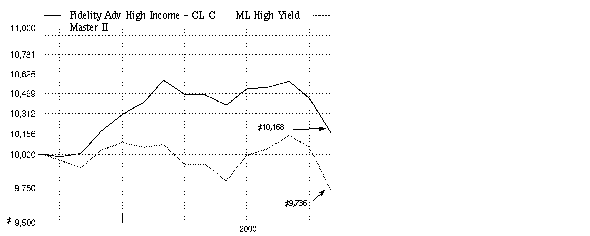
$10,000 Over Life of Fund: Let's say hypothetically that $10,000 was invested in Fidelity Advisor High Income Fund - Class C on September 7, 1999, when the fund started. As the chart shows, by October 31, 2000, the value of the investment, including the effect of the contingent deferred sales charge, would have grown to $10,168 - a 1.68% increase on the initial investment. For comparison, look at how the Merrill Lynch High Yield Master II Index did over the same period. With dividends reinvested, the same $10,000 would have been $9,736 - a 2.64% decrease.
Understanding
Performance
How a fund did yesterday is no guarantee of how it will do tomorrow. Bond prices, for example, generally move in the opposite direction of interest rates. In turn, the share price, return and yield of a fund that invests in bonds will vary. That means if you sell your shares during a market downturn, you might lose money. But if you can ride out the market's ups and downs, you may have a gain.
3Annual Report
Fidelity Advisor High Income Fund - Class C
Performance - continued
Total Return Components
|
|
Year ended |
September 7, 1999 |
|
|
|
2000 |
1999 |
|
|
Dividend returns |
7.25% |
0.98% |
|
Capital returns |
-5.65% |
-0.90% |
|
Total returns |
1.60% |
0.08% |
Total return components include both dividend returns and capital returns. A dividend return reflects the actual dividends paid by the class. A capital return reflects both the amount paid by the class to shareholders as capital gain distributions and changes in the class' share price. Both returns assume the dividends or capital gains, if any, paid by the class are reinvested.
Dividends and Yield
|
Periods ended October 31, 2000 |
Past 1 |
Past 6 |
Past 1 |
|
Dividends per share |
6.52¢ |
38.02¢ |
73.57¢ |
|
Annualized dividend rate |
8.10% |
7.68% |
7.39% |
|
30-day annualized yield |
9.93% |
- |
- |
Dividends per share show the income paid by the class for a set period. The annual dividend rate is based on an average share price of $9.48 over the past one month, $9.82 over the past six months and $9.96 over the past one year. The 30-day annualized yield is a standard formula based on the yields of the securities in the fund, averaged over the past 30 days. This figure shows you the yield characteristics of the fund's investments at the end of the period. It also helps you compare funds from different companies on an equal basis. The offering share price used in the calculation of the yield excludes the effect of Class C's contingent deferred sales charge. If Fidelity had not reimbursed certain class expenses, the yield would have been 9.26%.
Annual Report
Market Recap
With a negative return for the 12-month period ending October 31, 2000, the high-yield market can be viewed in one of two ways: as a distressed market that perhaps has not reached its bottom, or as an opportunity for investors to take advantage of attractively low prices. Early in the period, high-yield securities suffered in comparison to the high-flying NASDAQ market. High-yield debt suffered again when the NASDAQ tumbled and an economic slowdown loomed, resulting in a series of corporate earnings disappointments. Technical factors - abundant supply in the face of weak demand - further hampered performance. As the high-yield default rate crept higher, investors turned to the relative safety of investment-grade bonds. For the one-year period ending October 31, 2000, the Merrill Lynch High Yield Master II Index - a broad measure of high-yield market performance - fell 1.68%. This return lagged the overall U.S. taxable bond market as measured by the Lehman Brothers Aggregate Bond Index, which gained 7.30% during the past 12 months. A potential catalyst for improved performance could be a continued increase in merger and acquisition activity. From July to August, $90 billion in M&A activity took place where the target company was in the high-yield universe. Not only do these deals reduce the supply of high-yield credits, they also establish benchmark valuations for some sectors of the market.
(Portfolio Manager photograph)
An interview with David Glancy, Portfolio Manager of Fidelity Advisor High Income Fund
Q. David, how did the fund perform?
A. For the 12 months that ended October 31, 2000, the fund's Class A, Class T, Class B and Class C shares had total returns of 2.40%, 2.27%, 1.50% and 1.60%, respectively. The high-yield market, as measured by the Merrill Lynch High Yield Master II Index, returned -1.68%, while the high current yield funds average tracked by Lipper Inc. returned -2.77%.
Q. What helped the fund beat its peers and the index?
A. The fund was more insulated than its peers and the index against the negative influences of a very difficult market. The period was marked by high interest rates, difficulties encountered by individual companies and very little liquidity in the financial markets. High interest rates sparked by the Federal Reserve Board's desire to head off inflation increased borrowing costs for high-yield companies and slowed economic growth. These developments accelerated the overall default risk in the market. The "tech wreck" that knocked the wind out of the NASDAQ index also hurt the high-yield market, where one finds a significant number of telecommunications companies. These firms' access to capital was constricted at a time when they needed funding to continue building out their networks. With a substantial portion of the fund invested in this sector, it was not immune from these difficulties. However, as I said, the fund's structure helped it rebuff some of the factors that ate into market returns.
Annual Report
Fund Talk: The Manager's Overview - continued
Q. What was it about the fund's structure that helped it do that?
A. We had a large concentration of shorter-maturity, higher-quality bonds. These investments tend to be less susceptible to the problems caused by rising interest rates and deteriorating credit quality. In addition, for the first time in quite a while, I turned some attention to distressed securities, those that are characterized by uncertain or troubling financial situations. Previously, opportunities were few and far between because the area was characterized by poorly run companies with bad balance sheets and poor prospects. However, with all of the difficulties encountered by the high-yield market, some companies started trading at distressed prices despite favorable prospects and solid management. Because I maintained a fairly significant stake in cash through this bear market - for example, at the end of the period, the fund's assets in cash stood at about 10% - I was able to buy some of these securities at very attractive prices. The large cash holdings also enabled me to make other well-timed purchases and insulate the fund somewhat from even further downdrafts. I also maintained a small but important portion of the fund in leveraged equities - common stocks of companies that have high-yield bonds outstanding.
Q. Were there any investments or areas that provided positive performance during the period?
A. There weren't very many areas that performed well during this time frame. Nevertheless, the fund did benefit from the positive performance of some of its holdings in the health care, energy and cable TV industries. Higher energy prices were the force behind the improvement in some energy securities, and the recurring revenues earned by cable TV operators through their monthly fees were an attractive attribute during a period of market instability.
Q. What's your outlook?
A. The high-yield market could be choppy for at least the next couple of months, though it appears that most of the damage to the market has been done. A significant number of bonds are trading at very attractive prices, so I anticipate using the fund's cash position to continue adding bonds of companies with favorable prospects selling at cheap prices. If history is a guide, the high-yield market should ultimately attract buyers from across a broad spectrum and enjoy a recovery like we saw in 1990, after its last protracted period of difficulty.
Annual Report
Fund Talk: The Manager's Overview - continued
The views expressed in this report reflect those of the portfolio manager only through the end of the period of the report as stated on the cover and do not necessarily represent the views of Fidelity or any other person in the Fidelity organization. Any such views are subject to change at any time based upon market or other conditions and Fidelity disclaims any responsibility to update such views. These views may not be relied on as investment advice and, because investment decisions for a Fidelity fund are based on numerous factors, may not be relied on as an indication of trading intent on behalf of any Fidelity fund.
Fund Facts
Goal: seeks a high level of current income; the fund may also seek capital appreciation
Start date: September 7, 1999
Size: as of October 31, 2000, more than $43 million
Manager: David Glancy, since inception; manager, Fidelity Capital & Income Fund, since 1996; Spartan High Income Fund, 1993-1996; joined Fidelity in 1990
3David Glancy on the high-yield market:
"The volatility in the high-yield market doesn't necessarily reflect the underlying fundamentals of the companies in the fund, even though it may temporarily affect the fund's net asset value (NAV). Buyers of high-yield bonds have become so scarce that many attractive securities are trading as low as from 20 to 70 cents on the dollar and therefore offer some upside potential. In contrast, when these bonds are trading at face value, there's often no place for them to go but down. With Fidelity's resources and credit skills, we should be able to locate significant opportunities in this market for capital appreciation and earn a very attractive coupon, or interest rate. When things get as bad as they have been within the high-yield market, many investors follow a lemming mentality and seek to get out of it on its way down. My approach is to take advantage of desperate sellers and continue buying until the market eventually reaches the bottom in order to position the fund for a strong rebound when the market turns. In that way, like in 1990, I hope to reap the benefits when the market recovers and the winners start outnumbering the losers."
Annual Report
|
Top Five Holdings as of October 31, 2000 |
||
|
(by issuer, excluding cash equivalents) |
% of fund's |
% of fund's net assets |
|
Qwest Communications International, Inc. |
7.4 |
0.0 |
|
XO Communications, Inc. |
4.9 |
7.2 |
|
International Cabletel, Inc. |
4.7 |
6.3 |
|
Century Communications Corp. |
4.0 |
5.8 |
|
EchoStar Communications Corp. |
3.1 |
2.2 |
|
|
24.1 |
21.5 |
|
Top Five Market Sectors as of October 31, 2000 |
||
|
|
% of fund's |
% of fund's net assets |
|
Media & Leisure |
34.3 |
35.1 |
|
Utilities |
29.9 |
22.9 |
|
Technology |
5.0 |
10.2 |
|
Finance |
3.5 |
6.0 |
|
Industrial Machinery & Equipment |
2.7 |
3.5 |
|
Quality Diversification as of October 31, 2000 |
||
|
(Moody's Ratings) |
% of fund's investments |
% of fund's investments |
|
Aaa, Aa, A |
0.0 |
2.1 |
|
Baa |
7.6 |
0.4 |
|
Ba |
11.9 |
5.4 |
|
B |
52.6 |
65.9 |
|
Caa, Ca, C |
4.6 |
10.5 |
|
Not Rated |
1.6 |
1.7 |
|
Table excludes short-term investments. Where Moody's ratings are not available, we have used S&P ratings. Unrated debt securities that are equivalent to Ba and below at October 31, 2000 and April 30, 2000 account for 1.6% and 1.7% respectively, of the fund's investments. |
|
Asset Allocation (% of fund's net assets) |
|||||||
|
As of October 31, 2000 * |
As of April 30, 2000 ** |
||||||
|
Nonconvertible |
|
|
Nonconvertible |
|
||
|
Convertible Bonds, Preferred Stocks 6.9% |
|
|
Convertible Bonds, Preferred Stocks 8.0% |
|
||
|
Common Stocks 5.4% |
|
|
Common Stocks 4.1% |
|
||
|
Other Investments 4.8% |
|
|
Other Investments 3.7% |
|
||
|
Short-Term |
|
|
Short-Term |
|
||
|
* Foreign investments |
6.4% |
|
** Foreign investments |
8.7% |
|
||

Annual Report
Showing Percentage of Net Assets
|
Corporate Bonds - 72.0% |
|||||
|
Moody's Ratings (unaudited) (b) |
Principal Amount |
Value |
|||
|
Convertible Bonds - 1.5% |
|||||
|
ENERGY - 0.4% |
|||||
|
Oil & Gas - 0.4% |
|||||
|
Lomak Petroleum, Inc. 6% 2/1/07 |
Caa1 |
|
$ 250,000 |
$ 160,000 |
|
|
HEALTH - 0.9% |
|||||
|
Medical Facilities Management - 0.9% |
|||||
|
Sunrise Assisted Living, Inc. 5.5% 6/15/02 |
B2 |
|
30,000 |
27,600 |
|
|
Tenet Healthcare Corp. 6% 12/1/05 |
B1 |
|
200,000 |
170,000 |
|
|
Total Renal Care Holdings, Inc.: |
|
|
|
|
|
|
7% 5/15/09 |
B3 |
|
110,000 |
81,400 |
|
|
7% 5/15/09 (e) |
B3 |
|
160,000 |
118,400 |
|
|
|
397,400 |
||||
|
MEDIA & LEISURE - 0.1% |
|||||
|
Lodging & Gaming - 0.1% |
|||||
|
Hilton Hotels Corp. 5% 5/15/06 |
Ba2 |
|
80,000 |
64,800 |
|
|
RETAIL & WHOLESALE - 0.1% |
|||||
|
Retail & Wholesale, Miscellaneous - 0.1% |
|||||
|
Sunglass Hut International, Inc. 5.25% 6/15/03 |
B3 |
|
30,000 |
22,988 |
|
|
TOTAL CONVERTIBLE BONDS |
645,188 |
||||
|
Nonconvertible Bonds - 70.5% |
|||||
|
BASIC INDUSTRIES - 1.6% |
|||||
|
Chemicals & Plastics - 1.1% |
|||||
|
Huntsman Corp. 9.5% 7/1/07 (e) |
B2 |
|
600,000 |
360,000 |
|
|
Lyondell Chemical Co. 9.875% 5/1/07 |
Ba3 |
|
85,000 |
82,875 |
|
|
Sterling Chemicals, Inc. 11.75% 8/15/06 |
Caa3 |
|
60,000 |
33,000 |
|
|
|
475,875 |
||||
|
Packaging & Containers - 0.3% |
|||||
|
Gaylord Container Corp.: |
|
|
|
|
|
|
9.375% 6/15/07 |
Caa1 |
|
15,000 |
9,750 |
|
|
9.75% 6/15/07 |
Caa1 |
|
110,000 |
73,700 |
|
|
9.875% 2/15/08 |
Caa3 |
|
95,000 |
28,500 |
|
|
|
111,950 |
||||
|
Corporate Bonds - continued |
|||||
|
Moody's Ratings (unaudited) (b) |
Principal Amount |
Value |
|||
|
Nonconvertible Bonds - continued |
|||||
|
BASIC INDUSTRIES - continued |
|||||
|
Paper & Forest Products - 0.2% |
|||||
|
Container Corp. of America gtd. 11.25% 5/1/04 |
B2 |
|
$ 100,000 |
$ 100,250 |
|
|
Crown Paper Co. 11% 9/1/05 (c) |
Ca |
|
50,000 |
6,000 |
|
|
|
106,250 |
||||
|
TOTAL BASIC INDUSTRIES |
694,075 |
||||
|
CONSTRUCTION & REAL ESTATE - 0.6% |
|||||
|
Building Materials - 0.3% |
|||||
|
Atrium Companies, Inc. 10.5% 5/1/09 |
B3 |
|
60,000 |
50,850 |
|
|
Building Materials Corp. of America 8% 12/1/08 |
Ba3 |
|
45,000 |
13,500 |
|
|
Nortek, Inc. 9.875% 3/1/04 |
B3 |
|
20,000 |
18,200 |
|
|
Numatics, Inc. 9.625% 4/1/08 |
B3 |
|
52,000 |
40,040 |
|
|
|
122,590 |
||||
|
Construction - 0.0% |
|||||
|
Lennar Corp. 9.95% 5/1/10 |
Ba1 |
|
20,000 |
20,000 |
|
|
Real Estate - 0.3% |
|||||
|
LNR Property Corp. 9.375% 3/15/08 |
B1 |
|
125,000 |
112,500 |
|
|
TOTAL CONSTRUCTION & REAL ESTATE |
255,090 |
||||
|
DURABLES - 0.4% |
|||||
|
Autos, Tires, & Accessories - 0.1% |
|||||
|
Federal-Mogul Corp. 7.5% 1/15/09 |
Ba3 |
|
45,000 |
11,250 |
|
|
Textiles & Apparel - 0.3% |
|||||
|
Levi Strauss & Co. 6.8% 11/1/03 |
Ba3 |
|
10,000 |
8,200 |
|
|
Polymer Group, Inc.: |
|
|
|
|
|
|
8.75% 3/1/08 |
B3 |
|
20,000 |
14,100 |
|
|
9% 7/1/07 |
B3 |
|
115,000 |
82,800 |
|
|
St. John Knits International, Inc. 12.5% 7/1/09 |
B3 |
|
40,000 |
37,000 |
|
|
|
142,100 |
||||
|
TOTAL DURABLES |
153,350 |
||||
|
Corporate Bonds - continued |
|||||
|
Moody's Ratings (unaudited) (b) |
Principal Amount |
Value |
|||
|
Nonconvertible Bonds - continued |
|||||
|
ENERGY - 0.6% |
|||||
|
Energy Services - 0.4% |
|||||
|
Cliffs Drilling Co.: |
|
|
|
|
|
|
Class B 10.25% 5/15/03 |
Ba3 |
|
$ 100,000 |
$ 102,250 |
|
|
Class D 10.25% 5/15/03 |
Ba3 |
|
15,000 |
15,338 |
|
|
R&B Falcon Corp. 9.125% 12/15/03 |
Ba3 |
|
30,000 |
30,525 |
|
|
|
148,113 |
||||
|
Oil & Gas - 0.2% |
|||||
|
Gothic Production Corp. 11.125% 5/1/05 |
B3 |
|
65,000 |
68,250 |
|
|
Nuevo Energy Co. 9.375% 10/1/10 (e) |
B1 |
|
30,000 |
29,850 |
|
|
|
98,100 |
||||
|
TOTAL ENERGY |
246,213 |
||||
|
FINANCE - 2.8% |
|||||
|
Credit & Other Finance - 2.8% |
|||||
|
Delta Financial Corp. 9.5% 8/1/04 |
Caa2 |
|
255,000 |
114,750 |
|
|
GS Escrow Corp.: |
|
|
|
|
|
|
6.75% 8/1/01 |
Ba1 |
|
350,000 |
343,525 |
|
|
7% 8/1/03 |
Ba1 |
|
310,000 |
293,725 |
|
|
7.125% 8/1/05 |
Ba1 |
|
265,000 |
243,108 |
|
|
Macsaver Financial Services, Inc.: |
|
|
|
|
|
|
7.4% 2/15/02 (c) |
Ca |
|
10,000 |
1,200 |
|
|
7.875% 8/1/03 (c) |
Ca |
|
95,000 |
11,400 |
|
|
Metris Companies, Inc. 10% 11/1/04 |
Ba3 |
|
210,000 |
197,400 |
|
|
|
1,205,108 |
||||
|
Insurance - 0.0% |
|||||
|
ITT Corp. 6.75% 11/15/03 |
Ba1 |
|
20,000 |
18,525 |
|
|
TOTAL FINANCE |
1,223,633 |
||||
|
HEALTH - 1.0% |
|||||
|
Medical Facilities Management - 1.0% |
|||||
|
Columbia/HCA Healthcare Co.: |
|
|
|
|
|
|
8.12% 8/4/03 |
Ba2 |
|
125,000 |
123,125 |
|
|
8.125% 8/4/03 |
Ba2 |
|
40,000 |
39,400 |
|
|
Fountain View, Inc. 11.25% 4/15/08 |
Caa1 |
|
120,000 |
24,000 |
|
|
Oxford Health Plans, Inc. 11% 5/15/05 |
B2 |
|
175,000 |
190,750 |
|
|
Corporate Bonds - continued |
|||||
|
Moody's Ratings (unaudited) (b) |
Principal Amount |
Value |
|||
|
Nonconvertible Bonds - continued |
|||||
|
HEALTH - continued |
|||||
|
Medical Facilities Management - continued |
|||||
|
Tenet Healthcare Corp.: |
|
|
|
|
|
|
8.125% 12/1/08 |
Ba3 |
|
$ 50,000 |
$ 48,125 |
|
|
8.625% 1/15/07 |
Ba3 |
|
20,000 |
19,800 |
|
|
|
445,200 |
||||
|
INDUSTRIAL MACHINERY & EQUIPMENT - 2.6% |
|||||
|
Electrical Equipment - 0.7% |
|||||
|
Loral Space & Communications Ltd. 9.5% 1/15/06 |
B1 |
|
455,000 |
323,050 |
|
|
Industrial Machinery & Equipment - 0.8% |
|||||
|
Exide Corp. 10% 4/15/05 |
B1 |
|
355,000 |
255,600 |
|
|
Thermadyne Holdings Corp. 0% 6/1/08 (d) |
Caa1 |
|
25,000 |
7,500 |
|
|
Thermadyne Manufacturing LLC 9.875% 6/1/08 |
B3 |
|
135,000 |
97,200 |
|
|
|
360,300 |
||||
|
Pollution Control - 1.1% |
|||||
|
Allied Waste North America, Inc. 10% 8/1/09 |
B2 |
|
380,000 |
322,050 |
|
|
Browning-Ferris Industries, Inc. 6.1% 1/15/03 |
Ba3 |
|
160,000 |
147,200 |
|
|
|
469,250 |
||||
|
TOTAL INDUSTRIAL MACHINERY & EQUIPMENT |
1,152,600 |
||||
|
MEDIA & LEISURE - 30.2% |
|||||
|
Broadcasting - 25.8% |
|||||
|
360networks, Inc. 13% 5/1/08 |
B3 |
|
220,000 |
174,900 |
|
|
ACME Television LLC/ACME Financial Corp. 10.875% 9/30/04 |
B3 |
|
465,000 |
430,125 |
|
|
Adelphia Communications Corp.: |
|
|
|
|
|
|
9.25% 10/1/02 |
B2 |
|
1,215,000 |
1,184,625 |
|
|
10.875% 10/1/10 |
B2 |
|
50,000 |
46,500 |
|
|
Ascent Entertainment Group, Inc. 0% 12/15/04 (d) |
Ba1 |
|
1,380,000 |
1,138,500 |
|
|
Century Communications Corp.: |
|
|
|
|
|
|
0% 3/15/03 |
B2 |
|
30,000 |
22,650 |
|
|
9.5% 3/1/05 |
B2 |
|
125,000 |
114,688 |
|
|
9.75% 2/15/02 |
B2 |
|
1,590,000 |
1,558,200 |
|
|
Diamond Cable Communications PLC yankee: |
|
|
|
|
|
|
0% 12/15/05 (d) |
B2 |
|
200,000 |
180,500 |
|
|
0% 2/15/07 (d) |
B2 |
|
20,000 |
15,000 |
|
|
Corporate Bonds - continued |
|||||
|
Moody's Ratings (unaudited) (b) |
Principal Amount |
Value |
|||
|
Nonconvertible Bonds - continued |
|||||
|
MEDIA & LEISURE - continued |
|||||
|
Broadcasting - continued |
|||||
|
Diamond Cable Communications PLC yankee: - continued |
|
|
|
|
|
|
13.25% 9/30/04 |
B2 |
|
$ 315,000 |
$ 322,875 |
|
|
EchoStar DBS Corp.: |
|
|
|
|
|
|
9.25% 2/1/06 |
B1 |
|
200,000 |
196,000 |
|
|
9.375% 2/1/09 |
B1 |
|
420,000 |
411,600 |
|
|
Golden Sky DBS, Inc. 0% 3/1/07 (d) |
Caa1 |
|
300,000 |
204,000 |
|
|
Golden Sky Systems, Inc. 12.375% 8/1/06 |
B3 |
|
150,000 |
161,250 |
|
|
Impsat Fiber Networks, Inc. 13.75% 2/15/05 |
B3 |
|
200,000 |
144,000 |
|
|
International Cabletel, Inc.: |
|
|
|
|
|
|
Series A, 12.75% 4/15/05 |
B2 |
|
170,000 |
168,300 |
|
|
0% 2/1/06 (d) |
B2 |
|
2,130,000 |
1,874,400 |
|
|
Knology Holding, Inc. 0% 10/15/07 (d) |
- |
|
45,000 |
13,950 |
|
|
NTL Communications Corp. 11.875% 10/1/10 (e) |
B2 |
|
70,000 |
64,750 |
|
|
Olympus Communications LP/Olympus Capital Corp. 10.625% 11/15/06 |
B2 |
|
20,000 |
18,700 |
|
|
Pegasus Communications Corp.: |
|
|
|
|
|
|
9.625% 10/15/05 |
B3 |
|
550,000 |
536,250 |
|
|
9.75% 12/1/06 |
B3 |
|
350,000 |
341,250 |
|
|
Pegasus Media & Communications, Inc. 12.5% 7/1/05 |
B3 |
|
300,000 |
312,000 |
|
|
Satelites Mexicanos SA de CV: |
|
|
|
|
|
|
10.125% 11/1/04 |
B3 |
|
500,000 |
315,000 |
|
|
11.28% 6/30/04 (e)(f) |
B1 |
|
420,000 |
367,500 |
|
|
Telewest PLC 11% 10/1/07 |
B1 |
|
374,000 |
336,600 |
|
|
United International Holdings, Inc. 0% 2/15/08 (d) |
B3 |
|
400,000 |
232,000 |
|
|
United Pan-Europe Communications NV: |
|
|
|
|
|
|
0% 2/1/10 (d) |
B2 |
|
200,000 |
74,000 |
|
|
10.875% 11/1/07 |
B2 |
|
110,000 |
85,800 |
|
|
10.875% 8/1/09 |
B2 |
|
95,000 |
68,875 |
|
|
11.25% 2/1/10 |
B2 |
|
75,000 |
56,250 |
|
|
11.5% 2/1/10 |
B2 |
|
165,000 |
125,400 |
|
|
|
11,296,438 |
||||
|
Entertainment - 0.5% |
|||||
|
Alliance Gaming Corp. 10% 8/1/07 |
Caa1 |
|
180,000 |
99,000 |
|
|
Corporate Bonds - continued |
|||||
|
Moody's Ratings (unaudited) (b) |
Principal Amount |
Value |
|||
|
Nonconvertible Bonds - continued |
|||||
|
MEDIA & LEISURE - continued |
|||||
|
Entertainment - continued |
|||||
|
Mandalay Resort Group: |
|
|
|
|
|
|
9.5% 8/1/08 |
Ba2 |
|
$ 60,000 |
$ 61,200 |
|
|
10.25% 8/1/07 |
Ba3 |
|
75,000 |
76,875 |
|
|
|
237,075 |
||||
|
Leisure Durables & Toys - 0.0% |
|||||
|
Hedstrom Corp. 10% 6/1/07 (c) |
Caa3 |
|
85,000 |
1,700 |
|
|
Lodging & Gaming - 3.7% |
|||||
|
Courtyard by Marriott II LP/Courtyard II Finance Co. 10.75% 2/1/08 |
B- |
|
290,000 |
287,825 |
|
|
Florida Panthers Holdings, Inc. 9.875% 4/15/09 |
B2 |
|
220,000 |
207,350 |
|
|
International Game Technology 7.875% 5/15/04 |
Ba1 |
|
30,000 |
29,250 |
|
|
ITT Corp. 6.25% 11/15/00 |
Ba1 |
|
1,085,000 |
1,079,575 |
|
|
|
1,604,000 |
||||
|
Publishing - 0.2% |
|||||
|
American Lawyer Media Holdings, Inc. 9.75% 12/15/07 |
B2 |
|
85,000 |
75,650 |
|
|
TOTAL MEDIA & LEISURE |
13,214,863 |
||||
|
NONDURABLES - 0.6% |
|||||
|
Foods - 0.6% |
|||||
|
SFC New Holdings, Inc. 11.25% 8/15/01 |
CCC |
|
275,000 |
270,188 |
|
|
RETAIL & WHOLESALE - 1.7% |
|||||
|
Apparel Stores - 0.0% |
|||||
|
Norton McNaughton, Inc. 12.5% 6/1/05 |
B2 |
|
5,000 |
4,488 |
|
|
Drug Stores - 1.5% |
|||||
|
Rite Aid Corp.: |
|
|
|
|
|
|
6% 12/15/00 (e) |
B3 |
|
670,000 |
649,900 |
|
|
10.5% 9/15/02 (e) |
- |
|
5,000 |
3,100 |
|
|
|
653,000 |
||||
|
Retail & Wholesale, Miscellaneous - 0.2% |
|||||
|
National Vision Association Ltd. 12.75% 10/15/05 (c) |
Ca |
|
200,000 |
76,000 |
|
|
TOTAL RETAIL & WHOLESALE |
733,488 |
||||
|
Corporate Bonds - continued |
|||||
|
Moody's Ratings (unaudited) (b) |
Principal Amount |
Value |
|||
|
Nonconvertible Bonds - continued |
|||||
|
TECHNOLOGY - 4.8% |
|||||
|
Computer Services & Software - 3.1% |
|||||
|
Colo.com 13.875% 3/15/10 unit (e) |
- |
|
$ 100,000 |
$ 75,000 |
|
|
Concentric Network Corp. 12.75% 12/15/07 |
B |
|
160,000 |
159,200 |
|
|
Covad Communications Group, Inc.: |
|
|
|
|
|
|
0% 3/15/08 (d) |
B3 |
|
138,000 |
37,260 |
|
|
12% 2/15/10 |
B3 |
|
95,000 |
44,175 |
|
|
12.5% 2/15/09 |
B3 |
|
200,000 |
98,000 |
|
|
Exodus Communications, Inc.: |
|
|
|
|
|
|
10.75% 12/15/09 |
B3 |
|
455,000 |
418,600 |
|
|
11.25% 7/1/08 |
B3 |
|
110,000 |
103,950 |
|
|
11.625% 7/15/10 (e) |
B3 |
|
315,000 |
296,100 |
|
|
PSINet, Inc.: |
|
|
|
|
|
|
10% 2/15/05 |
B3 |
|
220,000 |
108,900 |
|
|
10.5% 12/1/06 |
B3 |
|
40,000 |
19,200 |
|
|
|
1,360,385 |
||||
|
Computers & Office Equipment - 1.3% |
|||||
|
Dictaphone Corp. 11.75% 8/1/05 |
B3 |
|
660,000 |
495,000 |
|
|
Globix Corp. 12.5% 2/1/10 |
B- |
|
130,000 |
71,500 |
|
|
|
566,500 |
||||
|
Electronic Instruments - 0.3% |
|||||
|
Telecommunications Techniques Co. LLC 9.75% 5/15/08 |
B3 |
|
145,000 |
129,050 |
|
|
Electronics - 0.1% |
|||||
|
Aavid Thermal Technologies, Inc. 12.75% 2/1/07 |
B2 |
|
40,000 |
34,800 |
|
|
Photographic Equipment - 0.0% |
|||||
|
IMAX Corp. 7.875% 12/1/05 |
Ba2 |
|
55,000 |
31,350 |
|
|
TOTAL TECHNOLOGY |
2,122,085 |
||||
|
TRANSPORTATION - 0.3% |
|||||
|
Air Transportation - 0.3% |
|||||
|
US Air, Inc. 9.625% 2/1/01 |
B3 |
|
150,000 |
148,500 |
|
|
UTILITIES - 23.3% |
|||||
|
Cellular - 5.2% |
|||||
|
Clearnet Communications, Inc. yankee 0% 12/15/05 (d) |
Ba1 |
|
100,000 |
106,000 |
|
|
Corporate Bonds - continued |
|||||
|
Moody's Ratings (unaudited) (b) |
Principal Amount |
Value |
|||
|
Nonconvertible Bonds - continued |
|||||
|
UTILITIES - continued |
|||||
|
Cellular - continued |
|||||
|
Echostar Broadband Corp. 10.375% 10/1/07 (e) |
B3 |
|
$ 250,000 |
$ 250,000 |
|
|
Globalstar LP/Globalstar Capital Corp. 11.5% 6/1/05 |
Caa1 |
|
30,000 |
3,600 |
|
|
Leap Wireless International, Inc.: |
|
|
|
|
|
|
0% 4/15/10 (d) |
- |
|
105,000 |
25,200 |
|
|
12.5% 4/15/10 |
Caa2 |
|
135,000 |
89,100 |
|
|
McCaw International Ltd. 0% 4/15/07 (d) |
Caa1 |
|
243,000 |
170,100 |
|
|
Nextel Communications, Inc.: |
|
|
|
|
|
|
0% 2/15/08 (d) |
B1 |
|
165,000 |
122,100 |
|
|
9.375% 11/15/09 |
B1 |
|
155,000 |
149,575 |
|
|
Nextel International, Inc.: |
|
|
|
|
|
|
0% 4/15/08 (d) |
Caa1 |
|
135,000 |
81,000 |
|
|
12.75% 8/1/10 (e) |
Caa1 |
|
350,000 |
322,000 |
|
|
Nextel Partners, Inc.: |
|
|
|
|
|
|
11% 3/15/10 (e) |
B3 |
|
750,000 |
750,000 |
|
|
11% 3/15/10 |
B3 |
|
115,000 |
115,000 |
|
|
Orion Network Systems, Inc. 11.25% 1/15/07 |
B2 |
|
45,000 |
15,750 |
|
|
Triton PCS, Inc. 0% 5/1/08 (d) |
B3 |
|
25,000 |
18,813 |
|
|
US Unwired, Inc. 0% 11/1/09 (d) |
Caa1 |
|
150,000 |
71,250 |
|
|
|
2,289,488 |
||||
|
Electric Utility - 0.3% |
|||||
|
CMS Energy Corp. 8.125% 5/15/02 |
Ba3 |
|
130,000 |
127,888 |
|
|
Telephone Services - 17.8% |
|||||
|
Allegiance Telecom, Inc. 0% 2/15/08 (d) |
B3 |
|
105,000 |
71,400 |
|
|
Asia Global Crossing Ltd. 13.375% 10/15/10 (e) |
B2 |
|
140,000 |
130,900 |
|
|
FirstWorld Communications, Inc. 0% 4/15/08 (d) |
- |
|
15,000 |
2,550 |
|
|
Flag Telecom Holdings Ltd. 11.625% 3/30/10 |
B2 |
|
100,000 |
83,000 |
|
|
Focal Communications Corp. 11.875% 1/15/10 |
B3 |
|
385,000 |
292,600 |
|
|
Hyperion Telecommunications, Inc.: |
|
|
|
|
|
|
0% 4/15/03 (d) |
B3 |
|
105,000 |
79,800 |
|
|
12.25% 9/1/04 |
B3 |
|
665,000 |
551,950 |
|
|
ICG Services, Inc. 0% 5/1/08 (d) |
Caa1 |
|
200,000 |
32,000 |
|
|
Intermedia Communications, Inc.: |
|
|
|
|
|
|
0% 5/15/06 (d) |
B2 |
|
455,000 |
429,975 |
|
|
0% 7/15/07 (d) |
B2 |
|
105,000 |
86,625 |
|
|
Corporate Bonds - continued |
|||||
|
Moody's Ratings (unaudited) (b) |
Principal Amount |
Value |
|||
|
Nonconvertible Bonds - continued |
|||||
|
UTILITIES - continued |
|||||
|
Telephone Services - continued |
|||||
|
Level 3 Communications, Inc.: |
|
|
|
|
|
|
0% 12/1/08 (d) |
B3 |
|
$ 50,000 |
$ 27,500 |
|
|
11% 3/15/08 |
B3 |
|
425,000 |
383,563 |
|
|
McLeodUSA, Inc.: |
|
|
|
|
|
|
0% 3/1/07 (d) |
B1 |
|
195,000 |
158,438 |
|
|
8.375% 3/15/08 |
B1 |
|
15,000 |
13,200 |
|
|
9.25% 7/15/07 |
B1 |
|
35,000 |
32,025 |
|
|
Metromedia Fiber Network, Inc.: |
|
|
|
|
|
|
10% 11/15/08 |
B2 |
|
10,000 |
8,800 |
|
|
10% 12/15/09 |
B2 |
|
330,000 |
290,400 |
|
|
NEXTLINK Communications LLC 12.5% 4/15/06 |
B2 |
|
20,000 |
18,900 |
|
|
NEXTLINK Communications, Inc.: |
|
|
|
|
|
|
0% 4/15/08 (d) |
B2 |
|
267,000 |
149,520 |
|
|
0% 6/1/09 (d) |
B2 |
|
211,000 |
109,720 |
|
|
0% 12/1/09 (d) |
B2 |
|
105,000 |
49,350 |
|
|
10.75% 11/15/08 |
B3 |
|
45,000 |
39,600 |
|
|
10.75% 6/1/09 |
B2 |
|
425,000 |
374,000 |
|
|
Qwest Communications International, Inc. 10.875% 4/1/07 |
Baa1 |
|
3,000,000 |
3,254,993 |
|
|
Rhythms NetConnections, Inc.: |
|
|
|
|
|
|
Series B, 14% 2/15/10 |
B3 |
|
165,000 |
75,900 |
|
|
12.75% 4/15/09 |
B3 |
|
20,000 |
9,200 |
|
|
Rochester Telephone Corp. 8.77% 4/16/01 |
Ba2 |
|
100,000 |
99,250 |
|
|
Teligent, Inc. 11.5% 12/1/07 |
Caa1 |
|
265,000 |
106,000 |
|
|
Versatel Telecom International NV 11.875% 7/15/09 |
B3 |
|
60,000 |
43,800 |
|
|
Viatel, Inc. 11.5% 3/15/09 |
B3 |
|
40,000 |
20,000 |
|
|
WinStar Communications, Inc.: |
|
|
|
|
|
|
0% 4/15/10 (d) |
B3 |
|
30,000 |
9,600 |
|
|
12.5% 4/15/08 |
B3 |
|
255,000 |
187,425 |
|
|
Corporate Bonds - continued |
|||||
|
Moody's Ratings (unaudited) (b) |
Principal Amount |
Value |
|||
|
Nonconvertible Bonds - continued |
|||||
|
UTILITIES - continued |
|||||
|
Telephone Services - continued |
|||||
|
WinStar Communications, Inc.: - continued |
|
|
|
|
|
|
12.75% 4/15/10 |
B3 |
|
$ 615,000 |
$ 442,800 |
|
|
Worldwide Fiber, Inc. 12% 8/1/09 |
B3 |
|
145,000 |
109,475 |
|
|
|
7,774,259 |
||||
|
TOTAL UTILITIES |
10,191,635 |
||||
|
TOTAL NONCONVERTIBLE BONDS |
30,850,920 |
||||
|
TOTAL CORPORATE BONDS (Cost $34,490,466) |
31,496,108 |
||||
|
Asset-Backed Securities - 0.1% |
|||||
|
|
|||||
|
Airplanes pass through trust 10.875% 3/15/19 |
Ba2 |
|
69,139 |
51,163 |
|
|
Commercial Mortgage Securities - 1.1% |
|||||
|
|
|||||
|
Mortgage Capital Funding, Inc. Series 1998-MC3 Class F, 7.3172% 11/18/31 (e)(f) |
Ba1 |
|
400,000 |
309,500 |
|
|
Nomura Asset Securities Corp. Series 1998-D6 Class B1, 6% 3/15/30 |
BB+ |
|
100,000 |
67,328 |
|
|
Nomura Depositor Trust floater Series 1998-ST1A Class B2, 10.8713% 1/15/03 (e)(f) |
- |
|
100,000 |
92,844 |
|
|
TOTAL COMMERCIAL MORTGAGE SECURITIES (Cost $473,782) |
469,672 |
||||
|
Common Stocks - 5.4% |
|||
|
Shares |
|
||
|
BASIC INDUSTRIES - 0.3% |
|||
|
Chemicals & Plastics - 0.0% |
|||
|
Georgia Gulf Corp. |
200 |
2,675 |
|
|
Lyondell Chemical Co. |
300 |
4,313 |
|
|
Sterling Chemicals Holdings, Inc. (a) |
1,000 |
1,625 |
|
|
|
8,613 |
||
|
Common Stocks - continued |
|||
|
Shares |
Value |
||
|
BASIC INDUSTRIES - continued |
|||
|
Packaging & Containers - 0.3% |
|||
|
Packaging Corp. of America |
7,100 |
$ 104,281 |
|
|
TOTAL BASIC INDUSTRIES |
112,894 |
||
|
FINANCE - 0.0% |
|||
|
Banks - 0.0% |
|||
|
Provident Financial Group, Inc. |
600 |
18,150 |
|
|
Credit & Other Finance - 0.0% |
|||
|
Associates First Capital Corp. (a) |
10,800 |
227 |
|
|
Delta Financial Corp. (a) |
6,800 |
3,188 |
|
|
|
3,415 |
||
|
TOTAL FINANCE |
21,565 |
||
|
HEALTH - 0.4% |
|||
|
Medical Facilities Management - 0.4% |
|||
|
Davita, Inc. (a) |
15,000 |
168,750 |
|
|
INDUSTRIAL MACHINERY & EQUIPMENT - 0.0% |
|||
|
Industrial Machinery & Equipment - 0.0% |
|||
|
Exide Corp. |
300 |
3,019 |
|
|
Pollution Control - 0.0% |
|||
|
Allied Waste Industries, Inc. (a) |
800 |
7,400 |
|
|
TOTAL INDUSTRIAL MACHINERY & EQUIPMENT |
10,419 |
||
|
MEDIA & LEISURE - 3.5% |
|||
|
Broadcasting - 3.1% |
|||
|
EchoStar Communications Corp. Class A (a) |
30,300 |
1,371,075 |
|
|
Entertainment - 0.0% |
|||
|
Clubhaus PLC (a) |
1,400 |
842 |
|
|
Leisure Durables & Toys - 0.0% |
|||
|
Brunswick Corp. |
200 |
3,888 |
|
|
Lodging & Gaming - 0.4% |
|||
|
Hollywood Casino Corp. (a) |
15,000 |
157,500 |
|
|
TOTAL MEDIA & LEISURE |
1,533,305 |
||
|
Common Stocks - continued |
|||
|
Shares |
Value |
||
|
RETAIL & WHOLESALE - 1.0% |
|||
|
Grocery Stores - 1.0% |
|||
|
Pathmark Stores, Inc. (a) |
26,670 |
$ 418,386 |
|
|
Pathmark Stores, Inc. warrants 9/19/10 (a) |
1,012 |
4,554 |
|
|
|
422,940 |
||
|
TECHNOLOGY - 0.2% |
|||
|
Computer Services & Software - 0.0% |
|||
|
PSINet, Inc. (a) |
1,200 |
7,988 |
|
|
Electronics - 0.2% |
|||
|
Aavid Thermal Technologies, Inc. warrants 2/1/07 (a)(e) |
40 |
0 |
|
|
California Micro Devices Corp. (a) |
5,000 |
63,438 |
|
|
Photographic Equipment - 0.0% |
|||
|
IMAX Corp. (a) |
2,800 |
13,793 |
|
|
TOTAL TECHNOLOGY |
85,219 |
||
|
UTILITIES - 0.0% |
|||
|
Cellular - 0.0% |
|||
|
Leap Wireless International, Inc.: |
|
|
|
|
warrants 4/15/10 (CV ratio 2.503) (a)(e) |
135 |
1,350 |
|
|
warrants 4/15/10 (CV ratio 5.146) (a)(e) |
105 |
1,050 |
|
|
|
2,400 |
||
|
Electric Utility - 0.0% |
|||
|
CMS Energy Corp. |
300 |
8,100 |
|
|
TOTAL UTILITIES |
10,500 |
||
|
TOTAL COMMON STOCKS (Cost $2,278,664) |
2,365,592 |
||
|
Preferred Stocks - 5.4% |
|||
|
|
|
|
|
|
Convertible Preferred Stocks - 0.1% |
|||
|
INDUSTRIAL MACHINERY & EQUIPMENT - 0.1% |
|||
|
Electrical Equipment - 0.1% |
|||
|
Loral Space & Communications Ltd. $3.00 (e) |
2,000 |
36,500 |
|
|
Preferred Stocks - continued |
|||
|
Shares |
Value |
||
|
Nonconvertible Preferred Stocks - 5.3% |
|||
|
FINANCE - 0.7% |
|||
|
Credit & Other Finance - 0.7% |
|||
|
American Annuity Group Capital Trust I $2.3125 |
13,435 |
$ 322,440 |
|
|
MEDIA & LEISURE - 0.5% |
|||
|
Broadcasting - 0.5% |
|||
|
CSC Holdings, Inc. Series M, 11.125% pay-in-kind |
2,230 |
236,380 |
|
|
UTILITIES - 4.1% |
|||
|
Cellular - 0.9% |
|||
|
Nextel Communications, Inc. 11.125% pay-in-kind |
422 |
390,350 |
|
|
Telephone Services - 3.2% |
|||
|
Intermedia Communications, Inc. 13.5% pay-in-kind |
178 |
151,300 |
|
|
XO Communications, Inc.: |
|
|
|
|
$7.00 pay-in-kind |
22,949 |
917,960 |
|
|
13% pay-in-kind |
442 |
318,240 |
|
|
|
1,387,500 |
||
|
TOTAL UTILITIES |
1,777,850 |
||
|
TOTAL NONCONVERTIBLE PREFERRED STOCKS |
2,336,670 |
||
|
TOTAL PREFERRED STOCKS (Cost $2,799,002) |
2,373,170 |
||
|
Floating Rate Loans - 3.6% |
|||||
|
Moody's Ratings (unaudited) (b) |
Principal Amount |
|
|||
|
CONSTRUCTION & REAL ESTATE - 0.7% |
|||||
|
Building Materials - 0.7% |
|||||
|
Flowserve Corp. Tranche B term loan 10.25% 6/30/08 (f) |
- |
|
$ 300,000 |
302,250 |
|
|
Construction - 0.0% |
|||||
|
Blount, Inc. Tranche B term loan 10.7222% 6/30/06 (f) |
B1 |
|
2,519 |
2,506 |
|
|
TOTAL CONSTRUCTION & REAL ESTATE |
304,756 |
||||
|
Floating Rate Loans - continued |
|||||
|
Moody's Ratings (unaudited) (b) |
Principal Amount |
Value |
|||
|
DURABLES - 0.4% |
|||||
|
Textiles & Apparel - 0.4% |
|||||
|
Synthetic Industries, Inc. term loan 14.9% 12/13/00 (f) |
- |
|
$ 200,000 |
$ 184,000 |
|
|
UTILITIES - 2.5% |
|||||
|
Cellular - 2.3% |
|||||
|
Cook Inlet/Voicestream Op Co. LLC Tranche B term loan 10.63% 12/31/08 (f) |
B2 |
|
1,000,000 |
1,010,000 |
|
|
Telephone Services - 0.2% |
|||||
|
McLeodUSA, Inc. Tranche B term loan 9.62% 5/31/08 (f) |
Ba2 |
|
100,000 |
99,875 |
|
|
TOTAL UTILITIES |
1,109,875 |
||||
|
TOTAL FLOATING RATE LOANS (Cost $1,601,779) |
1,598,631 |
||||
|
Cash Equivalents - 10.5% |
|||
|
Maturity Amount |
|
||
|
Investments in repurchase agreements (U.S. Treasury Obligations), in a joint trading account at 6.56%, dated 10/31/00 due
11/1/00 |
$ 4,585,835 |
4,585,000 |
|
|
TOTAL INVESTMENT PORTFOLIO - 98.1% (Cost $46,280,202) |
42,939,336 |
||
|
NET OTHER ASSETS - 1.9% |
818,821 |
||
|
NET ASSETS - 100% |
$ 43,758,157 |
||
|
Legend |
|
(a) Non-income producing |
|
(b) S&P credit ratings are used in the absence of a rating by Moody's Investors Service, Inc. |
|
(c) Non-income producing - issuer filed for protection under the Federal Bankruptcy Code or is in default of interest payment. |
|
(d) Debt obligation initially issued in zero coupon form which converts to coupon form at a specified rate and date. The rate shown is the rate at period end. |
|
(e) Security exempt from registration under Rule 144A of the Securities Act of 1933. These securities may be resold in transactions exempt from registration, normally to qualified institutional buyers. At the period end, the value of these securities amounted to $3,858,744 or 8.8% of net assets. |
|
(f) The coupon rate shown on floating or adjustable rate securities represents the rate at period end. |
|
Other Information |
|
The composition of long-term debt holdings as a percentage of total value of investments in securities, is as follows (ratings are unaudited): |
|
Moody's Ratings |
S&P Ratings |
|||
|
Aaa, Aa, A |
0.0% |
|
AAA, AA, A |
0.0% |
|
Baa |
7.6% |
|
BBB |
10.1% |
|
Ba |
11.7% |
|
BB |
7.1% |
|
B |
51.3% |
|
B |
46.1% |
|
Caa |
3.8% |
|
CCC |
9.3% |
|
Ca, C |
0.2% |
|
CC, C |
0.0% |
|
|
D |
0.0% |
||
|
The percentage not rated by Moody's |
|
Income Tax Information |
|
At October 31, 2000, the aggregate |
|
At October 31, 2000, the fund had a capital loss carryforward of approximately $275,000 of which $6,000 and $269,000 will expire on October 31, 2007 and 2008, respectively. |
See accompanying notes which are an integral part of the financial statements.
Annual Report
Statement of Assets and Liabilities
|
|
October 31, 2000 |
|
|
Assets |
|
|
|
Investment in securities, at value (including repurchase agreements of $4,585,000) (cost $46,280,202) - |
|
$ 42,939,336 |
|
Receivable for investments sold |
|
1,425,069 |
|
Receivable for fund shares sold |
|
49,387 |
|
Dividends receivable |
|
32,650 |
|
Interest receivable |
|
710,781 |
|
Total assets |
|
45,157,223 |
|
Liabilities |
|
|
|
Payable to custodian bank |
$ 993,288 |
|
|
Payable for investments purchased |
164,825 |
|
|
Payable for fund shares redeemed |
50,582 |
|
|
Distributions payable |
93,094 |
|
|
Accrued management fee |
17,397 |
|
|
Distribution fees payable |
16,462 |
|
|
Other payables and accrued expenses |
63,418 |
|
|
Total liabilities |
|
1,399,066 |
|
Net Assets |
|
$ 43,758,157 |
|
Net Assets consist of: |
|
|
|
Paid in capital |
|
$ 47,063,416 |
|
Undistributed net investment income |
|
312,346 |
|
Accumulated undistributed net realized gain (loss) on investments and foreign currency transactions |
|
(276,739) |
|
Net unrealized appreciation (depreciation) on investments |
|
(3,340,866) |
|
Net Assets |
|
$ 43,758,157 |
See accompanying notes which are an integral part of the financial statements.
Annual Report
Financial Statements - continued
Statement of Assets and Liabilities - continued
|
|
October 31, 2000 |
|
|
Calculation of Maximum Offering Price |
|
$9.35 |
|
Maximum offering price per share (100/95.25 of $9.35) |
|
$9.82 |
|
Class T: |
|
$9.35 |
|
Maximum offering price per share (100/96.50 of $9.35) |
|
$9.69 |
|
Class B: |
|
$9.34 |
|
Class C: |
|
$9.35 |
|
Institutional Class: |
|
$9.35 |
A Redemption price per share is equal to net asset value less any applicable contingent deferred sales charge.
See accompanying notes which are an integral part of the financial statements.
Annual Report
Financial Statements - continued
Statement of Operations
|
|
Year ended October 31, 2000 |
|
|
Investment Income Dividends |
|
$ 276,680 |
|
Interest |
|
3,288,926 |
|
Total income |
|
3,565,606 |
|
Expenses |
|
|
|
Management fee |
$ 201,987 |
|
|
Transfer agent fees |
62,937 |
|
|
Distribution fees |
163,650 |
|
|
Accounting fees and expenses |
60,006 |
|
|
Non-interested trustees' compensation |
103 |
|
|
Custodian fees and expenses |
9,853 |
|
|
Registration fees |
199,084 |
|
|
Audit |
19,881 |
|
|
Legal |
168 |
|
|
Miscellaneous |
103 |
|
|
Total expenses before reductions |
717,772 |
|
|
Expense reductions |
(260,745) |
457,027 |
|
Net investment income |
|
3,108,579 |
|
Realized and Unrealized Gain (Loss) Net realized gain (loss) on: |
|
|
|
Investment securities |
(236,662) |
|
|
Foreign currency transactions |
9 |
(236,653) |
|
Change in net unrealized appreciation (depreciation) on investment securities |
|
(3,297,642) |
|
Net gain (loss) |
|
(3,534,295) |
|
Net increase (decrease) in net assets resulting |
|
$ (425,716) |
See accompanying notes which are an integral part of the financial statements.
Annual Report
Financial Statements - continued
Statement of Changes in Net Assets
|
|
Year ended |
September 7, 1999 |
|
Increase (Decrease) in Net Assets |
|
|
|
Operations |
$ 3,108,579 |
$ 59,140 |
|
Net realized gain (loss) |
(236,653) |
(6,153) |
|
Change in net unrealized appreciation (depreciation) |
(3,297,642) |
(43,224) |
|
Net increase (decrease) in net assets resulting |
(425,716) |
9,763 |
|
Distributions to shareholders from net investment income |
(2,832,624) |
(56,682) |
|
Share transactions - net increase (decrease) |
39,193,976 |
7,869,440 |
|
Total increase (decrease) in net assets |
35,935,636 |
7,822,521 |
|
Net Assets |
|
|
|
Beginning of period |
7,822,521 |
- |
|
End of period (including undistributed net investment income of $312,346 and $2,608, respectively) |
$ 43,758,157 |
$ 7,822,521 |
See accompanying notes which are an integral part of the financial statements.
Annual Report
Financial Highlights - Class A
|
Years ended October 31, |
2000 |
1999 E |
|
Selected Per-Share Data |
|
|
|
Net asset value, beginning of period |
$ 9.920 |
$ 10.000 |
|
Income from Investment Operations |
|
|
|
Net investment income D |
.895 |
.116 |
|
Net realized and unrealized gain (loss) |
(.640) |
(.091) |
|
Total from investment operations |
.255 |
.025 |
|
Less Distributions |
|
|
|
From net investment income |
(.825) |
(.105) |
|
Net asset value, end of period |
$ 9.350 |
$ 9.920 |
|
Total Return B, C |
2.40% |
.25% |
|
Ratios and Supplemental Data |
|
|
|
Net assets, end of period (000 omitted) |
$ 13,295 |
$ 739 |
|
Ratio of expenses to average net assets |
1.00% F |
1.00% A, F |
|
Ratio of expenses to average net assets after expense reductions |
.98% G |
1.00% A |
|
Ratio of net investment income to average net assets |
9.17% |
7.92% A |
|
Portfolio turnover rate |
157% |
331% A |
A Annualized
B The total returns would have been lower had certain expenses not been reduced during the periods shown.
C Total returns do not include the one time sales charge and for periods of less than one year are not annualized.
D Net investment income per share has been calculated based on average shares outstanding during the period.
E For the period September 7, 1999 (commencement of operations) to October 31, 1999.
F FMR agreed to reimburse a portion of the class' expenses during the period. Without this reimbursement, the class' expense ratio would have been higher.
G FMR or the fund has entered into varying arrangements with third parties who either paid or reduced a portion of the class' expenses.
See accompanying notes which are an integral part of the financial statements.
Annual Report
Financial Highlights - Class T
|
Years ended October 31, |
2000 |
1999 E |
|
Selected Per-Share Data |
|
|
|
Net asset value, beginning of period |
$ 9.920 |
$ 10.000 |
|
Income from Investment Operations |
|
|
|
Net investment income D |
.898 |
.112 |
|
Net realized and unrealized gain (loss) |
(.656) |
(.089) |
|
Total from investment operations |
.242 |
.023 |
|
Less Distributions |
|
|
|
From net investment income |
(.812) |
(.103) |
|
Net asset value, end of period |
$ 9.350 |
$ 9.920 |
|
Total Return B, C |
2.27% |
.23% |
|
Ratios and Supplemental Data |
|
|
|
Net assets, end of period (000 omitted) |
$ 8,936 |
$ 2,422 |
|
Ratio of expenses to average net assets |
1.10% F |
1.10% A, F |
|
Ratio of expenses to average net assets after expense reductions |
1.08% G |
1.10% A |
|
Ratio of net investment income to average net assets |
9.07% |
7.82% A |
|
Portfolio turnover rate |
157% |
331% A |
A Annualized
B The total returns would have been lower had certain expenses not been reduced during the periods shown.
C Total returns do not include the one time sales charge and for periods of less than one year are not annualized.
D Net investment income per share has been calculated based on average shares outstanding during the period.
E For the period September 7, 1999 (commencement of operations) to October 31, 1999.
F FMR agreed to reimburse a portion of the class' expenses during the period. Without this reimbursement, the class' expense ratio would have been higher.
G FMR or the fund has entered into varying arrangements with third parties who either paid or reduced a portion of the class' expenses.
See accompanying notes which are an integral part of the financial statements.
Annual Report
Financial Highlights - Class B
|
Years ended October 31, |
2000 |
1999 E |
|
Selected Per-Share Data |
|
|
|
Net asset value, beginning of period |
$ 9.920 |
$ 10.000 |
|
Income from Investment Operations |
|
|
|
Net investment income D |
.830 |
.102 |
|
Net realized and unrealized gain (loss) |
(.663) |
(.083) |
|
Total from investment operations |
.167 |
.019 |
|
Less Distributions |
|
|
|
From net investment income |
(.747) |
(.099) |
|
Net asset value, end of period |
$ 9.340 |
$ 9.920 |
|
Total Return B, C |
1.50% |
.19% |
|
Ratios and Supplemental Data |
|
|
|
Net assets, end of period (000 omitted) |
$ 10,054 |
$ 2,089 |
|
Ratio of expenses to average net assets |
1.75% F |
1.75% A, F |
|
Ratio of expenses to average net assets after expense reductions |
1.73% G |
1.75% A |
|
Ratio of net investment income to average net assets |
8.42% |
7.17% A |
|
Portfolio turnover rate |
157% |
331% A |
A Annualized
B The total returns would have been lower had certain expenses not been reduced during the periods shown.
C Total returns do not include the contingent deferred sales charge and for periods of less than one year are not annualized.
D Net investment income per share has been calculated based on average shares outstanding during the period.
E For the period September 7, 1999 (commencement of operations) to October 31, 1999.
F FMR agreed to reimburse a portion of the class' expenses during the period. Without this reimbursement, the class' expense ratio would have been higher.
G FMR or the fund has entered into varying arrangements with third parties who either paid or reduced a portion of the class' expenses.
See accompanying notes which are an integral part of the financial statements.
Annual Report
Financial Highlights - Class C
|
Years ended October 31, |
2000 |
1999 E |
|
Selected Per-Share Data |
|
|
|
Net asset value, beginning of period |
$ 9.910 |
$ 10.000 |
|
Income from Investment Operations |
|
|
|
Net investment income D |
.819 |
.101 |
|
Net realized and unrealized gain (loss) |
(.643) |
(.093) |
|
Total from investment operations |
.176 |
.008 |
|
Less Distributions |
|
|
|
From net investment income |
(.736) |
(.098) |
|
Net asset value, end of period |
$ 9.350 |
$ 9.910 |
|
Total Return B, C |
1.60% |
.08% |
|
Ratios and Supplemental Data |
|
|
|
Net assets, end of period (000 omitted) |
$ 6,563 |
$ 1,854 |
|
Ratio of expenses to average net assets |
1.85% F |
1.85% A, F |
|
Ratio of expenses to average net assets after expense reductions |
1.83% G |
1.85% A |
|
Ratio of net investment income to average net assets |
8.32% |
7.07% A |
|
Portfolio turnover rate |
157% |
331% A |
A Annualized
B The total returns would have been lower had certain expenses not been reduced during the periods shown.
C Total returns do not include the contingent deferred sales charge and for periods of less than one year are not annualized.
D Net investment income per share has been calculated based on average shares outstanding during the period.
E For the period September 7, 1999 (commencement of operations) to October 31, 1999.
F FMR agreed to reimburse a portion of the class' expenses during the period. Without this reimbursement, the class' expense ratio would have been higher.
G FMR or the fund has entered into varying arrangements with third parties who either paid or reduced a portion of the class' expenses.
See accompanying notes which are an integral part of the financial statements.
Annual Report
Financial Highlights - Institutional Class
|
Years ended October 31, |
2000 |
1999 E |
|
Selected Per-Share Data |
|
|
|
Net asset value, beginning of period |
$ 9.920 |
$ 10.000 |
|
Income from Investment Operations |
|
|
|
Net investment income D |
.910 |
.118 |
|
Net realized and unrealized gain (loss) |
(.638) |
(.091) |
|
Total from investment operations |
.272 |
.027 |
|
Less Distributions |
|
|
|
From net investment income |
(.842) |
(.107) |
|
Net asset value, end of period |
$ 9.350 |
$ 9.920 |
|
Total Return B, C |
2.57% |
.28% |
|
Ratios and Supplemental Data |
|
|
|
Net assets, end of period (000 omitted) |
$ 4,910 |
$ 719 |
|
Ratio of expenses to average net assets |
.85% F |
.85% A, F |
|
Ratio of expenses to average net assets after expense reductions |
.83% G |
.85% A |
|
Ratio of net investment income to average net assets |
9.32% |
8.07% A |
|
Portfolio turnover rate |
157% |
331% A |
A Annualized
B The total returns would have been lower had certain expenses not been reduced during the periods shown.
C Total returns for periods of less than one year are not annualized.
D Net investment income per share has been calculated based on average shares outstanding during the period.
E For the period September 7, 1999 (commencement of operations) to October 31, 1999.
F FMR agreed to reimburse a portion of the class' expenses during the period. Without this reimbursement, the class' expense ratio would have been higher.
G FMR or the fund has entered into varying arrangements with third parties who either paid or reduced a portion of the class' expenses.
See accompanying notes which are an integral part of the financial statements.
Annual Report
For the period ended October 31, 2000
1. Significant Accounting Policies.
Fidelity Advisor High Income Fund (the fund) is a fund of Fidelity Advisor Series II (the trust) and is authorized to issue an unlimited number of shares. The trust is registered under the Investment Company Act of 1940, as amended (the 1940 Act), as an open-end management investment company organized as a Massachusetts business trust.
The fund offers Class A, Class T, Class B, Class C, and Institutional Class shares, each of which has equal rights as to assets and voting privileges. Each class has exclusive voting rights with respect to matters that affect that class. Class B shares will automatically convert to Class A shares after a holding period of seven years from the initial date of purchase. Investment income, realized and unrealized capital gains and losses, the common expenses of the fund, and certain fund-level expense reductions, if any, are allocated on a pro rata basis to each class based on the relative net assets of each class to the total net assets of the fund. Each class of shares differs in its respective distribution, transfer agent, and certain other class-specific fees, expenses, and expense reductions.
The financial statements have been prepared in conformity with generally accepted accounting principles which require management to make certain estimates and assumptions at the date of the financial statements. The following summarizes the significant accounting policies of the fund:
Security Valuation. Securities for which quotations are readily available are valued by a pricing service at their market values as determined by their most recent bid prices in the principal market (sales prices if the principal market is an exchange) in which such securities are normally traded. Securities (including restricted securities) for which market quotations are not readily available are valued at their fair value as determined in good faith under consistently applied procedures under the general supervision of the Board of Trustees. Short-term securities with remaining maturities of sixty days or less for which quotations are not readily available are valued at amortized cost or original cost plus accrued interest, both of which approximate current value. Investments in open-end investment companies are valued at their net asset value each business day.
Foreign Currency Translation. The accounting records of the fund are maintained in U.S. dollars. Investment securities and other assets and liabilities denominated in a foreign currency are translated into U.S. dollars at the prevailing rates of exchange at period end. Purchases and sales of securities, income receipts and expense payments are translated into U.S. dollars at the prevailing exchange rate on the respective dates of the transactions.
Net realized gains and losses on foreign currency transactions represent net gains and losses from sales and maturities of foreign currency contracts, disposition of foreign currencies, the difference between the amount of net investment income accrued and
Annual Report
Notes to Financial Statements - continued
1. Significant Accounting Policies - continued
Foreign Currency Translation - continued
the U.S. dollar amount actually received, and gains and losses between trade and settlement date on purchases and sales of securities. The effects of changes in foreign currency exchange rates on investments in securities are included with the net realized and unrealized gain or loss on investment securities.
Income Taxes. As a qualified regulated investment company under Subchapter M of the Internal Revenue Code, the fund is not subject to income taxes to the extent that it distributes substantially all of its taxable income for its fiscal year. The schedule of investments includes information regarding income taxes under the caption "Income Tax Information."
Investment Income. Dividend income is recorded on the ex-dividend date, except certain dividends from foreign securities where the ex-dividend date may have passed, are recorded as soon as the fund is informed of the ex-dividend date. Non-cash dividends included in dividend income, if any, are recorded at the fair market value of the securities received. Interest income, which includes accretion of original issue discount, is accrued as earned. Investment income is recorded net of foreign taxes withheld where recovery of such taxes is uncertain. The fund may place a debt obligation on non-accrual status and reduce related interest income by ceasing current accruals and writing off interest receivables when the collection of all or a portion of interest has become doubtful based on consistently applied procedures, under the general supervision of the Board of Trustees of the fund. A debt obligation is removed from non-accrual status when the issuer resumes interest payments or when collectibility of interest is reasonably assured.
Expenses. Most expenses of the trust can be directly attributed to a fund. Expenses which cannot be directly attributed are apportioned among the funds in the trust.
Prepaid Expenses. Fidelity Management & Research Company (FMR) bears all organizational expenses of the funds except for the cost of registering and qualifying shares of each class for distribution under federal and state securities law. These registration expenses are borne by the fund and amortized over one year.
Distributions to Shareholders. Distributions are declared daily and paid monthly from net investment income. Distributions from realized gains, if any, are recorded on the ex-dividend date. Income dividends and capital gain distributions are declared separately for each class.
Income and capital gain distributions are determined in accordance with income tax regulations which may differ from generally accepted accounting principles. These differences, which may result in distribution reclassifications, are primarily due to
Annual Report
Notes to Financial Statements - continued
1. Significant Accounting Policies - continued
Distributions to Shareholders - continued
differing treatments for litigation proceeds, foreign currency transactions, defaulted bonds, market discount, non-taxable dividends, capital loss carryforwards and losses deferred due to wash sales.
Permanent book and tax basis differences relating to shareholder distributions will result in reclassifications to paid in capital. Undistributed net investment income and accumulated undistributed net realized gain (loss) on investments and foreign currency transactions may include temporary book and tax basis differences which will reverse in a subsequent period. Any taxable income or gain remaining at fiscal year end is distributed in the following year.
Security Transactions. Security transactions are accounted for as of trade date. Gains and losses on securities sold are determined on the basis of identified cost.
2. Operating Policies.
Joint Trading Account. Pursuant to an Exemptive Order issued by the Securities and Exchange Commission (the SEC), the fund, along with other affiliated entities of FMR, may transfer uninvested cash balances into one or more joint trading accounts. These balances are invested in one or more repurchase agreements for U.S. Treasury or Federal Agency obligations.
Repurchase Agreements. The underlying U.S. Treasury, Federal Agency, or other obligations found to be satisfactory by FMR are transferred to an account of the fund, or to the Joint Trading Account, at a custodian bank. The securities are marked-to-market daily and maintained at a value at least equal to the principal amount of the repurchase agreement (including accrued interest). FMR, the fund's investment adviser, is responsible for determining that the value of the underlying securities remains in accordance with the market value requirements stated above.
Restricted Securities. The fund is permitted to invest in securities that are subject to legal or contractual restrictions on resale. These securities generally may be resold in transactions exempt from registration or to the public if the securities are registered. Disposal of these securities may involve time-consuming negotiations and expense, and prompt sale at an acceptable price may be difficult. At the end of the period, the fund had no investments in restricted securities (excluding 144A issues).
Loans and Other Direct Debt Instruments. The fund is permitted to invest in loans and loan participations, trade claims or other receivables. These investments may include standby financing commitments that obligate the fund to supply additional cash
Annual Report
Notes to Financial Statements - continued
2. Operating Policies - continued
Loans and Other Direct Debt Instruments - continued
to the borrower on demand. Loan participations involve a risk of insolvency of the lending bank or other financial intermediary. At the end of the period, these investments amounted to $1,598,631 or 3.6% of net assets.
3. Purchases and Sales of Investments.
Purchases and sales of securities, other than short-term securities, aggregated $81,796,237 and $45,940,554, respectively.
4. Fees and Other Transactions with Affiliates.
Management Fee. As the fund's investment adviser, FMR receives a monthly fee that is calculated on the basis of a group fee rate plus a fixed individual fund fee rate applied to the average net assets of the fund. The group fee rate is the weighted average of a series of rates and is based on the monthly average net assets of all the mutual funds advised by FMR. The rates ranged from .0920% to .3700% for the period. The annual individual fund fee rate is .45%. In the event that these rates were lower than the contractual rates in effect during the period, FMR voluntarily implemented the above rates, as they resulted in the same or a lower management fee. For the period, the management fee was equivalent to an annual rate of .58% of average net assets.
Sub-Adviser Fee. Beginning January 1, 2001, FMR Co.(FMRC) will serve as sub-adviser for the fund. FMRC is a wholly owned subsidiary of FMR and will receive a fee from FMR of 50% of the management fee payable to FMR with respect to that portion of the fund's assets that will be managed by FMRC.
Distribution and Service Plan. In accordance with Rule 12b-1 of the 1940 Act, the Board of Trustees has adopted separate Distribution and Service Plans with respect to each class of shares (collectively referred to as "the Plans"). Under certain of the Plans, the class pays Fidelity Distributors Corporation (FDC), an affiliate of FMR, a 12b-1 fee. A portion of this fee may be reallowed to securities dealers, banks and other financial institutions for the distribution of each class of shares and providing shareholder support services. For the period, this fee was based on the following annual rates of the average net assets of each applicable class:
|
Class A |
.15% |
|
Class T |
.25% |
|
Class B |
.90% * |
|
Class C |
1.00% ** |
* .65% represents a distribution fee and .25% represents a shareholder service fee.
** .75% represents a distribution fee and .25% represents a shareholder service fee.
Annual Report
Notes to Financial Statements - continued
4. Fees and Other Transactions with Affiliates - continued
Distribution and Service Plan - continued
For the period, each class paid FDC the following amounts, a portion of which was retained by FDC:
|
|
Paid to |
Retained |
|
Class A |
$ 12,519 |
$ 769 |
|
Class T |
24,004 |
1,376 |
|
Class B |
76,397 |
56,575 |
|
Class C |
50,730 |
37,631 |
|
|
$ 163,650 |
$ 96,351 |
Sales Load. FDC receives a front-end sales charge of up to 4.75% for selling Class A shares, and 3.50% for selling Class T shares of the fund. FDC receives the proceeds of contingent deferred sales charges levied on Class B share redemptions occurring within six years of purchase and Class C share redemptions occurring within one year of purchase. Contingent deferred sales charges are based on declining rates ranging from 5% to 1% for Class B and 1% for Class C, of the lesser of the cost of shares at the initial date of purchase or the net asset value of the redeemed shares, excluding any reinvested dividends and capital gains. In addition, purchases of Class A and Class T shares that were subject to a finder's fee bear a contingent deferred sales charge on assets that do not remain in the fund for at least one year. The Class A and Class T contingent deferred sales charge is based on 0.25% of the lesser of the cost of shares at the initial date of purchase or the net asset value of the redeemed shares, excluding any reinvested dividends and capital gains. A portion of the sales charges paid to FDC is paid to securities dealers, banks and other financial institutions.
For the period, sales charge amounts paid to and retained by FDC were as follows:
|
|
Paid to |
Retained |
|
Class A |
$ 20,151 |
$ 6,985 |
|
Class T |
30,650 |
11,175 |
|
Class B |
40,712 |
40,712 * |
|
Class C |
1,640 |
1,640 * |
|
|
$ 93,153 |
$ 60,512 |
* When Class B and Class C shares are initially sold, FDC pays commissions from its own resources to securities dealers,
banks, and other financial institutions through which the sales are made.
Annual Report
Notes to Financial Statements - continued
4. Fees and Other Transactions with Affiliates - continued
Transfer Agent Fees. Fidelity Investments Institutional Operations Company, Inc., (FIIOC), an affiliate of FMR, is the transfer, dividend disbursing and shareholder servicing agent (collectively referred to as the transfer agent) for each class of the fund. FIIOC receives account fees and asset-based fees that vary according to the account size and type of account of the shareholders of the respective classes of the fund. FIIOC pays for typesetting, printing and mailing of all shareholder reports, except proxy statements. For the period, the following amounts were paid to FIIOC:
|
|
Amount |
% of |
|
Class A |
$ 12,424 |
.15 |
|
Class T |
17,786 |
.19 |
|
Class B |
14,589 |
.17 |
|
Class C |
10,226 |
.20 |
|
Institutional Class |
7,912 |
.22 |
|
|
$ 62,937 |
|
Accounting Fees. Fidelity Service Company, Inc. maintains the fund's accounting records. The fee is based on the level of average net assets for the month plus out-of-pocket expenses.
Brokerage Commissions. The fund placed a portion of its portfolio transactions with brokerage firms which are affiliates of FMR. The commissions paid to these affiliated firms were $334 for the period.
5. Expense Reductions.
FMR voluntarily agreed to reimburse operating expenses (excluding interest, taxes, certain securities lending fees, brokerage commissions and extraordinary expenses, if any) above the following annual rates or range of annual rates of average net assets for each of the following classes:
|
|
FMR |
Reimbursement |
|
Class A |
1.00% |
$ 58,838 |
|
Class T |
1.10% |
69,642 |
|
Class B |
1.75% |
61,602 |
|
Class C |
1.85% |
38,667 |
|
Institutional Class |
0.85% |
26,643 |
|
|
|
$ 255,392 |
Annual Report
Notes to Financial Statements - continued
5. Expense Reductions - continued
FMR has also directed certain portfolio trades to brokers who paid a portion of the fund's expenses. For the period, the fund's expenses were reduced by $1,155 under this arrangement.
In addition, through an arrangement with the fund's custodian, credits realized as a result of uninvested cash balances were used to reduce a portion of expenses. During the period, the fund's custodian fees were reduced by $4,198 under the custodian arrangement.
6. Beneficial Interest.
At the end of the period, FMR and its affiliates were record owners of approximately 6% of the total outstanding shares of the fund. In addition, one unaffiliated shareholder was record owner of more than 10% of the total outstanding shares of the fund, totaling 32%.
7. Distributions to Shareholders.
Distributions to shareholders of each class were as follows:
|
|
Years ended October 31, |
|
|
|
2000 |
1999A |
|
From net investment income |
|
|
|
Class A |
$ 707,918 |
$ 7,152 |
|
Class T |
787,365 |
17,710 |
|
Class B |
645,402 |
10,995 |
|
Class C |
379,306 |
13,464 |
|
Institutional Class |
312,633 |
7,361 |
|
Total |
$ 2,832,624 |
$ 56,682 |
A Distributions for the period September 7, 1999 (commencement of operations) to October 31, 1999.
Annual Report
Notes to Financial Statements - continued
8. Share Transactions.
Transactions for each class of shares were as follows:
|
|
Shares |
Dollars |
||
|
|
Year ended October 31, |
Year ended October 31, |
Year ended October 31, |
Year ended October 31, |
|
|
2000 |
1999 A |
2000 |
1999 A |
|
|
|
|
|
|
|
Class A |
1,493,515 |
73,796 |
$ 15,002,914 |
$ 737,552 |
|
Reinvestment of distributions |
54,584 |
661 |
535,288 |
6,564 |
|
Shares redeemed |
(201,140) |
- |
(1,994,596) |
- |
|
Net increase (decrease) |
1,346,959 |
74,457 |
$ 13,543,606 |
$ 744,116 |
|
Class T |
1,656,133 |
242,680 |
$ 16,505,485 |
$ 2,421,256 |
|
Reinvestment of distributions |
43,976 |
1,481 |
434,581 |
14,699 |
|
Shares redeemed |
(988,162) |
(50) |
(9,733,802) |
(500) |
|
Net increase (decrease) |
711,947 |
244,111 |
$ 7,206,264 |
$ 2,435,455 |
|
Class B |
1,104,573 |
214,251 |
$ 11,052,135 |
$ 2,135,658 |
|
Reinvestment of distributions |
31,115 |
851 |
307,335 |
8,451 |
|
Shares redeemed |
(270,291) |
(4,468) |
(2,684,546) |
(44,468) |
|
Net increase (decrease) |
865,397 |
210,634 |
$ 8,674,924 |
$ 2,099,641 |
|
Class C |
809,417 |
185,931 |
$ 8,074,099 |
$ 1,855,443 |
|
Reinvestment of distributions |
21,753 |
1,090 |
214,658 |
10,817 |
|
Shares redeemed |
(316,051) |
- |
(3,125,853) |
- |
|
Net increase (decrease) |
515,119 |
187,021 |
$ 5,162,904 |
$ 1,866,260 |
|
Institutional Class |
446,427 |
71,695 |
$ 4,549,272 |
$ 716,650 |
|
Reinvestment of distributions |
30,213 |
737 |
297,604 |
7,318 |
|
Shares redeemed |
(24,209) |
- |
(240,598) |
- |
|
Net increase (decrease) |
452,431 |
72,432 |
$ 4,606,278 |
$ 723,968 |
A Share transactions are for the period September 7, 1999 (commencement of operations) to October 31, 1999.
Annual Report
To the Trustees of Fidelity Advisor Series II and Shareholders of Fidelity Advisor High Income Fund:
We have audited the accompanying statement of assets and liabilities of Fidelity Advisor High Income Fund, (the Fund), a fund of Fidelity Advisor Series II (the Trust), including the portfolio of investments, as of October 31, 2000, and the related statement of operations for the year then ended, the statement of changes in net assets and financial highlights for each of the two years in the period then ended. These financial statements and financial highlights are the responsibility of the Fund's management. Our responsibility is to express an opinion on these financial statements and financial highlights based on our audits.
We conducted our audits in accordance with auditing standards generally accepted in the United States of America. Those standards require that we plan and perform the audit to obtain reasonable assurance about whether the financial statements and financial highlights are free of material misstatement. An audit includes examining, on a test basis, evidence supporting the amounts and disclosures in the financial statements. Our procedures included confirmation of securities owned as of October 31, 2000, by correspondence with the custodian and brokers; where replies were not received from brokers, we performed other auditing procedures. An audit also includes assessing the accounting principles used and significant estimates made by management, as well as evaluating the overall financial statement presentation. We believe that our audits provide a reasonable basis for our opinion.
In our opinion, the financial statements and financial highlights referred to above present fairly, in all material respects, the financial position of Fidelity Advisor High Income Fund as of October 31, 2000, the results of its operations for the year then ended, the changes in its net assets and its financial highlights for each of the two years in the period then ended, in conformity with accounting principles generally accepted in the United States of America.
/s/DELOITTE & TOUCHE LLP
DELOITTE & TOUCHE LLP
Boston, Massachusetts
December 8, 2000
Annual Report
Annual Report
Annual Report
Annual Report
Annual Report
Annual Report
Annual Report
Annual Report
Investment Adviser
Fidelity Management & Research Company
Boston, MA
Investment Sub-Advisers
Fidelity Management & Research
(U.K.) Inc.
Fidelity Management & Research
(Far East) Inc.
Fidelity Investments Japan Limited
Officers
Edward C. Johnson 3d, President
Robert C. Pozen, Senior Vice President
Robert A. Lawrence, Vice President
David L. Glancy, Vice President
Eric D. Roiter, Secretary
Robert A. Dwight, Treasurer
Maria F. Dwyer, Deputy Treasurer
John H. Costello, Assistant Treasurer
Thomas J. Simpson, Assistant Treasurer
Board of Trustees
Ralph F. Cox *
Phyllis Burke Davis *
Robert M. Gates *
Edward C. Johnson 3d
Donald J. Kirk *
Ned C. Lautenbach *
Peter S. Lynch
Marvin L. Mann *
William O. McCoy *
Gerald C. McDonough *
Robert C. Pozen
Thomas R. Williams *
Advisory Board
J. Michael Cook
Abigail P. Johnson
Marie L. Knowles
General Distributor
Fidelity Distributors Corporation
Boston, MA
Transfer and Shareholder
Servicing Agent
Fidelity Investments Institutional Operations Company, Inc.
Boston, MA
Custodian
The Bank of New York
New York, NY
* Independent trustees
Annual Report
Focus Funds
Fidelity Advisor Consumer
Industries Fund
Fidelity Advisor Cyclical
Industries Fund
Fidelity Advisor Financial
Services Fund
Fidelity Advisor Health Care Fund
Fidelity Advisor Natural
Resources Fund
Fidelity Advisor Technology Fund
Fidelity Advisor Telecommunications & Utilities Growth Fund
Growth Funds
Fidelity Advisor Korea Fund
Fidelity Advisor Emerging Asia Fund
Fidelity Advisor Latin America Fund
Fidelity Advisor Japan Fund
Fidelity Advisor Europe Capital Appreciation Fund
Fidelity Advisor International
Capital Appreciation Fund
Fidelity Advisor Overseas Fund
Fidelity Advisor Diversified International Fund
Fidelity Advisor Global Equity Fund
Fidelity Advisor TechnoQuant ®
Growth Fund
Fidelity Advisor Small Cap Fund
Fidelity Advisor Value Strategies Fund
Fidelity Advisor Mid Cap Fund
Fidelity Advisor Dynamic Capital Appreciation Fund
Fidelity Advisor Equity Growth Fund
Fidelity Advisor Large Cap Fund
Fidelity Advisor Dividend Growth Fund
Fidelity Advisor Growth
Opportunities Fund
Growth and Income Funds
Fidelity Advisor Growth & Income Fund
Fidelity Advisor Equity Income Fund
Fidelity Advisor Asset Allocation Fund
Fidelity Advisor Balanced Fund
Taxable Income Funds
Fidelity Advisor Emerging Markets Income Fund
Fidelity Advisor High Yield Fund
Fidelity Advisor High Income Fund
Fidelity Advisor Strategic Income Fund
Fidelity Advisor Mortgage
Securities Fund
Fidelity Advisor Government Investment Fund
Fidelity Advisor Intermediate Bond Fund
Fidelity Advisor Short Fixed-Income Fund
Municipal Funds
Fidelity Advisor Municipal Income Fund
Money Market Funds
Prime Fund
Treasury Fund
Tax-Exempt Fund
|
AHI-ANN-1200 |
118952 |
|
1.728715.101 |
|
(Fidelity Investment logo)(registered trademark)
Fidelity® Advisor
Fund - Institutional Class
Annual Report
October 31, 2000
(2_fidelity_logos)
|
President's Message |
3 |
Ned Johnson on investing strategies. |
|
Performance |
4 |
How the fund has done over time. |
|
Fund Talk |
7 |
The manager's review of fund performance, strategy and outlook. |
|
Investment Changes |
10 |
A summary of major shifts in the fund's investments over the past six months. |
|
Investments |
11 |
A complete list of the fund's investments with their market values. |
|
Financial Statements |
26 |
Statements of assets and liabilities,
operations, and changes in net assets, |
|
Notes |
35 |
Notes to the financial statements. |
|
Independent Auditors' Report |
43 |
The auditors' opinion. |
Standard & Poor's, S&P and S&P 500 are registered service marks of The McGraw-Hill Companies, Inc. and have been licensed for use by Fidelity Distributors Corporation.
Other third party marks appearing herein are the property of their respective owners.
All other marks appearing herein are registered or unregistered trademarks or service marks of FMR Corp. or an affiliated company.
(Recycle graphic) This report is printed on recycled paper using soy-based inks.
This report and the financial statements contained herein are submitted for the general information of the shareholders of the fund. This report is not authorized for distribution to prospective investors in the fund unless preceded or accompanied by an effective prospectus.
Mutual fund shares are not deposits or obligations of, or guaranteed by, any depository institution. Shares are not insured by the FDIC, Federal Reserve Board or any other agency, and are subject to investment risks, including possible loss of principal amount invested.
Neither the fund nor Fidelity Distributors Corporation is a bank.
For more information on any Fidelity Advisor fund, including charges and expenses, contact your investment professional for a free prospectus. Read it carefully before you invest or send money.
Annual Report
(photo_of_Edward_C_Johnson_3d)
Dear Shareholder:
A sixth-straight year of double-digit positive returns for the Dow Jones Industrial Average, NASDAQ and S&P 500® could be in jeopardy unless the U.S. stock market shows marked improvement in the final two months of 2000. Through October, all three indexes had negative year-to-date returns. On the other hand, most fixed-income sectors were solidly in the black. Treasuries and other long-term government securities led the way, returning nearly 14%.
While it's impossible to predict the future direction of the markets with any degree of certainty, there are certain basic principles that can help investors plan for their future needs.
The longer your investment time frame, the less likely it is that you will be affected by short-term market volatility. A 10-year investment horizon appropriate for saving for a college education, for example, enables you to weather market cycles in a long-term fund, which may have a higher risk potential, but also has a higher potential rate of return.
An intermediate-length fund could make sense if your investment horizon is two to four years, while a short-term bond fund could be the right choice if you need your money in one or two years.
If your time horizon is less than a year, you might want to consider moving some of your bond investment into a money market fund. These funds seek income and a stable share price by investing in high-quality, short-term investments. Of course, it's important to remember that an investment in a money market fund is not insured or guaranteed by the Federal Deposit Insurance Corporation or any other government agency. Although money market funds seek to preserve the value of your investment at $1.00 per share, it is possible to lose money by investing in these types of funds.
Finally, no matter what your time horizon or portfolio diversity, it makes good sense to follow a regular investment plan, investing a certain amount of money in a fund at the same time each month or quarter and periodically reviewing your overall portfolio. By doing so, you won't get caught up in the excitement of a rapidly rising market, nor will you buy all your shares at market highs. While this strategy - known as dollar cost averaging - won't assure a profit or protect you from a loss in a declining market, it should help you lower the average cost of your purchases. Of course, you should consider your financial ability to continue your purchases through periods of low price levels before undertaking such a strategy.
Remember to contact your investment professional if you need help with your investments.
Best regards,
/s/Edward C. Johnson 3d
Edward C. Johnson 3d
Annual Report
Fidelity Advisor High Income Fund - Institutional Class
There are several ways to evaluate historical performance. You can look at the total percentage change in value, the average annual percentage change or the growth of a hypothetical $10,000 investment. Total return reflects the change in the value of an investment, assuming reinvestment of the class' dividend income and capital gains (the profits earned upon the sale of securities that have grown in value). If Fidelity had not reimbursed certain class expenses, the total returns and dividends would have been lower.
Cumulative Total Returns
|
Periods ended October 31, 2000 |
|
Past 1 |
Life of |
|
Fidelity Adv High Income - Inst CL |
|
2.57% |
2.85% |
|
ML High Yield Master II |
|
-1.68% |
-2.64% |
|
Lipper High Current Yield |
|
-2.77% |
n/a* |
Cumulative total returns show Institutional Class' performance in percentage terms over a set period - in this case, one year or since the fund started on September 7, 1999. For example, if you had invested $1,000 in a fund that had a 5% return over the past year, the value of your investment would be $1,050. You can compare Institutional Class' returns to the performance of the Merrill Lynch High Yield Master II Index - a market value-weighted index of all domestic and yankee high-yield bonds, including deferred interest bonds and payment-in-kind securities. Issues included in the index have maturities of one year or more and have a credit rating lower than BBB-/Baa3, but are not in default. To measure how Institutional Class' performance stacked up against its peers, you can compare it to the high current yield funds average, which reflects the performance of mutual funds with similar objectives tracked by Lipper Inc. The past one year average represents a peer group of 357 mutual funds. These benchmarks include reinvested dividends and capital gains, if any and exclude the effect of sales charges.
Average Annual Total Returns
|
Periods ended October 31, 2000 |
|
Past 1 |
Life of |
|
Fidelity Adv High Income - Inst CL |
|
2.57% |
2.47% |
|
ML High Yield Master II |
|
-1.68% |
-2.30% |
|
Lipper High Current Yield |
|
-2.77% |
n/a* |
Average annual total returns take Institutional Class shares' cumulative return and show you what would have happened if Institutional Class shares had performed at a constant rate each year.
* Not available
Annual Report
Fidelity Advisor High Income Fund - Institutional Class
Performance - continued
$10,000 Over Life of Fund
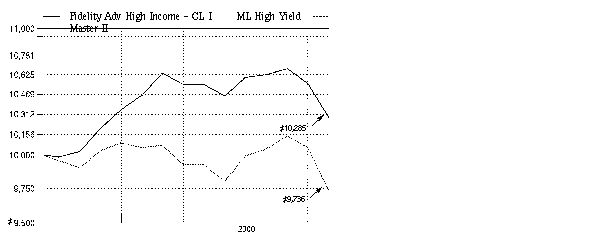
$10,000 Over Life of Fund: Let's say hypothetically that $10,000 was invested in Fidelity Advisor High Income Fund - Institutional Class on September 7, 1999, when the fund started. As the chart shows, by October 31, 2000, the value of the investment would have grown to $10,285 - a 2.85% increase on the initial investment. For comparison, look at how the Merrill Lynch High Yield Master II Index did over the same period. With dividends reinvested, the same $10,000 would have been $9,736 - a 2.64% decrease.
Understanding
Performance
How a fund did yesterday is no guarantee of how it will do tomorrow. Bond prices, for example, generally move in the opposite direction of interest rates. In turn, the share price, return and yield of a fund that invests in bonds will vary. That means if you sell your shares during a market downturn, you might lose money. But if you can ride out the market's ups and downs, you may have a gain.
3Annual Report
Fidelity Advisor High Income Fund - Institutional Class
Performance - continued
Total Return Components
|
|
Year ended |
September 7, 1999 |
|
|
Dividend returns |
1.08% |
1.08% |
|
Capital returns |
-5.75% |
-0.80% |
|
Total returns |
2.57% |
0.28% |
Total return components include both dividend returns and capital returns. A dividend return reflects the actual dividends paid by the class. A capital return reflects both the amount paid by the class to shareholders as capital gain distributions and changes in the class' share price. Both returns assume the dividends or capital gains, if any, paid by the class are reinvested.
Dividends and Yield
|
Periods ended October 31, 2000 |
Past 1 |
Past 6 |
Past 1 |
|
Dividends per share |
7.32¢ |
42.96¢ |
84.17¢ |
|
Annualized dividend rate |
9.08% |
8.68% |
8.44% |
|
30-day annualized yield |
10.96% |
- |
- |
Dividends per share show the income paid by the class for a set period. The annual dividend rate is based on an average share price of $9.49 over the past one month, $9.82 over the past six months and $9.97 over the past one year. The 30-day annualized yield is a standard formula based on the yields of the securities in the fund, averaged over the past 30 days. This figure shows you the yield characteristics of the fund's investments at the end of the period. It also helps you compare funds from different companies on an equal basis. If Fidelity had not reimbursed certain class expenses, the yield would have been 10.50%.
Annual Report
Market Recap
With a negative return for the 12-month period ending October 31, 2000, the high-yield market can be viewed in one of two ways: as a distressed market that perhaps has not reached its bottom, or as an opportunity for investors to take advantage of attractively low prices. Early in the period, high-yield securities suffered in comparison to the high-flying NASDAQ market. High-yield debt suffered again when the NASDAQ tumbled and an economic slowdown loomed, resulting in a series of corporate earnings disappointments. Technical factors - abundant supply in the face of weak demand - further hampered performance. As the high-yield default rate crept higher, investors turned to the relative safety of investment-grade bonds. For the one-year period ending October 31, 2000, the Merrill Lynch High Yield Master II Index - a broad measure of high-yield market performance - fell 1.68%. This return lagged the overall U.S. taxable bond market as measured by the Lehman Brothers Aggregate Bond Index, which gained 7.30% during the past 12 months. A potential catalyst for improved performance could be a continued increase in merger and acquisition activity. From July to August, $90 billion in M&A activity took place where the target company was in the high-yield universe. Not only do these deals reduce the supply of high-yield credits, they also establish benchmark valuations for some sectors of the market.
(Portfolio Manager photograph)
An interview with David Glancy, Portfolio Manager of Fidelity Advisor High Income Fund
Q. David, how did the fund perform?
A. For the 12 months that ended October 31, 2000, the fund's Institutional Class shares returned 2.57%. The high-yield market, as measured by the Merrill Lynch High Yield Master II Index, returned -1.68%, while the high current yield funds average tracked by Lipper Inc. returned -2.77%.
Q. What helped the fund beat its peers and the index?
A. The fund was more insulated than its peers and the index against the negative influences of a very difficult market. The period was marked by high interest rates, difficulties encountered by individual companies and very little liquidity in the financial markets. High interest rates sparked by the Federal Reserve Board's desire to head off inflation increased borrowing costs for high-yield companies and slowed economic growth. These developments accelerated the overall default risk in the market. The "tech wreck" that knocked the wind out of the NASDAQ index also hurt the high-yield market, where one finds a significant number of telecommunications companies. These firms' access to capital was constricted at a time when they needed funding to continue building out their networks. With a substantial portion of the fund invested in this sector, it was not immune from these difficulties. However, as I said, the fund's structure helped it rebuff some of the factors that ate into market returns.
Annual Report
Fund Talk: The Manager's Overview - continued
Q. What was it about the fund's structure that helped it do that?
A. We had a large concentration of shorter-maturity, higher-quality bonds. These investments tend to be less susceptible to the problems caused by rising interest rates and deteriorating credit quality. In addition, for the first time in quite a while, I turned some attention to distressed securities, those that are characterized by uncertain or troubling financial situations. Previously, opportunities were few and far between because the area was characterized by poorly run companies with bad balance sheets and poor prospects. However, with all of the difficulties encountered by the high-yield market, some companies started trading at distressed prices despite favorable prospects and solid management. Because I maintained a fairly significant stake in cash through this bear market - for example, at the end of the period, the fund's assets in cash stood at about 10% - I was able to buy some of these securities at very attractive prices. The large cash holdings also enabled me to make other well-timed purchases and insulate the fund somewhat from even further downdrafts. I also maintained a small but important portion of the fund in leveraged equities - common stocks of companies that have high-yield bonds outstanding.
Q. Were there any investments or areas that provided positive performance during the period?
A. There weren't very many areas that performed well during this time frame. Nevertheless, the fund did benefit from the positive performance of some of its holdings in the health care, energy and cable TV industries. Higher energy prices were the force behind the improvement in some energy securities, and the recurring revenues earned by cable TV operators through their monthly fees were an attractive attribute during a period of market instability.
Q. What's your outlook?
A. The high-yield market could be choppy for at least the next couple of months, though it appears that most of the damage to the market has been done. A significant number of bonds are trading at very attractive prices, so I anticipate using the fund's cash position to continue adding bonds of companies with favorable prospects selling at cheap prices. If history is a guide, the high-yield market should ultimately attract buyers from across a broad spectrum and enjoy a recovery like we saw in 1990, after its last protracted period of difficulty.
Annual Report
Fund Talk: The Manager's Overview - continued
The views expressed in this report reflect those of the portfolio manager only through the end of the period of the report as stated on the cover and do not necessarily represent the views of Fidelity or any other person in the Fidelity organization. Any such views are subject to change at any time based upon market or other conditions and Fidelity disclaims any responsibility to update such views. These views may not be relied on as investment advice and, because investment decisions for a Fidelity fund are based on numerous factors, may not be relied on as an indication of trading intent on behalf of any Fidelity fund.
Fund Facts
Goal: seeks a high level of current income; the fund may also seek capital appreciation
Start date: September 7, 1999
Size: as of October 31, 2000, more than $43 million
Manager: David Glancy, since inception; manager, Fidelity Capital & Income Fund, since 1996; Spartan High Income Fund, 1993-1996; joined Fidelity in 1990
3David Glancy on the high-yield market:
"The volatility in the high-yield market doesn't necessarily reflect the underlying fundamentals of the companies in the fund, even though it may temporarily affect the fund's net asset value (NAV). Buyers of high-yield bonds have become so scarce that many attractive securities are trading as low as from 20 to 70 cents on the dollar and therefore offer some upside potential. In contrast, when these bonds are trading at face value, there's often no place for them to go but down. With Fidelity's resources and credit skills, we should be able to locate significant opportunities in this market for capital appreciation and earn a very attractive coupon, or interest rate. When things get as bad as they have been within the high-yield market, many investors follow a lemming mentality and seek to get out of it on its way down. My approach is to take advantage of desperate sellers and continue buying until the market eventually reaches the bottom in order to position the fund for a strong rebound when the market turns. In that way, like in 1990, I hope to reap the benefits when the market recovers and the winners start outnumbering the losers."
Annual Report
|
Top Five Holdings as of October 31, 2000 |
||
|
(by issuer, excluding cash equivalents) |
% of fund's |
% of fund's net assets |
|
Qwest Communications International, Inc. |
7.4 |
0.0 |
|
XO Communications, Inc. |
4.9 |
7.2 |
|
International Cabletel, Inc. |
4.7 |
6.3 |
|
Century Communications Corp. |
4.0 |
5.8 |
|
EchoStar Communications Corp. |
3.1 |
2.2 |
|
|
24.1 |
21.5 |
|
Top Five Market Sectors as of October 31, 2000 |
||
|
|
% of fund's |
% of fund's net assets |
|
Media & Leisure |
34.3 |
35.1 |
|
Utilities |
29.9 |
22.9 |
|
Technology |
5.0 |
10.2 |
|
Finance |
3.5 |
6.0 |
|
Industrial Machinery & Equipment |
2.7 |
3.5 |
|
Quality Diversification as of October 31, 2000 |
||
|
(Moody's Ratings) |
% of fund's investments |
% of fund's investments |
|
Aaa, Aa, A |
0.0 |
2.1 |
|
Baa |
7.6 |
0.4 |
|
Ba |
11.9 |
5.4 |
|
B |
52.6 |
65.9 |
|
Caa, Ca, C |
4.6 |
10.5 |
|
Not Rated |
1.6 |
1.7 |
|
Table excludes short-term investments. Where Moody's ratings are not available, we have used S&P ratings. Unrated debt securities that are equivalent to Ba and below at October 31, 2000 and April 30, 2000 account for 1.6% and 1.7% respectively, of the fund's investments. |
|
Asset Allocation (% of fund's net assets) |
|||||||
|
As of October 31, 2000 * |
As of April 30, 2000 ** |
||||||
|
Nonconvertible |
|
|
Nonconvertible |
|
||
|
Convertible Bonds, Preferred Stocks 6.9% |
|
|
Convertible Bonds, Preferred Stocks 8.0% |
|
||
|
Common Stocks 5.4% |
|
|
Common Stocks 4.1% |
|
||
|
Other Investments 4.8% |
|
|
Other Investments 3.7% |
|
||
|
Short-Term |
|
|
Short-Term |
|
||
|
* Foreign investments |
6.4% |
|
** Foreign investments |
8.7% |
|
||
Annual Report
Showing Percentage of Net Assets
|
Corporate Bonds - 72.0% |
|||||
|
Moody's Ratings (unaudited) (b) |
Principal Amount |
Value |
|||
|
Convertible Bonds - 1.5% |
|||||
|
ENERGY - 0.4% |
|||||
|
Oil & Gas - 0.4% |
|||||
|
Lomak Petroleum, Inc. 6% 2/1/07 |
Caa1 |
|
$ 250,000 |
$ 160,000 |
|
|
HEALTH - 0.9% |
|||||
|
Medical Facilities Management - 0.9% |
|||||
|
Sunrise Assisted Living, Inc. 5.5% 6/15/02 |
B2 |
|
30,000 |
27,600 |
|
|
Tenet Healthcare Corp. 6% 12/1/05 |
B1 |
|
200,000 |
170,000 |
|
|
Total Renal Care Holdings, Inc.: |
|
|
|
|
|
|
7% 5/15/09 |
B3 |
|
110,000 |
81,400 |
|
|
7% 5/15/09 (e) |
B3 |
|
160,000 |
118,400 |
|
|
|
397,400 |
||||
|
MEDIA & LEISURE - 0.1% |
|||||
|
Lodging & Gaming - 0.1% |
|||||
|
Hilton Hotels Corp. 5% 5/15/06 |
Ba2 |
|
80,000 |
64,800 |
|
|
RETAIL & WHOLESALE - 0.1% |
|||||
|
Retail & Wholesale, Miscellaneous - 0.1% |
|||||
|
Sunglass Hut International, Inc. 5.25% 6/15/03 |
B3 |
|
30,000 |
22,988 |
|
|
TOTAL CONVERTIBLE BONDS |
645,188 |
||||
|
Nonconvertible Bonds - 70.5% |
|||||
|
BASIC INDUSTRIES - 1.6% |
|||||
|
Chemicals & Plastics - 1.1% |
|||||
|
Huntsman Corp. 9.5% 7/1/07 (e) |
B2 |
|
600,000 |
360,000 |
|
|
Lyondell Chemical Co. 9.875% 5/1/07 |
Ba3 |
|
85,000 |
82,875 |
|
|
Sterling Chemicals, Inc. 11.75% 8/15/06 |
Caa3 |
|
60,000 |
33,000 |
|
|
|
475,875 |
||||
|
Packaging & Containers - 0.3% |
|||||
|
Gaylord Container Corp.: |
|
|
|
|
|
|
9.375% 6/15/07 |
Caa1 |
|
15,000 |
9,750 |
|
|
9.75% 6/15/07 |
Caa1 |
|
110,000 |
73,700 |
|
|
9.875% 2/15/08 |
Caa3 |
|
95,000 |
28,500 |
|
|
|
111,950 |
||||
|
Corporate Bonds - continued |
|||||
|
Moody's Ratings (unaudited) (b) |
Principal Amount |
Value |
|||
|
Nonconvertible Bonds - continued |
|||||
|
BASIC INDUSTRIES - continued |
|||||
|
Paper & Forest Products - 0.2% |
|||||
|
Container Corp. of America gtd. 11.25% 5/1/04 |
B2 |
|
$ 100,000 |
$ 100,250 |
|
|
Crown Paper Co. 11% 9/1/05 (c) |
Ca |
|
50,000 |
6,000 |
|
|
|
106,250 |
||||
|
TOTAL BASIC INDUSTRIES |
694,075 |
||||
|
CONSTRUCTION & REAL ESTATE - 0.6% |
|||||
|
Building Materials - 0.3% |
|||||
|
Atrium Companies, Inc. 10.5% 5/1/09 |
B3 |
|
60,000 |
50,850 |
|
|
Building Materials Corp. of America 8% 12/1/08 |
Ba3 |
|
45,000 |
13,500 |
|
|
Nortek, Inc. 9.875% 3/1/04 |
B3 |
|
20,000 |
18,200 |
|
|
Numatics, Inc. 9.625% 4/1/08 |
B3 |
|
52,000 |
40,040 |
|
|
|
122,590 |
||||
|
Construction - 0.0% |
|||||
|
Lennar Corp. 9.95% 5/1/10 |
Ba1 |
|
20,000 |
20,000 |
|
|
Real Estate - 0.3% |
|||||
|
LNR Property Corp. 9.375% 3/15/08 |
B1 |
|
125,000 |
112,500 |
|
|
TOTAL CONSTRUCTION & REAL ESTATE |
255,090 |
||||
|
DURABLES - 0.4% |
|||||
|
Autos, Tires, & Accessories - 0.1% |
|||||
|
Federal-Mogul Corp. 7.5% 1/15/09 |
Ba3 |
|
45,000 |
11,250 |
|
|
Textiles & Apparel - 0.3% |
|||||
|
Levi Strauss & Co. 6.8% 11/1/03 |
Ba3 |
|
10,000 |
8,200 |
|
|
Polymer Group, Inc.: |
|
|
|
|
|
|
8.75% 3/1/08 |
B3 |
|
20,000 |
14,100 |
|
|
9% 7/1/07 |
B3 |
|
115,000 |
82,800 |
|
|
St. John Knits International, Inc. 12.5% 7/1/09 |
B3 |
|
40,000 |
37,000 |
|
|
|
142,100 |
||||
|
TOTAL DURABLES |
153,350 |
||||
|
Corporate Bonds - continued |
|||||
|
Moody's Ratings (unaudited) (b) |
Principal Amount |
Value |
|||
|
Nonconvertible Bonds - continued |
|||||
|
ENERGY - 0.6% |
|||||
|
Energy Services - 0.4% |
|||||
|
Cliffs Drilling Co.: |
|
|
|
|
|
|
Class B 10.25% 5/15/03 |
Ba3 |
|
$ 100,000 |
$ 102,250 |
|
|
Class D 10.25% 5/15/03 |
Ba3 |
|
15,000 |
15,338 |
|
|
R&B Falcon Corp. 9.125% 12/15/03 |
Ba3 |
|
30,000 |
30,525 |
|
|
|
148,113 |
||||
|
Oil & Gas - 0.2% |
|||||
|
Gothic Production Corp. 11.125% 5/1/05 |
B3 |
|
65,000 |
68,250 |
|
|
Nuevo Energy Co. 9.375% 10/1/10 (e) |
B1 |
|
30,000 |
29,850 |
|
|
|
98,100 |
||||
|
TOTAL ENERGY |
246,213 |
||||
|
FINANCE - 2.8% |
|||||
|
Credit & Other Finance - 2.8% |
|||||
|
Delta Financial Corp. 9.5% 8/1/04 |
Caa2 |
|
255,000 |
114,750 |
|
|
GS Escrow Corp.: |
|
|
|
|
|
|
6.75% 8/1/01 |
Ba1 |
|
350,000 |
343,525 |
|
|
7% 8/1/03 |
Ba1 |
|
310,000 |
293,725 |
|
|
7.125% 8/1/05 |
Ba1 |
|
265,000 |
243,108 |
|
|
Macsaver Financial Services, Inc.: |
|
|
|
|
|
|
7.4% 2/15/02 (c) |
Ca |
|
10,000 |
1,200 |
|
|
7.875% 8/1/03 (c) |
Ca |
|
95,000 |
11,400 |
|
|
Metris Companies, Inc. 10% 11/1/04 |
Ba3 |
|
210,000 |
197,400 |
|
|
|
1,205,108 |
||||
|
Insurance - 0.0% |
|||||
|
ITT Corp. 6.75% 11/15/03 |
Ba1 |
|
20,000 |
18,525 |
|
|
TOTAL FINANCE |
1,223,633 |
||||
|
HEALTH - 1.0% |
|||||
|
Medical Facilities Management - 1.0% |
|||||
|
Columbia/HCA Healthcare Co.: |
|
|
|
|
|
|
8.12% 8/4/03 |
Ba2 |
|
125,000 |
123,125 |
|
|
8.125% 8/4/03 |
Ba2 |
|
40,000 |
39,400 |
|
|
Fountain View, Inc. 11.25% 4/15/08 |
Caa1 |
|
120,000 |
24,000 |
|
|
Oxford Health Plans, Inc. 11% 5/15/05 |
B2 |
|
175,000 |
190,750 |
|
|
Corporate Bonds - continued |
|||||
|
Moody's Ratings (unaudited) (b) |
Principal Amount |
Value |
|||
|
Nonconvertible Bonds - continued |
|||||
|
HEALTH - continued |
|||||
|
Medical Facilities Management - continued |
|||||
|
Tenet Healthcare Corp.: |
|
|
|
|
|
|
8.125% 12/1/08 |
Ba3 |
|
$ 50,000 |
$ 48,125 |
|
|
8.625% 1/15/07 |
Ba3 |
|
20,000 |
19,800 |
|
|
|
445,200 |
||||
|
INDUSTRIAL MACHINERY & EQUIPMENT - 2.6% |
|||||
|
Electrical Equipment - 0.7% |
|||||
|
Loral Space & Communications Ltd. 9.5% 1/15/06 |
B1 |
|
455,000 |
323,050 |
|
|
Industrial Machinery & Equipment - 0.8% |
|||||
|
Exide Corp. 10% 4/15/05 |
B1 |
|
355,000 |
255,600 |
|
|
Thermadyne Holdings Corp. 0% 6/1/08 (d) |
Caa1 |
|
25,000 |
7,500 |
|
|
Thermadyne Manufacturing LLC 9.875% 6/1/08 |
B3 |
|
135,000 |
97,200 |
|
|
|
360,300 |
||||
|
Pollution Control - 1.1% |
|||||
|
Allied Waste North America, Inc. 10% 8/1/09 |
B2 |
|
380,000 |
322,050 |
|
|
Browning-Ferris Industries, Inc. 6.1% 1/15/03 |
Ba3 |
|
160,000 |
147,200 |
|
|
|
469,250 |
||||
|
TOTAL INDUSTRIAL MACHINERY & EQUIPMENT |
1,152,600 |
||||
|
MEDIA & LEISURE - 30.2% |
|||||
|
Broadcasting - 25.8% |
|||||
|
360networks, Inc. 13% 5/1/08 |
B3 |
|
220,000 |
174,900 |
|
|
ACME Television LLC/ACME Financial Corp. 10.875% 9/30/04 |
B3 |
|
465,000 |
430,125 |
|
|
Adelphia Communications Corp.: |
|
|
|
|
|
|
9.25% 10/1/02 |
B2 |
|
1,215,000 |
1,184,625 |
|
|
10.875% 10/1/10 |
B2 |
|
50,000 |
46,500 |
|
|
Ascent Entertainment Group, Inc. 0% 12/15/04 (d) |
Ba1 |
|
1,380,000 |
1,138,500 |
|
|
Century Communications Corp.: |
|
|
|
|
|
|
0% 3/15/03 |
B2 |
|
30,000 |
22,650 |
|
|
9.5% 3/1/05 |
B2 |
|
125,000 |
114,688 |
|
|
9.75% 2/15/02 |
B2 |
|
1,590,000 |
1,558,200 |
|
|
Diamond Cable Communications PLC yankee: |
|
|
|
|
|
|
0% 12/15/05 (d) |
B2 |
|
200,000 |
180,500 |
|
|
0% 2/15/07 (d) |
B2 |
|
20,000 |
15,000 |
|
|
Corporate Bonds - continued |
|||||
|
Moody's Ratings (unaudited) (b) |
Principal Amount |
Value |
|||
|
Nonconvertible Bonds - continued |
|||||
|
MEDIA & LEISURE - continued |
|||||
|
Broadcasting - continued |
|||||
|
Diamond Cable Communications PLC yankee: - continued |
|
|
|
|
|
|
13.25% 9/30/04 |
B2 |
|
$ 315,000 |
$ 322,875 |
|
|
EchoStar DBS Corp.: |
|
|
|
|
|
|
9.25% 2/1/06 |
B1 |
|
200,000 |
196,000 |
|
|
9.375% 2/1/09 |
B1 |
|
420,000 |
411,600 |
|
|
Golden Sky DBS, Inc. 0% 3/1/07 (d) |
Caa1 |
|
300,000 |
204,000 |
|
|
Golden Sky Systems, Inc. 12.375% 8/1/06 |
B3 |
|
150,000 |
161,250 |
|
|
Impsat Fiber Networks, Inc. 13.75% 2/15/05 |
B3 |
|
200,000 |
144,000 |
|
|
International Cabletel, Inc.: |
|
|
|
|
|
|
Series A, 12.75% 4/15/05 |
B2 |
|
170,000 |
168,300 |
|
|
0% 2/1/06 (d) |
B2 |
|
2,130,000 |
1,874,400 |
|
|
Knology Holding, Inc. 0% 10/15/07 (d) |
- |
|
45,000 |
13,950 |
|
|
NTL Communications Corp. 11.875% 10/1/10 (e) |
B2 |
|
70,000 |
64,750 |
|
|
Olympus Communications LP/Olympus Capital Corp. 10.625% 11/15/06 |
B2 |
|
20,000 |
18,700 |
|
|
Pegasus Communications Corp.: |
|
|
|
|
|
|
9.625% 10/15/05 |
B3 |
|
550,000 |
536,250 |
|
|
9.75% 12/1/06 |
B3 |
|
350,000 |
341,250 |
|
|
Pegasus Media & Communications, Inc. 12.5% 7/1/05 |
B3 |
|
300,000 |
312,000 |
|
|
Satelites Mexicanos SA de CV: |
|
|
|
|
|
|
10.125% 11/1/04 |
B3 |
|
500,000 |
315,000 |
|
|
11.28% 6/30/04 (e)(f) |
B1 |
|
420,000 |
367,500 |
|
|
Telewest PLC 11% 10/1/07 |
B1 |
|
374,000 |
336,600 |
|
|
United International Holdings, Inc. 0% 2/15/08 (d) |
B3 |
|
400,000 |
232,000 |
|
|
United Pan-Europe Communications NV: |
|
|
|
|
|
|
0% 2/1/10 (d) |
B2 |
|
200,000 |
74,000 |
|
|
10.875% 11/1/07 |
B2 |
|
110,000 |
85,800 |
|
|
10.875% 8/1/09 |
B2 |
|
95,000 |
68,875 |
|
|
11.25% 2/1/10 |
B2 |
|
75,000 |
56,250 |
|
|
11.5% 2/1/10 |
B2 |
|
165,000 |
125,400 |
|
|
|
11,296,438 |
||||
|
Entertainment - 0.5% |
|||||
|
Alliance Gaming Corp. 10% 8/1/07 |
Caa1 |
|
180,000 |
99,000 |
|
|
Corporate Bonds - continued |
|||||
|
Moody's Ratings (unaudited) (b) |
Principal Amount |
Value |
|||
|
Nonconvertible Bonds - continued |
|||||
|
MEDIA & LEISURE - continued |
|||||
|
Entertainment - continued |
|||||
|
Mandalay Resort Group: |
|
|
|
|
|
|
9.5% 8/1/08 |
Ba2 |
|
$ 60,000 |
$ 61,200 |
|
|
10.25% 8/1/07 |
Ba3 |
|
75,000 |
76,875 |
|
|
|
237,075 |
||||
|
Leisure Durables & Toys - 0.0% |
|||||
|
Hedstrom Corp. 10% 6/1/07 (c) |
Caa3 |
|
85,000 |
1,700 |
|
|
Lodging & Gaming - 3.7% |
|||||
|
Courtyard by Marriott II LP/Courtyard II Finance Co. 10.75% 2/1/08 |
B- |
|
290,000 |
287,825 |
|
|
Florida Panthers Holdings, Inc. 9.875% 4/15/09 |
B2 |
|
220,000 |
207,350 |
|
|
International Game Technology 7.875% 5/15/04 |
Ba1 |
|
30,000 |
29,250 |
|
|
ITT Corp. 6.25% 11/15/00 |
Ba1 |
|
1,085,000 |
1,079,575 |
|
|
|
1,604,000 |
||||
|
Publishing - 0.2% |
|||||
|
American Lawyer Media Holdings, Inc. 9.75% 12/15/07 |
B2 |
|
85,000 |
75,650 |
|
|
TOTAL MEDIA & LEISURE |
13,214,863 |
||||
|
NONDURABLES - 0.6% |
|||||
|
Foods - 0.6% |
|||||
|
SFC New Holdings, Inc. 11.25% 8/15/01 |
CCC |
|
275,000 |
270,188 |
|
|
RETAIL & WHOLESALE - 1.7% |
|||||
|
Apparel Stores - 0.0% |
|||||
|
Norton McNaughton, Inc. 12.5% 6/1/05 |
B2 |
|
5,000 |
4,488 |
|
|
Drug Stores - 1.5% |
|||||
|
Rite Aid Corp.: |
|
|
|
|
|
|
6% 12/15/00 (e) |
B3 |
|
670,000 |
649,900 |
|
|
10.5% 9/15/02 (e) |
- |
|
5,000 |
3,100 |
|
|
|
653,000 |
||||
|
Retail & Wholesale, Miscellaneous - 0.2% |
|||||
|
National Vision Association Ltd. 12.75% 10/15/05 (c) |
Ca |
|
200,000 |
76,000 |
|
|
TOTAL RETAIL & WHOLESALE |
733,488 |
||||
|
Corporate Bonds - continued |
|||||
|
Moody's Ratings (unaudited) (b) |
Principal Amount |
Value |
|||
|
Nonconvertible Bonds - continued |
|||||
|
TECHNOLOGY - 4.8% |
|||||
|
Computer Services & Software - 3.1% |
|||||
|
Colo.com 13.875% 3/15/10 unit (e) |
- |
|
$ 100,000 |
$ 75,000 |
|
|
Concentric Network Corp. 12.75% 12/15/07 |
B |
|
160,000 |
159,200 |
|
|
Covad Communications Group, Inc.: |
|
|
|
|
|
|
0% 3/15/08 (d) |
B3 |
|
138,000 |
37,260 |
|
|
12% 2/15/10 |
B3 |
|
95,000 |
44,175 |
|
|
12.5% 2/15/09 |
B3 |
|
200,000 |
98,000 |
|
|
Exodus Communications, Inc.: |
|
|
|
|
|
|
10.75% 12/15/09 |
B3 |
|
455,000 |
418,600 |
|
|
11.25% 7/1/08 |
B3 |
|
110,000 |
103,950 |
|
|
11.625% 7/15/10 (e) |
B3 |
|
315,000 |
296,100 |
|
|
PSINet, Inc.: |
|
|
|
|
|
|
10% 2/15/05 |
B3 |
|
220,000 |
108,900 |
|
|
10.5% 12/1/06 |
B3 |
|
40,000 |
19,200 |
|
|
|
1,360,385 |
||||
|
Computers & Office Equipment - 1.3% |
|||||
|
Dictaphone Corp. 11.75% 8/1/05 |
B3 |
|
660,000 |
495,000 |
|
|
Globix Corp. 12.5% 2/1/10 |
B- |
|
130,000 |
71,500 |
|
|
|
566,500 |
||||
|
Electronic Instruments - 0.3% |
|||||
|
Telecommunications Techniques Co. LLC 9.75% 5/15/08 |
B3 |
|
145,000 |
129,050 |
|
|
Electronics - 0.1% |
|||||
|
Aavid Thermal Technologies, Inc. 12.75% 2/1/07 |
B2 |
|
40,000 |
34,800 |
|
|
Photographic Equipment - 0.0% |
|||||
|
IMAX Corp. 7.875% 12/1/05 |
Ba2 |
|
55,000 |
31,350 |
|
|
TOTAL TECHNOLOGY |
2,122,085 |
||||
|
TRANSPORTATION - 0.3% |
|||||
|
Air Transportation - 0.3% |
|||||
|
US Air, Inc. 9.625% 2/1/01 |
B3 |
|
150,000 |
148,500 |
|
|
UTILITIES - 23.3% |
|||||
|
Cellular - 5.2% |
|||||
|
Clearnet Communications, Inc. yankee 0% 12/15/05 (d) |
Ba1 |
|
100,000 |
106,000 |
|
|
Corporate Bonds - continued |
|||||
|
Moody's Ratings (unaudited) (b) |
Principal Amount |
Value |
|||
|
Nonconvertible Bonds - continued |
|||||
|
UTILITIES - continued |
|||||
|
Cellular - continued |
|||||
|
Echostar Broadband Corp. 10.375% 10/1/07 (e) |
B3 |
|
$ 250,000 |
$ 250,000 |
|
|
Globalstar LP/Globalstar Capital Corp. 11.5% 6/1/05 |
Caa1 |
|
30,000 |
3,600 |
|
|
Leap Wireless International, Inc.: |
|
|
|
|
|
|
0% 4/15/10 (d) |
- |
|
105,000 |
25,200 |
|
|
12.5% 4/15/10 |
Caa2 |
|
135,000 |
89,100 |
|
|
McCaw International Ltd. 0% 4/15/07 (d) |
Caa1 |
|
243,000 |
170,100 |
|
|
Nextel Communications, Inc.: |
|
|
|
|
|
|
0% 2/15/08 (d) |
B1 |
|
165,000 |
122,100 |
|
|
9.375% 11/15/09 |
B1 |
|
155,000 |
149,575 |
|
|
Nextel International, Inc.: |
|
|
|
|
|
|
0% 4/15/08 (d) |
Caa1 |
|
135,000 |
81,000 |
|
|
12.75% 8/1/10 (e) |
Caa1 |
|
350,000 |
322,000 |
|
|
Nextel Partners, Inc.: |
|
|
|
|
|
|
11% 3/15/10 (e) |
B3 |
|
750,000 |
750,000 |
|
|
11% 3/15/10 |
B3 |
|
115,000 |
115,000 |
|
|
Orion Network Systems, Inc. 11.25% 1/15/07 |
B2 |
|
45,000 |
15,750 |
|
|
Triton PCS, Inc. 0% 5/1/08 (d) |
B3 |
|
25,000 |
18,813 |
|
|
US Unwired, Inc. 0% 11/1/09 (d) |
Caa1 |
|
150,000 |
71,250 |
|
|
|
2,289,488 |
||||
|
Electric Utility - 0.3% |
|||||
|
CMS Energy Corp. 8.125% 5/15/02 |
Ba3 |
|
130,000 |
127,888 |
|
|
Telephone Services - 17.8% |
|||||
|
Allegiance Telecom, Inc. 0% 2/15/08 (d) |
B3 |
|
105,000 |
71,400 |
|
|
Asia Global Crossing Ltd. 13.375% 10/15/10 (e) |
B2 |
|
140,000 |
130,900 |
|
|
FirstWorld Communications, Inc. 0% 4/15/08 (d) |
- |
|
15,000 |
2,550 |
|
|
Flag Telecom Holdings Ltd. 11.625% 3/30/10 |
B2 |
|
100,000 |
83,000 |
|
|
Focal Communications Corp. 11.875% 1/15/10 |
B3 |
|
385,000 |
292,600 |
|
|
Hyperion Telecommunications, Inc.: |
|
|
|
|
|
|
0% 4/15/03 (d) |
B3 |
|
105,000 |
79,800 |
|
|
12.25% 9/1/04 |
B3 |
|
665,000 |
551,950 |
|
|
ICG Services, Inc. 0% 5/1/08 (d) |
Caa1 |
|
200,000 |
32,000 |
|
|
Intermedia Communications, Inc.: |
|
|
|
|
|
|
0% 5/15/06 (d) |
B2 |
|
455,000 |
429,975 |
|
|
0% 7/15/07 (d) |
B2 |
|
105,000 |
86,625 |
|
|
Corporate Bonds - continued |
|||||
|
Moody's Ratings (unaudited) (b) |
Principal Amount |
Value |
|||
|
Nonconvertible Bonds - continued |
|||||
|
UTILITIES - continued |
|||||
|
Telephone Services - continued |
|||||
|
Level 3 Communications, Inc.: |
|
|
|
|
|
|
0% 12/1/08 (d) |
B3 |
|
$ 50,000 |
$ 27,500 |
|
|
11% 3/15/08 |
B3 |
|
425,000 |
383,563 |
|
|
McLeodUSA, Inc.: |
|
|
|
|
|
|
0% 3/1/07 (d) |
B1 |
|
195,000 |
158,438 |
|
|
8.375% 3/15/08 |
B1 |
|
15,000 |
13,200 |
|
|
9.25% 7/15/07 |
B1 |
|
35,000 |
32,025 |
|
|
Metromedia Fiber Network, Inc.: |
|
|
|
|
|
|
10% 11/15/08 |
B2 |
|
10,000 |
8,800 |
|
|
10% 12/15/09 |
B2 |
|
330,000 |
290,400 |
|
|
NEXTLINK Communications LLC 12.5% 4/15/06 |
B2 |
|
20,000 |
18,900 |
|
|
NEXTLINK Communications, Inc.: |
|
|
|
|
|
|
0% 4/15/08 (d) |
B2 |
|
267,000 |
149,520 |
|
|
0% 6/1/09 (d) |
B2 |
|
211,000 |
109,720 |
|
|
0% 12/1/09 (d) |
B2 |
|
105,000 |
49,350 |
|
|
10.75% 11/15/08 |
B3 |
|
45,000 |
39,600 |
|
|
10.75% 6/1/09 |
B2 |
|
425,000 |
374,000 |
|
|
Qwest Communications International, Inc. 10.875% 4/1/07 |
Baa1 |
|
3,000,000 |
3,254,993 |
|
|
Rhythms NetConnections, Inc.: |
|
|
|
|
|
|
Series B, 14% 2/15/10 |
B3 |
|
165,000 |
75,900 |
|
|
12.75% 4/15/09 |
B3 |
|
20,000 |
9,200 |
|
|
Rochester Telephone Corp. 8.77% 4/16/01 |
Ba2 |
|
100,000 |
99,250 |
|
|
Teligent, Inc. 11.5% 12/1/07 |
Caa1 |
|
265,000 |
106,000 |
|
|
Versatel Telecom International NV 11.875% 7/15/09 |
B3 |
|
60,000 |
43,800 |
|
|
Viatel, Inc. 11.5% 3/15/09 |
B3 |
|
40,000 |
20,000 |
|
|
WinStar Communications, Inc.: |
|
|
|
|
|
|
0% 4/15/10 (d) |
B3 |
|
30,000 |
9,600 |
|
|
12.5% 4/15/08 |
B3 |
|
255,000 |
187,425 |
|
|
Corporate Bonds - continued |
|||||
|
Moody's Ratings (unaudited) (b) |
Principal Amount |
Value |
|||
|
Nonconvertible Bonds - continued |
|||||
|
UTILITIES - continued |
|||||
|
Telephone Services - continued |
|||||
|
WinStar Communications, Inc.: - continued |
|
|
|
|
|
|
12.75% 4/15/10 |
B3 |
|
$ 615,000 |
$ 442,800 |
|
|
Worldwide Fiber, Inc. 12% 8/1/09 |
B3 |
|
145,000 |
109,475 |
|
|
|
7,774,259 |
||||
|
TOTAL UTILITIES |
10,191,635 |
||||
|
TOTAL NONCONVERTIBLE BONDS |
30,850,920 |
||||
|
TOTAL CORPORATE BONDS (Cost $34,490,466) |
31,496,108 |
||||
|
Asset-Backed Securities - 0.1% |
|||||
|
|
|||||
|
Airplanes pass through trust 10.875% 3/15/19 |
Ba2 |
|
69,139 |
51,163 |
|
|
Commercial Mortgage Securities - 1.1% |
|||||
|
|
|||||
|
Mortgage Capital Funding, Inc. Series 1998-MC3 Class F, 7.3172% 11/18/31 (e)(f) |
Ba1 |
|
400,000 |
309,500 |
|
|
Nomura Asset Securities Corp. Series 1998-D6 Class B1, 6% 3/15/30 |
BB+ |
|
100,000 |
67,328 |
|
|
Nomura Depositor Trust floater Series 1998-ST1A Class B2, 10.8713% 1/15/03 (e)(f) |
- |
|
100,000 |
92,844 |
|
|
TOTAL COMMERCIAL MORTGAGE SECURITIES (Cost $473,782) |
469,672 |
||||
|
Common Stocks - 5.4% |
|||
|
Shares |
|
||
|
BASIC INDUSTRIES - 0.3% |
|||
|
Chemicals & Plastics - 0.0% |
|||
|
Georgia Gulf Corp. |
200 |
2,675 |
|
|
Lyondell Chemical Co. |
300 |
4,313 |
|
|
Sterling Chemicals Holdings, Inc. (a) |
1,000 |
1,625 |
|
|
|
8,613 |
||
|
Common Stocks - continued |
|||
|
Shares |
Value |
||
|
BASIC INDUSTRIES - continued |
|||
|
Packaging & Containers - 0.3% |
|||
|
Packaging Corp. of America |
7,100 |
$ 104,281 |
|
|
TOTAL BASIC INDUSTRIES |
112,894 |
||
|
FINANCE - 0.0% |
|||
|
Banks - 0.0% |
|||
|
Provident Financial Group, Inc. |
600 |
18,150 |
|
|
Credit & Other Finance - 0.0% |
|||
|
Associates First Capital Corp. (a) |
10,800 |
227 |
|
|
Delta Financial Corp. (a) |
6,800 |
3,188 |
|
|
|
3,415 |
||
|
TOTAL FINANCE |
21,565 |
||
|
HEALTH - 0.4% |
|||
|
Medical Facilities Management - 0.4% |
|||
|
Davita, Inc. (a) |
15,000 |
168,750 |
|
|
INDUSTRIAL MACHINERY & EQUIPMENT - 0.0% |
|||
|
Industrial Machinery & Equipment - 0.0% |
|||
|
Exide Corp. |
300 |
3,019 |
|
|
Pollution Control - 0.0% |
|||
|
Allied Waste Industries, Inc. (a) |
800 |
7,400 |
|
|
TOTAL INDUSTRIAL MACHINERY & EQUIPMENT |
10,419 |
||
|
MEDIA & LEISURE - 3.5% |
|||
|
Broadcasting - 3.1% |
|||
|
EchoStar Communications Corp. Class A (a) |
30,300 |
1,371,075 |
|
|
Entertainment - 0.0% |
|||
|
Clubhaus PLC (a) |
1,400 |
842 |
|
|
Leisure Durables & Toys - 0.0% |
|||
|
Brunswick Corp. |
200 |
3,888 |
|
|
Lodging & Gaming - 0.4% |
|||
|
Hollywood Casino Corp. (a) |
15,000 |
157,500 |
|
|
TOTAL MEDIA & LEISURE |
1,533,305 |
||
|
Common Stocks - continued |
|||
|
Shares |
Value |
||
|
RETAIL & WHOLESALE - 1.0% |
|||
|
Grocery Stores - 1.0% |
|||
|
Pathmark Stores, Inc. (a) |
26,670 |
$ 418,386 |
|
|
Pathmark Stores, Inc. warrants 9/19/10 (a) |
1,012 |
4,554 |
|
|
|
422,940 |
||
|
TECHNOLOGY - 0.2% |
|||
|
Computer Services & Software - 0.0% |
|||
|
PSINet, Inc. (a) |
1,200 |
7,988 |
|
|
Electronics - 0.2% |
|||
|
Aavid Thermal Technologies, Inc. warrants 2/1/07 (a)(e) |
40 |
0 |
|
|
California Micro Devices Corp. (a) |
5,000 |
63,438 |
|
|
Photographic Equipment - 0.0% |
|||
|
IMAX Corp. (a) |
2,800 |
13,793 |
|
|
TOTAL TECHNOLOGY |
85,219 |
||
|
UTILITIES - 0.0% |
|||
|
Cellular - 0.0% |
|||
|
Leap Wireless International, Inc.: |
|
|
|
|
warrants 4/15/10 (CV ratio 2.503) (a)(e) |
135 |
1,350 |
|
|
warrants 4/15/10 (CV ratio 5.146) (a)(e) |
105 |
1,050 |
|
|
|
2,400 |
||
|
Electric Utility - 0.0% |
|||
|
CMS Energy Corp. |
300 |
8,100 |
|
|
TOTAL UTILITIES |
10,500 |
||
|
TOTAL COMMON STOCKS (Cost $2,278,664) |
2,365,592 |
||
|
Preferred Stocks - 5.4% |
|||
|
|
|
|
|
|
Convertible Preferred Stocks - 0.1% |
|||
|
INDUSTRIAL MACHINERY & EQUIPMENT - 0.1% |
|||
|
Electrical Equipment - 0.1% |
|||
|
Loral Space & Communications Ltd. $3.00 (e) |
2,000 |
36,500 |
|
|
Preferred Stocks - continued |
|||
|
Shares |
Value |
||
|
Nonconvertible Preferred Stocks - 5.3% |
|||
|
FINANCE - 0.7% |
|||
|
Credit & Other Finance - 0.7% |
|||
|
American Annuity Group Capital Trust I $2.3125 |
13,435 |
$ 322,440 |
|
|
MEDIA & LEISURE - 0.5% |
|||
|
Broadcasting - 0.5% |
|||
|
CSC Holdings, Inc. Series M, 11.125% pay-in-kind |
2,230 |
236,380 |
|
|
UTILITIES - 4.1% |
|||
|
Cellular - 0.9% |
|||
|
Nextel Communications, Inc. 11.125% pay-in-kind |
422 |
390,350 |
|
|
Telephone Services - 3.2% |
|||
|
Intermedia Communications, Inc. 13.5% pay-in-kind |
178 |
151,300 |
|
|
XO Communications, Inc.: |
|
|
|
|
$7.00 pay-in-kind |
22,949 |
917,960 |
|
|
13% pay-in-kind |
442 |
318,240 |
|
|
|
1,387,500 |
||
|
TOTAL UTILITIES |
1,777,850 |
||
|
TOTAL NONCONVERTIBLE PREFERRED STOCKS |
2,336,670 |
||
|
TOTAL PREFERRED STOCKS (Cost $2,799,002) |
2,373,170 |
||
|
Floating Rate Loans - 3.6% |
|||||
|
Moody's Ratings (unaudited) (b) |
Principal Amount |
|
|||
|
CONSTRUCTION & REAL ESTATE - 0.7% |
|||||
|
Building Materials - 0.7% |
|||||
|
Flowserve Corp. Tranche B term loan 10.25% 6/30/08 (f) |
- |
|
$ 300,000 |
302,250 |
|
|
Construction - 0.0% |
|||||
|
Blount, Inc. Tranche B term loan 10.7222% 6/30/06 (f) |
B1 |
|
2,519 |
2,506 |
|
|
TOTAL CONSTRUCTION & REAL ESTATE |
304,756 |
||||
|
Floating Rate Loans - continued |
|||||
|
Moody's Ratings (unaudited) (b) |
Principal Amount |
Value |
|||
|
DURABLES - 0.4% |
|||||
|
Textiles & Apparel - 0.4% |
|||||
|
Synthetic Industries, Inc. term loan 14.9% 12/13/00 (f) |
- |
|
$ 200,000 |
$ 184,000 |
|
|
UTILITIES - 2.5% |
|||||
|
Cellular - 2.3% |
|||||
|
Cook Inlet/Voicestream Op Co. LLC Tranche B term loan 10.63% 12/31/08 (f) |
B2 |
|
1,000,000 |
1,010,000 |
|
|
Telephone Services - 0.2% |
|||||
|
McLeodUSA, Inc. Tranche B term loan 9.62% 5/31/08 (f) |
Ba2 |
|
100,000 |
99,875 |
|
|
TOTAL UTILITIES |
1,109,875 |
||||
|
TOTAL FLOATING RATE LOANS (Cost $1,601,779) |
1,598,631 |
||||
|
Cash Equivalents - 10.5% |
|||
|
Maturity Amount |
|
||
|
Investments in repurchase agreements (U.S. Treasury Obligations), in a joint trading account at 6.56%, dated 10/31/00 due
11/1/00 |
$ 4,585,835 |
4,585,000 |
|
|
TOTAL INVESTMENT PORTFOLIO - 98.1% (Cost $46,280,202) |
42,939,336 |
||
|
NET OTHER ASSETS - 1.9% |
818,821 |
||
|
NET ASSETS - 100% |
$ 43,758,157 |
||
|
Legend |
|
(a) Non-income producing |
|
(b) S&P credit ratings are used in the absence of a rating by Moody's Investors Service, Inc. |
|
(c) Non-income producing - issuer filed for protection under the Federal Bankruptcy Code or is in default of interest payment. |
|
(d) Debt obligation initially issued in zero coupon form which converts to coupon form at a specified rate and date. The rate shown is the rate at period end. |
|
(e) Security exempt from registration under Rule 144A of the Securities Act of 1933. These securities may be resold in transactions exempt from registration, normally to qualified institutional buyers. At the period end, the value of these securities amounted to $3,858,744 or 8.8% of net assets. |
|
(f) The coupon rate shown on floating or adjustable rate securities represents the rate at period end. |
|
Other Information |
|
The composition of long-term debt holdings as a percentage of total value of investments in securities, is as follows (ratings are unaudited): |
|
Moody's Ratings |
S&P Ratings |
|||
|
Aaa, Aa, A |
0.0% |
|
AAA, AA, A |
0.0% |
|
Baa |
7.6% |
|
BBB |
10.1% |
|
Ba |
11.7% |
|
BB |
7.1% |
|
B |
51.3% |
|
B |
46.1% |
|
Caa |
3.8% |
|
CCC |
9.3% |
|
Ca, C |
0.2% |
|
CC, C |
0.0% |
|
|
D |
0.0% |
||
|
The percentage not rated by Moody's |
|
Income Tax Information |
|
At October 31, 2000, the aggregate |
|
At October 31, 2000, the fund had a capital loss carryforward of approximately $275,000 of which $6,000 and $269,000 will expire on October 31, 2007 and 2008, respectively. |
See accompanying notes which are an integral part of the financial statements.
Annual Report
Statement of Assets and Liabilities
|
|
October 31, 2000 |
|
|
Assets |
|
|
|
Investment in securities, at value (including repurchase agreements of $4,585,000) (cost $46,280,202) - |
|
$ 42,939,336 |
|
Receivable for investments sold |
|
1,425,069 |
|
Receivable for fund shares sold |
|
49,387 |
|
Dividends receivable |
|
32,650 |
|
Interest receivable |
|
710,781 |
|
Total assets |
|
45,157,223 |
|
Liabilities |
|
|
|
Payable to custodian bank |
$ 993,288 |
|
|
Payable for investments purchased |
164,825 |
|
|
Payable for fund shares redeemed |
50,582 |
|
|
Distributions payable |
93,094 |
|
|
Accrued management fee |
17,397 |
|
|
Distribution fees payable |
16,462 |
|
|
Other payables and accrued expenses |
63,418 |
|
|
Total liabilities |
|
1,399,066 |
|
Net Assets |
|
$ 43,758,157 |
|
Net Assets consist of: |
|
|
|
Paid in capital |
|
$ 47,063,416 |
|
Undistributed net investment income |
|
312,346 |
|
Accumulated undistributed net realized gain (loss) on investments and foreign currency transactions |
|
(276,739) |
|
Net unrealized appreciation (depreciation) on investments |
|
(3,340,866) |
|
Net Assets |
|
$ 43,758,157 |
See accompanying notes which are an integral part of the financial statements.
Annual Report
Financial Statements - continued
Statement of Assets and Liabilities - continued
|
|
October 31, 2000 |
|
|
Calculation of Maximum Offering Price |
|
$9.35 |
|
Maximum offering price per share (100/95.25 of $9.35) |
|
$9.82 |
|
Class T: |
|
$9.35 |
|
Maximum offering price per share (100/96.50 of $9.35) |
|
$9.69 |
|
Class B: |
|
$9.34 |
|
Class C: |
|
$9.35 |
|
Institutional Class: |
|
$9.35 |
A Redemption price per share is equal to net asset value less any applicable contingent deferred sales charge.
See accompanying notes which are an integral part of the financial statements.
Annual Report
Financial Statements - continued
Statement of Operations
|
|
Year ended October 31, 2000 |
|
|
Investment Income Dividends |
|
$ 276,680 |
|
Interest |
|
3,288,926 |
|
Total income |
|
3,565,606 |
|
Expenses |
|
|
|
Management fee |
$ 201,987 |
|
|
Transfer agent fees |
62,937 |
|
|
Distribution fees |
163,650 |
|
|
Accounting fees and expenses |
60,006 |
|
|
Non-interested trustees' compensation |
103 |
|
|
Custodian fees and expenses |
9,853 |
|
|
Registration fees |
199,084 |
|
|
Audit |
19,881 |
|
|
Legal |
168 |
|
|
Miscellaneous |
103 |
|
|
Total expenses before reductions |
717,772 |
|
|
Expense reductions |
(260,745) |
457,027 |
|
Net investment income |
|
3,108,579 |
|
Realized and Unrealized Gain (Loss) Net realized gain (loss) on: |
|
|
|
Investment securities |
(236,662) |
|
|
Foreign currency transactions |
9 |
(236,653) |
|
Change in net unrealized appreciation (depreciation) on investment securities |
|
(3,297,642) |
|
Net gain (loss) |
|
(3,534,295) |
|
Net increase (decrease) in net assets resulting |
|
$ (425,716) |
See accompanying notes which are an integral part of the financial statements.
Annual Report
Financial Statements - continued
Statement of Changes in Net Assets
|
|
Year ended |
September 7, 1999 |
|
Increase (Decrease) in Net Assets |
|
|
|
Operations |
$ 3,108,579 |
$ 59,140 |
|
Net realized gain (loss) |
(236,653) |
(6,153) |
|
Change in net unrealized appreciation (depreciation) |
(3,297,642) |
(43,224) |
|
Net increase (decrease) in net assets resulting |
(425,716) |
9,763 |
|
Distributions to shareholders from net investment income |
(2,832,624) |
(56,682) |
|
Share transactions - net increase (decrease) |
39,193,976 |
7,869,440 |
|
Total increase (decrease) in net assets |
35,935,636 |
7,822,521 |
|
Net Assets |
|
|
|
Beginning of period |
7,822,521 |
- |
|
End of period (including undistributed net investment income of $312,346 and $2,608, respectively) |
$ 43,758,157 |
$ 7,822,521 |
See accompanying notes which are an integral part of the financial statements.
Annual Report
Financial Highlights - Class A
|
Years ended October 31, |
2000 |
1999 E |
|
Selected Per-Share Data |
|
|
|
Net asset value, beginning of period |
$ 9.920 |
$ 10.000 |
|
Income from Investment Operations |
|
|
|
Net investment income D |
.895 |
.116 |
|
Net realized and unrealized gain (loss) |
(.640) |
(.091) |
|
Total from investment operations |
.255 |
.025 |
|
Less Distributions |
|
|
|
From net investment income |
(.825) |
(.105) |
|
Net asset value, end of period |
$ 9.350 |
$ 9.920 |
|
Total Return B, C |
2.40% |
.25% |
|
Ratios and Supplemental Data |
|
|
|
Net assets, end of period (000 omitted) |
$ 13,295 |
$ 739 |
|
Ratio of expenses to average net assets |
1.00% F |
1.00% A, F |
|
Ratio of expenses to average net assets after expense reductions |
.98% G |
1.00% A |
|
Ratio of net investment income to average net assets |
9.17% |
7.92% A |
|
Portfolio turnover rate |
157% |
331% A |
A Annualized
B The total returns would have been lower had certain expenses not been reduced during the periods shown.
C Total returns do not include the one time sales charge and for periods of less than one year are not annualized.
D Net investment income per share has been calculated based on average shares outstanding during the period.
E For the period September 7, 1999 (commencement of operations) to October 31, 1999.
F FMR agreed to reimburse a portion of the class' expenses during the period. Without this reimbursement, the class' expense ratio would have been higher.
G FMR or the fund has entered into varying arrangements with third parties who either paid or reduced a portion of the class' expenses.
See accompanying notes which are an integral part of the financial statements.
Annual Report
Financial Highlights - Class T
|
Years ended October 31, |
2000 |
1999 E |
|
Selected Per-Share Data |
|
|
|
Net asset value, beginning of period |
$ 9.920 |
$ 10.000 |
|
Income from Investment Operations |
|
|
|
Net investment income D |
.898 |
.112 |
|
Net realized and unrealized gain (loss) |
(.656) |
(.089) |
|
Total from investment operations |
.242 |
.023 |
|
Less Distributions |
|
|
|
From net investment income |
(.812) |
(.103) |
|
Net asset value, end of period |
$ 9.350 |
$ 9.920 |
|
Total Return B, C |
2.27% |
.23% |
|
Ratios and Supplemental Data |
|
|
|
Net assets, end of period (000 omitted) |
$ 8,936 |
$ 2,422 |
|
Ratio of expenses to average net assets |
1.10% F |
1.10% A, F |
|
Ratio of expenses to average net assets after expense reductions |
1.08% G |
1.10% A |
|
Ratio of net investment income to average net assets |
9.07% |
7.82% A |
|
Portfolio turnover rate |
157% |
331% A |
A Annualized
B The total returns would have been lower had certain expenses not been reduced during the periods shown.
C Total returns do not include the one time sales charge and for periods of less than one year are not annualized.
D Net investment income per share has been calculated based on average shares outstanding during the period.
E For the period September 7, 1999 (commencement of operations) to October 31, 1999.
F FMR agreed to reimburse a portion of the class' expenses during the period. Without this reimbursement, the class' expense ratio would have been higher.
G FMR or the fund has entered into varying arrangements with third parties who either paid or reduced a portion of the class' expenses.
See accompanying notes which are an integral part of the financial statements.
Annual Report
Financial Highlights - Class B
|
Years ended October 31, |
2000 |
1999 E |
|
Selected Per-Share Data |
|
|
|
Net asset value, beginning of period |
$ 9.920 |
$ 10.000 |
|
Income from Investment Operations |
|
|
|
Net investment income D |
.830 |
.102 |
|
Net realized and unrealized gain (loss) |
(.663) |
(.083) |
|
Total from investment operations |
.167 |
.019 |
|
Less Distributions |
|
|
|
From net investment income |
(.747) |
(.099) |
|
Net asset value, end of period |
$ 9.340 |
$ 9.920 |
|
Total Return B, C |
1.50% |
.19% |
|
Ratios and Supplemental Data |
|
|
|
Net assets, end of period (000 omitted) |
$ 10,054 |
$ 2,089 |
|
Ratio of expenses to average net assets |
1.75% F |
1.75% A, F |
|
Ratio of expenses to average net assets after expense reductions |
1.73% G |
1.75% A |
|
Ratio of net investment income to average net assets |
8.42% |
7.17% A |
|
Portfolio turnover rate |
157% |
331% A |
A Annualized
B The total returns would have been lower had certain expenses not been reduced during the periods shown.
C Total returns do not include the contingent deferred sales charge and for periods of less than one year are not annualized.
D Net investment income per share has been calculated based on average shares outstanding during the period.
E For the period September 7, 1999 (commencement of operations) to October 31, 1999.
F FMR agreed to reimburse a portion of the class' expenses during the period. Without this reimbursement, the class' expense ratio would have been higher.
G FMR or the fund has entered into varying arrangements with third parties who either paid or reduced a portion of the class' expenses.
See accompanying notes which are an integral part of the financial statements.
Annual Report
Financial Highlights - Class C
|
Years ended October 31, |
2000 |
1999 E |
|
Selected Per-Share Data |
|
|
|
Net asset value, beginning of period |
$ 9.910 |
$ 10.000 |
|
Income from Investment Operations |
|
|
|
Net investment income D |
.819 |
.101 |
|
Net realized and unrealized gain (loss) |
(.643) |
(.093) |
|
Total from investment operations |
.176 |
.008 |
|
Less Distributions |
|
|
|
From net investment income |
(.736) |
(.098) |
|
Net asset value, end of period |
$ 9.350 |
$ 9.910 |
|
Total Return B, C |
1.60% |
.08% |
|
Ratios and Supplemental Data |
|
|
|
Net assets, end of period (000 omitted) |
$ 6,563 |
$ 1,854 |
|
Ratio of expenses to average net assets |
1.85% F |
1.85% A, F |
|
Ratio of expenses to average net assets after expense reductions |
1.83% G |
1.85% A |
|
Ratio of net investment income to average net assets |
8.32% |
7.07% A |
|
Portfolio turnover rate |
157% |
331% A |
A Annualized
B The total returns would have been lower had certain expenses not been reduced during the periods shown.
C Total returns do not include the contingent deferred sales charge and for periods of less than one year are not annualized.
D Net investment income per share has been calculated based on average shares outstanding during the period.
E For the period September 7, 1999 (commencement of operations) to October 31, 1999.
F FMR agreed to reimburse a portion of the class' expenses during the period. Without this reimbursement, the class' expense ratio would have been higher.
G FMR or the fund has entered into varying arrangements with third parties who either paid or reduced a portion of the class' expenses.
See accompanying notes which are an integral part of the financial statements.
Annual Report
Financial Highlights - Institutional Class
|
Years ended October 31, |
2000 |
1999 E |
|
Selected Per-Share Data |
|
|
|
Net asset value, beginning of period |
$ 9.920 |
$ 10.000 |
|
Income from Investment Operations |
|
|
|
Net investment income D |
.910 |
.118 |
|
Net realized and unrealized gain (loss) |
(.638) |
(.091) |
|
Total from investment operations |
.272 |
.027 |
|
Less Distributions |
|
|
|
From net investment income |
(.842) |
(.107) |
|
Net asset value, end of period |
$ 9.350 |
$ 9.920 |
|
Total Return B, C |
2.57% |
.28% |
|
Ratios and Supplemental Data |
|
|
|
Net assets, end of period (000 omitted) |
$ 4,910 |
$ 719 |
|
Ratio of expenses to average net assets |
.85% F |
.85% A, F |
|
Ratio of expenses to average net assets after expense reductions |
.83% G |
.85% A |
|
Ratio of net investment income to average net assets |
9.32% |
8.07% A |
|
Portfolio turnover rate |
157% |
331% A |
A Annualized
B The total returns would have been lower had certain expenses not been reduced during the periods shown.
C Total returns for periods of less than one year are not annualized.
D Net investment income per share has been calculated based on average shares outstanding during the period.
E For the period September 7, 1999 (commencement of operations) to October 31, 1999.
F FMR agreed to reimburse a portion of the class' expenses during the period. Without this reimbursement, the class' expense ratio would have been higher.
G FMR or the fund has entered into varying arrangements with third parties who either paid or reduced a portion of the class' expenses.
See accompanying notes which are an integral part of the financial statements.
Annual Report
For the period ended October 31, 2000
1. Significant Accounting Policies.
Fidelity Advisor High Income Fund (the fund) is a fund of Fidelity Advisor Series II (the trust) and is authorized to issue an unlimited number of shares. The trust is registered under the Investment Company Act of 1940, as amended (the 1940 Act), as an open-end management investment company organized as a Massachusetts business trust.
The fund offers Class A, Class T, Class B, Class C, and Institutional Class shares, each of which has equal rights as to assets and voting privileges. Each class has exclusive voting rights with respect to matters that affect that class. Class B shares will automatically convert to Class A shares after a holding period of seven years from the initial date of purchase. Investment income, realized and unrealized capital gains and losses, the common expenses of the fund, and certain fund-level expense reductions, if any, are allocated on a pro rata basis to each class based on the relative net assets of each class to the total net assets of the fund. Each class of shares differs in its respective distribution, transfer agent, and certain other class-specific fees, expenses, and expense reductions.
The financial statements have been prepared in conformity with generally accepted accounting principles which require management to make certain estimates and assumptions at the date of the financial statements. The following summarizes the significant accounting policies of the fund:
Security Valuation. Securities for which quotations are readily available are valued by a pricing service at their market values as determined by their most recent bid prices in the principal market (sales prices if the principal market is an exchange) in which such securities are normally traded. Securities (including restricted securities) for which market quotations are not readily available are valued at their fair value as determined in good faith under consistently applied procedures under the general supervision of the Board of Trustees. Short-term securities with remaining maturities of sixty days or less for which quotations are not readily available are valued at amortized cost or original cost plus accrued interest, both of which approximate current value. Investments in open-end investment companies are valued at their net asset value each business day.
Foreign Currency Translation. The accounting records of the fund are maintained in U.S. dollars. Investment securities and other assets and liabilities denominated in a foreign currency are translated into U.S. dollars at the prevailing rates of exchange at period end. Purchases and sales of securities, income receipts and expense payments are translated into U.S. dollars at the prevailing exchange rate on the respective dates of the transactions.
Net realized gains and losses on foreign currency transactions represent net gains and losses from sales and maturities of foreign currency contracts, disposition of foreign currencies, the difference between the amount of net investment income accrued and
Annual Report
Notes to Financial Statements - continued
1. Significant Accounting Policies - continued
Foreign Currency Translation - continued
the U.S. dollar amount actually received, and gains and losses between trade and settlement date on purchases and sales of securities. The effects of changes in foreign currency exchange rates on investments in securities are included with the net realized and unrealized gain or loss on investment securities.
Income Taxes. As a qualified regulated investment company under Subchapter M of the Internal Revenue Code, the fund is not subject to income taxes to the extent that it distributes substantially all of its taxable income for its fiscal year. The schedule of investments includes information regarding income taxes under the caption "Income Tax Information."
Investment Income. Dividend income is recorded on the ex-dividend date, except certain dividends from foreign securities where the ex-dividend date may have passed, are recorded as soon as the fund is informed of the ex-dividend date. Non-cash dividends included in dividend income, if any, are recorded at the fair market value of the securities received. Interest income, which includes accretion of original issue discount, is accrued as earned. Investment income is recorded net of foreign taxes withheld where recovery of such taxes is uncertain. The fund may place a debt obligation on non-accrual status and reduce related interest income by ceasing current accruals and writing off interest receivables when the collection of all or a portion of interest has become doubtful based on consistently applied procedures, under the general supervision of the Board of Trustees of the fund. A debt obligation is removed from non-accrual status when the issuer resumes interest payments or when collectibility of interest is reasonably assured.
Expenses. Most expenses of the trust can be directly attributed to a fund. Expenses which cannot be directly attributed are apportioned among the funds in the trust.
Prepaid Expenses. Fidelity Management & Research Company (FMR) bears all organizational expenses of the funds except for the cost of registering and qualifying shares of each class for distribution under federal and state securities law. These registration expenses are borne by the fund and amortized over one year.
Distributions to Shareholders. Distributions are declared daily and paid monthly from net investment income. Distributions from realized gains, if any, are recorded on the ex-dividend date. Income dividends and capital gain distributions are declared separately for each class.
Income and capital gain distributions are determined in accordance with income tax regulations which may differ from generally accepted accounting principles. These differences, which may result in distribution reclassifications, are primarily due to
Annual Report
Notes to Financial Statements - continued
1. Significant Accounting Policies - continued
Distributions to Shareholders - continued
differing treatments for litigation proceeds, foreign currency transactions, defaulted bonds, market discount, non-taxable dividends, capital loss carryforwards and losses deferred due to wash sales.
Permanent book and tax basis differences relating to shareholder distributions will result in reclassifications to paid in capital. Undistributed net investment income and accumulated undistributed net realized gain (loss) on investments and foreign currency transactions may include temporary book and tax basis differences which will reverse in a subsequent period. Any taxable income or gain remaining at fiscal year end is distributed in the following year.
Security Transactions. Security transactions are accounted for as of trade date. Gains and losses on securities sold are determined on the basis of identified cost.
2. Operating Policies.
Joint Trading Account. Pursuant to an Exemptive Order issued by the Securities and Exchange Commission (the SEC), the fund, along with other affiliated entities of FMR, may transfer uninvested cash balances into one or more joint trading accounts. These balances are invested in one or more repurchase agreements for U.S. Treasury or Federal Agency obligations.
Repurchase Agreements. The underlying U.S. Treasury, Federal Agency, or other obligations found to be satisfactory by FMR are transferred to an account of the fund, or to the Joint Trading Account, at a custodian bank. The securities are marked-to-market daily and maintained at a value at least equal to the principal amount of the repurchase agreement (including accrued interest). FMR, the fund's investment adviser, is responsible for determining that the value of the underlying securities remains in accordance with the market value requirements stated above.
Restricted Securities. The fund is permitted to invest in securities that are subject to legal or contractual restrictions on resale. These securities generally may be resold in transactions exempt from registration or to the public if the securities are registered. Disposal of these securities may involve time-consuming negotiations and expense, and prompt sale at an acceptable price may be difficult. At the end of the period, the fund had no investments in restricted securities (excluding 144A issues).
Loans and Other Direct Debt Instruments. The fund is permitted to invest in loans and loan participations, trade claims or other receivables. These investments may include standby financing commitments that obligate the fund to supply additional cash
Annual Report
Notes to Financial Statements - continued
2. Operating Policies - continued
Loans and Other Direct Debt Instruments - continued
to the borrower on demand. Loan participations involve a risk of insolvency of the lending bank or other financial intermediary. At the end of the period, these investments amounted to $1,598,631 or 3.6% of net assets.
3. Purchases and Sales of Investments.
Purchases and sales of securities, other than short-term securities, aggregated $81,796,237 and $45,940,554, respectively.
4. Fees and Other Transactions with Affiliates.
Management Fee. As the fund's investment adviser, FMR receives a monthly fee that is calculated on the basis of a group fee rate plus a fixed individual fund fee rate applied to the average net assets of the fund. The group fee rate is the weighted average of a series of rates and is based on the monthly average net assets of all the mutual funds advised by FMR. The rates ranged from .0920% to .3700% for the period. The annual individual fund fee rate is .45%. In the event that these rates were lower than the contractual rates in effect during the period, FMR voluntarily implemented the above rates, as they resulted in the same or a lower management fee. For the period, the management fee was equivalent to an annual rate of .58% of average net assets.
Sub-Adviser Fee. Beginning January 1, 2001, FMR Co.(FMRC) will serve as sub-adviser for the fund. FMRC is a wholly owned subsidiary of FMR and will receive a fee from FMR of 50% of the management fee payable to FMR with respect to that portion of the fund's assets that will be managed by FMRC.
Distribution and Service Plan. In accordance with Rule 12b-1 of the 1940 Act, the Board of Trustees has adopted separate Distribution and Service Plans with respect to each class of shares (collectively referred to as "the Plans"). Under certain of the Plans, the class pays Fidelity Distributors Corporation (FDC), an affiliate of FMR, a 12b-1 fee. A portion of this fee may be reallowed to securities dealers, banks and other financial institutions for the distribution of each class of shares and providing shareholder support services. For the period, this fee was based on the following annual rates of the average net assets of each applicable class:
|
Class A |
.15% |
|
Class T |
.25% |
|
Class B |
.90% * |
|
Class C |
1.00% ** |
* .65% represents a distribution fee and .25% represents a shareholder service fee.
** .75% represents a distribution fee and .25% represents a shareholder service fee.
Annual Report
Notes to Financial Statements - continued
4. Fees and Other Transactions with Affiliates - continued
Distribution and Service Plan - continued
For the period, each class paid FDC the following amounts, a portion of which was retained by FDC:
|
|
Paid to |
Retained |
|
Class A |
$ 12,519 |
$ 769 |
|
Class T |
24,004 |
1,376 |
|
Class B |
76,397 |
56,575 |
|
Class C |
50,730 |
37,631 |
|
|
$ 163,650 |
$ 96,351 |
Sales Load. FDC receives a front-end sales charge of up to 4.75% for selling Class A shares, and 3.50% for selling Class T shares of the fund. FDC receives the proceeds of contingent deferred sales charges levied on Class B share redemptions occurring within six years of purchase and Class C share redemptions occurring within one year of purchase. Contingent deferred sales charges are based on declining rates ranging from 5% to 1% for Class B and 1% for Class C, of the lesser of the cost of shares at the initial date of purchase or the net asset value of the redeemed shares, excluding any reinvested dividends and capital gains. In addition, purchases of Class A and Class T shares that were subject to a finder's fee bear a contingent deferred sales charge on assets that do not remain in the fund for at least one year. The Class A and Class T contingent deferred sales charge is based on 0.25% of the lesser of the cost of shares at the initial date of purchase or the net asset value of the redeemed shares, excluding any reinvested dividends and capital gains. A portion of the sales charges paid to FDC is paid to securities dealers, banks and other financial institutions.
For the period, sales charge amounts paid to and retained by FDC were as follows:
|
|
Paid to |
Retained |
|
Class A |
$ 20,151 |
$ 6,985 |
|
Class T |
30,650 |
11,175 |
|
Class B |
40,712 |
40,712 * |
|
Class C |
1,640 |
1,640 * |
|
|
$ 93,153 |
$ 60,512 |
* When Class B and Class C shares are initially sold, FDC pays commissions from its own resources to securities dealers,
banks, and other financial institutions through which the sales are made.
Annual Report
Notes to Financial Statements - continued
4. Fees and Other Transactions with Affiliates - continued
Transfer Agent Fees. Fidelity Investments Institutional Operations Company, Inc., (FIIOC), an affiliate of FMR, is the transfer, dividend disbursing and shareholder servicing agent (collectively referred to as the transfer agent) for each class of the fund. FIIOC receives account fees and asset-based fees that vary according to the account size and type of account of the shareholders of the respective classes of the fund. FIIOC pays for typesetting, printing and mailing of all shareholder reports, except proxy statements. For the period, the following amounts were paid to FIIOC:
|
|
Amount |
% of |
|
Class A |
$ 12,424 |
.15 |
|
Class T |
17,786 |
.19 |
|
Class B |
14,589 |
.17 |
|
Class C |
10,226 |
.20 |
|
Institutional Class |
7,912 |
.22 |
|
|
$ 62,937 |
|
Accounting Fees. Fidelity Service Company, Inc. maintains the fund's accounting records. The fee is based on the level of average net assets for the month plus out-of-pocket expenses.
Brokerage Commissions. The fund placed a portion of its portfolio transactions with brokerage firms which are affiliates of FMR. The commissions paid to these affiliated firms were $334 for the period.
5. Expense Reductions.
FMR voluntarily agreed to reimburse operating expenses (excluding interest, taxes, certain securities lending fees, brokerage commissions and extraordinary expenses, if any) above the following annual rates or range of annual rates of average net assets for each of the following classes:
|
|
FMR |
Reimbursement |
|
Class A |
1.00% |
$ 58,838 |
|
Class T |
1.10% |
69,642 |
|
Class B |
1.75% |
61,602 |
|
Class C |
1.85% |
38,667 |
|
Institutional Class |
0.85% |
26,643 |
|
|
|
$ 255,392 |
Annual Report
Notes to Financial Statements - continued
5. Expense Reductions - continued
FMR has also directed certain portfolio trades to brokers who paid a portion of the fund's expenses. For the period, the fund's expenses were reduced by $1,155 under this arrangement.
In addition, through an arrangement with the fund's custodian, credits realized as a result of uninvested cash balances were used to reduce a portion of expenses. During the period, the fund's custodian fees were reduced by $4,198 under the custodian arrangement.
6. Beneficial Interest.
At the end of the period, FMR and its affiliates were record owners of approximately 6% of the total outstanding shares of the fund. In addition, one unaffiliated shareholder was record owner of more than 10% of the total outstanding shares of the fund, totaling 32%.
7. Distributions to Shareholders.
Distributions to shareholders of each class were as follows:
|
|
Years ended October 31, |
|
|
|
2000 |
1999A |
|
From net investment income |
|
|
|
Class A |
$ 707,918 |
$ 7,152 |
|
Class T |
787,365 |
17,710 |
|
Class B |
645,402 |
10,995 |
|
Class C |
379,306 |
13,464 |
|
Institutional Class |
312,633 |
7,361 |
|
Total |
$ 2,832,624 |
$ 56,682 |
A Distributions for the period September 7, 1999 (commencement of operations) to October 31, 1999.
Annual Report
Notes to Financial Statements - continued
8. Share Transactions.
Transactions for each class of shares were as follows:
|
|
Shares |
Dollars |
||
|
|
Year ended October 31, |
Year ended October 31, |
Year ended October 31, |
Year ended October 31, |
|
|
2000 |
1999 A |
2000 |
1999 A |
|
|
|
|
|
|
|
Class A |
1,493,515 |
73,796 |
$ 15,002,914 |
$ 737,552 |
|
Reinvestment of distributions |
54,584 |
661 |
535,288 |
6,564 |
|
Shares redeemed |
(201,140) |
- |
(1,994,596) |
- |
|
Net increase (decrease) |
1,346,959 |
74,457 |
$ 13,543,606 |
$ 744,116 |
|
Class T |
1,656,133 |
242,680 |
$ 16,505,485 |
$ 2,421,256 |
|
Reinvestment of distributions |
43,976 |
1,481 |
434,581 |
14,699 |
|
Shares redeemed |
(988,162) |
(50) |
(9,733,802) |
(500) |
|
Net increase (decrease) |
711,947 |
244,111 |
$ 7,206,264 |
$ 2,435,455 |
|
Class B |
1,104,573 |
214,251 |
$ 11,052,135 |
$ 2,135,658 |
|
Reinvestment of distributions |
31,115 |
851 |
307,335 |
8,451 |
|
Shares redeemed |
(270,291) |
(4,468) |
(2,684,546) |
(44,468) |
|
Net increase (decrease) |
865,397 |
210,634 |
$ 8,674,924 |
$ 2,099,641 |
|
Class C |
809,417 |
185,931 |
$ 8,074,099 |
$ 1,855,443 |
|
Reinvestment of distributions |
21,753 |
1,090 |
214,658 |
10,817 |
|
Shares redeemed |
(316,051) |
- |
(3,125,853) |
- |
|
Net increase (decrease) |
515,119 |
187,021 |
$ 5,162,904 |
$ 1,866,260 |
|
Institutional Class |
446,427 |
71,695 |
$ 4,549,272 |
$ 716,650 |
|
Reinvestment of distributions |
30,213 |
737 |
297,604 |
7,318 |
|
Shares redeemed |
(24,209) |
- |
(240,598) |
- |
|
Net increase (decrease) |
452,431 |
72,432 |
$ 4,606,278 |
$ 723,968 |
A Share transactions are for the period September 7, 1999 (commencement of operations) to October 31, 1999.
Annual Report
To the Trustees of Fidelity Advisor Series II and Shareholders of Fidelity Advisor High Income Fund:
We have audited the accompanying statement of assets and liabilities of Fidelity Advisor High Income Fund, (the Fund), a fund of Fidelity Advisor Series II (the Trust), including the portfolio of investments, as of October 31, 2000, and the related statement of operations for the year then ended, the statement of changes in net assets and financial highlights for each of the two years in the period then ended. These financial statements and financial highlights are the responsibility of the Fund's management. Our responsibility is to express an opinion on these financial statements and financial highlights based on our audits.
We conducted our audits in accordance with auditing standards generally accepted in the United States of America. Those standards require that we plan and perform the audit to obtain reasonable assurance about whether the financial statements and financial highlights are free of material misstatement. An audit includes examining, on a test basis, evidence supporting the amounts and disclosures in the financial statements. Our procedures included confirmation of securities owned as of October 31, 2000, by correspondence with the custodian and brokers; where replies were not received from brokers, we performed other auditing procedures. An audit also includes assessing the accounting principles used and significant estimates made by management, as well as evaluating the overall financial statement presentation. We believe that our audits provide a reasonable basis for our opinion.
In our opinion, the financial statements and financial highlights referred to above present fairly, in all material respects, the financial position of Fidelity Advisor High Income Fund as of October 31, 2000, the results of its operations for the year then ended, the changes in its net assets and its financial highlights for each of the two years in the period then ended, in conformity with accounting principles generally accepted in the United States of America.
/s/DELOITTE & TOUCHE LLP
DELOITTE & TOUCHE LLP
Boston, Massachusetts
December 8, 2000
Annual Report
Annual Report
Annual Report
Annual Report
Investment Adviser
Fidelity Management & Research Company
Boston, MA
Investment Sub-Advisers
Fidelity Management & Research
(U.K.) Inc.
Fidelity Management & Research
(Far East) Inc.
Fidelity Investments Japan Limited
Officers
Edward C. Johnson 3d, President
Robert C. Pozen, Senior Vice President
Robert A. Lawrence, Vice President
David L. Glancy, Vice President
Eric D. Roiter, Secretary
Robert A. Dwight, Treasurer
Maria F. Dwyer, Deputy Treasurer
John H. Costello, Assistant Treasurer
Thomas J. Simpson, Assistant Treasurer
Board of Trustees
Ralph F. Cox *
Phyllis Burke Davis *
Robert M. Gates *
Edward C. Johnson 3d
Donald J. Kirk *
Ned C. Lautenbach *
Peter S. Lynch
Marvin L. Mann *
William O. McCoy *
Gerald C. McDonough *
Robert C. Pozen
Thomas R. Williams *
Advisory Board
J. Michael Cook
Abigail P. Johnson
Marie L. Knowles
General Distributor
Fidelity Distributors Corporation
Boston, MA
Transfer and Shareholder
Servicing Agent
Fidelity Investments Institutional Operations Company, Inc.
Boston, MA
Custodian
The Bank of New York
New York, NY
* Independent trustees
Annual Report
Focus Funds
Fidelity Advisor Consumer
Industries Fund
Fidelity Advisor Cyclical
Industries Fund
Fidelity Advisor Financial
Services Fund
Fidelity Advisor Health Care Fund
Fidelity Advisor Natural
Resources Fund
Fidelity Advisor Technology Fund
Fidelity Advisor Telecommunications & Utilities Growth Fund
Growth Funds
Fidelity Advisor Korea Fund
Fidelity Advisor Emerging Asia Fund
Fidelity Advisor Latin America Fund
Fidelity Advisor Japan Fund
Fidelity Advisor Europe Capital Appreciation Fund
Fidelity Advisor International
Capital Appreciation Fund
Fidelity Advisor Overseas Fund
Fidelity Advisor Diversified International Fund
Fidelity Advisor Global Equity Fund
Fidelity Advisor TechnoQuant ®
Growth Fund
Fidelity Advisor Small Cap Fund
Fidelity Advisor Value Strategies Fund
Fidelity Advisor Mid Cap Fund
Fidelity Advisor Dynamic Capital Appreciation Fund
Fidelity Advisor Equity Growth Fund
Fidelity Advisor Large Cap Fund
Fidelity Advisor Dividend Growth Fund
Fidelity Advisor Growth
Opportunities Fund
Growth and Income Funds
Fidelity Advisor Growth & Income Fund
Fidelity Advisor Equity Income Fund
Fidelity Advisor Asset Allocation Fund
Fidelity Advisor Balanced Fund
Taxable Income Funds
Fidelity Advisor Emerging Markets Income Fund
Fidelity Advisor High Yield Fund
Fidelity Advisor High Income Fund
Fidelity Advisor Strategic Income Fund
Fidelity Advisor Mortgage
Securities Fund
Fidelity Advisor Government Investment Fund
Fidelity Advisor Intermediate Bond Fund
Fidelity Advisor Short Fixed-Income Fund
Municipal Funds
Fidelity Advisor Municipal Income Fund
Money Market Funds
Prime Fund
Treasury Fund
Tax-Exempt Fund
|
AHII-ANN-1200 |
118953 |
|
1.728716.101 |
|
(Fidelity Investment logo)(registered trademark)
|
|