
|
|
|
|
|
|
|
|
|
|
Previous: SEPRAGEN CORP, SB-2, EX-5, 2000-08-21 |
Next: FRONTIER INSURANCE GROUP INC, 10-Q, 2000-08-21 |
(Fidelity Investment logo)(registered trademark)
(2_fidelity_logos)Fidelity Advisor
Semiannual Report
June 30, 2000
|
President's Message |
3 |
Ned Johnson on investing strategies. |
|
Performance |
4 |
How the fund has done over time. |
|
Fund Talk |
21 |
The managers' review of fund performance, strategy and outlook. |
|
Investment Changes |
25 |
A summary of major shifts in the fund's investments over the past six months. |
|
Investments |
26 |
A complete list of the fund's investments with their market values. |
|
Financial Statements |
45 |
Statements of assets and liabilities,
operations, and changes in net assets, |
|
Notes |
54 |
Notes to the financial statements. |
Standard & Poor's, S&P and S&P 500 are registered service marks of The McGraw-Hill Companies, Inc. and have been licensed for use by Fidelity Distributors Corporation.
Other third party marks appearing herein are the property of their respective owners.
All other marks appearing herein are registered or unregistered trademarks or service marks of FMR Corp. or an affiliated company.
(Recycle graphic) This report is printed on recycled paper using soy-based inks.
This report and the financial statements contained herein are submitted for the general information of the shareholders of the fund. This report is not authorized for distribution to prospective investors in the fund unless preceded or accompanied by an effective prospectus.
Mutual fund shares are not deposits or obligations of, or guaranteed by, any depository institution. Shares are not insured by the FDIC, Federal Reserve Board or any other agency, and are subject to investment risks, including possible loss of principal amount invested.
Neither the fund nor Fidelity Distributors Corporation is a bank.
For more information on any Fidelity Advisor fund, including charges and expenses, contact your investment professional for a free prospectus. Read it carefully before you invest or send money.
Semiannual Report
(photo_of_Edward_C_Johnson_3d)Dear Shareholder:
In stark contrast to the final six months of 1999, most major equity market indexes posted negative returns for the first half of 2000, due mainly to a correction in the technology sector during the second quarter. The majority of bond markets - with the notable exception of high yield - fared better, as Treasuries and non-Treasuries alike benefited as a haven from the volatility of stocks and riskier investment alternatives.
While it's impossible to predict the future direction of the markets with any degree of certainty, there are certain basic principles that can help investors plan for their future needs.
The longer your investment time frame, the less likely it is that you will be affected by short-term market volatility. A 10-year investment horizon appropriate for saving for a college education, for example, enables you to weather market cycles in a long-term fund, which may have a higher risk potential, but also has a higher potential rate of return.
An intermediate-length fund could make sense if your investment horizon is two to four years, while a short-term bond fund could be the right choice if you need your money in one or two years.
If your time horizon is less than a year, you might want to consider moving some of your bond investment into a money market fund. These funds seek income and a stable share price by investing in high-quality, short-term investments. Of course, it's important to remember that an investment in a money market fund is not insured or guaranteed by the Federal Deposit Insurance Corporation or any other government agency. Although money market funds seek to preserve the value of your investment at $1.00 per share, it is possible to lose money by investing in these types of funds.
Finally, no matter what your time horizon or portfolio diversity, it makes good sense to follow a regular investment plan, investing a certain amount of money in a fund at the same time each month or quarter and periodically reviewing your overall portfolio. By doing so, you won't get caught up in the excitement of a rapidly rising market, nor will you buy all your shares at market highs. While this strategy - known as dollar cost averaging - won't assure a profit or protect you from a loss in a declining market, it should help you lower the average cost of your purchases. Of course, you should consider your financial ability to continue your purchases through periods of low price levels before undertaking such a strategy.
Remember to contact your investment professional if you need help with your investments.
Best regards,
/s/Edward C. Johnson 3d
Edward C. Johnson 3d
Semiannual Report
Fidelity Advisor Strategic Income Fund - Class A
There are several ways to evaluate historical performance. You can look at the total percentage change in value, the average annual percentage change or the growth of a hypothetical $10,000 investment. Total return reflects the change in the value of an investment, assuming reinvestment of the class' dividend income and capital gains (the profits earned upon the sale of securities that have grown in value). You can also look at the class' income to measure performance. The initial offering of Class A shares took place on September 3, 1996. Class A shares bear a 0.15% 12b-1 fee that is reflected in returns after September 3, 1996. Returns prior to that date are those of Class T, and reflect Class T shares' 0.25% 12b-1 fee. If Fidelity had not reimbursed certain class expenses, the past five year and life of fund total returns would have been lower.
Semiannual Report
Fidelity Advisor Strategic Income Fund - Class A
Cumulative Total Returns
|
Periods ended June 30, 2000 |
Past 6 |
Past 1 |
Past 5 |
Life of |
|
Fidelity Adv Strategic Income - CL A |
1.90% |
5.41% |
46.61% |
66.88% |
|
Fidelity Adv Strategic Income - CL A |
-2.94% |
0.40% |
39.65% |
58.95% |
|
Fidelity Strategic Income Composite |
1.85% |
4.47% |
43.72% |
60.78% |
|
JP EMBI Global |
6.95% |
20.74% |
107.11% |
111.56% |
|
LB Government Bond |
4.97% |
5.01% |
35.12% |
50.89% |
|
ML High Yield Master II |
-1.00% |
-0.97% |
40.48% |
58.92% |
|
SB Non-US Dollar |
-1.95% |
2.41% |
8.81% |
28.05% |
|
Multi-Sector Income Funds Average |
0.43% |
2.09% |
35.58% |
n/a * |
Cumulative total returns show Class A's performance in percentage terms over a set period - in this case, six months, one year, five years or since the fund started on October 31, 1994. For example, if you had invested $1,000 in a fund that had a 5% return over the past year, the value of your investment would be $1,050. You can compare Class A's returns to those of the Merrill Lynch High Yield Master II Index - a market value-weighted index of all domestic and yankee high-yield bonds, including deferred interest bonds and payment-in-kind securities. Issues included in the index have maturities of one year or more and have a credit rating lower than BBB-/Baa3, but are not in default. Additionally you can also compare Class A's returns to those of the Fidelity Strategic Income Composite Index - a hypothetical combination of unmanaged indices. The composite index combines the total returns of the J.P. Morgan Emerging Markets Bond Index Global, the Lehman Brothers Government Bond Index, the Merrill Lynch High Yield Master II Index and the Salomon Brothers Non-U.S. Dollar World Government Bond Index weighted according to the fund's neutral mix. To measure how Class A's performance stacked up against its peers, you can compare it to the multi-sector income funds average, which reflects the performance of mutual funds with similar objectives tracked by Lipper Inc. The past six months average represents a peer group of 124 mutual funds. The benchmarks listed in the table above include reinvested dividends and capital gains, if any, and exclude the effect of sales charges.
* Not available
Semiannual Report
Fidelity Advisor Strategic Income Fund - Class A
Average Annual Total Returns
|
Periods ended June 30, 2000 |
Past 1 |
Past 5 |
Life of |
|
Fidelity Adv Strategic Income - CL A |
5.41% |
7.95% |
9.46% |
|
Fidelity Adv Strategic Income - CL A |
0.40% |
6.91% |
8.52% |
|
Fidelity Strategic Income Composite |
4.47% |
7.52% |
8.74% |
Average annual total returns take Class A's cumulative return and show you what would have happened if Class A had performed at a constant rate each year.3
Understanding
Performance
How a fund did yesterday is no guarantee of how it will do tomorrow. If you sell your shares during a market downturn, you might lose money. But if you can ride out the market's ups and downs, you may have a gain.
Semiannual Report
Fidelity Advisor Strategic Income Fund - Class A
$10,000 Over Life of Fund
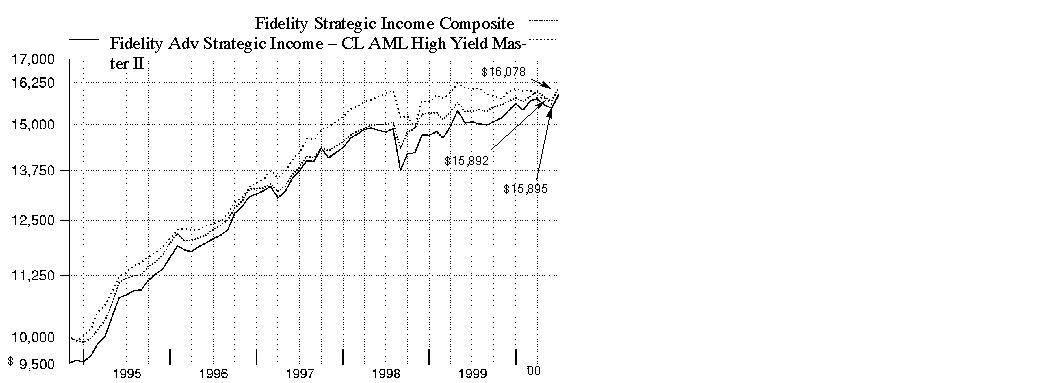
$10,000 Over Life of Fund: Let's say hypothetically that $10,000 was invested in Fidelity Advisor Strategic Income Fund - Class A on October 31, 1994, when the fund started, and the current 4.75% sales charge was paid. As the chart shows, by June 30, 2000, the value of the investment would have grown to $15,895 - a 58.95% increase on the initial investment. For comparison, look at how the Merrill Lynch High Yield Master II Index - a market value-weighted index of all domestic and yankee high-yield bonds, including deferred interest bonds and payment-in-kind securities - did over the same period. Issues included in the index have maturities of one year or more and have a credit rating lower than BBB-/Baa3, but are not in default. With dividends and capital gains, if any, reinvested, the same $10,000 investment would have grown to $15,892 - a 58.92% increase. You can also look at how the Fidelity Strategic Income Composite Index - a hypothetical combination of unmanaged indices that is more representative of the fund's investable universe - did over the same period. This index combines returns from the J.P. Morgan Emerging Markets Bond Index Global, Lehman Brothers Government Bond Index, Merrill Lynch High Yield Master II Index, and the Salomon Brothers Non-U.S. Dollar World Government Bond Index, according to the fund's neutral mix .** With dividends and capital gains, if any, reinvested, the same $10,000 investment would have grown to $16,078 - a 60.78% increase.
** 40% high yield, 30% U.S. government and investment-grade,
15% emerging markets, and 15% foreign developed markets.
Semiannual Report
Fidelity Advisor Strategic Income Fund - Class A
Total Return Components
|
|
Six months
ended |
Years ended December 31, |
September 3, 1996 |
||
|
|
2000 |
1999 |
1998 |
1997 |
1996 |
|
Dividend returns |
3.33% |
6.97% |
6.59% |
7.20% |
2.56% |
|
Capital returns |
-1.43% |
-0.85% |
-4.21% |
2.04% |
4.39% |
|
Total returns |
1.90% |
6.12% |
2.38% |
9.24% |
6.95% |
Total return components include both dividend returns and capital returns. A dividend return reflects the actual dividends paid by the class. A capital return reflects both the amount paid by the class to shareholders as capital gain distributions and changes in the class' share price. Both returns assume the dividends or capital gains, if any, paid by the class are reinvested, and exclude the effect of sales charges.
Dividends and Yield
|
Periods ended June 30, 2000 |
Past 1 |
Past 6 |
Past 1 |
|
Dividends per share |
5.79 ¢ |
34.33 ¢ |
70.52 ¢ |
|
Annualized dividend rate |
6.85% |
6.67% |
6.82% |
|
30-day annualized yield |
n/a |
- |
- |
Dividends per share show the income paid by the class for a set period. If you annualize this number, based on an average share price of $10.28 over the past one month, $10.32 over the past six months and $10.34 over the past one year, you can compare the class' income over these three periods. The 30-day annualized yield is a standard formula for all bond funds based on the yields of the bonds in the fund, averaged over the past 30 days. This figure shows you the yield characteristics of the fund's investments at the end of the period. It also helps you to compare funds from different companies on an equal basis. Yield information will be reported once Class A has a longer, more stable, operating history.
Semiannual Report
Fidelity Advisor Strategic Income Fund - Class T
There are several ways to evaluate historical performance. You can look at the total percentage change in value, the average annual percentage change or the growth of a hypothetical $10,000 investment. Total return reflects the change in the value of an investment, assuming reinvestment of the class' dividend income and capital gains (the profits earned upon the sale of securities that have grown in value). You can also look at the class' income, as reflected in its yield, to measure performance. If Fidelity had not reimbursed certain class expenses, the past five year and life of fund total returns would have been lower.
Cumulative Total Returns
|
Periods ended June 30, 2000 |
Past 6 |
Past 1 |
Past 5 |
Life of |
|
Fidelity Adv Strategic Income - CL T |
1.77% |
5.34% |
46.43% |
66.67% |
|
Fidelity Adv Strategic Income - CL T (incl. 3.50% sales charge) |
-1.79% |
1.65% |
41.30% |
60.83% |
|
Fidelity Strategic Income Composite |
1.85% |
4.47% |
43.72% |
60.78% |
|
JP EMBI Global |
6.95% |
20.74% |
107.11% |
111.56% |
|
LB Government Bond |
4.97% |
5.01% |
35.12% |
50.89% |
|
ML High Yield Master II |
-1.00% |
-0.97% |
40.48% |
58.92% |
|
SB Non-US Dollar |
-1.95% |
2.41% |
8.81% |
28.05% |
|
Multi-Sector Income Funds Average |
0.43% |
2.09% |
35.58% |
n/a* |
Cumulative total returns show Class T's performance in percentage terms over a set period - in this case, six months, one year, five years or since the fund started on October 31, 1994. For example, if you had invested $1,000 in a fund that had a 5% return over the past year, the value of your investment would be $1,050. You can compare Class T's returns to those of the Merrill Lynch High Yield Master II Index - a market value-weighted index of all domestic and yankee high-yield bonds, including deferred interest bonds and payment-in-kind securities. Issues included in the index have maturities of one year or more and have a credit rating lower than BBB-/Baa3, but are not in default. Additionally you can also compare Class T's returns to those of the Fidelity Strategic Income Composite Index - a hypothetical combination of unmanaged indices. The composite index combines the total returns of the J.P. Morgan Emerging Markets Bond Index Global, the Lehman Brothers Government Bond Index, the Merrill Lynch High Yield Master II Index and the Salomon Brothers Non-U.S. Dollar World Government Bond Index weighted according to the fund's neutral mix. To measure how Class T's performance stacked up against its peers, you can compare it to the multi-sector income funds average, which reflects the performance of mutual funds with similar objectives tracked by Lipper Inc. The past six months average represents a peer group of 124 mutual funds. The benchmarks listed in the table above include reinvested dividends and capital gains, if any, and exclude the effect of sales charges.
* Not available
Semiannual Report
Fidelity Advisor Strategic Income Fund - Class T
Average Annual Total Returns
|
Periods ended June 30, 2000 |
Past 1 |
Past 5 |
Life of |
|
Fidelity Adv Strategic Income - CL T |
5.34% |
7.93% |
9.43% |
|
Fidelity Adv Strategic Income - CL T |
1.65% |
7.16% |
8.75% |
|
Fidelity Strategic Income Composite |
4.47% |
7.52% |
8.74% |
Average annual total returns take Class T's cumulative return and show you what would have happened if Class T had performed at a constant rate each year.3
Understanding
Performance
How a fund did yesterday is no guarantee of how it will do tomorrow. If you sell your shares during a market downturn, you might lose money. But if you can ride out the market's ups and downs, you may have a gain.
Semiannual Report
Fidelity Advisor Strategic Income Fund - Class T
$10,000 Over Life of Fund
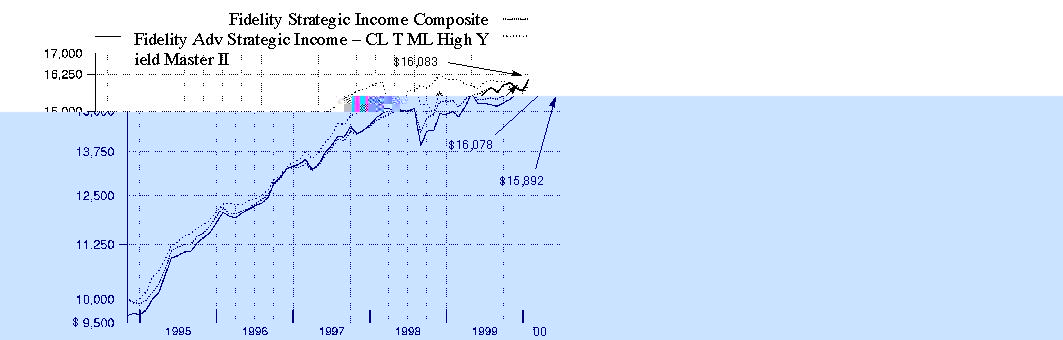
$10,000 Over Life of Fund: Let's say hypothetically that $10,000 was invested in Fidelity Advisor Strategic Income Fund - Class T on October 31, 1994, when the fund started, and the current 3.50% sales charge was paid. As the chart shows, by June 30, 2000, the value of the investment would have grown to $16,083 - a 60.83% increase on the initial investment. For comparison, look at how the Merrill Lynch High Yield Master II Index - a market value- weighted index of all domestic and yankee high-yield bonds, including deferred interest bonds and payment-in-kind securities - did over the same period. Issues included in the index have maturities of one year or more, and have a credit rating lower than BBB-/Baa3, but are not in default. With dividends and capital gains, if any, reinvested, the same $10,000 investment would have grown to $15,892 - a 58.92% increase. You can also look at how the Fidelity Strategic Income Composite Index - a hypothetical combination of unmanaged indices that is more representative of the fund's investable universe - did over the same period. This index combines returns from the J.P. Morgan Emerging Markets Bond Index Global, Lehman Brothers Government Bond Index, Merrill Lynch High Yield Master II Index, and the Salomon Brothers Non-U.S. Dollar World Government Bond Index, according to the fund's neutral mix .** With dividends and capital gains, if any, reinvested, the same $10,000 investment would have grown to $16,078 - a 60.78% increase.
** 40% high yield, 30% U.S. government and investment-grade,
15% emerging markets, and 15% foreign developed markets.
Semiannual Report
Fidelity Advisor Strategic Income Fund - Class T
Total Return Components
|
|
Six months
ended |
Years ended December 31, |
||||
|
|
2000 |
1999 |
1998 |
1997 |
1996 |
1995 |
|
Dividend returns |
3.30% |
6.91% |
6.56% |
7.29% |
7.73% |
8.65% |
|
Capital returns |
-1.53% |
-0.76% |
-4.30% |
2.04% |
5.16% |
13.37% |
|
Total returns |
1.77% |
6.15% |
2.26% |
9.33% |
12.89% |
22.02% |
Total return components include both dividend returns and capital returns. A dividend return reflects the actual dividends paid by the class. A capital return reflects both the amount paid by the class to shareholders as capital gain distributions and changes in the class' share price. Both returns assume the dividends or capital gains, if any, paid by the class are reinvested, and exclude the effect of sales charges.
Dividends and Yield
|
Periods ended June 30, 2000 |
Past 1 |
Past 6 |
Past 1 |
|
Dividends per share |
5.74 ¢ |
34.03 ¢ |
69.79 ¢ |
|
Annualized dividend rate |
6.79% |
6.62% |
6.75% |
|
30-day annualized yield |
7.51% |
- |
- |
Dividends per share show the income paid by the class for a set period. If you annualize this number, based on an average share price of $10.28 over the past one month, $10.31 over the past six months, and $10.34 over the past one year, you can compare the class' income over these three periods. The 30-day annualized yield is a standard formula for all bond funds based on the yields of the bonds in the fund, averaged over the past 30 days. This figure shows you the yield characteristics of the fund's investments at the end of the period. It also helps you to compare funds from different companies on an equal basis. The offering share price used in the calculation of the yield includes the effect of Class T's 3.50% sales charge.
Semiannual Report
Fidelity Advisor Strategic Income Fund - Class B
There are several ways to evaluate historical performance. You can look at the total percentage change in value, the average annual percentage change or the growth of a hypothetical $10,000 investment. Total return reflects the change in the value of an investment, assuming reinvestment of the class' dividend income and capital gains (the profits earned upon the sale of securities that have grown in value). You can also look at the class' income, as reflected in its yield to measure performance. Class B shares' contingent deferred sales charge included in the past six month, one year, five year and life of fund total return figures are 5%, 5%, 2% and 1%, respectively. If Fidelity had not reimbursed certain class expenses, the past five year and life of fund total returns would have been lower.
Cumulative Total Returns
|
Periods ended June 30, 2000 |
Past 6 |
Past 1 |
Past 5 |
Life of |
|
Fidelity Adv Strategic Income - CL B |
1.44% |
4.65% |
41.84% |
60.66% |
|
Fidelity Adv Strategic Income - CL B |
-3.49% |
-0.28% |
39.94% |
59.66% |
|
Fidelity Strategic Income Composite |
1.85% |
4.47% |
43.72% |
60.78% |
|
JP EMBI Global |
6.95% |
20.74% |
107.11% |
111.56% |
|
LB Government Bond |
4.97% |
5.01% |
35.12% |
50.89% |
|
ML High Yield Master II |
-1.00% |
-0.97% |
40.48% |
58.92% |
|
SB Non-US Dollar |
-1.95% |
2.41% |
8.81% |
28.05% |
|
Multi-Sector Income Funds Average |
0.43% |
2.09% |
35.58% |
n/a* |
Cumulative total returns show Class B's performance in percentage terms over a set period - in this case, six months, one year, five years or since the fund started on October 31, 1994. For example, if you had invested $1,000 in a fund that had a 5% return over the past year, the value of your investment would be $1,050. You can compare Class B's returns to those of the Merrill Lynch High Yield Master II Index - a market value-weighted index of all domestic and yankee high-yield bonds, including deferred interest bonds and payment-in-kind securities. Issues included in the index have maturities of one year or more and have a credit rating lower than BBB-/Baa3, but are not in default. Additionally you can also compare Class B's returns to those of the Fidelity Strategic Income Composite Index - a hypothetical combination of unmanaged indices. The composite index combines the total returns of the J.P. Morgan Emerging Markets Bond Index Global, the Lehman Brothers Government Bond Index, the Merrill Lynch High Yield Master II Index and the Salomon Brothers Non-U.S. Dollar World Government Bond Index weighted according to the fund's neutral mix. To measure how Class B's performance stacked up against its peers, you can compare it to the multi-sector income funds average, which reflects the performance of mutual funds with similar objectives tracked by Lipper Inc. The past six months average represents a peer group of 124 mutual funds. The benchmarks listed in the table above include reinvested dividends and capital gains, if any, and exclude the effect of sales charges.
* Not available
Semiannual Report
Fidelity Advisor Strategic Income Fund - Class B
Average Annual Total Returns
|
Periods ended June 30, 2000 |
Past 1 |
Past 5 |
Life of |
|
Fidelity Adv Strategic Income - CL B |
4.65% |
7.24% |
8.73% |
|
Fidelity Adv Strategic Income - CL B |
-0.28% |
6.95% |
8.61% |
|
Fidelity Strategic Income Composite |
4.47% |
7.52% |
8.74% |
Average annual total returns take Class B's cumulative return and show you what would have happened if Class B had performed at a constant rate each year. 3
Understanding
Performance
How a fund did yesterday is no guarantee of how it will do tomorrow. If you sell your shares during a market downturn, you might lose money. But if you can ride out the market's ups and downs, you may have a gain.
Semiannual Report
Fidelity Advisor Strategic Income Fund - Class B
$10,000 Over Life of Fund
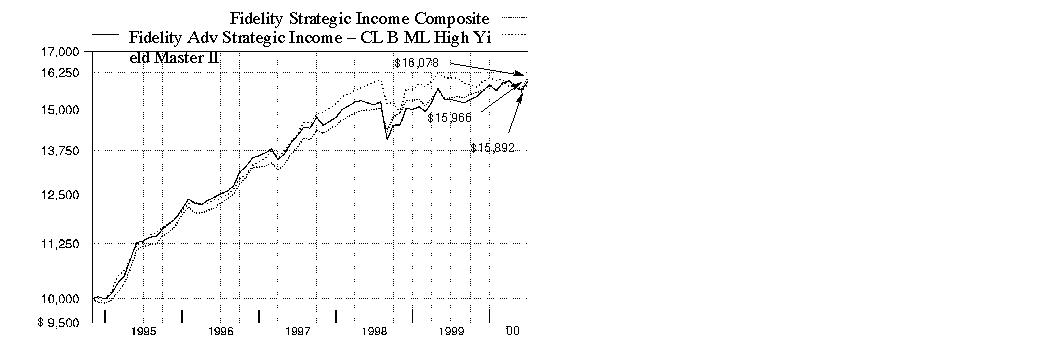
$10,000 Over Life of Fund: Let's say hypothetically that $10,000 was invested in Fidelity Advisor Strategic Income Fund - Class B on October 31, 1994, when the fund started. As the chart shows, by June 30, 2000, the value of the investment, including the effect of the contingent deferred sales charge, would have grown to $15,966 - a 59.66% increase on the initial investment. For comparison, look at how the Merrill Lynch High Yield Master II Index - a market value-weighted index of all domestic and yankee high-yield bonds, including deferred interest bonds and payment-in-kind securities - did over the same period. Issues included in the index have maturities of one year or more and have a credit rating lower than BBB-/Baa3, but are not in default. With dividends and capital gains, if any, reinvested, the same $10,000 investment would have grown to $15,892 - a 58.92% increase. You can also look at how the Fidelity Strategic Income Composite Index - a hypothetical combination of unmanaged indices that is more representative of the fund's investable universe - did over the same period. This index combines returns from the J.P. Morgan Emerging Markets Bond Index Global, Lehman Brothers Government Bond Index, Merrill Lynch High Yield Master II Index, and the Salomon Brothers Non-U.S. Dollar World Government Bond Index, according to the fund's neutral mix. ** With dividends and capital gains, if any, reinvested, the same $10,000 investment would have grown to $16,078 - a 60.78% increase.
** 40% high yield, 30% U.S. government and investment-grade,
15% emerging markets, and 15% foreign developed markets.
Semiannual Report
Fidelity Advisor Strategic Income Fund - Class B
Total Return Components
|
|
Six months
ended |
Years ended December 31, |
||||
|
|
1999 |
1999 |
1998 |
1997 |
1996 |
1995 |
|
Dividend returns |
2.96% |
6.21% |
5.89% |
6.58% |
7.00% |
7.78% |
|
Capital returns |
-1.52% |
-0.76% |
-4.20% |
2.02% |
5.14% |
13.57% |
|
Total returns |
1.44% |
5.45% |
1.69% |
8.60% |
12.14% |
21.35% |
Total return components include both dividend returns and capital returns. A dividend return reflects the actual dividends paid by the class. A capital return reflects both the amount paid by the class to shareholders as capital gain distributions and changes in the class' share price. Both returns assume the dividends or capital gains, if any, paid by the class are reinvested, and exclude the effect of sales charges.
Dividends and Yield
|
Periods ended June 30, 2000 |
Past 1 |
Past 6 |
Past 1 |
|
Dividends per share |
5.17 ¢ |
30.62 ¢ |
63.04 ¢ |
|
Annualized dividend rate |
6.11% |
5.94% |
6.08% |
|
30-day annualized yield |
7.08% |
- |
- |
Dividends per share show the income paid by the class for a set period. If you annualize this number based on an average share price of $10.29 over the past one month, $10.33 over the past six months, and $10.36 over the past one year, you can compare the class' income over these three periods. The 30-day annualized yield is a standard formula for all bond funds based on the yields of the bonds in the fund, averaged over the past 30 days. This figure shows you the yield characteristics of the fund's investments at the end of the period. It also helps you to compare funds from different companies on an equal basis. The offering share price used in the calculation of the yield excludes the effect of Class B's contingent deferred sales charge.
Semiannual Report
Fidelity Advisor Strategic Income Fund - Class C
There are several ways to evaluate historical performance. You can look at the total percentage change in value, the average annual percentage change or the growth of a hypothetical $10,000 investment. Total return reflects the change in the value of an investment, assuming reinvestment of the class' dividend income and capital gains (the profits earned upon the sale of securities that have grown in value). You can also look at the class' income, as reflected in its yield, to measure performance. The initial offering of Class C shares took place on November 3, 1997. Class C shares bear a 1.00% 12b-1 fee that is reflected in returns after November 3, 1997. Returns prior to November 3, 1997 are those of Class B shares and reflect Class B shares' 0.90% 12b-1 fee (1.00% prior to January 1, 1996). If Class C shares 12b-1 fee had been reflected, returns between January 1, 1996 and November 3, 1997 would have been lower. Class C shares' contingent deferred sales charge included in the past six month, one year, five year, and life of fund total return figures are 1%, 1%, 0% and 0%, respectively. If Fidelity had not reimbursed certain class expenses, the past five year and life of fund total returns and dividends would have been lower.
Cumulative Total Returns
|
Periods ended June 30, 2000 |
Past 6 |
Past 1 |
Past 5 |
Life of |
|
Fidelity Adv Strategic Income - CL C |
1.39% |
4.45% |
41.04% |
59.75% |
|
Fidelity Adv Strategic Income - CL C |
0.40% |
3.46% |
41.04% |
59.75% |
|
Fidelity Strategic Income Composite |
1.85% |
4.47% |
43.72% |
60.78% |
|
JP EMBI Global |
6.95% |
20.74% |
107.11% |
111.56% |
|
LB Government Bond |
4.97% |
5.01% |
35.12% |
50.89% |
|
ML High Yield Master II |
-1.00% |
-0.97% |
40.48% |
58.92% |
|
SB Non-US Dollar |
-1.95% |
2.41% |
8.81% |
28.05% |
|
Multi-Sector Income Funds Average |
0.43% |
2.09% |
35.58% |
n/a * |
Cumulative total returns show Class C's performance in percentage terms over a set period - in this case, six months, one year, five years or since the fund started on October 31, 1994. For example, if you had invested $1,000 in a fund that had a 5% return over the past year, the value of your investment would be $1,050. You can compare Class C's returns to those of the Merrill Lynch High Yield Master II Index - a market value-weighted index of all domestic and yankee high-yield bonds, including deferred interest bonds and payment-in-kind securities. Issues included in the index have maturities of one year or more and have a credit rating lower than BBB-/Baa3, but are not in default. Additionally you can also compare Class C's returns to those of the Fidelity Strategic Income Composite Index - a hypothetical combination of unmanaged indices. The composite index combines the total returns of the J.P. Morgan Emerging Markets Bond Index Global, the Lehman Brothers Government Bond Index, the Merrill Lynch High Yield Master II Index and the Salomon Brothers Non-U.S. Dollar World Government Bond Index weighted according to the fund's neutral mix. To measure how Class C's performance stacked up against its peers, you can compare it to the multi-sector income funds average, which reflects the performance of mutual funds with similar objectives tracked by Lipper Inc. The past six months average represents a peer group of 124 mutual funds. The benchmarks listed in the table above include reinvested dividends and capital gains, if any, and exclude the effect of sales charges.
* Not available
Semiannual Report
Fidelity Advisor Strategic Income Fund - Class C
Average Annual Total Returns
|
Periods ended June 30, 2000 |
Past 1 |
Past 5 |
Life of |
|
Fidelity Adv Strategic Income - CL C |
4.45% |
7.12% |
8.62% |
|
Fidelity Adv Strategic Income - CL C |
3.46% |
7.12% |
8.62% |
|
Fidelity Strategic Income Composite |
4.47% |
7.52% |
8.74% |
Average annual total returns take Class C's cumulative return and show you what would have happened if Class C had performed at a constant rate each year. 3
Understanding
Performance
How a fund did yesterday is no guarantee of how it will do tomorrow. If you sell your shares during a market downturn, you might lose money. But if you can ride out the market's ups and downs, you may have a gain.
Semiannual Report
Fidelity Advisor Strategic Income Fund - Class C
$10,000 Over Life of Fund
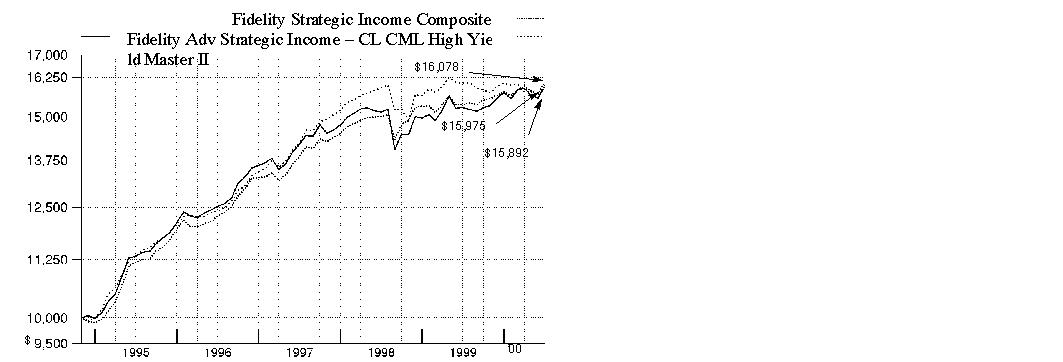
$10,000 Over Life of Fund: Let's say hypothetically that $10,000 was invested in Fidelity Advisor Strategic Income Fund - Class C on October 31, 1994, when the fund started. As the chart shows, by June 30, 2000, the value of the investment, would have grown to $15,975 - a 59.75% increase on the initial investment. For comparison, look at how the Merrill Lynch High Yield Master II Index - a market value-weighted index of all domestic and yankee high-yield bonds, including deferred interest bonds and payment-in-kind securities - did over the same period. Issues included in the index have maturities of one year or more and have a credit rating lower than BBB-/Baa3, but are not in default. With dividends and capital gains, if any, reinvested, the same $10,000 investment would have grown to $15,892 - a 58.92% increase. You can also look at how the Fidelity Strategic Income Composite Index - a hypothetical combination of unmanaged indices that is more representative of the fund's investable universe - did over the same period. This index combines returns from the J.P. Morgan Emerging Markets Bond Index Global, Lehman Brothers Government Bond Index, Merrill Lynch High Yield Master II Index, and the Salomon Brothers Non-U.S. Dollar World Government Bond Index, according to the fund's neutral mix. ** With dividends and capital gains, if any, reinvested, the same $10,000 investment would have grown to $16,078 - a 60.78% increase.
** 40% high yield, 30% U.S. government and investment-grade,
15% emerging markets, and 15% foreign developed markets.
Semiannual Report
Fidelity Advisor Strategic Income Fund - Class C
Total Return Components
|
|
Six months
ended |
Years ended December 31, |
November 3, 1997 |
|
|
|
2000 |
1999 |
1998 |
1997 |
|
Dividend returns |
2.91% |
6.10% |
5.63% |
1.36% |
|
Capital returns |
-1.52% |
-0.85% |
-4.21% |
-0.09% |
|
Total returns |
1.39% |
5.25% |
1.42% |
1.27% |
Total return components include both dividend returns and capital returns. A dividend return reflects the actual dividends paid by the class. A capital return reflects both the amount paid by the class to shareholders as capital gain distributions and changes in the class' share price. Both returns assume the dividends or capital gains, if any, paid by the class are reinvested, and exclude the effect of sales charges.
Dividends and Yield
|
Periods ended June 30, 2000 |
Past 1 |
Past 6 |
Past 1 |
|
Dividends per share |
5.09 ¢ |
30.06 ¢ |
61.94 ¢ |
|
Annualized dividend rate |
6.03% |
5.85% |
6.00% |
|
30-day annualized yield |
7.00% |
- |
- |
Dividends per share show the income paid by the class for a set period. If you annualize this number based on an average share price of $10.27 over the past one month, $10.31 over the past six months, and $10.33 over the past one year, you can compare the class' income over these three periods. The 30-day annualized yield is a standard formula for all bond funds based on the yields of the bonds in the fund, averaged over the past 30 days. This figure shows you the yield characteristics of the fund's investments at the end of the period. It also helps you to compare funds from different companies on an equal basis. The offering share price used in the calculation of the yield excludes the effect of Class C's contingent deferred sales charge.
Semiannual Report
Market Recap
International bond investors faced a myriad of negative factors throughout the majority of the six-month period ending June 30, 2000. Strong global economic growth and the threat of rising interest rates, currency fluctuations, and a weakening euro continued to plague global debt issues. Additionally, poor liquidity hampered bond prices in non-U.S. developed markets, particularly in the high-yield bond area, which historically is less sensitive to interest rates and driven more by credit fundamentals. High-yield bonds suffered as a result of declining demand and an increase in the default rate - except for telecommunications issues, which got a boost from the sector's global appeal for wireless communications. Those factors helped drag down the Salomon Brothers Non-U.S. World Government Bond Index, which returned -1.95%. On the bright side, a number of favorable factors propelled demand for emerging-market bonds, which was reflected in the 6.95% return of the J.P. Morgan Emerging Markets Bond Index Global - a popular benchmark of emerging market debt. Credit momentum, which was driven by improving fundamentals - such as the Russian government's Soviet-era debt restructuring and new political leadership - fostered the rally in emerging-market bonds. Elsewhere, Brazil's better-than-expected economic growth fueled a sharp increase in foreign direct investment. Often large commodity suppliers, emerging-market countries also benefited from a sharp increase in oil prices.
(Portfolio Manager photograph)
The following is an interview with John Carlson (top left), Lead Portfolio Manager of Fidelity Advisor Strategic Income Fund, with additional
comments from Kevin Grant (top right), on U.S. government and investment-grade securities; Mark Notkin (lower left) on high-yield securities; and
Ian Spreadbury (lower right) on foreign developed-market securities. John Carlson also manages the emerging-markets portion of the fund.
Q. How did the fund perform, John?
J.C. For the six months ending June 30, 2000, the fund's Class A, Class T, Class B and Class C shares returned 1.90%, 1.77%, 1.44% and 1.39%, respectively. The multi-sector income funds average, as tracked by Lipper Inc., returned 0.43%. Meanwhile, the Merrill Lynch High Yield Master II Index returned -1.00%. For the 12 months ending June 30, 2000, the fund's Class A, Class T, Class B and Class C shares returned 5.41%, 5.34%, 4.65% and 4.45%, respectively, while the Lipper average returned 2.09% and the Merrill Lynch index returned -0.97%.
Semiannual Report
Fund Talk: The Managers' Overview - continued
Q. What helped the fund outperform its benchmarks?
J.C. Three of the four subportfolios that make up the fund - high yield, non-U.S. developed markets and emerging markets - outperformed their respective benchmarks. The subportfolio managers will discuss this in more detail below.
Q. Kevin, what was your strategy for the U.S. government sector?
K.G. The subportfolio is designed to be the low risk portion of the fund. Most of the subportfolio's holdings are in U.S. Treasuries and agency issues, which are high-quality, liquid instruments. While the subportfolio did not outperform its benchmark, it did meet its objective of providing liquidity and security for the other subportfolios that make up the fund.
Q. Mark, how did the high-yield subportfolio achieve its outperformance?
M.N. Despite the high-yield market being negatively affected by rising interest rates, wider credit spreads, volatile equity markets and fears of an economic slowdown,
the subportfolio was able to outperform its benchmark. This was a result primarily of industry selection and, to a lesser extent, security selection. The portfolio's
underweighted position relative to its benchmark in the steel, automotive and entertainment sectors more than offset the negative performance of our overweighted
position in cable and underweighting in energy. The steel and
automotive sectors were negatively impacted by fears of an economic slowdown, while poor fundamentals in the movie theater industry drove the entertainment arena
downward. Energy benefited from robust oil and gas prices, and the cable industry was hurt by too much competition and a disappointing rollout of new services.
Q. Which securities helped and which hampered performance?
M.N. Positive contributions were made by Winstar, a wireless CLEC (competitive local exchange carrier); Laboratory Corp., one of the few large players left in the consolidating clinical laboratory testing business; and Voicestream Wireless, the owner and operator of one of the few national wireless platforms in the U.S. Unfortunately, these gains were somewhat offset by the poor stock performance of Signature Resorts, Kitty Hawk and GST Telecom, which are no longer in the fund.
Q. John, what events affected the emerging-market debt sector?
J.C. The year started off with one of the most important events - the resignation of Russian President Boris Yeltsin on New Year's Eve. Vladimir Putin, who acted as president until he was formally elected in March, enacted a number of reforms to enhance governability and the rule of law, which increased local and foreign investor confidence and drove asset prices upward. The Russian government also completed a restructuring of Soviet-era debt with private investors. Russia's performance was helped by the continued firmness in oil prices, providing an enormous boost to the country's external accounts. Mexico's story in the first half of this year is also noteworthy. Recognizing Mexico's strong fiscal discipline, reduced risk from the banking sector and increasing integration into the world economy, Moody's Credit Investor Services raised the country's rating to investment-grade level. In addition, with elections slated for the first week in July, President Ernesto Zedillo has been working diligently to avoid the election-related problems of the past. Finally, with respect to the overall market, many countries took advantage of ongoing strength in commodity prices, particularly oil, and continued growth in the U.S.
Semiannual Report
Fund Talk: The Managers' Overview - continued
Q. Ian, what were the factors that
influenced the non-U.S. developed
country subportfolio and what was
your strategy?
I.S. The subportfolio surpassed its benchmark by utilizing active security selection. The key factor was monetary tightening in both the United Kingdom and Euroland - the euro market countries. The Bank of England and the European Central Bank increased interest rates in an effort to slow their respective economies. Credit markets continued to underperform, driven by a number of factors including an increased level of corporate supply, reduced levels of government supply and equity volatility. In response, I reduced the subportfolio's credit exposure and increased holdings in government issues, since the outlook for the credit sector remained uncertain. In the euro market, I added value by utilizing a barbell approach, meaning the subportfolio's holdings were underweighted at the shorter durations, while overweighted in cash and 10-year duration bonds - in anticipation of an inversion in the yield curve and rising rates. In Japan, the economy showed some signs of recovery, as the government maintained its zero percent interest-rate policy in an attempt to encourage growth. As a result, the subportfolio maintained a short-duration position relative to the benchmark since interest rates remained very low both at the short and long-end of the yield curve.
Q. John, as lead portfolio manager, what's your outlook?
J.C. I see continued demand for credit product given current low yields and lack of supply at the long-end of the U.S. yield curve. Since I expect that fundamentals will drive the performance of credits in high-yield and emerging markets, we'll continue to focus Fidelity's research strength on selecting debt and securities that can enable the fund to continue outperforming.
The views expressed in this report reflect those of the portfolio managers only through the end of the period of the report as stated on the cover and do not necessarily represent the views of Fidelity or any other person in the Fidelity organization. Any such views are subject to change at any time based upon market or other conditions and Fidelity disclaims any responsibility to update such views. These views may not be relied on as investment advice and, because investment decisions for a Fidelity fund are based on numerous
Semiannual Report
Fund Talk: The Managers' Overview - continued
factors, may not be relied on as an indication of trading intent on behalf of any Fidelity fund.
Fund Facts
Goal: a high level of current income by investing primarily in debt securities; as a secondary objective, the fund may seek capital appreciation
Start date: October 31, 1994
Size: as of June 30, 2000, more than $321 million
Manager: John Carlson, lead and emerging-markets manager, since 1995 and 1999, respectively; Kevin Grant, U.S. government investments, since 1998; Mark Notkin, high-yield investments, since 1999; and Ian Spreadbury, foreign developed-market securities, since 1998
3John Carlson discusses emerging markets - five years later:
"This year marks my fifth anniversary managing Fidelity's emerging-market debt funds and funds holding positions in emerging markets. Over the past five years, the emerging-market debt marketplace has evolved positively, becoming more efficient, deeper and broader.
"When I began managing these funds, the benchmark index used was the J.P. Morgan Emerging Markets Bond Index, which included nine countries, was 88% invested in Latin America and contained no investment-grade securities. The current index used as the benchmark is the J.P. Morgan Emerging Markets Bond Index Global. As the marketplace has evolved, the index also changed to reflect greater diversification and today includes 27 countries, only 65% exposure to Latin America and now 30% in investment-grade securities. In addition, the new index holds a greater number of securities and has a much larger market capitalization - $190 billion as of June 30, 2000, compared to $66 billion as of June 30, 1995.
"The changes in the marketplace and the index complement our portfolio management style. We have always looked for undervalued, out-of-index countries and securities in an effort to enhance performance and achieve better diversification for the portfolios we manage. I remain optimistic about emerging-market debt and look forward to continued growth and development in this marketplace."
Semiannual Report
|
Top Five Holdings as of June 30, 2000 |
||
|
(by issuer, excluding cash equivalents) |
% of fund's |
% of fund's net assets |
|
U.S. Treasury Obligations |
16.9 |
15.5 |
|
Germany Federal Republic |
5.2 |
1.8 |
|
Fannie Mae |
4.9 |
5.3 |
|
Brazilian Federative Rep. |
2.8 |
2.7 |
|
Canadian Government |
2.5 |
3.0 |
|
|
32.3 |
28.3 |
|
Top Five Market Sectors as of June 30, 2000 |
||
|
|
% of fund's |
% of fund's net assets |
|
Media & Leisure |
16.8 |
16.7 |
|
Utilities |
9.6 |
10.0 |
|
Basic Industries |
3.1 |
3.9 |
|
Finance |
3.0 |
2.0 |
|
Technology |
2.2 |
2.1 |
|
Quality Diversification as of June 30, 2000 |
||
|
(Moody's Ratings) |
% of fund's investments |
% of fund's investments |
|
Aaa, Aa, A |
43.3 |
42.4 |
|
Baa |
3.2 |
1.2 |
|
Ba |
3.2 |
4.8 |
|
B |
34.4 |
34.4 |
|
Caa, Ca, C |
4.3 |
5.7 |
|
Not Rated |
2.7 |
2.2 |
|
Table excludes short-term investments. Where Moody's ratings are not available, we have used |
|
Asset Allocation (% of fund's net assets) |
|||||||
|
As of June 30, 2000 * |
As of December 31, 1999 ** |
||||||
 |
Corporate Bonds 35.8% |
|
|
Corporate Bonds 35.6% |
|
||
 |
U.S. Government and Government Agency Obligations 29.2% |
|
|
U.S. Government and Government Agency Obligations 29.0% |
|
||
 |
Foreign Government & Government Agency Obligations 23.5% |
|
|
Foreign Government & Government Agency Obligations 23.0% |
|
||
 |
Stocks 4.9% |
|
|
Stocks 6.6% |
|
||
 |
Other Investments 1.9% |
|
|
Other Investments 1.5% |
|
||
 |
Short-Term |
|
|
Short-Term |
|
||
|
* Foreign investments |
31.5% |
|
** Foreign investments |
31.8% |
|
||

Semiannual Report
(Unaudited)
Showing Percentage of Net Assets
|
Corporate Bonds - 35.8% |
|||||
|
Moody's Ratings (unaudited) (b) |
Principal Amount (d) |
Value |
|||
|
Convertible Bonds - 0.6% |
|||||
|
HEALTH - 0.2% |
|||||
|
Medical Facilities Management - 0.2% |
|||||
|
Total Renal Care Holdings, Inc. 7% 5/15/09 |
B1 |
|
$ 860,000 |
$ 571,900 |
|
|
MEDIA & LEISURE - 0.3% |
|||||
|
Broadcasting - 0.3% |
|||||
|
EchoStar Communications Corp. 4.875% 1/1/07 (g) |
- |
|
600,000 |
570,750 |
|
|
NTL, Inc. 5.75% 12/15/09 (g) |
CCC+ |
|
344,000 |
271,760 |
|
|
|
842,510 |
||||
|
RETAIL & WHOLESALE - 0.1% |
|||||
|
Retail & Wholesale, Miscellaneous - 0.1% |
|||||
|
Sunglass Hut International, Inc. 5.25% 6/15/03 |
B3 |
|
660,000 |
476,025 |
|
|
TOTAL CONVERTIBLE BONDS |
1,890,435 |
||||
|
Nonconvertible Bonds - 35.2% |
|||||
|
BASIC INDUSTRIES - 3.1% |
|||||
|
Chemicals & Plastics - 1.9% |
|||||
|
Avecia Group PLC 11% 7/1/09 |
B2 |
|
840,000 |
823,200 |
|
|
Berry Plastics Corp. 11% 7/15/07 |
B3 |
|
590,000 |
528,050 |
|
|
Huntsman Corp. 9.5% 7/1/07 (g) |
B2 |
|
940,000 |
857,750 |
|
|
Huntsman ICI Chemicals LLC 10.125% 7/1/09 |
B2 |
|
1,200,000 |
1,200,000 |
|
|
Lyondell Chemical Co.: |
|
|
|
|
|
|
9.625% 5/1/07 |
Ba3 |
|
750,000 |
742,500 |
|
|
9.875% 5/1/07 |
Ba3 |
|
1,230,000 |
1,217,700 |
|
|
Sovereign Specialty Chemicals, Inc. 11.875% 3/15/10 |
B3 |
|
795,000 |
817,856 |
|
|
|
6,187,056 |
||||
|
Metals & Mining - 0.3% |
|||||
|
Better Minerals & Aggregates Co. 13% 9/15/09 |
B3 |
|
280,000 |
271,600 |
|
|
Kaiser Aluminum & Chemical Corp. 12.75% 2/1/03 |
B3 |
|
780,000 |
709,800 |
|
|
|
981,400 |
||||
|
Corporate Bonds - continued |
|||||
|
Moody's Ratings (unaudited) (b) |
Principal Amount (d) |
Value |
|||
|
Nonconvertible Bonds - continued |
|||||
|
BASIC INDUSTRIES - continued |
|||||
|
Packaging & Containers - 0.4% |
|||||
|
Gaylord Container Corp.: |
|
|
|
|
|
|
9.375% 6/15/07 |
Caa1 |
|
$ 520,000 |
$ 400,400 |
|
|
9.75% 6/15/07 |
Caa1 |
|
1,125,000 |
877,500 |
|
|
|
1,277,900 |
||||
|
Paper & Forest Products - 0.5% |
|||||
|
Container Corp. of America: |
|
|
|
|
|
|
gtd.: |
|
|
|
|
|
|
9.75% 4/1/03 |
B2 |
|
210,000 |
208,950 |
|
|
11.25% 5/1/04 |
B2 |
|
50,000 |
50,750 |
|
|
10.75% 5/1/02 |
B2 |
|
70,000 |
71,225 |
|
|
Repap New Brunswick, Inc. yankee 10.625% 4/15/05 |
Caa1 |
|
470,000 |
413,600 |
|
|
Stone Container Corp. 12.58% 8/1/16 (h) |
B2 |
|
560,000 |
576,800 |
|
|
Tjiwi Kimia International Finance Co. 13.25% 8/1/01 |
Caa1 |
|
270,000 |
237,600 |
|
|
|
1,558,925 |
||||
|
TOTAL BASIC INDUSTRIES |
10,005,281 |
||||
|
CONSTRUCTION & REAL ESTATE - 0.6% |
|||||
|
Construction - 0.1% |
|||||
|
Blount, Inc. 13% 8/1/09 |
B3 |
|
490,000 |
498,575 |
|
|
Engineering - 0.2% |
|||||
|
360networks, Inc. 13% 5/1/08 (g) |
B3 |
|
635,000 |
628,650 |
|
|
Real Estate Investment Trusts - 0.3% |
|||||
|
Pinnacle Holdings, Inc. 0% 3/15/08 (e) |
B3 |
|
1,235,000 |
858,325 |
|
|
TOTAL CONSTRUCTION & REAL ESTATE |
1,985,550 |
||||
|
DURABLES - 0.4% |
|||||
|
Home Furnishings - 0.4% |
|||||
|
Omega Cabinets Ltd. 10.5% 6/15/07 |
B3 |
|
720,000 |
648,000 |
|
|
Sealy Corp., Inc. 10% 12/18/08 pay-in-kind (k) |
- |
|
676,406 |
581,709 |
|
|
Sealy Mattress Co. 9.875% 12/15/07 |
B3 |
|
170,000 |
163,200 |
|
|
|
1,392,909 |
||||
|
Corporate Bonds - continued |
|||||
|
Moody's Ratings (unaudited) (b) |
Principal Amount (d) |
Value |
|||
|
Nonconvertible Bonds - continued |
|||||
|
DURABLES - continued |
|||||
|
Textiles & Apparel - 0.0% |
|||||
|
St. John Knits International, Inc. 12.5% 7/1/09 |
B3 |
|
$ 75,000 |
$ 71,250 |
|
|
TOTAL DURABLES |
1,464,159 |
||||
|
ENERGY - 0.4% |
|||||
|
Energy Services - 0.3% |
|||||
|
Petroliam Nasional BHD (Petronas): |
|
|
|
|
|
|
7.125% 10/18/06 (Reg. S) |
Baa3 |
|
355,000 |
335,919 |
|
|
7.625% 10/15/26 (Reg. S) |
Baa3 |
|
250,000 |
214,063 |
|
|
yankee 7.625% 10/15/26 (g) |
Baa3 |
|
570,000 |
488,063 |
|
|
|
1,038,045 |
||||
|
Oil & Gas - 0.1% |
|||||
|
Petroleos Mexicanos 9.4367% 7/15/05 |
Baa3 |
|
235,000 |
235,588 |
|
|
TOTAL ENERGY |
1,273,633 |
||||
|
FINANCE - 2.9% |
|||||
|
Banks - 1.0% |
|||||
|
Banco Nacional de Comercio Exterior SNC 11.25% 5/30/06 |
Baa3 |
|
525,000 |
560,438 |
|
|
Banco Nacional de Desenvolvimento Economico e Social: |
|
|
|
|
|
|
12.554% 6/16/08 (h) |
B2 |
|
2,130,000 |
1,994,213 |
|
|
12.554% 6/16/08 (g)(h) |
B2 |
|
500,000 |
468,125 |
|
|
|
3,022,776 |
||||
|
Credit & Other Finance - 1.9% |
|||||
|
Ahold Finance USA, Inc. euro 6.375% 6/8/05 |
A3 |
EUR |
1,000,000 |
962,168 |
|
|
AMRESCO, Inc. 9.875% 3/15/05 |
Caa3 |
|
351,000 |
163,215 |
|
|
APP International Finance (Mauritius) Ltd. 0% 7/5/01 (g) |
B3 |
|
520,000 |
410,800 |
|
|
APP International Finance Co. 11.75% 10/1/05 |
Caa1 |
|
170,000 |
119,000 |
|
|
Astra Overseas Finance BV: |
|
|
|
|
|
|
6.7775% 6/30/05 (Reg.S) (h) |
- |
|
103,062 |
62,353 |
|
|
6.7775% 6/30/05 (g)(h) |
- |
|
92,755 |
56,117 |
|
|
Dobson/Sygnet Communications Co. 12.25% 12/15/08 |
- |
|
625,000 |
660,938 |
|
|
Ford Motor Credit Co. euro 1.2% 2/7/05 |
A1 |
JPY |
300,000,000 |
2,806,107 |
|
|
Kappa Beheer BV 10.625% 7/15/09 |
B2 |
|
715,000 |
715,000 |
|
|
Corporate Bonds - continued |
|||||
|
Moody's Ratings (unaudited) (b) |
Principal Amount (d) |
Value |
|||
|
Nonconvertible Bonds - continued |
|||||
|
FINANCE - continued |
|||||
|
Credit & Other Finance - continued |
|||||
|
Netia Holdings II BV euro 13.5% 6/15/09 |
B3 |
EUR |
230,000 |
$ 221,603 |
|
|
Stone Container Finance Co. 11.5% 8/15/06 (g) |
B2 |
|
120,000 |
124,200 |
|
|
|
6,301,501 |
||||
|
TOTAL FINANCE |
9,324,277 |
||||
|
HEALTH - 1.3% |
|||||
|
Medical Facilities Management - 1.3% |
|||||
|
Everest Healthcare Services, Inc. 9.75% 5/1/08 |
B3 |
|
740,000 |
621,600 |
|
|
Express Scripts, Inc. 9.625% 6/15/09 |
Ba2 |
|
630,000 |
614,250 |
|
|
Fountain View, Inc. 11.25% 4/15/08 |
Caa1 |
|
200,000 |
49,000 |
|
|
Hanger Orthopedic Group, Inc. 11.25% 6/15/09 |
B3 |
|
490,000 |
441,000 |
|
|
Mariner Post-Acute Network, Inc. 9.5% 11/1/07 (c) |
C |
|
1,136,000 |
114 |
|
|
Oxford Health Plans, Inc. 11% 5/15/05 |
B2 |
|
930,000 |
960,225 |
|
|
Unilab Corp. 12.75% 10/1/09 |
B3 |
|
1,330,000 |
1,369,900 |
|
|
|
4,056,089 |
||||
|
INDUSTRIAL MACHINERY & EQUIPMENT - 1.5% |
|||||
|
Electrical Equipment - 0.2% |
|||||
|
Motors & Gears, Inc. 10.75% 11/15/06 |
B3 |
|
570,000 |
547,200 |
|
|
Industrial Machinery & Equipment - 0.4% |
|||||
|
Applied Power, Inc. 8.75% 4/1/09 |
B1 |
|
810,000 |
838,350 |
|
|
Dunlop Standard Aero Holdings PLC 11.875% 5/15/09 |
B3 |
|
480,000 |
475,200 |
|
|
|
1,313,550 |
||||
|
Corporate Bonds - continued |
|||||
|
Moody's Ratings (unaudited) (b) |
Principal Amount (d) |
Value |
|||
|
Nonconvertible Bonds - continued |
|||||
|
INDUSTRIAL MACHINERY & EQUIPMENT - continued |
|||||
|
Pollution Control - 0.9% |
|||||
|
Allied Waste North America, Inc. 7.875% 1/1/09 |
Ba2 |
|
$ 2,145,000 |
$ 1,823,250 |
|
|
Browning-Ferris Industries, Inc. 7.4% 9/15/35 |
Ba3 |
|
1,640,000 |
1,131,600 |
|
|
|
2,954,850 |
||||
|
TOTAL INDUSTRIAL MACHINERY & EQUIPMENT |
4,815,600 |
||||
|
MEDIA & LEISURE - 14.7% |
|||||
|
Broadcasting - 12.8% |
|||||
|
ACME Television LLC/ACME Financial Corp. |
B3 |
|
1,020,000 |
974,100 |
|
|
Adelphia Communications Corp.: |
|
|
|
|
|
|
8.375% 2/1/08 |
B1 |
|
370,000 |
326,525 |
|
|
9.25% 10/1/02 |
B1 |
|
280,000 |
275,100 |
|
|
Ascent Entertainment Group, Inc. 0% 12/15/04 (e) |
Ba1 |
|
380,000 |
307,800 |
|
|
Callahan Nordrhein Westfalen 14% 7/15/10 (g) |
B3 |
|
1,260,000 |
1,261,576 |
|
|
CapStar Broadcasting Partners, Inc.: |
|
|
|
|
|
|
0% 2/1/09 (e) |
B2 |
|
315,000 |
287,438 |
|
|
9.25% 7/1/07 |
B1 |
|
1,010,000 |
1,016,313 |
|
|
Century Communications Corp.: |
|
|
|
|
|
|
Series B, 0% 1/15/08 |
B1 |
|
3,330,000 |
1,365,300 |
|
|
8.375% 12/15/07 |
B1 |
|
20,000 |
17,450 |
|
|
8.75% 10/1/07 |
B1 |
|
90,000 |
81,000 |
|
|
9.5% 3/1/05 |
B1 |
|
60,000 |
57,750 |
|
|
Chancellor Media Corp.: |
|
|
|
|
|
|
8.125% 12/15/07 |
B1 |
|
250,000 |
251,563 |
|
|
9% 10/1/08 |
B1 |
|
2,720,000 |
2,774,400 |
|
|
Charter Communications Holdings LLC/Charter Communications Holdings Capital Corp.: |
|
|
|
|
|
|
0% 1/15/10 (e) |
B2 |
|
1,770,000 |
1,004,475 |
|
|
0% 4/1/11 (e) |
B2 |
|
2,600,000 |
1,475,500 |
|
|
Citadel Broadcasting Co.: |
|
|
|
|
|
|
9.25% 11/15/08 |
B3 |
|
1,320,000 |
1,280,400 |
|
|
10.25% 7/1/07 |
B3 |
|
2,030,000 |
2,057,913 |
|
|
Comcast UK Cable Partners Ltd. 0% 11/15/07 (e) |
B2 |
|
220,000 |
204,600 |
|
|
Diamond Cable Communications PLC yankee |
B3 |
|
696,000 |
650,760 |
|
|
Corporate Bonds - continued |
|||||
|
Moody's Ratings (unaudited) (b) |
Principal Amount (d) |
Value |
|||
|
Nonconvertible Bonds - continued |
|||||
|
MEDIA & LEISURE - continued |
|||||
|
Broadcasting - continued |
|||||
|
Earthwatch, Inc. 0% 7/15/07 unit (e)(g) |
- |
|
$ 700,000 |
$ 448,000 |
|
|
EchoStar DBS Corp. 9.375% 2/1/09 |
B2 |
|
1,800,000 |
1,737,000 |
|
|
Fox Family Worldwide, Inc. 0% 11/1/07 (e) |
B1 |
|
1,920,000 |
1,190,400 |
|
|
FrontierVision Holdings LP/FrontierVision Holdings Capital Corp. 0% 9/15/07 (e) |
B1 |
|
901,000 |
777,113 |
|
|
Golden Sky DBS, Inc. 0% 3/1/07 (e) |
Caa1 |
|
2,505,000 |
1,684,613 |
|
|
Golden Sky Systems, Inc. 12.375% 8/1/06 |
B3 |
|
300,000 |
327,000 |
|
|
LIN Holdings Corp. 0% 3/1/08 (e) |
B3 |
|
1,240,000 |
815,300 |
|
|
NorthPoint Communication Holdings, Inc. 12.875% 2/15/10 |
Caa1 |
|
520,000 |
358,800 |
|
|
NTL Communications Corp.: |
|
|
|
|
|
|
0% 10/1/08 (e) |
B3 |
|
6,975,000 |
4,481,438 |
|
|
11.5% 10/1/08 |
B3 |
|
1,080,000 |
1,088,100 |
|
|
NTL, Inc. 0% 4/1/08 (e) |
B3 |
|
890,000 |
551,800 |
|
|
Olympus Communications LP/Olympus Capital Corp. 10.625% 11/15/06 |
B1 |
|
90,000 |
88,200 |
|
|
Pegasus Communications Corp. 12.5% 8/1/17 |
B3 |
|
1,010,000 |
1,070,600 |
|
|
Satelites Mexicanos SA de CV 10.125% 11/1/04 |
B3 |
|
580,000 |
391,500 |
|
|
Susquehanna Media Co. 8.5% 5/15/09 |
B1 |
|
90,000 |
85,500 |
|
|
Telemundo Holdings, Inc. 0% 8/15/08 (e) |
Caa1 |
|
3,405,000 |
2,366,475 |
|
|
Telewest Communications PLC: |
|
|
|
|
|
|
0% 4/15/09 (e) |
B1 |
|
2,030,000 |
1,116,500 |
|
|
0% 2/1/10 (e)(g) |
B1 |
|
2,970,000 |
1,574,100 |
|
|
9.875% 2/1/10 (g) |
B1 |
|
350,000 |
325,500 |
|
|
11.25% 11/1/08 |
B1 |
|
170,000 |
170,000 |
|
|
Telewest PLC yankee 9.625% 10/1/06 |
B1 |
|
625,000 |
587,500 |
|
|
United Pan-Europe Communications NV: |
|
|
|
|
|
|
0% 8/1/09 (e) |
B2 |
|
1,160,000 |
580,000 |
|
|
10.875% 8/1/09 |
B2 |
|
3,690,000 |
3,247,200 |
|
|
11.5% 2/1/10 |
B2 |
|
300,000 |
268,500 |
|
|
|
41,001,102 |
||||
|
Entertainment - 0.5% |
|||||
|
Bally Total Fitness Holding Corp. 9.875% 10/15/07 |
B3 |
|
455,000 |
414,050 |
|
|
Livent, Inc. 9.375% 10/15/04 (c) |
- |
|
300,000 |
60,000 |
|
|
Corporate Bonds - continued |
|||||
|
Moody's Ratings (unaudited) (b) |
Principal Amount (d) |
Value |
|||
|
Nonconvertible Bonds - continued |
|||||
|
MEDIA & LEISURE - continued |
|||||
|
Entertainment - continued |
|||||
|
Premier Parks, Inc.: |
|
|
|
|
|
|
0% 4/1/08 (e) |
B3 |
|
$ 1,170,000 |
$ 794,138 |
|
|
9.25% 4/1/06 |
B3 |
|
480,000 |
453,600 |
|
|
|
1,721,788 |
||||
|
Lodging & Gaming - 1.4% |
|||||
|
Florida Panthers Holdings, Inc. 9.875% 4/15/09 |
B2 |
|
930,000 |
869,550 |
|
|
HMH Properties, Inc. 7.875% 8/1/05 |
Ba2 |
|
700,000 |
644,000 |
|
|
Horseshoe Gaming LLC: |
|
|
|
|
|
|
8.625% 5/15/09 |
B2 |
|
480,000 |
451,200 |
|
|
9.375% 6/15/07 |
B+ |
|
890,000 |
883,325 |
|
|
ITT Corp. 7.375% 11/15/15 |
Ba1 |
|
720,000 |
603,000 |
|
|
KSL Recreation Group, Inc. 10.25% 5/1/07 |
B2 |
|
320,000 |
304,000 |
|
|
Station Casinos, Inc. 8.875% 12/1/08 |
B1 |
|
745,000 |
709,613 |
|
|
|
4,464,688 |
||||
|
TOTAL MEDIA & LEISURE |
47,187,578 |
||||
|
NONDURABLES - 0.4% |
|||||
|
Foods - 0.4% |
|||||
|
Del Monte Corp. 12.25% 4/15/07 |
B3 |
|
252,000 |
267,120 |
|
|
Del Monte Foods Co. 0% 12/15/07 (e) |
Caa1 |
|
1,564,000 |
1,173,000 |
|
|
|
1,440,120 |
||||
|
RETAIL & WHOLESALE - 0.2% |
|||||
|
Grocery Stores - 0.2% |
|||||
|
Pathmark Stores, Inc. 9.625% 5/1/03 (c) |
Caa3 |
|
910,000 |
627,900 |
|
|
SERVICES - 0.5% |
|||||
|
Printing - 0.4% |
|||||
|
Sullivan Graphics, Inc. 12.75% 8/1/05 |
Caa1 |
|
720,000 |
723,600 |
|
|
Von Hoffman Corp. 13.5% 5/15/09 pay-in-kind (g) |
- |
|
740,131 |
666,118 |
|
|
|
1,389,718 |
||||
|
Services - 0.1% |
|||||
|
Medaphis Corp. 9.5% 2/15/05 |
Caa1 |
|
190,000 |
142,500 |
|
|
TOTAL SERVICES |
1,532,218 |
||||
|
Corporate Bonds - continued |
|||||
|
Moody's Ratings (unaudited) (b) |
Principal Amount (d) |
Value |
|||
|
Nonconvertible Bonds - continued |
|||||
|
TECHNOLOGY - 2.1% |
|||||
|
Computer Services & Software - 1.2% |
|||||
|
Covad Communications Group, Inc.: |
|
|
|
|
|
|
0% 3/15/08 (e) |
B3 |
|
$ 510,000 |
$ 249,900 |
|
|
12% 2/15/10 |
B3 |
|
510,000 |
395,250 |
|
|
12.5% 2/15/09 |
B3 |
|
784,000 |
623,280 |
|
|
Federal Data Corp. 10.125% 8/1/05 |
B3 |
|
760,000 |
494,000 |
|
|
PSINet, Inc. 11% 8/1/09 |
B3 |
|
1,460,000 |
1,350,500 |
|
|
Verio, Inc. 11.25% 12/1/08 |
B3 |
|
705,000 |
775,500 |
|
|
|
3,888,430 |
||||
|
Computers & Office Equipment - 0.1% |
|||||
|
Globix Corp. 12.5% 2/1/10 |
B- |
|
580,000 |
478,500 |
|
|
Electronic Instruments - 0.2% |
|||||
|
Telecommunications Techniques Co. LLC 9.75% 5/15/08 |
B3 |
|
624,000 |
574,080 |
|
|
Electronics - 0.6% |
|||||
|
ChipPAC International Ltd. 12.75% 8/1/09 |
B3 |
|
385,000 |
413,875 |
|
|
Details, Inc. 10% 11/15/05 |
B3 |
|
65,000 |
61,750 |
|
|
Fairchild Semiconductor Corp. 10.125% 3/15/07 |
B2 |
|
595,000 |
600,950 |
|
|
Flextronics International Ltd. 9.875% 7/1/10 (g) |
Ba3 |
|
365,000 |
370,475 |
|
|
Intersil Corp. 13.25% 8/15/09 |
B3 |
|
294,000 |
335,160 |
|
|
|
1,782,210 |
||||
|
TOTAL TECHNOLOGY |
6,723,220 |
||||
|
UTILITIES - 7.1% |
|||||
|
Cellular - 4.8% |
|||||
|
Comunicacion Celular SA 0% 3/1/05 (e)(g) |
B3 |
|
310,000 |
229,400 |
|
|
Crown Castle International Corp. 0% 5/15/11 (e) |
B3 |
|
1,970,000 |
1,201,700 |
|
|
Leap Wireless International, Inc.: |
|
|
|
|
|
|
0% 4/15/10 (e)(g) |
- |
|
450,000 |
189,000 |
|
|
12.5% 4/15/10 (g) |
Caa2 |
|
775,000 |
682,000 |
|
|
McCaw International Ltd. 0% 4/15/07 (e) |
Caa1 |
|
930,000 |
706,800 |
|
|
Millicom International Cellular SA 0% 6/1/06 (e) |
Caa1 |
|
1,610,000 |
1,368,500 |
|
|
Nextel Communications, Inc.: |
|
|
|
|
|
|
0% 9/15/07 (e) |
B1 |
|
703,000 |
551,855 |
|
|
0% 10/31/07 (e) |
B1 |
|
850,000 |
633,250 |
|
|
0% 2/15/08 (e) |
B1 |
|
2,220,000 |
1,626,150 |
|
|
Corporate Bonds - continued |
|||||
|
Moody's Ratings (unaudited) (b) |
Principal Amount (d) |
Value |
|||
|
Nonconvertible Bonds - continued |
|||||
|
UTILITIES - continued |
|||||
|
Cellular - continued |
|||||
|
Nextel Communications, Inc.: - continued |
|
|
|
|
|
|
12% 11/1/08 |
B1 |
|
$ 460,000 |
$ 491,050 |
|
|
Occidente Y Caribe Celular SA 0% 3/15/04 (e) |
B3 |
|
200,000 |
140,000 |
|
|
Rogers Communications, Inc. 8.875% 7/15/07 |
Ba3 |
|
625,000 |
612,500 |
|
|
Tritel PCS, Inc. 0% 5/15/09 (e) |
B3 |
|
1,790,000 |
1,181,400 |
|
|
Triton PCS, Inc. 0% 5/1/08 (e) |
B3 |
|
1,810,000 |
1,307,725 |
|
|
VoiceStream Wireless Corp.: |
|
|
|
|
|
|
0% 11/15/09 (e) |
B2 |
|
5,200,000 |
3,484,000 |
|
|
10.375% 11/15/09 |
B2 |
|
990,000 |
1,029,600 |
|
|
|
15,434,930 |
||||
|
Telephone Services - 2.3% |
|||||
|
Allegiance Telecom, Inc. 0% 2/15/08 (e) |
B3 |
|
862,000 |
627,105 |
|
|
Esat Telecom Group PLC 11.875% 12/1/08 |
Caa1 |
|
60,000 |
69,600 |
|
|
Intermedia Communications, Inc. 8.5% 1/15/08 |
B2 |
|
445,000 |
409,400 |
|
|
NEXTLINK Communications, Inc.: |
|
|
|
|
|
|
0% 6/1/09 (e) |
B2 |
|
1,050,000 |
645,750 |
|
|
10.5% 12/1/09 |
B2 |
|
620,000 |
607,600 |
|
|
Rhythms NetConnections, Inc. 12.75% 4/15/09 |
B3 |
|
690,000 |
469,200 |
|
|
WinStar Communications, Inc.: |
|
|
|
|
|
|
0% 4/15/10 (e)(g) |
B3 |
|
6,271,000 |
2,916,015 |
|
|
12.75% 4/15/10 (g) |
B3 |
|
1,724,000 |
1,663,660 |
|
|
|
7,408,330 |
||||
|
TOTAL UTILITIES |
22,843,260 |
||||
|
TOTAL NONCONVERTIBLE BONDS |
113,278,885 |
||||
|
TOTAL CORPORATE BONDS (Cost $120,672,477) |
115,169,320 |
||||
|
U.S. Government and Government Agency Obligations - 25.9% |
|||||
|
|
|||||
|
U.S. Government Agency Obligations - 9.0% |
|||||
|
Fannie Mae: |
|
|
|
|
|
|
5.25% 1/15/09 |
Aaa |
|
6,500,000 |
5,729,165 |
|
|
6.5% 4/29/09 |
Aaa |
|
5,500,000 |
5,138,210 |
|
|
Federal Farm Credit Bank 6.66% 12/26/06 |
Aaa |
|
1,000,000 |
974,840 |
|
|
U.S. Government and Government Agency Obligations - continued |
|||||
|
Moody's Ratings (unaudited) (b) |
Principal Amount (d) |
Value |
|||
|
U.S. Government Agency Obligations - continued |
|||||
|
Federal Home Loan Bank: |
|
|
|
|
|
|
4.96% 10/7/05 |
Aaa |
|
$ 7,500,000 |
$ 6,803,925 |
|
|
6.75% 4/5/04 |
Aaa |
|
870,000 |
859,534 |
|
|
Freddie Mac 6.25% 7/15/04 |
Aaa |
|
800,000 |
777,752 |
|
|
Government Loan Trusts (assets of Trust guaranteed by U.S. Government through Agency for International Development) 8.5% 4/1/06 |
Aaa |
|
169,746 |
176,826 |
|
|
Government Trust Certificates (assets of Trust guaranteed by U.S. Government through Defense Security Assistance Agency): |
|
|
|
|
|
|
Class 1-C, 9.25% 11/15/01 |
Aaa |
|
2,017,833 |
2,055,526 |
|
|
Class 2-E, 9.4% 5/15/02 |
Aaa |
|
56,958 |
57,776 |
|
|
Class 3-T, 9.625% 5/15/02 |
Aaa |
|
20,621 |
20,991 |
|
|
Guaranteed Export Trust Certificates (assets of Trust guaranteed by U.S. Government through Export-Import Bank) Series 1995-A, 6.28% 6/15/04 |
Aaa |
|
960,000 |
941,217 |
|
|
Guaranteed Trade Trust Certificates (assets of Trust guaranteed by U.S. Government through Export-Import Bank) Series 1997-A, 6.104% 7/15/03 |
Aaa |
|
641,667 |
633,582 |
|
|
Private Export Funding Corp. secured: |
|
|
|
|
|
|
5.82% 6/15/03 (g) |
Aaa |
|
4,600,000 |
4,427,040 |
|
|
6.86% 4/30/04 |
Aaa |
|
456,000 |
452,575 |
|
|
TOTAL U.S. GOVERNMENT AGENCY OBLIGATIONS |
29,048,959 |
||||
|
U.S. Treasury Obligations - 16.9% |
|||||
|
U.S. Treasury Bonds: |
|
|
|
|
|
|
7% 7/15/06 |
Aaa |
|
18,780,000 |
19,460,775 |
|
|
8.75% 5/15/17 |
Aaa |
|
5,440,000 |
6,851,843 |
|
|
8.875% 8/15/17 |
Aaa |
|
6,685,000 |
8,521,303 |
|
|
10.75% 8/15/05 |
Aaa |
|
16,410,000 |
19,561,194 |
|
|
TOTAL U.S. TREASURY OBLIGATIONS |
54,395,115 |
||||
|
TOTAL U.S. GOVERNMENT AND GOVERNMENT (Cost $86,062,442) |
83,444,074 |
||||
|
U.S. Government Agency - Mortgage Securities - 3.3% |
|||||
|
Moody's Ratings (unaudited) (b) |
Principal Amount (d) |
Value |
|||
|
Fannie Mae - 1.5% |
|||||
|
5.5% 5/1/11 to 6/1/14 |
Aaa |
|
$ 610,741 |
$ 567,655 |
|
|
6% 11/1/10 to 1/1/26 |
Aaa |
|
1,242,853 |
1,179,800 |
|
|
6.5% 5/1/08 to 2/1/26 |
Aaa |
|
1,543,999 |
1,468,464 |
|
|
7% 9/1/25 to 12/1/28 |
Aaa |
|
571,191 |
552,904 |
|
|
7.5% 1/1/28 to 5/1/28 |
Aaa |
|
684,765 |
676,396 |
|
|
8% 7/1/26 to 12/1/27 |
Aaa |
|
497,343 |
500,974 |
|
|
TOTAL FANNIE MAE |
4,946,193 |
||||
|
Freddie Mac - 0.1% |
|||||
|
6% 12/1/07 |
Aaa |
|
35,146 |
33,927 |
|
|
8.5% 3/1/20 |
Aaa |
|
139,326 |
142,619 |
|
|
TOTAL FREDDIE MAC |
176,546 |
||||
|
Government National Mortgage Association - 1.7% |
|||||
|
6% 1/15/09 to 5/15/09 |
Aaa |
|
733,575 |
706,976 |
|
|
6.5% 4/15/26 to 5/15/26 |
Aaa |
|
777,452 |
739,310 |
|
|
7% 9/15/25 to 10/15/28 |
Aaa |
|
1,398,800 |
1,360,126 |
|
|
7.5% 2/15/22 to 8/15/28 |
Aaa |
|
2,262,500 |
2,251,317 |
|
|
8% 9/15/26 to 12/15/26 |
Aaa |
|
372,524 |
376,715 |
|
|
TOTAL GOVERNMENT NATIONAL MORTGAGE ASSOCIATION |
5,434,444 |
||||
|
TOTAL U.S. GOVERNMENT AGENCY - MORTGAGE SECURITIES (Cost $10,768,254) |
10,557,183 |
||||
|
Foreign Government and Government Agency Obligations (i) - 23.5% |
|||||
|
|
|||||
|
Argentinian Republic: |
|
|
|
|
|
|
BOCON 2.8068% 4/1/07 (h) |
B1 |
ARS |
2,952,031 |
2,045,802 |
|
|
Brady: |
|
|
|
|
|
|
discount 7.875% 3/31/23 (h) |
B1 |
|
700,000 |
565,250 |
|
|
par L-GP 6.00% 3/31/23 |
B1 |
|
1,970,000 |
1,310,050 |
|
|
floating rate bond 7.375% 3/31/05 (h) |
B1 |
|
1,246,400 |
1,137,963 |
|
|
9.75% 9/19/27 |
B1 |
|
725,000 |
564,594 |
|
|
11.375% 3/15/10 |
B1 |
|
315,000 |
285,863 |
|
|
11.75% 2/12/07 |
B1 |
ARS |
500,000 |
413,982 |
|
|
11.75% 4/7/09 |
B1 |
|
1,115,000 |
1,039,738 |
|
|
11.75% 6/15/15 |
B1 |
|
260,000 |
235,950 |
|
|
12% 2/1/20 |
B1 |
|
205,000 |
189,881 |
|
|
12.125% 2/25/19 |
B1 |
|
240,000 |
225,600 |
|
|
Foreign Government and Government Agency |
|||||
|
Moody's Ratings (unaudited) (b) |
Principal Amount (d) |
Value |
|||
|
Brazilian Federative Rep.: |
|
|
|
|
|
|
euro 11.625% 4/15/04 |
B2 |
|
$ 780,000 |
$ 785,850 |
|
|
Brady: |
|
|
|
|
|
|
capitalization bond 8% 4/15/14 |
B2 |
|
2,337,216 |
1,722,236 |
|
|
debt conversion bond 7.4375% 4/15/12 (h) |
B2 |
|
2,670,000 |
1,969,125 |
|
|
discount euro 7.375% 4/15/24 (h) |
B2 |
|
300,000 |
237,375 |
|
|
new money bond L, 7.4375% 4/15/09 (Bearer) (h) |
B2 |
|
572,000 |
479,765 |
|
|
7.375% 4/15/06 (h) |
B2 |
|
925,350 |
843,225 |
|
|
10.125% 5/15/27 |
B2 |
|
1,025,000 |
808,469 |
|
|
12.25% 3/6/30 |
B2 |
|
426,000 |
391,920 |
|
|
12.75% 1/15/20 |
B2 |
|
365,000 |
349,031 |
|
|
14.5% 10/15/09 |
B2 |
|
1,321,000 |
1,413,470 |
|
|
Bulgarian Republic Brady: |
|
|
|
|
|
|
discount A 7.0625% 7/28/24 (h) |
B2 |
|
346,000 |
273,773 |
|
|
FLIRB A 2.75% 7/28/12 (h) |
B2 |
|
572,000 |
421,135 |
|
|
interest arrears bond 7.0625% 7/28/11 (h) |
B2 |
|
336,000 |
266,700 |
|
|
Canadian Government: |
|
|
|
|
|
|
1.9% 3/23/09 |
Aa1 |
JPY |
70,000,000 |
674,778 |
|
|
7% 12/1/06 |
Aa1 |
CAD |
2,700,000 |
1,922,736 |
|
|
9% 6/1/25 |
Aa1 |
CAD |
2,100,000 |
1,990,241 |
|
|
10% 5/1/02 |
Aa1 |
CAD |
5,000,000 |
3,606,045 |
|
|
Central Bank of Nigeria: |
|
|
|
|
|
|
Brady 6.25% 11/15/20 |
- |
|
750,000 |
378,750 |
|
|
Promissory notes 5.092% 1/5/10 |
- |
|
704,527 |
308,439 |
|
|
warrants 11/15/20 (a)(j) |
- |
|
750 |
0 |
|
|
City of St. Petersburg Russia 9.5% 6/18/02 (Reg. S) |
Caa1 |
|
695,000 |
590,750 |
|
|
Colombian Republic: |
|
|
|
|
|
|
7.625% 2/15/07 |
Ba2 |
|
195,000 |
141,375 |
|
|
8.375% 2/15/27 |
Ba2 |
|
250,000 |
159,375 |
|
|
8.625% 4/1/08 |
Ba2 |
|
170,000 |
125,800 |
|
|
9.75% 4/23/09 |
Ba2 |
|
135,000 |
104,963 |
|
|
10.875% 3/9/04 |
Ba2 |
|
120,000 |
112,200 |
|
|
11.75% 2/25/20 |
Ba2 |
|
560,000 |
459,200 |
|
|
Croatia Republic 7.0325% 7/31/06 (h) |
Baa3 |
|
338,309 |
320,548 |
|
|
Ecuador Republic Brady: |
|
|
|
|
|
|
discount 7.1875% 2/28/25 (c)(h) |
Caa2 |
|
335,000 |
131,488 |
|
|
par 4% 2/28/25 (c)(f) |
Caa2 |
|
430,000 |
146,200 |
|
|
past due interest 7.1875% 2/28/15 (Bearer) (c)(h) |
Caa3 |
|
803,706 |
192,889 |
|
|
Foreign Government and Government Agency |
|||||
|
Moody's Ratings (unaudited) (b) |
Principal Amount (d) |
Value |
|||
|
Germany Federal Republic: |
|
|
|
|
|
|
4.25% 2/18/05 |
Aaa |
EUR |
1,000,000 |
$ 922,183 |
|
|
4.5% 5/17/02 |
Aaa |
EUR |
900,000 |
851,429 |
|
|
4.5% 7/4/09 |
Aaa |
EUR |
500,000 |
451,791 |
|
|
5.625% 1/4/28 |
Aaa |
EUR |
3,800,000 |
3,657,998 |
|
|
6.25% 4/26/06 |
Aaa |
EUR |
4,250,000 |
4,263,894 |
|
|
8% 7/22/02 |
Aaa |
EUR |
6,800,000 |
6,850,773 |
|
|
Italian Republic 3.75% 6/8/05 |
Aa3 |
JPY |
360,000,000 |
3,831,240 |
|
|
Ivory Coast Brady FLIRB A 1.9% 3/29/18 (c)(f) |
- |
FRF |
1,960,000 |
41,331 |
|
|
Panamanian Republic 8.25% 4/22/08 |
Ba1 |
|
255,000 |
225,675 |
|
|
Peruvian Republic Brady: |
|
|
|
|
|
|
FLIRB 3.75% 3/7/17 (h) |
Ba3 |
|
225,000 |
136,688 |
|
|
past due interest 4.5% 3/7/17 (h) |
Ba3 |
|
280,000 |
187,600 |
|
|
Philippine Government: |
|
|
|
|
|
|
8.875% 4/15/08 |
Ba1 |
|
265,000 |
238,500 |
|
|
9.875% 3/16/10 |
Ba1 |
|
215,000 |
197,800 |
|
|
9.875% 1/15/19 |
Ba1 |
|
265,000 |
216,306 |
|
|
Russian Federation: |
|
|
|
|
|
|
8.75% 7/24/05 (Reg. S) |
B3 |
|
869,000 |
674,561 |
|
|
9.25% 11/27/01 |
B3 |
|
264,000 |
252,120 |
|
|
10% 6/26/07 |
B3 |
|
761,000 |
586,921 |
|
|
11% 7/24/18 (Reg. S) |
B3 |
|
902,000 |
675,373 |
|
|
11.75% 6/10/03 (Reg. S) |
B3 |
|
568,000 |
527,530 |
|
|
12.75% 6/24/28 (Reg. S) |
B3 |
|
838,000 |
722,775 |
|
|
Russian Federation Ministry of Finance 3% 5/14/03 |
Caa3 |
|
520,000 |
231,400 |
|
|
Sealed Air Finance euro 5.625% 7/19/06 |
Baa3 |
EUR |
1,000,000 |
870,994 |
|
|
Treuhandanstalt 7.5% 9/9/04 |
Aaa |
EUR |
2,500,000 |
2,589,974 |
|
|
Turkish Republic 11.875% 11/5/04 |
B1 |
|
115,000 |
119,600 |
|
|
Ukraine Government 11% 3/15/07 (Reg. S) |
- |
|
505,000 |
345,925 |
|
|
United Kingdom, Great Britain & |
|
|
|
|
|
|
7.5% 12/7/06 |
Aaa |
GBP |
1,310,000 |
2,189,177 |
|
|
8% 12/7/15 |
Aaa |
GBP |
230,000 |
465,167 |
|
|
8.75% 8/25/17 |
Aaa |
GBP |
1,300,000 |
2,870,392 |
|
|
9.75% 8/27/02 |
Aaa |
GBP |
1,000,000 |
1,627,134 |
|
|
United Mexican States: |
|
|
|
|
|
|
Brady: |
|
|
|
|
|
|
discount A 7.3125% 12/31/19 (h) |
Baa3 |
|
1,050,000 |
1,031,625 |
|
|
par A 6.25% 12/31/19 unit |
Baa3 |
|
2,165,000 |
1,805,069 |
|
|
par B 6.25% 12/31/19 unit |
Baa3 |
|
250,000 |
208,438 |
|
|
Foreign Government and Government Agency Obligations (i) |
|||||
|
Moody's Ratings (unaudited) (b) |
Principal Amount (d) |
Value |
|||
|
United Mexican States: - continued |
|
|
|
|
|
|
value recovery rights 6/30/03: |
|
|
|
|
|
|
discount A (j) |
- |
|
$ 1,617,000 |
$ 16 |
|
|
discount C (j) |
- |
|
2,000 |
0 |
|
|
9.875% 2/1/10 |
Baa3 |
|
1,610,000 |
1,678,425 |
|
|
10.375% 2/17/09 |
Baa3 |
|
440,000 |
470,250 |
|
|
11.375% 9/15/16 |
Baa3 |
|
655,000 |
750,794 |
|
|
11.5% 5/15/26 |
Baa3 |
|
910,000 |
1,097,688 |
|
|
Venezuelan Republic: |
|
|
|
|
|
|
Brady debt conversion bond 7.875% 12/18/07 (h) |
B2 |
|
2,142,840 |
1,746,415 |
|
|
Oil recovery rights 4/15/20 (j) |
- |
|
10 |
0 |
|
|
9.25% 9/15/27 |
B2 |
|
1,155,000 |
762,300 |
|
|
TOTAL FOREIGN GOVERNMENT AND GOVERNMENT (Cost $74,537,253) |
75,715,795 |
||||
|
Supranational Obligations - 0.5% |
|||||
|
|
|||||
|
European Investment Bank 4% 4/15/09 |
Aaa |
EUR |
2,000,000 |
1,689,619 |
|
|
Common Stocks - 0.6% |
|||
|
Shares |
|
||
|
HEALTH - 0.4% |
|||
|
Medical Facilities Management - 0.4% |
|||
|
Laboratory Corp. of America Holdings |
17,818 |
1,374,213 |
|
|
MEDIA & LEISURE - 0.0% |
|||
|
Broadcasting - 0.0% |
|||
|
CS Wireless Systems, Inc. (a)(g) |
10 |
0 |
|
|
NTL, Inc. warrants 10/14/08 (a) |
1,586 |
65,026 |
|
|
UIH Australia/Pacific, Inc. warrants 5/15/06 (a) |
570 |
17,100 |
|
|
|
82,126 |
||
|
TECHNOLOGY - 0.1% |
|||
|
Computer Services & Software - 0.1% |
|||
|
Concentric Network Corp. warrants 12/15/07 (a)(g) |
200 |
105,400 |
|
|
DecisionOne Corp. |
1,980 |
20 |
|
|
DecisionOne Corp.: |
|
|
|
|
Class A warrants 4/18/07 (a) |
1,137 |
0 |
|
|
Common Stocks - continued |
|||
|
Shares |
Value (Note 1) |
||
|
TECHNOLOGY - continued |
|||
|
Computer Services & Software - continued |
|||
|
DecisionOne Corp.: - continued |
|
|
|
|
Class B warrants 4/18/07 (a) |
1,959 |
$ 0 |
|
|
Class C warrants 4/18/07 (a) |
1,162 |
0 |
|
|
|
105,420 |
||
|
Electronics - 0.0% |
|||
|
Intersil Holding Corp. warrants 8/15/09 (a)(g) |
120 |
100,800 |
|
|
TOTAL TECHNOLOGY |
206,220 |
||
|
UTILITIES - 0.1% |
|||
|
Cellular - 0.1% |
|||
|
Leap Wireless International, Inc.: |
|
|
|
|
warrants 4/15/10 (a)(g) |
775 |
0 |
|
|
warrants 4/15/10 (a) |
450 |
0 |
|
|
Loral Orion Network Systems, Inc.: |
|
|
|
|
warrants 1/15/07 (CV ratio .47) (a) |
230 |
575 |
|
|
warrants 1/15/07 (CV ratio .6) (a) |
480 |
2,040 |
|
|
McCaw International Ltd. warrants 4/16/07 (a)(g) |
1,753 |
4,383 |
|
|
Orbital Imaging Corp. warrants 3/1/05 (a)(g) |
56 |
280 |
|
|
Powertel, Inc. warrants 2/1/06 (a) |
3,328 |
193,024 |
|
|
|
200,302 |
||
|
Telephone Services - 0.0% |
|||
|
MGC Communications, Inc. (g) |
916 |
54,903 |
|
|
Source Media, Inc. (a) |
1,676 |
6,547 |
|
|
|
61,450 |
||
|
TOTAL UTILITIES |
261,752 |
||
|
TOTAL COMMON STOCKS (Cost $1,424,344) |
1,924,311 |
||
|
Nonconvertible Preferred Stocks - 4.3% |
|||
|
|
|
|
|
|
FINANCE - 0.1% |
|||
|
Insurance - 0.1% |
|||
|
American Annuity Group Capital Trust II 8.875% |
240 |
213,663 |
|
|
MEDIA & LEISURE - 1.8% |
|||
|
Broadcasting - 1.4% |
|||
|
Adelphia Communications Corp. $13.00 |
5,345 |
550,535 |
|
|
Nonconvertible Preferred Stocks - continued |
|||
|
Shares |
Value (Note 1) |
||
|
MEDIA & LEISURE - continued |
|||
|
Broadcasting - continued |
|||
|
Benedek Communications Corp. 11.5% pay-in-kind |
966 |
$ 531,300 |
|
|
Citadel Broadcasting Co. Series B, 13.25% pay-in-kind |
3,656 |
376,568 |
|
|
CSC Holdings, Inc.: |
|
|
|
|
11.125% pay-in-kind |
19,010 |
1,986,545 |
|
|
Series H, 11.75% pay-in-kind |
5,182 |
546,701 |
|
|
Granite Broadcasting Corp. 12.75% pay-in-kind |
622 |
522,480 |
|
|
|
4,514,129 |
||
|
Publishing - 0.4% |
|||
|
PRIMEDIA, Inc.: |
|
|
|
|
$9.20 |
1,600 |
138,800 |
|
|
8.625% |
7,377 |
627,045 |
|
|
Series D, $10.00 |
5,733 |
530,303 |
|
|
|
1,296,148 |
||
|
TOTAL MEDIA & LEISURE |
5,810,277 |
||
|
RETAIL & WHOLESALE - 0.0% |
|||
|
Grocery Stores - 0.0% |
|||
|
Supermarkets General Holdings Corp. $3.52 pay-in-kind |
12,725 |
12,725 |
|
|
UTILITIES - 2.4% |
|||
|
Cellular - 1.0% |
|||
|
Nextel Communications, Inc.: |
|
|
|
|
11.125% pay-in-kind |
1,087 |
1,048,955 |
|
|
Series D, 13% pay-in-kind |
2,084 |
2,177,780 |
|
|
|
3,226,735 |
||
|
Telephone Services - 1.4% |
|||
|
Adelphia Business Solution, Inc. 12.875% pay-in-kind |
14 |
12,530 |
|
|
Intermedia Communications, Inc. 13.5% pay-in-kind |
1,955 |
1,896,350 |
|
|
NEXTLINK Communications, Inc. 13.50% pay-in-kind |
862 |
836,140 |
|
|
NEXTLINK Communications, Inc. 14% pay-in-kind |
32,884 |
1,677,084 |
|
|
Source Media, Inc. 13.50% pay-in-kind |
4,183 |
24,052 |
|
|
|
4,446,156 |
||
|
TOTAL UTILITIES |
7,672,891 |
||
|
TOTAL NONCONVERTIBLE PREFERRED STOCKS (Cost $15,369,123) |
13,709,556 |
||
|
Sovereign Loan Participations - 1.4% |
|||||
|
Moody's Ratings (unaudited) |
Principal Amount |
Value |
|||
|
Algerian Republic loan participation: |
|
|
|
|
|
|
Series 1 - Deutsche Bank 6.625% 9/4/06 (h) |
- |
|
$ 415,000 |
$ 342,375 |
|
|
Series 1 - Merrill Lynch, Pierce, Fenner & Smith, Inc. 6.625% 9/4/06 (h) |
- |
|
284,000 |
234,300 |
|
|
Series 1- Societe Generale 6.625% 9/4/06 (h) |
- |
|
20,000 |
16,500 |
|
|
Series 3 - Merrill Lynch, Pierce, Fenner & Smith, Inc. 7.1875% 3/4/10 (h) |
- |
|
315,000 |
243,338 |
|
|
Series 3 - The Chase Manhattan Bank 7.1875% 3/4/10 (h) |
- |
|
142,000 |
109,695 |
|
|
Bank for Foreign Economic Affairs of Russia (Vnesheconombank) loan participation restructured under 1997 Agreement: |
|
|
|
|
|
|
- Deutsche Bank 7.9375% 12/15/20 (c)(h) |
- |
|
7,594,000 |
2,325,663 |
|
|
- ING Bank NV 7.9375% 12/15/20 (c)(h) |
- |
|
320,000 |
98,000 |
|
|
- Merrill Lynch, Pierce, Fenner & Smith, Inc. 7.9375% 12/15/20 (c)(h) |
- |
|
610,000 |
186,813 |
|
|
- Morgan (J.P.) Securities, Inc. 7.9375% 12/15/20 (c)(h) |
- |
|
265,000 |
81,156 |
|
|
- Paribas Capital Markets 7.9375% 12/15/20 (c)(h) |
- |
|
265,000 |
81,156 |
|
|
- The Chase Manhattan Bank 7.9375% 12/15/20 (c)(h) |
- |
|
530,000 |
162,313 |
|
|
Moroccan Kingdom loan participation: |
|
|
|
|
|
|
Series A - Deutsche Bank 7.75% 1/1/09 (h) |
- |
|
155,000 |
139,500 |
|
|
Series A - Morgan Guaranty Trust Co. 7.75% 1/1/09 (h) |
- |
|
117,052 |
105,347 |
|
|
Series A - Paribas Capital Markets 7.75% 1/1/09 (h) |
- |
|
198,579 |
178,721 |
|
|
Series A - The Chase Manhattan Bank 7.75% 1/1/09 (h) |
- |
|
54,429 |
48,986 |
|
|
TOTAL SOVEREIGN LOAN PARTICIPATIONS (Cost $2,961,127) |
4,353,863 |
||||
|
Cash Equivalents - 3.9% |
|||
|
Maturity Amount |
Value |
||
|
Investments in repurchase agreements (U.S. Treasury Obligations), in a joint trading account at 6.58%, dated 6/30/00 due 7/3/00 |
$ 12,619,918 |
$ 12,613,000 |
|
|
TOTAL INVESTMENT PORTFOLIO - 99.2% (Cost $326,448,627) |
319,176,721 |
||
|
NET OTHER ASSETS - 0.8% |
2,712,437 |
||
|
NET ASSETS - 100% |
$ 321,889,158 |
||
|
Security Type Abbreviations |
||
|
FLIRB |
- |
Front Loaded Interest Reduction Bonds |
|
Currency Abbreviations |
||
|
ARS |
- |
Argentine peso |
|
CAD |
- |
Canadian dollar |
|
EUR |
- |
European Monetary Unit |
|
FRF |
- |
French franc |
|
GBP |
- |
British pound |
|
JPY |
- |
Japanese yen |
|
Legend |
|
(a) Non-income producing |
|
(b) S&P credit ratings are used in the absence of a rating by Moody's Investors Service, Inc. |
|
(c) Non-income producing - issuer filed for protection under the Federal Bankruptcy Code or is in default of interest payment. |
|
(d) Principal amount is stated in United States dollars unless otherwise noted. |
|
(e) Debt obligation initially issued in zero coupon form which converts to coupon form at a specified rate and date. The rate shown is the rate at period end. |
|
(f) Debt obligation initially issued at one coupon which converts to a higher coupon at a specified date. The rate shown is the rate at period end. |
|
(g) Security exempt from registration under Rule 144A of the Securities Act of 1933. These securities may be resold in transactions exempt from registration, normally to qualified institutional buyers. At the period end, the value of these securities amounted to $18,894,865 or 5.9% of net assets. |
|
(h) The coupon rate shown on floating or adjustable rate securities represents the rate at period end. |
|
(i) For foreign government obligations not individually rated by S&P or Moody's, the ratings listed have been assigned by FMR, the fund's investment adviser, based principally on S&P and Moody's ratings of the sovereign credit of the issuing government. |
|
(j) Quantity represents share amount. |
|
(k) Restricted securities - Investment in securities not registered under the Securities Act of 1933. |
|
Additional information on each holding |
|
Security |
Acquisition Date |
Acquisition Cost |
|
Sealy Corp., Inc. |
2/23/98 - 6/30/00 |
$ 641,329 |
|
Other Information |
|
The composition of long-term debt holdings as a percentage of total value of investments in securities, is as follows (ratings are unaudited): |
|
Moody's Ratings |
S&P Ratings |
|||
|
Aaa, Aa, A |
43.3% |
|
AAA, AA, A |
37.2% |
|
Baa |
3.2% |
|
BBB |
1.5% |
|
Ba |
3.2% |
|
BB |
7.6% |
|
B |
34.0% |
|
B |
30.3% |
|
Caa |
4.2% |
|
CCC |
4.3% |
|
Ca, C |
0.0% |
|
CC, C |
0.0% |
|
|
|
|
D |
0.2% |
|
The percentage not rated by Moody's |
|
Distribution of investments by country of issue, as a percentage of total net assets, |
|
United States of America |
68.5% |
|
Germany |
6.0 |
|
United Kingdom |
3.9 |
|
Brazil |
3.6 |
|
Canada |
3.0 |
|
Mexico |
2.6 |
|
Argentina |
2.6 |
|
Russia |
2.3 |
|
Netherlands |
2.0 |
|
Italy |
1.2 |
|
Others (individually less than 1%) |
4.3 |
|
|
100.0% |
|
Income Tax Information |
|
At June 30, 2000, the aggregate cost |
|
At December 31, 1999, the fund had a capital loss carryforward of approximately $10,864,000 all of which will expire on December 31, 2007. |
|
The fund intends to elect to defer to its |
See accompanying notes which are an integral part of the financial statements.
Semiannual Report
Statement of Assets and Liabilities
|
|
June 30, 2000 (Unaudited) |
|
|
Assets |
|
|
|
Investment in securities, at value (including repurchase agreements of $12,613,000) (cost $326,448,627) - See accompanying schedule |
|
$ 319,176,721 |
|
Cash |
|
178,561 |
|
Receivable for investments sold |
|
1,541,679 |
|
Receivable for fund shares sold |
|
608,695 |
|
Dividends receivable |
|
221,206 |
|
Interest receivable |
|
6,009,559 |
|
Other receivables |
|
1,174 |
|
Total assets |
|
327,737,595 |
|
Liabilities |
|
|
|
Payable for investments purchased |
$ 4,201,849 |
|
|
Payable for fund shares redeemed |
950,405 |
|
|
Distributions payable |
324,109 |
|
|
Accrued management fee |
151,964 |
|
|
Distribution fees payable |
122,600 |
|
|
Other payables and accrued expenses |
97,510 |
|
|
Total liabilities |
|
5,848,437 |
|
Net Assets |
|
$ 321,889,158 |
|
Net Assets consist of: |
|
|
|
Paid in capital |
|
$ 342,602,234 |
|
Undistributed net investment income |
|
2,510,438 |
|
Accumulated undistributed net realized gain (loss) on investments and foreign currency transactions |
|
(15,913,854) |
|
Net unrealized appreciation (depreciation) on investments and assets and liabilities in foreign currencies |
|
(7,309,660) |
|
Net Assets |
|
$ 321,889,158 |
See accompanying notes which are an integral part of the financial statements.
Semiannual Report
Financial Statements - continued
Statement of Assets and Liabilities - continued
|
|
June 30, 2000 (Unaudited) |
|
|
Calculation of Maximum Offering Price |
|
$10.32 |
|
Maximum offering price per share (100/95.25 of $10.32) |
|
$10.83 |
|
Class T: |
|
$10.31 |
|
Maximum offering price per share (100/96.50 of $10.31) |
|
$10.68 |
|
Class B: |
|
$10.33 |
|
Class C: |
|
$10.30 |
|
Institutional Class: |
|
$10.37 |
A Redemption price per share is equal to net asset value less any applicable contingent deferred sales charge.
See accompanying notes which are an integral part of the financial statements.
Semiannual Report
Financial Statements - continued
Statement of Operations
|
|
Six months ended June 30, 2000 (Unaudited) |
|
|
Investment Income Dividends |
|
$ 951,028 |
|
Interest |
|
12,434,739 |
|
Total income |
|
13,385,767 |
|
Expenses |
|
|
|
Management fee |
$ 893,067 |
|
|
Transfer agent fees |
276,360 |
|
|
Distribution fees |
718,801 |
|
|
Accounting fees and expenses |
94,317 |
|
|
Non-interested trustees' compensation |
523 |
|
|
Custodian fees and expenses |
32,551 |
|
|
Registration fees |
63,573 |
|
|
Audit |
39,169 |
|
|
Legal |
6,497 |
|
|
Miscellaneous |
1,161 |
|
|
Total expenses before reductions |
2,126,019 |
|
|
Expense reductions |
(8,233) |
2,117,786 |
|
Net investment income |
|
11,267,981 |
|
Realized and Unrealized Gain (Loss) Net realized gain (loss) on: |
|
|
|
Investment securities |
(1,735,841) |
|
|
Foreign currency transactions |
(260,369) |
(1,996,210) |
|
Change in net unrealized appreciation (depreciation) on: |
|
|
|
Investment securities |
(3,949,116) |
|
|
Assets and liabilities in foreign currencies |
1,328 |
(3,947,788) |
|
Net gain (loss) |
|
(5,943,998) |
|
Net increase (decrease) in net assets resulting |
|
$ 5,323,983 |
See accompanying notes which are an integral part of the financial statements.
Semiannual Report
Financial Statements - continued
Statement of Changes in Net Assets
|
|
Six months ended June 30, 2000 (Unaudited) |
Year ended December 31, 1999 |
|
Increase (Decrease) in Net Assets |
|
|
|
Operations |
$ 11,267,981 |
$ 21,899,000 |
|
Net realized gain (loss) |
(1,996,210) |
(7,459,313) |
|
Change in net unrealized appreciation (depreciation) |
(3,947,788) |
3,043,574 |
|
Net increase (decrease) in net assets resulting |
5,323,983 |
17,483,261 |
|
Distributions to shareholders from net investment income |
(9,891,819) |
(19,936,469) |
|
Share transactions - net increase (decrease) |
16,634,027 |
24,266,774 |
|
Total increase (decrease) in net assets |
12,066,191 |
21,813,566 |
|
Net Assets |
|
|
|
Beginning of period |
309,822,967 |
288,009,401 |
|
End of period (including undistributed net investment income of $2,510,438 and $1,690,132, respectively) |
$ 321,889,158 |
$ 309,822,967 |
See accompanying notes which are an integral part of the financial statements.
Semiannual Report
Financial Highlights - Class A
|
|
Six months ended June 30, 2000 |
Years ended December 31, |
|||
|
|
(Unaudited) |
1999 |
1998 |
1997 |
1996 E |
|
Selected Per-Share Data |
|
|
|
|
|
|
Net asset value, |
$ 10.470 |
$ 10.560 |
$ 11.090 |
$ 11.250 |
$ 11.010 |
|
Income from Invest- |
|
|
|
|
|
|
Net investment income D |
.388 |
.775 |
.771 |
.802 |
.267 |
|
Net realized and |
(.195) |
(.152) |
(.512) |
.198 |
.493 |
|
Total from |
.193 |
.623 |
.259 |
1.000 |
.760 |
|
Less Distributions |
|
|
|
|
|
|
From net investment |
(.343) |
(.713) |
(.729) |
(.790) |
(.280) |
|
From net realized gain |
- |
- |
- |
(.370) |
(.240) |
|
In excess of net |
- |
- |
(.060) |
- |
- |
|
Total distributions |
(.343) |
(.713) |
(.789) |
(1.160) |
(.520) |
|
Net asset value, |
$ 10.320 |
$ 10.470 |
$ 10.560 |
$ 11.090 |
$ 11.250 |
|
Total Return B, C |
1.90% |
6.12% |
2.38% |
9.24% |
6.95% |
|
Ratios and Supplemental Data |
|
|
|
||
|
Net assets, end of period (000 omitted) |
$ 15,283 |
$ 12,800 |
$ 9,596 |
$ 3,379 |
$ 587 |
|
Ratio of expenses to |
1.10% A |
1.08% |
1.23% |
1.25% F |
1.25% A, F |
|
Ratio of expenses to |
1.09% A, G |
1.07% G |
1.22% G |
1.24% G |
1.25% A |
|
Ratio of net investment income to average |
7.59% A |
7.44% |
7.22% |
7.16% |
7.32% A |
|
Portfolio turnover rate |
94% A |
146% |
150% |
140% |
119% |
A Annualized
B The total returns would have been lower had certain expenses not been reduced during the periods shown.
C Total returns do not include the one time sales charge and for periods of less than one year are not annualized.
D Net investment income per share has been calculated based on average shares outstanding during the period.
E For the period September 3, 1996 (commencement of sale of Class A shares) to December 31, 1996.
F FMR agreed to reimburse a portion of the class' expenses during the period. Without this reimbursement, the class' expense ratio would have been higher.
G FMR or the fund has entered into varying arrangements with third parties who either paid or reduced a portion of the class' expenses.
See accompanying notes which are an integral part of the financial statements.
Semiannual Report
Financial Highlights - Class T
|
|
Six months ended June 30, 2000 |
Years ended December 31, |
||||
|
|
(Unaudited) |
1999 |
1998 |
1997 |
1996 |
1995 |
|
Selected Per-Share Data |
|
|
|
|
|
|
|
Net asset value, beginning |
$ 10.470 |
$ 10.550 |
$ 11.090 |
$ 11.250 |
$ 11.000 |
$ 9.920 |
|
Income from Invest- |
|
|
|
|
|
|
|
Net investment income |
.386 D |
.772 D |
.781 D |
.814 D |
.813 D |
.885 |
|
Net realized and unrealized gain (loss) |
(.206) |
(.147) |
(.535) |
.194 |
.542 |
1.231 |
|
Total from |
.180 |
.625 |
.246 |
1.008 |
1.355 |
2.116 |
|
Less Distributions |
|
|
|
|
|
|
|
From net |
(.340) |
(.705) |
(.726) |
(.798) |
(.805) |
(.806) |
|
From net realized gain |
- |
- |
- |
(.370) |
(.300) |
(.230) |
|
In excess of net realized gain |
- |
- |
(.060) |
- |
- |
- |
|
Total |
(.340) |
(.705) |
(.786) |
(1.168) |
(1.105) |
(1.036) |
|
Net asset value, end of period |
$ 10.310 |
$ 10.470 |
$ 10.550 |
$ 11.090 |
$ 11.250 |
$ 11.000 |
|
Total Return B, C |
1.77% |
6.15% |
2.26% |
9.33% |
12.89% |
22.02% |
|
Ratios and Supplemental Data |
|
|
|
|
|
|
|
Net assets, |
$ 196,251 |
$ 190,335 |
$ 189,755 |
$ 119,204 |
$ 99,327 |
$ 52,626 |
|
Ratio of expenses to average |
1.16% A |
1.13% |
1.18% |
1.20% |
1.23% |
1.35% E |
|
Ratio of expenses to average |
1.15% A, F |
1.13% |
1.17% F |
1.19% F |
1.22% F |
1.35% |
|
Ratio of net investment income to average |
7.52% A |
7.38% |
7.25% |
7.21% |
7.34% |
7.28% |
|
Portfolio turnover rate |
94% A |
146% |
150% |
140% |
119% |
193% |
A Annualized
B The total returns would have been lower had certain expenses not been reduced during the periods shown.
C Total returns do not include the one time sales charge and for periods of less than one year are not annualized.
D Net investment income per share has been calculated based on average shares outstanding during the period.
E FMR agreed to reimburse a portion of the class' expenses during the period. Without this reimbursement, the class' expense ratio would have been higher.
F FMR or the fund has entered into varying arrangements with third parties who either paid or reduced a portion of the class' expenses.
See accompanying notes which are an integral part of the financial statements.
Semiannual Report
Financial Highlights - Class B
|
|
Six months ended June 30, 2000 |
Years ended December 31, |
||||
|
|
(Unaudited) |
1999 |
1998 |
1997 |
1996 |
1995 |
|
Selected Per-Share Data |
|
|
|
|
|
|
|
Net asset value, beginning |
$ 10.490 |
$ 10.570 |
$ 11.100 |
$ 11.260 |
$ 11.010 |
$ 9.910 |
|
Income from Investment Operations |
|
|
|
|
|
|
|
Net investment |
.352 D |
.703 D |
.713 D |
.740 D |
.743 D |
.820 |
|
Net realized and unrealized gain (loss) |
(.206) |
(.146) |
(.529) |
.194 |
.538 |
1.237 |
|
Total from |
.146 |
.557 |
.184 |
.934 |
1.281 |
2.057 |
|
Less Distributions |
|
|
|
|
|
|
|
From net |
(.306) |
(.637) |
(.654) |
(.724) |
(.731) |
(.727) |
|
From net realized gain |
- |
- |
- |
(.370) |
(.300) |
(.230) |
|
In excess of net realized gain |
- |
- |
(.060) |
- |
- |
- |
|
Total |
(.306) |
(.637) |
(.714) |
(1.094) |
(1.031) |
(.957) |
|
Net asset value, end of period |
$ 10.330 |
$ 10.490 |
$ 10.570 |
$ 11.100 |
$ 11.260 |
$ 11.010 |
|
Total Return B, C |
1.44% |
5.45% |
1.69% |
8.60% |
12.14% |
21.35% |
|
Ratios and Supplemental Data |
|
|
|
|
|
|
|
Net assets, |
$ 86,077 |
$ 86,116 |
$ 72,773 |
$ 54,562 |
$ 37,403 |
$ 26,654 |
|
Ratio of expenses to average |
1.82% A |
1.78% |
1.83% |
1.86% |
1.88% |
2.10% E |
|
Ratio of expenses to average |
1.81% A, F |
1.78% |
1.83% |
1.85% F |
1.87% F |
2.10% |
|
Ratio of net investment income to average |
6.86% A |
6.73% |
6.56% |
6.55% |
6.69% |
6.53% |
|
Portfolio turnover rate |
94% A |
146% |
150% |
140% |
119% |
193% |
A Annualized
B The total returns would have been lower had certain expenses not been reduced during the periods shown.
C Total returns do not include the contingent deferred sales charge and for periods of less than one year are not annualized.
D Net investment income per share has been calculated based on average shares outstanding during the period.
E FMR agreed to reimburse a portion of the class' expenses during the period. Without this reimbursement, the class' expense ratio would have been higher.
F FMR or the fund has entered into varying arrangements with third parties who either paid or reduced a portion of the class' expenses.
See accompanying notes which are an integral part of the financial statements.
Semiannual Report
Financial Highlights - Class C
|
|
Six months ended June 30, 2000 |
Years ended December 31, |
||
|
|
(Unaudited) |
1999 |
1998 |
1997 E |
|
Selected Per-Share Data |
|
|
|
|
|
Net asset value, beginning of period |
$ 10.460 |
$ 10.550 |
$ 11.080 |
$ 11.400 |
|
Income from Investment Operations |
|
|
|
|
|
Net investment income D |
.345 |
.687 |
.672 |
.105 |
|
Net realized and unrealized |
(.204) |
(.151) |
(.517) |
.037 |
|
Total from investment operations |
.141 |
.536 |
.155 |
.142 |
|
Less Distributions |
|
|
|
|
|
From net investment income |
(.301) |
(.626) |
(.625) |
(.152) |
|
From net realized gain |
- |
- |
- |
(.310) |
|
In excess of net realized gain |
- |
- |
(.060) |
- |
|
Total distributions |
(.301) |
(.626) |
(.685) |
(.462) |
|
Net asset value, end of period |
$ 10.300 |
$ 10.460 |
$ 10.550 |
$ 11.080 |
|
Total Return B, C |
1.39% |
5.25% |
1.42% |
1.27% |
|
Ratios and Supplemental Data |
|
|
|
|
|
Net assets, end of period (000 omitted) |
$ 20,538 |
$ 16,927 |
$ 11,248 |
$ 659 |
|
Ratio of expenses to average net assets |
1.93% A |
1.91% |
2.07% F |
2.10% A, F |
|
Ratio of expenses to average net assets after expense reductions |
1.93% A |
1.90% G |
2.07% |
2.10% A |
|
Ratio of net investment income to average net assets |
6.75% A |
6.61% |
6.37% |
6.30% A |
|
Portfolio turnover rate |
94% A |
146% |
150% |
140% |
A Annualized
B The total returns would have been lower had certain expenses not been reduced during the periods shown.
C Total returns do not include the contingent deferred sales charge and for periods of less than one year are not annualized.
D Net investment income per share has been calculated based on average shares outstanding during the period.
E For the period November 3, 1997 (commencement of sale of Class C shares) to December 31, 1997.
F FMR agreed to reimburse a portion of the class' expenses during the period. Without this reimbursement, the class' expense ratio would have been higher.
G FMR or the fund has entered into varying arrangements with third parties who either paid or reduced a portion of the class' expenses.
See accompanying notes which are an integral part of the financial statements.
Semiannual Report
Financial Highlights - Institutional Class
|
|
Six months ended June 30, 2000 |
Years ended December 31, |
||||
|
|
(Unaudited) |
1999 |
1998 |
1997 |
1996 |
1995 E |
|
Selected Per-Share Data |
|
|
|
|
|
|
|
Net asset value,
beginning |
$ 10.530 |
$ 10.610 |
$ 11.140 |
$ 11.300 |
$ 11.030 |
$ 10.890 |
|
Income from Investment Operations |
|
|
|
|
|
|
|
Net investment |
.400 D |
.799 D |
.805 D |
.830 D |
.826 D |
.456 |
|
Net realized and unrealized gain (loss) |
(.208) |
(.150) |
(.533) |
.186 |
.548 |
.340 |
|
Total from |
.192 |
.649 |
.272 |
1.016 |
1.374 |
.796 |
|
Less Distributions |
|
|
|
|
|
|
|
From net investment income |
(.352) |
(.729) |
(.742) |
(.806) |
(.804) |
(.426) |
|
From net |
- |
- |
- |
(.370) |
(.300) |
(.230) |
|
In excess of net realized gain |
- |
- |
(.060) |
- |
- |
- |
|
Total distributions |
(.352) |
(.729) |
(.802) |
(1.176) |
(1.104) |
(.656) |
|
Net asset value, end of period |
$ 10.370 |
$ 10.530 |
$ 10.610 |
$ 11.140 |
$ 11.300 |
$ 11.030 |
|
Total Return B, C |
1.88% |
6.35% |
2.49% |
9.36% |
13.04% |
7.47% |
|
Ratios and Supplemental Data |
|
|
|
|
|
|
|
Net assets, |
$ 3,740 |
$ 3,645 |
$ 4,636 |
$ 6,289 |
$ 6,107 |
$ 107 |
|
Ratio of expenses
to average |
.93% A |
.93% |
1.07% |
1.10% F |
1.10% F |
1.10% A, F |
|
Ratio of expenses
to average |
.92% A, G |
.93% |
1.07% |
1.09% G |
1.10% |
1.10% A |
|
Ratio of net
investment
income to aver- |
7.76% A |
7.58% |
7.29% |
7.31% |
7.47% |
7.53% A |
|
Portfolio turnover rate |
94% A |
146% |
150% |
140% |
119% |
193% |
A Annualized
B The total returns would have been lower had certain expenses not been reduced during the periods shown.
C Total returns for periods of less than one year are not annualized.
D Net investment income per share has been calculated based on average shares outstanding during the period.
E For the period July 3, 1995 (commencement of sale of Institutional Class shares) to December 31, 1995.
F FMR agreed to reimburse a portion of the class' expenses during the period. Without this reimbursement, the class' expense ratio would have been higher.
G FMR or the fund has entered into varying arrangements with third parties who either paid or reduced a portion of the class' expenses.
See accompanying notes which are an integral part of the financial statements.
Semiannual Report
For the period ended June 30, 2000 (Unaudited)
1. Significant Accounting Policies.
Fidelity Advisor Strategic Income Fund (the fund) is a fund of Fidelity Advisor Series II (the trust) and is authorized to issue an unlimited number of shares. The trust is registered under the Investment Company Act of 1940, as amended (the 1940 Act), as an open-end management investment company organized as a Massachusetts business trust.
The fund offers Class A, Class T, Class B, Class C, and Institutional Class shares, each of which has equal rights as to assets and voting privileges. Each class has exclusive voting rights with respect to matters that affect that class. Class B shares will automatically convert to Class A shares after a holding period of seven years from the initial date of purchase. Investment income, realized and unrealized capital gains and losses, the common expenses of the fund, and certain fund-level expense reductions, if any, are allocated on a pro rata basis to each class based on the relative net assets of each class to the total net assets of the fund. Each class of shares differs in its respective distribution, transfer agent, and certain other class-specific fees, expenses, and expense reductions.
The financial statements have been prepared in conformity with generally accepted accounting principles which require management to make certain estimates and assumptions at the date of the financial statements. The following summarizes the significant accounting policies of the fund:
Security Valuation. Securities for which quotations are readily available are valued by a pricing service at their market values as determined by their most recent bid prices (sales prices if the principal market is an exchange) in the principal market in which such securities are normally traded. Securities for which market quotations are not readily available (and in certain cases debt securities which trade on an exchange) are valued primarily using dealer-supplied valuations or at their fair value as determined in good faith under consistently applied procedures under the general supervision of the Board of Trustees. Short-term securities with remaining maturities of sixty days or less for which quotations are not readily available are valued at amortized cost or original cost plus accrued interest, both of which approximate current value.
Foreign Currency Translation. The accounting records of the fund are maintained in U.S. dollars. Investment securities and other assets and liabilities denominated in a foreign currency are translated into U.S. dollars at the prevailing rates of exchange at period end. Purchases and sales of securities, income receipts and expense payments are translated into U.S. dollars at the prevailing exchange rate on the respective dates of the transactions.
Net realized gains and losses on foreign currency transactions represent net gains and losses from sales and maturities of foreign currency contracts, disposition of foreign currencies, the difference between the amount of net investment income accrued and the U.S. dollar amount actually received, and gains and losses between trade and settlement date on purchases and sales of securities. The effects of changes in foreign currency
Semiannual Report
Notes to Financial Statements (Unaudited) - continued
1. Significant Accounting Policies - continued
Foreign Currency Translation - continued
exchange rates on investments in securities are included with the net realized and unrealized gain or loss on investment securities.
Income Taxes. As a qualified regulated investment company under Subchapter M of the Internal Revenue Code, the fund is not subject to U.S. federal income taxes to the extent that it distributes substantially all of its taxable income for its fiscal year. The fund may be subject to foreign taxes on income and gains on investments which are accrued based upon the fund's understanding of the tax rules and regulations that exist in the markets in which it invests. Foreign governments may also impose taxes on other payments or transactions with respect to foreign securities. The fund accrues such taxes as applicable. The schedule of investments includes information regarding income taxes under the caption "Income Tax Information."
Investment Income. Interest income, which includes accretion of original issue discount, is accrued as earned and dividend income is recorded on the ex-dividend date. Non-cash dividends included in dividend income, if any, are recorded at the fair market value of the securities received. The fund may place a debt obligation on non-accrual status and reduce related interest income by ceasing current accruals and writing off interest receivables when the collection of all or a portion of interest has become doubtful based on consistently applied procedures, under the general supervision of the Board of Trustees of the fund. A debt obligation is removed from non-accrual status when the issuer resumes interest payments or when collectibility of interest is reasonably assured.
Expenses. Most expenses of the trust can be directly attributed to a fund. Expenses which cannot be directly attributed are apportioned among the funds in the trust.
Distributions to Shareholders. Distributions are declared daily and paid monthly from net investment income. Distributions from realized gains, if any, are recorded on the ex-dividend date. Income dividends and capital gain distributions are declared separately for each class.
Income and capital gain distributions are determined in accordance with income tax regulations which may differ from generally accepted accounting principles. These differences, which may result in distribution reclassifications, are primarily due to differing treatments for paydown gains/losses on certain securities, foreign currency transactions, non-taxable dividends, market discount, capital loss carryforwards, and losses deferred due to wash sales and excise tax regulations.
Permanent book and tax basis differences relating to shareholder distributions will result in reclassifications to paid in capital. Undistributed net investment income and accumulated undistributed net realized gain (loss) on investments and foreign currency transactions may include temporary book and tax basis differences which
Semiannual Report
Notes to Financial Statements (Unaudited) - continued
1. Significant Accounting Policies - continued
Distributions to Shareholders - continued
will reverse in a subsequent period. Any taxable income or gain remaining at fiscal year end is distributed in the following year.
Security Transactions. Security transactions are accounted for as of trade date.
Gains and losses on securities sold are determined on the basis of identified cost.
2. Operating Policies.
Foreign Currency Contracts. The fund generally uses foreign currency contracts to facilitate transactions in foreign-denominated securities. Losses may arise from changes in the value of the foreign currency or if the counterparties do not perform under the contracts' terms. The U.S. dollar value of foreign currency contracts is determined using contractual currency exchange rates established at the time of each trade.
Joint Trading Account. Pursuant to an Exemptive Order issued by the Securities and Exchange Commission (SEC), the fund, along with other affiliated entities of Fidelity Management & Research Company (FMR), may transfer uninvested cash balances into one or more joint trading accounts. These balances are invested in one or more repurchase agreements for U.S. Treasury or Federal Agency obligations.
Repurchase Agreements. The underlying U.S. Treasury, Federal Agency, or other obligations found to be satisfactory by FMR are transferred to an account of the fund, or to the Joint Trading Account, at a bank custodian. The securities are marked-to-market daily and maintained at a value at least equal to the principal amount of the repurchase agreement (including accrued interest). FMR, the fund's investment adviser, is responsible for determining that the value of the underlying securities remains in accordance with the market value requirements stated above.
Interfund Lending Program. Pursuant to an Exemptive Order issued by the SEC, the fund, along with other registered investment companies having management contracts with FMR, may participate in an interfund lending program. This program provides an alternative credit facility allowing the fund to borrow from, or lend money to, other participating funds.
Delayed Delivery Transactions. The fund may purchase or sell securities on a delayed delivery basis. Payment and delivery may take place after the customary settlement period for that security. The price of the underlying securities and the date when the securities will be delivered and paid for are fixed at the time the transaction is negotiated. The fund may receive compensation for interest forgone in the purchase of a delayed delivery security. With respect to purchase commitments, the fund identifies securities as segregated in its records with a value at least equal to the amount of the
Semiannual Report
Notes to Financial Statements (Unaudited) - continued
2. Operating Policies - continued
Delayed Delivery Transactions - continued
commitment. Losses may arise due to changes in the value of the underlying securities or if the counterparty does not perform under the contract.
Options. The fund may use options to manage its exposure to the bond market and to fluctuations in interest rates and currency values. Writing puts and buying calls tend to increase the fund's exposure to the underlying instrument. Buying puts and writing calls tend to decrease the fund's exposure to the underlying instrument, or hedge other fund investments. Losses may arise from changes in the value of the underlying instruments, if there is an illiquid secondary market for the contracts, or if the counterparties do not perform under the contracts' terms. Gains and losses are realized upon the expiration or closing of the options. Realized gains (losses) on purchased options are included in realized gains (losses) on investment securities.
Restricted Securities. The fund is permitted to invest in securities that are subject to legal or contractual restrictions on resale. These securities generally may be resold in transactions exempt from registration or to the public if the securities are registered. Disposal of these securities may involve time-consuming negotiations and expense, and prompt sale at an acceptable price may be difficult. At the end of the period, restricted securities (excluding 144A issues) amounted to $581,709 or .2% of net assets.
Loans and Other Direct Debt Instruments. The fund is permitted to invest in loans and loan participations, trade claims or other receivables. These investments may include standby financing commitments that obligate the fund to supply additional cash to the borrower on demand. Loan participations involve a risk of insolvency of the lending bank or other financial intermediary. At the end of the period, these investments amounted to $4,353,863 or 1.4% of net assets.
3. Purchases and Sales of Investments.
Purchases and sales of securities, other than short-term securities, aggregated $151,385,373 and $137,527,507, respectively, of which U.S. government and government agency obligations aggregated $10,167,001 and $6,324,104, respectively.
4. Fees and Other Transactions with Affiliates.
Management Fee. As the fund's investment adviser, FMR receives a monthly fee that is calculated on the basis of a group fee rate plus a fixed individual fund fee rate applied to the average net assets of the fund. The group fee rate is the weighted average of a series of rates and is based on the monthly average net assets of all the mutual funds advised by FMR. The rates ranged from .0920% to .3700% for the period. The annual individual fund
Semiannual Report
Notes to Financial Statements (Unaudited) - continued
4. Fees and Other Transactions with Affiliates - continued
Management Fee - continued
fee rate is .45%. In the event that these rates were lower than the contractual rates in effect during the period, FMR voluntarily implemented the above rates, as they resulted in the same or a lower management fee. For the period, the management fee was equivalent to an annualized rate of .58% of average net assets.
Sub-Adviser Fee. FMR, on behalf of the fund, entered into sub-advisory agreements with Fidelity Management & Research (U.K.) Inc., Fidelity Management & Research (Far East) Inc., and Fidelity International Investment Advisors (FIIA). Under the sub-advisory arrangements, FMR may receive investment advice and research services and may grant the sub-advisers investment management authority to buy and sell securities. FMR pays its sub-advisers either a portion of its management fee or a fee based on costs incurred for these services.
Distribution and Service Plan. In accordance with Rule 12b-1 of the 1940 Act, the Board of Trustees has adopted separate Distribution and Service Plans with respect to each class of shares (collectively referred to as "the Plans"). Under certain of the Plans, the class pays Fidelity Distributors Corporation (FDC), an affiliate of FMR, a 12b-1 fee. A portion of this fee may be reallowed to securities dealers, banks and other financial institutions for the distribution of each class of shares and providing shareholder support services. For the period, this fee was based on the following annual rates of the average net assets of each applicable class:
|
Class A |
.15% |
|
Class T |
.25% |
|
Class B |
.90%* |
|
Class C |
1.00%** |
* .65% represents a distribution fee and .25% represents a shareholder service fee.
** .75% represents a distribution fee and .25% represents a shareholder service fee.
For the period, each class paid FDC the following amounts, a portion of which was retained by FDC:
|
|
Paid to |
Retained |
|
Class A |
$ 10,206 |
$ 35 |
|
Class T |
238,115 |
2,757 |
|
Class B |
379,103 |
274,390 |
|
Class C |
91,377 |
46,971 |
|
|
$ 718,801 |
$ 324,153 |
Semiannual Report
Notes to Financial Statements (Unaudited) - continued
4. Fees and Other Transactions with Affiliates - continued
Sales Load. FDC receives a front-end sales charge of up to 4.75% for selling Class A shares, and 3.50% for selling Class T shares of the fund. FDC receives the proceeds of contingent deferred sales charges levied on Class B share redemptions occurring within six years of purchase and Class C share redemptions occurring within one year of purchase. Contingent deferred sales charges are based on declining rates ranging from 5% to 1% for Class B and 1% for Class C, of the lesser of the cost of shares at the initial date of purchase or the net asset value of the redeemed shares, excluding any reinvested dividends and capital gains. In addition, purchases of Class A and Class T shares that were subject to a finder's fee bear a contingent deferred sales charge on assets that do not remain in the fund for at least one year. The Class A and Class T contingent deferred sales charge is based on 0.25% of the lesser of the cost of shares at the initial date of purchase or the net asset value of the redeemed shares, excluding any reinvested dividends and capital gains. A portion of the sales charges paid to FDC is paid to securities dealers, banks and other financial institutions.
For the period, sales charge amounts paid to and retained by FDC were as follows:
|
|
Paid to |
Retained |
|
Class A |
$ 45,515 |
$ 14,579 |
|
Class T |
60,945 |
19,314 |
|
Class B |
131,289 |
131,289* |
|
Class C |
1,693 |
1,693* |
|
|
$ 239,442 |
$ 166,875 |
* When Class B and Class C shares are initially sold, FDC pays commissions from its own resources to securities dealers,
banks, and other financial institutions through which the sales are made.
Transfer Agent Fees. Fidelity Investments Institutional Operations Company, Inc., (FIIOC), an affiliate of FMR, is the transfer, dividend disbursing and shareholder servicing agent (collectively referred to as the transfer agent) for each class of the fund. FIIOC receives account fees and asset-based fees that vary according to the account size and type of account of the shareholders of the respective classes of the fund.
Semiannual Report
Notes to Financial Statements (Unaudited) - continued
4. Fees and Other Transactions with Affiliates - continued
Transfer Agent Fees - continued
FIIOC pays for typesetting, printing and mailing of all shareholder reports, except proxy statements. For the period, the following amounts were paid to FIIOC:
|
|
Amount |
% of |
|
Class A |
$ 14,374 |
.21 * |
|
Class T |
164,772 |
.17 * |
|
Class B |
76,225 |
.18 * |
|
Class C |
17,523 |
.19 * |
|
Institutional Class |
3,466 |
.19 * |
|
|
$ 276,360 |
|
* Annualized
Accounting Fees. Fidelity Service Company, Inc., an affiliate of FMR, maintains the fund's accounting records. The fee is based on the level of average net assets for the month plus out-of-pocket expenses.
5. Interfund Lending Program.
The fund participated in the interfund lending program as a lender. The average daily loan balance during the period for which loans were outstanding amounted to $7,926,200. The weighted average interest rate was 5.88%. Interest earned from the interfund lending program amounted to $ 6,476 and is included in interest income on the Statement of Operations.
6. Expense Reductions.
Through an arrangement with the fund's custodian, credits realized as a result of uninvested cash balances were used to reduce a portion of the fund's expenses. During the period, the fund's custodian fees were reduced by $8,233.
7. Credit Risk.
The fund's relatively large investment in countries with limited or developing capital markets may involve greater risks than investments in more developed markets and the prices of such investments may be volatile. The yields of emerging market debt obligations reflect, among other things, perceived credit risk. The consequences of political, social or economic changes in these markets may have disruptive effects on the market prices of the fund's investments and the income they generate, as well as the fund's ability to repatriate such amounts.
Semiannual Report
Notes to Financial Statements (Unaudited) - continued
8. Beneficial Interest.
At the end of the period, FMR was record owner of approximately 13% of the total outstanding shares of the fund.
9. Distributions to Shareholders.
Distributions to shareholders of each class were as follows:
|
|
Six months ended |
Year ended |
|
|
2000 |
1999 |
|
From net investment income |
|
|
|
Class A |
$ 452,969 |
$ 775,559 |
|
Class T |
6,287,009 |
13,041,860 |
|
Class B |
2,494,965 |
4,950,300 |
|
Class C |
534,679 |
853,483 |
|
Institutional Class |
122,197 |
315,267 |
|
Total |
$ 9,891,819 |
$ 19,936,469 |
Semiannual Report
Notes to Financial Statements (Unaudited) - continued
10. Share Transactions.
Transactions for each class of shares were as follows:
|
|
Shares |
Dollars |
||
|
|
Six months ended June 30, |
Year ended December 31, |
Six months ended June 30, |
Year ended December 31, |
|
|
2000 |
1999 |
2000 |
1999 |
|
|
|
|
|
|
|
Class A |
590,687 |
670,664 |
$ 6,103,658 |
$ 7,034,562 |
|
Reinvestment of distributions |
34,799 |
59,003 |
358,061 |
616,531 |
|
Shares redeemed |
(365,966) |
(416,786) |
(3,788,317) |
(4,352,173) |
|
Net increase (decrease) |
259,520 |
312,881 |
$ 2,673,402 |
$ 3,298,920 |
|
Class T |
3,852,768 |
7,300,446 |
$ 39,705,333 |
$ 76,364,764 |
|
Reinvestment of distributions |
518,443 |
1,043,417 |
5,331,824 |
10,903,390 |
|
Shares redeemed |
(3,514,147) |
(8,149,722) |
(36,341,664) |
(85,087,489) |
|
Net increase (decrease) |
857,064 |
194,141 |
$ 8,695,493 |
$ 2,180,665 |
|
Class B |
1,205,702 |
3,093,028 |
$ 12,456,860 |
$ 32,490,970 |
|
Reinvestment of distributions |
165,116 |
321,769 |
1,700,988 |
3,367,960 |
|
Shares redeemed |
(1,247,215) |
(2,090,413) |
(12,903,021) |
(21,891,154) |
|
Net increase (decrease) |
123,603 |
1,324,384 |
$ 1,254,827 |
$ 13,967,776 |
|
Class C |
694,053 |
1,002,410 |
$ 7,155,652 |
$ 10,478,051 |
|
Reinvestment of distributions |
38,924 |
62,617 |
399,961 |
653,680 |
|
Shares redeemed |
(357,189) |
(513,809) |
(3,696,630) |
(5,359,385) |
|
Net increase (decrease) |
375,788 |
551,218 |
$ 3,858,983 |
$ 5,772,346 |
|
Institutional Class |
53,982 |
137,655 |
$ 559,029 |
$ 1,449,056 |
|
Reinvestment of distributions |
9,533 |
20,355 |
98,650 |
213,945 |
|
Shares redeemed |
(49,084) |
(248,874) |
(506,357) |
(2,615,934) |
|
Net increase (decrease) |
14,431 |
(90,864) |
$ 151,322 |
$ (952,933) |
Semiannual Report
Investment Adviser
Fidelity Management & Research Company
Boston, MA
Investment Sub-Advisers
Fidelity Management & Research
(U.K.) Inc.
Fidelity Management & Research
(Far East) Inc.
Fidelity International Investment Advisors
Fidelity International Investment Advisors (U.K.) Limited
Fidelity Investments Japan Limited
Officers
Edward C. Johnson 3d, President
Robert C. Pozen, Senior Vice President
Bart A. Grenier, Vice President
John H. Carlson, Vice President
Kevin E. Grant, Vice President
Ian Spreadbury, Vice President
Eric D. Roiter, Secretary
Robert A. Dwight, Treasurer
Maria F. Dwyer, Deputy Treasurer
John H. Costello, Assistant Treasurer
Board of Trustees
Ralph F. Cox *
Phyllis Burke Davis *
Robert M. Gates *
Edward C. Johnson 3d
Donald J. Kirk *
Ned C. Lautenbach *
Peter S. Lynch
Marvin L. Mann *
William O. McCoy *
Gerald C. McDonough *
Robert C. Pozen
Thomas R. Williams *
Advisory Board
J. Michael Cook
Abigail P. Johnson
Marie L. Knowles
General Distributor
Fidelity Distributors Corporation
Boston, MA
Transfer and Shareholder
Servicing Agent
Fidelity Investments Institutional Operations Company, Inc.
Boston, MA
Custodian
The Bank of New York
New York, NY
* Independent trustees
Semiannual Report
Focus Funds
Fidelity Advisor Consumer
Industries Fund
Fidelity Advisor Cyclical
Industries Fund
Fidelity Advisor Financial
Services Fund
Fidelity Advisor Health Care Fund
Fidelity Advisor Natural
Resources Fund
Fidelity Advisor Technology Fund
Fidelity Advisor Utilities Growth Fund
Growth Funds
Fidelity Advisor Korea Fund
Fidelity Advisor Emerging Asia Fund
Fidelity Advisor Latin America Fund
Fidelity Advisor Japan Fund
Fidelity Advisor Europe Capital Appreciation Fund
Fidelity Advisor International Capital Appreciation Fund
Fidelity Advisor Overseas Fund
Fidelity Advisor Diversified International Fund
Fidelity Advisor Global Equity Fund
Fidelity Advisor TechnoQuant ®
Growth Fund
Fidelity Advisor Small Cap Fund
Fidelity Advisor Value Strategies Fund
Fidelity Advisor Mid Cap Fund
Fidelity Advisor Dynamic Capital Appreciation Fund
Fidelity Advisor Equity Growth Fund
Fidelity Advisor Large Cap Fund
Fidelity Advisor Dividend Growth Fund
Fidelity Advisor Growth
Opportunities Fund
Growth and Income Funds
Fidelity Advisor Growth & Income Fund
Fidelity Advisor Equity Income Fund
Fidelity Advisor Asset Allocation Fund
Fidelity Advisor Balanced Fund
Taxable Income Funds
Fidelity Advisor Emerging Markets Income Fund
Fidelity Advisor High Yield Fund
Fidelity Advisor High Income Fund
Fidelity Advisor Strategic Income Fund
Fidelity Advisor Mortgage Securities Fund
Fidelity Advisor Government Investment Fund
Fidelity Advisor Intermediate Bond Fund
Fidelity Advisor Short Fixed-Income Fund
Municipal Funds
Fidelity Advisor Municipal Income Fund
Money Market Funds
Prime Fund
Treasury Fund
Tax-Exempt Fund
SI-SANN-0800 108597
1.705747.102
(Fidelity Investment logo)(registered trademark)
(Fidelity Investment logo)(registered trademark)
(2_fidelity_logos)Fidelity Advisor
Semiannual Report
June 30, 2000
|
President's Message |
3 |
Ned Johnson on investing strategies. |
|
Performance |
4 |
How the fund has done over time. |
|
Fund Talk |
9 |
The managers' review of fund performance, strategy and outlook. |
|
Investment Changes |
13 |
A summary of major shifts in the fund's investments over the past six months. |
|
Investments |
14 |
A complete list of the fund's investments with their market values. |
|
Financial Statements |
33 |
Statements of assets and liabilities,
operations, and changes in net assets, |
|
Notes |
42 |
Notes to the financial statements. |
Standard & Poor's, S&P and S&P 500 are registered service marks of The McGraw-Hill Companies, Inc. and have been licensed for use by Fidelity Distributors Corporation.
Other third party marks appearing herein are the property of their respective owners.
All other marks appearing herein are registered or unregistered trademarks or service marks of FMR Corp. or an affiliated company.
(Recycle graphic) This report is printed on recycled paper using soy-based inks.
This report and the financial statements contained herein are submitted for the general information of the shareholders of the fund. This report is not authorized for distribution to prospective investors in the fund unless preceded or accompanied by an effective prospectus.
Mutual fund shares are not deposits or obligations of, or guaranteed by, any depository institution. Shares are not insured by the FDIC, Federal Reserve Board or any other agency, and are subject to investment risks, including possible loss of principal amount invested.
Neither the fund nor Fidelity Distributors Corporation is a bank.
For more information on any Fidelity Advisor fund, including charges and expenses, contact your investment professional for a free prospectus. Read it carefully before you invest or send money.
Semiannual Report
(photo_of_Edward_C_Johnson_3d)
Dear Shareholder:
In stark contrast to the final six months of 1999, most major equity market indexes posted negative returns for the first half of 2000, due mainly to a correction in the technology sector during the second quarter. The majority of bond markets - with the notable exception of high yield - fared better, as Treasuries and non-Treasuries alike benefited as a haven from the volatility of stocks and riskier investment alternatives.
While it's impossible to predict the future direction of the markets with any degree of certainty, there are certain basic principles that can help investors plan for their future needs.
The longer your investment time frame, the less likely it is that you will be affected by short-term market volatility. A 10-year investment horizon appropriate for saving for a college education, for example, enables you to weather market cycles in a long-term fund, which may have a higher risk potential, but also has a higher potential rate of return.
An intermediate-length fund could make sense if your investment horizon is two to four years, while a short-term bond fund could be the right choice if you need your money in one or two years.
If your time horizon is less than a year, you might want to consider moving some of your bond investment into a money market fund. These funds seek income and a stable share price by investing in high-quality, short-term investments. Of course, it's important to remember that an investment in a money market fund is not insured or guaranteed by the Federal Deposit Insurance Corporation or any other government agency. Although money market funds seek to preserve the value of your investment at $1.00 per share, it is possible to lose money by investing in these types of funds.
Finally, no matter what your time horizon or portfolio diversity, it makes good sense to follow a regular investment plan, investing a certain amount of money in a fund at the same time each month or quarter and periodically reviewing your overall portfolio. By doing so, you won't get caught up in the excitement of a rapidly rising market, nor will you buy all your shares at market highs. While this strategy - known as dollar cost averaging - won't assure a profit or protect you from a loss in a declining market, it should help you lower the average cost of your purchases. Of course, you should consider your financial ability to continue your purchases through periods of low price levels before undertaking such a strategy.
Remember to contact your investment professional if you need help with your investments.
Best regards,
/s/Edward C. Johnson 3d
Edward C. Johnson 3d
Semiannual Report
Fidelity Advisor Strategic Income Fund - Institutional Class
There are several ways to evaluate historical performance. You can look at the total percentage change in value, the average annual percentage change or the growth of a hypothetical $10,000 investment. Total return reflects the change in the value of an investment, assuming reinvestment of the class' dividend income and capital gains (the profits earned upon the sale of securities that have grown in value). You can also look at the class' income, as reflected in its yield, to measure performance. Initial offering of Institutional Class shares took place on July 3, 1995. Institutional Class shares are sold to eligible investors without a sales load or 12b-1 fee. Returns prior to July 3, 1995 are those of Class T, and reflect Class T shares' 0.25% 12b-1 fee. If Fidelity had not reimbursed certain class expenses, the past five year and life of fund total returns would have been lower.
Semiannual Report
Fidelity Advisor Strategic Income Fund - Institutional Class
Cumulative Total Returns
|
Periods ended June 30, 2000 |
Past 6 |
Past 1 |
Past 5 |
Life of |
|
Fidelity Adv Strategic Income - Inst CL |
1.88% |
5.56% |
47.89% |
68.33% |
|
Fidelity Strategic Income Composite |
1.85% |
4.47% |
43.72% |
60.78% |
|
JP EMBI Global |
6.95% |
20.74% |
107.11% |
111.56% |
|
LB Government Bond |
4.97% |
5.01% |
35.12% |
50.89% |
|
ML High Yield Master II |
-1.00% |
-0.97% |
40.48% |
58.92% |
|
SB Non-US Dollar |
-1.95% |
2.41% |
8.81% |
28.05% |
|
Multi-Sector Income Funds Average |
0.43% |
2.09% |
35.58% |
n/a * |
Cumulative total returns show Institutional Class' performance in percentage terms over a set period - in this case, six months, one year, five years or since the fund started on October 31, 1994. For example, if you had invested $1,000 in a fund that had a 5% return over the past year, the value of your investment would be $1,050. You can compare Institutional Class' returns to those of the Merrill Lynch High Yield Master II Index - a market value-weighted index of all domestic and yankee high-yield bonds, including deferred interest bonds and payment-in-kind securities. Issues included in the index have maturities of one year or more and have a credit rating lower than BBB-/Baa3, but are not in default. Additionally, you can also compare the Institutional Class' returns to the performance of the Fidelity Strategic Income Composite Index - a hypothetical combination of unmanaged indices. The composite index combines the total returns of the J.P. Morgan Emerging Markets Bond Index Global, the Lehman Brothers Government Bond Index, the Merrill Lynch High Yield Master II Index and the Salomon Brothers Non-U.S. Dollar World Government Bond Index weighted according to the fund's neutral mix. To measure how Institutional Class' performance stacked up against its peers, you can compare it to the multi-sector income funds average, which reflects the performance of mutual funds with similar objectives tracked by Lipper Inc. The past six months average represents a peer group of 124 mutual funds. The benchmarks listed in the table above include reinvested dividends and capital gains, if any, and exclude the effect of sales charges.
* Not available
Semiannual Report
Fidelity Advisor Strategic Income Fund - Institutional Class
Average Annual Total Returns
|
Periods ended June 30, 2000 |
Past 1 |
Past 5 |
Life of |
|
Fidelity Adv Strategic Income - Inst CL |
5.56% |
8.14% |
9.63% |
|
Fidelity Strategic Income Composite |
4.47% |
7.52% |
8.74% |
Average annual total returns take Institutional Class' cumulative return and show you what would have happened if Institutional Class had performed at a constant rate each year.3
Understanding
Performance
How a fund did yesterday is no guarantee of how it will do tomorrow. If you sell your shares during a market downturn, you might lose money. But if you can ride out the market's ups and downs, you may have a gain.
Semiannual Report
Fidelity Advisor Strategic Income Fund - Institutional Class
$10,000 Over Life of Fund
FA Strategic Inc -CL I FID Strategic Inc. Blend ML High Yield Master II
00648 F0097 ML012
1994/10/31 10000.00 10000.00 10000.00
1994/11/30 10050.16 9936.60 9913.96
1994/12/31 10017.44 9903.80 10018.42
1995/01/31 10129.20 9978.91 10159.09
1995/02/28 10368.45 10141.90 10484.71
1995/03/31 10518.89 10327.22 10626.39
1995/04/30 10913.50 10664.49 10895.62
1995/05/31 11324.23 11104.80 11237.63
1995/06/30 11382.14 11186.68 11313.19
1995/07/31 11496.09 11241.99 11460.51
1995/08/31 11515.97 11255.61 11520.65
1995/09/30 11722.27 11450.63 11654.54
1995/10/31 11858.92 11529.37 11753.05
1995/11/30 11991.80 11702.56 11869.53
1995/12/31 12262.15 11966.60 12068.40
1996/01/31 12535.82 12181.84 12270.00
1996/02/29 12434.95 12022.59 12307.50
1996/03/31 12406.66 12017.90 12257.18
1996/04/30 12523.21 12087.11 12274.37
1996/05/31 12607.92 12144.87 12362.83
1996/06/30 12714.41 12274.32 12412.09
1996/07/31 12791.31 12384.03 12493.68
1996/08/31 12938.43 12508.74 12646.07
1996/09/30 13341.77 12793.71 12943.32
1996/10/31 13515.35 12970.78 13055.66
1996/11/30 13779.59 13260.91 13317.84
1996/12/31 13860.66 13271.94 13428.55
1997/01/31 13942.67 13295.82 13529.44
1997/02/28 14076.48 13392.56 13737.43
1997/03/31 13767.86 13196.51 13548.48
1997/04/30 13922.06 13339.36 13722.19
1997/05/31 14282.92 13627.61 14011.11
1997/06/30 14490.10 13827.52 14227.65
1997/07/31 14775.44 14123.54 14604.77
1997/08/31 14766.31 14074.06 14587.19
1997/09/30 15126.16 14348.57 14849.59
1997/10/31 14882.86 14272.45 14925.41
1997/11/30 14998.62 14383.76 15058.37
1997/12/31 15157.95 14515.34 15210.02
1998/01/31 15430.92 14698.48 15452.41
1998/02/28 15560.57 14799.74 15515.02
1998/03/31 15697.07 14882.18 15662.39
1998/04/30 15748.76 14982.09 15729.66
1998/05/31 15676.85 14992.95 15824.25
1998/06/30 15634.85 15010.15 15905.97
1998/07/31 15734.44 15070.99 16007.35
1998/08/31 14520.66 14328.10 15199.31
1998/09/30 14987.25 14785.75 15238.87
1998/10/31 15020.70 14886.10 14910.04
1998/11/30 15557.45 15303.89 15687.24
1998/12/31 15535.33 15323.38 15659.13
1999/01/31 15656.38 15344.26 15870.47
1999/02/28 15471.80 15134.94 15762.48
1999/03/31 15799.12 15377.83 15945.58
1999/04/30 16289.62 15639.25 16237.32
1999/05/31 15917.08 15380.26 16088.37
1999/06/30 15946.83 15389.33 16048.50
1999/07/31 15890.39 15433.21 16070.08
1999/08/31 15847.45 15384.24 15900.29
1999/09/30 15969.04 15512.52 15836.54
1999/10/31 16078.26 15566.16 15750.59
1999/11/30 16304.86 15671.43 15955.98
1999/12/31 16521.95 15785.23 16052.29
2000/01/31 16331.86 15659.95 15990.83
2000/02/29 16608.01 15829.82 16025.02
2000/03/31 16705.09 15968.36 15789.80
2000/04/30 16478.32 15806.33 15790.02
2000/05/31 16398.00 15699.25 15591.59
2000/06/30 16832.74 16077.57 15892.45
IMATRL PRASUN SHR__CHT 20000630 20000721 152201 R00000000000071
Semiannual Report
Fidelity Advisor Strategic Income Fund - Institutional Class
$10,000 Over Life of Fund: Let's say hypothetically that $10,000 was invested in Fidelity Advisor Strategic Income Fund - Institutional Class on October 31, 1994, when the fund started. As the chart shows, by June 30, 2000, the value of the investment would have grown to $16,833 - a 68.33% increase on the initial investment. For comparison, look at how the Merrill Lynch High Yield Master II Index - a market value-weighted index of all domestic and yankee high-yield bonds, including deferred interest bonds and payment-in-kind securities - did over the same period. Issues included in the index have maturities of one year or more and have a credit rating lower than BBB-/Baa3, but are not in default. With dividends and capital gains, if any, reinvested, the same $10,000 investment would have grown to $15,892 - a 58.92% increase. You can also look at how the Fidelity Strategic Income Composite Index - a hypothetical combination of unmanaged indices that is more representative of the fund's investable universe - did over the same period. This index combines returns from the J.P. Morgan Emerging Markets Bond Index Global, Lehman Brothers Government Bond Index, Merrill Lynch High Yield Master II Index, and the Salomon Brothers Non-U.S. Dollar World Government Bond Index, according to the fund's neutral mix .** With dividends and capital gains, if any, reinvested, the same $10,000 investment would have grown to $16,078 - a 60.78% increase.
Semiannual Report
Fidelity Advisor Strategic Income Fund - Institutional Class
** 40% high yield, 30% U.S. government and investment-grade,
15% emerging markets, and 15% foreign developed markets.
Semiannual Report
Fidelity Advisor Strategic Income Fund - Institutional Class
Total Return Components
|
|
Six months
ended |
Years ended December 31, |
July 3, 1995 |
|||
|
|
2000 |
1999 |
1998 |
1997 |
1996 |
1995 |
|
Dividend returns |
3.40% |
7.10% |
6.68% |
7.33% |
7.70% |
4.00% |
|
Capital returns |
-1.52% |
-0.75% |
-4.19% |
2.03% |
5.34% |
3.47% |
|
Total |
1.88% |
6.35% |
2.49% |
9.36% |
13.04% |
7.47% |
Total return components include both dividend returns and capital returns. A dividend return reflects the actual dividends paid by the class. A capital return reflects both the amount paid by the class to shareholders as capital gain distributions and changes in the class' share price. Both returns assume the dividends or capital gains, if any, paid by the class are reinvested, and exclude the effect of sales charges.
Dividends and Yield
|
Period ended June 30, 2000 |
Past 1 |
Past 6 |
Past 1 |
|
Dividends per share |
5.94 ¢ |
35.22 ¢ |
72.23 ¢ |
|
Annualized dividend rate |
6.99% |
6.81% |
6.95% |
|
30-day annualized yield |
7.96% |
- |
- |
Dividends per share show the income paid by the class for a set period. If you annualize this number based on an average share price of $10.34 over the past one month, $10.37 over the past six months, and $10.40 over the past one year, you can compare the class' income over these three periods. The 30-day annualized yield is a standard formula for all bond funds based on the yields of the bonds in the fund, averaged over the past 30 days. This figure shows you the yield characteristics of the fund's investments at the end of the period. It also helps you to compare funds from different companies on an equal basis.
Semiannual Report
Market Recap
International bond investors faced a myriad of negative factors throughout the majority of the six-month period ending June 30, 2000. Strong global economic growth and the threat of rising interest rates, currency fluctuations, and a weakening euro continued to plague global debt issues. Additionally, poor liquidity hampered bond prices in non-U.S. developed markets, particularly in the high-yield bond area, which historically is less sensitive to interest rates and driven more by credit fundamentals. High-yield bonds suffered as a result of declining demand and an increase in the default rate - except for telecommunications issues, which got a boost from the sector's global appeal for wireless communications. Those factors helped drag down the Salomon Brothers Non-U.S. World Government Bond Index, which returned -1.95%. On the bright side, a number of favorable factors propelled demand for emerging-market bonds, which was reflected in the 6.95% return of the J.P. Morgan Emerging Markets Bond Index Global - a popular benchmark of emerging market debt. Credit momentum, which was driven by improving fundamentals - such as the Russian government's Soviet-era debt restructuring and new political leadership - fostered the rally in emerging-market bonds. Elsewhere, Brazil's better-than-expected economic growth fueled a sharp increase in foreign direct investment. Often large commodity suppliers, emerging-market countries also benefited from a sharp increase in oil prices.
(Portfolio Manager photograph)
The following is an interview with John Carlson (top left), Lead Portfolio Manager of Fidelity Advisor Strategic Income Fund, with additional
comments from Kevin Grant (top right), on U.S. government and investment-grade securities; Mark Notkin (lower left) on high-yield securities; and
Ian Spreadbury (lower right) on foreign developed-market securities. John Carlson also manages the emerging-markets portion of the fund.
Q. How did the fund perform, John?
Semiannual Report
Fund Talk: The Managers' Overview - continued
J.C. For the six months ending June 30, 2000, the fund's Institutional Class shares returned 1.88%. The multi-sector income funds average, as tracked by Lipper Inc., returned 0.43%. Meanwhile, the Merrill Lynch High Yield Master II Index returned -1.00%. For the 12 months ending June 30, 2000, the fund returned 5.56%, while the Lipper average returned 2.09% and the Merrill Lynch index returned -0.97%.
Q. What helped the fund outperform its benchmarks?
J.C. Three of the four subportfolios that make up the fund - high yield, non-U.S. developed markets and emerging markets - outperformed their respective benchmarks. The subportfolio managers will discuss this in more detail below.
Q. Kevin, what was your strategy for the U.S. government sector?
K.G. The subportfolio is designed to be the low risk portion of the fund. Most of the subportfolio's holdings are in U.S. Treasuries and agency issues, which are high-quality, liquid instruments. While the subportfolio did not outperform its benchmark, it did meet its objective of providing liquidity and security for the other subportfolios that make up the fund.
Q. Mark, how did the high-yield subportfolio achieve its outperformance?
M.N. Despite the high-yield market being negatively affected by rising interest rates, wider credit spreads, volatile equity markets and fears of an economic slowdown,
the subportfolio was able to outperform its benchmark. This was a result primarily of industry selection and, to a lesser extent, security selection. The portfolio's
underweighted position relative to its benchmark in the steel, automotive and entertainment sectors more than offset the negative performance of our overweighted
position in cable and underweighting in energy. The steel and
automotive sectors were negatively impacted by fears of an economic slowdown, while poor fundamentals in the movie theater industry drove the entertainment arena
downward. Energy benefited from robust oil and gas prices, and the cable industry was hurt by too much competition and a disappointing rollout of new services.
Q. Which securities helped and which hampered performance?
M.N. Positive contributions were made by Winstar, a wireless CLEC (competitive local exchange carrier); Laboratory Corp., one of the few large players left in the consolidating clinical laboratory testing business; and Voicestream Wireless, the owner and operator of one of the few national wireless platforms in the U.S. Unfortunately, these gains were somewhat offset by the poor stock performance of Signature Resorts, Kitty Hawk and GST Telecom, which are no longer in the fund.
Semiannual Report
Fund Talk: The Managers' Overview - continued
Q. John, what events affected the emerging-market debt sector?
J.C. The year started off with one of the most important events - the resignation of Russian President Boris Yeltsin on New Year's Eve. Vladimir Putin, who acted as president until he was formally elected in March, enacted a number of reforms to enhance governability and the rule of law, which increased local and foreign investor confidence and drove asset prices upward. The Russian government also completed a restructuring of Soviet-era debt with private investors. Russia's performance was helped by the continued firmness in oil prices, providing an enormous boost to the country's external accounts. Mexico's story in the first half of this year is also noteworthy. Recognizing Mexico's strong fiscal discipline, reduced risk from the banking sector and increasing integration into the world economy, Moody's Credit Investor Services raised the country's rating to investment-grade level. In addition, with elections slated for the first week in July, President Ernesto Zedillo has been working diligently to avoid the election-related problems of the past. Finally, with respect to the overall market, many countries took advantage of ongoing strength in commodity prices, particularly oil, and continued growth in the U.S.
Q. Ian, what were the factors that
influenced the non-U.S. developed
country subportfolio and what was
your strategy?
I.S. The subportfolio surpassed its benchmark by utilizing active security selection. The key factor was monetary tightening in both the United Kingdom and Euroland - the euro market countries. The Bank of England and the European Central Bank increased interest rates in an effort to slow their respective economies. Credit markets continued to underperform, driven by a number of factors including an increased level of corporate supply, reduced levels of government supply and equity volatility. In response, I reduced the subportfolio's credit exposure and increased holdings in government issues, since the outlook for the credit sector remained uncertain. In the euro market, I added value by utilizing a barbell approach, meaning the subportfolio's holdings were underweighted at the shorter durations, while overweighted in cash and 10-year duration bonds - in anticipation of an inversion in the yield curve and rising rates. In Japan, the economy showed some signs of recovery, as the government maintained its zero percent interest-rate policy in an attempt to encourage growth. As a result, the subportfolio maintained a short-duration position relative to the benchmark since interest rates remained very low both at the short and long-end of the yield curve.
Q. John, as lead portfolio manager, what's your outlook?
J.C. I see continued demand for credit product given current low yields and lack of supply at the long-end of the U.S. yield curve. Since I expect that fundamentals will drive the performance of credits in high-yield and emerging markets, we'll continue to focus Fidelity's research strength on selecting debt and securities that can enable the fund to continue outperforming.
The views expressed in this report reflect those of the portfolio managers only through the end of the period of the report as stated on the cover and do not necessarily represent the views of Fidelity or any other person in the Fidelity organization. Any such views are subject to change at any time based upon market or other conditions and Fidelity disclaims any responsibility to update such views. These views may not be relied on as investment advice and, because investment decisions for a Fidelity fund are based on numerous factors, may not be relied on as an indication of trading intent on behalf of any Fidelity fund.
Semiannual Report
Fund Talk: The Managers' Overview - continued
Fund Facts
Goal: a high level of current income by investing primarily in debt securities; as a secondary objective, the fund may seek capital appreciation
Start date: October 31, 1994
Size: as of June 30, 2000, more than $321 million
Manager: John Carlson, lead and emerging-markets manager, since 1995 and 1999, respectively; Kevin Grant, U.S. government investments, since 1998; Mark Notkin, high-yield investments, since 1999; and Ian Spreadbury, foreign developed-market securities, since 1998
3John Carlson discusses emerging markets - five years later:
"This year marks my fifth anniversary managing Fidelity's emerging-market debt funds and funds holding positions in emerging markets. Over the past five years, the emerging-market debt marketplace has evolved positively, becoming more efficient, deeper and broader.
"When I began managing these funds, the benchmark index used was the J.P. Morgan Emerging Markets Bond Index, which included nine countries, was 88% invested in Latin America and contained no investment-grade securities. The current index used as the benchmark is the J.P. Morgan Emerging Markets Bond Index Global. As the marketplace has evolved, the index also changed to reflect greater diversification and today includes 27 countries, only 65% exposure to Latin America and now 30% in investment-grade securities. In addition, the new index holds a greater number of securities and has a much larger market capitalization - $190 billion as of June 30, 2000, compared to $66 billion as of June 30, 1995.
"The changes in the marketplace and the index complement our portfolio management style. We have always looked for undervalued, out-of-index countries and securities in an effort to enhance performance and achieve better diversification for the portfolios we manage. I remain optimistic about emerging-market debt and look forward to continued growth and development in this marketplace."
Semiannual Report
|
Top Five Holdings as of June 30, 2000 |
||
|
(by issuer, excluding cash equivalents) |
% of fund's |
% of fund's net assets |
|
U.S. Treasury Obligations |
16.9 |
15.5 |
|
Germany Federal Republic |
5.2 |
1.8 |
|
Fannie Mae |
4.9 |
5.3 |
|
Brazilian Federative Rep. |
2.8 |
2.7 |
|
Canadian Government |
2.5 |
3.0 |
|
|
32.3 |
28.3 |
|
Top Five Market Sectors as of June 30, 2000 |
||
|
|
% of fund's |
% of fund's net assets |
|
Media & Leisure |
16.8 |
16.7 |
|
Utilities |
9.6 |
10.0 |
|
Basic Industries |
3.1 |
3.9 |
|
Finance |
3.0 |
2.0 |
|
Technology |
2.2 |
2.1 |
|
Quality Diversification as of June 30, 2000 |
||
|
(Moody's Ratings) |
% of fund's investments |
% of fund's investments |
|
Aaa, Aa, A |
43.3 |
42.4 |
|
Baa |
3.2 |
1.2 |
|
Ba |
3.2 |
4.8 |
|
B |
34.4 |
34.4 |
|
Caa, Ca, C |
4.3 |
5.7 |
|
Not Rated |
2.7 |
2.2 |
|
Table excludes short-term investments. Where Moody's ratings are not available, we have used |
|
Asset Allocation (% of fund's net assets) |
|||||||
|
As of June 30, 2000 * |
As of December 31, 1999 ** |
||||||
|
Corporate Bonds 35.8% |
|
|
Corporate Bonds 35.6% |
|
||
|
U.S. Government and Government Agency Obligations 29.2% |
|
|
U.S. Government and Government Agency Obligations 29.0% |
|
||
|
Foreign Government & Government Agency Obligations 23.5% |
|
|
Foreign Government & Government Agency Obligations 23.0% |
|
||
|
Stocks 4.9% |
|
|
Stocks 6.6% |
|
||
|
Other Investments 1.9% |
|
|
Other Investments 1.5% |
|
||
|
Short-Term |
|
|
Short-Term |
|
||
|
* Foreign investments |
31.5% |
|
** Foreign investments |
31.8% |
|
||
Semiannual Report
(Unaudited)
Showing Percentage of Net Assets
|
Corporate Bonds - 35.8% |
|||||
|
Moody's Ratings (unaudited) (b) |
Principal Amount (d) |
Value |
|||
|
Convertible Bonds - 0.6% |
|||||
|
HEALTH - 0.2% |
|||||
|
Medical Facilities Management - 0.2% |
|||||
|
Total Renal Care Holdings, Inc. 7% 5/15/09 |
B1 |
|
$ 860,000 |
$ 571,900 |
|
|
MEDIA & LEISURE - 0.3% |
|||||
|
Broadcasting - 0.3% |
|||||
|
EchoStar Communications Corp. 4.875% 1/1/07 (g) |
- |
|
600,000 |
570,750 |
|
|
NTL, Inc. 5.75% 12/15/09 (g) |
CCC+ |
|
344,000 |
271,760 |
|
|
|
842,510 |
||||
|
RETAIL & WHOLESALE - 0.1% |
|||||
|
Retail & Wholesale, Miscellaneous - 0.1% |
|||||
|
Sunglass Hut International, Inc. 5.25% 6/15/03 |
B3 |
|
660,000 |
476,025 |
|
|
TOTAL CONVERTIBLE BONDS |
1,890,435 |
||||
|
Nonconvertible Bonds - 35.2% |
|||||
|
BASIC INDUSTRIES - 3.1% |
|||||
|
Chemicals & Plastics - 1.9% |
|||||
|
Avecia Group PLC 11% 7/1/09 |
B2 |
|
840,000 |
823,200 |
|
|
Berry Plastics Corp. 11% 7/15/07 |
B3 |
|
590,000 |
528,050 |
|
|
Huntsman Corp. 9.5% 7/1/07 (g) |
B2 |
|
940,000 |
857,750 |
|
|
Huntsman ICI Chemicals LLC 10.125% 7/1/09 |
B2 |
|
1,200,000 |
1,200,000 |
|
|
Lyondell Chemical Co.: |
|
|
|
|
|
|
9.625% 5/1/07 |
Ba3 |
|
750,000 |
742,500 |
|
|
9.875% 5/1/07 |
Ba3 |
|
1,230,000 |
1,217,700 |
|
|
Sovereign Specialty Chemicals, Inc. 11.875% 3/15/10 |
B3 |
|
795,000 |
817,856 |
|
|
|
6,187,056 |
||||
|
Metals & Mining - 0.3% |
|||||
|
Better Minerals & Aggregates Co. 13% 9/15/09 |
B3 |
|
280,000 |
271,600 |
|
|
Kaiser Aluminum & Chemical Corp. 12.75% 2/1/03 |
B3 |
|
780,000 |
709,800 |
|
|
|
981,400 |
||||
|
Corporate Bonds - continued |
|||||
|
Moody's Ratings (unaudited) (b) |
Principal Amount (d) |
Value |
|||
|
Nonconvertible Bonds - continued |
|||||
|
BASIC INDUSTRIES - continued |
|||||
|
Packaging & Containers - 0.4% |
|||||
|
Gaylord Container Corp.: |
|
|
|
|
|
|
9.375% 6/15/07 |
Caa1 |
|
$ 520,000 |
$ 400,400 |
|
|
9.75% 6/15/07 |
Caa1 |
|
1,125,000 |
877,500 |
|
|
|
1,277,900 |
||||
|
Paper & Forest Products - 0.5% |
|||||
|
Container Corp. of America: |
|
|
|
|
|
|
gtd.: |
|
|
|
|
|
|
9.75% 4/1/03 |
B2 |
|
210,000 |
208,950 |
|
|
11.25% 5/1/04 |
B2 |
|
50,000 |
50,750 |
|
|
10.75% 5/1/02 |
B2 |
|
70,000 |
71,225 |
|
|
Repap New Brunswick, Inc. yankee 10.625% 4/15/05 |
Caa1 |
|
470,000 |
413,600 |
|
|
Stone Container Corp. 12.58% 8/1/16 (h) |
B2 |
|
560,000 |
576,800 |
|
|
Tjiwi Kimia International Finance Co. 13.25% 8/1/01 |
Caa1 |
|
270,000 |
237,600 |
|
|
|
1,558,925 |
||||
|
TOTAL BASIC INDUSTRIES |
10,005,281 |
||||
|
CONSTRUCTION & REAL ESTATE - 0.6% |
|||||
|
Construction - 0.1% |
|||||
|
Blount, Inc. 13% 8/1/09 |
B3 |
|
490,000 |
498,575 |
|
|
Engineering - 0.2% |
|||||
|
360networks, Inc. 13% 5/1/08 (g) |
B3 |
|
635,000 |
628,650 |
|
|
Real Estate Investment Trusts - 0.3% |
|||||
|
Pinnacle Holdings, Inc. 0% 3/15/08 (e) |
B3 |
|
1,235,000 |
858,325 |
|
|
TOTAL CONSTRUCTION & REAL ESTATE |
1,985,550 |
||||
|
DURABLES - 0.4% |
|||||
|
Home Furnishings - 0.4% |
|||||
|
Omega Cabinets Ltd. 10.5% 6/15/07 |
B3 |
|
720,000 |
648,000 |
|
|
Sealy Corp., Inc. 10% 12/18/08 pay-in-kind (k) |
- |
|
676,406 |
581,709 |
|
|
Sealy Mattress Co. 9.875% 12/15/07 |
B3 |
|
170,000 |
163,200 |
|
|
|
1,392,909 |
||||
|
Corporate Bonds - continued |
|||||
|
Moody's Ratings (unaudited) (b) |
Principal Amount (d) |
Value |
|||
|
Nonconvertible Bonds - continued |
|||||
|
DURABLES - continued |
|||||
|
Textiles & Apparel - 0.0% |
|||||
|
St. John Knits International, Inc. 12.5% 7/1/09 |
B3 |
|
$ 75,000 |
$ 71,250 |
|
|
TOTAL DURABLES |
1,464,159 |
||||
|
ENERGY - 0.4% |
|||||
|
Energy Services - 0.3% |
|||||
|
Petroliam Nasional BHD (Petronas): |
|
|
|
|
|
|
7.125% 10/18/06 (Reg. S) |
Baa3 |
|
355,000 |
335,919 |
|
|
7.625% 10/15/26 (Reg. S) |
Baa3 |
|
250,000 |
214,063 |
|
|
yankee 7.625% 10/15/26 (g) |
Baa3 |
|
570,000 |
488,063 |
|
|
|
1,038,045 |
||||
|
Oil & Gas - 0.1% |
|||||
|
Petroleos Mexicanos 9.4367% 7/15/05 |
Baa3 |
|
235,000 |
235,588 |
|
|
TOTAL ENERGY |
1,273,633 |
||||
|
FINANCE - 2.9% |
|||||
|
Banks - 1.0% |
|||||
|
Banco Nacional de Comercio Exterior SNC 11.25% 5/30/06 |
Baa3 |
|
525,000 |
560,438 |
|
|
Banco Nacional de Desenvolvimento Economico e Social: |
|
|
|
|
|
|
12.554% 6/16/08 (h) |
B2 |
|
2,130,000 |
1,994,213 |
|
|
12.554% 6/16/08 (g)(h) |
B2 |
|
500,000 |
468,125 |
|
|
|
3,022,776 |
||||
|
Credit & Other Finance - 1.9% |
|||||
|
Ahold Finance USA, Inc. euro 6.375% 6/8/05 |
A3 |
EUR |
1,000,000 |
962,168 |
|
|
AMRESCO, Inc. 9.875% 3/15/05 |
Caa3 |
|
351,000 |
163,215 |
|
|
APP International Finance (Mauritius) Ltd. 0% 7/5/01 (g) |
B3 |
|
520,000 |
410,800 |
|
|
APP International Finance Co. 11.75% 10/1/05 |
Caa1 |
|
170,000 |
119,000 |
|
|
Astra Overseas Finance BV: |
|
|
|
|
|
|
6.7775% 6/30/05 (Reg.S) (h) |
- |
|
103,062 |
62,353 |
|
|
6.7775% 6/30/05 (g)(h) |
- |
|
92,755 |
56,117 |
|
|
Dobson/Sygnet Communications Co. 12.25% 12/15/08 |
- |
|
625,000 |
660,938 |
|
|
Ford Motor Credit Co. euro 1.2% 2/7/05 |
A1 |
JPY |
300,000,000 |
2,806,107 |
|
|
Kappa Beheer BV 10.625% 7/15/09 |
B2 |
|
715,000 |
715,000 |
|
|
Corporate Bonds - continued |
|||||
|
Moody's Ratings (unaudited) (b) |
Principal Amount (d) |
Value |
|||
|
Nonconvertible Bonds - continued |
|||||
|
FINANCE - continued |
|||||
|
Credit & Other Finance - continued |
|||||
|
Netia Holdings II BV euro 13.5% 6/15/09 |
B3 |
EUR |
230,000 |
$ 221,603 |
|
|
Stone Container Finance Co. 11.5% 8/15/06 (g) |
B2 |
|
120,000 |
124,200 |
|
|
|
6,301,501 |
||||
|
TOTAL FINANCE |
9,324,277 |
||||
|
HEALTH - 1.3% |
|||||
|
Medical Facilities Management - 1.3% |
|||||
|
Everest Healthcare Services, Inc. 9.75% 5/1/08 |
B3 |
|
740,000 |
621,600 |
|
|
Express Scripts, Inc. 9.625% 6/15/09 |
Ba2 |
|
630,000 |
614,250 |
|
|
Fountain View, Inc. 11.25% 4/15/08 |
Caa1 |
|
200,000 |
49,000 |
|
|
Hanger Orthopedic Group, Inc. 11.25% 6/15/09 |
B3 |
|
490,000 |
441,000 |
|
|
Mariner Post-Acute Network, Inc. 9.5% 11/1/07 (c) |
C |
|
1,136,000 |
114 |
|
|
Oxford Health Plans, Inc. 11% 5/15/05 |
B2 |
|
930,000 |
960,225 |
|
|
Unilab Corp. 12.75% 10/1/09 |
B3 |
|
1,330,000 |
1,369,900 |
|
|
|
4,056,089 |
||||
|
INDUSTRIAL MACHINERY & EQUIPMENT - 1.5% |
|||||
|
Electrical Equipment - 0.2% |
|||||
|
Motors & Gears, Inc. 10.75% 11/15/06 |
B3 |
|
570,000 |
547,200 |
|
|
Industrial Machinery & Equipment - 0.4% |
|||||
|
Applied Power, Inc. 8.75% 4/1/09 |
B1 |
|
810,000 |
838,350 |
|
|
Dunlop Standard Aero Holdings PLC 11.875% 5/15/09 |
B3 |
|
480,000 |
475,200 |
|
|
|
1,313,550 |
||||
|
Corporate Bonds - continued |
|||||
|
Moody's Ratings (unaudited) (b) |
Principal Amount (d) |
Value |
|||
|
Nonconvertible Bonds - continued |
|||||
|
INDUSTRIAL MACHINERY & EQUIPMENT - continued |
|||||
|
Pollution Control - 0.9% |
|||||
|
Allied Waste North America, Inc. 7.875% 1/1/09 |
Ba2 |
|
$ 2,145,000 |
$ 1,823,250 |
|
|
Browning-Ferris Industries, Inc. 7.4% 9/15/35 |
Ba3 |
|
1,640,000 |
1,131,600 |
|
|
|
2,954,850 |
||||
|
TOTAL INDUSTRIAL MACHINERY & EQUIPMENT |
4,815,600 |
||||
|
MEDIA & LEISURE - 14.7% |
|||||
|
Broadcasting - 12.8% |
|||||
|
ACME Television LLC/ACME Financial Corp. |
B3 |
|
1,020,000 |
974,100 |
|
|
Adelphia Communications Corp.: |
|
|
|
|
|
|
8.375% 2/1/08 |
B1 |
|
370,000 |
326,525 |
|
|
9.25% 10/1/02 |
B1 |
|
280,000 |
275,100 |
|
|
Ascent Entertainment Group, Inc. 0% 12/15/04 (e) |
Ba1 |
|
380,000 |
307,800 |
|
|
Callahan Nordrhein Westfalen 14% 7/15/10 (g) |
B3 |
|
1,260,000 |
1,261,576 |
|
|
CapStar Broadcasting Partners, Inc.: |
|
|
|
|
|
|
0% 2/1/09 (e) |
B2 |
|
315,000 |
287,438 |
|
|
9.25% 7/1/07 |
B1 |
|
1,010,000 |
1,016,313 |
|
|
Century Communications Corp.: |
|
|
|
|
|
|
Series B, 0% 1/15/08 |
B1 |
|
3,330,000 |
1,365,300 |
|
|
8.375% 12/15/07 |
B1 |
|
20,000 |
17,450 |
|
|
8.75% 10/1/07 |
B1 |
|
90,000 |
81,000 |
|
|
9.5% 3/1/05 |
B1 |
|
60,000 |
57,750 |
|
|
Chancellor Media Corp.: |
|
|
|
|
|
|
8.125% 12/15/07 |
B1 |
|
250,000 |
251,563 |
|
|
9% 10/1/08 |
B1 |
|
2,720,000 |
2,774,400 |
|
|
Charter Communications Holdings LLC/Charter Communications Holdings Capital Corp.: |
|
|
|
|
|
|
0% 1/15/10 (e) |
B2 |
|
1,770,000 |
1,004,475 |
|
|
0% 4/1/11 (e) |
B2 |
|
2,600,000 |
1,475,500 |
|
|
Citadel Broadcasting Co.: |
|
|
|
|
|
|
9.25% 11/15/08 |
B3 |
|
1,320,000 |
1,280,400 |
|
|
10.25% 7/1/07 |
B3 |
|
2,030,000 |
2,057,913 |
|
|
Comcast UK Cable Partners Ltd. 0% 11/15/07 (e) |
B2 |
|
220,000 |
204,600 |
|
|
Diamond Cable Communications PLC yankee |
B3 |
|
696,000 |
650,760 |
|
|
Corporate Bonds - continued |
|||||
|
Moody's Ratings (unaudited) (b) |
Principal Amount (d) |
Value |
|||
|
Nonconvertible Bonds - continued |
|||||
|
MEDIA & LEISURE - continued |
|||||
|
Broadcasting - continued |
|||||
|
Earthwatch, Inc. 0% 7/15/07 unit (e)(g) |
- |
|
$ 700,000 |
$ 448,000 |
|
|
EchoStar DBS Corp. 9.375% 2/1/09 |
B2 |
|
1,800,000 |
1,737,000 |
|
|
Fox Family Worldwide, Inc. 0% 11/1/07 (e) |
B1 |
|
1,920,000 |
1,190,400 |
|
|
FrontierVision Holdings LP/FrontierVision Holdings Capital Corp. 0% 9/15/07 (e) |
B1 |
|
901,000 |
777,113 |
|
|
Golden Sky DBS, Inc. 0% 3/1/07 (e) |
Caa1 |
|
2,505,000 |
1,684,613 |
|
|
Golden Sky Systems, Inc. 12.375% 8/1/06 |
B3 |
|
300,000 |
327,000 |
|
|
LIN Holdings Corp. 0% 3/1/08 (e) |
B3 |
|
1,240,000 |
815,300 |
|
|
NorthPoint Communication Holdings, Inc. 12.875% 2/15/10 |
Caa1 |
|
520,000 |
358,800 |
|
|
NTL Communications Corp.: |
|
|
|
|
|
|
0% 10/1/08 (e) |
B3 |
|
6,975,000 |
4,481,438 |
|
|
11.5% 10/1/08 |
B3 |
|
1,080,000 |
1,088,100 |
|
|
NTL, Inc. 0% 4/1/08 (e) |
B3 |
|
890,000 |
551,800 |
|
|
Olympus Communications LP/Olympus Capital Corp. 10.625% 11/15/06 |
B1 |
|
90,000 |
88,200 |
|
|
Pegasus Communications Corp. 12.5% 8/1/17 |
B3 |
|
1,010,000 |
1,070,600 |
|
|
Satelites Mexicanos SA de CV 10.125% 11/1/04 |
B3 |
|
580,000 |
391,500 |
|
|
Susquehanna Media Co. 8.5% 5/15/09 |
B1 |
|
90,000 |
85,500 |
|
|
Telemundo Holdings, Inc. 0% 8/15/08 (e) |
Caa1 |
|
3,405,000 |
2,366,475 |
|
|
Telewest Communications PLC: |
|
|
|
|
|
|
0% 4/15/09 (e) |
B1 |
|
2,030,000 |
1,116,500 |
|
|
0% 2/1/10 (e)(g) |
B1 |
|
2,970,000 |
1,574,100 |
|
|
9.875% 2/1/10 (g) |
B1 |
|
350,000 |
325,500 |
|
|
11.25% 11/1/08 |
B1 |
|
170,000 |
170,000 |
|
|
Telewest PLC yankee 9.625% 10/1/06 |
B1 |
|
625,000 |
587,500 |
|
|
United Pan-Europe Communications NV: |
|
|
|
|
|
|
0% 8/1/09 (e) |
B2 |
|
1,160,000 |
580,000 |
|
|
10.875% 8/1/09 |
B2 |
|
3,690,000 |
3,247,200 |
|
|
11.5% 2/1/10 |
B2 |
|
300,000 |
268,500 |
|
|
|
41,001,102 |
||||
|
Entertainment - 0.5% |
|||||
|
Bally Total Fitness Holding Corp. 9.875% 10/15/07 |
B3 |
|
455,000 |
414,050 |
|
|
Livent, Inc. 9.375% 10/15/04 (c) |
- |
|
300,000 |
60,000 |
|
|
Corporate Bonds - continued |
|||||
|
Moody's Ratings (unaudited) (b) |
Principal Amount (d) |
Value |
|||
|
Nonconvertible Bonds - continued |
|||||
|
MEDIA & LEISURE - continued |
|||||
|
Entertainment - continued |
|||||
|
Premier Parks, Inc.: |
|
|
|
|
|
|
0% 4/1/08 (e) |
B3 |
|
$ 1,170,000 |
$ 794,138 |
|
|
9.25% 4/1/06 |
B3 |
|
480,000 |
453,600 |
|
|
|
1,721,788 |
||||
|
Lodging & Gaming - 1.4% |
|||||
|
Florida Panthers Holdings, Inc. 9.875% 4/15/09 |
B2 |
|
930,000 |
869,550 |
|
|
HMH Properties, Inc. 7.875% 8/1/05 |
Ba2 |
|
700,000 |
644,000 |
|
|
Horseshoe Gaming LLC: |
|
|
|
|
|
|
8.625% 5/15/09 |
B2 |
|
480,000 |
451,200 |
|
|
9.375% 6/15/07 |
B+ |
|
890,000 |
883,325 |
|
|
ITT Corp. 7.375% 11/15/15 |
Ba1 |
|
720,000 |
603,000 |
|
|
KSL Recreation Group, Inc. 10.25% 5/1/07 |
B2 |
|
320,000 |
304,000 |
|
|
Station Casinos, Inc. 8.875% 12/1/08 |
B1 |
|
745,000 |
709,613 |
|
|
|
4,464,688 |
||||
|
TOTAL MEDIA & LEISURE |
47,187,578 |
||||
|
NONDURABLES - 0.4% |
|||||
|
Foods - 0.4% |
|||||
|
Del Monte Corp. 12.25% 4/15/07 |
B3 |
|
252,000 |
267,120 |
|
|
Del Monte Foods Co. 0% 12/15/07 (e) |
Caa1 |
|
1,564,000 |
1,173,000 |
|
|
|
1,440,120 |
||||
|
RETAIL & WHOLESALE - 0.2% |
|||||
|
Grocery Stores - 0.2% |
|||||
|
Pathmark Stores, Inc. 9.625% 5/1/03 (c) |
Caa3 |
|
910,000 |
627,900 |
|
|
SERVICES - 0.5% |
|||||
|
Printing - 0.4% |
|||||
|
Sullivan Graphics, Inc. 12.75% 8/1/05 |
Caa1 |
|
720,000 |
723,600 |
|
|
Von Hoffman Corp. 13.5% 5/15/09 pay-in-kind (g) |
- |
|
740,131 |
666,118 |
|
|
|
1,389,718 |
||||
|
Services - 0.1% |
|||||
|
Medaphis Corp. 9.5% 2/15/05 |
Caa1 |
|
190,000 |
142,500 |
|
|
TOTAL SERVICES |
1,532,218 |
||||
|
Corporate Bonds - continued |
|||||
|
Moody's Ratings (unaudited) (b) |
Principal Amount (d) |
Value |
|||
|
Nonconvertible Bonds - continued |
|||||
|
TECHNOLOGY - 2.1% |
|||||
|
Computer Services & Software - 1.2% |
|||||
|
Covad Communications Group, Inc.: |
|
|
|
|
|
|
0% 3/15/08 (e) |
B3 |
|
$ 510,000 |
$ 249,900 |
|
|
12% 2/15/10 |
B3 |
|
510,000 |
395,250 |
|
|
12.5% 2/15/09 |
B3 |
|
784,000 |
623,280 |
|
|
Federal Data Corp. 10.125% 8/1/05 |
B3 |
|
760,000 |
494,000 |
|
|
PSINet, Inc. 11% 8/1/09 |
B3 |
|
1,460,000 |
1,350,500 |
|
|
Verio, Inc. 11.25% 12/1/08 |
B3 |
|
705,000 |
775,500 |
|
|
|
3,888,430 |
||||
|
Computers & Office Equipment - 0.1% |
|||||
|
Globix Corp. 12.5% 2/1/10 |
B- |
|
580,000 |
478,500 |
|
|
Electronic Instruments - 0.2% |
|||||
|
Telecommunications Techniques Co. LLC 9.75% 5/15/08 |
B3 |
|
624,000 |
574,080 |
|
|
Electronics - 0.6% |
|||||
|
ChipPAC International Ltd. 12.75% 8/1/09 |
B3 |
|
385,000 |
413,875 |
|
|
Details, Inc. 10% 11/15/05 |
B3 |
|
65,000 |
61,750 |
|
|
Fairchild Semiconductor Corp. 10.125% 3/15/07 |
B2 |
|
595,000 |
600,950 |
|
|
Flextronics International Ltd. 9.875% 7/1/10 (g) |
Ba3 |
|
365,000 |
370,475 |
|
|
Intersil Corp. 13.25% 8/15/09 |
B3 |
|
294,000 |
335,160 |
|
|
|
1,782,210 |
||||
|
TOTAL TECHNOLOGY |
6,723,220 |
||||
|
UTILITIES - 7.1% |
|||||
|
Cellular - 4.8% |
|||||
|
Comunicacion Celular SA 0% 3/1/05 (e)(g) |
B3 |
|
310,000 |
229,400 |
|
|
Crown Castle International Corp. 0% 5/15/11 (e) |
B3 |
|
1,970,000 |
1,201,700 |
|
|
Leap Wireless International, Inc.: |
|
|
|
|
|
|
0% 4/15/10 (e)(g) |
- |
|
450,000 |
189,000 |
|
|
12.5% 4/15/10 (g) |
Caa2 |
|
775,000 |
682,000 |
|
|
McCaw International Ltd. 0% 4/15/07 (e) |
Caa1 |
|
930,000 |
706,800 |
|
|
Millicom International Cellular SA 0% 6/1/06 (e) |
Caa1 |
|
1,610,000 |
1,368,500 |
|
|
Nextel Communications, Inc.: |
|
|
|
|
|
|
0% 9/15/07 (e) |
B1 |
|
703,000 |
551,855 |
|
|
0% 10/31/07 (e) |
B1 |
|
850,000 |
633,250 |
|
|
0% 2/15/08 (e) |
B1 |
|
2,220,000 |
1,626,150 |
|
|
Corporate Bonds - continued |
|||||
|
Moody's Ratings (unaudited) (b) |
Principal Amount (d) |
Value |
|||
|
Nonconvertible Bonds - continued |
|||||
|
UTILITIES - continued |
|||||
|
Cellular - continued |
|||||
|
Nextel Communications, Inc.: - continued |
|
|
|
|
|
|
12% 11/1/08 |
B1 |
|
$ 460,000 |
$ 491,050 |
|
|
Occidente Y Caribe Celular SA 0% 3/15/04 (e) |
B3 |
|
200,000 |
140,000 |
|
|
Rogers Communications, Inc. 8.875% 7/15/07 |
Ba3 |
|
625,000 |
612,500 |
|
|
Tritel PCS, Inc. 0% 5/15/09 (e) |
B3 |
|
1,790,000 |
1,181,400 |
|
|
Triton PCS, Inc. 0% 5/1/08 (e) |
B3 |
|
1,810,000 |
1,307,725 |
|
|
VoiceStream Wireless Corp.: |
|
|
|
|
|
|
0% 11/15/09 (e) |
B2 |
|
5,200,000 |
3,484,000 |
|
|
10.375% 11/15/09 |
B2 |
|
990,000 |
1,029,600 |
|
|
|
15,434,930 |
||||
|
Telephone Services - 2.3% |
|||||
|
Allegiance Telecom, Inc. 0% 2/15/08 (e) |
B3 |
|
862,000 |
627,105 |
|
|
Esat Telecom Group PLC 11.875% 12/1/08 |
Caa1 |
|
60,000 |
69,600 |
|
|
Intermedia Communications, Inc. 8.5% 1/15/08 |
B2 |
|
445,000 |
409,400 |
|
|
NEXTLINK Communications, Inc.: |
|
|
|
|
|
|
0% 6/1/09 (e) |
B2 |
|
1,050,000 |
645,750 |
|
|
10.5% 12/1/09 |
B2 |
|
620,000 |
607,600 |
|
|
Rhythms NetConnections, Inc. 12.75% 4/15/09 |
B3 |
|
690,000 |
469,200 |
|
|
WinStar Communications, Inc.: |
|
|
|
|
|
|
0% 4/15/10 (e)(g) |
B3 |
|
6,271,000 |
2,916,015 |
|
|
12.75% 4/15/10 (g) |
B3 |
|
1,724,000 |
1,663,660 |
|
|
|
7,408,330 |
||||
|
TOTAL UTILITIES |
22,843,260 |
||||
|
TOTAL NONCONVERTIBLE BONDS |
113,278,885 |
||||
|
TOTAL CORPORATE BONDS (Cost $120,672,477) |
115,169,320 |
||||
|
U.S. Government and Government Agency Obligations - 25.9% |
|||||
|
|
|||||
|
U.S. Government Agency Obligations - 9.0% |
|||||
|
Fannie Mae: |
|
|
|
|
|
|
5.25% 1/15/09 |
Aaa |
|
6,500,000 |
5,729,165 |
|
|
6.5% 4/29/09 |
Aaa |
|
5,500,000 |
5,138,210 |
|
|
Federal Farm Credit Bank 6.66% 12/26/06 |
Aaa |
|
1,000,000 |
974,840 |
|
|
U.S. Government and Government Agency Obligations - continued |
|||||
|
Moody's Ratings (unaudited) (b) |
Principal Amount (d) |
Value |
|||
|
U.S. Government Agency Obligations - continued |
|||||
|
Federal Home Loan Bank: |
|
|
|
|
|
|
4.96% 10/7/05 |
Aaa |
|
$ 7,500,000 |
$ 6,803,925 |
|
|
6.75% 4/5/04 |
Aaa |
|
870,000 |
859,534 |
|
|
Freddie Mac 6.25% 7/15/04 |
Aaa |
|
800,000 |
777,752 |
|
|
Government Loan Trusts (assets of Trust guaranteed by U.S. Government through Agency for International Development) 8.5% 4/1/06 |
Aaa |
|
169,746 |
176,826 |
|
|
Government Trust Certificates (assets of Trust guaranteed by U.S. Government through Defense Security Assistance Agency): |
|
|
|
|
|
|
Class 1-C, 9.25% 11/15/01 |
Aaa |
|
2,017,833 |
2,055,526 |
|
|
Class 2-E, 9.4% 5/15/02 |
Aaa |
|
56,958 |
57,776 |
|
|
Class 3-T, 9.625% 5/15/02 |
Aaa |
|
20,621 |
20,991 |
|
|
Guaranteed Export Trust Certificates (assets of Trust guaranteed by U.S. Government through Export-Import Bank) Series 1995-A, 6.28% 6/15/04 |
Aaa |
|
960,000 |
941,217 |
|
|
Guaranteed Trade Trust Certificates (assets of Trust guaranteed by U.S. Government through Export-Import Bank) Series 1997-A, 6.104% 7/15/03 |
Aaa |
|
641,667 |
633,582 |
|
|
Private Export Funding Corp. secured: |
|
|
|
|
|
|
5.82% 6/15/03 (g) |
Aaa |
|
4,600,000 |
4,427,040 |
|
|
6.86% 4/30/04 |
Aaa |
|
456,000 |
452,575 |
|
|
TOTAL U.S. GOVERNMENT AGENCY OBLIGATIONS |
29,048,959 |
||||
|
U.S. Treasury Obligations - 16.9% |
|||||
|
U.S. Treasury Bonds: |
|
|
|
|
|
|
7% 7/15/06 |
Aaa |
|
18,780,000 |
19,460,775 |
|
|
8.75% 5/15/17 |
Aaa |
|
5,440,000 |
6,851,843 |
|
|
8.875% 8/15/17 |
Aaa |
|
6,685,000 |
8,521,303 |
|
|
10.75% 8/15/05 |
Aaa |
|
16,410,000 |
19,561,194 |
|
|
TOTAL U.S. TREASURY OBLIGATIONS |
54,395,115 |
||||
|
TOTAL U.S. GOVERNMENT AND GOVERNMENT (Cost $86,062,442) |
83,444,074 |
||||
|
U.S. Government Agency - Mortgage Securities - 3.3% |
|||||
|
Moody's Ratings (unaudited) (b) |
Principal Amount (d) |
Value |
|||
|
Fannie Mae - 1.5% |
|||||
|
5.5% 5/1/11 to 6/1/14 |
Aaa |
|
$ 610,741 |
$ 567,655 |
|
|
6% 11/1/10 to 1/1/26 |
Aaa |
|
1,242,853 |
1,179,800 |
|
|
6.5% 5/1/08 to 2/1/26 |
Aaa |
|
1,543,999 |
1,468,464 |
|
|
7% 9/1/25 to 12/1/28 |
Aaa |
|
571,191 |
552,904 |
|
|
7.5% 1/1/28 to 5/1/28 |
Aaa |
|
684,765 |
676,396 |
|
|
8% 7/1/26 to 12/1/27 |
Aaa |
|
497,343 |
500,974 |
|
|
TOTAL FANNIE MAE |
4,946,193 |
||||
|
Freddie Mac - 0.1% |
|||||
|
6% 12/1/07 |
Aaa |
|
35,146 |
33,927 |
|
|
8.5% 3/1/20 |
Aaa |
|
139,326 |
142,619 |
|
|
TOTAL FREDDIE MAC |
176,546 |
||||
|
Government National Mortgage Association - 1.7% |
|||||
|
6% 1/15/09 to 5/15/09 |
Aaa |
|
733,575 |
706,976 |
|
|
6.5% 4/15/26 to 5/15/26 |
Aaa |
|
777,452 |
739,310 |
|
|
7% 9/15/25 to 10/15/28 |
Aaa |
|
1,398,800 |
1,360,126 |
|
|
7.5% 2/15/22 to 8/15/28 |
Aaa |
|
2,262,500 |
2,251,317 |
|
|
8% 9/15/26 to 12/15/26 |
Aaa |
|
372,524 |
376,715 |
|
|
TOTAL GOVERNMENT NATIONAL MORTGAGE ASSOCIATION |
5,434,444 |
||||
|
TOTAL U.S. GOVERNMENT AGENCY - MORTGAGE SECURITIES (Cost $10,768,254) |
10,557,183 |
||||
|
Foreign Government and Government Agency Obligations (i) - 23.5% |
|||||
|
|
|||||
|
Argentinian Republic: |
|
|
|
|
|
|
BOCON 2.8068% 4/1/07 (h) |
B1 |
ARS |
2,952,031 |
2,045,802 |
|
|
Brady: |
|
|
|
|
|
|
discount 7.875% 3/31/23 (h) |
B1 |
|
700,000 |
565,250 |
|
|
par L-GP 6.00% 3/31/23 |
B1 |
|
1,970,000 |
1,310,050 |
|
|
floating rate bond 7.375% 3/31/05 (h) |
B1 |
|
1,246,400 |
1,137,963 |
|
|
9.75% 9/19/27 |
B1 |
|
725,000 |
564,594 |
|
|
11.375% 3/15/10 |
B1 |
|
315,000 |
285,863 |
|
|
11.75% 2/12/07 |
B1 |
ARS |
500,000 |
413,982 |
|
|
11.75% 4/7/09 |
B1 |
|
1,115,000 |
1,039,738 |
|
|
11.75% 6/15/15 |
B1 |
|
260,000 |
235,950 |
|
|
12% 2/1/20 |
B1 |
|
205,000 |
189,881 |
|
|
12.125% 2/25/19 |
B1 |
|
240,000 |
225,600 |
|
|
Foreign Government and Government Agency |
|||||
|
Moody's Ratings (unaudited) (b) |
Principal Amount (d) |
Value |
|||
|
Brazilian Federative Rep.: |
|
|
|
|
|
|
euro 11.625% 4/15/04 |
B2 |
|
$ 780,000 |
$ 785,850 |
|
|
Brady: |
|
|
|
|
|
|
capitalization bond 8% 4/15/14 |
B2 |
|
2,337,216 |
1,722,236 |
|
|
debt conversion bond 7.4375% 4/15/12 (h) |
B2 |
|
2,670,000 |
1,969,125 |
|
|
discount euro 7.375% 4/15/24 (h) |
B2 |
|
300,000 |
237,375 |
|
|
new money bond L, 7.4375% 4/15/09 (Bearer) (h) |
B2 |
|
572,000 |
479,765 |
|
|
7.375% 4/15/06 (h) |
B2 |
|
925,350 |
843,225 |
|
|
10.125% 5/15/27 |
B2 |
|
1,025,000 |
808,469 |
|
|
12.25% 3/6/30 |
B2 |
|
426,000 |
391,920 |
|
|
12.75% 1/15/20 |
B2 |
|
365,000 |
349,031 |
|
|
14.5% 10/15/09 |
B2 |
|
1,321,000 |
1,413,470 |
|
|
Bulgarian Republic Brady: |
|
|
|
|
|
|
discount A 7.0625% 7/28/24 (h) |
B2 |
|
346,000 |
273,773 |
|
|
FLIRB A 2.75% 7/28/12 (h) |
B2 |
|
572,000 |
421,135 |
|
|
interest arrears bond 7.0625% 7/28/11 (h) |
B2 |
|
336,000 |
266,700 |
|
|
Canadian Government: |
|
|
|
|
|
|
1.9% 3/23/09 |
Aa1 |
JPY |
70,000,000 |
674,778 |
|
|
7% 12/1/06 |
Aa1 |
CAD |
2,700,000 |
1,922,736 |
|
|
9% 6/1/25 |
Aa1 |
CAD |
2,100,000 |
1,990,241 |
|
|
10% 5/1/02 |
Aa1 |
CAD |
5,000,000 |
3,606,045 |
|
|
Central Bank of Nigeria: |
|
|
|
|
|
|
Brady 6.25% 11/15/20 |
- |
|
750,000 |
378,750 |
|
|
Promissory notes 5.092% 1/5/10 |
- |
|
704,527 |
308,439 |
|
|
warrants 11/15/20 (a)(j) |
- |
|
750 |
0 |
|
|
City of St. Petersburg Russia 9.5% 6/18/02 (Reg. S) |
Caa1 |
|
695,000 |
590,750 |
|
|
Colombian Republic: |
|
|
|
|
|
|
7.625% 2/15/07 |
Ba2 |
|
195,000 |
141,375 |
|
|
8.375% 2/15/27 |
Ba2 |
|
250,000 |
159,375 |
|
|
8.625% 4/1/08 |
Ba2 |
|
170,000 |
125,800 |
|
|
9.75% 4/23/09 |
Ba2 |
|
135,000 |
104,963 |
|
|
10.875% 3/9/04 |
Ba2 |
|
120,000 |
112,200 |
|
|
11.75% 2/25/20 |
Ba2 |
|
560,000 |
459,200 |
|
|
Croatia Republic 7.0325% 7/31/06 (h) |
Baa3 |
|
338,309 |
320,548 |
|
|
Ecuador Republic Brady: |
|
|
|
|
|
|
discount 7.1875% 2/28/25 (c)(h) |
Caa2 |
|
335,000 |
131,488 |
|
|
par 4% 2/28/25 (c)(f) |
Caa2 |
|
430,000 |
146,200 |
|
|
past due interest 7.1875% 2/28/15 (Bearer) (c)(h) |
Caa3 |
|
803,706 |
192,889 |
|
|
Foreign Government and Government Agency |
|||||
|
Moody's Ratings (unaudited) (b) |
Principal Amount (d) |
Value |
|||
|
Germany Federal Republic: |
|
|
|
|
|
|
4.25% 2/18/05 |
Aaa |
EUR |
1,000,000 |
$ 922,183 |
|
|
4.5% 5/17/02 |
Aaa |
EUR |
900,000 |
851,429 |
|
|
4.5% 7/4/09 |
Aaa |
EUR |
500,000 |
451,791 |
|
|
5.625% 1/4/28 |
Aaa |
EUR |
3,800,000 |
3,657,998 |
|
|
6.25% 4/26/06 |
Aaa |
EUR |
4,250,000 |
4,263,894 |
|
|
8% 7/22/02 |
Aaa |
EUR |
6,800,000 |
6,850,773 |
|
|
Italian Republic 3.75% 6/8/05 |
Aa3 |
JPY |
360,000,000 |
3,831,240 |
|
|
Ivory Coast Brady FLIRB A 1.9% 3/29/18 (c)(f) |
- |
FRF |
1,960,000 |
41,331 |
|
|
Panamanian Republic 8.25% 4/22/08 |
Ba1 |
|
255,000 |
225,675 |
|
|
Peruvian Republic Brady: |
|
|
|
|
|
|
FLIRB 3.75% 3/7/17 (h) |
Ba3 |
|
225,000 |
136,688 |
|
|
past due interest 4.5% 3/7/17 (h) |
Ba3 |
|
280,000 |
187,600 |
|
|
Philippine Government: |
|
|
|
|
|
|
8.875% 4/15/08 |
Ba1 |
|
265,000 |
238,500 |
|
|
9.875% 3/16/10 |
Ba1 |
|
215,000 |
197,800 |
|
|
9.875% 1/15/19 |
Ba1 |
|
265,000 |
216,306 |
|
|
Russian Federation: |
|
|
|
|
|
|
8.75% 7/24/05 (Reg. S) |
B3 |
|
869,000 |
674,561 |
|
|
9.25% 11/27/01 |
B3 |
|
264,000 |
252,120 |
|
|
10% 6/26/07 |
B3 |
|
761,000 |
586,921 |
|
|
11% 7/24/18 (Reg. S) |
B3 |
|
902,000 |
675,373 |
|
|
11.75% 6/10/03 (Reg. S) |
B3 |
|
568,000 |
527,530 |
|
|
12.75% 6/24/28 (Reg. S) |
B3 |
|
838,000 |
722,775 |
|
|
Russian Federation Ministry of Finance 3% 5/14/03 |
Caa3 |
|
520,000 |
231,400 |
|
|
Sealed Air Finance euro 5.625% 7/19/06 |
Baa3 |
EUR |
1,000,000 |
870,994 |
|
|
Treuhandanstalt 7.5% 9/9/04 |
Aaa |
EUR |
2,500,000 |
2,589,974 |
|
|
Turkish Republic 11.875% 11/5/04 |
B1 |
|
115,000 |
119,600 |
|
|
Ukraine Government 11% 3/15/07 (Reg. S) |
- |
|
505,000 |
345,925 |
|
|
United Kingdom, Great Britain & |
|
|
|
|
|
|
7.5% 12/7/06 |
Aaa |
GBP |
1,310,000 |
2,189,177 |
|
|
8% 12/7/15 |
Aaa |
GBP |
230,000 |
465,167 |
|
|
8.75% 8/25/17 |
Aaa |
GBP |
1,300,000 |
2,870,392 |
|
|
9.75% 8/27/02 |
Aaa |
GBP |
1,000,000 |
1,627,134 |
|
|
United Mexican States: |
|
|
|
|
|
|
Brady: |
|
|
|
|
|
|
discount A 7.3125% 12/31/19 (h) |
Baa3 |
|
1,050,000 |
1,031,625 |
|
|
par A 6.25% 12/31/19 unit |
Baa3 |
|
2,165,000 |
1,805,069 |
|
|
par B 6.25% 12/31/19 unit |
Baa3 |
|
250,000 |
208,438 |
|
|
Foreign Government and Government Agency Obligations (i) |
|||||
|
Moody's Ratings (unaudited) (b) |
Principal Amount (d) |
Value |
|||
|
United Mexican States: - continued |
|
|
|
|
|
|
value recovery rights 6/30/03: |
|
|
|
|
|
|
discount A (j) |
- |
|
$ 1,617,000 |
$ 16 |
|
|
discount C (j) |
- |
|
2,000 |
0 |
|
|
9.875% 2/1/10 |
Baa3 |
|
1,610,000 |
1,678,425 |
|
|
10.375% 2/17/09 |
Baa3 |
|
440,000 |
470,250 |
|
|
11.375% 9/15/16 |
Baa3 |
|
655,000 |
750,794 |
|
|
11.5% 5/15/26 |
Baa3 |
|
910,000 |
1,097,688 |
|
|
Venezuelan Republic: |
|
|
|
|
|
|
Brady debt conversion bond 7.875% 12/18/07 (h) |
B2 |
|
2,142,840 |
1,746,415 |
|
|
Oil recovery rights 4/15/20 (j) |
- |
|
10 |
0 |
|
|
9.25% 9/15/27 |
B2 |
|
1,155,000 |
762,300 |
|
|
TOTAL FOREIGN GOVERNMENT AND GOVERNMENT (Cost $74,537,253) |
75,715,795 |
||||
|
Supranational Obligations - 0.5% |
|||||
|
|
|||||
|
European Investment Bank 4% 4/15/09 |
Aaa |
EUR |
2,000,000 |
1,689,619 |
|
|
Common Stocks - 0.6% |
|||
|
Shares |
|
||
|
HEALTH - 0.4% |
|||
|
Medical Facilities Management - 0.4% |
|||
|
Laboratory Corp. of America Holdings |
17,818 |
1,374,213 |
|
|
MEDIA & LEISURE - 0.0% |
|||
|
Broadcasting - 0.0% |
|||
|
CS Wireless Systems, Inc. (a)(g) |
10 |
0 |
|
|
NTL, Inc. warrants 10/14/08 (a) |
1,586 |
65,026 |
|
|
UIH Australia/Pacific, Inc. warrants 5/15/06 (a) |
570 |
17,100 |
|
|
|
82,126 |
||
|
TECHNOLOGY - 0.1% |
|||
|
Computer Services & Software - 0.1% |
|||
|
Concentric Network Corp. warrants 12/15/07 (a)(g) |
200 |
105,400 |
|
|
DecisionOne Corp. |
1,980 |
20 |
|
|
DecisionOne Corp.: |
|
|
|
|
Class A warrants 4/18/07 (a) |
1,137 |
0 |
|
|
Common Stocks - continued |
|||
|
Shares |
Value (Note 1) |
||
|
TECHNOLOGY - continued |
|||
|
Computer Services & Software - continued |
|||
|
DecisionOne Corp.: - continued |
|
|
|
|
Class B warrants 4/18/07 (a) |
1,959 |
$ 0 |
|
|
Class C warrants 4/18/07 (a) |
1,162 |
0 |
|
|
|
105,420 |
||
|
Electronics - 0.0% |
|||
|
Intersil Holding Corp. warrants 8/15/09 (a)(g) |
120 |
100,800 |
|
|
TOTAL TECHNOLOGY |
206,220 |
||
|
UTILITIES - 0.1% |
|||
|
Cellular - 0.1% |
|||
|
Leap Wireless International, Inc.: |
|
|
|
|
warrants 4/15/10 (a)(g) |
775 |
0 |
|
|
warrants 4/15/10 (a) |
450 |
0 |
|
|
Loral Orion Network Systems, Inc.: |
|
|
|
|
warrants 1/15/07 (CV ratio .47) (a) |
230 |
575 |
|
|
warrants 1/15/07 (CV ratio .6) (a) |
480 |
2,040 |
|
|
McCaw International Ltd. warrants 4/16/07 (a)(g) |
1,753 |
4,383 |
|
|
Orbital Imaging Corp. warrants 3/1/05 (a)(g) |
56 |
280 |
|
|
Powertel, Inc. warrants 2/1/06 (a) |
3,328 |
193,024 |
|
|
|
200,302 |
||
|
Telephone Services - 0.0% |
|||
|
MGC Communications, Inc. (g) |
916 |
54,903 |
|
|
Source Media, Inc. (a) |
1,676 |
6,547 |
|
|
|
61,450 |
||
|
TOTAL UTILITIES |
261,752 |
||
|
TOTAL COMMON STOCKS (Cost $1,424,344) |
1,924,311 |
||
|
Nonconvertible Preferred Stocks - 4.3% |
|||
|
|
|
|
|
|
FINANCE - 0.1% |
|||
|
Insurance - 0.1% |
|||
|
American Annuity Group Capital Trust II 8.875% |
240 |
213,663 |
|
|
MEDIA & LEISURE - 1.8% |
|||
|
Broadcasting - 1.4% |
|||
|
Adelphia Communications Corp. $13.00 |
5,345 |
550,535 |
|
|
Nonconvertible Preferred Stocks - continued |
|||
|
Shares |
Value (Note 1) |
||
|
MEDIA & LEISURE - continued |
|||
|
Broadcasting - continued |
|||
|
Benedek Communications Corp. 11.5% pay-in-kind |
966 |
$ 531,300 |
|
|
Citadel Broadcasting Co. Series B, 13.25% pay-in-kind |
3,656 |
376,568 |
|
|
CSC Holdings, Inc.: |
|
|
|
|
11.125% pay-in-kind |
19,010 |
1,986,545 |
|
|
Series H, 11.75% pay-in-kind |
5,182 |
546,701 |
|
|
Granite Broadcasting Corp. 12.75% pay-in-kind |
622 |
522,480 |
|
|
|
4,514,129 |
||
|
Publishing - 0.4% |
|||
|
PRIMEDIA, Inc.: |
|
|
|
|
$9.20 |
1,600 |
138,800 |
|
|
8.625% |
7,377 |
627,045 |
|
|
Series D, $10.00 |
5,733 |
530,303 |
|
|
|
1,296,148 |
||
|
TOTAL MEDIA & LEISURE |
5,810,277 |
||
|
RETAIL & WHOLESALE - 0.0% |
|||
|
Grocery Stores - 0.0% |
|||
|
Supermarkets General Holdings Corp. $3.52 pay-in-kind |
12,725 |
12,725 |
|
|
UTILITIES - 2.4% |
|||
|
Cellular - 1.0% |
|||
|
Nextel Communications, Inc.: |
|
|
|
|
11.125% pay-in-kind |
1,087 |
1,048,955 |
|
|
Series D, 13% pay-in-kind |
2,084 |
2,177,780 |
|
|
|
3,226,735 |
||
|
Telephone Services - 1.4% |
|||
|
Adelphia Business Solution, Inc. 12.875% pay-in-kind |
14 |
12,530 |
|
|
Intermedia Communications, Inc. 13.5% pay-in-kind |
1,955 |
1,896,350 |
|
|
NEXTLINK Communications, Inc. 13.50% pay-in-kind |
862 |
836,140 |
|
|
NEXTLINK Communications, Inc. 14% pay-in-kind |
32,884 |
1,677,084 |
|
|
Source Media, Inc. 13.50% pay-in-kind |
4,183 |
24,052 |
|
|
|
4,446,156 |
||
|
TOTAL UTILITIES |
7,672,891 |
||
|
TOTAL NONCONVERTIBLE PREFERRED STOCKS (Cost $15,369,123) |
13,709,556 |
||
|
Sovereign Loan Participations - 1.4% |
|||||
|
Moody's Ratings (unaudited) |
Principal Amount |
Value |
|||
|
Algerian Republic loan participation: |
|
|
|
|
|
|
Series 1 - Deutsche Bank 6.625% 9/4/06 (h) |
- |
|
$ 415,000 |
$ 342,375 |
|
|
Series 1 - Merrill Lynch, Pierce, Fenner & Smith, Inc. 6.625% 9/4/06 (h) |
- |
|
284,000 |
234,300 |
|
|
Series 1- Societe Generale 6.625% 9/4/06 (h) |
- |
|
20,000 |
16,500 |
|
|
Series 3 - Merrill Lynch, Pierce, Fenner & Smith, Inc. 7.1875% 3/4/10 (h) |
- |
|
315,000 |
243,338 |
|
|
Series 3 - The Chase Manhattan Bank 7.1875% 3/4/10 (h) |
- |
|
142,000 |
109,695 |
|
|
Bank for Foreign Economic Affairs of Russia (Vnesheconombank) loan participation restructured under 1997 Agreement: |
|
|
|
|
|
|
- Deutsche Bank 7.9375% 12/15/20 (c)(h) |
- |
|
7,594,000 |
2,325,663 |
|
|
- ING Bank NV 7.9375% 12/15/20 (c)(h) |
- |
|
320,000 |
98,000 |
|
|
- Merrill Lynch, Pierce, Fenner & Smith, Inc. 7.9375% 12/15/20 (c)(h) |
- |
|
610,000 |
186,813 |
|
|
- Morgan (J.P.) Securities, Inc. 7.9375% 12/15/20 (c)(h) |
- |
|
265,000 |
81,156 |
|
|
- Paribas Capital Markets 7.9375% 12/15/20 (c)(h) |
- |
|
265,000 |
81,156 |
|
|
- The Chase Manhattan Bank 7.9375% 12/15/20 (c)(h) |
- |
|
530,000 |
162,313 |
|
|
Moroccan Kingdom loan participation: |
|
|
|
|
|
|
Series A - Deutsche Bank 7.75% 1/1/09 (h) |
- |
|
155,000 |
139,500 |
|
|
Series A - Morgan Guaranty Trust Co. 7.75% 1/1/09 (h) |
- |
|
117,052 |
105,347 |
|
|
Series A - Paribas Capital Markets 7.75% 1/1/09 (h) |
- |
|
198,579 |
178,721 |
|
|
Series A - The Chase Manhattan Bank 7.75% 1/1/09 (h) |
- |
|
54,429 |
48,986 |
|
|
TOTAL SOVEREIGN LOAN PARTICIPATIONS (Cost $2,961,127) |
4,353,863 |
||||
|
Cash Equivalents - 3.9% |
|||
|
Maturity Amount |
Value |
||
|
Investments in repurchase agreements (U.S. Treasury Obligations), in a joint trading account at 6.58%, dated 6/30/00 due 7/3/00 |
$ 12,619,918 |
$ 12,613,000 |
|
|
TOTAL INVESTMENT PORTFOLIO - 99.2% (Cost $326,448,627) |
319,176,721 |
||
|
NET OTHER ASSETS - 0.8% |
2,712,437 |
||
|
NET ASSETS - 100% |
$ 321,889,158 |
||
|
Security Type Abbreviations |
||
|
FLIRB |
- |
Front Loaded Interest Reduction Bonds |
|
Currency Abbreviations |
||
|
ARS |
- |
Argentine peso |
|
CAD |
- |
Canadian dollar |
|
EUR |
- |
European Monetary Unit |
|
FRF |
- |
French franc |
|
GBP |
- |
British pound |
|
JPY |
- |
Japanese yen |
|
Legend |
|
(a) Non-income producing |
|
(b) S&P credit ratings are used in the absence of a rating by Moody's Investors Service, Inc. |
|
(c) Non-income producing - issuer filed for protection under the Federal Bankruptcy Code or is in default of interest payment. |
|
(d) Principal amount is stated in United States dollars unless otherwise noted. |
|
(e) Debt obligation initially issued in zero coupon form which converts to coupon form at a specified rate and date. The rate shown is the rate at period end. |
|
(f) Debt obligation initially issued at one coupon which converts to a higher coupon at a specified date. The rate shown is the rate at period end. |
|
(g) Security exempt from registration under Rule 144A of the Securities Act of 1933. These securities may be resold in transactions exempt from registration, normally to qualified institutional buyers. At the period end, the value of these securities amounted to $18,894,865 or 5.9% of net assets. |
|
(h) The coupon rate shown on floating or adjustable rate securities represents the rate at period end. |
|
(i) For foreign government obligations not individually rated by S&P or Moody's, the ratings listed have been assigned by FMR, the fund's investment adviser, based principally on S&P and Moody's ratings of the sovereign credit of the issuing government. |
|
(j) Quantity represents share amount. |
|
(k) Restricted securities - Investment in securities not registered under the Securities Act of 1933. |
|
Additional information on each holding |
|
Security |
Acquisition Date |
Acquisition Cost |
|
Sealy Corp., Inc. |
2/23/98 - 6/30/00 |
$ 641,329 |
|
Other Information |
|
The composition of long-term debt holdings as a percentage of total value of investments in securities, is as follows (ratings are unaudited): |
|
Moody's Ratings |
S&P Ratings |
|||
|
Aaa, Aa, A |
43.3% |
|
AAA, AA, A |
37.2% |
|
Baa |
3.2% |
|
BBB |
1.5% |
|
Ba |
3.2% |
|
BB |
7.6% |
|
B |
34.0% |
|
B |
30.3% |
|
Caa |
4.2% |
|
CCC |
4.3% |
|
Ca, C |
0.0% |
|
CC, C |
0.0% |
|
|
|
|
D |
0.2% |
|
The percentage not rated by Moody's |
|
Distribution of investments by country of issue, as a percentage of total net assets, |
|
United States of America |
68.5% |
|
Germany |
6.0 |
|
United Kingdom |
3.9 |
|
Brazil |
3.6 |
|
Canada |
3.0 |
|
Mexico |
2.6 |
|
Argentina |
2.6 |
|
Russia |
2.3 |
|
Netherlands |
2.0 |
|
Italy |
1.2 |
|
Others (individually less than 1%) |
4.3 |
|
|
100.0% |
|
Income Tax Information |
|
At June 30, 2000, the aggregate cost |
|
At December 31, 1999, the fund had a capital loss carryforward of approximately $10,864,000 all of which will expire on December 31, 2007. |
|
The fund intends to elect to defer to its |
See accompanying notes which are an integral part of the financial statements.
Semiannual Report
Statement of Assets and Liabilities
|
|
June 30, 2000 (Unaudited) |
|
|
Assets |
|
|
|
Investment in securities, at value (including repurchase agreements of $12,613,000) (cost $326,448,627) - See accompanying schedule |
|
$ 319,176,721 |
|
Cash |
|
178,561 |
|
Receivable for investments sold |
|
1,541,679 |
|
Receivable for fund shares sold |
|
608,695 |
|
Dividends receivable |
|
221,206 |
|
Interest receivable |
|
6,009,559 |
|
Other receivables |
|
1,174 |
|
Total assets |
|
327,737,595 |
|
Liabilities |
|
|
|
Payable for investments purchased |
$ 4,201,849 |
|
|
Payable for fund shares redeemed |
950,405 |
|
|
Distributions payable |
324,109 |
|
|
Accrued management fee |
151,964 |
|
|
Distribution fees payable |
122,600 |
|
|
Other payables and accrued expenses |
97,510 |
|
|
Total liabilities |
|
5,848,437 |
|
Net Assets |
|
$ 321,889,158 |
|
Net Assets consist of: |
|
|
|
Paid in capital |
|
$ 342,602,234 |
|
Undistributed net investment income |
|
2,510,438 |
|
Accumulated undistributed net realized gain (loss) on investments and foreign currency transactions |
|
(15,913,854) |
|
Net unrealized appreciation (depreciation) on investments and assets and liabilities in foreign currencies |
|
(7,309,660) |
|
Net Assets |
|
$ 321,889,158 |
See accompanying notes which are an integral part of the financial statements.
Semiannual Report
Financial Statements - continued
Statement of Assets and Liabilities - continued
|
|
June 30, 2000 (Unaudited) |
|
|
Calculation of Maximum Offering Price |
|
$10.32 |
|
Maximum offering price per share (100/95.25 of $10.32) |
|
$10.83 |
|
Class T: |
|
$10.31 |
|
Maximum offering price per share (100/96.50 of $10.31) |
|
$10.68 |
|
Class B: |
|
$10.33 |
|
Class C: |
|
$10.30 |
|
Institutional Class: |
|
$10.37 |
A Redemption price per share is equal to net asset value less any applicable contingent deferred sales charge.
See accompanying notes which are an integral part of the financial statements.
Semiannual Report
Financial Statements - continued
Statement of Operations
|
|
Six months ended June 30, 2000 (Unaudited) |
|
|
Investment Income Dividends |
|
$ 951,028 |
|
Interest |
|
12,434,739 |
|
Total income |
|
13,385,767 |
|
Expenses |
|
|
|
Management fee |
$ 893,067 |
|
|
Transfer agent fees |
276,360 |
|
|
Distribution fees |
718,801 |
|
|
Accounting fees and expenses |
94,317 |
|
|
Non-interested trustees' compensation |
523 |
|
|
Custodian fees and expenses |
32,551 |
|
|
Registration fees |
63,573 |
|
|
Audit |
39,169 |
|
|
Legal |
6,497 |
|
|
Miscellaneous |
1,161 |
|
|
Total expenses before reductions |
2,126,019 |
|
|
Expense reductions |
(8,233) |
2,117,786 |
|
Net investment income |
|
11,267,981 |
|
Realized and Unrealized Gain (Loss) Net realized gain (loss) on: |
|
|
|
Investment securities |
(1,735,841) |
|
|
Foreign currency transactions |
(260,369) |
(1,996,210) |
|
Change in net unrealized appreciation (depreciation) on: |
|
|
|
Investment securities |
(3,949,116) |
|
|
Assets and liabilities in foreign currencies |
1,328 |
(3,947,788) |
|
Net gain (loss) |
|
(5,943,998) |
|
Net increase (decrease) in net assets resulting |
|
$ 5,323,983 |
See accompanying notes which are an integral part of the financial statements.
Semiannual Report
Financial Statements - continued
Statement of Changes in Net Assets
|
|
Six months ended June 30, 2000 (Unaudited) |
Year ended December 31, 1999 |
|
Increase (Decrease) in Net Assets |
|
|
|
Operations |
$ 11,267,981 |
$ 21,899,000 |
|
Net realized gain (loss) |
(1,996,210) |
(7,459,313) |
|
Change in net unrealized appreciation (depreciation) |
(3,947,788) |
3,043,574 |
|
Net increase (decrease) in net assets resulting |
5,323,983 |
17,483,261 |
|
Distributions to shareholders from net investment income |
(9,891,819) |
(19,936,469) |
|
Share transactions - net increase (decrease) |
16,634,027 |
24,266,774 |
|
Total increase (decrease) in net assets |
12,066,191 |
21,813,566 |
|
Net Assets |
|
|
|
Beginning of period |
309,822,967 |
288,009,401 |
|
End of period (including undistributed net investment income of $2,510,438 and $1,690,132, respectively) |
$ 321,889,158 |
$ 309,822,967 |
See accompanying notes which are an integral part of the financial statements.
Semiannual Report
Financial Highlights - Class A
|
|
Six months ended June 30, 2000 |
Years ended December 31, |
|||
|
|
(Unaudited) |
1999 |
1998 |
1997 |
1996 E |
|
Selected Per-Share Data |
|
|
|
|
|
|
Net asset value, |
$ 10.470 |
$ 10.560 |
$ 11.090 |
$ 11.250 |
$ 11.010 |
|
Income from Invest- |
|
|
|
|
|
|
Net investment income D |
.388 |
.775 |
.771 |
.802 |
.267 |
|
Net realized and |
(.195) |
(.152) |
(.512) |
.198 |
.493 |
|
Total from |
.193 |
.623 |
.259 |
1.000 |
.760 |
|
Less Distributions |
|
|
|
|
|
|
From net investment |
(.343) |
(.713) |
(.729) |
(.790) |
(.280) |
|
From net realized gain |
- |
- |
- |
(.370) |
(.240) |
|
In excess of net |
- |
- |
(.060) |
- |
- |
|
Total distributions |
(.343) |
(.713) |
(.789) |
(1.160) |
(.520) |
|
Net asset value, |
$ 10.320 |
$ 10.470 |
$ 10.560 |
$ 11.090 |
$ 11.250 |
|
Total Return B, C |
1.90% |
6.12% |
2.38% |
9.24% |
6.95% |
|
Ratios and Supplemental Data |
|
|
|
||
|
Net assets, end of period (000 omitted) |
$ 15,283 |
$ 12,800 |
$ 9,596 |
$ 3,379 |
$ 587 |
|
Ratio of expenses to |
1.10% A |
1.08% |
1.23% |
1.25% F |
1.25% A, F |
|
Ratio of expenses to |
1.09% A, G |
1.07% G |
1.22% G |
1.24% G |
1.25% A |
|
Ratio of net investment income to average |
7.59% A |
7.44% |
7.22% |
7.16% |
7.32% A |
|
Portfolio turnover rate |
94% A |
146% |
150% |
140% |
119% |
A Annualized
B The total returns would have been lower had certain expenses not been reduced during the periods shown.
C Total returns do not include the one time sales charge and for periods of less than one year are not annualized.
D Net investment income per share has been calculated based on average shares outstanding during the period.
E For the period September 3, 1996 (commencement of sale of Class A shares) to December 31, 1996.
F FMR agreed to reimburse a portion of the class' expenses during the period. Without this reimbursement, the class' expense ratio would have been higher.
G FMR or the fund has entered into varying arrangements with third parties who either paid or reduced a portion of the class' expenses.
See accompanying notes which are an integral part of the financial statements.
Semiannual Report
Financial Highlights - Class T
|
|
Six months ended June 30, 2000 |
Years ended December 31, |
||||
|
|
(Unaudited) |
1999 |
1998 |
1997 |
1996 |
1995 |
|
Selected Per-Share Data |
|
|
|
|
|
|
|
Net asset value, beginning |
$ 10.470 |
$ 10.550 |
$ 11.090 |
$ 11.250 |
$ 11.000 |
$ 9.920 |
|
Income from Invest- |
|
|
|
|
|
|
|
Net investment income |
.386 D |
.772 D |
.781 D |
.814 D |
.813 D |
.885 |
|
Net realized and unrealized gain (loss) |
(.206) |
(.147) |
(.535) |
.194 |
.542 |
1.231 |
|
Total from |
.180 |
.625 |
.246 |
1.008 |
1.355 |
2.116 |
|
Less Distributions |
|
|
|
|
|
|
|
From net |
(.340) |
(.705) |
(.726) |
(.798) |
(.805) |
(.806) |
|
From net realized gain |
- |
- |
- |
(.370) |
(.300) |
(.230) |
|
In excess of net realized gain |
- |
- |
(.060) |
- |
- |
- |
|
Total |
(.340) |
(.705) |
(.786) |
(1.168) |
(1.105) |
(1.036) |
|
Net asset value, end of period |
$ 10.310 |
$ 10.470 |
$ 10.550 |
$ 11.090 |
$ 11.250 |
$ 11.000 |
|
Total Return B, C |
1.77% |
6.15% |
2.26% |
9.33% |
12.89% |
22.02% |
|
Ratios and Supplemental Data |
|
|
|
|
|
|
|
Net assets, |
$ 196,251 |
$ 190,335 |
$ 189,755 |
$ 119,204 |
$ 99,327 |
$ 52,626 |
|
Ratio of expenses to average |
1.16% A |
1.13% |
1.18% |
1.20% |
1.23% |
1.35% E |
|
Ratio of expenses to average |
1.15% A, F |
1.13% |
1.17% F |
1.19% F |
1.22% F |
1.35% |
|
Ratio of net investment income to average |
7.52% A |
7.38% |
7.25% |
7.21% |
7.34% |
7.28% |
|
Portfolio turnover rate |
94% A |
146% |
150% |
140% |
119% |
193% |
A Annualized
B The total returns would have been lower had certain expenses not been reduced during the periods shown.
C Total returns do not include the one time sales charge and for periods of less than one year are not annualized.
D Net investment income per share has been calculated based on average shares outstanding during the period.
E FMR agreed to reimburse a portion of the class' expenses during the period. Without this reimbursement, the class' expense ratio would have been higher.
F FMR or the fund has entered into varying arrangements with third parties who either paid or reduced a portion of the class' expenses.
See accompanying notes which are an integral part of the financial statements.
Semiannual Report
Financial Highlights - Class B
|
|
Six months ended June 30, 2000 |
Years ended December 31, |
||||
|
|
(Unaudited) |
1999 |
1998 |
1997 |
1996 |
1995 |
|
Selected Per-Share Data |
|
|
|
|
|
|
|
Net asset value, beginning |
$ 10.490 |
$ 10.570 |
$ 11.100 |
$ 11.260 |
$ 11.010 |
$ 9.910 |
|
Income from Investment Operations |
|
|
|
|
|
|
|
Net investment |
.352 D |
.703 D |
.713 D |
.740 D |
.743 D |
.820 |
|
Net realized and unrealized gain (loss) |
(.206) |
(.146) |
(.529) |
.194 |
.538 |
1.237 |
|
Total from |
.146 |
.557 |
.184 |
.934 |
1.281 |
2.057 |
|
Less Distributions |
|
|
|
|
|
|
|
From net |
(.306) |
(.637) |
(.654) |
(.724) |
(.731) |
(.727) |
|
From net realized gain |
- |
- |
- |
(.370) |
(.300) |
(.230) |
|
In excess of net realized gain |
- |
- |
(.060) |
- |
- |
- |
|
Total |
(.306) |
(.637) |
(.714) |
(1.094) |
(1.031) |
(.957) |
|
Net asset value, end of period |
$ 10.330 |
$ 10.490 |
$ 10.570 |
$ 11.100 |
$ 11.260 |
$ 11.010 |
|
Total Return B, C |
1.44% |
5.45% |
1.69% |
8.60% |
12.14% |
21.35% |
|
Ratios and Supplemental Data |
|
|
|
|
|
|
|
Net assets, |
$ 86,077 |
$ 86,116 |
$ 72,773 |
$ 54,562 |
$ 37,403 |
$ 26,654 |
|
Ratio of expenses to average |
1.82% A |
1.78% |
1.83% |
1.86% |
1.88% |
2.10% E |
|
Ratio of expenses to average |
1.81% A, F |
1.78% |
1.83% |
1.85% F |
1.87% F |
2.10% |
|
Ratio of net investment income to average |
6.86% A |
6.73% |
6.56% |
6.55% |
6.69% |
6.53% |
|
Portfolio turnover rate |
94% A |
146% |
150% |
140% |
119% |
193% |
A Annualized
B The total returns would have been lower had certain expenses not been reduced during the periods shown.
C Total returns do not include the contingent deferred sales charge and for periods of less than one year are not annualized.
D Net investment income per share has been calculated based on average shares outstanding during the period.
E FMR agreed to reimburse a portion of the class' expenses during the period. Without this reimbursement, the class' expense ratio would have been higher.
F FMR or the fund has entered into varying arrangements with third parties who either paid or reduced a portion of the class' expenses.
See accompanying notes which are an integral part of the financial statements.
Semiannual Report
Financial Highlights - Class C
|
|
Six months ended June 30, 2000 |
Years ended December 31, |
||
|
|
(Unaudited) |
1999 |
1998 |
1997 E |
|
Selected Per-Share Data |
|
|
|
|
|
Net asset value, beginning of period |
$ 10.460 |
$ 10.550 |
$ 11.080 |
$ 11.400 |
|
Income from Investment Operations |
|
|
|
|
|
Net investment income D |
.345 |
.687 |
.672 |
.105 |
|
Net realized and unrealized |
(.204) |
(.151) |
(.517) |
.037 |
|
Total from investment operations |
.141 |
.536 |
.155 |
.142 |
|
Less Distributions |
|
|
|
|
|
From net investment income |
(.301) |
(.626) |
(.625) |
(.152) |
|
From net realized gain |
- |
- |
- |
(.310) |
|
In excess of net realized gain |
- |
- |
(.060) |
- |
|
Total distributions |
(.301) |
(.626) |
(.685) |
(.462) |
|
Net asset value, end of period |
$ 10.300 |
$ 10.460 |
$ 10.550 |
$ 11.080 |
|
Total Return B, C |
1.39% |
5.25% |
1.42% |
1.27% |
|
Ratios and Supplemental Data |
|
|
|
|
|
Net assets, end of period (000 omitted) |
$ 20,538 |
$ 16,927 |
$ 11,248 |
$ 659 |
|
Ratio of expenses to average net assets |
1.93% A |
1.91% |
2.07% F |
2.10% A, F |
|
Ratio of expenses to average net assets after expense reductions |
1.93% A |
1.90% G |
2.07% |
2.10% A |
|
Ratio of net investment income to average net assets |
6.75% A |
6.61% |
6.37% |
6.30% A |
|
Portfolio turnover rate |
94% A |
146% |
150% |
140% |
A Annualized
B The total returns would have been lower had certain expenses not been reduced during the periods shown.
C Total returns do not include the contingent deferred sales charge and for periods of less than one year are not annualized.
D Net investment income per share has been calculated based on average shares outstanding during the period.
E For the period November 3, 1997 (commencement of sale of Class C shares) to December 31, 1997.
F FMR agreed to reimburse a portion of the class' expenses during the period. Without this reimbursement, the class' expense ratio would have been higher.
G FMR or the fund has entered into varying arrangements with third parties who either paid or reduced a portion of the class' expenses.
See accompanying notes which are an integral part of the financial statements.
Semiannual Report
Financial Highlights - Institutional Class
|
|
Six months ended June 30, 2000 |
Years ended December 31, |
||||
|
|
(Unaudited) |
1999 |
1998 |
1997 |
1996 |
1995 E |
|
Selected Per-Share Data |
|
|
|
|
|
|
|
Net asset value,
beginning |
$ 10.530 |
$ 10.610 |
$ 11.140 |
$ 11.300 |
$ 11.030 |
$ 10.890 |
|
Income from Investment Operations |
|
|
|
|
|
|
|
Net investment |
.400 D |
.799 D |
.805 D |
.830 D |
.826 D |
.456 |
|
Net realized and unrealized gain (loss) |
(.208) |
(.150) |
(.533) |
.186 |
.548 |
.340 |
|
Total from |
.192 |
.649 |
.272 |
1.016 |
1.374 |
.796 |
|
Less Distributions |
|
|
|
|
|
|
|
From net investment income |
(.352) |
(.729) |
(.742) |
(.806) |
(.804) |
(.426) |
|
From net |
- |
- |
- |
(.370) |
(.300) |
(.230) |
|
In excess of net realized gain |
- |
- |
(.060) |
- |
- |
- |
|
Total distributions |
(.352) |
(.729) |
(.802) |
(1.176) |
(1.104) |
(.656) |
|
Net asset value, end of period |
$ 10.370 |
$ 10.530 |
$ 10.610 |
$ 11.140 |
$ 11.300 |
$ 11.030 |
|
Total Return B, C |
1.88% |
6.35% |
2.49% |
9.36% |
13.04% |
7.47% |
|
Ratios and Supplemental Data |
|
|
|
|
|
|
|
Net assets, |
$ 3,740 |
$ 3,645 |
$ 4,636 |
$ 6,289 |
$ 6,107 |
$ 107 |
|
Ratio of expenses
to average |
.93% A |
.93% |
1.07% |
1.10% F |
1.10% F |
1.10% A, F |
|
Ratio of expenses
to average |
.92% A, G |
.93% |
1.07% |
1.09% G |
1.10% |
1.10% A |
|
Ratio of net
investment
income to aver- |
7.76% A |
7.58% |
7.29% |
7.31% |
7.47% |
7.53% A |
|
Portfolio turnover rate |
94% A |
146% |
150% |
140% |
119% |
193% |
A Annualized
B The total returns would have been lower had certain expenses not been reduced during the periods shown.
C Total returns for periods of less than one year are not annualized.
D Net investment income per share has been calculated based on average shares outstanding during the period.
E For the period July 3, 1995 (commencement of sale of Institutional Class shares) to December 31, 1995.
F FMR agreed to reimburse a portion of the class' expenses during the period. Without this reimbursement, the class' expense ratio would have been higher.
G FMR or the fund has entered into varying arrangements with third parties who either paid or reduced a portion of the class' expenses.
See accompanying notes which are an integral part of the financial statements.
Semiannual Report
For the period ended June 30, 2000 (Unaudited)
1. Significant Accounting Policies.
Fidelity Advisor Strategic Income Fund (the fund) is a fund of Fidelity Advisor Series II (the trust) and is authorized to issue an unlimited number of shares. The trust is registered under the Investment Company Act of 1940, as amended (the 1940 Act), as an open-end management investment company organized as a Massachusetts business trust.
The fund offers Class A, Class T, Class B, Class C, and Institutional Class shares, each of which has equal rights as to assets and voting privileges. Each class has exclusive voting rights with respect to matters that affect that class. Class B shares will automatically convert to Class A shares after a holding period of seven years from the initial date of purchase. Investment income, realized and unrealized capital gains and losses, the common expenses of the fund, and certain fund-level expense reductions, if any, are allocated on a pro rata basis to each class based on the relative net assets of each class to the total net assets of the fund. Each class of shares differs in its respective distribution, transfer agent, and certain other class-specific fees, expenses, and expense reductions.
The financial statements have been prepared in conformity with generally accepted accounting principles which require management to make certain estimates and assumptions at the date of the financial statements. The following summarizes the significant accounting policies of the fund:
Security Valuation. Securities for which quotations are readily available are valued by a pricing service at their market values as determined by their most recent bid prices (sales prices if the principal market is an exchange) in the principal market in which such securities are normally traded. Securities for which market quotations are not readily available (and in certain cases debt securities which trade on an exchange) are valued primarily using dealer-supplied valuations or at their fair value as determined in good faith under consistently applied procedures under the general supervision of the Board of Trustees. Short-term securities with remaining maturities of sixty days or less for which quotations are not readily available are valued at amortized cost or original cost plus accrued interest, both of which approximate current value.
Foreign Currency Translation. The accounting records of the fund are maintained in U.S. dollars. Investment securities and other assets and liabilities denominated in a foreign currency are translated into U.S. dollars at the prevailing rates of exchange at period end. Purchases and sales of securities, income receipts and expense payments are translated into U.S. dollars at the prevailing exchange rate on the respective dates of the transactions.
Net realized gains and losses on foreign currency transactions represent net gains and losses from sales and maturities of foreign currency contracts, disposition of foreign currencies, the difference between the amount of net investment income accrued and the U.S. dollar amount actually received, and gains and losses between trade and settlement date on purchases and sales of securities. The effects of changes in foreign currency
Semiannual Report
Notes to Financial Statements (Unaudited) - continued
1. Significant Accounting Policies - continued
Foreign Currency Translation - continued
exchange rates on investments in securities are included with the net realized and unrealized gain or loss on investment securities.
Income Taxes. As a qualified regulated investment company under Subchapter M of the Internal Revenue Code, the fund is not subject to U.S. federal income taxes to the extent that it distributes substantially all of its taxable income for its fiscal year. The fund may be subject to foreign taxes on income and gains on investments which are accrued based upon the fund's understanding of the tax rules and regulations that exist in the markets in which it invests. Foreign governments may also impose taxes on other payments or transactions with respect to foreign securities. The fund accrues such taxes as applicable. The schedule of investments includes information regarding income taxes under the caption "Income Tax Information."
Investment Income. Interest income, which includes accretion of original issue discount, is accrued as earned and dividend income is recorded on the ex-dividend date. Non-cash dividends included in dividend income, if any, are recorded at the fair market value of the securities received. The fund may place a debt obligation on non-accrual status and reduce related interest income by ceasing current accruals and writing off interest receivables when the collection of all or a portion of interest has become doubtful based on consistently applied procedures, under the general supervision of the Board of Trustees of the fund. A debt obligation is removed from non-accrual status when the issuer resumes interest payments or when collectibility of interest is reasonably assured.
Expenses. Most expenses of the trust can be directly attributed to a fund. Expenses which cannot be directly attributed are apportioned among the funds in the trust.
Distributions to Shareholders. Distributions are declared daily and paid monthly from net investment income. Distributions from realized gains, if any, are recorded on the ex-dividend date. Income dividends and capital gain distributions are declared separately for each class.
Income and capital gain distributions are determined in accordance with income tax regulations which may differ from generally accepted accounting principles. These differences, which may result in distribution reclassifications, are primarily due to differing treatments for paydown gains/losses on certain securities, foreign currency transactions, non-taxable dividends, market discount, capital loss carryforwards, and losses deferred due to wash sales and excise tax regulations.
Permanent book and tax basis differences relating to shareholder distributions will result in reclassifications to paid in capital. Undistributed net investment income and accumulated undistributed net realized gain (loss) on investments and foreign currency transactions may include temporary book and tax basis differences which
Semiannual Report
Notes to Financial Statements (Unaudited) - continued
1. Significant Accounting Policies - continued
Distributions to Shareholders - continued
will reverse in a subsequent period. Any taxable income or gain remaining at fiscal year end is distributed in the following year.
Security Transactions. Security transactions are accounted for as of trade date.
Gains and losses on securities sold are determined on the basis of identified cost.
2. Operating Policies.
Foreign Currency Contracts. The fund generally uses foreign currency contracts to facilitate transactions in foreign-denominated securities. Losses may arise from changes in the value of the foreign currency or if the counterparties do not perform under the contracts' terms. The U.S. dollar value of foreign currency contracts is determined using contractual currency exchange rates established at the time of each trade.
Joint Trading Account. Pursuant to an Exemptive Order issued by the Securities and Exchange Commission (SEC), the fund, along with other affiliated entities of Fidelity Management & Research Company (FMR), may transfer uninvested cash balances into one or more joint trading accounts. These balances are invested in one or more repurchase agreements for U.S. Treasury or Federal Agency obligations.
Repurchase Agreements. The underlying U.S. Treasury, Federal Agency, or other obligations found to be satisfactory by FMR are transferred to an account of the fund, or to the Joint Trading Account, at a bank custodian. The securities are marked-to-market daily and maintained at a value at least equal to the principal amount of the repurchase agreement (including accrued interest). FMR, the fund's investment adviser, is responsible for determining that the value of the underlying securities remains in accordance with the market value requirements stated above.
Interfund Lending Program. Pursuant to an Exemptive Order issued by the SEC, the fund, along with other registered investment companies having management contracts with FMR, may participate in an interfund lending program. This program provides an alternative credit facility allowing the fund to borrow from, or lend money to, other participating funds.
Delayed Delivery Transactions. The fund may purchase or sell securities on a delayed delivery basis. Payment and delivery may take place after the customary settlement period for that security. The price of the underlying securities and the date when the securities will be delivered and paid for are fixed at the time the transaction is negotiated. The fund may receive compensation for interest forgone in the purchase of a delayed delivery security. With respect to purchase commitments, the fund identifies securities as segregated in its records with a value at least equal to the amount of the
Semiannual Report
Notes to Financial Statements (Unaudited) - continued
2. Operating Policies - continued
Delayed Delivery Transactions - continued
commitment. Losses may arise due to changes in the value of the underlying securities or if the counterparty does not perform under the contract.
Options. The fund may use options to manage its exposure to the bond market and to fluctuations in interest rates and currency values. Writing puts and buying calls tend to increase the fund's exposure to the underlying instrument. Buying puts and writing calls tend to decrease the fund's exposure to the underlying instrument, or hedge other fund investments. Losses may arise from changes in the value of the underlying instruments, if there is an illiquid secondary market for the contracts, or if the counterparties do not perform under the contracts' terms. Gains and losses are realized upon the expiration or closing of the options. Realized gains (losses) on purchased options are included in realized gains (losses) on investment securities.
Restricted Securities. The fund is permitted to invest in securities that are subject to legal or contractual restrictions on resale. These securities generally may be resold in transactions exempt from registration or to the public if the securities are registered. Disposal of these securities may involve time-consuming negotiations and expense, and prompt sale at an acceptable price may be difficult. At the end of the period, restricted securities (excluding 144A issues) amounted to $581,709 or .2% of net assets.
Loans and Other Direct Debt Instruments. The fund is permitted to invest in loans and loan participations, trade claims or other receivables. These investments may include standby financing commitments that obligate the fund to supply additional cash to the borrower on demand. Loan participations involve a risk of insolvency of the lending bank or other financial intermediary. At the end of the period, these investments amounted to $4,353,863 or 1.4% of net assets.
3. Purchases and Sales of Investments.
Purchases and sales of securities, other than short-term securities, aggregated $151,385,373 and $137,527,507, respectively, of which U.S. government and government agency obligations aggregated $10,167,001 and $6,324,104, respectively.
4. Fees and Other Transactions with Affiliates.
Management Fee. As the fund's investment adviser, FMR receives a monthly fee that is calculated on the basis of a group fee rate plus a fixed individual fund fee rate applied to the average net assets of the fund. The group fee rate is the weighted average of a series of rates and is based on the monthly average net assets of all the mutual funds advised by FMR. The rates ranged from .0920% to .3700% for the period. The annual individual fund
Semiannual Report
Notes to Financial Statements (Unaudited) - continued
4. Fees and Other Transactions with Affiliates - continued
Management Fee - continued
fee rate is .45%. In the event that these rates were lower than the contractual rates in effect during the period, FMR voluntarily implemented the above rates, as they resulted in the same or a lower management fee. For the period, the management fee was equivalent to an annualized rate of .58% of average net assets.
Sub-Adviser Fee. FMR, on behalf of the fund, entered into sub-advisory agreements with Fidelity Management & Research (U.K.) Inc., Fidelity Management & Research (Far East) Inc., and Fidelity International Investment Advisors (FIIA). Under the sub-advisory arrangements, FMR may receive investment advice and research services and may grant the sub-advisers investment management authority to buy and sell securities. FMR pays its sub-advisers either a portion of its management fee or a fee based on costs incurred for these services.
Distribution and Service Plan. In accordance with Rule 12b-1 of the 1940 Act, the Board of Trustees has adopted separate Distribution and Service Plans with respect to each class of shares (collectively referred to as "the Plans"). Under certain of the Plans, the class pays Fidelity Distributors Corporation (FDC), an affiliate of FMR, a 12b-1 fee. A portion of this fee may be reallowed to securities dealers, banks and other financial institutions for the distribution of each class of shares and providing shareholder support services. For the period, this fee was based on the following annual rates of the average net assets of each applicable class:
|
Class A |
.15% |
|
Class T |
.25% |
|
Class B |
.90%* |
|
Class C |
1.00%** |
* .65% represents a distribution fee and .25% represents a shareholder service fee.
** .75% represents a distribution fee and .25% represents a shareholder service fee.
For the period, each class paid FDC the following amounts, a portion of which was retained by FDC:
|
|
Paid to |
Retained |
|
Class A |
$ 10,206 |
$ 35 |
|
Class T |
238,115 |
2,757 |
|
Class B |
379,103 |
274,390 |
|
Class C |
91,377 |
46,971 |
|
|
$ 718,801 |
$ 324,153 |
Semiannual Report
Notes to Financial Statements (Unaudited) - continued
4. Fees and Other Transactions with Affiliates - continued
Sales Load. FDC receives a front-end sales charge of up to 4.75% for selling Class A shares, and 3.50% for selling Class T shares of the fund. FDC receives the proceeds of contingent deferred sales charges levied on Class B share redemptions occurring within six years of purchase and Class C share redemptions occurring within one year of purchase. Contingent deferred sales charges are based on declining rates ranging from 5% to 1% for Class B and 1% for Class C, of the lesser of the cost of shares at the initial date of purchase or the net asset value of the redeemed shares, excluding any reinvested dividends and capital gains. In addition, purchases of Class A and Class T shares that were subject to a finder's fee bear a contingent deferred sales charge on assets that do not remain in the fund for at least one year. The Class A and Class T contingent deferred sales charge is based on 0.25% of the lesser of the cost of shares at the initial date of purchase or the net asset value of the redeemed shares, excluding any reinvested dividends and capital gains. A portion of the sales charges paid to FDC is paid to securities dealers, banks and other financial institutions.
For the period, sales charge amounts paid to and retained by FDC were as follows:
|
|
Paid to |
Retained |
|
Class A |
$ 45,515 |
$ 14,579 |
|
Class T |
60,945 |
19,314 |
|
Class B |
131,289 |
131,289* |
|
Class C |
1,693 |
1,693* |
|
|
$ 239,442 |
$ 166,875 |
* When Class B and Class C shares are initially sold, FDC pays commissions from its own resources to securities dealers,
banks, and other financial institutions through which the sales are made.
Transfer Agent Fees. Fidelity Investments Institutional Operations Company, Inc., (FIIOC), an affiliate of FMR, is the transfer, dividend disbursing and shareholder servicing agent (collectively referred to as the transfer agent) for each class of the fund. FIIOC receives account fees and asset-based fees that vary according to the account size and type of account of the shareholders of the respective classes of the fund.
Semiannual Report
Notes to Financial Statements (Unaudited) - continued
4. Fees and Other Transactions with Affiliates - continued
Transfer Agent Fees - continued
FIIOC pays for typesetting, printing and mailing of all shareholder reports, except proxy statements. For the period, the following amounts were paid to FIIOC:
|
|
Amount |
% of |
|
Class A |
$ 14,374 |
.21 * |
|
Class T |
164,772 |
.17 * |
|
Class B |
76,225 |
.18 * |
|
Class C |
17,523 |
.19 * |
|
Institutional Class |
3,466 |
.19 * |
|
|
$ 276,360 |
|
* Annualized
Accounting Fees. Fidelity Service Company, Inc., an affiliate of FMR, maintains the fund's accounting records. The fee is based on the level of average net assets for the month plus out-of-pocket expenses.
5. Interfund Lending Program.
The fund participated in the interfund lending program as a lender. The average daily loan balance during the period for which loans were outstanding amounted to $7,926,200. The weighted average interest rate was 5.88%. Interest earned from the interfund lending program amounted to $ 6,476 and is included in interest income on the Statement of Operations.
6. Expense Reductions.
Through an arrangement with the fund's custodian, credits realized as a result of uninvested cash balances were used to reduce a portion of the fund's expenses. During the period, the fund's custodian fees were reduced by $8,233.
7. Credit Risk.
The fund's relatively large investment in countries with limited or developing capital markets may involve greater risks than investments in more developed markets and the prices of such investments may be volatile. The yields of emerging market debt obligations reflect, among other things, perceived credit risk. The consequences of political, social or economic changes in these markets may have disruptive effects on the market prices of the fund's investments and the income they generate, as well as the fund's ability to repatriate such amounts.
Semiannual Report
Notes to Financial Statements (Unaudited) - continued
8. Beneficial Interest.
At the end of the period, FMR was record owner of approximately 13% of the total outstanding shares of the fund.
9. Distributions to Shareholders.
Distributions to shareholders of each class were as follows:
|
|
Six months ended |
Year ended |
|
|
2000 |
1999 |
|
From net investment income |
|
|
|
Class A |
$ 452,969 |
$ 775,559 |
|
Class T |
6,287,009 |
13,041,860 |
|
Class B |
2,494,965 |
4,950,300 |
|
Class C |
534,679 |
853,483 |
|
Institutional Class |
122,197 |
315,267 |
|
Total |
$ 9,891,819 |
$ 19,936,469 |
Semiannual Report
Notes to Financial Statements (Unaudited) - continued
10. Share Transactions.
Transactions for each class of shares were as follows:
|
|
Shares |
Dollars |
||
|
|
Six months ended June 30, |
Year ended December 31, |
Six months ended June 30, |
Year ended December 31, |
|
|
2000 |
1999 |
2000 |
1999 |
|
|
|
|
|
|
|
Class A |
590,687 |
670,664 |
$ 6,103,658 |
$ 7,034,562 |
|
Reinvestment of distributions |
34,799 |
59,003 |
358,061 |
616,531 |
|
Shares redeemed |
(365,966) |
(416,786) |
(3,788,317) |
(4,352,173) |
|
Net increase (decrease) |
259,520 |
312,881 |
$ 2,673,402 |
$ 3,298,920 |
|
Class T |
3,852,768 |
7,300,446 |
$ 39,705,333 |
$ 76,364,764 |
|
Reinvestment of distributions |
518,443 |
1,043,417 |
5,331,824 |
10,903,390 |
|
Shares redeemed |
(3,514,147) |
(8,149,722) |
(36,341,664) |
(85,087,489) |
|
Net increase (decrease) |
857,064 |
194,141 |
$ 8,695,493 |
$ 2,180,665 |
|
Class B |
1,205,702 |
3,093,028 |
$ 12,456,860 |
$ 32,490,970 |
|
Reinvestment of distributions |
165,116 |
321,769 |
1,700,988 |
3,367,960 |
|
Shares redeemed |
(1,247,215) |
(2,090,413) |
(12,903,021) |
(21,891,154) |
|
Net increase (decrease) |
123,603 |
1,324,384 |
$ 1,254,827 |
$ 13,967,776 |
|
Class C |
694,053 |
1,002,410 |
$ 7,155,652 |
$ 10,478,051 |
|
Reinvestment of distributions |
38,924 |
62,617 |
399,961 |
653,680 |
|
Shares redeemed |
(357,189) |
(513,809) |
(3,696,630) |
(5,359,385) |
|
Net increase (decrease) |
375,788 |
551,218 |
$ 3,858,983 |
$ 5,772,346 |
|
Institutional Class |
53,982 |
137,655 |
$ 559,029 |
$ 1,449,056 |
|
Reinvestment of distributions |
9,533 |
20,355 |
98,650 |
213,945 |
|
Shares redeemed |
(49,084) |
(248,874) |
(506,357) |
(2,615,934) |
|
Net increase (decrease) |
14,431 |
(90,864) |
$ 151,322 |
$ (952,933) |
Semiannual Report
Semiannual Report
Semiannual Report
Semiannual Report
Semiannual Report
Investment Adviser
Fidelity Management & Research Company
Boston, MA
Investment Sub-Advisers
Fidelity Management & Research
(U.K.) Inc.
Fidelity Management & Research
(Far East) Inc.
Fidelity International Investment Advisors
Fidelity International Investment Advisors (U.K.) Limited
Fidelity Investments Japan Limited
Officers
Edward C. Johnson 3d, President
Robert C. Pozen, Senior Vice President
Bart A. Grenier, Vice President
John H. Carlson, Vice President
Kevin E. Grant, Vice President
Ian Spreadbury, Vice President
Eric D. Roiter, Secretary
Robert A. Dwight, Treasurer
Maria F. Dwyer, Deputy Treasurer
John H. Costello, Assistant Treasurer
Board of Trustees
Ralph F. Cox *
Phyllis Burke Davis *
Robert M. Gates *
Edward C. Johnson 3d
Donald J. Kirk *
Ned C. Lautenbach *
Peter S. Lynch
Marvin L. Mann *
William O. McCoy *
Gerald C. McDonough *
Robert C. Pozen
Thomas R. Williams *
Advisory Board
J. Michael Cook
Abigail P. Johnson
Marie L. Knowles
General Distributor
Fidelity Distributors Corporation
Boston, MA
Transfer and Shareholder
Servicing Agent
Fidelity Investments Institutional Operations Company, Inc.
Boston, MA
Custodian
The Bank of New York
New York, NY
* Independent trustees
Semiannual Report
Focus Funds
Fidelity Advisor Consumer
Industries Fund
Fidelity Advisor Cyclical
Industries Fund
Fidelity Advisor Financial
Services Fund
Fidelity Advisor Health Care Fund
Fidelity Advisor Natural
Resources Fund
Fidelity Advisor Technology Fund
Fidelity Advisor Utilities Growth Fund
Growth Funds
Fidelity Advisor Korea Fund
Fidelity Advisor Emerging Asia Fund
Fidelity Advisor Latin America Fund
Fidelity Advisor Japan Fund
Fidelity Advisor Europe Capital Appreciation Fund
Fidelity Advisor International Capital Appreciation Fund
Fidelity Advisor Overseas Fund
Fidelity Advisor Diversified International Fund
Fidelity Advisor Global Equity Fund
Fidelity Advisor TechnoQuant ®
Growth Fund
Fidelity Advisor Small Cap Fund
Fidelity Advisor Value Strategies Fund
Fidelity Advisor Mid Cap Fund
Fidelity Advisor Dynamic Capital Appreciation Fund
Fidelity Advisor Equity Growth Fund
Fidelity Advisor Large Cap Fund
Fidelity Advisor Dividend Growth Fund
Fidelity Advisor Growth
Opportunities Fund
Growth and Income Funds
Fidelity Advisor Growth & Income Fund
Fidelity Advisor Equity Income Fund
Fidelity Advisor Asset Allocation Fund
Fidelity Advisor Balanced Fund
Taxable Income Funds
Fidelity Advisor Emerging Markets Income Fund
Fidelity Advisor High Yield Fund
Fidelity Advisor High Income Fund
Fidelity Advisor Strategic Income Fund
Fidelity Advisor Mortgage
Securities Fund
Fidelity Advisor Government Investment Fund
Fidelity Advisor Intermediate Bond Fund
Fidelity Advisor Short Fixed-Income Fund
Municipal Funds
Fidelity Advisor Municipal Income Fund
Money Market Funds
Prime Fund
Treasury Fund
Tax-Exempt Fund
SII-SANN-0800 108599
1.705748.102
(Fidelity Investment logo)(registered trademark)
|
|