
|
|
|
|
|
|
|
|
|
|
Previous: PUBLIC SERVICE CO OF NEW MEXICO, 8-K, 2000-09-21 |
Next: FORTIS SECURITIES INC, N-30D, 2000-09-21 |
Fidelity®
Fund
Annual Report
July 31, 2000
(2_fidelity_logos) (Registered_Trademark)
|
President's Message |
3 |
Ned Johnson on investing strategies. |
|
Performance |
4 |
How the fund has done over time. |
|
Fund Talk |
6 |
The managers' review of fund performance, strategy and outlook. |
|
Investment Changes |
10 |
A summary of major shifts in the fund's investments over the past six months. |
|
Investments |
11 |
A complete list of the fund's investments with their market values. |
|
Financial Statements |
31 |
Statements of assets and liabilities,
operations, and changes in net assets, |
|
Notes |
35 |
Notes to the financial statements. |
|
Report of Independent Accountants |
40 |
The auditors' opinion. |
|
Distributions |
41 |
|
Standard & Poor's, S&P and S&P 500 are registered service marks of The McGraw-Hill Companies, Inc. and have been licensed for use by Fidelity Distributors Corporation.
Other third party marks appearing herein are the property of their respective owners.
All other marks appearing herein are registered or unregistered trademarks or service marks of FMR Corp. or an affiliated company.
(Recycle graphic) This report is printed on recycled paper using soy-based inks. This report and the financial statements contained herein are submitted for the
general information
of the shareholders of the fund. This report is not authorized for distribution to prospective investors
in the fund unless preceded or accompanied by an effective prospectus.
Mutual fund shares are not deposits or obligations of, or guaranteed by, any depository institution. Shares are not insured by the FDIC, Federal Reserve Board or any other agency, and are subject to investment risks, including possible loss of principal amount invested.
Neither the fund nor Fidelity Distributors Corporation is a bank.
For more information on any Fidelity fund, including charges and expenses, call 1-800-544-6666 for a free prospectus. Read it carefully before you invest or send money.
Annual Report
(Photograph of Edward C. Johnson 3d.)
Dear Shareholder:
The Federal Reserve Board's effort to keep inflation in check without over-cooling the U.S. economy has taken a toll on the stock market. Through July 2000, bellwether equity indexes such as the Dow Jones Industrial Average, NASDAQ and S&P 500® have negative returns for the year. On the other hand, fixed-income markets are enjoying strong performance. Except for high-yield, most bond sectors - corporates, mortgages, Treasuries and agencies - have returned 4%-6% year to date.
While it's impossible to predict the future direction of the markets with any degree of certainty, there are certain basic principles that can help investors plan for their future needs.
First, investors are encouraged to take a long-term view of their portfolios. If you can afford to leave your money invested through the inevitable up and down cycles of the financial markets, you will greatly reduce your vulnerability to any single decline. We know from experience, for example, that stock prices have gone up over longer periods of time, have significantly outperformed other types of investments and have stayed ahead of inflation.
Second, you can further manage your investing risk through diversification. A stock mutual fund, for instance, is already diversified, because it invests in many different companies. You can increase your diversification further by investing in a number of different stock funds, or in such other investment categories as bonds. If you have a short investment time horizon, you might want to consider moving some of your investment into a money market fund, which seeks income and a stable share price by investing in high-quality, short-term investments. Of course, it's important to remember that an investment in a money market fund is not insured or guaranteed by the Federal Deposit Insurance Corporation or any other government agency. Although money market funds seek to preserve the value of your investment at $1.00 per share, it is possible to lose money by investing in these types of funds.
Finally, no matter what your time horizon or portfolio diversity, it makes good sense to follow a regular investment plan, investing a certain amount of money in a fund at the same time each month or quarter and periodically reviewing your overall portfolio. By doing so, you won't get caught up in the excitement of a rapidly rising market, nor will you buy all your shares at market highs. While this strategy - known as dollar cost averaging - won't assure a profit or protect you from a loss in a declining market, it should help you lower the average cost of your purchases. Of course, you should consider your financial ability to continue your purchases through periods of low price levels before undertaking such a strategy.
If you have questions, please call us at 1-800-544-6666, or visit our web site at www.fidelity.com. We are available 24 hours a day, seven days a week to provide you the information you need to make the investments that are right for you.
Best regards,
/s/Edward C. Johnson 3d
Edward C. Johnson 3d
Annual Report
There are several ways to evaluate a fund's historical performance. You can look at the total percentage change in value, the average annual percentage change or the growth of a hypothetical $10,000 investment. Total return reflects the change in the value of an investment, assuming reinvestment of the fund's dividend income and capital gains (the profits earned upon the sale of securities that have grown in value).
Cumulative Total Returns
|
Periods ended July 31, 2000 |
|
Past 1 |
Past 5 |
Past 10 |
|
Fidelity Balanced |
|
1.82% |
87.47% |
215.17% |
|
Fidelity Balanced Income Composite |
|
-0.04% |
82.70% |
222.99% |
|
LB Aggregate Bond |
|
5.97% |
36.94% |
111.27% |
|
S&P 500 ® |
|
8.98% |
177.11% |
408.31% |
|
Balanced Funds Average |
|
6.04% |
84.11% |
207.07% |
Cumulative total returns show the fund's performance in percentage terms over a set period - in this case, one year, five years or 10 years. For example, if you had invested $1,000 in a fund that had a 5% return over the past year, the value of your investment would be $1,050. You can compare the fund's returns to the performance of the Fidelity Balanced Income Composite Index - a hypothetical combination of unmanaged indices combining the total returns of the Russell 3000® Value Index and the Lehman Brothers Aggregate Bond Index using a weighting of 60% and 40%, respectively. To measure how the fund's performance stacked up against its peers, you can compare it to the balanced funds average, which reflects the performance of mutual funds with similar objectives tracked by Lipper Inc. The past one year average represents a peer group of 461 mutual funds. These benchmarks include reinvested dividends and capital gains, if any, and exclude the effect of sales charges.
Average Annual Total Returns
|
Periods ended July 31, 2000 |
Past 1 |
Past 5 |
Past 10 |
|
Fidelity Balanced |
1.82% |
13.39% |
12.16% |
|
Fidelity Balanced Income Composite |
-0.04% |
12.81% |
12.44% |
Average annual total returns take the fund's cumulative return and show you what would have happened if the fund had performed at a constant rate each year.
Annual Report
$10,000 Over 10 Years
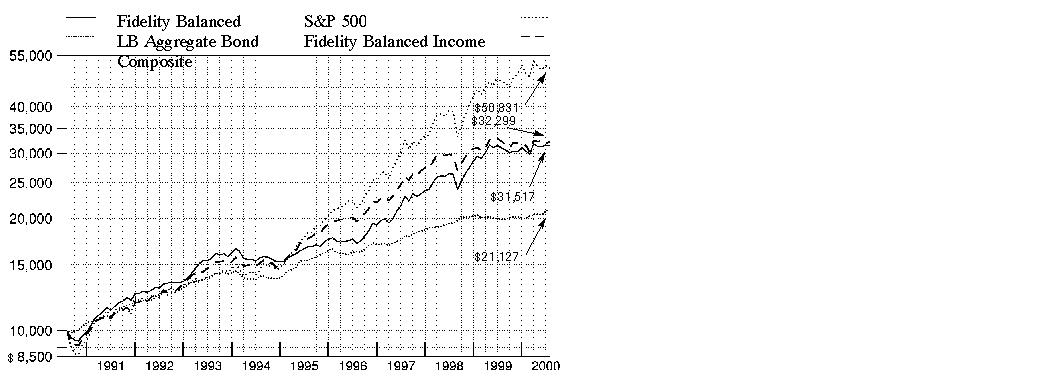
$10,000 Over 10 Years: Let's say hypothetically that $10,000 was invested in Fidelity Balanced Fund on July 31, 1990. As the chart shows, by July 31, 2000, the value of the investment would have grown to $31,517 - a 215.17% increase on the initial investment. For comparison, look at how both the Standard & Poor's 500 SM Index, a market capitalization-weighted index of common stocks, and the Lehman Brothers Aggregate Bond Index, a market value-weighted index of investment-grade fixed-rate debt issues, including government, corporate, asset-backed, and mortgage-backed securities, with maturities of one year or more, did over the same period. With dividends and capital gains, if any, reinvested, the Standard & Poor's 500 Index would have grown to $50,831 - a 408.31% increase. If $10,000 was invested in the Lehman Brothers Aggregate Bond Index, it would have grown to $21,127 - a 111.27% increase. You can also look at how the Fidelity Balanced Income Composite Index did over the same period. The composite index combines the total returns of the Russell 3000 Value Index and the Lehman Brothers Aggregate Bond Index, and assumes monthly rebalancing of the mix. With dividends and interest, if any, reinvested, the same $10,000 would have grown to $32,299 - a 222.99% increase.
Understanding
Performance
How a fund did yesterday is no guarantee of how it will do tomorrow. The stock market, for example, has a history of long-term growth and short-term volatility. In turn, the share price and return of a fund that invests in stocks will vary. That means if you sell your shares during a market downturn, you might lose money. But if you can ride out the market's ups and downs, you may have a gain.
3Annual Report
Market Recap
During the 12-month period that ended July 31, 2000, the U.S. securities markets struggled to break free from the grip of the Federal Reserve Board, whose effort to cool the overheated economy was delivered via a series of five interest-rate hikes. With every clench of its fist, the Fed's effort - which raised the federal funds rate by a combined total of 1.50% - gradually tempered the optimism toward stocks as the period progressed. Most of the effect of the Fed's tightening, coupled with the market's concerns about corporate earnings, took its toll on stocks starting in the second quarter of 2000. The Standard & Poor's 500 Index, an index of 500 larger companies, returned 8.98% for the past year, but feeling the impact of the Fed's action, has lost 1.98% year to date. Even the seemingly invincible NASDAQ Composite Index, which finished the period with a 43.08% gain, has given back 7.65% so far this year. Despite higher rates that put pressure on bonds earlier in the period, fixed-income markets posted solid returns relative to equities in 2000 as investors fled technology stocks in favor of less-volatile areas. The Lehman Brothers Aggregate Bond Index - a broad measure of the U.S. taxable investment-grade bond market - returned 5.97% for the 12-month period.
SM(Portfolio Manager photograph)
An interview with Robert Ewing (right), Lead Portfolio Manager of Fidelity Balanced Fund, and Kevin Grant (left), manager for fixed-income
investments
Q. How did the fund perform, Bob?
R.E. For the 12 months that ended July 31, 2000, the fund delivered a total return of 1.82%. That topped the Fidelity Balanced Income Composite Index, which returned -0.04%. The balanced funds average tracked by Lipper Inc. returned 6.04% during the same period.
Q. Why did the fund outperform its index, yet fall short of its peers?
R.E. Solid stock selection on the equity front, teamed with strong performance from the fund's bond subportfolio, helped us maintain an edge over the index. It was a difficult period overall for value stocks - which this fund favors - as growth dominated the investment landscape for most of the period, with technology stocks largely responsible for fueling the performance disparity in the marketplace. The major indexes highlighted this dichotomy, with the tech-laden NASDAQ Composite Index trouncing the Russell 3000 Value Index by a count of 43.08% to -4.39% during the past year. Not surprisingly, given the fund's emphasis on value, we struggled to keep pace with our competitors, which tended to own more growth-oriented tech names than we did, on average. In terms of absolute performance, our biggest wins came by way of the health, finance, energy and consumer nondurables sectors. Unfortunately, our modest exposure to technology stocks failed to pay dividends, as investors swarmed around market leaders, leaving many of the value tech names we owned by the wayside.
Annual Report
Fund Talk: The Managers' Overview - continued
Q. What changes did you make since taking over the fund in February?
R.E. The few changes I made were in preparation for an economic slowdown. My feeling was that the rate of economic growth was likely unsustainable, especially in light of markedly higher interest rates. So, I chose to adopt a more defensive posture, positioning the fund to take advantage of a deceleration in the economy. In addition to bringing down the overall price-to-earnings ratio, or P/E, of the fund, I began to focus even more intently on value characteristics. In every industry, I consciously decided to own the cheaper of two comparable situations. As the period progressed, I began to tilt the fund toward those sectors that tend to perform well in a slowdown, namely drug stocks and consumer nondurables. I also raised the fund's energy weighting early on to gain exposure to a favorable global supply/demand picture. My focus here was on individual energy services stocks, which benefited from a higher pricing environment, as energy
companies started to do more drilling and exploratory work for oil and gas. I did take profits late in the period, however, as many of these names reached all-time highs. In addition, effective September 28, 2000 - after the end of the period covered by this report - the fund's trustees approved allowing the fund to invest in high-yield securities. This investment alternative is available, and I plan to use it if I feel high-yield securities present attractive investment opportunities.
Q. What was your asset allocation strategy during the period?
R.E. Since this is a balanced fund, I try not to make big asset allocation calls outside of the 60%/40% stocks/bonds boundary. I was a little underweighted in equities overall, averaging around 56% during the period, which was consistent with my defensive posture.
Q. What stocks performed well for the fund?
R.E. Eli Lilly was rewarded for having one of the best drug pipelines in the business, including a possible blockbuster in Zovant, the first of its kind in the treatment of an often-fatal blood disease called sepsis. Weatherford is an energy services name that responded nicely to rising oil prices and improvements in the international marketplace. Timely trading allowed us to take profits in Chase Manhattan, which peaked in the spring. Computer chipmaker Micron Technology was one of the only cheap tech stocks that worked for the fund, nearly tripling in price during the period. Nabisco also was a key contributor.
Annual Report
Fund Talk: The Managers' Overview - continued
Q. Which stocks hurt performance during the period?
R.E. Unisys was a big disappointment. Shares of the computer services supplier shed over 75% of its market value during the period. The firm missed the mark on
earnings due to weakness in its government and financial services business, along with the deferral of several large technology contracts. The stock looked to provide
good value, yet company fundamentals continued to deteriorate.
Lucent was punished for missing a key product cycle in the fiber-optic space and giving up additional market share to key rival Nortel. AT&T continued to struggle in
the face of increased competition, which sparked a deterioration in its core consumer and business long-distance segments.
Q. Turning to you, Kevin, how did the fund's bond subportfolio fare?
K.G. It performed well during the past 12 months, benefiting from its ample exposure to a strong rally in the government market. An announcement by the U.S. Treasury in January of its intent to use government surplus proceeds to buy back long-term debt, as well as reduce future issuance, sent the price of the long bond higher and its yield lower. This move, coupled with rising short-term interest rates, induced an inverted yield curve, which occurs when short-term issues provide higher yields than their longer-term counterparts. This inversion forced the spread sectors - most notably corporate bonds and agency securities - to give up the returns they had accumulated during the first half of the period as yield spreads widened out significantly relative to comparable duration Treasuries. The fund was well-positioned for these changes, and we responded early to the buybacks by reducing our exposure to long-term corporates in exchange for more Treasuries, which worked out well. This strategy, along with strong security selection, helped the fund's bond subportfolio outperform the Lehman Brothers Aggregate Bond Index during the period. So, despite the Federal Reserve Board's efforts to raise rates during the period, the supply/demand imbalance spurred by the Treasury buybacks helped ensure our success.
Q. Bob, what's your outlook for the fund over the next several months?
R.E. Cautious, yet optimistic. If growth can slow sufficiently to convince the Fed to cease further tightening, industries that have been under pressure from rising rates could stage a comeback. If so, the fund should benefit given its significant exposure to these areas of the market. A slowing economy could make for a bumpy ride in the equity markets, which will place even more emphasis on security selection. I'm comfortable with the fund's conservative positioning heading into this period of uncertainty.
The views expressed in this report reflect those of the portfolio managers only through the end of the period of the report as stated on the cover and do not necessarily represent the views of Fidelity or any other person in the Fidelity organization. Any such views are subject to change at any time based upon market or other conditions and Fidelity disclaims any responsibility to update such views. These views may not be relied on as investment advice and, because investment decisions for a Fidelity fund are based on numerous factors, may not be relied on as an indication of trading intent on behalf of any Fidelity fund.
Annual Report
Fund Talk: The Managers' Overview - continued
Fund Facts
Goal: income and capital growth consistent with reasonable risk
Fund number: 304
Trading symbol: FBALX
Start date: November 6, 1986
Size: as of July 31, 2000, more than $5.8 billion
Manager: Robert Ewing, since February 2000; manager, Fidelity Advisor Financial Services Fund, 1998-2000; several Fidelity Select Portfolios, 1996-2000; joined Fidelity in 1990; Kevin Grant, since 1997; manager, several Fidelity investment-grade taxable bond funds; joined Fidelity in 1993
3Bob Ewing on finding value in today's marketplace:
"For a market that's incredibly expensive, there's a lot of value out there, which makes me feel pretty good about running a value-oriented fund under these conditions. Since history has a tendency of repeating itself, I'm fairly confident that there again will be a time when value outperforms growth. And when it does, the fund will be poised to benefit. The truth of the matter is, value hasn't mattered for some time now, with investors off chasing high-growth companies involved in the technological revolution.
"Leaders in the growth space continue to trade at unprecedented valuations, but that doesn't concern me much since I don't tend to traffic in this area to begin with. Those areas of the market I do frequent are currently ripe with bargain-basement specials. Traditional value names are trading at all-time lows in many cases, especially those sensitive to the economy's ebbs and flows. At some point, however, these stocks will get cheap enough that they'll be ready to go up again even if the economy is slowing. I'm starting to find more and more value by watching out for these cues."
Annual Report
|
Top Five Stocks as of July 31, 2000 |
||
|
|
% of fund's |
% of fund's net assets |
|
Exxon Mobil Corp. |
2.3 |
3.1 |
|
Eli Lilly & Co. |
1.4 |
1.4 |
|
Citigroup, Inc. |
1.4 |
1.2 |
|
Bristol-Myers Squibb Co. |
1.1 |
0.2 |
|
Associates First Capital Corp. Class A |
1.1 |
0.4 |
|
|
7.3 |
6.3 |
|
Top Five Bond Issuers as of July 31, 2000 |
||
|
(with maturities greater than one year) |
% of fund's |
% of fund's net assets |
|
Fannie Mae |
14.3 |
10.1 |
|
U.S. Treasury Obligations |
8.3 |
8.4 |
|
Government National Mortgage Association |
2.8 |
2.9 |
|
Freddie Mac |
0.9 |
0.3 |
|
Nomura Asset Securities Corp. |
0.4 |
0.3 |
|
|
26.7 |
22.0 |
|
Top Five Market Sectors as of July 31, 2000 |
||
|
|
% of fund's |
% of fund's net assets |
|
Finance |
16.0 |
17.2 |
|
Technology |
9.8 |
7.6 |
|
Utilities |
9.2 |
10.6 |
|
Health |
5.7 |
3.1 |
|
Media & Leisure |
5.0 |
6.9 |
|
Asset Allocation (% of fund's net assets) |
|||||||
|
As of July 31, 2000 * |
As of January 31, 2000 ** |
||||||
 |
Stocks 56.0% |
|
|
Stocks 56.6% |
|
||
 |
Bonds 39.6% |
|
|
Bonds 35.5% |
|
||
 |
Short-Term |
|
|
Short-Term |
|
||
|
* Foreign investments |
3.9% |
|
** Foreign investments |
2.6% |
|
||

Annual Report
Showing Percentage of Net Assets
|
Common Stocks - 56.0% |
|||
|
Shares |
Value (Note 1) (000s) |
||
|
AEROSPACE & DEFENSE - 1.1% |
|||
|
Boeing Co. |
543,200 |
$ 26,617 |
|
|
Northrop Grumman Corp. |
270,000 |
19,187 |
|
|
Textron, Inc. |
275,000 |
15,692 |
|
|
TOTAL AEROSPACE & DEFENSE |
61,496 |
||
|
BASIC INDUSTRIES - 1.8% |
|||
|
Chemicals & Plastics - 1.0% |
|||
|
E.I. du Pont de Nemours and Co. |
455,703 |
20,649 |
|
|
Praxair, Inc. |
475,000 |
18,792 |
|
|
Union Carbide Corp. |
400,000 |
17,925 |
|
|
|
57,366 |
||
|
Metals & Mining - 0.3% |
|||
|
Alcoa, Inc. |
331,600 |
10,031 |
|
|
Phelps Dodge Corp. |
157,400 |
6,404 |
|
|
|
16,435 |
||
|
Paper & Forest Products - 0.5% |
|||
|
Kimberly-Clark Corp. |
515,000 |
29,580 |
|
|
Pentair, Inc. |
100,000 |
3,063 |
|
|
|
32,643 |
||
|
TOTAL BASIC INDUSTRIES |
106,444 |
||
|
CONSTRUCTION & REAL ESTATE - 0.8% |
|||
|
Building Materials - 0.0% |
|||
|
Lafarge Corp. |
150,933 |
3,396 |
|
|
Construction - 0.3% |
|||
|
Centex Corp. |
332,000 |
7,947 |
|
|
Pulte Corp. |
325,000 |
7,455 |
|
|
|
15,402 |
||
|
Real Estate Investment Trusts - 0.5% |
|||
|
Equity Office Properties Trust |
772,400 |
23,558 |
|
|
ProLogis Trust |
150,000 |
3,497 |
|
|
|
27,055 |
||
|
TOTAL CONSTRUCTION & REAL ESTATE |
45,853 |
||
|
DURABLES - 1.9% |
|||
|
Autos, Tires, & Accessories - 1.2% |
|||
|
AutoNation, Inc. |
1,650,000 |
11,447 |
|
|
Common Stocks - continued |
|||
|
Shares |
Value (Note 1) (000s) |
||
|
DURABLES - continued |
|||
|
Autos, Tires, & Accessories - continued |
|||
|
Danaher Corp. |
73,400 |
$ 3,739 |
|
|
General Motors Corp. |
56,407 |
3,212 |
|
|
Navistar International Corp. (a) |
1,480,000 |
52,818 |
|
|
|
71,216 |
||
|
Consumer Durables - 0.5% |
|||
|
Minnesota Mining & Manufacturing Co. |
282,300 |
25,425 |
|
|
Consumer Electronics - 0.2% |
|||
|
General Motors Corp. Class H (a) |
429,403 |
11,111 |
|
|
TOTAL DURABLES |
107,752 |
||
|
ENERGY - 4.7% |
|||
|
Energy Services - 1.1% |
|||
|
Diamond Offshore Drilling, Inc. |
150,000 |
5,634 |
|
|
Halliburton Co. |
100,000 |
4,613 |
|
|
Varco International, Inc. (a) |
505,850 |
8,726 |
|
|
Weatherford International, Inc. |
1,163,400 |
46,609 |
|
|
|
65,582 |
||
|
Oil & Gas - 3.6% |
|||
|
Burlington Resources, Inc. |
325,000 |
10,603 |
|
|
Chevron Corp. |
190,400 |
15,042 |
|
|
Conoco, Inc. Class B |
625,000 |
14,414 |
|
|
Exxon Mobil Corp. |
1,662,200 |
132,976 |
|
|
Grant Prideco, Inc. (a) |
1,438,400 |
28,948 |
|
|
Sunoco, Inc. |
150,000 |
3,656 |
|
|
|
205,639 |
||
|
TOTAL ENERGY |
271,221 |
||
|
FINANCE - 12.5% |
|||
|
Banks - 3.0% |
|||
|
Bank of America Corp. |
572,300 |
27,113 |
|
|
Bank of New York Co., Inc. |
200,000 |
9,363 |
|
|
Bank One Corp. |
600,000 |
19,088 |
|
|
Chase Manhattan Corp. |
619,950 |
30,804 |
|
|
First Union Corp. |
325,000 |
8,389 |
|
|
Firstar Corp. |
600,000 |
11,850 |
|
|
Common Stocks - continued |
|||
|
Shares |
Value (Note 1) (000s) |
||
|
FINANCE - continued |
|||
|
Banks - continued |
|||
|
Mellon Financial Corp. |
1,304,000 |
$ 49,145 |
|
|
PNC Financial Services Group, Inc. |
327,500 |
16,662 |
|
|
|
172,414 |
||
|
Credit & Other Finance - 3.3% |
|||
|
American Express Co. |
595,000 |
33,729 |
|
|
Associates First Capital Corp. Class A |
2,400,000 |
62,850 |
|
|
Citigroup, Inc. |
1,178,950 |
83,190 |
|
|
Household International, Inc. |
350,000 |
15,597 |
|
|
|
195,366 |
||
|
Federal Sponsored Credit - 1.5% |
|||
|
Fannie Mae |
558,000 |
27,830 |
|
|
Freddie Mac |
1,527,500 |
60,241 |
|
|
|
88,071 |
||
|
Insurance - 3.0% |
|||
|
AFLAC, Inc. |
200,000 |
10,388 |
|
|
AMBAC Financial Group, Inc. |
268,600 |
17,308 |
|
|
American International Group, Inc. |
671,531 |
58,885 |
|
|
CIGNA Corp. |
109,800 |
10,966 |
|
|
Marsh & McLennan Companies, Inc. |
72,400 |
8,833 |
|
|
MetLife, Inc. |
1,450,000 |
30,450 |
|
|
Protective Life Corp. |
95,500 |
2,590 |
|
|
The Chubb Corp. |
183,300 |
13,564 |
|
|
UnumProvident Corp. |
600,000 |
13,800 |
|
|
XL Capital Ltd. Class A |
85,000 |
5,610 |
|
|
|
172,394 |
||
|
Securities Industry - 1.7% |
|||
|
Charles Schwab Corp. |
658,850 |
23,801 |
|
|
Lehman Brothers Holdings, Inc. |
236,300 |
26,554 |
|
|
Merrill Lynch & Co., Inc. |
145,000 |
18,741 |
|
|
Morgan Stanley Dean Witter & Co. |
332,600 |
30,350 |
|
|
|
99,446 |
||
|
TOTAL FINANCE |
727,691 |
||
|
HEALTH - 5.7% |
|||
|
Drugs & Pharmaceuticals - 4.1% |
|||
|
American Home Products Corp. |
168,500 |
8,941 |
|
|
Bristol-Myers Squibb Co. |
1,349,700 |
66,979 |
|
|
Common Stocks - continued |
|||
|
Shares |
Value (Note 1) (000s) |
||
|
HEALTH - continued |
|||
|
Drugs & Pharmaceuticals - continued |
|||
|
Elan Corp. PLC sponsored ADR (a) |
150,000 |
$ 8,016 |
|
|
Eli Lilly & Co. |
802,300 |
83,339 |
|
|
Exelixis, Inc. |
165,500 |
6,444 |
|
|
Pfizer, Inc. |
898,700 |
38,756 |
|
|
Schering-Plough Corp. |
641,000 |
27,683 |
|
|
|
240,158 |
||
|
Medical Equipment & Supplies - 1.4% |
|||
|
Abbott Laboratories |
1,055,700 |
43,944 |
|
|
Baxter International, Inc. |
292,900 |
22,773 |
|
|
Cardinal Health, Inc. |
125,000 |
9,188 |
|
|
Johnson & Johnson |
50,000 |
4,653 |
|
|
|
80,558 |
||
|
Medical Facilities Management - 0.2% |
|||
|
HCA - The Healthcare Co. |
400,000 |
13,600 |
|
|
TOTAL HEALTH |
334,316 |
||
|
INDUSTRIAL MACHINERY & EQUIPMENT - 2.2% |
|||
|
Electrical Equipment - 1.7% |
|||
|
Alcatel SA sponsored ADR |
225,000 |
16,453 |
|
|
Emerson Electric Co. |
417,400 |
25,487 |
|
|
General Electric Co. |
1,158,200 |
59,575 |
|
|
|
101,515 |
||
|
Industrial Machinery & Equipment - 0.5% |
|||
|
Caterpillar, Inc. |
342,700 |
11,673 |
|
|
Ingersoll-Rand Co. |
410,000 |
16,093 |
|
|
|
27,766 |
||
|
TOTAL INDUSTRIAL MACHINERY & EQUIPMENT |
129,281 |
||
|
MEDIA & LEISURE - 3.6% |
|||
|
Broadcasting - 1.2% |
|||
|
American Tower Corp. Class A (a) |
200,000 |
8,575 |
|
|
AMFM, Inc. (a) |
75,000 |
5,358 |
|
|
AT&T Corp. - Liberty Media Group Class A (a) |
1,163,600 |
25,890 |
|
|
Clear Channel Communications, Inc. (a) |
91,500 |
6,971 |
|
|
Infinity Broadcasting Corp. Class A (a) |
250,000 |
8,813 |
|
|
Time Warner, Inc. |
182,828 |
14,021 |
|
|
|
69,628 |
||
|
Common Stocks - continued |
|||
|
Shares |
Value (Note 1) (000s) |
||
|
MEDIA & LEISURE - continued |
|||
|
Entertainment - 1.6% |
|||
|
Fox Entertainment Group, Inc. Class A (a) |
588,000 |
$ 18,008 |
|
|
News Corp. Ltd. sponsored ADR |
223,200 |
10,993 |
|
|
Viacom, Inc. Class B (non-vtg.) (a) |
450,000 |
29,841 |
|
|
Walt Disney Co. |
821,400 |
31,778 |
|
|
|
90,620 |
||
|
Lodging & Gaming - 0.1% |
|||
|
Starwood Hotels & Resorts Worldwide, Inc. unit |
200,000 |
6,825 |
|
|
Publishing - 0.4% |
|||
|
McGraw-Hill Companies, Inc. |
223,300 |
13,272 |
|
|
The New York Times Co. Class A |
289,500 |
11,924 |
|
|
|
25,196 |
||
|
Restaurants - 0.3% |
|||
|
McDonald's Corp. |
485,200 |
15,284 |
|
|
TOTAL MEDIA & LEISURE |
207,553 |
||
|
NONDURABLES - 2.8% |
|||
|
Beverages - 0.6% |
|||
|
Anheuser-Busch Companies, Inc. |
355,400 |
28,610 |
|
|
Seagram Co. Ltd. |
100,000 |
5,606 |
|
|
|
34,216 |
||
|
Foods - 1.2% |
|||
|
Keebler Foods Co. |
575,000 |
25,372 |
|
|
Nabisco Group Holdings Corp. |
575,000 |
15,238 |
|
|
PepsiCo, Inc. |
125,000 |
5,727 |
|
|
Quaker Oats Co. |
361,900 |
24,338 |
|
|
|
70,675 |
||
|
Household Products - 0.5% |
|||
|
Avon Products, Inc. |
164,100 |
6,513 |
|
|
Procter & Gamble Co. |
395,000 |
22,466 |
|
|
|
28,979 |
||
|
Tobacco - 0.5% |
|||
|
Philip Morris Companies, Inc. |
1,100,000 |
27,775 |
|
|
TOTAL NONDURABLES |
161,645 |
||
|
PRECIOUS METALS - 0.1% |
|||
|
Newmont Mining Corp. |
500,300 |
8,880 |
|
|
Common Stocks - continued |
|||
|
Shares |
Value (Note 1) (000s) |
||
|
RETAIL & WHOLESALE - 1.5% |
|||
|
Apparel Stores - 0.6% |
|||
|
AnnTaylor Stores Corp. (a) |
425,000 |
$ 12,006 |
|
|
Gap, Inc. |
164,600 |
5,895 |
|
|
The Limited, Inc. |
745,000 |
15,226 |
|
|
|
33,127 |
||
|
General Merchandise Stores - 0.7% |
|||
|
BJ's Wholesale Club, Inc. (a) |
425,000 |
12,723 |
|
|
Costco Wholesale Corp. (a) |
150,000 |
4,884 |
|
|
Target Corp. |
720,000 |
20,880 |
|
|
|
38,487 |
||
|
Grocery Stores - 0.1% |
|||
|
Safeway, Inc. (a) |
205,400 |
9,256 |
|
|
Retail & Wholesale, Miscellaneous - 0.1% |
|||
|
Best Buy Co., Inc. (a) |
100,000 |
7,275 |
|
|
TOTAL RETAIL & WHOLESALE |
88,145 |
||
|
SERVICES - 0.7% |
|||
|
Printing - 0.1% |
|||
|
Reynolds & Reynolds Co. Class A |
475,000 |
7,927 |
|
|
Services - 0.6% |
|||
|
H&R Block, Inc. |
568,500 |
18,192 |
|
|
True North Communications |
299,800 |
14,634 |
|
|
|
32,826 |
||
|
TOTAL SERVICES |
40,753 |
||
|
TECHNOLOGY - 9.4% |
|||
|
Communications Equipment - 1.2% |
|||
|
ADC Telecommunications, Inc. (a) |
280,000 |
11,743 |
|
|
Cisco Systems, Inc. (a) |
530,000 |
34,682 |
|
|
Lucent Technologies, Inc. |
265,000 |
11,594 |
|
|
Nokia AB sponsored ADR |
310,000 |
13,737 |
|
|
|
71,756 |
||
|
Computer Services & Software - 2.3% |
|||
|
Adobe Systems, Inc. |
67,700 |
7,752 |
|
|
Cadence Design Systems, Inc. (a) |
487,100 |
10,168 |
|
|
Computer Associates International, Inc. |
1,001,200 |
24,842 |
|
|
Computer Sciences Corp. (a) |
242,300 |
15,144 |
|
|
Covad Communications Group, Inc. (a) |
351,750 |
5,804 |
|
|
Common Stocks - continued |
|||
|
Shares |
Value (Note 1) (000s) |
||
|
TECHNOLOGY - continued |
|||
|
Computer Services & Software - continued |
|||
|
Electronic Data Systems Corp. |
300,000 |
$ 12,900 |
|
|
Microsoft Corp. (a) |
490,400 |
34,236 |
|
|
Sabre Holdings Corp. Class A |
252,928 |
6,181 |
|
|
Unisys Corp. (a) |
1,859,500 |
18,246 |
|
|
|
135,273 |
||
|
Computers & Office Equipment - 3.1% |
|||
|
Adaptec, Inc. (a) |
225,000 |
5,569 |
|
|
Apple Computer, Inc. (a) |
556,200 |
28,262 |
|
|
Comdisco, Inc. |
330,000 |
8,539 |
|
|
Compaq Computer Corp. |
1,100,000 |
30,869 |
|
|
Dell Computer Corp. (a) |
500,100 |
21,973 |
|
|
Diebold, Inc. |
450,000 |
12,741 |
|
|
EMC Corp. (a) |
280,000 |
23,835 |
|
|
Hewlett-Packard Co. |
119,300 |
13,026 |
|
|
International Business Machines Corp. |
207,100 |
23,286 |
|
|
Lexmark International Group, Inc. Class A (a) |
200,000 |
9,013 |
|
|
|
177,113 |
||
|
Electronic Instruments - 0.5% |
|||
|
Agilent Technologies, Inc. |
418,148 |
17,040 |
|
|
Thermo Electron Corp. (a) |
400,000 |
8,300 |
|
|
|
25,340 |
||
|
Electronics - 2.3% |
|||
|
Advanced Micro Devices, Inc. (a) |
127,700 |
9,186 |
|
|
Analog Devices, Inc. (a) |
87,400 |
5,845 |
|
|
Intel Corp. |
160,000 |
10,680 |
|
|
Micron Technology, Inc. (a) |
458,000 |
37,327 |
|
|
Motorola, Inc. |
1,244,400 |
41,143 |
|
|
Texas Instruments, Inc. |
531,600 |
31,198 |
|
|
|
135,379 |
||
|
TOTAL TECHNOLOGY |
544,861 |
||
|
TRANSPORTATION - 0.5% |
|||
|
Air Transportation - 0.3% |
|||
|
AMR Corp. |
100,000 |
3,306 |
|
|
Continental Airlines, Inc. Class B (a) |
50,000 |
2,613 |
|
|
Southwest Airlines Co. |
426,900 |
10,086 |
|
|
|
16,005 |
||
|
Common Stocks - continued |
|||
|
Shares |
Value (Note 1) (000s) |
||
|
TRANSPORTATION - continued |
|||
|
Railroads - 0.2% |
|||
|
Burlington Northern Santa Fe Corp. |
400,000 |
$ 9,775 |
|
|
Union Pacific Corp. |
124,900 |
5,394 |
|
|
|
15,169 |
||
|
TOTAL TRANSPORTATION |
31,174 |
||
|
UTILITIES - 6.7% |
|||
|
Cellular - 1.2% |
|||
|
Nextel Communications, Inc. Class A (a) |
200,000 |
11,188 |
|
|
Sprint Corp. - PCS Group Series 1 (a) |
540,000 |
29,835 |
|
|
Vodafone Group PLC sponsored ADR |
273,400 |
11,790 |
|
|
VoiceStream Wireless Corp. (a) |
135,000 |
17,314 |
|
|
|
70,127 |
||
|
Electric Utility - 1.4% |
|||
|
AES Corp. (a) |
600,000 |
32,063 |
|
|
Calpine Corp. (a) |
300,000 |
21,375 |
|
|
IPALCO Enterprises, Inc. |
717,100 |
16,224 |
|
|
Montana Power Co. |
250,000 |
7,234 |
|
|
NRG Energy, Inc. |
149,000 |
3,492 |
|
|
|
80,388 |
||
|
Gas - 0.9% |
|||
|
Dynegy, Inc. Class A |
563,117 |
39,629 |
|
|
Enron Corp. |
188,500 |
13,878 |
|
|
|
53,507 |
||
|
Telephone Services - 3.2% |
|||
|
AT&T Corp. |
1,212,850 |
37,523 |
|
|
BellSouth Corp. |
785,500 |
31,273 |
|
|
Qwest Communications International, Inc. (a) |
719,300 |
33,762 |
|
|
SBC Communications, Inc. |
1,314,000 |
55,927 |
|
|
Time Warner Telecom, Inc. Class A (a) |
249,900 |
15,478 |
|
|
WorldCom, Inc. (a) |
276,771 |
10,811 |
|
|
|
184,774 |
||
|
TOTAL UTILITIES |
388,796 |
||
|
TOTAL COMMON STOCKS (Cost $2,834,796) |
3,255,861 |
||
|
Nonconvertible Bonds - 10.5% |
|||||
|
Moody's Ratings (unaudited) (b) |
Principal Amount (000s) |
Value (Note 1) (000s) |
|||
|
AEROSPACE & DEFENSE - 0.2% |
|||||
|
Defense Electronics - 0.2% |
|||||
|
Raytheon Co. 7.9% 3/1/03 (e) |
Baa2 |
|
$ 8,780 |
$ 8,830 |
|
|
BASIC INDUSTRIES - 0.0% |
|||||
|
Paper & Forest Products - 0.0% |
|||||
|
Abitibi-Consolidated, Inc. 8.85% 8/1/30 |
Baa3 |
|
2,130 |
2,128 |
|
|
Fort James Corp. 6.625% 9/15/04 |
Baa2 |
|
910 |
863 |
|
|
|
2,991 |
||||
|
CONSTRUCTION & REAL ESTATE - 0.7% |
|||||
|
Real Estate - 0.1% |
|||||
|
Duke Realty LP 7.3% 6/30/03 |
Baa1 |
|
5,000 |
4,936 |
|
|
Real Estate Investment Trusts - 0.6% |
|||||
|
CenterPoint Properties Trust 6.75% 4/1/05 |
Baa2 |
|
2,600 |
2,428 |
|
|
Equity Office Properties Trust: |
|
|
|
|
|
|
6.5% 1/15/04 |
Baa1 |
|
6,000 |
5,762 |
|
|
6.625% 2/15/05 |
Baa1 |
|
2,500 |
2,371 |
|
|
7.25% 2/15/18 |
Baa1 |
|
15,000 |
13,097 |
|
|
ProLogis Trust 6.7% 4/15/04 |
Baa1 |
|
1,550 |
1,484 |
|
|
Spieker Properties LP 6.8% 5/1/04 |
Baa2 |
|
2,050 |
1,972 |
|
|
Spieker Properties, Inc. 7.125% 7/1/09 |
Baa2 |
|
9,700 |
8,996 |
|
|
|
36,110 |
||||
|
TOTAL CONSTRUCTION & REAL ESTATE |
41,046 |
||||
|
ENERGY - 0.3% |
|||||
|
Oil & Gas - 0.3% |
|||||
|
Anadarko Petroleum Corp. 7.2% 3/15/29 |
Baa1 |
|
6,970 |
6,508 |
|
|
Apache Corp.: |
|
|
|
|
|
|
7.625% 7/1/19 |
Baa1 |
|
1,535 |
1,504 |
|
|
7.7% 3/15/26 |
Baa1 |
|
1,500 |
1,476 |
|
|
Apache Finance Property Ltd. 6.5% 12/15/07 |
Baa1 |
|
2,600 |
2,414 |
|
|
Conoco, Inc. 5.9% 4/15/04 |
A3 |
|
2,300 |
2,204 |
|
|
YPF Sociedad Anonima: |
|
|
|
|
|
|
7.75% 8/27/07 |
B1 |
|
175 |
166 |
|
|
8% 2/15/04 |
B1 |
|
1,190 |
1,170 |
|
|
|
15,442 |
||||
|
Nonconvertible Bonds - continued |
|||||
|
Moody's Ratings (unaudited) (b) |
Principal Amount (000s) |
Value (Note 1) (000s) |
|||
|
FINANCE - 3.5% |
|||||
|
Banks - 1.5% |
|||||
|
ABN-Amro Bank NV, Chicago 6.625% 10/31/01 |
A1 |
|
$ 6,750 |
$ 6,678 |
|
|
Bank of Tokyo-Mitsubishi Ltd. 8.4% 4/15/10 |
A3 |
|
3,300 |
3,322 |
|
|
Bank One Corp. 7.875% 8/1/10 |
A1 |
|
12,500 |
12,453 |
|
|
BanPonce Financial Corp. 6.75% 8/9/01 |
A3 |
|
770 |
765 |
|
|
Barclays Bank PLC yankee 5.95% 7/15/01 |
A1 |
|
10,200 |
10,140 |
|
|
Capital One Bank 6.375% 2/15/03 |
Baa2 |
|
5,300 |
5,096 |
|
|
Commonwealth Bank of Australia 8.5% 6/1/10 |
Aa3 |
|
2,000 |
2,072 |
|
|
HSBC Finance Nederland BV 7.4% 4/15/03 (e) |
A1 |
|
750 |
748 |
|
|
Korea Development Bank: |
|
|
|
|
|
|
6.625% 11/21/03 |
Baa2 |
|
4,045 |
3,896 |
|
|
7.125% 4/22/04 |
Baa2 |
|
600 |
574 |
|
|
7.375% 9/17/04 |
Baa2 |
|
1,295 |
1,257 |
|
|
MBNA Corp.: |
|
|
|
|
|
|
6.34% 6/2/03 |
Baa2 |
|
1,800 |
1,718 |
|
|
6.875% 11/15/02 |
Baa2 |
|
8,350 |
8,249 |
|
|
Providian National Bank: |
|
|
|
|
|
|
6.25% 5/7/01 |
Baa3 |
|
2,345 |
2,313 |
|
|
6.75% 3/15/02 |
Baa3 |
|
905 |
886 |
|
|
Sanwa Finance Aruba AEC 8.35% 7/15/09 |
Baa1 |
|
14,100 |
14,020 |
|
|
Sumitomo Bank International Finance NV 8.5% 6/15/09 |
Baa1 |
|
1,500 |
1,528 |
|
|
Union Planters National Bank 6.81% 8/20/01 |
A3 |
|
4,000 |
3,982 |
|
|
Zions Bancorp 8.625% 10/15/02 |
A3 |
|
6,000 |
6,118 |
|
|
|
85,815 |
||||
|
Credit & Other Finance - 1.8% |
|||||
|
Associates Corp. of North America: |
|
|
|
|
|
|
6% 4/15/03 |
Aa3 |
|
5,550 |
5,358 |
|
|
6% 7/15/05 |
Aa3 |
|
10,000 |
9,347 |
|
|
Bellsouth Capital Funding Corp. 7.75% 2/15/10 |
Aa3 |
|
2,800 |
2,808 |
|
|
CIT Group, Inc. 5.5% 2/15/04 |
A1 |
|
2,000 |
1,859 |
|
|
Daimler-Chrysler NA Holding Corp. 6.59% 6/18/02 |
A1 |
|
1,250 |
1,237 |
|
|
ERP Operating LP: |
|
|
|
|
|
|
6.55% 11/15/01 |
A3 |
|
2,000 |
1,974 |
|
|
7.1% 6/23/04 |
A3 |
|
4,000 |
3,886 |
|
|
Finova Capital Corp.: |
|
|
|
|
|
|
6.12% 5/28/02 |
Baa2 |
|
5,000 |
4,500 |
|
|
7.25% 11/8/04 |
Baa2 |
|
2,200 |
1,881 |
|
|
First Security Capital I 8.41% 12/15/26 |
A3 |
|
3,490 |
3,276 |
|
|
Nonconvertible Bonds - continued |
|||||
|
Moody's Ratings (unaudited) (b) |
Principal Amount (000s) |
Value (Note 1) (000s) |
|||
|
FINANCE - continued |
|||||
|
Credit & Other Finance - continued |
|||||
|
Ford Motor Credit Co. 7.875% 6/15/10 |
A2 |
|
$ 5,490 |
$ 5,490 |
|
|
General Motors Acceptance Corp. 7.5% 7/15/05 |
A2 |
|
5,000 |
4,975 |
|
|
Household Finance Corp. 8% 5/9/05 |
A2 |
|
6,900 |
6,983 |
|
|
HSBC Capital Funding LP 10.176% 12/31/49 (d)(e) |
A1 |
|
2,825 |
3,063 |
|
|
Newcourt Credit Group, Inc. 6.875% 2/16/05 |
A1 |
|
8,265 |
7,882 |
|
|
Popular North America, Inc. 7.375% 9/15/01 |
A3 |
|
3,000 |
2,990 |
|
|
Sprint Capital Corp.: |
|
|
|
|
|
|
5.875% 5/1/04 |
Baa1 |
|
8,670 |
8,212 |
|
|
6.875% 11/15/28 |
Baa1 |
|
16,065 |
13,891 |
|
|
The Money Store, Inc. 7.3% 12/1/02 |
A2 |
|
3,850 |
3,823 |
|
|
Trizec Finance Ltd. yankee 10.875% 10/15/05 |
Baa3 |
|
2,270 |
2,281 |
|
|
TXU Eastern Funding 6.75% 5/15/09 |
Baa1 |
|
3,920 |
3,505 |
|
|
U.S. West Capital Funding, Inc. 6.875% 7/15/28 |
Baa1 |
|
4,835 |
4,195 |
|
|
|
103,416 |
||||
|
Insurance - 0.2% |
|||||
|
Executive Risk Capital Trust 8.675% 2/1/27 |
Baa3 |
|
10,000 |
9,756 |
|
|
Savings & Loans - 0.0% |
|||||
|
Long Island Savings Bank FSB 6.2% 4/2/01 |
Baa3 |
|
3,750 |
3,708 |
|
|
Securities Industry - 0.0% |
|||||
|
Amvescap PLC yankee 6.375% 5/15/03 |
A3 |
|
3,600 |
3,443 |
|
|
TOTAL FINANCE |
206,138 |
||||
|
INDUSTRIAL MACHINERY & EQUIPMENT - 0.4% |
|||||
|
Tyco International Group SA: |
|
|
|
|
|
|
yankee 6.875% 1/15/29 |
Baa1 |
|
8,000 |
6,995 |
|
|
6.875% 9/5/02 |
Baa1 |
|
15,000 |
14,947 |
|
|
|
21,942 |
||||
|
MEDIA & LEISURE - 1.4% |
|||||
|
Broadcasting - 1.0% |
|||||
|
British Sky Broadcasting Group PLC 8.2% 7/15/09 |
Baa3 |
|
7,750 |
7,134 |
|
|
Clear Channel Communications, Inc.: |
|
|
|
|
|
|
6.875% 6/15/18 |
Baa3 |
|
10,000 |
8,835 |
|
|
7.25% 10/15/27 |
Baa3 |
|
2,000 |
1,800 |
|
|
Nonconvertible Bonds - continued |
|||||
|
Moody's Ratings (unaudited) (b) |
Principal Amount (000s) |
Value (Note 1) (000s) |
|||
|
MEDIA & LEISURE - continued |
|||||
|
Broadcasting - continued |
|||||
|
Continental Cablevision, Inc. 8.3% 5/15/06 |
A2 |
|
$ 2,485 |
$ 2,553 |
|
|
Nielsen Media Research, Inc. 7.6% 6/15/09 |
A3 |
|
3,495 |
3,335 |
|
|
Shaw Communications, Inc. 8.25% 4/11/10 |
Baa2 |
|
3,120 |
3,152 |
|
|
TCI Communications, Inc.: |
|
|
|
|
|
|
8.75% 8/1/15 |
A2 |
|
4,120 |
4,380 |
|
|
9.8% 2/1/12 |
A2 |
|
6,290 |
7,109 |
|
|
TCI Communications Financing III 9.65% 3/31/27 |
A3 |
|
4,100 |
4,583 |
|
|
Time Warner, Inc. 6.85% 1/15/26 |
Baa3 |
|
10,000 |
9,731 |
|
|
USA Networks, Inc./USANi LLC 6.75% 11/15/05 |
Baa3 |
|
3,760 |
3,615 |
|
|
|
56,227 |
||||
|
Entertainment - 0.1% |
|||||
|
Viacom, Inc. 7.75% 6/1/05 |
Baa1 |
|
5,300 |
5,338 |
|
|
Publishing - 0.3% |
|||||
|
News America Holdings, Inc. 8% 10/17/16 |
Baa3 |
|
13,000 |
12,631 |
|
|
News America, Inc. 7.125% 4/8/28 |
Baa3 |
|
1,800 |
1,551 |
|
|
Time Warner Entertainment Co. LP 8.375% 7/15/33 |
Baa2 |
|
6,500 |
6,689 |
|
|
|
20,871 |
||||
|
TOTAL MEDIA & LEISURE |
82,436 |
||||
|
NONDURABLES - 0.3% |
|||||
|
Beverages - 0.1% |
|||||
|
Seagram JE & Sons, Inc.: |
|
|
|
|
|
|
6.625% 12/15/05 |
Baa3 |
|
1,555 |
1,492 |
|
|
6.8% 12/15/08 |
Baa3 |
|
4,590 |
4,321 |
|
|
|
5,813 |
||||
|
Foods - 0.1% |
|||||
|
ConAgra, Inc. 7.125% 10/1/26 |
Baa1 |
|
5,000 |
4,741 |
|
|
Tobacco - 0.1% |
|||||
|
RJ Reynolds Tobacco Holdings, Inc. 7.375% 5/15/03 |
Baa2 |
|
5,100 |
4,774 |
|
|
TOTAL NONDURABLES |
15,328 |
||||
|
Nonconvertible Bonds - continued |
|||||
|
Moody's Ratings (unaudited) (b) |
Principal Amount (000s) |
Value (Note 1) (000s) |
|||
|
RETAIL & WHOLESALE - 0.2% |
|||||
|
Drug Stores - 0.1% |
|||||
|
Rite Aid Corp.: |
|
|
|
|
|
|
6.5% 12/15/05 (e) |
Caa1 |
|
$ 6,910 |
$ 2,971 |
|
|
7.125% 1/15/07 |
Caa1 |
|
2,465 |
1,035 |
|
|
|
4,006 |
||||
|
General Merchandise Stores - 0.1% |
|||||
|
Federated Department Stores, Inc.: |
|
|
|
|
|
|
6.79% 7/15/27 |
Baa1 |
|
6,000 |
5,716 |
|
|
8.5% 6/15/03 |
Baa1 |
|
2,275 |
2,276 |
|
|
|
7,992 |
||||
|
TOTAL RETAIL & WHOLESALE |
11,998 |
||||
|
TECHNOLOGY - 0.4% |
|||||
|
Computers & Office Equipment - 0.4% |
|||||
|
Comdisco, Inc.: |
|
|
|
|
|
|
5.95% 4/30/02 |
Baa1 |
|
6,000 |
5,703 |
|
|
6.375% 11/30/01 |
Baa1 |
|
12,000 |
11,624 |
|
|
7.25% 9/1/02 |
Baa1 |
|
6,360 |
6,159 |
|
|
|
23,486 |
||||
|
TRANSPORTATION - 0.6% |
|||||
|
Air Transportation - 0.1% |
|||||
|
Continental Airlines, Inc. pass thru trust certificates: |
|
|
|
|
|
|
7.434% 3/15/06 |
Baa1 |
|
1,615 |
1,570 |
|
|
7.73% 9/15/12 |
Baa1 |
|
659 |
633 |
|
|
Delta Air Lines, Inc.: |
|
|
|
|
|
|
equipment trust certificate 8.54% 1/2/07 |
Baa1 |
|
734 |
702 |
|
|
9.875% 4/30/08 |
Baa1 |
|
4,265 |
4,260 |
|
|
|
7,165 |
||||
|
Railroads - 0.5% |
|||||
|
Burlington Northern Santa Fe Corp.: |
|
|
|
|
|
|
6.53% 7/15/37 |
Baa2 |
|
12,000 |
11,650 |
|
|
6.875% 12/1/27 |
Baa2 |
|
5,000 |
4,369 |
|
|
Norfolk Southern Corp. 7.05% 5/1/37 |
Baa1 |
|
8,820 |
8,640 |
|
|
Union Pacific Corp. 7.125% 2/1/28 |
Baa3 |
|
4,000 |
3,605 |
|
|
|
28,264 |
||||
|
TOTAL TRANSPORTATION |
35,429 |
||||
|
Nonconvertible Bonds - continued |
|||||
|
Moody's Ratings (unaudited) (b) |
Principal Amount (000s) |
Value (Note 1) (000s) |
|||
|
UTILITIES - 2.5% |
|||||
|
Electric Utility - 1.0% |
|||||
|
Avon Energy Partners Holdings: |
|
|
|
|
|
|
6.46% 3/4/08 (e) |
Baa2 |
|
$ 6,800 |
$ 6,057 |
|
|
7.05% 12/11/07 (e) |
Baa2 |
|
20,000 |
18,499 |
|
|
Dominion Resources, Inc.: |
|
|
|
|
|
|
7.6% 7/15/03 |
Baa1 |
|
3,450 |
3,456 |
|
|
8.125% 6/15/10 |
Baa1 |
|
3,680 |
3,750 |
|
|
DR Investments UK PLC yankee 7.1% 5/15/02 (e) |
A2 |
|
7,500 |
7,436 |
|
|
Illinois Power Co. 7.5% 6/15/09 |
Baa1 |
|
3,330 |
3,217 |
|
|
Israel Electric Corp. Ltd.: |
|
|
|
|
|
|
7.75% 12/15/27 (e) |
A3 |
|
10,795 |
9,566 |
|
|
yankee 7.25% 12/15/06 (e) |
A3 |
|
3,000 |
2,905 |
|
|
Niagara Mohawk Power Corp. 8.875% 5/15/07 |
Baa3 |
|
1,660 |
1,722 |
|
|
Texas Utilities Co. 6.375% 1/1/08 |
Baa3 |
|
4,135 |
3,724 |
|
|
|
60,332 |
||||
|
Gas - 0.3% |
|||||
|
CMS Panhandle Holding Co.: |
|
|
|
|
|
|
6.125% 3/15/04 |
Baa3 |
|
3,500 |
3,318 |
|
|
7% 7/15/29 |
Baa3 |
|
2,650 |
2,259 |
|
|
Reliant Energy Resources Corp. 8.125% 7/15/05 (e) |
Baa1 |
|
4,000 |
4,008 |
|
|
Southwest Gas Corp. 9.75% 6/15/02 |
Baa2 |
|
8,700 |
8,972 |
|
|
|
18,557 |
||||
|
Telephone Services - 1.2% |
|||||
|
Cable & Wireless Optus Ltd.: |
|
|
|
|
|
|
8% 6/22/10 (e) |
Baa1 |
|
6,500 |
6,527 |
|
|
8.125% 6/15/09 (e) |
Baa1 |
|
5,000 |
5,042 |
|
|
Deutsche Telekom International Finance BV: |
|
|
|
|
|
|
8% 6/15/10 |
Aa2 |
|
7,800 |
7,841 |
|
|
8.25% 6/15/30 |
Aa2 |
|
13,130 |
13,320 |
|
|
Telecomunicaciones de Puerto Rico, Inc. 6.65% 5/15/06 |
Baa2 |
|
5,020 |
4,699 |
|
|
Teleglobe Canada, Inc.: |
|
|
|
|
|
|
7.2% 7/20/09 |
Baa1 |
|
10,070 |
9,620 |
|
|
7.7% 7/20/29 |
Baa1 |
|
11,392 |
10,756 |
|
|
Nonconvertible Bonds - continued |
|||||
|
Moody's Ratings (unaudited) (b) |
Principal Amount (000s) |
Value (Note 1) (000s) |
|||
|
UTILITIES - continued |
|||||
|
Telephone Services - continued |
|||||
|
WorldCom, Inc.: |
|
|
|
|
|
|
7.75% 4/1/07 |
A3 |
|
$ 1,350 |
$ 1,359 |
|
|
8.875% 1/15/06 |
A3 |
|
9,592 |
9,894 |
|
|
|
69,058 |
||||
|
TOTAL UTILITIES |
147,947 |
||||
|
TOTAL NONCONVERTIBLE BONDS (Cost $641,147) |
613,013 |
||||
|
U.S. Government and Government Agency Obligations - 11.4% |
|||||
|
|
|||||
|
U.S. Government Agency Obligations - 3.0% |
|||||
|
Fannie Mae: |
|
|
|
|
|
|
5.25% 1/15/09 |
Aaa |
|
9,850 |
8,674 |
|
|
6.5% 4/29/09 |
Aaa |
|
86,000 |
80,370 |
|
|
7% 7/15/05 |
Aaa |
|
15,320 |
15,332 |
|
|
7.25% 5/15/30 |
Aaa |
|
9,735 |
9,998 |
|
|
Federal Agricultural Mortgage Corp.: |
|
|
|
|
|
|
7.01% 2/10/05 |
Aaa |
|
1,530 |
1,529 |
|
|
7.04% 8/10/05 |
Aaa |
|
2,400 |
2,398 |
|
|
Financing Corp. - coupon STRIPS 0% 3/26/04 |
Aaa |
|
4,574 |
3,511 |
|
|
Freddie Mac: |
|
|
|
|
|
|
5.75% 3/15/09 |
Aaa |
|
12,000 |
10,920 |
|
|
6.25% 7/15/04 |
Aaa |
|
10,930 |
10,650 |
|
|
6.45% 4/29/09 |
Aaa |
|
12,000 |
11,188 |
|
|
6.875% 1/15/05 |
Aaa |
|
4,880 |
4,856 |
|
|
7% 7/15/05 |
Aaa |
|
6,800 |
6,802 |
|
|
Government Trust Certificates (assets of Trust guaranteed by U.S. Government through Defense Security Assistance Agency): |
|
|
|
|
|
|
Class 1-C, 9.25% 11/15/01 |
Aaa |
|
2,918 |
2,970 |
|
|
Class 3-T, 9.625% 5/15/02 |
Aaa |
|
555 |
564 |
|
|
Private Export Funding Corp. secured 6.86% 4/30/04 |
Aaa |
|
964 |
958 |
|
|
Tennessee Valley Authority 7.125% 5/1/30 |
Aaa |
|
2,065 |
2,074 |
|
|
TOTAL U.S. GOVERNMENT AGENCY OBLIGATIONS |
172,794 |
||||
|
U.S. Government and Government Agency Obligations - continued |
|||||
|
Moody's Ratings (unaudited) (b) |
Principal Amount (000s) |
Value (Note 1) (000s) |
|||
|
U.S. Treasury Obligations - 8.4% |
|||||
|
U.S. Treasury Bonds: |
|
|
|
|
|
|
6.125% 8/15/29 |
Aaa |
|
$ 37,370 |
$ 38,462 |
|
|
8.75% 5/15/17 |
Aaa |
|
7,665 |
9,738 |
|
|
8.875% 8/15/17 |
Aaa |
|
83,420 |
107,260 |
|
|
9.875% 11/15/15 |
Aaa |
|
9,860 |
13,464 |
|
|
14% 11/15/11 |
Aaa |
|
30,720 |
42,619 |
|
|
U.S. Treasury Notes: |
|
|
|
|
|
|
5.5% 2/15/08 |
Aaa |
|
23,610 |
22,677 |
|
|
5.625% 9/30/01 |
Aaa |
|
2,340 |
2,318 |
|
|
5.875% 10/31/01 |
Aaa |
|
68,800 |
68,327 |
|
|
6.5% 5/31/02 |
Aaa |
|
108,910 |
109,149 |
|
|
6.625% 6/30/01 |
Aaa |
|
5,000 |
5,008 |
|
|
7% 7/15/06 |
Aaa |
|
36,000 |
37,395 |
|
|
7.5% 11/15/01 |
Aaa |
|
8,510 |
8,618 |
|
|
U.S. Treasury Notes - coupon STRIPS 0% 11/15/11 |
Aaa |
|
54,800 |
27,477 |
|
|
TOTAL U.S. TREASURY OBLIGATIONS |
492,512 |
||||
|
TOTAL U.S. GOVERNMENT AND GOVERNMENT (Cost $663,230) |
665,306 |
||||
|
U.S. Government Agency - Mortgage Securities - 15.1% |
|||||
|
|
|||||
|
Fannie Mae - 12.3% |
|||||
|
5.5% 11/1/08 to 3/1/14 |
Aaa |
|
13,051 |
12,258 |
|
|
6% 1/1/12 to 1/1/29 |
Aaa |
|
53,329 |
49,071 |
|
|
6.5% 7/1/08 to 8/1/30 |
Aaa |
|
244,324 |
231,163 |
|
|
6.5% 8/1/30 (h) |
Aaa |
|
65,000 |
61,384 |
|
|
7% 12/1/08 to 4/1/30 |
Aaa |
|
88,458 |
85,683 |
|
|
7.5% 6/1/07 to 7/1/30 |
Aaa |
|
179,765 |
177,289 |
|
|
8% 9/1/17 to 8/1/30 |
Aaa |
|
95,844 |
96,138 |
|
|
TOTAL FANNIE MAE |
712,986 |
||||
|
Government National Mortgage Association - 2.8% |
|||||
|
6.5% 3/15/26 to 4/15/29 (i) |
Aaa |
|
66,043 |
62,627 |
|
|
7% 8/15/25 to 12/15/28 |
Aaa |
|
78,005 |
75,823 |
|
|
7.5% 1/15/26 to 9/15/28 |
Aaa |
|
23,366 |
23,165 |
|
|
8% 1/15/17 to 8/15/25 |
Aaa |
|
824 |
832 |
|
|
U.S. Government Agency - Mortgage Securities - continued |
|||||
|
Moody's Ratings (unaudited) (b) |
Principal Amount (000s) |
Value (Note 1) (000s) |
|||
|
Government National Mortgage Association - continued |
|||||
|
9% 11/15/14 to 1/15/23 |
Aaa |
|
$ 358 |
$ 371 |
|
|
9.5% 11/15/20 to 3/15/23 |
Aaa |
|
209 |
219 |
|
|
TOTAL GOVERNMENT NATIONAL MORTGAGE ASSOCIATION |
163,037 |
||||
|
TOTAL U.S. GOVERNMENT AGENCY - MORTGAGE SECURITIES (Cost $899,407) |
876,023 |
||||
|
Asset-Backed Securities - 0.7% |
|||||
|
|
|||||
|
American Express Credit Account Master Trust 6.1% 12/15/06 |
A1 |
|
4,200 |
4,021 |
|
|
Capita Equipment Receivables Trust 6.48% 10/15/06 |
Baa2 |
|
4,680 |
4,537 |
|
|
Discover Card Master Trust I 5.85% 11/16/04 |
A2 |
|
5,000 |
4,859 |
|
|
Ford Credit Auto Owner Trust: |
|
|
|
|
|
|
6.2% 12/15/02 |
Aa2 |
|
3,850 |
3,803 |
|
|
6.4% 12/15/02 |
Aa2 |
|
2,360 |
2,329 |
|
|
7.03% 11/15/03 |
Aaa |
|
1,119 |
1,119 |
|
|
Key Auto Finance Trust: |
|
|
|
|
|
|
6.3% 10/15/03 |
A2 |
|
1,405 |
1,395 |
|
|
6.65% 10/15/03 |
Baa3 |
|
412 |
411 |
|
|
Premier Auto Trust 5.59% 2/9/04 |
Aaa |
|
15,000 |
14,578 |
|
|
Sears Credit Account Master Trust II 7.5% 11/15/07 |
A2 |
|
6,100 |
6,096 |
|
|
TOTAL ASSET-BACKED SECURITIES (Cost $44,046) |
43,148 |
||||
|
Collateralized Mortgage Obligations - 0.1% |
|||||
|
|
|||||
|
U.S. Government Agency - 0.1% |
|||||
|
Freddie Mac planned amortization class |
Aaa |
|
4,100 |
3,825 |
|
|
Commercial Mortgage Securities - 1.3% |
|||||
|
|
|||||
|
CS First Boston Mortgage Securities Corp.: |
|
|
|
|
|
|
Series 1997-C2 Class D, 7.27% 1/17/35 |
Baa2 |
|
5,790 |
5,354 |
|
|
Series 1998-FL1: |
|
|
|
|
|
|
Class D, 7.145% 12/10/00 (e)(f) |
A2 |
|
6,100 |
6,103 |
|
|
Commercial Mortgage Securities - continued |
|||||
|
Moody's Ratings (unaudited) (b) |
Principal Amount (000s) |
Value (Note 1) (000s) |
|||
|
CS First Boston Mortgage Securities Corp.: - continued |
|
|
|
|
|
|
Class E, 7.495% 1/10/13 (e)(f) |
Baa2 |
|
$ 12,180 |
$ 12,158 |
|
|
Series 2000-C1 Class A2, 7.545% 4/15/62 |
AAA |
|
5,000 |
5,020 |
|
|
Equitable Life Assurance Society of the |
|
|
|
|
|
|
Class B1, 7.33% 5/15/06 (e) |
Aa2 |
|
4,000 |
3,938 |
|
|
Class C1, 7.52% 5/15/06 (e) |
A2 |
|
4,000 |
3,938 |
|
|
GS Mortgage Securities Corp. II Series 1998-GLII Class E, 6.9698% 4/13/31 (e)(f) |
Baa3 |
|
5,000 |
4,447 |
|
|
Nomura Asset Securities Corp. Series 1998-D6: |
|
|
|
|
|
|
Class A1C, 6.69% 3/17/28 |
Aaa |
|
10,000 |
9,314 |
|
|
Class A4, 7.3615% 3/17/28 (f) |
Baa2 |
|
20,000 |
18,291 |
|
|
Thirteen Affiliates of General Growth Properties, Inc. sequential pay Series 1 Class A2, 6.602% 12/15/10 (e) |
Aaa |
|
8,000 |
7,560 |
|
|
TOTAL COMMERCIAL MORTGAGE SECURITIES (Cost $79,070) |
76,123 |
||||
|
Foreign Government and Government Agency Obligations (g) - 0.4% |
|||||
|
|
|||||
|
Korean Republic yankee: |
|
|
|
|
|
|
8.75% 4/15/03 |
Baa2 |
|
1,900 |
1,936 |
|
|
8.875% 4/15/08 |
Baa2 |
|
2,946 |
3,035 |
|
|
Quebec Province yankee: |
|
|
|
|
|
|
7.125% 2/9/24 |
A2 |
|
680 |
649 |
|
|
7.5% 7/15/23 |
A2 |
|
2,880 |
2,870 |
|
|
United Mexican States: |
|
|
|
|
|
|
global 8.5% 2/1/06 |
Baa3 |
|
8,600 |
8,572 |
|
|
9.875% 2/1/10 |
Baa3 |
|
5,000 |
5,260 |
|
|
TOTAL FOREIGN GOVERNMENT AND (Cost $22,969) |
22,322 |
||||
|
Supranational Obligations - 0.1% |
|||||
|
|
|||||
|
Inter-American Development Bank yankee 6.29%
7/16/27 |
Aaa |
|
3,000 |
2,872 |
|
|
Cash Equivalents - 5.4% |
|||
|
Shares |
Value (Note 1) |
||
|
Fidelity Cash Central Fund, 6.57% (c) |
305,453,245 |
$ 305,453 |
|
|
Fidelity Securities Lending Cash Central Fund, 6.65% (c) |
6,489,200 |
6,489 |
|
|
TOTAL CASH EQUIVALENTS (Cost $311,942) |
311,942 |
||
|
TOTAL INVESTMENT PORTFOLIO - 101.0% (Cost $5,503,376) |
5,870,435 |
||
|
NET OTHER ASSETS - (1.0)% |
(56,346) |
||
|
NET ASSETS - 100% |
$ 5,814,089 |
||
|
Legend |
|
(a) Non-income producing |
|
(b) S&P ® credit ratings are used in the absence of a rating by Moody's Investors Service, Inc. |
|
(c) The rate quoted is the annualized seven-day yield of the fund at |
|
(d) Debt obligation initially issued at one coupon which converts to a higher coupon at a specified date. The rate shown is the rate at period end. |
|
(e) Security exempt from registration under Rule 144A of the Securities Act of 1933. These securities may be resold in transactions exempt from registration, normally to qualified institutional buyers. At the period end, the value of these securities amounted to $113,796,000 or 2.0% of net assets. |
|
(f) The coupon rate shown on floating or adjustable rate securities represents the rate at period end. |
|
(g) For foreign government obligations not individually rated by S&P or Moody's, the ratings listed have been assigned |
|
(h) Security purchased on a delayed delivery or when-issued basis. |
|
(i) Security is subject to a forward commitment to sell. |
|
Other Information |
|
The composition of long-term debt holdings as a percentage of total value of investments in securities, is as follows (ratings are unaudited): |
|
Moody's Ratings |
S&P Ratings |
|||
|
Aaa, Aa, A |
30.9% |
|
AAA, AA, A |
28.0% |
|
Baa |
8.2% |
|
BBB |
7.3% |
|
Ba |
0.0% |
|
BB |
0.4% |
|
B |
0.0% |
|
B |
0.1% |
|
Caa |
0.1% |
|
CCC |
0.0% |
|
Ca, C |
0.0% |
|
CC, C |
0.0% |
|
|
|
|
D |
0.0% |
|
Income Tax Information |
|
At July 31, 2000, the aggregate cost of investment securities for income tax purposes was $5,515,877,000. Net unrealized appreciation aggregated $354,558,000, of which $623,135,000 related to appreciated investment securities and $268,577,000 related to depreciated investment securities. |
|
The fund hereby designates approximately $351,419,000 as a capital gain dividend for the purpose of the dividend paid deduction. |
See accompanying notes which are an integral part of the financial statements.
Annual Report
Statement of Assets and Liabilities
|
Amounts in thousands (except per-share amount) |
July 31, 2000 |
|
|
Assets |
|
|
|
Investment in securities, at value (cost $5,503,376) - |
|
$ 5,870,435 |
|
Commitment to sell securities on a delayed delivery basis |
$ (61,628) |
|
|
Receivable for securities sold on a delayed delivery basis |
61,851 |
223 |
|
Receivable for investments sold, regular delivery |
|
66,113 |
|
Cash |
|
36 |
|
Receivable for fund shares sold |
|
3,583 |
|
Dividends receivable |
|
2,604 |
|
Interest receivable |
|
27,915 |
|
Other receivables |
|
90 |
|
Total assets |
|
5,970,999 |
|
Liabilities |
|
|
|
Payable for investments purchased |
77,626 |
|
|
Delayed delivery |
61,682 |
|
|
Payable for fund shares redeemed |
7,962 |
|
|
Accrued management fee |
2,088 |
|
|
Other payables and accrued expenses |
1,063 |
|
|
Collateral on securities loaned, at value |
6,489 |
|
|
Total liabilities |
|
156,910 |
|
Net Assets |
|
$ 5,814,089 |
|
Net Assets consist of: |
|
|
|
Paid in capital |
|
$ 5,332,631 |
|
Undistributed net investment income |
|
19,366 |
|
Accumulated undistributed net realized gain (loss) on investments and foreign currency transactions |
|
94,799 |
|
Net unrealized appreciation (depreciation) on investments |
|
367,293 |
|
Net Assets, for 379,169 shares outstanding |
|
$ 5,814,089 |
|
Net Asset Value, offering price and redemption price |
|
$15.33 |
See accompanying notes which are an integral part of the financial statements.
Annual Report
Financial Statements - continued
Statement of Operations
|
Amounts in thousands |
Year ended July 31, 2000 |
|
|
Investment Income Dividends |
|
$ 43,461 |
|
Interest |
|
169,793 |
|
Security lending |
|
246 |
|
Total income |
|
213,500 |
|
Expenses |
|
|
|
Management fee |
$ 25,268 |
|
|
Transfer agent fees |
12,864 |
|
|
Accounting and security lending fees |
815 |
|
|
Non-interested trustees' compensation |
24 |
|
|
Custodian fees and expenses |
149 |
|
|
Registration fees |
94 |
|
|
Audit |
70 |
|
|
Legal |
34 |
|
|
Reports to shareholders |
137 |
|
|
Miscellaneous |
12 |
|
|
Total expenses before reductions |
39,467 |
|
|
Expense reductions |
(2,110) |
37,357 |
|
Net investment income |
|
176,143 |
|
Realized and Unrealized Gain (Loss) Net realized gain (loss) on: |
|
|
|
Investment securities |
179,568 |
|
|
Foreign currency transactions |
1 |
179,569 |
|
Change in net unrealized appreciation (depreciation) on: |
|
|
|
Investment securities |
(252,300) |
|
|
Delayed delivery commitments |
223 |
(252,077) |
|
Net gain (loss) |
|
(72,508) |
|
Net increase (decrease) in net assets resulting |
|
$ 103,635 |
See accompanying notes which are an integral part of the financial statements.
Annual Report
Financial Statements - continued
Statement of Changes in Net Assets
|
Amounts in thousands |
Year ended |
Year ended |
|
Increase (Decrease) in Net Assets |
|
|
|
Operations |
$ 176,143 |
$ 143,436 |
|
Net realized gain (loss) |
179,569 |
683,387 |
|
Change in net unrealized appreciation (depreciation) |
(252,077) |
15,318 |
|
Net increase (decrease) in net assets resulting |
103,635 |
842,141 |
|
Distributions to shareholders |
(180,281) |
(128,130) |
|
From net realized gain |
(691,340) |
(378,957) |
|
Total distributions |
(871,621) |
(507,087) |
|
Share transactions |
1,740,915 |
1,527,019 |
|
Reinvestment of distributions |
853,559 |
495,851 |
|
Cost of shares redeemed |
(1,953,701) |
(1,379,305) |
|
Net increase (decrease) in net assets resulting |
640,773 |
643,565 |
|
Total increase (decrease) in net assets |
(127,213) |
978,619 |
|
Net Assets |
|
|
|
Beginning of period |
5,941,302 |
4,962,683 |
|
End of period (including undistributed net investment income of $19,366 and $22,329, respectively) |
$ 5,814,089 |
$ 5,941,302 |
|
Other Information Shares |
|
|
|
Sold |
112,488 |
91,041 |
|
Issued in reinvestment of distributions |
54,945 |
33,987 |
|
Redeemed |
(127,641) |
(83,449) |
|
Net increase (decrease) |
39,792 |
41,579 |
See accompanying notes which are an integral part of the financial statements.
Annual Report
Financial Highlights
|
Years ended July 31, |
2000 |
1999 |
1998 |
1997 |
1996 |
|
Selected Per-Share Data |
|
|
|
|
|
|
Net asset value, |
$ 17.51 |
$ 16.66 |
$ 16.49 |
$ 12.90 |
$ 13.20 |
|
Income from |
|
|
|
|
|
|
Net investment income |
.46 B |
.44 B |
.48 B |
.51 B |
.57 |
|
Net realized and |
(.18) |
2.09 |
1.67 |
3.73 |
(.27) |
|
Total from investment operations |
.28 |
2.53 |
2.15 |
4.24 |
.30 |
|
Less Distributions |
|
|
|
|
|
|
From net investment income |
(.48) |
(.40) |
(.52) |
(.65) |
(.60) |
|
From net realized gain |
(1.98) |
(1.28) |
(1.46) |
- |
- |
|
Total distributions |
(2.46) |
(1.68) |
(1.98) |
(.65) |
(.60) |
|
Net asset value, end of period |
$ 15.33 |
$ 17.51 |
$ 16.66 |
$ 16.49 |
$ 12.90 |
|
Total Return A |
1.82% |
17.48% |
14.54% |
33.82% |
2.25% |
|
Ratios and Supplemental Data |
|
|
|
|
|
|
Net assets, end of period |
$ 5,814 |
$ 5,941 |
$ 4,963 |
$ 4,173 |
$ 4,022 |
|
Ratio of expenses to average |
.67% |
.68% |
.70% |
.75% |
.82% |
|
Ratio of expenses to average net assets after expense reductions |
.63% C |
.65% C |
.67% C |
.74% C |
.79% C |
|
Ratio of net investment income |
2.98% |
2.67% |
2.97% |
3.58% |
4.12% |
|
Portfolio turnover rate |
139% |
157% |
135% |
70% |
247% |
|
A The total returns would have been lower had certain expenses not been reduced during the periods shown. B Net investment income per share has been calculated based on average shares outstanding during the period. C FMR or the fund has entered into varying arrangements with third parties who either paid or reduced a portion of the fund's expenses. |
|||||
See accompanying notes which are an integral part of the financial statements.
Annual Report
For the period ended July 31, 2000
1. Significant Accounting Policies.
Fidelity Balanced Fund (the fund) is a fund of Fidelity Puritan Trust (the trust) and is authorized to issue an unlimited number of shares. The trust is registered under the Investment Company Act of 1940, as amended, as an open-end management investment company organized as a Massachusetts business trust. The financial statements have been prepared in conformity with generally accepted accounting principles which require management to make certain estimates and assumptions at the date of the financial statements. The following summarizes the significant accounting policies of the fund:
Security Valuation. Equity securities for which quotations are readily available are valued at the last sale price, or if no sale price, at the closing bid price. Foreign equity securities are valued based on quotations from the principal market in which such securities are normally traded. If trading or events occurring in other markets after the close of the principal market in which foreign securities are traded, and before the close of the business of the fund, are expected to materially affect the value of those securities, then they are valued at their fair value taking this trading or these events into account. Fair value is determined in good faith under consistently applied procedures under the general supervision of the Board of Trustees. Debt securities for which quotations are readily available are valued by a pricing service at their market values as determined by their most recent bid prices in the principal market (sales prices if the principal market is an exchange) in which such securities are normally traded. Securities (including restricted securities) for which market quotations are not readily available are valued at their fair value. Short-term securities with remaining maturities of sixty days or less for which quotations are not readily available are valued at amortized cost or original cost plus accrued interest, both of which approximate current value.
Foreign Currency Translation. The accounting records of the fund are maintained in U.S. dollars. Investment securities and other assets and liabilities denominated in a foreign currency are translated into U.S. dollars at the prevailing rates of exchange at period end. Purchases and sales of securities, income receipts and expense payments are translated into U.S. dollars at the prevailing exchange rate on the respective dates of the transactions.
Net realized gains and losses on foreign currency transactions represent net gains and losses from sales and maturities of foreign currency contracts, disposition of foreign currencies, the difference between the amount of net investment income accrued and the U.S. dollar amount actually received, and gains and losses between trade and settlement date on purchases and sales of securities. The effects of changes in foreign currency exchange rates on investments in securities are included with the net realized and unrealized gain or loss on investment securities.
Annual Report
Notes to Financial Statements - continued
1. Significant Accounting Policies - continued
Income Taxes. As a qualified regulated investment company under Subchapter M of the Internal Revenue Code, the fund is not subject to income taxes to the extent that it distributes substantially all of its taxable income for its fiscal year. The schedule of investments includes information regarding income taxes under the caption "Income Tax Information."
Investment Income. Dividend income is recorded on the ex-dividend date, except certain dividends from foreign securities where the ex-dividend date may have passed, are recorded as soon as the fund is informed of the ex-dividend date. Non-cash dividends included in dividend income, if any, are recorded at the fair market value of the securities received. Interest income, which includes accretion of original issue discount, is accrued as earned. Investment income is recorded net of foreign taxes withheld where recovery of such taxes is uncertain.
Expenses. Most expenses of the trust can be directly attributed to a fund. Expenses which cannot be directly attributed are apportioned among the funds in the trust.
Deferred Trustee Compensation. Under a Deferred Compensation Plan (the Plan) non-interested Trustees must defer receipt of a portion of, and may elect to defer receipt of an additional portion of, their annual compensation. Deferred amounts are treated as though equivalent dollar amounts had been invested in shares of the fund or are invested in a cross-section of other Fidelity funds. Deferred amounts remain in the fund until distributed in accordance with the Plan.
Distributions to Shareholders. Distributions are recorded on the ex-dividend date.
Income and capital gain distributions are determined in accordance with income tax regulations which may differ from generally accepted accounting principles. These differences, which may result in distribution reclassifications, are primarily due to differing treatments for litigation proceeds, paydown gains/losses on certain securities, foreign currency transactions, market discount non-taxable dividends and losses deferred due to wash sales. The fund also utilized earnings and profits distributed to shareholders on redemption of shares as a part of the dividends paid deduction for income tax purposes.
Permanent book and tax basis differences relating to shareholder distributions will result in reclassifications to paid in capital. Undistributed net investment income and accumulated undistributed net realized gain (loss) on investments and foreign currency transactions may include temporary book and tax basis differences which will reverse in a subsequent period. Any taxable income or gain remaining at fiscal year end is distributed in the following year.
Security Transactions. Security transactions are accounted for as of trade date. Gains and losses on securities sold are determined on the basis of identified cost.
Annual Report
Notes to Financial Statements - continued
2. Operating Policies.
Foreign Currency Contracts. The fund generally uses foreign currency contracts to facilitate transactions in foreign-denominated securities. Losses may arise from changes in the value of the foreign currency or if the counterparties do not perform under the contracts' terms. The U.S. dollar value of foreign currency contracts is determined using contractual currency exchange rates established at the time of each trade.
Joint Trading Account. Pursuant to an Exemptive Order issued by the Securities and Exchange Commission (the SEC), the fund, along with other affiliated entities of Fidelity Management & Research Company (FMR), may transfer uninvested cash balances into one or more joint trading accounts. These balances are invested in one or more repurchase agreements for U.S. Treasury or Federal Agency obligations.
Repurchase Agreements. The underlying U.S. Treasury, Federal Agency, or other obligations found to be satisfactory by FMR are transferred to an account of the fund, or to the Joint Trading Account, at a custodian bank. The securities are marked-to-market daily and maintained at a value at least equal to the principal amount of the repurchase agreement (including accrued interest). FMR, the fund's investment adviser, is responsible for determining that the value of the underlying securities remains in accordance with the market value requirements stated above.
Cash Central Funds. Pursuant to an Exemptive Order issued by the SEC, the fund may invest in the Fidelity Cash Central Fund and the Fidelity Securities Lending Cash Central Fund (the Cash Funds) managed by Fidelity Investments Money Management, Inc., an affiliate of FMR. The Cash Funds are open-end money market funds available only to investment companies and other accounts managed by FMR and its affiliates. The Cash Funds seek preservation of capital, liquidity, and current income. Income distributions from the Cash Funds are declared daily and paid monthly from net interest income. Income distributions earned by the fund are recorded as either interest income or security lending income in the accompanying financial statements.
Delayed Delivery Transactions. The fund may purchase or sell securities on a delayed delivery basis. Payment and delivery may take place after the customary settlement period for that security. The price of the underlying securities and the date when the securities will be delivered and paid for are fixed at the time the transaction is negotiated. The market values of the securities purchased on a delayed delivery basis are identified as such in the fund's schedule of investments. The fund may receive compensation for interest forgone in the purchase of a delayed delivery security. With respect to purchase commitments, the fund identifies securities as segregated in its records with a value at least equal to the amount of the commitment. Losses may arise due to changes in the market value of the underlying securities or if the counterparty does not perform under the contract.
Annual Report
Notes to Financial Statements - continued
2. Operating Policies - continued
Restricted Securities. The fund is permitted to invest in securities that are subject to legal or contractual restrictions on resale. These securities generally may be resold in transactions exempt from registration or to the public if the securities are registered. Disposal of these securities may involve time-consuming negotiations and expense, and prompt sale at an acceptable price may be difficult. At the end of the period, the fund had no investments in restricted securities (excluding 144A issues).
3. Purchases and Sales of Investments.
Purchases and sales of securities, other than short-term securities, aggregated $7,803,075,000 and $7,746,036,000, respectively, of which U.S. government and government agency obligations aggregated $2,189,621,000 and $1,790,824,000, respectively.
4. Fees and Other Transactions with Affiliates.
Management Fee. As the fund's investment adviser, FMR receives a monthly fee that is calculated on the basis of a group fee rate plus a fixed individual fund fee rate applied to the average net assets of the fund. The group fee rate is the weighted average of a series of rates and is based on the monthly average net assets of all the mutual funds advised by FMR. The rates ranged from .2167% to .5200% for the period.
The annual individual fund fee rate is .15%. In the event that these rates were lower than the contractual rates in effect during the period, FMR voluntarily implemented the above rates, as they resulted in the same or a lower management fee. For the period, the management fee was equivalent to an annual rate of .43% of average net assets.
Transfer Agent Fees. Fidelity Service Company, Inc. (FSC), an affiliate of FMR, is the fund's transfer, dividend disbursing and shareholder servicing agent. FSC receives account fees and asset-based fees that vary according to account size and type of account. FSC pays for typesetting, printing and mailing of all shareholder reports, except proxy statements. For the period, the transfer agent fees were equivalent to an annual rate of .22% of average net assets.
Accounting and Security Lending Fees. FSC maintains the fund's accounting records and administers the security lending program. The security lending fee is based on the number and duration of lending transactions. The accounting fee is based on the level of average net assets for the month plus out-of-pocket expenses.
Brokerage Commissions. The fund placed a portion of its portfolio transactions with brokerage firms which are affiliates of FMR. The commissions paid to these affiliated firms were $439,000 for the period.
Annual Report
Notes to Financial Statements - continued
5. Security Lending.
The fund lends portfolio securities from time to time in order to earn additional income. The fund receives collateral in the form of U.S. Treasury obligations, letters of credit, and/or cash against the loaned securities, and maintains collateral in an amount not less than 100% of the market value of the loaned securities during the period of the loan. The market value of the loaned securities is determined at the close of business of the fund and any additional required collateral is delivered to the fund on the next business day. If the borrower defaults on its obligation to return the securities loaned because of insolvency or other reasons, the fund could experience delays and costs in recovering the securities loaned or in gaining access to the collateral. At period end, the value of the securities loaned amounted to $6,112,000. The fund received cash collateral of $6,489,000 which was invested in cash equivalents.
6. Expense Reductions.
FMR has directed certain portfolio trades to brokers who paid a portion of the fund's expenses. For the period, the fund's expenses were reduced by $1,528,000 under this arrangement.
In addition, through arrangements with the fund's custodian and transfer agent, credits realized as a result of uninvested cash balances were used to reduce a portion of the fund's expenses. During the period, the fund's custodian and transfer agent fees were reduced by $10,000 and $572,000, respectively, under these arrangements.
Annual Report
To the Trustees of Fidelity Puritan Trust and the Shareholders of Fidelity Balanced Fund:
In our opinion, the accompanying statement of assets and liabilities, including the schedule of investments, and the related statements of operations and of changes in net assets and the financial highlights present fairly, in all material respects, the financial position of Fidelity Balanced Fund (a fund of Fidelity Puritan Trust) at July 31, 2000, and the results of its operations, the changes in its net assets and the financial highlights for the periods indicated, in conformity with accounting principles generally accepted in the United States. These financial statements and financial highlights (hereafter referred to as "financial statements") are the responsibility of the Fidelity Balanced Fund's management; our responsibility is to express an opinion on these financial statements based on our audits. We conducted our audits of these financial statements in accordance with auditing standards generally accepted in the United States which require that we plan and perform the audit to obtain reasonable assurance about whether the financial statements are free of material misstatement. An audit includes examining, on a test basis, evidence supporting the amounts and disclosures in the financial statements, assessing the accounting principles used and significant estimates made by management, and evaluating the overall financial statement presentation. We believe that our audits, which included confirmation of securities at July 31, 2000 by correspondence with the custodian and brokers, provide a reasonable basis for the opinion expressed above.
/s/PricewaterhouseCoopers LLP
PricewaterhouseCoopers LLP
Boston, Massachusetts
September 11, 2000
Annual Report
The Board of Trustees of Fidelity Balanced Fund voted to pay on September 11, 2000, to shareholders of record at the opening of business on September 8, 2000, a distribution of $.28 per share derived from capital gains realized from sales of portfolio securities and a dividend of $.10 per share from net investment income.
A total of 6.35% of the dividends distributed during the fiscal year was derived from interest on U.S. Government securities which is generally exempt from state income tax.
A total of 8% of the dividends distributed during the fiscal year qualifies for the dividends-received deduction for corporate shareholders.
The fund hereby designates 100% of the long-term capital gain dividends distributed during the fiscal year as 20%-rate capital gain dividends.
The fund will notify shareholders in January 2001 of amounts for use in preparing 2000 income tax returns.
Annual Report
Fidelity offers several ways to conveniently manage your personal investments via your telephone or PC. You can access your account information, conduct trades and research your investments 24 hours a day.
By Phone
Fidelity Automated Service Telephone provides a single toll-free number to access account balances, positions, quotes and trading. It's easy to navigate the service, and on your first call, the system will help you create a personal identification number (PIN) for security.
(phone_graphic)
Fidelity Automated
Service Telephone (FAST®)
1-800-544-5555
Press
1 For mutual fund and brokerage trading.
2 For quotes.*
3 For account balances and holdings.
4 To review orders and mutual
fund activity.
5 To change your PIN.
*0 To speak to a Fidelity representative.
By PC
Fidelity's web site on the Internet provides a wide range of information, including daily financial news, fund performance, interactive planning tools and news about Fidelity products and services.
(computer_graphic)
Fidelity's Web Site
www.fidelity.com
If you are not currently on the Internet, call EarthLink Sprint at 1-800-288-2967, and be sure to ask for registration number SMD004 to receive a special Fidelity package that includes 30 days of free Internet access. EarthLink is North America's #1 independent Internet access provider.
(computer_graphic)
Fidelity On-line Xpress+®
Fidelity On-line Xpress+ software for Windows combines comprehensive portfolio management capabilities, securities trading and access to research and analysis tools . . . all on your desktop. Call Fidelity at 1-800-544-0240 or visit our web site for more information on how to manage your investments via your PC.
* When you call the quotes line, please remember that a fund's yield and return will vary and, except for money market funds, share price will also vary. This means that you may have a gain or loss when you sell your shares. There is no assurance that money market funds will be able to maintain a stable $1 share price; an investment in a money market fund is not insured or guaranteed by the U.S. government. Total returns are historical and include changes in share price, reinvestment of dividends and capital gains, and the effects of any sales charges.
Annual Report
If more than one address is listed, please locate the address that is closest to you. We'll give your correspondence immediate attention and send you written confirmation upon completion of your request.
(letter_graphic)
Making Changes
To Your Account
(such as changing name, address, bank, etc.)
Fidelity Investments
P.O. Box 770001
Cincinnati, OH 45277-0002
(letter_graphic)
For Non-Retirement
Accounts
Buying shares
Fidelity Investments
P.O. Box 770001
Cincinnati, OH 45277-0003
Overnight Express
Fidelity Investments
2300 Litton Lane - KH1A
Hebron, KY 41048
Selling shares
Fidelity Investments
P.O. Box 660602
Dallas, TX 75266-0602
Overnight Express
Fidelity Investments
Attn: Redemptions - CP6I
400 East Las Colinas Blvd.
Irving, TX 75039-5587
General Correspondence
Fidelity Investments
P.O. Box 500
Merrimack, NH 03054-0500
(letter_graphic)
For Retirement
Accounts
Buying shares
Fidelity Investments
P.O. Box 770001
Cincinnati, OH 45277-0003
Selling shares
Fidelity Investments
P.O. Box 660602
Dallas, TX 75266-0602
Overnight Express
Fidelity Investments
Attn: Redemptions - CP6R
400 East Las Colinas Blvd.
Irving, TX 75039-5587
General Correspondence
Fidelity Investments
P.O. Box 500
Merrimack, NH 03054-0500
Annual Report
For directions and hours,
please call 1-800-544-9797.
Arizona
7373 N. Scottsdale Road
Scottsdale, AZ
California
815 East Birch Street
Brea, CA
851 East Hamilton Avenue
Campbell, CA
527 North Brand Boulevard
Glendale, CA
19200 Von Karman Avenue
Irvine, CA
10100 Santa Monica Blvd.
Los Angeles, CA
251 University Avenue
Palo Alto, CA
1760 Challenge Way
Sacramento, CA
7676 Hazard Center Drive
San Diego, CA
8 Montgomery Street
San Francisco, CA
950 Northgate Drive
San Rafael, CA
1400 Civic Drive
Walnut Creek, CA
6300 Canoga Avenue
Woodland Hills, CA
Colorado
1625 Broadway
Denver, CO
Connecticut
48 West Putnam Avenue
Greenwich, CT
265 Church Street
New Haven, CT
300 Atlantic Street
Stamford, CT
29 South Main Street
West Hartford, CT
Delaware
222 Delaware Avenue
Wilmington, DE
Florida
4400 N. Federal Highway
Boca Raton, FL
90 Alhambra Plaza
Coral Gables, FL
4090 N. Ocean Boulevard
Ft. Lauderdale, FL
1907 West State Road 434
Longwood, FL
8880 Tamiami Trail, North
Naples, FL
2401 PGA Boulevard
Palm Beach Gardens, FL
8065 Beneva Road
Sarasota, FL
1502 N. Westshore Blvd.
Tampa, FL
Georgia
3445 Peachtree Road, N.E.
Atlanta, GA
1000 Abernathy Road
Atlanta, GA
Illinois
One North Franklin Street
Chicago, IL
1415 West 22nd Street
Oak Brook, IL
1700 East Golf Road
Schaumburg, IL
3232 Lake Avenue
Wilmette, IL
Indiana
4729 East 82nd Street
Indianapolis, IN
Maine
Three Canal Plaza
Portland, ME
Maryland
7401 Wisconsin Avenue
Bethesda, MD
One W. Pennsylvania Ave.
Towson, MD
Massachusetts
801 Boylston Street
Boston, MA
155 Congress Street
Boston, MA
25 State Street
Boston, MA
300 Granite Street
Braintree, MA
44 Mall Road
Burlington, MA
416 Belmont Street
Worcester, MA
Annual Report
Michigan
280 Old N. Woodward Ave.
Birmingham, MI
29155 Northwestern Hwy.
Southfield, MI
Minnesota
7600 France Avenue South
Edina, MN
Missouri
700 West 47th Street
Kansas City, MO
8885 Ladue Road
Ladue, MO
New Jersey
150 Essex Street
Millburn, NJ
56 South Street
Morristown, NJ
501 Route 17, South
Paramus, NJ
New York
1055 Franklin Avenue
Garden City, NY
999 Walt Whitman Road
Melville, L.I., NY
1271 Avenue of the Americas
New York, NY
71 Broadway
New York, NY
350 Park Avenue
New York, NY
North Carolina
4611 Sharon Road
Charlotte, NC
Ohio
600 Vine Street
Cincinnati, OH
28699 Chagrin Boulevard
Woodmere Village, OH
Oregon
16850 SW 72nd Avenue
Tigard, OR
Pennsylvania
1735 Market Street
Philadelphia, PA
439 Fifth Avenue
Pittsburgh, PA
Rhode Island
47 Providence Place
Providence, RI
Tennessee
6150 Poplar Avenue
Memphis, TN
Texas
10000 Research Boulevard
Austin, TX
4017 Northwest Parkway
Dallas, TX
1155 Dairy Ashford Street
Houston, TX
2701 Drexel Drive
Houston, TX
400 East Las Colinas Blvd.
Irving, TX
14100 San Pedro
San Antonio, TX
19740 IH 45 North
Spring, TX
Utah
215 South State Street
Salt Lake City, UT
Virginia
1861 International Drive
McLean, VA
Washington
411 108th Avenue, N.E.
Bellevue, WA
511 Pine Street
Seattle, WA
Washington, DC
1900 K Street, N.W.
Washington, DC
Wisconsin
595 North Barker Road
Brookfield, WI
Fidelity Brokerage Services, Inc., 100 Summer St., Boston, MA 02110 Member NYSE/SIPC
Annual Report
Annual Report
Annual Report
Investment Adviser
Fidelity Management & Research Company
Boston, MA
Investment Sub-Advisers
Fidelity Investments
Money Management, Inc.
Fidelity Management & Research
(U.K.) Inc.
Fidelity Management & Research
(Far East) Inc.
Fidelity Investments Japan Limited
Officers
Edward C. Johnson 3d, President
Robert C. Pozen, Senior Vice President
Kevin E. Grant, Vice President
Richard A. Spillane, Jr., Vice President
Eric D. Roiter, Secretary
Robert A. Dwight, Treasurer
Maria F. Dwyer, Deputy Treasurer
John H. Costello, Assistant Treasurer
Board of Trustees
Ralph F. Cox *
Phyllis Burke Davis *
Robert M. Gates *
Edward C. Johnson 3d
Donald J. Kirk *
Ned C. Lautenbach *
Peter S. Lynch
William O. McCoy *
Marvin L. Mann *
Gerald C. McDonough *
Robert C. Pozen
Thomas R. Williams *
Advisory Board
J. Michael Cook
Marie L. Knowles
* Independent trustees
General Distributor
Fidelity Distributors Corporation
Boston, MA
Transfer and Shareholder
Servicing Agent
Fidelity Service Company, Inc.
Boston, MA
Custodian
Brown Brothers Harriman & Co.
Boston, MA
Fidelity's Growth and Income Funds
Balanced Fund
Convertible Securities Fund
Equity-Income Fund
Equity-Income II Fund
Fidelity ® Fund
Global Balanced Fund
Growth & Income Portfolio
Growth & Income II Portfolio
Puritan® Fund
Real Estate Investment Portfolio
Utilities Fund
The Fidelity Telephone Connection
Mutual Fund 24-Hour Service
Exchanges/Redemptions
and Account Assistance 1-800-544-6666
Product Information 1-800-544-6666
Retirement Accounts 1-800-544-4774
(8 a.m. - 9 p.m.)
TDD Service 1-800-544-0118
for the deaf and hearing impaired
(9 a.m. - 9 p.m. Eastern time)
Fidelity Automated Service
Telephone (FAST®) (automated graphic) 1-800-544-5555
(automated graphic) Automated line for quickest service
BAL-ANN-0900 110698
1.536127.103
(Fidelity Investment logo)(registered trademark)
Corporate Headquarters
82 Devonshire St., Boston, MA 02109
www.fidelity.com
Fidelity®
Fund
Annual Report
July 31, 2000
(2_fidelity_logos) (Registered_Trademark)
|
President's Message |
3 |
Ned Johnson on investing strategies. |
|
Performance |
4 |
How the fund has done over time. |
|
Fund Talk |
6 |
The manager's review of fund performance, strategy and outlook. |
|
Investment Changes |
9 |
A summary of major shifts in the fund's investments over the past six months. |
|
Investments |
10 |
A complete list of the fund's investments with their market values. |
|
Financial Statements |
36 |
Statements of assets and liabilities,
operations, and changes in net assets, |
|
Notes |
40 |
Notes to the financial statements. |
|
Report of Independent Accountants |
53 |
The auditors' opinion |
|
Distributions |
54 |
|
Standard & Poor's, S&P and S&P 500 are registered service marks of The McGraw-Hill Companies, Inc. and have been licensed for use by Fidelity Distributors Corporation.
Other third party marks appearing herein are the property of their respective owners.
All other marks appearing herein are registered or unregistered trademarks or service marks of FMR Corp. or an affiliated company.
(Recycle graphic) This report is printed on recycled paper using soy-based inks. This report and the financial statements contained herein are submitted for the
general information
of the shareholders of the fund. This report is not authorized for distribution to prospective investors
in the fund unless preceded or accompanied by an effective prospectus.
Mutual fund shares are not deposits or obligations of, or guaranteed by, any depository institution. Shares are not insured by the FDIC, Federal Reserve Board or any other agency, and are subject to investment risks, including possible loss of principal amount invested.
Neither the fund nor Fidelity Distributors Corporation is a bank.
For more information on any Fidelity fund, including charges and expenses, call 1-800-544-6666 for a free prospectus. Read it carefully before you invest or send money.
Annual Report
(Photograph of Edward C. Johnson 3d.)
Dear Shareholder:
The Federal Reserve Board's effort to keep inflation in check without over-cooling the U.S. economy has taken a toll on the stock market. Through July 2000, bellwether equity indexes such as the Dow Jones Industrial Average, NASDAQ and S&P 500® have negative returns for the year. On the other hand, fixed-income markets are enjoying strong performance. Except for high-yield, most bond sectors - corporates, mortgages, Treasuries and agencies - have returned 4%-6% year to date.
While it's impossible to predict the future direction of the markets with any degree of certainty, there are certain basic principles that can help investors plan for their future needs.
First, investors are encouraged to take a long-term view of their portfolios. If you can afford to leave your money invested through the inevitable up and down cycles of the financial markets, you will greatly reduce your vulnerability to any single decline. We know from experience, for example, that stock prices have gone up over longer periods of time, have significantly outperformed other types of investments and have stayed ahead of inflation.
Second, you can further manage your investing risk through diversification. A stock mutual fund, for instance, is already diversified, because it invests in many different companies. You can increase your diversification further by investing in a number of different stock funds, or in such other investment categories as bonds. If you have a short investment time horizon, you might want to consider moving some of your investment into a money market fund, which seeks income and a stable share price by investing in high-quality, short-term investments. Of course, it's important to remember that an investment in a money market fund is not insured or guaranteed by the Federal Deposit Insurance Corporation or any other government agency. Although money market funds seek to preserve the value of your investment at $1.00 per share, it is possible to lose money by investing in these types of funds.
Finally, no matter what your time horizon or portfolio diversity, it makes good sense to follow a regular investment plan, investing a certain amount of money in a fund at the same time each month or quarter and periodically reviewing your overall portfolio. By doing so, you won't get caught up in the excitement of a rapidly rising market, nor will you buy all your shares at market highs. While this strategy - known as dollar cost averaging - won't assure a profit or protect you from a loss in a declining market, it should help you lower the average cost of your purchases. Of course, you should consider your financial ability to continue your purchases through periods of low price levels before undertaking such a strategy.
If you have questions, please call us at 1-800-544-6666, or visit our web site at www.fidelity.com. We are available 24 hours a day, seven days a week to provide you the information you need to make the investments that are right for you.
Best regards,
/s/Edward C. Johnson 3d
Edward C. Johnson 3d
Annual Report
There are several ways to evaluate a fund's historical performance. You can look at the total percentage change in value, the average annual percentage change or the growth of a hypothetical $10,000 investment. Total return reflects the change in the value of an investment, assuming reinvestment of the fund's dividend income and capital gains (the profits earned upon the sale of securities that have grown in value).
Cumulative Total Returns
|
Periods ended July 31, 2000 |
Past 1 |
Past 5 |
Past 10 |
|
Fidelity Low-Priced Stock |
4.57% |
86.40% |
390.34% |
|
Fidelity Low-Priced Stock |
1.43% |
80.81% |
375.63% |
|
Russell 2000 ® |
13.77% |
78.30% |
261.51% |
|
Small Cap Funds Average |
27.01% |
112.85% |
442.56% |
Cumulative total returns show the fund's performance in percentage terms over a set period - in this case, one year, five years or 10 years. For example, if you had invested $1,000 in a fund that had a 5% return over the past year, the value of your investment would be $1,050. You can compare the fund's returns to the performance of the Russell 2000 Index - a market capitalization-weighted index of 2,000 small company stocks. To measure how the fund's performance stacked up against its peers, you can compare it to the small cap funds average, which reflects the performance of mutual funds with similar objectives tracked by Lipper Inc. The past one year average represents a peer group of 788 mutual funds. These benchmarks include reinvested dividends and capital gains, if any, and exclude the effect of sales charges. Lipper has created new comparison categories that group funds according to portfolio characteristics and capitalization, as well as by capitalization only. These averages are listed on page 5 of this report.*
Average Annual Total Returns
|
Periods ended July 31, 2000 |
|
Past 1 |
Past 5 |
Past 10 |
|
Fidelity Low-Priced Stock |
|
4.57% |
13.26% |
17.23% |
|
Fidelity Low-Priced Stock |
|
1.43% |
12.58% |
16.88% |
|
Russell 2000 |
|
13.77% |
12.26% |
13.70% |
|
Small Cap Funds Average |
|
27.01% |
15.63% |
16.93% |
Average annual total returns take the fund's cumulative return and show you what would have happened if the fund had performed at a constant rate each year. (Note: Lipper calculates average annual total returns by annualizing each fund's total return, then taking an arithmetic average. This may produce a different figure than that obtained by averaging the cumulative total returns and annualizing the result.)
Annual Report
$10,000 Over 10 Years
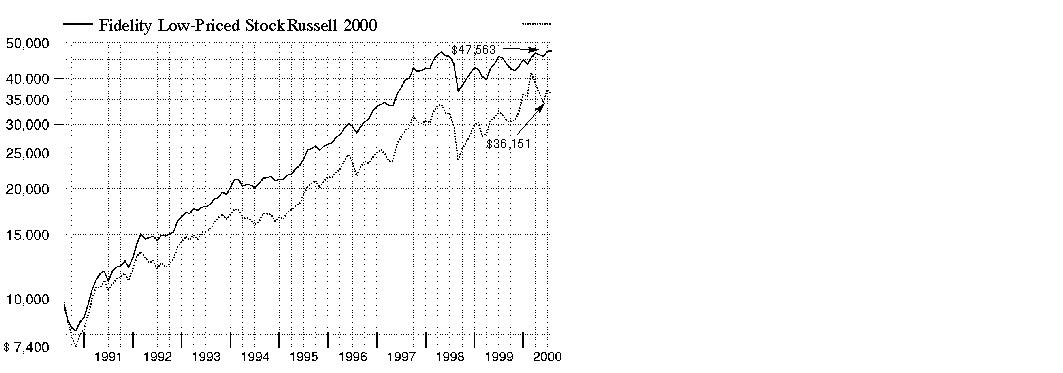
$10,000 Over 10 Years: Let's say hypothetically that $10,000 was invested in Fidelity Low-Priced Stock Fund on July 31, 1990, and the current 3.00% sales charge was paid. As the chart shows, by July 31, 2000, the value of the investment would have grown to $47,563 - a 375.63% increase on the initial investment. For comparison, look at how the Russell 2000 Index did over the same period. With dividends and capital gains, if any, reinvested, the same $10,000 would have grown to $36,151 - a 261.51% increase.
Understanding
Performance
How a fund did yesterday is no guarantee of how it will do tomorrow. The stock market, for example, has a history of long-term growth and short-term volatility. In turn, the share price and return of a fund that invests in stocks will vary. That means if you sell your shares during a market downturn, you might lose money. But if you can ride out the market's ups and downs, you may have a gain.
3* The Lipper small-cap value funds average reflects the performance (excluding sales charges) of mutual funds with similar portfolio characteristics and capitalization. The Lipper small-cap supergroup average reflects the performance (excluding sales charges) of mutual funds with similar capitalization. As of July 31, 2000, the one year, five year and 10 year cumulative total returns for the small-cap value funds average were 7.36%, 81.22%, and 245.15%, respectively. The one year, five year and 10 year average annual total returns were 7.36%, 12.20%, and 12.98%, respectively. The one year, five year and 10 year cumulative total returns for the small-cap supergroup average were 24.10%, 99.75%, and 298.72%, respectively. The one year, five year and 10 year average annual total returns were 24.10%, 14.22%, and 14.42%, respectively.
Annual Report
Market Recap
During the 12-month period that ended July 31, 2000, the U.S. equity markets struggled to break free from the grip of the Federal Reserve Board, whose effort to cool the overheated economy was delivered via a series of five interest-rate hikes. With every clench of its fist, the Fed's effort - which raised the federal funds rate by a combined total of 1.50% during the period - gradually tempered the robust optimism toward stocks as the period progressed. Most of the effect of the Fed's tightening, coupled with the market's concerns about corporate earnings, took its toll in the period's second half. The Dow Jones Industrial Average - a benchmark of blue chip stocks - returned 0.27% during the overall period, but has declined 7.65% during the past seven months. Similarly, the Standard & Poor's 500 Index, an index of 500 larger companies, returned 8.98% for the past year, but feeling the impact of the Fed's action, has lost 1.98% year to date. Even the seemingly invincible NASDAQ Composite Index, which finished the period with a 43.08% gain, has given back 7.33% in 2000. Growing concerns about a potential economic slowdown during the second half of the period also affected small-cap stocks, as evidenced by the Russell 2000®'s 13.77% advance for the 12-month period, compared to its weak -0.28% return year to date.
SM(Portfolio Manager photograph)
An interview with Joel Tillinghast, Portfolio Manager of Fidelity Low-Priced Stock Fund
Q. How did the fund perform, Joel?
A. For the 12 months that ended July 31, 2000, the fund returned 4.57%. This trailed both the Russell 2000 Index, which returned 13.77% during the same period, and the small cap funds average, which returned 27.01% according to Lipper Inc.
Q. What factors caused the fund
to underperform?
A. Through the first eight months of the period, investors were still drawn to momentum and story stocks, particularly those in industries such as biotechnology, the Internet and telecommunications. Much of the attraction to these stocks, however, seemed to come from what the companies may accomplish in the future rather than what they were currently producing. I've typically favored stocks that are demonstrating strong current performance and earnings, and this approach wasn't rewarded for most of the period. Momentum and technology stocks did fall back in April and May, and the latter months of the period were somewhat better for the fund. Good stock picking in the media and leisure area, especially among cable TV and radio stocks, added to the fund's return.
Annual Report
Fund Talk: The Manager's Overview - continued
Q. Were you able to find some good opportunities in the technology sector?
A. There were some good opportunities that came up after the technology decline, particularly with companies involved in semiconductors or those that offered specific tech-related services. For instance, I added to the fund's weighting in Dallas Semiconductor - its largest single holding at the end of the period - as well as General Semiconductor. In terms of service-related stocks, I raised the fund's position in Affiliated Computer Services, an outsourcing company that manages information technology departments, processes bills, etc. Overall, though, the majority of technology names were still at valuations that were difficult for me to justify.
Q. You mentioned media and leisure stocks as being good performers during the period. Can you elaborate?
A. The fund continued to get strong performance from Canadian cable TV stocks such as Moffat Communications and Cogeco. Each company benefited from offering broadband Internet connections over their cable wires. Another strong area was radio broadcasters, which performed well due to buoyant advertising demand. Scottish Radio and Capital Radio were two stocks that performed particularly well.
Q. How did the finance sector
perform during the period?
A. Not so well. The Federal Reserve Board raised interest rates five times during the period, raising banks' deposit costs and squeezing lending margins. Many lending institutions saw loan growth shrink as a result. Two fund holdings that were hurt by these trends were WSFS Financial Corp. and Washington Federal. On the insurance side, many firms were grappling with rising losses and inadequate pricing to cover those losses, especially in the areas of workers' compensation and commercial property. Stocks such as UICI and Fremont General Corp. fell during the period as a result. My attraction to the group remained strong at the end of the period, particularly as I began to see signs of better pricing trends.
Q. Together, retail and health stocks represented just under 19% of the fund's investments. How did these groups perform?
A. The retail group was sluggish primarily due to slower sales for many of the companies the fund owned, including Ross Stores, Brookstone and Claire's Stores. This slowdown may have been attributable to both a volatile stock market and higher interest rates. In terms of health stocks, I've been focusing on service-related companies that have the ability to manage or reduce costs. Quest Diagnostics, for example - the fund's top performer during the period - was able to cut costs after its merger with SmithKline Beecham's clinical lab division.
Q. What's in store for the next few months, Joel?
A. First, I'm going to spend a lot of time looking for new opportunities created by the Internet and the new wireless communications standards and applications. Also, since I'm worried that the interest-rate hikes we've seen during the period will ultimately dampen economic growth, I'm going to look for stocks that are steady growers and that reside in industries - such as health - that shouldn't be affected too much by a slowdown.
The views expressed in this report reflect those of the portfolio manager only through the end of the period of the report as stated on the cover and do not necessarily represent the views of Fidelity or any other person in the Fidelity organization. Any such views are subject to change at any time based upon market or other conditions and Fidelity disclaims any responsibility to update such views. These views may not be relied on as investment advice and, because investment decisions for a Fidelity fund are based on numerous factors, may not be relied on as an indication of trading intent on behalf of any Fidelity fund.
Annual Report
Fund Talk: The Manager's Overview - continued
Fund Facts
Goal: capital appreciation by normally investing in low-priced common stocks ($35 or less at time of purchase)
Fund number: 316
Trading symbol: FLPSX
Start date: December 27, 1989
Size: as of July 31, 2000, more than $6.0 billion
Manager: Joel Tillinghast, since 1989; equity analyst, 1986-1989; joined Fidelity in 1986
3Joel Tillinghast explores the futuristic mindset of investors:
"Over the past two years or so, the market has favored stocks with potentially brilliant futures, including many of those in the Internet, biotechnology and wireless areas. These industries offer a certain excitement, and investors have been mesmerized by the future potential of these companies. And they've been rewarded handsomely, as well.
"As a manager whose mandate is to make money for his shareholders over time, however, I try not to get caught up in the waves of excitement. My philosophy is that I'd rather buy stocks with a clear probability of a bright future than those with a chance at a brilliant future.
"My reasoning is that predicting the future is awfully difficult, particularly when we find ourselves in a period of technological change. Technology is changing things today in the blink of an eye, and if you're investing in companies that have low probability of being successful over time, your chance of hitting the bull's-eye becomes narrower and narrower.
"In 1998 and 1999, a lot of companies hit the bull's-eye. Their lottery number came in. But that trend - as we've seen in the latter months of the period - certainly won't last forever. I feel that looking for stocks with a high probability of succeeding over time is a better approach than waiting to win the lottery."
Annual Report
|
Top Ten Stocks as of July 31, 2000 |
||
|
|
% of fund's |
% of fund's net assets |
|
Dallas Semiconductor Corp. |
2.5 |
2.2 |
|
Quest Diagnostics, Inc. |
1.9 |
1.1 |
|
Universal Health Services, Inc. Class B |
1.5 |
1.1 |
|
Gallaher Group PLC sponsored ADR |
1.4 |
1.0 |
|
Biomet, Inc. |
1.3 |
1.2 |
|
Reynolds & Reynolds Co. Class A |
1.1 |
1.4 |
|
Black Box Corp. |
1.0 |
1.4 |
|
Sonic Corp. |
1.0 |
0.9 |
|
BJ's Wholesale Club, Inc. |
0.9 |
1.1 |
|
AutoZone, Inc. |
0.9 |
0.9 |
|
|
13.5 |
12.3 |
|
Top Five Market Sectors as of July 31, 2000 |
||
|
|
% of fund's |
% of fund's net assets |
|
Finance |
14.3 |
14.1 |
|
Technology |
13.5 |
17.9 |
|
Health |
11.0 |
9.5 |
|
Retail & Wholesale |
7.9 |
7.9 |
|
Media & Leisure |
7.2 |
8.0 |
|
Asset Allocation (% of fund's net assets) |
|||||||
|
As of July 31, 2000 * |
As of January 31, 2000 ** |
||||||
|
Stocks 93.9% |
|
|
Stocks 99.8% |
|
||
|
Short-Term |
|
|
Short-Term |
|
||
|
* Foreign investments |
20.1% |
|
** Foreign investments |
22.1% |
|
||

Annual Report
Showing Percentage of Net Assets
|
Common Stocks - 93.9% |
|||
|
Shares |
Value (Note 1) (000s) |
||
|
AEROSPACE & DEFENSE - 0.4% |
|||
|
Aerospace & Defense - 0.1% |
|||
|
Allied Research Corp. (a)(c) |
465,000 |
$ 3,633 |
|
|
Primex Technologies, Inc. |
171,100 |
3,946 |
|
|
|
7,579 |
||
|
Defense Electronics - 0.3% |
|||
|
Ducommun, Inc. (a)(c) |
1,090,500 |
14,585 |
|
|
TOTAL AEROSPACE & DEFENSE |
22,164 |
||
|
BASIC INDUSTRIES - 3.7% |
|||
|
Chemicals & Plastics - 2.1% |
|||
|
Aronkasei Co. Ltd. |
750,000 |
2,702 |
|
|
Asko Oyj |
550,000 |
9,588 |
|
|
Celanese AG |
100,000 |
1,700 |
|
|
Ellis & Everard PLC |
300,000 |
803 |
|
|
EVC International NV (a) |
100,000 |
1,099 |
|
|
General Chemical Group, Inc. (a) |
166,700 |
125 |
|
|
Georgia Gulf Corp. |
290,000 |
4,731 |
|
|
International Specialty Products, Inc. (a) |
734,300 |
4,314 |
|
|
Lyondell Chemical Co. |
13,000 |
182 |
|
|
Nihon Kagaku Sangyo Co. Ltd. |
200,000 |
560 |
|
|
Nippon Chemical Industrial Co. Ltd. |
300,000 |
960 |
|
|
Octel Corp. (a)(c) |
1,472,000 |
12,604 |
|
|
Peak International Ltd. (a)(c) |
1,048,700 |
7,472 |
|
|
Solutia, Inc. |
1,325,800 |
18,976 |
|
|
Spartech Corp. |
793,500 |
21,276 |
|
|
Tokyo Printing Ink Manufacturing Co. Ltd. |
375,000 |
874 |
|
|
USEC, Inc. (c) |
8,457,000 |
36,999 |
|
|
|
124,965 |
||
|
Iron & Steel - 0.2% |
|||
|
Beltecno Corp. |
125,000 |
325 |
|
|
Chubu Steel Plate Co. Ltd. |
1,000,000 |
1,472 |
|
|
Cold Metal Products, Inc. (c) |
435,800 |
1,362 |
|
|
Harris Steel Group, Inc. Class A |
251,100 |
3,208 |
|
|
Hawk Corp. Class A (a) |
18,800 |
145 |
|
|
Japan Steel Tower Co. Ltd. |
500,000 |
1,522 |
|
|
Kentucky Electric Steel, Inc. (a)(c) |
367,500 |
735 |
|
|
Mueller Industries, Inc. |
40,000 |
1,163 |
|
|
Nippon Steel Drum Co. Ltd. |
100,000 |
265 |
|
|
Roanoke Electric Steel Corp. |
228,500 |
2,713 |
|
|
Common Stocks - continued |
|||
|
Shares |
Value (Note 1) (000s) |
||
|
BASIC INDUSTRIES - continued |
|||
|
Iron & Steel - continued |
|||
|
Samuel Manu-Tech, Inc. |
75,000 |
$ 303 |
|
|
Takigami Steel Construction Co. Ltd. |
300,000 |
990 |
|
|
|
14,203 |
||
|
Metals & Mining - 0.7% |
|||
|
Acier Leroux, Inc.: |
|
|
|
|
Class B (a) |
125,000 |
504 |
|
|
Class B (sub. vtg.) (a) |
76,600 |
309 |
|
|
Chase Industries, Inc. (a)(c) |
908,200 |
8,287 |
|
|
De Beers Consolidated Mines Ltd. ADR |
1,000,000 |
23,313 |
|
|
Draka Holding NV |
50,000 |
3,510 |
|
|
General Cable Corp. |
125,000 |
1,078 |
|
|
Lindberg Corp. |
82,500 |
588 |
|
|
Major Drilling Group International, Inc. (a) |
100,000 |
197 |
|
|
Nagahori Corp. |
200,000 |
448 |
|
|
Reliance Steel & Aluminum Co. |
20,000 |
420 |
|
|
Toami Corp. (c) |
350,000 |
1,590 |
|
|
|
40,244 |
||
|
Packaging & Containers - 0.1% |
|||
|
Astronics Corp. (a)(c) |
395,650 |
4,006 |
|
|
Silgan Holdings, Inc. (a) |
523,600 |
4,639 |
|
|
|
8,645 |
||
|
Paper & Forest Products - 0.6% |
|||
|
Crown Van Gelder (CVG) (non-vtg.) |
300,000 |
4,200 |
|
|
Mercer International, Inc. (SBI) (a) |
212,200 |
1,837 |
|
|
Metsa-Serla Oyj Class B |
3,175,000 |
24,229 |
|
|
Noda Corp. (a) |
100,000 |
403 |
|
|
Rolland, Inc. |
153,900 |
543 |
|
|
Sino Forest Corp. Class A, (sub. vtg.) (a) |
787,200 |
810 |
|
|
Uehara Sei Shoji Co. Ltd. |
1,050,000 |
2,871 |
|
|
|
34,893 |
||
|
TOTAL BASIC INDUSTRIES |
222,950 |
||
|
CONSTRUCTION & REAL ESTATE - 6.6% |
|||
|
Building Materials - 1.1% |
|||
|
Asahi Concrete Works Co. Ltd. (c) |
1,150,000 |
3,575 |
|
|
Barnett, Inc. (a) |
355,000 |
4,393 |
|
|
Brampton Brick Ltd. Class A (a)(c) |
575,000 |
2,339 |
|
|
Centex Construction Products, Inc. |
122,000 |
2,989 |
|
|
Common Stocks - continued |
|||
|
Shares |
Value (Note 1) (000s) |
||
|
CONSTRUCTION & REAL ESTATE - continued |
|||
|
Building Materials - continued |
|||
|
Devcon International Corp. (a)(c) |
351,700 |
$ 2,308 |
|
|
Domco Tarkett, Inc. |
500,000 |
1,849 |
|
|
Drew Industries, Inc. (a)(c) |
900,000 |
7,031 |
|
|
Elcor Corp. |
5,000 |
96 |
|
|
Hibiya Engineering Ltd. |
1,500,000 |
6,638 |
|
|
Kingspan Group PLC |
250,000 |
656 |
|
|
Komai Tekko, Inc. |
100,000 |
272 |
|
|
Kondotec, Inc. |
275,000 |
1,081 |
|
|
Kyushu Fujisash Co. Ltd. |
200,000 |
384 |
|
|
Lafarge Corp. |
465,045 |
10,464 |
|
|
Manitowoc Co., Inc. |
50,000 |
1,231 |
|
|
Matsuo Bridge Co. Ltd. |
500,000 |
946 |
|
|
Nichiha Corp. |
300,000 |
2,002 |
|
|
Patrick Industries, Inc. (c) |
415,100 |
2,841 |
|
|
Penn Engineering & Manufacturing Corp. (non-vtg.) |
5,500 |
187 |
|
|
Quixote Corp. (c) |
758,000 |
10,896 |
|
|
Richelieu Hardware Ltd. (a) |
20,000 |
163 |
|
|
ROHN Industries, Inc. (a) |
540,000 |
2,228 |
|
|
Shaw Group (a) |
75,000 |
3,534 |
|
|
Watsco, Inc. |
94,800 |
1,321 |
|
|
|
69,424 |
||
|
Construction - 4.1% |
|||
|
American Homestar Corp. (a) |
839,200 |
1,259 |
|
|
Aoki Marine Co. Ltd. |
126,000 |
397 |
|
|
Barratt Developments PLC |
250,000 |
832 |
|
|
Beazer Homes USA, Inc. (a)(c) |
669,900 |
14,110 |
|
|
Clayton Homes, Inc. |
4,495,000 |
36,522 |
|
|
Crossman Communities, Inc. (a)(c) |
1,159,100 |
17,387 |
|
|
D.R. Horton, Inc. |
2,007,300 |
31,113 |
|
|
Del Webb Corp. (a) |
14,000 |
214 |
|
|
Dominion Homes, Inc. (a)(c) |
578,000 |
3,089 |
|
|
Engle Homes, Inc. (c) |
1,006,500 |
9,625 |
|
|
Henry Boot PLC |
1,100,000 |
3,298 |
|
|
Jacobs Engineering Group, Inc. (a) |
1,135,000 |
40,505 |
|
|
Kaneshita Construction Co. Ltd. |
400,000 |
1,873 |
|
|
Lennar Corp. |
1,029,982 |
24,720 |
|
|
M/I Schottenstein Homes, Inc. (c) |
880,000 |
15,840 |
|
|
Matsui Construction Co. Ltd. |
400,000 |
1,086 |
|
|
Meritage Corp. (a) |
272,600 |
3,544 |
|
|
NCI Building Systems, Inc. (a) |
834,500 |
15,751 |
|
|
Common Stocks - continued |
|||
|
Shares |
Value (Note 1) (000s) |
||
|
CONSTRUCTION & REAL ESTATE - continued |
|||
|
Construction - continued |
|||
|
Oakwood Homes Corp. (c) |
2,365,500 |
$ 4,731 |
|
|
Oriole Homes Corp. Class B (a)(c) |
261,800 |
360 |
|
|
Southern Energy Homes, Inc. (a)(c) |
1,425,100 |
1,781 |
|
|
Swan Hill Group PLC |
340,000 |
347 |
|
|
Takada Kiko Co. Ltd. |
700,000 |
2,797 |
|
|
Tay Homes PLC (a) |
750,000 |
809 |
|
|
Technip SA (d) |
50,000 |
6,259 |
|
|
Volker Wessels Stevin NV (Certificaten Van Aandelen) |
150,000 |
2,420 |
|
|
Writer Corp. (a) |
67,000 |
214 |
|
|
Yokogawa Bridge Corp. |
1,000,000 |
3,922 |
|
|
Yokogawa Construction Co. Ltd. |
300,000 |
960 |
|
|
|
245,765 |
||
|
Engineering - 0.9% |
|||
|
Anthony & Sylvan Pools Corp. (a) |
105,000 |
768 |
|
|
Dai-Dan Co. Ltd. |
300,000 |
1,344 |
|
|
Fugro NV |
320,000 |
16,839 |
|
|
Hoan Kogyo Co. Ltd. |
500,000 |
1,157 |
|
|
Japan Engineering Consultants |
300,000 |
620 |
|
|
Kawasaki Setsubi Kogyo Co. Ltd. |
200,000 |
550 |
|
|
Metalrax Group PLC Class L |
2,100,000 |
2,204 |
|
|
Ohba Co. Ltd. |
125,000 |
209 |
|
|
Sanshin Corp. |
250,000 |
398 |
|
|
Sanyo Engineering & Construction, Inc. |
900,000 |
2,798 |
|
|
Stantec, Inc. (a)(c) |
700,000 |
6,566 |
|
|
Taihei Dengyo Kaisha Ltd. |
100,000 |
237 |
|
|
URS Corp. (a)(c) |
1,310,600 |
19,659 |
|
|
Willbros Group, Inc. (a) |
383,400 |
2,061 |
|
|
|
55,410 |
||
|
Real Estate - 0.1% |
|||
|
Chuo Warehouse Co. Ltd. |
300,000 |
1,585 |
|
|
FRM Nexus, Inc. (a)(c) |
108,000 |
135 |
|
|
Nagawa Co. Ltd. |
825,000 |
4,979 |
|
|
Wilshire Oil of Texas (a) |
391,000 |
1,466 |
|
|
|
8,165 |
||
|
Real Estate Investment Trusts - 0.4% |
|||
|
AMRESCO Capital Trust, Inc. |
307,000 |
3,166 |
|
|
Banyan Strategic Realty Trust (SBI) |
632,500 |
3,775 |
|
|
Common Stocks - continued |
|||
|
Shares |
Value (Note 1) (000s) |
||
|
CONSTRUCTION & REAL ESTATE - continued |
|||
|
Real Estate Investment Trusts - continued |
|||
|
Meditrust Corp. unit |
450,000 |
$ 1,125 |
|
|
Redwood Trust, Inc. (c) |
929,900 |
13,251 |
|
|
|
21,317 |
||
|
TOTAL CONSTRUCTION & REAL ESTATE |
400,081 |
||
|
DURABLES - 6.0% |
|||
|
Autos, Tires, & Accessories - 2.9% |
|||
|
ArvinMeritor, Inc. |
1,327,500 |
20,742 |
|
|
AutoZone, Inc. (a) |
2,285,000 |
52,269 |
|
|
D.C. Cook Holdings PLC (a)(c) |
2,300,000 |
569 |
|
|
Dixon Motors PLC |
250,000 |
697 |
|
|
European Motor Holdings PLC |
250,000 |
206 |
|
|
FCC Co. Ltd. |
75,000 |
747 |
|
|
Federal Screw Works (c) |
108,800 |
4,393 |
|
|
Fuji Oozx, Inc. |
200,000 |
320 |
|
|
Giant Industries, Inc. (a)(c) |
536,200 |
3,753 |
|
|
Intermet Corp. |
75,000 |
544 |
|
|
Keiiyu Co. Ltd. |
100,000 |
649 |
|
|
Koito Industries Ltd. |
1,000,000 |
2,789 |
|
|
Lithia Motors, Inc. Class A (a) |
169,800 |
2,048 |
|
|
Lufkin Industries, Inc. |
210,600 |
4,001 |
|
|
Monaco Coach Corp. (a) |
384,500 |
5,743 |
|
|
Monro Muffler Brake, Inc. (a)(c) |
724,000 |
6,787 |
|
|
Murakami Corp. (c) |
800,000 |
4,747 |
|
|
Nissin Shoji Co. Ltd. |
250,000 |
889 |
|
|
O'Reilly Automotive, Inc. (a) |
592,000 |
8,547 |
|
|
Owari Precise Products Co. Ltd. |
350,000 |
688 |
|
|
Piolax, Inc. (c) |
750,000 |
4,663 |
|
|
Quicks Group PLC (c) |
4,399,998 |
3,957 |
|
|
Raytech Corp. (a)(c) |
323,300 |
889 |
|
|
Rocla Oyj |
50,000 |
318 |
|
|
Sanderson Bramal Motor Group PLC |
1,000,000 |
2,368 |
|
|
Sonic Automotive, Inc. Class A (a) |
49,800 |
570 |
|
|
Strattec Security Corp. (a)(c) |
528,700 |
18,505 |
|
|
Tachi-S Co. Ltd. |
1,000,000 |
4,572 |
|
|
TBC Corp. (a)(c) |
2,112,500 |
9,770 |
|
|
Tochigi Fuji Industrial Co. Ltd. |
600,000 |
1,234 |
|
|
Common Stocks - continued |
|||
|
Shares |
Value (Note 1) (000s) |
||
|
DURABLES - continued |
|||
|
Autos, Tires, & Accessories - continued |
|||
|
Transpro, Inc. (c) |
660,925 |
$ 2,933 |
|
|
Uni-Select, Inc. (c) |
1,090,100 |
6,524 |
|
|
|
177,431 |
||
|
Consumer Durables - 0.2% |
|||
|
Blyth, Inc. |
255,000 |
7,411 |
|
|
Mikasa, Inc. |
524,700 |
5,083 |
|
|
Portmeirion Potteries Holdings PLC |
150,000 |
360 |
|
|
|
12,854 |
||
|
Consumer Electronics - 0.7% |
|||
|
Fossil, Inc. (a) |
1,451,000 |
26,481 |
|
|
Koss Corp. (a) |
90,000 |
1,710 |
|
|
Movado Group, Inc. (c) |
949,300 |
13,053 |
|
|
|
41,244 |
||
|
Home Furnishings - 1.0% |
|||
|
Airsprung Furniture Group PLC |
975,000 |
1,462 |
|
|
Beter Bed Holding NV |
128,829 |
3,094 |
|
|
BMTC Group, Inc. Class A (sub. vtg.) (c) |
400,000 |
4,976 |
|
|
Bush Industries, Inc. Class A. (c) |
841,000 |
11,932 |
|
|
Chromcraft Revington, Inc. (a) |
332,900 |
3,662 |
|
|
Dorel Industries, Inc.: |
|
|
|
|
Class A (multi-vtg.) (a)(d) |
100,000 |
2,135 |
|
|
Class B (sub. vtg.) (a) |
500,600 |
10,721 |
|
|
La-Z-Boy, Inc. |
168,500 |
2,612 |
|
|
Nakayamafuku Co. Ltd. |
54,800 |
175 |
|
|
Nippon Filing |
100,000 |
475 |
|
|
Rosebys PLC |
525,000 |
2,607 |
|
|
Samas Groep NV CVA |
100,000 |
1,539 |
|
|
Silentnight Holdings PLC |
250,000 |
829 |
|
|
Stanley Furniture Co., Inc. (a)(c) |
709,400 |
16,050 |
|
|
Tosco Co. Ltd. |
452,000 |
1,653 |
|
|
|
63,922 |
||
|
Textiles & Apparel - 1.2% |
|||
|
Brown Shoe Co., Inc. |
17,300 |
245 |
|
|
Decorator Industries, Inc. (c) |
200,015 |
875 |
|
|
Dewhirst (IJ) Group PLC |
5,500,000 |
4,947 |
|
|
Endois PLC |
1,000,000 |
3,313 |
|
|
Hampshire Group Ltd. (a)(c) |
388,300 |
3,228 |
|
|
JLM Couture, Inc. (a)(c) |
181,500 |
499 |
|
|
Jones Apparel Group, Inc. (a) |
120,000 |
2,745 |
|
|
Common Stocks - continued |
|||
|
Shares |
Value (Note 1) (000s) |
||
|
DURABLES - continued |
|||
|
Textiles & Apparel - continued |
|||
|
K-Swiss, Inc. Class A |
5,000 |
$ 85 |
|
|
Mohawk Industries, Inc. (a) |
100,000 |
2,669 |
|
|
Nautica Enterprises, Inc. (a)(c) |
3,610,000 |
39,259 |
|
|
Novel Denim Holdings Ltd. (a) |
235,000 |
1,234 |
|
|
Perry Ellis International, Inc. (a)(c) |
456,000 |
4,446 |
|
|
Polo Ralph Lauren Corp. Class A (a) |
25,000 |
405 |
|
|
Stride Rite Corp. |
327,400 |
1,944 |
|
|
Tandy Brands Accessories, Inc. (a)(c) |
548,900 |
4,871 |
|
|
|
70,765 |
||
|
TOTAL DURABLES |
366,216 |
||
|
ENERGY - 4.7% |
|||
|
Coal - 0.0% |
|||
|
RJB Mining PLC |
2,450,000 |
2,277 |
|
|
Energy Services - 2.1% |
|||
|
AKITA Drilling Ltd. Class A (non-vtg.) |
863,500 |
5,951 |
|
|
Alpine Oil Services Corp. (a)(c) |
2,212,500 |
3,556 |
|
|
Australian Oil & Gas Corp. Ltd. |
751,506 |
584 |
|
|
Aztec Manufacturing Co. (c) |
465,200 |
6,978 |
|
|
Canadian Crude Separators, Inc. (a) |
119,200 |
377 |
|
|
Carbo Ceramics, Inc. |
640,200 |
22,167 |
|
|
Dawson Geophysical Co. (a)(c) |
297,900 |
2,960 |
|
|
IHC Caland NV |
65,000 |
3,134 |
|
|
Input/Output, Inc. (a) |
492,500 |
4,032 |
|
|
Kaneb Services, Inc. (a) |
1,473,400 |
6,170 |
|
|
Pe Ben Oilfield Services Ltd. (a)(c) |
334,500 |
1,012 |
|
|
Peak Energy Services Ltd. (a) |
469,800 |
711 |
|
|
Petroleum Helicopters, Inc. (c) |
211,200 |
2,138 |
|
|
Petroleum Helicopters, Inc. (non-vtg.) |
300,000 |
2,944 |
|
|
Powell Industries, Inc. (a)(c) |
674,500 |
5,649 |
|
|
Precision Drilling Corp. (a) |
250,000 |
8,489 |
|
|
RPC, Inc. (c) |
2,784,800 |
28,370 |
|
|
Ryan Energy Technologies, Inc. (a) |
279,300 |
441 |
|
|
Seitel, Inc. (a) |
376,000 |
4,324 |
|
|
Superior Energy Services, Inc. (a) |
1,610,000 |
16,100 |
|
|
Tetonka Drilling, Inc. (a) |
100,000 |
245 |
|
|
Trican Well Service Ltd. (a) |
26,900 |
213 |
|
|
|
126,545 |
||
|
Common Stocks - continued |
|||
|
Shares |
Value (Note 1) (000s) |
||
|
ENERGY - continued |
|||
|
Oil & Gas - 2.6% |
|||
|
Adams Resources & Energy, Inc. (c) |
421,300 |
$ 5,635 |
|
|
Berry Petroleum Co. Class A |
66,200 |
1,204 |
|
|
British-Borneo Oil & Gas PLC (a) |
10,000 |
10 |
|
|
Castle Energy Corp. (c) |
1,167,000 |
8,242 |
|
|
Columbus Energy Corp. (a)(c) |
307,500 |
1,922 |
|
|
Conoco, Inc. Class B |
55,000 |
1,268 |
|
|
Dorchester Hugoton Ltd. |
180,000 |
2,453 |
|
|
Edge Energy, Inc. (a) |
50,000 |
94 |
|
|
Elf Gabon |
10,000 |
890 |
|
|
ENEX Resources Corp. (a)(c) |
144,300 |
433 |
|
|
Fletcher Challenge Ltd. - Energy Division |
500,000 |
1,555 |
|
|
Forcenergy, Inc. (a) |
224,800 |
4,538 |
|
|
Foremost Industries, Inc. (a)(c) |
517,500 |
679 |
|
|
Gulf Island Fabrication, Inc. (a) |
84,500 |
1,278 |
|
|
Hallwood Energy Corp. |
450,028 |
3,544 |
|
|
Hartland Pipeline Services Ltd. (a) |
210,000 |
0 |
|
|
Hokuriku Gas Co. |
1,500,000 |
4,114 |
|
|
Holly Corp. (c) |
825,000 |
9,900 |
|
|
Markwest Hydrocarbon, Inc. (a)(c) |
684,900 |
5,479 |
|
|
Maynard Oil Co. (a)(c) |
478,900 |
7,483 |
|
|
Novus Petroleum Ltd. (a)(c) |
12,278,678 |
11,970 |
|
|
Penn Virginia Corp. |
138,100 |
3,202 |
|
|
Petroleum Development Corp. (a)(c) |
1,597,800 |
7,989 |
|
|
Premier Oil PLC (a) |
23,250,000 |
4,269 |
|
|
Renaissance Energy Ltd. (a) |
625,000 |
6,367 |
|
|
Search Energy Corp. (a) |
50,500 |
73 |
|
|
Summit Resources Ltd. (a) |
38,600 |
100 |
|
|
Sunoco, Inc. |
565,000 |
13,772 |
|
|
Swift Energy Co. (a)(c) |
2,060,000 |
45,191 |
|
|
UNIFAB International, Inc. (a) |
274,000 |
1,927 |
|
|
Upton Resources, Inc. (a) |
20,000 |
34 |
|
|
Wenzel Downhole Tools Ltd. (a) |
200,000 |
215 |
|
|
|
155,830 |
||
|
TOTAL ENERGY |
284,652 |
||
|
FINANCE - 14.3% |
|||
|
Banks - 4.9% |
|||
|
Bank of The Ozarks, Inc. (c) |
215,800 |
3,237 |
|
|
Canadian Western Bank |
347,900 |
4,480 |
|
|
Common Stocks - continued |
|||
|
Shares |
Value (Note 1) (000s) |
||
|
FINANCE - continued |
|||
|
Banks - continued |
|||
|
Cathay Bancorp, Inc. |
296,500 |
$ 13,750 |
|
|
DNB Holding ASA |
450,000 |
1,853 |
|
|
DNB Holding ASA (d) |
900,000 |
3,706 |
|
|
East West Bancorp, Inc. |
87,000 |
1,392 |
|
|
First BanCorp P R (c) |
2,679,200 |
51,407 |
|
|
GBC Bancorp |
525,000 |
17,063 |
|
|
Gronlandsbanken AS |
14,000 |
339 |
|
|
Hamilton Bancorp, Inc. (a) |
363,900 |
6,550 |
|
|
Hanmi Financial Corp. (a)(c) |
703,680 |
9,676 |
|
|
Jyske Bank AS (Reg.) |
1,000,000 |
18,528 |
|
|
Laurentian Bank |
926,800 |
14,115 |
|
|
Midtbank AS |
10,050 |
334 |
|
|
National Bank of Canada |
1,900,000 |
27,468 |
|
|
Nordlandsbanken AS (a)(c) |
330,700 |
9,029 |
|
|
Nordvestbank (Reg.) |
12,000 |
1,015 |
|
|
Okobank Class A |
500,000 |
5,123 |
|
|
Ringkjoebing Bank (c) |
31,730 |
2,367 |
|
|
Santander Bancorp |
288,420 |
3,497 |
|
|
Seacoast Financial Services Corp. |
316,600 |
3,027 |
|
|
SouthTrust Corp. |
1,275,000 |
31,397 |
|
|
Sparebanken More |
29,084 |
627 |
|
|
Sparebanken NOR primary shares certificates |
1,000,000 |
24,820 |
|
|
Sparebanken Rana Grunnfondsbevis (c) |
37,550 |
627 |
|
|
Sparebanken Rogaland capital certificates |
25,000 |
736 |
|
|
Sterling Bancorp (c) |
580,965 |
9,295 |
|
|
Sydbank AS |
315,000 |
11,140 |
|
|
UCBH Holdings, Inc. (c) |
674,500 |
19,350 |
|
|
Yardville National Bancorp |
69,500 |
738 |
|
|
|
296,686 |
||
|
Credit & Other Finance - 1.0% |
|||
|
Aeon Credit Service (ASIA) Co. Ltd. |
275,000 |
97 |
|
|
Amagerbanken AS |
30,000 |
1,192 |
|
|
Amtsspar Fyn Holding AS |
35,000 |
1,380 |
|
|
Associates First Capital Corp. Class A |
60,000 |
1,571 |
|
|
Credia Co. Ltd. |
50,000 |
859 |
|
|
Doral Financial Corp. (c) |
2,190,000 |
28,470 |
|
|
Home Capital Group Class B (sub. vtg.) |
285,000 |
814 |
|
|
JCG Holdings Ltd. |
15,000,000 |
7,982 |
|
|
Port Financial Corp. |
170,000 |
2,497 |
|
|
Surrey Metro Savings Credit Union (non-vtg.) |
565,000 |
3,951 |
|
|
Common Stocks - continued |
|||
|
Shares |
Value (Note 1) (000s) |
||
|
FINANCE - continued |
|||
|
Credit & Other Finance - continued |
|||
|
The Midland Co. |
27,000 |
$ 716 |
|
|
Triad Guaranty, Inc. (a) |
375,500 |
9,106 |
|
|
WSFS Financial Corp. |
79,800 |
808 |
|
|
|
59,443 |
||
|
Insurance - 7.6% |
|||
|
Amerus Life Holdings, Inc. |
887,200 |
20,295 |
|
|
Commerce Group, Inc. |
565,000 |
15,679 |
|
|
Cotton State Life & Health Insurance Co. (c) |
469,800 |
4,199 |
|
|
Desjardins-Laurentian Finance Corp. Class A (sub-vtg.) (c) |
482,500 |
5,369 |
|
|
E.W. Blanch Holdings, Inc. |
625,000 |
17,695 |
|
|
Fairfax Financial Holdings Ltd. rights 12/31/07 (a) |
1,117,900 |
22 |
|
|
Farm Family Holdings, Inc. (a)(c) |
362,600 |
12,079 |
|
|
Financial Industries Corp. (c) |
283,800 |
2,625 |
|
|
Fortune Financial, Inc. (a) |
112,300 |
253 |
|
|
FPIC Insurance Group, Inc. (a) |
370,000 |
4,417 |
|
|
Fremont General Corp. |
1,395,600 |
5,670 |
|
|
HCC Insurance Holdings, Inc. |
1,160,000 |
23,780 |
|
|
Healthcare Recoveries, Inc. (a)(c) |
1,112,500 |
4,380 |
|
|
Independence Holding Co. |
128,000 |
1,752 |
|
|
Independent Insurance PLC |
700,000 |
2,959 |
|
|
Intercontinental Life Corp. (a)(c) |
878,200 |
8,343 |
|
|
IPC Holdings Ltd. (c) |
2,503,000 |
39,735 |
|
|
Lasalle Re Holdings Ltd. (c) |
1,502,700 |
25,546 |
|
|
Markel Corp. rights (a) |
126,247 |
931 |
|
|
Medical Assurance, Inc. |
226,090 |
2,713 |
|
|
MEEMIC Holdings, Inc. (a) |
131,600 |
2,443 |
|
|
MetLife, Inc. |
2,200,000 |
46,200 |
|
|
MIIX Group, Inc. |
310,000 |
3,623 |
|
|
National Western Life Insurance Co. Class A (a)(c) |
170,000 |
12,495 |
|
|
Nationwide Financial Services, Inc. Class A |
50,000 |
1,838 |
|
|
Nymagic, Inc. |
142,700 |
2,194 |
|
|
PAULA Financial (c) |
591,800 |
1,332 |
|
|
Philadelphia Consolidated Holding Corp. (a)(c) |
1,093,300 |
17,698 |
|
|
PMI Group, Inc. |
650,400 |
40,731 |
|
|
Professionals Group, Inc. (a) |
244,015 |
5,429 |
|
|
Protective Life Corp. |
1,750,002 |
47,469 |
|
|
PXRE Group Ltd. (c) |
725,063 |
9,788 |
|
|
Radian Group, Inc. |
325,000 |
19,784 |
|
|
RenaissanceRe Holdings Ltd. |
665,800 |
31,001 |
|
|
Stirling Cooke Brown Holdings Ltd. (c) |
928,700 |
1,857 |
|
|
Common Stocks - continued |
|||
|
Shares |
Value (Note 1) (000s) |
||
|
FINANCE - continued |
|||
|
Insurance - continued |
|||
|
UICI (a) |
2,235,000 |
$ 17,880 |
|
|
Unico American Corp. |
87,900 |
588 |
|
|
|
460,792 |
||
|
Savings & Loans - 0.6% |
|||
|
American Bank of Connecticut |
43,700 |
830 |
|
|
Berkshire Hills Bancorp, Inc. (a) |
166,600 |
2,093 |
|
|
Connecticut Bancshares, Inc. |
50,000 |
769 |
|
|
First Federal Bankshares, Inc. |
129,500 |
1,020 |
|
|
First Mutual Bancshares, Inc. |
22,200 |
216 |
|
|
Home Port Bancorp, Inc. (c) |
172,600 |
6,170 |
|
|
Independence Federal Savings Bank (c) |
120,200 |
1,202 |
|
|
Iroquois Bancorp, Inc. |
61,400 |
2,019 |
|
|
Ringerikes Sparebank |
18,100 |
357 |
|
|
Washington Federal, Inc. |
1,365,000 |
25,594 |
|
|
|
40,270 |
||
|
Securities Industry - 0.2% |
|||
|
Daiko Shoken Business Co. Ltd. |
100,000 |
384 |
|
|
Garban-Intercapital PLC |
500,000 |
1,619 |
|
|
Globaly Corp. |
150,000 |
2,263 |
|
|
MFC Bancorp Ltd. (a)(c) |
763,800 |
5,370 |
|
|
Norvestia Oyj (B Shares) (a) |
240,000 |
2,938 |
|
|
|
12,574 |
||
|
TOTAL FINANCE |
869,765 |
||
|
HEALTH - 11.0% |
|||
|
Drugs & Pharmaceuticals - 1.0% |
|||
|
Decode Genetics, Inc. |
2,800 |
72 |
|
|
Embrex, Inc. (a) |
381,400 |
5,197 |
|
|
Fuji Pharmaceutical Co. Ltd. |
100,000 |
352 |
|
|
Herbalife International, Inc.: |
|
|
|
|
Class A |
1,037,500 |
9,921 |
|
|
Class B (non-vtg.) |
2,010,500 |
18,597 |
|
|
Nature's Sunshine Products, Inc. (c) |
1,539,900 |
12,319 |
|
|
Riken Vitamin Oil Co. Ltd. |
100,000 |
1,326 |
|
|
Serologicals Corp. (a) |
819,700 |
3,945 |
|
|
Taro Pharmaceuticals Industries (a) |
5,000 |
74 |
|
|
Common Stocks - continued |
|||
|
Shares |
Value (Note 1) (000s) |
||
|
HEALTH - continued |
|||
|
Drugs & Pharmaceuticals - continued |
|||
|
Theragenics Corp. (a) |
1,085,200 |
$ 8,071 |
|
|
USANA Health Sciences, Inc. (a) |
15,800 |
47 |
|
|
|
59,921 |
||
|
Medical Equipment & Supplies - 4.0% |
|||
|
Biomet, Inc. |
1,792,500 |
80,214 |
|
|
Del Global Technologies Corp. (a)(c) |
777,300 |
7,093 |
|
|
DENTSPLY International, Inc. |
300,000 |
10,144 |
|
|
Elscint Ltd. (a)(c) |
1,464,500 |
8,055 |
|
|
ESC Medical Systems Ltd. (a)(c) |
2,050,000 |
33,825 |
|
|
Exactech, Inc. (a) |
220,300 |
3,745 |
|
|
Hokuyaku, Inc. |
250,000 |
1,006 |
|
|
HPSC, Inc. (a) |
95,500 |
764 |
|
|
ICU Medical, Inc. (a)(c) |
807,700 |
20,950 |
|
|
Medstone International, Inc. (a)(c) |
561,200 |
3,069 |
|
|
Moulin International Holding Ltd. |
5,499,333 |
472 |
|
|
Ocular Sciences, Inc. (a)(c) |
1,625,000 |
19,602 |
|
|
Orthofix International NV (a)(c) |
983,447 |
19,546 |
|
|
Respironics, Inc. (a)(c) |
1,840,400 |
31,402 |
|
|
Utah Medical Products, Inc. (a)(c) |
758,800 |
5,312 |
|
|
|
245,199 |
||
|
Medical Facilities Management - 6.0% |
|||
|
Corvel Corp. (a)(c) |
750,000 |
20,625 |
|
|
Cryolife, Inc. (a)(c) |
640,000 |
14,280 |
|
|
Health Management Associates, Inc. Class A (a) |
375,000 |
5,883 |
|
|
HEALTHSOUTH Corp. (a) |
2,250,000 |
13,359 |
|
|
Horizon Health Corp. (a)(c) |
674,400 |
3,541 |
|
|
Lincare Holdings, Inc. (a) |
325,000 |
8,694 |
|
|
National Dentex Corp. (a) |
38,400 |
614 |
|
|
Quest Diagnostics, Inc. (a) |
1,153,100 |
116,391 |
|
|
Quorum Health Group, Inc. (a) |
2,155,000 |
23,301 |
|
|
Ramsay Health Care Ltd. |
800,000 |
501 |
|
|
RehabCare Group, Inc. (a)(c) |
1,295,000 |
46,053 |
|
|
Renal Care Group, Inc. (a) |
90,000 |
2,087 |
|
|
Res-Care, Inc. (a)(c) |
1,466,200 |
10,263 |
|
|
RightCHOICE Managed Care, Inc. Class A (a) |
47,500 |
914 |
|
|
Safeguard Health Enterprises, Inc. (a) |
143,000 |
79 |
|
|
Syncor International Corp. (a) |
21,000 |
1,523 |
|
|
United Wisconsin Services, Inc. |
223,300 |
1,284 |
|
|
Common Stocks - continued |
|||
|
Shares |
Value (Note 1) (000s) |
||
|
HEALTH - continued |
|||
|
Medical Facilities Management - continued |
|||
|
Universal Health Services, Inc. Class B (a) |
1,375,000 |
$ 92,641 |
|
|
US Oncology, Inc. (a) |
450,000 |
2,250 |
|
|
|
364,283 |
||
|
TOTAL HEALTH |
669,403 |
||
|
HOLDING COMPANIES - 0.7% |
|||
|
DCC PLC: |
|
|
|
|
(Ireland) |
1,025,000 |
9,029 |
|
|
(United Kingdom) |
3,050,000 |
26,517 |
|
|
Fonciere Financiere et Part SA |
25,000 |
1,669 |
|
|
Perry Group PLC (c) |
2,000,000 |
3,118 |
|
|
TOTAL HOLDING COMPANIES |
40,333 |
||
|
INDUSTRIAL MACHINERY & EQUIPMENT - 4.6% |
|||
|
Electrical Equipment - 1.8% |
|||
|
Aichi Electric Co. Ltd. |
1,000,000 |
1,920 |
|
|
American Power Conversion Corp. (a) |
675,000 |
17,170 |
|
|
Bairnco Corp. (c) |
900,900 |
6,475 |
|
|
Blick PLC |
1,250,000 |
5,921 |
|
|
Blonder Tongue Labs, Inc. (a) |
38,100 |
257 |
|
|
BMC Industries, Inc. |
456,500 |
2,283 |
|
|
C&D Technologies, Inc. |
879,500 |
35,620 |
|
|
Chase Corp. (c) |
398,100 |
4,329 |
|
|
Cobra Electronics Corp. (a)(c) |
613,200 |
3,794 |
|
|
Denyo Co. Ltd. |
250,000 |
1,596 |
|
|
Genlyte Group, Inc. (a)(c) |
715,000 |
15,909 |
|
|
Inaba Denkisangyo Co. Ltd. |
725,000 |
7,723 |
|
|
Pressac PLC |
25,000 |
108 |
|
|
Rofin Sinar Technologies, Inc. (a) |
225,000 |
2,813 |
|
|
Scientific Technologies, Inc. |
79,500 |
576 |
|
|
Sigmatron International, Inc. (a)(c) |
220,000 |
605 |
|
|
Yurtec Corp. |
1,150,000 |
3,575 |
|
|
|
110,674 |
||
|
Industrial Machinery & Equipment - 2.8% |
|||
|
AGCO Corp. |
750,000 |
9,656 |
|
|
Amada Machinics Co. Ltd. |
150,000 |
350 |
|
|
Baldwin Technology Co., Inc. Class A (a) |
136,700 |
265 |
|
|
BOLDER Technologies Corp. (a) |
231,400 |
1,446 |
|
|
Common Stocks - continued |
|||
|
Shares |
Value (Note 1) (000s) |
||
|
INDUSTRIAL MACHINERY & EQUIPMENT - continued |
|||
|
Industrial Machinery & Equipment - continued |
|||
|
Chart Industries, Inc. (a) |
241,500 |
$ 1,479 |
|
|
CNH Global NV |
111,600 |
872 |
|
|
DT Industries, Inc. (a) |
387,600 |
3,803 |
|
|
Engineered Support Systems, Inc. (c) |
371,750 |
5,390 |
|
|
Fansteel, Inc. (a)(c) |
834,200 |
3,389 |
|
|
Fukushima Industries Corp. |
25,000 |
151 |
|
|
Gardner Denver Machinery, Inc. (a)(c) |
1,210,000 |
17,772 |
|
|
Gehl Co. (a)(c) |
635,000 |
8,652 |
|
|
Graco, Inc. |
58,400 |
1,986 |
|
|
Hardinge, Inc. |
237,500 |
3,147 |
|
|
Hirsch International Corp. Class A (a)(c) |
681,500 |
831 |
|
|
Hughes Supply, Inc. |
721,800 |
13,669 |
|
|
IDEX Corp. |
1,354,600 |
44,702 |
|
|
Kaydon Corp. |
430,000 |
9,003 |
|
|
Linx Printing Technology |
380,361 |
1,686 |
|
|
Oilgear Co. (c) |
176,900 |
1,846 |
|
|
P&F Industries, Inc. Class A (a)(c) |
357,500 |
3,039 |
|
|
Quipp, Inc. (a) |
55,500 |
1,166 |
|
|
SAES Getters Spa sponsored ADR |
1,022,900 |
7,672 |
|
|
Sansei Transport |
800,000 |
2,289 |
|
|
Shin Nippon Machinery Co. Ltd. |
400,000 |
585 |
|
|
Specialty Equipment Companies, Inc. (a) |
338,000 |
9,211 |
|
|
Speizman Industries, Inc. (a) |
106,500 |
313 |
|
|
Stewart & Stevenson Services, Inc. |
200,000 |
3,025 |
|
|
TB Wood's Corp. (c) |
358,200 |
3,806 |
|
|
Twin Disc, Inc. (c) |
243,500 |
4,231 |
|
|
Wakita & Co. Ltd. |
850,000 |
2,153 |
|
|
|
167,585 |
||
|
Pollution Control - 0.0% |
|||
|
Weston (Roy F.), Inc. Class A (a) |
250,300 |
923 |
|
|
TOTAL INDUSTRIAL MACHINERY & EQUIPMENT |
279,182 |
||
|
MEDIA & LEISURE - 7.2% |
|||
|
Broadcasting - 2.4% |
|||
|
CanWest Global Communications Corp. (sub. vtg.) |
1,150,006 |
14,344 |
|
|
Capital Radio PLC |
275,000 |
7,111 |
|
|
Chubu-Nippon Broadcasting Co. Ltd. |
35,000 |
384 |
|
|
Cogeco Cable, Inc. (c) |
1,000,000 |
25,282 |
|
|
Cogeco, Inc. (sub. vtg.) (c) |
773,200 |
18,976 |
|
|
Common Stocks - continued |
|||
|
Shares |
Value (Note 1) (000s) |
||
|
MEDIA & LEISURE - continued |
|||
|
Broadcasting - continued |
|||
|
Moffat Communications Ltd. (c) |
2,094,000 |
$ 39,424 |
|
|
P4 Radio Hele Norge ASA |
450,000 |
2,335 |
|
|
Prime Television Ltd. |
1,546,499 |
1,902 |
|
|
Scottish Radio Holdings PLC |
425,000 |
9,875 |
|
|
SMG PLC |
1,400,000 |
7,345 |
|
|
Southern Cross Broadcasting Australia Ltd. |
815,500 |
4,495 |
|
|
TVA Group, Inc. Class B |
1,040,000 |
14,510 |
|
|
|
145,983 |
||
|
Entertainment - 0.3% |
|||
|
Alliance Atlantis Communications Corp. (a)(d) |
50,000 |
689 |
|
|
Alliance Atlantis Communications Corp. Class B (non-vtg.) (a) |
221,500 |
3,053 |
|
|
Allied Leisure PLC |
300,000 |
472 |
|
|
Carnival Corp. |
25,000 |
467 |
|
|
Lakes Gaming, Inc. (a)(c) |
1,037,700 |
9,339 |
|
|
MTR Gaming Group, Inc. (a) |
502,700 |
2,859 |
|
|
Shingakukai Co. |
200,000 |
649 |
|
|
Television & Media Services Ltd. |
800,749 |
929 |
|
|
|
18,457 |
||
|
Leisure Durables & Toys - 0.1% |
|||
|
Gametech International, Inc. (a) |
404,500 |
1,681 |
|
|
K2, Inc. (a) |
72,300 |
718 |
|
|
National R.V. Holdings, Inc. (a) |
337,400 |
3,037 |
|
|
|
5,436 |
||
|
Lodging & Gaming - 0.2% |
|||
|
Choice Hotels International, Inc. (a) |
216,000 |
2,025 |
|
|
Dover Downs Entertainment, Inc. |
184,000 |
2,116 |
|
|
Hanover International PLC |
629,070 |
1,000 |
|
|
Ryan Hotels PLC |
3,676,607 |
3,582 |
|
|
ShoLodge, Inc. (a)(c) |
311,500 |
1,207 |
|
|
WMS Industries, Inc. (a) |
160,000 |
2,440 |
|
|
|
12,370 |
||
|
Publishing - 0.8% |
|||
|
Fine Art Developments PLC Class L |
700,000 |
2,865 |
|
|
Harte Hanks Communications, Inc. |
50,000 |
1,266 |
|
|
Informa Group PLC |
650,000 |
7,490 |
|
|
Johnston Press PLC |
1,600,000 |
8,179 |
|
|
Journal Register Co. (a) |
393,300 |
6,883 |
|
|
Roto Smeets de Boer NV |
120,000 |
3,338 |
|
|
Sanoma-WSOY Oyj (B Shares) |
925,000 |
14,409 |
|
|
Common Stocks - continued |
|||
|
Shares |
Value (Note 1) (000s) |
||
|
MEDIA & LEISURE - continued |
|||
|
Publishing - continued |
|||
|
Southnews PLC |
100,000 |
$ 1,244 |
|
|
Talentum Oyj (B Shares) |
400,040 |
3,895 |
|
|
Topps Co., Inc. (a) |
70,000 |
673 |
|
|
VLT AB (B Shares) |
200,000 |
1,704 |
|
|
|
51,946 |
||
|
Restaurants - 3.4% |
|||
|
Applebee's International, Inc. (c) |
2,075,000 |
46,039 |
|
|
ARK Restaurants Corp. (a)(c) |
295,000 |
2,766 |
|
|
Benihana, Inc. (a)(c) |
347,400 |
4,864 |
|
|
Benihana, Inc. Class A (a)(c) |
266,800 |
3,468 |
|
|
Consolidated Products, Inc. (a) |
1,419,500 |
13,042 |
|
|
Elxsi Corp. (a)(c) |
233,700 |
2,600 |
|
|
Enterprise Inns PLC |
50,000 |
266 |
|
|
Flanigans Enterprises, Inc. (c) |
195,000 |
853 |
|
|
IHOP Corp. (a)(c) |
2,000,000 |
32,750 |
|
|
Mikes Restaurants, Inc. (a)(c) |
277,500 |
420 |
|
|
Morton's Restaurant Group, Inc. (a)(c) |
360,000 |
7,380 |
|
|
Outback Steakhouse, Inc. (a) |
665,000 |
15,253 |
|
|
Papa John's International, Inc. (a) |
665,000 |
15,835 |
|
|
Restaurant Brands NZ Ltd. |
291,666 |
143 |
|
|
Sonic Corp. (a)(c) |
1,925,000 |
58,592 |
|
|
Sportscene Restaurants, Inc. Class A |
30,000 |
121 |
|
|
|
204,392 |
||
|
TOTAL MEDIA & LEISURE |
438,584 |
||
|
NONDURABLES - 4.0% |
|||
|
Agriculture - 0.3% |
|||
|
IAWS Group PLC |
1,500,000 |
10,501 |
|
|
IAWS Group PLC Class A (UK Reg.) |
500,000 |
3,560 |
|
|
Sylvan, Inc. (a)(c) |
338,700 |
3,281 |
|
|
|
17,342 |
||
|
Beverages - 0.1% |
|||
|
National Beverage Corp. (a) |
276,500 |
2,247 |
|
|
Shikoku Coca-Cola Bottling Co. Ltd. |
175,000 |
1,886 |
|
|
|
4,133 |
||
|
Foods - 1.1% |
|||
|
American Italian Pasta Co. Class A (a) |
143,800 |
2,840 |
|
|
Cagle's, Inc. Class A |
220,200 |
1,844 |
|
|
Common Stocks - continued |
|||
|
Shares |
Value (Note 1) (000s) |
||
|
NONDURABLES - continued |
|||
|
Foods - continued |
|||
|
Corn Products International, Inc. |
35,900 |
$ 898 |
|
|
Monterey Pasta Co. (a) |
231,000 |
938 |
|
|
Nabisco Group Holdings Corp. |
1,500,000 |
39,750 |
|
|
Perkins Foods PLC |
1,000,320 |
1,425 |
|
|
Pilgrims Pride Corp. |
10,000 |
73 |
|
|
Riviana Foods, Inc. (c) |
864,000 |
14,040 |
|
|
Robert Wiseman Dairies PLC |
240,000 |
351 |
|
|
Shoei Foods Corp. |
250,000 |
1,051 |
|
|
Snackhouse PLC |
1,750,000 |
1,410 |
|
|
Suprema Specialties, Inc. (a)(c) |
398,000 |
4,104 |
|
|
|
68,724 |
||
|
Household Products - 0.5% |
|||
|
Aptargroup, Inc. |
45,000 |
1,122 |
|
|
Comany, Inc. |
100,000 |
585 |
|
|
CPAC, Inc. (c) |
582,200 |
4,367 |
|
|
Del Laboratories, Inc. |
277,900 |
3,474 |
|
|
DSG International Ltd. (a)(c) |
512,500 |
2,114 |
|
|
Helen of Troy Corp. (a)(c) |
2,835,000 |
16,656 |
|
|
IWP International PLC: |
|
|
|
|
(Dublin) (Reg.) (a) |
250,000 |
359 |
|
|
(United Kingdom) (Reg.) |
700,000 |
1,141 |
|
|
Stephan Co. (c) |
415,300 |
1,739 |
|
|
Swallowfield PLC Class L |
100,000 |
136 |
|
|
|
31,693 |
||
|
Tobacco - 2.0% |
|||
|
Gallaher Group PLC sponsored ADR |
3,975,000 |
83,227 |
|
|
RJ Reynolds Tobacco Holdings, Inc. |
1,150,000 |
32,631 |
|
|
Standard Commercial Corp. (c) |
1,286,300 |
6,271 |
|
|
|
122,129 |
||
|
TOTAL NONDURABLES |
244,021 |
||
|
PRECIOUS METALS - 0.4% |
|||
|
Industrias Penoles SA |
4,600,000 |
6,199 |
|
|
Normandy Mt. Leyshon Ltd. (a) |
1,100,000 |
1,117 |
|
|
Orogen Minerals Ltd. |
5,575,000 |
5,338 |
|
|
Orogen Minerals Ltd. GDR (d) |
265,000 |
2,451 |
|
|
Common Stocks - continued |
|||
|
Shares |
Value (Note 1) (000s) |
||
|
PRECIOUS METALS - continued |
|||
|
Richmont Mines, Inc. (a)(c) |
810,000 |
$ 910 |
|
|
Sons of Gwalia NL |
1,726,954 |
5,672 |
|
|
TOTAL PRECIOUS METALS |
21,687 |
||
|
RETAIL & WHOLESALE - 7.9% |
|||
|
Apparel Stores - 2.9% |
|||
|
Chateau Stores of Canada Ltd. Class A (c) |
192,900 |
616 |
|
|
Chico's FAS, Inc. (a) |
300,000 |
8,850 |
|
|
Christopher & Banks Corp. (a) |
434,850 |
9,893 |
|
|
Claire's Stores, Inc. |
2,375,000 |
40,078 |
|
|
Footstar, Inc. (a)(c) |
984,700 |
31,018 |
|
|
Goldlion Holdings Ltd. |
1,000,000 |
64 |
|
|
Kenneth Cole Productions, Inc. Class A (a) |
570,000 |
24,617 |
|
|
New Look Group PLC (d) |
950,000 |
1,296 |
|
|
One Price Clothing Stores, Inc. (a)(c) |
1,048,900 |
1,967 |
|
|
Ross Stores, Inc. |
2,975,000 |
45,741 |
|
|
S&K Famous Brands, Inc. (a) |
115,000 |
913 |
|
|
Shirmax Fashions Ltd. (a) |
450,000 |
530 |
|
|
The Buckle, Inc. (a) |
296,200 |
4,036 |
|
|
The Men's Wearhouse, Inc. (a) |
136,800 |
3,548 |
|
|
United Retail Group, Inc. (a) |
355,700 |
2,079 |
|
|
|
175,246 |
||
|
Drug Stores - 0.6% |
|||
|
Jean Coutu Group, Inc. Class A (c) |
1,620,100 |
39,217 |
|
|
General Merchandise Stores - 1.3% |
|||
|
Arnotts PLC |
100,387 |
652 |
|
|
BJ's Wholesale Club, Inc. (a) |
1,825,000 |
54,636 |
|
|
Daiwa Co. Ltd. |
300,000 |
631 |
|
|
Hot Topic, Inc. (a) |
2,000 |
65 |
|
|
Jo-Ann Stores, Inc.: |
|
|
|
|
Class A (a) |
384,300 |
2,786 |
|
|
Class B (non-vtg.) (a) |
1,110,900 |
7,776 |
|
|
Shopko Stores, Inc. (a) |
713,500 |
10,301 |
|
|
Stein Mart, Inc. (a) |
278,400 |
3,062 |
|
|
|
79,909 |
||
|
Grocery Stores - 1.1% |
|||
|
Iceland Group PLC |
4,500,000 |
20,844 |
|
|
Metro, Inc. Class A (c) |
3,200,000 |
40,237 |
|
|
Common Stocks - continued |
|||
|
Shares |
Value (Note 1) (000s) |
||
|
RETAIL & WHOLESALE - continued |
|||
|
Grocery Stores - continued |
|||
|
Schultz Sav-O Stores, Inc. (c) |
412,600 |
$ 4,900 |
|
|
Whittard of Chelsea PLC (a) |
368,950 |
301 |
|
|
|
66,282 |
||
|
Retail & Wholesale, Miscellaneous - 2.0% |
|||
|
Advanced Marketing Services, Inc. |
574,500 |
9,874 |
|
|
Alberto-Culver Co. Class A |
350,000 |
8,881 |
|
|
Blair Corp. (c) |
800,700 |
16,615 |
|
|
Brookstone Co., Inc. (a)(c) |
744,600 |
8,749 |
|
|
Cole National Corp. Class A (c) |
893,900 |
7,095 |
|
|
Farepak PLC |
1,025,000 |
2,842 |
|
|
Finish Line, Inc. Class A (a)(c) |
1,891,700 |
15,252 |
|
|
Finlay Enterprises, Inc. (a)(c) |
1,042,200 |
13,418 |
|
|
Friedmans, Inc. Class A (c) |
1,343,700 |
7,726 |
|
|
Guitar Center, Inc. (a) |
52,100 |
768 |
|
|
Heiton Holdings PLC |
350,000 |
909 |
|
|
HomeBase, Inc. (a) |
1,000,000 |
2,438 |
|
|
Partridge Fine Arts PLC |
140,000 |
130 |
|
|
Piercing Pagoda, Inc. (a)(c) |
917,600 |
13,535 |
|
|
Rex Stores Corp. (a)(c) |
658,300 |
11,520 |
|
|
Sound Advice, Inc. (a)(c) |
220,500 |
1,902 |
|
|
Sportsmans Guide, Inc. (a) |
207,300 |
363 |
|
|
|
122,017 |
||
|
Trading Companies - 0.0% |
|||
|
Mitani Sangyo Co. Ltd. |
100,000 |
429 |
|
|
TOTAL RETAIL & WHOLESALE |
483,100 |
||
|
SERVICES - 4.9% |
|||
|
Advertising - 0.8% |
|||
|
InfoUSA, Inc. (a)(c) |
3,250,000 |
19,500 |
|
|
R.H. Donnelley Corp. (a) |
1,289,700 |
25,875 |
|
|
|
45,375 |
||
|
Educational Services - 0.1% |
|||
|
Concorde Career Colleges, Inc. (a) |
250,000 |
128 |
|
|
Education Management Corp. (a) |
140,000 |
2,888 |
|
|
New Horizons Worldwide, Inc. (a) |
30,000 |
662 |
|
|
Up, Inc. (c) |
450,000 |
1,535 |
|
|
Wao Corp. (c) |
450,000 |
1,658 |
|
|
|
6,871 |
||
|
Common Stocks - continued |
|||
|
Shares |
Value (Note 1) (000s) |
||
|
SERVICES - continued |
|||
|
Leasing & Rental - 0.3% |
|||
|
Aaron Rents, Inc. Class B |
422,900 |
$ 6,132 |
|
|
Avis Group Holdings, Inc. Class A (a) |
226,100 |
5,059 |
|
|
Gowrings PLC |
200,000 |
294 |
|
|
Nishio Rent All Co. Ltd. |
500,000 |
3,292 |
|
|
Rainbow Rentals, Inc. (a) |
200,100 |
2,351 |
|
|
Rakentajain Konevuokraamo Oyj (B Shares) |
38,950 |
365 |
|
|
|
17,493 |
||
|
Printing - 1.6% |
|||
|
Adare Printing Group PLC: |
|
|
|
|
(Ireland) |
679,000 |
6,800 |
|
|
(United Kingdom) |
485,004 |
4,362 |
|
|
Pubco Corp. (a)(c) |
319,500 |
2,376 |
|
|
Reynolds & Reynolds Co. Class A (c) |
3,930,000 |
65,582 |
|
|
Valassis Communications, Inc. (a) |
500,000 |
16,813 |
|
|
Wyndeham Press Group PLC |
500,000 |
2,039 |
|
|
|
97,972 |
||
|
Services - 2.1% |
|||
|
ACNielsen Corp. (a) |
20,600 |
505 |
|
|
Asi Solutions, Inc. (a) |
185,600 |
2,088 |
|
|
Chodai Co. Ltd. |
200,000 |
859 |
|
|
Cornell Companies, Inc. (a) |
260,000 |
1,674 |
|
|
De La Rue PLC |
100,000 |
582 |
|
|
Diversified Corporate Resources, Inc. (a)(c) |
246,800 |
710 |
|
|
Edgewater Technology, Inc. (a) |
793,800 |
5,135 |
|
|
Eyeful Home Technology, Inc. |
200,000 |
1,152 |
|
|
Holidaybreak PLC |
275,000 |
1,200 |
|
|
Hunting Group PLC |
1,450,000 |
3,054 |
|
|
Insurance Auto Auctions, Inc. (a) |
22,600 |
475 |
|
|
Jenny Craig, Inc. (a) |
849,100 |
2,653 |
|
|
NOVA Corp. (a) |
10,000 |
116 |
|
|
Personnel Group of America, Inc. (a) |
1,000,000 |
3,188 |
|
|
Photoworks, Inc. (a) |
734,200 |
1,698 |
|
|
Pittston Co. - Brinks Group (c) |
3,123,009 |
37,476 |
|
|
Pre-Paid Legal Services, Inc. (a) |
40,000 |
1,223 |
|
|
Programming & Systems, Inc. (a)(c) |
313,300 |
0 |
|
|
RCM Technologies, Inc. (a)(c) |
647,200 |
4,571 |
|
|
RemedyTemp, Inc. Class A (a)(c) |
534,400 |
6,446 |
|
|
Right Management Consultants, Inc. (a)(c) |
673,000 |
6,730 |
|
|
Tanabe Management Consulting Co. |
200,000 |
713 |
|
|
Common Stocks - continued |
|||
|
Shares |
Value (Note 1) (000s) |
||
|
SERVICES - continued |
|||
|
Services - continued |
|||
|
Thomas Group (a) |
74,400 |
$ 595 |
|
|
Viad Corp. |
1,675,000 |
43,655 |
|
|
Wesco, Inc. |
200,000 |
541 |
|
|
|
127,039 |
||
|
TOTAL SERVICES |
294,750 |
||
|
TECHNOLOGY - 13.5% |
|||
|
Communications Equipment - 0.3% |
|||
|
Cable Design Technologies Corp. (a) |
400,000 |
14,100 |
|
|
Champion Technology Holdings Ltd. |
100,000 |
4 |
|
|
KTK Telecommunications Engineering Co. Ltd. |
105,000 |
463 |
|
|
Kyosan Electric Manufacturing Co. Ltd. |
500,000 |
1,088 |
|
|
LoJack Corp. (a) |
236,100 |
1,756 |
|
|
Perceptron, Inc. (a) |
315,700 |
1,115 |
|
|
|
18,526 |
||
|
Computer Services & Software - 4.0% |
|||
|
Affiliated Computer Services, Inc. Class A (a) |
1,100,000 |
49,569 |
|
|
Avant! Corp. (a)(c) |
2,277,500 |
35,586 |
|
|
Avici Systems, Inc. |
2,100 |
207 |
|
|
Black Box Corp. (a)(c) |
1,350,000 |
61,088 |
|
|
Computer Learning Centers, Inc. (a) |
75,000 |
96 |
|
|
Cotelligent, Inc. (a) |
347,800 |
1,500 |
|
|
Daitec Co. Ltd. |
425,200 |
5,404 |
|
|
Data Research Associates, Inc. |
124,000 |
760 |
|
|
Directrix, Inc. (a) |
89,000 |
312 |
|
|
Electronics for Imaging, Inc. (a) |
25,000 |
545 |
|
|
Fair, Isaac & Co., Inc. |
271,600 |
13,529 |
|
|
GSE Systems, Inc. (a) |
93,400 |
327 |
|
|
Infinium Software, Inc. (a) |
152,500 |
458 |
|
|
JDA Software Group, Inc. (a) |
750,000 |
12,188 |
|
|
Mapics, Inc. (a) |
686,000 |
2,573 |
|
|
Ontrack Data International, Inc. (a) |
297,900 |
3,128 |
|
|
Phoenix Technologies Ltd. (a) |
395,000 |
6,715 |
|
|
Progress Software Corp. (a) |
50,000 |
753 |
|
|
Project Software & Development, Inc. (a) |
613,000 |
10,804 |
|
|
Prophet 21, Inc. (a) |
115,500 |
1,906 |
|
|
RWD Technologies, Inc. (a) |
77,000 |
443 |
|
|
SPSS, Inc. (a)(c) |
850,000 |
25,394 |
|
|
Technology Solutions, Inc. |
50,000 |
250 |
|
|
Common Stocks - continued |
|||
|
Shares |
Value (Note 1) (000s) |
||
|
TECHNOLOGY - continued |
|||
|
Computer Services & Software - continued |
|||
|
Timberline Software Corp. |
436,100 |
$ 2,671 |
|
|
Unigraphics Solutions, Inc. Class A (a)(c) |
520,000 |
8,093 |
|
|
|
244,299 |
||
|
Computers & Office Equipment - 3.1% |
|||
|
Adaptec, Inc. (a) |
476,800 |
11,801 |
|
|
Advanced Digital Information Corp. (a) |
1,035,000 |
14,490 |
|
|
Amplicon, Inc. |
523,400 |
4,972 |
|
|
Avocent Corp. (a) |
840,000 |
37,498 |
|
|
Equinox Systems, Inc. (a)(c) |
535,000 |
2,943 |
|
|
Kronos, Inc. (a)(c) |
885,000 |
30,311 |
|
|
Maezawa Kasei Industries Co. Ltd. |
240,000 |
2,414 |
|
|
Nam Tai Electronics, Inc. |
419,000 |
6,285 |
|
|
Nam Tai Electronics, Inc. warrants 11/24/02 (a) |
102,000 |
242 |
|
|
Pomeroy Computer Resources, Inc. (a)(c) |
1,179,800 |
20,057 |
|
|
Quantum Corp. - DLT & Storage Systems Group (a) |
610,010 |
7,168 |
|
|
SBE, Inc. (a) |
81,900 |
1,556 |
|
|
SBS Technologies, Inc. (a)(c) |
541,600 |
21,664 |
|
|
SED International Holdings, Inc. (a)(c) |
960,000 |
3,390 |
|
|
Zebra Technologies Corp. Class B (a) |
500,000 |
25,531 |
|
|
|
190,322 |
||
|
Electronic Instruments - 0.6% |
|||
|
BTU International, Inc. (a)(c) |
600,000 |
6,338 |
|
|
Cohu, Inc. |
315,000 |
5,572 |
|
|
GenRad, Inc. (a) |
130,000 |
1,105 |
|
|
Halma PLC |
750,000 |
1,214 |
|
|
Hurco Companies, Inc. (a)(c) |
364,028 |
1,365 |
|
|
Intest Corp. (a)(c) |
650,000 |
10,075 |
|
|
Mesa Laboratories, Inc. (a)(c) |
195,400 |
1,099 |
|
|
MOCON, Inc. |
115,600 |
650 |
|
|
Reliability, Inc. (a)(c) |
666,000 |
2,206 |
|
|
Toko Seiki Co. Ltd. (a) |
250,000 |
503 |
|
|
Wireless Telecom Group, Inc. (a)(c) |
1,270,800 |
4,130 |
|
|
X-Rite, Inc. |
214,800 |
2,000 |
|
|
|
36,257 |
||
|
Electronics - 5.5% |
|||
|
Bel Fuse, Inc.: |
|
|
|
|
Class A (a) |
103,500 |
3,131 |
|
|
Class B |
138,000 |
3,795 |
|
|
Bergman & Beving AB (B Shares) |
100,000 |
1,158 |
|
|
Common Stocks - continued |
|||
|
Shares |
Value (Note 1) (000s) |
||
|
TECHNOLOGY - continued |
|||
|
Electronics - continued |
|||
|
Daidensha Co. Ltd. |
100,000 |
$ 551 |
|
|
Dallas Semiconductor Corp. (c) |
3,640,000 |
152,407 |
|
|
Diodes, Inc. (a) |
264,250 |
5,417 |
|
|
Elec & Eltek International Holdings Ltd. |
2,000,000 |
280 |
|
|
Esterline Technologies Corp. (a) |
50,000 |
738 |
|
|
General Semiconductor, Inc. (a)(c) |
2,535,700 |
38,036 |
|
|
Griffon Corp. (a)(c) |
2,670,000 |
16,688 |
|
|
Kingboard Chemical Holdings Ltd. |
7,500,000 |
3,655 |
|
|
Methode Electronics, Inc. Class A |
930,000 |
42,257 |
|
|
Micro Linear Corp. (a) |
470,000 |
2,644 |
|
|
Siliconix, Inc. (a) |
770,000 |
41,821 |
|
|
Stoneridge, Inc. (a) |
688,700 |
5,725 |
|
|
Taitron Components, Inc. Class A (a)(c) |
429,900 |
1,518 |
|
|
Techtronic Industries Co. |
5,000,000 |
1,199 |
|
|
TT Group PLC |
3,600,000 |
7,771 |
|
|
Virage Logic Corp. |
13,100 |
157 |
|
|
Wong's International Holdings Ltd. |
10,000,000 |
3,430 |
|
|
|
332,378 |
||
|
Photographic Equipment - 0.0% |
|||
|
Asahi Optical Co. Ltd. |
50,000 |
124 |
|
|
TOTAL TECHNOLOGY |
821,906 |
||
|
TRANSPORTATION - 2.4% |
|||
|
Air Transportation - 0.7% |
|||
|
AHL Services, Inc. (a) |
110,800 |
900 |
|
|
Alpha Airports Group PLC |
274,586 |
181 |
|
|
Ambassadors International, Inc. (a) |
45,500 |
746 |
|
|
America West Holding Corp. Class B (a) |
670,000 |
10,762 |
|
|
Mercury Air Group, Inc. (a)(c) |
525,140 |
3,348 |
|
|
Mesaba Holdings, Inc. (a) |
560,000 |
5,565 |
|
|
Midwest Express Holdings, Inc. (a) |
550,700 |
12,941 |
|
|
Transat AT, Inc. (a) |
110,000 |
695 |
|
|
World Fuel Services Corp. (c) |
1,249,906 |
9,921 |
|
|
|
45,059 |
||
|
Railroads - 0.1% |
|||
|
Genesee & Wyoming, Inc. Class A (a)(c) |
330,000 |
6,188 |
|
|
Shipping - 0.1% |
|||
|
Farstad Shipping ASA |
375,000 |
1,354 |
|
|
Common Stocks - continued |
|||
|
Shares |
Value (Note 1) (000s) |
||
|
TRANSPORTATION - continued |
|||
|
Shipping - continued |
|||
|
Isewan Terminal Service Co. Ltd. |
1,000,000 |
$ 2,441 |
|
|
Meiko Transportation Co. Ltd. |
500,000 |
1,554 |
|
|
Ocean Wilsons Holdings Ltd. |
600,000 |
791 |
|
|
Tokyo Kisen Co. Ltd. |
500,000 |
1,600 |
|
|
|
7,740 |
||
|
Trucking & Freight - 1.5% |
|||
|
Arkansas Best Corp. (a) |
505,400 |
7,170 |
|
|
Arnold Industries, Inc. |
958,800 |
13,124 |
|
|
Baltrans Holdings Ltd. |
5,000,000 |
930 |
|
|
Cannon Express, Inc. Class A (a) |
111,600 |
265 |
|
|
Covenant Transport, Inc. Class A (a) |
208,400 |
1,667 |
|
|
Daiwa Logistics Co. Ltd. |
300,000 |
1,509 |
|
|
Goodfellow, Inc. (c) |
413,700 |
2,851 |
|
|
Japan Logistic Systems Corp. |
300,000 |
1,070 |
|
|
Knights Transportation, Inc. (a) |
58,000 |
1,030 |
|
|
Landstar System, Inc. (a) |
150,000 |
8,166 |
|
|
Marten Transport Ltd. (a)(c) |
447,700 |
6,044 |
|
|
Old Dominion Freight Lines, Inc. (a)(c) |
831,200 |
8,104 |
|
|
P.A.M. Transportation Services, Inc. (a)(c) |
492,200 |
4,491 |
|
|
Trancom Co. Ltd. (c) |
520,000 |
2,140 |
|
|
USFreightways Corp. |
1,090,000 |
30,248 |
|
|
|
88,809 |
||
|
TOTAL TRANSPORTATION |
147,796 |
||
|
UTILITIES - 1.6% |
|||
|
Electric Utility - 0.3% |
|||
|
Bangor Hydro-Electric Co. |
366,400 |
8,588 |
|
|
Black Hills Corp. |
143,000 |
3,316 |
|
|
Central Vermont Public Service Corp. |
207,300 |
2,462 |
|
|
Green Mountain Power Corp. |
94,700 |
769 |
|
|
Maine Public Service Co. |
75,000 |
1,772 |
|
|
|
16,907 |
||
|
Gas - 0.4% |
|||
|
Midcoast Energy Resources, Inc. (c) |
698,525 |
11,176 |
|
|
Mitchell Energy & Development Corp. Class A |
132,000 |
4,208 |
|
|
Otaki Gas Co. Ltd. |
500,000 |
1,600 |
|
|
Southwestern Energy Co. (c) |
1,415,100 |
10,436 |
|
|
|
27,420 |
||
|
Common Stocks - continued |
|||
|
Shares |
Value (Note 1) (000s) |
||
|
UTILITIES - continued |
|||
|
Telephone Services - 0.1% |
|||
|
Atlantic Tele-Network, Inc. (c) |
494,120 |
$ 5,250 |
|
|
Water - 0.8% |
|||
|
Brockhampton Holdings PLC Class A (non-vtg.) |
4,790,000 |
6,103 |
|
|
Hyder PLC (c) |
8,778,800 |
42,505 |
|
|
Kelda Group PLC |
300,000 |
1,444 |
|
|
|
50,052 |
||
|
TOTAL UTILITIES |
99,629 |
||
|
TOTAL COMMON STOCKS (Cost $5,056,511) |
5,706,219 |
||
|
Convertible Bonds - 0.0% |
|||||
|
Moody's Ratings (unaudited) |
Principal Amount (000s) |
|
|||
|
TECHNOLOGY - 0.0% |
|||||
|
Communications Equipment - 0.0% |
|||||
|
Trans Lux Corp. 7.5% 12/1/06 |
- |
|
$ 500 |
390 |
|
|
Cash Equivalents - 6.1% |
|||
|
Shares |
|
||
|
Fidelity Cash Central Fund, 6.57% (b) |
353,912,962 |
353,913 |
|
|
Fidelity Securities Lending Cash Central Fund, 6.65% (b) |
17,920,000 |
17,920 |
|
|
TOTAL CASH EQUIVALENTS (Cost $371,833) |
371,833 |
||
|
TOTAL INVESTMENT PORTFOLIO - 100.0% (Cost $5,428,922) |
6,078,442 |
||
|
NET OTHER ASSETS - 0.0% |
1,848 |
||
|
NET ASSETS - 100% |
$ 6,080,290 |
||
|
Legend |
|
(a) Non-income producing |
|
(b) The rate quoted is the annualized seven-day yield of the fund at |
|
(c) Affiliated company |
|
(d) Security exempt from registration under Rule 144A of the Securities Act of 1933. These securities may be resold in transactions exempt from registration, normally to qualified
institutional buyers. At the period end, the value of these securities amounted to $16,536,000 |
|
Distribution of investments by country of issue, as a percentage of total net assets, |
|
United States of America |
79.9% |
|
Canada |
5.5 |
|
United Kingdom |
4.4 |
|
Bermuda |
1.8 |
|
Japan |
1.7 |
|
Ireland |
1.2 |
|
Finland |
1.1 |
|
Others (individually less than 1%) |
4.4 |
|
|
100.0% |
|
Income Tax Information |
|
At July 31, 2000, the aggregate cost of investment securities for income tax purposes was $5,433,882,000. Net unrealized appreciation aggregated $644,560,000, of which $1,766,675,000 related to appreciated investment securities and $1,122,115,000 related to depreciated investment securities. |
|
The fund hereby designates approximately $488,631,000 as a capital gain dividend for the purpose of the dividend paid deduction. |
See accompanying notes which are an integral part of the financial statements.
Annual Report
Statement of Assets and Liabilities
|
Amounts in thousands (except per-share amounts) |
July 31, 2000 |
|
|
Assets |
|
|
|
Investment in securities, at value (cost $5,428,922) - |
|
$ 6,078,442 |
|
Cash |
|
163 |
|
Foreign currency held at value (cost $169) |
|
167 |
|
Receivable for investments sold |
|
41,642 |
|
Receivable for fund shares sold |
|
4,583 |
|
Dividends receivable |
|
2,448 |
|
Interest receivable |
|
1,751 |
|
Redemption fees receivable |
|
2 |
|
Other receivables |
|
245 |
|
Total assets |
|
6,129,443 |
|
Liabilities |
|
|
|
Payable for investments purchased |
$ 16,739 |
|
|
Payable for fund shares redeemed |
10,619 |
|
|
Accrued management fee |
2,439 |
|
|
Other payables and accrued expenses |
1,436 |
|
|
Collateral on securities loaned, at value |
17,920 |
|
|
Total liabilities |
|
49,153 |
|
Net Assets |
|
$ 6,080,290 |
|
Net Assets consist of: |
|
|
|
Paid in capital |
|
$ 4,578,710 |
|
Undistributed net investment income |
|
23,907 |
|
Accumulated undistributed net realized gain (loss) on investments and foreign currency transactions |
|
828,164 |
|
Net unrealized appreciation (depreciation) on investments and assets and liabilities in foreign currencies |
|
649,509 |
|
Net Assets, for 254,120 shares outstanding |
|
$ 6,080,290 |
|
Net Asset Value and redemption price per share ($6,080,290 ÷ 254,120 shares) |
|
$23.93 |
|
Maximum offering price per share (100/97.00 of $23.93) |
|
$24.67 |
See accompanying notes which are an integral part of the financial statements.
Annual Report
Financial Statements - continued
Statement of Operations
|
Amounts in thousands
|
Year ended July 31, 2000 |
|
|
Investment Income Dividends (including $27,535 received from |
|
$ 81,630 |
|
Interest |
|
6,920 |
|
Security lending |
|
871 |
|
Total income |
|
89,421 |
|
Expenses |
|
|
|
Management fee |
$ 40,756 |
|
|
Performance adjustment |
(6,262) |
|
|
Transfer agent fees |
15,904 |
|
|
Accounting and security lending fees |
812 |
|
|
Non-interested trustees' compensation |
28 |
|
|
Custodian fees and expenses |
681 |
|
|
Registration fees |
126 |
|
|
Audit |
68 |
|
|
Legal |
38 |
|
|
Interest |
304 |
|
|
Miscellaneous |
222 |
|
|
Total expenses before reductions |
52,677 |
|
|
Expense reductions |
(755) |
51,922 |
|
Net investment income |
|
37,499 |
|
Realized and Unrealized Gain (Loss) Net realized gain (loss) on: |
|
|
|
Investment securities (including realized gain of $100,316 on sales of investments in affiliated issuers) |
909,637 |
|
|
Foreign currency transactions |
(1,022) |
908,615 |
|
Change in net unrealized appreciation (depreciation) on: |
|
|
|
Investment securities |
(731,385) |
|
|
Assets and liabilities in foreign currencies |
(288) |
(731,673) |
|
Net gain (loss) |
|
176,942 |
|
Net increase (decrease) in net assets resulting |
|
$ 214,441 |
See accompanying notes which are an integral part of the financial statements.
Annual Report
Financial Statements - continued
Statement of Changes in Net Assets
|
Amounts in thousands |
Year ended |
Year ended |
|
Increase (Decrease) in Net Assets |
|
|
|
Operations |
$ 37,499 |
$ 42,695 |
|
Net realized gain (loss) |
908,615 |
464,117 |
|
Change in net unrealized appreciation (depreciation) |
(731,673) |
(459,134) |
|
Net increase (decrease) in net assets resulting |
214,441 |
47,678 |
|
Distributions to shareholders |
(46,312) |
(77,740) |
|
From net realized gain |
(370,020) |
(752,214) |
|
Total distributions |
(416,332) |
(829,954) |
|
Share transactions |
1,073,395 |
1,590,582 |
|
Reinvestment of distributions |
398,565 |
800,524 |
|
Cost of shares redeemed |
(2,892,892) |
(4,423,505) |
|
Net increase (decrease) in net assets resulting |
(1,420,932) |
(2,032,399) |
|
Redemption fees |
1,209 |
1,485 |
|
Total increase (decrease) in net assets |
(1,621,614) |
(2,813,190) |
|
Net Assets |
|
|
|
Beginning of period |
7,701,904 |
10,515,094 |
|
End of period (including undistributed net investment income of $23,907 and $28,835, respectively) |
$ 6,080,290 |
$ 7,701,904 |
|
Other Information Shares |
|
|
|
Sold |
46,989 |
70,854 |
|
Issued in reinvestment of distributions |
17,839 |
39,125 |
|
Redeemed |
(128,080) |
(199,036) |
|
Net increase (decrease) |
(63,252) |
(89,057) |
See accompanying notes which are an integral part of the financial statements.
Annual Report
Financial Highlights
|
Years ended July 31, |
2000 |
1999 |
1998 |
1997 |
1996 |
|
Selected Per-Share Data |
|
|
|
|
|
|
Net asset value, |
$ 24.27 |
$ 25.87 |
$ 25.20 |
$ 19.87 |
$ 19.25 |
|
Income from |
|
|
|
|
|
|
Net investment income |
.13 C |
.12 C |
.29 C |
.30 C |
.26 |
|
Net realized and |
.87 |
.42 |
2.24 |
6.93 |
1.83 |
|
Total from investment operations |
1.00 |
.54 |
2.53 |
7.23 |
2.09 |
|
Less Distributions |
|
|
|
|
|
|
From net investment income |
(.15) |
(.20) |
(.28) |
(.24) |
(.23) |
|
From net realized gain |
(1.19) |
(1.94) |
(1.58) |
(1.66) |
(1.24) |
|
Total distributions |
(1.34) |
(2.14) |
(1.86) |
(1.90) |
(1.47) |
|
Redemption fees added to paid |
- |
- |
- |
- |
- |
|
Net asset value, end of period |
$ 23.93 |
$ 24.27 |
$ 25.87 |
$ 25.20 |
$ 19.87 |
|
Total Return A, B |
4.57% |
3.72% |
10.53% |
39.45% |
11.50% |
|
Ratios and Supplemental Data |
|
|
|
|
|
|
Net assets, end of period |
$ 6,080 |
$ 7,702 |
$ 10,515 |
$ 8,673 |
$ 4,019 |
|
Ratio of expenses to average |
.81% |
1.09% |
.97% |
1.02% |
1.05% |
|
Ratio of expenses to average net assets after expense reductions |
.80% D |
1.08% D |
.95% D |
1.01% D |
1.04% D |
|
Ratio of net investment income to average net assets |
.58% |
.52% |
1.10% |
1.36% |
1.46% |
|
Portfolio turnover rate |
15% |
24% |
47% |
45% |
79% |
A The total returns would have been lower had certain expenses not been reduced during the periods shown.
B Total returns do not include the one time sales charge.
C Net investment income per share has been calculated based on average shares outstanding during the period.
D FMR or the fund has entered into varying arrangements with third parties who either paid or reduced a portion of the fund's expenses.
See accompanying notes which are an integral part of the financial statements.
Annual Report
For the period ended July 31, 2000
1. Significant Accounting Policies.
Fidelity Low-Priced Stock Fund (the fund) is a fund of Fidelity Puritan Trust (the trust) and is authorized to issue an unlimited number of shares. The trust is registered under the Investment Company Act of 1940, as amended, as an open-end management investment company organized as a Massachusetts business trust. The financial statements have been prepared in conformity with generally accepted accounting principles which require management to make certain estimates and assumptions at the date of the financial statements. The following summarizes the significant accounting policies of the fund:
Security Valuation. Securities for which exchange quotations are readily available are valued at the last sale price, or if no sale price, at the closing bid price. Foreign securities are valued based on quotations from the principal market in which such securities are normally traded. If trading or events occurring in other markets after the close of the principal market in which foreign securities are traded, and before the close of the business of the fund, are expected to materially affect the value of those securities, then they are valued at their fair value taking this trading or these events into account. Fair value is determined in good faith under consistently applied procedures under the general supervision of the Board of Trustees. Securities (including restricted securities) for which exchange quotations are not readily available (and in certain cases debt securities which trade on an exchange) are valued primarily using
dealer-supplied valuations or at their fair value. Short-term securities with remaining maturities of sixty days or less for which quotations are not readily available are valued at amortized cost or original cost plus accrued interest, both of which approximate current value.
Foreign Currency Translation. The accounting records of the fund are maintained in U.S. dollars. Investment securities and other assets and liabilities denominated in a foreign currency are translated into U.S. dollars at the prevailing rates of exchange at period end. Purchases and sales of securities, income receipts and expense payments are translated into U.S. dollars at the prevailing exchange rate on the respective dates of the transactions.
Net realized gains and losses on foreign currency transactions represent net gains and losses from sales and maturities of foreign currency contracts, disposition of foreign currencies, the difference between the amount of net investment income accrued and the U.S. dollar amount actually received, and gains and losses between trade and settlement date on purchases and sales of securities. The effects of changes in foreign currency exchange rates on investments in securities are included with the net realized and unrealized gain or loss on investment securities.
Income Taxes. As a qualified regulated investment company under Subchapter M of the Internal Revenue Code, the fund is not subject to U.S. federal income taxes to the extent that it distributes substantially all of its taxable income for its fiscal year.
Annual Report
Notes to Financial Statements - continued
1. Significant Accounting Policies - continued
Income Taxes - continued
The fund may be subject to foreign taxes on income and gains on investments which are accrued based upon the fund's understanding of the tax rules and regulations that exist in the markets in which it invests. Foreign governments may also impose taxes on other payments or transactions with respect to foreign securities. The fund accrues such taxes as applicable. The schedule of investments includes information regarding income taxes under the caption "Income Tax Information."
Investment Income. Dividend income is recorded on the ex-dividend date, except certain dividends from foreign securities where the ex-dividend date may have passed, are recorded as soon as the fund is informed of the ex-dividend date. Non-cash dividends included in dividend income, if any, are recorded at the fair market value of the securities received. Interest income, which includes accretion of original issue discount, is accrued as earned. Investment income is recorded net of foreign taxes withheld where recovery of such taxes is uncertain.
Expenses. Most expenses of the trust can be directly attributed to a fund. Expenses which cannot be directly attributed are apportioned among the funds in the trust.
Deferred Trustee Compensation. Under a Deferred Compensation Plan (the Plan) non-interested Trustees must defer receipt of a portion of, and may elect to defer receipt of an additional portion of, their annual compensation. Deferred amounts are treated as though equivalent dollar amounts had been invested in shares of the fund or are invested in a cross-section of other Fidelity funds. Deferred amounts remain in the fund until distributed in accordance with the Plan.
Distributions to Shareholders. Distributions are recorded on the ex-dividend date.
Income and capital gain distributions are determined in accordance with income tax regulations which may differ from generally accepted accounting principles. These differences, which may result in distribution reclassifications, are primarily due to differing treatments for litigation proceeds, foreign currency transactions, passive foreign investment companies (PFIC), market discount, partnerships, non-taxable dividends and losses deferred due to wash sales. The fund also utilized earnings and profits distributed to shareholders on redemption of shares as a part of the dividends paid deduction for income tax purposes.
Permanent book and tax basis differences relating to shareholder distributions will result in reclassifications to paid in capital. Undistributed net investment income and accumulated undistributed net realized gain (loss) on investments and foreign currency transactions may include temporary book and tax basis differences which will reverse in a subsequent period. Any taxable income or gain remaining at fiscal year end is distributed in the following year.
Short-Term Trading (Redemption) Fees. Shares held in the fund less than 90 days are subject to a short-term trading fee equal to 1.50% of the proceeds of the redeemed shares. The fee, which is retained by the fund, is accounted for as an addition to paid in capital.
Annual Report
Notes to Financial Statements - continued
1. Significant Accounting Policies - continued
Security Transactions. Security transactions are accounted for as of trade date. Gains and losses on securities sold are determined on the basis of identified cost.
2. Operating Policies.
Foreign Currency Contracts. The fund generally uses foreign currency contracts to facilitate transactions in foreign-denominated securities. Losses may arise from changes in the value of the foreign currency or if the counterparties do not perform under the contracts' terms. The U.S. dollar value of foreign currency contracts is determined using contractual currency exchange rates established at the time of each trade.
Joint Trading Account. Pursuant to an Exemptive Order issued by the Securities and Exchange Commission (the SEC), the fund, along with other affiliated entities of Fidelity Management & Research Company (FMR), may transfer uninvested cash balances into one or more joint trading accounts. These balances are invested in one or more repurchase agreements for U.S. Treasury or Federal Agency obligations.
Repurchase Agreements. The underlying U.S. Treasury, Federal Agency, or other obligations found to be satisfactory by FMR are transferred to an account of the fund, or to the Joint Trading Account, at a custodian bank. The securities are marked-to-market daily and maintained at a value at least equal to the principal amount of the repurchase agreement (including accrued interest). FMR, the fund's investment adviser, is responsible for determining that the value of the underlying securities remains in accordance with the market value requirements stated above.
Cash Central Funds. Pursuant to an Exemptive Order issued by the SEC, the fund may invest in the Fidelity Cash Central Fund and the Fidelity Securities Lending Cash Central Fund (the Cash Funds) managed by Fidelity Investments Money Management, Inc., an affiliate of FMR. The Cash Funds are open-end money market funds available only to investment companies and other accounts managed by FMR and its affiliates. The Cash Funds seek preservation of capital, liquidity, and current income. Income distributions from the Cash Funds are declared daily and paid monthly from net interest income. Income distributions earned by the fund are recorded as either interest income or security lending income in the accompanying financial statements.
Interfund Lending Program. Pursuant to an Exemptive Order issued by the SEC, the fund, along with other registered investment companies having management contracts with FMR, may participate in an interfund lending program. This program provides an alternative credit facility allowing the fund to borrow from, or lend money to, other participating funds.
Restricted Securities. The fund is permitted to invest in securities that are subject to legal or contractual restrictions on resale. These securities generally may be resold in transactions exempt from registration or to the public if the securities are registered. Disposal of these securities may involve time-consuming negotiations and expense, and prompt sale at an acceptable price may be difficult. At the end
Annual Report
Notes to Financial Statements - continued
2. Operating Policies - continued
Restricted Securities - continued
of the period, the fund had no investments in restricted securities (excluding 144A issues).
3. Purchases and Sales of Investments.
Purchases and sales of securities, other than short-term securities, aggregated $970,125,000 and $2,995,849,000, respectively.
4. Fees and Other Transactions with Affiliates.
Management Fee. As the fund's investment adviser, FMR receives a monthly basic fee that is calculated on the basis of a group fee rate plus a fixed individual fund fee rate applied to the average net assets of the fund. The group fee rate is the weighted average of a series of rates and is based on the monthly average net assets of all the mutual funds advised by FMR. The rates ranged from .2167% to .5200% for the period. The annual individual fund fee rate is .35%. In the event that these rates were lower than the contractual rates in effect during the period, FMR voluntarily implemented the above rates, as they resulted in the same or a lower management fee. The basic fee is subject to a performance adjustment (up to a maximum of ±.20% of the fund's average net assets over the performance period) based on the fund's investment performance as compared to
the appropriate index over a specified period of time. For the period, the management fee was equivalent to an annual rate of .53% of average net assets after the performance adjustment.
Sales Load. For the period, Fidelity Distributors Corporation, an affiliate of FMR and the general distributor of the fund, received sales charges of $804,000 on sales of shares of the fund all of which was retained.
Transfer Agent Fees. Fidelity Service Company, Inc. (FSC), an affiliate of FMR, is the fund's transfer, dividend disbursing and shareholder servicing agent. FSC receives account fees and asset-based fees that vary according to account size and type of account. FSC pays for typesetting, printing and mailing of all shareholder reports, except proxy statements. For the period, the transfer agent fees were equivalent to an annual rate of .24% of average net assets.
Accounting and Security Lending Fees. FSC maintains the fund's accounting records and administers the security lending program. The security lending fee is based on the number and duration of lending transactions. The accounting fee is based on the level of average net assets for the month plus out-of-pocket expenses.
Brokerage Commissions. The fund placed a portion of its portfolio transactions with brokerage firms which are affiliates of FMR. The commissions paid to these affiliated firms were $186,000 for the period.
Annual Report
Notes to Financial Statements - continued
5. Interfund Lending Program.
The fund participated in the interfund lending program as a borrower. The average daily loan balance during the period for which loans were outstanding amounted to $ 17,207,000. The weighted average interest rate was 5.73%. Interest expense includes $219,000 paid under the interfund lending program.
6. Security Lending.
The fund lends portfolio securities from time to time in order to earn additional income. The fund receives collateral in the form of U.S. Treasury obligations, letters of credit, and/or cash against the loaned securities, and maintains collateral in an amount not less than 100% of the market value of the loaned securities during the period of the loan. The market value of the loaned securities is determined at the close of business of the fund and any additional required collateral is delivered to the fund on the next business day. If the borrower defaults on its obligation to return the securities loaned because of insolvency or other reasons, the fund could experience delays and costs in recovering the securities loaned or in gaining access to the collateral. At period end, the value of the securities loaned amounted to $17,086,000. The fund received cash collateral of $17,920,000 which was invested in cash equivalents.
7. Bank Borrowings.
The fund is permitted to have bank borrowings for temporary or emergency purposes to fund shareholder redemptions. The fund has established borrowing arrangements with certain banks. The interest rate on the borrowings is the bank's base rate, as revised from time to time. The average daily loan balance during the period for which loans were outstanding amounted to $11,752,000. The weighted average interest rate was 5.93%. Interest expense includes $85,000 paid under the bank borrowing program.
8. Expense Reductions.
FMR has directed certain portfolio trades to brokers who paid a portion of the fund's expenses. For the period, the fund's expenses were reduced by $419,000 under this arrangement.
In addition, through arrangements with the fund's custodian and transfer agent, credits realized as a result of uninvested cash balances were used to reduce a portion of the fund's expenses. During the period, the fund's custodian and transfer agent fees were reduced by $303,000 and $33,000, respectively, under these arrangements.
Annual Report
Notes to Financial Statements - continued
9. Transactions with Affiliated Companies.
An affiliated company is a company in which the fund has ownership of at least 5% of the voting securities. Transactions during the period with companies which are or were affiliates are as follows:
Summary of Transactions with Affiliated Companies
|
Amounts in thousands |
Purchase Cost |
Sales |
Dividend Income |
Value |
|
Adams Resources & Energy, Inc. |
$ - |
$ - |
$ 42 |
$ 5,635 |
|
Adare Printing Group PLC |
- |
268 |
56 |
- |
|
Advanced Digital Information Corp. |
- |
3,993 |
- |
- |
|
Align-Rite International, Inc. |
- |
883 |
- |
- |
|
Allied Research Corp. |
- |
96 |
- |
3,633 |
|
Alpine Oil Services Corp. |
185 |
- |
- |
3,556 |
|
Applebee's International, Inc. |
2,705 |
4,706 |
214 |
46,039 |
|
ARK Restaurants Corp. |
234 |
- |
- |
2,766 |
|
Arnold Industries, Inc. |
- |
5,706 |
624 |
- |
|
Asahi Concrete Works Co. Ltd. |
- |
- |
92 |
3,575 |
|
Astronics Corp. |
164 |
- |
- |
4,006 |
|
Atlantic Tele-Network, Inc. |
35 |
- |
319 |
5,250 |
|
Autocam Corp. |
- |
3,034 |
17 |
- |
|
Avant! Corp. |
4,715 |
- |
- |
35,586 |
|
Aztec Manufacturing Co. |
748 |
- |
67 |
6,978 |
|
Bairnco Corp. |
- |
- |
180 |
6,475 |
|
Ballard Medical Products |
- |
23,918 |
- |
- |
|
Bank of The Ozarks, Inc. |
409 |
- |
64 |
3,237 |
|
Banyan Strategic Realty Trust (SBI) |
- |
1,057 |
311 |
- |
|
Beazer Homes USA, Inc. |
721 |
- |
- |
14,110 |
|
Benihana, Inc. |
15 |
- |
- |
4,864 |
|
Benihana, Inc. Class A |
- |
- |
- |
3,468 |
|
Bergansbanken ASA |
- |
6,431 |
- |
- |
|
Black Box Corp. |
- |
2,570 |
- |
61,088 |
|
Blair Corp. |
193 |
- |
475 |
16,615 |
|
BMTC Group, Inc. Class A (sub. vtg.) |
- |
- |
57 |
4,976 |
|
Boyd Brothers Transportation, Inc. |
55 |
1,380 |
- |
- |
|
Brampton Brick Ltd. Class A |
472 |
- |
- |
2,339 |
|
Brookstone Co., Inc. |
- |
- |
- |
8,749 |
|
BTU International, Inc. |
1,216 |
10 |
- |
6,338 |
Annual Report
Notes to Financial Statements - continued
9. Transactions with Affiliated Companies - continued
Summary of Transactions with Affiliated Companies - continued
|
Amounts in thousands |
Purchase Cost |
Sales |
Dividend Income |
Value |
|
Bush Industries, Inc. Class A |
$ - |
$ 3,081 |
$ 179 |
$ 11,932 |
|
Cameron Ashley Building Products, Inc. |
286 |
5,624 |
- |
- |
|
Canadian Western Bank |
- |
4,222 |
61 |
- |
|
Cannon Express, Inc. Class A |
5 |
1,101 |
- |
- |
|
Castle Energy Corp. |
- |
267 |
238 |
8,242 |
|
Chase Corp. |
841 |
- |
105 |
4,329 |
|
Chase Industries, Inc. |
- |
- |
- |
8,287 |
|
Chateau Stores of Canada Ltd. Class A |
- |
- |
34 |
616 |
|
Cobra Electronics Corp. |
530 |
- |
- |
3,794 |
|
Cogeco Cable, Inc. |
- |
- |
140 |
25,282 |
|
Cogeco, Inc. (sub. vtg.) |
- |
4,706 |
144 |
18,976 |
|
Cold Metal Products, Inc. |
423 |
- |
54 |
1,362 |
|
Cole National Corp. Class A |
- |
5,105 |
11 |
7,095 |
|
Columbus Energy Corp. |
- |
- |
- |
1,922 |
|
Computer Learning Centers, Inc. |
- |
6,924 |
- |
- |
|
Concord Fabrics, Inc. Class A |
- |
294 |
- |
- |
|
Concord Fabrics, Inc. Class B |
- |
341 |
- |
- |
|
Conso International Corp. |
- |
4,067 |
- |
- |
|
Corvel Corp. |
2,050 |
39 |
- |
20,625 |
|
Cotton State Life & Health Insurance Co. |
589 |
369 |
66 |
4,199 |
|
CPAC, Inc. |
- |
1,006 |
167 |
4,367 |
|
Crossman Communities, Inc. |
183 |
- |
- |
17,387 |
|
Cryolife, Inc. |
- |
1,089 |
- |
14,280 |
|
Cybex Corp. |
7 |
992 |
- |
- |
|
D.C. Cook Holdings PLC |
- |
- |
- |
569 |
|
Dallas Semiconductor Corp. |
- |
6,252 |
456 |
152,407 |
|
Dawson Geophysical Co. |
- |
1,392 |
- |
2,960 |
|
Decorator Industries, Inc. |
- |
706 |
59 |
875 |
|
Del Global Technologies Corp. |
586 |
- |
- |
7,093 |
|
Desjardins-Laurentian Finance Corp. |
- |
- |
33 |
5,369 |
|
Devcon International Corp. |
219 |
- |
- |
2,308 |
|
Diodes, Inc. |
101 |
3,112 |
- |
- |
|
Diversified Corporate Resources |
- |
67 |
- |
710 |
|
Dominion Homes, Inc. |
- |
- |
- |
3,089 |
|
Doral Financial Corp. |
798 |
- |
197 |
28,470 |
|
Drew Industries, Inc. |
- |
2,950 |
- |
7,031 |
Annual Report
Notes to Financial Statements - continued
9. Transactions with Affiliated Companies - continued
Summary of Transactions with Affiliated Companies - continued
|
Amounts in thousands |
Purchase Cost |
Sales |
Dividend Income |
Value |
|
DSG International Ltd. |
$ - |
$ 1,932 |
$ - |
$ 2,114 |
|
Ducommun, Inc. |
- |
108 |
- |
14,585 |
|
Elscint Ltd. |
351 |
437 |
- |
8,055 |
|
Elxsi Corp. |
- |
352 |
- |
2,600 |
|
ENEX Resources Corp. |
- |
- |
- |
433 |
|
Engineered Support Systems, Inc. |
499 |
1,754 |
15 |
5,390 |
|
Engle Homes, Inc. |
32 |
- |
241 |
9,625 |
|
Equinox Systems, Inc. |
2,035 |
- |
- |
2,943 |
|
Equitrac Corp. |
- |
797 |
- |
- |
|
ESC Medical Systems Ltd. |
- |
3,206 |
- |
33,825 |
|
Fansteel, Inc. |
785 |
505 |
- |
3,389 |
|
Farm Family Holdings, Inc. |
- |
3,677 |
- |
12,079 |
|
Federal Screw Works |
- |
- |
250 |
4,393 |
|
Financial Industries Corp. |
369 |
- |
49 |
2,625 |
|
Finish Line, Inc. Class A |
- |
- |
- |
15,252 |
|
Finlay Enterprises, Inc. |
566 |
- |
- |
13,418 |
|
First BanCorp PR |
- |
1,411 |
989 |
51,407 |
|
First Commonwealth, Inc. |
- |
1,149 |
- |
- |
|
Flanigans Enterprises, Inc. |
84 |
- |
20 |
853 |
|
Footstar, Inc. |
- |
10,703 |
- |
31,018 |
|
Foremost Industries, Inc. |
- |
- |
- |
679 |
|
Friedmans, Inc. Class A |
- |
- |
74 |
7,726 |
|
FRM Nexus, Inc. |
- |
97 |
- |
135 |
|
Gardner Denver Machinery, Inc. |
1,148 |
226 |
- |
17,772 |
|
GBC Bancorp |
62 |
1,110 |
172 |
- |
|
Gehl Co. |
- |
- |
- |
8,652 |
|
General Semiconductor, Inc. |
5,264 |
10,529 |
- |
38,036 |
|
Genesee & Wyoming, Inc. Class A |
2,104 |
- |
- |
6,188 |
|
Genlyte Group, Inc. |
660 |
114 |
- |
15,909 |
|
Giant Cement Holding, Inc. |
3,960 |
8,285 |
- |
- |
|
Giant Industries, Inc. |
615 |
- |
- |
3,753 |
|
Goodfellow, Inc. |
248 |
- |
81 |
2,851 |
|
Griffon Corp. |
- |
284 |
- |
16,688 |
|
GSE Systems, Inc. |
103 |
1,365 |
- |
- |
|
Hampshire Group Ltd. |
- |
- |
- |
3,228 |
|
Hanmi Financial Corp. |
4,521 |
- |
- |
9,676 |
|
Healthcare Recoveries, Inc. |
481 |
- |
- |
4,380 |
Annual Report
Notes to Financial Statements - continued
9. Transactions with Affiliated Companies - continued
Summary of Transactions with Affiliated Companies - continued
|
Amounts in thousands |
Purchase Cost |
Sales |
Dividend Income |
Value |
|
Helen of Troy Corp. |
$ 1,226 |
$ - |
$ - |
$ 16,656 |
|
Herbalife International, Inc. Class A |
- |
- |
- |
- |
|
Hirsch International Corp. Class A |
34 |
- |
- |
831 |
|
Holly Corp. |
- |
- |
561 |
9,900 |
|
Home Port Bancorp, Inc. |
920 |
- |
141 |
6,170 |
|
Horizon Health Corp. |
232 |
- |
- |
3,541 |
|
Hurco Companies, Inc. |
- |
133 |
- |
1,365 |
|
Hyder PLC |
2,062 |
- |
940 |
42,505 |
|
ICU Medical, Inc. |
1,168 |
- |
- |
20,950 |
|
IDEX Corp. |
- |
800 |
210 |
- |
|
IHOP Corp. |
3,422 |
294 |
- |
32,750 |
|
Independence Federal Savings Bank |
- |
- |
82 |
1,202 |
|
InfoUSA, Inc. |
9,393 |
2,963 |
- |
19,500 |
|
Institution of General Education Co. |
- |
- |
63 |
- |
|
Intercontinental Life Corp. |
45 |
- |
- |
8,343 |
|
Intest Corp. |
8 |
28 |
- |
10,075 |
|
IPC Holdings Ltd. |
- |
- |
1,195 |
39,735 |
|
JDA Software Group Inc. |
- |
1,263 |
- |
- |
|
Jean Coutu Group, Inc. Class A |
- |
546 |
220 |
39,217 |
|
JLM Couture, Inc. |
- |
- |
- |
499 |
|
Kenneth Cole Productions, Inc. Class A |
- |
5,248 |
- |
- |
|
Kentucky Electric Steel, Inc. |
615 |
- |
- |
735 |
|
Koss Corp. |
- |
936 |
- |
- |
|
Kronos, Inc. |
1,881 |
4,536 |
- |
30,311 |
|
Lady Luck Gaming Corp. |
272 |
290 |
- |
- |
|
Lai Worldwide, Inc. |
- |
3,094 |
- |
- |
|
Lakes Gaming, Inc. |
2,330 |
- |
- |
9,339 |
|
Lasalle Re Holdings Ltd. |
- |
- |
- |
25,546 |
|
Life USA Holding, Inc. |
- |
3,368 |
- |
- |
|
M/I Schottenstein Homes, Inc. |
- |
- |
176 |
15,840 |
|
Mark VII, Inc. |
- |
3,266 |
- |
- |
|
Markwest Hydrocarbon, Inc. |
1,309 |
- |
- |
5,479 |
|
Marten Transport Ltd. |
- |
- |
- |
6,044 |
|
Maynard Oil Co. |
993 |
12 |
- |
7,483 |
|
Medstone International, Inc. |
- |
- |
- |
3,069 |
|
Mercury Air Group, Inc. |
- |
631 |
- |
3,348 |
|
Mesa Laboratories, Inc. |
31 |
- |
- |
1,099 |
Annual Report
Notes to Financial Statements - continued
9. Transactions with Affiliated Companies - continued
Summary of Transactions with Affiliated Companies - continued
|
Amounts in thousands |
Purchase Cost |
Sales |
Dividend Income |
Value |
|
Metro, Inc. Class A |
$ - |
$ - |
$ 518 |
$ 40,237 |
|
MFC Bancorp Ltd. |
1,240 |
- |
- |
5,370 |
|
Micro Linear Corp. |
- |
6,835 |
- |
- |
|
Microsemi Corp. |
- |
7,557 |
- |
- |
|
Midcoast Energy Resources, Inc. |
388 |
- |
96 |
11,176 |
|
Midwest Express Holdings, Inc. |
844 |
8,611 |
- |
- |
|
Mikes Restaurants, Inc. |
12 |
- |
- |
420 |
|
MMI Companies, Inc. |
- |
7,000 |
228 |
- |
|
Moffat Communications Ltd. |
- |
1,899 |
202 |
39,424 |
|
Monro Muffler Brake, Inc. |
974 |
313 |
- |
6,787 |
|
Morton's Restaurant Group, Inc. |
- |
- |
- |
7,380 |
|
Movado Group, Inc. |
60 |
- |
95 |
13,053 |
|
Murakami Corp. |
64 |
- |
52 |
4,747 |
|
MYR Group, Inc. |
1,452 |
2,459 |
67 |
- |
|
Nanometrics, Inc. |
- |
3,184 |
- |
- |
|
National Western Life |
- |
- |
- |
12,495 |
|
Nature's Sunshine Products, Inc. |
3,314 |
- |
169 |
12,319 |
|
Nautica Enterprises, Inc. |
- |
- |
- |
39,259 |
|
Nordlandsbanken AS |
- |
- |
319 |
9,029 |
|
Novus Petroleum Ltd. |
3,461 |
- |
- |
11,970 |
|
Nu Horizons Electronics Corp. |
- |
- |
- |
- |
|
Oakwood Homes Corp. |
- |
23,498 |
112 |
4,731 |
|
Octel Corp. |
- |
- |
- |
12,604 |
|
Ocular Sciences, Inc. |
8,259 |
- |
- |
19,602 |
|
OEC Medical Systems, Inc. |
- |
6,068 |
- |
- |
|
Oilgear Co. |
380 |
- |
41 |
1,846 |
|
Old Dominion Freight Lines, Inc. |
- |
- |
- |
8,104 |
|
One Price Clothing Stores, Inc. |
1,566 |
- |
- |
1,967 |
|
Oriole Homes Corp. Class B |
- |
- |
- |
360 |
|
Orthofix International NV |
426 |
- |
- |
19,546 |
|
P&F Industries, Inc. Class A |
573 |
- |
- |
3,039 |
|
P.A.M. Transportation Services, Inc. |
645 |
- |
- |
4,491 |
|
Patrick Industries, Inc. |
- |
2,597 |
77 |
2,841 |
|
PAULA Financial |
184 |
- |
47 |
1,332 |
|
Pe Ben Oilfield Services Ltd. |
61 |
- |
- |
1,012 |
Annual Report
Notes to Financial Statements - continued
9. Transactions with Affiliated Companies - continued
Summary of Transactions with Affiliated Companies - continued
|
Amounts in thousands |
Purchase Cost |
Sales |
Dividend Income |
Value |
|
Peak International Ltd. |
$ 4,091 |
$ - |
$ - |
$ 7,472 |
|
Perry Ellis International, Inc. |
15 |
- |
- |
4,446 |
|
Perry Group PLC |
251 |
- |
296 |
3,118 |
|
Petroleum Development Corp. |
124 |
- |
- |
7,989 |
|
Petroleum Helicopters, Inc. |
- |
- |
11 |
2,138 |
|
Philadelphia Consolodated Holding Corp. |
1,545 |
- |
- |
17,698 |
|
Piercing Pagoda, Inc. |
101 |
- |
- |
13,535 |
|
Piolax, Inc. |
700 |
- |
121 |
4,663 |
|
Pittston Co. - Brink's Group |
992 |
- |
156 |
37,476 |
|
Pittston Co. (BAX Group) |
622 |
12,338 |
197 |
- |
|
Pomeroy Computer Resources, Inc. |
239 |
- |
- |
20,057 |
|
Powell Industries, Inc. |
- |
2,777 |
- |
5,649 |
|
Pubco Corp. |
- |
- |
- |
2,376 |
|
PXRE Corp. |
3,237 |
- |
133 |
9,788 |
|
Quest Diagnostics, Inc. |
- |
- |
- |
- |
|
Quest Education Corp. |
37 |
3,566 |
- |
- |
|
Quicks Group PLC |
335 |
- |
511 |
3,957 |
|
Quixote Corp. |
475 |
- |
218 |
10,896 |
|
Raytech Corp. |
- |
36 |
- |
889 |
|
RCM Technologies, Inc. |
1,701 |
- |
- |
4,571 |
|
Redwood Trust, Inc. |
- |
2,150 |
1,120 |
13,251 |
|
RehabCare Group, Inc. |
429 |
654 |
- |
46,053 |
|
Reliability, Inc. |
801 |
743 |
- |
2,206 |
|
Remedy Corp. |
- |
1,000 |
- |
- |
|
RemedyTemp, Inc. Class A |
490 |
263 |
- |
6,446 |
|
Res-Care, Inc. |
1,466 |
97 |
- |
10,263 |
|
Respironics, Inc. |
- |
6,309 |
- |
31,402 |
|
Rex Stores Corp. |
2,838 |
326 |
- |
11,520 |
|
Reynolds & Reynolds Co. Class A |
1,819 |
1,621 |
1,710 |
65,582 |
|
Richardsons Westgarth PLC |
- |
2,748 |
29 |
- |
|
Richmont Mines, Inc. |
14 |
- |
- |
910 |
|
Right Management Consultants, Inc. |
- |
- |
- |
6,730 |
|
Ringkjoebing Bank |
- |
- |
56 |
2,367 |
|
Riviana Foods, Inc. |
443 |
- |
467 |
14,040 |
|
Robertson Ceco Corp. |
- |
1,468 |
- |
- |
|
RPC, Inc. |
119 |
7 |
389 |
28,370 |
|
S&K Famous Brands, Inc. |
- |
1,780 |
- |
- |
Annual Report
Notes to Financial Statements - continued
9. Transactions with Affiliated Companies - continued
Summary of Transactions with Affiliated Companies - continued
|
Amounts in thousands |
Purchase Cost |
Sales |
Dividend Income |
Value |
|
Safeguard Health Enterprises, Inc. |
$ - |
$ 2,977 |
$ - |
$ - |
|
SBS Technologies, Inc. |
1,499 |
263 |
- |
21,664 |
|
Schultz Sav-O Stores, Inc. |
204 |
- |
142 |
4,900 |
|
Seattle FilmWorks, Inc. |
- |
- |
- |
- |
|
SED International Holdings, Inc. |
- |
- |
- |
3,390 |
|
Serologicals Corp. |
- |
2,550 |
- |
- |
|
ShoLodge, Inc. |
- |
- |
- |
1,207 |
|
Sigmatron International, Inc. |
523 |
- |
- |
605 |
|
Sonic Corp. |
- |
- |
- |
58,592 |
|
Sons of Gwalia NL |
144 |
- |
132 |
- |
|
Sound Advice, Inc. |
68 |
- |
- |
1,902 |
|
Southern Energy Homes, Inc. |
- |
12 |
- |
1,781 |
|
Southwestern Energy Co. |
64 |
4,641 |
314 |
10,436 |
|
Sparebanken Rana Grunnfondsbevis |
- |
- |
38 |
627 |
|
Spiezman Industries, Inc. |
- |
246 |
- |
- |
|
SPSS, Inc. |
88 |
428 |
- |
25,394 |
|
Standard Commercial Corp. |
140 |
- |
253 |
6,271 |
|
Stanley Furniture Co., Inc. |
271 |
- |
- |
16,050 |
|
Stantec, Inc. |
956 |
- |
- |
6,566 |
|
Stephan Co. |
414 |
- |
28 |
1,739 |
|
Sterile Recoveries Inc. |
23 |
597 |
- |
- |
|
Sterling Bancorp |
702 |
- |
310 |
9,295 |
|
Stirling Cooke Brown Holdings Ltd. |
338 |
- |
98 |
1,857 |
|
Strattec Security Corp. |
1,658 |
- |
- |
18,505 |
|
Superior Energy Services, Inc. |
- |
- |
- |
- |
|
Suprema Specialties, Inc. |
- |
355 |
- |
4,104 |
|
Swift Energy Co. |
1,282 |
1,487 |
- |
45,191 |
|
Sylvan, Inc. |
463 |
- |
- |
3,281 |
|
Taitron Components, Inc. Class A |
- |
505 |
- |
1,518 |
|
Talentum Oyj (B Shares) |
- |
947 |
- |
- |
|
Tandy Brands Accessories, Inc. |
- |
436 |
- |
4,871 |
|
TB Wood's Corp. |
352 |
78 |
118 |
3,806 |
|
TBC Corp. |
1,670 |
- |
- |
9,770 |
|
Tech-Sym Corp. |
433 |
4,535 |
- |
- |
|
Terra Nova (Bermuda) |
412 |
26,478 |
216 |
- |
|
Toami Corp. |
- |
- |
47 |
1,590 |
Annual Report
Notes to Financial Statements - continued
9. Transactions with Affiliated Companies - continued
Summary of Transactions with Affiliated Companies - continued
|
Amounts in thousands |
Purchase Cost |
Sales |
Dividend Income |
Value |
|
Todhunter International Inc. |
$ - |
$ 249 |
$ - |
$ - |
|
Tollgrade Communications, Inc. |
- |
3,753 |
- |
- |
|
Trancom Co. Ltd. |
- |
192 |
43 |
2,140 |
|
Transpro, Inc. |
- |
- |
132 |
2,933 |
|
Twin Disc, Inc. |
194 |
- |
164 |
4,231 |
|
U.S. Home Corp. |
6,111 |
8,364 |
- |
- |
|
UCBH Holdings, Inc. |
1,666 |
41 |
68 |
19,350 |
|
UICI |
447 |
16,992 |
- |
- |
|
Unico American Corp. |
- |
567 |
- |
- |
|
Unigraphics Solutions, Inc. Class A |
- |
434 |
- |
8,093 |
|
Uni-Select, Inc. |
- |
990 |
137 |
6,524 |
|
Universal Health Services, Inc. Class B |
- |
3,303 |
- |
- |
|
Up, Inc. |
- |
- |
50 |
1,535 |
|
URS Corp. |
983 |
- |
- |
19,659 |
|
USEC, Inc. |
568 |
3,546 |
7,118 |
36,999 |
|
Utah Medical Products, Inc. |
- |
- |
- |
5,312 |
|
Vertex Communications Corp. |
- |
2,872 |
- |
- |
|
Video Display Corp. |
- |
210 |
- |
- |
|
Wao Corp. |
- |
- |
- |
1,658 |
|
Western Beef, Inc. |
- |
1,556 |
- |
- |
|
Willbros Group, Inc. |
- |
733 |
- |
- |
|
Winsloew Furniture, Inc. |
- |
2,208 |
- |
- |
|
Winston Resources, Inc. |
- |
738 |
- |
- |
|
Wireless Telecom Group, Inc. |
281 |
5,703 |
- |
4,130 |
|
World Fuel Services Corp. |
- |
- |
250 |
9,921 |
|
Wynn's International, Inc. |
446 |
7,263 |
499 |
- |
|
Totals |
$ 137,500 |
$ 397,360 |
$ 27,535 |
$ 2,402,464 |
Annual Report
To the Trustees of Fidelity Puritan Trust and the Shareholders of Fidelity Low-Priced Stock Fund:
In our opinion, the accompanying statement of assets and liabilities, including the schedule of investments, and the related statements of operations and of changes in net assets and the financial highlights present fairly, in all material respects, the financial position of Fidelity Low-Priced Stock Fund (a fund of Fidelity Puritan Trust) at July 31, 2000, and the results of its operations, the changes in its net assets and the financial highlights for the periods indicated, in conformity with accounting principles generally accepted in the United States. These financial statements and financial highlights (hereafter referred to as "financial statements") are the responsibility of the Fidelity Low-Priced Stock Fund's management; our responsibility is to express an opinion on these financial statements based on our audits. We conducted our audits of these financial statements in accordance with auditing standards generally accepted in the United States which require that we plan and perform the audit to obtain reasonable assurance about whether the financial statements are free of material misstatement. An audit includes examining, on a test basis, evidence supporting the amounts and disclosures in the financial statements, assessing the accounting principles used and significant estimates made by management, and evaluating the overall financial statement presentation. We believe that our audits, which included confirmation of securities at July 31, 2000 by correspondence with the custodian and brokers, provide a reasonable basis for the opinion expressed above.
/s/PricewaterhouseCoopers LLP
PricewaterhouseCoopers LLP
Boston, Massachusetts
September 11, 2000
Annual Report
The Board of Trustees of Fidelity Low-Priced Stock Fund voted to pay on September 11, 2000, to shareholders of record at the opening of business on September 8, 2000, a distribution of $2.75 per share derived from capital gains realized from sales of portfolio securities and a dividend of $.08 per share from net investment income.
A total of 80% of the dividends distributed during the fiscal year qualifies for the dividends-received deduction for corporate shareholders.
The fund hereby designates 100% of the long-term capital gain dividends distributed during the fiscal year as 20%-rate capital gain dividends.
The fund will notify shareholders in January 2001 of amounts for use in preparing 2000 income tax returns.
Annual Report
Fidelity offers several ways to conveniently manage your personal investments via your telephone or PC. You can access your account information, conduct trades and research your investments 24 hours a day.
By Phone
Fidelity Automated Service Telephone provides a single toll-free number to access account balances, positions, quotes and trading. It's easy to navigate the service, and on your first call, the system will help you create a personal identification number (PIN) for security.
(phone_graphic)
Fidelity Automated
Service Telephone (FAST®)
1-800-544-5555
Press
1 For mutual fund and brokerage trading.
2 For quotes.*
3 For account balances and holdings.
4 To review orders and mutual
fund activity.
5 To change your PIN.
*0 To speak to a Fidelity representative.
By PC
Fidelity's web site on the Internet provides a wide range of information, including daily financial news, fund performance, interactive planning tools and news about Fidelity products and services.
(computer_graphic)
Fidelity's Web Site
www.fidelity.com
If you are not currently on the Internet, call EarthLink Sprint at 1-800-288-2967, and be sure to ask for registration number SMD004 to receive a special Fidelity package that includes 30 days of free Internet access. EarthLink is North America's #1 independent Internet access provider.
(computer_graphic)
Fidelity On-line Xpress+®
Fidelity On-line Xpress+ software for Windows combines comprehensive portfolio management capabilities, securities trading and access to research and analysis tools . . . all on your desktop. Call Fidelity at 1-800-544-0240 or visit our web site for more information on how to manage your investments via your PC.
* When you call the quotes line, please remember that a fund's yield and return will vary and, except for money market funds, share price will also vary. This means that you may have a gain or loss when you sell your shares. There is no assurance that money market funds will be able to maintain a stable $1 share price; an investment in a money market fund is not insured or guaranteed by the U.S. government. Total returns are historical and include changes in share price, reinvestment of dividends and capital gains, and the effects of any sales charges.
Annual Report
Investment Adviser
Fidelity Management & Research Company
Boston, MA
Investment Sub-Adviser
Fidelity Management & Research
(U.K.) Inc.
Fidelity Management & Research
(Far East) Inc.
Fidelity Investments Japan Limited
Officers
Edward C. Johnson 3d, President
Robert C. Pozen, Senior Vice President
Abigail P. Johnson, Vice President
Joel C. Tillinghast, Vice President
Eric D. Roiter, Secretary
Robert A. Dwight, Treasurer
Maria F. Dwyer, Deputy Treasurer
John H. Costello, Assistant Treasurer
Board of Trustees
Ralph F. Cox *
Phyllis Burke Davis *
Robert M. Gates *
Edward C. Johnson 3d
Donald J. Kirk *
Ned C. Lautenbach *
Peter S. Lynch
Marvin L. Mann *
William O. McCoy *
Gerald C. McDonough *
Robert C. Pozen
Thomas R. Williams *
Advisory Board
J. Michael Cook
Marie L. Knowles
General Distributor
Fidelity Distributors Corporation
Boston, MA
Transfer and Shareholder
Servicing Agent
Fidelity Service Company, Inc.
Boston, MA
* Independent trustees
Custodian
Brown Brothers Harriman & Co.
Boston, MA
Fidelity's Growth Funds
Aggressive Growth Fund
Blue Chip Growth Fund
Capital Appreciation Fund
Contrafund ®
Contrafund® II
Disciplined Equity Fund
Dividend Growth Fund
Export and Multinational Fund
Fidelity Fifty ®
Growth Company Fund
Large Cap Stock Fund
Low-Priced Stock Fund
Magellan® Fund
Mid-Cap Stock Fund
New Millennium Fund®
OTC Portfolio
Retirement Growth Fund
Small Cap Selector
Small Cap Stock Fund
Stock Selector
Tax Managed Stock Fund
TechnoQuant ® Growth Fund
Trend Fund
Value Fund
The Fidelity Telephone Connection
Mutual Fund 24-Hour Service
Exchanges/Redemptions
and Account Assistance 1-800-544-6666
Product Information 1-800-544-6666
Retirement Accounts 1-800-544-4774
(8 a.m. - 9 p.m.)
TDD Service 1-800-544-0118
for the deaf and hearing impaired
(9 a.m. - 9 p.m. Eastern time)
Fidelity Automated Service
Telephone (FAST ®) (automated graphic) 1-800-544-5555
(automated graphic) Automated line for quickest service
LPS-ANN-0900 111654
1.536378.103
(Fidelity Investment logo)(registered trademark)
Corporate Headquarters
82 Devonshire St., Boston, MA 02109
www.fidelity.com
Fidelity®
Fund
Annual Report
July 31, 2000
(2_fidelity_logos) (Registered_Trademark)
|
President's Message |
3 |
Ned Johnson on investing strategies. |
|
Performance |
4 |
How the fund has done over time. |
|
Fund Talk |
6 |
The manager's review of fund performance, strategy and outlook. |
|
Investment Changes |
9 |
A summary of major shifts in the fund's investments over the past 12 months. |
|
Investments |
10 |
A complete list of the fund's investments with their market values. |
|
Financial Statements |
45 |
Statements of assets and liabilities,
operations, and changes in net assets, |
|
Notes |
49 |
Notes to the financial statements. |
|
Report of Independent |
55 |
The auditors' opinion |
|
Distributions |
56 |
|
Standard & Poor's, S&P and S&P 500 are registered service marks of The McGraw-Hill Companies, Inc. and have been licensed for use by Fidelity Distributors Corporation.
Other third party marks appearing herein are the property of their respective owners.
All other marks appearing herein are registered or unregistered trademarks or service marks of FMR Corp. or an affiliated company.
(Recycle graphic) This report is printed on recycled paper using soy-based inks. This report and the financial statements contained herein are submitted for the
general information
of the shareholders of the fund. This report is not authorized for distribution to prospective investors
in the fund unless preceded or accompanied by an effective prospectus.
Mutual fund shares are not deposits or obligations of, or guaranteed by, any depository institution. Shares are not insured by the FDIC, Federal Reserve Board or any other agency, and are subject to investment risks, including possible loss of principal amount invested.
Neither the fund nor Fidelity Distributors Corporation is a bank.
For more information on any Fidelity fund, including charges and expenses, call 1-800-544-6666 for a free prospectus. Read it carefully before you invest or send money.
Annual Report
(Photograph of Edward C. Johnson 3d.)
Dear Shareholder:
The Federal Reserve Board's effort to keep inflation in check without over-cooling the U.S. economy has taken a toll on the stock market. Through July 2000, bellwether equity indexes such as the Dow Jones Industrial Average, NASDAQ and S&P 500® have negative returns for the year. On the other hand, fixed-income markets are enjoying strong performance. Except for high-yield, most bond sectors - corporates, mortgages, Treasuries and agencies - have returned 4%-6% year to date.
While it's impossible to predict the future direction of the markets with any degree of certainty, there are certain basic principles that can help investors plan for their future needs.
First, investors are encouraged to take a long-term view of their portfolios. If you can afford to leave your money invested through the inevitable up and down cycles of the financial markets, you will greatly reduce your vulnerability to any single decline. We know from experience, for example, that stock prices have gone up over longer periods of time, have significantly outperformed other types of investments and have stayed ahead of inflation.
Second, you can further manage your investing risk through diversification. A stock mutual fund, for instance, is already diversified, because it invests in many different companies. You can increase your diversification further by investing in a number of different stock funds, or in such other investment categories as bonds. If you have a short investment time horizon, you might want to consider moving some of your investment into a money market fund, which seeks income and a stable share price by investing in high-quality, short-term investments. Of course, it's important to remember that an investment in a money market fund is not insured or guaranteed by the Federal Deposit Insurance Corporation or any other government agency. Although money market funds seek to preserve the value of your investment at $1.00 per share, it is possible to lose money by investing in these types of funds.
Finally, no matter what your time horizon or portfolio diversity, it makes good sense to follow a regular investment plan, investing a certain amount of money in a fund at the same time each month or quarter and periodically reviewing your overall portfolio. By doing so, you won't get caught up in the excitement of a rapidly rising market, nor will you buy all your shares at market highs. While this strategy - known as dollar cost averaging - won't assure a profit or protect you from a loss in a declining market, it should help you lower the average cost of your purchases. Of course, you should consider your financial ability to continue your purchases through periods of low price levels before undertaking such a strategy.
If you have questions, please call us at 1-800-544-6666, or visit our web site at www.fidelity.com. We are available 24 hours a day, seven days a week to provide you the information you need to make the investments that are right for you.
Best regards,
/s/Edward C. Johnson 3d
Edward C. Johnson 3d
Annual Report
There are several ways to evaluate a fund's historical performance. You can look at the total percentage change in value, the average annual percentage change or the growth of a hypothetical $10,000 investment. Total return reflects the change in the value of an investment, assuming reinvestment of the fund's dividend income and capital gains (the profits earned upon the sale of securities that have grown in value).
Cumulative Total Returns
|
Periods ended July 31, 2000 |
|
Past 1 |
Past 5 |
Past 10 |
|
Fidelity Puritan |
|
1.34% |
81.23% |
250.15% |
|
Fidelity Balanced Income Composite |
|
-0.04% |
82.70% |
222.99% |
|
LB Aggregate Bond |
|
5.97% |
36.94% |
111.27% |
|
S&P 500 |
|
8.98% |
177.11% |
408.31% |
|
Balanced Funds Average |
|
6.04% |
84.11% |
207.07% |
Cumulative total returns show the fund's performance in percentage terms over a set period - in this case, one year, five years or 10 years. For example, if you had invested $1,000 in a fund that had a 5% return over the past year, the value of your investment would be $1,050. You can compare the fund's returns to the performance of the Fidelity Balanced Income Composite Index - a hypothetical combination of unmanaged indices combining the total returns of the Russell 3000 Value Index and the Lehman Brothers Aggregate Bond Index using a weighting of 60% and 40%, respectively. To measure how the fund's performance stacked up against its peers, you can compare it to the balanced funds average, which reflects the performance of mutual funds with similar objectives tracked by Lipper Inc. The past one year average represents a peer group of 461 mutual funds. These benchmarks include reinvested dividends and capital gains, if any, and exclude the effect of sales charges.
Average Annual Total Returns
|
Periods ended July 31, 2000 |
Past 1 |
Past 5 |
Past 10 |
|
Fidelity Puritan |
1.34% |
12.63% |
13.35% |
|
Fidelity Balanced Income Composite |
-0.04% |
12.81% |
12.44% |
Average annual total returns take the fund's cumulative return and show you what would have happened if the fund had performed at a constant rate each year.
Annual Report
$10,000 Over 10 Years
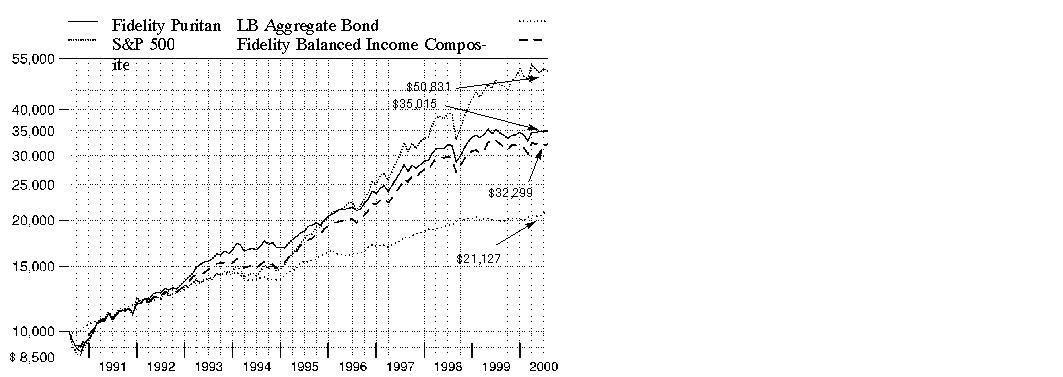
$10,000 Over 10 Years: Let's say hypothetically that $10,000 was invested in Fidelity Puritan Fund on July 31, 1990. As the chart shows, by July 31, 2000, the value of the investment would have grown to $35,015 - a 250.15% increase on the initial investment. For comparison, look at how the Standard & Poor's 500 Index, a market capitalization-weighted index of common stocks, and the Lehman Brothers Aggregate Bond Index, a market value-weighted index of investment-grade fixed-rate debt issues, including government, corporate, asset-backed, and mortgage-backed securities, with maturities of one year or more, did over the same period. With dividends and capital gains, if any, reinvested, the Standard & Poor's 500 Index would have grown to $50,831 - a 408.31% increase. If $10,000 was invested in the Lehman Brothers Aggregate Bond Index, it would have grown to $21,127 - a 111.27% increase. You can also look at how the Fidelity Balanced Income Composite Index did over the same period. The composite index combines the total returns of the Russell 3000 Value Index and the Lehman Brothers Aggregate Bond Index, and assumes monthly rebalancing of the mix. With dividends and interest, if any, reinvested, the same $10,000 would have grown to $32,299 - a 222.99% increase.
Understanding
Performance
How a fund did yesterday is no guarantee of how it will do tomorrow. The stock market, for example, has a history of long-term growth and short-term volatility. In turn, the share price and return of a fund that invests in stocks will vary. That means if you sell your shares during a market downturn, you might lose money. But if you can ride out the market's ups and downs, you may have a gain.
3Annual Report
Market Recap
During the 12-month period that ended July 31, 2000, the U.S. securities markets struggled to break free from the grip of the Federal Reserve Board, whose effort to cool the overheated economy was delivered via a series of five interest-rate hikes. With every clench of its fist, the Fed's effort - which raised the federal funds rate by a combined total of 1.50% - gradually tempered the optimism toward stocks as the period progressed. Most of the effect of the Fed's tightening, coupled with the market's concerns about corporate earnings, took its toll on stocks starting in the second quarter of 2000. The Standard & Poor's 500 Index, an index of 500 larger companies, returned 8.98% for the past year, but feeling the impact of the Fed's action, has lost 1.98% year to date. Even the seemingly invincible NASDAQ Composite Index, which finished the period with a 43.08% gain, has given back 7.65% so far this year. Despite higher rates that put pressure on bonds earlier in the period, fixed-income markets posted solid returns relative to equities in 2000 as investors fled technology stocks in favor of less-volatile areas. The Lehman Brothers Aggregate Bond Index - a broad measure of the U.S. taxable investment-grade bond market - returned 5.97% for the 12-month period.
SM(Portfolio Manager photograph)
An interview with Steve Petersen, Portfolio Manager of Fidelity Puritan Fund
Q. How did the fund perform, Steve?
A. For the 12-month period that ended July 31, 2000, the fund returned 1.34%. By comparison, the Standard & Poor's 500 Index and the Lehman Brothers Aggregate Bond Index returned 8.98% and 5.97%, respectively. During the same period, the fund underperformed the 6.04% return of the balanced funds average as tracked by Lipper Inc. Because of the fund's mix of stocks and bonds, we also compare its performance with the Fidelity Balanced Income Composite Index, a hypothetical combination of unmanaged indexes combining the total returns of the Russell 3000 Value Index and the Lehman Brothers Aggregate Bond Index using a weighting of 60% and 40%, respectively. This index returned -0.04% for the 12-month period.
Q. Why did the fund underperform its peer group during the period?
A. Puritan is a conservative balanced fund. Since its inception, it has followed a consistent investment approach, buying dividend-paying and conservative growth stocks, while limiting its exposure to the more volatile areas of the stock market. Many competitors don't follow this approach, investing instead in more volatile growth stocks, which did well for most of the period.
Annual Report
Fund Talk: The Manager's Overview - continued
Q. Did you make any changes to
the fund since taking over in February?
A. I culled selected underperforming stocks from the portfolio, replacing them with candidates with better underlying fundamentals. I also added some "household names" to the portfolio. The fund now holds a slightly higher number of stocks than it did in February.
Q. Finance was the fund's largest sector weighting. How did the fund's holdings do?
A. Their performance was mixed. On the positive side, many financial companies that earned a high percentage of their revenues from transactions or asset management businesses did well during the period. Examples include Citigroup, whose subsidiary Salomon Smith Barney enjoyed strong revenues, and Morgan Stanley. Bank of New York's successful custody business helped its performance. On the negative side, Fannie Mae and Freddie Mac continued to be plagued by higher interest rates and by Congress' ongoing debate about whether the U.S. government should continue to implicitly guarantee their debt.
Q. Which stocks were disappointments?
A. AT&T was hurt by announcements that its earnings growth would be lower than expected. Its core business - consumer long-distance telephone services - has
been flat over the past few years. SBC Communications, a telephone company specializing in local service, also announced slower-than-
expected earnings growth, and its stock performance suffered.
Q. How did the fund's fixed-income subportfolio perform?
A. Overall, it helped performance during the period, outperforming the Lehman Brothers index. I tried to keep the fund's fixed-income risk parameters close to the index, while focusing on adding value through individual security selection. This strategy worked well. The fund's overweighting in investment-grade corporate bonds and mortgage-backed securities relative to the index helped its performance, but its underweighting in Treasuries hurt. While mortgages outperformed Treasuries during the year, corporate bonds did not, so it was the selection of individual securities that accounted for the good relative performance of the fund's corporate bond holdings.
Q. What's your near-term outlook, Steve?
A. The big question is how much the economy will slow. If it strengthens, showing the past couple of months to be an anomaly, it would cause more worry about steps the Federal Reserve Board could take - such as increasing interest rates significantly to slow the economy, potentially causing a recession. On the other hand, if the Fed's tightening moves have been sufficient to slow the economy and reduce expectations for growth, perhaps causing a bit of a correction in technology stocks, the market would probably perceive that as a very positive scenario. No matter what scenario evolves, I will continue to invest in what I believe to be the cheapest part of the market. I'll focus on finding solid companies, looking for good value and strong dividend yields.
Annual Report
Fund Talk: The Manager's Overview - continued
The views expressed in this report reflect those of the portfolio manager only through the end of the period of the report as stated on the cover and do not necessarily represent the views of Fidelity or any other person in the Fidelity organization. Any such views are subject to change at any time based upon market or other conditions and Fidelity disclaims any responsibility to update such views. These views may not be relied on as investment advice and, because investment decisions for a Fidelity fund are based on numerous factors, may not be relied on as an indication of trading intent on behalf of any Fidelity fund.
Fund Facts
Goal: income and capital
growth consistent with
reasonable risk
Fund number: 004
Trading symbol: FPURX
Start date: April 16, 1947
Size: as of July 31, 2000, more than $20.9 billion
Manager: Steve Petersen, since February 2000; manager, Fidelity Equity-Income Fund, since 1993; Fidelity Balanced Fund, 1996-1997; joined Fidelity in 1980
3Steve Petersen on the fund's style:
"Since its inception in 1947, the fund's goal - income and capital growth consistent with reasonable risk - has held steady. Its objective - to deliver a balance of stock appreciation, dividend income from stocks and income from fixed-income securities - has provided investors with moderate exposure to many of the more conservative areas of the equity and fixed-income markets. Recently, the bells and whistles of high-tech and aggressive-growth stocks have gotten a lot of attention and delivered some out-of-the-ballpark investment returns. However, their volatility simply does not fit the investment profile of the fund, which is designed to be less volatile than the market as a whole, while delivering income. There will always be areas that have stellar performance, but they are usually relatively short-lived. The fund is designed for long-term performance and will not typically invest in these types of stocks, since they don't fit the goals and comfort level of conservative investors."
Annual Report
|
Top Five Stocks as of July 31, 2000 |
||
|
|
% of fund's |
% of fund's net assets |
|
Exxon Mobil Corp. |
3.9 |
3.7 |
|
General Electric Co. |
2.4 |
2.6 |
|
Eli Lilly & Co. |
2.2 |
1.5 |
|
Fannie Mae |
2.1 |
2.4 |
|
BP Amoco PLC |
2.0 |
2.1 |
|
|
12.6 |
12.3 |
|
Top Five Bond Issuers as of July 31, 2000 |
||
|
(with maturities greater than one year) |
% of fund's |
% of fund's net assets |
|
Fannie Mae |
10.9 |
8.8 |
|
U.S. Treasury Obligations |
5.8 |
6.8 |
|
Government National Mortgage Association |
2.2 |
2.1 |
|
CS First Boston Mortgage Securities Corp. |
0.5 |
0.4 |
|
Comdisco, Inc. |
0.4 |
0.4 |
|
|
19.8 |
18.5 |
|
Top Five Market Sectors as of July 31, 2000 |
||
|
|
% of fund's |
% of fund's net assets |
|
Finance |
18.7 |
18.4 |
|
Energy |
10.9 |
9.7 |
|
Utilities |
8.8 |
8.9 |
|
Technology |
7.5 |
10.3 |
|
Media & Leisure |
7.0 |
8.6 |
|
Asset Allocation (% of fund's net assets) |
|||||||
|
As of July 31, 2000 * |
As of January 31, 2000 ** |
||||||
|
Stocks 62.7% |
|
|
Stocks 64.4% |
|
||
 |
Bonds 36.2% |
|
|
Bonds 34.1% |
|
||
 |
Convertible |
|
|
Convertible |
|
||
|
Short-Term |
|
|
Short-Term |
|
||
|
* Foreign investments |
8.2% |
|
** Foreign investments |
7.3% |
|
||

A Short-term investments and net other assets are not included in the pie chart.
Annual Report
Showing Percentage of Net Assets
|
Common Stocks - 61.7% |
|||
|
Shares |
Value (Note 1) (000s) |
||
|
AEROSPACE & DEFENSE - 2.8% |
|||
|
Aerospace & Defense - 2.0% |
|||
|
Boeing Co. |
2,079,600 |
$ 101,900 |
|
|
Honeywell International, Inc. |
750,000 |
25,219 |
|
|
Rockwell International Corp. |
772,300 |
27,079 |
|
|
Textron, Inc. |
2,753,500 |
157,122 |
|
|
United Technologies Corp. |
1,915,820 |
111,836 |
|
|
|
423,156 |
||
|
Ship Building & Repair - 0.8% |
|||
|
General Dynamics Corp. |
2,750,000 |
155,203 |
|
|
TOTAL AEROSPACE & DEFENSE |
578,359 |
||
|
BASIC INDUSTRIES - 2.1% |
|||
|
Chemicals & Plastics - 1.4% |
|||
|
Crompton Corp. |
1,474,800 |
14,471 |
|
|
Dow Chemical Co. |
1,207,800 |
34,724 |
|
|
E.I. du Pont de Nemours and Co. |
821,300 |
37,215 |
|
|
Engelhard Corp. |
1,280,300 |
23,125 |
|
|
Great Lakes Chemical Corp. |
600,000 |
17,625 |
|
|
Praxair, Inc. |
3,505,100 |
138,671 |
|
|
Rohm & Haas Co. |
251,500 |
6,539 |
|
|
Solutia, Inc. |
1,606,300 |
22,990 |
|
|
|
295,360 |
||
|
Iron & Steel - 0.1% |
|||
|
Nucor Corp. |
400,000 |
15,100 |
|
|
Metals & Mining - 0.4% |
|||
|
Alcoa, Inc. |
3,002,100 |
90,814 |
|
|
Packaging & Containers - 0.1% |
|||
|
Ball Corp. |
509,755 |
17,682 |
|
|
Owens-Illinois, Inc. (a) |
905,200 |
12,050 |
|
|
|
29,732 |
||
|
Paper & Forest Products - 0.1% |
|||
|
Georgia-Pacific Corp. |
266,600 |
6,615 |
|
|
Smurfit-Stone Container Corp. (a) |
500,000 |
6,219 |
|
|
|
12,834 |
||
|
TOTAL BASIC INDUSTRIES |
443,840 |
||
|
Common Stocks - continued |
|||
|
Shares |
Value (Note 1) (000s) |
||
|
CONSTRUCTION & REAL ESTATE - 0.3% |
|||
|
Building Materials - 0.1% |
|||
|
Masco Corp. |
1,651,100 |
$ 32,609 |
|
|
Real Estate Investment Trusts - 0.2% |
|||
|
Equity Residential Properties Trust (SBI) |
807,200 |
40,259 |
|
|
TOTAL CONSTRUCTION & REAL ESTATE |
72,868 |
||
|
DURABLES - 1.1% |
|||
|
Autos, Tires, & Accessories - 0.4% |
|||
|
AutoNation, Inc. |
554,500 |
3,847 |
|
|
Goodyear Tire & Rubber Co. |
540,200 |
10,770 |
|
|
Johnson Controls, Inc. |
432,300 |
22,453 |
|
|
TRW, Inc. |
800,000 |
35,950 |
|
|
|
73,020 |
||
|
Consumer Durables - 0.6% |
|||
|
Minnesota Mining & Manufacturing Co. |
934,800 |
84,190 |
|
|
Snap-On, Inc. |
1,100,000 |
33,206 |
|
|
|
117,396 |
||
|
Consumer Electronics - 0.0% |
|||
|
Black & Decker Corp. |
200,000 |
7,438 |
|
|
Home Furnishings - 0.1% |
|||
|
Newell Rubbermaid, Inc. |
815,700 |
21,973 |
|
|
Textiles & Apparel - 0.0% |
|||
|
Kellwood Co. |
114,200 |
2,555 |
|
|
TOTAL DURABLES |
222,382 |
||
|
ENERGY - 10.4% |
|||
|
Energy Services - 1.8% |
|||
|
Baker Hughes, Inc. |
2,238,400 |
77,505 |
|
|
Halliburton Co. |
5,559,200 |
256,418 |
|
|
Schlumberger Ltd. (NY Shares) |
422,000 |
31,202 |
|
|
|
365,125 |
||
|
Oil & Gas - 8.6% |
|||
|
BP Amoco PLC |
11,927,024 |
103,989 |
|
|
BP Amoco PLC sponsored ADR |
6,180,326 |
323,308 |
|
|
Burlington Resources, Inc. |
1,341,600 |
43,770 |
|
|
Chevron Corp. |
350,000 |
27,650 |
|
|
Conoco, Inc. Class B |
2,750,323 |
63,429 |
|
|
Exxon Mobil Corp. |
10,156,262 |
812,501 |
|
|
Common Stocks - continued |
|||
|
Shares |
Value (Note 1) (000s) |
||
|
ENERGY - continued |
|||
|
Oil & Gas - continued |
|||
|
Royal Dutch Petroleum Co. (NY Shares) |
1,966,400 |
$ 114,543 |
|
|
TotalFinaElf SA: |
|
|
|
|
Class B |
655,800 |
96,485 |
|
|
sponsored ADR |
2,318,700 |
170,569 |
|
|
USX - Marathon Group |
2,071,200 |
50,356 |
|
|
|
1,806,600 |
||
|
TOTAL ENERGY |
2,171,725 |
||
|
FINANCE - 14.8% |
|||
|
Banks - 4.4% |
|||
|
Bank of America Corp. |
1,150,000 |
54,481 |
|
|
Bank of New York Co., Inc. |
1,213,700 |
56,816 |
|
|
Bank One Corp. |
2,104,000 |
66,934 |
|
|
Chase Manhattan Corp. |
8,485,050 |
421,601 |
|
|
Comerica, Inc. |
800,000 |
40,800 |
|
|
Firstar Corp. |
272,300 |
5,378 |
|
|
FleetBoston Financial Corp. |
600,000 |
21,488 |
|
|
Mellon Financial Corp. |
2,987,300 |
112,584 |
|
|
PNC Financial Services Group, Inc. |
547,300 |
27,844 |
|
|
U.S. Bancorp |
2,150,000 |
41,253 |
|
|
Wells Fargo & Co. |
1,675,000 |
69,198 |
|
|
|
918,377 |
||
|
Credit & Other Finance - 3.7% |
|||
|
American Express Co. |
4,755,281 |
269,565 |
|
|
Arcadia Financial Ltd. warrants 3/15/07 (a) |
361 |
0 |
|
|
Associates First Capital Corp. Class A |
3,516,210 |
92,081 |
|
|
Citigroup, Inc. |
5,297,928 |
373,835 |
|
|
Household International, Inc. |
1,250,000 |
55,703 |
|
|
|
791,184 |
||
|
Federal Sponsored Credit - 3.8% |
|||
|
Fannie Mae |
8,999,850 |
448,868 |
|
|
Freddie Mac |
8,845,100 |
348,829 |
|
|
|
797,697 |
||
|
Insurance - 2.3% |
|||
|
ACE Ltd. |
1,100,000 |
39,600 |
|
|
American International Group, Inc. |
1,618,238 |
141,899 |
|
|
Everest Re Group Ltd. |
101,100 |
4,012 |
|
|
Hartford Financial Services Group, Inc. |
2,817,800 |
181,044 |
|
|
Common Stocks - continued |
|||
|
Shares |
Value (Note 1) (000s) |
||
|
FINANCE - continued |
|||
|
Insurance - continued |
|||
|
Protective Life Corp. |
178,700 |
$ 4,847 |
|
|
The Chubb Corp. |
525,900 |
38,917 |
|
|
The St. Paul Companies, Inc. |
490,600 |
21,801 |
|
|
UnumProvident Corp. |
1,450,200 |
33,355 |
|
|
XL Capital Ltd. Class A |
297,900 |
19,661 |
|
|
|
485,136 |
||
|
Savings & Loans - 0.1% |
|||
|
TCF Financial Corp. |
759,700 |
22,364 |
|
|
Securities Industry - 0.5% |
|||
|
ECM Corp. LP (g) |
6,318 |
556 |
|
|
Morgan Stanley Dean Witter & Co. |
1,085,200 |
99,025 |
|
|
|
99,581 |
||
|
TOTAL FINANCE |
3,114,339 |
||
|
HEALTH - 6.8% |
|||
|
Drugs & Pharmaceuticals - 5.4% |
|||
|
Bristol-Myers Squibb Co. |
4,185,700 |
207,715 |
|
|
Eli Lilly & Co. |
4,412,700 |
458,369 |
|
|
Merck & Co., Inc. |
2,456,300 |
176,086 |
|
|
Pfizer, Inc. |
2,009,575 |
86,663 |
|
|
Schering-Plough Corp. |
4,563,600 |
197,090 |
|
|
|
1,125,923 |
||
|
Medical Equipment & Supplies - 1.4% |
|||
|
Abbott Laboratories |
4,570,400 |
190,243 |
|
|
Baxter International, Inc. |
696,000 |
54,114 |
|
|
Cardinal Health, Inc. |
680,400 |
50,009 |
|
|
|
294,366 |
||
|
TOTAL HEALTH |
1,420,289 |
||
|
INDUSTRIAL MACHINERY & EQUIPMENT - 4.7% |
|||
|
Electrical Equipment - 2.4% |
|||
|
General Electric Co. |
9,662,800 |
497,030 |
|
|
W.W. Grainger, Inc. |
266,200 |
8,452 |
|
|
|
505,482 |
||
|
Industrial Machinery & Equipment - 2.3% |
|||
|
Caterpillar, Inc. |
1,314,800 |
44,785 |
|
|
Common Stocks - continued |
|||
|
Shares |
Value (Note 1) (000s) |
||
|
INDUSTRIAL MACHINERY & EQUIPMENT - continued |
|||
|
Industrial Machinery & Equipment - continued |
|||
|
CNH Global NV |
655,900 |
$ 5,124 |
|
|
Deere & Co. |
1,665,200 |
64,214 |
|
|
Illinois Tool Works, Inc. |
352,800 |
20,198 |
|
|
Ingersoll-Rand Co. |
1,674,200 |
65,712 |
|
|
ITT Industries, Inc. |
304,000 |
9,994 |
|
|
Parker-Hannifin Corp. |
1,056,300 |
37,565 |
|
|
The Stanley Works |
388,000 |
10,161 |
|
|
Tyco International Ltd. |
4,227,724 |
226,183 |
|
|
|
483,936 |
||
|
TOTAL INDUSTRIAL MACHINERY & EQUIPMENT |
989,418 |
||
|
MEDIA & LEISURE - 3.6% |
|||
|
Broadcasting - 0.4% |
|||
|
Benedek Communications Corp. warrants 7/1/07 (a) |
51,900 |
104 |
|
|
Clear Channel Communications, Inc. (a) |
162,400 |
12,373 |
|
|
CS Wireless Systems, Inc. (a)(g) |
911 |
0 |
|
|
Motient Corp. warrants 4/1/08 (a) |
2,035 |
61 |
|
|
Time Warner, Inc. |
939,502 |
72,048 |
|
|
UIH Australia/Pacific, Inc. warrants 5/15/06 (a) |
26,110 |
783 |
|
|
|
85,369 |
||
|
Entertainment - 2.0% |
|||
|
Fox Entertainment Group, Inc. Class A (a) |
933,800 |
28,598 |
|
|
Mandalay Resort Group (a) |
797,100 |
19,479 |
|
|
News Corp. Ltd. sponsored ADR (preferred ltd. vtg.) |
631,200 |
26,629 |
|
|
Six Flags, Inc. (a) |
91,500 |
1,390 |
|
|
Viacom, Inc. Class B (non-vtg.) (a) |
4,499,717 |
298,387 |
|
|
Walt Disney Co. |
914,700 |
35,387 |
|
|
|
409,870 |
||
|
Lodging & Gaming - 0.1% |
|||
|
Harrah's Entertainment, Inc. (a) |
598,500 |
15,000 |
|
|
Motels of America, Inc. (a) |
3,000 |
43 |
|
|
|
15,043 |
||
|
Publishing - 0.6% |
|||
|
McGraw-Hill Companies, Inc. |
1,888,000 |
112,218 |
|
|
Reader's Digest Association, Inc. Class A (non-vtg.) |
400,000 |
15,125 |
|
|
|
127,343 |
||
|
Common Stocks - continued |
|||
|
Shares |
Value (Note 1) (000s) |
||
|
MEDIA & LEISURE - continued |
|||
|
Restaurants - 0.5% |
|||
|
McDonald's Corp. |
3,568,200 |
$ 112,398 |
|
|
TOTAL MEDIA & LEISURE |
750,023 |
||
|
NONDURABLES - 2.0% |
|||
|
Beverages - 0.2% |
|||
|
Brown-Forman Corp. Class B (non-vtg.) |
199,600 |
9,980 |
|
|
Seagram Co. Ltd. |
641,500 |
35,964 |
|
|
|
45,944 |
||
|
Foods - 0.3% |
|||
|
Nabisco Group Holdings Corp. |
1,545,600 |
40,958 |
|
|
Nabisco Holdings Corp. Class A |
278,800 |
14,742 |
|
|
|
55,700 |
||
|
Household Products - 1.1% |
|||
|
Avon Products, Inc. |
1,888,900 |
74,966 |
|
|
Clorox Co. |
758,600 |
31,340 |
|
|
Dial Corp. |
821,700 |
10,425 |
|
|
Gillette Co. |
1,193,400 |
34,832 |
|
|
International Flavors & Fragrances, Inc. |
330,600 |
8,844 |
|
|
Procter & Gamble Co. |
643,700 |
36,610 |
|
|
Unilever NV (NY Shares) |
233,165 |
10,318 |
|
|
Unilever PLC |
3,545,982 |
21,442 |
|
|
|
228,777 |
||
|
Tobacco - 0.4% |
|||
|
Philip Morris Companies, Inc. |
3,558,240 |
89,846 |
|
|
TOTAL NONDURABLES |
420,267 |
||
|
RETAIL & WHOLESALE - 1.0% |
|||
|
Apparel Stores - 0.4% |
|||
|
Mothers Work, Inc. (a)(k) |
2,416 |
24 |
|
|
The Limited, Inc. |
3,050,000 |
62,334 |
|
|
TJX Companies, Inc. |
1,765,200 |
29,567 |
|
|
Venator Group, Inc. (a) |
294,200 |
4,156 |
|
|
|
96,081 |
||
|
General Merchandise Stores - 0.6% |
|||
|
Ames Department Stores, Inc. (a) |
207,500 |
1,478 |
|
|
Consolidated Stores Corp. (a) |
300,000 |
3,581 |
|
|
JCPenney Co., Inc. |
391,000 |
6,305 |
|
|
Common Stocks - continued |
|||
|
Shares |
Value (Note 1) (000s) |
||
|
RETAIL & WHOLESALE - continued |
|||
|
General Merchandise Stores - continued |
|||
|
Target Corp. |
2,405,400 |
$ 69,757 |
|
|
Wal-Mart Stores, Inc. |
793,700 |
43,604 |
|
|
|
124,725 |
||
|
TOTAL RETAIL & WHOLESALE |
220,806 |
||
|
SERVICES - 0.3% |
|||
|
Printing - 0.0% |
|||
|
New England Business Service, Inc. |
292,800 |
6,076 |
|
|
Services - 0.3% |
|||
|
Dun & Bradstreet Corp. |
176,300 |
5,212 |
|
|
H&R Block, Inc. |
1,442,900 |
46,173 |
|
|
Viad Corp. |
500,300 |
13,039 |
|
|
|
64,424 |
||
|
TOTAL SERVICES |
70,500 |
||
|
TECHNOLOGY - 6.5% |
|||
|
Communications Equipment - 0.6% |
|||
|
Cisco Systems, Inc. (a) |
1,800,000 |
117,788 |
|
|
Nortel Networks Corp. |
171,015 |
12,719 |
|
|
|
130,507 |
||
|
Computer Services & Software - 0.7% |
|||
|
Ceridian Corp. (a) |
221,900 |
5,048 |
|
|
DecisionOne Corp. (a) |
11,480 |
0 |
|
|
DecisionOne Corp.: |
|
|
|
|
Class A warrants 4/18/07 (a) |
6,740 |
0 |
|
|
Class B warrants 4/18/07 (a) |
11,613 |
0 |
|
|
Class C warrants 4/18/07 (a) |
6,888 |
0 |
|
|
Electronic Data Systems Corp. |
220,200 |
9,469 |
|
|
IMS Health, Inc. |
1,581,700 |
28,569 |
|
|
Microsoft Corp. (a) |
381,100 |
26,606 |
|
|
NCR Corp. (a) |
1,077,900 |
38,198 |
|
|
Sabre Holdings Corp. Class A |
60,030 |
1,467 |
|
|
Unisys Corp. (a) |
2,658,500 |
26,087 |
|
|
|
135,444 |
||
|
Computers & Office Equipment - 3.7% |
|||
|
Compaq Computer Corp. |
4,491,700 |
126,048 |
|
|
EMC Corp. (a) |
3,363,444 |
286,313 |
|
|
Common Stocks - continued |
|||
|
Shares |
Value (Note 1) (000s) |
||
|
TECHNOLOGY - continued |
|||
|
Computers & Office Equipment - continued |
|||
|
Hewlett-Packard Co. |
1,089,300 |
$ 118,938 |
|
|
International Business Machines Corp. |
682,500 |
76,739 |
|
|
Pitney Bowes, Inc. |
4,720,480 |
163,447 |
|
|
Xerox Corp. |
600,000 |
8,925 |
|
|
|
780,410 |
||
|
Electronic Instruments - 0.2% |
|||
|
Thermo Electron Corp. (a) |
1,709,800 |
35,478 |
|
|
Electronics - 1.2% |
|||
|
Insilco Corp. warrants 8/15/07 (a) |
5,660 |
0 |
|
|
Intel Corp. |
700,000 |
46,725 |
|
|
Motorola, Inc. |
2,193,600 |
72,526 |
|
|
Texas Instruments, Inc. |
2,414,800 |
141,719 |
|
|
|
260,970 |
||
|
Photographic Equipment - 0.1% |
|||
|
Eastman Kodak Co. |
336,700 |
18,476 |
|
|
TOTAL TECHNOLOGY |
1,361,285 |
||
|
TRANSPORTATION - 0.8% |
|||
|
Air Transportation - 0.2% |
|||
|
AMR Corp. |
495,000 |
16,366 |
|
|
Southwest Airlines Co. |
619,700 |
14,640 |
|
|
|
31,006 |
||
|
Railroads - 0.6% |
|||
|
Burlington Northern Santa Fe Corp. |
3,502,500 |
85,592 |
|
|
CSX Corp. |
736,700 |
18,279 |
|
|
Union Pacific Corp. |
573,100 |
24,751 |
|
|
|
128,622 |
||
|
TOTAL TRANSPORTATION |
159,628 |
||
|
UTILITIES - 4.5% |
|||
|
Cellular - 0.1% |
|||
|
AT&T Corp. - Wireless Group |
595,100 |
16,365 |
|
|
Loral Orion Network Systems, Inc.: |
|
|
|
|
warrants 1/15/07 (CV ratio .47) (a) |
41,555 |
83 |
|
|
warrants 1/15/07 (CV ratio .6) (a) |
8,090 |
32 |
|
|
Common Stocks - continued |
|||
|
Shares |
Value (Note 1) (000s) |
||
|
UTILITIES - continued |
|||
|
Cellular - continued |
|||
|
McCaw International Ltd. warrants 4/16/07 (a)(g) |
40,960 |
$ 410 |
|
|
WebLink Wireless, Inc. Class A (a) |
97,009 |
976 |
|
|
|
17,866 |
||
|
Electric Utility - 0.7% |
|||
|
Allegheny Energy, Inc. |
300,000 |
9,413 |
|
|
DPL, Inc. |
229,379 |
5,534 |
|
|
Entergy Corp. |
2,333,200 |
63,288 |
|
|
IPALCO Enterprises, Inc. |
590,100 |
13,351 |
|
|
Niagara Mohawk Holdings, Inc. (a) |
2,269,700 |
30,215 |
|
|
NRG Energy, Inc. |
286,200 |
6,708 |
|
|
PG&E Corp. |
600,000 |
15,525 |
|
|
|
144,034 |
||
|
Telephone Services - 3.7% |
|||
|
AT&T Corp. |
6,785,444 |
209,925 |
|
|
BellSouth Corp. |
2,927,170 |
116,538 |
|
|
KMC Telecom Holdings, Inc. warrants 4/15/08 (a)(g) |
5,620 |
13 |
|
|
Pathnet, Inc. warrants 4/15/08 (a)(g) |
13,715 |
137 |
|
|
Qwest Communications International, Inc. (a) |
440,284 |
20,666 |
|
|
SBC Communications, Inc. |
7,699,087 |
327,692 |
|
|
Sprint Corp. - FON Group |
530,600 |
18,903 |
|
|
Verizon Communications |
345,200 |
16,224 |
|
|
WorldCom, Inc. (a) |
1,682,600 |
65,727 |
|
|
|
775,825 |
||
|
TOTAL UTILITIES |
937,725 |
||
|
TOTAL COMMON STOCKS (Cost $9,772,271) |
12,933,454 |
||
|
Preferred Stocks - 1.6% |
|||
|
|
|
|
|
|
Convertible Preferred Stocks - 0.6% |
|||
|
FINANCE - 0.2% |
|||
|
Insurance - 0.2% |
|||
|
ACE Ltd. $4.125 PRIDES |
300,300 |
22,544 |
|
|
MetLife, Inc. $4.00 |
300,600 |
20,441 |
|
|
|
42,985 |
||
|
Preferred Stocks - continued |
|||
|
Shares |
Value (Note 1) (000s) |
||
|
Convertible Preferred Stocks - continued |
|||
|
INDUSTRIAL MACHINERY & EQUIPMENT - 0.0% |
|||
|
Electrical Equipment - 0.0% |
|||
|
Loral Space & Communications Ltd. Series C, $3.00 (g) |
195,900 |
$ 3,624 |
|
|
MEDIA & LEISURE - 0.3% |
|||
|
Broadcasting - 0.3% |
|||
|
Cox Communications, Inc. $6.858 PRIZES |
160,000 |
16,340 |
|
|
Earthwatch, Inc. $8.50 (g) |
549,374 |
137 |
|
|
MediaOne Group, Inc. (Vodafone AirTouch PLC) $3.63 PIES |
453,100 |
42,308 |
|
|
|
58,785 |
||
|
Entertainment - 0.0% |
|||
|
Six Flags, Inc. $4.05 PIES |
200,000 |
6,725 |
|
|
TOTAL MEDIA & LEISURE |
65,510 |
||
|
UTILITIES - 0.1% |
|||
|
Electric Utility - 0.1% |
|||
|
Alliant Energy Resources, Inc. $4.91 (g) |
72,900 |
4,429 |
|
|
Telephone Services - 0.0% |
|||
|
Axxent, Inc. (k) |
568,781 |
3,106 |
|
|
TOTAL UTILITIES |
7,535 |
||
|
TOTAL CONVERTIBLE PREFERRED STOCKS |
119,654 |
||
|
Nonconvertible Preferred Stocks - 1.0% |
|||
|
ENERGY - 0.1% |
|||
|
Energy Services - 0.1% |
|||
|
R&B Falcon Corp. 13.875% |
10,054 |
11,462 |
|
|
FINANCE - 0.0% |
|||
|
Insurance - 0.0% |
|||
|
American Annuity Group Capital Trust II 8.875% |
6,030 |
5,537 |
|
|
HEALTH - 0.0% |
|||
|
Medical Facilities Management - 0.0% |
|||
|
Fresenius Medical Care Capital Trust II 7.875% |
9,690 |
9,098 |
|
|
MEDIA & LEISURE - 0.2% |
|||
|
Broadcasting - 0.2% |
|||
|
Adelphia Communications Corp. $13.00 |
38,030 |
3,803 |
|
|
Preferred Stocks - continued |
|||
|
Shares |
Value (Note 1) (000s) |
||
|
Nonconvertible Preferred Stocks - continued |
|||
|
MEDIA & LEISURE - continued |
|||
|
Broadcasting - continued |
|||
|
Citadel Broadcasting Co. Series B, 13.25% pay-in-kind |
44,672 |
$ 4,590 |
|
|
CSC Holdings, Inc.: |
|
|
|
|
11.125% pay-in-kind |
174,567 |
18,504 |
|
|
Series H, 11.75% pay-in-kind |
147,857 |
15,969 |
|
|
Granite Broadcasting Corp. 12.75% pay-in-kind |
4,774 |
3,819 |
|
|
|
46,685 |
||
|
TECHNOLOGY - 0.0% |
|||
|
Computers & Office Equipment - 0.0% |
|||
|
Ampex Corp. 8% non-cumulative |
683 |
1,065 |
|
|
UTILITIES - 0.7% |
|||
|
Cellular - 0.3% |
|||
|
Nextel Communications, Inc.: |
|
|
|
|
11.125% pay-in-kind |
34,361 |
34,361 |
|
|
Series D, 13% pay-in-kind |
30,447 |
32,274 |
|
|
|
66,635 |
||
|
Electric Utility - 0.0% |
|||
|
Entergy Gulf States, Inc. Series A, adj. rate |
29,829 |
2,789 |
|
|
Telephone Services - 0.4% |
|||
|
Adelphia Business Solution, Inc. 12.875% pay-in-kind |
1,788 |
1,556 |
|
|
e.spire Communications, Inc. $127.50 pay-in-kind |
9,288 |
2,043 |
|
|
ICG Holdings, Inc.: |
|
|
|
|
14% pay-in-kind |
5 |
4 |
|
|
14.25% pay-in-kind |
19,565 |
14,674 |
|
|
Intermedia Communications, Inc. 13.5% pay-in-kind |
15,905 |
11,372 |
|
|
NEXTLINK Communications, Inc. 13.5% pay-in-kind |
5,902 |
5,666 |
|
|
NEXTLINK Communications, Inc. 14% pay-in-kind |
698,890 |
33,197 |
|
|
|
68,512 |
||
|
TOTAL UTILITIES |
137,936 |
||
|
TOTAL NONCONVERTIBLE PREFERRED STOCKS |
211,783 |
||
|
TOTAL PREFERRED STOCKS (Cost $324,221) |
331,437 |
||
|
Corporate Bonds - 14.9% |
|||||
|
Moody's Ratings (unaudited) (b) |
Principal Amount (000s) |
Value (Note 1) (000s) |
|||
|
Convertible Bonds - 0.9% |
|||||
|
MEDIA & LEISURE - 0.6% |
|||||
|
Broadcasting - 0.3% |
|||||
|
Cox Communications, Inc. 1% 4/19/20 |
Baa3 |
|
$ 34,870 |
$ 17,261 |
|
|
EchoStar Communications Corp. 4.875% 1/1/07 (g) |
- |
|
30,000 |
32,081 |
|
|
Liberty Media Corp. 4% 11/15/29 (g) |
Baa3 |
|
17,982 |
24,118 |
|
|
|
73,460 |
||||
|
Publishing - 0.3% |
|||||
|
News America Holdings, Inc. liquid yield option notes 0% 3/11/13 |
Baa3 |
|
58,740 |
58,635 |
|
|
TOTAL MEDIA & LEISURE |
132,095 |
||||
|
TECHNOLOGY - 0.1% |
|||||
|
Electronics - 0.1% |
|||||
|
Solectron Corp. 0% 5/8/20 |
BBB |
|
14,790 |
9,198 |
|
|
Vitesse Semiconductor Corp. 4% 3/15/05 (g) |
B2 |
|
11,100 |
9,241 |
|
|
|
18,439 |
||||
|
UTILITIES - 0.2% |
|||||
|
Cellular - 0.1% |
|||||
|
Nextel Communications, Inc. 5.25% 1/15/10 (g) |
B1 |
|
19,070 |
19,165 |
|
|
Telephone Services - 0.1% |
|||||
|
Level 3 Communications, Inc. 6% 3/15/10 |
Caa1 |
|
18,720 |
14,976 |
|
|
TOTAL UTILITIES |
34,141 |
||||
|
TOTAL CONVERTIBLE BONDS |
184,675 |
||||
|
Nonconvertible Bonds - 14.0% |
|||||
|
AEROSPACE & DEFENSE - 0.2% |
|||||
|
Defense Electronics - 0.2% |
|||||
|
Raytheon Co.: |
|
|
|
|
|
|
6.3% 8/15/00 |
Baa2 |
|
5,000 |
4,994 |
|
|
7.9% 3/1/03 (g) |
Baa2 |
|
30,270 |
30,442 |
|
|
|
35,436 |
||||
|
Corporate Bonds - continued |
|||||
|
Moody's Ratings (unaudited) (b) |
Principal Amount (000s) |
Value (Note 1) (000s) |
|||
|
Nonconvertible Bonds - continued |
|||||
|
AEROSPACE & DEFENSE - continued |
|||||
|
Ship Building & Repair - 0.0% |
|||||
|
Newport News Shipbuilding, Inc. 9.25% 12/1/06 |
Ba3 |
|
$ 3,680 |
$ 3,698 |
|
|
TOTAL AEROSPACE & DEFENSE |
39,134 |
||||
|
BASIC INDUSTRIES - 0.7% |
|||||
|
Chemicals & Plastics - 0.4% |
|||||
|
Avecia Group PLC 11% 7/1/09 |
B2 |
|
5,725 |
5,711 |
|
|
Huntsman Corp.: |
|
|
|
|
|
|
9.5% 7/1/07 (g) |
B2 |
|
7,110 |
6,506 |
|
|
9.5% 7/1/07 (g) |
B2 |
|
22,170 |
20,286 |
|
|
Huntsman ICI Chemicals LLC 10.125% 7/1/09 |
B2 |
|
8,440 |
8,567 |
|
|
Lyondell Chemical Co.: |
|
|
|
|
|
|
9.625% 5/1/07 |
Ba3 |
|
6,550 |
6,550 |
|
|
9.875% 5/1/07 |
Ba3 |
|
8,360 |
8,360 |
|
|
10.875% 5/1/09 |
B2 |
|
13,635 |
13,703 |
|
|
Sterling Chemicals, Inc. 11.75% 8/15/06 |
Caa3 |
|
3,922 |
3,177 |
|
|
|
72,860 |
||||
|
Metals & Mining - 0.0% |
|||||
|
Kaiser Aluminum & Chemical Corp. 12.75% 2/1/03 |
B3 |
|
4,510 |
4,149 |
|
|
Packaging & Containers - 0.1% |
|||||
|
Gaylord Container Corp.: |
|
|
|
|
|
|
9.375% 6/15/07 |
Caa1 |
|
13,330 |
10,531 |
|
|
9.75% 6/15/07 |
Caa1 |
|
3,165 |
2,564 |
|
|
Packaging Corp. of America 9.625% 4/1/09 |
B2 |
|
8,360 |
8,465 |
|
|
|
21,560 |
||||
|
Paper & Forest Products - 0.2% |
|||||
|
Abitibi-Consolidated, Inc. 8.85% 8/1/30 |
Baa3 |
|
6,245 |
6,238 |
|
|
APP China Group Ltd. 14% 3/15/10 unit (g) |
B3 |
|
4,085 |
2,328 |
|
|
Container Corp. of America gtd. 9.75% 4/1/03 |
B2 |
|
1,020 |
1,019 |
|
|
Doman Industries Ltd. yankee 8.75% 3/15/04 |
Caa1 |
|
1,070 |
877 |
|
|
Fort James Corp. 6.625% 9/15/04 |
Baa2 |
|
3,010 |
2,854 |
|
|
Millar Western Forest Products Ltd. 9.875% 5/15/08 |
B2 |
|
11,820 |
11,465 |
|
|
Repap New Brunswick, Inc.: |
|
|
|
|
|
|
11.5% 6/1/04 |
B3 |
|
1,970 |
2,009 |
|
|
yankee 10.625% 4/15/05 |
Caa1 |
|
7,905 |
7,194 |
|
|
Corporate Bonds - continued |
|||||
|
Moody's Ratings (unaudited) (b) |
Principal Amount (000s) |
Value (Note 1) (000s) |
|||
|
Nonconvertible Bonds - continued |
|||||
|
BASIC INDUSTRIES - continued |
|||||
|
Paper & Forest Products - continued |
|||||
|
Stone Container Corp.: |
|
|
|
|
|
|
10.75% 10/1/02 |
B1 |
|
$ 5,340 |
$ 5,407 |
|
|
12.58% 8/1/16 (i) |
B2 |
|
810 |
842 |
|
|
|
40,233 |
||||
|
TOTAL BASIC INDUSTRIES |
138,802 |
||||
|
CONSTRUCTION & REAL ESTATE - 0.4% |
|||||
|
Construction - 0.0% |
|||||
|
Blount, Inc. 13% 8/1/09 |
B3 |
|
415 |
419 |
|
|
Lennar Corp. 9.95% 5/1/10 (g) |
Ba1 |
|
1,845 |
1,859 |
|
|
|
2,278 |
||||
|
Engineering - 0.0% |
|||||
|
360networks, Inc. 13% 5/1/08 (g) |
B3 |
|
6,620 |
6,306 |
|
|
Real Estate - 0.1% |
|||||
|
Duke Realty LP 7.3% 6/30/03 |
Baa1 |
|
10,000 |
9,872 |
|
|
LNR Property Corp. 9.375% 3/15/08 |
B1 |
|
13,585 |
12,091 |
|
|
|
21,963 |
||||
|
Real Estate Investment Trusts - 0.3% |
|||||
|
CenterPoint Properties Trust 6.75% 4/1/05 |
Baa2 |
|
8,720 |
8,142 |
|
|
Equity Office Properties Trust: |
|
|
|
|
|
|
6.625% 2/15/05 |
Baa1 |
|
10,300 |
9,770 |
|
|
7.25% 2/15/18 |
Baa1 |
|
6,005 |
5,243 |
|
|
ProLogis Trust 6.7% 4/15/04 |
Baa1 |
|
4,865 |
4,658 |
|
|
Spieker Properties LP 6.8% 5/1/04 |
Baa2 |
|
22,460 |
21,602 |
|
|
|
49,415 |
||||
|
TOTAL CONSTRUCTION & REAL ESTATE |
79,962 |
||||
|
DURABLES - 0.0% |
|||||
|
Autos, Tires, & Accessories - 0.0% |
|||||
|
Federal-Mogul Corp. 7.5% 1/15/09 |
Ba2 |
|
3,295 |
2,488 |
|
|
Textiles & Apparel - 0.0% |
|||||
|
Levi Strauss & Co.: |
|
|
|
|
|
|
6.8% 11/1/03 |
Ba3 |
|
2,925 |
2,399 |
|
|
Corporate Bonds - continued |
|||||
|
Moody's Ratings (unaudited) (b) |
Principal Amount (000s) |
Value (Note 1) (000s) |
|||
|
Nonconvertible Bonds - continued |
|||||
|
DURABLES - continued |
|||||
|
Textiles & Apparel - continued |
|||||
|
Levi Strauss & Co.: - continued |
|
|
|
|
|
|
7% 11/1/06 |
Ba3 |
|
$ 445 |
$ 350 |
|
|
Polymer Group, Inc. 9% 7/1/07 |
B2 |
|
2,770 |
2,299 |
|
|
|
5,048 |
||||
|
TOTAL DURABLES |
7,536 |
||||
|
ENERGY - 0.4% |
|||||
|
Coal - 0.0% |
|||||
|
P&L Coal Holdings Corp. 9.625% 5/15/08 |
B2 |
|
8,740 |
8,259 |
|
|
Energy Services - 0.0% |
|||||
|
Cliffs Drilling Co. 10.25% 5/15/03 |
Ba3 |
|
535 |
540 |
|
|
R&B Falcon Corp.: |
|
|
|
|
|
|
6.5% 4/15/03 |
Ba3 |
|
3,270 |
3,025 |
|
|
6.75% 4/15/05 |
Ba3 |
|
740 |
670 |
|
|
6.95% 4/15/08 |
Ba3 |
|
445 |
378 |
|
|
9.5% 12/15/08 |
Ba3 |
|
360 |
359 |
|
|
|
4,972 |
||||
|
Oil & Gas - 0.4% |
|||||
|
Anadarko Petroleum Corp. 7.2% 3/15/29 |
Baa1 |
|
23,125 |
21,592 |
|
|
Apache Corp.: |
|
|
|
|
|
|
7.625% 7/1/19 |
Baa1 |
|
6,435 |
6,305 |
|
|
7.7% 3/15/26 |
Baa1 |
|
4,785 |
4,708 |
|
|
Apache Finance Property Ltd. 6.5% 12/15/07 |
Baa1 |
|
5,010 |
4,652 |
|
|
Chesapeake Energy Corp.: |
|
|
|
|
|
|
7.875% 3/15/04 |
B2 |
|
1,160 |
1,073 |
|
|
8.5% 3/15/12 |
B2 |
|
1,480 |
1,243 |
|
|
9.125% 4/15/06 |
B2 |
|
977 |
921 |
|
|
9.625% 5/1/05 |
B2 |
|
5,896 |
5,749 |
|
|
Conoco, Inc. 5.9% 4/15/04 |
A3 |
|
7,300 |
6,995 |
|
|
Great Lakes Carbon Corp. 10.25% 5/15/08 pay-in-kind |
B3 |
|
4,945 |
3,363 |
|
|
Phillips Petroleum Co. 6.375% 3/30/09 |
Baa2 |
|
10,000 |
9,101 |
|
|
Plains Resources, Inc.: |
|
|
|
|
|
|
Series B 10.25% 3/15/06 |
B2 |
|
3,980 |
4,040 |
|
|
Series D 10.25% 3/15/06 |
B2 |
|
1,905 |
1,934 |
|
|
Corporate Bonds - continued |
|||||
|
Moody's Ratings (unaudited) (b) |
Principal Amount (000s) |
Value (Note 1) (000s) |
|||
|
Nonconvertible Bonds - continued |
|||||
|
ENERGY - continued |
|||||
|
Oil & Gas - continued |
|||||
|
YPF Sociedad Anonima: |
|
|
|
|
|
|
7.75% 8/27/07 |
B1 |
|
$ 570 |
$ 540 |
|
|
8% 2/15/04 |
B1 |
|
3,800 |
3,737 |
|
|
|
75,953 |
||||
|
TOTAL ENERGY |
89,184 |
||||
|
FINANCE - 3.7% |
|||||
|
Banks - 1.8% |
|||||
|
ABN-Amro Bank NV, Chicago 6.625% 10/31/01 |
A1 |
|
28,500 |
28,197 |
|
|
Bank of Tokyo-Mitsubishi Ltd. 8.4% 4/15/10 |
A3 |
|
10,800 |
10,872 |
|
|
Bank One Corp. 7.875% 8/1/10 |
A1 |
|
35,850 |
35,716 |
|
|
BankBoston Corp. 6.625% 2/1/04 |
A3 |
|
9,640 |
9,337 |
|
|
BanPonce Financial Corp. 6.75% 8/9/01 |
A3 |
|
18,240 |
18,122 |
|
|
Barclays Bank PLC yankee 5.95% 7/15/01 |
A1 |
|
35,500 |
35,292 |
|
|
Capital One Bank 6.375% 2/15/03 |
Baa2 |
|
20,000 |
19,229 |
|
|
Capital One Financial Corp. 7.125% 8/1/08 |
Baa3 |
|
20,300 |
18,884 |
|
|
Commonwealth Bank of Australia 8.5% 6/1/10 |
Aa3 |
|
6,400 |
6,630 |
|
|
HSBC Finance Nederland BV 7.4% 4/15/03 (g) |
A1 |
|
3,000 |
2,992 |
|
|
Kansallis-Osake-Pankki (NY Branch) yankee 10% 5/1/02 |
A1 |
|
5,285 |
5,499 |
|
|
Korea Development Bank: |
|
|
|
|
|
|
6.625% 11/21/03 |
Baa2 |
|
14,825 |
14,279 |
|
|
7.125% 4/22/04 |
Baa2 |
|
1,975 |
1,890 |
|
|
7.375% 9/17/04 |
Baa2 |
|
3,890 |
3,776 |
|
|
MBNA Corp.: |
|
|
|
|
|
|
6.34% 6/2/03 |
Baa2 |
|
6,475 |
6,178 |
|
|
6.875% 11/15/02 |
Baa2 |
|
29,550 |
29,192 |
|
|
Midlantic Corp. 9.2% 8/1/01 |
A3 |
|
11,550 |
11,753 |
|
|
National Westminster Bank PLC 7.375% 10/1/09 |
Aa3 |
|
9,775 |
9,493 |
|
|
Providian National Bank: |
|
|
|
|
|
|
6.25% 5/7/01 |
Baa3 |
|
20,195 |
19,917 |
|
|
6.75% 3/15/02 |
Baa3 |
|
7,805 |
7,642 |
|
|
Sanwa Finance Aruba AEC 8.35% 7/15/09 |
Baa1 |
|
45,800 |
45,542 |
|
|
Sumitomo Bank International Finance NV 8.5% 6/15/09 |
Baa1 |
|
5,000 |
5,095 |
|
|
Corporate Bonds - continued |
|||||
|
Moody's Ratings (unaudited) (b) |
Principal Amount (000s) |
Value (Note 1) (000s) |
|||
|
Nonconvertible Bonds - continued |
|||||
|
FINANCE - continued |
|||||
|
Banks - continued |
|||||
|
Summit Bancorp 8.625% 12/10/02 |
A3 |
|
$ 6,750 |
$ 6,869 |
|
|
Union Planters National Bank 6.81% 8/20/01 |
A3 |
|
13,000 |
12,942 |
|
|
|
365,338 |
||||
|
Credit & Other Finance - 1.7% |
|||||
|
Ahmanson Capital Trust I 8.36% 12/1/26 (g) |
A3 |
|
6,500 |
5,721 |
|
|
AMRESCO, Inc. 9.875% 3/15/05 |
Caa3 |
|
10,530 |
4,212 |
|
|
APP Global Finance III 10.7513% 4/17/02 (i) |
Caa1 |
|
3,700 |
2,451 |
|
|
Associates Corp. of North America: |
|
|
|
|
|
|
6% 4/15/03 |
Aa3 |
|
9,550 |
9,220 |
|
|
6% 7/15/05 |
Aa3 |
|
22,750 |
21,265 |
|
|
AT&T Capital Corp. 6.25% 5/15/01 |
A1 |
|
26,360 |
26,110 |
|
|
Bellsouth Capital Funding Corp. 7.75% 2/15/10 |
Aa3 |
|
3,740 |
3,751 |
|
|
CIT Group, Inc.: |
|
|
|
|
|
|
5.5% 2/15/04 |
A1 |
|
4,850 |
4,509 |
|
|
7.375% 3/15/03 |
A1 |
|
13,900 |
13,767 |
|
|
Daimler-Chrysler NA Holding Corp. 6.59% 6/18/02 |
A1 |
|
4,450 |
4,402 |
|
|
ERP Operating LP: |
|
|
|
|
|
|
6.55% 11/15/01 |
A3 |
|
7,000 |
6,909 |
|
|
7.1% 6/23/04 |
A3 |
|
10,300 |
10,007 |
|
|
Finova Capital Corp.: |
|
|
|
|
|
|
6.27% 9/29/00 |
Baa2 |
|
2,080 |
1,966 |
|
|
7.25% 11/8/04 |
Baa2 |
|
9,800 |
8,379 |
|
|
First Security Capital I 8.41% 12/15/26 |
A3 |
|
16,730 |
15,706 |
|
|
Ford Motor Credit Co. 7.875% 6/15/10 |
A2 |
|
44,240 |
44,242 |
|
|
General Motors Acceptance Corp. 7.5% 7/15/05 |
A2 |
|
10,500 |
10,448 |
|
|
GS Escrow Corp. 7.125% 8/1/05 |
Ba1 |
|
15,825 |
14,321 |
|
|
Household Finance Corp. 8% 5/9/05 |
A2 |
|
21,000 |
21,254 |
|
|
Imperial Credit Capital Trust I 10.25% 6/14/02 |
B2 |
|
3,600 |
3,060 |
|
|
Imperial Credit Industries 9.875% 1/15/07 |
B3 |
|
9,577 |
6,608 |
|
|
Macsaver Financial Services, Inc.: |
|
|
|
|
|
|
7.4% 2/15/02 |
Ba2 |
|
2,110 |
1,097 |
|
|
7.875% 8/1/03 |
Ba2 |
|
5,170 |
2,844 |
|
|
Metris Companies, Inc. 10.125% 7/15/06 |
Ba3 |
|
1,065 |
1,012 |
|
|
Newcourt Credit Group, Inc. 6.875% 2/16/05 |
A1 |
|
20,080 |
19,150 |
|
|
Popular North America, Inc. 7.375% 9/15/01 |
A3 |
|
10,000 |
9,968 |
|
|
PX Escrow Corp. 0% 2/1/06 (e) |
B3 |
|
2,550 |
944 |
|
|
Corporate Bonds - continued |
|||||
|
Moody's Ratings (unaudited) (b) |
Principal Amount (000s) |
Value (Note 1) (000s) |
|||
|
Nonconvertible Bonds - continued |
|||||
|
FINANCE - continued |
|||||
|
Credit & Other Finance - continued |
|||||
|
Sprint Capital Corp.: |
|
|
|
|
|
|
5.875% 5/1/04 |
Baa1 |
|
$ 27,585 |
$ 26,127 |
|
|
6.875% 11/15/28 |
Baa1 |
|
29,065 |
25,133 |
|
|
The Money Store, Inc. 7.3% 12/1/02 |
A2 |
|
13,900 |
13,802 |
|
|
Trizec Finance Ltd. yankee 10.875% 10/15/05 |
Baa3 |
|
8,968 |
9,013 |
|
|
TXU Eastern Funding 6.75% 5/15/09 |
Baa1 |
|
9,540 |
8,530 |
|
|
U.S. West Capital Funding, Inc. 6.875% 7/15/28 |
Baa1 |
|
10,120 |
8,780 |
|
|
|
364,708 |
||||
|
Savings & Loans - 0.1% |
|||||
|
Long Island Savings Bank FSB: |
|
|
|
|
|
|
6.2% 4/2/01 |
Baa3 |
|
14,750 |
14,586 |
|
|
7% 6/13/02 |
Baa3 |
|
14,850 |
14,596 |
|
|
|
29,182 |
||||
|
Securities Industry - 0.1% |
|||||
|
Amvescap PLC yankee 6.375% 5/15/03 |
A3 |
|
13,050 |
12,481 |
|
|
ECM Corp. LP 14% 6/10/02 (g) |
- |
|
36 |
34 |
|
|
|
12,515 |
||||
|
TOTAL FINANCE |
771,743 |
||||
|
HEALTH - 0.1% |
|||||
|
Drugs & Pharmaceuticals - 0.0% |
|||||
|
Global Health Sciences, Inc. 11% 5/1/08 |
Caa1 |
|
1,680 |
286 |
|
|
Warner Chilcott, Inc. 12.625% 2/15/08 (g) |
B2 |
|
2,840 |
2,883 |
|
|
|
3,169 |
||||
|
Medical Facilities Management - 0.1% |
|||||
|
Express Scripts, Inc. 9.625% 6/15/09 |
Ba2 |
|
3,760 |
3,732 |
|
|
Fountain View, Inc. 11.25% 4/15/08 |
Caa1 |
|
6,190 |
1,114 |
|
|
Mariner Post-Acute Network, Inc. 9.5% 11/1/07 (d) |
C |
|
9,440 |
1 |
|
|
Oxford Health Plans, Inc. 11% 5/15/05 |
B2 |
|
10,285 |
10,799 |
|
|
Unilab Corp. 12.75% 10/1/09 |
B3 |
|
3,950 |
4,138 |
|
|
|
19,784 |
||||
|
TOTAL HEALTH |
22,953 |
||||
|
Corporate Bonds - continued |
|||||
|
Moody's Ratings (unaudited) (b) |
Principal Amount (000s) |
Value (Note 1) (000s) |
|||
|
Nonconvertible Bonds - continued |
|||||
|
INDUSTRIAL MACHINERY & EQUIPMENT - 0.7% |
|||||
|
Electrical Equipment - 0.1% |
|||||
|
Loral Space & Communications Ltd. 9.5% 1/15/06 |
B1 |
|
$ 2,140 |
$ 1,605 |
|
|
Motors & Gears, Inc. 10.75% 11/15/06 |
B3 |
|
6,130 |
5,946 |
|
|
Telex Communications, Inc. 10.5% 5/1/07 |
B2 |
|
5,330 |
3,731 |
|
|
|
11,282 |
||||
|
Industrial Machinery & Equipment - 0.3% |
|||||
|
Tenneco Automotive, Inc. 11.625% 10/15/09 |
B2 |
|
5,080 |
4,496 |
|
|
Thermadyne Holdings Corp. 0% 6/1/08 (e) |
Caa1 |
|
11,150 |
4,014 |
|
|
Thermadyne Manufacturing LLC 9.875% 6/1/08 |
B3 |
|
7,810 |
6,014 |
|
|
Tokheim Corp. 11.375% 8/1/08 |
Ca |
|
3,250 |
325 |
|
|
Tyco International Group SA: |
|
|
|
|
|
|
yankee 6.875% 1/15/29 |
Baa1 |
|
20,500 |
17,924 |
|
|
6.875% 9/5/02 |
Baa1 |
|
35,000 |
34,877 |
|
|
|
67,650 |
||||
|
Pollution Control - 0.3% |
|||||
|
Allied Waste North America, Inc.: |
|
|
|
|
|
|
7.375% 1/1/04 |
Ba3 |
|
1,140 |
1,055 |
|
|
7.625% 1/1/06 |
Ba2 |
|
725 |
653 |
|
|
7.875% 1/1/09 |
Ba2 |
|
1,200 |
1,050 |
|
|
10% 8/1/09 |
B2 |
|
35,595 |
30,790 |
|
|
Envirosource, Inc. 9.75% 6/15/03 |
Caa3 |
|
8,750 |
3,500 |
|
|
WMX Technologies, Inc. 6.25% 10/15/00 |
Ba1 |
|
11,150 |
11,106 |
|
|
WMX Technologies, Inc. 7.7% 10/1/02 |
Ba1 |
|
10,000 |
9,768 |
|
|
|
57,922 |
||||
|
TOTAL INDUSTRIAL MACHINERY & EQUIPMENT |
136,854 |
||||
|
MEDIA & LEISURE - 2.3% |
|||||
|
Broadcasting - 1.8% |
|||||
|
Adelphia Communications Corp. 7.75% 1/15/09 |
B1 |
|
7,930 |
6,542 |
|
|
American Mobile Satellite Corp. 12.25% 4/1/08 |
- |
|
2,035 |
1,536 |
|
|
British Sky Broadcasting Group PLC 8.2% 7/15/09 |
Baa3 |
|
22,000 |
20,253 |
|
|
Charter Communications Holdings LLC/Charter Communications Holdings Capital Corp.: |
|
|
|
|
|
|
8.625% 4/1/09 |
B2 |
|
8,230 |
7,201 |
|
|
Corporate Bonds - continued |
|||||
|
Moody's Ratings (unaudited) (b) |
Principal Amount (000s) |
Value (Note 1) (000s) |
|||
|
Nonconvertible Bonds - continued |
|||||
|
MEDIA & LEISURE - continued |
|||||
|
Broadcasting - continued |
|||||
|
Charter Communications Holdings LLC/Charter Communications Holdings Capital Corp.: - continued |
|
|
|
|
|
|
10.25% 1/15/10 |
B2 |
|
$ 1,780 |
$ 1,713 |
|
|
Clear Channel Communications, Inc.: |
|
|
|
|
|
|
7.25% 10/15/27 |
Baa3 |
|
5,420 |
4,878 |
|
|
7.875% 6/15/05 |
Baa3 |
|
5,000 |
5,046 |
|
|
Continental Cablevision, Inc. 8.3% 5/15/06 |
A2 |
|
8,530 |
8,763 |
|
|
Diamond Cable Communications PLC: |
|
|
|
|
|
|
0% 2/15/07 (e) |
B2 |
|
8,480 |
6,530 |
|
|
yankee 0% 12/15/05 (e) |
B2 |
|
2,630 |
2,456 |
|
|
Earthwatch, Inc. 0% 7/15/07 (e)(g) |
- |
|
11,190 |
6,714 |
|
|
EchoStar DBS Corp. 9.375% 2/1/09 |
B2 |
|
20,320 |
19,609 |
|
|
Fox Family Worldwide, Inc. 0% 11/1/07 (e) |
B1 |
|
7,170 |
5,073 |
|
|
Impsat Fiber Networks, Inc. 13.75% 2/15/05 (g) |
B3 |
|
4,820 |
4,362 |
|
|
International Cabletel, Inc. 0% 2/1/06 (e) |
B2 |
|
20,440 |
19,214 |
|
|
LIN Holdings Corp. 0% 3/1/08 (e) |
B3 |
|
6,991 |
4,701 |
|
|
Nielsen Media Research, Inc. 7.6% 6/15/09 |
A3 |
|
11,355 |
10,836 |
|
|
NorthPoint Communication Holdings, Inc. 12.875% 2/15/10 |
Caa1 |
|
13,415 |
8,720 |
|
|
NTL Communications Corp. 11.5% 10/1/08 |
B3 |
|
8,890 |
8,957 |
|
|
NTL, Inc. 0% 4/1/08 (e) |
B3 |
|
3,700 |
2,313 |
|
|
Olympus Communications LP/Olympus Capital Corp. 10.625% 11/15/06 |
B1 |
|
10,275 |
9,967 |
|
|
Satelites Mexicanos SA de CV: |
|
|
|
|
|
|
10.125% 11/1/04 |
B3 |
|
13,940 |
9,897 |
|
|
11.28% 6/30/04 (g)(i) |
B1 |
|
7,537 |
6,934 |
|
|
Shaw Communications, Inc. 8.25% 4/11/10 |
Baa2 |
|
9,550 |
9,648 |
|
|
Spectrasite Holdings, Inc.: |
|
|
|
|
|
|
0% 4/15/09 (e) |
B3 |
|
3,530 |
2,092 |
|
|
0% 3/15/10 (e) |
B3 |
|
5,215 |
2,920 |
|
|
TCI Communications, Inc.: |
|
|
|
|
|
|
8.75% 8/1/15 |
A2 |
|
23,160 |
24,620 |
|
|
9.8% 2/1/12 |
A2 |
|
20,180 |
22,809 |
|
|
TCI Communications Financing III 9.65% 3/31/27 |
A3 |
|
13,120 |
14,667 |
|
|
Telewest PLC 0% 10/1/07 (e) |
B1 |
|
20,720 |
19,891 |
|
|
Time Warner, Inc.: |
|
|
|
|
|
|
6.85% 1/15/26 |
Baa3 |
|
19,000 |
18,489 |
|
|
Corporate Bonds - continued |
|||||
|
Moody's Ratings (unaudited) (b) |
Principal Amount (000s) |
Value (Note 1) (000s) |
|||
|
Nonconvertible Bonds - continued |
|||||
|
MEDIA & LEISURE - continued |
|||||
|
Broadcasting - continued |
|||||
|
Time Warner, Inc.: - continued |
|
|
|
|
|
|
8.18% 8/15/07 |
Baa3 |
|
$ 5,425 |
$ 5,546 |
|
|
UIH Australia/Pacific, Inc.: |
|
|
|
|
|
|
Series B 0% 5/15/06 (e) |
B2 |
|
24,670 |
22,696 |
|
|
Series D 0% 5/15/06 (e) |
B2 |
|
4,020 |
3,698 |
|
|
United International Holdings, Inc. 0% 2/15/08 (e) |
B3 |
|
29,280 |
21,082 |
|
|
United Pan-Europe Communications NV: |
|
|
|
|
|
|
0% 2/1/10 (e) |
B2 |
|
16,810 |
7,565 |
|
|
10.875% 11/1/07 |
B2 |
|
890 |
783 |
|
|
10.875% 8/1/09 |
B2 |
|
14,090 |
11,836 |
|
|
11.25% 11/1/09 |
B2 |
|
1,325 |
1,133 |
|
|
11.25% 2/1/10 |
B2 |
|
3,565 |
3,030 |
|
|
USA Networks, Inc./USANi LLC 6.75% 11/15/05 |
Baa3 |
|
8,340 |
8,017 |
|
|
|
382,737 |
||||
|
Entertainment - 0.2% |
|||||
|
AMC Entertainment, Inc.: |
|
|
|
|
|
|
9.5% 3/15/09 |
Caa3 |
|
3,210 |
1,669 |
|
|
9.5% 2/1/11 |
Caa3 |
|
2,570 |
1,362 |
|
|
Hollywood Entertainment Corp. 10.625% 8/15/04 |
B3 |
|
1,620 |
1,328 |
|
|
Mandalay Resort Group 10.25% 8/1/07 (g) |
Ba3 |
|
3,015 |
3,041 |
|
|
MGM Grand, Inc. 9.75% 6/1/07 |
Ba2 |
|
3,620 |
3,720 |
|
|
Paramount Communications, Inc. 7.5% 1/15/02 |
Baa1 |
|
3,325 |
3,317 |
|
|
Premier Parks, Inc.(OLD) 9.25% 4/1/06 |
B3 |
|
2,900 |
2,690 |
|
|
Viacom, Inc. 6.75% 1/15/03 |
Baa1 |
|
21,600 |
21,252 |
|
|
|
38,379 |
||||
|
Leisure Durables & Toys - 0.0% |
|||||
|
Marvel Enterprises, Inc. 12% 6/15/09 |
- |
|
8,410 |
6,770 |
|
|
Lodging & Gaming - 0.1% |
|||||
|
HMH Properties, Inc. 7.875% 8/1/05 |
Ba2 |
|
1,815 |
1,688 |
|
|
ITT Corp. 7.375% 11/15/15 |
Ba1 |
|
3,227 |
2,840 |
|
|
KSL Recreation Group, Inc. 10.25% 5/1/07 |
B2 |
|
6,870 |
6,595 |
|
|
|
11,123 |
||||
|
Publishing - 0.1% |
|||||
|
News America Holdings, Inc. 7.375% 10/17/08 |
Baa3 |
|
9,525 |
9,160 |
|
|
Corporate Bonds - continued |
|||||
|
Moody's Ratings (unaudited) (b) |
Principal Amount (000s) |
Value (Note 1) (000s) |
|||
|
Nonconvertible Bonds - continued |
|||||
|
MEDIA & LEISURE - continued |
|||||
|
Publishing - continued |
|||||
|
News America, Inc.: |
|
|
|
|
|
|
7.125% 4/8/28 |
Baa3 |
|
$ 6,100 |
$ 5,256 |
|
|
7.28% 6/30/28 |
Baa3 |
|
14,000 |
12,173 |
|
|
|
26,589 |
||||
|
Restaurants - 0.1% |
|||||
|
AFC Enterprises, Inc. 10.25% 5/15/07 |
B3 |
|
6,340 |
6,150 |
|
|
NE Restaurant, Inc. 10.75% 7/15/08 |
B3 |
|
3,355 |
2,550 |
|
|
|
8,700 |
||||
|
TOTAL MEDIA & LEISURE |
474,298 |
||||
|
NONDURABLES - 0.4% |
|||||
|
Beverages - 0.1% |
|||||
|
Seagram JE & Sons, Inc.: |
|
|
|
|
|
|
6.625% 12/15/05 |
Baa3 |
|
3,860 |
3,703 |
|
|
6.8% 12/15/08 |
Baa3 |
|
17,450 |
16,428 |
|
|
|
20,131 |
||||
|
Foods - 0.1% |
|||||
|
ConAgra, Inc. 7.125% 10/1/26 |
Baa1 |
|
22,725 |
21,546 |
|
|
Household Products - 0.0% |
|||||
|
AKI Holding Corp. 0% 7/1/09 (e) |
Caa1 |
|
1,930 |
772 |
|
|
Tobacco - 0.2% |
|||||
|
Philip Morris Companies, Inc. 7% 7/15/05 |
A2 |
|
27,190 |
25,667 |
|
|
RJ Reynolds Tobacco Holdings, Inc. 7.375% 5/15/03 |
Baa2 |
|
16,800 |
15,728 |
|
|
|
41,395 |
||||
|
TOTAL NONDURABLES |
83,844 |
||||
|
RETAIL & WHOLESALE - 0.3% |
|||||
|
Apparel Stores - 0.0% |
|||||
|
Mothers Work, Inc. 12.625% 8/1/05 |
B3 |
|
10,905 |
10,155 |
|
|
Specialty Retailers, Inc. 8.5% 7/15/05 (d) |
Ca |
|
12,790 |
128 |
|
|
|
10,283 |
||||
|
Corporate Bonds - continued |
|||||
|
Moody's Ratings (unaudited) (b) |
Principal Amount (000s) |
Value (Note 1) (000s) |
|||
|
Nonconvertible Bonds - continued |
|||||
|
RETAIL & WHOLESALE - continued |
|||||
|
Drug Stores - 0.1% |
|||||
|
Rite Aid Corp.: |
|
|
|
|
|
|
6.5% 12/15/05 (g) |
Caa1 |
|
$ 20,460 |
$ 8,798 |
|
|
7.125% 1/15/07 |
Caa1 |
|
7,925 |
3,329 |
|
|
|
12,127 |
||||
|
General Merchandise Stores - 0.2% |
|||||
|
Federated Department Stores, Inc.: |
|
|
|
|
|
|
6.79% 7/15/27 |
Baa1 |
|
11,500 |
10,955 |
|
|
8.5% 6/15/03 |
Baa1 |
|
34,210 |
34,221 |
|
|
|
45,176 |
||||
|
Grocery Stores - 0.0% |
|||||
|
Jitney-Jungle Stores of America, Inc.: |
|
|
|
|
|
|
10.375% 9/15/07 (d) |
C |
|
1,450 |
29 |
|
|
12% 3/1/06 (d) |
Caa3 |
|
1,780 |
223 |
|
|
Pathmark Stores, Inc. 9.625% 5/1/03 (d) |
Caa3 |
|
1,890 |
1,512 |
|
|
|
1,764 |
||||
|
TOTAL RETAIL & WHOLESALE |
69,350 |
||||
|
SERVICES - 0.1% |
|||||
|
Printing - 0.1% |
|||||
|
Sullivan Graphics, Inc. 12.75% 8/1/05 |
Caa1 |
|
10,940 |
11,049 |
|
|
World Color Press, Inc. 7.75% 2/15/09 |
Baa3 |
|
3,990 |
3,701 |
|
|
|
14,750 |
||||
|
Services - 0.0% |
|||||
|
AP Holdings, Inc. 0% 3/15/08 (e) |
Caa2 |
|
1,380 |
138 |
|
|
Apcoa, Inc. 9.25% 3/15/08 |
Caa1 |
|
10,445 |
3,917 |
|
|
Medaphis Corp. 9.5% 2/15/05 |
Caa1 |
|
10,385 |
8,412 |
|
|
|
12,467 |
||||
|
TOTAL SERVICES |
27,217 |
||||
|
TECHNOLOGY - 0.9% |
|||||
|
Computer Services & Software - 0.2% |
|||||
|
Amazon.com, Inc. 0% 5/1/08 (e) |
Caa1 |
|
4,190 |
2,095 |
|
|
Colo.com 13.875% 3/15/10 unit (g) |
- |
|
5,775 |
6,064 |
|
|
Concentric Network Corp. 12.75% 12/15/07 |
B |
|
4,690 |
4,925 |
|
|
Corporate Bonds - continued |
|||||
|
Moody's Ratings (unaudited) (b) |
Principal Amount (000s) |
Value (Note 1) (000s) |
|||
|
Nonconvertible Bonds - continued |
|||||
|
TECHNOLOGY - continued |
|||||
|
Computer Services & Software - continued |
|||||
|
Covad Communications Group, Inc.: |
|
|
|
|
|
|
0% 3/15/08 (e) |
B3 |
|
$ 11,059 |
$ 5,087 |
|
|
12% 2/15/10 |
B3 |
|
7,220 |
5,379 |
|
|
12.5% 2/15/09 |
B3 |
|
4,490 |
3,412 |
|
|
Exodus Communications, Inc.: |
|
|
|
|
|
|
10.75% 12/15/09 |
B- |
|
14,365 |
13,934 |
|
|
11.625% 7/15/10 (g) |
B |
|
5,335 |
5,348 |
|
|
PSINet, Inc.: |
|
|
|
|
|
|
10% 2/15/05 |
B3 |
|
4,495 |
3,686 |
|
|
10.5% 12/1/06 |
B3 |
|
3,550 |
2,876 |
|
|
11% 8/1/09 |
B3 |
|
2,095 |
1,697 |
|
|
11.5% 11/1/08 |
B3 |
|
350 |
291 |
|
|
|
54,794 |
||||
|
Computers & Office Equipment - 0.5% |
|||||
|
Comdisco, Inc.: |
|
|
|
|
|
|
5.95% 4/30/02 |
Baa1 |
|
19,000 |
18,059 |
|
|
6.375% 11/30/01 |
Baa1 |
|
24,500 |
23,731 |
|
|
7.25% 9/1/02 |
Baa1 |
|
43,630 |
42,250 |
|
|
9.5% 1/28/02 |
Baa2 |
|
2,580 |
2,627 |
|
|
Dictaphone Corp. 11.75% 8/1/05 |
B3 |
|
5,045 |
5,095 |
|
|
Globix Corp. 12.5% 2/1/10 |
B- |
|
8,935 |
6,969 |
|
|
|
98,731 |
||||
|
Electronic Instruments - 0.1% |
|||||
|
Telecommunications Techniques Co. LLC 9.75% 5/15/08 |
B3 |
|
15,230 |
14,240 |
|
|
Electronics - 0.1% |
|||||
|
ChipPAC International Ltd. 12.75% 8/1/09 |
B3 |
|
2,280 |
2,462 |
|
|
Hadco Corp. 9.5% 6/15/08 |
B2 |
|
7,680 |
7,728 |
|
|
Micron Technology, Inc. 6.5% 9/30/05 (k) |
B3 |
|
9,000 |
7,650 |
|
|
|
17,840 |
||||
|
TOTAL TECHNOLOGY |
185,605 |
||||
|
TRANSPORTATION - 0.5% |
|||||
|
Air Transportation - 0.1% |
|||||
|
Atlas Air, Inc.: |
|
|
|
|
|
|
8.77% 1/2/11 |
Ba1 |
|
8,241 |
8,076 |
|
|
10.75% 8/1/05 |
B1 |
|
945 |
973 |
|
|
Corporate Bonds - continued |
|||||
|
Moody's Ratings (unaudited) (b) |
Principal Amount (000s) |
Value (Note 1) (000s) |
|||
|
Nonconvertible Bonds - continued |
|||||
|
TRANSPORTATION - continued |
|||||
|
Air Transportation - continued |
|||||
|
Continental Airlines, Inc. pass thru trust certificates: |
|
|
|
|
|
|
7.434% 3/15/06 |
Baa1 |
|
$ 5,265 |
$ 5,118 |
|
|
7.73% 9/15/12 |
Baa1 |
|
2,150 |
2,065 |
|
|
Delta Air Lines, Inc. 7.9% 12/15/09 |
Baa3 |
|
10,000 |
9,439 |
|
|
|
25,671 |
||||
|
Railroads - 0.4% |
|||||
|
Burlington Northern Santa Fe Corp.: |
|
|
|
|
|
|
6.53% 7/15/37 |
Baa2 |
|
20,000 |
19,416 |
|
|
6.875% 12/1/27 |
Baa2 |
|
12,000 |
10,485 |
|
|
CSX Corp. 6.25% 10/15/08 |
Baa2 |
|
20,500 |
18,245 |
|
|
Norfolk Southern Corp. 7.05% 5/1/37 |
Baa1 |
|
39,550 |
38,742 |
|
|
|
86,888 |
||||
|
TOTAL TRANSPORTATION |
112,559 |
||||
|
UTILITIES - 3.3% |
|||||
|
Cellular - 0.6% |
|||||
|
Cellnet Data Systems, Inc. 0% 10/1/07 (e) |
- |
|
25,140 |
1,886 |
|
|
Crown Castle International Corp.: |
|
|
|
|
|
|
0% 11/15/07 (e) |
B3 |
|
3,500 |
2,643 |
|
|
10.75% 8/1/11 |
B3 |
|
3,650 |
3,732 |
|
|
Dobson Communications Corp. 10.875% 7/1/10 (g) |
- |
|
3,915 |
3,846 |
|
|
McCaw International Ltd. 0% 4/15/07 (e) |
Caa1 |
|
31,820 |
24,183 |
|
|
Metrocall, Inc.: |
|
|
|
|
|
|
9.75% 11/1/07 |
B3 |
|
1,760 |
1,250 |
|
|
10.375% 10/1/07 |
B3 |
|
6,825 |
5,051 |
|
|
11% 9/15/08 |
B3 |
|
1,570 |
1,178 |
|
|
Millicom International Cellular SA 0% 6/1/06 (e) |
Caa1 |
|
26,640 |
23,177 |
|
|
Nextel Communications, Inc.: |
|
|
|
|
|
|
9.375% 11/15/09 |
B1 |
|
15,950 |
15,192 |
|
|
12% 11/1/08 |
B1 |
|
1,450 |
1,555 |
|
|
Nextel International, Inc.: |
|
|
|
|
|
|
0% 4/15/08 (e) |
Caa1 |
|
14,260 |
9,126 |
|
|
12.75% 8/1/10 (g) |
Caa1 |
|
8,840 |
8,663 |
|
|
Orbital Imaging Corp.: |
|
|
|
|
|
|
11.625% 3/1/05 |
CCC+ |
|
1,260 |
504 |
|
|
Corporate Bonds - continued |
|||||
|
Moody's Ratings (unaudited) (b) |
Principal Amount (000s) |
Value (Note 1) (000s) |
|||
|
Nonconvertible Bonds - continued |
|||||
|
UTILITIES - continued |
|||||
|
Cellular - continued |
|||||
|
Orbital Imaging Corp.: - continued |
|
|
|
|
|
|
11.625% 3/1/05 |
CCC+ |
|
$ 2,570 |
$ 1,028 |
|
|
Orion Network Systems, Inc. 0% 1/15/07 (e) |
B2 |
|
8,015 |
3,286 |
|
|
PageMart Nationwide, Inc. 15% 2/1/05 |
B3 |
|
14,070 |
13,648 |
|
|
Paging Network, Inc.: |
|
|
|
|
|
|
8.875% 2/1/06 (d) |
Caa3 |
|
705 |
282 |
|
|
10% 10/15/08 (d) |
Caa3 |
|
1,410 |
564 |
|
|
Telesystem International Wireless, Inc.: |
|
|
|
|
|
|
0% 6/30/07 (e) |
Caa1 |
|
11,050 |
7,735 |
|
|
0% 11/1/07 (e) |
Caa1 |
|
10,500 |
6,300 |
|
|
|
134,829 |
||||
|
Electric Utility - 0.8% |
|||||
|
Avon Energy Partners Holdings: |
|
|
|
|
|
|
6.46% 3/4/08 (g) |
Baa2 |
|
25,500 |
22,714 |
|
|
6.73% 12/11/02 (g) |
Baa2 |
|
17,000 |
16,597 |
|
|
7.05% 12/11/07 (g) |
Baa2 |
|
18,000 |
16,649 |
|
|
Dominion Resources, Inc.: |
|
|
|
|
|
|
7.6% 7/15/03 |
Baa1 |
|
9,000 |
9,016 |
|
|
8.125% 6/15/10 |
Baa1 |
|
10,770 |
10,976 |
|
|
DR Investments UK PLC yankee 7.1% 5/15/02 (g) |
A2 |
|
32,000 |
31,727 |
|
|
Illinois Power Co. 7.5% 6/15/09 |
Baa1 |
|
9,760 |
9,428 |
|
|
Israel Electric Corp. Ltd.: |
|
|
|
|
|
|
7.75% 12/15/27 (g) |
A3 |
|
42,405 |
37,575 |
|
|
yankee 7.25% 12/15/06 (g) |
A3 |
|
9,250 |
8,958 |
|
|
Niagara Mohawk Power Corp. 8.875% 5/15/07 |
Baa3 |
|
5,060 |
5,250 |
|
|
Texas Utilities Co. 6.375% 1/1/08 |
Baa3 |
|
10,070 |
9,069 |
|
|
|
177,959 |
||||
|
Gas - 0.3% |
|||||
|
CMS Panhandle Holding Co.: |
|
|
|
|
|
|
6.125% 3/15/04 |
Baa3 |
|
11,950 |
11,329 |
|
|
7% 7/15/29 |
Baa3 |
|
9,050 |
7,714 |
|
|
Reliant Energy Resources Corp. 8.125% 7/15/05 (g) |
Baa1 |
|
12,500 |
12,526 |
|
|
Southwest Gas Corp. 9.75% 6/15/02 |
Baa2 |
|
20,650 |
21,297 |
|
|
|
52,866 |
||||
|
Corporate Bonds - continued |
|||||
|
Moody's Ratings (unaudited) (b) |
Principal Amount (000s) |
Value (Note 1) (000s) |
|||
|
Nonconvertible Bonds - continued |
|||||
|
UTILITIES - continued |
|||||
|
Telephone Services - 1.6% |
|||||
|
Allegiance Telecom, Inc. 0% 2/15/08 (e) |
B3 |
|
$ 8,879 |
$ 6,548 |
|
|
Axxent, Inc. 15% 12/30/04 (k) |
- |
|
10,684 |
10,008 |
|
|
Cable & Wireless Optus Ltd. 8% 6/22/10 (g) |
Baa1 |
|
7,300 |
7,330 |
|
|
Deutsche Telekom International Finance BV: |
|
|
|
|
|
|
8% 6/15/10 |
Aa2 |
|
24,450 |
24,578 |
|
|
8.25% 6/15/30 |
Aa2 |
|
36,875 |
37,407 |
|
|
FirstWorld Communications, Inc. 0% 4/15/08 (e) |
- |
|
11,180 |
3,130 |
|
|
Hyperion Telecommunications, Inc.: |
|
|
|
|
|
|
0% 4/15/03 (e) |
B3 |
|
2,635 |
2,372 |
|
|
12% 11/1/07 |
Caa1 |
|
2,135 |
1,836 |
|
|
ICG Holdings, Inc.: |
|
|
|
|
|
|
0% 9/15/05 (e) |
B3 |
|
12,200 |
11,529 |
|
|
0% 5/1/06 (e) |
B3 |
|
5,750 |
4,600 |
|
|
ICG Services, Inc.: |
|
|
|
|
|
|
0% 2/15/08 (e) |
B3 |
|
27,170 |
13,042 |
|
|
0% 5/1/08 (e) |
B3 |
|
2,010 |
925 |
|
|
Intermedia Communications, Inc.: |
|
|
|
|
|
|
0% 5/15/06 (e) |
B2 |
|
85 |
80 |
|
|
0% 7/15/07 (e) |
B2 |
|
5,315 |
3,561 |
|
|
KMC Telecom Holdings, Inc.: |
|
|
|
|
|
|
0% 2/15/08 (e) |
Caa2 |
|
11,340 |
4,990 |
|
|
13.5% 5/15/09 |
Caa2 |
|
4,440 |
3,774 |
|
|
Metromedia Fiber Network, Inc. 10% 11/15/08 |
B2 |
|
10,680 |
10,360 |
|
|
NEXTLINK Communications, Inc.: |
|
|
|
|
|
|
0% 12/1/09 (e) |
B2 |
|
6,820 |
3,819 |
|
|
10.75% 11/15/08 |
B3 |
|
230 |
221 |
|
|
10.75% 6/1/09 |
B2 |
|
7,260 |
7,006 |
|
|
Pathnet, Inc. 12.25% 4/15/08 |
- |
|
13,715 |
7,680 |
|
|
Rhythms NetConnections, Inc.: |
|
|
|
|
|
|
Series B, 14% 2/15/10 |
B3 |
|
4,640 |
2,877 |
|
|
0% 5/15/08 (e) |
B3 |
|
14,190 |
5,392 |
|
|
12.75% 4/15/09 |
B3 |
|
7,245 |
4,347 |
|
|
RSL Communications Ltd./RSL Communications PLC 12.25% 11/15/06 |
B2 |
|
3,780 |
1,285 |
|
|
RSL Communications PLC 9.875% 11/15/09 |
B2 |
|
4,060 |
1,259 |
|
|
Telecomunicaciones de Puerto Rico, Inc. 6.65% 5/15/06 |
Baa2 |
|
16,450 |
15,398 |
|
|
Corporate Bonds - continued |
|||||
|
Moody's Ratings (unaudited) (b) |
Principal Amount (000s) |
Value (Note 1) (000s) |
|||
|
Nonconvertible Bonds - continued |
|||||
|
UTILITIES - continued |
|||||
|
Telephone Services - continued |
|||||
|
Teleglobe Canada, Inc.: |
|
|
|
|
|
|
7.2% 7/20/09 |
Baa1 |
|
$ 32,523 |
$ 31,068 |
|
|
7.7% 7/20/29 |
Baa1 |
|
24,494 |
23,126 |
|
|
Teligent, Inc. 11.5% 12/1/07 |
Caa1 |
|
2,530 |
1,645 |
|
|
WinStar Communications, Inc.: |
|
|
|
|
|
|
0% 4/15/10 (e)(g) |
B3 |
|
24,111 |
10,609 |
|
|
12.5% 4/15/08 (g) |
B3 |
|
10,775 |
9,805 |
|
|
12.75% 4/15/10 (g) |
B3 |
|
20,234 |
18,312 |
|
|
WorldCom, Inc.: |
|
|
|
|
|
|
7.75% 4/1/07 |
A3 |
|
4,700 |
4,730 |
|
|
8.875% 1/15/06 |
A3 |
|
28,746 |
29,650 |
|
|
Worldwide Fiber, Inc. 12% 8/1/09 |
B3 |
|
6,955 |
6,225 |
|
|
|
330,524 |
||||
|
TOTAL UTILITIES |
696,178 |
||||
|
TOTAL NONCONVERTIBLE BONDS |
2,935,219 |
||||
|
TOTAL CORPORATE BONDS (Cost $3,318,310) |
3,119,894 |
||||
|
U.S. Government and Government Agency Obligations - 7.9% |
|||||
|
|
|||||
|
U.S. Government Agency Obligations - 1.9% |
|||||
|
Fannie Mae: |
|
|
|
|
|
|
6.5% 8/15/04 |
Aaa |
|
13,510 |
13,276 |
|
|
6.5% 4/29/09 |
Aaa |
|
175,990 |
164,468 |
|
|
7% 7/15/05 |
Aaa |
|
38,015 |
38,045 |
|
|
7.25% 5/15/30 |
Aaa |
|
47,030 |
48,299 |
|
|
Federal Agricultural Mortgage Corp.: |
|
|
|
|
|
|
7.01% 8/10/03 |
Aaa |
|
1,040 |
1,039 |
|
|
7.01% 8/10/04 |
Aaa |
|
1,340 |
1,338 |
|
|
7.04% 8/10/05 |
Aaa |
|
5,100 |
5,095 |
|
|
Freddie Mac: |
|
|
|
|
|
|
5.75% 3/15/09 |
Aaa |
|
5,000 |
4,550 |
|
|
6.25% 7/15/04 |
Aaa |
|
1,340 |
1,306 |
|
|
6.45% 4/29/09 |
Aaa |
|
34,000 |
31,700 |
|
|
6.875% 1/15/05 |
Aaa |
|
13,285 |
13,221 |
|
|
U.S. Government and Government Agency Obligations - continued |
|||||
|
Moody's Ratings (unaudited) (b) |
Principal Amount (000s) |
Value (Note 1) (000s) |
|||
|
U.S. Government Agency Obligations - continued |
|||||
|
Freddie Mac: - continued |
|
|
|
|
|
|
7% 7/15/05 |
Aaa |
|
$ 18,200 |
$ 18,206 |
|
|
Government Loan Trusts (assets of Trust
guaranteed by U.S. Government through
Agency for International Development) |
Aaa |
|
8,131 |
8,470 |
|
|
Government Trust Certificates (assets of Trust guaranteed by U.S. Government through Defense Security Assistance Agency): |
|
|
|
|
|
|
Class 1-C, 9.25% 11/15/01 |
Aaa |
|
9,491 |
9,659 |
|
|
Class 2-E, 9.4% 5/15/02 |
Aaa |
|
4,763 |
4,823 |
|
|
Class 3-T, 9.625% 5/15/02 |
Aaa |
|
4,576 |
4,649 |
|
|
Israel Export Trust Certificates (assets of Trust
guaranteed by U.S. Government through |
Aaa |
|
2,453 |
2,447 |
|
|
Overseas Private Investment Corp. U.S. Government guaranteed participation certificate Series 1996-A1, 6.726% 9/15/10 (callable) |
- |
|
27,391 |
27,363 |
|
|
Private Export Funding Corp. secured 6.86% 4/30/04 |
Aaa |
|
1,876 |
1,865 |
|
|
Tennessee Valley Authority 7.125% 5/1/30 |
Aaa |
|
9,970 |
10,012 |
|
|
TOTAL U.S. GOVERNMENT AGENCY OBLIGATIONS |
409,831 |
||||
|
U.S. Treasury Obligations - 6.0% |
|||||
|
U.S. Treasury Bonds: |
|
|
|
|
|
|
6.125% 8/15/29 |
Aaa |
|
55,505 |
57,127 |
|
|
8.875% 8/15/17 |
Aaa |
|
385,265 |
495,366 |
|
|
9.875% 11/15/15 |
Aaa |
|
93,450 |
127,603 |
|
|
10% 5/15/10 |
Aaa |
|
62,000 |
70,922 |
|
|
11.625% 11/15/04 |
Aaa |
|
30,500 |
36,543 |
|
|
12.375% 5/15/04 |
Aaa |
|
15,756 |
18,895 |
|
|
14% 11/15/11 |
Aaa |
|
18,400 |
25,527 |
|
|
U.S. Treasury Notes: |
|
|
|
|
|
|
5.625% 9/30/01 |
Aaa |
|
7,600 |
7,530 |
|
|
5.875% 10/31/01 |
Aaa |
|
33,100 |
32,872 |
|
|
6.5% 5/31/02 |
Aaa |
|
237,600 |
238,120 |
|
|
U.S. Government and Government Agency Obligations - continued |
|||||
|
Moody's Ratings (unaudited) (b) |
Principal Amount (000s) |
Value (Note 1) (000s) |
|||
|
U.S. Treasury Obligations - continued |
|||||
|
U.S. Treasury Notes: - continued |
|
|
|
|
|
|
6.625% 6/30/01 |
Aaa |
|
$ 32,500 |
$ 32,551 |
|
|
U.S. Treasury Notes - coupon STRIPS 0% 11/15/11 |
Aaa |
|
221,100 |
110,862 |
|
|
TOTAL U.S. TREASURY OBLIGATIONS |
1,253,918 |
||||
|
TOTAL U.S. GOVERNMENT AND GOVERNMENT AGENCY OBLIGATIONS (Cost $1,653,579) |
1,663,749 |
||||
|
U.S. Government Agency - Mortgage Securities - 11.8% |
|||||
|
|
|||||
|
Fannie Mae - 9.6% |
|||||
|
5.5% 10/1/08 to 5/1/14 |
Aaa |
|
172,883 |
160,905 |
|
|
6% 10/1/08 to 1/1/29 |
Aaa |
|
322,912 |
300,226 |
|
|
6.5% 12/1/06 to 8/1/30 |
Aaa |
|
851,615 |
805,730 |
|
|
6.5% 8/1/30 (h) |
Aaa |
|
150,000 |
141,656 |
|
|
7% 5/1/23 to 9/1/29 |
Aaa |
|
111,753 |
108,203 |
|
|
7.5% 8/1/07 to 8/1/30 |
Aaa |
|
246,611 |
243,276 |
|
|
8% 3/1/23 to 8/1/30 |
Aaa |
|
249,216 |
249,958 |
|
|
8.5% 1/1/09 to 7/1/21 |
Aaa |
|
47 |
48 |
|
|
10% 8/1/17 |
Aaa |
|
38 |
41 |
|
|
TOTAL FANNIE MAE |
2,010,043 |
||||
|
Freddie Mac - 0.0% |
|||||
|
8% 10/1/16 to 4/1/20 |
Aaa |
|
1,830 |
1,832 |
|
|
TOTAL FREDDIE MAC |
1,832 |
||||
|
Government National Mortgage Association - 2.2% |
|||||
|
6% 9/15/08 to 12/15/10 |
Aaa |
|
17,816 |
17,205 |
|
|
6.5% 6/15/02 to 5/15/29 (l) |
Aaa |
|
189,983 |
180,256 |
|
|
7% 10/15/17 to 12/15/28 |
Aaa |
|
74,446 |
72,368 |
|
|
7.5% 8/15/21 to 11/15/28 |
Aaa |
|
135,201 |
134,273 |
|
|
8% 6/15/01 to 10/15/25 |
Aaa |
|
45,628 |
46,138 |
|
|
8.5% 11/15/05 to 11/15/22 |
Aaa |
|
3,119 |
3,192 |
|
|
9% 3/15/10 to 5/15/22 |
Aaa |
|
589 |
611 |
|
|
U.S. Government Agency - Mortgage Securities - continued |
|||||
|
Moody's Ratings (unaudited) (b) |
Principal Amount (000s) |
Value (Note 1) (000s) |
|||
|
Government National Mortgage Association - continued |
|||||
|
9.5% 7/15/20 to 3/15/23 |
Aaa |
|
$ 56 |
$ 59 |
|
|
11% 7/20/13 to 7/20/20 |
Aaa |
|
1,087 |
1,165 |
|
|
TOTAL GOVERNMENT NATIONAL MORTGAGE ASSOCIATION |
455,267 |
||||
|
TOTAL U.S. GOVERNMENT AGENCY - MORTGAGE SECURITIES (Cost $2,527,830) |
2,467,142 |
||||
|
Asset-Backed Securities - 0.6% |
|||||
|
|
|||||
|
Airplanes pass through trust 10.875% 3/15/19 |
Ba2 |
|
4,988 |
3,641 |
|
|
American Express Credit Account Master Trust 6.1% 12/15/06 |
A1 |
|
14,200 |
13,595 |
|
|
Chase Manhattan Grantor Trust |
|
|
|
|
|
|
6.76% 9/15/02 |
A3 |
|
793 |
790 |
|
|
Chevy Chase Auto Receivables Trust 6.6% 12/15/02 |
Aaa |
|
1,138 |
1,126 |
|
|
Discover Card Master Trust I 5.85% 11/16/04 |
A2 |
|
12,421 |
12,072 |
|
|
Ford Credit Auto Owner Trust: |
|
|
|
|
|
|
6.2% 12/15/02 |
Aa2 |
|
14,100 |
13,928 |
|
|
6.4% 12/15/02 |
Aa2 |
|
8,660 |
8,546 |
|
|
7.03% 11/15/03 |
Aaa |
|
4,374 |
4,375 |
|
|
Key Auto Finance Trust: |
|
|
|
|
|
|
6.3% 10/15/03 |
A2 |
|
5,496 |
5,456 |
|
|
6.65% 10/15/03 |
Baa3 |
|
1,611 |
1,606 |
|
|
Premier Auto Trust 5.59% 2/9/04 |
Aaa |
|
42,000 |
40,819 |
|
|
Sears Credit Account Master Trust II 7% 7/15/08 |
Aaa |
|
13,200 |
13,122 |
|
|
TOTAL ASSET-BACKED SECURITIES (Cost $122,791) |
119,076 |
||||
|
Collateralized Mortgage Obligations - 0.1% |
|||||
|
|
|||||
|
U.S. Government Agency - 0.1% |
|||||
|
Freddie Mac planned amortization class Series
1608 Class L, 6.5% 9/15/23 |
Aaa |
|
12,270 |
11,448 |
|
|
Commercial Mortgage Securities - 1.4% |
|||||
|
Moody's Ratings (unaudited) (b) |
Principal Amount (000s) |
Value (Note 1) (000s) |
|||
|
Berkeley Federal Bank & Trust FSB Series 1994-1 Class B, 7.5003% 8/1/24 (g)(i) |
- |
|
$ 6,080 |
$ 4,193 |
|
|
CBM Funding Corp. Series 1996-1B Class C, 7.86% 2/1/08 |
BBB |
|
12,500 |
12,298 |
|
|
CS First Boston Mortgage Securities Corp.: |
|
|
|
|
|
|
Series 1995-WF1 Class A-2, 6.648% 12/21/27 |
AAA |
|
17,363 |
17,106 |
|
|
Series 1997-C2 Class D, 7.27% 1/17/35 |
Baa2 |
|
22,200 |
20,527 |
|
|
Series 1998-FL1: |
|
|
|
|
|
|
Class D, 7.145% 12/10/00 (g)(i) |
A2 |
|
20,100 |
20,110 |
|
|
Class E, 7.495% 1/10/13 (g)(i) |
Baa2 |
|
42,880 |
42,804 |
|
|
Series 2000-C1 Class A2, 7.545% 4/15/62 |
AAA |
|
10,600 |
10,643 |
|
|
Danmall Finance, Inc. Series 1 Class D, 13.12% 10/21/24 |
- |
|
2,442 |
2,472 |
|
|
Equitable Life Assurance Society of the |
A2 |
|
6,000 |
5,907 |
|
|
First Chicago/Lennar Trust I Series 1997-CHL1 Class E, 8.0835% 4/1/39 (i) |
- |
|
2,900 |
2,145 |
|
|
General Motors Acceptance Corp. Commercial Mortgage Securities, Inc. Series 1996-C1 Class F, 7.86% 10/15/28 (g) |
Ba3 |
|
3,500 |
2,823 |
|
|
GS Mortgage Securities Corp. II Series 1998-GLII Class E, 6.9698% 4/13/31 (g)(i) |
Baa3 |
|
20,000 |
17,788 |
|
|
LB Multifamily Mortgage Trust Series 1991-4 Class A1, 8.125% 4/25/21 (i) |
Caa1 |
|
2,283 |
1,827 |
|
|
Morgan Stanley Capital I, Inc. Series 1996-MBL1 Class E, 8.2198% 5/25/21 (g)(i) |
- |
|
3,099 |
3,080 |
|
|
Nomura Asset Securities Corp. Series 1998-D6: |
|
|
|
|
|
|
Class A1C, 6.69% 3/17/28 |
Aaa |
|
22,870 |
21,301 |
|
|
Class A4, 7.3615% 3/17/28 (i) |
Baa2 |
|
55,000 |
50,299 |
|
|
Nomura Depositor Trust: |
|
|
|
|
|
|
floater Series 1998-ST1A Class B2, 10.8763% 1/15/03 (g)(i) |
- |
|
2,200 |
2,042 |
|
|
Series 1998-ST1A Class B1A, 9.4013% 1/15/03 (g)(i) |
- |
|
3,500 |
3,265 |
|
|
Penn Mutual Life Insurance Co. (The)/Penn Insurance & Annuity Co. Series 1996-PML Class K, 7.9% 11/15/26 (g) |
- |
|
6,500 |
4,213 |
|
|
Resolution Trust Corp. Series 1995-C2 Class D, 7% 5/25/27 |
Baa2 |
|
3,397 |
3,351 |
|
|
Structured Asset Securities Corp.: |
|
|
|
|
|
|
Series 1992-M1 Class C, 7.05% 11/25/02 |
B2 |
|
2,200 |
2,081 |
|
|
Series 1995-C1: |
|
|
|
|
|
|
Class E, 7.375% 9/25/24 (g) |
BB |
|
7,896 |
7,296 |
|
|
Commercial Mortgage Securities - continued |
|||||
|
Moody's Ratings (unaudited) (b) |
Principal Amount (000s) |
Value (Note 1) (000s) |
|||
|
Structured Asset Securities Corp.: - continued |
|
|
|
|
|
|
Class F, 7.375% 9/25/24 (g) |
- |
|
$ 3,000 |
$ 2,394 |
|
|
Series 1996-CFL: |
|
|
|
|
|
|
Class E, 7.75% 2/25/28 |
BBB |
|
11,188 |
11,141 |
|
|
Class G, 7.75% 2/25/28 (g) |
B+ |
|
3,500 |
3,139 |
|
|
Thirteen Affiliates of General Growth Properties, Inc. sequential pay Series 1 Class A2, 6.602% 12/15/10 (g) |
Aaa |
|
32,000 |
30,240 |
|
|
TOTAL COMMERCIAL MORTGAGE SECURITIES (Cost $311,036) |
304,485 |
||||
|
Foreign Government and Government Agency Obligations (j) - 0.4% |
|||||
|
|
|||||
|
Korean Republic yankee: |
|
|
|
|
|
|
8.75% 4/15/03 |
Baa2 |
|
7,025 |
7,157 |
|
|
8.875% 4/15/08 |
Baa2 |
|
10,630 |
10,951 |
|
|
Manitoba Province yankee 6.75% 3/1/03 |
Aa3 |
|
5,000 |
4,980 |
|
|
Quebec Province yankee: |
|
|
|
|
|
|
6.86% 4/15/26 (f) |
A2 |
|
16,750 |
16,192 |
|
|
7.125% 2/9/24 |
A2 |
|
2,560 |
2,445 |
|
|
7.5% 7/15/23 |
A2 |
|
10,060 |
10,024 |
|
|
United Mexican States: |
|
|
|
|
|
|
global 8.5% 2/1/06 |
Baa3 |
|
22,500 |
22,427 |
|
|
9.875% 2/1/10 |
Baa3 |
|
15,900 |
16,727 |
|
|
TOTAL FOREIGN GOVERNMENT AND GOVERNMENT AGENCY OBLIGATIONS (Cost $93,420) |
90,903 |
||||
|
Supranational Obligations - 0.0% |
|||||
|
|
|||||
|
Inter-American Development Bank yankee 6.29%
7/16/27 |
Aaa |
|
10,850 |
10,388 |
|
|
Purchased Bank Debt - 0.0% |
|||||
|
|
|||||
|
Dynatech LLC term loan 10.03% 9/30/07 (i) |
- |
|
4,980 |
4,980 |
|
|
Voicestream Pcs Holding LLC term loan 9.76% 2/25/09 (i) |
B+ |
|
5,000 |
4,975 |
|
|
TOTAL PURCHASED BANK DEBT (Cost $9,921) |
9,955 |
||||
|
Cash Equivalents - 0.5% |
|||
|
Shares |
Value (Note 1) |
||
|
Fidelity Cash Central Fund, 6.57% (c) |
98,764,764 |
$ 98,765 |
|
|
Fidelity Securities Lending Cash Central Fund, 6.65% (c) |
96,000 |
96 |
|
|
TOTAL CASH EQUIVALENTS (Cost $98,861) |
98,861 |
||
|
TOTAL INVESTMENT PORTFOLIO - 100.9% (Cost $18,254,357) |
21,160,792 |
||
|
NET OTHER ASSETS - (0.9)% |
(194,761) |
||
|
NET ASSETS - 100% |
$ 20,966,031 |
||
|
Security Type Abbreviations |
||
|
PIES |
- |
Premium Income |
|
PRIDES |
- |
Preferred Redeemable Increased Dividend |
|
PRIZES |
- |
Participating Redeemable Indexed Zero-Premium Exchangeable Securities |
|
Legend |
|
(a) Non-income producing |
|
(b) S&P credit ratings are used in the absence of a rating by Moody's Investors Service, Inc. |
|
(c) The rate quoted is the annualized seven-day yield of the fund at |
|
(d) Non-income producing - issuer filed for protection under the Federal Bankruptcy Code or is in default of interest payment. |
|
(e) Debt obligation initially issued in zero coupon form which converts to coupon form at a specified rate and date. The rate shown is the rate at period end. |
|
(f) Debt obligation initially issued at one coupon which converts to a higher coupon at a specified date. The rate shown is the rate at period end. |
|
(g) Security exempt from registration under Rule 144A of the Securities Act of 1933. These securities may be resold in transactions exempt from registration, normally to qualified institutional buyers. At the period end, the value of these securities amounted to $569,134,000 or 2.7% of net assets. |
|
(h) Security purchased on a delayed delivery or when-issued basis. |
|
(i) The coupon rate shown on floating or adjustable rate securities represents the rate at period end. |
|
(j) For foreign government obligations not individually rated by S&P or Moody's, the ratings listed have been assigned by FMR, the fund's investment adviser, based principally on S&P and Moody's ratings of the sovereign credit of the issuing government. |
|
(k) Restricted securities - Investment in securities not registered under the Securities Act of 1933. |
|
Additional information on each holding |
|
Security |
Acquisition Date |
Acquisition Cost (000s) |
|
Axxent, Inc. |
12/31/97 |
$ 506 |
|
Axxent, Inc. 15% 12/30/04 |
12/31/97 - 6/30/00 |
$ 10,177 |
|
Micron Technology, Inc. 6.5% 9/30/05 |
3/3/99 |
$ 6,965 |
|
Mothers Work, Inc. |
6/18/98 |
$ 21 |
|
(l) A portion of the security is subject to a forward commitment to sell. |
|
Other Information |
|
The composition of long-term debt holdings as a percentage of total value of investments in securities, is as follows (ratings are unaudited): |
|
Moody's Ratings |
S&P Ratings |
|||
|
Aaa, Aa, A |
23.5% |
|
AAA, AA, A |
21.3% |
|
Baa |
6.8% |
|
BBB |
6.7% |
|
Ba |
0.5% |
|
BB |
0.7% |
|
B |
3.5% |
|
B |
3.8% |
|
Caa |
1.0% |
|
CCC |
0.5% |
|
Ca, C |
0.0% |
|
CC, C |
0.0% |
|
|
|
|
D |
0.0% |
|
The percentage not rated by Moody's or S&P amounted to 0.6%. FMR has determined that unrated debt securities that are lower quality account for 0.5% of the total value of investment in securities. |
|
Income Tax Information |
|
At July 31, 2000, the aggregate cost of investment securities for income tax purposes was $18,283,959,000. Net unrealized appreciation aggregated $2,876,833,000, of which $3,945,420,000 related to appreciated investment securities and $1,068,587,000 related to depreciated investment securities. |
|
The fund hereby designates approximately $1,218,231,000 as a capital gain dividend for the purpose of the dividend paid deduction. |
See accompanying notes which are an integral part of the financial statements.
Annual Report
Statement of Assets and Liabilities
|
Amounts in thousands (except per-share amount) |
July 31, 2000 |
|
|
Assets |
|
|
|
Investment in securities, at value (cost $18,254,357) - |
|
$ 21,160,792 |
|
Commitment to sell securities on a delayed delivery basis |
$ (142,219) |
|
|
Receivable for securities sold on a delayed delivery basis |
142,734 |
515 |
|
Receivable for investments sold, regular delivery |
|
109,303 |
|
Cash |
|
1,950 |
|
Receivable for fund shares sold |
|
14,896 |
|
Dividends receivable |
|
15,346 |
|
Interest receivable |
|
108,106 |
|
Other receivables |
|
1,514 |
|
Total assets |
|
21,412,422 |
|
Liabilities |
|
|
|
Payable for investments purchased |
163,628 |
|
|
Delayed delivery |
142,344 |
|
|
Payable for fund shares redeemed |
128,926 |
|
|
Accrued management fee |
7,529 |
|
|
Other payables and accrued expenses |
3,868 |
|
|
Collateral on securities loaned, at value |
96 |
|
|
Total liabilities |
|
446,391 |
|
Net Assets |
|
$ 20,966,031 |
|
Net Assets consist of: |
|
|
|
Paid in capital |
|
$ 17,201,490 |
|
Undistributed net investment income |
|
108,465 |
|
Accumulated undistributed net realized gain (loss) on investments and foreign currency transactions |
|
749,099 |
|
Net unrealized appreciation (depreciation) on investments and assets and liabilities in foreign currencies |
|
2,906,977 |
|
Net Assets, for 1,108,080 shares outstanding |
|
$ 20,966,031 |
|
Net Asset Value, offering price and redemption price |
|
$18.92 |
See accompanying notes which are an integral part of the financial statements.
Annual Report
Financial Statements - continued
Statement of Operations
|
Amounts in thousands |
Year ended July 31, 2000 |
|
|
Investment Income Dividends |
|
$ 255,970 |
|
Interest |
|
638,426 |
|
Security lending |
|
28 |
|
Total income |
|
894,424 |
|
Expenses |
|
|
|
Management fee |
$ 98,851 |
|
|
Transfer agent fees |
46,806 |
|
|
Accounting and security lending fees |
1,356 |
|
|
Non-interested trustees' compensation |
88 |
|
|
Custodian fees and expenses |
575 |
|
|
Registration fees |
215 |
|
|
Audit |
262 |
|
|
Legal |
144 |
|
|
Interest |
147 |
|
|
Reports to shareholders |
487 |
|
|
Miscellaneous |
55 |
|
|
Total expenses before reductions |
148,986 |
|
|
Expense reductions |
(3,984) |
145,002 |
|
Net investment income |
|
749,422 |
|
Realized and Unrealized Gain (Loss) Net realized gain (loss) on: |
|
|
|
Investment securities |
1,002,970 |
|
|
Foreign currency transactions |
(211) |
1,002,759 |
|
Change in net unrealized appreciation (depreciation) on: |
|
|
|
Investment securities |
(1,529,688) |
|
|
Assets and liabilities in foreign currencies |
(44) |
|
|
Delayed delivery commitments |
515 |
(1,529,217) |
|
Net gain (loss) |
|
(526,458) |
|
Net increase (decrease) in net assets resulting |
|
$ 222,964 |
See accompanying notes which are an integral part of the financial statements.
Annual Report
Financial Statements - continued
Statement of Changes in Net Assets
|
Amounts in thousands |
Year ended |
Year ended |
|
Increase (Decrease) in Net Assets |
|
|
|
Operations |
$ 749,422 |
$ 816,171 |
|
Net realized gain (loss) |
1,002,759 |
1,291,729 |
|
Change in net unrealized appreciation (depreciation) |
(1,529,217) |
(189,272) |
|
Net increase (decrease) in net assets resulting |
222,964 |
1,918,628 |
|
Distributions to shareholders |
(704,338) |
(848,159) |
|
From net realized gain |
(1,227,366) |
(1,843,513) |
|
Total distributions |
(1,931,704) |
(2,691,672) |
|
Share transactions |
3,074,425 |
4,290,936 |
|
Reinvestment of distributions |
1,840,198 |
2,565,257 |
|
Cost of shares redeemed |
(7,979,378) |
(5,283,873) |
|
Net increase (decrease) in net assets resulting |
(3,064,755) |
1,572,320 |
|
Total increase (decrease) in net assets |
(4,773,495) |
799,276 |
|
Net Assets |
|
|
|
Beginning of period |
25,739,526 |
24,940,250 |
|
End of period (including undistributed net investment income of $108,465 and $67,403, respectively) |
$ 20,966,031 |
$ 25,739,526 |
|
Other Information Shares |
|
|
|
Sold |
163,432 |
215,648 |
|
Issued in reinvestment of distributions |
96,294 |
140,924 |
|
Redeemed |
(424,811) |
(265,773) |
|
Net increase (decrease) |
(165,085) |
90,799 |
See accompanying notes which are an integral part of the financial statements.
Annual Report
Financial Highlights
|
Years ended July 31, |
2000 |
1999 |
1998 |
1997 |
1996 |
|
Selected Per-Share Data |
|
|
|
|
|
|
Net asset value, |
$ 20.22 |
$ 21.09 |
$ 20.37 |
$ 17.34 |
$ 16.69 |
|
Income from |
|
|
|
|
|
|
Net investment income |
.61 B |
.64 B |
.69 B |
.66 B |
.64 |
|
Net realized and |
(.36) |
.73 |
1.68 |
4.57 |
1.00 |
|
Total from investment operations |
.25 |
1.37 |
2.37 |
5.23 |
1.64 |
|
Less Distributions |
|
|
|
|
|
|
From net investment income |
(.58) |
(.68) |
(.69) |
(.66) |
(.55) |
|
From net realized gain |
(.97) |
(1.56) |
(.96) |
(1.54) |
(.44) |
|
Total distributions |
(1.55) |
(2.24) |
(1.65) |
(2.20) |
(.99) |
|
Net asset value, end of period |
$ 18.92 |
$ 20.22 |
$ 21.09 |
$ 20.37 |
$ 17.34 |
|
Total Return A |
1.34% |
8.03% |
12.56% |
33.63% |
10.06% |
|
Ratios and Supplemental Data |
|
|
|
|
|
|
Net assets, end of period |
$ 20,966 |
$ 25,740 |
$ 24,940 |
$ 22,327 |
$ 16,699 |
|
Ratio of expenses to average |
.64% |
.64% |
.64% |
.67% |
.74% |
|
Ratio of expenses to average net assets after expense reductions |
.63% C |
.63% C |
.63% C |
.66% C |
.72% C |
|
Ratio of net investment income to average net assets |
3.24% |
3.23% |
3.40% |
3.69% |
3.44% |
|
Portfolio turnover rate |
62% |
80% |
84% |
80% |
139% |
A The total returns would have been lower had certain expenses not been reduced during the periods shown.
B Net investment income per share has been calculated based on average shares outstanding during the period.
C FMR or the fund has entered into varying arrangements with third parties who either paid or reduced a portion of the fund's expenses.
See accompanying notes which are an integral part of the financial statements.
Annual Report
For the period ended July 31, 2000
1. Significant Accounting Policies.
Fidelity Puritan Fund (the fund) is a fund of Fidelity Puritan Trust (the trust) and is authorized to issue an unlimited number of shares. The trust is registered under the Investment Company Act of 1940, as amended, as an open-end management investment company organized as a Massachusetts business trust. The financial statements have been prepared in conformity with generally accepted accounting principles which require management to make certain estimates and assumptions at the date of the financial statements. The following summarizes the significant accounting policies of the fund:
Security Valuation. Equity securities for which quotations are readily available are valued at the last sale price, or if no sale price, at the closing bid price. Foreign equity securities are valued based on quotations from the principal market in which such securities are normally traded. If trading or events occurring in other markets after the close of the principal market in which foreign securities are traded, and before the close of the business of the fund, are expected to materially affect the value of those securities, then they are valued at their fair value taking this trading or these events into account. Fair value is determined in good faith under consistently applied procedures under the general supervision of the Board of Trustees. Debt securities for which quotations are readily available are valued by a pricing service at their market values as determined by their most recent bid prices in the principal market (sales prices if the principal market is an exchange) in which such securities are normally traded. Securities (including restricted securities) for which market quotations are not readily available are valued at their fair value. Short-term securities with remaining maturities of sixty days or less for which quotations are not readily available are valued at amortized cost or original cost plus accrued interest, both of which approximate current value.
Foreign Currency Translation. The accounting records of the fund are maintained in U.S. dollars. Investment securities and other assets and liabilities denominated in a foreign currency are translated into U.S. dollars at the prevailing rates of exchange at period end. Purchases and sales of securities, income receipts and expense payments are translated into U.S. dollars at the prevailing exchange rate on the respective dates of the transactions.
Net realized gains and losses on foreign currency transactions represent net gains and losses from sales and maturities of foreign currency contracts, disposition of foreign currencies, the difference between the amount of net investment income accrued and the U.S. dollar amount actually received, and gains and losses between trade and settlement date on purchases and sales of securities. The effects of changes in foreign currency exchange rates on investments in securities are included with the net realized and unrealized gain or loss on investment securities.
Annual Report
Notes to Financial Statements - continued
1. Significant Accounting Policies - continued
Income Taxes. As a qualified regulated investment company under Subchapter M of the Internal Revenue Code, the fund is not subject to income taxes to the extent that it distributes substantially all of its taxable income for its fiscal year. The schedule of investments includes information regarding income taxes under the caption "Income Tax Information."
Investment Income. Dividend income is recorded on the ex-dividend date, except certain dividends from foreign securities where the ex-dividend date may have passed, are recorded as soon as the fund is informed of the ex-dividend date. Non-cash dividends included in dividend income, if any, are recorded at the fair market value of the securities received. Interest income, which includes accretion of original issue discount, is accrued as earned. Investment income is recorded net of foreign taxes withheld where recovery of such taxes is uncertain.
Expenses. Most expenses of the trust can be directly attributed to a fund. Expenses which cannot be directly attributed are apportioned among the funds in the trust.
Deferred Trustee Compensation. Under a Deferred Compensation Plan (the Plan) non-interested Trustees must defer receipt of a portion of, and may elect to defer receipt of an additional portion of, their annual compensation. Deferred amounts are treated as though equivalent dollar amounts had been invested in shares of the fund or are invested in a cross-section of other Fidelity funds. Deferred amounts remain in the fund until distributed in accordance with the Plan.
Distributions to Shareholders. Distributions are recorded on the ex-dividend date.
Income and capital gain distributions are determined in accordance with income tax regulations which may differ from generally accepted accounting principles. These differences, which may result in distribution reclassifications, are primarily due to differing treatments for litigation proceeds, paydown gains/losses on certain securities, foreign currency transactions, defaulted bonds, market discount, partnerships, non-taxable dividends, and losses deferred due to wash sales. The fund also utilized earnings and profits distributed to shareholders on redemption of shares as a part of the dividends paid deduction for income tax purposes.
Permanent book and tax basis differences relating to shareholder distributions will result in reclassifications to paid in capital. Undistributed net investment income and accumulated undistributed net realized gain (loss) on investments and foreign currency transactions may include temporary book and tax basis differences which will reverse in a subsequent period. Any taxable income or gain remaining at fiscal year end is distributed in the following year.
Security Transactions. Security transactions are accounted for as of trade date. Gains and losses on securities sold are determined on the basis of identified cost.
Annual Report
Notes to Financial Statements - continued
2. Operating Policies.
Foreign Currency Contracts. The fund generally uses foreign currency contracts to facilitate transactions in foreign-denominated securities. Losses may arise from changes in the value of the foreign currency or if the counterparties do not perform under the contracts' terms. The U.S. dollar value of foreign currency contracts is determined using contractual currency exchange rates established at the time of each trade.
Joint Trading Account. Pursuant to an Exemptive Order issued by the Securities and Exchange Commission (the SEC), the fund, along with other affiliated entities of Fidelity Management & Research Company (FMR), may transfer uninvested cash balances into one or more joint trading accounts. These balances are invested in one or more repurchase agreements for U.S. Treasury or Federal Agency obligations.
Repurchase Agreements. The underlying U.S. Treasury, Federal Agency, or other obligations found to be satisfactory by FMR are transferred to an account of the fund, or to the Joint Trading Account, at a custodian bank. The securities are marked-to-market daily and maintained at a value at least equal to the principal amount of the repurchase agreement (including accrued interest). FMR, the fund's investment adviser, is responsible for determining that the value of the underlying securities remains in accordance with the market value requirements stated above.
Cash Central Funds. Pursuant to an Exemptive Order issued by the SEC, the fund may invest in the Fidelity Cash Central Fund and the Fidelity Securities Lending Cash Central Fund (the Cash Funds) managed by Fidelity Investments Money Management, Inc., an affiliate of FMR. The Cash Funds are open-end money market funds available only to investment companies and other accounts managed by FMR and its affiliates. The Cash Funds seek preservation of capital, liquidity, and current income. Income distributions from the Cash Funds are declared daily and paid monthly from net interest income. Income distributions earned by the fund are recorded as either interest income or security lending income in the accompanying financial statements.
Interfund Lending Program. Pursuant to an Exemptive Order issued by the SEC, the fund, along with other registered investment companies having management contracts with FMR, may participate in an interfund lending program. This program provides an alternative credit facility allowing the fund to borrow from, or lend money to, other participating funds.
Delayed Delivery Transactions. The fund may purchase or sell securities on a delayed delivery basis. Payment and delivery may take place after the customary settlement period for that security. The price of the underlying securities and the date when the securities will be delivered and paid for are fixed at the time the transaction is negotiated. The market values of the securities purchased on a delayed delivery basis are identified as such in the fund's schedule of investments. The fund
Annual Report
Notes to Financial Statements - continued
2. Operating Policies - continued
Delayed Delivery Transactions - continued
may receive compensation for interest forgone in the purchase of a delayed delivery security. With respect to purchase commitments, the fund identifies securities as segregated in its records with a value at least equal to the amount of the commitment. Losses may arise due to changes in the market value of the underlying securities or if the counterparty does not perform under the contract.
Loans and Other Direct Debt Instruments. The fund is permitted to invest in loans and loan participations, trade claims or other receivables. These investments may include standby financing commitments that obligate the fund to supply additional cash to the borrower on demand. Loan participations involve a risk of insolvency of the lending bank or other financial intermediary. At the end of the period, these investments amounted to $9,955,000 or 0.0% of net assets.
Restricted Securities. The fund is permitted to invest in securities that are subject to legal or contractual restrictions on resale. These securities generally may be resold in transactions exempt from registration or to the public if the securities are registered. Disposal of these securities may involve time-consuming negotiations and expense, and prompt sale at an acceptable price may be difficult. At the end of the period, restricted securities (excluding 144A issues) amounted to $20,788,000 or 0.1% of net assets.
3. Purchases and Sales of Investments.
Purchases and sales of securities, other than short-term securities, aggregated $14,161,156,000 and $17,299,658,000, respectively, of which U.S. government and government agency obligations aggregated $5,298,109,000 and $4,749,440,000, respectively.
4. Fees and Other Transactions with Affiliates.
Management Fee. As the fund's investment adviser, FMR receives a monthly fee that is calculated on the basis of a group fee rate plus a fixed individual fund fee rate applied to the average net assets of the fund. The group fee rate is the weighted average of a series of rates and is based on the monthly average net assets of all the mutual funds advised by FMR. The rates ranged from .2167% to .5200% for the period. The annual individual fund fee rate is .15%. In the event that these rates were lower than the contractual rates in effect during the period, FMR voluntarily implemented the above rates, as they resulted in the same or a lower management fee. For the period, the management fee was equivalent to an annual rate of .43% of average net assets.
Transfer Agent Fees. Fidelity Service Company, Inc. (FSC), an affiliate of FMR, is the fund's transfer, dividend disbursing and shareholder servicing agent. FSC receives account fees and asset-based fees that vary according to account size and type of account. FSC pays for typesetting, printing and mailing of all shareholder reports, except proxy statements.
Annual Report
Notes to Financial Statements - continued
4. Fees and Other Transactions with Affiliates - continued
Transfer Agent Fees - continued
For the period, the transfer agent fees were equivalent to an annual rate of .20% of average net assets.
Accounting and Security Lending Fees. FSC maintains the fund's accounting records and administers the security lending program. The security lending fee is based on the number and duration of lending transactions. The accounting fee is based on the level of average net assets for the month plus out-of-pocket expenses.
Brokerage Commissions. The fund placed a portion of its portfolio transactions with brokerage firms which are affiliates of FMR. The commissions paid to these affiliated firms were $445,000 for the period.
5. Interfund Lending Program.
The fund participated in the interfund lending program as a borrower. The average daily loan balance during the period for which loans were outstanding amounted to $37,583,000. The weighted average interest rate was 6.3%. Interest expense includes $145,000 paid under the interfund lending program.
6. Security Lending.
The fund lends portfolio securities from time to time in order to earn additional income. The fund receives collateral in the form of U.S. Treasury obligations, letters of credit, and/or cash against the loaned securities, and maintains collateral in an amount not less than 100% of the market value of the loaned securities during the period of the loan. The market value of the loaned securities is determined at the close of business of the fund and any additional required collateral is delivered to the fund on the next business day. If the borrower defaults on its obligation to return the securities loaned because of insolvency or other reasons, the fund could experience delays and costs in recovering the securities loaned or in gaining access to the collateral. At period end, the value of the securities loaned amounted to $95,000. The fund received cash collateral of $96,000 which was invested in cash equivalents.
Annual Report
Notes to Financial Statements - continued
7. Bank Borrowings.
The fund is permitted to have bank borrowings for temporary or emergency purposes to fund shareholder redemptions. The fund has established borrowing arrangements with certain banks. The interest rate on the borrowings is the bank's base rate, as revised from time to time. The average daily loan balance during the period for which the loan was outstanding amounted to $10,376,000. The weighted average interest rate was 6.4%. Interest expense includes $2,000 paid under the bank borrowing program.
8. Expense Reductions.
FMR has directed certain portfolio trades to brokers who paid a portion of the fund's expenses. For the period, the fund's expenses were reduced by $2,430,000 under this arrangement.
In addition, through arrangements with the fund's custodian and transfer agent, credits realized as a result of uninvested cash balances were used to reduce a portion of the fund's expenses. During the period, the fund's custodian and transfer agent fees were reduced by $35,000 and $1,519,000, respectively, under these arrangements.
Annual Report
To the Trustees of Fidelity Puritan Trust and the Shareholders of Fidelity Puritan Fund:
In our opinion, the accompanying statement of assets and liabilities, including the schedule of investments, and the related statements of operations and of changes in net assets and the financial highlights present fairly, in all material respects, the financial position of Fidelity Puritan Fund (a fund of Fidelity Puritan Trust) at July 31, 2000, and the results of its operations, the changes in its net assets and the financial highlights for the periods indicated, in conformity with accounting principles generally accepted in the United States. These financial statements and financial highlights (hereafter referred to as "financial statements") are the responsibility of the Fidelity Puritan Fund's management; our responsibility is to express an opinion on these financial statements based on our audits. We conducted our audits of these financial statements in accordance with auditing standards generally accepted in the United States which require that we plan and perform the audit to obtain reasonable assurance about whether the financial statements are free of material misstatement. An audit includes examining, on a test basis, evidence supporting the amounts and disclosures in the financial statements, assessing the accounting principles used and significant estimates made by management, and evaluating the overall financial statement presentation. We believe that our audits, which included confirmation of securities at July 31, 2000 by correspondence with the custodian and brokers, provide a reasonable basis for the opinion expressed above.
/s/PricewaterhouseCoopers LLP
PricewaterhouseCoopers LLP
Boston, Massachusetts
September 11, 2000
Annual Report
The Board of Trustees of Fidelity Puritan Fund voted to pay on September 11, 2000, to shareholders of record at the opening of business on September 8, 2000, a distribution of $.66 per share derived from capital gains realized from sales of portfolio securities and a dividend of $.14 per share from net investment income.
A total of 10.68% of the dividends distributed during the fiscal year was derived from interest on U.S. Government securities which is generally exempt from state income tax.
A total of 23% of the dividends distributed during the fiscal year qualifies for the dividends-received deduction for corporate shareholders.
The fund hereby designates 100% of the long-term capital gain dividends distributed during the fiscal year as 20%-rate capital gain dividends.
The fund will notify shareholders in January 2001 of amounts for use in preparing 2000 income tax returns.
Annual Report
Fidelity offers several ways to conveniently manage your personal investments via your telephone or PC. You can access your account information, conduct trades and research your investments 24 hours a day.
By Phone
Fidelity Automated Service Telephone provides a single toll-free number to access account balances, positions, quotes and trading. It's easy to navigate the service, and on your first call, the system will help you create a personal identification number (PIN) for security.
(phone_graphic)
Fidelity Automated
Service Telephone (FAST®)
1-800-544-5555
Press
1 For mutual fund and brokerage trading.
2 For quotes.*
3 For account balances and holdings.
4 To review orders and mutual
fund activity.
5 To change your PIN.
*0 To speak to a Fidelity representative.
By PC
Fidelity's web site on the Internet provides a wide range of information, including daily financial news, fund performance, interactive planning tools and news about Fidelity products and services.
(computer_graphic)
Fidelity's Web Site
www.fidelity.com
If you are not currently on the Internet, call EarthLink Sprint at 1-800-288-2967, and be sure to ask for registration number SMD004 to receive a special Fidelity package that includes 30 days of free Internet access. EarthLink is North America's #1 independent Internet access provider.
(computer_graphic)
Fidelity On-line Xpress+®
Fidelity On-line Xpress+ software for Windows combines comprehensive portfolio management capabilities, securities trading and access to research and analysis tools . . . all on your desktop. Call Fidelity at 1-800-544-0240 or visit our web site for more information on how to manage your investments via your PC.
* When you call the quotes line, please remember that a fund's yield and return will vary and, except for money market funds, share price will also vary. This means that you may have a gain or loss when you sell your shares. There is no assurance that money market funds will be able to maintain a stable $1 share price; an investment in a money market fund is not insured or guaranteed by the U.S. government. Total returns are historical and include changes in share price, reinvestment of dividends and capital gains, and the effects of any sales charges.
Annual Report
For directions and hours,
please call 1-800-544-9797.
Arizona
7373 N. Scottsdale Road
Scottsdale, AZ
California
815 East Birch Street
Brea, CA
851 East Hamilton Avenue
Campbell, CA
527 North Brand Boulevard
Glendale, CA
19200 Von Karman Avenue
Irvine, CA
10100 Santa Monica Blvd.
Los Angeles, CA
251 University Avenue
Palo Alto, CA
1760 Challenge Way
Sacramento, CA
7676 Hazard Center Drive
San Diego, CA
8 Montgomery Street
San Francisco, CA
950 Northgate Drive
San Rafael, CA
1400 Civic Drive
Walnut Creek, CA
6300 Canoga Avenue
Woodland Hills, CA
Colorado
1625 Broadway
Denver, CO
Connecticut
48 West Putnam Avenue
Greenwich, CT
265 Church Street
New Haven, CT
300 Atlantic Street
Stamford, CT
29 South Main Street
West Hartford, CT
Delaware
222 Delaware Avenue
Wilmington, DE
Florida
4400 N. Federal Highway
Boca Raton, FL
90 Alhambra Plaza
Coral Gables, FL
4090 N. Ocean Boulevard
Ft. Lauderdale, FL
1907 West State Road 434
Longwood, FL
8880 Tamiami Trail, North
Naples, FL
2401 PGA Boulevard
Palm Beach Gardens, FL
8065 Beneva Road
Sarasota, FL
1502 N. Westshore Blvd.
Tampa, FL
Georgia
3445 Peachtree Road, N.E.
Atlanta, GA
1000 Abernathy Road
Atlanta, GA
Illinois
One North Franklin Street
Chicago, IL
1415 West 22nd Street
Oak Brook, IL
1700 East Golf Road
Schaumburg, IL
3232 Lake Avenue
Wilmette, IL
Indiana
4729 East 82nd Street
Indianapolis, IN
Maine
Three Canal Plaza
Portland, ME
Maryland
7401 Wisconsin Avenue
Bethesda, MD
One W. Pennsylvania Ave.
Towson, MD
Massachusetts
801 Boylston Street
Boston, MA
155 Congress Street
Boston, MA
25 State Street
Boston, MA
300 Granite Street
Braintree, MA
44 Mall Road
Burlington, MA
416 Belmont Street
Worcester, MA
Annual Report
Michigan
280 Old N. Woodward Ave.
Birmingham, MI
29155 Northwestern Hwy.
Southfield, MI
Minnesota
7600 France Avenue South
Edina, MN
Missouri
700 West 47th Street
Kansas City, MO
8885 Ladue Road
Ladue, MO
New Jersey
150 Essex Street
Millburn, NJ
56 South Street
Morristown, NJ
501 Route 17, South
Paramus, NJ
New York
1055 Franklin Avenue
Garden City, NY
999 Walt Whitman Road
Melville, L.I., NY
1271 Avenue of the Americas
New York, NY
71 Broadway
New York, NY
350 Park Avenue
New York, NY
North Carolina
4611 Sharon Road
Charlotte, NC
Ohio
600 Vine Street
Cincinnati, OH
28699 Chagrin Boulevard
Woodmere Village, OH
Oregon
16850 SW 72nd Avenue
Tigard, OR
Pennsylvania
1735 Market Street
Philadelphia, PA
439 Fifth Avenue
Pittsburgh, PA
Rhode Island
47 Providence Place
Providence, RI
Tennessee
6150 Poplar Avenue
Memphis, TN
Texas
10000 Research Boulevard
Austin, TX
4017 Northwest Parkway
Dallas, TX
1155 Dairy Ashford Street
Houston, TX
2701 Drexel Drive
Houston, TX
400 East Las Colinas Blvd.
Irving, TX
14100 San Pedro
San Antonio, TX
19740 IH 45 North
Spring, TX
Utah
215 South State Street
Salt Lake City, UT
Virginia
1861 International Drive
McLean, VA
Washington
411 108th Avenue, N.E.
Bellevue, WA
511 Pine Street
Seattle, WA
Washington, DC
1900 K Street, N.W.
Washington, DC
Wisconsin
595 North Barker Road
Brookfield, WI
Fidelity Brokerage Services, Inc., 100 Summer St., Boston, MA 02110 Member NYSE/SIPC
Annual Report
If more than one address is listed, please locate the address that is closest to you. We'll give your correspondence immediate attention and send you written confirmation upon completion of your request.
(letter_graphic)
Making Changes
To Your Account
(such as changing name, address, bank, etc.)
Fidelity Investments
P.O. Box 770001
Cincinnati, OH 45277-0002
(letter_graphic)
For Non-Retirement
Accounts
Buying shares
Fidelity Investments
P.O. Box 770001
Cincinnati, OH 45277-0003
Overnight Express
Fidelity Investments
2300 Litton Lane - KH1A
Hebron, KY 41048
Selling shares
Fidelity Investments
P.O. Box 660602
Dallas, TX 75266-0602
Overnight Express
Fidelity Investments
Attn: Redemptions - CP6I
400 East Las Colinas Blvd.
Irving, TX 75039-5587
General Correspondence
Fidelity Investments
P.O. Box 500
Merrimack, NH 03054-0500
(letter_graphic)
For Retirement
Accounts
Buying shares
Fidelity Investments
P.O. Box 770001
Cincinnati, OH 45277-0003
Selling shares
Fidelity Investments
P.O. Box 660602
Dallas, TX 75266-0602
Overnight Express
Fidelity Investments
Attn: Redemptions - CP6R
400 East Las Colinas Blvd.
Irving, TX 75039-5587
General Correspondence
Fidelity Investments
P.O. Box 500
Merrimack, NH 03054-0500
Annual Report
Annual Report
Annual Report
Annual Report
Investment Adviser
Fidelity Management & Research Company
Boston, MA
Investment Sub-Advisers
Fidelity Management & Research
(U.K.) Inc.
Fidelity Management & Research
(Far East) Inc.
Fidelity Investments Money Management, Inc. (FIMM)
Fidelity Investments Japan Limited
Officers
Edward C. Johnson 3d, President
Robert C. Pozen, Senior Vice President
Richard A. Spillane, Jr., Vice President
Stephen R. Petersen, Vice President
Kevin E. Grant, Vice President
Eric D. Roiter, Secretary
Robert A. Dwight, Treasurer
Maria F. Dwyer, Deputy Treasurer
John H. Costello, Assistant Treasurer
Board of Trustees
Ralph F. Cox *
Phyllis Burke Davis *
Robert M. Gates *
Edward C. Johnson 3d
Donald J. Kirk *
Ned C. Lautenbach *
Peter S. Lynch
Marvin L. Mann *
William O. McCoy *
Gerald C. McDonough *
Robert C. Pozen
Thomas R. Williams *
Advisory Board
J. Michael Cook
Abigail P. Johnson
Marie L. Knowles
* Independent trustees
General Distributor
Fidelity Distributors Corporation
Boston, MA
Transfer and Shareholder
Servicing Agent
Fidelity Service Company, Inc.
Boston, MA
Custodian
The Chase Manhattan Bank
New York, NY
Fidelity's Growth and Income Funds
Balanced Fund
Congress Street Fund
Convertible Securities Fund
Equity-Income Fund
Equity-Income II Fund
Exchange Fund
Fidelity ® Fund
Global Balanced Fund
Growth & Income Portfolio
Growth & Income II Portfolio
Puritan® Fund
Real Estate Investment Portfolio
Utilities Fund
The Fidelity Telephone Connection
Mutual Fund 24-Hour Service
Exchanges/Redemptions
and Account Assistance 1-800-544-6666
Product Information 1-800-544-6666
Retirement Accounts 1-800-544-4774
(8 a.m. - 9 p.m.)
TDD Service 1-800-544-0118
for the deaf and hearing impaired
(9 a.m. - 9 p.m. Eastern time)
Fidelity Automated Service
Telephone (FAST®) (automated graphic) 1-800-544-5555
(automated graphic) Automated line for quickest service
PUR-ANN-0900 110706
1.536193.103
(Fidelity Investment logo)(registered trademark)
Corporate Headquarters
82 Devonshire St., Boston, MA 02109
www.fidelity.com
|
|