
|
|
|
|
|
|
|
|
|
|
Previous: GOLDMAN SACHS TRUST, N-30D, 2000-09-08 |
Next: MEDICAL MANAGEMENT SYSTEMS INC, 10-Q/A, 2000-09-08 |
GOLDMAN SACHS REAL ESTATE SECURITIES FUND
Market Overview
Dear Shareholder,
It has been an eventful period in the financial markets thus far in 2000—one marked by a dramatic increase in volatility, uncertainty and, ultimately, mixed performance results.
Equities — The S&P 500 Index fell slightly during the six-month reporting period, but this masked the volatile nature of the market. Early in the year stocks were led by a fairly narrow band of technology issues, while most other sectors of the market languished. This occurred during a period of rapid economic growth, inflationary concerns, and the Federal Reserve Board (the “Fed”) aggressively raising interest rates in an attempt to cool off the economy.
However, high stock valuations and rising interest rates caused investors to abandon the technology-heavy NASDAQ in the middle of March. While other types of stocks were dragged down, technology issues experienced the brunt of the damage. At one point, the NASDAQ was down 37% from its peak, before rallying strongly in June. By the end of the reporting period the NASDAQ had fallen 27% from its high, while the S&P 500 Index was down roughly 5% from its peak. The markets were more volatile than they had been in a number of years. For example, during the second quarter the spread between the daily high and low prices for the S&P 500 Index averaged 2.0%, versus its long-term average of 1.2%.
Fixed Income — The Fed has remained diligent in its attempts to ward off inflation, as it raised interest rates six consecutive times during the last year, prior to holding rates steady at the end of June. Investors have shown optimism that the Fed’s job is virtually complete. As such, many sectors of the market rallied late in the period.
Throughout the period, investors have also moved aggressively to purchase 30-year securities. The increase in demand for the 30-year bond has occurred due to the Treasury department’s decision to limit the future supply of longer-term issues. This supply/demand trend has helped long-term Treasury prices to rally sharply, creating an inverted yield curve.
Outlook
Equities — We remain cautiously optimistic about the near term prospects for the U.S equity market. Reasonable growth in the U.S., stronger demand growth outside of the U.S. (particularly in Asia), and a moderation in energy prices would be a combination of factors which would be quite beneficial to equities.
Fixed Income — We were encouraged to see the powerful rally that occurred in the fixed income markets in June. Economic data, such as housing and retail sales, are finally indicating that the economy may finally be showing signs of moderation. However, we will continue to closely scrutinize economic data to determine whether growth is actually declining.
We encourage you to maintain your long-term investment program, and look forward to serving your investment needs in the years ahead.
Sincerely,
![]()
| David B. Ford | David W. Blood |
| Co-Head, Goldman Sachs Asset Management | Co-Head, Goldman Sachs Asset Management |
July 17, 2000
GOLDMAN SACHS REAL ESTATE SECURITIES FUND
Fund Basics
as of June 30, 2000
PERFORMANCE REVIEW
| Fund Cumulative Total Return
|
Wilshire Real Estate
|
|
| December 31, 1999–June 30, 2000 | (based on NAV)1
|
Securities Index2
|
| Class A | 16.21%
|
15.21%
|
| Class B | 15.92
|
15.21
|
| Class C | 16.06
|
15.21
|
| Institutional | 16.53
|
15.21
|
| Service | 16.27
|
15.21
|
1 The net asset value represents the net assets of the Fund (ex-dividend) divided by the total number of shares outstanding. The Fund’s performance reflects the investment of dividends and other distributions. Total return figures are not annualized.
2 The Wilshire Real Estate Securities Index is a market capitalization-weighted index comprised of publicly traded real estate investment trusts (REIT) and real estate operating companies. The Index is unmanaged and does not reflect any fees or expenses.
STANDARDIZED TOTAL RETURNS
| For the period ended 6/30/003 | Class A
|
Class B
|
Class C
|
Institutional
|
Service
|
| Six Months | 9.76%
|
10.82%
|
15.04%
|
16.53%
|
16.27%
|
| One Year | –0.17%
|
–0.37%
|
3.91%
|
6.01%
|
5.50%
|
| Since Inception | 0.83%
|
0.95%
|
3.15%
|
4.27%
|
3.77%
|
| (7/27/98) | |||||
3 The Standardized Total Returns are average annual or cumulative (only if performance period is one year or less) total returns as of the most recent calendar quarter-end. They assume reinvestment of all distributions at NAV. These returns reflect a maximum initial sales charge of 5.5% for Class A shares, the assumed deferred sales charge for Class B shares (5% maximum declining to 0% after six years) and the assumed deferred sales charge for Class C shares (1% if redeemed within 12 months of purchase). Because Institutional and Service shares do not involve a sales charge, such a charge is not applied to their respective Standardized Total Returns.
Total return figures represent past performance and do not indicate future results, which will vary. The investment return and principal value of an investment will fluctuate and, therefore, an investor’s shares, when redeemed, may be worth more or less than their original cost. Performance reflects expense limitations in effect. In their absence, performance would be reduced.
An investment in real estate securities is subject to greater price volatility and the special risks associated with direct ownership of real estate.
TOP 10 HOLDINGS AS OF 6/30/004
| Holding | % of Total Net Assets
|
Line of Business |
| Starwood Hotels & Resorts Worldwide, Inc. | 6.9%
|
Hotels |
| Equity Office Properties Trust | 5.0
|
Office |
| Trizec Hahn Corp. | 4.8
|
Mixed Properties |
| Apartment Investment & Management Co. | 4.8
|
Apartments |
| ProLogis Trust | 4.6
|
Industrial |
| AvalonBay Communities, Inc. | 4.4
|
Apartments |
| Equity Residential Properties Trust | 4.3
|
Apartments |
| Duke-Weeks Realty Corp. | 4.1
|
Mixed Properties |
| Boston Properties, Inc. | 4.0
|
Office |
| Cousins Properties, Inc. | 3.9
|
Mixed Properties |
4 The top 10 holdings may not be representative of the Fund’s future investments.
GOLDMAN SACHS REAL ESTATE SECURITIES FUND
Performance Overview
Dear Shareholder,
We are pleased to report on the performance of the Goldman Sachs Real Estate Securities Fund. This semiannual report covers the six-month period ended June 30, 2000.
Performance Review
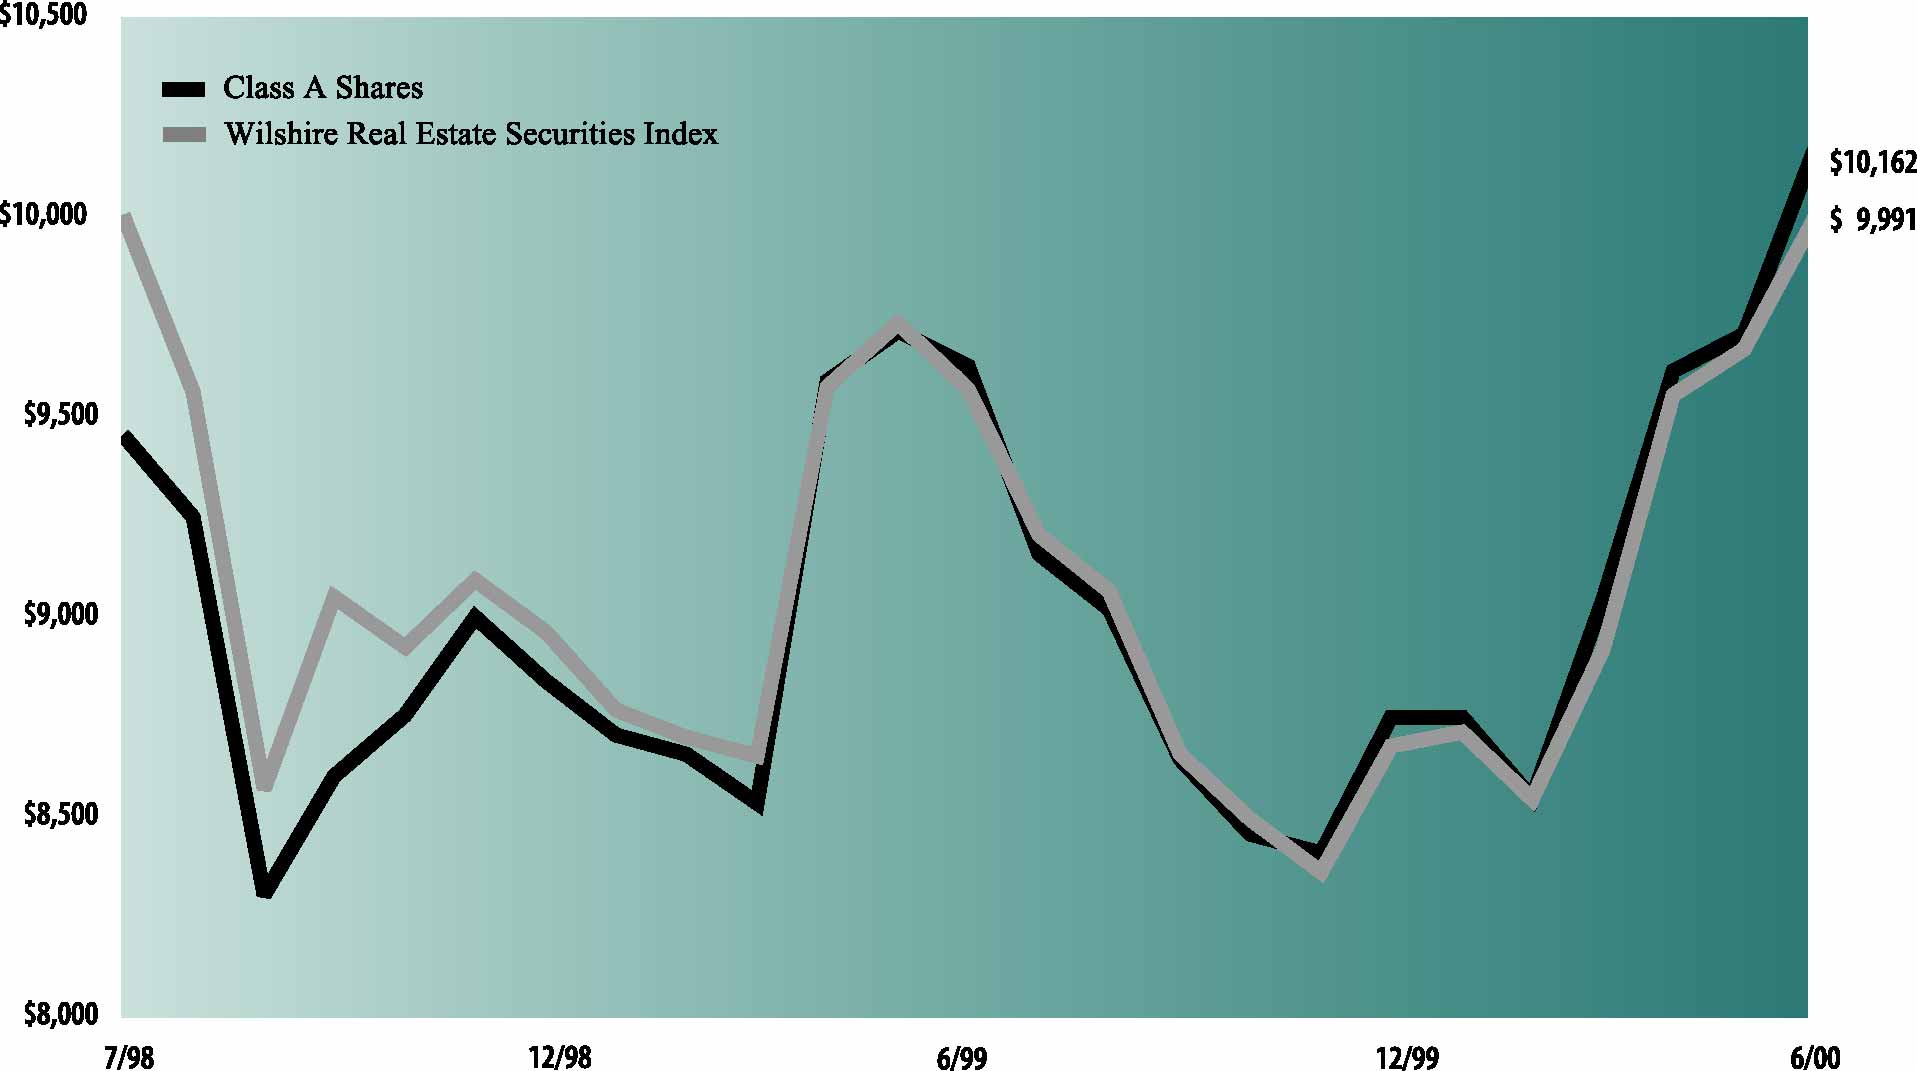
Over the six-month period that ended June 30, 2000 the Fund’s Class A, B, C, Institutional and Service shares generated, respectively, 16.21%, 15.92%, 16.06%, 16.53% and 16.27% cumulative total returns at net asset value. Over the same time period the Fund’s benchmark, the Wilshire Real Estate Securities Index (with dividends reinvested) generated a 15.21% cumulative total return.
REIT Market Review
Following lackluster results in 1999, the REIT market has produced outstanding results thus far in 2000. In fact, during the second quarter REITs outperformed all major market indices, including the Dow, the S&P 500, NASDAQ and Russell 2000. We attribute this outperformance to a change in market sentiment, along with strong and improving fundamentals in the real estate space markets. Facing substantial market volatility in the broader market, investors sought out predictable cash flows and attractive valuations. This resulted in positive net cash flows of $400 million to dedicated real estate mutual funds — the strongest flows since the first quarter of 1998.
Portfolio Positioning
Year to date, both stock and sector selection have aided the Fund’s performance. From a sector selection perspective, what the Fund didn’t own continued to be more important than what the Fund did own. Having no weighting in factory outlets and an underweight in retail shopping centers has added significantly to results. Astute stock selection in the hotel and shopping center categories further enhanced results, with strong performance posted in the office, regional mall and apartment sectors.
The Fund continues to maintain a significant overweight in the office and mixed properties sectors. Demand for office space has far exceeded expectations and, indeed, set an all time record for total net absorption. This demand, driven by the continued strength of the economy, has resulted in slightly increased occupancy rates and accelerating market rental rates. The high barriers to entry inhibiting new supply in most central business districts leads us to focus on companies that own downtown office properties, as opposed to suburban properties.
The apartment sector has also provided strong performance. Our favored stocks remain focused on high barrier to entry markets, where a combination of strong demand and limited new supply have led to re-accelerating rental rate growth.
GOLDMAN SACHS REAL ESTATE SECURITIES FUND
Portfolio Highlights
Starwood Hotels & Resorts Worldwide, Inc. — Starwood continues to be the Fund’s largest holding and it’s top contributor to performance. The stock’ s strong results are due to a variety of factors, including operating results which lead the industry, reported earnings which are well in excess of consensus expectations, and an extremely compelling valuation at the beginning of the year. Going forward, we are expecting a marked slowdown in hotel industry results, but a widened divergence between Starwood and its peers. In addition, rumors persist that several well-capitalized European hotel companies are interested in Starwood at prices at least 25% higher than its current valuation.
Boston Properties, Inc., and Spieker Properties, Inc. — These two office property companies have been among our top performers in 2000. Both own units in high-demand, supply-constrained space markets, that are exhibiting accelerating rental rates. Last quarter, market dynamics allowed these companies to raise expiring rents an average of 48% and 62%, respectively. These gains have resulted in superior earnings growth for the quarter, that we project, should continue for the next several years.
AvalonBay Communities, Inc. — AvalonBay has risen sharply this year, and we believe it is well positioned for above average earnings growth into the future. The company has benefited from extremely strong operating results which have lead to numerous upward revision of earnings estimates. The operating results have been driven, in part, by AvalonBay’s concentration in the country’s strongest apartment rental markets, including the Northeast and northern and southern California. We remain confident that AvalonBay’s portfolio is the best positioned of all apartment REITs, which should allow for continued industry-leading performance.
Portfolio Outlook
We remain optimistic about the long-term prospects for the real estate securities market. This is based on continued strong fundamentals, attractive valuations, accelerating earnings growth, and low volatility compared to the broader market. As in the past, we will focus on exploiting market inefficiencies by identifying undervalued growth opportunities that offer solid appreciation potential.
We thank you for your investment and look forward to your continued confidence.
Goldman Sachs Real Estate Securities Investment Team
July 17, 2000
GOLDMAN SACHS REAL ESTATE SECURITIES FUND
The Goldman Sachs Advantage
Founded in 1869, Goldman, Sachs & Co. is a premier financial services firm traditionally known on Wall Street and around the world for its institutional expertise.
Today, the firm’s Investment Management Division provides individual investors the opportunity to tap the resources of a global institutional powerhouse — and put this expertise to work in their individual portfolios.
What Sets Goldman Sachs Funds Apart?

To learn more about the Goldman Sachs Funds, call your investment professional today.
| The following graph shows the value as of June 30, 2000, of a $10,000 investment made on July 27, 1998 (commencement of
operations) in Class A shares (with the maximum sales charge of 5.5%) of the Goldman Sachs Real Estate Securities Fund. For comparative purposes, the performance of the Fund’s benchmark (the Wilshire Real Estate Securities Index) is shown. This
performance data represents past performance and should not be considered indicative of future performance which will fluctuate with changes in market conditions. These performance fluctuations will cause an investor’s shares, when redeemed, to be
worth more or less than their original cost. Performance of Class B, Class C, Institutional and Service Shares will vary from Class A due to differences in fees and loads.
|
| Real Estate Securities Fund’s Lifetime Performance
|
| Growth of a $10,000 Investment, July 27, 1998 to June 30, 2000.
|
 |
| Average Annual Total Return through June 30, 2000 | Since Inception | One Year | Six Months(a) | ||||
|---|---|---|---|---|---|---|---|
| Class A Shares (commenced July 27, 1998) | |||||||
| Excluding sales charges | 3.82% | 5.60% | 16.21% | ||||
| Including sales charges | 0.83% | -0.17% | 9.76% | ||||
| Class B Shares (commenced July 27, 1998) | |||||||
| Excluding contingent deferred sales charges | 3.10% | 4.85% | 15.92% | ||||
| Including contingent deferred sales charges | 0.95% | -0.37% | 10.82% | ||||
| Class C Shares (commenced July 27, 1998) | |||||||
| Excluding contingent deferred sales charges | 3.15% | 4.95% | 16.06% | ||||
| Including contingent deferred sales charges | 3.15% | 3.91% | 15.04% | ||||
| Institutional Class (commenced July 27, 1998) | 4.27% | 6.01% | 16.53% | ||||
| Service Class (commenced July 27, 1998) | 3.77% | 5.50% | 16.27% | ||||
(a)
|
Not annualized.
|
| Shares | Description | Value | |||
|---|---|---|---|---|---|
| Common Stocks – 98.0% | |||||
| Apartments – 19.6% | |||||
| 173,000 | Apartment Investment &
Management Co. |
$ 7,482,250 | |||
| 167,200 | Archstone Communities Trust | 3,521,650 | |||
| 166,900 | AvalonBay Communities, Inc. | 6,968,075 | |||
| 196,900 | Boardwalk Equities, Inc. * | 1,862,568 | |||
| 26,000 | BRE Properties, Inc. | 750,750 | |||
| 17,300 | Charles E. Smith Residential
Realty, Inc. |
657,400 | |||
| 145,500 | Equity Residential Properties Trust | 6,693,000 | |||
| 64,200 | Essex Property Trust, Inc. | 2,696,400 | |||
| 30,632,093 | |||||
| Development – 2.9% | |||||
| 302,100 | Catellus Development Corp. | 4,531,500 | |||
| Hotels – 11.5% | |||||
| 90,100 | GetThere.com, Inc. * | 951,681 | |||
| 69,600 | Harrah’s Entertainment, Inc. * | 1,457,250 | |||
| 77,400 | Hospitality Properties Trust | 1,746,337 | |||
| 35,000 | Marriott International, Inc. | 1,262,188 | |||
| 81,400 | MeriStar Hospitality Corp. | 1,709,400 | |||
| 334,500 | Starwood Hotels & Resorts
Worldwide, Inc. |
10,892,156 | |||
| 18,019,012 | |||||
| Industrial – 9.5% | |||||
| 36,700 | AMB Property Corp. | 837,219 | |||
| 59,400 | CenterPoint Properties Corp. | 2,420,550 | |||
| 166,500 | Liberty Property Trust | 4,318,594 | |||
| 340,500 | ProLogis Trust | 7,256,906 | |||
| 14,833,269 | |||||
| Manufactured Housing – 0.9% | |||||
| 59,700 | Manufactured Home Communities, Inc. | 1,429,069 | |||
| Mixed Properties – 21.6% | |||||
| 160,200 | Cousins Properties, Inc. | 6,167,700 | |||
| 287,700 | Duke-Weeks Realty Corp. | 6,437,287 | |||
| 58,800 | Highwoods Properties, Inc. | 1,411,200 | |||
| 242,900 | Prentiss Properties Trust | 5,829,600 | |||
| 65,950 | Reckson Associates Realty Corp. | 1,566,313 | |||
| 420,600 | Trizec Hahn Corp. | 7,518,225 | |||
| 140,200 | Vornado Realty Trust | 4,871,950 | |||
| 33,802,275 | |||||
| Office – 16.4% | |||||
| 164,700 | Boston Properties, Inc. | 6,361,537 | |||
| 121,400 | Brandywine Realty Trust | 2,321,775 | |||
| 217,900 | Corporate Office Properties Trust | 2,001,956 | |||
| 286,300 | Equity Office Properties Trust | 7,891,144 | |||
| 59,100 | Parkway Properties, Inc. | 1,802,550 | |||
| 115,900 | Spieker Properties, Inc. | 5,331,400 | |||
| 25,710,362 | |||||
| Shares | Description | Value | |||
|---|---|---|---|---|---|
| Common Stocks – (continued) | |||||
| Regional Malls – 7.8% | |||||
| 145,000 | General Growth Properties, Inc. | $ 4,603,750 | |||
| 190,200 | Simon Property Group, Inc. | 4,220,062 | |||
| 136,750 | The Rouse Co. | 3,384,563 | |||
| 12,208,375 | |||||
| Self-Storage – 3.2% | |||||
| 212,400 | Public Storage, Inc. | 4,978,125 | |||
| Shopping Centers – 4.6% | |||||
| 61,200 | Burnham Pacific Properties, Inc. | 420,750 | |||
| 181,100 | JDN Realty Corp. | 1,844,956 | |||
| 118,700 | Kimco Realty Corp. | 4,866,700 | |||
| 7,132,406 | |||||
| TOTAL COMMON STOCKS | |||||
| (Cost $140,113,829) | |||||
| $153,276,486 | |||||
| Principal
Amount |
Interest
Rate |
Maturity
Date |
Value | |||||
|---|---|---|---|---|---|---|---|---|
| Repurchase Agreement – 2.4% | ||||||||
| Joint Repurchase Agreement Account II | ||||||||
| $3,800,000 | 6.87 | % | 07/03/2000 | $ 3,800,000 | ||||
| TOTAL REPURCHASE AGREEMENT | ||||||||
| (Cost $3,800,000) | $ 3,800,000 | |||||||
| TOTAL INVESTMENTS | ||||||||
| (Cost $143,913,829) | $157,076,486 | |||||||
*
|
Non-income producing security.
|
| The percentage shown for each investment category reflects the value of investments in that category as a percentage of total net
assets.
|
| Assets:
|
| Investment in securities, at value (identified cost $143,913,829) | $157,076,486 | ||||||
| Cash | 113,589 | ||||||
| Receivables: | |||||||
| Investment securities sold | 629,356 | ||||||
| Dividends and interest | 877,662 | ||||||
| Fund shares sold | 1,920,868 | ||||||
| Reimbursement from adviser | 63,088 | ||||||
| Other assets | 779 | ||||||
| Total assets | 160,681,828 | ||||||
| Liabilities: | |||||||
| Payables: | |||||||
| Investment securities purchased | 3,749,098 | ||||||
| Fund shares repurchased | 277,732 | ||||||
| Amounts owed to affiliates | 164,144 | ||||||
| Options Written, at value (Premium received $35,643) | 22,800 | ||||||
| Accrued expenses and other liabilities | 18,042 | ||||||
| Total liabilities | 4,231,816 | ||||||
| Net Assets: | |||||||
| Paid-in capital | 149,040,625 | ||||||
| Accumulated undistributed net investment income | 18,314 | ||||||
| Accumulated net realized loss on investment transactions | (5,748,784 | ) | |||||
| Net unrealized gain on investments | 13,139,857 | ||||||
| NET ASSETS | $156,450,012 | ||||||
| Net asset value, offering and redemption price per share: (a) | |||||||
| Class A | $9.87 | ||||||
| Class B | $9.92 | ||||||
| Class C | $9.86 | ||||||
| Institutional | $9.89 | ||||||
| Service | $9.89 | ||||||
| Shares outstanding: | |||||||
| Class A | 10,107,599 | ||||||
| Class B | 305,367 | ||||||
| Class C | 201,737 | ||||||
| Institutional | 5,231,335 | ||||||
| Service | 163 | ||||||
| Total shares outstanding, $.001 par value (unlimited number of shares authorized) | 15,846,201 | ||||||
(a)
|
Maximum public offering price per share (NAV per share multiplied by 1.0582) for Class A shares is $10.44. At redemption, Class B
and Class C shares may be subject to a contingent deferred sales charge, assessed on the amount equal to the lesser of the current net asset value or the original purchase price of the shares.
|
| Investment income: | |||
| Dividends (a) | $ 3,910,479 | ||
| Interest | 97,718 | ||
| Total income | 4,008,197 | ||
| Expenses: | |||
| Management fees | 671,664 | ||
| Distribution and Service fees (b) | 230,312 | ||
| Transfer Agent fees (c) | 94,178 | ||
| Registration fees | 44,547 | ||
| Custodian fees | 29,574 | ||
| Professional fees | 5,584 | ||
| Trustee fees | 3,345 | ||
| Other | 85,126 | ||
| Total expenses | 1,164,330 | ||
| Less — expenses reimbursed and fees waived | (274,700 | ) | |
| Net expenses | 889,630 | ||
| NET INVESTMENT INCOME | 3,118,567 | ||
| Realized and unrealized gain (loss) on investment and written option transactions: | |||
| Net realized loss from investment transactions | (2,938,017 | ) | |
| Net change in unrealized gain (loss) on: | |||
| Investments | 19,737,920 | ||
| Options written | (22,800 | ) | |
| Net realized and unrealized gain on investment and option transactions: | 16,777,103 | ||
| NET INCREASE IN NET ASSETS RESULTING FROM OPERATIONS | $19,895,670 | ||
(a)
|
Foreign withholding taxes on dividends were $7,673.
|
(b)
|
Class A, Class B and Class C had Distribution and Service fees of $218,429, $6,625 and $5,258, respectively.
|
(c)
|
Class A, Class B, Class C, Institutional Class and Service Class had Transfer Agent fees of $83,003, $1,259, $999, $8,917 and $0,
respectively.
|
| For the Six
Months Ended June 30, 2000 (Unaudited) |
For the Year
Ended December 31, 1999 |
||||||
|---|---|---|---|---|---|---|---|
| From operations: | |||||||
| Net investment income | $ 3,118,567 | $ 6,326,342 | |||||
| Net realized loss on investment transactions | (2,938,017 | ) | (2,340,890 | ) | |||
| Net change in unrealized gain (loss) on investments | 19,715,120 | (6,845,259 | ) | ||||
| Net increase (decrease) in net assets resulting from operations | 19,895,670 | (2,859,807 | ) | ||||
| Distributions to shareholders: | |||||||
| From net investment income | |||||||
| Class A Shares | (1,952,326 | ) | (4,206,708 | ) | |||
| Class B Shares | (39,859 | ) | (9,242 | ) | |||
| Class C Shares | (30,035 | ) | (12,545 | ) | |||
| Institutional Shares | (1,112,187 | ) | (2,276,191 | ) | |||
| Service Shares | (33 | ) | (59 | ) | |||
| In excess of net investment income | |||||||
| Class A Shares | — | (252,747 | ) | ||||
| Class B Shares | — | (555 | ) | ||||
| Class C Shares | — | (754 | ) | ||||
| Institutional Shares | — | (136,758 | ) | ||||
| Service Shares | — | (4 | ) | ||||
| From capital | |||||||
| Class A Shares | — | (228,429 | ) | ||||
| Class B Shares | — | (502 | ) | ||||
| Class C Shares | — | (681 | ) | ||||
| Institutional Shares | — | (123,600 | ) | ||||
| Service Shares | — | (3 | ) | ||||
| Total distributions to shareholders | (3,134,440 | ) | (7,248,778 | ) | |||
| From share transactions: | |||||||
| Proceeds from sales of shares | 34,191,895 | 129,535,822 | |||||
| Reinvestment of dividends and distributions | 2,070,300 | 4,492,219 | |||||
| Cost of shares repurchased | (33,961,113 | ) | (54,013,009 | ) | |||
| Net increase in net assets resulting from share transactions | 2,301,082 | 80,015,032 | |||||
| TOTAL INCREASE | 19,062,312 | 69,906,447 | |||||
| Net assets: | |||||||
| Beginning of period | 137,387,700 | 67,481,253 | |||||
| End of period | $156,450,012 | $137,387,700 | |||||
| Accumulated undistributed net investment income | $ 18,314 | $ 34,187 | |||||
| Income (loss) from
investment operations(a) |
Distributions to shareholders |
||||||||||||||||||||
|---|---|---|---|---|---|---|---|---|---|---|---|---|---|---|---|---|---|---|---|---|---|
| Net asset
value, beginning of period |
Net
investment income |
Net realized
and unrealized gain (loss) |
From net
investment income |
In excess
of net investment income |
From
capital |
Net increase
(decrease) in net asset value |
|||||||||||||||
| FOR THE SIX MONTHS ENDED JUNE 30, (UNAUDITED) | |||||||||||||||||||||
| 2000 - Class A Shares | $8.68 | $0.21 | $1.19 | $(0.21 | ) | $ — | $ — | $1.19 | |||||||||||||
| 2000 - Class B Shares | 8.73 | 0.16 | 1.22 | (0.19 | ) | — | — | 1.19 | |||||||||||||
| 2000 - Class C Shares | 8.66 | 0.15 | 1.23 | (0.18 | ) | — | — | 1.20 | |||||||||||||
| 2000 - Institutional Shares | 8.69 | 0.22 | 1.20 | (0.22 | ) | — | — | 1.20 | |||||||||||||
| 2000 - Service Shares | 8.69 | 0.20 | 1.20 | (0.20 | ) | — | — | 1.20 | |||||||||||||
| FOR THE YEAR ENDED DECEMBER 31, | |||||||||||||||||||||
| 1999 - Class A Shares | 9.20 | 0.38 | (e) | (0.48 | ) (e) | (0.38 | ) | (0.02 | ) | (0.02 | ) | (0.52 | ) | ||||||||
| 1999 - Class B Shares | 9.27 | 0.28 | (e) | (0.45 | ) (e) | (0.28 | ) | (0.07 | ) | (0.02 | ) | (0.54 | ) | ||||||||
| 1999 - Class C Shares | 9.21 | 0.30 | (e) | (0.48 | ) (e) | (0.30 | ) | (0.05 | ) | (0.02 | ) | (0.55 | ) | ||||||||
| 1999 - Institutional Shares | 9.21 | 0.40 | (e) | (0.47 | ) (e) | (0.40 | ) | (0.03 | ) | (0.02 | ) | (0.52 | ) | ||||||||
| 1999 - Service Shares | 9.21 | 0.38 | (e) | (0.49 | ) (e) | (0.38 | ) | (0.01 | ) | (0.02 | ) | (0.52 | ) | ||||||||
| FOR THE PERIOD ENDED DECEMBER 31, | |||||||||||||||||||||
| 1998 - Class A Shares (commenced July 27) | 10.00 | 0.15 | (0.80 | ) | (0.15 | ) | — | — | (0.80 | ) | |||||||||||
| 1998 - Class B Shares (commenced July 27) | 10.00 | 0.14 | (e) | (0.83 | ) (e) | (0.04 | ) | — | — | (0.73 | ) | ||||||||||
| 1998 - Class C Shares (commenced July 27) | 10.00 | 0.22 | (e) | (0.91 | ) (e) | (0.10 | ) | — | — | (0.79 | ) | ||||||||||
| 1998 - Institutional Shares (commenced July 27) | 10.00 | 0.31 | (e) | (0.95 | ) (e) | (0.15 | ) | — | — | (0.79 | ) | ||||||||||
| 1998 - Service Shares (commenced July 27) | 10.00 | 0.25 | (e) | (0.91 | ) (e) | (0.13 | ) | — | — | (0.79 | ) | ||||||||||
(a)
|
Includes the balancing effect of calculating per share amounts.
|
(b)
|
Assumes investment at the net asset value at the beginning of the period, reinvestment of all dividends and distributions, a
complete redemption of the investment at the net asset value at the end of the period and no sales or redemption charges. Total return would be reduced if a sales or redemption charge were taken into account.
|
(c)
|
Annualized.
|
(d)
|
Not annualized.
|
(e)
|
Calculated based on the average shares outstanding methodology.
|
| Ratios assuming
no voluntary waiver of fees or expense limitations |
|||||||||||||||||||||||
| Net asset
value, end of period |
Total
return(b) |
Net assets
at end of period (in 000s) |
Ratio of
net expenses to average net assets |
Ratio of
net investment income to average net assets |
Ratio of
expenses to average net assets |
Ratio of
net investment income to average net assets |
Portfolio
turnover rate |
||||||||||||||||
| $9.87 | 16.21 | % (d) | $99,726 | 1.44 | % (c) | 4.50 | % (c) | 1.93 | % (c) | 4.01
|
% (c) | 28.89 | %(d) | ||||||||||
| 9.92 | 15.92 | (d) | 3,027 | 2.19 | (c) | 4.44 | (c) | 2.43 | (c) | 4.20
|
(c) | 28.89 | (d) | ||||||||||
| 9.86 | 16.06 | (d) | 1,986 | 2.19 | (c) | 4.50 | (c) | 2.43 | (c) | 4.26
|
(c) | 28.89 | (d) | ||||||||||
| 9.89 | 16.53 | (d) | 51,709 | 1.04 | (c) | 4.94 | (c) | 1.28 | (c) | 4.70
|
(c) | 28.89 | (d) | ||||||||||
| 9.89 | 16.27 | (d) | 2 | 1.54 | (c) | 4.52 | (c) | 1.78 | (c) | 4.28
|
(c) | 28.89 | (d) | ||||||||||
| 8.68 | (1.02 | ) | 93,443 | 1.44 | 4.14 | 1.96 | 3.62
|
37.43 | |||||||||||||||
| 8.73 | (1.73 | ) | 457 | 2.19 | 3.21 | 2.46 | 2.94
|
37.43 | |||||||||||||||
| 8.66 | (1.80 | ) | 697 | 2.19 | 3.38 | 2.46 | 3.11
|
37.43 | |||||||||||||||
| 8.69 | (0.64 | ) | 42,790 | 1.04 | 4.43 | 1.31 | 4.16
|
37.43 | |||||||||||||||
| 8.69 | (1.12 | ) | 1 | 1.54 | 4.17 | 1.81 | 3.90
|
37.43 | |||||||||||||||
| 9.20 | (6.53 | ) (d) | 19,961 | 1.47 | (c) | 23.52 | (c) | 3.52 | (c) | 21.47
|
(c) | 6.03 | (d) | ||||||||||
| 9.27 | (6.88 | ) (d) | 2 | 2.19 | (c) | 3.60 | (c) | 4.02 | (c) | 1.77
|
(c) | 6.03 | (d) | ||||||||||
| 9.21 | (6.85 | ) (d) | 1 | 2.19 | (c) | 5.49 | (c) | 4.02 | (c) | 3.66
|
(c) | 6.03 | (d) | ||||||||||
| 9.21 | (6.37 | ) (d) | 47,516 | 1.04 | (c) | 8.05 | (c) | 2.87 | (c) | 6.22
|
(c) | 6.03 | (d) | ||||||||||
| 9.21 | (6.56 | ) (d) | 1 | 1.54 | (c) | 6.29 | (c) | 3.37 | (c) | 4.46
|
(c) | 6.03 | (d) | ||||||||||
| 1. ORGANIZATION
|
| Goldman Sachs Trust (the “Trust”) is a Delaware business trust registered under the Investment Company Act of 1940 (as
amended) as an open-end management investment company. The Trust includes the Goldman Sachs Real Estate Securities Fund (the “Fund”). The Fund is a diversified portfolio offering five classes of shares — Class A, Class B, Class C,
Institutional and Service.
|
| The Fund invests primarily in securities of issuers that are engaged in or related to the real estate
industry and has a policy of concentrating its investments in the real estate industry. Therefore, an investment in the Fund is subject to certain risks associated with the direct ownership of real estate and with the real estate industry in general.
|
| 2. SIGNIFICANT ACCOUNTING POLICIES
|
| The following is a summary of the significant accounting policies consistently followed by the Fund. The preparation of financial
statements in conformity with generally accepted accounting principles requires management to make estimates and assumptions that may affect the reported amounts. Actual results could differ from those estimates.
|
| A. Investment Valuation — Investments in
securities traded on a U.S. or foreign securities exchange or the NASDAQ system are valued daily at their last sale price on the principal exchange on which they are traded. If no sale occurs, securities are valued at the last bid price. Unlisted equity
and debt securities for which market quotations are available are valued at the last sale price on valuation date, or if no sale occurs, at the last bid price. Short-term debt obligations maturing in sixty days or less are valued at amortized cost.
Securities for which quotations are not readily available, are valued at fair value using methods approved by the Trust’s Board of Trustees.
|
| B. Securities Transactions and Investment Income — Securities transactions are recorded as of the trade date. Realized gains and losses on sales of portfolio securities are calculated using the identified-cost basis. Dividend income is recorded on the ex-dividend date. Dividends for which the Fund has
the choice to receive either cash or stock are recognized as investment income in an amount equal to the cash dividend. This amount is also used as an estimate of the fair value of the stock received. Interest income is recorded on the basis of interest
accrued, premium amortized and discount earned.
|
| C. Federal Taxes — It is the Fund’s
policy to comply with the requirements of the Internal Revenue Code (the “Code”) applicable to regulated investment companies and to distribute each year substantially all of its investment company taxable income and capital gains to its
shareholders. Accordingly, no federal tax provision is required.
|
| The characterization of distributions to shareholders for financial reporting
purposes is determined in accordance with income tax rules. Therefore, the source of the Fund’s distributions may be shown in the accompanying financial statements as either from or in excess of net investment income or net realized gain on
investment transactions, or from capital, depending on the type of book/tax differences that may exist.
|
| In addition, distributions paid by the Fund’s investments in real estate
investment trusts (“REITs”) often include a “return of capital” which is recorded by the Fund as a reduction of the cost basis of the securities held. The Code requires a REIT to distribute at least 95% of its taxable income to
investors. In many cases, however, because of “non-cash” expenses such as property depreciation, an equity REIT’s cash flow will exceed its taxable income. The REIT may distribute this excess cash to offer a more competitive yield. This
portion of the distribution is deemed a return of capital, and is generally not taxable to shareholders.
|
| At June 30, 2000, the aggregate cost of portfolio securities for federal income
tax purposes is $144,314,161. Accordingly, the gross unrealized gain on investments was $14,202,640 and the gross unrealized loss on investments was $1,440,315 resulting in a net unrealized gain of $12,762,325.
|
| 2. SIGNIFICANT ACCOUNTING POLICIES (continued)
|
| D. Expenses — Expenses incurred by the
Trust which do not specifically relate to an individual fund of the Trust are allocated to the funds on a straight-line or pro-rata basis depending upon the nature of the expense.
|
| Class A, Class B and Class C shareholders of the Fund bear all expenses and fees
relating to their respective Distribution and Service Plans. Each class of shares separately bears its respective class-specific Transfer Agency fees. Shareholders of Service Shares bear all expenses and fees paid to service organizations.
|
| E. Segregation Transactions — The Fund may
enter into certain derivative transactions to seek to increase total return. Forward foreign currency exchange contracts, futures contracts, written options, mortgage dollar rolls, when-issued securities and forward commitments represent examples of such
transactions. As a result of entering into those transactions, the Fund is required to segregate liquid assets on the accounting records equal to or greater than the market value of the corresponding transactions.
|
| 3. AGREEMENTS
|
| Goldman Sachs Asset Management (“GSAM”), a unit of the Investment Management Division of Goldman Sachs & Co. (“
Goldman Sachs”), serves as investment adviser pursuant to an Investment Management Agreement (the “Agreement”). Under the Agreement, GSAM, subject to the general supervision of the Trust’s Board of Trustees, manages the Fund’s
portfolio. As compensation for the services rendered under the Agreement, the assumption of the expenses related thereto and administering the Fund’s business affairs, including providing facilities, GSAM is entitled to a fee, computed daily and
payable monthly, at an annual rate equal to 1.00% of the average daily net assets of the Fund.
|
| Goldman Sachs has voluntarily agreed to reduce or limit certain “Other
Expenses” for the Fund (excluding Management fees, Service Share fees, Distribution and Service fees, Transfer Agent fees, litigation and indemnification costs, taxes, interest, brokerage commissions and extraordinary expenses) until further notice
to the extent such expenses exceed .00% of the average daily net assets of the Fund. For the six months ended June 30, 2000, the adviser reimbursed approximately $162,000. In addition, the Fund has entered into certain expense offset arrangements with the
custodian resulting in a reduction in the Fund’s expenses. For the six months ended June 30, 2000, the Custody fees were reduced by approximately $4,000 under such arrangements.
|
| Goldman Sachs serves as the Distributor of shares of the Fund pursuant to a
Distribution Agreement. Goldman Sachs may receive a portion of the Class A sales load and Class B and Class C contingent deferred sales charges and has advised the Fund that it retained approximately $150,000 for the six months ended June 30, 2000.
|
| The Trust, on behalf of the Fund, has adopted Distribution and Service plans.
Under the Distribution and Service plans, Goldman Sachs and/or Authorized Dealers are entitled to a monthly fee for distribution and shareholder maintenance services equal, on an annual basis, to .50%, 1.00% and 1.00% of the average daily net assets
attributable to Class A, Class B and Class C Shares, respectively. Goldman Sachs has voluntarily agreed to waive a portion of the Distribution and Service fees equal, on an annual basis, to .25% of the average daily net assets attributable to the Class A
shares. For the six months ended June 30, 2000, Goldman Sachs has waived approximately $109,000 of the Distribution and Service fees attributable to the Class A shares. Goldman Sachs may discontinue or modify this waiver in the future at its discretion.
|
| The Trust, on behalf of the Fund, has adopted a Service Plan. This Plan allows for
Service shares to compensate service organizations for providing varying levels of account administration and shareholder liaison services to their customers who are beneficial owners of such shares. The Service Plan provides for compensation to the
service organizations in an amount up to .50% (on an annualized basis), of the average daily net asset value of the Service shares.
|
| Goldman Sachs also serves as the Transfer Agent of the Fund for a fee calculated
daily and payable monthly at an annual rate as follows: .19% of the average daily net assets for Class A, Class B and Class C Shares and .04% of the average daily net assets for Institutional and Service Shares.
|
| At June 30, 2000, the Fund owed approximately $124,000, $23,000 and $17,000 for
Management, Distribution and Service and Transfer Agent fees, respectively.
|
| 4. PORTFOLIO SECURITIES TRANSACTIONS
|
| Purchases and proceeds of sales or maturities of securities (excluding short-term investments) for the six months ended June 30,
2000, were $42,954,611 and $38,300,253, respectively.
|
| For the six months ended June 30, 2000, Goldman Sachs earned no brokerage
commissions from portfolio transactions.
|
| Option Accounting Principles — When the Fund writes
call or put options, an amount equal to the premium received is recorded as an asset and as an equivalent liability. The amount of the liability is subsequently marked-to-market to reflect the current market value of the option written. When a written
option expires on its stipulated expiration date or the Fund enters into a closing purchase transaction, the Fund realizes a gain or loss without regard to any unrealized gain or loss on the underlying security, and the liability related to such option is
extinguished. When a written call option is exercised, the Fund realizes a gain or loss from the sale of the underlying security, and the proceeds of the sale are increased by the premium originally received. When a written put option is exercised, the
amount of the premium originally received will reduce the cost of the security which the Fund purchases upon exercise. There is a risk of loss from a change in value of such options which may exceed the related premiums received.
|
| Upon the purchase of a call option or a protective put option by the Fund, the
premium paid is recorded as an investment and subsequently marked-to-market to reflect the current market value of the option. If an option which the Fund has purchased expires on the stipulated expiration date, the Fund will realize a loss in the amount
of the cost of the option. If the Fund enters into a closing sale transaction, the Fund will realize a gain or loss, depending on whether the sale proceeds for the closing sale transaction are greater or less than the cost of the option. If the Fund
exercises a purchased put option, the Fund will realize a gain or loss from the sale of the underlying security, and the proceeds from such sale will be decreased by the premium originally paid. If the Fund exercises a purchased call option, the cost of
the security which the Fund purchases upon exercise will be increased by the premium originally paid.
|
| For the six months ended June 30, 2000, written call option transactions in the
Fund were as follows:
|
| Written Options | Number of Contracts | Premium Received | |||
|---|---|---|---|---|---|
| Balance outstanding, beginning of period | — | $ — | |||
| Options written | 151 | 35,643 | |||
| BALANCE OUTSTANDING, END OF PERIOD | 151 | $35,643 | |||
| 5. REPURCHASE AGREEMENTS
|
| During the term of a repurchase agreement, the value of the underlying securities, including accrued interest, is required to
equal or exceed the value of the repurchase agreement. The underlying securities for all repurchase agreements are held in safekeeping by a custodian.
|
| 6. JOINT REPURCHASE AGREEMENT ACCOUNT
|
| The Fund, together with other registered investment companies having management agreements with GSAM or its affiliates, transfers
uninvested cash into joint accounts, the daily aggregate balance of which is invested in one or more repurchase agreements.
|
| At June 30, 2000, the Fund had an undivided interest in the repurchase agreement
in the following joint account which equaled $3,800,000 in principal amount. At June 30, 2000, the following repurchase agreements held in this joint account were fully collateralized by Federal Agency obligations.
|
| Repurchase Agreements | Principal
Amount |
Interest
Rate |
Maturity
Date |
Amortized
Cost |
Maturity
Value |
|||||||
|---|---|---|---|---|---|---|---|---|---|---|---|---|
| ABN/AMRO, Inc. | $995,900,000 | 6.85 | % | 07/03/00 | $ 995,900,000 | $ 996,468,493 | ||||||
| Banc of America Securities LLC | 800,000,000 | 6.88 | 07/03/00 | 800,000,000 | 800,458,667 | |||||||
| Bear Stearns Companies, Inc. | 500,000,000 | 6.85 | 07/03/00 | 500,000,000 | 500,285,417 | |||||||
| Donaldson, Lufkin & Jenrette, Inc. | 500,000,000 | 6.90 | 07/03/00 | 500,000,000 | 500,287,500 | |||||||
| TOTAL JOINT REPURCHASE AGREEMENT
ACCOUNT II |
$2,795,900,000 | $2,797,500,077 | ||||||||||
| 7. LINE OF CREDIT FACILITY
|
| Effective May 31, 2000, the Fund participates in a $350,000,000 committed, unsecured revolving line of credit facility. Prior
thereto, the Fund participated in a $250,000,000 uncommitted and a $250,000,000 committed, unsecured revolving line of credit facility. Under the most restrictive arrangement, the Fund must own securities having a market value in excess of 400% of the
total bank borrowings. These facilities are to be used solely for temporary or emergency purposes. The interest rate on borrowings is based on the Federal Funds rate. The committed facility also requires a fee to be paid by the Fund based on the amount of
the commitment which has not been utilized. During the six months ended June 30, 2000, the Fund did not have any borrowings under any of these facilities.
|
| 8. OTHER MATTERS
|
| As of June 30, 2000, the Goldman Sachs Growth and Income Strategy Portfolio and Growth Strategy Portfolio were the beneficial
owners of approximately 6% and 5%, respectively of the outstanding shares of the Fund.
|
| 9. CHANGE IN INDEPENDENT AUDITOR
|
| On October 26, 1999, the Board of Trustees of the Fund, upon the recommendation of the Board’s audit committee, determined
not to retain Arthur Andersen LLP and approved a change of the Fund’s independent auditors to Ernst & Young LLP. For the fiscal years ended December 31, 1999 and December 31, 1998, Arthur Andersen LLP’s audit reports contained no adverse
opinion or disclaimer of opinion; nor were their reports qualified or modified as to uncertainty, audit scope, or accounting principles. Further, there were no disagreements between the Fund and Arthur Andersen LLP on accounting principles or practices,
financial statement disclosure or audit scope or procedure, which if not resolved to the satisfaction of Arthur Andersen LLP would have caused them to make reference to the disagreement in their reports.
|
| 10. SUMMARY OF SHARE TRANSACTIONS
|
| Share activity for the six months ended June 30, 2000 and the year ended December 31, 1999 is as follows:
|
| For the six months Ended June 30, 2000 | For the year Ended December 31, 1999 | ||||||||||||
|---|---|---|---|---|---|---|---|---|---|---|---|---|---|
| (Unaudited) | |||||||||||||
| Shares | Dollars | Shares | Dollars | ||||||||||
| Class A Shares | |||||||||||||
| Shares sold | 2,217,744 | $20,448,733 | 11,403,124 | $104,642,563 | |||||||||
| Reinvestment of dividends and distributions | 186,443 | 1,763.736 | 412,356 | 3,571,008 | |||||||||
| Shares repurchased | (3,065,807 | ) | (26,657,214 | ) | (3,215,626 | ) | (27,495,073 | ) | |||||
| (661,620 | ) | (4,444,745 | ) | 8,599,854 | 80,718,498 | ||||||||
| Class B Shares | |||||||||||||
| Shares sold | 267,268 | 2,502,461 | 51,929 | 468,345 | |||||||||
| Reinvestment of dividends and distributions | 1,653 | 16,076 | 1,151 | 9,653 | |||||||||
| Shares repurchased | (15,820 | ) | (146,339 | ) | (1,003 | ) | (8,393 | ) | |||||
| 253,101 | 2,372,198 | 52,077 | 469,605 | ||||||||||
| Class C Shares | |||||||||||||
| Shares sold | 137,679 | 1,322,984 | 88,350 | 792,983 | |||||||||
| Reinvestment of dividends and distributions | 2,255 | 21,615 | 1,413 | 11,869 | |||||||||
| Shares repurchased | (18,674 | ) | (179,188 | ) | (9,449 | ) | (80,747 | ) | |||||
| 121,260 | 1,165,411 | 80,314 | 724,105 | ||||||||||
| Institutional Shares | |||||||||||||
| Shares sold | 1,064,920 | 9,917,717 | 2,581,373 | 23,631,931 | |||||||||
| Reinvestment of dividends and distributions | 28,304 | 268,840 | 101,530 | 899,623 | |||||||||
| Shares repurchased | (784,160 | ) | (6,978,372 | ) | (2,917,766 | ) | (26,428,706 | ) | |||||
| 309,064 | 3,208,185 | (234,863 | ) | (1,897,152 | ) | ||||||||
| Service Shares | |||||||||||||
| Shares sold | — | — | — | — | |||||||||
| Reinvestment of dividends and distributions | 4 | 33 | 7 | 66 | |||||||||
| Shares repurchased | — | — | (11 | ) | (90 | ) | |||||||
| 4 | 33 | (4 | ) | (24 | ) | ||||||||
| NET INCREASE | 21,809 | $ 2,301,082 | 8,497,378 | $ 80,015,032 | |||||||||
GOLDMAN SACHS FUND PROFILE
Goldman Sachs Real Estate Securities Fund
An Investment Idea for the Long Term
Over the long term, real estate investment trusts (REITs) have historically outperformed many traditional investments, such as fixed income securities, while seeking to provide competitive total returns against the broad equity market.1
Goldman Sachs Real Estate Securities Fund (“the Fund”) seeks to provide investors access to the benefits associated with equity investing. The Fund seeks long-term growth of capital and dividend income primarily through investments in equity securities of issuers engaged in or related to the real estate industry.
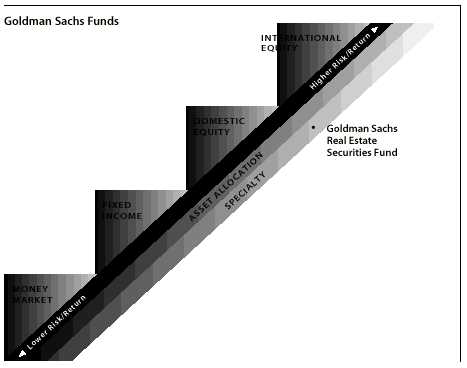
Target Your Needs
The Goldman Sachs Real Estate Securities Fund has a distinct investment objective and a defined place on the risk/return spectrum. As your investment objectives change, you can exchange shares within Goldman Sachs Funds without an additional charge.2 (Please note: in general, greater returns are associated with greater risk.)
Four professionals with more than 60 years of combined experience manage the Goldman Sachs Real Estate Securities Fund. The team draws on Goldman Sachs’ global real estate capabilities:

For More Information
To learn more about the Goldman Sachs Real Estate Securities Fund and other Goldman Sachs Funds, please call your investment professional today.
1 An investment in real estate securities is subject to greater price volatility and the special risks associated with direct ownership of real estate.
2 The exchange privilege is subject to termination and its terms are subject to change.
![]()
| TRUSTEES | OFFICERS | |
| Ashok N. Bakhru, Chairman | Douglas C. Grip, President | |
| David B. Ford | Jesse H. Cole, Vice President | |
| Douglas C. Grip | James A. Fitzpatrick, Vice President | |
| John P. McNulty | Nancy L. Mucker, Vice President | |
| Mary P. McPherson | John M. Perlowski, Treasurer | |
| Alan A. Shuch | Peter Fortner, Assistant Treasurer | |
| William H. Springer | Philip V. Giuca, Jr., Assistant Treasurer | |
| Richard P. Strubel | Michael J. Richman, Secretary | |
| Howard B. Surloff, Secretary | ||
| Amy E. Belanger, Assistant Secretary | ||
| Valerie A. Zondorak, Assistant Secretary | ||
| GOLDMAN, SACHS & CO. | GOLDMAN SACHS ASSET MANAGEMENT | |
| Distributor and Transfer Agent | Investment Adviser | |
Visit our internet address: www.gs.com/funds
This material is not authorized for distribution to prospective investors unless preceded or accompanied by a current Prospectus. Investors should read the Prospectus carefully before investing or sending money.
Goldman, Sachs & Co. is the distributor of the Fund.
An investment in the Real Estate Securities Fund is subject to certain risks associated with the direct ownership of real estate and with concentrating its investments in the real estate industry in general and may be suitable only for those investors who are financially able to assume greater risk and share price volatility than presented by funds that do not concentrate in the real estate industry.
| Copyright 2000 Goldman, Sachs & Co. All rights reserved. Date of first use: August 29, 2000 | 00-1155 / REITSAR / 8K / 8-00
|
|||
|
|