
|
|
|
|
|
|
|
|
|

GOLDMAN SACHS ASSET ALLOCATION PORTFOLIOS
Market Overview
Dear Shareholder,
It has been an eventful period in the global financial markets thus far in 2000 — one marked by a dramatic increase in volatility uncertainty, and, ultimately, mixed performance results.
• Global Equity Markets — In the U.S., the S&P 500 Index fell slightly during the six-month reporting period, but this masked the volatile nature of the market. After an early rally, limited mostly to technology-related stocks, the market abruptly turned in mid-March. High valuations and rising interest rates caused investors to abandon the technology-heavy NASDAQ. While other types of stocks were dragged down, technology issues experienced the brunt of the damage. At one point, the NASDAQ was down 37% from its peak before rallying strongly in June. By the end of the reporting period, the NASDAQ had fallen 27% from its high, while the S&P 500 Index was down roughly 5% from its peak.
The ramifications of the volatility in the U.S. were felt abroad as well — causing the stock markets in both developed and emerging markets to fall. In Europe, continued concern over the direction of interest rates and the prospects for ‘new economy’ stocks undermined investor confidence. European markets were also unsettled by two interest rate increases by the European Central Bank. Extreme volatility continued to characterize the market, compounded by thin trading volumes.
The Japanese market suffered as well with large cap growth stocks in the Information Technology (IT) sector leading the decline. However, corporate results for the year ended March 2000 confirmed improving underlying fundamentals. Non-financials’ pretax profits rose 13%, comfortably beating the street forecast. Also, corporate restructuring plans in a variety of industries contributed to firm earnings, despite a continued contraction in revenues.
• Global Fixed Income Markets — In the U.S., the Federal Reserve Board (the “Fed”) remained diligent in its attempts to ward off inflation. The Fed raised interest rates on six consecutive occasions during the last twelve months prior to holding rates steady at the end of June. Investors have shown optimism that the Fed’s job is virtually complete. As such, many sectors of the market rallied late in the period.
In Europe, the European Central Bank (ECB) raised the repo rate by 25 basis points in April and a surprise 50 basis points in June. The ECB voiced concerns over the weak currency and generous liquidity conditions in the Euro area. Inflation risks also continued to increase, as the growth outlook improved.
Japanese bonds began to outperform in the second quarter as the focus on ending the zero-interest rate policy diminished. Investors were encouraged as data pointed to a gradual recovery and an easing of deflationary pressures. However, by the end of the quarter, expectations for an early rate rise increased, pushing bond yields higher.
We encourage you to maintain your long-term investment program, and look forward to serving your investment needs in the years ahead.
Sincerely,

| David B. Ford | David W. Blood | |
| Co-Head, Goldman Sachs Asset Management | Co-Head, Goldman Sachs Asset Management | |
| July 17, 2000 |
NOT FDIC-INSURED
May Lose Value
No Bank Guarantee
FUND BASICS
Conservative Strategy
as of June 30, 2000
PERFORMANCE REVIEW
| December 31, 1999–June 30, 2000 | Fund Cumulative Total Return (based on NAV)1 | |||
| |
||||
| Class A | 1.90% | |||
| Class B | 1.41% | |||
| Class C | 1.52% | |||
| Institutional | 2.21% | |||
| Service | 1.89% | |||
| |
||||
1 The net asset value (“NAV”) represents the net assets of the Portfolio (ex-dividend) divided by the total number of shares outstanding. Performance does not reflect the deduction of any applicable sales charge. Total return figures are not annualized.
STANDARDIZED TOTAL RETURNS2
| For the period ending June 30, 2000 | Class A | Class B | Class C | Institutional | Service | ||||||||||
| |
|||||||||||||||
| One Year | –1.99% | –2.18% | 1.91% | 4.33% | 3.60% | ||||||||||
| Since Inception (2/8/99) | 1.17% | 1.58% | 4.54% | 5.95% | 5.36% | ||||||||||
| |
|||||||||||||||
2 The Standardized Total Returns are average annual or cumulative (only if performance period is one year or less) total returns as of the most recent calendar quarter-end. They assume reinvestment of all distributions at NAV. These returns reflect a maximum initial sales charge of 5.5% for Class A shares and the assumed deferred sales charge for Class B shares (5% maximum declining to 0% after six years) and the assumed deferred sales charge for Class C shares (1% if redeemed within 12 months of purchase). Because Institutional and Service shares do not involve a sales charge, such a charge is not applied to their respective Standardized Total Returns.
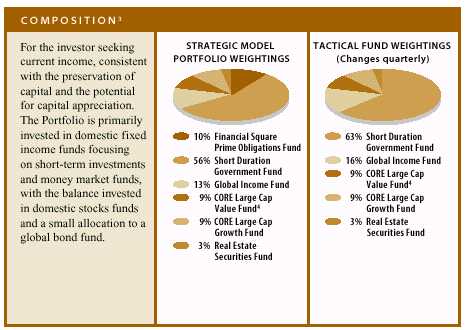
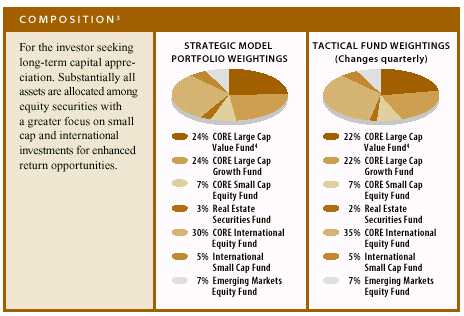
3 As of 6/30/00. Actual Fund weighting in the Asset Allocation Portfolios may differ slightly from the figures shown above due to rounding, differences in returns of the underlying Funds, or both. The above figures are not indicative of future allocations.
4 The allocation shown above for the Goldman Sachs CORE Large Cap Value Fund was gradually implemented; this process was completed in mid-February 1999. The Goldman Sachs CORE Large Cap Value Fund more closely tracks the Russell 1000 Value Index.
The Asset Allocation Portfolios invest primarily in other Goldman Sachs Fixed Income, Equity and Money Market Funds and are subject to the risks associated with investment in such Funds. Total return figures represent past performance and do not indicate future results, which will vary. The investment return and principal value of an investment will fluctuate and, therefore, an investor’s shares, when redeemed, may be worth more or less than their original cost.
FUND BASICS
Balanced Strategy
as of June 30, 2000
PERFORMANCE REVIEW
| December 31, 1999–June 30, 2000 | Fund Cumulative Total Return (based on NAV)1 | |||
| |
||||
| Class A | 0.16% | |||
| Class B | –0.22% | |||
| Class C | –0.3%0 | |||
| Institutional | 0.27% | |||
| Service | 0.09% | |||
| |
||||
1 The net asset value (“NAV”) represents the net assets of the Portfolio (ex-dividend) divided by the total number of shares outstanding. Performance does not reflect the deduction of any applicable sales charge. Total return figures are not annualized.
STANDARDIZED TOTAL RETURNS2
| For the period ending June 30, 2000 | Class A | Class B | Class C | Institutional | Service | ||||||||||
| |
|||||||||||||||
| One Year | 0.52% | 0.34% | 4.45% | 6.72% | 6.25% | ||||||||||
| Since Inception (1/2/98) | 4.41% | 4.83% | 6.01% | 7.21% | 6.69% | ||||||||||
| |
|||||||||||||||
2 The Standardized Total Returns are average annual or cumulative (only if performance is one year or less) total returns as of the most recent calendar quarter-end. They assume reinvestment of all distributions at NAV. These returns reflect a maximum initial sales charge of 5.5% for Class A shares and the assumed deferred sales charge for Class B shares (5% maximum declining to 0% after six years) and the assumed deferred sales charge for Class C shares (1% if redeemed within 12 months of purchase). Because Institutional and Service shares do not involve a sales charge, such a charge is not applied to their respective Standardized Total Returns.
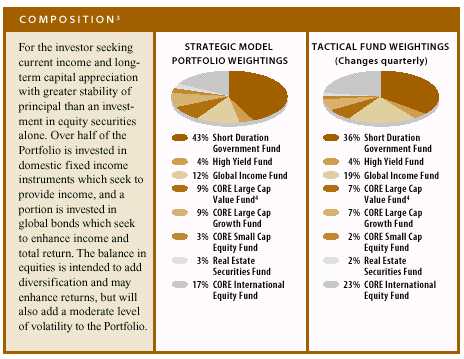
3 As of 6/30/00. Actual Fund weighting in the Asset Allocation Portfolios may differ slightly from the figures shown above due to rounding, differences in returns of the underlying Funds, or both. The above figures are not indicative of future allocations.
4 The allocation shown above for the Goldman Sachs CORE Large Cap Value Fund was gradually implemented; this process was completed in mid-February 1999. The Goldman Sachs CORE Large Cap Value Fund more closely tracks the Russell 1000 Value Index.
The Asset Allocation Portfolios invest primarily in other Goldman Sachs Fixed Income, Equity and Money Market Funds and are subject to the risks associated with investment in such Funds. Total return figures represent past performance and do not indicate future results, which will vary. The investment return and principal value of an investment will fluctuate and, therefore, an investor’s shares, when redeemed, may be worth more or less than their original cost.
FUND BASICS
Growth and Income Strategy
as of June 30, 2000
PERFORMANCE REVIEW
| December 31, 1999–June 30, 2000 | Fund Cumulative Total Return (based on NAV)1 | |||
| |
||||
| Class A | -0.37% | |||
| Class B | -0.74% | |||
| Class C | -0.74% | |||
| Institutional | 0.00% | |||
| Service | -0.41% | |||
| |
||||
1 The net asset value (“NAV”) represents the net assets of the Portfolio (ex-dividend) divided by the total number of shares outstanding. Performance does not reflect the deduction of any applicable sales charge. Total return figures are not annualized.
STANDARDIZED TOTAL RETURNS2
| For the period ending June 30, 2000 | Class A | Class B | Class C | Institutional | Service | ||||||||||
| |
|||||||||||||||
| One Year | 2.22% | 2.28% | 6.44% | 8.77% | 8.07% | ||||||||||
| Since Inception (1/2/98) | 6.19% | 6.71% | 7.83% | 9.08% | 8.48% | ||||||||||
| |
|||||||||||||||
2 The Standardized Total Returns are average annual or cumulative (only if performance period is one year or less) total returns as of the most recent calendar quarter-end. They assume reinvestment of all distributions at NAV. These returns reflect a maximum initial sales charge of 5.5% for Class A shares and the assumed deferred sales charge for Class B shares (5% maximum declining to 0% after six years) and the assumed deferred sales charge for Class C shares (1% if redeemed within 12 months of purchase). Because Institutional and Service shares do not involve a sales charge, such a charge is not applied to their respective Standardized Total Returns.
3 As of 6/30/00. Actual Fund weighting in the Asset Allocation Portfolios may differ slightly from the figures shown above due to rounding, differences in returns of the underlying Funds, or both. The above figures are not indicative of future allocations.
4 The allocation shown above for the Goldman Sachs CORE Large Cap Value Fund was gradually implemented; this process was completed in mid-February 1999. The Goldman Sachs CORE Large Cap Value Fund more closely tracks the Russell 1000 Value Index.
The Asset Allocation Portfolios invest primarily in other Goldman Sachs Fixed Income, Equity and Money Market Funds and are subject to the risks associated with investment in such Funds. Total return figures represent past performance and do not indicate future results, which will vary. The investment return and principal value of an investment will fluctuate and, therefore, an investor’s shares, when redeemed, may be worth more or less than their original cost.
FUND BASICS
Growth Strategy
as of June 30, 2000
PERFORMANCE REVIEW
| December 31, 1999–June 30, 2000 | Fund Cumulative Total Return (based on NAV)1 | |||
| |
||||
| Class A | -1.39% | |||
| Class B | -1.72% | |||
| Class C | -1.80% | |||
| Institutional | -1.14% | |||
| Service | -1.39% | |||
| |
||||
1 The net asset value (“NAV”) represents the net assets of the Portfolio (ex-dividend) divided by the total number of shares outstanding. Performance does not reflect the deduction of any applicable sales charge. Total return figures are not annualized.
STANDARDIZED TOTAL RETURNS2
| For the period ending June 30, 2000 | Class A | Class B | Class C | Institutional | Service | ||||||||||
| |
|||||||||||||||
| One Year | 3.30% | 3.46% | 7.48% | 9.79% | 9.15% | ||||||||||
| Since Inception (1/2/98) | 6.80% | 7.38% | 8.46% | 9.61% | 9.08% | ||||||||||
| |
|||||||||||||||
2 The Standardized Total Returns are average annual or cumulative (only if performance period is one year or less) total returns as of the most recent calendar quarter-end. They assume reinvestment of all distributions at NAV. These returns reflect a maximum initial sales charge of 5.5% for Class A shares and the assumed deferred sales charge for Class B shares (5% maximum declining to 0% after six years) and the assumed deferred sales charge for Class C shares (1% if redeemed within 12 months of purchase). Because Institutional and Service shares do not involve a sales charge, such a charge is not applied to their respective Standardized Total Returns.
3 As of 6/30/00. Actual Fund weighting in the Asset Allocation Portfolios may differ slightly from the figures shown above due to rounding, differences in returns of the underlying Funds, or both. The above figures are not indicative of future allocations.
4 The allocation shown above for the Goldman Sachs CORE Large Cap Value Fund was gradually implemented; this process was completed in mid-February 1999. The Goldman Sachs CORE Large Cap Value Fund more closely tracks the Russell 1000 Value Index.
The Asset Allocation Portfolios invest primarily in other Goldman Sachs Fixed Income, Equity and Money Market Funds and are subject to the risks associated with investment in such Funds. Total return figures represent past performance and do not indicate future results, which will vary. The investment return and principal value of an investment will fluctuate and, therefore, an investor’s shares, when redeemed, may be worth more or less than their original cost.
F U N D B A S I C S
Aggressive Growth Strategy
as of June 30, 2000
P E R F O R M A N C E R E V I E W
| December 31, 1999–June 30, 2000 | Fund Cumulative Total Return (based on NAV)1 | |||
| |
||||
| Class A | –2.22 | % | ||
| Class B | –2.55 | % | ||
| Class C | –2.47 | % | ||
| Institutional | –1.98 | % | ||
| Service | –2.22 | % | ||
| |
||||
| 1 | The net asset value (“NAV”) represents the net assets of the Portfolio (ex-dividend) divided by the total number of shares outstanding. Performance does not reflect the deduction of any applicable sales charge. Total return figures are not annualized. | |||
S TA N D A R D I Z E D T O TA L R E T U R N S 2
| For the period ending June 30, 2000 | Class A | Class B | Class C | Institutional | Service | ||||||
| |
|||||||||||
| One Year | 4.31 | % | 4.54 | % | 8.59 | % | 10.78 | % | 10.29 | % | |
| Since Inception (1/2/98) | 7.17 | % | 7.78 | % | 8.92 | % | 9.94 | % | 9.52 | % | |
| |
|||||||||||
| 2 | The Standardized Total Returns are average annual or cumulative (only if performance period is one year or less) total returns as of the most recent calendar quarter-end. They assume reinvestment of all distributions at NAV. These returns reflect a maximum initial sales charge of 5.5% for Class A shares and the assumed deferred sales charge for Class B shares (5% maximum declining to 0% after six years) and the assumed deferred sales charge for Class C shares (1% if redeemed within 12 months of purchase). Because Institutional and Service shares do not involve a sales charge, such a charge is not applied to their respective Standardized Total Returns. | ||||||||||
| 3 | As of 6/30/00. Actual Fund weighting in the Asset Allocation Portfolios may differ slightly from the figures shown above due to rounding, differences in returns of the underlying Funds, or both. The above figures are not indicative of future allocations. |
| 4 | The allocation shown above for the Goldman Sachs CORE Large Cap Value Fund was gradually implemented; this process was completed in mid-February 1999. The Goldman Sachs CORE Large Cap Value Fund more closely tracks the Russell 1000 Value Index. |
| The Asset Allocation Portfolios invest primarily in other Goldman Sachs Fixed Income, Equity and Money Market Funds and are subject to the risks associated with investment in such Funds. Total return figures represent past performance and do not indicate future results, which will vary. The investment return and principal value of an investment will fluctuate and, therefore, an investor’s shares, when redeemed, may be worth more or less than their original cost. |
5
P E R F O R M A N C E O V E R V I E W
Asset Allocation Portfolios
Dear Shareholder,
We are pleased to report on the performance of the Goldman Sachs Asset Allocation Portfolios (individually, the “Portfolio,” and collectively, the “Portfolios”). This semiannual report covers the six-month period ended June 30, 2000.
Asset Allocation
The performance of your Portfolio is driven primarily by three factors: 1) strategic asset allocation policy; 2) underlying fund performance; and 3) tactical reallocation. By reallocating your
Portfolio on a quarterly basis, we seek to enhance performance over the long term.
During the first half of the year, the Portfolios were subject to the extreme gyrations in the global financial markets. We sought to enhance performance with our tactical allocations that included a modest overweight in
stocks. The Portfolios’ overweight positions in international versus domestic stocks hurt performance, while our overweight positions in international versus domestic bonds helped performance.
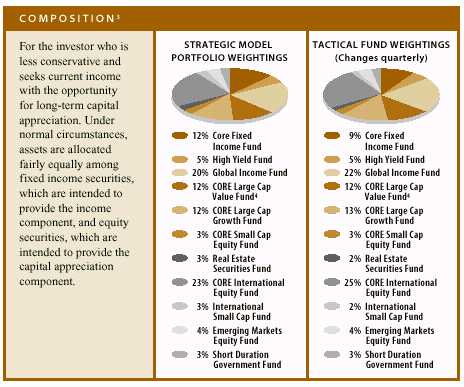
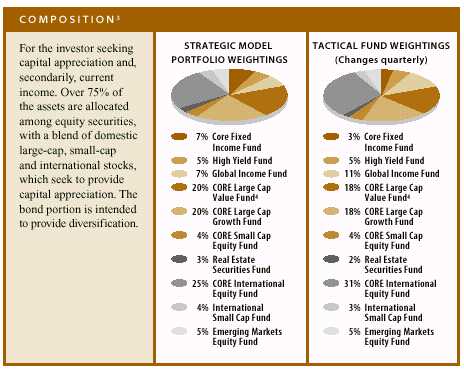
Overall, the various Portfolios invest their assets in a strategic mix of stocks, bonds and cash equivalents. Each quarter, the allocation is adjusted based on current market conditions and our economic and market forecast.
At the end of June, we completed our annual strategic benchmark rebalancing bringing the total equity portion of the various Portfolios back in line with our long-term target weights.
Regional Preferences
Performance
Increased volatility, coupled with rapid rotations among equity and fixed income sectors, led to a challenging market environment. During the first half of the reporting period, both tactical and fund allocations were oftentimes unsuccessful. However, during the second quarter, underlying fund performance aided results.
6
P E R F O R M A N C E O V E R V I E W
Current Outlook
7
P E R F O R M A N C E O V E R V I E W
We hope this summary has been helpful to you in understanding how we manage your Portfolio. If you have questions or comments, we encourage you to contact your Goldman Sachs representative.
We thank you for the confidence you have placed in us and look forward to your continued support.
Goldman Sachs Quantitative Strategies Group
July 17, 2000
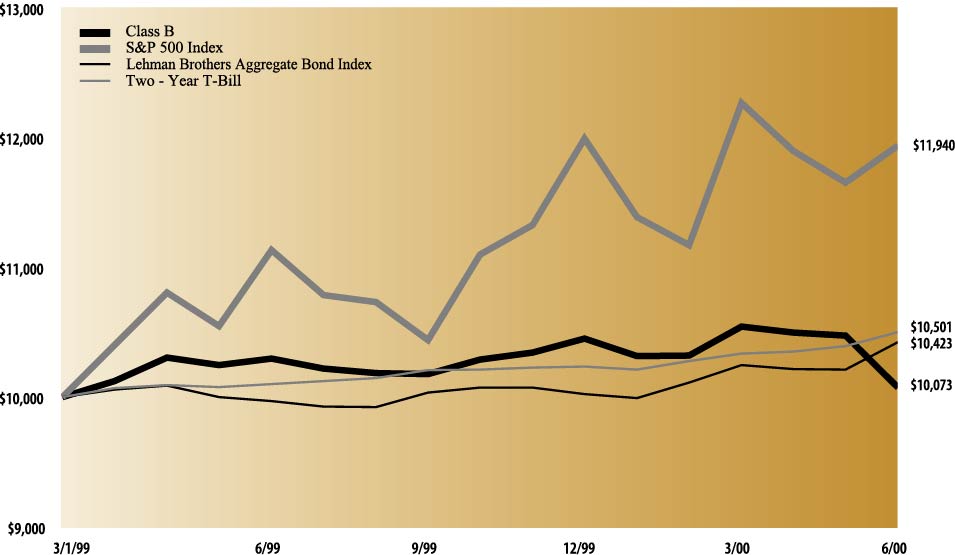
| The following graph shows the value, as of June 30, 2000, of a $10,000 investment made on March 1, 1999 in Class B Shares (with
the applicable maximum contingent deferred sales charges of 5% declining to 0% after six years). For comparative purposes, the performance of the Portfolio’s benchmarks with dividends reinvested (the S&P 500 Index, Lehman Brothers Aggregate Bond
Index and two-year U.S. Treasury Security (“Two-Year T-Bill”)) are also shown. All performance data shown represents past performance and should not be considered indicative of future performance which will fluctuate with changes in market
conditions. These performance fluctuations will cause an investor’s shares, when redeemed, to be worth more or less than the original cost. Performance of Class A, Class C, Institutional Shares and Service Shares will vary from Class B Shares due to
differences in fees and loads.
|
| Goldman Sachs Conservative Strategy Portfolio’s Lifetime Performance
|
| Performance of a $10,000 Investment, Distributions Reinvested March 1, 1999 to June 30, 2000.
(a)
|
 |
| Average Annual Total Return through June 30, 2000 | Since Inception(b) | One Year | Six Months (c) | ||||
|---|---|---|---|---|---|---|---|
| Class A | |||||||
| Excluding sales charges | 5.34% | 3.74% | 1.90% | ||||
| Including sales charges | 1.17% | -1.99% | -3.69% | ||||
| Class B | |||||||
| Excluding contingent deferred sales charges | 4.55% | 2.95% | 1.41% | ||||
| Including contingent deferred sales charges | 1.58% | -2.18% | -3.66% | ||||
| Class C | |||||||
| Excluding contingent deferred sales charges | 4.54% | 2.93% | 1.52% | ||||
| Including contingent deferred sales charges | 4.54% | 1.91% | 0.50% | ||||
| Institutional Class | 5.95% | 4.33% | 2.21% | ||||
| Service Class | 5.36% | 3.60% | 1.89% | ||||
(a)
|
For comparative purposes, initial investments are assumed to be made on the first day of the month following commencement of
operations.
|
(b)
|
All classes commenced operations on February 8, 1999.
|
(c)
|
Not annualized.
|
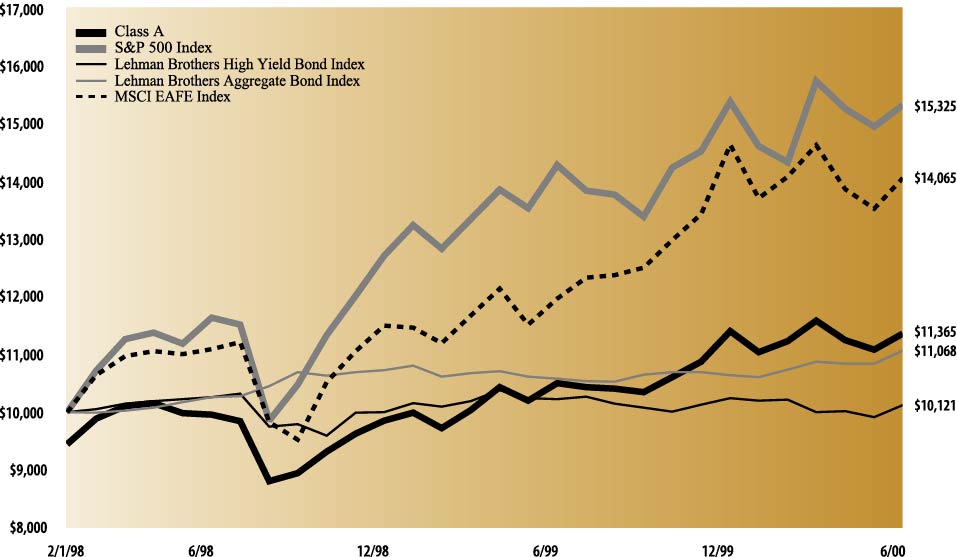
| The following graph shows the value, as of June 30, 2000, of a $10,000 investment made on February 1, 1998 in Class A Shares
(with the maximum sales charge of 5.5%). For comparative purposes, the performance of the Portfolio’s benchmarks with dividends reinvested (the S&P 500 Index, Lehman Brothers High Yield Bond Index and Two-Year T-Bill) are also shown. All
performance data shown represents past performance and should not be considered indicative of future performance which will fluctuate with changes in market conditions. These performance fluctuations will cause an investor’s shares, when redeemed, to
be worth more or less than the original cost. Performance of Class B, Class C, Institutional Shares and Service Shares will vary from Class A Shares due to differences in fees and loads.
|
| Goldman Sachs Balanced Strategy Portfolio’s Lifetime Performance
|
| Performance of a $10,000 Investment, Distributions Reinvested February 1, 1998 to June 30, 2000.
(a)
|
 |
| Average Annual Total Return through June 30, 2000 | Since Inception (b) | One Year | Six Months (c) | ||||
|---|---|---|---|---|---|---|---|
| Class A | |||||||
| Excluding sales charges | 6.79% | 6.38% | 0.16% | ||||
| Including sales charges | 4.41% | 0.52% | -5.35% | ||||
| Class B | |||||||
| Excluding contingent deferred sales charges | 6.02% | 5.49% | -0.22% | ||||
| Including contingent deferred sales charges | 4.83% | 0.34% | -5.21% | ||||
| Class C | |||||||
| Excluding contingent deferred sales charges | 6.01% | 5.48% | -0.30% | ||||
| Including contingent deferred sales charges | 6.01% | 4.45% | -1.30% | ||||
| Institutional Class | 7.21% | 6.72% | 0.27% | ||||
| Service Class | 6.69% | 6.25% | 0.09% | ||||
(a)
|
For comparative purposes, initial investments are assumed to be made on the first day of the month following commencement of
operations.
|
(b)
|
All classes commenced operations on January 2, 1998.
|
(c)
|
Not annualized.
|
| GOLDMAN SACHS
|
| CONSERVATIVE STRATEGY PORTFOLIO
|
| Shares
|
Description
|
Value
|
||
|---|---|---|---|---|
| Mutual Funds (Institutional Shares) – 99.3%
|
||||
| Equity – 21.2%
|
||||
| 61,107 | Goldman Sachs CORE Large Cap
Growth Fund – 9.6% |
$ 1,311,960 | ||
| 119,007 | Goldman Sachs CORE Large Cap
Value Fund – 8.7% |
1,191,261 | ||
| 40,846 | Goldman Sachs Real Estate Securities
Fund – 2.9% |
403,962 | ||
| |
||||
| $ 2,907,183 | ||||
| |
||||
| Fixed Income – 78.1% | ||||
| 907,369 | Goldman Sachs Short Duration
Government Fund – 62.2% |
$ 8,538,339 | ||
| 149,409 | Goldman Sachs Global Income
Fund – 15.9% |
2,175,389 | ||
| |
||||
| $10,713,728 | ||||
| |
||||
| TOTAL INVESTMENTS | ||||
| (Cost $13,535,636) | $13,620,911 | |||
| |
||||
| GOLDMAN SACHS
|
| BALANCED STRATEGY PORTFOLIO
|
| Shares | Description | Value | ||
|---|---|---|---|---|
| Mutual Funds (Institutional Shares) – 99.9%
|
||||
| Equity – 41.7%
|
||||
| 1,699,757 | Goldman Sachs CORE International
Equity Fund – 22.9% |
$20,227,104 | ||
| 327,285 | Goldman Sachs CORE Large Cap
Growth Fund – 7.7% |
6,749,753 | ||
| 571,342 | Goldman Sachs CORE Large Cap
Value Fund – 6.5% |
5,719,137 | ||
| 219,238 | Goldman Sachs Real Estate
Securities Fund – 2.5% |
2,168,265 | ||
| 153,100 | Goldman Sachs CORE Small Cap
Equity Fund – 2.1% |
1,893,845 | ||
| |
||||
| $36,758,104 | ||||
| |
||||
| Fixed Income – 58.2%
|
||||
| 3,322,403 | Goldman Sachs Short Duration
Government Fund – 35.5% |
$31,292,046 | ||
| 1,147,603 | Goldman Sachs Global
Income Fund – 19.0% |
16,709,096 | ||
| 370,116 | Goldman Sachs High Yield
Fund – 3.7% |
3,223,711 | ||
| |
||||
| $51,224,853 | ||||
| |
||||
| TOTAL INVESTMENTS | ||||
| (Cost $83,619,101) | $87,982,957 | |||
| |
||||
| The percentage shown for each investment category reflects the value of investments in that category as a percentage of total net
assets.
|
| For information on the underlying mutual funds, please call our toll free Shareholder Services Line at
|
| 1-800-526-7384 or visit us on the web at www.gs.com/funds.
|
| The following graph shows the value, as of June 30, 2000, of a $10,000 investment made on February 1, 1998 in Class A Shares
(with the maximum sales charge of 5.5%). For comparative purposes, the performance of the Portfolio’s benchmarks with dividends reinvested (the S&P 500 Index, Lehman Brothers High Yield Bond Index, Lehman Brothers Aggregate Bond Index and Morgan
Stanley EAFE Index (“MSCI EAFE”)) are also shown. All performance data shown represents past performance and should not be considered indicative of future performance which will fluctuate with changes in market conditions. These performance
fluctuations will cause an investor’s shares, when redeemed, to be worth more or less than the original cost. Performance of Class B, Class C, Institutional Shares and Service Shares will vary from Class A Shares due to differences in fees and loads.
|
| Goldman Sachs Growth and Income Strategy Portfolio’s Lifetime Performance
|
| Performance of a $10,000 Investment, Distributions Reinvested February 1, 1998 to June 30, 2000.
(a)
|
 |
| Average Annual Total Return through June 30, 2000 | Since Inception (b) | One Year | Six Months (c) | ||||
|---|---|---|---|---|---|---|---|
| Class A | |||||||
| Excluding sales charges | 8.62% | 8.16% | -0.37% | ||||
| Including sales charges | 6.19% | 2.22% | -5.84% | ||||
| Class B | |||||||
| Excluding contingent deferred sales charges | 7.84% | 7.37% | -0.74% | ||||
| Including contingent deferred sales charges | 6.71% | 2.28% | -5.71% | ||||
| Class C | |||||||
| Excluding contingent deferred sales charges | 7.83% | 7.46% | -0.74% | ||||
| Including contingent deferred sales charges | 7.83% | 6.44% | -1.73% | ||||
| Institutional Class | 9.08% | 8.77% | 0.00% | ||||
| Service Class | 8.48% | 8.07% | -0.41% | ||||
(a)
|
For comparative purposes, initial investments are assumed to be made on the first day of the month following commencement of
operations.
|
(b)
|
All classes commenced operations on January 2, 1998.
|
(c)
|
Not annualized.
|
| The following graph shows the value, as of June 30, 2000, of a $10,000 investment made on February 1, 1998 in Class A Shares
(with the maximum sales charge of 5.5%). For comparative purposes, the performance of the Portfolio’s benchmarks with dividends reinvested (the S&P 500 Index, MSCI EAFE Index, Russell 2000 Index and Morgan Stanley Emerging Markets Free Index
(“MSCI EMF”)) are also shown. All performance data shown represents past performance and should not be considered indicative of future performance which will fluctuate with changes in market conditions. These performance fluctuations will cause
an investor’s shares, when redeemed, to be worth more or less than the original cost. Performance of Class B, Class C, Institutional Shares and Service Shares will vary from Class A Shares due to differences in fees and loads.
|
| Goldman Sachs Growth Strategy Portfolio’s Lifetime Performance
|
| Performance of a $10,000 Investment, Distributions Reinvested February 1, 1998 to June 30, 2000.
(a)
|
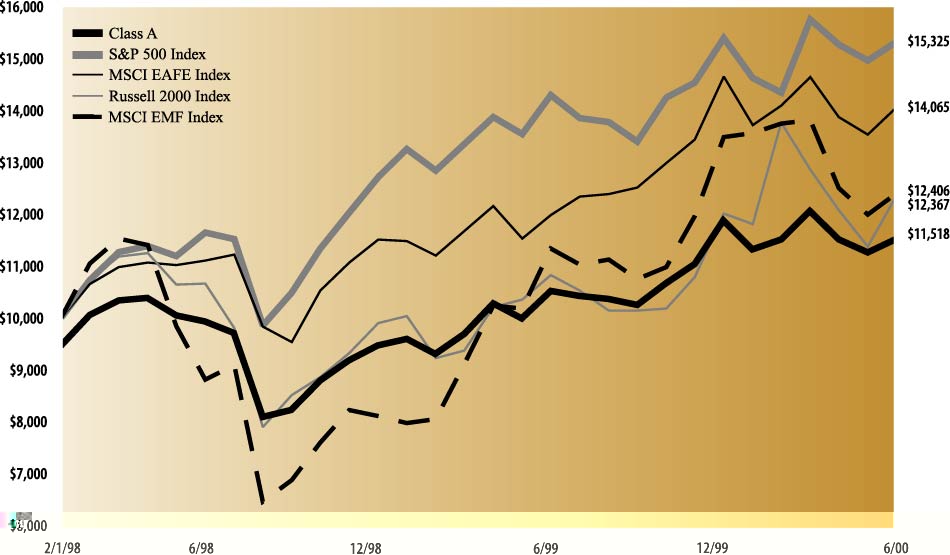 |
| Average Annual Total Return through June 30, 2000 | Since Inception (b) | One Year | Six Months (c) | ||||
|---|---|---|---|---|---|---|---|
| Class A | |||||||
| Excluding sales charges | 9.24% | 9.27% | -1.39% | ||||
| Including sales charges | 6.80% | 3.30% | -6.80% | ||||
| Class B | |||||||
| Excluding contingent deferred sales charges | 8.47% | 8.49% | -1.72% | ||||
| Including contingent deferred sales charges | 7.38% | 3.46% | -6.63% | ||||
| Class C | |||||||
| Excluding contingent deferred sales charges | 8.46% | 8.49% | -1.80% | ||||
| Including contingent deferred sales charges | 8.46% | 7.48% | -2.78% | ||||
| Institutional Class | 9.61% | 9.79% | -1.14% | ||||
| Service Class | 9.08% | 9.15% | -1.39% | ||||
(a)
|
For comparative purposes, initial investments are assumed to be made on the first day of the month following commencement of
operations.
|
(b)
|
All classes commenced operations on January 2, 1998.
|
(c)
|
Not annualized.
|
| GOLDMAN SACHS
GROWTH AND INCOME STRATEGY PORTFOLIO |
| Shares | Description
|
Value | ||
|---|---|---|---|---|
| Mutual Funds (Institutional Shares) – 99.9% | ||||
| Equity – 60.9%
|
||||
| 9,098,209 | Goldman Sachs CORE International
Equity Fund – 25.2% |
$108,268,683 | ||
| 2,572,500 | Goldman Sachs CORE Large Cap
Growth Fund – 12.9% |
55,231,578 | ||
| 5,054,844 | Goldman Sachs CORE Large Cap
Value Fund – 11.8% |
50,598,990 | ||
| 1,669,411 | Goldman Sachs Emerging Markets
Equity Fund – 4.3% |
18,664,020 | ||
| 891,039 | Goldman Sachs CORE Small Cap
Equity Fund – 2.6% |
11,022,149 | ||
| 584,409 | Goldman Sachs International Small
Cap Equity Fund – 2.2% |
9,496,649 | ||
| 839,841 | Goldman Sachs Real Estate
Securities Fund – 1.9% |
8,306,027 | ||
| |
||||
| $261,588,096 | ||||
| |
||||
| Fixed Income – 39.0%
|
||||
| 6,647,065 | Goldman Sachs Global Income
Fund – 22.5% |
$ 96,781,265 | ||
| 4,135,967 | Goldman Sachs Core Fixed Income
Fund – 9.1% |
39,002,171 | ||
| 2,376,363 | Goldman Sachs High Yield
Fund – 4.8% |
20,698,122 | ||
| 1,153,693 | Goldman Sachs Short Duration
Government Fund – 2.6% |
10,856,252 | ||
| |
||||
| $167,337,810 | ||||
| |
||||
| TOTAL INVESTMENTS | ||||
| (Cost $387,705,783) | $428,925,906 | |||
| |
||||
| GOLDMAN SACHS
GROWTH STRATEGY PORTFOLIO |
| Shares
|
Description
|
Value
|
||
|---|---|---|---|---|
| Mutual Funds (Institutional Shares) – 99.9% | ||||
| Equity – 81.0% | ||||
| 8,814,760 | Goldman Sachs CORE International
Equity Fund – 31.1% |
$104,895,643 | ||
| 2,914,244 | Goldman Sachs CORE Large Cap
Growth Fund – 18.6% |
62,568,817 | ||
| 5,734,634 | Goldman Sachs CORE Large Cap
Value Fund – 17.0% |
57,403,688 | ||
| 1,614,292 | Goldman Sachs Emerging Markets
Equity Fund – 5.3% |
18,047,787 | ||
| 1,009,485 | Goldman Sachs CORE Small Cap
Equity Fund – 3.7% |
12,487,333 | ||
| 635,111 | Goldman Sachs International Small
Cap Equity Fund – 3.1% |
10,320,554 | ||
| 733,785 | Goldman Sachs Real Estate
Securities Fund – 2.2% |
7,257,137 | ||
| |
||||
| $272,980,959 | ||||
| |
||||
| Fixed Income – 18.9% | ||||
| 2,661,310 | Goldman Sachs Global Income
Fund – 11.5% |
$ 38,748,675 | ||
| 1,827,494 | Goldman Sachs High Yield
Fund – 4.7% |
15,917,470 | ||
| 954,502 | Goldman Sachs Core Fixed Income
Fund – 2.7% |
9,000,956 | ||
| |
||||
| $ 63,667,101 | ||||
| |
||||
| TOTAL INVESTMENTS | ||||
| (Cost $292,231,850) | $336,648,060 | |||
| |
||||
| The percentage shown for each investment category reflects the value of investments in that category as a percentage of total net
assets.
|
| For information on the underlying mutual funds, please call our toll free Shareholder Services Line at
|
| 1-800-526-7384 or visit us on the web at www.gs.com/funds.
|
| The following graph shows the value, as of June 30, 2000, of a $10,000 investment made on February 1, 1998 in Class A Shares
(with the maximum sales charge of 5.5%). For comparative purposes, the performance of the Portfolio’s benchmarks with dividends reinvested (the S&P 500 Index, MSCI EAFE Index, Russell 2000 Index and MSCI EMF Index) are also shown. All performance
data shown represents past performance and should not be considered indicative of future performance which will fluctuate with changes in market conditions. These performance fluctuations will cause an investor’s shares, when redeemed, to be worth
more or less than the original cost. Performance of Class B, Class C, Institutional Shares and Service Shares will vary from Class A Shares due to differences in fees and loads.
|
| Goldman Sachs Aggressive Growth Strategy Portfolio’s Lifetime Performance
|
| Performance of a $10,000 Investment, Distributions Reinvested February 1, 1998 to June 30, 2000.
(a)
|
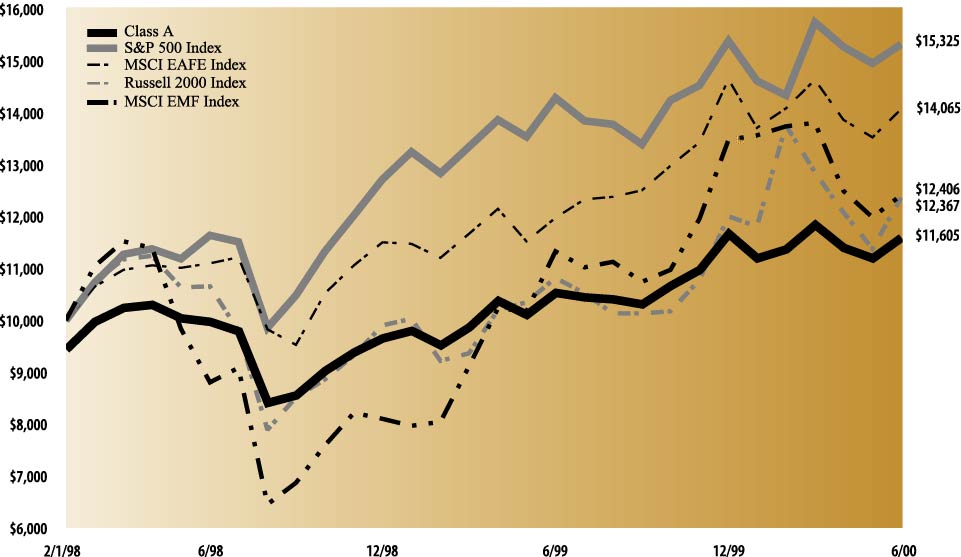 |
| Average Annual Total Return through June 30, 2000 | Since Inception (b) | One Year | Six Months (c) | ||||
|---|---|---|---|---|---|---|---|
| Class A | |||||||
| Excluding sales charges | 9.62% | 10.40% | -2.22% | ||||
| Including sales charges | 7.17% | 4.31% | -7.57% | ||||
| Class B | |||||||
| Excluding contingent deferred sales charges | 8.85% | 9.54% | -2.55% | ||||
| Including contingent deferred sales charges | 7.78% | 4.54% | -7.42% | ||||
| Class C | |||||||
| Excluding contingent deferred sales charges | 8.92% | 9.59% | -2.47% | ||||
| Including contingent deferred sales charges | 8.92% | 8.59% | -3.44% | ||||
| Institutional Class | 9.94% | 10.78% | -1.98% | ||||
| Service Class | 9.52% | 10.29% | -2.22% | ||||
(a)
|
For comparative purposes, initial investments are assumed to be made on the first day of the month following commencement of
operations.
|
(b)
|
All classes commenced operations on January 2, 1998.
|
(c)
|
Not annualized.
|
| GOLDMAN SACHS
AGGRESSIVE GROWTH STRATEGY PORTFOLIO |
| Shares | Description | Value | |||
|---|---|---|---|---|---|
| Mutual Funds (Institutional Shares) – 99.9% | |||||
| Equity – 99.9% | |||||
| 4,376,039 | Goldman Sachs CORE International
Equity Fund – 35.0% |
$ 52,074,861 | |||
| 1,573,771 | Goldman Sachs CORE Large Cap
Growth Fund – 22.7% |
33,788,853 | |||
| 3,088,533 | Goldman Sachs CORE Large Cap
Value Fund – 20.8% |
30,916,214 | |||
| 969,502 | Goldman Sachs Emerging Markets
Equity Fund – 7.3% |
10,839,033 | |||
| 848,568 | Goldman Sachs CORE Small Cap
Equity Fund – 7.0% |
10,496,784 | |||
| 426,981 | Goldman Sachs International Small
Cap Equity Fund – 4.7% |
6,938,444 | |||
| 367,902 | Goldman Sachs Real Estate
Securities Fund – 2.4% |
3,638,553 | |||
| $ 148,692,742 | |||||
| TOTAL MUTUAL FUNDS | |||||
| (Cost $126,618,317) | $ 148,692,742 | ||||
| Principal Amount | Interest Rate | Maturity Date | Value | |||
|---|---|---|---|---|---|---|
| Repurchase Agreement – 0.0% | ||||||
| Joint Repurchase Agreement Account II | ||||||
| $100,000 | 6.87% | 7/03/2000 | $ 100,000 | |||
| TOTAL REPURCHASE AGREEMENT ACCOUNT | ||||||
| (Cost $100,000) | $ 100,000 | |||||
| TOTAL INVESTMENTS | ||||||
| (Cost $126,718,317) | $148,792,742 | |||||
| The percentage shown for each investment category reflects the value of investments in that category as a percentage of total net
assets.
|
| For information on the underlying mutual funds, please call our toll free Shareholder Services Line at
|
| 1-800-526-7384 or visit us on the web at www.gs.com/funds.
|
| Conservative
Strategy |
Balanced
Strategy |
Growth and Income
Strategy |
Growth
Strategy |
Aggressive Growth
Strategy |
||||||
|---|---|---|---|---|---|---|---|---|---|---|
| Assets: | ||||||||||
| Investment in securities, at value
(identified cost $13,535,636, $83,619,101, $387,705,783, $292,231,850, $126,718,317, respectively) |
$13,620,911 | $87,982,957 | $428,925,906 | $336,648,060 | $148,792,742 | |||||
| Cash | — | 19,284 | 634,584 | 408,627 | 252,586 | |||||
| Receivables: | ||||||||||
| Investment securities sold | 331,012 | 1,916,783 | 23,388,799 | 11,965,352 | 1,492,000 | |||||
| Dividends and interest | 46,547 | 193,200 | 461,723 | 133,842 | 19 | |||||
| Fund shares sold | 33,698 | 31,403 | 243,686 | 319,645 | 399,984 | |||||
| Reimbursement from adviser | 61,540 | 88,108 | 94,697 | 97,634 | 91,169 | |||||
| Deferred organization expenses, net | — | 7,826 | 7,826 | 7,826 | 7,826 | |||||
| Other assets | 1,497 | 40,429 | 104,958 | 86,145 | 58,325 | |||||
| |
||||||||||
| Total assets | 14,095,205 | 90,279,990 | 453,862,179 | 349,667,131 | 151,094,651 | |||||
| |
||||||||||
| Liabilities: | ||||||||||
| Due to Custodian | 16,720 | — | — | — | — | |||||
| Payables: | ||||||||||
| Investment securities purchased | 293,000 | 1,816,000 | 23,282,000 | 11,784,000 | 1,602,560 | |||||
| Fund shares repurchased | 12,000 | 252,361 | 713,526 | 673,364 | 448,294 | |||||
| Amounts owed to affiliates | 14,332 | 75,020 | 338,148 | 280,415 | 121,449 | |||||
| Accrued expenses and other liabilities | 40,481 | 40,407 | 42,407 | 43,495 | 42,800 | |||||
| |
||||||||||
| Total liabilities | 376,533 | 2,183,788 | 24,376,081 | 12,781,274 | 2,215,103 | |||||
| |
||||||||||
| Net Assets: | ||||||||||
| Paid-in capital | 13,782,870 | 83,465,505 | 389,335,646 | 297,931,972 | 131,425,614 | |||||
| Accumulated undistributed net investment income
(loss) |
11,088 | 75,977 | 382,258 | 749,976 | (362,801) | |||||
| Accumulated net realized gain (loss) on investment
transactions |
(160,561 | ) | 190,864 | (1,451,929 | ) | (6,212,301 | ) | (4,257,690) | ||
| Net unrealized gain on investments | 85,275 | 4,363,856 | 41,220,123 | 44,416,210 | 22,074,425 | |||||
| |
||||||||||
| NET ASSETS | $ 13,718,672 | $ 88,096,202 | $429,486,098 | $336,885,857 | $148,879,548 | |||||
| |
||||||||||
| Net asset value, offering and redemption price per
share:(a) | ||||||||||
| Class A | $ 10.14 | $ 10.84 | $ 11.56 | $ 12.07 | $ 12.33 | |||||
| Class B | $ 10.14 | $ 10.83 | $ 11.54 | $ 12.00 | $ 12.25 | |||||
| Class C | $ 10.14 | $ 10.83 | $ 11.54 | $ 12.00 | $ 12.26 | |||||
| Institutional | $ 10.16 | $ 10.83 | $ 11.58 | $ 12.09 | $ 12.35 | |||||
| Service | $ 10.15 | $ 10.84 | $ 11.54 | $ 12.05 | $ 12.31 | |||||
| |
||||||||||
| Shares outstanding: | ||||||||||
| Class A | 90,165 | 3,100,770 | 15,574,240 | 11,498,465 | 4,863,684 | |||||
| Class B | 1,025,679 | 2,797,292 | 11,558,217 | 9,957,394 | 3,862,903 | |||||
| Class C | 208,064 | 2,043,070 | 7,811,546 | 6,044,109 | 2,948,145 | |||||
| Institutional | 20,426 | 164,093 | 2,078,694 | 463,209 | 428,634 | |||||
| Service | 8,397 | 26,975 | 158,579 | 40,899 | 9,695 | |||||
| |
||||||||||
| Total shares outstanding, $.001 par value
(unlimited number of shares authorized) |
1,352,731 | 8,132,200 | 37,181,276 | 28,004,076 | 12,113,061 | |||||
| |
||||||||||
| (a)
|
Maximum public offering price per share (NAV per share multiplied by 1.0582) for Class A Shares of the Conservative, Balanced,
Growth and Income, Growth and Aggressive Growth Strategy Portfolios is $10.73, $11.47, $12.23, $12.77 and $13.05, respectively. At redemption, Class B and Class C Shares may be subject to a contingent deferred sales charge, assessed on the amount equal to
the lesser of the current net asset value or the original purchase price of the shares.
|
| Conservative
Strategy |
Balanced
Strategy |
Growth and Income
Strategy |
Growth
Strategy |
Aggressive Growth
Strategy |
||||||||||||
|---|---|---|---|---|---|---|---|---|---|---|---|---|---|---|---|---|
| Investment income: | ||||||||||||||||
| Income distributions from underlying funds | $349,149 | $1,642,886 | $ 5,293,297 | $ 2,273,513 | $ 338,901 | |||||||||||
| Interest | 267 | — | 1,323 | 1,015 | 3,130 | |||||||||||
| Total income | 349,416 | 1,642,886 | 5,294,620 | 2,274,528 | 342,031 | |||||||||||
| Expenses: | ||||||||||||||||
| Management fees | 24,773 | 158,583 | 766,258 | 575,078 | 247,469 | |||||||||||
| Distribution and Service fees (a) | 65,080 | 311,726 | 1,364,214 | 1,113,580 | 465,128 | |||||||||||
| Transfer Agent fees (a) | 13,263 | 84,495 | 395,345 | 307,265 | 131,015 | |||||||||||
| Registration fees | 24,635 | 24,863 | 37,295 | 36,972 | 27,276 | |||||||||||
| Professional fees | 15,091 | 16,993 | 16,993 | 16,993 | 16,781 | |||||||||||
| Custodian fees | 14,613 | 11,288 | 12,353 | 14,421 | 11,852 | |||||||||||
| Trustee fees | 4,876 | 4,876 | 4,876 | 4,876 | 4,876 | |||||||||||
| Service Share fees | 161 | 808 | 4,509 | 1,577 | 323 | |||||||||||
| Amortization of deferred organization expenses | — | 1,558 | 1,558 | 1,558 | 1,558 | |||||||||||
| Other | 17,771 | 47,030 | 47,287 | 46,130 | 47,108 | |||||||||||
| Total expenses | 180,263 | 662,220 | 2,650,688 | 2,118,450 | 953,386 | |||||||||||
| Less — expenses reimbursed and fees waived | (90,858 | ) | (194,512 | ) | (549,466 | ) | (442,994 | ) | (248,034 | ) | ||||||
| Net expenses | 89,405 | 467,708 | 2,101,222 | 1,675,456 | 705,352 | |||||||||||
| NET INVESTMENT INCOME (LOSS) | 260,011 | 1,175,178 | 3,193,398 | 599,072 | (363,321 | ) | ||||||||||
| Realized and unrealized gain (loss) on investment transactions: | ||||||||||||||||
| Net realized gain (loss) from investment transactions | (88,985 | ) | 1,433,468 | 7,805,289 | 4,826,305 | 1,851,874 | ||||||||||
| Net change in unrealized gain (loss) on investments | 37,386 | (2,804,997 | ) | (13,712,692 | ) | (10,752,543 | ) | (4,791,723 | ) | |||||||
| Net realized and unrealized loss on investment
transactions: |
(51,599 | ) | (1,371,529 | ) | (5,907,403 | ) | (5,926,238 | ) | (2,939,849 | ) | ||||||
| NET INCREASE (DECREASE) IN NET ASSETS
RESULTING FROM OPERATIONS |
$208,412 | $ (196,351 | ) | $ (2,714,005 | ) | $ (5,327,166 | ) | $(3,303,170 | ) | |||||||
(a)
|
The fees were as follows:
|
| Distribution and Service fees |
Transfer Agent fees |
|||||||||||||||
|---|---|---|---|---|---|---|---|---|---|---|---|---|---|---|---|---|
| Class A |
Class B |
Class C |
Class A |
Class B |
Class C |
Institutional |
Service |
|||||||||
| Conservative Strategy Portfolio | $ 1,489 | $ 51,244 | $ 12,347 | $ 1,131 | $ 9,736 | $ 2,346 | $ 37 | $ 13 | ||||||||
| Balanced Strategy Portfolio | 43,584 | 156,274 | 111,868 | 33,123 | 29,692 | 21,255 | 360 | 65 | ||||||||
| Growth and Income Strategy Portfolio | 229,201 | 681,531 | 453,482 | 174,193 | 129,491 | 86,161 | 5,139 | 361 | ||||||||
| Growth Strategy Portfolio | 165,565 | 594,205 | 353,810 | 125,830 | 112,899 | 67,224 | 1,186 | 126 | ||||||||
| Aggressive Growth Strategy Portfolio | 73,254 | 232,666 | 159,208 | 55,672 | 44,207 | 30,249 | 861 | 26 | ||||||||
| Conservative
Strategy |
Balanced
Strategy |
Growth and Income
Strategy |
Growth
Strategy |
Aggressive Growth
Strategy |
||||||||||||
|---|---|---|---|---|---|---|---|---|---|---|---|---|---|---|---|---|
| From operations: | ||||||||||||||||
| Net investment income (loss) | $ 260,011 | $ 1,175,178 | $ 3,193,398 | $ 599,072 | $ (363,321 | ) | ||||||||||
| Net realized gain (loss) from investment transactions | (88,985 | ) | 1,433,468 | 7,805,289 | 4,826,305 | 1,851,874 | ||||||||||
| Net change in unrealized gain (loss) on investments | 37,386 | (2,804,997 | ) | (13,712,692 | ) | (10,752,543 | ) | (4,791,723 | ) | |||||||
| Net increase (decrease) in net assets resulting from
operations |
208,412 | (196,351 | ) | (2,714,005 | ) | (5,327,166 | ) | (3,303,170 | ) | |||||||
| Distributions to shareholders: | ||||||||||||||||
| From net investment income | ||||||||||||||||
| Class A Shares | (24,794 | ) | (521,344 | ) | (1,669,872 | ) | — | — | ||||||||
| Class B Shares | (184,483 | ) | (356,567 | ) | (738,091 | ) | — | — | ||||||||
| Class C Shares | (44,753 | ) | (261,257 | ) | (497,507 | ) | — | — | ||||||||
| Institutional Shares | (4,537 | ) | (31,009 | ) | (268,869 | ) | — | — | ||||||||
| Service Shares | (1,497 | ) | (3,031 | ) | (16,433 | ) | — | — | ||||||||
| Total distributions to shareholders | (260,064 | ) | (1,173,208 | ) | (3,190,772 | ) | — | — | ||||||||
| From share transactions: | ||||||||||||||||
| Proceeds from sales of shares | 3,263,314 | 7,710,786 | 38,162,431 | 61,025,384 | 35,194,715 | |||||||||||
| Reinvestment of dividends and distributions | 105,274 | 1,009,404 | 2,998,741 | — | — | |||||||||||
| Cost of shares repurchased | (4,183,684 | ) | (17,486,689 | ) | (71,187,867 | ) | (47,823,624 | ) | (21,141,331 | ) | ||||||
| Net increase (decrease) in net assets resulting from share
transactions |
(815,096 | ) | (8,766,499 | ) | (30,026,695 | ) | 13,201,760 | 14,053,384 | ||||||||
| TOTAL INCREASE (DECREASE) | (866,748 | ) | (10,136,058 | ) | (35,931,472 | ) | 7,874,594 | 10,750,214 | ||||||||
| Net assets: | ||||||||||||||||
| Beginning of period | 14,585,420 | 98,232,260 | 465,417,570 | 329,011,263 | 138,129,334 | |||||||||||
| End of period | $13,718,672 | $88,096,202 | $429,486,098 | $336,885,857 | $148,879,548 | |||||||||||
| Accumulated undistributed net investment income (loss) | $ 11,088 | $ 75,977 | $ 382,258 | $ 749,976 | $ (362,801 | ) | ||||||||||
| Conservative
Strategy Portfolio (a) |
Balanced
Strategy Portfolio |
Growth and Income
Strategy Portfolio |
Growth
Strategy Portfolio |
Aggressive Growth
Strategy Portfolio |
||||||||||||
|---|---|---|---|---|---|---|---|---|---|---|---|---|---|---|---|---|
| From operations: | ||||||||||||||||
| Net investment income (loss) | $ 371,330 | $ 2,765,062 | $ 7,154,416 | $ 1,482,627 | $ (326,952 | ) | ||||||||||
| Net realized gain (loss) from investment
transactions |
(45,594 | ) | 295,053 | (4,300,891 | ) | (4,578,554 | ) | (2,608,866 | ) | |||||||
| Net change in unrealized gain on investments | 47,889 | 6,486,202 | 60,600,001 | 60,257,599 | 30,030,774 | |||||||||||
| Net increase in net assets resulting from
operations |
373,625 | 9,546,317 | 63,453,526 | 57,161,672 | 27,094,956 | |||||||||||
| Distributions to shareholders: | ||||||||||||||||
| From net investment income | ||||||||||||||||
| Class A Shares | (48,073 | ) | (1,283,422 | ) | (3,513,379 | ) | (775,133 | ) | — | |||||||
| Class B Shares | (227,566 | ) | (837,467 | ) | (1,850,557 | ) | (419,987 | ) | — | |||||||
| Class C Shares | (93,720 | ) | (604,293 | ) | (1,236,421 | ) | (239,577 | ) | — | |||||||
| Institutional Shares | (1,684 | ) | (47,311 | ) | (520,875 | ) | (43,647 | ) | — | |||||||
| Service Shares | (287 | ) | (13,741 | ) | (33,184 | ) | (4,283 | ) | — | |||||||
| In excess of net investment income | ||||||||||||||||
| Class A Shares | (2,527 | ) | (196,066 | ) | (1,212,004 | ) | (1,254,133 | ) | (582,900 | ) | ||||||
| Class B Shares | (11,956 | ) | (127,938 | ) | (638,384 | ) | (679,523 | ) | (166,040 | ) | ||||||
| Class C Shares | (4,924 | ) | (92,317 | ) | (426,526 | ) | (387,627 | ) | (112,211 | ) | ||||||
| Institutional Shares | (88 | ) | (7,228 | ) | (179,686 | ) | (70,618 | ) | (45,376 | ) | ||||||
| Service Shares | (15 | ) | (2,099 | ) | (11,447 | ) | (6,931 | ) | (1,221 | ) | ||||||
| From net realized gain | ||||||||||||||||
| Class A Shares | (331 | ) | — | (133,498 | ) | — | — | |||||||||
| Class B Shares | (2,012 | ) | — | (98,778 | ) | — | — | |||||||||
| Class C Shares | (750 | ) | — | (65,692 | ) | — | — | |||||||||
| Institutional Shares | (36 | ) | — | (19,412 | ) | — | — | |||||||||
| Service Shares | (1 | ) | — | (1,276 | ) | — | — | |||||||||
| Total distributions to shareholders | (393,970 | ) | (3,211,882 | ) | (9,941,119 | ) | (3,881,459 | ) | (907,748 | ) | ||||||
| From share transactions: | ||||||||||||||||
| Proceeds from sales of shares | 17,086,075 | 32,867,922 | 136,387,842 | 92,727,150 | 46,103,886 | |||||||||||
| Reinvestment of dividends and distributions | 141,362 | 2,750,804 | 9,336,422 | 3,667,590 | 888,074 | |||||||||||
| Cost of shares repurchased | (2,621,672 | ) | (42,576,876 | ) | (165,269,449 | ) | (125,249,674 | ) | (45,359,768 | ) | ||||||
| Net increase (decrease) in net assets resulting
from share transactions |
14,605,765 | (6,958,150 | ) | (19,545,185 | ) | (28,854,934 | ) | 1,632,192 | ||||||||
| TOTAL INCREASE (DECREASE) | 14,585,420 | (623,715 | ) | 33,967,222 | 24,425,279 | 27,819,400 | ||||||||||
| Net assets: | ||||||||||||||||
| Beginning of year | — | 98,855,975 | 431,450,348 | 304,585,984 | 110,309,934 | |||||||||||
| End of year | $14,585,420 | $98,232,260 | $465,417,570 | $329,011,263 | $138,129,334 | |||||||||||
| Accumulated undistributed net investment
income |
$ 11,141 | $ 74,007 | $ 379,632 | $ 150,904 | $ 520 | |||||||||||
(a)
|
Commencement date of operations was February 8, 1999.
|
| 1. ORGANIZATION
|
| Goldman Sachs Trust (the “Trust”) is a Delaware business trust registered under the Investment Company Act of 1940 (as
amended) as an open-end, management investment company. The Trust includes Goldman Sachs Conservative Strategy Portfolio (“Conservative Strategy”), Goldman Sachs Balanced Strategy Portfolio (“Balanced Strategy”), Goldman Sachs Growth
and Income Strategy Portfolio (“Growth and Income Strategy”), Goldman Sachs Growth Strategy Portfolio (“Growth Strategy”) and Goldman Sachs Aggressive Growth Strategy Portfolio (“Aggressive Growth Strategy”), collectively,
the “Portfolios” or, individually, a “Portfolio”. All of the Portfolios offer five classes of shares — Class A, Class B, Class C, Institutional and Service Shares.
|
| 2. SIGNIFICANT ACCOUNTING POLICIES
|
| The following is a summary of significant accounting policies consistently followed by the Portfolios. The preparation of
financial statements in conformity with generally accepted accounting principles requires management to make estimates and assumptions that may affect the reported amounts. Actual results could differ from those estimates.
|
| A. Investment Valuation — Each Portfolio
invests in a combination of underlying funds (the “Underlying Funds”) for which Goldman Sachs Asset Management (“GSAM”), a business unit of the Investment Management Division of Goldman, Sachs & Co. (“Goldman Sachs”),
Goldman Sachs Funds Management L.P. (“GSFM”) and Goldman Sachs Asset Management International (“GSAMI”), affiliates of Goldman Sachs, act as investment adviser. Investments in the Underlying Funds are valued at the closing net asset
value per share of each Underlying Fund on the day of valuation. Because each Portfolio invests primarily in other mutual funds, which fluctuate in value, the Portfolios’ shares will correspondingly fluctuate in value. Short-term debt obligations
maturing in sixty days or less are valued at amortized cost, which approximates market value.
|
| B. Securities Transactions and Investment Income — Security transactions are recorded as of the trade date. Realized gains and losses on sales of portfolio securities are calculated on the identified cost basis. Dividend income and capital gains distributions from the Underlying Funds are recorded on the
ex-dividend date. Interest income is recorded on the basis of interest accrued.
|
| C. Federal Taxes — It is each
Portfolio’s policy to comply with the requirements of the Internal Revenue Code applicable to regulated investment companies and to distribute each year substantially all of its investment company taxable income and capital gains to its shareholders.
Accordingly, no federal tax provisions are required.
|
| The characterization of distributions to shareholders for financial reporting
purposes is determined in accordance with income tax rules. Therefore, the source of a Portfolio’s distributions may be shown in the accompanying financial statements as either from or in excess of net investment income or net realized gain on
investment transactions, or from paid-in-capital, depending on the type of book/tax differences that may exist.
|
| The following Portfolios, at their most recent tax year-ends of December 31, 1999,
had approximately the following amounts of capital loss carryforward for U.S. federal tax purposes. These amounts are available to be carried forward to offset future capital gains to the extent permitted by applicable laws or regulations.
|
| Portfolio | Amount | Years of
Expiration |
|||
|---|---|---|---|---|---|
| Growth and Income Strategy | $5,787,000 | 2007 | |||
| Growth Strategy | 9,058,000 | 2007 | |||
| Aggressive Growth Strategy | 4,741,000 | 2007 | |||
| At June 30, 2000, the Portfolios’ aggregate cost of portfolio securities,
gross unrealized gain on investments and gross unrealized loss on investments for federal income tax purposes were as follows:
|
| Portfolio | Tax Cost | Gross
Unrealized Gain |
Gross
Unrealized Loss |
Net
Unrealized Gain |
|||||
|---|---|---|---|---|---|---|---|---|---|
| Conservative Strategy | $ 13,564,393 | $ 440,818 | $ 384,300 | $ 56,518 | |||||
| Balanced Strategy | 84,370,284 | 5,182,150 | 1,569,477 | 3,612,673 | |||||
| Growth and Income Strategy | 390,486,157 | 43,390,450 | 4,950,701 | 38,439,749 | |||||
| Growth Strategy | 293,699,184 | 44,331,551 | 1,382,675 | 42,948,876 | |||||
| Aggressive Growth Strategy | 127,655,189 | 22,119,174 | 981,621 | 21,137,553 | |||||
| D. Expenses — Expenses incurred by the
Trust that do not specifically relate to an individual Portfolio of the Trust are allocated to the Portfolios based on a straight-line or pro rata basis depending upon the nature of the expense.
|
| Class A, Class B and Class C shareholders of the Portfolios bear all expenses and
fees relating to their respective Distribution and Service plans. Shareholders of Service shares bear all expenses and fees paid to service organizations. Each class of shares of the Portfolios separately bears its respective class-specific Transfer
Agency fees.
|
| E. Deferred Organization Expenses —
Organization-related costs are being amortized on a straight-line basis over a period of five years beginning with the commencement of each Portfolio’s operations (with the exception of the Conservative Strategy Portfolio which were completely
expensed in the first fiscal year).
|
| 3. AGREEMENTS
|
| GSAM serves as investment adviser to the Portfolios pursuant to an Investment Management Agreement (the “Agreement”).
Under the Agreement, GSAM, subject to the general supervision of the Trust’s Board of Trustees, manages the Portfolios. As compensation for the services rendered pursuant to the Agreement, the assumption of the expenses related thereto and
administering the Portfolio’s business affairs, including providing facilities, GSAM is entitled to a fee, computed daily and payable monthly, at an annual rate equal to .35% of the average daily net assets of each Portfolio. For the six months ended
June 30, 2000, GSAM has voluntarily agreed to waive a portion of the Management fee equal annually to .20% of each Portfolio’s average daily net assets. GSAM may discontinue or modify this waiver in the future at its discretion.
|
| The investment adviser has voluntarily agreed to limit “Other Expenses”
(excluding Management fees, Distribution and Service fees, Transfer Agent fees, taxes, interest, brokerage, litigation, Service Share fees, indemnification costs and other extraordinary expenses) to the extent that such expenses exceed .00% of the average
daily net assets of each Portfolio.
|
| For the six months ended June 30, 2000, the adviser waived and reimbursed certain
expenses as follows (in thousands):
|
| Portfolio | Management
Fee Waivers |
Reimbursement | Total | ||||
|---|---|---|---|---|---|---|---|
| |
|||||||
| Conservative Strategy | $ 14 | $ 77 | $ 91 | ||||
| |
|||||||
| Balanced Strategy | 91 | 104 | 195 | ||||
| |
|||||||
| Growth and Income Strategy | 438 | 111 | 549 | ||||
| |
|||||||
| Growth Strategy | 329 | 114 | 443 | ||||
| |
|||||||
| Aggressive Growth Strategy | 141 | 107 | 248 | ||||
| |
|||||||
| Goldman Sachs serves as Distributor of the shares of the Portfolios pursuant to
Distribution Agreements. Goldman Sachs may receive a portion of the Class A sales load and Class B and Class C contingent deferred sales charges and has advised the Portfolios that it retained approximately $400, $2,000, $28,000, $92,000 and $20,000 for
the six months ended June 30, 2000, from the Conservative, Balanced, Growth and Income, Growth and Aggressive Growth Strategy Portfolios, respectively.
|
| The Trust, on behalf of each Portfolio, has adopted Distribution and Service
Plans. Under the Distribution and Service Plans, Goldman Sachs and/or Authorized Dealers are entitled to a monthly fee from each Portfolio for distribution and shareholder maintenance services equal, on an annual basis, to .25%, 1.00% and 1.00% of the
average daily net assets attributable to Class A, Class B and Class C shares, respectively.
|
| The Trust, on behalf of each Portfolio, has adopted Service Plans. These plans
allow for Service Shares to compensate service organizations for providing varying levels of account administration and shareholder liaison services to their customers, who are beneficial owners of such shares. The Service Plan provides for compensation
to the service organizations in an amount up to .50% (on an annualized basis), respectively, of the average daily net asset value of the Service Shares.
|
| Goldman Sachs also serves as Transfer Agent to the Portfolios for a fee. Fees
charged for such transfer agency services are calculated daily and payable monthly at an annual rate as follows: 0.19% of average daily net assets for Class A, Class B and Class C Shares and .04% of average daily net assets for Institutional and Service
Shares.
|
| At June 30, 2000, the amounts owed to affiliates were as follows (in thousands):
|
| Portfolio | Management
Fees |
Transfer
Agent Fees |
Distribution
and Service Fees |
Total | |||||
|---|---|---|---|---|---|---|---|---|---|
| |
|||||||||
| Conservative Strategy | $2 | $2 | $10 | $14 | |||||
| |
|||||||||
| Balanced Strategy | 11
|
|
14
|
|
50
|
|
75
|
||
| |
|||||||||
| Growth and Income Strategy | 53
|
|
64
|
|
221
|
|
338
|
||
| |
|||||||||
| Growth Strategy | 41
|
|
52
|
|
187
|
|
280
|
||
| |
|||||||||
| Aggressive Growth Strategy | 18
|
|
22
|
|
81
|
|
121
|
||
| |
|||||||||
| 4. PORTFOLIO SECURITY TRANSACTIONS
|
| Purchases and proceeds of sales or maturities of long-term securities for the six months ended June 30, 2000, were as follows:
|
| Portfolio | Purchases | Sales | |||
|---|---|---|---|---|---|
| |
|||||
| Conservative Strategy | $ 4,291,078
|
$ 4,966,448
|
|||
| |
|||||
| Balanced Strategy | 9,504,783
|
17,938,543 | |||
| |
|||||
| Growth and Income Strategy | 52,917,996 | 82,352,372 | |||
| |
|||||
| Growth Strategy | 55,468,465 | 41,966,089 | |||
| |
|||||
| Aggressive Growth Strategy | 28,027,174 | 13,449,422 | |||
| |
|||||
| 5. LINE OF CREDIT FACILITY
|
| Effective May 31, 2000, the Portfolios participate in a $350,000,000 committed, unsecured revolving line of credit facility.
|
| Prior thereto, the Portfolios participated in a $250,000,000 committed and a $250,000,000 uncommitted, unsecured revolving line of
credit facility. Under the most restrictive arrangement, each Portfolio must own securities having a market value in excess of 400% of the total bank borrowings. These facilities are to be used solely for temporary or emergency purposes. The interest rate
on borrowings is based on the federal funds rate. The committed facility also requires a fee to be paid by the Portfolios based on the amount of the commitment, which has not been utilized. During the six months ended June 30, 2000, the Portfolios did not
have any borrowings under any of these facilities.
|
| 6. REPURCHASE AGREEMENTS
|
| During the term of a repurchase agreement, the value of the underlying securities, including accrued interest, is required to
equal or exceed the value of the repurchase agreement. The underlying securities for all repurchase agreements are held in safekeeping at the Portfolios’ custodian.
|
| 7. JOINT REPURCHASE AGREEMENT ACCOUNT
|
| The Portfolios, together with other registered investment companies having management agreements with GSAM or their affiliates,
transfer uninvested cash balances into joint accounts, the daily aggregate balance of which is invested in one or more repurchase agreements.
|
| At June 30, 2000, Aggressive Growth Strategy had an undivided interest in the
repurchase agreements in the following joint account which equaled $100,000 in principal amount. At June 30, 2000, the following repurchase agreements held in this joint account were fully collateralized by Federal Agency obligations.
|
| Repurchase Agreements | Principal
Amount |
Interest
Rate |
Maturity
Date |
Amortized
Cost |
Maturity
Value |
|||||||
|---|---|---|---|---|---|---|---|---|---|---|---|---|
| ABN/AMRO, Inc. | $995,900,000 | 6.85 | % | 07/03/2000 | $ 995,900,000 | $ 996,468,493 | ||||||
| Banc of America Securities LLC | 800,000,000 | 6.88 | 07/03/2000 | 800,000,000 | 800,458,667 | |||||||
| Bear Stearns Companies, Inc. | 500,000,000 | 6.85 | 07/03/2000 | 500,000,000 | 500,285,417 | |||||||
| Donaldson, Lufkin & Jenrette, Inc. | 500,000,000 | 6.90 | 07/03/2000 | 500,000,000 | 500,287,500 | |||||||
| TOTAL JOINT REPURCHASE AGREEMENT ACCOUNT II | $2,795,900,000 | $2,797,500,077 | ||||||||||
| 8. CHANGE IN INDEPENDENT ACCOUNTANTS
|
| On October 26, 1999, the Board of Trustees of the Portfolios, upon the recommendation of the Board’s audit committee,
determined not to retain Arthur Andersen LLP and approved a change of the Portfolios’ independent accountants to PricewaterhouseCoopers LLP. For the fiscal years ended December 31, 1999 and December 31, 1998, Arthur Andersen LLP’s audit reports
contained no adverse opinion or disclaimer of opinion; nor were their reports qualified or modified as to uncertainty, audit scope, or accounting principles. Further, there were no disagreements between the Portfolios and Arthur Andersen LLP on accounting
principles or practices, financial statement disclosure or audit scope or procedure, which if not resolved to the satisfaction of Arthur Andersen LLP, would have caused them to make reference to the disagreement in their report.
|
| 9. SUMMARY OF SHARE TRANSACTIONS
|
| Share activity for the six months ended June 30, 2000 (Unaudited) was as follows:
|
| Conservative Strategy | Balanced Strategy | ||||||||||||
|---|---|---|---|---|---|---|---|---|---|---|---|---|---|
| Shares | Dollars | Shares | Dollars | ||||||||||
| Class A Shares | |||||||||||||
| Shares sold | 15,215 | $ 154,065 | 289,882 | $3,154,933 | |||||||||
| Reinvestment of dividends and distributions | 2,389 | 24,026 | 44,125 | 479,994 | |||||||||
| Shares repurchased | (94,300 | ) | (951,090 | ) | (852,100 | ) | (9,252,962 | ) | |||||
| (76,696 | ) | (772,999 | ) | (518,093 | ) | (5,618,035 | ) | ||||||
| Class B Shares | |||||||||||||
| Shares sold | 172,945 | 1,749,787 | 119,402 | 1,291,995 | |||||||||
| Reinvestment of dividends and distributions | 3,235 | 32,639 | 25,360 | 275,719 | |||||||||
| Shares repurchased | (177,462 | ) | (1,795,208 | ) | (345,377 | ) | (3,747,544 | ) | |||||
| (1,282 | ) | (12,782 | ) | (200,615 | ) | (2,179,830 | ) | ||||||
| Class C Shares | |||||||||||||
| Shares sold | 103,087 | 1,037,648 | 275,814 | 2,982,427 | |||||||||
| Reinvestment of dividends and distributions | 4,225 | 42,563 | 20,485 | 222,681 | |||||||||
| Shares repurchased | (136,820 | ) | (1,380,042 | ) | (378,175 | ) | (4,100,236 | ) | |||||
| (29,508 | ) | (299,831 | ) | (81,876 | ) | (895,128 | ) | ||||||
| Institutional Shares | |||||||||||||
| Shares sold | 24,441 | 246,139 | 26,048 | 281,431 | |||||||||
| Reinvestment of dividends and distributions | 449 | 4,537 | 2,852 | 31,010 | |||||||||
| Shares repurchased | (5,020 | ) | (51,299 | ) | (24,365 | ) | (264,772 | ) | |||||
| 19,870 | 199,377 | 4,535 | 47,669 | ||||||||||
| Service Shares | |||||||||||||
| Shares sold | 7,460 | 75,675 | — | — | |||||||||
| Reinvestment of dividends and distributions | 149 | 1,509 | — | — | |||||||||
| Shares repurchased | (592 | ) | (6,045 | ) | (11,146 | ) | (121,175 | ) | |||||
| 7,017 | 71,139 | (11,146 | ) | (121,175 | ) | ||||||||
| NET INCREASE (DECREASE) | (80,599 | ) | $ (815,096 | ) | (807,195 | ) | $(8,766,499 | ) | |||||
| Growth and Income Strategy | Growth Strategy | Aggressive Growth Strategy | ||||||||||||||
|---|---|---|---|---|---|---|---|---|---|---|---|---|---|---|---|---|
| |
||||||||||||||||
| Shares | Dollars | Shares | Dollars | Shares | Dollars | |||||||||||
| |
||||||||||||||||
| 1,545,150 | $17,859,756 | 2,520,171 | $30,385,100 | 1,092,205 | $13,485,128 | |||||||||||
| 136,353 | 1,588,494 | — | — | — | — | |||||||||||
| (2,769,446 | ) | (31,977,817) | (1,670,232 | ) | (19,994,385 | ) | (860,246 | ) | (10,555,437 | ) | ||||||
| |
||||||||||||||||
| (1,087,943 | ) | (12,529,567) | 849,939 | 10,390,715 | 231,959 | 2,929,691 | ||||||||||
| |
||||||||||||||||
| 829,812 | 9,547,251 | 1,175,725 | 14,085,602 | 615,545 | 7,531,981 | |||||||||||
| 57,026 | 662,556 | — | — | — | — | |||||||||||
| (1,620,733 | ) | (18,715,802) | (1,205,056 | ) | (14,444,990 | ) | (528,031 | ) | (6,502,896 | ) | ||||||
| |
||||||||||||||||
| (733,895 | ) | (8,505,995) | (29,331 | ) | (359,388 | ) | 87,514 | 1,029,085 | ||||||||
| |
||||||||||||||||
| 865,952 | 9,974,597 | 1,292,620 | 15,487,683 | 938,805 | 11,528,761 | |||||||||||
| 40,393 | 469,167 | — | — | — | — | |||||||||||
| (1,269,404 | ) | (14,643,066) | (987,609 | ) | (11,881,613 | ) | (263,399 | ) | (3,243,312 | ) | ||||||
| |
||||||||||||||||
| (363,059 | ) | (4,199,302) | 305,011 | 3,606,070 | 675,406 | 8,285,449 | ||||||||||
| |
||||||||||||||||
| 49,888 | 623,827 | 86,353 | 1,046,999 | 212,222 | 2,643,438 | |||||||||||
| 23,046 | 268,869 | — | — | — | — | |||||||||||
| (487,058 | ) | (5,681,999) | (104,718 | ) | (1,250,855 | ) | (66,880 | ) | (818,920 | ) | ||||||
| |
||||||||||||||||
| (414,124 | ) | (4,789,303) | (18,365 | ) | (203,856 | ) | 145,342 | 1,824,518 | ||||||||
| |
||||||||||||||||
| 13,605 | 157,000 | 1,658 | 20,000 | 446 | 5,407 | |||||||||||
| 830 | 9,655 | — | — | — | — | |||||||||||
| (14,538 | ) | (169,183) | (20,871 | ) | (251,781 | ) | (1,659 | ) | (20,766 | ) | ||||||
| |
||||||||||||||||
| (103 | ) | (2,528) | (19,213 | ) | (231,781 | ) | (1,213 | ) | (15,359 | ) | ||||||
| |
||||||||||||||||
| (2,599,124 | ) | $(30,026,695) | 1,088,041 | $13,201,760 | 1,139,008 | $14,053,384 | ||||||||||
| |
||||||||||||||||
| 10. SUMMARY OF SHARE TRANSACTIONS
|
| Share activity for the year ended December 31, 1999 was as follows:
|
| Conservative Strategy Portfolio (a) | Balanced Strategy Portfolio | ||||||||||||
|---|---|---|---|---|---|---|---|---|---|---|---|---|---|
| Shares | Dollars | Shares | Dollars | ||||||||||
| Class A Shares | |||||||||||||
| Shares sold | 173,881 | $ 1,765,520 | 1,452,214 | $15,248,899 | |||||||||
| Reinvestment of dividends and distributions | 4,900 | 49,622 | 127,553 | 1,355,167 | |||||||||
| Shares repurchased | (11,920 | ) | (120,892 | ) | (1,862,291 | ) | (19,620,571 | ) | |||||
| 166,861 | 1,694,250 | (282,524 | ) | (3,016,505 | ) | ||||||||
| Class B Shares | |||||||||||||
| Shares sold | 1,075,897 | 10,973,463 | 606,873 | 6,367,717 | |||||||||
| Reinvestment of dividends and distributions | 3,547 | 35,869 | 70,976 | 755,337 | |||||||||
| Shares repurchased | (52,483 | ) | (530,826 | ) | (954,896 | ) | (10,069,732 | ) | |||||
| 1,026,961 | 10,478,506 | (277,047 | ) | (2,946,678 | ) | ||||||||
| Class C Shares | |||||||||||||
| Shares sold | 425,917 | 4,326,427 | 931,443 | 9,788,481 | |||||||||
| Reinvestment of dividends and distributions | 5,474 | 55,366 | 54,712 | 582,252 | |||||||||
| Shares repurchased | (193,819 | ) | (1,965,908 | ) | (1,206,850 | ) | (12,784,018 | ) | |||||
| 237,572 | 2,415,885 | (220,695 | ) | (2,413,285 | ) | ||||||||
| Institutional Shares | |||||||||||||
| Shares sold | 543 | 6,876 | 137,748 | 1,461,448 | |||||||||
| Reinvestment of dividends and distributions | 19 | 198 | 5,105 | 54,535 | |||||||||
| Shares repurchased | (6 | ) | (62 | ) | (3,152 | ) | (33,277 | ) | |||||
| 556 | 7,012 | 139,701 | 1,482,706 | ||||||||||
| Service Shares | |||||||||||||
| Shares sold | 1,356 | 13,789 | 131 | 1,377 | |||||||||
| Reinvestment of dividends and distributions | 30 | 307 | 330 | 3,513 | |||||||||
| Shares repurchased | (6 | ) | (3,984 | ) | (6,511 | ) | (69,278 | ) | |||||
| 1,380 | 10,112 | (6,050 | ) | (64,388 | ) | ||||||||
| NET INCREASE (DECREASE) | 1,433,330 | $14,605,765 | (646,615 | ) | $ (6,958,150 | ) | |||||||
(a)
|
Class A, Class B, Class C, Institutional and Service Share activity commenced on February 8, 1999.
|
| Growth and Income Strategy Portfolio | Growth Strategy Portfolio | Aggressive Growth Strategy Portfolio | ||||||||||
|---|---|---|---|---|---|---|---|---|---|---|---|---|
| Shares | Dollars | Shares | Dollars | Shares | Dollars | |||||||
| 5,321,949 | $ 57,499,167 | 2,940,937 | $32,088,679 | 1,807,637 | $19,472,820 | |||||||
| 420,316 | 4,671,976 | 161,757 | 1,953,023 | 46,124 | 572,389 | |||||||
| (6,552,403) | (70,781,847) | (4,972,176) | (54,217,259) | (1,860,531) | (20,223,331 | ) | ||||||
| (810,138) | (8,610,704) | (1,869,482) | (20,175,557) | (6,770) | (178,122 | ) | ||||||
| 2,489,932 | 26,764,231 | 2,725,853 | 29,543,291 | 1,035,164 | 11,351,648 | |||||||
| 209,269 | 2,340,983 | 84,773 | 1,021,397 | 13,429 | 165,006 | |||||||
| (3,809,849) | (40,992,020) | (3,454,501) | (37,424,031) | (1,335,025) | (14,327,319 | ) | ||||||
| (1,110,648) | (11,886,806) | (643,875) | (6,859,343) | (286,432) | (2,810,665 | ) | ||||||
| 2,921,455 | 31,397,342 | 2,351,893 | 25,617,083 | 1,091,686 | 12,048,959 | |||||||
| 143,029 | 1,597,077 | 47,622 | 574,333 | 8,448 | 104,481 | |||||||
| (4,612,257) | (49,632,323) | (2,877,112) | (31,223,289) | (967,274) | (10,464,012 | ) | ||||||
| (1,547,773) | (16,637,904) | (477,597) | (5,031,873) | 132,860 | 1,689,428 | |||||||
| 1,887,228 | 20,170,815 | 472,955 | 5,210,566 | 297,675 | 3,228,730 | |||||||
| 62,592 | 699,173 | 9,005 | 108,686 | 3,656 | 45,376 | |||||||
| (326,161) | (3,557,595) | (214,720) | (2,348,650) | (30,201) | (331,894 | ) | ||||||
| 1,623,659 | 17,312,393 | 267,240 | 2,970,602 | 271,130 | 2,942,212 | |||||||
| 53,127 | 556,287 | 25,821 | 267,531 | 151 | 1,729 | |||||||
| 2,455 | 27,213 | 841 | 10,151 | 66 | 822 | |||||||
| (27,488) | (305,664) | (3,260) | (36,445) | (1,195) | (13,212 | ) | ||||||
| 28,094 | 277,836 | 23,402 | 241,237 | (978) | (10,661 | ) | ||||||
| (1,816,806) | $ (19,545,185) | (2,700,312) | $(28,854,934) | 109,810 | $ 1,632,192 | |||||||
|
Income from investment operations (a) |
Distributions to shareholders |
|||||||||||||||||||
|---|---|---|---|---|---|---|---|---|---|---|---|---|---|---|---|---|---|---|---|---|
|
Net asset value, beginning of period |
Net
investment income |
Net realized
and unrealized gain (loss) |
From net
investment income |
In excess
of net investment income |
From net
realized gain |
Net increase
(decrease) in net asset value |
||||||||||||||
| FOR THE SIX MONTHS ENDED JUNE 30, (Unaudited) | ||||||||||||||||||||
| 2000 - Class A Shares | $10.17 | $0.23 | $(0.04 | ) | $(0.22 | ) | $ — | — | $(0.03 | ) | ||||||||||
| 2000 - Class B Shares | 10.18 | 0.18 | (0.04 | ) | (0.18 | ) | — | — | (0.04 | ) | ||||||||||
| 2000 - Class C Shares | 10.17 | 0.18 | (0.03 | ) | (0.18 | ) | — | — | (0.03 | ) | ||||||||||
| 2000 - Institutional Shares | 10.18 | 0.24 | (0.02 | ) | (0.24 | ) | — | — | (0.02 | ) | ||||||||||
| 2000 - Service Shares | 10.18 | 0.22 | (f) | (0.03 | ) (f) | (0.22 | ) | — | — | (0.03 | ) | |||||||||
| FOR THE PERIOD ENDED DECEMBER 31, (e) | ||||||||||||||||||||
| 1999 - Class A Shares | 10.00 | 0.36 | 0.18 | (0.36 | ) | (0.01 | ) | — | 0.17 | |||||||||||
| 1999 - Class B Shares | 10.00 | 0.30 | 0.19 | (0.30 | ) | (0.01 | ) | — | 0.18 | |||||||||||
| 1999 - Class C Shares | 10.00 | 0.29 | 0.18 | (0.29 | ) | (0.01 | ) | — | 0.17 | |||||||||||
| 1999 - Institutional Shares | 10.00 | 0.40 | (f) | 0.20 | (f) | (0.40 | ) | (0.02 | ) | — | 0.18 | |||||||||
| 1999 - Service Shares | 10.00 | 0.53 | 0.02 | (0.37 | ) | — | — | 0.18 | ||||||||||||
(a)
|
Includes the balancing effect of calculating per share amounts.
|
(b)
|
Assumes investment at the net asset value at the beginning of the period, reinvestment of all dividends and distributions, a
complete redemption of the investment at the net asset value at the end of the period and no sales or redemption charges. Total return would be reduced if sales or redemption charges were taken into account.
|
(c)
|
Annualized.
|
(d)
|
Not annualized.
|
(e)
|
Class A, Class B, Class C, Institutional and Service Share activity commenced on February 8, 1999.
|
(f)
|
Calculated based on average shares outstanding methodology.
|
| Ratios assuming
no voluntary waiver of fees or expense limitations |
|||||||||||||||||||||
|---|---|---|---|---|---|---|---|---|---|---|---|---|---|---|---|---|---|---|---|---|---|
| Net asset
value, end of period |
Total
return (b)(d) |
Net assets
at end of period (in 000s) |
Ratio of
net expenses to average net assets (c) |
Ratio of
net investment income to average net assets (c) |
Ratio of
expenses to average net assets (c) |
Ratio of
net investment income (loss) to average net assets (c) |
Portfolio
turnover rate (d) |
||||||||||||||
| $10.14 | 1.90 | % | $ 914 | 0.59 | % | 4.23 | % | 1.87 | % | 2.95 | % | 30.39 | % | ||||||||
| 10.14 | 1.41 | 10,402 | 1.34 | 3.60 | 2.62 | 2.32 | 30.39 | ||||||||||||||
| 10.14 | 1.52 | 2,110 | 1.34 | 3.58 | 2.62 | 2.30 | 30.39 | ||||||||||||||
| 10.16 | 2.21 | 208 | 0.19 | 4.90 | 1.47 | 3.62 | 30.39 | ||||||||||||||
| 10.15 | 1.89 | 85 | 0.69 | 4.43 | 1.97 | 3.15 | 30.39 | ||||||||||||||
| 10.17 | 5.52 | 1,697 | 0.59 | 4.38 | 3.46 | 1.51 | 62.99 | ||||||||||||||
| 10.18 | 4.92 | 10,451 | 1.34 | 3.74 | 4.21 | 0.87 | 62.99 | ||||||||||||||
| 10.17 | 4.79 | 2,417 | 1.34 | 3.62 | 4.21 | 0.75 | 62.99 | ||||||||||||||
| 10.18 | 6.04 | 6 | 0.19 | 4.43 | 3.06 | 1.56 | 62.99 | ||||||||||||||
| 10.18 | 5.56 | 14 | 0.69 | 2.39 | 3.56 | (0.48 | ) | 62.99 | |||||||||||||
|
Income from investment operations (a) |
Distributions to shareholders |
|||||||||||||||||||
|---|---|---|---|---|---|---|---|---|---|---|---|---|---|---|---|---|---|---|---|---|
|
Net asset value, beginning of period |
Net
investment income |
Net realized
and unrealized gain (loss) |
From net
investment income |
In excess
of net investment income |
From net
realized gain |
Net increase
(decrease) in net asset value |
||||||||||||||
| FOR THE SIX MONTHS ENDED JUNE 30, (Unaudited) | ||||||||||||||||||||
| 2000 - Class A Shares | $10.99 | $0.17 | $(0.15 | ) | $(0.17 | ) | $ — | $ — | $(0.15 | ) | ||||||||||
| 2000 - Class B Shares | 10.98 | 0.13 | (0.15 | ) | (0.13 | ) | — | — | (0.15 | ) | ||||||||||
| 2000 - Class C Shares | 10.99 | 0.12 | (0.15 | ) | (0.13 | ) | — | — | (0.16 | ) | ||||||||||
| 2000 - Institutional Shares | 10.99 | 0.19 | (0.16 | ) | (0.19 | ) | — | — | (0.16 | ) | ||||||||||
| 2000 - Service Shares | 10.99 | 0.17 | (0.16 | ) | (0.16 | ) | — | — | (0.15 | ) | ||||||||||
| FOR THE YEAR ENDED DECEMBER 31, | ||||||||||||||||||||
| 1999 - Class A Shares | 10.31 | 0.34 | 0.73 | (0.34 | ) | (0.05 | ) | — | 0.68 | |||||||||||
| 1999 - Class B Shares | 10.31 | 0.26 | 0.72 | (0.26 | ) | (0.05 | ) | — | 0.67 | |||||||||||
| 1999 - Class C Shares | 10.32 | 0.27 | 0.71 | (0.27 | ) | (0.04 | ) | — | 0.67 | |||||||||||
| 1999 - Institutional Shares | 10.32 | 0.37 | 0.74 | (0.37 | ) | (0.07 | ) | — | 0.67 | |||||||||||
| 1999 - Service Shares | 10.31 | 0.33 | 0.73 | (0.33 | ) | (0.05 | ) | — | 0.68 | |||||||||||
| FOR THE PERIOD ENDED DECEMBER 31, (e) | ||||||||||||||||||||
| 1998 - Class A Shares | 10.00 | 0.25 | 0.38 | (0.25 | ) | (0.03 | ) | (0.04 | ) | 0.31 | ||||||||||
| 1998 - Class B Shares | 10.00 | 0.19 | 0.38 | (0.19 | ) | (0.03 | ) | (0.04 | ) | 0.31 | ||||||||||
| 1998 - Class C Shares | 10.00 | 0.19 | 0.39 | (0.19 | ) | (0.03 | ) | (0.04 | ) | 0.32 | ||||||||||
| 1998 - Institutional Shares | 10.00 | 0.30 | 0.39 | (0.30 | ) | (0.03 | ) | (0.04 | ) | 0.32 | ||||||||||
| 1998 - Service Shares | 10.00 | 0.25 | 0.37 | (0.25 | ) | (0.02 | ) | (0.04 | ) | 0.31 | ||||||||||
(a)
|
Includes the balancing effect of calculating per share amounts.
|
(b)
|
Assumes investment at the net asset value at the beginning of the period, reinvestment of all dividends and distributions, a
complete redemption of the investment at the net asset value at the end of the period and no sales or redemption charges. Total return would be reduced if sales or redemption charges were taken into account.
|
(c)
|
Annualized.
|
(d)
|
Not annualized.
|
(e)
|
Class A, Class B, Class C, Institutional and Service Share activity commenced on January 2, 1998.
|
| Ratios assuming
no voluntary waiver of fees or expense limitations |
|||||||||||||||||||||
|---|---|---|---|---|---|---|---|---|---|---|---|---|---|---|---|---|---|---|---|---|---|
| Net asset
value, end of period |
Total
return (b) |
Net assets
at end of period (in 000s) |
Ratio of
net expenses to average net assets |
Ratio of
net investment income to average net assets |
Ratio of
expenses to average net assets |
Ratio of
net investment income to average net assets |
Portfolio
turnover rate |
||||||||||||||
| $10.84 | 0.16 | % (d) | $33,599 | 0.59 | % (c) | 3.02 | % (c) | 1.02 | % (c) | 2.59 | % (c) | 10.43 | % (d) | ||||||||
| 10.83 | (0.22 | ) (d) | 30,293 | 1.34 | (c) | 2.28 | (c) | 1.77 | (c) | 1.85 | (c) | 10.43 | (d) | ||||||||
| 10.83 | (0.30 | ) (d) | 22,135 | 1.34 | (c) | 2.30 | (c) | 1.77 | (c) | 1.87 | (c) | 10.43 | (d) | ||||||||
| 10.83 | 0.27 | (d) | 1,777 | 0.19 | (c) | 3.44 | (c) | 0.62 | (c) | 3.01 | (c) | 10.43 | (d) | ||||||||
| 10.84 | 0.09 | (d) | 292 | 0.69 | (c) | 2.90 | (c) | 1.12 | (c) | 2.47 | (c) | 10.43 | (d) | ||||||||
| 10.99 | 10.58 | 39,774 | 0.59 | 3.17 | 1.05 | 2.71 | 51.24 | ||||||||||||||
| 10.98 | 9.66 | 32,932 | 1.34 | 2.42 | 1.80 | 1.96 | 51.24 | ||||||||||||||
| 10.99 | 9.63 | 23,354 | 1.34 | 2.40 | 1.80 | 1.94 | 51.24 | ||||||||||||||
| 10.99 | 10.92 | 1,753 | 0.19 | 3.93 | 0.65 | 3.47 | 51.24 | ||||||||||||||
| 10.99 | 10.47 | 419 | 0.69 | 3.04 | 1.15 | 2.58 | 51.24 | ||||||||||||||
| 10.31 | 6.38 | (d) | 40,237 | 0.60 | (c) | 3.03 | (c) | 1.46 | (c) | 2.17 | (c) | 50.84 | (d) | ||||||||
| 10.31 | 5.75 | (d) | 33,763 | 1.30 | (c) | 2.38 | (c) | 2.08 | (c) | 1.60 | (c) | 50.84 | (d) | ||||||||
| 10.32 | 5.83 | (d) | 24,195 | 1.30 | (c) | 2.34 | (c) | 2.08 | (c) | 1.56 | (c) | 50.84 | (d) | ||||||||
| 10.32 | 6.99 | (d) | 205 | 0.24 | (c) | 3.55 | (c) | 1.02 | (c) | 2.77 | (c) | 50.84 | (d) | ||||||||
| 10.31 | 6.30 | (d) | 456 | 0.74 | (c) | 2.90 | (c) | 1.52 | (c) | 2.12 | (c) | 50.84 | (d) | ||||||||
|
Income from investment operations (a) |
Distributions to shareholders |
|||||||||||||||||||
|---|---|---|---|---|---|---|---|---|---|---|---|---|---|---|---|---|---|---|---|---|
|
Net asset value, beginning of period |
Net
investment income |
Net realized
and unrealized gain (loss) |
From net
investment income |
In excess
of net investment income |
From net
realized gain |
Net increase
(decrease) in net asset value |
||||||||||||||
| FOR THE SIX MONTHS ENDED JUNE 30, (Unaudited) | ||||||||||||||||||||
| 2000 - Class A Shares | $11.71 | $0.11 | $(0.15 | ) | $(0.11 | ) | $ — | $ — | $(0.15 | ) | ||||||||||
| 2000 - Class B Shares | 11.69 | 0.06 | (0.15 | ) | (0.06 | ) | — | — | (0.15 | ) | ||||||||||
| 2000 - Class C Shares | 11.69 | 0.06 | (0.15 | ) | (0.06 | ) | — | — | (0.15 | ) | ||||||||||
| 2000 - Institutional Shares | 11.71 | 0.14 | (0.14 | ) | (0.13 | ) | — | — | (0.13 | ) | ||||||||||
| 2000 - Service Shares | 11.69 | 0.09 | (0.14 | ) | (0.10 | ) | — | — | (0.15 | ) | ||||||||||
| FOR THE YEAR ENDED DECEMBER 31, | ||||||||||||||||||||
| 1999 - Class A Shares | 10.38 | 0.22 | 1.40 | (0.22 | ) | (0.06 | ) | (0.01 | ) | 1.33 | ||||||||||
| 1999 - Class B Shares | 10.36 | 0.14 | 1.40 | (0.14 | ) | (0.06 | ) | (0.01 | ) | 1.33 | ||||||||||
| 1999 - Class C Shares | 10.36 | 0.14 | 1.40 | (0.14 | ) | (0.06 | ) | (0.01 | ) | 1.33 | ||||||||||
| 1999 - Institutional Shares | 10.39 | 0.27 | 1.39 | (0.27 | ) | (0.06 | ) | (0.01 | ) | 1.32 | ||||||||||
| 1999 - Service Shares | 10.37 | 0.20 | 1.40 | (0.20 | ) | (0.07 | ) | (0.01 | ) | 1.32 | ||||||||||
| FOR THE PERIOD ENDED DECEMBER 31, (e) | ||||||||||||||||||||
| 1998 - Class A Shares | 10.00 | 0.18 | 0.47 | (0.18 | ) | (0.04 | ) | (0.05 | ) | 0.38 | ||||||||||
| 1998 - Class B Shares | 10.00 | 0.12 | 0.46 | (0.12 | ) | (0.05 | ) | (0.05 | ) | 0.36 | ||||||||||
| 1998 - Class C Shares | 10.00 | 0.12 | 0.46 | (0.12 | ) | (0.05 | ) | (0.05 | ) | 0.36 | ||||||||||
| 1998 - Institutional Shares | 10.00 | 0.20 | 0.49 | (0.20 | ) | (0.05 | ) | (0.05 | ) | 0.39 | ||||||||||
| 1998 - Service Shares | 10.00 | 0.16 | 0.48 | (0.16 | ) | (0.06 | ) | (0.05 | ) | 0.37 | ||||||||||
(a)
|
Includes the balancing effect of calculating per share amounts.
|
(b)
|
Assumes investment at the net asset value at the beginning of the period, reinvestment of all dividends and distributions, a
complete redemption of the investment at the net asset value at the end of the period and no sales or redemption charges. Total return would be reduced if sales or redemption charges were taken into account.
|
(c)
|
Annualized.
|
(d)
|
Not annualized.
|
(e)
|
Class A, Class B, Class C, Institutional and Service Share activity commenced on January 2, 1998.
|
| Ratios assuming
no voluntary waiver of fees or expense limitations |
||||||||||||||
|---|---|---|---|---|---|---|---|---|---|---|---|---|---|---|
| Net asset
value, end of period |
Total
return (b) |
Net assets
at end of period (in 000s) |
Ratio of
net expenses to average net assets |
Ratio of
net investment income to average net assets |
Ratio of
expenses to average net assets |
Ratio of
net investment income to average net assets |
Portfolio
turnover rate |
|||||||
| $11.56 | (0.37 | )% (d) | $180,084 | 0.59 | % (c) | 1.82 | % (c) | 0.84 | % (c) | 1.57 | % (c) | 12.18 | % (d) | ||||||||
| 11.54 | (0.74 | ) (d) | 133,383 | 1.34 | (c) | 1.07 | (c) | 1.59 | (c) | 0.82 | (c) | 12.18 | (d) | ||||||||
| 11.54 | (0.74 | ) (d) | 90,114 | 1.34 | (c) | 1.08 | (c) | 1.59 | (c) | 0.83 | (c) | 12.18 | (d) | ||||||||
| 11.58 | — | (d) | 24,075 | 0.19 | (c) | 2.20 | (c) | 0.44 | (c) | 1.95 | (c) | 12.18 | (d) | ||||||||
| 11.54 | (0.41 | ) (d) | 1,830 | 0.69 | (c) | 1.75 | (c) | 0.94 | (c) | 1.50 | (c) | 12.18 | (d) | ||||||||
| 11.71 | 15.79
|
195,153 | 0.59
|
2.00
|
0.85
|
1.74
|
49.06
|
|||||
| 11.69 | 14.95
|
143,686 | 1.34
|
1.24
|
1.60
|
0.98
|
49.06
|
|||||
| 11.69 | 14.94
|
95,523 | 1.34
|
1.23
|
1.60
|
0.97
|
49.06
|
|||||
| 11.71 | 16.14
|
29,200 | 0.19
|
2.53
|
0.45
|
2.27
|
49.06
|
|||||
| 11.69 | 15.60
|
1,856 | 0.69
|
1.91
|
0.95
|
1.65
|
49.06
|
|||||
| 10.38 | 6.55 | (d) | 181,441 | 0.60 | (c) | 2.37 | (c) | 1.05 | (c) | 1.92 | (c) | 41.91 | (d)
|
|||
| 10.36 | 5.82 | (d) | 138,914 | 1.30 | (c) | 1.72 | (c) | 1.68 | (c) | 1.34 | (c) | 41.91 | (d)
|
|||
| 10.36 | 5.80 | (d) | 100,711 | 1.30 | (c) | 1.68 | (c) | 1.68 | (c) | 1.30 | (c) | 41.91 | (d)
|
|||
| 10.39 | 6.96 | (d) | 9,030 | 0.23 | (c) | 2.97 | (c) | 0.61 | (c) | 2.59 | (c) | 41.91 | (d)
|
|||
| 10.37 | 6.43 | (d) | 1,354 | 0.73 | (c) | 2.28 | (c) | 1.11 | (c) | 1.90 | (c) | 41.91 | (d)
|
|||
| |
||||||||||||||||
|
Income from investment operations (a) |
Distributions to shareholders |
||||||||||||||||||||||||||||||||||||||
|---|---|---|---|---|---|---|---|---|---|---|---|---|---|---|---|---|---|---|---|---|---|---|---|---|---|---|---|---|---|---|---|---|---|---|---|---|---|---|---|
|
Net asset value, beginning of period |
Net
investment income |
Net realized
and unrealized gain (loss) |
From net
investment income |
In excess
of net investment income |
From net
realized gain |
Net increase
(decrease) in net asset value |
|||||||||||||||||||||||||||||||||
| FOR THE SIX MONTHS ENDED JUNE 30, (Unaudited) | |||||||||||||||||||||||||||||||||||||||
| 2000 - Class A Shares | $12.24 | $0.05 | $(0.22 | ) | $ — | $ — | $ — | $(0.17 | ) | ||||||||||||||||||||||||||||||
| 2000 - Class B Shares | 12.21 | 0.01 | (0.22 | ) | — | — | — | (0.21 | ) | ||||||||||||||||||||||||||||||
| 2000 - Class C Shares | 12.22 | 0.01 | (0.23 | ) | — | — | — | (0.22 | ) | ||||||||||||||||||||||||||||||
| 2000 - Institutional Shares | 12.23 | 0.08 | (0.22 | ) | — | — | — | (0.14 | ) | ||||||||||||||||||||||||||||||
| 2000 - Service Shares | 12.22 | 0.05 | (0.22 | ) | — | — | — | (0.17 | ) | ||||||||||||||||||||||||||||||
| FOR THE YEAR ENDED DECEMBER 31, | |||||||||||||||||||||||||||||||||||||||
| 1999 - Class A Shares | 10.29 | 0.11 | 2.03 | (0.11 | ) | (0.08 | ) | — | 1.95 | ||||||||||||||||||||||||||||||
| 1999 - Class B Shares | 10.28 | 0.02 | 2.02 | (0.02 | ) | (0.09 | ) | — | 1.93 | ||||||||||||||||||||||||||||||
| 1999 - Class C Shares | 10.28 | 0.02 | 2.03 | (0.02 | ) | (0.09 | ) | — | 1.94 | ||||||||||||||||||||||||||||||
| 1999 - Institutional Shares | 10.29 | 0.13 | 2.05 | (0.13 | ) | (0.11 | ) | — | 1.94 | ||||||||||||||||||||||||||||||
| 1999 - Service Shares | 10.29 | 0.09 | 2.03 | (0.09 | ) | (0.10 | ) | — | 1.93 | ||||||||||||||||||||||||||||||
| FOR THE PERIOD ENDED DECEMBER 31, (e) | |||||||||||||||||||||||||||||||||||||||
| 1998 - Class A Shares | 10.00 | 0.10 | 0.36 | (0.10 | ) | (0.02 | ) | (0.05 | ) | 0.29 | |||||||||||||||||||||||||||||
| 1998 - Class B Shares | 10.00 | 0.05 | 0.35 | (0.05 | ) | (0.02 | ) | (0.05 | ) | 0.28 | |||||||||||||||||||||||||||||
| 1998 - Class C Shares | 10.00 | 0.05 | 0.35 | (0.05 | ) | (0.02 | ) | (0.05 | ) | 0.28 | |||||||||||||||||||||||||||||
| 1998 - Institutional Shares | 10.00 | 0.12 | 0.37 | (0.12 | ) | (0.03 | ) | (0.05 | ) | 0.29 | |||||||||||||||||||||||||||||
| 1998 - Service Shares | 10.00 | 0.09 | 0.35 | (0.09 | ) | (0.01 | ) | (0.05 | ) | 0.29 | |||||||||||||||||||||||||||||
(a)
|
Includes the balancing effect of calculating per share amounts.
|
(b)
|
Assumes investment at the net asset value at the beginning of the period, reinvestment of all dividends and distributions, a
complete redemption of the investment at the net asset value at the end of the period and no sales or redemption charges. Total return would be reduced if sales or redemption charges were taken into account.
|
(c)
|
Annualized.
|
(d)
|
Not annualized.
|
(e)
|
Class A, Class B, Class C, Institutional and Service Share activity commenced on January 2, 1998.
|
| Ratios assuming
no voluntary waiver of fees or expense limitations |
||||||||||||
|---|---|---|---|---|---|---|---|---|---|---|---|---|
| Net asset
value, end of period |
Total
return (b) |
Net assets
at end of period (in 000s) |
Ratio of
net expenses to average net assets |
Ratio of
net investment income to average net assets |
Ratio of
expenses to average net assets |
Ratio of
net investment income (loss) to average net assets |
Portfolio
turnover rate |
|||||
| $12.07 | (1.39 | )% (d) | $138,782 | 0.59 | % (c) | 0.80 | % (c) | 0.86 | % (c) | 0.53 | % (c) | 12.73 | % (d) | |||||||
| 12.00 | (1.72 | ) (d) | 119,457 | 1.34 | (c) | 0.03 | (c) | 1.61 | (c) | (0.24 | ) (c) | 12.73 | (d) | |||||||
| 12.00 | (1.80 | ) (d) | 72,556 | 1.34 | (c) | 0.04 | (c) | 1.61 | (c) | (0.23 | ) (c) | 12.73 | (d) | |||||||
| 12.09 | (1.14 | ) (d) | 5,598 | 0.19 | (c) | 1.18 | (c) | 0.46 | (c) | 0.91 | (c) | 12.73 | (d) | |||||||
| 12.05 | (1.39 | ) (d) | 493 | 0.69 | (c) | 0.63 | (c) | 0.96 | (c) | 0.36 | (c) | 12.73 | (d) | |||||||
| 12.24 | 20.85 | 130,322 | 0.59 | 0.90 | 0.87 | 0.62 | 49.52 | |||||||||||||
| 12.21 | 19.87 | 121,937 | 1.34 | 0.17 | 1.62 | (0.11 | ) | 49.52 | ||||||||||||
| 12.22 | 19.96 | 70,127 | 1.34 | 0.16 | 1.62 | (0.12 | ) | 49.52 | ||||||||||||
| 12.23 | 21.24 | 5,891 | 0.19 | 1.40 | 0.47 | 1.12 | 49.52 | |||||||||||||
| 12.22 | 20.62 | 735 | 0.69 | 0.87 | 0.97 | 0.59 | 49.52 | |||||||||||||
| 10.29 | 4.62 | (d) | 128,832 | 0.60 | (c) | 1.50 | (c) | 1.15 | (c) | 0.95 | (c) | 38.43 | (d) | |||||||
| 10.28 | 3.98 | (d) | 109,246 | 1.30 | (c) | 0.83 | (c) | 1.78 | (c) | 0.35 | (c) | 38.43 | (d) | |||||||
| 10.28 | 3.96 | (d) | 63,925 | 1.30 | (c) | 0.79 | (c) | 1.78 | (c) | 0.31 | (c) | 38.43 | (d) | |||||||
| 10.29 | 4.92 | (d) | 2,205 | 0.23 | (c) | 2.88 | (c) | 0.71 | (c) | 2.40 | (c) | 38.43 | (d) | |||||||
| 10.29 | 4.45 | (d) | 378 | 0.73 | (c) | 1.63 | (c) | 1.21 | (c) | 1.15 | (c) | 38.43 | (d) |
| |
|
Income (loss) from investment operations (a) |
Distributions to shareholders |
|||||||||||||
|---|---|---|---|---|---|---|---|---|---|---|---|---|---|---|
|
Net asset value, beginning of period |
Net
investment income (loss) |
Net realized
and unrealized gain (loss) |
From net
investment income |
In excess
of net investment income |
From net
realized gain |
Net increase
(decrease) in net asset value |
||||||||
| FOR THE SIX MONTHS ENDED JUNE 30, (Unaudited) | ||||||||||||||
| 2000 - Class A Shares | $12.61 | $(0.01 | ) | $(0.27 | ) | $ — | $ — | $ — | $(0.28 | ) | |||||||||||
| 2000 - Class B Shares | 12.57 | (0.05 | ) | (0.27 | ) | — | — | — | (0.32 | ) | |||||||||||
| 2000 - Class C Shares | 12.57 | (0.05 | ) | (0.26 | ) | — | — | — | (0.31 | ) | |||||||||||
| 2000 - Institutional Shares | 12.60 | 0.02 | (0.27 | ) | — | — | — | (0.25 | ) | ||||||||||||
| 2000 - Service Shares | 12.59 | (0.02 | ) | (0.26 | ) | — | — | — | (0.28 | ) | |||||||||||
| FOR THE YEAR ENDED DECEMBER 31, |
| 1999 - Class A Shares | 10.16 | 0.02 | 2.56 | (0.02 | ) | (0.11 | ) | — | 2.45 | ||||||||||||
| 1999 - Class B Shares | 10.14 | (0.07 | ) | 2.54 | — | (0.04 | ) | — | 2.43 | ||||||||||||
| 1999 - Class C Shares | 10.15 | (0.06 | ) | 2.53 | — | (0.05 | ) | — | 2.42 | ||||||||||||
| 1999 - Institutional Shares | 10.16 | 0.06 | 2.55 | (0.06 | ) | (0.11 | ) | — | 2.44 | ||||||||||||
| 1999 - Service Shares | 10.15 | — | 2.55 | — | (0.11 | ) | — | 2.44 | |||||||||||||
| FOR THE PERIOD ENDED DECEMBER 31, (e) |
| 1998 - Class A Shares | 10.00 | 0.05 | 0.20 | (0.05 | ) | — | (0.04 | ) | 0.16 | ||||||||||||
| 1998 - Class B Shares | 10.00 | 0.01 | 0.18 | (0.01 | ) | — | (0.04 | ) | 0.14 | ||||||||||||
| 1998 - Class C Shares | 10.00 | 0.01 | 0.19 | (0.01 | ) | — | (0.04 | ) | 0.15 | ||||||||||||
| 1998 - Institutional Shares | 10.00 | 0.07 | 0.20 | (0.07 | ) | — | (0.04 | ) | 0.16 | ||||||||||||
| 1998 - Service Shares | 10.00 | 0.04 | 0.21 | (0.04 | ) | (0.02 | ) | (0.04 | ) | 0.15 | |||||||||||
| |
|||||||||||||||||||||
(a)
|
Includes the balancing effect of calculating per share amounts.
|
(b)
|
Assumes investment at the net asset value at the beginning of the period, reinvestment of all dividends and distributions, a
complete redemption of the investment at the net asset value at the end of the period and no sales or redemption charges. Total return would be reduced if sales or redemption charges were taken into account.
|
(c)
|
Annualized.
|
(d)
|
Not annualized.
|
(e)
|
Class A, Class B, Class C, Institutional and Service Share activity commenced on January 2, 1998.
|
| Ratios assuming
no voluntary waiver of fees or expense limitations |
|||||||||||||||||||||
| Net asset
value, end of period |
Total
return (b |
Net assets
at end of period (in 000s) |
Ratio of
net expenses to average net assets |
Ratio of
net investment income (loss) to average net assets |
Ratio of
expenses to average net assets |
Ratio of
net investment income (loss) to average net assets |
Portfolio
turnover rate |
||||||||||||||
| $12.33 | (2.22 | )% (d) | $59,975 | 0.59 | % (c) | (0.12 | )% (c) | 0.94 | % (c) | (0.47 | )% (c) | 9.50 | % (d) | ||||||||
| 12.25 | (2.55 | ) (d) | 47,337 | 1.34 | (c) | (0.87 | ) (c) | 1.69 | (c) | (1.22 | ) (c) | 9.50 | (d) | ||||||||
| 12.26 | (2.47 | ) (d) | 36,154 | 1.34 | (c) | (0.83 | ) (c) | 1.69 | (c) | (1.18 | ) (c) | 9.50 | (d) | ||||||||
| 12.35 | (1.98 | ) (d) | 5,295 | 0.19 | (c) | 0.34 | (c) | 0.54 | (c) | (0.01 | ) (c) | 9.50 | (d) | ||||||||
| 12.31 | (2.22 | ) (d) | 119 | 0.69 | (c) | (0.24 | ) (c) | 1.04 | (c) | (0.59 | ) (c) | 9.50 | (d) | ||||||||
| 12.61 | 25.39 | 58,387 | 0.59 | 0.12 | 1.00 | (0.29 | ) | 47.34 | |||||||||||||
| 12.57 | 24.41 | 47,462 | 1.34 | (0.63 | ) | 1.75 | (1.04 | ) | 47.34 | ||||||||||||
| 12.57 | 24.35 | 28,573 | 1.34 | (0.61 | ) | 1.75 | (1.02 | ) | 47.34 | ||||||||||||
| 12.60 | 25.74 | 3,570 | 0.19 | 0.66 | 0.60 | 0.25 | 47.34 | ||||||||||||||
| 12.59 | 25.17 | 137 | 0.69 | 0.00 | 1.10 | (0.41 | ) | 47.34 | |||||||||||||
| 10.16 | 2.57 | (d) | 47,135 | 0.60 | (c) | 0.91 | (c) | 1.42 | (c) | 0.09 | (c) | 26.27 | (d) | ||||||||
| 10.14 | 1.93 | (d) | 41,204 | 1.30 | (c) | 0.14 | (c) | 2.05 | (c) | (0.61 | )(c) | 26.27 | (d) | ||||||||
| 10.15 | 2.04 | (d) | 21,726 | 1.30 | (c) | 0.16 | (c) | 2.05 | (c) | (0.59 | )(c) | 26.27 | (d) | ||||||||
| 10.16 | 2.80 | (d) | 124 | 0.24 | (c) | 8.17 | (c) | 0.99 | (c) | 7.42 | (c) | 26.27 | (d) | ||||||||
| 10.15 | 2.54 | (d) | 121 | 0.74 | (c) | 0.76 | (c) | 1.49 | (c) | 0.01 | (c) | 26.27 | (d) | ||||||||
G O L D M A N S A C H S A S S E T A L L O C AT I O N P O R T F O L I O S
What Makes Asset Allocation at Goldman Sachs Different?
Many investors believe their success depends on investing at the right time or choosing high-performing stocks or bonds. In reality, when investors commit assets and which individual securities they buy are believed to account for just 8.5%* of a portfolio’s return over time. Instead, the asset allocation strategy accounts for the majority of a portfolio’s return.
With this in mind, Goldman Sachs has developed an exclusive asset allocation process that seeks to deliver the full range of global investment opportunities in constantly changing markets.
Goldman Sachs’ proprietary asset allocation strategy is based on an exclusive risk management framework, the Black-Litterman Asset Allocation Model.

|
|
|
|||
|
|
|
|||
|
|||||
|
|||||
|
|||||
|
A S S E T A L LOCAT I O N S T R AT E G I E S
| OTHER | GOLDMAN SACHS
|
|
| |
||
| Constant. | Tactical. | |
| Rebalance quarterly which keeps asset allocation | Reallocate quarterly which captures changing opportunities | |
| the same over time. | in global markets. | |
| |
||
| Backward-Looking. | Forward-Looking. | |
| Base allocation decisions on past returns and | Base allocation decisions on expected future returns given | |
| market relationships. | current market conditions. | |
| |
||
| Inconsistent Risk Profile. | Consistent Risk Profile. | |
| Identify the top performers and overweight that | Focus on how tactical reallocation impacts each Portfolio’s | |
| security/asset class, changing an investor’s original | risk profile, maintaining an investor’s original risk/return | |
| risk/return profile. | profile over time. | |
| |
||
* Source: Brinson, Hood & Beebower, “Determinants of Portfolio Performance,” Financial Analysts Journal, May/June 1991.
G O L D M A N S A C H S A S S E T A L L O C AT I O N P O R T F O L I O S
Goldman Sachs
Asset Allocation Portfolios
How you choose to allocate your assets may have a far greater impact on your portfolio’s total return potential than any other investment decision you can make. By carefully balancing the percentage of your portfolio allocated to each asset class — stocks, bonds and cash — you can tailor it to your current investment goals and timeframes.
The Goldman Sachs Asset Allocation Portfolios offer you easy access to the benefits associated with asset allocation. Each is designed to provide results consistent with your investment objectives via a complementary blend of Goldman Sachs Funds.
Target Your Needs
The five Goldman Sachs Asset Allocation Portfolios — Conservative Strategy, Balanced Strategy, Growth and Income Strategy, Growth Strategy and Aggressive Growth Strategy —are carefully tailored to specific financial goals. As your investment objectives change, you can exchange shares among the Goldman Sachs Asset Allocation Portfolios without any additional charge.* (Please note: in general, greater returns are associated with greater risk.)

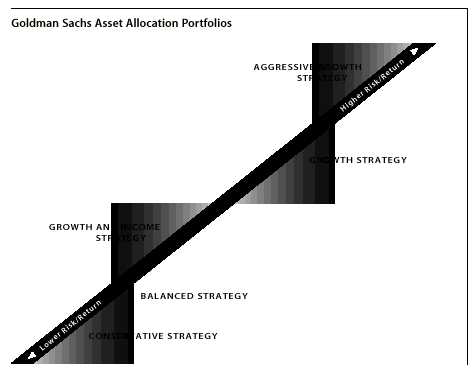
For More Information
To learn more about the Goldman Sachs Asset Allocation Portfolios, call your investment professional today.
*The exchange privilege is subject to termination and its terms are subject to change.
![]()
| TRUSTEES | OFFICERS |
| Ashok N. Bakhru, Chairman | Douglas C. Grip, President |
| David B. Ford | Jesse H. Cole, Vice President |
| Douglas C. Grip | James A. Fitzpatrick, Vice President |
| John P. McNulty | Nancy L. Mucker, Vice President |
| Mary P. McPherson | John M. Perlowski, Treasurer |
| Alan A. Shuch | Peter W. Fortner, Assistant Treasurer |
| William H. Springer | Philip V. Giuca, Jr., Assistant Treasurer |
| Richard P. Strubel | Michael J. Richman, Secretary |
| Howard B. Surloff, Secretary | |
| Amy E. Belanger, Assistant Secretary | |
| Valerie A. Zondorak, Assistant Secretary | |
| GOLDMAN, SACHS & CO. | GOLDMAN SACHS INTERNATIONAL |
| Distributor and Transfer Agent | 133 Fleet Street |
| London, England EC4A 2BB | |
| GOLDMAN SACHS ASSET MANAGEMENT | |
| Investment Adviser |
Visit our internet address: www.gs.com/funds
This material is not authorized for distribution to prospective investors unless preceded or accompanied by a current Prospectus. Investors should read the Prospectus carefully before investing or sending money.
Goldman, Sachs & Co. is the distributor of the Funds.
The Asset Allocation Conservative Strategy invests primarily in other Goldman Sachs Fixed Income, Equity and Money Market Funds and is subject to the risks associated with investment in such funds. In particular, some of the primary risk factors of this Fund include the price fluctuations of U.S. government securities in response to changes in interest rates; the political risks and currency fluctuations of non-U.S. securities; and the volatility of stock and real estate investments.
The Asset Allocation Balanced Strategy invests primarily in other Goldman Sachs Fixed Income, Equity and Money Market Funds and is subject to the risks associated with investments in such funds. In particular, some of the primary risk factors of this Fund include the price fluctuations of U.S. government securities in response to changes in interest rates; the risk that emerging markets securities may be difficult to sell in down markets and their volatility; the political risks and currency fluctuations of non-U.S. securities; the default risks of high yield bonds; and the volatility of stock and real estate investments.
The Asset Allocation Growth and Income Strategy invests primarily in other Goldman Sachs Fixed Income, Equity and Money Market Funds and is subject to the risks associated with investments in such funds. In particular, some of the primary risk factors of this Fund include the price fluctuations of fixed income securities in response to changes in interest rates; the risk that emerging markets securities may be difficult to sell in down markets and their volatility; the political risks and currency fluctuations of non-U.S. securities; the default risks of high yield bonds; and the volatility of stock investments, including the possibility that small cap stocks will be more difficult to sell during down markets.
The Asset Allocation Growth Strategy invests primarily in other Goldman Sachs Fixed Income, Equity and Money Market Funds and is subject to the risks associated with investments in such funds. In particular, some of the primary risk factors of this Fund include the price fluctuations of fixed income securities in response to changes in interest rates; the risk that emerging markets securities may be difficult to sell in down markets and their volatility; the political risks and currency fluctuations of non-U.S. securities; the default risks of high yield bonds; and the volatility of stock investments, including the possibility that small cap stocks will be more difficult to sell during down markets.
The Asset Allocation Aggressive Growth Strategy invests primarily in other Goldman Sachs Fixed Income, Equity and Money Market Funds and is subject to the risks associated with investments in such funds. In particular, some of the primary risk factors of this Fund include the risk that emerging markets securities may be difficult to sell in down markets and their volatility; the political risks and currency fluctuations of non-U.S. securities; the default risks of high yield bonds; and the volatility of stock investments, including the possibility that small cap stocks will be more difficult to sell during down markets.
Copyright 2000 Goldman, Sachs & Co. All rights reserved. Date of first use: August 29, 2000 00-1154 / AASAR / 44K / 8-00
|
|