|
|
|
|
|
|
|
|
|
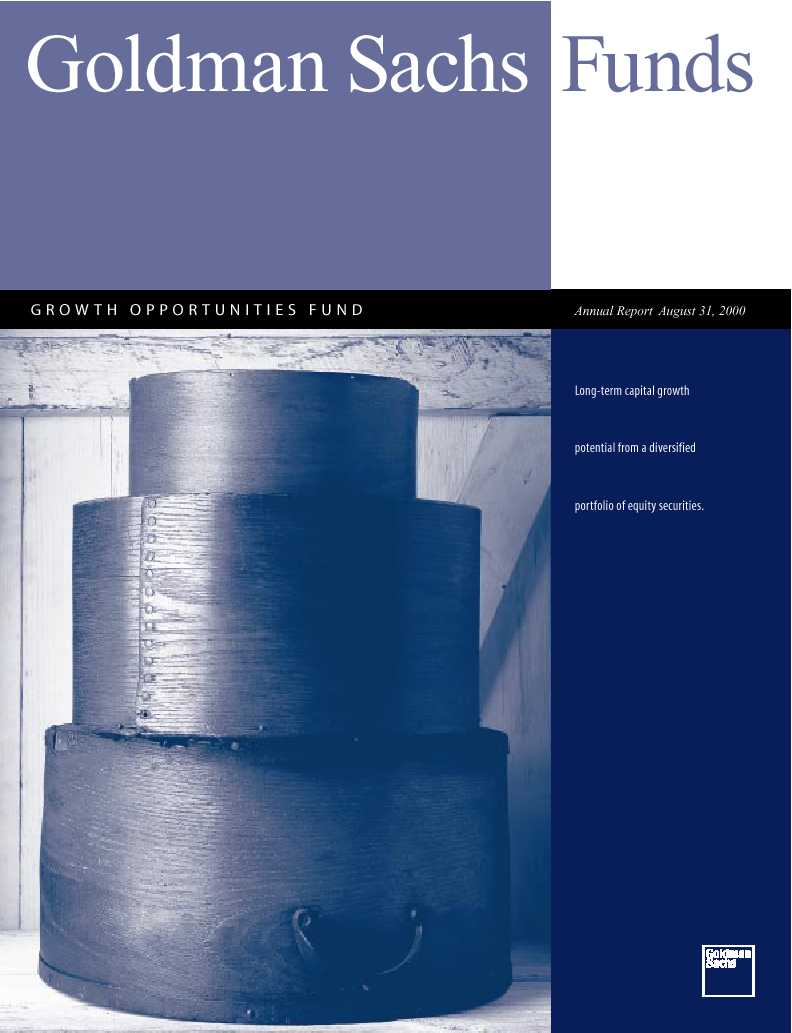
GOLDMAN SACHS GROWTH OPPORTUNITIES FUND
Market Overview
Dear Shareholder:
During the period under review the financial markets experienced a dramatic increase in volatility. However, investors who stayed the course were generally rewarded for their disciplined approach, as many sectors of the market generated solid returns.
While a range of stocks were negatively impacted by the correction, technology issues experienced the brunt of the decline. At one point the technology-heavy Nasdaq composite was down 37% from its peak. While the Nasdaq posted a one-year return of 45.93% for the period ended August 31, 2000, this was largely due to the strong performance of technology stocks late in 1999 and in the summer of 2000. However, by the end of the reporting period the Nasdaq was still off 19% from its peak. In contrast, the S&P 500 Index, which also fell during the middle of the period, recovered to the point that it was again nearing its record high by the end of August.
As always, we appreciate your support and we look forward to serving your investment needs in the years to come.
Sincerely,
 |
 |
|
| David B. Ford | David W. Blood | |
| Co-Head, Goldman Sachs Asset Management | Co-Head, Goldman Sachs Asset Management | |
| September 15, 2000 |
| GOLDMAN SACHS GROWTH OPPORTUNITIES FUND
|
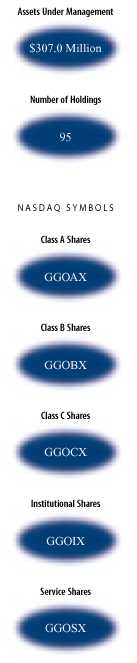
Fund Basics
as of August 31, 2000
| PERFORMANCE REVIEW | ||||
| August 31, 1999–August 31, 2000 | Fund Total Return (without sales charge)1
|
S&P MidCap 400 Index2
|
||
| |
|
|
||
| Class A | 95.73 | % | 39.75 | % |
| Class B | 94.27 | 39.75 | ||
| Class C | 94.43 | 39.75 | ||
| Institutional | 96.67 | 39.75 | ||
| Service | 95.41 | 39.75 | ||
| |
||||
1
The net asset value represents the net assets of the Fund (ex-dividend) divided by the total number of shares. The Fund’s performance assumes the reinvestment of dividends and other distributions.
2
The unmanaged S&P MidCap 400 Index (with dividends reinvested) figures do not reflect any fees or expenses.
In addition, investors cannot invest directly in the Index.
| STANDARDIZED TOTAL RETURNs3 | |||||||||||
| For the period ended 6/30/00 | Class A
|
Class B
|
Class C
|
Institutional
|
Service
|
||||||
| |
|||||||||||
| One Year | 61.01 | % | 65.30 | % | 68.14 | % | 71.10 | % | 70.10 | % | |
| Since Inception | 62.35 | 67.18 | 69.55 | 71.46 | 70.56 | ||||||
| (5/24/99) | |||||||||||
| |
|||||||||||
3 The Standardized Total Returns are average annual total returns or cumulative total returns (only if the performance period is one year or less) as of the most recent calendar quarter-end. They assume reinvestment of all distributions at net asset value. These returns reflect a maximum initial sales charge of 5.5% for Class A shares, the assumed deferred sales charge for Class B shares (5% maximum declining to 0% after six years) and the assumed deferred sales charge for Class C shares (1% if redeemed within 12 months of purchase). Because Institutional and Service shares do not involve a sales charge, such a charge is not applied to their Standardized Total Returns.
Total return figures represent past performance and do not indicate future results, which will vary. The investment return and principal value of an investment will fluctuate and, therefore, an investor’s shares, when redeemed, may be worth more or less than their original cost. Performance reflects expense limitations in effect. In their absence, performance would be reduced.
| TOP 10 HOLDINGS AS OF 8/31/00 | |||
| Holding | % of Total Net Assets
|
Line of Business | |
| |
|
|
|
| Sungard Data Systems, Inc. | 1.9 | % | Information Services |
| Crown Castle International Corp. | 1.9 | Wireless | |
| Ambac Financial Group, Inc. | 1.9 | Property Insurance | |
| Amphenol Corp. | 1.8 | Electrical Equipment | |
| Intuit, Inc. | 1.8 | Computer Software | |
| Harrah’s Entertainment, Inc. | 1.7 | Hotels | |
| Harman International Industries, Inc. | 1.6 | Consumer Durables | |
| Sanmina Corp. | 1.6 | Electrical Equipment | |
| Insight Communications, Inc. | 1.6 | Media | |
| Triton PCS Holdings, Inc. | 1.6 | Wireless | |
| |
|||
The top 10 holdings may not be representative of the Fund’s future investments.
GOLDMAN SACHS GROWTH OPPORTUNITIES FUND
Performance Overview
Dear Shareholder,
We are pleased to report on the performance of the Goldman Sachs Growth Opportunities Fund for the one year period that ended August 31, 2000.
Performance Review
Over the one-year period that ended August 31, 2000, the Fund’s Class A, B, C, Institutional and Service share classes generated cumulative total returns, without sales charges, of 95.73%, 94.27%, 94.43%, 96.67%, and 95.41%, respectively. The Fund dramatically outperformed its benchmark, the S&P MidCap 400 Index, which generated a cumulative total return of 39.75%
Portfolio Composition
The Fund invests primarily in medium-sized growth companies with a market capitalization between $1 and $10 billion. We seek companies that generally fall into these categories: (1) high growth companies with dominant market share in a niche industry, (2) companies that are undergoing fundamental improvements in their business or long-term growth rates, (3) under-followed/under-recognized growth companies whose long-term prospects are under-appreciated by Wall Street analysts. We strive to purchase these companies at reasonable valuations, in order to capture the full benefits of their growth. During the reporting period this strategy produced extremely strong relative and absolute returns.
Portfolio Highlights
| GOLDMAN SACHS GROWTH OPPORTUNITIES FUND
|
Portfolio Outlook
While we neither make nor rely on economic forecasts to make investment decisions, we are generally bullish on the U.S. economy. Over the last decade, global communication has increased, resulting from significant technological advances as well as a generally peaceful world political environment. We believe that this trend, combined with favorable demographic trends, will benefit U.S. companies over the long term. More fundamentally, though, we continue to focus on the core business characteristics which provide a foundation for long-term growth, such as strength of franchise, quality of management, and free cash flow, along with favorable demographic trends. We believe that the enduring competitive advantage of the companies we own — based on the criteria mentioned above — will withstand even an uncertain market environment.
Goldman Sachs Equity Investment Team
New York
September 15, 2000
GOLDMAN SACHS GROWTH OPPORTUNITIES FUND
The Goldman Sachs Advantage
Founded in 1869, Goldman, Sachs & Co. is a premier financial services firm traditionally known on Wall Street and around the world for its institutional expertise.
Today, the firm’s Investment Management Division provides individual investors the opportunity to tap the resources of a global institutional powerhouse — and put this expertise to work in their individual portfolios.
What Sets Goldman Sachs Funds Apart?

Our portfolio management teams are located on-site, around the world, in New York, London, Tokyo and Singapore. Their understanding of local economies, markets, industries and cultures helps deliver what many investors want: access to global investment opportunities and consistent, risk-adjusted performance.

Our portfolio management teams make on-site visits to hundreds of companies each month, then construct selective portfolios with an emphasis on their best ideas. Our teams also have access to Goldman, Sachs & Co.’s Global Investment Research Department.
In this, our institutional heritage is clear. Institutions, as well as many individual investors, often look to us to manage the risks of global investing over time in different market environments.
To learn more about the Goldman Sachs Funds, call your investment professional today.
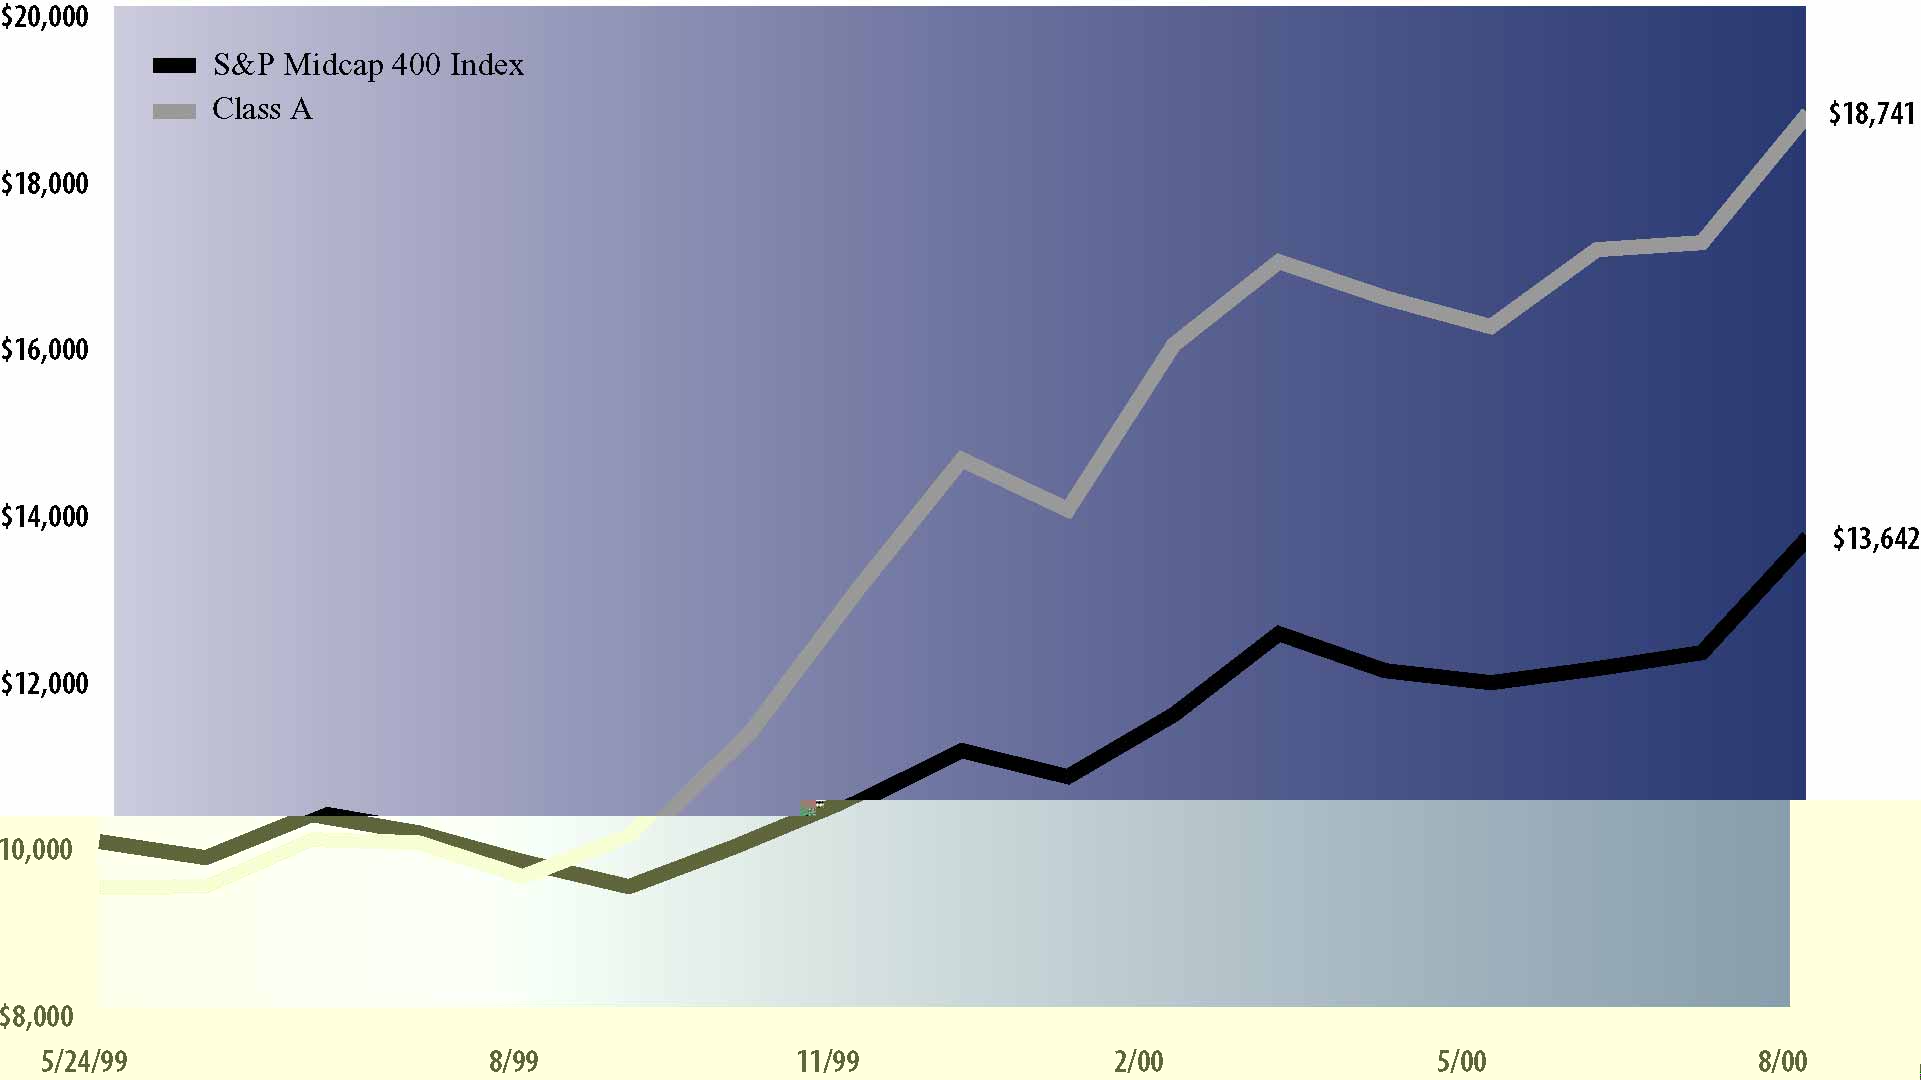
| The following graph shows the value, as of August 31, 2000, of a $10,000 investment made on May 24, 1999 (commencement of
operations) in Class A Shares (maximum sales charge of 5.5%) of the Goldman Sachs Growth Opportunities Fund. For comparative purposes, the performance of the Fund’s benchmark, the Standard and Poor’s Midcap 400 Index with dividend reinvestment
(“S&P Midcap 400 Index”), is shown. This performance data represents past performance and should not be considered indicative of future performance which will fluctuate with changes in market conditions. These performance fluctuations will
cause an investor’s shares, when redeemed, to be worth more or less than their original cost. Performance of Class B, Class C, Institutional, and Service Shares will vary from Class A due to differences in fees and loads.
|
| Growth Opportunities Fund’s Lifetime Performance
|
| Growth of a $10,000 Investment, Distributions reinvested May 24, 1999 to August 31, 2000.
|
 |
| Average Annual Return through August 31, 2000 | Since Inception | One Year | |||
|---|---|---|---|---|---|
| Class A (commenced May 24, 1999) | |||||
| Excluding sales charges | 70.94% | 95.73%
|
|||
| Including sales charges | 63.56% | 84.96%
|
|||
| |
|||||
| Class B (commenced May 24, 1999) | |||||
| Excluding contingent deferred sales charges | 70.59% | 94.27%
|
|||
| Including contingent deferred sales charges | 67.84% | 89.18%
|
|||
| |
|||||
| Class C (commenced May 24, 1999) | |||||
| Excluding contingent deferred sales charges | 69.66% | 94.43%
|
|||
| Including contingent deferred sales charges | 69.66% | 93.42%
|
|||
| |
|||||
| Institutional Class (commenced May 24, 1999) | 71.58% | 96.67%
|
|||
| |
|||||
| Service Class (commenced May 24, 1999) | 70.58% | 95.41%
|
|||
| |
|||||
|
Shares |
Description | Value | |||
|---|---|---|---|---|---|
| Common Stocks – 94.2% | |||||
| Banks – 1.9% | |||||
| 118,215 | Charter One Financial, Inc. | $ 2,807,606 | |||
| 157,600 | National Commerce Bancorp | 3,043,650 | |||
| 5,851,256 | |||||
| Chemicals – 2.5% | |||||
| 65,000 | Cambrex Corp. | 3,050,938 | |||
| 204,100 | Sybron International Corp.* | 4,643,275 | |||
| 7,694,213 | |||||
| Clothing – 2.0% | |||||
| 46,700 | Payless ShoeSource, Inc.* | 2,492,613 | |||
| 178,900 | The Limited, Inc. | 3,578,000 | |||
| 6,070,613 | |||||
| Computer Hardware – 2.1% | |||||
| 52,100 | Pitney Bowes, Inc. | 1,904,906 | |||
| 109,200 | Symbol Technologies, Inc. | 4,518,150 | |||
| 6,423,056 | |||||
| Computer Software – 5.6% | |||||
| 100,400 | Caminus Corp.* | 1,694,250 | |||
| 36,600 | CheckFree Corp.* | 1,896,338 | |||
| 90,500 | Intuit, Inc.* | 5,418,687 | |||
| 78,100 | PeopleSoft, Inc.* | 2,518,725 | |||
| 49,600 | Sabre Holdings Corp. | 1,382,600 | |||
| 54,300 | Symantec Corp.* | 2,650,519 | |||
| 81,600 | Witness Systems, Inc.* | 1,621,800 | |||
| 17,182,919 | |||||
| Construction – 1.6% | |||||
| 69,900 | Martin Marietta Materials | 2,796,000 | |||
| 103,700 | Masco Corp. | 2,022,150 | |||
| 4,818,150 | |||||
| Consumer Durables – 2.6% | |||||
| 107,800 | Ethan Allen Interiors, Inc. | 2,903,862 | |||
| 65,800 | Harman International Industries,
Inc. |
5,050,150 | |||
| 7,954,012 | |||||
| Drugs – 1.6% | |||||
| 22,600 | Forest Laboratories, Inc.* | 2,211,975 | |||
| 13,500 | MedImmune, Inc.* | 1,135,688 | |||
| 11,100 | Millennium Pharmaceuticals* | 1,588,687 | |||
| 4,936,350 | |||||
| Electrical Equipment – 10.7% | |||||
| 27,200 | American Tower Corp.* | 987,700 | |||
| 85,500 | Amphenol Corp.* | 5,472,000 | |||
| 12,700 | Corvis Corp.* | 1,318,419 | |||
| 124,300 | Harris Corp. | 3,736,769 | |||
| 69,200 | Jabil Circuit, Inc.* | 4,415,825 | |||
| 79,800 | Manufacturers’ Services Ltd.* | 2,034,900 | |||
| 29,600 | McDATA Corp. Class B* | 3,183,850 | |||
| 70,000 | Millipore Corp. | 4,261,250 | |||
| 42,700 | Sanmina Corp.* | 5,038,600 | |||
|
Shares |
Description | Value | |||
|---|---|---|---|---|---|
| Common Stocks – (continued) | |||||
| Electrical Equipment – (continued) | |||||
| 115,500 | Western Multiplex Corp.* | $ 2,302,781 | |||
| 32,752,094 | |||||
| Electrical Utilities – 1.8% | |||||
| 74,576 | Dynegy, Inc. | 3,355,920 | |||
| 88,200 | NRG Energy, Inc.* | 2,315,250 | |||
| 5,671,170 | |||||
| Energy Resources – 3.7% | |||||
| 24,400 | Apache Corp. | 1,537,200 | |||
| 64,000 | Burlington Resources, Inc. | 2,516,000 | |||
| 58,500 | Devon Energy Corp. | 3,425,906 | |||
| 110,000 | Louis Dreyfus Natural Gas Corp.* | 3,822,500 | |||
| 11,301,606 | |||||
| Fiber Optics – 0.3% | |||||
| 5,200 | Avici Systems, Inc.* | 779,025 | |||
| Financial Services – 2.0% | |||||
| 209,200 | Allied Capital Corp. | 4,236,300 | |||
| 78,600 | Comdisco, Inc. | 1,886,400 | |||
| 6,122,700 | |||||
| Food & Beverage – 1.1% | |||||
| 76,200 | Keebler Foods Co. | 3,490,913 | |||
| Heavy Electrical – 0.8% | |||||
| 49,625 | Molex, Inc. | 2,620,820 | |||
| Home Products – 2.3% | |||||
| 223,833 | Energizer Holdings, Inc.* | 4,420,702 | |||
| 110,500 | Ralston Purina Group | 2,500,062 | |||
| 6,920,764 | |||||
| Hotels – 2.3% | |||||
| 186,100 | Harrah’s Entertainment, Inc.* | 5,280,588 | |||
| 50,000 | MGM Mirage, Inc. | 1,718,750 | |||
| 6,999,338 | |||||
| Industrial Parts – 1.4% | |||||
| 93,200 | American Standard Cos., Inc.* | 4,316,325 | |||
| Industrial Services – 3.6% | |||||
| 85,550 | Cintas Corp. | 3,555,672 | |||
| 146,500 | ITT Educational Services, Inc.* | 3,369,500 | |||
| 161,764 | Pittston Brinks Group | 2,517,452 | |||
| 53,600 | Robert Half International, Inc.* | 1,705,150 | |||
| 11,147,774 | |||||
| Information Services – 9.6% | |||||
| 268,800 | Cendant Corp.* | 3,544,800 | |||
| 191,000 | Ceridian Corp.* | 4,619,812 | |||
| 90,700 | Convergys Corp.* | 3,548,638 | |||
| 82,800 | Dyax Corp.* | 2,898,000 | |||
| 83,200 | Fiserv, Inc.* | 4,508,400 | |||
| 165,700 | SunGard Data Systems, Inc.* | 5,965,200 | |||
| 153,400 | Valassis Communications, Inc.* | 4,429,425 | |||
| 29,514,275 | |||||
|
Shares |
Description | Value | |||
|---|---|---|---|---|---|
| Common Stocks – (continued) | |||||
| Internet – 3.8% | |||||
| 37,000 | DoubleClick, Inc.* | $ 1,505,437 | |||
| 23,480 | E.piphany, Inc.* | 2,441,920 | |||
| 140,800 | Intertrust Technologies Corp.* | 2,261,600 | |||
| 37,000 | Interwoven, Inc.* | 3,552,000 | |||
| 9,600 | VeriSign, Inc.* | 1,909,200 | |||
| 11,670,157 | |||||
| Life Insurance – 2.4% | |||||
| 132,600 | MetLife, Inc.* | 3,223,838 | |||
| 106,400 | Nationwide Financial Services, Inc. | 4,242,700 | |||
| 7,466,538 | |||||
| Media – 5.5% | |||||
| 32,100 | Cablevision Systems Corp.* | 2,158,725 | |||
| 94,700 | Emmis Communications Corp.* | 3,107,344 | |||
| 85,300 | Entravision Communications
Corp.* |
1,690,006 | |||
| 281,500 | Insight Communications, Inc.* | 5,014,219 | |||
| 59,300 | Univision Communications, Inc.* | 2,616,612 | |||
| 82,000 | Westwood One, Inc.* | 2,280,625 | |||
| 16,867,531 | |||||
| Medical Products – 1.6% | |||||
| 53,400 | Bausch & Lomb, Inc. | 1,909,050 | |||
| 56,100 | deCODE GENETICS, Inc.* | 1,549,763 | |||
| 100,000 | Owens & Minor, Inc. | 1,531,250 | |||
| 4,990,063 | |||||
| Medical Providers – 1.4% | |||||
| 374,000 | Hooper Holmes, Inc. | 4,371,125 | |||
| Oil Services – 2.3% | |||||
| 80,200 | Nabors Industries, Inc.* | 3,814,513 | |||
| 67,200 | Weatherford International | 3,154,200 | |||
| 6,968,713 | |||||
| Property Insurance – 3.1% | |||||
| 88,500 | Ambac Financial Group, Inc. | 5,719,312 | |||
| 48,100 | Loews Corp. | 3,893,094 | |||
| 9,612,406 | |||||
| Security/Asset Management – 1.4% | |||||
| 27,600 | Legg Mason, Inc. | 1,455,900 | |||
| 135,800 | TD Waterhouse Group, Inc.* | 2,749,950 | |||
| 4,205,850 | |||||
| Semiconductors – 1.7% | |||||
| 38,600 | Microchip Technology, Inc.* | 2,627,212 | |||
| 30,300 | Vitesse Semiconductor Corp.* | 2,691,019 | |||
| 5,318,231 | |||||
| Specialty Retail – 3.1% | |||||
| 61,800 | 99 Cents Only Stores* | 2,777,137 | |||
| 57,900 | Avnet, Inc. | 3,466,762 | |||
| 65,500 | Grainger W.W., Inc. | 1,891,313 | |||
|
Shares |
Description | Value | |||
|---|---|---|---|---|---|
| Common Stocks – (continued) | |||||
| Specialty Retail – (continued) | |||||
| 21,300 | RadioShack Corp. | $ 1,256,700 | |||
| 9,391,912 | |||||
| Telephone – 3.5% | |||||
| 144,700 | Broadwing, Inc. | 4,042,556 | |||
| 145,600 | CenturyTel, Inc. | 4,195,100 | |||
| 145,900 | Citizens Communications Co.* | 2,379,994 | |||
| 10,617,650 | |||||
| Wireless – 4.9% | |||||
| 167,100 | Crown Castle International Corp.* | 5,796,281 | |||
| 199,500 | Dobson Communications Corp.* | 4,301,719 | |||
| 88,900 | Triton PCS Holdings, Inc.* | 4,922,837 | |||
| 15,020,837 | |||||
| TOTAL COMMON STOCKS | |||||
| (Cost $248,471,799) | $289,068,386 | ||||
| Principal
Amount |
Interest
Rate |
Maturity
Date |
Value | |||||
|---|---|---|---|---|---|---|---|---|
| Repurchase Agreement – 6.3% | ||||||||
| Joint Repurchase Agreement Account II Ù | ||||||||
| $19,400,000 | 6.66 | % | 09/01/2000 | $ 19,400,000 | ||||
| TOTAL REPURCHASE AGREEMENT | ||||||||
| (Cost $19,400,000) | $ 19,400,000 | |||||||
| TOTAL INVESTMENTS | ||||||||
| (Cost $267,871,799) | $308,468,386 | |||||||
*
|
Non-income producing security.
|
Ù
|
Joint repurchase agreement was entered into on August 31, 2000.
|
| The percentage shown for each investment category reflects the value of investments in that category as a percentage of total net
assets.
|
| Assets: | |||
| Investment in securities, at value (identified cost $267,871,799) | $308,468,386 | ||
| Cash | 17,249 | ||
| Receivables: | |||
| Fund shares sold | 9,068,660 | ||
| Dividends and interest | 117,368 | ||
| Reimbursement from adviser | 35,571 | ||
| Other assets | 96 | ||
| Total assets | 317,707,330 | ||
| Liabilities: | |||
| Payables: | |||
| Investment securities purchased | 10,073,030 | ||
| Amounts owed to affiliates | 359,252 | ||
| Fund shares repurchased | 185,320 | ||
| Accrued expenses and other liabilities | 79,621 | ||
| Total liabilities | 10,697,223 | ||
| Net Assets: | |||
| Paid-in capital | 258,972,261 | ||
| Accumulated net realized gain on investment transactions | 7,441,259 | ||
| Net unrealized gain on investments | 40,596,587 | ||
| NET ASSETS | $307,010,107 | ||
| Net asset value, offering and redemption price per share: (a) | |||
| Class A | $19.50 | ||
| Class B | $19.45 | ||
| Class C | $19.31 | ||
| Institutional | $19.59 | ||
| Service | $19.45 | ||
| Shares outstanding: | |||
| Class A | 9,651,763 | ||
| Class B | 2,162,947 | ||
| Class C | 1,389,118 | ||
| Institutional | 2,548,325 | ||
| Service | 153 | ||
| Total shares outstanding, $.001 par value (unlimited number of shares authorized) | 15,752,306 | ||
(a)
|
Maximum public offering price per share (NAV per share multiplied by 1.0582) for Class A shares is $20.63. At redemption, Class B
and Class C shares may be subject to a contingent deferred sales charge, assessed on the amount equal to the lesser of the current net asset value or the original purchase price of the shares.
|
| Investment income: | |||
| Dividends | $ 504,212 | ||
| Interest | 465,831 | ||
| Total income | 970,043 | ||
| Expenses: | |||
| Management fees | 1,102,761 | ||
| Distribution and Service fees (a) | 438,870 | ||
| Transfer Agent fees (b) | 187,096 | ||
| Professional fees | 48,433 | ||
| Registration fees | 46,759 | ||
| Custodian fees | 17,248 | ||
| Trustee fees | 7,508 | ||
| Other | 65,561 | ||
| Total expenses | 1,914,236 | ||
| Less — expense reductions | (97,907 | ) | |
| Net expenses | 1,816,329 | ||
| NET INVESTMENT LOSS | (846,286 | ) | |
| Realized and unrealized gain on investment transactions: | |||
| Net realized gain from investment transactions | 8,337,861 | ||
| Net change in unrealized loss on investments | 41,373,281 | ||
| Net realized and unrealized gain on investments | 49,711,142 | ||
| NET INCREASE IN NET ASSETS RESULTING FROM OPERATIONS | $48,864,856 | ||
(a)
|
Class A, Class B and Class C had Distribution and Service fees of $171,456, $164,373 and $103,041, respectively.
|
(b)
|
Class A, Class B, Class C, Institutional Class and Service Class had Transfer Agent fees of $130,303, $31,231, $19,578, $5,931 and
$53, respectively.
|
| From operations: | ||||
| Net investment loss | $ (846,286 | ) | ||
| Net realized gain on investment transactions | 8,337,861 | |||
| Net change in unrealized loss on investments | 41,373,281 | |||
| Net increase in net assets resulting from operations | 48,864,856 | |||
| Distributions to shareholders: | ||||
| From net investment income | ||||
| Class A Shares | (1,699 | ) | ||
| Class B Shares | (381 | ) | ||
| Class C Shares | (280 | ) | ||
| Institutional Shares | (2,161 | ) | ||
| From net realized gain on investment transactions | ||||
| Class A Shares | (264,562 | ) | ||
| Class B Shares | (52,339 | ) | ||
| Class C Shares | (26,174 | ) | ||
| Institutional Shares | (129,481 | ) | ||
| Service Shares | (35 | ) | ||
| Total distributions to shareholders | (477,112 | ) | ||
| From share transactions: | ||||
| Proceeds from sales of shares | 269,642,227 | |||
| Reinvestment of dividends and distributions | 470,028 | |||
| Cost of shares repurchased | (25,694,467 | ) | ||
| Net increase in net assets resulting from share transactions | 244,417,788 | |||
| TOTAL INCREASE | 292,805,532 | |||
| Net assets: | ||||
| Beginning of year | $ 14,204,575 | |||
| End of year | $307,010,107 | |||
| Accumulated net investment loss | $ — | |||
| From operations: | ||||
| Net investment income | $ 2,304 | |||
| Net realized gain from investment transactions | 422,322 | |||
| Net change in unrealized loss on investments | (776,694 | ) | ||
| Net decrease in net assets resulting from operations | (352,068 | ) | ||
| From share transactions: | ||||
| Proceeds from sales of shares | 14,846,644 | |||
| Cost of shares repurchased | (290,001 | ) | ||
| Net increase in net assets resulting from share transactions | 14,556,643 | |||
| TOTAL INCREASE | 14,204,575 | |||
| Net assets: | ||||
| Beginning of period | — | |||
| End of period | $14,204,575 | |||
| Accumulated undistributed net investment income | $ 4,476 | |||
(a)
|
Commencement date of operations was May 24, 1999 for all share classes.
|
| 1. ORGANIZATION
|
| Goldman Sachs Trust (the “Trust”) is a Delaware business trust registered under the Investment Company Act of 1940 (as
amended) as an open-end management investment company. The Trust includes the Goldman Sachs Growth Opportunities Fund (the “Fund”). The Fund is a diversified portfolio offering five classes of shares — Class A, Class B, Class C,
Institutional and Service.
|
| 2. SIGNIFICANT ACCOUNTING POLICIES
|
| The following is a summary of the significant accounting policies consistently followed by the Fund. The preparation of financial
statements in conformity with generally accepted accounting principles requires management to make estimates and assumptions that may affect the reported amounts. Actual results could differ from those estimates.
|
| A. Investment Valuation — Investments in
securities traded on a U.S. or foreign securities exchange or the NASDAQ system are valued daily at their last sale price on the principal exchange on which they are traded. If no sale occurs, securities are valued at the last bid price. Debt securities
are valued at prices supplied by independent pricing services, broker/dealer-supplied valuations or matrix pricing systems. Unlisted equity and debt securities for which market quotations are available are valued at the last sale price on valuation date,
or if no sale occurs, at the last bid price. Short-term debt obligations maturing in sixty days or less are valued at amortized cost, which approximates market value. Securities for which quotations are not readily available are valued at fair value using
methods approved by the Board of Trustees of the Trust.
|
| B. Security Transactions and Investment Income — Security transactions are recorded as of the trade date. Realized gains and losses on sales of portfolio securities are calculated using the identified-cost basis. Dividend income is recorded on the ex-dividend date net of foreign withholding taxes where
applicable. Dividends for which the Fund has the choice to receive either cash or stock are recognized as investment income in an amount equal to the cash dividend. Interest income is recorded on the basis of interest accrued, premium amortized and
discount earned.
|
| Net investment income (other than class-specific expenses) and unrealized and
realized gains or losses are allocated daily to each class of shares of the Fund based upon the relative proportion of net assets of each class.
|
| C. Foreign Currency Translations — The
books and records of the Fund are maintained in U.S. dollars. Amounts denominated in foreign currencies are translated into U.S. dollars on the following basis: (i) investment valuations, foreign currency and other assets and liabilities initially
expressed in foreign currencies are converted each business day into U.S. dollars based upon current exchange rates; and (ii) purchases and sales of foreign investments, income and expenses are converted into U.S. dollars based upon currency exchange
rates prevailing on the respective dates of such transactions.
|
| Net realized and unrealized gain (loss) on foreign currency transactions will
represent: (i) foreign exchange gains and losses from the sale and holdings of foreign currencies; (ii) currency gains and losses between trade date and settlement date on investment securities transactions and forward exchange contracts; and (iii) gains
and losses from the difference between amounts of dividends and interest recorded and the amounts actually received.
|
| D. Segregation Transactions — The Fund may
enter into certain derivative transactions to seek to increase total return. Forward foreign currency exchange contracts, futures contracts, written options, when-issued securities and forward commitments represent examples of such transactions. As a
result of entering into these transactions, the Fund is required to segregate liquid assets on the accounting records equal to or greater than the market value of the corresponding transactions.
|
| E. Federal Taxes — It is the Fund’s
policy to comply with the requirements of the Internal Revenue Code applicable to regulated investment companies and to distribute each year substantially all of its investment company taxable income and
2. SIGNIFICANT ACCOUNTING POLICIES (continued)
|
| capital gains to its shareholders. Accordingly, no federal tax provision is required. Income and capital gains distributions, if
any, are declared and paid annually.
|
| The characterization of distributions to shareholders for financial reporting
purposes is determined in accordance with income tax rules. Therefore, the source of the Fund’s distributions may be shown in the accompanying financial statements as either from or in excess of net investment income or net realized gain on
investment transactions, or from paid-in capital, depending on the type of book/tax differences that may exist.
|
| At August 31, 2000, the aggregate cost of portfolio securities for federal income
tax purposes is $268,041,676. Accordingly, the gross unrealized gain on investments was $47,622,180 and the gross unrealized loss on investments was $7,195,470 resulting in a net unrealized gain of $40,426,710.
|
| F. Expenses — Expenses incurred by the
Trust that do not specifically relate to an individual Fund of the Trust are allocated to the Funds on a straight-line or pro rata basis depending upon the nature of the expense.
|
| Class A, Class B and Class C Shares bear all expenses and fees relating to their
respective Distribution and Service Plans. Shareholders of Service Shares bear all expenses and fees paid to service organizations. Each class of shares of the Fund separately bears its respective class-specific Transfer Agency fees.
|
| G. Repurchase Agreements — Repurchase
agreements involve the purchase of securities subject to the seller’s agreement to repurchase them at a mutually agreed upon date and place. During the term of a repurchase agreement, the value of the underlying securities, including accrued
interest, is required to equal or exceed the value of the repurchase agreement. The underlying securities for all repurchase agreements are held in safekeeping at the Fund’s custodian.
|
| 3. AGREEMENTS
|
| Pursuant to the Investment Management Agreement (the “Agreement”), Goldman Sachs Asset Management (“GSAM”), a
unit of the Investment Management Division of Goldman, Sachs & Co. (“Goldman Sachs”), serves as the investment adviser to the Fund. Under the Agreement, the adviser, subject to the general supervision of the Trust’s Board of Trustees,
manages the Fund’s portfolio. As compensation for the services rendered pursuant to the Agreement, the assumption of the expenses related thereto and administering the Fund’s business affairs, including providing facilities, the adviser is
entitled to a fee, computed daily and payable monthly, at an annual rate equal to 1.00% of the average daily net assets of the Fund.
|
| The adviser has voluntarily agreed to limit certain “Other Expenses” of
the Fund (excluding Management fees, Distribution and Service fees, Transfer Agent fees, taxes, interest, brokerage, litigation, Service Share fees, indemnification costs and other extraordinary expenses) to the extent such expenses exceed, on an annual
basis, 0.11% (0.00% prior to May 1, 2000) of the average daily net assets of the Fund. For the year ended August 31, 2000, the adviser reimbursed approximately $90,000. In addition, the Fund has entered into certain offset arrangements with the custodian
resulting in a reduction in the Fund’s expenses. For the year ended August 31, 2000, custody fees were reduced by approximately $8,000.
|
| The Trust, on behalf of the Fund, has adopted Distribution and Service Plans.
Under the Distribution and Service Plans, Goldman Sachs and/or authorized dealers are entitled to a monthly fee from the Fund for distribution and shareholder maintenance services equal, on an annual basis, to 0.25%, 1.00% and 1.00% of the Fund’s
average daily net assets attributable to Class A, Class B and Class C Shares, respectively.
|
| Goldman Sachs serves as the distributor of shares of the Fund pursuant to
Distribution Agreements. Goldman Sachs may receive a portion of the Class A sales load and Class B and Class C contingent deferred sales charges and has advised the Fund that it retained approximately $1,218,000 for the year ended August 31, 2000.
|
| 3. AGREEMENTS (continued)
|
| Goldman Sachs also serves as the Transfer Agent of the Fund for a fee. The fees
charged for such transfer agency services are calculated daily and payable monthly at an annual rate as follows: 0.19% of the average daily net assets for Class A, Class B and Class C Shares and 0.04% of the average daily net assets for Institutional and
Service Shares.
|
| The Trust, on behalf of the Fund, has adopted a Service Plan. This Plan allows for
Service Shares to compensate service organizations for providing varying levels of account administration and shareholder liaison services to their customers who are beneficial owners of such shares. The Service Plan provides for compensation to the
service organizations in an amount up to 0.50% (on an annualized basis), of the average daily net asset value of the Service Shares.
|
| As of August 31, 2000, the amounts owed to affiliates were approximately $232,000,
$88,000, and $39,000 for Management, Distribution and Service, and Transfer Agent fees, respectively.
|
| 4. PORTFOLIO SECURITIES TRANSACTIONS
|
| The cost of purchases and proceeds of sales and maturities of securities (excluding short-term investments) for the year ended
August 31, 2000, were $304,416,103 and $78,181,199, respectively.
|
| For the year ended August 31, 2000, Goldman Sachs earned approximately $19,000 of
brokerage commissions for portfolio transactions.
|
| Futures Contracts — The Fund may enter into futures transactions to hedge against changes in interest rates, securities prices, currency exchange rates or to seek to increase total return. Upon entering into a futures contract, the Fund is required to deposit with a broker
or the Fund’s custodian bank an amount of cash or securities equal to the minimum “initial margin” requirement of the associated futures exchange. Subsequent payments for futures contracts (“variation margin”) are paid or received
by the Fund daily, depending on the daily fluctuations in the value of the contracts, and are recorded for financial reporting purposes as unrealized gains or losses. When contracts are closed, the Fund realizes a gain or loss which is reported in the
Statement of Operations.
|
| The use of futures contracts involve, to varying degrees, elements of market risk
which may exceed the amounts recognized in the Statement of Assets and Liabilities. Changes in the value of the futures contract may not directly correlate with changes in the value of the underlying securities. This risk may decrease the effectiveness of
the Fund’s hedging strategies and potentially result in a loss. At August 31, 2000, there were no open futures contracts.
|
| Option Accounting Principles — When the Fund writes call or put options, an amount equal to the premium received is recorded as an asset and as an equivalent liability. The amount of the liability is subsequently marked-to-market to reflect the current market value of the option
written. When a written option expires on its stipulated expiration date or the Fund enters into a closing purchase transaction, the Fund realizes a gain or loss without regard to any unrealized gain or loss on the underlying security, and the liability
related to such option is extinguished. When a written call option is exercised, the Fund realizes a gain or loss from the sale of the underlying security, and the proceeds of the sale are increased by the premium originally received. When a written put
option is exercised, the amount of the premium originally received will reduce the cost of the security which the Fund purchases upon exercise. There is a risk of loss from a change in value of such options which may exceed the related premiums received.
|
| Upon the purchase of a call option or a protective put option by the Fund, the
premium paid is recorded as an investment and subsequently marked-to-market to reflect the current market value of the option. If an option which the Fund has purchased expires on the stipulated expiration date, the Fund will realize a loss in the amount
of the cost of the option. If the Fund enters into a closing sale transaction, the Fund will realize a gain or loss, depending on whether the sale proceeds for the closing sale transaction are greater or less than the cost of the option. If the Fund
exercises a purchased put option, the Fund will realize a gain or loss from the sale of the underlying security, and the proceeds from such sale will be decreased by the premium originally paid. If the Fund exercises a purchased call option, the cost of
the security which the Fund purchases
|
| upon exercise will be increased by the premium originally paid. At August 31, 2000, there were no open written option contracts.
|
| 5. LINE OF CREDIT FACILITY
|
| Effective May 31, 2000, the Fund participates in a $350,000,000 committed, unsecured revolving line of credit facility.
|
| Prior thereto, the Fund participated in a $250,000,000 uncommitted and a $250,000,000 committed, unsecured revolving line of
credit facility. Under the most restrictive arrangement, the Fund must own securities having a market value in excess of 400% of the total bank borrowings. This facility is to be used solely for temporary or emergency purposes. The interest rate on
borrowings is based on the Federal Funds rate. The committed facility also requires a fee to be paid by the Fund based on the amount of the commitment. During the year ended August 31, 2000, the Fund did not have any borrowings under any of these facilities
.
|
| 6. JOINT REPURCHASE AGREEMENT ACCOUNT
|
| The Fund, together with other registered investment companies having management agreements with GSAM or its affiliates, transfers
uninvested cash into joint accounts, the daily aggregate balance of which is invested in one or more repurchase agreements.
|
| At August 31, 2000, the Fund had an undivided interest in the repurchase
agreements in the joint account which equaled $19,400,000 in principal amount. At August 31, 2000, the following repurchase agreements held in this joint account were fully collateralized by Federal Agency obligations:
|
| Repurchase Agreements | Principal
Amount |
Interest
Rate |
Maturity
Date |
Amortized
Cost |
Maturity
Value |
|||||||
|---|---|---|---|---|---|---|---|---|---|---|---|---|
| ABN/AMRO, Inc. | $ 814,100,000 | 6.66 | % | 09/01/2000 | $ 814,100,000 | $ 814,250,608 | ||||||
| Banc of America Securities LLC | 900,000,000 | 6.67 | 09/01/2000 | 900,000,000 | 900,166,750 | |||||||
| Barclays Capital, Inc. | 500,000,000 | 6.67 | 09/01/2000 | 500,000,000 | 500,092,639 | |||||||
| Bear Stearns Companies, Inc. | 300,000,000 | 6.67 | 09/01/2000 | 300,000,000 | 300,055,583 | |||||||
| Chase Securities, Inc. | 450,000,000 | 6.67 | 09/01/2000 | 450,000,000 | 450,083,375 | |||||||
| Donaldson, Lufkin & Jenrette, Inc. | 1,000,000,000 | 6.67 | 09/01/2000 | 1,000,000,000 | 1,000,185,278 | |||||||
| J.P. Morgan & Co., Inc. | 800,000,000 | 6.65 | 09/01/2000 | 800,000,000 | 800,147,778 | |||||||
| Morgan Stanley Dean Witter & Co. | 750,000,000 | 6.65 | 09/01/2000 | 750,000,000 | 750,138,542 | |||||||
| Morgan Stanley Dean Witter & Co. | 300,000,000 | 6.60 | 09/01/2000 | 300,000,000 | 300,055,000 | |||||||
| UBS Warburg LLC | 800,000,000 | 6.65 | 09/01/2000 | 800,000,000 | 800,147,778 | |||||||
| TOTAL JOINT REPURCHASE AGREEMENT ACCOUNT II | $6,614,100,000 | $6,615,323,331 | ||||||||||
| 7. CHANGE IN INDEPENDENT ACCOUNTANTS
|
| On October 26, 1999, the Board of Trustees of the Fund upon the recommendation of the Board’s audit committee, determined not
to retain Arthur Andersen LLP and approved a change of the Fund’s independent accountants to PricewaterhouseCoopers LLP. For the period ended August 31, 1999, Arthur Andersen LLP’s audit reports contained no adverse opinion or disclaimer of
opinion; nor were their reports qualified or modified as to uncertainty, audit scope, or accounting principles. Further, there were no disagreements between the Fund and Arthur Andersen LLP on accounting principles or practices, financial statement
disclosure or audit scope or procedure, which if not resolved to the satisfaction of Arthur Andersen LLP would have caused them to make reference to the disagreement in their report.
|
| 8. CERTAIN RECLASSIFICATIONS
|
| In accordance with AICPA Statement of Position 93-2, the Fund has reclassified $846,331 and $2 from accumulated net realized gain
on investment transactions to accumulated net investment loss and paid-in capital, respectively. These reclassifications have no impact on the net asset value of the Fund and are designed to present the Fund’s capital accounts on a tax basis.
Reclassifications result primarily from the difference in the tax treatment of foreign currency, net operating losses and organization costs.
|
| Goldman Sachs Trust — Growth Opportunities Fund — Tax Information (unaudited)
|
| For the year ended August 31, 2000, 2.47% of the dividends paid from net investment
company taxable income by the Growth Opportunities Fund, qualify for the dividends received deduction available for corporations.
|
| 9. SUMMARY OF SHARE TRANSACTIONS
|
| Share activity is as follows:
|
| For the Year Ended
August 31, 2000 |
For the Period
Ended August 31, 1999 (a) |
||||||||||||
|---|---|---|---|---|---|---|---|---|---|---|---|---|---|
| Shares | Dollars | Shares | Dollars | ||||||||||
| Class A Shares | |||||||||||||
| Shares sold | 9,546,230 | $163,309,769 | 837,654 | $ 8,891,707 | |||||||||
| Reinvestment of dividends and distributions | 18,793 | 263,625 | — | — | |||||||||
| Shares repurchased | (723,140 | ) | (12,932,520 | ) | (27,774 | ) | (289,978 | ) | |||||
| 8,841,883 | 150,640,874 | 809,880 | 8,601,729 | ||||||||||
| Class B Shares | |||||||||||||
| Shares sold | 2,216,674 | 36,648,725 | 51,071 | 529,423 | |||||||||
| Reinvestment of dividends and distributions | 3,548 | 49,742 | — | — | |||||||||
| Shares repurchased | (108,346 | ) | (1,884,792 | ) | — | (2 | ) | ||||||
| 2,111,876 | 34,813,675 | 51,071 | 529,421 | ||||||||||
| Class C Shares | |||||||||||||
| Shares sold | 1,499,042 | 24,849,781 | 25,390 | 263,994 | |||||||||
| Reinvestment of dividends and distributions | 1,796 | 24,984 | — | — | |||||||||
| Shares repurchased | (137,110 | ) | (2,322,043 | ) | — | (1 | ) | ||||||
| 1,363,728 | 22,552,722 | 25,390 | 263,993 | ||||||||||
| Institutional Shares | |||||||||||||
| Shares sold | 2,559,976 | 44,573,678 | 515,358 | 5,160,020 | |||||||||
| Reinvestment of dividends and distributions | 9,403 | 131,642 | — | — | |||||||||
| Shares repurchased | (536,410 | ) | (8,258,792 | ) | (2 | ) | (20 | ) | |||||
| 2,032,969 | 36,446,528 | 515,356 | 5,160,000 | ||||||||||
| Service Shares | |||||||||||||
| Shares sold | 16,250 | 260,274 | 150 | 1,500 | |||||||||
| Reinvestment of dividends and distributions | 3 | 35 | — | — | |||||||||
| Shares repurchased | (16,250 | ) | (296,320 | ) | — | — | |||||||
| 3 | (36,011 | ) | 150 | 1,500 | |||||||||
| NET INCREASE | 14,350,459 | $244,417,788 | 1,401,847 | $14,556,643 | |||||||||
(a)
|
Commencement date of operations was May 24, 1999 for all share classes.
|
| Net asset
value, beginning of period |
Income from
investment operations |
Total
from investment operations |
Distributions
to shareholders |
|||||||||
|---|---|---|---|---|---|---|---|---|---|---|---|---|
| Net
investment income (loss) |
Net realized
and unrealized gain |
From net
realized gains |
||||||||||
| FOR THE YEAR ENDED AUGUST 31, | ||||||||||||
| 2000 - Class A Shares | $10.13 | $(0.11 | ) (c) | $9.71 | $9.60 | $(0.23 | ) | |||||
| 2000 - Class B Shares | 10.18 | (0.24 | ) (c) | 9.74 | 9.50 | (0.23 | ) | |||||
| 2000 - Class C Shares | 10.10 | (0.24 | ) (c) | 9.68 | 9.44 | (0.23 | ) | |||||
| 2000 - Institutional Shares | 10.13 | (0.04 | ) (c) | 9.73 | 9.69 | (0.23 | ) | |||||
| 2000 - Service Shares | 10.12 | (0.12 | ) (c) | 9.68 | 9.56 | (0.23 | ) | |||||
| FOR THE PERIOD ENDED AUGUST 31, | ||||||||||||
| 1999 - Class A Shares (commenced May 24) | 10.00 | (0.01 | ) (c) | 0.14 | 0.13 | — | ||||||
| 1999 - Class B Shares (commenced May 24) | 10.00 | (0.03 | ) (c) | 0.21 | 0.18 | — | ||||||
| 1999 - Class C Shares (commenced May 24) | 10.00 | (0.03 | ) (c) | 0.13 | 0.10 | — | ||||||
| 1999 - Institutional Shares (commenced May 24) | 10.00 | 0.01 | 0.12 | 0.13 | — | |||||||
| 1999 - Service Shares (commenced May 24) | 10.00 | — | 0.12 | 0.12 | — | |||||||
(a)
|
Assumes investment at the net asset value at the beginning of the period, reinvestment of all dividends and distributions, a
complete redemption of the investment at the net asset value at the end of the period and no sales or redemption charges. Total return would be reduced if a sales or redemption charge were taken into account. Total returns for periods less than one full
year are not annualized.
|
(b)
|
Annualized.
|
(c)
|
Calculated based on the average shares outstanding methodology.
|
|
Ratios assuming no expense reductions |
||||||||||||||||||||
|---|---|---|---|---|---|---|---|---|---|---|---|---|---|---|---|---|---|---|---|---|
| Net asset
value, end of period |
Total
return (a) |
Net assets
at end of period (in 000s) |
Ratio of
net expenses to average net assets |
Ratio of
net investment income (loss) to average net assets |
Ratio of expenses to
average net assets |
Ratio of
net investment loss to average net assets |
Portfolio
turnover rate |
|||||||||||||
| $19.50 | 95.73 | % | $188,199 | 1.52 | % | (0.64 | )% | 1.61 | % | (0.73 | )% | 73.35 | % | |||||||
| 19.45 | 94.27 | 42,061 | 2.27 | (1.38 | ) | 2.36 | (1.47 | ) | 73.35 | |||||||||||
| 19.31 | 94.43 | 26,826 | 2.27 | (1.38 | ) | 2.36 | (1.47 | ) | 73.35 | |||||||||||
| 19.59 | 96.67 | 49,921 | 1.12 | (0.23 | ) | 1.21 | (0.32 | ) | 73.35 | |||||||||||
| 19.45 | 95.41 | 3 | 1.62 | (0.69 | ) | 1.71 | (0.78 | ) | 73.35 | |||||||||||
| 10.13 | 1.30 | 8,204 | 1.44 | (b) | (0.27 | ) (b) | 14.15 | (b) | (12.98 | ) (b) | 26.53 | |||||||||
| 10.18 | 1.80 | 520 | 2.19 | (b) | (1.04 | ) (b) | 14.90 | (b) | (13.75 | ) (b) | 26.53 | |||||||||
| 10.10 | 1.00 | 256 | 2.19 | (b) | (1.12 | ) (b) | 14.90 | (b) | (13.83 | ) (b) | 26.53 | |||||||||
| 10.13 | 1.30 | 5,223 | 1.04 | (b) | 0.39 | (b) | 13.75 | (b) | (12.32 | ) (b) | 26.53 | |||||||||
| 10.12 | 1.20 | 2 | 1.54 | (b) | 0.03 | (b) | 14.25 | (b) | (12.68 | ) (b) | 26.53 | |||||||||
| To the Shareholders and Board of Trustees of
|
| Goldman Sachs Trust — Growth Opportunities Fund:
|
| In our opinion, the accompanying statement of assets and liabilities, including the statement of investments, and the related
statements of operations and of changes in net assets and the financial highlights present fairly, in all material respects, the financial position of Goldman Sachs Growth Opportunities Fund (“the Fund”), one of the portfolios constituting
Goldman Sachs Trust, at August 31, 2000, the results of its operations, the changes in its net assets and the financial highlights for the year then ended, in conformity with accounting principles generally accepted in the United States of America. These
financial statements and financial highlights (hereafter referred to as “financial statements”) are the responsibility of the Fund’s management; our responsibility is to express an opinion on these financial statements based on our audit.
We conducted our audit of these financial statements in accordance with auditing standards generally accepted in the United States of America, which require that we plan and perform the audit to obtain reasonable assurance about whether the financial
statements are free of material misstatement. An audit includes examining, on a test basis, evidence supporting the amounts and disclosures in the financial statements, assessing the accounting principles used and significant estimates made by management,
and evaluating the overall financial statement presentation. We believe that our audit, which included confirmation of securities at August 31, 2000 by correspondence with the custodian and brokers, provides a reasonable basis for our opinion. The
statement of changes in net assets and the financial highlights of the Fund for the period ended August 31, 1999, were audited by other independent accountants whose report dated October 8, 1999 expressed an unqualified opinion thereon.
|
| PricewaterhouseCoopers LLP
|
| Boston, Massachusetts
|
| October 23, 2000
|
GOLDMAN SACHS FUND PROFILE
Goldman Sachs Growth Opportunities Fund
An Investment Idea for the Long Term
Historically, stocks have demonstrated greater potential to build wealth over the long term than most other types of investments.
Goldman Sachs Growth Opportunities Fund provides investors access to the benefits associated with equity investing. The Fund seeks long-term capital growth and growth of income, primarily through equity securities that, in management’s view, offer favorable capital appreciation and/or dividend-paying ability.
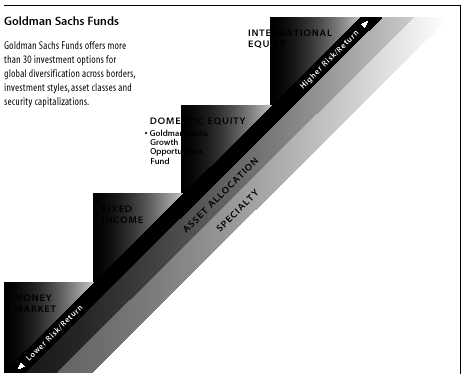
Target Your Needs
The Goldman Sachs Growth Opportunities Fund has a distinct investment objective and a defined place on the risk/return spectrum. As your investment objectives change, you can exchange shares within the Goldman Sachs Funds family without an additional charge.* (Please note: in general, greater returns are associated with greater risk.)
For More Information
To learn more about the Goldman Sachs Growth Opportunities Fund and other Goldman Sachs Funds, call your investment professional today.
*The exchange privilege is subject to termination and its terms are subject to change.
|
|